UNITED STATES
SECURITIES AND EXCHANGE COMMISSION
Washington, D.C. 20549
FORM N-CSR
CERTIFIED SHAREHOLDER REPORT OF REGISTERED
MANAGEMENT INVESTMENT COMPANIES
Investment Company Act file number | 811-08764 | |||||||
| ||||||||
PACE® Select Advisors Trust | ||||||||
(Exact name of registrant as specified in charter) | ||||||||
| ||||||||
1285 Avenue of the Americas, New York, New York |
| 10019-6028 | ||||||
(Address of principal executive offices) |
| (Zip code) | ||||||
| ||||||||
Mark F. Kemper, Esq. UBS Asset Management 1285 Avenue of the Americas New York, NY 10019-6028 | ||||||||
(Name and address of agent for service) | ||||||||
Copy to: Stephen H. Bier, Esq. Dechert LLP 1095 Avenue of the Americas New York, NY 10036-6797
| ||||||||
Registrant’s telephone number, including area code: | 212-821 3000 |
| ||||||
| ||||||||
Date of fiscal year end: | July 31 |
| ||||||
| ||||||||
Date of reporting period: | July 31, 2018 |
| ||||||
Item 1. Reports to Stockholders.

PACE® Select Advisors Trust
Annual Report | July 31, 2018
Table of contents | Page | ||||||
Introduction | 3 | ||||||
Portfolio Advisor's and Subadvisors' commentaries and Portfolios of investments | |||||||
PACE® Government Money Market Investments | 5 | ||||||
PACE® Mortgage-Backed Securities Fixed Income Investments | 10 | ||||||
PACE® Intermediate Fixed Income Investments | 31 | ||||||
PACE® Strategic Fixed Income Investments | 62 | ||||||
PACE® Municipal Fixed Income Investments | 101 | ||||||
PACE® Global Fixed Income Investments | 112 | ||||||
PACE® High Yield Investments | 128 | ||||||
PACE® Large Co Value Equity Investments | 157 | ||||||
PACE® Large Co Growth Equity Investments | 171 | ||||||
PACE® Small/Medium Co Value Equity Investments | 179 | ||||||
PACE® Small/Medium Co Growth Equity Investments | 188 | ||||||
PACE® International Equity Investments | 197 | ||||||
PACE® International Emerging Markets Equity Investments | 212 | ||||||
PACE® Global Real Estate Securities Investments | 222 | ||||||
PACE® Alternative Strategies Investments | 230 | ||||||
Understanding your Portfolio's expenses | 275 | ||||||
Statement of assets and liabilities | 280 | ||||||
Statement of operations | 288 | ||||||
Statement of changes in net assets | 292 | ||||||
Statement of cash flows | 298 | ||||||
Financial highlights | 301 | ||||||
Notes to financial statements | 330 | ||||||
Report of independent registered public accounting firm | 382 | ||||||
Tax information | 383 | ||||||
General information | 384 | ||||||
| Board approvals of investment management and administration agreement and subadvisory agreements | 385 | ||||||
Supplemental information, trustees and officers | 396 | ||||||
1
This page intentionally left blank.
2
Introduction
September 19, 2018
Dear PACE Shareholder,
We are pleased to provide you with the annual report for the PACE portfolios (the "Portfolios"), comprising the PACE Select Advisors Trust. This report includes summaries of the performance of each Portfolio, as well as commentaries from the investment advisor and subadvisors regarding the events that affected Portfolio performance during the 12 months ended July 31, 2018 (the "reporting period"). Please note that the opinions of the subadvisors do not necessarily represent those of UBS Asset Management (Americas) Inc.
The global economic expansion accelerates
The lengthy US economic expansion continued during the reporting period. Looking back, the US Commerce Department reported that gross domestic product ("GDP") grew at a revised 2.8% seasonally adjusted annualized rate during the third quarter of 2017. GDP growth then moderated to a revised 2.3% and 2.2% during the fourth quarter of 2017 and the first quarter of 2018, respectively. Finally, second quarter 2018 GDP grew at a 4.2% rate based on the US Commerce Department's second estimate.1 This represented the strongest pace since the third quarter of 2014.
As expected, the US Federal Reserve Board (the "Fed") continued to raise interest rates during the reporting period. Specifically, the Fed raised rates in December 2017, March 2018 and June 2018. With its last rate hike, the federal funds rate2 moved to a range between 1.75% and 2.00%. In addition, starting in October 2017, the Fed began reducing its balance sheet. For the remainder of 2018, the Fed currently anticipates making two additional 0.25% rate hikes, while continuing to pare its balance sheet.
From a global perspective, in its July 2018 World Economic Outlook Update, the International Monetary Fund ("IMF") said, "Global growth is projected to reach 3.9 percent in 2018 and 2019...but...the balance of risks has shifted further to the downside, including in the short term. The recently announced and anticipated tariff increases by the United States and retaliatory measures by trading partners have increased the likelihood of escalating and sustained trade actions. These could derail the recovery and depress medium-term growth prospects." From a regional perspective, the IMF projects 2018 growth in the eurozone will be 2.2%, compared to 2.4% in 2017. Japan's economy is expected to expand 1.0% in 2018, versus 1.7% in 2017. Elsewhere, the IMF projects that growth in emerging market countries will increase to 4.9% in 2018, versus 4.7% in 2017.
Global equities: The US leads the way
The global equity market generated positive results during the reporting period. US equities posted positive returns during 10 of the 12 months of the period. Supporting the market were corporate profits that often exceeded expectations and the December 2017 signing of a tax reform bill. All told, the US stock market, as measured by the S&P 500 Index,3 gained 16.24% for the 12 months ended July 31, 2018. International equities produced more muted gains, as growth rates in a number of countries moderated, global trade war concerns increased and, later in the period, the US dollar strengthened. International developed equities, as measured by the MSCI EAFE Index (net),4
1 Based on the Commerce Department's initial estimate announced on January 26, 2018, after the reporting period had ended.
2 The federal funds rate or the "fed funds rate," is the rate US banks charge one another for funds they borrow on an overnight basis.
3 The S&P 500 Index is an unmanaged, weighted index composed of 500 widely held common stocks varying in composition and is not available for direct investment. Investors should note that indices do not reflect the deduction of fees and expenses.
4 The MSCI EAFE Index (net) is an index of stocks designed to measure the investment returns of developed economies outside of North America. Net total return indices reinvest dividends after the deduction of withholding taxes, using a tax rate applicable to non-resident institutional investors who do not benefit from double taxation treaties. The index is constructed and managed with a view to being fully investable from the perspective of international institutional investors. Investors should note that indices do not reflect the deduction of fees and expenses.
3
rose 6.40% during the reporting period, while emerging markets equities, as measured by the MSCI Emerging Markets Index (net),5 gained 4.36%.
The fixed income market produces weak results
The global fixed income market posted weak results during the reporting period. In the US, short-term Treasury yields moved sharply higher in concert with the Fed's interest rate hikes. Longer-term Treasury yields also rose, albeit to a lesser extent. For the fiscal year as a whole, the yield on the US 10-year Treasury rose from 2.30% to 2.96% (bond yields and prices move in the opposite direction). The overall US bond market, as measured by the Bloomberg Barclays U.S. Aggregate Index,6 returned -0.80% for the 12 months ended July 31, 2018. Returns of riskier fixed income securities were mixed. High yield bonds, as measured by the ICE BofAML US High Yield Cash Pay Constrained Index,7 gained 2.47% during the reporting period. Elsewhere, emerging markets debt, as measured by the J.P. Morgan Emerging Markets Bond Index Global (EMBI Global),8 returned -1.09%.
Sincerely,

Mark E. Carver
President, PACE Select Advisors Trust
Managing Director, UBS Asset Management (Americas) Inc.
This report is intended to assist investors in understanding how the Portfolios performed during the 12-month period ended July 31, 2018. The views expressed in the Advisor's and Subadvisors' comments sections are as of the end of the reporting period, reflect performance results gross of fees and expenses, and are those of the investment advisor (with respect to PACE Government Money Market Investments only) and subadvisors. Subadvisors' comments on Portfolios that have more than one subadvisor are reflective of their portion of the Portfolio only. The views and opinions in this report were current as of [date]. They are not guarantees of future performance or investment results and should not be taken as investment advice. Investment decisions reflect a variety of factors, and the investment advisor and subadvisors reserve the right to change their views about individual securities, sectors and markets at any time. As a result, the views expressed should not be relied upon as a forecast of a Portfolio's future investment intent.
5 The MSCI Emerging Markets Index (net) is a market capitalization-weighted index composed of different emerging market countries in Europe, Latin America, and the Pacific Basin. Net total return indices reinvest dividends after the deduction of withholding taxes, using a tax rate applicable to non-resident institutional investors who do not benefit from double taxation treaties. The index is constructed and managed with a view to being fully investable from the perspective of international institutional investors. Investors should note that indices do not reflect the deduction of fees and expenses.
6 The Bloomberg Barclays US Aggregate Index is an unmanaged broad based index designed to measure the US dollar-denominated, investment-grade, taxable bond market. The index includes bonds from the Treasury, government-related, corporate, mortgage-backed, asset-backed and commercial mortgage-backed sectors. Investors should note that indices do not reflect the deduction of fees and expenses.
7 The ICE BofAML US High Yield Cash Pay Constrained Index is an unmanaged index of publicly placed, non-convertible, coupon-bearing US dollar denominated, below investment grade corporate debt with a term to maturity of at least one year. The index is market capitalization weighted, so that larger bond issuers have a greater effect on the index's return. However, the representation of any single bond issuer is restricted to a maximum of 2% of the total index. Investors should note that indices do not reflect the deduction of fees and expenses.
8 The J.P. Morgan Emerging Markets Bond Index Global (EMBI Global) is an unmanaged index which is designed to track total returns for US dollar denominated debt instruments issued by emerging market sovereign and quasi-sovereign entities: Brady bonds, loans and Eurobonds. Investors should note that indices do not reflect the deduction of fees and expenses.
4
PACE Government Money Market Investments
Performance (unaudited)
The seven-day current yield for the Portfolio as of July 31, 2018 was 1.36% (after fee waivers/expense reimbursements).1 For more information on the Portfolio's performance, refer to "Yields and characteristics at a glance" on page 6. Please remember that the PACE program fee is assessed outside the Portfolio at the PACE program account level. The program fee does not impact the determination of the Portfolio's net asset value per share. For a detailed commentary on the market environment in general during the period, please refer to page 3.
Advisor's comments (unaudited)
The Fed continued to normalize monetary policy during the reporting period. For example, the Fed raised rates in December 2017, March 2018 and June 2018. With its last rate hike, the federal funds rate moved to a range between 1.75% and 2.00%. In addition, the Fed began reducing its balance sheet in October 2017. For the remainder of 2018, the Fed currently expects to make two additional 0.25% rate hikes, while continuing to pare its balance sheet. While the yields on a wide range of short-term investments moved higher over the period, yields still remain low by historical comparison. As a result, the Portfolio's yield remained low during the reporting period.
We tactically adjusted the Portfolio's weighted average maturity ("WAM") throughout the 12-month review period. When the reporting period began, the Portfolio had a WAM of 40 days. This was decreased to 22 days at the end of the reporting period.
A number of adjustments were made to the Portfolio's sector and issuer positioning during the 12-month period. We increased the Portfolio's exposure to US government and agency obligations and reduced its allocation to repurchase agreements. (Repurchase agreements are transactions in which the seller of a security agrees to buy it back at a predetermined time and price or upon demand.)
1 Class P shares held through the PACE Select Advisors Program are subject to a maximum Program fee of 2.50%, which, if included, would have reduced performance. Class P shares held through other advisory programs also may be subject to a program fee, which, if included, would have reduced performance.
PACE Select Advisors Trust – PACE Government Money Market Investments
Investment Advisor:
UBS Asset Management (Americas) Inc.
Portfolio Manager:
Robert Sabatino
Objective:
Current income consistent with preservation of capital and liquidity
Investment process:
The Portfolio is a money market mutual fund and seeks to maintain a stable price of $1.00 per share, although it may be possible to lose money by investing in this Portfolio. The Portfolio invests in a diversified portfolio of high-quality money market instruments of governmental issuers. Security selection is based on the assessment of relative values and changes in market and economic conditions.
5
PACE Government Money Market Investments
Yields and characteristics at a glance—July 31, 2018 (unaudited)
Yields and characteristics | |||||||
Seven-day current yield after fee waivers and/or expense reimbursements1 | 1.36 | % | |||||
Seven-day effective yield after fee waivers and/or expense reimbursements1 | 1.37 | ||||||
Seven-day current yield before fee waivers and/or expense reimbursements1 | 1.35 | ||||||
Seven-day effective yield before fee waivers and/or expense reimbursements1 | 1.35 | ||||||
Weighted average maturity2 | 22 days | ||||||
Portfolio composition3 | |||||||
US government and agency obligations | 80.6 | % | |||||
Repurchase agreements | 21.8 | ||||||
Other assets less liabilities | (2.4 | ) | |||||
Total | 100.0 | % | |||||
You could lose money by investing in PACE Government Money Market Investments. Although the portfolio seeks to preserve the value of your investment at $1.00 per share, the portfolio cannot guarantee it will do so. An investment in PACE Government Money Market Investments is not insured or guaranteed by the Federal Deposit Insurance Corporation ("FDIC") or any other government agency. PACE Government Money Market Investments' sponsor has no legal obligation to provide financial support to PACE Government Money Market Investments, and you should not expect that the portfolio's sponsor will provide financial support to PACE Government Money Market Investments at any time.
Not FDIC insured. May lose value. No bank guarantee.
1 Yields will fluctuate and reflect fee waivers and/or expense reimbursements, if any, unless otherwise noted. Performance data quoted represents past performance. Past performance does not guarantee future results. Current performance may be higher or lower than the performance data quoted.
2 The Portfolio is actively managed and its weighted average maturity will differ over time.
3 Weightings represent percentages of the Portfolio's net assets as of the date indicated. The Portfolio is actively managed and its composition will vary over time.
6
PACE Government Money Market Investments
Portfolio of investments—July 31, 2018
| Face amount | Value | ||||||||||
US government and agency obligations—80.57% | |||||||||||
| Federal Farm Credit Bank 1 mo. USD LIBOR - 0.085%, 1.987%, due 08/30/181 | $1,000,000 | $999,958 | |||||||||
| Federal Home Loan Bank 1.850%, due 08/01/182 | 2,000,000 | 2,000,000 | |||||||||
1.850%, due 08/03/182 | 1,000,000 | 999,897 | |||||||||
1.850%, due 08/07/182 | 3,000,000 | 2,999,075 | |||||||||
1.860%, due 08/14/182 | 2,000,000 | 1,998,657 | |||||||||
1.879%, due 08/08/182 | 2,000,000 | 1,999,269 | |||||||||
1.890%, due 08/06/182 | 4,000,000 | 3,998,950 | |||||||||
1.890%, due 08/08/182 | 2,000,000 | 1,999,265 | |||||||||
1.890%, due 08/28/182 | 1,000,000 | 998,583 | |||||||||
1.893%, due 08/22/182 | 3,000,000 | 2,996,687 | |||||||||
1.895%, due 08/07/182 | 1,000,000 | 999,684 | |||||||||
1.895%, due 08/10/182 | 2,000,000 | 1,999,053 | |||||||||
1.895%, due 08/24/182 | 3,000,000 | 2,996,368 | |||||||||
1.899%, due 08/01/182 | 2,000,000 | 2,000,000 | |||||||||
1.900%, due 08/08/182 | 2,000,000 | 1,999,261 | |||||||||
1.900%, due 08/15/182 | 2,000,000 | 1,998,522 | |||||||||
1.900%, due 08/20/182 | 1,000,000 | 998,997 | |||||||||
1.910%, due 08/15/182 | 1,000,000 | 999,257 | |||||||||
1.910%, due 08/24/182 | 1,000,000 | 998,780 | |||||||||
1.910%, due 08/30/182 | 5,000,000 | 4,992,307 | |||||||||
1.915%, due 08/16/182 | 1,000,000 | 999,202 | |||||||||
1.915%, due 08/17/182 | 2,000,000 | 1,998,298 | |||||||||
1.915%, due 09/13/182 | 3,000,000 | 2,993,138 | |||||||||
1.915%, due 09/14/182 | 3,000,000 | 2,992,978 | |||||||||
1.917%, due 08/31/182 | 3,000,000 | 2,995,208 | |||||||||
1.918%, due 08/15/182 | 1,000,000 | 999,254 | |||||||||
1.918%, due 09/26/182 | 2,000,000 | 1,994,033 | |||||||||
1.919%, due 08/29/182 | 2,000,000 | 1,997,015 | |||||||||
1.929%, due 09/19/182 | 1,000,000 | 997,374 | |||||||||
1.930%, due 09/07/182 | 2,000,000 | 1,996,033 | |||||||||
1.950%, due 10/04/182 | 1,000,000 | 996,533 | |||||||||
1.984%, due 10/26/182 | 1,000,000 | 995,261 | |||||||||
1.989%, due 10/24/182 | 4,000,000 | 3,981,436 | |||||||||
1.995%, due 10/17/182 | 2,000,000 | 1,991,466 | |||||||||
2.008%, due 10/31/182 | 2,000,000 | 1,989,848 | |||||||||
2.060%, due 12/11/182 | 3,000,000 | 2,977,340 | |||||||||
| 1 mo. USD LIBOR - 0.070%, 1.994%, due 08/25/181 | 1,000,000 | 1,000,232 | |||||||||
| 1 mo. USD LIBOR - 0.070%, 2.002%, due 08/28/181 | 1,300,000 | 1,300,000 | |||||||||
| 1 mo. USD LIBOR - 0.080%, 1.993%, due 08/17/181 | 1,250,000 | 1,250,000 | |||||||||
| 1 mo. USD LIBOR - 0.080%, 2.002%, due 08/19/181 | 1,000,000 | 1,000,000 | |||||||||
| 1 mo. USD LIBOR - 0.080%, 2.020%, due 08/04/181 | 1,000,000 | 1,000,000 | |||||||||
| 1 mo. USD LIBOR - 0.085%, 2.005%, due 08/03/181 | 1,000,000 | 1,000,000 | |||||||||
| 1 mo. USD LIBOR - 0.090%, 1.996%, due 08/06/181 | 2,000,000 | 2,000,000 | |||||||||
| 1 mo. USD LIBOR - 0.095%, 1.986%, due 08/21/181 | 1,200,000 | 1,200,000 | |||||||||
| 1 mo. USD LIBOR - 0.100%, 1.979%, due 08/18/181 | 1,000,000 | 1,000,000 | |||||||||
| Face amount | Value | ||||||||||
US government and agency obligations—(continued) | |||||||||||
| 1 mo. USD LIBOR - 0.100%, 1.981%, due 08/21/181 | $ | 2,000,000 | $ | 2,000,000 | |||||||
| 1 mo. USD LIBOR - 0.105%, 1.965%, due 08/26/181 | 2,000,000 | 2,000,000 | |||||||||
| 1 mo. USD LIBOR - 0.105%, 1.976%, due 08/22/181 | 1,000,000 | 1,000,000 | |||||||||
| 1 mo. USD LIBOR - 0.105%, 1.981%, due 08/19/181 | 2,000,000 | 2,000,000 | |||||||||
| 1 mo. USD LIBOR - 0.110%, 1.963%, due 08/17/181 | 1,500,000 | 1,500,000 | |||||||||
| 1 mo. USD LIBOR - 0.115%, 1.954%, due 08/24/181 | 2,000,000 | 2,000,000 | |||||||||
| 1 mo. USD LIBOR - 0.115%, 1.949%, due 08/24/181 | 1,000,000 | 1,000,000 | |||||||||
| 1 mo. USD LIBOR - 0.115%, 1.964%, due 08/18/181 | 2,000,000 | 2,000,000 | |||||||||
| 1 mo. USD LIBOR - 0.115%, 1.967%, due 08/19/181 | 2,000,000 | 2,000,000 | |||||||||
| 1 mo. USD LIBOR - 0.115%, 1.975%, due 08/03/181 | 1,000,000 | 1,000,044 | |||||||||
| 1 mo. USD LIBOR - 0.115%, 1.985%, due 08/04/181 | 1,000,000 | 1,000,000 | |||||||||
| 1 mo. USD LIBOR - 0.120%, 1.952%, due 08/28/181 | 1,000,000 | 999,999 | |||||||||
| 1 mo. USD LIBOR - 0.125%, 1.956%, due 08/21/181 | 3,000,000 | 3,000,129 | |||||||||
| 1 mo. USD LIBOR - 0.125%, 1.947%, due 08/16/181 | 2,000,000 | 2,000,000 | |||||||||
| 1 mo. USD LIBOR - 0.125%, 1.952%, due 08/27/181 | 1,000,000 | 1,000,000 | |||||||||
| 1 mo. USD LIBOR - 0.125%, 1.961%, due 08/20/181 | 1,000,000 | 1,000,000 | |||||||||
| 1 mo. USD LIBOR - 0.130%, 1.956%, due 08/10/181 | 2,000,000 | 2,000,000 | |||||||||
| 1 mo. USD LIBOR - 0.130%, 1.942%, due 08/16/181 | 1,000,000 | 1,000,000 | |||||||||
| 1 mo. USD LIBOR - 0.130%, 1.943%, due 08/17/181 | 2,000,000 | 2,000,000 | |||||||||
| 1 mo. USD LIBOR - 0.130%, 1.951%, due 08/22/181 | 2,000,000 | 2,000,000 | |||||||||
| 1 mo. USD LIBOR - 0.130%, 1.952%, due 08/01/181 | 4,000,000 | 4,000,000 | |||||||||
| 1 mo. USD LIBOR - 0.130%, 1.967%, due 08/08/181 | 1,000,000 | 1,000,000 | |||||||||
| 1 mo. USD LIBOR - 0.135%, 1.932%, due 08/12/181 | 1,000,000 | 1,000,000 | |||||||||
| 1 mo. USD LIBOR - 0.135%, 1.937%, due 08/16/181 | 3,000,000 | 2,999,999 | |||||||||
| 1 mo. USD LIBOR - 0.135%, 1.937%, due 08/28/181 | 1,000,000 | 1,000,000 | |||||||||
| 1 mo. USD LIBOR - 0.135%, 1.937%, due 08/28/181 | 1,000,000 | 1,000,000 | |||||||||
| 1 mo. USD LIBOR - 0.135%, 1.965%, due 08/05/181 | 1,000,000 | 1,000,000 | |||||||||
| 1 mo. USD LIBOR - 0.140%, 1.927%, due 08/12/181 | 1,000,000 | 1,000,000 | |||||||||
7
PACE Government Money Market Investments
Portfolio of investments—July 31, 2018
| Face amount | Value | ||||||||||
US government and agency obligations—(concluded) | |||||||||||
| 1 mo. USD LIBOR - 0.140%, 1.924%, due 08/25/181 | $ | 2,000,000 | $ | 2,000,000 | |||||||
| 1 mo. USD LIBOR - 0.140%, 1.932%, due 08/16/181 | 1,000,000 | 1,000,000 | |||||||||
| 1 mo. USD LIBOR - 0.140%, 1.960%, due 08/05/181 | 2,000,000 | 2,000,000 | |||||||||
| 1 mo. USD LIBOR - 0.145%, 1.927%, due 08/29/181 | 2,000,000 | 2,000,000 | |||||||||
| 1 mo. USD LIBOR - 0.145%, 1.927%, due 08/15/181 | 1,000,000 | 1,000,000 | |||||||||
| 1 mo. USD LIBOR - 0.150%, 1.922%, due 08/16/181 | 3,000,000 | 3,000,000 | |||||||||
| 1 mo. USD LIBOR - 0.155%, 1.912%, due 08/12/181 | 1,000,000 | 1,000,000 | |||||||||
| 3 mo. USD LIBOR - 0.210%, 2.125%, due 10/26/181 | 2,000,000 | 1,999,848 | |||||||||
| 3 mo. USD LIBOR - 0.340%, 1.991%, due 10/10/181 | 2,000,000 | 2,000,000 | |||||||||
| 3 mo. USD LIBOR - 0.340%, 2.002%, due 10/24/181 | 1,000,000 | 1,000,000 | |||||||||
| 3 mo. USD LIBOR - 0.160%, 2.170%, due 08/24/181 | 1,000,000 | 1,001,287 | |||||||||
| US Treasury Bill 1.809%, due 08/09/182 | 3,000,000 | 2,998,816 | |||||||||
| US Treasury Note 3 mo. Treasury money market yield + 0.170%, 2.180%, due 08/01/181 | 1,000,000 | 1,000,020 | |||||||||
| Total US government and agency obligations (cost—$152,117,361) | 152,117,361 | ||||||||||
| Face amount | Value | ||||||||||
Repurchase agreements—21.82% | |||||||||||
| Repurchase agreement dated 07/31/18 with Fixed Income Clearing Corp., 0.350% due 08/01/18, collateralized by $210,000 US Treasury Note, 2.000% due 04/30/24; (value—$201,091); proceeds: $195,002 | $ | 195,000 | $ | 195,000 | |||||||
| Repurchase agreement dated 07/31/18 with Goldman Sachs & Co., 1.890% due 08/01/18, collateralized by $3,548,000 Federal National Mortgage Association obligations, 6.625% to 7.250% due 05/15/30 to 11/15/30, $4,645,900 US Treasury Inflation Index Bond, 2.500% due 01/15/29 and $45,270,404 US Treasury Bond STRIPs, zero coupon due 02/15/23 to 02/15/42; (value—$41,820,012); proceeds: $41,002,153 | 41,000,000 | 41,000,000 | |||||||||
| Total repurchase agreements (cost—$41,195,000) | 41,195,000 | ||||||||||
| Total investments (cost—$193,312,361 which approximates cost for federal income tax purposes)—102.39% | 193,312,361 | ||||||||||
Liabilities in excess of other assets—(2.39)% | (4,518,375 | ) | |||||||||
Net assets—100.00% | $ | 188,793,986 | |||||||||
For a listing of defined portfolio acronyms that are used throughout the Portfolio of investments as well as the tables that follow, please refer to page 273.
8
PACE Government Money Market Investments
Portfolio of investments—July 31, 2018
Fair valuation summary
The following is a summary of the fair valuations according to the inputs used as of July 31, 2018 in valuing the Portfolio's investments. In the event a Portfolio holds investments for which fair value is measured using the NAV per share practical expedient (or its equivalent), a separate column will be added to the fair value hierarchy table; this is intended to permit reconciliation to the amounts presented in the Portfolio of investments:
Description | Unadjusted quoted prices in active markets for identical investments (Level 1) | Other significant observable inputs (Level 2) | Unobservable inputs (Level 3) | Total | |||||||||||||||
US government and agency obligations | $ | — | $ | 152,117,361 | $ | — | $ | 152,117,361 | |||||||||||
Repurchase agreements | — | 41,195,000 | — | 41,195,000 | |||||||||||||||
Total | $ | — | $ | 193,312,361 | $ | — | $ | 193,312,361 | |||||||||||
At July 31, 2018, there were no transfers between Level 1 and Level 2.
Portfolio footnotes
1 Variable or floating rate security. The interest rate shown is the rate in effect as of period end and changes periodically.
2 Rate shown is the discount rate at the date of purchase unless otherwise noted.
See accompanying notes to financial statements.
9
PACE Mortgage-Backed Securities Fixed Income Investments
Performance (unaudited)
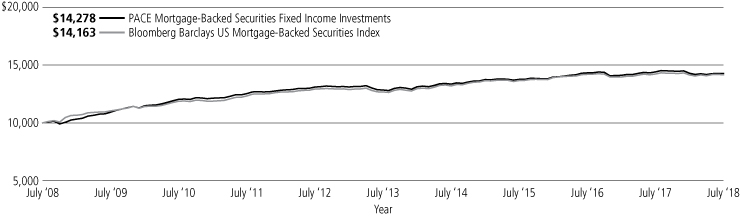
For the 12 months ended July 31, 2018, the Portfolio's Class P shares returned -0.87% before the deduction of the maximum PACE Select program fee.1 In comparison, the Bloomberg Barclays US Mortgage-Backed Securities Index (the "benchmark") returned -0.41%, and the Lipper US Mortgage Funds category posted a median return of -0.66%. (Returns for all share classes over various time periods are shown in the "Performance at a glance" table on page 12. Please note that the returns shown do not reflect the deduction of taxes that a shareholder would pay on Portfolio distributions or the redemption of Portfolio shares.) For a detailed commentary on the market environment in general during the reporting period, please refer to page 3.
Subadvisor's comments (unaudited)2
(Please note that while the subadvisor outperformed the benchmark on a gross-of-fees basis, the Portfolio underperformed net of fees, as reported in the "Performance at a glance" table. As stated in footnote two, the comments that follow address performance on a gross-of-fees basis.)
The Portfolio outperformed its benchmark during the reporting period. Overall, US interest rate strategies were negative for performance. A modest overweight to US duration detracted from performance as US Treasury yields generally rose. (Duration measures a portfolio's sensitivity to interest rate changes.) Additionally, yield curve positioning, including an overweight to short-term yields detracted from performance as they rose the most during the period.
Relative value positioning within the agency mortgage-backed security (MBS) sector added to returns. An overweight to Freddie Mac and Fannie Mae securities contributed to results as these segments outperformed the broader mortgage market. Additionally, an overall underweight to Ginnie Mae bonds was relatively beneficial as this segment lagged the broader mortgage market. Conversely, security selection within 30-year Fannie Mae mortgages detracted from performance. Exposure to mortgage credit, including select non-agency and commercial mortgages, contributed to returns.
Overall, derivative usage was positive during the period as the Portfolio was short long-term US swap rates and they underperformed Treasury rates. The Portfolio used interest rate swaps and constant maturity swaps to adjust interest rate and yield curve exposures, as well as to substitute for physical securities. The Portfolio benefited from the income generated from selling mortgage pool options as a way to manage interest rate and volatility risk within the sector. Additionally, options on swaps were primarily used to manage interest rate exposure and volatility. The purchase of options on swaps detracted from performance due to premium payments made. Total return swaps, used to replicate broad exposure to interest only agency mortgages while limiting idiosyncratic risk of owning individual bonds, was neutral for performance.
1 Class P shares held through the PACE Select Advisors Program are subject to a maximum Program fee of 2.50%, which, if included, would have reduced performance. Class P shares held through other advisory programs also may be subject to a program fee, which, if included, would have reduced performance.
2 All Sub-Advisors discuss performance on a gross-of-fees basis—meaning that no fees or expenses are reflected in their sleeves'/sleeve's performance. Alternately, Portfolio performance is shown net of fees, which does factor in fees and expenses associated with the Portfolio.
PACE Select Advisors Trust – PACE Mortgage-Backed Securities Fixed
Income Investments
Investment Manager:
UBS Asset Management (Americas) Inc. ("UBS AM")
Investment Subadvisor:
Pacific Investment Management Company LLC ("PIMCO")
Portfolio Management Team:
UBS AM: Mabel Lung, CFA, Gina Toth, CFA and Fred Lee, CFA
PIMCO: Daniel Hyman and Michael Cudzil
Objective:
Current income
Investment process:
The subadvisor utilizes a strategy that involves buying or
selling specific bonds based on an analysis of their values
relative to other similar bonds.
10
PACE Mortgage-Backed Securities Fixed Income Investments
Special considerations
The Portfolio may be appropriate for long-term investors seeking current income who are able to withstand short-term fluctuations in the fixed income markets in return for potentially higher returns over the long term. The yield and value of the Portfolio change every day and can be affected by changes in interest rates, general market conditions, and other political, social and economic developments, as well as specific matters relating to the issuers in which the Portfolio invests. It is important to note that an investment in the Portfolio is only one component of a balanced investment plan.
11
PACE Mortgage-Backed Securities Fixed Income Investments
Performance at a glance (unaudited)
Average annual total returns for periods ended 07/31/18 | 1 year | 5 years | 10 years | ||||||||||||
Before deducting maximum sales charge | |||||||||||||||
Class A1 | (1.12 | )% | 1.89 | % | 3.37 | % | |||||||||
Class C2 | (1.59 | ) | 1.40 | 2.85 | |||||||||||
Class Y3 | (0.87 | ) | 2.16 | 3.63 | |||||||||||
Class P4 | (0.87 | ) | 2.14 | 3.63 | |||||||||||
After deducting maximum sales charge | |||||||||||||||
Class A1 | (4.83 | ) | 1.11 | 2.97 | |||||||||||
Class C2 | (2.31 | ) | 1.40 | 2.85 | |||||||||||
Bloomberg Barclays US Mortgage-Backed Securities Index5 | (0.41 | ) | 2.25 | 3.54 | |||||||||||
Lipper US Mortgage Funds median | (0.66 | ) | 2.03 | 3.58 | |||||||||||
Most recent calendar quarter-end returns (unaudited)
Average annual total returns for periods ended 06/30/18 | 1 year | 5 years | 10 years | ||||||||||||
Before deducting maximum sales charge | |||||||||||||||
Class A1 | (0.53 | )% | 1.85 | % | 3.33 | % | |||||||||
Class C2 | (1.10 | ) | 1.33 | 2.81 | |||||||||||
Class Y3 | (0.35 | ) | 2.11 | 3.58 | |||||||||||
Class P4 | (0.35 | ) | 2.09 | 3.59 | |||||||||||
After deducting maximum sales charge | |||||||||||||||
Class A1 | (4.26 | ) | 1.08 | 2.94 | |||||||||||
Class C2 | (1.83 | ) | 1.33 | 2.81 | |||||||||||
The annualized gross and net expense ratios, respectively, for each class of shares as in the November 28, 2017 prospectuses, were as follows: Class A—1.08% and 0.97%; Class C—1.58% and 1.47%; Class Y—0.99% and 0.72%; and Class P—0.92% and 0.72%. Net expenses reflect fee waivers and/or expense reimbursements, if any, pursuant to an agreement that is in effect to cap the expenses. The Portfolio and UBS Asset Management (Americas) Inc. ("UBS AM") have entered into a written fee waiver/expense reimbursement agreement pursuant to which UBS AM is contractually obligated to waive its management fees and/or reimburse expenses so that the Portfolio's ordinary total operating expenses of each class through November 30, 2018 (excluding dividend expense, borrowing costs, and interest expense relating to short sales, and expenses attributable to investment in other investment companies, interest, taxes, brokerage commissions and extraordinary expenses) would not exceed Class A—0.97%; Class C—1.47%; Class Y—0.72%; and Class P—0.72%. The Portfolio has agreed to repay UBS AM for any waived fees/reimbursed expenses to the extent that it can do so over the following three fiscal years without causing the Portfolio's expenses in any of those three years to exceed these expense caps and that UBS AM has not waived the right to do so. The fee waiver/expense reimbursement agreement may be terminated by the Portfolio's board at any time and also will terminate automatically upon the expiration or termination of the Portfolio's advisory contract with UBS AM. Upon termination of the agreement, however, UBS AM's three year recoupment rights will survive.
1 Maximum sales charge for Class A shares is 3.75%. Class A shares bear ongoing 12b-1 service fees of 0.25% annually.
2 Maximum contingent deferred sales charge for Class C shares is 0.75% imposed on redemptions and is reduced to 0% after one year. Class C shares bear ongoing 12b-1 service and distribution fees of 0.25% and 0.50% annually, respectively. As of July 12, 2018, Class C shares ceased paying 12b-1 distribution fees. See notes to financial statements—Subsequent events for additional information.
3 The Portfolio offers Class Y shares to a limited group of eligible investors, including certain qualifying retirement plans. Class Y shares do not bear initial or contingent deferred sales charges or ongoing 12b-1 service and distribution fees.
4 Class P shares do not bear initial or contingent deferred sales charges or ongoing 12b-1 service and distribution fees, but Class P shares held through advisory programs may be subject to a program fee, which, if included, would have reduced performance.
5 The Bloomberg Barclays US Mortgage-Backed Securities Index is an unmanaged index which primarily covers the mortgage-backed passthrough securities issued by Ginnie Mae (formally known as the Government National Mortgage Association or GNMA), Freddie Mac (formally known as Federal Home Loan Mortgage Corporation or FHLMC), and Fannie Mae (formally known as Federal National Mortgage Association or FNMA). Investors should note that indices do not reflect the deduction of fees and expenses.
Past performance does not predict future performance, and the performance information provided does not reflect the deduction of taxes that a shareholder would pay on Portfolio distributions or the redemption of Portfolio shares. The return and principal value of an investment will fluctuate, so that an investor's shares, when redeemed, may be worth more or less than their original cost. Performance results assume reinvestment of all dividends and capital gain distributions at net asset value on the ex-dividend dates. Current performance may be higher or lower than the performance data quoted. For month-end performance figures, please visit www.ubs.com/us-mutualfundperformance.
Lipper peer group data calculated by Lipper Inc.; used with permission. The Lipper median is the return of the fund that places in the middle of a Lipper peer group.
12
PACE Mortgage-Backed Securities Fixed Income Investments
Illustration of an assumed investment of $10,000 in Class P shares of the Portfolio (unaudited)
The following graph depicts the performance of PACE Mortgage-Backed Securities Fixed Income Investments Class P shares versus the Bloomberg Barclays US Mortgage-Backed Securities Index over the 10 years ended July 31, 2018. Class P shares held through advisory programs may be subject to a program fee, which, if included, would have reduced performance. The performance of the other classes will vary based upon the different class specific expenses and sales charges. The performance provided does not reflect the deduction of taxes that a shareholder would pay on Portfolio distributions or the redemption of Portfolio shares. Past performance is no guarantee of future results. Share price and returns will vary with market conditions; investors may realize a gain or loss upon redemption. It is important to note that PACE Mortgage-Backed Securities Fixed Income Investments is a professionally managed portfolio while the Index is not available for investment and is unmanaged. The comparison is shown for illustration purposes only.
PACE Mortgage-Backed Securities Fixed Income Investments
13
PACE Mortgage-Backed Securities Fixed Income Investments
Portfolio statistics—July 31, 2018 (unaudited)
Characteristics | |||||||
Weighted average duration | 4.43 yrs. | ||||||
Weighted average maturity | 6.05 yrs. | ||||||
Average coupon | 2.99 | % | |||||
Top ten holdings (long holdings)1 | Percentage of net assets | ||||||
FNMA TBA, 3.500% | 15.9 | % | |||||
FHLMC TBA, 3.500% | 8.8 | ||||||
GNMA II TBA, 4.000% | 8.1 | ||||||
FNMA TBA, 3.000% | 7.0 | ||||||
GNMA II TBA, 3.500% | 5.0 | ||||||
GNMA II TBA, 3.000% | 4.5 | ||||||
FHLMC TBA, 4.000% | 3.2 | ||||||
FHLMC TBA, 3.000% | 3.1 | ||||||
FNMA TBA, 5.000% | 3.0 | ||||||
FNMA TBA, 2.500% | 2.9 | ||||||
Total | 61.5 | % | |||||
Asset allocation1 | Percentage of net assets | ||||||
US government agency mortgage pass-through certificates | 127.8 | % | |||||
Asset-backed securities | 18.5 | ||||||
Collateralized mortgage obligations | 17.2 | ||||||
US government obligations | 5.5 | ||||||
Commercial mortgage-backed securities | 0.5 | ||||||
Short-term investment | 0.5 | ||||||
Stripped mortgage-backed securities | 0.5 | ||||||
Options, swaptions, and swaps | 0.1 | ||||||
Investments sold short | (9.7 | ) | |||||
Cash equivalents and other assets less liabilities | (60.9 | ) | |||||
Total | 100.0 | % | |||||
1 The Portfolio is actively managed and its composition will vary over time.
14
PACE Mortgage-Backed Securities Fixed Income Investments
Portfolio of investments—July 31, 2018
| Face amount | Value | ||||||||||
US government obligations—5.51% | |||||||||||
| US Treasury Notes 1.750%, due 05/31/22 | $ | 2,930,000 | $ | 2,817,378 | |||||||
2.250%, due 11/15/251 | 1,800,000 | 1,719,773 | |||||||||
2.250%, due 02/15/27 | 9,675,000 | 9,165,551 | |||||||||
2.375%, due 01/31/23 | 1,100,000 | 1,078,730 | |||||||||
2.375%, due 05/15/27 | 2,500,000 | 2,389,160 | |||||||||
2.750%, due 05/31/23 | 3,000,000 | 2,987,813 | |||||||||
2.750%, due 02/28/251 | 1,500,000 | 1,485,293 | |||||||||
| Total US government obligations (cost—$22,459,637) | 21,643,698 | ||||||||||
| Government national mortgage association certificates—35.46% | |||||||||||
| GNMA 3.000%, due 11/15/421 | 103,576 | 101,456 | |||||||||
3.000%, due 02/15/431 | 603,160 | 592,845 | |||||||||
3.000%, due 05/15/431 | 1,489,075 | 1,461,412 | |||||||||
3.000%, due 06/15/431 | 466,286 | 457,157 | |||||||||
3.000%, due 07/15/431 | 118,206 | 115,545 | |||||||||
3.000%, due 01/15/451 | 433,411 | 426,040 | |||||||||
3.000%, due 02/15/451 | 48,066 | 47,093 | |||||||||
3.000%, due 07/15/451 | 669,478 | 655,870 | |||||||||
3.000%, due 08/15/451 | 50,458 | 49,295 | |||||||||
3.000%, due 10/15/451 | 1,000,883 | 979,467 | |||||||||
3.000%, due 12/15/45 | 602,136 | 588,261 | |||||||||
3.500%, due 11/15/421 | 714,505 | 716,722 | |||||||||
3.500%, due 03/15/45 | 301,979 | 302,302 | |||||||||
3.500%, due 04/15/45 | 824,784 | 825,814 | |||||||||
4.000%, due 12/15/41 | 1,384,274 | 1,422,095 | |||||||||
4.000%, due 01/15/47 | 180,484 | 185,135 | |||||||||
4.000%, due 02/15/47 | 980,519 | 1,005,776 | |||||||||
4.000%, due 04/15/47 | 1,025,548 | 1,051,981 | |||||||||
4.500%, due 09/15/39 | 734,859 | 776,346 | |||||||||
4.500%, due 06/15/40 | 336,646 | 355,669 | |||||||||
4.500%, due 12/15/45 | 19,260 | 20,018 | |||||||||
4.500%, due 07/15/46 | 8,367 | 8,694 | |||||||||
4.500%, due 08/15/46 | 12,875 | 13,377 | |||||||||
4.500%, due 09/15/46 | 496,005 | 515,464 | |||||||||
4.500%, due 10/15/46 | 713,348 | 741,152 | |||||||||
4.500%, due 01/15/47 | 917,428 | 953,568 | |||||||||
5.000%, due 12/15/34 | 158,311 | 165,508 | |||||||||
5.000%, due 04/15/38 | 155,553 | 165,450 | |||||||||
5.000%, due 08/15/39 | 229,595 | 239,752 | |||||||||
5.000%, due 12/15/39 | 11,241 | 11,815 | |||||||||
5.000%, due 05/15/40 | 309,243 | 325,019 | |||||||||
5.000%, due 09/15/40 | 6,036 | 6,301 | |||||||||
5.000%, due 05/15/41 | 37,038 | 38,652 | |||||||||
5.500%, due 08/15/35 | 25,590 | 27,783 | |||||||||
5.500%, due 02/15/38 | 2,603 | 2,818 | |||||||||
5.500%, due 04/15/38 | 230,309 | 248,917 | |||||||||
5.500%, due 05/15/38 | 239,880 | 257,613 | |||||||||
5.500%, due 06/15/38 | 132,129 | 141,846 | |||||||||
5.500%, due 10/15/38 | 659,560 | 713,344 | |||||||||
5.500%, due 11/15/38 | 40,901 | 43,953 | |||||||||
5.500%, due 12/15/38 | 7,732 | 8,373 | |||||||||
5.500%, due 03/15/39 | 32,714 | 35,064 | |||||||||
5.500%, due 05/15/39 | 60,221 | 64,547 | |||||||||
| Face amount | Value | ||||||||||
| Government national mortgage association certificates—(continued) | |||||||||||
5.500%, due 09/15/39 | $ | 315,696 | $ | 339,031 | |||||||
5.500%, due 01/15/40 | 4,876 | 5,236 | |||||||||
5.500%, due 03/15/40 | 361,340 | 390,937 | |||||||||
6.500%, due 02/15/29 | 651 | 716 | |||||||||
6.500%, due 01/15/36 | 11,007 | 12,090 | |||||||||
6.500%, due 09/15/36 | 192,714 | 214,307 | |||||||||
6.500%, due 02/15/37 | 10,961 | 12,040 | |||||||||
6.500%, due 04/15/37 | 7,183 | 7,889 | |||||||||
6.500%, due 01/15/38 | 9,073 | 9,966 | |||||||||
6.500%, due 06/15/38 | 27,650 | 30,371 | |||||||||
6.500%, due 07/15/38 | 21,393 | 23,858 | |||||||||
6.500%, due 11/15/38 | 6,202 | 7,080 | |||||||||
7.500%, due 08/15/21 | 641 | 642 | |||||||||
8.000%, due 02/15/23 | 291 | 305 | |||||||||
8.250%, due 04/15/19 | 390 | 390 | |||||||||
10.500%, due 02/15/19 | 2,552 | 2,557 | |||||||||
10.500%, due 07/15/19 | 1,350 | 1,353 | |||||||||
10.500%, due 07/15/20 | 883 | 886 | |||||||||
10.500%, due 08/15/20 | 5,811 | 5,829 | |||||||||
| GNMA I 3.000%, due 12/15/45 | 71,380 | 69,794 | |||||||||
4.500%, due 12/15/45 | 16,376 | 17,045 | |||||||||
| GNMA II 2.500%, due 04/20/47 | 954,336 | 901,305 | |||||||||
3.000%, due 09/20/47 | 5,205,834 | 5,078,733 | |||||||||
3.500%, due 04/20/45 | 12,878 | 12,916 | |||||||||
3.500%, due 11/20/45 | 818,017 | 820,608 | |||||||||
3.500%, due 04/20/46 | 932,260 | 935,188 | |||||||||
3.500%, due 05/20/46 | 1,935,402 | 1,962,668 | |||||||||
3.500%, due 04/20/47 | 634,305 | 636,293 | |||||||||
3.500%, due 07/20/47 | 1,294,334 | 1,299,983 | |||||||||
3.500%, due 08/20/47 | 528,015 | 530,631 | |||||||||
3.500%, due 09/20/47 | 217,630 | 218,607 | |||||||||
3.500%, due 11/20/47 | 746,245 | 749,384 | |||||||||
3.500%, due 12/20/47 | 145,703 | 146,421 | |||||||||
3.500%, due 01/20/48 | 848,219 | 851,091 | |||||||||
3.500%, due 02/20/48 | 2,681,057 | 2,687,434 | |||||||||
3.750%, due 05/20/30 | 659,654 | 669,981 | |||||||||
4.000%, due 12/20/40 | 740,515 | 751,191 | |||||||||
4.000%, due 07/20/41 | 50,683 | 51,845 | |||||||||
4.000%, due 03/20/48 | 492,845 | 505,893 | |||||||||
4.000%, due 04/20/48 | 244,810 | 251,494 | |||||||||
4.000%, due 05/20/48 | 119,875 | 123,451 | |||||||||
4.000%, due 06/20/48 | 132,131 | 135,614 | |||||||||
4.500%, due 10/20/44 | 507,251 | 524,627 | |||||||||
4.500%, due 02/20/45 | 404,726 | 418,654 | |||||||||
4.500%, due 08/20/45 | 312,233 | 328,517 | |||||||||
4.500%, due 02/20/46 | 347,959 | 360,043 | |||||||||
5.000%, due 12/20/33 | 250,667 | 268,182 | |||||||||
5.000%, due 01/20/34 | 127,578 | 136,444 | |||||||||
5.000%, due 02/20/38 | 168,217 | 179,484 | |||||||||
5.000%, due 04/20/38 | 186,170 | 199,072 | |||||||||
5.000%, due 08/20/41 | 23,237 | 24,791 | |||||||||
5.000%, due 12/20/42 | 35,506 | 37,789 | |||||||||
5.000%, due 08/20/43 | 2,904,614 | 3,091,356 | |||||||||
6.000%, due 10/20/38 | 6,004 | 6,237 | |||||||||
15
PACE Mortgage-Backed Securities Fixed Income Investments
Portfolio of investments—July 31, 2018
| Face amount | Value | ||||||||||
| Government national mortgage association certificates—(continued) | |||||||||||
6.500%, due 09/20/32 | $ | 2,863 | $ | 3,047 | |||||||
6.500%, due 11/20/38 | 11,127 | 11,447 | |||||||||
6.500%, due 12/20/38 | 16,296 | 16,750 | |||||||||
7.000%, due 03/20/28 | 43,931 | 44,364 | |||||||||
9.000%, due 04/20/25 | 6,226 | 6,777 | |||||||||
9.000%, due 12/20/26 | 2,852 | 2,952 | |||||||||
9.000%, due 01/20/27 | 9,007 | 9,126 | |||||||||
9.000%, due 09/20/30 | 1,054 | 1,056 | |||||||||
9.000%, due 10/20/30 | 3,429 | 3,530 | |||||||||
9.000%, due 11/20/30 | 4,516 | 4,558 | |||||||||
| GNMA II ARM 1 year CMT + 1.500%, 2.625%, due 06/20/222 | 26,176 | 26,676 | |||||||||
| 1 year CMT + 1.500%, 2.625%, due 04/20/242 | 49,171 | 49,413 | |||||||||
| 1 year CMT + 1.500%, 2.625%, due 05/20/252 | 4,694 | 4,814 | |||||||||
| 1 year CMT + 1.500%, 2.625%, due 04/20/262 | 80,548 | 81,782 | |||||||||
| 1 year CMT + 1.500%, 2.625%, due 06/20/262 | 35,242 | 36,093 | |||||||||
| 1 year CMT + 1.500%, 2.625%, due 04/20/272 | 21,051 | 21,688 | |||||||||
| 1 year CMT + 1.500%, 2.625%, due 04/20/302 | 14,080 | 14,563 | |||||||||
| 1 year CMT + 1.500%, 2.625%, due 05/20/302 | 333,733 | 345,102 | |||||||||
| 1 year CMT + 1.500%, 2.750%, due 09/20/212 | 36,192 | 36,899 | |||||||||
| 1 year CMT + 1.500%, 2.750%, due 08/20/252 | 12,263 | 12,567 | |||||||||
| 1 year CMT + 1.500%, 2.750%, due 09/20/252 | 16,134 | 16,536 | |||||||||
| 1 year CMT + 1.500%, 2.750%, due 08/20/262 | 19,323 | 19,846 | |||||||||
| 1 year CMT + 1.500%, 2.750%, due 09/20/262 | 3,019 | 3,101 | |||||||||
| 1 year CMT + 1.500%, 2.750%, due 07/20/272 | 7,134 | 7,342 | |||||||||
| 1 year CMT + 1.500%, 2.750%, due 08/20/272 | 19,660 | 19,936 | |||||||||
| 1 year CMT + 1.500%, 2.750%, due 07/20/302 | 77,340 | 79,795 | |||||||||
| 1 year CMT + 1.500%, 2.750%, due 08/20/302 | 75,701 | 78,149 | |||||||||
| 1 year CMT + 1.500%, 3.000%, due 05/20/252 | 28,711 | 29,492 | |||||||||
| 1 year CMT + 1.500%, 3.000%, due 06/20/252 | 12,263 | 12,483 | |||||||||
| 1 year CMT + 1.500%, 3.125%, due 11/20/212 | 4,883 | 4,865 | |||||||||
| 1 year CMT + 1.500%, 3.125%, due 10/20/302 | 12,204 | 12,478 | |||||||||
| 1 year CMT + 1.500%, 3.375%, due 01/20/232 | 22,572 | 22,936 | |||||||||
| Face amount | Value | ||||||||||
| Government national mortgage association certificates—(concluded) | |||||||||||
| 1 year CMT + 1.500%, 3.375%, due 03/20/232 | $ | 10,093 | $ | 10,232 | |||||||
| 1 year CMT + 1.500%, 3.375%, due 01/20/242 | 30,262 | 30,432 | |||||||||
| 1 year CMT + 1.500%, 3.375%, due 01/20/252 | 4,005 | 4,096 | |||||||||
| 1 year CMT + 1.500%, 3.375%, due 02/20/252 | 7,137 | 7,218 | |||||||||
| 1 year CMT + 1.500%, 3.375%, due 03/20/262 | 9,906 | 10,083 | |||||||||
| 1 year CMT + 1.500%, 3.375%, due 01/20/272 | 67,611 | 67,347 | |||||||||
| 1 year CMT + 1.500%, 3.375%, due 02/20/272 | 6,107 | 6,156 | |||||||||
| 1 year CMT + 1.500%, 3.375%, due 01/20/282 | 9,521 | 9,800 | |||||||||
| 1 year CMT + 1.500%, 3.375%, due 02/20/282 | 6,128 | 6,157 | |||||||||
| 1 year CMT + 1.500%, 3.500%, due 03/20/252 | 19,288 | 19,250 | |||||||||
3.500%, due 07/20/47 | 4,178,131 | 4,205,122 | |||||||||
3.500%, due 01/20/48 | 2,486,667 | 2,497,827 | |||||||||
| 1 year CMT + 1.500%, 4.000%, due 06/20/192 | 1,726 | 1,718 | |||||||||
4.000%, due 04/20/48 | 754,470 | 776,281 | |||||||||
| GNMA TBA 4.000% | 4,000,000 | 4,088,594 | |||||||||
| 4.500% | 2,000,000 | 2,076,686 | |||||||||
| GNMA II TBA 3.000% | 18,000,000 | 17,544,375 | |||||||||
| 3.500% | 19,500,000 | 19,530,469 | |||||||||
| 4.000% | 31,200,000 | 31,891,030 | |||||||||
| 4.500% | 9,000,000 | 9,344,736 | |||||||||
| 5.000% | 3,000,000 | 3,144,727 | |||||||||
| Total government national mortgage association certificates (cost—$140,253,299) | 139,226,057 | ||||||||||
Federal home loan mortgage corporation certificates—29.65% | |||||||||||
| FHLMC 2.500%, due 01/01/31 | 337,446 | 326,408 | |||||||||
2.500%, due 11/01/31 | 75,957 | 73,520 | |||||||||
2.500%, due 07/01/32 | 196,949 | 190,629 | |||||||||
2.500%, due 08/01/32 | 940,226 | 910,059 | |||||||||
2.500%, due 09/01/32 | 1,182,184 | 1,144,244 | |||||||||
2.500%, due 11/01/32 | 1,031,536 | 998,407 | |||||||||
2.500%, due 12/01/32 | 1,049,503 | 1,015,793 | |||||||||
2.500%, due 01/01/33 | 260,258 | 251,895 | |||||||||
3.000%, due 01/01/33 | 3,343,993 | 3,310,858 | |||||||||
3.000%, due 04/01/43 | 308,805 | 299,951 | |||||||||
3.000%, due 05/01/43 | 235,319 | 228,585 | |||||||||
3.000%, due 12/01/44 | 278,749 | 270,764 | |||||||||
3.000%, due 04/01/45 | 1,573,175 | 1,523,073 | |||||||||
3.000%, due 08/01/46 | 491,443 | 470,047 | |||||||||
3.000%, due 12/01/46 | 8,222,201 | 7,932,247 | |||||||||
3.000%, due 01/01/47 | 751,417 | 724,263 | |||||||||
16
PACE Mortgage-Backed Securities Fixed Income Investments
Portfolio of investments—July 31, 2018
| Face amount | Value | ||||||||||
Federal home loan mortgage corporation certificates—(continued) | |||||||||||
3.000%, due 10/01/47 | $ | 297,944 | $ | 287,150 | |||||||
3.000%, due 02/01/48 | 12,676,007 | 12,217,089 | |||||||||
3.000%, due 04/01/48 | 7,719,818 | 7,439,925 | |||||||||
3.000%, due 06/01/48 | 399,186 | 384,738 | |||||||||
3.500%, due 09/01/32 | 556,754 | 562,393 | |||||||||
3.500%, due 08/01/48 | 1,000,000 | 991,055 | |||||||||
4.000%, due 01/01/37 | 353,422 | 360,060 | |||||||||
4.000%, due 07/01/43 | 257,343 | 263,684 | |||||||||
4.000%, due 08/01/44 | 3,426,616 | 3,516,879 | |||||||||
4.500%, due 10/01/33 | 49,836 | 50,741 | |||||||||
4.500%, due 09/01/34 | 943,128 | 950,301 | |||||||||
4.500%, due 01/01/36 | 24,611 | 25,254 | |||||||||
4.500%, due 05/01/37 | 8,976 | 9,211 | |||||||||
4.500%, due 05/01/38 | 35,708 | 36,022 | |||||||||
5.000%, due 10/01/25 | 51,678 | 54,461 | |||||||||
5.000%, due 11/01/27 | 7,937 | 8,364 | |||||||||
5.000%, due 07/01/33 | 10,328 | 10,316 | |||||||||
5.000%, due 09/01/33 | 232,002 | 248,539 | |||||||||
5.000%, due 06/01/34 | 10,320 | 10,954 | |||||||||
5.000%, due 04/01/35 | 34,524 | 36,383 | |||||||||
5.000%, due 05/01/35 | 103,638 | 110,381 | |||||||||
5.000%, due 07/01/35 | 905,834 | 963,912 | |||||||||
5.000%, due 08/01/35 | 30,567 | 32,564 | |||||||||
5.000%, due 10/01/35 | 25,523 | 27,182 | |||||||||
5.000%, due 12/01/35 | 879 | 938 | |||||||||
5.000%, due 07/01/38 | 294,342 | 313,260 | |||||||||
5.000%, due 11/01/38 | 235,941 | 251,260 | |||||||||
5.000%, due 06/01/39 | 59,033 | 62,901 | |||||||||
5.000%, due 03/01/40 | 7,076 | 7,541 | |||||||||
5.000%, due 07/01/40 | 324,053 | 344,641 | |||||||||
5.000%, due 09/01/40 | 165,210 | 175,372 | |||||||||
5.000%, due 11/01/40 | 281,161 | 298,904 | |||||||||
5.000%, due 02/01/41 | 466,505 | 495,714 | |||||||||
5.000%, due 03/01/41 | 34,062 | 36,306 | |||||||||
5.000%, due 04/01/41 | 86,276 | 91,658 | |||||||||
5.000%, due 05/01/41 | 181,646 | 192,987 | |||||||||
5.000%, due 07/01/41 | 43,201 | 45,780 | |||||||||
5.000%, due 08/01/44 | 83,307 | 89,037 | |||||||||
5.500%, due 06/01/281 | 1,478 | 1,574 | |||||||||
5.500%, due 02/01/321 | 1,868 | 2,019 | |||||||||
5.500%, due 12/01/321 | 3,819 | 4,130 | |||||||||
5.500%, due 02/01/331 | 45,756 | 48,753 | |||||||||
5.500%, due 05/01/331 | 800 | 865 | |||||||||
5.500%, due 06/01/331 | 214,676 | 232,126 | |||||||||
5.500%, due 12/01/331 | 51,185 | 55,035 | |||||||||
5.500%, due 12/01/341 | 45,949 | 49,743 | |||||||||
5.500%, due 06/01/351 | 749,662 | 811,291 | |||||||||
5.500%, due 07/01/351 | 5,524 | 5,882 | |||||||||
5.500%, due 10/01/351 | 190,117 | 203,919 | |||||||||
5.500%, due 12/01/351 | 114,051 | 123,289 | |||||||||
5.500%, due 06/01/361 | 426,935 | 462,206 | |||||||||
5.500%, due 07/01/361 | 22,513 | 22,801 | |||||||||
5.500%, due 12/01/361 | 665,725 | 717,586 | |||||||||
5.500%, due 03/01/37 | 80,350 | 86,526 | |||||||||
5.500%, due 07/01/37 | 63,296 | 65,454 | |||||||||
5.500%, due 10/01/37 | 3,741 | 4,021 | |||||||||
5.500%, due 04/01/38 | 132,634 | 143,152 | |||||||||
| Face amount | Value | ||||||||||
Federal home loan mortgage corporation certificates—(concluded) | |||||||||||
5.500%, due 05/01/38 | $ | 13,116 | $ | 14,065 | |||||||
5.500%, due 12/01/38 | 2,667 | 2,870 | |||||||||
5.500%, due 01/01/39 | 59,467 | 64,053 | |||||||||
5.500%, due 09/01/39 | 185,528 | 200,950 | |||||||||
5.500%, due 02/01/40 | 8,330 | 8,952 | |||||||||
5.500%, due 03/01/40 | 7,634 | 8,158 | |||||||||
5.500%, due 05/01/40 | 112,404 | 121,051 | |||||||||
5.500%, due 03/01/41 | 120,338 | 129,623 | |||||||||
6.000%, due 11/01/37 | 1,044,203 | 1,141,741 | |||||||||
7.000%, due 08/01/25 | 181 | 193 | |||||||||
11.000%, due 06/01/19 | 47 | 47 | |||||||||
11.000%, due 09/01/20 | 36 | 36 | |||||||||
| FHLMC ARM 1 year CMT + 2.137%, 3.427%, due 01/01/282 | 12,392 | 12,660 | |||||||||
| 1 year CMT + 2.250%, 3.486%, due 09/01/342 | 1,055,620 | 1,117,720 | |||||||||
| 12 mo. USD LIBOR + 1.766%, 3.515%, due 11/01/362 | 348,732 | 365,859 | |||||||||
| 1 year CMT + 2.180%, 3.590%, due 04/01/292 | 49,177 | 50,113 | |||||||||
| 12 mo. USD LIBOR + 1.864%, 3.637%, due 11/01/412 | 2,288,746 | 2,394,923 | |||||||||
| 1 year CMT + 2.299%, 3.669%, due 10/01/232 | 15,766 | 16,101 | |||||||||
| 1 year CMT + 2.438%, 3.751%, due 10/01/272 | 122,478 | 128,162 | |||||||||
| 1 year CMT + 2.218%, 3.804%, due 07/01/242 | 65,503 | 66,408 | |||||||||
| 1 year CMT + 2.131%, 3.808%, due 11/01/272 | 58,370 | 59,109 | |||||||||
| 12 mo. USD LIBOR + 1.781%, 3.853%, due 10/01/392 | 1,837,677 | 1,929,255 | |||||||||
| 1 year CMT + 2.625%, 3.875%, due 01/01/302 | 24,434 | 24,496 | |||||||||
| 1 year CMT + 2.257%, 3.924%, due 11/01/292 | 180,094 | 187,316 | |||||||||
| 1 year CMT + 2.415%, 3.965%, due 01/01/292 | 114,223 | 119,535 | |||||||||
| 1 year CMT + 2.282%, 3.967%, due 06/01/282 | 148,259 | 154,182 | |||||||||
| 1 year CMT + 2.363%, 3.983%, due 12/01/292 | 21,997 | 22,724 | |||||||||
| 1 year CMT + 2.415%, 3.987%, due 11/01/252 | 99,176 | 103,901 | |||||||||
| 1 year CMT + 2.459%, 3.994%, due 10/01/272 | 108,654 | 113,367 | |||||||||
| 1 year CMT + 2.282%, 4.104%, due 07/01/282 | 75,424 | 78,085 | |||||||||
| FHLMC TBA 3.500% | 35,000,000 | 34,635,840 | |||||||||
| 4.000% | 12,500,000 | 12,672,332 | |||||||||
| 4.500% | 5,000,000 | 5,185,058 | |||||||||
| 5.000% | 1,500,000 | 1,580,801 | |||||||||
| Total federal home loan mortgage corporation certificates (cost—$117,445,000) | 116,424,658 | ||||||||||
17
PACE Mortgage-Backed Securities Fixed Income Investments
Portfolio of investments—July 31, 2018
| Face amount | Value | ||||||||||
Federal housing administration certificates—0.02% | |||||||||||
| FHA GMAC 7.400%, due 02/01/213,7 | $ | 6,040 | $ | 6,048 | |||||||
| FHA Reilly 6.896%, due 07/01/203,7 | 56,516 | 56,559 | |||||||||
| Total federal housing administration certificates (cost—$62,602) | 62,607 | ||||||||||
Federal national mortgage association certificates—62.75% | |||||||||||
| FNMA 2.000%, due 05/01/28 | 201,389 | 192,735 | |||||||||
2.000%, due 09/01/31 | 235,149 | 221,834 | |||||||||
2.000%, due 11/01/31 | 576,167 | 543,628 | |||||||||
2.000%, due 01/01/32 | 131,756 | 124,298 | |||||||||
2.348%, due 09/01/19 | 420,008 | 415,903 | |||||||||
2.500%, due 06/01/28 | 259,727 | 253,326 | |||||||||
2.500%, due 07/01/28 | 1,931,674 | 1,883,960 | |||||||||
2.500%, due 08/01/28 | 642,228 | 626,336 | |||||||||
2.500%, due 09/01/30 | 40,998 | 39,870 | |||||||||
2.500%, due 11/01/30 | 62,723 | 60,995 | |||||||||
2.500%, due 04/01/47 | 249,999 | 233,168 | |||||||||
2.610%, due 05/01/19 | 5,000,000 | 4,985,538 | |||||||||
| 12 mo. USD LIBOR + 1.790%, 2.717%, due 02/01/422 | 556,396 | 586,032 | |||||||||
3.000%, due 05/01/28 | 248,095 | 247,314 | |||||||||
3.000%, due 02/01/30 | 439,012 | 437,494 | |||||||||
3.000%, due 04/01/30 | 126,618 | 125,908 | |||||||||
3.000%, due 05/01/30 | 128,998 | 128,273 | |||||||||
3.000%, due 08/01/30 | 222,608 | 221,358 | |||||||||
3.000%, due 10/01/30 | 40,555 | 40,327 | |||||||||
3.000%, due 11/01/30 | 293,896 | 291,707 | |||||||||
3.000%, due 12/01/30 | 359,159 | 356,273 | |||||||||
3.000%, due 04/01/31 | 2,686,532 | 2,671,462 | |||||||||
3.000%, due 06/01/32 | 293,848 | 291,341 | |||||||||
3.000%, due 10/01/42 | 608,968 | 592,551 | |||||||||
3.000%, due 01/01/43 | 2,338,324 | 2,273,829 | |||||||||
3.000%, due 04/01/43 | 922,267 | 896,453 | |||||||||
3.000%, due 05/01/43 | 965,592 | 938,561 | |||||||||
3.000%, due 06/01/43 | 133,654 | 129,917 | |||||||||
3.000%, due 09/01/43 | 1,199,662 | 1,166,211 | |||||||||
3.000%, due 11/01/46 | 99,999 | 96,531 | |||||||||
3.000%, due 12/01/46 | 7,519,489 | 7,265,071 | |||||||||
3.440%, due 02/01/32 | 2,486,908 | 2,431,472 | |||||||||
3.500%, due 11/01/25 | 450,831 | 455,592 | |||||||||
3.500%, due 08/01/29 | 90,233 | 91,381 | |||||||||
3.500%, due 12/01/41 | 1,191,225 | 1,190,964 | |||||||||
3.500%, due 03/01/42 | 519,073 | 518,695 | |||||||||
3.500%, due 04/01/42 | 61,560 | 61,185 | |||||||||
3.500%, due 12/01/42 | 1,900,650 | 1,899,266 | |||||||||
3.500%, due 03/01/43 | 1,069,600 | 1,067,471 | |||||||||
3.500%, due 05/01/43 | 4,404,071 | 4,407,667 | |||||||||
3.500%, due 07/01/43 | 381,154 | 380,053 | |||||||||
3.500%, due 06/01/45 | 4,915,130 | 4,885,683 | |||||||||
3.500%, due 08/01/45 | 103,299 | 102,681 | |||||||||
3.500%, due 09/01/46 | 1,811,144 | 1,805,856 | |||||||||
3.500%, due 08/01/47 | 606,682 | 602,309 | |||||||||
3.500%, due 09/01/47 | 799,532 | 795,088 | |||||||||
| Face amount | Value | ||||||||||
Federal national mortgage association certificates—(continued) | |||||||||||
3.500%, due 11/01/47 | $ | 1,136,907 | $ | 1,128,210 | |||||||
3.500%, due 12/01/47 | 1,028,799 | 1,021,436 | |||||||||
3.500%, due 02/01/48 | 2,424,369 | 2,405,678 | |||||||||
3.500%, due 03/01/48 | 2,074,325 | 2,058,034 | |||||||||
3.570%, due 07/01/28 | 8,773,000 | 8,771,198 | |||||||||
3.600%, due 08/01/23 | 793,306 | 810,954 | |||||||||
| 1 year CMT + 2.040%, 3.670%, due 09/01/412 | 660,125 | 689,459 | |||||||||
| 1 year CMT + 2.280%, 3.763%, due 05/01/352 | 207,894 | 219,969 | |||||||||
| 1 year CMT + 2.220%, 3.775%, due 10/01/372 | 2,807,457 | 2,961,415 | |||||||||
| 12 mo. USD LIBOR + 1.731%, 3.844%, due 05/01/382 | 1,754,475 | 1,842,560 | |||||||||
| 1 year CMT + 2.238%, 3.945%, due 01/01/362 | 571,480 | 602,635 | |||||||||
4.000%, due 07/01/251 | 14,952 | 15,319 | |||||||||
4.000%, due 08/01/251 | 40,646 | 41,646 | |||||||||
4.000%, due 09/01/251 | 36,538 | 37,438 | |||||||||
4.000%, due 10/01/251 | 19,312 | 19,778 | |||||||||
4.000%, due 11/01/251 | 126,963 | 130,080 | |||||||||
4.000%, due 01/01/261 | 327,816 | 336,005 | |||||||||
4.000%, due 02/01/261 | 823,238 | 843,576 | |||||||||
4.000%, due 03/01/261 | 764,297 | 783,075 | |||||||||
4.000%, due 04/01/261 | 1,721,886 | 1,765,027 | |||||||||
4.000%, due 08/01/321 | 9,608 | 9,870 | |||||||||
4.000%, due 06/01/331 | 172,065 | 176,787 | |||||||||
4.000%, due 07/01/331 | 360,057 | 368,406 | |||||||||
4.000%, due 07/01/341 | 1,044,403 | 1,073,076 | |||||||||
4.000%, due 07/01/381 | 3,487,712 | 3,579,920 | |||||||||
4.000%, due 05/01/391 | 153,128 | 156,682 | |||||||||
4.000%, due 09/01/391 | 348,398 | 356,477 | |||||||||
4.000%, due 09/01/401 | 3,438,631 | 3,518,991 | |||||||||
4.000%, due 12/01/401 | 4,554,945 | 4,672,375 | |||||||||
4.000%, due 04/01/411 | 1,046,424 | 1,072,296 | |||||||||
4.000%, due 11/01/411 | 750,644 | 771,017 | |||||||||
4.000%, due 12/01/411 | 1,036,711 | 1,064,845 | |||||||||
4.000%, due 07/01/42 | 3,862,140 | 3,970,446 | |||||||||
4.000%, due 07/01/42 | 487,046 | 495,502 | |||||||||
4.000%, due 09/01/42 | 6,108,908 | 6,272,734 | |||||||||
4.000%, due 10/01/42 | 4,648,134 | 4,774,256 | |||||||||
4.000%, due 07/01/43 | 486,654 | 496,147 | |||||||||
4.000%, due 12/01/44 | 56,150 | 57,139 | |||||||||
4.000%, due 06/01/45 | 37,310 | 37,956 | |||||||||
4.000%, due 08/01/45 | 2,744,765 | 2,790,566 | |||||||||
4.000%, due 03/01/47 | 156,597 | 159,162 | |||||||||
4.000%, due 09/01/47 | 393,151 | 399,590 | |||||||||
4.000%, due 10/01/47 | 2,189,430 | 2,225,753 | |||||||||
4.000%, due 12/01/47 | 219,471 | 223,066 | |||||||||
4.000%, due 01/01/48 | 1,939,467 | 1,971,619 | |||||||||
4.500%, due 05/01/191 | 360 | 363 | |||||||||
4.500%, due 09/01/191 | 15,575 | 15,694 | |||||||||
4.500%, due 08/01/201 | 3,577 | 3,604 | |||||||||
4.500%, due 01/01/211 | 24,697 | 24,886 | |||||||||
4.500%, due 05/01/211 | 24,853 | 25,043 | |||||||||
4.500%, due 03/01/231 | 5,994 | 6,194 | |||||||||
4.500%, due 06/01/291 | 32,680 | 33,913 | |||||||||
18
PACE Mortgage-Backed Securities Fixed Income Investments
Portfolio of investments—July 31, 2018
| Face amount | Value | ||||||||||
Federal national mortgage association certificates—(continued) | |||||||||||
4.500%, due 06/01/351 | $ | 16,643 | $ | 16,750 | |||||||
4.500%, due 01/01/391 | 1,860 | 1,930 | |||||||||
4.500%, due 03/01/391 | 11,654 | 12,210 | |||||||||
4.500%, due 06/01/391 | 77,405 | 81,095 | |||||||||
4.500%, due 07/01/391 | 2,917 | 3,027 | |||||||||
4.500%, due 08/01/391 | 127,865 | 132,758 | |||||||||
4.500%, due 10/01/391 | 5,563 | 5,828 | |||||||||
4.500%, due 12/01/391 | 445,913 | 467,517 | |||||||||
4.500%, due 01/01/401 | 4,242 | 4,456 | |||||||||
4.500%, due 02/01/401 | 4,674 | 4,903 | |||||||||
4.500%, due 03/01/401 | 82,681 | 86,658 | |||||||||
4.500%, due 08/01/401 | 75,951 | 79,602 | |||||||||
4.500%, due 11/01/401 | 410,861 | 430,939 | |||||||||
4.500%, due 07/01/411 | 509,920 | 534,478 | |||||||||
4.500%, due 08/01/411 | 901,548 | 945,555 | |||||||||
4.500%, due 09/01/411 | 35,327 | 36,866 | |||||||||
4.500%, due 01/01/421 | 2,451,772 | 2,569,376 | |||||||||
4.500%, due 08/01/421 | 4,674 | 4,893 | |||||||||
4.500%, due 09/01/431 | 353,147 | 371,139 | |||||||||
4.500%, due 11/01/431 | 79,483 | 83,314 | |||||||||
4.500%, due 07/01/441 | 354,316 | 371,220 | |||||||||
4.500%, due 12/01/441 | 2,170 | 2,260 | |||||||||
5.000%, due 03/01/23 | 2,300 | 2,392 | |||||||||
5.000%, due 05/01/23 | 64,949 | 67,333 | |||||||||
5.000%, due 03/01/25 | 18,104 | 19,135 | |||||||||
5.000%, due 03/01/33 | 19,282 | 19,450 | |||||||||
5.000%, due 05/01/37 | 9,341 | 9,623 | |||||||||
5.000%, due 09/01/37 | 28,740 | 30,039 | |||||||||
5.000%, due 06/01/38 | 48,802 | 51,021 | |||||||||
5.500%, due 06/01/231 | 425,952 | 454,820 | |||||||||
5.500%, due 10/01/241 | 6,784 | 7,244 | |||||||||
5.500%, due 11/01/251 | 9,027 | 9,639 | |||||||||
5.500%, due 07/01/271 | 103,548 | 110,566 | |||||||||
5.500%, due 11/01/321 | 84,661 | 90,994 | |||||||||
5.500%, due 12/01/331 | 1,271 | 1,370 | |||||||||
5.500%, due 04/01/341 | 30,663 | 33,053 | |||||||||
5.500%, due 01/01/351 | 123,693 | 132,076 | |||||||||
5.500%, due 04/01/361 | 85,532 | 91,329 | |||||||||
5.500%, due 05/01/371 | 207,424 | 225,379 | |||||||||
5.500%, due 07/01/37 | 115,992 | 125,878 | |||||||||
5.500%, due 06/01/38 | 171,253 | 184,490 | |||||||||
5.500%, due 06/01/39 | 999,804 | 1,084,988 | |||||||||
5.500%, due 11/01/39 | 398,851 | 433,380 | |||||||||
5.500%, due 07/01/40 | 520,901 | 560,038 | |||||||||
5.500%, due 02/01/42 | 290,057 | 312,904 | |||||||||
6.000%, due 12/01/18 | 214 | 232 | |||||||||
6.000%, due 07/01/19 | 415 | 450 | |||||||||
6.000%, due 11/01/21 | 31,326 | 31,877 | |||||||||
6.000%, due 01/01/23 | 118,604 | 121,133 | |||||||||
6.000%, due 03/01/23 | 126,647 | 131,145 | |||||||||
6.000%, due 09/01/25 | 768,309 | 833,185 | |||||||||
6.000%, due 11/01/26 | 22,770 | 24,693 | |||||||||
6.000%, due 02/01/32 | 74,102 | 80,383 | |||||||||
6.000%, due 12/01/32 | 13,818 | 15,110 | |||||||||
6.000%, due 02/01/33 | 28,834 | 31,372 | |||||||||
6.000%, due 09/01/34 | 138,246 | 151,042 | |||||||||
6.000%, due 05/01/35 | 65,307 | 70,921 | |||||||||
| Face amount | Value | ||||||||||
Federal national mortgage association certificates—(concluded) | |||||||||||
6.000%, due 06/01/35 | $ | 17,856 | $ | 19,490 | |||||||
6.000%, due 07/01/35 | 46,154 | 50,143 | |||||||||
6.000%, due 09/01/35 | 1,685 | 1,841 | |||||||||
6.000%, due 01/01/36 | 32,960 | 36,069 | |||||||||
6.000%, due 06/01/36 | 233 | 252 | |||||||||
6.000%, due 09/01/36 | 42,057 | 46,019 | |||||||||
6.000%, due 10/01/36 | 16,733 | 18,259 | |||||||||
6.000%, due 12/01/36 | 138,752 | 151,362 | |||||||||
6.000%, due 03/01/37 | 15,699 | 17,159 | |||||||||
6.000%, due 10/01/37 | 57,051 | 59,947 | |||||||||
6.000%, due 11/01/38 | 406,603 | 446,619 | |||||||||
6.000%, due 05/01/39 | 50,615 | 55,598 | |||||||||
6.000%, due 11/01/40 | 559,587 | 614,678 | |||||||||
6.500%, due 07/01/19 | 2,305 | 2,525 | |||||||||
6.500%, due 10/01/36 | 431,839 | 473,143 | |||||||||
6.500%, due 02/01/37 | 3,472 | 3,804 | |||||||||
6.500%, due 07/01/37 | 32,367 | 35,462 | |||||||||
6.500%, due 08/01/37 | 42,531 | 46,599 | |||||||||
6.500%, due 09/01/37 | 57,366 | 63,275 | |||||||||
6.500%, due 12/01/37 | 144,069 | 157,849 | |||||||||
6.500%, due 08/01/38 | 1,167 | 1,278 | |||||||||
6.500%, due 05/01/40 | 1,216,250 | 1,386,535 | |||||||||
7.500%, due 11/01/26 | 14,527 | 14,603 | |||||||||
8.000%, due 11/01/26 | 6,669 | 6,740 | |||||||||
9.000%, due 02/01/26 | 9,494 | 9,594 | |||||||||
| FNMA ARM 12 mo. MTA + 1.200%, 2.757%, due 03/01/442 | 194,283 | 196,843 | |||||||||
| 6 mo. USD LIBOR + 1.105%, 2.980%, due 10/01/262 | 74,989 | 75,586 | |||||||||
| 1 year CMT + 2.095%, 3.337%, due 09/01/262 | 16,153 | 16,185 | |||||||||
| 1 year CMT + 2.082%, 3.405%, due 02/01/262 | 26,928 | 26,930 | |||||||||
| 1 year CMT + 2.250%, 3.500%, due 02/01/302 | 3,577 | 3,586 | |||||||||
| 1 year CMT + 2.100%, 3.777%, due 05/01/302 | 30,439 | 31,405 | |||||||||
| 1 year CMT + 2.507%, 3.858%, due 12/01/272 | 17,405 | 17,926 | |||||||||
| 1 year CMT + 2.325%, 4.124%, due 03/01/252 | 41,850 | 42,683 | |||||||||
| FNMA TBA 2.500% | 12,000,000 | 11,434,014 | |||||||||
| 3.000% | 28,100,000 | 27,488,261 | |||||||||
| 3.500% | 62,500,000 | 62,073,706 | |||||||||
| 4.000% | 1,500,000 | 1,535,713 | |||||||||
| 5.000% | 11,000,000 | 11,601,133 | |||||||||
| Total federal national mortgage association certificates (cost—$249,870,571) | 246,379,706 | ||||||||||
Collateralized mortgage obligations—17.17% | |||||||||||
| ARM Trust, Series 2005-8, Class 3A21 4.010%, due 11/25/354 | 708,701 | 604,203 | |||||||||
19
PACE Mortgage-Backed Securities Fixed Income Investments
Portfolio of investments—July 31, 2018
| Face amount | Value | ||||||||||
Collateralized mortgage obligations—(continued) | |||||||||||
| BCAP LLC 2010-RR1 Trust, Series 2010-RR1, Class 1A4 3.660%, due 03/26/374,5 | $ | 155,859 | $ | 135,459 | |||||||
| BCAP LLC 2011-RR10 Trust, Series 2011-RR10, Class 3A5 3.962%, due 06/26/354,5 | 100,234 | 98,531 | |||||||||
| BCAP LLC 2011-RR11 Trust, Series 2011-R11, Class 8A5 2.284%, due 07/26/364,5 | 172,497 | 164,567 | |||||||||
| BCAP LLC 2013-RR1 Trust, Series 2013-RR1, Class 3A4 6.000%, due 10/26/374,5 | 381,255 | 350,494 | |||||||||
| BCAP LLC 2013-RR5 Trust, Series 2013-RR5, Class 5A1 12 mo. MTA + 0.840%, 2.397%, due 11/26/462,5 | 206,331 | 205,625 | |||||||||
| Bear Stearns ARM Trust, Series 2002-011, Class 1A2 3.635%, due 02/25/334 | 4,236 | 3,918 | |||||||||
| Series 2004-002, Class 12A2 3.559%, due 05/25/344 | 48,139 | 48,335 | |||||||||
| Bear Stearns Asset-Backed Securities Trust, Series 2003-AC5, Class A1 5.750%, due 10/25/336 | 612,625 | 631,163 | |||||||||
| Series 2004-AC3, Class A2 6.000%, due 06/25/346 | 872,303 | 879,721 | |||||||||
| Chevy Chase Mortgage Funding Corp., Series 2004-1, Class A1 1 mo. USD LIBOR + 0.280%, 2.344%, due 01/25/352,5 | 91,242 | 89,354 | |||||||||
| CHL Mortgage Pass-Through Trust, Series 2003-HYB1, Class 1A1 4.013%, due 05/19/334 | 4,323 | 4,460 | |||||||||
| Series 2017-15, Class 2A2 6.500%, due 09/25/37 | 35,785 | 27,542 | |||||||||
| Civic Mortgage LLC, Series 2018-1, Class A1 3.892%, due 06/25/225,6 | 602,316 | 602,518 | |||||||||
| CSMC Trust, Series 2013-MH1, Class A 4.790%, due 05/27/533,4,5 | 1,038,733 | 1,026,116 | |||||||||
| FHLMC REMIC, Series 0023, Class KZ 6.500%, due 11/25/23 | 13,855 | 14,592 | |||||||||
| Series 0159, Class H 4.500%, due 09/15/21 | 1,946 | 1,958 | |||||||||
| Series 1003, Class H 1 mo. USD LIBOR + 0.750%, 2.822%, due 10/15/202 | 3,860 | 3,886 | |||||||||
| Series 1349, Class PS 7.500%, due 08/15/22 | 536 | 564 | |||||||||
| Series 1502, Class PX 7.000%, due 04/15/23 | 96,773 | 102,238 | |||||||||
| Series 1534, Class Z 5.000%, due 06/15/23 | 40,552 | 41,251 | |||||||||
| Series 1573, Class PZ 7.000%, due 09/15/23 | 12,489 | 13,264 | |||||||||
| Series 1658, Class GZ 7.000%, due 01/15/24 | 6,010 | 6,402 | |||||||||
| Face amount | Value | ||||||||||
Collateralized mortgage obligations—(continued) | |||||||||||
| Series 1694, Class Z 6.500%, due 03/15/24 | $ | 67,985 | $ | 72,338 | |||||||
| Series 1775, Class Z 8.500%, due 03/15/25 | 2,158 | 2,404 | |||||||||
| Series 2018-28, Class CA 3.000%, due 05/25/48 | 2,006,686 | 1,916,568 | |||||||||
| Series 2400, Class FQ 1 mo. USD LIBOR + 0.500%, 2.572%, due 01/15/322 | 145,113 | 145,672 | |||||||||
| Series 2411, Class FJ 1 mo. USD LIBOR + 0.350%, 2.422%, due 12/15/292 | 16,973 | 16,997 | |||||||||
| Series 2614, Class WO, PO 0.000%, due 05/15/33 | 1,031,937 | 905,289 | |||||||||
| Series 3096, Class FL 1 mo. USD LIBOR + 0.400%, 2.472%, due 01/15/362 | 157,550 | 158,021 | |||||||||
| Series 3114, Class PF 1 mo. USD LIBOR + 0.400%, 2.472%, due 02/15/362 | 800,540 | 804,333 | |||||||||
| Series 3153, Class UF 1 mo. USD LIBOR + 0.430%, 2.502%, due 05/15/362 | 208,790 | 209,722 | |||||||||
| Series 3339, Class LI, IO 1 mo. USD LIBOR + 6.480%, 4.408%, due 07/15/372 | 828,111 | 114,919 | |||||||||
| Series 3442, Class MT 1 mo. USD LIBOR, 2.072%, due 07/15/342 | 85,198 | 83,343 | |||||||||
| Series 3598, Class JI, IO 1.041%, due 10/15/374 | 55,510 | 2,131 | |||||||||
| Series 3621, Class WI, IO 1.195%, due 05/15/374 | 98,200 | 4,699 | |||||||||
| Series 3635, Class IB, IO 0.927%, due 10/15/374 | 187,868 | 7,165 | |||||||||
| Series 3667, Class FW 1 mo. USD LIBOR + 0.550%, 2.622%, due 02/15/382 | 80,713 | 81,140 | |||||||||
| Series 3671, Class FQ 1 mo. USD LIBOR + 0.850%, 2.922%, due 12/15/362 | 1,290,147 | 1,304,986 | |||||||||
| Series 3684, Class JI, IO 1.401%, due 11/15/364 | 476,631 | 27,729 | |||||||||
| Series 3864, Class NT 1 mo. USD LIBOR + 60.050%, 5.500%, due 03/15/392 | 645,069 | 676,286 | |||||||||
| Series 4037, Class PI, IO 3.000%, due 04/15/27 | 3,073,969 | 224,418 | |||||||||
| Series 4131, Class AI, IO 2.500%, due 10/15/22 | 1,366,402 | 50,137 | |||||||||
| Series 4136, Class EZ 3.000%, due 11/15/42 | 1,224,036 | 1,146,539 | |||||||||
| Series 4156, Class SA, IO 1 mo. USD LIBOR + 6.020%, 4.128%, due 01/15/332 | 2,143,765 | 269,197 | |||||||||
| Series 4165, Class TI, IO 3.000%, due 12/15/42 | 2,041,188 | 194,909 | |||||||||
20
PACE Mortgage-Backed Securities Fixed Income Investments
Portfolio of investments—July 31, 2018
| Face amount | Value | ||||||||||
Collateralized mortgage obligations—(continued) | |||||||||||
| Series 4182, Class YI, IO 2.500%, due 03/15/28 | $ | 4,867,748 | $ | 374,348 | |||||||
| Series 4255, Class SN 1 mo. USD LIBOR + 12.267%, 6.688%, due 05/15/352 | 342,985 | 352,639 | |||||||||
| Series 4263, Class SD 1 mo. USD LIBOR + 12.267%, 6.742%, due 11/15/432 | 387,679 | 416,690 | |||||||||
| Series 4265, Class ES 1 mo. USD LIBOR + 13.760%, 7.065%, due 11/15/432 | 828,981 | 867,362 | |||||||||
| Series 4324, Class IO, IO 1.619%, due 08/15/364 | 272,915 | 9,982 | |||||||||
| Series 4338, Class SB, IO 1.357%, due 10/15/414 | 286,071 | 11,790 | |||||||||
| Series 4367, Class GS, IO 1.350%, due 03/15/374 | 169,421 | 8,579 | |||||||||
| Series 4394, Class WI, IO 1.379%, due 08/15/414 | 153,710 | 7,657 | |||||||||
| Series 4438, Class WI, IO 1.315%, due 11/15/384 | 498,341 | 25,907 | |||||||||
| Series 4457, Class DI, IO 4.000%, due 08/15/24 | 1,077,290 | 90,342 | |||||||||
| Series 4463, Class IO, IO 1.527%, due 02/15/384 | 358,211 | 18,366 | |||||||||
| Series 4544, Class IP, IO 4.000%, due 01/15/46 | 3,937,164 | 845,233 | |||||||||
| Trust 2513, Class AS, IO 1 mo. USD LIBOR + 8.000%, 5.928%, due 02/15/322 | 350,615 | 67,166 | |||||||||
| Trust 3609, Class LI, IO 4.500%, due 12/15/24 | 222,594 | 4,384 | |||||||||
| Trust 3838, Class LI, IO 4.500%, due 04/15/22 | 182,482 | 7,320 | |||||||||
| Trust 3962, Class KS, IO 1.478%, due 06/15/384 | 315,983 | 16,850 | |||||||||
| Trust 4076, Class SW, IO 1 mo. USD LIBOR + 6.050%, 3.978%, due 07/15/422 | 2,521,663 | 425,889 | |||||||||
| Trust 4100, Class HI, IO 3.000%, due 08/15/27 | 557,954 | 47,692 | |||||||||
| Trust 4182, Class QI, IO 3.000%, due 02/15/33 | 212,475 | 20,325 | |||||||||
| Trust 4479, Class NI, IO 4.500%, due 11/15/19 | 122,435 | 1,590 | |||||||||
| FHLMC STRIPs, Series 303, Class C19, IO 3.500%, due 01/15/43 | 1,271,981 | 247,351 | |||||||||
| Series 330, Class F4 1 mo. USD LIBOR + 0.350%, 2.332%, due 10/15/372 | 705,678 | 704,971 | |||||||||
| Series 345, Class C13, IO 3.500%, due 08/15/45 | 2,322,179 | 459,908 | |||||||||
| FNMA REMIC, Series 386, Class 14, IO 6.500%, due 04/25/38 | 83,544 | 17,152 | |||||||||
| Face amount | Value | ||||||||||
Collateralized mortgage obligations—(continued) | |||||||||||
| Series 413, Class 111, IO 4.000%, due 07/25/424 | $ | 1,397,988 | $ | 289,169 | |||||||
| Series 419, Class C3, IO 3.000%, due 11/25/43 | 249,043 | 48,864 | |||||||||
| Trust 1992-129, Class L 6.000%, due 07/25/22 | 1,478 | 1,532 | |||||||||
| Trust 1992-158, Class ZZ 7.750%, due 08/25/22 | 2,400 | 2,566 | |||||||||
| Trust 1993-037, Class PX 7.000%, due 03/25/23 | 71,397 | 74,957 | |||||||||
| Trust 1997-022, Class F 2.069%, due 03/25/274 | 52,443 | 52,210 | |||||||||
| Trust 2002-060, Class F1 1 mo. USD LIBOR + 0.400%, 2.464%, due 06/25/322 | 59,412 | 59,342 | |||||||||
| Trust 2003-070, Class SH 1 mo. USD LIBOR + 14.000%, 9.873%, due 07/25/232 | 68,428 | 75,801 | |||||||||
| Trust 2007-067, Class FB 1 mo. USD LIBOR + 0.320%, 2.384%, due 07/25/372 | 346,448 | 346,186 | |||||||||
| Trust 2009-033, Class FB 1 mo. USD LIBOR + 0.820%, 2.884%, due 03/25/372 | 831,998 | 851,000 | |||||||||
| Trust 2010-141, Class FA 1 mo. USD LIBOR + 0.500%, 2.564%, due 12/25/402 | 450,561 | 454,810 | |||||||||
| Trust 2010-76, Class SA, IO 1 mo. USD LIBOR + 6.500%, 4.436%, due 07/25/402 | 1,560,380 | 221,941 | |||||||||
| Trust 2011-86, Class DI, IO 3.500%, due 09/25/21 | 129,168 | 5,244 | |||||||||
| Trust 2012-090, Class FB 1 mo. USD LIBOR + 0.440%, 2.504%, due 08/25/422 | 205,816 | 204,847 | |||||||||
| Trust 2012-111, Class HS 1 mo. USD LIBOR + 3.667%, 1.947%, due 10/25/422 | 232,074 | 164,951 | |||||||||
| Trust 2012-122, Class LI, IO 4.500%, due 07/25/41 | 1,118,829 | 160,442 | |||||||||
Trust 2012-128, Class FK | |||||||||||
| 1 mo. USD LIBOR + 0.350%, 2.414%, due 11/25/422 | 401,567 | 402,667 | |||||||||
| Trust 2012-32, Class AI, IO 3.000%, due 04/25/22 | 214,487 | 8,596 | |||||||||
| Trust 2012-77, Class IO, IO 1.378%, due 07/25/524 | 425,293 | 18,095 | |||||||||
Trust 2013-028, Class YS, IO | |||||||||||
| 1 mo. USD LIBOR + 6.150%, 4.086%, due 07/25/422 | 1,528,425 | 180,558 | |||||||||
| Trust 2013-030, Class GI, IO 3.000%, due 01/25/43 | 2,669,791 | 389,658 | |||||||||
| Trust 2013-030, Class JI, IO 3.000%, due 04/25/43 | 988,814 | 118,304 | |||||||||
Trust 2013-034, Class PS, IO | |||||||||||
| 1 mo. USD LIBOR + 6.150%, 4.086%, due 08/25/422 | 856,091 | 108,079 | |||||||||
21
PACE Mortgage-Backed Securities Fixed Income Investments
Portfolio of investments—July 31, 2018
| Face amount | Value | ||||||||||
Collateralized mortgage obligations—(continued) | |||||||||||
| Trust 2013-044, Class ZG 3.500%, due 03/25/42 | $ | 681,178 | $ | 667,934 | |||||||
| Trust 2013-045, Class IK, IO 3.000%, due 02/25/43 | 1,733,963 | 250,741 | |||||||||
| Trust 2013-116, Class IY, IO 3.000%, due 09/25/43 | 542,644 | 64,825 | |||||||||
| Trust 2014-42, Class SA, IO 1.342%, due 07/25/444 | 457,444 | 20,676 | |||||||||
| Trust 2014-43, Class BS, IO 1.323%, due 07/25/444 | 752,174 | 35,129 | |||||||||
| Trust 2014-45, Class SA, IO 1.629%, due 08/25/444 | 490,332 | 22,657 | |||||||||
| Trust 2014-47, Class BI, IO 1.487%, due 08/25/544 | 727,109 | 36,516 | |||||||||
| Trust 2014-92, Class SB, IO 1.414%, due 01/25/454 | 524,224 | 20,257 | |||||||||
| Trust 2015-073, Class ES 1 mo. USD LIBOR + 9.333%, 4.452%, due 10/25/452 | 488,006 | 379,730 | |||||||||
| Trust 2015-10, Class SA, IO 1.373%, due 03/25/454 | 430,494 | 18,941 | |||||||||
| Trust 2015-19, Class AI, IO 1.374%, due 04/25/554 | 705,727 | 33,215 | |||||||||
| Trust 2015-30, Class IO, IO 5.500%, due 05/25/45 | 403,738 | 89,837 | |||||||||
| Trust 2015-47, Class GI, IO 4.000%, due 06/25/44 | 301,710 | 51,751 | |||||||||
| Trust 2015-50, Class SB, IO 1.504%, due 07/25/454 | 2,434,599 | 128,369 | |||||||||
| Trust 2015-58, Class AI, IO 1.534%, due 08/25/554 | 450,262 | 23,216 | |||||||||
| Trust 2015-64, Class KS, IO 1.467%, due 09/25/454 | 567,327 | 29,301 | |||||||||
| Trust 2016-14, Class IO, IO 3.000%, due 03/25/46 | 1,507,106 | 234,541 | |||||||||
| Trust 2016-17, Class CS, IO 1.266%, due 04/25/464 | 339,100 | 13,867 | |||||||||
| Trust 2016-20, Class EI, IO 3.000%, due 04/25/46 | 537,972 | 79,071 | |||||||||
| Trust 2016-52, Class PI, IO 3.000%, due 04/25/46 | 1,683,493 | 245,234 | |||||||||
| Trust 2016-57, Class SN, IO 1 mo. USD LIBOR + 6.050%, 3.986%, due 06/25/462 | 3,700,519 | 535,386 | |||||||||
| Trust 2016-63, Class YI, IO 3.500%, due 04/25/46 | 1,143,878 | 146,633 | |||||||||
| Trust 2016-64, Class IA, IO 3.000%, due 05/25/46 | 1,143,164 | 167,943 | |||||||||
| Trust 2016-76, Class CS, IO 1.243%, due 10/25/464 | 148,090 | 5,863 | |||||||||
| Trust 2016-M11, Class AL 2.944%, due 07/25/39 | 4,012,879 | 3,855,808 | |||||||||
| Trust G92-040, Class ZC 7.000%, due 07/25/22 | 5,998 | 6,258 | |||||||||
| Trust G94-006, Class PJ 8.000%, due 05/17/24 | 9,622 | 10,335 | |||||||||
| Face amount | Value | ||||||||||
Collateralized mortgage obligations—(continued) | |||||||||||
| FREMF Multifamily Aggregation Risk Transfer Trust | |||||||||||
| 1 mo. USD LIBOR + 0.320%, 2.389%, due 02/25/202 | $ | 4,800,000 | $ | 4,810,476 | |||||||
| GMAC Mortgage Loan Trust, Series 2004-AR1, Class 12A 4.242%, due 06/25/344 | 13,325 | 13,491 | |||||||||
| GNMA REMIC, Trust 2000-035, Class F | |||||||||||
| 1 mo. USD LIBOR + 0.550%, 2.622%, due 12/16/252 | 79,943 | 80,545 | |||||||||
| Trust 2007-018, Class CO, PO 0.000%, due 03/20/35 | 29,876 | 24,437 | |||||||||
| Trust 2010-H01, Class FA 1 mo. USD LIBOR + 0.820%, 2.923%, due 01/20/602 | 3,011,277 | 3,037,327 | |||||||||
| Trust 2012-140, Class JI, IO 3.500%, due 01/20/41 | 1,379,914 | 174,951 | |||||||||
| Trust 2013-23, Class IP, IO 3.500%, due 08/20/42 | 1,554,450 | 278,082 | |||||||||
| Trust 2013-77, Class GI, IO 3.000%, due 02/20/43 | 3,608,121 | 517,381 | |||||||||
| Trust 2013-H19, Class DF 1 mo. USD LIBOR + 0.650%, 2.655%, due 05/20/632 | 1,333,966 | 1,341,127 | |||||||||
| Trust 2013-H20, Class FB 1 mo. USD LIBOR + 1.000%, 3.005%, due 08/20/632 | 2,302,004 | 2,333,944 | |||||||||
| Trust 2013-H23, Class TA 1 mo. USD LIBOR + 0.720%, 2.725%, due 09/20/632 | 949,246 | 957,273 | |||||||||
| Trust 2014-158, Class IA, IO 3.500%, due 10/20/29 | 1,213,714 | 132,349 | |||||||||
| Trust 2014-188, Class CI, IO 4.000%, due 05/20/44 | 313,536 | 53,202 | |||||||||
| Trust 2015-126, Class GS 1 mo. USD LIBOR + 9.333%, 4.452%, due 09/20/452 | 323,052 | 262,045 | |||||||||
| Trust 2015-127, Class AS, IO 0.742%, due 06/20/434 | 684,886 | 16,459 | |||||||||
| Trust 2015-165, Class IB, IO 3.500%, due 11/20/42 | 631,903 | 93,337 | |||||||||
| Trust 2015-166, Class SA, IO 0.343%, due 06/20/424 | 821,443 | 20,049 | |||||||||
| Trust 2015-180, Class SA, IO 0.293%, due 06/20/424 | 893,601 | 18,191 | |||||||||
| Trust 2015-42, Class AI, IO 3.000%, due 05/20/39 | 606,979 | 54,187 | |||||||||
| Trust 2015-H27, Class FA 1 mo. USD LIBOR + 0.750%, 2.755%, due 09/20/652 | 2,616,141 | 2,648,664 | |||||||||
| Trust 2015-H29, Class FA 1 mo. USD LIBOR + 0.700%, 2.705%, due 10/20/652 | 719,707 | 721,535 | |||||||||
| Trust 2015-H29, Class FJ 1 mo. USD LIBOR + 0.680%, 2.685%, due 11/20/652 | 2,219,211 | 2,240,802 | |||||||||
22
PACE Mortgage-Backed Securities Fixed Income Investments
Portfolio of investments—July 31, 2018
| Face amount | Value | ||||||||||
Collateralized mortgage obligations—(continued) | |||||||||||
| Trust 2015-H30, Class FA 1 mo. USD LIBOR + 0.680%, 2.685%, due 08/20/612 | $ | 577,945 | $ | 579,197 | |||||||
| Trust 2015-H30, Class FB 1 mo. USD LIBOR + 0.680%, 2.685%, due 03/20/622 | 110,089 | 110,289 | |||||||||
| Trust 2016-118, Class IE, IO 3.500%, due 09/20/46 | 88,472 | 15,894 | |||||||||
| Trust 2016-138, Class WI, IO 0.528%, due 08/20/454 | 601,010 | 15,305 | |||||||||
| Trust 2016-180, Class WI, IO 0.422%, due 09/20/454 | 1,244,600 | 31,863 | |||||||||
| Trust 2016-84, Class KS, IO 1 mo. USD LIBOR + 6.080%, 3.994%, due 11/20/452 | 2,868,230 | 479,399 | |||||||||
| Trust 2016-H04, Class FG 1 mo. USD LIBOR + 0.700%, 2.705%, due 12/20/612 | 1,131,268 | 1,134,052 | |||||||||
| Trust 2016-H14, Class FA 1 mo. USD LIBOR + 0.800%, 2.805%, due 06/20/662 | 645,372 | 655,329 | |||||||||
| Trust 2017-15, Class WI, IO 0.416%, due 11/20/454 | 619,237 | 16,884 | |||||||||
| Trust 2017-57, Class WI, IO 0.193%, due 12/20/454 | 349,779 | 6,915 | |||||||||
| GS Mortgage Securities Corp. II, Series 2015-GC30, Class A3 3.119%, due 05/10/50 | 5,000,000 | 4,849,380 | |||||||||
| GSR Mortgage Loan Trust, Series 2004-14, Class 2A1 1 mo. USD LIBOR + 0.330%, 2.394%, due 12/25/342 | 5,414 | 5,094 | |||||||||
| Indymac Index Mortgage Loan Trust, Series 2005-AR2, Class 2A1A 1 mo. USD LIBOR + 0.640%, 2.704%, due 02/25/352 | 511,328 | 502,859 | |||||||||
| JPMorgan Alternative Loan Trust, Series 2008-R4, Class 2A1 1 mo. USD LIBOR + 0.500%, 2.603%, due 06/27/372,5 | 1,237,673 | 1,107,758 | |||||||||
| Merrill Lynch Mortgage Investors Trust, Series 2004-1, Class 2A2 3.786%, due 12/25/344 | 246,983 | 248,292 | |||||||||
| Series 2004-A, Class A1 1 mo. USD LIBOR + 0.460%, 2.524%, due 04/25/292 | 55,150 | 54,384 | |||||||||
| Morgan Stanley Mortgage Loan Trust, Series 2004-11AR, Class 1A1 1 mo. USD LIBOR + 0.320%, 2.384%, due 01/25/352 | 46,872 | 46,044 | |||||||||
| Series 2005-6AR, Class 1A1 1 mo. USD LIBOR + 0.280%, 2.344%, due 11/25/352 | 37,757 | 37,904 | |||||||||
| Morgan Stanley Re-REMIC Trust, Series 2010-R4, Class 4B 1 mo. USD LIBOR + 0.230%, 3.126%, due 02/26/372,5 | 250,702 | 217,068 | |||||||||
| Face amount | Value | ||||||||||
Collateralized mortgage obligations—(concluded) | |||||||||||
| Series 2013-R10, Class 3A 1 mo. USD LIBOR + 0.310%, 2.401%, due 01/26/512,5 | $ | 333,992 | $ | 330,623 | |||||||
| Mortgage Equity Conversion Asset Trust, Series 2007-FF3, Class A | |||||||||||
| 1 year CMT + 0.500%, 2.920%, due 05/25/422,5 | 3,735,134 | 3,473,674 | |||||||||
| NCUA Guaranteed Notes Trust, Series 2010-R1, Class 1A | |||||||||||
| 1 mo. USD LIBOR + 0.450%, 2.537%, due 10/07/202 | 1,395,995 | 1,400,548 | |||||||||
| Series 2010-R2, Class 2A 1 mo. USD LIBOR + 0.470%, 1.002%, due 11/05/202 | 641,732 | 644,511 | |||||||||
| Series 2011-R2, Class 1A 1 mo. USD LIBOR + 0.400%, 2.425%, due 02/06/202 | 270,216 | 270,680 | |||||||||
| RBSSP Resecuritization Trust Certificate, Series 2009-6, Class 18A1 | |||||||||||
| 1 mo. USD LIBOR + 0.500%, 2.570%, due 12/26/362,5 | 50,718 | 50,650 | |||||||||
| Sequoia Mortgage Trust, Series 5, Class A 1 mo. USD LIBOR + 0.700%, 2.782%, due 10/19/262 | 82,985 | 83,442 | |||||||||
| Structured ARM Loan, Series 2007-4, Class 1A2 1 mo. USD LIBOR + 0.220%, 2.284%, due 05/25/372 | 229,217 | 227,825 | |||||||||
| Structured Asset Mortgage Investments, Inc., Series 2006-AR3, Class 11A1 | |||||||||||
| 1 mo. USD LIBOR + 0.210%, 2.274%, due 04/25/362 | 790,858 | 726,813 | |||||||||
| Thornburg Mortgage Securities Trust, Series 2005-1, Class A3 3.478%, due 04/25/454 | 94,195 | 94,787 | |||||||||
| Washington Mutual Mortgage Pass-Through Certificates, Series 2003-AR9, Class 2A 3.391%, due 09/25/334 | 240,240 | 243,281 | |||||||||
| Total collateralized mortgage obligations (cost—$68,246,028) | 67,429,047 | ||||||||||
Asset-backed securities—18.46% | |||||||||||
| Allegro CLO I Ltd., Series 2013-1A, Class A1R 3 mo. USD LIBOR + 1.220%, 3.559%, due 01/30/262,5 | 1,051,065 | 1,051,776 | |||||||||
| Ameriquest Mortgage Securities, Inc., Asset-Backed Pass-Through Certificates, Series 2004-R9, Class M2 1 mo. USD LIBOR + 0.975%, 3.039%, due 10/25/342 | 469,807 | 472,378 | |||||||||
| Series 2005-R1, Class M4 1 mo. USD LIBOR + 1.110%, 3.174%, due 03/25/352 | 200,000 | 198,426 | |||||||||
| Series 2005-R11, Class M1 1 mo. USD LIBOR + 0.450%, 2.514%, due 01/25/362 | 400,000 | 399,653 | |||||||||
23
PACE Mortgage-Backed Securities Fixed Income Investments
Portfolio of investments—July 31, 2018
| Face amount | Value | ||||||||||
Asset-backed securities—(continued) | |||||||||||
| Amortizing Residential Collateral Trust, Series 2004-1, Class A5 1 mo. USD LIBOR + 1.000%, 3.064%, due 10/25/342 | $ | 204,353 | $ | 204,919 | |||||||
| Atrium X, Series 10A, Class AR 3 mo. USD LIBOR + 0.950%, 3.289%, due 07/16/252,5 | 2,140,959 | 2,141,027 | |||||||||
| Bear Stearns Asset-Backed Securities Trust, Series 2004-2, Class M1 1 mo. USD LIBOR + 1.200%, 3.264%, due 08/25/342 | 7,063,138 | 6,892,076 | |||||||||
| Series 2006-2, Class M1 1 mo. USD LIBOR + 0.420%, 2.484%, due 07/25/362 | 19,502 | 19,505 | |||||||||
| Cent CLO 19 Ltd., Series 2013-19A, Class A1A 3 mo. USD LIBOR + 1.330%, 3.669%, due 10/29/252,5 | 422,197 | 422,490 | |||||||||
| Chase Funding Trust, Series 2002-3, Class 2A1 1 mo. USD LIBOR + 0.640%, 2.704%, due 08/25/322 | 160,300 | 157,091 | |||||||||
| Series 2002-4, Class 2A1 1 mo. USD LIBOR + 0.740%, 2.804%, due 10/25/322 | 10,904 | 10,819 | |||||||||
| CIFC Funding 2015-V Ltd., Series 2015-5A, Class A1R 3 mo. USD LIBOR + 0.860%, 3.195%, due 10/25/272,5 | 900,000 | 896,878 | |||||||||
| CIT Mortgage Loan Trust, Series 2007-1, Class 1A 1 mo. USD LIBOR + 1.350%, 3.414%, due 10/25/372,5 | 1,358,524 | 1,369,482 | |||||||||
| Countrywide Asset-Backed Certificates, Series 2004-2, Class 3A4 1 mo. USD LIBOR + 0.500%, 2.564%, due 07/25/342 | 80,086 | 75,234 | |||||||||
| Series 2004-4, Class M1 1 mo. USD LIBOR + 0.720%, 2.784%, due 07/25/342 | 163,479 | 164,296 | |||||||||
| Series 2004-6, Class M1 1 mo. USD LIBOR + 0.900%, 2.964%, due 10/25/342 | 182,700 | 180,358 | |||||||||
| CSMC, Series 2017-1 4.500%, due 03/25/214 | 279,346 | 280,874 | |||||||||
| Dryden XXV Senior Loan Fund, Series 2012-25A, Class ARR 3 mo. USD LIBOR + 0.900%, 3.239%, due 10/15/272,5 | 3,200,000 | 3,194,691 | |||||||||
| EMC Mortgage Loan Trust, Series 2003-A, Class A2 1 mo. USD LIBOR + 1.500%, 3.564%, due 08/25/402,5 | 93,249 | 91,812 | |||||||||
| Equifirst Loan Securitization Trust, Series 2007-1, Class A1 1 mo. USD LIBOR + 0.170%, 2.234%, due 04/25/372,5 | 2,433,352 | 2,324,753 | |||||||||
| Face amount | Value | ||||||||||
Asset-backed securities—(continued) | |||||||||||
| FBR Securitization Trust, Series 2005-5, Class AV24 1 mo. USD LIBOR + 0.740%, 2.804%, due 11/25/352 | $ | 32,022 | $ | 32,007 | |||||||
| Figueroa CLO Ltd., Series 2014-1A, Class AR 3 mo. USD LIBOR + 0.900%, 3.239%, due 01/15/272,3,5 | 500,000 | 500,000 | |||||||||
| First Franklin Mortgage Loan Trust, Series 2005-FFH1, Class M1 1 mo. USD LIBOR + 0.450%, 2.514%, due 06/25/362 | 102,581 | 102,897 | |||||||||
| Flagship VII Ltd., Series 2013-7A, Class A1R 3 mo. USD LIBOR + 1.120%, 3.468%, due 01/20/262,5 | 306,953 | 306,979 | |||||||||
| Flatiron CLO Ltd., Series 2013-1A, Class A1R 3 mo. USD LIBOR + 1.160%, 3.496%, due 01/17/262,5 | 2,528,673 | 2,530,062 | |||||||||
| FNMA DUS Securities 3.780%, due 08/01/287,8 | 3,350,000 | 3,405,484 | |||||||||
| Fremont Home Loan Trust, Series 2004-A, Class M1 1 mo. USD LIBOR + 0.825%, 2.889%, due 01/25/342 | 541,740 | 536,463 | |||||||||
| Gallatin CLO VIII Ltd., Series 2017-1A, Class A 3 mo. USD LIBOR + 1.050%, 3.389%, due 07/15/272,5 | 2,075,000 | 2,072,537 | |||||||||
| Green Tree Financial Corp., Series 1998-2, Class A5 6.240%, due 12/01/28 | 6,449 | 6,581 | |||||||||
| Halcyon Loan Advisors Funding Ltd., Series 2015-1A, Class AR 3 mo. USD LIBOR + 0.920%, 3.268%, due 04/20/272,5 | 5,200,000 | 5,196,542 | |||||||||
| JP Morgan Mortgage Acquisition Corp., Series 2005-FRE1, Class A2F3 3.365%, due 10/25/356 | 107,002 | 107,378 | |||||||||
| Series 2006-FRE1, Class A1 1 mo. USD LIBOR + 0.230%, 2.294%, due 05/25/352 | 24,531 | 24,527 | |||||||||
| Series 2006-FRE2, Class A1 1 mo. USD LIBOR + 0.180%, 2.244%, due 02/25/362 | 35,135 | 35,120 | |||||||||
| JP Morgan Mortgage Acquisition Trust, Series 2006-ACC1, Class A1 1 mo. USD LIBOR + 0.160%, 2.224%, due 05/25/362 | 78,451 | 78,364 | |||||||||
| Series 2006-ACC1, Class M1 1 mo. USD LIBOR + 0.270%, 2.334%, due 05/25/362 | 300,000 | 293,707 | |||||||||
| Series 2006-CH1, Class A5 1 mo. USD LIBOR + 0.230%, 2.294%, due 07/25/362 | 63,481 | 63,377 | |||||||||
24
PACE Mortgage-Backed Securities Fixed Income Investments
Portfolio of investments—July 31, 2018
| Face amount | Value | ||||||||||
Asset-backed securities—(continued) | |||||||||||
| Series 2007-CH2, Class AV1 1 mo. USD LIBOR + 0.160%, 2.224%, due 01/25/372 | $ | 117,230 | $ | 117,113 | |||||||
| KVK CLO Ltd., Series 2013-1A, Class AR 3 mo. USD LIBOR + 0.900%, 3.248%, due 01/15/282,5 | 2,900,000 | 2,894,948 | |||||||||
| Series 2013-2A, Class AR 3 mo. USD LIBOR + 1.150%, 3.489%, due 01/15/262,5 | 344,928 | 345,105 | |||||||||
| Madison Park Funding XII Ltd., Series 2014-12A, Class AR 3 mo. USD LIBOR + 1.260%, 3.608%, due 07/20/262,5 | 4,000,000 | 4,002,804 | |||||||||
| Merrill Lynch Mortgage Investors Trust, Series 2006-FF1, Class M3 1 mo. USD LIBOR + 0.310%, 2.374%, due 08/25/362 | 300,000 | 299,622 | |||||||||
| Morgan Stanley ABS Capital I, Inc., Series 2005-WMC6, Class M3 1 mo. USD LIBOR + 0.765%, 2.829%, due 07/25/352 | 250,307 | 251,440 | |||||||||
| Morgan Stanley Home Equity Loan Trust, Series 2005-1, Class M4 1 mo. USD LIBOR + 1.050%, 3.114%, due 12/25/342 | 400,000 | 400,676 | |||||||||
| NYMT Residential, Series 2016-RP1, Class A 4.000%, due 03/25/215,6 | 189,669 | 190,160 | |||||||||
| Oak Hill Credit Partners X Ltd., Series 2014-10A, Class AR 3 mo. USD LIBOR + 1.130%, 3.478%, due 07/20/262,5 | 1,500,000 | 1,500,605 | |||||||||
| Octagon Investment Partners XXIII Ltd., Series 2015-1A, Class A1R 3 mo. USD LIBOR + 0.850%, 3.111%, due 07/15/272,5 | 400,000 | 398,323 | |||||||||
| Option One Mortgage Loan Trust, Series 2007-4, Class 2A2 1 mo. USD LIBOR + 0.180%, 2.244%, due 04/25/372 | 68,951 | 47,442 | |||||||||
| Park Place Securities, Inc., Asset-Backed Pass-Through Certificates, Series 2005-WHQ3, Class M4 1 mo. USD LIBOR + 0.945%, 3.009%, due 06/25/352 | 200,000 | 200,053 | |||||||||
| RAAC, Series 2005-SP3 Trust, Series 2005-SP3, Class M1 1 mo. USD LIBOR + 0.530%, 2.594%, due 12/25/352 | 923,543 | 921,802 | |||||||||
| RASC, Series 2005-KS11 Trust, Series 2005-KS11, Class M2 1 mo. USD LIBOR + 0.420%, 2.484%, due 12/25/352 | 400,000 | 398,498 | |||||||||
| Face amount | Value | ||||||||||
Asset-backed securities—(continued) | |||||||||||
| Regatta V Funding Ltd., Series 2014-1A, Class A1AR 3 mo. USD LIBOR + 1.160%, 3.495%, due 10/25/262,5 | $ | 2,730,000 | $ | 2,731,021 | |||||||
| Renaissance Home Equity Loan Trust, Series 2003-2, Class A 1 mo. USD LIBOR + 0.880%, 2.944%, due 08/25/332 | 178,221 | 173,988 | |||||||||
| Saxon Asset Securities Trust, Series 2005-3, Class M3 1 mo. USD LIBOR + 0.750%, 2.814%, due 11/25/352 | 2,100,000 | 1,979,243 | |||||||||
| SLM Student Loan Trust, Series 2010-A, Class 2A 1 mo. USD LIBOR + 3.250%, 5.322%, due 05/16/442,5 | 350,537 | 357,557 | |||||||||
| Sound Point CLO IX Ltd., Series 2015-2A, Class AR 3 mo. USD LIBOR + 0.880%, 3.228%, due 07/20/272,5 | 400,000 | 399,076 | |||||||||
| Sound Point CLO VIII Ltd., Series 2015-1A, Class AR 3 mo. USD LIBOR + 0.860%, 3.199%, due 04/15/272,5 | 1,900,000 | 1,895,178 | |||||||||
| Specialty Underwriting & Residential Financing, Series 2003-BC1, Class A 1 mo. USD LIBOR + 0.680%, 2.744%, due 01/25/342 | 63,563 | 61,033 | |||||||||
| Staniford Street CLO Ltd., Series 2014-1A, Class AR 3 mo. USD LIBOR + 1.180%, 3.521%, due 06/15/252,5 | 362,789 | 362,907 | |||||||||
| Structured Asset Securities Corp. Mortgage Loan Trust, Series 2006-EQ1A, Class A1 1 mo. USD LIBOR + 0.135%, 2.199%, due 07/25/362,5 | 283,977 | 276,068 | |||||||||
| Structured Asset Securities Corp. Trust, Series 2005-AR1, Class M2 1 mo. USD LIBOR + 0.460%, 2.524%, due 09/25/352 | 1,700,000 | 1,594,544 | |||||||||
| Symphony CLO XIV Ltd., Series 2014-14A, Class A1R 3 mo. USD LIBOR + 1.280%, 3.619%, due 07/14/262,5 | 1,000,000 | 1,000,786 | |||||||||
| Symphony CLO XVII Ltd., Series 2016-17A, Class AR 3 mo. USD LIBOR + 0.880%, 3.219%, due 04/15/282,5 | 500,000 | 498,890 | |||||||||
| Telos CLO Ltd., Series 2014-5A, Class A1R 3 mo. USD LIBOR + 0.950%, 3.286%, due 04/17/282,5 | 3,750,000 | 3,745,699 | |||||||||
| Tralee CLO III Ltd., Series 2013-1A, Class AR 3 mo. USD LIBOR + 1.030%, 3.378%, due 10/20/272,5 | 6,800,000 | 6,801,809 | |||||||||
25
PACE Mortgage-Backed Securities Fixed Income Investments
Portfolio of investments—July 31, 2018
| Face amount | Value | ||||||||||
Asset-backed securities—(concluded) | |||||||||||
| Venture XX CLO Ltd., Series 2015-21A, Class AR 3 mo. USD LIBOR + 0.880%, 3.219%, due 07/15/272,5 | $1,100,000 | $1,096,561 | |||||||||
| VOLT LIX LLC, Series 2017-NPL6, Class A1 3.250%, due 05/25/475,6 | 208,702 | 207,672 | |||||||||
| Series 2017-NPL7, Class A1 3.250%, due 06/25/475,6 | 1,468,806 | 1,459,835 | |||||||||
| WhiteHorse VI Ltd., Series 2012-1A, Class A1R 3 mo. USD LIBOR + 1.200%, 3.563%, due 02/03/252,5 | 38,884 | 38,883 | |||||||||
| Total asset-backed securities (cost—$71,127,847) | 72,489,904 | ||||||||||
Commercial mortgage-backed securities—0.51% | |||||||||||
| FHLMC Multifamily Structured Pass-Through Certificates, Series KF05, Class A 1 mo. USD LIBOR + 0.350%, 2.440%, due 09/25/212 | 390,540 | 390,661 | |||||||||
| Series KF06, Class A 1 mo. USD LIBOR + 0.330%, 2.420%, due 11/25/212 | 347,290 | 347,397 | |||||||||
| Series KP03, Class A2 1.780%, due 07/25/19 | 1,266,040 | 1,255,780 | |||||||||
| Total commercial mortgage-backed securities (cost—$2,009,071) | 1,993,838 | ||||||||||
Stripped mortgage-backed securities—0.48% | |||||||||||
| FHLMC Multifamily Structured Pass-Through Certificates, Series K005, Class AX, IO 1.348%, due 11/25/194 | 21,638,652 | 335,239 | |||||||||
| Series K006, Class AX1, IO 0.949%, due 01/25/204 | 12,318,486 | 140,664 | |||||||||
| Series K014, Class X1, IO 1.149%, due 04/25/214 | 7,086,441 | 187,948 | |||||||||
| Series K027, Class X1, IO 0.788%, due 01/25/234 | 6,582,703 | 187,180 | |||||||||
| Series K712, Class X1, IO 1.331%, due 11/25/194 | 3,826,903 | 48,446 | |||||||||
| Series KAIV, Class X1, IO 1.282%, due 06/25/214 | 4,410,695 | 120,679 | |||||||||
| FHLMC REMIC, Series 0013, Class B, IO 7.000%, due 06/25/23 | 29,879 | 3,711 | |||||||||
| Series 2136, Class GD, IO 7.000%, due 03/15/29 | 2,968 | 556 | |||||||||
| Series 2178, Class PI, IO 7.500%, due 08/15/29 | 16,771 | 3,673 | |||||||||
| FNMA Aces, Trust 2013-M5, Class X2, IO 2.189%, due 01/25/224 | 1,492,700 | 56,126 | |||||||||
| Face amount | Value | ||||||||||
Stripped mortgage-backed securities—(concluded) | |||||||||||
| FNMA REMIC, Series 2014-84, Class AI, IO 1 mo. USD LIBOR + 6.150%, 0.200%, due 02/25/432 | $ | 623,215 | $ | 6,276 | |||||||
| GNMA REMIC, Trust 2011-92, Class IX, IO 0.727%, due 11/16/444 | 197,300 | 55,249 | |||||||||
| KGS Alpha SBA, Series 2012, IO 1.037%, due 04/25/384,5,7,8 | 27,369,714 | 718,739 | |||||||||
| Total stripped mortgage-backed securities (cost—$2,106,077) | 1,864,486 | ||||||||||
Commercial paper—0.14% | |||||||||||
| Arrow Electronics, Inc. 2.750%, due 08/20/18 (cost—$549,202) | 550,000 | 549,202 | |||||||||
| Number of shares | |||||||||||
Short-term investment—0.47% | |||||||||||
Investment companies—0.47% | |||||||||||
| State Street Institutional U.S. Government Money Market Fund (cost—$1,843,326) | 1,843,326 | 1,843,326 | |||||||||
| Number of contracts | Notional amount | ||||||||||||||
Swaptions purchased—0.06% | |||||||||||||||
Put swaptions3—0.06% | |||||||||||||||
| 3 Month USD LIBOR Interest Rate Swap, strike @ 3.550%, expires 01/31/19 (Counterparty MSCI; receive fixed rate); underlying swap terminates 02/04/29 | 2,900,000 | USD | 2,900,000 | 9,300 | |||||||||||
| 3 Month USD LIBOR Interest Rate Swap, strike @ 3.650%, expires 02/04/19 (Counterparty MSCI; receive fixed rate); underlying swap terminates 02/06/29 | 8,000,000 | USD | 8,000,000 | 18,134 | |||||||||||
| 3 Month USD LIBOR Interest Rate Swap, strike @ 3.650%, expires 02/13/19 (Counterparty CITI; receive fixed rate); underlying swap terminates 02/15/29 | 2,000,000 | USD | 2,000,000 | 5,038 | |||||||||||
26
PACE Mortgage-Backed Securities Fixed Income Investments
Portfolio of investments—July 31, 2018
| Number of contracts | Notional amount | Value | |||||||||||||
Swaptions purchased—(continued) | |||||||||||||||
Put swaptions3—(continued) | |||||||||||||||
| 3 Month USD LIBOR Interest Rate Swap, strike @ 3.360%, expires 10/22/18 (Counterparty CITI; receive fixed rate); underlying swap terminates 10/24/28 | 45,000,000 | USD | 45,000,000 | $ | 88,655 | ||||||||||
| 3 Month USD LIBOR Interest Rate Swap, strike @ 3.200%, expires 04/30/19 (Counterparty MSCI; receive fixed rate); underlying swap terminates 05/02/20 | 78,000,000 | USD | 78,000,000 | 69,108 | |||||||||||
| 3 Month USD LIBOR Interest Rate Swap, strike @ 3.400%, expires 11/01/18 (Counterparty MSCI; receive fixed rate); underlying swap terminates 11/05/28 | 8,000,000 | USD | 8,000,000 | 15,624 | |||||||||||
| 3 Month USD LIBOR Interest Rate Swap, strike @ 3.440%, expires 12/13/18 (Counterparty JPMCB; receive fixed rate); underlying swap terminates 12/17/28 | 1,500,000 | USD | 1,500,000 | 4,600 | |||||||||||
| Number of contracts | Notional amount | Value | |||||||||||||
Swaptions purchased—(concluded) | |||||||||||||||
Put swaptions3—(concluded) | |||||||||||||||
| 3 Month USD LIBOR Interest Rate Swap, strike @ 3.440%, expires 12/13/18 (Counterparty BNP; receive fixed rate); underlying swap terminates 12/17/28 | 1,000,000 | USD | 1,000,000 | $ | 3,067 | ||||||||||
| Total swaptions purchased (cost—$476,308) | 213,526 | ||||||||||||||
| Total investments before investments sold short (cost—$676,448,968)—170.68% | 670,120,055 | ||||||||||||||
| Face amount | |||||||||||||||
Investments sold short—(9.70)% | |||||||||||||||
| FHLMC TBA 5.500% | $ | (2,000,000 | ) | (2,129,509 | ) | ||||||||||
| FNMA TBA 4.000% | (19,900,000 | ) | (20,188,394 | ) | |||||||||||
| 4.500% | (9,500,000 | ) | (9,840,509 | ) | |||||||||||
| 5.500% | (500,000 | ) | (533,515 | ) | |||||||||||
| GNMA TBA 3.000% | (5,000,000 | ) | (4,878,859 | ) | |||||||||||
| 3.500% | (500,000 | ) | (499,980 | ) | |||||||||||
| Total investments sold short (proceeds—$38,135,164) | (38,070,766 | ) | |||||||||||||
Liabilities in excess of other assets—(60.98)% | (239,432,613 | ) | |||||||||||||
Net assets—100.00% | $ | 392,616,676 | |||||||||||||
For a listing of defined portfolio acronyms, counterparty acronyms and currency abbreviations that are used throughout the Portfolio of investments as well as the tables that follow, please refer to page 273.
Options written
| Notional amount | Number of contracts | Call options | Counterparty | Expiration date | Premiums received | Current value | Unrealized appreciation (depreciation) | ||||||||||||||||||||||||
$ | 9,920,000 | 10,000,000 | FNMA TBA, 3.500%, strike @ 99.20 | CITI | 08/06/18 | $ | 25,000 | $ | (10,472 | ) | $ | 14,528 | |||||||||||||||||||
1,027,500 | 1,000,000 | FNMA TBA, 4.000%, strike @ 102.75 | CITI | 08/06/18 | 1,406 | — | 1,406 | ||||||||||||||||||||||||
1,528,650 | 1,500,000 | FNMA TBA, 4.000%, strike @ 101.91 | CITI | 08/06/18 | 2,461 | (454 | ) | 2,007 | |||||||||||||||||||||||
1,485,750 | 1,500,000 | FNMA TBA, 3.500%, strike @ 99.05 | JPMCB | 09/06/18 | 6,856 | (4,753 | ) | 2,103 | |||||||||||||||||||||||
1,494,150 | 1,500,000 | FNMA TBA, 3.500%, strike @ 99.61 | CITI | 09/06/18 | 3,984 | (1,803 | ) | 2,181 | |||||||||||||||||||||||
1,525,650 | 1,500,000 | FNMA TBA, 4.000%, strike @ 101.71 | CITI | 09/06/18 | 4,453 | (2,918 | ) | 1,535 | |||||||||||||||||||||||
1,496,550 | 1,500,000 | FNMA TBA, 3.500%, strike @ 99.77 | CITI | 09/06/18 | 3,340 | (1,311 | ) | 2,029 | |||||||||||||||||||||||
999,900 | 1,000,000 | FNMA TBA, 3.500%, strike @ 99.99 | CITI | 09/06/18 | 1,953 | (563 | ) | 1,390 | |||||||||||||||||||||||
997,200 | 1,000,000 | FNMA TBA, 3.500%, strike @ 99.72 | CITI | 09/06/18 | 2,383 | (974 | ) | 1,409 | |||||||||||||||||||||||
27
PACE Mortgage-Backed Securities Fixed Income Investments
Portfolio of investments—July 31, 2018
Options written—(concluded)
| Notional amount | Number of contracts | Call options | Counterparty | Expiration date | Premiums received | Current value | Unrealized appreciation (depreciation) | ||||||||||||||||||||||||
$ | 4,951,500 | 5,000,000 | FNMA TBA, 3.500%, strike @ 99.03 | JPMCB | 09/06/18 | $ | 26,758 | $ | (16,224 | ) | $ | 10,534 | |||||||||||||||||||
13,006,500 | 13,000,000 | FNMA TBA, 3.500%, strike @ 100.05 | CITI | 09/06/18 | 24,883 | (6,361 | ) | 18,522 | |||||||||||||||||||||||
500,950 | 500,000 | FNMA TBA, 3.500%, strike @ 100.19 | JPMCB | 10/04/18 | 703 | (460 | ) | 243 | |||||||||||||||||||||||
1,493,850 | 1,500,000 | FNMA TBA, 3.500%, strike @ 99.59 | JPMCB | 09/06/18 | 3,691 | (1,857 | ) | 1,834 | |||||||||||||||||||||||
4,005,600 | 4,000,000 | FNMA TBA, 3.500%, strike @ 100.14 | JPMCB | 10/04/18 | 6,719 | (3,947 | ) | 2,772 | |||||||||||||||||||||||
1,028,400 | 1,000,000 | FNMA TBA, 4.000%, strike @ 102.84 | CSI | 08/06/18 | 1,250 | — | 1,250 | ||||||||||||||||||||||||
4,989,500 | 5,000,000 | FNMA TBA, 3.500%, strike @ 99.79 | CITI | 08/06/18 | 10,547 | (290 | ) | 10,257 | |||||||||||||||||||||||
$ | 126,387 | $ | (52,387 | ) | $ | 74,000 | |||||||||||||||||||||||||
Put options | |||||||||||||||||||||||||||||||
$ | 980,500 | 1,000,000 | FNMA TBA, 3.500%, strike @ 98.05 | CITI | 09/06/18 | $ | 2,383 | $ | (710 | ) | $ | 1,673 | |||||||||||||||||||
4,918,000 | 5,000,000 | FNMA TBA, 3.500%, strike @ 98.36 | JPMCB | 10/04/18 | 10,156 | (13,894 | ) | (3,738 | ) | ||||||||||||||||||||||
490,950 | 500,000 | FNMA TBA, 3.500%, strike @ 98.19 | JPMCB | 10/04/18 | 937 | (1,145 | ) | (208 | ) | ||||||||||||||||||||||
1,008,400 | 1,000,000 | FNMA TBA, 4.000%, strike @ 100.84 | CSI | 08/06/18 | 1,563 | (23 | ) | 1,540 | |||||||||||||||||||||||
1,007,500 | 1,000,000 | FNMA TBA, 4.000%, strike @ 100.75 | CITI | 08/06/18 | 1,797 | (11 | ) | 1,786 | |||||||||||||||||||||||
$ | 16,836 | $ | (15,783 | ) | $ | 1,053 | |||||||||||||||||||||||||
$ | 143,223 | $ | (68,170 | ) | $ | 75,053 | |||||||||||||||||||||||||
Futures contracts
| Number of contracts | Currency | Expiration date | Current notional amount | Value | Unrealized depreciation | ||||||||||||||||||||||
US Treasury futures sell contracts: | |||||||||||||||||||||||||||
28 | USD | US Treasury Note 10 Year Futures | September 2018 | $ | (3,331,975 | ) | $ | (3,343,813 | ) | $ | (11,838 | ) | |||||||||||||||
Interest rate swap agreements
Counterparty | Notional amount (000) | Maturity date | Payment frequency | Payments made by the Portfolio9 | Payments received by the Portfolio9 | Upfront payments received (made) | Value | Unrealized appreciation (depreciation) | |||||||||||||||||||||||||||
CITI | USD | 15,000 | 08/16/18 | Annual | 10 Year USD Constant Maturity Swap Rate plus 0.695% | CMM30_FNMA | $ | — | $ | (313 | ) | $ | (313 | ) | |||||||||||||||||||||
CITI | USD | 15,000 | 10/23/18 | Annual | 10 Year USD Constant Maturity Swap Rate plus 0.629% | CMM30_FNMA | — | 313 | 313 | ||||||||||||||||||||||||||
GSI | USD | 15,000 | 08/17/18 | Annual | 10 Year USD Constant Maturity Swap Rate plus 0.695% | CMM30_FNMA | — | (313 | ) | (313 | ) | ||||||||||||||||||||||||
GSI | USD | 150,000 | 10/12/18 | Annual | 10 Year USD Constant Maturity Swap Rate plus 0.695% | CMM30_FNMA | — | (8,913 | ) | (8,913 | ) | ||||||||||||||||||||||||
JPMCB | USD | 15,000 | 11/19/18 | Annual | 10 Year USD Constant Maturity Swap Rate plus 0.720% | CMM30_FNMA | — | 306 | 306 | ||||||||||||||||||||||||||
$ | — | $ | (8,920 | ) | $ | (8,920 | ) | ||||||||||||||||||||||||||||
28
PACE Mortgage-Backed Securities Fixed Income Investments
Portfolio of investments—July 31, 2018
Centrally cleared interest rate swap agreements
| Notional amount (000) | Maturity date | Payment frequency | Payments made by the Portfolio9 | Payments received by the Portfolio9 | Value | Unrealized appreciation (depreciation) | |||||||||||||||||||||
USD | 11,100 | 06/30/25 | Quarterly | 2.400 | % | 3 Month USD LIBOR | $ | 427,673 | $ | 427,673 | |||||||||||||||||
USD | 2,500 | 09/07/27 | Quarterly | 2.050 | 3 Month USD LIBOR | 188,911 | 188,911 | ||||||||||||||||||||
USD | 14,400 | 06/20/48 | Quarterly | 2.500 | 3 Month USD LIBOR | 1,717,923 | 392,038 | ||||||||||||||||||||
USD | 2,400 | 06/20/28 | Quarterly | 2.250 | 3 Month USD LIBOR | 168,373 | (2,912 | ) | |||||||||||||||||||
USD | 2,500 | 06/18/28 | Quarterly | 2.720 | 3 Month USD LIBOR | 72,593 | 72,593 | ||||||||||||||||||||
USD | 5,200 | 12/19/25 | Semi-Annual | 3 Month USD LIBOR | 2.750 | % | (100,287 | ) | (28,908 | ) | |||||||||||||||||
USD | 3,400 | 12/20/47 | Quarterly | 2.750 | 3 Month USD LIBOR | 229,844 | 361,086 | ||||||||||||||||||||
$ | 2,705,030 | $ | 1,410,481 | ||||||||||||||||||||||||
Total return swap agreements
Counterparty | Notional amount (000) | Maturity date | Payment frequency | Payments made by the Portfolio9 | Payments received by the Portfolio9 | Upfront payments received (made) | Value | Unrealized depreciation | |||||||||||||||||||||||||||
DB | USD | 1,361 | 01/12/38 | Monthly | 1 Month USD LIBOR | 6.500 | % | $ | 4,352 | $ | (4,674 | ) | $ | (322 | ) | ||||||||||||||||||||
DB | USD | 527 | 01/12/39 | Monthly | 1 Month USD LIBOR | 5.500 | 141 | (1,439 | ) | (1,298 | ) | ||||||||||||||||||||||||
JPMCB | USD | 592 | 01/12/39 | Monthly | 1 Month USD LIBOR | 6.000 | (2,784 | ) | (9,372 | ) | (12,156 | ) | |||||||||||||||||||||||
$ | 1,709 | $ | (15,485 | ) | $ | (13,776 | ) | ||||||||||||||||||||||||||||
Fair valuation summary
The following is a summary of the fair valuations according to the inputs used as of July 31, 2018 in valuing the Portfolio's investments. In the event a Portfolio holds investments for which fair value is measured using the NAV per share practical expedient (or its equivalent), a separate column will be added to the fair value hierarchy table; this is intended to permit reconciliation to the amounts presented in the Portfolio of investments:
| Assets Description | Unadjusted quoted prices in active markets for identical investments (Level 1) | Other significant observable inputs (Level 2) | Unobservable inputs (Level 3) | Total | |||||||||||||||
US government obligations | $ | — | $ | 21,643,698 | $ | — | $ | 21,643,698 | |||||||||||
Government national mortgage association certificates | — | 139,226,057 | — | 139,226,057 | |||||||||||||||
Federal home loan mortgage corporation certificates | — | 116,424,658 | — | 116,424,658 | |||||||||||||||
Federal housing administration certificates | — | 62,607 | — | 62,607 | |||||||||||||||
Federal national mortgage association certificates | — | 246,379,706 | — | 246,379,706 | |||||||||||||||
Collateralized mortgage obligations | — | 67,429,047 | — | 67,429,047 | |||||||||||||||
Asset-backed securities | — | 69,084,420 | 3,405,484 | 72,489,904 | |||||||||||||||
Commercial mortgage-backed securities | — | 1,993,838 | — | 1,993,838 | |||||||||||||||
Stripped mortgage-backed securities | — | 1,145,747 | 718,739 | 1,864,486 | |||||||||||||||
Commercial paper | — | 549,202 | — | 549,202 | |||||||||||||||
Short-term investment | — | 1,843,326 | — | 1,843,326 | |||||||||||||||
Swaptions purchased | — | 213,526 | — | 213,526 | |||||||||||||||
29
PACE Mortgage-Backed Securities Fixed Income Investments
Portfolio of investments—July 31, 2018
Fair valuation summary—(concluded)
| Assets Description | Unadjusted quoted prices in active markets for identical investments (Level 1) | Other significant observable inputs (Level 2) | Unobservable inputs (Level 3) | Total | |||||||||||||||
Swap agreements | $ | — | $ | 2,805,936 | $ | — | $ | 2,805,936 | |||||||||||
Total | $ | — | $ | 668,801,768 | $ | 4,124,223 | $ | 672,925,991 | |||||||||||
Liabilities | |||||||||||||||||||
Investments sold short | $ | — | $ | (38,070,766 | ) | $ | — | $ | (38,070,766 | ) | |||||||||
Options written | — | (68,170 | ) | — | (68,170 | ) | |||||||||||||
Futures contracts | (11,838 | ) | — | — | (11,838 | ) | |||||||||||||
Swap agreements | — | (125,311 | ) | — | (125,311 | ) | |||||||||||||
Total | $ | (11,838 | ) | $ | (38,264,247 | ) | $ | — | $ | (38,276,085 | ) | ||||||||
At July 31, 2018, there were no transfers between Level 1 and Level 2.
Level 3 rollforward disclosure
The following is a rollforward of the Portfolio's investment that was valued using unobservable inputs for the year ended July 31, 2018:
| Federal housing administration certificates | Asset-backed securities | Stripped mortgage- backed securities | Total | ||||||||||||||||
Beginning balance | $ | 111,973 | $ | — | $ | 933,062 | $ | 1,045,035 | |||||||||||
Purchases | — | 3,405,484 | — | 3,405,484 | |||||||||||||||
Sales/paydown | (49,485 | ) | — | (315,228 | ) | (364,713 | ) | ||||||||||||
Accrued discounts/(premiums) | (36 | ) | — | (31,902 | ) | (31,938 | ) | ||||||||||||
Total realized gain/(loss) | (55 | ) | — | (34,628 | ) | (34,683 | ) | ||||||||||||
Net change in unrealized appreciation/depreciation | 210 | — | 167,435 | 167,645 | |||||||||||||||
Transfers into Level 3 | — | — | — | — | |||||||||||||||
Transfers out of Level 3 | (62,607 | ) | — | — | (62,607 | ) | |||||||||||||
Ending balance | $ | — | $ | 3,405,484 | $ | 718,739 | $ | 4,124,223 | |||||||||||
The change in net unrealized appreciation/depreciation relating to the Level 3 investments held at July 31, 2018 was $7,912. Transfers out of Level 3 represent the value at the end of the period. At July 31, 2018, securities were transferred from Level 3 to Level 2 as the valuation is based primarily on observable inputs from an established pricing source.
Portfolio footnotes
† Amount represents less than 0.005%.
1 Security, or portion thereof, pledged as collateral for investments sold short, written options, futures and/or swap agreements.
2 Variable or floating rate security. The interest rate shown is the rate in effect as of period end and changes periodically.
3 Illiquid investment at period end. Illiquid assets, in the amount of $276,133, represented 0.07% of the Portfolio's net assets at period end.
4 Variable or floating rate security for which the interest rate adjusts periodically based on changes in current interest rates and prepayments on the underlying pool of assets. Rate shown is the rate in effect as of period end.
5 Security exempt from registration pursuant to Rule 144A under the Securities Act of 1933. These securities are considered liquid, unless noted otherwise, and may be resold in transactions exempt from registration, normally to qualified institutional buyers. Securities exempt from registration pursuant to Rule 144A, in the amount of $60,874,092, represented 15.50% of the Portfolio's net assets at period end.
6 Step bond—coupon rate increases in increments to maturity. The rate disclosed is the rate at the period end; the maturity date disclosed is the ultimate maturity date.
7 Significant unobservable inputs were used in the valuation of this security; i.e. a Level 3 security.
8 Security is being fair valued by a valuation committee under the direction of the board of trustees.
9 Payments made or received are based on the notional amount.
See accompanying notes to financial statements.
30
PACE Intermediate Fixed Income Investments
Performance (unaudited)
For the 12 months ended July 31, 2018, the Portfolio's Class P shares returned -1.20% before the deduction of the maximum PACE Select program fee.1 In comparison, the Bloomberg Barclays US Aggregate Bond Index (the "benchmark") returned -0.80%. Over the same period, the Lipper Core Bond Funds category posted a median return of -0.95%. (Returns for all share classes over various time periods are shown in the "Performance at a glance" table on page 33. Please note that the returns shown do not reflect the deduction of taxes that a shareholder could pay on Portfolio distributions or the redemption of Portfolio shares.) For a detailed commentary on the market environment in general during the reporting period, please refer to page 3.
Subadvisor's comments (unaudited)2
(Please note that while the subadvisor outperformed the benchmark on a gross-of-fees basis, the Portfolio underperformed net of fees, as reported in the "Performance at a glance" table. As stated in footnote two, the comments that follow address performance on a gross-of-fees basis.)
The Portfolio outperformed its benchmark during the reporting period, driven by a diverse set of factors. The largest contributor to performance was the Portfolio's positioning and selection to securitized assets. Both commercial mortgage-backed security (CMBS) and asset-backed security (ABS) spreads largely tightened over the reporting period (with the exception of the second quarter of 2018, when they marginally widened), benefiting the returns. Within CMBS, the Portfolio reduced its overweight position due to relative value considerations. The Portfolio also continues to maintain a diversified mix of sub-sectors within ABS. On the credit front, the Portfolio's allocation to high yield corporate bonds and security selection within investment grade corporate bonds, specifically within US financials and US industrials, were beneficial for performance. Over the period, the Portfolio moved to an overweight position in investment grade credit as spread widening allowed for attractive entry points. Another contributing factor was active foreign exchange (FX) positioning. On the downside, the Portfolio's yield curve positioning was a notable detractor over the reporting period. Underweight positioning to municipals and issue selection within the agency residential mortgage-backed security space also detracted from performance.
Derivatives were primarily used to adjust the Portfolio's duration and curve exposure, as well as to hedge risk. Interest rate swaps are the most common type of swaps and were useful in adding duration or subtracting it at particular points on the yield curve. Credit default swaps were used to provide protection against a particular issuer or basket of issuers defaulting, or as a way to express a negative or positive view on an issuer's or group of issuers' credit strength. Swaptions were used to hedge convexity, as well to take a view on volatility and interest rates.
1 Class P shares held through the PACE Select Advisors Program are subject to a maximum Program fee of 2.50%, which, if included, would have reduced performance. Class P shares held through other advisory programs also may be subject to a program fee, which, if included, would have reduced performance.
2 All Sub-Advisors discuss performance on a gross-of-fees basis—meaning that no fees or expenses are reflected in their sleeves'/sleeve's performance. Alternately, Portfolio performance is shown net of fees, which does factor in fees and expenses associated with the Portfolio.
PACE Select Advisors Trust – PACE Intermediate Fixed Income Investments
Investment Manager:
UBS Asset Management (Americas) Inc. ("UBS AM")
Investment Subadvisors:
BlackRock Financial Management, Inc. ("BlackRock")
Portfolio Management Team:
UBS AM: Mabel Lung, CFA, Gina Toth, CFA and Fred Lee, CFA
BlackRock: Akiva Dickstein and Harrison Segall
Objective:
Current income, consistent with reasonable stability of principal
Investment process:
The subadvisor utilizes a strategy that involves buying specific bonds based on its credit analysis and review.
31
PACE Intermediate Fixed Income Investments
Subadvisor's comments (unaudited) – concluded
Options on futures were most often used to take a view on volatility and/or interest rates. Foreign exchange options were used to give us the right, but not the obligation, to buy or sell a currency at a specified price for a specified period of time. Foreign exchange forwards were typically used to hedge non-US dollar currency risk back to the US dollar, as well as to implement active currency positions. In aggregate, the use of derivatives contributed to performance during this reporting period.
Special considerations
The Portfolio may be appropriate for long-term investors seeking current income and a reasonable stability of principal. Investors should be able to withstand short-term fluctuations in the fixed income markets. The value of the Portfolio changes every day and can be affected by changes in interest rates, general market conditions, and other political, social and economic developments, as well as specific matters relating to the companies in whose securities the Portfolio invests. It is important to note that an investment in the Portfolio is only one component of a balanced investment plan.
32
PACE Intermediate Fixed Income Investments
Performance at a glance (unaudited)
Average annual total returns for periods ended 07/31/18 | 1 year | 5 years | 10 years | ||||||||||||
Before deducting maximum sales charge | |||||||||||||||
Class A1 | (1.43 | )% | 1.23 | % | 2.45 | % | |||||||||
Class C2 | (1.94 | ) | 0.71 | 1.94 | |||||||||||
Class Y3 | (1.20 | ) | 1.48 | 2.71 | |||||||||||
Class P4 | (1.20 | ) | 1.48 | 2.70 | |||||||||||
After deducting maximum sales charge | |||||||||||||||
Class A1 | (5.12 | ) | 0.45 | 2.06 | |||||||||||
Class C2 | (2.67 | ) | 0.71 | 1.94 | |||||||||||
Bloomberg Barclays US Aggregate Bond Index5 | (0.80 | ) | 2.25 | 3.73 | |||||||||||
Lipper Core Bond Funds median | (0.95 | ) | 2.13 | 3.87 | |||||||||||
Most recent calendar quarter-end returns (unaudited)
Average annual total returns for periods ended 06/30/18 | 1 year | 5 years | 10 years | ||||||||||||
Before deducting maximum sales charge | |||||||||||||||
Class A1 | (1.25 | )% | 1.24 | % | 2.38 | % | |||||||||
Class C2 | (1.71 | ) | 0.74 | 1.87 | |||||||||||
Class Y3 | (0.93 | ) | 1.49 | 2.65 | |||||||||||
Class P4 | (0.94 | ) | 1.49 | 2.64 | |||||||||||
After deducting maximum sales charge | |||||||||||||||
Class A1 | (4.96 | ) | 0.48 | 1.99 | |||||||||||
Class C2 | (2.44 | ) | 0.74 | 1.87 | |||||||||||
The annualized gross and net expense ratios, respectively, for each class of shares as in the November 28, 2017 prospectuses, supplemented from time to time, were as follows: Class A—1.01% and 0.93%; Class C—1.52% and 1.43%; Class Y—0.93% and 0.68%; and Class P—0.82% and 0.68%. Net expenses reflect fee waivers and/or expense reimbursements, if any, pursuant to an agreement that is in effect to cap the expenses. The Portfolio and UBS Asset Management (Americas) Inc. ("UBS AM") have entered into a written fee waiver/expense reimbursement agreement pursuant to which UBS AM is contractually obligated to waive its management fees and/or reimburse expenses so that the Portfolio's ordinary total operating expenses of each class through November 30, 2018 (excluding dividend expense, borrowing costs, and interest expense relating to short sales, and expenses attributable to investment in other investment companies, interest, taxes, brokerage commissions and extraordinary expenses) would not exceed Class A—0.91%; Class C—1.41%; Class Y—0.66%; and Class P—0.66%. The Portfolio has agreed to repay UBS AM for any waived fees/reimbursed expenses to the extent that it can do so over the following three fiscal years without causing the Portfolio's expenses in any of those three years to exceed these expense caps and that UBS AM has not waived the right to do so. The fee waiver/expense reimbursement agreement may be terminated by the Portfolio's board at any time and also will terminate automatically upon the expiration or termination of the Portfolio's advisory contract with UBS AM. Upon termination of the agreement, however, UBS AM's three year recoupment rights will survive.
1 Maximum sales charge for Class A shares is 3.75%. Class A shares bear ongoing 12b-1 service fees of 0.25% annually.
2 Maximum contingent deferred sales charge for Class C shares is 0.75% imposed on redemptions and is reduced to 0% after one year. Class C shares bear ongoing 12b-1 service and distribution fees of 0.25% and 0.50% annually, respectively. As of July 12, 2018, Class C shares ceased paying 12b-1 distribution fees. See notes to financial statements—Subsequent events for additional information.
3 The Portfolio offers Class Y shares to a limited group of eligible investors, including certain qualifying retirement plans. Class Y shares do not bear initial or contingent deferred sales charges or ongoing 12b-1 service and distribution fees.
4 Class P shares do not bear initial or contingent deferred sales charges or ongoing 12b-1 service and distribution fees, but Class P shares held through advisory programs may be subject to a program fee, which, if included, would have reduced performance.
5 The Bloomberg Barclays US Aggregate Bond Index is a broad-based flagship benchmark that measures the investment grade, US dollar-denominated, fixed-rate taxable bond market. The index includes Treasuries, government-related and corporate securities, MBS (agency fixedrate and hybrid ARM pass-throughs), ABS and CMBS (agency and non-agency). Investors should note that indices do not reflect the deduction of fees and expenses.
Past performance does not predict future performance, and the performance information provided does not reflect the deduction of taxes that a shareholder would pay on Portfolio distributions or the redemption of Portfolio shares. The return and principal value of an investment will fluctuate, so that an investor's shares, when redeemed, may be worth more or less than their original cost. Performance results assume reinvestment of all dividends and capital gain distributions at net asset value on the ex-dividend dates. Current performance may be higher or lower than the performance data quoted. For month-end performance figures, please visit www.ubs.com/us-mutualfundperformance.
Lipper peer group data calculated by Lipper Inc.; used with permission. The Lipper median is the return of the fund that places in the middle of a Lipper peer group.
33
PACE Intermediate Fixed Income Investments
Illustration of an assumed investment of $10,000 in Class P shares of the Portfolio (unaudited)
The following graph depicts the performance of PACE Intermediate Fixed Income Investments Class P shares versus the Bloomberg Barclays US Aggregate Bond Index over the 10 years ended July 31, 2018. Class P shares held through advisory programs may be subject to a program fee, which, if included, would have reduced performance. The performance of the other classes will vary based upon the different class specific expenses and sales charges. The performance provided does not reflect the deduction of taxes that a shareholder would pay on Portfolio distributions or the redemption of Portfolio shares. Past performance is no guarantee of future results. Share price and returns will vary with market conditions; investors may realize a gain or loss upon redemption. It is important to note that PACE Intermediate Fixed Income Investments is a professionally managed portfolio while the Indices are not available for investment and is unmanaged. The comparison is shown for illustration purposes only.
PACE Intermediate Fixed Income Investments
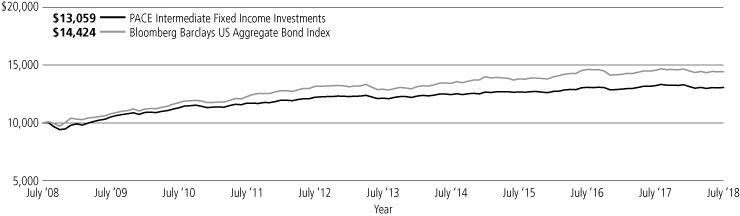
34
PACE Intermediate Fixed Income Investments
Portfolio statistics—July 31, 2018 (unaudited)
Characteristics | |||||||
Weighted average duration | 5.89 yrs. | ||||||
Weighted average maturity | 7.87 yrs. | ||||||
Average coupon | 4.28 | % | |||||
Top ten holdings1 | Percentage of net assets | ||||||
FNMA, 3.500% due 12/01/43 | 4.2 | % | |||||
US Treasury Notes, 2.875% due 05/15/28 | 2.0 | ||||||
US Treasury Bonds, 3.000% due 02/15/47 | 2.0 | ||||||
US Treasury Bonds, 3.625% due 02/15/44 | 2.0 | ||||||
FNMA, 3.000% due 03/01/47 | 1.8 | ||||||
US Treasury Notes, 2.500% due 05/31/20 | 1.8 | ||||||
Natixis, 2.370% due 08/10/18 | 1.7 | ||||||
FHLMC TBA, 3.000% | 1.6 | ||||||
GNMA TBA, 4.000% | 1.6 | ||||||
FNMA, 2.500% due 04/01/32 | 1.5 | ||||||
Total | 20.2 | % | |||||
Top five issuer breakdown by country or territory of origin1 | Percentage of net assets | ||||||
United States | 97.3 | % | |||||
United Kingdom | 3.2 | ||||||
France | 2.3 | ||||||
Netherlands | 1.7 | ||||||
Canada | 0.8 | ||||||
Total | 105.3 | % | |||||
Asset allocation1 | Percentage of net assets | ||||||
Corporate notes | 43.1 | % | |||||
US government agency mortgage pass-through certificates | 33.5 | ||||||
US government obligations | 12.3 | ||||||
Collateralized mortgage obligations | 6.3 | ||||||
Asset-backed securities | 6.0 | ||||||
Short-term investment | 2.8 | ||||||
Non-US government obligations | 1.7 | ||||||
Federal home loan bank certificate | 0.2 | ||||||
Options, swaptions, futures, swaps and forward foreign currency contracts | 0.2 | ||||||
Investments sold short | (8.3 | ) | |||||
Cash equivalents and other assets less liabilities | 2.2 | ||||||
Total | 100.0 | % | |||||
1 The Portfolio is actively managed and its composition will vary over time.
35
PACE Intermediate Fixed Income Investments
Portfolio of investments—July 31, 2018
| Face amount | Value | ||||||||||
US government obligations—12.30% | |||||||||||
| US Treasury Bonds 3.000%, due 02/15/471 | $ | 7,284,000 | $ | 7,174,740 | |||||||
3.125%, due 11/15/41 | 3,015,000 | 3,044,326 | |||||||||
3.125%, due 05/15/48 | 595,000 | 600,206 | |||||||||
3.625%, due 08/15/43 | 2,095,000 | 2,294,107 | |||||||||
3.625%, due 02/15/44 | 6,540,000 | 7,171,263 | |||||||||
4.750%, due 02/15/37 | 4,280,000 | 5,341,473 | |||||||||
| US Treasury Notes 1.750%, due 10/31/18 | 160,000 | 159,882 | |||||||||
2.000%, due 12/31/21 | 95,000 | 92,540 | |||||||||
2.125%, due 12/31/21 | 845,000 | 826,648 | |||||||||
2.500%, due 05/31/20 | 6,450,000 | 6,430,600 | |||||||||
2.625%, due 06/30/23 | 150,000 | 148,482 | |||||||||
2.750%, due 05/31/23 | 2,175,000 | 2,166,164 | |||||||||
2.750%, due 07/31/23 | 1,440,000 | 1,433,421 | |||||||||
2.750%, due 06/30/25 | 1,010,000 | 999,072 | |||||||||
2.875%, due 05/15/28 | 7,495,000 | 7,441,422 | |||||||||
| Total US government obligations (cost—$45,715,648) | 45,324,346 | ||||||||||
Federal home loan bank certificate—0.20% | |||||||||||
| FHLB 4.000%, due 09/01/28 (cost—$679,148) | 680,000 | 716,661 | |||||||||
| Federal home loan mortgage corporation certificates—6.89% | |||||||||||
| FHLMC 3.000%, due 09/01/27 | 62,332 | 61,744 | |||||||||
3.000%, due 07/01/28 | 33,937 | 33,617 | |||||||||
3.000%, due 10/01/43 | 524,523 | 509,831 | |||||||||
3.000%, due 10/01/46 | 2,463,454 | 2,380,687 | |||||||||
3.500%, due 04/01/42 | 19,908 | 19,882 | |||||||||
3.500%, due 08/01/42 | 31,811 | 31,770 | |||||||||
3.500%, due 11/01/42 | 12,188 | 12,172 | |||||||||
3.500%, due 12/01/43 | 655,782 | 654,930 | |||||||||
3.500%, due 01/01/441 | 2,894,810 | 2,891,050 | |||||||||
3.500%, due 04/01/44 | 77,338 | 77,238 | |||||||||
3.500%, due 06/01/44 | 10,321 | 10,308 | |||||||||
3.500%, due 07/01/46 | 366,435 | 365,301 | |||||||||
3.500%, due 07/01/47 | 17,515 | 17,487 | |||||||||
3.500%, due 10/01/47 | 96,580 | 96,305 | |||||||||
3.500%, due 12/01/47 | 1,281,195 | 1,273,828 | |||||||||
3.500%, due 01/01/48 | 408,063 | 405,381 | |||||||||
4.000%, due 09/01/40 | 47,095 | 48,206 | |||||||||
4.000%, due 07/01/44 | 42,464 | 43,423 | |||||||||
4.000%, due 07/01/46 | 49,761 | 50,741 | |||||||||
4.000%, due 08/01/46 | 27,586 | 28,130 | |||||||||
4.000%, due 09/01/46 | 3,893 | 3,954 | |||||||||
4.000%, due 10/01/46 | 8,010 | 8,136 | |||||||||
4.000%, due 01/01/47 | 1,103,723 | 1,127,348 | |||||||||
4.000%, due 02/01/47 | 120,505 | 122,897 | |||||||||
4.000%, due 08/01/47 | 329,515 | 337,184 | |||||||||
5.000%, due 02/01/421 | 774,631 | 825,617 | |||||||||
5.000%, due 09/01/43 | 257,100 | 272,888 | |||||||||
6.250%, due 07/15/32 | 302,000 | 399,333 | |||||||||
6.750%, due 03/15/31 | 82,000 | 110,690 | |||||||||
| Face amount | Value | ||||||||||
| Federal home loan mortgage corporation certificates—(concluded) | |||||||||||
| FHLMC TBA 2.500% | $ | 2,690,000 | $ | 2,599,093 | |||||||
| 3.000% | 6,114,000 | 5,928,416 | |||||||||
| 3.500% | 431,000 | 434,467 | |||||||||
| 4.000% | 2,329,000 | 2,364,384 | |||||||||
| 4.500% | 1,768,000 | 1,833,437 | |||||||||
| Total federal home loan mortgage corporation certificates (cost—$25,547,882) | 25,379,875 | ||||||||||
| Federal national mortgage association certificates—17.61% | |||||||||||
| FNMA 2.000%, due 10/01/311 | 26,093 | 24,615 | |||||||||
2.000%, due 11/01/311 | 331,446 | 312,681 | |||||||||
2.000%, due 12/01/311 | 34,718 | 32,753 | |||||||||
2.000%, due 03/01/321 | 213,016 | 200,955 | |||||||||
2.500%, due 04/01/321 | 5,663,436 | 5,485,880 | |||||||||
3.000%, due 10/01/29 | 57,078 | 56,881 | |||||||||
3.000%, due 09/01/31 | 53,239 | 52,826 | |||||||||
3.000%, due 09/01/32 | 100,879 | 100,429 | |||||||||
3.000%, due 11/01/46 | 603,395 | 585,951 | |||||||||
3.000%, due 03/01/47 | 6,790,225 | 6,562,096 | |||||||||
3.000%, due 04/01/471 | 3,015,875 | 2,910,398 | |||||||||
3.500%, due 12/01/29 | 63,270 | 64,188 | |||||||||
3.500%, due 08/01/30 | 259,620 | 262,933 | |||||||||
3.500%, due 02/01/32 | 533,467 | 539,312 | |||||||||
3.500%, due 04/01/32 | 1,183,009 | 1,200,467 | |||||||||
3.500%, due 05/01/32 | 864,552 | 874,012 | |||||||||
3.500%, due 04/01/42 | 4,010 | 4,007 | |||||||||
3.500%, due 12/01/42 | 7,209 | 7,204 | |||||||||
3.500%, due 05/01/43 | 10,175 | 10,149 | |||||||||
3.500%, due 07/01/43 | 66,255 | 66,172 | |||||||||
3.500%, due 11/01/43 | 14,692 | 14,681 | |||||||||
3.500%, due 12/01/431 | 15,499,181 | 15,462,774 | |||||||||
3.500%, due 01/01/44 | 12,342 | 12,352 | |||||||||
3.500%, due 05/01/44 | 15,147 | 15,150 | |||||||||
3.500%, due 02/01/45 | 7,886 | 7,866 | |||||||||
3.500%, due 07/01/45 | 38,558 | 38,508 | |||||||||
3.500%, due 08/01/45 | 8,193 | 8,148 | |||||||||
3.500%, due 10/01/45 | 71,063 | 70,637 | |||||||||
3.500%, due 11/01/45 | 92,773 | 92,660 | |||||||||
3.500%, due 12/01/45 | 39,463 | 39,410 | |||||||||
3.500%, due 04/01/46 | 88,879 | 88,417 | |||||||||
3.500%, due 06/01/46 | 52,387 | 52,073 | |||||||||
3.500%, due 11/01/46 | 521,272 | 518,287 | |||||||||
3.500%, due 12/01/46 | 21,966 | 21,848 | |||||||||
3.500%, due 01/01/47 | 38,295 | 38,194 | |||||||||
3.500%, due 02/01/47 | 134,003 | 133,463 | |||||||||
3.500%, due 05/01/47 | 22,912 | 22,859 | |||||||||
3.500%, due 06/01/47 | 59,294 | 58,936 | |||||||||
3.500%, due 07/01/47 | 42,826 | 42,609 | |||||||||
3.500%, due 11/01/47 | 56,555 | 56,426 | |||||||||
3.500%, due 12/01/47 | 489,622 | 487,446 | |||||||||
3.500%, due 01/01/48 | 319,718 | 318,239 | |||||||||
4.000%, due 09/01/291 | 8,754 | 8,969 | |||||||||
36
PACE Intermediate Fixed Income Investments
Portfolio of investments—July 31, 2018
| Face amount | Value | ||||||||||
| Federal national mortgage association certificates—(concluded) | |||||||||||
4.000%, due 03/01/311 | $ | 384,759 | $ | 394,445 | |||||||
4.000%, due 01/01/421 | 775,715 | 793,864 | |||||||||
4.000%, due 02/01/421 | 3,756,975 | 3,844,569 | |||||||||
4.000%, due 03/01/431 | 52,689 | 53,980 | |||||||||
4.000%, due 10/01/431 | 182,002 | 186,256 | |||||||||
4.000%, due 08/01/441 | 112,281 | 115,553 | |||||||||
4.000%, due 01/01/451 | 273,710 | 281,136 | |||||||||
4.000%, due 05/01/451 | 87,321 | 89,865 | |||||||||
4.000%, due 06/01/461 | 523,394 | 535,861 | |||||||||
4.000%, due 07/01/461 | 1,651,777 | 1,687,715 | |||||||||
4.000%, due 07/01/46 | 1,903,049 | 1,939,805 | |||||||||
4.000%, due 11/01/46 | 38,949 | 39,930 | |||||||||
4.000%, due 12/01/46 | 316,364 | 323,979 | |||||||||
4.000%, due 01/01/47 | 348,097 | 356,597 | |||||||||
4.000%, due 03/01/47 | 352,753 | 360,506 | |||||||||
4.000%, due 05/01/47 | 80,720 | 82,106 | |||||||||
4.000%, due 07/01/47 | 235,321 | 240,096 | |||||||||
4.000%, due 08/01/47 | 145,144 | 148,134 | |||||||||
4.000%, due 12/01/47 | 106,712 | 109,467 | |||||||||
4.000%, due 02/01/48 | 576,967 | 588,301 | |||||||||
4.000%, due 03/01/48 | 327,348 | 335,913 | |||||||||
4.000%, due 04/01/48 | 1,915,822 | 1,956,791 | |||||||||
4.500%, due 04/01/411 | 4,117,475 | 4,315,774 | |||||||||
4.500%, due 11/01/451 | 16,024 | 16,830 | |||||||||
4.500%, due 12/01/451 | 87,395 | 91,275 | |||||||||
4.500%, due 07/01/461 | 180,644 | 189,943 | |||||||||
4.500%, due 10/01/471 | 59,064 | 62,032 | |||||||||
4.500%, due 12/01/471 | 122,900 | 128,451 | |||||||||
4.500%, due 08/01/48 | 2,048,000 | 2,125,264 | |||||||||
5.000%, due 09/01/311 | 455,836 | 485,204 | |||||||||
5.000%, due 01/01/441 | 101,879 | 108,458 | |||||||||
5.000%, due 03/01/44 | 230,539 | 245,924 | |||||||||
| FNMA TBA 3.000% | 1,452,000 | 1,438,784 | |||||||||
| 3.500% | 3,100,000 | 3,072,327 | |||||||||
| 4.000% | 1,150,000 | 1,171,447 | |||||||||
| Total federal national mortgage association certificates (cost—$66,806,797) | 64,880,443 | ||||||||||
| Government national mortgage association certificates—8.99% | |||||||||||
| GNMA 3.000%, due 02/15/45 | 148,813 | 145,774 | |||||||||
3.000%, due 04/20/45 | 369,357 | 362,084 | |||||||||
3.000%, due 07/20/45 | 54,345 | 53,275 | |||||||||
3.000%, due 10/20/45 | 97,538 | 95,617 | |||||||||
3.000%, due 04/20/46 | 1,980,258 | 1,941,461 | |||||||||
3.000%, due 05/20/46 | 23,949 | 23,466 | |||||||||
3.000%, due 06/20/46 | 310,557 | 303,729 | |||||||||
3.000%, due 07/20/46 | 622,863 | 609,183 | |||||||||
3.000%, due 08/20/46 | 2,810,867 | 2,749,132 | |||||||||
3.000%, due 09/20/46 | 1,239,149 | 1,212,342 | |||||||||
3.000%, due 11/20/46 | 25,517 | 24,935 | |||||||||
3.000%, due 12/20/46 | 73,221 | 71,530 | |||||||||
3.000%, due 01/20/47 | 63,152 | 61,685 | |||||||||
3.000%, due 03/20/47 | 139,546 | 136,372 | |||||||||
| Face amount | Value | ||||||||||
| Government national mortgage association certificates—(concluded) | |||||||||||
3.000%, due 04/20/47 | $ | 80,645 | $ | 78,752 | |||||||
3.000%, due 07/20/47 | 59,245 | 57,823 | |||||||||
3.500%, due 08/20/42 | 92,817 | 93,709 | |||||||||
3.500%, due 01/20/431 | 4,564,145 | 4,608,004 | |||||||||
3.500%, due 04/20/43 | 93,320 | 94,217 | |||||||||
3.500%, due 05/20/43 | 93,009 | 93,903 | |||||||||
3.500%, due 05/20/45 | 536,353 | 538,533 | |||||||||
3.500%, due 03/20/46 | 1,356,232 | 1,361,327 | |||||||||
3.500%, due 04/20/46 | 3,380,449 | 3,392,108 | |||||||||
3.500%, due 05/20/46 | 639,904 | 642,013 | |||||||||
3.500%, due 06/20/46 | 1,239,967 | 1,243,670 | |||||||||
3.500%, due 07/20/46 | 242,344 | 243,031 | |||||||||
3.500%, due 09/20/46 | 45,989 | 46,112 | |||||||||
4.000%, due 04/20/39 | 5,289 | 5,453 | |||||||||
4.000%, due 04/20/42 | 110,085 | 113,534 | |||||||||
4.000%, due 08/20/44 | 923,388 | 951,131 | |||||||||
4.000%, due 02/20/47 | 150,948 | 154,428 | |||||||||
4.000%, due 06/15/47 | 27,536 | 28,337 | |||||||||
4.000%, due 09/15/47 | 41,371 | 42,573 | |||||||||
4.000%, due 10/15/47 | 173,841 | 178,888 | |||||||||
4.000%, due 11/15/47 | 31,633 | 32,553 | |||||||||
4.000%, due 12/15/47 | 96,023 | 98,818 | |||||||||
4.000%, due 01/15/48 | 208,334 | 214,407 | |||||||||
4.500%, due 07/20/40 | 11,251 | 11,847 | |||||||||
4.500%, due 08/20/40 | 11,096 | 11,684 | |||||||||
4.500%, due 09/20/40 | 17,170 | 18,056 | |||||||||
4.500%, due 10/20/40 | 19,290 | 20,314 | |||||||||
4.500%, due 06/20/44 | 561,310 | 591,929 | |||||||||
4.500%, due 03/15/47 | 36,233 | 38,240 | |||||||||
4.500%, due 04/15/47 | 87,257 | 92,124 | |||||||||
4.500%, due 05/15/47 | 31,437 | 33,200 | |||||||||
| GNMA TBA 3.000% | 1,214,500 | 1,183,758 | |||||||||
| 4.000% | 5,709,500 | 5,834,901 | |||||||||
| 4.500% | 1,845,000 | 1,915,671 | |||||||||
| 5.000% | 1,200,000 | 1,252,031 | |||||||||
| Total government national mortgage association certificates (cost—$33,377,117) | 33,107,664 | ||||||||||
Collateralized mortgage obligations—6.26% | |||||||||||
| BAMLL Commercial Mortgage Securities Trust, Series 2017-SCH, Class AL 1 mo. USD LIBOR + 0.900%, 2.972%, due 11/15/322,3,4 | 1,150,000 | 1,151,234 | |||||||||
| CD Mortgage Trust, Series 2017-CD3, Class A4 3.631%, due 02/10/50 | 545,000 | 540,785 | |||||||||
| Commercial Mortgage Pass-Through Certificates, Series 2006-GG7, Class AM | |||||||||||
5.757%, due 07/10/385 | 69,131 | 69,144 | |||||||||
| Series 2013-GAM, Class A2 3.367%, due 02/10/283 | 1,090,000 | 1,079,451 | |||||||||
| Series 2014-CR16, Class A4 4.051%, due 04/10/47 | 145,000 | 148,591 | |||||||||
37
PACE Intermediate Fixed Income Investments
Portfolio of investments—July 31, 2018
| Face amount | Value | ||||||||||
Collateralized mortgage obligations—(continued) | |||||||||||
| Series 2014-PAT, Class A 1 mo. USD LIBOR + 0.800%, | |||||||||||
2.897%, due 08/13/272,3 | $ | 915,000 | $ | 915,000 | |||||||
| Series 2018-COR3, Class A3 4.228%, due 05/10/51 | 179,000 | 183,812 | |||||||||
| Core Industrial Trust, Series 2015-TEXW, Class A 3.077%, due 02/10/343 | 1,735,000 | 1,720,979 | |||||||||
| CSMC Trust, Series 2017-CALI, Class A 3.431%, due 11/10/323 | 260,000 | 257,208 | |||||||||
| FHLMC Multifamily Structured Pass Through Certificates, Series K075, Class A2 3.650%, due 02/25/285 | 230,000 | 232,337 | |||||||||
| FHLMC Multifamily Structured Pass-Through Certificates, Series K038, Class X1, IO 1.168%, due 03/25/245 | 2,590,992 | 138,294 | |||||||||
| FHLMC REMIC, Trust 2626, Class A 4.000%, due 06/15/33 | 126,552 | 129,256 | |||||||||
| Trust 3990, Class VA 3.500%, due 01/15/25 | 233,732 | 234,340 | |||||||||
| Trust 4213, Class VE 3.500%, due 06/15/26 | 228,258 | 229,833 | |||||||||
| Trust 4248, Class FL 1 mo. USD LIBOR + 0.450%, 2.522%, due 05/15/412 | 266,863 | 268,239 | |||||||||
| Trust 4316, Class XZ 4.500%, due 03/15/44 | 370,535 | 391,988 | |||||||||
| Trust 4323, Class CA 4.000%, due 03/15/40 | 222,765 | 226,137 | |||||||||
| Trust 4325, Class MA 4.000%, due 09/15/39 | 642,736 | 653,902 | |||||||||
| Trust 4328, Class DA 4.000%, due 01/15/36 | 687,248 | 697,932 | |||||||||
| Trust 4336, Class MA 4.000%, due 01/15/40 | 597,151 | 607,053 | |||||||||
| Trust 4443, Class BA 3.500%, due 04/15/41 | 100,976 | 100,956 | |||||||||
| Trust 4447, Class PA 3.000%, due 12/15/44 | 94,555 | 92,733 | |||||||||
| Trust 4606, Class FB 1 mo. USD LIBOR + 0.500%, 2.572%, due 08/15/462 | 376,807 | 380,498 | |||||||||
| FNMA Connecticut Avenue Securities, Series 2016-C04, Class 1M1 1 mo. USD LIBOR + 1.450%, 3.514%, due 01/25/292 | 200,007 | 201,480 | |||||||||
| Series 2016-C05, Class 2M1 1 mo. USD LIBOR + 1.350%, 3.414%, due 01/25/292 | 132,215 | 132,740 | |||||||||
| Series 2016-C06, Class 1M1 1 mo. USD LIBOR + 1.300%, 3.364%, due 04/25/292 | 145,255 | 146,427 | |||||||||
| FNMA REMIC, Trust 2011-8, Class ZA 4.000%, due 02/25/41 | 2,239,648 | 2,270,891 | |||||||||
| Face amount | Value | ||||||||||
Collateralized mortgage obligations—(continued) | |||||||||||
| Trust 2013-112, Class HQ 4.000%, due 11/25/43 | $ | 73,103 | $ | 74,384 | |||||||
| Trust 2014-12, Class GV 3.500%, due 03/25/27 | 141,681 | 141,079 | |||||||||
| Trust 2014-48, Class AB 4.000%, due 10/25/40 | 168,459 | 171,069 | |||||||||
| Trust 2015-20, Class EV 3.500%, due 07/25/26 | 259,699 | 260,893 | |||||||||
| Trust 2015-58, Class JP 2.500%, due 03/25/37 | 140,018 | 138,444 | |||||||||
| Trust 2015-62, Class VA 4.000%, due 10/25/26 | 77,217 | 79,648 | |||||||||
| Trust 2016-48, Class UF 1 mo. USD LIBOR + 0.400%, 2.464%, due 08/25/462 | 650,022 | 654,271 | |||||||||
| Trust 2016-62, Class FC 1 mo. USD LIBOR + 0.500%, 2.564%, due 09/25/462 | 297,615 | 299,958 | |||||||||
| Trust 2016-74, Class GF 1 mo. USD LIBOR + 0.500%, 2.564%, due 10/25/462 | 380,017 | 383,223 | |||||||||
| FREMF Mortgage Trust, Series 2013-K712, Class B 3.360%, due 05/25/453,5 | 110,000 | 110,102 | |||||||||
| GAHR Commercial Mortgage Trust, Series 2015-NRF, Class DFX 3.382%, due 12/15/343,5 | 1,025,000 | 1,019,099 | |||||||||
| GNMA, Trust 2014-131, Class BW 2.847%, due 05/20/415 | 76,876 | 79,493 | |||||||||
| Trust 2015-3, Class ZD 4.000%, due 01/20/45 | 661,253 | 681,880 | |||||||||
| InTown Hotel Portfolio Trust, Series 2018-STAY, Class A | |||||||||||
| 1 mo. USD LIBOR + 0.700%, 2.772%, due 01/15/332,3 | 320,000 | 319,796 | |||||||||
| JP Morgan Chase Commercial Mortgage Securities Trust, Series 2015-JP1, Class A5 3.914%, due 01/15/49 | 800,000 | 810,517 | |||||||||
| JP Morgan Mortgage Trust, Series 2017-1, Class A4 3.500%, due 01/25/473,5 | 825,435 | 818,832 | |||||||||
| Series 2017-2, Class A6 3.000%, due 05/25/473,5 | 605,042 | 595,856 | |||||||||
| Merrill Lynch Mortgage Trust, Series 2005-MKB2, Class D 5.446%, due 09/12/425 | 591,631 | 602,940 | |||||||||
| Morgan Stanley Capital I Trust, Series 2015-MS1, Class A4 3.779%, due 05/15/485 | 520,000 | 522,931 | |||||||||
| New Residential Mortgage Loan Trust, Series 2016-4A, Class A1 3.750%, due 11/25/563,5 | 144,024 | 143,930 | |||||||||
| SFAVE Commercial Mortgage Securities Trust, Series 2015-5AVE, Class A2B 4.144%, due 01/05/433,5 | 515,000 | 495,343 | |||||||||
38
PACE Intermediate Fixed Income Investments
Portfolio of investments—July 31, 2018
| Face amount | Value | ||||||||||
Collateralized mortgage obligations—(concluded) | |||||||||||
| Shellpoint Co-Originator Trust, Series 2016-1, Class 2A3 3.000%, due 10/25/313,5 | $ | 313,578 | $ | 305,079 | |||||||
| Tharaldson Hotel Portfolio Trust, Series 2018-THL, Class A | |||||||||||
| 1 mo. USD LIBOR + 0.750%, 2.847%, due 11/11/342,3 | 86,558 | 86,503 | |||||||||
| Velocity Commercial Capital Loan Trust, Series 2016-2, Class AFX 2.997%, due 10/25/465 | 105,365 | 104,889 | |||||||||
| Wachovia Bank Commercial Mortgage Trust, Series 2007-C33, Class AM 6.009%, due 02/15/515 | 124,099 | 127,392 | |||||||||
| Wells Fargo Commercial Mortgage Trust, Series 2018-C44, Class A5 4.212%, due 05/15/51 | 445,000 | 455,454 | |||||||||
| WF-RBS Commercial Mortgage Trust, Series 2011-C3, Class A3FL 1 mo. USD LIBOR + 0.950%, 3.023%, due 03/15/442,3 | 358,679 | 360,047 | |||||||||
| Total collateralized mortgage obligations (cost—$23,718,195) | 23,044,292 | ||||||||||
Asset-backed securities—6.03% | |||||||||||
| ALM VIII Ltd., Series 2013-8A, Class A1R | |||||||||||
| 3 mo. USD LIBOR + 1.490%, 3.829%, due 10/15/282,3 | 510,000 | 510,615 | |||||||||
| American Homes 4 Rent, Series 2014-SFR3, Class A 3.678%, due 12/17/363 | 472,586 | 472,395 | |||||||||
| AmeriCredit Automobile Receivables Trust, Series 2014-1, Class D 2.540%, due 06/08/20 | 130,000 | 129,964 | |||||||||
| Series 2016-2, Class A3 1.600%, due 11/09/20 | 133,494 | 133,189 | |||||||||
| Series 2018-1, Class A2A 2.710%, due 07/19/21 | 700,000 | 699,210 | |||||||||
| B2R Mortgage Trust, Series 2015-2, Class A 3.336%, due 11/15/483 | 442,183 | 440,269 | |||||||||
| Chesapeake Funding II LLC, Series 2018-1A, Class A1 3.040%, due 04/15/303 | 1,230,000 | 1,224,271 | |||||||||
| Citibank Credit Card Issuance Trust, Series 2017-A5, Class A5 1 mo. USD LIBOR + 0.620%, 2.701%, due 04/22/262 | 650,000 | 658,233 | |||||||||
| Series 2017-A6, Class A6 1 mo. USD LIBOR + 0.770%, 2.842%, due 05/14/292 | 540,000 | 543,827 | |||||||||
| Credit Acceptance Auto Loan Trust, Series 2015-2A, Class B 3.040%, due 08/15/233 | 803,072 | 803,251 | |||||||||
| Series 2016-2A, Class A 2.420%, due 11/15/233 | 506,747 | 505,915 | |||||||||
| Face amount | Value | ||||||||||
Asset-backed securities—(continued) | |||||||||||
| Credit Suisse ABS Repackaging Trust, Series 2013-A, Class B 2.500%, due 01/25/303 | $ | 49,055 | $ | 45,404 | |||||||
| Credit Suisse Seasoned Loan Trust, Series 2006-1, Class A | |||||||||||
| 1 mo. USD LIBOR + 0.240%, 2.304%, due 10/25/342,3 | 87,962 | 87,770 | |||||||||
| DCP Rights LLC, Series 2014-1A, Class A 5.463%, due 10/25/443 | 1,698,750 | 1,689,290 | |||||||||
| Diamond Resorts Owner Trust, Series 2014-1, Class B 2.980%, due 05/20/273,4 | 37,411 | 37,254 | |||||||||
| Drive Auto Receivables Trust, Series 2018-2, Class A2 2.640%, due 09/15/20 | 890,000 | 889,694 | |||||||||
| Elara HGV Timeshare Issuer LLC, Series 2016-A, Class A 2.730%, due 04/25/283,4 | 126,791 | 123,775 | |||||||||
| Enterprise Fleet Financing LLC, Series 2016-1, Class A2 1.830%, due 09/20/213 | 49,956 | 49,872 | |||||||||
| First Franklin Mortgage Loan Trust, Series 2004-FFH4, Class M5 | |||||||||||
| 1 mo. USD LIBOR + 1.575%, 3.639%, due 01/25/352 | 123,643 | 124,289 | |||||||||
| Ford Credit Floorplan Master Owner Trust, Series 2014-2, Class A | |||||||||||
| 1 mo. USD LIBOR + 0.500%, 2.572%, due 02/15/212 | 2,160,000 | 2,164,854 | |||||||||
| Fremont Home Loan Trust, Series 2005-2, Class M2 | |||||||||||
| 1 mo. USD LIBOR + 0.720%, 2.784%, due 06/25/352 | 38,927 | 38,987 | |||||||||
| Greystone Commercial Real Estate Notes, Series 2017-FL1A, Class A | |||||||||||
| 1 mo. USD LIBOR + 1.550%, 3.622%, due 03/15/272,3 | 330,000 | 330,094 | |||||||||
| LCM XXIII Ltd., Series 23A, Class A1 | |||||||||||
| 3 mo. USD LIBOR + 1.400%, 3.748%, due 10/20/292,3 | 250,000 | 251,085 | |||||||||
| Lehman XS Trust, Series 2005-6, Class 1A1 | |||||||||||
| 1 mo. USD LIBOR + 0.520%, 2.584%, due 11/25/352 | 189,814 | 156,713 | |||||||||
| OneMain Financial Issuance Trust, Series 2015-1A, Class A 3.190%, due 03/18/263 | 810,298 | 811,391 | |||||||||
| Series 2015-2A, Class A 2.570%, due 07/18/253 | 37,831 | 37,821 | |||||||||
| PFS Financing Corp., Series 2016-BA, Class A 1.870%, due 10/15/213 | 160,000 | 157,705 | |||||||||
Series 2017-AA, Class A | |||||||||||
| 1 mo. USD LIBOR + 0.580%, 2.652%, due 03/15/212,3 | 2,390,000 | 2,391,887 | |||||||||
39
PACE Intermediate Fixed Income Investments
Portfolio of investments—July 31, 2018
| Face amount | Value | ||||||||||
Asset-backed securities—(continued) | |||||||||||
| Popular ABS Mortgage Pass-Through Trust, Series 2006-B, Class A3 | |||||||||||
| 1 mo. USD LIBOR + 0.280%, 2.344%, due 05/25/362 | $ | 71,877 | $ | 71,748 | |||||||
| Progress Residential Trust, Series 2015-SFR2, Class A 2.740%, due 06/12/323 | 1,037,011 | 1,022,140 | |||||||||
| RAAC Trust, Series 2006-RP2, Class A | |||||||||||
| 1 mo. USD LIBOR + 0.250%, 2.314%, due 02/25/372,3 | 23,321 | 23,310 | |||||||||
| Santander Drive Auto Receivables Trust, Series 2014-4, Class C 2.600%, due 11/16/20 | 39,843 | 39,840 | |||||||||
| SMB Private Education Loan Trust, Series 2014-A, Class A2B 1 mo. USD LIBOR + 1.150%, 3.222%, due 05/15/262,3 | 323,981 | 326,496 | |||||||||
| Series 2016-A, Class A2A 2.700%, due 05/15/313 | 97,836 | 95,449 | |||||||||
| Series 2016-C, Class A2A 2.340%, due 09/15/343 | 570,000 | 553,328 | |||||||||
| Series 2017-B, Class A2A 2.820%, due 10/15/353 | 380,000 | 368,158 | |||||||||
| Series 2017-B, Class A2B 1 mo. USD LIBOR + 0.750%, 2.822%, due 10/15/352,3 | 220,000 | 220,638 | |||||||||
| Series 2018-A, Class A2B 1 mo. USD LIBOR + 0.800%, 2.872%, due 02/15/362,3 | 575,000 | 577,035 | |||||||||
| Series 2018-B, Class A2A 3.600%, due 01/15/373 | 690,000 | 689,629 | |||||||||
| SoFi Professional Loan Program LLC, Series 2014-A, Class A2 3.020%, due 10/25/273 | 17,107 | 17,101 | |||||||||
| Series 2015-C, Class A2 2.510%, due 08/25/333 | 369,862 | 362,884 | |||||||||
| Series 2016-A, Class A1 1 mo. USD LIBOR + 1.750%, 3.814%, due 08/25/362,3 | 102,041 | 105,278 | |||||||||
| Series 2016-B, Class A1 1 mo. USD LIBOR + 1.200%, 3.264%, due 06/25/332,3 | 94,797 | 95,631 | |||||||||
| Series 2016-C, Class A2A 1.480%, due 05/26/313 | 87,787 | 87,536 | |||||||||
| Series 2018-A, Class A2A 2.390%, due 02/25/423 | 487,839 | 483,692 | |||||||||
| Series 2018-A, Class A2B 2.950%, due 02/25/423 | 270,000 | 263,507 | |||||||||
| SpringCastle America Funding LLC, Series 2016-AA, Class A 3.050%, due 04/25/293 | 217,994 | 216,782 | |||||||||
| Synchrony Credit Card Master Note Trust, Series 2016-1, Class A 2.040%, due 03/15/22 | 1,050,000 | 1,045,831 | |||||||||
| Face amount | Value | ||||||||||
Asset-backed securities—(concluded) | |||||||||||
| Westgate Resorts LLC, Series 2014-1A, Class A 2.150%, due 12/20/263,4 | $ | 51,547 | $ | 51,334 | |||||||
| Total asset-backed securities (cost—$22,278,022) | 22,226,371 | ||||||||||
Corporate notes—43.12% | |||||||||||
Aerospace & defense—1.34% | |||||||||||
| BAE Systems Holdings, Inc. 2.850%, due 12/15/203 | 50,000 | 49,317 | |||||||||
3.850%, due 12/15/253 | 160,000 | 158,264 | |||||||||
| General Dynamics Corp. 3.750%, due 05/15/28 | 350,000 | 355,397 | |||||||||
| Harris Corp. 4.400%, due 06/15/28 | 355,000 | 359,594 | |||||||||
| Lockheed Martin Corp. 2.900%, due 03/01/25 | 385,000 | 367,792 | |||||||||
3.100%, due 01/15/23 | 235,000 | 231,849 | |||||||||
3.350%, due 09/15/21 | 170,000 | 170,843 | |||||||||
3.800%, due 03/01/45 | 50,000 | 47,223 | |||||||||
4.090%, due 09/15/52 | 176,000 | 169,048 | |||||||||
4.700%, due 05/15/46 | 455,000 | 490,182 | |||||||||
| Northrop Grumman Corp. 2.080%, due 10/15/20 | 130,000 | 126,918 | |||||||||
2.930%, due 01/15/25 | 935,000 | 891,721 | |||||||||
3.250%, due 08/01/23 | 160,000 | 158,160 | |||||||||
3.250%, due 01/15/28 | 173,000 | 163,833 | |||||||||
4.030%, due 10/15/47 | 190,000 | 181,101 | |||||||||
| Rockwell Collins, Inc. 2.800%, due 03/15/22 | 245,000 | 238,243 | |||||||||
| Spirit AeroSystems, Inc. 3.950%, due 06/15/23 | 610,000 | 609,818 | |||||||||
| United Technologies Corp. 3.750%, due 11/01/46 | 180,000 | 161,718 | |||||||||
4,931,021 | |||||||||||
Airlines—0.10% | |||||||||||
| American Airlines Pass-Through Trust 2013-2, Class A 4.950%, due 01/15/23 | 133,280 | 137,020 | |||||||||
| American Airlines Pass-Through Trust 2014-1, Class B 4.375%, due 10/01/224 | 13,950 | 13,880 | |||||||||
| American Airlines Pass-Through Trust 2015-1, Class A 3.375%, due 05/01/27 | 68,268 | 65,858 | |||||||||
| Southwest Airlines Co. 2.750%, due 11/16/22 | 80,000 | 77,541 | |||||||||
| United Airlines Pass-Through Trust 2018-1, Class B 4.600%, due 03/01/26 | 70,000 | 70,040 | |||||||||
364,339 | |||||||||||
Auto & truck—0.26% | |||||||||||
| Aptiv PLC 4.400%, due 10/01/46 | 126,000 | 114,112 | |||||||||
40
PACE Intermediate Fixed Income Investments
Portfolio of investments—July 31, 2018
| Face amount | Value | ||||||||||
Corporate notes—(continued) | |||||||||||
Auto & truck—(concluded) | |||||||||||
| Delphi Corp. 4.150%, due 03/15/24 | $ | 43,000 | $ | 43,006 | |||||||
IHO Verwaltungs GmbH | |||||||||||
| 4.750% Cash or 5.500 PIK, 4.750%, due 09/15/263,6 | 320,000 | 300,960 | |||||||||
| ZF North America Capital, Inc. 4.500%, due 04/29/223 | 483,000 | 491,410 | |||||||||
949,488 | |||||||||||
Banking-non-US—4.79% | |||||||||||
| ABN AMRO Bank NV 2.650%, due 01/19/213 | 641,000 | 628,753 | |||||||||
| Australia & New Zealand Banking Group Ltd. 2.250%, due 11/09/20 | 250,000 | 244,443 | |||||||||
2.550%, due 11/23/21 | 250,000 | 242,387 | |||||||||
| Banco Santander SA 3.848%, due 04/12/23 | 200,000 | 197,876 | |||||||||
| Bancolombia SA 5.950%, due 06/03/217 | 220,000 | 232,925 | |||||||||
| Barclays Bank PLC 2.650%, due 01/11/21 | 200,000 | 196,040 | |||||||||
BNP Paribas SA | |||||||||||
| (fixed, converts to FRN on 03/01/28), 4.375%, due 03/01/333,7 | 200,000 | 192,352 | |||||||||
| BPCE SA 5.700%, due 10/22/233 | 200,000 | 209,204 | |||||||||
| Citizens Financial Group, Inc. 2.375%, due 07/28/21 | 15,000 | 14,461 | |||||||||
| Commerzbank AG 8.125%, due 09/19/233 | 735,000 | 841,496 | |||||||||
| Commonwealth Bank of Australia 3.450%, due 03/16/233 | 80,000 | 79,225 | |||||||||
| Cooperatieve Rabobank UA 2.500%, due 01/19/21 | 510,000 | 500,238 | |||||||||
| Credit Agricole SA 3.250%, due 10/04/243 | 500,000 | 473,624 | |||||||||
Credit Suisse Group AG | |||||||||||
| (fixed, converts to FRN on 01/12/28), 3.869%, due 01/12/293 | 295,000 | 281,787 | |||||||||
| Credit Suisse Group Funding Guernsey Ltd. 2.750%, due 03/26/20 | 345,000 | 341,418 | |||||||||
3.450%, due 04/16/21 | 505,000 | 503,709 | |||||||||
| Danske Bank A/S 3.875%, due 09/12/233,7 | 200,000 | 197,795 | |||||||||
| Deutsche Bank AG 4.100%, due 01/13/267 | 170,000 | 161,523 | |||||||||
4.250%, due 10/14/21 | 130,000 | 129,953 | |||||||||
| (fixed, converts to FRN on 12/01/27), 4.875%, due 12/01/327 | 480,000 | 424,258 | |||||||||
HSBC Holdings PLC | |||||||||||
| (fixed, converts to FRN on 03/13/22), 3.262%, due 03/13/23 | 565,000 | 555,792 | |||||||||
3.400%, due 03/08/21 | 320,000 | 319,629 | |||||||||
4.375%, due 11/23/267 | 400,000 | 398,012 | |||||||||
| Face amount | Value | ||||||||||
Corporate notes—(continued) | |||||||||||
Banking-non-US—(continued) | |||||||||||
ING Bank N.V. | |||||||||||
| (fixed, converts to FRN on 11/21/18), 4.125%, due 11/21/238 | $ | 210,000 | $ | 210,496 | |||||||
5.000%, due 06/09/213 | 200,000 | 207,681 | |||||||||
5.800%, due 09/25/233 | 200,000 | 213,268 | |||||||||
| ING Groep N.V. 3.150%, due 03/29/22 | 630,000 | 618,030 | |||||||||
| Intesa Sanpaolo SpA 3.125%, due 07/14/223 | 255,000 | 237,663 | |||||||||
| Kreditanstalt fuer Wiederaufbau 1.500%, due 02/06/19 | 509,000 | 506,672 | |||||||||
| Lloyds Bank PLC 6.500%, due 09/14/203 | 650,000 | 684,045 | |||||||||
| Lloyds Banking Group PLC 3.000%, due 01/11/22 | 200,000 | 195,568 | |||||||||
3.750%, due 01/11/27 | 200,000 | 189,766 | |||||||||
4.450%, due 05/08/257 | 200,000 | 202,170 | |||||||||
4.582%, due 12/10/25 | 335,000 | 331,330 | |||||||||
Macquarie Group Ltd. | |||||||||||
| (fixed, converts to FRN on 03/27/28), 4.654%, due 03/27/293,7 | 250,000 | 248,632 | |||||||||
| Mitsubishi UFJ Financial Group, Inc. 2.998%, due 02/22/22 | 75,000 | 73,433 | |||||||||
| Mitsubishi UFJ Trust & Banking Corp. 2.650%, due 10/19/203 | 920,000 | 903,616 | |||||||||
| Mizuho Financial Group, Inc. 2.601%, due 09/11/22 | 330,000 | 315,790 | |||||||||
| National Australia Bank Ltd. MTN 2.125%, due 05/22/20 | 250,000 | 245,466 | |||||||||
| Nordea Bank AB 4.875%, due 01/27/203 | 445,000 | 455,468 | |||||||||
| Royal Bank of Canada GMTN 2.500%, due 01/19/21 | 240,000 | 235,330 | |||||||||
| Santander UK Group Holdings PLC 2.875%, due 10/16/20 | 245,000 | 241,798 | |||||||||
2.875%, due 08/05/21 | 201,000 | 196,282 | |||||||||
| (fixed, converts to FRN on 01/05/23), 3.373%, due 01/05/247 | 580,000 | 559,856 | |||||||||
3.571%, due 01/10/23 | 200,000 | 195,686 | |||||||||
| Santander UK PLC 5.000%, due 11/07/233 | 690,000 | 700,306 | |||||||||
| Skandinaviska Enskilda Banken AB 2.625%, due 11/17/203 | 215,000 | 211,398 | |||||||||
| Standard Chartered PLC 2.250%, due 04/17/203,7 | 430,000 | 421,178 | |||||||||
Sumitomo Mitsui Banking Corp. | |||||||||||
| 3 mo. USD LIBOR + 0.310%, 2.643%, due 10/18/192 | 335,000 | 335,325 | |||||||||
| Sumitomo Mitsui Trust Bank Ltd. 1.950%, due 09/19/193 | 355,000 | 350,373 | |||||||||
| Svenska Handelsbanken AB MTN 1.875%, due 09/07/21 | 250,000 | 238,593 | |||||||||
| The Toronto-Dominion Bank GMTN 3.500%, due 07/19/23 | 120,000 | 119,741 | |||||||||
| Westpac Banking Corp. 2.150%, due 03/06/20 | 100,000 | 98,491 | |||||||||
41
PACE Intermediate Fixed Income Investments
Portfolio of investments—July 31, 2018
| Face amount | Value | ||||||||||
Corporate notes—(continued) | |||||||||||
Banking-non-US—(concluded) | |||||||||||
2.600%, due 11/23/20 | $ | 255,000 | $ | 251,391 | |||||||
3.650%, due 05/15/23 | 275,000 | 275,118 | |||||||||
17,636,860 | |||||||||||
Banking-US—6.98% | |||||||||||
| American Express Credit Corp. MTN 2.375%, due 05/26/20 | 95,000 | 93,748 | |||||||||
2.600%, due 09/14/20 | 155,000 | 153,229 | |||||||||
| Bank of America Corp. 2.250%, due 04/21/20 | 207,000 | 204,126 | |||||||||
| (fixed, converts to FRN on 07/21/20), 2.369%, due 07/21/21 | 1,340,000 | 1,317,241 | |||||||||
| (fixed, converts to FRN on 01/23/21), 2.738%, due 01/23/22 | 985,000 | 967,839 | |||||||||
| (fixed, converts to FRN on 04/24/22), 2.881%, due 04/24/23 | 195,000 | 189,555 | |||||||||
| (fixed, converts to FRN on 01/23/25), 3.366%, due 01/23/26 | 220,000 | 212,432 | |||||||||
| (fixed, converts to FRN on 03/05/23), 3.550%, due 03/05/24 | 350,000 | 345,912 | |||||||||
3.875%, due 08/01/25 | 570,000 | 568,646 | |||||||||
4.000%, due 01/22/25 | 110,000 | 108,659 | |||||||||
| (fixed, converts to FRN on 03/15/28), 5.875%, due 03/15/289 | 270,000 | 267,840 | |||||||||
| Bank of America Corp. GMTN 3.300%, due 01/11/23 | 320,000 | 315,773 | |||||||||
| Bank of America Corp. MTN 2.151%, due 11/09/20 | 850,000 | 830,374 | |||||||||
4.200%, due 08/26/24 | 690,000 | 693,295 | |||||||||
| (fixed, converts to FRN on 01/20/47), 4.443%, due 01/20/487 | 70,000 | 70,196 | |||||||||
5.625%, due 07/01/20 | 160,000 | 167,150 | |||||||||
| Branch Banking & Trust Co. 3.625%, due 09/16/25 | 250,000 | 246,295 | |||||||||
| Capital One Bank USA N.A. 2.250%, due 02/13/19 | 515,000 | 513,860 | |||||||||
| Capital One Financial Corp. 2.500%, due 05/12/20 | 270,000 | 266,558 | |||||||||
3.750%, due 07/28/26 | 110,000 | 103,461 | |||||||||
| Capital One N.A. 2.350%, due 01/31/20 | 590,000 | 582,580 | |||||||||
| CIT Group, Inc. 3.875%, due 02/19/19 | 147,500 | 147,795 | |||||||||
| Citibank N.A. 1.850%, due 09/18/19 | 380,000 | 375,584 | |||||||||
| Citizens Bank N.A./Providence, RI 2.200%, due 05/26/20 | 250,000 | 244,932 | |||||||||
| Discover Bank 2.600%, due 11/13/18 | 330,000 | 329,921 | |||||||||
3.100%, due 06/04/20 | 250,000 | 248,851 | |||||||||
| Goldman Sachs & Co. 2.335%, due 11/13/184,13,14 | 1,000,000 | 1,003,000 | |||||||||
2.775%, due 02/08/194,13,14 | 2,000,000 | 2,005,000 | |||||||||
| Goldman Sachs Bank USA 3.200%, due 06/05/20 | 25,000 | 25,034 | |||||||||
| Face amount | Value | ||||||||||
Corporate notes—(continued) | |||||||||||
Banking-US—(continued) | |||||||||||
| Goldman Sachs Group, Inc. 1.000%, due 10/12/184,13,14 | $ | 1,000,000 | $ | 1,000,000 | |||||||
2.550%, due 10/23/19 | 231,000 | 229,858 | |||||||||
2.750%, due 09/15/20 | 270,000 | 267,370 | |||||||||
2.875%, due 02/25/21 | 165,000 | 162,361 | |||||||||
| 3 mo. USD LIBOR + 0.780%, 3.122%, due 10/31/222 | 830,000 | 831,818 | |||||||||
3.200%, due 02/23/23 | 325,000 | 318,033 | |||||||||
| 3 mo. USD LIBOR + 1.170%, 3.491%, due 05/15/262 | 165,000 | 163,719 | |||||||||
| (fixed, converts to FRN on 06/05/27), 3.691%, due 06/05/28 | 285,000 | 271,764 | |||||||||
3.750%, due 05/22/25 | 75,000 | 73,394 | |||||||||
3.850%, due 01/26/27 | 315,000 | 305,392 | |||||||||
| Goldman Sachs Group, Inc. (The) 4.000%, due 03/03/24 | 410,000 | 412,572 | |||||||||
| (fixed, converts to FRN on 05/01/28), 4.223%, due 05/01/29 | 130,000 | 128,587 | |||||||||
4.250%, due 10/21/25 | 15,000 | 14,905 | |||||||||
| HSBC USA, Inc. 5.000%, due 09/27/20 | 100,000 | 102,950 | |||||||||
| JPMorgan Chase & Co. 2.700%, due 05/18/23 | 150,000 | 143,719 | |||||||||
| (fixed, converts to FRN on 04/25/22), 2.776%, due 04/25/23 | 620,000 | 601,440 | |||||||||
2.972%, due 01/15/23 | 313,000 | 304,799 | |||||||||
3.200%, due 06/15/26 | 150,000 | 142,467 | |||||||||
3.250%, due 09/23/22 | 105,000 | 104,309 | |||||||||
3.375%, due 05/01/23 | 85,000 | 83,110 | |||||||||
| (fixed, converts to FRN on 01/23/28), 3.509%, due 01/23/29 | 440,000 | 416,521 | |||||||||
| (fixed, converts to FRN on 06/18/21), 3.514%, due 06/18/22 | 310,000 | 309,889 | |||||||||
| (fixed, converts to FRN on 04/23/23), 3.559%, due 04/23/24 | 125,000 | 123,716 | |||||||||
| (fixed, converts to FRN on 02/01/27), 3.782%, due 02/01/28 | 1,000,000 | 973,025 | |||||||||
| KeyBank N.A. 2.500%, due 12/15/19 | 250,000 | 248,029 | |||||||||
| KeyCorp MTN 2.900%, due 09/15/20 | 100,000 | 99,127 | |||||||||
State Street Corp. | |||||||||||
| (fixed, converts to FRN on 09/15/20), 5.250%, due 09/15/207,9 | 147,000 | 150,675 | |||||||||
| Synchrony Bank 3.650%, due 05/24/21 | 420,000 | 415,382 | |||||||||
| Synovus Financial Corp. 3.125%, due 11/01/22 | 80,000 | 76,515 | |||||||||
| The Bank of New York Mellon Corp. 2.050%, due 05/03/21 | 175,000 | 169,547 | |||||||||
2.800%, due 05/04/26 | 10,000 | 9,427 | |||||||||
2.950%, due 01/29/23 | 290,000 | 283,458 | |||||||||
3.300%, due 08/23/29 | 240,000 | 226,394 | |||||||||
| (fixed, converts to FRN on 09/20/26), 4.625%, due 09/20/269 | 195,000 | 185,778 | |||||||||
42
PACE Intermediate Fixed Income Investments
Portfolio of investments—July 31, 2018
| Face amount | Value | ||||||||||
Corporate notes—(continued) | |||||||||||
Banking-US—(concluded) | |||||||||||
| Visa, Inc. 3.150%, due 12/14/25 | $ | 320,000 | $ | 311,059 | |||||||
| Wells Fargo & Co. 2.100%, due 07/26/21 | 80,000 | 77,028 | |||||||||
3.000%, due 04/22/26 | 210,000 | 196,116 | |||||||||
3.000%, due 10/23/26 | 51,000 | 47,376 | |||||||||
3.069%, due 01/24/23 | 360,000 | 351,065 | |||||||||
| Wells Fargo & Co. GMTN 4.300%, due 07/22/27 | 160,000 | 158,886 | |||||||||
| Wells Fargo & Co. MTN 2.625%, due 07/22/22 | 650,000 | 627,458 | |||||||||
| (fixed, converts to FRN on 05/22/27), 3.584%, due 05/22/287 | 5,000 | 4,794 | |||||||||
| Wells Fargo Bank NA 2.600%, due 01/15/21 | 2,020,000 | 1,986,342 | |||||||||
25,709,060 | |||||||||||
Beverages—0.63% | |||||||||||
| Anheuser-Busch InBev Finance, Inc. 4.700%, due 02/01/36 | 360,000 | 369,744 | |||||||||
4.900%, due 02/01/46 | 100,000 | 104,121 | |||||||||
| Anheuser-Busch InBev Worldwide, Inc. 4.600%, due 04/15/48 | 480,000 | 482,587 | |||||||||
4.750%, due 04/15/58 | 110,000 | 110,790 | |||||||||
| Keurig Dr. Pepper, Inc. 3.551%, due 05/25/213 | 225,000 | 225,653 | |||||||||
4.057%, due 05/25/233 | 95,000 | 95,663 | |||||||||
4.420%, due 12/15/46 | 30,000 | 27,556 | |||||||||
| Molson Coors Brewing Co. 1.900%, due 03/15/19 | 170,000 | 169,233 | |||||||||
2.250%, due 03/15/20 | 100,000 | 98,470 | |||||||||
| PepsiCo, Inc. 3.000%, due 10/15/277 | 240,000 | 229,571 | |||||||||
3.450%, due 10/06/46 | 80,000 | 72,721 | |||||||||
| The Coca-Cola Co. 1.875%, due 10/27/20 | 350,000 | 341,896 | |||||||||
2,328,005 | |||||||||||
Biotechnology—0.42% | |||||||||||
| Amgen, Inc. 2.200%, due 05/11/20 | 100,000 | 98,313 | |||||||||
3.125%, due 05/01/25 | 40,000 | 38,509 | |||||||||
4.400%, due 05/01/45 | 120,000 | 118,156 | |||||||||
4.563%, due 06/15/48 | 11,000 | 11,010 | |||||||||
4.663%, due 06/15/51 | 53,000 | 53,700 | |||||||||
| Baxalta, Inc. 2.875%, due 06/23/20 | 440,000 | 435,486 | |||||||||
| Celgene Corp. 3.875%, due 08/15/25 | 101,000 | 99,532 | |||||||||
3.900%, due 02/20/28 | 45,000 | 43,565 | |||||||||
| Gilead Sciences, Inc. 2.500%, due 09/01/23 | 30,000 | 28,523 | |||||||||
2.550%, due 09/01/20 | 10,000 | 9,894 | |||||||||
3.250%, due 09/01/22 | 80,000 | 79,632 | |||||||||
3.700%, due 04/01/24 | 185,000 | 185,763 | |||||||||
4.150%, due 03/01/47 | 200,000 | 193,921 | |||||||||
| Face amount | Value | ||||||||||
Corporate notes—(continued) | |||||||||||
Biotechnology—(concluded) | |||||||||||
4.750%, due 03/01/46 | $ | 140,000 | $ | 147,745 | |||||||
1,543,749 | |||||||||||
Building products—0.15% | |||||||||||
| Holcim US Finance Sarl & Cie SCS 6.000%, due 12/30/193 | 415,000 | 429,818 | |||||||||
| Johnson Controls International PLC 3.625%, due 07/02/2410 | 90,000 | 88,377 | |||||||||
| Owens Corning 4.400%, due 01/30/48 | 40,000 | 33,056 | |||||||||
551,251 | |||||||||||
Cable—0.08% | |||||||||||
| Sky PLC 3.750%, due 09/16/243 | 215,000 | 213,030 | |||||||||
| Time Warner Entertainment Co. LP 8.375%, due 03/15/23 | 80,000 | 92,992 | |||||||||
306,022 | |||||||||||
Chemicals—0.27% | |||||||||||
| E.I. du Pont de Nemours & Co. 2.200%, due 05/01/20 | 75,000 | 73,900 | |||||||||
| Eastman Chemical Co. 3.800%, due 03/15/25 | 42,000 | 41,535 | |||||||||
| Ecolab, Inc. 2.000%, due 01/14/19 | 270,000 | 269,692 | |||||||||
| LyondellBasell Industries N.V. 5.000%, due 04/15/19 | 243,000 | 245,339 | |||||||||
| RPM International, Inc. 6.125%, due 10/15/19 | 259,000 | 267,478 | |||||||||
| The Dow Chemical Co. 8.550%, due 05/15/19 | 55,000 | 57,376 | |||||||||
| The Sherwin-Williams Co. 4.500%, due 06/01/477 | 50,000 | 49,191 | |||||||||
1,004,511 | |||||||||||
Commercial services—0.57% | |||||||||||
| Duke University 4.077%, due 10/01/48 | 91,000 | 91,838 | |||||||||
| Equifax, Inc. 2.300%, due 06/01/21 | 20,000 | 19,272 | |||||||||
| Huntington Ingalls Industries, Inc. 3.483%, due 12/01/27 | 645,000 | 611,557 | |||||||||
5.000%, due 11/15/253 | 270,000 | 281,556 | |||||||||
| Iron Mountain, Inc. 4.375%, due 06/01/213 | 450,000 | 448,875 | |||||||||
| Republic Services, Inc. 2.900%, due 07/01/26 | 35,000 | 32,411 | |||||||||
3.375%, due 11/15/27 | 180,000 | 170,961 | |||||||||
3.950%, due 05/15/28 | 225,000 | 223,643 | |||||||||
| S&P Global, Inc. 4.000%, due 06/15/25 | 60,000 | 60,400 | |||||||||
| Total System Services, Inc. 3.750%, due 06/01/23 | 100,000 | 99,452 | |||||||||
3.800%, due 04/01/21 | 60,000 | 60,287 | |||||||||
2,100,252 | |||||||||||
43
PACE Intermediate Fixed Income Investments
Portfolio of investments—July 31, 2018
| Face amount | Value | ||||||||||
Corporate notes—(continued) | |||||||||||
Communications equipment—0.39% | |||||||||||
| Apple, Inc. 3.750%, due 11/13/477 | $ | 370,000 | $ | 352,633 | |||||||
3.850%, due 08/04/46 | 125,000 | 120,788 | |||||||||
4.500%, due 02/23/36 | 150,000 | 163,250 | |||||||||
4.650%, due 02/23/46 | 230,000 | 251,124 | |||||||||
| QUALCOMM, Inc. 3.450%, due 05/20/25 | 313,000 | 304,198 | |||||||||
4.300%, due 05/20/47 | 120,000 | 113,386 | |||||||||
4.800%, due 05/20/45 | 130,000 | 130,755 | |||||||||
1,436,134 | |||||||||||
Computers—0.11% | |||||||||||
| DXC Technology Co. 2.875%, due 03/27/20 | 30,000 | 29,711 | |||||||||
| Hewlett Packard Enterprise Co. 2.850%, due 10/05/1810 | 99,000 | 99,040 | |||||||||
| International Business Machines Corp. 3.450%, due 02/19/267 | 212,000 | 209,574 | |||||||||
| Seagate HDD Cayman 4.750%, due 01/01/25 | 65,000 | 63,077 | |||||||||
401,402 | |||||||||||
Containers & packaging—0.08% | |||||||||||
| WestRock RKT Co. 4.900%, due 03/01/22 | 293,000 | 305,041 | |||||||||
Diversified financial services—0.51% | |||||||||||
| Air Lease Corp. 3.625%, due 04/01/27 | 30,000 | 27,791 | |||||||||
3.875%, due 07/03/23 | 15,000 | 14,877 | |||||||||
| Aviation Capital Group LLC 2.875%, due 09/17/183 | 630,000 | 630,052 | |||||||||
| CME Group, Inc. 3.750%, due 06/15/28 | 50,000 | 50,434 | |||||||||
| Fidelity National Information Services, Inc. 3.000%, due 08/15/26 | 130,000 | 120,485 | |||||||||
3.500%, due 04/15/23 | 69,000 | 68,334 | |||||||||
| GE Capital International Funding Co. 4.418%, due 11/15/35 | 323,000 | 314,259 | |||||||||
| Intercontinental Exchange, Inc. 3.750%, due 12/01/25 | 100,000 | 100,037 | |||||||||
| Nomura Holdings, Inc. GMTN 2.750%, due 03/19/19 | 80,000 | 79,984 | |||||||||
| ORIX Corp. 2.900%, due 07/18/22 | 470,000 | 454,457 | |||||||||
1,860,710 | |||||||||||
Electric utilities—1.12% | |||||||||||
| AEP Texas, Inc. 2.400%, due 10/01/22 | 90,000 | 86,126 | |||||||||
| Alabama Power Co. 3.850%, due 12/01/42 | 60,000 | 56,829 | |||||||||
4.150%, due 08/15/44 | 120,000 | 117,447 | |||||||||
4.300%, due 07/15/48 | 110,000 | 112,838 | |||||||||
5.200%, due 06/01/41 | 35,000 | 38,926 | |||||||||
| Face amount | Value | ||||||||||
Corporate notes—(continued) | |||||||||||
Electric utilities—(concluded) | |||||||||||
| Alliant Energy Finance LLC 3.750%, due 06/15/233 | $ | 40,000 | $ | 40,012 | |||||||
| Ameren Illinois Co. 3.800%, due 05/15/28 | 50,000 | 50,340 | |||||||||
| Baltimore Gas & Electric Co. 3.750%, due 08/15/47 | 250,000 | 231,900 | |||||||||
| Berkshire Hathaway Energy Co. 3.250%, due 04/15/28 | 275,000 | 261,735 | |||||||||
| Black Hills Corp. 3.150%, due 01/15/27 | 30,000 | 27,583 | |||||||||
| Dominion Energy, Inc. 2.579%, due 07/01/2010 | 60,000 | 59,130 | |||||||||
| DTE Electric Co. 3.700%, due 03/15/45 | 100,000 | 93,420 | |||||||||
3.750%, due 08/15/47 | 120,000 | 113,905 | |||||||||
| DTE Energy Co. 3.300%, due 06/15/22 | 150,000 | 147,978 | |||||||||
| Duke Energy Carolinas LLC 2.950%, due 12/01/26 | 185,000 | 175,968 | |||||||||
3.700%, due 12/01/47 | 90,000 | 83,456 | |||||||||
| Duke Energy Corp. 1.800%, due 09/01/21 | 660,000 | 630,802 | |||||||||
2.650%, due 09/01/26 | 410,000 | 372,378 | |||||||||
3.550%, due 09/15/21 | 230,000 | 231,651 | |||||||||
3.750%, due 04/15/24 | 110,000 | 109,899 | |||||||||
3.950%, due 10/15/23 | 490,000 | 494,621 | |||||||||
4.800%, due 12/15/45 | 190,000 | 197,926 | |||||||||
| Duke Energy Florida LLC 2.100%, due 12/15/19 | 33,750 | 33,581 | |||||||||
3.800%, due 07/15/28 | 325,000 | 327,764 | |||||||||
| Duke Energy Progress LLC 3.250%, due 08/15/25 | 40,000 | 39,056 | |||||||||
4,135,271 | |||||||||||
Electric-generation—0.01% | |||||||||||
| Emera US Finance LP 2.150%, due 06/15/19 | 50,000 | 49,630 | |||||||||
Electric-integrated—1.44% | |||||||||||
| Agilent Technologies, Inc. 3.050%, due 09/22/26 | 15,000 | 13,971 | |||||||||
| CenterPoint Energy Houston Electric LLC 3.950%, due 03/01/48 | 40,000 | 39,183 | |||||||||
| CMS Energy Corp. 3.000%, due 05/15/26 | 30,000 | 27,876 | |||||||||
| Dominion Energy, Inc. 1.500%, due 09/30/183 | 355,000 | 354,399 | |||||||||
| Eaton Corp. 2.750%, due 11/02/22 | 80,000 | 77,619 | |||||||||
| Entergy Corp. 2.950%, due 09/01/26 | 45,000 | 41,277 | |||||||||
4.000%, due 07/15/22 | 195,000 | 196,932 | |||||||||
| Entergy Texas, Inc. 2.550%, due 06/01/21 | 45,000 | 43,756 | |||||||||
7.125%, due 02/01/19 | 340,000 | 346,838 | |||||||||
44
PACE Intermediate Fixed Income Investments
Portfolio of investments—July 31, 2018
| Face amount | Value | ||||||||||
Corporate notes—(continued) | |||||||||||
Electric-integrated—(continued) | |||||||||||
| Eversource Energy 2.900%, due 10/01/24 | $ | 95,000 | $ | 89,990 | |||||||
| Exelon Corp. 2.450%, due 04/15/21 | 5,000 | 4,861 | |||||||||
2.850%, due 06/15/20 | 70,000 | 69,332 | |||||||||
3.400%, due 04/15/26 | 270,000 | 258,185 | |||||||||
4.450%, due 04/15/46 | 120,000 | 118,455 | |||||||||
| Florida Power & Light Co. 3.125%, due 12/01/25 | 85,000 | 82,657 | |||||||||
3.700%, due 12/01/47 | 70,000 | 66,278 | |||||||||
3.800%, due 12/15/42 | 30,000 | 28,955 | |||||||||
4.050%, due 06/01/42 | 91,000 | 90,536 | |||||||||
5.690%, due 03/01/40 | 20,000 | 24,141 | |||||||||
| Georgia Power Co. 3.250%, due 03/30/27 | 30,000 | 28,208 | |||||||||
| IPALCO Enterprises, Inc. 3.700%, due 09/01/24 | 90,000 | 86,857 | |||||||||
| Israel Electric Corp. Ltd. 7.250%, due 01/15/193 | 200,000 | 203,770 | |||||||||
| ITC Holdings Corp. 2.700%, due 11/15/22 | 80,000 | 76,967 | |||||||||
| Northern States Power Co. 3.400%, due 08/15/42 | 260,000 | 232,958 | |||||||||
3.600%, due 09/15/47 | 20,000 | 18,571 | |||||||||
| NSTAR Electric Co. 3.200%, due 05/15/27 | 120,000 | 114,562 | |||||||||
| Ohio Power Co. 4.150%, due 04/01/48 | 40,000 | 40,538 | |||||||||
6.600%, due 02/15/33 | 60,000 | 75,476 | |||||||||
| Oncor Electric Delivery Co. LLC 3.800%, due 09/30/47 | 45,000 | 42,981 | |||||||||
| Pacificorp 4.125%, due 01/15/49 | 65,000 | 64,931 | |||||||||
5.500%, due 01/15/19 | 486,000 | 492,379 | |||||||||
5.750%, due 04/01/37 | 35,000 | 42,275 | |||||||||
| Southern Power Co. 2.375%, due 06/01/20 | 190,000 | 187,305 | |||||||||
| Tampa Electric Co. 4.300%, due 06/15/48 | 75,000 | 74,005 | |||||||||
| Trimble, Inc. 4.150%, due 06/15/23 | 40,000 | 39,819 | |||||||||
| Tyco Electronics Group SA 3.450%, due 08/01/24 | 30,000 | 29,387 | |||||||||
| Virginia Electric & Power Co. 2.750%, due 03/15/23 | 210,000 | 204,019 | |||||||||
3.100%, due 05/15/25 | 185,000 | 177,318 | |||||||||
3.150%, due 01/15/26 | 30,000 | 28,961 | |||||||||
3.500%, due 03/15/27 | 460,000 | 450,749 | |||||||||
3.800%, due 09/15/47 | 320,000 | 298,613 | |||||||||
4.000%, due 01/15/43 | 20,000 | 19,127 | |||||||||
| WEC Energy Group, Inc. 2.450%, due 06/15/20 | 170,000 | 167,518 | |||||||||
3.375%, due 06/15/21 | 65,000 | 64,957 | |||||||||
| Face amount | Value | ||||||||||
Corporate notes—(continued) | |||||||||||
Electric-integrated—(concluded) | |||||||||||
| Wisconsin Power & Light Co. 3.050%, due 10/15/27 | $ | 85,000 | $ | 79,648 | |||||||
5,317,140 | |||||||||||
Electric/gas—0.22% | |||||||||||
| MPLX LP 4.125%, due 03/01/27 | 80,000 | 78,486 | |||||||||
4.500%, due 07/15/23 | 260,000 | 265,877 | |||||||||
4.875%, due 06/01/25 | 100,000 | 103,910 | |||||||||
5.200%, due 03/01/47 | 20,000 | 20,241 | |||||||||
| Northern Natural Gas Co. 4.300%, due 01/15/493 | 200,000 | 196,991 | |||||||||
| Transcontinental Gas Pipe Line Co. LLC 4.600%, due 03/15/483 | 135,000 | 132,642 | |||||||||
798,147 | |||||||||||
Electronic equipment & instruments—0.16% | |||||||||||
| Avnet, Inc. 4.625%, due 04/15/26 | 30,000 | 29,651 | |||||||||
| Corning, Inc. 4.375%, due 11/15/57 | 515,000 | 453,478 | |||||||||
| Honeywell International, Inc. 2.500%, due 11/01/26 | 10,000 | 9,265 | |||||||||
| Thermo Fisher Scientific, Inc. 2.950%, due 09/19/26 | 25,000 | 23,177 | |||||||||
3.000%, due 04/15/23 | 30,000 | 29,096 | |||||||||
3.200%, due 08/15/27 | 45,000 | 42,106 | |||||||||
586,773 | |||||||||||
Finance-captive automotive—2.28% | |||||||||||
| American Express Co. 3.700%, due 08/03/23 | 205,000 | 204,787 | |||||||||
| American Honda Finance Corp. 1.700%, due 09/09/21 | 120,000 | 114,498 | |||||||||
| American International Group, Inc. 4.375%, due 01/15/55 | 140,000 | 126,362 | |||||||||
| (fixed, converts to FRN on 04/01/28), 5.750%, due 04/01/48 | 130,000 | 128,375 | |||||||||
| Ares Capital Corp. 4.250%, due 03/01/25 | 330,000 | 316,825 | |||||||||
| CDP Financial, Inc. 4.400%, due 11/25/193 | 860,000 | 877,122 | |||||||||
| Daimler Finance North America LLC 3.000%, due 02/22/213 | 270,000 | 266,665 | |||||||||
| Ford Motor Co. 4.346%, due 12/08/267 | 55,000 | 52,906 | |||||||||
5.291%, due 12/08/467 | 140,000 | 130,014 | |||||||||
| Ford Motor Credit Co. LLC 3.096%, due 05/04/237 | 400,000 | 379,884 | |||||||||
3.336%, due 03/18/21 | 200,000 | 197,964 | |||||||||
3.815%, due 11/02/277 | 200,000 | 183,010 | |||||||||
| General Motors Co. 5.400%, due 04/01/487 | 370,000 | 355,847 | |||||||||
45
PACE Intermediate Fixed Income Investments
Portfolio of investments—July 31, 2018
| Face amount | Value | ||||||||||
Corporate notes—(continued) | |||||||||||
Finance-captive automotive—(concluded) | |||||||||||
| General Motors Financial Co., Inc. 2.400%, due 05/09/19 | $ | 105,000 | $ | 104,809 | |||||||
3.200%, due 07/13/20 | 569,000 | 567,122 | |||||||||
3.450%, due 01/14/22 | 180,000 | 177,424 | |||||||||
3.550%, due 04/09/21 | 65,000 | 64,819 | |||||||||
3.950%, due 04/13/24 | 407,000 | 397,442 | |||||||||
4.375%, due 09/25/21 | 145,000 | 147,397 | |||||||||
| Hyundai Capital America 2.400%, due 10/30/183 | 105,000 | 104,932 | |||||||||
2.500%, due 03/18/193 | 30,000 | 29,879 | |||||||||
2.550%, due 02/06/193 | 550,000 | 548,335 | |||||||||
3.000%, due 10/30/203 | 285,000 | 280,658 | |||||||||
| Hyundai Capital Services, Inc. 3.000%, due 08/29/223 | 200,000 | 191,403 | |||||||||
3.750%, due 03/05/233,7 | 350,000 | 343,188 | |||||||||
| Nissan Motor Acceptance Corp. 1.900%, due 09/14/213 | 290,000 | 274,789 | |||||||||
3.150%, due 03/15/213 | 195,000 | 192,906 | |||||||||
| Synchrony Financial 2.600%, due 01/15/19 | 120,000 | 119,855 | |||||||||
2.700%, due 02/03/20 | 405,000 | 399,659 | |||||||||
3.000%, due 08/15/19 | 275,000 | 274,593 | |||||||||
3.950%, due 12/01/27 | 15,000 | 13,670 | |||||||||
The Charles Schwab Corp. | |||||||||||
| (fixed, converts to FRN on 03/01/22), 4.625%, due 03/01/229 | 295,000 | 295,000 | |||||||||
| Toyota Motor Corp. 3.669%, due 07/20/28 | 50,000 | 50,095 | |||||||||
| Volkswagen Group of America Finance LLC 2.400%, due 05/22/203 | 270,000 | 265,453 | |||||||||
| Volkswagen International Finance N.V. 4.000%, due 08/12/203 | 235,000 | 237,771 | |||||||||
8,415,458 | |||||||||||
Financial services—3.27% | |||||||||||
| Banque Federative du Credit Mutuel SA 2.750%, due 10/15/203 | 215,000 | 211,960 | |||||||||
| Barclays Bank PLC 5.140%, due 10/14/20 | 240,000 | 245,873 | |||||||||
| Barclays PLC 2.750%, due 11/08/19 | 200,000 | 198,693 | |||||||||
3.250%, due 01/12/21 | 405,000 | 399,423 | |||||||||
| (fixed, converts to FRN on 05/16/23), 4.338%, due 05/16/24 | 1,150,000 | 1,140,791 | |||||||||
4.375%, due 01/12/26 | 205,000 | 200,599 | |||||||||
| (fixed, converts to FRN on 05/16/28), 4.972%, due 05/16/29 | 280,000 | 281,274 | |||||||||
5.200%, due 05/12/26 | 505,000 | 498,902 | |||||||||
| Citigroup, Inc. 2.400%, due 02/18/207 | 170,000 | 168,256 | |||||||||
2.650%, due 10/26/20 | 210,000 | 207,074 | |||||||||
| (fixed, converts to FRN on 07/24/22), 2.876%, due 07/24/23 | 200,000 | 193,356 | |||||||||
| (fixed, converts to FRN on 04/23/28), 4.075%, due 04/23/29 | 85,000 | 83,500 | |||||||||
4.400%, due 06/10/25 | 290,000 | 289,499 | |||||||||
| Face amount | Value | ||||||||||
Corporate notes—(continued) | |||||||||||
Financial services—(concluded) | |||||||||||
| Corp. Financiera de Desarrollo SA 4.750%, due 07/15/253 | $ | 325,000 | $ | 331,500 | |||||||
| Deutsche Bank AG GMTN 3.375%, due 05/12/21 | 60,000 | 58,658 | |||||||||
| Doric Nimrod Air Alpha Ltd. 2013-1 Pass-Through Trust 5.250%, due 05/30/233,4 | 227,995 | 232,282 | |||||||||
| Export Development Canada 0.875%, due 08/27/183 | 275,000 | 274,723 | |||||||||
HSBC Holdings PLC | |||||||||||
| (fixed, converts to FRN on 05/18/23), 3.950%, due 05/18/24 | 200,000 | 199,652 | |||||||||
| JPMorgan Chase & Co. 2.200%, due 10/22/19 | 410,000 | 406,595 | |||||||||
2.250%, due 01/23/20 | 215,000 | 212,518 | |||||||||
2.750%, due 06/23/20 | 720,000 | 714,713 | |||||||||
| (fixed, converts to FRN on 05/01/27), 3.540%, due 05/01/28 | 260,000 | 248,229 | |||||||||
| 3 mo. USD LIBOR + 1.230%, 3.572%, due 10/24/232 | 135,000 | 137,876 | |||||||||
| Mitsubishi UFJ Financial Group, Inc. 3.535%, due 07/26/21 | 105,000 | 105,153 | |||||||||
| Morgan Stanley 2.500%, due 01/24/19 | 200,000 | 199,989 | |||||||||
2.800%, due 06/16/207 | 1,010,000 | 1,001,989 | |||||||||
3.125%, due 01/23/23 | 330,000 | 322,049 | |||||||||
| (fixed, converts to FRN on 07/22/27), 3.591%, due 07/22/28 | 340,000 | 322,827 | |||||||||
3.750%, due 02/25/23 | 460,000 | 460,810 | |||||||||
| (fixed, converts to FRN on 01/24/28), 3.772%, due 01/24/29 | 450,000 | 432,707 | |||||||||
3.950%, due 04/23/27 | 15,000 | 14,415 | |||||||||
| Morgan Stanley MTN 2.200%, due 12/07/18 | 125,000 | 124,882 | |||||||||
2.625%, due 11/17/21 | 190,000 | 184,871 | |||||||||
3.125%, due 07/27/26 | 480,000 | 447,947 | |||||||||
Royal Bank of Scotland Group PLC | |||||||||||
| (fixed, converts to FRN on 05/18/28), 4.892%, due 05/18/29 | 200,000 | 200,822 | |||||||||
| Societe Generale SA 2.500%, due 04/08/213 | 330,000 | 321,208 | |||||||||
| Sumitomo Mitsui Financial Group, Inc. 2.058%, due 07/14/21 | 277,000 | 265,372 | |||||||||
| SunTrust Banks, Inc. 4.000%, due 05/01/25 | 50,000 | 50,063 | |||||||||
| The Bank of Nova Scotia 3.125%, due 04/20/21 | 385,000 | 382,853 | |||||||||
| The Hartford Financial Services Group, Inc. 4.400%, due 03/15/48 | 30,000 | 29,475 | |||||||||
| US Bank N.A. 2.050%, due 10/23/20 | 250,000 | 244,149 | |||||||||
12,047,527 | |||||||||||
Food & drug retailing—0.39% | |||||||||||
| Bed Bath & Beyond, Inc. 5.165%, due 08/01/44 | 135,000 | 101,875 | |||||||||
46
PACE Intermediate Fixed Income Investments
Portfolio of investments—July 31, 2018
| Face amount | Value | ||||||||||
Corporate notes—(continued) | |||||||||||
Food & drug retailing—(concluded) | |||||||||||
| CVS Health Corp. 2.250%, due 08/12/19 | $ | 170,000 | $ | 168,981 | |||||||
3.125%, due 03/09/20 | 10,000 | 9,993 | |||||||||
3.350%, due 03/09/21 | 135,000 | 134,875 | |||||||||
3.700%, due 03/09/23 | 350,000 | 347,809 | |||||||||
3.875%, due 07/20/25 | 52,000 | 51,270 | |||||||||
4.300%, due 03/25/28 | 580,000 | 577,804 | |||||||||
5.050%, due 03/25/48 | 55,000 | 56,990 | |||||||||
1,449,597 | |||||||||||
Food products—0.43% | |||||||||||
| Campbell Soup Co. 3.650%, due 03/15/23 | 415,000 | 407,036 | |||||||||
3.950%, due 03/15/25 | 55,000 | 53,502 | |||||||||
| Danone SA 2.077%, due 11/02/213 | 575,000 | 548,489 | |||||||||
| Sysco Corp. 2.600%, due 10/01/20 | 250,000 | 246,599 | |||||||||
3.550%, due 03/15/25 | 60,000 | 58,844 | |||||||||
| Tyson Foods, Inc. 3.550%, due 06/02/27 | 165,000 | 157,027 | |||||||||
3.950%, due 08/15/24 | 80,000 | 79,926 | |||||||||
4.550%, due 06/02/47 | 30,000 | 28,444 | |||||||||
1,579,867 | |||||||||||
Gas pipelines—0.25% | |||||||||||
| Kinder Morgan Energy Partners LP 3.500%, due 09/01/23 | 745,000 | 729,720 | |||||||||
| Kinder Morgan, Inc. 3.050%, due 12/01/19 | 70,000 | 69,980 | |||||||||
4.300%, due 06/01/257 | 90,000 | 90,643 | |||||||||
5.550%, due 06/01/45 | 40,000 | 41,985 | |||||||||
932,328 | |||||||||||
Health care equipment & supplies—0.22% | |||||||||||
| Abbott Laboratories 3.400%, due 11/30/23 | 200,000 | 198,003 | |||||||||
| Baxter International, Inc. 1.700%, due 08/15/21 | 200,000 | 190,118 | |||||||||
| Becton Dickinson and Co. 2.675%, due 12/15/19 | 48,000 | 47,689 | |||||||||
3.363%, due 06/06/24 | 280,000 | 270,186 | |||||||||
3.734%, due 12/15/24 | 40,000 | 39,219 | |||||||||
| Stryker Corp. 3.375%, due 11/01/25 | 80,000 | 77,433 | |||||||||
822,648 | |||||||||||
Health care providers & services—0.22% | |||||||||||
| Aetna, Inc. 2.750%, due 11/15/22 | 215,000 | 206,750 | |||||||||
2.800%, due 06/15/23 | 30,000 | 28,744 | |||||||||
3.500%, due 11/15/24 | 44,000 | 42,985 | |||||||||
3.875%, due 08/15/47 | 30,000 | 26,815 | |||||||||
| Anthem, Inc. 3.125%, due 05/15/22 | 65,000 | 64,088 | |||||||||
3.350%, due 12/01/24 | 70,000 | 67,553 | |||||||||
| Face amount | Value | ||||||||||
Corporate notes—(continued) | |||||||||||
Health care providers & services—(concluded) | |||||||||||
| Cigna Corp. 3.050%, due 10/15/27 | $ | 50,000 | $ | 45,589 | |||||||
3.250%, due 04/15/25 | 140,000 | 132,909 | |||||||||
| Humana, Inc. 3.950%, due 03/15/27 | 55,000 | 54,303 | |||||||||
| UnitedHealth Group, Inc. 4.250%, due 06/15/487 | 145,000 | 148,212 | |||||||||
817,948 | |||||||||||
Hotels, restaurants & leisure—0.13% | |||||||||||
| Host Hotels & Resorts LP 4.500%, due 02/01/26 | 70,000 | 69,748 | |||||||||
| McDonald's Corp. 2.750%, due 12/09/20 | 25,000 | 24,807 | |||||||||
| McDonald's Corp. MTN 4.875%, due 12/09/457 | 320,000 | 341,390 | |||||||||
| Starbucks Corp. 3.750%, due 12/01/47 | 40,000 | 35,225 | |||||||||
471,170 | |||||||||||
Household durables—0.06% | |||||||||||
| Newell Brands, Inc. 2.600%, due 03/29/19 | 63,000 | 62,710 | |||||||||
| The Clorox Co. 3.900%, due 05/15/28 | 140,000 | 139,413 | |||||||||
202,123 | |||||||||||
Industrial conglomerates—0.31% | |||||||||||
| Crane Co. 4.200%, due 03/15/48 | 75,000 | 70,972 | |||||||||
| General Electric Co. 4.125%, due 10/09/42 | 200,000 | 185,305 | |||||||||
| (fixed, converts to FRN on 01/21/21), 5.000%, due 01/21/219 | 915,000 | 898,896 | |||||||||
1,155,173 | |||||||||||
Insurance—0.82% | |||||||||||
| American International Group, Inc. 3.300%, due 03/01/21 | 265,000 | 264,461 | |||||||||
| Aon PLC 3.875%, due 12/15/25 | 95,000 | 94,022 | |||||||||
4.450%, due 05/24/43 | 64,000 | 60,856 | |||||||||
4.600%, due 06/14/44 | 46,000 | 45,655 | |||||||||
4.750%, due 05/15/45 | 160,000 | 161,621 | |||||||||
| AXA Equitable Holdings, Inc. 3.900%, due 04/20/233 | 405,000 | 402,240 | |||||||||
| Berkshire Hathaway, Inc. 2.750%, due 03/15/23 | 50,000 | 48,945 | |||||||||
3.125%, due 03/15/26 | 35,000 | 33,959 | |||||||||
| Brighthouse Financial, Inc. 4.700%, due 06/22/47 | 45,000 | 38,767 | |||||||||
| Lincoln National Corp. 6.250%, due 02/15/20 | 235,000 | 244,903 | |||||||||
| Marsh & McLennan Cos., Inc. 3.750%, due 03/14/267 | 405,000 | 404,307 | |||||||||
4.350%, due 01/30/47 | 90,000 | 90,171 | |||||||||
47
PACE Intermediate Fixed Income Investments
Portfolio of investments—July 31, 2018
| Face amount | Value | ||||||||||
Corporate notes—(continued) | |||||||||||
Insurance—(concluded) | |||||||||||
| Nuveen Finance LLC 2.950%, due 11/01/193 | $ | 550,000 | $ | 549,643 | |||||||
| Principal Financial Group, Inc. 3.125%, due 05/15/237 | 57,000 | 55,720 | |||||||||
| Teachers Insurance & Annuity Association of America 4.270%, due 05/15/473 | 120,000 | 118,141 | |||||||||
| Trinity Acquisition PLC 3.500%, due 09/15/21 | 220,000 | 217,621 | |||||||||
4.625%, due 08/15/23 | 30,000 | 30,781 | |||||||||
| Willis Towers Watson PLC 5.750%, due 03/15/21 | 145,000 | 152,088 | |||||||||
3,013,901 | |||||||||||
Machinery—0.14% | |||||||||||
| John Deere Capital Corp. MTN 2.650%, due 01/06/22 | 30,000 | 29,464 | |||||||||
| Kennametal, Inc. 4.625%, due 06/15/28 | 170,000 | 167,589 | |||||||||
| Nvent Finance Sarl 3.950%, due 04/15/233 | 325,000 | 320,309 | |||||||||
517,362 | |||||||||||
Media—1.58% | |||||||||||
| CBS Corp. 3.700%, due 06/01/283 | 170,000 | 159,409 | |||||||||
| Charter Communications Operating LLC/ Charter Communications Operating Capital 4.464%, due 07/23/22 | 40,000 | 40,646 | |||||||||
4.500%, due 02/01/24 | 390,000 | 392,143 | |||||||||
4.908%, due 07/23/25 | 350,000 | 356,566 | |||||||||
5.375%, due 05/01/47 | 415,000 | 399,405 | |||||||||
5.750%, due 04/01/48 | 95,000 | 95,544 | |||||||||
6.484%, due 10/23/45 | 5,000 | 5,441 | |||||||||
| Comcast Corp. 1.625%, due 01/15/22 | 80,000 | 75,049 | |||||||||
3.400%, due 07/15/46 | 595,000 | 491,241 | |||||||||
5.150%, due 03/01/207 | 550,000 | 567,175 | |||||||||
| Cox Communications, Inc. 3.150%, due 08/15/243 | 150,000 | 142,245 | |||||||||
3.250%, due 12/15/223 | 60,000 | 58,083 | |||||||||
| Discovery Communications LLC 2.200%, due 09/20/19 | 55,000 | 54,418 | |||||||||
2.950%, due 03/20/23 | 120,000 | 115,014 | |||||||||
3.950%, due 06/15/253 | 195,000 | 191,378 | |||||||||
4.900%, due 03/11/267 | 90,000 | 92,946 | |||||||||
5.200%, due 09/20/47 | �� | 5,000 | 4,926 | ||||||||
NBCUniversal Enterprise, Inc. | |||||||||||
| 3 mo. USD LIBOR + 0.400%, 2.737%, due 04/01/212,3 | 140,000 | 140,291 | |||||||||
5.250%, due 03/19/213,9 | 1,140,000 | 1,151,400 | |||||||||
| NBCUniversal Media LLC 5.150%, due 04/30/20 | 25,000 | 25,876 | |||||||||
| RELX Capital, Inc. 3.125%, due 10/15/22 | 15,000 | 14,651 | |||||||||
3.500%, due 03/16/23 | 355,000 | 351,753 | |||||||||
| Face amount | Value | ||||||||||
Corporate notes—(continued) | |||||||||||
Media—(concluded) | |||||||||||
| Viacom, Inc. 4.375%, due 03/15/43 | $ | 115,000 | $ | 100,842 | |||||||
| Warner Media LLC 3.800%, due 02/15/27 | 790,000 | 756,766 | |||||||||
3.875%, due 01/15/26 | 38,000 | 36,813 | |||||||||
5,820,021 | |||||||||||
Medical providers—0.64% | |||||||||||
| HCA, Inc. 3.750%, due 03/15/19 | 515,000 | 515,798 | |||||||||
6.500%, due 02/15/20 | 350,000 | 364,280 | |||||||||
| Stryker Corp. 2.625%, due 03/15/21 | 45,000 | 44,170 | |||||||||
| Tenet Healthcare Corp. 6.000%, due 10/01/20 | 210,000 | 218,137 | |||||||||
| UnitedHealth Group, Inc. 1.700%, due 02/15/19 | 525,000 | 522,218 | |||||||||
2.875%, due 12/15/21 | 134,000 | 132,678 | |||||||||
2.875%, due 03/15/22 | 144,000 | 142,032 | |||||||||
3.100%, due 03/15/26 | 110,000 | 105,513 | |||||||||
3.750%, due 07/15/25 | 240,000 | 240,840 | |||||||||
4.750%, due 07/15/45 | 80,000 | 86,958 | |||||||||
2,372,624 | |||||||||||
Metals & mining—0.08% | |||||||||||
| Anglo American Capital PLC 3.625%, due 09/11/243 | 210,000 | 198,163 | |||||||||
| Newmont Mining Corp. 4.875%, due 03/15/42 | 80,000 | 80,919 | |||||||||
279,082 | |||||||||||
Oil & gas—1.59% | |||||||||||
| Anadarko Petroleum Corp. 3.450%, due 07/15/247 | 500,000 | 485,126 | |||||||||
| Andeavor 4.750%, due 12/15/23 | 160,000 | 165,602 | |||||||||
| Apache Corp. 4.750%, due 04/15/43 | 25,000 | 23,997 | |||||||||
5.100%, due 09/01/40 | 100,000 | 99,846 | |||||||||
| Chevron Corp. 2.954%, due 05/16/26 | 100,000 | 95,756 | |||||||||
| Cimarex Energy Co. 3.900%, due 05/15/27 | 255,000 | 245,451 | |||||||||
4.375%, due 06/01/24 | 705,000 | 713,721 | |||||||||
| Concho Resources, Inc. 3.750%, due 10/01/27 | 70,000 | 67,160 | |||||||||
| Continental Resources, Inc. 3.800%, due 06/01/24 | 40,000 | 39,291 | |||||||||
4.500%, due 04/15/23 | 828,000 | 842,483 | |||||||||
5.000%, due 09/15/22 | 150,000 | 152,212 | |||||||||
| Diamondback Energy, Inc. 5.375%, due 05/31/253 | 145,000 | 144,275 | |||||||||
5.375%, due 05/31/257 | 50,000 | 49,875 | |||||||||
| Ecopetrol SA 4.125%, due 01/16/25 | 195,000 | 191,953 | |||||||||
48
PACE Intermediate Fixed Income Investments
Portfolio of investments—July 31, 2018
| Face amount | Value | ||||||||||
Corporate notes—(continued) | |||||||||||
Oil & gas—(concluded) | |||||||||||
| EOG Resources, Inc. 2.450%, due 04/01/20 | $ | 165,000 | $ | 163,172 | |||||||
3.900%, due 04/01/35 | 90,000 | 88,150 | |||||||||
4.150%, due 01/15/26 | 220,000 | 225,462 | |||||||||
| Harvest Operations Corp. 4.200%, due 06/01/233 | 200,000 | 201,898 | |||||||||
| Occidental Petroleum Corp. 2.700%, due 02/15/23 | 135,000 | 131,075 | |||||||||
| Patterson-UTI Energy, Inc. 3.950%, due 02/01/283 | 385,000 | 358,618 | |||||||||
| Petroleos Mexicanos 5.625%, due 01/23/46 | 275,000 | 225,775 | |||||||||
| Phillips 66 3.900%, due 03/15/28 | 320,000 | 315,547 | |||||||||
| Pioneer Natural Resources Co. 3.950%, due 07/15/22 | 83,000 | 84,028 | |||||||||
4.450%, due 01/15/26 | 470,000 | 485,373 | |||||||||
| Schlumberger Holdings Corp. 4.000%, due 12/21/253 | 115,000 | 115,148 | |||||||||
| Shell International Finance BV 3.250%, due 05/11/25 | 30,000 | 29,515 | |||||||||
3.750%, due 09/12/46 | 30,000 | 28,460 | |||||||||
| Suncor Energy, Inc. 4.000%, due 11/15/47 | 10,000 | 9,551 | |||||||||
6.500%, due 06/15/38 | 50,000 | 62,509 | |||||||||
5,841,029 | |||||||||||
Oil services—0.06% | |||||||||||
| BP Capital Markets PLC 2.241%, due 09/26/18 | 150,000 | 149,960 | |||||||||
3.506%, due 03/17/257 | 60,000 | 59,366 | |||||||||
209,326 | |||||||||||
Paper & forest products—0.07% | |||||||||||
| Georgia-Pacific LLC 3.734%, due 07/15/233 | 115,000 | 115,414 | |||||||||
5.400%, due 11/01/203 | 32,000 | 33,426 | |||||||||
| International Paper Co. 4.350%, due 08/15/48 | 125,000 | 116,237 | |||||||||
265,077 | |||||||||||
Pharmaceuticals—1.37% | |||||||||||
| Abbott Laboratories 2.000%, due 09/15/18 | 105,000 | 104,968 | |||||||||
2.350%, due 11/22/19 | 150,000 | 149,067 | |||||||||
3.875%, due 09/15/25 | 15,000 | 15,072 | |||||||||
| AbbVie, Inc. 2.300%, due 05/14/21 | 70,000 | 68,090 | |||||||||
3.600%, due 05/14/25 | 480,000 | 467,673 | |||||||||
4.450%, due 05/14/46 | 40,000 | 38,051 | |||||||||
4.700%, due 05/14/45 | 25,000 | 24,555 | |||||||||
| Allergan Funding SCS 3.000%, due 03/12/20 | 190,000 | 189,212 | |||||||||
3.450%, due 03/15/22 | 225,000 | 222,492 | |||||||||
3.850%, due 06/15/24 | 70,000 | 69,102 | |||||||||
4.750%, due 03/15/457 | 160,000 | 158,162 | |||||||||
| Face amount | Value | ||||||||||
Corporate notes—(continued) | |||||||||||
Pharmaceuticals—(concluded) | |||||||||||
| Allergan Sales LLC 5.000%, due 12/15/213 | $ | 510,000 | $ | 527,140 | |||||||
| AstraZeneca PLC 2.375%, due 06/12/22 | 70,000 | 67,310 | |||||||||
| Bayer US Finance II LLC 3.950%, due 04/15/453 | 80,000 | 71,689 | |||||||||
| Edwards Lifesciences Corp. 4.300%, due 06/15/28 | 75,000 | 75,322 | |||||||||
| GlaxoSmithKline Capital PLC 2.850%, due 05/08/22 | 195,000 | 192,280 | |||||||||
| GlaxoSmithKline Capital, Inc. 3.875%, due 05/15/28 | 105,000 | 106,466 | |||||||||
| Johnson & Johnson 2.450%, due 03/01/26 | 25,000 | 23,513 | |||||||||
2.900%, due 01/15/28 | 130,000 | 124,444 | |||||||||
2.950%, due 03/03/27 | 115,000 | 111,299 | |||||||||
| Medtronic, Inc. 3.150%, due 03/15/22 | 150,000 | 149,138 | |||||||||
3.500%, due 03/15/25 | 80,000 | 79,602 | |||||||||
4.625%, due 03/15/45 | 150,000 | 162,710 | |||||||||
| Mylan N.V. 2.500%, due 06/07/19 | 121,000 | 120,579 | |||||||||
| Mylan, Inc. 3.125%, due 01/15/233 | 130,000 | 124,704 | |||||||||
| Novartis Capital Corp. 3.100%, due 05/17/27 | 10,000 | 9,655 | |||||||||
| Pfizer, Inc. 4.125%, due 12/15/46 | 40,000 | 41,000 | |||||||||
| Shire Acquisitions Investments Ireland DAC 1.900%, due 09/23/19 | 640,000 | 631,246 | |||||||||
2.875%, due 09/23/23 | 661,000 | 624,412 | |||||||||
| Teva Pharmaceutical Finance Netherlands III BV 1.700%, due 07/19/19 | 300,000 | 294,290 | |||||||||
5,043,243 | |||||||||||
Pipelines—2.30% | |||||||||||
Andeavor Logistics LP | |||||||||||
| (fixed, converts to FRN on 02/15/23), 6.875%, due 02/15/239 | 430,000 | 430,806 | |||||||||
| Andeavor Logistics LP/Tesoro Logistics Finance Corp. 5.250%, due 01/15/25 | 1,450,000 | 1,498,836 | |||||||||
6.250%, due 10/15/22 | 115,000 | 118,887 | |||||||||
| Buckeye Partners LP 3.950%, due 12/01/26 | 130,000 | 118,638 | |||||||||
4.150%, due 07/01/23 | 330,000 | 326,084 | |||||||||
4.875%, due 02/01/21 | 45,000 | 45,820 | |||||||||
5.600%, due 10/15/44 | 71,000 | 63,823 | |||||||||
5.850%, due 11/15/43 | 204,000 | 191,489 | |||||||||
| (fixed, converts to FRN on 01/22/23), 6.375%, due 01/22/78 | 270,000 | 249,550 | |||||||||
| Cheniere Energy Partners LP 5.250%, due 10/01/25 | 200,000 | 199,000 | |||||||||
Enbridge, Inc. | |||||||||||
| (fixed, converts to FRN on 07/15/27), 5.500%, due 07/15/77 | 160,000 | 150,000 | |||||||||
49
PACE Intermediate Fixed Income Investments
Portfolio of investments—July 31, 2018
| Face amount | Value | ||||||||||
Corporate notes—(continued) | |||||||||||
Pipelines—(concluded) | |||||||||||
| (fixed, converts to FRN on 03/01/28), 6.250%, due 03/01/78 | $ | 190,000 | $ | 185,641 | |||||||
| Energy Transfer Partners LP 4.750%, due 01/15/26 | 100,000 | 101,127 | |||||||||
5.150%, due 03/15/45 | 20,000 | 18,493 | |||||||||
5.300%, due 04/15/47 | 200,000 | 190,296 | |||||||||
| Energy Transfer Partners LP/Regency Energy Finance Corp. 5.000%, due 10/01/22 | 30,000 | 30,904 | |||||||||
| Enterprise Products Operating LLC 4.900%, due 05/15/46 | 240,000 | 247,385 | |||||||||
| (fixed, converts to FRN on 08/16/27), 5.250%, due 08/16/77 | 305,000 | 287,270 | |||||||||
| (fixed, converts to FRN on 02/15/28), 5.375%, due 02/15/78 | 170,000 | 159,814 | |||||||||
| Magellan Midstream Partners LP 4.200%, due 10/03/47 | 60,000 | 56,343 | |||||||||
| NGPL PipeCo LLC 4.375%, due 08/15/223 | 233,000 | 233,583 | |||||||||
| ONEOK Partners LP 8.625%, due 03/01/19 | 550,000 | 567,731 | |||||||||
| Plains All American Pipeline LP/PAA Finance Corp. 3.650%, due 06/01/22 | 30,000 | 29,541 | |||||||||
| Sabine Pass Liquefaction LLC 5.625%, due 04/15/2310 | 330,000 | 352,085 | |||||||||
5.625%, due 03/01/25 | 358,000 | 381,660 | |||||||||
5.750%, due 05/15/24 | 170,000 | 182,864 | |||||||||
5.875%, due 06/30/26 | 60,000 | 65,277 | |||||||||
6.250%, due 03/15/22 | 200,000 | 215,864 | |||||||||
| Spectra Energy Partners LP 3.500%, due 03/15/25 | 45,000 | 43,218 | |||||||||
4.500%, due 03/15/45 | 100,000 | 94,370 | |||||||||
| Sunoco Logistics Partners Operations LP 5.950%, due 12/01/25 | 93,000 | 100,187 | |||||||||
| Texas Eastern Transmission LP 2.800%, due 10/15/223 | 45,000 | 43,100 | |||||||||
3.500%, due 01/15/283 | 70,000 | 65,898 | |||||||||
4.150%, due 01/15/483 | 570,000 | 503,059 | |||||||||
| TransCanada PipeLines Ltd. 2.500%, due 08/01/22 | 80,000 | 76,930 | |||||||||
4.875%, due 05/15/48 | 120,000 | 125,357 | |||||||||
Transcanada Trust | |||||||||||
| (fixed, converts to FRN on 03/15/27), 5.300%, due 03/15/77 | 322,000 | 309,764 | |||||||||
| Transcontinental Gas Pipe Line Co. LLC 4.000%, due 03/15/283 | 300,000 | 295,513 | |||||||||
7.850%, due 02/01/26 | 88,000 | 107,594 | |||||||||
8,463,801 | |||||||||||
Real estate investment trusts—0.14% | |||||||||||
| Boston Properties LP 2.750%, due 10/01/26 | 10,000 | 9,052 | |||||||||
| Northwest Florida Timber Finance LLC 4.750%, due 03/04/293 | 200,000 | 190,750 | |||||||||
| Face amount | Value | ||||||||||
Corporate notes—(continued) | |||||||||||
Real estate investment trusts—(concluded) | |||||||||||
| Realty Income Corp. 3.000%, due 01/15/27 | $ | 85,000 | $ | 77,653 | |||||||
| Weyerhaeuser Co. 7.375%, due 10/01/19 | 230,000 | 240,894 | |||||||||
518,349 | |||||||||||
Retail—0.49% | |||||||||||
| Alibaba Group Holding Ltd. 4.400%, due 12/06/57 | 210,000 | 197,582 | |||||||||
| Amazon.com, Inc. 4.250%, due 08/22/57 | 90,000 | 91,225 | |||||||||
4.800%, due 12/05/34 | 125,000 | 138,053 | |||||||||
| eBay, Inc. 4.000%, due 07/15/42 | 50,000 | 42,800 | |||||||||
| Lowe's Cos., Inc. 2.500%, due 04/15/26 | 60,000 | 54,971 | |||||||||
| Tapestry, Inc. 4.125%, due 07/15/27 | 50,000 | 47,607 | |||||||||
| Tencent Holdings Ltd. 2.985%, due 01/19/233 | 200,000 | 194,178 | |||||||||
3.595%, due 01/19/283 | 390,000 | 371,473 | |||||||||
| The Home Depot, Inc. 2.125%, due 09/15/26 | 10,000 | 8,970 | |||||||||
3.000%, due 04/01/267 | 100,000 | 96,027 | |||||||||
| Walgreens Boots Alliance, Inc. 3.450%, due 06/01/267 | 105,000 | 99,308 | |||||||||
3.800%, due 11/18/24 | 175,000 | 172,158 | |||||||||
4.650%, due 06/01/46 | 110,000 | 103,311 | |||||||||
| Walmart, Inc. 3.550%, due 06/26/25 | 90,000 | 90,771 | |||||||||
4.050%, due 06/29/48 | 40,000 | 40,695 | |||||||||
4.300%, due 04/22/44 | 53,000 | 55,434 | |||||||||
1,804,563 | |||||||||||
Semiconductor equipment & products—1.13% | |||||||||||
| Analog Devices, Inc. 2.500%, due 12/05/21 | 110,000 | 106,356 | |||||||||
2.850%, due 03/12/20 | 80,000 | 79,581 | |||||||||
3.500%, due 12/05/26 | 65,000 | 62,024 | |||||||||
4.500%, due 12/05/36 | 58,000 | 56,584 | |||||||||
5.300%, due 12/15/45 | 10,000 | 10,878 | |||||||||
| Applied Materials, Inc. 5.850%, due 06/15/41 | 30,000 | 36,338 | |||||||||
| Broadcom Corp./Broadcom Cayman Finance Ltd. 3.000%, due 01/15/22 | 690,000 | 669,983 | |||||||||
3.125%, due 01/15/25 | 210,000 | 193,158 | |||||||||
3.625%, due 01/15/24 | 180,000 | 173,392 | |||||||||
3.875%, due 01/15/27 | 80,000 | 74,935 | |||||||||
| Intel Corp. 2.700%, due 12/15/22 | 200,000 | 195,715 | |||||||||
| KLA-Tencor Corp. 4.650%, due 11/01/24 | 4,000 | 4,118 | |||||||||
| Lam Research Corp. 2.750%, due 03/15/20 | 125,000 | 124,208 | |||||||||
2.800%, due 06/15/21 | 67,000 | 65,871 | |||||||||
50
PACE Intermediate Fixed Income Investments
Portfolio of investments—July 31, 2018
| Face amount | Value | ||||||||||
Corporate notes—(continued) | |||||||||||
Semiconductor equipment & products—(concluded) | |||||||||||
| NXP BV/NXP Funding LLC 3.875%, due 09/01/223 | $ | 250,000 | $ | 246,250 | |||||||
4.125%, due 06/01/213 | 1,858,000 | 1,862,701 | |||||||||
| Texas Instruments, Inc. 4.150%, due 05/15/48 | 45,000 | 46,245 | |||||||||
| Xilinx, Inc. 2.950%, due 06/01/24 | 175,000 | 167,080 | |||||||||
4,175,417 | |||||||||||
Software & services—0.51% | |||||||||||
| Activision Blizzard, Inc. 2.300%, due 09/15/21 | 315,000 | 304,539 | |||||||||
3.400%, due 09/15/26 | 175,000 | 167,691 | |||||||||
3.400%, due 06/15/27 | 250,000 | 236,208 | |||||||||
| Autodesk, Inc. 3.500%, due 06/15/27 | 75,000 | 69,983 | |||||||||
| Microsoft Corp. 3.300%, due 02/06/27 | 40,000 | 39,593 | |||||||||
3.700%, due 08/08/46 | 120,000 | 116,858 | |||||||||
4.100%, due 02/06/37 | 200,000 | 208,571 | |||||||||
4.500%, due 02/06/57 | 250,000 | 274,860 | |||||||||
| Oracle Corp. 4.000%, due 07/15/46 | 470,000 | 458,142 | |||||||||
1,876,445 | |||||||||||
Special purpose entity—0.21% | |||||||||||
| CC Holdings GS V LLC/Crown Castle GS III Corp. 3.849%, due 04/15/23 | 228,000 | 225,560 | |||||||||
| Penske Truck Leasing Co. LP/PTL Finance Corp. 2.500%, due 06/15/193 | 220,000 | 219,081 | |||||||||
3.050%, due 01/09/203 | 315,000 | 312,957 | |||||||||
757,598 | |||||||||||
Technology, hardware & equipment—0.27% | |||||||||||
| Dell International LLC/EMC Corp. 3.480%, due 06/01/193 | 225,000 | 225,735 | |||||||||
4.420%, due 06/15/213,7 | 125,000 | 126,909 | |||||||||
6.020%, due 06/15/263 | 145,000 | 153,105 | |||||||||
8.350%, due 07/15/463 | 40,000 | 49,266 | |||||||||
| Pitney Bowes, Inc. 3.625%, due 09/15/2010 | 360,000 | 356,850 | |||||||||
| Xerox Corp. 3.625%, due 03/15/23 | 80,000 | 76,359 | |||||||||
988,224 | |||||||||||
Telecommunications—0.80% | |||||||||||
| Cisco Systems, Inc. 2.200%, due 09/20/23 | 15,000 | 14,233 | |||||||||
| Deutsche Telekom International Finance BV 4.375%, due 06/21/283 | 470,000 | 472,737 | |||||||||
| Harris Corp. 2.700%, due 04/27/20 | 45,000 | 44,613 | |||||||||
3.832%, due 04/27/25 | 30,000 | 29,444 | |||||||||
| TELUS Corp. 4.600%, due 11/16/48 | 25,000 | 24,878 | |||||||||
| Face amount | Value | ||||||||||
Corporate notes—(continued) | |||||||||||
Telecommunications—(concluded) | |||||||||||
| Verizon Communications, Inc. 3.450%, due 03/15/21 | $ | 80,000 | $ | 80,091 | |||||||
4.272%, due 01/15/36 | 660,000 | 630,077 | |||||||||
4.329%, due 09/21/283,7 | 1,026,000 | 1,031,795 | |||||||||
4.500%, due 08/10/33 | 380,000 | 375,537 | |||||||||
4.862%, due 08/21/464 | 106,000 | 105,734 | |||||||||
5.012%, due 04/15/49 | 135,000 | 137,134 | |||||||||
2,946,273 | |||||||||||
Tobacco—0.69% | |||||||||||
| Altria Group, Inc. 2.850%, due 08/09/22 | 150,000 | 146,653 | |||||||||
| BAT Capital Corp. 3.222%, due 08/15/243 | 300,000 | 286,557 | |||||||||
3.557%, due 08/15/273 | 230,000 | 216,414 | |||||||||
4.540%, due 08/15/473 | 18,000 | 17,069 | |||||||||
| BAT International Finance PLC 2.750%, due 06/15/203 | 575,000 | 569,428 | |||||||||
| Cargill, Inc. 3.250%, due 03/01/233 | 65,000 | 64,282 | |||||||||
| Philip Morris International, Inc. 3.375%, due 08/11/25 | 150,000 | 147,036 | |||||||||
| Reynolds American, Inc. 3.250%, due 06/12/20 | 46,000 | 45,980 | |||||||||
4.000%, due 06/12/22 | 90,000 | 90,770 | |||||||||
4.450%, due 06/12/25 | 340,000 | 345,508 | |||||||||
4.850%, due 09/15/23 | 405,000 | 422,205 | |||||||||
| RJ Reynolds Tobacco Co. 6.875%, due 05/01/20 | 170,000 | 180,267 | |||||||||
2,532,169 | |||||||||||
Transportation—0.74% | |||||||||||
| Burlington Northern Santa Fe LLC 3.000%, due 04/01/25 | 25,000 | 24,116 | |||||||||
4.125%, due 06/15/47 | 115,000 | 115,526 | |||||||||
4.150%, due 12/15/4811 | 45,000 | 45,482 | |||||||||
4.550%, due 09/01/44 | 5,000 | 5,281 | |||||||||
| CSX Corp. 2.600%, due 11/01/26 | 50,000 | 45,843 | |||||||||
3.250%, due 06/01/27 | 165,000 | 157,398 | |||||||||
3.800%, due 03/01/28 | 215,000 | 212,197 | |||||||||
3.800%, due 11/01/46 | 180,000 | 164,579 | |||||||||
4.300%, due 03/01/48 | 70,000 | 69,317 | |||||||||
| FedEx Corp. 4.400%, due 01/15/47 | 140,000 | 136,486 | |||||||||
4.550%, due 04/01/46 | 230,000 | 227,883 | |||||||||
| Norfolk Southern Corp. 2.900%, due 06/15/26 | 124,000 | 116,392 | |||||||||
3.150%, due 06/01/27 | 80,000 | 76,073 | |||||||||
3.650%, due 08/01/25 | 45,000 | 45,001 | |||||||||
4.150%, due 02/28/48 | 95,000 | 93,742 | |||||||||
| Ryder System, Inc. MTN 2.250%, due 09/01/21 | 30,000 | 28,900 | |||||||||
2.450%, due 09/03/19 | 180,000 | 178,756 | |||||||||
51
PACE Intermediate Fixed Income Investments
Portfolio of investments—July 31, 2018
| Face amount | Value | ||||||||||
Corporate notes—(continued) | |||||||||||
Transportation—(concluded) | |||||||||||
2.550%, due 06/01/19 | $ | 10,000 | $ | 9,977 | |||||||
2.650%, due 03/02/20 | 210,000 | 208,131 | |||||||||
| Union Pacific Corp. 3.350%, due 08/15/46 | 100,000 | 84,908 | |||||||||
4.100%, due 09/15/67 | 470,000 | 412,901 | |||||||||
4.800%, due 09/10/58 | 20,000 | 20,814 | |||||||||
| Union Pacific Railroad Co. 2014-1 Pass-Through Trust 3.227%, due 05/14/264 | 172,480 | 168,386 | |||||||||
| Virgin Australia 2013-1B Pass-Through Trust 6.000%, due 10/23/203,4 | 68,561 | 69,590 | |||||||||
2,717,679 | |||||||||||
Utilities—0.19% | |||||||||||
| CenterPoint Energy Resources Corp. 4.100%, due 09/01/47 | 160,000 | 148,592 | |||||||||
| Entergy Louisiana LLC 4.000%, due 03/15/33 | 165,000 | 165,169 | |||||||||
| Mid-Atlantic Interstate Transmission LLC 4.100%, due 05/15/283 | 60,000 | 59,927 | |||||||||
| NiSource, Inc. 3.490%, due 05/15/27 | 195,000 | 187,231 | |||||||||
Sempra Energy | |||||||||||
| 3 mo. USD LIBOR + 0.500%, 2.839%, due 01/15/212 | 145,000 | 145,075 | |||||||||
705,994 | |||||||||||
Wireless telecommunications—2.11% | |||||||||||
| AT&T, Inc. 4.300%, due 02/15/303 | 1,426,000 | 1,359,758 | |||||||||
4.350%, due 06/15/457 | 390,000 | 337,168 | |||||||||
4.600%, due 02/15/21 | 118,000 | 120,747 | |||||||||
5.250%, due 03/01/37 | 30,000 | 30,044 | |||||||||
| Crown Castle International Corp. 2.250%, due 09/01/21 | 50,000 | 47,938 | |||||||||
3.400%, due 02/15/21 | 355,000 | 354,302 | |||||||||
3.700%, due 06/15/26 | 20,000 | 18,932 | |||||||||
4.750%, due 05/15/47 | 15,000 | 14,412 | |||||||||
4.875%, due 04/15/22 | 275,000 | 283,378 | |||||||||
5.250%, due 01/15/23 | 75,000 | 78,672 | |||||||||
| Deutsche Telekom International Finance BV 1.950%, due 09/19/213 | 330,000 | 314,881 | |||||||||
| Juniper Networks, Inc. 4.350%, due 06/15/25 | 25,000 | 24,927 | |||||||||
| Motorola Solutions, Inc. 3.500%, due 09/01/21 | 70,000 | 69,413 | |||||||||
4.000%, due 09/01/24 | 46,000 | 44,833 | |||||||||
| Rogers Communications, Inc. 4.300%, due 02/15/48 | 65,000 | 62,231 | |||||||||
| Sprint Spectrum Co. LLC/Sprint Spectrum Co. II LLC/Sprint Spectrum Co. III LLC 3.360%, due 09/20/213,10 | 2,327,813 | 2,316,173 | |||||||||
4.738%, due 03/20/253 | 495,000 | 491,238 | |||||||||
| Face amount | Value | ||||||||||
Corporate notes—(concluded) | |||||||||||
Wireless telecommunications—(concluded) | |||||||||||
| Telecom Italia SpA 5.303%, due 05/30/243,7 | $ | 680,000 | $ | 681,700 | |||||||
| Vodafone Group PLC 3.750%, due 01/16/24 | 380,000 | 375,544 | |||||||||
4.125%, due 05/30/25 | 160,000 | 160,058 | |||||||||
5.250%, due 05/30/48 | 580,000 | 600,772 | |||||||||
7,787,121 | |||||||||||
| Total corporate notes (cost—$161,372,937) | 158,843,943 | ||||||||||
Non-US government obligations—1.73% | |||||||||||
| Argentine Republic Government International Bond 5.875%, due 01/11/28 | 2,282,000 | 1,912,339 | |||||||||
| Colombia Government International Bond 3.875%, due 04/25/277 | 570,000 | 555,750 | |||||||||
| Indonesia Government International Bond 4.100%, due 04/24/287 | 291,000 | 285,238 | |||||||||
| Mexico Government International Bond 3.750%, due 01/11/287 | 1,316,000 | 1,246,910 | |||||||||
4.125%, due 01/21/26 | 523,000 | 519,339 | |||||||||
4.150%, due 03/28/277 | 401,000 | 394,584 | |||||||||
| Panama Government International Bond 3.750%, due 03/16/25 | 250,000 | 248,750 | |||||||||
3.875%, due 03/17/28 | 120,000 | 119,700 | |||||||||
| Philippine Government International Bond 3.000%, due 02/01/28 | 600,000 | 563,119 | |||||||||
| South Africa Government International Bond 5.375%, due 07/24/447 | 200,000 | 183,000 | |||||||||
| Uruguay Government International Bond 4.375%, due 10/27/27 | 250,000 | 256,000 | |||||||||
4.500%, due 08/14/247 | 85,000 | 88,230 | |||||||||
| Total non-US government obligations (cost—$6,434,018) | 6,372,959 | ||||||||||
Commercial paper12—2.32% | |||||||||||
Banking-non-US—1.71% | |||||||||||
| Natixis 2.370%, due 08/10/18 | 6,310,000 | 6,310,000 | |||||||||
Banking-US—0.61% | |||||||||||
| Barclays Bank PLC 2.430%, due 08/01/18 | 1,490,000 | 1,490,000 | |||||||||
| QUALCOMM, Inc. 2.407%, due 08/15/18 | 750,000 | 749,312 | |||||||||
2,239,312 | |||||||||||
| Total commercial paper (cost—$8,549,311) | 8,549,312 | ||||||||||
52
PACE Intermediate Fixed Income Investments
Portfolio of investments—July 31, 2018
| Number of contracts | Notional amount | Value | |||||||||||||
Options purchased—0.00%† | |||||||||||||||
Call options—0.00%† | |||||||||||||||
| 90-Day Eurodollar Futures, strike @ $97.37, expires 03/18/19 (Counterparty: BOA) | 35 | EUR | 8,520,750 | $ | 4,156 | ||||||||||
| 90-Day Eurodollar Futures, strike @ $97.75, expires 06/17/19 (Counterparty: BOA) | 107 | EUR | 26,148,125 | 5,350 | |||||||||||
9,506 | |||||||||||||||
Put option—0.00%† | |||||||||||||||
| US Treasury Note 10 Year Futures, strike @ $119.00, expires 09/21/18 (Counterparty: BOA) | 5 | USD | 595,000 | 2,578 | |||||||||||
| Total options purchased (cost—$20,655) | 12,084 | ||||||||||||||
Foreign exchange options purchased—0.01% | |||||||||||||||
Call option—0.00%† | |||||||||||||||
| EUR Call/USD Put, Strike @ 1.22, expiring 08/31/18 (Counterparty: GS) | 4,880,000 | EUR | 4,880,000 | 645 | |||||||||||
Put options—0.01% | |||||||||||||||
| EUR Put/SEK Call, Strike @ 9.90, expiring 08/15/18 (Counterparty: CSI) | 3,190,000 | EUR | 3,190,000 | 11 | |||||||||||
| NZD Put/CAD Call, Strike @ 0.89, expiring 09/25/18 (Counterparty: CSI) | 5,460,000 | NZD | 5,460,000 | 49,530 | |||||||||||
49,541 | |||||||||||||||
| Total foreign exchange options purchased (cost—$65,127) | 50,186 | ||||||||||||||
Swaptions purchased—0.21% | |||||||||||||||
Call swaptions—0.06% | |||||||||||||||
| 3 Month USD LIBOR Interest Rate Swap, strike @ 2.730% expires 12/07/27 (Counterparty: BOA; pay floating rate); underlying swap terminates 12/09/27 | 1,050,000 | USD | 1,050,000 | 45,173 | |||||||||||
| 6 Month USD LIBOR Interest Rate Swap, strike @ 2.730% expires 04/16/21 (Counterparty: JPMCB; pay floating rate); underlying swap terminates 04/20/41 | 36,200,000 | JPY | 36,200,000 | 7,167 | |||||||||||
| Number of contracts | Notional amount | Value | |||||||||||||
Swaptions purchased—(continued) | |||||||||||||||
Call swaptions—(concluded) | |||||||||||||||
| 3 Month USD LIBOR Interest Rate Swap, strike @ 2.985% expires 04/29/38 (Counterparty: JPMCB; pay floating rate); underlying swap terminates 04/29/48 | 315,000 | USD | 315,000 | $ | 15,687 | ||||||||||
| 3 Month USD LIBOR Interest Rate Swap, strike @ 3.113% expires 04/28/23 (Counterparty: GS; pay floating rate); underlying swap terminates 04/28/53 | 180,000 | USD | 180,000 | 19,348 | |||||||||||
| 3 Month USD LIBOR Interest Rate Swap, strike @ 2.950% expires 01/14/20 (Counterparty: GS; pay floating rate); underlying swap terminates 01/14/21 | 21,550,000 | USD | 21,550,000 | 44,134 | |||||||||||
| 3 Month USD LIBOR Interest Rate Swap, strike @ 2.950% expires 01/23/20 (Counterparty: GS; pay floating rate); underlying swap terminates 01/23/21 | 21,550,000 | USD | 21,550,000 | 45,068 | |||||||||||
| 5 Year Constant Maturity Swap Index, strike @ 0.115% expires 01/25/19 (Counterparty: GS; pay floating rate) | 28,780,000 | USD | 28,780,000 | 5,013 | |||||||||||
| 3 Month USD LIBOR Interest Rate Swap, strike @ 2.950% expires 01/30/20 (Counterparty: GS; pay floating rate); underlying swap terminates 02/03/21 | 10,490,000 | USD | 10,490,000 | 22,174 | |||||||||||
203,764 | |||||||||||||||
53
PACE Intermediate Fixed Income Investments
Portfolio of investments—July 31, 2018
| Number of contracts | Notional amount | Value | |||||||||||||
Swaptions purchased—(continued) | |||||||||||||||
Put swaptions—0.15% | |||||||||||||||
| 3 Month USD LIBOR Interest Rate Swap, strike @ 2.950% expires 08/17/22 (Counterparty: BOA; pay floating rate); underlying swap terminates 08/19/22 | 6,350,000 | USD | 6,350,000 | $ | 312,578 | ||||||||||
| 3 Month USD LIBOR Interest Rate Swap, strike @ 2.730% expires 12/07/27 (Counterparty: BOA; pay floating rate); underlying swap terminates 12/09/27 | 1,050,000 | USD | 1,050,000 | 73,114 | |||||||||||
| 3 Month USD LIBOR Interest Rate Swap, strike @ 3.400% expires 02/14/23 (Counterparty: GS; pay floating rate); underlying swap terminates 02/16/53 | 1,370,000 | USD | 1,370,000 | 93,863 | |||||||||||
| 6 Month USD LIBOR Interest Rate Swap, strike @ 0.780% expires 04/20/21 (Counterparty: JPMCB; pay floating rate); underlying swap terminates 04/20/41 | 36,200,000 | JPY | 36,200,000 | 16,287 | |||||||||||
| 3 Month USD LIBOR Interest Rate Swap, strike @ 2.985% expires 04/29/38 (Counterparty: JPMCB; pay floating rate); underlying swap terminates 04/29/48 | 315,000 | USD | 315,000 | 15,210 | |||||||||||
| 3 Month USD LIBOR Interest Rate Swap, strike @ 3.113% expires 04/28/23 (Counterparty: GS; pay floating rate); underlying swap terminates 04/28/53 | 180,000 | USD | 180,000 | 16,648 | |||||||||||
| Number of contracts | Notional amount | Value | |||||||||||||
Swaptions purchased—(concluded) | |||||||||||||||
Put swaptions—(concluded) | |||||||||||||||
| 3 Month USD LIBOR Interest Rate Swap, strike @ 3.800% expires 06/09/21 (Counterparty: GS; pay floating rate); underlying swap terminates 06/09/51 | 1,230,000 | USD | 1,230,000 | $ | 38,033 | ||||||||||
565,733 | |||||||||||
| Total swaptions purchased (cost—$805,932) | 769,497 | ||||||||||
| Number of shares | |||||||||||
Short-term investment—2.78% | |||||||||||
Investment companies—2.78% | |||||||||||
| State Street Institutional U.S. Government Money Market Fund (cost—$10,233,247) | 10,233,247 | 10,233,247 | |||||||||
Investment of cash collateral from securities loaned—3.28% | |||||||||||
Money market fund—3.28% | |||||||||||
| State Street Navigator Securities Lending Government Money Market Portfolio (cost—$12,098,990) | 12,098,990 | 12,098,990 | |||||||||
| Total investments before investments sold short (cost—$417,703,026)—111.73% | 411,609,870 | ||||||||||
| Face amount | |||||||||||
Investments sold short—(8.25)% | |||||||||||
Federal home loan mortgage corporation certificates—(0.87)% | |||||||||||
| FHLMC TBA 3.500% $(2,914,000) (2,886,283) 5.000% | (314,000 | ) | (330,914 | ) | |||||||
| Total federal home loan mortgage corporation certificates (proceeds—$3,228,656) | (3,217,197 | ) | |||||||||
Federal national mortgage association certificates—(6.66)% | |||||||||||
| FNMA TBA 2.000% (515,000) (485,569) 2.500% (2,838,000) (2,747,095) 3.000% (1,893,410) (1,825,033) 3.500% (7,023,452) (7,001,269) 4.000% (7,232,000) (7,346,977) 4.500% (4,462,000) (4,628,729) 5.000% | (482,000 | ) | (509,226 | ) | |||||||
| Total federal national mortgage association certificates (proceeds—$24,600,128) | (24,543,898 | ) | |||||||||
54
PACE Intermediate Fixed Income Investments
Portfolio of investments—July 31, 2018
| Face amount | Value | ||||||||||
Investments sold short—(concluded) | |||||||||||
Government national mortgage association certificates—(0.72)% | |||||||||||
| GNMA TBA 3.500% (proceeds—$2,634,369) | $ | (2,627,800 | ) | $ | (2,631,906 | ) | |||||
| Total investments sold short (proceeds—$30,463,153) | (30,393,001 | ) | |||||||||
Liabilities in excess of other assets—(3.48)% | (12,822,810 | ) | |||||||||
Net assets—100.00% | $ | 368,394,059 | |||||||||
For a listing of defined portfolio acronyms, counterparty acronyms and currency abbreviations that are used throughout the Portfolio of investments as well as the tables that follow, please refer to page 273.
Foreign exchange options written
| Notional amount (000) | Number of contracts | Call options | Counterparty | Expiration date | Premiums received | Current value | Unrealized appreciation (depreciation) | ||||||||||||||||||||||||
EUR | 4,880 | 4,880,000 | EUR Call/JPY Put, strike @ JPY 134.00 | GS | 08/31/18 | $ | 14,680 | $ | (4,434 | ) | $ | 10,246 | |||||||||||||||||||
Put options | |||||||||||||||||||||||||||||||
NZD | 10,915 | 10,915,000 | NZD Put/CAD Call, strike @ CAD 0.87 | CSI | 09/25/18 | $ | 25,611 | $ | (32,541 | ) | $ | (6,930 | ) | ||||||||||||||||||
$ | 40,291 | $ | (36,975 | ) | $ | 3,316 | |||||||||||||||||||||||||
Options written
| Notional amount (000) | Number of contracts | Call options | Counterparty | Expiration date | Premiums received | Current value | Unrealized appreciation | ||||||||||||||||||||||||
USD | 26,180 | 107 | 90-Day Eurodollar Futures, strike @ 97.87 | BOA | 06/17/19 | $ | 5,187 | $ | (4,013 | ) | $ | 1,174 | |||||||||||||||||||
USD | 5,835 | 24 | Eurodollar 2 Year Mid-Curve Options, strike @ 97.25 | BOA | 03/15/19 | 9,263 | (6,450 | ) | 2,813 | ||||||||||||||||||||||
$ | 14,450 | $ | (10,463 | ) | $ | 3,987 | |||||||||||||||||||||||||
Swaptions written
| Notional amount (000) | Number of contracts | Call swaptions | Counterparty | Pay/ receive floating rate | Expiration date | Premiums received | Current value | Unrealized appreciation (depreciation) | |||||||||||||||||||||||||||
USD | 3,290 | 3,290,000 | 3 Month USD LIBOR Interest Rate Swap strike @ 2.20%, terminating 02/11/22 | GS | Receive | 02/07/20 | $ | 8,653 | $ | (4,844 | ) | $ | 3,809 | ||||||||||||||||||||||
USD | 1,030 | 1,030,000 | 3 Month USD LIBOR Interest Rate Swap strike @ 2.35%, terminating 03/31/20 | BOA | Receive | 03/27/20 | 3,863 | (2,238 | ) | 1,625 | |||||||||||||||||||||||||
USD | 32,325 | 32,325,000 | 3 Month USD LIBOR Interest Rate Swap strike @ 2.45%, terminating 01/14/21 | GS | Receive | 01/10/20 | 39,717 | (26,846 | ) | 12,871 | |||||||||||||||||||||||||
USD | 32,325 | 32,325,000 | 3 Month USD LIBOR Interest Rate Swap strike @ 2.45%, terminating 01/23/21 | GS | Receive | 01/21/20 | 41,027 | (27,748 | ) | 13,279 | |||||||||||||||||||||||||
55
PACE Intermediate Fixed Income Investments
Portfolio of investments—July 31, 2018
Swaptions written—(continued)
| Notional amount (000) | Number of contracts | Call swaptions | Counterparty | Pay/ receive floating rate | Expiration date | Premiums received | Current value | Unrealized appreciation (depreciation) | |||||||||||||||||||||||||||
USD | 15,735 | 15,735,000 | 3 Month USD LIBOR Interest Rate Swap strike @ 2.45%, terminating 02/03/21 | GS | Receive | 01/30/20 | $ | 15,207 | $ | (13,842 | ) | $ | 1,365 | ||||||||||||||||||||||
USD | 9,275 | 9,275,000 | 3 Month USD LIBOR Interest Rate Swap strike @ 2.45%, terminating 06/03/21 | JPMCB | Receive | 06/03/19 | 16,973 | (8,104 | ) | 8,869 | |||||||||||||||||||||||||
USD | 540 | 540,000 | 3 Month USD LIBOR Interest Rate Swap strike @ 2.80%, terminating 10/15/28 | GS | Receive | 10/11/18 | 2,511 | (1,144 | ) | 1,367 | |||||||||||||||||||||||||
USD | 1,070 | 1,070,000 | 3 Month USD LIBOR Interest Rate Swap strike @ 2.88%, terminating 10/11/28 | GS | Receive | 10/09/18 | 5,386 | (2,438 | ) | 2,948 | |||||||||||||||||||||||||
USD | 5,780 | 5,780,000 | 3 Month USD LIBOR Interest Rate Swap strike @ 2.87%, terminating 04/16/22 | GS | Receive | 04/14/20 | 42,194 | (28,679 | ) | 13,515 | |||||||||||||||||||||||||
USD | 22,525 | 22,525,000 | 3 Month USD LIBOR Interest Rate Swap strike @ 2.90%, terminating 06/02/22 | GS | Receive | 05/29/20 | 165,559 | (123,221 | ) | 42,338 | |||||||||||||||||||||||||
USD | 5,690 | 5,690,000 | 3 Month USD LIBOR Interest Rate Swap strike @ 2.94%, terminating 04/20/20 | BOA | Receive | 04/17/20 | 39,545 | (31,064 | ) | 8,481 | |||||||||||||||||||||||||
USD | 11,400 | 11,400,000 | 3 Month USD LIBOR Interest Rate Swap strike @ 3.05%, terminating 06/10/21 | GS | Receive | 06/08/20 | 34,842 | (35,152 | ) | (310 | ) | ||||||||||||||||||||||||
USD | 17,970 | 17,970,000 | 3 Month USD LIBOR Interest Rate Swap strike @ 3.06%, terminating 05/11/22 | GS | Receive | 05/07/20 | 120,174 | (117,398 | ) | 2,776 | |||||||||||||||||||||||||
USD | 1,910 | 1,910,000 | 3 Month USD LIBOR Interest Rate Swap strike @ 3.08%, terminating 05/18/22 | GS | Receive | 05/14/20 | 12,871 | (12,959 | ) | (88 | ) | ||||||||||||||||||||||||
$ | 548,522 | $ | (435,677 | ) | $ | 112,845 | |||||||||||||||||||||||||||||
Put swaptions | |||||||||||||||||||||||||||||||||||
USD | 5,780 | 5,780,000 | 3 Month USD LIBOR Interest Rate Swap strike @ 2.88%, terminating 04/16/22 | GS | Pay | 04/14/20 | $ | 42,194 | $ | (49,206 | ) | $ | (7,012 | ) | |||||||||||||||||||||
USD | 1,950 | 1,950,000 | 3 Month USD LIBOR Interest Rate Swap strike @ 2.90%, terminating 04/18/19 | BOA | Pay | 04/16/19 | 50,919 | (51,703 | ) | (784 | ) | ||||||||||||||||||||||||
USD | 22,525 | 22,525,000 | 3 Month USD LIBOR Interest Rate Swap strike @ 2.90%, terminating 06/02/22 | GS | Pay | 05/29/20 | 165,559 | (189,798 | ) | (24,239 | ) | ||||||||||||||||||||||||
USD | 5,690 | 5,690,000 | 3 Month USD LIBOR Interest Rate Swap strike @ 2.94%, terminating 04/21/20 | BOA | Pay | 04/17/20 | 39,545 | (44,141 | ) | (4,596 | ) | ||||||||||||||||||||||||
USD | 11,400 | 11,400,000 | 3 Month USD LIBOR Interest Rate Swap strike @ 3.05%, terminating 06/10/21 | GS | Pay | 06/08/20 | 33,589 | (38,730 | ) | (5,141 | ) | ||||||||||||||||||||||||
USD | 17,970 | 17,970,000 | 3 Month USD LIBOR Interest Rate Swap strike @ 3.06%, terminating 05/11/22 | GS | Pay | 05/07/20 | 120,174 | (120,214 | ) | (40 | ) | ||||||||||||||||||||||||
USD | 1,910 | 1,910,000 | 3 Month USD LIBOR Interest Rate Swap strike @ 3.08%, terminating 05/18/22 | GS | Pay | 05/14/20 | 12,811 | (12,433 | ) | 378 | |||||||||||||||||||||||||
USD | 540 | 540,000 | 3 Month USD LIBOR Interest Rate Swap strike @ 3.10%, terminating 10/15/28 | GS | Pay | 10/11/18 | 3,240 | (3,461 | ) | (221 | ) | ||||||||||||||||||||||||
USD | 1,070 | 1,070,000 | 3 Month USD LIBOR Interest Rate Swap strike @ 3.12%, terminating 10/11/28 | GS | Pay | 10/09/18 | 5,671 | (5,889 | ) | (218 | ) | ||||||||||||||||||||||||
USD | 5,670 | 5,670,000 | 3 Month USD LIBOR Interest Rate Swap strike @ 3.15%, terminating 03/25/21 | GS | Pay | 03/21/19 | 12,896 | (13,972 | ) | (1,076 | ) | ||||||||||||||||||||||||
USD | 3,000 | 3,000,000 | 3 Month USD LIBOR Interest Rate Swap strike @ 3.15%, terminating 05/07/22 | GS | Pay | 05/05/20 | 16,575 | (17,437 | ) | (862 | ) | ||||||||||||||||||||||||
USD | 4,430 | 4,430,000 | 3 Month USD LIBOR Interest Rate Swap strike @ 3.15%, terminating 05/10/19 | BOA | Pay | 05/08/19 | 92,066 | (70,244 | ) | 21,822 | |||||||||||||||||||||||||
USD | 1,922 | 1,922,000 | 3 Month USD LIBOR Interest Rate Swap strike @ 3.15%, terminating 07/15/29 | GS | Pay | 07/11/19 | 32,818 | (35,550 | ) | (2,732 | ) | ||||||||||||||||||||||||
56
PACE Intermediate Fixed Income Investments
Portfolio of investments—July 31, 2018
Swaptions written—(concluded)
| Notional amount (000) | Number of contracts | Put swaptions | Counterparty | Pay/ receive floating rate | Expiration date | Premiums received | Current value | Unrealized appreciation (depreciation) | |||||||||||||||||||||||||||
USD | 3,290 | 3,290,000 | 3 Month USD LIBOR Interest Rate Swap strike @ 3.20%, terminating 02/11/22 | GS | Pay | 02/07/20 | $ | 13,110 | $ | (15,927 | ) | $ | (2,817 | ) | |||||||||||||||||||||
USD | 2,150 | 2,150,000 | 3 Month USD LIBOR Interest Rate Swap strike @ 3.25%, terminating 03/13/19 | BOA | Pay | 03/11/19 | 4,545 | (3,451 | ) | 1,094 | |||||||||||||||||||||||||
USD | 9,275 | 9,275,000 | 3 Month USD LIBOR Interest Rate Swap strike @ 3.25%, terminating 06/03/21 | JPMCB | Pay | 06/03/19 | 16,973 | (22,530 | ) | (5,557 | ) | ||||||||||||||||||||||||
USD | 1,030 | 1,030,000 | 3 Month USD LIBOR Interest Rate Swap strike @ 3.35%, terminating 03/31/20 | BOA | Pay | 03/27/20 | 3,862 | (4,056 | ) | (194 | ) | ||||||||||||||||||||||||
USD | 4,240 | 4,240,000 | 3 Month USD LIBOR Interest Rate Swap strike @ 3.35%, terminating 06/02/22 | GS | Pay | 05/29/20 | 15,423 | (18,227 | ) | (2,804 | ) | ||||||||||||||||||||||||
USD | 4,210 | 4,210,000 | 3 Month USD LIBOR Interest Rate Swap strike @ 3.45%, terminating 06/10/22 | GS | Pay | 06/08/20 | 17,429 | (15,409 | ) | 2,020 | |||||||||||||||||||||||||
USD | 2,660 | 2,660,000 | 3 Month USD LIBOR Interest Rate Swap strike @ 3.50%, terminating 06/17/22 | GS | Pay | 06/15/20 | 9,908 | (9,008 | ) | 900 | |||||||||||||||||||||||||
USD | 2,600 | 2,600,000 | 3 Month USD LIBOR Interest Rate Swap strike @ 3.87%, terminating 06/09/31 | GS | Pay | 06/07/21 | 50,575 | (41,078 | ) | 9,497 | |||||||||||||||||||||||||
EUR | 2,645 | 2,645,000 | 6 Month EURIBOR Interest Rate Swap strike @ 0.40%, terminating 07/10/21 | JPMCB | Pay | 07/10/19 | 10,241 | (1,836 | ) | 8,405 | |||||||||||||||||||||||||
EUR | 1,144 | 1,144,000 | 6 Month EURIBOR Interest Rate Swap strike @ 0.60%, terminating 06/27/24 | JPMCB | Pay | 06/27/19 | 8,701 | (9,606 | ) | (905 | ) | ||||||||||||||||||||||||
EUR | 3,520 | 3,520,000 | 6 Month EURIBOR Interest Rate Swap strike @ 1.65%, terminating 02/20/29 | JPMCB | Pay | 02/20/19 | 43,671 | (2,911 | ) | 40,760 | |||||||||||||||||||||||||
$ | 822,495 | $ | (796,817 | ) | $ | 25,678 | |||||||||||||||||||||||||||||
$ | 1,371,017 | $ | (1,232,494 | ) | $ | 138,523 | |||||||||||||||||||||||||||||
Futures contracts
| Number of contracts | Currency | Expiration date | Current notional amount | Value | Unrealized appreciation (depreciation) | ||||||||||||||||||||||
US Treasury futures buy contracts: | |||||||||||||||||||||||||||
23 | USD | US Long Bond Futures | September 2018 | $ | 3,265,332 | $ | 3,288,281 | $ | 22,949 | ||||||||||||||||||
108 | USD | US Treasury Note 2 Year Futures | September 2018 | 22,852,914 | 22,828,500 | (24,414 | ) | ||||||||||||||||||||
74 | USD | US Treasury Note 5 Year Futures | September 2018 | 8,451,131 | 8,371,250 | (79,881 | ) | ||||||||||||||||||||
388 | USD | US Treasury Note 10 Year Futures | September 2018 | 46,395,584 | 46,335,688 | (59,896 | ) | ||||||||||||||||||||
Interest rate futures buy contracts: | |||||||||||||||||||||||||||
10 | USD | 90-Day Eurodollar Futures | September 2020 | 2,425,989 | 2,423,375 | (2,614 | ) | ||||||||||||||||||||
$ | 83,390,950 | $ | 83,247,094 | $ | (143,856 | ) | |||||||||||||||||||||
US Treasury futures sell contracts: | |||||||||||||||||||||||||||
2 | USD | Ultra Long US Treasury Bond Futures | September 2018 | $ | (312,559 | ) | $ | (313,812 | ) | $ | (1,253 | ) | |||||||||||||||
58 | USD | US Ultra Treasury Note 10 Year Futures | September 2018 | (7,428,999 | ) | (7,372,344 | ) | 56,655 | |||||||||||||||||||
Interest rate futures sell contracts: | |||||||||||||||||||||||||||
35 | EUR | German Euro BOBL Futures | September 2018 | (5,389,270 | ) | (5,386,435 | ) | 2,835 | |||||||||||||||||||
24 | EUR | German Euro Bund Futures | September 2018 | (4,536,100 | ) | (4,534,646 | ) | 1,454 | |||||||||||||||||||
7 | EUR | Mid-Term Euro-OAT Futures | September 2018 | (1,252,531 | ) | (1,258,349 | ) | (5,818 | ) | ||||||||||||||||||
14 | GBP | United Kingdom Long Gilt Bond Futures | September 2018 | (2,264,003 | ) | (2,254,330 | ) | 9,673 | |||||||||||||||||||
10 | USD | 90-Day Eurodollar Futures | September 2021 | (2,426,708 | ) | (2,424,000 | ) | 2,708 | |||||||||||||||||||
$ | (23,610,170 | ) | $ | (23,543,916 | ) | $ | 66,254 | ||||||||||||||||||||
$ | (77,602 | ) | |||||||||||||||||||||||||
57
PACE Intermediate Fixed Income Investments
Portfolio of investments—July 31, 2018
Forward foreign currency contracts
Counterparty | Sell | Purchase | Settlement date | Unrealized appreciation (depreciation) | |||||||||||||||
ANZ | AUD | 1,240,000 | CAD | 1,217,188 | 09/20/18 | $ | 15,026 | ||||||||||||
BOA | EUR | 1,645,000 | USD | 1,977,066 | 08/15/18 | 51,685 | |||||||||||||
HSBC | CHF | 470,000 | NOK | 3,855,470 | 09/20/18 | (3,001 | ) | ||||||||||||
HSBC | NZD | 1,370,000 | CAD | 1,252,978 | 09/20/18 | 30,265 | |||||||||||||
HSBC | EUR | 770,000 | NOK | 7,306,541 | 09/20/18 | (6,134 | ) | ||||||||||||
JPMCB | EUR | 780,000 | SEK | 7,957,917 | 09/20/18 | (7,008 | ) | ||||||||||||
NTC | CHF | 920,000 | JPY | 102,289,004 | 09/20/18 | (15,103 | ) | ||||||||||||
NTC | USD | 930,000 | JPY | 102,199,467 | 09/20/18 | (13,001 | ) | ||||||||||||
RBS | CHF | 450,113 | CAD | 600,000 | 09/20/18 | 5,194 | |||||||||||||
$ | 57,923 | ||||||||||||||||||
Centrally cleared interest rate swap agreements
| Notional amount (000) | Maturity date | Payment frequency | Payments made by the Portfolio15 | Payments received by the Portfolio15 | Value | Unrealized appreciation (depreciation) | |||||||||||||||||||||
USD | 270 | 11/30/27 | Quarterly | 2.344 | % | 3 Month USD LIBOR | $ | 15,717 | $ | 15,712 | |||||||||||||||||
USD | 21,150 | 01/26/22 | Quarterly | 2.716 | 3 Month USD LIBOR | 68,777 | 68,488 | ||||||||||||||||||||
USD | 20,750 | 01/26/21 | Semi-Annual | 3 Month USD LIBOR | 2.660 | % | (90,461 | ) | (90,731 | ) | |||||||||||||||||
USD | 2,250 | 02/05/28 | Quarterly | 2.798 | 3 Month USD LIBOR | 30,275 | 30,231 | ||||||||||||||||||||
USD | 430 | 02/20/53 | Semi-Annual | 3 Month USD LIBOR | 3.080 | (324 | ) | (336 | ) | ||||||||||||||||||
USD | 1,660 | 02/18/22 | Quarterly | 2.964 | 3 Month USD LIBOR | 4,044 | 4,019 | ||||||||||||||||||||
USD | 1,590 | 02/24/22 | Quarterly | 2.962 | 3 Month USD LIBOR | 3,918 | 3,894 | ||||||||||||||||||||
USD | 6,260 | 09/16/20 | Quarterly | 2.870 | 3 Month USD LIBOR | 14,492 | 14,409 | ||||||||||||||||||||
USD | 3,220 | 03/24/22 | Quarterly | 2.981 | 3 Month USD LIBOR | 6,401 | 6,352 | ||||||||||||||||||||
USD | 1,290 | 04/07/22 | Quarterly | 2.851 | 3 Month USD LIBOR | 5,636 | 5,616 | ||||||||||||||||||||
USD | 1,280 | 04/07/22 | Quarterly | 2.898 | 3 Month USD LIBOR | 4,477 | 4,458 | ||||||||||||||||||||
EUR | 1,110 | 02/20/29 | Semi-Annual | 1.370 | 6 Month EURIBOR | (38,319 | ) | (38,350 | ) | ||||||||||||||||||
USD | 445 | 03/15/23 | Semi-Annual | 3 Month USD LIBOR | 2.796 | (342 | ) | (349 | ) | ||||||||||||||||||
USD | 6,110 | 09/17/19 | Semi-Annual | 3 Month USD LIBOR | 2.593 | (10,294 | ) | (10,366 | ) | ||||||||||||||||||
USD | 2,250 | 04/03/23 | Semi-Annual | 3 Month USD LIBOR | 2.706 | (11,986 | ) | (12,024 | ) | ||||||||||||||||||
EUR | 130 | 05/04/28 | Annual | 6 Month EURIBOR | 1.008 | 1,647 | 1,643 | ||||||||||||||||||||
USD | 2,840 | 05/16/23 | Semi-Annual | 3 Month USD LIBOR | 2.945 | (2,223 | ) | (2,271 | ) | ||||||||||||||||||
EUR | 180 | 05/31/28 | Annual | 6 Month EURIBOR | 0.868 | (909 | ) | (913 | ) | ||||||||||||||||||
USD | 1,300 | 06/02/22 | Quarterly | 2.870 | 3 Month USD LIBOR | 5,065 | 5,044 | ||||||||||||||||||||
USD | 130 | 05/11/22 | Quarterly | 3.047 | 3 Month USD LIBOR | 88 | 86 | ||||||||||||||||||||
USD | 1,450 | 11/15/43 | Quarterly | 3.200 | 3 Month USD LIBOR | (24,890 | ) | (24,924 | ) | ||||||||||||||||||
USD | 6,190 | 06/06/20 | Semi-Annual | 3 Month USD LIBOR | 2.000 | (100,165 | ) | (100,260 | ) | ||||||||||||||||||
USD | 580 | 11/15/43 | Quarterly | 3.126 | 3 Month USD LIBOR | (2,257 | ) | (2,271 | ) | ||||||||||||||||||
USD | 630 | 06/16/22 | Quarterly | 3.081 | 3 Month USD LIBOR | (15 | ) | (25 | ) | ||||||||||||||||||
USD | 640 | 06/16/22 | Quarterly | 3.082 | 3 Month USD LIBOR | (27 | ) | (37 | ) | ||||||||||||||||||
58
PACE Intermediate Fixed Income Investments
Portfolio of investments—July 31, 2018
Centrally cleared interest rate swap agreements—(concluded)
| Notional amount (000) | Maturity date | Payment frequency | Payments made by the Portfolio15 | Payments received by the Portfolio15 | Value | Unrealized appreciation (depreciation) | |||||||||||||||||||||
USD | 640 | 06/23/22 | Quarterly | 3.049 | % | 3 Month USD LIBOR | $ | 354 | $ | 344 | |||||||||||||||||
USD | 630 | 06/23/22 | Quarterly | 3.042 | 3 Month USD LIBOR | 435 | 425 | ||||||||||||||||||||
USD | 770 | 07/13/28 | Quarterly | 2.955 | 3 Month USD LIBOR | 6,880 | 6,864 | ||||||||||||||||||||
USD | 270 | 07/18/28 | Quarterly | 2.942 | 3 Month USD LIBOR | 2,772 | 2,766 | ||||||||||||||||||||
USD | 273 | 07/18/28 | Quarterly | 2.962 | 3 Month USD LIBOR | 2,312 | 2,306 | ||||||||||||||||||||
USD | 6,640 | 07/19/24 | Quarterly | 2.920 | 3 Month USD LIBOR | 16,195 | 16,085 | ||||||||||||||||||||
USD | 270 | 07/23/28 | Quarterly | 2.987 | 3 Month USD LIBOR | 1,569 | 1,563 | ||||||||||||||||||||
USD | 270 | 07/25/28 | Quarterly | 3.051 | 3 Month USD LIBOR | 98 | 92 | ||||||||||||||||||||
USD | 1,430 | 02/15/28 | Quarterly | 3.034 | 3 Month USD LIBOR | 3,864 | 3,835 | ||||||||||||||||||||
USD | 1,980 | 07/25/21 | Quarterly | 3.036 | 3 Month USD LIBOR | 2,187 | 2,154 | ||||||||||||||||||||
USD | 1,420 | 02/15/28 | Quarterly | 3.053 | 3 Month USD LIBOR | 1,702 | 1,673 | ||||||||||||||||||||
USD | 1,420 | 02/15/28 | Quarterly | 3.059 | 3 Month USD LIBOR | 1,002 | 973 | ||||||||||||||||||||
USD | 2,970 | 11/30/22 | Annual | 12 Month Federal Funds Rate | 2.690 | % | 2,625 | 2,571 | |||||||||||||||||||
USD | 3,270 | 08/02/23 | Quarterly | 2.985 | 3 Month USD LIBOR | 60 | — | ||||||||||||||||||||
USD | 2,995 | 11/30/22 | Semi-Annual | 3 Month USD LIBOR | 2.917 | (10,644 | ) | (10,698 | ) | ||||||||||||||||||
USD | 270 | 07/17/28 | Semi-Annual | 3 Month USD LIBOR | 2.929 | (3,056 | ) | (3,062 | ) | ||||||||||||||||||
USD | 1,230 | 07/18/21 | Semi-Annual | 3 Month USD LIBOR | 2.997 | (2,235 | ) | (2,255 | ) | ||||||||||||||||||
USD | 3,160 | 07/19/22 | Semi-Annual | 3 Month USD LIBOR | 2.965 | (6,465 | ) | (6,517 | ) | ||||||||||||||||||
USD | 3,500 | 07/19/26 | Semi-Annual | 3 Month USD LIBOR | 2.978 | (8,103 | ) | (8,162 | ) | ||||||||||||||||||
USD | 270 | 07/25/28 | Quarterly | 3.051 | 3 Month USD LIBOR | (691 | ) | (697 | ) | ||||||||||||||||||
USD | 580 | 11/15/43 | Semi-Annual | 3 Month USD LIBOR | 3.069 | (3,800 | ) | (3,815 | ) | ||||||||||||||||||
EUR | 2,330 | 08/15/27 | Annual | 6 Month EURIBOR | 0.824 | (8,902 | ) | (8,963 | ) | ||||||||||||||||||
USD | 580 | 11/15/43 | Semi-Annual | 3 Month USD LIBOR | 3.090 | (1,595 | ) | (1,609 | ) | ||||||||||||||||||
USD | 2,500 | 07/28/22 | Quarterly | 3.086 | 3 Month USD LIBOR | (478 | ) | (520 | ) | ||||||||||||||||||
USD | 1,230 | 07/30/21 | Quarterly | 3.096 | 3 Month USD LIBOR | (34 | ) | (55 | ) | ||||||||||||||||||
USD | 580 | 11/15/43 | Quarterly | 3.118 | 3 Month USD LIBOR | (1,400 | ) | (1,415 | ) | ||||||||||||||||||
USD | 390 | 08/01/21 | Quarterly | 3.103 | 3 Month USD LIBOR | (57 | ) | (63 | ) | ||||||||||||||||||
USD | 220 | 08/01/28 | Quarterly | 3.070 | 3 Month USD LIBOR | (160 | ) | (164 | ) | ||||||||||||||||||
$ | (127,240 | ) | $ | (129,249 | ) | ||||||||||||||||||||||
Credit default swap agreements on corporate issues—sell protection16
Counterparty | Referenced obligations | Notional amount (000) | Maturity date | Payment frequency | Payments received by the Portfolio15 | Upfront payments received (made) | Value | Unrealized appreciation (depreciation) | |||||||||||||||||||||||||||
JPMCB | Berkshire Hathaway, Inc., bond, 2.75%, due 03/15/23 | USD | 130,000 | 12/20/22 | Quarterly | 1.000 | % | $ | (2,638 | ) | $ | 3,082 | $ | 444 | |||||||||||||||||||||
JPMCB | Bristol-Myers Squibb Co., bond, 6.80%, due 11/15/26 | USD | 25,000 | 12/20/22 | Quarterly | 1.000 | (828 | ) | 781 | (47 | ) | ||||||||||||||||||||||||
BOA | General Electric Co., bond, 6.18%, due 10/09/22 | USD | 50,000 | 12/20/22 | Quarterly | 1.000 | (1,184 | ) | 764 | (420 | ) | ||||||||||||||||||||||||
BOA | Honeywell International, Inc., bond, 2.70%, due 03/15/36 | USD | 40,000 | 12/20/22 | Quarterly | 1.000 | (1,204 | ) | 1,235 | 31 | |||||||||||||||||||||||||
JPMCB | Johnson & Johnson, bond, 1.65%, due 03/01/21 | USD | 65,000 | 12/20/22 | Quarterly | 1.000 | (2,323 | ) | 2,427 | 104 | |||||||||||||||||||||||||
JPMCB | Pfizer, Inc., bond, 2.20%, due 12/15/21 | USD | 90,000 | 12/20/22 | Quarterly | 1.000 | (3,021 | ) | 2,887 | (134 | ) | ||||||||||||||||||||||||
JPMCB | The Procter & Gamble Co., bond, 1.60%, due 11/15/18 | USD | 90,000 | 12/20/22 | Quarterly | 1.000 | (3,021 | ) | 2,812 | (209 | ) | ||||||||||||||||||||||||
JPMCB | The Sherwin-Williams Co., bond, 7.38%, due 02/01/27 | USD | 40,000 | 12/20/22 | Quarterly | 1.000 | (694 | ) | 633 | (61 | ) | ||||||||||||||||||||||||
$ | (14,913 | ) | $ | 14,621 | $ | (292 | ) | ||||||||||||||||||||||||||||
59
PACE Intermediate Fixed Income Investments
Portfolio of investments—July 31, 2018
Fair valuation summary
The following is a summary of the fair valuations according to the inputs used as of July 31, 2018 in valuing the Portfolio's investments. In the event a Portfolio holds investments for which fair value is measured using the NAV per share practical expedient (or its equivalent), a separate column will be added to the fair value hierarchy table; this is intended to permit reconciliation to the amounts presented in the Portfolio of investments.
| Assets Description | Unadjusted quoted prices in active markets for identical investments (Level 1) | Other significant observable inputs (Level 2) | Unobservable inputs (Level 3) | Total | |||||||||||||||
US government obligations | $ | — | $ | 45,324,346 | $ | — | $ | 45,324,346 | |||||||||||
Federal home loan bank certificate | — | 716,661 | — | 716,661 | |||||||||||||||
Federal home loan mortgage corporation certificates | — | 25,379,875 | — | 25,379,875 | |||||||||||||||
Federal national mortgage association certificates | — | 64,880,443 | — | 64,880,443 | |||||||||||||||
Government national mortgage association certificates | — | 33,107,664 | — | 33,107,664 | |||||||||||||||
Collateralized mortgage obligations | — | 23,044,292 | — | 23,044,292 | |||||||||||||||
Asset-backed securities | — | 22,226,371 | — | 22,226,371 | |||||||||||||||
Corporate notes | — | 154,835,943 | 4,008,000 | 158,843,943 | |||||||||||||||
Non-US government obligations | — | 6,372,959 | — | 6,372,959 | |||||||||||||||
Commercial paper | — | 8,549,312 | — | 8,549,312 | |||||||||||||||
Options purchased | 12,084 | — | — | 12,084 | |||||||||||||||
Foreign exchange options purchased | — | 50,186 | — | 50,186 | |||||||||||||||
Swaptions purchased | — | 769,497 | — | 769,497 | |||||||||||||||
Short-term investment | — | 10,233,247 | — | 10,233,247 | |||||||||||||||
Investment of cash collateral from securities loaned | — | 12,098,990 | — | 12,098,990 | |||||||||||||||
Futures contracts | 96,274 | — | — | 96,274 | |||||||||||||||
Forward foreign currency contracts | — | 102,170 | — | 102,170 | |||||||||||||||
Swap agreements | — | 217,213 | — | 217,213 | |||||||||||||||
Total | $ | 108,358 | $ | 407,909,169 | $ | 4,008,000 | $ | 412,025,527 | |||||||||||
Liabilities | |||||||||||||||||||
Investments sold short | $ | — | $ | (30,393,001 | ) | $ | — | $ | (30,393,001 | ) | |||||||||
Foreign exchange options written | — | (36,975 | ) | — | (36,975 | ) | |||||||||||||
Options written | (10,463 | ) | — | — | (10,463 | ) | |||||||||||||
Swaptions written | — | (1,232,494 | ) | — | (1,232,494 | ) | |||||||||||||
Futures contracts | (173,876 | ) | — | — | (173,876 | ) | |||||||||||||
Forward foreign currency contracts | — | (44,247 | ) | — | (44,247 | ) | |||||||||||||
Swap agreements | — | (329,832 | ) | — | (329,832 | ) | |||||||||||||
Total | $ | (184,339 | ) | $ | (32,036,549 | ) | $ | — | $ | (32,220,888 | ) | ||||||||
At July 31, 2018, there were no transfers between Level 1 and Level 2.
60
PACE Intermediate Fixed Income Investments
Portfolio of investments—July 31, 2018
Level 3 rollforward disclosure
The following is a rollforward of the Portfolio's investments that was valued using unobservable inputs for the year ended July 31, 2018:
| Collateralized mortgage obligations | Total | ||||||||||
Beginning balance | $ | 355,249 | $ | 355,249 | |||||||
Purchases | 4,000,000 | 4,000,000 | |||||||||
Sales | (344,408 | ) | (344,408 | ) | |||||||
Accrued discounts/(premiums) | (179 | ) | (179 | ) | |||||||
Total realized gain/(loss) | (10,662 | ) | (10,662 | ) | |||||||
Net change in unrealized appreciation/depreciation | 8,000 | 8,000 | |||||||||
Transfers into Level 3 | — | — | |||||||||
Transfers out of Level 3 | — | — | |||||||||
Ending balance | $ | 4,008,000 | $ | 4,008,000 | |||||||
The change in net unrealized appreciation/depreciation relating to the Level 3 investments held at July 31, 2018, was $8,000.
Portfolio footnotes
† Amount represents less than 0.005%
1 Security, or portion thereof, pledged as collateral for investments sold short, written options, futures and/or swap agreements.
2 Variable or floating rate security. The interest rate shown is the rate in effect as of period end and changes periodically.
3 Security exempt from registration pursuant to Rule 144A under the Securities Act of 1933. These securities are considered liquid, unless noted otherwise, and may be resold in transactions exempt from registration, normally to qualified institutional buyers. Securities exempt from registration pursuant to Rule 144A, in the amount of $60,400,711, represented 16.40% of the Fund's net assets at period end.
4 Illiquid investment at period end. Illiquid assets, in the amount of $5,961,469, represented 1.62% of the Fund's net assets at period end.
5 Variable or floating rate security for which the interest rate adjusts periodically based on changes in current interest rates and prepayments on the underlying pool of assets. Rate shown is the rate in effect as of period end.
6 Payment-in-kind security for which interest may be paid in cash or additional principal, at the discretion of the issuer.
7 Security, or portion thereof, was on loan at the period end.
8 Security was purchased pursuant to Regulation S under the Securities Act of 1933, which exempts from registration securities offered and sold outside of the United States. Such a security cannot be sold in the United States without either an effective registration statement filed pursuant to the Securities Act of 1933, or pursuant to an exemption from registration.
9 Perpetual investment. Date shown reflects the next call date.
10 Step bond—coupon rate increases in increments to maturity. The rate disclosed is the rate at the period end; the maturity date disclosed is the ultimate maturity date.
11 Security purchased on a when-issued basis. When-issued refers to a transaction made conditionally because a security, although authorized, has not yet been issued.
12 Rate shown is the discount rate at the date of purchase unless otherwise noted.
13 Security is being fair valued by a valuation committee under the direction of the board of trustees.
14 Significant unobservable inputs were used in the valuation of this security; i.e. a Level 3 security.
15 Payments made or received are based on the notional amount.
16 If the Fund is a seller of protection and a credit event occurs, as defined under the terms of that particular swap agreement, the Fund will either (i) pay to the buyer of protection an amount equal to the notional amount of the swap and take delivery of the referenced obligation or underlying securities comprising the referenced obligation or (ii) pay a net settlement amount in the form of cash or securities equal to the notional amount of the swap less the recovery value of the referenced obligation
See accompanying notes to financial statements.
61
PACE Strategic Fixed Income Investments
Performance (unaudited)
For the 12 months ended July 31, 2018, the Portfolio's Class P shares returned -0.71% before the deduction of the maximum PACE Select program fee.1 In comparison, the Bloomberg Barclays US Government/Credit Index (the "benchmark") returned -0.97% and the Lipper Core Plus Bond Funds category posted a median return of -0.74%. (Returns for all share classes over various time periods are shown in the "Performance at a glance" table on page 64. Please note that the returns shown do not reflect the deduction of taxes that a shareholder would pay on Portfolio distributions or the redemption of Portfolio shares.) For a detailed commentary on the market environment in general during the reporting period, please refer to page 3.
Advisor's comments (unaudited)2
The Portfolio outperformed its benchmark during the reporting period. This was driven by an underexposure to short-term yields, as they rose the most during the period. Non-US developed market interest rate strategies added to performance, including an overall short position to UK interest rates, as yields in these regions rose during the period. Tactical exposure to core European interest rates was also beneficial for results.
Overall, spread sector strategies added to performance. An underweight to investment grade credit was negative for returns as the sector outperformed like-duration Treasuries. This was more than offset by allocations to high yield corporate bonds, non-agency mortgages and emerging market debt. Additionally, an allocation to agency mortgage-backed securities added to returns as the sector outperformed like-duration Treasuries. Lastly, currency strategies detracted from performance, including a long US dollar bias versus a basket of Asian emerging market currencies and select exposure to the Swedish krona.
Overall, derivative usage was positive during the period. The Portfolio's short exposure to US swap rates added to returns, as they underperformed Treasury rates. We used interest rate swaps to adjust interest rate and yield curve exposures, as well as to substitute for physical securities. The use of credit default swaps to manage credit exposure in lieu of the direct buying or selling of physical securities modestly added to performance. During the period they benefited from lower transaction costs versus cash bond equivalents. Options and options on swaps were modestly used to manage interest rate exposure and volatility. The use of options and swaptions was neutral for performance. Overall, the use of currency options was positive for performance as these securities generated positive income, whereas the use of currency forwards detracted from returns. Currency options and forwards were used
1 Class P shares held through the PACE Select Advisors Program are subject to a maximum Program fee of 2.50%, which, if included, would have reduced performance. Class P shares held through other advisory programs also may be subject to a program fee, which, if included, would have reduced performance.
2 All Sub-Advisors discuss performance on a gross-of-fees basis—meaning that no fees or expenses are reflected in their sleeves'/sleeve's performance. Alternately, Portfolio performance is shown net of fees, which does factor in fees and expenses associated with the Portfolio.
PACE Select Advisors Trust – PACE Strategic Fixed Income Investments
Investment Manager:
UBS Asset Management (Americas) Inc. ("UBS AM")
Investment Subadvisor:
Pacific Investment Management Company LLC ("PIMCO");
Neuberger Berman Investment Advisers LLC ("Neuberger Berman")
Portfolio Management Team:
UBS AM: Mabel Lung, CFA, Gina Toth, CFA and Fred Lee, CFA
PIMCO: Scott Mather;
Neuberger Berman: Thanos Bardas, David M. Brown, Andrew A. Johnson, Thomas J. Marthaler, Bradley C. Tank
Objective:
Total return consisting of income and capital appreciation
Investment process:
The main strategies of the subadvisors include:
• A strategy that focuses on those areas of the bond market that the subadvisor considers undervalued.
• An "opportunistic fixed income" strategy that employs a consistently applied, risk managed approach to portfolio management that leverages the subadvisor's proprietary fundamental research capabilities, decision making frameworks and quantitative risk management tools.
62
PACE Strategic Fixed Income Investments
Advisor's comments (unaudited) – concluded
to gain exposure to foreign currency markets and generate income in expected currency scenarios. The use of government futures to adjust interest rate exposures and replicate government bond positions detracted from performance.
Special considerations
The Portfolio may be appropriate for long-term investors seeking total return consisting of income and capital appreciation and who are able to withstand short-term fluctuations in the fixed income markets in return for potentially higher returns over the long term. The value of the Portfolio changes every day and can be affected by changes in interest rates, general market conditions, and other political, social and economic developments, as well as specific matters relating to the companies in whose securities the Portfolio invests. In addition, investments in foreign bonds involve special risks. It is important to note that an investment in the Portfolio is only one component of a balanced investment plan.
63
PACE Strategic Fixed Income Investments
Performance at a glance (unaudited)
Average annual total returns for periods ended 07/31/18 | 1 year | 5 years | 10 years | ||||||||||||
Before deducting maximum sales charge | |||||||||||||||
Class A1 | (0.89 | )% | 2.45 | % | 5.02 | % | |||||||||
Class C2 | (1.43 | ) | 1.95 | 4.52 | |||||||||||
Class Y3 | (0.71 | ) | 2.67 | 5.28 | |||||||||||
Class P4 | (0.71 | ) | 2.70 | 5.28 | |||||||||||
After deducting maximum sales charge | |||||||||||||||
Class A1 | (4.61 | ) | 1.67 | 4.62 | |||||||||||
Class C2 | (2.15 | ) | 1.95 | 4.52 | |||||||||||
Bloomberg Barclays US Government/Credit Index5 | (0.97 | ) | 2.26 | 3.78 | |||||||||||
Lipper Core Plus Bond Funds median | (0.74 | ) | 2.49 | 4.60 | |||||||||||
Most recent calendar quarter-end returns (unaudited)
Average annual total returns for periods ended 06/30/18 | 1 year | 5 years | 10 years | ||||||||||||
Before deducting maximum sales charge | |||||||||||||||
Class A1 | (0.75 | )% | 2.28 | % | 4.99 | % | |||||||||
Class C2 | (1.25 | ) | 1.79 | 4.48 | |||||||||||
Class Y3 | (0.51 | ) | 2.50 | 5.25 | |||||||||||
Class P4 | (0.50 | ) | 2.54 | 5.25 | |||||||||||
After deducting maximum sales charge | |||||||||||||||
Class A1 | (4.50 | ) | 1.51 | 4.59 | |||||||||||
Class C2 | (1.98 | ) | 1.79 | 4.48 | |||||||||||
The annualized gross and net expense ratios, respectively, for each class of shares as in the November 28, 2017 prospectuses, supplemented from time to time, were as follows: Class A—1.12% and 1.06%; Class C—1.62% and 1.56%; Class Y—1.03% and 0.81%; and Class P—0.90% and 0.81%. Net expenses reflect fee waivers and/or expense reimbursements, if any, pursuant to an agreement that is in effect to cap the expenses. The Portfolio and UBS Asset Management (Americas) Inc. ("UBS AM") have entered into a written fee waiver/expense reimbursement agreement pursuant to which UBS AM is contractually obligated to waive its management fees and/or reimburse expenses so that the Portfolio's ordinary total operating expenses of each class through November 30, 2018 (excluding dividend expense, borrowing costs, and interest expense relating to short sales, and expenses attributable to investment in other investment companies, interest, taxes, brokerage commissions and extraordinary expenses) would not exceed Class A—0.96%; Class C—1.46%; Class Y—0.71%; and Class P—0.71%. The Portfolio has agreed to repay UBS AM for any waived fees/reimbursed expenses to the extent that it can do so over the following three fiscal years without causing the Portfolio's expenses in any of those three years to exceed these expense caps and that UBS AM has not waived the right to do so. The fee waiver/expense reimbursement agreement may be terminated by the Portfolio's board at any time and also will terminate automatically upon the expiration or termination of the Portfolio's advisory contract with UBS AM. Upon termination of the agreement, however, UBS AM's three year recoupment rights will survive.
1 Maximum sales charge for Class A shares is 3.75%. Class A shares bear ongoing 12b-1 service fees of 0.25% annually.
2 Maximum contingent deferred sales charge for Class C shares is 0.75% imposed on redemptions and is reduced to 0% after one year. Class C shares bear ongoing 12b-1 service and distribution fees of 0.25% and 0.50% annually, respectively. As of July 12, 2018, Class C shares ceased paying 12b-1 distribution fees. See notes to financial statements—Subsequent events for additional information.
3 The Portfolio offers Class Y shares to a limited group of eligible investors, including certain qualifying retirement plans. Class Y shares do not bear initial or contingent deferred sales charges or ongoing 12b-1 service and distribution fees.
4 Class P shares do not bear initial or contingent deferred sales charges or ongoing 12b-1 service and distribution fees, but Class P shares held through advisory programs may be subject to a program fee, which, if included, would have reduced performance.
5 The Bloomberg Barclays US Government/Credit Index is an unmanaged index which is composed of all investment-grade bonds that have at least one year to maturity. The Index's total return comprises price appreciation/depreciation and income as a percentage of the original investment. The Index is rebalanced monthly by market capitalization. Investors should note that indices do not reflect the deduction of fees and expenses.
Past performance does not predict future performance, and the performance information provided does not reflect the deduction of taxes that a shareholder would pay on Portfolio distributions or the redemption of Portfolio shares. The return and principal value of an investment will fluctuate, so that an investor's shares, when redeemed, may be worth more or less than their original cost. Performance results assume reinvestment of all dividends and capital gain distributions at net asset value on the ex-dividend dates. Current performance may be higher or lower than the performance data quoted. For month-end performance figures, please visit www.ubs.com/us-mutualfundperformance.
Lipper peer group data calculated by Lipper Inc.; used with permission. The Lipper median is the return of the fund that places in the middle of a Lipper peer group.
64
PACE Strategic Fixed Income Investments
Illustration of an assumed investment of $10,000 in Class P shares of the Portfolio (unaudited)
The following graph depicts the performance of PACE Strategic Fixed Income Investments Class P shares versus the Bloomberg Barclays US Government/Credit Index over the 10 years ended July 31, 2018. Class P shares held through advisory programs may be subject to a program fee, which, if included, would have reduced performance. The performance of the other classes will vary based upon the different class specific expenses and sales charges. The performance provided does not reflect the deduction of taxes that a shareholder would pay on Portfolio distributions or the redemption of Portfolio shares. Past performance is no guarantee of future results. Share price and returns will vary with market conditions; investors may realize a gain or loss upon redemption. It is important to note that PACE Strategic Fixed Income Investments is a professionally managed portfolio while the Index is not available for investment and is unmanaged. The comparison is shown for illustration purposes only.
PACE Strategic Fixed Income Investments
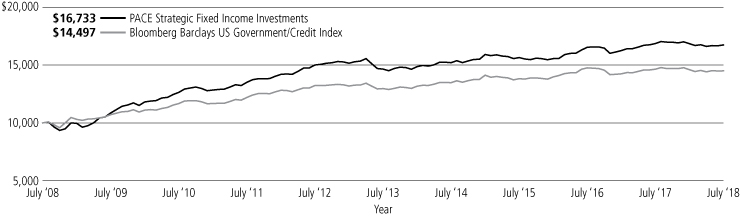
65
PACE Strategic Fixed Income Investments
Portfolio statistics—July 31, 2018 (unaudited)
Characteristics | |||||||
Weighted average duration | 4.63 yrs. | ||||||
Weighted average maturity | 7.70 yrs. | ||||||
Average coupon | 3.68 | % | |||||
Top ten holdings1 | Percentage of net assets | ||||||
FNMA TBA, 4.000% | 13.5 | % | |||||
US Treasury Bond, 2.500% due 02/15/45 | 6.1 | ||||||
FNMA TBA, 3.500% | 3.7 | ||||||
US Treasury Note, 2.125% due 09/30/21 | 3.5 | ||||||
FNMA TBA, 3.500% | 3.2 | ||||||
FNMA TBA, 3.500% | 2.4 | ||||||
US Treasury Note, 2.000% due 02/28/21 | 2.1 | ||||||
US Treasury Note, 2.125% due 09/30/24 | 1.9 | ||||||
US Treasury Note, 2.250% due 04/30/21 | 1.4 | ||||||
GNMA REMIC, Trust Series 2005-26, Class ZA, 5.500% due 01/20/35 | 1.4 | ||||||
Total | 39.2 | % | |||||
Top five issuer breakdown by country or territory of origin1 | Percentage of net assets | ||||||
United States | 80.6 | % | |||||
United Kingdom | 4.3 | ||||||
Cayman Islands | 3.3 | ||||||
Japan | 1.2 | ||||||
Australia | 0.9 | ||||||
Total | 90.3 | % | |||||
Asset allocation1 | Percentage of net assets | ||||||
Corporate notes | 47.7 | % | |||||
US government obligations | 25.2 | ||||||
US government agency mortgage pass-through certificates | 25.2 | ||||||
Collateralized mortgage obligations | 13.6 | ||||||
Asset-backed securities | 11.5 | ||||||
Non-US government obligations | 3.9 | ||||||
Loan assignments | 3.1 | ||||||
Municipal bonds and notes | 1.4 | ||||||
Options, swaptions, futures, swaps and forward foreign currency contracts | 0.1 | ||||||
Short-term US government obligation | 0.2 | ||||||
Cash equivalents and other assets less liabilities | (31.9 | ) | |||||
Total | 100.0 | % | |||||
1 The Portfolio is actively managed and its composition will vary over time.
66
PACE Strategic Fixed Income Investments
Portfolio of investments—July 31, 2018
| Face amount1 | Value | ||||||||||
US government obligations—25.17% | |||||||||||
| US Treasury Bonds 2.500%, due 02/15/45 | 53,400,000 | $ | 47,795,086 | ||||||||
2.750%, due 11/15/42 | 3,200,000 | 3,022,250 | |||||||||
2.875%, due 05/15/43 | 3,500,000 | 3,377,910 | |||||||||
2.875%, due 08/15/45 | 8,500,000 | 8,179,258 | |||||||||
3.000%, due 11/15/44 | 7,200,000 | 7,097,344 | |||||||||
3.000%, due 05/15/45 | 200,000 | 197,125 | |||||||||
3.000%, due 02/15/48 | 3,000,000 | 2,953,828 | |||||||||
3.125%, due 08/15/44 | 2,100,000 | 2,117,391 | |||||||||
3.625%, due 02/15/44 | 1,400,000 | 1,535,133 | |||||||||
3.875%, due 08/15/40 | 625,000 | 707,056 | |||||||||
| US Treasury Inflation Index Bonds (TIPS) 0.875%, due 02/15/47 | 937,890 | 923,266 | |||||||||
1.000%, due 02/15/46 | 1,358,925 | 1,377,876 | |||||||||
2.500%, due 01/15/29 | 5,020,563 | 5,826,977 | |||||||||
3.625%, due 04/15/28 | 2,037,443 | 2,554,843 | |||||||||
3.875%, due 04/15/29 | 3,771,943 | 4,909,886 | |||||||||
| US Treasury Notes 1.000%, due 06/30/19 | 2,050,000 | 2,023,734 | |||||||||
1.875%, due 08/31/22 | 9,600,000 | 9,252,000 | |||||||||
2.000%, due 02/28/21 | 16,900,000 | 16,584,445 | |||||||||
2.000%, due 10/31/222 | 1,000,000 | 966,953 | |||||||||
2.125%, due 09/30/21 | 27,500,000 | 26,950,000 | |||||||||
2.125%, due 09/30/24 | 15,700,000 | 15,012,512 | |||||||||
2.250%, due 04/30/212 | 11,200,000 | 11,048,187 | |||||||||
2.250%, due 02/15/27 | 1,315,000 | 1,245,757 | |||||||||
2.250%, due 08/15/27 | 5,000,000 | 4,720,508 | |||||||||
2.250%, due 11/15/27 | 8,000,000 | 7,540,625 | |||||||||
2.375%, due 08/15/24 | 785,000 | 762,278 | |||||||||
2.375%, due 05/15/27 | 8,000,000 | 7,645,312 | |||||||||
| Total US government obligations (cost—$206,261,252) | 196,327,540 | ||||||||||
| Government national mortgage association certificates—0.00%† | |||||||||||
| GNMA II ARM 1 year CMT + 1.500%, 2.625%, due 05/20/263 | 8,865 | 9,113 | |||||||||
| 1 year CMT + 1.500%, 2.750%, due 07/20/253 | 2,618 | 2,683 | |||||||||
| 1 year CMT + 1.500%, 3.125%, due 11/20/233 | 1,932 | 1,969 | |||||||||
| 1 year CMT + 1.500%, 3.375%, due 01/20/263 | 4,765 | 4,886 | |||||||||
| Total government national mortgage association certificates (cost—$18,364) | 18,651 | ||||||||||
| Federal home loan mortgage corporation certificates—0.55% | |||||||||||
| FHLMC 7.645%, due 05/01/25 | 829,688 | 920,345 | |||||||||
| FHLMC ARM 12 mo. USD LIBOR + 1.815%, 3.957%, due 03/01/363 | 14,796 | 14,979 | |||||||||
| FHLMC TBA 4.000% | 2,370,000 | 2,406,007 | |||||||||
4.500 | % | 930,000 | 964,421 | ||||||||
| Total federal home loan mortgage corporation certificates (cost—$4,226,277) | 4,305,752 | ||||||||||
| Face amount1 | Value | ||||||||||
Federal housing administration certificates—0.00%† | |||||||||||
| FHA GMAC 7.430%, due 06/01/214 | 662 | $ | 663 | ||||||||
| FHA Reilly 7.430%, due 10/01/204 | 1,254 | 1,256 | |||||||||
| Total federal housing administration certificates (cost—$1,936) | 1,919 | ||||||||||
| Federal national mortgage association certificates—24.60% | |||||||||||
| FNMA 3.310%, due 07/01/23 | 597,582 | 598,050 | |||||||||
3.500%, due 11/01/21 | 1,054,570 | 1,065,557 | |||||||||
4.500%, due 04/01/29 | 176,989 | 184,109 | |||||||||
5.407%, due 11/01/34 | 7,046,801 | 7,102,901 | |||||||||
| FNMA ARM 12 mo. MTA + 1.400%, 2.957%, due 08/01/403 | 39,977 | 39,479 | |||||||||
| 12 mo. USD LIBOR + 1.748%, 3.420%, due 03/01/363 | 10,421 | 10,581 | |||||||||
| 12 mo. USD LIBOR + 1.651%, 3.499%, due 12/01/353 | 64,244 | 67,221 | |||||||||
| 1 year CMT + 2.268%, 3.518%, due 10/01/353 | 4,520 | 4,704 | |||||||||
| 12 mo. USD LIBOR + 1.780%, 3.530%, due 11/01/353 | 42,261 | 44,217 | |||||||||
| 12 mo. USD LIBOR + 1.942%, 3.692%, due 09/01/353 | 12,491 | 13,104 | |||||||||
| 1 year CMT + 2.099%, 3.777%, due 05/01/303 | 30,439 | 31,405 | |||||||||
| 12 mo. USD LIBOR + 1.912%, 3.787%, due 02/01/363 | 48,976 | 51,357 | |||||||||
| 12 mo. USD LIBOR + 1.902%, 3.890%, due 03/01/363 | 52,147 | 54,336 | |||||||||
| 12 mo. USD LIBOR + 1.814%, 3.909%, due 03/01/363 | 23,595 | 24,931 | |||||||||
| 12 mo. USD LIBOR + 1.912%, 3.912%, due 03/01/363 | 23,599 | 24,633 | |||||||||
| 1 year CMT + 2.553%, 3.954%, due 01/01/363 | 31,080 | 32,760 | |||||||||
| 1 year CMT + 2.222%, 3.984%, due 04/01/273 | 9,427 | 9,817 | |||||||||
| 1 year CMT + 2.249%, 3.999%, due 05/01/273 | 6,041 | 6,127 | |||||||||
| 6 mo. USD LIBOR + 1.538%, 4.038%, due 01/01/363 | 24,119 | 25,143 | |||||||||
| 12 mo. USD LIBOR + 2.015%, 4.640%, due 06/01/363 | 8,358 | 8,374 | |||||||||
| FNMA ARM COFI 3.250%, due 11/01/265,6 | 13,312 | 12,102 | |||||||||
| FNMA TBA 3.000% | 19,000,000 | 18,296,406 | |||||||||
| 3.500% | 55,000,000 | 54,493,875 | |||||||||
| 4.000% | 107,075,000 | 108,631,072 | |||||||||
| 4.500% | 1,000,000 | 1,035,843 | |||||||||
| Total federal national mortgage association certificates (cost—$192,183,839) | 191,868,104 | ||||||||||
67
PACE Strategic Fixed Income Investments
Portfolio of investments—July 31, 2018
| Face amount1 | Value | ||||||||||
Collateralized mortgage obligations—13.62% | |||||||||||
| Alba PLC, Series 2007-1, Class A3 3 mo. LIBOR GBP + 0.170%, 0.801%, due 03/17/393,7 | GBP 501,648 | $625,603 | |||||||||
| ARM Trust, Series 2005-5, Class 2A1 4.065%, due 09/25/358 | 132,327 | 124,929 | |||||||||
| Ashford Hospitality Trust, Series KEYS, Class A 1 mo. USD LIBOR + 1.000%, 3.050%, due 05/15/353,9 | 1,500,000 | 1,501,398 | |||||||||
| Banc of America Funding Corp., Series 2005-D, Class A1 4.002%, due 05/25/358 | 625,362 | 653,440 | |||||||||
| Banc of America Merrill Lynch Large Loan, Series 2012-PARK, Class A 2.959%, due 12/10/309 | 1,000,000 | 982,348 | |||||||||
| Bank of America Mortgage Securities, Inc., Series 2002-G, Class 1A3 4.817%, due 07/20/328 | 625 | 635 | |||||||||
| Series 2004-H, Class 2A2 3.609%, due 09/25/348 | 698,588 | 691,794 | |||||||||
| BBCCRE Trust, Series 2015-GTP, Class A 3.966%, due 08/10/339 | 3,600,000 | 3,589,481 | |||||||||
| BCAP LLC 2011-RR10 Trust, Class 3A5 3.962%, due 06/26/358,9 | 282,479 | 277,678 | |||||||||
| BCAP LLC Trust, Series 2014-RR5, Class 1A3 1 mo. USD LIBOR + 0.225%, 2.302%, due 01/26/363,9 | 1,029,376 | 1,010,015 | |||||||||
| Bear Stearns Alternative Loan Trust-A Trust, Series 2003-3, Class 1A 4.180%, due 10/25/338 | 4,320 | 4,495 | |||||||||
| Series 2004-9, Class 2A1 3.707%, due 09/25/348 | 341,519 | 324,456 | |||||||||
| Series 2005-7, Class 22A1 4.024%, due 09/25/358 | 566,647 | 462,244 | |||||||||
| Series 2006-1, Class 21A2 3.862%, due 02/25/368 | 691,202 | 608,666 | |||||||||
| Bear Stearns ARM Trust, Series 2003-1, Class 6A1 3.827%, due 04/25/338 | 26,480 | 26,726 | |||||||||
| Series 2003-5, Class 2A1 4.233%, due 08/25/338 | 134,077 | 134,131 | |||||||||
| Series 2004-3, Class 1A2 4.241%, due 07/25/348 | 120,318 | 119,101 | |||||||||
| Series 2004-6, Class 2A1 3.816%, due 09/25/348 | 634,500 | 638,748 | |||||||||
| Series 2004-7, Class 1A1 3.750%, due 10/25/348 | 196,323 | 188,565 | |||||||||
| Chase Mortgage Finance Corp., Series 2005-S3, Class A10 5.500%, due 11/25/35 | 1,951,513 | 1,871,602 | |||||||||
| Series 2007-S6, Class 2A1 5.500%, due 12/25/22 | 718,760 | 531,723 | |||||||||
| Citigroup Commercial Mortgage Trust, Series 2013-GC17, Class XA, IO 1.390%, due 02/10/488 | 3,544,082 | 243,736 | |||||||||
| Face amount1 | Value | ||||||||||
Collateralized mortgage obligations—(continued) | |||||||||||
| Citigroup Mortgage Loan Trust, Inc., Series 2005-11, Class A1A | |||||||||||
| 1 year CMT + 2.400%, 4.490%, due 05/25/353 | 237,503 | $ | 238,679 | ||||||||
| Series 2005-4, Class A 4.072%, due 08/25/358 | 553,111 | 559,049 | |||||||||
Series 2005-6, Class A2 | |||||||||||
| 1 year CMT + 2.150%, 4.240%, due 09/25/353 | 43,784 | 44,333 | |||||||||
Series 2005-6, Class A3 | |||||||||||
| 1 year CMT + 1.800%, 3.890%, due 09/25/353 | 7,808 | 7,625 | |||||||||
| COMM Mortgage Trust, Series 2014-LC15, Class XA, IO 1.296%, due 04/10/478 | 12,212,943 | 520,533 | |||||||||
| Series 2014-UBS3, Class XA, IO 1.285%, due 06/10/478 | 3,518,178 | 161,937 | |||||||||
| Countrywide Alternative Loan Trust, Series 2003-J3, Class 2A1 6.250%, due 12/25/33 | 37,366 | 38,184 | |||||||||
Series 2005-62, Class 2A1 | |||||||||||
| 12 mo. MTA + 1.000%, 2.654%, due 12/25/353 | 204,087 | 185,837 | |||||||||
| Series 2006-41CB, Class 1A9 6.000%, due 01/25/37 | 540,743 | 461,779 | |||||||||
| Countrywide Home Loan Mortgage Pass-Through Trust, Series 2003-R4, Class 2A 5.030%, due 01/25/348,9 | 680,529 | 650,134 | |||||||||
| Series 2004-12, Class 11A1 3.939%, due 08/25/348 | 162,691 | 153,506 | |||||||||
| Series 2004-12, Class 11A2 3.939%, due 08/25/348 | 104,097 | 100,943 | |||||||||
| Series 2004-12, Class 12A1 4.216%, due 08/25/348 | 26,740 | 26,151 | |||||||||
Series 2005-HYB9, Class 5A1 | |||||||||||
| 12 mo. USD LIBOR + 1.750%, 3.537%, due 02/20/363 | 186,130 | 170,061 | |||||||||
| DSLA Mortgage Loan Trust, Series 2005-AR4, Class 2A1A | |||||||||||
| 1 mo. USD LIBOR + 0.260%, 2.342%, due 08/19/453 | 262,871 | 246,642 | |||||||||
| FHLMC REMIC, Series 0023, Class KZ 6.500%, due 11/25/23 | 31,488 | 33,165 | |||||||||
| Series 1278, Class K 7.000%, due 05/15/22 | 6,795 | 7,022 | |||||||||
| Series 1367, Class KA 6.500%, due 09/15/22 | 304 | 319 | |||||||||
| Series 1502, Class PX 7.000%, due 04/15/23 | 107,655 | 113,734 | |||||||||
| Series 1503, Class PZ 7.000%, due 05/15/23 | 32,336 | 34,427 | |||||||||
| Series 1534, Class Z 5.000%, due 06/15/23 | 32,442 | 33,000 | |||||||||
| Series 1548, Class Z 7.000%, due 07/15/23 | 23,392 | 24,663 | |||||||||
68
PACE Strategic Fixed Income Investments
Portfolio of investments—July 31, 2018
| Face amount1 | Value | ||||||||||
Collateralized mortgage obligations—(continued) | |||||||||||
| Series 1562, Class Z 7.000%, due 07/15/23 | 36,435 | $ | 38,508 | ||||||||
| Series 1694, Class Z 6.500%, due 03/15/24 | 20,713 | 22,040 | |||||||||
Series 2017-DNA1, Class M2 | |||||||||||
| 1 mo. USD LIBOR + 3.250%, 5.314%, due 07/25/293 | 515,000 | 560,072 | |||||||||
Series 2017-DNA2, Class M2 | |||||||||||
| 1 mo. USD LIBOR + 3.450%, 5.514%, due 10/25/293 | 1,190,000 | 1,307,693 | |||||||||
Series 2017-HQA2, Class M2 | |||||||||||
| 1 mo. USD LIBOR + 2.650%, 4.714%, due 12/25/293 | 530,000 | 551,909 | |||||||||
Series 2018-HQA1, Class M2 | |||||||||||
| 1 mo. USD LIBOR + 2.300%, 4.364%, due 09/25/303 | 870,000 | 872,621 | |||||||||
| Series 2061, Class Z 6.500%, due 06/15/28 | 71,695 | 77,466 | |||||||||
Series 2400, Class FQ | |||||||||||
| 1 mo. USD LIBOR + 0.500%, 2.572%, due 01/15/323 | 48,317 | 48,503 | |||||||||
| Series 2764, Class LZ 4.500%, due 03/15/34 | 639,904 | 662,554 | |||||||||
| Series 2764, Class ZG 5.500%, due 03/15/34 | 1,615,802 | 1,748,230 | |||||||||
| Series 2835, Class JZ 5.000%, due 08/15/34 | 385,578 | 408,688 | |||||||||
| Series 2921, Class PG 5.000%, due 01/15/35 | 2,460,742 | 2,588,853 | |||||||||
| Series 2983, Class TZ 6.000%, due 05/15/35 | 1,396,908 | 1,539,358 | |||||||||
| Series 3149, Class CZ 6.000%, due 05/15/36 | 1,739,478 | 1,904,269 | |||||||||
| Series T-054, Class 2A 6.500%, due 02/25/43 | 490,146 | 551,564 | |||||||||
| Series T-058, Class 2A 6.500%, due 09/25/43 | 1,689,351 | 1,898,411 | |||||||||
Series T-075, Class A1 | |||||||||||
| 1 mo. USD LIBOR + 0.040%, 1.891%, due 12/25/363 | 226,175 | 225,673 | |||||||||
| First Horizon Mortgage Pass-Through Trust, Series 2005-AR3, Class 2A1 4.225%, due 08/25/358 | 21,508 | 17,959 | |||||||||
| FNMA Connecticut Avenue Securities, Series 2017-C03, Class 1M2 | |||||||||||
| 1 mo. USD LIBOR + 3.000%, 5.064%, due 10/25/293 | 680,000 | 731,853 | |||||||||
Series 2017-C03, Class 2M2 | |||||||||||
| 1 mo. USD LIBOR + 2.800%, 4.864%, due 02/25/303 | 410,000 | 427,293 | |||||||||
Series 2017-C04, Class 2M2 | |||||||||||
| 1 mo. USD LIBOR + 2.850%, 4.914%, due 11/25/293 | 1,300,000 | 1,365,715 | |||||||||
Series 2017-C05, Class 1M2 | |||||||||||
| 1 mo. USD LIBOR + 2.200%, 4.264%, due 01/25/303 | 515,000 | 527,316 | |||||||||
| Face amount1 | Value | ||||||||||
Collateralized mortgage obligations—(continued) | |||||||||||
Series 2017-C06, Class 1M2 | |||||||||||
| 1 mo. USD LIBOR + 2.650%, 4.714%, due 02/25/303 | 320,000 | $ | 332,094 | ||||||||
Series 2017-C07, Class 2M2 | |||||||||||
| 1 mo. USD LIBOR + 2.500%, 4.564%, due 05/25/303 | 1,040,000 | 1,066,031 | |||||||||
Series 2018-C01, Class 1M2 | |||||||||||
| 1 mo. USD LIBOR + 2.250%, 4.314%, due 07/25/303 | 725,000 | 735,298 | |||||||||
Series 2018-C02, Class 2M2 | |||||||||||
| 1 mo. USD LIBOR + 2.200%, 4.264%, due 08/25/303 | 580,000 | 581,966 | |||||||||
| FNMA REMIC, Series 1991-065, Class Z 6.500%, due 06/25/21 | 580 | 597 | |||||||||
| Series 1992-129, Class L 6.000%, due 07/25/22 | 1,433 | 1,486 | |||||||||
| Series 1993-060, Class Z 7.000%, due 05/25/23 | 28,863 | 30,746 | |||||||||
| Series 1993-070, Class Z 6.900%, due 05/25/23 | 4,459 | 4,708 | |||||||||
| Series 1993-096, Class PZ 7.000%, due 06/25/23 | 22,164 | 23,498 | |||||||||
| Series 1993-160, Class ZB 6.500%, due 09/25/23 | 9,973 | 10,316 | |||||||||
| Series 1993-163, Class ZB 7.000%, due 09/25/23 | 2,285 | 2,411 | |||||||||
Series 1998-066, Class FG | |||||||||||
| 1 mo. USD LIBOR + 0.300%, 2.364%, due 12/25/283 | 14,649 | 14,719 | |||||||||
| Series 1999-W4, Class A9 6.250%, due 02/25/29 | 193,617 | 203,265 | |||||||||
Series 2000-034, Class F | |||||||||||
| 1 mo. USD LIBOR + 0.450%, 2.514%, due 10/25/303 | 3,682 | 3,696 | |||||||||
| Series 2002-080, Class A1 6.500%, due 11/25/42 | 663,685 | 724,730 | |||||||||
| Series 2003-064, Class AH 6.000%, due 07/25/33 | 1,661,099 | 1,793,454 | |||||||||
| Series 2003-W8, Class 2A 7.000%, due 10/25/42 | 35,044 | 39,303 | |||||||||
| Series 2004-T1, Class 1A1 6.000%, due 01/25/44 | 521,608 | 565,778 | |||||||||
| Series 2004-W8, Class 2A 6.500%, due 06/25/44 | 544,392 | 598,074 | |||||||||
| Series 2005-024, Class ZE 5.000%, due 04/25/35 | 765,629 | 816,690 | |||||||||
| Series 2005-120, Class ZU 5.500%, due 01/25/36 | 1,889,314 | 2,045,012 | |||||||||
| Series 2006-065, Class GD 6.000%, due 07/25/26 | 673,338 | 712,412 | |||||||||
Series 2017-C02, Class 2M2 | |||||||||||
| 1 mo. USD LIBOR + 3.650%, 5.714%, due 09/25/293 | 1,508,000 | 1,653,148 | |||||||||
| Trust 1993-037, Class PX 7.000%, due 03/25/23 | 4,950 | 5,197 | |||||||||
| Trust G92-040, Class ZC 7.000%, due 07/25/22 | 3,008 | 3,138 | |||||||||
69
PACE Strategic Fixed Income Investments
Portfolio of investments—July 31, 2018
| Face amount1 | Value | ||||||||||
Collateralized mortgage obligations—(continued) | |||||||||||
| GNMA REMIC, Trust Series 2002-031, Class FW | |||||||||||
| 1 mo. USD LIBOR + 0.400%, 2.472%, due 06/16/313 | 37,658 | $ | 37,864 | ||||||||
| Trust Series 2003-98, Class Z 6.000%, due 11/20/33 | 4,789,812 | 5,296,285 | |||||||||
| Trust Series 2005-26, Class ZA 5.500%, due 01/20/35 | 9,976,914 | 10,765,041 | |||||||||
Trust Series 2015-H20, Class FB | |||||||||||
| 1 mo. USD LIBOR + 0.600%, 2.605%, due 08/20/653 | 1,441,055 | 1,450,226 | |||||||||
Trust Series 2016-154, Class WF | |||||||||||
| 1 mo. USD LIBOR + 0.400%, 2.492%, due 11/20/453 | 888,032 | 885,173 | |||||||||
Trust Series 2016-H11, Class F | |||||||||||
| 1 mo. USD LIBOR + 0.800%, 2.805%, due 05/20/663 | 1,073,794 | 1,090,044 | |||||||||
Trust Series 2016-H15, Class FA | |||||||||||
| 1 mo. USD LIBOR + 0.800%, 2.805%, due 07/20/663 | 2,031,858 | 2,061,935 | |||||||||
Trust Series 2016-H19, Class FE | |||||||||||
| 1 mo. USD LIBOR + 0.370%, 2.375%, due 06/20/613 | 392,053 | 392,247 | |||||||||
Trust Series 2017-182, Class FW | |||||||||||
| 1 mo. USD LIBOR + 0.350%, 2.442%, due 05/20/473 | 1,306,813 | 1,306,596 | |||||||||
Trust Series 2018-38, Class WF | |||||||||||
| 1 mo. USD LIBOR + 0.300%, 2.392%, due 10/20/433 | 3,165,192 | 3,160,849 | |||||||||
| GreenPoint MTA Trust, Series 2005-AR3, Class 1A1 | |||||||||||
| 1 mo. USD LIBOR + 0.240%, 2.304%, due 08/25/453 | 1,337,479 | 1,245,193 | |||||||||
| GS Residential Mortgage Loan Trust, Series 2005-AR6, Class 2A1 | |||||||||||
3.714%, due 09/25/358 | 374,165 | 381,147 | |||||||||
| Harborview Mortgage Loan Trust, Series 2004-11, Class 3A1A | |||||||||||
| 1 mo. USD LIBOR + 0.700%, 2.782%, due 01/19/353 | 51,158 | 46,132 | |||||||||
| Series 2005-4, Class 3A1 4.078%, due 07/19/358 | 248,090 | 217,167 | |||||||||
| Housing Security, Inc., Series 1992-8, Class B 1.073%, due 06/25/248 | 2,374 | 2,373 | |||||||||
| JPMorgan Chase Commercial Mortgage Securities Trust, Series 2018-LAQ, Class A | |||||||||||
| 1 mo. USD LIBOR + 1.000%, 3.072%, due 06/15/323,9 | 1,900,000 | 1,902,367 | |||||||||
Series 2018-PHH, Class A | |||||||||||
| 1 mo. USD LIBOR + 0.910%, 2.910%, due 06/15/203,4,9,10 | 1,600,000 | 1,600,470 | |||||||||
| JPMorgan Mortgage Trust, 2005-A8, Series Class 1A1 3.562%, due 11/25/358 | 891,145 | 862,278 | |||||||||
| JPMorgan Mortgage Trust, 2006-A4, Series 2006-A4, Class 2A2 3.901%, due 06/25/368 | 399,415 | 377,548 | |||||||||
| Face amount1 | Value | ||||||||||
Collateralized mortgage obligations—(continued) | |||||||||||
| Ludgate Funding PLC, Series 2007-1, Class A2A | |||||||||||
| 3 mo. LIBOR GBP + 0.160%, 0.840%, due 01/01/613,7 | GBP | 1,795,391 | $ | 2,245,452 | |||||||
Series 2008-W1X, Class A1 | |||||||||||
| 3 mo. LIBOR GBP + 0.600%, 1.280%, due 01/01/613,7 | GBP | 764,925 | 985,330 | ||||||||
| Mansard Mortgages, Series 2007-1X, Class A2 | |||||||||||
| 3 mo. LIBOR GBP + 0.180%, 0.933%, due 04/15/473,7 | GBP | 1,138,535 | 1,431,975 | ||||||||
| Morgan Stanley Capital I Trust, Series 2014-CPT, Class B 3.446%, due 07/13/298,9 | 1,800,000 | 1,784,177 | |||||||||
| NAAC Reperforming Loan REMIC Trust, Series 2004-R3, Class A1 6.500%, due 02/25/359 | 763,126 | 770,045 | |||||||||
| Nomura Resecuritization Trust, Series 2014-7R, Class 2A3 | |||||||||||
| 1 mo. USD LIBOR + 0.200%, 2.291%, due 12/26/353,9 | 1,916,263 | 1,889,610 | |||||||||
| Reperforming Loan REMIC Trust, Series 2006-R1, Class AF1 | |||||||||||
| 1 mo. USD LIBOR + 0.340%, 2.404%, due 01/25/363,9 | 950,174 | 932,017 | |||||||||
| Residential Accredit Loans, Inc., Series 2006-Q03, Class A1 | |||||||||||
| 1 mo. USD LIBOR + 0.210%, 2.274%, due 04/25/463 | 1,117,960 | 535,315 | |||||||||
| Residential Asset Securitization Trust, Series 2006-A14C, Class 2A6 | |||||||||||
| 1 mo. USD LIBOR + 0.450%, 2.514%, due 12/25/363 | 1,018,071 | 334,843 | |||||||||
| Residential Funding Mortgage Security I, Series 2004-S9, Class 1A23 5.500%, due 12/25/34 | 537,018 | 542,604 | |||||||||
| Sequoia Mortgage Trust, Series 2007-3, Class 1A1 | |||||||||||
| 1 mo. USD LIBOR + 0.200%, 2.286%, due 07/20/363 | 193,935 | 184,936 | |||||||||
| Structured ARM Loan Trust, Series 2004-8, Class 3A 4.284%, due 07/25/348 | 381,773 | 380,653 | |||||||||
| Structured Asset Mortgage Investments, Inc., Series 2002-AR3, Class A1 | |||||||||||
| 1 mo. USD LIBOR + 0.660%, 2.742%, due 09/19/323 | 98,311 | 96,005 | |||||||||
Series 2006-AR3, Class 11A1 | |||||||||||
| 1 mo. USD LIBOR + 0.210%, 2.274%, due 04/25/363 | 1,739,887 | 1,598,989 | |||||||||
| Thornburg Mortgage Securities Trust, Series 2007-4, Class 2A1 3.852%, due 09/25/378 | 1,000,201 | 999,450 | |||||||||
| United States Small Business Administration, Series 1999-20K, Class 1 7.060%, due 11/01/19 | 14,641 | 14,784 | |||||||||
70
PACE Strategic Fixed Income Investments
Portfolio of investments—July 31, 2018
| Face amount1 | Value | ||||||||||
Collateralized mortgage obligations—(concluded) | |||||||||||
| Series 2002-20K, Class 1 5.080%, due 11/01/22 | 201,300 | $ | 205,287 | ||||||||
| Series 2005-20H, Class 1 5.110%, due 08/01/25 | 251,207 | 257,924 | |||||||||
| Series 2007-20D, Class 1 5.320%, due 04/01/27 | 974,595 | 1,001,962 | |||||||||
| Uropa Securities PLC, Series 2007-1, Class A3A | |||||||||||
| 3 mo. LIBOR GBP + 0.200%, 0.920%, due 10/10/403,7 | GBP | 3,100,000 | 3,868,522 | ||||||||
| WaMu Mortgage Pass-Through Certificates, Series 2002-AR6, Class A | |||||||||||
| 12 mo. MTA + 1.400%, 3.054%, due 06/25/423 | 18,440 | 17,685 | |||||||||
Series 2005-AR13, Class A1A1 | |||||||||||
| 1 mo. USD LIBOR + 0.290%, 2.354%, due 10/25/453 | 676,217 | 676,125 | |||||||||
Series 2005-AR15, Class A1A1 | |||||||||||
| 1 mo. USD LIBOR + 0.260%, 2.324%, due 11/25/453 | 90,019 | 89,058 | |||||||||
| Series 2006-AR2, Class 2A1 3.307%, due 03/25/368 | 760,591 | 697,839 | |||||||||
Series 2006-AR9, Class 1A | |||||||||||
| 12 mo. MTA + 1.000%, 2.654%, due 08/25/463 | 791,332 | 735,874 | |||||||||
Series 2006-AR9, Class 2A | |||||||||||
| 11th District Cost of Funds + 1.500%, 2.385%, due 08/25/463 | 682,213 | 658,065 | |||||||||
| Wells Fargo Mortgage Backed Securities Trust, Series 2003-M, Class A1 3.734%, due 12/25/338 | 115,981 | 118,866 | |||||||||
| Series 2004-CC, Class A1 3.754%, due 01/25/358 | 59,368 | 60,682 | |||||||||
| Series 2004-DD, Class 2A6 3.785%, due 01/25/358 | 567,377 | 584,704 | |||||||||
| Series 2006-AR2, Class 2A1 3.863%, due 03/25/368 | 496,806 | 504,671 | |||||||||
| WFRBS Commercial Mortgage Trust, Series 2014-C22, Class XA, IO 0.852%, due 09/15/578 | 7,025,185 | 272,312 | |||||||||
| Series 2014-LC14, Class XA, IO 1.293%, due 03/15/478 | 4,320,330 | 185,727 | |||||||||
| Total collateralized mortgage obligations (cost—$103,008,341) | 106,209,975 | ||||||||||
Asset-backed securities—11.54% | |||||||||||
| Accredited Mortgage Loan Trust, Series 2004-2, Class A1 | |||||||||||
| 1 mo. USD LIBOR + 0.580%, 2.644%, due 07/25/343 | 1,155,203 | 1,135,280 | |||||||||
| Ally Auto Receivables Trust, Series 2017-3, Class A2 1.530%, due 03/16/20 | 170,848 | 170,419 | |||||||||
| Series 2018-3, Class A2 2.720%, due 05/17/21 | 1,900,000 | 1,899,359 | |||||||||
| American Express Credit Account Master Trust, Series 2017-4, Class A 1.640%, due 12/15/21 | 2,600,000 | 2,579,782 | |||||||||
| Face amount1 | Value | ||||||||||
Asset-backed securities—(continued) | |||||||||||
| Americredit Automobile Receivables Trust, Series 2018-1, Class A1 2.450%, due 05/20/19 | 325,898 | $ | 325,903 | ||||||||
Series 2018-1, Class A2B | |||||||||||
| 1 mo. USD LIBOR + 0.230%, 2.309%, due 07/19/213 | 1,300,000 | 1,300,085 | |||||||||
| Ameriquest Mortgage Securities, Inc. Asset-Backed Pass-Through Certificates, Series 2005-R8, Class M1 | |||||||||||
| 1 mo. USD LIBOR + 0.470%, 2.534%, due 10/25/353 | 84,782 | 84,812 | |||||||||
| Arbor Realty Commercial Real Estate Notes Ltd., Series 2017-FL1, Class A | |||||||||||
| 1 mo. USD LIBOR + 1.300%, 3.372%, due 04/15/273,9 | 2,000,000 | 2,010,210 | |||||||||
| Atrium X, Series 10A, Class AR | |||||||||||
| 3 mo. USD LIBOR + 0.950%, 3.289%, due 07/16/253,9 | 648,775 | 648,796 | |||||||||
| Avery Point III CLO Ltd., Series 2013-3A, Class AR | |||||||||||
| 3 mo. USD LIBOR + 1.120%, 3.453%, due 01/18/253,9 | 412,944 | 413,129 | |||||||||
| Avery Point IV CLO Ltd., Series 2014-1A, Class AR | |||||||||||
| 3 mo. USD LIBOR + 1.100%, 3.435%, due 04/25/263,9 | 1,124,305 | 1,124,805 | |||||||||
| BMW Vehicle Lease Trust, Series 2017-1, Class A2 1.640%, due 07/22/19 | 700,395 | 699,340 | |||||||||
| Capital One Multi-Asset Execution Trust, Series 2016-A1, Class A1 | |||||||||||
| 1 mo. USD LIBOR + 0.450%, 2.522%, due 02/15/223 | 1,800,000 | 1,804,860 | |||||||||
| Cent CLO 20 Ltd., Series 2013-20A, Class AR | |||||||||||
| 3 mo. USD LIBOR + 1.100%, 3.435%, due 01/25/263,9 | 1,146,834 | 1,147,372 | |||||||||
| Chase Issuance Trust, Series 2016-A2, Class A 1.370%, due 06/15/21 | 1,440,000 | 1,423,346 | |||||||||
Series 2018-A1, Class A1 | |||||||||||
| 1 mo. USD LIBOR + 0.200%, 2.272%, due 04/17/233 | 2,190,000 | 2,190,651 | |||||||||
| CHEC Loan Trust, Series 2004-2, Class M1 | |||||||||||
| 1 mo. USD LIBOR + 0.640%, 2.704%, due 06/25/343 | 743,417 | 729,249 | |||||||||
| CIFC Funding Ltd., Series 2014-5A, Class A2R | |||||||||||
| 3 mo. USD LIBOR + 1.400%, 3.736%, due 01/17/273,9 | 2,100,000 | 2,101,966 | |||||||||
| Cork Street CLO Designated Activity Co. Series 1A, Class A1BE | |||||||||||
| 3 mo. Euribor + 1.350%, 0.760%, due 11/27/283,9 | EUR | 2,400,000 | 2,802,306 | ||||||||
71
PACE Strategic Fixed Income Investments
Portfolio of investments—July 31, 2018
| Face amount1 | Value | ||||||||||
Asset-backed securities—(continued) | |||||||||||
| CSAB Mortgage Backed Trust, Series 2006-1, Class A6A 6.172%, due 06/25/3611 | 366,192 | $ | 164,702 | ||||||||
| Delta Funding Home Equity Loan Trust, Series 1999-003, Class A1A | |||||||||||
| 1 mo. USD LIBOR + 0.820%, 2.892%, due 09/15/293 | 44,487 | 43,623 | |||||||||
| DT Auto Owner Trust, Series 2017-2, Class A 1.720%, due 05/15/209 | 106,534 | 106,482 | |||||||||
| ECMC Group Student Loan Trust, Series 2018-1A, Class A | |||||||||||
| 1 mo. USD LIBOR + 0.750%, 2.814%, due 02/27/683,9 | 1,534,553 | 1,538,372 | |||||||||
| Evans Grove CLO Ltd., Series 2018-1A, Class A1 | |||||||||||
| 3 mo. USD LIBOR + 0.920%, 3.239%, due 05/28/283,9 | 1,600,000 | 1,588,494 | |||||||||
| Figueroa CLO Ltd., Series 2014-1A, Class AR | |||||||||||
| 3 mo. USD LIBOR + 0.900%, 3.239%, due 01/15/273,9 | 1,600,000 | 1,600,000 | |||||||||
| First Frankin Mortgage Loan Trust, Series 2005-FFH3, Class M2 | |||||||||||
| 1 mo. USD LIBOR + 0.795%, 2.859%, due 09/25/353 | 663,912 | 665,369 | |||||||||
| Flagship VII Ltd., Series 2013-7A, Class A1R | |||||||||||
| 3 mo. USD LIBOR + 1.120%, 3.468%, due 01/20/263,9 | 920,860 | 920,936 | |||||||||
| GMF Floorplan Owner Revolving Trust, Series 2018-2, Class A2 | |||||||||||
| 1 mo. USD LIBOR + 0.380%, 2.277%, due 03/15/233,9 | 1,900,000 | 1,903,003 | |||||||||
| GoldenTree Loan Opportunities IX Ltd., Series 2014-9A, Class AR | |||||||||||
| 3 mo. USD LIBOR + 1.370%, 3.709%, due 10/29/263,9 | 3,000,000 | 3,002,748 | |||||||||
| GSAMP Trust, Series 2006-HE4, Class A1 | |||||||||||
| 1 mo. USD LIBOR + 0.140%, 2.204%, due 06/25/363 | 1,961,120 | 1,913,220 | |||||||||
| Home Equity Asset Trust, Series 2005-2, Class M5 | |||||||||||
| 1 mo. USD LIBOR + 1.095%, 3.159%, due 07/25/353 | 1,000,000 | 1,009,274 | |||||||||
| Jamestown CLO V Ltd., Series 2014-5A, Class AR | |||||||||||
| 3 mo. USD LIBOR + 1.220%, 3.556%, due 01/17/273,9 | 960,938 | 961,548 | |||||||||
| JPMorgan Mortgage Acquisition Corp., Series 2006-FRE1, Class M1 | |||||||||||
| 1 mo. USD LIBOR + 0.390%, 2.454%, due 05/25/353 | 2,400,000 | 2,384,172 | |||||||||
Series 2006-WMC1, Class A1 | |||||||||||
| 1 mo. USD LIBOR + 0.180%, 2.244%, due 03/25/363 | 335,388 | 335,319 | |||||||||
| Face amount1 | Value | ||||||||||
Asset-backed securities—(continued) | |||||||||||
| JPMorgan Mortgage Acquisition Trust, Series 2006-NC1, Class A1 | |||||||||||
| 1 mo. USD LIBOR + 0.170%, 2.234%, due 04/25/363 | 700,485 | $ | 698,276 | ||||||||
Series 2007-CH1, Class MV2 | |||||||||||
| 1 mo. USD LIBOR + 0.280%, 2.344%, due 11/25/363 | 1,680,000 | 1,672,187 | |||||||||
Series 2007-CH2, Class AV1 | |||||||||||
| 1 mo. USD LIBOR + 0.160%, 2.224%, due 01/25/373 | 335,278 | 334,942 | |||||||||
| KVK CLO Ltd., Series 2013-2A, Class AR | |||||||||||
| 3 mo. USD LIBOR + 1.150%, 3.489%, due 01/15/263,9 | 1,149,760 | 1,150,351 | |||||||||
| LoanCore Issuer Ltd., Series 2018-CRE1, Class A | |||||||||||
| 1 mo. USD LIBOR + 1.310%, 3.202%, due 05/15/283,9 | 1,600,000 | 1,601,008 | |||||||||
| Loomis Sayles CLO II Ltd., Series 2015-2A, Class A1R | |||||||||||
| 3 mo. USD LIBOR + 0.900%, 3.239%, due 04/15/283,9 | 1,900,000 | 1,897,026 | |||||||||
| M360 LLC, Series 2018-CRE1, Class A | |||||||||||
4.395%, due 07/24/284,9 | 1,600,000 | 1,599,083 | |||||||||
| Morgan Stanley ABS Capital I, Inc. Trust, Series 2005-HE1, Class M2 | |||||||||||
| 1 mo. USD LIBOR + 0.705%, 2.769%, due 12/25/343 | 237,547 | 219,629 | |||||||||
| Morgan Stanley Dean Witter Capital I, Inc. Trust, Series 2003-NC1, Class M1 | |||||||||||
| 1 mo. USD LIBOR + 1.575%, 3.639%, due 11/25/323 | 717,165 | 715,838 | |||||||||
| Mountain View CLO Ltd., Series 2014-1A, Class ARR | |||||||||||
| 3 mo. USD LIBOR + 0.800%, 3.139%, due 10/15/263,9 | 1,200,000 | 1,198,382 | |||||||||
| Navient Private Education Loan Trust, Series 2018-BA, Class A1 | |||||||||||
| 1 mo. USD LIBOR + 0.350%, 2.422%, due 12/15/593,9 | 1,377,473 | 1,377,332 | |||||||||
Series 2018-BA, Class A2B | |||||||||||
| 1 mo. USD LIBOR + 0.720%, 2.792%, due 12/15/593,9 | 400,000 | 400,123 | |||||||||
| Navient Private Education Refi Loan Trust, Series 2018-CA, Class A1 3.010%, due 06/16/424,9 | 1,600,000 | 1,599,853 | |||||||||
| Navient Student Loan Trust, Series 2016-6A, Class A1 | |||||||||||
| 1 mo. USD LIBOR + 0.480%, 2.544%, due 03/25/663,9 | 120,281 | 120,451 | |||||||||
| New Century Home Equity Loan Trust, Series 2005-B, Class M1 | |||||||||||
| 1 mo. USD LIBOR + 0.480%, 2.544%, due 10/25/353 | 1,900,000 | 1,840,608 | |||||||||
Series 2005-D, Class A2D | |||||||||||
| 1 mo. USD LIBOR + 0.330%, 2.394%, due 02/25/363 | 1,170,709 | 1,170,330 | |||||||||
72
PACE Strategic Fixed Income Investments
Portfolio of investments—July 31, 2018
| Face amount1 | Value | ||||||||||
Asset-backed securities—(continued) | |||||||||||
| Nomura Home Equity Loan, Inc. Home Equity Loan Trust, Series 2006-FM1, Class 2A4 | |||||||||||
| 1 mo. USD LIBOR + 0.330%, 2.394%, due 11/25/353 | 3,000,000 | $ | 2,657,501 | ||||||||
| OneMain Direct Auto Receivables Trust, Series 2018-1A, Class A 3.430%, due 12/16/244,9 | 1,600,000 | 1,599,634 | |||||||||
| RASC, Series 2005-KS11 Trust, Class M2 | |||||||||||
| 1 mo. USD LIBOR + 0.420%, 2.484%, due 12/25/353 | 1,100,000 | 1,095,871 | |||||||||
| SASCO Mortgage Loan Trust, Series 2005-GEL1, Class M2 | |||||||||||
| 1 mo. USD LIBOR + 1.350%, 3.414%, due 12/25/343 | 753,022 | 753,021 | |||||||||
| Saxon Asset Securities Trust, Series 2004-1, Class M1 | |||||||||||
| 1 mo. USD LIBOR + 0.795%, 2.859%, due 03/25/353 | 432,054 | 421,592 | |||||||||
Series 2006-1, Class M1 | |||||||||||
| 1 mo. USD LIBOR + 0.465%, 2.529%, due 03/25/363 | 2,000,000 | 1,783,610 | |||||||||
| SLM Student Loan Trust, Series 2008-9, Class A | |||||||||||
| 3 mo. USD LIBOR + 1.500%, 3.835%, due 04/25/233 | 1,666,523 | 1,699,355 | |||||||||
| SoFi Professional Loan Program, Series 2017-A, Class A2A 1.550%, due 03/26/409 | 716,777 | 710,698 | |||||||||
| Sound Point CLO X Ltd., Series 2015-3A, Class AR | |||||||||||
| 3 mo. USD LIBOR + 0.890%, 3.238%, due 01/20/283,9 | 1,600,000 | 1,597,064 | |||||||||
| Soundview Home Loan Trust, Series 2006-OPT2, Class A3 | |||||||||||
| 1 mo. USD LIBOR + 0.180%, 2.244%, due 05/25/363 | 679,956 | 678,513 | |||||||||
Series 2006-OPT3, Class 2A4 | |||||||||||
| 1 mo. USD LIBOR + 0.250%, 2.314%, due 06/25/363 | 2,675,000 | 2,618,979 | |||||||||
| Structured Asset Securities Corp., Series 2001-SB1, Class A2 3.375%, due 08/25/31 | 346,843 | 342,434 | |||||||||
Series 2005-WF1, Class M1 | |||||||||||
| 1 mo. USD LIBOR + 0.660%, 2.724%, due 02/25/353 | 171,474 | 171,416 | |||||||||
| Symphony CLO XII Ltd., Series 2013-12A, Class AR | |||||||||||
| 3 mo. USD LIBOR + 1.030%, 3.369%, due 10/15/253,9 | 1,953,218 | 1,953,362 | |||||||||
| Telos CLO Ltd., Series 2014-6A, Class A1R | |||||||||||
| 3 mo. USD LIBOR + 1.270%, 3.606%, due 01/17/273,9 | 2,000,000 | 2,001,054 | |||||||||
| TICP CLO III-2 Ltd., Series 2018-3R, Class A | |||||||||||
| 3 mo. USD LIBOR + 0.840%, 3.199%, due 04/20/283,9 | 1,300,000 | 1,286,281 | |||||||||
| Face amount1 | Value | ||||||||||
Asset-backed securities—(concluded) | |||||||||||
| Toyota Auto Receivables Owner Trust, Series 2017-B, Class A2A 1.460%, due 01/15/20 | 310,715 | $ | 309,919 | ||||||||
| Series 2018-B, Class A2A 2.640%, due 03/15/21 | 1,310,000 | 1,308,632 | |||||||||
| Trillium Credit Card Trust II, Series 2018-1A, Class A | |||||||||||
| 1 mo. USD LIBOR + 0.250%, 2.320%, due 02/27/233,9 | 1,800,000 | 1,800,021 | |||||||||
| Utah State Board of Regents, Series 2017-1, Class A | |||||||||||
| 1 mo. USD LIBOR + 0.750%, 2.710%, due 01/25/573 | 884,350 | 886,154 | |||||||||
| Verizon Owner Trust, Series 2017-1A, Class A 2.060%, due 09/20/219 | 1,000,000 | 988,470 | |||||||||
| VOLT LVII LLC, Series 2017-NPL4, Class A1 3.375%, due 04/25/479,11 | 494,424 | 492,795 | |||||||||
| WhiteHorse X Ltd., Series 2015-10A, Class A1R | |||||||||||
| 3 mo. USD LIBOR + 0.930%, 3.266%, due 04/17/273,9 | 1,600,000 | 1,599,986 | |||||||||
| World Omni Automobile Lease Securitization Trust, Series 2017-A, Class A2 | |||||||||||
1.680%, due 12/16/19 | 954,750 | 951,665 | |||||||||
| Total asset-backed securities (cost—$87,486,812) | 90,032,378 | ||||||||||
Corporate notes—47.68% | |||||||||||
Advertising—0.01% | |||||||||||
| Outfront Media Capital LLC/ Outfront Media Capital Corp. 5.875%, due 03/15/25 | 90,000 | 90,788 | |||||||||
Agriculture—0.51% | |||||||||||
| BAT Capital Corp. 2.764%, due 08/15/229 | 1,300,000 | 1,255,257 | |||||||||
4.540%, due 08/15/479 | 1,030,000 | 976,748 | |||||||||
| Philip Morris International, Inc. 2.500%, due 11/02/22 | 1,800,000 | 1,729,998 | |||||||||
3,962,003 | |||||||||||
Airlines—0.76% | |||||||||||
| Air Canada 2013-1, Class B Pass-Through Trust 5.375%, due 05/15/219 | 1,504,857 | 1,534,954 | |||||||||
| American Airlines 2013-2, Class A Pass-Through Trust 4.950%, due 01/15/23 | 1,732,637 | 1,781,254 | |||||||||
| Continental Airlines 2009-2, Series A Pass-Through Trust 7.250%, due 11/10/19 | 731,191 | 766,288 | |||||||||
| Continental Airlines 2012-2, Class A Pass-Through Trust 4.000%, due 10/29/24 | 1,236,087 | 1,240,970 | |||||||||
| Northwest Airlines, Series 2000-1, Class G 7.150%, due 10/01/19 | 598,715 | 612,186 | |||||||||
5,935,652 | |||||||||||
73
PACE Strategic Fixed Income Investments
Portfolio of investments—July 31, 2018
| Face amount1 | Value | ||||||||||
Corporate notes—(continued) | |||||||||||
Auto & truck—1.17% | |||||||||||
| General Motors Co. 6.250%, due 10/02/43 | 500,000 | $ | 522,243 | ||||||||
General Motors Financial Co., Inc. | |||||||||||
| 3 mo. USD LIBOR + 0.540%, 2.903%, due 11/06/203 | 1,500,000 | 1,498,139 | |||||||||
3.100%, due 01/15/19 | 657,000 | 658,340 | |||||||||
3.200%, due 07/13/20 | 1,300,000 | 1,295,710 | |||||||||
3.550%, due 04/09/2112 | 1,600,000 | 1,595,552 | |||||||||
| Harley-Davidson Financial Services, Inc. 2.550%, due 06/09/229 | 1,100,000 | 1,047,612 | |||||||||
| SMBC Aviation Capital Finance DAC 4.125%, due 07/15/239 | 1,600,000 | 1,599,256 | |||||||||
| ZF North America Capital, Inc. 4.000%, due 04/29/209 | 900,000 | 903,784 | |||||||||
9,120,636 | |||||||||||
Auto parts & equipment—0.01% | |||||||||||
| The Goodyear Tire & Rubber Co. 5.125%, due 11/15/23 | 40,000 | 39,700 | |||||||||
Banking-non-US—10.02% | |||||||||||
Banco Bilbao Vizcaya Argentaria SA | |||||||||||
| (fixed, converts to FRN on 02/19/19), 7.000%, due 02/19/197,13 | EUR | 1,400,000 | 1,677,965 | ||||||||
| Bank of Scotland PLC MTN 6.375%, due 08/16/19 | GBP | 1,100,000 | 1,515,273 | ||||||||
| Barclays Bank PLC 6.750%, due 05/22/19 | 1,900,000 | 1,958,329 | |||||||||
Barclays PLC | |||||||||||
| 3 mo. USD LIBOR + 1.625%, 3.956%, due 01/10/233,12 | 2,000,000 | 2,039,346 | |||||||||
4.375%, due 01/12/26 | 1,315,000 | 1,286,767 | |||||||||
4.836%, due 05/09/28 | 785,000 | 748,440 | |||||||||
| (fixed, converts to FRN on 09/15/19), 7.000%, due 09/15/197,13 | GBP | 2,000,000 | 2,690,727 | ||||||||
7.625%, due 11/21/22 | 1,600,000 | 1,732,000 | |||||||||
| (fixed, converts to FRN on 12/15/18), 8.250%, due 12/15/1813 | 1,700,000 | 1,731,192 | |||||||||
| Barclays PLC MTN 3.250%, due 02/12/277 | GBP | 1,100,000 | 1,425,656 | ||||||||
| BNP Paribas SA 2.375%, due 05/21/20 | 630,000 | 620,658 | |||||||||
| Cooperatieve Rabobank UA 6.875%, due 03/19/207 | EUR | 1,400,000 | 1,804,823 | ||||||||
Credit Suisse Group AG | |||||||||||
| 3 mo. USD LIBOR + 1.240%, 3.566%, due 06/12/243,9 | 1,600,000 | 1,607,568 | |||||||||
| (fixed, converts to FRN on 06/12/23), 4.207%, due 06/12/249 | 1,600,000 | 1,604,779 | |||||||||
| Credit Suisse Group Funding Guernsey Ltd. 3.750%, due 03/26/25 | 2,000,000 | 1,937,495 | |||||||||
3.800%, due 09/15/22 | 1,900,000 | 1,894,566 | |||||||||
3.800%, due 06/09/23 | 3,200,000 | 3,172,029 | |||||||||
| Deutsche Bank AG 2.700%, due 07/13/20 | 700,000 | 683,992 | |||||||||
3.300%, due 11/16/22 | 1,900,000 | 1,799,015 | |||||||||
3.950%, due 02/27/23 | 1,300,000 | 1,262,935 | |||||||||
4.250%, due 10/14/21 | 1,100,000 | 1,090,590 | |||||||||
| 3 mo. USD LIBOR + 1.910%, 4.263%, due 05/10/193 | 3,500,000 | 3,516,707 | |||||||||
| Face amount1 | Value | ||||||||||
Corporate notes—(continued) | |||||||||||
Banking-non-US—(concluded) | |||||||||||
| HSBC Holdings PLC 3.400%, due 03/08/21 | 1,700,000 | $ | 1,698,028 | ||||||||
| (fixed, converts to FRN on 05/22/27), 6.000%, due 05/22/2713 | 870,000 | 843,030 | |||||||||
| ICICI Bank Ltd. 4.800%, due 05/22/199 | 1,600,000 | 1,616,149 | |||||||||
| ING Bank NV 2.625%, due 12/05/229 | 3,400,000 | 3,310,352 | |||||||||
| Lloyds Banking Group PLC 3.000%, due 01/11/22 | 1,300,000 | 1,271,192 | |||||||||
| 3 mo. USD LIBOR + 0.800%, 3.130%, due 06/21/213 | 1,300,000 | 1,302,797 | |||||||||
| (fixed, converts to FRN on 06/27/19), 7.000%, due 06/27/197,13 | GBP | 900,000 | 1,219,722 | ||||||||
| Lloyds Banking Group PLC MTN 4.000%, due 03/07/25 | AUD | 1,700,000 | 1,255,463 | ||||||||
| Mitsubishi UFJ Financial Group, Inc. 2.950%, due 03/01/21 | 748,000 | 738,412 | |||||||||
| 3 mo. USD LIBOR + 0.740%, 3.061%, due 03/02/233 | 1,600,000 | 1,601,805 | |||||||||
3.455%, due 03/02/23 | 1,900,000 | 1,877,673 | |||||||||
| National Australia Bank Ltd. 2.400%, due 12/07/219 | 3,300,000 | 3,211,080 | |||||||||
3.625%, due 06/20/23 | 1,600,000 | 1,594,074 | |||||||||
Royal Bank of Scotland Group PLC | |||||||||||
| 3 mo. USD LIBOR + 1.550%, 3.885%, due 06/25/243 | 1,600,000 | 1,613,408 | |||||||||
| Royal Bank of Scotland Group PLC MTN 2.500%, due 03/22/237 | EUR | 1,800,000 | 2,220,172 | ||||||||
| Santander UK Group Holdings PLC 2.875%, due 08/05/21 | 1,700,000 | 1,660,094 | |||||||||
3.125%, due 01/08/21 | 1,700,000 | 1,678,043 | |||||||||
Skandinaviska Enskilda Banken AB | |||||||||||
| 3 mo. USD LIBOR + 0.430%, 2.751%, due 05/17/213,9 | 1,600,000 | 1,600,294 | |||||||||
3.250%, due 05/17/219 | 1,600,000 | 1,590,536 | |||||||||
Societe Generale SA MTN | |||||||||||
| (fixed, converts to FRN on 11/29/18), 8.250%, due 11/29/187,13 | 2,000,000 | 2,029,316 | |||||||||
| United Overseas Bank Ltd. 3.200%, due 04/23/219 | 1,600,000 | 1,590,736 | |||||||||
| Westpac Banking Corp. 2.100%, due 02/25/219 | 2,500,000 | 2,432,210 | |||||||||
3.050%, due 05/15/2012 | 1,600,000 | 1,596,035 | |||||||||
| (fixed, converts to FRN on 09/21/27), 5.000%, due 09/21/2713 | 890,000 | 800,651 | |||||||||
78,152,124 | |||||||||||
Banking-US—5.11% | |||||||||||
| Aviation Capital Group Corp. 6.750%, due 04/06/219 | 4,820,000 | 5,199,094 | |||||||||
| Banco Santander SA 3.800%, due 02/23/28 | 545,000 | 506,291 | |||||||||
Bank of America Corp. | |||||||||||
| (fixed, converts to FRN on 12/20/22), 3.004%, due 12/20/23 | 3,131,000 | 3,038,260 | |||||||||
| (fixed, converts to FRN on 03/05/23), 3.550%, due 03/05/24 | 1,600,000 | 1,581,312 | |||||||||
| (fixed, converts to FRN on 07/23/23), 3.864%, due 07/23/24 | 1,600,000 | 1,599,618 | |||||||||
3.950%, due 04/21/25 | 660,000 | 647,946 | |||||||||
74
PACE Strategic Fixed Income Investments
Portfolio of investments—July 31, 2018
| Face amount1 | Value | ||||||||||
Corporate notes—(continued) | |||||||||||
Banking-US—(concluded) | |||||||||||
Bank of America Corp. MTN | |||||||||||
| (fixed, converts to FRN on 03/05/28), 3.970%, due 03/05/29 | 565,000 | $ | 553,903 | ||||||||
4.000%, due 01/22/25 | 1,500,000 | 1,481,712 | |||||||||
4.125%, due 01/22/24 | 3,700,000 | 3,757,703 | |||||||||
| CIT Group, Inc. 4.125%, due 03/09/21 | 50,000 | 49,938 | |||||||||
5.000%, due 08/15/22 | 500,000 | 509,375 | |||||||||
5.250%, due 03/07/25 | 45,000 | 46,013 | |||||||||
6.125%, due 03/09/28 | 35,000 | 36,750 | |||||||||
| Compass Bank 3.500%, due 06/11/21 | 1,600,000 | 1,594,571 | |||||||||
| Dexia Credit Local SA 2.375%, due 09/20/229 | 3,000,000 | 2,901,169 | |||||||||
| Discover Bank 4.200%, due 08/08/23 | 1,600,000 | 1,613,208 | |||||||||
| Goldman Sachs Bank USA 3.200%, due 06/05/20 | 1,500,000 | 1,502,043 | |||||||||
JPMorgan Chase Bank NA | |||||||||||
| (fixed, converts to FRN on 04/26/20), 3.086%, due 04/26/21 | 3,000,000 | 2,997,353 | |||||||||
| Synchrony Bank 3.650%, due 05/24/21 | 1,600,000 | 1,582,406 | |||||||||
| Synchrony Financial 2.700%, due 02/03/20 | 755,000 | 745,044 | |||||||||
| The Toronto-Dominion Bank 2.500%, due 01/18/229 | 2,400,000 | 2,340,883 | |||||||||
| Wells Fargo & Co. 2.100%, due 07/26/21 | 1,200,000 | 1,155,422 | |||||||||
2.500%, due 03/04/21 | 1,200,000 | 1,174,009 | |||||||||
| 3 mo. USD LIBOR + 1.230%, 3.589%, due 10/31/233 | 1,400,000 | 1,430,100 | |||||||||
| Wells Fargo & Co. GMTN 2.600%, due 07/22/20 | 1,800,000 | 1,780,700 | |||||||||
39,824,823 | |||||||||||
Beverages—0.51% | |||||||||||
| Anheuser-Busch InBev Worldwide, Inc. 4.750%, due 04/15/58 | 840,000 | 846,031 | |||||||||
| Constellation Brands, Inc. 2.650%, due 11/07/22 | 1,600,000 | 1,530,455 | |||||||||
| Keurig Dr. Pepper, Inc. 4.057%, due 05/25/234,9 | 1,600,000 | 1,611,161 | |||||||||
3,987,647 | |||||||||||
Building & construction—0.16% | |||||||||||
| Lennar Corp. 4.750%, due 11/15/2211 | 145,000 | 145,000 | |||||||||
5.375%, due 10/01/22 | 125,000 | 126,875 | |||||||||
| Meritage Homes Corp. 6.000%, due 06/01/25 | 15,000 | 15,103 | |||||||||
7.000%, due 04/01/22 | 50,000 | 53,750 | |||||||||
| Odebrecht Offshore Drilling Finance Ltd. 6.720%, due 12/01/229 | 347,271 | 329,040 | |||||||||
7.720%, due 12/01/269,14 | 1,120,009 | 324,803 | |||||||||
| Taylor Morrison Communities, Inc./ Taylor Morrison Holdings II, Inc. 5.625%, due 03/01/249 | 105,000 | 102,144 | |||||||||
| Face amount1 | Value | ||||||||||
Corporate notes—(continued) | |||||||||||
Building & construction—(concluded) | |||||||||||
| Toll Brothers Finance Corp. 4.350%, due 02/15/28 | 40,000 | $ | 35,850 | ||||||||
4.875%, due 11/15/25 | 40,000 | 38,868 | |||||||||
5.625%, due 01/15/24 | 105,000 | 107,887 | |||||||||
1,279,320 | |||||||||||
Building materials—0.01% | |||||||||||
| Jeld-Wen, Inc. 4.625%, due 12/15/259 | 20,000 | 19,000 | |||||||||
4.875%, due 12/15/279 | 45,000 | 41,906 | |||||||||
| Masonite International Corp. 5.625%, due 03/15/239 | 50,000 | 51,000 | |||||||||
111,906 | |||||||||||
Building products—0.02% | |||||||||||
| USG Corp. 5.500%, due 03/01/259 | 120,000 | 122,700 | |||||||||
Cable—0.13% | |||||||||||
| CCO Holdings LLC/CCO Holdings Capital Corp. 5.000%, due 02/01/289 | 140,000 | 131,075 | |||||||||
5.125%, due 05/01/239 | 180,000 | 179,550 | |||||||||
5.250%, due 09/30/22 | 100,000 | 101,000 | |||||||||
5.375%, due 05/01/259 | 75,000 | 73,688 | |||||||||
5.750%, due 02/15/269 | 155,000 | 154,116 | |||||||||
| CSC Holdings LLC 5.500%, due 04/15/279 | 200,000 | 192,500 | |||||||||
| Unitymedia Hessen GmbH & Co. KG/Unitymedia NRW GmbH 5.000%, due 01/15/259 | 200,000 | 203,500 | |||||||||
1,035,429 | |||||||||||
Chemicals—0.27% | |||||||||||
| CF Industries, Inc. 5.375%, due 03/15/44 | 30,000 | 26,625 | |||||||||
7.125%, due 05/01/20 | 70,000 | 73,762 | |||||||||
| Huntsman International LLC 5.125%, due 11/15/22 | 50,000 | 51,703 | |||||||||
| NOVA Chemicals Corp. 4.875%, due 06/01/249 | 80,000 | 77,276 | |||||||||
5.000%, due 05/01/259 | 140,000 | 133,350 | |||||||||
5.250%, due 06/01/279 | 70,000 | 65,519 | |||||||||
| PQ Corp. 6.750%, due 11/15/229 | 60,000 | 63,000 | |||||||||
| Syngenta Finance N.V. 4.441%, due 04/24/239 | 1,600,000 | 1,595,615 | |||||||||
| WR Grace & Co-Conn 5.125%, due 10/01/219 | 45,000 | 45,788 | |||||||||
5.625%, due 10/01/249 | 15,000 | 15,750 | |||||||||
2,148,388 | |||||||||||
Commercial services—0.86% | |||||||||||
| Advanced Disposal Services, Inc. 5.625%, due 11/15/249 | 90,000 | 88,875 | |||||||||
| Aircastle Ltd. 4.625%, due 12/15/18 | 15,000 | 15,078 | |||||||||
75
PACE Strategic Fixed Income Investments
Portfolio of investments—July 31, 2018
| Face amount1 | Value | ||||||||||
Corporate notes—(continued) | |||||||||||
Commercial services—(concluded) | |||||||||||
| Avis Budget Car Rental LLC/ Avis Budget Finance, Inc. 5.250%, due 03/15/259 | 25,000 | $ | 23,000 | ||||||||
| CDK Global, Inc. 4.875%, due 06/01/27 | 40,000 | 39,150 | |||||||||
5.000%, due 10/15/2411 | 75,000 | 76,500 | |||||||||
5.875%, due 06/15/26 | 30,000 | 30,750 | |||||||||
| ERAC USA Finance LLC 2.350%, due 10/15/199 | 1,650,000 | 1,635,106 | |||||||||
| Harland Clarke Holdings Corp. 8.375%, due 08/15/229 | 120,000 | 114,744 | |||||||||
| IHS Markit Ltd. 5.000%, due 11/01/229 | 110,000 | 112,938 | |||||||||
| Iron Mountain US Holdings, Inc. 5.375%, due 06/01/269 | 145,000 | 137,931 | |||||||||
| Iron Mountain, Inc. 5.750%, due 08/15/24 | 80,000 | 79,300 | |||||||||
| Live Nation Entertainment, Inc. 4.875%, due 11/01/249 | 95,000 | 93,694 | |||||||||
| Moody's Corp. 2.625%, due 01/15/23 | 1,700,000 | 1,627,954 | |||||||||
| R.R. Donnelley & Sons Co. 7.625%, due 06/15/20 | 27,000 | 27,675 | |||||||||
7.875%, due 03/15/21 | 125,000 | 127,500 | |||||||||
| Republic Services, Inc. 3.550%, due 06/01/22 | 2,100,000 | 2,105,964 | |||||||||
| Service Corp. International 5.375%, due 05/15/24 | 90,000 | 91,125 | |||||||||
| The ADT Corp. 3.500%, due 07/15/22 | 40,000 | 38,000 | |||||||||
4.875%, due 07/15/329 | 70,000 | 55,300 | |||||||||
| The Hertz Corp. 5.500%, due 10/15/249 | 50,000 | 39,375 | |||||||||
5.875%, due 10/15/20 | 65,000 | 64,259 | |||||||||
| The ServiceMaster Co. LLC 5.125%, due 11/15/249 | 70,000 | 67,550 | |||||||||
6,691,768 | |||||||||||
Communications equipment—0.26% | |||||||||||
| QUALCOMM, Inc. 4.800%, due 05/20/45 | 2,000,000 | 2,011,609 | |||||||||
Computer software & services—0.02% | |||||||||||
| EMC Corp. 2.650%, due 06/01/20 | 135,000 | 131,598 | |||||||||
Computers—0.74% | |||||||||||
| Apple, Inc. 3.000%, due 06/20/27 | 1,200,000 | 1,147,886 | |||||||||
3.350%, due 02/09/27 | 550,000 | 540,548 | |||||||||
4.650%, due 02/23/46 | 455,000 | 496,790 | |||||||||
| Dell International LLC/EMC Corp. 4.420%, due 06/15/219,12 | 1,800,000 | 1,827,486 | |||||||||
5.450%, due 06/15/239 | 1,125,000 | 1,181,061 | |||||||||
6.020%, due 06/15/269 | 545,000 | 575,465 | |||||||||
5,769,236 | |||||||||||
| Face amount1 | Value | ||||||||||
Corporate notes—(continued) | |||||||||||
Construction & engineering—0.00%† | |||||||||||
| AECOM 5.875%, due 10/15/24 | 35,000 | $ | 36,663 | ||||||||
Consumer products—0.29% | |||||||||||
| Reckitt Benckiser Treasury Services PLC 2.375%, due 06/24/229 | 2,300,000 | 2,201,730 | |||||||||
| Spectrum Brands, Inc. 5.750%, due 07/15/25 | 25,000 | 24,938 | |||||||||
6.625%, due 11/15/22 | 35,000 | 36,050 | |||||||||
2,262,718 | |||||||||||
Containers & packaging—0.03% | |||||||||||
| Owens-Brockway Glass Container, Inc. 5.000%, due 01/15/229 | 65,000 | 65,000 | |||||||||
| Sealed Air Corp. 5.250%, due 04/01/239 | 75,000 | 76,312 | |||||||||
| Silgan Holdings, Inc. 5.500%, due 02/01/22 | 65,000 | 65,650 | |||||||||
206,962 | |||||||||||
Diversified financials—2.75% | |||||||||||
| AIG Global Funding 3.350%, due 06/25/219 | 1,600,000 | 1,596,889 | |||||||||
| American Express Co. 3.375%, due 05/17/21 | 1,600,000 | 1,601,248 | |||||||||
| Doric Nimrod Air Finance Alpha Ltd. 2012-1, Class A Pass-Through Trust 5.125%, due 11/30/229 | 346,689 | 360,573 | |||||||||
| Emerald Bay SA 0.000%, due 10/08/209,15 | EUR | 1,553,000 | 1,697,960 | ||||||||
| First Data Corp. 5.000%, due 01/15/249 | 215,000 | 216,881 | |||||||||
7.000%, due 12/01/239 | 205,000 | 214,481 | |||||||||
| Lehman Brothers Holdings, Inc. MTN 0.000%, due 12/30/164,16 | 1,900,000 | 57,760 | |||||||||
1.000%, due 01/24/134,16 | 4,500,000 | 137,700 | |||||||||
1.000%, due 12/30/164,16 | 900,000 | 27,360 | |||||||||
| LPL Holdings, Inc. 5.750%, due 09/15/259 | 153,000 | 148,410 | |||||||||
| Navient Corp. 5.875%, due 10/25/24 | 25,000 | 24,188 | |||||||||
6.625%, due 07/26/21 | 100,000 | 103,250 | |||||||||
6.750%, due 06/15/26 | 50,000 | 49,250 | |||||||||
| Navient Corp. MTN 6.125%, due 03/25/24 | 360,000 | 354,600 | |||||||||
8.000%, due 03/25/20 | 35,000 | 36,925 | |||||||||
| Rio Oil Finance Trust, Series 2014-1 | |||||||||||
9.250%, due 07/06/249 | 1,265,076 | 1,359,956 | |||||||||
| Springleaf Finance Corp. 5.250%, due 12/15/19 | 2,200,000 | 2,235,750 | |||||||||
5.625%, due 03/15/23 | 40,000 | 40,104 | |||||||||
6.125%, due 05/15/22 | 85,000 | 86,913 | |||||||||
6.875%, due 03/15/25 | 1,410,000 | 1,431,150 | |||||||||
7.125%, due 03/15/26 | 70,000 | 71,138 | |||||||||
7.750%, due 10/01/21 | 105,000 | 113,400 | |||||||||
8.250%, due 12/15/20 | 50,000 | 54,125 | |||||||||
76
PACE Strategic Fixed Income Investments
Portfolio of investments—July 31, 2018
| Face amount1 | Value | ||||||||||
Corporate notes—(continued) | |||||||||||
Diversified financials—(concluded) | |||||||||||
| The Goldman Sachs Group, Inc. 2.600%, due 04/23/20 | 255,000 | $ | 252,395 | ||||||||
| (fixed, converts to FRN on 10/31/21), 2.876%, due 10/31/22 | 1,300,000 | 1,264,755 | |||||||||
| 3 mo. USD LIBOR + 1.160%, 3.507%, due 04/23/203 | 1,800,000 | 1,823,686 | |||||||||
| (fixed, converts to FRN on 06/05/27), 3.691%, due 06/05/28 | 555,000 | 529,224 | |||||||||
| (fixed, converts to FRN on 04/23/28), 3.814%, due 04/23/29 | 1,005,000 | 961,105 | |||||||||
| (fixed, converts to FRN on 10/31/37), 4.017%, due 10/31/38 | 455,000 | 424,854 | |||||||||
5.150%, due 05/22/45 | 565,000 | 586,010 | |||||||||
6.000%, due 06/15/20 | 3,400,000 | 3,563,359 | |||||||||
21,425,399 | |||||||||||
Diversified manufacturing—0.51% | |||||||||||
General Electric Co. | |||||||||||
| (fixed, converts to FRN on 01/21/21), 5.000%, due 01/21/2113 | 4,079,000 | 4,007,210 | |||||||||
Electric utilities—1.11% | |||||||||||
| Commonwealth Edison Co. 4.000%, due 03/01/48 | 645,000 | 639,625 | |||||||||
| Duke Energy Corp. 3.550%, due 09/15/21 | 1,300,000 | 1,309,329 | |||||||||
3.750%, due 04/15/24 | 1,700,000 | 1,698,439 | |||||||||
Mississippi Power Co. | |||||||||||
| 3 mo. USD LIBOR + 0.650%, 2.987%, due 03/27/203 | 1,900,000 | 1,900,359 | |||||||||
| NextEra Energy Capital Holdings, Inc. 3.550%, due 05/01/2712 | 1,700,000 | 1,640,907 | |||||||||
| NextEra Energy Operating Partners LP 4.250%, due 09/15/249 | 53,000 | 51,145 | |||||||||
| NRG Energy, Inc. 6.250%, due 05/01/24 | 150,000 | 154,313 | |||||||||
6.625%, due 01/15/27 | 140,000 | 144,200 | |||||||||
7.250%, due 05/15/26 | 75,000 | 79,875 | |||||||||
| Ohio Power Co., Series M 5.375%, due 10/01/21 | 480,000 | 509,705 | |||||||||
| Talen Energy Supply LLC 6.500%, due 06/01/25 | 45,000 | 33,075 | |||||||||
9.500%, due 07/15/229 | 105,000 | 100,800 | |||||||||
| Vistra Energy Corp. 5.875%, due 06/01/23 | 90,000 | 92,588 | |||||||||
7.625%, due 11/01/24 | 175,000 | 187,521 | |||||||||
8.000%, due 01/15/259 | 65,000 | 70,606 | |||||||||
8.125%, due 01/30/269 | 35,000 | 38,598 | |||||||||
8,651,085 | |||||||||||
Electric-generation—0.02% | |||||||||||
| Calpine Corp. 5.375%, due 01/15/23 | 150,000 | 143,063 | |||||||||
5.750%, due 01/15/25 | 30,000 | 27,600 | |||||||||
170,663 | |||||||||||
| Face amount1 | Value | ||||||||||
Corporate notes—(continued) | |||||||||||
Electric-integrated—1.35% | |||||||||||
| Entergy Gulf States Louisiana LLC 5.590%, due 10/01/24 | 2,207,000 | $ | 2,422,519 | ||||||||
| PPL Capital Funding, Inc. 3.500%, due 12/01/22 | 1,700,000 | 1,686,346 | |||||||||
| Puget Energy, Inc. 6.500%, due 12/15/20 | 6,000,000 | 6,387,329 | |||||||||
10,496,194 | |||||||||||
Electronics—0.84% | |||||||||||
| Amkor Technology, Inc. 6.375%, due 10/01/22 | 90,000 | 91,800 | |||||||||
| Broadcom Corp./Broadcom Cayman Finance Ltd. 3.500%, due 01/15/28 | 155,000 | 140,193 | |||||||||
3.625%, due 01/15/24 | 1,800,000 | 1,733,916 | |||||||||
3.875%, due 01/15/27 | 965,000 | 903,908 | |||||||||
| Microchip Technology, Inc. 3.922%, due 06/01/219 | 1,300,000 | 1,302,439 | |||||||||
4.333%, due 06/01/239 | 595,000 | 596,601 | |||||||||
| Micron Technology, Inc. 5.500%, due 02/01/25 | 40,000 | 41,350 | |||||||||
| Monongahela Power Co. 3.550%, due 05/15/279 | 1,800,000 | 1,746,260 | |||||||||
6,556,467 | |||||||||||
Energy-exploration & production—0.03% | |||||||||||
| Antero Resources Corp. 5.125%, due 12/01/22 | 30,000 | 30,075 | |||||||||
5.375%, due 11/01/21 | 100,000 | 101,375 | |||||||||
5.625%, due 06/01/23 | 95,000 | 96,900 | |||||||||
228,350 | |||||||||||
Energy-integrated—0.21% | |||||||||||
Consolidated Edison Co. of New York, Inc. | |||||||||||
| 3 mo. USD LIBOR + 0.400%, 2.739%, due 06/25/213 | 1,600,000 | 1,603,947 | |||||||||
Finance-captive automotive—0.77% | |||||||||||
| International Lease Finance Corp. 5.875%, due 04/01/19 | 2,100,000 | 2,139,839 | |||||||||
| Lions Gate Capital Holdings LLC 5.875%, due 11/01/249 | 80,000 | 81,800 | |||||||||
| Park Aerospace Holdings Ltd. 5.250%, due 08/15/229 | 235,000 | 235,000 | |||||||||
5.500%, due 02/15/249 | 160,000 | 158,000 | |||||||||
| Prime Security Services Borrower LLC/ Prime Finance, Inc. 9.250%, due 05/15/239 | 135,000 | 144,450 | |||||||||
The Charles Schwab Corp. | |||||||||||
| (fixed, converts to FRN on 12/01/27), 5.000%, due 12/01/2713 | 1,300,000 | 1,252,875 | |||||||||
The Depository Trust & Clearing Corp. | |||||||||||
| (fixed, converts to FRN on 06/15/20), 4.875%, due 06/15/209,13 | 2,000,000 | 2,035,000 | |||||||||
6,046,964 | |||||||||||
77
PACE Strategic Fixed Income Investments
Portfolio of investments—July 31, 2018
| Face amount1 | Value | ||||||||||
Corporate notes—(continued) | |||||||||||
Finance-non-captive diversified—1.17% | |||||||||||
| Ford Motor Co. 4.346%, due 12/08/26 | 600,000 | $ | 577,151 | ||||||||
| Ford Motor Credit Co. LLC 2.459%, due 03/27/20 | 2,800,000 | 2,757,273 | |||||||||
2.597%, due 11/04/19 | 2,300,000 | 2,283,164 | |||||||||
3.200%, due 01/15/21 | 315,000 | 310,789 | |||||||||
8.125%, due 01/15/20 | 3,000,000 | 3,197,130 | |||||||||
9,125,507 | |||||||||||
Financial services—3.41% | |||||||||||
| Ally Financial, Inc. 3.750%, due 11/18/19 | 105,000 | 105,000 | |||||||||
4.250%, due 04/15/21 | 105,000 | �� | 105,262 | ||||||||
4.750%, due 09/10/18 | 1,400,000 | 1,402,380 | |||||||||
8.000%, due 03/15/20 | 50,000 | 53,250 | |||||||||
| Citicorp Lease Pass-Through Trust 1999-1 8.040%, due 12/15/199 | 744,348 | 789,931 | |||||||||
Citigroup, Inc. | |||||||||||
| (fixed, converts to FRN on 07/24/22), 2.876%, due 07/24/23 | 1,400,000 | 1,353,493 | |||||||||
| 3 mo. USD LIBOR + 0.960%, 3.295%, due 04/25/223 | 2,000,000 | 2,025,399 | |||||||||
| (fixed, converts to FRN on 10/27/27), 3.520%, due 10/27/28 | 280,000 | 263,725 | |||||||||
| (fixed, converts to FRN on 01/10/27), 3.887%, due 01/10/28 | 230,000 | 223,234 | |||||||||
4.400%, due 06/10/25 | 980,000 | 978,309 | |||||||||
| JPMorgan Chase & Co. 2.250%, due 01/23/20 | 3,150,000 | 3,113,629 | |||||||||
2.750%, due 06/23/20 | 1,400,000 | 1,389,719 | |||||||||
| 3 mo. USD LIBOR + 0.610%, 2.945%, due 06/18/223 | 1,900,000 | 1,900,565 | |||||||||
| (fixed, converts to FRN on 07/23/23), 3.797%, due 07/23/24 | 1,600,000 | 1,598,723 | |||||||||
| (fixed, converts to FRN on 07/24/37), 3.882%, due 07/24/38 | 415,000 | 390,864 | |||||||||
| (fixed, converts to FRN on 01/23/48), 3.897%, due 01/23/49 | 400,000 | 365,633 | |||||||||
| (fixed, converts to FRN on 04/23/28), 4.005%, due 04/23/29 | 800,000 | 786,698 | |||||||||
4.400%, due 07/22/20 | 600,000 | 613,556 | |||||||||
6.300%, due 04/23/19 | 400,000 | 410,444 | |||||||||
Morgan Stanley | |||||||||||
| 3 mo. USD LIBOR + 1.180%, 3.528%, due 01/20/223 | 2,000,000 | 2,032,086 | |||||||||
| (fixed, converts to FRN on 07/15/19), 5.450%, due 07/15/1913 | 395,000 | 400,925 | |||||||||
| Morgan Stanley GMTN 2.450%, due 02/01/19 | 3,500,000 | 3,496,792 | |||||||||
7.300%, due 05/13/19 | 2,570,000 | 2,658,144 | |||||||||
| The Nielsen Co. Luxembourg SARL 5.000%, due 02/01/259 | 65,000 | 59,963 | |||||||||
5.500%, due 10/01/219 | 50,000 | 49,875 | |||||||||
26,567,599 | |||||||||||
| Face amount1 | Value | ||||||||||
Corporate notes—(continued) | |||||||||||
Food & drug retailing—0.29% | |||||||||||
| CVS Health Corp. 4.300%, due 03/25/28 | 965,000 | $ | 961,346 | ||||||||
5.050%, due 03/25/48 | 1,225,000 | 1,269,330 | |||||||||
2,230,676 | |||||||||||
Food processors/beverage/bottling—0.01% | |||||||||||
| BBA US Holdings, Inc. 5.375%, due 05/01/269 | 65,000 | 65,487 | |||||||||
Food products—0.59% | |||||||||||
| Albertsons Cos. LLC/Safeway, Inc./ New Albertson's LP/Albertson's LLC 5.750%, due 03/15/25 | 30,000 | 26,943 | |||||||||
6.625%, due 06/15/24 | 30,000 | 28,725 | |||||||||
| Aramark Services, Inc. 5.125%, due 01/15/24 | 260,000 | 262,275 | |||||||||
Campbell Soup Co. | |||||||||||
| 3 mo. USD LIBOR + 0.500%, 2.835%, due 03/16/203 | 1,000,000 | 1,000,648 | |||||||||
| Grupo Bimbo SAB de C.V. 4.700%, due 11/10/479 | 705,000 | 658,646 | |||||||||
| Post Holdings, Inc. 5.500%, due 03/01/259 | 135,000 | 132,975 | |||||||||
5.750%, due 03/01/279 | 25,000 | 24,375 | |||||||||
| Smithfield Foods, Inc. 2.700%, due 01/31/209 | 2,400,000 | 2,362,008 | |||||||||
| The Kroger Co. 3.875%, due 10/15/46 | 115,000 | 97,936 | |||||||||
4,594,531 | |||||||||||
Food-wholesale—0.01% | |||||||||||
| Pinnacle Foods Finance LLC/ Pinnacle Foods Finance Corp. 5.875%, due 01/15/24 | 40,000 | 42,050 | |||||||||
Gaming—0.39% | |||||||||||
| Boyd Gaming Corp. 6.000%, due 08/15/269 | 65,000 | 65,325 | |||||||||
6.375%, due 04/01/26 | 60,000 | 61,350 | |||||||||
6.875%, due 05/15/23 | 180,000 | 189,281 | |||||||||
| Cedar Fair LP/Canada's Wonderland Co./ Magnum Management Corp. 5.375%, due 06/01/24 | 125,000 | 125,937 | |||||||||
| Eldorado Resorts, Inc. 6.000%, due 04/01/25 | 60,000 | 60,600 | |||||||||
7.000%, due 08/01/23 | 60,000 | 63,059 | |||||||||
| GLP Capital LP/GLP Financing II, Inc. 4.375%, due 04/15/21 | 50,000 | 50,889 | |||||||||
4.875%, due 11/01/20 | 50,000 | 50,750 | |||||||||
5.375%, due 11/01/23 | 65,000 | 67,112 | |||||||||
5.375%, due 04/15/26 | 25,000 | 25,403 | |||||||||
| MGM Resorts International 5.750%, due 06/15/25 | 50,000 | 50,422 | |||||||||
6.625%, due 12/15/21 | 25,000 | 26,642 | |||||||||
6.750%, due 10/01/20 | 170,000 | 179,137 | |||||||||
8.625%, due 02/01/19 | 15,000 | 15,335 | |||||||||
78
PACE Strategic Fixed Income Investments
Portfolio of investments—July 31, 2018
| Face amount1 | Value | ||||||||||
Corporate notes—(continued) | |||||||||||
Gaming—(concluded) | |||||||||||
| Six Flags Entertainment Corp. 4.875%, due 07/31/249 | 65,000 | $ | 63,619 | ||||||||
| Wynn Las Vegas LLC/Wynn Las Vegas Capital Corp. 5.500%, due 03/01/259,12 | 2,000,000 | 1,975,000 | |||||||||
3,069,861 | |||||||||||
Gas pipelines—0.23% | |||||||||||
| Kinder Morgan, Inc. 3.050%, due 12/01/19 | 500,000 | 499,858 | |||||||||
5.000%, due 02/15/219 | 610,000 | 630,508 | |||||||||
5.550%, due 06/01/45 | 625,000 | 656,008 | |||||||||
1,786,374 | |||||||||||
Health care providers & services—0.32% | |||||||||||
| Abbott Laboratories 4.900%, due 11/30/46 | 355,000 | 390,677 | |||||||||
| Acadia Healthcare Co., Inc. 5.625%, due 02/15/23 | 75,000 | 75,563 | |||||||||
6.500%, due 03/01/24 | 75,000 | 76,312 | |||||||||
| Anthem, Inc. 4.350%, due 08/15/20 | 1,200,000 | 1,226,254 | |||||||||
| Centene Corp. 4.750%, due 05/15/22 | 125,000 | 126,406 | |||||||||
5.375%, due 06/01/269 | 45,000 | 46,069 | |||||||||
6.125%, due 02/15/24 | 50,000 | 52,625 | |||||||||
| Endo Dac/Endo Finance LLC/Endo Finco, Inc. 5.875%, due 10/15/249 | 200,000 | 197,060 | |||||||||
| Envision Healthcare Corp. 6.250%, due 12/01/249 | 170,000 | 181,050 | |||||||||
| Hologic, Inc. 4.375%, due 10/15/259 | 90,000 | 87,049 | |||||||||
| Mallinckrodt International Finance SA/ Mallinckrodt CB LLC 5.500%, due 04/15/259 | 40,000 | 32,200 | |||||||||
2,491,265 | |||||||||||
Health facilities—0.02% | |||||||||||
| DaVita, Inc. 5.125%, due 07/15/24 | 80,000 | 77,850 | |||||||||
5.750%, due 08/15/22 | 100,000 | 101,750 | |||||||||
179,600 | |||||||||||
Hotels, restaurants & leisure—0.55% | |||||||||||
McDonald's Corp. | |||||||||||
| 3 mo. USD LIBOR + 0.430%, 2.769%, due 10/28/213 | 600,000 | 602,302 | |||||||||
| Starbucks Corp. 2.700%, due 06/15/2212 | 1,900,000 | 1,848,521 | |||||||||
4.300%, due 06/15/45 | 1,900,000 | 1,811,901 | |||||||||
4,262,724 | |||||||||||
| Face amount1 | Value | ||||||||||
Corporate notes—(continued) | |||||||||||
Insurance—0.46% | |||||||||||
| American International Group, Inc. 3.375%, due 08/15/20 | 1,500,000 | $ | 1,501,644 | ||||||||
| AXA Equitable Holdings, Inc. 4.350%, due 04/20/289 | 1,700,000 | 1,660,667 | |||||||||
5.000%, due 04/20/489 | 485,000 | 464,214 | |||||||||
3,626,525 | |||||||||||
IT consulting & services—0.17% | |||||||||||
| Gartner, Inc. 5.125%, due 04/01/259 | 65,000 | 65,578 | |||||||||
| Hewlett Packard Enterprise Co. 3.600%, due 10/15/2011 | 515,000 | 517,887 | |||||||||
4.900%, due 10/15/2511 | 700,000 | 714,682 | |||||||||
1,298,147 | |||||||||||
Lodging—0.03% | |||||||||||
| Hilton Domestic Operating Co., Inc. 5.125%, due 05/01/269 | 45,000 | 45,000 | |||||||||
| Hilton Worldwide Finance LLC/ Hilton Worldwide Finance Corp. 4.625%, due 04/01/25 | 50,000 | 48,750 | |||||||||
4.875%, due 04/01/27 | 40,000 | 38,900 | |||||||||
| Jack Ohio Finance LLC/Jack Ohio Finance 1 Corp. 6.750%, due 11/15/219 | 50,000 | 51,625 | |||||||||
| NCL Corp. Ltd. 4.750%, due 12/15/219 | 32,000 | 32,040 | |||||||||
216,315 | |||||||||||
Machinery—0.23% | |||||||||||
| John Deere Capital Corp. 3.450%, due 06/07/23 | 1,700,000 | 1,697,692 | |||||||||
| Sensata Technologies BV 4.875%, due 10/15/239 | 75,000 | 75,562 | |||||||||
1,773,254 | |||||||||||
Machinery-diversified—0.01% | |||||||||||
| RBS Global, Inc./Rexnord LLC 4.875%, due 12/15/259 | 100,000 | 96,000 | |||||||||
Media—1.86% | |||||||||||
| Altice France SA 5.875%, due 02/01/274,9 | EUR | 1,100,000 | 1,312,011 | ||||||||
6.250%, due 05/15/249 | 200,000 | 198,750 | |||||||||
7.375%, due 05/01/269 | 800,000 | 794,500 | |||||||||
8.125%, due 02/01/279 | 200,000 | 204,000 | |||||||||
| Altice Luxembourg SA 7.250%, due 05/15/227 | EUR | 1,700,000 | 2,037,592 | ||||||||
7.750%, due 05/15/229 | 200,000 | 199,000 | |||||||||
| AMC Networks, Inc. 4.750%, due 12/15/22 | 65,000 | 65,000 | |||||||||
| CBS Radio, Inc. 7.250%, due 11/01/249,12 | 1,500,000 | 1,409,250 | |||||||||
| Charter Communications Operating LLC/ Charter Communications Operating Capital 3.579%, due 07/23/20 | 1,600,000 | 1,602,346 | |||||||||
4.464%, due 07/23/22 | 1,700,000 | 1,727,437 | |||||||||
79
PACE Strategic Fixed Income Investments
Portfolio of investments—July 31, 2018
| Face amount1 | Value | ||||||||||
Corporate notes—(continued) | |||||||||||
Media—(concluded) | |||||||||||
4.908%, due 07/23/25 | 1,230,000 | $ | 1,253,074 | ||||||||
5.375%, due 05/01/47 | 195,000 | 187,672 | |||||||||
5.750%, due 04/01/48 | 510,000 | 512,922 | |||||||||
6.484%, due 10/23/45 | 445,000 | 484,250 | |||||||||
| Comcast Corp. 4.000%, due 08/15/47 | 550,000 | 503,398 | |||||||||
| Discovery Communications LLC 5.200%, due 09/20/47 | 115,000 | 113,306 | |||||||||
| DISH DBS Corp. 5.000%, due 03/15/23 | 55,000 | 47,575 | |||||||||
5.875%, due 11/15/24 | 40,000 | 33,350 | |||||||||
6.750%, due 06/01/21 | 60,000 | 60,450 | |||||||||
7.750%, due 07/01/26 | 30,000 | 26,213 | |||||||||
| Lamar Media Corp. 5.000%, due 05/01/23 | 40,000 | 40,500 | |||||||||
5.375%, due 01/15/24 | 25,000 | 25,625 | |||||||||
5.750%, due 02/01/26 | 45,000 | 46,125 | |||||||||
| Liberty Interactive LLC 8.500%, due 07/15/29 | 50,000 | 53,500 | |||||||||
| LIN Television Corp. 5.875%, due 11/15/22 | 15,000 | 15,244 | |||||||||
| MDC Partners, Inc. 6.500%, due 05/01/249 | 105,000 | 92,662 | |||||||||
| Netflix, Inc. 4.375%, due 11/15/26 | 25,000 | 23,438 | |||||||||
5.375%, due 02/01/21 | 25,000 | 25,656 | |||||||||
5.500%, due 02/15/22 | 40,000 | 41,250 | |||||||||
5.875%, due 02/15/25 | 25,000 | 25,630 | |||||||||
5.875%, due 11/15/289 | 35,000 | 35,088 | |||||||||
| Nielsen Finance LLC/Nielsen Finance Co. 5.000%, due 04/15/229 | 170,000 | 165,219 | |||||||||
| Sinclair Television Group, Inc. 5.375%, due 04/01/21 | 15,000 | 15,094 | |||||||||
5.625%, due 08/01/249 | 185,000 | 182,687 | |||||||||
| Sirius XM Radio, Inc. 5.000%, due 08/01/279 | 70,000 | 66,500 | |||||||||
5.375%, due 04/15/259 | 165,000 | 163,762 | |||||||||
5.375%, due 07/15/269 | 125,000 | 122,344 | |||||||||
| Telenet Finance Luxembourg Notes Sarl 5.500%, due 03/01/289 | 200,000 | 182,500 | |||||||||
| Univision Communications, Inc. 5.125%, due 05/15/239 | 210,000 | 200,550 | |||||||||
6.750%, due 09/15/229 | 65,000 | 66,381 | |||||||||
| Zayo Group LLC/Zayo Capital, Inc. 5.750%, due 01/15/279 | 40,000 | 39,600 | |||||||||
6.000%, due 04/01/23 | 35,000 | 35,788 | |||||||||
6.375%, due 05/15/25 | 100,000 | 103,500 | |||||||||
14,540,739 | |||||||||||
Media-cable—0.19% | |||||||||||
| Cable One, Inc. 5.750%, due 06/15/229 | 90,000 | 91,781 | |||||||||
| Time Warner Entertainment Co. LP 8.375%, due 03/15/23 | 1,200,000 | 1,394,874 | |||||||||
1,486,655 | |||||||||||
| Face amount1 | Value | ||||||||||
Corporate notes—(continued) | |||||||||||
Medical providers—1.02% | |||||||||||
| HCA Healthcare, Inc. 6.250%, due 02/15/21 | 50,000 | $ | 52,062 | ||||||||
| HCA, Inc. 4.750%, due 05/01/23 | 55,000 | 55,715 | |||||||||
5.000%, due 03/15/24 | 165,000 | 167,475 | |||||||||
5.250%, due 04/15/25 | 120,000 | 122,625 | |||||||||
5.375%, due 02/01/25 | 25,000 | 25,313 | |||||||||
5.875%, due 03/15/22 | 105,000 | 110,381 | |||||||||
6.500%, due 02/15/20 | 2,914,000 | 3,032,891 | |||||||||
7.500%, due 02/15/22 | 120,000 | 131,850 | |||||||||
| Tenet Healthcare Corp. 4.375%, due 10/01/21 | 80,000 | 79,700 | |||||||||
4.625%, due 07/15/24 | 57,000 | 55,219 | |||||||||
7.500%, due 01/01/229 | 120,000 | 125,700 | |||||||||
| UnitedHealth Group, Inc. 1.700%, due 02/15/19 | 3,986,000 | 3,964,879 | |||||||||
7,923,810 | |||||||||||
Metals & mining—0.17% | |||||||||||
| Ardagh Packaging Finance PLC/ Ardagh MP Holdings USA, Inc. 4.625%, due 05/15/239 | 200,000 | 197,500 | |||||||||
| FMG Resources August 2006 Pty Ltd. 4.750%, due 05/15/229 | 20,000 | 19,450 | |||||||||
5.125%, due 05/15/249 | 20,000 | 19,150 | |||||||||
| Freeport-McMoRan, Inc. 3.550%, due 03/01/22 | 60,000 | 58,125 | |||||||||
3.875%, due 03/15/23 | 185,000 | 178,063 | |||||||||
4.550%, due 11/14/24 | 45,000 | 43,510 | |||||||||
5.400%, due 11/14/34 | 100,000 | 91,750 | |||||||||
5.450%, due 03/15/43 | 55,000 | 48,840 | |||||||||
| Glencore Funding LLC 4.000%, due 03/27/279 | 450,000 | 422,767 | |||||||||
| Hudbay Minerals, Inc. 7.250%, due 01/15/239 | 35,000 | 36,006 | |||||||||
7.625%, due 01/15/259 | 35,000 | 36,181 | |||||||||
| Novelis Corp. 5.875%, due 09/30/269 | 40,000 | 38,350 | |||||||||
6.250%, due 08/15/249 | 50,000 | 50,125 | |||||||||
| Teck Resources Ltd. 6.250%, due 07/15/41 | 120,000 | 125,100 | |||||||||
1,364,917 | |||||||||||
Oil & gas—0.90% | |||||||||||
| Ascent Resources Utica Holdings LLC/ ARU Finance Corp. 10.000%, due 04/01/229 | 100,000 | 110,500 | |||||||||
| Canadian Natural Resources Ltd. 6.250%, due 03/15/38 | 445,000 | 525,782 | |||||||||
| Continental Resources, Inc. 5.000%, due 09/15/222 | 140,000 | 142,065 | |||||||||
| Crestwood Midstream Partners LP/ Crestwood Midstream Finance Corp. 6.250%, due 04/01/2311 | 90,000 | 91,800 | |||||||||
| Energy Transfer Equity LP 7.500%, due 10/15/20 | 180,000 | 192,150 | |||||||||
80
PACE Strategic Fixed Income Investments
Portfolio of investments—July 31, 2018
| Face amount1 | Value | ||||||||||
Corporate notes—(continued) | |||||||||||
Oil & gas—(concluded) | |||||||||||
| EP Energy LLC/Everest Acquisition Finance, Inc. 7.750%, due 05/15/269 | 40,000 | $ | 40,800 | ||||||||
| Extraction Oil & Gas, Inc. 5.625%, due 02/01/269 | 45,000 | 43,650 | |||||||||
7.375%, due 05/15/249 | 25,000 | 26,250 | |||||||||
| KazMunayGas National Co. JSC 5.375%, due 04/24/309 | 200,000 | 204,547 | |||||||||
5.750%, due 04/19/477 | 200,000 | 196,400 | |||||||||
| Newfield Exploration Co. 5.750%, due 01/30/22 | 150,000 | 156,375 | |||||||||
| Noble Energy, Inc. 5.250%, due 11/15/43 | 715,000 | 740,912 | |||||||||
| Oasis Petroleum, Inc. 6.250%, due 05/01/269 | 55,000 | 55,275 | |||||||||
6.875%, due 03/15/22 | 105,000 | 106,969 | |||||||||
| Odebrecht Oil & Gas Finance Ltd. 1.161%, due 08/31/189,13,15 | 174,037 | 2,524 | |||||||||
| PDC Energy, Inc. 6.125%, due 09/15/24 | 85,000 | 85,319 | |||||||||
| Petroleos Mexicanos 5.350%, due 02/12/289 | 100,000 | 93,430 | |||||||||
6.500%, due 03/13/27 | 555,000 | 563,880 | |||||||||
6.750%, due 09/21/47 | 83,000 | 76,567 | |||||||||
6.875%, due 08/04/26 | 253,000 | 264,385 | |||||||||
| Pioneer Natural Resources Co. 3.950%, due 07/15/22 | 1,900,000 | 1,923,539 | |||||||||
| Precision Drilling Corp. 7.750%, due 12/15/23 | 145,000 | 153,337 | |||||||||
| Range Resources Corp. 5.000%, due 08/15/22 | 20,000 | 19,600 | |||||||||
5.000%, due 03/15/23 | 105,000 | 100,669 | |||||||||
| Sinopec Group Overseas Development 2014 Ltd. 4.375%, due 04/10/247 | 200,000 | 203,913 | |||||||||
| SM Energy Co. 6.125%, due 11/15/22 | 75,000 | 76,875 | |||||||||
6.750%, due 09/15/26 | 55,000 | 55,962 | |||||||||
| State Oil Co. of the Azerbaijan Republic MTN 4.750%, due 03/13/237 | 200,000 | 199,000 | |||||||||
| Targa Resources Partners LP/Targa Resources Partners Finance Corp. 4.250%, due 11/15/23 | 55,000 | 52,800 | |||||||||
5.000%, due 01/15/289 | 40,000 | 37,750 | |||||||||
5.125%, due 02/01/25 | 30,000 | 30,075 | |||||||||
5.375%, due 02/01/27 | 95,000 | 94,049 | |||||||||
5.875%, due 04/15/269 | 60,000 | 61,200 | |||||||||
| Whiting Petroleum Corp. 5.750%, due 03/15/21 | 30,000 | 30,600 | |||||||||
6.250%, due 04/01/23 | 70,000 | 72,537 | |||||||||
6.625%, due 01/15/26 | 25,000 | 25,891 | |||||||||
| WPX Energy, Inc. 5.250%, due 09/15/24 | 85,000 | 84,469 | |||||||||
5.750%, due 06/01/26 | 35,000 | 35,087 | |||||||||
6.000%, due 01/15/22 | 11,000 | 11,412 | |||||||||
6,988,345 | |||||||||||
| Face amount1 | Value | ||||||||||
Corporate notes—(continued) | |||||||||||
Packaging & containers—0.10% | |||||||||||
| Ball Corp. 4.375%, due 12/15/20 | 50,000 | $ | 50,500 | ||||||||
5.000%, due 03/15/22 | 80,000 | 82,200 | |||||||||
| Berry Plastics Corp. 5.125%, due 07/15/23 | 70,000 | 69,475 | |||||||||
| BWAY Holding Co. 5.500%, due 04/15/249 | 115,000 | 112,269 | |||||||||
| Crown Americas LLC/Crown Americas Capital Corp. IV 4.500%, due 01/15/23 | 40,000 | 39,575 | |||||||||
| Crown Americas LLC/Crown Americas Capital Corp. V 4.250%, due 09/30/26 | 25,000 | 22,695 | |||||||||
| Crown Americas LLC/Crown Americas Capital Corp. VI 4.750%, due 02/01/269 | 45,000 | 42,300 | |||||||||
| Graphic Packaging International, Inc. 4.750%, due 04/15/21 | 65,000 | 65,650 | |||||||||
| Reynolds Group Issuer, Inc./ Reynolds Group Issuer LLC 5.125%, due 07/15/239 | 210,000 | 208,824 | |||||||||
5.750%, due 10/15/20 | 82,374 | 82,522 | |||||||||
| 3 mo. USD LIBOR + 3.500%, 5.839%, due 07/15/213,9 | 25,000 | 25,300 | |||||||||
801,310 | |||||||||||
Personal & household product—0.01% | |||||||||||
| Edgewell Personal Care Co. 4.700%, due 05/19/21 | 65,000 | 65,000 | |||||||||
Pharmaceuticals—0.89% | |||||||||||
| AbbVie, Inc. 4.700%, due 05/14/45 | 450,000 | 441,992 | |||||||||
| Actavis Funding SCS 3.450%, due 03/15/22 | 1,400,000 | 1,384,396 | |||||||||
| Bausch Health Cos., Inc. 5.500%, due 11/01/259 | 65,000 | 65,061 | |||||||||
6.500%, due 03/15/229 | 115,000 | 119,911 | |||||||||
Bayer US Finance II LLC | |||||||||||
| 3 mo. USD LIBOR + 1.010%, 3.345%, due 12/15/233,9 | 1,900,000 | 1,920,919 | |||||||||
| Shire Acquisitions Investments Ireland DAC 1.900%, due 09/23/19 | 2,500,000 | 2,465,806 | |||||||||
2.400%, due 09/23/21 | 595,000 | 572,884 | |||||||||
6,970,969 | |||||||||||
Pipelines—1.41% | |||||||||||
| Abu Dhabi Crude Oil Pipeline LLC 4.600%, due 11/02/477 | 200,000 | 193,760 | |||||||||
| Antero Midstream Partners LP/ Antero Midstream Finance Corp. 5.375%, due 09/15/24 | 155,000 | 155,581 | |||||||||
| Cheniere Corpus Christi Holdings LLC 5.875%, due 03/31/25 | 155,000 | 163,137 | |||||||||
| Cheniere Energy Partners LP 5.250%, due 10/01/25 | 125,000 | 124,375 | |||||||||
81
PACE Strategic Fixed Income Investments
Portfolio of investments—July 31, 2018
| Face amount1 | Value | ||||||||||
Corporate notes—(continued) | |||||||||||
Pipelines—(concluded) | |||||||||||
| DCP Midstream Operating LP 4.750%, due 09/30/219 | 70,000 | $ | 70,892 | ||||||||
5.375%, due 07/15/25 | 65,000 | 66,381 | |||||||||
6.750%, due 09/15/379 | 30,000 | 32,250 | |||||||||
8.125%, due 08/16/30 | 65,000 | 78,325 | |||||||||
| Energy Transfer Partners LP 5.800%, due 06/15/38 | 235,000 | 242,279 | |||||||||
Series B | |||||||||||
| (fixed, converts to FRN on 02/15/28), 6.625%, due 02/15/2813 | 750,000 | 712,500 | |||||||||
| Enterprise Products Operating LLC 5.250%, due 01/31/20 | 2,100,000 | 2,162,634 | |||||||||
| NuStar Logistics LP 4.800%, due 09/01/20 | 25,000 | 25,094 | |||||||||
5.625%, due 04/28/27 | 75,000 | 73,219 | |||||||||
6.750%, due 02/01/21 | 35,000 | 36,487 | |||||||||
| Rockies Express Pipeline LLC 5.625%, due 04/15/209 | 50,000 | 51,445 | |||||||||
| Sabine Pass Liquefaction LLC 5.750%, due 05/15/24 | 5,800,000 | 6,238,885 | |||||||||
| SemGroup Corp. 7.250%, due 03/15/26 | 25,000 | 24,938 | |||||||||
| SemGroup Corp./Rose Rock Finance Corp. 5.625%, due 11/15/23 | 125,000 | 119,375 | |||||||||
| Southern Gas Corridor CJSC 6.875%, due 03/24/267 | 200,000 | 219,940 | |||||||||
| Summit Midstream Holdings LLC/ Summit Midstream Finance Corp. 5.750%, due 04/15/25 | 100,000 | 96,500 | |||||||||
| The Williams Cos., Inc. 5.750%, due 06/24/44 | 50,000 | 53,250 | |||||||||
7.875%, due 09/01/21 | 25,000 | 27,750 | |||||||||
Series A | |||||||||||
7.500%, due 01/15/31 | 45,000 | 54,225 | |||||||||
11,023,222 | |||||||||||
Real estate—0.43% | |||||||||||
| Equinix, Inc. 5.375%, due 01/01/22 | 50,000 | 51,688 | |||||||||
| MPT Operating Partnership LP/MPT Finance Corp. 5.000%, due 10/15/27 | 75,000 | 72,563 | |||||||||
5.250%, due 08/01/26 | 115,000 | 113,275 | |||||||||
5.500%, due 05/01/24 | 65,000 | 65,488 | |||||||||
6.375%, due 03/01/24 | 110,000 | 115,500 | |||||||||
| Ontario Teachers' Cadillac Fairview Properties Trust 3.125%, due 03/20/229 | 300,000 | 295,026 | |||||||||
| Realogy Group LLC/Realogy Co-Issuer Corp. 4.875%, due 06/01/239 | 130,000 | 121,030 | |||||||||
| RHP Hotel Properties LP/RHP Finance Corp. 5.000%, due 04/15/23 | 65,000 | 64,838 | |||||||||
| Starwood Property Trust, Inc. 4.750%, due 03/15/259 | 40,000 | 39,500 | |||||||||
5.000%, due 12/15/21 | 75,000 | 75,937 | |||||||||
| Face amount1 | Value | ||||||||||
Corporate notes—(continued) | |||||||||||
Real estate—(concluded) | |||||||||||
| Tesco Property Finance 5 PLC 5.661%, due 10/13/417 | GBP | 689,042 | $ | 1,034,296 | |||||||
| Vesteda Finance BV MTN 2.500%, due 10/27/227 | EUR | 1,000,000 | 1,245,135 | ||||||||
| VICI Properties 1 LLC/VICI FC, Inc. 8.000%, due 10/15/23 | 70,000 | 77,437 | |||||||||
3,371,713 | |||||||||||
Rental auto/equipment—0.01% | |||||||||||
| United Rentals North America, Inc. 5.750%, due 11/15/24 | 55,000 | 56,238 | |||||||||
Retail—0.22% | |||||||||||
| 1011778 BC ULC/New Red Finance, Inc. 4.250%, due 05/15/249 | 95,000 | 90,369 | |||||||||
4.625%, due 01/15/229 | 40,000 | 39,900 | |||||||||
5.000%, due 10/15/259 | 35,000 | 33,556 | |||||||||
| Amazon.com, Inc. 3.150%, due 08/22/27 | 1,300,000 | 1,251,437 | |||||||||
| Beacon Roofing Supply, Inc. 6.375%, due 10/01/23 | 50,000 | 51,750 | |||||||||
| KFC Holding Co./Pizza Hut Holdings LLC/ Taco Bell of America LLC 5.000%, due 06/01/249 | 40,000 | 39,600 | |||||||||
5.250%, due 06/01/269 | 50,000 | 49,313 | |||||||||
| Penske Automotive Group, Inc. 5.375%, due 12/01/24 | 65,000 | 63,537 | |||||||||
5.750%, due 10/01/22 | 75,000 | 76,576 | |||||||||
1,696,038 | |||||||||||
Software—0.10% | |||||||||||
| j2 Cloud Services LLC/j2 Global Co-Obligor, Inc. 6.000%, due 07/15/259 | 90,000 | 91,125 | |||||||||
| MSCI, Inc. 5.250%, due 11/15/249 | 170,000 | 174,250 | |||||||||
5.750%, due 08/15/259 | 10,000 | 10,425 | |||||||||
| Nuance Communications, Inc. 5.625%, due 12/15/26 | 145,000 | 144,275 | |||||||||
6.000%, due 07/01/24 | 55,000 | 55,962 | |||||||||
| Open Text Corp. 5.875%, due 06/01/269 | 100,000 | 102,500 | |||||||||
| Quintiles Transnational Corp. 4.875%, due 05/15/239 | 90,000 | 91,350 | |||||||||
| Rackspace Hosting, Inc. 8.625%, due 11/15/249 | 150,000 | 151,500 | |||||||||
821,387 | |||||||||||
Special purpose entity—1.04% | |||||||||||
| CVS Pass-Through Trust 4.704%, due 01/10/369 | 3,124,919 | 3,066,171 | |||||||||
| Daimler Finance North America LLC 2.000%, due 08/03/189 | 2,900,000 | 2,899,963 | |||||||||
2.250%, due 09/03/199 | 2,150,000 | 2,130,311 | |||||||||
8,096,445 | |||||||||||
82
PACE Strategic Fixed Income Investments
Portfolio of investments—July 31, 2018
| Face amount1 | Value | ||||||||||
Corporate notes—(continued) | |||||||||||
Steel producers/products—0.18% | |||||||||||
| Big River Steel LLC/BRS Finance Corp. 7.250%, due 09/01/259 | 61,000 | $ | 63,440 | ||||||||
| Steel Dynamics, Inc. 5.250%, due 04/15/23 | 50,000 | 50,500 | |||||||||
| Vale Overseas Ltd. 6.250%, due 08/10/26 | 1,170,000 | 1,286,298 | |||||||||
1,400,238 | |||||||||||
Telecom-integrated/services—0.05% | |||||||||||
| Frontier Communications Corp. 8.500%, due 04/01/269 | 105,000 | 100,800 | |||||||||
11.000%, due 09/15/25 | 308,000 | 249,480 | |||||||||
| Hughes Satellite Systems Corp. 7.625%, due 06/15/21 | 40,000 | 42,900 | |||||||||
393,180 | |||||||||||
Telecommunication services—0.04% | |||||||||||
| Altice US Finance I Corp. 5.500%, due 05/15/269 | 200,000 | 196,250 | |||||||||
| CommScope Technologies LLC 6.000%, due 06/15/259 | 135,000 | 139,050 | |||||||||
335,300 | |||||||||||
Telecommunications—0.62% | |||||||||||
| CommScope, Inc. 5.500%, due 06/15/249 | 15,000 | 15,150 | |||||||||
| Embarq Corp. 7.995%, due 06/01/36 | 165,000 | 155,100 | |||||||||
| Qwest Corp. 6.875%, due 09/15/33 | 105,000 | 99,553 | |||||||||
| Telecom Italia Capital SA 6.000%, due 09/30/34 | 40,000 | 39,520 | |||||||||
| Verizon Communications, Inc. 3.376%, due 02/15/25 | 866,000 | 839,321 | |||||||||
4.672%, due 03/15/55 | 675,000 | 634,677 | |||||||||
| Virgin Media Finance PLC 6.000%, due 10/15/249 | 240,000 | 234,000 | |||||||||
| Virgin Media Secured Finance PLC 5.000%, due 04/15/279 | GBP | 2,200,000 | 2,825,872 | ||||||||
4,843,193 | |||||||||||
Telecommunications equipment—0.01% | |||||||||||
| CDW LLC/CDW Finance Corp. 5.000%, due 09/01/23 | 100,000 | 101,000 | |||||||||
Telephone-integrated—0.05% | |||||||||||
| Level 3 Financing, Inc. 5.125%, due 05/01/23 | 210,000 | 207,637 | |||||||||
5.375%, due 08/15/22 | 155,000 | 155,388 | |||||||||
363,025 | |||||||||||
Tobacco—0.47% | |||||||||||
| Imperial Brands Finance PLC 3.500%, due 02/11/239 | 3,755,000 | 3,661,399 | |||||||||
| Face amount1 | Value | ||||||||||
Corporate notes—(concluded) | |||||||||||
Transportation services—0.24% | |||||||||||
| AP Moller—Maersk A/S 2.550%, due 09/22/199 | 1,700,000 | $ | 1,683,390 | ||||||||
| Transnet SOC Ltd. 4.000%, due 07/26/227 | 200,000 | 192,250 | |||||||||
1,875,640 | |||||||||||
Utilities—0.37% | |||||||||||
| HD Supply, Inc. 5.750%, due 04/15/249,11 | 90,000 | 94,500 | |||||||||
| IPALCO Enterprises, Inc. 3.450%, due 07/15/20 | 2,800,000 | 2,779,000 | |||||||||
2,873,500 | |||||||||||
Wireless telecommunication services—0.23% | |||||||||||
| CenturyLink, Inc. 5.625%, due 04/01/20 | 70,000 | 71,575 | |||||||||
| Sprint Capital Corp. 6.900%, due 05/01/19 | 1,700,000 | 1,736,125 | |||||||||
1,807,700 | |||||||||||
Wireless telecommunications—0.70% | |||||||||||
| AT&T, Inc. 3.800%, due 03/15/22 | 975,000 | 977,720 | |||||||||
4.750%, due 05/15/46 | 515,000 | 471,362 | |||||||||
5.450%, due 03/01/47 | 905,000 | 906,455 | |||||||||
| Deutsche Telekom International Finance BV 2.820%, due 01/19/229 | 1,600,000 | 1,553,036 | |||||||||
| Sprint Corp. 7.125%, due 06/15/24 | 235,000 | 241,463 | |||||||||
7.625%, due 03/01/26 | 65,000 | 67,255 | |||||||||
7.875%, due 09/15/23 | 140,000 | 149,275 | |||||||||
| T-Mobile USA, Inc. 5.375%, due 04/15/27 | 45,000 | 44,381 | |||||||||
6.000%, due 03/01/23 | 170,000 | 175,100 | |||||||||
6.000%, due 04/15/24 | 40,000 | 41,400 | |||||||||
6.500%, due 01/15/26 | 95,000 | 99,631 | |||||||||
| Vodafone Group PLC 3.750%, due 01/16/24 | 715,000 | 706,615 | |||||||||
5,433,693 | |||||||||||
| Total corporate notes (cost—$376,540,959) | 371,828,520 | ||||||||||
Loan assignments—3.06% | |||||||||||
Aerospace & defense—0.02% | |||||||||||
| TransDigm, Inc. 2018 Term Loan E, | |||||||||||
| 1 mo. USD LIBOR + 2.500%, 4.577%, due 05/30/253 | 124,688 | 124,591 | |||||||||
Airlines—0.02% | |||||||||||
| American Airlines, Inc. 2018 Term Loan B, | |||||||||||
| 1 mo. USD LIBOR + 1.750%, 3.827%, due 06/27/253 | 85,000 | 83,513 | |||||||||
United Airlines, Inc. | |||||||||||
| 2018 Term Loan B, 0.000%, due 04/01/2417 | 69,823 | 69,561 | |||||||||
153,074 | |||||||||||
83
PACE Strategic Fixed Income Investments
Portfolio of investments—July 31, 2018
| Face amount1 | Value | ||||||||||
Loan assignments—(continued) | |||||||||||
Auto & truck—0.00%† | |||||||||||
Tenneco, Inc. | |||||||||||
| 1st Lien Term Loan B, 0.000%, due 06/14/2517 | 20,000 | $ | 19,950 | ||||||||
Automotive parts—0.03% | |||||||||||
| CS Intermediate Holdco 2 LLC 2016 Term Loan B, | |||||||||||
| 3 mo. USD LIBOR + 2.000%, 4.334%, due 11/02/233 | 114,419 | 114,491 | |||||||||
| Dealer Tire, LLC 2017 Term Loan B, | |||||||||||
| 3 mo. USD LIBOR + 3.250%, 5.625%, due 12/22/213 | 29,962 | 28,988 | |||||||||
| Goodyear Tire & Rubber Company (The) New 2nd Lien Term Loan, | |||||||||||
| 1 mo. USD LIBOR + 2.000%, 4.080%, due 03/07/253 | 115,000 | 114,821 | |||||||||
258,300 | |||||||||||
Broadcast—0.25% | |||||||||||
AlixPartners LLP 2017 Term Loan B | |||||||||||
| 1 mo. USD LIBOR + 2.750%, 4.827%, due 04/04/243 | 325,875 | 326,351 | |||||||||
Asurion LLC | |||||||||||
| 2018 Term Loan B7, 0.000%, due 11/03/2317 | 55,000 | 54,911 | |||||||||
Capital Automotive LP 2017 1st Lien Term Loan | |||||||||||
| 1 mo. USD LIBOR + 2.500%, 4.580%, due 03/24/243 | 319,626 | 319,227 | |||||||||
| Clark Equipment Co. 2018 Term Loan B, | |||||||||||
| 3 mo. USD LIBOR + 2.000%, 4.334%, due 05/18/243 | 236,365 | 236,155 | |||||||||
| CPG International, Inc. 2017 Term Loan, | |||||||||||
| 5 mo. USD LIBOR + 3.750%, 6.251%, due 05/03/243 | 20,036 | 20,044 | |||||||||
| Emerald Expositions Holding, Inc. 2017 Term Loan B | |||||||||||
| 1 mo. USD LIBOR + 2.750%, 4.827%, due 05/22/243 | 315,019 | 315,904 | |||||||||
| Gates Global LLC 2017 USD Repriced Term Loan B | |||||||||||
| 3 mo. USD LIBOR + 2.750%, 5.084%, due 04/01/243 | 325,887 | 326,484 | |||||||||
Infor (US), Inc. Term Loan B6 | |||||||||||
| 1 mo. USD LIBOR + 2.750%, 4.827%, due 02/01/223 | 322,472 | 322,816 | |||||||||
1,921,892 | |||||||||||
Building materials—0.01% | |||||||||||
| American Builders & Contractors Supply Co., Inc. 2018 Term Loan B, | |||||||||||
| 1 mo. USD LIBOR + 2.000%, 4.077%, due 10/31/233 | 44,886 | 44,657 | |||||||||
| Face amount1 | Value | ||||||||||
Loan assignments—(continued) | |||||||||||
Building materials—(concluded) | |||||||||||
| Forterra Finance LLC 2017 Term Loan B, | |||||||||||
| 1 mo. USD LIBOR + 3.000%, 5.077%, due 10/25/233 | 54,772 | $ | 51,054 | ||||||||
95,711 | |||||||||||
Cable—0.01% | |||||||||||
Unitymedia Hessen GmbH & Co. KG | |||||||||||
| 2018 Term Loan E, 0.000%, due 06/01/2317 | 55,000 | 54,817 | |||||||||
Chemicals—0.02% | |||||||||||
| H.B. Fuller Co. 2017 Term Loan B, | |||||||||||
| 1 mo. USD LIBOR + 2.000%, 4.086%, due 10/20/243 | 64,544 | 64,517 | |||||||||
Solenis International, LP | |||||||||||
| 2018 1st Lien Term Loan, 0.000%, due 12/18/2317 | 50,000 | 50,210 | |||||||||
114,727 | |||||||||||
Commercial services—0.06% | |||||||||||
| Ceridian HCM Holding, Inc. 2018 Term Loan B, | |||||||||||
| 1 mo. USD LIBOR + 3.250%, 5.327%, due 04/05/253 | 60,000 | 59,975 | |||||||||
| Filtration Group Corp. 2018 1st Lien Term Loan, 1 mo. USD LIBOR + 3.000%, 5.077%, due 03/29/253 | 144,638 | 145,149 | |||||||||
| Harland Clarke Holdings Corp. Term Loan B7, 3 mo. USD LIBOR + 4.750%, 7.084%, due 11/03/233 | 54,209 | 51,987 | |||||||||
| Iron Mountain, Inc. 2018 Term Loan B, | |||||||||||
| 1 mo. USD LIBOR + 1.750%, 3.827%, due 01/02/263 | 49,875 | 49,189 | |||||||||
| PI US MergerCo, Inc. USD 2017 1st Lien Term Loan, 1 mo. USD LIBOR + 3.500%, 5.768%, due 12/20/243 | 29,925 | 29,682 | |||||||||
Wrangler Buyer Corp. | |||||||||||
Term Loan B, | |||||||||||
| 1 mo. USD LIBOR + 2.750%, 4.827%, due 09/27/243 | 139,300 | 139,562 | |||||||||
475,544 | |||||||||||
Commercial services & supplies—0.02% | |||||||||||
| Bright Horizons Family Solutions, Inc. 2017 Term Loan B, | |||||||||||
| 1 mo. USD LIBOR + 1.750%, 3.827%, due 11/07/233 | 114,421 | 114,326 | |||||||||
Computer software & services—0.12% | |||||||||||
BMC Software Finance, Inc. | |||||||||||
| USD 2017 1st Lien Term Loan, 0.000%, due 06/26/2517 | 35,000 | 34,968 | |||||||||
84
PACE Strategic Fixed Income Investments
Portfolio of investments—July 31, 2018
| Face amount1 | Value | ||||||||||
Loan assignments—(continued) | |||||||||||
Computer software & services—(concluded) | |||||||||||
| USD 2017 1st Lien Term Loan, | |||||||||||
| 1 mo. USD LIBOR + 3.250%, 5.327%, due 09/10/223 | 324,491 | $ | 324,581 | ||||||||
| Change Healthcare Holdings, Inc. 2017 Term Loan B | |||||||||||
| 1 mo. USD LIBOR + 2.750%, 4.827%, due 03/01/243 | 325,875 | 325,243 | |||||||||
SS&C Technologies Holdings Europe S.a.r.l. | |||||||||||
| 2018 Term Loan B4, 0.000%, due 04/16/2517 | 56,102 | 56,242 | |||||||||
SS&C Technologies Inc. | |||||||||||
| 2018 Term Loan B3, 0.000%, due 04/16/2517 | 147,787 | 148,157 | |||||||||
| Western Digital Corp. 2018 Term Loan B4, | |||||||||||
| 1 mo. USD LIBOR + 1.750%, 3.827%, due 04/29/233 | 59,850 | 59,825 | |||||||||
949,016 | |||||||||||
Computers & peripherals—0.02% | |||||||||||
| Dell, Inc. 2017 Term Loan B, | |||||||||||
| 1 mo. USD LIBOR + 2.000%, 4.080%, due 09/07/233 | 159,198 | 159,211 | |||||||||
Construction products—0.00%† | |||||||||||
| CHG PPC Parent LLC 2018 Term Loan B, | |||||||||||
| 1 mo. USD LIBOR + 2.750%, 4.827%, due 03/31/253 | 20,000 | 19,975 | |||||||||
Consumer products—0.01% | |||||||||||
| Albea Beauty Holdings SA 2018 USD Term Loan B2, | |||||||||||
| 5 mo. USD LIBOR + 3.000%, 5.445%, due 04/22/243 | 19,950 | 19,867 | |||||||||
| Spectrum Brands, Inc. 2017 Term Loan B, | |||||||||||
| 3 mo. USD LIBOR + 2.000%, 4.350%, due 06/23/223 | 54,723 | 54,782 | |||||||||
74,649 | |||||||||||
Containers & packaging—0.01% | |||||||||||
| Berry Global, Inc. 2018 Term Loan S, | |||||||||||
| 1 mo. USD LIBOR + 1.750%, 3.921%, due 02/08/203 | 75,000 | 75,068 | |||||||||
| 2018 Term Loan T, | |||||||||||
| 1 mo. USD LIBOR + 1.750%, 3.921%, due 01/06/213 | 15,000 | 15,013 | |||||||||
90,081 | |||||||||||
Diversified financial services—0.02% | |||||||||||
| Travelport Finance (Luxembourg) S.a.r.l. 2018 Term Loan B, | |||||||||||
| 3 mo. USD LIBOR + 2.500%, 4.830%, due 03/17/253 | 125,000 | 124,801 | |||||||||
| Face amount1 | Value | ||||||||||
Loan assignments—(continued) | |||||||||||
Diversified financials—0.04% | |||||||||||
| First Data Corp. 2024 USD Term Loan, | |||||||||||
| 1 mo. USD LIBOR + 2.000%, 4.069%, due 04/26/243 | 215,000 | $ | 214,899 | ||||||||
| LPL Holdings, Inc. 2017 1st Lien Term Loan B, | |||||||||||
| 1 mo. USD LIBOR + 2.250%, 4.336%, due 09/23/243 | 114,424 | 114,424 | |||||||||
329,323 | |||||||||||
Diversified telecommunication services—0.01% | |||||||||||
TDC A/S | |||||||||||
| USD Term Loan, 0.000%, due 05/31/2517 | 60,000 | 60,300 | |||||||||
Electric utilities—0.05% | |||||||||||
| NRG Energy, Inc. 2016 Term Loan B, | |||||||||||
| 3 mo. USD LIBOR + 1.750%, 4.084%, due 06/30/233 | 84,569 | 84,353 | |||||||||
| Talen Energy Supply, LLC 2017 Term Loan B2 | |||||||||||
| 1 mo. USD LIBOR + 4.000%, 6.077%, due 04/15/243 | 324,885 | 326,841 | |||||||||
411,194 | |||||||||||
Electric-generation—0.04% | |||||||||||
| Vistra Operations Co. LLC 2016 Term Loan B2 | |||||||||||
| 1 mo. USD LIBOR + 2.250%, 4.327%, due 12/14/233 | 339,825 | 339,641 | |||||||||
Electronic equipment & instruments—0.00%† | |||||||||||
| Celestica, Inc. 2018 1st Lien Term Loan B, | |||||||||||
| 1 mo. USD LIBOR + 2.000%, 4.077%, due 06/14/253 | 10,000 | 9,969 | |||||||||
Electronics—0.02% | |||||||||||
| Microchip Technology Incorporated 2018 Term Loan B, | |||||||||||
| 1 mo. USD LIBOR + 2.000%, 4.080%, due 05/29/253 | 35,000 | 35,070 | |||||||||
| Micron Technology, Inc. Term Loan, 1 mo. USD LIBOR + 1.750%, 3.830%, due 04/26/223 | 114,071 | 114,308 | |||||||||
| Southwire Co. 2018 Term Loan B, | |||||||||||
| 1 mo. USD LIBOR + 2.000%, 4.079%, due 05/15/253 | 20,000 | 20,033 | |||||||||
169,411 | |||||||||||
Engineering & construction—0.02% | |||||||||||
Minimax GmbH & Co. KG | |||||||||||
| 2018 USD Term Loan B, 0.000%, due 06/14/2517 | 80,000 | 80,300 | |||||||||
85
PACE Strategic Fixed Income Investments
Portfolio of investments—July 31, 2018
| Face amount1 | Value | ||||||||||
Loan assignments—(continued) | |||||||||||
Engineering & construction—(concluded) | |||||||||||
| Reece Ltd. 2018 Term Loan B, | |||||||||||
| 2 mo. USD LIBOR + 2.000%, 4.340%, due 07/02/253 | 40,000 | $ | 40,000 | ||||||||
120,300 | |||||||||||
Entertainment—0.01% | |||||||||||
| GVC Holdings PLC 2018 USD Term Loan, | |||||||||||
| 1 mo. USD LIBOR + 2.500%, 4.577%, due 03/29/243 | 24,937 | 24,937 | |||||||||
| Lions Gate Entertainment Corp. 2018 Term Loan B, | |||||||||||
| 1 mo. USD LIBOR + 2.250%, 4.314%, due 03/24/253 | 29,925 | 30,000 | |||||||||
54,937 | |||||||||||
Environmental—0.02% | |||||||||||
| Clean Harbors, Inc. 2017 Term Loan B, | |||||||||||
| 1 mo. USD LIBOR + 1.750%, 3.827%, due 06/27/243 | 114,422 | 114,374 | |||||||||
Finance-captive automotive—0.01% | |||||||||||
| Prime Security Services Borrower LLC 2016 1st Lien Term Loan, | |||||||||||
| 1 mo. USD LIBOR + 2.750%, 4.827%, due 05/02/223 | 104,736 | 104,842 | |||||||||
Financial services—0.07% | |||||||||||
| Avolon TLB Borrower 1 (US) LLC Term Loan B3, 1 mo. USD LIBOR + 2.000%, 4.086%, due 01/15/253 | 214,460 | 212,877 | |||||||||
Clipper Acquisitions Corp. | |||||||||||
| 2017 Term Loan B, 0.000%, due 12/27/2417 | 34,912 | 34,782 | |||||||||
| Crown Finance US, Inc. 2018 USD Term Loan, | |||||||||||
| 1 mo. USD LIBOR + 2.500%, 4.577%, due 02/28/253 | 159,600 | 159,051 | |||||||||
Fortress Investment Group LLC | |||||||||||
| 2018 Term Loan B, 0.000%, due 12/27/2217 | 60,000 | 60,015 | |||||||||
| Harbourvest Partners LLC 2018 Term Loan B, | |||||||||||
| 1 mo. USD LIBOR + 2.250%, 4.322%, due 03/01/253 | 112,563 | 112,422 | |||||||||
579,147 | |||||||||||
Food products—0.04% | |||||||||||
| Albertsons, LLC USD 2017 Term Loan B4, | |||||||||||
| 1 mo. USD LIBOR + 2.750%, 4.827%, due 08/25/213 | 159,579 | 158,890 | |||||||||
| USD 2017 Term Loan B6, | |||||||||||
| 3 mo. USD LIBOR + 3.000%, 5.319%, due 06/22/233 | 109,447 | 108,717 | |||||||||
| Face amount1 | Value | ||||||||||
Loan assignments—(continued) | |||||||||||
Food products—(concluded) | |||||||||||
| Aramark Services, Inc. 2018 Term Loan B2, | |||||||||||
| 3 mo. USD LIBOR + 1.750%, 4.084%, due 03/28/243 | 45,000 | $ | 45,056 | ||||||||
| 2018 Term Loan B3, | |||||||||||
| 3 mo. USD LIBOR + 1.750%, 4.084%, due 03/11/253 | 10,000 | 10,008 | |||||||||
US Foods, Inc. | |||||||||||
| 2016 Term Loan B, 0.000%, due 06/27/2317 | 14,962 | 14,950 | |||||||||
337,621 | |||||||||||
Gaming—0.15% | |||||||||||
| Cedar Fair LP 2017 Term Loan B, | |||||||||||
| 1 mo. USD LIBOR + 1.750%, 3.827%, due 04/13/243 | 115,000 | 115,216 | |||||||||
| Churchill Downs Incorporated 2017 Term Loan B, | |||||||||||
| 1 mo. USD LIBOR + 2.000%, 4.080%, due 12/27/243 | 144,035 | 144,035 | |||||||||
| CityCenter Holdings LLC 2017 Term Loan B | |||||||||||
| 1 mo. USD LIBOR + 2.250%, 4.327%, due 04/18/243 | 326,700 | 326,925 | |||||||||
| Mohegan Tribal Gaming Authority 2016 Term Loan B, | |||||||||||
| 1 mo. USD LIBOR + 4.000%, 6.077%, due 10/13/233 | 129,662 | 121,018 | |||||||||
| Penn National Gaming, Inc. 2017 Term Loan B, | |||||||||||
| 1 mo. USD LIBOR + 2.500%, 4.577%, due 01/19/243 | 85,172 | 85,439 | |||||||||
| Scientific Games International, Inc. 2018 Term Loan B5, | |||||||||||
| 2 mo. USD LIBOR + 2.750%, 4.921%, due 08/14/243 | 214,463 | 214,493 | |||||||||
The Stars Group Holdings BV | |||||||||||
| 2018 USD Incremental Term Loan, 0.000%, due 07/10/2517 | 25,000 | 25,212 | |||||||||
| WMG Acquisition Corp. 2018 Term Loan F, | |||||||||||
| 1 mo. USD LIBOR + 2.125%, 4.202%, due 11/01/233 | 160,000 | 159,309 | |||||||||
1,191,647 | |||||||||||
Health care providers & services—0.08% | |||||||||||
| Convatec, Inc. USD 2016 Term Loan B, | |||||||||||
| 3 mo. USD LIBOR + 2.250%, 4.584%, due 10/31/233 | 119,550 | 119,550 | |||||||||
Envision Healthcare Corp. 2016 Term Loan B | |||||||||||
| 1 mo. USD LIBOR + 3.000%, 5.080%, due 12/01/233 | 189,258 | 189,062 | |||||||||
86
PACE Strategic Fixed Income Investments
Portfolio of investments—July 31, 2018
| Face amount1 | Value | ||||||||||
Loan assignments—(continued) | |||||||||||
Health care providers & services—(concluded) | |||||||||||
| MPH Acquisition Holdings LLC 2016 Term Loan B, | |||||||||||
| 3 mo. USD LIBOR + 2.750%, 5.084%, due 06/07/233 | 152,930 | $ | 152,891 | ||||||||
| Team Health Holdings, Inc. 1st Lien Term Loan, | |||||||||||
| 1 mo. USD LIBOR + 2.750%, 4.827%, due 02/06/243 | 129,672 | 125,944 | |||||||||
587,447 | |||||||||||
Health services—0.00%† | |||||||||||
Ortho-Clinical Diagnostics SA | |||||||||||
| 2018 Term Loan B, 0.000%, due 06/30/2517 | 10,000 | 9,984 | |||||||||
Hotels, restaurants & leisure—0.07% | |||||||||||
| Eldorado Resorts LLC 2017 Term Loan B | |||||||||||
| 1 mo. USD LIBOR + 2.250%, 4.375%, due 04/17/243 | 217,743 | 217,651 | |||||||||
| Four Seasons Holdings, Inc. New 1st Lien Term Loan | |||||||||||
| 1 mo. USD LIBOR + 2.000%, 4.077%, due 11/30/233 | 339,825 | 339,584 | |||||||||
557,235 | |||||||||||
Hotels, restaurants & leisure—0.00%† | |||||||||||
Las Vegas Sands, LLC | |||||||||||
| 2018 Term Loan B, 0.000%, due 03/27/2517 | 34,825 | 34,738 | |||||||||
Industrial conglomerates—0.02% | |||||||||||
| Gardner Denver, Inc. 2017 USD Term Loan B, | |||||||||||
| 1 mo. USD LIBOR + 2.750%, 4.827%, due 07/30/243 | 123,795 | 124,021 | |||||||||
IT consulting & services—0.06% | |||||||||||
| Fleetcor Technologies, Inc. 2017 Term Loan B3, | |||||||||||
| 1 mo. USD LIBOR + 2.000%, 4.077%, due 08/02/243 | 124,373 | 124,270 | |||||||||
Gartner, Inc. 2016 Term Loan A | |||||||||||
| 1 mo. USD LIBOR + 2.000%, 4.077%, due 03/20/223 | 309,375 | 309,375 | |||||||||
433,645 | |||||||||||
Lodging—0.55% | |||||||||||
Belmond Interfin Ltd. | |||||||||||
| Dollar Term Loan, 0.000%, due 07/03/2417 | 129,347 | 129,401 | |||||||||
| Caesars Resort Collection, LLC 2017 1st Lien Term Loan B, | |||||||||||
| 1 mo. USD LIBOR + 2.750%, 4.827%, due 12/22/243 | 104,475 | 104,850 | |||||||||
Hilton Worldwide Finance LLC Term Loan B2 | |||||||||||
| 1 mo. USD LIBOR + 1.750%, 3.814%, due 10/25/233 | 3,954,313 | 3,967,085 | |||||||||
| Face amount1 | Value | ||||||||||
Loan assignments—(continued) | |||||||||||
Lodging—(concluded) | |||||||||||
| NCL Corp. Ltd. 2017 Term Loan B, | |||||||||||
| 1 mo. USD LIBOR + 1.750%, 3.822%, due 10/10/213 | 114,425 | $ | 114,568 | ||||||||
RHP Hotel Properties LP | |||||||||||
| 2017 Term Loan B, 0.000%, due 05/11/2417 | 26,932 | 26,905 | |||||||||
4,342,809 | |||||||||||
Machinery—0.02% | |||||||||||
| Sensata Technologies BV 2015 Term Loan B, | |||||||||||
| 1 mo. USD LIBOR + 1.750%, 3.824%, due 10/14/213 | 115,000 | 115,263 | |||||||||
| Titan Acquisition Ltd. 2018 Term Loan B, | |||||||||||
| 1 mo. USD LIBOR + 3.000%, 5.076%, due 03/28/253 | 64,838 | 63,712 | |||||||||
178,975 | |||||||||||
Machinery-construction & mining—0.02% | |||||||||||
Brookfield WEC Holdings, Inc. | |||||||||||
| 2018 1st Lien Term Loan, 0.000%, due 07/25/2517 | 70,000 | 70,449 | |||||||||
| Terex Corp. 2018 Term Loan B, | |||||||||||
| 3 mo. USD LIBOR + 2.000%, 4.334%, due 01/31/243 | 114,420 | 114,420 | |||||||||
184,869 | |||||||||||
Machinery-diversified—0.02% | |||||||||||
Zodiac Pool Solutions LLC | |||||||||||
| 2018 Term Loan B, 0.000%, due 03/31/2517 | 115,000 | 114,952 | |||||||||
Manufacturing-diversified—0.02% | |||||||||||
| Penn Engineering & Manufacturing Corp. 2017 USD Term Loan B, | |||||||||||
| 1 mo. USD LIBOR + 2.750%, 4.827%, due 06/27/243 | 129,347 | 129,267 | |||||||||
Media—0.23% | |||||||||||
| Cogeco Communications (USA) II LP 2017 1st Lien Term Loan, | |||||||||||
| 1 mo. USD LIBOR + 2.375%, 4.452%, due 01/03/253 | 135,000 | 134,943 | |||||||||
| CSC Holdings LLC 2017 1st Lien Term Loan | |||||||||||
| 1 mo. USD LIBOR + 2.250%, 4.322%, due 07/17/253 | 325,875 | 323,838 | |||||||||
Cumulus Media New Holdings, Inc. | |||||||||||
| Exit Term Loan, 0.000%, due 05/15/2217 | 50,000 | 49,300 | |||||||||
| Gray Television, Inc. 2017 Term Loan B | |||||||||||
| 2 mo. USD LIBOR + 2.250%, 4.331%, due 02/07/243 | 306,021 | 305,792 | |||||||||
87
PACE Strategic Fixed Income Investments
Portfolio of investments—July 31, 2018
| Face amount1 | Value | ||||||||||
Loan assignments—(continued) | |||||||||||
Media—(concluded) | |||||||||||
| Lamar Media Corp. 2018 Term Loan B, | |||||||||||
| 1 mo. USD LIBOR + 1.750%, 3.875%, due 03/14/253 | 114,713 | $ | 114,808 | ||||||||
| Nielsen Finance LLC USD Term Loan B4 | |||||||||||
| 1 mo. USD LIBOR + 2.000%, 4.097%, due 10/04/233 | 325,875 | 323,956 | |||||||||
| Sinclair Television Group, Inc. Term Loan B2 | |||||||||||
| 1 mo. USD LIBOR + 2.250%, 4.330%, due 01/03/243 | 334,900 | 334,481 | |||||||||
Univision Communications, Inc. | |||||||||||
Term Loan C5, | |||||||||||
| 1 mo. USD LIBOR + 2.750%, 4.827%, due 03/15/243 | 218,807 | 212,243 | |||||||||
1,799,361 | |||||||||||
Medical providers—0.02% | |||||||||||
| HCA, Inc. 2018 Term Loan B10, | |||||||||||
| 1 mo. USD LIBOR + 2.000%, 4.077%, due 03/13/253 | 159,600 | 160,465 | |||||||||
Oil & gas—0.10% | |||||||||||
BCP Raptor LLC | |||||||||||
Term Loan B, | |||||||||||
| 2 mo. USD LIBOR + 4.250%, 6.421%, due 06/24/243 | 89,610 | 85,662 | |||||||||
| Brazos Delaware II LLC Term Loan B, 1 mo. USD LIBOR + 4.000%, 6.086%, due 05/21/253 | 20,000 | 19,658 | |||||||||
| Energy Transfer Equity LP USD 2017 Term Loan B | |||||||||||
| 1 mo. USD LIBOR + 2.000%, 4.064%, due 02/02/243 | 281,888 | 280,938 | |||||||||
| Kestrel Acquisition, LLC 2018 Term Loan B, | |||||||||||
| 1 mo. USD LIBOR + 4.250%, 6.330%, due 05/01/253 | 25,000 | 25,180 | |||||||||
| Lucid Energy Group II LLC 2018 1st Lien Term Loan, | |||||||||||
| 1 mo. USD LIBOR + 3.000%, 5.079%, due 02/17/253 | 84,788 | 82,138 | |||||||||
| Medallion Midland Acquisition LLC 1st Lien Term Loan, | |||||||||||
| 1 mo. USD LIBOR + 3.250%, 5.327%, due 10/30/243 | 64,725 | 63,612 | |||||||||
TPF II Power LLC Term Loan B | |||||||||||
| 1 mo. USD LIBOR + 3.750%, 5.827%, due 10/02/233 | 188,301 | 189,066 | |||||||||
746,254 | |||||||||||
Packaging & containers—0.08% | |||||||||||
| Berlin Packaging LLC 2018 Term Loan B, | |||||||||||
| 1 mo. USD LIBOR + 3.000%, 5.100%, due 11/07/253 | 105,000 | 104,978 | |||||||||
| Face amount1 | Value | ||||||||||
Loan assignments—(continued) | |||||||||||
Packaging & containers—(concluded) | |||||||||||
BWAY Holding Co. 2017 Term Loan B | |||||||||||
| 3 mo. USD LIBOR + 3.250%, 5.581%, due 04/03/243 | 326,700 | $ | 325,681 | ||||||||
| Pro Mach Group, Inc. 2018 Term Loan B, | |||||||||||
| 1 mo. USD LIBOR + 3.000%, 5.097%, due 03/07/253 | 114,713 | 113,852 | |||||||||
| Trident TPI Holdings, Inc. 2017 USD Term Loan B1, | |||||||||||
| 1 mo. USD LIBOR + 3.250%, 5.327%, due 10/17/243 | 59,850 | 59,580 | |||||||||
604,091 | |||||||||||
Pharmaceuticals—0.08% | |||||||||||
Akorn, Inc. | |||||||||||
Term Loan B, | |||||||||||
| 1 mo. USD LIBOR + 4.750%, 6.875%, due 04/16/213 | 10,000 | 9,808 | |||||||||
| Amneal Pharmaceuticals LLC 2018 Term Loan B, | |||||||||||
| 1 mo. USD LIBOR + 3.500%, 5.625%, due 05/04/253 | 104,976 | 105,698 | |||||||||
| Endo Luxembourg Finance Co. I S.a r.l. 2017 Term Loan B, | |||||||||||
| 1 mo. USD LIBOR + 4.250%, 6.375%, due 04/29/243 | 64,836 | 64,850 | |||||||||
| Grifols Worldwide Operations USA, Inc. 2017 Acquisition Term Loan, | |||||||||||
| USD LIBOR + 2.250%, 4.200%, due 01/31/253 | 159,194 | 159,624 | |||||||||
| Syneos Health, Inc. 2018 Term Loan B, | |||||||||||
| 1 mo. USD LIBOR + 2.000%, 4.077%, due 08/01/243 | 33,623 | 33,591 | |||||||||
| Valeant Pharmaceuticals International, Inc. 2018 Term Loan B, | |||||||||||
| 1 mo. USD LIBOR + 3.000%, 5.092%, due 06/01/253 | 213,173 | 213,363 | |||||||||
| �� | 586,934 | ||||||||||
Real estate—0.05% | |||||||||||
| ESH Hospitality, Inc. 2018 Term Loan B, | |||||||||||
| 1 mo. USD LIBOR + 2.000%, 4.077%, due 08/30/233 | 309,882 | 309,364 | |||||||||
| Jo-Ann Stores, Inc. 2016 Term Loan, | |||||||||||
| 3 mo. USD LIBOR + 5.000%, 7.347%, due 10/20/233 | 34,154 | 34,218 | |||||||||
| MGM Growth Properties Operating Partnership LP 2016 Term Loan B, | |||||||||||
| 1 mo. USD LIBOR + 2.000%, 4.077%, due 04/25/233 | 54,720 | 54,746 | |||||||||
398,328 | |||||||||||
88
PACE Strategic Fixed Income Investments
Portfolio of investments—July 31, 2018
| Face amount1 | Value | ||||||||||
Loan assignments—(continued) | |||||||||||
Retail—0.05% | |||||||||||
| 1011778 B.C. Unlimited Liability Co. Term Loan B3, | |||||||||||
| 1 mo. USD LIBOR + 2.250%, 4.327%, due 02/16/243 | 104,470 | $ | 104,361 | ||||||||
| Beacon Roofing Supply, Inc. 2017 Term Loan B, | |||||||||||
| 1 mo. USD LIBOR + 2.250%, 4.347%, due 01/02/253 | 139,650 | 139,446 | |||||||||
| BJ's Wholesale Club, Inc. 2017 1st Lien Term Loan, | |||||||||||
| 1 mo. USD LIBOR + 3.500%, 5.597%, due 02/03/243 | 159,594 | 159,794 | |||||||||
403,601 | |||||||||||
Retail-specialty—0.04% | |||||||||||
| Bass Pro Group LLC Term Loan B | |||||||||||
| 1 mo. USD LIBOR + 5.000%, 7.077%, due 09/25/243 | 172,840 | 174,190 | |||||||||
| Michaels Stores, Inc. 2018 Term Loan B, | |||||||||||
| 1 mo. USD LIBOR + 2.500%, 4.572%, due 01/28/233 | 74,813 | 74,696 | |||||||||
| Sally Holdings LLC Term Loan B1, | |||||||||||
| 1 mo. USD LIBOR + 2.250%, 4.327%, due 07/05/243 | 49,749 | 48,443 | |||||||||
297,329 | |||||||||||
Semiconductor—0.01% | |||||||||||
| MKS Instruments, Inc. Term Loan B4, | |||||||||||
| 1 mo. USD LIBOR + 1.750%, 3.827%, due 05/01/233 | 113,687 | 113,972 | |||||||||
Semiconductor equipment & products—0.01% | |||||||||||
ON Semiconductor Corp. | |||||||||||
| 2018 1st Lien Term Loan B, 0.000%, due 03/31/2317 | 71,887 | 71,927 | |||||||||
Software—0.03% | |||||||||||
| IQVIA, Inc. 2018 USD Term Loan B3, | |||||||||||
| 3 mo. USD LIBOR + 1.750%, 4.084%, due 06/07/253 | 45,000 | 44,676 | |||||||||
| Open Text Corp. Term Loan B, 1 mo. USD LIBOR + 1.750%, 3.827%, due 05/23/253 | 24,938 | 25,031 | |||||||||
| Rackspace Hosting, Inc. 2017 Incremental 1st Lien Term Loan, | |||||||||||
| 3 mo. USD LIBOR + 3.000%, 5.363%, due 11/03/233 | 109,723 | 109,134 | |||||||||
Sound Inpatient Physicians | |||||||||||
| 2018 1st Lien Term Loan, 0.000%, due 06/27/2517 | 25,000 | 25,062 | |||||||||
Vertafore, Inc. | |||||||||||
| 2018 1st Lien Term Loan B, 0.000%, due 07/02/2517 | 60,000 | 59,833 | |||||||||
263,736 | |||||||||||
| Face amount1 | Value | ||||||||||
Loan assignments—(continued) | |||||||||||
Software & services—0.07% | |||||||||||
| Greeneden U.S. Holdings II, LLC 2018 USD Term Loan B, | |||||||||||
| 1 mo. USD LIBOR + 3.500%, 5.577%, due 12/01/233 | 270,896 | $ | 272,153 | ||||||||
| Kronos Incorporated 2017 Term Loan B, | |||||||||||
| 3 mo. USD LIBOR + 3.000%, 5.358%, due 11/01/233 | 74,813 | 74,991 | |||||||||
| Riverbed Technology, Inc. 2016 Term Loan, | |||||||||||
| 1 mo. USD LIBOR + 3.250%, 5.330%, due 04/24/223 | 104,175 | 103,561 | |||||||||
| VeriFone, Inc. 2018 Term Loan B, | |||||||||||
| 1 mo. USD LIBOR + 2.000%, 4.077%, due 01/31/253 | 114,713 | 114,521 | |||||||||
565,226 | |||||||||||
Support-services—0.02% | |||||||||||
ServiceMaster Co. 2016 Term Loan B | |||||||||||
| 1 mo. USD LIBOR + 2.500%, 4.577%, due 11/08/233 | 170,255 | 170,213 | |||||||||
Telecom-integrated/services—0.04% | |||||||||||
| Frontier Communications Corp. 2017 Term Loan B1, | |||||||||||
| 1 mo. USD LIBOR + 3.750%, 5.830%, due 06/15/243 | 326,700 | 321,682 | |||||||||
Telecommunication services—0.08% | |||||||||||
| Altice US Finance I Corp. 2017 Term Loan B, | |||||||||||
| 1 mo. USD LIBOR + 2.250%, 4.327%, due 07/28/253 | 326,700 | 325,066 | |||||||||
| SBA Senior Finance II LLC 2018 Term Loan B, | |||||||||||
| 1 mo. USD LIBOR + 2.000%, 4.080%, due 04/11/253 | 144,624 | 144,227 | |||||||||
| Switch Ltd. 2017 Term Loan B, | |||||||||||
| 1 mo. USD LIBOR + 2.250%, 4.327%, due 06/27/243 | 124,372 | 124,838 | |||||||||
594,131 | |||||||||||
Telecommunications—0.08% | |||||||||||
| GTT Communications, Inc. 2018 USD Term Loan B, | |||||||||||
| 1 mo. USD LIBOR + 2.750%, 4.830%, due 05/31/253 | 145,000 | 143,450 | |||||||||
| Numericable Group SA USD Term Loan B11 | |||||||||||
| 1 mo. USD LIBOR + 2.750%, 4.822%, due 07/31/253 | 325,875 | 310,233 | |||||||||
Telenet Financing USD, LLC | |||||||||||
| USD Term Loan AN, 0.000%, due 08/15/2617 | 75,000 | 74,552 | |||||||||
89
PACE Strategic Fixed Income Investments
Portfolio of investments—July 31, 2018
| Face amount1 | Value | ||||||||||
Loan assignments—(concluded) | |||||||||||
Telecommunications—(concluded) | |||||||||||
| West Corp. 2018 Term Loan B1, | |||||||||||
| 1 mo. USD LIBOR + 3.500%, 5.577%, due 10/10/243 | 35,000 | $ | 34,796 | ||||||||
| 2017 Term Loan, | |||||||||||
| 1 mo. USD LIBOR + 4.000%, 6.077%, due 10/10/243 | 84,600 | 84,579 | |||||||||
647,610 | |||||||||||
Trading companies & distributors—0.01% | |||||||||||
| MRC Global (US), Inc. 2018 1st Lien Term Loan B, | |||||||||||
| 1 mo. USD LIBOR + 3.000%, 5.077%, due 09/20/243 | 59,850 | 59,999 | |||||||||
Wireless telecommunication services—0.10% | |||||||||||
| CenturyLink, Inc. 2017 Term Loan B, | |||||||||||
| 1 mo. USD LIBOR + 2.750%, 4.827%, due 01/31/253 | 328,350 | 323,096 | |||||||||
| Intelsat Jackson Holdings SA 2017 Term Loan B3, | |||||||||||
| 1 mo. USD LIBOR + 3.750%, 5.827%, due 11/27/233 | 95,000 | 95,253 | |||||||||
| Sprint Communications, Inc. 1st Lien Term Loan B, | |||||||||||
| 1 mo. USD LIBOR + 2.500%, 4.625%, due 02/02/243 | 325,875 | 325,794 | |||||||||
744,143 | |||||||||||
| Total loan assignments (cost—$23,842,472) | 23,820,315 | ||||||||||
Non-US government obligations—3.87% | |||||||||||
| Angolan Government International Bond 8.250%, due 05/09/287 | 200,000 | 207,240 | |||||||||
| Argentine Republic Government International Bond 2.500%, due 12/31/3811 | 1,105,000 | 665,762 | |||||||||
6.250%, due 04/22/19 | 2,300,000 | 2,313,363 | |||||||||
| Bermuda Government International Bond 4.854%, due 02/06/247 | 200,000 | 207,250 | |||||||||
| Bonos de la Nacion Argentina con Ajuste por CER 3.750%, due 02/08/19 | ARS | 22,300,000 | 787,313 | ||||||||
4.000%, due 03/06/20 | ARS | 43,800,000 | 1,682,557 | ||||||||
| Brazil Minas SPE via State of Minas Gerais 5.333%, due 02/15/287 | 200,000 | 194,500 | |||||||||
| Brazilian Government International Bond 7.125%, due 01/20/37 | 100,000 | 111,850 | |||||||||
8.250%, due 01/20/34 | 70,000 | 85,225 | |||||||||
| Colombia Government International Bond 6.125%, due 01/18/41 | 320,000 | 360,800 | |||||||||
8.125%, due 05/21/24 | 100,000 | 121,000 | |||||||||
| Costa Rica Government International Bond 7.158%, due 03/12/457 | 230,000 | 240,350 | |||||||||
| Croatia Government International Bond 5.500%, due 04/04/237 | 400,000 | 425,584 | |||||||||
6.625%, due 07/14/207 | 120,000 | 126,593 | |||||||||
| Face amount1 | Value | ||||||||||
Non-US government obligations—(continued) | |||||||||||
| Dominican Republic International Bond 6.850%, due 01/27/457 | 100,000 | $ | 101,828 | ||||||||
| Egypt Government International Bond 7.903%, due 02/21/487 | 250,000 | 248,116 | |||||||||
| Ghana Government International Bond 7.625%, due 05/16/297 | 200,000 | 206,614 | |||||||||
10.750%, due 10/14/307 | 200,000 | 258,662 | |||||||||
| Hungary Government International Bond 7.625%, due 03/29/41 | 150,000 | 211,875 | |||||||||
| Indonesia Government International Bond 6.625%, due 02/17/377 | 240,000 | 285,897 | |||||||||
7.750%, due 01/17/387 | 100,000 | 133,385 | |||||||||
| Israel Government International Bond 4.125%, due 01/17/48 | 1,600,000 | 1,550,768 | |||||||||
| Ivory Coast Government International Bond 5.750%, due 12/31/327,11 | 582,750 | 553,671 | |||||||||
| Japan Bank for International Cooperation/Japan 2.875%, due 07/21/27 | 2,200,000 | 2,116,236 | |||||||||
| Japan Finance Organization for Municipalities 2.125%, due 04/13/219 | 2,000,000 | 1,939,521 | |||||||||
2.625%, due 04/20/229 | 2,500,000 | 2,434,047 | |||||||||
| Japan International Cooperation Agency 2.750%, due 04/27/27 | 1,300,000 | 1,232,585 | |||||||||
| Kenya Government International Bond 8.250%, due 02/28/487 | 200,000 | 201,998 | |||||||||
| Kuwait International Government Bond 2.750%, due 03/20/229 | 1,700,000 | 1,659,795 | |||||||||
| Lebanon Government International Bond 6.850%, due 03/23/277 | 80,000 | 67,416 | |||||||||
| Mexico Government International Bond 5.750%, due 10/12/10 | 426,000 | 419,610 | |||||||||
| Mongolia Government International Bond 5.625%, due 05/01/237 | 200,000 | 195,171 | |||||||||
| Morocco Government International Bond 4.250%, due 12/11/227 | 200,000 | 203,000 | |||||||||
| Nigeria Government International Bond 5.625%, due 06/27/22 | 60,000 | 60,600 | |||||||||
6.750%, due 01/28/217 | 400,000 | 418,500 | |||||||||
7.143%, due 02/23/307 | 200,000 | 199,174 | |||||||||
| Oman Government International Bond 5.625%, due 01/17/287 | 200,000 | 195,248 | |||||||||
| Panama Government International Bond 6.700%, due 01/26/36 | 50,000 | 61,937 | |||||||||
8.875%, due 09/30/27 | 80,000 | 108,400 | |||||||||
| Paraguay Government International Bond 6.100%, due 08/11/447 | 200,000 | 217,000 | |||||||||
| Qatar Government International Bond 4.500%, due 04/23/289 | 1,700,000 | 1,734,136 | |||||||||
5.103%, due 04/23/487 | 200,000 | 204,256 | |||||||||
5.103%, due 04/23/489 | 1,600,000 | 1,634,048 | |||||||||
| Republic of Azerbaijan International Bond 4.750%, due 03/18/247 | 270,000 | 270,393 | |||||||||
| Republic of South Africa Government International Bond 5.500%, due 03/09/20 | 100,000 | 102,879 | |||||||||
5.875%, due 06/22/30 | 200,000 | 202,192 | |||||||||
90
PACE Strategic Fixed Income Investments
Portfolio of investments—July 31, 2018
| Face amount1 | Value | ||||||||||
Non-US government obligations—(concluded) | |||||||||||
| Republic of Turkey Government International Bond 6.875%, due 03/17/36 | 50,000 | $ | 45,920 | ||||||||
| Romanian Government International Bond 4.875%, due 01/22/247 | 50,000 | 52,063 | |||||||||
6.750%, due 02/07/227 | 160,000 | 175,405 | |||||||||
| Russian Foreign Bond - Eurobond 4.250%, due 06/23/277 | 200,000 | 194,931 | |||||||||
7.500%, due 03/31/307,11 | 267,000 | 297,286 | |||||||||
| Serbia International Bond 4.875%, due 02/25/207 | 400,000 | 407,000 | |||||||||
| South Africa Government International Bond 6.875%, due 05/27/19 | 100,000 | 102,725 | |||||||||
| Sri Lanka Government International Bond 6.200%, due 05/11/277 | 200,000 | 192,290 | |||||||||
6.250%, due 07/27/217 | 200,000 | 204,748 | |||||||||
6.750%, due 04/18/287 | 200,000 | 197,805 | |||||||||
| Turkey Government International Bond 5.125%, due 03/25/22 | 450,000 | 431,437 | |||||||||
5.625%, due 03/30/21 | 110,000 | 108,370 | |||||||||
6.125%, due 10/24/28 | 200,000 | 182,500 | |||||||||
7.375%, due 02/05/25 | 430,000 | 437,525 | |||||||||
| Uruguay Government International Bond 5.100%, due 06/18/50 | 197,500 | 199,682 | |||||||||
| Total non-US government obligations (cost—$31,537,575) | 30,188,032 | ||||||||||
Municipal bonds and notes—1.41% | |||||||||||
Education—0.09% | |||||||||||
| Will County Community High School District No. 210 Lincoln-Way (Capital Appreciation), (AGM Insured), 4.016%, due 01/01/2115 | 780,000 | 743,597 | |||||||||
General obligation—0.66% | |||||||||||
| Alabama Economic Settlement Authority, Series B, 3.163%, due 09/15/25 | 2,000,000 | 1,973,300 | |||||||||
| City of Chicago, Series B, 7.375%, due 01/01/33 | 1,600,000 | 1,803,536 | |||||||||
| State of Illinois 5.877%, due 03/01/19 | 1,335,000 | 1,355,426 | |||||||||
5,132,262 | |||||||||||
Transportation—0.42% | |||||||||||
| Harris County Metropolitan Transportation Authority (Build America Bonds), Series C, 6.875%, due 11/01/38 | 3,100,000 | 3,246,320 | |||||||||
Utilities—0.24% | |||||||||||
| Cincinnati Water System Revenue (Build America Bonds), Series B, 6.458%, due 12/01/34 | 100,000 | 104,767 | |||||||||
| Face amount1 | Value | ||||||||||
Municipal bonds and notes—(concluded) | |||||||||||
Utilities—(concluded) | |||||||||||
| Metropolitan Water District Southern California (Build America Bonds) 5.906%, due 07/01/25 | 1,700,000 | $ | 1,749,589 | ||||||||
1,854,356 | |||||||||||
| Total municipal bonds and notes (cost—$10,550,952) | 10,976,535 | ||||||||||
Commercial paper—0.24% | |||||||||||
| Schlumberger Holdings 2.677%, due 10/03/18 (cost—$1,891,289) | 1,900,000 | 1,891,289 | |||||||||
Short-term US government obligation18—0.17% | |||||||||||
| US Treasury Bill 1.926%, due 08/23/18 (cost—$1,348,441) | 1,350,000 | 1,348,455 | |||||||||
| Number of contracts | Notional amount | ||||||||||||||
Options purchased—0.00%† | |||||||||||||||
Call options—0.00%† | |||||||||||||||
| Canada Government Bond 10 Year Futures, strike @ $159.50, expires 08/17/18 (Counterparty: MSCI) | 67 | CAD | 10,686,500 | 258 | |||||||||||
| US Bond Future Option Futures, strike @ $168 expires 08/24/18 (Counterparty: MSCI) | 41 | USD | 6,888,000 | 41 | |||||||||||
| US Bond Future Option Futures, strike @ $170 expires 08/24/18 (Counterparty: MSCI) | 75 | USD | 12,750,000 | 75 | |||||||||||
| US Bond Future Option Futures, strike @ $171 expires 08/24/18 (Counterparty: MSCI) | 7 | USD | 1,197,000 | 7 | |||||||||||
| US Bond Future Option Futures, strike @ $175 expires 08/24/18 (Counterparty: MSCI) | 20 | USD | 3,500,000 | 20 | |||||||||||
401 | |||||||||||||||
Put options—0.00%† | |||||||||||||||
| US Treasury Note 10 Year Futures, strike @ $106.50, expires 08/24/18 (Counterparty: MSCI) | 200 | USD | 21,300,000 | 200 | |||||||||||
| US Treasury Note 10 Year Futures, strike @ $107.00, expires 08/24/18 (Counterparty: MSCI) | 626 | USD | 66,982,000 | 626 | |||||||||||
| US Treasury Note 10 Year Futures, strike @ $107.50, expires 08/24/18 (Counterparty: MSCI) | 300 | USD | 32,250,000 | 300 | |||||||||||
91
PACE Strategic Fixed Income Investments
Portfolio of investments—July 31, 2018
| Number of contracts | Notional amount | Value | |||||||||||||
Options purchased—(concluded) | |||||||||||||||
Put options—(concluded) | |||||||||||||||
| US Treasury Note 10 Year Futures, strike @ $108.00, expires 08/24/18 (Counterparty: MSCI) | 245 | USD | 26,460,000 | $ | 245 | ||||||||||
| US Treasury Note 5 Year Futures, strike @ $106.25, expires 08/24/18 (Counterparty: MSCI) | 100 | USD | 10,625,000 | 100 | |||||||||||
| US Treasury Note 5 Year Futures, strike @ $106.50, expires 08/24/18 (Counterparty: MSCI) | 100 | USD | 10,650,000 | 100 | |||||||||||
| US Treasury Note 5 Year Futures, strike @ $106.75, expires 08/24/18 (Counterparty: MSCI) | 195 | USD | 20,816,250 | 195 | |||||||||||
| US Treasury Note 5 Year Futures, strike @ $107.00, expires 08/24/18 (Counterparty: MSCI) | 122 | USD | 13,054,000 | 122 | |||||||||||
1,888 | |||||||||||||||
| Total options purchased (cost—$17,939) | 2,289 | ||||||||||||||
Swaptions purchased—0.03% | |||||||||||||||
Put swaptions—0.03% | |||||||||||||||
| 3 Month USD LIBOR Interest Rate Swap, strike @ 2.905%, expires 08/22/184 (Counterparty: MSCI; pay floating rate); underlying swap terminates 08/22/48 | 3,600,000 | USD | 3,600,000 | 134,643 | |||||||||||
| 3 Month USD LIBOR Interest Rate Swap, strike @ 2.940%, expires 08/22/184 (Counterparty: GSB; pay floating rate); underlying swap terminates 08/22/48 | 1,200,000 | USD | 1,200,000 | 37,068 | |||||||||||
| Number of contracts | Notional amount | Value | |||||||||||||
Swaptions purchased—(concluded) | |||||||||||||||
Put swaptions—(concluded) | |||||||||||||||
| 3 Month USD LIBOR Interest Rate Swap, strike @ 2.943%, expires 12/16/194 (Counterparty: GSB; pay floating rate); underlying swap terminates 12/16/49 | 500,000 | USD | 500,000 | $ | 36,839 | ||||||||||
| Total swaptions purchased (cost—$496,360) | 208,550 | ||||||||||||||
| Number of shares | |||||||||||
Short-term investment—0.57% | |||||||||||
Investment companies—0.57% | |||||||||||
| State Street Institutional U.S. Government Money Market Fund (cost—$4,454,932) | 4,454,932 | 4,454,932 | |||||||||
Investment of cash collateral from securities loaned—1.11% | |||||||||||
Money market fund—1.11% | |||||||||||
| State Street Navigator Securities Lending Government Money Market Portfolio (cost—$8,610,323) | 8,610,323 | 8,610,323 | |||||||||
| Total investments (cost—$1,052,478,063)—133.62% | 1,042,093,559 | ||||||||||
Liabilities in excess of other assets—(33.62)% | (262,174,602 | ) | |||||||||
Net assets—100.00% | $ | 779,918,957 | |||||||||
For a listing of defined portfolio acronyms, counterparty acronyms and currency type abbreviations that are used throughout the Portfolio of investments as well as the tables that follow, please refer to page 273.
92
PACE Strategic Fixed Income Investments
Portfolio of investments—July 31, 2018
Foreign exchange options written
| Notional amount (000) | Number of contracts | Call options | Counterparty | Expiration date | Premiums received | Current value | Unrealized appreciation | ||||||||||||||||||||||||
USD | 4,100 | 4,100,000 | USD Call/MXN Put, strike @ MXN 19.18 | HSBC | 08/24/18 | $ | 22,447 | $ | (20,832 | ) | $ | 1,615 | |||||||||||||||||||
USD | 1,600 | 1,600,000 | USD Call/MXN Put, strike @ MXN 19.34 | HSBC | 09/05/18 | 10,360 | (9,006 | ) | 1,354 | ||||||||||||||||||||||
USD | 2,850 | 2,850,000 | USD Call/MXN Put, strike @ MXN 19.50 | JPMCB | 08/21/18 | 46,996 | (4,785 | ) | 42,211 | ||||||||||||||||||||||
USD | 2,500 | 2,500,000 | USD Call/MXN Put, strike @ MXN 19.70 | JPMCB | 08/22/18 | 17,526 | (2,903 | ) | 14,623 | ||||||||||||||||||||||
USD | 1,700 | 1,700,000 | USD Call/MXN Put, strike @ MXN 19.89 | BNP | 08/20/18 | 12,318 | (828 | ) | 11,490 | ||||||||||||||||||||||
$ | 109,647 | $ | (38,354 | ) | $ | 71,293 | |||||||||||||||||||||||||
Put options | |||||||||||||||||||||||||||||||
AUD | 8,200 | 8,200,000 | AUD Put/USD Call, strike @ USD 0.73 | GSB | 08/23/18 | $ | 32,783 | $ | (7,920 | ) | $ | 24,863 | |||||||||||||||||||
$ | 142,430 | $ | (46,274 | ) | $ | 96,156 | |||||||||||||||||||||||||
Swaptions written
| Notional amount (000) | Number of contracts | Put swaptions | Counterparty | Pay/ receive floating rate | Expiration date | Premiums received | Current value | Unrealized appreciation (depreciation) | |||||||||||||||||||||||||||
USD | 2,400 | 2,400,000 | 3 Month USD LIBOR Interest Rate Swap strike @ 2.750%, terminating 12/16/24 | GSB | Pay | 12/12/19 | $ | 26,182 | $ | (54,871 | ) | $ | (28,689 | ) | |||||||||||||||||||||
USD | 5,100 | 5,100,000 | 3 Month USD LIBOR Interest Rate Swap strike @ 2.800%, terminating 08/22/23 | GSB | Pay | 08/20/18 | 113,591 | (48,022 | ) | 65,569 | |||||||||||||||||||||||||
USD | 15,800 | 15,800,000 | 3 Month USD LIBOR Interest Rate Swap strike @ 2.800%, terminating 08/22/23 | MSCI | Pay | 08/20/18 | 352,560 | (148,772 | ) | 203,788 | |||||||||||||||||||||||||
$ | 492,333 | $ | (251,665 | ) | $ | 240,668 | |||||||||||||||||||||||||||||
Futures contracts
| Number of contracts | Currency | Expiration date | Current notional amount | Value | Unrealized appreciation (depreciation) | ||||||||||||||||||||||
Interest rate futures buy contracts: | |||||||||||||||||||||||||||
427 | EUR | 3 Month EURIBOR Futures | September 2018 | $ | 125,184,940 | $ | 125,221,314 | $ | 36,374 | ||||||||||||||||||
113 | EUR | 3 Month EURIBOR Futures | December 2018 | 33,121,049 | 33,131,586 | 10,537 | |||||||||||||||||||||
40 | EUR | Call Options on Euro BTP Futures 08/24/18, strike @ EUR 152 | August 2018 | 508 | 468 | (40 | ) | ||||||||||||||||||||
20 | EUR | Call Options on Euro Oat Futures 08/24/18, strike @ EUR 168 | August 2018 | 254 | 234 | (20 | ) | ||||||||||||||||||||
43 | EUR | Call Options on Euro Oat Futures 08/24/18, strike @ EUR 197 | August 2018 | 546 | 503 | (43 | ) | ||||||||||||||||||||
93
PACE Strategic Fixed Income Investments
Portfolio of investments—July 31, 2018
Futures contracts—(concluded)
| Number of contracts | Currency | Expiration date | Current notional amount | Value | Unrealized appreciation (depreciation) | ||||||||||||||||||||||
Interest rate futures buy contracts—(concluded) | |||||||||||||||||||||||||||
111 | EUR | Put Options on Euro Bund Futures 08/24/18, strike @ EUR 144 | August 2018 | $ | 1,410 | $ | 1,298 | $ | (112 | ) | |||||||||||||||||
150 | EUR | Put Options on Euro Bund Futures 08/24/18, strike @ EUR 145 | August 2018 | 1,905 | 1,754 | (151 | ) | ||||||||||||||||||||
26 | USD | 90-Day Eurodollar Futures | March 2019 | 6,319,327 | 6,316,050 | (3,277 | ) | ||||||||||||||||||||
2 | USD | Australian Dollar Future | September 2018 | 152,398 | 148,780 | (3,618 | ) | ||||||||||||||||||||
4 | USD | British Pound Future | September 2018 | 335,895 | 328,750 | (7,145 | ) | ||||||||||||||||||||
2 | USD | Canadian Dollar Futures | September 2018 | 154,258 | 153,990 | (268 | ) | ||||||||||||||||||||
US Treasury futures buy contracts: | |||||||||||||||||||||||||||
1,058 | USD | US Treasury Note 10 Year Futures | September 2018 | 126,843,998 | 126,348,344 | (495,654 | ) | ||||||||||||||||||||
200 | USD | US Treasury Note 2 Year Futures | September 2018 | 42,295,045 | 42,275,000 | (20,045 | ) | ||||||||||||||||||||
724 | USD | US Treasury Note 5 Year Futures | September 2018 | 82,111,010 | 81,902,500 | (208,510 | ) | ||||||||||||||||||||
$ | 416,522,543 | $ | 415,830,571 | $ | (691,972 | ) | |||||||||||||||||||||
Interest rate futures sell contracts: | |||||||||||||||||||||||||||
223 | AUD | Australian Bond 10 Year Futures | September 2018 | (21,145,551 | ) | (21,407,033 | ) | (261,482 | ) | ||||||||||||||||||
64 | CAD | Canada Government Bond 10 Year Futures | September 2018 | (6,603,839 | ) | (6,630,495 | ) | (26,656 | ) | ||||||||||||||||||
43 | EUR | German Euro Bund Futures | September 2018 | (8,061,169 | ) | (8,124,573 | ) | (63,404 | ) | ||||||||||||||||||
37 | EUR | German Euro Buxl 30 Year Futures | September 2018 | (7,591,052 | ) | (7,597,500 | ) | (6,448 | ) | ||||||||||||||||||
54 | EUR | German Euro Schatz Futures | September 2018 | (7,071,695 | ) | (7,066,230 | ) | 5,465 | |||||||||||||||||||
117 | EUR | Italian Government Bond Futures | September 2018 | (17,522,147 | ) | (17,416,415 | ) | 105,732 | |||||||||||||||||||
302 | EUR | Mid-Term Euro-OAT Futures | September 2018 | (54,070,679 | ) | (54,288,778 | ) | (218,099 | ) | ||||||||||||||||||
36 | EUR | Put Options on Euro Bund Futures 08/24/18, strike @ EUR 160 | August 2018 | (10,487 | ) | (6,314 | ) | 4,173 | |||||||||||||||||||
62 | EUR | Put Options on Euro Bund Futures 08/24/18, strike @ EUR 160.5 | August 2018 | (27,488 | ) | (17,400 | ) | 10,088 | |||||||||||||||||||
171 | USD | 90-Day Eurodollar Futures | June 2020 | (41,529,327 | ) | (41,437,575 | ) | 91,752 | |||||||||||||||||||
151 | USD | 90-Day Eurodollar Futures | September 2020 | (36,624,239 | ) | (36,592,963 | ) | 31,276 | |||||||||||||||||||
79 | USD | 90-Day Eurodollar Futures | December 2020 | (19,141,406 | ) | (19,143,675 | ) | (2,269 | ) | ||||||||||||||||||
2 | USD | Euro Fx Futures with American Style Options | September 2018 | (297,317 | ) | (293,438 | ) | 3,879 | |||||||||||||||||||
US Treasury futures sell contracts: | |||||||||||||||||||||||||||
27 | USD | Ultra Long US Treasury Bond Futures | September 2018 | (4,208,112 | ) | (4,236,469 | ) | (28,357 | ) | ||||||||||||||||||
296 | USD | US Long Bond Futures | September 2018 | (41,832,924 | ) | (42,318,750 | ) | (485,826 | ) | ||||||||||||||||||
160 | USD | US Ultra Treasury Note 10 Year Futures | September 2018 | (20,287,426 | ) | (20,337,500 | ) | (50,074 | ) | ||||||||||||||||||
$ | (286,024,858 | ) | $ | (286,915,108 | ) | $ | (890,250 | ) | |||||||||||||||||||
$ | (1,582,222 | ) | |||||||||||||||||||||||||
Forward foreign currency contracts
Counterparty | Sell | Purchase | Settlement date | Unrealized appreciation (depreciation) | |||||||||||||||
BB | GBP | 14,907,000 | USD | 19,520,412 | 08/02/18 | $ | (45,764 | ) | |||||||||||
BB | MXN | 13,497,700 | USD | 709,875 | 08/23/18 | (11,851 | ) | ||||||||||||
BB | MXN | 12,628,000 | USD | 655,887 | 08/27/18 | (18,893 | ) | ||||||||||||
BB | MYR | 2,596,159 | USD | 650,324 | 09/19/18 | 12,559 | |||||||||||||
94
PACE Strategic Fixed Income Investments
Portfolio of investments—July 31, 2018
Forward foreign currency contracts—(continued)
Counterparty | Sell | Purchase | Settlement date | Unrealized appreciation (depreciation) | |||||||||||||||
BB | USD | 9,449,659 | GBP | 7,119,000 | 08/02/18 | $ | (105,619 | ) | |||||||||||
BNP | EUR | 14,367,000 | USD | 16,753,215 | 08/02/18 | (46,836 | ) | ||||||||||||
BNP | USD | 298,783 | INR | 20,439,741 | 09/19/18 | (2,438 | ) | ||||||||||||
BNP | USD | 2,934,699 | JPY | 323,400,000 | 08/15/18 | (40,003 | ) | ||||||||||||
BNP | USD | 3,341,888 | MXN | 67,220,000 | 08/27/18 | 250,025 | |||||||||||||
BNP | USD | 119,503 | ZAR | 1,514,000 | 08/08/18 | (4,611 | ) | ||||||||||||
BOA | EUR | 12,028,000 | USD | 14,049,774 | 09/04/18 | (48,604 | ) | ||||||||||||
BOA | GBP | 2,545,000 | USD | 3,338,831 | 08/02/18 | (1,607 | ) | ||||||||||||
BOA | JPY | 1,992,900,000 | USD | 18,283,793 | 08/15/18 | 445,699 | |||||||||||||
BOA | SEK | 12,635,000 | USD | 1,445,280 | 08/15/18 | 6,951 | |||||||||||||
BOA | USD | 14,016,228 | EUR | 12,028,000 | 08/02/18 | 48,713 | |||||||||||||
BOA | USD | 2,807,803 | JPY | 310,000,000 | 08/15/18 | (33,048 | ) | ||||||||||||
CITI | BRL | 2,431,868 | USD | 647,652 | 08/02/18 | (276 | ) | ||||||||||||
CITI | BRL | 2,431,868 | USD | 650,241 | 09/05/18 | 4,834 | |||||||||||||
CITI | GBP | 1,582,000 | USD | 2,074,833 | 08/02/18 | (1,621 | ) | ||||||||||||
CITI | GBP | 1,619,000 | USD | 2,134,068 | 08/02/18 | 9,050 | |||||||||||||
CITI | GBP | 8,736,000 | USD | 11,457,323 | 09/04/18 | (24,397 | ) | ||||||||||||
CITI | JPY | 173,700,000 | USD | 1,565,175 | 08/15/18 | 10,417 | |||||||||||||
CITI | MXN | 78,484,000 | USD | 3,987,453 | 08/27/18 | (206,354 | ) | ||||||||||||
CITI | USD | 652,850 | BRL | 2,431,868 | 08/02/18 | (4,923 | ) | ||||||||||||
CITI | USD | 2,391,826 | EUR | 2,050,000 | 08/02/18 | 5,341 | |||||||||||||
CITI | USD | 11,441,966 | GBP | 8,736,000 | 08/02/18 | 24,466 | |||||||||||||
CITI | USD | 16,438,322 | JPY | 1,795,700,000 | 08/15/18 | (365,330 | ) | ||||||||||||
CITI | USD | 631,967 | MXN | 12,735,000 | 08/27/18 | 48,530 | |||||||||||||
CITI | USD | 1,674,598 | SEK | 14,850,000 | 08/15/18 | 15,879 | |||||||||||||
CSI | BRL | 4,212,099 | USD | 1,121,761 | 08/02/18 | (478 | ) | ||||||||||||
CSI | MXN | 18,632,000 | USD | 928,286 | 08/27/18 | (67,318 | ) | ||||||||||||
CSI | USD | 1,105,973 | BRL | 4,212,099 | 08/02/18 | 16,266 | |||||||||||||
DB | BRL | 4,212,099 | USD | 1,086,660 | 08/02/18 | (35,579 | ) | ||||||||||||
DB | MXN | 37,906,000 | USD | 1,875,458 | 08/27/18 | (150,056 | ) | ||||||||||||
DB | USD | 1,121,761 | BRL | 4,212,099 | 08/02/18 | 478 | |||||||||||||
DB | USD | 677,267 | BRL | 2,635,381 | 09/05/18 | 22,152 | |||||||||||||
GSI | BRL | 1,038,555 | USD | 270,000 | 08/02/18 | (6,705 | ) | ||||||||||||
GSI | GBP | 1,568,000 | USD | 2,053,981 | 08/02/18 | (4,096 | ) | ||||||||||||
GSI | JPY | 344,400,000 | USD | 3,121,734 | 08/15/18 | 39,071 | |||||||||||||
GSI | MXN | 66,345,000 | USD | 3,277,554 | 08/27/18 | (267,604 | ) | ||||||||||||
GSI | USD | 11,731,668 | SEK | 100,060,000 | 08/15/18 | (341,152 | ) | ||||||||||||
GSI | USD | 276,587 | BRL | 1,038,555 | 08/02/18 | 118 | |||||||||||||
GSI | USD | 3,156,349 | JPY | 346,400,000 | 08/15/18 | (55,784 | ) | ||||||||||||
GSI | USD | 8,385,552 | MXN | 166,026,179 | 08/27/18 | 486,087 | |||||||||||||
HSBC | MXN | 12,938,000 | USD | 626,605 | 08/27/18 | (64,739 | ) | ||||||||||||
HSBC | USD | 6,301,401 | GBP | 4,798,000 | 08/02/18 | (3,788 | ) | ||||||||||||
JPMCB | AUD | 1,578,000 | USD | 1,190,335 | 08/15/18 | 17,865 | |||||||||||||
JPMCB | BRL | 1,393,313 | USD | 375,000 | 08/02/18 | 3,777 | |||||||||||||
JPMCB | EUR | 918,000 | USD | 1,073,043 | 08/02/18 | (420 | ) | ||||||||||||
95
PACE Strategic Fixed Income Investments
Portfolio of investments—July 31, 2018
Forward foreign currency contracts—(concluded)
Counterparty | Sell | Purchase | Settlement date | Unrealized appreciation (depreciation) | |||||||||||||||
JPMCB | JPY | 3,428,200,000 | USD | 31,282,055 | 08/15/18 | $ | 596,845 | ||||||||||||
JPMCB | MXN | 12,746,340 | USD | 684,000 | 08/23/18 | 2,450 | |||||||||||||
JPMCB | MXN | 24,040,000 | USD | 1,258,955 | 08/27/18 | (25,627 | ) | ||||||||||||
JPMCB | MXN | 28,538,179 | USD | 1,529,787 | 08/27/18 | 4,844 | |||||||||||||
JPMCB | SEK | 18,020,000 | USD | 2,062,105 | 08/15/18 | 10,765 | |||||||||||||
JPMCB | USD | 371,065 | BRL | 1,393,313 | 08/02/18 | 158 | |||||||||||||
JPMCB | USD | 338,029 | EUR | 289,000 | 08/02/18 | (87 | ) | ||||||||||||
JPMCB | USD | 21,744,217 | JPY | 2,396,700,000 | 08/15/18 | (291,780 | ) | ||||||||||||
JPMCB | USD | 6,104,718 | JPY | 685,200,000 | 08/15/18 | 28,385 | |||||||||||||
JPMCB | USD | 1,662,441 | MXN | 33,530,000 | 08/27/18 | 129,241 | |||||||||||||
JPMCB | USD | 1,514,894 | MXN | 28,538,179 | 10/26/18 | (4,705 | ) | ||||||||||||
$ | (41,127 | ) | |||||||||||||||||
Centrally cleared credit default swap agreements on corporate issues—sell protection21
| Referenced obligations | Notional amount (000) | Maturity date | Payment frequency | Payments received by the Portfolio19 | Upfront payments received (made) | Value | Unrealized appreciation | ||||||||||||||||||||||||
| Berkshire Hathaway, Inc. bond, 1.550%, due 02/09/18 | USD | 2,200 | 12/20/21 | Quarterly | 1.000 | % | $ | (12,354 | ) | $ | 50,473 | $ | 38,119 | ||||||||||||||||||
| Carefour Operates Supermarkets, bond, 1.750%, due 05/22/19 | EUR | 1,500 | 06/20/23 | Quarterly | 1.000 | (10,041 | ) | 17,022 | 6,981 | ||||||||||||||||||||||
| Exelon Generation Co. LLC, bond, 6.200%, due 10/01/17 | USD | 2,000 | 12/20/21 | Quarterly | 1.000 | 60,759 | 33,667 | 94,426 | |||||||||||||||||||||||
| MetLife, Inc. bond, 4.75%, due 02/08/21 | USD | 1,900 | 12/20/21 | Quarterly | 1.000 | 15,424 | 42,455 | 57,879 | |||||||||||||||||||||||
| Tesco PLC, bond, 6.000%, due 12/14/29 | EUR | 3,000 | 06/20/22 | Quarterly | 1.000 | 109,206 | 44,715 | 153,921 | |||||||||||||||||||||||
| Verizon Communications, Inc., bond, 2.550%, due 06/17/19 | USD | 1,600 | 12/20/22 | Quarterly | 1.000 | (27,585 | ) | 33,639 | 6,054 | ||||||||||||||||||||||
$ | 135,409 | $ | 221,971 | $ | 357,380 | ||||||||||||||||||||||||||
Centrally cleared credit default swap agreements on credit indices—buy protection20
| Referenced obligations | Notional amount (000) | Maturity date | Payment frequency | Payments made by the Portfolio19 | Upfront payments received (made) | Value | Unrealized depreciation | ||||||||||||||||||||||||
CDX North America High Yield 29 Index | USD | 4,600 | 12/20/22 | Quarterly | 5.000 | % | $ | 336,796 | $ | (365,033 | ) | $ | (28,237 | ) | |||||||||||||||||
CDX North America High Yield 26 Index | USD | 4,229 | 06/20/21 | Quarterly | 5.000 | 97,527 | (340,703 | ) | (243,176 | ) | |||||||||||||||||||||
$ | 434,323 | $ | (705,736 | ) | $ | (271,413 | ) | ||||||||||||||||||||||||
96
PACE Strategic Fixed Income Investments
Portfolio of investments—July 31, 2018
Centrally cleared credit default swap agreements on credit indices—sell protection21
| Referenced obligations | Notional amount (000) | Maturity date | Payment frequency | Payments received by the Portfolio19 | Upfront payments received (made) | Value | Unrealized appreciation | ||||||||||||||||||||||||
| CDX North American Investment Grade 30 Index | USD | 129,700 | 06/20/23 | Quarterly | 1.000 | % | $ | (2,071,388 | ) | $ | 2,602,647 | $ | 531,259 | ||||||||||||||||||
CDX North America High Yield 30 Index | USD | 1,000 | 06/20/23 | Quarterly | 5.000 | (56,018 | ) | 76,379 | 20,361 | ||||||||||||||||||||||
| CDX North American Investment Grade 28 Index | USD | 40,600 | 06/20/22 | Quarterly | 1.000 | (623,501 | ) | 833,829 | 210,328 | ||||||||||||||||||||||
$ | (2,750,907 | ) | $ | 3,512,855 | $ | 761,948 | |||||||||||||||||||||||||
Centrally cleared interest rate swap agreements
| Notional amount (000) | Maturity date | Payment frequency | Payments made by the Portfolio19 | Payments received by the Portfolio19 | Value | Unrealized appreciation (depreciation) | |||||||||||||||||||||
USD | 13,500 | 12/20/27 | Quarterly | 2.500% | 3 Month USD LIBOR | $ | 614,017 | $ | 939,172 | ||||||||||||||||||
JPY | 310,000 | 03/21/28 | Semi-Annual | 0.300 | 6 Month JPY LIBOR | 2,724 | (18,454 | ) | |||||||||||||||||||
JPY | 3,180,000 | 03/18/26 | Semi-Annual | 0.300 | 6 Month JPY LIBOR | (187,757 | ) | (9,730 | ) | ||||||||||||||||||
USD | 32,600 | 12/05/19 | Semi-Annual | 3 Month USD LIBOR | 1.958% | (371,153 | ) | (371,153 | ) | ||||||||||||||||||
JPY | 230,000 | 06/19/28 | Semi-Annual | 0.399 | 6 Month JPY LIBOR | (14,316 | ) | (14,128 | ) | ||||||||||||||||||
USD | 13,700 | 06/20/28 | Quarterly | 2.250 | 3 Month USD LIBOR | 924,114 | 186,495 | ||||||||||||||||||||
GBP | 9,600 | 09/19/28 | Semi-Annual | 1.500 | 6 Month GBP LIBOR | 125,576 | (95,746 | ) | |||||||||||||||||||
JPY | 20,000 | 06/19/28 | Semi-Annual | 0.380 | 6 Month JPY LIBOR | (906 | ) | (1,217 | ) | ||||||||||||||||||
GBP | 10,500 | 09/19/23 | Semi-Annual | 1.500 | 6 Month GBP LIBOR | (62,148 | ) | (60,106 | ) | ||||||||||||||||||
EUR | 5,900 | 07/04/42 | Annual | 6 Month EURIBOR | 1.501 | 6,322 | (17,225 | ) | |||||||||||||||||||
EUR | 2,300 | 09/21/48 | Annual | 6 Month EURIBOR | 1.500 | (22,545 | ) | 3,732 | |||||||||||||||||||
EUR | 28,600 | 09/19/28 | Annual | 6 Month EURIBOR | 1.250 | 905,678 | 120,535 | ||||||||||||||||||||
EUR | 5,000 | 12/19/28 | Annual | 6 Month EURIBOR | 1.250 | 126,547 | 41,809 | ||||||||||||||||||||
BRL | 14,900 | 01/04/21 | Monthly | 1 Month Brazilian Interbank Deposit Average | 9.200 | 37,887 | 52,397 | ||||||||||||||||||||
GBP | 2,600 | 12/19/28 | Semi-Annual | 1.500 | 6 Month GBP LIBOR | 42,054 | (819 | ) | |||||||||||||||||||
JPY | 230,000 | 03/21/29 | Semi-Annual | 0.450 | 6 Month JPY LIBOR | (11,820 | ) | 4,957 | |||||||||||||||||||
BRL | 118,300 | 01/02/20 | Monthly | 1 Month Brazilian Interbank Deposit Average | 7.500 | (76,962 | ) | (1,313 | ) | ||||||||||||||||||
GBP | 4,900 | 12/21/48 | Semi-Annual | 1.500 | 6 Month GBP LIBOR | 298,866 | 275,892 | ||||||||||||||||||||
BRL | 79,200 | 01/02/20 | Monthly | 1 Month Brazilian Interbank Deposit Average | 7.750 | 12,545 | 156,005 | ||||||||||||||||||||
JPY | 60,000 | 03/23/48 | Semi-Annual | 1.000 | 6 Month JPY LIBOR | (12,406 | ) | (10,532 | ) | ||||||||||||||||||
JPY | 390,000 | 03/22/38 | Semi-Annual | 0.750 | 6 Month JPY LIBOR | (16,898 | ) | (27,302 | ) | ||||||||||||||||||
CAD | 500 | 12/16/46 | Semi-Annual | 1.750 | 3 Month Canadian Bankers Acceptance Rate | 85,205 | 91,449 | ||||||||||||||||||||
JPY | 3,620,000 | 03/18/26 | Semi-Annual | 0.300 | 6 Month JPY LIBOR | (218,333 | ) | (48,395 | ) | ||||||||||||||||||
JPY | 580,000 | 09/21/27 | Semi-Annual | 0.300 | 6 Month JPY LIBOR | (6,894 | ) | 19,643 | |||||||||||||||||||
$ | 2,179,397 | $ | 1,215,966 | ||||||||||||||||||||||||
97
PACE Strategic Fixed Income Investments
Portfolio of investments—July 31, 2018
Credit default swap agreements on corporate issues—sell protection21
Counterparty | Referenced obligations | Notional amount (000) | Maturity date | Payment frequency | Payments received by the Portfolio19 | Upfront payments received (made) | Value | Unrealized appreciation | |||||||||||||||||||||||||||
BNP | Petroleo Brasileiro SA, bond, 8.375%, due 12/10/18 | USD | 1,300 | 03/20/20 | Quarterly | 1.000 | % | $ | 62,765 | $ | (8,116 | ) | $ | 54,649 | |||||||||||||||||||||
GSI | Petroleo Brasileiro SA, bond, 8.375%, due 12/10/18 | USD | 1,500 | 03/20/20 | Quarterly | 1.000 | 75,307 | (9,364 | ) | 65,943 | |||||||||||||||||||||||||
| �� | $ | 138,072 | $ | (17,480 | ) | $ | 120,592 | ||||||||||||||||||||||||||||
Credit default swap agreements on credit indices—sell protection21
Counterparty | Referenced obligations | Notional amount (000) | Maturity date | Payment frequency | Payments received by the Portfolio19 | Upfront payments received (made) | Value | Unrealized appreciation | |||||||||||||||||||||||||||
BOA | CMBX.NA.AAA.9 Index | USD | 3,200 | 09/17/58 | Monthly | 0.500 | % | $ | 235,556 | $ | 9,303 | $ | 244,859 | ||||||||||||||||||||||
Fair valuation summary
The following is a summary of the fair valuations according to the inputs used as of July 31, 2018 in valuing the Portfolio's investments. In the event a Portfolio holds investments for which fair value is measured using the NAV per share practical expedient (or its equivalent), a separate column will be added to the fair value hierarchy table; this is intended to permit reconciliation to the amounts presented in the Portfolio of investments:
| Assets Description | Unadjusted quoted prices in active markets for identical investments (Level 1) | Other significant observable inputs (Level 2) | Unobservable inputs (Level 3) | Total | |||||||||||||||
US government obligations | $ | — | $ | 196,327,540 | $ | — | $ | 196,327,540 | |||||||||||
Government national mortgage association certificates | — | 18,651 | — | 18,651 | |||||||||||||||
Federal home loan mortgage corporation certificates | — | 4,305,752 | — | 4,305,752 | |||||||||||||||
Federal housing administration certificates | — | 1,919 | — | 1,919 | |||||||||||||||
Federal national mortgage association certificates | — | 191,856,002 | 12,102 | 191,868,104 | |||||||||||||||
Collateralized mortgage obligations | — | 106,209,975 | — | 106,209,975 | |||||||||||||||
Asset-backed securities | — | 90,032,378 | — | 90,032,378 | |||||||||||||||
Corporate notes | — | 371,828,520 | — | 371,828,520 | |||||||||||||||
Loan assignments | — | 23,820,315 | — | 23,820,315 | |||||||||||||||
Non-US government obligations | — | 30,188,032 | — | 30,188,032 | |||||||||||||||
Municipal bonds and notes | — | 10,976,535 | — | 10,976,535 | |||||||||||||||
Commercial paper | — | 1,891,289 | — | 1,891,289 | |||||||||||||||
Short-term US government obligation | — | 1,348,455 | — | 1,348,455 | |||||||||||||||
Options purchased | 2,289 | — | — | 2,289 | |||||||||||||||
Swaptions purchased | — | 208,550 | — | 208,550 | |||||||||||||||
98
PACE Strategic Fixed Income Investments
Portfolio of investments—July 31, 2018
Fair valuation summary—(concluded)
| Assets Description | Unadjusted quoted prices in active markets for identical investments (Level 1) | Other significant observable inputs (Level 2) | Unobservable inputs (Level 3) | Total | |||||||||||||||
Short-term investment | $ | — | $ | 4,454,932 | $ | — | $ | 4,454,932 | |||||||||||
Investment of cash collateral from securities loaned | — | 8,610,323 | — | 8,610,323 | |||||||||||||||
Futures contracts | 299,276 | — | — | 299,276 | |||||||||||||||
Forward foreign currency contracts | — | 2,240,966 | — | 2,240,966 | |||||||||||||||
Swap agreements | — | 6,925,664 | — | 6,925,664 | |||||||||||||||
Total | $ | 301,565 | $ | 1,051,245,798 | $ | 12,102 | $ | 1,051,559,465 | |||||||||||
Liabilities | |||||||||||||||||||
Swaptions written | $ | — | $ | (251,665 | ) | $ | — | $ | (251,665 | ) | |||||||||
Foreign exchange options written | — | (46,274 | ) | — | (46,274 | ) | |||||||||||||
Futures contracts | (1,881,498 | ) | — | — | (1,881,498 | ) | |||||||||||||
Forward foreign currency contracts | — | (2,282,093 | ) | — | (2,282,093 | ) | |||||||||||||
Swap agreements | — | (1,725,354 | ) | — | (1,725,354 | ) | |||||||||||||
Total | $ | (1,881,498 | ) | $ | (4,305,386 | ) | $ | — | $ | (6,186,884 | ) | ||||||||
At July 31, 2018, there were no transfers between Level 1 and Level 2.
Level 3 rollforward disclosure
The following is a rollforward of the Portfolio's investment that was valued using unobservable inputs for the year ended July 31, 2018:
| Federal housing administration certificates | Federal national mortgage association certificates | Total | |||||||||||||
Beginning balance | $ | 7,700 | $ | 14,454 | $ | 22,154 | |||||||||
Purchases | — | — | — | ||||||||||||
Sales | (5,788 | ) | (2,714 | ) | (8,502 | ) | |||||||||
Accrued discounts/(premiums) | (38 | ) | — | (38 | ) | ||||||||||
Total realized gain/(loss) | (169 | ) | — | (169 | ) | ||||||||||
Net change in unrealized appreciation/depreciation | 214 | 362 | 576 | ||||||||||||
Transfers into Level 3 | — | — | — | ||||||||||||
Transfers out of Level 3 | (1,919 | ) | — | (1,919 | ) | ||||||||||
Ending balance | $ | — | $ | 12,102 | $ | 12,102 | |||||||||
The change in net unrealized appreciation/depreciation relating to the Level 3 investments held at July 31, 2018, was $95.
99
PACE Strategic Fixed Income Investments
Portfolio of investments—July 31, 2018
Portfolio footnotes
† Amount represents less than 0.005%.
1 In US dollars unless otherwise indicated.
2 Security, or portion thereof, pledged as collateral for investments sold short, written options, futures and/or swap agreements.
3 Variable or floating rate security. The interest rate shown is the rate in effect as of period end and changes periodically.
4 Illiquid investment at period end. Illiquid assets, in the amount of $9,755,502, represented 1.25% of the Portfolio's net assets at period end.
5 Significant unobservable inputs were used in the valuation of this security; i.e. a Level 3 security.
6 Security is being fair valued by a valuation committee under the direction of the board of trustees.
7 Security was purchased pursuant to Regulation S under the Securities Act of 1933, which exempts from registration securities offered and sold outside of the United States. Such a security cannot be sold in the United States without either an effective registration statement filed pursuant to the Securities Act of 1933, or pursuant to an exemption from registration.
8 Variable or floating rate security for which the interest rate adjusts periodically based on changes in current interest rates and prepayments on the underlying pool of assets. Rate shown is the rate in effect as of period end.
9 Security exempt from registration pursuant to Rule 144A under the Securities Act of 1933. These securities are considered liquid, unless noted otherwise, and may be resold in transactions exempt from registration, normally to qualified institutional buyers. Securities exempt from registration pursuant to Rule 144A, in the amount of $175,142,299, represented 22.46% of the Portfolio's net assets at period end.
10 Security purchased on a when-issued basis. When-issued refers to a transaction made conditionally because a security, although authorized, has not yet been issued.
11 Step bond—coupon rate increases in increments to maturity. The rate disclosed is the rate at the period end; the maturity date disclosed is the ultimate maturity date.
12 Security, or portion thereof, was on loan at the period end.
13 Perpetual investment. Date shown reflects the next call date.
14 Payment-in-kind security for which interest may be paid in cash or additional principal, at the discretion of the issuer.
15 Rate shown reflects annualized yield at the period end on zero coupon bond.
16 Bond interest in default.
17 Position is unsettled. Contract rate was not determined at July 31, 2018 and does not take effect until settlement.
18 Rate shown is the discount rate at the date of purchase unless otherwise noted.
19 Payments made or received are based on the notional amount.
20 If the Fund is a buyer of protection and a credit event occurs, as defined under the terms of that particular swap agreement, the Fund will either (i) receive from the seller of protection an amount equal to the notional amount of the swap and deliver the referenced obligation or underlying securities comprising the referenced obligation or (ii) receive a net settlement amount in the form of cash or securities equal to the notional amount of the swap less the recovery value of the referenced obligation or underlying securities comprising the referenced obligation.
21 If the Fund is a seller of protection and a credit event occurs, as defined under the terms of that particular swap agreement, the Fund will either (i) pay to the buyer of protection an amount equal to the notional amount of the swap and take delivery of the referenced obligation or underlying securities comprising the referenced obligation or (ii) pay a net settlement amount in the form of cash or securities equal to the notional amount of the swap less the recovery value of the referenced obligation or underlying securities comprising the referenced obligation.
See accompanying notes to financial statements.
100
PACE Municipal Fixed Income Investments
Performance (unaudited)
For the 12 months ended July 31, 2018, the Portfolio's Class P shares returned 0.34% before the deduction of the maximum PACE Select program fee.1 In comparison, the Bloomberg Barclays US Municipal 3-15 Year Blend Index (the "benchmark") returned 0.56%, and the Lipper Intermediate Municipal Debt Funds category posted a median return of 0.54%. (Returns for all share classes over various time periods are shown in the "Performance at a glance" table on page 103. Please note that the returns shown do not reflect the deduction of taxes that a shareholder would pay on Portfolio distributions or the redemption of Portfolio shares.) For a detailed commentary on the market environment in general during the reporting period, please refer to page 3.
Subadvisor's comments (unaudited)2
(Please note that while the subadvisor outperformed the benchmark on a gross-of-fees basis, the Portfolio underperformed net of fees, as reported in the "Performance at a glance" table. As stated in footnote two, the comments that follow address performance on a gross-of-fees basis.)
The Portfolio outperformed its benchmark during the reporting period. The primary drivers of performance versus the benchmark were positive contributions from both sector allocation and security selection, while interest rate positioning was a detractor in the rising interest rate environment.
The Portfolio's performance overall benefited from being overweight higher-yielding revenue-backed bonds and underweighted both the state and local general obligation sectors. Treasury-backed pre-refunded bonds lagged amid less demand among income-seeking retail investors, benefiting the Portfolio's underweight. Our results were particularly favorable from revenue bonds backed by hospitals and the states' settlement of litigation with US tobacco companies, as those high-yielding bonds continued to perform well amidst strong demand. Conversely, the Portfolio's overweights to airport and broker-backed prepaid gas bonds detracted from results. Within the general obligation sector, the Portfolio's underweight exposure to lagging state-backed general obligation bonds was beneficial, although a higher-quality bias among local general obligation bonds was a modest detractor from returns.
State and local government credit fundamentals were stable overall during the reporting period, supported by solid property, income and sales tax trends. Furthermore, positive credit developments included the recent US Supreme Court verdicts in the South Dakota vs. Wayfair, Inc. and Janus vs. American Federation of State, County, and Municipal Employees cases. Pension challenges continue to weigh on certain states, notably Illinois, New Jersey and Connecticut. A modest overweight to New Jersey-backed bonds was additive, as those issues outperformed. The Portfolio had no exposure to Illinois general obligation bonds (1.2% in the benchmark). This detracted from returns, as those bonds were a top performer, as their prices rallied on news of the state budget being passed on time. From
1 Class P shares held through the PACE Select Advisors Program are subject to a maximum Program fee of 2.50%, which, if included, would have reduced performance Class P shares held through other advisory programs also may be subject to a program fee, which, if included, would have reduced performance.
2 All Sub-Advisors discuss performance on a gross-of-fees basis—meaning that no fees or expenses are reflected in their sleeves'/sleeve's performance. Alternately, Portfolio performance is shown net of fees, which does factor in fees and expenses associated with the Portfolio.
PACE Select Advisors Trust – PACE Municipal Fixed Income Investments
Investment Manager:
UBS Asset Management (Americas) Inc. ("UBS AM")
Investment Subadvisor:
BNY Mellon Asset Management North America Corporation (f/k/a Standish Mellon Asset Management Company LLC) ("BNY Mellon AMNA")
Portfolio Management Team:
UBS AM: Mabel Lung, CFA, Gina Toth, CFA and Fred Lee, CFA
BNY Mellon AMNA: Daniel Marques, CFA and Daniel Rabasco, CFA
Objective:
High current income exempt from federal income tax
Investment process:
The subadvisor utilizes a strategy that involves investing
in undervalued sectors, geographical regions or individual
securities.
101
PACE Municipal Fixed Income Investments
Advisor's comments (unaudited) – concluded
a bond credit rating perspective, investment grade securities rated BBB were the strongest performers, as investors continue to exhibit heavy demand for higher-yielding bonds. The Portfolio was underweight the lowest investment grade BBB-rated segment. However, this was partially offset from being overweight A-rated revenue bonds, which also performed well.
Yields moved sharply higher during the reporting period, especially among short to intermediate maturities as the US Federal Reserve Board continues to raise interest rates. The Portfolio was positioned with a modest long duration posture, which detracted from results in the rising interest rate environment. The Portfolio's yield advantage versus the benchmark contributed to returns, although a modest overweight to 5-year bonds was a mitigating factor as this was the weakest performing area across the yield curve spectrum.
No derivatives were used during the reporting period.
Special considerations
The Portfolio may be appropriate for long-term investors seeking high current income exempt from federal income taxes. Investors should be able to withstand short-term fluctuations in the fixed income markets in return for potentially higher returns over the long term. The yield and value of the Portfolio change every day and can be affected by changes in interest rates, general market conditions, and other political, social and economic developments, as well as specific matters relating to the issuers in which the Portfolio invests. It is important to note that an investment in the Portfolio is only one component of a balanced investment plan.
102
PACE Municipal Fixed Income Investments
Performance at a glance (unaudited)
Average annual total returns for periods ended 07/31/18 | 1 year | 5 years | 10 years | ||||||||||||
Before deducting maximum sales charge | |||||||||||||||
Class A1 | 0.03 | % | 2.70 | % | 3.50 | % | |||||||||
Class C2 | (0.42 | ) | 2.19 | 2.98 | |||||||||||
Class Y3 | 0.34 | 2.94 | 3.75 | ||||||||||||
Class P4 | 0.34 | 2.97 | 3.76 | ||||||||||||
After deducting maximum sales charge | |||||||||||||||
Class A1 | (2.21 | ) | 2.23 | 3.27 | |||||||||||
Class C2 | (1.15 | ) | 2.19 | 2.98 | |||||||||||
Bloomberg Barclays US Municipal 3-15 Year Blend Index5 | 0.56 | 3.18 | 4.10 | ||||||||||||
Lipper Intermediate Municipal Debt Funds median | 0.54 | 2.77 | 3.55 | ||||||||||||
Most recent calendar quarter-end returns (unaudited)
Average annual total returns for periods ended 06/30/18 | 1 year | 5 years | 10 years | ||||||||||||
Before deducting maximum sales charge | |||||||||||||||
Class A1 | 0.48 | % | 2.57 | % | 3.54 | % | |||||||||
Class C2 | 0.00 | 2.06 | 3.03 | ||||||||||||
Class Y3 | 0.79 | 2.83 | 3.79 | ||||||||||||
Class P4 | 0.79 | 2.84 | 3.81 | ||||||||||||
After deducting maximum sales charge | |||||||||||||||
Class A1 | (1.79 | ) | 2.11 | 3.31 | |||||||||||
Class C2 | (0.73 | ) | 2.06 | 3.03 | |||||||||||
The annualized gross and net expense ratios, respectively, for each class of shares as in the November 28, 2017 prospectuses, were as follows: Class A—0.92% and 0.82%; Class C—1.42% and 1.32%; Class Y—0.71% and 0.57%; and Class P—0.67% and 0.57%. Net expenses reflect fee waivers and/or expense reimbursements, if any, pursuant to an agreement that is in effect to cap the expenses. The Portfolio and UBS Asset Management (Americas) Inc. ("UBS AM") have entered into a written fee waiver/expense reimbursement agreement pursuant to which UBS AM is contractually obligated to waive its management fees and/or reimburse expenses so that the Portfolio's ordinary total operating expenses of each class through November 30, 2018 (excluding dividend expense, borrowing costs, and interest expense relating to short sales, and expenses attributable to investment in other investment companies, interest, taxes, brokerage commissions and extraordinary expenses) would not exceed Class A—0.82%; Class C—1.32%; Class Y—0.57%; and Class P—0.57%. "Management fee waiver/expense reimbursements" are based on estimated amounts for the current fiscal year. The Portfolio has agreed to repay UBS AM for any waived fees/reimbursed expenses to the extent that it can do so over the following three fiscal years without causing the Portfolio's expenses in any of those three years to exceed these expense caps and that UBS AM has not waived the right to do so. The fee waiver/expense reimbursement agreement may be terminated by the Portfolio's board at any time and also will terminate automatically upon the expiration or termination of the Portfolio's advisory contract with UBS AM. Upon termination of the agreement, however, UBS AM's three year recoupment rights will survive.
1 Maximum sales charge for Class A shares is 2.25%. Class A shares bear ongoing 12b-1 service fees of 0.25% annually.
2 Maximum contingent deferred sales charge for Class C shares is 0.75% imposed on redemptions and is reduced to 0% after one year. Class C shares bear ongoing 12b-1 service and distribution fees of 0.25% and 0.50% annually, respectively. As of July 12, 2018, Class C shares ceased paying 12b-1 distribution fees. See notes to financial statements—Subsequent events for additional information.
3 The Portfolio offers Class Y shares to a limited group of eligible investors, including certain qualifying retirement plans. Class Y shares do not bear initial or contingent deferred sales charges or ongoing 12b-1 service and distribution fees.
4 Class P shares do not bear initial or contingent deferred sales charges or ongoing 12b-1 service and distribution fees, but Class P shares held through advisory programs may be subject to a program fee, which, if included, would have reduced performance.
5 The Bloomberg Barclays US Municipal 3-15 Year Blend Index is an unmanaged total return performance benchmark for the tax-exempt bond market. The Index includes municipal bonds with an effective maturity between 2 and 17 years that have at least one year to maturity and are investment grade. Investors should note that indices do not reflect the deduction of fees and expenses.
Past performance does not predict future performance, and the performance information provided does not reflect the deduction of taxes that a shareholder could pay on Portfolio distributions or the redemption of Portfolio shares. The return and principal value of an investment will fluctuate, so that an investor's shares, when redeemed, may be worth more or less than their original cost. Performance results assume reinvestment of all dividends and capital gain distributions at net asset value on the ex-dividend dates. Current performance may be higher or lower than the performance data quoted. For month-end performance figures, please visit www.ubs.com/us-mutualfundperformance.
Lipper peer group data calculated by Lipper Inc.; used with permission. The Lipper median is the return of the fund that places in the middle of a Lipper peer group.
103
PACE Municipal Fixed Income Investments
Illustration of an assumed investment of $10,000 in Class P shares of the Portfolio (unaudited)
The following graph depicts the performance of PACE Municipal Fixed Income Investments Class P shares versus the Bloomberg Barclays US Municipal 3-15 Year Blend Index over the 10 years ended July 31, 2018. Class P shares held through advisory programs may be subject to a program fee, which, if included, would have reduced performance. The performance of the other classes will vary based upon the different class specific expenses and sales charges. The performance provided does not reflect the deduction of taxes that a shareholder could pay on Portfolio distributions or the redemption of Portfolio shares. Past performance is no guarantee of future results. Share price and returns will vary with market conditions; investors may realize a gain or loss upon redemption. It is important to note that PACE Municipal Fixed Income Investments is a professionally managed portfolio while the Index is not available for investment and is unmanaged. The comparison is shown for illustration purposes only.
PACE Municipal Fixed Income Investments
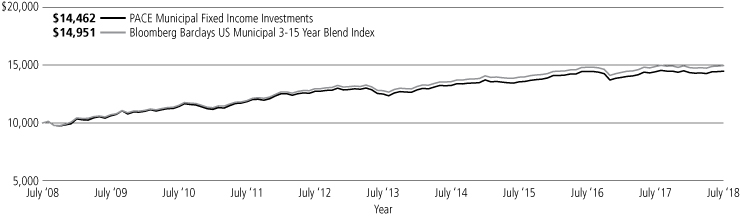
104
PACE Municipal Fixed Income Investments
Portfolio statistics—July 31, 2018 (unaudited)
Characteristics | |||||||
Weighted average duration | 4.96 yrs. | ||||||
Weighted average maturity | 9.61 yrs. | ||||||
Average coupon | 4.99 | % | |||||
Top five states1 | Percentage of net assets | ||||||
Texas | 14.0 | % | |||||
New York | 11.3 | ||||||
Illinois | 10.0 | ||||||
New Jersey | 6.6 | ||||||
Pennsylvania | 4.8 | ||||||
Total | 46.7 | % | |||||
Credit rating2 | Percentage of total investments | ||||||
AAA | 8.1 | % | |||||
AA | 38.0 | ||||||
A | 32.7 | ||||||
BBB | 4.8 | ||||||
Non-rated | 15.7 | ||||||
Cash equivalents and other assets less liabilities | 0.7 | ||||||
Total | 100.0 | % | |||||
1 The Portfolio is actively managed and its composition will vary over time.
2 Credit ratings shown are based on the ratings assigned to portfolio holdings by Standard & Poor's Financial Services LLC, an independent rating agency.
105
PACE Municipal Fixed Income Investments
Portfolio of investments—July 31, 2018
| Face amount | Value | ||||||||||
Municipal bonds and notes—99.32% | |||||||||||
Alabama—1.80% | |||||||||||
| Alabama Federal Aid Highway Finance Authority, Series A, 5.000%, due 09/01/29 | $ | 2,000,000 | $ | 2,377,060 | |||||||
| Birmingham-Jefferson Civic Center Authority, Special Tax Revenue Subordinate Lien, Series B, 5.000%, due 07/01/321 | 2,000,000 | 2,283,280 | |||||||||
| Lower Alabama Gas District Gas Project Revenue, Series A, 5.000%, due 09/01/31 | 1,500,000 | 1,743,060 | |||||||||
6,403,400 | |||||||||||
Alaska—0.46% | |||||||||||
| City of Anchorage AK Wastewater Revenue Refunding, Series B, 5.000%, due 05/01/31 | 1,395,000 | 1,622,176 | |||||||||
Arizona—1.30% | |||||||||||
| Maricopa County Industrial Development Authority (Banner Health Obligation Group), Series A, 5.000%, due 01/01/31 | 3,000,000 | 3,467,310 | |||||||||
| Salt Verde Financial Corp., Revenue Bonds 5.000%, due 12/01/32 | 1,000,000 | 1,165,400 | |||||||||
4,632,710 | |||||||||||
Arkansas—0.45% | |||||||||||
| University of Arkansas, (Fayetteville Campus), Series A, 5.000%, due 11/01/29 | 1,385,000 | 1,592,708 | |||||||||
California—3.68% | |||||||||||
| California Infrastructure & Economic Development Bank Revenue Refunding (Academy of Motion Picture Arts) 5.000%, due 11/01/28 | 1,205,000 | 1,373,869 | |||||||||
| California State 5.000%, due 12/01/24 | 2,000,000 | 2,317,240 | |||||||||
5.000%, due 08/01/30 | 1,000,000 | 1,178,610 | |||||||||
| California State Public Works Board Lease Revenue (Judicial Council Project), Series A, 5.000%, due 03/01/24 | 1,750,000 | 1,981,945 | |||||||||
| California State Public Works Board Lease Revenue Refunding, Series H, 5.000%, due 12/01/23 | 1,205,000 | 1,391,510 | |||||||||
| Los Angeles Department of Airports (Los Angeles International Airport), Series A, AMT, 5.000%, due 05/15/32 | 2,000,000 | 2,222,240 | |||||||||
| Orange County Transportation Authority Toll Road Revenue Refunding (Senior Lien 91 Express Lanes) 5.000%, due 08/15/29 | 1,000,000 | 1,133,290 | |||||||||
| Stockton Unified School District, (AGM Insured), 5.000%, due 07/01/23 | 1,270,000 | 1,414,754 | |||||||||
| Face amount | Value | ||||||||||
Municipal bonds and notes—(continued) | |||||||||||
California—(concluded) | |||||||||||
| University of California Revenue Unrefunded General, Series Q, 5.250%, due 05/15/23 | $ | 110,000 | $ | 110,352 | |||||||
13,123,810 | |||||||||||
Colorado—2.85% | |||||||||||
| Denver City & County Airport Revenue, Subseries A, AMT, 5.500%, due 11/15/26 | 7,000,000 | 8,041,040 | |||||||||
| University of Colorado Revenue Refunding, Series A-2, 5.000%, due 06/01/30 | 1,750,000 | 2,103,798 | |||||||||
10,144,838 | |||||||||||
Connecticut—1.49% | |||||||||||
| Connecticut State (Gaap Conversion Bonds—2013), Series A, 5.000%, due 10/15/25 | 2,900,000 | 3,196,438 | |||||||||
| Hartford County Metropolitan District Revenue (Green Bonds), Series A, 5.000%, due 11/01/29 | 1,870,000 | 2,104,218 | |||||||||
5,300,656 | |||||||||||
District of Columbia—1.44% | |||||||||||
| Metropolitan Washington, Airport Authority Airport System Revenue, AMT, 5.000%, due 10/01/28 | 2,500,000 | 2,921,925 | |||||||||
| Metropolitan Washington, Airport Authority Airport System Revenue, Series A, AMT, 5.000%, due 10/01/22 | 2,000,000 | 2,221,600 | |||||||||
5,143,525 | |||||||||||
Florida—4.19% | |||||||||||
| Broward Port Facilities Revenue Refunding, Series B, AMT, 5.000%, due 09/01/21 | 2,000,000 | 2,166,500 | |||||||||
| Citizens Property Insurance Corp. Revenue, Series A-1, 5.000%, due 06/01/25 | 7,000,000 | 8,102,850 | |||||||||
| JEA Electric System Revenue, Series A, 5.000%, due 10/01/24 | 1,200,000 | 1,359,996 | |||||||||
| Miami Beach Redevelopment Agency Tax Increment Revenue Refunding 5.000%, due 02/01/28 | 1,000,000 | 1,132,050 | |||||||||
| Orange County Florida Tourist Development Tax Revenue Refunding, Series B, 5.000%, due 10/01/30 | 1,885,000 | 2,164,941 | |||||||||
14,926,337 | |||||||||||
Georgia—2.22% | |||||||||||
| Atlanta Development Authority Revenue Senior Lien, Series A-1, 5.000%, due 07/01/32 | 2,000,000 | 2,269,400 | |||||||||
106
PACE Municipal Fixed Income Investments
Portfolio of investments—July 31, 2018
| Face amount | Value | ||||||||||
Municipal bonds and notes—(continued) | |||||||||||
Georgia—(concluded) | |||||||||||
| Fulton County Development Authority of Georgia Revenue (Anticipation CTFS-Wellstar Health System, Inc. Project), Series A, 5.000%, due 04/01/36 | $ | 1,000,000 | $ | 1,114,390 | |||||||
| Fulton County Development Authority of Georgia Revenue (Piedmont Healthcare, Inc. Project), Series A, 5.000%, due 07/01/27 | 1,500,000 | 1,741,995 | |||||||||
| Main Street Natural Gas, Inc. Revenue, Series A, 5.500%, due 09/15/28 | 1,500,000 | 1,783,305 | |||||||||
| Series B, 1 mo. USD LIBOR + 0.750%, 2.152%, due 04/01/482 | 1,000,000 | 996,530 | |||||||||
7,905,620 | |||||||||||
Illinois—10.05% | |||||||||||
| Chicago O'Hare International Airport Revenue Refunding, Series A, AMT, 5.000%, due 01/01/29 | 2,500,000 | 2,774,300 | |||||||||
| Chicago O'Hare International Airport Revenue Senior Lien, Series B, 5.000%, due 01/01/35 | 1,750,000 | 1,945,405 | |||||||||
| Chicago O'Hare International Airport Revenue, Series A, AMT, 5.000%, due 01/01/23 | 1,150,000 | 1,251,361 | |||||||||
| Cook County Forest Preservation District, (AMBAC Insured), 5.000%, due 11/15/19 | 5,180,000 | 5,386,267 | |||||||||
| Illinois County of Cook Sale Tax Revenue Refunding 5.000%, due 11/15/35 | 2,500,000 | 2,841,700 | |||||||||
| Illinois Finance Authority Revenue Advocate Health Care Network 5.000%, due 06/01/27 | 3,000,000 | 3,324,750 | |||||||||
| Illinois Finance Authority Revenue University of Chicago, Series A, 5.000%, due 10/01/29 | 2,440,000 | 2,650,743 | |||||||||
| Illinois Municipal Electric Agency Power Supply System Revenue Refunding, Series A, 5.000%, due 02/01/32 | 2,500,000 | 2,805,100 | |||||||||
| Railsplitter Tobacco Settlement Authority 5.500%, due 06/01/23 | 5,000,000 | 5,503,800 | |||||||||
| Southwestern Illinois Development Authority Health Facility Revenue (Memorial Group, Inc.) 7.125%, due 11/01/30 | 1,500,000 | 1,868,355 | |||||||||
| University of Illinois, Series A, 5.000%, due 04/01/30 | 1,000,000 | 1,094,700 | |||||||||
| University of Illinois, (Auxiliary Facilities System), Series A, 5.000%, due 04/01/27 | 4,000,000 | 4,349,240 | |||||||||
35,795,721 | |||||||||||
Indiana—1.56% | |||||||||||
| Indiana Finance Authority Revenue Refunding (Stadium Project), Series A, 5.250%, due 02/01/35 | 1,000,000 | 1,156,770 | |||||||||
| Face amount | Value | ||||||||||
Municipal bonds and notes—(continued) | |||||||||||
Indiana—(concluded) | |||||||||||
| Richmond Hospital Authority Revenue Refunding Reid Hospital & Health Care, Series A, 5.000%, due 01/01/30 | $ | 2,055,000 | $ | 2,274,166 | |||||||
| Whiting City Revenue (BP Products North America, Inc. Project), AMT, 5.000%, due 11/01/47 | 1,840,000 | 2,114,785 | |||||||||
5,545,721 | |||||||||||
Kentucky—0.97% | |||||||||||
| Kentucky Public Energy Authority Revenue, Series A, 4.000%, due 04/01/48 | 3,250,000 | 3,456,375 | |||||||||
Louisiana—1.90% | |||||||||||
| East Baton Rouge Sewerage Commission Revenue Refunding, Series B, 5.000%, due 02/01/28 | 1,000,000 | 1,143,910 | |||||||||
| New Orleans Aviation Board Revenue, Series B, (AGM Insured), AMT, 5.000%, due 01/01/28 | 1,500,000 | 1,682,190 | |||||||||
| State of Louisiana State Highway Improvement Revenue, Series A, 5.000%, due 06/15/29 | 3,500,000 | 3,950,345 | |||||||||
6,776,445 | |||||||||||
Maryland—0.77% | |||||||||||
| Maryland Economic Development Corp. (Purple Line Light Rail Project) Revenue Bonds, Series A, AMT, 5.000%, due 03/31/24 | 1,000,000 | 1,078,990 | |||||||||
| Maryland Health & Higher Educational Facilities Authority Revenue Peninsula Regional Medical Center 5.000%, due 07/01/32 | 1,500,000 | 1,647,780 | |||||||||
2,726,770 | |||||||||||
Massachusetts—3.96% | |||||||||||
| Commonwealth of Massachusetts Federal Highway Grant Anticipation Notes (Accelerated Bridge Program), Series A, 5.000%, due 06/15/23 | 2,500,000 | 2,787,750 | |||||||||
| Massachusetts Educational Financing Authority, Series K, AMT, 5.000%, due 07/01/22 | 2,500,000 | 2,739,425 | |||||||||
| Massachusetts State College Building Authority Revenue Refunding, Series B, 5.000%, due 05/01/29 | 2,500,000 | 2,753,225 | |||||||||
| Massachusetts State School Building Authority Dedicated Sales Tax Revenue, Series B, 5.000%, due 08/15/28 | 3,000,000 | 3,322,710 | |||||||||
| Massachusetts State, Series B, 5.000%, due 08/01/22 | 2,250,000 | 2,516,333 | |||||||||
14,119,443 | |||||||||||
107
PACE Municipal Fixed Income Investments
Portfolio of investments—July 31, 2018
| Face amount | Value | ||||||||||
Municipal bonds and notes—(continued) | |||||||||||
Michigan—2.76% | |||||||||||
| Detroit Sewer Disposal Revenue Senior Lien, Series A, (AGM Insured), 5.250%, due 07/01/19 | $ | 2,500,000 | $ | 2,576,175 | |||||||
| Great Lakes Water Authority Water Supply System Revenue Refunding Senior Lien, Series D, 5.000%, due 07/01/26 | 1,100,000 | 1,265,638 | |||||||||
| Michigan State Finance Authority Revenue Refunding (Beaumont Health Credit Group) 5.000%, due 08/01/33 | 2,415,000 | 2,685,311 | |||||||||
| Michigan State Finance Authority Revenue Refunding (Detroit School District), Series A, 5.000%, due 05/01/22 | 1,485,000 | 1,633,158 | |||||||||
| Michigan State Finance Authority Revenue Refunding Senior Lien (Detroit Water And Sewerage), Series C-3, (AGM Insured), 5.000%, due 07/01/30 | 1,500,000 | 1,675,200 | |||||||||
9,835,482 | |||||||||||
Minnesota—0.29% | |||||||||||
| Minneapolis-St Paul Metropolitan Airports Commission Senior Revenue, Series C, 5.000%, due 01/01/34 | 900,000 | 1,040,193 | |||||||||
Missouri—3.68% | |||||||||||
| City of Kansas City, Missouri Airport Revenue, Series A, AMT, 5.000%, due 09/01/23 | 5,000,000 | 5,425,600 | |||||||||
| Missouri Joint Municipal Electric Utility Commission Revenue Refunding Prairie State Project, Series A, 5.000%, due 12/01/25 | 2,300,000 | 2,652,682 | |||||||||
| Missouri State Health & Educational Facilities Authority Health Facilities Revenue Coxhealth, Series A, 5.000%, due 11/15/34 | 2,000,000 | 2,215,780 | |||||||||
| Missouri State Health & Educational Facilities Authority Health Facilities Revenue Saint Luke's Health System 5.000%, due 11/15/28 | 1,000,000 | 1,146,130 | |||||||||
| Missouri State Health & Educational Facilities Authority Health Facilities Revenue SSM Health Care, Series A, 5.000%, due 06/01/27 | 1,500,000 | 1,688,355 | |||||||||
13,128,547 | |||||||||||
Nebraska—1.98% | |||||||||||
| City of Lincoln, Nebraska Electric System Revenue 5.000%, due 09/01/22 | 3,790,000 | 4,236,500 | |||||||||
| Public Power Generation Agency Revenue Refunding Whelan Energy Center Unit 2, Series A, 5.000%, due 01/01/30 | 2,500,000 | 2,809,875 | |||||||||
7,046,375 | |||||||||||
| Face amount | Value | ||||||||||
Municipal bonds and notes—(continued) | |||||||||||
Nevada—1.00% | |||||||||||
| Las Vegas Valley Water District, Series B, 5.000%, due 06/01/25 | $ | 2,700,000 | $ | 2,985,606 | |||||||
| Reno Sales Tax Revenue Refunding, First Lien, Series 2018A, 5.000%, due 06/01/33 | 500,000 | 577,190 | |||||||||
3,562,796 | |||||||||||
New Jersey—6.57% | |||||||||||
| New Jersey Economic Development Authority Revenue Refunding, Series WW, 5.250%, due 06/15/31 | 2,100,000 | 2,314,494 | |||||||||
| Series XX, 5.000%, due 06/15/26 | 1,600,000 | 1,773,168 | |||||||||
| New Jersey Economic Development Authority Water Facilities Revenue Refunding American Water Co., Series C, AMT, 5.100%, due 06/01/23 | 1,000,000 | 1,051,540 | |||||||||
| New Jersey Health Care Facilities Financing Authority Revenue Refunding (Virtua Health) 5.000%, due 07/01/25 | 1,500,000 | 1,705,020 | |||||||||
| New Jersey State Higher Education Assistance Authority Revenue, Series 1A, AMT, 5.000%, due 12/01/18 | 1,000,000 | 1,010,900 | |||||||||
| Series 1A, AMT, 5.000%, due 12/01/21 | 2,550,000 | 2,766,878 | |||||||||
| Series B, AMT, 5.000%, due 12/01/23 | 2,000,000 | 2,223,740 | |||||||||
| New Jersey Turnpike Authority Revenue, Series E, 5.000%, due 01/01/30 | 1,350,000 | 1,586,925 | |||||||||
| Tobacco Settlement Financing Corp. Tobacco Settlement Revenue Refunding, Series A, 5.000%, due 06/01/34 | 8,000,000 | 8,990,480 | |||||||||
23,423,145 | |||||||||||
New York—11.29% | |||||||||||
| Metropolitan Transportation Authority New York Dedicated Tax Fund, Subseries B-1, 5.000%, due 11/15/29 | 2,500,000 | 2,830,100 | |||||||||
| Metropolitan Transportation Authority Revenue Refunding, Series D, 5.000%, due 11/15/30 | 1,500,000 | 1,726,905 | |||||||||
| Nassau County New York Industrial Development, Series B, 5.000%, due 10/01/21 | 4,045,000 | 4,416,452 | |||||||||
| New York City Municipal Finance Authority Water & Sewer Systems Revenue Refunding, Series DD, 5.000%, due 06/15/29 | 1,500,000 | 1,713,165 | |||||||||
| New York City Municipal Water Finance Authority Water & Sewer Systems Revenue (Second General Resolution), Series HH, 5.000%, due 06/15/29 | 2,500,000 | 2,711,725 | |||||||||
108
PACE Municipal Fixed Income Investments
Portfolio of investments—July 31, 2018
| Face amount | Value | ||||||||||
Municipal bonds and notes—(continued) | |||||||||||
New York—(concluded) | |||||||||||
| New York City Transitional Finance Authority Future Tax Secured Revenue, Series B, 5.000%, due 02/01/23 | $ | 1,500,000 | $ | 1,616,700 | |||||||
| Subseries I, 5.000%, due 05/01/23 | 2,435,000 | 2,760,633 | |||||||||
| New York City, Series E, 5.000%, due 08/01/24 | 3,065,000 | 3,448,738 | |||||||||
| Series H, 5.000%, due 08/01/25 | 2,990,000 | 3,402,979 | |||||||||
| New York State Dorm Authority State Personal Income Tax Revenue General Purpose, Series C, 5.000%, due 03/15/25 | 2,320,000 | 2,503,512 | |||||||||
| New York State Dorm Authority State University Dormitory Facilities, Series A, 5.000%, due 07/01/34 | 2,500,000 | 2,882,125 | |||||||||
| New York State Urban Development Corp. Empire State Development State Personal Income Tax Revenue Bonds, Series E, 5.000%, due 03/15/31 | 2,000,000 | 2,237,180 | |||||||||
| New York Transportation Development Corp. Special Facility Revenue Refunding (Laguardia Airport Terminal B Redevelopment), Series A, AMT, 5.000%, due 07/01/34 | 1,000,000 | 1,085,040 | |||||||||
| New York Transportation Development Corp. Special Facility Revenue Refunding (Terminal One Group Association), AMT, 5.000%, due 01/01/22 | 1,500,000 | 1,625,025 | |||||||||
| Port Authority of New York & New Jersey Revenue Consolidated (One Hundred Eighty-Fifth), AMT, 5.000%, due 09/01/22 | 2,400,000 | 2,662,824 | |||||||||
| Triborough Bridge & Tunnel Authority Revenue, Subseries 2003B-2, 1 mo. USD LIBOR + 0.350%, 1.752%, due 01/01/332 | 1,500,000 | 1,502,700 | |||||||||
| TSASC, Inc. Tobacco Settlement Bonds, Series A, 5.000%, due 06/01/34 | 1,000,000 | 1,106,650 | |||||||||
40,232,453 | |||||||||||
North Carolina—0.88% | |||||||||||
| North Carolina Medical Care Commission Health Care Facilities Revenue Refunding (Vidant Health) 5.000%, due 06/01/32 | 1,500,000 | 1,679,070 | |||||||||
| North Carolina Turnpike Authority Senior Lien, (AGM Insured), 5.000%, due 01/01/26 | 1,250,000 | 1,439,250 | |||||||||
3,118,320 | |||||||||||
Ohio—0.31% | |||||||||||
| American Municipal Power, Inc., Revenue, Series A, 5.000%, due 02/15/27 | 1,000,000 | 1,121,900 | |||||||||
| Face amount | Value | ||||||||||
Municipal bonds and notes—(continued) | |||||||||||
Oregon—0.73% | |||||||||||
| Oregon State Facilities Authority Revenue Refunding (Legacy Health Project), Series A, 5.000%, due 06/01/32 | $ | 2,300,000 | $ | 2,606,797 | |||||||
Pennsylvania—4.82% | |||||||||||
| Allegheny County Port Authority Special Revenue Refunding Transportation 5.000%, due 03/01/25 | 1,000,000 | 1,072,980 | |||||||||
| Commonwealth Financing Authority Tobacco Master Settlement Payment Revenue 5.000%, due 06/01/31 | 1,500,000 | 1,699,065 | |||||||||
| Delaware Valley Regional Finance Authority, Pennsylvania Local Government Revenue Bonds, Series B, SIFMA + 0.420%, 1.360%, due 09/01/482 | 3,500,000 | 3,500,000 | |||||||||
| Pennsylvania Turnpike Commission Motor License Fund-Enhanced Turnpike Subordinate Special Revenue 5.000%, due 12/01/33 | 1,500,000 | 1,698,135 | |||||||||
| Pennsylvania Turnpike Commission Turnpike Refunding Subordinated Revenue, Series B, 5.000%, due 06/01/28 | 2,000,000 | 2,259,360 | |||||||||
| Pennsylvania Turnpike Commission Turnpike Revenue, Series B, 5.000%, due 12/01/32 | 1,250,000 | 1,411,613 | |||||||||
| Philadelphia Airport Revenue, Series B, AMT, 5.000%, due 07/01/32 | 1,250,000 | 1,417,037 | |||||||||
| Philadelphia School District Prerefunded, Series F, 5.000%, due 09/01/30 | 10,000 | 11,851 | |||||||||
| Philadelphia School District Unrefunded, Series F, 5.000%, due 09/01/30 | 2,640,000 | 2,969,947 | |||||||||
| Philadelphia School District, Series A, 5.000%, due 09/01/31 | 1,000,000 | 1,140,140 | |||||||||
17,180,128 | |||||||||||
Rhode Island—1.10% | |||||||||||
| Rhode Island Health & Educational Building Corp. Higher Educational Facilities Revenue (Brown University) 5.000%, due 09/01/22 | 3,500,000 | 3,913,805 | |||||||||
South Carolina—0.77% | |||||||||||
| Columbia Waterworks & Sewer Systems Refunding 5.000%, due 02/01/28 | 2,500,000 | 2,743,225 | |||||||||
Tennessee—0.95% | |||||||||||
| Greeneville Tennessee Health & Educational Facilities Board, Hospital Revenue Bonds (Ballad Health Obligation Group), Series A, 5.000%, due 07/01/32 | 1,500,000 | 1,636,800 | |||||||||
109
PACE Municipal Fixed Income Investments
Portfolio of investments—July 31, 2018
| Face amount | Value | ||||||||||
Municipal bonds and notes—(continued) | |||||||||||
Tennessee—(concluded) | |||||||||||
| Tennessee Energy Acquisition Corp. Gas Revenue, Series A, 5.250%, due 09/01/26 | $ | 1,500,000 | $ | 1,737,045 | |||||||
3,373,845 | |||||||||||
Texas—14.04% | |||||||||||
| Arlington City, Texas Special Tax Revenue Senior Lien, (AGM Insured), 5.000%, due 02/15/31 | 1,500,000 | 1,698,720 | |||||||||
| Arlington Independent School District School Building Bond, Series A, (PSF-GTD), 5.000%, due 02/15/25 | 1,400,000 | 1,577,366 | |||||||||
| Series A, (PSF-GTD), 5.000%, due 02/15/26 | 1,295,000 | 1,454,285 | |||||||||
| Central Texas Regional Mobility Authority Senior Lien Revenue, Series A, 5.000%, due 01/01/35 | 1,100,000 | 1,205,468 | |||||||||
| Central Texas Turnpike System, Series C, 5.000%, due 08/15/31 | 2,000,000 | 2,190,400 | |||||||||
| City of Brownsville, Texas Utilities System Revenue, Series A, 5.000%, due 09/01/28 | 2,225,000 | 2,471,975 | |||||||||
| Clifton Higher Education Finance Corp. Revenue Refunding Idea Public Schools, (PSF-GTD), 5.000%, due 08/15/28 | 1,100,000 | 1,243,968 | |||||||||
| Cypress-Fairbanks Independent School District, (PSF-GTD), 5.000%, due 02/15/25 | 2,500,000 | 2,802,900 | |||||||||
| Dickinson Independent School District, (PSF-GTD), 5.000%, due 02/15/30 | 2,500,000 | 2,844,800 | |||||||||
| EL Paso County Hospital District 5.000%, due 08/15/29 | 2,000,000 | 2,139,300 | |||||||||
| El Paso Texas 5.000%, due 08/15/34 | 2,000,000 | 2,286,800 | |||||||||
| Grand Parkway Transportation Corporation Bond Anticipation Notes Revenue 5.000%, due 02/01/23 | 500,000 | 553,755 | |||||||||
| Harris County Metropolitan Transportation Authority Sales & Use Tax Revenue Contractual Obligations 5.000%, due 11/01/23 | 2,000,000 | 2,285,620 | |||||||||
| Harris County Toll Road Authority Revenue Refunding Senior Lien, Series A, 5.000%, due 08/15/29 | 2,025,000 | 2,397,418 | |||||||||
| Harris County-Houston Sports Authority Revenue Refunding Senior Lien, Series A, 5.000%, due 11/15/29 | 1,000,000 | 1,123,510 | |||||||||
| Houston Airport System Revenue Refunding, Series B, 5.000%, due 07/01/29 | 2,000,000 | 2,391,960 | |||||||||
| Houston Utility System Revenue First Lien, Series D, 5.000%, due 11/15/29 | 2,000,000 | 2,183,840 | |||||||||
| Face amount | Value | ||||||||||
Municipal bonds and notes—(continued) | |||||||||||
Texas—(concluded) | |||||||||||
| Love Field Airport Modernization Corp. General Airport Revenue, AMT, 5.000%, due 11/01/35 | $ | 1,700,000 | $ | 1,887,170 | |||||||
| North Texas Tollway Authority Revenue Refunding, Series A, 5.000%, due 01/01/31 | 2,750,000 | 3,097,710 | |||||||||
5.000%, due 01/01/34 | 2,775,000 | 3,096,567 | |||||||||
| Socorro Independent School District Refunding, Series A, (PSF-GTD), 5.000%, due 08/15/28 | 3,885,000 | 4,487,214 | |||||||||
| Tarrant County Cultural Education Facilities Finance Corp. Hospital Revenue Refunding (Baylor Scott and White Memorial Hospital), Series B, 5.000%, due 11/15/32 | 1,000,000 | 1,138,650 | |||||||||
| University of Houston Revenue Refunding, Series C, 5.000%, due 02/15/29 | 2,000,000 | 2,313,220 | |||||||||
| West Travis County Public Utility Agency Revenue, (BAM Insured), 5.000%, due 08/15/30 | 1,000,000 | 1,161,560 | |||||||||
50,034,176 | |||||||||||
Virginia—2.11% | |||||||||||
| City of Richmond, Virginia Public Utility Revenue 5.000%, due 01/15/26 | 2,030,000 | 2,394,263 | |||||||||
| Virginia College Building Authority Virginia Educational Facilities Revenue Bonds, (21st Century College), Series C, 5.000%, due 02/01/31 | 2,825,000 | 3,301,380 | |||||||||
| Virginia Small Business Financing Authority Senior Lien Revenue Bonds, (95 Express Lanes LLLC Project), AMT, 5.000%, due 07/01/34 | 1,700,000 | 1,804,397 | |||||||||
7,500,040 | |||||||||||
Washington—4.02% | |||||||||||
| Central Puget Sound Regional Transit Authority Revenue (Green Bonds), Series S-1, 5.000%, due 11/01/26 | 1,000,000 | 1,190,160 | |||||||||
| Energy Northwest Project 1 Electric Revenue Refunding, Series A, 5.000%, due 07/01/26 | 1,000,000 | 1,107,210 | |||||||||
| Energy Northwest Revenue Refunding, Series A, 5.000%, due 07/01/32 | 3,000,000 | 3,559,260 | |||||||||
| Port of Seattle Revenue Refunding, AMT, 5.500%, due 12/01/22 | 500,000 | 548,780 | |||||||||
| Port of Seattle Revenue, Series C, AMT, 5.000%, due 04/01/32 | 1,955,000 | 2,166,511 | |||||||||
| Washington State, Series A-1, 5.000%, due 08/01/31 | 5,000,000 | 5,745,950 | |||||||||
14,317,871 | |||||||||||
110
PACE Municipal Fixed Income Investments
Portfolio of investments—July 31, 2018
| Face amount | Value | ||||||||||
Municipal bonds and notes—(concluded) | |||||||||||
Wisconsin—2.93% | |||||||||||
| Public Finance Authority lease Development Revenue (Central District Development Project) 5.000%, due 03/01/34 | $ | 1,500,000 | $ | 1,676,145 | |||||||
| Wisconsin Health & Educational Facilities Authority Revenue (Aspirus, Inc. Obligated Group) 5.000%, due 08/15/27 | 1,000,000 | 1,110,600 | |||||||||
| Wisconsin Health & Educational Facilities Authority Revenue (Aurora Health Care, Inc.), Series A, 5.125%, due 04/15/31 | 3,000,000 | 3,246,060 | |||||||||
| Wisconsin Health & Educational Facilities Authority Revenue (Unitypoint Health), Series A, 5.000%, due 12/01/26 | 1,175,000 | 1,337,326 | |||||||||
| WPPI Energy Power Supply Revenue, Series A, 5.000%, due 07/01/32 | 2,760,000 | 3,069,037 | |||||||||
10,439,168 | |||||||||||
| Total municipal bonds and notes (cost—$350,304,697) | 353,834,521 | ||||||||||
| Number of shares | Value | ||||||||||
Short-term investment—0.16% | |||||||||||
Investment companies—0.16% | |||||||||||
| State Street Institutional U.S. Government Money Market Fund (cost—$564,632) | 564,632 | $ | 564,632 | ||||||||
| Total investments (cost—$350,869,329)—99.48% | 354,399,153 | ||||||||||
Other assets in excess of liabilities—0.52% | 1,852,448 | ||||||||||
Net assets—100.00% | $ | 356,251,601 | |||||||||
For a listing of defined portfolio acronyms that are used throughout the Portfolio of investments as well as the tables that follow, please refer to page 273.
Fair valuation summary
The following is a summary of the fair valuations according to the inputs used as of July 31, 2018 in valuing the Portfolio's investments. In the event a Portfolio holds investments for which fair value is measured using the NAV per share practical expedient (or its equivalent), a separate column will be added to the fair value hierarchy table; this is intended to permit reconciliation to the amounts presented in the Portfolio of investments:
Description | Unadjusted quoted prices in active markets for identical investments (Level 1) | Other significant observable inputs (Level 2) | Unobservable inputs (Level 3) | Total | |||||||||||||||
Municipal bonds and notes | $ | — | $ | 353,834,521 | $ | — | $ | 353,834,521 | |||||||||||
Short-term investment | — | 564,632 | — | 564,632 | |||||||||||||||
Total | $ | — | $ | 354,399,153 | $ | — | $ | 354,399,153 | |||||||||||
At July 31, 2018 there were no transfers between Level 1 and Level 2.
Portfolio footnotes
1 Security purchased on a when-issued basis. When-issued refers to a transaction made conditionally because a security, although authorized, has not yet been issued.
2 Variable or floating rate security. The interest rate shown is the rate in effect as of period end and changes periodically.
See accompanying notes to financial statements.
111
PACE Global Fixed Income Investments
Performance (unaudited)
For the 12 months ended July 31, 2018, the Portfolio's Class P shares returned -1.50% before the deduction of the maximum PACE Select program fee.1 In comparison, the Bloomberg Barclays Global Aggregate ex-US Index (the "benchmark") returned -0.48%, the Bloomberg Barclays Global Aggregate ex-USD 50% Hedged Index returned 1.40%, the Lipper Global Income Funds median returned -0.38%. (Returns for all share classes over various time periods are shown in the "Performance at a glance" table on page 114. Please note that the returns shown do not reflect the deduction of taxes that a shareholder would pay on Portfolio distributions or the redemption of Portfolio shares.) For a detailed commentary on the market environment in general during the reporting period, please refer to page 3.
Subadvisor's comments (unaudited)2
The Portfolio underperformed its benchmark during the reporting period. Overweight allocations to investment grade and European high yield corporate bonds were the main detractors from results. Conversely, short positioning in US duration and long positioning in peripheral Europe versus Germany were the main contributors to performance.
The Portfolio's overweight to investment grade corporate bonds detracted from performance, especially in the first half of 2018. This was driven by weak technicals caused by an increase in merger and acquisition (M&A) related supply in the market. This, combined with slightly deteriorating fundamentals, such as increased leverage at the aggregate level, was detrimental to the sector's performance. We moved from an overweight in investment grade corporate bonds to an almost neutral position relative to benchmark towards the end of the period, as we became more cautious on the direction of spreads over the near-term. The Portfolio's overweight to European high yield corporate bonds also detracted from results during the first half of 2018, as political risks in Europe weighed on investor sentiment. This overshadowed very strong fundamentals, as there have been no defaults this year and leverage levels are encouraging.
The Portfolio's long-term strategic short positioning in US duration in the two-year to 10-year part of the curve contributed to performance for most of the period. US growth remained healthy and the Federal Reserve Board's preferred measure of inflation reached its target for the first time since early 2011. The US economy is still on a particularly steady path, with the initial estimate for second quarter 2018 gross domestic product growth of 4.1%. Meanwhile, retail sales grew 6.6% in June 2018 versus the previous year and the Purchasing Managers Indexes held steady in July. The Portfolio's positioning in periphery Europe, mainly via long positions in Spain (10 year and 30 year) and Portugal (10 year) compared to Germany also contributed to performance. Yield/spread tightening in Spain and Portugal relative to Germany occurred on the back of strong fundamentals and healthy technicals. There were also rating upgrades for Spain earlier this year that opened the door for new investors. We remain positive on Spanish government bonds.
1 Class P shares held through the PACE Select Advisors Program are subject to a maximum Program fee of 2.50%, which, if included, would have reduced performance. Class P shares held through other advisory programs also may be subject to a program fee, which, if included, would have reduced performance.
2 All Sub-Advisors discuss performance on a gross-of-fees basis—meaning that no fees or expenses are reflected in their sleeves'/sleeve's performance. Alternately, Portfolio performance is shown net of fees, which does factor in fees and expenses associated with the Portfolio.
PACE Select Advisors Trust – PACE Global Fixed Income Investments
Investment Manager:
UBS Asset Management (Americas) Inc. ("UBS AM")
Investment Subadvisor:
J.P. Morgan Investment Management, Inc. (d/b/a J.P. Morgan Asset Management) ("J.P. Morgan")
Portfolio Management Team:
UBS AM: Mabel Lung, CFA, Gina Toth, CFA and Fred Lee, CFA
J.P. Morgan: Iain Stealey, CFA and Linda Raggi, CFA since January 2017
Objective:
High total return
Investment process:
The subadvisor utilizes a strategy that involves investing
primarily in global fixed income securities either directly
or through the use of financial derivative instruments
where appropriate.
112
PACE Global Fixed Income Investments
Subadvisor's comments (unaudited) – concluded
We utilized derivatives over the period for efficient portfolio management purposes. The main types of financial derivative contracts we use are interest rate futures and foreign exchange currency forwards contracts. This allows us to implement our strategy as well as to hedge or take currency risk. We used interest rate futures to take a short position in US duration via Eurodollar futures contracts. Overall, the use of derivatives was beneficial to our portfolio management process.
Special considerations
The Portfolio may be appropriate for long-term investors seeking high total return and who are able to withstand short-term fluctuations in the fixed income markets in return for potentially higher returns over the long term. The yield and value of the Portfolio change every day and can be affected by changes in interest rates, general market conditions, and other political, social and economic developments, as well as specific matters relating to the issuers in which the Portfolio invests. It is important to note that an investment in the Portfolio is only one component of a balanced investment plan. The value of the Portfolio's investments in foreign securities may fall due to adverse political, social and economic developments abroad and due to decreases in foreign currency values relative to the US dollar. These risks are greater for investments in emerging markets than in more developed countries.
113
PACE Global Fixed Income Investments
Performance at a glance (unaudited)
Average annual total returns for periods ended 07/31/18 | 1 year | 5 years | 10 years | ||||||||||||
Before deducting maximum sales charge | |||||||||||||||
Class A1 | (1.72 | )% | 0.87 | % | 1.54 | % | |||||||||
Class C2 | (2.18 | ) | 0.37 | 1.05 | |||||||||||
Class Y3 | (1.51 | ) | 1.04 | 1.76 | |||||||||||
Class P4 | (1.50 | ) | 1.05 | 1.75 | |||||||||||
After deducting maximum sales charge | |||||||||||||||
Class A1 | (5.39 | ) | 0.11 | 1.15 | |||||||||||
Class C2 | (2.90 | ) | 0.37 | 1.05 | |||||||||||
Bloomberg Barclays Global Aggregate Index5 | (0.48 | ) | 1.21 | 2.55 | |||||||||||
Bloomberg Barclays Global Aggregate ex USD 50% Hedged Index6 | 1.40 | 2.20 | 3.07 | ||||||||||||
Lipper Global Income Funds median | (0.38 | ) | 1.69 | 3.22 | |||||||||||
Most recent calendar quarter-end returns (unaudited)
Average annual total returns for periods ended 06/30/18 | 1 year | 5 years | 10 years | ||||||||||||
Before deducting maximum sales charge | |||||||||||||||
Class A1 | 0.03 | % | 1.08 | % | 1.59 | % | |||||||||
Class C2 | (0.45 | ) | 0.61 | 1.10 | |||||||||||
Class Y3 | 0.14 | 1.27 | 1.80 | ||||||||||||
Class P4 | 0.25 | 1.29 | 1.80 | ||||||||||||
After deducting maximum sales charge | |||||||||||||||
Class A1 | (3.68 | ) | 0.31 | 1.20 | |||||||||||
Class C2 | (1.19 | ) | 0.61 | 1.10 | |||||||||||
The annualized gross and net expense ratios, respectively, for each class of shares as in the November 28, 2017 prospectuses, supplemented from time to time, were as follows: Class A—1.29% and 1.06%; Class C—1.77% and 1.54%; Class Y—1.13% and 0.90%; and Class P—1.11% and 0.87%. Net expenses reflect fee waivers and/or expense reimbursements, if any, pursuant to an agreement that is in effect to cap the expenses. The Portfolio and UBS Asset Management (Americas) Inc. ("UBS AM") have entered into a written fee waiver/expense reimbursement agreement pursuant to which UBS AM is contractually obligated to waive its management fees and/or reimburse expenses so that the Portfolio's ordinary total operating expenses of each class through November 30, 2018 (excluding dividend expense, borrowing costs, and interest expense relating to short sales, and expenses attributable to investment in other investment companies, interest, taxes, brokerage commissions and extraordinary expenses) would not exceed Class A—1.03%; Class C—1.51%; Class Y—0.87%; and Class P—0.84%. "Management fee waiver/expense reimbursements" are based on estimated amounts for the current fiscal year. The Portfolio has agreed to repay UBS AM for any waived fees/reimbursed expenses to the extent that it can do so over the following three fiscal years without causing the Portfolio's expenses in any of those three years to exceed these expense caps and that UBS AM has not waived the right to do so. The fee waiver/expense reimbursement agreement may be terminated by the Portfolio's board at any time and also will terminate automatically upon the expiration or termination of the Portfolio's advisory contract with UBS AM. Upon termination of the agreement, however, UBS AM's three year recoupment rights will survive.
1 Maximum sales charge for Class A shares is 3.75%. Class A shares bear ongoing 12b-1 service fees of 0.25% annually.
2 Maximum contingent deferred sales charge for Class C shares is 0.75% imposed on redemptions and is reduced to 0% after one year. Class C shares bear ongoing 12b-1 service and distribution fees of 0.25% and 0.50% annually, respectively. As of July 12, 2018, Class C shares ceased paying 12b-1 distribution fees. See notes to financial statements—Subsequent events for additional information.
3 The Portfolio offers Class Y shares to a limited group of eligible investors, including certain qualifying retirement plans. Class Y shares do not bear initial or contingent deferred sales charges or ongoing 12b-1 service and distribution fees.
4 Class P shares do not bear initial or contingent deferred sales charges or ongoing 12b-1 service and distribution fees, but Class P shares held through advisory programs may be subject to a program fee, which, if included, would have reduced performance.
5 The Bloomberg Barclays Global Aggregate Index is an unmanaged broad-based, market capitalization weighted index which is designed to measure the broad global markets for US and non US corporate, government, governmental agency, supranational, mortgage-backed and asset-backed fixed income securities. Investors should note that indices do not reflect the deduction of fees and expenses.
6 The Bloomberg Barclays Global Aggregate ex USD 50% Hedged Index, is an index which provides a broad-based measure of the global investment grade fixed income markets excluding US dollar-denominated debt and provides 50% of its currency exposure in the US dollar. The other major currency exposures in this index are the Euro, the Japanese yen and, to a lesser extent, the British pound and the Canadian dollar. The two major components of this index are the Pan-European Aggregate and the Asian-Pacific Aggregate indices. The index also includes Canadian, Euro-yen, and other non-USD-denominated investment grade aggregate index eligible securities not already in the indices already noted. Investors should note that indices do not reflect the deduction of fees and expenses.
Past performance does not predict future performance, and the performance information provided does not reflect the deduction of taxes that a shareholder would pay on Portfolio distributions or the redemption of Portfolio shares. The return and principal value of an investment will fluctuate, so that an investor's shares, when redeemed, may be worth more or less than their original cost. Performance results assume reinvestment of all dividends and capital gain distributions at net asset value on the ex-dividend dates. Current performance may be higher or lower than the performance data quoted. For month-end performance figures, please visit www.ubs.com/us-mutualfundperformance.
Lipper peer group data calculated by Lipper Inc.; used with permission. The Lipper median is the return of the fund that places in the middle of a Lipper peer group.
114
PACE Global Fixed Income Investments
Illustration of an assumed investment of $10,000 in Class P shares of the Portfolio (unaudited)
The following graph depicts the performance of PACE Global Fixed Income Investments Class P shares versus the Bloomberg Barclays Global Aggregate Index and the Bloomberg Barclays Global Aggregate ex USD 50% Hedged Index over the 10 years ended July 31, 2018. Class P shares held through advisory programs may be subject to a program fee, which, if included, would have reduced performance. The performance of the other classes will vary based upon the different class specific expenses and sales charges. The performance provided does not reflect the deduction of taxes that a shareholder would pay on Portfolio distributions or the redemption of Portfolio shares. Past performance is no guarantee of future results. Share price and returns will vary with market conditions; investors may realize a gain or loss upon redemption. It is important to note that PACE Global Fixed Income Investments is a professionally managed portfolio while the Indices are not available for investment and are unmanaged. The comparison is shown for illustration purposes only.
PACE Global Fixed Income Investments
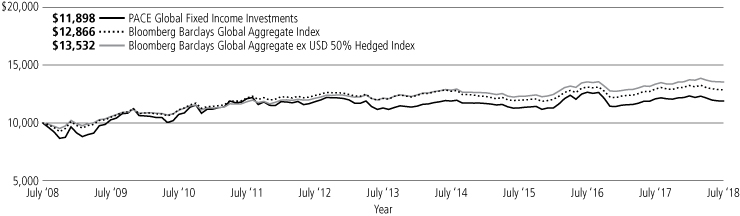
115
PACE Global Fixed Income Investments
Portfolio statistics—July 31, 2018 (unaudited)
Characteristics | |||||||
Weighted average duration | 6.46 yrs. | ||||||
Weighted average maturity | 11.84 yrs. | ||||||
Average coupon | 2.97 | % | |||||
Top ten holdings1 | Percentage of net assets | ||||||
Japan Government Five Year Bond, 0.100% due 09/20/21 | 4.7 | % | |||||
FHLMC TBA, 4.000% | 3.3 | ||||||
Japan Government Twenty Year Bond, 2.200% due 09/20/26 | 3.1 | ||||||
Japan Government Two Year Bond, 0.100% due 09/15/19 | 2.9 | ||||||
US Treasury Note, 1.375%, due 12/15/19 | 2.4 | ||||||
FNMA TBA, 3.500% | 2.1 | ||||||
Italy Buoni Poliennali Del Tesoro, 2.000% due 02/01/28 | 1.5 | ||||||
US Treasury Inflation Index Note (TIPS), 0.125% due 04/15/19 | 1.5 | ||||||
FNMA TBA, 4.500% | 1.4 | ||||||
Korea Treasury Bond, 3.000% due 09/10/24 | 1.4 | ||||||
Total | 24.3 | % | |||||
Top five issuer breakdown by country or territory of origin1 | Percentage of net assets | ||||||
United States | 41.8 | % | |||||
Japan | 16.5 | ||||||
United Kingdom | 7.4 | ||||||
Italy | 5.3 | ||||||
Netherlands | 5.1 | ||||||
Total | 76.1 | % | |||||
Investments by type of issuer1 | Percentage of total investments | ||||||
Government and other public issuers | 59.0 | % | |||||
Industrial | 20.0 | ||||||
Banks and other financial institutions | 19.0 | ||||||
Investment companies | 11.7 | ||||||
Cash equivalents and other assets less liabilities | (9.7 | ) | |||||
Total | 100.0 | % | |||||
1 The Portfolio is actively managed and its composition will vary over time.
116
PACE Global Fixed Income Investments
Portfolio of investments—July 31, 2018
| Face amount | Value | ||||||||||
Government debt securities—48.59% | |||||||||||
Argentina—0.09% | |||||||||||
| Argentine Republic Government International Bond 3.875%, due 01/15/221 | EUR | 200,000 | $ | 224,132 | |||||||
6.875%, due 01/11/48 | USD | 187,000 | 146,423 | ||||||||
370,555 | |||||||||||
Australia—2.07% | |||||||||||
| Australia Government Bond 3.000%, due 03/21/471 | AUD | 3,900,000 | 2,829,077 | ||||||||
4.250%, due 04/21/261 | AUD | 4,050,000 | 3,364,297 | ||||||||
5.750%, due 07/15/221 | AUD | 2,600,000 | 2,191,307 | ||||||||
8,384,681 | |||||||||||
Austria—0.67% | |||||||||||
| Republic of Austria Government Bond 1.200%, due 10/20/251,2 | EUR | 2,200,000 | 2,737,883 | ||||||||
Belgium—0.97% | |||||||||||
| Kingdom of Belgium Government Bond 4.250%, due 09/28/221 | EUR | 1,250,000 | 1,734,175 | ||||||||
5.000%, due 03/28/351,2 | EUR | 1,200,000 | 2,204,608 | ||||||||
3,938,783 | |||||||||||
Canada—2.08% | |||||||||||
| Canadian Government Bond 1.750%, due 03/01/23 | CAD | 3,500,000 | 2,633,643 | ||||||||
5.000%, due 06/01/37 | CAD | 650,000 | 696,559 | ||||||||
5.750%, due 06/01/33 | CAD | 910,000 | 991,427 | ||||||||
| Province of Ontario Canada 2.400%, due 06/02/26 | CAD | 4,050,000 | 3,002,078 | ||||||||
| Province of Quebec Canada 5.000%, due 12/01/41 | CAD | 1,100,000 | 1,104,964 | ||||||||
8,428,671 | |||||||||||
Colombia—0.05% | |||||||||||
| Colombia Government International Bond 5.000%, due 06/15/45 | USD | 216,000 | 214,920 | ||||||||
Denmark—0.43% | |||||||||||
| Denmark Government Bond 1.500%, due 11/15/23 | DKK | 10,250,000 | 1,742,311 | ||||||||
Egypt—0.13% | |||||||||||
| Egypt Government International Bond 4.750%, due 04/16/262 | EUR | 230,000 | 263,476 | ||||||||
5.625%, due 04/16/302 | EUR | 220,000 | 247,606 | ||||||||
511,082 | |||||||||||
France—0.16% | |||||||||||
| French Republic Government Bond OAT 4.000%, due 04/25/551 | EUR | 350,000 | 669,406 | ||||||||
Germany—1.30% | |||||||||||
| Bundesrepublik Deutschland Bundesanleihe 4.750%, due 07/04/341 | EUR | 2,800,000 | 5,257,298 | ||||||||
| Face amount | Value | ||||||||||
Government debt securities—(continued) | |||||||||||
Hungary—1.10% | |||||||||||
| Hungary Government Bond 0.500%, due 04/21/21 | HUF | 238,120,000 | $ | 843,565 | |||||||
1.750%, due 10/26/22 | HUF | 297,010,000 | 1,068,000 | ||||||||
7.500%, due 11/12/20 | HUF | 455,000,000 | 1,890,800 | ||||||||
| Hungary Government International Bond 5.375%, due 03/25/24 | USD | 600,000 | 644,760 | ||||||||
4,447,125 | |||||||||||
Indonesia—0.73% | |||||||||||
| Indonesia Government International Bond 3.375%, due 04/15/231 | USD | 1,950,000 | 1,897,272 | ||||||||
| Indonesia Treasury Bond 7.000%, due 05/15/27 | IDR | 16,042,000,000 | 1,049,728 | ||||||||
2,947,000 | |||||||||||
Ireland—0.30% | |||||||||||
| Ireland Government Bond 1.000%, due 05/15/261 | EUR | 1,030,000 | 1,239,573 | ||||||||
Italy—3.82% | |||||||||||
| Italy Buoni Poliennali Del Tesoro 2.000%, due 02/01/28 | EUR | 5,550,000 | 6,102,088 | ||||||||
2.050%, due 08/01/27 | EUR | 1,440,000 | 1,600,193 | ||||||||
4.750%, due 09/01/21 | EUR | 3,700,000 | 4,774,631 | ||||||||
5.000%, due 09/01/401 | EUR | 2,100,000 | 3,021,143 | ||||||||
15,498,055 | |||||||||||
Japan—16.37% | |||||||||||
| Japan Government Five Year Bond 0.100%, due 09/20/21 | JPY | 2,137,300,000 | 19,243,824 | ||||||||
| Japan Government Forty Year Bond 2.200%, due 03/20/51 | JPY | 405,100,000 | 5,093,213 | ||||||||
| Japan Government Thirty Year Bond 1.700%, due 06/20/44 | JPY | 183,450,000 | 2,037,548 | ||||||||
2.300%, due 12/20/36 | JPY | 386,850,000 | 4,566,432 | ||||||||
2.300%, due 03/20/39 | JPY | 162,900,000 | 1,946,467 | ||||||||
| Japan Government Twenty Year Bond 0.700%, due 03/20/37 | JPY | 463,100,000 | 4,292,170 | ||||||||
2.100%, due 09/20/29 | JPY | 435,600,000 | 4,743,118 | ||||||||
2.200%, due 09/20/26 | JPY | 1,195,150,000 | 12,605,217 | ||||||||
| Japan Government Two Year Bond 0.100%, due 09/15/19 | JPY | 1,319,850,000 | 11,833,146 | ||||||||
66,361,135 | |||||||||||
Luxembourg—0.94% | |||||||||||
| European Financial Stability Facility 0.400%, due 05/31/261 | EUR | 3,290,000 | 3,804,135 | ||||||||
Malaysia—0.25% | |||||||||||
| Malaysia Government Bond 4.160%, due 07/15/21 | MYR | 4,100,000 | 1,023,852 | ||||||||
Mexico—0.63% | |||||||||||
| Mexican Bonos 5.750%, due 03/05/26 | MXN | 28,950,000 | 1,373,800 | ||||||||
117
PACE Global Fixed Income Investments
Portfolio of investments—July 31, 2018
| Face amount | Value | ||||||||||
Government debt securities—(continued) | |||||||||||
Mexico—(concluded) | |||||||||||
| Mexico Government International Bond 4.125%, due 01/21/263 | USD | 1,180,000 | $ | 1,171,740 | |||||||
2,545,540 | |||||||||||
Netherlands—0.62% | |||||||||||
| Netherlands Government Bond 1.750%, due 07/15/231,2 | EUR | 850,000 | 1,087,335 | ||||||||
4.000%, due 01/15/371,2 | EUR | 800,000 | 1,437,291 | ||||||||
2,524,626 | |||||||||||
New Zealand—0.03% | |||||||||||
| New Zealand Government Bond 2.750%, due 04/15/371 | NZD | 181,000 | 116,636 | ||||||||
Oman—0.28% | |||||||||||
| Oman Government International Bond 4.750%, due 06/15/261 | USD | 1,200,000 | 1,133,978 | ||||||||
Poland—1.11% | |||||||||||
| Republic of Poland Government Bond 5.750%, due 09/23/22 | PLN | 3,850,000 | 1,197,454 | ||||||||
| Republic of Poland Government International Bond 1.500%, due 09/09/251 | EUR | 500,000 | 609,144 | ||||||||
3.000%, due 03/17/23 | USD | 2,750,000 | 2,701,462 | ||||||||
4,508,060 | |||||||||||
Portugal—1.19% | |||||||||||
| Portugal Government International Bond 5.125%, due 10/15/241 | USD | 1,000,000 | 1,042,664 | ||||||||
| Portugal Obrigacoes do Tesouro OT 2.250%, due 04/18/341,2 | EUR | 250,000 | 291,177 | ||||||||
4.125%, due 04/14/271,2 | EUR | 2,490,000 | 3,506,549 | ||||||||
4,840,390 | |||||||||||
Qatar—0.39% | |||||||||||
| Qatar Government International Bond 2.375%, due 06/02/211 | USD | 900,000 | 874,125 | ||||||||
5.103%, due 04/23/482 | USD | 680,000 | 694,470 | ||||||||
1,568,595 | |||||||||||
Russia—0.11% | |||||||||||
| Russian Federal Bond—OFZ 8.150%, due 02/03/27 | RUB | 26,050,000 | 431,945 | ||||||||
Saudi Arabia—0.07% | |||||||||||
| Saudi Government International Bond 4.500%, due 10/26/461 | USD | 300,000 | 282,750 | ||||||||
Slovenia—0.14% | |||||||||||
| Slovenia Government International Bond 5.250%, due 02/18/241 | USD | 510,000 | 553,393 | ||||||||
| Face amount | Value | ||||||||||
Government debt securities—(concluded) | |||||||||||
South Korea—1.67% | |||||||||||
| Korea Treasury Bond 3.000%, due 09/10/24 | KRW | 5,964,350,000 | $ | 5,486,930 | |||||||
5.750%, due 09/10/18 | KRW | 1,426,460,000 | 1,280,921 | ||||||||
6,767,851 | |||||||||||
Spain—2.88% | |||||||||||
| Spain Government Bond 1.400%, due 01/31/20 | EUR | 1,700,000 | 2,041,309 | ||||||||
1.500%, due 04/30/271,2 | EUR | 1,800,000 | 2,155,396 | ||||||||
2.700%, due 10/31/481,2 | EUR | 3,468,000 | 4,236,578 | ||||||||
4.900%, due 07/30/401,2 | EUR | 1,100,000 | 1,896,787 | ||||||||
5.850%, due 01/31/221,2 | EUR | 950,000 | 1,338,831 | ||||||||
11,668,901 | |||||||||||
Sri Lanka—0.08% | |||||||||||
| Sri Lanka Government International Bond 5.750%, due 04/18/232 | USD | 340,000 | 335,987 | ||||||||
Supranationals—0.07% | |||||||||||
| European Union 3.375%, due 04/04/321 | EUR | 200,000 | 302,741 | ||||||||
Sweden—0.37% | |||||||||||
| Sweden Government Bond 3.500%, due 06/01/22 | SEK | 11,625,000 | 1,510,399 | ||||||||
United Arab Emirates—0.49% | |||||||||||
| Abu Dhabi Government International Bond 3.125%, due 10/11/272 | USD | 2,100,000 | 1,977,654 | ||||||||
United Kingdom—2.53% | |||||||||||
| United Kingdom Gilt 1.750%, due 09/07/221 | GBP | 550,000 | 745,230 | ||||||||
3.250%, due 01/22/441 | GBP | 2,730,000 | 4,641,906 | ||||||||
3.750%, due 09/07/211 | GBP | 1,200,000 | 1,715,032 | ||||||||
4.250%, due 12/07/551 | GBP | 1,400,000 | 3,146,898 | ||||||||
10,249,066 | |||||||||||
United States—4.47% | |||||||||||
| US Treasury Bond 3.000%, due 02/15/47 | USD | 2,561,900 | 2,523,472 | ||||||||
| US Treasury Inflation Index Note (TIPS) 0.125%, due 04/15/19 | USD | 6,140,706 | 6,085,216 | ||||||||
| US Treasury Note 1.375%, due 12/15/19 | USD | 9,670,000 | 9,513,240 | ||||||||
18,121,928 | |||||||||||
| Total government debt securities (cost—$198,085,193) | 197,016,905 | ||||||||||
Corporate debt securities—38.60% | |||||||||||
Australia—0.73% | |||||||||||
BHP Billiton Finance Ltd. | |||||||||||
| (fixed, converts to FRN on 10/22/22), 6.500%, due 10/22/771 | GBP | 280,000 | 417,877 | ||||||||
| Westpac Banking Corp. 2.100%, due 02/25/211 | USD | 2,600,000 | 2,529,498 | ||||||||
2,947,375 | |||||||||||
118
PACE Global Fixed Income Investments
Portfolio of investments—July 31, 2018
| Face amount | Value | ||||||||||
Corporate debt securities—(continued) | |||||||||||
Canada—2.19% | |||||||||||
| Bausch Health Cos., Inc. 5.875%, due 05/15/232,3 | USD | 50,000 | $ | 48,025 | |||||||
7.000%, due 03/15/242 | USD | 250,000 | 265,062 | ||||||||
| Canadian Imperial Bank of Commerce 2.350%, due 07/27/221 | USD | 1,100,000 | 1,060,955 | ||||||||
| Canadian Natural Resources Ltd. 3.900%, due 02/01/25 | USD | 80,000 | 79,383 | ||||||||
| Cenovus Energy, Inc. 4.250%, due 04/15/27 | USD | 210,000 | 203,980 | ||||||||
5.200%, due 09/15/43 | USD | 137,000 | 133,377 | ||||||||
6.750%, due 11/15/39 | USD | 221,000 | 253,877 | ||||||||
| Fortis, Inc. 3.055%, due 10/04/26 | USD | 655,000 | 600,153 | ||||||||
| Hydro-Quebec 6.500%, due 02/15/35 | CAD | 750,000 | 825,752 | ||||||||
| MEG Energy Corp. 6.500%, due 01/15/252,3 | USD | 150,000 | 147,563 | ||||||||
| National Bank of Canada 0.500%, due 01/26/221 | EUR | 2,000,000 | 2,370,670 | ||||||||
| Precision Drilling Corp. 7.750%, due 12/15/233 | USD | 175,000 | 185,062 | ||||||||
| The Toronto-Dominion Bank 0.250%, due 04/27/221 | EUR | 1,600,000 | 1,877,856 | ||||||||
| TransCanada PipeLines Ltd. 4.250%, due 05/15/28 | USD | 685,000 | 691,703 | ||||||||
| Videotron Ltd. 5.375%, due 06/15/242 | USD | 145,000 | 149,713 | ||||||||
8,893,131 | |||||||||||
Cayman Islands—0.15% | |||||||||||
| Shimao Property Holdings Ltd. 4.750%, due 07/03/221 | USD | 420,000 | 400,191 | ||||||||
| UPCB Finance IV Ltd. 5.375%, due 01/15/252 | USD | 200,000 | 194,500 | ||||||||
594,691 | |||||||||||
France—3.20% | |||||||||||
| Air Liquide Finance SA 2.250%, due 09/27/232,3 | USD | 410,000 | 383,787 | ||||||||
| Altice France SA 5.625%, due 05/15/241 | EUR | 200,000 | 242,490 | ||||||||
| Cie de Saint-Gobain 5.625%, due 11/15/241 | GBP | 100,000 | 156,259 | ||||||||
| Credit Agricole Home Loan SFH SA 0.625%, due 09/11/231 | EUR | 2,700,000 | 3,210,953 | ||||||||
| Credit Agricole SA 3.750%, due 04/24/232 | USD | 650,000 | 640,422 | ||||||||
| Dexia Credit Local SA 1.250%, due 11/26/241 | EUR | 1,700,000 | 2,076,310 | ||||||||
| Elis SA 1.875%, due 02/15/231 | EUR | 200,000 | 235,039 | ||||||||
| Engie SA 2.875%, due 10/10/221 | USD | 2,369,000 | 2,309,967 | ||||||||
| Europcar Mobility Group 4.125%, due 11/15/241 | EUR | 200,000 | 231,078 | ||||||||
5.750%, due 06/15/221 | EUR | 100,000 | 120,193 | ||||||||
| Face amount | Value | ||||||||||
Corporate debt securities—(continued) | |||||||||||
France—(concluded) | |||||||||||
| Faurecia SA 2.625%, due 06/15/251 | EUR | 300,000 | $ | 359,196 | |||||||
| La Financiere Atalian SASU 4.000%, due 05/15/241 | EUR | 250,000 | 282,208 | ||||||||
| Orano SA 4.875%, due 09/23/24 | EUR | 200,000 | 248,838 | ||||||||
| Rexel SA 2.125%, due 06/15/251 | EUR | 175,000 | 198,186 | ||||||||
| Societe Generale SA 5.200%, due 04/15/211 | USD | 800,000 | 832,426 | ||||||||
| SPIE SA 3.125%, due 03/22/241 | EUR | 300,000 | 351,640 | ||||||||
| Total Capital SA 5.125%, due 03/26/241 | EUR | 550,000 | 809,368 | ||||||||
| Vallourec SA 6.625%, due 10/15/221 | EUR | 250,000 | 302,333 | ||||||||
12,990,693 | |||||||||||
Germany—0.41% | |||||||||||
| CTC BondCo GmbH 5.250%, due 12/15/251 | EUR | 350,000 | 401,146 | ||||||||
| IHO Verwaltungs GmbH 4.000% PIK, 3.250%, due 09/15/231,4 | EUR | 150,000 | 178,736 | ||||||||
| Nidda BondCo GmbH 5.000%, due 09/30/251 | EUR | 200,000 | 221,885 | ||||||||
| Nidda Healthcare Holding GmbH 3.500%, due 09/30/241 | EUR | 250,000 | 285,441 | ||||||||
| Tele Columbus AG 3.875%, due 05/02/252 | EUR | 200,000 | 224,843 | ||||||||
| Unitymedia GmbH 3.750%, due 01/15/271 | EUR | 300,000 | 368,345 | ||||||||
1,680,396 | |||||||||||
Hong Kong—0.10% | |||||||||||
| Hong Kong Red Star Macalline Universal Home Furnishings Ltd. 3.375%, due 09/21/221 | USD | 500,000 | 419,957 | ||||||||
Indonesia—0.41% | |||||||||||
| Pertamina Persero PT 4.300%, due 05/20/231 | USD | 1,650,000 | 1,645,557 | ||||||||
Ireland—0.48% | |||||||||||
| AerCap Ireland Capital DAC/AerCap Global Aviation Trust 3.650%, due 07/21/27 | USD | 375,000 | 345,926 | ||||||||
| Ardagh Packaging Finance PLC/Ardagh Holdings USA, Inc. 2.750%, due 03/15/241 | EUR | 300,000 | 352,802 | ||||||||
7.250%, due 05/15/242,3 | USD | 225,000 | 234,563 | ||||||||
| GE Capital International Funding Co., Unlimited Co. 3.373%, due 11/15/25 | USD | 410,000 | 393,641 | ||||||||
| Shire Acquisitions Investments Ireland DAC 2.875%, due 09/23/23 | USD | 670,000 | 632,914 | ||||||||
1,959,846 | |||||||||||
119
PACE Global Fixed Income Investments
Portfolio of investments—July 31, 2018
| Face amount | Value | ||||||||||
Corporate debt securities—(continued) | |||||||||||
Italy—1.45% | |||||||||||
| Autostrade per l'Italia SpA 1.750%, due 06/26/261 | EUR | 500,000 | $ | 585,023 | |||||||
6.250%, due 06/09/22 | GBP | 1,000,000 | 1,517,921 | ||||||||
| Eni SpA 1.125%, due 09/19/281 | EUR | 900,000 | 981,559 | ||||||||
| EVOCA SpA 7.000%, due 10/15/231 | EUR | 125,000 | 154,629 | ||||||||
| Intesa Sanpaolo SpA 3.875%, due 07/14/272 | USD | 440,000 | 384,319 | ||||||||
| Leonardo SpA 4.875%, due 03/24/25 | EUR | 300,000 | 403,764 | ||||||||
| Telecom Italia SpA 3.000%, due 09/30/251 | EUR | 450,000 | 535,511 | ||||||||
| Wind Tre SpA 2.625%, due 01/20/231 | EUR | 100,000 | 110,942 | ||||||||
3.125%, due 01/20/251 | EUR | 900,000 | 983,461 | ||||||||
5.000%, due 01/20/262 | USD | 250,000 | 224,525 | ||||||||
5,881,654 | |||||||||||
Japan—0.14% | |||||||||||
| Sumitomo Mitsui Banking Corp. 3.200%, due 07/18/22 | USD | 580,000 | 571,312 | ||||||||
Jersey—0.21% | |||||||||||
| Heathrow Funding Ltd. 6.750%, due 12/03/261 | GBP | 500,000 | 857,588 | ||||||||
Luxembourg—0.92% | |||||||||||
| Altice Finco SA 4.750%, due 01/15/281 | EUR | 300,000 | 304,603 | ||||||||
| Altice Luxembourg SA 6.250%, due 02/15/251 | EUR | 250,000 | 283,933 | ||||||||
7.750%, due 05/15/222 | USD | 150,000 | 149,250 | ||||||||
| Dana Financing Luxembourg Sarl 6.500%, due 06/01/262,3 | USD | 235,000 | 237,938 | ||||||||
| eDreams ODIGEO SA 8.500%, due 08/01/211 | EUR | 195,402 | 237,684 | ||||||||
| Fiat Chrysler Finance Europe SA 4.750%, due 07/15/221 | EUR | 350,000 | 457,717 | ||||||||
| INEOS Group Holdings SA 5.375%, due 08/01/241 | EUR | 200,000 | 246,148 | ||||||||
| Intelsat Jackson Holdings SA 8.000%, due 02/15/242,3 | USD | 200,000 | 210,250 | ||||||||
| Matterhorn Telecom Holding SA 4.875%, due 05/01/231 | EUR | 200,000 | 236,560 | ||||||||
| Picard Bondco SA 5.500%, due 11/30/241 | EUR | 200,000 | 224,890 | ||||||||
SES SA | |||||||||||
| (fixed, converts to FRN on 01/02/22), 4.625%, due 01/02/221,5 | EUR | 300,000 | 372,818 | ||||||||
| SIG Combibloc Holdings SCA 7.750%, due 02/15/231 | EUR | 300,000 | 364,865 | ||||||||
| Telenet Finance VI Luxembourg SCA 4.875%, due 07/15/271 | EUR | 324,000 | 402,071 | ||||||||
3,728,727 | |||||||||||
| Face amount | Value | ||||||||||
Corporate debt securities—(continued) | |||||||||||
Mexico—0.28% | |||||||||||
| Petroleos Mexicanos 4.250%, due 01/15/25 | USD | 510,000 | $ | 475,575 | |||||||
6.750%, due 09/21/47 | USD | 700,000 | 645,750 | ||||||||
1,121,325 | |||||||||||
Netherlands—4.44% | |||||||||||
| ABN AMRO Bank N.V. 2.375%, due 01/23/241 | EUR | 1,800,000 | 2,339,087 | ||||||||
| (fixed, converts to FRN on 06/30/20), 2.875%, due 06/30/251 | EUR | 1,400,000 | 1,706,421 | ||||||||
6.375%, due 04/27/211 | EUR | 1,950,000 | 2,647,343 | ||||||||
| Airbus Finance BV 2.125%, due 10/29/291 | EUR | 400,000 | 502,144 | ||||||||
| EDP Finance BV 1.125%, due 02/12/241 | EUR | 800,000 | 935,507 | ||||||||
2.000%, due 04/22/251 | EUR | 910,000 | 1,100,664 | ||||||||
| Enel Finance International N.V. 1.966%, due 01/27/25 | EUR | 264,000 | 320,139 | ||||||||
5.750%, due 09/14/401 | GBP | 250,000 | 416,593 | ||||||||
| Iberdrola International BV 0.375%, due 09/15/251 | EUR | 500,000 | 558,771 | ||||||||
| ING Bank N.V. 3.375%, due 01/10/221 | EUR | 3,200,000 | 4,179,975 | ||||||||
ING Groep N.V. | |||||||||||
| (fixed, converts to FRN on 04/11/23), 3.000%, due 04/11/28 | EUR | 1,600,000 | 1,988,325 | ||||||||
| Nyrstar Netherlands Holdings BV 6.875%, due 03/15/241 | EUR | 225,000 | 210,483 | ||||||||
Telefonica Europe BV | |||||||||||
| (fixed, converts to FRN on 03/31/24), 5.875%, due 03/31/241,5 | EUR | 400,000 | 520,945 | ||||||||
| Teva Pharmaceutical Finance Netherlands II BV 1.125%, due 10/15/241 | EUR | 350,000 | 362,162 | ||||||||
| Ziggo Bond Finance BV 4.625%, due 01/15/251 | EUR | 200,000 | 232,408 | ||||||||
18,020,967 | |||||||||||
New Zealand—0.85% | |||||||||||
| ANZ New Zealand Int'l Ltd. 0.625%, due 01/27/221 | EUR | 2,900,000 | 3,447,346 | ||||||||
Portugal—0.24% | |||||||||||
| Brisa Concessao Rodoviaria SA 2.375%, due 05/10/271 | EUR | 800,000 | 968,912 | ||||||||
Spain—1.16% | |||||||||||
Bankinter S.A. | |||||||||||
| 3 mo. Euribor + 0.160%, 0.000%, due 06/21/431,6 | EUR | 1,419,149 | 1,647,940 | ||||||||
| Cellnex Telecom S.A. 2.375%, due 01/16/241 | EUR | 100,000 | 118,478 | ||||||||
| Fondo de Titulizacion de Activos Santander Hipotecario, Series 2 | |||||||||||
| 3 mo. Euribor + 0.150%, 0.000%, due 01/18/491,6 | EUR | 1,104,785 | 1,272,891 | ||||||||
120
PACE Global Fixed Income Investments
Portfolio of investments—July 31, 2018
| Face amount | Value | ||||||||||
Corporate debt securities—(continued) | |||||||||||
Spain—(concluded) | |||||||||||
| Grifols SA 3.200%, due 05/01/251 | EUR | 200,000 | $ | 233,589 | |||||||
| PITCH1 5.125%, due 07/20/22 | EUR | 800,000 | 1,109,460 | ||||||||
| Telefonica Emisiones SAU 5.213%, due 03/08/47 | USD | 300,000 | 304,185 | ||||||||
4,686,543 | |||||||||||
Supranationals—0.92% | |||||||||||
| European Investment Bank 0.875%, due 09/13/241 | EUR | 2,600,000 | 3,150,186 | ||||||||
| European Stability Mechanism 1.125%, due 05/03/321 | EUR | 500,000 | 585,799 | ||||||||
3,735,985 | |||||||||||
Sweden—0.11% | |||||||||||
| Verisure Holding AB 6.000%, due 11/01/221 | EUR | 180,000 | 219,073 | ||||||||
| Verisure Midholding AB 5.750%, due 12/01/231 | EUR | 200,000 | 230,900 | ||||||||
449,973 | |||||||||||
Switzerland—0.47% | |||||||||||
Credit Suisse Group AG | |||||||||||
| (fixed, converts to FRN on 09/12/24), 2.125%, due 09/12/251 | GBP | 600,000 | 754,165 | ||||||||
| (fixed, converts to FRN on 06/12/23), 4.207%, due 06/12/242 | USD | 1,150,000 | 1,153,435 | ||||||||
1,907,600 | |||||||||||
United Kingdom—4.88% | |||||||||||
Barclays PLC | |||||||||||
| (fixed, converts to FRN on 11/11/20), 2.625%, due 11/11/251 | EUR | 1,500,000 | 1,781,289 | ||||||||
3.250%, due 02/12/271 | GBP | 650,000 | 842,433 | ||||||||
| BP Capital Markets PLC 3.119%, due 05/04/26 | USD | 690,000 | 661,806 | ||||||||
| Centrica PLC 4.375%, due 03/13/291 | GBP | 200,000 | 296,372 | ||||||||
Gracechurch Card Funding PLC | |||||||||||
| 1 mo. USD LIBOR + 0.400%, 2.486%, due 07/15/222,6 | USD | 1,370,000 | 1,368,100 | ||||||||
Holmes Master Issuer PLC | |||||||||||
| 3 mo. USD LIBOR + 0.360%, 2.699%, due 10/15/542,6 | USD | 780,000 | 779,247 | ||||||||
HSBC Holdings PLC | |||||||||||
| (fixed, converts to FRN on 11/22/22), 3.033%, due 11/22/23 | USD | 1,200,000 | 1,157,570 | ||||||||
| 3 mo. USD LIBOR + 1.000%, 3.326%, due 05/18/246 | USD | 684,000 | 684,808 | ||||||||
| (fixed, converts to FRN on 03/13/27), 4.041%, due 03/13/28 | USD | 385,000 | 378,247 | ||||||||
| Iceland Bondco PLC 4.625%, due 03/15/251 | GBP | 200,000 | 241,509 | ||||||||
| International Game Technology PLC 4.750%, due 02/15/231 | EUR | 150,000 | 190,094 | ||||||||
| Face amount | Value | ||||||||||
Corporate debt securities—(continued) | |||||||||||
United Kingdom—(concluded) | |||||||||||
Lanark Master Issuer PLC | |||||||||||
| 3 mo. USD LIBOR + 0.420%, 2.749%, due 12/22/692,6 | USD | 1,029,300 | $ | 1,026,543 | |||||||
| Nationwide Building Society 0.750%, due 10/26/221 | EUR | 1,700,000 | 2,032,338 | ||||||||
3.900%, due 07/21/252 | USD | 1,380,000 | 1,371,778 | ||||||||
Permanent Master Issuer PLC | |||||||||||
| 3 mo. USD LIBOR + 0.380%, 2.747%, due 07/15/582,6 | USD | 1,134,000 | 1,130,869 | ||||||||
Royal Bank of Scotland Group PLC | |||||||||||
| (fixed, converts to FRN on 05/15/22), 3.498%, due 05/15/23 | USD | 985,000 | 960,224 | ||||||||
| Santander UK Group Holdings PLC 3.125%, due 01/08/21 | USD | 1,300,000 | 1,283,209 | ||||||||
Sensata Technologies UK Financing | |||||||||||
| Co. PLC 6.250%, due 02/15/262 | USD | 300,000 | 314,625 | ||||||||
Silverstone Master Issuer PLC | |||||||||||
| 3 mo. USD LIBOR + 0.390%, 2.725%, due 01/21/702,6 | USD | 1,300,000 | 1,292,875 | ||||||||
| Sky PLC GMTN 2.250%, due 11/17/251 | EUR | 510,000 | 636,268 | ||||||||
| Synlab Unsecured Bondco PLC 8.250%, due 07/01/231 | EUR | 200,000 | 248,010 | ||||||||
| Tesco Corporate Treasury Services PLC 2.500%, due 07/01/241 | EUR | 520,000 | 643,036 | ||||||||
| Vodafone Group PLC 4.125%, due 05/30/25 | USD | 425,000 | 425,153 | ||||||||
4.375%, due 05/30/283 | USD | 20,000 | 20,033 | ||||||||
19,766,436 | |||||||||||
United States—14.86% | |||||||||||
| AbbVie, Inc. 4.450%, due 05/14/46 | USD | 135,000 | 128,423 | ||||||||
| Altria Group, Inc. 4.250%, due 08/09/42 | USD | 400,000 | 378,671 | ||||||||
| AMC Networks, Inc. 5.000%, due 04/01/24 | USD | 125,000 | 123,281 | ||||||||
| American Airlines Pass-Through Trust, Series 2016-2, Class AA 3.200%, due 06/15/28 | USD | 691,500 | 652,313 | ||||||||
| American Axle & Manufacturing, Inc. 6.250%, due 04/01/253 | USD | 210,000 | 204,225 | ||||||||
| American International Group, Inc. 4.875%, due 06/01/22 | USD | 884,000 | 924,531 | ||||||||
| American Tower Corp. 3.375%, due 10/15/26 | USD | 710,000 | 661,963 | ||||||||
| American Woodmark Corp. 4.875%, due 03/15/262 | USD | 175,000 | 166,688 | ||||||||
| Amkor Technology, Inc. 6.375%, due 10/01/22 | USD | 225,000 | 229,500 | ||||||||
| Anheuser-Busch InBev Finance, Inc. 3.650%, due 02/01/26 | USD | 1,215,000 | 1,193,915 | ||||||||
4.700%, due 02/01/36 | USD | 340,000 | 349,202 | ||||||||
121
PACE Global Fixed Income Investments
Portfolio of investments—July 31, 2018
| Face amount | Value | ||||||||||
Corporate debt securities—(continued) | |||||||||||
United States—(continued) | |||||||||||
| AT&T, Inc. 4.300%, due 12/15/42 | USD | 355,000 | $ | 308,735 | |||||||
4.500%, due 03/09/48 | USD | 220,000 | 193,545 | ||||||||
| Avis Budget Car Rental LLC/Avis Budget Finance, Inc. 6.375%, due 04/01/242,3 | USD | 125,000 | 123,750 | ||||||||
| Baker Hughes LLC 3.337%, due 12/15/27 | USD | 360,000 | 339,827 | ||||||||
Bank of America Corp. | |||||||||||
| (fixed, converts to FRN on 12/20/22), 3.004%, due 12/20/23 | USD | 915,000 | 887,898 | ||||||||
Bank of America Corp. MTN | |||||||||||
| (fixed, converts to FRN on 01/20/27), 3.824%, due 01/20/28 | USD | 1,340,000 | 1,305,262 | ||||||||
| Bank of America NA 2.050%, due 12/07/183 | USD | 500,000 | 499,510 | ||||||||
| BAT Capital Corp. 3.557%, due 08/15/272 | USD | 970,000 | 912,704 | ||||||||
4.390%, due 08/15/372 | USD | 345,000 | 329,757 | ||||||||
| Becton Dickinson and Co. 3.734%, due 12/15/24 | USD | 890,000 | 872,627 | ||||||||
| Boyd Gaming Corp. 6.375%, due 04/01/26 | USD | 100,000 | 102,250 | ||||||||
| Buckeye Partners LP 5.850%, due 11/15/43 | USD | 185,000 | 173,654 | ||||||||
| Burlington Northern Santa Fe LLC 4.150%, due 12/15/48 | USD | 340,000 | 343,643 | ||||||||
| Capital One Financial Corp. 3.750%, due 07/28/26 | USD | 670,000 | 630,169 | ||||||||
| CCO Holdings LLC/CCO Holdings Capital Corp. 5.125%, due 05/01/272 | USD | 125,000 | 119,375 | ||||||||
5.500%, due 05/01/262 | USD | 175,000 | 171,938 | ||||||||
5.750%, due 02/15/262 | USD | 300,000 | 298,290 | ||||||||
| Charter Communications Operating LLC/Charter Communications Operating Capital 6.484%, due 10/23/45 | USD | 320,000 | 348,225 | ||||||||
| Citigroup Commercial Mortgage Trust, Series 2017-P7, Class A4, 3.712%, due 04/14/50 | USD | 807,500 | 802,557 | ||||||||
Citigroup, Inc. | |||||||||||
| (fixed, converts to FRN on 07/24/22), 2.876%, due 07/24/23 | USD | 4,225,000 | 4,084,647 | ||||||||
| (fixed, converts to FRN on 01/24/22), 3.142%, due 01/24/23 | USD | 345,000 | 337,993 | ||||||||
| Clear Channel Worldwide Holdings, Inc., Series B, 6.500%, due 11/15/22 | USD | 300,000 | 306,000 | ||||||||
| Comcast Corp. 2.350%, due 01/15/27 | USD | 510,000 | 451,694 | ||||||||
3.900%, due 03/01/38 | USD | 395,000 | 368,088 | ||||||||
| CommScope Technologies LLC 6.000%, due 06/15/252 | USD | 150,000 | 154,500 | ||||||||
| Constellation Brands, Inc. 4.500%, due 05/09/47 | USD | 80,000 | 77,857 | ||||||||
| Face amount | Value | ||||||||||
Corporate debt securities—(continued) | |||||||||||
United States—(continued) | |||||||||||
| Cooper-Standard Automotive, Inc. 5.625%, due 11/15/262 | USD | 125,000 | $ | 122,813 | |||||||
| Coty, Inc. 4.750%, due 04/15/261 | EUR | 150,000 | 172,859 | ||||||||
| Cox Communications, Inc. 3.500%, due 08/15/272 | USD | 510,000 | 478,449 | ||||||||
| CSC Holdings LLC 6.625%, due 10/15/252 | USD | 200,000 | 206,500 | ||||||||
| CVS Health Corp. 4.300%, due 03/25/28 | USD | 640,000 | 637,577 | ||||||||
| Dell International LLC/EMC Corp. 6.020%, due 06/15/262,3 | USD | 640,000 | 675,775 | ||||||||
| DISH DBS Corp. 5.875%, due 11/15/24 | USD | 400,000 | 333,500 | ||||||||
| Energizer Holdings, Inc. 5.500%, due 06/15/252,3 | USD | 105,000 | 103,425 | ||||||||
| Enterprise Products Operating LLC 4.900%, due 05/15/46 | USD | 320,000 | 329,847 | ||||||||
| Equinix, Inc. 2.875%, due 03/15/24 | EUR | 325,000 | 379,962 | ||||||||
5.875%, due 01/15/26 | USD | 100,000 | 103,375 | ||||||||
| Exelon Corp. 5.150%, due 12/01/20 | USD | 1,300,000 | 1,339,270 | ||||||||
| Exelon Generation Co. LLC 3.400%, due 03/15/22 | USD | 725,000 | 720,367 | ||||||||
| First Data Corp. 5.750%, due 01/15/242,3 | USD | 200,000 | 204,500 | ||||||||
| FirstEnergy Corp. Series B 3.900%, due 07/15/27 | USD | 255,000 | 248,604 | ||||||||
| General Electric Co. 2.125%, due 05/17/37 | EUR | 240,000 | 261,327 | ||||||||
4.500%, due 03/11/44 | USD | 180,000 | 176,878 | ||||||||
| General Motors Co. 5.150%, due 04/01/38 | USD | 460,000 | 442,046 | ||||||||
| GRACE 2014-GRCE Mortgage Trust, Class A, 3.369%, due 06/10/282 | USD | 2,550,000 | 2,555,411 | ||||||||
| Harris Corp. 4.400%, due 06/15/28 | USD | 300,000 | 303,882 | ||||||||
| HCA, Inc. 5.375%, due 02/01/253 | USD | 545,000 | 551,812 | ||||||||
| Huntsman International LLC 4.250%, due 04/01/25 | EUR | 300,000 | 401,938 | ||||||||
| Infor US, Inc. 6.500%, due 05/15/22 | USD | 200,000 | 202,500 | ||||||||
| IQVIA, Inc. 3.250%, due 03/15/251 | EUR | 400,000 | 468,839 | ||||||||
| Jack Ohio Finance LLC/Jack Ohio Finance 1 Corp. 6.750%, due 11/15/212,3 | USD | 200,000 | 206,500 | ||||||||
| John Deere Capital Corp. 3.050%, due 01/06/28 | USD | 645,000 | 611,313 | ||||||||
| Keurig Dr Pepper, Inc. 4.057%, due 05/25/232 | USD | 660,000 | 664,604 | ||||||||
4.417%, due 05/25/252,3 | USD | 530,000 | 538,915 | ||||||||
122
PACE Global Fixed Income Investments
Portfolio of investments—July 31, 2018
| Face amount | Value | ||||||||||
Corporate debt securities—(continued) | |||||||||||
United States—(continued) | |||||||||||
| Kraft Heinz Foods Co. 3.500%, due 07/15/22 | USD | 1,560,000 | $ | 1,552,060 | |||||||
| Kronos International, Inc. 3.750%, due 09/15/251 | EUR | 300,000 | 344,673 | ||||||||
| Level 3 Financing, Inc. 5.375%, due 05/01/25 | USD | 150,000 | 146,250 | ||||||||
| Magellan Midstream Partners LP 4.200%, due 03/15/45 | USD | 360,000 | 319,862 | ||||||||
| MetLife, Inc. 3.600%, due 11/13/25 | USD | 670,000 | 659,755 | ||||||||
| MGM Resorts International 4.625%, due 09/01/263 | USD | 325,000 | 305,500 | ||||||||
| Morgan Stanley 1.875%, due 04/27/27 | EUR | 1,020,000 | 1,209,884 | ||||||||
| (fixed, converts to FRN on 04/24/23), 3.737%, due 04/24/24 | USD | 990,000 | 983,506 | ||||||||
| MPLX LP 4.500%, due 04/15/38 | USD | 375,000 | 356,433 | ||||||||
| New England Power Co. 3.800%, due 12/05/472 | USD | 170,000 | 159,680 | ||||||||
| Norfolk Southern Corp. 3.942%, due 11/01/47 | USD | 305,000 | 289,884 | ||||||||
4.150%, due 02/28/48 | USD | 120,000 | 118,410 | ||||||||
| Oasis Petroleum, Inc. 6.875%, due 01/15/23 | USD | 110,000 | 112,475 | ||||||||
| OBP Depositor LLC Trust, Series 2010-OBP, Class A, 4.646%, due 07/15/452 | USD | 1,348,000 | 1,379,090 | ||||||||
| Oracle Corp. 2.650%, due 07/15/26 | USD | 115,000 | 107,523 | ||||||||
4.125%, due 05/15/45 | USD | 420,000 | 417,280 | ||||||||
| Owens Corning 4.300%, due 07/15/47 | USD | 240,000 | 196,950 | ||||||||
| PetSmart, Inc. 7.125%, due 03/15/232 | USD | 125,000 | 84,375 | ||||||||
| Philip Morris International, Inc. 4.125%, due 03/04/43 | USD | 690,000 | 653,913 | ||||||||
| PNC Bank NA 3.800%, due 07/25/23 | USD | 640,000 | 641,943 | ||||||||
| Post Holdings, Inc. 5.500%, due 03/01/252 | USD | 150,000 | 147,750 | ||||||||
| Reynolds Group Issuer, Inc./Reynolds Group Issuer LLC 5.750%, due 10/15/20 | USD | 121,138 | 121,357 | ||||||||
| Rockwell Collins, Inc. 3.500%, due 03/15/27 | USD | 640,000 | 613,478 | ||||||||
| Sempra Energy 3.550%, due 06/15/24 | USD | 550,000 | 536,518 | ||||||||
4.000%, due 02/01/48 | USD | 165,000 | 149,655 | ||||||||
| Sierra Pacific Power Co. 2.600%, due 05/01/26 | USD | 325,000 | 299,299 | ||||||||
| Silgan Holdings, Inc. 3.250%, due 03/15/25 | EUR | 300,000 | 358,698 | ||||||||
| Sirius XM Radio, Inc. 6.000%, due 07/15/242 | USD | 250,000 | 258,438 | ||||||||
| Face amount | Value | ||||||||||
Corporate debt securities—(continued) | |||||||||||
United States—(continued) | |||||||||||
| Southern California Edison Co., Series B, 3.650%, due 03/01/28 | USD | 610,000 | $ | 597,698 | |||||||
| Southwestern Electric Power Co., Series J, 3.900%, due 04/01/45 | USD | 55,000 | 50,469 | ||||||||
| Sprint Corp. 7.625%, due 02/15/25 | USD | 200,000 | 209,560 | ||||||||
7.875%, due 09/15/23 | USD | 250,000 | 266,563 | ||||||||
| Sunoco Logistics Partners Operations LP 5.350%, due 05/15/45 | USD | 360,000 | 341,100 | ||||||||
| Synchrony Financial 3.950%, due 12/01/27 | USD | 407,000 | 370,910 | ||||||||
| T-Mobile USA, Inc. 6.500%, due 01/15/26 | USD | 395,000 | 414,256 | ||||||||
| Tempur Sealy International, Inc. 5.625%, due 10/15/23 | USD | 185,000 | 182,225 | ||||||||
| Tenet Healthcare Corp. 4.625%, due 07/15/243 | USD | 100,000 | 96,875 | ||||||||
7.500%, due 01/01/222 | USD | 80,000 | 83,800 | ||||||||
8.125%, due 04/01/22 | USD | 100,000 | 106,500 | ||||||||
| The Cleveland Electric Illuminating Co. 3.500%, due 04/01/282 | USD | 420,000 | 399,082 | ||||||||
| The Geo Group, Inc. 5.875%, due 10/15/24 | USD | 210,000 | 204,750 | ||||||||
| The Goldman Sachs Group, Inc. 1.625%, due 07/27/261 | EUR | 600,000 | 697,797 | ||||||||
| (fixed, converts to FRN on 06/05/22), 2.908%, due 06/05/233 | USD | 185,000 | 179,002 | ||||||||
3.850%, due 01/26/27 | USD | 850,000 | 824,073 | ||||||||
5.150%, due 05/22/45 | USD | 310,000 | 321,527 | ||||||||
| The Hertz Corp. 6.250%, due 10/15/22 | USD | 250,000 | 224,375 | ||||||||
| The Kroger Co. 2.650%, due 10/15/26 | USD | 625,000 | 557,116 | ||||||||
| The Sherwin-Williams Co. 4.500%, due 06/01/47 | USD | 95,000 | 93,462 | ||||||||
| United Rentals North America, Inc. 5.500%, due 05/15/27 | USD | 125,000 | 123,863 | ||||||||
5.750%, due 11/15/24 | USD | 80,000 | 81,800 | ||||||||
| United Technologies Corp. 4.500%, due 06/01/42 | USD | 160,000 | 161,341 | ||||||||
| Uniti Group LP/Uniti Group Finance, Inc./CSL Capital LLC 8.250%, due 10/15/23 | USD | 125,000 | 116,875 | ||||||||
| Verizon Communications, Inc. 4.522%, due 09/15/48 | USD | 55,000 | 52,101 | ||||||||
| Verizon Owner Trust, Series 2016-2, Class A, 1.680%, due 05/20/212 | USD | 3,940,000 | 3,900,358 | ||||||||
| VICI Properties 1 LLC/VICI FC, Inc. 8.000%, due 10/15/23 | USD | 127,118 | 140,624 | ||||||||
| Virginia Electric & Power Co., Series B, 2.950%, due 11/15/26 | USD | 190,000 | 179,106 | ||||||||
123
PACE Global Fixed Income Investments
Portfolio of investments—July 31, 2018
| Face amount | Value | ||||||||||
Corporate debt securities—(concluded) | |||||||||||
United States—(concluded) | |||||||||||
| Welbilt, Inc. 9.500%, due 02/15/24 | USD | 200,000 | $ | 218,500 | |||||||
| Wells Fargo & Co. 1.375%, due 10/26/261 | EUR | 600,000 | 695,771 | ||||||||
| (fixed, converts to FRN on 05/22/27), 3.584%, due 05/22/283 | USD | 375,000 | 359,573 | ||||||||
Wells Fargo Bank NA | |||||||||||
| (fixed, converts to FRN on 07/23/20), 3.325%, due 07/23/21 | USD | 2,100,000 | 2,105,223 | ||||||||
| Wynn Las Vegas LLC/Wynn Las Vegas Capital Corp. 5.500%, due 03/01/252,3 | USD | 205,000 | 202,438 | ||||||||
| Zayo Group LLC/Zayo Capital, Inc. 6.375%, due 05/15/25 | USD | 150,000 | 155,250 | ||||||||
60,238,597 | |||||||||||
| Total corporate debt securities (cost—$157,690,158) | 156,514,611 | ||||||||||
Government national mortgage association certificates—2.18% | |||||||||||
| GNMA II TBA 3.500% | USD | 3,900,000 | 3,906,094 | ||||||||
| 4.000% | USD | 2,550,000 | 2,606,478 | ||||||||
| 4.500% | USD | 2,250,000 | 2,336,184 | ||||||||
| Total government national mortgage association certificates (cost—$8,847,750) | 8,848,756 | ||||||||||
Federal home loan mortgage corporation certificates—3.26% | |||||||||||
| FHLMC TBA 4.000% (cost—$13,227,500) | USD | 13,000,000 | 13,197,506 | ||||||||
| Face amount | Value | ||||||||||
Federal national mortgage association certificates—5.28% | |||||||||||
| FNMA TBA 2.500% | USD | 2,200,000 | $ | 2,129,531 | |||||||
| 3.000% | USD | 1,240,000 | 1,195,220 | ||||||||
| 3.500% | USD | 8,720,000 | 8,642,159 | ||||||||
| 4.000% | USD | 3,900,000 | 3,962,004 | ||||||||
| 4.500% | USD | 5,300,000 | 5,498,042 | ||||||||
| Total federal national mortgage association certificates (cost—$21,468,047) | 21,426,956 | ||||||||||
| Number of shares | |||||||||||
Short-term investment—11.73% | |||||||||||
Investment companies—11.73% | |||||||||||
| State Street Institutional U.S. Government Money Market Fund (cost—$47,567,596) | 47,567,596 | 47,567,596 | |||||||||
Investment of cash collateral from securities loaned—1.15% | |||||||||||
Money market fund—1.15% | |||||||||||
| State Street Navigator Securities Lending Government Money Market Portfolio (cost—$4,661,150) | 4,661,150 | 4,661,150 | |||||||||
| Total investments (cost—$451,547,394)—110.79% | 449,233,480 | ||||||||||
Liabilities in excess of other assets—(10.79)% | (43,748,787 | ) | |||||||||
Net assets—100.00% | $ | 405,484,693 | |||||||||
For a listing of defined portfolio acronyms, counterparty acronyms and currency abbreviations that are used throughout the Portfolio of investments as well as the tables that follow, please refer to page 273.
Futures contracts
| Number of contracts | Currency | Expiration date | Current notional amount | Value | Unrealized appreciation (depreciation) | ||||||||||||||||||||||
Interest rate futures buy contracts: | |||||||||||||||||||||||||||
5 | CAD | Canada Government Bond 10 Year Futures | September 2018 | $ | 518,785 | $ | 518,008 | $ | (777 | ) | |||||||||||||||||
18 | EUR | German Euro Buxl 30 Year Futures | September 2018 | 3,696,525 | 3,696,081 | (444 | ) | ||||||||||||||||||||
14 | EUR | Mid-Term Euro-OAT Futures | September 2018 | 2,506,081 | 2,516,698 | 10,617 | |||||||||||||||||||||
71 | EUR | Short-Term Euro-BTP Futures | September 2018 | 9,235,868 | 9,194,061 | (41,807 | ) | ||||||||||||||||||||
11 | GBP | United Kingdom Long Gilt Bond Futures | September 2018 | 1,771,314 | 1,771,259 | (55 | ) | ||||||||||||||||||||
2 | JPY | Japan Government Bond 10 Year Futures | September 2018 | 2,694,458 | 2,695,345 | 887 | |||||||||||||||||||||
124
PACE Global Fixed Income Investments
Portfolio of investments—July 31, 2018
Futures contracts—(concluded)
| Number of contracts | Currency | Expiration date | Current notional amount | Value | Unrealized appreciation (depreciation) | ||||||||||||||||||||||
US Treasury futures buy contracts: | |||||||||||||||||||||||||||
28 | USD | Ultra Long US Treasury Bond Futures | September 2018 | $ | 4,373,547 | $ | 4,393,375 | $ | 19,828 | ||||||||||||||||||
9 | USD | US Long Bond Futures | September 2018 | 1,277,739 | 1,286,719 | 8,980 | |||||||||||||||||||||
119 | USD | US Treasury Note 5 Year Futures | September 2018 | 13,469,916 | 13,461,875 | (8,041 | ) | ||||||||||||||||||||
$ | 39,544,233 | $ | 39,533,421 | $ | (10,812 | ) | |||||||||||||||||||||
Interest rate futures sell contracts: | |||||||||||||||||||||||||||
72 | AUD | Australian Bond 10 Year Futures | September 2018 | $ | (6,908,941 | ) | $ | (6,911,688 | ) | $ | (2,747 | ) | |||||||||||||||
137 | EUR | German Euro BOBL Futures | September 2018 | (21,087,720 | ) | (21,084,046 | ) | 3,674 | |||||||||||||||||||
60 | EUR | German Euro Bund Futures | September 2018 | (11,327,289 | ) | (11,336,614 | ) | (9,325 | ) | ||||||||||||||||||
30 | EUR | Italian Government Bond Futures | September 2018 | (4,550,288 | ) | (4,465,747 | ) | 84,541 | |||||||||||||||||||
US Treasury futures sell contracts: | |||||||||||||||||||||||||||
10 | USD | US Treasury Note 10 Year Futures | September 2018 | (1,194,837 | ) | (1,194,219 | ) | 618 | |||||||||||||||||||
44 | USD | US Treasury Note 2 Year Futures | September 2018 | (9,316,788 | ) | (9,300,500 | ) | 16,288 | |||||||||||||||||||
16 | USD | Ultra Long US Treasury Bond Futures | September 2018 | (2,021,715 | ) | (2,033,750 | ) | (12,035 | ) | ||||||||||||||||||
$ | (56,407,578 | ) | $ | (56,326,564 | ) | $ | 81,014 | ||||||||||||||||||||
$ | 70,202 | ||||||||||||||||||||||||||
Forward foreign currency contracts
Counterparty | Sell | Purchase | Settlement date | Unrealized appreciation (depreciation) | |||||||||||||||
ANZ | USD | 2,816,737 | JPY | 312,515,332 | 08/17/18 | $ | (19,107 | ) | |||||||||||
ANZ | USD | 1,145,010 | THB | 38,091,406 | 08/17/18 | 249 | |||||||||||||
BB | DKK | 1,522,187 | USD | 239,632 | 08/17/18 | 494 | |||||||||||||
BB | EUR | 27,284,300 | USD | 32,018,396 | 08/17/18 | 79,042 | |||||||||||||
BB | USD | 9,444,457 | CAD | 12,411,286 | 08/17/18 | 98,991 | |||||||||||||
BOA | AUD | 3,982,933 | USD | 2,944,276 | 08/17/18 | (15,113 | ) | ||||||||||||
BOA | EUR | 664,967 | USD | 775,550 | 08/17/18 | (2,869 | ) | ||||||||||||
BOA | USD | 776,944 | CHF | 769,107 | 08/17/18 | 710 | |||||||||||||
CITI | SEK | 31,382,554 | NOK | 28,959,725 | 08/17/18 | (20,393 | ) | ||||||||||||
CITI | TRY | 7,038,638 | USD | 1,433,405 | 08/17/18 | 14,118 | |||||||||||||
CITI | USD | 2,432,683 | EUR | 2,082,883 | 08/17/18 | 5,566 | |||||||||||||
CITI | USD | 734,417 | GBP | 559,174 | 08/17/18 | (30 | ) | ||||||||||||
GSI | AUD | 4,823,344 | JPY | 400,735,503 | 08/17/18 | 3,546 | |||||||||||||
GSI | AUD | 2,031,219 | USD | 1,508,844 | 08/17/18 | (387 | ) | ||||||||||||
GSI | CAD | 939,642 | USD | 715,607 | 08/17/18 | (6,915 | ) | ||||||||||||
GSI | CHF | 3,557,314 | EUR | 3,055,078 | 08/17/18 | (20,534 | ) | ||||||||||||
GSI | CNY | 18,593,040 | USD | 2,738,452 | 08/17/18 | 14,839 | |||||||||||||
GSI | EUR | 2,449,603 | MXN | 55,616,765 | 08/17/18 | 109,234 | |||||||||||||
GSI | GBP | 278,005 | USD | 365,572 | 08/17/18 | 455 | |||||||||||||
GSI | GBP | 2,219,321 | USD | 2,891,969 | 08/17/18 | (22,763 | ) | ||||||||||||
GSI | HUF | 999,539,031 | USD | 3,616,407 | 08/17/18 | (31,113 | ) | ||||||||||||
GSI | JPY | 395,051,507 | AUD | 4,809,929 | 08/17/18 | 37,369 | |||||||||||||
125
PACE Global Fixed Income Investments
Portfolio of investments—July 31, 2018
Forward foreign currency contracts—(continued)
Counterparty | Sell | Purchase | Settlement date | Unrealized appreciation (depreciation) | |||||||||||||||
GSI | JPY | 396,693,348 | EUR | 3,062,004 | 08/17/18 | $ | 33,232 | ||||||||||||
GSI | JPY | 408,362,765 | USD | 3,635,495 | 08/17/18 | (20,159 | ) | ||||||||||||
GSI | NOK | 29,056,862 | EUR | 3,037,964 | 08/17/18 | (8,261 | ) | ||||||||||||
GSI | NOK | 11,982,705 | USD | 1,470,537 | 08/17/18 | 563 | |||||||||||||
GSI | NZD | 5,247,677 | AUD | 4,810,596 | 08/17/18 | (2,396 | ) | ||||||||||||
GSI | NZD | 2,111,645 | USD | 1,422,279 | 08/17/18 | (16,992 | ) | ||||||||||||
GSI | NZD | 3,107,737 | USD | 2,120,465 | 08/17/18 | 2,269 | |||||||||||||
GSI | SEK | 13,823,126 | USD | 1,552,234 | 08/17/18 | (21,580 | ) | ||||||||||||
GSI | SEK | 31,632,206 | USD | 3,559,387 | 08/17/18 | (42,055 | ) | ||||||||||||
GSI | SEK | 4,626,136 | USD | 528,509 | 08/17/18 | 1,807 | |||||||||||||
GSI | USD | 1,391,631 | AUD | 1,884,415 | 08/17/18 | 8,522 | |||||||||||||
GSI | USD | 1,384,520 | AUD | 1,876,051 | 08/17/18 | 9,419 | |||||||||||||
GSI | USD | 1,429,726 | AUD | 1,937,033 | 08/17/18 | 9,523 | |||||||||||||
GSI | USD | 2,847,337 | AUD | 3,835,624 | 08/17/18 | 2,599 | |||||||||||||
GSI | USD | 1,429,689 | CAD | 1,885,723 | 08/17/18 | 20,305 | |||||||||||||
GSI | USD | 1,544,874 | CHF | 1,532,200 | 08/17/18 | 4,354 | |||||||||||||
GSI | USD | 1,265,937 | EUR | 1,079,618 | 08/17/18 | (2,123 | ) | ||||||||||||
GSI | USD | 656,187 | GBP | 495,283 | 08/17/18 | (5,710 | ) | ||||||||||||
GSI | USD | 654,269 | NOK | 5,280,083 | 08/17/18 | (6,536 | ) | ||||||||||||
GSI | USD | 3,605,429 | NZD | 5,275,260 | 08/17/18 | (9,877 | ) | ||||||||||||
GSI | USD | 858,728 | SEK | 7,493,400 | 08/17/18 | (5,577 | ) | ||||||||||||
GSI | USD | 324,757 | SEK | 2,837,396 | 08/17/18 | (1,709 | ) | ||||||||||||
GSI | USD | 779,358 | SGD | 1,060,339 | 08/17/18 | (322 | ) | ||||||||||||
MSCI | PLN | 1,173,704 | USD | 317,473 | 08/17/18 | (3,742 | ) | ||||||||||||
MSCI | USD | 11,176,243 | GBP | 8,421,800 | 08/17/18 | (115,523 | ) | ||||||||||||
MSCI | USD | 509,454 | ILS | 1,850,463 | 08/17/18 | (5,072 | ) | ||||||||||||
MSCI | USD | 11,324,674 | NOK | 91,118,013 | 08/17/18 | (146,801 | ) | ||||||||||||
NAB | EUR | 925,572 | USD | 1,081,058 | 08/17/18 | (2,429 | ) | ||||||||||||
NAB | JPY | 236,943,181 | USD | 2,146,820 | 08/17/18 | 25,710 | |||||||||||||
NAB | NZD | 4,822,755 | USD | 3,276,951 | 08/17/18 | (10,180 | ) | ||||||||||||
NAB | USD | 3,926,150 | AUD | 5,306,942 | 08/17/18 | 17,001 | |||||||||||||
NAB | USD | 2,775,349 | CNY | 18,593,040 | 08/17/18 | (51,737 | ) | ||||||||||||
NAB | USD | 1,173,257 | GBP | 891,104 | 08/17/18 | (2,931 | ) | ||||||||||||
RBC | CAD | 267,264 | USD | 202,966 | 08/17/18 | (2,542 | ) | ||||||||||||
RBC | CHF | 13,582,675 | USD | 13,702,752 | 08/17/18 | (30,872 | ) | ||||||||||||
RBC | EUR | 3,034,648 | SEK | 31,248,332 | 08/17/18 | 5,339 | |||||||||||||
RBC | EUR | 174,356 | USD | 203,004 | 08/17/18 | (1,099 | ) | ||||||||||||
RBC | NZD | 1,057,277 | USD | 714,315 | 08/17/18 | (6,312 | ) | ||||||||||||
RBC | SEK | 126,040,091 | USD | 14,404,623 | 08/17/18 | 54,498 | |||||||||||||
RBC | USD | 612,724 | CHF | 614,106 | 08/17/18 | 8,206 | |||||||||||||
RBC | USD | 1,463,102 | CHF | 1,457,728 | 08/17/18 | 10,826 | |||||||||||||
RBC | USD | 3,168,237 | CZK | 69,988,646 | 08/17/18 | 33,718 | |||||||||||||
SSC | EUR | 1,992,683 | USD | 2,323,305 | 08/17/18 | (9,356 | ) | ||||||||||||
SSC | EUR | 3,397,553 | USD | 3,963,751 | 08/17/18 | (13,469 | ) | ||||||||||||
SSC | JPY | 334,616,654 | USD | 3,013,676 | 08/17/18 | 18,196 | |||||||||||||
126
PACE Global Fixed Income Investments
Portfolio of investments—July 31, 2018
Forward foreign currency contracts—(concluded)
Counterparty | Sell | Purchase | Settlement date | Unrealized appreciation (depreciation) | |||||||||||||||
SSC | MXN | 4,590,948 | USD | 239,583 | 08/17/18 | $ | (6,138 | ) | |||||||||||
SSC | USD | 1,574,453 | JPY | 174,677,376 | 08/17/18 | (10,745 | ) | ||||||||||||
TD | TRY | 6,913,512 | USD | 1,431,000 | 08/17/18 | 36,945 | |||||||||||||
$ | (33,824 | ) | |||||||||||||||||
Fair valuation summary
The following is a summary of the fair valuations according to the inputs used as of July 31, 2018 in valuing the Portfolio's investments. In the event a Portfolio holds investments for which fair value is measured using the NAV per share practical expedient (or its equivalent), a separate column will be added to the fair value hierarchy table; this is intended to permit reconciliation to the amounts presented in the Portfolio of investments:
| Assets Description | Unadjusted quoted prices in active markets for identical investments (Level 1) | Other significant observable inputs (Level 2) | Unobservable inputs (Level 3) | Total | |||||||||||||||
Government debt securities | $ | — | $ | 197,016,905 | $ | — | $ | 197,016,905 | |||||||||||
Corporate debt securities | — | 156,514,611 | — | 156,514,611 | |||||||||||||||
Government national mortgage association certificates | — | 8,848,756 | — | 8,848,756 | |||||||||||||||
Federal home loan mortgage corporation certificates | — | 13,197,506 | — | 13,197,506 | |||||||||||||||
Federal national mortgage association certificates | — | 21,426,956 | — | 21,426,956 | |||||||||||||||
Short-term investment | — | 47,567,596 | — | 47,567,596 | |||||||||||||||
Investment of cash collateral from securities loaned | — | 4,661,150 | — | 4,661,150 | |||||||||||||||
Futures contracts | 145,433 | — | — | 145,433 | |||||||||||||||
Forward foreign currency contracts | — | 667,645 | — | 667,645 | |||||||||||||||
Total | $ | 145,433 | $ | 449,901,125 | $ | — | $ | 450,046,558 | |||||||||||
Liabilities | |||||||||||||||||||
Futures contracts | (75,231 | ) | — | — | (75,231 | ) | |||||||||||||
Forward foreign currency contracts | — | (701,469 | ) | — | (701,469 | ) | |||||||||||||
Total | $ | (75,231 | ) | $ | (701,469 | ) | $ | — | $ | (776,700 | ) | ||||||||
At July 31, 2018, there were no transfers between Level 1 and Level 2.
Portfolio footnotes
1 Security was purchased pursuant to Regulation S under the Securities Act of 1933, which exempts from registration securities offered and sold outside of the United States. Such a security cannot be sold in the United States without either an effective registration statement filed pursuant to the Securities Act of 1933, or pursuant to an exemption from registration.
2 Security exempt from registration pursuant to Rule 144A under the Securities Act of 1933. These securities are considered liquid, unless noted otherwise, and may be resold in transactions exempt from registration, normally to qualified institutional buyers. Securities exempt from registration pursuant to Rule 144A, in the amount of $50,992,765, represented 12.58% of the Portfolio's net assets at period end.
3 Security, or portion thereof, was on loan at the period end.
4 Payment-in-kind security for which interest may be paid in cash or additional principal, at the discretion of the issuer.
5 Perpetual investment. Date shown reflects the next call date.
6 Variable or floating rate security. The interest rate shown is the rate in effect as of period end and changes periodically.
See accompanying notes to financial statements.
127
PACE High Yield Investments
Performance (unaudited)
For the 12 months ended July 31, 2018, the Portfolio's Class P shares gained 2.96% before the deduction of the maximum PACE Select program fee.1 In comparison, the ICE BofAML Global High Yield Index (hedged in USD) (the "benchmark") returned 2.42%, and the Lipper High Yield Funds category posted a median return of 1.90%. (Returns for all share classes over various time periods are shown in the "Performance at a glance" table on page 130. Please note that the returns shown do not reflect the deduction of taxes that a shareholder would pay on Portfolio distributions or the redemption of Portfolio shares.) For a detailed commentary on the market environment in general during the reporting period, please refer to page 3.
Subadvisor's comments (unaudited)2
The Portfolio outperformed its benchmark during the reporting period. There were several factors that drove performance in the global credit markets during the second half of 2017. Synchronized global growth, low default rates and a slow normalization of monetary policy were the main themes supporting the market. After a strong start to the fourth quarter, a combination of relatively tight valuations and a few negative events caused a period of profit taking in early November. However, by the second half of November and into December, the passage of tax reform in the US, a rally in oil prices and a general sense of positive economic growth around the world supported risk markets into year-end. In the first quarter of 2018, financial markets were grappling with increased volatility driven by macro factors. Rates and equity volatility that began in January continued into March. Furthermore, increased trade rhetoric out of the Trump administration added a new layer of complexity to the markets. In a reversal from the first quarter, US high yield outperformed meaningfully, while European and emerging markets high yield declined during the second quarter of the year. The strong relative performance of US high yield was driven by the continued strength of the US economy, exhibited by generally strong employment reports and the ongoing strength of oil prices, which are important for US high yield. Meanwhile, a number of macro factors pressures emerging markets and, to a lesser extent, European high yield. Foreign exchange volatility and rising interest rates in the US pressured emerging markets assets broadly. Rising trade tensions due to the Trump administration's increasing rhetoric and political noise in specific emerging markets countries were also headwinds. In Europe, political risk in Italy, Germany, Spain and the UK all contributed to weakness.
Looking at the Portfolio, an overweight and positive issuer selection in the energy sector contributed the most to its relative performance. Positive issuer selection, along with underweights in the banking and automotive sectors,
1 Class P shares held through the PACE Select Advisors Program are subject to a maximum Program fee of 2.50%, which, if included, would have reduced performance. Class P shares held through other advisory programs also may be subject to a program fee, which, if included, would have reduced performance.
2 All Sub-Advisors discuss performance on a gross-of-fees basis—meaning that no fees or expenses are reflected in their sleeves'/sleeve's performance. Alternately, Portfolio performance is shown net of fees, which does factor in fees and expenses associated with the Portfolio.
PACE Select Advisors Trust – PACE High Yield Investments
Investment Manager:
UBS Asset Management (Americas) Inc. ("UBS AM")
Investment Subadvisor:
Nomura Corporate Research and Asset Management Inc. ("NCRAM") (NCRAM has retained Nomura Asset Management Singapore Limited "NAM Singapore" and together with NCRAM "Nomura" to serve as a sub-manager to provide certain investment advisory services pursuant to a sub-management contract between NCRAM and NAM Singapore.
Portfolio Management Team:
UBS AM: Mabel Lung, CFA, Gina Toth, CFA and Fred Lee, CFA
Nomura: David Crall, CFA, Stephen Kotsen, CFA, Steven Rosenthal, CFA, Eric Torres, Simon Tan, CFA
Objective:
Total return
Investment process:
The subadvisor utilizes a "total return" strategy driven
by credit research and a team effort to generate alpha in
high yield.
128
PACE High Yield Investments
Advisor's comments (unaudited) – concluded
also benefited performance. This was offset by an underweight to the utility sector and an overweight to foreign sovereigns, which were among the largest detractors from performance during the period. From a ratings perspective, an overweight and positive issuer selection in B-rated issuers was the largest contributor to performance. An underweight in BB-rated issuers, coupled with an overweight in CCC-rated issuers, further contributed results. In contrast, modest underweights to D-rated and BBB-rated issuers slightly detracted from returns.
Currency forwards were used during the reporting period to hedge the currency exposure of the Portfolio into US dollars. They did not meaningfully impact the Portfolio's performance during the reporting period.
Special considerations
The Portfolio may be appropriate for long-term investors seeking total return and who are able to withstand short-term fluctuations in the fixed income markets in return for potentially higher returns over the long term. The Portfolio seeks to achieve its objective by investing primarily in a professionally managed, diversified portfolio of fixed income securities rated below investment grade or considered to be of comparable quality (commonly referred to as "junk bonds"). These securities are subject to higher risks than investment grade securities, including greater price volatility and a greater risk of loss of principal and nonpayment of interest. Issuers of such securities are typically in poor financial health, and their ability to pay interest and principal is uncertain. The prices of such securities may be more vulnerable to bad economic news, or even the expectation of bad news, than higher rated or investment grade bonds and other fixed income securities. The value of the Portfolio changes every day and can be affected by changes in interest rates, general market conditions and other political, social and economic developments, as well as specific matters relating to the issuers in which the Portfolio invests. In addition, investments in foreign bonds involve special risks. It is important to note that an investment in the Portfolio is only one component of a balanced investment plan.
129
PACE High Yield Investments
Performance at a glance (unaudited)
Average annual total returns for periods ended 07/31/18 | 1 year | 5 years | 10 years | Since Inception1 | |||||||||||||||
Before deducting maximum sales charge | |||||||||||||||||||
Class A2 | 2.76 | % | 4.68 | % | 8.14 | % | 6.97 | % | |||||||||||
Class C3 | 2.27 | 4.18 | N/A | 9.63 | |||||||||||||||
Class Y4 | 3.06 | 4.94 | N/A | 11.43 | |||||||||||||||
Class P5 | 2.96 | 4.87 | 8.37 | 7.20 | |||||||||||||||
After deducting maximum sales charge | |||||||||||||||||||
Class A2 | (1.07 | ) | 3.87 | 7.73 | 6.63 | ||||||||||||||
Class C3 | 1.54 | 4.18 | N/A | 9.63 | |||||||||||||||
ICE BofAML Global High Yield Index (Hedged in USD)6 | 2.42 | 5.73 | 8.86 | 7.70 | |||||||||||||||
Lipper High Yield Funds median | 1.90 | 4.19 | 6.84 | 6.02 | |||||||||||||||
Most recent calendar quarter-end returns (unaudited)
Average annual total returns for periods ended 06/30/18 | 1 year | 5 years | 10 years | Since Inception1 | |||||||||||||||
Before deducting maximum sales charge | |||||||||||||||||||
Class A2 | 2.94 | % | 4.76 | % | 7.88 | % | 6.92 | % | |||||||||||
Class C3 | 2.53 | 4.28 | N/A | 9.60 | |||||||||||||||
Class Y4 | 3.24 | 5.02 | N/A | 11.40 | |||||||||||||||
Class P5 | 3.04 | 4.95 | 8.10 | 7.15 | |||||||||||||||
After deducting maximum sales charge | |||||||||||||||||||
Class A2 | (0.93 | ) | 3.96 | 7.47 | 6.58 | ||||||||||||||
Class C3 | 1.80 | 4.28 | N/A | 9.60 | |||||||||||||||
The annualized gross and net expense ratios, respectively, for each class of shares as in the November 28, 2017 prospectuses, supplemented from time to time, were as follows: Class A—1.25% and 1.06%; Class C—1.74% and 1.56%; Class Y—1.05% and 0.88%; and Class P—1.10% and 0.91%. Net expenses reflect fee waivers and/or expense reimbursements, if any, pursuant to an agreement that is in effect to cap the expenses. The Portfolio and UBS Asset Management (Americas) Inc. ("UBS AM") have entered into a written fee waiver/expense reimbursement agreement pursuant to which UBS AM is contractually obligated to waive its management fees and/or reimburse expenses so that the Portfolio's ordinary total operating expenses of each class through November 30, 2018 (excluding dividend expense, borrowing costs, and interest expense relating to short sales, and expenses attributable to investment in other investment companies, interest, taxes, brokerage commissions and extraordinary expenses) would not exceed Class A—1.06%; Class C—1.56%; Class Y—0.88%; and Class P—0.91%. "Management fee waiver/expense reimbursements" are based on estimated amounts for the current fiscal year. The Portfolio has agreed to repay UBS AM for any waived fees/reimbursed expenses to the extent that it can do so over the following three fiscal years without causing the Portfolio's expenses in any of those three years to exceed these expense caps and that UBS AM has not waived the right to do so. The fee waiver/expense reimbursement agreement may be terminated by the Portfolio's board at any time and also will terminate automatically upon the expiration or termination of the Portfolio's advisory contract with UBS AM. Upon termination of the agreement, however, UBS AM's three year recoupment rights will survive.
1 Since inception returns are calculated as of commencement of issuance on April 10, 2006 for Class P shares, May 1, 2006 for Class A shares and January 21, 2009 for Class C shares. Class Y shares commenced issuance on April 3, 2006 and had fully redeemed by July 24, 2006 remaining inactive through December 25, 2008. The inception return of Class Y shares is calculated from December 26, 2008, which is the date the Class Y shares recommenced investment operations. Since inception returns for the Index and Lipper median are shown as of April 30, 2006, which is the month-end after the inception date of the oldest share class (Class P).
2 Maximum sales charge for Class A shares is 3.75%. Class A shares bear ongoing 12b-1 service fees of 0.25% annually.
3 Maximum contingent deferred sales charge for Class C shares is 0.75% imposed on redemptions and is reduced to 0% after one year. Class C shares bear ongoing 12b-1 service and distribution fees of 0.25% and 0.50% annually, respectively. As of July 12, 2018, Class C shares ceased paying 12b-1 distribution fees. See notes to financial statements—Subsequent events for additional information.
4 The Portfolio offers Class Y shares to a limited group of eligible investors, including certain qualifying retirement plans. Class Y shares do not bear initial or contingent deferred sales charges or ongoing 12b-1 service and distribution fees.
5 Class P shares do not bear initial or contingent deferred sales charges or ongoing 12b-1 service and distribution fees, but Class P shares held through advisory programs may be subject to a program fee, which, if included, would have reduced performance.
6 The ICE BofAML Global High Yield Index (hedged in USD) is an unmanaged index which covers US dollar, Canadian dollar, sterling and eurodenominated fixed rate debt of corporate issuers domiciled in an investment grade rated country (i.e., BBB or higher foreign currency longterm debt rating). Individual bonds must be rated below investment grade (i.e., BB or lower based on a composite of Moody's and S&P) but not in default; and must have at least one year remaining term to maturity; a minimum face value outstanding of $100 million, C$100 million, 50 million pounds sterling or 100 million euros; and have available price quotations. New issues qualify for inclusion after they settle. Investors should note that indices do not reflect the deduction of fees and expenses.
Past performance does not predict future performance, and the performance information provided does not reflect the deduction of taxes that a shareholder would pay on Portfolio distributions or the redemption of Portfolio shares. The return and principal value of an investment will fluctuate, so that an investor's shares, when redeemed, may be worth more or less than their original cost. Performance results assume reinvestment of all dividends and capital gain distributions at net asset value on the ex-dividend dates. Current performance may be higher or lower than the performance data quoted. For month-end performance figures, please visit www.ubs.com/us-mutualfundperformance.
Lipper peer group data calculated by Lipper Inc.; used with permission. The Lipper median is the return of the fund that places in the middle of a Lipper peer group.
130
PACE High Yield Investments
Illustration of an assumed investment of $10,000 in Class P shares of the Portfolio (unaudited)
The following graph depicts the performance of PACE High Yield Investments Class P shares versus the ICE BofAML Global High Yield Index (Hedged in USD) over the 10 years ended July 31, 2018. Class P shares held through advisory programs may be subject to a program fee, which, if included, would have reduced performance. The performance of the other classes will vary based upon the different class specific expenses and sales charges. The performance provided does not reflect the deduction of taxes that a shareholder would pay on Portfolio distributions or the redemption of Portfolio shares. Past performance is no guarantee of future results. Share price and returns will vary with market conditions; investors may realize a gain or loss upon redemption. It is important to note that PACE High Yield Investments is a professionally managed portfolio while the Index is not available for investment and is unmanaged. The comparison is shown for illustration purposes only.
PACE High Yield Investments
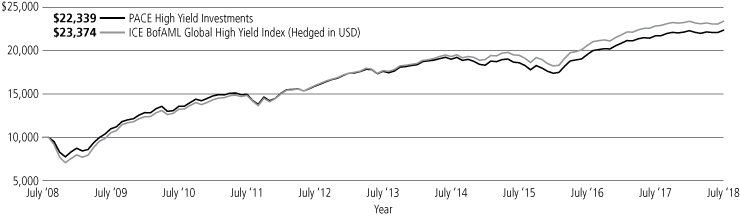
131
PACE High Yield Investments
Portfolio statistics—July 31, 2018 (unaudited)
Characteristics | |||||||
Weighted average duration | 3.77 yrs. | ||||||
Weighted average maturity | 5.65 yrs. | ||||||
Average coupon | 6.32 | % | |||||
Top ten holdings1 | Percentage of net assets | ||||||
Sprint Capital Corp., 8.750% due 03/15/32 | 0.7 | % | |||||
Navient Corp., 8.000% due 03/25/20 | 0.6 | ||||||
Bausch Health Cos., Inc., 7.500% due 07/15/21 | 0.6 | ||||||
American Airlines Group, Inc., 4.625% due 03/01/20 | 0.5 | ||||||
Suburban Propane Partners LP/Suburban Energy Finance Corp., 5.500% due 06/01/24 | 0.5 | ||||||
Russian Foreign Bond, 4.875% due 09/16/23 | 0.5 | ||||||
FelCor Lodging LP, 6.000% due 06/01/25 | 0.5 | ||||||
UniCredit SpA, 6.950% due 10/31/22 | 0.5 | ||||||
Altice Luxembourg SA, 7.750% due 05/15/22 | 0.5 | ||||||
HCA, Inc., 7.500% due 02/15/22 | 0.4 | ||||||
Total | 5.3 | % | |||||
Top five issuer breakdown by country or territory of origin1 | Percentage of net assets | ||||||
United States | 65.5 | % | |||||
Netherlands | 6.0 | ||||||
United Kingdom | 5.1 | ||||||
Canada | 4.9 | ||||||
Cayman Islands | 4.0 | ||||||
Total | 85.5 | % | |||||
Credit rating2 | Percentage of total investments | ||||||
BBB & higher | 5.0 | % | |||||
BB | 35.8 | ||||||
B | 37.6 | ||||||
CCC & below | 10.2 | ||||||
Not rated | 8.9 | ||||||
Cash equivalents and other assets less liabilities | 2.5 | ||||||
Total | 100.0 | % | |||||
1 The Portfolio is actively managed and its composition will vary over time.
2 Credit ratings shown are based on the ratings assigned to portfolio holdings by Standard & Poor's Financial Services LLC, an independent rating agency.
132
PACE High Yield Investments
Portfolio of investments—July 31, 2018
| Face amount1 | Value | ||||||||||
Corporate bonds—93.72% | |||||||||||
Aerospace & defense—1.15% | |||||||||||
| Arconic, Inc. 5.125%, due 10/01/242 | 25,000 | $ | 24,938 | ||||||||
5.900%, due 02/01/27 | 50,000 | 50,000 | |||||||||
5.950%, due 02/01/37 | 375,000 | 367,969 | |||||||||
| DAE Funding LLC 4.500%, due 08/01/223 | 350,000 | 344,750 | |||||||||
5.000%, due 08/01/243 | 175,000 | 172,375 | |||||||||
| Leonardo SpA 4.500%, due 01/19/21 | EUR | 725,000 | 924,841 | ||||||||
| Pioneer Holdings LLC/Pioneer Finance Corp. 9.000%, due 11/01/223 | 175,000 | 180,687 | |||||||||
| TA MFG. Ltd. 3.625%, due 04/15/234 | EUR | 625,000 | 741,920 | ||||||||
| TransDigm, Inc. 5.500%, due 10/15/20 | 75,000 | 75,094 | |||||||||
6.000%, due 07/15/22 | 1,010,000 | 1,027,877 | |||||||||
| Triumph Group, Inc. 7.750%, due 08/15/25 | 175,000 | 163,187 | |||||||||
4,073,638 | |||||||||||
Agriculture—0.08% | |||||||||||
| Vector Group Ltd. 6.125%, due 02/01/253 | 300,000 | 290,250 | |||||||||
Airlines—0.90% | |||||||||||
| Air Canada 7.750%, due 04/15/212,3 | 225,000 | 241,594 | |||||||||
| Allegiant Travel Co. 5.500%, due 07/15/19 | 325,000 | 328,250 | |||||||||
| American Airlines Group, Inc. 4.625%, due 03/01/203 | 1,750,000 | 1,756,562 | |||||||||
| United Continental Holdings, Inc. 4.250%, due 10/01/22 | 75,000 | 73,313 | |||||||||
6.000%, due 12/01/202 | 75,000 | 78,375 | |||||||||
| US Airways Pass-Through Trust 2012-1, Class B 8.000%, due 10/01/19 | 400,458 | 420,481 | |||||||||
| Virgin Australia Holdings Ltd. 8.500%, due 11/15/194 | 300,000 | 303,000 | |||||||||
3,201,575 | |||||||||||
Apparel—0.11% | |||||||||||
| PB International BV 7.625%, due 01/26/224 | 400,000 | 390,100 | |||||||||
Auto & truck—1.62% | |||||||||||
| BCD Acquisition, Inc. 9.625%, due 09/15/233 | 175,000 | 184,187 | |||||||||
| Delphi Technologies PLC 5.000%, due 10/01/253 | 175,000 | 165,813 | |||||||||
| Federal-Mogul LLC/Federal-Mogul Financing Corp. 5.000%, due 07/15/243 | EUR | 325,000 | 397,095 | ||||||||
5.000%, due 07/15/244 | EUR | 330,000 | 403,204 | ||||||||
| General Motors Financial Co., Inc. (fixed, converts to FRN on 09/30/27), 5.750%, due 09/30/272,5 | 50,000 | 49,125 | |||||||||
| Face amount1 | Value | ||||||||||
Corporate bonds—(continued) | |||||||||||
Auto & truck—(concluded) | |||||||||||
| Grupo-Antolin Irausa SA 3.375%, due 04/30/263 | EUR | 225,000 | $ | 249,317 | |||||||
| IHO Verwaltungs GmbH 4.125% Cash or 4.875 PIK, | |||||||||||
4.125%, due 09/15/213,6 | 200,000 | 197,500 | |||||||||
| 4.500% Cash or 5.250 PIK, | |||||||||||
4.500%, due 09/15/233,6 | 200,000 | 192,000 | |||||||||
| JB Poindexter & Co., Inc. 7.125%, due 04/15/263 | 225,000 | 232,875 | |||||||||
| Kronos International, Inc. 3.750%, due 09/15/254 | EUR | 476,000 | 546,881 | ||||||||
| Mclaren Finance PLC 5.000%, due 08/01/224 | GBP | 375,000 | 475,624 | ||||||||
5.000%, due 08/01/223 | GBP | 100,000 | 126,833 | ||||||||
5.750%, due 08/01/223 | 200,000 | 197,040 | |||||||||
| Metalsa SA de CV 4.900%, due 04/24/234 | 175,000 | 171,500 | |||||||||
| Navistar International Corp. 6.625%, due 11/01/253 | 525,000 | 548,625 | |||||||||
| Nemak SAB de CV 4.750%, due 01/23/254 | 218,000 | 210,915 | |||||||||
| Samvardhana Motherson Automotive Systems Group BV 4.875%, due 12/16/214 | 500,000 | 503,901 | |||||||||
| Superior Industries International, Inc. 6.000%, due 06/15/253 | EUR | 400,000 | 459,585 | ||||||||
| Tenneco, Inc. 5.000%, due 07/15/26 | 200,000 | 176,500 | |||||||||
| Tesla, Inc. 5.300%, due 08/15/252,3 | 225,000 | 197,437 | |||||||||
| The Goodyear Tire & Rubber Co. 5.000%, due 05/31/26 | 50,000 | 46,656 | |||||||||
5,732,613 | |||||||||||
Automotive parts—0.17% | |||||||||||
| Cooper-Standard Automotive, Inc. 5.625%, due 11/15/263 | 275,000 | 270,188 | |||||||||
| Titan International, Inc. 6.500%, due 11/30/233 | 325,000 | 325,000 | |||||||||
595,188 | |||||||||||
Banking-non-US—3.44% | |||||||||||
| Akbank Turk AS 5.000%, due 10/24/224 | 550,000 | 506,777 | |||||||||
5.125%, due 03/31/254 | 400,000 | 345,000 | |||||||||
| Australia & New Zealand Banking Group Ltd. 5 year USD ICE Swap + 5.168%, 6.750%, due 06/15/265,7 | 250,000 | 260,312 | |||||||||
| Banco Bilbao Vizcaya Argentaria SA (fixed, converts to FRN on 02/18/20), 6.750%, due 02/18/204,5 | EUR | 1,000,000 | 1,230,741 | ||||||||
| Banco do Brasil SA 5.875%, due 01/26/222,3 | 450,000 | 457,819 | |||||||||
| Banco Nacional de Costa Rica 5.875%, due 04/25/213 | 300,000 | 307,500 | |||||||||
6.250%, due 11/01/234 | 450,000 | 465,187 | |||||||||
133
PACE High Yield Investments
Portfolio of investments—July 31, 2018
| Face amount1 | Value | ||||||||||
Corporate bonds—(continued) | |||||||||||
Banking-non-US—(concluded) | |||||||||||
| Bankia SA (fixed, converts to FRN on 03/15/22), 3.375%, due 03/15/274 | EUR | 800,000 | $ | 966,310 | |||||||
| Credit Suisse AG (fixed, converts to FRN on 09/18/20), 5.750%, due 09/18/254 | EUR | 325,000 | 417,153 | ||||||||
| Credit Suisse Group AG (fixed, converts to FRN on 12/18/24), 6.250%, due 12/18/243,5 | 200,000 | 200,750 | |||||||||
| Export Credit Bank of Turkey 5.375%, due 10/24/233 | 200,000 | 177,500 | |||||||||
5.375%, due 10/24/234 | 950,000 | 843,125 | |||||||||
| Royal Bank of Scotland Group PLC 3 mo. Euribor + 2.330%, 2.006%, due 09/30/184,5,7 | EUR | 1,050,000 | 1,196,361 | ||||||||
| (fixed, converts to FRN on 03/25/19), 3.625%, due 03/25/244 | EUR | 400,000 | 476,427 | ||||||||
| (fixed, converts to FRN on 08/10/20), 7.500%, due 08/10/205 | 400,000 | 413,000 | |||||||||
| (fixed, converts to FRN on 08/10/25), 8.000%, due 08/10/252,5 | 200,000 | 212,424 | |||||||||
| (fixed, converts to FRN on 08/15/21), 8.625%, due 08/15/215 | 200,000 | 215,820 | |||||||||
| Ukreximbank Via Biz Finance PLC 9.625%, due 04/27/224 | 500,000 | 514,006 | |||||||||
9.750%, due 01/22/254 | 800,000 | 819,520 | |||||||||
| UniCredit SpA 6.950%, due 10/31/224 | EUR | 1,175,000 | 1,600,644 | ||||||||
| Unione di Banche Italiane SpA (fixed, converts to FRN on 09/15/27), 4.450%, due 09/15/274 | EUR | 200,000 | 235,694 | ||||||||
| Unione di Banche Italiane SpA MTN 0.750%, due 10/17/224 | EUR | 300,000 | 329,030 | ||||||||
12,191,100 | |||||||||||
Banking-US—0.93% | |||||||||||
| JPMorgan Chase & Co. (fixed, converts to FRN on 04/30/24), 6.125%, due 04/30/245 | 900,000 | 932,625 | |||||||||
| (fixed, converts to FRN on 02/01/24), 6.750%, due 02/01/242,5 | 500,000 | 546,250 | |||||||||
| The Goldman Sachs Group, Inc. (fixed, converts to FRN on 05/10/20), 5.375%, due 05/10/205 | 375,000 | 382,500 | |||||||||
| Washington Mutual, Inc. 0.000%, due 09/21/178,13 | 500,000 | 3,875 | |||||||||
| Wells Fargo & Co. (fixed, converts to FRN on 06/15/24), 5.900%, due 06/15/245 | 1,430,000 | 1,435,005 | |||||||||
3,300,255 | |||||||||||
Building & construction—2.09% | |||||||||||
| Aeropuertos Argentina 2000 SA 6.875%, due 02/01/273 | 775,000 | 753,532 | |||||||||
6.875%, due 02/01/274 | 250,000 | 243,075 | |||||||||
| Face amount1 | Value | ||||||||||
Corporate bonds—(continued) | |||||||||||
Building & construction—(concluded) | |||||||||||
| Aeropuertos Dominicanos Siglo XXI SA 6.750%, due 03/30/293 | 500,000 | $ | 522,500 | ||||||||
6.750%, due 03/30/294 | 410,000 | 428,450 | |||||||||
| American Woodmark Corp. 4.875%, due 03/15/263 | 50,000 | 47,625 | |||||||||
| Ashton Woods USA LLC/ Ashton Woods Finance Co. 6.750%, due 08/01/253 | 175,000 | 163,844 | |||||||||
| AV Homes, Inc. 6.625%, due 05/15/22 | 250,000 | 257,500 | |||||||||
| Beazer Homes USA, Inc. 6.750%, due 03/15/25 | 200,000 | 188,000 | |||||||||
| Brookfield Residential Properties, Inc. 6.375%, due 05/15/252,3 | 150,000 | 149,250 | |||||||||
| Century Communities, Inc. 5.875%, due 07/15/25 | 250,000 | 235,625 | |||||||||
6.875%, due 05/15/22 | 325,000 | 330,461 | |||||||||
| Engility Corp. 8.875%, due 09/01/24 | 100,000 | 107,250 | |||||||||
| Indika Energy Capital III Pte Ltd. 5.875%, due 11/09/243 | 300,000 | 286,959 | |||||||||
| Lennar Corp. 4.125%, due 01/15/22 | 525,000 | 520,406 | |||||||||
| Mattamy Group Corp. 6.500%, due 10/01/252,3 | 75,000 | 73,125 | |||||||||
| Meritage Homes Corp. 6.000%, due 06/01/25 | 1,165,000 | 1,173,027 | |||||||||
| Shea Homes LP/Shea Homes Funding Corp. 6.125%, due 04/01/253 | 1,225,000 | 1,212,750 | |||||||||
| Toll Brothers Finance Corp. 5.875%, due 02/15/22 | 92,000 | 95,910 | |||||||||
| TRI Pointe Group, Inc. 5.250%, due 06/01/27 | 200,000 | 183,500 | |||||||||
| William Lyon Homes, Inc. 5.875%, due 01/31/25 | 225,000 | 212,661 | |||||||||
6.000%, due 09/01/233 | 150,000 | 147,000 | |||||||||
| Williams Scotsman International, Inc. 7.875%, due 12/15/223 | 50,000 | 52,125 | |||||||||
7,384,575 | |||||||||||
Building products—1.44% | |||||||||||
| BMBG Bond Finance SCA 3.000%, due 06/15/214 | EUR | 100,000 | 118,323 | ||||||||
| BMC East LLC 5.500%, due 10/01/243 | 225,000 | 220,500 | |||||||||
| Builders FirstSource, Inc. 5.625%, due 09/01/243 | 325,000 | 318,500 | |||||||||
| CEMEX Finance LLC 4.625%, due 06/15/244 | EUR | 350,000 | 432,233 | ||||||||
6.000%, due 04/01/244 | 200,000 | 206,840 | |||||||||
| Cemex SAB de CV 2.750%, due 12/05/243 | EUR | 275,000 | 315,121 | ||||||||
5.700%, due 01/11/254 | 300,000 | 304,500 | |||||||||
7.750%, due 04/16/263 | 400,000 | 440,304 | |||||||||
134
PACE High Yield Investments
Portfolio of investments—July 31, 2018
| Face amount1 | Value | ||||||||||
Corporate bonds—(continued) | |||||||||||
Building products—(concluded) | |||||||||||
| CPG Merger Sub LLC 8.000%, due 10/01/213 | 125,000 | $ | 126,250 | ||||||||
| Gibraltar Industries, Inc. 6.250%, due 02/01/219 | 125,000 | 125,625 | |||||||||
| Griffon Corp. 5.250%, due 03/01/222 | 475,000 | 461,344 | |||||||||
| Grupo Cementos de Chihuahua SAB de CV 5.250%, due 06/23/244 | 600,000 | 588,000 | |||||||||
| Jeld-Wen, Inc. 4.625%, due 12/15/253 | 125,000 | 118,750 | |||||||||
| Standard Industries, Inc. 4.750%, due 01/15/282,3 | 175,000 | 160,125 | |||||||||
5.375%, due 11/15/243 | 175,000 | 173,302 | |||||||||
5.500%, due 02/15/233 | 175,000 | 178,727 | |||||||||
| Summit Materials LLC/ Summit Materials Finance Corp. 5.125%, due 06/01/253 | 50,000 | 47,437 | |||||||||
6.125%, due 07/15/23 | 100,000 | 101,500 | |||||||||
8.500%, due 04/15/22 | 75,000 | 80,625 | |||||||||
| US Concrete, Inc. 6.375%, due 06/01/24 | 600,000 | 596,250 | |||||||||
5,114,256 | |||||||||||
Building products-cement—0.71% | |||||||||||
| Indo Energy Finance II BV 6.375%, due 01/24/234 | 400,000 | 394,162 | |||||||||
| New Enterprise Stone & Lime Co., Inc. 6.250%, due 03/15/262,3 | 175,000 | 177,352 | |||||||||
10.125%, due 04/01/223 | 225,000 | 239,063 | |||||||||
| TopBuild Corp. 5.625%, due 05/01/263 | 200,000 | 196,000 | |||||||||
| Tutor Perini Corp. 6.875%, due 05/01/252,3 | 50,000 | 49,625 | |||||||||
| Union Andina de Cementos SAA 5.875%, due 10/30/214 | 750,000 | 773,437 | |||||||||
| Weekley Homes LLC/Weekley Finance Corp. 6.000%, due 02/01/23 | 175,000 | 168,875 | |||||||||
6.625%, due 08/15/253 | 225,000 | 213,750 | |||||||||
| West China Cement Ltd. 6.500%, due 09/11/194 | 300,000 | 300,915 | |||||||||
2,513,179 | |||||||||||
Cable—2.81% | |||||||||||
| Altice France SA 5.625%, due 05/15/244 | EUR | 275,000 | 333,424 | ||||||||
6.000%, due 05/15/223 | 1,000,000 | 1,030,700 | |||||||||
6.250%, due 05/15/242,3 | 200,000 | 198,750 | |||||||||
7.375%, due 05/01/263 | 400,000 | 397,250 | |||||||||
8.125%, due 02/01/273 | 400,000 | 408,000 | |||||||||
| Cablevision SA 6.500%, due 06/15/213 | 900,000 | 895,653 | |||||||||
| Cablevision Systems Corp. 5.875%, due 09/15/22 | 25,000 | 25,063 | |||||||||
| CCO Holdings LLC/CCO Holdings Capital Corp. 5.125%, due 02/15/23 | 275,000 | 273,625 | |||||||||
5.125%, due 05/01/233 | 375,000 | 374,063 | |||||||||
| Face amount1 | Value | ||||||||||
Corporate bonds—(continued) | |||||||||||
Cable—(concluded) | |||||||||||
5.125%, due 05/01/273 | 50,000 | $ | 47,750 | ||||||||
5.250%, due 09/30/22 | 150,000 | 151,500 | |||||||||
5.500%, due 05/01/263 | 350,000 | 343,875 | |||||||||
5.750%, due 09/01/232 | 675,000 | 683,437 | |||||||||
5.750%, due 01/15/24 | 25,000 | 25,250 | |||||||||
5.750%, due 02/15/263 | 750,000 | 745,725 | |||||||||
5.875%, due 05/01/273 | 125,000 | 124,063 | |||||||||
| Cequel Communications Holdings I LLC/ Cequel Capital Corp. 5.125%, due 12/15/213 | 50,000 | 49,875 | |||||||||
7.750%, due 07/15/253 | 200,000 | 210,750 | |||||||||
| Digi Communications NV 5.000%, due 10/15/233 | EUR | 100,000 | 122,641 | ||||||||
| Midcontinent Communications/ Midcontinent Finance Corp. 6.875%, due 08/15/233 | 475,000 | 499,938 | |||||||||
| Unitymedia GmbH 6.125%, due 01/15/252,3 | 400,000 | 415,960 | |||||||||
| Unitymedia Hessen GmbH & Co. KG/ Unitymedia NRW GmbH 3.500%, due 01/15/274 | EUR | 525,000 | 644,837 | ||||||||
4.625%, due 02/15/264 | EUR | 607,500 | 771,542 | ||||||||
| UPCB Finance IV Ltd. 4.000%, due 01/15/274 | EUR | 975,000 | 1,166,407 | ||||||||
9,940,078 | |||||||||||
Car rental—0.46% | |||||||||||
| Ahern Rentals, Inc. 7.375%, due 05/15/233 | 400,000 | 392,000 | |||||||||
| Herc Rentals, Inc. 7.500%, due 06/01/223 | 122,000 | 128,710 | |||||||||
7.750%, due 06/01/242,3 | 331,000 | 354,693 | |||||||||
| Hertz Holdings Netherlands BV 5.500%, due 03/30/233 | EUR | 150,000 | 173,540 | ||||||||
5.500%, due 03/30/234 | EUR | 250,000 | 289,560 | ||||||||
| United Rentals North America, Inc. 4.875%, due 01/15/28 | 50,000 | 46,704 | |||||||||
5.500%, due 05/15/27 | 75,000 | 74,317 | |||||||||
5.875%, due 09/15/26 | 175,000 | 177,625 | |||||||||
1,637,149 | |||||||||||
Chemicals—3.13% | |||||||||||
| A Schulman, Inc. 6.875%, due 06/01/239 | 250,000 | 261,563 | |||||||||
| Alpha 3 BV/Alpha US Bidco, Inc. 6.250%, due 02/01/252,3 | 200,000 | 195,500 | |||||||||
| Axalta Coating Systems Dutch Holding B BV 3.750%, due 01/15/254 | EUR | 600,000 | 724,917 | ||||||||
| Blue Cube Spinco LLC 10.000%, due 10/15/25 | 325,000 | 376,594 | |||||||||
| Braskem Finance Ltd. 5.375%, due 05/02/224 | 500,000 | 516,255 | |||||||||
5.750%, due 04/15/214 | 300,000 | 310,986 | |||||||||
| CF Industries, Inc. 5.375%, due 03/15/44 | 200,000 | 177,500 | |||||||||
7.125%, due 05/01/202 | 83,000 | 87,461 | |||||||||
135
PACE High Yield Investments
Portfolio of investments—July 31, 2018
| Face amount1 | Value | ||||||||||
Corporate bonds—(continued) | |||||||||||
Chemicals—(concluded) | |||||||||||
| Consolidated Energy Finance SA 6.500%, due 05/15/262,3 | 300,000 | $ | 295,875 | ||||||||
| Cornerstone Chemical Co. 6.750%, due 08/15/243 | 125,000 | 122,500 | |||||||||
| CVR Partners LP/CVR Nitrogen Finance Corp. 9.250%, due 06/15/232,3 | 125,000 | 132,969 | |||||||||
| GCP Applied Technologies, Inc. 5.500%, due 04/15/263 | 75,000 | 74,250 | |||||||||
| Hexion, Inc./Hexion Nova Scotia Finance ULC 9.000%, due 11/15/20 | 575,000 | 490,187 | |||||||||
| Huntsman International LLC 5.125%, due 04/15/21 | EUR | 500,000 | 649,907 | ||||||||
| Kissner Holdings LP/Kissner Milling Co. Ltd./ BSC Holding, Inc./Kissner USA 8.375%, due 12/01/223 | 375,000 | 381,562 | |||||||||
| Kraton Polymers LLC/ Kraton Polymers Capital Corp. 5.250%, due 05/15/263 | EUR | 250,000 | 300,742 | ||||||||
| Kronos International, Inc. 3.750%, due 09/15/253 | EUR | 175,000 | 201,059 | ||||||||
| NOVA Chemicals Corp. 5.000%, due 05/01/25 | 50,000 | 47,625 | |||||||||
5.250%, due 06/01/273 | 225,000 | 210,598 | |||||||||
| OCI NV 5.000%, due 04/15/233 | EUR | 810,000 | 995,356 | ||||||||
6.625%, due 04/15/233 | 200,000 | 204,310 | |||||||||
| Perstorp Holding AB 3 mo. Euribor + 4.250%, 4.250%, due 09/15/223,7 | EUR | 250,000 | 292,703 | ||||||||
| Platform Specialty Products Corp. 5.875%, due 12/01/253 | 125,000 | 125,588 | |||||||||
6.500%, due 02/01/222,3 | 125,000 | 128,125 | |||||||||
| PQ Corp. 5.750%, due 12/15/252,3 | 100,000 | 99,000 | |||||||||
| Prague CE S.a.r.l. 10.000% Cash or 11.250% PIK, 10.000%, due 12/15/224,6 | EUR | 600,000 | 715,614 | ||||||||
| PSPC Escrow Corp. 6.000%, due 02/01/234 | EUR | 625,000 | 766,626 | ||||||||
| The Chemours Co. 4.000%, due 05/15/26 | EUR | 550,000 | 648,815 | ||||||||
| TPC Group, Inc. 8.750%, due 12/15/203 | 650,000 | 646,750 | |||||||||
| Trinseo Materials Operating SCA/ Trinseo Materials Finance, Inc. 5.375%, due 09/01/253 | 225,000 | 222,188 | |||||||||
| Tronox Finance PLC 5.750%, due 10/01/252,3 | 275,000 | 265,031 | |||||||||
| Valvoline, Inc. 5.500%, due 07/15/24 | 200,000 | 202,000 | |||||||||
| Venator Finance Sarl/Venator Materials LLC 5.750%, due 07/15/253 | 100,000 | 92,500 | |||||||||
| Versum Materials, Inc. 5.500%, due 09/30/243 | 125,000 | 127,344 | |||||||||
11,090,000 | |||||||||||
| Face amount1 | Value | ||||||||||
Corporate bonds—(continued) | |||||||||||
Coal—0.81% | |||||||||||
| Alliance Resource Operating Partners LP/ Alliance Resource Finance Corp. 7.500%, due 05/01/253 | 300,000 | $ | 316,875 | ||||||||
| Cloud Peak Energy Resources LLC/ Cloud Peak Energy Finance Corp. 6.375%, due 03/15/24 | 550,000 | 401,500 | |||||||||
12.000%, due 11/01/21 | 250,000 | 256,250 | |||||||||
| CONSOL Energy, Inc. 11.000%, due 11/15/253 | 225,000 | 248,625 | |||||||||
| Murray Energy Corp. 11.250%, due 04/15/212,3 | 25,000 | 17,188 | |||||||||
| 9.000% Cash, 3.000% PIK, 12.000%, due 04/15/243,6 | 1,239,000 | 954,030 | |||||||||
| Peabody Energy Corp. 6.000%, due 03/31/223 | 100,000 | 103,000 | |||||||||
6.250%, due 11/15/213,8,10,13 | 75,000 | 0 | |||||||||
10.000%, due 03/15/223,8,10,13,15 | 1,025,000 | 0 | |||||||||
| Warrior Met Coal, Inc. 8.000%, due 11/01/243 | 550,000 | 568,562 | |||||||||
2,866,030 | |||||||||||
Commercial services—3.30% | |||||||||||
| AA Bond Co. Ltd. 5.500%, due 07/31/224 | GBP | 725,000 | 863,813 | ||||||||
| Aircastle Ltd. 5.125%, due 03/15/21 | 500,000 | 512,960 | |||||||||
| Algeco Global Finance PLC 3 mo. Euribor + 6.250%, 6.250%, due 02/15/233,7 | EUR | 275,000 | 324,787 | ||||||||
6.500%, due 02/15/233 | EUR | 275,000 | 333,225 | ||||||||
8.000%, due 02/15/233 | 200,000 | 204,500 | |||||||||
| APTIM Corp. 7.750%, due 06/15/252,3 | 25,000 | 20,750 | |||||||||
| Ashtead Capital, Inc. 5.625%, due 10/01/243 | 400,000 | 411,520 | |||||||||
| Blitz F18-674 GmbH 6.000%, due 07/30/263 | EUR | 300,000 | 352,998 | ||||||||
| Brand Industrial Services, Inc. 8.500%, due 07/15/253 | 350,000 | 357,000 | |||||||||
| Clear Channel International BV 8.750%, due 12/15/203 | 50,000 | 51,375 | |||||||||
| Garda World Security Corp. 7.250%, due 11/15/213 | 25,000 | 24,813 | |||||||||
| Gartner, Inc. 5.125%, due 04/01/253 | 225,000 | 227,002 | |||||||||
| Graham Holdings Co. 5.750%, due 06/01/263 | 175,000 | 176,313 | |||||||||
| Great Lakes Dredge & Dock Corp. 8.000%, due 05/15/22 | 200,000 | 206,500 | |||||||||
| Harland Clarke Holdings Corp. 6.875%, due 03/01/202,3 | 125,000 | 123,125 | |||||||||
8.375%, due 08/15/223 | 400,000 | 382,480 | |||||||||
9.250%, due 03/01/212,3 | 1,025,000 | 964,781 | |||||||||
| Inter Media and Communication SpA 4.875%, due 12/31/223 | EUR | 100,000 | 117,043 | ||||||||
4.875%, due 12/31/224 | EUR | 725,000 | 848,559 | ||||||||
136
PACE High Yield Investments
Portfolio of investments—July 31, 2018
| Face amount1 | Value | ||||||||||
Corporate bonds—(continued) | |||||||||||
Commercial services—(concluded) | |||||||||||
| Iron Mountain UK PLC 3.875%, due 11/15/254 | GBP | 325,000 | $ | 405,557 | |||||||
| Iron Mountain, Inc. 5.750%, due 08/15/242 | 1,465,000 | 1,452,181 | |||||||||
| La Financiere Atalian SASU 4.000%, due 05/15/244 | EUR | 375,000 | 423,312 | ||||||||
5.125%, due 05/15/253 | EUR | 250,000 | 286,637 | ||||||||
| Live Nation Entertainment, Inc. 5.375%, due 06/15/222,3 | 425,000 | 432,437 | |||||||||
5.625%, due 03/15/263 | 100,000 | 99,750 | |||||||||
| Matthews International Corp. 5.250%, due 12/01/253 | 150,000 | 143,625 | |||||||||
| Michael Baker International LLC 8.750%, due 03/01/233 | 350,000 | 345,187 | |||||||||
| Paprec Holding SA 4.000%, due 03/31/253 | EUR | 350,000 | 410,549 | ||||||||
| Ritchie Bros Auctioneers, Inc. 5.375%, due 01/15/252,3 | 175,000 | 172,156 | |||||||||
| Sotheby's 4.875%, due 12/15/253 | 200,000 | 191,423 | |||||||||
| The ADT Corp. 5.250%, due 03/15/20 | 275,000 | 279,125 | |||||||||
| TMS International Corp. 7.250%, due 08/15/253 | 125,000 | 127,031 | |||||||||
| Wabash National Corp. 5.500%, due 10/01/253 | 225,000 | 213,188 | |||||||||
| Waste Italia SpA 10.500%, due 11/15/194,8,11 | EUR | 1,425,000 | 33,326 | ||||||||
| Weight Watchers International, Inc. 8.625%, due 12/01/253 | 75,000 | 82,500 | |||||||||
| Wrangler Buyer Corp. 6.000%, due 10/01/253 | 75,000 | 70,500 | |||||||||
11,672,028 | |||||||||||
Communications equipment—0.17% | |||||||||||
| NXP BV/NXP Funding LLC 3.875%, due 09/01/223 | 400,000 | 394,000 | |||||||||
4.125%, due 06/01/213 | 200,000 | 200,506 | |||||||||
594,506 | |||||||||||
Computer software & services—2.49% | |||||||||||
| BMC Software Finance, Inc. 8.125%, due 07/15/212,3 | 475,000 | 486,281 | |||||||||
| Camelot Finance SA 7.875%, due 10/15/243 | 450,000 | 446,625 | |||||||||
| CDK Global, Inc. 5.875%, due 06/15/262 | 200,000 | 205,000 | |||||||||
| Change Healthcare Holdings LLC/ Change Healthcare Finance, Inc. 5.750%, due 03/01/253 | 325,000 | 314,437 | |||||||||
| Dell International LLC/EMC Corp. 5.450%, due 06/15/233 | 75,000 | 78,737 | |||||||||
5.875%, due 06/15/213 | 475,000 | 486,246 | |||||||||
| Diebold Nixdorf, Inc. 8.500%, due 04/15/242 | 100,000 | 92,000 | |||||||||
| Face amount1 | Value | ||||||||||
Corporate bonds—(continued) | |||||||||||
Computer software & services—(concluded) | |||||||||||
| Donnelley Financial Solutions, Inc. 8.250%, due 10/15/24 | 450,000 | $ | 469,125 | ||||||||
| Everi Payments, Inc. 7.500%, due 12/15/253 | 200,000 | 200,000 | |||||||||
| Exela Intermediate LLC/Exela Finance, Inc. 10.000%, due 07/15/233 | 300,000 | 309,375 | |||||||||
| First Data Corp. 5.000%, due 01/15/243 | 50,000 | 50,438 | |||||||||
5.750%, due 01/15/242,3 | 100,000 | 102,250 | |||||||||
7.000%, due 12/01/233 | 300,000 | 313,875 | |||||||||
| Infor Software Parent LLC/ Infor Software Parent, Inc. 7.125% Cash or 7.875% PIK, 7.125%, due 05/01/213,6 | 700,000 | 707,000 | |||||||||
| Infor US, Inc. 6.500%, due 05/15/22 | 850,000 | 860,625 | |||||||||
| Informatica LLC 7.125%, due 07/15/233 | 100,000 | 101,750 | |||||||||
| InterXion Holding NV 4.750%, due 06/15/253 | EUR | 225,000 | 272,970 | ||||||||
| j2 Cloud Services LLC/ j2 Global Co-Obligor, Inc. 6.000%, due 07/15/252,3 | 200,000 | 202,500 | |||||||||
| NCR Corp. 6.375%, due 12/15/23 | 780,000 | 795,600 | |||||||||
| Open Text Corp. 5.875%, due 06/01/262,3 | 400,000 | 410,000 | |||||||||
| Rackspace Hosting, Inc. 8.625%, due 11/15/242,3 | 150,000 | 151,500 | |||||||||
| RP Crown Parent LLC 7.375%, due 10/15/243 | 450,000 | 460,125 | |||||||||
| Solera LLC/Solera Finance, Inc. 10.500%, due 03/01/243 | 400,000 | 442,303 | |||||||||
| Veritas US, Inc./Veritas Bermuda Ltd. 10.500%, due 02/01/242,3 | 400,000 | 336,000 | |||||||||
| Western Digital Corp. 4.750%, due 02/15/26 | 525,000 | 516,141 | |||||||||
8,810,903 | |||||||||||
Consumer products—0.94% | |||||||||||
| Central Garden & Pet Co. 5.125%, due 02/01/28 | 50,000 | 46,750 | |||||||||
6.125%, due 11/15/23 | 275,000 | 282,562 | |||||||||
| First Quality Finance Co., Inc. 5.000%, due 07/01/253 | 75,000 | 69,188 | |||||||||
| High Ridge Brands Co. 8.875%, due 03/15/253 | 125,000 | 57,500 | |||||||||
| Prestige Brands, Inc. 5.375%, due 12/15/213 | 200,000 | 200,250 | |||||||||
6.375%, due 03/01/242,3 | 325,000 | 324,594 | |||||||||
| Revlon Consumer Products Corp. 6.250%, due 08/01/24 | 250,000 | 132,500 | |||||||||
| Spectrum Brands, Inc. 4.000%, due 10/01/263 | EUR | 325,000 | 376,875 | ||||||||
4.000%, due 10/01/264 | EUR | 250,000 | 289,903 | ||||||||
137
PACE High Yield Investments
Portfolio of investments—July 31, 2018
| Face amount1 | Value | ||||||||||
Corporate bonds—(continued) | |||||||||||
Consumer products—(concluded) | |||||||||||
| TRI Pointe Holdings, Inc. 5.875%, due 06/15/24 | 1,575,000 | $ | 1,563,187 | ||||||||
3,343,309 | |||||||||||
Consumer services—0.16% | |||||||||||
| Garda World Security Corp. 8.750%, due 05/15/253 | 575,000 | 577,875 | |||||||||
Containers & packaging—2.25% | |||||||||||
| ARD Finance SA 6.625% Cash or 7.375% PIK, 6.625%, due 09/15/236 | EUR 300,000 | 362,189 | |||||||||
| 7.125% Cash or 7.875% PIK, 7.125%, due 09/15/236 | 400,000 | 405,500 | |||||||||
| Ardagh Packaging Finance PLC/ Ardagh Holdings USA, Inc. 4.250%, due 09/15/222,3 | 200,000 | 196,500 | |||||||||
6.000%, due 02/15/253 | 600,000 | 585,750 | |||||||||
| Ball Corp. 4.375%, due 12/15/20 | 350,000 | 353,500 | |||||||||
| Berry Global, Inc. 4.500%, due 02/15/263 | 100,000 | 94,000 | |||||||||
6.000%, due 10/15/22 | 300,000 | 306,750 | |||||||||
| BWAY Holding Co. 7.250%, due 04/15/252,3 | 750,000 | 730,781 | |||||||||
| Crown European Holdings SA 2.250%, due 02/01/233 | EUR | 225,000 | 266,090 | ||||||||
2.875%, due 02/01/263 | EUR | 350,000 | 396,817 | ||||||||
| Flex Acquisition Co., Inc. 6.875%, due 01/15/253 | 150,000 | 145,875 | |||||||||
7.875%, due 07/15/263 | 175,000 | 176,208 | |||||||||
| Hercule Debtco Sarl 6.750% Cash or 7.500% PIK, 6.750%, due 06/30/243,6 | EUR | 275,000 | 313,609 | ||||||||
| 6.750% Cash or 7.500% PIK, 6.750%, due 06/30/244,6 | EUR | 250,000 | 285,099 | ||||||||
| Kleopatra Holdings 1 SCA 8.500% Cash or 9.250% PIK, 8.500%, due 06/30/234,6 | EUR | 625,000 | 508,265 | ||||||||
| Multi-Color Corp. 6.125%, due 12/01/223 | 175,000 | 178,062 | |||||||||
| OI European Group BV 3.125%, due 11/15/243 | EUR | 225,000 | 268,432 | ||||||||
3.125%, due 11/15/244 | EUR | 175,000 | 208,780 | ||||||||
| Owens-Brockway Glass Container, Inc. 6.375%, due 08/15/253 | 600,000 | 615,000 | |||||||||
| Plastipak Holdings, Inc. 6.250%, due 10/15/253 | 125,000 | 114,688 | |||||||||
| Reynolds Group Issuer, Inc./Reynolds Group Issuer LLC/Reynolds Group Issuer Lu 5.125%, due 07/15/232,3 | 450,000 | 447,480 | |||||||||
| SAN Miguel Industrias Pet SA 4.500%, due 09/18/224 | 300,000 | 296,250 | |||||||||
| Face amount1 | Value | ||||||||||
Corporate bonds—(continued) | |||||||||||
Containers & packaging—(concluded) | |||||||||||
| Silgan Holdings, Inc. 3.250%, due 03/15/25 | EUR | 525,000 | $ | 627,722 | |||||||
4.750%, due 03/15/25 | 75,000 | 71,531 | |||||||||
7,954,878 | |||||||||||
Diversified financial services—4.88% | |||||||||||
| Alliance Data Systems Corp. 4.500%, due 03/15/224 | EUR | 125,000 | 149,487 | ||||||||
4.500%, due 03/15/223 | EUR | 550,000 | 657,744 | ||||||||
| Ally Financial, Inc. 3.750%, due 11/18/19 | 300,000 | 300,000 | |||||||||
8.000%, due 12/31/18 | 475,000 | 484,262 | |||||||||
8.000%, due 11/01/31 | 150,000 | 180,750 | |||||||||
8.000%, due 11/01/31 | 285,000 | 343,425 | |||||||||
| ASP AMC Merger Sub, Inc. 8.000%, due 05/15/253 | 700,000 | 574,000 | |||||||||
| Bank of America Corp. (fixed, converts to FRN on 03/15/28), 5.875%, due 03/15/285 | 50,000 | 49,600 | |||||||||
| (fixed, converts to FRN on 09/05/24), 6.250%, due 09/05/245 | 700,000 | 728,875 | |||||||||
| (fixed, converts to FRN on 03/10/26), 6.300%, due 03/10/265 | 175,000 | 186,375 | |||||||||
| Barclays PLC (fixed, converts to FRN on 12/15/20), 8.000%, due 12/15/205 | EUR | 600,000 | 780,541 | ||||||||
| (fixed, converts to FRN on 12/15/18), 8.250%, due 12/15/185 | 300,000 | 305,504 | |||||||||
| BNP Paribas SA MTN 2.375%, due 02/17/254 | EUR | 450,000 | 544,441 | ||||||||
| CIT Group, Inc. 3.875%, due 02/19/19 | 175,000 | 175,350 | |||||||||
4.125%, due 03/09/21 | 75,000 | 74,906 | |||||||||
| Citigroup, Inc. (fixed, converts to FRN on 02/15/23), 5.900%, due 02/15/232,5 | 925,000 | 946,645 | |||||||||
| (fixed, converts to FRN on 08/15/20), 5.950%, due 08/15/205 | 175,000 | 181,213 | |||||||||
| (fixed, converts to FRN on 01/30/23), 5.950%, due 01/30/232,5 | 175,000 | 179,375 | |||||||||
| (fixed, converts to FRN on 08/15/26), 6.250%, due 08/15/265 | 150,000 | 155,342 | |||||||||
| CNG Holdings, Inc. 9.375%, due 05/15/202,3 | 225,000 | 224,438 | |||||||||
| Cooke Omega Investments, Inc./ Alpha VesselCo Holdings, Inc. 8.500%, due 12/15/223 | 275,000 | 277,062 | |||||||||
| Credivalores-Crediservicios SAS 9.750%, due 07/27/224 | 200,000 | 204,000 | |||||||||
| Fly Leasing Ltd. 5.250%, due 10/15/24 | 200,000 | 188,500 | |||||||||
| Garfunkelux Holdco 3 SA 3 mo. Euribor + 3.500%, 3.500%, due 09/01/233,7 | EUR | 475,000 | 481,312 | ||||||||
8.500%, due 11/01/224 | GBP | 400,000 | 509,269 | ||||||||
138
PACE High Yield Investments
Portfolio of investments—July 31, 2018
| Face amount1 | Value | ||||||||||
Corporate bonds—(continued) | |||||||||||
Diversified financial services—(concluded) | |||||||||||
| goeasy Ltd. 7.875%, due 11/01/223 | 150,000 | $ | 157,517 | ||||||||
| Grupo KUO SAB De CV 5.750%, due 07/07/274 | 300,000 | 292,500 | |||||||||
| Hexion, Inc. 10.375%, due 02/01/222,3 | 250,000 | 245,938 | |||||||||
13.750%, due 02/01/223 | 275,000 | 246,125 | |||||||||
| Intelsat Connect Finance SA 12.500%, due 04/01/222,3 | 350,000 | 349,562 | |||||||||
| Jefferies Finance LLC/JFIN Co-Issuer Corp. 7.375%, due 04/01/203 | 400,000 | 407,000 | |||||||||
| KOC Holding AS 5.250%, due 03/15/234 | 750,000 | 711,600 | |||||||||
| Ladder Capital Finance Holdings LLLP/ Ladder Capital Finance Corp. 5.250%, due 03/15/223 | 325,000 | 325,036 | |||||||||
| LHC3 PLC 4.125% PIK 4.125%, due 08/15/243,6 | EUR | 200,000 | 231,531 | ||||||||
| 4.125% Cash or 4.875% PIK, 4.125%, due 08/15/244,6 | EUR | 600,000 | 694,594 | ||||||||
| Louvre Bidco SAS 4.250%, due 09/30/243 | EUR | 125,000 | 136,675 | ||||||||
| Nationstar Mortgage LLC/ Nationstar Capital Corp. 6.500%, due 06/01/22 | 275,000 | 273,625 | |||||||||
9.625%, due 05/01/19 | 375,000 | 375,000 | |||||||||
| NFP Corp. 6.875%, due 07/15/253 | 325,000 | 316,062 | |||||||||
| Oxford Finance LLC/ Oxford Finance Co-Issuer II, Inc. 6.375%, due 12/15/223 | 100,000 | 101,500 | |||||||||
| ProGroup AG 3.000%, due 03/31/264 | EUR | 600,000 | 687,578 | ||||||||
| Promontoria Holding 264 BV 3 mo. Euribor + 6.250%, 5.935%, due 08/15/233,7,12 | EUR | 250,000 | 291,636 | ||||||||
6.750%, due 08/15/233,12 | EUR | 200,000 | 236,232 | ||||||||
| Tempo Acquisition LLC/ Tempo Acquisition Finance Corp. 6.750%, due 06/01/253 | 375,000 | 362,512 | |||||||||
| The Charles Schwab Corp. (fixed, converts to FRN on 12/01/27), 5.000%, due 12/01/275 | 225,000 | 216,844 | |||||||||
| Vantiv LLC/Vantiv Issuer Corp. 3.875%, due 11/15/253 | GBP | 400,000 | 503,783 | ||||||||
| Vertiv Intermediate Holding Corp. 12.000% Cash or 13.000% PIK, 12.000%, due 02/15/223,6 | 900,000 | 870,750 | |||||||||
| Werner FinCo LP/Werner FinCo, Inc. 8.750%, due 07/15/253 | 375,000 | 360,000 | |||||||||
17,276,016 | |||||||||||
| Face amount1 | Value | ||||||||||
Corporate bonds—(continued) | |||||||||||
Electric utilities—0.46% | |||||||||||
| NRG Energy, Inc. 6.250%, due 07/15/22 | 25,000 | $ | 25,781 | ||||||||
6.250%, due 05/01/24 | 25,000 | 25,719 | |||||||||
6.625%, due 01/15/27 | 200,000 | 206,000 | |||||||||
7.250%, due 05/15/26 | 75,000 | 79,875 | |||||||||
| NRG Yield Operating LLC 5.000%, due 09/15/26 | 225,000 | 211,359 | |||||||||
| Vistra Energy Corp. 7.375%, due 11/01/22 | 1,025,000 | 1,068,563 | |||||||||
7.625%, due 11/01/24 | 25,000 | 26,789 | |||||||||
1,644,086 | |||||||||||
Electric-generation—1.09% | |||||||||||
| AmeriGas Partners LP/AmeriGas Finance Corp. 5.500%, due 05/20/25 | 275,000 | 266,062 | |||||||||
5.625%, due 05/20/24 | 75,000 | 73,875 | |||||||||
5.750%, due 05/20/27 | 275,000 | 262,969 | |||||||||
| Calpine Corp. 5.375%, due 01/15/232 | 825,000 | 786,844 | |||||||||
5.500%, due 02/01/24 | 475,000 | 439,375 | |||||||||
| ContourGlobal Power Holdings SA 3.375%, due 08/01/233 | EUR | 250,000 | 292,776 | ||||||||
4.125%, due 08/01/253 | EUR | 125,000 | 145,745 | ||||||||
5.125%, due 06/15/213 | EUR | 725,000 | 867,744 | ||||||||
| Drax Finco PLC 6.625%, due 11/01/253 | 200,000 | 200,500 | |||||||||
| GenOn Energy, Inc. 7.875%, due 06/15/178,11 | 75,000 | 47,625 | |||||||||
| Greenko Investment Co. 4.875%, due 08/16/234 | 300,000 | 278,312 | |||||||||
| Rockpoint Gas Storage Canada Ltd. 7.000%, due 03/31/233 | 125,000 | 124,375 | |||||||||
| Superior Plus LP/Superior General Partner, Inc. 7.000%, due 07/15/263 | 75,000 | 75,750 | |||||||||
3,861,952 | |||||||||||
Electric-integrated—0.85% | |||||||||||
| AES Andres BV/Dominican Power Partners/ Empresa Generadora de Electricidad It 7.950%, due 05/11/264 | 300,000 | 312,000 | |||||||||
| AES El Salvador Trust II 6.750%, due 03/28/234 | 450,000 | 423,000 | |||||||||
| Capex SA 6.875%, due 05/15/244 | 475,000 | 426,318 | |||||||||
6.875%, due 05/15/243 | 400,000 | 359,004 | |||||||||
| Centrais Eletricas Brasileiras SA 5.750%, due 10/27/214 | 300,000 | 301,980 | |||||||||
| Hrvatska Elektroprivreda 5.875%, due 10/23/223 | 800,000 | 838,384 | |||||||||
| Talen Energy Supply LLC 9.500%, due 07/15/222,3 | 25,000 | 24,000 | |||||||||
10.500%, due 01/15/263 | 375,000 | 323,906 | |||||||||
3,008,592 | |||||||||||
139
PACE High Yield Investments
Portfolio of investments—July 31, 2018
| Face amount1 | Value | ||||||||||
Corporate bonds—(continued) | |||||||||||
Electronics—1.06% | |||||||||||
| Advanced Micro Devices, Inc. 7.000%, due 07/01/24 | 353,000 | $ | 373,297 | ||||||||
7.500%, due 08/15/22 | 245,000 | 272,562 | |||||||||
| Amkor Technology, Inc. 6.375%, due 10/01/22 | 50,000 | 51,000 | |||||||||
| Belden, Inc. 3.875%, due 03/15/283 | EUR | 375,000 | 417,677 | ||||||||
| Energizer Gamma Acquisition BV 4.625%, due 07/15/263 | EUR | 650,000 | 776,077 | ||||||||
| Energizer Gamma Acquisition, Inc. 6.375%, due 07/15/262,3 | 175,000 | 179,865 | |||||||||
| Energizer Holdings, Inc. 5.500%, due 06/15/252,3 | 100,000 | 98,500 | |||||||||
| Entegris, Inc. 4.625%, due 02/10/263 | 200,000 | 189,500 | |||||||||
| GCL New Energy Holdings Ltd. 7.100%, due 01/30/214 | 200,000 | 186,013 | |||||||||
| Itron, Inc. 5.000%, due 01/15/263 | 75,000 | 71,438 | |||||||||
| Qorvo, Inc. 5.500%, due 07/15/263 | 150,000 | 152,805 | |||||||||
7.000%, due 12/01/25 | 8,000 | 8,660 | |||||||||
| Senvion Holding GmbH 3.875%, due 10/25/224 | EUR | 775,000 | 802,028 | ||||||||
| TTM Technologies, Inc. 5.625%, due 10/01/252,3 | 175,000 | 172,813 | |||||||||
3,752,235 | |||||||||||
Energy—0.51% | |||||||||||
| Neerg Energy Ltd. 6.000%, due 02/13/224 | 500,000 | 472,599 | |||||||||
| Nordex SE 6.500%, due 02/01/233 | EUR | 375,000 | 425,298 | ||||||||
| Pattern Energy Group, Inc. 5.875%, due 02/01/243 | 75,000 | 75,563 | |||||||||
| Rio Energy SA/UGEN SA/UENSA SA 6.875%, due 02/01/253 | 500,000 | 414,500 | |||||||||
6.875%, due 02/01/254 | 350,000 | 290,150 | |||||||||
| TerraForm Power Operating LLC 4.250%, due 01/31/233 | 125,000 | 120,313 | |||||||||
1,798,423 | |||||||||||
Energy-exploration & production—0.20% | |||||||||||
| Antero Resources Corp. 5.125%, due 12/01/222 | 150,000 | 150,375 | |||||||||
5.375%, due 11/01/21 | 200,000 | 202,750 | |||||||||
| Covey Park Energy LLC/ Covey Park Finance Corp. 7.500%, due 05/15/253 | 350,000 | 355,250 | |||||||||
| Midstates Petroleum Co., Inc./ Midstates Petroleum Co. LLC 10.750%, due 10/01/208,10,11,15 | 850,000 | 0 | |||||||||
708,375 | |||||||||||
| Face amount1 | Value | ||||||||||
Corporate bonds—(continued) | |||||||||||
Finance-captive automotive—1.82% | |||||||||||
| Ausdrill Finance Pty Ltd. 6.875%, due 11/01/193 | 880,000 | $ | 883,300 | ||||||||
| Barminco Finance Pty Ltd. 6.625%, due 05/15/223 | 50,000 | 47,450 | |||||||||
| Cabot Financial Luxembourg II SA 3 mo. Euribor + 5.875%, 5.875%, due 11/15/214,7 | EUR | 550,000 | 644,750 | ||||||||
| CyrusOne LP/CyrusOne Finance Corp. 5.000%, due 03/15/242 | 75,000 | 75,281 | |||||||||
| Five Point Operating Co. LP/ Five Point Capital Corp. 7.875%, due 11/15/253 | 125,000 | 126,875 | |||||||||
| HT1 Funding GmbH 12 mo. Euribor + 2.000%, 1.819%, due 06/30/195,7 | EUR | 500,000 | 556,260 | ||||||||
| Hunt Cos., Inc. 6.250%, due 02/15/263 | 200,000 | 185,500 | |||||||||
| Icahn Enterprises LP/ Icahn Enterprises Finance Corp. 6.000%, due 08/01/20 | 1,330,000 | 1,352,178 | |||||||||
6.250%, due 02/01/22 | 250,000 | 254,842 | |||||||||
6.375%, due 12/15/25 | 125,000 | 125,625 | |||||||||
| Lions Gate Capital Holdings LLC 5.875%, due 11/01/243 | 175,000 | 178,938 | |||||||||
| Mason Finance Sub, Inc. 6.875%, due 08/15/233 | 150,000 | 150,000 | |||||||||
| Midas Intermediate Holdco II LLC/ Midas Intermediate Holdco II Finance, Inc. 7.875%, due 10/01/223 | 275,000 | 253,687 | |||||||||
| NWH Escrow Corp. 7.500%, due 08/01/213 | 250,000 | 228,750 | |||||||||
| Park Aerospace Holdings Ltd. 5.250%, due 08/15/223 | 150,000 | 150,000 | |||||||||
5.500%, due 02/15/243 | 100,000 | 98,750 | |||||||||
| Prime Security Services Borrower LLC/ Prime Finance, Inc. 9.250%, due 05/15/233 | 235,000 | 251,450 | |||||||||
| Radian Group, Inc. 4.500%, due 10/01/242 | 225,000 | 218,250 | |||||||||
7.000%, due 03/15/21 | 144,000 | 154,080 | |||||||||
| Spectrum Brands Holdings, Inc. 7.750%, due 01/15/22 | 395,000 | 407,344 | |||||||||
| Trident Merger Sub, Inc. 6.625%, due 11/01/253 | 100,000 | 94,000 | |||||||||
6,437,310 | |||||||||||
Finance-other—1.40% | |||||||||||
| Credivalores-Crediservicios SAS 9.750%, due 07/27/223 | 600,000 | 612,000 | |||||||||
| Navient Corp. 6.500%, due 06/15/22 | 100,000 | 102,000 | |||||||||
6.625%, due 07/26/21 | 75,000 | 77,438 | |||||||||
6.750%, due 06/25/25 | 150,000 | 148,875 | |||||||||
6.750%, due 06/15/26 | 200,000 | 197,000 | |||||||||
7.250%, due 09/25/232 | 125,000 | 130,937 | |||||||||
8.000%, due 03/25/20 | 2,000,000 | 2,110,000 | |||||||||
140
PACE High Yield Investments
Portfolio of investments—July 31, 2018
| Face amount1 | Value | ||||||||||
Corporate bonds—(continued) | |||||||||||
Finance-other—(concluded) | |||||||||||
| Springleaf Finance Corp. 6.000%, due 06/01/20 | 1,050,000 | $ | 1,081,500 | ||||||||
6.875%, due 03/15/25 | 275,000 | 279,125 | |||||||||
7.125%, due 03/15/26 | 200,000 | 203,250 | |||||||||
4,942,125 | |||||||||||
Financial services—0.52% | |||||||||||
| Banco de Bogota SA 5.375%, due 02/19/233 | 750,000 | 781,875 | |||||||||
| Intesa Sanpaolo SpA 3.928%, due 09/15/264 | EUR | 400,000 | 477,583 | ||||||||
| Monitchem HoldCo 2 SA 6.875%, due 06/15/224 | EUR | 400,000 | 416,967 | ||||||||
| VFH Parent LLC/Orchestra Co-Issuer, Inc. 6.750%, due 06/15/223 | 150,000 | 154,312 | |||||||||
1,830,737 | |||||||||||
Food products—1.60% | |||||||||||
| Central American Bottling Corp. 5.750%, due 01/31/273 | 400,000 | 400,000 | |||||||||
5.750%, due 01/31/274 | 200,000 | 200,000 | |||||||||
| Clearwater Seafoods, Inc. 6.875%, due 05/01/253 | 25,000 | 24,000 | |||||||||
| Cott Corp. 5.500%, due 07/01/244 | EUR | 450,000 | 554,126 | ||||||||
| Cott Finance Corp. 5.500%, due 07/01/243 | EUR | 500,000 | 615,695 | ||||||||
| Darling Global Finance BV 3.625%, due 05/15/263 | EUR | 125,000 | 148,911 | ||||||||
| JBS Investments GmbH 7.250%, due 04/03/244 | 800,000 | 802,000 | |||||||||
7.750%, due 10/28/204 | 200,000 | 205,030 | |||||||||
| Marfrig Holdings Europe BV 8.000%, due 06/08/234 | 100,000 | 102,250 | |||||||||
| Minerva Luxembourg SA 6.500%, due 09/20/263 | 1,150,000 | 1,070,938 | |||||||||
6.500%, due 09/20/264 | 250,000 | 232,813 | |||||||||
| Pilgrim's Pride Corp. 5.750%, due 03/15/253 | 225,000 | 215,156 | |||||||||
5.875%, due 09/30/272,3 | 250,000 | 233,125 | |||||||||
| Post Holdings, Inc. 5.750%, due 03/01/272,3 | 200,000 | 195,000 | |||||||||
| Sunshine Mid BV 6.500%, due 05/15/263 | EUR | 375,000 | 431,481 | ||||||||
| TreeHouse Foods, Inc. 6.000%, due 02/15/242,3 | 250,000 | 250,000 | |||||||||
5,680,525 | |||||||||||
Food-wholesale—1.78% | |||||||||||
| Albertsons Cos. LLC/Safeway, Inc./ New Albertsons LP/Albertson's LLC 5.750%, due 03/15/25 | 200,000 | 179,616 | |||||||||
6.625%, due 06/15/24 | 350,000 | 335,125 | |||||||||
| Albertsons Cos., Inc. 3 mo. USD LIBOR + 3.750%, 6.085%, due 01/15/242,3,7 | 75,000 | 75,938 | |||||||||
| Face amount1 | Value | ||||||||||
Corporate bonds—(continued) | |||||||||||
Food-wholesale—(concluded) | |||||||||||
| Aramark International Finance Sarl 3.125%, due 04/01/253 | EUR | 375,000 | $ | 453,744 | |||||||
3.125%, due 04/01/254 | EUR | 100,000 | 120,998 | ||||||||
| Aramark Services, Inc. 5.000%, due 02/01/282,3 | 275,000 | 265,292 | |||||||||
5.125%, due 01/15/24 | 400,000 | 403,500 | |||||||||
| B&G Foods, Inc. 5.250%, due 04/01/252 | 75,000 | 72,000 | |||||||||
| Casino Guichard Perrachon SA 4.048%, due 08/05/264,9 | EUR | 300,000 | 338,641 | ||||||||
| (fixed, converts to FRN on 01/31/19), 4.870%, due 01/31/194,5 | EUR | 500,000 | 496,097 | ||||||||
| Casino Guichard Perrachon SA MTN 3.580%, due 02/07/254,9 | EUR | 300,000 | 334,999 | ||||||||
| Iceland Bondco PLC 4.625%, due 03/15/253 | GBP | 375,000 | 452,830 | ||||||||
| Nomad Foods Bondco PLC 3.250%, due 05/15/244 | EUR | 500,000 | 582,353 | ||||||||
3.250%, due 05/15/243 | EUR | 250,000 | 291,176 | ||||||||
| Ocado Group PLC 4.000%, due 06/15/243 | GBP | 200,000 | 262,757 | ||||||||
4.000%, due 06/15/244 | GBP | 175,000 | 229,912 | ||||||||
| Picard Bondco SA 5.500%, due 11/30/243 | EUR | 225,000 | 253,001 | ||||||||
5.500%, due 11/30/244 | EUR | 100,000 | 112,445 | ||||||||
| Pinnacle Foods Finance LLC/ Pinnacle Foods Finance Corp. 5.875%, due 01/15/24 | 150,000 | 157,688 | |||||||||
| Sigma Holdco BV 5.750%, due 05/15/263 | EUR | 800,000 | 886,262 | ||||||||
6,304,374 | |||||||||||
Gaming—2.35% | |||||||||||
| Boyd Gaming Corp. 6.000%, due 08/15/263 | 300,000 | 301,500 | |||||||||
6.875%, due 05/15/23 | 925,000 | 972,693 | |||||||||
| Grupo Posadas SAB de CV 7.875%, due 06/30/224 | 800,000 | 816,000 | |||||||||
| Hilton Domestic Operating Co., Inc. 5.125%, due 05/01/263 | 375,000 | 375,000 | |||||||||
| Inn of the Mountain Gods Resort & Casino 9.250%, due 11/30/206 | 70,251 | 66,475 | |||||||||
| International Game Technology PLC 3.500%, due 07/15/243 | EUR | 250,000 | 297,088 | ||||||||
| Jacobs Entertainment, Inc. 7.875%, due 02/01/243 | 250,000 | 261,250 | |||||||||
| LHMC Finco Sarl 7.875%, due 12/20/233 | 200,000 | 200,450 | |||||||||
| Mattel, Inc. 6.750%, due 12/31/253 | 150,000 | 145,687 | |||||||||
| MGM Resorts International 5.750%, due 06/15/25 | 500,000 | 504,220 | |||||||||
6.000%, due 03/15/23 | 100,000 | 103,625 | |||||||||
6.750%, due 10/01/20 | 313,000 | 329,824 | |||||||||
7.750%, due 03/15/22 | 740,000 | 810,300 | |||||||||
141
PACE High Yield Investments
Portfolio of investments—July 31, 2018
| Face amount1 | Value | ||||||||||
Corporate bonds—(continued) | |||||||||||
Gaming—(concluded) | |||||||||||
| Mohegan Gaming & Entertainment 7.875%, due 10/15/242,3 | 625,000 | $ | 590,625 | ||||||||
| Pinewood Finco PLC MTN 3.750%, due 12/01/234 | GBP | 225,000 | 296,055 | ||||||||
Scientific Games International, Inc. | |||||||||||
3.375%, due 02/15/263 | EUR | 275,000 | 308,708 | ||||||||
5.000%, due 10/15/253 | 50,000 | 48,124 | |||||||||
5.500%, due 02/15/263 | EUR | 425,000 | 473,616 | ||||||||
6.250%, due 09/01/20 | 75,000 | 74,812 | |||||||||
6.625%, due 05/15/21 | 75,000 | 75,844 | |||||||||
| Stars Group Holdings BV/ Stars Group US Co. Borrower LLC 7.000%, due 07/15/262,3 | 250,000 | 257,500 | |||||||||
| Studio City Co. Ltd. 5.875%, due 11/30/193 | 200,000 | 202,000 | |||||||||
| WMG Acquisition Corp. 4.125%, due 11/01/244 | EUR | 525,000 | 634,966 | ||||||||
5.000%, due 08/01/233 | 125,000 | 123,594 | |||||||||
| Wynn Las Vegas LLC/ Wynn Las Vegas Capital Corp. 5.500%, due 03/01/253 | 50,000 | 49,375 | |||||||||
8,319,331 | |||||||||||
Health care equipment & supplies—0.05% | |||||||||||
| Crimson Merger Sub, Inc. 6.625%, due 05/15/222,3 | 175,000 | 172,813 | |||||||||
Health care providers & services—5.60% | |||||||||||
| AHP Health Partners, Inc. 9.750%, due 07/15/263 | 75,000 | 76,219 | |||||||||
| Avantor, Inc. 6.000%, due 10/01/242,3 | 100,000 | 99,938 | |||||||||
9.000%, due 10/01/252,3 | 375,000 | 380,156 | |||||||||
| Bausch Health Cos., Inc. 4.500%, due 05/15/234 | EUR | 700,000 | 790,698 | ||||||||
5.875%, due 05/15/232,3 | 375,000 | 360,187 | |||||||||
7.500%, due 07/15/213 | 1,920,000 | 1,958,640 | |||||||||
9.000%, due 12/15/253 | 1,450,000 | 1,537,000 | |||||||||
| Catalent Pharma Solutions, Inc. 4.750%, due 12/15/243 | EUR | 200,000 | 245,727 | ||||||||
4.750%, due 12/15/244 | EUR | 200,000 | 245,727 | ||||||||
| Centene Corp. 4.750%, due 05/15/22 | 175,000 | 176,969 | |||||||||
5.375%, due 06/01/262,3 | 400,000 | 409,500 | |||||||||
6.125%, due 02/15/242 | 25,000 | 26,313 | |||||||||
| Charles River Laboratories International, Inc. 5.500%, due 04/01/263 | 150,000 | 151,875 | |||||||||
| CHS/Community Health Systems, Inc. 6.875%, due 02/01/222 | 112,000 | 54,880 | |||||||||
8.125%, due 06/30/242,3 | 359,000 | 295,277 | |||||||||
8.625%, due 01/15/242,3 | 150,000 | 155,070 | |||||||||
11.000%, due 06/30/232,3,9 | 125,000 | 112,500 | |||||||||
| DJO Finance LLC/DJO Finance Corp. 8.125%, due 06/15/212,3 | 275,000 | 282,562 | |||||||||
| Eagle Holding Co. II LLC 7.625% Cash or 8.375% PIK, 7.625%, due 05/15/223,6 | 100,000 | 100,969 | |||||||||
| Face amount1 | Value | ||||||||||
Corporate bonds—(continued) | |||||||||||
Health care providers & services—(continued) | |||||||||||
| Encompass Health Corp. 5.750%, due 11/01/242 | 425,000 | $ | 431,150 | ||||||||
| Endo Dac/Endo Finance LLC/Endo Finco, Inc. 6.000%, due 07/15/233 | 1,400,000 | 1,190,000 | |||||||||
| Endo Finance LLC 5.750%, due 01/15/222,3 | 25,000 | 22,938 | |||||||||
| Endo Finance LLC/Endo Finco, Inc. 5.375%, due 01/15/233,9 | 150,000 | 127,125 | |||||||||
| Envision Healthcare Corp. 5.625%, due 07/15/22 | 175,000 | 178,937 | |||||||||
6.250%, due 12/01/242,3 | 175,000 | 186,375 | |||||||||
| Grifols SA 3.200%, due 05/01/253 | EUR | 600,000 | 700,768 | ||||||||
| HCA, Inc. 3.750%, due 03/15/19 | 275,000 | 275,426 | |||||||||
4.750%, due 05/01/23 | 200,000 | 202,600 | |||||||||
5.000%, due 03/15/24 | 175,000 | 177,625 | |||||||||
5.375%, due 02/01/252 | 200,000 | 202,500 | |||||||||
5.875%, due 03/15/22 | 100,000 | 105,125 | |||||||||
5.875%, due 05/01/23 | 150,000 | 156,937 | |||||||||
5.875%, due 02/15/262 | 100,000 | 103,375 | |||||||||
6.500%, due 02/15/20 | 250,000 | 260,200 | |||||||||
7.500%, due 02/15/22 | 1,425,000 | 1,565,719 | |||||||||
| Hill-Rom Holdings, Inc. 5.750%, due 09/01/233 | 150,000 | 152,250 | |||||||||
| inVentiv Group Holdings, Inc./inVentiv Health, Inc./inVentiv Health Clinical, Inc. 7.500%, due 10/01/243 | 255,000 | 267,750 | |||||||||
| LifePoint Health, Inc. 5.500%, due 12/01/212 | 125,000 | 127,188 | |||||||||
| Mallinckrodt International Finance SA/ Mallinckrodt CB LLC 5.625%, due 10/15/232,3 | 150,000 | 129,188 | |||||||||
| MPH Acquisition Holdings LLC 7.125%, due 06/01/242,3 | 50,000 | 51,750 | |||||||||
| Polaris Intermediate Corp. 8.500% Cash or 9.250% PIK, 8.500%, due 12/01/223,6 | 300,000 | 310,125 | |||||||||
| Select Medical Corp. 6.375%, due 06/01/21 | 250,000 | 252,500 | |||||||||
| Tenet Healthcare Corp. 4.625%, due 07/15/242 | 175,000 | 169,531 | |||||||||
5.500%, due 03/01/19 | 1,000,000 | 1,010,000 | |||||||||
7.500%, due 01/01/223 | 125,000 | 130,938 | |||||||||
8.125%, due 04/01/222 | 25,000 | 26,625 | |||||||||
| Teva Pharmaceutical Finance Netherlands II BV 0.375%, due 07/25/204 | EUR | 400,000 | 460,893 | ||||||||
1.625%, due 10/15/284 | EUR | 1,025,000 | 975,421 | ||||||||
3.250%, due 04/15/22 | EUR | 175,000 | 213,318 | ||||||||
4.500%, due 03/01/25 | EUR | 100,000 | 123,928 | ||||||||
| Teva Pharmaceutical Finance Netherlands III BV 6.000%, due 04/15/242 | 1,050,000 | 1,086,452 | |||||||||
142
PACE High Yield Investments
Portfolio of investments—July 31, 2018
| Face amount1 | Value | ||||||||||
Corporate bonds—(continued) | |||||||||||
Health care providers & services—(concluded) | |||||||||||
| Unilabs Subholding AB 5.750%, due 05/15/253 | EUR | 175,000 | $ | 196,650 | |||||||
| Universal Hospital Services, Inc. 7.625%, due 08/15/20 | 350,000 | 350,493 | |||||||||
| Valeant Pharmaceuticals International 8.500%, due 01/31/273 | 150,000 | 154,050 | |||||||||
| West Street Merger Sub, Inc. 6.375%, due 09/01/252,3 | 300,000 | 291,750 | |||||||||
19,827,807 | |||||||||||
Hotels, restaurants & leisure—2.48% | |||||||||||
| Boyne USA, Inc. 7.250%, due 05/01/252,3 | 250,000 | 261,250 | |||||||||
| Carlson Travel, Inc. 3 mo. Euribor + 4.750%, 4.750%, due 06/15/234,7 | EUR | 550,000 | 632,209 | ||||||||
9.500%, due 12/15/242,3 | 200,000 | 183,750 | |||||||||
| CCM Merger, Inc. 6.000%, due 03/15/223 | 200,000 | 203,500 | |||||||||
| Churchill Downs, Inc. 4.750%, due 01/15/283 | 150,000 | 140,625 | |||||||||
| Constellation Merger Sub, Inc. 8.500%, due 09/15/253 | 275,000 | 259,875 | |||||||||
| CPUK Finance Ltd. 4.250%, due 08/28/223 | GBP | 350,000 | 457,874 | ||||||||
4.875%, due 08/28/254 | GBP | 200,000 | 261,409 | ||||||||
| Downstream Development Authority of the Quapaw Tribe of Oklahoma 10.500%, due 02/15/233 | 225,000 | 224,935 | |||||||||
| Eldorado Resorts, Inc. 6.000%, due 04/01/25 | 375,000 | 378,750 | |||||||||
7.000%, due 08/01/23 | 375,000 | 394,118 | |||||||||
| FelCor Lodging LP 6.000%, due 06/01/25 | 1,575,000 | 1,610,437 | |||||||||
| Gateway Casinos & Entertainment Ltd. 8.250%, due 03/01/243 | 225,000 | 238,500 | |||||||||
| GLP Capital LP/GLP Financing II, Inc. 5.250%, due 06/01/25 | 100,000 | 101,839 | |||||||||
5.375%, due 04/15/26 | 100,000 | 101,610 | |||||||||
| KFC Holding Co./Pizza Hut Holdings LLC/ Taco Bell of America LLC 5.000%, due 06/01/243 | 300,000 | 297,000 | |||||||||
| LTF Merger Sub, Inc. 8.500%, due 06/15/233 | 1,217,000 | 1,268,722 | |||||||||
| NCL Corp. Ltd. 4.750%, due 12/15/213 | 50,000 | 50,063 | |||||||||
| Silversea Cruise Finance Ltd. 7.250%, due 02/01/253 | 200,000 | 216,500 | |||||||||
| The Enterprise Development Authority 12.000%, due 07/15/243 | 200,000 | 194,000 | |||||||||
| Thomas Cook Group PLC 6.250%, due 06/15/223 | EUR | 350,000 | 433,317 | ||||||||
| Viking Cruises Ltd. 5.875%, due 09/15/273 | 50,000 | 49,125 | |||||||||
| VOC Escrow Ltd. 5.000%, due 02/15/283 | 50,000 | 47,875 | |||||||||
| Face amount1 | Value | ||||||||||
Corporate bonds—(continued) | |||||||||||
Hotels, restaurants & leisure—(concluded) | |||||||||||
| Wynn Las Vegas LLC/ Wynn Las Vegas Capital Corp. 5.250%, due 05/15/273 | 225,000 | $ | 211,525 | ||||||||
| Wynn Macau Ltd. 4.875%, due 10/01/243 | 200,000 | 190,750 | |||||||||
5.500%, due 10/01/272,3 | 400,000 | 383,080 | |||||||||
8,792,638 | |||||||||||
Insurance—1.14% | |||||||||||
| Acrisure LLC/Acrisure Finance, Inc. 7.000%, due 11/15/253 | 375,000 | 339,375 | |||||||||
| Ardonagh Midco 3 PLC 8.375%, due 07/15/233 | GBP | 525,000 | 696,324 | ||||||||
8.625%, due 07/15/233 | 400,000 | 410,000 | |||||||||
| AssuredPartners, Inc. 7.000%, due 08/15/253 | 250,000 | 241,250 | |||||||||
| Fidelity & Guaranty Life Holdings, Inc. 5.500%, due 05/01/253 | 275,000 | 266,406 | |||||||||
| FWD Ltd. (fixed, converts to FRN on 01/24/22), 6.250%, due 01/24/224,5 | 800,000 | 782,051 | |||||||||
| Genworth Financial, Inc. 7.625%, due 09/24/21 | 50,000 | 52,000 | |||||||||
| Genworth Holdings, Inc. 7.700%, due 06/15/202 | 50,000 | 51,750 | |||||||||
| HUB International Ltd. 7.000%, due 05/01/263 | 75,000 | 75,281 | |||||||||
| MGIC Investment Corp. 5.750%, due 08/15/23 | 275,000 | 283,511 | |||||||||
| USIS Merger Sub, Inc. 6.875%, due 05/01/253 | 350,000 | 345,625 | |||||||||
| Wand Merger Corp. 8.125%, due 07/15/233 | 300,000 | 311,715 | |||||||||
9.125%, due 07/15/263 | 175,000 | 183,750 | |||||||||
4,039,038 | |||||||||||
Lodging—0.33% | |||||||||||
| Caesars Resort Collection LLC/ CRC Finco, Inc. 5.250%, due 10/15/253 | 475,000 | 457,187 | |||||||||
| Jack Ohio Finance LLC/Jack Ohio Finance 1 Corp. 10.250%, due 11/15/223 | 250,000 | 270,938 | |||||||||
| NH Hotel Group SA 3.750%, due 10/01/234 | EUR | 350,000 | 428,521 | ||||||||
1,156,646 | |||||||||||
Machinery—0.42% | |||||||||||
| Orano SA 4.875%, due 09/23/24 | EUR | 750,000 | 933,141 | ||||||||
| Vertiv Group Corp. 9.250%, due 10/15/242,3 | 250,000 | 246,563 | |||||||||
| Welbilt, Inc. 9.500%, due 02/15/24 | 275,000 | 300,437 | |||||||||
1,480,141 | |||||||||||
143
PACE High Yield Investments
Portfolio of investments—July 31, 2018
| Face amount1 | Value | ||||||||||
Corporate bonds—(continued) | |||||||||||
Machinery-construction & mining—0.15% | |||||||||||
| BlueLine Rental Finance Corp./ BlueLine Rental LLC 9.250%, due 03/15/243 | 350,000 | $ | 369,687 | ||||||||
| BWX Technologies, Inc. 5.375%, due 07/15/263 | 100,000 | 101,500 | |||||||||
| Terex Corp. 5.625%, due 02/01/253 | 50,000 | 49,953 | |||||||||
521,140 | |||||||||||
Manufacturing-diversified—1.16% | |||||||||||
| Apergy Corp. 6.375%, due 05/01/263 | 75,000 | 76,500 | |||||||||
| Bombardier, Inc. 6.000%, due 10/15/223 | 675,000 | 679,219 | |||||||||
6.125%, due 01/15/233 | 350,000 | 354,812 | |||||||||
7.500%, due 12/01/243 | 375,000 | 398,906 | |||||||||
7.500%, due 03/15/252,3 | 125,000 | 131,250 | |||||||||
8.750%, due 12/01/213 | 275,000 | 303,531 | |||||||||
| Cloud Crane LLC 10.125%, due 08/01/243 | 350,000 | 378,000 | |||||||||
| CMF SpA 9.000%, due 06/15/224 | EUR | 200,000 | 208,144 | ||||||||
| FXI Holdings, Inc. 7.875%, due 11/01/243 | 150,000 | 146,250 | |||||||||
| Galapagos SA 5.375%, due 06/15/214 | EUR | 275,000 | 273,336 | ||||||||
| JPW Industries Holding Corp. 9.000%, due 10/01/243 | 150,000 | 152,813 | |||||||||
| Koppers, Inc. 6.000%, due 02/15/253 | 75,000 | 75,150 | |||||||||
| Mueller Water Products, Inc. 5.500%, due 06/15/263 | 75,000 | 75,469 | |||||||||
| Norican A/S 4.500%, due 05/15/234 | EUR | 350,000 | 376,756 | ||||||||
| SPX FLOW, Inc. 5.625%, due 08/15/243 | 175,000 | 173,687 | |||||||||
5.875%, due 08/15/262,3 | 175,000 | 175,000 | |||||||||
| Tennant Co. 5.625%, due 05/01/25 | 125,000 | 124,375 | |||||||||
4,103,198 | |||||||||||
Media—3.29% | |||||||||||
| AMC Entertainment Holdings, Inc. 5.750%, due 06/15/252 | 75,000 | 73,969 | |||||||||
5.875%, due 02/15/222 | 75,000 | 76,313 | |||||||||
6.125%, due 05/15/272 | 300,000 | 291,000 | |||||||||
6.375%, due 11/15/24 | GBP | 600,000 | 797,374 | ||||||||
| Carmike Cinemas, Inc. 6.000%, due 06/15/233 | 300,000 | 304,500 | |||||||||
| Cinemark USA, Inc. 5.125%, due 12/15/22 | 375,000 | 376,875 | |||||||||
| Clear Channel Worldwide Holdings, Inc. 6.500%, due 11/15/22 | 278,000 | 283,560 | |||||||||
7.625%, due 03/15/20 | 1,323,000 | 1,325,911 | |||||||||
7.625%, due 03/15/202 | 127,000 | 126,365 | |||||||||
| Face amount1 | Value | ||||||||||
Corporate bonds—(continued) | |||||||||||
Media—(concluded) | |||||||||||
| CSC Holdings LLC 8.625%, due 02/15/19 | 150,000 | $ | 153,937 | ||||||||
| DISH DBS Corp. 5.000%, due 03/15/232 | 475,000 | 410,875 | |||||||||
5.125%, due 05/01/20 | 200,000 | 198,500 | |||||||||
5.875%, due 11/15/24 | 25,000 | 20,844 | |||||||||
7.750%, due 07/01/262 | 550,000 | 480,562 | |||||||||
| Gray Television, Inc. 5.125%, due 10/15/242,3 | 225,000 | 216,000 | |||||||||
5.875%, due 07/15/262,3 | 525,000 | 513,187 | |||||||||
| iHeartCommunications, Inc. 12.000% Cash, 2.000% PIK, 14.000%, due 02/01/216,8,11 | 415,467 | 55,049 | |||||||||
| Meredith Corp. 6.875%, due 02/01/263 | 25,000 | 25,188 | |||||||||
| National CineMedia LLC 5.750%, due 08/15/26 | 75,000 | 69,563 | |||||||||
| Nexstar Broadcasting, Inc. 5.625%, due 08/01/243 | 500,000 | 492,500 | |||||||||
| Quebecor Media, Inc. 5.750%, due 01/15/23 | 450,000 | 462,375 | |||||||||
| Salem Media Group, Inc. 6.750%, due 06/01/243 | 75,000 | 67,875 | |||||||||
| Sinclair Television Group, Inc. 5.125%, due 02/15/272,3 | 150,000 | 139,125 | |||||||||
5.875%, due 03/15/263 | 225,000 | 221,766 | |||||||||
6.125%, due 10/01/22 | 142,000 | 144,485 | |||||||||
| Sirius XM Radio, Inc. 3.875%, due 08/01/222,3 | 350,000 | 339,937 | |||||||||
4.625%, due 05/15/233 | 25,000 | 24,625 | |||||||||
5.000%, due 08/01/273 | 25,000 | 23,750 | |||||||||
6.000%, due 07/15/243 | 50,000 | 51,688 | |||||||||
| TEGNA, Inc. 6.375%, due 10/15/23 | 125,000 | 129,063 | |||||||||
| Tele Columbus AG 3.875%, due 05/02/253 | EUR | 400,000 | 449,685 | ||||||||
| Telenet Finance Luxembourg Notes Sarl 3.500%, due 03/01/283 | EUR | 300,000 | 335,405 | ||||||||
3.500%, due 03/01/284 | EUR | 200,000 | 223,603 | ||||||||
5.500%, due 03/01/283 | 200,000 | 182,500 | |||||||||
| Telenet Finance VI Luxembourg SCA 4.875%, due 07/15/274 | EUR | 90,000 | 111,686 | ||||||||
| The EW Scripps Co. 5.125%, due 05/15/253 | 225,000 | 211,711 | |||||||||
| Townsquare Media, Inc. 6.500%, due 04/01/232,3 | 300,000 | 275,250 | |||||||||
| Univision Communications, Inc. 6.750%, due 09/15/222,3 | 226,000 | 230,802 | |||||||||
| Urban One, Inc. 9.250%, due 02/15/202,3 | 150,000 | 146,625 | |||||||||
| VTR Finance BV 6.875%, due 01/15/244 | 400,000 | 413,460 | |||||||||
| Ziggo Bond Finance BV 4.625%, due 01/15/254 | EUR | 600,000 | 697,225 | ||||||||
6.000%, due 01/15/273 | 500,000 | 457,500 | |||||||||
11,632,213 | |||||||||||
144
PACE High Yield Investments
Portfolio of investments—July 31, 2018
| Face amount1 | Value | ||||||||||
Corporate bonds—(continued) | |||||||||||
Metals—0.73% | |||||||||||
| Cia Brasileira de Aluminio 4.750%, due 06/17/244 | 1,100,000 | $ | 1,064,250 | ||||||||
| Coeur Mining, Inc. 5.875%, due 06/01/24 | 150,000 | 144,000 | |||||||||
| Constellium NV 4.250%, due 02/15/263 | EUR | 125,000 | 145,835 | ||||||||
6.625%, due 03/01/252,3 | 500,000 | 509,845 | |||||||||
| Ferroglobe PLC/Globe Specialty Metals, Inc. 9.375%, due 03/01/222,3 | 150,000 | 154,313 | |||||||||
| Vedanta Resources PLC 6.375%, due 07/30/223 | 300,000 | 294,750 | |||||||||
8.250%, due 06/07/213 | 250,000 | 262,862 | |||||||||
2,575,855 | |||||||||||
Metals & mining—2.86% | |||||||||||
| AK Steel Corp. 7.625%, due 10/01/21 | 175,000 | 178,062 | |||||||||
| Alcoa Nederland Holding BV 6.125%, due 05/15/282,3 | 200,000 | 206,000 | |||||||||
7.000%, due 09/30/263 | 600,000 | 648,000 | |||||||||
| Aleris International, Inc. 10.750%, due 07/15/232,3 | 125,000 | 132,969 | |||||||||
| Anglo American Capital PLC 4.125%, due 09/27/223 | 400,000 | 400,221 | |||||||||
| ArcelorMittal 6.125%, due 06/01/25 | 100,000 | 108,320 | |||||||||
6.750%, due 03/01/419 | 75,000 | 83,344 | |||||||||
| Baffinland Iron Mines Corp./ Baffinland Iron Mines LP 8.750%, due 07/15/263 | 175,000 | 175,219 | |||||||||
| Big River Steel LLC/BRS Finance Corp. 7.250%, due 09/01/253 | 175,000 | 182,000 | |||||||||
| Cleveland-Cliffs, Inc. 5.750%, due 03/01/252 | 350,000 | 339,500 | |||||||||
| First Quantum Minerals Ltd. 6.500%, due 03/01/243 | 1,000,000 | 973,750 | |||||||||
6.875%, due 03/01/262,3 | 200,000 | 195,250 | |||||||||
7.000%, due 02/15/213 | 75,000 | 75,750 | |||||||||
7.250%, due 04/01/233 | 200,000 | 201,250 | |||||||||
| Fortune Star BVI Ltd. 5.250%, due 03/23/224 | 300,000 | 283,751 | |||||||||
| Freeport-McMoRan, Inc. 3.100%, due 03/15/20 | 75,000 | 74,063 | |||||||||
5.400%, due 11/14/34 | 100,000 | 91,750 | |||||||||
5.450%, due 03/15/43 | 400,000 | 355,200 | |||||||||
| Grinding Media, Inc./Moly-Cop AltaSteel Ltd. 7.375%, due 12/15/233 | 175,000 | 182,437 | |||||||||
| GTL Trade Finance, Inc./Gerdau Holdings, Inc. 5.893%, due 04/29/244 | 400,000 | 413,500 | |||||||||
| Hecla Mining Co. 6.875%, due 05/01/21 | 275,000 | 276,719 | |||||||||
| Hudbay Minerals, Inc. 7.250%, due 01/15/232,3 | 125,000 | 128,594 | |||||||||
7.625%, due 01/15/252,3 | 100,000 | 103,375 | |||||||||
| IAMGOLD Corp. 7.000%, due 04/15/253 | 225,000 | 229,725 | |||||||||
| Face amount1 | Value | ||||||||||
Corporate bonds—(continued) | |||||||||||
Metals & mining—(concluded) | |||||||||||
| Kinross Gold Corp. 5.125%, due 09/01/212 | 175,000 | $ | 180,852 | ||||||||
| Metinvest BV 7.750%, due 04/23/233 | 600,000 | 580,458 | |||||||||
| Mountain Province Diamonds, Inc. 8.000%, due 12/15/223 | 100,000 | 101,500 | |||||||||
| Northwest Acquisitions ULC/ Dominion Finco, Inc. 7.125%, due 11/01/223 | 25,000 | 24,938 | |||||||||
| Novelis Corp. 5.875%, due 09/30/263 | 125,000 | 119,844 | |||||||||
6.250%, due 08/15/243 | 150,000 | 150,375 | |||||||||
| Park-Ohio Industries, Inc. 6.625%, due 04/15/272 | 100,000 | 101,000 | |||||||||
| Petra Diamonds US Treasury PLC 7.250%, due 05/01/223 | 200,000 | 191,000 | |||||||||
| Teck Resources Ltd. 3.750%, due 02/01/232 | 125,000 | 123,437 | |||||||||
4.500%, due 01/15/21 | 100,000 | 101,500 | |||||||||
4.750%, due 01/15/222 | 350,000 | 360,500 | |||||||||
5.200%, due 03/01/42 | 25,000 | 23,063 | |||||||||
6.000%, due 08/15/40 | 475,000 | 479,750 | |||||||||
6.125%, due 10/01/35 | 25,000 | 26,063 | |||||||||
6.250%, due 07/15/41 | 50,000 | 52,250 | |||||||||
| United States Steel Corp. 6.250%, due 03/15/262 | 175,000 | 175,000 | |||||||||
6.875%, due 08/15/25 | 250,000 | 255,617 | |||||||||
| Vale Overseas Ltd. 5.875%, due 06/10/21 | 250,000 | 264,250 | |||||||||
| Vallourec SA 2.250%, due 09/30/244 | EUR | 200,000 | 190,312 | ||||||||
6.375%, due 10/15/233 | EUR | 125,000 | 145,343 | ||||||||
6.625%, due 10/15/223 | EUR | 375,000 | 453,024 | ||||||||
10,138,825 | |||||||||||
Oil & gas—11.80% | |||||||||||
| Aker BP ASA 5.875%, due 03/31/253 | 150,000 | 153,750 | |||||||||
| Alta Mesa Holdings LP/ Alta Mesa Finance Services Corp. 7.875%, due 12/15/24 | 250,000 | 260,000 | |||||||||
| American Midstream Partners LP/ American Midstream Finance Corp. 9.250%, due 12/15/213,9 | 175,000 | 173,250 | |||||||||
| Antero Midstream Partners LP/ Antero Midstream Finance Corp. 5.375%, due 09/15/24 | 275,000 | 276,031 | |||||||||
| Ascent Resources Utica Holdings LLC/ ARU Finance Corp. 10.000%, due 04/01/223 | 450,000 | 497,250 | |||||||||
| Blue Racer Midstream LLC/ Blue Racer Finance Corp. 6.125%, due 11/15/223 | 325,000 | 329,160 | |||||||||
6.625%, due 07/15/263 | 75,000 | 75,563 | |||||||||
| Bristow Group, Inc. 8.750%, due 03/01/232,3 | 125,000 | 122,500 | |||||||||
145
PACE High Yield Investments
Portfolio of investments—July 31, 2018
| Face amount1 | Value | ||||||||||
Corporate bonds—(continued) | |||||||||||
Oil & gas—(continued) | |||||||||||
| Bruin E&P Partners LLC 8.875%, due 08/01/233 | 350,000 | $ | 352,933 | ||||||||
| Calfrac Holdings LP 8.500%, due 06/15/263 | 250,000 | 241,562 | |||||||||
| California Resources Corp. 8.000%, due 12/15/223 | 425,000 | 380,375 | |||||||||
| Callon Petroleum Co. 6.125%, due 10/01/24 | 475,000 | 482,125 | |||||||||
6.375%, due 07/01/263 | 200,000 | 201,750 | |||||||||
| Carrizo Oil & Gas, Inc. 6.250%, due 04/15/232 | 150,000 | 152,625 | |||||||||
7.500%, due 09/15/20 | 343,000 | 343,429 | |||||||||
| Chaparral Energy, Inc. 8.750%, due 07/15/233 | 200,000 | 200,750 | |||||||||
| Cheniere Corpus Christi Holdings LLC 5.875%, due 03/31/252 | 75,000 | 78,938 | |||||||||
7.000%, due 06/30/24 | 300,000 | 328,312 | |||||||||
| Cheniere Energy Partners LP 5.250%, due 10/01/25 | 150,000 | 149,250 | |||||||||
| Chesapeake Energy Corp. 5.500%, due 09/15/269 | 75,000 | 74,913 | |||||||||
6.625%, due 08/15/202 | 675,000 | 702,000 | |||||||||
6.875%, due 11/15/202 | 150,000 | 156,375 | |||||||||
8.000%, due 01/15/252 | 475,000 | 486,875 | |||||||||
| CNX Resources Corp. 5.875%, due 04/15/22 | 175,000 | 175,352 | |||||||||
| Crestwood Midstream Partners LP/ Crestwood Midstream Finance Corp. 5.750%, due 04/01/25 | 50,000 | 50,500 | |||||||||
6.250%, due 04/01/239 | 1,345,000 | 1,371,900 | |||||||||
| CrownRock LP/CrownRock Finance, Inc. 5.625%, due 10/15/253 | 350,000 | 337,750 | |||||||||
| DCP Midstream Operating LP 5.375%, due 07/15/252 | 100,000 | 102,125 | |||||||||
| Delek Logistics Partners LP/ Delek Logistics Finance Corp. 6.750%, due 05/15/252 | 200,000 | 200,000 | |||||||||
| Denbury Resources, Inc. 6.375%, due 08/15/21 | 325,000 | 305,500 | |||||||||
9.000%, due 05/15/213 | 485,000 | 515,919 | |||||||||
9.250%, due 03/31/222,3 | 140,000 | 148,400 | |||||||||
| Diamond Offshore Drilling, Inc. 7.875%, due 08/15/252 | 150,000 | 156,187 | |||||||||
| Diamondback Energy, Inc. 5.375%, due 05/31/253 | 100,000 | 99,500 | |||||||||
| Eclipse Resources Corp. 8.875%, due 07/15/23 | 75,000 | 71,813 | |||||||||
| Energy Transfer Equity LP 4.250%, due 03/15/23 | 175,000 | 170,187 | |||||||||
7.500%, due 10/15/20 | 825,000 | 880,687 | |||||||||
| Ensco PLC 5.750%, due 10/01/442 | 75,000 | 54,563 | |||||||||
7.750%, due 02/01/26 | 100,000 | 97,000 | |||||||||
| EP Energy LLC/ Everest Acquisition Finance, Inc. 6.375%, due 06/15/23 | 512,000 | 345,600 | |||||||||
| Face amount1 | Value | ||||||||||
Corporate bonds—(continued) | |||||||||||
Oil & gas—(continued) | |||||||||||
8.000%, due 02/15/253 | 25,000 | $ | 19,063 | ||||||||
9.375%, due 05/01/20 | 742,000 | 730,870 | |||||||||
9.375%, due 05/01/243 | 786,000 | 646,485 | |||||||||
| Exterran Energy Solutions LP/ EES Finance Corp. 8.125%, due 05/01/25 | 325,000 | 341,250 | |||||||||
| Extraction Oil & Gas, Inc. 5.625%, due 02/01/263 | 100,000 | 97,000 | |||||||||
7.375%, due 05/15/242,3 | 100,000 | 105,000 | |||||||||
| Ferrellgas LP/Ferrellgas Finance Corp. 6.500%, due 05/01/212 | 430,000 | 392,375 | |||||||||
6.750%, due 06/15/232,9 | 225,000 | 194,625 | |||||||||
| Ferrellgas Partners LP/ Ferrellgas Partners Finance Corp. 8.625%, due 06/15/20 | 100,000 | 96,875 | |||||||||
| FTS International, Inc. 6.250%, due 05/01/22 | 375,000 | 373,954 | |||||||||
| Gazprom OAO Via Gaz Capital SA 4.950%, due 07/19/224 | 400,000 | 405,080 | |||||||||
| Genesis Energy LP/ Genesis Energy Finance Corp. 6.250%, due 05/15/26 | 75,000 | 70,500 | |||||||||
6.500%, due 10/01/25 | 125,000 | 120,938 | |||||||||
| Global Marine, Inc. 7.000%, due 06/01/28 | 100,000 | 101,000 | |||||||||
| Gulfport Energy Corp. 6.000%, due 10/15/242 | 100,000 | 96,500 | |||||||||
6.375%, due 05/15/25 | 150,000 | 146,250 | |||||||||
6.375%, due 01/15/26 | 150,000 | 145,125 | |||||||||
| Halcon Resources Corp. 6.750%, due 02/15/252 | 175,000 | 162,312 | |||||||||
| Hess Infrastructure Partners LP/ Hess Infrastructure Partners Finance Corp. 5.625%, due 02/15/263 | 225,000 | 226,125 | |||||||||
| HighPoint Operating Corp. 7.000%, due 10/15/22 | 125,000 | 125,469 | |||||||||
| Holly Energy Partners LP/ Holly Energy Finance Corp. 6.000%, due 08/01/243 | 175,000 | 179,163 | |||||||||
| Indigo Natural Resources LLC 6.875%, due 02/15/263 | 200,000 | 193,500 | |||||||||
| Jonah Energy LLC/ Jonah Energy Finance Corp. 7.250%, due 10/15/252,3 | 150,000 | 124,125 | |||||||||
| Jones Energy Holdings LLC/ Jones Energy Finance Corp. 9.250%, due 03/15/23 | 200,000 | 126,000 | |||||||||
9.250%, due 03/15/233 | 125,000 | 126,562 | |||||||||
| KazMunayGas National Co. JSC 4.400%, due 04/30/234 | 850,000 | 853,641 | |||||||||
4.750%, due 04/19/274 | 625,000 | 626,750 | |||||||||
| KCA Deutag UK Finance PLC 9.625%, due 04/01/233 | 200,000 | 200,750 | |||||||||
| Laredo Petroleum, Inc. 5.625%, due 01/15/22 | 275,000 | 274,656 | |||||||||
146
PACE High Yield Investments
Portfolio of investments—July 31, 2018
| Face amount1 | Value | ||||||||||
Corporate bonds—(continued) | |||||||||||
Oil & gas—(continued) | |||||||||||
| Magnolia Oil & Gas Operating LLC/ Magnolia Oil & Gas Finance Corp. 6.000%, due 08/01/263 | 275,000 | $ | 276,636 | ||||||||
| McDermott Technology Americas, Inc./ McDermott Technology US, Inc. 10.625%, due 05/01/243 | 175,000 | 181,562 | |||||||||
| MEG Energy Corp. 6.375%, due 01/30/233 | 750,000 | 676,875 | |||||||||
7.000%, due 03/31/243 | 250,000 | 225,625 | |||||||||
| Moss Creek Resources Holdings, Inc. 7.500%, due 01/15/263 | 525,000 | 511,875 | |||||||||
| Murphy Oil Corp. 4.450%, due 12/01/222,9 | 1,050,000 | 1,037,809 | |||||||||
| Nabors Industries, Inc. 4.625%, due 09/15/212 | 75,000 | 73,688 | |||||||||
5.000%, due 09/15/202 | 225,000 | 226,125 | |||||||||
| Noble Holding International Ltd. 6.200%, due 08/01/40 | 50,000 | 36,750 | |||||||||
7.750%, due 01/15/242 | 750,000 | 727,500 | |||||||||
7.875%, due 02/01/262,3 | 175,000 | 179,812 | |||||||||
8.950%, due 04/01/459 | 25,000 | 23,000 | |||||||||
| Oasis Petroleum, Inc. 6.250%, due 05/01/262,3 | 125,000 | 125,625 | |||||||||
6.500%, due 11/01/21 | 375,000 | 381,562 | |||||||||
| Paramount Resources Ltd. 6.875%, due 06/30/233 | 275,000 | 284,625 | |||||||||
| Parker Drilling Co. 6.750%, due 07/15/222 | 125,000 | 101,875 | |||||||||
7.500%, due 08/01/202 | 75,000 | 67,313 | |||||||||
| Parkland Fuel Corp. 6.000%, due 04/01/263 | 75,000 | 73,969 | |||||||||
| Parsley Energy LLC/Parsley Finance Corp. 5.625%, due 10/15/273 | 100,000 | 99,250 | |||||||||
6.250%, due 06/01/243 | 175,000 | 182,000 | |||||||||
| PDC Energy, Inc. 6.125%, due 09/15/24 | 225,000 | 225,844 | |||||||||
| Petrobras Global Finance BV 4.375%, due 05/20/23 | 1,225,000 | 1,180,287 | |||||||||
5.299%, due 01/27/254 | 600,000 | 574,500 | |||||||||
5.999%, due 01/27/284 | 300,000 | 283,800 | |||||||||
6.125%, due 01/17/22 | 720,000 | 746,424 | |||||||||
6.250%, due 12/14/26 | GBP | 100,000 | 135,834 | ||||||||
7.250%, due 03/17/44 | 370,000 | 363,525 | |||||||||
7.375%, due 01/17/27 | 685,000 | 711,715 | |||||||||
| Precision Drilling Corp. 5.250%, due 11/15/24 | 75,000 | 71,625 | |||||||||
6.500%, due 12/15/21 | 67,906 | 69,094 | |||||||||
7.125%, due 01/15/262,3 | 200,000 | 205,250 | |||||||||
7.750%, due 12/15/232 | 75,000 | 79,313 | |||||||||
| QEP Resources, Inc. 5.625%, due 03/01/262 | 125,000 | 120,313 | |||||||||
| Range Resources Corp. 5.000%, due 08/15/22 | 75,000 | 73,500 | |||||||||
5.000%, due 03/15/232 | 125,000 | 119,844 | |||||||||
5.750%, due 06/01/21 | 275,000 | 281,187 | |||||||||
5.875%, due 07/01/22 | 500,000 | 502,500 | |||||||||
| Face amount1 | Value | ||||||||||
Corporate bonds—(continued) | |||||||||||
Oil & gas—(continued) | |||||||||||
| Resolute Energy Corp. 8.500%, due 05/01/20 | 475,000 | $ | 475,891 | ||||||||
| Rowan Cos., Inc. 7.375%, due 06/15/252 | 325,000 | 313,219 | |||||||||
| Sanchez Energy Corp. 6.125%, due 01/15/232 | 825,000 | 568,219 | |||||||||
7.750%, due 06/15/212 | 575,000 | 497,375 | |||||||||
| Sandridge Energy, Inc. 7.500%, due 03/15/218,10,11,13,15 | 1,425,000 | 0 | |||||||||
| SESI LLC 7.125%, due 12/15/21 | 125,000 | 126,875 | |||||||||
7.750%, due 09/15/24 | 275,000 | 283,937 | |||||||||
| Seven Generations Energy Ltd. 5.375%, due 09/30/253 | 200,000 | 192,000 | |||||||||
| Shelf Drilling Holdings Ltd. 8.250%, due 02/15/253 | 175,000 | 177,625 | |||||||||
| SM Energy Co. 5.625%, due 06/01/252 | 175,000 | 170,625 | |||||||||
6.125%, due 11/15/222 | 425,000 | 435,625 | |||||||||
6.500%, due 01/01/232 | 200,000 | 203,000 | |||||||||
6.750%, due 09/15/262 | 275,000 | 279,812 | |||||||||
| Southwestern Energy Co. 4.100%, due 03/15/222 | 475,000 | 451,250 | |||||||||
6.200%, due 01/23/252,9 | 25,000 | 24,656 | |||||||||
7.500%, due 04/01/262 | 25,000 | 25,938 | |||||||||
| State Oil Co. of the Azerbaijan Republic 4.750%, due 03/13/234 | 800,000 | 796,000 | |||||||||
| Summit Midstream Holdings LLC/ Summit Midstream Finance Corp. 5.500%, due 08/15/22 | 675,000 | 668,250 | |||||||||
5.750%, due 04/15/25 | 175,000 | 168,875 | |||||||||
| Summit Midstream Partners LP (fixed, converts to FRN on 12/15/22), 9.500%, due 12/15/225 | 350,000 | 348,250 | |||||||||
| Sunoco LP/Sunoco Finance Corp. 4.875%, due 01/15/232,3 | 300,000 | 294,816 | |||||||||
5.500%, due 02/15/263 | 50,000 | 47,563 | |||||||||
| Tallgrass Energy Partners LP/ Tallgrass Energy Finance Corp. 5.500%, due 09/15/243 | 75,000 | 76,875 | |||||||||
| Targa Resources Partners LP/ Targa Resources Partners Finance Corp. 5.125%, due 02/01/25 | 50,000 | 50,125 | |||||||||
6.750%, due 03/15/242 | 50,000 | 52,750 | |||||||||
| Transocean Guardian Ltd. 5.875%, due 01/15/243 | 50,000 | 50,563 | |||||||||
| Transocean Pontus Ltd. 6.125%, due 08/01/253 | 75,000 | 76,407 | |||||||||
| Transocean, Inc. 5.800%, due 10/15/222,9 | 175,000 | 172,594 | |||||||||
7.500%, due 01/15/263 | 350,000 | 357,875 | |||||||||
9.000%, due 07/15/233 | 375,000 | 405,000 | |||||||||
9.350%, due 12/15/419 | 450,000 | 448,875 | |||||||||
| Trinidad Drilling Ltd. 6.625%, due 02/15/253 | 200,000 | 194,000 | |||||||||
147
PACE High Yield Investments
Portfolio of investments—July 31, 2018
| Face amount1 | Value | ||||||||||
Corporate bonds—(continued) | |||||||||||
Oil & gas—(concluded) | |||||||||||
| Tullow Oil PLC 6.250%, due 04/15/223 | 400,000 | $ | 397,000 | ||||||||
7.000%, due 03/01/253 | 200,000 | 194,750 | |||||||||
| USA Compression Partners LP/ USA Compression Finance Corp. 6.875%, due 04/01/263 | 225,000 | 231,469 | |||||||||
| Vermilion Energy, Inc. 5.625%, due 03/15/253 | 225,000 | 222,050 | |||||||||
| Vine Oil & Gas LP/ Vine Oil & Gas Finance Corp. 8.750%, due 04/15/233 | 275,000 | 254,375 | |||||||||
| Weatherford International LLC 6.800%, due 06/15/372 | 75,000 | 59,438 | |||||||||
9.875%, due 03/01/252,3 | 125,000 | 126,250 | |||||||||
| Weatherford International Ltd. 5.125%, due 09/15/20 | 100,000 | 101,000 | |||||||||
7.750%, due 06/15/212 | 125,000 | 128,437 | |||||||||
8.250%, due 06/15/232 | 100,000 | 99,250 | |||||||||
9.875%, due 02/15/242 | 425,000 | 431,375 | |||||||||
| Whiting Petroleum Corp. 5.750%, due 03/15/212 | 550,000 | 561,000 | |||||||||
| WildHorse Resource Development Corp. 6.875%, due 02/01/253 | 125,000 | 126,562 | |||||||||
6.875%, due 02/01/25 | 350,000 | 354,375 | |||||||||
| WPX Energy, Inc. 5.750%, due 06/01/26 | 150,000 | 150,375 | |||||||||
6.000%, due 01/15/22 | 37,000 | 38,388 | |||||||||
41,753,632 | |||||||||||
Oil services—0.26% | |||||||||||
| Citgo Holding, Inc. 10.750%, due 02/15/202,3 | 250,000 | 266,013 | |||||||||
| CITGO Petroleum Corp. 6.250%, due 08/15/222,3 | 655,000 | 659,912 | |||||||||
925,925 | |||||||||||
Paper & forest products—0.37% | |||||||||||
| Appvion, Inc. 9.000%, due 06/01/203,8,11 | 650,000 | 9,750 | |||||||||
| Mercer International, Inc. 6.500%, due 02/01/24 | 175,000 | 178,938 | |||||||||
| Suzano Austria GmbH 7.000%, due 03/16/473 | 600,000 | 640,500 | |||||||||
7.000%, due 03/16/474 | 450,000 | 480,375 | |||||||||
1,309,563 | |||||||||||
Pipelines—1.09% | |||||||||||
| Andeavor Logistics LP/ Tesoro Logistics Finance Corp. 5.250%, due 01/15/25 | 50,000 | 51,684 | |||||||||
| CNX Midstream Partners LP/ CNX Midstream Finance Corp. 6.500%, due 03/15/263 | 125,000 | 122,500 | |||||||||
| Martin Midstream Partners LP/ Martin Midstream Finance Corp. 7.250%, due 02/15/21 | 450,000 | 443,250 | |||||||||
| Face amount1 | Value | ||||||||||
Corporate bonds—(continued) | |||||||||||
Pipelines—(concluded) | |||||||||||
| NGPL PipeCo LLC 4.375%, due 08/15/223 | 250,000 | $ | 250,625 | ||||||||
| PBF Logistics LP/PBF Logistics Finance Corp. 6.875%, due 05/15/23 | 400,000 | 407,000 | |||||||||
| Plains All American Pipeline LP (fixed, converts to FRN on 11/15/22), 6.125%, due 11/15/225 | 150,000 | 145,875 | |||||||||
| Rockies Express Pipeline LLC 6.875%, due 04/15/403 | 75,000 | 87,000 | |||||||||
| SemGroup Corp. 7.250%, due 03/15/26 | 200,000 | 199,500 | |||||||||
| SemGroup Corp./Rose Rock Finance Corp. 5.625%, due 07/15/22 | 475,000 | 467,875 | |||||||||
| Targa Resources Partners LP/ Targa Resources Partners Finance Corp. 5.875%, due 04/15/263 | 125,000 | 127,500 | |||||||||
| The Williams Cos., Inc. 3.700%, due 01/15/23 | 425,000 | 416,105 | |||||||||
4.550%, due 06/24/24 | 100,000 | 100,500 | |||||||||
7.875%, due 09/01/21 | 325,000 | 360,750 | |||||||||
| TransMontaigne Partners LP/ TLP Finance Corp. 6.125%, due 02/15/26 | 100,000 | 98,750 | |||||||||
| Transportadora de Gas del Sur SA 6.750%, due 05/02/253 | 600,000 | 563,820 | |||||||||
3,842,734 | |||||||||||
Real estate investment trusts—3.82% | |||||||||||
| ADLER Real Estate AG 1.500%, due 12/06/214 | EUR | 325,000 | 382,469 | ||||||||
| China Aoyuan Property Group Ltd. 5.375%, due 09/13/224 | 300,000 | 264,159 | |||||||||
6.350%, due 01/11/204 | 200,000 | 197,196 | |||||||||
6.525%, due 04/25/194 | 250,000 | 250,375 | |||||||||
| China Evergrande Group 7.500%, due 06/28/234 | 500,000 | 460,472 | |||||||||
8.750%, due 06/28/254 | 200,000 | 185,615 | |||||||||
9.500%, due 03/29/244 | 850,000 | 824,912 | |||||||||
| China SCE Property Holdings Ltd. 5.875%, due 03/10/224 | 200,000 | 181,561 | |||||||||
10.000%, due 07/02/204 | 600,000 | 626,386 | |||||||||
| CIFI Holdings Group Co. Ltd. 5.500%, due 01/23/224,8 | 900,000 | 832,752 | |||||||||
| Country Garden Holdings Co. Ltd. 4.750%, due 07/25/224 | 300,000 | 283,878 | |||||||||
| Crescent Communities LLC/ Crescent Ventures, Inc. 8.875%, due 10/15/213 | 319,000 | 337,885 | |||||||||
| Equinix, Inc. 5.750%, due 01/01/25 | 100,000 | 103,125 | |||||||||
| Fantasia Holdings Group Co. Ltd. 7.375%, due 10/04/214 | 400,000 | 333,006 | |||||||||
| Greystar Real Estate Partners LLC 5.750%, due 12/01/253 | 50,000 | 48,500 | |||||||||
| iStar, Inc. 4.625%, due 09/15/20 | 175,000 | 173,469 | |||||||||
5.250%, due 09/15/222 | 50,000 | 48,750 | |||||||||
148
PACE High Yield Investments
Portfolio of investments—July 31, 2018
| Face amount1 | Value | ||||||||||
Corporate bonds—(continued) | |||||||||||
Real estate investment trusts—(concluded) | |||||||||||
| Jababeka International BV 6.500%, due 10/05/234 | 400,000 | $ | 346,193 | ||||||||
| Kennedy-Wilson, Inc. 5.875%, due 04/01/24 | 525,000 | 511,875 | |||||||||
| Logan Property Holdings Co. Ltd. 5.750%, due 01/03/224 | 200,000 | 185,055 | |||||||||
| MPT Operating Partnership LP/ MPT Finance Corp. 6.375%, due 03/01/24 | 325,000 | 341,250 | |||||||||
| New Metro Global Ltd. 5.000%, due 08/08/224 | 500,000 | 445,181 | |||||||||
6.500%, due 04/23/214 | 300,000 | 292,576 | |||||||||
| Realogy Group LLC/Realogy Co-Issuer Corp. 4.500%, due 04/15/193 | 225,000 | 225,562 | |||||||||
4.875%, due 06/01/233 | 500,000 | 465,500 | |||||||||
| RKI Overseas Finance Ltd. 4.700%, due 09/06/214 | 300,000 | 276,075 | |||||||||
| SBA Communications Corp. 4.000%, due 10/01/22 | 325,000 | 314,541 | |||||||||
| Shimao Property Holdings Ltd. 8.375%, due 02/10/224 | 500,000 | 525,032 | |||||||||
| Starwood Property Trust, Inc. 4.750%, due 03/15/252,3 | 125,000 | 123,437 | |||||||||
| Summit Germany Ltd. 2.000%, due 01/31/253 | EUR | 450,000 | 495,489 | ||||||||
| Tesco Property Finance 3 PLC 5.744%, due 04/13/404 | GBP | 631,803 | 954,549 | ||||||||
| The GEO Group, Inc. 6.000%, due 04/15/26 | 200,000 | 195,000 | |||||||||
| Times China Holdings Ltd. 5.750%, due 04/26/224 | 200,000 | 177,564 | |||||||||
6.250%, due 01/23/204 | 600,000 | 594,796 | |||||||||
| Uniti Group LP/Uniti Fiber Holdings, Inc./ CSL Capital LLC 7.125%, due 12/15/242,3 | 250,000 | 227,500 | |||||||||
| Yanlord Land HK Co. Ltd. 5.875%, due 01/23/224 | 500,000 | 495,127 | |||||||||
| Yuzhou Properties Co. Ltd. 6.000%, due 01/25/224 | 650,000 | 601,431 | |||||||||
6.375%, due 03/06/214 | 200,000 | 194,111 | |||||||||
13,522,354 | |||||||||||
Retail—2.62% | |||||||||||
| 1011778 BC ULC/New Red Finance, Inc. 5.000%, due 10/15/253 | 150,000 | 143,812 | |||||||||
| Arcos Dorados Holdings, Inc. 5.875%, due 04/04/273 | 475,000 | 460,949 | |||||||||
6.625%, due 09/27/234 | 200,000 | 209,920 | |||||||||
| Asbury Automotive Group, Inc. 6.000%, due 12/15/24 | 100,000 | 99,500 | |||||||||
| Beacon Roofing Supply, Inc. 4.875%, due 11/01/253 | 125,000 | 116,444 | |||||||||
6.375%, due 10/01/23 | 250,000 | 258,750 | |||||||||
| Carrols Restaurant Group, Inc. 8.000%, due 05/01/22 | 25,000 | 26,094 | |||||||||
| Face amount1 | Value | ||||||||||
Corporate bonds—(continued) | |||||||||||
Retail—(concluded) | |||||||||||
| Cumberland Farms, Inc. 6.750%, due 05/01/253 | 75,000 | $ | 75,469 | ||||||||
| EVOCA SpA 7.000%, due 10/15/234 | EUR | 400,000 | 494,812 | ||||||||
| FirstCash, Inc. 5.375%, due 06/01/243 | 125,000 | 124,375 | |||||||||
| Golden Nugget, Inc. 6.750%, due 10/15/243 | 600,000 | 598,500 | |||||||||
8.750%, due 10/01/252,3 | 225,000 | 233,437 | |||||||||
| Group 1 Automotive, Inc. 5.250%, due 12/15/233 | 175,000 | 170,625 | |||||||||
| Grupo Unicomer Co. Ltd. 7.875%, due 04/01/244 | 850,000 | 906,312 | |||||||||
7.875%, due 04/01/243 | 250,000 | 266,562 | |||||||||
| H&E Equipment Services, Inc. 5.625%, due 09/01/25 | 300,000 | 296,250 | |||||||||
| IRB Holding Corp. 6.750%, due 02/15/263 | 275,000 | 261,250 | |||||||||
| JC Penney Corp., Inc. 6.375%, due 10/15/36 | 150,000 | 82,875 | |||||||||
8.625%, due 03/15/252,3 | 200,000 | 168,500 | |||||||||
| Lithia Motors, Inc. 5.250%, due 08/01/253 | 125,000 | 119,375 | |||||||||
| Matalan Finance PLC 6.750%, due 01/31/233 | GBP | 450,000 | 550,513 | ||||||||
9.500%, due 01/31/243 | GBP | 150,000 | 179,951 | ||||||||
| Nathan's Famous, Inc. 6.625%, due 11/01/253 | 125,000 | 125,625 | |||||||||
| Neiman Marcus Group Ltd. LLC 8.000%, due 10/15/213 | 75,000 | 47,250 | |||||||||
| 8.750% Cash or 9.500% PIK, 8.750%, due 10/15/213,6 | 125,000 | 79,063 | |||||||||
| Party City Holdings, Inc. 6.625%, due 08/01/263,12 | 75,000 | 75,188 | |||||||||
| Penske Automotive Group, Inc. 3.750%, due 08/15/20 | 125,000 | 123,437 | |||||||||
| Rite Aid Corp. 7.700%, due 02/15/27 | 75,000 | 64,969 | |||||||||
| rue21, Inc. 9.000%, due 10/15/213,8,11,13 | 250,000 | 313 | |||||||||
| Shop Direct Funding PLC 7.750%, due 11/15/223 | GBP | 425,000 | 490,887 | ||||||||
| Sonic Automotive, Inc. 6.125%, due 03/15/27 | 275,000 | 257,125 | |||||||||
| Suburban Propane Partners LP/ Suburban Energy Finance Corp. 5.500%, due 06/01/24 | 1,800,000 | 1,746,000 | |||||||||
| The Hillman Group, Inc. 6.375%, due 07/15/222,3 | 200,000 | 191,194 | |||||||||
| The Scotts Miracle-Gro Co. 6.000%, due 10/15/23 | 225,000 | 231,750 | |||||||||
9,277,076 | |||||||||||
149
PACE High Yield Investments
Portfolio of investments—July 31, 2018
| Face amount1 | Value | ||||||||||
Corporate bonds—(continued) | |||||||||||
Software—0.06% | |||||||||||
| MSCI, Inc. 4.750%, due 08/01/263 | 175,000 | $ | 172,812 | ||||||||
5.375%, due 05/15/272,3 | 25,000 | 25,188 | |||||||||
198,000 | |||||||||||
Software & services—0.03% | |||||||||||
| Ascend Learning LLC 6.875%, due 08/01/253 | 100,000 | 101,250 | |||||||||
Specialty retail—0.31% | |||||||||||
| CBR Fashion Finance BV 5.125%, due 10/01/223 | EUR | 275,000 | 285,791 | ||||||||
| L Brands, Inc. 5.250%, due 02/01/282 | 50,000 | 44,094 | |||||||||
6.750%, due 07/01/36 | 225,000 | 190,125 | |||||||||
| Takko Luxembourg 2 SCA 5.375%, due 11/15/233 | EUR | 150,000 | 160,569 | ||||||||
| 3 mo. Euribor + 5.375%, 5.375%, due 11/15/233,7 | EUR | 275,000 | 298,659 | ||||||||
| Takko Luxembourg 2 SCA MTN 5.375%, due 11/15/234 | EUR | 100,000 | 107,046 | ||||||||
1,086,284 | |||||||||||
Telecom-integrated/services—0.22% | |||||||||||
| Hughes Satellite Systems Corp. 6.625%, due 08/01/26 | 300,000 | 285,750 | |||||||||
| Intelsat Luxembourg SA 8.125%, due 06/01/23 | 590,000 | 505,925 | |||||||||
791,675 | |||||||||||
Telecommunication services—1.95% | |||||||||||
| Altice Financing SA 7.500%, due 05/15/263 | 200,000 | 194,720 | |||||||||
| Altice Finco SA 4.750%, due 01/15/284 | EUR | 750,000 | 761,508 | ||||||||
| Altice Luxembourg SA 6.250%, due 02/15/254 | EUR | 700,000 | 795,012 | ||||||||
7.750%, due 05/15/222,3 | 1,600,000 | 1,592,000 | |||||||||
| Block Communications, Inc. 6.875%, due 02/15/253 | 250,000 | 248,750 | |||||||||
| CommScope Technologies LLC 6.000%, due 06/15/253 | 725,000 | 746,750 | |||||||||
| Digicel Ltd. 6.000%, due 04/15/212,3 | 125,000 | 115,625 | |||||||||
6.750%, due 03/01/234 | 500,000 | 431,250 | |||||||||
| eircom Finance DAC 4.500%, due 05/31/224 | EUR | 425,000 | 507,560 | ||||||||
| Embarq Corp. 7.995%, due 06/01/36 | 375,000 | 352,500 | |||||||||
| Level 3 Parent LLC 5.750%, due 12/01/22 | 175,000 | 175,656 | |||||||||
| Matterhorn Telecom Holding SA 4.875%, due 05/01/234 | EUR | 550,000 | 650,539 | ||||||||
| Nokia of America Corp. Alcatel-Lucent USA Inc, 6.450%, due 03/15/29 | 100,000 | 102,500 | |||||||||
| Face amount1 | Value | ||||||||||
Corporate bonds—(continued) | |||||||||||
Telecommunication services—(concluded) | |||||||||||
| Qualitytech LP/QTS Finance Corp. 4.750%, due 11/15/253 | 125,000 | $ | 118,437 | ||||||||
| Xplornet Communications, Inc. 9.625% Cash or 10.625% PIK, 9.625%, due 06/01/223,6 | 110,938 | 113,157 | |||||||||
6,905,964 | |||||||||||
Telecommunications equipment—0.07% | |||||||||||
| CDW LLC/CDW Finance Corp. 5.000%, due 09/01/25 | 250,000 | 247,421 | |||||||||
Telephone-integrated—1.87% | |||||||||||
| Frontier Communications Corp. 8.500%, due 04/01/262,3 | 150,000 | 144,000 | |||||||||
10.500%, due 09/15/222 | 1,150,000 | 1,043,625 | |||||||||
11.000%, due 09/15/252 | 225,000 | 182,250 | |||||||||
| Level 3 Financing, Inc. 5.375%, due 08/15/22 | 125,000 | 125,313 | |||||||||
5.625%, due 02/01/23 | 250,000 | 251,875 | |||||||||
| Sprint Capital Corp. 8.750%, due 03/15/32 | 2,170,000 | 2,335,462 | |||||||||
| Telecom Italia Finance SA 7.750%, due 01/24/33 | EUR | 500,000 | 807,631 | ||||||||
| Virgin Media Finance PLC 5.750%, due 01/15/253 | 200,000 | 187,750 | |||||||||
6.000%, due 10/15/243 | 400,000 | 390,000 | |||||||||
6.375%, due 04/15/233 | 200,000 | 205,500 | |||||||||
| Virgin Media Receivables Financing Notes I DAC 5.500%, due 09/15/244 | GBP | 725,000 | 944,415 | ||||||||
6,617,821 | |||||||||||
Trading companies & distributors—0.28% | |||||||||||
| Eagle Intermediate Global Holding BV/ Ruyi US Finance LLC 5.375%, due 05/01/233 | EUR | 300,000 | 350,472 | ||||||||
| Golden Legacy Pte Ltd. 6.875%, due 03/27/243 | 250,000 | 228,877 | |||||||||
8.250%, due 06/07/214 | 400,000 | 403,085 | |||||||||
982,434 | |||||||||||
Transportation services—0.20% | |||||||||||
| XPO Logistics, Inc. 6.125%, due 09/01/233 | 225,000 | 231,188 | |||||||||
6.500%, due 06/15/222,3 | 469,000 | 481,897 | |||||||||
713,085 | |||||||||||
Wireless telecommunication services—2.88% | |||||||||||
| Avaya, Inc. 7.000%, due 04/01/193,8,10,11,13 | 500,000 | 0 | |||||||||
9.000%, due 04/01/193,8,10,11,13 | 225,000 | 0 | |||||||||
| CenturyLink, Inc. 5.625%, due 04/01/202 | 100,000 | 102,250 | |||||||||
5.800%, due 03/15/22 | 50,000 | 49,938 | |||||||||
6.750%, due 12/01/232 | 200,000 | 205,000 | |||||||||
7.600%, due 09/15/39 | 1,000,000 | 830,000 | |||||||||
150
PACE High Yield Investments
Portfolio of investments—July 31, 2018
| Face amount1 | Value | ||||||||||
Corporate bonds—(concluded) | |||||||||||
Wireless telecommunication services—(concluded) | |||||||||||
| Cogent Communications Group, Inc. 5.375%, due 03/01/223 | 150,000 | $ | 153,000 | ||||||||
| Digicel Group Ltd. 8.250%, due 09/30/203 | 1,550,000 | 1,127,625 | |||||||||
| eDreams ODIGEO SA 8.500%, due 08/01/214 | EUR | 160,230 | 194,901 | ||||||||
| Intelsat Jackson Holdings SA 7.250%, due 10/15/20 | 275,000 | 276,031 | |||||||||
9.750%, due 07/15/253 | 375,000 | 400,781 | |||||||||
| Match Group, Inc. 6.375%, due 06/01/24 | 425,000 | 449,438 | |||||||||
| Netflix, Inc. 3.625%, due 05/15/27 | EUR | 500,000 | 574,735 | ||||||||
4.875%, due 04/15/283 | 350,000 | 331,188 | |||||||||
5.375%, due 02/01/21 | 125,000 | 128,281 | |||||||||
5.500%, due 02/15/22 | 50,000 | 51,563 | |||||||||
5.875%, due 02/15/252 | 150,000 | 153,780 | |||||||||
5.875%, due 11/15/283 | 50,000 | 50,125 | |||||||||
| Nokia OYJ 3.375%, due 06/12/22 | 75,000 | 72,375 | |||||||||
| Radiate Holdco LLC/Radiate Finance, Inc. 6.625%, due 02/15/252,3 | 200,000 | 187,000 | |||||||||
| Sable Intrenational Finance Ltd. 6.875%, due 08/01/223 | 400,000 | 418,000 | |||||||||
| Sprint Communications, Inc. 9.250%, due 04/15/22 | 225,000 | 253,125 | |||||||||
| Sprint Corp. 7.875%, due 09/15/23 | 450,000 | 479,812 | |||||||||
| T-Mobile USA, Inc. 4.000%, due 04/15/222 | 175,000 | 173,031 | |||||||||
4.500%, due 02/01/262 | 175,000 | 164,500 | |||||||||
4.750%, due 02/01/28 | 125,000 | 115,900 | |||||||||
5.125%, due 04/15/25 | 25,000 | 25,110 | |||||||||
6.000%, due 03/01/23 | 225,000 | 231,750 | |||||||||
| United Group BV 4.875%, due 07/01/244 | EUR | 900,000 | 1,073,779 | ||||||||
| Windstream Services LLC/ Windstream Finance Corp. 6.375%, due 08/01/232,3 | 54,000 | 31,320 | |||||||||
7.750%, due 10/15/20 | 300,000 | 270,000 | |||||||||
7.750%, due 10/01/21 | 46,000 | 36,800 | |||||||||
8.625%, due 10/31/253 | 102,000 | 95,370 | |||||||||
| WTT Investment Ltd. 5.500%, due 11/21/224 | 500,000 | 481,502 | |||||||||
| Yell Bondco PLC 8.500%, due 05/02/233 | GBP | 250,000 | 321,575 | ||||||||
| Zayo Group LLC/Zayo Capital, Inc. 5.750%, due 01/15/273 | 500,000 | 495,000 | |||||||||
6.000%, due 04/01/23 | 175,000 | 178,938 | |||||||||
10,183,523 | |||||||||||
| Total corporate bonds (cost—$335,757,188) | 331,736,621 | ||||||||||
Non-US government obligations—0.59% | |||||||||||
| Argentine Republic Government International Bond 5.875%, due 01/11/28 | 150,000 | 125,702 | |||||||||
| Face amount1 | Value | ||||||||||
Non-US government obligations—(concluded) | |||||||||||
| Qatar Government International Bond 3.875%, due 04/23/234 | 300,000 | $ | 301,110 | ||||||||
| Russian Foreign Bond 4.875%, due 09/16/234 | 1,600,000 | 1,668,000 | |||||||||
| Total non-US government obligations (cost—$2,081,139) | 2,094,812 | ||||||||||
Loan assignments—2.67% | |||||||||||
Auto manufacturers—0.10% | |||||||||||
| Navistar International Corp. 2017 1st Lien Term Loan B, 1 mo. USD LIBOR + 3.500%, 5.600%, due 11/06/247 | 348,063 | 348,063 | |||||||||
Building & construction—0.02% | |||||||||||
| Ply Gem Industries, Inc. 2018 Term Loan, 3 mo. USD LIBOR + 3.750%, 6.087%, due 04/12/257 | 75,000 | 75,070 | |||||||||
Building materials—0.01% | |||||||||||
| Forterra Finance LLC 2017 Term Loan B, 1 mo. USD LIBOR + 3.000%, 5.077%, due 10/25/237 | 24,686 | 23,010 | |||||||||
Chemicals—0.09% | |||||||||||
| Consolidated Energy Finance SA Term Loan B, 1 mo. USD LIBOR + 2.500%, 4.597%, due 05/07/257 | 225,000 | 224,437 | |||||||||
| Venator Materials Corp. Term Loan B, 1 mo. USD LIBOR + 3.000%, 5.077%, due 08/08/247 | 99,250 | 98,878 | |||||||||
323,315 | |||||||||||
Commercial services—0.13% | |||||||||||
| National Intergovernmental Purchasing Alliance Co. 1st Lien Term Loan, 3 mo. USD LIBOR + 3.750%, 6.084%, due 05/23/257 | 100,000 | 99,625 | |||||||||
| Parexel International Corp. Term Loan B, 1 mo. USD LIBOR + 2.750%, 4.827%, due 09/27/247 | 148,875 | 148,354 | |||||||||
| PSAV Holdings LLC 2018 1st Lien Term Loan, 1 mo. USD LIBOR + 3.250%, 5.350%, due 03/01/257 | 24,938 | 24,735 | |||||||||
| USS Ultimate Holdings, Inc. 1st Lien Term Loan, 1 mo. USD LIBOR + 3.750%, 5.827%, due 08/25/247 | 173,875 | 174,962 | |||||||||
447,676 | |||||||||||
Computer software & services—0.13% | |||||||||||
| Everi Payments, Inc. Term Loan B, 1 mo. USD LIBOR + 3.000%, 5.077%, due 05/09/247 | 272,250 | 273,102 | |||||||||
151
PACE High Yield Investments
Portfolio of investments—July 31, 2018
| Face amount1 | Value | ||||||||||
Loan assignments—(continued) | |||||||||||
Computer software & services—(concluded) | |||||||||||
| Tempo Acquisition LLC Term Loan, | |||||||||||
| 1 mo. USD LIBOR + 3.000%, 5.077%, due 05/01/247 | 198,000 | $ | 198,107 | ||||||||
471,209 | |||||||||||
Containers & packaging—0.14% | |||||||||||
| Consolidated Container Co. LLC 2017 1st Lien Term Loan, 1 mo. USD LIBOR + 2.750%, 4.827%, due 05/22/247 | 148,877 | 148,908 | |||||||||
| Flex Acquisition Co., Inc. 1st Lien Term Loan, 3 mo. USD LIBOR + 3.000%, 5.337%, due 12/29/237 | 345,625 | 344,948 | |||||||||
493,856 | |||||||||||
Entertainment—0.18% | |||||||||||
| Caesars Entertainment Operating Co. Exit Term Loan, 1 mo. USD LIBOR + 2.000%, 4.077%, due 10/06/247 | 273,625 | 273,198 | |||||||||
| Delta 2 (LUX) S.a.r.l. 2018 USD Term Loan, 1 mo. USD LIBOR + 2.500%, 4.577%, due 02/01/247 | 21,971 | 21,829 | |||||||||
| Gateway Casinos & Entertainment Ltd. 2018 Term Loan B, 6 mo. USD LIBOR + 3.000%, 5.473%, due 12/01/237 | 200,000 | 200,562 | |||||||||
| Lions Gate Entertainment Corp. 2018 Term Loan B, 1 mo. USD LIBOR + 2.250%, 4.314%, due 03/24/257 | 124,688 | 124,999 | |||||||||
620,588 | |||||||||||
Financial services—0.09% | |||||||||||
| Air Methods Corp. 2017 Term Loan B, 3 mo. USD LIBOR + 3.500%, 5.834%, due 04/21/247 | 196,688 | 180,314 | |||||||||
| Seminole Tribe of Florida 2018 Term Loan B, 1 mo. USD LIBOR + 1.750%, 3.827%, due 07/08/247 | 48,628 | 48,795 | |||||||||
| Werner Co. 2017 Term Loan, 1 mo. USD LIBOR + 4.000%, 6.092%, due 07/24/247 | 74,438 | 72,762 | |||||||||
301,871 | |||||||||||
Food-wholesale—0.02% | |||||||||||
| Aramark Services, Inc. 2018 Term Loan B3, 3 mo. USD LIBOR + 1.750%, 4.084%, due 03/11/257 | 74,813 | 74,875 | |||||||||
| Face amount1 | Value | ||||||||||
Loan assignments—(continued) | |||||||||||
Gaming—0.02% | |||||||||||
| Scientific Games International, Inc. 2018 Term Loan B5, | |||||||||||
| 2 mo. USD LIBOR + 2.750%, 4.921%, due 08/14/247 | 74,438 | $ | 74,449 | ||||||||
Health care providers & services—0.02% | |||||||||||
| MPH Acquisition Holdings LLC 2016 Term Loan B, 0.000%, due 06/07/2314 | 75,000 | 74,981 | |||||||||
Healthcare-services—0.08% | |||||||||||
| Davis Vision, Inc. 1st Lien Term Loan B, 1 mo. USD LIBOR + 3.000%, 5.077%, due 12/02/247 | 149,250 | 148,616 | |||||||||
| Surgery Center Holdings, Inc. 2017 Term Loan B, 1 mo. USD LIBOR + 3.250%, 5.330%, due 09/02/247 | 124,063 | 124,036 | |||||||||
272,652 | |||||||||||
Hotels, restaurants & leisure—0.19% | |||||||||||
| LTF Merger Sub, Inc. 2017 Term Loan B, 3 mo. USD LIBOR + 2.750%, 5.057%, due 06/10/227 | 687,006 | 687,198 | |||||||||
Insurance—0.29% | |||||||||||
| Asurion LLC 2017 Term Loan B4, 1 mo. USD LIBOR + 3.000%, 5.077%, due 08/04/227 | 825,584 | 825,139 | |||||||||
| Genworth Financial, Inc. Term Loan, 1 mo. USD LIBOR + 4.500%, 6.578%, due 03/07/237 | 124,688 | 126,948 | |||||||||
| Hub International Ltd. 2018 Term Loan B, 0.000%, due 04/25/2514 | 75,000 | 74,925 | |||||||||
1,027,012 | |||||||||||
Lodging—0.08% | |||||||||||
| Golden Nugget, Inc. 2017 Incremental Term Loan, 1 mo. USD LIBOR + 2.750%, 4.827%, due 10/04/237 | 98,992 | 99,253 | |||||||||
| RHP Hotel Properties LP 2017 Term Loan B, 3 mo. USD LIBOR + 2.000%, 4.340%, due 05/11/247 | 172,064 | 171,892 | |||||||||
271,145 | |||||||||||
Machinery-construction & mining—0.02% | |||||||||||
| Terex Corp. 2018 Term Loan B, 3 mo. USD LIBOR + 2.000%, 4.334%, due 02/03/257 | 74,063 | 74,063 | |||||||||
152
PACE High Yield Investments
Portfolio of investments—July 31, 2018
| Face amount1 | Value | ||||||||||
Loan assignments—(continued) | |||||||||||
Machinery-diversified—0.01% | |||||||||||
| Engineered Machinery Holdings, Inc. USD 1st Lien Term Loan, 3 mo. USD LIBOR + 3.250%, 5.584%, due 07/19/247 | 49,750 | $ | 49,688 | ||||||||
Media—0.15% | |||||||||||
| Altice France SA 2018 Term Loan B13, 0.000%, due 07/13/2614 | 550,000 | 537,537 | |||||||||
Media-publishing—0.05% | |||||||||||
| Meredith Corp. Term Loan B, 1 mo. USD LIBOR + 3.000%, 5.077%, due 01/31/257 | 174,563 | 174,974 | |||||||||
Metals & mining—0.14% | |||||||||||
| Aleris International, Inc. 2018 Term Loan, 1 mo. USD LIBOR + 4.750%, 6.827%, due 02/08/237 | 175,000 | 176,458 | |||||||||
| Big River Steel LLC Term Loan B, 3 mo. USD LIBOR + 5.000%, 7.334%, due 08/23/237 | 74,251 | 75,365 | |||||||||
| Covia Holdings Corp. Term Loan, 3 mo. USD LIBOR + 3.750%, 6.050%, due 06/01/257 | 100,000 | 100,000 | |||||||||
| Neenah Foundry Co. 2017 Term Loan, 2 mo. USD LIBOR + 6.500%, 8.671%, due 12/13/227 | 146,250 | 144,787 | |||||||||
496,610 | |||||||||||
Oil & gas—0.39% | |||||||||||
| California Resources Corp. 2017 1st Lien Term Loan, 1 mo. USD LIBOR + 4.750%, 6.831%, due 12/31/227 | 675,000 | 685,685 | |||||||||
| Second Out Term Loan, 1 mo. USD LIBOR + 10.375%, 12.439%, due 12/31/217 | 75,000 | 82,688 | |||||||||
| Chesapeake Energy Corp. Term Loan, 1 mo. USD LIBOR + 7.500%, 9.577%, due 08/23/217 | 250,000 | 261,125 | |||||||||
| Keane Group Holdings LLC 2018 1st Lien Term Loan, 1 mo. USD LIBOR + 3.750%, 5.822%, due 05/25/257 | 75,000 | 74,250 | |||||||||
| McDermott Technology Americas, Inc. 2018 1st Lien Term Loan, 1 mo. USD LIBOR + 5.000%, 7.077%, due 05/10/257 | 199,500 | 200,597 | |||||||||
| Peabody Energy Corp. 2018 Term Loan, | |||||||||||
| Face amount1 | Value | ||||||||||
Loan assignments—(concluded) | |||||||||||
Oil & gas—(concluded) | |||||||||||
| 1 mo. USD LIBOR + 2.750%, 4.827%, due 03/31/257 | 81,954 | $ | 81,954 | ||||||||
1,386,299 | |||||||||||
Packaging & containers—0.04% | |||||||||||
| Berry Plastics Group, Inc. Term Loan R, 1 mo. USD LIBOR + 2.000%, 4.086%, due 01/19/247 | 123,438 | 123,540 | |||||||||
Pipelines—0.08% | |||||||||||
| BCP Renaissance Parent LLC 2017 Term Loan B, 3 mo. USD LIBOR + 3.500%, 5.842%, due 10/31/247 | 275,000 | 276,031 | |||||||||
Retail—0.06% | |||||||||||
| IRB Holding Corp. 1st Lien Term Loan, 2 mo. USD LIBOR + 3.250%, 5.347%, due 02/05/257 | 49,875 | 50,166 | |||||||||
| LSF9 Cypress Holdings LLC 2018 Term Loan B, 0.000%, due 05/10/2514 | 175,000 | 174,673 | |||||||||
224,839 | |||||||||||
Retail-restaurants—0.06% | |||||||||||
| 1011778 B.C. Unlimited Liability Co. Term Loan B3, 1 mo. USD LIBOR + 2.250%, 4.327%, due 02/16/247 | 148,121 | 147,967 | |||||||||
| Tacala LLC 1st Lien Term Loan, 1 mo. USD LIBOR + 3.250%, 5.327%, due 01/31/257 | 74,813 | 74,925 | |||||||||
222,892 | |||||||||||
Wireless telecommunication services—0.08% | |||||||||||
| Radiate Holdco LLC 1st Lien Term Loan, 1 mo. USD LIBOR + 3.000%, 5.077%, due 02/01/247 | 296,250 | 293,400 | |||||||||
| Total loan assignments (cost—$9,400,638) | 9,446,843 | ||||||||||
| Number of shares | |||||||||||
Common stocks—0.44% | |||||||||||
Energy-exploration & production—0.10% | |||||||||||
Chaparral Energy, Inc.* | 16,834 | 307,220 | |||||||||
Chaparral Energy, Inc.*,8,10 | 3,605 | 65,359 | |||||||||
372,579 | |||||||||||
Metals & mining—0.01% | |||||||||||
Aleris International*,8,13 | 795 | 19,080 | |||||||||
Oil, gas & consumable fuels—0.25% | |||||||||||
Bonanza Creek Energy, Inc.* | 11,869 | 441,527 | |||||||||
153
PACE High Yield Investments
Portfolio of investments—July 31, 2018
| Number of shares | Value | ||||||||||
Common stocks—(concluded) | |||||||||||
Oil, gas & consumable fuels—(concluded) | |||||||||||
Denbury Resources, Inc.* | 28,906 | $ | 130,366 | ||||||||
Halcon Resources Corp.*,2 | 52,786 | 206,393 | |||||||||
Linn Energy, Inc.*,8 | 2,353 | 97,885 | |||||||||
Midstates Petroleum Co., Inc.*,13 | 404 | 5,296 | |||||||||
SandRidge Energy, Inc.* | 1,102 | 17,985 | |||||||||
899,452 | |||||||||||
Software—0.08% | |||||||||||
Avaya Holdings Corp.*,2 | 13,087 | 269,331 | |||||||||
| Total common stocks (cost—$1,788,438) | 1,560,442 | ||||||||||
Preferred stock—0.08% | |||||||||||
Transportation infrastructure—0.08% | |||||||||||
| Seaspan Corp. 6.375%, due 04/30/19 (cost—$284,308) | 11,327 | 285,893 | |||||||||
| Number of warrants | |||||||||||
Warrants—0.00%† | |||||||||||
Oil & Gas—0.00%† | |||||||||||
| SandRidge Energy, Inc. strike price $41.34, expires 10/04/22* | 2,784 | 779 | |||||||||
| SandRidge Energy, Inc. strike price $42.03, expires 10/04/22*,8 | 1,172 | 293 | |||||||||
1,072 | |||||||||||
| Number of shares | Value | ||||||||||
Warrants—(concluded) | |||||||||||
Oil, gas & consumable fuels—0.00%† | |||||||||||
| Midstates Petroleum Co., Inc. strike price $24.00, expires 04/21/20*,8 | 2,872 | $ | 1 | ||||||||
| Total warrants (cost—$0) | 1,073 | ||||||||||
Short-term investment—0.99% | |||||||||||
Investment companies—0.99% | |||||||||||
| State Street Institutional U.S. Government Money Market Fund (cost—$3,487,096) | 3,487,096 | 3,487,096 | |||||||||
Investment of cash collateral from securities loaned—10.71% | |||||||||||
Money market fund—10.71% | |||||||||||
| State Street Navigator Securities Lending Government Money Market Portfolio (cost—$37,901,428) | 37,901,428 | 37,901,428 | |||||||||
| Total investments (cost—$390,700,235)—109.20% | 386,514,208 | ||||||||||
Liabilities in excess of other assets—(9.20)% | (32,574,224 | ) | |||||||||
Net assets—100.00% | $ | 353,939,984 | |||||||||
For a listing of defined portfolio acronyms, counterparty acronyms and currency abbreviations that are used throughout the Portfolio of investments as well as the tables that follow, please refer to page 273.
Forward foreign currency contracts
Counterparty | Sell | Purchase | Settlement date | Unrealized appreciation (depreciation) | |||||||||||||||
SSC | USD | 151,000 | EUR | 128,897 | 08/01/18 | $ | (275 | ) | |||||||||||
SSC | USD | 91,035 | EUR | 77,870 | 08/01/18 | 22 | |||||||||||||
SSC | USD | 219,619 | EUR | 189,058 | 08/01/18 | 1,456 | |||||||||||||
SSC | USD | 123,000 | EUR | 105,174 | 08/01/18 | (15 | ) | ||||||||||||
SSC | USD | 242,170 | EUR | 206,298 | 09/04/18 | (362 | ) | ||||||||||||
SSC | EUR | 565,528 | GBP | 500,000 | 08/01/18 | (5,025 | ) | ||||||||||||
SSC | EUR | 55,876,282 | USD | 65,010,155 | 08/01/18 | (328,772 | ) | ||||||||||||
SSC | EUR | 62,617 | USD | 72,616 | 08/01/18 | (605 | ) | ||||||||||||
SSC | EUR | 56,268,256 | USD | 65,745,969 | 09/04/18 | (207,739 | ) | ||||||||||||
SSC | GBP | 8,192,047 | USD | 10,794,522 | 08/01/18 | 42,054 | |||||||||||||
SSC | GBP | 9,224 | USD | 12,078 | 08/01/18 | (29 | ) | ||||||||||||
SSC | GBP | 7,720,316 | USD | 10,136,049 | 09/04/18 | (10,759 | ) | ||||||||||||
$ | (510,049 | ) | |||||||||||||||||
154
PACE High Yield Investments
Portfolio of investments—July 31, 2018
Fair valuation summary
The following is a summary of the fair valuations according to the inputs used as of July 31, 2018 in valuing the Portfolio's investments. In the event a Portfolio holds investments for which fair value is measured using the NAV per share practical expedient (or its equivalent), a separate column will be added to the fair value hierarchy table; this is intended to permit reconciliation to the amounts presented in the Portfolio of investments.
| Assets Description | Unadjusted quoted prices in active markets for identical investments (Level 1) | Other significant observable inputs (Level 2) | Unobservable inputs (Level 3) | Total | |||||||||||||||
Corporate bonds | $ | — | $ | 331,732,433 | $ | 4,188 | $ | 331,736,621 | |||||||||||
Non-US government obligations | — | 2,094,812 | — | 2,094,812 | |||||||||||||||
Loan assignments | — | 9,446,843 | — | 9,446,843 | |||||||||||||||
Common stocks | 1,476,003 | 65,359 | 19,080 | 1,560,442 | |||||||||||||||
Preferred stock | 285,893 | — | — | 285,893 | |||||||||||||||
Warrants | 1,072 | 1 | — | 1,073 | |||||||||||||||
Short-term investment | — | 3,487,096 | — | 3,487,096 | |||||||||||||||
Investment of cash collateral from securities loaned | — | 37,901,428 | — | 37,901,428 | |||||||||||||||
Forward foreign currency contracts | — | 43,532 | — | 43,532 | |||||||||||||||
Total | $ | 1,762,968 | $ | 384,771,504 | $ | 23,268 | $ | 386,557,740 | |||||||||||
Liabilities | |||||||||||||||||||
Forward foreign currency contracts | $ | — | $ | (553,581 | ) | $ | — | $ | (553,581 | ) | |||||||||
At July 31, 2018, there were transfers between Level 1 and Level 2.
Level 3 rollforward disclosure
The following is a rollforward of the Portfolio's investments that was valued using unobservable inputs for the year ended July 31, 2018:
| Corporate bonds | Common stocks | Loan assignments | Total | ||||||||||||||||
Beginning balance | $ | — | $ | 20,670 | $ | 147,931 | $ | 168,601 | |||||||||||
Purchases | — | — | — | — | |||||||||||||||
Sales | — | — | (149,334 | ) | (149,334 | ) | |||||||||||||
Accrued discounts/(premiums) | — | — | 9 | 9 | |||||||||||||||
Total realized gain/(loss) | — | — | (47,801 | ) | (47,801 | ) | |||||||||||||
Net change in unrealized appreciation/depreciation | 3,875 | (1,590 | ) | 49,195 | 51,480 | ||||||||||||||
Transfers into Level 3 | 313 | — | — | 313 | �� | ||||||||||||||
Transfers out of Level 3 | — | — | — | — | |||||||||||||||
Ending balance | $ | 4,188 | $ | 19,080 | $ | — | $ | 23,268 | |||||||||||
The change in net unrealized appreciation/depreciation relating to the Level 3 investments held at July 31, 2018, was $(227,938).
Portfolio footnotes
† Amount represents less than 0.005%.
* Non-income producing security.
1 In US dollars unless otherwise indicated.
2 Security, or portion thereof, was on loan at the period end.
3 Security exempt from registration pursuant to Rule 144A under the Securities Act of 1933. These securities are considered liquid, unless noted otherwise, and may be resold in transactions exempt from registration, normally to qualified institutional buyers. Securities exempt from registration pursuant to Rule 144A, in the amount of $142,263,047, represented 40.19% of the Portfolio's net assets at period end.
155
PACE High Yield Investments
Portfolio of investments—July 31, 2018
Portfolio footnotes—(concluded)
4 Security was purchased pursuant to Regulation S under the Securities Act of 1933, which exempts from registration securities offered and sold outside of the United States. Such a security cannot be sold in the United States without either an effective registration statement filed pursuant to the Securities Act of 1933, or pursuant to an exemption from registration.
5 Perpetual investment. Date shown reflects the next call date.
6 Payment-in-kind security for which interest may be paid in cash or additional principal, at the discretion of the issuer.
7 Variable or floating rate security. The interest rate shown is the current rate at the period end and changes periodically.
8 Illiquid investment at period end. Illiquid assets, in the amount of $1,165,308, represented 0.33% of the Portfolio's net assets at period end.
9 Step bond—coupon rate increases in increments to maturity. The rate disclosed is the rate at the period end; the maturity date disclosed is the ultimate maturity date.
10 Security is being fair valued by a valuation committee under the direction of the board of trustees.
11 Bond interest in default.
12 Security purchased on a when-issued basis. When-issued refers to a transaction made conditionally because a security, although authorized, has not yet been issued.
13 Significant unobservable inputs were used in the valuation of this security; i.e. a Level 3 security.
14 Position is unsettled. Contract rate was not determined at July 31, 2018 and does not take effect until settlement.
15 These securities are considered illiquid and restricted. At period end, the value of these securities was $0, representing 0.00% of the Portfolio's net assets. The table below provides further information:
Illiquid & restricted security | Acquisition date | Acquisition cost | Acquisition cost as a percentage of net asset | Value at 7/31/18 | Value as a percentage of net assets | ||||||||||||||||||
Peabody Energy Corp., 10.000%, due 03/15/22 | 04/03/17 | $ | 0 | 0.00 | % | $ | 0 | 0.00 | % | ||||||||||||||
| Midstates Petroleum Co., Inc./Midstates Petroleum Co. LLC, 10.750%, due 10/01/20 | 11/10/16 | 0 | 0.00 | 0 | 0.00 | ||||||||||||||||||
Sandridge Energy, Inc., 7.500%, due 03/15/21 | 10/04/16 | 0 | 0.00 | 0 | 0.00 | ||||||||||||||||||
See accompanying notes to financial statements.
156
PACE Large Co Value Equity Investments
Performance (unaudited)
For the 12 months ended July 31, 2018, the Portfolio's Class P shares returned 9.06% before the deduction of the maximum PACE Select program fee.1 In comparison, the Russell 1000 Value Index (the "benchmark") gained 9.54%, and the Lipper Large-Cap Value Funds category posted a median return of 10.15%. (Returns for all share classes over various time periods are shown in the "Performance at a glance" table on page 159. Please note that the returns shown do not reflect the deduction of taxes that a shareholder would pay on Portfolio distributions or the redemption of Portfolio shares.) For a detailed commentary on the market environment in general during the reporting period, please refer to page 3.
Advisor's comments (unaudited)2
The Portfolio underperformed its benchmark during the reporting period. Stock selection overall was negative, particularly within the financials, health care and consumer discretionary sectors, offsetting positive stock selection within consumer staples and energy. Allocation across sectors was additive to performance overall. The highest returning sectors in the benchmark were energy and information technology, with both sectors returning over 22% during the fiscal year. Underweights to more defensive sectors, including consumer staples, telecommunication services and utilities, aided relative returns, as did an overweight to information technology. From a style perspective, overweights to momentum and beta were positives while an overweight to earnings yield was modestly negative. (Beta is a measure of volatility or risk relative to the market as a whole.)
Derivatives were not used during the reporting period.
1 Class P shares held through the PACE Select Advisors Program are subject to a maximum Program fee of 2.50%, which, if included, would have reduced performance. Class P shares held through other advisory programs also may be subject to a program fee, which, if included, would have reduced performance.
2 All Sub-Advisors discuss performance on a gross of fees basis—meaning that no fees or expenses are reflected in their sleeves'/sleeve's performance. Alternately, Portfolio performance is shown net of fees, which does factor in fees and expenses associated with the Portfolio.
PACE Select Advisors Trust – PACE Large Co Value Equity Investments
Investment Manager:
UBS Asset Management (Americas) Inc. ("UBS AM")
Investment Subadvisors:
Pzena Investment Management, LLC ("Pzena");
Boston Partners Global Investors, Inc. ("Boston Partners");
Los Angeles Capital Management and Equity Research, Inc. ("Los Angeles Capital");
River Road Asset Management, LLC ("River Road")
Portfolio Management Team:
UBS AM: Mabel Lung, CFA and Fred Lee, CFA, assisted by Vincent Russo and Mayoor Joshi
Pzena: Richard S. Pzena, John J. Flynn and Benjamin Silver;
Boston Partners: Martin P. MacDonnell, CFA and Mark Donovan, CFA;
Los Angeles Capital: Thomas D. Stevens, CFA, Hal W. Reynolds, CFA and Daniel E. Allen, CFA;
River Road: Henry W. Sanders III, Thomas S. Forsha, James C. Shircliff, Andrew R. McIntosh
Objective:
Capital appreciation and dividend income
Investment process:
The main strategies of the subadvisors include:
• A "deep value" strategy which follows a disciplined investment process.
(continued on next page)
157
PACE Large Co Value Equity Investments
Investment process
(concluded)
• A "long/short" or "130/30" equity strategy in which the subadvisor invests in companies with attractive valuations, business fundamentals and business momentum implemented using a blend of quantitative and fundamental analysis.
• A "long/short" or "130/30" equity strategy in which the subadvisor employs a dynamic, quantitative factor based approach to investing.
• A "dividend all cap value" strategy in which the subadvisor invests in a diversified, all-capitalization portfolio of income-producing equity securities.
Special considerations
The Portfolio may be appropriate for long-term investors seeking capital appreciation and dividend income and who are able to withstand short-term fluctuations in the equity markets in return for potentially higher returns over the long term. The value of the Portfolio changes every day and can be affected by changes in interest rates, general market conditions and other political, social and economic developments, as well as specific matters relating to the companies in whose securities the Portfolio invests. It is important to note that an investment in the Portfolio is only one component of a balanced investment plan.
158
PACE Large Co Value Equity Investments
Performance at a glance (unaudited)
Average annual total returns for periods ended 07/31/18 | 1 year | 5 years | 10 years | ||||||||||||
Before deducting maximum sales charge | |||||||||||||||
Class A1 | 8.83 | % | 9.50 | % | 8.56 | % | |||||||||
Class C2 | 8.00 | 8.65 | 7.71 | ||||||||||||
Class Y3 | 9.08 | 9.77 | 8.85 | ||||||||||||
Class P4 | 9.06 | 9.76 | 8.83 | ||||||||||||
After deducting maximum sales charge | |||||||||||||||
Class A1 | 2.84 | 8.27 | 7.95 | ||||||||||||
Class C2 | 7.00 | 8.65 | 7.71 | ||||||||||||
Russell 1000 Value Index5 | 9.54 | 10.04 | 8.95 | ||||||||||||
Lipper Multi-Cap Value Funds median | 10.15 | 9.40 | 8.42 | ||||||||||||
Most recent calendar quarter-end returns (unaudited)
Average annual total returns for periods ended 06/30/18 | 1 year | 5 years | 10 years | ||||||||||||
Before deducting maximum sales charge | |||||||||||||||
Class A1 | 6.23 | % | 9.84 | % | 8.11 | % | |||||||||
Class C2 | 5.43 | 8.99 | 7.26 | ||||||||||||
Class Y3 | 6.48 | 10.11 | 8.40 | ||||||||||||
Class P4 | 6.50 | 10.10 | 8.38 | ||||||||||||
After deducting maximum sales charge | |||||||||||||||
Class A1 | 0.39 | 8.60 | 7.50 | ||||||||||||
Class C2 | 4.46 | 8.99 | 7.26 | ||||||||||||
The annualized gross and net expense ratios, respectively, for each class of shares as in the November 28, 2017 prospectuses, supplemented from time to time, were as follows: Class A—1.46% and 1.46%; Class C—2.25% and 2.23%; Class Y—1.21% and 1.21%; and Class P—1.24% and 1.23%. Net expenses reflect fee waivers and/or expense reimbursements, if any, pursuant to an agreement that is in effect to cap the expenses. The Portfolio and UBS Asset Management (Americas) Inc. ("UBS AM") have entered into a written fee waiver/expense reimbursement agreement pursuant to which UBS AM is contractually obligated to waive its management fees and/or reimburse expenses so that the Portfolio's ordinary total operating expenses of each class through November 30, 2018 (excluding dividend expense, borrowing costs, and interest expense relating to short sales, and expenses attributable to investment in other investment companies, interest, taxes, brokerage commissions and extraordinary expenses) would not exceed Class A—1.14%; Class C—1.89%; Class Y—0.89%; and Class P—0.89%. "Management fee waiver/expense reimbursements" are based on estimated amounts for the current fiscal year. The Portfolio has agreed to repay UBS AM for any waived fees/reimbursed expenses to the extent that it can do so over the following three fiscal years without causing the Portfolio's expenses in any of those three years to exceed these expense caps and that UBS AM has not waived the right to do so. The fee waiver/expense reimbursement agreement may be terminated by the Portfolio's board at any time and also will terminate automatically upon the expiration or termination of the Portfolio's advisory contract with UBS AM. Upon termination of the agreement, however, UBS AM's three year recoupment rights will survive.
1 Maximum sales charge for Class A shares is 5.5%. Class A shares bear ongoing 12b-1 service fees of 0.25% annually.
2 Maximum contingent deferred sales charge for Class C shares is 1% imposed on redemptions and is reduced to 0% after one year. Class C shares bear ongoing 12b-1 service and distribution fees of 0.25% and 0.75% annually, respectively. As of July 12, 2018, Class C shares ceased paying 12b-1 distribution fees. See notes to financial statements—Subsequent events for additional information.
3 The Portfolio offers Class Y shares to a limited group of eligible investors, including certain qualifying retirement plans. Class Y shares do not bear initial or contingent deferred sales charges or ongoing 12b-1 service and distribution fees.
4 Class P shares do not bear initial or contingent deferred sales charges or ongoing 12b-1 service and distribution fees, but Class P shares held through advisory programs may be subject to a program fee, which, if included, would have reduced performance.
5 The Russell 1000 Value Index measures the performance of the large-cap value segment of the US equity universe. It includes those Russell 1000 Index companies with lower price-to-book ratios and lower expected growth values. The Russell 1000 Value Index is constructed to provide a comprehensive and unbiased barometer for the large-cap value segment. The Index is completely reconstituted annually to ensure new and growing equities are included and that the represented companies continue to reflect value characteristics. Investors should note that indices do not reflect the deduction of fees and expenses.
Past performance does not predict future performance, and the performance information provided does not reflect the deduction of taxes that a shareholder would pay on Portfolio distributions or the redemption of Portfolio shares. The return and principal value of an investment will fluctuate, so that an investor's shares, when redeemed, may be worth more or less than their original cost. Performance results assume reinvestment of all dividends and capital gain distributions at net asset value on the ex-dividend dates. Current performance may be higher or lower than the performance data quoted. For month-end performance figures, please visit www.ubs.com/us-mutualfundperformance.
Lipper peer group data calculated by Lipper Inc.; used with permission. The Lipper median is the return of the fund that places in the middle of a Lipper peer group.
159
PACE Large Co Value Equity Investments
Illustration of an assumed investment of $10,000 in Class P shares of the Portfolio (unaudited)
The following graph depicts the performance of PACE Large Co Value Equity Investments Class P shares versus the Russell 1000 Value Index over the 10 years ended July 31, 2018. Class P shares held through advisory programs may be subject to a program fee, which, if included, would have reduced performance. The performance of the other classes will vary based upon the different class specific expenses and sales charges. The performance provided does not reflect the deduction of taxes that a shareholder would pay on Portfolio distributions or the redemption of Portfolio shares. Past performance is no guarantee of future results. Share price and returns will vary with market conditions; investors may realize a gain or loss upon redemption. It is important to note that PACE Large Co Value Equity Investments is a professionally managed portfolio while the Index is not available for investment and is unmanaged. The comparison is shown for illustration purposes only.
PACE Large Co Value Equity Investments
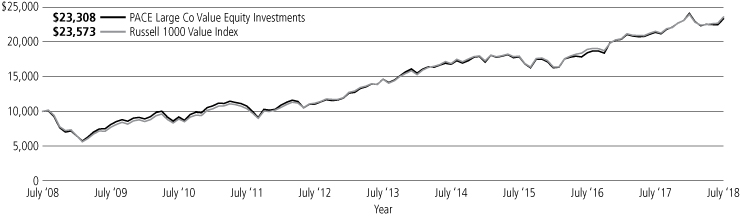
160
PACE Large Co Value Equity Investments
Portfolio statistics—July 31, 2018 (unaudited)
Top ten holdings (long holdings)1 | Percentage of net assets | ||||||
Wells Fargo & Co. | 2.5 | % | |||||
JPMorgan Chase & Co. | 2.4 | ||||||
Bank of America Corp. | 2.3 | ||||||
Cisco Systems, Inc. | 2.1 | ||||||
Citigroup, Inc. | 2.0 | ||||||
State Street Institutional U.S. Government Money Market Fund | 1.9 | ||||||
Berkshire Hathaway, Inc., Class B | 1.8 | ||||||
Chevron Corp. | 1.7 | ||||||
Marathon Petroleum Corp. | 1.7 | ||||||
Oracle Corp. | 1.6 | ||||||
Total | 20.0 | % | |||||
Top ten holdings (short holdings)1 | Percentage of net assets | ||||||
Flowserve Corp. | (0.3 | )% | |||||
Willis Towers Watson PLC | (0.2 | ) | |||||
Johnson Controls International PLC | (0.2 | ) | |||||
National Oilwell Varco, Inc. | (0.2 | ) | |||||
DXC Technology Co. | (0.2 | ) | |||||
Hormel Foods Corp. | (0.2 | ) | |||||
Ashland Global Holdings, Inc. | (0.2 | ) | |||||
Micron Technology, Inc. | (0.2 | ) | |||||
Owens Corning | (0.2 | ) | |||||
Molson Coors Brewing Co., Class B | (0.1 | ) | |||||
Total | (2.0 | )% | |||||
| Top five Issuer breakdown by country or territory of origin (long holdings)1 | Percentage of net assets | ||||||
United States | 104.0 | % | |||||
United Kingdom | 3.2 | ||||||
Bermuda | 1.9 | ||||||
Ireland | 1.5 | ||||||
Switzerland | 1.2 | ||||||
Total | 111.8 | % | |||||
Sectors (long holdings)1 | Percentage of net assets | ||||||
Financials | 32.8 | % | |||||
Energy | 13.6 | ||||||
Information Technology | 12.9 | ||||||
Industrials | 12.0 | ||||||
Consumer Discretionary | 11.8 | ||||||
Health Care | 11.3 | ||||||
Consumer Staples | 6.9 | ||||||
Materials | 5.1 | ||||||
Utilities | 3.3 | ||||||
Telecommunication Services | 1.7 | ||||||
Total | 111.4 | % | |||||
| Top five Issuer breakdown by country or territory of origin (short holdings)1 | Percentage of net assets | ||||||
United States | (11.7 | )% | |||||
Ireland | (0.4 | ) | |||||
Canada | (0.4 | ) | |||||
Netherlands | (0.2 | ) | |||||
United Kingdom | (0.1 | ) | |||||
Total | (12.8 | )% | |||||
Sectors (short holdings)1 | Percentage of net assets | ||||||
Financials | (3.5 | )% | |||||
Information Technology | (2.3 | ) | |||||
Consumer Discretionary | (1.9 | ) | |||||
Industrials | (1.4 | ) | |||||
Materials | (1.3 | ) | |||||
Energy | (1.2 | ) | |||||
Consumer Staples | (0.7 | ) | |||||
Utilities | (0.4 | ) | |||||
Health Care | (0.3 | ) | |||||
Total | (13.0 | )% | |||||
1 The Portfolio is actively managed and its composition will vary over time.
161
PACE Large Co Value Equity Investments
Portfolio of investments—July 31, 2018
| Number of shares | Value | ||||||||||
Common stocks—111.43% | |||||||||||
Aerospace & defense—1.72% | |||||||||||
Curtiss-Wright Corp. | 16,030 | $ | 2,132,471 | ||||||||
General Dynamics Corp. | 9,924 | 1,982,418 | |||||||||
Hexcel Corp. | 24,950 | 1,721,800 | |||||||||
Lockheed Martin Corp. | 1,910 | 622,851 | |||||||||
Raytheon Co. | 7,942 | 1,572,754 | |||||||||
The Boeing Co. | 17,763 | 6,328,957 | |||||||||
United Technologies Corp. | 61,934 | 8,406,921 | |||||||||
22,768,172 | |||||||||||
Air freight & logistics—0.78% | |||||||||||
Expeditors International of Washington, Inc. | 14,450 | 1,100,657 | |||||||||
United Parcel Service, Inc., Class B | 76,523 | 9,174,342 | |||||||||
10,274,999 | |||||||||||
Airlines—0.83% | |||||||||||
Copa Holdings SA, Class A | 6,110 | 594,747 | |||||||||
Delta Air Lines, Inc. | 114,848 | 6,250,028 | |||||||||
Southwest Airlines Co. | 70,955 | 4,126,743 | |||||||||
10,971,518 | |||||||||||
Auto components—0.10% | |||||||||||
BorgWarner, Inc. | 19,199 | 883,538 | |||||||||
Gentex Corp. | 21,340 | 495,088 | |||||||||
1,378,626 | |||||||||||
Automobiles—0.71% | |||||||||||
Ford Motor Co. | 931,422 | 9,351,477 | |||||||||
Banks—7.29% | |||||||||||
BB&T Corp. | 277,038 | 14,076,301 | |||||||||
Citizens Financial Group, Inc. | 35,289 | 1,403,796 | |||||||||
Commerce Bancshares, Inc.1 | 46,175 | 3,084,490 | |||||||||
East West Bancorp, Inc. | 40,612 | 2,629,221 | |||||||||
Fifth Third Bancorp | 104,129 | 3,081,177 | |||||||||
First Hawaiian, Inc. | 26,740 | 755,672 | |||||||||
KeyCorp2 | 178,759 | 3,730,700 | |||||||||
Lloyds Banking Group PLC, ADR2 | 724,376 | 2,404,928 | |||||||||
Popular, Inc. | 34,304 | 1,702,508 | |||||||||
Regions Financial Corp. | 261,989 | 4,875,615 | |||||||||
Synovus Financial Corp.1 | 65,580 | 3,240,964 | �� | ||||||||
The PNC Financial Services Group, Inc. | 39,955 | 5,786,683 | |||||||||
US Bancorp | 295,827 | 15,681,789 | |||||||||
Webster Financial Corp. | 5,330 | 343,945 | |||||||||
Wells Fargo & Co.1 | 570,373 | 32,676,669 | |||||||||
Western Alliance Bancorp* | 18,790 | 1,065,769 | |||||||||
96,540,227 | |||||||||||
Beverages—1.00% | |||||||||||
Coca-Cola European Partners PLC | 77,138 | 3,181,171 | |||||||||
PepsiCo, Inc. | 78,018 | 8,972,070 | |||||||||
The Coca-Cola Co. | 24,228 | 1,129,752 | |||||||||
13,282,993 | |||||||||||
Biotechnology—1.82% | |||||||||||
Alnylam Pharmaceuticals, Inc.* | 4,150 | 394,250 | |||||||||
Amgen, Inc. | 83,687 | 16,448,680 | |||||||||
Bluebird Bio, Inc.*,2 | 3,390 | 525,111 | |||||||||
Gilead Sciences, Inc. | 86,555 | 6,736,575 | |||||||||
24,104,616 | |||||||||||
| Number of shares | Value | ||||||||||
Common stocks—(continued) | |||||||||||
Building products—0.68% | |||||||||||
Johnson Controls International PLC2 | 171,989 | $ | 6,451,308 | ||||||||
Owens Corning2 | 41,828 | 2,602,538 | |||||||||
9,053,846 | |||||||||||
Capital markets—3.71% | |||||||||||
Affiliated Managers Group, Inc. | 5,060 | 809,651 | |||||||||
BlackRock, Inc. | 4,540 | 2,282,530 | |||||||||
Cboe Global Markets, Inc. | 13,080 | 1,270,460 | |||||||||
Franklin Resources, Inc. | 172,523 | 5,920,989 | |||||||||
Intercontinental Exchange, Inc. | 18,050 | 1,334,075 | |||||||||
KKR & Co., Inc., Class A | 131,731 | 3,606,795 | |||||||||
Morgan Stanley | 159,521 | 8,065,382 | |||||||||
State Street Corp. | 13,550 | 1,196,601 | |||||||||
TD Ameritrade Holding Corp.2 | 40,532 | 2,316,404 | |||||||||
The Bank of New York Mellon Corp. | 18,770 | 1,003,632 | |||||||||
The Goldman Sachs Group, Inc. | 63,479 | 15,071,819 | |||||||||
Thomson Reuters Corp.2 | 151,583 | 6,275,536 | |||||||||
49,153,874 | |||||||||||
Chemicals—2.94% | |||||||||||
Air Products & Chemicals, Inc. | 8,610 | 1,413,504 | |||||||||
Cabot Corp. | 25,490 | 1,684,889 | |||||||||
CF Industries Holdings, Inc. | 22,530 | 1,000,783 | |||||||||
Eastman Chemical Co. | 8,070 | 836,213 | |||||||||
FMC Corp. | 21,110 | 1,897,367 | |||||||||
LyondellBasell Industries N.V., Class A | 42,569 | 4,716,219 | |||||||||
Methanex Corp. | 34,366 | 2,374,691 | |||||||||
Nutrien Ltd.2 | 45,471 | 2,464,983 | |||||||||
Praxair, Inc. | 80,705 | 13,518,087 | |||||||||
RPM International, Inc. | 120,805 | 7,776,218 | |||||||||
W. R. Grace & Co. | 17,340 | 1,280,732 | |||||||||
38,963,686 | |||||||||||
Commercial services & supplies—1.07% | |||||||||||
KAR Auction Services, Inc. | 157,177 | 9,344,173 | |||||||||
Republic Services, Inc. | 14,520 | 1,052,409 | |||||||||
Stericycle, Inc.* | 28,450 | 1,987,517 | |||||||||
Waste Management, Inc. | 20,410 | 1,836,900 | |||||||||
14,220,999 | |||||||||||
Communications equipment—2.61% | |||||||||||
Cisco Systems, Inc.1 | 645,837 | 27,312,447 | |||||||||
Juniper Networks, Inc. | 72,539 | 1,910,677 | |||||||||
Motorola Solutions, Inc. | 44,094 | 5,348,602 | |||||||||
34,571,726 | |||||||||||
Construction materials—0.30% | |||||||||||
Cemex SAB de C.V., ADR*,2 | 246,371 | 1,835,464 | |||||||||
CRH PLC, ADR2 | 63,497 | 2,177,312 | |||||||||
4,012,776 | |||||||||||
Consumer finance—1.75% | |||||||||||
American Express Co. | 41,809 | 4,160,832 | |||||||||
Capital One Financial Corp. | 126,857 | 11,965,152 | |||||||||
Discover Financial Services | 81,540 | 5,822,771 | |||||||||
Synchrony Financial | 44,047 | 1,274,720 | |||||||||
23,223,475 | |||||||||||
162
PACE Large Co Value Equity Investments
Portfolio of investments—July 31, 2018
| Number of shares | Value | ||||||||||
Common stocks—(continued) | |||||||||||
Containers & packaging—0.80% | |||||||||||
AptarGroup, Inc.2 | 16,151 | $ | 1,654,347 | ||||||||
Bemis Co., Inc. | 38,070 | 1,747,794 | |||||||||
Berry Global Group, Inc.* | 12,285 | 600,122 | |||||||||
Graphic Packaging Holding Co. | 77,145 | 1,120,917 | |||||||||
Sonoco Products Co.2 | 35,007 | 1,954,091 | |||||||||
WestRock Co. | 60,234 | 3,492,367 | |||||||||
10,569,638 | |||||||||||
Diversified consumer services—0.08% | |||||||||||
H&R Block, Inc.2 | 40,300 | 1,013,948 | |||||||||
Diversified financial services—7.88% | |||||||||||
AXA Equitable Holdings, Inc.* | 247,863 | 5,450,507 | |||||||||
Bank of America Corp.1 | 967,312 | 29,870,594 | |||||||||
Citigroup, Inc.1 | 367,281 | 26,403,831 | |||||||||
CME Group, Inc. | 14,238 | 2,265,551 | |||||||||
Jefferies Financial Group, Inc. | 48,291 | 1,171,057 | |||||||||
JPMorgan Chase & Co.1 | 274,786 | 31,586,651 | |||||||||
Voya Financial, Inc. | 151,253 | 7,641,302 | |||||||||
104,389,493 | |||||||||||
Diversified telecommunication services—1.63% | |||||||||||
AT&T, Inc.1 | 136,867 | 4,375,638 | |||||||||
CenturyLink, Inc. | 104,140 | 1,954,708 | |||||||||
Verizon Communications, Inc. | 295,546 | 15,261,995 | |||||||||
21,592,341 | |||||||||||
Electric utilities—1.08% | |||||||||||
American Electric Power Co., Inc. | 11,917 | 847,775 | |||||||||
Edison International | 169,801 | 11,313,841 | |||||||||
The Southern Co.2 | 25,520 | 1,240,272 | |||||||||
Xcel Energy, Inc. | 18,665 | 874,642 | |||||||||
14,276,530 | |||||||||||
Electrical equipment—1.33% | |||||||||||
ABB Ltd., ADR | 70,229 | 1,616,671 | |||||||||
AMETEK, Inc. | 39,250 | 3,053,650 | |||||||||
Eaton Corp. PLC | 62,481 | 5,196,545 | |||||||||
Emerson Electric Co. | 107,157 | 7,745,308 | |||||||||
17,612,174 | |||||||||||
Electronic equipment, instruments & components—2.03% | |||||||||||
Arrow Electronics, Inc.* | 9,739 | 738,606 | |||||||||
Avnet, Inc.2 | 25,600 | 1,122,560 | |||||||||
Corning, Inc.2 | 409,583 | 13,589,964 | |||||||||
Dolby Laboratories, Inc., Class A | 14,480 | 933,236 | |||||||||
FLIR Systems, Inc. | 14,890 | 872,554 | |||||||||
Jabil, Inc. | 21,758 | 612,923 | |||||||||
National Instruments Corp. | 8,210 | 359,680 | |||||||||
TE Connectivity Ltd. | 81,576 | 7,633,066 | |||||||||
Trimble, Inc.* | 30,730 | 1,084,769 | |||||||||
26,947,358 | |||||||||||
Energy equipment & services—1.12% | |||||||||||
Apergy Corp.* | 43,001 | 1,763,041 | |||||||||
Halliburton Co. | 114,047 | 4,837,874 | |||||||||
Helmerich & Payne, Inc.2 | 17,774 | 1,090,435 | |||||||||
| Number of shares | Value | ||||||||||
Common stocks—(continued) | |||||||||||
Energy equipment & services—(concluded) | |||||||||||
National Oilwell Varco, Inc.2 | 118,825 | $ | 5,777,271 | ||||||||
Patterson-UTI Energy, Inc. | 25,450 | 437,740 | |||||||||
Schlumberger Ltd. | 13,280 | 896,666 | |||||||||
14,803,027 | |||||||||||
Equity real estate investment trusts—5.76% | |||||||||||
American Homes 4 Rent, Class A | 29,500 | 653,130 | |||||||||
Apple Hospitality REIT, Inc. | 89,930 | 1,617,841 | |||||||||
Brandywine Realty Trust | 67,080 | 1,106,149 | |||||||||
Brixmor Property Group, Inc. | 130,390 | 2,306,599 | |||||||||
Camden Property Trust | 7,790 | 721,276 | |||||||||
Duke Realty Corp. | 50,390 | 1,467,357 | |||||||||
Equity Residential | 67,152 | 4,393,755 | |||||||||
Forest City Realty Trust, Inc., Class A | 82,420 | 2,058,027 | |||||||||
Highwoods Properties, Inc. | 23,790 | 1,168,327 | |||||||||
Iron Mountain, Inc.2 | 357,654 | 12,557,232 | |||||||||
Park Hotels & Resorts, Inc. | 36,760 | 1,149,853 | |||||||||
Piedmont Office Realty Trust, Inc., Class A | 57,117 | 1,129,774 | |||||||||
Prologis, Inc. | 28,830 | 1,891,825 | |||||||||
Retail Value, Inc.* | 3,410 | 112,666 | |||||||||
Ryman Hospitality Properties, Inc. | 88,176 | 7,495,842 | |||||||||
Sabra Health Care REIT, Inc.2 | 315,426 | 6,816,356 | |||||||||
SL Green Realty Corp.2 | 43,034 | 4,437,236 | |||||||||
The GEO Group, Inc. | 265,034 | 6,859,080 | |||||||||
Ventas, Inc. | 161,968 | 9,131,756 | |||||||||
Weingarten Realty Investors | 42,306 | 1,278,487 | |||||||||
Weyerhaeuser Co. | 209,765 | 7,169,768 | |||||||||
WP Carey, Inc. | 11,450 | 748,601 | |||||||||
76,270,937 | |||||||||||
Food & staples retailing—2.06% | |||||||||||
Walgreens Boots Alliance, Inc. | 109,242 | 7,386,944 | |||||||||
Walmart, Inc.1 | 222,474 | 19,851,355 | |||||||||
27,238,299 | |||||||||||
Food products—0.88% | |||||||||||
Lamb Weston Holdings, Inc. | 22,780 | 1,600,751 | |||||||||
Mondelez International, Inc., Class A | 10,676 | 463,125 | |||||||||
Nomad Foods Ltd.* | 140,198 | 2,663,762 | |||||||||
The Kraft Heinz Co. | 115,445 | 6,955,561 | |||||||||
11,683,199 | |||||||||||
Gas utilities—0.94% | |||||||||||
AmeriGas Partners LP | 110,615 | 4,759,763 | |||||||||
National Fuel Gas Co.2 | 143,960 | 7,730,652 | |||||||||
12,490,415 | |||||||||||
Health care equipment & supplies—0.57% | |||||||||||
Baxter International, Inc. | 15,120 | 1,095,444 | |||||||||
Danaher Corp. | 20,630 | 2,116,225 | |||||||||
DENTSPLY SIRONA, Inc. | 18,780 | 903,506 | |||||||||
Medtronic PLC | 23,120 | 2,086,118 | |||||||||
The Cooper Cos., Inc. | 5,010 | 1,305,105 | |||||||||
7,506,398 | |||||||||||
163
PACE Large Co Value Equity Investments
Portfolio of investments—July 31, 2018
| Number of shares | Value | ||||||||||
Common stocks—(continued) | |||||||||||
Health care providers & services—4.08% | |||||||||||
Anthem, Inc.1 | 34,173 | $ | 8,645,769 | ||||||||
Cardinal Health, Inc. | 72,022 | 3,597,499 | |||||||||
Centene Corp.* | 15,470 | 2,016,205 | |||||||||
Cigna Corp. | 26,708 | 4,791,949 | |||||||||
CVS Health Corp. | 141,138 | 9,154,211 | |||||||||
DaVita, Inc.* | 7,150 | 502,502 | |||||||||
Express Scripts Holding Co.* | 89,448 | 7,107,538 | |||||||||
HCA Healthcare, Inc. | 12,450 | 1,546,664 | |||||||||
Laboratory Corp. of America Holdings* | 18,932 | 3,319,537 | |||||||||
McKesson Corp. | 89,405 | 11,229,268 | |||||||||
UnitedHealth Group, Inc. | 8,260 | 2,091,597 | |||||||||
54,002,739 | |||||||||||
Health care technology—0.04% | |||||||||||
Cerner Corp.* | 9,160 | 568,653 | |||||||||
Hotels, restaurants & leisure—2.10% | |||||||||||
Carnival Corp. | 9,530 | 564,557 | |||||||||
Cedar Fair LP | 53,990 | 3,084,989 | |||||||||
Extended Stay America, Inc. | 502,837 | 10,705,400 | |||||||||
International Game Technology PLC | 1,390 | 35,139 | |||||||||
Royal Caribbean Cruises Ltd. | 9,530 | 1,074,603 | |||||||||
Starbucks Corp. | 116,796 | 6,118,942 | |||||||||
Wyndham Destinations, Inc. | 50,863 | 2,345,801 | |||||||||
Wyndham Hotels & Resorts, Inc. | 44,346 | 2,572,068 | |||||||||
Yum China Holdings, Inc. | 36,860 | 1,329,909 | |||||||||
27,831,408 | |||||||||||
Household durables—0.45% | |||||||||||
Lennar Corp., Class A | 16,030 | 837,888 | |||||||||
Newell Brands, Inc.2 | 196,786 | 5,153,825 | |||||||||
5,991,713 | |||||||||||
Household products—1.06% | |||||||||||
Kimberly-Clark Corp. | 91,698 | 10,440,734 | |||||||||
The Procter & Gamble Co.1 | 45,249 | 3,659,739 | |||||||||
14,100,473 | |||||||||||
Independent power and renewable electricity producers—0.24% | |||||||||||
NRG Energy, Inc. | 22,818 | 722,646 | |||||||||
Vistra Energy Corp.* | 109,076 | 2,465,118 | |||||||||
3,187,764 | |||||||||||
Industrial conglomerates—0.70% | |||||||||||
General Electric Co. | 517,754 | 7,056,987 | |||||||||
Roper Technologies, Inc. | 7,420 | 2,240,098 | |||||||||
9,297,085 | |||||||||||
Insurance—7.05% | |||||||||||
American Financial Group, Inc. | 12,044 | 1,357,238 | |||||||||
American International Group, Inc.2 | 221,400 | 12,223,494 | |||||||||
Assured Guaranty Ltd. | 35,265 | 1,372,514 | |||||||||
Axis Capital Holdings Ltd. | 241,130 | 13,638,313 | |||||||||
Berkshire Hathaway, Inc., Class B*,1 | 119,908 | 23,726,196 | |||||||||
Brown & Brown, Inc. | 34,940 | 1,022,344 | |||||||||
Chubb Ltd. | 30,590 | 4,274,035 | |||||||||
CNA Financial Corp. | 74,940 | 3,505,693 | |||||||||
| Number of shares | Value | ||||||||||
Common stocks—(continued) | |||||||||||
Insurance—(concluded) | |||||||||||
Everest Re Group Ltd. | 10,881 | $ | 2,375,866 | ||||||||
First American Financial Corp. | 30,380 | 1,701,280 | |||||||||
Markel Corp.* | 2,220 | 2,597,400 | |||||||||
Mercury General Corp. | 10,546 | 542,381 | |||||||||
MetLife, Inc.2 | 244,437 | 11,180,548 | |||||||||
Old Republic International Corp. | 64,370 | 1,371,725 | |||||||||
ProAssurance Corp. | 25,109 | 1,037,002 | |||||||||
RenaissanceRe Holdings Ltd. | 15,430 | 2,034,445 | |||||||||
The Allstate Corp. | 63,389 | 6,029,562 | |||||||||
The Hanover Insurance Group, Inc. | 20,442 | 2,563,836 | |||||||||
Torchmark Corp. | 9,010 | 793,511 | |||||||||
93,347,383 | |||||||||||
Internet & catalog retail—0.26% | |||||||||||
Booking Holdings, Inc.* | 538 | 1,091,452 | |||||||||
Qurate Retail Inc.* | 111,801 | 2,380,243 | |||||||||
3,471,695 | |||||||||||
Internet software & services—0.76% | |||||||||||
Akamai Technologies, Inc.* | 14,130 | 1,063,424 | |||||||||
Alphabet, Inc., Class A* | 1,714 | 2,103,455 | |||||||||
eBay, Inc.* | 168,128 | 5,623,882 | |||||||||
LogMeIn, Inc. | 6,890 | 558,434 | |||||||||
Zillow Group, Inc., Class C*,2 | 12,770 | 711,289 | |||||||||
10,060,484 | |||||||||||
IT services—1.54% | |||||||||||
Alliance Data Systems Corp. | 2,997 | 673,965 | |||||||||
Cognizant Technology Solutions Corp., Class A | 98,299 | 8,011,368 | |||||||||
DXC Technology Co.2 | 77,466 | 6,564,469 | |||||||||
Fidelity National Information Services, Inc. | 16,720 | 1,724,334 | |||||||||
Teradata Corp.* | 12,260 | 469,435 | |||||||||
Worldpay, Inc., Class A* | 36,250 | 2,979,388 | |||||||||
20,422,959 | |||||||||||
Leisure products—0.33% | |||||||||||
Hasbro, Inc. | 6,858 | 683,125 | |||||||||
Polaris Industries, Inc.2 | 35,524 | 3,744,940 | |||||||||
4,428,065 | |||||||||||
Life sciences tools & services—0.30% | |||||||||||
Bio-Rad Laboratories, Inc., Class A* | 5,410 | 1,658,976 | |||||||||
QIAGEN NV* | 18,706 | 675,661 | |||||||||
Thermo Fisher Scientific, Inc. | 7,184 | 1,684,864 | |||||||||
4,019,501 | |||||||||||
Machinery—1.74% | |||||||||||
Crane Co. | 23,180 | 2,099,413 | |||||||||
Cummins, Inc. | 48,838 | 6,974,555 | |||||||||
Dover Corp. | 123,770 | 10,270,434 | |||||||||
Flowserve Corp. | 100 | 4,433 | |||||||||
Fortive Corp. | 12,910 | 1,059,653 | |||||||||
Gardner Denver Holdings, Inc.* | 28,210 | 807,088 | |||||||||
Ingersoll-Rand PLC | 10,080 | 992,981 | |||||||||
Terex Corp. | 17,550 | 774,306 | |||||||||
22,982,863 | |||||||||||
164
PACE Large Co Value Equity Investments
Portfolio of investments—July 31, 2018
| Number of shares | Value | ||||||||||
Common stocks—(continued) | |||||||||||
Media—5.37% | |||||||||||
Cinemark Holdings, Inc.2 | 238,244 | $ | 8,557,725 | ||||||||
Comcast Corp., Class A | 443,738 | 15,876,946 | |||||||||
Discovery, Inc., Class C* | 24,900 | 611,295 | |||||||||
GCI Liberty, Inc., Class A* | 14,540 | 699,519 | |||||||||
Liberty Broadband Corp., Class A* | 10,757 | 853,460 | |||||||||
Liberty Broadband Corp., Class C* | 32,120 | 2,552,576 | |||||||||
Liberty Media Corp.-Liberty Formula One, Class A*,2 | 9,820 | 329,068 | |||||||||
Liberty Media Corp.-Liberty Formula One, Class C* | 26,010 | 916,853 | |||||||||
Liberty Media Corp.-Liberty SiriusXM, Class A* | 33,330 | 1,571,176 | |||||||||
Liberty Media Corp.-Liberty SiriusXM, Class C* | 40,000 | 1,889,200 | |||||||||
Meredith Corp.2 | 87,912 | 4,672,523 | |||||||||
News Corp., Class A | 159,317 | 2,400,907 | |||||||||
Omnicom Group, Inc.2 | 209,268 | 14,403,916 | |||||||||
The Interpublic Group of Cos., Inc.2 | 583,168 | 13,150,438 | |||||||||
The Madison Square Garden Co., Class A* | 4,620 | 1,442,272 | |||||||||
The Walt Disney Co. | 10,610 | 1,204,872 | |||||||||
71,132,746 | |||||||||||
Metals & mining—0.55% | |||||||||||
Newmont Mining Corp. | 24,826 | 910,618 | |||||||||
Rio Tinto PLC, ADR | 33,735 | 1,872,293 | |||||||||
Steel Dynamics, Inc. | 95,994 | 4,520,357 | |||||||||
7,303,268 | |||||||||||
Mortgage real estate investment trusts—0.38% | |||||||||||
Annaly Capital Management, Inc. | 93,240 | 999,533 | |||||||||
MFA Financial, Inc. | 157,040 | 1,264,172 | |||||||||
New Residential Investment Corp. | 102,750 | 1,838,197 | |||||||||
Starwood Property Trust, Inc. | 42,850 | 978,694 | |||||||||
5,080,596 | |||||||||||
Multi-utilities—0.74% | |||||||||||
Ameren Corp. | 11,084 | 687,873 | |||||||||
Black Hills Corp.2 | 88,176 | 5,287,915 | |||||||||
CenterPoint Energy, Inc. | 31,228 | 889,374 | |||||||||
Dominion Energy, Inc. | 9,985 | 716,024 | |||||||||
MDU Resources Group, Inc. | 77,200 | 2,238,800 | |||||||||
9,819,986 | |||||||||||
Multiline retail—1.24% | |||||||||||
Dollar General Corp. | 7,400 | 726,310 | |||||||||
Macy's, Inc. | 12,720 | 505,366 | |||||||||
Nordstrom, Inc. | 15,869 | 831,964 | |||||||||
Target Corp. | 177,993 | 14,360,475 | |||||||||
16,424,115 | |||||||||||
Oil, gas & consumable fuels—12.73% | |||||||||||
Anadarko Petroleum Corp. | 16,430 | 1,201,854 | |||||||||
Andeavor1 | 64,275 | 9,645,106 | |||||||||
| BP PLC, ADR | 128,864 | 5,810,478 | |||||||||
Cabot Oil & Gas Corp. | 89,466 | 2,102,451 | |||||||||
Cenovus Energy, Inc.2 | 480,632 | 4,825,545 | |||||||||
Cheniere Energy, Inc.* | 21,380 | 1,357,630 | |||||||||
Chevron Corp.1 | 176,654 | 22,306,101 | |||||||||
Cimarex Energy Co. | 24,440 | 2,409,784 | |||||||||
Concho Resources, Inc.* | 11,440 | 1,668,524 | |||||||||
| Number of shares | Value | ||||||||||
Common stocks—(continued) | |||||||||||
Oil, gas & consumable fuels—(concluded) | |||||||||||
ConocoPhillips | 103,345 | $ | 7,458,409 | ||||||||
Continental Resources, Inc.*,2 | 14,800 | 945,276 | |||||||||
Devon Energy Corp. | 15,203 | 684,287 | |||||||||
Diamondback Energy, Inc.2 | 14,216 | 1,875,801 | |||||||||
Energen Corp.* | 29,632 | 2,198,102 | |||||||||
EOG Resources, Inc. | 19,280 | 2,485,963 | |||||||||
EQT Corp. | 66,095 | 3,283,600 | |||||||||
Exxon Mobil Corp.1 | 248,980 | 20,294,360 | |||||||||
Gulfport Energy Corp.* | 34,220 | 393,872 | |||||||||
Jagged Peak Energy, Inc.*,2 | 52,655 | 752,967 | |||||||||
Kinder Morgan, Inc. | 97,348 | 1,730,847 | |||||||||
Magellan Midstream Partners LP | 117,367 | 8,422,256 | |||||||||
Marathon Oil Corp. | 176,040 | 3,717,965 | |||||||||
Marathon Petroleum Corp. | 273,989 | 22,146,531 | |||||||||
Occidental Petroleum Corp. | 114,202 | 9,584,974 | |||||||||
Parsley Energy, Inc., Class A* | 21,351 | 671,062 | |||||||||
Peabody Energy Corp. | 24,782 | 1,052,987 | |||||||||
Phillips 66 | 10,314 | 1,272,129 | |||||||||
Pioneer Natural Resources Co. | 2,840 | 537,527 | |||||||||
Royal Dutch Shell PLC, Class A, ADR2 | 231,063 | 15,797,777 | |||||||||
Spectra Energy Partners LP | 173,473 | 6,413,297 | |||||||||
Targa Resources Corp. | 10,990 | 561,259 | |||||||||
The Williams Cos., Inc. | 21,424 | 637,364 | |||||||||
Valero Energy Corp. | 33,880 | 4,009,698 | |||||||||
World Fuel Services Corp. | 15,870 | 441,662 | |||||||||
168,697,445 | |||||||||||
Personal products—0.98% | |||||||||||
Coty, Inc., Class A2 | 267,251 | 3,583,836 | |||||||||
Nu Skin Enterprises, Inc., Class A | 15,044 | 1,095,955 | |||||||||
Unilever PLC, ADR2 | 144,653 | 8,246,668 | |||||||||
12,926,459 | |||||||||||
Pharmaceuticals—5.30% | |||||||||||
Abbott Laboratories | 21,504 | 1,409,372 | |||||||||
Allergan PLC | 7,120 | 1,310,721 | |||||||||
Bristol-Myers Squibb Co. | 20,870 | 1,226,113 | |||||||||
Johnson & Johnson1 | 153,585 | 20,353,084 | |||||||||
Merck & Co., Inc.1 | 287,336 | 18,926,822 | |||||||||
Mylan N.V.* | 234,824 | 8,761,283 | |||||||||
Novartis AG, ADR | 30,508 | 2,559,621 | |||||||||
Perrigo Co. PLC2 | 20,326 | 1,636,650 | |||||||||
Pfizer, Inc.1 | 351,566 | 14,038,030 | |||||||||
70,221,696 | |||||||||||
Professional services—0.52% | |||||||||||
Equifax, Inc. | 12,230 | 1,534,865 | |||||||||
Nielsen Holdings PLC | 173,147 | 4,079,344 | |||||||||
The Dun & Bradstreet Corp. | 10,480 | 1,319,327 | |||||||||
6,933,536 | |||||||||||
Real estate management & development—0.07% | |||||||||||
CBRE Group, Inc., Class A* | 19,049 | 948,640 | |||||||||
Road & rail—0.81% | |||||||||||
CSX Corp. | 10,890 | 769,705 | |||||||||
Kansas City Southern | 6,710 | 780,172 | |||||||||
Union Pacific Corp. | 61,220 | 9,176,266 | |||||||||
10,726,143 | |||||||||||
165
PACE Large Co Value Equity Investments
Portfolio of investments—July 31, 2018
| Number of shares | Value | ||||||||||
Common stocks—(concluded) | |||||||||||
Semiconductors & semiconductor equipment—1.80% | |||||||||||
Intel Corp.1 | 195,793 | $ | 9,417,643 | ||||||||
Marvell Technology Group Ltd. | 86,460 | 1,842,463 | |||||||||
QUALCOMM, Inc. | 196,196 | 12,574,202 | |||||||||
23,834,308 | |||||||||||
Software—2.44% | |||||||||||
Autodesk, Inc.* | 5,930 | 761,649 | |||||||||
CDK Global, Inc. | 15,998 | 999,262 | |||||||||
Dell Technologies, Inc., Class V* | 5,560 | 514,411 | |||||||||
Microsoft Corp. | 56,282 | 5,970,395 | |||||||||
Oracle Corp.1 | 439,391 | 20,950,163 | |||||||||
Symantec Corp. | 39,940 | 807,587 | |||||||||
Synopsys, Inc.* | 26,160 | 2,339,489 | |||||||||
32,342,956 | |||||||||||
Specialty retail—0.51% | |||||||||||
Best Buy Co., Inc. | 7,670 | 575,480 | |||||||||
Burlington Stores, Inc.* | 9,830 | 1,502,122 | |||||||||
Dick's Sporting Goods, Inc. | 11,840 | 404,218 | |||||||||
Lowe's Cos., Inc. | 23,923 | 2,376,511 | |||||||||
The Home Depot, Inc. | 6,818 | 1,346,691 | |||||||||
Tiffany & Co. | 4,400 | 605,264 | |||||||||
6,810,286 | |||||||||||
Technology hardware, storage & peripherals—1.73% | |||||||||||
Hewlett Packard Enterprise Co.2 | 538,514 | 8,314,656 | |||||||||
HP, Inc. | 363,576 | 8,391,334 | |||||||||
NetApp, Inc. | 65,276 | 5,060,196 | |||||||||
Western Digital Corp. | 15,434 | 1,082,695 | |||||||||
22,848,881 | |||||||||||
Textiles, apparel & luxury goods—0.19% | |||||||||||
Columbia Sportswear Co. | 6,970 | 606,251 | |||||||||
Ralph Lauren Corp. | 9,920 | 1,339,001 | |||||||||
Skechers U.S.A., Inc., Class A* | 20,460 | 567,151 | |||||||||
2,512,403 | |||||||||||
Tobacco—0.20% | |||||||||||
Philip Morris International, Inc. | 30,874 | 2,664,426 | |||||||||
Trading companies & distributors—1.65% | |||||||||||
Aircastle Ltd. | 174,922 | 3,626,133 | |||||||||
Fastenal Co.2 | 271,597 | 15,462,017 | |||||||||
HD Supply Holdings, Inc.* | 22,977 | 1,010,529 | |||||||||
MSC Industrial Direct Co., Inc., Class A | 13,060 | 1,105,268 | |||||||||
WESCO International, Inc.* | 9,770 | 595,970 | |||||||||
21,799,917 | |||||||||||
Water utilities—0.05% | |||||||||||
Aqua America, Inc. | 17,060 | 630,196 | |||||||||
Wireless telecommunication services—0.05% | |||||||||||
Telephone & Data Systems, Inc. | 28,440 | 718,110 | |||||||||
| Total common stocks (cost—$1,268,955,144) | 1,476,355,665 | ||||||||||
| Number of shares | Value | ||||||||||
Short-term investment—1.92% | |||||||||||
Investment companies—1.92% | |||||||||||
| State Street Institutional U.S. Government Money Market Fund (cost—$25,465,071) | 25,465,071 | $ | 25,465,071 | ||||||||
Investment of cash collateral from securities loaned—1.13% | |||||||||||
Money market fund—1.13% | |||||||||||
| State Street Navigator Securities Lending Government Money Market Portfolio (cost—$14,983,370) | 14,983,370 | 14,983,370 | |||||||||
| Total investments before investments sold short (cost—$1,309,403,585)—114.48% | 1,516,804,106 | ||||||||||
Investments sold short—(13.04)% | |||||||||||
Common stocks—(13.04)% | |||||||||||
Aerospace & defense—(0.09)% | |||||||||||
TransDigm Group, Inc. | (3,147 | ) | (1,181,824 | ) | |||||||
Airlines—(0.04)% | |||||||||||
Alaska Air Group, Inc. | (9,420 | ) | (591,859 | ) | |||||||
Auto components—(0.26)% | |||||||||||
Adient PLC | (10,860 | ) | (517,262 | ) | |||||||
Autoliv, Inc. | (9,154 | ) | (937,919 | ) | |||||||
The Goodyear Tire & Rubber Co. | (61,510 | ) | (1,489,157 | ) | |||||||
Veoneer, Inc. | (9,154 | ) | (478,754 | ) | |||||||
(3,423,092 | ) | ||||||||||
Automobiles—(0.13)% | |||||||||||
General Motors Co. | (16,940 | ) | (642,195 | ) | |||||||
Harley-Davidson, Inc. | (25,639 | ) | (1,099,657 | ) | |||||||
(1,741,852 | ) | ||||||||||
Banks—(1.21)% | |||||||||||
CIT Group, Inc. | (19,560 | ) | (1,035,311 | ) | |||||||
Community Bank System, Inc. | (21,629 | ) | (1,368,034 | ) | |||||||
Cullen/Frost Bankers, Inc. | (4,747 | ) | (524,496 | ) | |||||||
CVB Financial Corp. | (41,072 | ) | (982,442 | ) | |||||||
First Financial Bankshares, Inc. | (28,254 | ) | (1,599,177 | ) | |||||||
First Republic Bank | (13,048 | ) | (1,289,925 | ) | |||||||
FNB Corp. | (84,670 | ) | (1,086,316 | ) | |||||||
Glacier Bancorp, Inc. | (13,019 | ) | (555,911 | ) | |||||||
KeyCorp | (83,620 | ) | (1,745,149 | ) | |||||||
People's United Financial, Inc. | (41,119 | ) | (749,599 | ) | |||||||
Prosperity Bancshares, Inc. | (16,591 | ) | (1,163,859 | ) | |||||||
| SVB Financial Group | (3,880 | ) | (1,194,575 | ) | |||||||
Trustmark Corp. | (17,761 | ) | (625,010 | ) | |||||||
United Bankshares, Inc. | (22,695 | ) | (838,580 | ) | |||||||
Westamerica BanCorp. | (21,015 | ) | (1,261,320 | ) | |||||||
(16,019,704 | ) | ||||||||||
Beverages—(0.13)% | |||||||||||
Molson Coors Brewing Co., Class B | (26,270 | ) | (1,760,090 | ) | |||||||
Building products—(0.40)% | |||||||||||
AAON, Inc. | (28,752 | ) | (1,085,388 | ) | |||||||
Johnson Controls International PLC | (59,170 | ) | (2,219,466 | ) | |||||||
Owens Corning | (31,540 | ) | (1,962,419 | ) | |||||||
(5,267,273 | ) | ||||||||||
166
PACE Large Co Value Equity Investments
Portfolio of investments—July 31, 2018
| Number of shares | Value | ||||||||||
Investments sold short—(continued) | |||||||||||
Common stocks—(continued) | |||||||||||
Capital markets—(0.42)% | |||||||||||
Ameriprise Financial, Inc. | (5,320 | ) | $ | (774,964 | ) | ||||||
FactSet Research Systems, Inc. | (2,219 | ) | (446,818 | ) | |||||||
MarketAxess Holdings, Inc. | (8,197 | ) | (1,588,333 | ) | |||||||
TD Ameritrade Holding Corp. | (19,063 | ) | (1,089,451 | ) | |||||||
Thomson Reuters Corp. | (39,703 | ) | (1,643,704 | ) | |||||||
(5,543,270 | ) | ||||||||||
Chemicals—(0.75)% | |||||||||||
Ashland Global Holdings, Inc. | (25,700 | ) | (2,110,227 | ) | |||||||
Balchem Corp. | (14,981 | ) | (1,502,444 | ) | |||||||
Celanese Corp., Series A | (14,410 | ) | (1,701,965 | ) | |||||||
HB Fuller Co. | (22,153 | ) | (1,255,632 | ) | |||||||
NewMarket Corp. | (3,679 | ) | (1,506,330 | ) | |||||||
Quaker Chemical Corp. | (3,371 | ) | (598,487 | ) | |||||||
RPM International, Inc. | (18,610 | ) | (1,197,926 | ) | |||||||
(9,873,011 | ) | ||||||||||
Commercial services & supplies—(0.31)% | |||||||||||
Cimpress NV | (10,758 | ) | (1,571,421 | ) | |||||||
Ritchie Bros Auctioneers, Inc. | (40,733 | ) | (1,355,187 | ) | |||||||
Rollins, Inc. | (21,387 | ) | (1,175,002 | ) | |||||||
(4,101,610 | ) | ||||||||||
Communications equipment—(0.09)% | |||||||||||
ViaSat, Inc. | (16,419 | ) | (1,154,912 | ) | |||||||
Construction & engineering—(0.05)% | |||||||||||
Jacobs Engineering Group, Inc. | (10,584 | ) | (715,796 | ) | |||||||
Construction materials—(0.10)% | |||||||||||
Vulcan Materials Co. | (11,210 | ) | (1,255,520 | ) | |||||||
Consumer finance—(0.07)% | |||||||||||
Synchrony Financial | (32,930 | ) | (952,994 | ) | |||||||
Containers & packaging—(0.30)% | |||||||||||
AptarGroup, Inc. | (9,668 | ) | (990,293 | ) | |||||||
Ball Corp. | (39,930 | ) | (1,556,072 | ) | |||||||
International Paper Co. | (16,640 | ) | (894,067 | ) | |||||||
Sonoco Products Co. | (9,853 | ) | (549,995 | ) | |||||||
(3,990,427 | ) | ||||||||||
Diversified consumer services—(0.08)% | |||||||||||
Chegg, Inc. | (36,805 | ) | (1,019,498 | ) | |||||||
Diversified financial services—(0.07)% | |||||||||||
Voya Financial, Inc. | (18,050 | ) | (911,886 | ) | |||||||
Electric utilities—(0.20)% | |||||||||||
El Paso Electric Co. | (13,163 | ) | (820,055 | ) | |||||||
Entergy Corp. | (14,510 | ) | (1,179,373 | ) | |||||||
IDACORP, Inc. | (7,059 | ) | (665,240 | ) | |||||||
(2,664,668 | ) | ||||||||||
Electronic equipment, instruments & components—(0.39)% | |||||||||||
Avnet, Inc. | (13,450 | ) | (589,782 | ) | |||||||
Corning, Inc. | (42,490 | ) | (1,409,818 | ) | |||||||
| Number of shares | Value | ||||||||||
Investments sold short—(continued) | |||||||||||
Common stocks—(continued) | |||||||||||
Electronic equipment, instruments & components—(concluded) | |||||||||||
Fitbit, Inc., Class A | (89,104 | ) | $ | (528,387 | ) | ||||||
Keysight Technologies, Inc. | (24,160 | ) | (1,401,280 | ) | |||||||
National Instruments Corp. | (27,963 | ) | (1,225,059 | ) | |||||||
(5,154,326 | ) | ||||||||||
Energy equipment & services—(0.45)% | |||||||||||
Baker Hughes a GE Co. | (15,610 | ) | (539,794 | ) | |||||||
Core Laboratories N.V. | (5,811 | ) | (651,529 | ) | |||||||
Helmerich & Payne, Inc. | (15,440 | ) | (947,244 | ) | |||||||
National Oilwell Varco, Inc. | (45,554 | ) | (2,214,836 | ) | |||||||
Oceaneering International, Inc. | (42,530 | ) | (1,163,621 | ) | |||||||
Weatherford International PLC | (122,465 | ) | (415,156 | ) | |||||||
(5,932,180 | ) | ||||||||||
Equity real estate investment trusts—(0.38)% | |||||||||||
Extra Space Storage, Inc. | (9,192 | ) | (863,772 | ) | |||||||
Iron Mountain, Inc. | (23,346 | ) | (819,678 | ) | |||||||
Lamar Advertising Co., Class A | (12,277 | ) | (903,956 | ) | |||||||
Public Storage | (4,387 | ) | (955,620 | ) | |||||||
Realty Income Corp. | (9,921 | ) | (553,294 | ) | |||||||
Washington Prime Group, Inc. | (111,710 | ) | (897,031 | ) | |||||||
(4,993,351 | ) | ||||||||||
Food & staples retailing—(0.10)% | |||||||||||
Casey's General Stores, Inc. | (6,635 | ) | (725,737 | ) | |||||||
PriceSmart, Inc. | (7,307 | ) | (597,347 | ) | |||||||
(1,323,084 | ) | ||||||||||
Food products—(0.40)% | |||||||||||
Hormel Foods Corp. | (60,212 | ) | (2,165,826 | ) | |||||||
Lancaster Colony Corp. | (5,183 | ) | (751,690 | ) | |||||||
McCormick & Co., Inc. | (2,509 | ) | (294,908 | ) | |||||||
Post Holdings, Inc. | (10,930 | ) | (946,101 | ) | |||||||
The Hain Celestial Group, Inc. | (16,379 | ) | (465,819 | ) | |||||||
Tyson Foods, Inc., Class A | (10,860 | ) | (626,079 | ) | |||||||
(5,250,423 | ) | ||||||||||
Health care equipment & supplies—(0.04)% | |||||||||||
West Pharmaceutical Services, Inc. | (5,275 | ) | (578,404 | ) | |||||||
Health care providers & services—(0.09)% | |||||||||||
Envision Healthcare Corp. | (14,130 | ) | (625,394 | ) | |||||||
Premier, Inc., Class A | (16,230 | ) | (607,002 | ) | |||||||
(1,232,396 | ) | ||||||||||
Health care technology—(0.13)% | |||||||||||
Medidata Solutions, Inc. | (13,958 | ) | (1,037,219 | ) | |||||||
Teladoc, Inc. | (10,427 | ) | (624,056 | ) | |||||||
(1,661,275 | ) | ||||||||||
Hotels, restaurants & leisure—(0.44)% | |||||||||||
Chipotle Mexican Grill, Inc. | (3,240 | ) | (1,405,058 | ) | |||||||
International Game Technology PLC | (38,180 | ) | (965,191 | ) | |||||||
MGM Resorts International | (44,622 | ) | (1,399,792 | ) | |||||||
Norwegian Cruise Line Holdings Ltd. | (12,694 | ) | (635,081 | ) | |||||||
167
PACE Large Co Value Equity Investments
Portfolio of investments—July 31, 2018
| Number of shares | Value | ||||||||||
Investments sold short—(continued) | |||||||||||
Common stocks—(continued) | |||||||||||
Hotels, restaurants & leisure—(concluded) | |||||||||||
Shake Shack, Inc., Class A | (11,173 | ) | $ | (696,413 | ) | ||||||
Texas Roadhouse, Inc. | (12,173 | ) | (764,951 | ) | |||||||
(5,866,486 | ) | ||||||||||
Household durables—(0.22)% | |||||||||||
D.R. Horton, Inc. | (17,120 | ) | (748,144 | ) | |||||||
Garmin Ltd. | (13,904 | ) | (868,305 | ) | |||||||
Newell Brands, Inc. | (26,730 | ) | (700,059 | ) | |||||||
PulteGroup, Inc. | (23,190 | ) | (660,683 | ) | |||||||
(2,977,191 | ) | ||||||||||
Household products—(0.07)% | |||||||||||
Spectrum Brands Holdings, Inc. | (10,078 | ) | (880,515 | ) | |||||||
Insurance—(1.40)% | |||||||||||
Aflac, Inc. | (26,650 | ) | (1,240,291 | ) | |||||||
American International Group, Inc. | (31,070 | ) | (1,715,375 | ) | |||||||
Athene Holding Ltd., Class A | (20,020 | ) | (918,317 | ) | |||||||
Cincinnati Financial Corp. | (20,312 | ) | (1,536,196 | ) | |||||||
Erie Indemnity Co., Class A | (7,091 | ) | (880,986 | ) | |||||||
Lincoln National Corp. | (11,570 | ) | (787,917 | ) | |||||||
Loews Corp. | (23,650 | ) | (1,200,947 | ) | |||||||
MetLife, Inc. | (11,280 | ) | (515,947 | ) | |||||||
Principal Financial Group, Inc. | (23,360 | ) | (1,356,749 | ) | |||||||
Prudential Financial, Inc. | (11,280 | ) | (1,138,265 | ) | |||||||
RLI Corp. | (20,322 | ) | (1,519,273 | ) | |||||||
The Hartford Financial Services Group, Inc. | (17,261 | ) | (909,655 | ) | |||||||
Unum Group | (34,260 | ) | (1,361,150 | ) | |||||||
White Mountains Insurance Group Ltd. | (890 | ) | (812,596 | ) | |||||||
Willis Towers Watson PLC | (16,350 | ) | (2,606,517 | ) | |||||||
(18,500,181 | ) | ||||||||||
Internet & catalog retail—(0.13)% | |||||||||||
Liberty Expedia Holdings, Inc., Class A | (11,750 | ) | (565,997 | ) | |||||||
Wayfair, Inc., Class A | (10,379 | ) | (1,129,443 | ) | |||||||
(1,695,440 | ) | ||||||||||
Internet software & services—(0.21)% | |||||||||||
MercadoLibre, Inc. | (4,617 | ) | (1,583,215 | ) | |||||||
MINDBODY, Inc., Class A | (17,382 | ) | (649,218 | ) | |||||||
Shopify, Inc., Class A | (4,288 | ) | (592,645 | ) | |||||||
(2,825,078 | ) | ||||||||||
IT services—(0.46)% | |||||||||||
Acxiom Corp. | (21,694 | ) | (879,475 | ) | |||||||
Conduent, Inc. | (71,130 | ) | (1,277,495 | ) | |||||||
DXC Technology Co. | (26,030 | ) | (2,205,782 | ) | |||||||
Gartner, Inc. | (5,972 | ) | (808,788 | ) | |||||||
International Business Machines Corp. | (6,750 | ) | (978,277 | ) | |||||||
(6,149,817 | ) | ||||||||||
Leisure products—(0.04)% | |||||||||||
Mattel, Inc. | (35,923 | ) | (570,098 | ) | |||||||
| Number of shares | Value | ||||||||||
Investments sold short—(continued) | |||||||||||
Common stocks—(continued) | |||||||||||
Machinery—(0.39)% | |||||||||||
Flowserve Corp. | (75,425 | ) | $ | (3,343,590 | ) | ||||||
John Bean Technologies Corp. | (7,239 | ) | (800,634 | ) | |||||||
Wabtec Corp. | (9,566 | ) | (1,055,321 | ) | |||||||
(5,199,545 | ) | ||||||||||
Media—(0.18)% | |||||||||||
Altice USA, Inc., Class A | (42,933 | ) | (735,442 | ) | |||||||
Cinemark Holdings, Inc. | (17,630 | ) | (633,270 | ) | |||||||
Omnicom Group, Inc. | (6,090 | ) | (419,175 | ) | |||||||
The Interpublic Group of Cos., Inc. | (26,820 | ) | (604,791 | ) | |||||||
(2,392,678 | ) | ||||||||||
Metals & mining—(0.11)% | |||||||||||
Alcoa Corp. | (17,540 | ) | (758,956 | ) | |||||||
Compass Minerals International, Inc. | (10,835 | ) | (735,155 | ) | |||||||
(1,494,111 | ) | ||||||||||
Multi-utilities—(0.17)% | |||||||||||
NiSource, Inc. | (50,110 | ) | (1,311,880 | ) | |||||||
Public Service Enterprise Group, Inc. | (18,510 | ) | (954,375 | ) | |||||||
(2,266,255 | ) | ||||||||||
Oil, gas & consumable fuels—(0.80)% | |||||||||||
Antero Resources Corp. | (36,470 | ) | (749,094 | ) | |||||||
Apache Corp. | (36,652 | ) | (1,685,992 | ) | |||||||
Cenovus Energy, Inc. | (119,889 | ) | (1,203,686 | ) | |||||||
Continental Resources, Inc. | (18,814 | ) | (1,201,650 | ) | |||||||
Hess Corp. | (23,304 | ) | (1,529,442 | ) | |||||||
Kosmos Energy Ltd. | (49,256 | ) | (373,360 | ) | |||||||
Murphy Oil Corp. | (21,311 | ) | (708,804 | ) | |||||||
Oasis Petroleum, Inc. | (52,041 | ) | (635,941 | ) | |||||||
PBF Energy, Inc., Class A | (20,380 | ) | (951,746 | ) | |||||||
Range Resources Corp. | (53,053 | ) | (818,608 | ) | |||||||
SM Energy Co. | (27,950 | ) | (768,904 | ) | |||||||
(10,627,227 | ) | ||||||||||
Personal products—(0.04)% | |||||||||||
Coty, Inc., Class A | (35,774 | ) | (479,729 | ) | |||||||
Professional services—(0.10)% | |||||||||||
CoStar Group, Inc. | (1,768 | ) | (735,223 | ) | |||||||
Verisk Analytics, Inc. | (5,251 | ) | (580,865 | ) | |||||||
(1,316,088 | ) | ||||||||||
Road & rail—(0.14)% | |||||||||||
Heartland Express, Inc. | (45,775 | ) | (878,422 | ) | |||||||
Ryder System, Inc. | (11,710 | ) | (916,893 | ) | |||||||
(1,795,315 | ) | ||||||||||
Semiconductors & semiconductor equipment—(0.25)% | |||||||||||
Cree, Inc. | (28,823 | ) | (1,359,004 | ) | |||||||
Micron Technology, Inc. | (37,540 | ) | (1,981,737 | ) | |||||||
(3,340,741 | ) | ||||||||||
168
PACE Large Co Value Equity Investments
Portfolio of investments—July 31, 2018
| Number of shares | Value | ||||||||||
Investments sold short—(continued) | |||||||||||
Common stocks—(continued) | |||||||||||
Software—(0.55)% | |||||||||||
ACI Worldwide, Inc. | (45,578 | ) | $ | (1,177,736 | ) | ||||||
Blackbaud, Inc. | (12,305 | ) | (1,228,162 | ) | |||||||
Guidewire Software, Inc. | (12,487 | ) | (1,076,379 | ) | |||||||
HubSpot, Inc. | (13,425 | ) | (1,666,042 | ) | |||||||
Proofpoint, Inc. | (10,872 | ) | (1,239,952 | ) | |||||||
Workday, Inc., Class A | (6,830 | ) | (847,057 | ) | |||||||
(7,235,328 | ) | ||||||||||
Specialty retail—(0.30)% | |||||||||||
At Home Group, Inc. | (13,549 | ) | (491,422 | ) | |||||||
CarMax, Inc. | (19,105 | ) | (1,426,761 | ) | |||||||
Floor & Decor Holdings, Inc., Class A | (14,614 | ) | (697,819 | ) | |||||||
Monro, Inc. | (10,874 | ) | (733,451 | ) | |||||||
Penske Automotive Group, Inc. | (12,650 | ) | (660,330 | ) | |||||||
(4,009,783 | ) | ||||||||||
Technology hardware, storage & peripherals—(0.13)% | |||||||||||
Hewlett Packard Enterprise Co. | (60,699 | ) | (937,193 | ) | |||||||
Xerox Corp. | (29,764 | ) | (772,971 | ) | |||||||
(1,710,164 | ) | ||||||||||
| Number of shares | Value | ||||||||||
Investments sold short—(concluded) | |||||||||||
Common stocks—(concluded) | |||||||||||
Textiles, apparel & luxury goods—(0.06)% | |||||||||||
Under Armour, Inc., Class A | (41,764 | ) | $ | (834,027 | ) | ||||||
Thrifts & mortgage finance—(0.07)% | |||||||||||
New York Community Bancorp, Inc. | (90,970 | ) | (979,747 | ) | |||||||
Trading companies & distributors—(0.06)% | |||||||||||
Air Lease Corp. | (17,980 | ) | (790,401 | ) | |||||||
Transportation infrastructure—(0.04)% | |||||||||||
Macquarie Infrastructure Corp. | (10,990 | ) | (499,056 | ) | |||||||
| Total investments sold short (proceeds—$152,807,307) | (172,729,726 | ) | |||||||||
Liabilities in excess of other assets—(1.44)% | (19,114,812 | ) | |||||||||
Net assets—100.00% | $ | 1,324,959,568 | |||||||||
For a listing of defined portfolio acronyms that are used throughout the Portfolio of investments as well as the tables that follow, please refer to page 273.
Fair valuation summary
The following is a summary of the fair valuations according to the inputs used as of July 31, 2018 in valuing the Portfolio's investments. In the event a Portfolio holds investments for which fair value is measured using the NAV per share practical expedient (or its equivalent), a separate column will be added to the fair value hierarchy table; this is intended to permit reconciliation to the amounts presented in the Portfolio of investments.
| Assets Description | Unadjusted quoted prices in active markets for identical investments (Level 1) | Other significant observable inputs (Level 2) | Unobservable inputs (Level 3) | Total | |||||||||||||||
Common stocks | $ | 1,476,355,665 | $ | — | $ | — | $ | 1,476,355,665 | |||||||||||
Short-term investment | — | 25,465,071 | — | 25,465,071 | |||||||||||||||
Investment of cash collateral from securities loaned | — | 14,983,370 | — | 14,983,370 | |||||||||||||||
Total | $ | 1,476,355,665 | $ | 40,448,441 | $ | — | $ | 1,516,804,106 | |||||||||||
Liabilities | |||||||||||||||||||
Investments sold short | $ | (172,729,726 | ) | $ | — | $ | — | $ | (172,729,726 | ) | |||||||||
169
PACE Large Co Value Equity Investments
Portfolio of investments—July 31, 2018
At July 31, 2018, there were no transfers between Level 1 and Level 2.
Level 3 rollforward disclosure
The following is a rollforward of the Portfolio's investment that was valued using unobservable inputs for the year ended July 31, 2018:
Rights | |||||||
Beginning balance | $ | 9,940 | |||||
Purchases | — | ||||||
Issuances | — | ||||||
Sales | (33,252 | ) | |||||
Accrued discounts/(premiums) | — | ||||||
Total realized gain/(loss) | (3,774 | ) | |||||
Net change in unrealized appreciation/depreciation | 27,086 | ||||||
Transfers into Level 3 | — | ||||||
Transfers out of Level 3 | — | ||||||
Ending balance | $ | — | |||||
The change in net unrealized appreciation/depreciation relating to the Level 3 investments held at July 31, 2017 was $27,086.
Portfolio footnotes
* Non-income producing security.
1 Security, or portion thereof, pledged as collateral for investments sold short.
2 Security, or portion thereof, was on loan at the period end.
See accompanying notes to financial statements.
170
PACE Large Co Growth Equity Investments
Performance (unaudited)
For the 12 months ended July 31, 2018, the Portfolio's Class P shares gained 19.03% before the deduction of the maximum PACE Select program fee.1 In comparison, the Russell 1000 Growth Index (the "benchmark") gained 22.84%, and the Lipper Large-Cap Growth Funds category posted a median return of 21.63%. (Returns for all share classes over various time periods are shown in the "Performance at a glance" table on page 173. Please note that the returns shown do not reflect the deduction of taxes that a shareholder would pay on Portfolio distributions or the redemption of Portfolio shares.) For a detailed commentary on the market environment in general during the reporting period, please refer to page 3.
Advisors' Comments (unaudited)2
The Portfolio underperformed the benchmark during the reporting period. The primary detractor from performance was stock selection, particularly within health care and information technology. In terms of individual holdings, the largest detractor from performance was Allergan plc. We sold out of the position during the reporting period. Positive stock selection in industrials partially offset difficulty in the aforementioned sectors. XPO Logistics, Inc. was a significant individual contributor to performance. Sector allocation was a modest headwind for returns, partially due to the Portfolio's overweight to financials.
Derivatives were not used during the reporting period.
1 Class P shares held through the PACE Select Advisors Program are subject to a maximum Program fee of 2.50%, which, if included, would have reduced performance. Class P shares held through other advisory programs also may be subject to a program fee, which, if included, would have reduced performance.
2 All Sub-Advisors discuss performance on a gross-of-fees basis—meaning that no fees or expenses are reflected in their sleeves'/sleeve's performance. Alternately, Portfolio performance is shown net of fees, which does factor in fees and expenses associated with the Portfolio.
PACE Select Advisors Trust – PACE Large Co Growth Equity Investments
Investment Manager:
UBS Asset Management (Americas) Inc. ("UBS AM")
Investment Subadvisors:
Jackson Square Partners, LLC ("Jackson Square");
Mar Vista Investment Partners ("Mar Vista");
J.P. Morgan Investment Management Inc. ("J.P. Morgan")
Portfolio Management Team:
UBS AM: Mabel Lung, CFA and Fred Lee, CFA, assisted by Vincent Russo and Mayoor Joshi
Jackson Square: Jeffrey Van Harte, Christopher Bonavico, Daniel Prislin and Christopher Ericksen;
Mar Vista: Brian L. Massey and Silas A. Myers;
J.P. Morgan: Giri Devulapally and Joseph Wilson
Objective:
Capital appreciation
Investment process:
The main strategies of the subadvisors include:
• A strategy in which the subadvisor seeks to identify companies with secular business models and opportunities to generate consistent, long-term growth of intrinsic business value.
• A strategy in which the subadvisor seeks to identify companies with sustainable competitive advantages and ample opportunities to grow
(continued on next page)
171
PACE Large Co Growth Equity Investments
Investment process
(concluded)
and reinvest capital at high rates of return.
• A strategy in which the subadvisor employs a concentrated, fundamentally driven sustainable growth strategy.
Special considerations
The Portfolio may be appropriate for long-term investors seeking capital appreciation who are able to withstand short-term fluctuations in the equity markets in return for potentially higher returns over the long term. The value of the Portfolio changes every day and can be affected by changes in interest rates, general market conditions, and other political, social and economic developments, as well as specific matters relating to the companies in whose securities the Portfolio invests. Also, to the extent the Portfolio invests a large portion of its assets in a particular sector, the Portfolio may experience greater volatility and risk of loss due to unfavorable developments in that sector. It is important to note that an investment in the Portfolio is only one component of a balanced investment plan.
172
PACE Large Co Growth Equity Investments
Performance at a glance (unaudited)
Average annual total returns for periods ended 07/31/18 | 1 year | 5 years | 10 years | ||||||||||||
Before deducting maximum sales charge | |||||||||||||||
Class A1 | 18.72 | % | 13.81 | % | 10.52 | % | |||||||||
Class C2 | 17.79 | 12.88 | 9.63 | ||||||||||||
Class Y3 | 19.03 | 14.09 | 10.83 | ||||||||||||
Class P4 | 19.03 | 14.09 | 10.81 | ||||||||||||
After deducting maximum sales charge | |||||||||||||||
Class A1 | 12.17 | 12.53 | 9.90 | ||||||||||||
Class C2 | 16.79 | 12.88 | 9.63 | ||||||||||||
Russell 1000 Growth Index5 | 22.84 | 15.83 | 12.37 | ||||||||||||
Lipper Large-Cap Growth Funds median | 21.63 | 14.73 | 11.03 | ||||||||||||
Most recent calendar quarter-end returns (unaudited)
Average annual total returns for periods ended 06/30/18 | 1 year | 5 years | 10 years | ||||||||||||
Before deducting maximum sales charge | |||||||||||||||
Class A1 | 19.00 | % | 14.35 | % | 9.89 | % | |||||||||
Class C2 | 18.00 | 13.41 | 8.99 | ||||||||||||
Class Y3 | 19.29 | 14.65 | 10.19 | ||||||||||||
Class P4 | 19.24 | 14.64 | 10.17 | ||||||||||||
After deducting maximum sales charge | |||||||||||||||
Class A1 | 12.44 | 13.06 | 9.26 | ||||||||||||
Class C2 | 17.00 | 13.41 | 8.99 | ||||||||||||
The annualized gross and net expense ratios, respectively, for each class of shares as in the November 28, 2017 prospectuses, supplemented from time to time, were as follows: Class A—1.18% and 1.18%; Class C—1.99% and 1.93%; Class Y—0.92% and 0.92%; and Class P—0.93% and 0.93%. Net expenses reflect fee waivers and/or expense reimbursements, if any, pursuant to an agreement that is in effect to cap the expenses. The Portfolio and UBS Asset Management (Americas) Inc. ("UBS AM") have entered into a written fee waiver/expense reimbursement agreement pursuant to which UBS AM is contractually obligated to waive its management fees and/or reimburse expenses so that the Portfolio's ordinary total operating expenses through November 30, 2018 (excluding dividend expense, borrowing costs, and interest expense relating to short sales, and expenses attributable to investment in other investment companies, interest, taxes, brokerage commissions and extraordinary expenses) would not exceed Class A—1.13%; Class C—1.88%; Class Y—0.88%; and Class P—0.88%. "Management fee waiver/expense reimbursements" are based on estimated amounts for the current fiscal year. The Portfolio has agreed to repay UBS AM for any waived fees/reimbursed expenses to the extent that it can do so over the following three fiscal years without causing the Portfolio's expenses in any of those three years to exceed this expense cap and that UBS AM has not waived the right to do so. The fee waiver/expense reimbursement agreement may be terminated by the Portfolio's board at any time and also will terminate automatically upon the expiration or termination of the Portfolio's advisory contract with UBS AM. Upon termination of the agreement, however, UBS AM's three year recoupment rights will survive.
1 Maximum sales charge for Class A shares is 5.5%. Class A shares bear ongoing 12b-1 service fees of 0.25% annually.
2 Maximum contingent deferred sales charge for Class C shares is 1% imposed on redemptions and is reduced to 0% after one year. Class C shares bear ongoing 12b-1 service and distribution fees of 0.25% and 0.75% annually, respectively. As of July 12, 2018, Class C shares ceased paying 12b-1 distribution fees. See notes to financial statements—Subsequent events for additional information.
3 The Portfolio offers Class Y shares to a limited group of eligible investors, including certain qualifying retirement plans. Class Y shares do not bear initial or contingent deferred sales charges or ongoing 12b-1 service and distribution fees.
4 Class P shares do not bear initial or contingent deferred sales charges or ongoing 12b-1 service and distribution fees, but Class P shares held through advisory programs may be subject to a program fee, which, if included, would have reduced performance.
5 The Russell 1000 Growth Index measures the performance of the large-cap growth segment of the US equity universe. It includes those Russell 1000 Index companies with higher price-to-book ratios and higher forecasted growth values. The Russell 1000 Growth Index is constructed to provide a comprehensive and unbiased barometer for the large-cap growth segment. The Index is completely reconstituted annually to ensure new and growing equities are included and that the represented companies continue to reflect growth characteristics. Investors should note that indices do not reflect the deduction of fees and expenses.
Past performance does not predict future performance, and the performance information provided does not reflect the deduction of taxes that a shareholder would pay on Portfolio distributions or the redemption of Portfolio shares. The return and principal value of an investment will fluctuate, so that an investor's shares, when redeemed, may be worth more or less than their original cost. Performance results assume reinvestment of all dividends and capital gain distributions at net asset value on the ex-dividend dates. Current performance may be higher or lower than the performance data quoted. For month-end performance figures, please visit www.ubs.com/us-mutualfundperformance.
Lipper peer group data calculated by Lipper Inc.; used with permission. The Lipper median is the return of the fund that places in the middle of a Lipper peer group.
173
PACE Large Co Growth Equity Investments
Illustration of an assumed investment of $10,000 in Class P shares of the Portfolio (unaudited)
The following graph depicts the performance of PACE Large Co Growth Equity Investments Class P shares versus the Russell 1000 Growth Index over the 10 years ended July 31, 2018. Class P shares held through advisory programs may be subject to a program fee, which, if included, would have reduced performance. The performance of the other classes will vary based upon the different class specific expenses and sales charges. The performance provided does not reflect the deduction of taxes that a shareholder would pay on Portfolio distributions or the redemption of Portfolio shares. Past performance is no guarantee of future results. Share price and returns will vary with market conditions; investors may realize a gain or loss upon redemption. It is important to note that PACE Large Co Growth Equity Investments is a professionally managed portfolio while the Index is not available for investment and is unmanaged. The comparison is shown for illustration purposes only.
PACE Large Co Growth Equity Investments
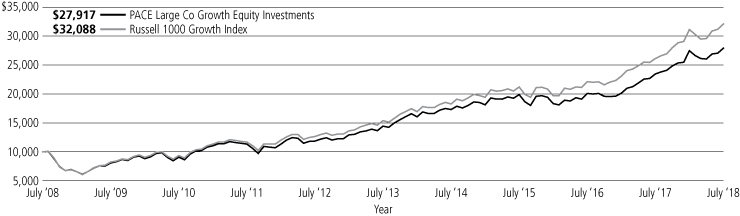
174
PACE Large Co Growth Equity Investments
Portfolio statistics—July 31, 2018 (unaudited)
Top ten holdings1 | Percentage of net assets | ||||||
Alphabet, Inc. Class C | 3.9 | % | |||||
Microsoft Corp. | 3.6 | ||||||
MasterCard, Inc., Class A | 3.4 | ||||||
Visa, Inc., Class A | 3.0 | ||||||
Berkshire Hathaway, Inc., Class B | 2.9 | ||||||
Markel Corp. | 2.8 | ||||||
Amazon.com, Inc. | 2.8 | ||||||
XPO Logistic, Inc. | 2.7 | ||||||
Apple, Inc. | 2.6 | ||||||
Honeywell International, Inc. | 2.5 | ||||||
Total | 30.2 | % | |||||
Top five issuer breakdown by country or territory of origin1 | Percentage of net assets | ||||||
United States | 95.2 | % | |||||
Curacao | 1.7 | ||||||
United Kingdom | 1.5 | ||||||
Netherlands | 1.5 | ||||||
Cayman Islands | 0.7 | ||||||
Total | 100.6 | % | |||||
Sectors1 | Percentage of net assets | ||||||
Information Technology | 40.9 | % | |||||
Financials | 18.3 | ||||||
Consumer Discretionary | 11.7 | ||||||
Industrials | 10.4 | ||||||
Health Care | 10.1 | ||||||
Consumer Staples | 3.3 | ||||||
Energy | 1.7 | ||||||
Materials | 1.6 | ||||||
Total | 98.0 | % | |||||
1 The Portfolio is actively managed and its composition will vary over time.
175
PACE Large Co Growth Equity Investments
Portfolio of investments—July 31, 2018
| Number of shares | Value | ||||||||||
Common stocks—98.00% | |||||||||||
Aerospace & defense—2.13% | |||||||||||
Northrop Grumman Corp. | 8,465 | $ | 2,543,648 | ||||||||
The Boeing Co. | 17,472 | 6,225,273 | |||||||||
TransDigm Group, Inc.1 | 55,683 | 20,911,194 | |||||||||
29,680,115 | |||||||||||
Air freight & logistics—4.19% | |||||||||||
FedEx Corp. | 87,321 | 21,469,614 | |||||||||
XPO Logistics, Inc.*,1 | 370,635 | 36,959,722 | |||||||||
58,429,336 | |||||||||||
Airlines—0.14% | |||||||||||
Delta Air Lines, Inc. | 5,778 | 314,439 | |||||||||
Southwest Airlines Co. | 27,511 | 1,600,040 | |||||||||
1,914,479 | |||||||||||
Automobiles—0.11% | |||||||||||
Tesla, Inc.*,1 | 5,114 | 1,524,688 | |||||||||
Banks—1.77% | |||||||||||
SVB Financial Group* | 7,264 | 2,236,440 | |||||||||
US Bancorp | 422,658 | 22,405,101 | |||||||||
24,641,541 | |||||||||||
Beverages—0.40% | |||||||||||
Constellation Brands, Inc., Class A | 14,575 | 3,064,102 | |||||||||
Monster Beverage Corp.* | 40,795 | 2,448,516 | |||||||||
5,512,618 | |||||||||||
Biotechnology—2.23% | |||||||||||
Alnylam Pharmaceuticals, Inc.* | 8,265 | 785,175 | |||||||||
Biogen, Inc.* | 80,901 | 27,050,867 | |||||||||
Regeneron Pharmaceuticals, Inc.* | 336 | 123,651 | |||||||||
Vertex Pharmaceuticals, Inc.* | 17,590 | 3,079,130 | |||||||||
31,038,823 | |||||||||||
Capital markets—5.57% | |||||||||||
Intercontinental Exchange, Inc. | 309,332 | 22,862,728 | |||||||||
KKR & Co., Inc., Class A | 843,655 | 23,099,274 | |||||||||
Morgan Stanley | 44,740 | 2,262,054 | |||||||||
S&P Global, Inc. | 29,058 | 5,824,386 | |||||||||
The Charles Schwab Corp. | 462,900 | 23,635,674 | |||||||||
77,684,116 | |||||||||||
Chemicals—1.77% | |||||||||||
Ecolab, Inc. | 157,838 | 22,207,806 | |||||||||
The Sherwin-Williams Co. | 5,542 | 2,442,526 | |||||||||
24,650,332 | |||||||||||
Communications equipment—0.81% | |||||||||||
Arista Networks, Inc.* | 44,027 | 11,259,025 | |||||||||
Diversified financial services—3.78% | |||||||||||
Berkshire Hathaway, Inc., Class B* | 203,394 | 40,245,571 | |||||||||
CME Group, Inc. | 77,804 | 12,380,172 | |||||||||
52,625,743 | |||||||||||
| Number of shares | Value | ||||||||||
Common stocks—(continued) | |||||||||||
Electrical equipment—0.14% | |||||||||||
Rockwell Automation, Inc. | 10,118 | $ | 1,897,732 | ||||||||
Electronic equipment, instruments & components—0.07% | |||||||||||
Amphenol Corp., Class A | 10,125 | 946,789 | |||||||||
Energy equipment & services—1.69% | |||||||||||
Schlumberger Ltd. | 348,209 | 23,511,072 | |||||||||
Equity real estate investment trusts—4.37% | |||||||||||
American Tower Corp. | 234,842 | 34,812,978 | |||||||||
Crown Castle International Corp. | 142,222 | 15,762,464 | |||||||||
Equinix, Inc. | 23,561 | 10,349,876 | |||||||||
60,925,318 | |||||||||||
Food products—1.10% | |||||||||||
Mondelez International, Inc., Class A | 354,895 | 15,395,345 | |||||||||
Health care equipment & supplies—2.60% | |||||||||||
ABIOMED, Inc.* | 4,244 | 1,504,625 | |||||||||
Becton Dickinson and Co. | 23,008 | 5,760,513 | |||||||||
Boston Scientific Corp.* | 108,560 | 3,648,702 | |||||||||
DENTSPLY SIRONA, Inc. | 238,863 | 11,491,699 | |||||||||
DexCom, Inc.* | 16,058 | 1,527,598 | |||||||||
Intuitive Surgical, Inc.* | 24,176 | 12,286,001 | |||||||||
36,219,138 | |||||||||||
Health care providers & services—1.77% | |||||||||||
UnitedHealth Group, Inc. | 97,598 | 24,713,766 | |||||||||
Hotels, restaurants & leisure—0.04% | |||||||||||
Las Vegas Sands Corp. | 8,093 | 581,887 | |||||||||
Industrial conglomerates—4.82% | |||||||||||
Honeywell International, Inc. | 218,896 | 34,946,747 | |||||||||
Roper Industries, Inc. | 106,646 | 32,196,427 | |||||||||
67,143,174 | |||||||||||
Insurance—2.83% | |||||||||||
Markel Corp.* | 33,707 | 39,437,190 | |||||||||
Internet & catalog retail—4.87% | |||||||||||
Amazon.com, Inc.* | 22,104 | 39,288,534 | |||||||||
Booking Holdings, Inc.* | 1,024 | 2,077,409 | |||||||||
Netflix, Inc.* | 24,467 | 8,256,389 | |||||||||
TripAdvisor, Inc.*,1 | 302,244 | 17,527,130 | |||||||||
Wayfair, Inc., Class A*,1 | 6,473 | 704,392 | |||||||||
67,853,854 | |||||||||||
Internet software & services—9.31% | |||||||||||
Alibaba Group Holding Ltd., ADR* | 54,764 | 10,253,464 | |||||||||
Alphabet, Inc., Class A* | 17,777 | 21,816,290 | |||||||||
Alphabet, Inc., Class C* | 45,044 | 54,830,260 | |||||||||
eBay, Inc.* | 414,306 | 13,858,536 | |||||||||
Facebook, Inc., Class A* | 119,604 | 20,641,258 | |||||||||
GrubHub, Inc.* | 11,874 | 1,447,322 | |||||||||
Match Group, Inc.* | 23,477 | 847,989 | |||||||||
MercadoLibre, Inc.1 | 9,629 | 3,301,880 | |||||||||
Shopify, Inc., Class A* | 9,719 | 1,343,263 | |||||||||
Twitter, Inc.* | 42,915 | 1,367,701 | |||||||||
129,707,963 | |||||||||||
176
PACE Large Co Growth Equity Investments
Portfolio of investments—July 31, 2018
| Number of shares | Value | ||||||||||
Common stocks—(continued) | |||||||||||
IT services—9.13% | |||||||||||
MasterCard, Inc., Class A | 235,816 | $ | 46,691,568 | ||||||||
PayPal Holdings, Inc.* | 407,078 | 33,437,387 | |||||||||
Square, Inc., Class A* | 30,950 | 2,000,917 | |||||||||
Visa, Inc., Class A | 307,558 | 42,055,481 | |||||||||
Worldpay, Inc., Class A* | 37,515 | 3,083,358 | |||||||||
127,268,711 | |||||||||||
Leisure products—1.22% | |||||||||||
Hasbro, Inc. | 170,388 | 16,972,349 | |||||||||
Life sciences tools & services—3.82% | |||||||||||
Illumina, Inc.* | 49,235 | 15,969,864 | |||||||||
IQVIA Holdings, Inc.* | 208,248 | 25,393,761 | |||||||||
Mettler-Toledo International, Inc.* | 17,992 | 10,660,440 | |||||||||
Thermo Fisher Scientific, Inc. | 5,277 | 1,237,615 | |||||||||
53,261,680 | |||||||||||
Media—1.44% | |||||||||||
Liberty Global PLC, Class A* | 136,865 | 3,863,699 | |||||||||
Liberty Global PLC, Series C* | 598,038 | 16,230,751 | |||||||||
20,094,450 | |||||||||||
Multiline retail—1.26% | |||||||||||
Dollar General Corp. | 179,107 | 17,579,352 | |||||||||
Personal products—1.80% | |||||||||||
The Estee Lauder Cos., Inc., Class A | 31,626 | 4,267,612 | |||||||||
Unilever N.V. | 361,798 | 20,788,913 | |||||||||
25,056,525 | |||||||||||
Professional services—0.10% | |||||||||||
CoStar Group, Inc.* | 3,400 | 1,413,890 | |||||||||
Semiconductors & semiconductor equipment—3.36% | |||||||||||
Applied Materials, Inc. | 370,555 | 18,020,090 | |||||||||
Broadcom, Inc. | 2,920 | 647,568 | |||||||||
Microchip Technology, Inc.1 | 234,452 | 21,904,850 | |||||||||
NVIDIA Corp. | 25,546 | 6,255,194 | |||||||||
46,827,702 | |||||||||||
| Number of shares | Value | ||||||||||
Common stocks—(concluded) | |||||||||||
Software—15.59% | |||||||||||
Activision Blizzard, Inc. | 90,191 | $ | 6,621,823 | ||||||||
Adobe Systems, Inc.* | 117,898 | 28,847,283 | |||||||||
Atlassian Corp. PLC, Class A* | 16,279 | 1,178,762 | |||||||||
Autodesk, Inc.* | 117,410 | 15,080,140 | |||||||||
Electronic Arts, Inc.* | 175,036 | 22,535,885 | |||||||||
Intuit, Inc. | 129,073 | 26,361,869 | |||||||||
Microsoft Corp. | 477,710 | 50,675,477 | |||||||||
Oracle Corp. | 707,988 | 33,756,868 | |||||||||
Salesforce.com, Inc.* | 44,139 | 6,053,664 | |||||||||
ServiceNow, Inc.* | 41,020 | 7,217,879 | |||||||||
Take-Two Interactive Software, Inc.* | 166,580 | 18,826,872 | |||||||||
217,156,522 | |||||||||||
Specialty retail—0.86% | |||||||||||
Ross Stores, Inc. | 36,025 | 3,149,666 | |||||||||
The Home Depot, Inc. | 44,746 | 8,838,230 | |||||||||
11,987,896 | |||||||||||
Technology hardware, storage & peripherals—2.63% | |||||||||||
Apple, Inc. | 192,645 | 36,658,417 | |||||||||
Textiles, apparel & luxury goods—0.12% | |||||||||||
Lululemon Athletica, Inc.* | 14,303 | 1,715,645 | |||||||||
Trading companies & distributors—0.16% | |||||||||||
United Rentals, Inc.* | 14,769 | 2,197,627 | |||||||||
| Total common stocks (cost—$970,868,771) | 1,365,484,810 | ||||||||||
Short-term investment—2.05% | |||||||||||
Investment companies—2.05% | |||||||||||
| State Street Institutional U.S. Government Money Market Fund (cost—$28,533,871) | 28,533,871 | 28,533,871 | |||||||||
Investment of cash collateral from securities loaned—0.66% | |||||||||||
Money market fund—0.66% | |||||||||||
| State Street Navigator Securities Lending Government Money Market Portfolio (cost—$9,167,476) | 9,167,476 | 9,167,476 | |||||||||
| Total investments (cost—$1,008,570,118)—100.71% | 1,403,186,157 | ||||||||||
Liabilities in excess of other assets—(0.71)% | (9,914,918 | ) | |||||||||
Net assets—100.00% | $ | 1,393,271,239 | |||||||||
For a listing of defined portfolio acronyms that are used throughout the Portfolio of investments as well as the tables that follow, please refer to page 273.
177
PACE Large Co Growth Equity Investments
Portfolio of investments—July 31, 2018
Fair valuation summary
The following is a summary of the fair valuations according to the inputs used as of July 31, 2018 in valuing the Portfolio's investments. In the event a Portfolio holds investments for which fair value is measured using the NAV per share practical expedient (or its equivalent), a separate column will be added to the fair value hierarchy table; this is intended to permit reconciliation to the amounts presented in the Portfolio of investments:
| Assets Description | Unadjusted quoted prices in active markets for identical investments (Level 1) | Other significant observable inputs (Level 2) | Unobservable inputs (Level 3) | Total | |||||||||||||||
Common stocks | $ | 1,365,484,810 | $ | — | $ | — | $ | 1,365,484,810 | |||||||||||
Short-term investment | — | 28,533,871 | — | 28,533,871 | |||||||||||||||
Investment of cash collateral from securities loaned | — | 9,167,476 | — | 9,167,476 | |||||||||||||||
Total | $ | 1,365,484,810 | $ | 37,701,347 | $ | — | $ | 1,403,186,157 | |||||||||||
At July 31, 2018, there were no transfers between Level 1 and Level 2.
Portfolio footnotes
* Non-income producing security.
1 Security, or portion thereof, was on loan at the period end.
See accompanying notes to financial statements.
178
PACE Small/Medium Co Value Equity Investments
Performance (unaudited)
For the 12 months ended July 31, 2018, the Portfolio's Class P shares gained 13.07% before the deduction of the maximum PACE Select program fee.1 In comparison, the Russell 2500 Value Index (the "benchmark") rose 12.83%, and the Lipper Small-Cap Value Funds category posted a median return of 13.33% and Lipper Small-Cap Core Funds category posted a median return of 15.62%. (Returns for all share classes over various time periods are shown in the "Performance at a glance" table on page 181. Please note that the returns shown do not reflect the deduction of taxes that a shareholder would pay on Portfolio distributions or the redemption of Portfolio shares.) For a detailed commentary on the market environment in general during the reporting period, please refer to page 3.
Advisor's comments (unaudited)2
The Portfolio outperformed its benchmark during the reporting period. Allocation across sectors was the most additive to performance. Stock selection was also beneficial for returns. Overall, energy and health care performed the best, as these two sectors posted returns near 22% in the benchmark during the period. An overweight to industrials and underweight to real estate investment trusts ("REITs") were additive on a relative basis, but partially offset by a cash drag. Stock selection was the strongest within information technology, particularly within the software and communications equipment industries, offsetting weak stock selection within the consumer discretionary sector. From a style perspective, underweights to the value factor and book-to-price were positive, while an underweight to dividend yield was negative.
Please note that no derivatives were used during the reporting period.
1 Class P shares held through the PACE Select Advisors Program are subject to a maximum Program fee of 2.50%, which, if included, would have reduced performance. Class P shares held through other advisory programs also may be subject to a program fee, which, if included, would have reduced performance.
2 All Sub-Advisors discuss performance on a gross-of-fees basis—meaning that no fees or expenses are reflected in their sleeves'/sleeve's performance. Alternately, Portfolio performance is shown net of fees, which does factor in fees and expenses associated with the Portfolio.
PACE Select Advisors Trust – PACE Small/Medium Co Value Equity Investments
Investment Manager:
UBS Asset Management (Americas) Inc. ("UBS AM")
Investment Subadvisors:
Systematic Financial Management, L.P. ("Systematic");
Kayne Anderson Rudnick, LLC ("Kayne Anderson Rudnick"); Sapience Investments, LLC ("Sapience");
Huber Capital Management LLC ("Huber")
Portfolio Management Team:
UBS AM: Mabel Lung, CFA and Fred Lee, CFA, assisted by Vincent Russo and Mayoor Joshi
Systematic: Ronald M. Mushock, D. Kevin McCreesh and Aman Patel;
Kayne Anderson Rudnick: Julie Kutasov and Craig Stone Sapience: Samir Sikka;
Huber Capital: Joseph Huber
Objective:
Capital appreciation
Investment process:
The main strategies of the subadvisors include:
• A "value equity" strategy in which the subadvisor targets smaller capitalization companies with sustainable business models selling below their value.
• A strategy that employs a two-pronged investment approach that utilizes quantitative screening and fundamental research to identify
(continued on next page)
179
PACE Small/Medium Co Value Equity Investments
Investment process
(concluded)
value companies with strong potential for positive earnings revisions.
• A strategy that employs a fundamental, bottom-up, research-driven investment style and follows a disciplined investment process to identify high-quality companies.
• A "deep value" strategy that seeks long-term total investment return through capital appreciation, generally investing in common stocks of US companies that are considered to be undervalued.
Special considerations
The Portfolio may be appropriate for long-term investors seeking capital appreciation who are able to withstand short-term fluctuations in the equity markets in return for potentially higher returns over the long term. The value of the Portfolio changes every day and can be affected by changes in interest rates, general market conditions, and other political, social and economic developments, as well as specific matters relating to the companies in whose securities the Portfolio invests. It is important to note that an investment in the Portfolio is only one component of a balanced investment plan. In addition, small- and mid-cap companies are typically subject to a greater degree of change in earnings and business prospects than are larger, more established companies. Therefore, they are considered to have a higher level of volatility and risk.
180
PACE Small/Medium Co Value Equity Investments
Performance at a glance (unaudited)
Average annual total returns for periods ended 07/31/18 | 1 year | 5 years | 10 years | ||||||||||||
Before deducting maximum sales charge | |||||||||||||||
Class A1 | 12.93 | % | 9.86 | % | 9.69 | % | |||||||||
Class C2 | 12.09 | 9.03 | 8.87 | ||||||||||||
Class Y3 | 13.26 | 10.03 | 9.92 | ||||||||||||
Class P4 | 13.07 | 9.99 | 9.85 | ||||||||||||
After deducting maximum sales charge | |||||||||||||||
Class A1 | 6.70 | 8.62 | 9.07 | ||||||||||||
Class C2 | 11.12 | 9.03 | 8.87 | ||||||||||||
Russell 2500 Value Index5 | 12.83 | 9.99 | 10.12 | ||||||||||||
Lipper Small-Cap Value Funds median6 | 13.33 | 9.03 | 9.55 | ||||||||||||
Lipper Small-Cap Core Funds median6 | 15.62 | 10.23 | 9.98 | ||||||||||||
Most recent calendar quarter-end returns (unaudited)
Average annual total returns for periods ended 06/30/18 | 1 year | 5 years | 10 years | ||||||||||||
Before deducting maximum sales charge | |||||||||||||||
Class A1 | 10.78 | % | 10.79 | % | 9.76 | % | |||||||||
Class C2 | 9.93 | 9.94 | 8.93 | ||||||||||||
Class Y3 | 11.10 | 10.96 | 9.98 | ||||||||||||
Class P4 | 10.93 | 10.93 | 9.93 | ||||||||||||
After deducting maximum sales charge | |||||||||||||||
Class A1 | 4.70 | 9.54 | 9.14 | ||||||||||||
Class C2 | 8.97 | 9.94 | 8.93 | ||||||||||||
The annualized gross and net expense ratios, respectively, for each class of shares as in the November 28, 2017 prospectuses, supplemented from time to time, were as follows: Class A—1.23% and 1.23%; Class C—1.99% and 1.99%; Class Y—1.13% and 1.04%; and Class P—1.09% and 1.04%. Net expenses reflect fee waivers and/or expense reimbursements, if any, pursuant to an agreement that is in effect to cap the expenses. The Portfolio and UBS Asset Management (Americas) Inc. ("UBS AM") have entered into a written fee waiver/expense reimbursement agreement pursuant to which UBS AM is contractually obligated to waive its management fees and/or reimburse expenses so that the Portfolio's ordinary total operating expenses through November 30, 2018 (excluding dividend expense, borrowing costs, and interest expense relating to short sales, and expenses attributable to investment in other investment companies, interest, taxes, brokerage commissions and extraordinary expenses) would not exceed Class A—1.29%; Class C—2.04%; Class Y—1.04%; and Class P—1.04%. "Management fee waiver/expense reimbursements" are based on estimated amounts for the current fiscal year. The Portfolio has agreed to repay UBS AM for any waived fees/reimbursed expenses to the extent that it can do so over the following three fiscal years without causing the Portfolio's expenses in any of those three years to exceed this expense cap and that UBS AM has not waived the right to do so. The fee waiver/expense reimbursement agreement may be terminated by the Portfolio's board at any time and also will terminate automatically upon the expiration or termination of the Portfolio's advisory contract with UBS AM. Upon termination of the agreement, however, UBS AM's three year recoupment rights will survive.
1 Maximum sales charge for Class A shares is 5.5%. Class A shares bear ongoing 12b-1 service fees of 0.25% annually.
2 Maximum contingent deferred sales charge for Class C shares is 1% imposed on redemptions and is reduced to 0% after one year. Class C shares bear ongoing 12b-1 service and distribution fees of 0.25% and 0.75% annually, respectively. As of July 12, 2018, Class C shares ceased paying 12b-1 distribution fees. See notes to financial statements—Subsequent events for additional information.
3 The Portfolio offers Class Y shares to a limited group of eligible investors, including certain qualifying retirement plans. Class Y shares do not bear initial or contingent deferred sales charges or ongoing 12b-1 service and distribution fees.
4 Class P shares do not bear initial or contingent deferred sales charges or ongoing 12b-1 service and distribution fees, but Class P shares held through advisory programs may be subject to a program fee, which, if included, would have reduced performance.
5 The Russell 2500 Value Index measures the performance of the small to mid-cap value segment of the US equity universe. It includes those Russell 2500 Index companies with lower price-to-book ratios and lower forecasted growth values. The Russell 2500 Value Index is constructed to provide a comprehensive and unbiased barometer of the small to mid-cap value market. The Index is completely reconstituted annually to ensure larger stocks do not distort the performance and characteristics of the true small to mid-cap opportunity set and that the represented companies continue to reflect value characteristics. Investors should note that indices do not reflect the deduction of fees and expenses.
6 On April 18, 2018, Lipper changed the peer group classification for PACE Small/Medium Co Value Equity Investments from the Small-Cap Core Funds category to the Small-Cap Value Funds category.
Past performance does not predict future performance, and the performance information provided does not reflect the deduction of taxes that a shareholder would pay on Portfolio distributions or the redemption of Portfolio shares. The return and principal value of an investment will fluctuate, so that an investor's shares, when redeemed, may be worth more or less than their original cost. Performance results assume reinvestment of all dividends and capital gain distributions at net asset value on the ex-dividend dates. Current performance may be higher or lower than the performance data quoted. For month-end performance figures, please visit www.ubs.com/us-mutualfundperformance.
Lipper peer group data calculated by Lipper Inc.; used with permission. The Lipper median is the return of the fund that places in the middle of a Lipper peer group.
181
PACE Small/Medium Co Value Equity Investments
Illustration of an assumed investment of $10,000 in Class P shares of the Portfolio (unaudited)
The following graph depicts the performance of PACE Small/Medium Co Value Equity Investments Class P shares versus the Russell 2500 Value Index over the 10 years ended July 31, 2018. Class P shares held through advisory programs may be subject to a program fee, which, if included, would have reduced performance. The performance of the other classes will vary based upon the different class specific expenses and sales charges. The performance provided does not reflect the deduction of taxes that a shareholder would pay on Portfolio distributions or the redemption of Portfolio shares. Past performance is no guarantee of future results. Share price and returns will vary with market conditions; investors may realize a gain or loss upon redemption. It is important to note that PACE Small/Medium Co Value Equity Investments is a professionally managed portfolio while the Index is not available for investment and is unmanaged. The comparison is shown for illustration purposes only.
PACE Small/Medium Co Value Equity Investments
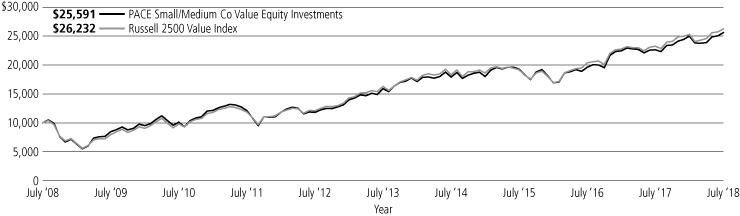
182
PACE Small/Medium Co Value Equity Investments
Portfolio statistics—July 31, 2018 (unaudited)
Top ten holdings1 | Percentage of net assets | ||||||
TransUnion | 1.9 | % | |||||
The Cheesecake Factory, Inc. | 1.8 | ||||||
Lamar Advertising Co., Class A | 1.8 | ||||||
Broadridge Financial Solutions, Inc. | 1.8 | ||||||
RBC Bearings, Inc. | 1.7 | ||||||
Expeditors International of Washington, Inc. | 1.5 | ||||||
HFF, Inc., Class A | 1.5 | ||||||
W.R. Berkley Corp. | 1.5 | ||||||
The Scotts Miracle-Gro Co., Class A | 1.5 | ||||||
Snap-on, Inc. | 1.4 | ||||||
Total | 16.4 | % | |||||
Top five issuer breakdown by country or territory of origin1 | Percentage of net assets | ||||||
United States | 92.0 | % | |||||
Bermuda | 6.5 | ||||||
Netherlands | 1.3 | ||||||
Puerto Rico | 1.3 | ||||||
Canada | 1.2 | ||||||
Total | 102.3 | % | |||||
Sectors1 | Percentage of net assets | ||||||
Financials | 29.7 | % | |||||
Industrials | 20.3 | ||||||
Information Technology | 12.2 | ||||||
Consumer Discretionary | 11.4 | ||||||
Energy | 8.5 | ||||||
Materials | 5.8 | ||||||
Health Care | 4.7 | ||||||
Consumer Staples | 2.4 | ||||||
Utilities | 1.7 | ||||||
Total | 96.7 | % | |||||
1 The Portfolio is actively managed and its composition will vary over time.
183
PACE Small/Medium Co Value Equity Investments
Portfolio of investments—July 31, 2018
| Number of shares | Value | ||||||||||
Common stocks—96.73% | |||||||||||
Aerospace & defense—0.14% | |||||||||||
Arconic, Inc. | 16,800 | $ | 364,392 | ||||||||
Wesco Aircraft Holdings, Inc.* | 34,600 | 413,470 | |||||||||
777,862 | |||||||||||
Air freight & logistics—1.77% | |||||||||||
Echo Global Logistics, Inc.* | 37,145 | 1,279,645 | |||||||||
Expeditors International of Washington, Inc. | 108,600 | 8,272,062 | |||||||||
9,551,707 | |||||||||||
Automobiles—0.93% | |||||||||||
Thor Industries, Inc. | 52,900 | 5,017,565 | |||||||||
Banks—9.86% | |||||||||||
Atlantic Capital Bancshares, Inc.* | 27,700 | 494,445 | |||||||||
Bank of Hawaii Corp.1 | 80,216 | 6,456,586 | |||||||||
Cadence BanCorp | 49,650 | 1,351,970 | |||||||||
Cathay General Bancorp | 45,200 | 1,879,868 | |||||||||
Citizens Financial Group, Inc. | 86,950 | 3,458,871 | |||||||||
Comerica, Inc. | 21,065 | 2,042,041 | |||||||||
First Citizens BancShares Inc., Class A | 2,400 | 976,368 | |||||||||
First Hawaiian, Inc. | 133,200 | 3,764,232 | |||||||||
First Horizon National Corp. | 104,600 | 1,871,294 | |||||||||
Glacier Bancorp, Inc. | 62,800 | 2,681,560 | |||||||||
Hancock Whitney Corp. | 54,450 | 2,736,112 | |||||||||
KeyCorp | 90,425 | 1,887,170 | |||||||||
PacWest Bancorp | 20,580 | 1,033,528 | |||||||||
Pinnacle Financial Partners, Inc. | 7,740 | 483,750 | |||||||||
Popular, Inc. | 52,450 | 2,603,093 | |||||||||
Regions Financial Corp. | 24,400 | 454,084 | |||||||||
Signature Bank | 46,770 | 5,131,137 | |||||||||
Sterling Bancorp | 282,175 | 6,264,285 | |||||||||
SunTrust Banks, Inc. | 11,500 | 828,805 | |||||||||
The Bank of NT Butterfield & Son Ltd. | 60,440 | 2,989,362 | |||||||||
United Community Banks, Inc. | 36,150 | 1,085,585 | |||||||||
Wintrust Financial Corp. | 30,736 | 2,696,469 | |||||||||
53,170,615 | |||||||||||
Building products—0.61% | |||||||||||
Continental Building Products, Inc.* | 102,400 | 3,266,560 | |||||||||
Capital markets—2.87% | |||||||||||
Artisan Partners Asset Management, Inc., Class A | 68,100 | 2,346,045 | |||||||||
BrightSphere Investment Group PLC | 31,700 | 451,725 | |||||||||
E*TRADE Financial Corp.* | 9,105 | 544,570 | |||||||||
Lazard Ltd., Class A | 17,250 | 936,675 | |||||||||
MSCI, Inc. | 44,750 | 7,437,003 | |||||||||
Stifel Financial Corp. | 24,510 | 1,351,236 | |||||||||
Uranium Participation Corp.* | 159,000 | 540,247 | |||||||||
Virtus Investment Partners, Inc. | 13,900 | 1,852,175 | |||||||||
15,459,676 | |||||||||||
Chemicals—3.73% | |||||||||||
Axalta Coating Systems Ltd.* | 162,258 | 4,908,304 | |||||||||
FMC Corp. | 14,145 | 1,271,352 | |||||||||
Huntsman Corp. | 56,605 | 1,897,966 | |||||||||
Innospec, Inc. | 25,392 | 2,055,482 | |||||||||
The Mosaic Co. | 34,090 | 1,026,450 | |||||||||
The Scotts Miracle-Gro Co., Class A1 | 99,790 | 7,926,320 | |||||||||
| Number of shares | Value | ||||||||||
Common stocks—(continued) | |||||||||||
Chemicals—(concluded) | |||||||||||
Venator Materials PLC* | 69,530 | $ | 1,016,529 | ||||||||
20,102,403 | |||||||||||
Commercial services & supplies—1.75% | |||||||||||
Herman Miller, Inc. | 17,465 | 661,050 | |||||||||
KAR Auction Services, Inc. | 68,150 | 4,051,517 | |||||||||
Ritchie Bros Auctioneers, Inc. | 86,550 | 2,879,519 | |||||||||
Steelcase, Inc., Class A | 134,650 | 1,851,438 | |||||||||
9,443,524 | |||||||||||
Communications equipment—0.66% | |||||||||||
ARRIS International PLC* | 17,800 | 449,628 | |||||||||
Comtech Telecommunications Corp. | 92,477 | 3,107,227 | |||||||||
3,556,855 | |||||||||||
Construction & engineering—1.44% | |||||||||||
EMCOR Group, Inc. | 18,845 | 1,450,123 | |||||||||
Granite Construction, Inc. | 12,665 | 683,277 | |||||||||
Jacobs Engineering Group, Inc. | 20,910 | 1,414,143 | |||||||||
KBR, Inc. | 210,525 | 4,206,289 | |||||||||
7,753,832 | |||||||||||
Consumer finance—0.91% | |||||||||||
Ally Financial, Inc. | 12,500 | 334,500 | |||||||||
Enova International, Inc.* | 19,426 | 602,206 | |||||||||
EZCORP, Inc., Class A* | 64,310 | 736,350 | |||||||||
Navient Corp. | 221,150 | 2,921,391 | |||||||||
Nelnet, Inc., Class A | 5,600 | 329,168 | |||||||||
4,923,615 | |||||||||||
Containers & packaging—0.83% | |||||||||||
Silgan Holdings, Inc. | 109,650 | 3,016,471 | |||||||||
WestRock Co. | 25,270 | 1,465,155 | |||||||||
4,481,626 | |||||||||||
Diversified financial services—0.60% | |||||||||||
FGL Holdings*,1 | 324,800 | 2,929,696 | |||||||||
Voya Financial, Inc. | 6,400 | 323,328 | |||||||||
3,253,024 | |||||||||||
Electric utilities—0.79% | |||||||||||
Entergy Corp. | 42,850 | 3,482,848 | |||||||||
Evergy, Inc. | 7,894 | 442,774 | |||||||||
Portland General Electric Co. | 7,000 | 317,520 | |||||||||
4,243,142 | |||||||||||
Electronic equipment, instruments & components—1.72% | |||||||||||
CDW Corp. | 77,700 | 6,533,793 | |||||||||
Control4 Corp.* | 33,010 | 839,444 | |||||||||
Orbotech Ltd.* | 4,740 | 304,498 | |||||||||
Zebra Technologies Corp., Class A* | 11,675 | 1,610,333 | |||||||||
9,288,068 | |||||||||||
Energy equipment & services—5.29% | |||||||||||
Cactus, Inc., Class A* | 61,350 | 2,007,372 | |||||||||
Core Laboratories N.V.1 | 64,550 | 7,237,346 | |||||||||
Dril-Quip, Inc.*,1 | 80,000 | 4,124,000 | |||||||||
Ensco PLC, Class A | 51,100 | 379,673 | |||||||||
184
PACE Small/Medium Co Value Equity Investments
Portfolio of investments—July 31, 2018
| Number of shares | Value | ||||||||||
Common stocks—(continued) | |||||||||||
Energy equipment & services—(concluded) | |||||||||||
Forum Energy Technologies, Inc.* | 338,050 | $ | 4,445,358 | ||||||||
McDermott International, Inc.* | 49,130 | 884,831 | |||||||||
NCS Multistage Holdings, Inc.*,1 | 200,823 | 3,185,053 | |||||||||
Precision Drilling Corp.* | 581,645 | 2,111,371 | |||||||||
Superior Energy Services, Inc.* | 43,200 | 425,088 | |||||||||
TETRA Technologies, Inc.* | 77,900 | 335,749 | |||||||||
Weatherford International PLC*,1 | 1,009,600 | 3,422,544 | |||||||||
28,558,385 | |||||||||||
Equity real estate investment trusts—8.03% | |||||||||||
CatchMark Timber Trust, Inc., Class A | 24,337 | 302,266 | |||||||||
CoreCivic, Inc. | 100,350 | 2,572,974 | |||||||||
Cousins Properties, Inc. | 131,050 | 1,221,386 | |||||||||
Gaming and Leisure Properties, Inc. | 38,080 | 1,383,066 | |||||||||
Government Properties Income Trust | 68,600 | 1,033,802 | |||||||||
Granite Real Estate Investment Trust | 25,900 | 1,071,224 | |||||||||
Host Hotels & Resorts, Inc. | 76,650 | 1,605,051 | |||||||||
Lamar Advertising Co., Class A | 133,250 | 9,811,197 | |||||||||
Liberty Property Trust | 57,065 | 2,445,806 | |||||||||
Medical Properties Trust, Inc. | 183,875 | 2,649,639 | |||||||||
Outfront Media, Inc. | 184,630 | 3,923,387 | |||||||||
Physicians Realty Trust | 173,900 | 2,740,664 | |||||||||
Piedmont Office Realty Trust, Inc., Class A | 82,173 | 1,625,382 | |||||||||
QTS Realty Trust, Inc., Class A | 115,800 | 4,950,450 | |||||||||
Redwood Trust, Inc. | 210,650 | 3,541,026 | |||||||||
Ryman Hospitality Properties, Inc. | 11,365 | 966,139 | |||||||||
Sabra Health Care REIT, Inc. | 37,360 | 807,350 | |||||||||
SL Green Realty Corp. | 6,255 | 644,953 | |||||||||
43,295,762 | |||||||||||
Food & staples retailing—0.16% | |||||||||||
US Foods Holding Corp.* | 25,645 | 867,057 | |||||||||
Food products—1.91% | |||||||||||
Conagra Brands, Inc. | 9,000 | 330,390 | |||||||||
Lamb Weston Holdings, Inc. | 6,600 | 463,782 | |||||||||
Nomad Foods Ltd.* | 64,210 | 1,219,990 | |||||||||
Pinnacle Foods, Inc. | 7,285 | 483,870 | |||||||||
Post Holdings, Inc.*,1 | 59,533 | 5,153,176 | |||||||||
TreeHouse Foods, Inc.* | 50,633 | 2,404,561 | |||||||||
Tyson Foods, Inc., Class A | 4,500 | 259,425 | |||||||||
10,315,194 | |||||||||||
Health care equipment & supplies—1.89% | |||||||||||
Anika Therapeutics, Inc.* | 116,600 | 4,667,498 | |||||||||
CONMED Corp. | 6,400 | 473,600 | |||||||||
Hill-Rom Holdings, Inc. | 17,245 | 1,624,479 | |||||||||
Natus Medical, Inc.* | 94,200 | 3,438,300 | |||||||||
10,203,877 | |||||||||||
Health care providers & services—1.44% | |||||||||||
Acadia Healthcare Co., Inc.*,1 | 64,000 | 2,526,720 | |||||||||
Amedisys, Inc.* | 14,950 | 1,399,769 | |||||||||
Encompass Health Corp. | 12,540 | 948,400 | |||||||||
Hanger, Inc.* | 30,400 | 532,000 | |||||||||
Tenet Healthcare Corp.* | 16,100 | 605,843 | |||||||||
WellCare Health Plans, Inc.* | 6,670 | 1,783,691 | |||||||||
7,796,423 | |||||||||||
| Number of shares | Value | ||||||||||
Common stocks—(continued) | |||||||||||
Hotels, restaurants & leisure—3.34% | |||||||||||
Brinker International, Inc. | 14,835 | $ | 699,767 | ||||||||
Caesars Entertainment Corp.* | 166,565 | 1,882,185 | |||||||||
Darden Restaurants, Inc. | 4,000 | 427,760 | |||||||||
Dave & Buster's Entertainment, Inc.*,1 | 102,950 | 5,059,992 | |||||||||
The Cheesecake Factory, Inc.1 | 177,300 | 9,934,119 | |||||||||
18,003,823 | |||||||||||
Household durables—1.04% | |||||||||||
Lennar Corp., Class B | 10,750 | 464,400 | |||||||||
Tupperware Brands Corp. | 28,100 | 1,031,551 | |||||||||
Whirlpool Corp. | 31,220 | 4,092,942 | |||||||||
5,588,893 | |||||||||||
Household products—0.71% | |||||||||||
WD-40 Co.1 | 24,100 | 3,859,615 | |||||||||
Independent power and renewable electricity producers—0.31% | |||||||||||
NRG Energy, Inc. | 16,515 | 523,030 | |||||||||
Vistra Energy Corp.* | 52,095 | 1,177,347 | |||||||||
1,700,377 | |||||||||||
Insurance—5.02% | |||||||||||
Argo Group International Holdings Ltd. | 74,272 | 4,645,714 | |||||||||
Aspen Insurance Holdings Ltd. | 154,030 | 6,230,513 | |||||||||
Assured Guaranty Ltd. | 56,700 | 2,206,764 | |||||||||
Athene Holding Ltd., Class A* | 23,965 | 1,099,275 | |||||||||
Brighthouse Financial, Inc.* | 13,000 | 564,590 | |||||||||
CNA Financial Corp. | 40,025 | 1,872,370 | |||||||||
CNO Financial Group, Inc. | 39,237 | 798,473 | |||||||||
Old Republic International Corp. | 74,720 | 1,592,283 | |||||||||
W.R. Berkley Corp. | 106,150 | 8,047,231 | |||||||||
27,057,213 | |||||||||||
Internet software & services—0.91% | |||||||||||
Cars.com, Inc.* | 172,200 | 4,885,314 | |||||||||
IT services—5.35% | |||||||||||
Broadridge Financial Solutions, Inc. | 86,000 | 9,716,280 | |||||||||
Cass Information Systems, Inc. | 101,895 | 6,862,628 | |||||||||
EVERTEC, Inc. | 184,450 | 4,297,685 | |||||||||
Jack Henry & Associates, Inc. | 47,000 | 6,330,900 | |||||||||
Perficient, Inc.* | 47,195 | 1,242,172 | |||||||||
Science Applications International Corp. | 5,400 | 455,598 | |||||||||
28,905,263 | |||||||||||
Life sciences tools & services—1.05% | |||||||||||
ICON PLC* | 2,730 | 379,907 | |||||||||
PerkinElmer, Inc. | 16,725 | 1,324,285 | |||||||||
Syneos Health, Inc.* | 80,200 | 3,951,855 | |||||||||
5,656,047 | |||||||||||
Machinery—7.53% | |||||||||||
Altra Industrial Motion Corp. | 67,085 | 2,945,031 | |||||||||
Donaldson Co., Inc. | 93,800 | 4,474,260 | |||||||||
EnPro Industries, Inc. | 40,600 | 3,101,434 | |||||||||
Graco, Inc. | 130,100 | 6,002,814 | |||||||||
Meritor, Inc.* | 65,990 | 1,359,394 | |||||||||
RBC Bearings, Inc.* | 61,100 | 8,882,718 | |||||||||
185
PACE Small/Medium Co Value Equity Investments
Portfolio of investments—July 31, 2018
| Number of shares | Value | ||||||||||
Common stocks—(continued) | |||||||||||
Machinery—(concluded) | |||||||||||
Snap-on, Inc. | 45,600 | $ | 7,733,304 | ||||||||
Terex Corp. | 80,075 | 3,532,909 | |||||||||
The Greenbrier Cos, Inc. | 18,485 | 1,047,175 | |||||||||
The Timken Co. | 13,715 | 675,464 | |||||||||
Trinity Industries, Inc. | 23,115 | 880,682 | |||||||||
40,635,185 | |||||||||||
Media—1.42% | |||||||||||
Cinemark Holdings, Inc., Class A1 | 151,800 | 5,452,656 | |||||||||
Liberty Latin America Ltd., Class A* | 116,370 | 2,220,340 | |||||||||
7,672,996 | |||||||||||
Metals & mining—0.56% | |||||||||||
Alcoa Corp.* | 16,570 | 716,984 | |||||||||
Carpenter Technology Corp. | 7,100 | 388,867 | |||||||||
Commercial Metals Co. | 58,760 | 1,312,698 | |||||||||
Kaiser Aluminum Corp. | 5,500 | 613,910 | |||||||||
3,032,459 | |||||||||||
Multi-utilities—0.56% | |||||||||||
NorthWestern Corp. | 50,998 | 3,025,711 | |||||||||
Oil, gas & consumable fuels—3.21% | |||||||||||
Chesapeake Energy Corp.* | 154,700 | 730,184 | |||||||||
Delek US Holdings, Inc. | 25,260 | 1,346,863 | |||||||||
Energen Corp.* | 46,605 | 3,457,159 | |||||||||
Euronav N.V.* | 10,500 | 88,725 | |||||||||
Golar LNG Ltd. | 22,070 | 574,041 | |||||||||
Golar LNG Partners LP | 85,400 | 1,401,414 | |||||||||
HighPoint Resources Corp.* | 80,900 | 529,086 | |||||||||
Oasis Petroleum, Inc.* | 348,690 | 4,260,992 | |||||||||
Teekay Tankers Ltd., Class A | 427,091 | 405,096 | |||||||||
WPX Energy, Inc.* | 242,395 | 4,549,754 | |||||||||
17,343,314 | |||||||||||
Paper & forest products—0.20% | |||||||||||
KapStone Paper and Packaging Corp. | 14,100 | 490,398 | |||||||||
Louisiana-Pacific Corp. | 21,390 | 575,819 | |||||||||
1,066,217 | |||||||||||
Personal products—0.33% | |||||||||||
elf Beauty, Inc.*,1 | 124,400 | 1,796,336 | |||||||||
Pharmaceuticals—0.27% | |||||||||||
Jazz Pharmaceuticals PLC* | 8,275 | 1,432,237 | |||||||||
Professional services—2.51% | |||||||||||
ICF International, Inc. | 11,010 | 810,887 | |||||||||
Resources Connection, Inc. | 151,420 | 2,407,578 | |||||||||
TransUnion | 142,500 | 10,317,000 | |||||||||
13,535,465 | |||||||||||
Real estate management & development—1.83% | |||||||||||
CBRE Group, Inc., Class A* | 31,940 | 1,590,612 | |||||||||
HFF, Inc., Class A | 183,650 | 8,266,087 | |||||||||
9,856,699 | |||||||||||
| Number of shares | Value | ||||||||||
Common stocks—(concluded) | |||||||||||
Road & rail—2.58% | |||||||||||
Genesee & Wyoming, Inc., Class A* | 39,450 | $ | 3,392,700 | ||||||||
Knight-Swift Transportation Holdings, Inc.1 | 118,642 | 3,861,797 | |||||||||
Landstar System, Inc. | 60,200 | 6,691,230 | |||||||||
13,945,727 | |||||||||||
Semiconductors & semiconductor equipment—0.64% | |||||||||||
Ichor Holdings Ltd.* | 24,430 | 513,030 | |||||||||
MKS Instruments, Inc. | 7,430 | 700,649 | |||||||||
Rudolph Technologies, Inc.* | 30,670 | 877,162 | |||||||||
SMART Global Holdings, Inc.* | 27,115 | 827,821 | |||||||||
SolarEdge Technologies, Inc.* | 10,165 | 541,286 | |||||||||
3,459,948 | |||||||||||
Software—1.97% | |||||||||||
American Software, Inc., Class A | 408,580 | 6,112,357 | |||||||||
CA, Inc. | 30,000 | 1,326,300 | |||||||||
Synopsys, Inc.* | 19,300 | 1,725,999 | |||||||||
Verint Systems, Inc.* | 32,440 | 1,456,556 | |||||||||
10,621,212 | |||||||||||
Specialty retail—3.63% | |||||||||||
Ascena Retail Group, Inc.* | 1,021,360 | 3,758,605 | |||||||||
Burlington Stores, Inc.* | 3,195 | 488,228 | |||||||||
Dick's Sporting Goods, Inc. | 53,680 | 1,832,635 | |||||||||
Foot Locker, Inc. | 29,725 | 1,450,877 | |||||||||
Party City Holdco, Inc.* | 113,600 | 1,789,200 | |||||||||
Signet Jewelers Ltd.1 | 59,390 | 3,429,179 | |||||||||
The Michaels Cos. Inc.* | 334,595 | 6,829,084 | |||||||||
19,577,808 | |||||||||||
Technology hardware, storage & peripherals—0.75% | |||||||||||
Diebold Nixdorf, Inc.1 | 324,900 | 3,687,615 | |||||||||
Hewlett Packard Enterprise Co. | 22,800 | 352,032 | |||||||||
4,039,647 | |||||||||||
Textiles, apparel & luxury goods—0.34% | |||||||||||
PVH Corp. | 7,667 | 1,177,038 | |||||||||
Ralph Lauren Corp. | 4,860 | 656,003 | |||||||||
1,833,041 | |||||||||||
Thrifts & mortgage finance—1.16% | |||||||||||
Essent Group Ltd.* | 93,850 | 3,603,840 | |||||||||
Washington Federal, Inc. | 78,869 | 2,646,055 | |||||||||
6,249,895 | |||||||||||
Trading companies & distributors—2.18% | |||||||||||
Air Lease Corp. | 51,300 | 2,255,148 | |||||||||
Beacon Roofing Supply, Inc.* | 152,400 | 6,412,992 | |||||||||
Titan Machinery, Inc.* | 74,730 | 1,131,412 | |||||||||
Triton International Ltd. | 55,230 | 1,944,096 | |||||||||
11,743,648 | |||||||||||
| Total common stocks (cost—$440,314,972) | 521,850,862 | ||||||||||
186
PACE Small/Medium Co Value Equity Investments
Portfolio of investments—July 31, 2018
| Number of shares | Value | ||||||||||
Short-term investment—3.47% | |||||||||||
Investment companies—3.47% | |||||||||||
| State Street Institutional U.S. Government Money Market Fund (cost—$18,732,789) | 18,732,789 | $ | 18,732,789 | ||||||||
Investment of cash collateral from securities loaned—4.75% | |||||||||||
Money market fund—4.75% | |||||||||||
| State Street Navigator Securities Lending Government Money Market Portfolio (cost—$25,616,918) | 25,616,918 | 25,616,918 | |||||||||
| Total investments (cost—$484,664,679)—104.95% | 566,200,569 | ||||||||||
Liabilities in excess of other assets—(4.95)% | (26,728,900 | ) | |||||||||
Net assets—100.00% | $ | 539,471,669 | |||||||||
For a listing of defined portfolio acronyms that are used throughout the Portfolio of investments as well as the tables that follow, please refer to page 273.
Fair valuation summary
The following is a summary of the fair valuations according to the inputs used as of July 31, 2018 in valuing the Portfolio's investments. In the event a Portfolio holds investments for which fair value is measured using the NAV per share practical expedient (or its equivalent), a separate column will be added to the fair value hierarchy table; this is intended to permit reconciliation to the amounts presented in the Portfolio of investments.
| Assets Description | Unadjusted quoted prices in active markets for identical investments (Level 1) | Other significant observable inputs (Level 2) | Unobservable inputs (Level 3) | Total | |||||||||||||||
Common stocks | $ | 521,850,862 | $ | — | $ | — | $ | 521,850,862 | |||||||||||
Short-term investment | — | 18,732,789 | — | 18,732,789 | |||||||||||||||
Investment of cash collateral from securities loaned | — | 25,616,918 | — | 25,616,918 | |||||||||||||||
Total | $ | 521,850,862 | $ | 44,349,707 | $ | — | $ | 566,200,569 | |||||||||||
At July 31, 2018, there were no transfers between Level 1 and Level 2.
Portfolio footnotes
* Non-income producing security.
1 Security, or portion thereof, was on loan at the period end.
See accompanying notes to financial statements.
187
PACE Small/Medium Co Growth Equity Investments
Performance (unaudited)
For the 12 months ended July 31, 2018, the Portfolio's Class P shares gained 23.46% before the deduction of the maximum PACE Select program fee.1 In comparison, the Russell 2500 Growth Index (the "benchmark") returned 22.18%, and the Lipper Small-Cap Growth Funds category posted a median return of 23.67%. (Returns for all share classes over various time periods are shown in the "Performance at a glance" table on page 190. Please note that the returns shown do not reflect the deduction of taxes that a shareholder would pay on Portfolio distributions or the redemption of Portfolio shares.) For a detailed commentary on the market environment in general during the reporting period, please refer to page 3.
Advisor comments (unaudited)2
The Portfolio outperformed the benchmark during the reporting period. The primary contributor was sector allocation, largely due to underweights to materials and real estate, along with an overweight to information technology. Stock selection was additive due to strong performance within the consumer discretionary sector. Grand Canyon Education, Inc. was a top individual contributor. Stock selection in the industrials and information technology sectors detracted from performance. Meanwhile, the Portfolio's tilt towards growth was additive during the period.
Derivatives were not used during the reporting period.
1 Class P shares held through the PACE Select Advisors Program are subject to a maximum Program fee of 2.50%, which, if included, would have reduced performance. Class P shares held through other advisory programs also may be subject to a program fee, which, if included, would have reduced performance.
2 All Sub-Advisors discuss performance on a gross-of-fees basis—meaning that no fees or expenses are reflected in their sleeves'/sleeve's performance. Alternately, Portfolio performance is shown net of fees, which does factor in fees and expenses associated with the Portfolio.
PACE Select Advisors Trust – PACE Small/Medium Co Growth Equity Investments
Investment Manager:
UBS Asset Management (Americas) Inc. ("UBS AM")
Investment Subadvisors:
Riverbridge Partners, LLC ("Riverbridge"); LMCG Investments, LLC, formerly Lee Munder Capital Group ("LMCG"); Timpani Capital Management LLC ("Timpani")
Portfolio Management Team:
UBS AM: Mabel Lung, CFA and Fred Lee, CFA, assisted by Vincent Russo and Mayoor Joshi
Riverbridge: Mark Thompson;
LMCG: Andrew Morey;
Timpani: Brandon Nelson
Objective:
Capital appreciation
Investment process:
The main strategies of the subadvisors include:
• A growth strategy that focuses on companies viewed as building their earnings power and intrinsic value.
• A growth strategy that involves seeking to achieve competitive returns in small/medium capitalization companies by identifying unrecognized growth potential.
• A strategy in which the subadvisor seeks to identify and exploit the perception gap that exits between a company's business strength and the market's expectation of that strength.
188
PACE Small/Medium Co Growth Equity Investments
Special considerations
The Portfolio may be appropriate for long-term investors seeking capital appreciation who are able to withstand short-term fluctuations in the equity markets in return for potentially higher returns over the long term. The value of the Portfolio changes every day and can be affected by changes in interest rates, general market conditions and other political, social and economic developments, as well as specific matters relating to the companies in whose securities the Portfolio invests. It is important to note that an investment in the Portfolio is only one component of a balanced investment plan. In addition, small- and mid-cap companies are typically subject to a greater degree of change in earnings and business prospects than are larger, more established companies. Therefore, they are considered to have a higher level of volatility and risk. Also, to the extent the Portfolio invests a large portion of its assets in a particular sector, the Portfolio may experience greater volatility and risk of loss due to unfavorable developments in that sector.
189
PACE Small/Medium Co Growth Equity Investments
Performance at a glance (unaudited)
Average annual total returns for periods ended 07/31/18 | 1 year | 5 years | 10 years | ||||||||||||
Before deducting maximum sales charge | |||||||||||||||
Class A1 | 23.29 | % | 10.20 | % | 10.49 | % | |||||||||
Class C2 | 22.33 | 9.36 | 9.64 | ||||||||||||
Class Y3 | 23.97 | 10.40 | 10.70 | ||||||||||||
Class P4 | 23.46 | 10.32 | 10.65 | ||||||||||||
After deducting maximum sales charge | |||||||||||||||
Class A1 | 16.49 | 8.95 | 9.86 | ||||||||||||
Class C2 | 21.33 | 9.36 | 9.64 | ||||||||||||
Russell 2500 Growth Index5 | 22.18 | 12.67 | 11.62 | ||||||||||||
Lipper Small-Cap Growth Funds median | 23.67 | 11.82 | 11.20 | ||||||||||||
Most recent calendar quarter-end returns (unaudited)
Average annual total returns for periods ended 06/30/18 | 1 year | 5 years | 10 years | ||||||||||||
Before deducting maximum sales charge | |||||||||||||||
Class A1 | 23.68 | % | 11.60 | % | 10.21 | ||||||||||
Class C2 | 22.71 | 10.74 | 9.36 | ||||||||||||
Class Y3 | 24.23 | 11.77 | 10.41 | ||||||||||||
Class P4 | 23.83 | 11.72 | 10.37 | ||||||||||||
After deducting maximum sales charge | |||||||||||||||
Class A1 | 16.90 | 10.34 | 9.59 | ||||||||||||
Class C2 | 21.71 | 10.74 | 9.36 | ||||||||||||
The annualized gross and net expense ratios, respectively, for each class of shares as in the November 28, 2017 prospectuses, supplemented from time to time, were as follows: Class A—1.23% and 1.23%; Class C—2.00% and 2.00%; Class Y—1.24% and 1.08%; and Class P—1.11% and 1.08%. Net expenses reflect fee waivers and/or expense reimbursements, if any, pursuant to an agreement that is in effect to cap the expenses. The Portfolio and UBS Asset Management (Americas) Inc. ("UBS AM") have entered into a written fee waiver/expense reimbursement agreement pursuant to which UBS AM is contractually obligated to waive its management fees and/or reimburse expenses so that the Portfolio's ordinary total operating expenses through November 30, 2018 (excluding dividend expense, borrowing costs, and interest expense relating to short sales, and expenses attributable to investment in other investment companies, interest, taxes, brokerage commissions and extraordinary expenses) would not exceed Class A—1.33%; Class C—2.08%; Class Y—1.08%; and Class P—1.08%. "Management fee waiver/expense reimbursements" are based on estimated amounts for the current fiscal year. The Portfolio has agreed to repay UBS AM for any waived fees/reimbursed expenses to the extent that it can do so over the following three fiscal years without causing the Portfolio's expenses in any of those three years to exceed this expense cap and that UBS AM has not waived the right to do so. The fee waiver/expense reimbursement agreement may be terminated by the Portfolio's board at any time and also will terminate automatically upon the expiration or termination of the Portfolio's advisory contract with UBS AM. Upon termination of the agreement, however, UBS AM's three year recoupment rights will survive.
1 Maximum sales charge for Class A shares is 5.5%. Class A shares bear ongoing 12b-1 service fees of 0.25% annually.
2 Maximum contingent deferred sales charge for Class C shares is 1% imposed on redemptions and is reduced to 0% after one year. Class C shares bear ongoing 12b-1 service and distribution fees of 0.25% and 0.75% annually, respectively. As of July 12, 2018, Class C shares ceased paying 12b-1 distribution fees. See notes to financial statements—Subsequent events for additional information.
3 The Portfolio offers Class Y shares to a limited group of eligible investors, including certain qualifying retirement plans. Class Y shares do not bear initial or contingent deferred sales charges or ongoing 12b-1 service and distribution fees.
4 Class P shares do not bear initial or contingent deferred sales charges or ongoing 12b-1 service and distribution fees, but Class P shares held through advisory programs may be subject to a program fee, which, if included, would have reduced performance.
5 The Russell 2500 Growth Index measures the performance of the small to mid-cap growth segment of the US equity universe. It includes those Russell 2500 Index companies with higher price-to-book ratios and higher forecasted growth values. The Russell 2500 Growth Index is constructed to provide a comprehensive and unbiased barometer of the small to mid-cap growth market. The Index is completely reconstituted annually to ensure larger stocks do not distort the performance and characteristics of the true small to mid-cap opportunity set and that the represented companies continue to reflect growth characteristics. Investors should note that indices do not reflect the deduction of fees and expenses.
Past performance does not predict future performance, and the performance information provided does not reflect the deduction of taxes that a shareholder would pay on Portfolio distributions or the redemption of Portfolio shares. The return and principal value of an investment will fluctuate, so that an investor's shares, when redeemed, may be worth more or less than their original cost. Performance results assume reinvestment of all dividends and capital gain distributions at net asset value on the ex-dividend dates. Current performance may be higher or lower than the performance data quoted. For month-end performance figures, please visit www.ubs.com/us-mutualfundperformance.
Lipper peer group data calculated by Lipper Inc.; used with permission. The Lipper median is the return of the fund that places in the middle of a Lipper peer group.
190
PACE Small/Medium Co Growth Equity Investments
Illustration of an assumed investment of $10,000 in Class P shares of the Portfolio (unaudited)
The following graph depicts the performance of PACE Small/Medium Co Growth Equity Investments Class P shares versus the Russell 2500 Growth Index over the 10 years ended July 31, 2018. Class P shares held through advisory programs may be subject to a program fee, which, if included, would have reduced performance. The performance of the other classes will vary based upon the different class specific expenses and sales charges. The performance provided does not reflect the deduction of taxes that a shareholder would pay on Portfolio distributions or the redemption of Portfolio shares. Past performance is no guarantee of future results. Share price and returns will vary with market conditions; investors may realize a gain or loss upon redemption. It is important to note that PACE Small/Medium Co Growth Equity Investments is a professionally managed portfolio while the Index is not available for investment and is unmanaged. The comparison is shown for illustration purposes only.
PACE Small/Medium Co Growth Equity Investments
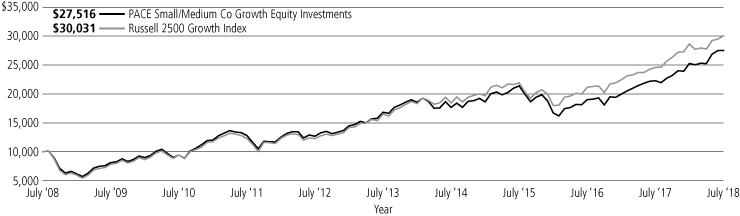
191
PACE Small/Medium Co Growth Equity Investments
Portfolio statistics—July 31, 2018 (unaudited)
Top ten holdings1 | Percentage of net assets | ||||||
Proto Labs, Inc. | 2.4 | % | |||||
Five Below, Inc. | 2.1 | ||||||
Paylocity Holding Corp. | 2.0 | ||||||
Chemed Corp. | 2.0 | ||||||
Grand Canyon Education, Inc. | 2.0 | ||||||
Ritchie Brothers Auctioneers, Inc. | 1.7 | ||||||
LHC Group, Inc. | 1.6 | ||||||
2U, Inc. | 1.6 | ||||||
GTT Communications, Inc. | 1.5 | ||||||
Ultimate Software Group, Inc. | 1.5 | ||||||
Total | 18.4 | % | |||||
Top five issuer breakdown by country or territory of origin1 | Percentage of net assets | ||||||
United States | 98.5 | % | |||||
Canada | 1.8 | ||||||
Luxembourg | 1.2 | ||||||
Jersey | 0.9 | ||||||
Bermuda | 0.5 | ||||||
Total | 102.9 | % | |||||
Sectors1 | Percentage of net assets | ||||||
Information Technology | 32.6 | % | |||||
Health Care | 21.7 | ||||||
Industrials | 17.8 | ||||||
Consumer Discretionary | 14.6 | ||||||
Financials | 4.5 | ||||||
Consumer Staples | 2.9 | ||||||
Telecommunication Services | 2.1 | ||||||
Materials | 0.6 | ||||||
Energy | 0.1 | ||||||
Total | 96.9 | % | |||||
1 The Portfolio is actively managed and its composition will vary over time.
192
PACE Small/Medium Co Growth Equity Investments
Portfolio of investments—July 31, 2018
| Number of shares | Value | ||||||||||
Common stocks—96.91% | |||||||||||
Aerospace & defense—2.33% | |||||||||||
Curtiss-Wright Corp. | 33,526 | $ | 4,459,964 | ||||||||
HEICO Corp. | 103,480 | 7,902,767 | |||||||||
Mercury Systems, Inc.* | 8,444 | 352,368 | |||||||||
12,715,099 | |||||||||||
Auto components—2.24% | |||||||||||
Dorman Products, Inc.* | 81,957 | 6,120,549 | |||||||||
Gentex Corp. | 264,104 | 6,127,213 | |||||||||
12,247,762 | |||||||||||
Banks—1.74% | |||||||||||
Cadence BanCorp | 23,067 | 628,115 | |||||||||
Home Bancshares, Inc. | 82,702 | 1,917,859 | |||||||||
Pinnacle Financial Partners, Inc. | 14,501 | 906,313 | |||||||||
SVB Financial Group* | 6,039 | 1,859,287 | |||||||||
Texas Capital Bancshares, Inc.* | 8,953 | 812,932 | |||||||||
Western Alliance Bancorp* | 59,257 | 3,361,057 | |||||||||
9,485,563 | |||||||||||
Beverages—0.05% | |||||||||||
Primo Water Corp.* | 14,542 | 255,212 | |||||||||
Biotechnology—3.55% | |||||||||||
Agios Pharmaceuticals, Inc.*,1 | 33,326 | 2,879,700 | |||||||||
Alkermes PLC*,1 | 21,423 | 939,399 | |||||||||
AnaptysBio, Inc.*,1 | 11,526 | 902,716 | |||||||||
Bluebird Bio, Inc.*,1 | 13,269 | 2,055,368 | |||||||||
Blueprint Medicines Corp.* | 15,931 | 948,532 | |||||||||
CareDx, Inc.* | 27,971 | 376,490 | |||||||||
Immunomedics, Inc.*,1 | 56,282 | 1,346,828 | |||||||||
Ligand Pharmaceuticals, Inc.*,1 | 15,955 | 3,483,455 | |||||||||
Loxo Oncology, Inc.*,1 | 3,032 | 508,133 | |||||||||
Myriad Genetics, Inc.* | 19,612 | 858,025 | |||||||||
Natera, Inc.* | 14,179 | 325,550 | |||||||||
Neurocrine Biosciences, Inc.* | 5,790 | 581,837 | |||||||||
REGENXBIO, Inc.*,1 | 3,238 | 227,631 | |||||||||
Sarepta Therapeutics, Inc.*,1 | 24,886 | 2,892,749 | |||||||||
Veracyte, Inc.* | 33,715 | 365,133 | |||||||||
Vericel Corp.* | 69,841 | 729,838 | |||||||||
19,421,384 | |||||||||||
Building products—0.66% | |||||||||||
PGT Innovations, Inc.* | 54,629 | 1,311,096 | |||||||||
Trex Co., Inc.* | 29,306 | 2,278,248 | |||||||||
3,589,344 | |||||||||||
Capital markets—0.20% | |||||||||||
Blucora, Inc.* | 14,181 | 492,790 | |||||||||
LPL Financial Holdings, Inc. | 8,838 | 585,871 | |||||||||
1,078,661 | |||||||||||
Chemicals—0.61% | |||||||||||
Ingevity Corp.* | 24,664 | 2,458,261 | |||||||||
KMG Chemicals, Inc. | 12,105 | 869,139 | |||||||||
3,327,400 | |||||||||||
| Number of shares | Value | ||||||||||
Common stocks—(continued) | |||||||||||
Commercial services & supplies—4.52% | |||||||||||
Healthcare Services Group, Inc.1 | 194,713 | $ | 7,839,145 | ||||||||
Mobile Mini, Inc. | 181,606 | 7,745,496 | |||||||||
Ritchie Brothers Auctioneers, Inc. | 273,624 | 9,103,471 | |||||||||
24,688,112 | |||||||||||
Communications equipment—0.42% | |||||||||||
Digi International, Inc.* | 170,927 | 2,307,515 | |||||||||
Construction & engineering—1.11% | |||||||||||
MasTec, Inc.* | 72,660 | 3,382,323 | |||||||||
NV5 Global, Inc.*,1 | 8,151 | 613,770 | |||||||||
Quanta Services, Inc.* | 60,797 | 2,071,354 | |||||||||
6,067,447 | |||||||||||
Consumer finance—1.58% | |||||||||||
Green Dot Corp., Class A* | 29,619 | 2,349,379 | |||||||||
PRA Group, Inc.*,1 | 159,781 | 6,263,415 | |||||||||
8,612,794 | |||||||||||
Diversified consumer services—3.05% | |||||||||||
Aspen Group, Inc.*,1 | 14,350 | 99,589 | |||||||||
Chegg, Inc.*,1 | 119,117 | 3,292,987 | |||||||||
Grand Canyon Education, Inc.* | 92,792 | 10,813,052 | |||||||||
Weight Watchers International, Inc.* | 27,421 | 2,455,002 | |||||||||
16,660,630 | |||||||||||
Diversified telecommunication services—1.00% | |||||||||||
Zayo Group Holdings, Inc.* | 146,702 | 5,441,177 | |||||||||
Electrical equipment—0.31% | |||||||||||
TPI Composites, Inc.* | 55,170 | 1,700,339 | |||||||||
Electronic equipment, instruments & components—1.78% | |||||||||||
FLIR Systems, Inc. | 14,367 | 841,906 | |||||||||
Littelfuse, Inc. | 3,711 | 804,619 | |||||||||
National Instruments Corp. | 184,897 | 8,100,338 | |||||||||
9,746,863 | |||||||||||
Energy equipment & services—0.06% | |||||||||||
Profire Energy, Inc.* | 93,705 | 326,093 | |||||||||
Food & staples retailing—0.29% | |||||||||||
United Natural Foods, Inc.* | 49,254 | 1,585,979 | |||||||||
Food products—1.87% | |||||||||||
Calavo Growers, Inc.1 | 61,935 | 5,728,988 | |||||||||
Freshpet, Inc.*,1 | 154,254 | 4,473,366 | |||||||||
10,202,354 | |||||||||||
Health care equipment & supplies—4.28% | |||||||||||
AxoGen, Inc.* | 12,197 | 547,950 | |||||||||
Heska Corp.* | 53,940 | 5,407,485 | |||||||||
Inogen, Inc.* | 9,991 | 1,990,707 | |||||||||
iRadimed Corp.* | 12,155 | 279,565 | |||||||||
iRhythm Technologies, Inc.* | 20,636 | 1,559,050 | |||||||||
Merit Medical Systems, Inc.* | 41,316 | 2,243,459 | |||||||||
Neogen Corp.* | 63,562 | 5,237,509 | |||||||||
193
PACE Small/Medium Co Growth Equity Investments
Portfolio of investments—July 31, 2018
| Number of shares | Value | ||||||||||
Common stocks—(continued) | |||||||||||
Health care equipment & supplies—(concluded) | |||||||||||
Neuronetics, Inc.* | 2,984 | $ | 74,451 | ||||||||
Penumbra, Inc.* | 6,057 | 861,608 | |||||||||
Tactile Systems Technology, Inc.*,1 | 32,294 | 1,552,372 | |||||||||
The Cooper Cos., Inc. | 13,898 | 3,620,429 | |||||||||
23,374,585 | |||||||||||
Health care providers & services—7.01% | |||||||||||
Addus HomeCare Corp.* | 18,629 | 1,232,308 | |||||||||
AMN Healthcare Services, Inc.*,1 | 66,289 | 4,010,484 | |||||||||
Chemed Corp. | 35,235 | 11,135,317 | |||||||||
Encompass Health Corp. | 23,595 | 1,784,490 | |||||||||
LHC Group, Inc.* | 102,968 | 8,863,485 | |||||||||
PetIQ, Inc.*,1 | 32,619 | 893,761 | |||||||||
R1 RCM, Inc.* | 58,228 | 466,989 | |||||||||
US Physical Therapy, Inc. | 69,120 | 7,240,320 | |||||||||
WellCare Health Plans, Inc.* | 10,056 | 2,689,176 | |||||||||
38,316,330 | |||||||||||
Health care technology—5.07% | |||||||||||
athenahealth, Inc.* | 48,163 | 7,258,646 | |||||||||
Evolent Health, Inc., Class A*,1 | 239,394 | 4,835,759 | |||||||||
HealthStream, Inc. | 157,564 | 4,424,397 | |||||||||
Inovalon Holdings, Inc., Class A*,1 | 144,860 | 1,542,759 | |||||||||
Omnicell, Inc.* | 10,072 | 599,284 | |||||||||
Tabula Rasa HealthCare, Inc.* | 19,386 | 1,129,040 | |||||||||
Teladoc, Inc.* | 132,347 | 7,920,968 | |||||||||
27,710,853 | |||||||||||
Hotels, restaurants & leisure—3.03% | |||||||||||
BJ's Restaurants, Inc. | 30,901 | 1,954,488 | |||||||||
Chuy's Holdings, Inc.* | 8,798 | 278,457 | |||||||||
Marriott Vacations Worldwide Corp.1 | 33,647 | 4,007,694 | |||||||||
Noodles & Co.*,1 | 87,110 | 910,299 | |||||||||
Planet Fitness, Inc., Class A* | 31,834 | 1,512,752 | |||||||||
Red Rock Resorts, Inc., Class A | 72,331 | 2,556,178 | |||||||||
Ruth's Hospitality Group, Inc. | 23,164 | 670,598 | |||||||||
Texas Roadhouse, Inc. | 9,000 | 565,560 | |||||||||
The Cheesecake Factory, Inc.1 | 57,980 | 3,248,619 | |||||||||
Wingstop, Inc. | 16,934 | 835,693 | |||||||||
16,540,338 | |||||||||||
Household durables—0.15% | |||||||||||
Century Communities, Inc.* | 20,550 | 626,775 | |||||||||
The Lovesac Co.* | 10,669 | 213,380 | |||||||||
840,155 | |||||||||||
Household products—0.70% | |||||||||||
Central Garden & Pet Co.*,1 | 18,920 | 816,776 | |||||||||
Central Garden and Pet Co., Class A* | 75,015 | 3,009,602 | |||||||||
3,826,378 | |||||||||||
Insurance—0.94% | |||||||||||
Health Insurance Innovations, Inc., Class A*,1 | 61,911 | 2,058,541 | |||||||||
Trupanion, Inc.*,1 | 73,567 | 3,060,387 | |||||||||
5,118,928 | |||||||||||
| Number of shares | Value | ||||||||||
Common stocks—(continued) | |||||||||||
Internet software & services—9.66% | |||||||||||
2U, Inc.* | 113,026 | $ | 8,551,547 | ||||||||
Alarm.com Holdings, Inc.*,1 | 165,633 | 7,100,687 | |||||||||
Apptio, Inc., Class A*,1 | 100,126 | 3,361,230 | |||||||||
Carbonite, Inc.* | 122,885 | 4,214,955 | |||||||||
Coupa Software, Inc.* | 7,918 | 485,453 | |||||||||
Dropbox, Inc., Class A*,1 | 53,381 | 1,429,009 | |||||||||
Envestnet, Inc.* | 37,367 | 2,189,706 | |||||||||
Five9, Inc.* | 42,260 | 1,348,094 | |||||||||
GrubHub, Inc.* | 5,655 | 689,288 | |||||||||
GTT Communications, Inc.*,1 | 186,004 | 8,267,878 | |||||||||
Instructure, Inc.* | 7,445 | 288,121 | |||||||||
Mimecast Ltd.* | 111,421 | 4,001,128 | |||||||||
ShotSpotter, Inc.*,1 | 37,058 | 1,581,265 | |||||||||
SPS Commerce, Inc.* | 89,225 | 7,654,613 | |||||||||
TechTarget, Inc.* | 13,217 | 375,627 | |||||||||
Twilio, Inc., Class A* | 7,574 | 438,459 | |||||||||
Zillow Group, Inc., Class A*,1 | 14,546 | 819,958 | |||||||||
52,797,018 | |||||||||||
IT services—3.28% | |||||||||||
Cass Information Systems, Inc. | 53,306 | 3,590,159 | |||||||||
EPAM Systems, Inc.* | 8,423 | 1,096,759 | |||||||||
Euronet Worldwide, Inc.* | 20,734 | 1,906,284 | |||||||||
ExlService Holdings, Inc.* | 68,005 | 4,055,818 | |||||||||
Gartner, Inc.*,1 | 6,180 | 836,958 | |||||||||
MAXIMUS, Inc. | 87,010 | 5,639,118 | |||||||||
WNS Holdings Ltd., ADR* | 16,999 | 827,171 | |||||||||
17,952,267 | |||||||||||
Life sciences tools & services—1.15% | |||||||||||
Bio-Techne Corp. | 39,165 | 6,291,466 | |||||||||
Machinery—2.72% | |||||||||||
DMC Global, Inc. | 18,976 | 778,965 | |||||||||
Proto Labs, Inc.* | 106,684 | 13,298,160 | |||||||||
Spartan Motors, Inc. | 51,604 | 761,159 | |||||||||
14,838,284 | |||||||||||
Media—1.83% | |||||||||||
Gray Television, Inc.* | 203,499 | 3,144,060 | |||||||||
Nexstar Media Group, Inc., Class A | 14,687 | 1,093,447 | |||||||||
Sinclair Broadcast Group, Inc., Class A | 223,285 | 5,760,753 | |||||||||
9,998,260 | |||||||||||
Multiline retail—0.47% | |||||||||||
Ollie's Bargain Outlet Holdings, Inc.* | 36,742 | 2,553,569 | |||||||||
Pharmaceuticals—0.66% | |||||||||||
Intersect ENT, Inc.* | 53,934 | 1,744,765 | |||||||||
Jazz Pharmaceuticals PLC* | 5,623 | 973,229 | |||||||||
Supernus Pharmaceuticals, Inc.* | 17,029 | 901,685 | |||||||||
3,619,679 | |||||||||||
Professional services—3.35% | |||||||||||
Barrett Business Services, Inc. | 9,139 | 839,691 | |||||||||
BG Staffing, Inc. | 27,941 | 734,848 | |||||||||
CoStar Group, Inc.* | 7,950 | 3,306,008 | |||||||||
Exponent, Inc. | 102,552 | 5,014,793 | |||||||||
194
PACE Small/Medium Co Growth Equity Investments
Portfolio of investments—July 31, 2018
| Number of shares | Value | ||||||||||
Common stocks—(continued) | |||||||||||
Professional services—(concluded) | |||||||||||
Insperity, Inc. | 21,171 | $ | 2,013,362 | ||||||||
TransUnion | 24,950 | 1,806,380 | |||||||||
WageWorks, Inc.* | 86,486 | 4,566,461 | |||||||||
18,281,543 | |||||||||||
Road & rail—1.16% | |||||||||||
Knight-Swift Transportation Holdings, Inc. | 107,769 | 3,507,881 | |||||||||
Old Dominion Freight Line, Inc. | 7,228 | 1,061,070 | |||||||||
Saia, Inc.* | 23,236 | 1,750,833 | |||||||||
6,319,784 | |||||||||||
Semiconductors & semiconductor equipment—2.82% | |||||||||||
ACM Research, Inc.* | 20,397 | 264,345 | |||||||||
Adesto Technologies Corp.*,1 | 66,031 | 363,171 | |||||||||
Advanced Micro Devices, Inc.*,1 | 44,175 | 809,728 | |||||||||
Cabot Microelectronics Corp. | 33,823 | 4,073,980 | |||||||||
Diodes, Inc.* | 9,000 | 334,440 | |||||||||
Marvell Technology Group Ltd. | 123,011 | 2,621,365 | |||||||||
Mellanox Technologies Ltd.* | 12,184 | 956,444 | |||||||||
Monolithic Power Systems, Inc. | 10,290 | 1,365,277 | |||||||||
Nova Measuring Instruments Ltd.* | 13,075 | 365,969 | |||||||||
Power Integrations, Inc. | 59,770 | 4,273,555 | |||||||||
15,428,274 | |||||||||||
Software—14.79% | |||||||||||
Altair Engineering, Inc., Class A* | 62,242 | 2,184,694 | |||||||||
Asure Software, Inc.*,1 | 15,943 | 224,637 | |||||||||
Blackline, Inc.*,1 | 138,836 | 5,928,297 | |||||||||
Bottomline Technologies de, Inc.* | 26,555 | 1,431,315 | |||||||||
Cadence Design Systems, Inc.* | 31,323 | 1,381,031 | |||||||||
Ellie Mae, Inc.*,1 | 57,126 | 5,668,042 | |||||||||
Everbridge, Inc.*,1 | 43,520 | 1,957,530 | |||||||||
Fair Isaac Corp.* | 6,564 | 1,322,383 | |||||||||
Globant SA* | 113,954 | 6,317,610 | |||||||||
HubSpot, Inc.* | 4,613 | 572,473 | |||||||||
NICE Systems Ltd., ADR* | 7,382 | 807,591 | |||||||||
Paylocity Holding Corp.* | 192,863 | 11,186,054 | |||||||||
Pegasystems, Inc. | 141,419 | 7,862,896 | |||||||||
PROS Holdings, Inc.* | 183,145 | 6,802,005 | |||||||||
PTC, Inc.* | 9,035 | 830,407 | |||||||||
RealPage, Inc.* | 91,094 | 5,019,279 | |||||||||
RingCentral, Inc., Class A* | 37,126 | 2,738,043 | |||||||||
Tyler Technologies, Inc.* | 2,403 | 540,651 | |||||||||
Ultimate Software Group, Inc.*,1 | 29,525 | 8,175,177 | |||||||||
Varonis Systems, Inc.* | 27,868 | 1,665,810 | |||||||||
Verint Systems, Inc.* | 80,420 | 3,610,858 | |||||||||
Workiva, Inc.* | 181,360 | 4,579,340 | |||||||||
80,806,123 | |||||||||||
Specialty retail—3.69% | |||||||||||
At Home Group, Inc.*,1 | 118,823 | 4,309,710 | |||||||||
Boot Barn Holdings, Inc.* | 52,651 | 1,231,507 | |||||||||
Five Below, Inc.* | 115,211 | 11,193,901 | |||||||||
| Number of shares | Value | ||||||||||
Common stocks—(concluded) | |||||||||||
Specialty retail—(concluded) | |||||||||||
Floor & Decor Holdings, Inc., Class A*,1 | 56,411 | $ | 2,693,625 | ||||||||
National Vision Holdings, Inc.* | 121 | 4,920 | |||||||||
The Children's Place, Inc.1 | 5,825 | 715,892 | |||||||||
20,149,555 | |||||||||||
Technology hardware, storage & peripherals—0.33% | |||||||||||
USA Technologies, Inc.*,1 | 134,065 | 1,803,174 | |||||||||
Textiles, apparel & luxury goods—0.18% | |||||||||||
Canada Goose Holdings, Inc.*,1 | 17,414 | 1,000,086 | |||||||||
Thrifts & mortgage finance—0.04% | |||||||||||
LendingTree, Inc.*,1 | 889 | 212,293 | |||||||||
Trading companies & distributors—1.60% | |||||||||||
Beacon Roofing Supply, Inc.* | 146,009 | 6,144,059 | |||||||||
SiteOne Landscape Supply, Inc.*,1 | 29,352 | 2,617,024 | |||||||||
8,761,083 | |||||||||||
Wireless telecommunication services—0.63% | |||||||||||
Boingo Wireless, Inc.* | 148,541 | 3,432,783 | |||||||||
| Total common stocks (cost—$415,173,095) | 529,432,536 | ||||||||||
| Number of rights | |||||||||||
Right—0.02% | |||||||||||
| Dyax Corp.*,2,3,4 (cost—$80,090) | 72,153 | 126,268 | |||||||||
| Number of shares | |||||||||||
Short-term investment—2.13% | |||||||||||
Investment companies—2.13% | |||||||||||
| State Street Institutional U.S. Government Money Market Fund (cost—$11,599,856) | 11,599,856 | 11,599,856 | |||||||||
Investment of cash collateral from securities loaned—4.51% | |||||||||||
Money market fund—4.51% | |||||||||||
| State Street Navigator Securities Lending Government Money Market Portfolio (cost—$24,656,399) | 24,656,399 | 24,656,399 | |||||||||
| Total investments (cost—$451,509,440)—103.57% | 565,815,059 | ||||||||||
Liabilities in excess of other assets—(3.57)% | (19,477,374 | ) | |||||||||
Net assets—100.00% | $ | 546,337,685 | |||||||||
For a listing of defined portfolio acronyms that are used throughout the Portfolio of investments as well as the tables that follow, please refer to page 273.
195
PACE Small/Medium Co Growth Equity Investments
Portfolio of investments—July 31, 2018
Fair valuation summary
The following is a summary of the fair valuations according to the inputs used as of July 31, 2018 in valuing the Portfolio's investments. In the event a Portfolio holds investments for which fair value is measured using the NAV per share practical expedient (or its equivalent), a separate column will be added to the fair value hierarchy table; this is intended to permit reconciliation to the amounts presented in the Portfolio of investments:
| Assets Description | Unadjusted quoted prices in active markets for identical investments (Level 1) | Other significant observable inputs (Level 2) | Unobservable inputs (Level 3) | Total | |||||||||||||||
Common stocks | $ | 529,432,536 | $ | — | $ | — | $ | 529,432,536 | |||||||||||
Right | — | — | 126,268 | 126,268 | |||||||||||||||
Short-term investment | — | 11,599,856 | — | 11,599,856 | |||||||||||||||
Investment of cash collateral from securities loaned | — | 24,656,399 | — | 24,656,399 | |||||||||||||||
Total | $ | 529,432,536 | $ | 36,256,255 | $ | 126,268 | $ | 565,815,059 | |||||||||||
At July 31, 2018, there were no transfers between Level 1 and Level 2.
Level 3 rollforward disclosure
The following is a rollforward of the Portfolio's investment that was valued using unobservable inputs for the year ended July 31, 2018:
Right | |||||||
Beginning balance | $ | 90,191 | |||||
Purchases | — | ||||||
Issuances | — | ||||||
Sales | — | ||||||
Accrued discounts/(premiums) | — | ||||||
Total realized gain/(loss) | — | ||||||
Net change in unrealized appreciation/depreciation | 36,077 | ||||||
Transfers into Level 3 | — | ||||||
Transfers out of Level 3 | — | ||||||
Ending balance | $ | 126,268 | |||||
The change in net unrealized appreciation/depreciation relating to the Level 3 investment held at July 31, 2018 was $36,077.
Portfolio footnotes
* Non-income producing security.
1 Security, or portion thereof, was on loan at the period end.
2 Illiquid investment at period end. Illiquid assets, in the amount of $126,268, represented 0.02% of the Portfolio's net assets at period end.
3 Significant unobservable inputs were used in the valuation of this security; i.e. a Level 3 security.
4 Security is being fair valued by a valuation committee under the direction of the board of trustees.
See accompanying notes to financial statements.
196
PACE International Equity Investments
Performance (unaudited)
For the 12 months ended July 31, 2018, the Portfolio's Class P shares gained 7.14% before the deduction of the maximum PACE Select program fee.1 In comparison, the MSCI EAFE Index (net) (the "benchmark") returned 6.40% and the Lipper International Multi-Cap Growth Funds category had a median return of 7.02%. (Returns for all share classes over various time periods are shown in the "Performance at a glance" table on page 199. Please note that the returns shown do not reflect the deduction of taxes that a shareholder would pay on Portfolio distributions or the redemption of Portfolio shares.) For a detailed commentary on the market environment in general during the reporting period, please refer to page 3.
Advisor Comments (unaudited)2
The Portfolio outperformed the benchmark during the reporting period. From a sector perspective, the key driver of performance was stock selection in the financials and information technology sectors. Positive performance was partially offset by negative stock selection in health Care and industrials. Sector allocation provided a tailwind, as the Portfolio benefited from overweights to information technology and energy. From a country perspective, stock selection was additive in Germany and the Netherlands, as well as the UK.
Derivatives were not used during the reporting period.
1 Class P shares held through the PACE Select Advisors Program are subject to a maximum Program fee of 2.50%, which, if included, would have reduced performance. Class P shares held through other advisory programs also may be subject to a program fee, which, if included, would have reduced performance.
2 All Sub-Advisors discuss performance on a gross-of-fees basis—meaning that no fees or expenses are reflected in their sleeves'/sleeve's performance. Alternately, Portfolio performance is shown net of fees, which does factor in fees and expenses associated with the Portfolio.
PACE Select Advisors Trust –
PACE International Equity Investments
Investment Manager:
UBS Asset Management (Americas) Inc. ("UBS AM")
Investment Subadvisors:
Mondrian Investment Partners Limited ("Mondrian");
Chautauqua Capital Management, a division of Robert W. Baird & Co. Incorporated ("Baird");
Los Angeles Capital Management and Equity Research, Inc. ("Los Angeles Capital")
Portfolio Management Team:
UBS AM: Mabel Lung, CFA and Fred Lee, CFA, assisted by Vincent Russo and Mayoor Joshi
Mondrian: Elizabeth A. Desmond, Nigel Bliss and Steve Dutaut;
Baird: Brian M. Beitner, CFA;
Los Angeles Capital: Thomas D. Stevens, CFA, Hal W. Reynolds, CFA and Daniel E. Allen, CFA
Objective:
Capital appreciation
Investment process:
The main strategies of the subadvisors include:
• A strategy that invests in durable large-cap franchises that can grow excess returns on capital well into the future and trade at a significant discount to the subadvisor's estimate of the true worth of these operations.
• A "long/short" or "130/30" equity strategy in which the
(continued on next page)
197
PACE International Equity Investments
Investment process
(concluded)
subadvisor will buy securities "long" that it believes will outperform the market or decrease portfolio risk, sells securities "short" that it believes will underperform the market and may invest the proceeds from those sales in additional securities.
• A strategy that involves achieving consistent risk adjusted excess returns by managing a concentrated portfolio of quality, growth companies generally headquartered outside of the United States.
Special considerations
The Portfolio may be appropriate for long-term investors seeking capital appreciation who are able to withstand short-term fluctuations in the equity markets in return for potentially higher returns over the long term. The value of the Portfolio changes every day and can be affected by changes in interest rates, general market conditions, and other political, social and economic developments, as well as specific matters relating to the companies in whose securities the Portfolio invests. It is important to note that an investment in the Portfolio is only one component of a balanced investment plan. The value of the Portfolio's investments in foreign securities may fall due to adverse political, social, and economic developments abroad and due to decreases in foreign currency values relative to the US dollar. These risks are greater for investments in emerging market issuers than for issuers in more developed countries.
198
PACE International Equity Investments
Performance at a glance (unaudited)
Average annual total returns for periods ended 07/31/18 | 1 year | 5 years | 10 years | ||||||||||||
Before deducting maximum sales charge | |||||||||||||||
Class A1 | 6.88 | % | 6.02 | % | 2.86 | % | |||||||||
Class C2 | 6.12 | 5.20 | 2.02 | ||||||||||||
Class Y3 | 7.24 | 6.32 | 3.16 | ||||||||||||
Class P4 | 7.14 | 6.31 | 3.12 | ||||||||||||
After deducting maximum sales charge | |||||||||||||||
Class A1 | 1.03 | 4.83 | 2.28 | ||||||||||||
Class C2 | 5.12 | 5.20 | 2.02 | ||||||||||||
MSCI EAFE Index (net)5 | 6.40 | 5.86 | 3.43 | ||||||||||||
Lipper International Multi-Cap Growth Funds median | 7.02 | 6.16 | 3.72 | ||||||||||||
Most recent calendar quarter-end returns (unaudited)
Average annual total returns for periods ended 06/30/18 | 1 year | 5 years | 10 years | ||||||||||||
Before deducting maximum sales charge | |||||||||||||||
Class A1 | 7.95 | % | 6.56 | % | 2.27 | % | |||||||||
Class C2 | 7.07 | 5.71 | 1.44 | ||||||||||||
Class Y3 | 8.20 | 6.85 | 2.57 | ||||||||||||
Class P4 | 8.22 | 6.85 | 2.54 | ||||||||||||
After deducting maximum sales charge | |||||||||||||||
Class A1 | 2.04 | 5.36 | 1.69 | ||||||||||||
Class C2 | 6.07 | 5.71 | 1.44 | ||||||||||||
The annualized gross and net expense ratios, respectively, for each class of shares as in the November 28, 2017 prospectuses, were as follows: Class A—1.79% and 1.74%; Class C—2.58% and 2.49%; Class Y—1.51% and 1.49%; and Class P—1.51% and 1.49%. Net expenses reflect fee waivers and/or expense reimbursements, if any, pursuant to an agreement that is in effect to cap the expenses. The Portfolio and UBS Asset Management (Americas) Inc. ("UBS AM") have entered into a written fee waiver/expense reimbursement agreement pursuant to which UBS AM is contractually obligated to waive its management fees and/or reimburse expenses so that the Portfolio's ordinary total operating expenses of each class through November 30, 2018 (excluding dividend expense, borrowing costs, and interest expense relating to short sales, and expenses attributable to investment in other investment companies, interest, taxes, brokerage commissions and extraordinary expenses) would not exceed Class A—1.35%; Class C—2.10%; Class Y—1.10%; and Class P—1.10%. "Management fee waiver/expense reimbursements" are based on estimated amounts for the current fiscal year. The Portfolio has agreed to repay UBS AM for any waived fees/reimbursed expenses to the extent that it can do so over the following three fiscal years without causing the Portfolio's expenses in any of those three years to exceed these expense caps and that UBS AM has not waived the right to do so. The fee waiver/expense reimbursement agreement may be terminated by the Portfolio's board at any time and also will terminate automatically upon the expiration or termination of the Portfolio's advisory contract with UBS AM. Upon termination of the agreement, however, UBS AM's three year recoupment rights will survive.
1 Maximum sales charge for Class A shares is 5.5%. Class A shares bear ongoing 12b-1 service fees of 0.25% annually.
2 Maximum contingent deferred sales charge for Class C shares is 1% imposed on redemptions and is reduced to 0% after one year. Class C shares bear ongoing 12b-1 service and distribution fees of 0.25% and 0.75% annually, respectively. As of July 12, 2018, Class C shares ceased paying 12b-1 distribution fees. See notes to financial statements—Subsequent events for additional information.
3 The Portfolio offers Class Y shares to a limited group of eligible investors, including certain qualifying retirement plans. Class Y shares do not bear initial or contingent deferred sales charges or ongoing 12b-1 service and distribution fees.
4 Class P shares do not bear initial or contingent deferred sales charges or ongoing 12b-1 service and distribution fees, but Class P shares held through advisory programs may be subject to a program fee, which, if included, would have reduced performance.
5 The MSCI EAFE Index (net) is an index of stocks designed to measure the investment returns of developed economies outside of North America. Net total return indices reinvest dividends after the deduction of withholding taxes, using a tax rate applicable to non-resident institutional investors who do not benefit from double taxation treaties. The Index is constructed and managed with a view to being fully investable from the perspective of international institutional investors. Investors should note that indices do not reflect the deduction of fees and expenses.
Past performance does not predict future performance, and the performance information provided does not reflect the deduction of taxes that a shareholder would pay on Portfolio distributions or the redemption of Portfolio shares. The return and principal value of an investment will fluctuate, so that an investor's shares, when redeemed, may be worth more or less than their original cost. Performance results assume reinvestment of all dividends and capital gain distributions at net asset value on the ex-dividend dates. Current performance may be higher or lower than the performance data quoted. For month-end performance figures, please visit www.ubs.com/us-mutualfundperformance.
Lipper peer group data calculated by Lipper Inc.; used with permission. The Lipper median is the return of the fund that places in the middle of a Lipper peer group.
199
PACE International Equity Investments
Illustration of an assumed investment of $10,000 in Class P shares of the Portfolio (unaudited)
The following graph depicts the performance of PACE International Equity Investments Class P shares versus the MSCI EAFE Index (net) over the 10 years ended July 31, 2018. Class P shares held through advisory programs may be subject to a program fee, which, if included, would have reduced performance. The performance of the other classes will vary based upon the different class specific expenses and sales charges. The performance provided does not reflect the deduction of taxes that a shareholder would pay on Portfolio distributions or the redemption of Portfolio shares. Past performance is no guarantee of future results. Share price and returns will vary with market conditions; investors may realize a gain or loss upon redemption. It is important to note that PACE International Equity Investments is a professionally managed portfolio while the Index is not available for investment and is unmanaged. The comparison is shown for illustration purposes only.
PACE International Equity Investments
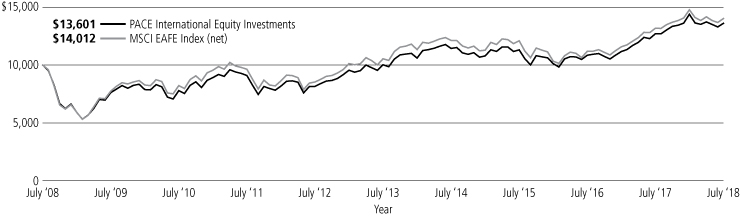
200
PACE International Equity Investments
Portfolio statistics—July 31, 2018 (unaudited)
Top ten holdings (long holdings)1 | Percentage of net assets | ||||||
ENI SpA | 1.8 | % | |||||
Sanofi SA | 1.6 | ||||||
Temenos AG | 1.5 | ||||||
Tesco PLC | 1.5 | ||||||
ASML Holding N.V., NY Registered Shares | 1.3 | ||||||
Enel SpA | 1.3 | ||||||
Wirecard AG | 1.3 | ||||||
Takeda Pharmaceutical Co. Ltd. | 1.3 | ||||||
Royal Dutch Shell PLC, B Shares | 1.2 | ||||||
GlaxoSmithKline PLC | 1.2 | ||||||
Total | 14.0 | % | |||||
Top ten holdings (short holdings)1 | Percentage of net assets | ||||||
Inpex Corp. | (0.4 | )% | |||||
TDK Corp. | (0.4 | ) | |||||
Daimler AG | (0.3 | ) | |||||
Tabcorp Holdings Ltd. | (0.3 | ) | |||||
Yahoo Japan Corp. | (0.3 | ) | |||||
EXOR N.V. | (0.3 | ) | |||||
Vifor Pharma AG | (0.3 | ) | |||||
Dufry AG | (0.3 | ) | |||||
EDP—Energias de Portugal SA | (0.3 | ) | |||||
SBI Holdings, Inc. | (0.3 | ) | |||||
Total | (3.2 | )% | |||||
Top five issuer breakdown by country or territory of origin (long holdings)1 | Percentage of net assets | ||||||
Japan | 23.6 | % | |||||
United Kingdom | 14.8 | ||||||
Switzerland | 10.1 | ||||||
Germany | 8.7 | ||||||
France | 6.9 | ||||||
Total | 64.1 | % | |||||
Top five issuer breakdown by country or territory of origin (short holdings)1 | Percentage of net assets | ||||||
Japan | (5.2 | )% | |||||
Germany | (1.5 | ) | |||||
Australia | (1.2 | ) | |||||
France | (1.0 | ) | |||||
Hong Kong | (0.8 | ) | |||||
Total | (9.7 | )% | |||||
1 The Portfolio is actively managed and its composition will vary over time.
201
PACE International Equity Investments
Industry diversification—(unaudited)
As a percentage of net assets as of July 31, 2018
Common stocks | |||||||
Aerospace & defense | 0.19 | % | |||||
Air freight & logistics | 0.26 | ||||||
Airlines | 0.12 | ||||||
Auto components | 0.75 | ||||||
Automobiles | 2.83 | ||||||
Banks | 10.91 | ||||||
Beverages | 1.48 | ||||||
Biotechnology | 1.41 | ||||||
Building products | 0.97 | ||||||
Capital markets | 2.63 | ||||||
Chemicals | 2.52 | ||||||
Commercial services & supplies | 2.30 | ||||||
Communications equipment | 0.02 | ||||||
Construction & engineering | 0.44 | ||||||
Construction materials | 0.09 | ||||||
Consumer finance | 0.14 | ||||||
Containers & packaging | 0.13 | ||||||
Diversified consumer services | 0.41 | ||||||
Diversified financial services | 0.93 | ||||||
Diversified telecommunication services | 2.94 | ||||||
Electric utilities | 4.76 | ||||||
Electrical equipment | 2.69 | ||||||
Electronic equipment, instruments & components | 1.66 | ||||||
Energy equipment & services | 1.52 | ||||||
Equity real estate investment trusts | 1.44 | ||||||
Food & staples retailing | 3.18 | ||||||
Food products | 1.29 | ||||||
Gas utilities | �� | 0.47 | |||||
Health care equipment & supplies | 1.19 | ||||||
Health care providers & services | 0.96 | ||||||
Health care technology | 0.06 | ||||||
Hotels, restaurants & leisure | 2.38 | ||||||
Household durables | 0.71 | ||||||
Household products | 1.36 | ||||||
Independent power and renewable electricity producers | 0.08 | ||||||
Industrial conglomerates | 0.63 | ||||||
Insurance | 5.79 | ||||||
Internet & catalog retail | 0.35 | ||||||
Internet software & services | 0.39 | ||||||
IT services | 2.65 | ||||||
Leisure products | 0.69 | ||||||
Life sciences tools & services | 0.10 | ||||||
Machinery | 2.47 | ||||||
Common stocks—(concluded) | |||||||
Marine | 0.13 | % | |||||
Media | 1.75 | ||||||
Metals & mining | 1.73 | ||||||
Multi-utilities | 0.59 | ||||||
Multiline retail | 0.24 | ||||||
Oil, gas & consumable fuels | 6.92 | ||||||
Paper & forest products | 0.92 | ||||||
Personal products | 1.33 | ||||||
Pharmaceuticals | 10.83 | ||||||
Professional services | 2.07 | ||||||
Real estate management & development | 2.67 | ||||||
Road & rail | 0.70 | ||||||
Semiconductors & semiconductor equipment | 4.07 | ||||||
Software | 2.59 | ||||||
Specialty retail | 1.09 | ||||||
Technology hardware, storage & peripherals | 0.73 | ||||||
Textiles, apparel & luxury goods | 2.49 | ||||||
Tobacco | 0.18 | ||||||
Trading companies & distributors | 0.94 | ||||||
Transportation infrastructure | 0.06 | ||||||
Wireless telecommunication services | 1.18 | ||||||
Total common stocks | 111.50 | ||||||
Preferred stocks | |||||||
Automobiles | 0.62 | ||||||
Chemicals | 0.03 | ||||||
Household products | 0.12 | ||||||
Total preferred stocks | 0.77 | ||||||
Investment companies | 1.09 | ||||||
Investment of cash collateral from securities loaned | 3.18 | ||||||
Total investments before investments sold short | 116.54 | ||||||
| Investments sold short Common stocks | |||||||
Aerospace & defense | (0.21 | ) | |||||
Air freight & logistics | (0.16 | ) | |||||
Airlines | (0.09 | ) | |||||
Auto components | (0.05 | ) | |||||
Automobiles | (0.51 | ) | |||||
Banks | (0.25 | ) | |||||
Beverages | (0.09 | ) | |||||
Biotechnology | (0.03 | ) | |||||
202
PACE International Equity Investments
Industry diversification—(unaudited) (concluded)
As a percentage of net assets as of July 31, 2018
| Investments sold short—(continued) Common stocks—(continued) | |||||||
Capital markets | (0.27 | )% | |||||
Chemicals | (0.88 | ) | |||||
Commercial services & supplies | (0.28 | ) | |||||
Communications equipment | (0.05 | ) | |||||
Construction & engineering | (0.48 | ) | |||||
Consumer finance | (0.05 | ) | |||||
Containers & packaging | (0.09 | ) | |||||
Diversified financial services | (0.45 | ) | |||||
Diversified telecommunication services | (0.57 | ) | |||||
Electric utilities | (0.35 | ) | |||||
Electronic equipment, instruments & components | (0.54 | ) | |||||
Energy equipment & services | (0.16 | ) | |||||
Equity real estate investment trusts | (0.39 | ) | |||||
Food & staples retailing | (0.32 | ) | |||||
Food products | (0.17 | ) | |||||
Hotels, restaurants & leisure | (0.94 | ) | |||||
Household durables | (0.31 | ) | |||||
Industrial conglomerates | (0.06 | ) | |||||
Insurance | (0.40 | ) | |||||
Internet software & services | (0.45 | ) | |||||
Life sciences tools & services | (0.08 | ) | |||||
| Investments sold short—(concluded) Common stocks—(concluded) | |||||||
Machinery | (0.25 | )% | |||||
Marine | (0.17 | ) | |||||
Media | (0.17 | ) | |||||
Metals & mining | (0.78 | ) | |||||
Multi-utilities | (0.35 | ) | |||||
Oil, gas & consumable fuels | (0.57 | ) | |||||
Pharmaceuticals | (0.47 | ) | |||||
Real estate management & development | (0.78 | ) | |||||
Road & rail | (0.29 | ) | |||||
Semiconductors & semiconductor equipment | (0.02 | ) | |||||
Software | (0.19 | ) | |||||
Specialty retail | (0.54 | ) | |||||
Technology hardware, storage & peripherals | (0.07 | ) | |||||
Textiles, apparel & luxury goods | (0.09 | ) | |||||
Tobacco | (0.11 | ) | |||||
Trading companies & distributors | (0.01 | ) | |||||
Transportation infrastructure | (0.05 | ) | |||||
Total investments sold short | (13.59 | ) | |||||
Liabilities in excess of other assets | (2.95 | ) | |||||
Net assets | 100.00 | % | |||||
203
PACE International Equity Investments
Portfolio of investments—July 31, 2018
| Number of shares | Value | ||||||||||
Common stocks—111.50% | |||||||||||
Australia—5.20% | |||||||||||
AGL Energy Ltd. | 100,562 | $ | 1,642,928 | ||||||||
Alumina Ltd. | 684,908 | 1,440,052 | |||||||||
Amcor Ltd. | 139,927 | 1,566,658 | |||||||||
Aristocrat Leisure Ltd. | 73,476 | 1,757,765 | |||||||||
ASX Ltd. | 31,666 | 1,545,439 | |||||||||
Aurizon Holdings Ltd. | 213,643 | 722,204 | |||||||||
Australia & New Zealand Banking Group Ltd. | 79,758 | 1,736,206 | |||||||||
BHP Billiton Ltd. | 35,456 | 918,283 | |||||||||
BlueScope Steel Ltd. | 27,940 | 366,587 | |||||||||
Brambles Ltd. | 243,831 | 1,789,803 | |||||||||
Caltex Australia Ltd. | 19,459 | 470,722 | |||||||||
CIMIC Group Ltd. | 52,302 | 1,877,996 | |||||||||
Coca-Cola Amatil Ltd. | 112,826 | 803,035 | |||||||||
Cochlear Ltd. | 2,936 | 443,589 | |||||||||
Computershare Ltd. | 120,250 | 1,625,089 | |||||||||
Crown Ltd. | 178,356 | 1,788,879 | |||||||||
CSL Ltd. | 13,461 | 1,966,267 | |||||||||
Dexus | 7,149 | 53,538 | |||||||||
Incitec Pivot Ltd. | 67,161 | 189,111 | |||||||||
Insurance Australia Group Ltd. | 59,931 | 357,987 | |||||||||
Macquarie Group Ltd. | 39,805 | 3,632,170 | |||||||||
Medibank Pvt Ltd. | 679,440 | 1,569,896 | |||||||||
Mirvac Group | 194,177 | 328,921 | |||||||||
Newcrest Mining Ltd.1 | 460,212 | 7,395,609 | |||||||||
Origin Energy Ltd.*,1 | 707,353 | 5,134,406 | |||||||||
QBE Insurance Group Ltd.1 | 1,354,349 | 10,162,754 | |||||||||
Ramsay Health Care Ltd. | 37,467 | 1,565,502 | |||||||||
Sonic Healthcare Ltd. | 60,485 | 1,171,965 | |||||||||
South32 Ltd. | 154,420 | 409,573 | |||||||||
Stockland | 114,167 | 352,005 | |||||||||
The GPT Group | 84,150 | 322,599 | |||||||||
Westpac Banking Corp. | 4,367 | 95,582 | |||||||||
Woolworths Ltd.1 | 289,590 | 6,473,888 | |||||||||
Total Australia common stocks | 61,677,008 | ||||||||||
Austria—1.34% | |||||||||||
ams AG*,2 | 132,393 | 9,554,920 | |||||||||
Erste Group Bank AG* | 25,343 | 1,095,303 | |||||||||
OMV AG1 | 91,674 | 5,184,143 | |||||||||
Total Austria common stocks | 15,834,366 | ||||||||||
Belgium—0.87% | |||||||||||
Anheuser-Busch InBev SA/NV | 22,693 | 2,297,757 | |||||||||
KBC Group N.V.1 | 77,194 | 5,935,945 | |||||||||
Proximus SADP | 6,163 | 150,836 | |||||||||
UCB SA | 22,165 | 1,903,984 | |||||||||
Total Belgium common stocks | 10,288,522 | ||||||||||
Bermuda—0.82% | |||||||||||
Hongkong Land Holdings Ltd.1 | 786,700 | 5,719,309 | |||||||||
Jardine Matheson Holdings Ltd. | 58,900 | 3,975,750 | |||||||||
Total Bermuda common stocks | 9,695,059 | ||||||||||
| Number of shares | Value | ||||||||||
Common stocks—(continued) | |||||||||||
Canada—1.56% | |||||||||||
CI Financial Corp. | 345,215 | $ | 6,032,007 | ||||||||
The Toronto-Dominion Bank | 209,247 | 12,413,108 | |||||||||
Total Canada common stocks | 18,445,115 | ||||||||||
Cayman Islands—3.02% | |||||||||||
Alibaba Group Holding Ltd., ADR*,2 | 20,340 | 3,808,258 | |||||||||
CK Asset Holdings Ltd. | 546,000 | 4,177,232 | |||||||||
CK Hutchison Holdings Ltd. | 1,095,500 | 11,905,409 | |||||||||
Ctrip.com International Ltd., ADR* | 120,471 | 4,957,382 | |||||||||
Sands China Ltd. | 466,800 | 2,402,675 | |||||||||
TAL Education Group, ADR* | 142,207 | 4,549,202 | |||||||||
WH Group Ltd.3 | 5,033,500 | 4,040,113 | |||||||||
Total Cayman Islands common stocks | 35,840,271 | ||||||||||
China—0.31% | |||||||||||
BYD Co. Ltd., Class H2 | 535,622 | 3,029,872 | |||||||||
Sinopharm Group Co., Class H | 158,265 | 669,431 | |||||||||
Total China common stocks | 3,699,303 | ||||||||||
Denmark—3.86% | |||||||||||
Danske Bank A/S | 38,423 | 1,116,956 | |||||||||
DSV A/S | 28,559 | 2,394,949 | |||||||||
Genmab A/S* | 75,122 | 12,872,904 | |||||||||
H. Lundbeck A/S | 19,706 | 1,426,490 | |||||||||
ISS A/S | 233,563 | 8,730,368 | |||||||||
Novo Nordisk A/S, ADR | 200,117 | 9,959,823 | |||||||||
Novo Nordisk A/S, Class B1 | 122,854 | 6,133,494 | |||||||||
Novozymes A/S, B Shares | 36,144 | 1,902,898 | |||||||||
Vestas Wind Systems A/S | 6,491 | 418,741 | |||||||||
William Demant Holding A/S* | 15,714 | 751,110 | |||||||||
Total Denmark common stocks | 45,707,733 | ||||||||||
Finland—1.87% | |||||||||||
Neste Oyj | 22,937 | 1,894,126 | |||||||||
Nokian Renkaat Oyj | 78,273 | 3,394,793 | |||||||||
Orion Oyj, Class B2 | 29,118 | 1,003,087 | |||||||||
Sampo Oyj, A Shares1 | 135,501 | 6,886,154 | |||||||||
Stora Enso Oyj, R Shares | 64,921 | 1,073,064 | |||||||||
UPM-Kymmene Oyj1 | 224,353 | 7,964,860 | |||||||||
Total Finland common stocks | 22,216,084 | ||||||||||
France—6.92% | |||||||||||
Accor SA | 50,118 | 2,583,329 | |||||||||
Arkema SA | 6,453 | 809,289 | |||||||||
Atos SE | 11,656 | 1,565,399 | |||||||||
Bureau Veritas SA | 43,639 | 1,124,175 | |||||||||
Capgemini SE | 6,133 | 787,444 | |||||||||
Cie de Saint-Gobain | 150,294 | 6,691,540 | |||||||||
Cie Generale des Etablissements Michelin SCA | 5,522 | 710,932 | |||||||||
CNP Assurances | 43,936 | 1,027,531 | |||||||||
Dassault Aviation SA | 100 | 184,757 | |||||||||
Dassault Systemes SE | 15,570 | 2,326,826 | |||||||||
Eiffage SA | 2,194 | 245,575 | |||||||||
Engie SA | 71,167 | 1,149,672 | |||||||||
Essilor International SA1 | 54,171 | 7,994,121 | |||||||||
204
PACE International Equity Investments
Portfolio of investments—July 31, 2018
| Number of shares | Value | ||||||||||
Common stocks—(continued) | |||||||||||
France—(concluded) | |||||||||||
Hermes International | 3,904 | $ | 2,472,481 | ||||||||
Ipsen SA | 6,933 | 1,152,425 | |||||||||
Kering SA | 4,322 | 2,304,592 | |||||||||
Klepierre SA | 53,755 | 2,028,441 | |||||||||
LVMH Moet Hennessy Louis Vuitton SE1 | 22,007 | 7,690,571 | |||||||||
Orange SA | 97,805 | 1,671,492 | |||||||||
Pernod Ricard SA | 11,621 | 1,874,605 | |||||||||
Publicis Groupe SA | 9,208 | 588,545 | |||||||||
Sanofi SA | 223,336 | 19,422,316 | |||||||||
SCOR SE | 24,374 | 947,683 | |||||||||
Societe Generale SA2 | 105,775 | 4,713,749 | |||||||||
Teleperformance | 288 | 52,806 | |||||||||
Thales SA | 7,542 | 991,723 | |||||||||
Total SA | 49,937 | 3,261,879 | |||||||||
Unibail-Rodamco-Westfield | 25,561 | 5,674,570 | |||||||||
Total France common stocks | 82,048,468 | ||||||||||
Germany—7.90% | |||||||||||
adidas AG1 | 35,396 | 7,828,977 | |||||||||
Allianz SE | 45,371 | 10,034,743 | |||||||||
BASF SE | 23,152 | 2,224,300 | |||||||||
Bayer AG | 28,259 | 3,147,834 | |||||||||
Bayerische Motoren Werke AG | 37,835 | 3,658,400 | |||||||||
Beiersdorf AG | 21,043 | 2,450,820 | |||||||||
Brenntag AG | 22,640 | 1,357,591 | |||||||||
Continental AG | 5,315 | 1,224,374 | |||||||||
Daimler AG | 144,499 | 9,994,569 | |||||||||
Deutsche Post AG | 75,304 | 2,658,433 | |||||||||
Deutsche Telekom AG* | 454,263 | 7,516,373 | |||||||||
Evonik Industries AG | 165,591 | 6,128,511 | |||||||||
Fraport AG Frankfurt Airport Services Worldwide | 4,216 | 420,922 | |||||||||
Fresenius Medical Care AG & Co. KGaA | 46,682 | 4,560,248 | |||||||||
Fresenius SE & Co. KGaA | 16,891 | 1,303,993 | |||||||||
Hannover Rueck SE | 4,580 | 610,541 | |||||||||
Hochtief AG | 10,743 | 1,930,830 | |||||||||
Infineon Technologies AG | 67,363 | 1,784,949 | |||||||||
Muenchener Rueckversicherungs-Gesellschaft AG1 | 34,296 | 7,609,739 | |||||||||
Puma SE | 386 | 193,637 | |||||||||
SAP SE | 6,571 | 767,227 | |||||||||
United Internet AG | 14,940 | 803,624 | |||||||||
Vonovia SE | 10,829 | 524,370 | |||||||||
Wirecard AG | 79,681 | 14,884,702 | |||||||||
Total Germany common stocks | 93,619,707 | ||||||||||
Hong Kong—2.31% | |||||||||||
AIA Group Ltd. | 136,200 | 1,188,641 | |||||||||
BOC Hong Kong Holdings Ltd. | 226,000 | 1,094,145 | |||||||||
China Mobile Ltd. | 890,000 | 8,027,978 | |||||||||
CLP Holdings Ltd. | 101,500 | 1,159,309 | |||||||||
Galaxy Entertainment Group Ltd. | 478,000 | 3,839,688 | |||||||||
Hang Lung Group Ltd. | 213,000 | 629,579 | |||||||||
Hang Seng Bank Ltd. | 79,023 | 2,150,491 | |||||||||
HKT Trust & HKT Ltd. | 58,000 | 77,441 | |||||||||
Hong Kong Exchanges & Clearing Ltd. | 14,300 | 421,947 | |||||||||
Hysan Development Co. Ltd. | 55,000 | 300,960 | |||||||||
Power Assets Holdings Ltd. | 197,000 | 1,394,226 | |||||||||
| Number of shares | Value | ||||||||||
Common stocks—(continued) | |||||||||||
Hong Kong—(concluded) | |||||||||||
Sun Hung Kai Properties Ltd. | 182,000 | $ | 2,852,065 | ||||||||
Swire Pacific Ltd., Class A | 185,500 | 2,011,205 | |||||||||
Swire Properties Ltd. | 322,800 | 1,270,793 | |||||||||
Wheelock & Co. Ltd. | 134,000 | 949,211 | |||||||||
Total Hong Kong common stocks | 27,367,679 | ||||||||||
India—1.06% | |||||||||||
HDFC Bank Ltd., ADR | 121,494 | 12,555,190 | |||||||||
Indonesia—0.11% | |||||||||||
PT Bank Rakyat Indonesia Persero Tbk | 6,254,867 | 1,331,653 | |||||||||
Ireland—0.82% | |||||||||||
Allergan PLC | 41,871 | 7,708,032 | |||||||||
DCC PLC | 21,788 | 2,016,147 | |||||||||
Total Ireland common stocks | 9,724,179 | ||||||||||
Israel—0.36% | |||||||||||
Bank Leumi Le-Israel B.M. | 264,459 | 1,656,380 | |||||||||
Check Point Software Technologies Ltd.* | 17,644 | 1,987,949 | |||||||||
Nice Ltd.* | 5,799 | 632,139 | |||||||||
Total Israel common stocks | 4,276,468 | ||||||||||
Italy—4.43% | |||||||||||
Enel SpA | 2,739,937 | 15,282,818 | |||||||||
ENI SpA1 | 1,087,309 | 20,933,066 | |||||||||
Mediobanca Banca di Credito Finanziario SpA | 373,694 | 3,882,122 | |||||||||
Moncler SpA | 15,866 | 699,816 | |||||||||
Prysmian SpA | 80,100 | 2,055,945 | |||||||||
Recordati SpA | 67,584 | 2,527,358 | |||||||||
Snam SpA | 731,123 | 3,141,899 | |||||||||
Terna Rete Elettrica Nazionale SpA | 707,622 | 3,963,523 | |||||||||
Total Italy common stocks | 52,486,547 | ||||||||||
Japan—23.64% | |||||||||||
Aeon Co. Ltd. | 29,300 | 593,914 | |||||||||
Amada Holdings Co. Ltd. | 145,600 | 1,455,805 | |||||||||
Aozora Bank Ltd. | 15,300 | 571,278 | |||||||||
Astellas Pharma, Inc.1 | 297,800 | 4,840,598 | |||||||||
Benesse Holdings, Inc. | 7,700 | 279,931 | |||||||||
Brother Industries Ltd. | 37,300 | 758,243 | |||||||||
Canon, Inc.1 | 221,700 | 7,171,568 | |||||||||
Chubu Electric Power Co., Inc. | 55,800 | 858,596 | |||||||||
Concordia Financial Group Ltd. | 165,000 | 885,391 | |||||||||
Credit Saison Co. Ltd. | 104,300 | 1,622,123 | |||||||||
Daifuku Co. Ltd. | 3,700 | 161,646 | |||||||||
Daiichi Sankyo Co. Ltd. | 8,800 | 363,758 | |||||||||
Daikin Industries Ltd. | 20,900 | 2,489,720 | |||||||||
Daito Trust Construction Co. Ltd. | 2,000 | 333,855 | |||||||||
Daiwa Securities Group, Inc. | 240,000 | 1,396,879 | |||||||||
Disco Corp. | 4,000 | 678,621 | |||||||||
Eisai Co. Ltd.1 | 58,000 | 4,970,317 | |||||||||
Electric Power Development Co. Ltd. | 36,700 | 992,868 | |||||||||
FANUC Corp. | 31,145 | 6,105,607 | |||||||||
Fast Retailing Co. Ltd. | 8,800 | 3,836,694 | |||||||||
Fuji Electric Holdings Co. Ltd. | 115,000 | 845,414 | |||||||||
FUJIFILM Holdings Corp. | 175,600 | 7,225,646 | |||||||||
205
PACE International Equity Investments
Portfolio of investments—July 31, 2018
| Number of shares | Value | ||||||||||
Common stocks—(continued) | |||||||||||
Japan—(continued) | |||||||||||
Fujitsu Ltd. | 177,000 | $ | 1,203,692 | ||||||||
Hamamatsu Photonics KK | 35,200 | 1,489,031 | |||||||||
Hirose Electric Co. Ltd. | 6,404 | 778,342 | |||||||||
Hitachi High-Technologies Corp. | 17,700 | 721,835 | |||||||||
Honda Motor Co. Ltd. | 382,000 | 11,461,879 | |||||||||
Hoshizaki Corp. | 1,500 | 151,053 | |||||||||
Hoya Corp. | 16,100 | 964,718 | |||||||||
Isuzu Motors Ltd. | 200,000 | 2,698,207 | |||||||||
Japan Airport Terminal Co. Ltd. | 4,900 | 232,259 | |||||||||
Japan Exchange Group, Inc. | 177,500 | 3,151,075 | |||||||||
Japan Post Bank Co. Ltd. | 84,200 | 1,009,813 | |||||||||
Japan Post Holdings Co. Ltd. | 119,300 | 1,314,471 | |||||||||
Japan Real Estate Investment Corp. | 383 | 2,003,801 | |||||||||
Japan Retail Fund Investment Corp. | 131 | 238,885 | |||||||||
Kao Corp. | 54,800 | 3,987,905 | |||||||||
Keikyu Corp. | 49,000 | 801,511 | |||||||||
Keyence Corp. | 25,883 | 13,636,520 | |||||||||
Kintetsu Group Holdings Co. Ltd. | 19,300 | 766,373 | |||||||||
Kirin Holdings Co. Ltd. | 171,000 | 4,369,244 | |||||||||
Koito Manufacturing Co. Ltd. | 21,100 | 1,353,012 | |||||||||
Konami Holdings Corp. | 36,500 | 1,713,768 | |||||||||
Kubota Corp. | 99,500 | 1,663,598 | |||||||||
Kuraray Co. Ltd. | 26,300 | 370,456 | |||||||||
Kurita Water Industries Ltd. | 70,100 | 2,043,787 | |||||||||
Kyocera Corp. | 29,500 | 1,711,720 | |||||||||
Kyowa Hakko Kirin Co. Ltd. | 29,100 | 550,952 | |||||||||
Kyushu Electric Power Co., Inc. | 180,200 | 2,117,630 | |||||||||
Kyushu Railway Co. | 116,500 | 3,573,715 | |||||||||
Lion Corp. | 106,900 | 1,932,164 | |||||||||
M3, Inc. | 18,700 | 709,936 | |||||||||
Marubeni Corp. | 206,200 | 1,568,975 | |||||||||
McDonald's Holdings Co. Japan Ltd. | 11,800 | 563,538 | |||||||||
Mebuki Financial Group, Inc. | 364,500 | 1,297,420 | |||||||||
Medipal Holdings Corp. | 52,300 | 1,060,359 | |||||||||
MEIJI Holdings Co. Ltd. | 34,000 | 2,669,767 | |||||||||
MINEBEA MITSUMI, Inc. | 46,000 | 820,731 | |||||||||
Mitsubishi Corp. | 83,200 | 2,319,317 | |||||||||
Mitsubishi Electric Corp. | 338,500 | 4,575,797 | |||||||||
Mitsubishi Tanabe Pharma Corp. | 2,500 | 46,774 | |||||||||
Mizuho Financial Group, Inc.1 | 3,022,300 | 5,259,934 | |||||||||
Namco Bandai Holdings, Inc. | 46,600 | 1,860,833 | |||||||||
NH Foods Ltd. | 13,500 | 536,064 | |||||||||
Nikon Corp. | 145,200 | 2,443,915 | |||||||||
Nintendo Co. Ltd. | 8,000 | 2,630,059 | |||||||||
Nippon Building Fund, Inc. | 201 | 1,118,115 | |||||||||
Nippon Yusen K.K. | 81,700 | 1,570,212 | |||||||||
Nomura Holdings, Inc. | 725,900 | 3,431,008 | |||||||||
Nomura Research Institute Ltd. | 30,200 | 1,447,677 | |||||||||
NTT DOCOMO, Inc. | 68,100 | 1,749,777 | |||||||||
Olympus Corp. | 17,000 | 687,967 | |||||||||
Ono Pharmaceutical Co. Ltd. | 4,400 | 103,669 | |||||||||
Oracle Corp. Japan | 6,400 | 536,887 | |||||||||
Otsuka Corp. | 21,200 | 826,651 | |||||||||
Otsuka Holdings Co. Ltd. | 64,200 | 2,956,938 | |||||||||
| Number of shares | Value | ||||||||||
Common stocks—(continued) | |||||||||||
Japan—(concluded) | |||||||||||
Panasonic Corp. | 54,600 | $ | 702,185 | ||||||||
Pola Orbis Holdings, Inc. | 41,800 | 1,618,692 | |||||||||
Rakuten, Inc. | 394,800 | 2,778,412 | |||||||||
Recruit Holdings Co. Ltd. | 416,592 | 11,382,091 | |||||||||
Renesas Electronics Corp.* | 58,500 | 521,093 | |||||||||
Resona Holdings, Inc. | 197,700 | 1,124,334 | |||||||||
Ricoh Co. Ltd. | 63,200 | 614,959 | |||||||||
Rinnai Corp. | 3,600 | 311,014 | |||||||||
Rohm Co. Ltd. | 12,200 | 1,036,534 | |||||||||
Sankyo Co. Ltd. | 32,200 | 1,267,093 | |||||||||
Secom Co. Ltd. | 92,100 | 7,026,007 | |||||||||
Sega Sammy Holdings, Inc. | 58,300 | 928,087 | |||||||||
Sekisui Chemical Co. Ltd. | 337,300 | 6,027,147 | |||||||||
Seven & I Holdings Co. Ltd. | 22,800 | 928,802 | |||||||||
Shimano, Inc. | 11,800 | 1,693,780 | |||||||||
Shin-Etsu Chemical Co. Ltd.1 | 86,400 | 8,708,384 | |||||||||
Shinsei Bank Ltd. | 66,500 | 1,046,134 | |||||||||
Shionogi & Co. Ltd. | 68,000 | 3,695,103 | |||||||||
Shiseido Co. Ltd. | 33,200 | 2,437,705 | |||||||||
Showa Shell Sekiyu K.K. | 14,000 | 229,379 | |||||||||
SoftBank Group Corp. | 23,900 | 1,979,287 | |||||||||
Sohgo Security Services Co. Ltd. | 5,400 | 246,783 | |||||||||
Stanley Electric Co. Ltd. | 10,400 | 364,137 | |||||||||
Start Today Co. Ltd. | 35,200 | 1,411,904 | |||||||||
SUMCO Corp. | 33,200 | 707,558 | |||||||||
Sumitomo Corp. | 121,700 | 1,997,223 | |||||||||
Sumitomo Electric Industries Ltd. | 417,900 | 6,405,944 | |||||||||
Sumitomo Mitsui Financial Group, Inc.1 | 120,100 | 4,774,355 | |||||||||
Sumitomo Mitsui Trust Holdings, Inc. | 70,300 | 2,788,989 | |||||||||
Sumitomo Rubber Industries Ltd. | 85,500 | 1,411,555 | |||||||||
Sundrug Co. Ltd. | 12,700 | 507,705 | |||||||||
Suntory Beverage & Food Ltd. | 39,900 | 1,696,771 | |||||||||
Suzuki Motor Corp. | 8,700 | 509,714 | |||||||||
Taisei Corp. | 20,400 | 1,132,979 | |||||||||
Takeda Pharmaceutical Co. Ltd.2 | 353,500 | 14,779,882 | |||||||||
The Chugoku Electric Power Co., Inc. | 15,500 | 203,774 | |||||||||
The Kansai Electric Power Co., Inc. | 174,800 | 2,482,515 | |||||||||
THK Co. Ltd. | 12,400 | 335,465 | |||||||||
Tohoku Electric Power Co., Inc. | 145,300 | 1,843,945 | |||||||||
Tokio Marine Holdings, Inc. | 211,800 | 10,041,155 | |||||||||
Tokyo Gas Co. Ltd. | 15,700 | 382,408 | |||||||||
Toyo Suisan Kaisha Ltd. | 22,200 | 802,111 | |||||||||
Toyoda Gosei Co. Ltd. | 19,400 | 489,272 | |||||||||
Trend Micro, Inc. | 36,700 | 2,162,975 | |||||||||
UniCharm Corp. | 80,900 | 2,457,786 | |||||||||
United Urban Investment Corp. | 261 | 404,752 | |||||||||
USS Co. Ltd. | 29,500 | 558,261 | |||||||||
Yakult Honsha Co. Ltd. | 29,500 | 2,121,182 | |||||||||
Yamaha Motor Co. Ltd. | 41,700 | 1,096,809 | |||||||||
Yamato Holdings Co. Ltd. | 14,500 | 419,251 | |||||||||
Yokogawa Electric Corp. | 21,500 | 380,910 | |||||||||
Total Japan common stocks | 280,216,500 | ||||||||||
206
PACE International Equity Investments
Portfolio of investments—July 31, 2018
| Number of shares | Value | ||||||||||
Common stocks—(continued) | |||||||||||
Jersey—1.05% | |||||||||||
Experian PLC | 13,084 | $ | 321,830 | ||||||||
Ferguson PLC | 12,643 | 997,333 | |||||||||
Glencore PLC* | 624,471 | 2,741,726 | |||||||||
Shire PLC | 7,198 | 411,071 | |||||||||
WPP PLC | 512,373 | 8,016,378 | |||||||||
Total Jersey common stocks | 12,488,338 | ||||||||||
Luxembourg—0.10% | |||||||||||
Eurofins Scientific SE | 2,079 | 1,134,341 | |||||||||
Netherlands—4.56% | |||||||||||
AerCap Holdings N.V.* | 38,900 | 2,183,457 | |||||||||
ASML Holding N.V. | 19,909 | 4,271,988 | |||||||||
ASML Holding N.V., NY Registered Shares | 73,299 | 15,685,986 | |||||||||
CNH Industrial N.V. | 290,556 | 3,409,508 | |||||||||
Core Laboratories N.V.2 | 93,644 | 10,499,365 | |||||||||
Ferrari N.V. | 8,475 | 1,127,785 | |||||||||
Heineken N.V.2 | 12,600 | 1,275,064 | |||||||||
Koninklijke Ahold Delhaize N.V. | 389,774 | 9,915,542 | |||||||||
Koninklijke DSM N.V. | 15,739 | 1,677,377 | |||||||||
Randstad N.V. | 43,351 | 2,750,575 | |||||||||
STMicroelectronics N.V. | 59,967 | 1,304,627 | |||||||||
Total Netherlands common stocks | 54,101,274 | ||||||||||
New Zealand—0.15% | |||||||||||
Fletcher Building Ltd. | 229,092 | 1,097,728 | |||||||||
Ryman Healthcare Ltd.2 | 81,535 | 676,339 | |||||||||
Total New Zealand common stocks | 1,774,067 | ||||||||||
Norway—0.57% | |||||||||||
DNB ASA | 113,915 | 2,298,090 | |||||||||
Equinor ASA | 34,274 | 910,147 | |||||||||
Norsk Hydro ASA | 359,539 | 2,049,685 | |||||||||
Orkla ASA | 181,342 | 1,534,036 | |||||||||
Total Norway common stocks | 6,791,958 | ||||||||||
Papua New Guinea—0.24% | |||||||||||
Oil Search Ltd. | 428,867 | 2,861,267 | |||||||||
Portugal—0.21% | |||||||||||
Galp Energia, SGPS SA | 32,764 | 673,918 | |||||||||
Jeronimo Martins, SGPS SA | 122,452 | 1,822,799 | |||||||||
Total Portugal common stocks | 2,496,717 | ||||||||||
Singapore—3.38% | |||||||||||
Ascendas Real Estate Investment Trust | 2,090,100 | 4,222,114 | |||||||||
DBS Group Holdings Ltd. | 661,766 | 13,003,446 | |||||||||
Genting Singapore Ltd. | 2,591,800 | 2,436,922 | |||||||||
Oversea-Chinese Banking Corp. Ltd. | 34,500 | 293,213 | |||||||||
Singapore Exchange Ltd. | 122,800 | 671,122 | |||||||||
Singapore Telecommunications Ltd. | 2,295,900 | 5,413,625 | |||||||||
United Overseas Bank Ltd. | 672,098 | 13,339,764 | |||||||||
Yangzijiang Shipbuilding Holdings Ltd. | 909,200 | 631,134 | |||||||||
Total Singapore common stocks | 40,011,340 | ||||||||||
| Number of shares | Value | ||||||||||
Common stocks—(continued) | |||||||||||
South Africa—0.75% | |||||||||||
Naspers Ltd., N Shares | 36,228 | $ | 8,919,778 | ||||||||
South Korea—0.45% | |||||||||||
Amorepacific Corp. | 22,113 | 5,287,827 | |||||||||
Spain—4.99% | |||||||||||
Amadeus IT Holding SA1 | 105,875 | 9,037,759 | |||||||||
Banco Bilbao Vizcaya Argentaria SA | 558,721 | 4,106,897 | |||||||||
Banco Santander SA2 | 1,205,253 | 6,792,423 | |||||||||
CaixaBank SA | 559,972 | 2,591,056 | |||||||||
Enagas SA | 72,042 | 2,015,076 | |||||||||
Endesa SA1 | 231,295 | 5,349,794 | |||||||||
Iberdrola SA | 1,447,855 | 11,258,777 | |||||||||
Iberdrola SA*,2 | 40,098 | 311,809 | |||||||||
Red Electrica Corp. SA | 109,484 | 2,322,375 | |||||||||
Repsol SA1 | 381,735 | 7,577,331 | |||||||||
Telefonica SA | 866,559 | 7,793,373 | |||||||||
Total Spain common stocks | 59,156,670 | ||||||||||
Sweden—2.71% | |||||||||||
Alfa Laval AB | 22,489 | 618,176 | |||||||||
Assa Abloy AB, B Shares | 12,746 | 252,733 | |||||||||
Atlas Copco AB, A Shares | 52,841 | 1,513,185 | |||||||||
Boliden AB | 71,887 | 2,141,988 | |||||||||
Epiroc AB, Class A* | 51,150 | 612,431 | |||||||||
Hexagon AB, B Shares | 19,837 | 1,209,673 | |||||||||
Industrivarden AB, C Shares | 26,131 | 550,974 | |||||||||
Investor AB, B Shares | 87,326 | 3,807,685 | |||||||||
Kinnevik AB, B Shares | 15,044 | 519,605 | |||||||||
Sandvik AB | 26,652 | 487,547 | |||||||||
| SKF AB, B Shares | 162,216 | 3,335,474 | |||||||||
Swedish Match AB | 15,196 | 830,920 | |||||||||
Tele2 AB, B Shares | 105,621 | 1,418,018 | |||||||||
Telefonaktiebolaget LM Ericsson, B Shares | 27,709 | 217,060 | |||||||||
Telia Co. AB | 2,530,508 | 12,173,444 | |||||||||
Volvo AB, B Shares | 135,909 | 2,382,633 | |||||||||
Total Sweden common stocks | 32,071,546 | ||||||||||
Switzerland—10.07% | |||||||||||
ABB Ltd. | 452,494 | 10,378,366 | |||||||||
Adecco Group SA | 50,322 | 3,099,162 | |||||||||
Cie Financiere Richemont SA1 | 64,509 | 5,668,114 | |||||||||
Coca-Cola HBC AG* | 76,350 | 2,739,828 | |||||||||
EMS-Chemie Holding AG | 2,009 | 1,288,406 | |||||||||
Geberit AG | 4,607 | 2,055,155 | |||||||||
Julius Baer Group Ltd.* | 129,217 | 7,104,553 | |||||||||
Nestle SA1 | 62,359 | 5,082,433 | |||||||||
Novartis AG1 | 166,447 | 13,992,878 | |||||||||
Pargesa Holding SA | 3,932 | 329,206 | |||||||||
Partners Group Holding AG1 | 6,478 | 4,923,188 | |||||||||
Roche Holding AG1 | 47,836 | 11,742,201 | |||||||||
Schindler Holding AG | 9,786 | 2,281,077 | |||||||||
SGS SA | 1,558 | 4,069,068 | |||||||||
Sika AG1 | 36,660 | 5,216,779 | |||||||||
Straumann Holding AG | 4,824 | 3,751,432 | |||||||||
Swiss Prime Site AG* | 10,911 | 1,001,126 | |||||||||
Swiss Re AG1 | 64,597 | 5,922,452 | |||||||||
207
PACE International Equity Investments
Portfolio of investments—July 31, 2018
| Number of shares | Value | ||||||||||
Common stocks—(continued) | |||||||||||
Switzerland—(concluded) | |||||||||||
Temenos AG* | 110,397 | $ | 17,783,489 | ||||||||
The Swatch Group AG | 7,433 | 3,339,839 | |||||||||
Zurich Insurance Group AG | 24,594 | 7,568,340 | |||||||||
Total Switzerland common stocks | 119,337,092 | ||||||||||
Taiwan—1.07% | |||||||||||
Taiwan Semiconductor Manufacturing Co. Ltd. | 921,000 | 7,400,732 | |||||||||
Taiwan Semiconductor Manufacturing Co. Ltd., ADR | 128,702 | 5,303,809 | |||||||||
Total Taiwan common stocks | 12,704,541 | ||||||||||
United Kingdom—14.80% | |||||||||||
| 3i Group PLC | 371,769 | 4,623,959 | |||||||||
Admiral Group PLC | 62,415 | 1,622,890 | |||||||||
Antofagasta PLC | 85,391 | 1,124,162 | |||||||||
Ashtead Group PLC | 1,728 | 53,096 | |||||||||
Associated British Foods PLC | 28,567 | 920,517 | |||||||||
AstraZeneca PLC | 15,726 | 1,210,604 | |||||||||
Barclays PLC | 1,249,536 | 3,181,095 | |||||||||
Barratt Developments PLC | 82,055 | 575,125 | |||||||||
| BP PLC | 1,757,496 | 13,224,888 | |||||||||
British American Tobacco PLC | 22,833 | 1,259,016 | |||||||||
Bunzl PLC | 23,300 | 692,691 | |||||||||
Burberry Group PLC | 60,347 | 1,668,922 | |||||||||
Carnival PLC | 69,241 | 4,021,539 | |||||||||
Coca-Cola European Partners PLC | 51,300 | 2,115,612 | |||||||||
Compass Group PLC | 50,230 | 1,080,912 | |||||||||
Croda International PLC | 48,791 | 3,291,687 | |||||||||
Diageo PLC | 9,513 | 349,866 | |||||||||
easyJet PLC | 64,172 | 1,363,666 | |||||||||
G4S PLC | 2,629,996 | 9,527,520 | |||||||||
GlaxoSmithKline PLC | 689,328 | 14,309,956 | |||||||||
HSBC Holdings PLC | 236,037 | 2,263,164 | |||||||||
Informa PLC | 31,067 | 321,893 | |||||||||
InterContinental Hotels Group PLC | 45,832 | 2,831,579 | |||||||||
Intertek Group PLC | 21,954 | 1,694,364 | |||||||||
John Wood Group PLC | 887,492 | 7,569,372 | |||||||||
Kingfisher PLC | 2,192,945 | 8,540,061 | |||||||||
Legal & General Group PLC | 273,758 | 943,936 | |||||||||
Lloyds Banking Group PLC | 14,005,594 | 11,467,338 | |||||||||
Mondi PLC | 69,694 | 1,918,269 | |||||||||
National Grid PLC | 389,498 | 4,157,878 | |||||||||
Next PLC | 7,189 | 560,116 | |||||||||
NMC Health PLC | 6,668 | 332,229 | |||||||||
Persimmon PLC | 24,873 | 810,300 | |||||||||
Prudential PLC | 13,410 | 317,703 | |||||||||
Reckitt Benckiser Group PLC | 131,528 | 11,734,138 | |||||||||
RELX PLC | 68,374 | 1,491,998 | |||||||||
Rio Tinto PLC | 17,594 | 969,098 | |||||||||
Rolls-Royce Holdings PLC*,4 | 84,182 | 1,094,986 | |||||||||
Royal Dutch Shell PLC, A Shares1,5 | 151,538 | 5,201,265 | |||||||||
Royal Dutch Shell PLC, B Shares4 | 411,264 | 14,420,874 | |||||||||
RSA Insurance Group PLC | 53,309 | 450,751 | |||||||||
Sky PLC | 70,367 | 1,407,107 | |||||||||
| Number of shares | Value | ||||||||||
Common stocks—(concluded) | |||||||||||
United Kingdom—(concluded) | |||||||||||
Smith & Nephew PLC | 25,107 | $ | 435,160 | ||||||||
SSE PLC | 482,547 | 7,917,086 | |||||||||
Standard Chartered PLC | 166,450 | 1,503,100 | |||||||||
Tesco PLC1 | 5,112,734 | 17,467,996 | |||||||||
The British Land Co. PLC | 36,836 | 319,201 | |||||||||
The Sage Group PLC | 21,555 | 175,976 | |||||||||
Vodafone Group PLC | 354,991 | 866,654 | |||||||||
Total United Kingdom common stocks | 175,401,315 | ||||||||||
| Total common stocks (cost—$1,213,935,704) | 1,321,567,923 | ||||||||||
Preferred stocks—0.77% | |||||||||||
Germany—0.77% | |||||||||||
Bayerische Motoren Werke AG | 7,036 | 582,510 | |||||||||
FUCHS PETROLUB SE | 5,881 | 332,019 | |||||||||
Henkel AG & Co. KGaA Vorzug | 11,220 | 1,407,132 | |||||||||
Porsche Automobil Holding SE1 | 100,767 | 6,822,466 | |||||||||
| Total preferred stocks (cost—$9,267,603) | 9,144,127 | ||||||||||
Short-term investment—1.09% | |||||||||||
Investment companies—1.09% | |||||||||||
| State Street Institutional U.S. Government Money Market Fund (cost—$12,954,076) | 12,954,076 | 12,954,076 | |||||||||
Investment of cash collateral from securities loaned—3.18% | |||||||||||
Money market fund—3.18% | |||||||||||
| State Street Navigator Securities Lending Government Money Market Portfolio (cost—$37,718,542) | 37,718,542 | 37,718,542 | |||||||||
| Total investments before investments sold short (cost—$1,273,875,925)—116.54% | 1,381,384,668 | ||||||||||
Investments sold short—(13.59)% | |||||||||||
Common stocks—(13.59)% | |||||||||||
Australia—(1.18)% | |||||||||||
AusNet Services | (812,319 | ) | (983,725 | ) | |||||||
Bendigo & Adelaide Bank Ltd. | (24,564 | ) | (213,705 | ) | |||||||
Challenger Ltd. | (182,345 | ) | (1,685,286 | ) | |||||||
Domino's Pizza Enterprises Ltd. | (24,171 | ) | (896,994 | ) | |||||||
Fortescue Metals Group Ltd. | (493,473 | ) | (1,602,154 | ) | |||||||
Orica Ltd. | (52,718 | ) | (688,553 | ) | |||||||
Scentre Group | (164,035 | ) | (517,947 | ) | |||||||
Tabcorp Holdings Ltd. | (1,071,342 | ) | (3,717,102 | ) | |||||||
Telstra Corp. Ltd. | (599,979 | ) | (1,265,942 | ) | |||||||
TPG Telecom Ltd. | (253,456 | ) | (1,084,637 | ) | |||||||
Treasury Wine Estates Ltd. | (51,418 | ) | (703,662 | ) | |||||||
Vicinity Centres | (295,560 | ) | (584,100 | ) | |||||||
(13,943,807 | ) | ||||||||||
208
PACE International Equity Investments
Portfolio of investments—July 31, 2018
| Number of shares | Value | ||||||||||
Investments sold short—(continued) | |||||||||||
Common stocks—(continued) | |||||||||||
Austria—(0.10)% | |||||||||||
voestalpine AG | (23,592 | ) | $ | (1,182,668 | ) | ||||||
Bermuda—(0.06)% | |||||||||||
Li & Fung Ltd. | (398,000 | ) | (134,880 | ) | |||||||
Yue Yuen Industrial Holdings Ltd. | (225,500 | ) | (606,194 | ) | |||||||
(741,074 | ) | ||||||||||
Cayman Islands—(0.23)% | |||||||||||
ASM Pacific Technology Ltd. | (22,100 | ) | (265,936 | ) | |||||||
Melco Resorts & Entertainment Ltd., ADR | (30,200 | ) | (780,972 | ) | |||||||
MGM China Holdings Ltd. | (508,800 | ) | (1,094,215 | ) | |||||||
Minth Group Ltd. | (168,000 | ) | (633,554 | ) | |||||||
(2,774,677 | ) | ||||||||||
Denmark—(0.22)% | |||||||||||
AP Moller—Maersk A/S, Class B | (1,396 | ) | (2,007,070 | ) | |||||||
ISS A/S | (8,341 | ) | (311,779 | ) | |||||||
Pandora A/S | (4,013 | ) | (285,268 | ) | |||||||
(2,604,117 | ) | ||||||||||
Finland—(0.05)% | |||||||||||
Nokia Oyj | (114,665 | ) | (622,952 | ) | |||||||
France—(0.99)% | |||||||||||
Bollore SA | (380,816 | ) | (1,773,213 | ) | |||||||
Carrefour SA | (106,349 | ) | (1,910,157 | ) | |||||||
Casino Guichard Perrachon SA | (25,246 | ) | (1,028,526 | ) | |||||||
Electricite de France SA | (3,954 | ) | (59,182 | ) | |||||||
Getlink | (41,350 | ) | (546,143 | ) | |||||||
Iliad SA | (4,494 | ) | (712,060 | ) | |||||||
Ingenico Group SA | (3,458 | ) | (286,935 | ) | |||||||
JCDecaux SA | (35,234 | ) | (1,151,152 | ) | |||||||
Sodexo SA | (18,606 | ) | (2,059,946 | ) | |||||||
Suez | (24,966 | ) | (353,393 | ) | |||||||
Unibail-Rodamco-Westfield | (80,233 | ) | (1,224,968 | ) | |||||||
Veolia Environnement SA | (16,574 | ) | (378,604 | ) | |||||||
Wendel SA | (1,787 | ) | (260,577 | ) | |||||||
(11,744,856 | ) | ||||||||||
Germany—(1.46)% | |||||||||||
Daimler AG | (58,296 | ) | (4,032,162 | ) | |||||||
Deutsche Telekom AG | (130,218 | ) | (2,154,626 | ) | |||||||
Deutsche Wohnen AG | (22,983 | ) | (1,119,620 | ) | |||||||
E.ON SE | (83,693 | ) | (943,824 | ) | |||||||
GEA Group AG | (32,376 | ) | (1,264,486 | ) | |||||||
KION Group AG | (13,583 | ) | (932,984 | ) | |||||||
LANXESS AG | (24,449 | ) | (2,009,837 | ) | |||||||
RWE AG | (96,379 | ) | (2,529,006 | ) | |||||||
Telefonica Deutschland Holding AG | (97,344 | ) | (426,518 | ) | |||||||
thyssenkrupp AG | (72,823 | ) | (1,943,250 | ) | |||||||
(17,356,313 | ) | ||||||||||
| Number of shares | Value | ||||||||||
Investments sold short—(continued) | |||||||||||
Common stocks—(continued) | |||||||||||
Hong Kong—(0.79)% | |||||||||||
MTR Corp. Ltd. | (525,659 | ) | $ | (2,946,725 | ) | ||||||
New World Development Co. Ltd. | (1,025,321 | ) | (1,460,443 | ) | |||||||
SJM Holdings Ltd. | (1,444,000 | ) | (1,753,247 | ) | |||||||
The Bank of East Asia Ltd. | (75,797 | ) | (301,293 | ) | |||||||
Wharf Holdings Ltd. | (884,000 | ) | (2,922,621 | ) | |||||||
(9,384,329 | ) | ||||||||||
Ireland—(0.08)% | |||||||||||
Kerry Group PLC, Class A | (6,304 | ) | (668,603 | ) | |||||||
Paddy Power Betfair PLC | (2,613 | ) | (284,926 | ) | |||||||
(953,529 | ) | ||||||||||
Italy—(0.06)% | |||||||||||
Assicurazioni Generali SpA | (13,288 | ) | (236,182 | ) | |||||||
Leonardo SpA | (10,032 | ) | (120,242 | ) | |||||||
Telecom Italia SpA | (515,564 | ) | (397,536 | ) | |||||||
(753,960 | ) | ||||||||||
Japan—(5.22)% | |||||||||||
AEON Financial Service Co. Ltd. | (26,800 | ) | (551,987 | ) | |||||||
Alps Electric Co. Ltd. | (15,600 | ) | (448,545 | ) | |||||||
Casio Computer Co. Ltd. | (27,100 | ) | (442,315 | ) | |||||||
Coca-Cola Bottlers Japan, Inc. | (9,400 | ) | (338,371 | ) | |||||||
Dai-ichi Life Holdings, Inc. | (93,100 | ) | (1,750,178 | ) | |||||||
Daicel Corp. | (133,400 | ) | (1,465,056 | ) | |||||||
Daiwa House Industry Co. Ltd. | (33,400 | ) | (1,215,143 | ) | |||||||
DeNA Co. Ltd. | (62,900 | ) | (1,184,139 | ) | |||||||
FamilyMart UNY Holdings Co. Ltd. | (900 | ) | (83,710 | ) | |||||||
Hitachi Metals Ltd. | (88,800 | ) | (959,356 | ) | |||||||
Idemitsu Kosan Co. Ltd. | (34,900 | ) | (1,569,977 | ) | |||||||
Iida Group Holdings Co. Ltd. | (104,700 | ) | (2,049,710 | ) | |||||||
Inpex Corp. | (418,300 | ) | (4,603,301 | ) | |||||||
Japan Airlines Co. Ltd. | (29,400 | ) | (1,084,078 | ) | |||||||
Japan Tobacco, Inc. | (44,700 | ) | (1,269,662 | ) | |||||||
JFE Holdings, Inc. | (50,000 | ) | (1,013,057 | ) | |||||||
JGC Corp. | (141,100 | ) | (2,729,502 | ) | |||||||
JSR Corp. | (74,400 | ) | (1,424,589 | ) | |||||||
Kakaku.com, Inc. | (25,400 | ) | (534,283 | ) | |||||||
Kansai Paint Co. Ltd. | (47,100 | ) | (1,080,880 | ) | |||||||
LINE Corp. | (5,900 | ) | (257,497 | ) | |||||||
Maruichi Steel Tube Ltd. | (35,500 | ) | (1,220,744 | ) | |||||||
Mitsubishi Chemical Holdings Corp. | (9,500 | ) | (82,812 | ) | |||||||
Mitsubishi Heavy Industries Ltd. | (21,900 | ) | (820,063 | ) | |||||||
Mitsubishi Materials Corp. | (12,700 | ) | (360,050 | ) | |||||||
Nexon Co. Ltd. | (107,600 | ) | (1,544,498 | ) | |||||||
Nippon Paint Holdings Co. Ltd. | (15,900 | ) | (691,088 | ) | |||||||
Nissan Motor Co. Ltd. | (207,800 | ) | (1,961,570 | ) | |||||||
Nomura Real Estate Holdings, Inc. | (50,700 | ) | (1,104,096 | ) | |||||||
Park24 Co. Ltd. | (48,300 | ) | (1,356,365 | ) | |||||||
SBI Holdings, Inc. | (115,400 | ) | (3,142,628 | ) | |||||||
Seiko Epson Corp. | (44,500 | ) | (801,131 | ) | |||||||
Sekisui House Ltd. | (25,500 | ) | (433,647 | ) | |||||||
Seven Bank Ltd. | (114,500 | ) | (346,116 | ) | |||||||
SG Holdings Co. Ltd. | (2,600 | ) | (56,853 | ) | |||||||
209
PACE International Equity Investments
Portfolio of investments—July 31, 2018
| Number of shares | Value | ||||||||||
Investments sold short—(continued) | |||||||||||
Common stocks—(continued) | |||||||||||
Japan—(concluded) | |||||||||||
Sumitomo Dainippon Pharma Co. Ltd. | (116,000 | ) | $ | (2,243,957 | ) | ||||||
Sumitomo Metal Mining Co. Ltd. | (25,300 | ) | (908,460 | ) | |||||||
Sumitomo Realty & Development Co. Ltd. | (12,000 | ) | (438,725 | ) | |||||||
Suruga Bank Ltd. | (91,400 | ) | (818,239 | ) | |||||||
T&D Holdings, Inc. | (187,800 | ) | (2,796,467 | ) | |||||||
TDK Corp. | (38,600 | ) | (4,118,392 | ) | |||||||
Teijin Ltd. | (40,300 | ) | (749,667 | ) | |||||||
Tokyu Corp. | (27,000 | ) | (464,106 | ) | |||||||
Tosoh Corp. | (94,400 | ) | (1,536,538 | ) | |||||||
Toyo Seikan Group Holdings Ltd. | (56,800 | ) | (1,042,379 | ) | |||||||
Yahoo Japan Corp. | (948,800 | ) | (3,606,314 | ) | |||||||
Yamada Denki Co. Ltd. | (452,600 | ) | (2,242,458 | ) | |||||||
Yamaguchi Financial Group, Inc. | (81,000 | ) | (917,104 | ) | |||||||
(61,859,803 | ) | ||||||||||
Luxembourg—(0.24)% | |||||||||||
RTL Group SA | (2,391 | ) | (178,240 | ) | |||||||
SES SA | (34,737 | ) | (694,394 | ) | |||||||
Tenaris SA | (104,583 | ) | (1,911,457 | ) | |||||||
(2,784,091 | ) | ||||||||||
Mauritius—(0.05)% | |||||||||||
Golden Agri-Resources Ltd. | (2,799,400 | ) | (575,775 | ) | |||||||
Netherlands—(0.60)% | |||||||||||
AerCap Holdings N.V. | (1,100 | ) | (61,743 | ) | |||||||
Airbus SE | (18,961 | ) | (2,350,237 | ) | |||||||
EXOR N.V. | (51,978 | ) | (3,420,725 | ) | |||||||
Koninklijke Ahold Delhaize N.V. | (29,664 | ) | (754,628 | ) | |||||||
Koninklijke Vopak N.V. | (11,261 | ) | (530,409 | ) | |||||||
(7,117,742 | ) | ||||||||||
New Zealand—(0.05)% | |||||||||||
a2 Milk Co. Ltd. | (82,089 | ) | (585,257 | ) | |||||||
Portugal—(0.27)% | |||||||||||
EDP—Energias de Portugal SA | (770,441 | ) | (3,143,293 | ) | |||||||
Singapore—(0.48)% | |||||||||||
CapitaLand Mall Trust | (926,100 | ) | (1,469,406 | ) | |||||||
Sembcorp Industries Ltd. | (377,200 | ) | (742,569 | ) | |||||||
Suntec Real Estate Investment Trust | (591,900 | ) | (800,012 | ) | |||||||
UOL Group Ltd. | (176,800 | ) | (931,176 | ) | |||||||
Venture Corp. Ltd. | (124,400 | ) | (1,524,216 | ) | |||||||
Wilmar International Ltd. | (85,000 | ) | (195,431 | ) | |||||||
(5,662,810 | ) | ||||||||||
| Number of shares | Value | ||||||||||
Investments sold short—(concluded) | |||||||||||
Common stocks—(concluded) | |||||||||||
Spain—(0.31)% | |||||||||||
Ferrovial SA | (120,091 | ) | $ | (2,482,774 | ) | ||||||
Grifols SA | (13,978 | ) | (406,177 | ) | |||||||
Telefonica SA | (84,282 | ) | (757,988 | ) | |||||||
(3,646,939 | ) | ||||||||||
Sweden—(0.19)% | |||||||||||
Electrolux AB, Series B | (30,660 | ) | (719,693 | ) | |||||||
Hennes & Mauritz AB, B Shares | (42,939 | ) | (668,042 | ) | |||||||
Nordea Bank AB | (29,999 | ) | (319,063 | ) | |||||||
Skanska AB | (27,324 | ) | (514,600 | ) | |||||||
Svenska Handelsbanken AB, A Shares | (4,859 | ) | (60,040 | ) | |||||||
(2,281,438 | ) | ||||||||||
Switzerland—(0.71)% | |||||||||||
Clariant AG | (29,350 | ) | (702,218 | ) | |||||||
Credit Suisse Group AG | (3,412 | ) | (55,032 | ) | |||||||
Dufry AG | (25,008 | ) | (3,311,164 | ) | |||||||
Lonza Group AG | (3,273 | ) | (1,009,187 | ) | |||||||
Vifor Pharma AG | (17,766 | ) | (3,367,852 | ) | |||||||
(8,445,453 | ) | ||||||||||
United Kingdom—(0.25)% | |||||||||||
Babcock International Group PLC | (179,632 | ) | (1,684,855 | ) | |||||||
Hammerson PLC | (7,641 | ) | (52,332 | ) | |||||||
Kingfisher PLC | (37,534 | ) | (146,170 | ) | |||||||
Micro Focus International PLC | (25,963 | ) | (425,971 | ) | |||||||
Royal Mail PLC | (8,623 | ) | (53,071 | ) | |||||||
Whitbread PLC | (11,612 | ) | (596,698 | ) | |||||||
(2,959,097 | ) | ||||||||||
| Total investments sold short (proceeds—$162,759,811) | (161,123,980 | ) | |||||||||
Liabilities in excess of other assets—(2.95)% | (34,977,364 | ) | |||||||||
Net assets—100.00% | $ | 1,185,283,324 | |||||||||
For a listing of defined portfolio acronyms that are used throughout the Portfolio of investments as well as the tables that follow, please refer to page 273.
210
PACE International Equity Investments
Portfolio of investments—July 31, 2018
Forward foreign currency contracts
Counterparty | Sell | Purchase | Settlement date | Unrealized depreciation | |||||||||||||||
DB | USD | 108,822 | JPY | 12,085,192 | 08/02/18 | $ | (740 | ) | |||||||||||
Fair valuation summary
The following is a summary of the fair valuations according to the inputs used as of July 31, 2018 in valuing the Portfolio's investments. In the event a Portfolio holds investments for which fair value is measured using the NAV per share practical expedient (or its equivalent), a separate column will be added to the fair value hierarchy table; this is intended to permit reconciliation to the amounts presented in the Portfolio of investments:
| Assets Description | Unadjusted quoted prices in active markets for identical investments (Level 1) | Other significant observable inputs (Level 2) | Unobservable inputs (Level 3) | Total | |||||||||||||||
Common stocks | $ | 1,321,567,923 | $ | — | $ | — | $ | 1,321,567,923 | |||||||||||
Preferred stocks | 9,144,127 | — | — | 9,144,127 | |||||||||||||||
Short-term investment | — | 12,954,076 | — | 12,954,076 | |||||||||||||||
Investment of cash collateral from securities loaned | — | 37,718,542 | — | 37,718,542 | |||||||||||||||
Total | $ | 1,330,712,050 | $ | 50,672,618 | $ | — | $ | 1,381,384,668 | |||||||||||
Liabilities | |||||||||||||||||||
Investments sold short | (161,123,980 | ) | — | — | (161,123,980 | ) | |||||||||||||
Forward foreign currency contracts | — | (740 | ) | — | (740 | ) | |||||||||||||
Total | $ | (161,123,980 | ) | $ | (740 | ) | $ | — | $ | (161,124,720 | ) | ||||||||
At July 31, 2018, there were no transfers between Level 1 and Level 2.
Portfolio footnotes
* Non-income producing security.
1 Security, or portion thereof, pledged as collateral for investments sold short.
2 Security, or portion thereof, was on loan at the period end.
3 Security exempt from registration pursuant to Rule 144A under the Securities Act of 1933. These securities are considered liquid, unless noted otherwise, and may be resold in transactions exempt from registration, normally to qualified institutional buyers. Securities exempt from registration pursuant to Rule 144A, in the amount of $4,040,113, represented 0.34% of the Portfolio's net assets at period end.
4 Security is traded on the London Exchange.
5 Security is traded on the Amsterdam Exchange.
See accompanying notes to financial statements.
211
PACE International Emerging Markets Equity Investments
Performance (unaudited)
For the 12 months ended July 31, 2018, the Portfolio's Class P shares gained 1.42% before the deduction of the maximum PACE Select program fee.1 In comparison, the MSCI Emerging Markets Index (net) (the "benchmark") returned 4.36%, and the Lipper Emerging Markets Funds category posted a median return of 3.12%. (Returns for all share classes over various time periods are shown in the "Performance at a glance" table on page 214. Please note that the returns shown do not reflect the deduction of taxes that a shareholder would pay on Portfolio distributions or the redemption of Portfolio shares.) For a detailed commentary on the market environment in general during the reporting period, please refer to page 3.
Advisor's comments (unaudited)2
The Portfolio underperformed its benchmark during the reporting period. Stock selection was the primary detractor from results. Stock selection was the weakest within the materials sector, particularly the mining and metals industry, as well as the information technology sector. This offset positive stock selection within the consumer discretionary sector. Energy returned over 17% in the benchmark and was the best performing sector as the price of crude recovered. Conversely, industrials returned -14%, selling off on escalated trade war concerns. From a country perspective, the most significant detractors were weak stock selection within India and an overweight to and stock selection within Brazil. The latter recently sold off sharply due to geopolitical concerns. An underweight to China, which drove nearly half the returns of the benchmark, was also a detractor. From a style perspective, an overweight to momentum was additive, but offset by stock specific exposures.
Derivatives were not used during the reporting period.
1 Class P shares held through the PACE Select Advisors Program are subject to a maximum Program fee of 2.50%, which, if included, would have reduced performance. Class P shares held through other advisory programs also may be subject to a program fee, which, if included, would have reduced performance.
2 All Sub-Advisors discuss performance on a gross-of-fees basis—meaning that no fees or expenses are reflected in their sleeves'/sleeve's performance. Alternately, Portfolio performance is shown net of fees, which does factor in fees and expenses associated with the Portfolio.
PACE Select Advisors Trust – PACE International Emerging Markets Equity Investments
Investment Manager:
UBS Asset Management (Americas) Inc. ("UBS AM")
Investment Subadvisors:
Mondrian Investment Partners Limited ("Mondrian"); William Blair & Company L.L.C. ("William Blair");
LMCG Investments, LLC, formerly Lee Munder Capital Group ("LMCG")
Portfolio Management Team:
UBS AM: Mabel Lung, CFA and Fred Lee, CFA, assisted by Vincent Russo and Mayoor Joshi
Mondrian: Ginny Chong, Gregory Halton and Andrew Miller;
William Blair: Todd M. McClone and Jack Murphy;
LMCG: Gordon Johnson and Shannon Ericson
Objective:
Capital appreciation
Investment process:
The main strategies of the subadvisors include:
• A strategy using fundamental research to identify companies that are attractive based on a value-oriented dividend discount model and market analysis.
• A strategy that invests in mid and large cap companies with a quality growth orientation.
• A strategy that uses a bottom-up quantitative approach.
212
PACE International Emerging Markets Equity Investments
Special considerations
The Portfolio may be appropriate for long-term investors seeking capital appreciation who are able to withstand short-term fluctuations in the equity markets in return for potentially higher returns over the long term. The value of the Portfolio changes every day and can be affected by changes in interest rates, general market conditions, and other political, social and economic developments, as well as specific matters relating to the companies in whose securities the Portfolio invests. It is important to note that an investment in the Portfolio is only one component of a balanced investment plan. The value of the Portfolio's investments in foreign securities may fall due to adverse political, social and economic developments abroad, and due to decreases in foreign currency values relative to the US dollar. These risks are greater for investments in emerging market issuers than for issuers in more developed countries.
213
PACE International Emerging Markets Equity Investments
Performance at a glance (unaudited)
Average annual total returns for periods ended 07/31/18 | 1 year | 5 years | 10 years | ||||||||||||
Before deducting maximum sales charge | |||||||||||||||
Class A1 | 1.11 | % | 2.66 | % | 0.91 | % | |||||||||
Class C2 | 0.41 | 1.92 | 0.17 | ||||||||||||
Class Y3 | 1.41 | 2.92 | 1.18 | ||||||||||||
Class P4 | 1.42 | 2.89 | 1.03 | ||||||||||||
After deducting maximum sales charge | |||||||||||||||
Class A1 | (4.45 | ) | 1.50 | 0.34 | |||||||||||
Class C2 | (0.59 | ) | 1.92 | 0.17 | |||||||||||
MSCI Emerging Markets Index (net)5 | 4.36 | 5.25 | 2.87 | ||||||||||||
Lipper Emerging Markets Funds median | 3.12 | 4.63 | 2.57 | ||||||||||||
Most recent calendar quarter-end returns (unaudited)
Average annual total returns for periods ended 06/30/18 | 1 year | 5 years | 10 years | ||||||||||||
Before deducting maximum sales charge | |||||||||||||||
Class A1 | 4.87 | % | 2.41 | % | 0.34 | % | |||||||||
Class C2 | 4.03 | 1.66 | (0.40 | ) | |||||||||||
Class Y3 | 5.15 | 2.66 | 0.61 | ||||||||||||
Class P4 | 5.10 | 2.63 | 0.46 | ||||||||||||
After deducting maximum sales charge | |||||||||||||||
Class A1 | (0.89 | ) | 1.26 | (0.22 | ) | ||||||||||
Class C2 | 3.03 | 1.66 | (0.40 | ) | |||||||||||
The annualized gross and net expense ratios, respectively, for each class of shares as in the November 28, 2017 prospectuses, supplemented from time to time, were as follows: Class A—1.80% and 1.70%; Class C—2.55% and 2.45%; Class Y—1.54% and 1.45%; and Class P—1.59% and 1.45%. Net expenses reflect fee waivers and/or expense reimbursements, if any, pursuant to an agreement that is in effect to cap the expenses. The Portfolio and UBS Asset Management (Americas) Inc. ("UBS AM") have entered into a written fee waiver/expense reimbursement agreement pursuant to which UBS AM is contractually obligated to waive its management fees and/or reimburse expenses so that the Portfolio's ordinary total operating expenses of each class through November 30, 2018 (excluding dividend expense, borrowing costs, and interest expense relating to short sales, and expenses attributable to investment in other investment companies, interest, taxes, brokerage commissions and extraordinary expenses) would not exceed Class A—1.70%; Class C—2.45%; Class Y—1.45%; and Class P—1.45%. "Management fee waiver/expense reimbursements" are based on estimated amounts for the current fiscal year. The Portfolio has agreed to repay UBS AM for any waived fees/reimbursed expenses to the extent that it can do so over the following three fiscal years without causing the Portfolio's expenses in any of those three years to exceed these expense caps and that UBS AM has not waived the right to do so. The fee waiver/expense reimbursement agreement may be terminated by the Portfolio's board at any time and also will terminate automatically upon the expiration or termination of the Portfolio's advisory contract with UBS AM. Upon termination of the agreement, however, UBS AM's three year recoupment rights will survive.
1 Maximum sales charge for Class A shares is 5.5%. Class A shares bear ongoing 12b-1 service fees of 0.25% annually.
2 Maximum contingent deferred sales charge for Class C shares is 1%imposed on redemptions and is reduced to 0% after one year. Class C shares bear ongoing 12b-1 service and distribution fees of 0.25% and 0.75% annually, respectively. As of July 12, 2018, Class C shares ceased paying 12b-1 distribution fees. See notes to financial statements—Subsequent events for additional information.
3 The Portfolio offers Class Y shares to a limited group of eligible investors, including certain qualifying retirement plans. Class Y shares do not bear initial or contingent deferred sales charges or ongoing 12b-1 service and distribution fees.
4 Class P shares do not bear initial or contingent deferred sales charges or ongoing 12b-1 service and distribution fees, but Class P shares held through advisory programs may be subject to a program fee, which, if included, would have reduced performance.
5 The MSCI Emerging Markets Index (net) is a market capitalization-weighted index composed of different emerging market countries in Europe, Latin America, and the Pacific Basin. Net total return indices reinvest dividends after the deduction of withholding taxes, using a tax rate applicable to nonresident institutional investors who do not benefit from double taxation treaties. The index is constructed and managed with a view to being fully investable from the perspective of international institutional investors. Investors should note that indices do not reflect the deduction of fees and expenses.
Past performance does not predict future performance, and the performance information provided does not reflect the deduction of taxes that a shareholder would pay on Portfolio distributions or the redemption of Portfolio shares. The return and principal value of an investment will fluctuate, so that an investor's shares, when redeemed, may be worth more or less than their original cost. Performance results assume reinvestment of all dividends and capital gain distributions at net asset value on the ex-dividend dates. Current performance may be higher or lower than the performance data quoted. For month-end performance figures, please visit www.ubs.com/us-mutualfundperformance.
Lipper peer group data calculated by Lipper Inc.; used with permission. The Lipper median is the return of the fund that places in the middle of a Lipper peer group.
214
PACE International Emerging Markets Equity Investments
Illustration of an assumed investment of $10,000 in Class P shares of the Portfolio (unaudited)
The following graph depicts the performance of PACE International Emerging Markets Equity Investments Class P shares versus the MSCI Emerging Markets Index (net) over the 10 years ended July 31, 2018. Class P shares held through advisory programs may be subject to a program fee, which, if included, would have reduced performance. The performance of the other classes will vary based upon the different class specific expenses and sales charges. The performance provided does not reflect the deduction of taxes that a shareholder would pay on Portfolio distributions or the redemption of Portfolio shares. Past performance is no guarantee of future results. Share price and returns will vary with market conditions; investors may realize a gain or loss upon redemption. It is important to note that PACE International Emerging Markets Equity Investments is a professionally managed portfolio while the Index is not available for investment and are unmanaged. The comparison is shown for illustration purposes only.
PACE International Emerging Markets Equity Investments
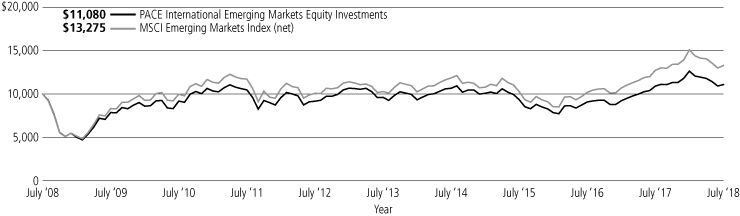
215
PACE International Emerging Markets Equity Investments
Portfolio statistics—July 31, 2018 (unaudited)
Top ten holdings1 | Percentage of net assets | ||||||
Samsung Electronics Co. Ltd. | 4.3 | % | |||||
Alibaba Group Holding Ltd., ADR | 3.8 | ||||||
Tencent Holdings Ltd. | 3.7 | ||||||
Taiwan Semiconductor Manufacturing Co. Ltd. | 2.9 | ||||||
Ping An Insurance (Group) Co. of China Ltd., Class H | 1.9 | ||||||
Housing Development Finance Corp. | 1.9 | ||||||
Naspers Ltd., N Shares | 1.9 | ||||||
Taiwan Semiconductor Manufacturing Co. Ltd., ADR | 1.8 | ||||||
China Construction Bank Corp., Class H | 1.6 | ||||||
Grupo Financiero Banorte SAB de C.V., Series O | 1.2 | ||||||
Total | 25.0 | % | |||||
Top five issuer breakdown by country or territory of origin1 | Percentage of net assets | ||||||
Cayman Islands | 14.7 | % | |||||
India | 13.9 | ||||||
South Korea | 11.8 | ||||||
Taiwan | 10.5 | ||||||
China | 10.0 | ||||||
Total | 60.9 | % | |||||
1 The Portfolio is actively managed and its composition will vary over time.
216
PACE International Emerging Markets Equity Investments
Industry diversification—(unaudited)
As a percentage of net assets as of July 31, 2018
Common stocks | |||||||
Aerospace & defense | 0.84 | % | |||||
Auto components | 0.64 | ||||||
Automobiles | 2.66 | ||||||
Banks | 15.26 | ||||||
Beverages | 0.73 | ||||||
Capital markets | 0.49 | ||||||
Chemicals | 1.95 | ||||||
Construction & engineering | 1.14 | ||||||
Construction materials | 0.45 | ||||||
Consumer finance | 0.55 | ||||||
Diversified consumer services | 0.96 | ||||||
Diversified financial services | 0.42 | ||||||
Diversified telecommunication services | 0.67 | ||||||
Electric utilities | 0.73 | ||||||
Electronic equipment, instruments & components | 1.67 | ||||||
Equity real estate investment trusts | 0.91 | ||||||
Food & staples retailing | 2.40 | ||||||
Food products | 2.49 | ||||||
Gas utilities | 0.42 | ||||||
Health care equipment & supplies | 0.20 | ||||||
Health care providers & services | 0.31 | ||||||
Hotels, restaurants & leisure | 2.89 | ||||||
Household durables | 1.42 | ||||||
Household products | 1.08 | ||||||
Independent power and renewable electricity producers | 0.77 | ||||||
Industrial conglomerates | 0.52 | ||||||
Insurance | 3.86 | ||||||
Internet software & services | 9.32 | ||||||
IT services | 1.61 | ||||||
Machinery | 0.74 | ||||||
Media | 1.87 | ||||||
Common stocks—(concluded) | |||||||
Metals & mining | 4.17 | % | |||||
Multi-utilities | 0.18 | ||||||
Multiline retail | 0.22 | ||||||
Oil, gas & consumable fuels | 4.97 | ||||||
Paper & forest products | 1.02 | ||||||
Personal products | 1.16 | ||||||
Pharmaceuticals | 2.42 | ||||||
Real estate management & development | 0.62 | ||||||
Semiconductors & semiconductor equipment | 6.20 | ||||||
Software | 0.53 | ||||||
Specialty retail | 0.39 | ||||||
Technology hardware, storage & peripherals | 5.11 | ||||||
Textiles, apparel & luxury goods | 0.83 | ||||||
Thrifts & mortgage finance | 3.01 | ||||||
Transportation infrastructure | 1.48 | ||||||
Wireless telecommunication services | 3.26 | ||||||
Total common stocks | 95.54 | ||||||
Preferred stocks | |||||||
Banks | 1.34 | ||||||
Insurance | 0.20 | ||||||
Metals & mining | 0.07 | ||||||
Oil, gas & consumable fuels | 0.25 | ||||||
Total preferred stocks | 1.86 | ||||||
Short-term investment | |||||||
Investment companies | 2.56 | ||||||
Investment of cash collateral from securities loaned | 1.20 | ||||||
Total investments | 101.16 | ||||||
Liabilities in excess of other assets | (1.16 | ) | |||||
Net assets | 100.00 | % | |||||
217
PACE International Emerging Markets Equity Investments
Portfolio of investments—July 31, 2018
| Number of shares | Value | ||||||||||
Common stocks—95.54% | |||||||||||
Argentina—0.34% | |||||||||||
Grupo Financiero Galicia SA, ADR | 15,603 | $ | 555,935 | ||||||||
YPF SA, ADR | 57,733 | 958,368 | |||||||||
Total Argentina common stocks | 1,514,303 | ||||||||||
Bermuda—1.57% | |||||||||||
Brilliance China Automotive Holdings Ltd. | 986,000 | 1,286,352 | |||||||||
Credicorp Ltd. | 17,258 | 3,948,113 | |||||||||
Haier Electronics Group Co. Ltd.* | 635,000 | 1,852,644 | |||||||||
Total Bermuda common stocks | 7,087,109 | ||||||||||
Brazil—5.60% | |||||||||||
AMBEV SA, ADR | 264,016 | 1,357,042 | |||||||||
B3 SA—Brasil Bolsa Balcao | 243,300 | 1,542,138 | |||||||||
Banco Santander Brasil SA | 126,900 | 1,233,398 | |||||||||
Companhia de Concessoes Rodoviarias (CCR) | 581,545 | 1,631,543 | |||||||||
Embraer SA, ADR | 183,928 | 3,761,328 | |||||||||
Hypera SA | 351,400 | 2,598,074 | |||||||||
Itau Unibanco Holdings SA, ADR | 147,686 | 1,770,755 | |||||||||
Kroton Educacional SA | 553,900 | 1,667,618 | |||||||||
MRV Engenharia e Participacoes SA | 258,200 | 908,753 | |||||||||
Raia Drogasil SA | 95,100 | 1,884,111 | |||||||||
Suzano Papel e Celulose SA | 304,700 | 3,616,653 | |||||||||
TIM Participacoes SA | 277,500 | 916,793 | |||||||||
Vale SA | 156,056 | 2,280,156 | |||||||||
Total Brazil common stocks | 25,168,362 | ||||||||||
Cayman Islands—14.70% | |||||||||||
58.com, Inc., ADR* | 24,682 | 1,660,111 | |||||||||
Agile Group Holdings Ltd. | 962,000 | 1,478,105 | |||||||||
Alibaba Group Holding Ltd., ADR* | 90,637 | 16,969,966 | |||||||||
Anta Sports Products Ltd. | 256,000 | 1,304,616 | |||||||||
Autohome, Inc., ADR | 15,562 | 1,505,624 | |||||||||
Baidu, Inc., ADR* | 3,458 | 854,748 | |||||||||
China Medical System Holdings Ltd. | 1,013,000 | 1,731,988 | |||||||||
China State Construction International Holdings Ltd. | 1,557,750 | 1,855,634 | |||||||||
Ctrip.com International Ltd., ADR* | 33,407 | 1,374,698 | |||||||||
ENN Energy Holdings Ltd. | 185,000 | 1,882,043 | |||||||||
Hengan International Group Co. Ltd. | 150,500 | 1,339,325 | |||||||||
Huazhu Group Ltd.1 | 47,597 | 1,904,356 | |||||||||
Momo, Inc., ADR* | 49,101 | 2,014,123 | |||||||||
Sands China Ltd. | 418,400 | 2,153,555 | |||||||||
Shenzhou International Group Holdings Ltd. | 199,000 | 2,440,263 | |||||||||
Shimao Property Holdings Ltd. | 456,500 | 1,294,058 | |||||||||
Sunny Optical Technology Group Co. Ltd. | 48,000 | 791,943 | |||||||||
TAL Education Group, ADR* | 27,066 | 865,841 | |||||||||
Tencent Holdings Ltd. | 371,800 | 16,825,394 | |||||||||
Tingyi Cayman Islands Holding Corp. | 644,000 | 1,488,353 | |||||||||
Tongda Group Holdings Ltd.1 | 5,760,000 | 1,159,478 | |||||||||
WH Group Ltd.2 | 4,000,000 | 3,210,580 | |||||||||
Total Cayman Islands common stocks | 66,104,802 | ||||||||||
Chile—0.27% | |||||||||||
Sociedad Quimica y Minera de Chile SA, ADR1 | 24,861 | 1,200,040 | |||||||||
China—10.00% | |||||||||||
Agricultural Bank of China Ltd., Class H | 3,274,000 | 1,585,058 | |||||||||
Anhui Conch Cement Co. Ltd., Class H | 317,500 | 2,032,650 | |||||||||
| Number of shares | Value | ||||||||||
Common stocks—(continued) | |||||||||||
China—(concluded) | |||||||||||
Bank of China Ltd., Class H | 2,706,000 | $ | 1,268,699 | ||||||||
China CITIC Bank Corp. Ltd., Class H | 2,108,000 | 1,350,895 | |||||||||
China Construction Bank Corp., Class H | 8,076,000 | 7,315,581 | |||||||||
| China Huarong Asset Management Co. Ltd., Class H2 | 2,613,000 | 665,813 | |||||||||
| China International Travel Service Corp. Ltd., Class A | 153,900 | 1,583,300 | |||||||||
China Longyuan Power Group Corp., Class H | 1,403,000 | 1,306,646 | |||||||||
China Merchants Bank Co. Ltd., Class H | 370,500 | 1,446,777 | |||||||||
China Pacific Insurance Group Co. Ltd., Class H | 199,600 | 778,153 | |||||||||
China Petroleum & Chemical Corp., Class H | 1,892,000 | 1,824,735 | |||||||||
China Shenhua Energy Co. Ltd., Class H | 592,500 | 1,336,117 | |||||||||
Dongfeng Motor Group Co. Ltd., Class H | 600,000 | 601,601 | |||||||||
| Industrial & Commercial Bank of China Ltd., Class H | 2,450,000 | 1,813,532 | |||||||||
Jiangsu Expressway Co. Ltd., Class H | 826,000 | 1,003,948 | |||||||||
Jiangsu Hengrui Medicine Co. Ltd., Class A | 164,204 | 1,656,593 | |||||||||
Kweichow Moutai Co. Ltd., Class A | 18,000 | 1,915,465 | |||||||||
Midea Group Co. Ltd., Class A | 346,300 | 2,415,197 | |||||||||
| New Oriental Education & Technology Group, Inc., ADR | 20,728 | 1,783,437 | |||||||||
| Ping An Insurance (Group) Co. of China Ltd., Class H | 940,000 | 8,718,507 | |||||||||
SAIC Motor Corp. Ltd., Class A | 367,497 | 1,716,762 | |||||||||
| Sinopec Shanghai Petrochemical Co. Ltd., Class H | 1,440,000 | 864,105 | |||||||||
Total China common stocks | 44,983,571 | ||||||||||
Hong Kong—4.18% | |||||||||||
China Mobile Ltd. | 591,500 | 5,335,448 | |||||||||
China Resources Power Holdings Co. Ltd. | 1,124,911 | 2,169,836 | |||||||||
| China Traditional Chinese Medicine Holdings Co. Ltd. | 1,714,000 | 1,262,181 | |||||||||
CITIC Ltd. | 792,000 | 1,118,016 | |||||||||
CNOOC Ltd. | 2,833,000 | 4,735,472 | |||||||||
CSPC Pharmaceutical Group Ltd. | 1,600,000 | 4,178,850 | |||||||||
Total Hong Kong common stocks | 18,799,803 | ||||||||||
Hungary—0.84% | |||||||||||
OTP Bank Nyrt | 100,021 | 3,763,125 | |||||||||
India—13.81% | |||||||||||
Asian Paints Ltd. | 63,301 | 1,339,555 | |||||||||
Bajaj Auto Ltd. | 61,367 | 2,415,848 | |||||||||
Bajaj Finance Ltd. | 62,981 | 2,477,413 | |||||||||
Bharat Forge Ltd. | 97,549 | 911,185 | |||||||||
Britannia Industries Ltd. | 13,918 | 1,327,589 | |||||||||
Dewan Housing Finance Corp. Ltd. | 137,724 | 1,205,829 | |||||||||
Eicher Motors Ltd. | 2,520 | 1,021,376 | |||||||||
HCL Technologies Ltd. | 183,547 | 2,582,751 | |||||||||
HDFC Bank Ltd. | 75,769 | 2,407,750 | |||||||||
HDFC Standard Life Insurance Co. Ltd.2 | 211,746 | 1,551,983 | |||||||||
Hindalco Industries Ltd. | 425,559 | 1,324,089 | |||||||||
Hindustan Petroleum Corp. Ltd. | 200,893 | 834,195 | |||||||||
Hindustan Unilever Ltd. | 143,974 | 3,635,023 | |||||||||
Housing Development Finance Corp. | 296,407 | 8,621,079 | |||||||||
218
PACE International Emerging Markets Equity Investments
Portfolio of investments—July 31, 2018
| Number of shares | Value | ||||||||||
Common stocks—(continued) | |||||||||||
India—(concluded) | |||||||||||
Indiabulls Housing Finance Ltd. | 196,773 | $ | 3,721,219 | ||||||||
IndusInd Bank Ltd. | 60,428 | 1,757,829 | |||||||||
Infosys Ltd. | 161,552 | 3,215,435 | |||||||||
JSW Steel Ltd. | 306,600 | 1,476,982 | |||||||||
Jubilant Foodworks Ltd. | 77,696 | 1,591,501 | |||||||||
Larsen & Toubro Ltd. | 69,109 | 1,312,226 | |||||||||
Lupin Ltd. | 171,364 | 2,059,779 | |||||||||
Mahindra & Mahindra Ltd. | 127,734 | 1,743,099 | |||||||||
Maruti Suzuki India Ltd. | 30,323 | 4,209,177 | |||||||||
MRF Ltd. | 1,707 | 1,978,385 | |||||||||
NIIT Technologies Ltd. | 75,004 | 1,341,703 | |||||||||
Power Grid Corp. of India Ltd. | 488,848 | 1,299,342 | |||||||||
Tech Mahindra Ltd. | 147,459 | 1,463,598 | |||||||||
Vedanta Ltd. | 1,016,319 | 3,292,585 | |||||||||
Total India common stocks | 62,118,525 | ||||||||||
Indonesia—1.99% | |||||||||||
PT Bank Mandiri (Persero) Tbk | 2,290,100 | 1,056,114 | |||||||||
PT Bank Rakyat Indonesia (Persero) Tbk | 16,505,300 | 3,513,958 | |||||||||
Telekomunikasi Indonesia Persero Tbk PT | 7,869,700 | 1,948,324 | |||||||||
Unilever Indonesia Tbk PT | 404,500 | 1,213,220 | |||||||||
United Tractors Tbk PT | 507,000 | 1,239,372 | |||||||||
Total Indonesia common stocks | 8,970,988 | ||||||||||
Malaysia—2.49% | |||||||||||
AMMB Holdings Berhad | 1,161,500 | 1,148,642 | |||||||||
Genting Berhad | 445,100 | 958,087 | |||||||||
Genting Malaysia Berhad | 1,676,600 | 2,086,985 | |||||||||
Malayan Banking Berhad | 1,071,158 | 2,585,009 | |||||||||
Public Bank Berhad | 258,700 | 1,531,199 | |||||||||
Tenaga Nasional Berhad | 513,200 | 1,979,576 | |||||||||
Top Glove Corp. Berhad | 368,600 | 919,460 | |||||||||
Total Malaysia common stocks | 11,208,958 | ||||||||||
Mexico—2.53% | |||||||||||
Fibra Uno Administracion SA de C.V. | 1,899,450 | 2,735,375 | |||||||||
Grupo Aeroportuario del Pacifico SAB de C.V. | 178,300 | 1,684,870 | |||||||||
Grupo Financiero Banorte SAB de C.V., Series O | 791,653 | 5,520,153 | |||||||||
Wal-Mart de Mexico SAB de C.V. | 491,339 | 1,434,915 | |||||||||
Total Mexico common stocks | 11,375,313 | ||||||||||
Netherlands—0.46% | |||||||||||
Yandex N.V.* | 57,902 | 2,082,156 | |||||||||
Philippines—0.26% | |||||||||||
PLDT, Inc. | 46,741 | 1,176,777 | |||||||||
Poland—0.26% | |||||||||||
Powszechna Kasa Oszczednosci Bank Polski SA* | 103,162 | 1,177,075 | |||||||||
Qatar—0.46% | |||||||||||
Qatar Electricity & Water Co. | 15,491 | 808,374 | |||||||||
Qatar National Bank | 26,433 | 1,270,468 | |||||||||
Total Qatar common stocks | 2,078,842 | ||||||||||
Romania—0.09% | |||||||||||
| Societatea Nationala de Gaze Naturale ROMGAZ SA, GDR3 | 52,750 | 398,262 | |||||||||
| Number of shares | Value | ||||||||||
Common stocks—(continued) | |||||||||||
Russia—2.74% | |||||||||||
Gazprom PAO, ADR1,4 | 631,244 | $ | 2,865,848 | ||||||||
Gazprom PAO, ADR5 | 345,340 | 1,548,159 | |||||||||
Lukoil PJSC, ADR4 | 22,630 | 1,624,382 | |||||||||
Lukoil PJSC, ADR1,5 | 26,163 | 1,870,655 | |||||||||
MMC Norilsk Nickel PJSC, ADR1 | 91,509 | 1,584,478 | |||||||||
MMC Norilsk Nickel PJSC, ADR | 38,331 | 663,126 | |||||||||
Mobile TeleSystems, ADR | 142,486 | 1,249,602 | |||||||||
Severstal PJSC, GDR | 57,325 | 935,544 | |||||||||
Total Russia common stocks | 12,341,794 | ||||||||||
South Africa—4.96% | |||||||||||
Bid Corp. Ltd. | 56,643 | 1,133,591 | |||||||||
Capitec Bank Holdings Ltd.1 | 29,091 | 2,102,218 | |||||||||
Clicks Group Ltd. | 78,951 | 1,158,767 | |||||||||
FirstRand Ltd. | 361,480 | 1,901,630 | |||||||||
Growthpoint Properties Ltd. | 686,102 | 1,362,564 | |||||||||
Naspers Ltd., N Shares | 34,130 | 8,403,225 | |||||||||
Rand Merchant Investment Holdings Ltd. | 447,744 | 1,357,089 | |||||||||
Sappi Ltd. | 135,575 | 966,297 | |||||||||
Sasol Ltd. | 43,103 | 1,696,296 | |||||||||
The Bidvest Group Ltd. | 85,888 | 1,221,707 | |||||||||
Woolworths Holdings Ltd. | 254,028 | 986,981 | |||||||||
Total South Africa common stocks | 22,290,365 | ||||||||||
South Korea—11.81% | |||||||||||
Daelim Industrial Co. Ltd. | 16,045 | 1,124,505 | |||||||||
DB Insurance Co. Ltd. | 14,183 | 817,775 | |||||||||
Doosan Infracore Co. Ltd.*,1 | 118,629 | 1,065,768 | |||||||||
Douzone Bizon Co. Ltd. | 21,048 | 1,021,684 | |||||||||
Hanwha Life Insurance Co. Ltd. | 142,875 | 660,317 | |||||||||
Hotel Shilla Co. Ltd. | 12,506 | 1,115,719 | |||||||||
Hyundai Marine & Fire Insurance Co. Ltd. | 24,362 | 798,165 | |||||||||
Industrial Bank of Korea | 85,763 | 1,199,831 | |||||||||
Kangwon Land, Inc. | 57,249 | 1,330,598 | |||||||||
KB Financial Group, Inc. | 29,033 | 1,391,113 | |||||||||
Korea Zinc Co. Ltd. | 5,647 | 2,082,320 | |||||||||
LG Chem Ltd. | 8,130 | 2,725,383 | |||||||||
LG Electronics, Inc. | 17,942 | 1,199,715 | |||||||||
LG Household & Health Care Ltd. | 1,187 | 1,283,932 | |||||||||
LG Uplus Corp. | 76,823 | 1,057,591 | |||||||||
POSCO | 6,331 | 1,870,465 | |||||||||
Samsung Electronics Co. Ltd. | 465,378 | 19,240,810 | |||||||||
Samsung SDI Co. Ltd. | 14,985 | 3,067,595 | |||||||||
Shinhan Financial Group Co. Ltd. | 70,943 | 2,761,872 | |||||||||
Shinsegae, Inc. | 3,553 | 1,054,482 | |||||||||
SK Hynix, Inc. | 33,999 | 2,622,906 | |||||||||
SK Telecom Co. Ltd. | 16,284 | 3,646,486 | |||||||||
Total South Korea common stocks | 53,139,032 | ||||||||||
Taiwan—10.51% | |||||||||||
ASE Technology Holding Co. Ltd. | 646,000 | 1,654,354 | |||||||||
Catcher Technology Co. Ltd. | 139,000 | 1,709,463 | |||||||||
Cathay Financial Holding Co. Ltd. | 759,000 | 1,306,569 | |||||||||
Chinatrust Financial Holding Co. Ltd. | 3,828,934 | 2,595,230 | |||||||||
Far EasTone Telecommunications Co. Ltd. | 381,000 | 903,528 | |||||||||
Formosa Chemicals & Fibre Corp. | 353,000 | 1,389,446 | |||||||||
219
PACE International Emerging Markets Equity Investments
Portfolio of investments—July 31, 2018
| Number of shares | Value | ||||||||||
Common stocks—(continued) | |||||||||||
Taiwan—(concluded) | |||||||||||
Gigabyte Technology Co. Ltd. | 550,000 | $ | 1,103,090 | ||||||||
Mega Financial Holding Co. Ltd. | 2,085,118 | 1,855,996 | |||||||||
Nan Ya Plastics Corp. | 443,000 | 1,228,546 | |||||||||
Nanya Technology Corp. | 612,000 | 1,571,281 | |||||||||
Novatek Microelectronics Corp. | 266,000 | 1,285,948 | |||||||||
President Chain Store Corp. | 98,000 | 1,077,187 | |||||||||
Shin Kong Financial Holding Co. Ltd. | 3,630,000 | 1,375,449 | |||||||||
Synnex Technology International Corp. | 686,000 | 978,111 | |||||||||
Taiwan Semiconductor Manufacturing Co. Ltd. | 1,597,156 | 12,834,010 | |||||||||
Taiwan Semiconductor Manufacturing Co. Ltd., ADR | 191,682 | 7,899,215 | |||||||||
Tripod Technology Corp. | 261,000 | 719,553 | |||||||||
Uni-President Enterprises Corp. | 1,524,000 | 4,022,317 | |||||||||
Unimicron Technology Corp. | 1,519,000 | 806,290 | |||||||||
Wistron Corp. | 1,217,011 | 940,168 | |||||||||
Total Taiwan common stocks | 47,255,751 | ||||||||||
Thailand—3.35% | |||||||||||
Advanced Info Service PCL | 237,600 | 1,442,597 | |||||||||
Airports of Thailand PCL | 1,176,200 | 2,342,148 | |||||||||
Bangkok Dusit Medical Services PCL | 1,764,700 | 1,405,607 | |||||||||
Beauty Community PCL, NVDR | 2,755,900 | 646,108 | |||||||||
| CP ALL PCL | 1,031,700 | 2,325,744 | |||||||||
IRPC PCL | 4,025,400 | 780,398 | |||||||||
Kasikornbank Public Co. Ltd., NVDR | 343,900 | 2,243,051 | |||||||||
PTT Exploration and Production PCL, NVDR | 455,200 | 1,894,956 | |||||||||
Thai Union Group PCL | 2,342,300 | 1,154,605 | |||||||||
Thanachart Capital PCL | 528,700 | 814,424 | |||||||||
Total Thailand common stocks | 15,049,638 | ||||||||||
Turkey—1.48% | |||||||||||
BIM Birlesik Magazalar A.S. | 49,452 | 710,832 | |||||||||
Eregli Demir ve Celik Fabrikalari TAS | 655,458 | 1,469,141 | |||||||||
Tekfen Holding A.S. | 210,269 | 832,453 | |||||||||
Turkiye Garanti Bankasi A.S. | 1,104,837 | 1,594,841 | |||||||||
Turkiye Halk Bankasi A.S. | 952,783 | 1,340,531 | |||||||||
Yapi ve Kredi Bankasi A.S.* | 1,618,366 | 696,566 | |||||||||
Total Turkey common stocks | 6,644,364 | ||||||||||
| Number of shares | Value | ||||||||||
Common stocks—(concluded) | |||||||||||
United Arab Emirates—0.45% | |||||||||||
First Abu Dhabi Bank PJSC | 543,127 | $ | 2,010,952 | ||||||||
United States—0.39% | |||||||||||
Southern Copper Corp. | 35,638 | 1,759,092 | |||||||||
| Total common stocks (cost—$389,953,941) | 429,698,999 | ||||||||||
Preferred stocks—1.86% | |||||||||||
Brazil—1.79% | |||||||||||
Itau Unibanco Holding SA | 193,180 | 2,316,122 | |||||||||
Itausa—Investimentos Itau SA | 1,330,230 | 3,693,016 | |||||||||
Petroleo Brasileiro SA, ADR | 210,900 | 1,108,077 | |||||||||
Sul America SA | 156,800 | 922,009 | |||||||||
Total Brazil preferred stocks | 8,039,224 | ||||||||||
India—0.07% | |||||||||||
| Vedanta Ltd. 7.500%, due 10/28/183 | 2,205,616 | 329,623 | |||||||||
| Total preferred stocks (cost—$8,031,070) | 8,368,847 | ||||||||||
Short-term investment—2.56% | |||||||||||
Investment companies—2.56% | |||||||||||
| State Street Institutional U.S. Government Money Market Fund (cost—$11,522,132) | 11,522,132 | 11,522,132 | |||||||||
Investment of cash collateral from securities loaned—1.20% | |||||||||||
Money market fund—1.20% | |||||||||||
| State Street Navigator Securities Lending Government Money Market Portfolio (cost—$5,422,498) | 5,422,498 | 5,422,498 | |||||||||
| Total investments (cost—$414,929,641)—101.16% | 455,012,476 | ||||||||||
Liabilities in excess of other assets—(1.16)% | (5,238,912 | ) | |||||||||
Net assets—100.00% | $ | 449,773,564 | |||||||||
For a listing of defined portfolio acronyms that are used throughout the Portfolio of investments as well as the tables that follow, please refer to 273.
220
PACE International Emerging Markets Equity Investments
Portfolio of investments—July 31, 2018
Fair valuation summary
The following is a summary of the fair valuations according to the inputs used as of July 31, 2018 in valuing the Portfolio's investments. In the event a Portfolio holds investments for which fair value is measured using the NAV per share practical expedient (or its equivalent), a separate column will be added to the fair value hierarchy table; this is intended to permit reconciliation to the amounts presented in the Portfolio of investments:
| Assets Description | Unadjusted quoted prices in active markets for identical investments (Level 1) | Other significant observable inputs (Level 2) | Unobservable inputs (Level 3) | Total | |||||||||||||||
Common stocks | $ | 429,698,999 | $ | — | $ | — | $ | 429,698,999 | |||||||||||
Preferred stocks | 8,368,847 | — | — | 8,368,847 | |||||||||||||||
Short-term investment | — | 11,522,132 | — | 11,522,132 | |||||||||||||||
Investment of cash collateral from securities loaned | — | 5,422,498 | — | 5,422,498 | |||||||||||||||
Total | $ | 438,067,846 | $ | 16,944,630 | $ | — | $ | 455,012,476 | |||||||||||
At July 31, 2018, there were no transfers between Level 1 and Level 2.
Portfolio footnotes
* Non-income producing security.
1 Security, or portion thereof, was on loan at the period end.
2 Security exempt from registration pursuant to Rule 144A under the Securities Act of 1933. These securities are considered liquid, unless noted otherwise, and may be resold in transactions exempt from registration, normally to qualified institutional buyers. Securities exempt from registration pursuant to Rule 144A, in the amount of $5,428,376, represented 1.21% of the Portfolio's net assets at period end.
3 Illiquid investment at period end. Illiquid assets, in the amount of $727,885, represented 0.16% of the Portfolio's net assets at period end.
4 Security is traded on the Turquoise Exchange.
5 Security is traded on the over-the-counter ("OTC") market.
See accompanying notes to financial statements.
221
PACE Global Real Estate Securities Investments
Performance (unaudited)
For the 12 months ended July 31, 2018, the Portfolio's Class P shares returned 3.68% before the deduction of the maximum PACE Select program fee.1 In comparison, the FTSE EPRA Nareit Developed Index (the "benchmark") returned 5.67%, while the Lipper Global Real Estate Funds category posted a median return of 4.84%. (Returns for all share classes over various time periods are shown in the "Performance at a glance" table on page 224. Please note that the returns shown do not reflect the deduction of taxes that a shareholder would pay on Portfolio distributions or the redemption of Portfolio shares.) For a detailed commentary on the market environment in general during the reporting period, please refer to page 3.
Subadvisor's comments (unaudited)2
The Portfolio underperformed its benchmark during the reporting period. By sector, data centers was the leading detractor from relative performance, driven by stock selection and an overweight position. Stock selection within residential also detracted, as did a combination of stock selection and an underweight position in self storage. Conversely, retail was the leading contributor to results, due to stock selection. An underweight allocation to health care also contributed to relative returns, as did an overweight position and stock selection within specialty.
The leading regional detractor from relative performance was Japan, driven by stock selection and an overweight position. Zero allocation to Canada was also a headwind for results. Conversely, China/Hong Kong was the leading contributor due to stock selection. An overweight allocation to the US was also beneficial.
By security, an overweight position in CBL & Associates Properties (retail, US) was the leading detractor during the period. The stock declined meaningfully after reporting disappointing quarterly results in November 2017. Rent spreads declined from prior-quarter levels due to the company using more aggressive rental rates to maintain occupancy. This decline in rent spreads was greater than the company's mall peers. We sold out of the position during the reporting period. Overweight positions to QTS Realty Trust, Inc. (data centers, US) and Land Securities Group PLC (diversified, U.K.) detracted from returns as well. We sold out of the QTR Realty Trust, Inc. position during the reporting period. We continue to hold our position in Land Securities Group PLC. Partially offsetting these negatives were overweight positions in Great Portland Estates plc (office, UK), Simon Property Group, Inc. (retail, US) and Westfield Corporation Limited (retail, U.S.).
The Portfolio did not hold derivatives during the reporting period.
1 Class P shares held through the PACE Select Advisors Program are subject to a maximum Program fee of 2.50%, which, if included, would have reduced performance. Class P shares held through other advisory programs also may be subject to a program fee, which, if included, would have reduced performance.
2 All Sub-Advisors discuss performance on a gross-of-fees basis—meaning that no fees or expenses are reflected in their sleeves'/sleeve's performance. Alternately, Portfolio performance is shown net of fees, which does factor in fees and expenses associated with the Portfolio.
PACE Select Advisors Trust –
PACE Global Real Estate Securities Investments
Investment Manager:
UBS Asset Management (Americas) Inc. ("UBS AM")
Investment Subadvisor:
Brookfield Investment Management Inc. ("Brookfield")
Portfolio Management Team:
UBS AM: Mabel Lung, CFA and Fred Lee, CFA
Brookfield: Jason Baine and Bernhard Krieg
Objective:
Total Return
Investment process:
The subadvisor utilizes a strategy that involves achieving total returns by investing in a diversified portfolio of global securities of companies primarily in the real estate industry.
222
PACE Global Real Estate Securities Investments
Special considerations
The Portfolio may be appropriate for long-term investors seeking to diversify a portion of their assets into real estate related investments. Investors should be willing to withstand short-term fluctuations in the equity and real estate markets in return for potentially higher returns over the long term. The value of the Portfolio changes every day and can be affected by changes in interest rates, general market conditions, and other political, social and economic developments, as well as specific matters relating to the companies or issuers in whose securities the Portfolio invests. The value of the Portfolio's investments in foreign securities may fall due to adverse political, social, and economic developments abroad, and due to decreases in foreign currency values relative to the US dollar. These risks are greater for investments in emerging market issuers than for issuers in more developed countries. There are certain risks associated with investing in real estate-related investments, including sensitivity to economic downturns, interest rates, declines in property values and variation in property management.
223
PACE Global Real Estate Securities Investments
Performance at a glance (unaudited)
Average annual total returns for periods ended 07/31/18 | 1 year | 5 years | 10 years | ||||||||||||
Before deducting maximum sales charge | |||||||||||||||
Class A1 | 3.50 | % | 5.91 | % | 3.66 | % | |||||||||
Class C2 | 2.84 | 5.13 | 2.88 | ||||||||||||
Class P3 | 3.68 | 6.18 | 3.92 | ||||||||||||
After deducting maximum sales charge | |||||||||||||||
Class A1 | (2.22 | ) | 4.72 | 3.07 | |||||||||||
Class C2 | 1.85 | 5.13 | 2.88 | ||||||||||||
FTSE EPRA Nareit Developed Index4 | 5.67 | 6.82 | 5.74 | ||||||||||||
Lipper Global Real Estate Funds median | 4.84 | 5.86 | 4.99 | ||||||||||||
Most recent calendar quarter-end returns (unaudited)
Average annual total returns for periods ended 06/30/18 | 1 year | 5 years | 10 years | ||||||||||||
Before deducting maximum sales charge | |||||||||||||||
Class A1 | 4.73 | % | 6.21 | % | 3.60 | % | |||||||||
Class C2 | 3.98 | 5.43 | 2.82 | ||||||||||||
Class P3 | 4.95 | 6.48 | 3.87 | ||||||||||||
After deducting maximum sales charge | |||||||||||||||
Class A1 | (1.01 | ) | 5.03 | 3.02 | |||||||||||
Class C2 | 2.98 | 5.43 | 2.82 | ||||||||||||
The annualized gross and net expense ratios, respectively, for each class of shares as in the November 28, 2017 prospectuses, were as follows: Class A—1.54% and 1.45%; Class C—2.22% and 2.20%; and Class P—1.58% and 1.20%. Net expenses reflect fee waivers and/or expense reimbursements, if any, pursuant to an agreement that is in effect to cap the expenses. The Portfolio and UBS Asset Management (Americas) Inc. ("UBS AM") have entered into a written fee waiver/expense reimbursement agreement pursuant to which UBS AM is contractually obligated to waive its management fees and/or reimburse expenses so that the Portfolio's ordinary total operating expenses of each class through November 30, 2018 (excluding dividend expense, borrowing costs, and interest expense relating to short sales, and expenses attributable to investment in other investment companies, interest, taxes, brokerage commissions and extraordinary expenses) would not exceed Class A—1.45%; Class C—2.20%; and Class P—1.20%. The Portfolio has agreed to repay UBS AM for any waived fees/reimbursed expenses to the extent that it can do so over the following three fiscal years without causing the Portfolio's expenses in any of those three years to exceed these expense caps and that UBS AM has not waived the right to do so. The fee waiver/expense reimbursement agreement may be terminated by the Portfolio's board at any time and also will terminate automatically upon the expiration or termination of the Portfolio's advisory contract with UBS AM. Upon termination of the agreement, however, UBS AM's three year recoupment rights will survive.
1 Maximum sales charge for Class A shares is 5.5%. Class A shares bear ongoing 12b-1 service fees of 0.25% annually.
2 Maximum contingent deferred sales charge for Class C shares is 1% imposed on redemptions and is reduced to 0% after one year. Class C shares bear ongoing 12b-1 service and distribution fees of 0.25% and 0.75% annually, respectively. As of July 12, 2018, Class C shares ceased paying 12b-1 distribution fees. See notes to financial statements—Subsequent events for additional information.
3 Class P shares do not bear initial or contingent deferred sales charges or ongoing 12b-1 service and distribution fees, but Class P shares held through advisory programs may be subject to a program fee, which, if included, would have reduced performance.
4 The FTSE EPRA Nareit Developed Index is designed to measure the stock performance of companies engaged in special real estate activities of the North American, European and Asian real estate markets. Relevant real estate activities are defined as the ownership, trading and development of income-producing real estate. Investors should note that indices do not reflect the deduction of fees and expenses.
Past performance does not predict future performance, and the performance information provided does not reflect the deduction of taxes that a shareholder would pay on Portfolio distributions or the redemption of Portfolio shares. The return and principal value of an investment will fluctuate, so that an investor's shares, when redeemed, may be worth more or less than their original cost. Performance results assume reinvestment of all dividends and capital gain distributions at net asset value on the ex-dividend dates. Current performance may be higher or lower than the performance data quoted. For month-end performance figures, please visit www.ubs.com/us-mutualfundperformance.
Lipper peer group data calculated by Lipper Inc.; used with permission. The Lipper median is the return of the fund that places in the middle of a Lipper peer group.
224
PACE Global Real Estate Securities Investments
Illustration of an assumed investment of $10,000 in Class P shares of the Portfolio (unaudited)
The following graph depicts the performance of PACE Global Real Estate Securities Investments Class P shares versus the FTSE EPRA Nareit Developed Index over the 10 years ended July 31, 2018. Class P shares held through advisory programs may be subject to a program fee, which, if included, would have reduced performance. The performance of the other classes will vary based upon the different class specific expenses and sales charges. The performance provided does not reflect the deduction of taxes that a shareholder would pay on Portfolio distributions or the redemption of Portfolio shares. Past performance is no guarantee of future results. Share price and returns will vary with market conditions; investors may realize a gain or loss upon redemption. It is important to note that PACE Global Real Estate Securities Investments is a professionally managed portfolio while the Index is not available for investment and is unmanaged. The comparison is shown for illustration purposes only.
PACE Global Real Estate Securities Investments
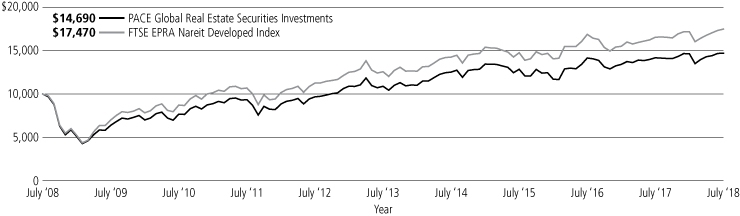
* The performance graph has been changed from Class A to Class P as Class P shares hold the most assets out of the Portfolio.
225
PACE Global Real Estate Securities Investments
Portfolio statistics—July 31, 2018 (unaudited)
Top ten equity holdings1 | Percentage of net assets | ||||||
Simon Property Group, Inc. | 8.2 | % | |||||
Mitsui Fudosan Co. Ltd. | 4.9 | ||||||
Land Securities Group PLC | 4.8 | ||||||
Mitsubishi Estate Co. Ltd. | 4.0 | ||||||
Mid-America Apartment Communities, Inc. | 3.8 | ||||||
Public Storage | 3.5 | ||||||
AvalonBay Communities, Inc. | 3.0 | ||||||
Merlin Properties Socimi SA | 2.8 | ||||||
Dexus | 2.6 | ||||||
Vonovia SE | 2.5 | ||||||
Total | 40.1 | % | |||||
Top five issuer breakdown by country or territory of origin1 | Percentage of net assets | ||||||
United States | 55.3 | % | |||||
Japan | 12.5 | ||||||
United Kingdom | 10.3 | ||||||
Australia | 4.1 | ||||||
France | 3.8 | ||||||
Total | 86.0 | % | |||||
1 The Portfolio is actively managed and its composition will vary over time.
226
PACE Global Real Estate Securities Investments
Industry diversification—(unaudited)
As a percentage of net assets as of July 31, 2018
Common stocks | |||||||
Apartments | 10.66 | % | |||||
Diversified | 24.93 | ||||||
Health care | 9.08 | ||||||
Hotels | 4.62 | ||||||
Hotels & motels | 4.79 | ||||||
Office property | 10.68 | ||||||
Real estate management/service | 8.16 | ||||||
Real estate operations/development | 11.55 | ||||||
Regional malls | 8.16 | ||||||
Shopping centers | 2.35 | ||||||
Storage | 4.50 | ||||||
Warehouse/industrial | 0.74 | ||||||
Total common stocks | 100.22 | ||||||
Investment companies | 1.30 | ||||||
Investment of cash collateral from securities loaned | 0.71 | ||||||
Total investments | 102.23 | ||||||
Liabilities in excess of other assets | (2.23 | ) | |||||
Net assets | 100.00 | % | |||||
227
PACE Global Real Estate Securities Investments
Portfolio of investments—July 31, 2018
| Number of shares | Value | ||||||||||
Common stocks—100.22% | |||||||||||
Australia—4.10% | |||||||||||
Dexus | 469,196 | $ | 3,513,778 | ||||||||
The GPT Group | 555,900 | 2,131,110 | |||||||||
Total Australia common stocks | 5,644,888 | ||||||||||
Bermuda—2.42% | |||||||||||
Hongkong Land Holdings Ltd. | 458,300 | 3,331,841 | |||||||||
Cayman Islands—2.67% | |||||||||||
Soho China Ltd. | 2,399,200 | 1,127,913 | |||||||||
Wharf Real Estate Investment Co. Ltd. | 349,456 | 2,544,437 | |||||||||
Total Cayman Islands common stocks | 3,672,350 | ||||||||||
France—3.85% | |||||||||||
Accor SA | 48,400 | 2,494,775 | |||||||||
Gecina SA | 16,400 | 2,797,974 | |||||||||
Total France common stocks | 5,292,749 | ||||||||||
Germany—3.44% | |||||||||||
Alstria Office REIT-AG | 87,192 | 1,354,002 | |||||||||
Vonovia SE | 69,815 | 3,380,636 | |||||||||
Total Germany common stocks | 4,734,638 | ||||||||||
Hong Kong—0.42% | |||||||||||
Hysan Development Co. Ltd. | 105,100 | 575,107 | |||||||||
Japan—12.52% | |||||||||||
Activia Properties, Inc. | 232 | 1,035,353 | |||||||||
Hulic Reit, Inc. | 411 | 635,531 | |||||||||
Invincible Investment Corp. | 4,560 | 2,012,574 | |||||||||
Mitsubishi Estate Co. Ltd. | 317,689 | 5,511,932 | |||||||||
Mitsui Fudosan Co. Ltd. | 283,300 | 6,754,709 | |||||||||
Nippon Accommodations Fund, Inc. | 272 | 1,286,840 | |||||||||
Total Japan common stocks | 17,236,939 | ||||||||||
Luxembourg—1.13% | |||||||||||
Grand City Properties SA | 59,800 | 1,553,781 | |||||||||
Singapore—2.48% | |||||||||||
CapitaLand Commercial Trust | 1,006,600 | 1,293,973 | |||||||||
City Developments Ltd. | 287,500 | 2,113,986 | |||||||||
Total Singapore common stocks | 3,407,959 | ||||||||||
Spain—2.83% | |||||||||||
Merlin Properties Socimi SA | 263,500 | 3,897,765 | |||||||||
United Kingdom—10.34% | |||||||||||
Great Portland Estates PLC | 294,092 | 2,763,448 | |||||||||
Land Securities Group PLC | 531,200 | 6,573,450 | |||||||||
The British Land Co. PLC | 363,500 | 3,149,892 | |||||||||
Tritax Big Box REIT PLC | 511,300 | 1,022,095 | |||||||||
Tritax EuroBox PLC*,1 | 529,100 | 726,415 | |||||||||
Total United Kingdom common stocks | 14,235,300 | ||||||||||
| Number of shares | Value | ||||||||||
Common stocks—(concluded) | |||||||||||
United States—54.02% | |||||||||||
American Homes 4 Rent, Class A | 105,700 | $ | 2,340,198 | ||||||||
AvalonBay Communities, Inc. | 23,000 | 4,067,550 | |||||||||
Cousins Properties, Inc. | 179,500 | 1,672,940 | |||||||||
CubeSmart | 46,200 | 1,402,632 | |||||||||
DDR Corp. | 131,850 | 1,806,345 | |||||||||
Duke Realty Corp. | 108,300 | 3,153,696 | |||||||||
Empire State Realty Trust, Inc., Class A | 77,500 | 1,291,925 | |||||||||
EPR Properties | 23,900 | 1,589,111 | |||||||||
Equinix, Inc. | 6,300 | 2,767,464 | |||||||||
Essex Property Trust, Inc. | 8,600 | 2,067,870 | |||||||||
Extended Stay America, Inc. | 93,100 | 1,982,099 | |||||||||
Federal Realty Investment Trust | 11,400 | 1,430,700 | |||||||||
HCP, Inc. | 128,200 | 3,320,380 | |||||||||
Highwoods Properties, Inc. | 45,000 | 2,209,950 | |||||||||
Hudson Pacific Properties, Inc. | 93,400 | 3,199,884 | |||||||||
Kilroy Realty Corp. | 44,400 | 3,238,980 | |||||||||
MGM Growth Properties LLC, Class A2 | 86,600 | 2,623,980 | |||||||||
Mid-America Apartment Communities, Inc. | 52,000 | 5,240,560 | |||||||||
Park Hotels & Resorts, Inc. | 53,822 | 1,683,552 | |||||||||
Physicians Realty Trust | 177,200 | 2,792,672 | |||||||||
Public Storage | 22,000 | 4,792,260 | |||||||||
RLJ Lodging Trust | 90,800 | 2,051,172 | |||||||||
Simon Property Group, Inc. | 63,691 | 11,222,991 | |||||||||
Ventas, Inc. | 59,700 | 3,365,886 | |||||||||
Welltower, Inc. | 48,200 | 3,017,320 | |||||||||
Total United States common stocks | 74,332,117 | ||||||||||
| Total common stocks (cost—$136,135,356) | 137,915,434 | ||||||||||
Short-term investment—1.30% | |||||||||||
Investment companies—1.30% | |||||||||||
| State Street Institutional U.S. Government Money Market Fund (cost—$1,783,896) | 1,783,896 | 1,783,896 | |||||||||
Investment of cash collateral from securities loaned—0.71% | |||||||||||
Money market fund—0.71% | |||||||||||
| State Street Navigator Securities Lending Government Money Market Portfolio (cost—$971,695) | 971,695 | 971,695 | |||||||||
| Total investments (cost—$138,890,947)—102.23% | 140,671,025 | ||||||||||
Liabilities in excess of other assets—(2.23)% | (3,063,137 | ) | |||||||||
Net assets—100.00% | $ | 137,607,888 | |||||||||
For a listing of defined portfolio acronyms that are used throughout the Portfolio of investments as well as the tables that follow, please refer to page 273.
228
PACE Global Real Estate Securities Investments
Portfolio of investments—July 31, 2018
Fair valuation summary
The following is a summary of the fair valuations according to the inputs used as of July 31, 2018 in valuing the Portfolio's investments. In the event a Portfolio holds investments for which fair value is measured using the NAV per share practical expedient (or its equivalent), a separate column will be added to the fair value hierarchy table; this is intended to permit reconciliation to the amounts presented in the Portfolio of investments.
| Assets Description | Unadjusted quoted prices in active markets for identical investments (Level 1) | Other significant observable inputs (Level 2) | Unobservable inputs (Level 3) | Total | |||||||||||||||
Common stocks | $ | 137,915,434 | $ | — | $ | — | $ | 137,915,434 | |||||||||||
Short-term investment | — | 1,783,896 | — | 1,783,896 | |||||||||||||||
Investment of cash collateral from securities loaned | — | 971,695 | — | 971,695 | |||||||||||||||
Total | $ | 137,915,434 | $ | 2,755,591 | $ | — | $ | 140,671,025 | |||||||||||
At July 31, 2018, there were no transfers between Level 1 and Level 2.
Portfolio footnotes
* Non-income producing security.
1 Security exempt from registration pursuant to Rule 144A under the Securities Act of 1933. These securities are considered liquid, unless noted otherwise, and may be resold in transactions exempt from registration, normally to qualified institutional buyers. Securities exempt from registration pursuant to Rule 144A, in the amount of $726,415, represented 0.53% of the Portfolio's net assets at period end.
2 Security, or portion thereof, was on loan at the period end.
See accompanying notes to financial statements.
229
PACE Alternative Strategies Investments
Performance (unaudited)
For the 12 months ended July 31, 2018, the Portfolio's Class P shares returned 1.32% before the deduction of the maximum PACE Select program fee.1 In comparison, the FTSE Three-Month US Treasury Bill Index (the "benchmark") returned 1.41%, the Bloomberg Barclays Global Aggregate Index returned -0.48%, the MSCI World Index (net) returned 11.88%, the HFRI Fund of Funds Composite Index (net) returned 4.18%, and the Lipper Alternative Multi-Strategy Funds category posted a median return of 1.65%. (Returns for all share classes over various time periods are shown in the "Performance at a glance" table on page 234. Please note that the returns shown do not reflect the deduction of taxes that a shareholder would pay on Portfolio distributions or the redemption of Portfolio shares.) For a detailed commentary on the market environment in general during the reporting period, please refer to page 3.
Advisor's comments (unaudited)2
The Portfolio underperformed its benchmark during the reporting period. The primary detractors from returns were certain currency exposures within our allocations to systematic currency and managed futures strategies. This was partially offset by exposures to equity markets and positive stock selection from allocations to fundamental and systematic long-short equity, equity market neutral and certain global macro allocations, as equity markets posted strong results over the period.
While the systematic currency allocation experienced several months of positive performance, the second half of the period proved to be more challenging. This was due to the heightened volatility in the currency markets over the latter part of period. During this time, markets became decoupled from changes in underlying fundamentals, creating a misalignment between macroeconomic forecasts and market valuations. Positioning in the US dollar, (both long and short) and the Canadian dollar proved to be most costly. Several factors caused reversals in the US dollar, including NAFTA renegotiations, trade tensions and rising interest rates. Collectively, this caused the US dollar to reverse its long-term bearish trend. Elsewhere, early in the reporting period the Bank of Canada unexpectedly raised interest rates, despite lackluster inflation. This caused the Canadian dollar to appreciate, negatively impacting the Portfolio's short position. Positioning in the New Zealand dollar also significantly detracted from returns, largely due to negative performance in the first half of the reporting period. Partial offsets included positive
1 Class P shares held through the PACE Select Advisors Program are subject to a maximum Program fee of 2.50%, which, if included, would have reduced performance. Class P shares held through other advisory programs also may be subject to a program fee, which, if included, would have reduced performance.
2 All Sub-Advisors discuss performance on a gross of fees basis—meaning that no fees or expenses are reflected in their sleeves'/sleeve's performance. Alternately, Portfolio performance is shown net of fees, which does factor in fees and expenses associated with the Portfolio.
3 When a long position is taken, a security is purchased with the expectation that it will rise in value. A short position is taken when we believe, based on our research, that securities are overpriced, and, therefore, we hope to make a profit when the security falls in value. When shorting an investment, we borrow the security, sell it, and then buy an equal number of shares later—hopefully at a lower price—to replace those we borrowed.
PACE Select Advisors Trust –
PACE Alternative Strategies Investments
Investment Manager and Subadvisor:
UBS Asset Management (Americas) Inc. ("UBS AM")
Investment Subadvisors:
Analytic Investors, LLC ("Analytic Investors"); First Quadrant L.P. ("First Quadrant"); Standard Life Investments (Corporate Funds) Limited ("Standard Life Investments"); AQR Capital Management, LLC ("AQR"); Sirios Capital Management, L.P. ("Sirios");
Principal Global Investors, LLC d/b/a Macro Currency Group ("MCG");
Aviva Investors Americas, LLC ("Aviva");
PCJ Investment Counsel LTD ("PCJ")
Kettle Hill Capital Management, LLC ("Kettle Hill")
Portfolio Management Team:
UBS AM: Mabel Lung, CFA, Gina Toth, CFA and Fred Lee, CFA
Analytic Investors: Dennis Bein, David Krider and Harindra de Silva;
First Quadrant: Dori Levanoni and Jeppe Ladekarl;
Standard Life Investments: Guy Stern and Roger Sadewsky;
AQR: Clifford Asness, John Liew, Brian Hurst, Yao Hua Ooi and Ari Levine;
MCG: Mark Farrington and David Petitcolin;
(continued on next page)
230
PACE Alternative Strategies Investments
Advisor's comments (unaudited) – concluded
performance from positioning in the Swedish krona, as a short view on the currency delivered sizable gains in the second half of the reporting period. Positioning in the euro also contributed to performance.
Similar to the systematic currency strategy, the Portfolio's allocation to managed futures struggled. The was largely due to positioning in currencies, again due to reversals not only in the US dollar, but also in the euro and Japanese yen. Positioning in equities and fixed income contributed to results. By signal horizon, short-term and over-extended signals detracted from performance, whereas long-term signals performed well.
Our fundamental and systematic long-short equity and market neutral allocations added to returns, driven by exposure to the broad market and specific stock selection. Holdings in the energy/industrials, consumer, health care and financials/real estate sectors broadly contributed to performance, while allocations to the technology/telecom sector generally detracted from performance during the period.
Our fundamental global macro allocations generally contributed to performance due to exposures to US and European equity markets. Short positioning in US interest rates and holdings in US Treasury Inflation-Protected Securities ("TIPS") also contributed to returns. Positioning in these strategies largely reflected the subadvisers' constructive view for global growth and subsequent expectation for tighter financial conditions among developed economies. Currency positioning was among the largest detractors from performance, particularly in the Japanese yen.
In general, derivatives were used in the Portfolio to gain economic exposure and for hedging or risk management purposes, mostly across currencies, fixed income and equity markets. Derivatives are the primary instrument to implement currency and managed futures strategies because of their high degree of liquidity, low cost and trading efficiency. The instruments utilized in the Portfolio over the period primarily included currency forwards, both deliverable and non-deliverable, exchanged-traded futures in global developed and emerging markets, swaps and options across equities, fixed income and currencies.
Investment process
(continued)
Aviva: Peter Fitzgerald, Ian Pizer and James McAlevey
PCJ: Nereo Piticco, Adam Posman, Aly Alladina, Heiki Altosaar, Bryan Rock and Jenny Yan
Kettle Hill: Andrew Y. Kurita
UBS AM sleeve: Mabel Lung, Gina Toth and Fred Lee;
Sirios: John F. Brennan, Jr.
Objective:
Long-term capital appreciation
Investment process:
The main strategies of the subadvisors include:
• An "opportunistic strategy" in which UBS AM allocates a portion of the fund's assets primarily to unaffiliated actively- and passively-managed pooled investment vehicles that UBS AM believes are suitable for return generation, risk management or both.
• A "long/short global equity" strategy in which the subadvisor buys securities "long" that the subadvisor believes will out-perform the market, and sells securities "short" that the subadvisor believes will underperform the market.
• A "currency strategy" that seeks to produce absolute return from investing in currency markets.
• A "global multi-asset strategy" that involves achieving a total return by delivering a diversified global portfolio that makes use of multiple strategies across various asset classes.
(continued on next page)
231
PACE Alternative Strategies Investments
Investment process
(continued)
• A "managed futures strategy" in which the subadvisor takes both long and short positions in a portfolio of futures contracts, futures related instruments, forward contracts and swaps across different asset classes.
• A "liquid alternative long/short equity strategy" in which the subadvisor generally utilizes long positions that the subadvisor believes are attractively-valued, growth-oriented companies of mid to large capitalization and short positions that the subadvisor believes have deteriorating fundamentals or appear overvalued.
• A "global unconstrained multi-strategy" strategy that identifies and pursues diverse strategies across asset classes, sectors, currencies, interest rates, inflation and volatility that are expected to work well together whether markets are rising or falling.
• An "absolute return equity market neutral" strategy that aims to earn a positive absolute and attractive risk-adjusted return while demonstrating low correlation with, and lower volatility than, traditional long only investment portfolios.
• A "diversified currency strategy" that seeks to produce absolute returns from a blend of a fundamental discretionary process and a fundamental systematic process by investing in developed market currency instruments.
(continued on next page)
232
PACE Alternative Strategies Investments
Investment process
(concluded)
• A "long/short US, small cap equity" strategy in which the subadvisor primarily buys securities of US small capitalization companies "long" that the subadvisor believes will out-perform the market, and sells securities of US small capitalization companies "short" that the subadvisor believes will underperform the market.
Special considerations
The Portfolio may be appropriate for investors seeking long-term capital appreciation who are able to withstand short-term fluctuations in the equity markets and fixed income markets in return for potentially higher returns over the long term. The Portfolio may employ investment strategies that involve greater risks than the strategies used by many other mutual funds, including increased use of short sales (which involve the risk of an unlimited increase in the market value of the security sold short, which could result in a theoretically unlimited loss), leverage and derivative transactions, and hedging strategies. The value of the Portfolio changes every day and can be affected by changes in interest rates, general market conditions, and other political, social and economic developments, as well as specific matters relating to the issuers of securities in which the Portfolio invests. The value of the Portfolio's investments in foreign securities may fall due to adverse political, social and economic developments abroad, and due to decreases in foreign currency values relative to the US dollar. It is important to note that an investment in the Portfolio is only one component of a balanced investment plan.
233
PACE Alternative Strategies Investments
Performance at a glance (unaudited)
Average annual total returns for periods ended 07/31/18 | 1 year | 5 years | 10 years | Since Inception1 | |||||||||||||||
Before deducting maximum sales charge | |||||||||||||||||||
Class A2 | 1.21 | % | 2.04 | % | 1.05 | % | 1.45 | % | |||||||||||
Class C3 | 0.40 | 1.29 | 0.32 | 0.75 | |||||||||||||||
Class Y4 | 1.41 | 2.31 | 1.31 | 1.29 | |||||||||||||||
Class P5 | 1.32 | 2.28 | 1.30 | 1.70 | |||||||||||||||
After deducting maximum sales charge | |||||||||||||||||||
Class A2 | (4.32 | ) | 0.90 | 0.47 | 0.99 | ||||||||||||||
Class C3 | (0.60 | ) | 1.29 | 0.32 | 0.75 | ||||||||||||||
FTSE Three-Month US Treasury Bill Index6 | 1.41 | 0.43 | 0.32 | 1.01 | |||||||||||||||
Bloomberg Barclays Global Aggregate Index7 | (0.48 | ) | 1.21 | 2.55 | 3.53 | ||||||||||||||
MSCI World Index (net)8 | 11.88 | 9.49 | 6.85 | 5.90 | |||||||||||||||
HFRI Fund of Funds Composite Index (net)9 | 4.18 | 3.27 | 1.68 | 2.03 | |||||||||||||||
Lipper Alternative Multi-Strategy Funds median | 1.65 | 1.84 | 1.49 | 1.57 | |||||||||||||||
Most recent calendar quarter-end returns (unaudited)
Average annual total returns for periods ended 06/30/18 | 1 year | 5 years | 10 years | Since Inception1 | |||||||||||||||
Before deducting maximum sales charge | |||||||||||||||||||
Class A2 | 0.37 | % | 1.95 | % | 0.72 | % | 1.36 | % | |||||||||||
Class C3 | (0.30 | ) | 1.23 | 0.00 | 0.66 | ||||||||||||||
Class Y4 | 0.66 | 2.25 | N/A | 1.18 | |||||||||||||||
Class P5 | 0.66 | 2.23 | 0.98 | 1.62 | |||||||||||||||
After deducting maximum sales charge | |||||||||||||||||||
Class A2 | (5.13 | ) | 0.80 | 0.16 | 0.89 | ||||||||||||||
Class C3 | (1.30 | ) | 1.23 | 0.00 | 0.66 | ||||||||||||||
The annualized gross and net expense ratios, respectively, for each class of shares as in the November 28, 2017 prospectuses, were as follows: Class A—2.35% and 2.28%; Class C—3.12% and 3.05%; Class Y—2.18% and 2.11%; and Class P—2.13% and 2.06%. Net expenses reflect fee waivers and/or expense reimbursements, if any, pursuant to an agreement that is in effect to cap the expenses. The Portfolio and UBS Asset Management (Americas) Inc. ("UBS AM") have entered into a written fee waiver/expense reimbursement agreement pursuant to which UBS AM is contractually obligated to: (1) waive its management fees through November 30, 2018 to the extent necessary to offset the cost savings to UBS AM for allocating a portion of the Portfolio's assets to other unaffiliated pooled investment vehicles and index futures; and (2) waive its management fees and/or reimburse expenses so that the Portfolio's ordinary total operating expenses through November 30, 2018 (excluding dividend expense, borrowing costs, and interest expense relating to short sales, and expenses attributable to investment in other investment companies, interest, taxes, brokerage commissions and extraordinary expenses) would not exceed Class A—1.88%; Class C—2.63%; Class Y—1.63%; and Class P—1.63%. The Portfolio has agreed to repay UBS AM for any waived fees/reimbursed expenses (pursuant to item (2)) to the extent that it can do so over the following three fiscal years without causing the Portfolio's expenses in any of those three years to exceed this expense cap and that UBS AM has not waived the right to do so. The fee waiver/expense reimbursement agreement may be terminated by the Portfolio's board at any time and also will terminate automatically upon the expiration or termination of the Portfolio's advisory contract with UBS AM.
1 Since inception returns are calculated as of commencement of issuance on April 10, 2006 for Class P and Class A shares, and April 11, 2006 for Class C shares. Class Y shares commenced issuance on April 3, 2006, and had fully redeemed by July 27, 2006 remaining inactive through July 22, 2008. The inception return of Class Y shares is calculated from July 23, 2008, which is the date the Class Y shares recommenced investment operations. Since inception returns for the Indices and Lipper median are shown as of April 30, 2006, which is the month-end after the inception date of the oldest share classes (Class P and Class A).
2 Maximum sales charge for Class A shares is 5.5%. Class A shares bear ongoing 12b-1 service fees of 0.25% annually.
3 Maximum contingent deferred sales charge for Class C shares is 1% imposed on redemptions and is reduced to 0% after one year. Class C shares bear ongoing 12b-1 service and distribution fees of 0.25% and 0.75% annually, respectively. As of July 12, 2018, Class C shares ceased paying 12b-1 distribution fees. See notes to financial statements—Subsequent events for additional information.
4 The Portfolio offers Class Y shares to a limited group of eligible investors, including certain qualifying retirement plans. Class Y shares do not bear initial or contingent deferred sales charges or ongoing 12b-1 service and distribution fees.
5 Class P shares do not bear initial or contingent deferred sales charges or ongoing 12b-1 service and distribution fees, but Class P shares held through advisory programs may be subject to a program fee, which, if included, would have reduced performance.
6 The FTSE Three-Month US Treasury Bill Index is an unmanaged index reflecting monthly return equivalents of yield averages that are not marked to the market and an average of the last three 3-month T-bill month-end rates. 3-month T-bills are the short-term debt obligations of the US government. Investors should note that indices do not reflect the deduction of fees and expenses.
7 The Bloomberg Barclays Global Aggregate Index is an unmanaged broad-based, market capitalization weighted index which is designed to measure the broad global markets for US and non US corporate, government, governmental agency, supranational, mortgage-backed and asset-backed fixed income securities. Investors should note that indices do not reflect the deduction of fees and expenses.
8 The MSCI World Index (net) is a free float-adjusted market capitalization weighted index that is designed to measure the equity market performance of developed markets. Net total return indices reinvest dividends after the deduction of withholding taxes, using a tax rate applicable to non-resident institutional investors who do not benefit from double taxation treaties. The index is constructed and managed with a view to being fully investable from the perspective of international institutional investors. Investors should note that indices do not reflect the deduction of fees and expenses.
9 The HFRI Fund of Funds Composite Index is a Fund of Funds index with multiple managers through funds or managed accounts. The strategy designs a diversified portfolio of managers with the objective of significantly lowering the risk (volatility) of investing with an individual manager. The Fund of Funds manager has discretion in choosing which strategies to invest in for the portfolio. A manager may allocate funds to numerous managers within a single strategy, or with numerous managers in multiple strategies. The minimum investment in a Fund of Funds may be lower than an investment in an individual hedge fund or managed account. The investor has the advantage of diversification among managers and styles with significantly less capital than investing with separate managers. Investors should note that indices do not reflect the deduction of fees and expenses.
Past performance does not predict future performance, and the performance information provided does not reflect the deduction of taxes that a shareholder would pay on Portfolio distributions or the redemption of Portfolio shares. The return and principal value of an investment will fluctuate, so that an investor's shares, when redeemed, may be worth more or less than their original cost. Performance results assume reinvestment of all dividends and capital gain distributions at net asset value on the ex-dividend dates. Current performance may be higher or lower than the performance data quoted. For month-end performance figures, please visit www.ubs.com/us-mutualfundperformance.
Lipper peer group data calculated by Lipper Inc.; used with permission. The Lipper median is the return of the fund that places in the middle of a Lipper peer group.
234
PACE Alternative Strategies Investments
Illustration of an assumed investment of $10,000 in Class P shares of the Portfolio (unaudited)
The following graph depicts the performance of PACE Alternative Strategies Investments Class P shares versus the FTSE Three-Month US Treasury Bill Index, the Bloomberg Barclays Global Aggregate Index, the MSCI World Index (net) and the HFRI Fund of Funds Composite Index (net) over the 10 years ended July 31, 2018. Class P shares held through advisory programs may be subject to a program fee, which, if included, would have reduced performance. The performance of the other classes will vary based upon the different class specific expenses and sales charges. The performance provided does not reflect the deduction of taxes that a shareholder would pay on Portfolio distributions or the redemption of Portfolio shares. Past performance is no guarantee of future results. Share price and returns will vary with market conditions; investors may realize a gain or loss upon redemption. It is important to note that PACE Alternative Strategies Investments is a professionally managed portfolio while the Indices are not available for investment and are unmanaged. The comparison is shown for illustration purposes only.
PACE Alternative Strategies Investments
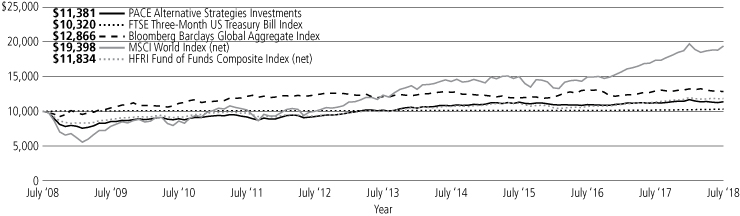
235
PACE Alternative Strategies Investments
Portfolio statistics—July 31, 2018 (unaudited)
Top ten equity holdings (long holdings)1 | Percentage of net assets | ||||||
The Sherwin-Williams Co. | 0.9 | % | |||||
Becton, Dickinson and Co. | 0.7 | ||||||
JPMorgan Chase & Co. | 0.7 | ||||||
Airbus SE | 0.6 | ||||||
Abbott Laboratories | 0.5 | ||||||
Bank of America Corp. | 0.5 | ||||||
Berkshire Hathaway, Inc., Class B | 0.5 | ||||||
Boston Scientific Corp. | 0.5 | ||||||
FedEx Corp. | 0.5 | ||||||
Broadridge Financial Solutions, Inc. | 0.4 | ||||||
Total | 5.8 | % | |||||
Top ten equity holdings (short holdings)1 | Percentage of net assets | ||||||
Nutrien Ltd. | (0.4 | )% | |||||
BioMarin Pharmaceutical, Inc. | (0.3 | ) | |||||
Seattle Genetics, Inc. | (0.3 | ) | |||||
General Electric Co. | (0.3 | ) | |||||
Allergan PLC | (0.3 | ) | |||||
Devon Energy Corp. | (0.3 | ) | |||||
Zayo Group Holdings, Inc. | (0.3 | ) | |||||
Autodesk, Inc. | (0.2 | ) | |||||
Alnylam Pharmaceuticals, Inc. | (0.2 | ) | |||||
Accenture PLC, Class A | (0.2 | ) | |||||
Total | (2.8 | )% | |||||
Top ten long-term fixed income holdings1 | Percentage of net assets | ||||||
French Republic Government Bond OAT, 1.850% due 07/25/27 | 1.3 | % | |||||
US Treasury Inflation Index Bond (TIPS), 2.125% due 02/15/40 | 0.8 | ||||||
US Treasury Inflation Index Bond (TIPS), 0.875% due 02/15/47 | 0.6 | ||||||
Deutsche Bundesrepublik Inflation Linked Bond, 0.100% due 04/15/26 | 0.5 | ||||||
Brazil Letras do Tesouro Nacional, 0.010% due 07/01/21 | 0.4 | ||||||
Indonesia Treasury Bond, 8.250% due 07/15/21 | 0.4 | ||||||
Brazil Letras do Tesouro Nacional, 0.010% due 07/01/20 | 0.4 | ||||||
Brazil Notas do Tesouro Nacional, Series F, 10.000% due 01/01/27 | 0.3 | ||||||
Brazil Notas do Tesouro Nacional, Series F, 10.000% due 01/01/23 | 0.3 | ||||||
Indonesia Treasury Bond, 7.000% due 05/15/27 | 0.2 | ||||||
Total | 5.2 | % | |||||
| Top five issuer breakdown by country or territory of origin (long holdings)1 | Percentage of net assets | ||||||
United States | 25.9 | % | |||||
Canada | 5.8 | ||||||
Japan | 4.0 | ||||||
Germany | 1.4 | ||||||
United Kingdom | 1.3 | ||||||
Total | 38.4 | % | |||||
| Top five issuer breakdown by country or territory of origin (short holdings)1 | Percentage of net assets | ||||||
United States | (9.8 | )% | |||||
Canada | (4.2 | ) | |||||
Ireland | (0.5 | ) | |||||
United Kingdom | (0.2 | ) | |||||
Luxembourg | (0.1 | ) | |||||
Total | (14.8 | )% | |||||
1 The Portfolio is actively managed and its composition will vary over time.
236
PACE Alternative Strategies Investments
Industry diversification—(unaudited)
As a percentage of net assets as of July 31, 2018
Common stocks | |||||||
Aerospace & defense | 2.17 | % | |||||
Air freight & logistics | 0.91 | ||||||
Airlines | 0.59 | ||||||
Auto components | 0.22 | ||||||
Banks | 2.94 | ||||||
Beverages | 0.87 | ||||||
Biotechnology | 0.28 | ||||||
Building products | 0.16 | ||||||
Capital markets | 0.78 | ||||||
Chemicals | 1.72 | ||||||
Commercial services & supplies | 0.38 | ||||||
Communications equipment | 0.29 | ||||||
Construction & engineering | 0.32 | ||||||
Construction materials | 0.14 | ||||||
Consumer finance | 0.21 | ||||||
Containers & packaging | 0.21 | ||||||
Distributors | 0.01 | ||||||
Diversified financial services | 0.71 | ||||||
Diversified telecommunication services | 0.39 | ||||||
Electric utilities | 0.74 | ||||||
Electrical equipment | 0.12 | ||||||
Electronic equipment, instruments & components | 0.36 | ||||||
Energy equipment & services | 0.30 | ||||||
Energy-exploration & production | 0.04 | ||||||
Equity real estate investment trusts | 2.56 | ||||||
Food & staples retailing | 0.36 | ||||||
Food products | 0.46 | ||||||
Gas utilities | 0.07 | ||||||
Health care equipment & supplies | 1.66 | ||||||
Health care providers & services | 0.94 | ||||||
Health care technology | 0.01 | ||||||
Hotels, restaurants & leisure | 1.98 | ||||||
Household durables | 0.62 | ||||||
Independent power and renewable electricity producers | 0.31 | ||||||
Industrial conglomerates | 0.01 | ||||||
Insurance | 0.88 | ||||||
Internet & catalog retail | 0.42 | ||||||
Internet & Direct Marketing Retail | 0.31 | ||||||
Internet software & services | 1.17 | ||||||
IT services | 1.98 | ||||||
Leisure products | 0.02 | ||||||
Life sciences tools & services | 0.03 | ||||||
Machinery | 0.32 | ||||||
Media | 0.93 | ||||||
Common stocks—(concluded) | |||||||
Metals & mining | 0.55 | % | |||||
Mortgage Real estate investment trust | 0.28 | ||||||
Multi-utilities | 0.09 | ||||||
Multiline retail | 0.48 | ||||||
Oil, gas & consumable fuels | 3.63 | ||||||
Paper & forest products | 0.46 | ||||||
Personal products | 0.41 | ||||||
Pharmaceuticals | 0.67 | ||||||
Professional services | 1.07 | ||||||
Real estate management & development | 0.45 | ||||||
Road & rail | 2.02 | ||||||
Semiconductors & semiconductor equipment | 1.16 | ||||||
Software | 1.35 | ||||||
Specialty retail | 0.81 | ||||||
Technology hardware, storage & peripherals | 0.12 | ||||||
Textiles, apparel & luxury goods | 1.59 | ||||||
Trading companies & distributors | 0.50 | ||||||
Transportation infrastructure | 0.03 | ||||||
Wireless telecommunication services | 0.17 | ||||||
Total common stocks | 45.74 | ||||||
Preferred stocks | |||||||
Aerospace & defense | 0.01 | ||||||
Automobiles | 0.06 | ||||||
Banks | 0.16 | ||||||
Diversified telecommunication services | 0.01 | ||||||
Total preferred stocks | 0.24 | ||||||
US government obligations | 2.32 | ||||||
Corporate notes | |||||||
Banks | 2.26 | ||||||
Finance-captive automotive | 0.56 | ||||||
International government obligations | 1.19 | ||||||
Oil & gas | 0.13 | ||||||
Real estate | 0.07 | ||||||
Total corporate notes | 4.21 | ||||||
Non-US government obligations | 4.50 | ||||||
Certificates of deposit | 3.10 | ||||||
Commercial paper | 2.30 | ||||||
Time deposits | 1.64 | ||||||
Short-term US government obligations | 11.20 | ||||||
Investment companies | 10.80 | ||||||
237
PACE Alternative Strategies Investments
Industry diversification—(unaudited) (concluded)
As a percentage of net assets as of July 31, 2018
Options purchased | |||||||
Call options | 0.39 | % | |||||
Put options | 0.05 | ||||||
Total options purchased | 0.44 | ||||||
Swaptions purchased | |||||||
Call swaptions | 0.12 | ||||||
Put swaptions | 0.62 | ||||||
Total swaptions purchased | 0.74 | ||||||
Foreign exchange options purchased | |||||||
Call option | 0.00 | † | |||||
Put options | 0.06 | ||||||
Total foreign exchange options purchased | 0.06 | ||||||
Short-term investment | |||||||
Investment companies | 18.47 | ||||||
| Investments sold short Common stocks | |||||||
Aerospace & defense | (0.07 | ) | |||||
Airlines | (0.16 | ) | |||||
Auto components | (0.10 | ) | |||||
Automobiles | (0.11 | ) | |||||
Banks | (0.11 | ) | |||||
Biotechnology | (1.10 | ) | |||||
Building products | (0.10 | ) | |||||
Capital markets | (1.09 | ) | |||||
Chemicals | (0.43 | ) | |||||
Commercial services & supplies | (0.18 | ) | |||||
Communications equipment | (0.05 | ) | |||||
Construction & engineering | (0.02 | ) | |||||
Construction materials | (0.01 | ) | |||||
Diversified telecommunication services | (0.44 | ) | |||||
Electric utilities | (0.17 | ) | |||||
Electrical equipment | (0.17 | ) | |||||
Electronic equipment, instruments & components | (0.07 | ) | |||||
Energy equipment & services | (0.20 | ) | |||||
Equity real estate investment trusts | (0.10 | ) | |||||
| Investments sold short—(concluded) Common stocks—(concluded) | |||||||
Food & staples retailing | (0.14 | )% | |||||
Food products | (0.15 | ) | |||||
Gas utilities | (0.12 | ) | |||||
Health care equipment & supplies | (0.05 | ) | |||||
Health care providers & services | (0.08 | ) | |||||
Hotels, restaurants & leisure | (0.23 | ) | |||||
Household durables | (0.27 | ) | |||||
Household products | (0.14 | ) | |||||
Industrial conglomerates | (0.31 | ) | |||||
Internet & catalog retail | (0.05 | ) | |||||
Internet software & services | (0.21 | ) | |||||
IT services | (0.20 | ) | |||||
Leisure products | (0.04 | ) | |||||
Machinery | (0.12 | ) | |||||
Marine | (0.09 | ) | |||||
Media | (0.39 | ) | |||||
Metals & mining | (0.48 | ) | |||||
Multi-utilities | (0.10 | ) | |||||
Multiline retail | (0.01 | ) | |||||
Oil, gas & consumable fuels | (1.18 | ) | |||||
Paper & forest products | (0.32 | ) | |||||
Pharmaceuticals | (0.58 | ) | |||||
Professional services | (0.10 | ) | |||||
Road & rail | (0.12 | ) | |||||
Semiconductors & semiconductor equipment | (0.16 | ) | |||||
Software | (0.23 | ) | |||||
Specialty retail | (0.14 | ) | |||||
Textiles, apparel & luxury goods | (0.19 | ) | |||||
Trading companies & distributors | (0.08 | ) | |||||
Wireless telecommunication services | (0.09 | ) | |||||
Investment companies | (4.09 | ) | |||||
Total investments sold short | (15.14 | ) | |||||
Other assets in excess of liabilities | 9.38 | ||||||
Net assets | 100.00 | % | |||||
† Weighting represents less than 0.005% of the Portfolio's net assets as of July 31, 2018.
238
PACE Alternative Strategies Investments
Portfolio of investments—July 31, 2018
| Number of shares | Value | ||||||||||
Common stocks—45.74% | |||||||||||
Australia—0.24% | |||||||||||
Caltex Australia Ltd. | 7,423 | $ | 179,566 | ||||||||
Coca-Cola Amatil Ltd. | 13,015 | 92,634 | |||||||||
Flight Centre Travel Group Ltd. | 2,131 | 107,675 | |||||||||
Newcrest Mining Ltd. | 7,505 | 120,605 | |||||||||
Sonic Healthcare Ltd. | 2,771 | 53,691 | |||||||||
Treasury Wine Estates Ltd. | 61,589 | 842,854 | |||||||||
Wesfarmers Ltd. | 3,310 | 121,630 | |||||||||
Total Australia common stocks | 1,518,655 | ||||||||||
Austria—0.04% | |||||||||||
OMV AG | 2,089 | 118,132 | |||||||||
Raiffeisen Bank International AG | 1,974 | 65,856 | |||||||||
voestalpine AG | 1,633 | 81,862 | |||||||||
Total Austria common stocks | 265,850 | ||||||||||
Belgium—0.19% | |||||||||||
Ageas | 2,905 | 155,751 | |||||||||
Groupe Bruxelles Lambert SA | 1,181 | 125,505 | |||||||||
KBC Groupe N.V. | 1,897 | 145,872 | |||||||||
Proximus SADP | 2,290 | 56,047 | |||||||||
Solvay SA | 1,074 | 147,252 | |||||||||
UCB SA | 1,850 | 158,916 | |||||||||
Umicore SA | 7,260 | 424,474 | |||||||||
Total Belgium common stocks | 1,213,817 | ||||||||||
Bermuda—0.34% | |||||||||||
Bunge Ltd.1 | 12,044 | 832,602 | |||||||||
First Pacific Co. Ltd. | 130,000 | 60,288 | |||||||||
Kerry Properties Ltd. | 39,000 | 197,508 | |||||||||
Li & Fung Ltd. | 134,000 | 45,412 | |||||||||
Marvell Technology Group Ltd. | 23,572 | 502,319 | |||||||||
VEON Ltd., ADR | 78,648 | 238,303 | |||||||||
Yue Yuen Industrial Holdings Ltd. | 92,500 | 248,661 | |||||||||
Total Bermuda common stocks | 2,125,093 | ||||||||||
British Virgin Islands—0.23% | |||||||||||
Michael Kors Holdings Ltd.*,1 | 21,743 | 1,450,910 | |||||||||
Canada—5.83% | |||||||||||
Aecon Group, Inc.1 | 20,510 | 259,676 | |||||||||
| Agellan Commercial Real Estate Investment Trust1 | 6,480 | 68,693 | |||||||||
Air Canada*,1 | 76,368 | 1,381,358 | |||||||||
Alimentation Couche Tard, Inc., Class B1 | 14,220 | 653,146 | |||||||||
ATS Automation Tooling Systems, Inc.*,1 | 53,120 | 798,729 | |||||||||
Badger Daylighting Ltd.1 | 27,390 | 621,768 | |||||||||
BlackPearl Resources, Inc.*,1 | 160,780 | 165,619 | |||||||||
Bombardier, Inc., Class B*,1 | 68,310 | 257,308 | |||||||||
Boralex, Inc., Class A1 | 18,800 | 287,307 | |||||||||
Canadian Natural Resources Ltd.1 | 26,330 | 964,731 | |||||||||
Canadian Pacific Railway Ltd.1 | 12,099 | 2,399,716 | |||||||||
Canadian Tire Corp. Ltd., Class A | 400 | 54,478 | |||||||||
CCL Industries, Inc., Class B1 | 4,150 | 210,555 | |||||||||
CGI Group, Inc., Class A*,1 | 13,713 | 882,431 | |||||||||
CGI Group, Inc., Class A* | 6,200 | 400,258 | |||||||||
Chorus Aviation, Inc.1 | 58,550 | 330,816 | |||||||||
CI Financial Corp. | 6,600 | 115,323 | |||||||||
| Number of shares | Value | ||||||||||
Common stocks—(continued) | |||||||||||
Canada—(concluded) | |||||||||||
Colliers International Group, Inc.1 | 6,760 | $ | 552,711 | ||||||||
Cominar Real Estate Investment Trust1 | 51,370 | 497,174 | |||||||||
Constellation Software, Inc. | 2,600 | 1,884,828 | |||||||||
Cott Corp.1 | 17,138 | 274,037 | |||||||||
Detour Gold Corp.*,1 | 12,000 | 118,261 | |||||||||
Dollarama, Inc.1 | 11,930 | 431,033 | |||||||||
Dorel Industries, Inc., Class B1 | 9,970 | 182,792 | |||||||||
Emera, Inc. | 4,900 | 158,769 | |||||||||
Empire Co. Ltd. | 57,100 | 1,177,247 | |||||||||
Enbridge, Inc.1 | 22,360 | 794,121 | |||||||||
Encana Corp.1 | 17,100 | 229,824 | |||||||||
Enerplus Corp.1 | 22,400 | 292,544 | |||||||||
ERO Copper Corp.*,1 | 84,000 | 555,329 | |||||||||
Fairfax Financial Holdings Ltd. | 1,900 | 1,073,529 | |||||||||
Finning International, Inc.1 | 31,820 | 833,139 | |||||||||
Hardwoods Distribution, Inc.1 | 100,870 | 1,287,966 | |||||||||
Interfor Corp.*,1 | 77,047 | 1,217,732 | |||||||||
Kelt Exploration Ltd.*,1 | 42,370 | 323,756 | |||||||||
Keyera Corp.1 | 13,710 | 396,909 | |||||||||
Kinaxis, Inc.*,1 | 5,560 | 375,183 | |||||||||
Knight Therapeutics, Inc.*,1 | 40,762 | 267,913 | |||||||||
Magna International, Inc. | 18,500 | 1,126,909 | |||||||||
Major Drilling Group International, Inc.*,1 | 69,846 | 327,525 | |||||||||
Martinrea International, Inc.1 | 7,520 | 81,336 | |||||||||
Mav Beauty Brands, Inc.*,1 | 39,540 | 401,221 | |||||||||
NFI Group, Inc.1 | 6,610 | 253,912 | |||||||||
Northland Power, Inc.1 | 75,171 | 1,374,153 | |||||||||
Parkland Fuel Corp.1 | 29,847 | 807,178 | |||||||||
Pinnacle Renewable Holdings1 | 18,930 | 221,045 | |||||||||
Power Corp. of Canada | 90,900 | 2,067,672 | |||||||||
Pure Multi-Family REIT LP1 | 31,900 | 226,587 | |||||||||
Raging River Exploration, Inc.*,1 | 186,240 | 787,424 | |||||||||
Restaurant Brands International, Inc.1 | 20,406 | 1,288,231 | |||||||||
RioCan Real Estate Investment Trust | 16,700 | 318,633 | |||||||||
Rogers Communications, Inc., Class B1 | 8,600 | 437,482 | |||||||||
SmartCentres Real Estate Investment Trust | 2,200 | 51,311 | |||||||||
SNC-Lavalin Group, Inc.1 | 17,818 | 789,096 | |||||||||
Spin Master Corp.*,1,2 | 3,040 | 124,558 | |||||||||
The Bank of Nova Scotia1 | 1,790 | 106,078 | |||||||||
| Tidewater Midstream and Infrastructure Ltd.1 | 167,237 | 164,556 | |||||||||
Tree Island Steel Ltd.1 | 83,450 | 167,432 | |||||||||
Tricon Capital Group, Inc.1 | 23,830 | 199,492 | |||||||||
Trinidad Drilling Ltd.*,1 | 374,190 | 448,735 | |||||||||
Troilus Gold Corp.*,1 | 122,880 | 118,077 | |||||||||
Waste Connections, Inc.1 | 17,081 | 1,325,656 | |||||||||
West Fraser Timber Co. Ltd.1 | 11,620 | 721,756 | |||||||||
Total Canada common stocks | 36,712,764 | ||||||||||
Cayman Islands—0.19% | |||||||||||
Ctrip.com International Ltd., ADR* | 9,280 | 381,872 | |||||||||
| Shenzhou International Group Holdings Ltd. | 42,775 | 524,534 | |||||||||
Tencent Holdings Ltd. | 6,424 | 290,711 | |||||||||
Total Cayman Islands common stocks | 1,197,117 | ||||||||||
239
PACE Alternative Strategies Investments
Portfolio of investments—July 31, 2018
| Number of shares | Value | ||||||||||
Common stocks—(continued) | |||||||||||
Denmark—0.49% | |||||||||||
Danske Bank A/S | 8,053 | $ | 234,101 | ||||||||
DSV A/S | 25,332 | 2,124,333 | |||||||||
Pandora A/S | 10,418 | 740,576 | |||||||||
Total Denmark common stocks | 3,099,010 | ||||||||||
Finland—0.18% | |||||||||||
Elisa Oyj | 2,203 | 95,753 | |||||||||
Fortum Oyj | 6,401 | 160,778 | |||||||||
Kone Oyj, Class B | 6,843 | 374,407 | |||||||||
Neste Oyj | 1,884 | 155,580 | |||||||||
Nokian Renkaat Oyj | 2,009 | 87,133 | |||||||||
Stora Enso Oyj, R Shares | 8,436 | 139,437 | |||||||||
Wartsila Oyj Abd | 6,650 | 143,781 | |||||||||
Total Finland common stocks | 1,156,869 | ||||||||||
France—0.98% | |||||||||||
Accor SA | 3,039 | 156,645 | |||||||||
Aeroports de Paris | 408 | 91,316 | |||||||||
Alstom SA | 2,338 | 104,929 | |||||||||
Arkema SA | 1,050 | 131,683 | |||||||||
BNP Paribas SA | 8,148 | 530,416 | |||||||||
Bureau Veritas SA | 3,878 | 99,900 | |||||||||
Credit Agricole SA | 10,591 | 148,801 | |||||||||
Edenred | 3,447 | 135,715 | |||||||||
Eiffage SA | 1,435 | 160,620 | |||||||||
Electricite de France SA | 7,036 | 105,313 | |||||||||
Faurecia SA | 1,074 | 73,017 | |||||||||
Gecina SA | 788 | 134,439 | |||||||||
Getlink | 6,805 | 89,879 | |||||||||
Iliad SA | 411 | 65,122 | |||||||||
Ingenico Group SA | 860 | 71,360 | |||||||||
Ipsen SA | 535 | 88,929 | |||||||||
Klepierre | 3,046 | 114,941 | |||||||||
Natixis SA | 21,629 | 155,545 | |||||||||
Orpea | 4,544 | 625,136 | |||||||||
Rexel SA | 4,424 | 69,243 | |||||||||
Rubis SCA | 1,243 | 73,329 | |||||||||
SCOR SE | 2,572 | 100,002 | |||||||||
Societe Generale SA | 7,743 | 345,058 | |||||||||
Sodexho SA | 1,334 | 147,693 | |||||||||
Suez | 5,620 | 79,551 | |||||||||
Teleperformance | 802 | 147,050 | |||||||||
Thales SA | 3,194 | 419,990 | |||||||||
Total SA | 20,403 | 1,332,722 | |||||||||
Ubisoft Entertainment SA* | 3,153 | 348,197 | |||||||||
Total France common stocks | 6,146,541 | ||||||||||
Germany—1.31% | |||||||||||
Beiersdorf AG | 4,677 | 544,717 | |||||||||
Brenntag AG | 2,262 | 135,639 | |||||||||
Commerzbank AG* | 20,099 | 217,072 | |||||||||
Covestro AG2 | 18,901 | 1,814,565 | |||||||||
Delivery Hero SE*,2 | 1,666 | 94,640 | |||||||||
Deutsche Bank AG | 27,127 | 354,894 | |||||||||
Deutsche Lufthansa AG | 62,203 | 1,745,690 | |||||||||
Evonik Industries AG | 2,179 | 80,645 | |||||||||
| Number of shares | Value | ||||||||||
Common stocks—(continued) | |||||||||||
Germany—(concluded) | |||||||||||
GEA Group AG | 2,281 | $ | 89,087 | ||||||||
Hannover Rueck SE | 879 | 117,176 | |||||||||
HUGO BOSS AG | 922 | 83,103 | |||||||||
Infineon Technologies AG | 20,559 | 544,761 | |||||||||
Innogy SE* | 1,888 | 81,344 | |||||||||
K+S AG | 2,788 | 73,647 | |||||||||
KION Group AG | 977 | 67,108 | |||||||||
LANXESS AG | 1,206 | 99,140 | |||||||||
LEG Immobilien AG | 925 | 104,098 | |||||||||
MTU Aero Engines AG | 762 | 161,279 | |||||||||
OSRAM Licht AG | 1,406 | 62,772 | |||||||||
ProSiebenSat.1 Media SE | 3,411 | 92,297 | |||||||||
Rheinmetall AG | 635 | 76,704 | |||||||||
Scout24 AG2 | 6,053 | 314,974 | |||||||||
Siemens Healthineers AG*,2 | 2,042 | 90,964 | |||||||||
Siltronic AG | 1,123 | 195,861 | |||||||||
Symrise AG | 1,786 | 161,396 | |||||||||
TUI AG | 13,114 | 280,740 | |||||||||
Uniper SE | 10,032 | 313,098 | |||||||||
United Internet AG | 1,830 | 98,436 | |||||||||
Zalando SE*,2 | 2,117 | 121,449 | |||||||||
Total Germany common stocks | 8,217,296 | ||||||||||
Hong Kong—0.01% | |||||||||||
Swire Pacific Ltd., Class A | 6,500 | 70,473 | |||||||||
Ireland—0.40% | |||||||||||
Accenture PLC, Class A1 | 3,577 | 569,923 | |||||||||
Allegion PLC | 4,498 | 366,767 | |||||||||
Bank of Ireland Group PLC | 13,590 | 116,723 | |||||||||
CRH PLC | 14,533 | 497,589 | |||||||||
Kingspan Group PLC | 2,223 | 103,251 | |||||||||
Paddy Power Betfair PLC | 4,604 | 501,256 | |||||||||
Ryanair Holdings PLC, ADR* | 2,237 | 235,780 | |||||||||
Smurfit Kappa Group PLC | 3,228 | 132,415 | |||||||||
Total Ireland common stocks | 2,523,704 | ||||||||||
Israel—0.12% | |||||||||||
Check Point Software Technologies Ltd.* | 6,740 | 759,396 | |||||||||
Italy—0.58% | |||||||||||
Banco BPM SpA* | 55,216 | 175,622 | |||||||||
Eni SpA | 52,814 | 1,016,785 | |||||||||
Intesa Sanpaolo SpA | 183,037 | 563,766 | |||||||||
Leonardo SpA | 5,878 | 70,453 | |||||||||
| Mediobanca Banca di Credito Finanziario SpA | 9,274 | 96,343 | |||||||||
Moncler SpA | 2,562 | 113,004 | |||||||||
Prysmian SpA | 23,368 | 599,792 | |||||||||
Snam SpA | 32,564 | 139,939 | |||||||||
Telecom Italia SpA* | 169,207 | 130,470 | |||||||||
Terna Rete Elettrica Nazionale SpA | 20,633 | 115,569 | |||||||||
UniCredit SpA | 30,499 | 540,809 | |||||||||
Unione di Banche Italiane SpA | 20,212 | 83,715 | |||||||||
Total Italy common stocks | 3,646,267 | ||||||||||
240
PACE Alternative Strategies Investments
Portfolio of investments—July 31, 2018
| Number of shares | Value | ||||||||||
Common stocks—(continued) | |||||||||||
Japan—4.03% | |||||||||||
Activia Properties, Inc. | 70 | $ | 312,391 | ||||||||
Advance Residence Investment Corp. | 142 | 369,430 | |||||||||
AEON REIT Investment Corp. | 146 | 156,035 | |||||||||
Asahi Group Holdings Ltd. | 5,588 | 270,967 | |||||||||
Brother Industries Ltd. | 2,500 | 50,821 | |||||||||
Comforia Residential REIT, Inc. | 59 | 138,141 | |||||||||
CRE Logistics REIT, Inc. | 16 | 15,855 | |||||||||
CyberAgent, Inc. | 4,500 | 236,238 | |||||||||
Daiwa Office Investment Corp. | 34 | 207,074 | |||||||||
Dawa House REIT Investment Corp. | 179 | 441,837 | |||||||||
DeNA Co. Ltd. | 31,606 | 595,006 | |||||||||
Frontier Real Estate Investment Corp. | 53 | 213,299 | |||||||||
Fukuoka REIT Corp. | 80 | 125,922 | |||||||||
Global One Real Estate Investment Corp. | 98 | 99,652 | |||||||||
GLP J-Reit | 319 | 340,639 | |||||||||
Hankyu Reit, Inc. | 67 | 81,492 | |||||||||
Health Care & Medical Investment Corp. | 19 | 18,963 | |||||||||
Heiwa Real Estate REIT, Inc. | 96 | 92,639 | |||||||||
Hoshino Resorts REIT, Inc. | 25 | 128,337 | |||||||||
Hulic Reit, Inc. | 105 | 162,362 | |||||||||
Ichigo Hotel REIT Investment Corp. | 24 | 30,007 | |||||||||
Ichigo Office REIT Investment | 119 | 98,337 | |||||||||
| Industrial & Infrastructure Fund Investment Corp. | 179 | 193,064 | |||||||||
Invesco Office J-Reit, Inc. | 904 | 126,527 | |||||||||
Invincible Investment Corp. | 421 | 185,810 | |||||||||
Japan Excellent, Inc. | 138 | 177,352 | |||||||||
Japan Hotel REIT Investment Corp. | 443 | 324,480 | |||||||||
Japan Logistics Fund, Inc. | 103 | 198,971 | |||||||||
Japan Prime Realty Investment Corp. | 97 | 349,170 | |||||||||
Japan Real Estate Investment Corp. | 153 | 800,474 | |||||||||
Japan Rental Housing Investments, Inc. | 173 | 140,795 | |||||||||
Japan Retail Fund Investment Corp. | 290 | 528,829 | |||||||||
JXTG Holdings, Inc. | 331,845 | 2,432,115 | |||||||||
Kenedix Realty Investment Corp. | 48 | 291,052 | |||||||||
Kenedix Residential Next Investment Corp. | 78 | 115,798 | |||||||||
Kenedix Retail REIT Corp. | 56 | 122,252 | |||||||||
Komatsu Ltd. | 10,885 | 319,010 | |||||||||
LaSalle Logiport REIT | 116 | 114,325 | |||||||||
Marimo Regional Revitalization REIT, Inc. | 13 | 13,394 | |||||||||
MCUBS MidCity Investment Corp. | 172 | 126,445 | |||||||||
Mirai Corp. | 23 | 40,728 | |||||||||
| Mitsubishi Estate Logistics REIT Investment Corp. | 15 | 36,140 | |||||||||
Mitsui Fudosan Co. Ltd. | 16,415 | 391,382 | |||||||||
Mitsui Fudosan Logistics Park, Inc. | 29 | 83,643 | |||||||||
Mixi, Inc. | 41,300 | 1,084,811 | |||||||||
Mori Hills REIT Investment Corp. | 165 | 203,787 | |||||||||
Mori Trust Hotel Reit, Inc. | 34 | 46,919 | |||||||||
Mori Trust Sogo Reit, Inc. | 110 | 159,469 | |||||||||
Nippon Accommodations Fund, Inc. | 51 | 241,282 | |||||||||
Nippon Building Fund, Inc. | 149 | 828,851 | |||||||||
Nippon Express Co. Ltd. | 19,700 | 1,286,142 | |||||||||
Nippon Healthcare Investment Corp. | 8 | 12,127 | |||||||||
Nippon Prologis REIT, Inc. | 205 | 414,528 | |||||||||
NIPPON REIT Investment Corp. | 48 | 148,746 | |||||||||
| Number of shares | Value | ||||||||||
Common stocks—(continued) | |||||||||||
Japan—(concluded) | |||||||||||
Nomura Real Estate Master Fund, Inc. | 454 | $ | 643,148 | ||||||||
One REIT, Inc. | 17 | 39,393 | |||||||||
Ooedo Onsen Reit Investment Corp. | 26 | 19,997 | |||||||||
Orix JREIT, Inc. | 305 | 475,169 | |||||||||
Otsuka Corp. | 5,700 | 222,260 | |||||||||
Persol Holdings Co. Ltd. | 23,100 | 502,843 | |||||||||
Premier Investment Corp. | 139 | 140,224 | |||||||||
Rakuten, Inc. | 341,700 | 2,404,720 | |||||||||
Sakura Sogo REIT Investment Corp. | 37 | 30,211 | |||||||||
Samty Residential Investment Corp. | 27 | 23,036 | |||||||||
Sekisui House Reit, Inc. | 385 | 248,598 | |||||||||
Shimamura Co. Ltd. | 500 | 46,774 | |||||||||
Shionogi & Co. Ltd. | 8,085 | 439,337 | |||||||||
Star Asia Investment Corp. | 36 | 34,643 | |||||||||
Start Today Co. Ltd. | 39,800 | 1,596,414 | |||||||||
Starts Proceed Investment Corp. | 25 | 37,763 | |||||||||
Suzuken Co. Ltd. | 1,200 | 52,426 | |||||||||
TDK Corp. | 3,188 | 340,141 | |||||||||
Tokyo Electron Ltd. | 9,200 | 1,576,050 | |||||||||
Tokyu REIT, Inc. | 103 | 140,478 | |||||||||
Tosei Reit Investment Corp. | 25 | 25,533 | |||||||||
United Urban Investment Corp. | 339 | 525,713 | |||||||||
XYMAX REIT Investment Corp.* | 15 | 15,347 | |||||||||
Yamada Denki Co. Ltd. | 9,400 | 46,573 | |||||||||
Total Japan common stocks | 25,350,653 | ||||||||||
Jersey—0.13% | |||||||||||
Ferguson PLC | 3,432 | 270,731 | |||||||||
Glencore PLC* | 78,762 | 345,803 | |||||||||
Shire PLC | 3,808 | 217,471 | |||||||||
Total Jersey common stocks | 834,005 | ||||||||||
Luxembourg—0.23% | |||||||||||
Eurofins Scientific SE | 160 | 87,299 | |||||||||
Intelsat SA* | 58,915 | 1,148,843 | |||||||||
SES SA | 5,614 | 112,224 | |||||||||
Tenaris SA | 6,833 | 124,886 | |||||||||
Total Luxembourg common stocks | 1,473,252 | ||||||||||
Netherlands—1.28% | |||||||||||
ABN AMRO Group N.V.2 | 11,363 | 314,909 | |||||||||
Aegon N.V. | 26,261 | 173,256 | |||||||||
Airbus SE | 32,274 | 4,000,398 | |||||||||
ASML Holding N.V. | 2,189 | 469,706 | |||||||||
ASR Nederland N.V. | 17,386 | 778,651 | |||||||||
EXOR N.V. | 1,658 | 109,115 | |||||||||
Heineken Holding N.V. | 1,481 | 143,134 | |||||||||
ING Groep N.V. | 31,526 | 483,004 | |||||||||
Koninklijke KPN N.V. | 48,544 | 140,493 | |||||||||
LyondellBasell Industries N.V., Class A1 | 495 | 54,841 | |||||||||
QIAGEN N.V.* | 3,383 | 122,594 | |||||||||
Randstad N.V. | 19,925 | 1,264,220 | |||||||||
Total Netherlands common stocks | 8,054,321 | ||||||||||
New Zealand—0.07% | |||||||||||
a2 Milk Co. Ltd.* | 58,572 | 417,591 | |||||||||
241
PACE Alternative Strategies Investments
Portfolio of investments—July 31, 2018
| Number of shares | Value | ||||||||||
Common stocks—(continued) | |||||||||||
Portugal—0.11% | |||||||||||
EDP—Energias de Portugal SA | 37,224 | $ | 151,869 | ||||||||
Galp Energia, SGPS SA | 23,396 | 481,229 | |||||||||
Jeronimo Martins, SGPS SA | 3,563 | 53,038 | |||||||||
Total Portugal common stocks | 686,136 | ||||||||||
Singapore—0.17% | |||||||||||
Genting Singapore Ltd. | 1,122,200 | 1,055,141 | |||||||||
Spain—0.70% | |||||||||||
| ACS, Actividades de Contruccion y Servicios SA | 4,019 | 176,330 | |||||||||
Banco Bilbao Vizcaya Argentaria SA | 63,679 | 468,075 | |||||||||
Banco de Sabadell SA | 125,743 | 210,043 | |||||||||
Banco Santander SA | 209,364 | 1,179,909 | |||||||||
Bankia SA | 37,161 | 146,484 | |||||||||
Bankinter SA | 9,451 | 91,308 | |||||||||
CaixaBank SA | 48,398 | 223,943 | |||||||||
Enagas SA | 3,320 | 92,863 | |||||||||
Endesa SA | 23,983 | 554,721 | |||||||||
Grifols SA | 4,296 | 124,835 | |||||||||
Naturgy Energy Group SA | 5,199 | 140,922 | |||||||||
Red Electrica Corp. SA | 6,337 | 134,420 | |||||||||
Repsol SA | 44,379 | 880,910 | |||||||||
Total Spain common stocks | 4,424,763 | ||||||||||
Sweden—0.05% | |||||||||||
Swedbank AB, A Shares | 12,032 | 284,894 | |||||||||
Switzerland—0.60% | |||||||||||
Adecco Group AG | 20,765 | 1,278,846 | |||||||||
Chocoladefabriken Lindt & Spruengli AG | 192 | 1,324,405 | |||||||||
Credit Suisse Group AG* | 20,236 | 326,384 | |||||||||
The Swatch Group AG | 6,154 | 507,473 | |||||||||
Zurich Insurance Group AG | 1,202 | 369,893 | |||||||||
Total Switzerland common stocks | 3,807,001 | ||||||||||
United Kingdom—1.31% | |||||||||||
Anglo American PLC | 16,467 | 374,523 | |||||||||
Antofagasta PLC | 21,702 | 285,704 | |||||||||
BHP Billiton PLC | 17,308 | 398,603 | |||||||||
| BP PLC | 169,404 | 1,274,739 | |||||||||
| BP PLC, ADR | 7,280 | 328,255 | |||||||||
BrightSphere Investment Group PLC | 25,516 | 363,603 | |||||||||
Coca-Cola European Partners PLC1 | 15,351 | 633,075 | |||||||||
Indivior PLC* | 54,651 | 219,357 | |||||||||
Next PLC | 8,089 | 630,238 | |||||||||
Prudential PLC | 18,941 | 448,741 | |||||||||
Rio Tinto PLC | 6,974 | 384,136 | |||||||||
Royal Dutch Shell PLC, A Shares | 36,194 | 1,241,770 | |||||||||
Royal Dutch Shell PLC, ADR | 4,652 | 318,057 | |||||||||
Royal Dutch Shell PLC, B Shares | 9,386 | 329,118 | |||||||||
TechnipFMC PLC | 13,080 | 425,754 | |||||||||
Tullow Oil PLC* | 69,710 | 207,243 | |||||||||
Vodafone Group PLC | 149,796 | 365,704 | |||||||||
Total United Kingdom common stocks | 8,228,620 | ||||||||||
| Number of shares | Value | ||||||||||
Common stocks—(continued) | |||||||||||
United States—25.93% | |||||||||||
Abbott Laboratories | 50,198 | $ | 3,289,977 | ||||||||
ABIOMED, Inc.*,1 | 379 | 134,367 | |||||||||
Adobe Systems, Inc.* | 1,464 | 358,212 | |||||||||
Advanced Disposal Services, Inc.*,1 | 28,710 | 706,266 | |||||||||
Affiliated Managers Group, Inc.1 | 9,947 | 1,591,620 | |||||||||
AGNC Investment Corp.1 | 90,822 | 1,768,304 | |||||||||
Akamai Technologies, Inc.*,1 | 2,213 | 166,550 | |||||||||
Alphabet, Inc., Class A*,1 | 537 | 659,017 | |||||||||
Alphabet, Inc., Class C* | 827 | 1,006,674 | |||||||||
American International Group, Inc. | 3,698 | 204,167 | |||||||||
American Tower Corp. | 4,813 | 713,479 | |||||||||
Analog Devices, Inc.1 | 11,150 | 1,071,961 | |||||||||
Andeavor | 2,141 | 321,278 | |||||||||
Apple, Inc. | 3,669 | 698,174 | |||||||||
Ball Corp. | 17,103 | 666,504 | |||||||||
Bank of America Corp.1 | 105,094 | 3,245,303 | |||||||||
Baxter International, Inc. | 7,123 | 516,061 | |||||||||
BB&T Corp.1 | 6,840 | 347,540 | |||||||||
Becton, Dickinson and Co. | 18,742 | 4,692,435 | |||||||||
Bemis Co., Inc. | 7,328 | 336,429 | |||||||||
Berkshire Hathaway, Inc., Class B*,1 | 16,234 | 3,212,222 | |||||||||
Best Buy Co., Inc.1 | 18,681 | 1,401,635 | |||||||||
BJ's Wholesale Club Holdings, Inc.* | 10,211 | 253,131 | |||||||||
Booking Holdings, Inc.*,1 | 52 | 105,493 | |||||||||
Boston Scientific Corp.*,1 | 94,540 | 3,177,489 | |||||||||
Broadcom, Inc. | 3,382 | 750,026 | |||||||||
Broadridge Financial Solutions, Inc.1 | 24,453 | 2,762,700 | |||||||||
Builders FirstSource, Inc.*,1 | 30,900 | 554,037 | |||||||||
C.H. Robinson Worldwide, Inc.1 | 3,883 | 358,129 | |||||||||
Camping World Holdings, Inc., Class A | 16,755 | 371,458 | |||||||||
CarMax, Inc.*,1 | 10,970 | 819,240 | |||||||||
Carrols Restaurant Group, Inc.*,1 | 35,982 | 521,739 | |||||||||
Celanese Corp., Series A | 4,629 | 546,731 | |||||||||
Celgene Corp.*,1 | 498 | 44,865 | |||||||||
Centene Corp.*,1 | 8,073 | 1,052,154 | |||||||||
Chevron Corp. | 6,915 | 873,157 | |||||||||
Citigroup, Inc. | 4,648 | 334,145 | |||||||||
Citrix Systems, Inc.*,1 | 12,399 | 1,363,518 | |||||||||
CME Group, Inc. | 2,293 | 364,862 | |||||||||
CMS Energy Corp. | 7,580 | 366,417 | |||||||||
| Cognizant Technology Solutions Corp., Class A1 | 24,667 | 2,010,361 | |||||||||
Commercial Metals Co. | 7,518 | 167,952 | |||||||||
Constellation Brands, Inc., Class A1 | 8,010 | 1,683,942 | |||||||||
CSX Corp.1 | 28,205 | 1,993,529 | |||||||||
D.R. Horton, Inc.1 | 50,270 | 2,196,799 | |||||||||
Darden Restaurants, Inc.1 | 23,276 | 2,489,135 | |||||||||
Dave & Buster's Entertainment, Inc.* | 20,989 | 1,031,609 | |||||||||
Del Frisco's Restaurant Group, Inc.* | 1,559 | 13,340 | |||||||||
DISH Network Corp., Class A* | 37,148 | 1,172,391 | |||||||||
Dollar General Corp.1 | 551 | 54,081 | |||||||||
Dollar Tree, Inc.* | 4,068 | 371,327 | |||||||||
DowDuPont, Inc. | 9,490 | 652,627 | |||||||||
DTE Energy Co.1 | 641 | 69,574 | |||||||||
DXC Technology Co.1 | 16,283 | 1,379,821 | |||||||||
E*TRADE Financial Corp.*,1 | 22,225 | 1,329,277 | |||||||||
242
PACE Alternative Strategies Investments
Portfolio of investments—July 31, 2018
| Number of shares | Value | ||||||||||
Common stocks—(continued) | |||||||||||
United States—(continued) | |||||||||||
Electronic Arts, Inc.* | 1,758 | $ | 226,343 | ||||||||
Entergy Corp.1 | 33,939 | 2,758,562 | |||||||||
Equinix, Inc. | 1,370 | 601,814 | |||||||||
| Expeditors International of Washington, Inc.1 | 33,274 | 2,534,481 | |||||||||
Express Scripts Holding Co.*,1 | 2,917 | 231,785 | |||||||||
Extended Stay America, Inc. | 31,645 | 673,722 | |||||||||
Exxon Mobil Corp. | 10,570 | 861,561 | |||||||||
F5 Networks, Inc.*,1 | 10,743 | 1,841,135 | |||||||||
Facebook, Inc., Class A* | 951 | 164,124 | |||||||||
FedEx Corp. | 11,529 | 2,834,635 | |||||||||
First Republic Bank | 5,304 | 524,353 | |||||||||
Fortinet, Inc.*,1 | 28,406 | 1,787,021 | |||||||||
Gaming and Leisure Properties, Inc. | 27,154 | 986,233 | |||||||||
General Dynamics Corp.1 | 10,138 | 2,025,167 | |||||||||
Gilead Sciences, Inc.1 | 1,945 | 151,379 | |||||||||
Gran Tierra Energy, Inc.*,1 | 110,860 | 370,712 | |||||||||
Halliburton Co. | 7,194 | 305,170 | |||||||||
Herc Holdings, Inc.* | 9,834 | 558,768 | |||||||||
Hess Corp. | 7,198 | 472,405 | |||||||||
Hilton Grand Vacations, Inc.* | 5,087 | 175,959 | |||||||||
HollyFrontier Corp.1 | 18,081 | 1,348,481 | |||||||||
Huntington Ingalls Industries, Inc.1 | 6,236 | 1,453,300 | |||||||||
Imperva, Inc.* | 8,682 | 401,543 | |||||||||
Inspire Medical Systems, Inc.* | 1,592 | 71,322 | |||||||||
Instructure, Inc.* | 23,231 | 899,040 | |||||||||
Intel Corp.1 | 21,595 | 1,038,720 | |||||||||
Intercontinental Exchange, Inc. | 3,675 | 271,619 | |||||||||
International Business Machines Corp.1 | 9,135 | 1,323,936 | |||||||||
Intuit, Inc.1 | 4,871 | 994,853 | |||||||||
Jefferies Financial Group, Inc.1 | 14,817 | 359,312 | |||||||||
Jones Lang LaSalle, Inc.1 | 7,620 | 1,303,096 | |||||||||
JPMorgan Chase & Co.1 | 38,417 | 4,416,034 | |||||||||
Kansas City Southern1 | 16,301 | 1,895,317 | |||||||||
KAR Auction Services, Inc. | 4,156 | 247,074 | |||||||||
Keysight Technologies, Inc.*,1 | 31,498 | 1,826,884 | |||||||||
Kimco Realty Corp. | 35,260 | 588,489 | |||||||||
Kite Realty Group Trust | 20,363 | 343,524 | |||||||||
Knight-Swift Transportation Holdings, Inc. | 5,652 | 183,973 | |||||||||
Kohl's Corp.1 | 19,555 | 1,444,528 | |||||||||
Lam Research Corp.1 | 2,984 | 568,870 | |||||||||
Lattice Semiconductor Corp.* | 49,591 | 381,355 | |||||||||
LendingClub Corp.* | 319,810 | 1,317,617 | |||||||||
Lennar Corp., Class A1 | 10,220 | 534,199 | |||||||||
| Liberty Media Corp-Liberty Formula One., Class C* | 36,673 | 1,292,723 | |||||||||
Lockheed Martin Corp.1 | 2,987 | 974,061 | |||||||||
Lululemon Athletica, Inc.*,1 | 21,104 | 2,531,425 | |||||||||
ManpowerGroup, Inc.1 | 15,660 | 1,460,452 | |||||||||
Martin Marietta Materials, Inc. | 1,851 | 369,126 | |||||||||
MasterCard, Inc., Class A1 | 10,690 | 2,116,620 | |||||||||
McDonald's Corp.1 | 12,534 | 1,974,606 | |||||||||
Mercer International, Inc.1 | 46,290 | 830,906 | |||||||||
Mohawk Industries, Inc.* | 2,013 | 379,169 | |||||||||
NextEra Energy, Inc. | 3,247 | 544,002 | |||||||||
NIKE, Inc., Class B1 | 5,160 | 396,856 | |||||||||
| Number of shares | Value | ||||||||||
Common stocks—(concluded) | |||||||||||
United States—(concluded) | |||||||||||
Nordstrom, Inc.1 | 1,009 | $ | 52,882 | ||||||||
Northrop Grumman Corp.1 | 156 | 46,876 | |||||||||
NVR, Inc.*,1 | 55 | 151,769 | |||||||||
Occidental Petroleum Corp. | 15,945 | 1,338,264 | |||||||||
Old Dominion Freight Line, Inc.1 | 18,273 | 2,682,476 | |||||||||
Owens & Minor, Inc. | 9,659 | 182,265 | |||||||||
Perspecta, Inc. | 18,491 | 401,255 | |||||||||
Phillips 661 | 2,900 | 357,686 | |||||||||
Pioneer Natural Resources Co. | 1,801 | 340,875 | |||||||||
PPG Industries, Inc. | 5,802 | 642,049 | |||||||||
Ralph Lauren Corp.1 | 11,909 | 1,607,477 | |||||||||
Rayonier Advanced Materials, Inc.1 | 25,760 | 464,710 | |||||||||
Raytheon Co.1 | 11,926 | 2,361,706 | |||||||||
Regeneron Pharmaceuticals, Inc.*,1 | 147 | 54,098 | |||||||||
Regions Financial Corp.1 | 73,679 | 1,371,166 | |||||||||
Robert Half International, Inc.1 | 26,211 | 1,985,745 | |||||||||
Ross Stores, Inc.1 | 3,261 | 285,109 | |||||||||
Schlumberger Ltd. | 8,787 | 593,298 | |||||||||
Scholastic Corp. | 8,960 | 374,170 | |||||||||
Spirit Aerosystems Holdings, Inc., Class A1 | 20,135 | 1,877,589 | |||||||||
Tapestry, Inc.1 | 38,475 | 1,812,942 | |||||||||
The Charles Schwab Corp. | 9,006 | 459,846 | |||||||||
The Children's Place, Inc. | 4,887 | 600,612 | |||||||||
The Coca-Cola Co.1 | 33,275 | 1,551,613 | |||||||||
The Estee Lauder Cos., Inc., Class A1 | 12,130 | 1,636,822 | |||||||||
The Gap, Inc.1 | 51,260 | 1,546,514 | |||||||||
The Kraft Heinz Co. | 5,810 | 350,053 | |||||||||
The Madison Square Garden Co., Class A* | 2,562 | 799,805 | |||||||||
The PNC Financial Services Group, Inc.1 | 1,700 | 246,211 | |||||||||
The Sherwin-Williams Co. | 12,506 | 5,511,769 | |||||||||
TRI Pointe Group, Inc.*,1 | 34,020 | 482,063 | |||||||||
Twenty-First Century Fox, Inc., Class B1 | 11,399 | 506,344 | |||||||||
Twitter, Inc.*,1 | 22,993 | 732,787 | |||||||||
Ultra Clean Holdings, Inc.* | 13,608 | 182,619 | |||||||||
Union Pacific Corp.1 | 1,210 | 181,367 | |||||||||
United Therapeutics Corp.*,1 | 5,025 | 617,623 | |||||||||
UnitedHealth Group, Inc.1 | 4,984 | 1,262,049 | |||||||||
Universal Health Services, Inc., Class B1 | 20,006 | 2,442,733 | |||||||||
Unum Group1 | 1,302 | 51,728 | |||||||||
Valero Energy Corp.1 | 11,515 | 1,362,800 | |||||||||
Varian Medical Systems, Inc.*,1 | 15,837 | 1,828,382 | |||||||||
VeriSign, Inc.*,1 | 8,733 | 1,268,294 | |||||||||
Vertex Pharmaceuticals, Inc.* | 1,493 | 261,350 | |||||||||
Western Alliance Bancorp* | 1,076 | 61,031 | |||||||||
World Wrestling Entertainment, Inc., Class A1 | 15,844 | 1,253,419 | |||||||||
Worldpay, Inc., Class A* | 4,505 | 370,266 | |||||||||
Wyndham Hotels & Resorts, Inc. | 11,808 | 684,864 | |||||||||
Yum! Brands, Inc.1 | 16,884 | 1,338,732 | |||||||||
Zayo Group Holdings, Inc.* | 22,452 | 832,745 | |||||||||
Zions Bancorp. | 25,770 | 1,332,309 | |||||||||
Total United States common stocks | 163,252,749 | ||||||||||
| Total common stocks (cost—$271,391,324) | 287,972,888 | ||||||||||
243
PACE Alternative Strategies Investments
Portfolio of investments—July 31, 2018
| Number of shares | Value | ||||||||||
Preferred stocks—0.24% | |||||||||||
France—0.01% | |||||||||||
Safran SA3 | 461 | $ | 57,168 | ||||||||
Germany—0.06% | |||||||||||
Bayerische Motoren Werke AG | 2,884 | 238,766 | |||||||||
Porsche Automobil Holding SE | 2,242 | 151,796 | |||||||||
Total Germany preferred stocks | 390,562 | ||||||||||
Italy—0.17% | |||||||||||
Intesa Sanpaolo SpA | 320,316 | 1,022,179 | |||||||||
Telecom Italia SpA | 29,804 | 19,865 | |||||||||
Total Italy preferred stocks | 1,042,044 | ||||||||||
| Total preferred stocks (cost—$1,496,676) | 1,489,774 | ||||||||||
Investment companies—10.80% | |||||||||||
AQR Style Premia Alternative Fund | 2,660,908 | 25,597,939 | |||||||||
ASG Managed Futures Strategy Fund | 679,971 | 6,561,718 | |||||||||
Boyd Group Income Fund1 | 5,160 | 467,349 | |||||||||
Brookfield Business Partners LP1 | 5,120 | 200,612 | |||||||||
Carillon Reams Unconstrained Bond Fund | 2,382,120 | 27,584,952 | |||||||||
Dream Hard Asset Alternatives Trust1 | 37,740 | 200,181 | |||||||||
| iShares MSCI Emerging Markets Small-Cap ETF | 73,831 | 3,605,168 | |||||||||
SPDR S&P Emerging Markets SmallCap ETF | 78,983 | 3,814,879 | |||||||||
| Total investment companies (cost—$68,661,109) | 68,032,798 | ||||||||||
| Face amount | |||||||||||
US government obligations—2.32% | |||||||||||
US Treasury Inflation Index Bonds (TIPS) | |||||||||||
0.625%, due 02/15/43 | USD | 754,191 | 703,179 | ||||||||
0.750%, due 02/15/42 | USD | 677,981 | 652,191 | ||||||||
0.750%, due 02/15/45 | USD | 722,357 | 690,216 | ||||||||
0.875%, due 02/15/47 | USD | 3,713,419 | 3,655,519 | ||||||||
1.000%, due 02/15/46 | USD | 604,722 | 613,155 | ||||||||
1.000%, due 02/15/48 | USD | 27,951 | 28,400 | ||||||||
1.375%, due 02/15/44 | USD | 686,041 | 754,433 | ||||||||
2.125%, due 02/15/40 | USD | 4,101,175 | 5,078,473 | ||||||||
2.125%, due 02/15/41 | USD | 534,146 | 666,434 | ||||||||
2.500%, due 01/15/29 | USD | 286,705 | 332,756 | ||||||||
3.375%, due 04/15/32 | USD | 332,761 | 437,714 | ||||||||
3.875%, due 04/15/291 | USD | 751,481 | 978,193 | ||||||||
| Total US government obligations (cost—$14,809,211) | 14,590,663 | ||||||||||
Corporate notes—4.21% | |||||||||||
Canada—0.20% | |||||||||||
Alcanna, Inc. | |||||||||||
4.700%, due 01/31/22 | CAD | 480,300 | 371,436 | ||||||||
Delphi Energy Corp. | |||||||||||
10.000%, due 07/15/211,2,4 | CAD | 610,000 | 465,407 | ||||||||
Tricon Capital Group, Inc. | |||||||||||
5.750%, due 03/31/221,2 | USD | 429,000 | 449,163 | ||||||||
Total Canada corporate notes | 1,286,006 | ||||||||||
| Face amount | Value | ||||||||||
Corporate notes—(concluded) | |||||||||||
Germany—1.19% | |||||||||||
| Kreditanstalt fuer Wiederaufbau 1.000%, due 09/07/18 | USD | 3,500,000 | $ | 3,495,835 | |||||||
1.125%, due 08/06/18 | USD | 4,000,000 | 3,999,517 | ||||||||
Total Germany corporate notes | 7,495,352 | ||||||||||
Supranationals—2.76% | |||||||||||
| Asian Development Bank 1.750%, due 09/11/18 | USD | 2,500,000 | 2,498,625 | ||||||||
1.875%, due 10/23/18 | USD | 4,270,000 | 4,265,709 | ||||||||
| European Investment Bank 1.875%, due 03/15/19 | USD | 4,000,000 | 3,986,754 | ||||||||
| Inter-American Development Bank 1.750%, due 08/24/18 | USD | 3,100,000 | 3,098,989 | ||||||||
| 1 mo. USD LIBOR + 0.040%, 2.110%, due 11/26/185 | USD | 3,500,000 | 3,499,530 | ||||||||
Total Supranationals corporate notes | 17,349,607 | ||||||||||
United States—0.06% | |||||||||||
SM Energy Co. | |||||||||||
1.500%, due 07/01/211 | USD | 363,500 | 381,239 | ||||||||
| Total corporate notes (cost—$26,462,695) | 26,512,204 | ||||||||||
Non-US government obligations—4.50% | |||||||||||
Brazil—1.54% | |||||||||||
| Brazil Letras do Tesouro Nacional 0.010%, due 07/01/206 | BRL | 9,957,000 | 2,273,330 | ||||||||
0.010%, due 07/01/216 | BRL | 13,745,000 | 2,825,073 | ||||||||
| Brazil Notas do Tesouro Nacional Series F, 10.000%, due 01/01/21 | BRL | 3,108,000 | 853,639 | ||||||||
10.000%, due 01/01/23 | BRL | 5,924,000 | 1,578,676 | ||||||||
10.000%, due 01/01/25 | BRL | 2,081,000 | 539,607 | ||||||||
10.000%, due 01/01/27 | BRL | 6,323,000 | 1,606,714 | ||||||||
Total Brazil | 9,677,039 | ||||||||||
France—1.28% | |||||||||||
| French Republic Government Bond OAT 1.850%, due 07/25/274 | EUR | 5,447,056 | 8,029,155 | ||||||||
Germany—0.53% | |||||||||||
| Deutsche Bundesrepublik Inflation Linked Bond 0.100%, due 04/15/264 | EUR | 2,585,110 | 3,329,652 | ||||||||
Indonesia—0.84% | |||||||||||
| Indonesia Treasury Bond 7.000%, due 05/15/22 | IDR | 18,900,000,000 | 1,281,845 | ||||||||
7.000%, due 05/15/27 | IDR | 21,040,000,000 | 1,376,778 | ||||||||
8.250%, due 07/15/21 | IDR | 37,500,000,000 | 2,655,816 | ||||||||
Total Indonesia | 5,314,439 | ||||||||||
Sweden—0.31% | |||||||||||
Sweden Government International Bond | |||||||||||
1.125%, due 03/15/194 | USD | 2,000,000 | 1,983,502 | ||||||||
| Total non-US government obligations (cost—$28,842,333) | 28,333,787 | ||||||||||
244
PACE Alternative Strategies Investments
Portfolio of investments—July 31, 2018
| Face amount | Value | ||||||||||
Certificates of deposit—3.10% | |||||||||||
Belgium—0.48% | |||||||||||
| Sumitomo Mitsui Banking Corp. 2.270%, due 09/25/18 | USD | 3,000,000 | $ | 3,000,000 | |||||||
Canada—0.48% | |||||||||||
| Bank of Montreal 2.080%, due 08/17/18 | USD | 3,000,000 | 2,999,985 | ||||||||
France—0.63% | |||||||||||
| Natixis 2.350%, due 08/01/18 | USD | 4,000,000 | 4,000,000 | ||||||||
Netherlands—0.55% | |||||||||||
| ING Bank N.V. 2.320%, due 09/20/18 | USD | 3,500,000 | 3,500,000 | ||||||||
United Arab Emirates—0.48% | |||||||||||
| National Bank of Abu Dhabi 2.380%, due 09/18/18 | USD | 3,000,000 | 3,000,981 | ||||||||
United Kingdom—0.48% | |||||||||||
| MUFG Bank Ltd. 2.100%, due 08/06/18 | USD | 3,000,000 | 3,000,000 | ||||||||
| Total certificates of deposit (cost—$19,500,000) | 19,500,966 | ||||||||||
Commercial paper—2.30% | |||||||||||
| Bank Nederlandse Gemeenten 2.115%, due 08/20/18 | USD | 2,000,000 | 1,997,780 | ||||||||
| Caisse Des Depots Etconsignat 2.200%, due 10/26/18 | USD | 2,500,000 | 2,486,937 | ||||||||
| DGZ Dekabank 2.280%, due 10/24/18 | USD | 2,500,000 | 2,486,778 | ||||||||
| Nationwide Building Society 2.270%, due 08/14/18 | USD | 4,000,000 | 3,996,740 | ||||||||
| NRW Bank 2.000%, due 08/21/18 | USD | 3,500,000 | 3,496,118 | ||||||||
| Total commercial paper (cost—$14,464,353) | 14,464,353 | ||||||||||
Time deposits—1.64% | |||||||||||
| BNP Paribas London 1.850%, due 08/01/18 | USD | 278,235 | 278,235 | ||||||||
| DBS Bank Ltd. 2.100%, due 08/23/18 | USD | 3,013,667 | 3,013,667 | ||||||||
| DZ Bank AG 1.920%, due 08/01/18 | USD | 4,020,494 | 4,020,494 | ||||||||
| KBC Bank N.V. 1.900%, due 08/01/18 | USD | 3,052,270 | 3,052,270 | ||||||||
| Total time deposits (cost—$10,364,666) | 10,364,666 | ||||||||||
Short-term US government obligations7—11.20% | |||||||||||
| US Treasury Bills 1.687%, due 08/09/18 | USD | 622,000 | 621,745 | ||||||||
1.822%, due 08/16/181 | USD | 9,504,000 | 9,496,625 | ||||||||
1.855%, due 08/23/18 | USD | 1,250,000 | 1,248,570 | ||||||||
1.873%, due 08/30/188 | USD | 859,000 | 857,687 | ||||||||
1.881%, due 09/13/181 | USD | 20,500,000 | 20,453,905 | ||||||||
1.940%, due 09/27/18 | USD | 6,668,000 | 6,648,099 | ||||||||
1.947%, due 10/04/181 | USD | 6,952,000 | 6,928,301 | ||||||||
| Face amount | Value | ||||||||||
Short-term US government obligations7—(concluded) | |||||||||||
1.990%, due 10/11/181 | USD | 14,309,000 | $ | 14,254,287 | |||||||
2.020%, due 11/08/181 | USD | 2,400,000 | 2,386,841 | ||||||||
2.033%, due 10/25/18 | USD | 5,161,000 | 5,137,116 | ||||||||
2.050%, due 12/13/18 | USD | 2,500,000 | 2,481,063 | ||||||||
| Total short-term US government obligations (cost—$70,516,113) | 70,514,239 | ||||||||||
| Number of shares | |||||||||||
Short-term investment—18.47% | |||||||||||
Investment companies—18.47% | |||||||||||
| State Street Institutional U.S. Government Money Market Fund (cost—$116,274,931) | 116,274,931 | 116,274,931 | |||||||||||||
| Number of contracts | Notional amount | ||||||||||||||
Options purchased—0.44% | |||||||||||||||
Call options—0.39% | |||||||||||||||
| ESTX Banks Index, strike @ 111, expires 09/21/18 (Counterparty: DB) | 5,024 | EUR | 557,664 | 38,529 | |||||||||||
| ESTX Banks Index, strike @ 112, expires 09/21/18 (Counterparty: BOA) | 3,456 | EUR | 387,072 | 23,662 | |||||||||||
| ESTX Banks Index, strike @ 115, expires 08/17/18 | 464 | EUR | 2,668,000 | 80,030 | |||||||||||
| ESTX Banks Index, strike @ 118, expires 09/21/18 | 2,379 | EUR | 14,036,100 | 403,373 | |||||||||||
| S&P 500 Index, strike @ 2,850, expires 12/18/20 | 28 | USD | 7,980,000 | 781,760 | |||||||||||
| S&P 500 Index, strike @ 2,900, expires 12/20/19 | 70 | USD | 20,300,000 | 1,145,900 | |||||||||||
2,473,254 | |||||||||||||||
Put options—0.05% | |||||||||||||||
| Euro STOXX 50 Index, strike @ 3,200, expires 12/20/19 | 150 | EUR | 48,000,000 | 298,009 | |||||||||||
| Ibovespa Bank Index, strike @ 70,861, expires 08/15/18 (Counterparty: BNP) | 50 | BRL | 3,543,050 | 270 | |||||||||||
| Ibovespa Bank Index, strike @ 73,673, expires 08/15/18 (Counterparty: BNP) | 29 | BRL | 2,136,517 | 711 | |||||||||||
245
PACE Alternative Strategies Investments
Portfolio of investments—July 31, 2018
| Number of contracts | Notional amount | Value | |||||||||||||
Options purchased—(concluded) | |||||||||||||||
Put options—(concluded) | |||||||||||||||
| Swiss Market Index, strike @ 8,566, expires 09/21/18 (Counterparty: DB) | 117 | CHF | 1,002,222 | $ | 3,509 | ||||||||||
302,499 | |||||||||||||||
| Total options purchased (cost—$3,075,662) | 2,775,753 | ||||||||||||||
Swaptions purchased—0.74% | |||||||||||||||
Call swaptions—0.12% | |||||||||||||||
| 3 Month USD LIBOR Interest Rate Swap, strike @ 1.000%, expires 05/09/31 (counterparty: CITI; receive fixed rate); underlying swap terminates 05/09/46 | 14,300,000 | USD | 14,300,000 | 261,214 | |||||||||||
| 3 Month USD LIBOR Interest Rate Swap, strike @ 2.870%, expires 05/17/19 (counterparty: GS; receive fixed rate); underlying swap terminates 05/21/21 | 83,004,000 | USD | 83,004,000 | 200,654 | |||||||||||
| 3 Month USD LIBOR Interest Rate Swap, strike @ 1.000%, expires 05/31/33 (counterparty: GS; receive fixed rate); underlying swap terminates 06/02/48 | 9,200,000 | USD | 9,200,000 | 281,966 | |||||||||||
743,834 | |||||||||||||||
Put swaptions—0.62% | |||||||||||||||
| 3 Month USD LIBOR Interest Rate Swap, strike @ 3.850%, expires 05/09/31 (counterparty: CITI; receive fixed rate); underlying swap terminates 05/09/46 | 32,700,000 | USD | 32,700,000 | 1,404,370 | |||||||||||
| 3 Month USD LIBOR Interest Rate Swap, strike @ 3.850%, expires 05/31/33 (counterparty: GS; receive fixed rate); underlying swap terminates 06/02/48 | 14,400,000 | USD | 14,400,000 | 881,809 | |||||||||||
| Number of contracts | Notional amount | Value | |||||||||||||
Swaptions purchased—(concluded) | |||||||||||||||
Put swaptions—(concluded) | |||||||||||||||
| 6 Month USD LIBOR Interest Rate Swap, strike @ 0.983%, expires 06/21/28 (counterparty: GS; receive fixed rate); underlying swap terminates 06/23/38 | 4,000,000,000 | JPY | 4,000,000,000 | $ | 1,638,253 | ||||||||||
3,924,432 | |||||||||||||||
| Total swaptions purchased (cost—$5,347,920) | 4,668,266 | ||||||||||||||
Foreign exchange options purchased—0.06% | |||||||||||||||
Call option—0.00%† | |||||||||||||||
| USD Call/SAR Put, strike @ 3.82, expires 02/12/19 (Counterparty: BNP) | 16,350,000 | USD | 16,350,000 | 19,587 | |||||||||||
Put options—0.06% | |||||||||||||||
| EUR Put/USD Call, Strike @ 1.23, expires 04/03/19 (Counterparty: DB) | 5,100,000 | EUR | 5,100,000 | 251,930 | |||||||||||
| EUR Put/CHF Call, strike @ 1.16, expires 10/05/18 (Counterparty: CITI) | 15,568,660 | EUR | 15,568,660 | 126,763 | |||||||||||
| USD Put/TRY Call, strike @ 3.80, expires 06/19/19 (Counterparty: CITI) | 1,004,465 | USD | 1,004,465 | 25 | |||||||||||
| USD Put/TRY Call, strike @ 3.80, expires 06/27/19 (Counterparty: CITI) | 500,000 | USD | 500,000 | 12 | |||||||||||
| USD Put/TRY Call, strike @ 3.80, expires 07/10/19 (Counterparty: CITI) | 1,006,696 | USD | 1,006,696 | 23 | |||||||||||
| USD Put/TRY Call, strike @ 3.80, expires 07/17/19 (Counterparty: CITI) | 502,232 | USD | 502,232 | 12 | |||||||||||
| USD Put/TRY Call, strike @ 3.90, expires 03/21/19 (Counterparty: JPMCB) | 5,645,000 | USD | 5,645,000 | 282 | |||||||||||
| USD Put/TRY Call, strike @ 3.90, expires 04/05/19 (Counterparty: JPMCB) | 3,878,000 | USD | 3,878,000 | 213 | |||||||||||
246
PACE Alternative Strategies Investments
Portfolio of investments—July 31, 2018
| Number of contracts | Notional amount | Value | |||||||||||||
Foreign exchange options purchased—(concluded) | |||||||||||||||
Put options—(concluded) | |||||||||||||||
| USD Put/TRY Call, strike @ 4.00, expires 03/08/19 (Counterparty: BNP) | 5,685,000 | USD | 5,685,000 | $ | 563 | ||||||||||
| USD Put/TRY Call, strike @ 4.00, expires 05/04/20 (Counterparty: CITI) | 500,000 | USD | 500,000 | 124 | |||||||||||
| USD Put/TRY Call, strike @ 4.00, expires 06/04/20 (Counterparty: CITI) | 1,005,000 | USD | 1,005,000 | 274 | |||||||||||
380,221 | |||||||||||||||
| Total foreign exchange options purchased (cost—$1,436,632) | 399,808 | ||||||||||||||
| Total investments before investments sold short (cost—$652,643,625)—105.76% | 665,895,096 | ||||||||||||||
| Number of shares | |||||||||||
Investments sold short—(15.14)% | |||||||||||
Common stocks—(11.05)% | |||||||||||
Australia—(0.04)% | |||||||||||
BHP Billiton Ltd., ADR | (5,108 | ) | (266,944 | ) | |||||||
Canada—(3.43)% | |||||||||||
AltaGas Ltd. | (38,180 | ) | (776,896 | ) | |||||||
CAE, Inc. | (12,600 | ) | (262,490 | ) | |||||||
Canaccord Genuity Group, Inc. | (91,980 | ) | (511,923 | ) | |||||||
Canadian National Railway Co. | (5,951 | ) | (531,214 | ) | |||||||
Canadian Utilities Ltd., Class A | (14,935 | ) | (372,557 | ) | |||||||
Canfor Corp. | (8,590 | ) | (188,328 | ) | |||||||
Cenovus Energy, Inc. | (68,230 | ) | (684,477 | ) | |||||||
CI Financial Corp. | (33,952 | ) | (593,250 | ) | |||||||
Cineplex, Inc. | (32,970 | ) | (740,580 | ) | |||||||
Conifex Timber, Inc. | (17,610 | ) | (65,520 | ) | |||||||
DHX Media Ltd. | (66,439 | ) | (133,813 | ) | |||||||
Emera, Inc. | (13,672 | ) | (442,999 | ) | |||||||
First Quantum Minerals Ltd. | (65,500 | ) | (1,021,636 | ) | |||||||
Gildan Activewear, Inc. | (17,110 | ) | (440,755 | ) | |||||||
Gluskin Sheff + Associates, Inc. | (14,490 | ) | (187,133 | ) | |||||||
Goldcorp, Inc. | (90,300 | ) | (1,128,707 | ) | |||||||
Hydro One Ltd. | (44,877 | ) | (655,466 | ) | |||||||
IGM Financial, Inc. | (13,786 | ) | (413,840 | ) | |||||||
Imperial Oil Ltd. | (28,920 | ) | (990,419 | ) | |||||||
Inter Pipeline Ltd. | (19,020 | ) | (362,606 | ) | |||||||
Just Energy Group, Inc. | (68,310 | ) | (258,358 | ) | |||||||
Leon's Furniture Ltd. | (20,247 | ) | (284,674 | ) | |||||||
Magna International, Inc. | (3,460 | ) | (210,762 | ) | |||||||
Maple Leaf Foods, Inc. | (22,840 | ) | (546,924 | ) | |||||||
Medical Facilities Corp. | (42,306 | ) | (474,818 | ) | |||||||
| Number of shares | Value | ||||||||||
Investments sold short—(continued) | |||||||||||
Common stocks—(continued) | |||||||||||
Canada—(concluded) | |||||||||||
MTY Food Group, Inc. | (10,250 | ) | $ | (439,989 | ) | ||||||
National Bank of Canada | (13,580 | ) | (665,716 | ) | |||||||
Norbord, Inc. | (17,110 | ) | (615,557 | ) | |||||||
Novagold Resources, Inc. | (61,752 | ) | (266,309 | ) | |||||||
Nutrien Ltd. | (50,200 | ) | (2,726,394 | ) | |||||||
Paramount Resources Ltd., Class A | (17,200 | ) | (193,043 | ) | |||||||
Richelieu Hardware Ltd. | (5,130 | ) | (111,012 | ) | |||||||
Ritchie Bros Auctioneers, Inc. | (26,120 | ) | (868,826 | ) | |||||||
Saputo, Inc. | (5,140 | ) | (171,366 | ) | |||||||
ShawCor Ltd. | (16,260 | ) | (331,237 | ) | |||||||
Shopify, Inc., Class A | (1,000 | ) | (139,309 | ) | |||||||
Sleep Country Canada Holdings, Inc. | (10,225 | ) | (243,039 | ) | |||||||
Sprott, Inc. | (92,250 | ) | (213,455 | ) | |||||||
Stantec, Inc. | (18,280 | ) | (477,358 | ) | |||||||
Stella-Jones, Inc. | (11,316 | ) | (377,968 | ) | |||||||
Thomson Reuters Corp. | (6,865 | ) | (284,870 | ) | |||||||
TransCanada Corp. | (10,490 | ) | (471,822 | ) | |||||||
Turquoise Hill Resources Ltd. | (17,200 | ) | (47,732 | ) | |||||||
WestJet Airlines Ltd. | (49,143 | ) | (692,086 | ) | |||||||
International Petroleum Corp. | (1 | ) | (7 | ) | |||||||
Total Canada common stocks | (21,617,240 | ) | |||||||||
Denmark—(0.08)% | |||||||||||
AP Moller—Maersk A/S, Class B | (377 | ) | (542,024 | ) | |||||||
Germany—(0.05)% | |||||||||||
thyssenkrupp AG | (11,636 | ) | (310,502 | ) | |||||||
Ireland—(0.54)% | |||||||||||
Accenture PLC, Class A | (7,901 | ) | (1,258,866 | ) | |||||||
Adient PLC | (3,990 | ) | (190,044 | ) | |||||||
Alkermes PLC | (1,148 | ) | (50,340 | ) | |||||||
Allergan PLC | (10,204 | ) | (1,878,454 | ) | |||||||
Total Ireland common stocks | (3,377,704 | ) | |||||||||
Japan—(0.09)% | |||||||||||
SoftBank Group Corp. | (6,600 | ) | (546,581 | ) | |||||||
Luxembourg—(0.14)% | |||||||||||
Tenaris SA | (47,255 | ) | (863,677 | ) | |||||||
Netherlands—(0.02)% | |||||||||||
Mylan N.V. | (3,681 | ) | (137,338 | ) | |||||||
Sweden—(0.03)% | |||||||||||
Electrolux AB, Series B | (7,606 | ) | (178,538 | ) | |||||||
Switzerland—(0.01)% | |||||||||||
LafargeHolcim Ltd. | (922 | ) | (47,155 | ) | |||||||
United Kingdom—(0.19)% | |||||||||||
John Wood Group PLC | (10,499 | ) | (89,545 | ) | |||||||
Melrose Industries PLC | (367,298 | ) | (1,040,847 | ) | |||||||
Ocado Group PLC | (3,556 | ) | (51,622 | ) | |||||||
Total United Kingdom common stocks | (1,182,014 | ) | |||||||||
247
PACE Alternative Strategies Investments
Portfolio of investments—July 31, 2018
| Number of shares | Value | ||||||||||
Investments sold short—(continued) | |||||||||||
Common stocks—(continued) | |||||||||||
United States—(6.43)% | |||||||||||
Domtar Corp. | (16,230 | ) | $ | (782,648 | ) | ||||||
Acushnet Holdings Corp. | (522 | ) | (12,617 | ) | |||||||
Alnylam Pharmaceuticals, Inc. | (13,510 | ) | (1,283,450 | ) | |||||||
AMC Entertainment Holdings, Inc., Class A | (16,622 | ) | (270,939 | ) | |||||||
AMC Networks, Inc., Class A | (3,374 | ) | (203,418 | ) | |||||||
Amgen, Inc. | (3,660 | ) | (719,373 | ) | |||||||
Armstrong World Industries, Inc. | (5,760 | ) | (391,104 | ) | |||||||
AT&T, Inc. | (3,400 | ) | (108,698 | ) | |||||||
Autodesk, Inc. | (11,020 | ) | (1,415,409 | ) | |||||||
Axon Enterprise, Inc. | (2,424 | ) | (164,662 | ) | |||||||
BioMarin Pharmaceutical, Inc. | (21,642 | ) | (2,176,320 | ) | |||||||
BlueLinx Holdings, Inc. | (3,380 | ) | (115,157 | ) | |||||||
Brinker International, Inc. | (6,224 | ) | (293,586 | ) | |||||||
Callaway Golf Co. | (13,022 | ) | (250,543 | ) | |||||||
CarMax, Inc. | (3,460 | ) | (258,393 | ) | |||||||
Caterpillar, Inc. | (5,130 | ) | (737,694 | ) | |||||||
CenturyLink, Inc. | (51,929 | ) | (974,707 | ) | |||||||
Charter Communications, Inc., Class A | (190 | ) | (57,870 | ) | |||||||
Choice Hotels International, Inc. | (4,554 | ) | (353,390 | ) | |||||||
Cloudera, Inc. | (14,837 | ) | (198,667 | ) | |||||||
Cognex Corp. | (5,769 | ) | (304,488 | ) | |||||||
Cracker Barrel Old Country Store, Inc. | (1,142 | ) | (167,297 | ) | |||||||
Cree, Inc. | (7,082 | ) | (333,916 | ) | |||||||
Crocs, Inc. | (13,760 | ) | (249,194 | ) | |||||||
D.R. Horton, Inc. | (10,080 | ) | (440,496 | ) | |||||||
Delek US Holdings, Inc. | (5,323 | ) | (283,822 | ) | |||||||
Devon Energy Corp. | (38,493 | ) | (1,732,570 | ) | |||||||
Dycom Industries, Inc. | (1,186 | ) | (105,744 | ) | |||||||
Eli Lilly & Co. | (8,112 | ) | (801,547 | ) | |||||||
Ennis, Inc. | (12,520 | ) | (272,310 | ) | |||||||
EQT Corp. | (21,522 | ) | (1,069,213 | ) | |||||||
Equity Residential | (5,187 | ) | (339,385 | ) | |||||||
Evercore, Inc., Class A | (3,515 | ) | (397,195 | ) | |||||||
Exxon Mobil Corp. | (8,027 | ) | (654,281 | ) | |||||||
FactSet Research Systems, Inc. | (1,670 | ) | (336,271 | ) | |||||||
Federated Investors, Inc., Class B | (20,680 | ) | (500,456 | ) | |||||||
Franklin Resources, Inc. | (21,468 | ) | (736,782 | ) | |||||||
General Electric Co. | (145,159 | ) | (1,978,517 | ) | |||||||
GoPro, Inc., Class A | (25,094 | ) | (146,549 | ) | |||||||
Hawaiian Holdings, Inc. | (8,275 | ) | (331,827 | ) | |||||||
Hortonworks, Inc. | (9,568 | ) | (166,675 | ) | |||||||
Incyte Corp. | (10,344 | ) | (688,290 | ) | |||||||
Insteel Industries, Inc. | 6,059 | ) | (249,207 | ) | |||||||
iRhythm Technologies, Inc. | (2,418 | ) | (182,680 | ) | |||||||
j2 Global, Inc. | (1,188 | ) | (100,790 | ) | |||||||
Kansas City Southern | (1,710 | ) | (198,822 | ) | |||||||
KB Home | (18,860 | ) | (447,925 | ) | |||||||
KEMET Corp. | (2,233 | ) | (58,218 | ) | |||||||
Kimberly-Clark Corp. | (5,970 | ) | (679,744 | ) | |||||||
Korn/Ferry International | (2,409 | ) | (158,946 | ) | |||||||
Lam Research Corp. | (1,744 | ) | (332,303 | ) | |||||||
Legg Mason, Inc. | (10,260 | ) | (350,174 | ) | |||||||
Live Nation Entertainment, Inc. | (9,103 | ) | (448,596 | ) | |||||||
| Number of shares | Value | ||||||||||
Investments sold short—(continued) | |||||||||||
Common stocks—(continued) | |||||||||||
United States—(concluded) | |||||||||||
MercadoLibre, Inc. | (1,366 | ) | $ | (468,415 | ) | ||||||
Meritage Homes Corp. | (5,410 | ) | (233,441 | ) | |||||||
Moelis & Co., Class A | (7,006 | ) | (445,582 | ) | |||||||
Movado Group, Inc. | (3,547 | ) | (176,641 | ) | |||||||
MSG Networks, Inc., Class A | (9,930 | ) | (233,851 | ) | |||||||
Nasdaq, Inc. | (5,575 | ) | (509,555 | ) | |||||||
Nektar Therapeutics | (16,239 | ) | (854,171 | ) | |||||||
Neogen Corp. | (1,536 | ) | (126,566 | ) | |||||||
NETGEAR, Inc. | (4,854 | ) | (319,636 | ) | |||||||
Nordstrom, Inc. | (1,700 | ) | (89,097 | ) | |||||||
PetMed Express, Inc. | (6,868 | ) | (255,009 | ) | |||||||
Quotient Technology, Inc. | (14,078 | ) | (207,650 | ) | |||||||
SBA Communications Corp. | (332 | ) | (52,539 | ) | |||||||
Seattle Genetics, Inc. | (28,798 | ) | (2,027,379 | ) | |||||||
SiteOne Landscape Supply, Inc. | (3,350 | ) | (298,686 | ) | |||||||
TD Ameritrade Holding Corp. | (8,588 | ) | (490,804 | ) | |||||||
Teradyne, Inc. | (8,374 | ) | (362,175 | ) | |||||||
Tesla, Inc. | (2,206 | ) | (657,697 | ) | |||||||
The Charles Schwab Corp. | (17,619 | ) | (899,626 | ) | |||||||
The Cheesecake Factory, Inc. | (3,563 | ) | (199,635 | ) | |||||||
The Hershey Co. | (1,967 | ) | (193,179 | ) | |||||||
The Meet Group, Inc. | (14,064 | ) | (57,100 | ) | |||||||
The New York Times Co., Class A | (14,931 | ) | (370,289 | ) | |||||||
The Williams Cos., Inc. | (33,437 | ) | (994,751 | ) | |||||||
Under Armour, Inc., Class C | (16,350 | ) | (306,399 | ) | |||||||
Urban Outfitters, Inc. | (2,554 | ) | (113,398 | ) | |||||||
Vishay Intertechnology, Inc. | (2,830 | ) | (70,934 | ) | |||||||
Visteon Corp. | (1,960 | ) | (229,477 | ) | |||||||
WalMart, Inc. | (10,095 | ) | (900,777 | ) | |||||||
WD-40 Co. | (1,085 | ) | (173,763 | ) | |||||||
Weyerhaeuser Co. | (8,640 | ) | (295,315 | ) | |||||||
Whirlpool Corp. | (2,040 | ) | (267,444 | ) | |||||||
Zayo Group Holdings, Inc. | (43,803 | ) | (1,624,653 | ) | |||||||
Total United States common stocks | (40,518,509 | ) | |||||||||
| Total common stocks (proceeds—$67,371,989) | (69,588,226 | ) | |||||||||
Investment companies—(4.09)% | |||||||||||
| Consumer Discretionary Select Sector SPDR Fund | 12,194 | ) | (1,356,826 | ) | |||||||
Industrial Select Sector SPDR Fund | (16,274 | ) | (1,251,796 | ) | |||||||
| Invesco CurrencyShares Japanese Yen Trust | (6,926 | ) | (592,727 | ) | |||||||
Invesco QQQ Trust, Series 1 | (8,599 | ) | (1,517,294 | ) | |||||||
| iShares Core S&P/TSX Capped Composite Index ETF | (120,695 | ) | (2,421,601 | ) | |||||||
| iShares iBoxx $ Investment Grade Corporate Bond ETF | (7,741 | ) | (896,098 | ) | |||||||
iShares Russell 1000 ETF | (17,901 | ) | (2,801,864 | ) | |||||||
iShares Russell 2000 ETF | (9,426 | ) | (1,563,491 | ) | |||||||
iShares S&P/TSX 60 Index ETF | (119,276 | ) | (2,258,345 | ) | |||||||
| SPDR Bloomberg Barclays High Yield Bond ETF | (34,266 | ) | (1,231,520 | ) | |||||||
248
PACE Alternative Strategies Investments
Portfolio of investments—July 31, 2018
| Number of shares | Value | ||||||||||
Investments sold short—(concluded) | |||||||||||
Investment companies—(concluded) | |||||||||||
| SPDR Dow Jones Industrial Average ETF Trust | (2,200 | ) | $ | (559,174 | ) | ||||||
SPDR S&P 500 ETF Trust | (24,516 | ) | (6,897,086 | ) | |||||||
Technology Select Sector SPDR Fund | (33,238 | ) | (2,357,239 | ) | |||||||
| Total investment companies (proceeds—$22,558,981) | (25,705,061 | ) | |||||||||
| Number of shares | Value | ||||||||||
| Total investments sold short (proceeds—$89,930,970) | (95,293,287 | ) | |||||||||
Other assets in excess of liabilities—9.38% | 59,028,929 | ||||||||||
Net assets—100.00% | $ | 629,630,738 | |||||||||
For a listing of defined portfolio acronyms, counterparty acronyms and currency abbreviations that are used throughout the Portfolio of investments as well as the tables that follow, please refer to page 273.
Options written
| Notional amount | Number of contracts | Call options | Counterparty | Expiration date | Premiums received | Current value | Unrealized appreciation (depreciation) | ||||||||||||||||||||||||
EUR | 14,274,000 | 2,379 | ESTX Banks Index, strike @ 120 | JPMCB | 09/21/18 | $ | 207,919 | $ | (257,324 | ) | $ | (49,405 | ) | ||||||||||||||||||
EUR | 1,079,262 | 306 | Euro STOXX 50 Index, strike @ 3,527 | BB | 08/31/18 | 14,313 | (14,313 | ) | — | ||||||||||||||||||||||
BRL | 2,136,517 | 29 | Ibovespa Bank Index, strike @ 73,673 | BNP | 08/15/18 | 21,506 | (44,902 | ) | (23,396 | ) | |||||||||||||||||||||
BRL | 3,543,050 | 50 | Ibovespa Bank Index, strike @ 70,861 | BNP | 08/15/18 | 32,776 | (113,810 | ) | (81,034 | ) | |||||||||||||||||||||
KRW | 938,520,000 | 3,160,000 | Kospi 200 Index, strike @ 297 | DB | 08/31/18 | 11,313 | (11,313 | ) | — | ||||||||||||||||||||||
JPY | 93,150,000 | 4,140 | Nikkei 225 Index, strike @ 22,500 | DB | 08/31/18 | 12,292 | (12,292 | ) | — | ||||||||||||||||||||||
AUD | 571,480 | 91 | S&P 200 Index, strike @ 6,280 | BNP | 08/31/18 | 3,015 | (3,015 | ) | — | ||||||||||||||||||||||
USD | 2,103,552 | 747 | S&P 500 Index, strike @ 2,816 | BNP | 08/31/18 | 23,457 | (23,457 | ) | — | ||||||||||||||||||||||
CHF | 412,875 | 45 | Swiss Market Index, strike @ 9,175 | BNP | 08/31/18 | 4,552 | (4,552 | ) | — | ||||||||||||||||||||||
CHF | 1,002,222 | 117 | Swiss Market Index, strike @ 8,566 | DB | 09/21/18 | 24,345 | (73,119 | ) | (48,774 | ) | |||||||||||||||||||||
$ | 355,488 | $ | (558,097 | ) | $ | (202,609 | ) | ||||||||||||||||||||||||
Put options | |||||||||||||||||||||||||||||||
EUR | 2,668,000 | 464 | ESTX Banks Index, strike @ 115 | JPMCB | 08/17/18 | $ | 122,387 | $ | (32,555 | ) | $ | 89,832 | |||||||||||||||||||
EUR | 2,610,300 | 462 | ESTX Banks Index, strike @ 113 | JPMCB | 09/21/18 | 102,790 | (45,921 | ) | 56,869 | ||||||||||||||||||||||
EUR | 557,664 | 5,024 | ESTX Banks Index, strike @ 111 | DB | 09/21/18 | 29,557 | (8,875 | ) | 20,682 | ||||||||||||||||||||||
EUR | 387,072 | 3,456 | ESTX Banks Index, strike @ 112 | BOA | 09/21/18 | 22,429 | (7,117 | ) | 15,312 | ||||||||||||||||||||||
EUR | 1,079,262 | 306 | Euro STOXX 50 Index, strike @ 3,527 | BB | 08/31/18 | 15,301 | (15,301 | ) | — | ||||||||||||||||||||||
KRW | 938,520,000 | 3,160,000 | Kospi 200 Index, strike @ 297 | DB | 08/31/18 | 11,281 | (11,281 | ) | — | ||||||||||||||||||||||
JPY | 93,150,000 | 4,140 | Nikkei 225 Index, strike @ 22,500 | DB | 08/31/18 | 13,329 | (13,329 | ) | — | ||||||||||||||||||||||
AUD | 571,480 | 91 | S&P 200 Index, strike @ 6,280 | BNP | 08/31/18 | 5,882 | (5,882 | ) | — | ||||||||||||||||||||||
249
PACE Alternative Strategies Investments
Portfolio of investments—July 31, 2018
Options written—(concluded)
| Notional amount | Number of contracts | Put options | Counterparty | Expiration date | Premiums received | Current value | Unrealized appreciation (depreciation) | ||||||||||||||||||||||||
USD | 2,103,552 | 747 | S&P 500 Index, strike @ 2,816 | BNP | 08/31/18 | $ | 23,457 | $ | (23,457 | ) | $ | — | |||||||||||||||||||
CHF | 412,875 | 45 | Swiss Market Index, strike @ 9,175 | BNP | 08/31/18 | 4,884 | (4,884 | ) | — | ||||||||||||||||||||||
$ | 351,297 | $ | (168,602 | ) | $ | 182,695 | |||||||||||||||||||||||||
$ | 706,785 | $ | (726,699 | ) | $ | (19,914 | ) | ||||||||||||||||||||||||
Swaptions written
| Notional amount (000) | Number of contracts | Call swaptions | Counterparty | Pay/ receive floating rate | Expiration date | Premiums received | Current value | Unrealized depreciation | |||||||||||||||||||||||||||
USD | 18,549 | 18,549,000 | 3 Month USD LIBOR Interest Rate Swap, strike @ 2.860%, terminates 05/21/29 | GS | Receive | 05/17/19 | $ | 203,270 | $ | (218,189 | ) | $ | (14,919 | ) | |||||||||||||||||||||
Foreign exchange options written
| Notional amount (000) | Number of contracts | Call options | Counterparty | Expiration date | Premiums received | Current value | Unrealized appreciation | ||||||||||||||||||||||||
EUR | 510 | 510,000 | EUR Call/USD Put, strike @ 1.33 | DB | 04/03/19 | $ | 7,868 | $ | (729 | ) | $ | 7,139 | |||||||||||||||||||
EUR | 585 | 585,225 | EUR Call/USD Put, strike @ 1.33 | DB | 04/03/19 | 8,990 | (837 | ) | 8,153 | ||||||||||||||||||||||
EUR | 689 | 688,500 | EUR Call/USD Put, strike @ 1.33 | DB | 04/03/19 | 9,798 | (985 | ) | 8,813 | ||||||||||||||||||||||
EUR | 630 | 630,000 | EUR Call/USD Put, strike @ 1.33 | DB | 04/03/19 | 8,547 | (901 | ) | 7,646 | ||||||||||||||||||||||
EUR | 516 | 516,275 | EUR Call/USD Put, strike @ 1.33 | DB | 04/03/19 | 7,347 | (738 | ) | 6,609 | ||||||||||||||||||||||
EUR | 630 | 630,000 | EUR Call/USD Put, strike @ 1.33 | DB | 04/03/19 | 9,217 | (901 | ) | 8,316 | ||||||||||||||||||||||
EUR | 755 | 755,000 | EUR Call/USD Put, strike @ 1.33 | DB | 04/03/19 | 9,539 | (1,079 | ) | 8,460 | ||||||||||||||||||||||
EUR | 785 | 785,000 | EUR Call/USD Put, strike @ 1.33 | DB | 04/03/19 | 10,806 | (1,123 | ) | 9,683 | ||||||||||||||||||||||
$ | 72,112 | $ | (7,293 | ) | $ | 64,819 | |||||||||||||||||||||||||
Futures contracts
| Number of contracts | Currency | Expiration date | Current notional amount | Value | Unrealized appreciation (depreciation) | ||||||||||||||||||||||
Index futures buy contracts: | |||||||||||||||||||||||||||
10 | AUD | ASX SPI 200 Index Futures | September 2018 | $ | 1,135,411 | $ | 1,154,916 | $ | 19,505 | ||||||||||||||||||
6 | CAD | S&P TSX 60 Index Futures | September 2018 | 884,821 | 902,548 | 17,727 | |||||||||||||||||||||
2 | EUR | Amsterdam Index Futures | August 2018 | 261,230 | 267,126 | 5,896 | |||||||||||||||||||||
20 | EUR | CAC 40 Index Futures | August 2018 | 1,266,147 | 1,288,624 | 22,477 | |||||||||||||||||||||
250
PACE Alternative Strategies Investments
Portfolio of investments—July 31, 2018
Futures contracts—(continued)
| Number of contracts | Currency | Expiration date | Current notional amount | Value | Unrealized appreciation (depreciation) | ||||||||||||||||||||||
Index futures buy contracts—(concluded) | |||||||||||||||||||||||||||
39 | EUR | EURO STOXX 50 Index Futures | September 2018 | $ | 1,575,315 | $ | 1,607,564 | $ | 32,249 | ||||||||||||||||||
68 | GBP | FTSE 100 Index Futures | September 2018 | 6,812,277 | 6,875,187 | 62,910 | |||||||||||||||||||||
21 | JPY | NIKKEI 225 Index Futures | September 2018 | 4,189,210 | 4,225,730 | 36,520 | |||||||||||||||||||||
43 | JPY | TOPIX Index Futures | September 2018 | 6,815,450 | 6,722,175 | (93,275 | ) | ||||||||||||||||||||
34 | SEK | OMX 30 Index Futures | August 2018 | 604,998 | 625,541 | 20,543 | |||||||||||||||||||||
1 | TWD | Taiex Futures Index Futures* | August 2018 | 69,756 | 71,797 | 2,041 | |||||||||||||||||||||
5 | USD | Dow Jones E-Mini Index Futures | September 2018 | 635,074 | 634,875 | (199 | ) | ||||||||||||||||||||
92 | USD | MSCI Emerging Markets E-Mini Index Futures | September 2018 | 5,196,610 | 5,042,980 | (153,630 | ) | ||||||||||||||||||||
21 | USD | NASDAQ 100 E-Mini Index Futures | September 2018 | 3,047,648 | 3,042,795 | (4,853 | ) | ||||||||||||||||||||
41 | USD | Russell 2000 Mini Index Futures | September 2018 | 3,451,313 | 3,428,420 | (22,893 | ) | ||||||||||||||||||||
46 | USD | S&P 500 E-Mini Index Futures | September 2018 | 6,397,695 | 6,479,330 | 81,635 | |||||||||||||||||||||
17 | USD | S&P Midcap 400 E-Mini Index Futures | September 2018 | 3,395,765 | 3,376,200 | (19,565 | ) | ||||||||||||||||||||
37 | USD | XAF Financial Index Futures | September 2018 | 3,190,942 | 3,182,925 | (8,017 | ) | ||||||||||||||||||||
Interest rate futures buy contracts: | |||||||||||||||||||||||||||
84 | AUD | Australian Bond 3 Year Futures | September 2018 | 6,922,324 | 6,942,924 | 20,600 | |||||||||||||||||||||
3 | CHF | 3 month Euroswiss Interest Rate Futures | December 2018 | 763,042 | 763,066 | 24 | |||||||||||||||||||||
2 | CHF | 3 month Euroswiss Interest Rate Futures | March 2019 | 508,561 | 508,610 | 49 | |||||||||||||||||||||
1 | CHF | 3 month Euroswiss Interest Rate Futures | June 2019 | 254,003 | 254,179 | 176 | |||||||||||||||||||||
20 | EUR | 3 Month EURIBOR Futures | June 2019 | 5,862,101 | 5,861,366 | (735 | ) | ||||||||||||||||||||
25 | EUR | 3 Month EURIBOR Futures | September 2019 | 7,317,426 | 7,321,227 | 3,801 | |||||||||||||||||||||
19 | EUR | 3 Month EURIBOR Futures | December 2019 | 5,555,653 | 5,559,411 | 3,758 | |||||||||||||||||||||
18 | EUR | 3 Month EURIBOR Futures | March 2020 | 5,258,767 | 5,262,075 | 3,308 | |||||||||||||||||||||
15 | EUR | 3 Month EURIBOR Futures | June 2020 | 4,380,606 | 4,381,116 | 510 | |||||||||||||||||||||
27 | EUR | German Euro BOBL Futures | September 2018 | 4,160,235 | 4,155,250 | (4,985 | ) | ||||||||||||||||||||
86 | EUR | German Euro BOBL Futures* | September 2018 | 13,304,006 | 13,235,240 | (68,766 | ) | ||||||||||||||||||||
39 | EUR | German Euro Bund Futures | September 2018 | 7,389,045 | 7,368,799 | (20,246 | ) | ||||||||||||||||||||
76 | EUR | German Euro Bund Futures* | September 2018 | 14,458,547 | 14,359,711 | (98,836 | ) | ||||||||||||||||||||
23 | EUR | Mid-Term Euro-OAT Futures* | September 2018 | 4,139,938 | 4,134,576 | (5,362 | ) | ||||||||||||||||||||
3 | GBP | 90-Day Sterling Pound Futures | March 2019 | 487,634 | 487,235 | (399 | ) | ||||||||||||||||||||
2 | GBP | 90-Day Sterling Pound Futures | June 2019 | 324,949 | 324,593 | (356 | ) | ||||||||||||||||||||
1 | GBP | 90-Day Sterling Pound Futures | March 2020 | 162,220 | 162,001 | (219 | ) | ||||||||||||||||||||
1 | GBP | United Kingdom Long Gilt Bond Futures* | September 2018 | 163,059 | 161,024 | (2,035 | ) | ||||||||||||||||||||
90 | GBP | United Kingdom Long Gilt Bond Futures | September 2018 | 14,325,770 | 14,492,121 | 166,351 | |||||||||||||||||||||
$ | 144,667,548 | $ | 144,663,257 | $ | (4,291 | ) | |||||||||||||||||||||
US Treasury futures sell contracts: | |||||||||||||||||||||||||||
2 | USD | Ultra Long US Treasury Bond Futures | September 2018 | (315,183 | ) | (313,812 | ) | 1,371 | |||||||||||||||||||
96 | USD | US Long Bond Futures | September 2018 | (13,837,305 | ) | (13,725,000 | ) | 112,305 | |||||||||||||||||||
2 | USD | US Long Bond Futures* | September 2018 | (285,065 | ) | (285,938 | ) | (873 | ) | ||||||||||||||||||
41 | USD | US Treasury Note 10 Year Futures | September 2018 | (4,897,537 | ) | (4,896,297 | ) | 1,240 | |||||||||||||||||||
81 | USD | US Treasury Note 10 Year Futures* | September 2018 | (9,677,733 | ) | (9,673,172 | ) | 4,561 | |||||||||||||||||||
89 | USD | US Treasury Note 2 Year Futures* | September 2018 | (18,835,448 | ) | (18,812,375 | ) | 23,073 | |||||||||||||||||||
46 | USD | US Treasury Note 5 Year Futures | September 2018 | (5,201,910 | ) | (5,203,750 | ) | (1,840 | ) | ||||||||||||||||||
222 | USD | US Treasury Note 5 Year Futures* | September 2018 | (25,096,692 | ) | (25,113,750 | ) | (17,058 | ) | ||||||||||||||||||
251
PACE Alternative Strategies Investments
Portfolio of investments—July 31, 2018
Futures contracts—(concluded)
| Number of contracts | Currency | Expiration date | Current notional amount | Value | Unrealized appreciation (depreciation) | ||||||||||||||||||||||
Index futures sell contracts: | |||||||||||||||||||||||||||
9 | AUD | ASX SPI 200 Index Futures | September 2018 | $ | (1,014,981 | ) | $ | (1,039,424 | ) | $ | (24,443 | ) | |||||||||||||||
116 | EUR | EURO STOXX 50 Index Futures | September 2018 | (4,708,624 | ) | (4,781,472 | ) | (72,848 | ) | ||||||||||||||||||
1 | EUR | FTSE MIB Index Futures | September 2018 | (126,932 | ) | (129,716 | ) | (2,784 | ) | ||||||||||||||||||
2 | EUR | IBEX 35 Index Futures | August 2018 | (229,142 | ) | (230,984 | ) | (1,842 | ) | ||||||||||||||||||
26 | GBP | FTSE 100 Index Futures | September 2018 | (2,606,440 | ) | (2,628,748 | ) | (22,308 | ) | ||||||||||||||||||
2 | HKD | Hang Seng Index Futures | August 2018 | (368,352 | ) | (362,210 | ) | 6,142 | |||||||||||||||||||
6 | HKD | Hang Seng Index Futures | August 2018 | (421,266 | ) | (420,624 | ) | 642 | |||||||||||||||||||
11 | HKD | Hang Seng Index Futures*** | August 2018 | (773,569 | ) | (771,144 | ) | 2,425 | |||||||||||||||||||
22 | KRW | Kospi 200 Index Futures | September 2018 | (1,474,250 | ) | (1,464,913 | ) | 9,337 | |||||||||||||||||||
30 | SEK | OMX 30 Index Futures | August 2018 | (531,271 | ) | (551,948 | ) | (20,677 | ) | ||||||||||||||||||
2 | SGD | MSCI Singapore Index Future | August 2018 | (54,144 | ) | (54,196 | ) | (52 | ) | ||||||||||||||||||
14 | USD | Mini MSCI Emerging Markets (EM) Index Futures | September 2018 | (744,649 | ) | (767,410 | ) | (22,761 | ) | ||||||||||||||||||
2 | USD | MSCI Taiwan Index Futures** | August 2018 | (80,798 | ) | (81,560 | ) | (762 | ) | ||||||||||||||||||
148 | USD | Russell 2000 Mini Index Futures | September 2018 | (12,414,061 | ) | (12,375,760 | ) | 38,301 | |||||||||||||||||||
67 | USD | S&P 500 E-Mini Index Futures | September 2018 | (9,303,285 | ) | (9,437,285 | ) | (134,000 | ) | ||||||||||||||||||
22 | USD | SGX FTSE China A50 Index Futures | August 2018 | (260,323 | ) | (258,665 | ) | 1,658 | |||||||||||||||||||
2 | USD | SGX FTSE China A50 Index Futures** | August 2018 | (23,628 | ) | (23,515 | ) | 113 | |||||||||||||||||||
Interest rate futures sell contracts: | |||||||||||||||||||||||||||
8 | CAD | Canadian Bankers Acceptance Futures | March 2019 | (1,502,151 | ) | (1,500,941 | ) | 1,210 | |||||||||||||||||||
81 | EUR | German Euro BOBL Futures | September 2018 | (12,465,853 | ) | (12,465,750 | ) | 103 | |||||||||||||||||||
51 | EUR | German Euro Bund Futures | September 2018 | (9,602,452 | ) | (9,636,122 | ) | (33,670 | ) | ||||||||||||||||||
57 | EUR | Mid-Term Euro-OAT Futures | September 2018 | (10,183,843 | ) | (10,246,557 | ) | (62,714 | ) | ||||||||||||||||||
59 | USD | 90-Day Eurodollar Futures | December 2018 | (14,385,183 | ) | (14,354,700 | ) | 30,483 | |||||||||||||||||||
55 | USD | 90-Day Eurodollar Futures | March 2019 | (13,392,474 | ) | (13,360,875 | ) | 31,599 | |||||||||||||||||||
54 | USD | 90-Day Eurodollar Futures | June 2019 | (13,140,811 | ) | (13,102,425 | ) | 38,386 | |||||||||||||||||||
54 | USD | 90-Day Eurodollar Futures | September 2019 | (13,128,361 | ) | (13,092,975 | ) | 35,386 | |||||||||||||||||||
54 | USD | 90-Day Eurodollar Futures | December 2019 | (13,120,927 | ) | (13,086,900 | ) | 34,027 | |||||||||||||||||||
55 | USD | 90-Day Eurodollar Futures | March 2020 | (13,340,823 | ) | (13,327,876 | ) | 12,947 | |||||||||||||||||||
48 | USD | 90-Day Eurodollar Futures | June 2020 | (11,638,654 | ) | (11,631,601 | ) | 7,053 | |||||||||||||||||||
$ | (239,184,120 | ) | $ | (239,210,390 | ) | $ | (26,270 | ) | |||||||||||||||||||
$ | (30,561 | ) | |||||||||||||||||||||||||
** Exposure to Futures Contracts is achieved through the use of a swap contract with Bank of America N.A.
*** Exposure to Futures Contracts is achieved through the use of a swap contract with Goldman Sachs.
Forward foreign currency contracts
Counterparty | Sell | Purchase | Settlement date | Unrealized appreciation (depreciation) | |||||||||||||||
ANZ | AUD | 10,521,800 | USD | 8,028,965 | 08/24/18 | $ | 210,828 | ||||||||||||
ANZ | AUD | 5,144,100 | USD | 3,817,462 | 08/24/18 | (4,818 | ) | ||||||||||||
ANZ | EUR | 24,738,711 | USD | 29,096,261 | 08/24/18 | 122,224 | |||||||||||||
ANZ | JPY | 859,514,408 | USD | 7,740,375 | 08/24/18 | 42,546 | |||||||||||||
252
PACE Alternative Strategies Investments
Portfolio of investments—July 31, 2018
Forward foreign currency contracts—(continued)
Counterparty | Sell | Purchase | Settlement date | Unrealized appreciation (depreciation) | |||||||||||||||
ANZ | USD | 7,765,794 | AUD | 10,495,536 | 08/24/18 | $ | 32,827 | ||||||||||||
ANZ | USD | 4,024,300 | CAD | 5,281,894 | 08/24/18 | 37,600 | |||||||||||||
ANZ | USD | 7,740,375 | EUR | 6,608,080 | 08/24/18 | (975 | ) | ||||||||||||
ANZ | USD | 19,986,592 | JPY | 2,197,328,672 | 08/24/18 | (307,272 | ) | ||||||||||||
BB | AUD | 9,604,511 | USD | 7,279,877 | 09/19/18 | 142,805 | |||||||||||||
BB | AUD | 10,214,842 | USD | 7,532,509 | 09/19/18 | (58,098 | ) | ||||||||||||
BB | AUD | 550,000 | USD | 408,216 | 11/01/18 | (579 | ) | ||||||||||||
BB | BRL | 3,950,000 | USD | 1,012,431 | 10/30/18 | (30,952 | ) | ||||||||||||
BB | CAD | 4,606,668 | USD | 3,560,054 | 09/19/18 | 15,885 | |||||||||||||
BB | CAD | 15,520,929 | USD | 11,761,458 | 09/19/18 | (179,667 | ) | ||||||||||||
BB | CHF | 770,000 | USD | 788,731 | 09/10/18 | 8,609 | |||||||||||||
BB | CHF | 527,500 | USD | 536,503 | 10/19/18 | 237 | |||||||||||||
BB | CNY | 1,200,000 | USD | 187,237 | 08/10/18 | 11,455 | |||||||||||||
BB | DKK | 1,360,000 | USD | 224,525 | 08/02/18 | 11,109 | |||||||||||||
BB | DKK | 1,270,000 | USD | 200,356 | 09/14/18 | 402 | |||||||||||||
BB | EUR | 10,637,993 | USD | 12,577,371 | 09/19/18 | 93,971 | |||||||||||||
BB | EUR | 7,233,506 | USD | 8,451,684 | 09/19/18 | (36,641 | ) | ||||||||||||
BB | GBP | 12,744,324 | USD | 17,005,886 | 09/19/18 | 245,040 | |||||||||||||
BB | GBP | 579,141 | USD | 757,216 | 09/19/18 | (4,447 | ) | ||||||||||||
BB | JPY | 217,000,000 | USD | 1,992,714 | 09/10/18 | 47,043 | |||||||||||||
BB | JPY | 1,941,725,359 | USD | 17,706,778 | 09/19/18 | 285,622 | |||||||||||||
BB | JPY | 115,957,168 | USD | 1,033,268 | 09/19/18 | (7,099 | ) | ||||||||||||
BB | MXN | 2,700,000 | USD | 140,959 | 08/02/18 | (3,908 | ) | ||||||||||||
BB | MYR | 420,000 | USD | 107,610 | 08/02/18 | 4,289 | |||||||||||||
BB | MYR | 420,000 | USD | 103,372 | 11/02/18 | 279 | |||||||||||||
BB | NOK | 163,117,257 | USD | 20,189,565 | 09/19/18 | 153,575 | |||||||||||||
BB | NZD | 12,246,753 | USD | 8,569,299 | 09/19/18 | 222,402 | |||||||||||||
BB | NZD | 13,615,640 | USD | 9,237,942 | 09/19/18 | (41,935 | ) | ||||||||||||
BB | SEK | 37,626,502 | USD | 4,325,153 | 09/19/18 | 30,542 | |||||||||||||
BB | SEK | 16,283,888 | USD | 1,849,398 | 09/19/18 | (9,211 | ) | ||||||||||||
BB | SGD | 20,429,876 | USD | 15,349,202 | 09/19/18 | 329,222 | |||||||||||||
BB | SGD | 4,812,003 | USD | 3,525,367 | 09/19/18 | (12,402 | ) | ||||||||||||
BB | USD | 408,064 | AUD | 550,000 | 08/01/18 | 559 | |||||||||||||
BB | USD | 12,575,363 | AUD | 16,432,095 | 09/19/18 | (364,742 | ) | ||||||||||||
BB | USD | 5,286,308 | AUD | 7,144,643 | 09/19/18 | 22,845 | |||||||||||||
BB | USD | 21,131,461 | CAD | 27,370,385 | 09/19/18 | (73,882 | ) | ||||||||||||
BB | USD | 1,429,124 | CAD | 1,875,024 | 09/19/18 | 13,437 | |||||||||||||
BB | USD | 231,655 | COP | 684,000,000 | 09/25/18 | 4,433 | |||||||||||||
BB | USD | 199,674 | DKK | 1,270,000 | 08/02/18 | (381 | ) | ||||||||||||
BB | USD | 36,070,823 | EUR | 30,537,919 | 09/19/18 | (235,392 | ) | ||||||||||||
BB | USD | 3,407,700 | EUR | 2,917,952 | 09/19/18 | 16,438 | |||||||||||||
BB | USD | 29,967,254 | GBP | 22,346,723 | 09/19/18 | (577,703 | ) | ||||||||||||
BB | USD | 1,083,616 | GBP | 825,282 | 09/19/18 | 1,763 | |||||||||||||
BB | USD | 816,794 | IDR | 11,770,000,000 | 09/25/18 | (5,741 | ) | ||||||||||||
BB | USD | 299,832 | INR | 20,680,000 | 09/25/18 | (220 | ) | ||||||||||||
253
PACE Alternative Strategies Investments
Portfolio of investments—July 31, 2018
Forward foreign currency contracts—(continued)
Counterparty | Sell | Purchase | Settlement date | Unrealized appreciation (depreciation) | |||||||||||||||
BB | USD | 2,100,654 | JPY | 228,100,000 | 08/17/18 | $ | (58,708 | ) | |||||||||||
BB | USD | 1,350,107 | JPY | 147,735,000 | 09/13/18 | (25,197 | ) | ||||||||||||
BB | USD | 13,879,315 | JPY | 1,509,333,843 | 09/19/18 | (337,572 | ) | ||||||||||||
BB | USD | 2,076,423 | JPY | 232,556,642 | 09/19/18 | 10,075 | |||||||||||||
BB | USD | 103,614 | MYR | 420,000 | 08/02/18 | (293 | ) | ||||||||||||
BB | USD | 202,691 | MYR | 809,000 | 09/07/18 | (3,889 | ) | ||||||||||||
BB | USD | 267,289 | MYR | 1,076,000 | 09/25/18 | (3,005 | ) | ||||||||||||
BB | USD | 886 | NOK | 7,178 | 09/14/18 | (5 | ) | ||||||||||||
BB | USD | 10,386,372 | NOK | 83,839,664 | 09/19/18 | (88,192 | ) | ||||||||||||
BB | USD | 779,458 | NOK | 6,373,766 | 09/19/18 | 3,444 | |||||||||||||
BB | USD | 2,651,102 | NZD | 3,789,075 | 09/19/18 | (68,619 | ) | ||||||||||||
BB | USD | 1,288,523 | NZD | 1,901,773 | 09/19/18 | 7,650 | |||||||||||||
BB | USD | 315,169 | RUB | 20,250,000 | 09/25/18 | 7,102 | |||||||||||||
BB | USD | 16,969,202 | SEK | 146,409,790 | 09/19/18 | (258,290 | ) | ||||||||||||
BB | USD | 5,107,508 | SEK | 45,194,213 | 09/19/18 | 50,865 | |||||||||||||
BB | USD | 5,817,379 | SGD | 7,834,604 | 09/19/18 | (57,403 | ) | ||||||||||||
BB | USD | 880,309 | SGD | 1,204,044 | 09/19/18 | 4,900 | |||||||||||||
BB | USD | 513,765 | ZAR | 7,010,000 | 09/25/18 | 14,926 | |||||||||||||
BNP | AUD | 1,654,000 | USD | 1,238,335 | 08/01/18 | 9,496 | |||||||||||||
BNP | AUD | 1,654,000 | USD | 1,238,407 | 08/08/18 | 9,511 | |||||||||||||
BNP | AUD | 1,654,000 | USD | 1,238,477 | 08/15/18 | 9,537 | |||||||||||||
BNP | AUD | 1,654,000 | USD | 1,238,546 | 08/22/18 | 9,566 | |||||||||||||
BNP | AUD | 1,654,000 | USD | 1,238,616 | 08/29/18 | 9,597 | |||||||||||||
BNP | BRL | 2,000,000 | USD | 513,232 | 09/17/18 | (16,953 | ) | ||||||||||||
BNP | BRL | 3,900,000 | USD | 998,721 | 09/24/18 | (34,452 | ) | ||||||||||||
BNP | BRL | 3,550,000 | USD | 902,971 | 10/02/18 | (36,767 | ) | ||||||||||||
BNP | CAD | 1,467,300 | USD | 1,105,915 | 09/14/18 | (22,869 | ) | ||||||||||||
BNP | CHF | 877,000 | USD | 893,654 | 09/14/18 | 4,816 | |||||||||||||
BNP | CNY | 1,200,000 | USD | 186,957 | 08/10/18 | 11,175 | |||||||||||||
BNP | EUR | 1,336,036 | USD | 1,575,000 | 08/16/18 | 11,131 | |||||||||||||
BNP | EUR | 3,258,000 | USD | 3,862,621 | 10/17/18 | 31,141 | |||||||||||||
BNP | EUR | 4,009,000 | USD | 4,735,211 | 11/02/18 | 14,614 | |||||||||||||
BNP | GBP | 104,147 | USD | 141,695 | 08/16/18 | 4,920 | |||||||||||||
BNP | GBP | 3,986,000 | USD | 5,342,755 | 09/07/18 | 103,270 | |||||||||||||
BNP | INR | 13,500,000 | USD | 200,887 | 08/02/18 | 4,054 | |||||||||||||
BNP | INR | 13,500,000 | USD | 194,203 | 11/02/18 | (487 | ) | ||||||||||||
BNP | JPY | 680,335,470 | USD | 6,464,674 | 08/16/18 | 374,720 | |||||||||||||
BNP | JPY | 307,701,960 | USD | 2,821,698 | 09/14/18 | 61,983 | |||||||||||||
BNP | NOK | 690,000 | USD | 85,360 | 09/14/18 | 621 | |||||||||||||
BNP | TWD | 15,000,000 | USD | 501,533 | 09/11/18 | 10,474 | |||||||||||||
BNP | TWD | 183,790,638 | USD | 6,058,100 | 11/28/18 | 7,245 | |||||||||||||
BNP | USD | 125,368 | ARS | 3,405,000 | 09/07/18 | (5,364 | ) | ||||||||||||
BNP | USD | 361,493 | CAD | 480,000 | 08/02/18 | 7,502 | |||||||||||||
BNP | USD | 744,100 | CAD | 987,300 | 09/10/18 | 15,372 | |||||||||||||
BNP | USD | 62,691 | CAD | 82,265 | 09/14/18 | 595 | |||||||||||||
254
PACE Alternative Strategies Investments
Portfolio of investments—July 31, 2018
Forward foreign currency contracts—(continued)
Counterparty | Sell | Purchase | Settlement date | Unrealized appreciation (depreciation) | |||||||||||||||
BNP | USD | 223,357 | CHF | 220,000 | 08/02/18 | $ | (1,169 | ) | |||||||||||
BNP | USD | 669,249 | CHF | 657,000 | 09/10/18 | (3,612 | ) | ||||||||||||
BNP | USD | 4,702,662 | EUR | 4,009,000 | 08/02/18 | (14,738 | ) | ||||||||||||
BNP | USD | 3,135,000 | EUR | 2,643,636 | 08/16/18 | (40,548 | ) | ||||||||||||
BNP | USD | 523,280 | EUR | 450,000 | 08/16/18 | 3,458 | |||||||||||||
BNP | USD | 196,478 | INR | 13,500,000 | 08/02/18 | 355 | |||||||||||||
BNP | USD | 215,614 | INR | 14,720,000 | 09/07/18 | (1,890 | ) | ||||||||||||
BNP | USD | 1,665,975 | INR | 113,200,000 | 09/12/18 | (23,371 | ) | ||||||||||||
BNP | USD | 3,848,100 | INR | 268,776,317 | 11/28/18 | 16,170 | |||||||||||||
BNP | USD | 1,454,031 | JPY | 159,000,000 | 08/02/18 | (32,040 | ) | ||||||||||||
BNP | USD | 1,356,174 | JPY | 147,735,000 | 09/05/18 | (32,023 | ) | ||||||||||||
BNP | USD | 1,317,614 | JPY | 143,700,000 | 09/10/18 | (29,168 | ) | ||||||||||||
BNP | USD | 116,358 | JPY | 13,000,000 | 10/24/18 | 571 | |||||||||||||
BNP | USD | 646,508 | MXN | 13,030,000 | 09/25/18 | 46,484 | |||||||||||||
BNP | USD | 85,216 | NOK | 690,000 | 08/02/18 | (622 | ) | ||||||||||||
BNP | USD | 160,006 | PEN | 526,500 | 09/07/18 | 675 | |||||||||||||
BNP | USD | 339,075 | RUB | 21,200,000 | 09/07/18 | (1,101 | ) | ||||||||||||
BNP | USD | 374,633 | THB | 11,940,000 | 09/07/18 | (15,470 | ) | ||||||||||||
BNP | USD | 529,777 | THB | 17,370,000 | 09/25/18 | (7,016 | ) | ||||||||||||
BOA | BRL | 1,820,000 | USD | 467,626 | 09/28/18 | (14,338 | ) | ||||||||||||
BOA | BRL | 730,000 | USD | 185,864 | 10/02/18 | (7,378 | ) | ||||||||||||
BOA | EUR | 2,690,181 | USD | 3,135,000 | 08/16/18 | (13,934 | ) | ||||||||||||
BOA | EUR | 8,935,000 | USD | 10,721,685 | 08/16/18 | 263,010 | |||||||||||||
BOA | IDR | 1,300,000,000 | USD | 91,938 | 08/02/18 | 1,785 | |||||||||||||
BOA | JPY | 125,714,397 | USD | 1,158,071 | 08/16/18 | 32,751 | |||||||||||||
BOA | RUB | 7,900,000 | USD | 124,209 | 11/02/18 | (1,073 | ) | ||||||||||||
BOA | USD | 3,892,935 | EUR | 3,350,000 | 08/16/18 | 28,337 | |||||||||||||
BOA | USD | 90,196 | IDR | 1,300,000,000 | 08/02/18 | (44 | ) | ||||||||||||
BOA | USD | 125,337 | RUB | 7,900,000 | 08/02/18 | 1,116 | |||||||||||||
CITI | AUD | 4,167,768 | USD | 3,200,000 | 08/16/18 | 103,290 | |||||||||||||
CITI | AUD | 3,489,457 | USD | 2,656,384 | 08/24/18 | 63,572 | |||||||||||||
CITI | AUD | 18,055,830 | USD | 13,278,526 | 08/24/18 | (137,709 | ) | ||||||||||||
CITI | AUD | 5,201,000 | USD | 3,933,962 | 09/19/18 | 69,121 | |||||||||||||
CITI | AUD | 4,977,000 | USD | 3,673,835 | 09/19/18 | (24,553 | ) | ||||||||||||
CITI | BRL | 1,409,250 | USD | 378,698 | 09/19/18 | 5,186 | |||||||||||||
CITI | BRL | 1,743,750 | USD | 452,814 | 09/19/18 | (9,357 | ) | ||||||||||||
CITI | CAD | 36,113,416 | USD | 27,555,047 | 08/24/18 | (217,019 | ) | ||||||||||||
CITI | CAD | 62,998 | USD | 47,793 | 09/14/18 | (671 | ) | ||||||||||||
CITI | CAD | 14,184,000 | USD | 10,729,347 | 09/19/18 | (183,204 | ) | ||||||||||||
CITI | CHF | 5,163,182 | SEK | 45,749,600 | 09/20/18 | (13,440 | ) | ||||||||||||
CITI | CHF | 220,000 | USD | 226,813 | 08/02/18 | 4,625 | |||||||||||||
CITI | CHF | 16,175,528 | USD | 16,479,241 | 08/24/18 | 114,497 | |||||||||||||
CITI | CHF | 24,267 | USD | 24,799 | 09/19/18 | 193 | |||||||||||||
CITI | CHF | 1,733 | USD | 1,756 | 09/19/18 | (1 | ) | ||||||||||||
CITI | CHF | 2,512,500 | USD | 2,550,484 | 10/25/18 | (5,129 | ) | ||||||||||||
255
PACE Alternative Strategies Investments
Portfolio of investments—July 31, 2018
Forward foreign currency contracts—(continued)
Counterparty | Sell | Purchase | Settlement date | Unrealized appreciation (depreciation) | |||||||||||||||
CITI | CLP | 423,176,000 | USD | 652,777 | 09/20/18 | $ | (11,208 | ) | |||||||||||
CITI | COP | 372,943,000 | USD | 126,771 | 09/19/18 | (1,991 | ) | ||||||||||||
CITI | COP | 18,383,000 | USD | 6,373 | 09/19/18 | 26 | |||||||||||||
CITI | EUR | 3,437,204 | USD | 4,007,587 | 08/24/18 | (18,074 | ) | ||||||||||||
CITI | EUR | 241,000 | USD | 283,395 | 09/10/18 | 782 | |||||||||||||
CITI | EUR | 1,741,511 | USD | 2,039,808 | 09/14/18 | (3,028 | ) | ||||||||||||
CITI | EUR | 11,651,000 | USD | 13,754,724 | 09/19/18 | 82,586 | |||||||||||||
CITI | EUR | 3,787,000 | USD | 4,430,458 | 09/19/18 | (13,484 | ) | ||||||||||||
CITI | GBP | 2,977,147 | USD | 3,879,202 | 08/24/18 | (31,922 | ) | ||||||||||||
CITI | GBP | 1,270,000 | USD | 1,675,715 | 09/19/18 | 5,460 | |||||||||||||
CITI | GBP | 256,000 | USD | 336,436 | 09/19/18 | (246 | ) | ||||||||||||
CITI | HKD | 473,000 | USD | 60,344 | 09/19/18 | 19 | |||||||||||||
CITI | HKD | 96,000 | USD | 12,243 | 09/19/18 | (1 | ) | ||||||||||||
CITI | HUF | 81,220,000 | USD | 300,589 | 09/19/18 | 3,573 | |||||||||||||
CITI | HUF | 47,450,000 | USD | 171,523 | 09/19/18 | (1,998 | ) | ||||||||||||
CITI | IDR | 1,300,000,000 | USD | 90,196 | 08/02/18 | 44 | |||||||||||||
CITI | IDR | 1,049,204,828 | USD | 72,290 | 09/19/18 | (67 | ) | ||||||||||||
CITI | IDR | 3,243,972,484 | USD | 227,811 | 09/19/18 | 4,094 | |||||||||||||
CITI | IDR | 1,300,000,000 | USD | 88,798 | 11/02/18 | (289 | ) | ||||||||||||
CITI | ILS | 713,000 | USD | 198,237 | 09/20/18 | 3,447 | |||||||||||||
CITI | INR | 94,000,000 | USD | 1,367,273 | 08/06/18 | (2,636 | ) | ||||||||||||
CITI | INR | 51,886,972 | USD | 748,439 | 09/19/18 | (3,843 | ) | ||||||||||||
CITI | JPY | 121,000,000 | USD | 1,119,295 | 08/02/18 | 37,150 | |||||||||||||
CITI | JPY | 881,626,920 | USD | 8,049,177 | 08/24/18 | 153,309 | |||||||||||||
CITI | JPY | 844,665,992 | USD | 7,697,440 | 09/19/18 | 119,095 | |||||||||||||
CITI | JPY | 352,369,000 | USD | 3,141,664 | 09/19/18 | (19,791 | ) | ||||||||||||
CITI | KRW | 1,000,000,000 | USD | 897,706 | 09/10/18 | 3,034 | |||||||||||||
CITI | KRW | 2,664,681,008 | USD | 2,409,732 | 09/19/18 | 25,171 | |||||||||||||
CITI | KRW | 1,024,075,000 | USD | 910,928 | 09/19/18 | (5,495 | ) | ||||||||||||
CITI | MXN | 44,608,000 | USD | 2,190,647 | 09/19/18 | (184,102 | ) | ||||||||||||
CITI | MXN | 2,700,000 | USD | 142,409 | 11/05/18 | (239 | ) | ||||||||||||
CITI | NOK | 715,000 | USD | 88,527 | 09/19/18 | 702 | |||||||||||||
CITI | NOK | 349,000 | USD | 42,768 | 09/19/18 | (100 | ) | ||||||||||||
CITI | NZD | 14,973,125 | USD | 10,537,187 | 08/24/18 | 331,849 | |||||||||||||
CITI | NZD | 7,543,000 | USD | 5,214,388 | 09/19/18 | 73,379 | |||||||||||||
CITI | NZD | 4,538,000 | USD | 3,074,466 | 09/19/18 | (18,455 | ) | ||||||||||||
CITI | PHP | 4,408,250 | USD | 83,116 | 09/19/18 | 286 | |||||||||||||
CITI | PHP | 629,750 | USD | 11,817 | 09/19/18 | (16 | ) | ||||||||||||
CITI | PLN | 4,120,375 | USD | 1,118,765 | 09/19/18 | (9,425 | ) | ||||||||||||
CITI | PLN | 1,145,625 | USD | 315,393 | 09/19/18 | 1,710 | |||||||||||||
CITI | SEK | 2,400,000 | USD | 284,265 | 08/02/18 | 11,319 | |||||||||||||
CITI | SEK | 13,943,667 | USD | 1,607,689 | 09/19/18 | 16,189 | |||||||||||||
CITI | SEK | 10,643,333 | USD | 1,205,167 | 09/19/18 | (9,641 | ) | ||||||||||||
CITI | SGD | 450,000 | USD | 340,983 | 08/02/18 | 10,428 | |||||||||||||
CITI | SGD | 121,000 | USD | 89,116 | 09/19/18 | 157 | |||||||||||||
256
PACE Alternative Strategies Investments
Portfolio of investments—July 31, 2018
Forward foreign currency contracts—(continued)
Counterparty | Sell | Purchase | Settlement date | Unrealized appreciation (depreciation) | |||||||||||||||
CITI | SGD | 760,000 | USD | 557,177 | 09/19/18 | $ | (1,572 | ) | |||||||||||
CITI | SGD | 6,365,708 | USD | 4,700,000 | 09/20/18 | 19,848 | |||||||||||||
CITI | TRY | 146,000 | USD | 28,771 | 09/19/18 | (256 | ) | ||||||||||||
CITI | TRY | 9,766,000 | USD | 1,993,355 | 09/19/18 | 51,741 | |||||||||||||
CITI | TWD | 183,953,158 | USD | 6,373,100 | 08/16/18 | 359,838 | |||||||||||||
CITI | TWD | 31,312,000 | USD | 1,049,745 | 09/19/18 | 24,149 | |||||||||||||
CITI | TWD | 4,143,000 | USD | 135,466 | 09/19/18 | (235 | ) | ||||||||||||
CITI | USD | 12,032,386 | AUD | 15,851,278 | 08/24/18 | (254,225 | ) | ||||||||||||
CITI | USD | 6,950,793 | AUD | 9,169,000 | 09/19/18 | (137,347 | ) | ||||||||||||
CITI | USD | 744,659 | AUD | 1,009,000 | 09/19/18 | 5,124 | |||||||||||||
CITI | USD | 1,794,755 | BRL | 6,700,000 | 08/10/18 | (11,268 | ) | ||||||||||||
CITI | USD | 1,880,233 | BRL | 7,100,000 | 09/10/18 | 3,179 | |||||||||||||
CITI | USD | 111,447 | CAD | 146,317 | 09/14/18 | 1,114 | |||||||||||||
CITI | USD | 4,298,525 | CAD | 5,543,000 | 09/19/18 | (33,983 | ) | ||||||||||||
CITI | USD | 1,790,253 | CAD | 2,334,000 | 09/19/18 | 5,425 | |||||||||||||
CITI | USD | 426,366 | CHF | 421,356 | 08/24/18 | (81 | ) | ||||||||||||
CITI | USD | 26,271 | CHF | 26,000 | 09/19/18 | 91 | |||||||||||||
CITI | USD | 273,724 | CLP | 171,697,008 | 09/20/18 | (4,326 | ) | ||||||||||||
CITI | USD | 8,452 | CLP | 5,397,000 | 09/20/18 | 17 | |||||||||||||
CITI | USD | 130,214 | COP | 375,004,000 | 09/19/18 | (740 | ) | ||||||||||||
CITI | USD | 7,540 | COP | 22,156,000 | 09/19/18 | 110 | |||||||||||||
CITI | USD | 136,882 | CZK | 3,025,000 | 09/25/18 | 1,722 | |||||||||||||
CITI | USD | 14,142 | DKK | 90,000 | 08/02/18 | (19 | ) | ||||||||||||
CITI | USD | 15,221,487 | EUR | 13,075,000 | 08/16/18 | 83,177 | |||||||||||||
CITI | USD | 15,654,276 | EUR | 13,430,536 | 08/24/18 | 75,600 | |||||||||||||
CITI | USD | 7,658,721 | EUR | 6,488,500 | 09/19/18 | (44,639 | ) | ||||||||||||
CITI | USD | 7,043,093 | EUR | 6,033,500 | 09/19/18 | 37,059 | |||||||||||||
CITI | USD | 13,691,896 | GBP | 10,297,811 | 08/24/18 | (163,504 | ) | ||||||||||||
CITI | USD | 746,192 | GBP | 562,000 | 09/19/18 | (7,070 | ) | ||||||||||||
CITI | USD | 80,127 | GBP | 61,000 | 09/19/18 | 98 | |||||||||||||
CITI | USD | 6,003 | HKD | 47,000 | 09/19/18 | (8 | ) | ||||||||||||
CITI | USD | 224,903 | HUF | 60,800,000 | 09/07/18 | (2,741 | ) | ||||||||||||
CITI | USD | 371,826 | HUF | 102,900,000 | 09/25/18 | 4,624 | |||||||||||||
CITI | USD | 90,059 | IDR | 1,300,000,000 | 08/02/18 | 94 | |||||||||||||
CITI | USD | 627,437 | IDR | 8,850,000,000 | 09/07/18 | (16,135 | ) | ||||||||||||
CITI | USD | 232,860 | IDR | 3,316,608,032 | 09/19/18 | (4,133 | ) | ||||||||||||
CITI | USD | 66,968 | IDR | 976,351,992 | 09/19/18 | 364 | |||||||||||||
CITI | USD | 196,197 | ILS | 713,000 | 09/20/18 | (1,404 | ) | ||||||||||||
CITI | USD | 1,392,180 | INR | 94,000,000 | 08/06/18 | (22,271 | ) | ||||||||||||
CITI | USD | 3,563,100 | INR | 235,431,833 | 08/16/18 | (136,001 | ) | ||||||||||||
CITI | USD | 690,274 | INR | 47,207,000 | 09/19/18 | (5,845 | ) | ||||||||||||
CITI | USD | 67,514 | INR | 4,680,000 | 09/19/18 | 339 | |||||||||||||
CITI | USD | 1,351,891 | INR | 94,000,000 | 11/05/18 | 3,244 | |||||||||||||
CITI | USD | 3,979,952 | JPY | 436,178,362 | 08/24/18 | (73,529 | ) | ||||||||||||
CITI | USD | 222,869 | JPY | 24,985,529 | 08/24/18 | 902 | |||||||||||||
257
PACE Alternative Strategies Investments
Portfolio of investments—July 31, 2018
Forward foreign currency contracts—(continued)
Counterparty | Sell | Purchase | Settlement date | Unrealized appreciation (depreciation) | |||||||||||||||
CITI | USD | 302,740 | JPY | 33,344,897 | 09/14/18 | $ | (3,676 | ) | |||||||||||
CITI | USD | 9,882,439 | JPY | 1,081,437,000 | 09/19/18 | (179,787 | ) | ||||||||||||
CITI | USD | 244,743 | KRW | 270,000,000 | 09/10/18 | (3,181 | ) | ||||||||||||
CITI | USD | 1,131,729 | KRW | 1,211,553,136 | 09/19/18 | (47,536 | ) | ||||||||||||
CITI | USD | 1,223,196 | KRW | 1,385,414,976 | 09/19/18 | 16,581 | |||||||||||||
CITI | USD | 144,632 | MXN | 2,700,000 | 08/02/18 | 235 | |||||||||||||
CITI | USD | 431,035 | MXN | 8,655,000 | 09/07/18 | 30,617 | |||||||||||||
CITI | USD | 3,154,694 | MXN | 60,996,000 | 09/19/18 | 92,483 | |||||||||||||
CITI | USD | 264,302 | MXN | 4,941,000 | 09/19/18 | (1,264 | ) | ||||||||||||
CITI | USD | 7,750,631 | NOK | 62,965,165 | 08/24/18 | (24,228 | ) | ||||||||||||
CITI | USD | 84,236 | NOK | 682,822 | 09/14/18 | (379 | ) | ||||||||||||
CITI | USD | 115,318 | NOK | 931,000 | 09/19/18 | (960 | ) | ||||||||||||
CITI | USD | 16,179 | NOK | 133,000 | 09/19/18 | 158 | |||||||||||||
CITI | USD | 4,022,914 | NZD | 5,716,477 | 08/24/18 | (126,694 | ) | ||||||||||||
CITI | USD | 2,610,135 | NZD | 3,775,000 | 09/19/18 | (37,246 | ) | ||||||||||||
CITI | USD | 110,858 | PEN | 365,000 | 09/25/18 | 437 | |||||||||||||
CITI | USD | 85,162 | PHP | 4,513,000 | 09/19/18 | (364 | ) | ||||||||||||
CITI | USD | 9,709 | PHP | 517,000 | 09/19/18 | 5 | |||||||||||||
CITI | USD | 235,724 | PLN | 863,000 | 09/19/18 | 573 | |||||||||||||
CITI | USD | 279,173 | PLN | 1,016,000 | 09/19/18 | (985 | ) | ||||||||||||
CITI | USD | 194,040 | RON | 771,500 | 09/07/18 | 775 | |||||||||||||
CITI | USD | 312,092 | RON | 1,260,000 | 09/25/18 | 5,833 | |||||||||||||
CITI | USD | 2,545 | SEK | 22,000 | 09/19/18 | (34 | ) | ||||||||||||
CITI | USD | 655,487 | SGD | 878,000 | 09/19/18 | (9,983 | ) | ||||||||||||
CITI | USD | 2,200 | SGD | 3,000 | 09/19/18 | 6 | |||||||||||||
CITI | USD | 179,932 | TRY | 837,000 | 09/07/18 | (12,664 | ) | ||||||||||||
CITI | USD | 7,557 | TRY | 36,000 | 09/19/18 | (399 | ) | ||||||||||||
CITI | USD | 216,655 | TRY | 1,067,000 | 09/25/18 | (5,066 | ) | ||||||||||||
CITI | USD | 2,995 | TWD | 89,000 | 09/19/18 | (80 | ) | ||||||||||||
CITI | USD | 1,305,851 | ZAR | 16,700,000 | 09/19/18 | (45,368 | ) | ||||||||||||
CITI | USD | 996,875 | ZAR | 13,396,000 | 09/19/18 | 14,226 | |||||||||||||
CITI | ZAR | 2,100,000 | USD | 168,896 | 08/02/18 | 9,413 | |||||||||||||
CITI | ZAR | 3,972,000 | USD | 308,447 | 09/19/18 | 8,648 | |||||||||||||
CITI | ZAR | 25,918,000 | USD | 1,906,552 | 09/19/18 | (49,686 | ) | ||||||||||||
DB | AUD | 1,104,000 | USD | 819,839 | 11/01/18 | (725 | ) | ||||||||||||
DB | BRL | 6,400,000 | USD | 1,607,798 | 10/02/18 | (86,377 | ) | ||||||||||||
DB | BRL | 2,750,000 | USD | 711,422 | 10/11/18 | (16,042 | ) | ||||||||||||
DB | BRL | 4,000,000 | USD | 1,025,641 | 10/30/18 | (30,949 | ) | ||||||||||||
DB | EUR | 7,185,000 | USD | 8,836,551 | 08/02/18 | 434,772 | |||||||||||||
DB | EUR | 570,000 | USD | 663,812 | 09/10/18 | (4,608 | ) | ||||||||||||
DB | EUR | 3,600,000 | USD | 4,208,157 | 09/19/18 | (16,346 | ) | ||||||||||||
DB | EUR | 520,000 | USD | 611,250 | 09/19/18 | 1,044 | |||||||||||||
DB | EUR | 1,300,000 | USD | 1,517,814 | 09/25/18 | (8,401 | ) | ||||||||||||
DB | JPY | 38,000,000 | USD | 349,888 | 08/02/18 | 10,041 | |||||||||||||
DB | JPY | 32,619,651 | USD | 296,623 | 09/14/18 | 4,064 | |||||||||||||
258
PACE Alternative Strategies Investments
Portfolio of investments—July 31, 2018
Forward foreign currency contracts—(continued)
Counterparty | Sell | Purchase | Settlement date | Unrealized appreciation (depreciation) | |||||||||||||||
DB | RUB | 7,900,000 | USD | 126,621 | 08/02/18 | $ | 168 | ||||||||||||
DB | SEK | 1,843,000 | USD | 208,799 | 09/19/18 | (1,558 | ) | ||||||||||||
DB | USD | 819,528 | AUD | 1,104,000 | 08/01/18 | 689 | |||||||||||||
DB | USD | 447,402 | AUD | 604,873 | 09/14/18 | 2,073 | |||||||||||||
DB | USD | 831,803 | BRL | 3,170,000 | 09/25/18 | 7,902 | |||||||||||||
DB | USD | 312,344 | EUR | 267,000 | 09/19/18 | 974 | |||||||||||||
DB | USD | 127,995 | EUR | 109,000 | 09/19/18 | (86 | ) | ||||||||||||
DB | USD | 394,647 | SEK | 3,463,000 | 09/19/18 | 613 | |||||||||||||
GSI | AUD | 6,168,526 | USD | 4,590,000 | 08/16/18 | 6,699 | |||||||||||||
GSI | AUD | 216,110 | USD | 158,401 | 08/24/18 | (2,178 | ) | ||||||||||||
GSI | CAD | 596,064 | USD | 452,067 | 08/24/18 | (6,321 | ) | ||||||||||||
GSI | CHF | 2,614,939 | SEK | 23,150,400 | 09/20/18 | (9,077 | ) | ||||||||||||
GSI | CHF | 12,433,217 | USD | 12,507,363 | 08/24/18 | (71,293 | ) | ||||||||||||
GSI | EUR | 15,480,000 | USD | 19,233,619 | 08/16/18 | 1,113,833 | |||||||||||||
GSI | EUR | 13,774,241 | USD | 16,246,950 | 08/24/18 | 114,526 | |||||||||||||
GSI | EUR | 13,552,081 | USD | 15,779,423 | 08/24/18 | (92,806 | ) | ||||||||||||
GSI | GBP | 5,580,000 | USD | 7,701,061 | 08/16/18 | 372,897 | |||||||||||||
GSI | GBP | 11,375,618 | USD | 15,142,764 | 08/24/18 | 198,440 | |||||||||||||
GSI | JPY | 383,196,100 | USD | 3,500,000 | 08/16/18 | 69,859 | |||||||||||||
GSI | JPY | 4,260,951,149 | USD | 38,647,758 | 08/24/18 | 486,594 | |||||||||||||
GSI | JPY | 15,511,004 | USD | 138,752 | 08/24/18 | (165 | ) | ||||||||||||
GSI | NOK | 196,661,455 | USD | 24,341,096 | 08/24/18 | 208,933 | |||||||||||||
GSI | SEK | 105,744,270 | USD | 12,148,604 | 08/24/18 | 103,011 | |||||||||||||
GSI | SEK | 125,364,477 | USD | 14,184,147 | 08/24/18 | (96,432 | ) | ||||||||||||
GSI | TRY | 7,174,268 | USD | 1,560,000 | 08/16/18 | 112,747 | |||||||||||||
GSI | TWD | 183,438,493 | USD | 6,383,800 | 09/20/18 | 375,052 | |||||||||||||
GSI | USD | 3,058,000 | AUD | 4,109,663 | 08/16/18 | (4,463 | ) | ||||||||||||
GSI | USD | 12,160,469 | AUD | 16,387,415 | 08/24/18 | 16,063 | |||||||||||||
GSI | USD | 12,768,912 | AUD | 17,092,707 | 08/24/18 | (68,318 | ) | ||||||||||||
GSI | USD | 12,749,430 | CAD | 16,650,342 | 08/24/18 | 55,075 | |||||||||||||
GSI | USD | 15,693,396 | CHF | 15,574,729 | 08/24/18 | 63,521 | |||||||||||||
GSI | USD | 2,481,447 | EUR | 2,130,210 | 08/24/18 | 13,459 | |||||||||||||
GSI | USD | 16,409,150 | EUR | 13,994,562 | 08/24/18 | (18,687 | ) | ||||||||||||
GSI | USD | 5,570,508 | GBP | 4,230,000 | 08/16/18 | (15,288 | ) | ||||||||||||
GSI | USD | 37,568,197 | GBP | 28,256,072 | 08/24/18 | (447,761 | ) | ||||||||||||
GSI | USD | 11,766,030 | GBP | 8,971,293 | 08/24/18 | 19,695 | |||||||||||||
GSI | USD | 3,573,800 | INR | 236,789,267 | 09/19/18 | (140,723 | ) | ||||||||||||
GSI | USD | 29,739,268 | JPY | 3,249,197,054 | 08/24/18 | (639,395 | ) | ||||||||||||
GSI | USD | 7,750,631 | JPY | 869,379,754 | 08/24/18 | 35,551 | |||||||||||||
GSI | USD | 8,024,059 | NOK | 64,318,847 | 08/24/18 | (131,546 | ) | ||||||||||||
GSI | USD | 501,968 | NOK | 4,103,460 | 08/24/18 | 1,564 | |||||||||||||
GSI | USD | 8,222,891 | NZD | 11,684,725 | 08/24/18 | (258,852 | ) | ||||||||||||
GSI | USD | 6,865,371 | NZD | 10,171,448 | 08/24/18 | 67,255 | |||||||||||||
GSI | USD | 27,824,519 | SEK | 241,912,949 | 08/24/18 | (267,614 | ) | ||||||||||||
JPMCB | AUD | 1,480,000 | USD | 1,126,372 | 08/02/18 | 26,807 | |||||||||||||
259
PACE Alternative Strategies Investments
Portfolio of investments—July 31, 2018
Forward foreign currency contracts—(continued)
Counterparty | Sell | Purchase | Settlement date | Unrealized appreciation (depreciation) | |||||||||||||||
JPMCB | AUD | 2,930,877 | USD | 2,241,643 | 08/24/18 | $ | 63,879 | ||||||||||||
JPMCB | AUD | 5,165,308 | USD | 3,800,649 | 08/24/18 | (37,390 | ) | ||||||||||||
JPMCB | AUD | 1,113,000 | USD | 826,057 | 09/14/18 | (1,003 | ) | ||||||||||||
JPMCB | AUD | 367,000 | USD | 272,770 | 11/02/18 | (10 | ) | ||||||||||||
JPMCB | BRL | 975,000 | USD | 249,475 | 09/17/18 | (8,990 | ) | ||||||||||||
JPMCB | BRL | 1,400,000 | USD | 356,243 | 10/02/18 | (14,358 | ) | ||||||||||||
JPMCB | BRL | 4,500,000 | USD | 1,155,001 | 10/22/18 | (34,391 | ) | ||||||||||||
JPMCB | CAD | 480,000 | USD | 374,746 | 08/02/18 | 5,751 | |||||||||||||
JPMCB | CAD | 1,230,000 | USD | 954,611 | 09/10/18 | 8,443 | |||||||||||||
JPMCB | CHF | 28,089,354 | USD | 28,588,117 | 08/24/18 | 170,184 | |||||||||||||
JPMCB | CHF | 3,992,855 | USD | 4,024,342 | 08/24/18 | (15,221 | ) | ||||||||||||
JPMCB | EUR | 2,500,000 | USD | 3,047,073 | 08/16/18 | 120,751 | |||||||||||||
JPMCB | EUR | 188,000 | USD | 218,827 | 08/16/18 | (1,232 | ) | ||||||||||||
JPMCB | EUR | 6,769,070 | USD | 7,959,276 | 08/24/18 | 31,325 | |||||||||||||
JPMCB | EUR | 3,300,000 | USD | 3,898,821 | 09/10/18 | 29,020 | |||||||||||||
JPMCB | EUR | 3,176,000 | USD | 3,731,973 | 09/14/18 | 6,445 | |||||||||||||
JPMCB | GBP | 16,031,447 | USD | 21,441,219 | 08/24/18 | 380,461 | |||||||||||||
JPMCB | GBP | 2,671,429 | USD | 3,594,050 | 09/10/18 | 82,071 | |||||||||||||
JPMCB | GBP | 1,559,000 | USD | 2,078,331 | 09/14/18 | 28,442 | |||||||||||||
JPMCB | HKD | 11,800,000 | USD | 1,506,947 | 09/10/18 | 2,245 | |||||||||||||
JPMCB | HKD | 6,669,641 | USD | 851,038 | 09/14/18 | 471 | |||||||||||||
JPMCB | JPY | 2,341,116,474 | USD | 21,182,226 | 08/24/18 | 215,141 | |||||||||||||
JPMCB | JPY | 31,533,930 | USD | 286,734 | 09/14/18 | 3,913 | |||||||||||||
JPMCB | KRW | 5,191,150,000 | USD | 4,700,000 | 09/20/18 | 54,438 | |||||||||||||
JPMCB | NOK | 1,000,000 | USD | 127,200 | 08/02/18 | 4,600 | |||||||||||||
JPMCB | NOK | 28,167,651 | USD | 3,455,569 | 08/24/18 | (860 | ) | ||||||||||||
JPMCB | NOK | 310,000 | USD | 38,238 | 11/02/18 | 97 | |||||||||||||
JPMCB | NZD | 6,154,879 | USD | 4,205,709 | 08/24/18 | 10,685 | |||||||||||||
JPMCB | NZD | 11,737,582 | USD | 7,998,799 | 08/24/18 | (1,268 | ) | ||||||||||||
JPMCB | SEK | 141,046,782 | USD | 15,800,474 | 08/24/18 | (266,515 | ) | ||||||||||||
JPMCB | SEK | 1,800,000 | USD | 207,052 | 09/10/18 | 1,748 | |||||||||||||
JPMCB | SEK | 2,591,000 | USD | 293,612 | 09/14/18 | (2,005 | ) | ||||||||||||
JPMCB | SGD | 196,000 | USD | 144,091 | 09/14/18 | 8 | |||||||||||||
JPMCB | SGD | 2,043,040 | USD | 1,500,000 | 09/20/18 | (2,069 | ) | ||||||||||||
JPMCB | SGD | 254,000 | USD | 187,007 | 11/02/18 | 61 | |||||||||||||
JPMCB | USD | 106,531 | ARS | 3,255,000 | 09/25/18 | 6,070 | |||||||||||||
JPMCB | USD | 1,098,649 | AUD | 1,480,000 | 08/02/18 | 917 | |||||||||||||
JPMCB | USD | 11,930,853 | AUD | 15,599,210 | 08/24/18 | (339,989 | ) | ||||||||||||
JPMCB | USD | 190,639 | AUD | 258,309 | 09/14/18 | 1,308 | |||||||||||||
JPMCB | USD | 386,132 | BRL | 1,459,000 | �� | 09/06/18 | 1,043 | ||||||||||||
JPMCB | USD | 19,905,038 | CAD | 26,454,861 | 08/24/18 | 439,372 | |||||||||||||
JPMCB | USD | 990,452 | CAD | 1,301,716 | 09/14/18 | 10,950 | |||||||||||||
JPMCB | USD | 9,086,372 | CHF | 8,916,229 | 08/24/18 | (65,843 | ) | ||||||||||||
JPMCB | USD | 1,085,886 | CHF | 1,080,969 | 08/24/18 | 7,728 | |||||||||||||
JPMCB | USD | 374,569 | COP | 1,087,000,000 | 09/07/18 | 948 | |||||||||||||
260
PACE Alternative Strategies Investments
Portfolio of investments—July 31, 2018
Forward foreign currency contracts—(continued)
Counterparty | Sell | Purchase | Settlement date | Unrealized appreciation (depreciation) | |||||||||||||||
JPMCB | USD | 226,983 | COP | 658,000,000 | 09/25/18 | $ | 131 | ||||||||||||
JPMCB | USD | 83,024 | CZK | 1,818,000 | 09/07/18 | 215 | |||||||||||||
JPMCB | USD | 3,719,955 | EUR | 3,176,000 | 08/02/18 | (6,100 | ) | ||||||||||||
JPMCB | USD | 900,000 | EUR | 745,179 | 08/16/18 | (27,747 | ) | ||||||||||||
JPMCB | USD | 2,770,073 | EUR | 2,363,830 | 08/24/18 | (1,550 | ) | ||||||||||||
JPMCB | USD | 15,496,093 | EUR | 13,277,718 | 08/24/18 | 54,802 | |||||||||||||
JPMCB | USD | 5,687,277 | GBP | 4,222,588 | 08/24/18 | (139,998 | ) | ||||||||||||
JPMCB | USD | 2,077,971 | GBP | 1,559,000 | 09/10/18 | (28,441 | ) | ||||||||||||
JPMCB | USD | 385,380 | HKD | 3,020,000 | 09/10/18 | (278 | ) | ||||||||||||
JPMCB | USD | 11,814,779 | JPY | 1,289,663,047 | 08/24/18 | (264,532 | ) | ||||||||||||
JPMCB | USD | 1,347,986 | JPY | 145,530,000 | 09/06/18 | (43,504 | ) | ||||||||||||
JPMCB | USD | 833,298 | JPY | 91,959,779 | 09/14/18 | (8,530 | ) | ||||||||||||
JPMCB | USD | 38,107 | NOK | 310,000 | 08/02/18 | (101 | ) | ||||||||||||
JPMCB | USD | 7,959,276 | NOK | 63,941,679 | 08/24/18 | (113,046 | ) | ||||||||||||
JPMCB | USD | 7,704,325 | NZD | 11,401,468 | 08/24/18 | 66,653 | |||||||||||||
JPMCB | USD | 109,290 | PEN | 360,000 | 09/25/18 | 481 | |||||||||||||
JPMCB | USD | 271,076 | SEK | 2,400,000 | 08/02/18 | 1,869 | |||||||||||||
JPMCB | USD | 10,612,631 | SEK | 92,135,416 | 08/24/18 | (117,257 | ) | ||||||||||||
JPMCB | USD | 21,637 | SEK | 191,000 | 09/10/18 | 148 | |||||||||||||
JPMCB | USD | 143,964 | SGD | 196,000 | 08/02/18 | 11 | |||||||||||||
JPMCB | USD | 186,613 | SGD | 254,000 | 08/02/18 | (33 | ) | ||||||||||||
JPMCB | USD | 143,702 | SGD | 195,998 | 09/14/18 | 379 | |||||||||||||
JPMCB | USD | 159,441 | ZAR | 2,100,000 | 08/02/18 | 43 | |||||||||||||
JPMCB | USD | 464,126 | ZAR | 5,865,000 | 09/07/18 | (20,763 | ) | ||||||||||||
JPMCB | ZAR | 2,100,000 | USD | 157,557 | 11/02/18 | (60 | ) | ||||||||||||
MSCI | AUD | 3,894,438 | USD | 2,921,748 | 09/19/18 | 27,807 | |||||||||||||
MSCI | AUD | 5,691,870 | USD | 4,207,808 | 09/19/18 | (21,796 | ) | ||||||||||||
MSCI | CAD | 2,920,516 | USD | 2,260,723 | 09/19/18 | 13,806 | |||||||||||||
MSCI | CAD | 5,725,175 | USD | 4,373,314 | 09/19/18 | (31,386 | ) | ||||||||||||
MSCI | EUR | 7,332,976 | USD | 8,639,947 | 09/19/18 | 34,895 | |||||||||||||
MSCI | EUR | 1,355,389 | USD | 1,575,703 | 09/19/18 | (14,809 | ) | ||||||||||||
MSCI | GBP | 3,336,518 | USD | 4,486,542 | 09/19/18 | 98,481 | |||||||||||||
MSCI | GBP | 7,783 | USD | 10,205 | 09/19/18 | (31 | ) | ||||||||||||
MSCI | JPY | 1,876,627,760 | USD | 17,092,169 | 09/19/18 | 255,068 | |||||||||||||
MSCI | JPY | 62,540,130 | USD | 556,361 | 09/19/18 | (4,749 | ) | ||||||||||||
MSCI | NOK | 136,230,095 | USD | 16,816,945 | 09/19/18 | 83,554 | |||||||||||||
MSCI | NOK | 33,045,394 | USD | 4,042,171 | 09/19/18 | (16,855 | ) | ||||||||||||
MSCI | NZD | 3,855,859 | USD | 2,655,971 | 09/19/18 | 27,972 | |||||||||||||
MSCI | NZD | 8,200,221 | USD | 5,565,341 | 09/19/18 | (23,602 | ) | ||||||||||||
MSCI | SEK | 408,990,726 | USD | 47,497,970 | 09/19/18 | 816,614 | |||||||||||||
MSCI | SEK | 13,590,673 | USD | 1,533,538 | 09/19/18 | (17,674 | ) | ||||||||||||
MSCI | SGD | 22,154,850 | USD | 16,610,118 | 09/19/18 | 321,943 | |||||||||||||
MSCI | SGD | 3,275,027 | USD | 2,405,256 | 09/19/18 | (2,533 | ) | ||||||||||||
MSCI | USD | 15,601,538 | AUD | 20,444,383 | 09/19/18 | (409,402 | ) | ||||||||||||
MSCI | USD | 3,851,838 | AUD | 5,202,135 | 09/19/18 | 13,846 | |||||||||||||
261
PACE Alternative Strategies Investments
Portfolio of investments—July 31, 2018
Forward foreign currency contracts—(concluded)
Counterparty | Sell | Purchase | Settlement date | Unrealized appreciation (depreciation) | |||||||||||||||
MSCI | USD | 515,357 | CAD | 669,011 | 09/19/18 | $ | (650 | ) | |||||||||||
MSCI | USD | 232,095 | CAD | 305,619 | 09/19/18 | 3,035 | |||||||||||||
MSCI | USD | 4,881,923 | EUR | 4,135,663 | 09/19/18 | (28,832 | ) | ||||||||||||
MSCI | USD | 6,227,789 | EUR | 5,336,249 | 09/19/18 | 34,156 | |||||||||||||
MSCI | USD | 4,490,097 | GBP | 3,354,761 | 09/19/18 | (78,044 | ) | ||||||||||||
MSCI | USD | 6,483,359 | JPY | 706,334,909 | 09/19/18 | (146,123 | ) | ||||||||||||
MSCI | USD | 72,239 | JPY | 8,106,629 | 09/19/18 | 493 | |||||||||||||
MSCI | USD | 8,850,847 | NOK | 71,439,239 | 09/19/18 | (75,834 | ) | ||||||||||||
MSCI | USD | 956,528 | NOK | 7,806,534 | 09/19/18 | 2,362 | |||||||||||||
MSCI | USD | 22,980,574 | NZD | 32,981,598 | 09/19/18 | (501,634 | ) | ||||||||||||
MSCI | USD | 8,370,078 | NZD | 12,375,782 | 09/19/18 | 64,762 | |||||||||||||
MSCI | USD | 4,671,991 | SEK | 40,508,262 | 09/19/18 | (48,462 | ) | ||||||||||||
MSCI | USD | 3,200,395 | SEK | 28,345,324 | 09/19/18 | 34,882 | |||||||||||||
MSCI | USD | 11,696,603 | SGD | 15,653,504 | 09/19/18 | (188,198 | ) | ||||||||||||
MSCI | USD | 1,461,549 | SGD | 1,991,703 | 09/19/18 | 2,745 | |||||||||||||
SG | AUD | 9,946,403 | USD | 7,650,000 | 08/16/18 | 259,684 | |||||||||||||
SG | CAD | 5,214,742 | USD | 4,024,342 | 08/24/18 | 14,083 | |||||||||||||
SG | EUR | 8,284,537 | USD | 10,300,000 | 08/16/18 | 602,711 | |||||||||||||
SG | GBP | 305,853 | USD | 416,211 | 08/16/18 | 14,537 | |||||||||||||
SG | KRW | 3,493,393,000 | USD | 3,130,000 | 10/24/18 | 416 | |||||||||||||
SG | USD | 4,896,420 | AUD | 6,475,547 | 08/24/18 | (84,819 | ) | ||||||||||||
SG | USD | 2,658,059 | CAD | 3,490,829 | 08/24/18 | 26,470 | |||||||||||||
SG | USD | 8,107,609 | JPY | 888,593,985 | 08/24/18 | (149,344 | ) | ||||||||||||
SG | USD | 1,560,000 | TRY | 6,934,986 | 08/16/18 | (161,016 | ) | ||||||||||||
$ | 2,290,034 | ||||||||||||||||||
Variance swap agreements
Counterparty | Notional amount (000) | Maturity date | Pay/ receive variance | Reference entity | Volatility strike price | Upfront payments received (made) | Value | Unrealized appreciation (depreciation) | |||||||||||||||||||||||||||
BNP | EUR | 5 | 12/20/19 | Receive | DJ Euro Stoxx 50 | 21.40 | % | $ | — | $ | (17,967 | ) | $ | (17,967 | ) | ||||||||||||||||||||
BNP | EUR | 5 | 12/20/19 | Receive | DJ Euro Stoxx 50 | 21.55 | — | (20,046 | ) | (20,046 | ) | ||||||||||||||||||||||||
BNP | EUR | 6 | 12/20/19 | Receive | DJ Euro Stoxx 50 | 21.60 | — | (50,007 | ) | (50,007 | ) | ||||||||||||||||||||||||
BNP | EUR | 3 | 12/20/19 | Receive | DJ Euro Stoxx 50 | 21.65 | — | (10,736 | ) | (10,736 | ) | ||||||||||||||||||||||||
BNP | EUR | 4 | 12/20/19 | Receive | DJ Euro Stoxx 50 | 21.70 | — | (15,844 | ) | (15,844 | ) | ||||||||||||||||||||||||
BNP | EUR | 3 | 12/20/19 | Receive | DJ Euro Stoxx 50 | 22.05 | — | (11,849 | ) | (11,849 | ) | ||||||||||||||||||||||||
BNP | EUR | 2 | 12/20/19 | Receive | DJ Euro Stoxx 50 | 22.50 | — | (7,815 | ) | (7,815 | ) | ||||||||||||||||||||||||
BNP | EUR | 3 | 12/20/19 | Receive | DJ Euro Stoxx 50 | 22.70 | — | (13,493 | ) | (13,493 | ) | ||||||||||||||||||||||||
BNP | GBP | 10 | 12/21/18 | Pay | FTSE 100 Index | 20.15 | — | 91,597 | 91,597 | ||||||||||||||||||||||||||
BNP | HKD | 95 | 12/28/18 | Receive | Hang Seng China Enterprises Index | 25.15 | — | (56,258 | ) | (56,258 | ) | ||||||||||||||||||||||||
BNP | HKD | 39 | 12/28/18 | Receive | Hang Seng China Enterprises Index | 25.45 | — | (24,068 | ) | (24,068 | ) | ||||||||||||||||||||||||
BNP | HKD | 23 | 12/28/18 | Receive | Hang Seng China Enterprises Index | 27.70 | — | (17,434 | ) | (17,434 | ) | ||||||||||||||||||||||||
BNP | HKD | 97 | 12/28/18 | Receive | Hang Seng China Enterprises Index | 29.30 | — | (102,322 | ) | (102,322 | ) | ||||||||||||||||||||||||
262
PACE Alternative Strategies Investments
Portfolio of investments—July 31, 2018
Variance swap agreements—(continued)
Counterparty | Notional amount (000) | Maturity date | Pay/ receive variance | Reference entity | Volatility strike price | Upfront payments received (made) | Value | Unrealized appreciation (depreciation) | |||||||||||||||||||||||||||
BNP | HKD | 23 | 12/30/19 | Receive | Hang Seng China Enterprises Index | 26.35 | % | $ | — | $ | (4,376 | ) | $ | (4,376 | ) | ||||||||||||||||||||
BNP | JPY | 999 | 12/14/18 | Receive | Nikkei 225 Index | 19.85 | — | (30,165 | ) | (30,165 | ) | ||||||||||||||||||||||||
BNP | KRW | 1,860 | 12/13/18 | Receive | Kospi 200 Index | 21.90 | — | (11,173 | ) | (11,173 | ) | ||||||||||||||||||||||||
BNP | USD | 9 | 12/21/18 | Pay | S&P 500 Index | 17.15 | — | 27,455 | 27,455 | ||||||||||||||||||||||||||
BNP | USD | 12 | 12/21/18 | Pay | S&P 500 Index | 17.75 | — | 49,559 | 49,559 | ||||||||||||||||||||||||||
BNP | USD | 5 | 12/21/18 | Pay | S&P 500 Index | 18.05 | — | 21,242 | 21,242 | ||||||||||||||||||||||||||
BNP | USD | 3 | 12/21/18 | Pay | S&P 500 Index | 20.20 | — | 17,191 | 17,191 | ||||||||||||||||||||||||||
BNP | USD | 2 | 12/21/18 | Pay | S&P 500 Index | 21.60 | — | 9,864 | 9,864 | ||||||||||||||||||||||||||
BNP | USD | 3 | 12/20/19 | Pay | S&P 500 Index | 19.05 | — | 5,588 | 5,588 | ||||||||||||||||||||||||||
BNP | USD | 6 | 12/20/19 | Pay | S&P 500 Index | 19.30 | — | 10,214 | 10,214 | ||||||||||||||||||||||||||
BNP | USD | 6 | 12/20/19 | Pay | S&P 500 Index | 19.40 | — | 11,540 | 11,540 | ||||||||||||||||||||||||||
BNP | USD | 8 | 12/20/19 | Pay | S&P 500 Index | 19.50 | — | 15,460 | 15,460 | ||||||||||||||||||||||||||
BNP | USD | 3 | 12/20/19 | Pay | S&P 500 Index | 19.70 | — | 6,793 | 6,793 | ||||||||||||||||||||||||||
BNP | USD | 3 | 12/20/19 | Pay | S&P 500 Index | 19.80 | — | 6,952 | 6,952 | ||||||||||||||||||||||||||
BNP | USD | 5 | 12/20/19 | Pay | S&P 500 Index | 20.20 | — | 11,867 | 11,867 | ||||||||||||||||||||||||||
BNP | USD | 7 | 12/20/19 | Pay | S&P 500 Index | 20.30 | — | 18,924 | 18,924 | ||||||||||||||||||||||||||
BNP | USD | 2 | 12/20/19 | Pay | S&P 500 Index | 20.75 | — | 5,885 | 5,885 | ||||||||||||||||||||||||||
BNP | USD | 3 | 12/20/19 | Pay | S&P 500 Index | 21.00 | — | 10,346 | 10,346 | ||||||||||||||||||||||||||
DB | EUR | 1 | 12/20/19 | Receive | DJ Euro Stoxx 50 | 21.50 | — | (5,115 | ) | (5,115 | ) | ||||||||||||||||||||||||
DB | HKD | 19 | 12/28/18 | Receive | Hang Seng China Enterprises Index | 25.80 | — | (10,321 | ) | (10,321 | ) | ||||||||||||||||||||||||
DB | HKD | 18 | 12/30/19 | Receive | Hang Seng China Enterprises Index | 26.50 | — | (4,392 | ) | (4,392 | ) | ||||||||||||||||||||||||
DB | HKD | 140 | 12/30/19 | Receive | Hang Seng China Enterprises Index | 27.75 | — | (49,968 | ) | (49,968 | ) | ||||||||||||||||||||||||
DB | HKD | 45 | 12/30/19 | Receive | Hang Seng China Enterprises Index | 28.60 | — | (20,645 | ) | (20,645 | ) | ||||||||||||||||||||||||
DB | HKD | 31 | 12/30/20 | Receive | Hang Seng China Enterprises Index | 26.85 | — | (2,884 | ) | (2,884 | ) | ||||||||||||||||||||||||
DB | USD | 3 | 12/21/18 | Pay | S&P 500 Index | 19.05 | — | 9,719 | 9,719 | ||||||||||||||||||||||||||
DB | USD | 2 | 12/20/19 | Pay | S&P 500 Index | 19.45 | — | 3,443 | 3,443 | ||||||||||||||||||||||||||
DB | USD | 2 | 12/20/19 | Pay | S&P 500 Index | 19.70 | — | 3,371 | 3,371 | ||||||||||||||||||||||||||
DB | USD | 18 | 12/20/19 | Pay | S&P 500 Index | 20.50 | — | 54,172 | 54,172 | ||||||||||||||||||||||||||
DB | USD | 6 | 12/20/19 | Pay | S&P 500 Index | 21.35 | — | 23,579 | 23,579 | ||||||||||||||||||||||||||
DB | USD | 4 | 12/18/20 | Pay | S&P 500 Index | 19.60 | — | 3,639 | 3,639 | ||||||||||||||||||||||||||
GS | EUR | 9 | 12/20/19 | Receive | DJ Euro Stoxx 50 | 23.50 | — | (54,402 | ) | (54,402 | ) | ||||||||||||||||||||||||
GS | USD | 10 | 12/20/19 | Pay | S&P 500 Index | 20.60 | — | 49,133 | 49,133 | ||||||||||||||||||||||||||
JPMCB | EUR | 9 | 12/20/19 | Receive | DJ Euro Stoxx 50 | 21.60 | — | (38,143 | ) | (38,143 | ) | ||||||||||||||||||||||||
JPMCB | EUR | 7 | 12/20/19 | Receive | DJ Euro Stoxx 50 | 22.90 | — | (40,258 | ) | (40,258 | ) | ||||||||||||||||||||||||
JPMCB | EUR | 1 | 12/20/19 | Receive | DJ Euro Stoxx 50 | 23.05 | — | (6,605 | ) | (6,605 | ) | ||||||||||||||||||||||||
JPMCB | EUR | 2 | 12/20/19 | Receive | DJ Euro Stoxx 50 | 23.15 | — | (13,427 | ) | (13,427 | ) | ||||||||||||||||||||||||
JPMCB | EUR | 2 | 12/20/19 | Receive | DJ Euro Stoxx 50 | 23.20 | — | (13,523 | ) | (13,523 | ) | ||||||||||||||||||||||||
JPMCB | GBP | 4 | 12/21/18 | Pay | FTSE 100 Index | 19.68 | — | 35,888 | 35,888 | ||||||||||||||||||||||||||
JPMCB | GBP | 1 | 12/21/18 | Pay | FTSE 100 Index | 19.87 | — | 10,687 | 10,687 | ||||||||||||||||||||||||||
JPMCB | GBP | 20 | 12/21/18 | Pay | FTSE 100 Index | 22.55 | — | 226,016 | 226,016 | ||||||||||||||||||||||||||
JPMCB | HKD | 190 | 12/21/18 | Receive | Hang Seng China Enterprises Index | 31.55 | — | (244,530 | ) | (244,530 | ) | ||||||||||||||||||||||||
JPMCB | HKD | 38 | 12/28/18 | Receive | Hang Seng China Enterprises Index | 25.07 | — | (22,683 | ) | (22,683 | ) | ||||||||||||||||||||||||
JPMCB | HKD | 37 | 12/28/18 | Receive | Hang Seng China Enterprises Index | 25.32 | — | (17,061 | ) | (17,061 | ) | ||||||||||||||||||||||||
JPMCB | HKD | 40 | 12/28/18 | Receive | Hang Seng China Enterprises Index | 25.40 | — | (24,824 | ) | (24,824 | ) | ||||||||||||||||||||||||
JPMCB | HKD | 73 | 12/28/18 | Receive | Hang Seng China Enterprises Index | 25.48 | — | (35,327 | ) | (35,327 | ) | ||||||||||||||||||||||||
263
PACE Alternative Strategies Investments
Portfolio of investments—July 31, 2018
Variance swap agreements—(continued)
Counterparty | Notional amount (000) | Maturity date | Pay/ receive variance | Reference entity | Volatility strike price | Upfront payments received (made) | Value | Unrealized appreciation (depreciation) | |||||||||||||||||||||||||||
JPMCB | HKD | 60 | 12/28/18 | Receive | Hang Seng China Enterprises Index | 25.49 | % | $ | — | $ | (37,777 | ) | $ | (37,777 | ) | ||||||||||||||||||||
JPMCB | HKD | 40 | 12/28/18 | Receive | Hang Seng China Enterprises Index | 25.87 | — | (27,583 | ) | (27,583 | ) | ||||||||||||||||||||||||
JPMCB | HKD | 44 | 12/28/18 | Receive | Hang Seng China Enterprises Index | 26.41 | — | (33,435 | ) | (33,435 | ) | ||||||||||||||||||||||||
JPMCB | HKD | 19 | 12/28/18 | Receive | Hang Seng China Enterprises Index | 26.53 | — | (11,570 | ) | (11,570 | ) | ||||||||||||||||||||||||
JPMCB | HKD | 83 | 12/28/18 | Receive | Hang Seng China Enterprises Index | 27.09 | — | (68,844 | ) | (68,844 | ) | ||||||||||||||||||||||||
JPMCB | HKD | 100 | 12/28/18 | Receive | Hang Seng China Enterprises Index | 27.10 | — | (82,625 | ) | (82,625 | ) | ||||||||||||||||||||||||
JPMCB | HKD | 20 | 12/28/18 | Receive | Hang Seng China Enterprises Index | 27.87 | — | (14,956 | ) | (14,956 | ) | ||||||||||||||||||||||||
JPMCB | HKD | 63 | 12/28/18 | Receive | Hang Seng China Enterprises Index | 27.89 | — | (57,357 | ) | (57,357 | ) | ||||||||||||||||||||||||
JPMCB | HKD | 12 | 12/28/18 | Receive | Hang Seng China Enterprises Index | 29.26 | — | (12,584 | ) | (12,584 | ) | ||||||||||||||||||||||||
JPMCB | HKD | 40 | 12/28/18 | Receive | Hang Seng China Enterprises Index | 29.29 | — | (42,044 | ) | (42,044 | ) | ||||||||||||||||||||||||
JPMCB | HKD | 45 | 12/30/19 | Reveive | Hang Seng China Enterprises Index | 26.20 | — | (9,361 | ) | (9,361 | ) | ||||||||||||||||||||||||
JPMCB | HKD | 26 | 12/30/19 | Receive | Hang Seng China Enterprises Index | 26.50 | — | (5,473 | ) | (5,473 | ) | ||||||||||||||||||||||||
JPMCB | HKD | 52 | 12/30/19 | Receive | Hang Seng China Enterprises Index | 26.72 | — | (12,278 | ) | (12,278 | ) | ||||||||||||||||||||||||
JPMCB | HKD | 69 | 12/30/19 | Receive | Hang Seng China Enterprises Index | 26.76 | — | (18,275 | ) | (18,275 | ) | ||||||||||||||||||||||||
JPMCB | HKD | 22 | 12/30/19 | Receive | Hang Seng China Enterprises Index | 27.10 | — | (6,652 | ) | (6,652 | ) | ||||||||||||||||||||||||
JPMCB | JPY | 520 | 12/14/18 | Receive | Nikkei 225 Index | 19.80 | — | (15,630 | ) | (15,630 | ) | ||||||||||||||||||||||||
JPMCB | JPY | 1,030 | 12/14/18 | Receive | Nikkei 225 Index | 20.28 | — | (34,551 | ) | (34,551 | ) | ||||||||||||||||||||||||
JPMCB | JPY | 1,545 | 12/14/18 | Receive | Nikkei 225 Index | 20.51 | — | (54,599 | ) | (54,599 | ) | ||||||||||||||||||||||||
JPMCB | JPY | 517 | 12/14/18 | Receive | Nikkei 225 Index | 20.58 | — | (17,764 | ) | (17,764 | ) | ||||||||||||||||||||||||
JPMCB | USD | 5 | 12/21/18 | Pay | S&P 500 Index | 16.70 | — | 12,498 | 12,498 | ||||||||||||||||||||||||||
JPMCB | USD | 5 | 12/21/18 | Pay | S&P 500 Index | 17.40 | — | 14,591 | 14,591 | ||||||||||||||||||||||||||
JPMCB | USD | 9 | 12/21/18 | Pay | S&P 500 Index | 17.48 | — | 30,773 | 30,773 | ||||||||||||||||||||||||||
JPMCB | USD | 5 | 12/21/18 | Pay | S&P 500 Index | 17.49 | — | 14,650 | 14,650 | ||||||||||||||||||||||||||
JPMCB | USD | 14 | 12/21/18 | Pay | S&P 500 Index | 17.51 | — | 46,800 | 46,800 | ||||||||||||||||||||||||||
JPMCB | USD | 9 | 12/21/18 | Pay | S&P 500 Index | 17.65 | — | 30,253 | 30,253 | ||||||||||||||||||||||||||
JPMCB | USD | 5 | 12/21/18 | Pay | S&P 500 Index | 17.67 | — | 19,968 | 19,968 | ||||||||||||||||||||||||||
JPMCB | USD | 5 | 12/21/18 | Pay | S&P 500 Index | 18.00 | — | 21,952 | 21,952 | ||||||||||||||||||||||||||
JPMCB | USD | 8 | 12/21/18 | Pay | S&P 500 Index | 18.09 | — | 33,321 | 33,321 | ||||||||||||||||||||||||||
JPMCB | USD | 5 | 12/21/18 | Pay | S&P 500 Index | 18.37 | — | 24,222 | 24,222 | ||||||||||||||||||||||||||
JPMCB | USD | 6 | 12/21/18 | Pay | S&P 500 Index | 18.41 | — | 27,466 | 27,466 | ||||||||||||||||||||||||||
JPMCB | USD | 11 | 12/21/18 | Pay | S&P 500 Index | 19.09 | — | 57,446 | 57,446 | ||||||||||||||||||||||||||
JPMCB | USD | 13 | 12/21/18 | Receive | S&P 500 Index | 19.15 | — | 69,109 | 69,109 | ||||||||||||||||||||||||||
JPMCB | USD | 10 | 12/21/18 | Pay | S&P 500 Index | 19.24 | — | 53,080 | 53,080 | ||||||||||||||||||||||||||
JPMCB | USD | 3 | 12/21/18 | Pay | S&P 500 Index | 19.47 | — | 10,842 | 10,842 | ||||||||||||||||||||||||||
JPMCB | USD | 3 | 12/21/18 | Pay | S&P 500 Index | 21.08 | — | 16,170 | 16,170 | ||||||||||||||||||||||||||
JPMCB | USD | 3 | 12/20/19 | Pay | S&P 500 Index | 19.04 | — | 5,739 | 5,739 | ||||||||||||||||||||||||||
JPMCB | USD | 6 | 12/20/19 | Pay | S&P 500 Index | 19.20 | — | 9,723 | 9,723 | ||||||||||||||||||||||||||
JPMCB | USD | 4 | 12/20/19 | Pay | S&P 500 Index | 19.60 | — | 8,370 | 8,370 | ||||||||||||||||||||||||||
JPMCB | USD | 9 | 12/20/19 | Pay | S&P 500 Index | 19.86 | — | 19,656 | 19,656 | ||||||||||||||||||||||||||
JPMCB | USD | 3 | 12/20/19 | Pay | S&P 500 Index | 20.10 | — | 6,883 | 6,883 | ||||||||||||||||||||||||||
JPMCB | USD | 11 | 12/20/19 | Pay | S&P 500 Index | 20.50 | — | 30,182 | 30,182 | ||||||||||||||||||||||||||
JPMCB | USD | 6 | 12/20/19 | Pay | S&P 500 Index | 20.90 | — | 19,798 | 19,798 | ||||||||||||||||||||||||||
JPMCB | USD | 7 | 12/20/19 | Pay | S&P 500 Index | 21.50 | — | 26,242 | 26,242 | ||||||||||||||||||||||||||
JPMCB | USD | 3 | 12/20/19 | Pay | S&P 500 Index | 21.70 | — | 10,971 | 10,971 | ||||||||||||||||||||||||||
SG | HKD | 38 | 12/28/18 | Receive | Hang Seng China Enterprises Index | 25.00 | — | (22,615 | ) | (22,615 | ) | ||||||||||||||||||||||||
264
PACE Alternative Strategies Investments
Portfolio of investments—July 31, 2018
Variance swap agreements—(concluded)
Counterparty | Notional amount (000) | Maturity date | Pay/ receive variance | Reference entity | Volatility strike price | Upfront payments received (made) | Value | Unrealized appreciation (depreciation) | |||||||||||||||||||||||||||
SG | HKD | 39 | 12/28/18 | Receive | Hang Seng China Enterprises Index | 26.05 | % | $ | — | $ | (28,103 | ) | $ | (28,103 | ) | ||||||||||||||||||||
SG | HKD | 44 | 12/28/18 | Receive | Hang Seng China Enterprises Index | 27.60 | — | (38,537 | ) | (38,537 | ) | ||||||||||||||||||||||||
SG | HKD | 43 | 12/28/18 | Receive | Hang Seng China Enterprises Index | 27.85 | — | (38,921 | ) | (38,921 | ) | ||||||||||||||||||||||||
SG | HKD | 132 | 12/28/18 | Receive | Hang Seng China Enterprises Index | 27.90 | — | (120,607 | ) | (120,607 | ) | ||||||||||||||||||||||||
SG | HKD | 43 | 12/28/18 | Receive | Hang Seng China Enterprises Index | 27.95 | — | (39,430 | ) | (39,430 | ) | ||||||||||||||||||||||||
SG | HKD | 176 | 12/28/18 | Receive | Hang Seng China Enterprises Index | 28.05 | — | (162,294 | ) | (162,294 | ) | ||||||||||||||||||||||||
SG | HKD | 44 | 12/28/18 | Receive | Hang Seng China Enterprises Index | 28.15 | — | (41,142 | ) | (41,142 | ) | ||||||||||||||||||||||||
SG | HKD | 22 | 12/30/19 | Receive | Hang Seng China Enterprises Index | 26.65 | — | (5,624 | ) | (5,624 | ) | ||||||||||||||||||||||||
SG | USD | 5 | 12/21/18 | Pay | S&P 500 Index | 18.10 | — | 21,894 | 21,894 | ||||||||||||||||||||||||||
SG | USD | 5 | 12/21/18 | Pay | S&P 500 Index | 18.30 | — | 23,837 | 23,837 | ||||||||||||||||||||||||||
SG | USD | 23 | 12/21/18 | Pay | S&P 500 Index | 19.10 | — | 123,070 | 123,070 | ||||||||||||||||||||||||||
SG | USD | 11 | 12/21/18 | Pay | S&P 500 Index | 19.20 | — | 61,233 | 61,233 | ||||||||||||||||||||||||||
SG | USD | 6 | 12/21/18 | Pay | S&P 500 Index | 19.25 | — | 31,450 | 31,450 | ||||||||||||||||||||||||||
SG | USD | 17 | 12/21/18 | Pay | S&P 500 Index | 19.30 | — | 94,736 | 94,736 | ||||||||||||||||||||||||||
SG | USD | 6 | 12/21/18 | Pay | S&P 500 Index | 19.35 | — | 31,745 | 31,745 | ||||||||||||||||||||||||||
SG | USD | 3 | 12/20/19 | Pay | S&P 500 Index | 19.65 | — | (5,744 | ) | (5,744 | ) | ||||||||||||||||||||||||
$ | — | $ | (315,242 | ) | $ | (315,242 | ) | ||||||||||||||||||||||||||||
Centrally cleared interest rate swap agreements
| Notional amount (000) | Maturity date | Payment frequency | Payments made by the Portfolio9 | Payments received by the Portfolio9 | Value | Unrealized appreciation (depreciation) | |||||||||||||||||||||
AUD | 5,278 | 05/13/21 | Semi-Annual | 6 Month AUD Bank Bill Rate | 2.565 | % | $ | 13,691 | $ | 13,691 | |||||||||||||||||
AUD | 5,278 | 05/15/21 | Semi-Annual | 6 Month AUD Bank Bill Rate | 2.500 | 8,704 | 8,704 | ||||||||||||||||||||
AUD | 7,917 | 05/17/21 | Semi-Annual | 6 Month AUD Bank Bill Rate | 2.486 | 11,378 | 11,378 | ||||||||||||||||||||
AUD | 7,917 | 05/20/21 | Semi-Annual | 6 Month AUD Bank Bill Rate | 2.357 | (3,342 | ) | (3,342 | ) | ||||||||||||||||||
AUD | 11,510 | 05/23/21 | Semi-Annual | 6 Month AUD Bank Bill Rate | 2.385 | (587 | ) | (587 | ) | ||||||||||||||||||
AUD | 51,590 | 06/19/21 | Quarterly | 3 Month AUD Bank Bill Rate | 2.370 | 89,997 | 89,997 | ||||||||||||||||||||
AUD | 37,000 | 11/27/21 | Semi-Annual | 6 Month AUD Bank Bill Rate | 2.430 | (27,030 | ) | (27,030 | ) | ||||||||||||||||||
CAD | 5,364 | 10/18/19 | Semi-Annual | 3 Month Canadian Bankers Acceptance Rate | 1.879 | (11,690 | ) | (11,657 | ) | ||||||||||||||||||
CAD | 3,576 | 10/19/19 | Semi-Annual | 3 Month Canadian Bankers Acceptance Rate | 1.840 | (9,529 | ) | (9,510 | ) | ||||||||||||||||||
CAD | 1,788 | 10/26/19 | Semi-Annual | 3 Month Canadian Bankers Acceptance Rate | 1.830 | (5,048 | ) | (5,048 | ) | ||||||||||||||||||
CAD | 5,364 | 11/02/19 | Semi-Annual | 3 Month Canadian Bankers Acceptance Rate | 1.775 | (19,222 | ) | (19,222 | ) | ||||||||||||||||||
CAD | 3,576 | 11/03/19 | Semi-Annual | 3 Month Canadian Bankers Acceptance Rate | 1.800 | (11,930 | ) | (11,930 | ) | ||||||||||||||||||
CAD | 3,576 | 11/06/19 | Semi-Annual | 3 Month Canadian Bankers Acceptance Rate | 1.795 | (15,894 | ) | (15,894 | ) | ||||||||||||||||||
CAD 5,364 11/07/19 Semi-Annual 3 Month Canadian Bankers 1.775 (25,146) (25,146)
Acceptance Rate
265
PACE Alternative Strategies Investments
Portfolio of investments—July 31, 2018
Centrally cleared interest rate swap agreements—(continued)
| Notional amount (000) | Maturity date | Payment frequency | Payments made by the Portfolio9 | Payments received by the Portfolio9 | Value | Unrealized appreciation (depreciation) | |||||||||||||||||||||
CAD | 1,788 | 11/09/19 | Semi-Annual | 3 Month Canadian Bankers Acceptance Rate | 1.780 | % | $ | (8,438 | ) | $ | (8,438 | ) | |||||||||||||||
CAD | 1,788 | 11/10/19 | Semi-Annual | 3 Month Canadian Bankers Acceptance Rate | 1.800 | (8,097 | ) | (8,097 | ) | ||||||||||||||||||
CAD | 5,364 | 11/14/19 | Semi-Annual | 3 Month Canadian Bankers Acceptance Rate | 1.810 | (23,649 | ) | (23,649 | ) | ||||||||||||||||||
CAD | 1,788 | 11/28/19 | Semi-Annual | 3 Month Canadian Bankers Acceptance Rate | 1.760 | (9,279 | ) | (9,270 | ) | ||||||||||||||||||
CAD | 1,788 | 11/29/19 | Semi-Annual | 3 Month Canadian Bankers Acceptance Rate | 1.763 | (9,244 | ) | (9,235 | ) | ||||||||||||||||||
CAD | 1,788 | 12/01/19 | Semi-Annual | 3 Month Canadian Bankers Acceptance Rate | 1.835 | (6,038 | ) | (6,007 | ) | ||||||||||||||||||
CAD | 1,788 | 12/04/19 | Semi-Annual | 3 Month Canadian Bankers Acceptance Rate | 1.871 | (5,301 | ) | (5,301 | ) | ||||||||||||||||||
CAD | 5,037 | 06/17/21 | Semi-Annual | 3 Month Canadian Bankers Acceptance Rate | 2.531 | (9,022 | ) | (9,022 | ) | ||||||||||||||||||
CAD | 5,037 | 06/18/21 | Semi-Annual | 3 Month Canadian Bankers Acceptance Rate | 2.525 | (9,498 | ) | (9,498 | ) | ||||||||||||||||||
CAD | 2,195 | 07/03/21 | Semi-Annual | 3 Month Canadian Bankers Acceptance Rate | 2.505 | (4,998 | ) | (4,998 | ) | ||||||||||||||||||
CAD | 3,766 | 07/05/21 | Semi-Annual | 3 Month Canadian Bankers Acceptance Rate | 2.504 | (8,666 | ) | (8,666 | ) | ||||||||||||||||||
CAD | 3,766 | 07/08/21 | Semi-Annual | 3 Month Canadian Bankers Acceptance Rate | 2.503 | (8,777 | ) | (8,777 | ) | ||||||||||||||||||
CAD | 7,533 | 07/09/21 | Semi-Annual | 3 Month Canadian Bankers Acceptance Rate | 2.510 | (16,770 | ) | (16,770 | ) | ||||||||||||||||||
CAD | 3,766 | 07/10/21 | Semi-Annual | 3 Month Canadian Bankers Acceptance Rate | 2.503 | (8,861 | ) | (8,861 | ) | ||||||||||||||||||
CAD | 1,883 | 07/11/21 | Semi-Annual | 3 Month Canadian Bankers Acceptance Rate | 2.520 | (3,943 | ) | (3,943 | ) | ||||||||||||||||||
CAD | 2,228 | 07/12/21 | Semi-Annual | 3 Month Canadian Bankers Acceptance Rate | 2.500 | (5,324 | ) | (5,324 | ) | ||||||||||||||||||
CAD | 3,766 | 07/22/21 | Semi-Annual | 3 Month Canadian Bankers Acceptance Rate | 2.500 | (9,182 | ) | (9,182 | ) | ||||||||||||||||||
CAD | 1,020 | 07/23/21 | Semi-Annual | 3 Month Canadian Bankers Acceptance Rate | 2.500 | (2,493 | ) | (2,493 | ) | ||||||||||||||||||
CAD | 8,080 | 07/26/21 | Semi-Annual | 3 Month Canadian Bankers Acceptance Rate | 2.609 | (6,904 | ) | (6,904 | ) | ||||||||||||||||||
CAD | 6,060 | 07/29/21 | Semi-Annual | 3 Month Canadian Bankers Acceptance Rate | 2.620 | (4,277 | ) | (4,277 | ) | ||||||||||||||||||
CAD | 6,060 | 07/30/21 | Semi-Annual | 3 Month Canadian Bankers Acceptance Rate | 2.639 | (2,590 | ) | (2,590 | ) | ||||||||||||||||||
CAD | 4,040 | 07/31/21 | Semi-Annual | 3 Month Canadian Bankers Acceptance Rate | 2.615 | — | — | ||||||||||||||||||||
CAD | 1,037 | 10/18/27 | Semi-Annual | 2.357 % | 3 Month Canadian Bankers Acceptance Rate | 20,516 | 20,497 | ||||||||||||||||||||
CAD | 691 | 10/19/27 | Semi-Annual | 2.325 | 3 Month Canadian Bankers Acceptance Rate | 15,164 | 15,152 | ||||||||||||||||||||
266
PACE Alternative Strategies Investments
Portfolio of investments—July 31, 2018
Centrally cleared interest rate swap agreements—(continued)
| Notional amount (000) | Maturity date | Payment frequency | Payments made by the Portfolio9 | Payments received by the Portfolio9 | Value | Unrealized appreciation (depreciation) | |||||||||||||||||||||
CAD | 346 | 10/26/27 | Semi-Annual | 2.356 | % | 3 Month Canadian Bankers Acceptance Rate | $ | 6,896 | $ | 6,896 | |||||||||||||||||
CAD | 1,037 | 11/02/27 | Semi-Annual | 2.288 | 3 Month Canadian Bankers Acceptance Rate | 25,480 | 25,480 | ||||||||||||||||||||
CAD | 691 | 11/03/27 | Semi-Annual | 2.301 | 3 Month Canadian Bankers Acceptance Rate | 16,457 | 16,457 | ||||||||||||||||||||
CAD | 691 | 11/06/27 | Semi-Annual | 2.280 | 3 Month Canadian Bankers Acceptance Rate | 18,827 | 18,827 | ||||||||||||||||||||
CAD | 1,037 | 11/07/27 | Semi-Annual | 2.257 | 3 Month Canadian Bankers Acceptance Rate | 29,750 | 29,750 | ||||||||||||||||||||
CAD | 346 | 11/09/27 | Semi-Annual | 2.266 | 3 Month Canadian Bankers Acceptance Rate | 9,732 | 9,732 | ||||||||||||||||||||
CAD | 346 | 11/10/27 | Semi-Annual | 2.297 | 3 Month Canadian Bankers Acceptance Rate | 9,053 | 9,053 | ||||||||||||||||||||
CAD | 1,037 | 11/14/27 | Semi-Annual | 2.312 | 3 Month Canadian Bankers Acceptance Rate | 26,172 | 26,172 | ||||||||||||||||||||
CAD | 346 | 11/28/27 | Semi-Annual | 2.195 | 3 Month Canadian Bankers Acceptance Rate | 11,481 | 11,476 | ||||||||||||||||||||
CAD | 346 | 11/29/27 | Semi-Annual | 2.209 | 3 Month Canadian Bankers Acceptance Rate | 11,176 | 11,171 | ||||||||||||||||||||
CAD | 346 | 12/01/27 | Semi-Annual | 2.268 | 3 Month Canadian Bankers Acceptance Rate | 9,201 | 9,184 | ||||||||||||||||||||
CAD | 346 | 12/04/27 | Semi-Annual | 2.285 | 3 Month Canadian Bankers Acceptance Rate | 8,825 | 8,825 | ||||||||||||||||||||
EUR | 12,500 | 03/16/48 | Semi-Annual | 1.892 | 6 Month EURIBOR | (91,023 | ) | (91,023 | ) | ||||||||||||||||||
EUR | 5,000 | 05/09/48 | Semi-Annual | 1.815 | 6 Month EURIBOR | 7,775 | 7,775 | ||||||||||||||||||||
GBP | 5,411 | 06/29/47 | Semi-Annual | 1.643 | 6 Month GBP LIBOR | 48,421 | 48,421 | ||||||||||||||||||||
GBP | 5,400 | 07/05/47 | Semi-Annual | 1.720 | 6 Month GBP LIBOR | (12,151 | ) | (12,151 | ) | ||||||||||||||||||
GBP | 5,100 | 10/06/47 | Semi-Annual | 1.765 | 6 Month GBP LIBOR | (50,300 | ) | (50,300 | ) | ||||||||||||||||||
GBP | 3,500 | 01/14/48 | Semi-Annual | 1.519 | 6 Month GBP LIBOR | 86,864 | 86,864 | ||||||||||||||||||||
GBP | 1,035 | 02/15/48 | Semi-Annual | 1.798 | 6 Month GBP LIBOR | (16,458 | ) | (16,458 | ) | ||||||||||||||||||
JPY | 440,500 | 08/27/39 | Semi-Annual | 0.805 | 6 Month JPY LIBOR | 12,313 | 12,313 | ||||||||||||||||||||
JPY | 440,500 | 09/02/39 | Semi-Annual | 0.800 | 6 Month JPY LIBOR | 16,759 | 16,759 | ||||||||||||||||||||
JPY | 120,500 | 09/02/39 | Semi-Annual | 6 Month JPY LIBOR | 0.800 | % | (4,585 | ) | (7,095 | ) | |||||||||||||||||
SEK | 33,480 | 10/20/19 | Quarterly | 0.213 | 3 Month SEK STIBOR | 5,037 | 5,037 | ||||||||||||||||||||
SEK | 22,320 | 10/23/19 | Quarterly | 0.220 | 3 Month SEK STIBOR | 3,317 | 9,357 | ||||||||||||||||||||
SEK | 11,160 | 10/30/19 | Annual | 3 Month SEK STIBOR | 0.220 | 2,167 | 5,009 | ||||||||||||||||||||
SEK | 11,160 | 10/30/19 | Quarterly | 0.220 | 3 Month SEK STIBOR | (362 | ) | (362 | ) | ||||||||||||||||||
SEK | 33,480 | 11/06/19 | Quarterly | 0.247 | 3 Month SEK STIBOR | 3,993 | 3,974 | ||||||||||||||||||||
SEK | 22,320 | 11/07/19 | Quarterly | 0.245 | 3 Month SEK STIBOR | 2,583 | 2,580 | ||||||||||||||||||||
SEK | 22,320 | 11/08/19 | Quarterly | 0.257 | 3 Month SEK STIBOR | 3,230 | 3,221 | ||||||||||||||||||||
SEK | 33,480 | 11/09/19 | Quarterly | 0.249 | 3 Month SEK STIBOR | 4,390 | 4,386 | ||||||||||||||||||||
SEK | 11,160 | 11/13/19 | Quarterly | 0.234 | 3 Month SEK STIBOR | (1,142 | ) | (1,150 | ) | ||||||||||||||||||
SEK | 11,160 | 11/14/19 | Quarterly | 0.222 | 3 Month SEK STIBOR | 779 | 766 | ||||||||||||||||||||
SEK | 33,480 | 11/16/19 | Quarterly | 0.255 | 3 Month SEK STIBOR | 5,069 | 5,086 | ||||||||||||||||||||
SEK | 11,160 | 11/30/19 | Quarterly | 0.245 | 3 Month SEK STIBOR | 1,473 | 2,934 | ||||||||||||||||||||
SEK | 11,160 | 12/01/19 | Quarterly | 0.236 | 3 Month SEK STIBOR | 1,260 | 1,260 | ||||||||||||||||||||
267
PACE Alternative Strategies Investments
Portfolio of investments—July 31, 2018
Centrally cleared interest rate swap agreements—(concluded)
| Notional amount (000) | Maturity date | Payment frequency | Payments made by the Portfolio9 | Payments received by the Portfolio9 | Value | Unrealized appreciation (depreciation) | |||||||||||||||||||||
SEK | 11,160 | 12/04/19 | Quarterly | 0.212 | % | 3 Month SEK STIBOR | $ | 694 | $ | 681 | |||||||||||||||||
SEK | 11,160 | 12/05/19 | Quarterly | 0.223 | 3 Month SEK STIBOR | 991 | 951 | ||||||||||||||||||||
SEK | 6,324 | 10/20/27 | Annual | 3 Month SEK STIBOR | 1.190 | % | 10,475 | 10,475 | |||||||||||||||||||
SEK | 6,324 | 10/20/27 | Quarterly | 0.362 | 3 Month SEK STIBOR | 86 | 59,507 | ||||||||||||||||||||
SEK | 4,216 | 10/23/27 | Annual | 3 Month SEK STIBOR | 1.158 | 5,359 | 5,359 | ||||||||||||||||||||
SEK | 4,216 | 10/23/27 | Quarterly | 0.361 | 3 Month SEK STIBOR | 43 | 39,222 | ||||||||||||||||||||
SEK | 2,108 | 10/30/27 | Annual | 3 Month SEK STIBOR | 1.212 | 3,881 | 3,881 | ||||||||||||||||||||
SEK | 2,108 | 10/30/27 | Quarterly | 0.431 | 3 Month SEK STIBOR | 5 | 19,088 | ||||||||||||||||||||
SEK | 6,324 | 11/06/27 | Annual | 3 Month SEK STIBOR | 1.166 | 8,001 | 8,001 | ||||||||||||||||||||
SEK | 6,324 | 11/06/27 | Quarterly | 0.455 | 3 Month SEK STIBOR | 638 | 56,365 | ||||||||||||||||||||
SEK | 4,216 | 11/07/27 | Annual | 3 Month SEK STIBOR | 1.156 | 4,847 | 4,847 | ||||||||||||||||||||
SEK | 4,216 | 11/07/27 | Quarterly | 0.457 | 3 Month SEK STIBOR | 420 | 37,427 | ||||||||||||||||||||
SEK | 4,216 | 11/08/27 | Annual | 3 Month SEK STIBOR | 1.130 | 3,581 | 3,581 | ||||||||||||||||||||
SEK | 4,216 | 11/08/27 | Quarterly | 0.447 | 3 Month SEK STIBOR | 415 | 37,277 | ||||||||||||||||||||
SEK | 6,324 | 11/09/27 | Annual | 3 Month SEK STIBOR | 1.133 | 5,592 | 5,592 | ||||||||||||||||||||
SEK | 6,324 | 11/09/27 | Quarterly | 0.444 | 3 Month SEK STIBOR | 611 | 55,686 | ||||||||||||||||||||
SEK | 2,108 | 11/13/27 | Annual | 3 Month SEK STIBOR | 1.154 | 2,283 | 2,283 | ||||||||||||||||||||
SEK | 2,108 | 11/13/27 | Quarterly | 0.448 | 3 Month SEK STIBOR | 197 | 18,266 | ||||||||||||||||||||
SEK | 2,108 | 11/14/27 | Annual | 3 Month SEK STIBOR | 1.175 | 2,770 | 2,770 | ||||||||||||||||||||
SEK | 2,108 | 11/14/27 | Quarterly | 0.460 | 3 Month SEK STIBOR | 195 | 18,191 | ||||||||||||||||||||
SEK | 6,324 | 11/16/27 | Annual | 3 Month SEK STIBOR | 1.152 | 6,616 | 6,616 | ||||||||||||||||||||
SEK | 6,324 | 11/16/27 | Quarterly | 0.470 | 3 Month SEK STIBOR | 568 | 54,123 | ||||||||||||||||||||
SEK | 2,108 | 11/30/27 | Annual | 3 Month SEK STIBOR | 1.090 | 560 | 560 | ||||||||||||||||||||
SEK | 2,108 | 11/30/27 | Quarterly | 0.467 | 3 Month SEK STIBOR | 170 | 17,008 | ||||||||||||||||||||
SEK | 2,108 | 12/01/27 | Annual | 3 Month SEK STIBOR | 1.110 | 1,014 | 1,014 | ||||||||||||||||||||
SEK | 2,108 | 12/01/27 | Quarterly | 0.465 | 3 Month SEK STIBOR | 165 | 16,930 | ||||||||||||||||||||
SEK | 2,108 | 12/04/27 | Annual | 3 Month SEK STIBOR | 1.110 | 955 | 958 | ||||||||||||||||||||
SEK | 2,108 | 12/04/27 | Quarterly | 0.458 | 3 Month SEK STIBOR | 155 | 16,703 | ||||||||||||||||||||
SEK | 2,108 | 12/05/27 | Annual | 3 Month SEK STIBOR | 1.110 | 947 | 947 | ||||||||||||||||||||
SEK | 2,108 | 12/05/27 | Quarterly | 0.458 | 3 Month SEK STIBOR | 152 | 152 | ||||||||||||||||||||
USD | 32,850 | 06/19/21 | Semi-Annual | 3.080 | 3 Month USD LIBOR | (4,572 | ) | (4,572 | ) | ||||||||||||||||||
USD | 168,900 | 06/19/21 | Semi-Annual | 3 Month USD LIBOR | 3.095 | 23,294 | 134,471 | ||||||||||||||||||||
USD | 32,850 | 06/22/21 | Quarterly | 3.069 | 3 Month USD LIBOR | (1,439 | ) | (1,439 | ) | ||||||||||||||||||
USD | 33,541 | 09/18/24 | Semi-Annual | 3 Month USD LIBOR | 3.035 | (22,653 | ) | (22,653 | ) | ||||||||||||||||||
USD | 71,900 | 06/17/25 | Quarterly | 3.150 | 3 Month USD LIBOR | (340,752 | ) | (511,183 | ) | ||||||||||||||||||
USD | 17,000 | 06/17/25 | Quarterly | 3.150 | 3 Month USD LIBOR | (83,369 | ) | (123,665 | ) | ||||||||||||||||||
USD | 19,100 | 03/20/29 | Semi-Annual | 3 Month USD LIBOR | 3.030 | (70,333 | ) | (70,333 | ) | ||||||||||||||||||
USD | 8,100 | 03/20/49 | Quarterly | 3.052 | 3 Month USD LIBOR | 1,585 | 1,585 | ||||||||||||||||||||
USD | 7,607 | 09/18/49 | Quarterly | 3.027 | 3 Month USD LIBOR | 40,591 | 40,591 | ||||||||||||||||||||
$ | (324,122 | ) | $ | 26,240 | |||||||||||||||||||||||
268
PACE Alternative Strategies Investments
Portfolio of investments—July 31, 2018
Centrally cleared credit default swap agreements on credit indices—buy protection10
Referenced obligations | Notional amount (000) | Maturity date | Payment frequency | Payments made by the Portfolio9 | Upfront payments received (made) | Value | Unrealized depreciation | ||||||||||||||||||||||||
| CDX North American Investment Grade 30 Index | USD | 15,213 | 06/20/23 | Quarterly | 1.000 | % | $ | 283,707 | $ | (305,275 | ) | $ | (21,568 | ) | |||||||||||||||||
iTraxx Europe Main Series 29 Index | EUR | 13,100 | 06/20/23 | Quarterly | 1.000 | 281,330 | (307,208 | ) | (25,878 | ) | |||||||||||||||||||||
$ | 565,037 | $ | (612,483 | ) | $ | (47,446 | ) | ||||||||||||||||||||||||
Centrally cleared credit default swap agreements on credit indices—sell protection11
Referenced obligations | Notional amount (000) | Maturity date | Payment frequency | Payments received by the Portfolio9 | Upfront payments received (made) | Value | Unrealized appreciation | ||||||||||||||||||||||||
CDX North America High Yield 30 Index | USD | 6,139 | 06/20/23 | Quarterly | 5.000 | % | $ | (354,339 | ) | $ | 467,371 | $ | 113,032 | ||||||||||||||||||
Interest rate swap agreements
Counterparty | Notional amount (000) | Maturity date | Payment frequency | Payments made by the Portfolio9 | Payments received by the Portfolio9 | Upfront payments received (made) | Value | Unrealized appreciation (depreciation) | |||||||||||||||||||||||||||
BNP | KRW | 6,336,684 | 03/20/21 | Quarterly | 3 Month KRW CD | 2.425 | % | $ | — | $ | 32,676 | $ | 32,676 | ||||||||||||||||||||||
BNP | KRW | 1,624,919 | 03/20/29 | Quarterly | 2.563% | 3 Month KRW CD | — | (35,351 | ) | (35,351 | ) | ||||||||||||||||||||||||
GS | BRL | 9,522 | 01/04/21 | Annual | 1 Month Brazilian Interbank Deposit Average | 8.420 | — | (11,505 | ) | (11,505 | ) | ||||||||||||||||||||||||
GS | BRL | 4,750 | 01/04/21 | Annual | 1 Month Brazilian Interbank Deposit Average | 8.545 | — | (2,679 | ) | (2,679 | ) | ||||||||||||||||||||||||
GS | BRL | 4,813 | 01/04/21 | Annual | 1 Month Brazilian Interbank Deposit Average | 8.520 | — | (3,349 | ) | (3,349 | ) | ||||||||||||||||||||||||
GS | BRL | 48,250 | 01/04/21 | Monthly | 1 Month Brazilian Interbank Deposit Average | 8.790 | — | 103,474 | 103,474 | ||||||||||||||||||||||||||
GS | KRW | 1,927,800 | 03/19/21 | Quarterly | 3 Month KRW CD | 2.095 | — | (1,074 | ) | (1,074 | ) | ||||||||||||||||||||||||
GS | KRW | 10,243,360 | 03/20/21 | Quarterly | 3 Month KRW CD | 2.388 | — | 46,162 | 46,162 | ||||||||||||||||||||||||||
GS | KRW | 4,933,732 | 03/20/21 | Quarterly | 3 Month KRW CD | 2.415 | — | 24,586 | 24,586 | ||||||||||||||||||||||||||
GS | KRW | 4,933,732 | 03/20/21 | Quarterly | 3 Month KRW CD | 2.415 | — | 24,586 | 24,586 | ||||||||||||||||||||||||||
GS | KRW | 404,600 | 03/20/29 | Quarterly | 2.255 | 3 Month KRW CD | — | 1,036 | 1,036 | ||||||||||||||||||||||||||
GS | KRW | 2,179,840 | 03/20/29 | Quarterly | 2.533 | 3 Month KRW CD | — | (42,253 | ) | (42,253 | ) | ||||||||||||||||||||||||
GS | KRW | 1,041,385 | 03/20/29 | Quarterly | 2.560 | 3 Month KRW CD | — | (22,450 | ) | (22,450 | ) | ||||||||||||||||||||||||
GS | KRW | 1,041,385 | 03/20/29 | Quarterly | 2.560 | 3 Month KRW CD | — | (22,450 | ) | (22,450 | ) | ||||||||||||||||||||||||
JPMCB | BRL | 18,777 | 01/04/21 | Annual | 1 Month Brazilian Interbank Deposit Average | 8.310 | — | (33,662 | ) | (33,662 | ) | ||||||||||||||||||||||||
269
PACE Alternative Strategies Investments
Portfolio of investments—July 31, 2018
Interest rate swap agreements—(concluded)
Counterparty | Notional amount (000) | Maturity date | Payment frequency | Payments made by the Portfolio9 | Payments received by the Portfolio9 | Upfront payments received (made) | Value | Unrealized appreciation (depreciation) | |||||||||||||||||||||||||||
JPMCB | BRL | 9,375 | 01/04/21 | Annual | 1 Month Brazilian Interbank Deposit Average | 8.370% | $ | — | $ | (13,815 | ) | $ | (13,815 | ) | |||||||||||||||||||||
JPMCB | BRL | 4,754 | 01/04/21 | Annual | 1 Month Brazilian Interbank Deposit Average | 8.490 | — | (4,061 | ) | (4,061 | ) | ||||||||||||||||||||||||
JPMCB | BRL | 17,342 | 01/04/21 | Annual | 1 Month Brazilian Interbank Deposit Average | 10.053 | — | 114,492 | 114,492 | ||||||||||||||||||||||||||
JPMCB | BRL | 5,785 | 01/04/21 | Annual | 1 Month Brazilian Interbank Deposit Average | 10.125 | — | 40,043 | 40,043 | ||||||||||||||||||||||||||
JPMCB | BRL | 5,779 | 01/04/21 | Annual | 1 Month Brazilian Interbank Deposit Average | 10.140 | — | 41,263 | 41,263 | ||||||||||||||||||||||||||
JPMCB | BRL | 2,901 | 01/04/21 | Annual | 1 Month Brazilian Interbank Deposit Average | 10.000 | — | 18,316 | 18,316 | ||||||||||||||||||||||||||
JPMCB | BRL | 49,340 | 01/04/21 | Monthly | 1 Month Brazilian Interbank Deposit Average | 8.820 | — | 111,430 | 111,430 | ||||||||||||||||||||||||||
JPMCB | KRW | 3,855,600 | 03/19/21 | Quarterly | 3 Month KRW CD | 2.088 | — | (2,648 | ) | (2,648 | ) | ||||||||||||||||||||||||
JPMCB | KRW | 3,855,600 | 03/20/21 | Quarterly | 3 Month KRW CD | 2.100 | — | (1,843 | ) | (1,843 | ) | ||||||||||||||||||||||||
JPMCB | KRW | 1,927,800 | 03/20/21 | Quarterly | 3 Month KRW CD | 2.090 | — | (1,256 | ) | (1,256 | ) | ||||||||||||||||||||||||
JPMCB | KRW | 4,633,200 | 03/20/21 | Quarterly | 3 Month KRW CD | 2.120 | — | — | — | ||||||||||||||||||||||||||
JPMCB | KRW | 809,200 | 03/20/29 | Quarterly | 2.248% | 3 Month KRW CD | — | 2,552 | 2,552 | ||||||||||||||||||||||||||
JPMCB | KRW | 809,200 | 03/20/29 | Quarterly | 2.260 | 3 Month KRW CD | — | 1,752 | 1,752 | ||||||||||||||||||||||||||
JPMCB | KRW | 404,600 | 03/20/29 | Quarterly | 2.250 | 3 Month KRW CD | — | 1,196 | 1,196 | ||||||||||||||||||||||||||
JPMCB | KRW | 972,400 | 03/20/29 | Quarterly | 2.280 | 3 Month KRW CD | — | — | — | ||||||||||||||||||||||||||
$ | — | $ | 365,168 | $ | 365,168 | ||||||||||||||||||||||||||||||
Total return swap agreements
Counterparty | Notional amount (000) | Maturity date | Payment frequency | Payments made by the Portfolio9 | Payments received by the Portfolio9 | Upfront payments received (made) | Value | Unrealized appreciation (depreciation) | |||||||||||||||||||||||||||
BNP | USD | 1,733 | 03/05/19 | Monthly | 1 Month USD LIBOR plus 67 bps | FTSE EPRA NAREIT Developed Total Return Index | $ | — | $ | (908 | ) | $ | (908 | ) | |||||||||||||||||||||
BNP | USD | 4,140 | 07/25/19 | Monthly | 1 Month USD LIBOR plus 49 bps | FTSE EPRA NAREIT Developed Total Return Index | — | 30,098 | 30,098 | ||||||||||||||||||||||||||
BNP | USD | 1,861 | 12/12/18 | Quarterly | Ibovespa Brasil Sao Paulo Stock Exchange Index | 3 Month USD LIBOR plus 35 bps | — | (135,430 | ) | (135,430 | ) | ||||||||||||||||||||||||
270
PACE Alternative Strategies Investments
Portfolio of investments—July 31, 2018
Total return swap agreements—(concluded)
Counterparty | Notional amount (000) | Maturity date | Payment frequency | Payments made by the Portfolio9 | Payments received by the Portfolio9 | Upfront payments received (made) | Value | Unrealized appreciation (depreciation) | |||||||||||||||||||||||||||
BNP | USD | 1,987 | 05/21/19 | Quarterly | Ibovespa Brasil Sao Paulo Stock Exchange Index | 1 Month USD LIBOR plus 15 bps | $ | — | $ | 141,009 | $ | 141,009 | |||||||||||||||||||||||
CITI | EUR | 2,594 | 08/07/19 | Quarterly | 3 Month EURIBOR plus 10 bps | Euro STOXX Banks Index | — | 148,668 | 148,668 | ||||||||||||||||||||||||||
$ | — | $ | 183,437 | $ | 183,437 | ||||||||||||||||||||||||||||||
Fair valuation summary
The following is a summary of the fair valuations according to the inputs used as of July 31, 2018 in valuing the Portfolio's investments. In the event a Portfolio holds investments for which fair value is measured using the NAV per share practical expedient (or its equivalent), a separate column will be added to the fair value hierarchy table; this is intended to permit reconciliation to the amounts presented in the Portfolio's of investments:
| Assets Description | Investments measured at fair value using the net asset value per share (or its equivalent) practical expedient | Unadjusted quoted prices in active markets for identical investments (Level 1) | Other significant observable inputs (Level 2) | Unobservable inputs (Level 3) | Total | ||||||||||||||||||
Common stocks | $ | — | $ | 287,972,888 | $ | — | $ | — | $ | 287,972,888 | |||||||||||||
Preferred stocks | — | 1,432,606 | 57,168 | — | 1,489,774 | ||||||||||||||||||
Investment companies | 32,159,657 | 35,873,141 | — | — | 68,032,798 | ||||||||||||||||||
US government obligations | — | — | 14,590,663 | — | 14,590,663 | ||||||||||||||||||
Corporate notes | — | — | 26,512,204 | — | 26,512,204 | ||||||||||||||||||
Non-US government obligations | — | — | 28,333,787 | — | 28,333,787 | ||||||||||||||||||
Certificates of deposit | — | — | 19,500,966 | — | 19,500,966 | ||||||||||||||||||
Commercial paper | — | — | 14,464,353 | — | 14,464,353 | ||||||||||||||||||
Time deposits | — | — | 10,364,666 | — | 10,364,666 | ||||||||||||||||||
Short-term US government obligations | — | — | 70,514,239 | — | 70,514,239 | ||||||||||||||||||
Short-term investment | — | — | 116,274,931 | — | 116,274,931 | ||||||||||||||||||
Options purchased | — | 2,709,072 | 66,681 | — | 2,775,753 | ||||||||||||||||||
Swaptions purchased | — | — | 4,668,266 | — | 4,668,266 | ||||||||||||||||||
Foreign exchange options purchased | — | — | 399,808 | — | 399,808 | ||||||||||||||||||
Futures contracts | — | 892,442 | — | — | 892,442 | ||||||||||||||||||
Forward foreign currency contracts | — | — | 13,906,633 | — | 13,906,633 | ||||||||||||||||||
Swap agreements | — | — | 3,775,290 | — | 3,775,290 | ||||||||||||||||||
Total | $ | 32,159,657 | $ | 328,880,149 | $ | 323,429,655 | $ | — | $ | 684,469,461 | |||||||||||||
271
PACE Alternative Strategies Investments
Portfolio of investments—July 31, 2018
Fair valuation summary—(concluded)
Description | Investments measured at fair value using the net asset value per share (or its equivalent) practical expedient | Unadjusted quoted prices in active markets for identical investments (Level 1) | Other significant observable inputs (Level 2) | Unobservable inputs (Level 3) | Total | ||||||||||||||||||
Liabilities | |||||||||||||||||||||||
Investments sold short | $ | — | $ | (95,293,287 | ) | $ | — | $ | — | $ | (95,293,287 | ) | |||||||||||
Options written | — | (478,876 | ) | (247,823 | ) | — | (726,699 | ) | |||||||||||||||
Swaptions written | — | — | (218,189 | ) | — | (218,189 | ) | ||||||||||||||||
Foreign exchange options written | — | — | (7,293 | ) | — | (7,293 | ) | ||||||||||||||||
Futures contracts | — | (923,003 | ) | — | — | (923,003 | ) | ||||||||||||||||
Forward foreign currency contracts | — | — | (11,616,599 | ) | — | (11,616,599 | ) | ||||||||||||||||
Swap agreements | — | — | (4,011,161 | ) | — | (4,011,161 | ) | ||||||||||||||||
Total | $ | — | $ | (96,695,166 | ) | $ | (16,101,065 | ) | $ | — | $ | (112,796,231 | ) | ||||||||||
At July 31, 2018, there were no transfers between Level 1 and Level 2.
Portfolio footnotes
* Non-income producing security.
† Amount represents less than 0.005%.
1 Security, or portion thereof, pledged as collateral for investments sold short, written options, futures and/or swap agreements.
2 Security exempt from registration pursuant to Rule 144A under the Securities Act of 1933. These securities are considered liquid, unless noted otherwise, and may be resold in transactions exempt from registration, normally to qualified institutional buyers. Securities exempt from registration pursuant to Rule 144A, in the amount of $3,790,629, represented 0.60% of the Portfolio's net assets at period end.
3 Illiquid investment at period end. Illiquid assets, in the amount of $57,168, represented 0.01% of the Portfolio's net assets at period end.
4 Security was purchased pursuant to Regulation S under the Securities Act of 1933, which exempts from registration securities offered and sold outside of the United States. Such a security cannot be sold in the United States without either an effective registration statement filed pursuant to the Securities Act of 1933, or pursuant to an exemption from registration.
5 Variable or floating rate security. The interest rate shown is the rate in effect as of period end and changes periodically.
6 Rate shown reflects annualized yield at the period end on zero coupon bond.
7 Rates shown is the discount rates at date of purchase.
8 Security purchased on a when-issued basis. When-issued refers to a transaction made conditionally because a security, although authorized, has not yet been issued.
9 Payments made/received are based on the notional amount.
10 If the Portfolio is a buyer of protection and a credit event occurs, as defined under the terms of that particular swap agreement, the Portfolio will either (i) receive from the seller of protection an amount equal to the notional value of the swap and deliver the referenced obligation or underlying securities comprising the referenced index or (ii) receive a net settlement amount in the form of cash or securities equal to the notional amount of the swap less the recovery value of the referenced obligation or underlying securities comprising the referenced index.
11 If the Portfolio is a seller of protection and a credit event occurs, as defined under the terms of that particular swap agreement, the Portfolio will either (i) pay to the buyer of protection an amount equal to the notional amount of the swap and take delivery of the referenced obligation or underlying securities comprising the referenced index or (ii) pay a net settlement amount in the form of cash or securities equal to the notional amount of the swap less the recovery value of the referenced obligation or underlying securities comprising the referenced index.
See accompanying notes to financial statements.
272
PACE Select Advisors Trust
Portfolio acronyms:
ABS Asset-backed Security
ADR American Depositary Receipt
AGM Assured Guaranty Municipal
AMBAC American Municipal Bond Assurance Corporation
AMT Alternative Minimum Tax
ARM Adjustable Rate Mortgage
BOBL Bundesobligationen
CJSC Closed Joint Stock Company
CLO Collateralized Loan Obligation
CMT Constant Maturity Treasury Index
COFI Cost of Funds Index
DAC Designated Activity Company
ETF Exchange Traded Fund
EURIBOR Euro Interbank Offered Rate
FHA Federal Housing Administration
FHLB Federal Home Loan Bank
FHLMC Federal Home Loan Mortgage Corporation
FNMA Federal National Mortgage Association
FRN Floating Rate Note
GDR Global Depositary Receipt
GMAC General Motors Acceptance Corporation
GMTN Global Medium Term Note
GNMA Government National Mortgage Association
GSAMP Goldman Sachs Asset Mortgage Passthrough
GTD Guaranteed
IO Interest Only
JSC Joint Stock Company
LIBOR London Interbank Offered Rate
MGIC Mortgage Guaranty Insurance Corporation
MTA Monthly Treasury Average Index
MTN Medium Term Note
NVDR Non-Voting Depository Receipt
OAT Obligation Assimilables du Trésor (French Government Bonds)
PJSC Private Joint Stock Company
PO Principal Only
PSF Permanent School Fund
RASC Retirement Administration Service Center
REIT Real Estate Investment Trust
REMIC Real Estate Mortgage Investment Conduit
SBA Small Business Administration
SIFMA Municipal Swap Index Yield
SPDR Standard and Poor's Depository Receipts
STIBOR Stockholm Interbank Offered Rate
STRIP Separate Trading of Registered Interest and Principal of Securities
TBA (To Be Announced) Security is purchased on a forward commitment basis with an approximate principal amount (generally +/- 1.0%) and no definite maturity date. The actual principal amount and maturity date will be determined upon settlement when the specific mortgage pools are assigned.
TIPS Treasury inflation protected securities ("TIPS") are debt securities issued by the US Treasury whose principal and/ or interest payments are adjusted for inflation, unlike debt that make fixed principal and interest payments. The interest rate paid by the TIPS is fixed, while the principal value rises or falls based on changes in a published Consumer Price Index ("CPI"). Thus, if inflation occurs, the principal and interest payments on TIPS are adjusted accordingly to protect investors from inflationary loss. During a deflationary period, the principal and interest payments decrease, although the TIPS principal amounts will not drop below their face amounts at maturity. In exchange for the inflation protection, the TIPS generally pay lower interest rates than typical US Treasury securities. Only if inflation occurs will TIPS offer a higher real yield than a conventional Treasury bond of the same maturity.
Currency type abbreviations:
ARS Argentine Peso
AUD Australian Dollar
BRL Brazilian Real
CAD Canadian Dollar
CHF Swiss Franc
CLP Chilean Peso
CNY Chinese Yuan Renminbi
COP Colombian Peso
CZK Czech Koruna
DKK Danish Krone
EUR Euro
GBP Great Britain Pound
HKD Hong Kong Dollar
HUF Hungarian Forint
IDR Indonesian Rupiah
ILS Israeli Shekel
INR Indian Rupee
JPY Japanese Yen
KRW South Korean Won
MXN Mexican Peso
MYR Malaysian Ringgit
NOK Norwegian Krone
NZD New Zealand Dollar
PEN Peruvian Sol
PHP Philippine Peso
PLN Polish Zloty
RON Romanian Leu
RUB Russian Ruble
SEK Swedish Krona
SGD Singapore Dollar
THB Thai Baht
TRY Turkish Lira
TWD Taiwan Dollar
USD United States Dollar
ZAR South African Rand
See accompanying notes to financial statements.
273
PACE Select Advisors Trust
Counterparty acronyms:
ANZ Australia and New Zealand Banking Group
BB Barclays Bank PLC
BNP BNP Paribas
BOA Bank of America
CITI Citibank NA
CSI Credit Suisse International
DB Deutsche Bank AG
GS Goldman Sachs
GSB Goldman Sachs Bank USA
GSI Goldman Sachs International
HSBC HSBC Bank PLC
JPMCB JPMorgan Chase Bank
MSCI Morgan Stanley & Co. International PLC
NAB National Australia Bank Ltd.
NTC Northern Trust Company
RBC Royal Bank of Canada
RBS Royal Bank of Scotland PLC
SCB Standard Chartered Bank
SG Societe Generale
SSC State Street Bank and Trust Co.
TD Toronto-Dominion Bank
See accompanying notes to financial statements.
274
PACE Select Advisors Trust
Understanding your Portfolio's expenses (unaudited)
As a shareholder of a Portfolio, you incur two types of costs: (1) transactional costs (as applicable), including sales charges (loads), or ongoing program fees; and (2) ongoing Portfolio costs, including management fees; service and/or distribution (12b-1) fees (if applicable); and other Portfolio expenses. These examples are intended to help you understand your ongoing costs (in dollars) of investing in each Portfolio and to compare these costs with the ongoing costs of investing in other mutual funds.
The examples below are based on an investment of $1,000 invested at the beginning of the period and held for the entire period, February 1, 2018 to July 31, 2018.
Actual expenses (unaudited)
The first line for each class of shares in the table below for each Portfolio provides information about its actual account values and actual expenses. You may use the information in this line, together with the amount you invested, to estimate the expenses that you paid over a period. Simply divide your account value by $1,000 (for example, an $8,600 account value divided by $1,000 = 8.6), then multiply the result by the number in the first line for each class of shares for each respective Portfolio under the heading entitled "Expenses paid during period" to estimate the expenses you paid on your account during the period.
Hypothetical example for comparison purposes (unaudited)
The second line for each class of shares in the table below for each Portfolio provides information about hypothetical account values and hypothetical expenses based on that Portfolio's actual expense ratios for each class of shares and an assumed rate of return of 5% per year before expenses, which is not that Portfolio's actual return for each class of shares. The hypothetical account values and expenses may not be used to estimate the actual ending account balance or expenses you paid for the period. You may use this information to compare the ongoing costs of investing in a Portfolio and other funds. To do so, compare this 5% hypothetical example with the 5% hypothetical examples that appear in the shareholder reports of other funds.
Please note that the expenses shown in the table are meant to highlight your ongoing Portfolio costs only and do not reflect any transactional costs (as applicable), such as sales charges (loads), or program fees. Therefore, the second line in the table for each class of shares for each Portfolio is useful in comparing ongoing Portfolio costs only, and will not help you determine the relative total costs of owning different funds. In addition, if these transactional costs or program fees were included, your costs would have been higher.
275
PACE Select Advisors Trust
| Beginning account value February 1, 2018 | Ending account value July 31, 2018 | Expenses paid during period1 02/01/18 to 07/31/18 | Expense ratio during the period | ||||||||||||||||||||
PACE Government Money Market Investments | |||||||||||||||||||||||
Class P | Actual | $ | 1,000.00 | $ | 1,005.50 | $ | 2.98 | 0.60 | % | ||||||||||||||
Hypothetical (5% annual return before expenses) | 1,000.00 | 1,021.82 | 3.01 | 0.60 | |||||||||||||||||||
PACE Mortgage-Backed Securities Fixed Income Investments | |||||||||||||||||||||||
Class A | Actual | 1,000.00 | 996.90 | 4.80 | 0.97 | ||||||||||||||||||
Hypothetical (5% annual return before expenses) | 1,000.00 | 1,019.98 | 4.86 | 0.97 | |||||||||||||||||||
Class C | Actual | 1,000.00 | 994.70 | 7.27 | 1.47 | ||||||||||||||||||
Hypothetical (5% annual return before expenses) | 1,000.00 | 1,017.51 | 7.35 | 1.47 | |||||||||||||||||||
Class Y | Actual | 1,000.00 | 998.90 | 3.57 | 0.72 | ||||||||||||||||||
Hypothetical (5% annual return before expenses) | 1,000.00 | 1,021.22 | 3.61 | 0.72 | |||||||||||||||||||
Class P | Actual | 1,000.00 | 998.90 | 3.57 | 0.72 | ||||||||||||||||||
Hypothetical (5% annual return before expenses) | 1,000.00 | 1,021.22 | 3.61 | 0.72 | |||||||||||||||||||
PACE Intermediate Fixed Income Investments | |||||||||||||||||||||||
Class A | Actual | 1,000.00 | 992.90 | 4.60 | 0.93 | ||||||||||||||||||
Hypothetical (5% annual return before expenses) | 1,000.00 | 1,020.18 | 4.66 | 0.93 | |||||||||||||||||||
Class C | Actual | 1,000.00 | 990.20 | 7.06 | 1.43 | ||||||||||||||||||
Hypothetical (5% annual return before expenses) | 1,000.00 | 1,017.70 | 7.15 | 1.43 | |||||||||||||||||||
Class Y | Actual | 1,000.00 | 994.00 | 3.36 | 0.68 | ||||||||||||||||||
Hypothetical (5% annual return before expenses) | 1,000.00 | 1,021.42 | 3.41 | 0.68 | |||||||||||||||||||
Class P | Actual | 1,000.00 | 994.00 | 3.36 | 0.68 | ||||||||||||||||||
Hypothetical (5% annual return before expenses) | 1,000.00 | 1,021.42 | 3.41 | 0.68 | |||||||||||||||||||
PACE Strategic Fixed Income Investments | |||||||||||||||||||||||
Class A | Actual | 1,000.00 | 992.30 | 5.19 | 1.05 | ||||||||||||||||||
Hypothetical (5% annual return before expenses) | 1,000.00 | 1,019.59 | 5.26 | 1.05 | |||||||||||||||||||
Class C | Actual | 1,000.00 | 989.40 | 7.65 | 1.55 | ||||||||||||||||||
Hypothetical (5% annual return before expenses) | 1,000.00 | 1,017.11 | 7.75 | 1.55 | |||||||||||||||||||
Class Y | Actual | 1,000.00 | 992.80 | 3.95 | 0.80 | ||||||||||||||||||
Hypothetical (5% annual return before expenses) | 1,000.00 | 1,020.83 | 4.01 | 0.80 | |||||||||||||||||||
Class P | Actual | 1,000.00 | 993.50 | 3.95 | 0.80 | ||||||||||||||||||
Hypothetical (5% annual return before expenses) | 1,000.00 | 1,020.83 | 4.01 | 0.80 | |||||||||||||||||||
PACE Municipal Fixed Income Investments | |||||||||||||||||||||||
Class A | Actual | 1,000.00 | 1,006.40 | 4.08 | 0.82 | ||||||||||||||||||
Hypothetical (5% annual return before expenses) | 1,000.00 | 1,020.73 | 4.11 | 0.82 | |||||||||||||||||||
Class C | Actual | 1,000.00 | 1,004.50 | 6.56 | 1.32 | ||||||||||||||||||
Hypothetical (5% annual return before expenses) | 1,000.00 | 1,018.25 | 6.61 | 1.32 | |||||||||||||||||||
Class Y | Actual | 1,000.00 | 1,008.20 | 2.84 | 0.57 | ||||||||||||||||||
Hypothetical (5% annual return before expenses) | 1,000.00 | 1,021.97 | 2.86 | 0.57 | |||||||||||||||||||
Class P | Actual | 1,000.00 | 1,008.20 | 2.84 | 0.57 | ||||||||||||||||||
Hypothetical (5% annual return before expenses) | 1,000.00 | 1,021.97 | 2.86 | 0.57 | |||||||||||||||||||
276
PACE Select Advisors Trust
| Beginning account value February 1, 2018 | Ending account value July 31, 2018 | Expenses paid during period1 02/01/18 to 07/31/18 | Expense ratio during the period | ||||||||||||||||||||
PACE Global Fixed Income Investments | |||||||||||||||||||||||
Class A | Actual | $ | 1,000.00 | $ | 964.90 | $ | 5.16 | 1.06 | % | ||||||||||||||
Hypothetical (5% annual return before expenses) | 1,000.00 | 1,019.54 | 5.31 | 1.06 | |||||||||||||||||||
Class C | Actual | 1,000.00 | 961.80 | 7.49 | 1.54 | ||||||||||||||||||
Hypothetical (5% annual return before expenses) | 1,000.00 | 1,017.16 | 7.70 | 1.54 | |||||||||||||||||||
Class Y | Actual | 1,000.00 | 966.00 | 4.44 | 0.91 | ||||||||||||||||||
Hypothetical (5% annual return before expenses) | 1,000.00 | 1,020.28 | 4.56 | 0.91 | |||||||||||||||||||
Class P | Actual | 1,000.00 | 965.10 | 4.24 | 0.87 | ||||||||||||||||||
Hypothetical (5% annual return before expenses) | 1,000.00 | 1,020.48 | 4.36 | 0.87 | |||||||||||||||||||
PACE High Yield Investments | |||||||||||||||||||||||
Class A | Actual | 1,000.00 | 1,002.20 | 5.26 | 1.06 | ||||||||||||||||||
Hypothetical (5% annual return before expenses) | 1,000.00 | 1,019.54 | 5.31 | 1.06 | |||||||||||||||||||
Class C | Actual | 1,000.00 | 999.90 | 7.74 | 1.56 | ||||||||||||||||||
Hypothetical (5% annual return before expenses) | 1,000.00 | 1,017.06 | 7.80 | 1.56 | |||||||||||||||||||
Class Y | Actual | 1,000.00 | 1,004.10 | 3.73 | 0.75 | ||||||||||||||||||
Hypothetical (5% annual return before expenses) | 1,000.00 | 1,021.08 | 3.76 | 0.75 | |||||||||||||||||||
Class P | Actual | 1,000.00 | 1,002.40 | 4.52 | 0.91 | ||||||||||||||||||
Hypothetical (5% annual return before expenses) | 1,000.00 | 1,020.28 | 4.56 | 0.91 | |||||||||||||||||||
PACE Large Co Value Equity Investments | |||||||||||||||||||||||
Class A | Actual | 1,000.00 | 966.20 | 7.22 | 1.48 | ||||||||||||||||||
Hypothetical (5% annual return before expenses) | 1,000.00 | 1,017.46 | 7.40 | 1.48 | |||||||||||||||||||
Class C | Actual | 1,000.00 | 962.80 | 10.61 | 2.18 | ||||||||||||||||||
Hypothetical (5% annual return before expenses) | 1,000.00 | 1,013.98 | 10.89 | 2.18 | |||||||||||||||||||
Class Y | Actual | 1,000.00 | 967.50 | 6.00 | 1.23 | ||||||||||||||||||
Hypothetical (5% annual return before expenses) | 1,000.00 | 1,018.70 | 6.16 | 1.23 | |||||||||||||||||||
Class P | Actual | 1,000.00 | 967.40 | 6.10 | 1.25 | ||||||||||||||||||
Hypothetical (5% annual return before expenses) | 1,000.00 | 1,018.60 | 6.26 | 1.25 | |||||||||||||||||||
PACE Large Co Growth Equity Investments | |||||||||||||||||||||||
Class A | Actual | 1,000.00 | 1,015.00 | 5.60 | 1.12 | ||||||||||||||||||
Hypothetical (5% annual return before expenses) | 1,000.00 | 1,019.24 | 5.61 | 1.12 | |||||||||||||||||||
Class C | Actual | 1,000.00 | 1,011.20 | 9.37 | 1.88 | ||||||||||||||||||
Hypothetical (5% annual return before expenses) | 1,000.00 | 1,015.47 | 9.39 | 1.88 | |||||||||||||||||||
Class Y | Actual | 1,000.00 | 1,015.80 | 4.30 | 0.86 | ||||||||||||||||||
Hypothetical (5% annual return before expenses) | 1,000.00 | 1,020.53 | 4.31 | 0.86 | |||||||||||||||||||
Class P | Actual | 1,000.00 | 1,016.30 | 4.40 | 0.88 | ||||||||||||||||||
Hypothetical (5% annual return before expenses) | 1,000.00 | 1,020.43 | 4.41 | 0.88 | |||||||||||||||||||
277
PACE Select Advisors Trust
| Beginning account value February 1, 2018 | Ending account value July 31, 2018 | Expenses paid during period1 02/01/18 to 07/31/18 | Expense ratio during the period | ||||||||||||||||||||
PACE Small/Medium Co Value Equity Investments | |||||||||||||||||||||||
Class A | Actual | $ | 1,000.00 | $ | 1,023.80 | $ | 6.02 | 1.20 | % | ||||||||||||||
Hypothetical (5% annual return before expenses) | 1,000.00 | 1,018.84 | 6.01 | 1.20 | |||||||||||||||||||
Class C | Actual | 1,000.00 | 1,020.20 | 9.47 | 1.89 | ||||||||||||||||||
Hypothetical (5% annual return before expenses) | 1,000.00 | 1,015.42 | 9.44 | 1.89 | |||||||||||||||||||
Class Y | Actual | 1,000.00 | 1,025.60 | 3.77 | 0.75 | ||||||||||||||||||
Hypothetical (5% annual return before expenses) | 1,000.00 | 1,021.08 | 3.76 | 0.75 | |||||||||||||||||||
Class P | Actual | 1,000.00 | 1,024.10 | 5.22 | 1.04 | ||||||||||||||||||
Hypothetical (5% annual return before expenses) | 1,000.00 | 1,019.64 | 5.21 | 1.04 | |||||||||||||||||||
PACE Small/Medium Co Growth Equity Investments | |||||||||||||||||||||||
Class A | Actual | 1,000.00 | 1,087.90 | 6.11 | 1.18 | ||||||||||||||||||
Hypothetical (5% annual return before expenses) | 1,000.00 | 1,018.94 | 5.91 | 1.18 | |||||||||||||||||||
Class C | Actual | 1,000.00 | 1,083.80 | 9.66 | 1.87 | ||||||||||||||||||
Hypothetical (5% annual return before expenses) | 1,000.00 | 1,015.52 | 9.35 | 1.87 | |||||||||||||||||||
Class Y | Actual | 1,000.00 | 1,093.00 | 1.92 | 0.37 | ||||||||||||||||||
Hypothetical (5% annual return before expenses) | 1,000.00 | 1,022.96 | 1.86 | 0.37 | |||||||||||||||||||
Class P | Actual | 1,000.00 | 1,088.80 | 5.33 | 1.03 | ||||||||||||||||||
Hypothetical (5% annual return before expenses) | 1,000.00 | 1,019.69 | 5.16 | 1.03 | |||||||||||||||||||
PACE International Equity Investments | |||||||||||||||||||||||
Class A | Actual | 1,000.00 | 945.10 | 9.60 | 1.99 | ||||||||||||||||||
Hypothetical (5% annual return before expenses) | 1,000.00 | 1,014.93 | 9.94 | 1.99 | |||||||||||||||||||
Class C | Actual | 1,000.00 | 941.80 | 13.10 | 2.72 | ||||||||||||||||||
Hypothetical (5% annual return before expenses) | 1,000.00 | 1,011.31 | 13.56 | 2.72 | |||||||||||||||||||
Class Y | Actual | 1,000.00 | 946.50 | 8.25 | 1.71 | ||||||||||||||||||
Hypothetical (5% annual return before expenses) | 1,000.00 | 1,016.32 | 8.55 | 1.71 | |||||||||||||||||||
Class P | Actual | 1,000.00 | 945.80 | 8.25 | 1.71 | ||||||||||||||||||
Hypothetical (5% annual return before expenses) | 1,000.00 | 1,016.32 | 8.55 | 1.71 | |||||||||||||||||||
PACE International Emerging Markets Equity Investments | |||||||||||||||||||||||
Class A | Actual | 1,000.00 | 875.00 | 7.90 | 1.70 | ||||||||||||||||||
Hypothetical (5% annual return before expenses) | 1,000.00 | 1,016.36 | 8.50 | 1.70 | |||||||||||||||||||
Class C | Actual | 1,000.00 | 872.00 | 11.37 | 2.45 | ||||||||||||||||||
Hypothetical (5% annual return before expenses) | 1,000.00 | 1,012.65 | 12.23 | 2.45 | |||||||||||||||||||
Class Y | Actual | 1,000.00 | 875.60 | 6.74 | 1.45 | ||||||||||||||||||
Hypothetical (5% annual return before expenses) | 1,000.00 | 1,017.60 | 7.25 | 1.45 | |||||||||||||||||||
Class P | Actual | 1,000.00 | 875.60 | 6.74 | 1.45 | ||||||||||||||||||
Hypothetical (5% annual return before expenses) | 1,000.00 | 1,017.60 | 7.25 | 1.45 | |||||||||||||||||||
278
PACE Select Advisors Trust
| Beginning account value February 1, 2018 | Ending account value July 31, 2018 | Expenses paid during period1 02/01/18 to 07/31/18 | Expense ratio during the period | ||||||||||||||||||||
PACE Global Real Estate Securities Investments | |||||||||||||||||||||||
Class A | Actual | $ | 1,000.00 | $ | 1,002.60 | $ | 7.20 | 1.45 | % | ||||||||||||||
Hypothetical (5% annual return before expenses) | 1,000.00 | 1,017.60 | 7.25 | 1.45 | |||||||||||||||||||
Class C | Actual | 1,000.00 | 1,000.00 | 10.91 | 2.20 | ||||||||||||||||||
Hypothetical (5% annual return before expenses) | 1,000.00 | 1,013.89 | 10.99 | 2.20 | |||||||||||||||||||
Class P | Actual | 1,000.00 | 1,004.10 | 5.96 | 1.20 | ||||||||||||||||||
Hypothetical (5% annual return before expenses) | 1,000.00 | 1,018.84 | 6.01 | 1.20 | |||||||||||||||||||
PACE Alternative Strategies Investments | |||||||||||||||||||||||
Class A | Actual | 1,000.00 | 974.00 | 11.55 | 2.36 | ||||||||||||||||||
Hypothetical (5% annual return before expenses) | 1,000.00 | 1,013.09 | 11.78 | 2.36 | |||||||||||||||||||
Class C | Actual | 1,000.00 | 970.20 | 14.80 | 3.03 | ||||||||||||||||||
Hypothetical (5% annual return before expenses) | 1,000.00 | 1,009.77 | 15.10 | 3.03 | |||||||||||||||||||
Class Y | Actual | 1,000.00 | 975.70 | 10.04 | 2.05 | ||||||||||||||||||
Hypothetical (5% annual return before expenses) | 1,000.00 | 1,014.63 | 10.24 | 2.05 | |||||||||||||||||||
Class P | Actual | 1,000.00 | 973.80 | 10.38 | 2.12 | ||||||||||||||||||
Hypothetical (5% annual return before expenses) | 1,000.00 | 1,014.28 | 10.59 | 2.12 | |||||||||||||||||||
1 Expenses are equal to the Portfolios' annualized net expense ratios, multiplied by the average account value over the period, multiplied by 181 divided by 365 (to reflect the one-half year period).
279
PACE Select Advisors Trust
Statement of assets and liabilities
July 31, 2018
| PACE Government Money Market Investments | PACE Mortgage-Backed Securities Fixed Income Investments | PACE Intermediate Fixed Income Investments | PACE Strategic Fixed Income Investments | ||||||||||||||||
Assets: | |||||||||||||||||||
| Investments, at value (cost—$152,117,361; $676,448,968; $417,703,026; $1,052,478,063; $350,869,329; $451,547,394 and $390,700,235, respectively)1 | $ | 152,117,361 | $ | 670,120,055 | $ | 411,609,870 | $ | 1,042,093,559 | |||||||||||
Repurchase agreements, at value (cost—$41,195,000; $0; $0; $0; $0; $0 and $0, respectively) | 41,195,000 | — | — | — | |||||||||||||||
| Total investments in securities, at value (cost—$193,312,361; $676,448,968; $417,703,026; $1,052,478,063; $350,869,329; $451,547,394 and $390,700,235, respectively) | $ | 193,312,361 | $ | 670,120,055 | $ | 411,609,870 | $ | 1,042,093,559 | |||||||||||
Cash | 800 | 13,029 | — | 42,113 | |||||||||||||||
Cash collateral on futures contracts | — | 81,000 | 660,982 | 558,000 | |||||||||||||||
Cash collateral on swap agreements | — | 1,557,000 | 391,529 | 3,434,634 | |||||||||||||||
Foreign currency, at value (cost—$0; $0; $568,190; $1,804,992; $0; $1,421,558 and $2,157,743, respectively) | — | — | 570,906 | 1,820,504 | |||||||||||||||
Receivable for investments sold | — | — | 1,385,437 | 344,674 | |||||||||||||||
Receivable for investments sold short | — | 79,208,024 | 30,503,494 | 1,039,922 | |||||||||||||||
Receivable for shares of beneficial interest sold | 250,379 | 343,313 | 224,913 | 505,857 | |||||||||||||||
Receivable for interest | 67,093 | 1,631,447 | 2,416,235 | 6,248,300 | |||||||||||||||
Outstanding swap agreements, at value2 | — | 619 | 14,621 | 9,303 | |||||||||||||||
Due from broker | — | 18,610 | 121,542 | 1,632,481 | |||||||||||||||
Receivable for when issued TBA securities | — | 258,885,515 | 4,972,303 | 212,104,395 | |||||||||||||||
Unrealized appreciation on forward foreign currency contracts | — | — | 102,170 | 2,240,966 | |||||||||||||||
Receivable for foreign tax reclaims | — | — | 458 | 11,927 | |||||||||||||||
Receivable for variation margin on futures contracts | — | — | — | — | |||||||||||||||
Receivable for variation margin on centrally cleared swap agreements | — | 233,296 | — | 547,305 | |||||||||||||||
Other assets | 10,803 | 113,710 | 20,693 | 24,655 | |||||||||||||||
Total assets | 193,641,436 | 1,012,205,618 | 452,995,153 | 1,272,658,595 | |||||||||||||||
Liabilities: | |||||||||||||||||||
Payable for investments purchased | 3,983,881 | 16,043,213 | 4,931,912 | 4,730,267 | |||||||||||||||
Payable for fund shares redeemed | 442,752 | 691,169 | 741,299 | 1,464,514 | |||||||||||||||
Dividends payable to shareholders | 108,454 | — | — | — | |||||||||||||||
Payable to affiliate | 33,942 | 172,113 | 163,345 | 389,427 | |||||||||||||||
Payable to custodian | 204 | 66,638 | 142,220 | 112,115 | |||||||||||||||
Payable for variation margin on futures contracts | — | 11,813 | 76,530 | 1,095,486 | |||||||||||||||
Payable for cash collateral from securities loaned | — | — | 12,098,990 | 8,610,323 | |||||||||||||||
Payable for foreign withholding taxes and foreign capital gains taxes | — | — | 1,686 | 7,145 | |||||||||||||||
Investments sold short, at value (proceeds—$0; $38,135,164; $30,463,153; $0; $0; $0 and $0, respectively) | — | 38,070,766 | 30,393,001 | — | |||||||||||||||
Outstanding swap agreements, at value2 | — | 25,024 | — | 17,480 | |||||||||||||||
Unrealized depreciation on forward foreign currency contracts | — | — | 44,247 | 2,282,093 | |||||||||||||||
| Options and swaptions written, at value (premiums received $0; $143,223; $1,425,758; $634,763; $0; $0 and $0, respectively) | — | 68,170 | 1,279,932 | 297,939 | |||||||||||||||
Due to broker | — | 490,000 | 270,000 | 1,502,000 | |||||||||||||||
Payable for dividend and interest expense on investments sold short | — | — | 42,609 | — | |||||||||||||||
Payable for dollar roll transactions | — | 7,796,041 | — | 74,182,510 | |||||||||||||||
Deferred payable for dollar roll transactions | — | 106 | — | 1,696 | |||||||||||||||
Payable for variation margin on centrally cleared swap agreements | — | — | 36,260 | — | |||||||||||||||
Payable for when issued TBA securities | — | 555,838,420 | 34,111,081 | 397,704,538 | |||||||||||||||
Accrued expenses and other liabilities | 278,217 | 315,469 | 267,982 | 342,105 | |||||||||||||||
Total liabilities | 4,847,450 | 619,588,942 | 84,601,094 | 492,739,638 | |||||||||||||||
Net assets | 188,793,986 | 392,616,676 | 368,394,059 | 779,918,957 | |||||||||||||||
1 Includes $0; $0; $12,638,687; $8,428,681; $0; $5,154,378 and $40,949,792, respectively, of investments in securities on loan, at value plus accrued interest and dividends, if any.
2 Net upfront payments received by PACE Mortgage-Backed Securities Fixed Income Investments and PACE Strategic Fixed Income Investments were $1,709 and $373,628, respectively. Net upfront payment made by PACE Intermediate Fixed Income Investments was $14,913.
280
PACE Select Advisors Trust
| PACE Municipal Fixed Income Investments | PACE Global Fixed Income Investments | PACE High Yield Investments | |||||||||||||
Assets: | |||||||||||||||
| Investments, at value (cost—$152,117,361; $676,448,968; $417,703,026; $1,052,478,063; $350,869,329; $451,547,394 and $390,700,235, respectively)1 | $ | 354,399,153 | $ | 449,233,480 | $ | 386,514,208 | |||||||||
Repurchase agreements, at value (cost—$41,195,000; $0; $0; $0; $0; $0 and $0, respectively) | — | — | — | ||||||||||||
| Total investments in securities, at value (cost—$193,312,361; $676,448,968; $417,703,026; $1,052,478,063; $350,869,329; $451,547,394 and $390,700,235, respectively) | $ | 354,399,153 | $ | 449,233,480 | $ | 386,514,208 | |||||||||
Cash | — | 406,796 | 22,895 | ||||||||||||
Cash collateral on futures contracts | — | 586,138 | — | ||||||||||||
Cash collateral on swap agreements | — | — | — | ||||||||||||
Foreign currency, at value (cost—$0; $0; $568,190; $1,804,992; $0; $1,421,558 and $2,157,743, respectively) | — | 1,427,926 | 2,162,672 | ||||||||||||
Receivable for investments sold | — | 789,419 | 887,408 | ||||||||||||
Receivable for investments sold short | — | — | — | ||||||||||||
Receivable for shares of beneficial interest sold | 579,186 | 178,736 | 196,122 | ||||||||||||
Receivable for interest | 4,110,097 | 2,869,983 | 5,606,198 | ||||||||||||
Outstanding swap agreements, at value2 | — | — | — | ||||||||||||
Due from broker | — | 255,603 | — | ||||||||||||
Receivable for when issued TBA securities | — | — | — | ||||||||||||
Unrealized appreciation on forward foreign currency contracts | — | 667,645 | 43,532 | ||||||||||||
Receivable for foreign tax reclaims | — | 20,852 | 4,532 | ||||||||||||
Receivable for variation margin on futures contracts | — | 69,391 | — | ||||||||||||
Receivable for variation margin on centrally cleared swap agreements | — | — | — | ||||||||||||
Other assets | 20,939 | 19,590 | 25,780 | ||||||||||||
Total assets | 359,109,375 | 456,525,559 | 395,463,347 | ||||||||||||
Liabilities: | |||||||||||||||
Payable for investments purchased | 2,296,020 | 44,607,254 | 2,050,451 | ||||||||||||
Payable for fund shares redeemed | 268,617 | 402,075 | 480,965 | ||||||||||||
Dividends payable to shareholders | — | — | — | ||||||||||||
Payable to affiliate | 158,344 | 232,168 | 236,872 | ||||||||||||
Payable to custodian | 24,610 | 92,414 | 45,109 | ||||||||||||
Payable for variation margin on futures contracts | — | — | — | ||||||||||||
Payable for cash collateral from securities loaned | — | 4,661,150 | 37,901,428 | ||||||||||||
Payable for foreign withholding taxes and foreign capital gains taxes | — | 10,010 | 249 | ||||||||||||
Investments sold short, at value (proceeds—$0; $38,135,164; $30,463,153; $0; $0; $0 and $0, respectively) | — | — | — | ||||||||||||
Outstanding swap agreements, at value2 | — | — | — | ||||||||||||
Unrealized depreciation on forward foreign currency contracts | — | 701,469 | 553,581 | ||||||||||||
| Options and swaptions written, at value (premiums received $0; $143,223; $1,425,758; $634,763; $0; $0 and $0, respectively) | — | — | — | ||||||||||||
Due to broker | — | — | — | ||||||||||||
Payable for dividend and interest expense on investments sold short | — | — | — | ||||||||||||
Payable for dollar roll transactions | — | — | — | ||||||||||||
Deferred payable for dollar roll transactions | — | — | — | ||||||||||||
Payable for variation margin on centrally cleared swap agreements | — | — | — | ||||||||||||
Payable for when issued TBA securities | — | — | — | ||||||||||||
Accrued expenses and other liabilities | 110,183 | 334,326 | 254,708 | ||||||||||||
Total liabilities | 2,857,774 | 51,040,866 | 41,523,363 | ||||||||||||
Net assets | 356,251,601 | 405,484,693 | 353,939,984 | ||||||||||||
See accompanying notes to financial statements.
281
PACE Select Advisors Trust
Statement of assets and liabilities (continued)
July 31, 2018
| PACE Government Money Market Investments | PACE Mortgage-Backed Securities Fixed Income Investments | PACE Intermediate Fixed Income Investments | PACE Strategic Fixed Income Investments | ||||||||||||||||
Net assets consist of: | |||||||||||||||||||
Beneficial interest shares of $0.001 par value (unlimited amount authorized) | $ | 188,795,684 | $ | 421,986,125 | $ | 378,948,892 | $ | 815,243,591 | |||||||||||
Accumulated undistributed (distributions in excess of) net investment income (loss) | — | 480,551 | 1,411,682 | 9,890,110 | |||||||||||||||
Accumulated net realized gain (loss) | (1,698 | ) | (25,036,510 | ) | (5,943,660 | ) | (35,929,909 | ) | |||||||||||
Net unrealized appreciation (depreciation) | — | (4,813,490 | ) | (6,022,855 | ) | (9,284,835 | ) | ||||||||||||
Net assets | $ | 188,793,986 | $ | 392,616,676 | $ | 368,394,059 | $ | 779,918,957 | |||||||||||
Class A | |||||||||||||||||||
Net assets | $ | — | $ | 30,488,997 | $ | 14,254,136 | $ | 13,652,325 | |||||||||||
Shares outstanding | — | 2,470,034 | 1,198,142 | 1,025,212 | |||||||||||||||
Net asset value per share | $ | — | $ | 12.34 | $ | 11.90 | $ | 13.32 | |||||||||||
Maximum offering price per share | $ | — | $ | 12.82 | $ | 12.36 | $ | 13.84 | |||||||||||
Class C | |||||||||||||||||||
Net assets | $ | — | $ | 9,674,471 | $ | 981,728 | $ | 6,594,374 | |||||||||||
Shares outstanding | — | 782,879 | 82,430 | 495,145 | |||||||||||||||
Net asset value and offering price per share | $ | — | $ | 12.36 | $ | 11.91 | $ | 13.32 | |||||||||||
Class Y | |||||||||||||||||||
Net assets | $ | — | $ | 30,541,614 | $ | 293,122 | $ | 1,369,637 | |||||||||||
Shares outstanding | — | 2,473,940 | 24,639 | 103,047 | |||||||||||||||
Net asset value, offering price and redemption value per share3 | $ | — | $ | 12.35 | $ | 11.90 | $ | 13.29 | |||||||||||
Class P | |||||||||||||||||||
Net assets | $ | 188,793,986 | $ | 321,911,594 | $ | 352,865,073 | $ | 758,302,621 | |||||||||||
Shares outstanding | 188,794,482 | 26,066,667 | 29,651,253 | 56,975,513 | |||||||||||||||
Net asset value, offering price and redemption value per share3 | $ | 1.00 | $ | 12.35 | $ | 11.90 | $ | 13.31 | |||||||||||
3 Assumes shares were held a sufficient period or are otherwise not subject to a redemption fee.
282
PACE Select Advisors Trust
| PACE Municipal Fixed Income Investments | PACE Global Fixed Income Investments | PACE High Yield Investments | |||||||||||||
Net assets consist of: | |||||||||||||||
Beneficial interest shares of $0.001 par value (unlimited amount authorized) | $ | 352,181,907 | $ | 419,032,330 | $ | 361,685,458 | |||||||||
Accumulated undistributed (distributions in excess of) net investment income (loss) | — | (2,948,467 | ) | 2,364,833 | |||||||||||
Accumulated net realized gain (loss) | 539,870 | (8,289,475 | ) | (5,626,908 | ) | ||||||||||
Net unrealized appreciation (depreciation) | 3,529,824 | (2,309,695 | ) | (4,483,399 | ) | ||||||||||
Net assets | $ | 356,251,601 | $ | 405,484,693 | $ | 353,939,984 | |||||||||
Class A | |||||||||||||||
Net assets | $ | 38,713,698 | $ | 31,480,028 | $ | 3,747,640 | |||||||||
Shares outstanding | 3,040,500 | 3,236,659 | 382,029 | ||||||||||||
Net asset value per share | $ | 12.73 | $ | 9.73 | $ | 9.81 | |||||||||
Maximum offering price per share | $ | 13.02 | $ | 10.11 | $ | 10.19 | |||||||||
Class C | |||||||||||||||
Net assets | $ | 7,594,880 | $ | 2,327,410 | $ | 2,293,638 | |||||||||
Shares outstanding | 596,656 | 239,152 | 234,064 | ||||||||||||
Net asset value and offering price per share | $ | 12.73 | $ | 9.73 | $ | 9.80 | |||||||||
Class Y | |||||||||||||||
Net assets | $ | 64,877 | $ | 2,323,757 | $ | 534,304 | |||||||||
Shares outstanding | 5,094 | 239,917 | 54,209 | ||||||||||||
Net asset value, offering price and redemption value per share3 | $ | 12.74 | $ | 9.69 | $ | 9.86 | |||||||||
Class P | |||||||||||||||
Net assets | $ | 309,878,146 | $ | 369,353,498 | $ | 347,364,402 | |||||||||
Shares outstanding | 24,323,685 | 37,995,935 | 35,338,862 | ||||||||||||
Net asset value, offering price and redemption value per share3 | $ | 12.74 | $ | 9.72 | $ | 9.83 | |||||||||
See accompanying notes to financial statements.
283
PACE Select Advisors Trust
Statement of assets and liabilities (continued)
July 31, 2018
| PACE Large Co Value Equity Investments | PACE Large Co Growth Equity Investments | PACE Small/Medium Co Value Equity Investments | PACE Small/Medium Co Growth Equity Investments | ||||||||||||||||
Assets: | |||||||||||||||||||
| Investments, at value (cost—$1,309,403,585; $1,008,570,118; $484,664,679; $451,509,440; $1,273,875,925; $414,929,641; $138,890,947 and $652,643,625, respectively)1 | $ | 1,516,804,106 | $ | 1,403,186,157 | $ | 566,200,569 | $ | 565,815,059 | |||||||||||
Cash | 117,697 | — | — | 7,438 | |||||||||||||||
Cash collateral on options | — | — | — | — | |||||||||||||||
Cash collateral for forward foreign currency contracts | — | — | — | — | |||||||||||||||
Cash collateral on swap agreements | — | — | — | — | |||||||||||||||
Cash collateral on futures contracts | — | — | — | — | |||||||||||||||
Cash collateral on investments sold short | 2,594,033 | — | — | — | |||||||||||||||
Foreign currency, at value (cost—$0; $0; $0; $0; $896,932; $412,710; $77,291 and $1,829,236, respectively) | — | — | — | — | |||||||||||||||
Receivable for investments sold | 9,151,864 | 1,554,041 | 1,764,537 | 11,733,693 | |||||||||||||||
Receivable for investments sold short | 2,311,937 | — | — | — | |||||||||||||||
Receivable for shares of beneficial interest sold | 599,122 | 536,442 | 286,743 | 327,083 | |||||||||||||||
Receivable for dividends and interest | 903,529 | 225,133 | 216,072 | 49,553 | |||||||||||||||
Receivable for foreign tax reclaims | 9,032 | 9,271 | — | — | |||||||||||||||
Outstanding swap agreements, at value | — | — | — | — | |||||||||||||||
Due from broker | — | — | — | — | |||||||||||||||
Unrealized appreciation on forward foreign currency contracts | — | — | — | — | |||||||||||||||
Receivable for variation margin on futures contracts | — | — | — | — | |||||||||||||||
Other assets | 28,611 | 28,357 | 20,658 | 20,470 | |||||||||||||||
Total assets | 1,532,519,931 | 1,405,539,401 | 568,488,579 | 577,953,296 | |||||||||||||||
Liabilities: | |||||||||||||||||||
| Investments sold short, at value (proceeds—$152,807,307; $0; $0; $0; $162,759,811; $0; $0 and $89,930,970, respectively) | 172,729,726 | — | — | — | |||||||||||||||
Payable for investments purchased | 14,404,413 | 610,387 | 2,036,980 | 5,761,999 | |||||||||||||||
Payable for cash collateral from securities loaned | 17,577,403 | 9,167,476 | 25,616,918 | 24,656,399 | |||||||||||||||
Payable for fund shares redeemed | 1,307,839 | 1,119,592 | 555,387 | 442,262 | |||||||||||||||
Payable to custodian | 113,742 | 104,454 | 69,682 | 56,385 | |||||||||||||||
Payable to affiliate | 852,960 | 935,273 | 386,716 | 389,072 | |||||||||||||||
Payable for foreign withholding taxes and foreign capital gains taxes | — | — | 6,004 | — | |||||||||||||||
Due to broker | — | — | — | — | |||||||||||||||
Deferred foreign capital gain taxes payable | — | — | — | — | |||||||||||||||
Unrealized depreciation on forward foreign currency contracts | — | — | — | — | |||||||||||||||
Payable for variation margin on futures contracts | — | — | — | — | |||||||||||||||
Payable for variation margin on centrally cleared swap agreements | — | — | — | — | |||||||||||||||
Outstanding swap agreements, at value2 | — | — | — | — | |||||||||||||||
Options and swaptions written, at value (premiums received $0; $0; $0; $0; $0; $0; $0 and $982,167, respectively) | — | — | — | — | |||||||||||||||
Payable for dividend and interest expense on investments sold short | 91,741 | — | — | — | |||||||||||||||
Accrued expenses and other liabilities | 482,539 | 330,980 | 345,223 | 309,494 | |||||||||||||||
Total liabilities | 207,560,363 | 12,268,162 | 29,016,910 | 31,615,611 | |||||||||||||||
Net assets | 1,324,959,568 | 1,393,271,239 | 539,471,669 | 546,337,685 | |||||||||||||||
1 Includes $98,240,574; $46,233,042; $64,071,439; $97,129,800; $46,107,649; $11,006,368; $1,241,664 and $0, respectively, of investments in securities on loan, at value plus accrued interest and dividends, if any.
2 Net upfront payments received by PACE Alternative Strategies Investments was $210,698.
284
PACE Select Advisors Trust
| PACE International Equity Investments | PACE International Emerging Markets Equity Investments | PACE Global Real Estate Securities Investments | PACE Alternative Strategies Investments | ||||||||||||||||
Assets: | |||||||||||||||||||
| Investments, at value (cost—$1,309,403,585; $1,008,570,118; $484,664,679; $451,509,440; $1,273,875,925; $414,929,641; $138,890,947 and $652,643,625, respectively)1 | $ | 1,381,384,668 | $ | 455,012,476 | $ | 140,671,025 | $ | 665,895,096 | |||||||||||
Cash | — | — | 61,193 | — | |||||||||||||||
Cash collateral on options | — | — | — | 6,970,629 | |||||||||||||||
Cash collateral for forward foreign currency contracts | — | — | — | 1,680,000 | |||||||||||||||
Cash collateral on swap agreements | — | — | — | 5,125,262 | |||||||||||||||
Cash collateral on futures contracts | — | — | — | 4,997,576 | |||||||||||||||
Cash collateral on investments sold short | 4,058,687 | — | — | 48,592,213 | |||||||||||||||
Foreign currency, at value (cost—$0; $0; $0; $0; $896,932; $412,710; $77,291 and $1,829,236, respectively) | 899,534 | 412,996 | 77,394 | 1,841,068 | |||||||||||||||
Receivable for investments sold | 304,941 | 716,684 | 43,896 | 9,568,916 | |||||||||||||||
Receivable for investments sold short | �� | — | — | — | |||||||||||||||
Receivable for shares of beneficial interest sold | 532,907 | 235,400 | 85,477 | 320,220 | |||||||||||||||
Receivable for dividends and interest | 1,757,531 | 2,237,400 | 193,955 | 804,823 | |||||||||||||||
Receivable for foreign tax reclaims | 3,355,287 | 8,845 | 31,127 | 131,225 | |||||||||||||||
Outstanding swap agreements, at value | — | — | — | 2,632,133 | |||||||||||||||
Due from broker | — | — | — | 193,006 | |||||||||||||||
Unrealized appreciation on forward foreign currency contracts | — | — | — | 13,906,633 | |||||||||||||||
Receivable for variation margin on futures contracts | — | — | — | 440,229 | |||||||||||||||
Other assets | 100,859 | 21,214 | 10,882 | 179,746 | |||||||||||||||
Total assets | 1,392,394,414 | 458,645,015 | 141,174,949 | 763,278,775 | |||||||||||||||
Liabilities: | |||||||||||||||||||
| Investments sold short, at value (proceeds—$152,807,307; $0; $0; $0; $162,759,811; $0; $0 and $89,930,970, respectively) | 161,123,980 | — | — | 95,293,287 | |||||||||||||||
Payable for investments purchased | 814,936 | 516,581 | 1,753,799 | 18,530,095 | |||||||||||||||
Payable for cash collateral from securities loaned | 41,777,229 | 5,422,498 | 971,695 | — | |||||||||||||||
Payable for fund shares redeemed | 1,495,093 | 848,100 | 390,122 | 1,692,571 | |||||||||||||||
Payable to custodian | 178,806 | 287,140 | 34,407 | 509,287 | |||||||||||||||
Payable to affiliate | 884,454 | 436,940 | 69,353 | 702,797 | |||||||||||||||
Payable for foreign withholding taxes and foreign capital gains taxes | 106,569 | 307,702 | 67,774 | 28,427 | |||||||||||||||
Due to broker | — | — | — | 855,987 | |||||||||||||||
Deferred foreign capital gain taxes payable | — | 682,295 | — | — | |||||||||||||||
Unrealized depreciation on forward foreign currency contracts | 740 | — | — | 11,616,599 | |||||||||||||||
Payable for variation margin on futures contracts | — | — | — | 470,581 | |||||||||||||||
Payable for variation margin on centrally cleared swap agreements | — | — | — | 135,659 | |||||||||||||||
Outstanding swap agreements, at value2 | — | — | — | 2,398,770 | |||||||||||||||
Options and swaptions written, at value (premiums received $0; $0; $0; $0; $0; $0; $0 and $982,167, respectively) | — | — | — | 952,181 | |||||||||||||||
Payable for dividend and interest expense on investments sold short | 227,522 | — | — | 73,822 | |||||||||||||||
Accrued expenses and other liabilities | 501,761 | 370,195 | 279,911 | 387,974 | |||||||||||||||
Total liabilities | 207,111,090 | 8,871,451 | 3,567,061 | 133,648,037 | |||||||||||||||
Net assets | 1,185,283,324 | 449,773,564 | 137,607,888 | 629,630,738 | |||||||||||||||
See accompanying notes to financial statements.
285
PACE Select Advisors Trust
Statement of assets and liabilities (concluded)
July 31, 2018
| PACE Large Co Value Equity Investments | PACE Large Co Growth Equity Investments | PACE Small/Medium Co Value Equity Investments | PACE Small/Medium Co Growth Equity Investments | ||||||||||||||||
Net assets consist of: | |||||||||||||||||||
Beneficial interest shares of $0.001 par value (unlimited amount authorized) | $ | 1,061,712,333 | $ | 831,616,149 | $ | 435,216,646 | $ | 375,835,450 | |||||||||||
Accumulated undistributed (distributions in excess of) net investment income (loss) | 12,294,327 | 77,940 | 1,666,136 | (3 | ) | ||||||||||||||
Accumulated net realized gain (loss) | 63,474,806 | 166,961,111 | 21,052,999 | 56,196,619 | |||||||||||||||
Net unrealized appreciation | 187,478,102 | 394,616,039 | 81,535,888 | 114,305,619 | |||||||||||||||
Net assets | $ | 1,324,959,568 | $ | 1,393,271,239 | $ | 539,471,669 | $ | 546,337,685 | |||||||||||
Class A | |||||||||||||||||||
Net assets | $ | 111,758,696 | $ | 47,549,470 | $ | 18,341,856 | $ | 24,749,147 | |||||||||||
Shares outstanding | 4,703,823 | 1,757,293 | 871,507 | 1,266,300 | |||||||||||||||
Net asset value per share | $ | 23.76 | $ | 27.06 | $ | 21.05 | $ | 19.54 | |||||||||||
Maximum offering price per share | $ | 25.14 | $ | 28.63 | $ | 22.28 | $ | 20.68 | |||||||||||
Class C | |||||||||||||||||||
Net assets | $ | 11,017,572 | $ | 2,744,482 | $ | 3,535,050 | $ | 2,672,884 | |||||||||||
Shares outstanding | 463,229 | 126,596 | 205,666 | 179,629 | |||||||||||||||
Net asset value and offering price per share | $ | 23.78 | $ | 21.68 | $ | 17.19 | $ | 14.88 | |||||||||||
Class Y | |||||||||||||||||||
Net assets | $ | 17,206,107 | $ | 15,714,949 | $ | 232,128 | $ | 47,098 | |||||||||||
Shares outstanding | 722,017 | 556,770 | 10,551 | 2,216 | |||||||||||||||
Net asset value, offering price and redemption value per share2 | $ | 23.83 | $ | 28.23 | $ | 22.00 | $ | 21.26 | |||||||||||
Class P | |||||||||||||||||||
Net assets | $ | 1,184,977,193 | $ | 1,327,262,338 | $ | 517,362,635 | $ | 518,868,556 | |||||||||||
Shares outstanding | 49,986,929 | 47,393,333 | 23,850,383 | 24,885,183 | |||||||||||||||
Net asset value, offering price and redemption value per share2 | $ | 23.71 | $ | 28.01 | $ | 21.69 | $ | 20.85 | |||||||||||
2 Assumes shares were held a sufficient period or are otherwise not subject to a redemption fee.
286
PACE Select Advisors Trust
| PACE International Equity Investments | PACE International Emerging Markets Equity Investments | PACE Global Real Estate Securities Investments | PACE Alternative Strategies Investments | ||||||||||||||||
Net assets consist of: | |||||||||||||||||||
Beneficial interest shares of $0.001 par value (unlimited amount authorized) | $ | 1,078,638,776 | $ | 438,958,733 | $ | 138,672,252 | $ | 633,797,636 | |||||||||||
Accumulated undistributed (distributions in excess of) net investment income (loss) | 10,996,433 | 5,046,086 | 1,104,185 | (11,442,213 | ) | ||||||||||||||
Accumulated net realized gain (loss) | (13,421,300 | ) | (33,630,382 | ) | (3,946,843 | ) | (3,273,546 | ) | |||||||||||
Net unrealized appreciation | 109,069,415 | 39,399,127 | 1,778,294 | 10,548,861 | |||||||||||||||
Net assets | $ | 1,185,283,324 | $ | 449,773,564 | $ | 137,607,888 | $ | 629,630,738 | |||||||||||
Class A | |||||||||||||||||||
Net assets | $ | 31,164,522 | $ | 3,810,600 | $ | 370,425 | $ | 7,207,964 | |||||||||||
Shares outstanding | 1,829,790 | 280,040 | 48,391 | 664,396 | |||||||||||||||
Net asset value per share | $ | 17.03 | $ | 13.61 | $ | 7.65 | $ | 10.85 | |||||||||||
Maximum offering price per share | $ | 18.02 | $ | 14.40 | $ | 8.10 | $ | 11.48 | |||||||||||
Class C | |||||||||||||||||||
Net assets | $ | 1,987,604 | $ | 1,181,579 | $ | 168,032 | $ | 6,100,665 | |||||||||||
Shares outstanding | 119,242 | 94,291 | 22,929 | 603,173 | |||||||||||||||
Net asset value and offering price per share | $ | 16.67 | $ | 12.53 | $ | 7.33 | $ | 10.11 | |||||||||||
Class Y | |||||||||||||||||||
Net assets | $ | 13,966,440 | $ | 7,418,772 | $ | — | $ | 543,980 | |||||||||||
Shares outstanding | 822,737 | 540,515 | — | 50,278 | |||||||||||||||
Net asset value, offering price and redemption value per share2 | $ | 16.98 | $ | 13.73 | $ | — | $ | 10.82 | |||||||||||
Class P | |||||||||||||||||||
Net assets | $ | 1,138,164,758 | $ | 437,362,613 | $ | 137,069,431 | $ | 615,778,129 | |||||||||||
Shares outstanding | 67,208,529 | 32,031,483 | 18,588,239 | 57,135,601 | |||||||||||||||
Net asset value, offering price and redemption value per share2 | $ | 16.93 | $ | 13.65 | $ | 7.37 | $ | 10.78 | |||||||||||
See accompanying notes to financial statements.
287
PACE Select Advisors Trust
Statement of operations
For the year ended July 31, 2018
| PACE Government Money Market Investments | PACE Mortgage-Backed Securities Fixed Income Investments | PACE Intermediate Fixed Income Investments | PACE Strategic Fixed Income Investments | ||||||||||||||||
Investment income: | |||||||||||||||||||
Dividends | $ | — | $ | — | $ | — | $ | — | |||||||||||
Interest (net of foreign withholding taxes of $0; $39,688; $0; $3,640; $0; $43,711 and $309, respectively) | 2,952,689 | 12,065,298 | 11,158,543 | 29,059,203 | |||||||||||||||
Securities lending | — | — | 17,876 | 17,691 | |||||||||||||||
Total income | 2,952,689 | 12,065,298 | 11,176,419 | 29,076,894 | |||||||||||||||
Expenses: | |||||||||||||||||||
Investment management and administration fees | 729,181 | 2,659,965 | 2,043,348 | 4,903,693 | |||||||||||||||
Service fees–Class A | — | 83,142 | 39,109 | 35,323 | |||||||||||||||
Service and distribution fees–Class C | — | 74,246 | 8,185 | 54,072 | |||||||||||||||
Transfer agency and related services fees | 858,725 | 774,044 | 605,398 | 818,249 | |||||||||||||||
Professional services | 113,675 | 183,664 | 147,654 | 170,784 | |||||||||||||||
Custody and fund accounting | 12,057 | 144,621 | 118,199 | 310,773 | |||||||||||||||
Interest expense | — | 5,090 | 1,356 | 411,754 | |||||||||||||||
Federal and state registration | 29,364 | 59,945 | 59,016 | 64,054 | |||||||||||||||
Shareholder reports | 34,178 | 45,684 | 47,224 | 50,944 | |||||||||||||||
Trustees' fees | 21,157 | 26,477 | 25,900 | 32,197 | |||||||||||||||
Insurance expense | 3,724 | 9,123 | 7,973 | 16,459 | |||||||||||||||
Other | 43,999 | 27,207 | 35,470 | 46,605 | |||||||||||||||
Total expenses | 1,846,060 | 4,093,208 | 3,138,832 | 6,914,907 | |||||||||||||||
Fee waivers and/or expense reimbursements by investment manager and administrator | (596,039 | ) | (886,117 | ) | (480,958 | ) | (646,500 | ) | |||||||||||
Net expenses | 1,250,021 | 3,207,091 | 2,657,874 | 6,268,407 | |||||||||||||||
Net investment income | 1,702,668 | 8,858,207 | 8,518,545 | 22,808,487 | |||||||||||||||
Net realized and unrealized gains (loss) from investment activities: | |||||||||||||||||||
Net realized gain (loss) on: | |||||||||||||||||||
Investments (net of foreign tax expense of $0; $0; $0; $0; $0; $19,999 and $0, respectively) | 6 | (7,254,044 | ) | (4,936,060 | ) | (990,940 | ) | ||||||||||||
Futures contracts | — | 7,878 | (1,711,970 | ) | (7,583,771 | ) | |||||||||||||
Options and swaptions written | — | 709,903 | 1,578,494 | 1,188,247 | |||||||||||||||
Investments sold short | — | (157,989 | ) | (85,283 | ) | (79,612 | ) | ||||||||||||
Swap agreements | — | 844,280 | 319,998 | 4,101,730 | |||||||||||||||
Forward foreign currency contracts | — | — | (616,737 | ) | (2,088,152 | ) | |||||||||||||
Foreign currency transactions | — | — | 777,472 | 211,683 | |||||||||||||||
Net realized gain (loss) | 6 | (5,849,972 | ) | (4,674,086 | ) | (5,240,815 | ) | ||||||||||||
Change in net unrealized appreciation (depreciation) on: | |||||||||||||||||||
Investments | — | (8,694,018 | ) | (8,633,158 | ) | (21,867,572 | ) | ||||||||||||
Futures contracts | — | (11,813 | ) | (70,776 | ) | (2,548,028 | ) | ||||||||||||
Options and swaptions written | — | 36,572 | (20,041 | ) | (363,901 | ) | |||||||||||||
Investments sold short | — | 134,544 | 296,979 | 4,077 | |||||||||||||||
Swap agreements | — | 1,725,121 | (162,728 | ) | 1,281,191 | ||||||||||||||
Forward foreign currency contracts | — | — | 19,437 | 330,680 | |||||||||||||||
Translation of other assets and liabilities denominated in foreign currency | — | — | 18 | (109,613 | ) | ||||||||||||||
Change in net unrealized appreciation (depreciation) | — | (6,809,594 | ) | (8,570,269 | ) | (23,273,166 | ) | ||||||||||||
Net realized and unrealized gain (loss) | 6 | (12,659,566 | ) | (13,244,355 | ) | (28,513,981 | ) | ||||||||||||
Net increase (decrease) in net assets resulting from operations | $ | 1,702,674 | $ | (3,801,359 | ) | $ | (4,725,810 | ) | $ | (5,705,494 | ) | ||||||||
288
PACE Select Advisors Trust
| PACE Municipal Fixed Income Investments | PACE Global Fixed Income Investments | PACE High Yield Investments | |||||||||||||
Investment income: | |||||||||||||||
Dividends | $ | — | $ | — | $ | 19,975 | |||||||||
Interest (net of foreign withholding taxes of $0; $39,688; $0; $3,640; $0; $43,711 and $309, respectively) | 12,519,023 | 8,693,910 | 23,261,673 | ||||||||||||
Securities lending | — | 13,902 | 222,809 | ||||||||||||
Total income | 12,519,023 | 8,707,812 | 23,504,457 | ||||||||||||
Expenses: | |||||||||||||||
Investment management and administration fees | 1,963,166 | 3,225,437 | 2,957,777 | ||||||||||||
Service fees–Class A | 106,280 | 88,210 | 9,807 | ||||||||||||
Service and distribution fees–Class C | 59,130 | 17,993 | 18,589 | ||||||||||||
Transfer agency and related services fees | 132,015 | 754,901 | 609,812 | ||||||||||||
Professional services | 146,291 | 204,552 | 126,390 | ||||||||||||
Custody and fund accounting | 78,451 | 260,334 | 113,093 | ||||||||||||
Interest expense | — | 888 | — | ||||||||||||
Federal and state registration | 58,195 | 57,812 | 57,385 | ||||||||||||
Shareholder reports | 12,961 | 75,340 | 31,062 | ||||||||||||
Trustees' fees | 25,663 | 26,491 | 22,063 | ||||||||||||
Insurance expense | 7,510 | 9,296 | 7,975 | ||||||||||||
Other | 23,671 | 32,088 | 31,743 | ||||||||||||
Total expenses | 2,613,333 | 4,753,342 | 3,985,696 | ||||||||||||
Fee waivers and/or expense reimbursements by investment manager and administrator | (350,329 | ) | (780,484 | ) | (581,299 | ) | |||||||||
Net expenses | 2,263,004 | 3,972,858 | 3,404,397 | ||||||||||||
Net investment income | 10,256,019 | 4,734,954 | 20,100,060 | ||||||||||||
Net realized and unrealized gains (loss) from investment activities: | |||||||||||||||
Net realized gain (loss) on: | |||||||||||||||
Investments (net of foreign tax expense of $0; $0; $0; $0; $0; $19,999 and $0, respectively) | 545,692 | 3,483,853 | 7,207,454 | ||||||||||||
Futures contracts | — | 916,795 | — | ||||||||||||
Options and swaptions written | — | — | — | ||||||||||||
Investments sold short | — | — | — | ||||||||||||
Swap agreements | — | — | — | ||||||||||||
Forward foreign currency contracts | — | 532,718 | 1,630,248 | ||||||||||||
Foreign currency transactions | — | 217,413 | (1,440,370 | ) | |||||||||||
Net realized gain (loss) | 545,692 | 5,150,779 | 7,397,332 | ||||||||||||
Change in net unrealized appreciation (depreciation) on: | |||||||||||||||
Investments | (9,714,421 | ) | (15,691,764 | ) | (18,977,692 | ) | |||||||||
Futures contracts | — | (236,118 | ) | — | |||||||||||
Options and swaptions written | — | — | — | ||||||||||||
Investments sold short | — | — | — | ||||||||||||
Swap agreements | — | — | — | ||||||||||||
Forward foreign currency contracts | — | (146,599 | ) | 2,913,935 | |||||||||||
Translation of other assets and liabilities denominated in foreign currency | — | (140,538 | ) | (583,182 | ) | ||||||||||
Change in net unrealized appreciation (depreciation) | (9,714,421 | ) | (16,215,019 | ) | (16,646,939 | ) | |||||||||
Net realized and unrealized gain (loss) | (9,168,729 | ) | (11,064,240 | ) | (9,249,607 | ) | |||||||||
Net increase (decrease) in net assets resulting from operations | $ | 1,087,290 | $ | (6,329,286 | ) | $ | 10,850,453 | ||||||||
See accompanying notes to financial statements.
289
PACE Select Advisors Trust
Statement of operations (concluded)
For the year ended July 31, 2018
| PACE Large Co Value Equity Investments | PACE Large Co Growth Equity Investments | PACE Small/Medium Co Value Equity Investments | PACE Small/Medium Co Growth Equity Investments | ||||||||||||||||
Investment income: | |||||||||||||||||||
| Dividends (net of foreign withholding taxes of $176,878; $119,277; $48,733; $22,380; $3,833,072; $1,469,428; $196,798 and $354,370, respectively) | $ | 38,998,973 | $ | 12,477,631 | $ | 8,043,224 | $ | 2,456,728 | |||||||||||
Interest (net of foreign withholding taxes of $0; $0; $0; $0; $0; $594; $0 and $68,362, respectively) | 122,612 | 127,514 | 90,605 | 43,475 | |||||||||||||||
Securities lending | 92,066 | 113,096 | 115,814 | 232,578 | |||||||||||||||
Total income | 39,213,651 | 12,718,241 | 8,249,643 | 2,732,781 | |||||||||||||||
Expenses: | |||||||||||||||||||
Investment management and administration fees | 9,981,442 | 10,670,526 | 4,240,396 | 4,153,179 | |||||||||||||||
Service fees–Class A | 288,554 | 116,620 | 44,553 | 59,050 | |||||||||||||||
Service and distribution fees–Class C | 112,315 | 27,085 | 37,209 | 25,938 | |||||||||||||||
Dividend expense, interest expense and other borrowing costs for investments sold short | 4,796,768 | — | — | — | |||||||||||||||
Transfer agency and related services fees | 954,537 | 915,210 | 868,114 | 867,989 | |||||||||||||||
Custody and fund accounting | 334,834 | 325,401 | 155,858 | 137,409 | |||||||||||||||
Professional services | 153,729 | 155,738 | 184,209 | 140,196 | |||||||||||||||
Federal and state registration | 64,070 | 63,454 | 57,643 | 57,472 | |||||||||||||||
Shareholder reports | 66,344 | 58,975 | 72,419 | 45,752 | |||||||||||||||
Trustees' fees | 39,717 | 40,040 | 27,915 | 27,739 | |||||||||||||||
Insurance expense | 26,993 | 25,418 | 10,772 | 9,669 | |||||||||||||||
Interest expense | 1,746 | 843 | — | 617 | |||||||||||||||
Other | 66,163 | 49,658 | 33,517 | 37,926 | |||||||||||||||
Total expenses | 16,887,212 | 12,448,968 | 5,732,605 | 5,562,936 | |||||||||||||||
Fee waivers and/or expense reimbursements by investment manager and administrator | (56,044 | ) | (33,676 | ) | (63,558 | ) | (72,219 | ) | |||||||||||
Net expenses | 16,831,168 | 12,415,292 | 5,669,047 | 5,490,717 | |||||||||||||||
Net investment income (loss) | 22,382,483 | 302,949 | 2,580,596 | (2,757,936 | ) | ||||||||||||||
Net realized and unrealized gains (loss) from investment activities: | |||||||||||||||||||
Net realized gain (loss) on: | |||||||||||||||||||
Investments (net of foreign tax expense of $0; $0; $0; $0; $0; $92,340; $0 and $1,955, respectively) | 98,147,896 | 202,013,107 | 25,892,023 | 70,275,617 | |||||||||||||||
Futures contracts | — | — | — | — | |||||||||||||||
Options and swaptions written | — | — | — | — | |||||||||||||||
Investments sold short | (21,958,427 | ) | — | — | — | ||||||||||||||
Swap agreements | — | — | — | — | |||||||||||||||
Forward foreign currency contracts | — | — | — | — | |||||||||||||||
Foreign currency transactions | 464 | — | (944 | ) | — | ||||||||||||||
Net realized gain (loss) | 76,189,933 | 202,013,107 | 25,891,079 | 70,275,617 | |||||||||||||||
Change in net unrealized appreciation (depreciation) on: | |||||||||||||||||||
| Investments (net of change in deferred foreign capital gain taxes of $0; $0; $0; $0; $0; $314,411; $0 and 0, respectively) | 18,944,387 | 36,043,130 | 36,843,710 | 42,104,817 | |||||||||||||||
Futures contracts | — | — | — | — | |||||||||||||||
Options and swaptions written | — | — | — | — | |||||||||||||||
Investments sold short | (830,183 | ) | — | — | — | ||||||||||||||
Swap agreements | — | — | — | — | |||||||||||||||
Forward foreign currency contracts | — | — | — | — | |||||||||||||||
Translation of other assets and liabilities denominated in foreign currency | — | — | (16 | ) | — | ||||||||||||||
Change in net unrealized appreciation (depreciation) | 18,114,204 | 36,043,130 | 36,843,694 | 42,104,817 | |||||||||||||||
Net realized and unrealized gain | 94,304,137 | 238,056,237 | 62,734,773 | 112,380,434 | |||||||||||||||
Net increase in net assets resulting from operations | $ | 116,686,620 | $ | 238,359,186 | $ | 65,315,369 | $ | 109,622,498 | |||||||||||
290
PACE Select Advisors Trust
| PACE International Equity Investments | PACE International Emerging Markets Equity Investments | PACE Global Real Estate Securities Investments | PACE Alternative Strategies Investments | ||||||||||||||||
Investment income: | |||||||||||||||||||
| Dividends (net of foreign withholding taxes of $176,878; $119,277; $48,733; $22,380; $3,833,072; $1,469,428; $196,798 and $354,370, respectively) | $ | 38,046,819 | $ | 12,358,385 | $ | 5,894,400 | $ | 8,062,065 | |||||||||||
Interest (net of foreign withholding taxes of $0; $0; $0; $0; $0; $594; $0 and $68,362, respectively) | 151,022 | 41,237 | 5,804 | 6,004,605 | |||||||||||||||
Securities lending | 581,461 | 86,364 | 5,526 | — | |||||||||||||||
Total income | 38,779,302 | 12,485,986 | 5,905,730 | 14,066,670 | |||||||||||||||
Expenses: | |||||||||||||||||||
Investment management and administration fees | 10,570,817 | 5,292,714 | 1,103,661 | 9,198,204 | |||||||||||||||
Service fees–Class A | 79,825 | 10,265 | 981 | 20,352 | |||||||||||||||
Service and distribution fees–Class C | 19,971 | 12,801 | 1,752 | 73,497 | |||||||||||||||
Dividend expense, interest expense and other borrowing costs for investments sold short | 6,527,859 | — | — | 3,360,283 | |||||||||||||||
Transfer agency and related services fees | 887,184 | 800,533 | 622,808 | 469,111 | |||||||||||||||
Custody and fund accounting | 647,431 | 658,050 | 71,186 | 483,045 | |||||||||||||||
Professional services | 180,215 | 214,936 | 158,809 | 287,524 | |||||||||||||||
Federal and state registration | 67,026 | 59,013 | 53,127 | 61,887 | |||||||||||||||
Shareholder reports | 6,674 | 47,749 | 32,251 | 71,712 | |||||||||||||||
Trustees' fees | 37,920 | 27,427 | 22,294 | 30,013 | |||||||||||||||
Insurance expense | 20,940 | 8,560 | 2,721 | 13,531 | |||||||||||||||
Interest expense | 712 | 1,015 | 38 | 37,579 | |||||||||||||||
Other | 80,428 | 85,542 | 38,556 | 73,507 | |||||||||||||||
Total expenses | 19,127,002 | 7,218,605 | 2,108,184 | 14,180,245 | |||||||||||||||
Fee waivers and/or expense reimbursements by investment manager and administrator | (117,858 | ) | (216,624 | ) | (449,830 | ) | (547,182 | ) | |||||||||||
Net expenses | 19,009,144 | 7,001,981 | 1,658,354 | 13,633,063 | |||||||||||||||
Net investment income (loss) | 19,770,158 | 5,484,005 | 4,247,376 | 433,607 | |||||||||||||||
Net realized and unrealized gains (loss) from investment activities: | |||||||||||||||||||
Net realized gain (loss) on: | |||||||||||||||||||
Investments (net of foreign tax expense of $0; $0; $0; $0; $0; $92,340; $0 and $1,955, respectively) | 80,751,625 | 34,017,237 | (1,091,329 | ) | 35,691,574 | ||||||||||||||
Futures contracts | — | — | — | (3,140,235 | ) | ||||||||||||||
Options and swaptions written | — | — | — | 2,538,168 | |||||||||||||||
Investments sold short | (13,853,129 | ) | — | — | (10,373,544 | ) | |||||||||||||
Swap agreements | — | — | — | (400,980 | ) | ||||||||||||||
Forward foreign currency contracts | (42,454 | ) | (5,442 | ) | 25,298 | (9,398,160 | ) | ||||||||||||
Foreign currency transactions | (104,180 | ) | (316,291 | ) | (62,943 | ) | (100,668 | ) | |||||||||||
Net realized gain (loss) | 66,751,862 | 33,695,504 | (1,128,974 | ) | 14,816,155 | ||||||||||||||
Change in net unrealized appreciation (depreciation) on: | |||||||||||||||||||
| Investments (net of change in deferred foreign capital gain taxes of $0; $0; $0; $0; $0; $314,411; $0 and 0, respectively) | (16,259,727 | ) | (31,603,338 | ) | 2,074,653 | (12,829,488 | ) | ||||||||||||
Futures contracts | — | — | — | 630,438 | |||||||||||||||
Options and swaptions written | — | — | — | (439,687 | ) | ||||||||||||||
Investments sold short | 12,607,544 | — | — | 301,027 | |||||||||||||||
Swap agreements | — | — | — | 1,615,829 | |||||||||||||||
Forward foreign currency contracts | (740 | ) | — | — | 5,711,001 | ||||||||||||||
Translation of other assets and liabilities denominated in foreign currency | (132,416 | ) | (12,351 | ) | (4,715 | ) | (7,596 | ) | |||||||||||
Change in net unrealized appreciation (depreciation) | (3,785,339 | ) | (31,615,689 | ) | 2,069,938 | (5,018,476 | ) | ||||||||||||
Net realized and unrealized gain | 62,966,523 | 2,079,815 | 940,964 | 9,797,679 | |||||||||||||||
Net increase in net assets resulting from operations | $ | 82,736,681 | $ | 7,563,820 | $ | 5,188,340 | $ | 10,231,286 | |||||||||||
See accompanying notes to financial statements.
291
PACE Select Advisors Trust
Statement of changes in net assets
| PACE Government Money Market Investments | PACE Mortgaged-Backed Securities Fixed Income Investments | PACE Intermediate Fixed Income Investments | |||||||||||||||||||||||||
For the years ended July 31, | For the years ended July 31, | For the years ended July 31, | |||||||||||||||||||||||||
2018 | 2017 | 2018 | 2017 | 2018 | 2017 | ||||||||||||||||||||||
From operations: | |||||||||||||||||||||||||||
Net investment income | $ | 1,702,668 | $ | 227,818 | $ | 8,858,207 | $ | 7,437,310 | $ | 8,518,545 | $ | 6,415,882 | |||||||||||||||
Net realized gain (loss) | 6 | (1,112 | ) | (5,849,972 | ) | (603,111 | ) | (4,674,086 | ) | 71,869 | |||||||||||||||||
Change in net unrealized appreciation (depreciation) | — | — | (6,809,594 | ) | (4,894,805 | ) | (8,570,269 | ) | (2,560,430 | ) | |||||||||||||||||
Net increase (decrease) in net assets resulting from operations | 1,702,674 | 226,706 | (3,801,359 | ) | 1,939,394 | (4,725,810 | ) | 3,927,321 | |||||||||||||||||||
Dividends and distributions to shareholders from: | |||||||||||||||||||||||||||
Net investment income–Class A | — | — | (961,787 | ) | (999,111 | ) | (337,935 | ) | (248,850 | ) | |||||||||||||||||
Net investment income–Class C | — | — | (248,183 | ) | (241,527 | ) | (19,206 | ) | (12,274 | ) | |||||||||||||||||
Net investment income–Class Y | — | — | (1,190,592 | ) | (1,357,824 | ) | (7,635 | ) | (6,037 | ) | |||||||||||||||||
Net investment income–Class P | (1,702,668 | ) | (227,818 | ) | (10,787,361 | ) | (10,920,203 | ) | (8,822,909 | ) | (6,505,074 | ) | |||||||||||||||
Net realized gains | — | — | — | — | — | (53,263 | ) | ||||||||||||||||||||
Net realized gains–Class C | — | — | — | — | — | (4,338 | ) | ||||||||||||||||||||
Net realized gains–Class Y | — | — | — | — | — | (1,117 | ) | ||||||||||||||||||||
Net realized gains–Class P | — | — | — | — | — | (1,190,266 | ) | ||||||||||||||||||||
Total dividends and distributions to shareholders | (1,702,668 | ) | (227,818 | ) | (13,187,923 | ) | (13,518,665 | ) | (9,187,685 | ) | (8,021,219 | ) | |||||||||||||||
From beneficial interest transactions: | |||||||||||||||||||||||||||
Proceeds from shares sold | 153,320,074 | 279,769,071 | 71,821,639 | 90,902,809 | 61,354,338 | 60,949,841 | |||||||||||||||||||||
Cost of shares redeemed | (165,625,042 | ) | (263,332,595 | ) | (119,862,443 | ) | (156,678,233 | ) | (79,892,545 | ) | (103,374,812 | ) | |||||||||||||||
Shares issued on reinvestment of dividends and distributions | 1,513,589 | 173,450 | 12,034,990 | 12,331,064 | 8,264,039 | 7,226,182 | |||||||||||||||||||||
| Net increase (decrease) in net assets from beneficial interest transactions | (10,791,379 | ) | 16,609,926 | (36,005,814 | ) | (53,444,360 | ) | (10,274,168 | ) | (35,198,789 | ) | ||||||||||||||||
Net increase (decrease) in net assets | (10,791,373 | ) | 16,608,814 | (52,995,096 | ) | (65,023,631 | ) | (24,187,663 | ) | (39,292,687 | ) | ||||||||||||||||
Net assets: | |||||||||||||||||||||||||||
Beginning of year | 199,585,359 | 182,976,545 | 445,611,772 | 510,635,403 | 392,581,722 | 431,874,409 | |||||||||||||||||||||
End of year | $ | 188,793,986 | $ | 199,585,359 | $ | 392,616,676 | $ | 445,611,772 | $ | 368,394,059 | $ | 392,581,722 | |||||||||||||||
| Accumulated undistributed (distributions in excess of) net investment income | $ | — | $ | — | $ | 480,551 | $ | 521,882 | $ | 1,411,682 | $ | 1,236,003 | |||||||||||||||
292
PACE Select Advisors Trust
| PACE Strategic Fixed Income Investments | PACE Municipal Fixed Income Investments | ||||||||||||||||||
For the years ended July 31, | For the years ended July 31, | ||||||||||||||||||
2018 | 2017 | 2018 | 2017 | ||||||||||||||||
From operations: | |||||||||||||||||||
Net investment income | $ | 22,808,487 | $ | 23,923,226 | $ | 10,256,019 | $ | 10,389,220 | |||||||||||
Net realized gain (loss) | (5,240,815 | ) | (6,935,149 | ) | 545,692 | 804,680 | |||||||||||||
Change in net unrealized appreciation (depreciation) | (23,273,166 | ) | (2,379,364 | ) | (9,714,421 | ) | (12,678,000 | ) | |||||||||||
Net increase (decrease) in net assets resulting from operations | (5,705,494 | ) | 14,608,713 | 1,087,290 | (1,484,100 | ) | |||||||||||||
Dividends and distributions to shareholders from: | |||||||||||||||||||
Net investment income–Class A | (383,426 | ) | (373,634 | ) | (1,101,076 | ) | (1,196,328 | ) | |||||||||||
Net investment income–Class C | (164,449 | ) | (213,828 | ) | (174,754 | ) | (186,374 | ) | |||||||||||
Net investment income–Class Y | (44,283 | ) | (57,890 | ) | (2,149 | ) | (2,088 | ) | |||||||||||
Net investment income–Class P | (23,346,881 | ) | (25,022,010 | ) | (8,984,515 | ) | (8,998,907 | ) | |||||||||||
Net realized gains | — | (212,312 | ) | (58,589 | ) | (361,045 | ) | ||||||||||||
Net realized gains–Class C | — | (152,383 | ) | (10,998 | ) | (70,658 | ) | ||||||||||||
Net realized gains–Class Y | — | (30,485 | ) | (118 | ) | (500 | ) | ||||||||||||
Net realized gains–Class P | — | (13,137,303 | ) | (421,544 | ) | (2,468,971 | ) | ||||||||||||
Total dividends and distributions to shareholders | (23,939,039 | ) | (39,199,845 | ) | (10,753,743 | ) | (13,284,871 | ) | |||||||||||
From beneficial interest transactions: | |||||||||||||||||||
Proceeds from shares sold | 109,826,434 | 111,384,315 | 48,856,462 | 52,483,400 | |||||||||||||||
Cost of shares redeemed | (153,633,513 | ) | (174,065,722 | ) | (71,525,103 | ) | (81,616,612 | ) | |||||||||||
Shares issued on reinvestment of dividends and distributions | 21,980,495 | 36,180,494 | 9,034,151 | 11,312,647 | |||||||||||||||
| Net increase (decrease) in net assets from beneficial interest transactions | (21,826,584 | ) | (26,500,913 | ) | (13,634,490 | ) | (17,820,565 | ) | |||||||||||
Net increase (decrease) in net assets | (51,471,117 | ) | (51,092,045 | ) | (23,300,943 | ) | (32,589,536 | ) | |||||||||||
Net assets: | |||||||||||||||||||
Beginning of year | 831,390,074 | 882,482,119 | 379,552,544 | 412,142,080 | |||||||||||||||
End of year | $ | 779,918,957 | $ | 831,390,074 | $ | 356,251,601 | $ | 379,552,544 | |||||||||||
| Accumulated undistributed (distributions in excess of) net investment income | $ | 9,890,110 | $ | 8,560,371 | $ | — | $ | 2,516 | |||||||||||
See accompanying notes to financial statements.
293
PACE Select Advisors Trust
Statement of changes in net assets (continued)
| PACE Global Fixed Income Investments | PACE High Yield Investments | PACE Large Co Value Equity Investments | |||||||||||||||||||||||||
For the years ended July 31, | For the years ended July 31, | For the years ended July 31, | |||||||||||||||||||||||||
2018 | 2017 | 2018 | 2017 | 2018 | 2017 | ||||||||||||||||||||||
From operations: | |||||||||||||||||||||||||||
Net investment income | $ | 4,734,954 | $ | 6,320,428 | $ | 20,100,060 | $ | 23,237,420 | $ | 22,382,483 | $ | 22,375,751 | |||||||||||||||
Net realized gain | 5,150,779 | (24,334,285 | ) | 7,397,332 | 8,621,540 | 76,189,933 | 102,752,134 | ||||||||||||||||||||
Change in net unrealized appreciation (depreciation) | (16,215,019 | ) | (10,024,777 | ) | (16,646,939 | ) | 11,962,946 | 18,114,204 | 73,532,988 | ||||||||||||||||||
Net increase (decrease) in net assets resulting from operations | (6,329,286 | ) | (28,038,634 | ) | 10,850,453 | 43,821,906 | 116,686,620 | 198,660,873 | |||||||||||||||||||
Dividends and distributions to shareholders from: | |||||||||||||||||||||||||||
Net investment income–Class A | — | (698,459 | ) | (208,373 | ) | (234,072 | ) | (1,490,821 | ) | (1,794,574 | ) | ||||||||||||||||
Net investment income–Class C | — | (41,628 | ) | (123,408 | ) | (149,979 | ) | (59,827 | ) | (87,986 | ) | ||||||||||||||||
Net investment income–Class Y | — | (54,336 | ) | (29,010 | ) | (36,967 | ) | (265,210 | ) | (323,059 | ) | ||||||||||||||||
Net investment income–Class P | — | (8,442,767 | ) | (19,994,007 | ) | (22,930,243 | ) | (18,285,278 | ) | (21,042,472 | ) | ||||||||||||||||
Net realized gains–Class A | — | — | — | — | (8,009,384 | ) | (3,142,416 | ) | |||||||||||||||||||
Net realized gains–Class C | — | — | — | — | (828,457 | ) | (329,787 | ) | |||||||||||||||||||
Net realized gains–Class Y | — | — | — | — | (1,190,186 | ) | (489,234 | ) | |||||||||||||||||||
Net realized gains–Class P | — | — | — | — | (82,958,088 | ) | (32,190,594 | ) | |||||||||||||||||||
Return of capital–Class A | (488,837 | ) | (295,590 | ) | — | — | — | — | |||||||||||||||||||
Return of capital–Class C | (22,988 | ) | (12,799 | ) | — | — | — | — | |||||||||||||||||||
Return of capital–Class Y | (39,668 | ) | (22,046 | ) | — | — | — | — | |||||||||||||||||||
Return of capital–Class P | (6,308,471 | ) | (3,682,347 | ) | — | — | — | — | |||||||||||||||||||
Total dividends and distributions to shareholders | (6,859,964 | ) | (13,249,972 | ) | (20,354,798 | ) | (23,351,261 | ) | (113,087,251 | ) | (59,400,122 | ) | |||||||||||||||
From beneficial interest transactions: | |||||||||||||||||||||||||||
Proceeds from shares sold | 45,352,964 | 58,371,399 | 36,001,719 | 56,193,257 | 84,980,768 | 100,350,237 | |||||||||||||||||||||
Cost of shares redeemed | (79,605,170 | ) | (148,124,325 | ) | (75,275,294 | ) | (134,944,631 | ) | (213,881,391 | ) | (253,996,261 | ) | |||||||||||||||
Shares issued on reinvestment of dividends and distributions | 6,312,446 | 12,200,509 | 18,703,014 | 21,521,712 | 106,234,784 | 55,848,030 | |||||||||||||||||||||
| Net increase (decrease) in net assets from beneficial interest transactions | (27,939,760 | ) | (77,552,417 | ) | (20,570,561 | ) | (57,229,662 | ) | (22,665,839 | ) | (97,797,994 | ) | |||||||||||||||
Net increase (decrease) in net assets | (41,129,010 | ) | (118,841,023 | ) | (30,074,906 | ) | (36,759,017 | ) | (19,066,470 | ) | 41,462,757 | ||||||||||||||||
Net assets: | |||||||||||||||||||||||||||
Beginning of year | 446,613,703 | 565,454,726 | 384,014,890 | 420,773,907 | 1,344,026,038 | 1,302,563,281 | |||||||||||||||||||||
End of year | $ | 405,484,693 | $ | 446,613,703 | $ | 353,939,984 | $ | 384,014,890 | $ | 1,324,959,568 | $ | 1,344,026,038 | |||||||||||||||
| Accumulated undistributed (distributions in excess of) net investment income | $ | (2,948,467 | ) | $ | (37,835,408 | ) | $ | 2,364,833 | $ | 779,282 | $ | 12,294,327 | $ | 10,520,659 | |||||||||||||
294
PACE Select Advisors Trust
| PACE Large Co Growth Equity Investments | PACE Small/Medium Co Value Equity Investments | ||||||||||||||||||
For the years ended July 31, | For the years ended July 31, | ||||||||||||||||||
2018 | 2017 | 2018 | 2017 | ||||||||||||||||
From operations: | |||||||||||||||||||
Net investment income | $ | 302,949 | $ | 3,879,364 | $ | 2,580,596 | $ | 4,313,901 | |||||||||||
Net realized gain | 202,013,107 | 107,429,870 | 25,891,079 | 67,191,426 | |||||||||||||||
Change in net unrealized appreciation (depreciation) | 36,043,130 | 85,272,003 | 36,843,694 | 5,245,663 | |||||||||||||||
Net increase (decrease) in net assets resulting from operations | 238,359,186 | 196,581,237 | 65,315,369 | 76,750,990 | |||||||||||||||
Dividends and distributions to shareholders from: | |||||||||||||||||||
Net investment income–Class A | — | (53,501 | ) | (19,006 | ) | (240,797 | ) | ||||||||||||
Net investment income–Class C | — | — | — | (35,921 | ) | ||||||||||||||
Net investment income–Class Y | (16,901 | ) | (48,062 | ) | (704 | ) | (5,472 | ) | |||||||||||
Net investment income–Class P | (1,303,992 | ) | (4,211,251 | ) | (1,236,385 | ) | (7,324,442 | ) | |||||||||||
Net realized gains–Class A | (4,492,312 | ) | (1,344,842 | ) | (1,942,489 | ) | (483,160 | ) | |||||||||||
Net realized gains–Class C | (337,739 | ) | (118,699 | ) | (554,561 | ) | (133,716 | ) | |||||||||||
Net realized gains–Class Y | (1,382,122 | ) | (402,707 | ) | (31,899 | ) | (10,874 | ) | |||||||||||
Net realized gains–Class P | (121,930,288 | ) | (36,392,528 | ) | (54,355,494 | ) | (13,555,466 | ) | |||||||||||
Return of capital–Class A | — | — | — | — | |||||||||||||||
Return of capital–Class C | — | — | — | — | |||||||||||||||
Return of capital–Class Y | — | — | — | — | |||||||||||||||
Return of capital–Class P | — | — | — | — | |||||||||||||||
Total dividends and distributions to shareholders | (129,463,354 | ) | (42,571,590 | ) | (58,140,538 | ) | (21,789,848 | ) | |||||||||||
From beneficial interest transactions: | |||||||||||||||||||
Proceeds from shares sold | 73,887,591 | 100,602,806 | 39,600,056 | 46,350,974 | |||||||||||||||
Cost of shares redeemed | (245,103,947 | ) | (236,697,202 | ) | (87,821,671 | ) | (108,673,345 | ) | |||||||||||
Shares issued on reinvestment of dividends and distributions | 122,702,402 | 40,489,153 | 54,891,264 | 20,535,489 | |||||||||||||||
| Net increase (decrease) in net assets from beneficial interest transactions | (48,513,954 | ) | (95,605,243 | ) | 6,669,649 | (41,786,882 | ) | ||||||||||||
Net increase (decrease) in net assets | 60,381,878 | 58,404,404 | 13,844,480 | 13,174,260 | |||||||||||||||
Net assets: | |||||||||||||||||||
Beginning of year | 1,332,889,361 | 1,274,484,957 | 525,627,189 | 512,452,929 | |||||||||||||||
End of year | $ | 1,393,271,239 | $ | 1,332,889,361 | $ | 539,471,669 | $ | 525,627,189 | |||||||||||
| Accumulated undistributed (distributions in excess of) net investment income | $ | 77,940 | $ | 108,076 | $ | 1,666,136 | $ | 35,794 | |||||||||||
See accompanying notes to financial statements.
295
PACE Select Advisors Trust
Statement of changes in net assets (concluded)
| PACE Small/Medium Co Growth Equity Investments | PACE International Equity Investments | PACE International Emerging Markets Equity Investments | |||||||||||||||||||||||||
For the years ended July 31, | For the years ended July 31, | For the years ended July 31, | |||||||||||||||||||||||||
2018 | 2017 | 2018 | 2017 | 2018 | 2017 | ||||||||||||||||||||||
From operations: | |||||||||||||||||||||||||||
Net investment income (loss) | $ | (2,757,936 | ) | $ | (2,388,905 | ) | $ | 19,770,158 | $ | 21,191,293 | $ | 5,484,005 | $ | 5,570,515 | |||||||||||||
Net realized gain (loss) | 70,275,617 | 36,174,906 | 66,751,862 | 35,383,737 | 33,695,504 | 12,937,450 | |||||||||||||||||||||
Change in net unrealized appreciation (depreciation) | 42,104,817 | 42,237,611 | (3,785,339 | ) | 108,403,807 | (31,615,689 | ) | 62,374,624 | |||||||||||||||||||
Net increase (decrease) in net assets resulting from operations | 109,622,498 | 76,023,612 | 82,736,681 | 164,978,837 | 7,563,820 | 80,882,589 | |||||||||||||||||||||
Dividends and distributions to shareholders from: | |||||||||||||||||||||||||||
Net investment income–Class A | — | — | (590,355 | ) | (572,185 | ) | (39,712 | ) | (30,175 | ) | |||||||||||||||||
Net investment income–Class C | — | — | (24,291 | ) | (22,364 | ) | (4,341 | ) | (1,193 | ) | |||||||||||||||||
Net investment income–Class Y | — | — | (316,169 | ) | (318,588 | ) | (96,566 | ) | (75,310 | ) | |||||||||||||||||
Net investment income–Class P | — | — | (24,378,517 | ) | (20,728,400 | ) | (5,530,760 | ) | (4,085,462 | ) | |||||||||||||||||
Net realized gains–Class A | (1,297,698 | ) | — | — | — | — | — | ||||||||||||||||||||
Net realized gains–Class C | (198,913 | ) | — | — | — | — | — | ||||||||||||||||||||
Net realized gains–Class Y | (5,347 | ) | — | — | — | — | — | ||||||||||||||||||||
Net realized gains–Class P | (25,626,125 | ) | — | — | — | — | — | ||||||||||||||||||||
Total dividends and distributions to shareholders | (27,128,083 | ) | — | (25,309,332 | ) | (21,641,537 | ) | (5,671,379 | ) | (4,192,140 | ) | ||||||||||||||||
From beneficial interest transactions: | |||||||||||||||||||||||||||
Proceeds from shares sold | 33,327,231 | 44,322,542 | 120,993,437 | 183,012,794 | 52,628,267 | 67,086,338 | |||||||||||||||||||||
Cost of shares redeemed | (90,679,821 | ) | (94,477,371 | ) | (169,203,401 | ) | (166,846,663 | ) | (78,225,424 | ) | (87,148,727 | ) | |||||||||||||||
Shares issued on reinvestment of dividends and distributions | 25,873,218 | 700 | 23,629,324 | 20,182,585 | 5,347,076 | 3,965,359 | |||||||||||||||||||||
| Net increase (decrease) in net assets from beneficial interest transactions | (31,479,372 | ) | (50,154,129 | ) | (24,580,640 | ) | 36,348,716 | (20,250,081 | ) | (16,097,030 | ) | ||||||||||||||||
Net increase (decrease) in net assets | 51,015,043 | 25,869,483 | 32,846,709 | 179,686,016 | (18,357,640 | ) | 60,593,419 | ||||||||||||||||||||
Net assets: | |||||||||||||||||||||||||||
Beginning of year | 495,322,642 | 469,453,159 | 1,152,436,615 | 972,750,599 | 468,131,204 | 407,537,785 | |||||||||||||||||||||
End of year | $ | 546,337,685 | $ | 495,322,642 | $ | 1,185,283,324 | $ | 1,152,436,615 | $ | 449,773,564 | $ | 468,131,204 | |||||||||||||||
| Accumulated undistributed (distributions in excess of) net investment income | $ | (3 | ) | $ | (1,762,888 | ) | $ | 10,996,433 | $ | 13,975,215 | $ | 5,046,086 | $ | 5,513,473 | |||||||||||||
296
PACE Select Advisors Trust
| PACE Global Real Estate Securities Investments | PACE Alternative Strategies Investments | ||||||||||||||||||
For the years ended July 31, | For the years ended July 31, | ||||||||||||||||||
2018 | 2017 | 2018 | 2017 | ||||||||||||||||
From operations: | |||||||||||||||||||
Net investment income (loss) | $ | 4,247,376 | $ | 3,628,686 | $ | 433,607 | $ | (3,464,048 | ) | ||||||||||
Net realized gain (loss) | (1,128,974 | ) | 5,865,431 | 14,816,155 | 12,715,954 | ||||||||||||||
Change in net unrealized appreciation (depreciation) | 2,069,938 | (9,851,290 | ) | (5,018,476 | ) | 5,516,030 | |||||||||||||
Net increase (decrease) in net assets resulting from operations | 5,188,340 | (357,173 | ) | 10,231,286 | 14,767,936 | ||||||||||||||
Dividends and distributions to shareholders from: | |||||||||||||||||||
Net investment income–Class A | (13,326 | ) | (17,802 | ) | — | — | |||||||||||||
Net investment income–Class C | (4,396 | ) | (10,900 | ) | — | — | |||||||||||||
Net investment income–Class Y | (1,142 | ) | (938 | ) | — | — | |||||||||||||
Net investment income–Class P | (5,497,154 | ) | (6,046,507 | ) | — | — | |||||||||||||
Net realized gains–Class A | (1,863 | ) | — | — | — | ||||||||||||||
Net realized gains–Class C | (870 | ) | — | — | — | ||||||||||||||
Net realized gains–Class Y | (147 | ) | — | — | — | ||||||||||||||
Net realized gains–Class P | (706,670 | ) | — | — | — | ||||||||||||||
Total dividends and distributions to shareholders | (6,225,568 | ) | (6,076,147 | ) | — | — | |||||||||||||
From beneficial interest transactions: | |||||||||||||||||||
Proceeds from shares sold | 15,638,497 | 17,169,512 | 85,248,055 | 110,510,485 | |||||||||||||||
Cost of shares redeemed | (23,801,441 | ) | (27,668,849 | ) | (134,906,601 | ) | (193,020,289 | ) | |||||||||||
Shares issued on reinvestment of dividends and distributions | 5,806,661 | 5,652,218 | — | — | |||||||||||||||
| Net increase (decrease) in net assets from beneficial interest transactions | (2,356,283 | ) | (4,847,119 | ) | (49,658,546 | ) | (82,509,804 | ) | |||||||||||
Net increase (decrease) in net assets | (3,393,511 | ) | (11,280,439 | ) | (39,427,260 | ) | (67,741,868 | ) | |||||||||||
Net assets: | |||||||||||||||||||
Beginning of year | 141,001,399 | 152,281,838 | 669,057,998 | 736,799,866 | |||||||||||||||
End of year | $ | 137,607,888 | $ | 141,001,399 | $ | 629,630,738 | $ | 669,057,998 | |||||||||||
| Accumulated undistributed (distributions in excess of) net investment income | $ | 1,104,185 | $ | 979,609 | $ | (11,442,213 | ) | $ | (6,810,171 | ) | |||||||||
See accompanying notes to financial statements.
297
PACE Select Advisors Trust
Statement of cash flows
For the year ended July 31, 2018
| PACE Large Co Value Equity Investments | |||||||
Cash flows from operating activities | |||||||
Net increase in net assets resulting from operations | $ | 116,686,620 | |||||
| Adjustments to reconcile net increase in net assets resulting from operations to net cash used for operating activities: | |||||||
Purchases of long-term investments | (688,589,980 | ) | |||||
Purchases to cover investments sold short | (221,798,194 | ) | |||||
Proceeds from disposition of long-term investments | 839,267,176 | ||||||
Sales of investments sold short | 189,977,112 | ||||||
Net purchases from short-term investments | (9,084,623 | ) | |||||
Net realized (gains) from investments in securities | (98,147,896 | ) | |||||
Net realized losses from investments sold short | 21,958,427 | ||||||
Net change in unrealized appreciation/depreciation of investments in securities | (18,944,387 | ) | |||||
Net change in unrealized appreciation/depreciation of investments sold short | 830,183 | ||||||
Changes in assets and liabilities: | |||||||
(Increase) decrease in assets: | |||||||
Cash collateral on investments sold short | 1,251,098 | ||||||
Receivable for interest and dividends | 239,322 | ||||||
Receivable for foreign tax reclaims | (3,181 | ) | |||||
Other assets | 4,471 | ||||||
Increase (decrease) in liabilities: | |||||||
Payable for cash collateral from securities loaned | 2,354,454 | ||||||
Payable to affiliate | (14,519 | ) | |||||
Payable for dividends and interest on investments sold short | 19,185 | ||||||
Payable to custodian | 26,730 | ||||||
Accrued expenses and other liabilities | (195,255 | ) | |||||
Net cash provided from operating activities | 135,836,743 | ||||||
Cash flows from financing activities | |||||||
Proceeds from borrowings | 6,086,013 | ||||||
Payments from borrowings | (6,086,013 | ) | |||||
Proceeds from shares sold | 85,017,862 | ||||||
Cost of shares repurchased | (213,923,639 | ) | |||||
Dividends paid to shareholders | (6,852,467 | ) | |||||
Net cash used in financing activities | (135,758,244 | ) | |||||
Net increase in cash and foreign currency | 78,499 | ||||||
Cash beginning of year | 39,198 | ||||||
Cash end of year | $ | 117,697 | |||||
Supplemental disclosure of cash flow information: | |||||||
Reinvestment of dividends | $ | (106,234,784 | ) | ||||
Cash paid during the year for interest | $ | 1,746 | |||||
See accompanying notes to financial statements.
298
PACE Select Advisors Trust
Statement of cash flows (concluded)
For the year ended July 31, 2018
| PACE International Equity Investments | |||||||
Cash flows from operating activities | |||||||
Net increase in net assets resulting from operations | $ | 82,736,681 | |||||
| Adjustments to reconcile net decrease in net assets resulting from operations to net cash provided from operating activities: | |||||||
Purchases of long-term investments | (724,532,144 | ) | |||||
Purchases to cover investments sold short | (209,726,985 | ) | |||||
Proceeds from disposition of long-term investments | 750,087,829 | ||||||
Sales of investments sold short | 218,436,592 | ||||||
Net purchases from short-term investments | (26,858,196 | ) | |||||
Net realized (gains) from investments in securities | (80,751,625 | ) | |||||
Net realized losses from investments sold short | 13,853,129 | ||||||
Net change in unrealized appreciation/depreciation of investments in securities | 16,259,727 | ||||||
Net change in unrealized appreciation/depreciation of investments sold short | (12,607,544 | ) | |||||
Changes in assets and liabilities: | |||||||
(Increase) decrease in assets: | |||||||
Cash collateral on investments sold short | 7,112,290 | ||||||
Receivable for interest and dividends | (234,075 | ) | |||||
Receivable for foreign tax reclaims | (686,351 | ) | |||||
Other assets | 837 | ||||||
Increase (decrease) in liabilities: | |||||||
Payable for cash collateral from securities loaned | 17,852,830 | ||||||
Payable for foreign withholding taxes and foreign capital gains taxes | 3,685 | ||||||
Payable for bank loan | (1,528,972 | ) | |||||
Payable to affiliate | 55,722 | ||||||
Payable for dividends and interest on investments sold short | 22,413 | ||||||
Payable to custodian | (686 | ) | |||||
Accrued expenses and other liabilities | (191,269 | ) | |||||
Net cash provided from operating activities | 49,303,888 | ||||||
Cash flows from financing activities | |||||||
Proceeds from borrowings | 7,309,975 | ||||||
Payments from borrowings | (7,309,975 | ) | |||||
Proceeds from shares sold | 121,475,274 | ||||||
Cost of shares repurchased | (169,233,546 | ) | |||||
Dividends paid to shareholders | (1,680,008 | ) | |||||
Net cash used in financing activities | (49,438,280 | ) | |||||
Net decrease in cash and foreign currency | (134,392 | ) | |||||
Cash and foreign currency, beginning of year | 1,033,926 | ||||||
Cash and foreign currency, end of year | $ | 899,534 | |||||
Supplemental disclosure of cash flow information: | |||||||
Reinvestment of dividends | $ | (23,629,324 | ) | ||||
Cash paid during the year for interest | $ | 712 | |||||
See accompanying notes to financial statements.
299
This page intentionally left blank.
300
PACE Government Money Market Investments
Financial highlights
Selected financial data throughout each year is presented below:
Class P
Years ended July 31, | |||||||||||||||||||||||
2018 | 2017 | 2016 | 2015 | 2014 | |||||||||||||||||||
Net asset value, beginning of year | $ | 1.00 | $ | 1.00 | $ | 1.00 | $ | 1.00 | $ | 1.00 | |||||||||||||
Net investment income | 0.008 | 0.001 | 0.0001 | 0.0001 | 0.0001 | ||||||||||||||||||
Net realized gains (losses) | 0.0001 | (0.000 | )1 | 0.0001 | — | 0.0001 | |||||||||||||||||
Net increase from operations | 0.008 | 0.001 | 0.0001 | 0.0001 | 0.0001 | ||||||||||||||||||
Dividends from net investment income | (0.008 | ) | (0.001 | ) | (0.000 | )1 | (0.000 | )1 | (0.000 | )1 | |||||||||||||
Distributions from net realized gains | — | — | (0.000 | )1 | — | (0.000 | )1 | ||||||||||||||||
Total dividends and distributions | (0.008 | ) | (0.001 | ) | (0.000 | )1 | (0.000 | )1 | (0.000 | )1 | |||||||||||||
Net asset value, end of year | $ | 1.00 | $ | 1.00 | $ | 1.00 | $ | 1.00 | $ | 1.00 | |||||||||||||
Total investment return2 | 0.83 | % | 0.11 | % | 0.01 | % | 0.01 | % | 0.01 | %3 | |||||||||||||
Ratios to average net assets: | |||||||||||||||||||||||
Expenses before fee waivers and/or expense reimbursements | 0.89 | % | 0.95 | % | 0.96 | % | 0.93 | % | 0.91 | % | |||||||||||||
Expenses after fee waivers and/or expense reimbursements | 0.60 | % | 0.52 | % | 0.26 | % | 0.14 | % | 0.14 | % | |||||||||||||
Net investment income | 0.82 | % | 0.12 | % | 0.01 | % | 0.01 | % | 0.01 | % | |||||||||||||
Supplemental data: | |||||||||||||||||||||||
Net assets, end of year (000's) | $ | 188,794 | $ | 199,585 | $ | 182,977 | $ | 168,503 | $ | 212,025 | |||||||||||||
1 Amount represents less than $0.0005 per share.
2 Total investment return is calculated assuming a $10,000 investment on the first day of each year reported, reinvestment of all dividends and other distributions, if any, at net asset value on the payable dates, and a sale at net asset value on the last day of each year reported. The figures do not include program fees; results would be lower if these fees were included. Returns do not reflect the deduction of taxes that a shareholder would pay on Portfolio distributions.
3 In August 2013, UBS AM made a voluntary cash payment of $2,340 to the Portfolio in order to address a differential between the number of shares outstanding and the Portfolio's net assets. The differential was attributable to historical embedded capital losses that were experienced by the Portfolio over several years prior to credit crisis of 2008. Payment from investment advisor had no impact on the Portfolio's total investment return and represents less than $0.0005 per share.
See accompanying notes to financial statements.
301
PACE Mortgage-Backed Securities Fixed Income Investments
Financial highlights
Selected data for a share of beneficial interest outstanding throughout each year is presented below:
Class A
Years ended July 31, | |||||||||||||||||||||||
2018 | 2017 | 2016 | 2015 | 2014 | |||||||||||||||||||
Net asset value, beginning of year | $ | 12.85 | $ | 13.15 | $ | 12.96 | $ | 12.82 | $ | 12.62 | |||||||||||||
Net investment income1 | 0.24 | 0.17 | 0.19 | 0.11 | 0.15 | ||||||||||||||||||
Net realized and unrealized gains (losses) | (0.38 | ) | (0.13 | ) | 0.29 | 0.26 | 0.32 | ||||||||||||||||
Net increase (decrease) from operations | (0.14 | ) | 0.04 | 0.48 | 0.37 | 0.47 | |||||||||||||||||
Dividends from net investment income | (0.37 | ) | (0.34 | ) | (0.29 | ) | (0.23 | ) | (0.27 | ) | |||||||||||||
Net asset value, end of year | $ | 12.34 | $ | 12.85 | $ | 13.15 | $ | 12.96 | $ | 12.82 | |||||||||||||
Total investment return2 | (1.12 | )% | 0.30 | % | 3.76 | % | 2.86 | % | 3.74 | % | |||||||||||||
Ratios to average net assets: | |||||||||||||||||||||||
Expenses before fee waivers and/or expense reimbursements | 1.09 | %3 | 1.08 | % | 1.07 | %3 | 1.07 | % | 1.07 | % | |||||||||||||
Expenses after fee waivers and/or expense reimbursements | 0.97 | %3 | 0.97 | % | 0.97 | %3 | 0.97 | % | 0.97 | % | |||||||||||||
Net investment income | 1.88 | % | 1.33 | % | 1.47 | % | 0.87 | % | 1.17 | % | |||||||||||||
Supplemental data: | |||||||||||||||||||||||
Net assets, end of year (000's) | $ | 30,489 | $ | 36,239 | $ | 41,260 | $ | 47,860 | $ | 59,834 | |||||||||||||
Portfolio turnover | 887 | % | 1,255 | % | 1,383 | % | 1,360 | % | 1,117 | % | |||||||||||||
Class Y
Years ended July 31, | |||||||||||||||||||||||
2018 | 2017 | 2016 | 2015 | 2014 | |||||||||||||||||||
Net asset value, beginning of year | $ | 12.86 | $ | 13.16 | $ | 12.96 | $ | 12.82 | $ | 12.62 | |||||||||||||
Net investment income1 | 0.27 | 0.19 | 0.23 | 0.15 | 0.18 | ||||||||||||||||||
Net realized and unrealized gains (losses) | (0.38 | ) | (0.12 | ) | 0.29 | 0.25 | 0.32 | ||||||||||||||||
Net increase (decrease) from operations | (0.11 | ) | 0.07 | 0.52 | 0.40 | 0.50 | |||||||||||||||||
Dividends from net investment income | (0.40 | ) | (0.37 | ) | (0.32 | ) | (0.26 | ) | (0.30 | ) | |||||||||||||
Net asset value, end of year | $ | 12.35 | $ | 12.86 | $ | 13.16 | $ | 12.96 | $ | 12.82 | |||||||||||||
Total investment return2 | (0.87 | )% | 0.63 | % | 4.03 | % | 3.12 | % | 4.00 | % | |||||||||||||
Ratios to average net assets: | |||||||||||||||||||||||
Expenses before fee waivers and/or expense reimbursements | 1.01 | %3 | 0.99 | % | 0.89 | %3 | 0.86 | % | 0.87 | % | |||||||||||||
Expenses after fee waivers and/or expense reimbursements | 0.72 | %3 | 0.72 | % | 0.72 | %3 | 0.72 | % | 0.72 | % | |||||||||||||
Net investment income | 2.12 | % | 1.49 | % | 1.73 | % | 1.13 | % | 1.42 | % | |||||||||||||
Supplemental data: | |||||||||||||||||||||||
Net assets, end of year (000's) | $ | 30,542 | $ | 45,658 | $ | 51,823 | $ | 46,071 | $ | 47,959 | |||||||||||||
Portfolio turnover | 887 | % | 1,255 | % | 1,383 | % | 1,360 | % | 1,117 | % | |||||||||||||
1 Calculated using the average shares method.
2 Total investment return is calculated assuming a $10,000 investment on the first day of each year reported, reinvestment of all dividends and other distributions, if any, at net asset value on the ex-dividend dates, and a sale at net asset value on the last day of each year reported. The figures do not include any applicable sales charges, redemption fees or program fees; results would be lower if they were included. Returns do not reflect the deduction of taxes that a shareholder would pay on Portfolio distributions or the redemption of Portfolio shares.
3 Includes interest expense representing less than 0.005%.
302
PACE Mortgage-Backed Securities Fixed Income Investments
Financial highlights (continued)
Class C
Years ended July 31, | |||||||||||||||||||||||
2018 | 2017 | 2016 | 2015 | 2014 | |||||||||||||||||||
Net asset value, beginning of year | $ | 12.87 | $ | 13.17 | $ | 12.97 | $ | 12.84 | $ | 12.63 | |||||||||||||
Net investment income1 | 0.17 | 0.11 | 0.13 | 0.05 | 0.09 | ||||||||||||||||||
Net realized and unrealized gains (losses) | (0.37 | ) | (0.14 | ) | 0.30 | 0.24 | 0.32 | ||||||||||||||||
Net increase (decrease) from operations | (0.20 | ) | (0.03 | ) | 0.43 | 0.29 | 0.41 | ||||||||||||||||
Dividends from net investment income | (0.31 | ) | (0.27 | ) | (0.23 | ) | (0.16 | ) | (0.20 | ) | |||||||||||||
Net asset value, end of year | $ | 12.36 | $ | 12.87 | $ | 13.17 | $ | 12.97 | $ | 12.84 | |||||||||||||
Total investment return2 | (1.59 | )% | (0.21 | )% | 3.32 | % | 2.27 | % | 3.29 | % | |||||||||||||
Ratios to average net assets: | |||||||||||||||||||||||
Expenses before fee waivers and/or expense reimbursements | 1.56 | %3 | 1.58 | % | 1.60 | %3 | 1.59 | % | 1.59 | % | |||||||||||||
Expenses after fee waivers and/or expense reimbursements | 1.47 | %3 | 1.47 | % | 1.47 | %3 | 1.47 | % | 1.47 | % | |||||||||||||
Net investment income | 1.38 | % | 0.83 | % | 0.97 | % | 0.37 | % | 0.67 | % | |||||||||||||
Supplemental data: | |||||||||||||||||||||||
Net assets, end of year (000's) | $ | 9,674 | $ | 10,926 | $ | 12,299 | $ | 12,887 | $ | 13,958 | |||||||||||||
Portfolio turnover | 887 | % | 1,255 | % | 1,383 | % | 1,360 | % | 1,117 | % | |||||||||||||
Class P
Years ended July 31, | |||||||||||||||||||||||
2018 | 2017 | 2016 | 2015 | 2014 | |||||||||||||||||||
Net asset value, beginning of year | $ | 12.86 | $ | 13.16 | $ | 12.96 | $ | 12.83 | $ | 12.63 | |||||||||||||
Net investment income1 | 0.27 | 0.21 | 0.22 | 0.15 | 0.18 | ||||||||||||||||||
Net realized and unrealized gains (losses) | (0.38 | ) | (0.14 | ) | 0.30 | 0.24 | 0.32 | ||||||||||||||||
Net increase (decrease) from operations | (0.11 | ) | 0.07 | 0.52 | 0.39 | 0.50 | |||||||||||||||||
Dividends from net investment income | (0.40 | ) | (0.37 | ) | (0.32 | ) | (0.26 | ) | (0.30 | ) | |||||||||||||
Net asset value, end of year | $ | 12.35 | $ | 12.86 | $ | 13.16 | $ | 12.96 | $ | 12.83 | |||||||||||||
Total investment return2 | (0.87 | )% | 0.55 | % | 4.10 | % | 3.04 | % | 4.00 | % | |||||||||||||
Ratios to average net assets: | |||||||||||||||||||||||
Expenses before fee waivers and/or expense reimbursements | 0.93 | %3 | 0.92 | % | 0.91 | %3 | 0.91 | % | 0.90 | % | |||||||||||||
Expenses after fee waivers and/or expense reimbursements | 0.72 | %3 | 0.72 | % | 0.72 | %3 | 0.72 | % | 0.72 | % | |||||||||||||
Net investment income | 2.14 | % | 1.60 | % | 1.72 | % | 1.13 | % | 1.41 | % | |||||||||||||
Supplemental data: | |||||||||||||||||||||||
Net assets, end of year (000's) | $ | 321,912 | $ | 352,789 | $ | 405,253 | $ | 422,604 | $ | 435,063 | |||||||||||||
Portfolio turnover | 887 | % | 1,255 | % | 1,383 | % | 1,360 | % | 1,117 | % | |||||||||||||
See accompanying notes to financial statements.
303
PACE Intermediate Fixed Income Investments
Financial highlights
Selected data for a share of beneficial interest outstanding throughout each year is presented below:
Class A
Years ended July 31, | |||||||||||||||||||||||
2018 | 2017 | 2016 | 2015 | 2014 | |||||||||||||||||||
Net asset value, beginning of year | $ | 12.34 | $ | 12.45 | $ | 12.36 | $ | 12.33 | $ | 12.20 | |||||||||||||
Net investment income1 | 0.24 | 0.16 | 0.16 | 0.16 | 0.14 | ||||||||||||||||||
Net realized and unrealized gains (losses) | (0.42 | ) | (0.06 | ) | 0.18 | 0.04 | 0.14 | ||||||||||||||||
Net increase (decrease) from operations | (0.18 | ) | 0.10 | 0.34 | 0.20 | 0.28 | |||||||||||||||||
Dividends from net investment income | (0.26 | ) | (0.17 | ) | (0.17 | ) | (0.16 | ) | (0.15 | ) | |||||||||||||
Distributions from net realized gains | — | (0.04 | ) | (0.08 | ) | (0.01 | ) | — | |||||||||||||||
Total dividends and distributions | (0.26 | ) | (0.21 | ) | (0.25 | ) | (0.17 | ) | (0.15 | ) | |||||||||||||
Net asset value, end of year | $ | 11.90 | $ | 12.34 | $ | 12.45 | $ | 12.36 | $ | 12.33 | |||||||||||||
Total investment return2 | (1.43 | )% | 0.84 | % | 2.85 | % | 1.64 | % | 2.30 | % | |||||||||||||
Ratios to average net assets: | |||||||||||||||||||||||
Expenses before fee waivers and/or expense reimbursements | 1.00 | %3 | 1.01 | %3 | 1.03 | %3 | 1.03 | %3 | 1.03 | % | |||||||||||||
Expenses after fee waivers and/or expense reimbursements | 0.93 | %3 | 0.93 | %3 | 0.93 | %3 | 0.93 | %3 | 0.93 | % | |||||||||||||
Net investment income | 1.97 | % | 1.32 | % | 1.31 | % | 1.26 | % | 1.18 | % | |||||||||||||
Supplemental data: | |||||||||||||||||||||||
Net assets, end of year (000's) | $ | 14,254 | $ | 16,884 | $ | 18,681 | $ | 19,932 | $ | 28,080 | |||||||||||||
Portfolio turnover | 537 | % | 437 | % | 284 | % | 476 | % | 827 | % | |||||||||||||
Class Y
Years ended July 31, | |||||||||||||||||||||||
2018 | 2017 | 2016 | 2015 | 2014 | |||||||||||||||||||
Net asset value, beginning of year | $ | 12.34 | $ | 12.45 | $ | 12.36 | $ | 12.33 | $ | 12.20 | |||||||||||||
Net investment income1 | 0.27 | 0.19 | 0.19 | 0.19 | 0.18 | ||||||||||||||||||
Net realized and unrealized gains (losses) | (0.42 | ) | (0.05 | ) | 0.18 | 0.04 | 0.13 | ||||||||||||||||
Net increase (decrease) from operations | (0.15 | ) | 0.14 | 0.37 | 0.23 | 0.31 | |||||||||||||||||
Dividends from net investment income | (0.29 | ) | (0.21 | ) | (0.20 | ) | (0.19 | ) | (0.18 | ) | |||||||||||||
Distributions from net realized gains | — | (0.04 | ) | (0.08 | ) | (0.01 | ) | — | |||||||||||||||
Total dividends and distributions | (0.29 | ) | (0.25 | ) | (0.28 | ) | (0.20 | ) | (0.18 | ) | |||||||||||||
Net asset value, end of year | $ | 11.90 | $ | 12.34 | $ | 12.45 | $ | 12.36 | $ | 12.33 | |||||||||||||
Total investment return2 | (1.20 | )% | 1.09 | % | 3.11 | % | 1.90 | % | 2.56 | % | |||||||||||||
Ratios to average net assets: | |||||||||||||||||||||||
Expenses before fee waivers and/or expense reimbursements | 0.95 | %3 | 0.93 | %3 | 0.94 | %3 | 0.86 | %3 | 1.05 | % | |||||||||||||
Expenses after fee waivers and/or expense reimbursements | 0.68 | %3 | 0.68 | %3 | 0.68 | %3 | 0.68 | %3 | 0.68 | % | |||||||||||||
Net investment income | 2.23 | % | 1.57 | % | 1.56 | % | 1.51 | % | 1.43 | % | |||||||||||||
Supplemental data: | |||||||||||||||||||||||
Net assets, end of year (000's) | $ | 293 | $ | 337 | $ | 401 | $ | 444 | $ | 543 | |||||||||||||
Portfolio turnover | 537 | % | 437 | % | 284 | % | 476 | % | 827 | % | |||||||||||||
1 Calculated using the average shares method.
2 Total investment return is calculated assuming a $10,000 investment on the first day of each year reported, reinvestment of all dividends and other distributions, if any, at net asset value on the ex-dividend dates, and a sale at net asset value on the last day of each year reported. The figures do not include any applicable sales charges, redemption fees or program fees; results would be lower if they were included. Returns do not reflect the deduction of taxes that a shareholder would pay on Portfolio distributions or the redemption of Portfolio shares.
3 Includes interest expense representing less than 0.005%.
304
PACE Intermediate Fixed Income Investments
Financial highlights (continued)
Class C
Years ended July 31, | |||||||||||||||||||||||
2018 | 2017 | 2016 | 2015 | 2014 | |||||||||||||||||||
Net asset value, beginning of year | $ | 12.36 | $ | 12.47 | $ | 12.37 | $ | 12.35 | $ | 12.22 | |||||||||||||
Net investment income1 | 0.18 | 0.10 | 0.10 | 0.09 | 0.08 | ||||||||||||||||||
Net realized and unrealized gains (losses) | (0.42 | ) | (0.06 | ) | 0.19 | 0.04 | 0.14 | ||||||||||||||||
Net increase (decrease) from operations | (0.24 | ) | 0.04 | 0.29 | 0.13 | 0.22 | |||||||||||||||||
Dividends from net investment income | (0.21 | ) | (0.11 | ) | (0.11 | ) | (0.10 | ) | (0.09 | ) | |||||||||||||
Distributions from net realized gains | — | (0.04 | ) | (0.08 | ) | (0.01 | ) | — | |||||||||||||||
Total dividends and distributions | (0.21 | ) | (0.15 | ) | (0.19 | ) | (0.11 | ) | (0.09 | ) | |||||||||||||
Net asset value, end of year | $ | 11.91 | $ | 12.36 | $ | 12.47 | $ | 12.37 | $ | 12.35 | |||||||||||||
Total investment return2 | (1.94 | )% | 0.32 | % | 2.41 | % | 1.05 | % | 1.78 | % | |||||||||||||
Ratios to average net assets: | |||||||||||||||||||||||
Expenses before fee waivers and/or expense reimbursements | 1.48 | %3 | 1.52 | %3 | 1.53 | %3 | 1.53 | %3 | 1.52 | % | |||||||||||||
Expenses after fee waivers and/or expense reimbursements | 1.43 | %3 | 1.43 | %3 | 1.43 | %3 | 1.43 | %3 | 1.43 | % | |||||||||||||
Net investment income | 1.47 | % | 0.81 | % | 0.81 | % | 0.76 | % | 0.68 | % | |||||||||||||
Supplemental data: | |||||||||||||||||||||||
Net assets, end of year (000's) | $ | 982 | $ | 1,217 | $ | 1,644 | $ | 1,931 | $ | 2,260 | |||||||||||||
Portfolio turnover | 537 | % | 437 | % | 284 | % | 476 | % | 827 | % | |||||||||||||
Class P
Years ended July 31, | |||||||||||||||||||||||
2018 | 2017 | 2016 | 2015 | 2014 | |||||||||||||||||||
Net asset value, beginning of year | $ | 12.34 | $ | 12.45 | $ | 12.36 | $ | 12.33 | $ | 12.20 | |||||||||||||
Net investment income1 | 0.27 | 0.19 | 0.19 | 0.19 | 0.18 | ||||||||||||||||||
Net realized and unrealized gains (losses) | (0.42 | ) | (0.05 | ) | 0.18 | 0.04 | 0.13 | ||||||||||||||||
Net increase (decrease) from operations | (0.15 | ) | 0.14 | 0.37 | 0.23 | 0.31 | |||||||||||||||||
Dividends from net investment income | (0.29 | ) | (0.21 | ) | (0.20 | ) | (0.19 | ) | (0.18 | ) | |||||||||||||
Distributions from net realized gains | — | (0.04 | ) | (0.08 | ) | (0.01 | ) | — | |||||||||||||||
Total dividends and distributions | (0.29 | ) | (0.25 | ) | (0.28 | ) | (0.20 | ) | (0.18 | ) | |||||||||||||
Net asset value, end of year | $ | 11.90 | $ | 12.34 | $ | 12.45 | $ | 12.36 | $ | 12.33 | |||||||||||||
Total investment return2 | (1.20 | )% | 1.09 | % | 3.11 | % | 1.90 | % | 2.56 | % | |||||||||||||
Ratios to average net assets: | |||||||||||||||||||||||
Expenses before fee waivers and/or expense reimbursements | 0.81 | %3 | 0.82 | %3 | 0.83 | %3 | 0.83 | %3 | 0.82 | % | |||||||||||||
Expenses after fee waivers and/or expense reimbursements | 0.68 | %3 | 0.68 | %3 | 0.68 | %3 | 0.68 | %3 | 0.68 | % | |||||||||||||
Net investment income | 2.23 | % | 1.57 | % | 1.56 | % | 1.51 | % | 1.43 | % | |||||||||||||
Supplemental data: | |||||||||||||||||||||||
Net assets, end of year (000's) | $ | 352,865 | $ | 374,144 | $ | 411,148 | $ | 403,358 | $ | 417,011 | |||||||||||||
Portfolio turnover | 537 | % | 437 | % | 284 | % | 476 | % | 827 | % | |||||||||||||
See accompanying notes to financial statements.
305
PACE Strategic Fixed Income Investments
Financial highlights
Selected data for a share of beneficial interest outstanding throughout each year is presented below:
Class A
Years ended July 31, | |||||||||||||||||||||||
2018 | 2017 | 2016 | 2015 | 2014 | |||||||||||||||||||
Net asset value, beginning of year | $ | 13.81 | $ | 14.21 | $ | 13.93 | $ | 13.90 | $ | 14.16 | |||||||||||||
Net investment income1 | 0.35 | 0.36 | 0.37 | 0.35 | 0.37 | ||||||||||||||||||
Net realized and unrealized gain (losses) | (0.47 | ) | (0.15 | ) | 0.38 | 0.01 | 0.11 | ||||||||||||||||
Net increase (decrease) from operations | (0.12 | ) | 0.21 | 0.75 | 0.36 | 0.48 | |||||||||||||||||
Dividends from net investment income | (0.37 | ) | (0.39 | ) | (0.37 | ) | (0.33 | ) | (0.28 | ) | |||||||||||||
Distributions from net realized gains | — | (0.22 | ) | (0.10 | ) | — | (0.37 | ) | |||||||||||||||
Return of capital | — | — | — | — | (0.09 | ) | |||||||||||||||||
Total dividends, distributions and return of capital | (0.37 | ) | (0.61 | ) | (0.47 | ) | (0.33 | ) | (0.74 | ) | |||||||||||||
Net asset value, end of year | $ | 13.32 | $ | 13.81 | $ | 14.21 | $ | 13.93 | $ | 13.90 | |||||||||||||
Total investment return2 | (0.89 | )% | 1.61 | % | 5.43 | % | 2.69 | % | 3.51 | % | |||||||||||||
Ratios to average net assets: | |||||||||||||||||||||||
| Expenses before fee waivers and/or expense reimbursements/ recoupments, including interest expense | 1.05 | % | 1.12 | % | 1.10 | %3 | 1.07 | % | 1.06 | %3 | |||||||||||||
| Expenses after fee waivers and/or expense reimbursements/ recoupments, including interest expense | 1.01 | % | 1.06 | % | 1.01 | %3 | 1.05 | % | 1.06 | %3 | |||||||||||||
| Expenses after fee waivers and/or expense reimbursements/ recoupments, excluding interest expense | 0.96 | % | 0.96 | % | 0.95 | % | 1.03 | % | 1.05 | % | |||||||||||||
Net investment income | 2.57 | % | 2.59 | % | 2.69 | % | 2.52 | % | 2.63 | % | |||||||||||||
Supplemental data: | |||||||||||||||||||||||
Net assets, end of year (000's) | $ | 13,652 | $ | 13,605 | $ | 13,480 | $ | 13,699 | $ | 44,465 | |||||||||||||
Portfolio turnover | 243 | % | 212 | % | 133 | % | 154 | % | 154 | % | |||||||||||||
Class Y
Years ended July 31, | |||||||||||||||||||||||
2018 | 2017 | 2016 | 2015 | 2014 | |||||||||||||||||||
Net asset value, beginning of year | $ | 13.79 | $ | 14.19 | $ | 13.91 | $ | 13.89 | $ | 14.15 | |||||||||||||
Net investment income1 | 0.38 | 0.39 | 0.39 | 0.37 | 0.40 | ||||||||||||||||||
Net realized and unrealized gains (losses) | (0.48 | ) | (0.15 | ) | 0.38 | 0.02 | 0.12 | ||||||||||||||||
Net increase (decrease) from operations | (0.10 | ) | 0.24 | 0.77 | 0.39 | 0.52 | |||||||||||||||||
Dividends from net investment income | (0.40 | ) | (0.42 | ) | (0.39 | ) | (0.37 | ) | (0.31 | ) | |||||||||||||
Distributions from net realized gains | — | (0.22 | ) | (0.10 | ) | — | (0.37 | ) | |||||||||||||||
Return of capital | — | — | — | — | (0.10 | ) | |||||||||||||||||
Total dividends, distributions and return of capital | (0.40 | ) | (0.64 | ) | (0.49 | ) | (0.37 | ) | (0.78 | ) | |||||||||||||
Net asset value, end of year | $ | 13.29 | $ | 13.79 | $ | 14.19 | $ | 13.91 | $ | 13.89 | |||||||||||||
Total investment return2 | (0.71 | )% | 1.87 | % | 5.68 | % | 2.81 | % | 3.82 | % | |||||||||||||
Ratios to average net assets: | |||||||||||||||||||||||
| Expenses before fee waivers and/or expense reimbursements/ recoupments, including interest expense | 0.93 | % | 1.03 | % | 0.97 | %3 | 0.93 | % | 0.93 | %3 | |||||||||||||
| Expenses after fee waivers and/or expense reimbursements/ recoupments, including interest expense | 0.76 | % | 0.81 | % | 0.87 | %3 | 0.83 | % | 0.81 | %3 | |||||||||||||
| Expenses after fee waivers and/or expense reimbursements/ recoupments, excluding interest expense | 0.71 | % | 0.71 | % | 0.81 | % | 0.81 | % | 0.81 | % | |||||||||||||
Net investment income | 2.81 | % | 2.84 | % | 2.82 | % | 2.66 | % | 2.90 | % | |||||||||||||
Supplemental data: | |||||||||||||||||||||||
Net assets, end of year (000's) | $ | 1,370 | $ | 1,599 | $ | 2,283 | $ | 2,543 | $ | 3,158 | |||||||||||||
Portfolio turnover | 243 | % | 212 | % | 133 | % | 154 | % | 154 | % | |||||||||||||
1 Calculated using the average shares method.
2 Total investment return is calculated assuming a $10,000 investment on the first day of each year reported, reinvestment of all dividends and other distributions, if any, at net asset value on the ex-dividend dates, and a sale at net asset value on the last day of each year reported. The figures do not include any applicable sales charges, redemption fees or program fees; results would be lower if they were included. Returns do not reflect the deduction of taxes that a shareholder would pay on Portfolio distributions or the redemption of Portfolio shares.
306
PACE Strategic Fixed Income Investments
Financial highlights (continued)
Class C
Years ended July 31, | |||||||||||||||||||||||
2018 | 2017 | 2016 | 2015 | 2014 | |||||||||||||||||||
Net asset value, beginning of year | $ | 13.82 | $ | 14.22 | $ | 13.93 | $ | 13.91 | $ | 14.17 | |||||||||||||
Net investment income1 | 0.28 | 0.29 | 0.30 | 0.28 | 0.30 | ||||||||||||||||||
Net realized and unrealized gain (losses) | (0.48 | ) | (0.15 | ) | 0.39 | 0.01 | 0.11 | ||||||||||||||||
Net increase (decrease) from operations | (0.20 | ) | 0.14 | 0.69 | 0.29 | 0.41 | |||||||||||||||||
Dividends from net investment income | (0.30 | ) | (0.32 | ) | (0.30 | ) | (0.27 | ) | (0.23 | ) | |||||||||||||
Distributions from net realized gains | — | (0.22 | ) | (0.10 | ) | — | (0.37 | ) | |||||||||||||||
Return of capital | — | — | — | — | (0.07 | ) | |||||||||||||||||
Total dividends, distributions and return of capital | (0.30 | ) | (0.54 | ) | (0.40 | ) | (0.27 | ) | (0.67 | ) | |||||||||||||
Net asset value, end of year | $ | 13.32 | $ | 13.82 | $ | 14.22 | $ | 13.93 | $ | 13.91 | |||||||||||||
Total investment return2 | (1.43 | )% | 1.10 | % | 4.98 | % | 2.16 | % | 3.03 | % | |||||||||||||
Ratios to average net assets: | |||||||||||||||||||||||
Expenses before fee waivers and/or expense reimbursements/ | |||||||||||||||||||||||
recoupments, including interest expense | 1.54 | % | 1.62 | % | 1.60 | %3 | 1.54 | % | 1.53 | %3 | |||||||||||||
Expenses after fee waivers and/or expense reimbursements/ | |||||||||||||||||||||||
recoupments, including interest expense | 1.51 | % | 1.56 | % | 1.51 | %3 | 1.52 | % | 1.53 | %3 | |||||||||||||
Expenses after fee waivers and/or expense reimbursements/ | |||||||||||||||||||||||
recoupments, excluding interest expense | 1.46 | % | 1.46 | % | 1.45 | % | 1.50 | % | 1.52 | % | |||||||||||||
Net investment income | 2.06 | % | 2.09 | % | 2.19 | % | 1.98 | % | 2.17 | % | |||||||||||||
Supplemental data: | |||||||||||||||||||||||
Net assets, end of year (000's) | $ | 6,594 | $ | 8,177 | $ | 10,418 | $ | 11,752 | $ | 15,143 | |||||||||||||
Portfolio turnover | 243 | % | 212 | % | 133 | % | 154 | % | 154 | % | |||||||||||||
Class P
Years ended July 31, | |||||||||||||||||||||||
2018 | 2017 | 2016 | 2015 | 2014 | |||||||||||||||||||
Net asset value, beginning of year | $ | 13.81 | $ | 14.20 | $ | 13.92 | $ | 13.90 | $ | 14.16 | |||||||||||||
Net investment income1 | 0.38 | 0.39 | 0.40 | 0.38 | 0.40 | ||||||||||||||||||
Net realized and unrealized gains (losses) | (0.48 | ) | (0.14 | ) | 0.38 | 0.01 | 0.11 | ||||||||||||||||
Net increase (decrease) from operations | (0.10 | ) | 0.25 | 0.78 | 0.39 | 0.51 | |||||||||||||||||
Dividends from net investment income | (0.40 | ) | (0.42 | ) | (0.40 | ) | (0.37 | ) | (0.30 | ) | |||||||||||||
Distributions from net realized gains | — | (0.22 | ) | (0.10 | ) | — | (0.37 | ) | |||||||||||||||
Return of capital | — | — | — | — | (0.10 | ) | |||||||||||||||||
Total dividends, distributions and return of capital | (0.40 | ) | (0.64 | ) | (0.50 | ) | (0.37 | ) | (0.77 | ) | |||||||||||||
Net asset value, end of year | $ | 13.31 | $ | 13.81 | $ | 14.20 | $ | 13.92 | $ | 13.90 | |||||||||||||
Total investment return2 | (0.71 | )% | 1.94 | % | 5.68 | % | 2.91 | % | 3.77 | % | |||||||||||||
Ratios to average net assets: | |||||||||||||||||||||||
| Expenses before fee waivers and/or expense reimbursements/ recoupments, including interest expense | 0.84 | % | 0.90 | % | 0.88 | %3 | 0.82 | % | 0.81 | %3 | |||||||||||||
| Expenses after fee waivers and/or expense reimbursements/ recoupments, including interest expense | 0.76 | % | 0.81 | % | 0.79 | %3 | 0.80 | % | 0.81 | %3,4 | |||||||||||||
| Expenses after fee waivers and/or expense reimbursements/ recoupments, excluding interest expense | 0.71 | % | 0.71 | % | 0.72 | % | 0.78 | % | 0.81 | %4 | |||||||||||||
Net investment income | 2.82 | % | 2.84 | % | 2.92 | % | 2.69 | % | 2.90 | % | |||||||||||||
Supplemental data: | |||||||||||||||||||||||
Net assets, end of year (000's) | $ | 758,303 | $ | 808,009 | $ | 856,301 | $ | 893,373 | $ | 889,402 | |||||||||||||
Portfolio turnover | 243 | % | 212 | % | 133 | % | 154 | % | 154 | % | |||||||||||||
3 Includes interest expense representing less than 0.005%.
4 The investment manager recouped expenses previously reimbursed by the investment manager on behalf of the Portfolio, not to exceed the expense cap.
See accompanying notes to financial statements.
307
PACE Municipal Fixed Income Investments
Financial highlights
Selected data for a share of beneficial interest outstanding throughout each year is presented below:
Class A
Years ended July 31, | |||||||||||||||||||||||
2018 | 2017 | 2016 | 2015 | 2014 | |||||||||||||||||||
Net asset value, beginning of year | $ | 13.08 | $ | 13.55 | $ | 13.14 | $ | 13.19 | $ | 12.91 | |||||||||||||
Net investment income1 | 0.33 | 0.32 | 0.33 | 0.32 | 0.34 | ||||||||||||||||||
Net realized and unrealized gains (losses) | (0.32 | ) | (0.37 | ) | 0.48 | (0.05 | ) | 0.38 | |||||||||||||||
Net increase (decrease) from operations | 0.01 | (0.05 | ) | 0.81 | 0.27 | 0.72 | |||||||||||||||||
Dividends from net investment income | (0.34 | ) | (0.32 | ) | (0.33 | ) | (0.32 | ) | (0.34 | ) | |||||||||||||
Distributions from net realized gains | (0.02 | ) | (0.10 | ) | (0.07 | ) | — | (0.10 | ) | ||||||||||||||
Total dividends and distributions | (0.36 | ) | (0.42 | ) | (0.40 | ) | (0.32 | ) | (0.44 | ) | |||||||||||||
Net asset value, end of year | $ | 12.73 | $ | 13.08 | $ | 13.55 | $ | 13.14 | $ | 13.19 | |||||||||||||
Total investment return2 | 0.03 | % | (0.29 | )% | 6.26 | % | 2.07 | % | 5.64 | % | |||||||||||||
Ratios to average net assets: | |||||||||||||||||||||||
Expenses before fee waivers and/or expense reimbursements | 0.91 | % | 0.92 | % | 0.92 | % | 0.92 | % | 0.92 | % | |||||||||||||
Expenses after fee waivers and/or expense reimbursements | 0.82 | % | 0.85 | % | 0.85 | % | 0.90 | %3 | 0.90 | % | |||||||||||||
Net investment income | 2.58 | % | 2.47 | % | 2.49 | % | 2.42 | % | 2.59 | % | |||||||||||||
Supplemental data: | |||||||||||||||||||||||
Net assets, end of year (000's) | $ | 38,714 | $ | 46,784 | $ | 51,397 | $ | 53,923 | $ | 63,225 | |||||||||||||
Portfolio turnover | 19 | % | 14 | % | 15 | % | 21 | % | 30 | % | |||||||||||||
Class Y
Years ended July 31, | |||||||||||||||||||||||
2018 | 2017 | 2016 | 2015 | 2014 | |||||||||||||||||||
Net asset value, beginning of year | $ | 13.08 | $ | 13.56 | $ | 13.15 | $ | 13.20 | $ | 12.92 | |||||||||||||
Net investment income1 | 0.37 | 0.35 | 0.36 | 0.35 | 0.37 | ||||||||||||||||||
Net realized and unrealized gains (losses) | (0.32 | ) | (0.38 | ) | 0.48 | (0.05 | ) | 0.38 | |||||||||||||||
Net increase (decrease) from operations | 0.05 | (0.03 | ) | 0.84 | 0.30 | 0.75 | |||||||||||||||||
Dividends from net investment income | (0.37 | ) | (0.35 | ) | (0.36 | ) | (0.35 | ) | (0.37 | ) | |||||||||||||
Distributions from net realized gains | (0.02 | ) | (0.10 | ) | (0.07 | ) | — | (0.10 | ) | ||||||||||||||
Total dividends and distributions | (0.39 | ) | (0.45 | ) | (0.43 | ) | (0.35 | ) | (0.47 | ) | |||||||||||||
Net asset value, end of year | $ | 12.74 | $ | 13.08 | $ | 13.56 | $ | 13.15 | $ | 13.20 | |||||||||||||
Total investment return2 | 0.34 | % | (0.16 | )% | 6.49 | % | 2.32 | % | 5.89 | % | |||||||||||||
Ratios to average net assets: | |||||||||||||||||||||||
Expenses before fee waivers and/or expense reimbursements | 0.71 | % | 0.71 | % | 0.72 | % | 0.70 | % | 0.72 | % | |||||||||||||
Expenses after fee waivers and/or expense reimbursements | 0.57 | % | 0.64 | % | 0.65 | % | 0.65 | % | 0.65 | % | |||||||||||||
Net investment income | 2.83 | % | 2.67 | % | 2.69 | % | 2.67 | % | 2.84 | % | |||||||||||||
Supplemental data: | |||||||||||||||||||||||
Net assets, end of year (000's) | $ | 65 | $ | 91 | $ | 70 | $ | 81 | $ | 83 | |||||||||||||
Portfolio turnover | 19 | % | 14 | % | 15 | % | 21 | % | 30 | % | |||||||||||||
1 Calculated using the average shares method.
2 Total investment return is calculated assuming a $10,000 investment on the first day of each year reported, reinvestment of all dividends and other distributions, if any, at net asset value on the ex-dividend dates, and a sale at net asset value on the last day of each year reported. The figures do not include any applicable sales charges, redemption fees or program fees; results would be lower if they were included. Returns do not reflect the deduction of taxes that a shareholder could pay on Portfolio distributions or the redemption of Portfolio shares.
3 The investment manager recouped expenses previously reimbursed by the investment manager on behalf of the Portfolio, not to exceed the expense cap.
308
PACE Municipal Fixed Income Investments
Financial highlights (continued)
Class C
Years ended July 31, | |||||||||||||||||||||||
2018 | 2017 | 2016 | 2015 | 2014 | |||||||||||||||||||
Net asset value, beginning of year | $ | 13.08 | $ | 13.55 | $ | 13.14 | $ | 13.19 | $ | 12.91 | |||||||||||||
Net investment income1 | 0.27 | 0.26 | 0.26 | 0.25 | 0.27 | ||||||||||||||||||
Net realized and unrealized gains (losses) | (0.32 | ) | (0.37 | ) | 0.49 | (0.05 | ) | 0.38 | |||||||||||||||
Net increase (decrease) from operations | (0.05 | ) | (0.11 | ) | 0.75 | 0.20 | 0.65 | ||||||||||||||||
Dividends from net investment income | (0.28 | ) | (0.26 | ) | (0.27 | ) | (0.25 | ) | (0.27 | ) | |||||||||||||
Distributions from net realized gains | (0.02 | ) | (0.10 | ) | (0.07 | ) | — | (0.10 | ) | ||||||||||||||
Total dividends and distributions | (0.30 | ) | (0.36 | ) | (0.34 | ) | (0.25 | ) | (0.37 | ) | |||||||||||||
Net asset value, end of year | $ | 12.73 | $ | 13.08 | $ | 13.55 | $ | 13.14 | $ | 13.19 | |||||||||||||
Total investment return2 | (0.42 | )% | (0.80 | )% | 5.72 | % | 1.55 | % | 5.10 | % | |||||||||||||
Ratios to average net assets: | |||||||||||||||||||||||
Expenses before fee waivers and/or expense reimbursements | 1.39 | % | 1.42 | % | 1.42 | % | 1.42 | % | 1.43 | % | |||||||||||||
Expenses after fee waivers and/or expense reimbursements | 1.32 | % | 1.35 | % | 1.35 | % | 1.40 | % | 1.40 | % | |||||||||||||
Net investment income | 2.08 | % | 1.96 | % | 1.98 | % | 1.92 | % | 2.09 | % | |||||||||||||
Supplemental data: | |||||||||||||||||||||||
Net assets, end of year (000's) | $ | 7,595 | $ | 8,962 | $ | 10,537 | $ | 10,388 | $ | 11,033 | |||||||||||||
Portfolio turnover | 19 | % | 14 | % | 15 | % | 21 | % | 30 | % | |||||||||||||
Class P
Years ended July 31, | |||||||||||||||||||||||
2018 | 2017 | 2016 | 2015 | 2014 | |||||||||||||||||||
Net asset value, beginning of year | $ | 13.08 | $ | 13.56 | $ | 13.15 | $ | 13.19 | $ | 12.91 | |||||||||||||
Net investment income1 | 0.37 | 0.35 | 0.36 | 0.35 | 0.37 | ||||||||||||||||||
Net realized and unrealized gains (losses) | (0.32 | ) | (0.38 | ) | 0.49 | (0.04 | ) | 0.38 | |||||||||||||||
Net increase (decrease) from operations | 0.05 | (0.03 | ) | 0.85 | 0.31 | 0.75 | |||||||||||||||||
Dividends from net investment income | (0.37 | ) | (0.35 | ) | (0.37 | ) | (0.35 | ) | (0.37 | ) | |||||||||||||
Distributions from net realized gains | (0.02 | ) | (0.10 | ) | (0.07 | ) | — | (0.10 | ) | ||||||||||||||
Total dividends and distributions | (0.39 | ) | (0.45 | ) | (0.44 | ) | (0.35 | ) | (0.47 | ) | |||||||||||||
Net asset value, end of year | $ | 12.74 | $ | 13.08 | $ | 13.56 | $ | 13.15 | $ | 13.19 | |||||||||||||
Total investment return2 | 0.34 | % | (0.13 | )% | 6.51 | % | 2.39 | % | 5.90 | % | |||||||||||||
Ratios to average net assets: | |||||||||||||||||||||||
Expenses before fee waivers and/or expense reimbursements | 0.67 | % | 0.67 | % | 0.67 | % | 0.67 | % | 0.68 | % | |||||||||||||
Expenses after fee waivers and/or expense reimbursements | 0.57 | % | 0.61 | % | 0.60 | % | 0.65 | % | 0.65 | % | |||||||||||||
Net investment income | 2.84 | % | 2.71 | % | 2.73 | % | 2.67 | % | 2.84 | % | |||||||||||||
Supplemental data: | |||||||||||||||||||||||
Net assets, end of year (000's) | $ | 309,878 | $ | 323,715 | $ | 350,137 | $ | 345,157 | $ | 334,999 | |||||||||||||
Portfolio turnover | 19 | % | 14 | % | 15 | % | 21 | % | 30 | % | |||||||||||||
See accompanying notes to financial statements.
309
PACE Global Fixed Income Investments
Financial highlights
Selected data for a share of beneficial interest outstanding throughout each year is presented below:
Class A
Years ended July 31, | |||||||||||||||||||||||
2018 | 2017 | 2016 | 2015 | 2014 | |||||||||||||||||||
Net asset value, beginning of year | $ | 10.04 | $ | 10.79 | $ | 9.94 | $ | 10.82 | $ | 10.56 | |||||||||||||
Net investment income1 | 0.09 | 0.11 | 0.14 | 0.16 | 0.19 | ||||||||||||||||||
Net realized and unrealized gains (losses) | (0.26 | ) | (0.61 | ) | 1.00 | (0.71 | ) | 0.34 | |||||||||||||||
Net increase (decrease) from operations | (0.17 | ) | (0.50 | ) | 1.14 | (0.55 | ) | 0.53 | |||||||||||||||
Dividends from net investment income | — | (0.18 | ) | (0.29 | ) | (0.23 | ) | (0.14 | ) | ||||||||||||||
Return of capital | (0.14 | ) | (0.07 | ) | — | (0.10 | ) | (0.13 | ) | ||||||||||||||
Total dividends and return of capital | (0.14 | ) | (0.25 | ) | (0.29 | ) | (0.33 | ) | (0.27 | ) | |||||||||||||
Net asset value, end of year | $ | 9.73 | $ | 10.04 | $ | 10.79 | $ | 9.94 | $ | 10.82 | |||||||||||||
Total investment return2 | (1.72 | )% | (4.59 | )% | 11.77 | % | (5.17 | )% | 5.08 | % | |||||||||||||
Ratios to average net assets: | |||||||||||||||||||||||
Expenses before fee waivers and/or expense reimbursements/recoupments | 1.27 | %3 | 1.29 | %3 | 1.28 | %3 | 1.27 | %3 | 1.28 | %3 | |||||||||||||
Expenses after fee waivers and/or expense reimbursements/recoupments | 1.09 | %3 | 1.10 | %3 | 1.04 | %3 | 1.17 | %3 | 1.22 | %3 | |||||||||||||
Net investment income | 0.93 | % | 1.11 | % | 1.33 | % | 1.56 | % | 1.79 | % | |||||||||||||
Supplemental data: | |||||||||||||||||||||||
Net assets, end of year (000's) | $ | 31,480 | $ | 38,368 | $ | 45,624 | $ | 44,725 | $ | 62,808 | |||||||||||||
Portfolio turnover | 221 | % | 199 | % | 38 | % | 40 | % | 46 | % | |||||||||||||
Class Y
Years ended July 31, | |||||||||||||||||||||||
2018 | 2017 | 2016 | 2015 | 2014 | |||||||||||||||||||
Net asset value, beginning of year | $ | 10.00 | $ | 10.75 | $ | 9.91 | $ | 10.79 | $ | 10.54 | |||||||||||||
Net investment income1 | 0.11 | 0.13 | 0.16 | 0.18 | 0.21 | ||||||||||||||||||
Net realized and unrealized gains (losses) | (0.26 | ) | (0.62 | ) | 0.99 | (0.71 | ) | 0.33 | |||||||||||||||
Net increase (decrease) from operations | (0.15 | ) | (0.49 | ) | 1.15 | (0.53 | ) | 0.54 | |||||||||||||||
Dividends from net investment income | — | (0.18 | ) | (0.31 | ) | (0.24 | ) | (0.14 | ) | ||||||||||||||
Return of capital | (0.16 | ) | (0.08 | ) | — | (0.11 | ) | (0.15 | ) | ||||||||||||||
Total dividends and return of capital | (0.16 | ) | (0.26 | ) | (0.31 | ) | (0.35 | ) | (0.29 | ) | |||||||||||||
Net asset value, end of year | $ | 9.69 | $ | 10.00 | $ | 10.75 | $ | 9.91 | $ | 10.79 | |||||||||||||
Total investment return2 | (1.51 | )% | (4.45 | )% | 11.93 | % | (5.00 | )% | 5.23 | % | |||||||||||||
Ratios to average net assets: | |||||||||||||||||||||||
Expenses before fee waivers and/or expense reimbursements | 1.15 | %3 | 1.13 | %3 | 1.07 | %3 | 1.09 | %3 | 1.07 | %3 | |||||||||||||
Expenses after fee waivers and/or expense reimbursements | 0.94 | %3 | 0.94 | %3 | 0.84 | %3 | 1.00 | %3,4 | 1.00 | %3 | |||||||||||||
Net investment income | 1.08 | % | 1.28 | % | 1.54 | % | 1.72 | % | 2.01 | % | |||||||||||||
Supplemental data: | |||||||||||||||||||||||
Net assets, end of year (000's) | $ | 2,324 | $ | 2,592 | $ | 4,040 | $ | 4,510 | $ | 5,479 | |||||||||||||
Portfolio turnover | 221 | % | 199 | % | 38 | % | 40 | % | 46 | % | |||||||||||||
1 Calculated using the average shares method.
2 Total investment return is calculated assuming a $10,000 investment on the first day of each year reported, reinvestment of all dividends and other distributions, if any, at net asset value on the ex-dividend dates, and a sale at net asset value on the last day of each year reported. The figures do not include any applicable sales charges, redemption fees or program fees; results would be lower if they were included. Returns do not reflect the deduction of taxes that a shareholder would pay on Portfolio distributions or the redemption of Portfolio shares.
3 Includes interest expense representing less than 0.005%.
4 The investment manager recouped expenses previously reimbursed by the investment manager on behalf of the Portfolio, not to exceed the expense cap.
310
PACE Global Fixed Income Investments
Financial highlights (continued)
Class C
Years ended July 31, | |||||||||||||||||||||||
2018 | 2017 | 2016 | 2015 | 2014 | |||||||||||||||||||
Net asset value, beginning of year | $ | 10.04 | $ | 10.79 | $ | 9.95 | $ | 10.82 | $ | 10.57 | |||||||||||||
Net investment income1 | 0.05 | 0.06 | 0.09 | 0.11 | 0.14 | ||||||||||||||||||
Net realized and unrealized gains (losses) | (0.27 | ) | (0.61 | ) | 0.99 | (0.70 | ) | 0.33 | |||||||||||||||
Net increase (decrease) from operations | (0.22 | ) | (0.55 | ) | 1.08 | (0.59 | ) | 0.47 | |||||||||||||||
Dividends from net investment income | — | (0.15 | ) | (0.24 | ) | (0.22 | ) | (0.12 | ) | ||||||||||||||
Return of capital | (0.09 | ) | (0.05 | ) | — | (0.06 | ) | (0.10 | ) | ||||||||||||||
Total dividends and return of capital | (0.09 | ) | (0.20 | ) | (0.24 | ) | (0.28 | ) | (0.22 | ) | |||||||||||||
Net asset value, end of year | $ | 9.73 | $ | 10.04 | $ | 10.79 | $ | 9.95 | $ | 10.82 | |||||||||||||
Total investment return2 | (2.18 | )% | (5.04 | )% | 11.12 | % | (5.55 | )% | 4.47 | % | |||||||||||||
Ratios to average net assets: | |||||||||||||||||||||||
Expenses before fee waivers and/or expense reimbursements/recoupments | 1.71 | %3 | 1.77 | %3 | 1.76 | %3 | 1.76 | %3 | 1.76 | %3 | |||||||||||||
Expenses after fee waivers and/or expense reimbursements/recoupments | 1.57 | %3 | 1.58 | %3 | 1.52 | %3 | 1.65 | %3 | 1.70 | %3 | |||||||||||||
Net investment income | 0.45 | % | 0.63 | % | 0.85 | % | 1.07 | % | 1.31 | % | |||||||||||||
Supplemental data: | |||||||||||||||||||||||
Net assets, end of year (000's) | $ | 2,327 | $ | 2,639 | $ | 3,160 | $ | 2,994 | $ | 4,559 | |||||||||||||
Portfolio turnover | 221 | % | 199 | % | 38 | % | 40 | % | 46 | % | |||||||||||||
Class P
Years ended July 31, | |||||||||||||||||||||||
2018 | 2017 | 2016 | 2015 | 2014 | |||||||||||||||||||
Net asset value, beginning of year | $ | 10.03 | $ | 10.79 | $ | 9.94 | $ | 10.82 | $ | 10.56 | |||||||||||||
Net investment income1 | 0.11 | 0.13 | 0.15 | 0.18 | 0.21 | ||||||||||||||||||
Net realized and unrealized gains (losses) | (0.26 | ) | (0.63 | ) | 1.01 | (0.71 | ) | 0.34 | |||||||||||||||
Net increase (decrease) from operations | (0.15 | ) | (0.50 | ) | 1.16 | (0.53 | ) | 0.55 | |||||||||||||||
Dividends from net investment income | — | (0.18 | ) | (0.31 | ) | (0.23 | ) | (0.14 | ) | ||||||||||||||
Return of capital | (0.16 | ) | (0.08 | ) | — | (0.12 | ) | (0.15 | ) | ||||||||||||||
Total dividends and return of capital | (0.16 | ) | (0.26 | ) | (0.31 | ) | (0.35 | ) | (0.29 | ) | |||||||||||||
Net asset value, end of year | $ | 9.72 | $ | 10.03 | $ | 10.79 | $ | 9.94 | $ | 10.82 | |||||||||||||
Total investment return2 | (1.50 | )% | (4.51 | )% | 11.99 | % | (4.99 | )% | 5.31 | % | |||||||||||||
Ratios to average net assets: | |||||||||||||||||||||||
Expenses before fee waivers and/or expense reimbursements | 1.09 | %3 | 1.11 | %3 | 1.08 | %3 | 1.08 | %3 | 1.10 | %3 | |||||||||||||
Expenses after fee waivers and/or expense reimbursements | 0.90 | %3 | 0.92 | %3 | 0.85 | %3 | 1.00 | %3,4 | 1.00 | %3 | |||||||||||||
Net investment income | 1.12 | % | 1.29 | % | 1.52 | % | 1.71 | % | 2.01 | % | |||||||||||||
Supplemental data: | |||||||||||||||||||||||
Net assets, end of year (000's) | $ | 369,353 | $ | 403,015 | $ | 512,631 | $ | 502,122 | $ | 526,312 | |||||||||||||
Portfolio turnover | 221 | % | 199 | % | 38 | % | 40 | % | 46 | % | |||||||||||||
See accompanying notes to financial statements.
311
PACE High Yield Investments
Financial highlights
Selected data for a share of beneficial interest outstanding throughout each year is presented below:
Class A
Years ended July 31, | |||||||||||||||||||||||
2018 | 2017 | 2016 | 2015 | 2014 | |||||||||||||||||||
Net asset value, beginning of year | $ | 10.07 | $ | 9.59 | $ | 9.70 | $ | 10.62 | $ | 10.41 | |||||||||||||
Net investment income1 | 0.53 | 0.54 | 0.54 | 0.54 | 0.56 | ||||||||||||||||||
Net realized and unrealized gains (losses) | (0.26 | ) | 0.48 | (0.11 | ) | (0.78 | ) | 0.21 | |||||||||||||||
Net increase (decrease) from operations | 0.27 | 1.02 | 0.43 | (0.24 | ) | 0.77 | |||||||||||||||||
Dividends from net investment income | (0.53 | ) | (0.54 | ) | (0.47 | ) | (0.53 | ) | (0.56 | ) | |||||||||||||
Distributions from net realized gains | — | — | — | (0.15 | ) | — | |||||||||||||||||
Return of capital | — | — | (0.07 | ) | — | — | |||||||||||||||||
Total dividends, distributions and return of capital | (0.53 | ) | (0.54 | ) | (0.54 | ) | (0.68 | ) | (0.56 | ) | |||||||||||||
Net asset value, end of year | $ | 9.81 | $ | 10.07 | $ | 9.59 | $ | 9.70 | $ | 10.62 | |||||||||||||
Total investment return2 | 2.76 | % | 10.93 | % | 4.88 | % | (2.29 | )% | 7.59 | % | |||||||||||||
Ratios to average net assets: | |||||||||||||||||||||||
Expenses before fee waivers and/or expense reimbursements/recoupments | 1.22 | % | 1.25 | % | 1.26 | % | 1.26 | % | 1.26 | % | |||||||||||||
Expenses after fee waivers and/or expense reimbursements/recoupments | 1.06 | % | 1.07 | % | 1.08 | % | 1.25 | % | 1.26 | % | |||||||||||||
Net investment income | 5.29 | % | 5.43 | % | 5.84 | % | 5.20 | % | 5.28 | % | |||||||||||||
Supplemental data: | |||||||||||||||||||||||
Net assets, end of year (000's) | $ | 3,748 | $ | 4,251 | $ | 3,764 | $ | 5,330 | $ | 23,516 | |||||||||||||
Portfolio turnover | 63 | % | 91 | % | 103 | % | 57 | % | 20 | % | |||||||||||||
Class Y
Years ended July 31, | |||||||||||||||||||||||
2018 | 2017 | 2016 | 2015 | 2014 | |||||||||||||||||||
Net asset value, beginning of year | $ | 10.10 | $ | 9.62 | $ | 9.73 | $ | 10.66 | $ | 10.44 | |||||||||||||
Net investment income1 | 0.56 | 0.56 | 0.56 | 0.55 | 0.59 | ||||||||||||||||||
Net realized and unrealized gains (losses) | (0.25 | ) | 0.48 | (0.10 | ) | (0.78 | ) | 0.22 | |||||||||||||||
Net increase (decrease) from operations | 0.31 | 1.04 | 0.46 | (0.23 | ) | 0.81 | |||||||||||||||||
Dividends from net investment income | (0.55 | ) | (0.56 | ) | (0.49 | ) | (0.55 | ) | (0.59 | ) | |||||||||||||
Distributions from net realized gains | — | — | — | (0.15 | ) | — | |||||||||||||||||
Return of capital | — | — | (0.08 | ) | — | — | |||||||||||||||||
Total dividends, distributions and return of capital | (0.55 | ) | (0.56 | ) | (0.57 | ) | (0.70 | ) | (0.59 | ) | |||||||||||||
Net asset value, end of year | $ | 9.86 | $ | 10.10 | $ | 9.62 | $ | 9.73 | $ | 10.66 | |||||||||||||
Total investment return2 | 3.06 | % | 11.21 | % | 5.11 | % | (2.13 | )% | 7.94 | % | |||||||||||||
Ratios to average net assets: | |||||||||||||||||||||||
Expenses before fee waivers and/or expense reimbursements/recoupments | 0.85 | % | 1.05 | % | 1.03 | % | 1.03 | % | 1.00 | % | |||||||||||||
Expenses after fee waivers and/or expense reimbursements/recoupments | 0.79 | % | 0.88 | % | 0.86 | % | 1.02 | % | 1.00 | % | |||||||||||||
Net investment income | 5.57 | % | 5.66 | % | 6.09 | % | 5.40 | % | 5.54 | % | |||||||||||||
Supplemental data: | |||||||||||||||||||||||
Net assets, end of year (000's) | $ | 534 | $ | 518 | $ | 874 | $ | 1,119 | $ | 1,692 | |||||||||||||
Portfolio turnover | 63 | % | 91 | % | 103 | % | 57 | % | 20 | % | |||||||||||||
1 Calculated using the average shares method.
2 Total investment return is calculated assuming a $10,000 investment on the first day of each year reported, reinvestment of all dividends and other distributions, if any, at net asset value on the ex-dividend dates, and a sale at net asset value on the last day of each year reported. The figures do not include any applicable sales charges, redemption fees or program fees; results would be lower if they were included. Returns do not reflect the deduction of taxes that a shareholder would pay on Portfolio distributions or the redemption of Portfolio shares.
312
PACE High Yield Investments
Financial highlights (continued)
Class C
Years ended July 31, | |||||||||||||||||||||||
2018 | 2017 | 2016 | 2015 | 2014 | |||||||||||||||||||
Net asset value, beginning of year | $ | 10.06 | $ | 9.58 | $ | 9.69 | $ | 10.62 | $ | 10.40 | |||||||||||||
Net investment income1 | 0.48 | 0.49 | 0.49 | 0.48 | 0.51 | ||||||||||||||||||
Net realized and unrealized gains (losses) | (0.26 | ) | 0.48 | (0.10 | ) | (0.78 | ) | 0.22 | |||||||||||||||
Net increase (decrease) from operations | 0.22 | 0.97 | 0.39 | (0.30 | ) | 0.73 | |||||||||||||||||
Dividends from net investment income | (0.48 | ) | (0.49 | ) | (0.43 | ) | (0.48 | ) | (0.51 | ) | |||||||||||||
Distributions from net realized gains | — | — | — | (0.15 | ) | — | |||||||||||||||||
Return of capital | — | — | (0.07 | ) | — | — | |||||||||||||||||
Total dividends, distributions and return of capital | (0.48 | ) | (0.49 | ) | (0.50 | ) | (0.63 | ) | (0.51 | ) | |||||||||||||
Net asset value, end of year | $ | 9.80 | $ | 10.06 | $ | 9.58 | $ | 9.69 | $ | 10.62 | |||||||||||||
Total investment return2 | 2.27 | % | 10.39 | % | 4.38 | % | (2.83 | )% | 7.20 | % | |||||||||||||
Ratios to average net assets: | |||||||||||||||||||||||
Expenses before fee waivers and/or expense reimbursements/recoupments | 1.69 | % | 1.74 | % | 1.75 | % | 1.73 | % | 1.72 | % | |||||||||||||
Expenses after fee waivers and/or expense reimbursements/recoupments | 1.56 | % | 1.57 | % | 1.57 | % | 1.72 | % | 1.72 | % | |||||||||||||
Net investment income | 4.79 | % | 4.95 | % | 5.36 | % | 4.71 | % | 4.82 | % | |||||||||||||
Supplemental data: | |||||||||||||||||||||||
Net assets, end of year (000's) | $ | 2,294 | $ | 2,822 | $ | 3,347 | $ | 3,913 | $ | 5,607 | |||||||||||||
Portfolio turnover | 63 | % | 91 | % | 103 | % | 57 | % | 20 | % | |||||||||||||
Class P
Years ended July 31, | |||||||||||||||||||||||
2018 | 2017 | 2016 | 2015 | 2014 | |||||||||||||||||||
Net asset value, beginning of year | $ | 10.09 | $ | 9.61 | $ | 9.72 | $ | 10.65 | $ | 10.43 | |||||||||||||
Net investment income1 | 0.54 | 0.55 | 0.56 | 0.55 | 0.58 | ||||||||||||||||||
Net realized and unrealized gains (losses) | (0.25 | ) | 0.49 | (0.11 | ) | (0.78 | ) | 0.23 | |||||||||||||||
Net increase (decrease) from operations | 0.29 | 1.04 | 0.45 | (0.23 | ) | 0.81 | |||||||||||||||||
Dividends from net investment income | (0.55 | ) | (0.56 | ) | (0.49 | ) | (0.55 | ) | (0.59 | ) | |||||||||||||
Distributions from net realized gains | — | — | — | (0.15 | ) | — | |||||||||||||||||
Return of capital | — | — | (0.07 | ) | — | — | |||||||||||||||||
Total dividends, distributions and return of capital | (0.55 | ) | (0.56 | ) | (0.56 | ) | (0.70 | ) | (0.59 | ) | |||||||||||||
Net asset value, end of year | $ | 9.83 | $ | 10.09 | $ | 9.61 | $ | 9.72 | $ | 10.65 | |||||||||||||
Total investment return2 | 2.96 | % | 11.07 | % | 5.03 | % | (2.14 | )% | 7.92 | % | |||||||||||||
Ratios to average net assets: | |||||||||||||||||||||||
Expenses before fee waivers and/or expense reimbursements/recoupments | 1.07 | % | 1.10 | % | 1.11 | % | 1.09 | % | 1.10 | % | |||||||||||||
Expenses after fee waivers and/or expense reimbursements/recoupments | 0.91 | % | 0.92 | % | 0.94 | % | 1.03 | % | 1.03 | % | |||||||||||||
Net investment income | 5.44 | % | 5.59 | % | 6.00 | % | 5.39 | % | 5.50 | % | |||||||||||||
Supplemental data: | |||||||||||||||||||||||
Net assets, end of year (000's) | $ | 347,364 | $ | 376,424 | $ | 412,789 | $ | 428,061 | $ | 431,812 | |||||||||||||
Portfolio turnover | 63 | % | 91 | % | 103 | % | 57 | % | 20 | % | |||||||||||||
See accompanying notes to financial statements.
313
PACE Large Co Value Equity Investments
Financial highlights
Selected data for a share of beneficial interest outstanding throughout each year is presented below:
Class A
Years ended July 31, | |||||||||||||||||||||||
2018 | 2017 | 2016 | 2015 | 2014 | |||||||||||||||||||
Net asset value, beginning of year | $ | 23.70 | $ | 21.35 | $ | 23.72 | $ | 25.25 | $ | 22.53 | |||||||||||||
Net investment income1 | 0.35 | 0.33 | 0.34 | 0.23 | 0.30 | ||||||||||||||||||
Net realized and unrealized gains | 1.73 | 2.99 | 0.11 | 1.34 | 2.92 | ||||||||||||||||||
Net increase from operations | 2.08 | 3.32 | 0.45 | 1.57 | 3.22 | ||||||||||||||||||
Dividends from net investment income | (0.32 | ) | (0.35 | ) | (0.32 | ) | (0.30 | ) | (0.21 | ) | |||||||||||||
Distributions from net realized gains | (1.70 | ) | (0.62 | ) | (2.50 | ) | (2.80 | ) | (0.29 | ) | |||||||||||||
Total dividends and distributions | (2.02 | ) | (0.97 | ) | (2.82 | ) | (3.10 | ) | (0.50 | ) | |||||||||||||
Net asset value, end of year | $ | 23.76 | $ | 23.70 | $ | 21.35 | $ | 23.72 | $ | 25.25 | |||||||||||||
Total investment return2 | 8.83 | % | 15.74 | % | 2.87 | % | 6.23 | % | 14.39 | % | |||||||||||||
Ratios to average net assets: | |||||||||||||||||||||||
| Expenses before fee waivers and/or expense reimbursements/recoupments including dividend expense, interest expense and other borrowing costs for investments sold short | 1.46 | % | 1.45 | % | 1.48 | % | 1.48 | % | 1.32 | % | |||||||||||||
| Expenses after fee waivers and/or expense reimbursements/recoupments, including dividend expense, interest expense and other borrowing costs for investments sold short | 1.46 | % | 1.44 | % | 1.47 | % | 1.47 | % | 1.31 | % | |||||||||||||
| Expenses after fee waivers and/or expense reimbursements/recoupments, excluding dividend expense, interest expense and other borrowing costs for investments sold short | 1.10 | % | 1.11 | % | 1.13 | % | 1.13 | % | 1.13 | % | |||||||||||||
Net investment income | 1.46 | % | 1.47 | % | 1.63 | % | 0.94 | % | 1.25 | % | |||||||||||||
Supplemental data: | |||||||||||||||||||||||
Net assets, end of year (000's) | $ | 111,759 | $ | 117,223 | $ | 111,716 | $ | 124,198 | $ | 155,480 | |||||||||||||
Portfolio turnover | 68 | % | 71 | % | 65 | % | 97 | % | 71 | % | |||||||||||||
Class Y
Years ended July 31, | |||||||||||||||||||||||
| �� | 2018 | 2017 | 2016 | 2015 | 2014 | ||||||||||||||||||
Net asset value, beginning of year | $ | 23.77 | $ | 21.41 | $ | 23.78 | $ | 25.32 | $ | 22.60 | |||||||||||||
Net investment income1 | 0.41 | 0.39 | 0.40 | 0.29 | 0.36 | ||||||||||||||||||
Net realized and unrealized gains | 1.73 | 3.00 | 0.11 | 1.35 | 2.91 | ||||||||||||||||||
Net increase from operations | 2.14 | 3.39 | 0.51 | 1.64 | 3.27 | ||||||||||||||||||
Dividends from net investment income | (0.38 | ) | (0.41 | ) | (0.38 | ) | (0.38 | ) | (0.26 | ) | |||||||||||||
Distributions from net realized gains | (1.70 | ) | (0.62 | ) | (2.50 | ) | (2.80 | ) | (0.29 | ) | |||||||||||||
Total dividends and distributions | (2.08 | ) | (1.03 | ) | (2.88 | ) | (3.18 | ) | (0.55 | ) | |||||||||||||
Net asset value, end of year | $ | 23.83 | $ | 23.77 | $ | 21.41 | $ | 23.78 | $ | 25.32 | |||||||||||||
Total investment return2 | 9.08 | % | 16.02 | % | 3.16 | % | 6.51 | % | 14.62 | % | |||||||||||||
Ratios to average net assets: | |||||||||||||||||||||||
| Expenses before fee waivers and/or expense reimbursements including dividend expense, interest expense and other borrowing costs for investments sold short | 1.21 | % | 1.20 | % | 1.23 | % | 1.23 | % | 1.07 | % | |||||||||||||
| Expenses after fee waivers and/or expense reimbursements/recoupments, including dividend expense, interest expense and other borrowing costs for investments sold short | 1.21 | % | 1.19 | % | 1.21 | % | 1.23 | % | 1.06 | % | |||||||||||||
| Expenses after fee waivers and/or expense reimbursements/recoupments, excluding dividend expense, interest expense and other borrowing costs for investments sold short | 0.85 | % | 0.86 | % | 0.88 | % | 0.88 | % | 0.89 | % | |||||||||||||
Net investment income | 1.71 | % | 1.73 | % | 1.89 | % | 1.19 | % | 1.50 | % | |||||||||||||
Supplemental data: | |||||||||||||||||||||||
Net assets, end of year (000's) | $ | 17,206 | $ | 17,451 | $ | 17,870 | $ | 19,593 | $ | 19,765 | |||||||||||||
Portfolio turnover | 68 | % | 71 | % | 65 | % | 97 | % | 71 | % | |||||||||||||
1 Calculated using the average shares method.
2 Total investment return is calculated assuming a $10,000 investment on the first day of each year reported, reinvestment of all dividends and other distributions, if any, at net asset value on the ex-dividend dates, and a sale at net asset value on the last day of each year reported. The figures do not include any applicable sales charges, redemption fees or program fees; results would be lower if they were included. Returns do not reflect the deduction of taxes that a shareholder would pay on Portfolio distributions or the redemption of Portfolio shares.
314
PACE Large Co Value Equity Investments
Financial highlights (continued)
Class C
Years ended July 31, | |||||||||||||||||||||||
2018 | 2017 | 2016 | 2015 | 2014 | |||||||||||||||||||
Net asset value, beginning of year | $ | 23.71 | $ | 21.36 | $ | 23.69 | $ | 25.23 | $ | 22.53 | |||||||||||||
Net investment income1 | 0.17 | 0.16 | 0.18 | 0.04 | 0.11 | ||||||||||||||||||
Net realized and unrealized gains | 1.72 | 2.97 | 0.12 | 1.33 | 2.91 | ||||||||||||||||||
Net increase from operations | 1.89 | 3.13 | 0.30 | 1.37 | 3.02 | ||||||||||||||||||
Dividends from net investment income | (0.12 | ) | (0.16 | ) | (0.13 | ) | (0.11 | ) | (0.03 | ) | |||||||||||||
Distributions from net realized gains | (1.70 | ) | (0.62 | ) | (2.50 | ) | (2.80 | ) | (0.29 | ) | |||||||||||||
Total dividends and distributions | (1.82 | ) | (0.78 | ) | (2.63 | ) | (2.91 | ) | (0.32 | ) | |||||||||||||
Net asset value, end of year | $ | 23.78 | $ | 23.71 | $ | 21.36 | $ | 23.69 | $ | 25.23 | |||||||||||||
Total investment return2 | 8.00 | % | 14.80 | % | 2.11 | % | 5.44 | % | 13.43 | % | |||||||||||||
Ratios to average net assets: | |||||||||||||||||||||||
| Expenses before fee waivers and/or expense reimbursements/recoupments including dividend expense, interest expense and other borrowing costs for investments sold short | 2.20 | % | 2.23 | % | 2.26 | % | 2.25 | % | 2.10 | % | |||||||||||||
| Expenses after fee waivers and/or expense reimbursements/recoupments, including dividend expense, interest expense and other borrowing costs for investments sold short | 2.20 | % | 2.21 | % | 2.25 | % | 2.25 | % | 2.09 | % | |||||||||||||
| Expenses after fee waivers and/or expense reimbursements/recoupments, excluding dividend expense, interest expense and other borrowing costs for investments sold short | 1.84 | % | 1.89 | % | 1.91 | % | 1.90 | % | 1.92 | % | |||||||||||||
Net investment income | 0.73 | % | 0.70 | % | 0.85 | % | 0.17 | % | 0.47 | % | |||||||||||||
Supplemental data: | |||||||||||||||||||||||
Net assets, end of year (000's) | $ | 11,018 | $ | 12,197 | $ | 12,690 | $ | 14,500 | $ | 15,380 | |||||||||||||
Portfolio turnover | 68 | % | 71 | % | 65 | % | 97 | % | 71 | % | |||||||||||||
Class P
Years ended July 31, | |||||||||||||||||||||||
2018 | 2017 | 2016 | 2015 | 2014 | |||||||||||||||||||
Net asset value, beginning of year | $ | 23.66 | $ | 21.31 | $ | 23.68 | $ | 25.24 | $ | 22.52 | |||||||||||||
Net investment income1 | 0.40 | 0.38 | 0.39 | 0.29 | 0.36 | ||||||||||||||||||
Net realized and unrealized gains | 1.72 | 2.99 | 0.12 | 1.33 | 2.91 | ||||||||||||||||||
Net increase from operations | 2.12 | 3.37 | 0.51 | 1.62 | 3.27 | ||||||||||||||||||
Dividends from net investment income | (0.37 | ) | (0.40 | ) | (0.38 | ) | (0.38 | ) | (0.26 | ) | |||||||||||||
Distributions from net realized gains | (1.70 | ) | (0.62 | ) | (2.50 | ) | (2.80 | ) | (0.29 | ) | |||||||||||||
Total dividends and distributions | (2.07 | ) | (1.02 | ) | (2.88 | ) | (3.18 | ) | (0.55 | ) | |||||||||||||
Net asset value, end of year | $ | 23.71 | $ | 23.66 | $ | 21.31 | $ | 23.68 | $ | 25.24 | |||||||||||||
Total investment return2 | 9.06 | % | 16.03 | % | 3.17 | % | 6.48 | % | 14.62 | % | |||||||||||||
Ratios to average net assets: | |||||||||||||||||||||||
| Expenses before fee waivers and/or expense reimbursements including dividend expense, interest expense and other borrowing costs for investments sold short | 1.23 | % | 1.22 | % | 1.24 | % | 1.24 | % | 1.08 | % | |||||||||||||
| Expenses after fee waivers and/or expense reimbursements/recoupments, including dividend expense, interest expense and other borrowing costs for investments sold short | 1.22 | % | 1.20 | % | 1.23 | % | 1.23 | % | 1.07 | % | |||||||||||||
| Expenses after fee waivers and/or expense reimbursements/recoupments, excluding dividend expense, interest expense and other borrowing costs for investments sold short | 0.87 | % | 0.88 | % | 0.89 | % | 0.88 | % | 0.90 | % | |||||||||||||
Net investment income | 1.69 | % | 1.70 | % | 1.87 | % | 1.19 | % | 1.49 | % | |||||||||||||
Supplemental data: | |||||||||||||||||||||||
Net assets, end of year (000's) | $ | 1,184,977 | $ | 1,197,155 | $ | 1,160,287 | $ | 1,248,338 | $ | 1,263,296 | |||||||||||||
Portfolio turnover | 68 | % | 71 | % | 65 | % | 97 | % | 71 | % | |||||||||||||
See accompanying notes to financial statements.
315
PACE Large Co Growth Equity Investments
Financial highlights
Selected data for a share of beneficial interest outstanding throughout each year is presented below:
Class A
Years ended July 31, | |||||||||||||||||||||||
2018 | 2017 | 2016 | 2015 | 2014 | |||||||||||||||||||
Net asset value, beginning of year | $ | 25.18 | $ | 22.37 | $ | 26.24 | $ | 25.75 | $ | 23.52 | |||||||||||||
Net investment income (loss)1 | (0.06 | ) | 0.02 | (0.05 | ) | (0.15 | ) | 0.07 | |||||||||||||||
Net realized and unrealized gains | 4.55 | 3.54 | 0.10 | 3.70 | 4.39 | ||||||||||||||||||
Net increase from operations | 4.49 | 3.56 | 0.05 | 3.55 | 4.46 | ||||||||||||||||||
Dividends from net investment income | — | (0.03 | ) | — | — | (0.04 | ) | ||||||||||||||||
Distributions from net realized gains | (2.61 | ) | (0.72 | ) | (3.92 | ) | (3.06 | ) | (2.19 | ) | |||||||||||||
Total dividends and distributions | (2.61 | ) | (0.75 | ) | (3.92 | ) | (3.06 | ) | (2.23 | ) | |||||||||||||
Net asset value, end of year | $ | 27.06 | $ | 25.18 | $ | 22.37 | $ | 26.24 | $ | 25.75 | |||||||||||||
Total investment return2 | 18.72 | % | 16.50 | % | 0.73 | % | 14.60 | % | 19.60 | % | |||||||||||||
Ratios to average net assets: | |||||||||||||||||||||||
Expenses before fee waivers and/or expense reimbursements/recoupments | 1.14 | %3 | 1.18 | %3 | 1.19 | %3 | 1.18 | %3 | 1.18 | % | |||||||||||||
Expenses after fee waivers and/or expense reimbursements/recoupments | 1.14 | %3 | 1.17 | %3 | 1.18 | %3 | 1.18 | %3 | 1.18 | % | |||||||||||||
Net investment income (loss) | (0.22 | )% | 0.07 | % | (0.24 | )% | (0.57 | )% | 0.28 | % | |||||||||||||
Supplemental data: | |||||||||||||||||||||||
Net assets, end of year (000's) | $ | 47,549 | $ | 45,095 | $ | 42,862 | $ | 46,777 | $ | 68,207 | |||||||||||||
Portfolio turnover | 41 | % | 40 | % | 33 | % | 48 | % | 40 | % | |||||||||||||
Class Y
Years ended July 31, | |||||||||||||||||||||||
2018 | 2017 | 2016 | 2015 | 2014 | |||||||||||||||||||
Net asset value, beginning of year | $ | 26.12 | $ | 23.19 | $ | 26.98 | $ | 26.39 | $ | 24.06 | |||||||||||||
Net investment income (loss)1 | 0.01 | 0.08 | 0.01 | (0.09 | ) | 0.14 | |||||||||||||||||
Net realized and unrealized gains | 4.74 | 3.66 | 0.12 | 3.80 | 4.48 | ||||||||||||||||||
Net increase from operations | 4.75 | 3.74 | 0.13 | 3.71 | 4.62 | ||||||||||||||||||
Dividends from net investment income | (0.03 | ) | (0.09 | ) | — | (0.06 | ) | (0.10 | ) | ||||||||||||||
Distributions from net realized gains | (2.61 | ) | (0.72 | ) | (3.92 | ) | (3.06 | ) | (2.19 | ) | |||||||||||||
Total dividends and distributions | (2.64 | ) | (0.81 | ) | (3.92 | ) | (3.12 | ) | (2.29 | ) | |||||||||||||
Net asset value, end of year | $ | 28.23 | $ | 26.12 | $ | 23.19 | $ | 26.98 | $ | 26.39 | |||||||||||||
Total investment return2 | 19.03 | % | 16.73 | % | 1.04 | % | 14.89 | % | 19.86 | % | |||||||||||||
Ratios to average net assets: | |||||||||||||||||||||||
Expenses before fee waivers and/or expense reimbursements | 0.88 | %3 | 0.92 | %3 | 0.92 | %3 | 0.92 | %3 | 0.93 | % | |||||||||||||
Expenses after fee waivers and/or expense reimbursements | 0.88 | %3 | 0.91 | %3 | 0.91 | %3 | 0.92 | %3 | 0.93 | % | |||||||||||||
Net investment income (loss) | 0.05 | % | 0.33 | % | 0.02 | % | (0.32 | )% | 0.53 | % | |||||||||||||
Supplemental data: | |||||||||||||||||||||||
Net assets, end of year (000's) | $ | 15,715 | $ | 14,238 | $ | 13,989 | $ | 16,174 | $ | 15,858 | |||||||||||||
Portfolio turnover | 41 | % | 40 | % | 33 | % | 48 | % | 40 | % | |||||||||||||
1 Calculated using the average shares method.
2 Total investment return is calculated assuming a $10,000 investment on the first day of each year reported, reinvestment of all dividends and other distributions, if any, at net asset value on the ex-dividend dates, and a sale at net asset value on the last day of each year reported. The figures do not include any applicable sales charges, redemption fees or program fees; results would be lower if they were included. Returns do not reflect the deduction of taxes that a shareholder would pay on Portfolio distributions or the redemption of Portfolio shares.
316
PACE Large Co Growth Equity Investments
Financial highlights (continued)
Class C
Years ended July 31, | |||||||||||||||||||||||
2018 | 2017 | 2016 | 2015 | 2014 | |||||||||||||||||||
Net asset value, beginning of year | $ | 20.80 | $ | 18.73 | $ | 22.79 | $ | 22.91 | $ | 21.29 | |||||||||||||
Net investment loss1 | (0.21 | ) | (0.13 | ) | (0.20 | ) | (0.31 | ) | (0.13 | ) | |||||||||||||
Net realized and unrealized gains | 3.70 | 2.92 | 0.06 | 3.25 | 3.94 | ||||||||||||||||||
Net increase (decrease) from operations | 3.49 | 2.79 | (0.14 | ) | 2.94 | 3.81 | |||||||||||||||||
Distributions from net realized gains | (2.61 | ) | (0.72 | ) | (3.92 | ) | (3.06 | ) | (2.19 | ) | |||||||||||||
Net asset value, end of year | $ | 21.68 | $ | 20.80 | $ | 18.73 | $ | 22.79 | $ | 22.91 | |||||||||||||
Total investment return2 | 17.79 | % | 15.55 | % | (0.08 | )% | 13.67 | % | 18.54 | % | |||||||||||||
Ratios to average net assets: | |||||||||||||||||||||||
Expenses before fee waivers and/or expense reimbursements/recoupments | 1.93 | %3 | 1.99 | %3 | 2.00 | %3 | 1.99 | %3 | 2.00 | % | |||||||||||||
Expenses after fee waivers and/or expense reimbursements/recoupments | 1.93 | %3 | 1.99 | %3 | 1.99 | %3 | 1.99 | %3 | 2.03 | %4 | |||||||||||||
Net investment loss | (0.99 | )% | (0.69 | )% | (1.06 | )% | (1.39 | )% | (0.57 | )% | |||||||||||||
Supplemental data: | |||||||||||||||||||||||
Net assets, end of year (000's) | $ | 2,744 | $ | 2,860 | $ | 3,565 | $ | 4,104 | $ | 4,204 | |||||||||||||
Portfolio turnover | 41 | % | 40 | % | 33 | % | 48 | % | 40 | % | |||||||||||||
Class P
Years ended July 31, | |||||||||||||||||||||||
2018 | 2017 | 2016 | 2015 | 2014 | |||||||||||||||||||
Net asset value, beginning of year | $ | 25.94 | $ | 23.03 | $ | 26.83 | $ | 26.26 | $ | 23.95 | |||||||||||||
Net investment income (loss)1 | 0.01 | 0.07 | 0.005 | (0.08 | ) | 0.14 | |||||||||||||||||
Net realized and unrealized gains | 4.70 | 3.64 | 0.12 | 3.77 | 4.46 | ||||||||||||||||||
Net increase from operations | 4.71 | 3.71 | 0.12 | 3.69 | 4.60 | ||||||||||||||||||
Dividends from net investment income | (0.03 | ) | (0.08 | ) | — | (0.06 | ) | (0.10 | ) | ||||||||||||||
Distributions from net realized gains | (2.61 | ) | (0.72 | ) | (3.92 | ) | (3.06 | ) | (2.19 | ) | |||||||||||||
Total dividends and distributions | (2.64 | ) | (0.80 | ) | (3.92 | ) | (3.12 | ) | (2.29 | ) | |||||||||||||
Net asset value, end of year | $ | 28.01 | $ | 25.94 | $ | 23.03 | $ | 26.83 | $ | 26.26 | |||||||||||||
Total investment return2 | 19.03 | % | 16.75 | % | 1.01 | % | 14.88 | % | 19.87 | % | |||||||||||||
Ratios to average net assets: | |||||||||||||||||||||||
Expenses before fee waivers and/or expense reimbursements | 0.90 | %3 | 0.93 | %3 | 0.93 | %3 | 0.92 | %3 | 0.93 | % | |||||||||||||
Expenses after fee waivers and/or expense reimbursements | 0.89 | %3 | 0.92 | %3 | 0.92 | %3 | 0.92 | %3 | 0.93 | % | |||||||||||||
Net investment income (loss) | 0.03 | % | 0.32 | % | 0.01 | % | (0.32 | )% | 0.53 | % | |||||||||||||
Supplemental data: | |||||||||||||||||||||||
Net assets, end of year (000's) | $ | 1,327,262 | $ | 1,270,696 | $ | 1,214,069 | $ | 1,359,224 | $ | 1,289,577 | |||||||||||||
Portfolio turnover | 41 | % | 40 | % | 33 | % | 48 | % | 40 | % | |||||||||||||
3 Includes interest expense representing less than 0.005%.
4 The investment manager recouped expenses previously reimbursed by the investment manager on behalf of the Portfolio, not to exceed the expense cap.
5 Amount represents less than $0.005 per share.
See accompanying notes to financial statements.
317
PACE Small/Medium Co Value Equity Investments
Financial highlights
Selected data for a share of beneficial interest outstanding throughout each year is presented below:
Class A
Years ended July 31, | |||||||||||||||||||||||
2018 | 2017 | 2016 | 2015 | 2014 | |||||||||||||||||||
Net asset value, beginning of year | $ | 20.90 | $ | 18.86 | $ | 20.81 | $ | 22.05 | $ | 22.19 | |||||||||||||
Net investment income1 | 0.07 | 0.13 | 0.07 | 0.11 | 0.05 | ||||||||||||||||||
Net realized and unrealized gains | 2.49 | 2.75 | 0.08 | 1.41 | 2.67 | ||||||||||||||||||
Net increase from operations | 2.56 | 2.88 | 0.15 | 1.52 | 2.72 | ||||||||||||||||||
Dividends from net investment income | (0.02 | ) | (0.28 | ) | (0.11 | ) | (0.03 | ) | (0.09 | ) | |||||||||||||
Distributions from net realized gains | (2.39 | ) | (0.56 | ) | (1.99 | ) | (2.73 | ) | (2.77 | ) | |||||||||||||
Total dividends and distributions | (2.41 | ) | (0.84 | ) | (2.10 | ) | (2.76 | ) | (2.86 | ) | |||||||||||||
Net asset value, end of year | $ | 21.05 | $ | 20.90 | $ | 18.86 | $ | 20.81 | $ | 22.05 | |||||||||||||
Total investment return2 | 12.93 | % | 15.25 | % | 1.60 | % | 7.35 | % | 12.74 | % | |||||||||||||
Ratios to average net assets: | |||||||||||||||||||||||
Expenses before fee waivers and/or expense reimbursements | 1.21 | % | 1.23 | %3 | 1.24 | % | 1.24 | % | 1.24 | % | |||||||||||||
Expenses after fee waivers and/or expense reimbursements | 1.21 | % | 1.21 | %3 | 1.24 | % | 1.24 | % | 1.24 | % | |||||||||||||
Net investment income | 0.34 | % | 0.66 | % | 0.41 | % | 0.53 | % | 0.24 | % | |||||||||||||
Supplemental data: | |||||||||||||||||||||||
Net assets, end of year (000's) | $ | 18,342 | $ | 17,627 | $ | 16,670 | $ | 18,334 | $ | 32,039 | |||||||||||||
Portfolio turnover | 60 | % | 102 | % | 74 | % | 66 | % | 86 | % | |||||||||||||
Class Y
Years ended July 31, | |||||||||||||||||||||||
2018 | 2017 | 2016 | 2015 | 2014 | |||||||||||||||||||
Net asset value, beginning of year | $ | 21.71 | $ | 19.55 | $ | 21.48 | $ | 22.73 | $ | 22.79 | |||||||||||||
Net investment income1 | 0.15 | 0.30 | 0.12 | 0.14 | 0.08 | ||||||||||||||||||
Net realized and unrealized gains | 2.58 | 2.70 | 0.09 | 1.45 | 2.75 | ||||||||||||||||||
Net increase from operations | 2.73 | 3.00 | 0.21 | 1.59 | 2.83 | ||||||||||||||||||
Dividends from net investment income | (0.05 | ) | (0.28 | ) | (0.15 | ) | (0.11 | ) | (0.12 | ) | |||||||||||||
Distributions from net realized gains | (2.39 | ) | (0.56 | ) | (1.99 | ) | (2.73 | ) | (2.77 | ) | |||||||||||||
Total dividends and distributions | (2.44 | ) | (0.84 | ) | (2.14 | ) | (2.84 | ) | (2.89 | ) | |||||||||||||
Net asset value, end of year | $ | 22.00 | $ | 21.71 | $ | 19.55 | $ | 21.48 | $ | 22.73 | |||||||||||||
Total investment return2 | 13.26 | % | 15.35 | % | 1.81 | % | 7.47 | % | 12.84 | % | |||||||||||||
Ratios to average net assets: | |||||||||||||||||||||||
Expenses before fee waivers and/or expense reimbursements/recoupments | 0.89 | % | 1.13 | %3 | 1.07 | % | 1.10 | % | 1.11 | % | |||||||||||||
Expenses after fee waivers and/or expense reimbursements/recoupments | 0.89 | % | 1.10 | %3 | 1.07 | % | 1.10 | % | 1.13 | %4 | |||||||||||||
Net investment income | 0.70 | % | 1.43 | % | 0.63 | % | 0.63 | % | 0.35 | % | |||||||||||||
Supplemental data: | |||||||||||||||||||||||
Net assets, end of year (000's) | $ | 232 | $ | 297 | $ | 697 | $ | 998 | $ | 912 | |||||||||||||
Portfolio turnover | 60 | % | 102 | % | 74 | % | 66 | % | 86 | % | |||||||||||||
1 Calculated using the average shares method.
2 Total investment return is calculated assuming a $10,000 investment on the first day of each year reported, reinvestment of all dividends and other distributions, if any, at net asset value on the ex-dividend dates, and a sale at net asset value on the last day of each year reported. The figures do not include any applicable sales charges, redemption fees or program fees; results would be lower if they were included. Returns do not reflect the deduction of taxes that a shareholder would pay on Portfolio distributions or the redemption of Portfolio shares.
318
PACE Small/Medium Co Value Equity Investments
Financial highlights (continued)
Class C
Years ended July 31, | |||||||||||||||||||||||
2018 | 2017 | 2016 | 2015 | 2014 | |||||||||||||||||||
Net asset value, beginning of year | $ | 17.58 | $ | 15.99 | $ | 17.99 | $ | 19.52 | $ | 20.00 | |||||||||||||
Net investment loss1 | (0.07 | ) | (0.01 | ) | (0.06 | ) | (0.05 | ) | (0.10 | ) | |||||||||||||
Net realized and unrealized gains | 2.07 | 2.31 | 0.05 | 1.25 | 2.39 | ||||||||||||||||||
Net increase from operations | 2.00 | 2.30 | (0.01 | ) | 1.20 | 2.29 | |||||||||||||||||
Dividends from net investment income | — | (0.15 | ) | — | — | — | |||||||||||||||||
Distributions from net realized gains | (2.39 | ) | (0.56 | ) | (1.99 | ) | (2.73 | ) | (2.77 | ) | |||||||||||||
Total dividends and distributions | (2.39 | ) | (0.71 | ) | (1.99 | ) | (2.73 | ) | (2.77 | ) | |||||||||||||
Net asset value, end of year | $ | 17.19 | $ | 17.58 | $ | 15.99 | $ | 17.99 | $ | 19.52 | |||||||||||||
Total investment return2 | 12.09 | % | 14.35 | % | 0.83 | % | 6.59 | % | 11.84 | % | |||||||||||||
Ratios to average net assets: | |||||||||||||||||||||||
Expenses before fee waivers and/or expense reimbursements | 1.94 | % | 1.99 | %3 | 2.01 | % | 1.98 | % | 2.00 | % | |||||||||||||
Expenses after fee waivers and/or expense reimbursements | 1.94 | % | 1.97 | %3 | 2.01 | % | 1.98 | % | 2.00 | % | |||||||||||||
Net investment income | (0.39 | )% | (0.06 | )% | (0.36 | )% | (0.24 | )% | (0.51 | )% | |||||||||||||
Supplemental data: | |||||||||||||||||||||||
Net assets, end of year (000's) | $ | 3,535 | $ | 4,239 | $ | 4,324 | $ | 4,843 | $ | 5,106 | |||||||||||||
Portfolio turnover | 60 | % | 102 | % | 74 | % | 66 | % | 86 | % | |||||||||||||
Class P
Years ended July 31, | |||||||||||||||||||||||
2018 | 2017 | 2016 | 2015 | 2014 | |||||||||||||||||||
Net asset value, beginning of year | $ | 21.47 | $ | 19.35 | $ | 21.30 | $ | 22.54 | $ | 22.63 | |||||||||||||
Net investment income1 | 0.11 | 0.17 | 0.10 | 0.14 | 0.07 | ||||||||||||||||||
Net realized and unrealized gains | 2.55 | 2.81 | 0.08 | 1.46 | 2.72 | ||||||||||||||||||
Net increase from operations | 2.66 | 2.98 | 0.18 | 1.60 | 2.79 | ||||||||||||||||||
Dividends from net investment income | (0.05 | ) | (0.30 | ) | (0.14 | ) | (0.11 | ) | (0.11 | ) | |||||||||||||
Distributions from net realized gains | (2.39 | ) | (0.56 | ) | (1.99 | ) | (2.73 | ) | (2.77 | ) | |||||||||||||
Total dividends and distributions | (2.44 | ) | (0.86 | ) | (2.13 | ) | (2.84 | ) | (2.88 | ) | |||||||||||||
Net asset value, end of year | $ | 21.69 | $ | 21.47 | $ | 19.35 | $ | 21.30 | $ | 22.54 | |||||||||||||
Total investment return2 | 13.07 | % | 15.41 | % | 1.77 | % | 7.49 | % | 12.77 | % | |||||||||||||
Ratios to average net assets: | |||||||||||||||||||||||
Expenses before fee waivers and/or expense reimbursements/recoupments | 1.07 | % | 1.09 | %3 | 1.11 | % | 1.09 | % | 1.11 | % | |||||||||||||
Expenses after fee waivers and/or expense reimbursements/recoupments | 1.06 | % | 1.07 | %3 | 1.11 | % | 1.09 | % | 1.16 | %4 | |||||||||||||
Net investment income | 0.50 | % | 0.82 | % | 0.53 | % | 0.65 | % | 0.32 | % | |||||||||||||
Supplemental data: | |||||||||||||||||||||||
Net assets, end of year (000's) | $ | 517,363 | $ | 503,464 | $ | 490,762 | $ | 525,959 | $ | 510,377 | |||||||||||||
Portfolio turnover | 60 | % | 102 | % | 74 | % | 66 | % | 86 | % | |||||||||||||
3 Includes interest expense representing less than 0.005%.
4 The investment manager recouped expenses previously reimbursed by the investment manager on behalf of the Portfolio, not to exceed the expense cap.
See accompanying notes to financial statements.
319
PACE Small/Medium Co Growth Equity Investments
Financial highlights
Selected data for a share of beneficial interest outstanding throughout each year is presented below:
Class A
Years ended July 31, | |||||||||||||||||||||||
2018 | 2017 | 2016 | 2015 | 2014 | |||||||||||||||||||
Net asset value, beginning of year | $ | 16.79 | $ | 14.34 | $ | 20.45 | $ | 19.72 | $ | 21.42 | |||||||||||||
Net investment loss1 | (0.12 | ) | (0.09 | ) | (0.10 | ) | (0.14 | ) | (0.16 | ) | |||||||||||||
Net realized and unrealized gains (losses) | 3.88 | 2.54 | (2.23 | ) | 3.90 | 1.34 | |||||||||||||||||
Net increase (decrease) from operations | 3.76 | 2.45 | (2.33 | ) | 3.76 | 1.18 | |||||||||||||||||
Distributions from net realized gains | (1.01 | ) | — | (3.78 | ) | (3.03 | ) | (2.88 | ) | ||||||||||||||
Net asset value, end of year | $ | 19.54 | $ | 16.79 | $ | 14.34 | $ | 20.45 | $ | 19.72 | |||||||||||||
Total investment return2 | 23.29 | % | 17.09 | % | (11.20 | )% | 20.82 | % | 4.92 | % | |||||||||||||
Ratios to average net assets: | |||||||||||||||||||||||
Expenses before fee waivers and/or expense reimbursements/recoupments | 1.20 | %3 | 1.23 | % | 1.25 | %4 | 1.24 | % | 1.25 | % | |||||||||||||
Expenses after fee waivers and/or expense reimbursements/recoupments | 1.19 | %3 | 1.19 | % | 1.21 | %4 | 1.21 | % | 1.25 | % | |||||||||||||
Net investment loss | (0.66 | )% | (0.61 | )% | (0.64 | )% | (0.70 | )% | (0.77 | )% | |||||||||||||
Supplemental data: | |||||||||||||||||||||||
Net assets, end of year (000's) | $ | 24,749 | $ | 22,681 | $ | 21,912 | $ | 28,386 | $ | 40,210 | |||||||||||||
Portfolio turnover | 99 | % | 93 | % | 98 | % | 88 | % | 94 | % | |||||||||||||
Class Y
Years ended July 31, | |||||||||||||||||||||||
2018 | 2017 | 2016 | 2015 | 2014 | |||||||||||||||||||
Net asset value, beginning of year | $ | 18.08 | $ | 15.44 | $ | 21.67 | $ | 20.72 | $ | 22.34 | |||||||||||||
Net investment loss1 | (0.02 | ) | (0.08 | ) | (0.09 | ) | (0.13 | ) | (0.15 | ) | |||||||||||||
Net realized and unrealized gains (losses) | 4.21 | 2.72 | (2.36 | ) | 4.11 | 1.41 | |||||||||||||||||
Net increase (decrease) from operations | 4.19 | 2.64 | (2.45 | ) | 3.98 | 1.26 | |||||||||||||||||
Distributions from net realized gains | (1.01 | ) | — | (3.78 | ) | (3.03 | ) | (2.88 | ) | ||||||||||||||
Net asset value, end of year | $ | 21.26 | $ | 18.08 | $ | 15.44 | $ | 21.67 | $ | 20.72 | |||||||||||||
Total investment return2 | 23.97 | % | 17.16 | % | (11.11 | )% | 20.89 | % | 5.09 | % | |||||||||||||
Ratios to average net assets: | |||||||||||||||||||||||
Expenses before fee waivers and/or expense reimbursements | 0.69 | %3 | 1.24 | % | 1.09 | %3,4 | 1.13 | % | 1.14 | % | |||||||||||||
Expenses after fee waivers and/or expense reimbursements | 0.67 | %3 | 1.13 | % | 1.12 | %3,4 | 1.11 | %4 | 1.13 | % | |||||||||||||
Net investment loss | (0.12 | )% | (0.48 | )% | (0.55 | )% | (0.62 | )% | (0.65 | )% | |||||||||||||
Supplemental data: | |||||||||||||||||||||||
Net assets, end of year (000's) | $ | 47 | $ | 100 | $ | 488 | $ | 844 | $ | 667 | |||||||||||||
Portfolio turnover | 99 | % | 93 | % | 98 | % | 88 | % | 94 | % | |||||||||||||
1 Calculated using the average shares method.
2 Total investment return is calculated assuming a $10,000 investment on the first day of each year reported, reinvestment of all dividends and other distributions, if any, at net asset value on the ex-dividend dates, and a sale at net asset value on the last day of each year reported. The figures do not include any applicable sales charges, redemption fees or program fees; results would be lower if they were included. Returns do not reflect the deduction of taxes that a shareholder would pay on Portfolio distributions or the redemption of Portfolio shares.
320
PACE Small/Medium Co Growth Equity Investments
Financial highlights (continued)
Class C
Years ended July 31, | |||||||||||||||||||||||
2018 | 2017 | 2016 | 2015 | 2014 | |||||||||||||||||||
Net asset value, beginning of year | $ | 13.10 | $ | 11.27 | $ | 17.11 | $ | 17.07 | $ | 19.02 | |||||||||||||
Net investment loss1 | (0.19 | ) | (0.17 | ) | (0.17 | ) | (0.24 | ) | (0.28 | ) | |||||||||||||
Net realized and unrealized gains (losses) | 2.98 | 2.00 | (1.89 | ) | 3.31 | 1.21 | |||||||||||||||||
Net increase (decrease) from operations | 2.79 | 1.83 | (2.06 | ) | 3.07 | 0.93 | |||||||||||||||||
Distributions from net realized gains | (1.01 | ) | — | (3.78 | ) | (3.03 | ) | (2.88 | ) | ||||||||||||||
Net asset value, end of year | $ | 14.88 | $ | 13.10 | $ | 11.27 | $ | 17.11 | $ | 17.07 | |||||||||||||
Total investment return2 | 22.33 | % | 16.24 | % | (11.93 | )% | 19.93 | % | 4.16 | % | |||||||||||||
Ratios to average net assets: | |||||||||||||||||||||||
Expenses before fee waivers and/or expense reimbursements/recoupments | 1.94 | %3 | 2.00 | % | 2.02 | %4 | 1.99 | % | 2.01 | % | |||||||||||||
Expenses after fee waivers and/or expense reimbursements/recoupments | 1.92 | %3 | 1.96 | % | 1.98 | %4 | 1.96 | % | 2.00 | % | |||||||||||||
Net investment loss | (1.39 | )% | (1.39 | )% | (1.41 | )% | (1.46 | )% | (1.52 | )% | |||||||||||||
Supplemental data: | |||||||||||||||||||||||
Net assets, end of year (000's) | $ | 2,673 | $ | 2,985 | $ | 2,753 | $ | 4,116 | $ | 3,977 | |||||||||||||
Portfolio turnover | 99 | % | 93 | % | 98 | % | 88 | % | 94 | % | |||||||||||||
Class P
Years ended July 31, | |||||||||||||||||||||||
2018 | 2017 | 2016 | 2015 | 2014 | |||||||||||||||||||
Net asset value, beginning of year | $ | 17.82 | $ | 15.21 | $ | 21.40 | $ | 20.49 | $ | 22.13 | |||||||||||||
Net investment loss1 | (0.10 | ) | (0.08 | ) | (0.08 | ) | (0.13 | ) | (0.14 | ) | |||||||||||||
Net realized and unrealized gains (losses) | 4.14 | 2.69 | (2.33 | ) | 4.07 | 1.38 | |||||||||||||||||
Net increase (decrease) from operations | 4.04 | 2.61 | (2.41 | ) | 3.94 | 1.24 | |||||||||||||||||
Distributions from net realized gains | (1.01 | ) | — | (3.78 | ) | (3.03 | ) | (2.88 | ) | ||||||||||||||
Net asset value, end of year | $ | 20.85 | $ | 17.82 | $ | 15.21 | $ | 21.40 | $ | 20.49 | |||||||||||||
Total investment return2 | 23.46 | % | 17.16 | % | (11.07 | )% | 20.93 | % | 5.04 | % | |||||||||||||
Ratios to average net assets: | |||||||||||||||||||||||
Expenses before fee waivers and/or expense reimbursements | 1.06 | %3 | 1.11 | % | 1.13 | %4 | 1.10 | % | 1.12 | % | |||||||||||||
Expenses after fee waivers and/or expense reimbursements | 1.05 | %3 | 1.07 | % | 1.09 | %4 | 1.11 | %4 | 1.13 | %4 | |||||||||||||
Net investment loss | (0.52 | )% | (0.49 | )% | (0.52 | )% | (0.61 | )% | (0.65 | )% | |||||||||||||
Supplemental data: | |||||||||||||||||||||||
Net assets, end of year (000's) | $ | 518,869 | $ | 469,557 | $ | 444,300 | $ | 545,517 | $ | 474,468 | |||||||||||||
Portfolio turnover | 99 | % | 93 | % | 98 | % | 88 | % | 94 | % | |||||||||||||
3 Includes interest expense representing less than 0.005%.
4 The investment manager recouped expenses previously reimbursed by the investment manager on behalf of the Portfolio, not to exceed the expense cap.
See accompanying notes to financial statements.
321
PACE International Equity Investments
Financial highlights
Selected data for a share of beneficial interest outstanding throughout each year is presented below:
Class A
Years ended July 31, | |||||||||||||||||||||||
2018 | 2017 | 2016 | 2015 | 2014 | |||||||||||||||||||
Net asset value, beginning of year | $ | 16.23 | $ | 14.19 | $ | 15.04 | $ | 15.60 | $ | 13.96 | |||||||||||||
Net investment income1 | 0.23 | 0.26 | 0.22 | 0.20 | 0.35 | ||||||||||||||||||
Net realized and unrealized gains (losses) | 0.88 | 2.06 | (0.87 | ) | (0.43 | ) | 1.56 | ||||||||||||||||
Net increase (decrease) from operations | 1.11 | 2.32 | (0.65 | ) | (0.23 | ) | 1.91 | ||||||||||||||||
Dividends from net investment income | (0.31 | ) | (0.28 | ) | (0.20 | ) | (0.33 | ) | (0.27 | ) | |||||||||||||
Net asset value, end of year | $ | 17.03 | $ | 16.23 | $ | 14.19 | $ | 15.04 | $ | 15.60 | |||||||||||||
Total investment return2 | 6.88 | % | 16.71 | % | (4.30 | )% | (1.38 | )% | 13.78 | % | |||||||||||||
Ratios to average net assets: | |||||||||||||||||||||||
| Expenses before fee waivers and/or expense reimbursements/recoupments including dividend expense, interest expense and other borrowing costs for investments sold short | 1.86 | %3 | 1.79 | %3 | 1.86 | %3 | 1.78 | %3 | 1.70 | % | |||||||||||||
| Expenses after fee waivers and/or expense reimbursements/recoupments, including dividend expense, interest expense and other borrowing costs for investments sold short | 1.85 | %3 | 1.76 | %3 | 1.82 | %3 | 1.75 | %3 | 1.68 | % | |||||||||||||
| Expenses after fee waivers and/or expense reimbursements/recoupments, excluding dividend expense, interest expense and other borrowing costs for investments sold short | 1.31 | % | 1.37 | % | 1.38 | % | 1.37 | % | 1.37 | % | |||||||||||||
Net investment income | 1.37 | % | 1.77 | % | 1.61 | % | 1.31 | % | 2.33 | % | |||||||||||||
Supplemental data: | |||||||||||||||||||||||
Net assets, end of year (000's) | $ | 31,165 | $ | 31,113 | $ | 29,788 | $ | 33,882 | $ | 57,389 | |||||||||||||
Portfolio turnover | 78 | % | 81 | % | 80 | % | 79 | % | 86 | % | |||||||||||||
Class Y
Years ended July 31, | |||||||||||||||||||||||
2018 | 2017 | 2016 | 2015 | 2014 | |||||||||||||||||||
Net asset value, beginning of year | $ | 16.17 | $ | 14.14 | $ | 15.00 | $ | 15.59 | $ | 13.95 | |||||||||||||
Net investment income1 | 0.28 | 0.30 | 0.26 | 0.25 | 0.40 | ||||||||||||||||||
Net realized and unrealized gains (losses) | 0.89 | 2.05 | (0.88 | ) | (0.44 | ) | 1.55 | ||||||||||||||||
Net increase (decrease) from operations | 1.17 | 2.35 | (0.62 | ) | (0.19 | ) | 1.95 | ||||||||||||||||
Dividends from net investment income | (0.36 | ) | (0.32 | ) | (0.24 | ) | (0.40 | ) | (0.31 | ) | |||||||||||||
Net asset value, end of year | $ | 16.98 | $ | 16.17 | $ | 14.14 | $ | 15.00 | $ | 15.59 | |||||||||||||
Total investment return2 | 7.24 | % | 17.04 | % | (4.09 | )% | (1.09 | )% | 14.10 | % | |||||||||||||
Ratios to average net assets: | |||||||||||||||||||||||
| Expenses before fee waivers and/or expense reimbursements/recoupments including dividend expense, interest expense and other borrowing costs for investments sold short | 1.59 | %3 | 1.51 | %3 | 1.56 | %3 | 1.51 | %3 | 1.42 | % | |||||||||||||
| Expenses after fee waivers and/or expense reimbursements/recoupments, including dividend expense, interest expense and other borrowing costs for investments sold short | 1.58 | %3 | 1.48 | %3 | 1.53 | %3 | 1.48 | %3 | 1.40 | % | |||||||||||||
| Expenses after fee waivers and/or expense reimbursements/recoupments, excluding dividend expense, interest expense and other borrowing costs for investments sold short | 1.04 | % | 1.09 | % | 1.09 | % | 1.10 | % | 1.09 | % | |||||||||||||
Net investment income | 1.63 | % | 2.04 | % | 1.86 | % | 1.64 | % | 2.63 | % | |||||||||||||
Supplemental data: | |||||||||||||||||||||||
Net assets, end of year (000's) | $ | 13,966 | $ | 14,726 | $ | 15,900 | $ | 19,150 | $ | 22,915 | |||||||||||||
Portfolio turnover | 78 | % | 81 | % | 80 | % | 79 | % | 86 | % | |||||||||||||
1 Calculated using the average shares method.
2 Total investment return is calculated assuming a $10,000 investment on the first day of each year reported, reinvestment of all dividends and other distributions, if any, at net asset value on the ex-dividend dates, and a sale at net asset value on the last day of each year reported. The figures do not include any applicable sales charges, redemption fees or program fees; results would be lower if they were included. Returns do not reflect the deduction of taxes that a shareholder would pay on Portfolio distributions or the redemption of Portfolio shares.
322
PACE International Equity Investments
Financial highlights (continued)
Class C
Years ended July 31, | |||||||||||||||||||||||
2018 | 2017 | 2016 | 2015 | 2014 | |||||||||||||||||||
Net asset value, beginning of year | $ | 15.89 | $ | 13.88 | $ | 14.72 | $ | 15.29 | $ | 13.68 | |||||||||||||
Net investment income1 | 0.10 | 0.14 | 0.11 | 0.09 | 0.23 | ||||||||||||||||||
Net realized and unrealized gains (losses) | 0.87 | 2.02 | (0.86 | ) | (0.43 | ) | 1.53 | ||||||||||||||||
Net increase (decrease) from operations | 0.97 | 2.16 | (0.75 | ) | (0.34 | ) | 1.76 | ||||||||||||||||
Dividends from net investment income | (0.19 | ) | (0.15 | ) | (0.09 | ) | (0.23 | ) | (0.15 | ) | |||||||||||||
Net asset value, end of year | $ | 16.67 | $ | 15.89 | $ | 13.88 | $ | 14.72 | $ | 15.29 | |||||||||||||
Total investment return2 | 6.12 | % | 15.78 | % | (5.10 | )% | (2.14 | )% | 12.93 | % | |||||||||||||
Ratios to average net assets: | |||||||||||||||||||||||
| Expenses before fee waivers and/or expense reimbursements/recoupments including dividend expense, interest expense and other borrowing costs for investments sold short | 2.62 | %3 | 2.58 | %3 | 2.65 | %3 | 2.58 | %3 | 2.51 | % | |||||||||||||
| Expenses after fee waivers and/or expense reimbursements/recoupments, including dividend expense, interest expense and other borrowing costs for investments sold short | 2.61 | %3 | 2.55 | %3 | 2.62 | %3 | 2.55 | %3 | 2.49 | % | |||||||||||||
| Expenses after fee waivers and/or expense reimbursements/recoupments, excluding dividend expense, interest expense and other borrowing costs for investments sold short | 2.07 | % | 2.16 | % | 2.17 | % | 2.16 | % | 2.18 | % | |||||||||||||
Net investment income | 0.60 | % | 0.95 | % | 0.83 | % | 0.62 | % | 1.52 | % | |||||||||||||
Supplemental data: | |||||||||||||||||||||||
Net assets, end of year (000's) | $ | 1,988 | $ | 2,047 | $ | 2,230 | $ | 2,744 | $ | 2,919 | |||||||||||||
Portfolio turnover | 78 | % | 81 | % | 80 | % | 79 | % | 86 | % | |||||||||||||
Class P
Years ended July 31, | |||||||||||||||||||||||
2018 | 2017 | 2016 | 2015 | 2014 | |||||||||||||||||||
Net asset value, beginning of year | $ | 16.13 | $ | 14.11 | $ | 14.97 | $ | 15.56 | $ | 13.92 | |||||||||||||
Net investment income1 | 0.28 | 0.31 | 0.26 | 0.25 | 0.40 | ||||||||||||||||||
Net realized and unrealized gains (losses) | 0.88 | 2.03 | (0.88 | ) | (0.44 | ) | 1.54 | ||||||||||||||||
Net increase (decrease) from operations | 1.16 | 2.34 | (0.62 | ) | (0.19 | ) | 1.94 | ||||||||||||||||
Dividends from net investment income | (0.36 | ) | (0.32 | ) | (0.24 | ) | (0.40 | ) | (0.30 | ) | |||||||||||||
Net asset value, end of year | $ | 16.93 | $ | 16.13 | $ | 14.11 | $ | 14.97 | $ | 15.56 | |||||||||||||
Total investment return2 | 7.14 | % | 17.08 | % | (4.09 | )% | (1.11 | )% | 14.12 | % | |||||||||||||
Ratios to average net assets: | |||||||||||||||||||||||
| Expenses before fee waivers and/or expense reimbursements/recoupments including dividend expense, interest expense and other borrowing costs for investments sold short | 1.59 | %3 | 1.51 | %3 | 1.58 | %3 | 1.52 | %3 | 1.45 | % | |||||||||||||
| Expenses after fee waivers and/or expense reimbursements/recoupments, including dividend expense, interest expense and other borrowing costs for investments sold short | 1.58 | %3 | 1.48 | %3 | 1.54 | %3 | 1.49 | %3 | 1.43 | % | |||||||||||||
| Expenses after fee waivers and/or expense reimbursements/recoupments, excluding dividend expense, interest expense and other borrowing costs for investments sold short | 1.03 | % | 1.09 | % | 1.10 | % | 1.10 | % | 1.11 | % | |||||||||||||
Net investment income | 1.66 | % | 2.10 | % | 1.90 | % | 1.69 | % | 2.63 | % | |||||||||||||
Supplemental data: | |||||||||||||||||||||||
Net assets, end of year (000's) | $ | 1,138,165 | $ | 1,104,550 | $ | 924,833 | $ | 1,016,420 | $ | 1,025,757 | |||||||||||||
Portfolio turnover | 78 | % | 81 | % | 80 | % | 79 | % | 86 | % | |||||||||||||
3 Includes interest expense representing less than 0.005%.
See accompanying notes to financial statements.
323
PACE International Emerging Markets Equity Investments
Financial highlights
Selected data for a share of beneficial interest outstanding throughout each year is presented below:
Class A
Years ended July 31, | |||||||||||||||||||||||
2018 | 2017 | 2016 | 2015 | 2014 | |||||||||||||||||||
Net asset value, beginning of year | $ | 13.59 | $ | 11.41 | $ | 11.81 | $ | 13.56 | $ | 12.29 | |||||||||||||
Net investment income1 | 0.13 | 0.13 | 0.09 | 0.09 | 0.14 | ||||||||||||||||||
Net realized and unrealized gains (losses) | 0.03 | 2.14 | (0.46 | ) | (1.78 | ) | 1.17 | ||||||||||||||||
Net increase (decrease) from operations | 0.16 | 2.27 | (0.37 | ) | (1.69 | ) | 1.31 | ||||||||||||||||
Dividends from net investment income | (0.14 | ) | (0.09 | ) | (0.03 | ) | (0.06 | ) | (0.04 | ) | |||||||||||||
Net asset value, end of year | $ | 13.61 | $ | 13.59 | $ | 11.41 | $ | 11.81 | $ | 13.56 | |||||||||||||
Total investment return2 | 1.11 | % | 19.95 | % | (3.08 | )% | (12.50 | )% | 10.71 | % | |||||||||||||
Ratios to average net assets: | |||||||||||||||||||||||
Expenses before fee waivers and/or expense reimbursements | 1.72 | %3 | 1.80 | %3 | 1.90 | %3 | 1.77 | %3 | 1.80 | % | |||||||||||||
Expenses after fee waivers and/or expense reimbursements | 1.70 | %3 | 1.75 | %3 | 1.80 | %3 | 1.67 | %3 | 1.69 | % | |||||||||||||
Net investment income | 0.89 | % | 1.06 | % | 0.86 | % | 0.67 | % | 1.14 | % | |||||||||||||
Supplemental data: | |||||||||||||||||||||||
Net assets, end of year (000's) | $ | 3,811 | $ | 4,076 | $ | 3,931 | $ | 4,707 | $ | 17,200 | |||||||||||||
Portfolio turnover | 65 | % | 65 | % | 65 | % | 63 | % | 74 | % | |||||||||||||
Class Y
Years ended July 31, | |||||||||||||||||||||||
2018 | 2017 | 2016 | 2015 | 2014 | |||||||||||||||||||
Net asset value, beginning of year | $ | 13.70 | $ | 11.51 | $ | 11.97 | $ | 13.82 | $ | 12.53 | |||||||||||||
Net investment income1 | 0.17 | 0.16 | 0.12 | 0.15 | 0.18 | ||||||||||||||||||
Net realized and unrealized gains (losses) | 0.03 | 2.15 | (0.47 | ) | (1.84 | ) | 1.18 | ||||||||||||||||
Net increase (decrease) from operations | 0.20 | 2.31 | (0.35 | ) | (1.69 | ) | 1.36 | ||||||||||||||||
Dividends from net investment income | (0.17 | ) | (0.12 | ) | (0.11 | ) | (0.16 | ) | (0.07 | ) | |||||||||||||
Net asset value, end of year | $ | 13.73 | $ | 13.70 | $ | 11.51 | $ | 11.97 | $ | 13.82 | |||||||||||||
Total investment return2 | 1.41 | % | 20.21 | % | (2.80 | )% | (12.30 | )% | 10.94 | % | |||||||||||||
Ratios to average net assets: | |||||||||||||||||||||||
Expenses before fee waivers and/or expense reimbursements | 1.45 | %3 | 1.54 | %3 | 1.63 | %3 | 1.53 | %3 | 1.55 | % | |||||||||||||
Expenses after fee waivers and/or expense reimbursements | 1.45 | %3 | 1.50 | %3 | 1.54 | %3 | 1.44 | %3 | 1.44 | % | |||||||||||||
Net investment income | 1.15 | % | 1.30 | % | 1.14 | % | 1.15 | % | 1.37 | % | |||||||||||||
Supplemental data: | |||||||||||||||||||||||
Net assets, end of year (000's) | $ | 7,419 | $ | 7,795 | $ | 7,923 | $ | 8,767 | $ | 11,978 | |||||||||||||
Portfolio turnover | 65 | % | 65 | % | 65 | % | 63 | % | 74 | % | |||||||||||||
1 Calculated using the average shares method.
2 Total investment return is calculated assuming a $10,000 investment on the first day of each year reported, reinvestment of all dividends and other distributions, if any, at net asset value on the ex-dividend dates, and a sale at net asset value on the last day of each year reported. The figures do not include any applicable sales charges, redemption fees or program fees; results would be lower if they were included. Returns do not reflect the deduction of taxes that a shareholder would pay on Portfolio distributions or the redemption of Portfolio shares.
3 Includes interest expense representing less than 0.005%.
324
PACE International Emerging Markets Equity Investments
Financial highlights (continued)
Class C
Years ended July 31, | |||||||||||||||||||||||
2018 | 2017 | 2016 | 2015 | 2014 | |||||||||||||||||||
Net asset value, beginning of year | $ | 12.53 | $ | 10.52 | $ | 10.93 | $ | 12.61 | $ | 11.48 | |||||||||||||
Net investment income1 | 0.02 | 0.03 | 0.01 | 0.03 | 0.04 | ||||||||||||||||||
Net realized and unrealized gains (losses) | 0.02 | 1.99 | (0.42 | ) | (1.68 | ) | 1.09 | ||||||||||||||||
Net increase (decrease) from operations | 0.04 | 2.02 | (0.41 | ) | (1.65 | ) | 1.13 | ||||||||||||||||
Dividends from net investment income | (0.04 | ) | (0.01 | ) | — | (0.03 | ) | — | |||||||||||||||
Net asset value, end of year | $ | 12.53 | $ | 12.53 | $ | 10.52 | $ | 10.93 | $ | 12.61 | |||||||||||||
Total investment return2 | 0.41 | % | 19.04 | % | (3.75 | )% | (13.17 | )% | 9.93 | % | |||||||||||||
Ratios to average net assets: | |||||||||||||||||||||||
Expenses before fee waivers and/or expense reimbursements | 2.45 | %3 | 2.55 | %3 | 2.65 | %3 | 2.50 | %3 | 2.55 | % | |||||||||||||
Expenses after fee waivers and/or expense reimbursements | 2.45 | %3 | 2.50 | %3 | 2.55 | %3 | 2.41 | %3 | 2.44 | % | |||||||||||||
Net investment income | 0.12 | % | 0.29 | % | 0.12 | % | 0.21 | % | 0.37 | % | |||||||||||||
Supplemental data: | |||||||||||||||||||||||
Net assets, end of year (000's) | $ | 1,182 | $ | 1,355 | $ | 1,337 | $ | 1,661 | $ | 2,079 | |||||||||||||
Portfolio turnover | 65 | % | 65 | % | 65 | % | 63 | % | 74 | % | |||||||||||||
Class P
Years ended July 31, | |||||||||||||||||||||||
2018 | 2017 | 2016 | 2015 | 2014 | |||||||||||||||||||
Net asset value, beginning of year | $ | 13.63 | $ | 11.45 | $ | 11.91 | $ | 13.75 | $ | 12.47 | |||||||||||||
Net investment income1 | 0.16 | 0.16 | 0.12 | 0.16 | 0.18 | ||||||||||||||||||
Net realized and unrealized gains (losses) | 0.03 | 2.14 | (0.47 | ) | (1.85 | ) | 1.17 | ||||||||||||||||
Net increase (decrease) from operations | 0.19 | 2.30 | (0.35 | ) | (1.69 | ) | 1.35 | ||||||||||||||||
Dividends from net investment income | (0.17 | ) | (0.12 | ) | (0.11 | ) | (0.15 | ) | (0.07 | ) | |||||||||||||
Net asset value, end of year | $ | 13.65 | $ | 13.63 | $ | 11.45 | $ | 11.91 | $ | 13.75 | |||||||||||||
Total investment return2 | 1.42 | % | 20.18 | % | (2.82 | )% | (12.33 | )% | 10.86 | % | |||||||||||||
Ratios to average net assets: | |||||||||||||||||||||||
Expenses before fee waivers and/or expense reimbursements | 1.50 | %3 | 1.59 | %3 | 1.69 | %3 | 1.56 | %3 | 1.64 | % | |||||||||||||
Expenses after fee waivers and/or expense reimbursements | 1.45 | %3 | 1.50 | %3 | 1.60 | %3 | 1.47 | %3 | 1.53 | % | |||||||||||||
Net investment income | 1.14 | % | 1.33 | % | 1.10 | % | 1.18 | % | 1.37 | % | |||||||||||||
Supplemental data: | |||||||||||||||||||||||
Net assets, end of year (000's) | $ | 437,363 | $ | 454,178 | $ | 394,346 | $ | 417,751 | $ | 450,438 | |||||||||||||
Portfolio turnover | 65 | % | 65 | % | 65 | % | 63 | % | 74 | % | |||||||||||||
See accompanying notes to financial statements.
325
PACE Global Real Estate Securities Investments
Financial highlights
Selected data for a share of beneficial interest outstanding throughout each year is presented below:
Class A
Years ended July 31, | |||||||||||||||||||||||
2018 | 2017 | 2016 | 2015 | 2014 | |||||||||||||||||||
Net asset value, beginning of year | $ | 7.69 | $ | 8.03 | $ | 7.51 | $ | 7.33 | $ | 6.52 | |||||||||||||
Net investment income1 | 0.21 | 0.17 | 0.13 | 0.16 | 0.10 | ||||||||||||||||||
Net realized and unrealized gains (losses) | 0.06 | (0.21 | ) | 0.58 | 0.02 | 0.83 | |||||||||||||||||
Net increase (decrease) from operations | 0.27 | (0.04 | ) | 0.71 | 0.18 | 0.93 | |||||||||||||||||
Dividends from net investment income | (0.27 | ) | (0.30 | ) | (0.19 | ) | — | (0.12 | ) | ||||||||||||||
Distributions from net realized gains | (0.04 | ) | — | — | — | — | |||||||||||||||||
Total dividends and distributions | (0.31 | ) | (0.30 | ) | (0.19 | ) | — | (0.12 | ) | ||||||||||||||
Net asset value, end of year | $ | 7.65 | $ | 7.69 | $ | 8.03 | $ | 7.51 | $ | 7.33 | |||||||||||||
Total investment return2 | 3.50 | % | (0.15 | )% | 9.86 | % | 2.46 | % | 14.56 | % | |||||||||||||
Ratios to average net assets: | |||||||||||||||||||||||
Expenses before fee waivers and/or expense reimbursements | 1.50 | %3 | 1.54 | %3 | 1.65 | % | 1.59 | % | 1.59 | % | |||||||||||||
Expenses after fee waivers and/or expense reimbursements | 1.45 | %3 | 1.46 | %3 | 1.45 | % | 1.45 | % | 1.45 | % | |||||||||||||
Net investment income | 2.82 | % | 2.28 | % | 1.79 | % | 2.21 | % | 1.55 | % | |||||||||||||
Supplemental data: | |||||||||||||||||||||||
Net assets, end of year (000's) | $ | 370 | $ | 458 | $ | 373 | $ | 363 | $ | 5,692 | |||||||||||||
Portfolio turnover | 73 | % | 98 | % | 75 | % | 102 | % | 53 | % | |||||||||||||
Class P
Years ended July 31, | |||||||||||||||||||||||
2018 | 2017 | 2016 | 2015 | 2014 | |||||||||||||||||||
Net asset value, beginning of year | $ | 7.42 | $ | 7.76 | $ | 7.28 | $ | 7.35 | $ | 6.53 | |||||||||||||
Net investment income1 | 0.22 | 0.19 | 0.14 | 0.14 | 0.12 | ||||||||||||||||||
Net realized and unrealized gains (losses) | 0.07 | (0.21 | ) | 0.56 | 0.05 | 0.84 | |||||||||||||||||
Net increase (decrease) from operations | 0.29 | (0.02 | ) | 0.70 | 0.19 | 0.96 | |||||||||||||||||
Dividends from net investment income | (0.30 | ) | (0.32 | ) | (0.22 | ) | (0.26 | ) | (0.14 | ) | |||||||||||||
Distributions from net realized gains | (0.04 | ) | — | — | — | — | |||||||||||||||||
Total dividends and distributions | (0.34 | ) | (0.32 | ) | (0.22 | ) | (0.26 | ) | (0.14 | ) | |||||||||||||
Net asset value, end of year | $ | 7.37 | $ | 7.42 | $ | 7.76 | $ | 7.28 | $ | 7.35 | |||||||||||||
Total investment return2 | 3.68 | % | 0.19 | % | 10.13 | % | 2.59 | % | 15.00 | % | |||||||||||||
Ratios to average net assets: | |||||||||||||||||||||||
Expenses before fee waivers and/or expense reimbursements | 1.53 | %3 | 1.58 | %3 | 1.59 | % | 1.56 | % | 1.63 | % | |||||||||||||
Expenses after fee waivers and/or expense reimbursements | 1.20 | %3 | 1.21 | %3 | 1.20 | % | 1.20 | % | 1.20 | % | |||||||||||||
Net investment income | 3.08 | % | 2.58 | % | 2.07 | % | 1.83 | % | 1.79 | % | |||||||||||||
Supplemental data: | |||||||||||||||||||||||
Net assets, end of year (000's) | $ | 137,069 | $ | 140,262 | $ | 151,565 | $ | 148,096 | $ | 145,067 | |||||||||||||
Portfolio turnover | 73 | % | 98 | % | 75 | % | 102 | % | 53 | % | |||||||||||||
1 Calculated using the average shares method.
2 Total investment return is calculated assuming a $10,000 investment on the first day of each year reported, reinvestment of all dividends and other distributions, if any, at net asset value on the ex-dividend dates, and a sale at net asset value on the last day of each year reported. The figures do not include any applicable sales charges, redemption fees or program fees; results would be lower if they were included. Returns do not reflect the deduction of taxes that a shareholder would pay on Portfolio distributions or the redemption of Portfolio shares.
3 Includes interest expense representing less than 0.005%.
326
PACE Global Real Estate Securities Investments
Financial highlights (continued)
Class C
Years ended July 31, | |||||||||||||||||||||||
2018 | 2017 | 2016 | 2015 | 2014 | |||||||||||||||||||
Net asset value, beginning of year | $ | 7.35 | $ | 7.69 | $ | 7.21 | $ | 7.29 | $ | 6.48 | |||||||||||||
Net investment income1 | 0.16 | 0.12 | 0.08 | 0.06 | 0.05 | ||||||||||||||||||
Net realized and unrealized gains (losses) | 0.05 | (0.21 | ) | 0.56 | 0.06 | 0.83 | |||||||||||||||||
Net increase (decrease) from operations | 0.21 | (0.09 | ) | 0.64 | 0.12 | 0.88 | |||||||||||||||||
Dividends from net investment income | (0.19 | ) | (0.25 | ) | (0.16 | ) | (0.20 | ) | (0.07 | ) | |||||||||||||
Distributions from net realized gains | (0.04 | ) | — | — | — | — | |||||||||||||||||
Total dividends and distributions | (0.23 | ) | (0.25 | ) | (0.16 | ) | (0.20 | ) | (0.07 | ) | |||||||||||||
Net asset value, end of year | $ | 7.33 | $ | 7.35 | $ | 7.69 | $ | 7.21 | $ | 7.29 | |||||||||||||
Total investment return2 | 2.84 | % | (0.96 | )% | 9.11 | % | 1.58 | % | 13.77 | % | |||||||||||||
Ratios to average net assets: | |||||||||||||||||||||||
Expenses before fee waivers and/or expense reimbursements | 2.20 | %3 | 2.22 | %3 | 2.26 | % | 2.24 | % | 2.30 | % | |||||||||||||
Expenses after fee waivers and/or expense reimbursements | 2.20 | %3 | 2.21 | %3 | 2.20 | % | 2.20 | % | 2.20 | % | |||||||||||||
Net investment income | 2.23 | % | 1.63 | % | 1.11 | % | 0.79 | % | 0.78 | % | |||||||||||||
Supplemental data: | |||||||||||||||||||||||
Net assets, end of year (000's) | $ | 168 | $ | 252 | $ | 319 | $ | 340 | $ | 272 | |||||||||||||
Portfolio turnover | 73 | % | 98 | % | 75 | % | 102 | % | 53 | % | |||||||||||||
See accompanying notes to financial statements.
327
PACE Alternative Strategies Investments
Financial highlights
Selected data for a share of beneficial interest outstanding throughout each year is presented below:
Class A
Years ended July 31, | |||||||||||||||||||||||
2018 | 2017 | 2016 | 2015 | 2014 | |||||||||||||||||||
Net asset value, beginning of year | $ | 10.71 | $ | 10.49 | $ | 11.10 | $ | 10.62 | $ | 10.21 | |||||||||||||
Net investment loss1 | (0.02 | ) | (0.07 | ) | (0.06 | ) | (0.08 | ) | (0.09 | ) | |||||||||||||
Net realized and unrealized gains (losses) | 0.16 | 0.29 | (0.32 | ) | 0.56 | 0.70 | |||||||||||||||||
Net increase (decrease) from operations | 0.14 | 0.22 | (0.38 | ) | 0.48 | 0.61 | |||||||||||||||||
Dividends from net investment income | — | — | (0.23 | ) | — | (0.20 | ) | ||||||||||||||||
Net asset value, end of year | $ | 10.85 | $ | 10.71 | $ | 10.49 | $ | 11.10 | $ | 10.62 | |||||||||||||
Total investment return2 | 1.21 | % | 2.19 | % | (3.47 | )% | 4.52 | % | 5.99 | % | |||||||||||||
Ratios to average net assets: | |||||||||||||||||||||||
| Expenses before fee waivers and/or expense reimbursements/recoupments, including dividend expense, interest expense and other borrowing costs for investments sold short | 2.36 | % | 2.26 | % | 2.02 | % | 1.93 | % | 1.97 | % | |||||||||||||
| Expenses after fee waivers and/or expense reimbursements/recoupments, including dividend expense, interest expense and other borrowing costs for investments sold short | 2.27 | % | 2.17 | % | 1.95 | % | 1.88 | % | 1.99 | %3 | |||||||||||||
| Expenses after fee waivers and/or expense reimbursements/recoupments, excluding dividend expense, interest expense and other borrowing costs for investments sold short | 1.76 | % | 1.75 | % | 1.79 | % | 1.81 | % | 1.88 | %3 | |||||||||||||
Net investment loss | (0.16 | )% | (0.71 | )% | (0.53 | )% | (0.74 | )% | (0.89 | )% | |||||||||||||
Supplemental data: | |||||||||||||||||||||||
Net assets, end of year (000's) | $ | 7,208 | $ | 8,702 | $ | 9,800 | $ | 7,408 | $ | 77,331 | |||||||||||||
Portfolio turnover | 346 | % | 292 | % | 221 | % | 165 | % | 114 | % | |||||||||||||
Class Y
Years ended July 31, | |||||||||||||||||||||||
2018 | 2017 | 2016 | 2015 | 2014 | |||||||||||||||||||
Net asset value, beginning of year | $ | 10.65 | $ | 10.42 | $ | 11.12 | $ | 10.71 | $ | 10.30 | |||||||||||||
Net investment income (loss)1 | 0.01 | (0.06 | ) | (0.02 | ) | (0.05 | ) | (0.07 | ) | ||||||||||||||
Net realized and unrealized gains (losses) | 0.16 | 0.29 | (0.31 | ) | 0.56 | 0.70 | |||||||||||||||||
Net increase (decrease) from operations | 0.17 | 0.23 | (0.33 | ) | 0.51 | 0.63 | |||||||||||||||||
Dividends from net investment income | — | — | (0.37 | ) | (0.10 | ) | (0.22 | ) | |||||||||||||||
Net asset value, end of year | $ | 10.82 | $ | 10.65 | $ | 10.42 | $ | 11.12 | $ | 10.71 | |||||||||||||
Total investment return2 | 1.41 | % | 2.40 | % | (2.99 | )% | 4.82 | % | 6.18 | % | |||||||||||||
Ratios to average net assets: | |||||||||||||||||||||||
| Expenses before fee waivers and/or expense reimbursements/recoupments, including dividend expense and other borrowing costs for investments sold short | 2.11 | % | 2.06 | % | 1.69 | % | 1.72 | % | 1.74 | % | |||||||||||||
| Expenses after fee waivers and/or expense reimbursements/recoupments, including dividend expense, interest expense and other borrowing costs for investments sold short | 2.02 | % | 1.96 | % | 1.62 | % | 1.68 | %3 | 1.75 | %3 | |||||||||||||
| Expenses after fee waivers and/or expense reimbursements/recoupments, excluding dividend expense, interest expense and other borrowing costs for investments sold short | 1.51 | % | 1.57 | % | 1.48 | % | 1.60 | % | 1.63 | %3 | |||||||||||||
Net investment income (loss) | 0.09 | % | (0.54 | )% | (0.17 | )% | (0.43 | )% | (0.65 | )% | |||||||||||||
Supplemental data: | |||||||||||||||||||||||
Net assets, end of year (000's) | $ | 544 | $ | 646 | $ | 1,926 | $ | 2,449 | $ | 4,629 | |||||||||||||
Portfolio turnover | 346 | % | 292 | % | 221 | % | 165 | % | 114 | % | |||||||||||||
1 Calculated using the average shares method.
2 Total investment return is calculated assuming a $10,000 investment on the first day of each year reported, reinvestment of all dividends and other distributions, if any, at net asset value on the ex-dividend dates, and a sale at net asset value on the last day of each year reported. The figures do not include any applicable sales charges, redemption fees or program fees; results would be lower if they were included. Returns do not reflect the deduction of taxes that a shareholder would pay on Portfolio distributions or the redemption of Portfolio shares.
328
PACE Alternative Strategies Investments
Financial highlights (concluded)
Class C
Years ended July 31, | |||||||||||||||||||||||
2018 | 2017 | 2016 | 2015 | 2014 | |||||||||||||||||||
Net asset value, beginning of year | $ | 10.05 | $ | 9.93 | $ | 10.66 | $ | 10.29 | $ | 9.90 | |||||||||||||
Net investment loss1 | (0.09 | ) | (0.15 | ) | (0.13 | ) | (0.14 | ) | (0.16 | ) | |||||||||||||
Net realized and unrealized gains (losses) | 0.15 | 0.27 | (0.30 | ) | 0.53 | 0.67 | |||||||||||||||||
Net increase (decrease) from operations | 0.06 | 0.12 | (0.43 | ) | 0.39 | 0.51 | |||||||||||||||||
Dividends from net investment income | — | — | (0.30 | ) | (0.02 | ) | (0.12 | ) | |||||||||||||||
Net asset value, end of year | $ | 10.11 | $ | 10.05 | $ | 9.93 | $ | 10.66 | $ | 10.29 | |||||||||||||
Total investment return2 | 0.40 | % | 1.41 | % | (4.08 | )% | 3.81 | % | 5.18 | % | |||||||||||||
Ratios to average net assets: | |||||||||||||||||||||||
| Expenses before fee waivers and/or expense reimbursements/recoupments, including dividend expense, interest expense and other borrowing costs for investments sold short | 3.07 | % | 3.02 | % | 2.75 | % | 2.67 | % | 2.71 | % | |||||||||||||
| Expenses after fee waivers and/or expense reimbursements/recoupments, including dividend expense, interest expense and other borrowing costs for investments sold short | 2.99 | % | 2.92 | % | 2.68 | % | 2.60 | % | 2.70 | % | |||||||||||||
| Expenses after fee waivers and/or expense reimbursements/recoupments, excluding dividend expense, interest expense and other borrowing costs for investments sold short | 2.49 | % | 2.51 | % | 2.52 | % | 2.52 | % | 2.58 | % | |||||||||||||
Net investment loss | (0.92 | )% | (1.47 | )% | (1.27 | )% | (1.37 | )% | (1.60 | )% | |||||||||||||
Supplemental data: | |||||||||||||||||||||||
Net assets, end of year (000's) | $ | 6,101 | $ | 9,363 | $ | 12,398 | $ | 9,385 | $ | 6,346 | |||||||||||||
Portfolio turnover | 346 | % | 292 | % | 221 | % | 165 | % | 114 | % | |||||||||||||
Class P
Years ended July 31, | |||||||||||||||||||||||
2018 | 2017 | 2016 | 2015 | 2014 | |||||||||||||||||||
Net asset value, beginning of year | $ | 10.61 | $ | 10.38 | $ | 11.09 | $ | 10.69 | $ | 10.27 | |||||||||||||
Net investment income (loss)1 | 0.01 | (0.05 | ) | (0.03 | ) | (0.04 | ) | (0.07 | ) | ||||||||||||||
Net realized and unrealized gains (losses) | 0.16 | 0.28 | (0.31 | ) | 0.55 | 0.71 | |||||||||||||||||
Net increase (decrease) from operations | 0.17 | 0.23 | (0.34 | ) | 0.51 | 0.64 | |||||||||||||||||
Dividends from net investment income | — | — | (0.37 | ) | (0.11 | ) | (0.22 | ) | |||||||||||||||
Net asset value, end of year | $ | 10.78 | $ | 10.61 | $ | 10.38 | $ | 11.09 | $ | 10.69 | |||||||||||||
Total investment return2 | 1.32 | % | 2.41 | % | (3.13 | )% | 4.79 | % | 6.27 | % | |||||||||||||
Ratios to average net assets: | |||||||||||||||||||||||
| Expenses before fee waivers and/or expense reimbursements/recoupments, including dividend expense and other borrowing costs for investments sold short | 2.13 | % | 2.04 | % | 1.77 | % | 1.69 | % | 1.74 | %4 | |||||||||||||
| Expenses after fee waivers and/or expense reimbursements/recoupments, including dividend expense, interest expense and other borrowing costs for investments sold short | 2.04 | % | 1.94 | % | 1.69 | % | 1.62 | % | 1.74 | %3,4 | |||||||||||||
| Expenses after fee waivers and/or expense reimbursements/recoupments, excluding dividend expense, interest expense and other borrowing costs for investments sold short | 1.53 | % | 1.52 | % | 1.53 | % | 1.54 | % | 1.62 | %3 | |||||||||||||
Net investment income (loss) | 0.08 | % | (0.48 | )% | (0.30 | )% | (0.38 | )% | (0.64 | )% | |||||||||||||
Supplemental data: | |||||||||||||||||||||||
Net assets, end of year (000's) | $ | 615,778 | $ | 650,347 | $ | 712,676 | $ | 782,683 | $ | 611,399 | |||||||||||||
Portfolio turnover | 346 | % | 292 | % | 221 | % | 165 | % | 114 | % | |||||||||||||
3 The investment manager recouped expenses previously reimbursed by the investment manager on behalf of the Portfolio, not to exceed the expense cap.
4 The ratios after and before fee waivers and/or expense reimbursements by and recoupments to manager are the same since the recoupments to manager represent less than 0.01%.
See accompanying notes to financial statements.
329
PACE Select Advisors Trust
Notes to financial statements
Organization and significant accounting policies
PACE Select Advisors Trust (the "Trust") is an open-end management investment company registered with the US Securities and Exchange Commission ("SEC") under the Investment Company Act of 1940, as amended (the "1940 Act"), currently offering multiple series representing separate investment portfolios. The Trust is a Delaware statutory trust organized under the laws of the State of Delaware by Certificate of Trust dated September 9, 1994, as amended June 9, 1995 and thereafter. The trustees of the Trust have authority to issue an unlimited number of shares of beneficial interest at par value of $0.001 per share.
The Trust has fifteen series available for investment, each having its own investment objectives and policies: PACE Government Money Market Investments, PACE Mortgage-Backed Securities Fixed Income Investments, PACE Intermediate Fixed Income Investments, PACE Strategic Fixed Income Investments, PACE Municipal Fixed Income Investments, PACE Global Fixed Income Investments, PACE High Yield Investments, PACE Large Co Value Equity Investments, PACE Large Co Growth Equity Investments, PACE Small/Medium Co Value Equity Investments, PACE Small/Medium Co Growth Equity Investments, PACE International Equity Investments, PACE International Emerging Markets Equity Investments, PACE Global Real Estate Securities Investments and PACE Alternative Strategies Investments (each a "Portfolio" and collectively, the "Portfolios"). Each of the Portfolios is classified as a diversified investment company for purposes of the 1940 Act.
UBS Asset Management (Americas) Inc. ("UBS AM") serves as the investment manager and administrator for the Portfolios and also as the investment advisor for PACE Government Money Market Investments and a portion of PACE Alternative Strategies Investments' assets. Subject to the approval and oversight of the Portfolios' Board of Trustees (the "Board"), UBS AM selects and oversees other investment subadvisors, who provide advisory services for the other Portfolios. UBS Asset Management (US) Inc. ("UBS AM (US)") serves as principal underwriter for the Portfolios. UBS AM and UBS AM (US) are indirect wholly owned subsidiaries of UBS Group AG. UBS Group AG is an internationally diversified organization with headquarters in Zurich, Switzerland. UBS Group AG operates in many areas of the financial services industry.
Each Portfolio currently offers Class A, Class Y, and Class P shares, with the exception of PACE Government Money Market Investments, which currently offers Class P shares only, and PACE Global Real Estate Securities Investments, which, effective January 25, 2018, only offers Class A, and Class P shares. Each class represents interests in the same assets of the applicable Portfolio and the classes are identical except for differences in their sales charge structures, ongoing service and distribution charges and certain transfer agency and related services expenses. All classes of shares have equal voting privileges except that each class has exclusive voting rights with respect to its service and/or distribution plan, if any. Class Y and Class P shares have no service or distribution plan. The Portfolios' Class P shares currently are available for purchase only to participants in the PACESM Select Advisors Program and certain other advisory programs offered through select sponsors, except that PACE Government Money Market Investments shares are also available to participants in the PACESM Multi Advisor Program.
The Trust accounts separately for the assets, liabilities and operations of each Portfolio. Expenses directly attributable to each Portfolio are charged to that Portfolio's operations; expenses which are applicable to all Portfolios are allocated among them on a pro rata basis.
In the normal course of business, the Portfolios may enter into contracts that contain a variety of representations that provide indemnification for certain liabilities. The Portfolios' maximum exposure under these arrangements is unknown, as this would involve future claims that may be made against the Portfolios that have not yet occurred. However, the Portfolios have not had any prior claims or losses pursuant to these contracts and expect the risk of loss to be remote.
PACE Government Money Market Investments attempts to maintain a stable net asset value of $1.00 per share. There is no assurance, however, that the Portfolio will be able to maintain a stable net asset value of $1.00 per share. The Portfolio has adopted certain investment, portfolio valuation and dividend/distribution policies in an attempt to
330
PACE Select Advisors Trust
Notes to financial statements
enable it to do so. The Portfolio has adopted a policy to operate as a "government money market fund" and as such the Portfolio is permitted to seek to maintain a stable price per share. In addition, by operating as a "government money market fund", the Portfolio is exempt from requirements that permit the imposition of a liquidity fee and/or temporary redemption gates. While the Portfolio's Board may elect to subject the Portfolio to liquidity fee and gate requirements in the future, the Board has not elected to do so at this time.
The Financial Accounting Standards Board ("FASB") Accounting Standards Codification ("ASC") is the exclusive reference of authoritative US generally accepted accounting principles ("US GAAP") recognized by the FASB to be applied by nongovernmental entities. Rules and interpretive releases of the SEC under authority of federal laws are also sources of authoritative US GAAP for SEC registrants. The Portfolios' financial statements are prepared in accordance with US GAAP, which may require the use of management estimates and assumptions. Actual results could differ from those estimates.
In October 2016, the SEC adopted new rules and forms, and amendments to certain then current rules and forms, to modernize reporting and disclosure of information by registered investment companies. The amendments to Regulation S-X require standardized, enhanced disclosure about derivatives in investment company financial statements, and change the rules governing the form and content of such financial statements. The amendments to Regulation S-X took effect on August 1, 2017. Management has assessed the impact of these regulatory developments and the changes are incorporated within the financial statements.
In March 2017, the FASB issued Accounting Standards Update 2017-08, Receivables—Nonrefundable Fees and Other Costs (Subtopic 310-20): "Premium Amortization On Purchased Callable Debt Securities" ("ASU 2017-08"). The update provides guidance related to the amortization period for certain purchased callable debt securities held at a premium. ASU 2017-08 will be effective for annual periods beginning after December 15, 2018. Management is currently assessing the potential impact of these changes to future financial statements.
The following is a summary of significant accounting policies:
Investment transactions, investment income and expenses—Investment transactions are recorded on the trade date. Realized gains and losses from investment transactions and foreign exchange transactions are calculated using the identified cost method. Dividend income and expense are recorded net of withholding taxes on the ex-dividend date ("ex-date") except in the case of certain dividends from foreign securities which are recorded as soon after the ex-date as the respective Portfolio, using reasonable diligence, becomes aware of such dividends. Interest income is recorded on an accrual basis. Discounts are accreted and premiums are amortized as adjustments to interest income and the identified cost of investments.
Income, expenses (excluding class-specific expenses) and realized/unrealized gains/losses are allocated proportionately to each class of shares based upon the relative net asset value of outstanding shares (or the value of dividend-eligible shares, as appropriate) of each class at the beginning of the day after adjusting for current capital share activity of the respective classes. Class specific expenses are charged directly to the applicable class of shares.
Dividends and distributions—Dividends and distributions to shareholders are recorded on the ex-dividend date. The amount of dividends from net investment income and distributions from net realized capital gains and/or return of capital are determined in accordance with US federal income tax regulations, which may differ from US GAAP. These "book/tax" differences are either considered temporary or permanent in nature. To the extent these differences are permanent in nature, such amounts are reclassified within the capital accounts based on their federal tax-basis treatment; temporary differences do not require reclassification.
Foreign currency translation—The books and records of the Portfolios are maintained in US dollars. Foreign currency amounts are translated into US dollars as follows: (1) the foreign currency market value of investment securities
331
PACE Select Advisors Trust
Notes to financial statements
and other assets and liabilities stated in foreign currencies are translated into US dollars based on the current exchange rates each business day; and (2) purchases and sales of investment securities and income and expenses are translated at the rate of exchange prevailing on the respective dates of such transactions. The resulting exchange gains and losses are included in the Statement of operations.
The Portfolios do not generally isolate the effect of fluctuations in foreign exchange rates from the effect of the changes in the market prices of securities. However, the Portfolios do isolate the effect of fluctuations in foreign exchange rates when determining the realized gain or loss upon the sale or maturity of foreign currency-denominated securities pursuant to US federal income tax regulations. Net realized foreign currency transaction gain (loss) is treated as ordinary income (loss) for income tax reporting purposes.
Concentration of risk—Investing in securities of foreign issuers and currency transactions may involve certain considerations and risks not typically associated with investments in the United States. These risks include revaluation of currencies, adverse fluctuations in foreign currency values and possible adverse political, social and economic developments, including those particular to a specific industry, country or region, which could cause the securities and their markets to be less liquid and prices more volatile than those of comparable US companies and US government securities. These risks are greater with respect to securities of issuers located in emerging market countries in which some Portfolios in the Trust invest.
Small capitalization ("small cap") companies may be more vulnerable than larger capitalization ("large cap") companies to adverse business or economic developments. Small cap companies may also have limited product lines, markets or financial resources, and may be dependent on a relatively small management group. Securities of such companies may be less liquid and more volatile than securities of large cap companies or the market averages in general and therefore may involve greater risk than investing in large cap companies. In addition, small cap companies may not be well-known to the investing public, may not have institutional ownership and may have only cyclical, static or moderate growth prospects.
The ability of the issuers of debt securities held by the Portfolios to meet their obligations may be affected by economic and political developments particular to a specific industry, country, state or region.
Investments in bonds with ratings of BB (Standard & Poor's Financial Services LLC or Fitch Ratings, Inc.) or Ba (Moody's Investors Service, Inc.) or below (commonly referred to as "high yield" bonds), or deemed of equivalent quality, have an increased risk of defaulting or otherwise being unable to honor a financial obligation. These securities are considered to be predominantly speculative with respect to an issuer's capacity to pay interest and repay principal in accordance with the terms of the obligations. Lower-quality bonds are more likely to be subject to an issuer's default or downgrade than investment grade (higher-quality) bonds.
Valuation of investments
Each Portfolio generally calculates its net asset value on days that the New York Stock Exchange ("NYSE") is open. A Portfolio calculates net asset value separately for each class as of the close of regular trading on the NYSE (generally, 4:00 p.m., Eastern time). The NYSE normally is not open, and the Portfolios do not price their shares, on most national holidays and Good Friday. To the extent that a Portfolio's assets are traded in other markets on days when the NYSE is not open, the value of a Portfolio's assets may be affected on those days. If trading on the NYSE is halted for the day before 4:00 p.m., Eastern Time, a Portfolio's net asset value per share generally will still be calculated as of the close of regular trading on the NYSE. The time at which a Portfolio calculates its net asset value and until which purchase, sale or exchange orders are accepted may be changed as permitted by the SEC.
Under Rule 2a-7 under the 1940 Act, as amended ("Rule 2a-7"), PACE Government Money Market Investments has adopted a policy to operate as a "government money market fund". Under Rule 2a-7, a "government money market fund" invests 99.5% or more of its total assets in cash, government securities, and/or repurchase agreements
332
PACE Select Advisors Trust
Notes to financial statements
that are collateralized fully (i.e., collateralized by cash and/or government securities). As a "government money market fund", PACE Government Money Market Investments values its investments at amortized cost unless the Portfolio's Board determines that this does not represent fair value. Periodic review and monitoring of the valuation of the securities held by the Portfolio is performed in an effort to ensure that amortized cost approximates market value.
Each Portfolio (other than PACE Government Money Market Investments) calculates its net asset value based on the current market value, where available, for its portfolio investments. The Portfolios normally obtain market values for their investments from independent pricing sources and broker-dealers. Independent pricing sources may use reported last sale prices, official market closing prices, current market quotations or valuations from computerized "evaluation" systems that derive values based on comparable investments. An evaluation system incorporates parameters such as security quality, maturity and coupon, and/ or research and evaluations by its staff, including review of broker-dealer market price quotations, if available, in determining the valuation of the portfolio investments. Investments also may be valued based on appraisals derived from information concerning the investment or similar investments received from recognized dealers in those holdings.
Investments traded in the over-the-counter ("OTC") market and listed on The NASDAQ Stock Market, Inc. ("NASDAQ") normally are valued at the NASDAQ Official Closing Price. Other OTC securities are valued at the last bid price on the valuation date available prior to valuation. Investments which are listed on US and foreign stock exchanges normally are valued at the market closing price, the last sale price on the day the securities are valued or, lacking any sales on such day, at the last available bid price. Investments listed on foreign stock exchanges may be fair valued based on significant events that have occurred subsequent to the close of the foreign markets. In cases where investments are traded on more than one exchange, the investments are valued on the exchange designated as the primary market by UBS AM. If a market value is not readily available from an independent pricing source for a particular investment, that investment is valued at fair value as determined in good faith by or under the direction of the Board. Foreign currency exchange rates are generally determined as of the close of the NYSE.
Certain investments in which the Portfolios invest are traded in markets that close before 4:00 p.m., Eastern time. Normally, developments that occur between the close of the foreign markets and 4:00 p.m., Eastern time, will not be reflected in a Portfolio's net asset value. However, if any of the Portfolios determine that such developments are so significant that they will materially affect the value of the Portfolio's investments, the Portfolio may adjust the previous closing prices to reflect what is believed to be the fair value of these investments as of 4:00 p.m., Eastern time.
Certain Portfolios may use a systematic fair valuation model provided by an independent third party to value investments principally traded in foreign markets in order to adjust for possible stale pricing that may occur between the close of the foreign exchanges and the time for valuation. The systematic fair valuation model may use calculations based on indices of domestic securities and other appropriate indicators, such as prices of relevant ADRs and futures contracts. If an investment is valued at "fair value," that value is likely to be different from the last quoted market price for the investment. The use of the fair valuation model may result in securities being transferred between Level 1 and Level 2 of the fair valuation hierarchy at the end of the reporting period. Transfers between Level 1 and Level 2, if any, are disclosed near the end of each Portfolio's Portfolio of investments.
The amortized cost method of valuation, which approximates market value, generally is used to value short-term debt instruments with 60 days or less remaining to maturity, unless the Board determines that this does not represent fair value.
Investments in open-end investment companies are valued at the daily closing net asset value of the respective investment company. Pursuant to the Portfolios' use of the practical expedient within ASC Topic 820, Fair Value Measurement, investments in investment companies without publicly published prices are also valued at the daily net asset value.
333
PACE Select Advisors Trust
Notes to financial statements
All investments quoted in foreign currencies are valued daily in US dollars on the basis of the foreign currency exchange rates prevailing at the time such valuation is determined by the Portfolios' custodian.
Futures contracts are generally valued at the settlement price established each day on the exchange on which they are traded. Forward foreign currency contracts are valued daily using forward exchange rates quoted by independent pricing services.
OTC swaps are marked-to-market daily based upon values from third party vendors or quotations from market makers to the extent available. In the event that market quotations are not readily available or deemed unreliable, the swap is valued at fair value as determined in good faith by or under the direction of the Board. Centrally cleared swaps are valued using prices from the counterparty clearing houses.
The Board has delegated to the Equities, Fixed Income, and Multi-Asset Valuation Committee ("VC") (formerly UBS AM Global Valuation Committee or GVC) the responsibility for making fair value determinations with respect to the Portfolios' portfolio holdings. The VC is comprised of representatives of management. The VC provides reports to the Board at each quarterly meeting regarding any investments that have been fair valued, valued pursuant to standing instructions approved by the VC, or where non-vendor pricing sources had been used to make fair value determinations when sufficient information exists during the prior quarter. Fair valuation determinations are subject to review at least monthly by the VC during scheduled meetings. Pricing decisions, processes, and controls over fair value determinations are subject to internal and external reviews, including annual internal compliance reviews and periodic internal audit reviews.
The types of investments for which such fair value pricing may be necessary include, but are not limited to: foreign investments under some circumstances, securities of an issuer that has entered into a restructuring; investments whose trading has been halted or suspended; fixed income securities that are in default and for which there is no current market value quotation; and investments that are restricted as to transfer or resale. The need to fair value a Portfolio's portfolio investments may also result from low trading volume in foreign markets or thinly traded domestic investments, and when a security that is subject to a trading limit or collar on the exchange or market on which it is primarily traded reaches the "limit up" or "limit down" price and no trading has taken place at that price. Various factors may be reviewed in order to make a good faith determination of an investment's fair value. These factors include, but are not limited to, fundamental analytical data relating to the investment; the nature and duration of restrictions on disposition of the investment; and the evaluation of forces which influence the market in which the investment is purchased and sold. Valuing investments at fair value involves greater reliance on judgment than valuing investments that have readily available market quotations. Fair value determinations can also involve reliance on quantitative models employed by a fair value pricing service.
US GAAP requires disclosure regarding the various inputs that are used in determining the value of each Portfolio's investments. These inputs are summarized into the three broad levels listed below:
Level 1—Unadjusted quoted prices in active markets for identical investments.
Level 2—Other significant observable inputs, including but not limited to, quoted prices for similar investments, interest rates, prepayment speeds and credit risks.
Level 3—Unobservable inputs inclusive of each Portfolio's own assumptions in determining the fair value of investments.
A fair value hierarchy table has been included near the end of each Portfolio's Portfolio of investments.
334
PACE Select Advisors Trust
Notes to financial statements
Investments
Real estate investment trusts—The Portfolios may invest in real estate investment trusts ("REITs"). Distributions from a REIT are initially recorded as dividend income and may subsequently be recharacterized by the REIT at the end of its tax year as a return of capital and/or capital gains. The Portfolio estimates the character of dividends received from REITs for financial reporting purposes based on the distribution history of each REIT. Once actual distribution characterizations are made available by the REITs, typically after calendar year end, the Portfolio updates its accounting and/or tax books and records.
Repurchase agreements—The Portfolios may purchase securities or other obligations from a bank or securities dealer (or its affiliate), subject to the seller's agreement to repurchase them at an agreed upon date (or upon demand) and price. The Portfolios maintain custody of the underlying obligations prior to their repurchase, either through their regular custodian or through a special "tri-party" custodian or sub-custodian that maintains a separate account for both the Portfolios and their counterparty. The underlying collateral is valued daily in an effort to ensure that the value, including accrued interest, is at least equal to the repurchase price.
Repurchase agreements carry certain risks not associated with direct investments in securities, including a possible decline in the market value of the underlying obligations. If their value becomes less than the repurchase price, plus any agreed-upon additional amount, the counterparty must provide additional collateral so that the collateral is at least equal to the repurchase price plus any agreed-upon additional amount. The difference between the total amount to be received upon repurchase of the obligations and the price that was paid by a Portfolio upon acquisition is accrued as interest and included in its net investment income. In the event of default of the obligation to repurchase, the Portfolios generally have the right to liquidate the collateral and apply the proceeds in satisfaction of the obligation. Repurchase agreements involving obligations other than US government securities (such as commercial paper, corporate bonds, equities and mortgage loans) may be subject to special risks and may not have the benefit of certain protections in the event of counterparty insolvency. Moreover, repurchase agreements secured by obligations that are not eligible for direct investment under Rule 2a-7 or a Portfolio's investment strategies and limitations, may require the Portfolio to promptly dispose of such collateral if the seller or guarantor becomes insolvent. If the seller (or seller's guarantor, if any) becomes insolvent, the Portfolios may suffer delays, costs and possible losses in connection with the disposition or retention of the collateral. Under certain circumstances, in the event of default or bankruptcy by the other party to the agreement, realization and/or retention of the collateral may be subject to legal proceedings. Each Portfolio intends to enter into repurchase agreements only in transactions with counterparties believed by UBS AM and the applicable subadvisor to present minimal credit risks.
Each Portfolio may participate in joint repurchase agreement transactions with other Portfolios managed, advised or subadvised by UBS AM in accordance with an exemptive order granted by the SEC pursuant to Section 17(d) of the 1940 Act and Rule 17d-1 thereunder. Under certain circumstances, the Portfolios may engage in a repurchase agreement transaction with a yield of zero in order to invest cash amounts remaining in its portfolio at the end of the day in order to avoid having the Portfolios potentially exposed to a fee for uninvested cash held in a business account at a bank.
Reverse repurchase agreements—Certain Portfolios may enter into reverse repurchase agreements with qualified third party banks, securities dealers or their affiliates. Interest on the value of reverse repurchase agreements issued and outstanding is based upon competitive market rates at the time of issuance. At the time a Portfolio enters into a reverse repurchase agreement, the Portfolio establishes and maintains a segregated account with the Portfolio's custodian containing liquid securities having a value not less than the repurchase price, including accrued interest, of the reverse repurchase agreement. At the period ended July 31, 2018, there were no reverse repurchase agreements outstanding.
335
PACE Select Advisors Trust
Notes to financial statements
Securities traded on to-be-announced basis—Certain Portfolios may from time to time purchase, or short sell, securities on a to-be-announced ("TBA") basis. In a TBA transaction, the Portfolio commits to purchasing or selling securities for which all specific information is not yet known at the time of the trade, particularly the face amount and maturity date of the underlying securities. Securities purchased on a TBA basis are not settled until they are delivered to the Portfolio, normally 15 to 45 days later. Beginning on the date the Portfolio enters into a TBA transaction, cash, US government securities or other liquid securities are segregated in an amount equal in value to the purchase price of the TBA security. These transactions are subject to market fluctuations, and their current value is determined in the same manner as for other securities.
Treasury roll transactions—Certain Portfolios may enter into treasury roll transactions. In a treasury roll transaction, a Portfolio sells a Treasury security to a counterparty with a simultaneous agreement to repurchase the same security at an agreed upon price and date. The Portfolio receives cash from the sale of the Treasury security to use for other investment purposes. For US GAAP purposes, a treasury roll transaction is accounted for as a secured borrowing and not as a purchase and sale. The difference between the sale price and repurchase price represents net interest income or net interest expense reflective of an agreed upon rate between the Portfolio and the counterparty over the term of the borrowing. The Portfolio will benefit from the transaction if the income earned on the investment purchased with the cash received in the treasury roll transaction exceeds the interest expense incurred by the Portfolio. If the interest expense exceeds the income earned, the Portfolio's net investment income and dividends to shareholders may be adversely impacted.
Treasury roll transactions involve the risk that the market value of the securities that the Portfolio is required to repurchase may decline below the agreed upon repurchase price of those securities. During the period ended July 31, 2018, only PACE Mortgage-Backed Securities Fixed Income Investments, PACE Intermediate Fixed Income Investments and PACE Strategic Fixed Income Investments utilized treasury roll transactions.
The table below represents the remaining contractual maturity as of July 31, 2018, of the treasury roll transactions accounted for as secured borrowings.
PACE Mortgage-Backed Securities Fixed Income Investments
Types of securities being bought back | Overnight and continuous | Up to 30 days | 31-90 days | Greater than 90 days | Total | ||||||||||||||||||
US government obligations | $ | — | $ | 7,796,041 | $ | — | $ | — | $ | 7,796,041 | |||||||||||||
PACE Strategic Fixed Income Investments
Types of securities being bought back | Overnight and continuous | Up to 30 days | 31-90 days | Greater than 90 days | Total | ||||||||||||||||||
US government obligations | $ | — | $ | 39,415,071 | $ | — | $ | 34,767,439 | $ | 74,182,510 | |||||||||||||
Mortgage-backed securities—Certain Portfolios may invest in mortgage-backed securities ("MBS"), representing direct or indirect interests in pools of underlying mortgage loans that are secured by real property. These securities provide investors with payments consisting of both principal and interest as the mortgages in the underlying mortgage pools are paid.
The timely payment of principal and interest (but not the market value) on MBS issued or guaranteed by Ginnie Mae (formally known as the Government National Mortgage Association or GNMA) is backed by Ginnie Mae and the full faith and credit of the US government. Obligations issued by Fannie Mae (formally known as the Federal National Mortgage Association or FNMA) and Freddie Mac (formally known as the Federal Home Loan Mortgage Company or FHLMC) are historically supported only by the credit of the issuer, but currently are guaranteed by the US government in connection with such agencies being placed temporarily into conservatorship by the US government.
336
PACE Select Advisors Trust
Notes to financial statements
Some MBS are sponsored or issued by private entities. Payments of principal and interest (but not the market value) of such private MBS may be supported by pools of mortgage loans or other MBS that are guaranteed, directly or indirectly, by the US government or one of its agencies or instrumentalities, or they may be issued without any government guarantee of the underlying mortgage assets but with some form of non-government credit enhancement.
Collateralized mortgage obligations ("CMO") are a type of MBS. A CMO is a debt security that may be collateralized by whole mortgage loans or mortgage pass-through securities. The mortgage loans or mortgage pass-through securities are divided into classes or tranches with each class having its own characteristics. Investors typically receive payments out of the interest and principal on the underlying mortgages. The portions of these payments that investors receive, as well as the priority of their rights to receive payments, are determined by the specific terms of the CMO class.
The yield characteristics of MBS differ from those of traditional debt securities. Among the major differences are that interest and principal payments are made more frequently, usually monthly, and that principal may be prepaid at any time because the underlying mortgage loans or other obligations generally may be prepaid at any time. Prepayments on a pool of mortgage loans are influenced by a variety of economic, geographic, social and other factors. Generally, prepayments on fixed-rate mortgage loans will increase during a period of falling interest rates and decrease during a period of rising interest rates. Certain classes of CMOs and other MBS are structured in a manner that makes them extremely sensitive to changes in prepayment rates. Such classes include interest-only ("IO") and principal-only ("PO") classes. IOs are entitled to receive all or a portion of the interest, but none (or only a nominal amount) of the principal payments, from the underlying mortgage assets. If the mortgage assets underlying an IO experience greater than anticipated principal prepayments, then the total amount of interest payments allocable to the IO class, and therefore the yield to investors, generally will be reduced. Conversely, PO classes are entitled to receive all or a portion of the principal payments, but none of the interest, from the underlying mortgage assets. PO classes are purchased at substantial discounts from par, and the yield to investors will be reduced if principal payments are slower than expected.
Asset-backed securities—Certain Portfolios may invest in asset-backed securities ("ABS"), representing interests in pools of certain types of underlying installment loans, home equity loans, leases of various types of real and personal property and receivables from revolving lines of credit (credit cards). Such assets are securitized through the use of trusts or special purpose corporations. The yield characteristics of ABS differ from those of traditional debt securities. One such major difference is that principal may be prepaid at any time because the underlying obligations generally may be prepaid at any time. ABS may decrease in value as a result of increases in interest rates and may benefit less than other fixed-income securities from declining interest rates because of the risk of prepayment.
Loan assignments and participations—Certain Portfolios may invest in secured or unsecured fixed or floating rate loans ("Loans") arranged through private negotiations between a borrowing corporation, government or other entity and one or more financial institutions ("Lenders") which may be in the form of participations ("Participations") in Loans or assignments ("Assignments") of all or a portion of Loans from third parties. A Portfolio may invest in multiple series or tranches of a Loan, which may have varying terms and carry different associated risks. Participations typically result in a Portfolio having a contractual relationship only with the Lender, not with the borrower. A Portfolio has the right to receive payments of principal, interest and any fees to which it is entitled only from the Lender selling the Participation and only upon receipt by the Lender of the payments from the borrower. In connection with purchasing Participations, a Portfolio generally has no direct right to enforce compliance by the borrower with the terms of the loan agreement relating to the Loan, or any rights of set-off against the borrower, and a Portfolio may not directly benefit from any collateral supporting the Loan in which it has purchased the Participation. As a result, a Portfolio assumes the credit risk of both the borrower and the Lender that is selling the Participation. In the event of the insolvency of the selling Lender, the Portfolio may be treated as a general creditor of that Lender and may not benefit from any set-off between the Lender and the borrower. A Portfolio will acquire Participations only if its subadvisor
337
PACE Select Advisors Trust
Notes to financial statements
determines that the selling Lender is creditworthy. When a Portfolio purchases Assignments from Lenders, it acquires direct rights against the borrower on the Loan. In an Assignment, the Portfolio is entitled to receive payments directly from the borrower and, therefore, does not depend on the selling bank to pass these payments onto the Portfolio. However, because Assignments are arranged through private negotiations between potential assignees and assignors, the rights and obligations acquired by a Portfolio as the purchaser of an Assignment may differ from, and be more limited than, those held by the assigning Lender.
Short sales "against the box"—Each Portfolio (other than PACE Government Money Market Investments and PACE Municipal Fixed Income Investments) may engage in short sale transactions of securities it owns or has the right to acquire at no added cost through conversion or exchange of other securities it owns (short sales "against the box"). A Portfolio might make a short sale "against the box" to hedge against market risks when its subadvisor believes that the price of a security may decline, thereby causing a decline in the value of a security owned by the Portfolio or a security convertible into or exchangeable for a security owned by the Portfolio.
The Portfolio must borrow the security to make delivery to the buyer. The initial amount of a short sale is recorded as a liability which is marked to market daily. Fluctuations in the value of this liability are recorded as unrealized appreciation or depreciation on the Statement of operations. Any loss in the Portfolio's long position after the short sale should be reduced by a corresponding gain in the short position. Conversely, any gain in the long position after the short sale should be reduced by a corresponding loss in the short position. When a Portfolio sells short, it establishes a margin account with the broker effecting the short sale and deposits collateral with the broker. In addition, the Portfolio maintains, in a segregated account with its custodian, the securities that could be used to cover the short sale. Each Portfolio incurs transaction costs, including dividend expense, borrowing costs and interest expense, in connection with opening, maintaining and closing short sales "against the box". These dividends and interest are booked as an expense or liability to the Portfolio.
Uncovered short sales—PACE Mortgage-Backed Securities Fixed Income Investments (with respect to securities issued by the US Treasury and TBA securities coupon trades), PACE Large Co Value Equity Investments, PACE International Equity Investments, PACE Global Real Estate Securities Investments and PACE Alternative Strategies Investments may engage in short sale transactions in which the Portfolio sells a security it does not own (or does not have the right to acquire at no added cost), in anticipation of a decline in the security's price.
The Portfolio must borrow the security to make delivery to the buyer. The initial amount of a short sale is recorded as a liability which is marked to market daily. Fluctuations in the value of this liability are recorded as unrealized appreciation or depreciation on the Statement of operations. The Portfolio will realize a loss as a result of the short sale if the price of the security increases between the date of the short sale and the date on which the Portfolio replaces the borrowed security, and the Portfolio will realize a gain if the security declines in price between those same dates. Each Portfolio segregates collateral, consisting of cash or liquid assets, sufficient to collateralize the market value of the investments sold short. Each Portfolio incurs transaction costs, including dividend expense, borrowing costs and interest expenses in connection with opening, maintaining and closing short sales. These dividends and interest are booked as an expense or liability to the Portfolio.
Because a Portfolio's loss on a short sale arises from increases in the value of the investment sold short, such loss, like the potential increase in price of the security sold short, is theoretically unlimited. The Portfolio's investments held long could also decline in value at the same time the value of the investment sold short increases, thereby increasing the Portfolio's potential for loss. There is also the risk that the counterparty to a short sale transaction may fail to honor its contract terms, causing a loss to the Portfolio. In addition, PACE Large Co Value Equity Investments and PACE International Equity Investments may invest the proceeds received upon the initial sale of the security, resulting in leverage and increasing each Portfolio's return and loss potential. PACE Large Co Value Equity Investments and PACE International Equity Investments may also engage in short sale transactions that are effected through their custodian
338
PACE Select Advisors Trust
Notes to financial statements
and may deliver cash received in connection with its securities lending activity to the custodian as collateral to secure the short sale transactions.
For the year ended July 31, 2018, PACE Global Real Estate Securities Investments did not engage in uncovered short sale transactions.
Restricted securities—The Portfolios may invest in securities that are subject to legal or contractual restrictions on resale. These securities generally may be resold in transactions exempt from registration or to the public if the securities are registered. Disposal of these securities may involve time-consuming negotiations and expense, and prompt sale at an acceptable price may be difficult. Information regarding restricted securities, if any, is included in each Portfolio's portfolio footnotes.
Derivative instruments
Purchased options—Certain Portfolios may purchase put and call options, including, but not limited to, options on foreign or US securities, indices, foreign currencies, options on futures contracts and options on swap agreements (commonly referred to as swaptions), in order to gain exposure to or protect against changes in the markets or in an attempt to enhance income or gains. Purchasing call options tends to increase exposure to the underlying instrument. Purchasing put options tends to decrease exposure to the underlying instrument.
The Portfolio pays a premium which is included on the Statement of assets and liabilities as an investment and subsequently marked to market to reflect the current value of the option. Premiums paid for purchasing options which expire are treated as realized losses. Purchased options are shown as portfolio holdings within the Portfolio of investments and are included in the Statement of assets and liabilities in investments, at value.
The risk associated with purchasing put and call options is limited to the premium paid. Premiums paid for purchasing options which are exercised or closed are added to the amounts paid or offset against the proceeds on the underlying future, security or currency transaction to determine the realized gain or loss.
Option writing—Certain Portfolios may write (sell) put and call options, including, but not limited to, options on foreign or US securities, indices, foreign currencies, options on futures contracts and options on swap agreements (commonly referred to as swaptions), in order to gain exposure to or protect against changes in the markets or in an attempt to enhance income or gains.
When a Portfolio writes a call or a put option, an amount equal to the premium received by the Portfolio is included on the Portfolio's Statement of assets and liabilities as a liability. The amount of the liability is subsequently marked-to-market to reflect the current market value of the option written. If an option which the Portfolio has written either expires on its stipulated expiration date or the Portfolio enters into a closing purchase transaction, the Portfolio realizes a gain (or loss if the cost of a closing purchase transaction exceeds the premium received when the option was written) without regard to any unrealized gain or loss on the underlying security or derivative instrument, and the liability related to such option is extinguished. If a call option, which a Portfolio has written, is exercised, the Portfolio recognizes a realized gain or loss (long-term or short-term, depending on the holding period of the underlying security) from the sale of the underlying security or derivative instrument and the proceeds from the sale are increased by the premium originally received. If a put option, which a Portfolio has written, is exercised, the amount of the premium originally received reduces the cost of the security or derivative instrument which the Portfolio purchases upon exercise of the option.
In writing an option, a Portfolio bears the market risk of an unfavorable change in the price of the derivative instrument, security, or currency underlying the written option. Exercise of an option written by a Portfolio could result in the Portfolio selling or buying a derivative instrument, security or currency at a price different from current market value.
339
PACE Select Advisors Trust
Notes to financial statements
In the normal course of trading activities, the Portfolios trade and hold certain fair valued derivative contracts that constitute guarantees. Such contracts include written put options, where the Portfolios would be obligated to purchase securities at specified prices (i.e. the options are exercised by the counterparties). The maximum payout for these contracts is limited to the number of put option contracts written and the related strike prices, respectively. Maximum payout amounts could be offset by the subsequent sale, if any, of assets obtained via the execution of a payout event. At July 31, 2018, PACE Mortgage-Backed Securities Fixed Income Investments, PACE Intermediate Fixed Income Investments, PACE Strategic Fixed Income Investments, and PACE Alternative Strategies Investments had maximum payout amounts of approximately $8,405,350, $8,551,339, $5,986,000, and $13,156,105 respectively, relating to written put option contracts.
Futures contracts—Certain Portfolios may purchase or sell futures contracts to increase or reduce their exposure to an asset class without purchasing or selling the underlying securities, either as a hedge or to enhance income or realized gains. Generally, a futures contract is a standard binding agreement to buy or sell a specified quantity of an underlying reference asset, such as a specific security or currency, at a specified price at a specified later date.
Upon entering into a futures contract, a Portfolio is required to deliver to a broker an amount of cash and/or US government securities equal to a certain percentage of the contract amount. This amount is known as the "initial margin". Subsequent payments, known as "variation margin", generally are made or received by a Portfolio, depending on the daily fluctuations in the value of the underlying futures contracts, except that in the case of certain futures contracts that are held through swap contracts, payments may be made or received at settlement. Such variation margin is recorded for financial statement purposes on a daily basis as an unrealized appreciation or depreciation on futures until the futures contract is closed or expires, at which time the net gain or loss is reclassified to realized gain or loss on futures.
Using futures contracts involves various market risks, including interest rate and equity risk. Risks of entering into futures contracts include the possibility that there may be an illiquid market or that a change in the value of the contract may not correlate with changes in the value of the underlying securities. To the extent that market prices move in an unexpected direction, there is a risk that a Portfolio will not achieve the anticipated benefits of the futures contract or may realize a loss.
Forward foreign currency contracts—Certain Portfolios may enter into forward foreign currency contracts as part of their investment objective, for purposes of risk management or to hedge the US dollar value of portfolio securities denominated in a particular currency. Generally, a forward foreign currency contract is a commitment to purchase or sell a foreign currency at a future date at a negotiated forward rate. Non-deliverable forward foreign currency contracts are settled with the counterparty in US dollars, or another fully convertible currency, without the physical delivery of foreign currency.
Fluctuations in the value of open forward foreign currency contracts are recorded daily for book purposes as unrealized appreciation or depreciation on forward foreign currency contracts by the Portfolios. Realized gains and losses on forward foreign currency contracts include net gains or losses recognized by the Portfolios on contracts which have been sold or matured.
Risks may arise upon entering into forward foreign currency contracts from the potential inability of counterparties to meet the terms of their contracts and from unanticipated movements in the value of foreign currencies relative to the US dollar or each other.
Swap agreements—Certain Portfolios may engage in swap agreements, including, but not limited to, interest rate, credit default, total return and variance swap agreements. A Portfolio expects to enter into these transactions to preserve a return or spread on a particular investment or to hedge a portion of the portfolio's duration,
340
PACE Select Advisors Trust
Notes to financial statements
to protect against any increase in the price of securities the Portfolio anticipates purchasing at a later date, to gain exposure to certain markets in the most economical way possible or in an attempt to enhance income or gains.
The Portfolios accrue for interim payments on swap agreements on a daily basis, with the net amount recorded within unrealized appreciation or depreciation of swap agreements. Once interim payments are settled in cash, the net amount is recorded as realized gain/loss on swap agreements, in addition to realized gain/loss recorded upon the termination of swap agreements on the Statement of operations. Fluctuations in the value of swap agreements are recorded for financial statement purposes as unrealized appreciation or depreciation on swap agreements.
Certain Portfolios may enter into interest rate swap agreements with another party to receive or pay interest (e.g., an exchange of fixed rate payments for floating rate payments) to protect themselves from interest rate fluctuations. This type of swap is an agreement that obligates two parties to exchange a series of cash flows at specified intervals based upon or calculated by reference to a specified interest rate(s) for a specified amount. The payment flows are usually netted against each other, with the difference being paid by one party to the other. Interest rate swap agreements are subject to general market risk, liquidity risk, counterparty risk and interest rate risk.
Credit default swap agreements involve commitments to make or receive payments in the event of a default of a security or other credit event of the referenced obligation. As a buyer, the Portfolio would make periodic payments to the counterparty, and the Portfolio would receive payments only upon the occurrence of a default or credit event. If no default or credit event occurs, the Portfolio will lose its periodic stream of payments over the term of the contract. However, if a default or a credit event does occur, the Portfolio typically would receive full notional value for the referenced obligation that may have little or no value. As a seller, the Portfolio would receive periodic payments from the counterparty, and the Portfolio would make payments only upon the occurrence of a default or a credit event. If no default or credit event occurs, the Portfolio will gain the periodic stream of payments it received over the term of the contract and the counterparty will lose its periodic stream of payments over the term of the contract. However, if a default or credit event occurs, the Portfolio typically would pay full notional value for the referenced obligation that may have little or no value. Credit default swap agreements may involve greater risks than if the Portfolio had invested in the referenced obligation directly and are subject to general market risk, liquidity risk and credit risk.
Credit default swap agreements on credit indices involve one party making a stream of payments to another party in exchange for the right to receive a specified return in the event of a write-down, principal shortfall, interest shortfall or default of all or part of the referenced entities comprising the credit index. A credit index is a list of a basket of credit instruments or exposures designed to be representative of some part of the credit market as a whole. These indices are made up of referenced credits that are judged by a poll of dealers to be the most liquid entities in the credit default swap market based on the sector of the index. Components of the indices may include, but are not limited to, investment grade securities, high yield securities, asset backed securities, emerging markets, and/or various credit ratings within each sector. Credit indices are traded using credit default swaps with standardized terms including a fixed spread and standard maturity dates. An index credit default swap references all the names in the index, and if there is a default, the credit event is settled based on that name's weight in the index. The composition of the indices changes periodically, usually every six months, and for most indices, each name has an equal weight in the index. A Portfolio may use credit default swap agreements on credit indices to hedge a portfolio of credit default swaps or bonds with a credit default swap on indices which is less expensive than it would be to buy many credit default swaps to achieve a similar effect. Credit default swap agreements on credit indices are benchmarks for protecting investors owning bonds against default, and traders use them to speculate on changes in credit quality.
Credit default swap agreements on corporate issues or sovereign issues of an emerging market country involve one party making a stream of payments to another party in exchange for the right to receive a specified return in the event of a default or other credit event. If a credit event occurs and cash settlement is not elected, a variety of other
341
PACE Select Advisors Trust
Notes to financial statements
obligations may be delivered in lieu of the specific referenced obligation. The ability to deliver other obligations may result in a cheapest-to-deliver option (the buyer of protection's right to choose the deliverable obligation with the lowest value following a credit event). A Portfolio may use credit default swap agreements on corporate issues or sovereign issues of an emerging market country to provide a measure of protection against defaults of the issuers (i.e., to reduce risk where the Portfolio owns or has exposure to the referenced obligation) or to take an active long or short position with respect to the likelihood of a particular issuer's default.
The maximum potential amount of future payments (undiscounted) that a Portfolio as a seller of protection could be required to make under a credit default swap agreement would be an amount equal to the notional amount of the agreement, which may exceed the amount of the value reflected on the Statement of assets and liabilities. Notional amounts of all credit default swap agreements outstanding as of the period end for which a Portfolio is the seller of protection are disclosed under the sections "Credit default swap agreements on credit indices—sell protection" and "Credit default swap agreements on corporate and sovereign issues—sell protection" in the Portfolios of investments. These potential amounts would be partially offset by any recovery values of the respective referenced obligations, upfront payments received upon entering into the agreement, or net amounts received from the settlement of buy protection credit default swap agreements entered into, if any, by a Portfolio for the same referenced entity or entities.
Total return swap agreements involve commitments to pay or receive interest in exchange for a market-linked return based on a notional amount. To the extent the total return of the security or index underlying the transactions exceeds or falls short of the offsetting interest rate obligation, the Portfolio will receive a payment from or make a payment to the counterparty, respectively. Total return swap agreements are marked-to-market daily, and the change, if any, is recorded as unrealized appreciation or depreciation. Total return swap agreements are subject to general market risk, liquidity risk, counterparty risk, interest rate risk, credit risk and the risk that there may be unfavorable changes in the underlying investments or instruments.
Variance swap agreements involve two parties agreeing to exchange cash flows based on the measured variance (or square of volatility) of a specified underlying asset. One party agrees to exchange a "fixed rate" or volatility strike price payment for the "floating rate" or realized price variance on the underlying asset with respect to the notional amount. At inception, the strike price is generally chosen such that the fair value of the swap is zero. At the maturity date, a net cash flow is exchanged, where the payoff amount is equivalent to the difference between the realized price variance of the underlying asset and the strike price multiplied by the notional amount. As a receiver of the realized price variance, the Portfolio would receive the payoff amount when the realized price variance of the underlying asset is greater than the strike price and would owe the payoff amount when the realized price variance of the underlying asset is less than the strike price. As a payer of the realized price variance the Portfolio would owe the payoff amount when the realized price variance of the underlying asset is greater than the strike price and would receive the payoff amount when the variance is less than the strike price.
The use of swap agreements involves investment techniques, risks, and transaction costs different from those associated with ordinary portfolio security transactions, including assumptions about market conditions, interest rates, and other applicable factors. As a result, the performance of the Portfolio will be different than if it had used ordinary portfolio security transactions. OTC swap agreements do not involve the delivery of securities and are subject to counterparty risk. If the other party to a swap agreement defaults and fails to consummate the transaction, the Portfolio's risk of loss will consist of the net amount of interest or other payments that the Portfolio is contractually entitled to receive. Therefore, the Portfolio would consider the creditworthiness of the counterparty to a swap agreement in evaluating potential credit risk.
Certain clearinghouses offer clearing for limited types of derivatives transactions, such as interest rate and credit default swap agreements. Centrally cleared swap agreements must be transacted through a futures commission merchant ("FCM") and cleared through a clearinghouse that serves as a central counterparty. The performance of a centrally cleared swap transaction is effectively guaranteed by a central clearinghouse, thereby reducing the Portfolio's exposure
342
PACE Select Advisors Trust
Notes to financial statements
to the credit risk of its original counterparty. The Portfolio will be required to post specified levels of margin with the clearinghouse or at the instruction of the clearinghouse; the margin required by a clearinghouse may be greater than the margin the Portfolio would be required to post in an uncleared transaction. Centrally cleared swap agreements, if any, are reported on the Statement of assets and liabilities based on variation margin received or paid, if any.
Derivatives by underlying risk—Investment companies value their derivatives at fair value and recognize changes in fair value through the Statement of operations. Under US GAAP, investment companies do not qualify for hedge accounting. Accordingly, even though a Portfolio's investments in derivatives may represent economic hedges, they are considered to be non-hedge transactions for purposes of disclosure under US GAAP.
The volume of derivatives as disclosed in each Portfolio's Portfolio of investments is representative of the volume of derivatives outstanding during the period ended July 31, 2018.
Swap agreements, forward foreign currency contracts, swaptions and options written entered into by the Portfolios may contain credit-risk related contingent features that could be triggered subject to certain circumstances. Such circumstances include agreed upon net asset value thresholds. If triggered, the derivative counterparty could request additional cash margin and/or terminate the derivative contract. The aggregate fair value of the derivative contracts that are in a net liability position that contain these triggers can be found in the Portfolio of investments. The aggregate fair value of assets that are already posted as collateral as of July 31, 2018 is reflected in the Statement of assets and liabilities.
At July 31, 2018, the Portfolio had the following derivatives categorized by underlying risk:
Asset derivatives1
| Interest rate risk | Foreign exchange risk | Credit risk | Equity risk | Total | |||||||||||||||||||
PACE Mortgage-Backed Securities Fixed Income Investments | |||||||||||||||||||||||
Options and swaptions purchased | $ | 213,526 | $ | — | $ | — | $ | — | $ | 213,526 | |||||||||||||
Swap agreements | 2,805,936 | — | — | — | 2,805,936 | ||||||||||||||||||
Total value | $ | 3,019,462 | $ | — | $ | — | $ | — | $ | 3,019,462 | |||||||||||||
Liability derivatives2
| Interest rate risk | Foreign exchange risk | Credit risk | Equity risk | Total | |||||||||||||||||||
PACE Mortgage-Backed Securities Fixed Income Investments | |||||||||||||||||||||||
Futures contracts | $ | (11,838 | ) | $ | — | $ | — | $ | — | $ | (11,838 | ) | |||||||||||
Options and swaptions written | (68,170 | ) | — | — | — | (68,170 | ) | ||||||||||||||||
Swap agreements | (125,311 | ) | — | — | — | (125,311 | ) | ||||||||||||||||
Total value | $ | (205,319 | ) | $ | — | $ | — | $ | — | $ | (205,319 | ) | |||||||||||
Table footnotes begin on page 350
343
PACE Select Advisors Trust
Notes to financial statements
During the period ended July 31, 2018, net realized gains (losses) and net change in unrealized appreciation (depreciation) from derivatives were as follows:
| Interest rate risk | Foreign exchange risk | Credit risk | Equity risk | Total | |||||||||||||||||||
PACE Mortgage-Backed Securities Fixed Income Investments | |||||||||||||||||||||||
Net realized gain (loss)3 | |||||||||||||||||||||||
Futures contracts | $ | 7,878 | $ | — | $ | — | $ | — | $ | 7,878 | |||||||||||||
| Options and swaptions purchased | (315,806 | ) | — | — | — | (315,806 | ) | ||||||||||||||||
Options and swaptions written | 709,903 | — | — | — | 709,903 | ||||||||||||||||||
Swap agreements | 844,280 | — | — | — | 844,280 | ||||||||||||||||||
Total net realized gain (loss) | $ | 1,246,255 | $ | — | $ | — | $ | — | $ | 1,246,255 | |||||||||||||
Net change in unrealized appreciation (depreciation)4 | |||||||||||||||||||||||
Futures contracts | $ | (11,838 | ) | $ | — | $ | — | $ | — | $ | (11,838 | ) | |||||||||||
Options and swaptions purchased | 224,084 | — | — | — | 224,084 | ||||||||||||||||||
Options and swaptions written | 36,572 | — | — | — | 36,572 | ||||||||||||||||||
Swap agreements | 1,725,121 | — | — | — | 1,725,121 | ||||||||||||||||||
Net change in appreciation (depreciation) | $ | 1,973,939 | $ | — | $ | — | $ | — | $ | 1,973,939 | |||||||||||||
At July 31, 2018, the Portfolio had the following derivatives categorized by underlying risk:
Asset derivatives1
| Interest rate risk | Foreign exchange risk | Credit risk | Equity risk | Total | |||||||||||||||||||
PACE Intermediate Fixed Income Investments | |||||||||||||||||||||||
Futures contracts | $ | 96,274 | $ | — | $ | — | $ | — | $ | 96,274 | |||||||||||||
Forward foreign currency contracts | — | 102,170 | — | — | 102,170 | ||||||||||||||||||
Options and swaptions purchased | 769,497 | 50,186 | — | 12,084 | 831,767 | ||||||||||||||||||
Swap agreements | 202,592 | — | 14,621 | — | 217,213 | ||||||||||||||||||
Total value | $ | 1,068,363 | $ | 152,356 | $ | 14,621 | $ | 12,084 | $ | 1,247,424 | |||||||||||||
Liability derivatives2
| Interest rate risk | Foreign exchange risk | Credit risk | Equity risk | Total | |||||||||||||||||||
PACE Intermediate Fixed Income Investments | |||||||||||||||||||||||
Futures contracts | $ | (173,876 | ) | $ | — | $ | — | $ | — | $ | (173,876 | ) | |||||||||||
Forward foreign currency contracts | — | (44,247 | ) | — | — | (44,247 | ) | ||||||||||||||||
Options and swaptions written | (1,242,957 | ) | (36,975 | ) | — | — | (1,279,932 | ) | |||||||||||||||
Swap agreements | (329,832 | ) | — | — | — | (329,832 | ) | ||||||||||||||||
Total value | $ | (1,746,665 | ) | $ | (81,222 | ) | $ | — | $ | — | $ | (1,827,887 | ) | ||||||||||
Table footnotes begin on page 350
344
PACE Select Advisors Trust
Notes to financial statements
During the period ended July 31, 2018, net realized gains (losses) and net change in unrealized appreciation (depreciation) from derivatives were as follows:
| Interest rate risk | Foreign exchange risk | Credit risk | Equity risk | Total | |||||||||||||||||||
PACE Intermediate Fixed Income Investments | |||||||||||||||||||||||
Net realized gain (loss)3 | |||||||||||||||||||||||
Futures contracts | $ | (1,711,970 | ) | $ | — | $ | — | $ | — | $ | (1,711,970 | ) | |||||||||||
Forward foreign currency contracts | — | (616,737 | ) | — | — | (616,737 | ) | ||||||||||||||||
Options and swaptions purchased | (31,640 | ) | (1,594,391 | ) | — | — | (1,626,031 | ) | |||||||||||||||
Options and swaptions written | (14,569 | ) | 1,593,063 | — | — | 1,578,494 | |||||||||||||||||
Swap agreements | 68,353 | — | 251,645 | — | 319,998 | ||||||||||||||||||
Total net realized gain (loss) | $ | (1,689,826 | ) | $ | (618,065 | ) | $ | 251,645 | $ | — | $ | (2,056,246 | ) | ||||||||||
Net change in unrealized appreciation (depreciation)4 | |||||||||||||||||||||||
Futures contracts | $ | (70,776 | ) | $ | — | $ | — | $ | — | $ | (70,776 | ) | |||||||||||
Forward foreign currency contracts | — | 19,437 | — | — | 19,437 | ||||||||||||||||||
Options and swaptions purchased | 22,682 | 42,175 | — | (8,571 | ) | 56,286 | |||||||||||||||||
Options and swaptions written | (17,853 | ) | (2,188 | ) | — | — | (20,041 | ) | |||||||||||||||
Swap agreements | (168,899 | ) | — | 6,171 | — | (162,728 | ) | ||||||||||||||||
Net change in appreciation (depreciation) | $ | (234,846 | ) | $ | 59,424 | $ | 6,171 | $ | (8,571 | ) | $ | (177,822 | ) | ||||||||||
At July 31, 2018, the Portfolio had the following derivatives categorized by underlying risk:
Asset derivatives1
| Interest rate risk | Foreign exchange risk | Credit risk | Equity risk | Total | |||||||||||||||||||
PACE Strategic Fixed Income Investments | |||||||||||||||||||||||
Futures contracts | $ | 295,397 | $ | 3,879 | $ | — | $ | — | $ | 299,276 | |||||||||||||
Forward foreign currency contracts | — | 2,240,966 | — | — | 2,240,966 | ||||||||||||||||||
Options and swaptions purchased | 210,839 | — | — | — | 210,839 | ||||||||||||||||||
Swap agreements | 3,181,535 | — | 3,744,129 | — | 6,925,664 | ||||||||||||||||||
Total value | $ | 3,687,771 | $ | 2,244,845 | $ | 3,744,129 | $ | — | $ | 9,676,745 | |||||||||||||
Liability derivatives2
| Interest rate risk | Foreign exchange risk | Credit risk | Equity risk | Total | |||||||||||||||||||
PACE Strategic Fixed Income Investments | |||||||||||||||||||||||
Futures contracts | $ | (1,870,467 | ) | $ | (11,031 | ) | $ | — | $ | — | $ | (1,881,498 | ) | ||||||||||
Forward foreign currency contracts | — | (2,282,093 | ) | — | — | (2,282,093 | ) | ||||||||||||||||
Options and swaptions written | (251,665 | ) | (46,274 | ) | — | — | (297,939 | ) | |||||||||||||||
Swap agreements | (1,002,138 | ) | — | (723,216 | ) | — | (1,725,354 | ) | |||||||||||||||
Total value | $ | (3,124,270 | ) | $ | (2,339,398 | ) | $ | (723,216 | ) | $ | — | $ | (6,186,884 | ) | |||||||||
Table footnotes begin on page 350
345
PACE Select Advisors Trust
Notes to financial statements
During the period ended July 31, 2018, net realized gains (losses) and net change in unrealized appreciation (depreciation) from derivatives were as follows:
| Interest rate risk | Foreign exchange risk | Credit risk | Equity risk | Total | |||||||||||||||||||
PACE Strategic Fixed Income Investments | |||||||||||||||||||||||
Net realized gain (loss)3 | |||||||||||||||||||||||
Futures contracts | $ | (7,504,780 | ) | $ | (78,991 | ) | $ | — | $ | — | $ | (7,583,771 | ) | ||||||||||
Forward foreign currency contracts | — | (2,088,152 | ) | — | — | (2,088,152 | ) | ||||||||||||||||
Options and swaptions purchased | (3,709 | ) | (14 | ) | — | — | (3,723 | ) | |||||||||||||||
Options and swaptions written | 253,653 | 934,594 | — | — | 1,188,247 | ||||||||||||||||||
Swap agreements | 2,403,925 | — | 1,697,805 | — | 4,101,730 | ||||||||||||||||||
Total net realized gain (loss) | $ | (4,850,911 | ) | $ | (1,232,563 | ) | $ | 1,697,805 | $ | — | $ | (4,385,669 | ) | ||||||||||
Net change in unrealized appreciation (depreciation)4 | |||||||||||||||||||||||
Futures contracts | $ | (2,567,038 | ) | $ | 19,010 | $ | — | $ | — | $ | (2,548,028 | ) | |||||||||||
Forward foreign currency contracts | — | 330,680 | — | — | 330,680 | ||||||||||||||||||
Options and swaptions purchased | 50,308 | — | — | — | 50,308 | ||||||||||||||||||
Options and swaptions written | (159,159 | ) | (204,742 | ) | — | — | (363,901 | ) | |||||||||||||||
Swap agreements | 775,472 | — | 505,719 | — | 1,281,191 | ||||||||||||||||||
Net change in appreciation (depreciation) | $ | (1,900,417 | ) | $ | 144,948 | $ | 505,719 | $ | — | $ | (1,249,750 | ) | |||||||||||
At July 31, 2018, the Portfolio had the following derivatives categorized by underlying risk:
Asset derivatives1
| Interest rate risk | Foreign exchange risk | Credit risk | Equity risk | Total | |||||||||||||||||||
| PACE Global Fixed Income Investments | |||||||||||||||||||||||
Futures contracts | $ | 145,433 | $ | — | $ | — | $ | — | $ | 145,433 | |||||||||||||
Forward foreign currency contracts | — | 667,645 | — | — | 667,645 | ||||||||||||||||||
Total value | $ | 145,433 | $ | 667,645 | $ | — | $ | — | $ | 813,078 | |||||||||||||
Liability derivatives2
| Interest rate risk | Foreign exchange risk | Credit risk | Equity risk | Total | |||||||||||||||||||
PACE Global Fixed Income Investments | |||||||||||||||||||||||
Futures contracts | $ | (75,231 | ) | $ | — | $ | — | $ | — | $ | (75,231 | ) | |||||||||||
Forward foreign currency contracts | — | (701,469 | ) | — | — | (701,469 | ) | ||||||||||||||||
Total value | $ | (75,231 | ) | $ | (701,469 | ) | $ | — | $ | — | $ | (776,700 | ) | ||||||||||
Table footnotes begin on page 350
346
PACE Select Advisors Trust
Notes to financial statements
During the period ended July 31, 2018, net realized gains (losses) and net change in unrealized appreciation (depreciation) from derivatives were as follows:
| Interest rate risk | Foreign exchange risk | Credit risk | Equity risk | Total | |||||||||||||||||||
PACE Global Fixed Income Investments | |||||||||||||||||||||||
Net realized gain (loss)3 | |||||||||||||||||||||||
Futures contracts | $ | 916,795 | $ | — | $ | — | $ | — | $ | 916,795 | |||||||||||||
Forward foreign currency contracts | — | 532,718 | — | — | 532,718 | ||||||||||||||||||
Total net realized gain (loss) | $ | 916,795 | $ | 532,718 | $ | — | $ | — | $ | 1,449,513 | |||||||||||||
Net change in unrealized appreciation (depreciation)4 | |||||||||||||||||||||||
Futures contracts | $ | (236,118 | ) | $ | — | $ | — | $ | — | $ | (236,118 | ) | |||||||||||
Forward foreign currency contracts | — | (146,599 | ) | — | — | (146,599 | ) | ||||||||||||||||
Net change in appreciation (depreciation) | $ | (236,118 | ) | $ | (146,599 | ) | $ | — | $ | — | $ | (382,717 | ) | ||||||||||
At July 31, 2018, the Portfolio had the following derivatives categorized by underlying risk:
Asset derivatives1
| Interest rate risk | Foreign exchange risk | Credit risk | Equity risk | Total | |||||||||||||||||||
PACE High Yield Investments | |||||||||||||||||||||||
Forward foreign currency contracts | $ | — | $ | 43,532 | $ | — | $ | — | $ | 43,532 | |||||||||||||
Liability derivatives2
| Interest rate risk | Foreign exchange risk | Credit risk | Equity risk | Total | |||||||||||||||||||
PACE High Yield Investments | |||||||||||||||||||||||
Forward foreign currency contracts | $ | — | $ | (553,581 | ) | $ | — | $ | — | $ | (553,581 | ) | |||||||||||
During the period ended July 31, 2018, net realized gains (losses) and net change in unrealized appreciation (depreciation) from derivatives were as follows:
| Interest rate risk | Foreign exchange risk | Credit risk | Equity risk | Total | |||||||||||||||||||
PACE High Yield Investments | |||||||||||||||||||||||
Net realized gain (loss)3 | |||||||||||||||||||||||
Forward foreign currency contracts | $ | — | $ | 1,630,248 | $ | — | $ | — | $ | 1,630,248 | |||||||||||||
Net change in unrealized appreciation (depreciation)4 | |||||||||||||||||||||||
Forward foreign currency contracts | $ | — | $ | 2,913,935 | $ | — | $ | — | $ | 2,913,935 | |||||||||||||
Table footnotes begin on page 350
347
PACE Select Advisors Trust
Notes to financial statements
At July 31, 2018, the Portfolio had the following derivatives categorized by underlying risk:
Liability derivatives2
| Interest rate risk | Foreign exchange risk | Credit risk | Equity risk | Total | |||||||||||||||||||
PACE International Equity Investments | |||||||||||||||||||||||
Forward foreign currency contracts | $ | — | $ | (740 | ) | $ | — | $ | — | $ | (740 | ) | |||||||||||
During the period ended July 31, 2018, net realized gains (losses) and net change in unrealized appreciation (depreciation) from derivatives were as follows:
| Interest rate risk | Foreign exchange risk | Credit risk | Equity risk | Total | |||||||||||||||||||
PACE International Equity Investments | |||||||||||||||||||||||
Net realized gain (loss)3 | |||||||||||||||||||||||
Forward foreign currency contracts | $ | — | $ | (42,454 | ) | $ | — | $ | — | $ | (42,454 | ) | |||||||||||
Net change in unrealized appreciation (depreciation)4 | |||||||||||||||||||||||
Forward foreign currency contracts | $ | — | $ | (740 | ) | $ | — | $ | — | $ | (740 | ) | |||||||||||
During the period ended July 31, 2018, net realized gains (losses) and net change in unrealized appreciation (depreciation) from derivatives were as follows:
| Interest rate risk | Foreign exchange risk | Credit risk | Equity risk | Total | |||||||||||||||||||
PACE International Emerging Markets Equity Investments | |||||||||||||||||||||||
Net realized gain (loss)3 | |||||||||||||||||||||||
Forward foreign currency contracts | $ | — | $ | (5,442 | ) | $ | — | $ | — | $ | (5,442 | ) | |||||||||||
During the period ended July 31, 2018, net realized gains (losses) and net change in unrealized appreciation (depreciation) from derivatives were as follows:
| Interest rate risk | Foreign exchange risk | Credit risk | Equity risk | Total | |||||||||||||||||||
PACE Global Real Estate Securities Investments | |||||||||||||||||||||||
Net realized gain (loss)3 | |||||||||||||||||||||||
Forward foreign currency contracts | $ | — | $ | 25,298 | $ | — | $ | — | $ | 25,298 | |||||||||||||
Table footnotes begin on page 350
348
PACE Select Advisors Trust
Notes to financial statements
At July 31, 2018, the Portfolio had the following derivatives categorized by underlying risk:
Asset derivatives1
| Interest rate risk | Foreign exchange risk | Credit risk | Equity risk | Total | |||||||||||||||||||
PACE Alternative Strategies Investments | |||||||||||||||||||||||
Futures contracts | $ | 389,771 | $ | — | $ | — | $ | 502,671 | $ | 892,442 | |||||||||||||
Forward foreign currency contracts | — | 13,906,633 | — | — | 13,906,633 | ||||||||||||||||||
Options and swaptions purchased | 4,668,266 | 399,808 | — | 2,775,753 | 7,843,827 | ||||||||||||||||||
Swap agreements | 1,239,350 | — | 467,371 | 2,068,569 | 3,775,290 | ||||||||||||||||||
Total value | $ | 6,297,387 | $ | 14,306,441 | $ | 467,371 | $ | 5,346,993 | $ | 26,418,192 | |||||||||||||
Liability derivatives2
| Interest rate risk | Foreign exchange risk | Credit risk | Equity risk | Total | |||||||||||||||||||
PACE Alternative Strategies Investments | |||||||||||||||||||||||
Futures contracts | $ | (298,323 | ) | $ | — | $ | — | $ | (624,680 | ) | $ | (923,003 | ) | ||||||||||
Forward foreign currency contracts | — | (11,616,599 | ) | — | — | (11,616,599 | ) | ||||||||||||||||
Options and swaptions written | (218,189 | ) | (7,293 | ) | — | (726,699 | ) | (952,181 | ) | ||||||||||||||
Swap agreements | (1,198,304 | ) | — | (612,483 | ) | (2,200,374 | ) | (4,011,161 | ) | ||||||||||||||
Total value | $ | (1,714,816 | ) | $ | (11,623,892 | ) | $ | (612,483 | ) | $ | (3,551,753 | ) | $ | (17,502,944 | ) | ||||||||
During the period ended July 31, 2018, net realized gains (losses) and net change in unrealized appreciation (depreciation) from derivatives were as follows:
| Interest rate risk | Foreign exchange risk | Credit risk | Equity risk | Total | |||||||||||||||||||
PACE Alternative Strategies Investments | |||||||||||||||||||||||
Net realized gain (loss)3 | |||||||||||||||||||||||
Futures contracts | $ | (1,131,041 | ) | $ | — | $ | — | $ | (2,009,194 | ) | $ | (3,140,235 | ) | ||||||||||
Forward foreign currency contracts | — | (9,398,160 | ) | — | — | (9,398,160 | ) | ||||||||||||||||
Options and swaptions purchased | (907,688 | ) | (2,773,804 | ) | — | (711,217 | ) | (4,392,709 | ) | ||||||||||||||
Options and swaptions written | 1,301,547 | 381,726 | — | 854,895 | 2,538,168 | ||||||||||||||||||
Swap agreements | (198,537 | ) | — | 1,426,622 | (1,629,069 | ) | (400,984 | ) | |||||||||||||||
Total net realized gain (loss) | $ | (935,719 | ) | $ | (11,790,238 | ) | $ | 1,426,622 | $ | (3,494,585 | ) | $ | (14,793,920 | ) | |||||||||
Net change in unrealized appreciation (depreciation)4 | |||||||||||||||||||||||
Futures contracts | $ | 598,173 | $ | — | $ | — | $ | 32,265 | $ | 630,438 | |||||||||||||
Forward foreign currency contracts | — | 5,711,001 | — | — | 5,711,001 | ||||||||||||||||||
Options and swaptions purchased | (459,719 | ) | (779,083 | ) | — | 1,412,332 | 173,530 | ||||||||||||||||
Options and swaptions written | (14,919 | ) | 64,819 | — | (489,587 | ) | (439,687 | ) | |||||||||||||||
Swap agreements | 775,139 | — | (451,448 | ) | 1,292,138 | 1,615,829 | |||||||||||||||||
Net change in appreciation (depreciation) | $ | 898,674 | $ | 4,996,737 | $ | (451,448 | ) | $ | 2,247,148 | $ | 7,691,111 | ||||||||||||
Table footnotes begin on page 350
349
PACE Select Advisors Trust
Notes to financial statements
1 In the Statement of assets and liabilities, options and swaptions purchased are shown within investments, at value, swap agreements (except centrally cleared swap agreements) are shown within swap agreements, at value, while forward foreign currency contracts are shown within unrealized appreciation on forward foreign currency contracts. Futures contracts are reported using cumulative appreciation on futures contracts and centrally cleared swap agreements are reported at value, as reported in the futures contracts and centrally cleared swap agreements tables at the end of the Portfolio of investments, respectively, but only the variation margin to be received, if any, is reported within the Statement of assets and liabilities.
2 In the Statement of assets and liabilities, options and swaptions written are shown within options and swaptions written, at value, swap agreements (except centrally cleared swap agreements) are shown within swap agreements, at value, while forward foreign currency contracts are shown within unrealized depreciation on forward foreign currency contracts. Futures contracts are reported using cumulative depreciation of futures contracts and centrally cleared swap agreements are reported at value, as reported in the futures contracts and centrally cleared swap agreements tables at the end of the Portfolio of investments, respectively, but only the variation margin to be paid, if any, is reported within the Statement of assets and liabilities.
3 The net realized gain (loss) is shown in the Statement of operations in net realized gains (losses) from futures, options and swaptions written, swap agreements and forward foreign currency contracts. The net realized gain (loss) on options and swaptions purchased is shown in the Statement of operations in net realized gains (losses) from investments.
4 The net change in unrealized appreciation/depreciation is shown in the Statement of operations in net change in unrealized appreciation/depreciation of futures, options and swaptions written, swap agreements and forward foreign currency contracts. The net change in unrealized appreciation/depreciation of options and swaptions purchased is shown in the Statement of operations in net change in unrealized appreciation/depreciation of investments.
Offsetting of certain derivatives—The Portfolios typically enter into International Swaps and Derivatives Association, Inc. Master Agreements ("ISDA Master Agreements") or similar master agreements with its OTC derivative contract counterparties in order to, among other things, reduce its credit risk to counterparties. ISDA Master Agreements include provisions for general obligations, representations, collateral and events of default or termination. Under an ISDA Master Agreement, the Portfolios typically may offset with the counterparty certain derivative financial instrument's payables and/or receivables with collateral held and/or posted and create one single net payment (close-out netting) in the event of default or termination. The Statement of assets and liabilities is presented gross of any netting.
At July 31, 2018, derivative assets and liabilities (by type) on a gross basis and derivatives subject to an enforceable master netting arrangement ("MNA") or similar were as follows:
PACE Mortgage-Backed Securities Fixed Income Investments
Derivative Financial Instruments: | Assets | Liabilities | |||||||||
Futures contracts1 | $ | — | $ | (11,838 | ) | ||||||
Options and swaptions purchased | 213,526 | — | |||||||||
Options and swaptions written | — | (68,170 | ) | ||||||||
Swap agreements1 | 2,805,936 | (125,311 | ) | ||||||||
Total gross amount of derivative assets and liabilities in the Statement of Assets and Liabilities | 3,019,462 | (205,319 | ) | ||||||||
Derivatives not subject to MNA or similar agreements | (2,805,317 | ) | 112,125 | ||||||||
Total gross amount of assets and liabilities subject to MNA or similar agreements | $ | 214,145 | $ | (93,194 | ) | ||||||
350
PACE Select Advisors Trust
Notes to financial statements
The following tables present the Portfolio's derivative assets and liabilities by counterparty net of amounts available for offset under a MNA and net of the related collateral received/pledged by the Portfolio as of the period end.
PACE Mortgage-Backed Securities Fixed Income Investments
| Counterparty | Gross amount of assets | Financial instruments and derivatives available for offset | Collateral received2 | Net amount of assets | |||||||||||||||
BNP | $ | 3,067 | $ | — | $ | — | $ | 3,067 | |||||||||||
CITI | 94,006 | (26,180 | ) | (67,826 | ) | — | |||||||||||||
JPMCB | 4,906 | (4,906 | ) | — | — | ||||||||||||||
MSCI | 112,166 | — | (63,000 | ) | 49,166 | ||||||||||||||
Total | $ | 214,145 | $ | (31,086 | ) | $ | (130,826 | ) | $ | 52,233 | |||||||||
| Counterparty | Gross amount of liabilities | Financial instruments and derivatives available for offset | Collateral pledged2 | Net amount of liabilities | |||||||||||||||
CITI | $ | (26,180 | ) | $ | 26,180 | $ | — | $ | — | ||||||||||
CSI | (23 | ) | — | — | (23 | ) | |||||||||||||
DB | (6,113 | ) | — | — | (6,113 | ) | |||||||||||||
GSI | (9,226 | ) | — | — | (9,226 | ) | |||||||||||||
JPMCB | (51,652 | ) | 4,906 | — | (46,746 | ) | |||||||||||||
Total | $ | (93,194 | ) | $ | 31,086 | $ | — | $ | (62,108 | ) | |||||||||
At July 31, 2018, derivative assets and liabilities (by type) on a gross basis and derivatives subject to an enforceable master netting arrangement ("MNA") or similar were as follows:
PACE Intermediate Fixed Income Investments
Derivative Financial Instruments: | Assets | Liabilities | |||||||||
Forward foreign currency contracts | $ | 102,170 | $ | (44,247 | ) | ||||||
Futures contracts1 | 96,274 | (173,876 | ) | ||||||||
Options and swaptions purchased | 831,767 | — | |||||||||
Options and swaptions written | — | (1,279,932 | ) | ||||||||
Swap agreements1 | 217,213 | (329,832 | ) | ||||||||
Total gross amount of derivative assets and liabilities in the Statement of Assets and Liabilities | 1,247,424 | (1,827,887 | ) | ||||||||
Derivatives not subject to MNA or similar agreements | (298,866 | ) | 503,708 | ||||||||
Total gross amount of assets and liabilities subject to MNA or similar agreements | $ | 948,558 | $ | (1,324,179 | ) | ||||||
Table footnotes begin on page 356
351
PACE Select Advisors Trust
Notes to financial statements
The following tables present the Portfolio's derivative assets and liabilities by counterparty net of amounts available for offset under a MNA and net of the related collateral received/pledged by the Portfolio as of the period end.
PACE Intermediate Fixed Income Investments
| Counterparty | Gross amount of assets | Financial instruments and derivatives available for offset | Collateral received2 | Net amount of assets | |||||||||||||||
ANZ | $ | 15,026 | $ | — | $ | — | $ | 15,026 | |||||||||||
BOA | 496,633 | (217,360 | ) | (230,000 | ) | 49,273 | |||||||||||||
CSI | 49,541 | (32,541 | ) | (17,000 | ) | — | |||||||||||||
GS | 284,926 | (284,926 | ) | — | — | ||||||||||||||
HSBC | 30,265 | (9,135 | ) | — | 21,130 | ||||||||||||||
JPMCB | 66,973 | (51,995 | ) | (14,978 | ) | — | |||||||||||||
RBS | 5,194 | — | — | 5,194 | |||||||||||||||
Total | $ | 948,558 | $ | (595,957 | ) | $ | (261,978 | ) | $ | 90,623 | |||||||||
| Counterparty | Gross amount of liabilities | Financial instruments and derivatives available for offset | Collateral pledged2 | Net amount of liabilities | |||||||||||||||
BOA | $ | (217,360 | ) | $ | 217,360 | $ | — | $ | — | ||||||||||
CSI | (32,541 | ) | 32,541 | — | — | ||||||||||||||
GS | (985,044 | ) | 284,926 | — | (700,118 | ) | |||||||||||||
HSBC | (9,135 | ) | 9,135 | — | — | ||||||||||||||
JPMCB | (51,995 | ) | 51,995 | — | — | ||||||||||||||
NTC | (28,104 | ) | — | — | (28,104 | ) | |||||||||||||
Total | $ | (1,324,179 | ) | $ | 595,957 | $ | — | $ | (728,222 | ) | |||||||||
At July 31, 2018, derivative assets and liabilities (by type) on a gross basis and derivatives subject to an enforceable master netting arrangement ("MNA") or similar were as follows:
PACE Strategic Fixed Income Investments
Derivative Financial Instruments: | Assets | Liability | |||||||||
Forward foreign currency contracts | $ | 2,240,966 | $ | (2,282,093 | ) | ||||||
Futures contracts1 | 299,276 | (1,881,498 | ) | ||||||||
Options and swaptions purchased | 210,839 | — | |||||||||
Options and swaptions written | — | (297,939 | ) | ||||||||
Swap agreements1 | 6,925,664 | (1,725,354 | ) | ||||||||
Total gross amount of derivative assets and liabilities in the Statement of Assets and Liabilities | 9,676,745 | (6,186,884 | ) | ||||||||
Derivatives not subject to MNA or similar agreements | (7,215,637 | ) | 3,589,372 | ||||||||
Total gross amount of assets and liabilities subject to MNA or similar agreements | $ | 2,461,108 | $ | (2,597,512 | ) | ||||||
Table footnotes begin on page 356
352
PACE Select Advisors Trust
Notes to financial statements
The following tables present the Portfolio's derivative assets and liabilities by counterparty net of amounts available for offset under a MNA and net of the related collateral received/pledged by the Portfolio as of the period end.
PACE Strategic Fixed Income Investments
| Counterparty | Gross amount of assets | Instruments and derivatives available for offset | Collateral received | Net amount of assets | |||||||||||||||
BB | $ | 12,559 | $ | (12,559 | ) | $ | — | $ | — | ||||||||||
BNP | 250,025 | (102,832 | ) | — | 147,193 | ||||||||||||||
BOA | 510,666 | (83,259 | ) | (270,000 | ) | 157,407 | |||||||||||||
CITI | 118,517 | (118,517 | ) | — | — | ||||||||||||||
CSI | 16,266 | (16,266 | ) | — | — | ||||||||||||||
DB | 22,630 | (22,630 | ) | — | — | ||||||||||||||
GSB | 73,907 | (73,907 | ) | — | — | ||||||||||||||
GSI | 525,276 | (525,276 | ) | — | — | ||||||||||||||
JPMCB | 794,330 | (330,307 | ) | (400,000 | ) | 64,023 | |||||||||||||
MSCI | 136,932 | (136,932 | ) | — | — | ||||||||||||||
Total | $ | 2,461,108 | $ | (1,422,485 | ) | $ | (670,000 | ) | $ | 368,623 | |||||||||
| Counterparty | Gross amount of liabilities | Financial instruments and derivatives available for offset | Collateral pledged | Net amount of liabilities | |||||||||||||||
BB | $ | (182,127 | ) | $ | 12,559 | $ | — | $ | (169,568 | ) | |||||||||
BNP | (102,832 | ) | 102,832 | — | — | ||||||||||||||
BOA | (83,259 | ) | 83,259 | — | — | ||||||||||||||
CITI | (602,901 | ) | 118,517 | — | (484,384 | ) | |||||||||||||
CSI | (67,796 | ) | 16,266 | — | (51,530 | ) | |||||||||||||
DB | (185,635 | ) | 22,630 | — | (163,005 | ) | |||||||||||||
GSB | (110,813 | ) | 73,907 | — | (36,906 | ) | |||||||||||||
GSI | (684,705 | ) | 525,276 | — | (159,429 | ) | |||||||||||||
HSBC | (98,365 | ) | — | — | (98,365 | ) | |||||||||||||
JPMCB | (330,307 | ) | 330,307 | — | — | ||||||||||||||
MSCI | (148,772 | ) | 136,932 | — | (11,840 | ) | |||||||||||||
Total | $ | (2,597,512 | ) | $ | 1,422,485 | $ | — | $ | (1,175,027 | ) | |||||||||
Table footnotes begin on page 356
353
PACE Select Advisors Trust
Notes to financial statements
At July 31, 2018, derivative assets and liabilities (by type) on a gross basis and derivatives subject to an enforceable master netting arrangement ("MNA") or similar were as follows:
PACE Global Fixed Income Investments
Derivative Financial Instruments: | Assets | Liabilities | |||||||||
Forward foreign currency contracts | $ | 667,645 | $ | (701,469 | ) | ||||||
Futures contracts1 | 145,433 | (75,231 | ) | ||||||||
Total gross amount of derivative assets and liabilities in the Statement of Assets and Liabilities | 813,078 | (776,700 | ) | ||||||||
Derivatives not subject to MNA or similar agreements | (813,078 | ) | 776,700 | ||||||||
Total gross amount of assets and liabilities subject to MNA or similar agreements | $ | — | $ | — | |||||||
At July 31, 2018, derivative assets and liabilities (by type) on a gross basis and derivatives subject to an enforceable master netting arrangement ("MNA") or similar were as follows:
PACE High Yield Investments
Derivative Financial Instruments: | Assets | Liabilities | |||||||||
Forward foreign currency contracts | $ | 43,532 | $ | (553,581 | ) | ||||||
Total gross amount of derivative assets and liabilities in the Statement of Assets and Liabilities | 43,532 | (553,581 | ) | ||||||||
Derivatives not subject to MNA or similar agreements | (43,532 | ) | 553,581 | ||||||||
Total gross amount of assets and liabilities subject to MNA or similar agreements | $ | — | $ | — | |||||||
At July 31, 2018, derivative assets and liabilities (by type) on a gross basis and derivatives subject to an enforceable master netting arrangement ("MNA") or similar were as follows:
PACE International Equity Investments
Derivative Financial Instruments: | Assets | Liabilities | |||||||||
Forward foreign currency contracts | $ | — | $ | (740 | ) | ||||||
Total gross amount of derivative assets and liabilities in the Statement of Assets and Liabilities | — | (740 | ) | ||||||||
Derivatives not subject to MNA or similar agreements | — | 740 | |||||||||
Total gross amount of assets and liabilities subject to MNA or similar agreements | $ | — | $ | — | |||||||
Table footnotes begin on page 356
354
PACE Select Advisors Trust
Notes to financial statements
At July 31, 2018, derivative assets and liabilities (by type) on a gross basis and derivatives subject to an enforceable master netting arrangement ("MNA") or similar were as follows:
PACE Alternative Strategies Investments
Derivative Financial Instruments: | Assets | Liabilities | |||||||||
Forward foreign currency contracts | $ | 13,906,633 | $ | (11,616,599 | ) | ||||||
Futures contracts1 | 892,442 | (923,003 | ) | ||||||||
Options and swaptions purchased | 7,843,827 | — | |||||||||
Options and swaptions written | — | (952,181 | ) | ||||||||
Swap agreements1 | 3,775,290 | (4,011,161 | ) | ||||||||
Total gross amount of derivative assets and liabilities in the Statement of Assets and Liabilities | 26,418,192 | (17,502,944 | ) | ||||||||
Derivatives not subject to MNA or similar agreements | (4,744,671 | ) | 2,535,394 | ||||||||
Total gross amount of assets and liabilities subject to MNA or similar agreements | $ | 21,673,521 | $ | (14,967,550 | ) | ||||||
The following tables present the Portfolio's derivative assets and liabilities by counterparty net of amounts available for offset under a MNA and net of the related collateral received/pledged by the Portfolio as of the period end.
PACE Alternative Strategies Investments
| Counterparty | Gross amount of assets | Financial instruments and derivatives available for offset | Collateral received2 | Net amount of assets | |||||||||||||||
ANZ | $ | 446,025 | $ | (313,065 | ) | $ | (132,960 | ) | $ | — | |||||||||
BB | 1,760,924 | (1,760,924 | ) | — | — | ||||||||||||||
BNP | 1,324,444 | (1,108,861 | ) | — | 215,583 | ||||||||||||||
BOA | 350,661 | (43,884 | ) | — | 306,777 | ||||||||||||||
CITI | 4,043,627 | (2,398,046 | ) | — | 1,645,581 | ||||||||||||||
DB | 854,231 | (395,919 | ) | — | 458,312 | ||||||||||||||
GS | 3,251,659 | (378,351 | ) | — | 2,873,308 | ||||||||||||||
GSI | 3,434,774 | (2,270,919 | ) | — | 1,163,855 | ||||||||||||||
JPMCB | 3,064,889 | (2,975,908 | ) | (21,647 | ) | 67,334 | |||||||||||||
MSCI | 1,836,421 | (1,610,614 | ) | 225,807 | |||||||||||||||
SG | 1,305,866 | (898,196 | ) | — | 407,670 | ||||||||||||||
Total | $ | 21,673,521 | $ | (14,154,687 | ) | $ | (154,607 | ) | $ | 7,364,227 | |||||||||
Table footnotes begin on page 356
355
PACE Select Advisors Trust
Notes to financial statements
| Counterparty | Gross amount of liabilities | Financial instruments and derivatives available for offset | Collateral pledged2 | Net amount of liabilities | |||||||||||||||
ANZ | $ | (313,065 | ) | $ | 313,065 | $ | — | $ | — | ||||||||||
BB | (2,573,787 | ) | 1,760,924 | — | (812,863 | ) | |||||||||||||
BNP | (1,108,861 | ) | 1,108,861 | — | — | ||||||||||||||
BOA | (43,884 | ) | 43,884 | — | — | ||||||||||||||
CITI | (2,398,046 | ) | 2,398,046 | — | — | ||||||||||||||
DB | (395,919 | ) | 395,919 | — | — | ||||||||||||||
GS | (378,351 | ) | 378,351 | — | — | ||||||||||||||
GSI | (2,270,919 | ) | 2,270,919 | — | — | ||||||||||||||
JPMCB | (2,975,908 | ) | 2,975,908 | — | — | ||||||||||||||
MSCI | (1,610,614 | ) | 1,610,614 | — | — | ||||||||||||||
SG | (898,196 | ) | 898,196 | — | — | ||||||||||||||
Total | $ | (14,967,550 | ) | $ | 14,154,687 | $ | — | $ | (812,863 | ) | |||||||||
1 Includes cumulative appreciation/depreciation of futures contracts and centrally cleared swaps, at value as reported in the futures contracts and centrally cleared swaps tables in the Portfolio of investments, but only the unpaid variation margin is reported within the Statement of assets and liabilities within variation margin on futures contracts and centrally cleared swap agreements, respectively.
2 In some instances, the actual collateral received and/or pledged may be more than the amount shown and may be comprised of cash collateral, non-cash collateral or combination of both.
Investment management and administration fees and other transactions with affiliates
The Trust has entered into an investment management and administration contract ("Management Contract") with UBS AM. In accordance with the Management Contract, each Portfolio paid UBS AM investment management and administration fees, which were accrued daily and paid monthly, in accordance with the following schedule as of July 31, 2018:
Portfolio | Annual rate as a percentage of each Portfolio's average daily net assets | ||||||
PACE Government Money Market Investments | 0.350% | ||||||
PACE Mortgage-Backed Securities Fixed Income Investments | 0.650% up to $250 million 0.600% above $250 million up to $500 million 0.575% above $500 million up to $750 million 0.550% above $750 million up to $1 billion 0.525% above $1 billion | ||||||
PACE Intermediate Fixed Income Investments | 0.550% up to $250 million 0.500% above $250 million up to $500 million 0.475% above $500 million up to $750 million 0.450% above $750 million up to $1 billion 0.425% above $1 billion | ||||||
PACE Strategic Fixed Income Investments | 0.650% up to $250 million 0.600% above $250 million up to $500 million 0.575% above $500 million up to $750 million 0.550% above $750 million up to $1 billion 0.525% above $1 billion up to $1.25 billion 0.500% above $1.25 billion | ||||||
PACE Municipal Fixed Income Investments | 0.550% up to $250 million 0.500% above $250 million up to $500 million 0.475% above $500 million up to $750 million 0.450% above $750 million up to $1 billion 0.425% above $1 billion | ||||||
356
PACE Select Advisors Trust
Notes to financial statements
Portfolio | Annual rate as a percentage of each Portfolio's average daily net assets | ||||||
PACE Global Fixed Income Investments | 0.750% up to $500 million 0.725% above $500 million up to $1 billion 0.700% above $1 billion | ||||||
PACE High Yield Investments | 0.800% up to $500 million 0.750% above $500 million up to $1 billion 0.725% above $1 billion up to $1.5 billion 0.700% above $1.5 billion up to $2 billion 0.675% above $2 billion | ||||||
PACE Large Co Value Equity Investments | 0.800% up to $250 million 0.770% above $250 million up to $500 million 0.730% above $500 million up to $1 billion 0.700% above $1 billion | ||||||
PACE Large Co Growth Equity Investments | 0.800% up to $500 million 0.775% above $500 million up to $1 billion 0.750% above $1 billion up to $1.5 billion 0.725% above $1.5 billion up to $2 billion 0.700% above $2 billion | ||||||
PACE Small/Medium Co Value Equity Investments | 0.800% up to $500 million 0.775% above $500 million | ||||||
PACE Small/Medium Co Growth Equity Investments | 0.800% up to $500 million 0.775% above $500 million | ||||||
PACE International Equity Investments | 0.900% up to $500 million 0.875% above $500 million up to $1 billion 0.850% above $1 billion up to $1.5 billion 0.825% above $1.5 billion up to $2 billion 0.800% above $2 billion | ||||||
PACE International Emerging Markets Equity Investments | 1.100% up to $500 million 1.075% above $500 million up to $1 billion 1.050% above $1 billion up to $1.5 billion 1.025% above $1.5 billion up to $2 billion 1.000% above $2 billion | ||||||
PACE Global Real Estate Securities Investments | 0.800% up to $500 million 0.750% above $500 million up to $1 billion 0.725% above $1 billion up to $1.5 billion 0.700% above $1.5 billion up to $2 billion 0.675% above $2 billion | ||||||
PACE Alternative Strategies Investments | 1.400% up to $500 million 1.350% above $500 million up to $1 billion 1.300% above $1 billion up to $1.5 billion 1.275% above $1.5 billion up to $2 billion 1.250% above $2 billion | ||||||
Under separate Subdvisory Agreements, with the exception of PACE Government Money Market Investments, UBS AM (not the Portfolios) pays the following investment subadvisors a fee from the investment management and administration fees which UBS AM receives, which is accrued daily and paid monthly:
Portfolio | Investment subadvisor | ||||||
PACE Mortgage-Backed Securities Fixed Income Investments | Pacific Investment Management Company LLC | ||||||
PACE Intermediate Fixed Income Investments | BlackRock Financial Management, Inc. | ||||||
PACE Strategic Fixed Income Investments | Pacific Investment Management Company LLC Neuberger Berman Investment Advisers LLC | ||||||
357
PACE Select Advisors Trust
Notes to financial statements
Portfolio | Investment subadvisor | ||||||
PACE Municipal Fixed Income Investments | Standish Mellon Asset Management Company LLC | ||||||
PACE Global Fixed Income Investments | J.P. Morgan Investment Management Inc. | ||||||
PACE High Yield Investments | Nomura Corporate Research and Asset Management, Inc. | ||||||
PACE Large Co Value Equity Investments | Los Angeles Capital Management and Equity Research, Inc. River Road Asset Management, LLC Pzena Investment Management, LLC Boston Partners Global Investors Inc. | ||||||
PACE Large Co Growth Equity Investments | Jackson Square Partners, LLC J.P. Morgan Investment Management Inc. Mar Vista Investment Partners, LLC | ||||||
PACE Small/Medium Co Value Equity Investments | Kayne Anderson Rudnick Investment Management, LLC Sapience Investments, LLC Systematic Financial Management, L.P. Huber Capital Management LLC | ||||||
PACE Small/Medium Co Growth Equity Investments | LMCG Investments, LLC Riverbridge Partners, LLC Timpani Capital Management LLC | ||||||
PACE International Equity Investments | Robert W. Baird & Co. Incorporated Los Angeles Capital Management and Equity Research, Inc. Mondrian Investment Partners Ltd. | ||||||
PACE International Emerging Markets Equity Investments | LMCG Investments, LLC Mondrian Investment Partners Ltd. William Blair & Company LLC | ||||||
PACE Global Real Estate Securities Investments | Brookfield Investment Management Inc. | ||||||
PACE Alternative Strategies Investments1 | Analytic Investors, LLC AQR Capital Management LLC Aviva Investors America LLC First Quadrant L.P. PCJ Investment Counsel Ltd. Sirios Capital Management, L.P. Standard Life Investments (Corporate Funds) Limited Principal Global Investors, LLC Kettle Hill Capital Management, LLC | ||||||
1 UBS Asset Management (Americas) Inc. has the authority to allocate a portion of the Portfolio's assets to unaffiliated actively- and passively-managed pooled investment vehicles and index futures.
At July 31, 2018, the Portfolios owe UBS AM for investment management and administration fees, net of fee waivers/expense reimbursements and/or recoupments as follows:
Portfolio | Amounts due to UBS AM | ||||||
PACE Government Money Market Investments | $ | 33,942 | |||||
PACE Mortgage-Backed Securities Fixed Income Investments | 162,080 | ||||||
PACE Intermediate Fixed Income Investments | 159,945 | ||||||
PACE Strategic Fixed Income Investments | 384,140 | ||||||
PACE Municipal Fixed Income Investments | 147,285 | ||||||
PACE Global Fixed Income Investments | 224,626 | ||||||
PACE High Yield Investments | 235,249 | ||||||
PACE Large Co Value Equity Investments | 824,746 | ||||||
PACE Large Co Growth Equity Investments | 923,900 | ||||||
358
PACE Select Advisors Trust
Notes to financial statements
Portfolio | Amounts due to UBS AM | ||||||
PACE Small/Medium Co Value Equity Investments | $ | 381,246 | |||||
PACE Small/Medium Co Growth Equity Investments | 382,379 | ||||||
PACE International Equity Investments | 877,045 | ||||||
PACE International Emerging Markets Equity Investments | 435,619 | ||||||
PACE Global Real Estate Securities Investments | 69,197 | ||||||
PACE Alternative Strategies Investments | 698,555 | ||||||
UBS AM had entered into a written fee waiver agreement with PACE Mortgage-Backed Securities Fixed Income Investments, under which UBS AM was contractually obligated to waive its management fees to the extent necessary to reflect the lower subadvisory fees paid by UBS AM to Pacific Investment Management Company LLC. This waiver will not be subject to future recoupment and was terminated effective December 1, 2017.
UBS AM had agreed to lower its management fee so that the annual fee rate for management services (but not the administrative services) for PACE Global Fixed Income Investments Portfolios did not exceed the following rate: $0 to $500 million—0.600%; in excess of $500 million up to $1 billion—0.575%; and over $1 billion—0.550%. UBS AM had further voluntarily waived its fees in the following amounts for PACE Global Fixed Income Investments and PACE High Yield Investments: 0.100% and 0.100%, respectively, through November 30, 2017. These management fee waivers will not be subject to future recoupment and were terminated effective December 1, 2017.
For the year ended July 31, 2018, UBS AM was contractually obligated to waive as follows:
| Management fees waived | |||||||
PACE Mortgage-Backed Securities Fixed Income Investments | $ | 66,473 | |||||
PACE Global Fixed Income Investments | 221,199 | ||||||
PACE High Yield Investments | 127,272 | ||||||
Additionally, PACE Alternative Strategies Investments and UBS AM have entered into a written fee waiver agreement pursuant to which UBS AM is contractually obligated to waive its management fees to the extent necessary to offset the cost savings to UBS AM for allocating a portion of the Portfolio's assets to other unaffiliated pooled investment vehicles and index futures. The fee waiver agreement may be terminated by the Portfolio's Board at any time and also will be terminated automatically upon the expiration or termination of the Portfolio's advisory contract with UBS AM. For the year ended July 31, 2018, UBS AM was contractually obligated to waive $447,757 in investment management and administration fees. This management fee waiver will not be subject to future recoupment.
With respect to the following Portfolios, UBS AM voluntarily waived its management fees to the extent necessary to reflect lower subadvisory fees paid. This management fee waiver will not be subject to future recoupment and was terminated effective December 1, 2017. For the year ended July 31, 2018, UBS AM voluntarily waived fees of:
Portfolio | Management fees waived | ||||||
PACE Intermediate Fixed Income Investments | $ | 15,714 | |||||
PACE High Yield Investments | 222,726 | ||||||
PACE Large Co Value Equity Investments | 56,044 | ||||||
PACE Large Co Growth Equity Investments | 33,676 | ||||||
PACE Small/Medium Co Growth Equity Investments | 72,219 | ||||||
PACE International Equity Investments | 117,858 | ||||||
PACE Alternative Strategies Investments | 99,425 | ||||||
359
PACE Select Advisors Trust
Notes to financial statements
Additionally, with respect to PACE Government Money Market Investments, UBS AM may voluntarily waive fees and/or reimburse expenses from time to time in the event that the Portfolio's yield falls below a certain level. Once started, there is no guarantee that UBS AM would continue to voluntarily waive an additional portion of its fees and/or reimburse expenses. This management fee waiver will not be subject to future recoupment. For the year ended July 31, 2018, UBS AM did not voluntarily waive and/or reimburse expenses for PACE Government Money Market Investments for that purpose.
UBS AM is contractually obligated to waive all or a portion of its investment management and administration fees and/or to reimburse the Portfolios for certain operating expenses in order to maintain the total annual ordinary operating expenses of each class (with certain exclusions such as dividend expense, borrowing costs and interest expense, relating to short sales, and expenses attributable to investment in other companies, interest, taxes, brokerage commissions and extraordinary expenses) through November 30, 2018 at a level not to exceed the amounts in the table below.
Each Portfolio will repay UBS AM for any such waived fees/reimbursed expenses during a three-year period following July 31, 2015, to the extent that ordinary operating expenses (with certain exclusions such as dividend expense, borrowing costs and interest expense) are otherwise below the applicable expense cap in effect at the time the fees or expenses were waived/reimbursed. The fee waivers/expense reimbursements, portions of which are subject to repayment by the Portfolios through July 31, 2021, and recoupments for the year ended July 31, 2018 were as follows:
Portfolio | Class A expense cap | Class C expense cap | Class Y expense cap | Class P expense cap | Fee waivers/ expense reimbursements | Recoupments | |||||||||||||||||||||
PACE Government Money Market Investments | N/A | N/A | N/A | 0.60 | % | $ | 409,180 | $ | — | ||||||||||||||||||
PACE Mortgage-Backed Securities Fixed Income Investments | 0.97 | % | 1.47 | % | 0.72 | % | 0.72 | 819,644 | — | ||||||||||||||||||
PACE Intermediate Fixed Income Investments | 0.93 | 1.43 | 0.68 | 0.68 | 465,244 | — | |||||||||||||||||||||
PACE Strategic Fixed Income Investments | 0.96 | 1.46 | 0.71 | 0.71 | 646,500 | — | |||||||||||||||||||||
PACE Municipal Fixed Income Investments | 0.82 | 1.32 | 0.57 | 0.57 | 350,329 | — | |||||||||||||||||||||
PACE Global Fixed Income Investments1 | 1.06 | 1.54 | 0.90 | 0.87 | 559,285 | — | |||||||||||||||||||||
PACE High Yield Investments1 | 1.06 | 1.56 | 0.88 | 0.91 | 231,301 | — | |||||||||||||||||||||
PACE Large Co Value Equity Investments1 | 1.14 | 1.89 | 0.89 | 0.89 | — | — | |||||||||||||||||||||
PACE Large Co Growth Equity Investments1 | 1.18 | 1.93 | 0.93 | 0.93 | — | — | |||||||||||||||||||||
PACE Small/Medium Co Value Equity Investments1 | 1.29 | 2.04 | 1.04 | 1.04 | 63,558 | — | |||||||||||||||||||||
PACE Small/Medium Co Growth Equity Investments1 | 1.33 | 2.08 | 1.08 | 1.08 | — | — | |||||||||||||||||||||
PACE International Equity Investments1 | 1.35 | 2.10 | 1.10 | 1.10 | — | — | |||||||||||||||||||||
PACE International Emerging Markets Equity Investments | 1.70 | 2.45 | 1.45 | 1.45 | 216,624 | — | |||||||||||||||||||||
PACE Global Real Estate Securities Investments | 1.45 | 2.20 | 1.202 | 1.20 | 449,830 | — | |||||||||||||||||||||
PACE Alternative Strategies Investments | 1.88 | 2.63 | 1.63 | 1.63 | — | — | |||||||||||||||||||||
1 Expense caps in the table above became effective December 1, 2017. Prior to December 1, 2017, expense caps were as follows:
Portfolio | Class A expense cap | Class C expense cap | Class Y expense cap | Class P expense cap | |||||||||||||||
PACE Global Fixed Income Investments | 1.25 | % | 1.75 | % | 1.00 | % | 1.00 | % | |||||||||||
PACE High Yield Investments | 1.28 | 1.78 | 1.03 | 1.03 | |||||||||||||||
PACE Large Co Value Equity Investments | 1.27 | 2.02 | 1.02 | 1.02 | |||||||||||||||
PACE Large Co Growth Equity Investments | 1.30 | 2.05 | 1.05 | 1.05 | |||||||||||||||
PACE Small/Medium Co Value Equity Investments | 1.41 | 2.16 | 1.16 | 1.16 | |||||||||||||||
PACE Small/Medium Co Growth Equity Investments | 1.38 | 2.13 | 1.13 | 1.13 | |||||||||||||||
PACE International Equity Investments | 1.55 | 2.30 | 1.30 | 1.30 | |||||||||||||||
2 Class Y closed as of January 25, 2018.
360
PACE Select Advisors Trust
Notes to financial statements
At July 31, 2018, the following Portfolios had remaining fee waivers/expense reimbursements subject to repayment to UBS AM and respective dates of expiration as follows:
Portfolio | Fee waivers/ expense reimbursements subject to repayment | Expires July 31, 2019 | Expires July 31, 2020 | Expires July 31, 2021 | |||||||||||||||
PACE Government Money Market Investments | $ | 1,786,903 | $ | 706,786 | $ | 670,937 | $ | 409,180 | |||||||||||
PACE Mortgage-Backed Fixed Income Investments—Class A | 84,395 | 26,932 | 23,641 | 33,822 | |||||||||||||||
PACE Mortgage-Backed Fixed Income Investments—Class C | 25,787 | 10,225 | 7,603 | 7,959 | |||||||||||||||
PACE Mortgage-Backed Fixed Income Investments—Class Y | 267,916 | 59,611 | 105,223 | 103,082 | |||||||||||||||
PACE Mortgage-Backed Fixed Income Investments—Class P | 1,874,024 | 617,442 | 581,801 | 674,781 | |||||||||||||||
PACE Intermediate Fixed Income Investments—Class A | 39,081 | 16,399 | 12,254 | 10,428 | |||||||||||||||
PACE Intermediate Fixed Income Investments—Class C | 3,203 | 1,604 | 1,058 | 541 | |||||||||||||||
PACE Intermediate Fixed Income Investments—Class Y | 2,782 | 1,065 | 881 | 836 | |||||||||||||||
PACE Intermediate Fixed Income Investments—Class P | 1,502,204 | 555,469 | 493,296 | 453,439 | |||||||||||||||
PACE Strategic Fixed Income Investments—Class A | 13,766 | — | 8,002 | 5,764 | |||||||||||||||
PACE Strategic Fixed Income Investments—Class C | 8,113 | — | 5,921 | 2,192 | |||||||||||||||
PACE Strategic Fixed Income Investments—Class Y | 6,663 | — | 4,185 | 2,478 | |||||||||||||||
PACE Strategic Fixed Income Investments—Class P | 1,447,611 | — | 811,545 | 636,066 | |||||||||||||||
PACE Municipal Fixed Income Investments—Class A | 39,809 | — | — | 39,809 | |||||||||||||||
PACE Municipal Fixed Income Investments—Class C | 5,769 | — | — | 5,769 | |||||||||||||||
PACE Municipal Fixed Income Investments—Class Y | 109 | — | — | 109 | |||||||||||||||
PACE Municipal Fixed Income Investments—Class P | 304,642 | — | — | 304,642 | |||||||||||||||
PACE Global Fixed Income Investments—Class A | 43,394 | — | — | 43,394 | |||||||||||||||
PACE Global Fixed Income Investments—Class C | 2,295 | — | — | 2,295 | |||||||||||||||
PACE Global Fixed Income Investments—Class Y | 3,952 | — | — | 3,952 | |||||||||||||||
PACE Global Fixed Income Investments—Class P | 509,644 | — | — | 509,644 | |||||||||||||||
PACE High Yield Investments—Class A | 2,186 | — | — | 2,186 | |||||||||||||||
PACE High Yield Investments—Class C | 694 | — | — | 694 | |||||||||||||||
PACE High Yield Investments—Class P | 228,596 | — | — | 228,596 | |||||||||||||||
PACE Small/Medium Co Value Equity Investments—Class P | 63,558 | — | — | 63,558 | |||||||||||||||
PACE Small/Medium Co Growth Equity Investments—Class Y | 144 | — | 144 | — | |||||||||||||||
PACE International Emerging Markets Equity Investments A | 2,617 | — | 1,829 | 788 | |||||||||||||||
PACE International Emerging Markets Equity Investments C | 610 | — | 610 | — | |||||||||||||||
PACE International Emerging Markets Equity Investments Y | 2,846 | — | 2,637 | 209 | |||||||||||||||
PACE International Emerging Markets Equity Investments P | 571,729 | — | 355,968 | 215,761 | |||||||||||||||
PACE Global Real Estate Securities Investments—Class A | 1,245 | 682 | 365 | 198 | |||||||||||||||
PACE Global Real Estate Securities Investments—Class C | 222 | 182 | 40 | — | |||||||||||||||
PACE Global Real Estate Securities Investments—Class Y | 691 | 556 | 79 | 56 | |||||||||||||||
PACE Global Real Estate Securities Investments—Class P | 1,519,126 | 545,960 | 523,554 | 449,612 | |||||||||||||||
For the year ended July 31, 2018, the Portfolios listed below paid broker commissions to affiliates of the investment manager as detailed in the below table. These broker commissions are reflected in the Statement of assets and liabilities within cost of investments, and the Statement of operations within net realized gains (losses) from, and/or net change in unrealized appreciation/depreciation of investments and/or futures.
361
PACE Select Advisors Trust
Notes to financial statements
Affiliated broker | PACE Large Co Growth Equity Investments | PACE Small/ Medium Co Value Equity Investments | PACE International Equity Investments | PACE International Emerging Markets Equity Investments | PACE Global Real Estate Securities Investments | PACE Alternative Strategies Investments | |||||||||||||||||||||
UBS AG | $ | — | $ | — | $ | 1,046 | $ | 3,029 | $ | 78 | $ | 114 | |||||||||||||||
UBS Securities Asia Ltd. | — | — | 3,052 | 2,839 | — | — | |||||||||||||||||||||
UBS Securities LLC | 85 | 7,230 | — | 253 | — | — | |||||||||||||||||||||
UBS Securities Pte Ltd. | — | — | — | 3,913 | — | — | |||||||||||||||||||||
UBS Limited | — | — | 12,949 | — | 41 | 14 | |||||||||||||||||||||
UBS Financial Services Inc. | — | — | — | — | — | 12,337 | |||||||||||||||||||||
Service and distribution plans
UBS AM (US) is the principal underwriter of each Portfolio's shares. The Portfolios (with the exception of PACE Government Money Market Investments, which only offers Class P shares) have adopted service and/or distribution plans (the "Plans") pursuant to Rule 12b-1 under the 1940 Act for Class A and Class C shares. The Plans govern payments made for the expenses incurred in the service and/or distribution of Class A and Class C shares. Annual fees under the Plans as a percentage of the average daily net assets of each representative class of each of the Portfolios are as follows:
Class A | Class C | ||||||||||||||
Portfolio | Service fees | Service fees | Distribution fees1 | ||||||||||||
PACE Mortgage-Backed Securities Fixed Income Investments | 0.25 | % | 0.25 | % | 0.50 | % | |||||||||
PACE Intermediate Fixed Income Investments | 0.25 | 0.25 | 0.50 | ||||||||||||
PACE Strategic Fixed Income Investments | 0.25 | 0.25 | 0.50 | ||||||||||||
PACE Municipal Fixed Income Investments | 0.25 | 0.25 | 0.50 | ||||||||||||
PACE Global Fixed Income Investments | 0.25 | 0.25 | 0.50 | ||||||||||||
PACE High Yield Investments | 0.25 | 0.25 | 0.50 | ||||||||||||
PACE Large Co Value Equity Investments | 0.25 | 0.25 | 0.75 | ||||||||||||
PACE Large Co Growth Equity Investments | 0.25 | 0.25 | 0.75 | ||||||||||||
PACE Small/Medium Co Value Equity Investments | 0.25 | 0.25 | 0.75 | ||||||||||||
PACE Small/Medium Co Growth Equity Investments | 0.25 | 0.25 | 0.75 | ||||||||||||
PACE International Equity Investments | 0.25 | 0.25 | 0.75 | ||||||||||||
PACE International Emerging Markets Equity Investments | 0.25 | 0.25 | 0.75 | ||||||||||||
PACE Global Real Estate Securities Investments | 0.25 | 0.25 | 0.75 | ||||||||||||
PACE Alternative Strategies Investments | 0.25 | 0.25 | 0.75 | ||||||||||||
1 Effective July 12, 2018, the distribution fee for Class C shares was terminated.
UBS AM (US) also receives the proceeds of the initial sales charges paid upon purchase of Class A shares and the contingent deferred sales charges paid by shareholders upon certain redemptions of Class A and Class C shares.
362
PACE Select Advisors Trust
Notes to financial statements
At July 31, 2018, certain Portfolios owed UBS AM (US) service and distribution fees, and for the period ended July 31, 2018, certain Portfolios were informed by UBS AM (US) that it had earned sales charges as follows:
Portfolio | Service and distribution fees owed | Sales charges earned by distributor | |||||||||
PACE Mortgage-Backed Securities Fixed Income Investments—Class A | $ | 6,516 | $ | — | |||||||
PACE Mortgage-Backed Securities Fixed Income Investments—Class C | 3,517 | — | |||||||||
PACE Intermediate Fixed Income Investments—Class A | 3,043 | 378 | |||||||||
PACE Intermediate Fixed Income Investments—Class C | 357 | — | |||||||||
PACE Strategic Fixed Income Investments—Class A | 2,897 | 1,095 | |||||||||
PACE Strategic Fixed Income Investments—Class C | 2,390 | — | |||||||||
PACE Municipal Fixed Income Investments—Class A | 8,260 | 137 | |||||||||
PACE Municipal Fixed Income Investments—Class C | 2,799 | — | |||||||||
PACE Global Fixed Income Investments—Class A | 6,701 | — | |||||||||
PACE Global Fixed Income Investments—Class C | 841 | — | |||||||||
PACE High Yield Investments—Class A | 795 | 6,368 | |||||||||
PACE High Yield Investments—Class C | 828 | — | |||||||||
PACE Large Co Value Equity Investments—Class A | 23,461 | 1,014 | |||||||||
PACE Large Co Value Equity Investments—Class C | 4,753 | 3 | |||||||||
PACE Large Co Growth Equity Investments—Class A | 10,167 | 552 | |||||||||
PACE Large Co Growth Equity Investments—Class C | 1,206 | — | |||||||||
PACE Small/Medium Co Value Equity Investments—Class A | 3,911 | 2,511 | |||||||||
PACE Small/Medium Co Value Equity Investments—Class C | 1,559 | — | |||||||||
PACE Small/Medium Co Growth Equity Investments—Class A | 5,485 | 182 | |||||||||
PACE Small/Medium Co Growth Equity Investments—Class C | 1,208 | 116 | |||||||||
PACE International Equity Investments—Class A | 6,549 | — | |||||||||
PACE International Equity Investments—Class C | 860 | 2,713 | |||||||||
PACE International Emerging Markets Equity Investments—Class A | 804 | 1,937 | |||||||||
PACE International Emerging Markets Equity Investments—Class C | 517 | — | |||||||||
PACE Global Real Estate Securities Investments—Class A | 81 | 3 | |||||||||
PACE Global Real Estate Securities Investments—Class C | 75 | — | |||||||||
PACE Alternative Strategies Investments—Class A | 1,558 | 10,315 | |||||||||
PACE Alternative Strategies Investments—Class C | 2,684 | 23 | |||||||||
Transfer agency and related services fees
UBS Financial Services Inc. provides certain services to the Portfolios pursuant to a delegation of authority from BNY Mellon Investment Servicing (US) Inc. ("BNY Mellon"), the Portfolios' transfer agent, and is compensated for these services by BNY Mellon, not the Portfolios.
UBS Financial Services Inc. has voluntarily agreed to waive a portion of the fee that it would otherwise have received from BNY Mellon with respect to PACE Government Money Market Investments so that BNY Mellon would correspondingly reduce the fees it would have charged to that Portfolio. Given that UBS AM has voluntarily undertaken to reduce its fees and/or reimburse expenses to keep the Portfolio's yield at or above a certain level, and that such amount exceeds the reduction in BNY Mellon's fees, the net effect of BNY Mellon's pass through of the waiver by UBS Financial Services Inc. is to partially reduce the amount that UBS AM would have otherwise voluntarily waived/reimbursed. For the period ended July 31, 2018, the amount of the reduction in transfer agency and related services fees charged by BNY Mellon to the Portfolio was $186,859 which reflected an equal amount of compensation that was voluntarily waived by UBS Financial Services Inc. Voluntary fee waiver/expense reimbursement arrangements may end at any time.
363
PACE Select Advisors Trust
Notes to financial statements
For the period ended July 31, 2018, UBS Financial Services Inc. received from BNY Mellon, not the Portfolios, total delegated services fees as follows:
Portfolio | Delegated services fees earned | ||||||
PACE Government Money Market Investments | $ | 341,720 | |||||
PACE Mortgage-Backed Securities Fixed Income Investments | 378,213 | ||||||
PACE Intermediate Fixed Income Investments | 342,269 | ||||||
PACE Strategic Fixed Income Investments | 458,250 | ||||||
PACE Municipal Fixed Income Investments | 71,070 | ||||||
PACE Global Fixed Income Investments | 420,147 | ||||||
PACE High Yield Investments | 348,164 | ||||||
PACE Large Co Value Equity Investments | 522,368 | ||||||
PACE Large Co Growth Equity Investments | 504,714 | ||||||
PACE Small/Medium Co Value Equity Investments | 490,752 | ||||||
PACE Small/Medium Co Growth Equity Investments | 490,937 | ||||||
PACE International Equity Investments | 489,067 | ||||||
PACE International Emerging Markets Equity Investments | 450,190 | ||||||
PACE Global Real Estate Securities Investments | 355,644 | ||||||
PACE Alternative Strategies Investments | 264,884 | ||||||
Securities lending
Each Portfolio may lend securities up to 331/3% of its total assets to qualified broker-dealers or institutional investors. The loans are initially secured by cash, U.S. government securities and irrevocable letters of credit in an amount at least equal to 102% of the market value of the securities loaned with respect to domestic securities and 105% of the market value of the securities loaned with respect to foreign securities. In the event that the market value of the cash, U.S. government securities, and irrevocable letters of credit securing the loan falls below 100% for domestic securities, and 103% for foreign securities, the borrower must provide additional cash, U.S. government securities, and irrevocable letters of credit so that the total securing the loan is at least 102% of the market value for domestic securities and 105% of the market value for foreign securities.
Each Portfolio will regain ownership of loaned securities to exercise certain beneficial rights; however, each Portfolio may bear the risk of delay in recovery of, or even loss of rights in, the securities loaned should the borrower fail financially. Each Portfolio receives compensation for lending its securities from interest or dividends earned on the cash, US government securities and irrevocable letters of credit held as collateral, net of fee rebates paid to the borrower plus reasonable administrative and custody fees. Cash collateral received is invested in State Street Institutional U.S. Government Money Market Fund, which is included in each Portfolio's Portfolio of investments. State Street Bank and Trust Company serves as the Portfolios' lending agent.
In addition, PACE Large Co Value Equity Investments, PACE International Equity Investments and PACE Alternative Strategies Investments participate in State Street's enhanced custody program. Through this program, State Street is capable of facilitating the Portfolios' short selling activity at a lower cost. A portion of the cash collateral received in connection with the Portfolios' securities lending activity is pledged back to State Street for the financing of short sales. This amount is shown as cash collateral on investments sold short in the Statement of assets and liabilities.
At July 31, 2018, the following Portfolios had securities on loan at value, cash collateral and non-cash collateral as follows:
| Portfolio | Value of securities on loan | Cash collateral | Non-cash collateral* | Total collateral | Security types held as non-cash collateral | ||||||||||||||||||
PACE Intermediate Fixed Income Investments | $ | 12,638,687 | $ | 12,098,990 | $ | 787,025 | $ | 12,886,015 | US Treasury Notes and US Treasury Bills | ||||||||||||||
PACE Strategic Fixed Income Investments | 8,428,681 | 8,610,323 | — | 8,610,323 | |||||||||||||||||||
364
PACE Select Advisors Trust
Notes to financial statements
Portfolio | Value of securities on loan | Cash collateral | Non-cash collateral* | Total collateral | Security types held as non-cash collateral | ||||||||||||||||||
PACE Global Fixed Income Investments | $ | 5,154,378 | $ | 4,661,150 | $ | 623,985 | $ | 5,285,135 | US Treasury Notes and US Treasury Bills | ||||||||||||||
PACE High Yield Investments | 40,949,792 | 37,901,428 | 3,893,692 | 41,795,120 | US Treasury Notes and US Treasury Bills | ||||||||||||||||||
PACE Large Co Value Equity Investments** | 98,240,574 | 17,577,403 | 81,653,181 | 99,230,584 | US Treasury Notes and US Treasury Bills | ||||||||||||||||||
PACE Large Co Growth Equity Investments | 46,233,042 | 9,167,476 | 37,613,936 | 46,781,412 | US Treasury Notes and US Treasury Bills | ||||||||||||||||||
PACE Small/Medium Co Value Equity Investments | 64,071,439 | 25,616,918 | 40,047,862 | 65,664,780 | US Treasury Notes and US Treasury Bills | ||||||||||||||||||
PACE Small/Medium Co Growth Equity Investments | 97,129,800 | 24,656,399 | 73,652,939 | 98,309,338 | US Treasury Notes and US Treasury Bills | ||||||||||||||||||
PACE International Equity Investments** | 46,107,649 | 41,777,229 | 5,997,241 | 47,774,470 | US Treasury Notes and US Treasury Bills | ||||||||||||||||||
PACE International Emerging Markets Equity Investments | 11,006,368 | 5,422,498 | 5,766,857 | 11,189,355 | US Treasury Notes and US Treasury Bills | ||||||||||||||||||
PACE Global Real Estate Securities Investments | 1,241,664 | 971,695 | 298,654 | 1,270,349 | US Treasury Notes and US Treasury Bills | ||||||||||||||||||
* These securities are held for the benefit of the Portfolio's custodian. The Portfolio cannot repledge or resell this collateral. As such, this collateral is excluded from the Statement of assets and liabilities.
** This Portfolio participates in the enhanced custody program which permits self-borrow transactions that does not require any collateral for the securities on loan under those transactions.
The table below represents the disaggregation at July 31, 2018 of the gross amount of recognized liabilities for securities lending transactions. As the securities loaned are subject to termination by the Portfolios or the borrower at any time, the remaining contractual maturities of the transactions presented below are considered to be overnight and continuous.
Type of securities loaned | Total gross amount of recognized liabilities for | ||||||||||||||
| Portfolio | Equity securities | Corporate bonds | securities lending transactions | ||||||||||||
PACE Intermediate Fixed Income Investments | $ | — | $ | 12,886,015 | $ | 12,886,015 | |||||||||
PACE Strategic Fixed Income Investments | — | 8,610,323 | 8,610,323 | ||||||||||||
PACE Global Fixed Income Investments | — | 5,285,135 | 5,285,135 | ||||||||||||
PACE High Yield Investments | 494,173 | 41,300,947 | 41,795,120 | ||||||||||||
PACE Large Co Value Equity Investments | 99,230,584 | — | 99,230,584 | ||||||||||||
PACE Large Co Growth Equity Investments | 46,781,412 | — | 46,781,412 | ||||||||||||
PACE Small/Medium Co Value Equity Investments | 65,664,780 | — | 65,664,780 | ||||||||||||
PACE Small/Medium Co Growth Equity Investments | 98,309,338 | — | 98,309,338 | ||||||||||||
PACE International Equity Investments | 47,774,470 | — | 47,774,470 | ||||||||||||
PACE International Emerging Markets Equity Investments | 11,189,355 | — | 11,189,355 | ||||||||||||
PACE Global Real Estate Securities Investments | 1,270,349 | — | 1,270,349 | ||||||||||||
Bank line of credit
With the exception of PACE Government Money Market Investments, the Portfolios participate with other Portfolios managed, advised or subadvised by UBS AM in a $125 million committed credit facility (the "Committed Credit Facility") with State Street Bank and Trust Company. The Committed Credit Facility is to be utilized for temporary financing until the settlement of sales or purchases of portfolio securities, the repurchase or redemption of shares of a participating Portfolio at the request of shareholders and other temporary or emergency purposes.
Interest on amounts borrowed is calculated based on the prevailing rates in effect at the time of borrowing. Each Portfolio covered by the Committed Credit Facility has agreed to pay commitment fees on the average daily balance of the Committed Credit Facility not utilized. Commitment fees have been allocated among the Portfolios in the Committed Credit Facility as follows: 50% of the allocation is based on the relative asset size of Portfolios and the
365
PACE Select Advisors Trust
Notes to financial statements
other 50% of the allocation is based on utilization. For the period ended July 31, 2018, the following Portfolios had borrowings as follows:
Portfolio | Average daily amount of borrowing outstanding | Days outstanding | Interest expense | Weighted average annualized interest rate | |||||||||||||||
PACE Intermediate Fixed Income Investments | $ | 564,340 | 1 | $ | 45 | 2.841 | % | ||||||||||||
PACE Strategic Fixed Income Investments | 256,275 | 5 | 92 | 2.581 | |||||||||||||||
PACE Large Co Value Equity Investments | 1,149,554 | 22 | 1,746 | 2.648 | |||||||||||||||
PACE Large Co Growth Equity Investments | 1,508,435 | 9 | 843 | 2.234 | |||||||||||||||
PACE Small/Medium Co Growth Equity Investments | 823,927 | 11 | 617 | 2.801 | |||||||||||||||
PACE International Equity Investments | 1,064,881 | 9 | 712 | 2.490 | |||||||||||||||
PACE International Emerging Markets Equity Investments | 1,133,171 | 13 | 1,015 | 2.480 | |||||||||||||||
PACE Global Real Estate Securities Investments | 529,978 | 1 | 38 | 2.575 | |||||||||||||||
PACE Alternative Strategies Investments | 637,481 | 4 | 276 | 2.590 | |||||||||||||||
Commission recapture program
Certain Portfolios participate in a brokerage commission recapture program. These Portfolios have established commission recapture arrangements with certain participating brokers or dealers. If a Portfolio's investment subadvisor chooses to execute a transaction through a participating broker subject to best price and execution, the broker will rebate a portion of the commission back to the Portfolio. Any collateral benefit received through participation in the commission recapture program is directed exclusively to the Portfolio. For the period ended July 31, 2018, the following Portfolios recorded recaptured commissions which are reflected in the Statement of operations within the net realized gains (losses) from investments:
Portfolio | Amount | ||||||
PACE Large Co Value Equity Investments | $ | 41,867 | |||||
PACE Large Co Growth Equity Investments | 44,673 | ||||||
PACE Small/Medium Co Value Equity Investments | 113,617 | ||||||
PACE Small/Medium Co Growth Equity Investments | 39,214 | ||||||
PACE International Equity Investments | 29,350 | ||||||
PACE International Emerging Markets Equity Investments | 12,978 | ||||||
PACE Global Real Estate Securities Investments | 9,055 | ||||||
PACE Alternative Strategies Investments | 22,193 | ||||||
Additional information regarding compensation to affiliate of a board member
Professor Meyer Feldberg serves as a senior advisor to Morgan Stanley, a financial services firm with which the Portfolios may conduct transactions, resulting in him being an interested trustee of the Portfolios. The Portfolios have been informed that Professor Feldberg's role at Morgan Stanley does not involve matters directly affecting any UBS funds. Portfolio transactions are executed through Morgan Stanley based on that firm's ability to provide best execution of the transactions. For the period ended July 31, 2018, the following Portfolios paid brokerage commissions to Morgan Stanley in the amounts as follows:
PACE Large Co Value Equity Investments | $ | 27,442 | |||||
PACE Large Co Growth Equity Investments | 28,957 | ||||||
PACE Small/Medium Co Value Equity Investments | 4,291 | ||||||
PACE International Equity Investments | 37,122 | ||||||
PACE International Emerging Markets Equity Investments | 17,646 | ||||||
PACE Global Real Estate Securities Investments | 18,006 | ||||||
PACE Alternative Strategies Investments | 117,633 | ||||||
366
PACE Select Advisors Trust
Notes to financial statements
For the period ended July 31, 2018, the following Portfolios purchased and sold certain securities (e.g., fixed income securities) in principal trades with Morgan Stanley having aggregate values as follows:
PACE Government Money Market Investments | $ | 7,978,864 | |||||
PACE Mortgage-Backed Securities Fixed Income Investments | 1,794,188,359 | ||||||
PACE Intermediate Fixed Income Investments | 2,704,805,834 | ||||||
PACE Strategic Fixed Income Investments | 3,295,711,269 | ||||||
PACE Municipal Fixed Income Investments | 12,920,168 | ||||||
PACE Global Fixed Income Investments | 39,913,158 | ||||||
PACE High Yield Investments | 29,445,876 | ||||||
PACE Alternative Strategies Investments | 235,938,394 | ||||||
Morgan Stanley received compensation in connection with these trades, which may have been in the form of a "mark-up" or "mark-down" of the price of the securities, a fee from the issuer for maintaining a commercial paper program, or some other form of compensation. Although the precise amount of this compensation is not generally known by the investment manager, it is believed that under normal circumstances it represents a small portion of the total value of the transactions.
Purchases and sales of securities
For the period ended July 31, 2018, aggregate purchases and sales of portfolio securities, excluding short-term securities, were as follows:
Portfolio | Purchases | Sales | |||||||||
PACE Mortgage-Backed Securities Fixed Income Investments (long transactions) | $ | 6,553,256,058 | $ | 6,544,893,346 | |||||||
PACE Intermediate Fixed Income Investments | 2,325,483,299 | 2,342,171,171 | |||||||||
PACE Strategic Fixed Income Investments | 2,339,323,612 | 2,209,366,205 | |||||||||
PACE Municipal Fixed Income Investments | 69,330,031 | 78,186,678 | |||||||||
PACE Global Fixed Income Investments | 902,785,898 | 937,460,582 | |||||||||
PACE High Yield Investments | 224,479,296 | 242,061,793 | |||||||||
PACE Large Co Value Equity Investments (long transactions) | 684,417,774 | 825,620,418 | |||||||||
PACE Large Co Value Equity Investments (short transactions) | 219,391,746 | 192,355,702 | |||||||||
PACE Large Co Growth Equity Investments | 550,053,454 | 720,157,845 | |||||||||
PACE Small/Medium Co Value Equity Investments | 306,796,937 | 342,585,521 | |||||||||
PACE Small/Medium Co Growth Equity Investments | 507,989,699 | 582,079,455 | |||||||||
PACE International Equity Investments (long transactions) | 722,310,435 | 745,816,162 | |||||||||
PACE International Equity Investments (short transactions) | 201,600,483 | 210,813,886 | |||||||||
PACE International Emerging Markets Equity Investments | 305,611,606 | 328,382,326 | |||||||||
PACE Global Real Estate Securities Investments | 100,184,806 | 103,169,206 | |||||||||
PACE Alternative Strategies Investments (long transactions) | 705,063,012 | 737,457,974 | |||||||||
PACE Alternative Strategies Investments (short transactions) | 369,222,556 | 358,587,321 | |||||||||
367
PACE Select Advisors Trust
Notes to financial statements
Shares of beneficial interest
There are an unlimited number of $0.001 par value shares of beneficial interest authorized. Transactions in shares of beneficial interest for each of the Portfolios, except PACE Government Money Market Investments, which transacts at $1.00 per share, were as follows:
PACE Mortgage-Backed Securities Fixed Income Investments
For the year ended July 31, 2018:
Class A | Class C | ||||||||||||||||||
Shares | Amount | Shares | Amount | ||||||||||||||||
Shares sold | 11,209 | $ | 141,197 | 82 | $ | 1,037 | |||||||||||||
Shares repurchased | (417,067 | ) | (5,278,244 | ) | (82,429 | ) | (1,043,958 | ) | |||||||||||
Dividends reinvested | 56,477 | 709,946 | 16,317 | 205,181 | |||||||||||||||
Net decrease | (349,381 | ) | $ | (4,427,101 | ) | (66,030 | ) | $ | (837,740 | ) | |||||||||
Class Y | Class P | ||||||||||||||||||
Shares | Amount | Shares | Amount | ||||||||||||||||
Shares sold | 976,592 | $ | 12,341,074 | 4,698,193 | $ | 59,338,331 | |||||||||||||
Shares repurchased | (2,148,967 | ) | (27,134,005 | ) | (6,854,914 | ) | (86,406,236 | ) | |||||||||||
Dividends reinvested | 94,635 | 1,190,388 | 789,889 | 9,929,475 | |||||||||||||||
Net decrease | (1,077,740 | ) | $ | (13,602,543 | ) | (1,366,832 | ) | $ | (17,138,430 | ) | |||||||||
For the year ended July 31, 2017:
Class A | Class C | ||||||||||||||||||
Shares | Amount | Shares | Amount | ||||||||||||||||
Shares sold | 24,803 | $ | 324,266 | 280 | $ | 3,652 | |||||||||||||
Shares repurchased | (399,286 | ) | (5,151,214 | ) | (100,310 | ) | (1,298,023 | ) | |||||||||||
Dividends reinvested | 57,294 | 738,418 | 15,145 | 195,472 | |||||||||||||||
Net decrease | (317,189 | ) | $ | (4,088,530 | ) | (84,885 | ) | $ | (1,098,899 | ) | |||||||||
Class Y | Class P | ||||||||||||||||||
Shares | Amount | Shares | Amount | ||||||||||||||||
Shares sold | 1,828,107 | $ | 23,584,420 | 5,185,379 | $ | 66,990,471 | |||||||||||||
Shares repurchased | (2,320,771 | ) | (30,067,977 | ) | (9,322,519 | ) | (120,161,019 | ) | |||||||||||
Dividends reinvested | 105,340 | 1,357,824 | 778,507 | 10,039,350 | |||||||||||||||
Net decrease | (387,324 | ) | $ | (5,125,733 | ) | (3,358,633 | ) | $ | (43,131,198 | ) | |||||||||
PACE Intermediate Fixed Income Investments
For the year ended July 31, 2018:
Class A | Class C | ||||||||||||||||||
Shares | Amount | Shares | Amount | ||||||||||||||||
Shares sold | 72,324 | $ | 885,654 | 6,183 | $ | 76,173 | |||||||||||||
Shares repurchased | (262,231 | ) | (3,189,347 | ) | (23,414 | ) | (282,187 | ) | |||||||||||
Dividends reinvested | 19,628 | 237,150 | 1,173 | 14,171 | |||||||||||||||
Net decrease | (170,279 | ) | $ | (2,066,543 | ) | (16,058 | ) | $ | (191,843 | ) | |||||||||
368
PACE Select Advisors Trust
Notes to financial statements
Class Y | Class P | ||||||||||||||||||
Shares | Amount | Shares | Amount | ||||||||||||||||
Shares sold | — | $ | — | 4,968,101 | $ | 60,392,511 | |||||||||||||
Shares repurchased | (3,294 | ) | (39,556 | ) | (6,300,333 | ) | (76,381,455 | ) | |||||||||||
Dividends reinvested | 632 | 7,635 | 662,674 | 8,005,083 | |||||||||||||||
Net decrease | (2,662 | ) | $ | (31,921 | ) | (669,558 | ) | $ | (7,983,861 | ) | |||||||||
For the year ended July 31, 2017:
Class A | Class C | ||||||||||||||||||
Shares | Amount | Shares | Amount | ||||||||||||||||
Shares sold | 39,571 | $ | 483,060 | 13,098 | $ | 159,408 | |||||||||||||
Shares repurchased | (188,733 | ) | (2,316,132 | ) | (47,437 | ) | (581,631 | ) | |||||||||||
Dividends reinvested | 17,024 | 208,555 | 936 | 11,478 | |||||||||||||||
Net decrease | (132,138 | ) | $ | (1,624,517 | ) | (33,403 | ) | $ | (410,745 | ) | |||||||||
Class Y | Class P | ||||||||||||||||||
Shares | Amount | Shares | Amount | ||||||||||||||||
Shares sold | 42 | $ | 511 | 4,914,065 | $ | 60,306,862 | |||||||||||||
Shares repurchased | (5,535 | ) | (67,833 | ) | (8,186,664 | ) | (100,409,216 | ) | |||||||||||
Dividends reinvested | 584 | 7,153 | 571,153 | 6,998,996 | |||||||||||||||
Net decrease | (4,909 | ) | $ | (60,169 | ) | (2,701,446 | ) | $ | (33,103,358 | ) | |||||||||
PACE Strategic Fixed Income Investments
For the year ended July 31, 2018:
Class A | Class C | ||||||||||||||||||
Shares | Amount | Shares | Amount | ||||||||||||||||
Shares sold | 289,126 | $ | 4,001,147 | 6,196 | $ | 85,534 | |||||||||||||
Shares repurchased | (269,135 | ) | (3,698,466 | ) | (111,814 | ) | (1,519,101 | ) | |||||||||||
Dividends reinvested | 20,280 | 274,749 | 8,996 | 121,882 | |||||||||||||||
Net increase (decrease) | 40,271 | $ | 577,430 | (96,622 | ) | $ | (1,311,685 | ) | |||||||||||
Class Y | Class P | ||||||||||||||||||
Shares | Amount | Shares | Amount | ||||||||||||||||
Shares sold | 1,026 | $ | 13,858 | 7,768,303 | $ | 105,725,895 | |||||||||||||
Shares repurchased | (17,230 | ) | (233,064 | ) | (10,912,777 | ) | (148,182,882 | ) | |||||||||||
Dividends reinvested | 3,274 | 44,283 | 1,591,281 | 21,539,581 | |||||||||||||||
Net decrease | (12,930 | ) | $ | (174,923 | ) | (1,553,193 | ) | $ | (20,917,406 | ) | |||||||||
For the year ended July 31, 2017:
Class A | Class C | ||||||||||||||||||
Shares | Amount | Shares | Amount | ||||||||||||||||
Shares sold | 138,847 | $ | 1,902,451 | 32,769 | $ | 448,558 | |||||||||||||
Shares repurchased | (135,375 | ) | (1,857,529 | ) | (192,885 | ) | (2,652,160 | ) | |||||||||||
Dividends reinvested | 32,977 | 446,367 | 19,054 | 257,504 | |||||||||||||||
Net increase (decrease) | 36,449 | $ | 491,289 | (141,062 | ) | $ | (1,946,098 | ) | |||||||||||
369
PACE Select Advisors Trust
Notes to financial statements
Class Y | Class P | ||||||||||||||||||
Shares | Amount | Shares | Amount | ||||||||||||||||
Shares sold | 36,268 | $ | 490,502 | 7,895,823 | $ | 108,542,804 | |||||||||||||
Shares repurchased | (87,754 | ) | (1,206,837 | ) | (12,264,489 | ) | (168,349,196 | ) | |||||||||||
Dividends reinvested | 6,535 | 88,375 | 2,613,274 | 35,388,248 | |||||||||||||||
Net decrease | (44,951 | ) | $ | (627,960 | ) | (1,755,392 | ) | $ | (24,418,144 | ) | |||||||||
PACE Municipal Fixed Income Investments
For the year ended July 31, 2018:
Class A | Class C | ||||||||||||||||||
Shares | Amount | Shares | Amount | ||||||||||||||||
Shares sold | 27,191 | $ | 352,054 | 110 | $ | 1,429 | |||||||||||||
Shares repurchased | (628,875 | ) | (8,121,868 | ) | (97,639 | ) | (1,266,374 | ) | |||||||||||
Dividends reinvested | 64,074 | 824,458 | 8,939 | 115,030 | |||||||||||||||
Net decrease | (537,610 | ) | $ | (6,945,356 | ) | (88,590 | ) | $ | (1,149,915 | ) | |||||||||
Class Y | Class P | ||||||||||||||||||
Shares | Amount | Shares | Amount | ||||||||||||||||
Shares sold | — | $ | — | 3,762,685 | $ | 48,502,979 | |||||||||||||
Shares repurchased | (1,943 | ) | (25,186 | ) | (4,816,449 | ) | (62,111,675 | ) | |||||||||||
Dividends reinvested | 57 | 735 | 628,926 | 8,093,928 | |||||||||||||||
Net decrease | (1,886 | ) | $ | (24,451 | ) | (424,838 | ) | $ | (5,514,768 | ) | |||||||||
For the year ended July 31, 2017:
Class A | Class C | ||||||||||||||||||
Shares | Amount | Shares | Amount | ||||||||||||||||
Shares sold | 22,482 | $ | 292,349 | 1,477 | $ | 19,532 | |||||||||||||
Shares repurchased | (321,637 | ) | (4,209,887 | ) | (106,756 | ) | (1,392,164 | ) | |||||||||||
Dividends reinvested | 84,731 | 1,097,789 | 13,137 | 169,983 | |||||||||||||||
Net decrease | (214,424 | ) | $ | (2,819,749 | ) | (92,142 | ) | $ | (1,202,649 | ) | |||||||||
Class Y | Class P | ||||||||||||||||||
Shares | Amount | Shares | Amount | ||||||||||||||||
Shares sold | 2,674 | $ | 34,577 | 3,997,284 | $ | 52,136,942 | |||||||||||||
Shares repurchased | (894 | ) | (11,634 | ) | (5,850,419 | ) | (76,002,927 | ) | |||||||||||
Dividends reinvested | 36 | 469 | 774,501 | 10,044,406 | |||||||||||||||
Net increase (decrease) | 1,816 | $ | 23,412 | (1,078,634 | ) | $ | (13,821,579 | ) | |||||||||||
PACE Global Fixed Income Investments
For the year ended July 31, 2018:
Class A | Class C | ||||||||||||||||||
Shares | Amount | Shares | Amount | ||||||||||||||||
Shares sold | 6,240 | $ | 62,798 | 4 | $ | 38 | |||||||||||||
Shares repurchased | (631,775 | ) | (6,324,717 | ) | (25,490 | ) | (255,245 | ) | |||||||||||
Dividends reinvested | 39,201 | 390,648 | 1,833 | 18,252 | |||||||||||||||
Net decrease | (586,334 | ) | $ | (5,871,271 | ) | (23,653 | ) | $ | (236,955 | ) | |||||||||
370
PACE Select Advisors Trust
Notes to financial statements
Class Y | Class P | ||||||||||||||||||
Shares | Amount | Shares | Amount | ||||||||||||||||
Shares sold | 1,397 | $ | 13,969 | 4,521,816 | $ | 45,276,159 | |||||||||||||
Shares repurchased | (24,553 | ) | (245,594 | ) | (7,276,687 | ) | (72,779,614 | ) | |||||||||||
Dividends reinvested | 3,927 | 38,983 | 588,671 | 5,864,563 | |||||||||||||||
Net decrease | (19,229 | ) | $ | (192,642 | ) | (2,166,200 | ) | $ | (21,638,892 | ) | |||||||||
For the year ended July 31, 2017:
Class A | Class C | ||||||||||||||||||
Shares | Amount | Shares | Amount | ||||||||||||||||
Shares sold | 42,161 | $ | 428,440 | 1,827 | $ | 19,490 | |||||||||||||
Shares repurchased | (528,768 | ) | (5,288,643 | ) | (36,049 | ) | (360,691 | ) | |||||||||||
Dividends reinvested | 80,054 | 784,718 | 4,329 | 42,300 | |||||||||||||||
Net decrease | (406,553 | ) | $ | (4,075,485 | ) | (29,893 | ) | $ | (298,901 | ) | |||||||||
Class Y | Class P | ||||||||||||||||||
Shares | Amount | Shares | Amount | ||||||||||||||||
Shares sold | 20,528 | $ | 199,642 | 5,805,630 | $ | 57,723,827 | |||||||||||||
Shares repurchased | (144,767 | ) | (1,457,720 | ) | (14,325,980 | ) | (141,017,271 | ) | |||||||||||
Dividends reinvested | 7,667 | 75,266 | 1,151,793 | 11,298,225 | |||||||||||||||
Net decrease | (116,572 | ) | $ | (1,182,812 | ) | (7,368,557 | ) | $ | (71,995,219 | ) | |||||||||
PACE High Yield Investments
For the year ended July 31, 2018:
Class A | Class C | ||||||||||||||||||
Shares | Amount | Shares | Amount | ||||||||||||||||
Shares sold | 54,048 | $ | 536,960 | 18,013 | $ | 179,406 | |||||||||||||
Shares repurchased | (107,968 | ) | (1,084,727 | ) | (71,222 | ) | (708,775 | ) | |||||||||||
Dividends reinvested | 13,566 | 134,816 | 6,655 | 66,146 | |||||||||||||||
Net decrease | (40,354 | ) | $ | (412,951 | ) | (46,554 | ) | $ | (463,223 | ) | |||||||||
Class Y | Class P | ||||||||||||||||||
Shares | Amount | Shares | Amount | ||||||||||||||||
Shares sold | — | $ | — | 3,525,583 | $ | 35,285,353 | |||||||||||||
Shares repurchased | — | — | (7,348,836 | ) | (73,481,792 | ) | |||||||||||||
Dividends reinvested | 2,909 | 29,010 | 1,854,734 | 18,473,042 | |||||||||||||||
Net increase (decrease) | 2,909 | $ | 29,010 | (1,968,519 | ) | $ | (19,723,397 | ) | |||||||||||
For the year ended July 31, 2017:
Class A | Class C | ||||||||||||||||||
Shares | Amount | Shares | Amount | ||||||||||||||||
Shares sold | 187,204 | $ | 1,834,110 | 25,004 | $ | 244,734 | |||||||||||||
Shares repurchased | (172,758 | ) | (1,691,398 | ) | (101,939 | ) | (1,003,120 | ) | |||||||||||
Dividends reinvested | 15,426 | 152,398 | 8,203 | 80,939 | |||||||||||||||
Net increase (decrease) | 29,872 | $ | 295,110 | (68,732 | ) | $ | (677,447 | ) | |||||||||||
371
PACE Select Advisors Trust
Notes to financial statements
Class Y | Class P | ||||||||||||||||||
Shares | Amount | Shares | Amount | ||||||||||||||||
Shares sold | 158 | $ | 1,582 | 5,454,783 | $ | 54,112,831 | |||||||||||||
Shares repurchased | (43,448 | ) | (430,252 | ) | (13,245,821 | ) | (131,819,861 | ) | |||||||||||
Dividends reinvested | 3,735 | 36,967 | 2,146,838 | 21,251,408 | |||||||||||||||
Net decrease | (39,555 | ) | $ | (391,703 | ) | (5,644,200 | ) | $ | (56,455,622 | ) | |||||||||
PACE Large Co Value Equity Investments
For the year ended July 31, 2018:
Class A | Class C | ||||||||||||||||||
Shares | Amount | Shares | Amount | ||||||||||||||||
Shares sold | 16,448 | $ | 390,273 | 3,645 | $ | 87,808 | |||||||||||||
Shares repurchased | (621,424 | ) | (14,808,493 | ) | (88,430 | ) | (2,109,149 | ) | |||||||||||
Dividends reinvested | 363,578 | 8,562,250 | 33,684 | 797,625 | |||||||||||||||
Net decrease | (241,398 | ) | $ | (5,855,970 | ) | (51,101 | ) | $ | (1,223,716 | ) | |||||||||
Class Y | Class P | ||||||||||||||||||
Shares | Amount | Shares | Amount | ||||||||||||||||
Shares sold | 5,878 | $ | 138,904 | 3,555,141 | $ | 84,363,783 | |||||||||||||
Shares repurchased | (79,280 | ) | (1,900,484 | ) | (8,241,539 | ) | (195,063,264 | ) | |||||||||||
Dividends reinvested | 61,245 | 1,444,783 | 4,066,047 | 95,430,125 | |||||||||||||||
Net decrease | (12,157 | ) | $ | (316,797 | ) | (620,351 | ) | $ | (15,269,356 | ) | |||||||||
For the year ended July 31, 2017:
Class A | Class C | ||||||||||||||||||
Shares | Amount | Shares | Amount | ||||||||||||||||
Shares sold | 97,416 | $ | 2,116,816 | 8,839 | $ | 199,165 | |||||||||||||
Shares repurchased | (578,984 | ) | (13,129,356 | ) | (105,269 | ) | (2,343,246 | ) | |||||||||||
Dividends reinvested | 195,073 | 4,430,117 | 16,545 | 377,559 | |||||||||||||||
Net decrease | (286,495 | ) | $ | (6,582,423 | ) | (79,885 | ) | $ | (1,766,522 | ) | |||||||||
Class Y | Class P | ||||||||||||||||||
Shares | Amount | Shares | Amount | ||||||||||||||||
Shares sold | 13,076 | $ | 299,723 | 4,321,121 | $ | 97,734,533 | |||||||||||||
Shares repurchased | (149,139 | ) | (3,392,757 | ) | (10,383,085 | ) | (235,130,902 | ) | |||||||||||
Dividends reinvested | 35,514 | 807,218 | 2,219,766 | 50,233,136 | |||||||||||||||
Net decrease | (100,549 | ) | $ | (2,285,816 | ) | (3,842,198 | ) | $ | (87,163,233 | ) | |||||||||
PACE Large Co Growth Equity Investments
For the year ended July 31, 2018:
Class A | Class C | ||||||||||||||||||
Shares | Amount | Shares | Amount | ||||||||||||||||
Shares sold | 15,496 | $ | 408,750 | 852 | $ | 17,589 | |||||||||||||
Shares repurchased | (216,995 | ) | (5,684,237 | ) | (27,024 | ) | (572,662 | ) | |||||||||||
Dividends reinvested | 167,775 | 4,180,943 | 15,249 | 305,897 | |||||||||||||||
Net decrease | (33,724 | ) | $ | (1,094,544 | ) | (10,923 | ) | $ | (249,176 | ) | |||||||||
372
PACE Select Advisors Trust
Notes to financial statements
Class Y | Class P | ||||||||||||||||||
Shares | Amount | Shares | Amount | ||||||||||||||||
Shares sold | 3,475 | $ | 94,002 | 2,728,091 | $ | 73,367,250 | |||||||||||||
Shares repurchased | (45,596 | ) | (1,246,826 | ) | (8,855,088 | ) | (237,600,222 | ) | |||||||||||
Dividends reinvested | 53,891 | 1,399,023 | 4,534,804 | 116,816,539 | |||||||||||||||
Net increase (decrease) | 11,770 | $ | 246,199 | (1,592,193 | ) | $ | (47,416,433 | ) | |||||||||||
For the year ended July 31, 2017:
Class A | Class C | ||||||||||||||||||
Shares | Amount | Shares | Amount | ||||||||||||||||
Shares sold | 35,214 | $ | 797,762 | 4,805 | $ | 89,015 | |||||||||||||
Shares repurchased | (221,741 | ) | (5,017,890 | ) | (63,737 | ) | (1,191,712 | ) | |||||||||||
Dividends reinvested | 61,879 | 1,318,013 | 6,142 | 108,599 | |||||||||||||||
Net decrease | (124,648 | ) | $ | (2,902,115 | ) | (52,790 | ) | $ | (994,098 | ) | |||||||||
Class Y | Class P | ||||||||||||||||||
Shares | Amount | Shares | Amount | ||||||||||||||||
Shares sold | 5,931 | $ | 139,872 | 4,297,217 | $ | 99,576,157 | |||||||||||||
Shares repurchased | (84,723 | ) | (1,997,979 | ) | (9,795,290 | ) | (228,489,621 | ) | |||||||||||
Dividends reinvested | 20,433 | 450,768 | 1,762,289 | 38,611,773 | |||||||||||||||
Net decrease | (58,359 | ) | $ | (1,407,339 | ) | (3,735,784 | ) | $ | (90,301,691 | ) | |||||||||
PACE Small/Medium Co Value Equity Investments
For the year ended July 31, 2018:
Class A | Class C | ||||||||||||||||||
Shares | Amount | Shares | Amount | ||||||||||||||||
Shares sold | 17,544 | $ | 356,801 | 6,058 | $ | 98,840 | |||||||||||||
Shares repurchased | (78,526 | ) | (1,625,174 | ) | (72,326 | ) | (1,197,996 | ) | |||||||||||
Dividends reinvested | 89,152 | 1,775,917 | 30,827 | 503,716 | |||||||||||||||
Net increase (decrease) | 28,170 | $ | 507,544 | (35,441 | ) | $ | (595,440 | ) | |||||||||||
Class Y | Class P | ||||||||||||||||||
Shares | Amount | Shares | Amount | ||||||||||||||||
Shares sold | — | $ | — | 1,848,682 | $ | 39,144,415 | |||||||||||||
Shares repurchased | (4,642 | ) | (99,668 | ) | (4,010,485 | ) | (84,898,833 | ) | |||||||||||
Dividends reinvested | 1,506 | 31,275 | 2,563,645 | 52,580,356 | |||||||||||||||
Net increase (decrease) | (3,136 | ) | $ | (68,393 | ) | 401,842 | $ | 6,825,938 | |||||||||||
For the year ended July 31, 2017:
Class A | Class C | ||||||||||||||||||
Shares | Amount | Shares | Amount | ||||||||||||||||
Shares sold | 22,524 | $ | 442,534 | 5,365 | $ | 97,193 | |||||||||||||
Shares repurchased | (94,015 | ) | (1,933,931 | ) | (43,473 | ) | (721,678 | ) | |||||||||||
Dividends reinvested | 31,163 | 647,548 | 8,801 | 154,544 | |||||||||||||||
Net decrease | (40,328 | ) | $ | (843,849 | ) | (29,307 | ) | $ | (469,941 | ) | |||||||||
373
PACE Select Advisors Trust
Notes to financial statements
Class Y | Class P | ||||||||||||||||||
Shares | Amount | Shares | Amount | ||||||||||||||||
Shares sold | 380 | $ | 8,190 | 2,186,330 | $ | 45,803,057 | |||||||||||||
Shares repurchased | (23,076 | ) | (475,970 | ) | (5,020,452 | ) | (105,541,766 | ) | |||||||||||
Dividends reinvested | 737 | 15,893 | 924,407 | 19,717,504 | |||||||||||||||
Net decrease | (21,959 | ) | $ | (451,887 | ) | (1,909,715 | ) | $ | (40,021,205 | ) | |||||||||
PACE Small/Medium Co Growth Equity Investments
For the year ended July 31, 2018:
Class A | Class C | ||||||||||||||||||
Shares | Amount | Shares | Amount | ||||||||||||||||
Shares sold | 6,286 | $ | 115,013 | 1,315 | $ | 17,899 | |||||||||||||
Shares repurchased | (159,548 | ) | (2,857,000 | ) | (62,678 | ) | (834,272 | ) | |||||||||||
Dividends reinvested | 68,619 | 1,175,452 | 13,101 | 171,628 | |||||||||||||||
Net decrease | (84,643 | ) | $ | (1,566,535 | ) | (48,262 | ) | $ | (644,745 | ) | |||||||||
Class Y | Class P | ||||||||||||||||||
Shares | Amount | Shares | Amount | ||||||||||||||||
Shares sold | — | $ | — | 1,750,390 | $ | 33,194,319 | |||||||||||||
Shares repurchased | (3,589 | ) | (73,821 | ) | (4,551,648 | ) | (86,914,728 | ) | |||||||||||
Dividends reinvested | 289 | 5,347 | 1,342,869 | 24,520,791 | |||||||||||||||
Net decrease | (3,300 | ) | $ | (68,474 | ) | (1,458,389 | ) | $ | (29,199,618 | ) | |||||||||
For the year ended July 31, 2017:
Class A | Class C | ||||||||||||||||||
Shares | Amount | Shares | Amount | ||||||||||||||||
Shares sold | 21,537 | $ | 307,658 | 27,464 | $ | 324,342 | |||||||||||||
Shares repurchased | (198,619 | ) | (2,997,232 | ) | (43,816 | ) | (506,314 | ) | |||||||||||
Dividends reinvested | — | — | — | — | |||||||||||||||
Net decrease | (177,082 | ) | $ | (2,689,574 | ) | (16,352 | ) | $ | (181,972 | ) | |||||||||
Class Y | Class P | ||||||||||||||||||
Shares | Amount | Shares | Amount | ||||||||||||||||
Shares sold | 262 | $ | 4,401 | 2,716,804 | $ | 43,686,141 | |||||||||||||
Shares repurchased | (26,378 | ) | (409,960 | ) | (5,593,573 | ) | (90,563,865 | ) | |||||||||||
Dividends reinvested | — | — | 46 | 700 | |||||||||||||||
Net decrease | (26,116 | ) | $ | (405,559 | ) | (2,876,723 | ) | $ | (46,877,024 | ) | |||||||||
PACE International Equity Investments
For the year ended July 31, 2018:
Class A | Class C | ||||||||||||||||||
Shares | Amount | Shares | Amount | ||||||||||||||||
Shares sold | 14,058 | $ | 241,691 | 5,447 | $ | 90,193 | |||||||||||||
Shares repurchased | (133,104 | ) | (2,263,205 | ) | (16,335 | ) | (276,772 | ) | |||||||||||
Dividends reinvested | 31,358 | 531,517 | 1,325 | 22,082 | |||||||||||||||
Net decrease | (87,688 | ) | $ | (1,489,997 | ) | (9,563 | ) | $ | (164,497 | ) | |||||||||
374
PACE Select Advisors Trust
Notes to financial statements
Class Y | Class P | ||||||||||||||||||
Shares | Amount | Shares | Amount | ||||||||||||||||
Shares sold | 11,514 | $ | 195,044 | 7,124,780 | $ | 120,466,509 | |||||||||||||
Shares repurchased | (117,890 | ) | (1,999,327 | ) | (9,729,905 | ) | (164,664,097 | ) | |||||||||||
Dividends reinvested | 18,530 | 312,609 | 1,352,532 | 22,763,116 | |||||||||||||||
Net decrease | (87,846 | ) | $ | (1,491,674 | ) | (1,252,593 | ) | $ | (21,434,472 | ) | |||||||||
For the year ended July 31, 2017:
Class A | Class C | ||||||||||||||||||
Shares | Amount | Shares | Amount | ||||||||||||||||
Shares sold | 36,409 | $ | 535,552 | 1,730 | $ | 25,008 | |||||||||||||
Shares repurchased | (256,375 | ) | (3,739,739 | ) | (35,061 | ) | (487,060 | ) | |||||||||||
Dividends reinvested | 37,580 | 519,732 | 1,452 | 19,766 | |||||||||||||||
Net decrease | (182,386 | ) | $ | (2,684,455 | ) | (31,879 | ) | $ | (442,286 | ) | |||||||||
Class Y | Class P | ||||||||||||||||||
Shares | Amount | Shares | Amount | ||||||||||||||||
Shares sold | 22,403 | $ | 335,300 | 12,384,069 | $ | 182,116,934 | |||||||||||||
Shares repurchased | (259,024 | ) | (3,739,939 | ) | (10,880,708 | ) | (158,879,925 | ) | |||||||||||
Dividends reinvested | 22,854 | 314,477 | 1,407,765 | 19,328,610 | |||||||||||||||
Net increase (decrease) | (213,767 | ) | $ | (3,090,162 | ) | 2,911,126 | $ | 42,565,619 | |||||||||||
PACE International Emerging Markets Equity Investments
For the year ended July 31, 2018:
Class A | Class C | ||||||||||||||||||
Shares | Amount | Shares | Amount | ||||||||||||||||
Shares sold | 49,453 | $ | 730,319 | 2,591 | $ | 34,410 | |||||||||||||
Shares repurchased | (72,272 | ) | (1,038,785 | ) | (16,939 | ) | (219,728 | ) | |||||||||||
Dividends reinvested | 2,470 | 34,896 | 267 | 3,484 | |||||||||||||||
Net decrease | (20,349 | ) | $ | (273,570 | ) | (14,081 | ) | $ | (181,834 | ) | |||||||||
Class Y | Class P | ||||||||||||||||||
Shares | Amount | Shares | Amount | ||||||||||||||||
Shares sold | 25,185 | $ | 365,023 | 3,588,386 | $ | 51,498,515 | |||||||||||||
Shares repurchased | (61,174 | ) | (867,540 | ) | (5,291,813 | ) | (76,099,371 | ) | |||||||||||
Dividends reinvested | 6,786 | 96,566 | 368,348 | 5,212,130 | |||||||||||||||
Net decrease | (29,203 | ) | $ | (405,951 | ) | (1,335,079 | ) | $ | (19,388,726 | ) | |||||||||
For the year ended July 31, 2017:
Class A | Class C | ||||||||||||||||||
Shares | Amount | Shares | Amount | ||||||||||||||||
Shares sold | 15,192 | $ | 181,698 | — | $ | — | |||||||||||||
Shares repurchased | (61,822 | ) | (732,375 | ) | (18,856 | ) | (203,093 | ) | |||||||||||
Dividends reinvested | 2,482 | 26,782 | 92 | 915 | |||||||||||||||
Net decrease | (44,148 | ) | $ | (523,895 | ) | (18,764 | ) | $ | (202,178 | ) | |||||||||
375
PACE Select Advisors Trust
Notes to financial statements
Class Y | Class P | ||||||||||||||||||
Shares | Amount | Shares | Amount | ||||||||||||||||
Shares sold | 20,151 | $ | 245,755 | 5,624,189 | $ | 66,658,885 | |||||||||||||
Shares repurchased | (145,722 | ) | (1,715,451 | ) | (7,063,584 | ) | (84,497,808 | ) | |||||||||||
Dividends reinvested | 6,934 | 75,304 | 357,626 | 3,862,358 | |||||||||||||||
Net decrease | (118,637 | ) | $ | (1,394,392 | ) | (1,081,769 | ) | $ | (13,976,565 | ) | |||||||||
PACE Global Real Estate Securities Investments
For the year ended July 31, 2018:
Class A | Class C | ||||||||||||||||||
Shares | Amount | Shares | Amount | ||||||||||||||||
Shares sold | 2,857 | $ | 21,301 | — | $ | — | |||||||||||||
Shares repurchased | (15,793 | ) | (119,785 | ) | (12,022 | ) | (87,735 | ) | |||||||||||
Dividends reinvested | 1,778 | 13,616 | 716 | 5,266 | |||||||||||||||
Net decrease | (11,158 | ) | $ | (84,868 | ) | (11,306 | ) | $ | (82,469 | ) | |||||||||
Class Y* | Class P | ||||||||||||||||||
Shares | Amount | Shares | Amount | ||||||||||||||||
Shares sold | — | $ | — | 2,160,408 | $ | 15,617,196 | |||||||||||||
Shares repurchased | (4,239 | ) | (31,230 | ) | (3,253,350 | ) | (23,562,691 | ) | |||||||||||
Dividends reinvested | 174 | 1,289 | 785,141 | 5,786,490 | |||||||||||||||
Net decrease | (4,065 | ) | $ | (29,941 | ) | (307,801 | ) | $ | (2,159,005 | ) | |||||||||
* Class Y was fully redeemed as of January 25, 2018.
For the year ended July 31, 2017:
Class A | Class C | ||||||||||||||||||
Shares | Amount | Shares | Amount | ||||||||||||||||
Shares sold | 24,369 | $ | 187,585 | 10,552 | $ | 79,994 | |||||||||||||
Shares repurchased | (13,227 | ) | (99,468 | ) | (19,433 | ) | (137,938 | ) | |||||||||||
Dividends reinvested | 1,996 | 14,210 | 1,594 | 10,900 | |||||||||||||||
Net increase (decrease) | 13,138 | $ | 102,327 | (7,287 | ) | $ | (47,044 | ) | |||||||||||
Class Y | Class P | ||||||||||||||||||
Shares | Amount | Shares | Amount | ||||||||||||||||
Shares sold | 1,146 | $ | 8,282 | 2,337,461 | $ | 16,893,651 | |||||||||||||
Shares repurchased | (484 | ) | (3,514 | ) | (3,790,450 | ) | (27,427,929 | ) | |||||||||||
Dividends reinvested | 136 | 938 | 820,141 | 5,626,170 | |||||||||||||||
Net increase (decrease) | 798 | $ | 5,706 | (632,848 | ) | $ | (4,908,108 | ) | |||||||||||
PACE Alternative Strategies Investments
For the year ended July 31, 2018:
Class A | Class C | ||||||||||||||||||
Shares | Amount | Shares | Amount | ||||||||||||||||
Shares sold | 62,177 | $ | 679,328 | 2,456 | $ | 24,990 | |||||||||||||
Shares repurchased | (210,542 | ) | (2,286,869 | ) | (330,601 | ) | (3,363,213 | ) | |||||||||||
Net decrease | (148,365 | ) | $ | (1,607,541 | ) | (328,145 | ) | $ | (3,338,223 | ) | |||||||||
376
PACE Select Advisors Trust
Notes to financial statements
Class Y | Class P | ||||||||||||||||||
Shares | Amount | Shares | Amount | ||||||||||||||||
Shares sold | 2,305 | $ | 25,051 | 7,832,097 | $ | 84,518,686 | |||||||||||||
Shares repurchased | (12,642 | ) | (137,763 | ) | (11,977,868 | ) | (129,118,756 | ) | |||||||||||
Net decrease | (10,337 | ) | $ | (112,712 | ) | (4,145,771 | ) | $ | (44,600,070 | ) | |||||||||
For the year ended July 31, 2017:
Class A | Class C | ||||||||||||||||||
Shares | Amount | Shares | Amount | ||||||||||||||||
Shares sold | 113,582 | $ | 1,184,373 | 56,144 | $ | 555,670 | |||||||||||||
Shares repurchased | (234,713 | ) | (2,474,229 | ) | (373,423 | ) | (3,711,389 | ) | |||||||||||
Dividends reinvested | — | — | — | — | |||||||||||||||
Net decrease | (121,131 | ) | $ | (1,289,856 | ) | (317,279 | ) | $ | (3,155,719 | ) | |||||||||
Class Y | Class P | ||||||||||||||||||
Shares | Amount | Shares | Amount | ||||||||||||||||
Shares sold | 8,528 | $ | 89,460 | 10,350,762 | $ | 108,680,982 | |||||||||||||
Shares repurchased | (132,701 | ) | (1,380,661 | ) | (17,743,826 | ) | (185,454,010 | ) | |||||||||||
Dividends reinvested | — | — | — | — | |||||||||||||||
Net decrease | (124,173 | ) | $ | (1,291,201 | ) | (7,393,064 | ) | $ | (76,773,028 | ) | |||||||||
Federal tax status
Each of the Portfolios intends to distribute substantially all of its income and to comply with the other requirements of the Internal Revenue Code applicable to regulated investment companies. Accordingly, no provision for federal income taxes is required. In addition, by distributing during each calendar year substantially all of its net investment income, net realized capital gains and certain other amounts, if any, each Portfolio intends not to be subject to a federal excise tax.
The tax character of distributions paid during the fiscal years ended July 31, 2018 and July 31, 2017 were as follows:
2018 | 2017 | ||||||||||||||||||||||||||||||||||
| Portfolio | Tax- exempt income | Ordinary income | Long term realized capital gains | Return of capital | Tax- exempt income | Ordinary income | Long term realized capital gains | Return of capital | |||||||||||||||||||||||||||
| PACE Government Money Market Investments | $ | — | $ | 1,702,668 | $ | — | $ | — | $ | — | $ | 227,818 | $ | — | $ | — | |||||||||||||||||||
| PACE Mortgage-Backed Securities Fixed Income Investments | — | 13,187,923 | — | — | — | 13,518,665 | — | — | |||||||||||||||||||||||||||
| PACE Intermediate Fixed Income Investments | — | 9,187,685 | — | — | — | 8,021,219 | — | — | |||||||||||||||||||||||||||
| PACE Strategic Fixed Income Investments | — | 23,939,039 | — | — | — | 32,945,823 | 6,254,022 | — | |||||||||||||||||||||||||||
| PACE Municipal Fixed Income Investments | 10,258,435 | 4,059 | 491,249 | — | 10,386,704 | 92,505 | 2,805,662 | — | |||||||||||||||||||||||||||
| PACE Global Fixed Income Investments | — | — | — | 6,859,964 | — | 9,237,190 | — | 4,012,782 | |||||||||||||||||||||||||||
PACE High Yield Investments | — | 20,354,798 | — | — | — | 23,351,261 | — | — | |||||||||||||||||||||||||||
| PACE Large Co Value Equity Investments | — | 28,848,195 | 84,239,056 | — | — | 23,248,091 | 36,152,031 | — | |||||||||||||||||||||||||||
| PACE Large Co Growth Equity Investments | — | 8,069,886 | 121,393,468 | — | — | 4,312,814 | 38,258,776 | — | |||||||||||||||||||||||||||
377
PACE Select Advisors Trust
Notes to financial statements
2018 | 2017 | ||||||||||||||||||||||||||||||||||
Portfolio | Tax- exempt income | Ordinary income | Long term realized capital gains | Return of capital | Tax- exempt income | Ordinary income | Long term realized capital gains | Return of capital | |||||||||||||||||||||||||||
| PACE Small/Medium Co Value Equity Investments | $ | — | $ | 31,579,718 | $ | 26,560,820 | $ | — | $ | — | $ | 16,268,383 | $ | 5,521,465 | $ | — | |||||||||||||||||||
| PACE Small/Medium Co Growth Equity Investments | — | 1,103,205 | 26,024,878 | — | — | — | — | — | |||||||||||||||||||||||||||
| PACE International Equity Investments | — | 25,309,332 | — | — | — | 21,641,537 | — | — | |||||||||||||||||||||||||||
| PACE International Emerging Markets Equity Investments | — | 5,671,379 | — | — | — | 4,192,140 | — | — | |||||||||||||||||||||||||||
| PACE Global Real Estate Securities Investments | — | 6,006,803 | 218,765 | — | — | 6,076,147 | — | — | |||||||||||||||||||||||||||
For federal income tax purposes, the estimated cost and unrealized appreciation (depreciation) in value of investments, including derivatives, held at July 31, 2018 were as follows:
| Portfolio | Cost of investments | Gross unrealized appreciation | Gross unrealized depreciation | Net unrealized appreciation (depreciation) on investments | |||||||||||||||
PACE Government Money Market Investments | $ | 193,312,361 | $ | — | $ | — | $ | — | |||||||||||
PACE Mortgage-Backed Securities Fixed Income Investments | 639,989,756 | 5,950,388 | (12,421,448 | ) | (6,471,060 | ) | |||||||||||||
PACE Intermediate Fixed Income Investments | 387,649,832 | 1,361,100 | (7,772,285 | ) | (6,411,185 | ) | |||||||||||||
PACE Strategic Fixed Income Investments | 1,059,864,694 | 18,389,540 | (34,682,043 | ) | (16,292,503 | ) | |||||||||||||
PACE Municipal Fixed Income Investments | 350,869,329 | 6,474,667 | (2,944,843 | ) | 3,529,824 | ||||||||||||||
PACE Global Fixed Income Investments | 455,006,272 | 8,773,036 | (14,548,538 | ) | (5,775,502 | ) | |||||||||||||
PACE High Yield Investments | 391,190,591 | 7,501,432 | (12,177,815 | ) | (4,676,383 | ) | |||||||||||||
PACE Large Co Value Equity Investments | 1,168,504,986 | 231,089,979 | (55,520,585 | ) | 175,569,394 | ||||||||||||||
PACE Large Co Growth Equity Investments | 1,011,347,061 | 400,265,194 | (8,426,098 | ) | 391,839,096 | ||||||||||||||
PACE Small/Medium Co Value Equity Investments | 486,379,414 | 94,378,844 | (14,557,689 | ) | 79,821,155 | ||||||||||||||
PACE Small/Medium Co Growth Equity Investments | 452,958,883 | 120,722,505 | (7,866,329 | ) | 112,856,176 | ||||||||||||||
PACE International Equity Investments | 1,126,352,823 | 155,880,177 | (61,972,312 | ) | 93,907,865 | ||||||||||||||
PACE International Emerging Markets Equity Investments | 417,184,885 | 65,739,892 | (27,912,301 | ) | 37,827,591 | ||||||||||||||
PACE Global Real Estate Securities Investments | 141,914,894 | 2,629,385 | (3,873,254 | ) | (1,243,869 | ) | |||||||||||||
PACE Alternative Strategies Investments | 565,665,699 | 45,750,829 | (39,065,200 | ) | 6,685,629 | ||||||||||||||
The difference between book and tax basis appreciation (depreciation) on investments is primarily attributed to tax deferral of losses on wash sales, tax treatment of certain derivatives, mark-to-market of passive foreign investment companies and non-taxable special dividends.
378
PACE Select Advisors Trust
Notes to financial statements
At July 31, 2018, the components of accumulated earnings (deficit) on a tax basis were as follows:
| Portfolio | income | Undistributed ordinary capital gains | Accumulated Undistributed long-term other losses | realized capital and (depreciation) | Unrealized appreciation Total | ||||||||||||||||||
PACE Government Money Market Investments | $ | 107,862 | $ | — | $ | (1,106 | ) | $ | — | $ | 106,756 | ||||||||||||
PACE Mortgage-Backed Securities Fixed Income Investments | 394,225 | — | (23,321,878 | ) | (6,441,796 | ) | (29,369,449 | ) | |||||||||||||||
PACE Intermediate Fixed Income Investments | 1,470,128 | — | (5,615,885 | ) | (6,409,076 | ) | (10,554,833 | ) | |||||||||||||||
PACE Strategic Fixed Income Investments | 1,480,361 | — | (20,394,443 | ) | (16,410,552 | ) | (35,324,634 | ) | |||||||||||||||
PACE Municipal Fixed Income Investments | 149,560 | 390,310 | — | 3,529,824 | 4,069,694 | ||||||||||||||||||
PACE Global Fixed Income Investments | — | — | (7,739,979 | ) | (5,807,658 | ) | (13,547,637 | ) | |||||||||||||||
PACE High Yield Investments | 2,586,809 | — | (5,646,601 | ) | (4,685,682 | ) | (7,745,474 | ) | |||||||||||||||
PACE Large Co Value Equity Investments | 9,498,516 | 81,633,769 | (3,454,440 | ) | 175,569,390 | 263,247,235 | |||||||||||||||||
PACE Large Co Growth Equity Investments | 12,096,863 | 157,719,120 | — | 391,839,107 | 561,655,090 | ||||||||||||||||||
PACE Small/Medium Co Value Equity Investments | 13,055,554 | 11,378,317 | — | 79,821,152 | 104,255,023 | ||||||||||||||||||
PACE Small/Medium Co Growth Equity Investments | 19,224,526 | 38,421,535 | — | 112,856,174 | 170,502,235 | ||||||||||||||||||
PACE International Equity Investments | 15,320,294 | — | (2,509,189 | ) | 93,833,443 | 106,644,548 | |||||||||||||||||
PACE International Emerging Markets Equity Investments | 5,433,086 | — | (31,762,140 | ) | 37,143,885 | 10,814,831 | |||||||||||||||||
PACE Global Real Estate Securities Investments | 3,058,912 | — | (2,891,737 | ) | (1,231,539 | ) | (1,064,364 | ) | |||||||||||||||
PACE Alternative Strategies Investments | — | — | (10,798,233 | ) | 6,631,335 | (4,166,898 | ) | ||||||||||||||||
Under the Regulated Investment Company Modernization Act of 2010 (the "Act"), net capital losses recognized by the Portfolios after December 22, 2010, may be carried forward indefinitely, and retain their character as short-term and/or long-term losses. The Act requires that post-enactment net capital losses be used before pre-enactment net capital losses. Post-enactment loss incurred that will be carried forward indefinitely are as follows:
Portfolio | Short-term | Long-term | Total | ||||||||||||
PACE Government Money Market Investments | $ | 1,106 | $ | — | $ | 1,106 | |||||||||
PACE Mortgage-Backed Securities Fixed Income Investments | 10,077,104 | 13,233,061 | 23,310,165 | ||||||||||||
PACE Intermediate Fixed Income Investments | 3,973,510 | 1,602,485 | 5,575,995 | ||||||||||||
PACE Strategic Fixed Income Investments | 20,382,141 | — | 20,382,141 | ||||||||||||
PACE Global Fixed Income Investments | 7,258,048 | — | 7,258,048 | ||||||||||||
PACE High Yield Investments | — | 5,646,601 | 5,646,601 | ||||||||||||
PACE International Emerging Markets Equity Investments | 31,762,140 | — | 31,762,140 | ||||||||||||
PACE Global Real Estate Securities Investments | — | 2,891,737 | 2,891,737 | ||||||||||||
During the fiscal year, the following Portfolios utilized capital loss carryforwards to offset current year realized gains:
| Capital loss carryforwards utilized | |||||||
PACE Government Money Market Investments | $ | 6 | |||||
PACE High Yield Investments | 8,237,365 | ||||||
PACE International Equity Investments | 61,970,961 | ||||||
PACE International Emerging Markets Equity Investments | 32,477,503 | ||||||
PACE Alternative Strategies Investments | 28,469,411 | ||||||
379
PACE Select Advisors Trust
Notes to financial statements
During the fiscal year ended July 31, 2018, the following Portfolios had expired capital loss carryforwards not utilized:
| Capital loss carryforwards expired | |||||||
PACE Global Fixed Income Investments | $ | 7,784,695 | |||||
PACE International Equity Investments | 60,069,744 | ||||||
PACE Alternative Strategies Investments | 7,271,957 | ||||||
Qualified late year losses are deemed to arise on the first business day of a Portfolio's next taxable year. For the year ended July 31, 2018, the following Portfolio incurred, and elected to defer losses of the following:
| Late year ordinary | Post-October capital losses | ||||||||||||||
Portfolio | losses | Short-term | Long-term | ||||||||||||
PACE Alternative Strategies Investments | $ | 9,771,070 | $ | — | $ | — | |||||||||
At July 31, 2018, the effect of permanent "book/tax" reclassifications resulted in increases and decreases to components of the Portfolios' net assets as follows:
| Portfolio | Accumulated net investment income/ (distributions in excess of) | Accumulated net realized gain/loss | Beneficial interest | ||||||||||||
PACE Mortgage-Backed Securities Fixed Income Investments | $ | 4,288,385 | $ | (4,288,385 | ) | $ | — | ||||||||
PACE Intermediate Fixed Income Investments | 844,819 | (844,819 | ) | — | |||||||||||
PACE Strategic Fixed Income Investments | 2,460,291 | (2,460,291 | ) | — | |||||||||||
PACE Municipal Fixed Income Investments | 3,959 | (3,959 | ) | — | |||||||||||
PACE Global Fixed Income Investments | 30,151,987 | 1,442,631 | (31,594,618 | ) | |||||||||||
PACE High Yield Investments | 1,840,289 | (1,840,289 | ) | — | |||||||||||
PACE Large Co Value Equity Investments | (507,679 | ) | 507,679 | — | |||||||||||
PACE Large Co Growth Equity Investments | 987,808 | (987,808 | ) | — | |||||||||||
PACE Small/Medium Co Value Equity Investments | 305,841 | (305,841 | ) | — | |||||||||||
PACE Small/Medium Co Growth Equity Investments | 4,520,821 | (4,520,821 | ) | — | |||||||||||
PACE International Equity Investments | 2,560,392 | 57,509,352 | (60,069,744 | ) | |||||||||||
PACE International Emerging Markets Equity Investments | (280,013 | ) | 280,013 | — | |||||||||||
PACE Global Real Estate Securities Investments | 1,393,218 | (1,393,218 | ) | — | |||||||||||
PACE Alternative Strategies Investments | (5,065,649 | ) | 21,529,653 | (16,464,004 | ) | ||||||||||
These differences are primarily due to tax treatment of foreign currency and futures transactions, net operating losses, paydown gains and losses, distributions in excess of net investment income, disposition of PFIC investments, swap adjustments, REIT adjustments, tax character of distributions and adjustments for certain debt obligations.
ASC 740-10 "Income Taxes—Overall" sets forth a minimum threshold for financial statement recognition of the benefit of a tax position taken or expected to be taken. The Portfolios have conducted an analysis and concluded as of July 31, 2018, that there are no significant uncertain tax positions taken or expected to be taken that would require recognition in the financial statements. As of July 31, 2018, PACE International Emerging Markets Equity Investments has recognized a liability of $682,295 related to uncertain tax positions which is included in deferred foreign capital gain taxes payable in the Statement of assets and liabilities. The Portfolios recognize interest and penalties, if any, related to uncertain tax positions as income tax expense in the Statement of operations. During the period ended
380
PACE Select Advisors Trust
Notes to financial statements
July 31, 2018, the Portfolios did not incur any interest or penalties. Capital gains realized by the Portfolios on securities issued in or by certain foreign countries may be subject to capital gains tax imposed by those countries.
Under the applicable foreign tax laws, gains on certain securities held in certain foreign countries may be subject to taxes will be paid by the Portfolios.
Each of the tax years in the four year period ended July 31, 2018, remains subject to examination by the Internal Revenue Service and state taxing authorities.
Subsequent events
At the recommendation of UBS Asset Management (Americas) Inc., each Portfolio's investment advisor, the Board of Trustees of the Trust approved the closure of Class C of each Fund and the automatic conversion of Class C shares of each Fund into Class A shares of the same Portfolio (the "Conversion").
Effective on July 12, 2018 (the "Closure Date"), the Portfolios ceased offering Class C shares. New or additional investments into Class C shares, including investments through an automatic investment plan, were not permitted after the Closure Date.
On or about October 12, 2018 (the "Conversion Date"), all outstanding Class C shares of each Portfolio will be automatically converted into Class A shares of the same Portfolio. From the Closure Date to the Conversion Date (the "Conversion Period"), the 12b-1 distribution fees (currently, 0.50% of average net assets for PACE Mortgage-Backed Securities Fixed Income Investments, PACE Intermediate Fixed Income Investments, PACE Strategic Fixed Income Investments, PACE Municipal Fixed Income Investments, PACE Global Fixed Income Investments and PACE High Yield Investments, and 0.75% of average net assets for all other Portfolios) and any contingent deferred sales charges applicable to Class C shares will be waived; 12b-1 service fees (currently, 0.25% of average net assets) will continue to be assessed. During the Conversion Period, automatic reinvestment of Class C share dividend and capital gain distributions will continue and existing shareholders may exchange their Class C shares of the Portfolios for Class C shares of other UBS Family Funds (as defined in the Prospectus), as permitted by existing exchange privileges. Upon the conversion of Class C shares into Class A shares, each Class C shareholder will own Class A shares having an aggregate value equal to the aggregate value of Class C shares held by that shareholder as of the close of business on the Conversion Date. Any contingent deferred sales charges applicable to Class C shares will be waived in connection with the conversion to Class A shares, and the 12b-1 service fee currently applicable to Class A shares will then apply to the converted shares. It is anticipated that the conversion of Class C shares into Class A shares will be tax-free for federal income tax purposes.
The Conversion will occur without any action being necessary from shareholders.
Effective August 1, 2018, PACE Intermediate Fixed Income Investments lowered its expense cap so that the Portfolio's ordinary total operating expenses of each class (excluding dividend expense, borrowing costs, and interest expense relating to short sales, and expenses attributable to investment in other investment companies, interest, taxes, brokerage commissions and extraordinary expenses) would not exceed 0.91% for Class A, 1.41% for Class C and 0.66% for both Class Y and Class P. Effective August 1, 2018, PACE Global Fixed Income Investments lowered its expense cap so that the Portfolio's ordinary total operating expenses of each class (excluding dividend expense, borrowing costs, and interest expense relating to short sales, and expenses attributable to investment in other investment companies, interest, taxes, brokerage commissions and extraordinary expenses) would not exceed 1.03% for Class A, 1.51% for Class C, 0.87% for Class Y and 0.84% for Class P. In addition, effective August 1, 2018, PACE Large Co Growth Equity Investments lowered its expense cap so that the Portfolio's ordinary total operating expenses of each class (excluding dividend expense, borrowing costs, and interest expense relating to short sales, and expenses attributable to investment in other investment companies, interest, taxes, brokerage commissions and extraordinary expenses) would not exceed 1.13% for Class A, 1.88% for Class C and 0.88% for both Class Y and Class P.
381
PACE Select Advisors Trust
Report of Independent Registered Public Accounting Firm
To the Shareholders and the Board of Trustees of
PACE Select Advisors Trust
Opinion on the Financial Statements
We have audited the accompanying statements of assets and liabilities of PACE Select Advisors Trust (the "Trust"), (comprising PACE Government Money Market Investments, PACE Mortgage-Backed Securities Fixed Income Investments, PACE Intermediate Fixed Income Investments, PACE Strategic Fixed Income Investments, PACE Municipal Fixed Income Investments, PACE Global Fixed Income Investments, PACE High Yield Investments, PACE Large Co Value Equity Investments, PACE Large Co Growth Equity Investments, PACE Small/Medium Co Value Equity Investments, PACE Small/Medium Co Growth Equity Investments, PACE International Equity Investments, PACE International Emerging Markets Equity Investments, PACE Global Real Estate Securities Investments and PACE Alternative Strategies Investments (collectively referred to as the "Funds")), including the portfolios of investments, as of July 31, 2018, and the related statements of operations and cash flows (for PACE Large Co Value Equity Investments and PACE International Equity Investments) for the year then ended, the statements of changes in net assets for each of the two years in the period then ended, the financial highlights for each of the five years in the period then ended and the related notes (collectively referred to as the "financial statements"). In our opinion, the financial statements present fairly, in all material respects, the financial position of each of the Funds comprising The PACE Select Advisors Trust at July 31, 2018, the results of their operations and their cash flows (for PACE Large Co Value Equity Investments and PACE International Equity Investments) for the year then ended, the changes in their net assets for each of the two years in the period then ended and their financial highlights for each of the five years in the period then ended, in conformity with U.S. generally accepted accounting principles.
Basis for Opinion
These financial statements are the responsibility of the Trust's management. Our responsibility is to express an opinion on each of the Funds' financial statements based on our audits. We are a public accounting firm registered with the Public Company Accounting Oversight Board (United States) ("PCAOB") and are required to be independent with respect to the Trust in accordance with the U.S. federal securities laws and the applicable rules and regulations of the Securities and Exchange Commission and the PCAOB.
We conducted our audits in accordance with the standards of the PCAOB. Those standards require that we plan and perform the audit to obtain reasonable assurance about whether the financial statements are free of material misstatement, whether due to error or fraud. The Trust is not required to have, nor were we engaged to perform, an audit of the Trust's internal control over financial reporting. As part of our audits we are required to obtain an understanding of internal control over financial reporting but not for the purpose of expressing an opinion on the effectiveness of the Trust's internal control over financial reporting. Accordingly, we express no such opinion.
Our audits included performing procedures to assess the risks of material misstatement of the financial statements, whether due to error or fraud, and performing procedures that respond to those risks. Such procedures included examining, on a test basis, evidence regarding the amounts and disclosures in the financial statements. Our procedures included confirmation of securities owned as of July 31, 2018, by correspondence with the custodian and brokers or by other appropriate auditing procedures where replies from brokers were not received. Our audits also included evaluating the accounting principles used and significant estimates made by management, as well as evaluating the overall presentation of the financial statements. We believe that our audits provide a reasonable basis for our opinion.

We have served as the auditor of one or more UBS investment companies since 1978.
New York, New York
September 28, 2018
382
PACE Select Advisors Trust
Tax information (unaudited)
We are required by Subchapter M of the Internal Revenue Code of 1986, as amended, to advise you in writing as to the federal tax status of distributions received by shareholders during the fiscal year. Accordingly, the percentage of ordinary dividends paid that qualify for the dividends received deduction for corporate shareholders and the amount of foreign tax credit to be passed through to shareholders are as follows:
| Portfolio | Dividends received deduction | Foreign tax credit | |||||||||
PACE High Yield Investments | $ | 2,151 | $ | — | |||||||
PACE Large Co Value Equity Investments | 27,683,896 | — | |||||||||
PACE Large Co Growth Equity Investments | 5,744,088 | — | |||||||||
PACE Small/Medium Co Value Equity Investments | 6,680,018 | — | |||||||||
PACE Small/Medium Co Growth Equity Investments | 87,495 | — | |||||||||
PACE International Equity Investments | — | 2,442,075 | |||||||||
PACE International Emerging Markets Equity Investments | 43,613 | 1,491,833 | |||||||||
PACE Global Real Estate Securities Investments | 33,126 | — | |||||||||
Also, for the fiscal year ended July 31, 2018, the foreign source income for information reporting purposes for PACE International Equity Investments and PACE International Emerging Markets Equity Investments is $32,668,158 and $13,085,535, respectively.
For the taxable year ended July 31, 2018, the Portfolios designate the amounts below as the maximum amount that may be considered qualified dividend income for individual shareholders.
| Portfolio | Maximum amount considered qualified dividend income | ||||||
PACE High Yield Investments | $ | 2,183 | |||||
PACE Large Co Value Equity Investments | 28,852,476 | ||||||
PACE Large Co Growth Equity Investments | 5,962,917 | ||||||
PACE Small/Medium Co Value Equity Investments | 6,840,739 | ||||||
PACE Small/Medium Co Growth Equity Investments | 88,929 | ||||||
PACE International Equity Investments | 27,751,407 | ||||||
PACE International Emerging Markets Equity Investments | 7,163,212 | ||||||
PACE Global Real Estate Securities Investments | 332,449 | ||||||
Dividends received by tax-exempt recipients (e.g., IRAs and Keoghs) need not be reported as taxable income. Some retirement trusts (e.g., corporate, Keogh and 403(b)(7) plans) may need this information for their annual information reporting.
Shareholders should not use the above information to prepare their tax returns. Since each Portfolio's fiscal year is not the calendar year, another notification will be sent with respect to calendar year 2018. Such notification, which will reflect the amount to be used by calendar year taxpayers on their federal income tax returns, will be made in conjunction with Form 1099 DIV and will be mailed in February 2019. Shareholders are advised to consult their own tax advisers with respect to the tax consequences of their investment in each of the Portfolios.
383
PACE Select Advisors Trust
General information (unaudited)
Monthly and quarterly portfolio holdings disclosure
Each Portfolio will file its complete schedule of portfolio holdings with the Securities and Exchange Commission ("SEC") for the first and third quarters of each fiscal year on Form N-Q. The Portfolios' Forms N-Q are available on the SEC's Web site at http://www.sec.gov. The Portfolios' Forms N-Q may be reviewed and copied at the SEC's Public Reference Room in Washington, D.C. Information on the operation of the SEC's Public Reference Room may be obtained by calling 1-202-551 8090. Additionally, you may obtain copies of Forms N-Q from the Portfolios upon request by calling 1-800-647 1568.
In addition, PACE Government Money Market Investments discloses, on a monthly basis: (a) a complete schedule of its portfolio holdings; and (b) information regarding its weighted average maturity and weighted average life on UBS's Web site at the following internet address: www.ubs.com/usmoneymarketfunds. In addition, at this location, you will find a link to more detailed Portfolio information appearing in filings with the SEC on Form N-MFP.
Proxy voting policies, procedures and record
You may obtain a description of each Portfolio's (1) proxy voting policies, (2) proxy voting procedures and (3) information regarding how a Portfolio voted any proxies related to portfolio securities during the most recent 12-month period ended June 30 for which an SEC filing has been made, without charge, upon request by contacting a Portfolio directly at 1-800-647 1568, online on a Portfolio's Web site: www.ubs.com/ubsam-proxy, or on the EDGAR Database on the SEC's Web site (http://www.sec.gov).
384
PACE Select Advisors Trust
Board approvals of investment management and administration agreement and subadvisory agreements (unaudited)
Background—At a meeting of the board of PACE Select Advisors Trust (the "Trust") on July 17-18, 2018, the members of the board, including the trustees who are not "interested persons," as defined in the Investment Company Act of 1940, as amended, of the Trust (the "Independent Trustees"), considered and approved the continuance of the investment management and administration agreement (the "Investment Management and Administration Agreement") between UBS Asset Management (Americas) Inc. ("UBS AM") and the Trust, on behalf of each series of the Trust (each a "Portfolio" and together the "Portfolios"), and, for those Portfolios with subadvisors/sub-manager(s), the subadvisory/sub-management agreements for the Portfolios. (Throughout this discussion, each subadvisor/sub-manager to a Portfolio is referred to as a "Subadvisor" and each subadvisory/sub-management agreement is referred to as a "Subadvisory Agreement.") In preparing for the meeting, the Independent Trustees had requested and received extensive information from UBS AM to assist them, including information about UBS AM and the Portfolios' Subadvisors, as well as the management, subadvisory, administrative and distribution arrangements for the Portfolios. The board reviewed and discussed with management the materials initially provided by UBS AM prior to the scheduled board meeting. The Independent Trustees also met in executive session to review the disclosure that had been made to them. At these sessions the Independent Trustees were joined by their independent legal counsel. The Independent Trustees also received a memorandum from their independent legal counsel discussing the duties of board members in considering the approval of management, subadvisory/sub-management, administration and distribution agreements.
In its consideration of the approval of the Investment Management and Administration Agreement and the Subadvisory Agreements, the board considered the following factors:
Nature, extent and quality of the services under the Investment Management and Administration Agreement and the Subadvisory Agreements—The board received and considered information regarding the nature, extent and quality of management services provided to the Portfolios by UBS AM and, for those Portfolios with Subadvisor(s), subadvisory services provided by each Subadvisor during the past year. The board also considered the nature, extent and quality of administrative, distribution and shareholder services performed by UBS AM and its affiliates for the Portfolios and the resources devoted to, and the record of compliance with, each Portfolio's compliance policies and procedures. The board noted that it received information at regular meetings throughout the year regarding the services rendered by UBS AM concerning the management of each Portfolio's affairs and UBS AM's role in coordinating and overseeing providers of other services to the Portfolios. The board noted the complexity of this process for the Portfolios, given their broad range of investment strategies. The board noted that UBS AM provided extensive oversight of the Subadvisors for the Portfolios and reported to the board at each regular meeting on the Subadvisors' performance and compliance with applicable requirements and made recommendations with respect to Subadvisor changes (both in terms of the allocation of Portfolio assets to Subadvisors and their hiring and termination) from time to time based on the performance of the Subadvisors and other relevant factors. The board's evaluation of the services provided by UBS AM and the Subadvisors took into account the board's knowledge and familiarity gained as board members of funds in the UBS New York fund complex, including the scope and quality of UBS AM's investment management and other capabilities and the quality of its administrative and other services. The board observed that the scope of services provided by UBS AM had expanded over time as a result of regulatory and other developments, including (i) maintaining and monitoring its own and the Portfolios' expanded compliance programs and (ii) hiring and replacing Subadvisors, monitoring current Subadvisors (including adjusting their Portfolio asset allocations) and coordinating strategies among Subadvisors to continue to optimize the implementation and effectuation of the Portfolios' investment strategies. It also was noted that the Investment Management and Administration Agreement under consideration had been approved by shareholders at a special meeting of shareholders of the Trust held in 2008.
The board had available to it the qualifications, backgrounds and responsibilities of the senior personnel at UBS AM responsible for the Portfolios and had previously met with and received information regarding the person(s) or portfolio management team from each Subadvisor and/or UBS AM primarily responsible for the day-to-day management of each Portfolio. The board recognized that several senior personnel at UBS AM report to the board regularly,
385
PACE Select Advisors Trust
Board approvals of investment management and administration agreement and subadvisory agreements (unaudited)
and that at each regular meeting the board receives a detailed report from UBS AM on each Portfolio's performance and receives more extensive information periodically from each Subadvisor. The board also considered, based on its knowledge of UBS AM and its affiliates, the financial resources available to UBS AM and its parent organization, UBS Group AG. In that regard, the board received extensive financial information regarding UBS AM and noted that it was a wholly owned, indirect subsidiary of one of the largest financial services firms in the world. It also was noted that UBS AM had approximately $174 billion in assets under management as of March 31, 2018 and was part of the UBS Asset Management Division, which had approximately $831 billion in assets under management worldwide as of March 31, 2018. The board also was cognizant of, and considered, the regulatory and litigation actions and investigations occurring in the past few years involving UBS Group AG, UBS AM and certain of their affiliates.
The board concluded that, overall, it was satisfied with the nature, extent and quality of services provided (and expected to be provided) to the Portfolios under the Investment Management and Administration Agreement as well as under the Subadvisory Agreements.
Management and subadvisory fees and expense ratios—For each Portfolio, the board reviewed and considered the contractual management fee (the "Contractual Management Fee") payable by the Portfolio to UBS AM in light of the nature, extent and quality of the services provided by UBS AM pursuant to the Investment Management and Administration Agreement. The board also reviewed and considered the fee waiver and/or expense reimbursement arrangements for each Portfolio (if any) and considered the actual fee rate (after taking any waivers and reimbursements into account) (the "Actual Management Fee") payable by the Portfolio. The board considered whether UBS AM had entered into one or more fee waiver and/or expense reimbursement agreements with a Portfolio under which UBS AM was contractually obligated to waive its management fees and/or reimburse the Portfolio so that the total ordinary operating expenses of certain or all classes of that Portfolio through November 30, 2018 (excluding dividend expense, borrowing costs, interest expense relating to short sales, expenses attributable to investment in other investment companies, interest, taxes, brokerage commissions and extraordinary expenses) would not exceed specified limits for each class (or, with respect to certain Portfolios, an agreement to waive a portion of its management fee). The board also considered that each Portfolio with such a fee waiver/reimbursement agreement had agreed to repay UBS AM for those waived fees and/or reimbursed expenses if the Portfolio can do so over the following three fiscal years without causing its expenses in any of those years to exceed the expense caps. Moreover, the board considered that, in addition to continuing to waive certain fees and/or reimbursing certain expenses as in past years, UBS AM also offered specific new expense caps for certain Portfolios as discussed below. Additionally, the board received and considered information comparing each Portfolio's Contractual Management Fee, Actual Management Fee and overall expenses with those of funds in a group of funds selected and provided by Broadridge, an independent provider of investment company data (the "Expense Group"). The board also received from Broadridge comparative data on a supplemental expense group of subadvised peers (which may include certain of the subadvised peers contained within the primary Expense Group) (the "Supplemental Expense Group"). A discussion of the board's considerations with respect to each Portfolio's fees is set forth below.
In connection with its consideration of each Portfolio's management fees, the board also received information on UBS AM's standard institutional account fees for accounts of a similar investment type to each of the Portfolios. The board noted management's explanation that comparisons with such accounts may be of limited relevance given the different structures and regulatory requirements of mutual funds, such as the Portfolios, versus those accounts and the differences in the levels of services required by the Portfolios and those accounts. The board also received information on fees charged to other mutual funds managed by UBS AM. The board observed that it had received certain information regarding fees, compensation from other similar funds, and economies of scale from certain Subadvisors as part of the summary of each Subadvisor's responses to requests for due diligence materials in connection with the board's annual reconsideration of the Subadvisory Agreements; however, the board also observed that the compensation paid to a Subadvisor is paid by UBS AM, not by the particular Portfolio, and, accordingly,
386
PACE Select Advisors Trust
Board approvals of investment management and administration agreement and subadvisory agreements (unaudited)
that the retention of a Subadvisor generally does not increase the fees otherwise incurred by a Portfolio's shareholders (unless a management fee waiver level was affected by a subadvisory fee increase or a reallocation of assets).
Portfolio performance—For each Portfolio, the board received and considered (a) annualized total return information of the Portfolio compared to other funds (the "Performance Universe") selected by Broadridge over the one-, three-, five-, ten-year and since inception periods ended April 30, 2018, and (b) annualized performance information for each year in the ten-year period ended April 30, 2018. Although the board received information for the ten-year and since inception periods, in its analysis, it generally placed greater emphasis on the one-, three- and five-year periods. The board was provided with a description of the methodology Broadridge used to determine the similarity of a Portfolio with the funds included in its Performance Universe. The board also considered UBS AM's statement that while management believed that the Broadridge peer groups were useful in evaluating Portfolio expenses relative to peers, they were less useful in evaluating performance, as in many cases they were broad-based and consisted of funds that did not necessarily have similar investment parameters to the applicable Portfolio. The board also noted that it had received information throughout the year at periodic intervals with respect to each Portfolio's performance, in most cases with respect to certain benchmark indices, including with respect to each Subadvisor's performance. Further discussion of the board's considerations with respect to each Portfolio's performance is set forth below.
Advisor profitability—The board received and considered a profitability analysis of UBS AM and its affiliates in providing services to each Portfolio. The board also received profitability information with respect to the UBS New York fund complex as a whole. UBS AM's profitability was considered not excessive in light of the nature, extent and quality of the services provided to the Portfolios. A Subadvisor's profitability in providing services to a Portfolio was not a significant factor considered by the board, as the subadvisory fees are paid by UBS AM, not by the relevant Portfolio.
Economies of scale—The board received and considered information from management regarding whether UBS AM realized economies of scale as the Portfolios' assets grew, whether the Portfolios have appropriately benefited from any economies of scale, and whether there is potential for realization of any further economies of scale for the Portfolios. The board considered whether economies of scale in the provision of services to the Portfolios were being passed along to the shareholders. The board noted that each Portfolio's Contractual Management Fee contained breakpoints, with the exception of PACE Government Money Market Investments. The board also noted that as of April 30, 2018, with the exception of PACE International Emerging Markets Equity Investments, PACE Global Fixed Income Investments, PACE Global Real Estate Securities Investments and PACE High Yield Investments, for those Portfolios having breakpoints, each Portfolio's asset level exceeded at least its first breakpoint. Accordingly, the board determined that actual economies of scale existed for those Portfolios whose assets had reached the first breakpoint level and potential economies of scale existed for those Portfolios whose assets had not yet reached their first breakpoint level. The board also noted that to the extent a Portfolio's assets have increased over time, it has realized other economies of scale as certain expenses, such as fees for trustees, auditor and legal fees and printing and postage, become a smaller percentage of overall assets. The board also took note of the relationship between any breakpoints in a subadvisory fee and the breakpoints in fees paid by the Portfolios to UBS AM.
Generally, in light of UBS AM's profitability data, the Actual Management Fees, the Contractual Management Fees, the breakpoints currently in place for the Portfolios and the current assets of the Portfolios, the board believed that UBS AM's sharing of potential and current economies of scale with the Portfolios was acceptable.
Other benefits to UBS AM and the Subadvisors—The board was informed by management that the Subadvisors' relationships with the Portfolios were limited to their provision of subadvisory services to these Portfolios, and that therefore, management believed that the Subadvisors and their affiliates did not receive tangible ancillary benefits as a result of the Subadvisors' relationships with the Portfolios, with the exception of possible benefits from soft dollars (e.g., research credits related to transaction commissions) for the equity Portfolios (which
387
PACE Select Advisors Trust
Board approvals of investment management and administration agreement and subadvisory agreements (unaudited)
also would potentially benefit such Portfolios) and possible limited benefits to certain affiliates of a Subadvisor, such as broker-dealers (e.g., an affiliate's execution of portfolio transactions subject to detailed restrictions in SEC rules and board oversight procedures). The board recognized that certain Subadvisors could receive intangible benefits from their association with the Trust, such as increased name recognition or publicity from being selected as Subadvisors to the Trust after an extensive review process. Similarly, a Portfolio could benefit from having a Subadvisor with an established or well-regarded reputation. In light of the costs of providing investment management, administrative and other services to the Portfolios and UBS AM's ongoing commitment to the Portfolios, the profits and other ancillary benefits that UBS AM and its affiliates received were considered reasonable.
In the discussions that follow, reference is made to the "median" in the Broadridge Expense Group, Supplemental Expense Group and Broadridge Performance Universe categories. With respect to expenses, below median fees or expenses represent fees or expenses that are lower relative to the median, and above median fees or expenses represent fees or expenses that are higher relative to the median of the funds in the relevant Expense Group. With respect to performance, below median performance represents performance that is worse relative to the median, and above median performance represents performance that is better relative to the median of the funds in the relevant Performance Universe. Broadridge information is calculated on a share class basis. References appearing below relate to Class A shares; the board also had information relevant to other share classes (e.g., Class P shares) during its considerations.
PACE Large Co Growth Equity Investments
In approving the Investment Management and Administration Agreement and the Subadvisory Agreements with each of J.P. Morgan Investment Management Inc. ("J.P. Morgan"), Jackson Square Partners, LLC and Mar Vista Investment Partners, LLC, the board, including the Independent Trustees, also considered the following factors:
Portfolio performance—The comparative Broadridge information showed that the Portfolio's performance was below the Performance Universe median for the one-, three-, five- and ten-year periods and since inception. It was noted that the Portfolio's recent performance had improved and, for the one-year period, was closer to the median.
Management and subadvisory fees and expense ratios—The comparative Broadridge information showed that the Portfolio's Contractual Management Fee, Actual Management Fee and total expenses were above the median in the Portfolio's Expense Group for the comparison periods utilized in the Broadridge report. Management noted that the Portfolio's total expenses, although above the median, were reasonably close to the Expense Group median (within two basis points (that is, hundredths of a percentage point)—i.e., 0.02%) within a tightly-ranged peer group. Management also noted that, compared to the Supplemental Expense Group, consisting of five other subadvised funds, the Portfolio's Actual Management Fee was more closely aligned with its peers, and the Portfolio's total expenses were below the median. Management stated that the Portfolio's total expenses were lower than those of the only other multi-managed fund in the Supplemental Expense Group. Management also noted the downward trend in the Portfolio's total expenses over the last year, and proposed to voluntarily lower the Portfolio's expense cap by five basis points (i.e., 0.05%).
PACE Large Co Value Equity Investments
In approving the Investment Management and Administration Agreement and the Subadvisory Agreements with each of Boston Partners Global Investors, Inc., Los Angeles Capital Management and Equity Research, Inc. ("Los Angeles Capital"), Pzena Investment Management, LLC and River Road Asset Management, LLC, the board, including the Independent Trustees, also considered the following factors:
388
PACE Select Advisors Trust
Board approvals of investment management and administration agreement and subadvisory agreements (unaudited)
Portfolio performance—The comparative Broadridge information showed that the Portfolio's performance was above the Performance Universe median for the three-, five- and ten-year periods, but slightly below the Performance Universe median for the one-year period and since inception.
Management and subadvisory fees and expense ratios—The comparative Broadridge information showed that the Portfolio's Contractual Management Fee, Actual Management Fee and total expenses were above the median in the Portfolio's Expense Group for the comparison periods utilized in the Broadridge report. Management explained that the Portfolio's total expenses, although above the median, were reasonably close to the Expense Group median (within two basis points—i.e., 0.02%). It was noted that, compared to the Supplemental Expense Group, consisting of four other subadvised funds, the Portfolio's Contractual Management Fee and Actual Management Fee were more closely aligned with its peers, and the Portfolio's Actual Management Fee and total expenses were at or below the median. Management also noted the downward trend in the Portfolio's total expenses over the last year.
PACE Small/Medium Co Growth Equity Investments
In approving the Investment Management and Administration Agreement and the Subadvisory Agreements with each of LMCG Investments, LLC ("LMCG"), Riverbridge Partners, LLC and Timpani Capital Management LLC, the board, including the Independent Trustees, also considered the following factors:
Portfolio performance—The comparative Broadridge information showed that the Portfolio's performance was below the Performance Universe median for the one-, three-, five- and ten-year periods and since inception. It was noted that the Portfolio's recent performance had improved and, for the one-year period, was closer to the median.
Management and subadvisory fees and expense ratios—The comparative Broadridge information showed that the Portfolio's Contractual Management Fee, Actual Management Fee and total expenses were below the median in the Portfolio's Expense Group, as well as the Supplemental Expense Group, for the comparison periods utilized in the Broadridge report.
PACE Small/Medium Co Value Equity Investments
In approving the Investment Management and Administration Agreement and the Subadvisory Agreements with each of Huber Capital Management LLC, Kayne Anderson Rudnick Investment Management, LLC, Sapience Investments, LLC and Systematic Financial Management, L.P., the board, including the Independent Trustees, also considered the following factors:
Portfolio performance—The comparative Broadridge information showed that the Portfolio's performance was below the Performance Universe median for the one-, three-, five- and ten-year periods and since inception. Management stated that the Portfolio was classified under the Broadridge Small Cap Core category, as there is not a Broadridge small/medium cap value category. Management noted that small cap companies outperformed small-mid cap value companies by a wide margin during the one-year period, and that within the small-mid cap universe, growth companies largely outperformed value companies during the same period. Management also noted that one of the Portfolio's Subadvisors was a significant detractor to Portfolio performance and underperformed due to stock selection.
Management and subadvisory fees and expense ratios—The comparative Broadridge information showed that the Portfolio's Contractual Management Fee, Actual Management Fee and total expenses were below the median in the Portfolio's Expense Group, as well as below or at the median in the Supplemental Expense Group, for the comparison periods utilized in the Broadridge report.
389
PACE Select Advisors Trust
Board approvals of investment management and administration agreement and subadvisory agreements (unaudited)
PACE International Equity Investments
In approving the Investment Management and Administration Agreement and the Subadvisory Agreements with each of Chautauqua Capital Management—a division of Robert W. Baird & Co. Incorporated, Los Angeles Capital and Mondrian Investment Partners Limited ("Mondrian"), the board, including the Independent Trustees, also considered the following factors:
Portfolio performance—The comparative Broadridge information showed that the Portfolio's performance was below the Performance Universe median for the one-, three-, five- and ten-year periods and since inception, with performance being reasonably close to the median for the three- and five-year periods. Management explained that although the Portfolio's benchmark is a large cap core index, the Portfolio was classified under the Broadridge International Multi-Cap Growth category due to a bias in small-mid cap portfolio holdings over the last year. Management noted that the Portfolio also had a smaller concentration of growth companies than other funds in the category and that, as growth companies outperformed value companies during the one-year period, the Fund under-performed within the category.
Management and subadvisory fees and expense ratios—The comparative Broadridge information showed that the Portfolio's Contractual Management Fee, Actual Management Fee and total expenses were above the median in the Portfolio's Expense Group for the comparison periods utilized in the Broadridge report. Management explained that the Portfolio's total expenses, although above the median, were reasonably close to the Expense Group median (within two basis points—i.e., 0.02%). Management explained the composition of the Expense Group changed during the comparison periods, which resulted in the Fund's Actual Management Fee moving above the median while the Fund's Contractual Management Fee remained reasonably close to the Expense Group median (within three basis points—i.e., 0.03%). Management also noted that, with respect to the Supplemental Expense Group, the Portfolio's total expenses were below the median, notwithstanding that the managers of all of the other subadvised funds utilize only one subadvisor.
PACE International Emerging Markets Equity Investments
In approving the Investment Management and Administration Agreement and the Subadvisory Agreements with each of LMCG, Mondrian and William Blair Investment Management, LLC, the board, including the Independent Trustees, also considered the following factors:
Portfolio performance—The comparative Broadridge information showed that the Portfolio's performance was below the Performance Universe median for the one-, three-, five- and ten-year periods and since inception. Management noted that the Portfolio's recent performance had improved and, for the one-year period, was closer to the median.
Management and subadvisory fees and expense ratios—The comparative Broadridge information showed that the Portfolio's Contractual Management Fee and Actual Management Fee were at the median and total expenses were above the median in the Portfolio's Expense Group for the comparison periods utilized in the Broadridge report. Management noted that the variance in the Portfolio's total expenses relative to the Expense Group median was primarily attributable to non-management fee expenses, including custody fees. Management explained that the Portfolio's custody costs were historically asset-based, but that starting in April 2018, those costs became calculated primarily on a transaction-basis and that, all else remaining constant, custody costs of the Portfolio are reasonably expected to decrease. Management further noted that the Portfolio's expense cap has declined 45 basis points (i.e., 0.45%). since 2014 while the Expense Group median remained within a five basis point (i.e., 0.05%) range over the same period.
390
PACE Select Advisors Trust
Board approvals of investment management and administration agreement and subadvisory agreements (unaudited)
PACE Alternative Strategies Investments
In approving the Investment Management and Administration Agreement and the Subadvisory Agreements with each of Analytic Investors, LLC, AQR Capital Management, LLC, Aviva Investors Americas LLC, First Quadrant L.P., Kettle Hill Capital Management, LLC, PCJ Investment Counsel Ltd., Principal Global Investors, LLC doing business as Macro Currency Group, Sirios Capital Management, L.P. and Standard Life Investments (Corporate Funds) Limited, the board, including the Independent Trustees, also considered the following factors:
Portfolio performance—The comparative Broadridge information showed that the Portfolio's performance was above the Performance Universe median for the five-year period, but the Portfolio's performance was below the Performance Universe median for the one-, three- and ten-year periods and since inception.
Management and subadvisory fees and expense ratios—The comparative Broadridge information showed that the Portfolio's Contractual Management Fee and total expenses were below the median and its Actual Management Fee was slightly above the median in the Portfolio's Expense Group for the comparison periods utilized in the Broadridge report. With respect to the Supplemental Expense Group, the Portfolio's Actual Management Fee was at the median, while its Contractual Management Fee and total expenses were below the median.
PACE Global Real Estate Securities Investments
In approving the Investment Management and Administration Agreement and the Subadvisory Agreement with Brookfield Investment Management Inc., the board, including the Independent Trustees, also considered the following factors:
Portfolio performance—The comparative Broadridge information showed that the Portfolio's performance was below the Performance Universe median for the one-, three- and ten-year periods and since inception, but the Portfolio's performance was above the Performance Universe median for the five-year period. Management noted that, during the one-year period, the Portfolio's value focus resulted in underperformance against the Performance Universe, which had rewarded funds with a growth focus.
Management and subadvisory fees and expense ratios—The comparative Broadridge information showed that the Portfolio's Contractual Management Fee and Actual Management Fee were below the median (lowest Actual Management Fee in the Expense Group) and its total expenses were above the median in the Portfolio's Expense Group for the comparison periods utilized in the Broadridge report. Similarly, the Portfolio's Contractual Management Fee, Actual Management Fee and total expenses were at or below each of their respective medians in the Supplemental Expense Group. Management explained that the Portfolio's total expenses, although above the median, were reasonably close to the Expense Group median (within five basis points—i.e., 0.05%). Management explained that the Portfolio's higher transfer agent fees are the main driver of the Portfolio's higher total expenses, which are a result of the large number of shareholder accounts with smaller account sizes within the Portfolio.
PACE Mortgage-Backed Securities Fixed Income Investments
In approving the Investment Management and Administration Agreement and the Subadvisory Agreement with Pacific Investment Management Company LLC ("PIMCO"), the board, including the Independent Trustees, also considered the following factors:
Portfolio performance—The comparative Broadridge information showed that the Portfolio's performance was below the Performance Universe median for the one-, three-, five-year and ten-year periods, but above the Performance Universe median since inception. Management noted that that the Portfolio is managed as a higher-quality offering with a small exposure to non-investment grade securities compared to the Performance Universe.
391
PACE Select Advisors Trust
Board approvals of investment management and administration agreement and subadvisory agreements (unaudited)
Management also noted it believes the Portfolio outperformed expectations in a market environment where funds with greater exposure to lower-quality, non-agency securities significantly outperformed funds with a greater exposure to higher-quality agency securities.
Management and subadvisory fees and expense ratios—The comparative Broadridge information showed that the Portfolio's Contractual Management Fee, Actual Management Fee and total expenses were above the median (with the Portfolio's Contractual Management Fee the highest in the Expense Group) for the comparison periods utilized in the Broadridge report. Management noted that the Portfolio's Contractual Management Fee was reasonably close to the Supplemental Expense Group median (within three basis points—i.e., 0.03%) and the Portfolio's Actual Management Fee and total expenses were at or below the Supplemental Expense Group medians. It was noted that, compared to the Supplemental Expense Group, the Portfolio's Contractual Management Fee and Actual Management Fee were more closely aligned to its peers.
PACE High Yield Investments
In approving the Investment Management and Administration Agreement and the Subadvisory Agreements with each of Nomura Corporate Research and Asset Management Inc. ("NCRAM") and Nomura Asset Management Singapore Limited (the latter being a sub-manager to NCRAM for Asia), the board, including the Independent Trustees, also considered the following factors:
Portfolio performance—The comparative Broadridge information showed that the Portfolio's performance was above the Performance Universe median for the one-, three-, five- and ten-year periods and since inception.
Management and subadvisory fees and expense ratios—The comparative Broadridge information showed that the Portfolio's Contractual Management Fee and Actual Management Fee were above the median in the Portfolio's Expense Group (with the Portfolio's Contractual Management Fee the highest in the Expense Group) and its total expenses were at the median for the comparison periods utilized in the Broadridge report. Management explained that the Actual Management Fee, although above the median, was reasonably close to the Expense Group median (within four basis points—i.e., 0.04%). Management noted the downward trend in the Portfolio's total expenses over the last few years.
PACE Intermediate Fixed Income Investments
In approving the Investment Management and Administration Agreement and the Subadvisory Agreement with BlackRock Financial Management, Inc., the board, including the Independent Trustees, also considered the following factors:
Portfolio performance—The comparative Broadridge information showed that the Portfolio's performance was below the Performance Universe median for the one-, three-, five- and ten-year periods and since inception. Management noted that poorly-timed portfolio positioning detracted from the Portfolio's performance during the one-year period. With regard to the comparability of longer-term performance, management noted that the Fund's benchmark changed in April 2017 and the duration of the Portfolio was generally about two years less than the average duration of the Performance Universe before April 2017. Management explained that during the recent period of prolonged historically low interest rates, the Portfolio has produced lower returns versus longer-duration peers.
Management and subadvisory fees and expense ratios—The comparative Broadridge information showed that the Portfolio's Contractual Management Fee, Actual Management Fee and total expenses were above the median in the Portfolio's Expense Group for the comparison periods utilized in the Broadridge report. Management explained that the Portfolio's Actual Management Fee, although above the median, was reasonably close to the
392
PACE Select Advisors Trust
Board approvals of investment management and administration agreement and subadvisory agreements (unaudited)
Expense Group median (within six basis points—i.e., 0.06%). Management explained that the Portfolio's high transfer agent fees are the main driver of the Portfolio's higher total expenses, which are a result of the large number of shareholder accounts with smaller account sizes within the Portfolio. Management proposed to voluntarily lower the Portfolio's expense cap by two basis points (i.e., 0.02%).
PACE Global Fixed Income Investments
In approving the Investment Management and Administration Agreement and the Subadvisory Agreement with J.P. Morgan, the board, including the Independent Trustees, also considered the following factors:
Portfolio performance—The comparative Broadridge information showed that the Portfolio's performance was above the Performance Universe median for the one-year period, but was below the Performance Universe median for the three-, five- and ten-year periods and since inception.
Management and subadvisory fees and expense ratios—The comparative Broadridge information showed that the Portfolio's Contractual Management Fee, Actual Management Fee and total expenses were above the median (with the Portfolio's Contractual Management Fee and Actual Management Fee the highest in the Expense Group) for the comparison periods utilized in the Broadridge report. Management noted that the Portfolio's Actual Management Fee was reasonably close to the Expense Group median (within seven basis points—i.e., 0.07%). Management also noted that as of December 1, 2016, the Portfolio changed its name, investment strategy and performance benchmark, which resulted in the Portfolio being reclassified under the Global Income category. Management explained that the Expense Group composition of comparable funds has changed considerably as a result of the Portfolio's strategy change. Management noted that the Broadridge materials do not fully reflect the expense limitation agreement which brings the Portfolio's total expenses to only eight basis points (i.e., 0.08%) above the Expense Group median. Management noted that the Actual Management Fee currently in effect is only five basis points (i.e., 0.05%) above the Expense Group median. Management proposed to voluntarily lower the Portfolio's expense cap by three basis points (i.e., 0.03%).
PACE Municipal Fixed Income Investments
In approving the Investment Management and Administration Agreement and the Subadvisory Agreement with BNY Mellon Asset Management North America Corporation, the board, including the Independent Trustees, also considered the following factors:
Portfolio performance—The comparative Broadridge information showed that the Portfolio's performance was at the Performance Universe median for the five-year period, but below the Performance Universe median for the one-, three and ten-year periods and since inception, although for the three- and ten-year periods, the Portfolio's performance was within one basis point (i.e., 0.01%) and four basis points (i.e., 0.04%), respectively, of the median. Management explained that the Portfolio is managed as a higher-quality offering and was underweight to BBB-rated securities and overweight to A-rated securities relative to its peers during the one-year period. Management stated that this led the Portfolio to underperform, as BBB-rated municipal bonds produced a total return more than twice the return of A-rated municipal bonds. Management stated that it believes the Portfolio performed consistent with management expectations given its higher-quality focus relative to Performance Universe peer funds.
Management and subadvisory fees and expense ratios—The comparative Broadridge information showed that the Portfolio's Contractual Management Fee, Actual Management Fee and total expenses were above the median in the Portfolio's Expense Group for the comparison periods utilized in the Broadridge report. Management noted the downward trend in the Portfolio's expenses and explained that the Portfolio's Contractual Management Fee, Actual Management Fee and total expenses, although all above the respective median, were reasonably close
393
PACE Select Advisors Trust
Board approvals of investment management and administration agreement and subadvisory agreements (unaudited)
to the Expense Group median (within two basis points—i.e., 0.02%, two basis points—i.e., 0.02% and five basis points—i.e., 0.05%, respectively).
PACE Strategic Fixed Income Investments
In approving the Investment Management and Administration Agreement and the Subadvisory Agreement with Neuberger Berman Investment Advisers LLC and PIMCO, the board, including the Independent Trustees, also considered the following factors:
Portfolio performance—The comparative Broadridge information showed that the Portfolio's performance was above the Performance Universe median for the three- and ten-year periods and since inception and below the Performance Universe median for the one- and five-year periods.
Management and subadvisory fees and expense ratios—The comparative Broadridge information showed that the Portfolio's Contractual Management Fee, Actual Management Fee and total expenses were above the median in the Portfolio's Expense Group for the comparison periods utilized in the Broadridge report. Management noted the Portfolio's total expenses have become more closely aligned with its peer group over the last few years. Management noted that the Portfolio's Contractual Management Fee, Actual Management Fee and total expenses were similar to or lower than the only other fund utilizing multiple subadvisors in its Supplemental Expense Group (which consisted of seven other subadvised funds, five of which utilize affiliated subadvisors). Management further noted the downward trend in the Portfolio's total expenses, and explained that slightly higher transfer agency and non-management expenses contribute to the Portfolio's overall higher total expense ratio.
PACE Government Money Market Investments
In approving the Investment Management and Administration Agreement, the board, including the Independent Trustees, also considered the following factors:
Portfolio performance—The comparative Broadridge information showed that the Portfolio's performance was at or above the Performance Universe median for the one-, three-, five- and ten-year periods and since inception. The board noted that the Portfolio's above median performance included periods during which the Portfolio was managed as a prime money market fund, in contrast to the government money market funds in the Portfolio's Performance Universe.
Management fees and expense ratios—The comparative Broadridge information showed that the Portfolio's Contractual Management Fee and its Actual Management Fee were below the median, and its total expenses were above the median in the Portfolio's Expense Group for the comparison periods utilized in the Broadridge report. Management noted that the Portfolio's total expenses were reasonably close to the Expense Group median (within 3 basis points—i.e., 0.03%). Management explained that the Portfolio's higher total expenses relative to its Expense Group were in part due to higher transfer agency expenses relative to peers, reflective of the smaller average size of Portfolio shareholder accounts.
Conclusion
Based on its review and, in certain instances, management's explanations upon further questioning, the board concluded that each Portfolio's investment performance was satisfactory or acceptable and that each management fee and subadvisory fee, as proposed by management after questions and/or suggestions posed by the board, was reasonable in light of the nature, extent and quality of the services provided to the Portfolio under the applicable Investment Management and Administration Agreement and Subadvisory Agreement or Subadvisory Agreements, respectively.
394
PACE Select Advisors Trust
Board approvals of investment management and administration agreement and subadvisory agreements (unaudited)
In light of all of the foregoing, the board, including a majority of the Independent Trustees, approved the Investment Management and Administration Agreement for each Portfolio and, for those Portfolios with Subadvisors, the Subadvisory Agreement(s). No single factor reviewed by the board was identified by the board as the principal factor in determining whether to approve the Investment Management and Administration Agreement or, for the subadvised Portfolios, the Subadvisory Agreement(s). The Independent Trustees were advised by separate independent legal counsel throughout the process. The board discussed the proposed continuance of the Investment Management and Administration Agreement and the Subadvisory Agreements in private sessions with their independent legal counsel at which no representatives of UBS AM or the Subadvisors were present.
395
PACE Select Advisors Trust
Supplemental information (unaudited)
Board of Trustees & Officers
The Trust is governed by a Board of Trustees which oversees the Portfolios' operations. Each Trustee serves an indefinite term of office. Officers are appointed by the trustees and serve at the pleasure of the Board. The table below shows, for each trustee and officer, his or her name, address and age, the position held with the Trust, the length of time served as a trustee or officer of the Trust, the trustee's or officer's principal occupations during the last five years, the number of portfolios in the UBS fund complex overseen by the trustee or for which a person served as an officer, and other directorships held by the trustee.
The Trust's Statement of Additional Information contains additional information about the trustees and is available, without charge, upon request by calling 1-800-647 1568.
Interested Trustees:
| Name, address, and age | Position(s) held with Trust | Term of office1 and length of time served | Principal occupation(s) during past 5 years | Number of portfolios in fund complex overseen by Trustee | Other directorships held by Trustee | ||||||||||||||||||
| Meyer Feldberg2; 76 Morgan Stanley 1585 Broadway 36th Floor New York, NY 10036 | Trustee | Since 2001 (Trustee); Since November 2017 (Chairman of the Board of Trustees) | Professor Feldberg is Dean Emeritus and Professor of Leadership and Ethics at Columbia Business School, although on an extended leave of absence. He is also a senior advisor to Morgan Stanley (financial services) (since 2005). Professor Feldberg also served as president of New York City Global Partners (an organization located in part of the Office of the Mayor of the City of New York that promoted interaction with other cities around the world) (2007-2014). Prior to 2004, he was Dean and Professor of Management and Ethics of the Graduate School of Business at Columbia University (since 1989). From 1992 to 2016, Professor Feldberg was a director of Macy's, Inc. (operator of department stores). From 1997 to 2017, Professor Feldberg was a director of Revlon, Inc. (cosmetics). | Professor Feldberg is a director or trustee of 12 investment companies (consisting of 50 portfolios) for which UBS Asset Management (Americas) Inc. ("UBS AM") or one of its affiliates serves as investment advisor or manager. | Professor Feldberg is also a director of the New York City Ballet. | ||||||||||||||||||
396
PACE Select Advisors Trust
Supplemental information (unaudited)
Independent Trustees:
| Name, address, and age | Position(s) held with Trust | Term of office1 and length of time served | Principal occupation(s) during past 5 years | Number of portfolios in fund complex overseen by Trustee | Other directorships held by Trustee | ||||||||||||||||||
| Alan S. Bernikow; 77 207 Benedict Ave. Staten Island, NY 10314 | Trustee | Since 2005 | Mr. Bernikow is retired. Previously, he was deputy chief executive officer at Deloitte & Touche (international accounting and consulting firm). From 2003 to March 2017, Mr. Bernikow was also a director of Destination XL Group, Inc. (menswear) (and served as a member of its nominating and corporate governance committee). | Mr. Bernikow is a director or trustee of 7 investment companies (consisting of 45 portfolios) for which UBS AM serves as investment advisor or manager. | Mr. Bernikow is also a director of Revlon, Inc. (cosmetics) (and serves as the chair of its audit committee and as the chair of the compensation committee), the lead director of Mack-Cali Realty Corporation (real estate investment trust) (and serves as the chair of its audit committee). He is also a director of FCB Financial Holdings, Inc. (banking) (and serves as the chair of its audit committee and member of the nominating and governance committee and compensation committee). | ||||||||||||||||||
| Richard R. Burt; 71 McLarty Associates 900 17th Street Washington, D.C. 20006 | Trustee | Since 2001 | Mr. Burt is a managing director to McLarty Associates (a consulting firm) (since 2007). He was chairman of IEP Advisors (international investments and consulting firm) until 2009. | Mr. Burt is a director or trustee of 7 investment companies (consisting of 45 portfolios) for which UBS AM serves as investment advisor or manager. | Mr. Burt is also a director of The Central Europe, Russia and Turkey Fund, Inc., The European Equity Fund, Inc. and The New Germany Fund, Inc. (and serves as a member of each such fund's audit, nominating and governance committee). | ||||||||||||||||||
| Bernard H. Garil; 78 6754 Casa Grande Way Delray Beach, FL 33446 | Trustee | Since 2005 | Mr. Garil is retired (since 2001). He was a managing director at PIMCO Advisory Services (from 1999 to 2001) where he served as president of closed-end funds and vice-president of the variable insurance product funds advised by OpCap Advisors (until 2001). | Mr. Garil is a director or trustee of 7 investment companies (consisting of 45 portfolios) for which UBS AM serves as investment advisor or manager. | Mr. Garil is also a director of OFI Global Trust Company (commercial trust company), The Leukemia and Lymphoma Society (voluntary health organization) and a trustee for the Brooklyn College Foundation, Inc. (charitable foundation). | ||||||||||||||||||
397
PACE Select Advisors Trust
Supplemental information (unaudited)
Independent Trustees (concluded):
| Name, address, and age | Position(s) held with Trust | Term of office1 and length of time served | Principal occupation(s) during past 5 years | Number of portfolios in fund complex overseen by Trustee | Other directorships held by Trustee | ||||||||||||||||||
| Heather R. Higgins; 58 c/o Keith A. Weller Assistant Fund Secretary UBS Asset Management (Americas) Inc. 1285 Avenue of the Americas New York, NY 10019 | Trustee | Since 2005 | Ms. Higgins is the president and director of The Randolph Foundation (charitable foundation) (since 1991). Ms. Higgins also serves (or has served) on the boards of several non-profit charitable groups, including the Independent Women's Forum (chairman) and the Philanthropy Roundtable (vice chairman). She also serves on the board of the Hoover Institution (from 2001 to 2007 and since 2009). | Ms. Higgins is a director or trustee of 7 investment companies (consisting of 45 portfolios) for which UBS AM serves as investment advisor or manager. | None | ||||||||||||||||||
398
PACE Select Advisors Trust
Supplemental information (unaudited)
Officers:
| Name, address and age | Position(s) held with Trust | Term of office1 and length of time served | Principal occupation(s) during past 5 years; number of portfolios in fund complex for which person serves as officer | ||||||||||||
| Rose Ann Bubloski*; 50 | Vice President and Assistant Treasurer | Since 2011 | Ms. Bubloski is a director (since 2012) (prior to which she was an associate director (from 2008 to 2012)) and a senior manager of product control and investment support (previously named registered fund product control) of UBS AM—Americas region. Ms. Bubloski is vice president and assistant treasurer of 10 investment companies (consisting of 64 portfolios) for which UBS AM serves as investment advisor or manager. | ||||||||||||
| Mark E. Carver*; 55 | President | Since 2010 | Mr. Carver is a managing director and head of product development and management for UBS AM—Americas region (since 2008). In this role, he oversees product development and management for both wholesale and institutional businesses. He is a member of the Americas Management Committee (since 2008) and the Regional Operating Committee (since 2008). Mr. Carver is president of 10 investment companies (consisting of 64 portfolios) for which UBS AM serves as investment advisor or manager. | ||||||||||||
| Franklin P. Dickson*; 40 | Vice President | Since November 2017 | Mr. Dickson is an associate director (since 2015) and tax compliance manager (since October 2017) (prior to which he was a product controller (from 2015 to 2017) of product control and investment support (previously named registered fund product control) of UBS AM—Americas region. From 2013 through 2015, Mr. Dickson was fund administration and compliance manager for U.S. Bancorp Fund Services, LLC, and from April 2008 through June 2013, Mr. Dickson was vice president, client service manager at BNY Mellon Asset Servicing. Mr. Dickson is a vice president of 10 investment companies (consisting of 64 portfolios) for which UBS AM serves as investment advisor or manager. | ||||||||||||
| Mark F. Kemper**; 60 | Vice President and Secretary | Since 2004 | Mr. Kemper is a managing director and general counsel of UBS AM—Americas region (since 2006 and 2004 respectively). He has been secretary of UBS AM—Americas region (since 2004), and assistant secretary of UBS Asset Management Trust Company (since 1993). Mr. Kemper is vice president and secretary of 10 investment companies (consisting of 64 portfolios) for which UBS AM serves as investment advisor or manager. Mr. Kemper is employed by UBS Business Solutions US LLC (since January 2017). | ||||||||||||
| Joanne M. Kilkeary*; 50 | Vice President, Treasurer and Principal Accounting Officer | Since 1999 (Vice President); since October 2017 (Treasurer and Principal Accounting Officer) | Ms. Kilkeary is an executive director (since 2013) (prior to which she was a director) (from 2008 to 2013)) and head of regulatory, tax, audit and board governance for product control and investment support (since October 2017) (prior to which she was a senior manager of registered fund product control of UBS AM—Americas region (from 2004 to 2017)). Ms. Kilkeary is a vice president and assistant treasurer of 10 investment companies (consisting of 64 portfolios) for which UBS AM serves as investment advisor or manager. | ||||||||||||
| William Lawlor**; 31 | Vice President and Assistant Secretary | Since May 2018 | Mr. Lawlor is a director and associate general counsel with UBS Business Solutions US LLC (since January 2017) and also with UBS AM—Americas region since 2013. Prior to joining UBS AM—Americas region, Mr. Lawlor attended Kent College of Law, where he graduated in 2013. Mr. Lawlor is a vice president and assistant secretary of 10 investment companies (consisting of 64 portfolios) for which UBS AM serves as investment advisor or manager. | ||||||||||||
| Mabel Lung***; 60 | Vice President | Since May 2016 | Ms. Lung is a managing director and portfolio manager, Multi-Component Portfolios, of UBS AM—Americas region which she joined in 1995. Ms. Lung is a vice president of one investment company (consisting of 15 portfolios) for which UBS AM serves as investment advisor or manager. | ||||||||||||
399
PACE Select Advisors Trust
Supplemental information (unaudited)
Officers (continued):
| Name, address and age | Position(s) held with Trust | Term of office1 and length of time served | Principal occupation(s) during past 5 years; number of portfolios in fund complex for which person serves as officer | ||||||||||||
| Nancy D. Osborn*; 52 | Vice President and Assistant Treasurer | Since 2007 | Mrs. Osborn is a director (since 2010) (prior to which she was an associate director) and a senior manager of product control and investment support (previously named registered fund product control) of UBS AM—Americas region (since 2006). Mrs. Osborn is a vice president and assistant treasurer of 10 investment companies (consisting of 64 portfolios) for which UBS AM serves as investment advisor or manager. | ||||||||||||
| Frank S. Pluchino***, 59 | Chief Compliance Officer | Since November 2017 | Mr. Pluchino is an executive director with UBS AM—Americas region and is also the chief compliance officer of UBS Hedge Fund Solutions LLC (since 2010). Mr. Pluchino serves as chief compliance officer of 15 investment companies (consisting of 69 portfolios) for which UBS AM or one of its affiliates serves as investment advisor or manager. | ||||||||||||
| Robert Sabatino**; 45 | Vice President | Since 2001 | Mr. Sabatino is a managing director (since 2010) (prior to which he was an executive director) (from 2007 to 2010)), global head of liquidity portfolio management (since 2015), head of US taxable money markets (from 2009 to 2015), and portfolio manager of UBS AM—Americas region in the short duration fixed income group (since 2001). Mr. Sabatino is a vice president of three investment companies (consisting of 27 portfolios) for which UBS AM serves as investment advisor or manager. | ||||||||||||
| Eric Sanders*; 52 | Vice President and Assistant Secretary | Since 2005 | Mr. Sanders is a director and associate general counsel with UBS Business Solutions US LLC (since January 2017) and also with UBS AM—Americas region (since 2005). Mr. Sanders is a vice president and assistant secretary of 10 investment companies (consisting of 64 portfolios) for which UBS AM serves as investment advisor or manager. | ||||||||||||
| Philip Stacey**; 33 | Vice President and Assistant Secretary | Since May 2018 | Mr. Stacey is a director and associate general counsel with UBS Business Solutions US LLC (Since January 2017) and also with UBS AM—Americas region since 2015. Prior to joining UBS AM—Americas region. Mr. Stacey was a legal associate with the Chicago-based investment manager HFR Asset Management, LLC from 2009 through 2015. Mr. Stacey is a vice president and assistant secretary of 10 investment companies (consisting of 64 portfolios) for which UBS AM serves as investment advisor or manager. | ||||||||||||
| Gina M. Toth***; 54 | Vice President | Since May 2016 | Ms. Toth is an executive director and portfolio manager in the Multi-Manager Solutions team of UBS AM—Americas region (since 2013). Prior to joining UBS AM—Americas region, Ms. Toth was a senior portfolio manager at Alliance Bernstein (from 1993 to 2012). Ms. Toth is a vice president of one investment company (consisting of 15 portfolios) for which UBS AM serves as investment advisor or manager. | ||||||||||||
| David Walczak**; 35 | Vice President | Since 2016 | Mr. Walczak is an executive director (since 2016), head of US taxable money markets (since 2015) and portfolio manager of UBS AM—Americas region. Mr. Walczak is a vice president of three investment companies (consisting of 41 portfolios) for which UBS AM serves as investment advisor or manager. | ||||||||||||
400
PACE Select Advisors Trust
Supplemental information (unaudited)
Officers (concluded):
| Name, address and age | Position(s) held with Trust | Term of office1 and length of time served | Principal occupation(s) during past 5 years; number of portfolios in fund complex for which person serves as officer | ||||||||||||
| Keith A. Weller*; 57 | Vice President and Assistant Secretary | Since 2000 | Mr. Weller is an executive director and senior associate general counsel with UBS Business Solutions US LLC (since January 2017) and also with UBS AM—Americas region (since 2005) and has been an attorney with affiliated entities since 1995. Mr. Weller is a vice president and assistant secretary of 10 investment companies (consisting of 64 portfolios) for which UBS AM serves as investment advisor or manager. | ||||||||||||
1 Each trustee holds office for an indefinite term. Officers are appointed by the trustees and serve at the pleasure of the Board.
2 Professor Feldberg is deemed an "interested person" of the Trust as defined in the Investment Company Act of 1940, as amended, because he is a senior advisor to Morgan Stanley, a financial services firm with which the Trust may conduct transactions.
* This person's business address is 1285 Avenue of the Americas, New York, New York 10019-6028.
** This person's business address is One North Wacker Drive, Chicago, Illinois 60606.
*** This person's business address is 787 Seventh Avenue, New York, New York 10019.
401
This page intentionally left blank.
402
This page intentionally left blank.
403
This page intentionally left blank.
404
Trustees
Meyer Feldberg
Chairman
Alan S. Bernikow
Richard R. Burt
Bernard H. Garil
Heather R. Higgins
Principal Officers
Mark E. Carver
President
Mark F. Kemper
Vice President and Secretary
Joanne M. Kilkeary
Vice President, Treasurer and
Principal Accounting Officer
Robert Sabatino
Vice President
Investment Manager and
Administrator
UBS Asset Management (Americas) Inc.
1285 Avenue of the Americas
New York, New York 10019-6028
Principal Underwriter
UBS Asset Management (US) Inc.
1285 Avenue of the Americas
New York, New York 10019-6028
This report is not to be used in connection with the offering of shares of the Portfolios unless accompanied or preceded by an effective prospectus.
©UBS 2018. All rights reserved.
UBS Asset Management (Americas) Inc.
PRESORTED
STANDARD
U.S. POSTAGE
PAID
COMPUTERSHARE

UBS Asset Management (Americas) Inc.
1285 Avenue of the Americas
New York, NY 10019-6028
S003

PACE® Government Money Market Investments
Annual Report | July 31, 2018
PACE Government Money Market Investments
Performance
The seven-day current yield for the Portfolio as of July 31, 2018 was 1.36% (after fee waivers/expense reimbursements).1 For more information on the Portfolio's performance, refer to "Yields and characteristics at a glance" on page 6. Please remember that the PACE program fee is assessed outside the Portfolio at the PACE program account level. The program fee does not impact the determination of the Portfolio's net asset value per share.
Advisor's Comments
The Fed continued to normalize monetary policy during the reporting period. For example, the Fed raised rates in December 2017, March 2018 and June 2018. With its last rate hike, the federal funds rate moved to a range between 1.75% and 2.00%. In addition, the Fed began reducing its balance sheet in October 2017. For the remainder of 2018, the Fed currently expects to make two additional 0.25% rate hikes, while continuing to pare its balance sheet. While the yields on a wide range of short-term investments moved higher over the period, yields still remain low
PACE Select Advisors Trust – PACE Government Money Market Investments
Investment Advisor:
UBS Asset Management (Americas) Inc.
Portfolio Manager:
Robert Sabatino
Objective:
Current income consistent with preservation of capital and liquidity
Investment process:
The Portfolio is a money market mutual fund and seeks to maintain a stable price of $1.00 per share, although it may be possible to lose money by investing in this Portfolio. The Portfolio invests in a diversified portfolio of high-quality money market instruments of governmental issuers. Security selection is based on the assessment of relative values and changes in market and economic conditions.
1 Class P shares held through the PACE Select Advisors Program are subject to a maximum Program fee of 2.50%, which, if included, would have reduced performance. Class P shares held through other advisory programs also may be subject to a program fee, which, if included, would have reduced performance.
1
PACE Government Money Market Investments
by historical comparison. As a result, the Portfolio's yield remained low during the reporting period.
We tactically adjusted the Portfolio's weighted average maturity ("WAM") throughout the 12-month review period. When the reporting period began, the Portfolio had a WAM of 40 days. This was decreased to 22 days at the end of the reporting period.
A number of adjustments were made to the Portfolio's sector and issuer positioning during the 12-month period. We increased the Portfolio's exposure to US government and agency obligations and reduced its allocation to repurchase agreements. (Repurchase agreements are transactions in which the seller of a security agrees to buy it back at a predetermined time and price or upon demand.)
We thank you for your continued support and welcome any comments or questions you may have. For any additional information on the UBS family of funds,* please contact your financial advisor, or visit us at www.ubs.com/am-us.
Sincerely,
|
| ||||||
| Mark E. Carver President PACE Select Advisors Trust Managing Director UBS Asset Management (Americas) Inc. | Robert Sabatino Portfolio Manager, PACE Government Money Market Investments Managing Director, UBS Asset Management (Americas) Inc. | ||||||


* Mutual funds are sold by prospectus only. You should read it carefully and consider a fund's investment objectives, risks, charges, expenses and other important information contained in the prospectus before investing. Prospectus for most of our funds can be obtained from your financial advisor, by calling UBS Funds at 800-647 1568 or by visiting our Website at www.ubs.com/am-us.
2
PACE Government Money Market Investments
This letter is intended to assist shareholders in understanding how the Fund performed during the 12 month period ended July 31, 2018. The views and opinions in the letter were current as of September 15, 2018. They are not guarantees of future performance or investment results and should not be taken as investment advice. Investment decisions reflect a variety of factors, and we reserve the right to change our views about individual securities, sectors and markets at any time. As a result, the views expressed should not be relied upon as a forecast of the Fund's future investment intent. We encourage you to consult your financial advisor regarding your personal investment program.
3
PACE Government Money Market Investments
Understanding your Portfolio's expenses (unaudited)
As a shareholder of the Portfolio, you incur two types of costs: (1) on-going program fees; and (2) ongoing Portfolio costs, including management fees and other Portfolio expenses. This example is intended to help you understand your ongoing costs (in dollars) of investing in the Portfolio and to compare these costs with the ongoing costs of investing in other mutual funds.
The example below is based on an investment of $1,000 invested at the beginning of the period and held for the entire period, February 1, 2018 to July 31, 2018.
Actual expenses
The first line in the table below provides information about actual account values and actual expenses. You may use the information in this line, together with the amount you invested, to estimate the expenses that you paid over a period. Simply divide your account value by $1,000 (for example, an $8,600 account value divided by $1,000 = 8.6), then multiply the result by the number in the first line under the heading "Expenses paid during period" to estimate the expenses you paid on your account during this period.
Hypothetical example for comparison purposes
The second line in the table below provides information about hypothetical account values and hypothetical expenses based on the Portfolio's actual expense ratio and an assumed rate of return of 5% per year before expenses, which is not the Portfolio's actual return. The hypothetical account values and expenses may not be used to estimate your actual ending account balance or expenses you paid for the period. You may use this information to compare the ongoing costs of investing in the Portfolio and other funds. To do so, compare this 5% hypothetical example with the 5% hypothetical examples that appear in the shareholder reports of other funds.
4
PACE Government Money Market Investments
Understanding your Portfolio's expenses (unaudited) (concluded)
Please note that the expenses shown in the table are meant to highlight your ongoing Portfolio costs only and do not reflect any program fees. Therefore, the second line in the table is useful in comparing ongoing Portfolio costs only, and will not help you determine the relative total costs of owning different funds. In addition, if program fees were included, your costs would have been higher.
| Beginning account value February 1, 2018 | Ending account value July 31, 2018 | Expenses paid during period1 02/01/18 to 07/31/18 | Expense ratio during the period | ||||||||||||||||
Actual | $ | 1,000.00 | $ | 1,005.50 | $ | 2.98 | 0.60 | % | |||||||||||
| Hypothetical (5% annual return before expenses) | 1,000.00 | 1,021.82 | 3.01 | 0.60 | |||||||||||||||
1 Expenses are equal to the Portfolio's annualized net expense ratios, multiplied by the average account value over the period, multiplied by 181 divided by 365 (to reflect the one-half year period).
5
PACE Government Money Market Investments
Yields and characteristics at a glance—July 31, 2018
(unaudited)
Yields and characteristics | |||||||
Seven-day current yield after fee waivers and/or expense reimbursements1 | 1.36 | % | |||||
Seven-day effective yield after fee waivers and/or expense reimbursements1 | 1.37 | ||||||
Seven-day current yield before fee waivers and/or expense reimbursements1 | 1.35 | ||||||
Seven-day effective yield before fee waivers and/or expense reimbursements1 | 1.35 | ||||||
Weighted average maturity2 | 22 days | ||||||
Portfolio composition3 | |||||||
US government and agency obligations | 80.6 | % | |||||
Repurchase agreements | 21.8 | ||||||
Other assets less liabilities | (2.4 | ) | |||||
Total | 100.0 | % | |||||
You could lose money by investing in PACE Government Money Market Investments. Although the portfolio seeks to preserve the value of your investment at $1.00 per share, the portfolio cannot guarantee it will do so. An investment in PACE Government Money Market Investments is not insured or guaranteed by the Federal Deposit Insurance Corporation ("FDIC") or any other government agency. PACE Government Money Market Investments' sponsor has no legal obligation to provide financial support to PACE Government Money Market Investments, and you should not expect that the portfolio's sponsor will provide financial support to PACE Government Money Market Investments at any time.
Not FDIC insured. May lose value. No bank guarantee.
1 Yields will fluctuate and reflect fee waivers and/or expense reimbursements, if any, unless otherwise noted. Performance data quoted represents past performance. Past performance does not guarantee future results. Current performance may be higher or lower than the performance data quoted.
2 The Portfolio is actively managed and its weighted average maturity will differ over time.
3 Weightings represent percentages of the Portfolio's net assets as of the date indicated. The Portfolio is actively managed and its composition will vary over time.
6
PACE Government Money Market Investments
Portfolio of investments—July 31, 2018
| Face amount | Value | ||||||||||
US government and agency obligations—80.57% | |||||||||||
Federal Farm Credit Bank | |||||||||||
1 mo. USD LIBOR – 0.085%, | |||||||||||
1.987%, due 08/30/181 | $ | 1,000,000 | $ | 999,958 | |||||||
Federal Home Loan Bank | |||||||||||
1.850%, due 08/01/182 | 2,000,000 | 2,000,000 | |||||||||
1.850%, due 08/03/182 | 1,000,000 | 999,897 | |||||||||
1.850%, due 08/07/182 | 3,000,000 | 2,999,075 | |||||||||
1.860%, due 08/14/182 | 2,000,000 | 1,998,657 | |||||||||
1.879%, due 08/08/182 | 2,000,000 | 1,999,269 | |||||||||
1.890%, due 08/06/182 | 4,000,000 | 3,998,950 | |||||||||
1.890%, due 08/08/182 | 2,000,000 | 1,999,265 | |||||||||
1.890%, due 08/28/182 | 1,000,000 | 998,583 | |||||||||
1.893%, due 08/22/182 | 3,000,000 | 2,996,687 | |||||||||
1.895%, due 08/07/182 | 1,000,000 | 999,684 | |||||||||
1.895%, due 08/10/182 | 2,000,000 | 1,999,053 | |||||||||
1.895%, due 08/24/182 | 3,000,000 | 2,996,368 | |||||||||
1.899%, due 08/01/182 | 2,000,000 | 2,000,000 | |||||||||
1.900%, due 08/08/182 | 2,000,000 | 1,999,261 | |||||||||
1.900%, due 08/15/182 | 2,000,000 | 1,998,522 | |||||||||
1.900%, due 08/20/182 | 1,000,000 | 998,997 | |||||||||
1.910%, due 08/15/182 | 1,000,000 | 999,257 | |||||||||
1.910%, due 08/24/182 | 1,000,000 | 998,780 | |||||||||
1.910%, due 08/30/182 | 5,000,000 | 4,992,307 | |||||||||
1.915%, due 08/16/182 | 1,000,000 | 999,202 | |||||||||
1.915%, due 08/17/182 | 2,000,000 | 1,998,298 | |||||||||
1.915%, due 09/13/182 | 3,000,000 | 2,993,138 | |||||||||
1.915%, due 09/14/182 | 3,000,000 | 2,992,978 | |||||||||
1.917%, due 08/31/182 | 3,000,000 | 2,995,208 | |||||||||
1.918%, due 08/15/182 | 1,000,000 | 999,254 | |||||||||
1.918%, due 09/26/182 | 2,000,000 | 1,994,033 | |||||||||
1.919%, due 08/29/182 | 2,000,000 | 1,997,015 | |||||||||
1.929%, due 09/19/182 | 1,000,000 | 997,374 | |||||||||
1.930%, due 09/07/182 | 2,000,000 | 1,996,033 | |||||||||
7
PACE Government Money Market Investments
Portfolio of investments—July 31, 2018
| Face amount | Value | ||||||||||
US government and agency obligations—(continued) | |||||||||||
1.950%, due 10/04/182 | $ | 1,000,000 | $ | 996,533 | |||||||
1.984%, due 10/26/182 | 1,000,000 | 995,261 | |||||||||
1.989%, due 10/24/182 | 4,000,000 | 3,981,436 | |||||||||
1.995%, due 10/17/182 | 2,000,000 | 1,991,466 | |||||||||
2.008%, due 10/31/182 | 2,000,000 | 1,989,848 | |||||||||
2.060%, due 12/11/182 | 3,000,000 | 2,977,340 | |||||||||
1 mo. USD LIBOR – 0.070%, | |||||||||||
1.994%, due 08/25/181 | 1,000,000 | 1,000,232 | |||||||||
1 mo. USD LIBOR – 0.070%, | |||||||||||
2.002%, due 08/28/181 | 1,300,000 | 1,300,000 | |||||||||
1 mo. USD LIBOR – 0.080%, | |||||||||||
1.993%, due 08/17/181 | 1,250,000 | 1,250,000 | |||||||||
1 mo. USD LIBOR – 0.080%, | |||||||||||
2.002%, due 08/19/181 | 1,000,000 | 1,000,000 | |||||||||
1 mo. USD LIBOR – 0.080%, | |||||||||||
2.020%, due 08/04/181 | 1,000,000 | 1,000,000 | |||||||||
1 mo. USD LIBOR – 0.085%, | |||||||||||
2.005%, due 08/03/181 | 1,000,000 | 1,000,000 | |||||||||
1 mo. USD LIBOR – 0.090%, | |||||||||||
1.996%, due 08/06/181 | 2,000,000 | 2,000,000 | |||||||||
1 mo. USD LIBOR – 0.095%, | |||||||||||
1.986%, due 08/21/181 | 1,200,000 | 1,200,000 | |||||||||
1 mo. USD LIBOR – 0.100%, | |||||||||||
1.979%, due 08/18/181 | 1,000,000 | 1,000,000 | |||||||||
1 mo. USD LIBOR – 0.100%, | |||||||||||
1.981%, due 08/21/181 | 2,000,000 | 2,000,000 | |||||||||
1 mo. USD LIBOR – 0.105%, | |||||||||||
1.965%, due 08/26/181 | 2,000,000 | 2,000,000 | |||||||||
1 mo. USD LIBOR – 0.105%, | |||||||||||
1.976%, due 08/22/181 | 1,000,000 | 1,000,000 | |||||||||
1 mo. USD LIBOR – 0.105%, | |||||||||||
1.981%, due 08/19/181 | 2,000,000 | 2,000,000 | |||||||||
1 mo. USD LIBOR – 0.110%, | |||||||||||
1.963%, due 08/17/181 | 1,500,000 | 1,500,000 | |||||||||
8
PACE Government Money Market Investments
Portfolio of investments—July 31, 2018
| Face amount | Value | ||||||||||
US government and agency obligations—(continued) | |||||||||||
1 mo. USD LIBOR – 0.115%, | |||||||||||
1.954%, due 08/24/181 | $ | 2,000,000 | $ | 2,000,000 | |||||||
1 mo. USD LIBOR – 0.115%, | |||||||||||
1.949%, due 08/24/181 | 1,000,000 | 1,000,000 | |||||||||
1 mo. USD LIBOR – 0.115%, | |||||||||||
1.964%, due 08/18/181 | 2,000,000 | 2,000,000 | |||||||||
1 mo. USD LIBOR – 0.115%, | |||||||||||
1.967%, due 08/19/181 | 2,000,000 | 2,000,000 | |||||||||
1 mo. USD LIBOR – 0.115%, | |||||||||||
1.975%, due 08/03/181 | 1,000,000 | 1,000,044 | |||||||||
1 mo. USD LIBOR – 0.115%, | |||||||||||
1.985%, due 08/04/181 | 1,000,000 | 1,000,000 | |||||||||
1 mo. USD LIBOR – 0.120%, | |||||||||||
1.952%, due 08/28/181 | 1,000,000 | 999,999 | |||||||||
1 mo. USD LIBOR – 0.125%, | |||||||||||
1.956%, due 08/21/181 | 3,000,000 | 3,000,129 | |||||||||
1 mo. USD LIBOR – 0.125%, | |||||||||||
1.947%, due 08/16/181 | 2,000,000 | 2,000,000 | |||||||||
1 mo. USD LIBOR – 0.125%, | |||||||||||
1.952%, due 08/27/181 | 1,000,000 | 1,000,000 | |||||||||
1 mo. USD LIBOR – 0.125%, | |||||||||||
1.961%, due 08/20/181 | 1,000,000 | 1,000,000 | |||||||||
1 mo. USD LIBOR – 0.130%, | |||||||||||
1.956%, due 08/10/181 | 2,000,000 | 2,000,000 | |||||||||
1 mo. USD LIBOR – 0.130%, | |||||||||||
1.942%, due 08/16/181 | 1,000,000 | 1,000,000 | |||||||||
1 mo. USD LIBOR – 0.130%, | |||||||||||
1.943%, due 08/17/181 | 2,000,000 | 2,000,000 | |||||||||
1 mo. USD LIBOR – 0.130%, | |||||||||||
1.951%, due 08/22/181 | 2,000,000 | 2,000,000 | |||||||||
1 mo. USD LIBOR – 0.130%, | |||||||||||
1.952%, due 08/01/181 | 4,000,000 | 4,000,000 | |||||||||
1 mo. USD LIBOR – 0.130%, | |||||||||||
1.967%, due 08/08/181 | 1,000,000 | 1,000,000 | |||||||||
1 mo. USD LIBOR – 0.135%, | |||||||||||
1.932%, due 08/12/181 | 1,000,000 | 1,000,000 | |||||||||
9
PACE Government Money Market Investments
Portfolio of investments—July 31, 2018
| Face amount | Value | ||||||||||
US government and agency obligations—(continued) | |||||||||||
1 mo. USD LIBOR – 0.135%, | |||||||||||
1.937%, due 08/16/181 | $ | 3,000,000 | $ | 2,999,999 | |||||||
1 mo. USD LIBOR – 0.135%, | |||||||||||
1.937%, due 08/28/181 | 1,000,000 | 1,000,000 | |||||||||
1 mo. USD LIBOR – 0.135%, | |||||||||||
1.937%, due 08/28/181 | 1,000,000 | 1,000,000 | |||||||||
1 mo. USD LIBOR – 0.135%, | |||||||||||
1.965%, due 08/05/181 | 1,000,000 | 1,000,000 | |||||||||
1 mo. USD LIBOR – 0.140%, | |||||||||||
1.927%, due 08/12/181 | 1,000,000 | 1,000,000 | |||||||||
1 mo. USD LIBOR – 0.140%, | |||||||||||
1.924%, due 08/25/181 | 2,000,000 | 2,000,000 | |||||||||
1 mo. USD LIBOR – 0.140%, | |||||||||||
1.932%, due 08/16/181 | 1,000,000 | 1,000,000 | |||||||||
1 mo. USD LIBOR – 0.140%, | |||||||||||
1.960%, due 08/05/181 | 2,000,000 | 2,000,000 | |||||||||
1 mo. USD LIBOR – 0.145%, | |||||||||||
1.927%, due 08/29/181 | 2,000,000 | 2,000,000 | |||||||||
1 mo. USD LIBOR – 0.145%, | |||||||||||
1.927%, due 08/15/181 | 1,000,000 | 1,000,000 | |||||||||
1 mo. USD LIBOR – 0.150%, | |||||||||||
1.922%, due 08/16/181 | 3,000,000 | 3,000,000 | |||||||||
1 mo. USD LIBOR – 0.155%, | |||||||||||
1.912%, due 08/12/181 | 1,000,000 | 1,000,000 | |||||||||
3 mo. USD LIBOR – 0.210%, | |||||||||||
2.125%, due 10/26/181 | 2,000,000 | 1,999,848 | |||||||||
3 mo. USD LIBOR – 0.340%, | |||||||||||
1.991%, due 10/10/181 | 2,000,000 | 2,000,000 | |||||||||
3 mo. USD LIBOR – 0.340%, | |||||||||||
2.002%, due 10/24/181 | 1,000,000 | 1,000,000 | |||||||||
3 mo. USD LIBOR – 0.160%, | |||||||||||
2.170%, due 08/24/181 | 1,000,000 | 1,001,287 | |||||||||
US Treasury Bill | |||||||||||
1.809%, due 08/09/182 | 3,000,000 | 2,998,816 | |||||||||
10
PACE Government Money Market Investments
Portfolio of investments—July 31, 2018
| Face amount | Value | ||||||||||
US government and agency obligations—(concluded) | |||||||||||
US Treasury Note | |||||||||||
3 mo. Treasury money market yield + 0.170%, | |||||||||||
2.180%, due 08/01/181 | $ | 1,000,000 | $ | 1,000,020 | |||||||
Total US government and agency obligations (cost—$152,117,361) | 152,117,361 | ||||||||||
Repurchase agreements—21.82% | |||||||||||
| Repurchase agreement dated 07/31/18 with Fixed Income Clearing Corp., 0.350% due 08/01/18, collateralized by $210,000 US Treasury Note, 2.000% due 04/30/24; (value—$201,091); proceeds: $195,002 | 195,000 | 195,000 | |||||||||
| Repurchase agreement dated 07/31/18 with Goldman Sachs & Co., 1.890% due 08/01/18, collateralized by $3,548,000 Federal National Mortgage Association obligations, 6.625% to 7.250% due 05/15/30 to 11/15/30, $4,645,900 US Treasury Inflation Index Bond, 2.500% due 01/15/29 and $45,270,404 US Treasury Bond STRIPs, zero coupon due 02/15/23 to 02/15/42; (value—$41,820,012); proceeds: $41,002,153 | 41,000,000 | 41,000,000 | |||||||||
Total repurchase agreements (cost—$41,195,000) | 41,195,000 | ||||||||||
| Total investments (cost—$193,312,361 which approximates cost for federal income tax purposes)—102.39% | 193,312,361 | ||||||||||
Liabilities in excess of other assets—(2.39)% | (4,518,375 | ) | |||||||||
Net assets—100.00% | $ | 188,793,986 | |||||||||
11
PACE Government Money Market Investments
Portfolio of investments—July 31, 2018
Fair valuation summary
The following is a summary of the fair valuations according to the inputs used as of July 31, 2018 in valuing the Portfolio's investments. In the event a Portfolio holds investments for which fair value is measured using the NAV per share practical expedient (or its equivalent), a separate column will be added to the fair value hierarchy table; this is intended to permit reconciliation to the amounts presented in the Portfolio of investments:
Description | Unadjusted quoted prices in active markets for identical investments (Level 1) | Other significant observable inputs (Level 2) | Unobservable inputs (Level 3) | Total | |||||||||||||||
| US government and agency obligations | $ | — | $ | 152,117,361 | $ | — | $ | 152,117,361 | |||||||||||
Repurchase agreements | — | 41,195,000 | — | 41,195,000 | |||||||||||||||
Total | $ | — | $ | 193,312,361 | $ | — | $ | 193,312,361 | |||||||||||
At July 31, 2018, there were no transfers between Level 1 and Level 2.
Portfolio footnotes
1 Variable or floating rate security. The interest rate shown is the rate in effect as of period end and changes periodically.
2 Rate shown is the discount rate at the date of purchase unless otherwise noted.
Portfolio acronyms
LIBOR London Interbank Offered Rate
STRIP Separate Trading of Registered Interest and Principal of Securities
See accompanying notes to financial statements
12
PACE Government Money Market Investments
Statement of assets and liabilities—July 31, 2018
Assets: | |||||||
Investments, at value (cost—$152,117,361) | $ | 152,117,361 | |||||
Repurchase agreements, at value (cost—$41,195,000) | 41,195,000 | ||||||
Total investments in securities, at value (cost—$193,312,361) | 193,312,361 | ||||||
Cash | 800 | ||||||
Receivable for interest | 67,093 | ||||||
Receivable for shares of beneficial interest sold | 250,379 | ||||||
Other assets | 10,803 | ||||||
Total assets | 193,641,436 | ||||||
Liabilities: | |||||||
Payable for investments purchased | 3,983,881 | ||||||
Payable for shares of beneficial interest repurchased | 442,752 | ||||||
Dividends payable to shareholders | 108,454 | ||||||
Payable to affiliate | 33,942 | ||||||
Payable to custodian | 204 | ||||||
Accrued expenses and other liabilities | 278,217 | ||||||
Total liabilities | 4,847,450 | ||||||
Net assets: | |||||||
Beneficial interest shares of $0.001 par value (unlimited amount authorized) | $ | 188,795,684 | |||||
Accumulated net realized loss | (1,698 | ) | |||||
Net assets | $ | 188,793,986 | |||||
Shares outstanding | 188,794,482 | ||||||
Net asset value | $ | 1.00 | |||||
See accompanying notes to financial statements
13
PACE Government Money Market Investments
Statement of operations
| For the year ended July 31, 2018 | |||||||
Investment income: | |||||||
Interest | $ | 2,952,689 | |||||
Expenses: | |||||||
Investment management and administration fees | 729,181 | ||||||
Transfer agency and related services fees | 858,725 | ||||||
Professional services | 113,675 | ||||||
Reports and notices to shareholders | 34,178 | ||||||
State registration fees | 29,364 | ||||||
Trustees' fees | 21,157 | ||||||
Custody and accounting fees | 12,057 | ||||||
Insurance expense | 3,724 | ||||||
Other expense | 43,999 | ||||||
1,846,060 | |||||||
Fee waivers and/or expense reimbursements by investment manager and administrator | (596,039 | ) | |||||
Net expenses | 1,250,021 | ||||||
Net investment income | 1,702,668 | ||||||
Net realized gain | 6 | ||||||
Net increase in net assets resulting from operations | $ | 1,702,674 | |||||
See accompanying notes to financial statements
14
PACE Government Money Market Investments
Statement of changes in net assets
For the years ended July 31, | |||||||||||
2018 | 2017 | ||||||||||
From operations: | |||||||||||
Net investment income | $ | 1,702,668 | $ | 227,818 | |||||||
Net realized gain (loss) | 6 | (1,112 | ) | ||||||||
Net increase in net assets resulting from operations | 1,702,674 | 226,706 | |||||||||
Dividends to shareholders from: | |||||||||||
Net investment income | (1,702,668 | ) | (227,818 | ) | |||||||
| Net increase (decrease) in net assets from beneficial interest transactions | (10,791,379 | ) | 16,609,926 | ||||||||
Net increase (decrease) in net assets | (10,791,373 | ) | 16,608,814 | ||||||||
Net assets: | |||||||||||
Beginning of year | 199,585,359 | 182,976,545 | |||||||||
End of year | $ | 188,793,986 | $ | 199,585,359 | |||||||
Accumulated undistributed net investment income | $ | — | $ | — | |||||||
See accompanying notes to financial statements
15
PACE Government Money Market Investments
Financial highlights
Selected financial data throughout each year is presented below:
Class P
Years ended July 31, | |||||||||||||||||||||||
2018 | 2017 | 2016 | 2015 | 2014 | |||||||||||||||||||
| Net asset value, beginning of year | $ | 1.00 | $ | 1.00 | $ | 1.00 | $ | 1.00 | $ | 1.00 | |||||||||||||
Net investment income | 0.008 | 0.001 | 0.0001 | 0.0001 | 0.0001 | ||||||||||||||||||
Net realized gains (losses) | 0.0001 | (0.000 | )1 | 0.0001 | — | 0.0001 | |||||||||||||||||
Net increase from operations | 0.008 | 0.001 | 0.0001 | 0.0001 | 0.0001 | ||||||||||||||||||
| Dividends from net investment income | (0.008 | ) | (0.001 | ) | (0.000 | )1 | (0.000 | )1 | (0.000 | )1 | |||||||||||||
| Distributions from net realized gains | — | — | (0.000 | )1 | — | (0.000 | )1 | ||||||||||||||||
Total dividends and distributions | (0.008 | ) | (0.001 | ) | (0.000 | )1 | (0.000 | )1 | (0.000 | )1 | |||||||||||||
Net asset value, end of year | $ | 1.00 | $ | 1.00 | $ | 1.00 | $ | 1.00 | $ | 1.00 | |||||||||||||
Total investment return2 | 0.83 | % | 0.11 | % | 0.01 | % | 0.01 | % | 0.01 | %3 | |||||||||||||
Ratios to average net assets: | |||||||||||||||||||||||
| Expenses before fee waivers and/or expense reimbursements | 0.89 | % | 0.95 | % | 0.96 | % | 0.93 | % | 0.91 | % | |||||||||||||
| Expenses after fee waivers and/or expense reimbursements | 0.60 | % | 0.52 | % | 0.26 | % | 0.14 | % | 0.14 | % | |||||||||||||
Net investment income | 0.82 | % | 0.12 | % | 0.01 | % | 0.01 | % | 0.01 | % | |||||||||||||
Supplemental data: | |||||||||||||||||||||||
Net assets, end of year (000's) | $ | 188,794 | $ | 199,585 | $ | 182,977 | $ | 168,503 | $ | 212,025 | |||||||||||||
1 Amount represents less than $0.0005 per share.
2 Total investment return is calculated assuming a $10,000 investment on the first day of each year reported, reinvestment of all dividends and other distributions, if any, at net asset value on the payable dates, and a sale at net asset value on the last day of each year reported. The figures do not include program fees; results would be lower if these fees were included. Returns do not reflect the deduction of taxes that a shareholder would pay on Portfolio distributions.
3 In August 2013, UBS AM made a voluntary cash payment of $2,340 to the Portfolio in order to address a differential between the number of shares outstanding and the Portfolio's net assets. The differential was attributable to historical embedded capital losses that were experienced by the Portfolio over several years prior to credit crisis of 2008. Payment from investment advisor had no impact on the Portfolio's total investment return and represents less than $0.0005 per share.
See accompanying notes to financial statements
16
PACE Government Money Market Investments
Notes to financial statements
Organization and significant accounting policies
PACE Government Money Market Investments (the "Portfolio") is registered with the US Securities and Exchange Commission ("SEC") under the Investment Company Act of 1940, as amended (the "1940 Act"), as a diversified series of PACE Select Advisors Trust (the "Trust"), an open-end management investment company organized as a Delaware statutory trust under the laws of the State of Delaware by Certificate of Trust dated September 9, 1994, as amended June 9, 1995 and thereafter. The trustees of the Trust have authority to issue an unlimited number of shares of beneficial interest, par value $0.001 per share.
The Trust has fifteen series available for investment, each having its own investment objectives and policies. The financial statements for the other series of the Trust are not included herein. Shares of the Portfolio currently are available only to participants in the PACESM Select Advisors Program and the PACESM Multi Advisor Program.
UBS Asset Management (Americas) Inc. ("UBS AM") serves as the investment manager, investment advisor and administrator for the Portfolio. UBS AM is an indirect wholly owned subsidiary of UBS Group AG. UBS Group AG is an internationally diversified organization with headquarters in Zurich, Switzerland. UBS Group AG operates in many areas of the financial services industry.
The Trust accounts separately for the assets, liabilities and operations of each Portfolio. Expenses directly attributable to each Portfolio are charged to that Portfolio's operations; expenses which are applicable to all Portfolios are allocated among them on a pro rata basis.
In the normal course of business, the Portfolio may enter into contracts that contain a variety of representations that provide indemnification for certain liabilities. The Portfolio's maximum exposure under these arrangements is unknown, as this would involve future claims that may be made against the Portfolio that have not yet occurred. However, the Portfolio has not had any prior claims or losses pursuant to these contracts and expects the risk of loss to be remote.
17
PACE Government Money Market Investments
Notes to financial statements
The Financial Accounting Standards Board ("FASB") Accounting Standards Codification ("ASC") is the exclusive reference of authoritative US generally accepted accounting principles ("US GAAP") recognized by the FASB to be applied by nongovernmental entities. Rules and interpretive releases of the SEC under authority of federal laws are also sources of authoritative US GAAP for SEC registrants. The Portfolio's financial statements are prepared in accordance with US GAAP, which may require the use of management estimates and assumptions. Actual results could differ from those estimates.
In October 2016, the SEC adopted new rules and forms, and amendments to certain then current rules and forms, to modernize reporting and disclosure of information by registered investment companies. The amendments to Regulation S-X require standardized, enhanced disclosure about derivatives in investment company financial statements, and change the rules governing the form and content of such financial statements. The amendments to Regulation S-X took effect on August 1, 2017. Management has assessed the impact of these regulatory developments, and the changes are incorporated within the financial statements.
In March 2017, the FASB issued Accounting Standards Update 2017-08, Receivables—Nonrefundable Fees and Other Costs (Subtopic 310-20): "Premium Amortization On Purchased Callable Debt Securities" ("ASU 2017-08"). The update provides guidance related to the amortization period for certain purchased callable debt securities held at a premium. ASU 2017-08 will be effective for annual periods beginning after December 15, 2018. Management is currently assessing the potential impact of these changes to future financial statements.
The following is a summary of significant accounting policies:
Valuation of investments—Under Rule 2a-7 under the 1940 Act, as amended ("Rule 2a-7"), the Portfolio has adopted a policy to operate as a "government money market fund". Under Rule 2a-7, a
18
PACE Government Money Market Investments
Notes to financial statements
"government money market fund" invests 99.5% or more of its total assets in cash, government securities, and/or repurchase agreements that are collateralized fully (i.e., collateralized by cash and/or government securities). As a "government money market fund", the Portfolio values its investments at amortized cost unless the Portfolio's Board of Trustees (the "Board") determines that this does not represent fair value. Periodic review and monitoring of the valuation of the securities held by the Portfolio is performed in an effort to ensure that amortized cost approximates market value.
US GAAP requires disclosure regarding the various inputs that are used in determining the value of the Portfolio's investments. These inputs are summarized into the three broad levels listed below:
Level 1—Unadjusted quoted prices in active markets for identical investments.
Level 2—Other significant observable inputs, including but not limited to, quoted prices for similar investments, interest rates, prepayment speeds and credit risks.
Level 3—Unobservable inputs inclusive of the Portfolio's own assumptions in determining the fair value of investments.
A fair value hierarchy table has been included near the end of the Portfolio's Portfolio of investments.
Constant net asset value per share—The Portfolio attempts to maintain a stable net asset value of $1.00 per share. There is no assurance, however, that the Portfolio will be able to maintain a stable net asset value of $1.00 per share. The Portfolio has adopted certain investment, portfolio valuation and dividend/distribution policies in an attempt to enable it to do so. The Portfolio has adopted a policy to operate as a "government money market fund" and as such the Portfolio is permitted to seek to maintain a stable price per share.
Liquidity fee and/or redemption gates—By operating as a "government money market fund," the Portfolio is exempt from requirements that permit the imposition of a liquidity fee and/or
19
PACE Government Money Market Investments
Notes to financial statements
temporary redemption gates. While the Board may elect to subject the Portfolio to liquidity fee and gate requirements in the future, the Board has not elected to do so at this time.
Repurchase agreements—The Portfolio may purchase securities or other obligations from a bank or securities dealer (or its affiliate), subject to the seller's agreement to repurchase them at an agreed upon date (or upon demand) and price. The Portfolio maintains custody of the underlying obligations prior to their repurchase, either through its regular custodian or through a special "tri-party" custodian or sub-custodian that maintains a separate account for both the Portfolio and its counterparty. The underlying collateral is valued daily in an effort to ensure that the value, including accrued interest, is at least equal to the repurchase price.
Repurchase agreements carry certain risks not associated with direct investments in securities, including a possible decline in the market value of the underlying obligations. If their value becomes less than the repurchase price, plus any agreed-upon additional amount, the counterparty must provide additional collateral so that the collateral is at least equal to the repurchase price plus any agreed-upon additional amount. The difference between the total amount to be received upon repurchase of the obligations and the price that was paid by a Portfolio upon acquisition is accrued as interest and included in its net investment income. In the event of default of the obligation to repurchase, the Portfolio generally has the right to liquidate the collateral and apply the proceeds in satisfaction of the obligation. Repurchase agreements secured by obligations that are not eligible for direct investment under Rule 2a-7 of the 1940 Act or a Portfolio's investment strategies and limitations may require the Portfolio to promptly dispose of such collateral if the seller or guarantor becomes insolvent. If the seller (or seller's guarantor, if any) becomes insolvent, the Portfolio may suffer delays, costs and possible losses in connection with the disposition or retention of the collateral. Under certain circumstances, in the event of default or bankruptcy by the other party to the agreement, realization and/or retention of the collateral may be subject to legal proceedings. The Portfolio intends to enter into
20
PACE Government Money Market Investments
Notes to financial statements
repurchase agreements only in transactions with counterparties believed by UBS AM to present minimal credit risks.
The Portfolio may participate in joint repurchase agreement transactions with other Portfolios managed, advised or subadvised by UBS AM. Under certain circumstances, the Portfolio may engage in a repurchase agreement transaction with a yield of zero in order to invest cash amounts remaining in its portfolio at the end of the day in order to avoid having the Portfolio potentially exposed to a fee for uninvested cash held in a business account at a bank.
Investment transactions and investment income—Investment transactions are recorded on the trade date. Realized gains and losses from investment transactions are calculated using the identified cost method. Interest income is recorded on an accrual basis. Discounts are accreted and premiums are amortized as adjustments to interest income and the identified cost of investments.
Dividends and distributions—Dividends and distributions to shareholders are recorded on the ex-dividend date. The amount of dividends and distributions are determined in accordance with US federal income tax regulations, which may differ from US GAAP. These "book/tax" differences are either considered temporary or permanent in nature. To the extent these differences are permanent in nature, such amounts are reclassified within the capital accounts based on their federal tax-basis treatment; temporary differences do not require reclassification.
Concentration of risk—The ability of the issuers of debt securities held by the Portfolio to meet their obligations may be affected by economic and political developments particular to a specific industry, country, state or region.
Investment management and administration fees and other transactions with affiliates
The Portfolio's Board has approved an investment management and administration contract ("Management Contract") with UBS AM. In
21
PACE Government Money Market Investments
Notes to financial statements
accordance with the Management Contract, the Portfolio pays UBS AM an investment management and administration fee, which is accrued daily and paid monthly, at an annual rate of 0.35% of the Portfolio's average daily net assets. At July 31, 2018, UBS AM is owed $33,942 from the Portfolio, representing investment management and administration fees net of fee waivers/expense reimbursements.
UBS AM has contractually undertaken to waive a portion of the Portfolio's investment management and administration fees and/or reimburse a portion of the Portfolio's other expenses, when necessary, to maintain the total ordinary annual operating expenses (excluding borrowing costs and interest expense, if any) through November 30, 2018 at a level not to exceed 0.60%. For the period ended July 31, 2018, UBS AM waived $409,180 in investment management and administration fees. The Portfolio will make a payment to UBS AM for any previously waived fees/reimbursed expenses during the following three fiscal years to the extent that operating expenses are otherwise below the expense cap.
At July 31, 2018, the Portfolio had remaining fee waivers/expense reimbursements subject to repayment to UBS AM and respective dates of expiration as follows:
| Fee waivers/expense reimbursements subject to repayment | Expires July 31, 2019 | Expires July 31, 2020 | Expires July 31, 2021 | ||||||||||||
$ | 1,786,903 | $ | 706,786 | $ | 670,937 | $ | 409,180 | ||||||||
No amount was repaid back to UBS AM in the past year.
UBS AM may voluntarily waive fees and/or reimburse expenses from time to time in the event that the Portfolio's yield falls below a certain level. Once started, there is no guarantee that UBS AM would continue to voluntarily waive an additional portion of its fees and/or reimburse expenses. This management fee waiver will not be subject to future recoupment. For the period ended July 31, 2018, UBS AM did not voluntarily waived and/or reimbursed expenses for that purpose.
22
PACE Government Money Market Investments
Notes to financial statements
Additional information regarding compensation to affiliate of a board member
Professor Meyer Feldberg serves as a senior advisor to Morgan Stanley, a financial services firm with which the Portfolio may conduct transactions, resulting in him being an interested trustee of the Portfolio. The Portfolio has been informed that Professor Feldberg's role at Morgan Stanley does not involve matters directly affecting any UBS funds. Portfolio transactions are executed through Morgan Stanley based on that firm's ability to provide best execution of the transactions.
During the period ended July 31, 2018, the Portfolio purchased and sold certain securities (e.g., fixed income securities) in principal trades with Morgan Stanley, having an aggregate value of $7,978,864. Morgan Stanley received compensation in connection with these trades, which may have been in the form of a "mark-up" or "mark-down" of the price of the securities, a fee from the issuer for maintaining a commercial paper program, or some other form of compensation. Although the precise amount of this compensation is not generally known by the Portfolio's investment manager, it is believed that under normal circumstances it represents a small portion of the total value of the transactions.
Transfer agency and related services fees
UBS Financial Services Inc. provides certain services to the Portfolio pursuant to a delegation of authority from BNY Mellon Investment Servicing (US) Inc. ("BNY Mellon"), the Portfolio's transfer agent, and is compensated for these services by BNY Mellon, not the Portfolio.
UBS Financial Services Inc. has voluntarily agreed to waive a portion of the fee that it would otherwise have received from BNY Mellon with respect to PACE Government Money Market Investments so that BNY Mellon would correspondingly reduce the fees it would have charged to that Portfolio. For the year ended July 31, 2018, the amount of the reduction in transfer agency and related services fees charged by BNY Mellon to the Portfolio was $186,859, which reflected an equal amount of compensation that was voluntarily waived by UBS Financial
23
PACE Government Money Market Investments
Notes to financial statements
Services Inc. Voluntary fee waiver/expense reimbursement arrangements may be amended or end at any time.
For the period ended July 31, 2018, UBS Financial Services Inc. received from BNY Mellon, not the Portfolio, $341,720 of the total transfer agency and related services fees paid by the Portfolio to BNY Mellon.
Shares of beneficial interest
There is an unlimited amount of $0.001 par value shares of beneficial interest authorized. Transactions in shares of beneficial interest, at $1.00 per share, were as follows:
Years ended July 31, | |||||||||||
2018 | 2017 | ||||||||||
Shares sold | 153,320,074 | 279,769,071 | |||||||||
Shares repurchased | (165,625,042 | ) | (263,332,595 | ) | |||||||
Dividends reinvested | 1,513,589 | 173,450 | |||||||||
Net increase (decrease) in shares outstanding | (10,791,379 | ) | 16,609,926 | ||||||||
Federal tax status
The Portfolio intends to distribute substantially all of its income and to comply with the other requirements of the Internal Revenue Code applicable to regulated investment companies. Accordingly, no provision for federal income taxes is required. In addition, by distributing during each calendar year substantially all of its net investment income, net realized capital gains and certain other amounts, if any, the Portfolio intends not to be subject to a federal excise tax.
The tax character of distributions paid to shareholders by the Portfolio during the fiscal years ended July 31, 2018 and July 31, 2017 was ordinary income in the amount of $1,702,668 and $227,818, respectively.
24
PACE Government Money Market Investments
Notes to financial statements
At July 31, 2018, the components of accumulated earnings on a tax basis were undistributed ordinary income of $107,862 and accumulated realized capital and other losses of $1,106.
There were no reclassifications arising from permanent "book/tax" differences for the fiscal year ended July 31, 2018.
Under the Regulated Investment Company Modernization Act of 2010 (The "Act"), net capital losses recognized by the portfolio after December 22, 2010, may be carried forward indefinitely, and retain their character as short-term and/or long-term losses. The Act requires that post-enactment net capital losses be used before pre-enactment net capital losses. At July 31, 2018, the Portfolio had post-enactment short-term capital loss carryforwards of $(1,106). During the current fiscal year, the Portfolio utilized $6 of capital loss carryforwards to offset current year realized gains.
ASC 740-10 "Income-Overall" sets forth a minimum threshold for financial statement recognition of the benefit of a tax position taken or expected to be taken. The Portfolio has analyzed and concluded as of July 31, 2018, that there are no significant uncertain tax positions taken or expected to be taken that would require recognition in the financial statements. The Portfolio recognizes interest and penalties, if any, related to uncertain tax positions as income tax expense in the Statement of Operations. During the period ended July 31, 2018, the Portfolio did not incur any interest or penalties.
Each of the tax years in the four year period ended July 31, 2018, remains subject to examination by the Internal Revenue Service and state taxing authorities.
25
PACE Government Money Market Investments
Report of Ernst & Young LLP, independent
registered public accounting firm
To the Shareholders and the Board of
Trustees of PACE Government Money Market Investments
Opinion on the Financial Statements
We have audited the accompanying statement of assets and liabilities of PACE Government Money Market Investments (the "Fund") (one of the funds constituting PACE Select Advisors Trust), including the portfolio of investments, as of July 31, 2018, and the related statement of operations for the year then ended, the statements of changes in net assets for each of the two years in the period then ended, the financial highlights for each of the five years in the period then ended and the related notes (collectively referred to as the "financial statements"). In our opinion, the financial statements present fairly, in all material respects, the financial position of the Fund (one of the funds constituting PACE Select Advisors Trust) at July 31, 2018, the results of its operations for the year then ended, the changes in its net assets for each of the two years in the period then ended and its financial highlights for each of the five years in the period then ended, in conformity with U.S. generally accepted accounting principles.
Basis for Opinion
These financial statements are the responsibility of the Trust's management. Our responsibility is to express an opinion on the Fund's financial statements based on our audits. We are a public accounting firm registered with the Public Company Accounting Oversight Board (United States) ("PCAOB") and are required to be independent with respect to the Trust in accordance with the U.S. federal securities laws and the applicable rules and regulations of the Securities and Exchange Commission and the PCAOB.
We conducted our audits in accordance with the standards of the PCAOB. Those standards require that we plan and perform the audit to obtain reasonable assurance about whether the financial statements are free of material misstatement, whether due to error or fraud. The Trust is not required to have, nor were we engaged to perform, an audit of the Trust's internal control over financial reporting. As part of our audits we are required to obtain an understanding of internal control over
26
PACE Government Money Market Investments
Report of Ernst & Young LLP, independent
registered public accounting firm
financial reporting but not for the purpose of expressing an opinion on the effectiveness of the Trust's internal control over financial reporting. Accordingly, we express no such opinion.
Our audits included performing procedures to assess the risks of material misstatement of the financial statements, whether due to error or fraud, and performing procedures that respond to those risks. Such procedures included examining, on a test basis, evidence regarding the amounts and disclosures in the financial statements. Our procedures included confirmation of securities owned as of July 31, 2018, by correspondence with the custodian and brokers or by other appropriate auditing procedures where replies from brokers were not received. Our audits also included evaluating the accounting principles used and significant estimates made by management, as well as evaluating the overall presentation of the financial statements. We believe that our audits provide a reasonable basis for our opinion.

We have served as the auditor of one or more UBS investment companies since 1978.
New York, New York
September 28, 2018
27
PACE Government Money Market Investments
General information (unaudited)
Monthly and quarterly portfolio holdings disclosure
The Portfolio will file its complete schedule of portfolio holdings with the Securities and Exchange Commission ("SEC") for the first and third quarters of each fiscal year on Form N-Q. The Portfolio's Forms N-Q are available on the SEC's Web site at http://www.sec.gov. The Portfolio's Forms N-Q may be reviewed and copied at the SEC's Public Reference Room in Washington, D.C. Information on the operation of the SEC's Public Reference Room may be obtained by calling 1-800-SEC 0330. Additionally, you may obtain copies of Forms N-Q from the Portfolio upon request by calling 1-800-647 1568.
In addition, the Portfolio discloses, on a monthly basis: (a) a complete schedule of its portfolio holdings; and (b) information regarding its weighted average maturity and weighted average life on UBS's Web site at the following internet address: www.ubs.com/usmoneymarketfunds. In addition, at this location, you will find a link to more detailed Portfolio information appearing in filings with the SEC on Form N-MFP.
Proxy voting policies, procedures and record
You may obtain a description of the Portfolio's (1) proxy voting policies, (2) proxy voting procedures and (3) information regarding how the Portfolio voted any proxies related to portfolio securities during the most recent 12-month period ended June 30 for which an SEC filing has been made, without charge, upon request by contacting the Portfolio directly at 1-800-647 1568, online on the Portfolio's Web site: www.ubs.com/ubsam-proxy, or on the EDGAR Database on SEC's Web site (http://www.sec.gov).
Other tax information
Pursuant to sections 871(k)(1)(C)(i) and 871(k)(2)(C)(i) of the Internal Revenue Code, the Portfolio designates $1,702,668 of ordinary income distributions paid as qualified interest income.
28
PACE Government Money Market Investments
Board approval of investment managment and administration agreement (unaudited)
Background—At a meeting of the board of PACE Select Advisors Trust (the "Trust") on July 17-18, 2018, the members of the board, including the trustees who are not "interested persons," as defined in the Investment Company Act of 1940, as amended, of the Trust (the "Independent Trustees"), considered and approved the continuance of the investment management and administration agreement (the "Investment Management and Administration Agreement") between UBS Asset Management (Americas) Inc. ("UBS AM") and the Trust, on behalf of PACE Government Money Market Investments (the "Portfolio"). In preparing for the meeting, the Independent Trustees had requested and received extensive information from UBS AM to assist them, including information about UBS AM, as well as the management, administrative and distribution arrangements for the Portfolio. The board reviewed and discussed with management the materials initially provided by UBS AM prior to the scheduled board meeting. The Independent Trustees also met in executive session to review the disclosure that had been made to them. At these sessions the Independent Trustees were joined by their independent legal counsel. The Independent Trustees also received a memorandum from their independent legal counsel discussing the duties of board members in considering the approval of management, administration and distribution agreements.
In its consideration of the approval of the Investment Management and Administration Agreement, the board considered the following factors:
Nature, extent and quality of the services under the Investment Management and Administration Agreement—The board received and considered information regarding the nature, extent and quality of management services provided to the Portfolio by UBS AM. The board also considered the nature, extent and quality of administrative, distribution and shareholder services performed by UBS AM and its affiliates for the Portfolio and the resources devoted to, and the record of compliance with, the Portfolio's compliance policies and procedures. The board noted that it received information at regular meetings throughout the year regarding the services
29
PACE Government Money Market Investments
Board approval of investment managment and administration agreement (unaudited)
rendered by UBS AM concerning the management of the Portfolio's affairs and UBS AM's role in coordinating and overseeing providers of other services to the Portfolio. The board's evaluation of the services provided by UBS AM took into account the board's knowledge and familiarity gained as board members of funds in the UBS New York fund complex, including the scope and quality of UBS AM's investment management and other capabilities and the quality of its administrative and other services. The board observed that the scope of services provided by UBS AM had expanded over time as a result of regulatory and other developments, including maintaining and monitoring its own and the Portfolio's expanded compliance programs.
The board had available to it the qualifications, backgrounds and responsibilities of the senior personnel at UBS AM responsible for the Portfolio and had previously met with and received information regarding the persons primarily responsible for the day-to-day management of the Portfolio. The board recognized that several senior personnel at UBS AM report to the board regularly, and that at each regular meeting the board receives a detailed report from UBS AM on the Portfolio's performance. The board also considered, based on its knowledge of UBS AM and its affiliates, the financial resources available to UBS AM and its parent organization, UBS Group AG. In that regard, the board received extensive financial information regarding UBS AM and noted that it was a wholly owned, indirect subsidiary of one of the largest financial services firms in the world. It also was noted that UBS AM had approximately $174 billion in assets under management as of March 31, 2018 and was part of the UBS Asset Management Division, which had approximately $831 billion in assets under management worldwide as of March 31, 2018. The board also was cognizant of, and considered, the regulatory and litigation actions and investigations occurring in the past few years involving UBS Group AG, UBS AM and certain of their affiliates.
The board concluded that, overall, it was satisfied with the nature, extent and quality of services provided (and expected to be provided)
30
PACE Government Money Market Investments
Board approval of investment managment and administration agreement (unaudited)
to the Portfolio under the Investment Management and Administration Agreement.
Management fees and expense ratios—The board reviewed and considered the contractual management fee (the "Contractual Management Fee") payable by the Portfolio to UBS AM in light of the nature, extent and quality of the services provided by UBS AM pursuant to the Investment Management and Administration Agreement. The board also reviewed and considered the fee waiver and/or expense reimbursement arrangement for the Portfolio and considered the actual fee rate (after taking any waivers and reimbursements into account) (the "Actual Management Fee") payable by the Portfolio. The board considered that UBS AM had entered into a fee waiver and/or expense reimbursement agreement with the Portfolio under which UBS AM was contractually obligated to waive its management fees and/or reimburse the Portfolio so that the total ordinary operating expenses of the Portfolio through November 30, 2018 (excluding certain miscellaneous items) would not exceed a specified limit. The board also considered that the Portfolio had agreed to repay UBS AM for those waived fees and/or reimbursed expenses if the Portfolio can do so over the following three fiscal years without causing its expenses in any of those years to exceed the expense cap. Additionally, the board received and considered information comparing the Portfolio's Contractual Management Fee, Actual Management Fee and overall expenses with those of funds in a group of funds selected and provided by Broadridge, an independent provider of investment company data (the "Expense Group").
In connection with its consideration of the Portfolio's management fees, the board also received information on UBS AM with respect to fees paid by institutional or separate accounts; however, in management's view, such fee information was not very relevant to the Portfolio because, among other reasons, separately managed and institutional accounts with a "cash" mandate (a) were not subject to all of the constraints of Rule 2a-7 under the 1940 Act to which the Portfolio is subject and (b) do not involve the management responsibilities attendant to the operation of a 1940 Act regulated
31
PACE Government Money Market Investments
Board approval of investment managment and administration agreement (unaudited)
fund, and, therefore, were not totally comparable. The board also received information on fees charged to other mutual funds managed by UBS AM.
The comparative Broadridge information showed that the Portfolio's Contractual Management Fee and its Actual Management Fee, were below the median, and its total expenses were above the median in the Portfolio's Expense Group for the comparison periods utilized in the Broadridge report. (Below median fees or expenses represent fees or expenses that are lower relative to the median, and above median fees or expenses represent fees or expenses that are higher relative to the median of the funds in the Expense Group.) Management noted that the Portfolio's total expenses were reasonably close to the Expense Group median (within 3 basis points—i.e., 0.03%). Management explained that the Portfolio's higher total expenses relative to its Expense Group were in part due to higher transfer agency expenses relative to peers, reflective of the smaller average size of Portfolio shareholder accounts.
In light of the foregoing, the board determined that the proposed contractual management fee payable by the Portfolio to UBS AM was reasonable in light of the nature, extent and quality of services expected to be provided to the Portfolio under the Investment Management and Administration Agreement.
Portfolio performance—The board received and considered (a) annualized total return information of the Portfolio compared to other funds (the "Performance Universe") selected by Broadridge over the one-, three-, five-, ten-year and since inception periods ended April 30, 2018, and (b) annualized performance information for each year in the ten-year period ended April 30, 2018. Although the board received information for the ten-year and since inception periods, in its analysis, it generally placed greater emphasis on the one-, three- and five-year periods. The board was provided with a description of the methodology Broadridge used to determine the similarity of the Portfolio with the funds included in its Performance Universe. The
32
PACE Government Money Market Investments
Board approval of investment managment and administration agreement (unaudited)
board also noted that it had received information throughout the year at periodic intervals with respect to the Portfolio's performance.
The comparative Broadridge information showed that the Portfolio's performance was at or above the median for the one-, three-, five- and ten-year periods and since inception. (Below median performance represents performance that is worse relative to the median, and above median performance represents performance that is better relative to the median.) The board noted that the Portfolio's above median performance included periods during which the Portfolio was managed as a prime money market fund, in contrast to the government money market funds in the Portfolio's Performance Universe. Based on its review of the Portfolio, the board concluded that the Portfolio's investment performance was acceptable.
Advisor profitability—The board received and considered a profitability analysis of UBS AM and its affiliates in providing services to the Portfolio. The board also received profitability information with respect to the UBS New York fund complex as a whole. UBS AM's profitability was considered not excessive in light of the nature, extent and quality of the services provided to the Portfolio.
Economies of scale—The board received and considered information from management regarding whether UBS AM realized economies of scale as the Portfolio's assets grew, whether the Portfolio has appropriately benefited from any economies of scale, and whether there is potential for realization of any further economies of scale for the Portfolio. The board considered whether economies of scale in the provision of services to the Portfolio were being passed along to the shareholders. The board noted that the Portfolio's Contractual Management Fee did not contain breakpoints. However, the board also noted that to the extent the Portfolio's assets increase over time, it will realize economies of scale as certain expenses, such as fees for trustees, auditor and legal fees and printing and postage, become a smaller percentage of overall assets.
33
PACE Government Money Market Investments
Board approval of investment managment and administration agreement (unaudited)
In light of UBS AM's profitability data, the Actual Management Fee, the Contractual Management Fee and the current assets of the Portfolio, the board believed that UBS AM's sharing of potential and current economies of scale with the Portfolio was acceptable.
Other benefits to UBS AM—The board considered other benefits received by UBS AM and its affiliates as a result of its relationship with the Portfolio, including the opportunity to offer additional products and services to Portfolio shareholders. In light of the costs of providing investment management, administrative and other services to the Portfolio and UBS AM's ongoing commitment to the Portfolio, the profits and other ancillary benefits that UBS AM and its affiliates received were considered reasonable.
In light of all of the foregoing, the board, including a majority of the Independent Trustees, approved the Investment Management and Administration Agreement for the Portfolio. No single factor reviewed by the board was identified by the board as the principal factor in determining whether to approve the Investment Management and Administration Agreement. The Independent Trustees were advised by separate independent legal counsel throughout the process. The board discussed the proposed continuance of the Investment Management and Administration Agreement in private sessions with their independent legal counsel at which no representatives of UBS AM were present.
34
PACE Government Money Market Investments
Supplemental information (unaudited)
Board of Trustees & Officers
The Trust is governed by a Board of Trustees which oversees the Portfolios' operations. Each Trustee serves an indefinite term of office. Officers are appointed by the trustees and serve at the pleasure of the Board. The table below shows, for each trustee and officer, his or her name, address and age, the position held with the Trust, the length of time served as a trustee or officer of the Trust, the trustee's or officer's principal occupations during the last five years, the number of portfolios in the UBS fund complex overseen by the trustee or for which a person served as an officer, and other directorships held by the trustee.
The Trust's Statement of Additional Information contains additional information about the trustees and is available, without charge, upon request by calling 1-800-647 1568.
35
PACE Government Money Market Investments
Supplemental information (unaudited)
Interested Trustees:
| Name, address, and age | Position(s) held with Trust | Term of office1 and length of time served | Principal occupation(s) during past 5 years | ||||||||||||
| Meyer Feldberg2; 76 Morgan Stanley 1585 Broadway 36th Floor New York, NY 10036 | Trustee | Since 2001 (Trustee); Since November 2017 (Chairman of the Board of Trustees) | Professor Feldberg is Dean Emeritus and Professor of Leadership and Ethics at Columbia Business School, although on an extended leave of absence. He is also a senior advisor to Morgan Stanley (financial services) (since 2005). Professor Feldberg also served as president of New York City Global Partners (an organization located in part of the Office of the Mayor of the City of New York that promoted interaction with other cities around the world) (2007-2014). Prior to 2004, he was Dean and Professor of Management and Ethics of the Graduate School of Business at Columbia University (since 1989). From 1992 to 2016, Professor Feldberg was a director of Macy's, Inc. (operator of department stores). From 1997 to 2017, Professor Feldberg was a director of Revlon, Inc. (cosmetics). | ||||||||||||
36
PACE Government Money Market Investments
Supplemental information (unaudited)
| Name, address, and age | Number of portfolios in fund complex overseen by Trustee | Other directorships held by Trustee | |||||||||
| Meyer Feldberg2; 76 Morgan Stanley 1585 Broadway 36th Floor New York, NY 10036 | Professor Feldberg is a director or trustee of 12 investment companies (consisting of 50 portfolios) for which UBS Asset Management (Americas) Inc. ("UBS AM") or one of its affiliates serves as investment advisor or manager. | Professor Feldberg is also a director of the New York City Ballet. | |||||||||
37
PACE Government Money Market Investments
Supplemental information (unaudited)
Independent Trustees:
| Name, address, and age | Position(s) held with Trust | Term of office1 and length of time served | Principal occupation(s) during past 5 years | ||||||||||||
| Alan S. Bernikow; 77 207 Benedict Ave. Staten Island, NY 10314 | Trustee | Since 2005 | Mr. Bernikow is retired. Previously, he was deputy chief executive officer at Deloitte & Touche (international accounting and consulting firm). From 2003 to March 2017, Mr. Bernikow was also a director of Destination XL Group, Inc. (menswear) (and served as a member of its nominating and corporate governance committee). | ||||||||||||
| Richard R. Burt; 71 McLarty Associates 900 17th Street Washington, D.C. 20006 | Trustee | Since 2001 | Mr. Burt is a managing director to McLarty Associates (a consulting firm) (since 2007). He was chairman of IEP Advisors (international investments and consulting firm) until 2009. | ||||||||||||
| Bernard H. Garil; 78 6754 Casa Grande Way Delray Beach, FL 33446 | Trustee | Since 2005 | Mr. Garil is retired (since 2001). He was a managing director at PIMCO Advisory Services (from 1999 to 2001) where he served as president of closed-end funds and vice-president of the variable insurance product funds advised by OpCap Advisors (until 2001). | ||||||||||||
38
PACE Government Money Market Investments
Supplemental information (unaudited)
| Name, address, and age | Number of portfolios in fund complex overseen by Trustee | Other directorships held by Trustee | |||||||||
| Alan S. Bernikow; 77 207 Benedict Ave. Staten Island, NY 10314 | Mr. Bernikow is a director or trustee of 7 investment companies (consisting of 45 portfolios) for which UBS AM serves as investment advisor or manager. | Mr. Bernikow is also a director of Revlon, Inc. (cosmetics) (and serves as the chair of its audit committee and as the chair of the compensation committee), the lead director of Mack-Cali Realty Corporation (real estate investment trust) (and serves as the chair of its audit committee). He is also a director of FCB Financial Holdings, Inc. (banking) (and serves as the chair of its audit committee and member of the nominating and governance committee and compensation committee). | |||||||||
| Richard R. Burt; 71 McLarty Associates 900 17th Street Washington, D.C. 20006 | Mr. Burt is a director or trustee of 7 investment companies (consisting of 45 portfolios) for which UBS AM serves as investment advisor or manager. | Mr. Burt is also a director of The Central Europe, Russia and Turkey Fund, Inc., The European Equity Fund, Inc. and The New Germany Fund, Inc. (and serves as a member of each such fund's audit, nominating and governance committee). | |||||||||
| Bernard H. Garil; 78 6754 Casa Grande Way Delray Beach, FL 33446 | Mr. Garil is a director or trustee of 7 investment companies (consisting of 45 portfolios) for which UBS AM serves as investment advisor or manager. | Mr. Garil is also a director of OFI Global Trust Company (commercial trust company), The Leukemia and Lymphoma Society (voluntary health organization) and a trustee for the Brooklyn College Foundation, Inc. (charitable foundation). | |||||||||
39
PACE Government Money Market Investments
Supplemental information (unaudited)
Independent Trustees (concluded):
| Name, address, and age | Position(s) held with Trust | Term of office1 and length of time served | Principal occupation(s) during past 5 years | ||||||||||||
| Heather R. Higgins; 58 c/o Keith A. Weller Assistant Fund Secretary UBS Asset Management (Americas) Inc. 1285 Avenue of the Americas New York, NY 10019 | Trustee | Since 2005 | Ms. Higgins is the president and director of The Randolph Foundation (charitable foundation) (since 1991). Ms. Higgins also serves (or has served) on the boards of several non-profit charitable groups, including the Independent Women's Forum (chairman) and the Philanthropy Roundtable (vice chairman). She also serves on the board of the Hoover Institution (from 2001 to 2007 and since 2009). | ||||||||||||
40
PACE Government Money Market Investments
Supplemental information (unaudited)
| Name, address, and age | Number of portfolios in fund complex overseen by Trustee | Other directorships held by Trustee | |||||||||
| Heather R. Higgins; 58 c/o Keith A. Weller Assistant Fund Secretary UBS Asset Management (Americas) Inc. 1285 Avenue of the Americas New York, NY 10019 | Ms. Higgins is a director or trustee of 7 investment companies (consisting of 45 portfolios) for which UBS AM serves as investment advisor or manager. | None | |||||||||
41
PACE Government Money Market Investments
Supplemental information (unaudited)
Officers:
| Name, address, and age | Position(s) held with Trust | Term of office1 and length of time served | Principal occupation(s) during past 5 years; number of portfolios in fund complex for which person serves as officer | ||||||||||||
| Rose Ann Bubloski*; 50 | Vice President and Assistant Treasurer | Since 2011 | Ms. Bubloski is a director (since 2012) (prior to which she was an associate director (from 2008 to 2012)) and a senior manager of product control and investment support (previously named registered fund product control) of UBS AM—Americas region. Ms. Bubloski is vice president and assistant treasurer of 10 investment companies (consisting of 64 portfolios) for which UBS AM serves as investment advisor or manager. | ||||||||||||
| Mark E. Carver*; 55 | President | Since 2010 | Mr. Carver is a managing director and head of product development and management for UBS AM—Americas region (since 2008). In this role, he oversees product development and management for both wholesale and institutional businesses. He is a member of the Americas Management Committee (since 2008) and the Regional Operating Committee (since 2008). Mr. Carver is president of 10 investment companies (consisting of 64 portfolios) for which UBS AM serves as investment advisor or manager. | ||||||||||||
42
PACE Government Money Market Investments
Supplemental information (unaudited)
Officers (continued):
| Name, address, and age | Position(s) held with Trust | Term of office1 and length of time served | Principal occupation(s) during past 5 years; number of portfolios in fund complex for which person serves as officer | ||||||||||||
| Franklin P. Dickson*; 40 | Vice President | Since November 2017 | Mr. Dickson is an associate director (since 2015) and tax compliance manager (since October 2017) (prior to which he was a product controller (from 2015 to 2017) of product control and investment support (previously named registered fund product control) of UBS AM—Americas region. From 2013 through 2015, Mr. Dickson was fund administration and compliance manager for U.S. Bancorp Fund Services, LLC, and from April 2008 through June 2013, Mr. Dickson was vice president, client service manager at BNY Mellon Asset Servicing. Mr. Dickson is a vice president of 10 investment companies (consisting of 64 portfolios) for which UBS AM serves as investment advisor or manager. | ||||||||||||
43
PACE Government Money Market Investments
Supplemental information (unaudited)
Officers (continued):
| Name, address, and age | Position(s) held with Trust | Term of office1 and length of time served | Principal occupation(s) during past 5 years; number of portfolios in fund complex for which person serves as officer | ||||||||||||
| Mark F. Kemper**; 60 | Vice President and Secretary | Since 2004 | Mr. Kemper is a managing director and general counsel of UBS AM—Americas region (since 2006 and 2004 respectively). He has been secretary of UBS AM—Americas region (since 2004), and assistant secretary of UBS Asset Management Trust Company (since 1993). Mr. Kemper is vice president and secretary of 10 investment companies (consisting of 64 portfolios) for which UBS AM serves as investment advisor or manager. Mr. Kemper is employed by UBS Business Solutions US LLC (since January 2017). | ||||||||||||
| Joanne M. Kilkeary*; 50 | Vice President, Treasurer and Principal Accounting Officer | Since 1999 (Vice President); since October 2017 (Treasurer and Principal Accounting Officer) | Ms. Kilkeary is an executive director (since 2013) (prior to which she was a director) (from 2008 to 2013)) and head of regulatory, tax, audit and board governance for product control and investment support (since October 2017) (prior to which she was a senior manager of registered fund product control of UBS AM—Americas region (from 2004 to 2017)). Ms. Kilkeary is a vice president and assistant treasurer of 10 investment companies (consisting of 64 portfolios) for which UBS AM serves as investment advisor or manager. | ||||||||||||
44
PACE Government Money Market Investments
Supplemental information (unaudited)
Officers (continued):
| Name, address, and age | Position(s) held with Trust | Term of office1 and length of time served | Principal occupation(s) during past 5 years; number of portfolios in fund complex for which person serves as officer | ||||||||||||
| William Lawlor**; 31 | Vice President and Assistant Secretary | Since May 2018 | Mr. Lawlor is a director and associate general counsel with UBS Business Solutions US LLC (since January 2017) and also with UBS AM—Americas region since 2013. Prior to joining UBS AM—Americas region, Mr. Lawlor attended Kent College of Law, where he graduated in 2013. Mr. Lawlor is a vice president and assistant secretary of 10 investment companies (consisting of 64 portfolios) for which UBS AM serves as investment advisor or manager. | ||||||||||||
| Mabel Lung***; 60 | Vice President | Since May 2016 | Ms. Lung is a managing director and portfolio manager, Multi-Component Portfolios, of UBS AM—Americas region which she joined in 1995. Ms. Lung is a vice president of one investment company (consisting of 15 portfolios) for which UBS AM serves as investment advisor or manager. | ||||||||||||
| Nancy D. Osborn*; 52 | Vice President and Assistant Treasurer | Since 2007 | Mrs. Osborn is a director (since 2010) (prior to which she was an associate director) and a senior manager of product control and investment support (previously named registered fund product control) of UBS AM—Americas region (since 2006). Mrs. Osborn is a vice president and assistant treasurer of 10 investment companies (consisting of 64 portfolios) for which UBS AM serves as investment advisor or manager. | ||||||||||||
45
PACE Government Money Market Investments
Supplemental information (unaudited)
Officers (continued):
| Name, address, and age | Position(s) held with Trust | Term of office1 and length of time served | Principal occupation(s) during past 5 years; number of portfolios in fund complex for which person serves as officer | ||||||||||||
| Frank S. Pluchino***, 59 | Chief Compliance Officer | Since November 2017 | Mr. Pluchino is an executive director with UBS AM—Americas region and is also the chief compliance officer of UBS Hedge Fund Solutions LLC (since 2010). Mr. Pluchino serves as chief compliance officer of 15 investment companies (consisting of 69 portfolios) for which UBS AM or one of its affiliates serves as investment advisor or manager. | ||||||||||||
| Robert Sabatino**; 45 | Vice President | Since 2001 | Mr. Sabatino is a managing director (since 2010) (prior to which he was an executive director) (from 2007 to 2010)), global head of liquidity portfolio management (since 2015), head of US taxable money markets (from 2009 to 2015), and portfolio manager of UBS AM—Americas region in the short duration fixed income group (since 2001). Mr. Sabatino is a vice president of three investment companies (consisting of 27 portfolios) for which UBS AM serves as investment advisor or manager. | ||||||||||||
| Eric Sanders*; 52 | Vice President and Assistant Secretary | Since 2005 | Mr. Sanders is a director and associate general counsel with UBS Business Solutions US LLC (since January 2017) and also with UBS AM—Americas region (since 2005). Mr. Sanders is a vice president and assistant secretary of 10 investment companies (consisting of 64 portfolios) for which UBS AM serves as investment advisor or manager. | ||||||||||||
46
PACE Government Money Market Investments
Supplemental information (unaudited)
Officers (continued):
| Name, address, and age | Position(s) held with Trust | Term of office1 and length of time served | Principal occupation(s) during past 5 years; number of portfolios in fund complex for which person serves as officer | ||||||||||||
Philip Stacey**; 33 | Vice President and Assistant Secretary | Since May 2018 | Mr. Stacey is a director and associate general counsel with UBS Business Solutions US LLC (Since January 2017) and also with UBS AM—Americas region since 2015. Prior to joining UBS AM—Americas region. Mr. Stacey was a legal associate with the Chicago-based investment manager HFR Asset Management, LLC from 2009 through 2015. Mr. Stacey is a vice president and assistant secretary of 10 investment companies (consisting of 64 portfolios) for which UBS AM serves as investment advisor or manager. | ||||||||||||
| Gina M. Toth***; 54 | Vice President | Since May 2016 | Ms. Toth is an executive director and portfolio manager in the Multi-Manager Solutions team of UBS AM—Americas region (since 2013). Prior to joining UBS AM—Americas region, Ms. Toth was a senior portfolio manager at Alliance Bernstein (from 1993 to 2012). Ms. Toth is a vice president of one investment company (consisting of 15 portfolios) for which UBS AM serves as investment advisor or manager. | ||||||||||||
| David Walczak**; 35 | Vice President | Since 2016 | Mr. Walczak is an executive director (since 2016), head of US taxable money markets (since 2015) and portfolio manager of UBS AM—Americas region. Mr. Walczak is a vice president of three investment companies (consisting of 41 portfolios) for which UBS AM serves as investment advisor or manager. | ||||||||||||
47
PACE Government Money Market Investments
Supplemental information (unaudited)
Officers (concluded):
| Name, address, and age | Position(s) held with Trust | Term of office1 and length of time served | Principal occupation(s) during past 5 years; number of portfolios in fund complex for which person serves as officer | ||||||||||||
| Keith A. Weller*; 57 | Vice President and Assistant Secretary | Since 2000 | Mr. Weller is an executive director and senior associate general counsel with UBS Business Solutions US LLC (since January 2017) and also with UBS AM—Americas region (since 2005) and has been an attorney with affiliated entities since 1995. Mr. Weller is a vice president and assistant secretary of 10 investment companies (consisting of 64 portfolios) for which UBS AM serves as investment advisor or manager. | ||||||||||||
1 Each trustee holds office for an indefinite term. Officers are appointed by the trustees and serve at the pleasure of the Board.
2 Professor Feldberg is deemed an "interested person" of the Trust as defined in the Investment Company Act of 1940, as amended, because he is a senior advisor to Morgan Stanley, a financial services firm with which the Trust may conduct transactions.
* This person's business address is 1285 Avenue of the Americas, New York, New York 10019-6028.
** This person's business address is One North Wacker Drive, Chicago, Illinois 60606.
*** This person's business address is 787 Seventh Avenue, New York, New York 10019.
48
Trustees
Meyer Feldberg
Chairman
Alan S. Bernikow
Richard R. Burt
Bernard H. Garil
Heather R. Higgins
Principal Officers
Mark E. Carver
President
Mark F. Kemper
Vice President and Secretary
Joanne M. Kilkeary
Vice President, Treasurer and Principal Accounting Officer
Robert Sabatino
Vice President
Investment Manager and
Administrator
UBS Asset Management (Americas) Inc.
1285 Avenue of the Americas
New York, New York 10019-6028
Principal Underwriter
UBS Asset Management (US) Inc.
1285 Avenue of the Americas
New York, New York 10019-6028
This report is not to be used in connection with the offering of shares of the Portfolio unless accompanied or preceded by an effective prospectus.
© UBS 2018. All rights reserved.
UBS Asset Management (Americas), Inc.
PRESORTED
STANDARD
U.S. POSTAGE
PAID
COMPUTERSHARE

UBS Asset Management (Americas) Inc.
1285 Avenue of the Americas
New York, New York 10019-6028
S026
Item 2. Code of Ethics.
The registrant has adopted a code of ethics that applies to its principal executive officer, principal financial officer, principal accounting officer or controller, or persons performing similar functions pursuant to Section 406 of the Sarbanes-Oxley Act of 2002. (The registrant has designated the code of ethics adopted pursuant to Sarbanes-Oxley as a “Code of Conduct” to lessen the risk of confusion with its separate code of ethics adopted pursuant to Rule 17j-1 under the Investment Company Act of 1940, as amended.)
Item 3. Audit Committee Financial Expert.
The registrant’s Board has determined that the following person serving on the registrant’s Audit Committee is an “audit committee financial expert” as defined in item 3 of Form N-CSR: Alan S. Bernikow. Mr. Bernikow is independent as defined in item 3 of Form N-CSR.
Item 4. Principal Accountant Fees and Services.
(a) Audit Fees:
For the fiscal years ended July 31, 2018 and July 31, 2017, the aggregate Ernst & Young LLP (EY) audit fees for professional services rendered to the registrant were approximately $973,597 and $956,102, respectively.
Fees included in the audit fees category are those associated with the annual audits of financial statements and services that are normally provided in connection with statutory and regulatory filings.
(b) Audit-Related Fees:
In each of the fiscal years ended July 31, 2018 and July 31, 2017, the aggregate audit-related fees billed by EY for services rendered to the registrant that are reasonably related to the performance of the audits of the financial statements, but not reported as audit fees, were approximately $42,826 and $42,826, respectively.
Fees included in the audit-related fees category are those associated with the reading and providing of comments on the 2018 and 2017 semiannual financial statements.
There were no audit-related fees required to be approved pursuant to paragraph (c)(7)(ii) of Rule 2-01 of Regulation S-X during the fiscal years indicated above.
(c) Tax Fees:
In each of the fiscal years ended July 31, 2018 and July 31, 2017, the aggregate tax fees billed by EY for professional services rendered to the registrant were approximately $470,773 and $275,795, respectively.
Fees included in the tax fees category comprise all services performed by professional staff in the independent accountant’s tax division except those services related to the audits. This category comprises fees for review of tax compliance, tax return preparation and excise tax calculations.
There were no tax fees required to be approved pursuant to paragraph (c)(7)(ii) of Rule 2-01 of Regulation S-X during the fiscal years indicated above.
(d) All Other Fees:
In each of the fiscal years ended July 31, 2018 and July 31, 2017, there were no fees billed by EY for products and services, other than the services reported in Item 4(a)-(c) above, rendered to the registrant.
There were no “all other fees” required to be approved pursuant to paragraph (c)(7)(ii) of Rule 2-01 of Regulation S-X during the fiscal years indicated above.
(e) (1) Audit Committee Pre-Approval Policies and Procedures:
The registrant’s Audit Committee (“audit committee”) has adopted an “Audit Committee Charter” (the “charter”). The charter contains the audit committee’s pre-approval policies and procedures. Reproduced below is an excerpt from the charter regarding pre-approval policies and procedures:
The [audit] Committee shall:
…
2. Pre-approve (a) all audit and permissible non-audit services(1) to be provided to the Fund and (b) all permissible non-audit services to be provided by the Fund’s independent auditors to UBS AM and any Covered Service Providers, if the engagement relates directly to the operations and financial reporting of the Fund. In carrying out this responsibility, the Committee shall seek periodically from UBS AM and from the independent auditors a list of such audit and permissible non-audit services that can be expected to be rendered to the Fund, UBS AM or any Covered Service Providers by the Fund’s independent auditors, and an estimate of the fees sought to be paid in connection with such services. The Committee has delegated its responsibility to pre-approve any such audit and permissible non-audit services not exceeding $100,000 (excluding reasonable out-of-pocket expenses) on an annual basis to the Chairperson. All such pre-approvals will be reported to the full Committee on a quarterly basis at the Committee’s next regularly scheduled meeting after the pre-approval. The Committee may not delegate to management its responsibility to pre-approve services to be performed by the independent auditor. Requests or applications to provide services that require specific pre-approval by the Committee or the
Chairperson will be submitted by both the Fund’s independent auditors and the Fund’s Treasurer or other designated Fund officer and must include a joint statement as to whether, in their view, the request or application is consistent with SEC rules on auditor independence. From year to year, the Committee shall report to the Board whether this system of pre-approval has been effective and efficient or whether this Charter should be amended to allow for pre-approval pursuant to such policies and procedures as the Committee shall approve, including the delegation of some or all of the Committee’s pre-approval responsibilities to other persons (other than UBS AM or the Fund’s officers).
(1) The Committee will not approve non-audit services that the Committee believes may taint the independence of the auditors. Currently, permissible non-audit services include any professional services (including tax services) that are not prohibited services as described below, provided to the Fund by the independent auditors, other than those provided to the Fund in connection with an audit or a review of the financial statements of the Fund. Permissible non-audit services may not include: (i) bookkeeping or other services related to the accounting records or financial statements of the Fund; (ii) financial information systems design and implementation; (iii) appraisal or valuation services, fairness opinions or contribution-in-kind reports; (iv) actuarial services; (v) internal audit outsourcing services; (vi) management functions or human resources; (vii) broker or dealer, investment adviser or investment banking services; (viii) legal services and expert services unrelated to the audit; and (ix) any other service the Public Company Accounting Oversight Board determines, by regulation, is impermissible. Pre-approval by the Committee of any permissible non-audit services is not required so long as: (i) the aggregate amount of all such permissible non-audit services provided to the Fund, UBS AM and any service providers controlling, controlled by or under common control with UBS AM that provide ongoing services to the Fund (“Covered Service Providers”) constitutes not more than 5% of the total amount of revenues paid to the independent auditors (during the fiscal year in which the permissible non-audit services are provided) by (a) the Fund, (b) its investment adviser and (c) any entity controlling, controlled by, or under common control with the investment adviser that provides ongoing services to the Fund during the fiscal year in which the services are provided that would have to be approved by the Committee; (ii) the permissible non-audit services were not recognized by the Fund at the time of the engagement to be non-audit services; and (iii) such services are promptly brought to the attention of the Committee and approved by the Committee (or its delegate(s)) prior to the completion of the audit.
(e) (2) Services approved pursuant to paragraph (c)(7)(i)(C) of Rule 2-01 of Regulation S-X:
Audit-Related Fees:
There were no amounts that were approved by the audit committee pursuant to the de minimis exception for the fiscal years ended July 31, 2018 and July 31, 2017 on behalf of the registrant.
There were no amounts that were required to be approved by the audit committee pursuant to the de minimis exception for the fiscal years ended July 31, 2018 and July 31, 2017 on behalf of the registrant’s service providers that relate directly to the operations and financial reporting of the registrant.
Tax Fees:
There were no amounts that were approved by the audit committee pursuant to the de minimis exception for the fiscal years ended July 31, 2018 and July 31, 2017 on behalf of the registrant.
There were no amounts that were required to be approved by the audit committee pursuant to the de minimis exception for the fiscal years ended July 31, 2018 and July 31, 2017 on behalf of the registrant’s service providers that relate directly to the operations and financial reporting of the registrant.
All Other Fees:
There were no amounts that were approved by the audit committee pursuant to the de minimis exception for the fiscal years ended July 31, 2018 and July 31, 2017 on behalf of the registrant.
There were no amounts that were required to be approved by the audit committee pursuant to the de minimis exception for the fiscal years ended July 31, 2018 and July 31, 2017 on behalf of the registrant’s service providers that relate directly to the operations and financial reporting of the registrant.
(f) For the fiscal year ended July 31, 2018, if greater than 50%, specify the percentage of hours spent on the audit of the registrant’s financial statements for the most recent fiscal year that were attributed to work performed by persons who are not full-time, permanent employees of E&Y. According to E&Y, such amount was below 50%; therefore, disclosure item not applicable for this filing.
(g) For the fiscal years ended July 31, 2018 and July 31, 2017, the aggregate fees billed by EY of $710,839 and $378,621, respectively, for non-audit services rendered on behalf of the registrant (“covered”), its investment adviser (not including any sub-adviser whose role is primarily portfolio management and is subcontracted with or overseen by another investment adviser) and any entity controlling, controlled by, or under common control with the adviser (“non-covered”) that provides ongoing services to the registrant for each of the last two fiscal years of the registrant is shown in the table below:
|
| 2018 |
| 2017 |
| ||
Covered Services |
| $ | 513,599 |
| $ | 318,621 |
|
Non-Covered Services |
| 197,240 |
| 60,000 |
| ||
(h) The registrant’s audit committee was not required to consider whether the provision of non-audit services that were rendered to the registrant’s investment adviser (not including any
sub-adviser whose role is primarily portfolio management and is subcontracted with or overseen by another investment adviser), and any entity controlling, controlled by, or under common control with the investment adviser that provides ongoing services to the registrant that were not pre-approved pursuant to paragraph (c)(7)(ii) of Rule 2-01 of Regulation S-X is compatible with maintaining the principal accountant’s independence.
Item 5. Audit Committee of Listed Registrants.
Not applicable to the registrant.
Item 6. Investments.
(a) Included as part of the report to shareholders filed under Item 1 of this form.
(b) Not applicable.
Item 7. Disclosure of Proxy Voting Policies and Procedures for Closed-End Management Investment Companies.
Not applicable to the registrant.
Item 8. Portfolio Managers of Closed-End Management Investment Companies.
Not applicable to the registrant.
Item 9. Purchases of Equity Securities by Closed-End Management Investment Company and Affiliated Purchasers.
Not applicable to the registrant.
Item 10. Submission of Matters to a Vote of Security Holders.
The registrant’s Board has established a Nominating and Corporate Governance Committee. The Nominating and Corporate Governance Committee will consider nominees recommended by shareholders if a vacancy occurs among those board members who are not “interested persons” as defined in Section 2(a)(19) of the Investment Company Act of 1940, as amended. In order to recommend a nominee, a shareholder should send a letter to the chairperson of the Nominating and Corporate Governance Committee, Richard R. Burt, care of the Secretary of the registrant at UBS Asset Management, UBS Building, One North Wacker Drive, Chicago, IL 60606, Attn: Mark Kemper, Secretary, and indicate on the envelope “Nominating and Corporate Governance Committee.” The shareholder’s letter should state the nominee’s name and should include the nominee’s resume or curriculum vitae, and must be accompanied by a written consent of the individual to stand for election if nominated for the Board and to serve if elected by shareholders.
Item 11. Controls and Procedures.
(a) The registrant’s principal executive officer and principal financial officer have concluded that the registrant’s disclosure controls and procedures (as defined in Rule 30a-3(c) under the Investment Company Act of 1940, as amended) are effective based on their evaluation of these controls and procedures as of a date within 90 days of the filing date of this document.
(b) The registrant’s principal executive officer and principal financial officer are aware of no changes in the registrant’s internal control over financial reporting that occurred during the second fiscal quarter of the period covered by this report that has materially affected, or is reasonably likely to materially affect, the registrant’s internal control over financial reporting.
Item 12. Disclosure of Securities Lending Activities for Closed-End Management Investment Companies.
Not applicable to the registrant
Item 13. Exhibits.
(a) (1) Code of Ethics as required pursuant to Section 406 of the Sarbanes-Oxley Act of 2002 (and designated by registrant as a “Code of Conduct”) is filed herewith as Exhibit EX-99.CODE ETH.
(a) (2) Certifications of principal executive officer and principal financial officer pursuant to Section 302 of the Sarbanes-Oxley Act of 2002 are attached hereto as Exhibit EX-99.CERT.
(a) (3) Written solicitation to purchase securities under Rule 23c-1 under the Investment Company Act of 1940 sent or given during the period covered by the report by or on behalf of the registrant to 10 or more persons — not applicable to the registrant.
(a) (4) Change in the registrants independent public accountant — not applicable
Certifications of principal executive officer and principal financial officer pursuant to Section 906 of the Sarbanes-Oxley Act of 2002 are attached hereto as Exhibit EX-99.906CERT.
(b) Disclosure pursuant to Section 13(r) of the Securities Exchange Act of 1934, as amended, is attached hereto as Exhibit EX-99.IRANNOTICE.
SIGNATURES
Pursuant to the requirements of the Securities Exchange Act of 1934 and the Investment Company Act of 1940, the registrant has duly caused this report to be signed on its behalf by the undersigned, thereunto duly authorized.
PACE Select Advisors Trust |
| |
|
|
|
By: | /s/ Igor Lasun |
|
| Igor Lasun |
|
| President |
|
|
|
|
Date: | October 9, 2018 |
|
Pursuant to the requirements of the Securities Exchange Act of 1934 and the Investment Company Act of 1940, this report has been signed below by the following persons on behalf of the registrant and in the capacities and on the dates indicated.
By: | /s/ Igor Lasun |
|
| Igor Lasun |
|
| President |
|
|
|
|
Date: | October 9, 2018 |
|
|
|
|
By: | /s/ Joanne M. Kilkeary |
|
| Joanne M. Kilkeary |
|
| Vice President, Treasurer and Principal Accounting Officer |
|
|
|
|
Date: | October 9, 2018 |
|