UNITED STATES
SECURITIES AND EXCHANGE COMMISSION
Washington, D.C. 20549
FORM N-CSR
CERTIFIED SHAREHOLDER REPORT OF REGISTERED
MANAGEMENT INVESTMENT COMPANIES
| | Investment Company Act file number: 811-08764 | |
| | | |
| PACE® Select Advisors Trust |
| |
(Exact name of registrant as specified in charter)
| 1285 Avenue of the Americas, New York, New York 10019-6028 |
| |
(Address of principal executive offices) (Zip code)
Keith A. Weller, Esq.
UBS Asset Management
One North Wacker Drive
Chicago, IL 60606
(Name and address of agent for service)
Copy to:
Stephen H. Bier, Esq.
Dechert LLP
1095 Avenue of the Americas
New York, NY 10036-6797
Registrant’s telephone number, including area code: 212-821 3000
Date of fiscal year end: July 31
Date of reporting period: July 31, 2020
Item 1. Reports to Stockholders.
| (a) | Copy of the report transmitted to shareholders: |

PACE® Select Advisors Trust
Annual Report | July 31, 2020
Table of contents | | Page | |
Introduction | | | 2 | | |
Portfolio Advisor's and Subadvisors' commentaries and Portfolios of investments | | | |
UBS Government Money Market Investments Fund | | | 4 | | |
PACE® Mortgage-Backed Securities Fixed Income Investments | | | 9 | | |
PACE® Intermediate Fixed Income Investments | | | 29 | | |
PACE® Strategic Fixed Income Investments | | | 74 | | |
PACE® Municipal Fixed Income Investments | | | 103 | | |
PACE® Global Fixed Income Investments | | | 114 | | |
PACE® High Yield Investments | | | 132 | | |
PACE® Large Co Value Equity Investments | | | 163 | | |
PACE® Large Co Growth Equity Investments | | | 176 | | |
PACE® Small/Medium Co Value Equity Investments | | | 184 | | |
PACE® Small/Medium Co Growth Equity Investments | | | 192 | | |
PACE® International Equity Investments | | | 203 | | |
PACE® International Emerging Markets Equity Investments | | | 217 | | |
PACE® Global Real Estate Securities Investments | | | 228 | | |
PACE® Alternative Strategies Investments | | | 236 | | |
Understanding your Portfolio's expenses | | | 268 | | |
Statement of assets and liabilities | | | 272 | | |
Statement of operations | | | 280 | | |
Statement of changes in net assets | | | 284 | | |
Statement of cash flows | | | 290 | | |
Financial highlights | | | 293 | | |
Notes to financial statements | | | 322 | | |
Report of independent registered public accounting firm | | | 371 | | |
Tax information | | | 372 | | |
General information | | | 373 | | |
Board approvals of investment management and administration agreement and
subadvisory agreements | | | 375 | | |
Supplemental information, trustees and officers | | | 387 | | |
1
September 11, 2020
Dear PACE Shareholder,
We are pleased to provide you with the annual report for the PACE portfolios (the "Portfolios"), comprising the PACE Select Advisors Trust. This report includes summaries of the performance of each Portfolio, as well as commentaries from the investment advisor and subadvisors regarding the events that affected Portfolio performance during the 12 months ended July 31, 2020 (the "reporting period"). Please note that the opinions of the subadvisors do not necessarily represent those of UBS Asset Management (Americas) Inc.
A global recession
After initially expanding, the global economy fell into a recession as the fallout from the COVID-19 pandemic triggered a severe contraction. Lockdowns were instituted around the world in an attempt to stem the spread of the virus—with varying degrees of success. In the US, the US Commerce Department reported that gross domestic product ("GDP") grew at 2.1% and 2.1% seasonally adjusted annualized rates during the third and fourth quarters of 2019, respectively. GDP growth was then -5.0% during the first quarter of 2020. The Commerce Department's initial estimate for second quarter annualized GDP growth was -32.9%—the steepest quarterly decline on record.
The US Federal Reserve Board (the "Fed") took a number of unprecedented actions to support the economy and maintain the proper functioning of the financial markets. After lowering the federal funds rate three times in 2019, the Fed moved decisively in March 2020. On March 3, 2020, it lowered the federal funds rate to a range between 1.00% and 1.25% and, on March 15, this was reduced to a range between 0.00% and 0.25%. Later in the month, the Fed announced it would make unlimited purchases of Treasury and mortgage securities. The Fed also expanded its credit facilities to include the purchase of individual corporate bonds. Meanwhile, in March 2020, the US government passed a $2 trillion fiscal stimulus bill to aid the economy.
From a global perspective, in its June 2020 World Economic Outlook Update, the International Monetary Fund ("IMF") said, "The COVID-19 pandemic has had a more negative impact on activity in the first half of 2020 than anticipated, and the recovery is projected to be more gradual than previously forecast...As with the April 2020 WEO [World Economic Outlook] projections, there is a higher-than-usual degree of uncertainty around this forecast. The baseline projection rests on key assumptions about the fallout from the pandemic. In economies with declining infection rates, the slower recovery path in the updated forecast reflects persistent social distancing into the second half of 2020... For economies struggling to control infection rates, a lengthier lockdown will inflict an additional toll on activity." From a regional perspective, the IMF projects the US economy will contract 8.0% in 2020, compared to the 2.3% GDP expansion in 2019. Elsewhere, the IMF anticipates that 2020 GDP growth in the eurozone, UK and Japan will be -10.2%, -10.2% and -5.8%, respectively. For comparison purposes, the GDP of these economies expanded 1.3%, 1.4% and 0.7%, respectively, in 2019.
Global equities post mixed results
The global equity markets generated mixed results during the reporting period. US stocks initially moved higher and reached an all-time high in mid-February 2020. Supporting the market was optimism over the completion of the first phase of the trade agreement between the US and China, and overall positive corporate results. However, over the next six weeks the impact from the pandemic triggered a rapid decline, as the US market experienced the fastest fall on record from an all-time high to a bear market. A similar dynamic also played out in stock markets overseas. In a surprise to many, global equities then sharply rallied from May through July 2020. This turnaround occurred given the aggressive actions by global central banks, reopenings of some economies and hopes for a COVID-19 vaccine. For the 12-months ended July 31, 2020, the S&P 500 Index1 gained 11.96%. Returns were weaker outside the US. International developed equities, as measured by the MSCI EAFE Index (net),2 returned
1 The S&P 500 Index is an unmanaged, weighted index composed of 500 widely held common stocks varying in composition and is not available for direct investment. Investors should note that indices do not reflect the deduction of fees and expenses.
2 The MSCI EAFE Index (net) is an index of stocks designed to measure the investment returns of developed economies outside of North America. Net total return indices reinvest dividends after the deduction of withholding taxes, using a tax rate applicable to non-resident institutional investors who do not benefit from double taxation treaties. The index is constructed and managed with a view to being fully investable from the perspective of international institutional investors. Investors should note that indices do not reflect the deduction of fees and expenses.
2
-1.67% during the reporting period, while emerging markets equities, as measured by the MSCI Emerging Markets Index (net),3 returned 6.55%.
The overall fixed income market rallies
The global fixed income market generated strong results during the reporting period, as it was aided by periods of elevated investor risk aversion. In the US, both short- and long-term Treasury yields moved significantly lower (bond yields and prices move in the opposite direction). For the 12 month reporting period as a whole, the yield on the US 10-year Treasury fell from 2.02% to 0.55%. Government bond yields outside the US also moved lower given the fallout from the pandemic. The overall US bond market, as measured by the Bloomberg Barclays US Aggregate Index,4 returned 10.12% during the 12-months ended July 31, 2020. Returns of riskier fixed income securities were less robust. High yield bonds, as measured by the ICE BofAML US High Yield Cash Pay Constrained Index,5 returned 3.04%. Elsewhere, emerging markets debt, as measured by the J.P. Morgan Emerging Markets Bond Index Global (EMBI Global),6 gained 4.08% during the reporting period.
Sincerely,

Igor Lasun
President, PACE Select Advisors Trust
Executive Director, UBS Asset Management (Americas) Inc.
This report is intended to assist investors in understanding how the Portfolios performed during the 12-month period ended July 31, 2020. The views expressed in the Investment manager's and Subadvisors' comments sections are as of the end of the reporting period, reflect performance results gross of fees and expenses, and are those of the investment manager and subadvisors. Subadvisors' comments on Portfolios that have more than one subadvisor are reflective of their portion of the Portfolio only. The views and opinions in this report were current as of September 11, 2020. They are not guarantees of future performance or investment results and should not be taken as investment advice. Investment decisions reflect a variety of factors, and the investment manager and subadvisors reserve the right to change their views about individual securities, sectors and markets at any time. As a result, the views expressed should not be relied upon as a forecast of a Portfolio's future investment intent.
3 The MSCI Emerging Markets Index (net) is a market capitalization-weighted index composed of different emerging market countries in Europe, Latin America, and the Pacific Basin. Net total return indices reinvest dividends after the deduction of withholding taxes, using a tax rate applicable to non-resident institutional investors who do not benefit from double taxation treaties. The index is constructed and managed with a view to being fully investable from the perspective of international institutional investors. Investors should note that indices do not reflect the deduction of fees and expenses.
4 The Bloomberg Barclays US Aggregate Index is an unmanaged broad based index designed to measure the US dollar-denominated, investment-grade, taxable bond market. The index includes bonds from the Treasury, government-related, corporate, mortgage-backed, asset-backed and commercial mortgage-backed sectors. Investors should note that indices do not reflect the deduction of fees and expenses.
5 The ICE BofAML US High Yield Cash Pay Constrained Index is an unmanaged index of publicly placed, non-convertible, coupon-bearing US dollar denominated, below investment grade corporate debt with a term to maturity of at least one year. The index is market capitalization weighted, so that larger bond issuers have a greater effect on the index's return. However, the representation of any single bond issuer is restricted to a maximum of 2% of the total index. Investors should note that indices do not reflect the deduction of fees and expenses.
6 The J.P. Morgan Emerging Markets Bond Index Global (EMBI Global) is an unmanaged index which is designed to track total returns for US dollar denominated debt instruments issued by emerging market sovereign and quasi-sovereign entities: Brady bonds, loans and Eurobonds. Investors should note that indices do not reflect the deduction of fees and expenses.
3
UBS Government Money Market Investments Fund
Performance
The seven-day current yield for the Fund as of July 31, 2020 was 0.01% (after fee waivers/expense reimbursements).1 For more information on the Fund's performance, refer to "Yields and characteristics at a glance" on page 5. Please remember that the PACE program fee, or other advisory fee to which your account is subject, is assessed outside the Portfolio at the account level. The program fee does not impact the determination of the Fund's net asset value per share. For a detailed commentary on the market environment in general during the period, please refer to page 2.
Advisor's Comments
The US Federal Reserve Board (the "Fed") took a number of unprecedented actions to support the economy and maintain the proper functioning of the financial markets. After lowering the federal funds rate three times in 2019, the Fed moved decisively in March 2020. On March 3, 2020, it lowered the federal funds rate to a range between 1.00% and 1.25% and, on March 15, this was reduced to a range between 0.00% and 0.25%. As a result, the Portfolio's yield also remained low during the reporting period.
We tactically adjusted the Portfolio's weighted average maturity ("WAM") which is the weighted average maturity of the securities in the portfolio throughout the 12-month review period. When the reporting period began, the Portfolio had a WAM of 34 days. This was 53 days at the end of the reporting period.
A number of adjustments were made to the Portfolio's sector and issuer positioning during the 12-month period. We reduced the Portfolio's exposures to US government and agency obligations and repurchase agreements, while initiating a position in US Treasury obligations. (Repurchase agreements are transactions in which the seller of a security agrees to buy it back at a predetermined time and price or upon demand.)
Mutual funds are sold by prospectus only. You should read it carefully and consider a fund's investment objectives, risks, charges, expenses and other important information contained in the prospectus before investing. Prospectuses for most of our funds can be obtained from your financial advisor, by calling UBS Funds at 800-647 1568 or by visiting our Website at www.ubs.com/am-us.
PACE Select Advisors Trust – UBS Government Money Market Investments Fund (formerly PACE Government Money Market Investments)
Investment Advisor:
UBS Asset Management (Americas) Inc.
Portfolio Manager:
Robert Sabatino
Objective:
Current income consistent with preservation of capital and liquidity
Investment process:
The Portfolio is a money market mutual fund and seeks to maintain a stable price of $1.00 per share, although it may be possible to lose money by investing in this Portfolio. The Portfolio invests in a diversified portfolio of high-quality money market instruments of governmental issuers and in related repurchase agreements. Security selection is based on the assessment of relative values and changes in market and economic conditions.
1 Class P shares held through the PACE Select Advisors Program are subject to a maximum Program fee of 2.50%, which, if included, would have reduced performance. Class P shares held through other advisory programs also may be subject to a program fee, which, if included, would have reduced performance.
4
UBS Government Money Market Investments Fund
Yields and characteristics at a glance—July 31, 2020 (unaudited)
Yields and Characteristics | |
Seven-Day current yield after fee waivers and/or expense reimbursements1 | | | 0.01 | | |
Seven-Day effective yield after fee waivers and/or expense reimbursements1 | | | 0.01 | | |
Seven-Day current yield before fee waivers and/or expense reimbursements1 | | | (1.01 | ) | |
Seven-Day effective yield before fee waivers and/or expense reimbursements1 | | | (1.01 | ) | |
Weighted average maturity2 | | | 53 days | | |
Portfolio composition3 | |
U.S. government agency obligations | | | 67.0 | % | |
U.S. Treasury obligations | | | 16.9 | | |
Repurchase agreements | | | 16.3 | | |
Liabilities in excess of other assets | | | (0.2 | ) | |
Total | | | 100.0 | % | |
You could lose money by investing in UBS Government Money Market Investments Fund. Although the portfolio seeks to preserve the value of your investment at $1.00 per share, the portfolio cannot guarantee it will do so. An investment in UBS Government Money Market Investments Fund is not insured or guaranteed by the Federal Deposit Insurance Corporation ("FDIC") or any other government agency. UBS Government Money Market Investments Fund's sponsor has no legal obligation to provide financial support to UBS Government Money Market Investments Fund at any time.
Not FDIC insured. May lose value. No bank guarantee.
1 Yields will fluctuate and reflect fee waivers and/or expense reimbursements, if any, unless otherwise noted. Performance data quoted represents past performance. Past performance does not guarantee future results. Current performance may be higher or lower than the performance data quoted.
2 The Portfolio is actively managed and its weighted average maturity will differ over time.
3 Weightings represent percentages of the Portfolio's net assets as of the date indicated. The Portfolio is actively managed and its composition will vary over time.
5
UBS Government Money Market Investments Fund
Portfolio of investments—July 31, 2020
| | | Face
amount | | Value | |
U.S. government agency obligations—67.0% | |
Federal Farm Credit Bank
0.080%, due 10/02/201 | | $ | 4,000,000 | | | $ | 3,999,449 | | |
0.150%, due 03/02/211 | | | 1,750,000 | | | | 1,748,447 | | |
0.150%, due 05/26/21 | | | 1,000,000 | | | | 999,943 | | |
0.180%, due 07/13/21 | | | 1,000,000 | | | | 1,000,000 | | |
SOFR + 0.080%,
0.180%, due 11/27/202 | | | 1,000,000 | | | | 1,000,000 | | |
0.200%, due 11/06/201 | | | 3,000,000 | | | | 2,998,383 | | |
1 mo. USD LIBOR + 0.020%,
0.203%, due 09/09/202 | | | 2,000,000 | | | | 1,999,889 | | |
SOFR + 0.110%,
0.210%, due 05/18/212 | | | 2,000,000 | | | | 2,000,000 | | |
0.520%, due 09/11/201 | | | 3,000,000 | | | | 2,998,223 | | |
0.520%, due 10/16/201 | | | 1,500,000 | | | | 1,498,353 | | |
0.520%, due 10/28/201 | | | 1,500,000 | | | | 1,498,093 | | |
1.550%, due 08/04/201 | | | 2,000,000 | | | | 1,999,742 | | |
Federal Home Loan Bank
0.105%, due 12/18/201 | | | 2,000,000 | | | | 1,999,189 | | |
0.110%, due 09/15/201 | | | 2,900,000 | | | | 2,899,601 | | |
0.110%, due 09/18/201 | | | 2,800,000 | | | | 2,799,589 | | |
0.119%, due 10/21/201 | | | 5,000,000 | | | | 4,998,661 | | |
SOFR + 0.020%,
0.120%, due 08/19/202 | | | 1,000,000 | | | | 1,000,000 | | |
1 mo. USD LIBOR—0.050%,
0.122%, due 01/27/212 | | | 1,000,000 | | | | 1,000,000 | | |
SOFR + 0.030%,
0.130%, due 08/21/202 | | | 1,000,000 | | | | 1,000,000 | | |
SOFR + 0.030%,
0.130%, due 09/04/202 | | | 6,500,000 | | | | 6,498,961 | | |
0.140%, due 10/02/201 | | | 2,500,000 | | | | 2,499,397 | | |
0.140%, due 10/14/201 | | | 6,000,000 | | | | 5,998,273 | | |
0.140%, due 11/19/201 | | | 1,000,000 | | | | 999,572 | | |
1 mo. USD LIBOR—0.040%,
0.141%, due 12/17/202 | | | 1,250,000 | | | | 1,250,000 | | |
1 mo. USD LIBOR—0.040%,
0.143%, due 01/08/212 | | | 2,500,000 | | | | 2,500,000 | | |
0.144%, due 09/25/201 | | | 3,000,000 | | | | 2,999,340 | | |
1 mo. USD LIBOR—0.040%,
0.147%, due 12/18/202 | | | 2,000,000 | | | | 2,000,000 | | |
0.148%, due 08/28/201 | | | 5,000,000 | | | | 4,999,445 | | |
1 mo. USD LIBOR—0.030%,
0.148%, due 02/12/212 | | | 1,500,000 | | | | 1,500,000 | | |
0.150%, due 08/19/201 | | | 3,000,000 | | | | 2,999,775 | | |
0.158%, due 12/30/201 | | | 6,000,000 | | | | 5,996,036 | | |
0.160%, due 09/18/201 | | | 4,000,000 | | | | 3,999,147 | | |
0.164%, due 12/30/201 | | | 2,000,000 | | | | 1,998,624 | | |
0.170%, due 08/31/201 | | | 3,000,000 | | | | 2,999,575 | | |
0.170%, due 12/02/201 | | | 3,000,000 | | | | 2,998,258 | | |
0.174%, due 12/18/201 | | | 1,000,000 | | | | 999,328 | | |
0.174%, due 12/23/201 | | | 3,000,000 | | | | 2,997,912 | | |
0.185%, due 05/26/211 | | | 1,500,000 | | | | 1,497,703 | | |
0.185%, due 06/24/211 | | | 1,500,000 | | | | 1,497,480 | | |
0.190%, due 10/02/201 | | | 3,000,000 | | | | 2,999,018 | | |
0.190%, due 11/03/201 | | | 4,000,000 | | | | 3,998,016 | | |
0.200%, due 09/18/201 | | | 1,000,000 | | | | 999,733 | | |
0.200%, due 11/06/201 | | | 13,000,000 | | | | 12,992,995 | | |
| | | Face
amount | | Value | |
U.S. government agency obligations—(continued) | |
SOFR + 0.100%,
0.200%, due 10/06/202 | | $ | 3,000,000 | | | $ | 3,000,000 | | |
SOFR + 0.100%,
0.200%, due 10/09/202 | | | 3,000,000 | | | | 3,000,000 | | |
SOFR + 0.120%,
0.220%, due 10/07/202 | | | 1,000,000 | | | | 1,000,000 | | |
0.240%, due 01/06/211 | | | 2,000,000 | | | | 1,997,893 | | |
SOFR + 0.140%,
0.240%, due 01/08/212 | | | 3,000,000 | | | | 3,000,000 | | |
SOFR + 0.160%,
0.260%, due 01/07/212 | | | 3,000,000 | | | | 3,000,000 | | |
0.280%, due 11/24/201 | | | 2,000,000 | | | | 1,998,211 | | |
0.290%, due 09/01/201 | | | 5,000,000 | | | | 4,998,752 | | |
0.310%, due 09/11/20 | | | 2,000,000 | | | | 1,999,939 | | |
SOFR + 0.230%,
0.330%, due 09/25/202 | | | 3,000,000 | | | | 3,000,000 | | |
SOFR + 0.230%,
0.330%, due 04/13/212 | | | 6,500,000 | | | | 6,500,000 | | |
0.340%, due 11/16/201 | | | 3,000,000 | | | | 2,996,968 | | |
SOFR + 0.240%,
0.340%, due 04/07/212 | | | 4,000,000 | | | | 4,000,276 | | |
0.520%, due 08/03/201 | | | 2,500,000 | | | | 2,499,928 | | |
1.590%, due 08/10/201 | | | 1,000,000 | | | | 999,603 | | |
Federal Home Loan Bank Discount Notes,
0.120%, due 08/21/201 | | | 6,000,000 | | | | 5,999,600 | | |
Federal Home Loan Bank Discount Notes,
0.150%, due 09/04/201 | | | 3,000,000 | | | | 2,999,575 | | |
Federal Home Loan Bank Discount Notes,
0.320%, due 10/26/201 | | | 3,000,000 | | | | 2,997,707 | | |
Federal Home Loan Banks
0.160%, due 02/16/21 | | | 1,000,000 | | | | 999,980 | | |
0.160%, due 04/05/21 | | | 2,000,000 | | | | 1,999,831 | | |
0.200%, due 01/19/21 | | | 1,000,000 | | | | 1,000,006 | | |
SOFR + 0.150%,
0.250%, due 11/15/212 | | | 2,500,000 | | | | 2,500,000 | | |
Federal Home Loan Mortgage Corp. | |
SOFR + 0.010%,
0.110%, due 08/25/202 | | | 2,000,000 | | | | 2,000,000 | | |
SOFR + 0.025%,
0.125%, due 02/26/212 | | | 2,600,000 | | | | 2,600,000 | | |
0.130%, due 08/19/201 | | | 3,000,000 | | | | 2,999,805 | | |
SOFR + 0.050%,
0.150%, due 03/05/212 | | | 3,000,000 | | | | 3,000,000 | | |
SOFR + 0.100%,
0.200%, due 07/29/222 | | | 3,000,000 | | | | 3,000,000 | | |
SOFR + 0.190%,
0.290%, due 05/11/222 | | | 2,000,000 | | | | 2,000,000 | | |
0.810%, due 08/19/201 | | | 4,000,000 | | | | 3,998,380 | | |
Federal National Mortgage Association | |
SOFR + 0.040%,
0.140%, due 09/11/202 | | | 1,500,000 | | | | 1,500,000 | | |
0.190%, due 09/16/201 | | | 2,000,000 | | | | 1,999,515 | | |
SOFR + 0.130%,
0.230%, due 06/11/212 | | | 2,000,000 | | | | 2,000,086 | | |
SOFR + 0.180%,
0.280%, due 05/13/222 | | | 2,000,000 | | | | 2,000,000 | | |
6
UBS Government Money Market Investments Fund
Portfolio of investments—July 31, 2020
| | | Face
amount | | Value | |
U.S. government agency obligations—(concluded) | |
SOFR + 0.200%,
0.300%, due 06/15/222 | | $ | 2,500,000 | | | $ | 2,500,000 | | |
Total U.S. government agency
obligations
(cost—$211,742,205) | | | 211,742,205 | | |
U.S. Treasury obligations—16.9% | |
U.S. Treasury Bills | |
0.102%, due 11/17/201 | | | 2,000,000 | | | | 1,999,414 | | |
0.102%, due 12/15/201 | | | 2,000,000 | | | | 1,999,237 | | |
0.103%, due 10/29/201 | | | 10,000,000 | | | | 9,997,489 | | |
0.109%, due 04/22/211 | | | 2,000,000 | | | | 1,998,431 | | |
0.137%, due 10/06/201 | | | 3,000,000 | | | | 2,999,257 | | |
0.138%, due 08/25/201 | | | 2,000,000 | | | | 1,999,819 | | |
0.150%, due 09/03/201 | | | 2,000,000 | | | | 1,999,730 | | |
0.153%, due 11/05/201 | | | 2,000,000 | | | | 1,999,197 | | |
0.173%, due 09/10/201 | | | 2,000,000 | | | | 1,999,621 | | |
0.175%, due 09/17/201 | | | 2,000,000 | | | | 1,999,550 | | |
0.178%, due 10/27/201 | | | 2,000,000 | | | | 1,999,152 | | |
0.179%, due 10/15/201 | | | 3,000,000 | | | | 2,998,897 | | |
0.185%, due 10/20/201 | | | 3,000,000 | | | | 2,998,787 | | |
0.188%, due 10/08/201 | | | 2,000,000 | | | | 1,999,301 | | |
U.S. Treasury Notes | |
3 mo.Treasury money market yield + 0.220%,
0.325%, due 07/31/212 | | | 2,000,000 | | | | 1,999,132 | | |
3 mo.Treasury money market yield + 0.300%,
0.405%, due 10/31/212 | | | 500,000 | | | | 500,365 | | |
1.375%, due 08/31/20 | | | 1,000,000 | | | | 999,780 | | |
1.375%, due 09/30/20 | | | 1,000,000 | | | | 999,534 | | |
1.375%, due 10/31/20 | | | 2,000,000 | | | | 2,002,992 | | |
1.625%, due 10/15/20 | | | 1,500,000 | | | | 1,502,492 | | |
2.000%, due 09/30/20 | | | 2,000,000 | | | | 2,003,790 | | |
2.000%, due 11/30/20 | | | 1,000,000 | | | | 1,005,206 | | |
2.000%, due 01/15/21 | | | 1,000,000 | | | | 1,007,318 | | |
2.625%, due 08/15/20 | | | 1,000,000 | | | | 1,000,375 | | |
2.750%, due 09/30/20 | | | 1,500,000 | | | | 1,503,401 | | |
Total U.S. Treasury obligations
(cost—$53,512,267) | | | 53,512,267 | | |
| | | Face
amount | | Value | |
Repurchase agreements—16.3% | |
Repurchase agreement dated
07/31/20 with Fixed Income Clearing Corp.,
0.080% due 08/03/20, collateralized by
$170,400 U.S. Treasury Note, 0.160%
due 07/31/22; (value—$170,370);
proceeds: $167,001 | | $ | 167,000 | | | $ | 167,000 | | |
Repurchase agreement dated
07/31/20 with Goldman Sachs & Co.,
0.060% due 08/03/20, collateralized by
$2,741,000 Federal Home Loan Bank
obligations, zero coupon due 08/04/20,
$280,000 Federal Home Loan Mortgage
Corp., 6.250% due 07/15/32,
$780,000 Federal National Mortgage
Association, 1.250% due 08/17/21,
$4,419,800 U.S. Treasury Bill, zero coupon
due 08/20/20 to 09/15/20, $37,277,700
U.S. Treasury Inflation Index Note, 0.750 to
1.125% due on 01/15/21 to 7/15/28;
(value—$52,224,028); proceeds: $51,200,256 | | | 51,200,000 | | | | 51,200,000 | | |
Total repurchase agreements
(cost—$51,367,000) | | | 51,367,000 | | |
Total investments
(cost—$316,621,472 which approximates
cost for federal income tax purposes)—100.2% | | | 316,621,472 | | |
Liabilities in excess of other assets—(0.2)% | | | | | (518,106 | ) | |
Net assets—100.0% | | $ | 316,103,366 | | |
7
UBS Government Money Market Investments Fund
Portfolio of investments—July 31, 2020
For a listing of defined portfolio acronyms that are used throughout the Portfolio of investments as well as the tables that follow, please refer to page 267.
Fair valuation summary
The following is a summary of the fair valuations according to the inputs used as of July 31, 2020 in valuing the Portfolio's investments. In the event a Portfolio holds investments for which fair value is measured using the NAV per share practical expedient (or its equivalent), a separate column will be added to the fair value hierarchy table; this is intended to permit reconciliation to the amounts presented in the Portfolio of investments:
Description | | Unadjusted
quoted prices in
active markets for
identical investments
(Level 1) | | Other significant
observable inputs
(Level 2) | | Unobservable
inputs
(Level 3) | | Total | |
U.S. government agency obligations | | $ | — | | | $ | 211,742,205 | | | $ | — | | | $ | 211,742,205 | | |
U.S. Treasury obligations | | | — | | | | 53,512,267 | | | | — | | | | 53,512,267 | | |
Repurchase agreements | | | — | | | | 51,367,000 | | | | — | | | | 51,367,000 | | |
Total | | $ | — | | | $ | 316,621,472 | | | $ | — | | | $ | 316,621,472 | | |
At July 31, 2020, there were no transfers in or out of Level 3.
Portfolio footnotes
1 Rate shown is the discount rate at the date of purchase unless otherwise noted.
2 Variable or floating rate security. The interest rate shown is the rate in effect as of period end and changes periodically.
See accompanying notes to financial statements.
8
PACE Mortgage-Backed Securities Fixed Income Investments
Performance
For the 12-months ended July 31, 2020, the Portfolio's Class P shares returned 6.20% before the deduction of the maximum PACE Select program fee.1 In comparison, the Bloomberg Barclays US Mortgage-Backed Securities Index (the "benchmark") returned 5.43%. (Returns for all share classes over various time periods are shown in the "Performance at a glance" table on page 11. Please note that the returns shown do not reflect the deduction of taxes that a shareholder would pay on Portfolio distributions or the redemption of Portfolio shares.) For a detailed commentary on the market environment in general during the reporting period, please refer to page 2.
Subadvisor's comments2
The Portfolio outperformed its benchmark during the reporting period. Overall US interest rate strategies were positive for performance. Yield curve positioning, including a focus on the outperforming intermediate portion of the curve, contributed to performance. Near benchmark US duration exposure was neutral for performance. (Duration measures a portfolio's sensitivity to interest rate changes.)
An overweight to mortgage-back securities issued by US government agencies ("Agency MBS") positioning detracted from performance as the sector underperformed like-duration Treasuries over the period. However, this was more than offset by relative value positioning within Agency MBS, including a focus on lower coupon mortgages and positive security selection within Ginnie Mae mortgages. An allocation to senior securitized credit detracted from performance versus like-duration Treasurys, as the former underperformed amid broader risk off sentiment towards the end of the period. Non-mortgage securitized debt exposure, including holdings of collateralized loan obligations, was positive for returns.
Overall, derivative usage was negative during the period. The use of interest rate swaps to reduce long-end U.S. interest rate exposure was negative for performance as swap rates outperformed relative to Treasury rates. The Fund used interest rate swaps and constant maturity swaps to adjust interest rate and yield curve exposures, as well as to substitute for physical securities. The portfolio benefitted from the income generated from selling mortgage pool options as a way to manage interest rate and volatility risk within the sector. Additionally, options on swaps were primarily used to manage interest rate exposure and volatility. The purchase of options on swaps detracted from portfolio performance due to premium payments made. Total return swaps used to replicate broad exposure to interest only Agency mortgages while limiting idiosyncratic risk of owning individual bonds was neutral for performance. The use of government futures to adjust interest rate exposures and replicate government bond positions was neutral for performance.
PACE Select Advisors Trust – PACE Mortgage-Backed Securities Fixed
Income Investments
Investment Manager:
UBS Asset Management (Americas) Inc. ("UBS AM")
Investment Subadvisor:
Pacific Investment Management Company LLC ("PIMCO")
Portfolio Management Team:
UBS AM: Mabel Lung, CFA, Gina Toth, CFA, Fred Lee, CFA, Joseph Sciortino and Steve Bienashski
PIMCO: Daniel Hyman and Michael Cudzil
Objective:
Current income
Investment process:
The subadvisor utilizes a strategy that involves buying or
selling specific bonds based on an analysis of their values
relative to other similar bonds.
1 Class P shares held through the PACE Select Advisors Program are subject to a maximum Program fee of 2.50%, which, if included, would have reduced performance. Class P shares held through other advisory programs also may be subject to a program fee, which, if included, would have reduced performance.
2 Performance is discussed on a gross-of-fees basis—meaning that no fees or expenses are reflected when discussed at the level of a subadvisor's sleeve (or subadvisors' sleeves, if applicable). Alternatively, performance at the overall Portfolio level is shown net of fees, which does factor in fees and expenses associated with the Portfolio.
9
PACE Mortgage-Backed Securities Fixed Income Investments
Mutual funds are sold by prospectus only. You should read it carefully and consider a fund's investment objectives, risks, charges, expenses and other important information contained in the prospectus before investing. Prospectuses for most of our funds can be obtained from your financial advisor, by calling UBS Funds at 800-647 1568 or by visiting our Website at www.ubs.com/am-us
Special considerations
The Portfolio may be appropriate for long-term investors seeking current income who are able to withstand short-term fluctuations in the fixed income markets in return for potentially higher returns over the long term. The yield and value of the Portfolio change every day and can be affected by changes in interest rates, general market conditions, and other political, social and economic developments, as well as specific matters relating to the issuers in which the Portfolio invests. It is important to note that an investment in the Portfolio is only one component of a balanced investment plan.
10
PACE Mortgage-Backed Securities Fixed Income Investments
Performance at a glance (unaudited)
Average annual total returns for periods ended 07/31/20 | | 1 year | | 5 years | | 10 years | |
Before deducting maximum sales charge | |
Class A1 | | | 6.02 | % | | | 3.00 | % | | | 2.72 | % | |
Class Y2 | | | 6.28 | | | | 3.26 | | | | 2.98 | | |
Class P3 | | | 6.20 | | | | 3.26 | | | | 2.98 | | |
After deducting maximum sales charge | |
Class A1 | | | 2.08 | | | | 2.23 | | | | 2.34 | | |
Bloomberg Barclays US Mortgage-Backed Securities Index4 | | | 5.43 | | | | 3.13 | | | | 2.99 | | |
Most recent calendar quarter-end returns (unaudited)
Average annual total returns for periods ended 06/30/20 | | 1 year | | 5 years | | 10 years | |
Before deducting maximum sales charge | |
Class A1 | | | 5.84 | % | | | 2.99 | % | | | 2.78 | % | |
Class Y3 | | | 6.18 | | | | 3.26 | | | | 3.05 | | |
Class P4 | | | 6.10 | | | | 3.26 | | | | 3.04 | | |
After deducting maximum sales charge | |
Class A1 | | | 1.90 | | | | 2.21 | | | | 2.39 | | |
The annualized gross and net expense ratios, respectively, for each class of shares as in the November 27, 2019 prospectuses, were as follows: Class A—1.38% and 1.25%; Class Y—1.25% and 0.98%; and Class P—1.22% and 1.00%. Net expenses reflect fee waivers and/or expense reimbursements, if any, pursuant to an agreement that is in effect to cap the expenses. The Portfolio and UBS Asset Management (Americas) Inc. ("UBS AM") have entered into a written fee waiver/expense reimbursement agreement pursuant to which UBS AM is contractually obligated to waive its management fees and/or reimburse expenses so that the Portfolio's ordinary total operating expenses of each class through November 30, 2020 (excluding dividend expense, borrowing costs, and interest expense relating to short sales, and expenses attributable to investment in other investment companies, interest, taxes, brokerage commissions and extraordinary expenses) would not exceed Class A—0.97%; Class Y—0.72%; and Class P—0.72%. The Portfolio has agreed to repay UBS AM for any waived fees/reimbursed expenses to the extent that it can do so over the following three fiscal years without causing the Portfolio's expenses in any of those three years to exceed these expense caps and that UBS AM has not waived the right to do so. The fee waiver/expense reimbursement agreement may be terminated by the Portfolio's board at any time and also will terminate automatically upon the expiration or termination of the Portfolio's advisory contract with UBS AM. Upon termination of the agreement, however, UBS AM's three year recoupment rights will survive.
1 Maximum sales charge for Class A shares is 3.75%. Class A shares bear ongoing 12b-1 service fees of 0.25% annually.
2 The Portfolio offers Class Y shares to a limited group of eligible investors, including certain qualifying retirement plans. Class Y shares do not bear initial or contingent deferred sales charges or ongoing 12b-1 service and distribution fees.
3 Class P shares do not bear initial or contingent deferred sales charges or ongoing 12b-1 service and distribution fees, but Class P shares held through advisory programs may be subject to a program fee, which, if included, would have reduced performance.
4 The Bloomberg Barclays US Mortgage-Backed Securities Index is an unmanaged index which primarily covers the mortgage-backed passthrough securities issued by Ginnie Mae (formally known as the Government National Mortgage Association or GNMA), Freddie Mac (formally known as Federal Home Loan Mortgage Corporation or FHLMC), and Fannie Mae (formally known as Federal National Mortgage Association or FNMA). Investors should note that indices do not reflect the deduction of fees and expenses.
Prior to August 3, 2015, a 1% redemption fee was imposed on sales or exchanges of any class of shares of the Portfolio made during the specified holding period.
Past performance does not predict future performance, and the performance information provided does not reflect the deduction of taxes that a shareholder would pay on Portfolio distributions or the redemption of Portfolio shares. The return and principal value of an investment will fluctuate, so that an investor's shares, when redeemed, may be worth more or less than their original cost. Performance results assume reinvestment of all dividends and capital gain distributions at net asset value on the ex-dividend dates. Current performance may be higher or lower than the performance data quoted. For month-end performance figures, please visit www.ubs.com/us-mutualfundperformance.
11
PACE Mortgage-Backed Securities Fixed Income Investments
Illustration of an assumed investment of $10,000 in Class P shares of the Portfolio (unaudited)
The following graph depicts the performance of PACE Mortgage-Backed Securities Fixed Income Investments Class P shares versus the Bloomberg Barclays US Mortgage-Backed Securities Index over the 10 years ended July 31, 2020. Class P shares held through advisory programs may be subject to a program fee, which, if included, would have reduced performance. The performance of the other classes will vary based upon the different class specific expenses and sales charges. The performance provided does not reflect the deduction of taxes that a shareholder would pay on Portfolio distributions or the redemption of Portfolio shares. Past performance is no guarantee of future results. Share price and returns will vary with market conditions; investors may realize a gain or loss upon redemption. It is important to note that PACE Mortgage-Backed Securities Fixed Income Investments is a professionally managed portfolio while the Index is not available for investment and is unmanaged. The comparison is shown for illustration purposes only.
PACE Mortgage-Backed Securities Fixed Income Investments

12
PACE Mortgage-Backed Securities Fixed Income Investments
Portfolio statistics—July 31, 2020 (unaudited)
Characteristics | |
Weighted average duration | | | 1.10 yrs. | | |
Weighted average maturity | | | 1.45 yrs. | | |
Average coupon | | | 2.94 | % | |
Top ten holdings (long holdings)1 | | Percentage of
net assets | |
UMBS TBA, 2.500% | | | 20.1 | % | |
UMBS TBA, 3.000% | | | 9.8 | | |
GNMA II TBA, 3.000% | | | 9.1 | | |
UMBS TBA, 3.500% | | | 8.0 | | |
FHLMC, 3.500% due 05/01/50 | | | 6.4 | | |
UMBS TBA, 4.000% | | | 4.4 | | |
FNMA, 3.000% due 03/01/50 | | | 2.9 | | |
UMBS TBA, 2.000% | | | 2.8 | | |
GNMA II TBA, 4.000% | | | 2.6 | | |
FNMA, 3.000% due 12/01/46 | | | 1.9 | | |
Total | | | 68.0 | % | |
Asset allocation1 | | Percentage of
net assets | |
U.S. government agency obligations | | | 138.5 | % | |
Mortgage-backed securities | | | 23.5 | | |
Asset-backed securities | | | 14.3 | | |
Short-term investments | | | 1.1 | | |
Options and swaptions purchased | | | 0.0 | † | |
Short-term U.S. Treasury obligations | | | 0.0 | † | |
Investments sold short | | | (2.7 | ) | |
Cash equivalents and liabilities in excess of other assets | | | (74.7 | ) | |
Total | | | 100.0 | % | |
† Amount is less than 0.05% or (0.05)%.
1 The Portfolio is actively managed and its composition will vary over time.
13
PACE Mortgage-Backed Securities Fixed Income Investments
Portfolio of investments—July 31, 2020
| | | Face
amount | | Value | |
Asset-backed securities—14.3% | |
Ameriquest Mortgage Securities, Inc.,
Asset-Backed Pass-Through Certificates,
Series 2004-R9, Class M2,
1 mo. USD LIBOR + 0.975%,
1.147%, due 10/25/341 | | $ | 71,202 | | | $ | 71,184 | | |
Series 2005-R1, Class M4,
1 mo. USD LIBOR + 1.110%,
1.282%, due 03/25/351 | | | 200,000 | | | | 190,902 | | |
Series 2005-R11, Class M1,
1 mo. USD LIBOR + 0.450%,
0.622%, due 01/25/361 | | | 150,839 | | | | 150,549 | | |
Amortizing Residential Collateral Trust,
Series 2004-1, Class A5,
1 mo. USD LIBOR + 1.000%,
1.172%, due 10/25/341 | | | 159,956 | | | | 156,086 | | |
Bear Stearns Asset-Backed Securities Trust,
Series 2004-2, Class M1,
1 mo. USD LIBOR + 1.200%,
1.372%, due 08/25/341 | | | 5,122,186 | | | | 4,997,343 | | |
Benefit Street Partners CLO IV Ltd.,
Series 2014-IVA, Class A1RR,
3 mo. USD LIBOR + 1.250%,
1.522%, due 01/20/291,2 | | | 2,000,000 | | | | 1,987,290 | | |
Cent CLO 19 Ltd.,
Series 2013-19A, Class A1A,
3 mo. USD LIBOR + 1.330%,
1.600%, due 10/29/251,2 | | | 150,936 | | | | 150,691 | | |
Chase Funding Trust,
Series 2002-3 , Class 2A1,
1 mo. USD LIBOR + 0.640%,
0.812%, due 08/25/321 | | | 146,733 | | | | 138,320 | | |
Series 2002-4, Class 2A1,
1 mo. USD LIBOR + 0.740%,
0.912%, due 10/25/321 | | | 9,683 | | | | 9,519 | | |
CIFC Funding Ltd.,
Series 2015-5A, Class A1R,
3 mo. USD LIBOR + 0.860%,
1.105%, due 10/25/271,2 | | | 888,372 | | | | 880,956 | | |
CIT Mortgage Loan Trust,
Series 2007-1, Class 1A,
1 mo. USD LIBOR + 1.350%,
1.522%, due 10/25/371,2 | | | 895,021 | | | | 895,953 | | |
Colombia Cent CLO Ltd.,
Series 2018-27A, Class A1,
3 mo. USD LIBOR + 1.150%,
1.395%, due 10/25/281,2 | | | 1,700,000 | | | | 1,686,272 | | |
Countrywide Asset-Backed Certificates,
Series 2004-2, Class 3A4,
1 mo. USD LIBOR + 0.500%,
0.672%, due 07/25/341 | | | 80,086 | | | | 73,952 | | |
Series 2004-6, Class M1,
1 mo. USD LIBOR + 0.900%,
1.072%, due 10/25/341 | | | 94,238 | | | | 86,661 | | |
CWABS, Inc. Asset-Backed Certificates Trust,
Series 2004-4, Class M1,
1 mo. USD LIBOR + 0.720%,
0.892%, due 07/25/341 | | | 107,896 | | | | 105,176 | | |
| | | Face
amount | | Value | |
Asset-backed securities—(continued) | |
Dryden XXV Senior Loan Fund,
Series 2012-25A, Class ARR,
3 mo. USD LIBOR + 0.900%,
1.175%, due 10/15/271,2 | | $ | 2,875,209 | | | $ | 2,854,628 | | |
EMC Mortgage Loan Trust,
Series 2003-A, Class A2,
1 mo. USD LIBOR + 1.500%,
1.672%, due 08/25/401,2 | | | 83,410 | | | | 81,575 | | |
Equifirst Loan Securitization Trust,
Series 2007-1, Class A1,
1 mo. USD LIBOR + 0.170%,
0.342%, due 04/25/371,2 | | | 1,901,590 | | | | 1,750,479 | | |
Figueroa CLO Ltd.,
Series 2014-1A, Class AR,
3 mo. USD LIBOR + 0.900%,
1.175%, due 01/15/271,2 | | | 108,498 | | | | 108,018 | | |
First Franklin Mortgage Loan Trust,
Series 2005-FFH1, Class M1,
1 mo. USD LIBOR + 0.675%,
0.847%, due 06/25/361 | | | 56,201 | | | | 55,826 | | |
Gallatin CLO VIII Ltd.,
Series 2017-1A, Class A,
3 mo. USD LIBOR + 1.300%,
1.575%, due 07/15/271,2 | | | 2,002,713 | | | | 1,996,591 | | |
Halcyon Loan Advisors Funding Ltd.,
Series 2015-1A, Class AR,
3 mo. USD LIBOR + 0.920%,
1.192%, due 04/20/271,2 | | | 2,417,826 | | | | 2,401,053 | | |
JP Morgan Mortgage Acquisition Corp.,
Series 2005-FRE1, Class A2F3,
3.158%, due 10/25/353 | | | 10,678 | | | | 10,649 | | |
JP Morgan Mortgage Acquisition Trust,
Series 2006-ACC1, Class M1,
1 mo. USD LIBOR + 0.270%,
0.442%, due 05/25/361 | | | 201,022 | | | | 199,397 | | |
KGS Alpha SBA,
Series 2012-5, Class A, IO,
1.040%, due 04/25/382,4,5,6 | | | 15,588,153 | | | | 418,932 | | |
KVK CLO Ltd.,
Series 2013-1A, Class AR,
3 mo. USD LIBOR + 0.900%,
1.168%, due 01/14/281,2 | | | 2,165,748 | | | | 2,147,339 | | |
LCM XX LP,
Series 20A, Class AR,
3 mo. USD LIBOR + 1.040%,
1.312%, due 10/20/271,2 | | | 250,000 | | | | 247,598 | | |
Legacy Mortgage Asset Trust,
Series 2019-GS4, Class A1,
3.438%, due 05/25/592,3 | | | 350,961 | | | | 350,868 | | |
Madison Park Funding XII Ltd.,
Series 2014-12A, Class AR,
3 mo. USD LIBOR + 1.260%,
1.532%, due 07/20/261,2 | | | 783,457 | | | | 782,800 | | |
Morgan Stanley ABS Capital I, Inc.,
Series 2005-WMC6, Class M3,
1 mo. USD LIBOR + 0.765%,
0.937%, due 07/25/351 | | | 115,704 | | | | 116,343 | | |
14
PACE Mortgage-Backed Securities Fixed Income Investments
Portfolio of investments—July 31, 2020
| | | Face
amount | | Value | |
Asset-backed securities—(continued) | |
Octagon Investment Partners XXIII Ltd.,
Series 2015-1A, Class A1R,
3 mo. USD LIBOR + 0.850%,
1.125%, due 07/15/271,2 | | $ | 385,224 | | | $ | 381,397 | | |
Option One Mortgage Loan Trust,
Series 2007-4, Class 2A2,
1 mo. USD LIBOR + 0.180%,
0.352%, due 04/25/371 | | | 59,807 | | | | 39,665 | | |
OZLM XIII Ltd.,
Series 2015-13A, Class A1R,
3 mo. USD LIBOR + 1.080%,
1.348%, due 07/30/271,2 | | | 494,588 | | | | 491,614 | | |
Palmer Square Loan Funding Ltd.,
Series 2018-4A, Class A1,
3 mo. USD LIBOR + 0.900%,
1.292%, due 11/15/261,2 | | | 312,030 | | | | 310,233 | | |
Park Place Securities, Inc., Asset-Backed
Pass-Through Certificates,
Series 2005-WHQ3, Class M4,
1 mo. USD LIBOR + 0.945%,
1.117%, due 06/25/351 | | | 200,000 | | | | 196,731 | | |
RAAC Trust,
Series 2005-SP3, Class M1,
1 mo. USD LIBOR + 0.530%,
0.702%, due 12/25/351 | | | 22,418 | | | | 22,412 | | |
RASC Trust,
Series 2005-KS11, Class M2,
1 mo. USD LIBOR + 0.420%,
0.592%, due 12/25/351 | | | 400,000 | | | | 388,234 | | |
Recette CLO Ltd.,
Series 2015-1A, Class AR,
3 mo. USD LIBOR + 0.920%,
1.192%, due 10/20/271,2 | | | 1,657,559 | | | | 1,646,618 | | |
Renaissance Home Equity Loan Trust,
Series 2003-2, Class A,
1 mo. USD LIBOR + 0.880%,
1.052%, due 08/25/331 | | | 126,532 | | | | 122,009 | | |
Saxon Asset Securities Trust,
Series 2005-3, Class M3,
1 mo. USD LIBOR + 0.750%,
0.922%, due 11/25/351 | | | 2,100,000 | | | | 2,010,073 | | |
Soundview Home Loan Trust,
Series 2007-OPT1, Class 1A1,
1 mo. USD LIBOR + 0.200%,
0.372%, due 06/25/371 | | | 349,853 | | | | 273,751 | | |
SpringCastle Funding Asset-Backed Notes,
Series 2019-AA, Class A,
3.200%, due 05/27/362 | | | 1,268,280 | | | | 1,279,971 | | |
Structured Asset Securities Corp.
Mortgage Loan Trust,
Series 2006-EQ1A, Class A1,
1 mo. USD LIBOR + 0.135%,
0.307%, due 07/25/361,2 | | | 181,925 | | | | 175,077 | | |
Structured Asset Securities Corp. Trust,
Series 2005-AR1, Class M2,
1 mo. USD LIBOR + 0.460%,
0.632%, due 09/25/351 | | | 1,697,289 | | | | 1,630,620 | | |
| | | Face
amount | | Value | |
Asset-backed securities—(concluded) | |
Symphony CLO XIV Ltd.,
Series 2014-14A, Class AR,
3 mo. USD LIBOR + 0.950%,
1.218%, due 07/14/261,2 | | $ | 680,795 | | | $ | 676,912 | | |
Symphony CLO XVII Ltd.,
Series 2016-17A, Class AR,
3 mo. USD LIBOR + 0.880%,
1.155%, due 04/15/281,2 | | | 496,896 | | | | 493,224 | | |
Telos CLO Ltd.,
Series 2014-5A, Class A1R,
3 mo. USD LIBOR + 0.950%,
1.223%, due 04/17/281,2 | | | 3,520,831 | | | | 3,487,147 | | |
Tralee CLO III Ltd.,
Series 2014-3A, Class AR,
3 mo. USD LIBOR + 1.030%,
1.302%, due 10/20/271,2 | | | 4,336,710 | | | | 4,300,724 | | |
Tralee CLO V Ltd.,
Series 2018-5A, Class A1,
3 mo. USD LIBOR + 1.110%,
1.382%, due 10/20/281,2 | | | 1,100,000 | | | | 1,087,646 | | |
Venture CLO 35 Ltd.,
Series 2018-35A, Class AS,
3 mo. USD LIBOR + 1.150%,
1.408%, due 10/22/311,2 | | | 1,000,000 | | | | 987,655 | | |
Venture XXI CLO Ltd.,
Series 2015-21A, Class AR,
3 mo. USD LIBOR + 0.880%,
1.155%, due 07/15/271,2 | | | 873,125 | | | | 864,306 | | |
Zais CLO 1 Ltd.,
Series 2014-1A, Class A1AR,
3 mo. USD LIBOR + 1.150%,
1.425%, due 04/15/281,2 | | | 1,007,347 | | | | 1,000,765 | | |
Total asset-backed securities
(cost—$46,624,295) | | | 46,969,734 | | |
Mortgage-backed securities—23.5% | |
Adjustable Rate Mortgage Trust,
Series 2005-8, Class 3A21,
3.268%, due 11/25/356 | | | 471,072 | | | | 400,010 | | |
AREIT Trust,
Series 2018-CRE2, Class A,
1 mo. USD LIBOR + 0.980%,
1.157%, due 11/14/351,2 | | | 978,999 | | | | 965,499 | | |
BCAP LLC Trust,
Series 2010-RR1, Class 1A4,
3.643%, due 03/26/372,6 | | | 92,509 | | | | 77,429 | | |
Series 2011-R11, Class 8A5,
0.590%, due 07/26/362,6 | | | 45,555 | | | | 44,788 | | |
Series 2013-RR1, Class 3A4,
6.000%, due 10/26/372,6 | | | 282,136 | | | | 232,357 | | |
Series 2013-RR5, Class 5A1,
12 mo. MTA + 0.840%,
2.344%, due 11/26/461,2 | | | 104,293 | | | | 104,345 | | |
Bear Stearns ARM Trust,
Series 2002-011, Class 1A2,
3.753%, due 02/25/336 | | | 3,894 | | | | 3,438 | | |
15
PACE Mortgage-Backed Securities Fixed Income Investments
Portfolio of investments—July 31, 2020
| | | Face
amount | | Value | |
Mortgage-backed securities—(continued) | |
Series 2004-002, Class 12A2,
3.415%, due 05/25/346 | | $ | 36,955 | | | $ | 34,090 | | |
Bear Stearns Asset Backed Securities Trust,
Series 2003-AC5, Class A1,
5.750%, due 10/25/333 | | | 442,018 | | | | 460,846 | | |
Series 2004-AC3, Class A2,
6.000%, due 06/25/343 | | | 605,661 | | | | 621,814 | | |
BX Commercial Mortgage Trust,
Series 2018-IND, Class A,
1 mo. USD LIBOR + 0.750%,
0.925%, due 11/15/351,2 | | | 2,917,910 | | | | 2,901,501 | | |
Series 2018-IND, Class D,
1 mo. USD LIBOR + 1.300%,
1.475%, due 11/15/351,2 | | | 5,600,000 | | | | 5,557,814 | | |
Chevy Chase Funding LLC
Mortgage-Backed Certificates,
Series 2004-1, Class A1,
1 mo. USD LIBOR + 0.280%,
0.452%, due 01/25/351,2 | | | 41,641 | | | | 40,682 | | |
CHL Mortgage Pass-Through Trust,
Series 2003-HYB1, Class 1A1,
4.098%, due 05/19/336 | | | 3,342 | | | | 3,213 | | |
Series 2007-15, Class 2A2,
6.500%, due 09/25/37 | | | 28,292 | | | | 17,694 | | |
Citigroup Commercial Mortgage Trust,
Series 2019-SMRT, Class A,
4.149%, due 01/10/362 | | | 3,200,000 | | | | 3,459,383 | | |
CSMC Trust,
Series 2013-MH1, Class A,
4.788%, due 05/27/532,6 | | | 1,008,878 | | | | 1,159,154 | | |
FHLMC Multifamily Structured
Pass-Through Certificates,
Series K014, Class X1, IO,
1.149%, due 04/25/216 | | | 6,788,751 | | | | 34,099 | | |
Series K027, Class X1, IO,
0.748%, due 01/25/236 | | | 6,253,058 | | | | 92,138 | | |
Series KAIV, Class X1, IO,
1.223%, due 06/25/216 | | | 4,162,515 | | | | 18,139 | | |
Series KF05, Class A,
1 mo. USD LIBOR + 0.350%,
0.512%, due 09/25/211 | | | 35,099 | | | | 35,095 | | |
Series KF06, Class A,
1 mo. USD LIBOR + 0.330%,
0.492%, due 11/25/211 | | | 165,242 | | | | 164,763 | | |
Series KP05, Class AH,
3.254%, due 04/25/236 | | | 1,198,495 | | | | 1,227,330 | | |
FHLMC REMIC,
Series 0013, Class B, IO,
7.000%, due 06/25/23 | | | 12,407 | | | | 947 | | |
Series 1003, Class H,
1 mo. USD LIBOR + 0.750%,
0.925%, due 10/15/201 | | | 237 | | | | 236 | | |
Series 1349, Class PS,
7.500%, due 08/15/22 | | | 196 | | | | 205 | | |
Series 1502, Class PX,
7.000%, due 04/15/23 | | | 42,918 | | | | 45,327 | | |
| | | Face
amount | | Value | |
Mortgage-backed securities—(continued) | |
Series 1534, Class Z,
5.000%, due 06/15/23 | | $ | 19,154 | | | $ | 19,809 | | |
Series 1573, Class PZ,
7.000%, due 09/15/23 | | | 5,373 | | | | 5,740 | | |
Series 1658, Class GZ,
7.000%, due 01/15/24 | | | 2,959 | | | | 3,175 | | |
Series 1694, Class Z,
6.500%, due 03/15/24 | | | 35,880 | | | | 38,712 | | |
Series 1775, Class Z,
8.500%, due 03/15/25 | | | 1,371 | | | | 1,553 | | |
Series 2136, Class GD, IO,
7.000%, due 03/15/29 | | | 1,917 | | | | 314 | | |
Series 2178, Class PI, IO,
7.500%, due 08/15/29 | | | 10,456 | | | | 2,060 | | |
Series 2400, Class FQ, | | | | | |
1 mo. USD LIBOR + 0.500%,
0.675%, due 01/15/321 | | | 76,922 | | | | 76,969 | | |
Series 2411, Class FJ,
1 mo. USD LIBOR + 0.350%,
0.525%, due 12/15/291 | | | 11,842 | | | | 11,801 | | |
Series 2614, Class WO, PO,
0.010%, due 05/15/33 | | | 791,454 | | | | 729,822 | | |
Series 3096, Class FL,
1 mo. USD LIBOR + 0.400%,
0.575%, due 01/15/361 | | | 111,879 | | | | 112,123 | | |
Series 3114, Class PF,
1 mo. USD LIBOR + 0.400%,
0.575%, due 02/15/361 | | | 583,052 | | | | 585,996 | | |
Series 3153, Class UF,
1 mo. USD LIBOR + 0.430%,
0.605%, due 05/15/361 | | | 136,709 | | | | 137,073 | | |
Series 3339, Class LI, IO,
1 mo. USD LIBOR + 6.480%,
6.305%, due 07/15/371 | | | 643,264 | | | | 113,423 | | |
Series 3442, Class MT,
1 mo. USD LIBOR,
0.175%, due 07/15/341 | | | 60,158 | | | | 60,167 | | |
Series 3598, Class JI, IO,
3.005%, due 10/15/376 | | | 30,115 | | | | 1,257 | | |
Series 3609, Class LI, IO,
4.500%, due 12/15/24 | | | 2,282 | | | | 20 | | |
Series 3621, Class WI, IO,
3.179%, due 05/15/376 | | | 73,558 | | | | 3,392 | | |
Series 3635, Class IB, IO,
2.839%, due 10/15/376 | | | 110,071 | | | | 4,635 | | |
Series 3667, Class FW,
1 mo. USD LIBOR + 0.550%,
0.725%, due 02/15/381 | | | 45,748 | | | | 45,463 | | |
Series 3671, Class FQ,
1 mo. USD LIBOR + 0.850%,
1.025%, due 12/15/361 | | | 922,707 | | | | 928,361 | | |
Series 3684, Class JI, IO,
3.543%, due 11/15/366 | | | 270,723 | | | | 16,641 | | |
Series 3838, Class LI, IO,
4.500%, due 04/15/22 | | | 12,637 | | | | 202 | | |
16
PACE Mortgage-Backed Securities Fixed Income Investments
Portfolio of investments—July 31, 2020
| | | Face
amount | | Value | |
Mortgage-backed securities—(continued) | |
Series 3864, Class NT,
(9.17)* 1 mo. USD LIBOR + 60.500%,
5.500%, due 03/15/391 | | $ | 459,915 | | | $ | 520,850 | | |
Series 3962, Class KS, IO,
3.571%, due 06/15/386 | | | 205,373 | | | | 14,615 | | |
Series 4037, Class PI, IO,
3.000%, due 04/15/27 | | | 1,681,757 | | | | 82,340 | | |
Series 4068, Class UF,
1 mo. USD LIBOR + 0.500%,
0.675%, due 06/15/421 | | | 1,042,208 | | | | 1,048,115 | | |
Series 4076, Class SW, IO,
1 mo. USD LIBOR + 6.050%,
5.875%, due 07/15/421 | | | 1,868,563 | | | | 434,926 | | |
Series 4100, Class HI, IO,
3.000%, due 08/15/27 | | | 336,989 | | | | 21,918 | | |
Series 4131, Class AI, IO,
2.500%, due 10/15/22 | | | 417,064 | | | | 8,078 | | |
Series 4136, Class EZ,
3.000%, due 11/15/42 | | | 781,086 | | | | 789,101 | | |
Series 4156, Class SA, IO,
1 mo. USD LIBOR + 6.200%,
6.025%, due 01/15/331 | | | 1,405,439 | | | | 262,249 | | |
Series 4165, Class TI, IO,
3.000%, due 12/15/42 | | | 1,138,393 | | | | 87,971 | | |
Series 4182, Class QI, IO,
3.000%, due 02/15/33 | | | 149,965 | | | | 11,521 | | |
Series 4182, Class YI, IO,
2.500%, due 03/15/28 | | | 2,958,165 | | | | 180,877 | | |
Series 4255, Class SN,
1 mo. USD LIBOR + 12.267%,
11.811%, due 05/15/351 | | | 342,985 | | | | 491,074 | | |
Series 4263, Class SD,
1 mo. USD LIBOR + 12.267%,
11.801%, due 11/15/431 | | | 381,272 | | | | 560,521 | | |
Series 4265, Class ES,
1 mo. USD LIBOR + 13.760%,
13.213%, due 11/15/431 | | | 828,981 | | | | 1,283,249 | | |
Series 4324, Class IO,
3.551%, due 08/15/366 | | | 138,066 | | | | 7,809 | | |
Series 4338, Class SB, IO,
3.404%, due 10/15/416 | | | 150,712 | | | | 8,004 | | |
Series 4367, Class GS, IO,
3.263%, due 03/15/376 | | | 90,120 | | | | 4,756 | | |
Series 4394, Class WI, IO,
3.372%, due 08/15/416 | | | 82,857 | | | | 4,372 | | |
Series 4438, Class WI, IO,
3.487%, due 11/15/386 | | | 265,257 | | | | 14,760 | | |
Series 4457, Class DI, IO,
4.000%, due 08/15/24 | | | 503,824 | | | | 26,038 | | |
Series 4463, Class IO,
3.519%, due 02/15/386 | | | 193,656 | | | | 10,488 | | |
Series 4544, Class IP, IO,
4.000%, due 01/15/46 | | | 2,722,347 | | | | 326,964 | | |
Series 4832, Class FW,
1 mo. USD LIBOR + 0.350%,
0.523%, due 04/15/381 | | | 1,775,855 | | | | 1,769,421 | | |
| | | Face
amount | | Value | |
Mortgage-backed securities—(continued) | |
Series 4836, Class PO, PO,
0.010%, due 10/15/58 | | $ | 1,296,459 | | | $ | 1,120,684 | | |
Series 4839, Class UO, PO,
0.010%, due 08/15/56 | | | 781,935 | | | | 733,587 | | |
Series 4940, Class FE,
1 mo. USD LIBOR + 0.550%,
0.725%, due 01/25/501 | | | 748,014 | | | | 751,592 | | |
Series 4945, Class F,
1 mo. USD LIBOR + 0.500%,
0.673%, due 12/15/461 | | | 280,949 | | | | 282,359 | | |
Series 513, Class AS, IO, | | | | | |
1 mo. USD LIBOR + 8.000%,
7.825%, due 02/15/321 | | | 248,013 | | | | 56,325 | | |
Series G23, Class KZ,
6.500%, due 11/25/23 | | | 5,937 | | | | 6,306 | | |
FHLMC STRIPs,
Series 303, Class C19, IO,
3.500%, due 01/15/43 | | | 935,010 | | | | 99,724 | | |
Series 326, Class F2,
1 mo. USD LIBOR + 0.550%,
0.725%, due 03/15/441 | | | 664,522 | | | | 669,401 | | |
Series 330, Class F4,
1 mo. USD LIBOR + 0.350%,
0.523%, due 10/15/371 | | | 399,674 | | | | 399,238 | | |
Series 345, Class C13, IO,
3.500%, due 08/15/45 | | | 1,544,526 | | | | 139,731 | | |
FNMA Aces,
Series 2013-M5, Class X2, IO,
2.039%, due 01/25/226 | | | 565,482 | | | | 6,733 | | |
Series 2016-M11, Class AL,
2.944%, due 07/25/39 | | | 1,803,401 | | | | 1,863,303 | | |
Series 2020-M33, Class X2, IO,
2.358%, due 01/25/314,6 | | | 600,000 | | | | 91,968 | | |
FNMA REMIC,
Series 1992-040, Class ZC,
7.000%, due 07/25/22 | | | 2,099 | | | | 2,166 | | |
Series 1992-129, Class L,
6.000%, due 07/25/22 | | | 475 | | | | 488 | | |
Series 1993-037, Class PX,
7.000%, due 03/25/23 | | | 33,932 | | | | 35,566 | | |
Series 1997-022, Class F,
1.858%, due 03/25/276 | | | 17,899 | | | | 17,989 | | |
Series 2002-060, Class F1,
1 mo. USD LIBOR + 0.400%,
0.572%, due 06/25/321 | | | 47,189 | | | | 45,207 | | |
Series 2003-070, Class SH,
1 mo. USD LIBOR + 14.000%,
13.657%, due 07/25/231 | | | 68,428 | | | | 80,276 | | |
Series 2007-067, Class FB,
1 mo. USD LIBOR + 0.320%,
0.492%, due 07/25/371 | | | 186,947 | | | | 183,999 | | |
Series 2009-033, Class FB,
1 mo. USD LIBOR + 0.820%,
0.992%, due 03/25/371 | | | 573,947 | | | | 584,010 | | |
Series 2010-141, Class FA,
1 mo. USD LIBOR + 0.500%,
0.672%, due 12/25/401 | | | 320,079 | | | | 321,566 | | |
17
PACE Mortgage-Backed Securities Fixed Income Investments
Portfolio of investments—July 31, 2020
| | | Face
amount | | Value | |
Mortgage-backed securities—(continued) | |
Series 2010-76, Class SA, IO,
1 mo. USD LIBOR + 6.500%,
6.328%, due 07/25/401 | | $ | 1,058,100 | | | $ | 215,789 | | |
Series 2011-86, Class DI, IO,
3.500%, due 09/25/21 | | | 23,603 | | | | 352 | | |
Series 2012-090, Class FB, | | | | | |
1 mo. USD LIBOR + 0.440%,
0.612%, due 08/25/421 | | | 127,890 | | | | 128,040 | | |
Series 2012-111, Class HS, | | | | | |
1 mo. USD LIBOR + 3.667%,
3.524%, due 10/25/421 | | | 202,575 | | | | 197,950 | | |
Series 2012-122, Class LI, IO,
4.500%, due 07/25/41 | | | 719,510 | | | | 81,096 | | |
Series 2012-128, Class FK, | | | | | |
1 mo. USD LIBOR + 0.350%,
0.522%, due 11/25/421 | | | 286,305 | | | | 285,619 | | |
Series 2012-32, Class AI, IO,
3.000%, due 04/25/22 | | | 56,488 | | | | 1,024 | | |
Series 2012-77, Class IO,
2.907%, due 07/25/526 | | | 253,930 | | | | 13,042 | | |
Series 2013-028, Class YS, IO, | | | | | |
1 mo. USD LIBOR + 6.150%,
5.978%, due 07/25/421 | | | 1,073,306 | | | | 193,868 | | |
Series 2013-030, Class GI, IO,
3.000%, due 01/25/43 | | | 1,570,498 | | | | 169,927 | | |
Series 2013-044, Class ZG,
3.500%, due 03/25/42 | | | 653,472 | | | | 719,037 | | |
Series 2013-045, Class IK, IO,
3.000%, due 02/25/43 | | | 1,242,393 | | | | 126,863 | | |
Series 2013-116, Class IY, IO,
3.000%, due 09/25/43 | | | 379,754 | | | | 25,089 | | |
Series 2013-30, Class JI, IO,
3.000%, due 04/25/43 | | | 655,171 | | | | 67,226 | | |
Series 2013-34, Class PS, IO,
1 mo. USD LIBOR + 6.150%,
5.978%, due 08/25/421 | | | 641,612 | | | | 107,909 | | |
Series 2013-74, Class YS,
1 mo. USD LIBOR + 6.000%,
5.743%, due 07/25/431 | | | 832,606 | | | | 856,984 | | |
Series 2014-42, Class SA, IO,
2.931%, due 07/25/446 | | | 285,634 | | | | 16,064 | | |
Series 2014-43, Class BS, IO,
3.006%, due 07/25/446 | | | 441,690 | | | | 22,810 | | |
Series 2014-45, Class SA, IO,
3.209%, due 08/25/446 | | | 230,616 | | | | 12,900 | | |
Series 2014-47, Class BI, IO,
3.191%, due 08/25/546 | | | 420,734 | | | | 27,423 | | |
Series 2014-84, Class AI, IO,
1 mo. USD LIBOR + 6.150%,
0.200%, due 02/25/431 | | | 483,452 | | | | 3,799 | | |
Series 2014-92, Class SB, IO,
3.076%, due 03/25/456 | | | 228,257 | | | | 11,289 | | |
Series 2014-92, Class SB, IO,
3.081%, due 01/25/456 | | | 268,431 | | | | 12,847 | | |
Series 2015-073, Class ES,
1 mo. USD LIBOR + 9.333%,
8.934%, due 10/25/451 | | | 488,006 | | | | 624,590 | | |
| | | Face
amount | | Value | |
Mortgage-backed securities—(continued) | |
Series 2015-10, Class SA, IO,
3.133%, due 04/25/556 | | $ | 419,394 | | | $ | 24,297 | | |
Series 2015-47, Class GI, IO,
4.000%, due 06/25/44 | | | 163,056 | | | | 15,954 | | |
Series 2015-50, Class SB, IO,
3.203%, due 07/25/456 | | | 1,356,658 | | | | 99,473 | | |
Series 2015-58, Class AI, IO,
3.186%, due 08/25/556 | | | 254,893 | | | | 14,705 | | |
Series 2015-64, Class KS, IO,
3.197%, due 09/25/456 | | | 346,563 | | | | 24,010 | | |
Series 2016-14, Class IO,
3.000%, due 03/25/46 | | | 946,265 | | | | 85,225 | | |
Series 2016-17, Class CS, IO,
2.868%, due 04/25/466 | | | 185,825 | | | | 8,798 | | |
Series 2016-52, Class PI, IO,
3.000%, due 04/25/46 | | | 1,572,924 | | | | 135,161 | | |
Series 2016-63, Class YI, IO,
3.500%, due 04/25/46 | | | 495,954 | | | | 21,315 | | |
Series 2016-64, Class IA, IO,
3.000%, due 05/25/46 | | | 782,195 | | | | 82,440 | | |
Series 2016-76, Class CS, IO,
2.787%, due 10/25/466 | | | 89,806 | | | | 4,424 | | |
Series 2018-28, Class CA,
3.000%, due 05/25/48 | | | 1,141,349 | | | | 1,198,340 | | |
Series 2018-85, Class FE,
1 mo. USD LIBOR + 0.300%,
0.472%, due 12/25/481 | | | 3,008,302 | | | | 3,002,611 | | |
Series 2019-62, Class SN, IO,
1 mo. USD LIBOR + 6.000%,
5.828%, due 11/25/491 | | | 415,297 | | | | 82,849 | | |
Series 2020-54, Class WF,
1 mo. USD LIBOR + 0.450%,
0.626%, due 08/25/501,4 | | | 1,889,585 | | | | 1,887,560 | | |
Series 386, Class 14, IO,
6.500%, due 04/25/38 | | | 56,814 | | | | 11,941 | | |
Series 413, Class 111, IO,
4.000%, due 07/25/426 | | | 1,011,759 | | | | 144,157 | | |
Series 419, Class C3, IO,
3.000%, due 11/25/43 | | | 188,979 | | | | 22,369 | | |
Series G94-006, Class PJ,
8.000%, due 05/17/24 | | | 3,622 | | | | 3,864 | | |
Fremont Home Loan Trust,
Series 2004-A, Class M1,
1 mo. USD LIBOR + 0.825%,
0.997%, due 01/25/341 | | | 452,547 | | | | 443,769 | | |
GNMA REMIC,
Series 013-77, Class GI, IO,
3.000%, due 02/20/43 | | | 2,218,346 | | | | 147,248 | | |
Series 2007-018, Class CO, PO,
0.010%, due 03/20/35 | | | 29,786 | | | | 29,163 | | |
Series 2010-H01, Class FA,
1 mo. USD LIBOR + 0.820%,
1.004%, due 01/20/601 | | | 1,879,062 | | | | 1,890,117 | | |
Series 2013-23, Class IP, IO,
3.500%, due 08/20/42 | | | 1,042,021 | | | | 120,925 | | |
18
PACE Mortgage-Backed Securities Fixed Income Investments
Portfolio of investments—July 31, 2020
| | | Face
amount | | Value | |
Mortgage-backed securities—(continued) | |
Series 2013-H19, Class DF,
1 mo. USD LIBOR + 0.650%,
0.828%, due 05/20/631 | | $ | 955,379 | | | $ | 957,391 | | |
Series 2013-H20, Class FB,
1 mo. USD LIBOR + 1.000%,
1.178%, due 08/20/631 | | | 1,853,154 | | | | 1,867,655 | | |
Series 2013-H23, Class TA,
1 mo. USD LIBOR + 0.720%,
0.898%, due 09/20/631 | | | 744,578 | | | | 747,585 | | |
Series 2014-158, Class IA, IO,
3.500%, due 10/20/29 | | | 770,684 | | | | 70,074 | | |
Series 2015-126, Class GS, | | | | | |
1 mo. USD LIBOR + 9.333%,
8.934%, due 09/20/451 | | | 323,052 | | | | 446,893 | | |
Series 2015-127, Class AS, IO,
2.723%, due 06/20/436 | | | 346,978 | | | | 16,114 | | |
Series 2015-165, Class IB, IO,
3.500%, due 11/20/42 | | | 425,893 | | | | 41,187 | | |
Series 2015-166, Class SA, IO,
3.402%, due 06/20/426 | | | 383,513 | | | | 18,467 | | |
Series 2015-180, Class SA, IO,
3.352%, due 06/20/426 | | | 416,504 | | | | 19,956 | | |
Series 2015-42, Class AI, IO,
3.000%, due 05/20/39 | | | 319,805 | | | | 9,489 | | |
Series 2015-H27, Class FA,
1 mo. USD LIBOR + 0.750%,
0.928%, due 09/20/651 | | | 2,316,324 | | | | 2,331,145 | | |
Series 2015-H29, Class FA,
1 mo. USD LIBOR + 0.700%,
0.878%, due 10/20/651 | | | 33,026 | | | | 33,094 | | |
Series 2015-H29, Class FJ,
1 mo. USD LIBOR + 0.680%,
0.858%, due 11/20/651 | | | 2,024,551 | | | | 2,030,069 | | |
Series 2015-H30, Class FA,
1 mo. USD LIBOR + 0.680%,
0.858%, due 08/20/611 | | | 10,680 | | | | 10,729 | | |
Series 2016-118, Class IE, IO,
3.500%, due 09/20/46 | | | 68,341 | | | | 8,905 | | |
Series 2016-138, Class WI, IO,
2.688%, due 08/20/456 | | | 316,852 | | | | 12,734 | | |
Series 2016-180, Class WI, IO,
2.641%, due 09/20/456 | | | 617,785 | | | | 21,813 | | |
Series 2016-84, Class KS, IO,
1 mo. USD LIBOR + 6.080%,
5.893%, due 11/20/451 | | | 1,942,741 | | | | 378,678 | | |
Series 2016-H14, Class FA,
1 mo. USD LIBOR + 0.800%,
0.978%, due 06/20/661 | | | 568,007 | | | | 572,913 | | |
Series 2017-15, Class WI, IO,
2.804%, due 11/20/456 | | | 392,596 | | | | 17,312 | | |
Series 2017-57, Class WI, IO,
2.794%, due 12/20/456 | | | 171,589 | | | | 6,821 | | |
GS Mortgage Securities Trust,
Series 2015-GC30, Class A3,
3.119%, due 05/10/50 | | | 4,932,116 | | | | 5,248,753 | | |
| | | Face
amount | | Value | |
Mortgage-backed securities—(continued) | |
GSR Mortgage Loan Trust,
Series 2004-14, Class 2A1,
1 mo. USD LIBOR + 0.330%,
0.502%, due 12/25/341 | | $ | 4,580 | | | $ | 4,296 | | |
Indymac Index Mortgage Loan Trust,
Series 2005-AR2, Class 2A1A,
1 mo. USD LIBOR + 0.640%,
0.812%, due 02/25/351 | | | 357,188 | | | | 326,730 | | |
JP Morgan Mortgage Trust,
Series 2019-6, Class A11,
1 mo. USD LIBOR + 0.900%,
1.072%, due 12/25/491,2 | | | 4,329,793 | | | | 4,302,795 | | |
JPMorgan Alternative Loan Trust,
Series 2008-R4, Class 2A1,
1 mo. USD LIBOR + 0.500%,
0.684%, due 06/27/371,2 | | | 866,422 | | | | 687,045 | | |
Merrill Lynch Mortgage Investors Trust,
Series 2004-1, Class 2A2,
3.256%, due 12/25/346
Series 2004-A, Class A1, | | | 139,375 | | | | 137,259 | | |
1 mo. USD LIBOR + 0.460%,
0.632%, due 04/25/291 | | | 31,062 | | | | 29,499 | | |
Morgan Stanley Mortgage Loan Trust,
Series 2004-11AR, Class 1A1,
1 mo. USD LIBOR + 0.320%,
0.492%, due 01/25/351 | | | 28,744 | | | | 27,217 | | |
Morgan Stanley Re-REMIC Trust,
Series 2010-R4, Class 4B,
1 mo. USD LIBOR + 0.230%,
2.716%, due 02/26/371,2 | | | 171,903 | | | | 150,010 | | |
Series 2013-R10, Class 3A, | | | | | |
1 mo. USD LIBOR + 0.310%,
0.805%, due 01/26/511,2 | | | 82,587 | | | | 82,390 | | |
Mortgage Equity Conversion Asset Trust,
Series 2007-FF3, Class A,
1 year CMT + 0.500%,
0.640%, due 05/25/421,2 | | | 3,016,354 | | | | 2,617,970 | | |
NCUA Guaranteed Notes Trust,
Series 2010-R1, Class 1A,
1 mo. USD LIBOR + 0.450%,
0.616%, due 10/07/201 | | | 600,631 | | | | 600,059 | | |
Series 2010-R2, Class 2A, | | | | | |
1 mo. USD LIBOR + 0.470%,
0.636%, due 11/05/201 | | | 408,225 | | | | 408,246 | | |
Pepper Residential Securities Trust,
Series 22-A, Class A1U,
1 mo. USD LIBOR + 1.000%,
1.187%, due 06/20/601,2 | | | 2,117,223 | | | | 2,112,389 | | |
Residential Asset Securitization Trust,
Series 2006-A7CB, Class 1A1,
1 mo. USD LIBOR + 0.500%,
0.672%, due 07/25/361 | | | 285,337 | | | | 225,413 | | |
Sequoia Mortgage Trust,
Series 11, Class A,
1 mo. USD LIBOR + 0.900%,
1.087%, due 12/20/321 | | | 208,360 | | | | 201,996 | | |
19
PACE Mortgage-Backed Securities Fixed Income Investments
Portfolio of investments—July 31, 2020
| | | Face
amount | | Value | |
Mortgage-backed securities—(concluded) | |
Series 5, Class A,
1 mo. USD LIBOR + 0.350%,
0.537%, due 10/19/261 | | $ | 60,188 | | | $ | 58,261 | | |
Structured ARM Loan Trust,
Series 2007-4, Class 1A2,
1 mo. USD LIBOR + 0.220%,
0.392%, due 05/25/371 | | | 142,683 | | | | 135,080 | | |
Structured Asset Mortgage Investments, Inc.,
Series 2006-AR3, Class 11A1,
1 mo. USD LIBOR + 0.210%,
0.382%, due 04/25/361 | | | 492,905 | | | | 492,823 | | |
Thornburg Mortgage Securities Trust,
Series 2005-1, Class A3,
3.636%, due 04/25/456 | | | 45,707 | | | | 43,438 | | |
Washington Mutual Mortgage
Pass-Through Certificates,
Series 2003-AR9, Class 2A,
4.253%, due 09/25/336 | | | 105,120 | | | | 98,978 | | |
Total mortgage-backed securities
(cost—$76,200,662) | | | 77,095,202 | | |
U.S. government agency obligations—138.5% | |
FHLMC
2.500%, due 01/01/31 | | | 206,315 | | | | 217,965 | | |
2.500%, due 11/01/31 | | | 53,162 | | | | 56,609 | | |
2.500%, due 07/01/32 | | | 142,172 | | | | 149,543 | | |
2.500%, due 08/01/32 | | | 639,048 | | | | 671,117 | | |
2.500%, due 09/01/32 | | | 823,722 | | | | 865,170 | | |
2.500%, due 11/01/32 | | | 21,019 | | | | 22,112 | | |
2.500%, due 12/01/32 | | | 738,269 | | | | 775,621 | | |
2.500%, due 01/01/33 | | | 183,613 | | | | 192,904 | | |
3.000%, due 01/01/33 | | | 2,232,148 | | | | 2,343,314 | | |
3.000%, due 04/01/43 | | | 228,564 | | | | 245,861 | | |
3.000%, due 05/01/43 | | | 173,870 | | | | 187,074 | | |
3.000%, due 12/01/44 | | | 173,222 | | | | 185,522 | | |
3.000%, due 04/01/45 | | | 1,171,700 | | | | 1,264,844 | | |
3.000%, due 08/01/46 | | | 366,659 | | | | 387,137 | | |
3.000%, due 12/01/46 | | | 1,381,436 | | | | 1,468,893 | | |
3.000%, due 06/01/50 | | | 999,048 | | | | 1,073,256 | | |
3.500%, due 09/01/32 | | | 404,862 | | | | 440,725 | | |
3.500%, due 05/01/50 | | | 20,011,092 | | | | 21,092,976 | | |
4.000%, due 01/01/37 | | | 220,016 | | | | 241,036 | | |
4.000%, due 07/01/43 | | | 191,691 | | | | 209,508 | | |
4.000%, due 04/01/44 | | | 181,435 | | | | 205,834 | | |
4.000%, due 08/01/44 | | | 2,470,096 | | | | 2,783,284 | | |
4.000%, due 04/01/47 | | | 349,358 | | | | 373,526 | | |
4.000%, due 05/01/47 | | | 347,318 | | | | 370,981 | | |
4.000%, due 08/01/47 | | | 669,328 | | | | 747,650 | | |
4.000%, due 11/01/47 | | | 493,977 | | | | 527,826 | | |
4.000%, due 01/01/48 | | | 1,276,115 | | | | 1,359,609 | | |
4.000%, due 02/01/48 | | | 55,961 | | | | 59,676 | | |
4.000%, due 03/01/48 | | | 37,102 | | | | 39,536 | | |
4.000%, due 04/01/48 | | | 100,499 | | | | 106,868 | | |
4.000%, due 06/01/48 | | | 368,984 | | | | 404,768 | | |
4.000%, due 12/01/48 | | | 601,926 | | | | 653,163 | | |
4.500%, due 09/01/34 | | | 847,033 | | | | 900,743 | | |
4.500%, due 01/01/36 | | | 19,353 | | | | 20,681 | | |
| | | Face
amount | | Value | |
U.S. government agency obligations—(continued) | |
4.500%, due 05/01/37 | | $ | 5,641 | | | $ | 6,103 | | |
4.500%, due 05/01/38 | | | 32,905 | | | | 34,269 | | |
5.000%, due 10/01/25 | | | 29,019 | | | | 31,713 | | |
5.000%, due 11/01/27 | | | 6,005 | | | | 6,562 | | |
5.000%, due 07/01/33 | | | 8,943 | | | | 9,657 | | |
5.000%, due 09/01/33 | | | 154,802 | | | | 174,904 | | |
5.000%, due 06/01/34 | | | 7,257 | | | | 8,331 | | |
5.000%, due 04/01/35 | | | 31,520 | | | | 34,507 | | |
5.000%, due 05/01/35 | | | 70,639 | | | | 81,048 | | |
5.000%, due 07/01/35 | | | 130,161 | | | | 149,337 | | |
5.000%, due 08/01/35 | | | 20,992 | | | | 24,091 | | |
5.000%, due 10/01/35 | | | 17,575 | | | | 20,171 | | |
5.000%, due 12/01/35 | | | 577 | | | | 662 | | |
5.000%, due 07/01/38 | | | 231,100 | | | | 264,433 | | |
5.000%, due 11/01/38 | | | 160,526 | | | | 183,958 | | |
5.000%, due 06/01/39 | | | 39,899 | | | | 45,839 | | |
5.000%, due 03/01/40 | | | 4,535 | | | | 5,212 | | |
5.000%, due 07/01/40 | | | 241,639 | | | | 276,088 | | |
5.000%, due 09/01/40 | | | 127,683 | | | | 143,794 | | |
5.000%, due 11/01/40 | | | 189,042 | | | | 216,709 | | |
5.000%, due 02/01/41 | | | 282,748 | | | | 321,233 | | |
5.000%, due 03/01/41 | | | 21,398 | | | | 24,432 | | |
5.000%, due 04/01/41 | | | 74,798 | | | | 84,868 | | |
5.000%, due 05/01/41 | | | 132,310 | | | | 151,877 | | |
5.000%, due 07/01/41 | | | 32,820 | | | | 37,541 | | |
5.000%, due 08/01/44 | | | 52,498 | | | | 60,255 | | |
5.000%, due 03/01/49 | | | 1,841,838 | | | | 2,076,744 | | |
5.500%, due 06/01/28 | | | 1,162 | | | | 1,283 | | |
5.500%, due 02/01/32 | | | 1,300 | | | | 1,491 | | |
5.500%, due 12/01/32 | | | 2,685 | | | | 3,130 | | |
5.500%, due 02/01/33 | | | 37,827 | | | | 41,812 | | |
5.500%, due 05/01/33 | | | 525 | | | | 611 | | |
5.500%, due 06/01/33 | | | 154,621 | | | | 180,363 | | |
5.500%, due 12/01/33 | | | 36,619 | | | | 41,527 | | |
5.500%, due 12/01/34 | | | 32,478 | | | | 38,028 | | |
5.500%, due 06/01/35 | | | 522,273 | | | | 610,678 | | |
5.500%, due 07/01/35 | | | 3,945 | | | | 4,377 | | |
5.500%, due 10/01/35 | | | 128,050 | | | | 142,774 | | |
5.500%, due 12/01/35 | | | 83,778 | | | | 97,519 | | |
5.500%, due 06/01/36 | | | 293,723 | | | | 342,909 | | |
5.500%, due 07/01/36 | | | 7,292 | | | | 7,663 | | |
5.500%, due 12/01/36 | | | 503,070 | | | | 579,672 | | |
5.500%, due 03/01/37 | | | 59,733 | | | | 68,797 | | |
5.500%, due 07/01/37 | | | 58,848 | | | | 63,712 | | |
5.500%, due 10/01/37 | | | 2,596 | | | | 2,996 | | |
5.500%, due 04/01/38 | | | 93,662 | | | | 108,006 | | |
5.500%, due 05/01/38 | | | 10,407 | | | | 11,931 | | |
5.500%, due 12/01/38 | | | 1,678 | | | | 1,920 | | |
5.500%, due 01/01/39 | | | 42,469 | | | | 48,992 | | |
5.500%, due 09/01/39 | | | 125,820 | | | | 145,489 | | |
5.500%, due 02/01/40 | | | 5,726 | | | | 6,580 | | |
5.500%, due 03/01/40 | | | 5,811 | | | | 6,655 | | |
5.500%, due 05/01/40 | | | 77,089 | | | | 88,806 | | |
5.500%, due 03/01/41 | | | 83,517 | | | | 96,108 | | |
6.000%, due 11/01/37 | | | 722,269 | | | | 846,876 | | |
7.000%, due 08/01/25 | | | 102 | | | | 112 | | |
20
PACE Mortgage-Backed Securities Fixed Income Investments
Portfolio of investments—July 31, 2020
| | | Face
amount | | Value | |
U.S. government agency obligations—(continued) | |
FHLMC ARM
1 year CMT + 2.282%,
3.529%, due 07/01/281 | | | $49,887 | | | | $50,103 | | |
1 year CMT + 2.132%,
3.570%, due 11/01/271 | | | 45,040 | | | | 45,110 | | |
12 mo. USD LIBOR + 1.783%,
3.612%, due 10/01/391 | | | 1,109,358 | | | | 1,169,641 | | |
1 year CMT + 2.257%,
3.616%, due 11/01/291 | | | 107,428 | | | | 110,945 | | |
1 year CMT + 2.225%,
3.714%, due 07/01/241 | | | 34,607 | | | | 34,932 | | |
12 mo. USD LIBOR + 1.865%,
3.732%, due 11/01/411 | | | 859,480 | | | | 898,348 | | |
1 year CMT + 2.282%,
3.819%, due 06/01/281 | | | 74,901 | | | | 75,504 | | |
1 year CMT + 2.137%,
3.845%, due 01/01/281 | | | 9,888 | | | | 9,910 | | |
1 year CMT + 2.371%,
3.883%, due 12/01/291 | | | 14,177 | | | | 14,284 | | |
1 year CMT + 2.415%,
3.947%, due 01/01/291 | | | 57,265 | | | | 57,834 | | |
12 mo. USD LIBOR + 1.765%,
3.989%, due 11/01/361 | | | 302,526 | | | | 317,990 | | |
1 year CMT + 2.468%,
4.003%, due 10/01/271 | | | 71,607 | | | | 72,179 | | |
1 year CMT + 2.415%,
4.011%, due 11/01/251 | | | 50,128 | | | | 50,398 | | |
1 year CMT + 2.185%,
4.053%, due 04/01/291 | | | 27,158 | | | | 27,336 | | |
1 year CMT + 2.250%,
4.115%, due 09/01/341 | | | 636,328 | | | | 664,812 | | |
1 year CMT + 2.303%,
4.168%, due 10/01/231 | | | 4,251 | | | | 4,260 | | |
1 year CMT + 2.447%,
4.196%, due 10/01/271 | | | 66,951 | | | | 67,224 | | |
1 year CMT + 2.625%,
4.375%, due 01/01/301 | | | 20,993 | | | | 21,058 | | |
FNMA | |
1 mo. USD LIBOR,
0.572%, due 03/25/491 | | | 5,347,448 | | | | 5,351,073 | | |
2.000%, due 05/01/28 | | | 153,670 | | | | 160,633 | | |
2.000%, due 09/01/31 | | | 179,034 | | | | 187,110 | | |
2.000%, due 11/01/31 | | | 373,013 | | | | 389,342 | | |
2.000%, due 01/01/32 | | | 72,077 | | | | 75,206 | | |
2.500%, due 06/01/28 | | | 155,629 | | | | 165,770 | | |
2.500%, due 07/01/28 | | | 1,249,768 | | | | 1,329,217 | | |
2.500%, due 08/01/28 | | | 411,489 | | | | 438,602 | | |
2.500%, due 09/01/30 | | | 27,802 | | | | 29,584 | | |
2.500%, due 11/01/30 | | | 45,966 | | | | 48,875 | | |
2.500%, due 01/01/33 | | | 419,081 | | | | 442,429 | | |
2.500%, due 07/01/50 | | | 1,496,446 | | | | 1,571,687 | | |
2.500%, due 08/01/50 | | | 5,500,000 | | | | 5,776,105 | | |
3.000%, due 11/01/26 | | | 382,874 | | | | 405,986 | | |
3.000%, due 05/01/28 | | | 154,773 | | | | 162,618 | | |
3.000%, due 02/01/30 | | | 245,671 | | | | 258,326 | | |
3.000%, due 04/01/30 | | | 80,571 | | | | 84,629 | | |
3.000%, due 05/01/30 | | | 88,457 | | | | 93,022 | | |
| | | Face
amount | | Value | |
U.S. government agency obligations—(continued) | |
3.000%, due 10/01/30 | | $ | 29,987 | | | $ | 31,537 | | |
3.000%, due 04/01/31 | | | 1,809,364 | | | | 1,937,457 | | |
3.000%, due 01/01/38 | | | 754,178 | | | | 801,368 | | |
3.000%, due 04/01/38 | | | 812,203 | | | | 862,786 | | |
3.000%, due 10/01/42 | | | 480,283 | | | | 518,701 | | |
3.000%, due 01/01/43 | | | 1,764,861 | | | | 1,899,135 | | |
3.000%, due 04/01/43 | | | 714,482 | | | | 771,808 | | |
3.000%, due 05/01/43 | | | 730,795 | | | | 786,618 | | |
3.000%, due 06/01/43 | | | 100,176 | | | | 107,745 | | |
3.000%, due 09/01/43 | | | 1,010,800 | | | | 1,099,190 | | |
3.000%, due 11/01/46 | | | 73,176 | | | | 77,631 | | |
3.000%, due 12/01/46 | | | 5,867,729 | | | | 6,310,792 | | |
3.000%, due 09/01/49 | | | 1,414,271 | | | | 1,531,556 | | |
3.000%, due 02/01/50 | | | 2,478,854 | | | | 2,678,615 | | |
3.000%, due 03/01/50 | | | 8,879,211 | | | | 9,451,137 | | |
3.000%, due 02/01/57 | | | 901,830 | | | | 970,241 | | |
3.000%, due 05/01/58 | | | 1,185,937 | | | | 1,275,421 | | |
3.500%, due 11/01/25 | | | 239,838 | | | | 251,927 | | |
3.500%, due 08/01/29 | | | 47,586 | | | | 50,427 | | |
3.500%, due 05/01/35 | | | 2,234,620 | | | | 2,342,519 | | |
3.500%, due 03/01/42 | | | 386,652 | | | | 425,116 | | |
3.500%, due 04/01/42 | | | 40,483 | | | | 43,863 | | |
3.500%, due 12/01/42 | | | 1,340,131 | | | | 1,481,289 | | |
3.500%, due 03/01/43 | | | 826,586 | | | | 913,924 | | |
3.500%, due 07/01/43 | | | 299,070 | | | | 327,751 | | |
3.500%, due 06/01/45 | | | 3,353,580 | | | | 3,599,855 | | |
3.500%, due 08/01/45 | | | 69,844 | | | | 74,737 | | |
3.500%, due 09/01/46 | | | 1,241,036 | | | | 1,350,430 | | |
3.500%, due 08/01/47 | | | 380,709 | | | | 415,710 | | |
3.500%, due 09/01/47 | | | 522,003 | | | | 580,465 | | |
3.500%, due 11/01/47 | | | 770,469 | | | | 840,688 | | |
3.500%, due 12/01/47 | | | 666,833 | | | | 728,143 | | |
3.500%, due 02/01/48 | | | 432,171 | | | | 473,125 | | |
3.500%, due 03/01/48 | | | 1,807,591 | | | | 1,978,893 | | |
3.500%, due 06/01/56 | | | 1,287,703 | | | | 1,403,909 | | |
3.500%, due 01/01/57 | | | 1,227,627 | | | | 1,338,411 | | |
3.500%, due 01/01/59 | | | 2,018,473 | | | | 2,200,268 | | |
3.575%, due 02/01/26 | | | 500,000 | | | | 563,012 | | |
4.000%, due 07/01/25 | | | 6,575 | | | | 6,960 | | |
4.000%, due 09/01/25 | | | 3,172 | | | | 3,360 | | |
4.000%, due 10/01/25 | | | 3,543 | | | | 3,752 | | |
4.000%, due 11/01/25 | | | 7,496 | | | | 7,942 | | |
4.000%, due 01/01/26 | | | 202,076 | | | | 214,068 | | |
4.000%, due 02/01/26 | | | 478,604 | | | | 507,467 | | |
4.000%, due 03/01/26 | | | 37,983 | | | | 40,234 | | |
4.000%, due 04/01/26 | | | 928,606 | | | | 985,785 | | |
4.000%, due 08/01/32 | | | 5,220 | | | | 5,606 | | |
4.000%, due 06/01/33 | | | 150,483 | | | | 162,286 | | |
4.000%, due 07/01/33 | | | 324,466 | | | | 349,999 | | |
4.000%, due 08/01/33 | | | 2,137,094 | | | | 2,336,454 | | |
4.000%, due 07/01/34 | | | 449,720 | | | | 483,133 | | |
4.000%, due 07/01/35 | | | 1,540,776 | | | | 1,680,934 | | |
4.000%, due 04/01/37 | | | 1,130,448 | | | | 1,220,439 | | |
4.000%, due 03/01/38 | | | 798,632 | | | | 878,306 | | |
4.000%, due 07/01/38 | | | 2,007,911 | | | | 2,146,833 | | |
4.000%, due 08/01/38 | | | 640,396 | | | | 689,221 | | |
4.000%, due 09/01/38 | | | 1,099,453 | | | | 1,173,285 | | |
21
PACE Mortgage-Backed Securities Fixed Income Investments
Portfolio of investments—July 31, 2020
| | | Face
amount | | Value | |
U.S. government agency obligations—(continued) | |
4.000%, due 05/01/39 | | $ | 112,539 | | | $ | 124,981 | | |
4.000%, due 09/01/39 | | | 268,587 | | | | 300,751 | | |
4.000%, due 09/01/40 | | | 2,373,366 | | | | 2,607,719 | | |
4.000%, due 12/01/40 | | | 3,515,773 | | | | 3,933,339 | | |
4.000%, due 04/01/41 | | | 802,157 | | | | 894,021 | | |
4.000%, due 11/01/41 | | | 527,079 | | | | 592,340 | | |
4.000%, due 12/01/41 | | | 728,196 | | | | 819,058 | | |
4.000%, due 07/01/42 | | | 3,181,723 | | | | 3,574,531 | | |
4.000%, due 09/01/42 | | | 4,606,588 | | | | 5,189,731 | | |
4.000%, due 10/01/42 | | | 3,642,692 | | | | 4,105,830 | | |
4.000%, due 08/01/44 | | | 188,608 | | | | 213,233 | | |
4.000%, due 12/01/44 | | | 33,394 | | | | 36,023 | | |
4.000%, due 06/01/45 | | | 24,589 | | | | 26,675 | | |
4.000%, due 08/01/45 | | | 2,049,833 | | | | 2,207,689 | | |
4.000%, due 02/01/47 | | | 229,234 | | | | 247,516 | | |
4.000%, due 03/01/47 | | | 94,702 | | | | 101,563 | | |
4.000%, due 04/01/47 | | | 522,191 | | | | 565,925 | | |
4.000%, due 05/01/47 | | | 646,142 | | | | 696,859 | | |
4.000%, due 06/01/47 | | | 25,050 | | | | 27,215 | | |
4.000%, due 09/01/47 | | | 181,286 | | | | 192,924 | | |
4.000%, due 10/01/47 | | | 23,564 | | | | 25,139 | | |
4.000%, due 11/01/47 | | | 59,363 | | | | 63,466 | | |
4.000%, due 01/01/48 | | | 1,388,678 | | | | 1,480,105 | | |
4.000%, due 02/01/48 | | | 553,098 | | | | 605,345 | | |
4.000%, due 03/01/48 | | | 471,085 | | | | 506,176 | | |
4.000%, due 04/01/48 | | | 287,102 | | | | 305,246 | | |
4.000%, due 12/01/48 | | | 980,785 | | | | 1,063,717 | | |
4.000%, due 02/01/49 | | | 219,782 | | | | 232,794 | | |
4.000%, due 06/01/49 | | | 2,308,174 | | | | 2,481,428 | | |
4.500%, due 06/01/29 | | | 18,202 | | | | 19,569 | | |
4.500%, due 06/01/35 | | | 15,354 | | | | 16,378 | | |
4.500%, due 12/01/38 | | | 376,688 | | | | 417,255 | | |
4.500%, due 01/01/39 | | | 1,136 | | | | 1,219 | | |
4.500%, due 03/01/39 | | | 7,713 | | | | 8,581 | | |
4.500%, due 06/01/39 | | | 52,751 | | | | 58,701 | | |
4.500%, due 07/01/39 | | | 2,716 | | | | 2,929 | | |
4.500%, due 08/01/39 | | | 86,462 | | | | 94,577 | | |
4.500%, due 10/01/39 | | | 3,879 | | | | 4,325 | | |
4.500%, due 12/01/39 | | | 315,817 | | | | 353,895 | | |
4.500%, due 01/01/40 | | | 3,127 | | | | 3,548 | | |
4.500%, due 02/01/40 | | | 3,369 | | | | 3,803 | | |
4.500%, due 03/01/40 | | | 63,656 | | | | 71,395 | | |
4.500%, due 08/01/40 | | | 54,211 | | | | 60,981 | | |
4.500%, due 11/01/40 | | | 360,590 | | | | 408,888 | | |
4.500%, due 07/01/41 | | | 354,212 | | | | 396,673 | | |
4.500%, due 08/01/41 | | | 648,961 | | | | 737,351 | | |
4.500%, due 09/01/41 | | | 5,463 | | | | 5,873 | | |
4.500%, due 01/01/42 | | | 1,682,778 | | | | 1,893,961 | | |
4.500%, due 08/01/42 | | | 2,951 | | | | 3,251 | | |
4.500%, due 09/01/43 | | | 253,333 | | | | 287,810 | | |
4.500%, due 11/01/43 | | | 48,936 | | | | 55,235 | | |
4.500%, due 07/01/44 | | | 252,368 | | | | 284,715 | | |
4.500%, due 12/01/44 | | | 1,607 | | | | 1,776 | | |
4.500%, due 08/01/48 | | | 200,000 | | | | 215,023 | | |
4.500%, due 09/01/48 | | | 688,652 | | | | 748,819 | | |
4.500%, due 01/01/49 | | | 601,766 | | | | 653,179 | | |
4.500%, due 04/01/59 | | | 1,411,673 | | | | 1,579,574 | | |
| | | Face
amount | | Value | |
U.S. government agency obligations—(continued) | |
5.000%, due 03/01/23 | | $ | 692 | | | $ | 727 | | |
5.000%, due 05/01/23 | | | 32,590 | | | | 34,349 | | |
5.000%, due 03/01/25 | | | 10,420 | | | | 11,385 | | |
5.000%, due 03/01/33 | | | 13,137 | | | | 13,674 | | |
5.000%, due 05/01/37 | | | 5,765 | | | | 6,273 | | |
5.000%, due 09/01/37 | | | 26,223 | | | | 28,393 | | |
5.000%, due 06/01/38 | | | 45,926 | | | | 49,779 | | |
5.000%, due 06/01/48 | | | 368,596 | | | | 412,190 | | |
5.000%, due 07/01/48 | | | 844,279 | | | | 924,169 | | |
5.000%, due 10/01/48 | | | 668,519 | | | | 731,285 | | |
5.000%, due 12/01/48 | | | 9,873 | | | | 10,790 | | |
5.000%, due 01/01/49 | | | 89,000 | | | | 97,382 | | |
5.000%, due 03/01/49 | | | 139,593 | | | | 152,792 | | |
5.500%, due 11/01/32 | | | 25,299 | | | | 27,874 | | |
5.500%, due 12/01/33 | | | 963 | | | | 1,085 | | |
5.500%, due 04/01/34 | | | 23,900 | | | | 27,068 | | |
5.500%, due 01/01/35 | | | 112,996 | | | | 125,105 | | |
5.500%, due 04/01/36 | | | 79,787 | | | | 87,903 | | |
5.500%, due 05/01/37 | | | 141,399 | | | | 163,257 | | |
5.500%, due 07/01/37 | | | 81,538 | | | | 94,118 | | |
5.500%, due 06/01/38 | | | 105,379 | | | | 121,113 | | |
5.500%, due 11/01/39 | | | 272,224 | | | | 313,184 | | |
5.500%, due 07/01/40 | | | 371,625 | | | | 427,019 | | |
5.500%, due 02/01/42 | | | 199,937 | | | | 230,881 | | |
6.000%, due 11/01/21 | | | 7,287 | | | | 7,428 | | |
6.000%, due 01/01/23 | | | 36,302 | | | | 36,756 | | |
6.000%, due 03/01/23 | | | 37,769 | | | | 39,130 | | |
6.000%, due 11/01/26 | | | 14,309 | | | | 15,913 | | |
6.000%, due 12/01/32 | | | 8,923 | | | | 10,448 | | |
6.000%, due 02/01/33 | | | 26,029 | | | | 29,691 | | |
6.000%, due 09/01/34 | | | 84,104 | | | | 97,463 | | |
6.000%, due 05/01/35 | | | 33,229 | | | | 37,127 | | |
6.000%, due 06/01/35 | | | 12,359 | | | | 14,543 | | |
6.000%, due 07/01/35 | | | 33,467 | | | | 37,543 | | |
6.000%, due 09/01/35 | | | 1,228 | | | | 1,446 | | |
6.000%, due 01/01/36 | | | 22,734 | | | | 26,796 | | |
6.000%, due 06/01/36 | | | 218 | | | | 243 | | |
6.000%, due 09/01/36 | | | 29,508 | | | | 34,684 | | |
6.000%, due 10/01/36 | | | 9,616 | | | | 10,824 | | |
6.000%, due 12/01/36 | | | 94,886 | | | | 111,518 | | |
6.000%, due 03/01/37 | | | 12,097 | | | | 14,190 | | |
6.000%, due 10/01/37 | | | 30,810 | | | | 35,873 | | |
6.000%, due 11/01/38 | | | 278,547 | | | | 336,202 | | |
6.000%, due 05/01/39 | | | 35,563 | | | | 41,614 | | |
6.000%, due 11/01/40 | | | 394,569 | | | | 484,584 | | |
6.500%, due 10/01/36 | | | 321,119 | | | | 370,929 | | |
6.500%, due 02/01/37 | | | 3,227 | | | | 3,806 | | |
6.500%, due 07/01/37 | | | 30,533 | | | | 33,977 | | |
6.500%, due 08/01/37 | | | 26,968 | | | | 30,010 | | |
6.500%, due 09/01/37 | | | 30,755 | | | | 34,625 | | |
6.500%, due 12/01/37 | | | 48,538 | | | | 57,516 | | |
6.500%, due 08/01/38 | | | 1,097 | | | | 1,268 | | |
6.500%, due 05/01/40 | | | 828,708 | | | | 966,567 | | |
7.500%, due 11/01/26 | | | 9,769 | | | | 9,844 | | |
8.000%, due 11/01/26 | | | 3,213 | | | | 3,239 | | |
9.000%, due 02/01/26 | | | 5,323 | | | | 5,380 | | |
22
PACE Mortgage-Backed Securities Fixed Income Investments
Portfolio of investments—July 31, 2020
| | | Face
amount | | Value | |
U.S. government agency obligations—(continued) | |
FNMA ARM
12 mo. MTA + 1.200%,
2.523%, due 03/01/441 | | | $135,302 | | | | $135,588 | | |
12 mo. USD LIBOR + 1.731%,
3.299%, due 05/01/381 | | | 984,390 | | | | 1,037,308 | | |
1 year CMT + 2.217%,
3.331%, due 10/01/371 | | | 1,592,068 | | | | 1,662,476 | | |
1 year CMT + 2.237%,
3.349%, due 01/01/361 | | | 336,466 | | | | 351,732 | | |
1 year CMT + 2.050%,
3.456%, due 09/01/411 | | | 381,700 | | | | 397,910 | | |
1 year CMT + 2.102%,
3.685%, due 05/01/301 | | | 25,075 | | | | 25,119 | | |
12 mo. USD LIBOR + 1.790%,
3.790%, due 02/01/421 | | | 213,610 | | | | 224,221 | | |
1 year CMT + 2.083%,
3.795%, due 02/01/261 | | | 19,702 | | | | 19,907 | | |
1 year CMT + 2.325%,
3.825%, due 03/01/251 | | | 16,947 | | | | 16,982 | | |
1 year CMT + 2.283%,
3.914%, due 05/01/351 | | | 161,252 | | | | 168,780 | | |
1 year CMT + 2.095%,
4.095%, due 09/01/261 | | | 141 | | | | 141 | | |
1 year CMT + 2.507%,
4.156%, due 12/01/271 | | | 14,140 | | | | 14,194 | | |
GNMA
3.000%, due 11/15/42 | | | 69,469 | | | | 73,584 | | |
3.000%, due 02/15/43 | | | 534,077 | | | | 582,572 | | |
3.000%, due 05/15/43 | | | 865,870 | | | | 914,439 | | |
3.000%, due 06/15/43 | | | 321,577 | | | | 339,753 | | |
3.000%, due 07/15/43 | | | 98,282 | | | | 103,941 | | |
3.000%, due 01/15/45 | | | 344,161 | | | | 374,876 | | |
3.000%, due 02/15/45 | | | 42,247 | | | | 46,020 | | |
3.000%, due 07/15/45 | | | 575,129 | | | | 626,680 | | |
3.000%, due 10/15/45 | | | 900,498 | | | | 975,608 | | |
3.500%, due 11/15/42 | | | 673,893 | | | | 715,797 | | |
3.500%, due 03/15/45 | | | 281,387 | | | | 316,764 | | |
3.500%, due 04/15/45 | | | 572,975 | | | | 614,813 | | |
4.000%, due 12/15/41 | | | 967,333 | | | | 1,040,561 | | |
4.000%, due 01/15/47 | | | 117,828 | | | | 126,144 | | |
4.000%, due 02/15/47 | | | 637,371 | | | | 681,399 | | |
4.000%, due 04/15/47 | | | 966,659 | | | | 1,030,529 | | |
4.000%, due 05/15/47 | | | 111,487 | | | | 118,705 | | |
4.000%, due 06/15/47 | | | 109,154 | | | | 115,900 | | |
4.000%, due 07/15/47 | | | 127,702 | | | | 135,527 | | |
4.000%, due 08/15/47 | | | 197,053 | | | | 209,808 | | |
4.000%, due 12/15/47 | | | 49,854 | | | | 52,957 | | |
4.500%, due 09/15/39 | | | 446,464 | | | | 501,513 | | |
4.500%, due 06/15/40 | | | 224,320 | | | | 249,378 | | |
4.500%, due 12/15/45 | | | 21,150 | | | | 23,263 | | |
4.500%, due 07/15/46 | | | 8,078 | | | | 8,922 | | |
4.500%, due 08/15/46 | | | 9,780 | | | | 10,845 | | |
4.500%, due 09/15/46 | | | 190,294 | | | | 211,751 | | |
4.500%, due 10/15/46 | | | 479,790 | | | | 532,153 | | |
4.500%, due 01/15/47 | | | 627,067 | | | | 693,681 | | |
5.000%, due 12/15/34 | | | 39,155 | | | | 43,025 | | |
5.000%, due 04/15/38 | | | 72,915 | | | | 81,118 | | |
| | | Face
amount | | Value | |
U.S. government agency obligations—(continued) | |
5.000%, due 12/15/39 | | $ | 5,543 | | | $ | 6,350 | | |
5.000%, due 05/15/40 | | | 203,985 | | | | 232,066 | | |
5.000%, due 05/15/41 | | | 35,090 | | | | 38,511 | | |
5.500%, due 08/15/35 | | | 20,081 | | | | 23,490 | | |
5.500%, due 02/15/38 | | | 1,943 | | | | 2,272 | | |
5.500%, due 04/15/38 | | | 162,900 | | | | 188,442 | | |
5.500%, due 05/15/38 | | | 186,239 | | | | 216,954 | | |
5.500%, due 06/15/38 | | | 86,867 | | | | 101,561 | | |
5.500%, due 10/15/38 | | | 452,281 | | | | 526,531 | | |
5.500%, due 11/15/38 | | | 27,298 | | | | 31,579 | | |
5.500%, due 12/15/38 | | | 5,362 | | | | 6,268 | | |
5.500%, due 03/15/39 | | | 30,936 | | | | 34,095 | | |
5.500%, due 05/15/39 | | | 40,682 | | | | 47,479 | | |
5.500%, due 09/15/39 | | | 210,273 | | | | 245,838 | | |
5.500%, due 01/15/40 | | | 4,625 | | | | 5,237 | | |
5.500%, due 03/15/40 | | | 266,560 | | | | 309,491 | | |
6.500%, due 02/15/29 | | | 487 | | | | 542 | | |
6.500%, due 01/15/36 | | | 10,005 | | | | 11,023 | | |
6.500%, due 09/15/36 | | | 115,176 | | | | 128,595 | | |
6.500%, due 02/15/37 | | | 10,273 | | | | 12,196 | | |
6.500%, due 04/15/37 | | | 5,053 | | | | 5,758 | | |
6.500%, due 01/15/38 | | | 6,012 | | | | 6,934 | | |
6.500%, due 06/15/38 | | | 26,233 | | | | 31,360 | | |
6.500%, due 07/15/38 | | | 4,958 | | | | 5,552 | | |
6.500%, due 11/15/38 | | | 4,245 | | | | 5,187 | | |
8.000%, due 02/15/23 | | | 100 | | | | 104 | | |
GNMA II
3.000%, due 09/20/47 | | | 1,520,189 | | | | 1,609,511 | | |
3.000%, due 05/20/50 | | | 2,488,067 | | | | 2,634,259 | | |
3.500%, due 04/20/45 | | | 8,465 | | | | 9,052 | | |
3.500%, due 11/20/45 | | | 599,661 | | | | 653,713 | | |
3.500%, due 04/20/46 | | | 680,409 | | | | 733,579 | | |
3.500%, due 05/20/46 | | | 1,127,074 | | | | 1,186,721 | | |
3.500%, due 04/20/47 | | | 481,038 | | | | 527,858 | | |
3.500%, due 07/20/47 | | | 4,425,233 | | | | 4,861,463 | | |
3.500%, due 08/20/47 | | | 440,171 | | | | 485,927 | | |
3.500%, due 09/20/47 | | | 175,013 | | | | 191,811 | | |
3.500%, due 11/20/47 | | | 575,922 | | | | 628,847 | | |
3.500%, due 12/20/47 | | | 121,320 | | | | 133,931 | | |
3.500%, due 01/20/48 | | | 2,726,463 | | | | 2,985,789 | | |
3.500%, due 02/20/48 | | | 2,240,442 | | | | 2,445,233 | | |
3.500%, due 03/20/48 | | | 3,655,318 | | | | 4,009,268 | | |
3.500%, due 09/20/48 | | | 1,923,200 | | | | 2,031,751 | | |
3.500%, due 01/20/50 | | | 671,205 | | | | 705,936 | | |
3.500%, due 03/20/50 | | | 2,936,722 | | | | 3,106,076 | | |
3.750%, due 05/20/30 | | | 494,308 | | | | 526,386 | | |
4.000%, due 12/20/40 | | | 437,079 | | | | 465,862 | | |
4.000%, due 07/20/41 | | | 48,091 | | | | 51,141 | | |
4.000%, due 03/20/47 | | | 993,235 | | | | 1,069,381 | | |
4.000%, due 12/20/47 | | | 65,734 | | | | 75,184 | | |
4.000%, due 01/20/48 | | | 184,611 | | | | 211,270 | | |
4.000%, due 03/20/48 | | | 412,967 | | | | 456,216 | | |
4.000%, due 04/20/48 | | | 897,888 | | | | 976,749 | | |
4.000%, due 05/20/48 | | | 233,374 | | | | 256,608 | | |
4.000%, due 06/20/48 | | | 301,174 | | | | 336,483 | | |
4.000%, due 07/20/48 | | | 109,693 | | | | 123,184 | | |
4.500%, due 10/20/44 | | | 302,333 | | | | 319,471 | | |
23
PACE Mortgage-Backed Securities Fixed Income Investments
Portfolio of investments—July 31, 2020
| | | Face
amount | | Value | |
U.S. government agency obligations—(continued) | |
4.500%, due 02/20/45 | | $ | 388,738 | | | $ | 410,879 | | |
4.500%, due 08/20/45 | | | 189,966 | | | | 209,388 | | |
4.500%, due 02/20/46 | | | 132,841 | | | | 140,318 | | |
4.500%, due 04/20/48 | | | 88,661 | | | | 95,668 | | |
4.500%, due 05/20/48 | | | 263,616 | | | | 284,300 | | |
4.500%, due 06/20/48 | | | 669,997 | | | | 722,119 | | |
4.500%, due 10/20/48 | | | 487,865 | | | | 523,369 | | |
4.500%, due 01/20/49 | | | 682,062 | | | | 730,026 | | |
4.500%, due 02/20/49 | | | 1,137,321 | | | | 1,216,359 | | |
5.000%, due 12/20/33 | | | 160,087 | | | | 181,550 | | |
5.000%, due 01/20/34 | | | 82,132 | | | | 93,313 | | |
5.000%, due 02/20/38 | | | 94,907 | | | | 106,728 | | |
5.000%, due 04/20/38 | | | 127,530 | | | | 145,093 | | |
5.000%, due 08/20/41 | | | 15,652 | | | | 17,806 | | |
5.000%, due 12/20/42 | | | 21,992 | | | | 25,021 | | |
5.000%, due 08/20/43 | | | 1,895,983 | | | | 2,156,628 | | |
5.000%, due 09/20/48 | | | 343,352 | | | | 377,203 | | |
5.000%, due 10/20/48 | | | 392,387 | | | | 432,858 | | |
5.000%, due 11/20/48 | | | 1,206,427 | | | | 1,308,606 | | |
5.000%, due 12/20/48 | | | 920,033 | | | | 997,742 | | |
5.500%, due 09/20/48 | | | 76,816 | | | | 84,121 | | |
6.000%, due 10/20/38 | | | 2,745 | | | | 3,180 | | |
6.500%, due 09/20/32 | | | 2,587 | | | | 2,949 | | |
6.500%, due 11/20/38 | | | 10,510 | | | | 11,168 | | |
6.500%, due 12/20/38 | | | 5,083 | | | | 5,522 | | |
7.000%, due 03/20/28 | | | 35,150 | | | | 35,572 | | |
9.000%, due 04/20/25 | | | 4,169 | | | | 4,618 | | |
9.000%, due 12/20/26 | | | 2,190 | | | | 2,263 | | |
9.000%, due 01/20/27 | | | 7,465 | | | | 7,536 | | |
9.000%, due 09/20/30 | | | 951 | | | | 955 | | |
9.000%, due 10/20/30 | | | 3,074 | | | | 3,182 | | |
9.000%, due 11/20/30 | | | 3,898 | | | | 3,915 | | |
GNMA II ARM | |
1 year CMT + 1.500%,
2.875%, due 06/20/221 | | | 9,487 | | | | 9,555 | | |
1 year CMT + 1.500%,
2.875%, due 04/20/241 | | | 11,118 | | | | 11,191 | | |
1 year CMT + 1.500%,
2.875%, due 05/20/251 | | | 2,783 | | | | 2,863 | | |
1 year CMT + 1.500%,
2.875%, due 04/20/261 | | | 55,738 | | | | 56,044 | | |
1 year CMT + 1.500%,
2.875%, due 06/20/261 | | | 23,006 | | | | 23,281 | | |
1 year CMT + 1.500%,
2.875%, due 04/20/271 | | | 12,819 | | | | 12,891 | | |
1 year CMT + 1.500%,
2.875%, due 04/20/301 | | | 8,550 | | | | 8,908 | | |
1 year CMT + 1.500%,
2.875%, due 05/20/301 | | | 227,932 | | | | 238,182 | | |
1 year CMT + 1.500%,
3.000%, due 01/20/231 | | | 10,299 | | | | 10,509 | | |
1 year CMT + 1.500%,
3.000%, due 03/20/231 | | | 4,467 | | | | 4,519 | | |
1 year CMT + 1.500%,
3.000%, due 01/20/241 | | | 15,885 | | | | 16,080 | | |
1 year CMT + 1.500%,
3.000%, due 01/20/251 | | | 2,109 | | | | 2,177 | | |
| | | Face
amount | | Value | |
U.S. government agency obligations—(continued) | | | |
1 year CMT + 1.500%,
3.000%, due 02/20/251 | | $ | 3,776 | | | $ | 3,819 | | |
1 year CMT + 1.500%,
3.000%, due 03/20/251 | | | 7,866 | | | | 7,990 | | |
1 year CMT + 1.500%,
3.000%, due 05/20/251 | | | 17,117 | | | | 17,159 | | |
1 year CMT + 1.500%,
3.000%, due 06/20/251 | | | 9,056 | | | | 9,115 | | |
1 year CMT + 1.500%,
3.000%, due 03/20/261 | | | 5,817 | | | | 5,898 | | |
1 year CMT + 1.500%,
3.000%, due 01/20/271 | | | 53,262 | | | | 54,156 | | |
1 year CMT + 1.500%,
3.000%, due 02/20/271 | | | 4,045 | | | | 4,086 | | |
1 year CMT + 1.500%,
3.000%, due 01/20/281 | | | 5,521 | | | | 5,723 | | |
1 year CMT + 1.500%,
3.000%, due 02/20/281 | | | 4,227 | | | | 4,281 | | |
1 year CMT + 1.500%,
3.125%, due 11/20/211 | | | 1,796 | | | | 1,808 | | |
1 year CMT + 1.500%,
3.125%, due 10/20/301 | | | 10,673 | | | | 10,806 | | |
1 year CMT + 1.500%,
3.250%, due 09/20/211 | | | 10,468 | | | | 10,510 | | |
1 year CMT + 1.500%,
3.250%, due 08/20/251 | | | 7,366 | | | | 7,483 | | |
1 year CMT + 1.500%,
3.250%, due 09/20/251 | | | 10,866 | | | | 11,207 | | |
1 year CMT + 1.500%,
3.250%, due 08/20/261 | | | 11,558 | | | | 11,726 | | |
1 year CMT + 1.500%,
3.250%, due 09/20/261 | | | 1,925 | | | | 1,944 | | |
1 year CMT + 1.500%,
3.250%, due 07/20/271 | | | 4,566 | | | | 4,735 | | |
1 year CMT + 1.500%,
3.250%, due 08/20/271 | | | 14,929 | | | | 15,044 | | |
1 year CMT + 1.500%,
3.250%, due 07/20/301 | | | 47,042 | | | | 48,701 | | |
1 year CMT + 1.500%,
3.250%, due 08/20/301 | | | 52,080 | | | | 54,715 | | |
GNMA TBA
4.000% | | | 2,500,000 | | | | 2,647,363 | | |
| 4.500% | | | 2,000,000 | | | | 2,183,672 | | |
GNMA II TBA
2.000% | | | 1,500,000 | | | | 1,565,274 | | |
| 2.500% | | | 1,000,000 | | | | 1,051,602 | | |
| 3.000% | | | 28,350,000 | | | | 29,867,659 | | |
| 3.500% | | | 2,350,000 | | | | 2,472,732 | | |
| 4.000% | | | 8,150,000 | | | | 8,653,326 | | |
| 4.500% | | | 2,410,000 | | | | 2,573,616 | | |
UMBS TBA
1.500% | | | 3,000,000 | | | | 3,069,492 | | |
| 2.000%7 | | | 9,000,000 | | | | 9,318,786 | | |
| 2.500%7 | | | 62,950,000 | | | | 65,923,530 | | |
| 3.000% | | | 30,650,000 | | | | 32,238,732 | | |
| 3.500%7 | | | 24,597,000 | | | | 25,911,932 | | |
| 4.000% | | | 13,700,000 | | | | 14,553,881 | | |
24
PACE Mortgage-Backed Securities Fixed Income Investments
Portfolio of investments—July 31, 2020
| | | Face
amount | | Value | |
U.S. government agency obligations—(concluded) | | | |
| 4.500% | | $ | 3,000,000 | | | $ | 3,227,109 | | |
| 5.000% | | | 2,000,000 | | | | 2,187,987 | | |
| 6.000% | | | 1,000,000 | | | | 1,113,982 | | |
Total U.S. government agency obligations
(cost—$444,953,647) | | | 454,634,623 | | |
| | | Number of
shares | | | |
Short-term investments—1.1% | | | |
Investment companies—1.1% | | | |
State Street Institutional U.S. Government
Money Market Fund, 0.09%8
(cost—$3,555,289) | | | 3,555,289 | | | | 3,555,289 | | |
| | | Face
amount | | | |
Short-term U.S. Treasury obligations—0.0%†,9 | | | |
U.S. Treasury Bills
0.158%, due 09/03/20
(cost—$40,994) | | $ | 41,000 | | | | 40,994 | | |
Repurchase agreements—1.1% | | | |
Repurchase agreement dated 07/31/20 with
BNP Paribas Securities Corp., 0.130% due
08/03/20, collateralized by 3,666,881
Government National Mortgage Association
obligations, 4.000% due 02/20/49;
(value—$3,900,091); proceeds: $3, 800,041
(cost—$3,800,000) | | | 3,800,000 | | | | 3,800,000 | | |
| | Number of
contracts | | Notional
amount | | | |
Options purchased—0.0%† | |
Put options—0.0%† | |
FNMA TBA, 0.000%, strike
@ 69.00, expires 08/06/20
(Counterparty JPMCB) | | | 29,000 | | | USD | 200,100,000 | | | | 0 | | |
FNMA TBA, 0.000%, strike
@ 70.00, expires 08/06/20
(Counterparty JPMCB) | | | 50,000 | | | USD | 350,000,000 | | | | 0 | | |
FNMA TBA, 0.000%, strike
@ 76.00, expires 08/06/20
(Counterparty JPMCB) | | | 120,000 | | | USD | 912,000,000 | | | | 0 | | |
FNMA TBA, 2.000%, strike
@ 69.00, expires 08/06/20
(Counterparty JPMCB) | | | 130,000 | | | USD | 897,000,000 | | | | 0 | | |
FNMA TBA, 2.000%, strike
@ 70.00, expires 08/06/20
(Counterparty JPMCB) | | | 150,000 | | | USD | 1,050,000,000 | | | | 0 | | |
FNMA TBA, 2.000%, strike
@ 71.00, expires 10/07/20
(Counterparty JPMCB) | | | 180,000 | | | USD | 1,278,000,000 | | | | 0 | | |
FNMA TBA, 2.500%, strike
@ 65.00, expires 08/06/20
(Counterparty CITI) | | | 365,000 | | | USD | 2,372,500,000 | | | | 1 | | |
| | | Number of
contracts | | Notional
amount | | Value | |
Options purchased—(concluded) | |
FNMA TBA, 2.500%, strike
@ 70.00, expires 08/06/20
(Counterparty JPMCB) | | | 50,000 | | | USD | 350,000,000 | | | $ | 0 | | |
FNMA TBA, 2.500%, strike
@ 72.00, expires 10/07/20
(Counterparty JPMCB) | | | 400,000 | | | USD | 2,880,000,000 | | | | 1 | | |
FNMA TBA, 3.000%, strike
@ 71.00, expires 08/06/20
(Counterparty JPMCB) | | | 75,000 | | | USD | 532,500,000 | | | | 0 | | |
Total options purchased
(cost—$6,051) | | | | | | | 2 | | |
| | | Number of
shares | | | | | |
Swaptions purchased—0.0%† | |
Put swaptions—0.0%† | |
3 Month USD LIBOR Interest
Rate Swap, strike @ 0.400%,
expires 08/06/20
(Counterparty GS; receive
fixed rate); underlying swap
terminates 08/10/25 | | | 49,000 | | | USD | 4,900,000 | | | | 2 | | |
3 Month USD LIBOR Interest
Rate Swap, strike @ 0.815%,
expires 08/06/20
(Counterparty DB; receive
fixed rate); underlying swap
terminates 08/10/30 | | | 76,000 | | | USD | 7,600,000 | | | | 10 | | |
3 Month USD LIBOR Interest
Rate Swap, strike @ 1.016%,
expires 08/06/20
(Counterparty GS; receive
fixed rate); underlying swap
terminates 08/10/30 | | | 16,000 | | | USD | 1,600,000 | | | | 0 | | |
3 Month USD LIBOR Interest
Rate Swap, strike @ 1.030%,
expires 08/06/20
(Counterparty GS; receive
fixed rate); underlying swap
terminates 08/10/30 | | | 90,000 | | | USD | 9,000,000 | | | | 1 | | |
3 Month USD LIBOR Interest
Rate Swap, strike @ 1.500%,
expires 02/26/21
(Counterparty BNP; receive
fixed rate); underlying swap
terminates 03/03/31 | | | 38,000 | | | USD | 3,800,000 | | | | 3,053 | | |
3 Month USD LIBOR Interest
Rate Swap, strike @ 1.500%,
expires 02/26/21
(Counterparty DB; receive
fixed rate); underlying swap
terminates 03/02/31 | | | 62,500 | | | USD | 6,250,000 | | | | 5,021 | | |
25
PACE Mortgage-Backed Securities Fixed Income Investments
Portfolio of investments—July 31, 2020
| | | Number of
shares | | Notional
amount | | Value | |
Swaptions purchased—(concluded) | |
3 Month USD LIBOR Interest
Rate Swap, strike @ 1.500%,
expires 02/26/21
(Counterparty GS; receive
fixed rate); underlying swap
terminates 03/02/31 | | | 13,500 | | | USD | 1,350,000 | | | $ | 1,084 | | |
Total swaptions purchased
(cost—$195,530) | | | | | | | 9,171 | | |
Total investments before
investments sold short
(cost—$575,376,468)—178.5% | | | | | | | 586,105,015 | | |
| | | Face
amount | | Value | |
Investments sold short—(2.7)% | | | |
UMBS TBA
2.000% | | $ | (1,500,000 | ) | | $ | (1,551,606 | ) | |
| 2.500% | | | (1,900,000 | ) | | | (1,992,923 | ) | |
| 3.500% | | | (3,097,000 | ) | | | (3,267,380 | ) | |
| 5.500% | | | (2,000,000 | ) | | | (2,207,494 | ) | |
Total investments sold short
(proceeds—$8,999,178) | | | | | (9,019,403 | ) | |
Liabilities in excess of other assets—(75.8)% | | | | | (248,755,737 | ) | |
Net assets—100.0% | | | | $ | 328,329,875 | | |
For a listing of defined portfolio acronyms, counterparty acronyms and currency abbreviations that are used throughout the Portfolio of investments as well as the tables that follow, please refer to page 267.
| | Face
amount | | Value | |
Reverse repurchase agreements—(6.5)% | |
Reverse repurchase agreement dated 07/13/20 with Bank of America Securities, 0.210%, to be repurchased 08/13/20 for $(21,221,036),
collateralized by 2,470,095 Federal Home Loan Mortgage Corp. obligation, 4.000% due 08/01/44, 10,742,004 Federal National
Mortgage Association obligations, 3.000% - 4.000% due 10/01/42 - 12/01/46 and 7,007,052 Government National Mortgage
Association obligations, 3.500% - 4.000% due 03/20/48 - 02/20/49; (value—$(22,167,651)) (cost—$(21,219,427)) | | | (21,219,427 | ) | | $ | (21,219,427 | ) | |
Options written
Notional
amount | | Number of
contracts | | Call option | | Expiration
date | | Premiums
received | | Current
value | | Unrealized
appreciation
(depreciation) | |
USD | 516,550,000 | | | | 5,000,000 | | | FNMA TBA, 2.000%, strike @ 103.31 (Counterparty JPMCB) | | 09/08/20 | | $ | 15,625 | | | $ | (21,687 | ) | | $ | (6,062 | ) | |
USD | 414,400,000 | | | | 4,000,000 | | | FNMA TBA, 2.000%, strike @ 103.60 (Counterparty JPMCB) | | 10/07/20 | | | 9,375 | | | | (13,112 | ) | | | (3,737 | ) | |
USD | 103,970,000 | | | | 1,000,000 | | | FNMA TBA, 2.000%, strike @ 103.97 (Counterparty JPMCB) | | 10/07/20 | | | 1,953 | | | | (1,642 | ) | | | 311 | | |
Total | | | | | | | | $ | 26,953 | | | $ | (36,441 | ) | | $ | (9,488 | ) | |
| | | | | Put options | | | | | | | | | |
USD | 402,560,000 | | | | 4,000,000 | | | FNMA TBA, 2.000%, strike @ 100.64 (Counterparty JPMCB) | | 08/06/20 | | $ | 30,000 | | | $ | — | | | $ | 30,000 | | |
USD | 1,004,400,000 | | | | 10,000,000 | | | FNMA TBA, 2.000%, strike @ 100.44 (Counterparty JPMCB) | | 08/06/20 | | | 84,375 | | | | — | | | | 84,375 | | |
USD | 506,550,000 | | | | 5,000,000 | | | FNMA TBA, 2.000%, strike @ 101.31 (Counterparty JPMCB) | | 09/08/20 | | | 22,656 | | | | (5,201 | ) | | | 17,455 | | |
USD | 203,960,000 | | | | 2,000,000 | | | FNMA TBA, 2.000%, strike @ 101.98 (Counterparty JPMCB) | | 10/07/20 | | | 6,562 | | | | (6,966 | ) | | | (404 | ) | |
USD | 406,400,000 | | | | 4,000,000 | | | FNMA TBA, 2.000%, strike @ 101.60 (Counterparty JPMCB) | | 10/07/20 | | | 14,375 | | | | (12,106 | ) | | | 2,269 | | |
USD | 203,100,000 | | | | 2,000,000 | | | FNMA TBA, 2.000%, strike @ 101.55 (Counterparty JPMCB) | | 10/07/20 | | | 9,063 | | | | (5,951 | ) | | | 3,112 | | |
USD | 203,680,000 | | | | 2,000,000 | | | FNMA TBA, 2.000%, strike @ 101.84 (Counterparty JPMCB) | | 10/07/20 | | | 6,641 | | | | (6,593 | ) | | | 48 | | |
USD | 357,175,000 | | | | 3,500,000 | | | FNMA TBA, 2.500%, strike @ 102.05 (Counterparty GS) | | 08/06/20 | | | 14,219 | | | | — | | | | 14,219 | | |
USD | 255,325,000 | | | | 2,500,000 | | | FNMA TBA, 2.500%, strike @ 102.13 (Counterparty GS) | | 08/06/20 | | | 9,766 | | | | — | | | | 9,766 | | |
USD | 357,315,000 | | | | 3,500,000 | | | FNMA TBA, 2.500%, strike @ 102.09 (Counterparty JPMCB) | | 08/06/20 | | | 13,672 | | | | — | | | | 13,672 | | |
USD | 204,260,000 | | | | 2,000,000 | | | FNMA TBA, 2.500%, strike @ 102.13 (Counterparty JPMCB) | | 08/06/20 | | | 7,812 | | | | — | | | | 7,812 | | |
USD | 461,520,000 | | | | 4,500,000 | | | FNMA TBA, 2.500%, strike @ 102.56 (Counterparty JPMCB) | | 08/06/20 | | | 23,906 | | | | — | | | | 23,906 | | |
USD | 357,280,000 | | | | 3,500,000 | | | FNMA TBA, 2.500%, strike @ 102.08 (Counterparty GS) | | 08/06/20 | | | 14,766 | | | | — | | | | 14,766 | | |
USD | 358,470,000 | | | | 3,500,000 | | | FNMA TBA, 2.500%, strike @ 102.42 (Counterparty CITI) | | 08/06/20 | | | 22,969 | | | | — | | | | 22,969 | | |
USD | 208,800,000 | | | | 2,000,000 | | | FNMA TBA, 3.000%, strike @ 104.40 (Counterparty GS) | | 08/06/20 | | | 9,687 | | | | — | | | | 9,687 | | |
USD | 313,680,000 | | | | 3,000,000 | | | FNMA TBA, 3.000%, strike @ 104.56 (Counterparty GS) | | 08/06/20 | | | 13,125 | | | | — | | | | 13,125 | | |
USD | 104,570,000 | | | | 1,000,000 | | | FNMA TBA, 3.000%, strike @ 104.57 (Counterparty GS) | | 08/06/20 | | | 4,375 | | | | — | | | | 4,375 | | |
Total | | | | | | | | $ | 307,969 | | | $ | (36,817 | ) | | $ | 271,152 | | |
Total options written | | | | | | | | $ | 334,922 | | | $ | (73,258 | ) | | $ | 261,664 | | |
26
PACE Mortgage-Backed Securities Fixed Income Investments
Portfolio of investments—July 31, 2020
Swaptions written
Notional
amount
(000) | | Number of
contracts | | Call swaptions | | Counterparty | | Pay/
receive
floating
rate | | Expiration
date | | Premiums
received | | Current
value | | Unrealized
appreciation
(depreciation) | |
USD | 7,500 | | | | 7,500,000 | | | 3 Month USD LIBOR Interest Rate Swap
strike @ 0.08%, terminating 10/09/25 | | MSCI | | Receive | | 10/07/20 | | $ | 6,375 | | | $ | (2,595 | ) | | $ | 3,780 | | |
| | | | | Put swaptions | | | | | | | | | | | | | |
USD | 7,500 | | | | 7,500,000 | | | 3 Month USD LIBOR Interest Rate Swap
strike @ 0.58%, terminating 10/09/25 | | MSCI | | Pay | | 10/07/20 | | $ | 6,375 | | | $ | (648 | ) | | $ | 5,727 | | |
Total swaptions written | | | | | | | | | | | | $ | 12,750 | | | $ | (3,243 | ) | | $ | 9,507 | | |
Futures contracts
Number of
contracts | | Currency | | | | Expiration
date | | Current
notional
amount | | Value | | Unrealized
appreciation
(depreciation) | |
U.S. Treasury futures sell contracts: | | | |
| | 296 | | | | USD | | | U.S. Treasury Note 10 Year Futures | | September 2020 | | $ | (41,208,720 | ) | | $ | (41,463,125 | ) | | $ | (254,405 | ) | |
Centrally cleared interest rate swap agreements
Notional
amount
(000) | | Maturity
date | | Payment
frequency | | Payments
made by the
Portfolio10 | | Payments
received by
the Portfolio10 | | Value | | Unrealized
appreciation
(depreciation) | |
USD | 5,100 | | | 12/19/23 | | Quarterly | | | 2.750 | % | | 3 Month USD LIBOR | | $ | (454,911 | ) | | $ | (502,083 | ) | |
USD | 1,100 | | | 12/18/26 | | Quarterly | | | 2.750 | | | 3 Month USD LIBOR | | | (172,061 | ) | | | (117,693 | ) | |
USD | 3,500 | | | 06/17/25 | | Quarterly | | | 1.250 | | | 3 Month USD LIBOR | | | (173,983 | ) | | | (121,485 | ) | |
USD | 15,800 | | | 06/17/30 | | Quarterly | | | 1.250 | | | 3 Month USD LIBOR | | | (1,141,630 | ) | | | (513,840 | ) | |
USD | 3,100 | | | 10/16/28 | | Semi-Annual | | | 3 Month USD LIBOR | | | | 3.183 | % | | | 722,398 | | | | 722,398 | | |
USD | 2,000 | | | 12/18/29 | | Semi-Annual | | | 3 Month USD LIBOR | | | | 1.500 | | | | 188,656 | | | | 246,695 | | |
| | Total | | | | | | | | | | | $ | (1,031,531 | ) | | $ | (286,008 | ) | |
OTC total return swap agreements
Counterparty | | Notional
amount
(000) | | Maturity
date | | Payment
frequency | | Payments
made by
the Portfolio10 | | Payments
received by
the Portfolio10 | | Upfront
payments
received
(made) | | Value | | Unrealized
appreciation
(depreciation) | |
DB | | USD | 946 | | | 01/12/38 | | Monthly | | | 1 Month USD
LIBOR | | | | 6.500 | % | | $ | 3,023 | | | $ | (2,984 | ) | | $ | 39 | | |
27
PACE Mortgage-Backed Securities Fixed Income Investments
Portfolio of investments—July 31, 2020
Fair valuation summary
The following is a summary of the fair valuations according to the inputs used as of July 31, 2020 in valuing the Portfolio's investments. In the event a Portfolio holds investments for which fair value is measured using the NAV per share practical expedient (or its equivalent), a separate column will be added to the fair value hierarchy table; this is intended to permit reconciliation to the amounts presented in the Portfolio of investments:
Assets
Description | | Unadjusted
quoted prices in
active markets for
identical investments
(Level 1) | | Other significant
observable inputs
(Level 2) | | Unobservable
inputs
(Level 3) | | Total | |
Asset-backed securities | | $ | — | | | $ | 46,550,802 | | | $ | 418,932 | | | $ | 46,969,734 | | |
Mortgage-backed securities | | | — | | | | 75,115,674 | | | | 1,979,528 | | | | 77,095,202 | | |
U.S. government agency obligations | | | — | | | | 454,634,623 | | | | — | | | | 454,634,623 | | |
Short-term investments | | | — | | | | 3,555,289 | | | | — | | | | 3,555,289 | | |
Short-term U.S. Treasury obligations | | | — | | | | 40,994 | | | | — | | | | 40,994 | | |
Repurchase agreements | | | — | | | | 3,800,000 | | | | — | | | | 3,800,000 | | |
Options purchased | | | — | | | | 2 | | | | — | | | | 2 | | |
Swaptions purchased | | | — | | | | 9,171 | | | | — | | | | 9,171 | | |
Swap agreements | | | — | | | | 911,054 | | | | — | | | | 911,054 | | |
Total | | $ | — | | | $ | 584,617,609 | | | $ | 2,398,460 | | | $ | 587,016,069 | | |
Liabilities | |
Investments sold short | | $ | — | | | $ | (9,019,403 | ) | | $ | — | | | $ | (9,019,403 | ) | |
Reverse repurchase agreements | | | — | | | | (21,219,427 | ) | | | — | | | | (21,219,427 | ) | |
Options written | | | — | | | | (73,258 | ) | | | — | | | | (73,258 | ) | |
Swaptions written | | | — | | | | (3,243 | ) | | | — | | | | (3,243 | ) | |
Futures contracts | | | (254,405 | ) | | | — | | | | — | | | | (254,405 | ) | |
Swap agreements | | | — | | | | (1,945,569 | ) | | | — | | | | (1,945,569 | ) | |
Total | | $ | (254,405 | ) | | $ | (32,260,900 | ) | | $ | — | | | $ | (32,515,305 | ) | |
Level 3 rollforward disclosure
At July 31, 2020, there were no transfers in or out of Level 3.
Securities valued using unobservable inputs, i.e. Level 3, were not considered significant to the Fund.
Portfolio footnotes
† Amount represents less than 0.05% or (0.05)%.
1 Variable or floating rate security. The interest rate shown is the rate in effect as of period end and changes periodically.
2 Security exempt from registration pursuant to Rule 144A under the Securities Act of 1933. These securities are considered liquid, unless noted otherwise, and may be resold in transactions exempt from registration, normally to qualified institutional buyers. Securities exempt from registration pursuant to Rule 144A, in the amount of $60,419,883, represented 18.7% of the Portfolio's net assets at period end.
3 Step bond—coupon rate increases in increments to maturity. The rate disclosed is the rate at the period end; the maturity date disclosed is the ultimate maturity date.
4 Significant unobservable inputs were used in the valuation of this security; i.e. Level 3.
5 Security fair valued by a Valuation Committee under the direction of the Board of Trustees.
6 Variable or floating rate security for which the interest rate adjusts periodically based on changes in current interest rates and prepayments on the underlying pool of assets. Rate shown is the rate in effect as of period end.
7 Security, or portion thereof, pledged as collateral for investments sold short, written options, futures and/or swap agreements.
8 Rates shown reflect yield at July 31, 2020.
9 Rate shown is the discount rate at the date of purchase unless otherwise noted.
10 Payments made or received are based on the notional amount.
See accompanying notes to financial statements.
28
PACE Intermediate Fixed Income Investments
Performance
For the 12-months ended July 31, 2020, the Portfolio's Class P shares returned 9.89% before the deduction of the maximum PACE Select program fee.1 In comparison, the Bloomberg Barclays US Aggregate Bond Index (the "benchmark") returned 10.12%. (Returns for all share classes over various time periods are shown in the "Performance at a glance" table on page 31. Please note that the returns shown do not reflect the deduction of taxes that a shareholder could pay on Portfolio distributions or the redemption of Portfolio shares.) For a detailed commentary on the market environment in general during the reporting period, please refer to page 2.
Subadvisor's comments2
(Please note that while the subadvisor outperformed the benchmark on a gross-of-fees basis, the Portfolio underperformed net of fees, as reported in the "Performance at a glance" table. As stated in footnote two, the comments that follow address performance on a gross-of-fees basis.)
The Portfolio outperformed its benchmark during the reporting period, driven by a diverse set of factors. The main contributors to performance were positioning and selection within investment-grade credit, agency mortgage positioning, yield curve positioning and non-US sovereign positioning. The Portfolio held an overweight to investment-grade credit for much of the second half of 2019, which benefited from supportive central bank policy. As spreads moved tighter, we tactically moved to an underweight position, which was beneficial in the first quarter of 2020, before moving back to an overweight position into quarter-end as valuations became attractive. We continued to build the overweight position early in the second quarter of 2020 given historic new issue supply, attractive valuations and supportive central bank policy. This was partly offset by negative performance in the first quarter of 2020, as the global spread of COVID-19 caused risk assets to underperform.
The most notable detractors from relative performance were the Portfolio's allocation to high-yield bonds, an allocation to Treasury Inflation-Protected Securities (TIPS), an overweight position in commercial mortgage-backed securities (CMBS) and an underweight duration position. As the Fed cut rates and risk assets sold off meaningfully in March 2020, those positions all negatively impacted returns. As of the end of the period, we had been trimming overweights across spread sectors given the strong performance recently. That said we remain overweight spread sector assets.
Derivatives were primarily used to adjust the Portfolio's duration and yield curve exposure, as well as to hedge risk. We believe derivatives are generally beneficial to performance, as they help us manage the portfolio more efficiently. Over the period, the following kinds of derivatives were the most commonly used. Interest rate swaps are the most common type of swaps and were useful in adding duration or subtracting it at particular points on the yield
PACE Select Advisors Trust – PACE Intermediate Fixed Income Investments
Investment Manager:
UBS Asset Management (Americas) Inc. ("UBS AM")
Investment Subadvisor:
BlackRock Financial Management, Inc. ("BlackRock")
Portfolio Management Team:
UBS AM: Mabel Lung, CFA, Gina Toth, CFA, Fred Lee, CFA, Joseph Sciortino and Steve Bienashski
BlackRock: Akiva Dickstein and Harrison Segall
Objective:
Current income, consistent with reasonable stability of principal
Investment process:
The subadvisor utilizes a strategy that involves buying specific bonds based on its credit analysis and review.
1 Class P shares held through the PACE Select Advisors Program are subject to a maximum Program fee of 2.50%, which, if included, would have reduced performance. Class P shares held through other advisory programs also may be subject to a program fee, which, if included, would have reduced performance.
2 Performance is discussed on a gross-of-fees basis—meaning that no fees or expenses are reflected when discussed at the level of a subadvisor's sleeve (or subadvisors' sleeves, if applicable). Alternatively, performance at the overall Portfolio level is shown net of fees, which does factor in fees and expenses associated with the Portfolio.
29
PACE Intermediate Fixed Income Investments
Subadvisor's comments – concluded
curve. Credit default swaps were used to provide protection against a particular issuer or basket of issuers defaulting, or as a way to express a negative or positive view on an issuer's or group of issuers' credit strength. Options on interest rate swaps (swaptions) were used to hedge convexity, as well as to take a view on volatility and interest rates. Options on futures were most often used to take a view on volatility and/or interest rates. Foreign exchange options were used to give us the right, but not the obligation, to buy or sell a currency at a specified price for a specified period of time. Foreign exchange forwards were typically used to hedge non-US dollar currency risk back to the US dollar, as well as to implement active currency positions.
Mutual funds are sold by prospectus only. You should read it carefully and consider a fund's investment objectives, risks, charges, expenses and other important information contained in the prospectus before investing. Prospectuses for most of our funds can be obtained from your financial advisor, by calling UBS Funds at 800-647 1568 or by visiting our Website at www.ubs.com/am-us.
Special considerations
The Portfolio may be appropriate for long-term investors seeking current income and a reasonable stability of principal. Investors should be able to withstand short-term fluctuations in the fixed income markets. The value of the Portfolio changes every day and can be affected by changes in interest rates, general market conditions, and other political, social and economic developments, as well as specific matters relating to the companies in whose securities the Portfolio invests. It is important to note that an investment in the Portfolio is only one component of a balanced investment plan.
30
PACE Intermediate Fixed Income Investments
Performance at a glance (unaudited)
Average annual total returns for periods ended 07/31/20 | | 1 year | | 5 years | | 10 years | |
Before deducting maximum sales charge | |
Class A1 | | | 9.61 | % | | | 3.76 | % | | | 2.91 | % | |
Class Y2 | | | 9.89 | | | | 4.02 | | | | 3.17 | | |
Class P3 | | | 9.89 | | | | 4.01 | | | | 3.17 | | |
After deducting maximum sales charge | |
Class A1 | | | 5.54 | | | | 2.97 | | | | 2.51 | | |
Bloomberg Barclays US Aggregate Bond Index4 | | | 10.12 | | | | 4.47 | | | | 3.87 | | |
Most recent calendar quarter-end returns (unaudited)
Average annual total returns for periods ended 06/30/20 | | 1 year | | 5 years | | 10 years | |
Before deducting maximum sales charge | |
Class A1 | | | 8.14 | % | | | 3.48 | % | | | 2.84 | % | |
Class Y2 | | | 8.41 | | | | 3.74 | | | | 3.10 | | |
Class P3 | | | 8.33 | | | | 3.74 | | | | 3.10 | | |
After deducting maximum sales charge | |
Class A1 | | | 4.12 | | | | 2.69 | | | | 2.45 | | |
The annualized gross and net expense ratios, respectively, for each class of shares as in the November 27, 2019 prospectuses, supplemented from time to time, were as follows: Class A—1.05% and 0.91%; Class Y—0.98% and 0.66%; and Class P—0.86% and 0.66%. Net expenses reflect fee waivers and/or expense reimbursements, if any, pursuant to an agreement that is in effect to cap the expenses. The Portfolio and UBS Asset Management (Americas) Inc. ("UBS AM") have entered into a written fee waiver/expense reimbursement agreement pursuant to which UBS AM is contractually obligated to waive its management fees and/or reimburse expenses so that the Portfolio's ordinary total operating expenses of each class through November 30, 2020 (excluding dividend expense, borrowing costs, and interest expense relating to short sales, and expenses attributable to investment in other investment companies, interest, taxes, brokerage commissions and extraordinary expenses) would not exceed Class A—0.91%; Class Y—0.66%; and Class P—0.66%. "Management fee waiver/expense reimbursements" are based on estimated amounts for the current fiscal year. The Portfolio has agreed to repay UBS AM for any waived fees/reimbursed expenses to the extent that it can do so over the following three fiscal years without causing the Portfolio's expenses in any of those three years to exceed these expense caps and that UBS AM has not waived the right to do so. The fee waiver/expense reimbursement agreement may be terminated by the Portfolio's board at any time and also will terminate automatically upon the expiration or termination of the Portfolio's advisory contract with UBS AM. Upon termination of the agreement, however, UBS AM's three year recoupment rights will survive.
1 Maximum sales charge for Class A shares is 3.75%. Class A shares bear ongoing 12b-1 service fees of 0.25% annually.
2 The Portfolio offers Class Y shares to a limited group of eligible investors, including certain qualifying retirement plans. Class Y shares do not bear initial or contingent deferred sales charges or ongoing 12b-1 service and distribution fees.
3 Class P shares do not bear initial or contingent deferred sales charges or ongoing 12b-1 service and distribution fees, but Class P shares held through advisory programs may be subject to a program fee, which, if included, would have reduced performance.
4 The Bloomberg Barclays US Aggregate Bond Index is a broad-based flagship benchmark that measures the investment grade, US dollar-denominated, fixed-rate taxable bond market. The index includes Treasuries, government-related and corporate securities, MBS (agency fixedrate and hybrid ARM pass-throughs), ABS and CMBS (agency and non-agency). Investors should note that indices do not reflect the deduction of fees and expenses.
Prior to August 3, 2015, a 1% redemption fee was imposed on sales or exchanges of any class of shares of the Portfolio made during the specified holding period.
Past performance does not predict future performance, and the performance information provided does not reflect the deduction of taxes that a shareholder would pay on Portfolio distributions or the redemption of Portfolio shares. The return and principal value of an investment will fluctuate, so that an investor's shares, when redeemed, may be worth more or less than their original cost. Performance results assume reinvestment of all dividends and capital gain distributions at net asset value on the ex-dividend dates. Current performance may be higher or lower than the performance data quoted. For month-end performance figures, please visit www.ubs.com/us-mutualfundperformance.
31
PACE Intermediate Fixed Income Investments
Illustration of an assumed investment of $10,000 in Class P shares of the Portfolio (unaudited)
The following graph depicts the performance of PACE Intermediate Fixed Income Investments Class P shares versus the Bloomberg Barclays US Aggregate Bond Index over the 10 years ended July 31, 2020. Class P shares held through advisory programs may be subject to a program fee, which, if included, would have reduced performance. The performance of the other classes will vary based upon the different class specific expenses and sales charges. The performance provided does not reflect the deduction of taxes that a shareholder would pay on Portfolio distributions or the redemption of Portfolio shares. Past performance is no guarantee of future results. Share price and returns will vary with market conditions; investors may realize a gain or loss upon redemption. It is important to note that PACE Intermediate Fixed Income Investments is a professionally managed portfolio while the Indices are not available for investment and is unmanaged. The comparison is shown for illustration purposes only.
PACE Intermediate Fixed Income Investments

32
PACE Intermediate Fixed Income Investments
Portfolio statistics—July 31, 2020 (unaudited)
Characteristics | |
Weighted average duration | | | 5.44 yrs. | | |
Weighted average maturity | | | 8.65 yrs. | | |
Average coupon | | | 2.93 | % | |
Top ten holdings1 | | Percentage of
net assets | |
FNMA, 3.500% due 12/01/43 | | | 3.5 | % | |
U.S. Treasury Bonds, 3.000% due 02/15/47 | | | 2.6 | | |
UMBS TBA, 3.000% | | | 2.3 | | |
GNMA TBA, 3.000% | | | 2.2 | | |
U.S. Treasury Notes, 0.625% due 05/15/30 | | | 2.1 | | |
UMBS TBA, 2.500% | | | 1.9 | | |
FNMA, 3.000% due 03/01/47 | | | 1.8 | | |
U.S. Treasury Bonds, 3.625% due 02/15/44 | | | 1.6 | | |
UMBS TBA, 4.000% | | | 1.5 | | |
FNMA, 2.500% due 04/01/32 | | | 1.4 | | |
Total | | | 20.9 | % | |
Top five issuer breakdown by country or territory of origin1 | | Percentage of
net assets | |
United States | | | 95.2 | % | |
France | | | 2.0 | | |
United Kingdom | | | 2.0 | | |
Netherlands | | | 1.7 | | |
Japan | | | 1.5 | | |
Total | | | 102.4 | % | |
Asset allocation1 | | Percentage of
net assets | |
Corporate bonds | | | 45.9 | % | |
U.S. government agency obligations | | | 31.5 | | |
U.S. Treasury obligations | | | 15.1 | | |
Mortgage-backed securities | | | 8.4 | | |
Asset-backed securities | | | 4.1 | | |
Non-U.S. government agency obligations | | | 2.2 | | |
Municipal bonds | | | 1.4 | | |
Options and swaptions purchased | | | 0.6 | | |
Investments sold short | | | (7.4 | ) | |
Cash equivalents and other assets less liabilities | | | (1.8 | ) | |
Total | | | 100.0 | % | |
1 The Portfolio is actively managed and its composition will vary over time.
33
PACE Intermediate Fixed Income Investments
Portfolio of investments—July 31, 2020
| | | Face
amount1 | | Value | |
Asset-backed securities—4.1% | |
American Homes 4 Rent Trust,
Series 2014-SFR3, Class A,
3.678%, due 12/17/362 | | | 453,396 | | | $ | 485,717 | | |
B2R Mortgage Trust,
Series 2015-2, Class A,
3.336%, due 11/15/482 | | | 49,851 | | | | 49,820 | | |
CarMax Auto Owner Trust,
Series 2020-2, Class A3,
1.700%, due 11/15/24 | | | 400,000 | | | | 409,734 | | |
Chesapeake Funding II LLC,
Series 2018-1A, Class A1,
3.040%, due 04/15/302 | | | 551,451 | | | | 563,504 | | |
Citibank Credit Card Issuance Trust,
Series 2018-A1, Class A1,
2.490%, due 01/20/23 | | | 270,000 | | | | 272,797 | | |
Cloud Pass-Through Trust,
Series 2019-1A,
3.554%, due 12/05/222,3 | | | 1,149,503 | | | | 1,167,127 | | |
Credit Acceptance Auto Loan Trust,
Series 2019-3A, Class A,
2.380%, due 11/15/282 | | | 630,000 | | | | 644,302 | | |
Series 2020-2A, Class A,
1.370%, due 07/16/292 | | | 320,000 | | | | 320,700 | | |
Credit Suisse ABS Repackaging Trust,
Series 2013-A, Class B,
2.500%, due 01/25/302 | | | 31,861 | | | | 31,773 | | |
Credit Suisse Seasoned Loan Trust,
Series 2006-1, Class A,
1 mo. USD LIBOR + 0.240%,
0.412%, due 10/25/342,4 | | | 47,393 | | | | 47,352 | | |
Elara HGV Timeshare Issuer LLC,
Series 2016-A, Class A,
2.730%, due 04/25/282 | | | 66,053 | | | | 66,062 | | |
First Franklin Mortgage Loan Trust,
Series 2004-FFH4, Class M5,
1 mo. USD LIBOR + 1.575%,
1.747%, due 01/25/354 | | | 26,181 | | | | 26,208 | | |
Ford Credit Floorplan Master Owner Trust,
Series 2019-2, Class A,
3.060%, due 04/15/26 | | | 870,000 | | | | 928,269 | | |
Series 2019-4, Class A,
2.440%, due 09/15/26 | | | 810,000 | | | | 848,526 | | |
Hyundai Auto Receivables Trust,
Series 2020-A, Class A3,
1.410%, due 11/15/24 | | | 300,000 | | | | 306,088 | | |
Lehman XS Trust,
Series 2005-6, Class 1A1,
1 mo. USD LIBOR + 1.520%,
0.692%, due 11/25/354 | | | 127,717 | | | | 114,630 | | |
Navient Private Education Refi Loan Trust,
Series 2019-D, Class A2B,
1 mo. USD LIBOR + 1.050%,
1.225%, due 12/15/592,4 | | | 420,000 | | | | 411,735 | | |
Navient Student Loan Trust,
Series 2018-EA, Class A2,
4.000%, due 12/15/592 | | | 100,000 | | | | 104,367 | | |
| | | Face
amount1 | | Value | |
Asset-backed securities—(continued) | |
Nissan Master Owner Trust Receivables,
Series 2019-A, Class A,
1 mo. USD LIBOR + 0.560%,
0.735%, due 02/15/244 | | | 875,000 | | | | $874,475 | | |
Series 2019-B, Class A,
1 mo. USD LIBOR + 0.430%,
0.605%, due 11/15/234 | | | 410,000 | | | | 409,715 | | |
PFS Financing Corp.,
Series 2018-E, Class A,
1 mo. USD LIBOR + 0.450%,
0.625%, due 10/17/222,4 | | | 265,000 | | | | 263,799 | | |
Popular ABS Mortgage Pass-Through Trust,
Series 2006-B, Class A3,
1 mo. USD LIBOR + 0.280%,
0.452%, due 05/25/364 | | | 11,283 | | | | 11,271 | | |
Sesac Finance LLC,
Series 2019-1, Class A2,
5.216%, due 07/25/492 | | | 118,800 | | | | 125,073 | | |
SLM Private Education Loan Trust,
Series 2010-C, Class A5,
1 mo. USD LIBOR + 4.750%,
4.925%, due 10/15/412,4 | | | 475,000 | | | | 513,971 | | |
SMB Private Education Loan Trust,
Series 2016-A, Class A2A,
2.700%, due 05/15/312 | | | 56,480 | | | | 57,793 | | |
Series 2016-C, Class A2A,
2.340%, due 09/15/342 | | | 342,487 | | | | 348,408 | | |
Series 2017-B, Class A2A,
2.820%, due 10/15/352 | | | 283,366 | | | | 293,037 | | |
Series 2017-B, Class A2B,
1 mo. USD LIBOR + 0.750%,
0.925%, due 10/15/352,4 | | | 164,054 | | | | 162,558 | | |
Series 2018-A, Class A2B,
1 mo. USD LIBOR + 0.800%,
0.975%, due 02/15/362,4 | | | 560,462 | | | | 547,461 | | |
Series 2018-B, Class A2A,
3.600%, due 01/15/372 | | | 617,408 | | | | 645,259 | | |
Series 2018-C, Class A2B,
1 mo. USD LIBOR + 0.750%,
0.925%, due 11/15/352,4 | | | 724,304 | | | | 714,308 | | |
SoFi Professional Loan Program LLC,
Series 2015-C, Class A2,
2.510%, due 08/25/332 | | | 152,805 | | | | 153,993 | | |
Series 2016-A, Class A1,
1 mo. USD LIBOR + 1.750%,
1.922%, due 08/25/362,4 | | | 41,395 | | | | 41,605 | | |
Series 2016-B, Class A1,
1 mo. USD LIBOR + 1.200%,
1.372%, due 06/25/332,4 | | | 31,573 | | | | 31,616 | | |
Series 2018-A, Class A2A,
2.390%, due 02/25/422 | | | 40,474 | | | | 40,525 | | |
Series 2018-A, Class A2B,
2.950%, due 02/25/422 | | | 270,000 | | | | 277,839 | | |
SoFi Professional Loan Program Trust,
Series 2020-C, Class AFX,
1.950%, due 02/15/462 | | | 281,580 | | | | 287,674 | | |
34
PACE Intermediate Fixed Income Investments
Portfolio of investments—July 31, 2020
| | | Face
amount1 | | Value | |
Asset-backed securities—(concluded) | |
Westlake Automobile Receivables Trust,
Series 2020-1A, Class A2,
1.440%, due 09/15/232 | | | 1,370,000 | | | $ | 1,378,715 | | |
Total asset-backed securities
(cost—$13,705,775) | | | 13,977,806 | | |
Corporate bonds—45.9% | |
Advertising—0.4% | |
Anheuser-Busch InBev Worldwide, Inc.
4.950%, due 01/15/42 | | | 14,000 | | | | 17,686 | | |
Comcast Corp.
3.300%, due 02/01/27 | | | 138,000 | | | | 156,640 | | |
Goldman Sachs Group, Inc./The
3.750%, due 05/22/25 | | | 425,000 | | | | 475,299 | | |
Interpublic Group of Cos., Inc./The
3.500%, due 10/01/20 | | | 75,000 | | | | 75,362 | | |
JPMorgan Chase & Co.
2.625%, due 04/23/215 | | EUR | 100,000 | | | | 120,227 | | |
NXP BV/NXP Funding LLC
4.625%, due 06/01/232 | | | 260,000 | | | | 286,272 | | |
Omnicom Group, Inc.
3.650%, due 11/01/24 | | | 15,000 | | | | 16,609 | | |
Sky Ltd.
1.500%, due 09/15/215 | | EUR | 100,000 | | | | 119,872 | | |
WPP Finance SA
2.375%, due 05/19/275 | | EUR | 120,000 | | | | 150,168 | | |
| | | | | | 1,418,135 | | |
Aerospace & defense—2.3% | |
Airbus SE
2.000%, due 04/07/285 | | EUR | 300,000 | | | | 381,067 | | |
BAE Systems Holdings, Inc.
2.850%, due 12/15/202 | | | 300,000 | | | | 301,636 | | |
3.800%, due 10/07/242 | | | 345,000 | | | | 384,058 | | |
3.850%, due 12/15/252 | | | 121,000 | | | | 136,300 | | |
Boeing Co./The
3.625%, due 03/01/48 | | | 8,000 | | | | 7,116 | | |
4.508%, due 05/01/23 | | | 492,000 | | | | 514,354 | | |
4.875%, due 05/01/25 | | | 370,000 | | | | 399,618 | | |
General Dynamics Corp.
3.500%, due 04/01/276 | | | 226,000 | | | | 262,570 | | |
3.750%, due 05/15/28 | | | 25,000 | | | | 29,860 | | |
Howmet Aerospace, Inc.
6.875%, due 05/01/25 | | | 70,000 | | | | 79,483 | | |
L3Harris Technologies, Inc.
3.850%, due 06/15/236 | | | 60,000 | | | | 65,354 | | |
3.850%, due 12/15/26 | | | 320,000 | | | | 368,933 | | |
4.400%, due 06/15/28 | | | 212,000 | | | | 255,940 | | |
Lockheed Martin Corp.
2.800%, due 06/15/50 | | | 283,000 | | | | 318,905 | | |
3.550%, due 01/15/26 | | | 25,000 | | | | 28,711 | | |
4.700%, due 05/15/46 | | | 33,000 | | | | 48,226 | | |
6.150%, due 09/01/36 | | | 11,000 | | | | 17,040 | | |
Northrop Grumman Corp.
2.080%, due 10/15/20 | | | 130,000 | | | | 130,447 | | |
2.930%, due 01/15/25 | | | 539,000 | | | | 586,771 | | |
4.400%, due 05/01/30 | | | 178,000 | | | | 222,588 | | |
5.250%, due 05/01/50 | | | 18,000 | | | | 27,340 | | |
| | | Face
amount1 | | Value | |
Corporate bonds—(continued) | |
Aerospace & defense—(concluded) | |
Raytheon Technologies Corp.
2.150%, due 05/18/30 | | EUR | 150,000 | | | $ | 196,427 | | |
2.250%, due 07/01/306 | | | 301,000 | | | | 323,186 | | |
2.800%, due 03/15/222 | | | 120,000 | | | | 124,098 | | |
3.100%, due 11/15/212 | | | 80,000 | | | | 81,987 | | |
4.150%, due 05/15/45 | | | 141,000 | | | | 179,485 | | |
4.200%, due 12/15/442 | | | 75,000 | | | | 91,140 | | |
5.400%, due 05/01/35 | | | 40,000 | | | | 56,247 | | |
7.000%, due 11/01/282 | | | 24,000 | | | | 33,568 | | |
7.200%, due 08/15/272 | | | 54,000 | | | | 73,786 | | |
Rolls-Royce PLC
2.125%, due 06/18/215 | | EUR | 130,000 | | | | 151,420 | | |
Spirit AeroSystems, Inc.
7.500%, due 04/15/252,6 | | | 325,000 | | | | 319,410 | | |
Thales SA
0.010%, due 05/31/225 | | EUR | 200,000 | | | | 235,491 | | |
Thales SA GMTN
0.750%, due 06/07/235 | | EUR | 100,000 | | | | 119,912 | | |
TransDigm, Inc.
6.250%, due 03/15/262 | | | 170,000 | | | | 179,350 | | |
8.000%, due 12/15/252 | | | 994,000 | | | | 1,080,975 | | |
| | | | | | 7,812,799 | | |
Agriculture—0.6% | |
Altria Group, Inc.
3.125%, due 06/15/31 | | EUR | 160,000 | | | | 212,909 | | |
4.000%, due 01/31/24 | | | 120,000 | | | | 132,946 | | |
4.800%, due 02/14/29 | | | 153,000 | | | | 184,376 | | |
5.800%, due 02/14/39 | | | 210,000 | | | | 276,547 | | |
BAT Capital Corp.
3.215%, due 09/06/26 | | | 124,000 | | | | 135,170 | | |
3.557%, due 08/15/27 | | | 284,000 | | | | 312,519 | | |
4.540%, due 08/15/47 | | | 20,000 | | | | 22,888 | | |
BAT International Finance PLC
1.250%, due 03/13/275 | | EUR | 100,000 | | | | 119,134 | | |
BAT International Finance PLC, EMTN
0.875%, due 10/13/235 | | EUR | 155,000 | | | | 185,434 | | |
Philip Morris International, Inc.
1.450%, due 08/01/39 | | EUR | 210,000 | | | | 244,820 | | |
Reynolds American, Inc.
4.000%, due 06/12/22 | | | 80,000 | | | | 84,782 | | |
4.450%, due 06/12/25 | | | 42,000 | | | | 47,770 | | |
4.850%, due 09/15/23 | | | 5,000 | | | | 5,613 | | |
5.850%, due 08/15/45 | | | 147,000 | | | | 194,244 | | |
| | | | | | 2,159,152 | | |
Airlines—0.9% | |
Air Canada Pass-Through Trust,
Series 2015-1, Class B,
3.875%, due 03/15/232 | | | 503,566 | | | | 428,362 | | |
Series 2017-1, Class AA,
3.300%, due 01/15/302 | | | 50,266 | | | | 46,151 | | |
Series 2017-1, Class B,
3.700%, due 01/15/262 | | | 804 | | | | 663 | | |
35
PACE Intermediate Fixed Income Investments
Portfolio of investments—July 31, 2020
| | | Face
amount1 | | Value | |
Corporate bonds—(continued) | |
Airlines—(continued) | |
American Airlines Pass-Through Trust,
Series 2015-2, Class AA,
3.600%, due 09/22/27 | | | 45,391 | | | $ | 42,357 | | |
Series 2015-2, Class B,
4.400%, due 09/22/23 | | | 158,395 | | | | 114,065 | | |
Series 2016-1, Class AA,
3.575%, due 01/15/28 | | | 56,656 | | | | 53,766 | | |
Series 2016-1, Class B,
5.250%, due 01/15/24 | | | 45,165 | | | | 30,248 | | |
Series 2016-2, Class AA,
3.200%, due 06/15/28 | | | 45,760 | | | | 43,036 | | |
Series 2016-2, Class B,
4.375%, due 06/15/242 | | | 89,050 | | | | 62,818 | | |
Series 2016-3, Class AA,
3.000%, due 10/15/28 | | | 109,240 | | | | 102,429 | | |
Series 2016-3, Class B,
3.750%, due 10/15/25 | | | 779 | | | | 557 | | |
Series 2017-1, Class AA,
3.650%, due 02/15/29 | | | 34,953 | | | | 33,380 | | |
Series 2017-1, Class B,
4.950%, due 02/15/25 | | | 479,171 | | | | 360,397 | | |
Series 2017-2, Class B,
3.700%, due 10/15/25 | | | 27,923 | | | | 19,042 | | |
Series 2019-1, Class AA,
3.150%, due 02/15/32 | | | 118,152 | | | | 110,213 | | |
Series 2019-1, Class B,
3.850%, due 02/15/28 | | | 131,419 | | | | 84,444 | | |
British Airways Pass Through Trust,
Series 2019-1, Class A,
3.350%, due 06/15/292 | | | 299,752 | | | | 249,610 | | |
Series 2019-1, Class AA,
3.300%, due 12/15/322 | | | 251,637 | | | | 233,139 | | |
Delta Airlines Pass-Through Trust,
Series 2019-1, Class AA,
3.204%, due 04/25/24 | | | 120,000 | | | | 120,360 | | |
Series 2020, Class AA,
2.000%, due 06/10/28 | | | 90,000 | | | | 86,080 | | |
United Airlines Pass-Through Trust,
Series 2014-1, Class B,
4.750%, due 04/11/22 | | | 152,607 | | | | 132,650 | | |
Series 2014-2, Class B,
4.625%, due 09/03/22 | | | 243,968 | | | | 218,964 | | |
Series 2015-1, Class AA,
3.450%, due 12/01/27 | | | 37,910 | | | | 37,111 | | |
Series 2016-1, Class AA,
3.100%, due 07/07/28 | | | 5,050 | | | | 4,809 | | |
Series 2016-1, Class B,
3.650%, due 01/07/26 | | | 15,718 | | | | 11,696 | | |
Series 2016-2, Class AA,
2.875%, due 10/07/28 | | | 65,088 | | | | 61,100 | | |
Series 2016-2, Class B,
3.650%, due 10/07/25 | | | 8,645 | | | | 6,354 | | |
Series 2018-1, Class AA,
3.500%, due 03/01/30 | | | 18,661 | | | | 17,495 | | |
Series 2018-1, Class B,
4.600%, due 03/01/26 | | | 60,981 | | | | 45,293 | | |
| | | Face
amount1 | | Value | |
Corporate bonds—(continued) | |
Airlines—(concluded) | |
Series 2019-1, Class AA,
4.150%, due 08/25/31 | | | 66,662 | | | $ | 64,851 | | |
Series 2019-2, Class AA,
2.700%, due 05/01/32 | | | 50,000 | | | | 45,828 | | |
Series 2019-2, Class B,
3.500%, due 05/01/28 | | | 82,000 | | | | 57,814 | | |
US Airways Pass-Through Trust,
Series 2012-2, Class B,
6.750%, due 06/03/21 3,250 2,685
Series 2013-1, Class B,
5.375%, due 11/15/21 | | | 11,830 | | | | 9,733 | | |
| | | | | | 2,937,500 | | |
Apparel—0.4% | |
Hanesbrands, Inc.
4.875%, due 05/15/262,6 | | | 250,000 | | | | 272,500 | | |
Kering SA
0.750%, due 05/13/285 | | EUR | 100,000 | | | | 121,196 | | |
LVMH Moet Hennessy Louis Vuitton SE
0.010%, due 02/11/245 | | EUR | 200,000 | | | | 235,972 | | |
0.010%, due 02/11/265 | | EUR | 300,000 | | | | 352,440 | | |
0.375%, due 05/26/225 | | EUR | 110,000 | | | | 130,617 | | |
NIKE, Inc.
2.750%, due 03/27/27 | | | 294,000 | | | | 328,612 | | |
| | | | | | 1,441,337 | | |
Auto manufacturers—1.5% | |
American Honda Finance Corp.
1.375%, due 11/10/22 | | EUR | 120,000 | | | | 145,670 | | |
American Honda Finance Corp. GMTN
2.300%, due 09/09/26 | | | 3,000 | | | | 3,228 | | |
American Honda Finance Corp. MTN
2.400%, due 06/27/24 | | | 35,000 | | | | 37,159 | | |
BMW Finance N.V.
0.010%, due 04/14/235 | | EUR | 290,000 | | | | 341,349 | | |
Daimler Finance North America LLC
2.125%, due 03/10/252 | | | 250,000 | | | | 257,878 | | |
Daimler International Finance BV
0.250%, due 08/09/215 | | EUR | 165,000 | | | | 195,002 | | |
0.250%, due 11/06/235 | | EUR | 60,000 | | | | 70,080 | | |
Ford Motor Credit Co. LLC
5.085%, due 01/07/21 | | | 460,000 | | | | 462,392 | | |
General Motors Financial Co., Inc.
2.750%, due 06/20/25 | | | 80,000 | | | | 82,501 | | |
3.500%, due 11/07/24 | | | 5,000 | | | | 5,252 | | |
3.550%, due 04/09/21 | | | 40,000 | | | | 40,621 | | |
3.700%, due 05/09/23 | | | 110,000 | | | | 114,789 | | |
4.000%, due 01/15/25 | | | 38,000 | | | | 40,442 | | |
4.200%, due 03/01/21 | | | 18,000 | | | | 18,267 | | |
4.375%, due 09/25/21 | | | 20,000 | | | | 20,684 | | |
5.200%, due 03/20/236 | | | 565,000 | | | | 614,631 | | |
Hyundai Capital America
2.375%, due 02/10/232 | | | 365,000 | | | | 371,957 | | |
3.000%, due 10/30/202 | | | 285,000 | | | | 286,089 | | |
3.950%, due 02/01/222 | | | 290,000 | | | | 301,015 | | |
36
PACE Intermediate Fixed Income Investments
Portfolio of investments—July 31, 2020
| | | Face
amount1 | | Value | |
Corporate bonds—(continued) | |
Auto manufacturers—(concluded) | |
Hyundai Capital Services, Inc.
3.000%, due 08/29/222 | | | 200,000 | | | $ | 205,625 | | |
3.750%, due 03/05/232 | | | 350,000 | | | | 367,719 | | |
Toyota Motor Corp.
2.157%, due 07/02/22 | | | 20,000 | | | | 20,644 | | |
Toyota Motor Credit Corp.
0.010%, due 07/21/215 | | EUR | 155,000 | | | | 182,929 | | |
1.800%, due 02/13/25 | | | 124,000 | | | | 129,856 | | |
Toyota Motor Credit Corp. GMTN
3.450%, due 09/20/23 | | | 40,000 | | | | 43,596 | | |
Toyota Motor Credit Corp. MTN
3.000%, due 04/01/25 | | | 116,000 | | | | 127,681 | | |
Toyota Motor Finance Netherlands BV
0.250%, due 01/10/225 | | EUR | 105,000 | | | | 124,343 | | |
Volkswagen Financial Services AG
0.750%, due 10/14/215 | | EUR | 120,000 | | | | 142,200 | | |
Volkswagen International Finance N.V.
4.000%, due 08/12/202 | | | 235,000 | | | | 235,183 | | |
Volvo Treasury AB
3 mo. Euribor + 0.650%,
0.292%, due 09/13/214,5 | | | EUR 200,000 | | | | 235,619 | | |
| | | | | | 5,224,401 | | |
Auto parts & equipment—0.1% | |
Conti-Gummi Finance BV
1.125%, due 09/25/245 | | EUR | 110,000 | | | | 131,748 | | |
Magna International, Inc.
2.450%, due 06/15/30 | | | 145,000 | | | | 154,037 | | |
| | | | | | 285,785 | | |
Banks—6.7% | |
Banco Santander SA
3.306%, due 06/27/29 | | | 200,000 | | | | 220,771 | | |
Bank of America Corp.
(fixed, converts to FRN on 04/24/22),
2.881%, due 04/24/234 | | | 175,000 | | | | 181,622 | | |
(fixed, converts to FRN on 12/20/22),
3.004%, due 12/20/234 | | | 440,000 | | | | 463,789 | | |
(fixed, converts to FRN on 01/23/25),
3.366%, due 01/23/264 | | | 101,000 | | | | 111,462 | | |
(fixed, converts to FRN on 12/20/27),
3.419%, due 12/20/284 | | | 187,000 | | | | 211,416 | | |
(fixed, converts to FRN on 03/05/23),
3.550%, due 03/05/244 | | | 123,000 | | | | 131,806 | | |
(fixed, converts to FRN on 04/24/27),
3.705%, due 04/24/284 | | | 320,000 | | | | 366,041 | | |
5.700%, due 01/24/22 | | | 176,000 | | | | 189,716 | | |
Bank of America Corp. GMTN
(fixed, converts to FRN on 07/21/27),
3.593%, due 07/21/284 | | | 130,000 | | | | 148,134 | | |
Bank of America Corp. MTN
(fixed, converts to FRN on 07/23/23),
3.864%, due 07/23/244 | | | 52,000 | | | | 56,777 | | |
(fixed, converts to FRN on 03/05/28),
3.970%, due 03/05/294,6 | | | 172,000 | | | | 200,195 | | |
4.000%, due 01/22/25 | | | 61,000 | | | | 68,172 | | |
| | | Face
amount1 | | Value | |
Corporate bonds—(continued) | |
Banks—(continued) | |
4.200%, due 08/26/24 | | | 178,000 | | | $ | 199,538 | | |
4.250%, due 10/22/26 | | | 38,000 | | | | 43,734 | | |
4.450%, due 03/03/26 | | | 208,000 | | | | 240,329 | | |
Bank of New York Mellon Corp./The,
Series F,
(fixed, converts to FRN on 09/20/26),
4.625%, due 09/20/264,6,7 | | | 115,000 | | | | 118,731 | | |
Bank of New York Mellon Corp./The MTN
(fixed, converts to FRN on 02/07/27),
3.442%, due 02/07/284 | | | 160,000 | | | | 185,677 | | |
Bank of Nova Scotia/The
2.350%, due 10/21/20 | | | 10,000 | | | | 10,045 | | |
2.800%, due 07/21/21 | | | 29,000 | | | | 29,715 | | |
3.125%, due 04/20/21 | | | 50,000 | | | | 51,049 | | |
Banque Federative du Credit Mutuel SA
0.125%, due 08/30/215 | | EUR | 200,000 | | | | 236,584 | | |
0.750%, due 06/15/235 | | EUR | 100,000 | | | | 120,501 | | |
Barclays PLC
3.250%, due 01/12/21 | | | 405,000 | | | | 409,949 | | |
(fixed, converts to FRN on 05/16/23),
4.338%, due 05/16/244 | | | 285,000 | | | | 309,078 | | |
BNP Paribas SA
1.125%, due 01/15/235 | | EUR | 250,000 | | | | 303,253 | | |
3.500%, due 03/01/232 | | | 230,000 | | | | 245,076 | | |
BPCE SA
0.250%, due 01/15/265 | | EUR | 100,000 | | | | 118,220 | | |
2.700%, due 10/01/292,6 | | | 313,000 | | | | 341,103 | | |
Citibank N.A.
(fixed, converts to FRN on 02/19/21),
3.165%, due 02/19/224 | | | 250,000 | | | | 253,666 | | |
Citigroup, Inc.
2.650%, due 10/26/20 | | | 65,000 | | | | 65,348 | | |
2.700%, due 03/30/21 | | | 46,000 | | | | 46,722 | | |
(fixed, converts to FRN on 07/24/22),
2.876%, due 07/24/234 | | | 14,000 | | | | 14,605 | | |
(fixed, converts to FRN on 11/05/29),
2.976%, due 11/05/304 | | | 205,000 | | | | 224,680 | | |
(fixed, converts to FRN on 01/24/22),
3.142%, due 01/24/234 | | | 137,000 | | | | 141,831 | | |
(fixed, converts to FRN on 10/27/27),
3.520%, due 10/27/284 | | | 31,000 | | | | 34,935 | | |
(fixed, converts to FRN on 07/24/27),
3.668%, due 07/24/284 | | | 568,000 | | | | 645,827 | | |
4.400%, due 06/10/25 | | | 132,000 | | | | 149,814 | | |
Citizens Financial Group, Inc.
2.375%, due 07/28/21 | | | 15,000 | | | | 15,266 | | |
Commonwealth Bank of Australia
3.450%, due 03/16/232 | | | 80,000 | | | | 86,284 | | |
Cooperatieve Rabobank UA GMTN
2.500%, due 01/19/21 | | | 250,000 | | | | 252,583 | | |
Danske Bank A/S
5.000%, due 01/12/222 | | | 250,000 | | | | 263,459 | | |
5.375%, due 01/12/242 | | | 360,000 | | | | 406,842 | | |
Deutsche Bank AG
4.100%, due 01/13/26 | | | 45,000 | | | | 48,217 | | |
37
PACE Intermediate Fixed Income Investments
Portfolio of investments—July 31, 2020
| | | Face
amount1 | | Value | |
Corporate bonds—(continued) | |
Banks—(continued) | |
Goldman Sachs Group, Inc./The
3 mo. Euribor + 0.550%,
0.107%, due 04/21/234,5 | | | EUR 230,000 | | | | $269,092 | | |
3 mo. USD LIBOR + 0.780%,
1.041%, due 10/31/224 | | | 65,000 | | | | 65,189 | | |
3 mo. USD LIBOR + 1.170%,
1.562%, due 05/15/264 | | | 155,000 | | | | 155,175 | | |
2.750%, due 09/15/20 | | | 305,000 | | | | 305,225 | | |
2.875%, due 02/25/21 | | | 100,000 | | | | 101,210 | | |
(fixed, converts to FRN on 10/31/21),
2.876%, due 10/31/224 | | | 445,000 | | | | 456,887 | | |
(fixed, converts to FRN on 06/05/22),
2.908%, due 06/05/234 | | | 79,000 | | | | 82,092 | | |
(fixed, converts to FRN on 09/29/24),
3.272%, due 09/29/254 | | | 10,000 | | | | 10,912 | | |
3.500%, due 01/23/25 | | | 75,000 | | | | 82,456 | | |
3.500%, due 04/01/25 | | | 655,000 | | | | 725,648 | | |
3.500%, due 11/16/26 | | | 21,000 | | | | 23,427 | | |
3.625%, due 02/20/24 | | | 20,000 | | | | 21,898 | | |
3.850%, due 01/26/27 | | | 178,000 | | | | 202,520 | | |
HSBC USA, Inc.
5.000%, due 09/27/20 | | | 100,000 | | | | 100,642 | | |
ING Bank N.V.
(fixed, converts to FRN on 02/25/21),
3.625%, due 02/25/264,5 | | | EUR 200,000 | | | | 239,469 | | |
5.000%, due 06/09/212 | | | 200,000 | | | | 207,854 | | |
ING Bank N.V. GMTN
0.010%, due 04/08/225 | | EUR | 200,000 | | | | 235,902 | | |
JPMorgan Chase & Co.
3 mo. USD LIBOR + 1.230%,
1.494%, due 10/24/234 | | | 135,000 | | | | 137,078 | | |
2.550%, due 03/01/21 | | | 18,000 | | | | 18,204 | | |
(fixed, converts to FRN on 04/25/22),
2.776%, due 04/25/234 | | | 90,000 | | | | 93,465 | | |
2.972%, due 01/15/23 | | | 141,000 | | | | 146,045 | | |
3.200%, due 06/15/26 | | | 9,000 | | | | 10,109 | | |
(fixed, converts to FRN on 04/01/22),
3.207%, due 04/01/234 | | | 385,000 | | | | 402,136 | | |
(fixed, converts to FRN on 03/01/24),
3.220%, due 03/01/254 | | | 484,000 | | | | 524,199 | | |
(fixed, converts to FRN on 01/23/28),
3.509%, due 01/23/294 | | | 9,000 | | | | 10,239 | | |
(fixed, converts to FRN on 05/01/27),
3.540%, due 05/01/284 | | | 128,000 | | | | 145,143 | | |
(fixed, converts to FRN on 04/23/23),
3.559%, due 04/23/244 | | | 70,000 | | | | 75,421 | | |
3.625%, due 12/01/27 | | | 135,000 | | | | 152,282 | | |
(fixed, converts to FRN on 02/01/27),
3.782%, due 02/01/284 | | | 1,255,000 | | | | 1,440,981 | | |
(fixed, converts to FRN on 04/23/28),
4.005%, due 04/23/294,6 | | | 188,000 | | | | 221,039 | | |
(fixed, converts to FRN on 12/05/23),
4.023%, due 12/05/244 | | | 325,000 | | | | 359,525 | | |
(fixed, converts to FRN on 07/23/28),
4.203%, due 07/23/294 | | | 301,000 | | | | 359,267 | | |
| | | Face
amount1 | | Value | |
Corporate bonds—(continued) | |
Banks—(continued) | |
JPMorgan Chase & Co. MTN
2.295%, due 08/15/21 | | | 97,000 | | | $ | 97,055 | | |
KBC Group N.V.
1.125%, due 01/25/245 | | EUR | 100,000 | | | | 121,865 | | |
KeyBank NA/Cleveland OH
3.375%, due 03/07/23 | | | 250,000 | | | | 267,867 | | |
KeyCorp MTN
2.900%, due 09/15/20 | | | 100,000 | | | | 100,287 | | |
4.100%, due 04/30/28 | | | 3,000 | | | | 3,552 | | |
4.150%, due 10/29/25 | | | 38,000 | | | | 44,077 | | |
Lloyds Banking Group PLC
(fixed, converts to FRN on 11/07/22),
2.907%, due 11/07/234 | | | 200,000 | | | | 209,237 | | |
Mitsubishi UFJ Financial Group, Inc.
3.195%, due 07/18/29 | | | 600,000 | | | | 671,547 | | |
Mitsubishi UFJ Trust & Banking Corp.
2.650%, due 10/19/202,6 | | | 920,000 | | | | 924,637 | | |
Mizuho Financial Group, Inc.
0.523%, due 06/10/245 | | EUR | 100,000 | | | | 118,916 | | |
(fixed, converts to FRN on 09/13/24),
2.555%, due 09/13/254 | | | 200,000 | | | | 210,053 | | |
(fixed, converts to FRN on 07/16/24),
2.839%, due 07/16/254 | | | 280,000 | | | | 296,572 | | |
Morgan Stanley
(fixed, converts to FRN on 07/22/27),
3.591%, due 07/22/284 | | | 209,000 | | | | 238,755 | | |
Morgan Stanley GMTN
(fixed, converts to FRN on 01/22/30),
2.699%, due 01/22/314 | | | 121,000 | | | | 131,840 | | |
(fixed, converts to FRN on 01/24/28),
3.772%, due 01/24/294 | | | 289,000 | | | | 335,212 | | |
Morgan Stanley MTN
(fixed, converts to FRN on 04/01/30),
3.622%, due 04/01/314,6 | | | 512,000 | | | | 598,722 | | |
Northern Trust Corp.
3.150%, due 05/03/296 | | | 13,000 | | | | 15,111 | | |
Royal Bank of Canada GMTN
3.700%, due 10/05/23 | | | 111,000 | | | | 122,064 | | |
Santander UK Group Holdings PLC
2.875%, due 10/16/20 | | | 21,000 | | | | 21,104 | | |
3.125%, due 01/08/21 | | | 178,000 | | | | 180,055 | | |
Societe Generale SA
0.010%, due 05/27/225 | | EUR | 400,000 | | | | 471,216 | | |
State Street Corp.
(fixed, converts to FRN on 09/15/20),
5.250%, due 09/15/204,7 | | | 132,000 | | | | 131,497 | | |
(fixed, converts to FRN on 12/15/23),
5.625%, due 12/15/234,7 | | | 125,000 | | | | 124,063 | | |
Sumitomo Mitsui Financial Group, Inc.
2.058%, due 07/14/21 | | | 58,000 | | | | 58,910 | | |
2.442%, due 10/19/21 | | | 21,000 | | | | 21,513 | | |
2.784%, due 07/12/22 | | | 105,000 | | | | 109,476 | | |
2.934%, due 03/09/21 | | | 10,000 | | | | 10,155 | | |
3.040%, due 07/16/29 | | | 200,000 | | | | 221,505 | | |
3.446%, due 01/11/27 | | | 24,000 | | | | 26,921 | | |
38
PACE Intermediate Fixed Income Investments
Portfolio of investments—July 31, 2020
| | | Face
amount1 | | Value | |
Corporate bonds—(continued) | |
Banks—(concluded) | |
Synovus Financial Corp.
3.125%, due 11/01/22 | | | 78,000 | | | $ | 80,021 | | |
Toronto-Dominion Bank/The
0.375%, due 04/25/245 | | EUR | 200,000 | | | | 237,758 | | |
Truist Bank
(fixed, converts to FRN on 10/26/20),
3.525%, due 10/26/214 | | | 192,000 | | | | 193,403 | | |
US Bancorp,
Series X,
3.150%, due 04/27/27 | | | 1,000 | | | | 1,141 | | |
US Bancorp MTN
3.100%, due 04/27/26 | | | 40,000 | | | | 45,084 | | |
Wells Fargo & Co.
1.125%, due 10/29/215 | | EUR | 155,000 | | | | 185,345 | | |
Wells Fargo & Co. MTN
(fixed, converts to FRN on 06/02/27),
2.393%, due 06/02/284 | | | 139,000 | | | | 146,033 | | |
(fixed, converts to FRN on 02/11/30),
2.572%, due 02/11/314 | | | 97,000 | | | | 102,948 | | |
3.550%, due 09/29/25 | | | 53,000 | | | | 59,649 | | |
(fixed, converts to FRN on 05/22/27),
3.584%, due 05/22/284 | | | 159,000 | | | | 178,405 | | |
| | | | | | 22,456,864 | | |
Beverages—1.1% | |
Anheuser-Busch Cos. LLC/Anheuser-Busch
InBev Worldwide, Inc.
4.700%, due 02/01/36 | | | 685,000 | | | | 841,708 | | |
Anheuser-Busch InBev Finance, Inc.
4.700%, due 02/01/36 | | | 10,000 | | | | 12,155 | | |
Anheuser-Busch InBev Worldwide, Inc.
3.500%, due 06/01/30 | | | 619,000 | | | | 708,289 | | |
5.450%, due 01/23/39 | | | 50,000 | | | | 65,692 | | |
Coca-Cola Co./The
0.750%, due 03/09/23 | | EUR | 235,000 | | | | 282,283 | | |
1.125%, due 09/22/22 | | EUR | 280,000 | | | | 338,663 | | |
1.450%, due 06/01/27 | | | 33,000 | | | | 34,360 | | |
1.650%, due 06/01/30 | | | 107,000 | | | | 111,953 | | |
2.125%, due 09/06/29 | | | 65,000 | | | | 70,557 | | |
2.200%, due 05/25/22 | | | 4,000 | | | | 4,142 | | |
3.375%, due 03/25/27 | | | 337,000 | | | | 390,243 | | |
Keurig Dr Pepper, Inc.
4.057%, due 05/25/23 | | | 145,000 | | | | 158,607 | | |
Molson Coors Beverage Co.
2.100%, due 07/15/21 | | | 120,000 | | | | 121,527 | | |
Pernod Ricard SA
0.000%, due 10/24/235,8 | | EUR | 100,000 | | | | 117,463 | | |
1.125%, due 04/07/255 | | EUR | 100,000 | | | | 122,470 | | |
Suntory Holdings Ltd.
2.250%, due 10/16/242 | | | 380,000 | | | | 397,592 | | |
| | | | | | 3,777,704 | | |
Biotechnology—0.3% | |
Amgen, Inc.
2.300%, due 02/25/31 | | | 145,000 | | | | 154,647 | | |
2.450%, due 02/21/30 | | | 181,000 | | | | 195,104 | | |
| | | Face
amount1 | | Value | |
Corporate bonds—(continued) | |
Biotechnology—(concluded) | |
3.150%, due 02/21/40 | | | 60,000 | | | $ | 67,925 | | |
4.400%, due 05/01/45 | | | 57,000 | | | | 76,236 | | |
4.663%, due 06/15/51 | | | 5,000 | | | | 7,084 | | |
Biogen, Inc.
2.250%, due 05/01/30 | | | 176,000 | | | | 184,309 | | |
Gilead Sciences, Inc.
3.250%, due 09/01/22 | | | 6,000 | | | | 6,336 | | |
4.500%, due 02/01/45 | | | 54,000 | | | | 74,567 | | |
4.800%, due 04/01/44 | | | 97,000 | | | | 138,345 | | |
| | | | | | 904,553 | | |
Building materials—0.2% | |
Carrier Global Corp.
2.242%, due 02/15/252 | | | 540,000 | | | | 564,012 | | |
Chemicals—0.6% | |
Air Liquide Finance SA
0.375%, due 04/18/225 | | EUR | 100,000 | | | | 118,554 | | |
BASF SE
0.250%, due 06/05/275 | | EUR | 100,000 | | | | 119,054 | | |
Covestro AG
0.875%, due 02/03/265 | | EUR | 70,000 | | | | 84,330 | | |
Dow Chemical Co./The
1.875%, due 03/15/40 | | EUR | 200,000 | | | | 229,196 | | |
4.550%, due 11/30/25 | | | 88,000 | | | | 101,985 | | |
DuPont de Nemours, Inc.
4.493%, due 11/15/25 | | | 309,000 | | | | 361,045 | | |
Eastman Chemical Co.
3.500%, due 12/01/21 | | | 33,000 | | | | 34,189 | | |
3.800%, due 03/15/25 | | | 82,000 | | | | 90,865 | | |
Linde Finance BV
0.550%, due 05/19/325 | | EUR | 200,000 | | | | 240,258 | | |
LYB International Finance BV
5.250%, due 07/15/43 | | | 48,000 | | | | 61,586 | | |
RPM International, Inc.
3.750%, due 03/15/27 | | | 25,000 | | | | 27,004 | | |
Sherwin-Williams Co./The | |
2.750%, due 06/01/22 | | | 31,000 | | | | 32,075 | | |
4.000%, due 12/15/42 | | | 5,000 | | | | 5,810 | | |
4.200%, due 01/15/22 | | | 360,000 | | | | 375,955 | | |
| | | | | | 1,881,906 | | |
Commercial banks—3.8% | |
Bank of America Corp.
(fixed, converts to FRN on 03/15/28),
5.875%, due 03/15/284,7 | | | 90,000 | | | | 95,850 | | |
Series L,
3.950%, due 04/21/25 | | | 4,000 | | | | 4,479 | | |
Bank of America Corp. MTN
(fixed, converts to FRN on 06/19/40),
2.676%, due 06/19/414 | | | 110,000 | | | | 117,286 | | |
(fixed, converts to FRN on 10/01/24),
3.093%, due 10/01/254 | | | 134,000 | | | | 145,374 | | |
(fixed, converts to FRN on 07/23/29),
3.194%, due 07/23/304 | | | 716,000 | | | | 800,248 | | |
(fixed, converts to FRN on 03/15/24),
3.458%, due 03/15/254 | | | 677,000 | | | | 739,817 | | |
39
PACE Intermediate Fixed Income Investments
Portfolio of investments—July 31, 2020
| | | Face
amount1 | | Value | |
Corporate bonds—(continued) | |
Commercial banks—(continued) | |
(fixed, converts to FRN on 01/20/27),
3.824%, due 01/20/284 | | | 962,000 | | | $ | 1,100,676 | | |
Bank of New York Mellon Corp./The MTN
3.400%, due 01/29/28 | | | 57,000 | | | | 66,944 | | |
BNP Paribas SA
(fixed, converts to FRN on 11/19/24),
2.819%, due 11/19/252,4 | | | 200,000 | | | | 212,434 | | |
Citigroup, Inc.
(fixed, converts to FRN on 05/15/23),
1.678%, due 05/15/244 | | | 206,000 | | | | 211,710 | | |
(fixed, converts to FRN on 03/31/30),
4.412%, due 03/31/314 | | | 598,000 | | | | 728,779 | | |
4.450%, due 09/29/27 | | | 139,000 | | | | 161,907 | | |
Credit Suisse AG MTN
3.625%, due 09/09/24 | | | 250,000 | | | | 278,661 | | |
Credit Suisse Group AG
(fixed, converts to FRN on 06/05/25),
2.193%, due 06/05/262,4,6 | | | 295,000 | | | | 304,013 | | |
(fixed, converts to FRN on 04/02/25),
3.250%, due 04/02/264,5 | | EUR | 200,000 | | | | 262,668 | | |
Danske Bank A/S
1.226%, due 06/22/242 | | | 578,000 | | | | 584,434 | | |
Goldman Sachs Group, Inc./The
4.000%, due 03/03/24 | | | 40,000 | | | | 44,432 | | |
HSBC Holdings PLC
2.650%, due 01/05/22 | | | 200,000 | | | | 205,940 | | |
3.600%, due 05/25/236 | | | 355,000 | | | | 381,765 | | |
(fixed, converts to FRN on 06/19/28),
4.583%, due 06/19/294 | | | 200,000 | | | | 233,353 | | |
ING Groep N.V.
(fixed, converts to FRN on 07/01/25),
1.400%, due 07/01/262,4 | | | 200,000 | | | | 203,716 | | |
JPMorgan Chase & Co.
(fixed, converts to FRN on 03/13/25),
2.005%, due 03/13/264 | | | 989,000 | | | | 1,030,842 | | |
(fixed, converts to FRN on 04/22/25),
2.083%, due 04/22/264 | | | 165,000 | | | | 173,001 | | |
(fixed, converts to FRN on 06/01/27),
2.182%, due 06/01/284 | | | 228,000 | | | | 239,342 | | |
3.900%, due 07/15/25 | | | 194,000 | | | | 220,912 | | |
(fixed, converts to FRN on 12/05/28),
4.452%, due 12/05/294 | | | 67,000 | | | | 81,548 | | |
Kreditanstalt fuer Wiederaufbau
1.750%, due 09/14/29 | | | 95,000 | | | | 104,121 | | |
Mizuho Financial Group, Inc.
(fixed, converts to FRN on 07/10/30),
2.201%, due 07/10/314 | | | 200,000 | | | | 205,705 | | |
(fixed, converts to FRN on 05/25/25),
2.226%, due 05/25/264 | | | 455,000 | | | | 472,681 | | |
Morgan Stanley
7.250%, due 04/01/32 | | | 22,000 | | | | 33,904 | | |
Morgan Stanley GMTN
(fixed, converts to FRN on 01/23/29),
4.431%, due 01/23/304 | | | 917,000 | | | | 1,114,911 | | |
Northern Trust Corp.
1.950%, due 05/01/30 | | | 53,000 | | | | 56,313 | | |
| | | Face
amount1 | | Value | |
Corporate bonds—(continued) | |
Commercial banks—(concluded) | |
OP Corporate Bank PLC
0.500%, due 08/12/255 | | EUR | 100,000 | | | $ | 120,200 | | |
(fixed, converts to FRN on 06/09/25),
1.625%, due 06/09/304,5 | | EUR | 300,000 | | | | 356,876 | | |
Royal Bank of Canada GMTN
3 mo. USD LIBOR + 0.470%,
0.740%, due 04/29/224 | | | 20,000 | | | | 20,088 | | |
State Street Corp.
(fixed, converts to FRN on 11/01/24),
2.354%, due 11/01/254 | | | 57,000 | | | | 61,121 | | |
Sumitomo Mitsui Financial Group, Inc.
3.364%, due 07/12/276 | | | 29,000 | | | | 32,577 | | |
Wells Fargo & Co.
(fixed, converts to FRN on 05/04/24),
1.338%, due 05/04/254,5 | | | EUR 100,000 | | | | 120,463 | | |
3.000%, due 04/22/26 | | | 379,000 | | | | 415,304 | | |
(fixed, converts to FRN on 04/30/40),
3.068%, due 04/30/414 | | | 263,000 | | | | 287,335 | | |
Wells Fargo & Co. MTN
3.000%, due 02/19/25 | | | 55,000 | | | | 59,812 | | |
3.750%, due 01/24/24 | | | 434,000 | | | | 475,743 | | |
4.150%, due 01/24/29 | | | 38,000 | | | | 45,130 | | |
Wells Fargo Bank NA
(fixed, converts to FRN on 09/09/21),
2.082%, due 09/09/224 | | | 336,000 | | | | 341,535 | | |
| | | | | | 12,953,950 | | |
Commercial services—0.6% | |
Amadeus IT Group SA
2.875%, due 05/20/275 | | EUR | 100,000 | | | | 125,733 | | |
APRR SA
0.010%, due 01/20/235 | | EUR | 100,000 | | | | 117,834 | | |
Duke University
2.832%, due 10/01/55 | | | 143,000 | | | | 162,461 | | |
4.077%, due 10/01/48 | | | 91,000 | | | | 125,400 | | |
Global Payments, Inc.
2.900%, due 05/15/30 | | | 96,000 | | | | 105,151 | | |
Moody's Corp.
3.750%, due 03/24/25 | | | 423,000 | | | | 480,078 | | |
4.250%, due 02/01/29 | | | 55,000 | | | | 66,260 | | |
PayPal Holdings, Inc.
1.650%, due 06/01/25 | | | 109,000 | | | | 113,616 | | |
RELX Capital, Inc.
3.000%, due 05/22/306 | | | 152,000 | | | | 168,953 | | |
3.500%, due 03/16/23 | | | 505,000 | | | | 540,985 | | |
4.000%, due 03/18/29 | | | 20,000 | | | | 23,702 | | |
| | | | | | 2,030,173 | | |
Computers—0.7% | |
Apple, Inc.
1.000%, due 11/10/22 | | EUR | 165,000 | | | | 199,907 | | |
2.650%, due 05/11/50 | | | 120,000 | | | | 132,580 | | |
2.750%, due 01/13/25 | | | 17,000 | | | | 18,553 | | |
2.900%, due 09/12/27 | | | 44,000 | | | | 49,741 | | |
3.850%, due 05/04/43 | | | 50,000 | | | | 64,903 | | |
3.850%, due 08/04/46 | | | 38,000 | | | | 49,463 | | |
40
PACE Intermediate Fixed Income Investments
Portfolio of investments—July 31, 2020
| | | Face
amount1 | | Value | |
Corporate bonds—(continued) | |
Computers—(concluded) | |
Dell International LLC/EMC Corp.
5.850%, due 07/15/252 | | | 247,000 | | | $ | 287,806 | | |
8.100%, due 07/15/362 | | | 185,000 | | | | 251,271 | | |
DXC Technology Co.
4.000%, due 04/15/23 | | | 60,000 | | | | 63,544 | | |
Hewlett Packard Enterprise Co.
4.400%, due 10/15/229 | | | 150,000 | | | | 160,719 | | |
4.650%, due 10/01/24 | | | 129,000 | | | | 145,057 | | |
International Business Machines Corp.
0.500%, due 09/07/21 | | EUR | 300,000 | | | | 355,818 | | |
2.850%, due 05/15/40 | | | 215,000 | | | | 235,323 | | |
3.300%, due 05/15/26 | | | 182,000 | | | | 207,017 | | |
| | | | | | 2,221,702 | | |
Construction materials—0.0%† | |
Mohawk Capital Finance SA
1.750%, due 06/12/27 | | EUR | 100,000 | | | | 105,222 | | |
Cosmetics & personal care—0.0%† | |
Unilever N.V.
1.250%, due 03/25/255 | | EUR | 100,000 | | | | 125,014 | | |
Diversified financial services—0.9% | |
American Express Co.
2.200%, due 10/30/20 | | | 20,000 | | | | 20,058 | | |
2.500%, due 07/30/24 | | | 345,000 | | | | 370,041 | | |
2.750%, due 05/20/22 | | | 105,000 | | | | 109,304 | | |
3.000%, due 02/22/21 | | | 11,000 | | | | 11,138 | | |
3.000%, due 10/30/24 | | | 10,000 | | | | 10,950 | | |
3.700%, due 11/05/216 | | | 5,000 | | | | 5,194 | | |
3.700%, due 08/03/23 | | | 215,000 | | | | 234,298 | | |
American Express Credit Corp.
2.600%, due 09/14/20 | | | 75,000 | | | | 75,048 | | |
Capital One Financial Corp.
3.650%, due 05/11/276 | | | 81,000 | | | | 90,302 | | |
Charles Schwab Corp./The
3.250%, due 05/22/296 | | | 112,000 | | | | 129,385 | | |
(fixed, converts to FRN on 03/01/22),
4.625%, due 03/01/224,7 | | | 190,000 | | | | 187,150 | | |
Discover Financial Services
3.950%, due 11/06/24 | | | 50,000 | | | | 54,892 | | |
E*TRADE Financial Corp.
3.800%, due 08/24/27 | | | 10,000 | | | | 11,301 | | |
GE Capital International Funding Co. Unlimited Co.
4.418%, due 11/15/35 | | | 328,000 | | | | 339,018 | | |
Intercontinental Exchange, Inc.
2.100%, due 06/15/306 | | | 195,000 | | | | 206,812 | | |
Mastercard, Inc.
1.100%, due 12/01/22 | | EUR | 265,000 | | | | 319,972 | | |
3.350%, due 03/26/30 | | | 191,000 | | | | 228,230 | | |
Nuveen LLC
4.000%, due 11/01/282 | | | 10,000 | | | | 12,002 | | |
ORIX Corp.
2.900%, due 07/18/22 | | | 249,000 | | | | 258,744 | | |
4.050%, due 01/16/24 | | | 46,000 | | | | 50,763 | | |
| | | Face
amount1 | | Value | |
Corporate bonds—(continued) | |
Diversified financial services—(concluded) | |
Synchrony Financial
4.250%, due 08/15/24 | | | 20,000 | | | $ | 21,242 | | |
4.375%, due 03/19/24 | | | 60,000 | | | | 63,833 | | |
Visa, Inc.
4.150%, due 12/14/35 | | | 67,000 | | | | 89,276 | | |
| | | | | | 2,898,953 | | |
Electric—3.2% | |
AEP Texas, Inc.
3.450%, due 01/15/50 | | | 153,000 | | | | 181,072 | | |
AEP Transmission Co. LLC
3.150%, due 09/15/49 | | | 95,000 | | | | 111,100 | | |
3.650%, due 04/01/50 | | | 15,000 | | | | 18,861 | | |
3.750%, due 12/01/47 | | | 97,000 | | | | 122,223 | | |
4.250%, due 09/15/48 | | | 62,000 | | | | 83,261 | | |
Alabama Power Co.
4.150%, due 08/15/44 | | | 124,000 | | | | 159,380 | | |
5.200%, due 06/01/41 | | | 35,000 | | | | 48,028 | | |
Ameren Illinois Co.
3.250%, due 03/15/50 | | | 110,000 | | | | 134,217 | | |
3.800%, due 05/15/28 | | | 50,000 | | | | 59,243 | | |
Baltimore Gas & Electric Co.
2.900%, due 06/15/50 | | | 2,000 | | | | 2,221 | | |
3.200%, due 09/15/49 | | | 10,000 | | | | 11,687 | | |
3.750%, due 08/15/47 | | | 236,000 | | | | 297,602 | | |
CenterPoint Energy Houston Electric LLC
3.550%, due 08/01/42 | | | 60,000 | | | | 73,170 | | |
CMS Energy Corp.
3.000%, due 05/15/26 | | | 22,000 | | | | 24,002 | | |
Commonwealth Edison Co.
3.200%, due 11/15/49 | | | 32,000 | | | | 38,041 | | |
4.600%, due 08/15/43 | | | 15,000 | | | | 20,563 | | |
Consumers Energy Co.
3.100%, due 08/15/50 | | | 8,000 | | | | 9,540 | | |
3.500%, due 08/01/51 | | | 225,000 | | | | 287,359 | | |
3.750%, due 02/15/50 | | | 98,000 | | | | 129,671 | | |
3.800%, due 11/15/28 | | | 47,000 | | | | 56,289 | | |
Dayton Power & Light Co./The
3.950%, due 06/15/49 | | | 112,000 | | | | 128,486 | | |
DTE Electric Co.
3.950%, due 03/01/49 | | | 160,000 | | | | 212,116 | | |
Duke Energy Carolinas LLC
2.950%, due 12/01/26 | | | 5,000 | | | | 5,622 | | |
3.700%, due 12/01/47 | | | 105,000 | | | | 133,546 | | |
3.875%, due 03/15/46 | | | 100,000 | | | | 129,499 | | |
3.950%, due 03/15/48 | | | 3,000 | | | | 3,974 | | |
Duke Energy Florida LLC
1.750%, due 06/15/30 | | | 79,000 | | | | 82,508 | | |
2.500%, due 12/01/29 | | | 350,000 | | | | 389,835 | | |
3.400%, due 10/01/46 | | | 102,000 | | | | 124,635 | | |
3.800%, due 07/15/28 | | | 200,000 | | | | 238,308 | | |
4.200%, due 07/15/48 | | | 38,000 | | | | 52,317 | | |
Duke Energy Ohio, Inc.
2.125%, due 06/01/30 | | | 22,000 | | | | 23,665 | | |
3.650%, due 02/01/29 | | | 110,000 | | | | 130,534 | | |
3.700%, due 06/15/46 | | | 85,000 | | | | 107,186 | | |
41
PACE Intermediate Fixed Income Investments
Portfolio of investments—July 31, 2020
| | | Face
amount1 | | Value | |
Corporate bonds—(continued) | |
Electric—(continued) | |
Duke Energy Progress LLC
3.000%, due 09/15/21 | | | 50,000 | | | $ | 51,147 | | |
3.700%, due 09/01/28 | | | 15,000 | | | | 17,914 | | |
4.100%, due 05/15/42 | | | 166,000 | | | | 215,972 | | |
4.100%, due 03/15/43 | | | 50,000 | | | | 65,065 | | |
4.200%, due 08/15/45 | | | 75,000 | | | | 100,342 | | |
E.ON SE
0.010%, due 10/24/225 | | EUR | 220,000 | | | | 259,290 | | |
Edison International
3.125%, due 11/15/22 | | | 24,000 | | | | 24,984 | | |
4.950%, due 04/15/25 | | | 57,000 | | | | 63,393 | | |
Elia Transmission Belgium SA
0.875%, due 04/28/305 | | EUR | 100,000 | | | | 122,379 | | |
Enel Finance International N.V.
0.010%, due 06/17/245 | | EUR | 100,000 | | | | 117,367 | | |
Engie SA
0.375%, due 02/28/235 | | EUR | 200,000 | | | | 238,191 | | |
1.375%, due 03/27/255 | | EUR | 200,000 | | | | 250,148 | | |
Entergy Louisiana LLC
2.400%, due 10/01/266 | | | 1,000 | | | | 1,085 | | |
4.000%, due 03/15/33 | | | 72,000 | | | | 91,633 | | |
4.200%, due 09/01/48 | | | 99,000 | | | | 136,254 | | |
5.400%, due 11/01/24 | | | 35,000 | | | | 41,494 | | |
Entergy Texas, Inc.
2.550%, due 06/01/21 | | | 45,000 | | | | 45,696 | | |
ESB Finance DAC
3.494%, due 01/12/245 | | EUR | 100,000 | | | | 131,244 | | |
Eurogrid GmbH
1.113%, due 05/15/325 | | EUR | 100,000 | | | | 126,068 | | |
Eversource Energy
2.900%, due 10/01/24 | | | 93,000 | | | | 100,636 | | |
Exelon Corp.
2.450%, due 04/15/21 | | | 5,000 | | | | 5,062 | | |
5.625%, due 06/15/35 | | | 60,000 | | | | 82,206 | | |
FirstEnergy Corp.
2.050%, due 03/01/25 | | | 29,000 | | | | 29,405 | | |
2.650%, due 03/01/30 | | | 115,000 | | | | 117,730 | | |
Series C,
3.400%, due 03/01/50 | | | 36,000 | | | | 36,906 | | |
FirstEnergy Transmission LLC
4.350%, due 01/15/252 | | | 169,000 | | | | 186,989 | | |
4.550%, due 04/01/492 | | | 125,000 | | | | 149,870 | | |
5.450%, due 07/15/442 | | | 60,000 | | | | 78,136 | | |
Florida Power & Light Co.
3.125%, due 12/01/25 | | | 85,000 | | | | 95,181 | | |
3.150%, due 10/01/49 | | | 60,000 | | | | 73,669 | | |
3.250%, due 06/01/24 | | | 6,000 | | | | 6,553 | | |
3.700%, due 12/01/47 | | | 113,000 | | | | 149,093 | | |
3.800%, due 12/15/42 | | | 30,000 | | | | 38,687 | | |
3.950%, due 03/01/48 | | | 180,000 | | | | 247,400 | | |
5.250%, due 02/01/41 | | | 5,000 | | | | 7,462 | | |
5.650%, due 02/01/37 | | | 7,000 | | | | 10,358 | | |
5.690%, due 03/01/40 | | | 14,000 | | | | 21,961 | | |
innogy Finance BV
0.750%, due 11/30/225 | | EUR | 45,000 | | | | 53,820 | | |
| | | Face
amount1 | | Value | |
Corporate bonds—(continued) | |
Electric—(concluded) | |
ITC Holdings Corp.
2.700%, due 11/15/22 | | | 80,000 | | | $ | 83,639 | | |
MidAmerican Energy Co.
3.100%, due 05/01/27 | | | 105,000 | | | | 119,355 | | |
3.150%, due 04/15/50 | | | 70,000 | | | | 84,955 | | |
3.650%, due 04/15/29 | | | 204,000 | | | | 248,076 | | |
3.650%, due 08/01/48 | | | 34,000 | | | | 44,227 | | |
National Grid Electricity Transmission PLC
0.190%, due 01/20/255 | | EUR | 100,000 | | | | 118,679 | | |
Northern States Power Co.
2.900%, due 03/01/50 | | | 30,000 | | | | 34,881 | | |
3.400%, due 08/15/42 | | | 155,000 | | | | 190,048 | | |
3.600%, due 09/15/47 | | | 5,000 | | | | 6,435 | | |
4.000%, due 08/15/45 | | | 59,000 | | | | 78,499 | | |
NRG Energy, Inc.
3.750%, due 06/15/242 | | | 15,000 | | | | 16,076 | | |
4.450%, due 06/15/292 | | | 5,000 | | | | 5,450 | | |
NSTAR Electric Co.
3.200%, due 05/15/27 | | | 55,000 | | | | 62,443 | | |
Ohio Power Co.
4.000%, due 06/01/49 | | | 35,000 | | | | 45,846 | | |
4.150%, due 04/01/48 | | | 40,000 | | | | 52,986 | | |
6.600%, due 02/15/33 | | | 60,000 | | | | 87,319 | | |
Oncor Electric Delivery Co. LLC
2.750%, due 05/15/302,6 | | | 39,000 | | | | 44,125 | | |
3.100%, due 09/15/49 | | | 45,000 | | | | 53,457 | | |
3.700%, due 11/15/28 | | | 265,000 | | | | 316,699 | | |
3.800%, due 09/30/47 | | | 28,000 | | | | 36,532 | | |
5.750%, due 03/15/29 | | | 40,000 | | | | 53,664 | | |
PECO Energy Co.
3.900%, due 03/01/48 | | | 47,000 | | | | 62,118 | | |
Public Service Electric & Gas Co. MTN
3.200%, due 05/15/29 | | | 2,000 | | | | 2,301 | | |
3.650%, due 09/01/28 | | | 100,000 | | | | 118,623 | | |
RTE Reseau de Transport d'Electricite SADIR
4.125%, due 02/03/21 | | EUR | 100,000 | | | | 120,218 | | |
Sempra Energy
3 mo. USD LIBOR + 0.500%,
0.775%, due 01/15/214,6 | | | 145,000 | | | | 145,039 | | |
Southern California Edison Co.
1.845%, due 02/01/22 | | | 15,714 | | | | 15,694 | | |
2.250%, due 06/01/30 | | | 136,000 | | | | 140,840 | | |
Series A,
2.900%, due 03/01/21 | | | 50,000 | | | | 50,735 | | |
Series E,
3.700%, due 08/01/25 | | | 471,000 | | | | 528,643 | | |
Tampa Electric Co.
2.600%, due 09/15/22 | | | 40,000 | | | | 41,198 | | |
Virginia Electric & Power Co.
2.750%, due 03/15/23 | | | 230,000 | | | | 241,873 | | |
3.100%, due 05/15/25 | | | 93,000 | | | | 102,482 | | |
3.800%, due 09/15/47 | | | 179,000 | | | | 229,808 | | |
Vistra Operations Co. LLC
3.550%, due 07/15/242 | | | 140,000 | | | | 147,259 | | |
| | | | | | 10,950,773 | | |
42
PACE Intermediate Fixed Income Investments
Portfolio of investments—July 31, 2020
| | | Face
amount1 | | Value | |
Corporate bonds—(continued) | |
Electrical components & equipment—0.2% | |
Eaton Capital Unlimited Co.
0.021%, due 05/14/215 | | EUR | 255,000 | | | $ | 300,042 | | |
Schneider Electric SE
0.000%, due 06/12/235,8 | | EUR | 100,000 | | | | 118,081 | | |
0.250%, due 09/09/245 | | EUR | 100,000 | | | | 119,352 | | |
| | | | | | 537,475 | | |
Electronics—0.3% | |
Agilent Technologies, Inc.
3.050%, due 09/22/26 | | | 2,000 | | | | 2,209 | | |
3.200%, due 10/01/22 | | | 114,000 | | | | 119,600 | | |
Amphenol Technologies Holding GmbH
0.750%, due 05/04/265 | | EUR | 135,000 | | | | 160,227 | | |
Honeywell International, Inc.
0.010%, due 03/10/24 | | EUR | 120,000 | | | | 140,637 | | |
0.750%, due 03/10/32 | | EUR | 140,000 | | | | 165,121 | | |
1.300%, due 02/22/23 | | EUR | 265,000 | | | | 321,946 | | |
Tyco Electronics Group SA
3.450%, due 08/01/24 | | | 30,000 | | | | 32,783 | | |
| | | | | | 942,523 | | |
Environmental control—0.1% | |
Republic Services, Inc.
3.375%, due 11/15/27 | | | 106,000 | | | | 122,347 | | |
3.950%, due 05/15/28 | | | 150,000 | | | | 179,680 | | |
Waste Management, Inc.
3.125%, due 03/01/25 | | | 60,000 | | | | 66,007 | | |
4.150%, due 07/15/49 | | | 24,000 | | | | 31,902 | | |
| | | | | | 399,936 | | |
Food—0.2% | |
Albertsons Cos., Inc./Safeway, Inc./
New Albertsons LP/
Albertson's LLC
4.625%, due 01/15/272 | | | 233,000 | | | | 246,398 | | |
General Mills, Inc.
0.450%, due 01/15/26 | | EUR | 100,000 | | | | 117,808 | | |
Seven & I Holdings Co. Ltd.
3.350%, due 09/17/212 | | | 230,000 | | | | 235,517 | | |
Sysco Corp.
2.600%, due 10/01/20 | | | 78,000 | | | | 78,120 | | |
| | | | | | 677,843 | | |
Forest products & paper—0.2% | |
Georgia-Pacific LLC
1.750%, due 09/30/252 | | | 80,000 | | | | 83,954 | | |
3.600%, due 03/01/252 | | | 130,000 | | | | 145,000 | | |
3.734%, due 07/15/232 | | | 160,000 | | | | 173,605 | | |
5.400%, due 11/01/202 | | | 52,000 | | | | 52,646 | | |
International Paper Co.
4.400%, due 08/15/47 | | | 67,000 | | | | 83,640 | | |
| | | | | | 538,845 | | |
Gas—0.1% | |
Dominion Energy Gas Holdings LLC
4.800%, due 11/01/43 | | | 25,000 | | | | 31,656 | | |
| | | Face
amount1 | | Value | |
Corporate bonds—(continued) | |
Gas—(concluded) | |
ONE Gas, Inc.
4.658%, due 02/01/44 | | | 13,000 | | | $ | 17,311 | | |
Piedmont Natural Gas Co., Inc.
3.500%, due 06/01/29 | | | 20,000 | | | | 23,358 | | |
Redexis Gas Finance BV
1.875%, due 05/28/255 | | EUR | 100,000 | | | | 123,012 | | |
| | | | | | 195,337 | | |
Hand & machine tools—0.0%† | |
Kennametal, Inc.
4.625%, due 06/15/28 | | | 3,000 | | | | 3,300 | | |
Healthcare-products—0.5% | |
Abbott Ireland Financing DAC
0.100%, due 11/19/245 | | EUR | 100,000 | | | | 117,935 | | |
0.875%, due 09/27/235 | | EUR | 100,000 | | | | 121,122 | | |
Boston Scientific Corp.
3.450%, due 03/01/24 | | | 220,000 | | | | 240,053 | | |
3.750%, due 03/01/26 | | | 61,000 | | | | 70,237 | | |
DH Europe Finance II SARL
0.200%, due 03/18/26 | | EUR | 130,000 | | | | 152,497 | | |
1.800%, due 09/18/49 | | EUR | 100,000 | | | | 122,953 | | |
Medtronic Global Holdings SCA
0.010%, due 12/02/22 | | EUR | 325,000 | | | | 382,984 | | |
1.750%, due 07/02/49 | | EUR | 100,000 | | | | 125,214 | | |
3.350%, due 04/01/27 | | | 5,000 | | | | 5,806 | | |
Stryker Corp.
0.250%, due 12/03/24 | | EUR | 160,000 | | | | 188,266 | | |
Thermo Fisher Scientific, Inc.
1.875%, due 10/01/49 | | EUR | 100,000 | | | | 124,329 | | |
| | | | | | 1,651,396 | | |
Healthcare-services—0.7% | |
Aetna, Inc.
3.500%, due 11/15/24 | | | 16,000 | | | | 17,665 | | |
4.125%, due 11/15/42 | | | 15,000 | | | | 17,947 | | |
4.500%, due 05/15/42 | | | 25,000 | | | | 31,039 | | |
Anthem, Inc.
2.375%, due 01/15/25 | | | 6,000 | | | | 6,419 | | |
3.125%, due 05/15/22 | | | 400,000 | | | | 418,661 | | |
3.500%, due 08/15/24 | | | 11,000 | | | | 12,125 | | |
4.850%, due 08/15/54 | | | 27,000 | | | | 33,033 | | |
BayCare Health System, Inc.,
Series 2020,
3.831%, due 11/15/50 | | | 48,000 | | | | 62,169 | | |
Fresenius Medical Care AG & Co. KGaA
1.500%, due 05/29/305 | | EUR | 90,000 | | | | 110,886 | | |
HCA, Inc.
4.500%, due 02/15/27 | | | 33,000 | | | | 38,002 | | |
4.750%, due 05/01/23 | | | 76,000 | | | | 83,246 | | |
5.000%, due 03/15/24 | | | 34,000 | | | | 38,312 | | |
5.250%, due 04/15/25 | | | 247,000 | | | | 287,867 | | |
5.250%, due 06/15/26 | | | 212,000 | | | | 249,103 | | |
Humana, Inc.
3.850%, due 10/01/24 | | | 49,000 | | | | 54,391 | | |
4.500%, due 04/01/25 | | | 77,000 | | | | 89,070 | | |
43
PACE Intermediate Fixed Income Investments
Portfolio of investments—July 31, 2020
| | | Face
amount1 | | Value | |
Corporate bonds—(continued) | |
Healthcare-services—(concluded) | |
New York and Presbyterian Hospital/The,
Series 2019,
3.954%, due 08/01/19 | | | 161,000 | | | $ | 187,845 | | |
UnitedHealth Group, Inc.
3.700%, due 12/15/25 | | | 55,000 | | | | 63,583 | | |
4.250%, due 06/15/48 | | | 120,000 | | | | 164,496 | | |
4.750%, due 07/15/45 | | | 334,000 | | | | 480,270 | | |
5.950%, due 02/15/41 | | | 3,000 | | | | 4,648 | | |
| | | | | | 2,450,777 | | |
Insurance—0.5% | |
Allianz Finance II BV
0.010%, due 01/14/255 | | EUR | 100,000 | | | | 118,435 | | |
Allianz SE
(fixed, converts to FRN on 07/08/30),
2.121%, due 07/08/504,5 | | | EUR 200,000 | | | | 246,625 | | |
Aon Corp.
3.750%, due 05/02/29 | | | 56,000 | | | | 65,673 | | |
Aon PLC
4.000%, due 11/27/23 | | | 3,000 | | | | 3,303 | | |
4.450%, due 05/24/43 | | | 64,000 | | | | 79,349 | | |
4.600%, due 06/14/44 | | | 56,000 | | | | 74,885 | | |
4.750%, due 05/15/45 | | | 100,000 | | | | 137,966 | | |
Equitable Holdings, Inc.
3.900%, due 04/20/23 | | | 178,000 | | | | 191,623 | | |
Hartford Financial Services Group, Inc./The
4.300%, due 04/15/43 | | | 30,000 | | | | 36,657 | | |
Loews Corp.
3.750%, due 04/01/26 | | | 38,000 | | | | 43,622 | | |
Marsh & McLennan Cos., Inc.
1.979%, due 03/21/30 | | EUR | 165,000 | | | | 218,676 | | |
2.250%, due 11/15/30 | | | 61,000 | | | | 65,300 | | |
3.500%, due 12/29/20 | | | 75,000 | | | | 75,952 | | |
Metropolitan Life Global Funding I
0.010%, due 09/23/225 | | EUR | 100,000 | | | | 117,892 | | |
Series GMTN,
1.250%, due 09/17/215 | | EUR | 115,000 | | | | 137,556 | | |
Teachers Insurance & Annuity
Association of America
4.270%, due 05/15/472 | | | 47,000 | | | | 59,687 | | |
Trinity Acquisition PLC
4.400%, due 03/15/26 | | | 55,000 | | | | 63,958 | | |
4.625%, due 08/15/23 | | | 30,000 | | | | 32,916 | | |
Willis North America, Inc.
2.950%, due 09/15/29 | | | 47,000 | | | | 51,559 | | |
4.500%, due 09/15/28 | | | 4,000 | | | | 4,809 | | |
| | | | | | 1,826,443 | | |
Internet—0.5% | |
Amazon.com, Inc.
2.400%, due 02/22/23 | | | 2,000 | | | | 2,103 | | |
3.875%, due 08/22/37 | | | 40,000 | | | | 51,932 | | |
Booking Holdings Inc
3.650%, due 03/15/25 | | | 69,000 | | | | 76,781 | | |
Booking Holdings, Inc.
4.100%, due 04/13/25 | | | 319,000 | | | | 362,981 | | |
| | | Face
amount1 | | Value | |
Corporate bonds—(continued) | |
Internet—(concluded) | |
Expedia Group, Inc.
3.250%, due 02/15/30 | | | 20,000 | | | $ | 18,901 | | |
3.800%, due 02/15/28 | | | 60,000 | | | | 59,408 | | |
5.000%, due 02/15/26 | | | 113,000 | | | | 119,208 | | |
6.250%, due 05/01/252 | | | 275,000 | | | | 300,504 | | |
Tencent Holdings Ltd.
2.985%, due 01/19/232 | | | 200,000 | | | | 208,187 | | |
3.595%, due 01/19/282 | | | 390,000 | | | | 437,287 | | |
Twitter, Inc.
3.875%, due 12/15/272,6 | | | 200,000 | | | | 213,966 | | |
| | | | | | 1,851,258 | | |
Investment companies—0.1% | |
Ares Capital Corp.
4.250%, due 03/01/25 | | | 330,000 | | | | 339,293 | | |
IT services—0.5% | |
Apple, Inc.
2.850%, due 05/11/24 | | | 76,000 | | | | 82,394 | | |
3.000%, due 11/13/27 | | | 26,000 | | | | 29,678 | | |
3.750%, due 09/12/47 | | | 102,000 | | | | 131,413 | | |
Capgemini SE
1.125%, due 06/23/305 | | EUR | 100,000 | | | | 120,960 | | |
International Business Machines Corp.
1.700%, due 05/15/27 | | | 234,000 | | | | 243,126 | | |
3.450%, due 02/19/26 | | | 192,000 | | | | 218,677 | | |
Leidos, Inc.
2.950%, due 05/15/232 | | | 254,000 | | | | 266,954 | | |
3.625%, due 05/15/252 | | | 95,000 | | | | 104,855 | | |
4.375%, due 05/15/302 | | | 331,000 | | | | 386,211 | | |
| | | | | | 1,584,268 | | |
Machinery-diversified—0.2% | |
John Deere Cash Management SA
2.200%, due 04/02/325 | | EUR | 100,000 | | | | 139,844 | | |
Nvent Finance SARL
3.950%, due 04/15/23 | | | 465,000 | | | | 483,862 | | |
Otis Worldwide Corp.
2.293%, due 04/05/272 | | | 20,000 | | | | 21,447 | | |
| | | | | | 645,153 | | |
Media—2.2% | |
AMC Networks, Inc.
5.000%, due 04/01/24 | | | 460,000 | | | | 467,475 | | |
Charter Communications Operating LLC/
Charter Communications Operating Capital
4.500%, due 02/01/24 | | | 89,000 | | | | 98,916 | | |
4.800%, due 03/01/50 | | | 316,000 | | | | 380,231 | | |
5.375%, due 05/01/47 | | | 60,000 | | | | 75,945 | | |
6.484%, due 10/23/45 | | | 205,000 | | | | 287,939 | | |
Comcast Corp.
1.250%, due 02/20/40 | | EUR | 100,000 | | | | 120,387 | | |
1.950%, due 01/15/31 | | | 87,000 | | | | 90,872 | | |
2.650%, due 02/01/30 | | | 236,000 | | | | 261,255 | | |
3.300%, due 04/01/27 | | | 265,000 | | | | 302,932 | | |
3.400%, due 07/15/46 | | | 257,000 | | | | 307,467 | | |
3.969%, due 11/01/47 | | | 111,000 | | | | 142,224 | | |
44
PACE Intermediate Fixed Income Investments
Portfolio of investments—July 31, 2020
| | | Face
amount1 | | Value | |
Corporate bonds—(continued) | |
Media—(concluded) | |
4.150%, due 10/15/28 | | | 160,000 | | | $ | 196,532 | | |
4.250%, due 01/15/33 | | | 139,000 | | | | 176,826 | | |
4.400%, due 08/15/35 | | | 24,000 | | | | 31,175 | | |
Cox Communications, Inc.
3.150%, due 08/15/242 | | | 215,000 | | | | 233,724 | | |
3.250%, due 12/15/222 | | | 60,000 | | | | 63,556 | | |
3.350%, due 09/15/262 | | | 9,000 | | | | 10,113 | | |
4.800%, due 02/01/352 | | | 4,000 | | | | 5,143 | | |
Discovery Communications LLC
3.800%, due 03/13/24 | | | 288,000 | | | | 315,155 | | |
5.000%, due 09/20/37 | | | 31,000 | | | | 37,998 | | |
5.200%, due 09/20/47 | | | 70,000 | | | | 89,299 | | |
NBCUniversal Enterprise, Inc.
5.250%, due 03/19/212,7 | | | 1,140,000 | | | | 1,148,550 | | |
NBCUniversal Media LLC
5.950%, due 04/01/41 | | | 165,000 | | | | 258,412 | | |
RELX Finance BV
0.010%, due 03/18/245 | | EUR | 100,000 | | | | 117,402 | | |
Sirius XM Radio, Inc.
4.625%, due 07/15/242 | | | 970,000 | | | | 1,021,410 | | |
Time Warner Cable, Inc.
6.550%, due 05/01/37 | | | 14,000 | | | | 19,372 | | |
ViacomCBS, Inc.
4.375%, due 03/15/43 | | | 66,000 | | | | 73,222 | | |
5.850%, due 09/01/43 | | | 76,000 | | | | 96,528 | | |
Walt Disney Co./The
1.750%, due 08/30/24 | | | 15,000 | | | | 15,709 | | |
1.750%, due 01/13/266 | | | 122,000 | | | | 127,485 | | |
2.000%, due 09/01/29 | | | 285,000 | | | | 296,445 | | |
2.650%, due 01/13/31 | | | 160,000 | | | | 173,919 | | |
3.350%, due 03/24/25 | | | 252,000 | | | | 281,706 | | |
| | | | | | 7,325,324 | | |
Mining—0.0%† | |
Newmont Corp.
4.875%, due 03/15/42 | | | 17,000 | | | | 23,491 | | |
Teck Resources Ltd.
6.000%, due 08/15/40 | | | 3,000 | | | | 3,305 | | |
6.125%, due 10/01/35 | | | 20,000 | | | | 23,398 | | |
| | | | | | 50,194 | | |
Miscellaneous manufacturers—0.4% | |
3M Co.
0.950%, due 05/15/23 | | EUR | 130,000 | | | | 158,116 | | |
General Electric Co.
4.250%, due 05/01/40 | | | 6,000 | | | | 6,143 | | |
General Electric Co. GMTN
6.150%, due 08/07/37 | | | 26,000 | | | | 31,164 | | |
6.875%, due 01/10/39 | | | 43,000 | | | | 55,555 | | |
Parker-Hannifin Corp.
3.250%, due 06/14/29 | | | 34,000 | | | | 38,684 | | |
Siemens Financieringsmaatschappij N.V.
0.010%, due 09/05/215 | | EUR | 370,000 | | | | 436,256 | | |
0.010%, due 02/20/235 | | EUR | 300,000 | | | | 354,222 | | |
| | | Face
amount1 | | Value | |
Corporate bonds—(continued) | |
Miscellaneous manufacturers—(concluded) | |
Trane Technologies Luxembourg Finance SA
3.500%, due 03/21/26 | | | 95,000 | | | $ | 105,420 | | |
| | | | | | 1,185,560 | | |
Oil & gas—1.3% | |
BP Capital Markets PLC
1.109%, due 02/16/235 | | EUR | 115,000 | | | | 139,584 | | |
1.373%, due 03/03/225 | | EUR | 165,000 | | | | 198,766 | | |
2.822%, due 04/07/325 | | EUR | 130,000 | | | | 183,699 | | |
Concho Resources, Inc.
3.750%, due 10/01/27 | | | 35,000 | | | | 38,341 | | |
Diamondback Energy, Inc.
5.375%, due 05/31/25 | | | 17,000 | | | | 17,654 | | |
Ecopetrol SA
4.125%, due 01/16/256 | | | 195,000 | | | | 203,349 | | |
EOG Resources, Inc.
3.900%, due 04/01/356 | | | 25,000 | | | | 30,179 | | |
4.150%, due 01/15/26 | | | 50,000 | | | | 58,186 | | |
Equinor ASA
1.375%, due 05/22/325 | | EUR | 100,000 | | | | 127,349 | | |
Exxon Mobil Corp.
1.408%, due 06/26/39 | | EUR | 270,000 | | | | 317,952 | | |
Marathon Oil Corp.
2.800%, due 11/01/22 | | | 925,000 | | | | 936,662 | | |
Marathon Petroleum Corp.
4.500%, due 05/01/23 | | | 214,000 | | | | 231,871 | | |
4.750%, due 12/15/23 | | | 20,000 | | | | 22,077 | | |
Occidental Petroleum Corp.
0.010%, due 10/10/36 | | | 1,105,000 | | | | 482,056 | | |
Shell International Finance BV
2.375%, due 11/07/29 | | | 284,000 | | | | 306,847 | | |
3.125%, due 11/07/49 | | | 45,000 | | | | 49,900 | | |
3.625%, due 08/21/42 | | | 4,000 | | | | 4,652 | | |
3.875%, due 11/13/286 | | | 231,000 | | | | 274,312 | | |
Suncor Energy, Inc.
6.500%, due 06/15/386 | | | 65,000 | | | | 88,436 | | |
9.250%, due 10/15/21 | | | 30,000 | | | | 32,702 | | |
Total Capital International SA
2.125%, due 11/19/215 | | EUR | 100,000 | | | | 121,039 | | |
2.125%, due 03/15/235 | | EUR | 100,000 | | | | 124,670 | | |
2.750%, due 06/19/21 | | | 10,000 | | | | 10,214 | | |
Viper Energy Partners LP
5.375%, due 11/01/272,6 | | | 305,000 | | | | 317,200 | | |
| | | | | | 4,317,697 | | |
Packaging & containers—0.1% | |
Berry Global, Inc.
4.875%, due 07/15/262 | | | 250,000 | | | | 264,063 | | |
Sealed Air Corp.
4.000%, due 12/01/272,6 | | | 155,000 | | | | 160,425 | | |
| | | | | | 424,488 | | |
Pharmaceuticals—2.1% | |
AbbVie, Inc.
2.850%, due 05/14/23 | | | 135,000 | | | | 142,835 | | |
2.950%, due 11/21/262 | | | 187,000 | | | | 206,378 | | |
45
PACE Intermediate Fixed Income Investments
Portfolio of investments—July 31, 2020
| | | Face
amount1 | | Value | |
Corporate bonds—(continued) | |
Pharmaceuticals—(continued) | |
3.250%, due 10/01/222 | | | 70,000 | | | $ | 73,387 | | |
3.375%, due 11/14/21 | | | 33,000 | | | | 34,254 | | |
3.600%, due 05/14/25 | | | 200,000 | | | | 223,927 | | |
3.800%, due 03/15/252 | | | 3,000 | | | | 3,367 | | |
4.050%, due 11/21/392,6 | | | 46,000 | | | | 56,340 | | |
4.500%, due 05/14/356 | | | 161,000 | | | | 201,982 | | |
4.550%, due 03/15/352 | | | 209,000 | | | | 266,376 | | |
4.625%, due 10/01/422 | | | 6,000 | | | | 7,597 | | |
4.875%, due 02/15/212 | | | 12,000 | | | | 12,151 | | |
5.000%, due 12/15/212 | | | 114,000 | | | | 119,489 | | |
AstraZeneca PLC
3.375%, due 11/16/25 | | | 401,000 | | | | 455,443 | | |
Bayer AG
1.375%, due 07/06/325 | | EUR | 200,000 | | | | 237,932 | | |
Becton Dickinson and Co.
1.401%, due 05/24/23 | | EUR | 100,000 | | | | 120,588 | | |
Bristol-Myers Squibb Co.
4.550%, due 02/20/48 | | | 39,000 | | | | 56,244 | | |
Cigna Corp.
3.250%, due 04/15/25 | | | 71,000 | | | | 78,092 | | |
3.500%, due 06/15/246 | | | 125,000 | | | | 137,045 | | |
3.750%, due 07/15/23 | | | 246,000 | | | | 267,990 | | |
4.125%, due 11/15/25 | | | 375,000 | | | | 434,443 | | |
CVS Health Corp.
2.625%, due 08/15/24 | | | 2,000 | | | | 2,150 | | |
3.350%, due 03/09/21 | | | 59,000 | | | | 60,064 | | |
3.375%, due 08/12/24 | | | 10,000 | | | | 10,922 | | |
3.625%, due 04/01/27 | | | 72,000 | | | | 82,406 | | |
3.700%, due 03/09/23 | | | 353,000 | | | | 379,893 | | |
3.875%, due 07/20/25 | | | 85,000 | | | | 96,488 | | |
4.100%, due 03/25/25 | | | 473,000 | | | | 537,565 | | |
4.300%, due 03/25/28 | | | 281,000 | | | | 333,824 | | |
5.125%, due 07/20/45 | | | 99,000 | | | | 134,589 | | |
Eli Lilly and Co.
1.700%, due 11/01/49 | | EUR | 100,000 | | | | 131,384 | | |
Merck & Co., Inc.
2.450%, due 06/24/50 | | | 24,000 | | | | 25,866 | | |
Merck Financial Services GmbH
0.005%, due 12/15/235 | | EUR | 400,000 | | | | 471,272 | | |
0.125%, due 07/16/255 | | EUR | 100,000 | | | | 118,037 | | |
Novartis Finance SA
0.500%, due 08/14/235 | | EUR | 120,000 | | | | 144,143 | | |
Pfizer, Inc.
1.700%, due 05/28/30 | | | 93,000 | | | | 97,493 | | |
2.625%, due 04/01/30 | | | 84,000 | | | | 95,267 | | |
4.125%, due 12/15/46 | | | 25,000 | | | | 34,340 | | |
4.200%, due 09/15/48 | | | 6,000 | | | | 8,283 | | |
4.400%, due 05/15/44 | | | 35,000 | | | | 48,654 | | |
Shire Acquisitions Investments Ireland DAC
3.200%, due 09/23/26 | | | 327,000 | | | | 367,359 | | |
Takeda Pharmaceutical Co. Ltd.
2.000%, due 07/09/40 | | EUR | 350,000 | | | | 437,641 | | |
4.400%, due 11/26/23 | | | 200,000 | | | | 223,666 | | |
Upjohn Finance BV
1.023%, due 06/23/245 | | EUR | 140,000 | | | | 168,314 | | |
| | | Face
amount1 | | Value | |
Corporate bonds—(continued) | |
Pharmaceuticals—(concluded) | |
Wyeth LLC
6.500%, due 02/01/34 | | | 6,000 | | | $ | 9,562 | | |
| | | | | | 7,155,042 | | |
Pipelines—2.2% | |
Boardwalk Pipelines LP
4.800%, due 05/03/29 | | | 20,000 | | | | 21,757 | | |
Cameron LNG LLC
3.302%, due 01/15/352 | | | 135,000 | | | | 152,899 | | |
3.402%, due 01/15/382 | | | 145,000 | | | | 159,359 | | |
Cheniere Corpus Christi Holdings LLC
5.875%, due 03/31/256 | | | 30,000 | | | | 34,216 | | |
7.000%, due 06/30/24 | | | 298,000 | | | | 344,072 | | |
Cheniere Energy Partners LP
4.500%, due 10/01/29 | | | 60,000 | | | | 63,468 | | |
5.250%, due 10/01/25 | | | 360,000 | | | | 369,000 | | |
5.625%, due 10/01/26 | | | 545,000 | | | | 575,656 | | |
Energy Transfer Operating LP
2.900%, due 05/15/25 | | | 39,000 | | | | 39,441 | | |
4.050%, due 03/15/25 | | | 20,000 | | | | 21,071 | | |
4.200%, due 04/15/27 | | | 214,000 | | | | 223,677 | | |
4.500%, due 04/15/24 | | | 100,000 | | | | 106,531 | | |
4.950%, due 06/15/28 | | | 5,000 | | | | 5,343 | | |
Enterprise Products Operating LLC
4.450%, due 02/15/43 | | | 90,000 | | | | 103,709 | | |
4.850%, due 03/15/44 | | | 6,000 | | | | 7,255 | | |
5.100%, due 02/15/45 | | | 32,000 | | | | 39,629 | | |
Kinder Morgan Energy Partners LP
4.250%, due 09/01/24 | | | 55,000 | | | | 61,396 | | |
5.000%, due 08/15/42 | | | 20,000 | | | | 23,769 | | |
5.500%, due 03/01/44 | | | 41,000 | | | | 50,459 | | |
MPLX LP
5.250%, due 01/15/25 | | | 979,000 | | | | 1,021,402 | | |
NGPL PipeCo LLC
4.375%, due 08/15/222 | | | 547,000 | | | | 567,308 | | |
4.875%, due 08/15/272 | | | 46,000 | | | | 50,887 | | |
7.768%, due 12/15/372,6 | | | 12,000 | | | | 15,281 | | |
Northern Natural Gas Co.
4.300%, due 01/15/492 | | | 156,000 | | | | 193,207 | | |
Northwest Pipeline LLC
4.000%, due 04/01/27 | | | 265,000 | | | | 293,836 | | |
Sabine Pass Liquefaction LLC
5.000%, due 03/15/27 | | | 84,000 | | | | 96,094 | | |
5.625%, due 04/15/236,9 | | | 169,000 | | | | 186,232 | | |
5.625%, due 03/01/25 | | | 182,000 | | | | 211,184 | | |
Sunoco Logistics Partners Operations LP
3.900%, due 07/15/26 | | | 152,000 | | | | 157,416 | | |
4.000%, due 10/01/276 | | | 106,000 | | | | 108,606 | | |
4.250%, due 04/01/24 | | | 2,000 | | | | 2,111 | | |
6.100%, due 02/15/42 | | | 15,000 | | | | 15,769 | | |
Targa Resources Partners LP/Targa
Resources Partners Finance Corp.
5.125%, due 02/01/25 | | | 350,000 | | | | 355,250 | | |
Texas Eastern Transmission LP
2.800%, due 10/15/222 | | | 45,000 | | | | 46,013 | | |
3.500%, due 01/15/282 | | | 151,000 | | | | 165,188 | | |
46
PACE Intermediate Fixed Income Investments
Portfolio of investments—July 31, 2020
| | | Face
amount1 | | Value | |
Corporate bonds—(continued) | |
Pipelines—(concluded) | |
4.150%, due 01/15/482 | | | 252,000 | | | $ | 281,891 | | |
Transcontinental Gas Pipe Line Co. LLC
4.000%, due 03/15/28 | | | 268,000 | | | | 303,777 | | |
4.600%, due 03/15/486 | | | 57,000 | | | | 70,706 | | |
7.850%, due 02/01/26 | | | 410,000 | | | | 537,352 | | |
Williams Cos., Inc./The
7.500%, due 01/15/31 | | | 40,000 | | | | 52,467 | | |
7.875%, due 09/01/21 | | | 280,000 | | | | 301,094 | | |
| | | | | | 7,435,778 | | |
Real estate—0.2% | |
Northwest Florida Timber Finance LLC
4.750%, due 03/04/292 | | | 200,000 | | | | 216,387 | | |
Vonovia Finance BV
0.125%, due 04/06/235 | | EUR | 200,000 | | | | 235,647 | | |
0.750%, due 01/25/225 | | EUR | 100,000 | | | | 118,976 | | |
| | | | | | 571,010 | | |
Real estate investment trusts—1.2% | |
American Tower Corp.
1.300%, due 09/15/25 | | | 122,000 | | | | 123,839 | | |
1.950%, due 05/22/26 | | EUR | 125,000 | | | | 158,708 | | |
2.100%, due 06/15/30 | | | 167,000 | | | | 173,660 | �� | |
2.250%, due 01/15/22 | | | 125,000 | | | | 128,218 | | |
3.800%, due 08/15/29 | | | 91,000 | | | | 106,605 | | |
Boston Properties LP
2.900%, due 03/15/30 | | | 79,000 | | | | 84,628 | | |
3.400%, due 06/21/29 | | | 28,000 | | | | 31,352 | | |
4.500%, due 12/01/28 | | | 20,000 | | | | 24,177 | | |
CC Holdings GS V LLC/Crown
Castle GS III Corp.
3.849%, due 04/15/23 | | | 460,000 | | | | 497,155 | | |
Crown Castle International Corp.
1.350%, due 07/15/25 | | | 166,000 | | | | 169,487 | | |
2.250%, due 01/15/31 | | | 67,000 | | | | 69,501 | | |
3.100%, due 11/15/29 | | | 177,000 | | | | 197,393 | | |
3.150%, due 07/15/23 | | | 35,000 | | | | 37,462 | | |
3.300%, due 07/01/30 | | | 141,000 | | | | 159,393 | | |
3.700%, due 06/15/26 | | | 20,000 | | | | 22,853 | | |
3.800%, due 02/15/28 | | | 10,000 | | | | 11,647 | | |
4.000%, due 03/01/276 | | | 6,000 | | | | 6,928 | | |
4.150%, due 07/01/50 | | | 17,000 | | | | 21,400 | | |
4.450%, due 02/15/26 | | | 89,000 | | | | 104,165 | | |
5.200%, due 02/15/49 | | | 22,000 | | | | 30,971 | | |
5.250%, due 01/15/23 | | | 90,000 | | | | 100,055 | | |
Digital Dutch Finco BV
1.500%, due 03/15/305 | | EUR | 100,000 | | | | 122,305 | | |
Equinix, Inc.
1.250%, due 07/15/256 | | | 23,000 | | | | 23,365 | | |
2.625%, due 11/18/24 | | | 193,000 | | | | 206,805 | | |
3.200%, due 11/18/29 | | | 109,000 | | | | 122,297 | | |
GLP Capital LP/GLP Financing II, Inc.
3.350%, due 09/01/24 | | | 41,000 | | | | 41,191 | | |
4.000%, due 01/15/30 | | | 24,000 | | | | 24,878 | | |
5.250%, due 06/01/25 | | | 160,000 | | | | 172,336 | | |
| | | Face
amount1 | | Value | |
Corporate bonds—(continued) | |
Real estate investment trusts—(concluded) | |
Merlin Properties Socimi SA
2.375%, due 07/13/275 | | EUR | 200,000 | | | $ | 237,046 | | |
Prologis Euro Finance LLC
1.500%, due 09/10/49 | | EUR | 100,000 | | | | 117,667 | | |
Realty Income Corp.
3.000%, due 01/15/27 | | | 45,000 | | | | 49,254 | | |
3.250%, due 01/15/31 | | | 10,000 | | | | 11,219 | | |
4.125%, due 10/15/26 | | | 40,000 | | | | 46,420 | | |
Simon International Finance SCA
1.375%, due 11/18/225 | | EUR | 105,000 | | | | 124,202 | | |
Unibail-Rodamco-Westfield SE
2.000%, due 06/29/325 | | EUR | 200,000 | | | | 241,603 | | |
VICI Properties LP/VICI Note Co., Inc.
4.250%, due 12/01/262 | | | 250,000 | | | | 257,500 | | |
| | | | | | 4,057,685 | | |
Retail—0.6% | |
Dollar General Corp.
3.500%, due 04/03/30 | | | 82,000 | | | | 94,727 | | |
4.125%, due 05/01/28 | | | 5,000 | | | | 5,948 | | |
Home Depot, Inc./The
3.300%, due 04/15/406 | | | 28,000 | | | | 33,336 | | |
5.950%, due 04/01/41 | | | 47,000 | | | | 75,153 | | |
Lowe's Cos., Inc.
2.500%, due 04/15/26 | | | 10,000 | | | | 10,867 | | |
3.125%, due 09/15/24 | | | 344,000 | | | | 377,889 | | |
4.000%, due 04/15/25 | | | 287,000 | | | | 329,049 | | |
McDonald's Corp. GMTN
1.000%, due 11/15/235 | | EUR | 200,000 | | | | 243,746 | | |
McDonald's Corp. MTN
2.750%, due 12/09/20 | | | 25,000 | | | | 25,162 | | |
3.300%, due 07/01/25 | | | 21,000 | | | | 23,508 | | |
3.625%, due 09/01/496 | | | 114,000 | | | | 133,987 | | |
4.450%, due 09/01/48 | | | 130,000 | | | | 170,965 | | |
Starbucks Corp.
2.550%, due 11/15/30 | | | 214,000 | | | | 229,492 | | |
3.550%, due 08/15/29 | | | 15,000 | | | | 17,404 | | |
Walmart, Inc.
2.375%, due 09/24/29 | | | 95,000 | | | | 106,047 | | |
| | | | | | 1,877,280 | | |
Semiconductors—1.6% | |
Analog Devices, Inc.
2.950%, due 04/01/25 | | | 2,000 | | | | 2,197 | | |
3.500%, due 12/05/26 | | | 5,000 | | | | 5,699 | | |
Applied Materials, Inc.
1.750%, due 06/01/30 | | | 129,000 | | | | 136,064 | | |
3.300%, due 04/01/27 | | | 119,000 | | | | 137,815 | | |
ASML Holding N.V.
0.625%, due 05/07/295 | | EUR | 100,000 | | | | 120,884 | | |
Broadcom Corp./Broadcom
Cayman Finance Ltd.
3.875%, due 01/15/27 | | | 228,000 | | | | 253,260 | | |
Broadcom, Inc.
2.250%, due 11/15/232,6 | | | 613,000 | | | | 638,089 | | |
3.459%, due 09/15/262 | | | 519,000 | | | | 568,537 | | |
47
PACE Intermediate Fixed Income Investments
Portfolio of investments—July 31, 2020
| | | Face
amount1 | | Value | |
Corporate bonds—(continued) | |
Semiconductors—(concluded) | |
4.110%, due 09/15/282 | | | 189,000 | | | $ | 214,088 | | |
4.250%, due 04/15/262 | | | 127,000 | | | | 143,424 | | |
4.700%, due 04/15/252,6 | | | 130,000 | | | | 148,650 | | |
Intel Corp.
2.450%, due 11/15/29 | | | 294,000 | | | | 325,035 | | |
2.700%, due 12/15/22 | | | 19,000 | | | | 20,036 | | |
3.900%, due 03/25/30 | | | 332,000 | | | | 407,443 | | |
4.100%, due 05/19/46 | | | 29,000 | | | | 37,849 | | |
KLA Corp.
4.100%, due 03/15/29 | | | 140,000 | | | | 169,165 | | |
4.650%, due 11/01/24 | | | 140,000 | | | | 161,587 | | |
Lam Research Corp.
3.750%, due 03/15/266 | | | 394,000 | | | | 455,285 | | |
4.875%, due 03/15/49 | | | 34,000 | | | | 51,421 | | |
NVIDIA Corp.
2.850%, due 04/01/306 | | | 190,000 | | | | 211,926 | | |
3.200%, due 09/16/26 | | | 134,000 | | | | 152,000 | | |
3.500%, due 04/01/50 | | | 95,000 | | | | 114,856 | | |
NXP BV/NXP Funding LLC
4.125%, due 06/01/212 | | | 348,000 | | | | 357,570 | | |
5.550%, due 12/01/282 | | | 61,000 | | | | 76,609 | | |
NXP BV/NXP Funding LLC/NXP USA, Inc.
3.150%, due 05/01/272 | | | 13,000 | | | | 14,155 | | |
3.400%, due 05/01/302 | | | 167,000 | | | | 184,407 | | |
4.300%, due 06/18/292 | | | 57,000 | | | | 66,434 | | |
QUALCOMM, Inc.
4.300%, due 05/20/47 | | | 101,000 | | | | 136,058 | | |
4.800%, due 05/20/45 | | | 51,000 | | | | 72,824 | | |
Texas Instruments, Inc.
1.750%, due 05/04/30 | | | 64,000 | | | | 67,121 | | |
| | | | | | 5,450,488 | | |
Shipbuilding—0.2% | |
Huntington Ingalls Industries, Inc.
3.483%, due 12/01/27 | | | 225,000 | | | | 249,184 | | |
3.844%, due 05/01/252 | | | 191,000 | | | | 212,171 | | |
4.200%, due 05/01/302 | | | 136,000 | | | | 159,549 | | |
5.000%, due 11/15/252 | | | 202,000 | | | | 208,884 | | |
| | | | | | 829,788 | | |
Software—1.8% | |
Activision Blizzard, Inc.
3.400%, due 09/15/26 | | | 290,000 | | | | 331,744 | | |
Autodesk, Inc.
2.850%, due 01/15/30 | | | 141,000 | | | | 158,222 | | |
4.375%, due 06/15/25 | | | 135,000 | | | | 154,205 | | |
Dassault Systemes SE
0.010%, due 09/16/225 | | EUR | 300,000 | | | | 353,539 | | |
Electronic Arts, Inc.
4.800%, due 03/01/26 | | | 370,000 | | | | 444,852 | | |
Fidelity National Information Services, Inc.
0.125%, due 12/03/22 | | EUR | 100,000 | | | | 118,163 | | |
0.750%, due 05/21/23 | | EUR | 200,000 | | | | 239,911 | | |
1.000%, due 12/03/28 | | EUR | 170,000 | | | | 205,274 | | |
2.950%, due 05/21/39 | | EUR | 100,000 | | | | 144,281 | | |
| | | Face
amount1 | | Value | |
Corporate bonds—(continued) | |
Software—(concluded) | |
Fiserv, Inc.
2.650%, due 06/01/306 | | | 62,000 | | | $ | 67,830 | | |
2.750%, due 07/01/24 | | | 238,000 | | | | 256,890 | | |
3.500%, due 07/01/29 | | | 116,000 | | | | 134,226 | | |
3.850%, due 06/01/25 | | | 51,000 | | | | 58,289 | | |
4.200%, due 10/01/28 | | | 195,000 | | | | 235,871 | | |
Microsoft Corp.
2.525%, due 06/01/50 | | | 184,000 | | | | 201,390 | | |
3.450%, due 08/08/36 | | | 153,000 | | | | 191,553 | | |
3.700%, due 08/08/46 | | | 143,000 | | | | 185,778 | | |
MSCI, Inc.
3.875%, due 02/15/312 | | | 405,000 | | | | 439,931 | | |
Oracle Corp.
1.900%, due 09/15/216 | | | 29,000 | | | | 29,486 | | |
2.500%, due 04/01/256 | | | 351,000 | | | | 379,478 | | |
2.800%, due 04/01/27 | | | 843,000 | | | | 936,051 | | |
2.950%, due 11/15/246 | | | 304,000 | | | | 333,078 | | |
3.600%, due 04/01/406 | | | 52,000 | | | | 61,536 | | |
3.800%, due 11/15/37 | | | 305,000 | | | | 371,731 | | |
4.300%, due 07/08/34 | | | 44,000 | | | | 56,495 | | |
5.375%, due 07/15/40 | | | 31,000 | | | | 45,154 | | |
| | | | | | 6,134,958 | | |
Supranationals—0.1% | |
International Bank for Reconstruction &
Development
0.875%, due 05/14/30 | | | 325,000 | | | | 329,145 | | |
Telecommunications—2.3% | |
AT&T, Inc.
2.250%, due 02/01/3210 | | | 155,000 | | | | 158,926 | | |
2.600%, due 05/19/38 | | EUR | 210,000 | | | | 274,701 | | |
3.300%, due 02/01/5210 | | | 78,000 | | | | 81,091 | | |
3.400%, due 06/15/229 | | | 213,000 | | | | 224,768 | | |
3.550%, due 06/01/24 | | | 25,000 | | | | 27,646 | | |
3.600%, due 07/15/25 | | | 85,000 | | | | 95,674 | | |
3.800%, due 02/15/27 | | | 215,000 | | | | 245,759 | | |
3.875%, due 01/15/26 | | | 38,000 | | | | 43,257 | | |
4.250%, due 03/01/27 | | | 221,000 | | | | 258,741 | | |
4.500%, due 05/15/35 | | | 506,000 | | | | 608,965 | | |
4.750%, due 05/15/46 | | | 108,000 | | | | 133,783 | | |
4.800%, due 06/15/44 | | | 25,000 | | | | 31,255 | | |
5.150%, due 03/15/42 | | | 10,000 | | | | 12,735 | | |
5.150%, due 11/15/46 | | | 55,000 | | | | 70,979 | | |
Corning, Inc.
3.700%, due 11/15/23 | | | 20,000 | | | | 21,376 | | |
Motorola Solutions, Inc.
4.600%, due 05/23/29 | | | 126,000 | | | | 147,739 | | |
5.500%, due 09/01/44 | | | 135,000 | | | | 160,902 | | |
Orange SA
0.500%, due 01/15/225 | | EUR | 200,000 | | | | 237,671 | | |
SES SA GMTN
2.000%, due 07/02/285 | | EUR | 100,000 | | | | 119,163 | | |
48
PACE Intermediate Fixed Income Investments
Portfolio of investments—July 31, 2020
| | | Face
amount1 | | Value | |
Corporate bonds—(continued) | |
Telecommunications—(concluded) | |
Sprint Spectrum Co. LLC/Sprint
Spectrum Co. II LLC/Sprint
Spectrum Co. III LLC
3.360%, due 09/20/212,9 | | | 898,438 | | | $ | 909,668 | | |
Swisscom Finance BV
0.375%, due 11/14/285 | | EUR | 100,000 | | | | 120,023 | | |
T-Mobile USA, Inc.
2.050%, due 02/15/282 | | | 140,000 | | | | 143,762 | | |
3.750%, due 04/15/272 | | | 730,000 | | | | 829,433 | | |
Telenor ASA
0.010%, due 09/25/235 | | EUR | 100,000 | | | | 118,076 | | |
Telstra Corp. Ltd.
3.500%, due 09/21/225 | | EUR | 265,000 | | | | 335,320 | | |
Verizon Communications, Inc.
1.850%, due 05/18/40 | | EUR | 200,000 | | | | 254,823 | | |
2.625%, due 08/15/26 | | | 157,000 | | | | 173,601 | | |
3.000%, due 03/22/27 | | | 20,000 | | | | 22,535 | | |
3.875%, due 02/08/29 | | | 40,000 | | | | 48,217 | | |
4.125%, due 03/16/27 | | | 426,000 | | | | 509,957 | | |
4.272%, due 01/15/36 | | | 335,000 | | | | 430,426 | | |
4.329%, due 09/21/286 | | | 348,000 | | | | 429,032 | | |
4.500%, due 08/10/33 | | | 54,000 | | | | 70,702 | | |
4.522%, due 09/15/48 | | | 35,000 | | | | 48,761 | | |
Series 20Y,
2.875%, due 01/15/38 | | EUR | 100,000 | | | | 148,539 | | |
Vodafone Group PLC
4.125%, due 05/30/25 | | | 63,000 | | | | 72,078 | | |
4.375%, due 02/19/43 | | | 28,000 | | | | 34,193 | | |
5.125%, due 06/19/59 | | | 1,000 | | | | 1,357 | | |
5.250%, due 05/30/48 | | | 180,000 | | | | 244,575 | | |
| | | | | | 7,900,209 | | |
Toys/Games/Hobbies—0.0%† | |
Hasbro, Inc.
2.600%, due 11/19/22 | | | 79,000 | | | | 81,698 | | |
3.900%, due 11/19/29 | | | 69,000 | | | | 73,182 | | |
| | | | | | 154,880 | | |
Transportation—1.0% | |
Burlington Northern Santa Fe LLC
4.150%, due 04/01/45 | | | 81,000 | | | | 107,708 | | |
Canadian Pacific Railway Co.
2.050%, due 03/05/30 | | | 69,000 | | | | 72,742 | | |
Cargo Aircraft Management, Inc.
4.750%, due 02/01/282,6 | | | 435,000 | | | | 444,787 | | |
CSX Corp.
2.600%, due 11/01/26 | | | 379,000 | | | | 420,028 | | |
3.250%, due 06/01/27 | | | 116,000 | | | | 132,503 | | |
3.800%, due 03/01/28 | | | 110,000 | | | | 130,654 | | |
4.300%, due 03/01/48 | | | 15,000 | | | | 20,094 | | |
5.500%, due 04/15/41 | | | 17,000 | | | | 24,404 | | |
FedEx Corp.
3.200%, due 02/01/25 | | | 43,000 | | | | 47,334 | | |
3.800%, due 05/15/25 | | | 379,000 | | | | 428,334 | | |
3.875%, due 08/01/42 | | | 17,000 | | | | 18,751 | | |
4.100%, due 04/15/43 | | | 15,000 | | | | 17,146 | | |
4.550%, due 04/01/46 | | | 73,000 | | | | 88,099 | | |
| | | Face
amount1 | | Value | |
Corporate bonds—(concluded) | |
Transportation—(concluded) | |
Norfolk Southern Corp.
2.550%, due 11/01/29 | | | 85,000 | | | $ | 93,955 | | |
2.900%, due 06/15/26 | | | 129,000 | | | | 144,166 | | |
3.400%, due 11/01/49 | | | 65,000 | | | | 77,964 | | |
3.650%, due 08/01/25 | | | 39,000 | | | | 44,226 | | |
3.950%, due 10/01/42 | | | 2,000 | | | | 2,470 | | |
4.450%, due 06/15/45 | | | 25,000 | | | | 32,995 | | |
Penske Truck Leasing Co. LP/PTL Finance Corp.
2.700%, due 11/01/242 | | | 95,000 | | | | 100,143 | | |
Ryder System, Inc. MTN
2.250%, due 09/01/21 | | | 5,000 | | | | 5,077 | | |
2.500%, due 09/01/24 | | | 4,000 | | | | 4,211 | | |
4.625%, due 06/01/25 | | | 105,000 | | | | 120,397 | | |
Union Pacific Corp.
2.750%, due 03/01/26 | | | 35,000 | | | | 38,427 | | |
3.250%, due 02/05/50 | | | 58,000 | | | | 67,988 | | |
3.799%, due 10/01/51 | | | 204,000 | | | | 263,001 | | |
United Parcel Service, Inc.
0.375%, due 11/15/23 | | EUR | 120,000 | | | | 143,251 | | |
2.500%, due 09/01/29 | | | 63,000 | | | | 69,981 | | |
3.400%, due 03/15/29 | | | 96,000 | | | | 113,471 | | |
3.400%, due 09/01/49 | | | 5,000 | | | | 5,993 | | |
| | | | | | 3,280,300 | | |
Water—0.2% | |
Suez SA
1.250%, due 05/14/355 | | EUR | 100,000 | | | | 123,501 | | |
Veolia Environnement SA
0.672%, due 03/30/225 | | EUR | 300,000 | | | | 356,495 | | |
0.800%, due 01/15/325 | | EUR | 100,000 | | | | 120,040 | | |
| | | | | | 600,036 | | |
Total corporate bonds
(cost—$144,846,092) | | | 154,873,644 | | |
Mortgage-backed securities—8.4% | |
Arbor Multifamily Mortgage Securities Trust,
Series 2020-MF1, Class A5,
2.756%, due 05/15/532 | | | 465,000 | | | | 509,890 | | |
BAMLL Commercial Mortgage Securities Trust,
Series 2017-SCH, Class AL,
1 mo. USD LIBOR + 0.900%,
1.075%, due 11/15/322,4 | | | 1,150,000 | | | | 1,086,932 | | |
Benchmark Mortgage Trust,
Series 2018-B7, Class A4,
4.510%, due 05/15/533 | | | 103,000 | | | | 126,202 | | |
Series 2019-B15, Class B,
3.564%, due 12/15/72 | | | 210,000 | | | | 227,557 | | |
Series 2019-B15, Class C,
3.723%, due 12/15/723 | | | 111,000 | | | | 110,712 | | |
BFLD DPLO,
Series 2019-DPLO, Class A,
1 mo. USD LIBOR + 1.090%,
1.265%, due 10/15/342,4 | | | 350,000 | | | | 337,707 | | |
49
PACE Intermediate Fixed Income Investments
Portfolio of investments—July 31, 2020
| | | Face
amount1 | | Value | |
Mortgage-backed securities—(continued) | |
BX Commercial Mortgage Trust,
Series 2019-XL, Class A,
1 mo. USD LIBOR + 0.920%,
1.095%, due 10/15/362,4 | | | 401,553 | | | | $400,545 | | |
Series 2020-BXLP, Class A,
1 mo. USD LIBOR + 0.800%,
0.975%, due 12/15/362,4 | | | 344,685 | | | | 342,645 | | |
Cantor Commercial Real Estate Lending,
Series 2019-CF3, Class B,
3.500%, due 01/15/533 | | | 101,000 | | | | 100,405 | | |
CD Mortgage Trust,
Series 2017-CD3, Class A4,
3.631%, due 02/10/50 | | | 545,000 | | | | 613,982 | | |
Chase Home Lending Mortgage Trust,
Series 2019-ATR2, Class A11,
1 mo. USD LIBOR + 0.900%,
1.072%, due 07/25/492,4 | | | 171,841 | | | | 170,634 | | |
CIM Trust,
Series 2019-INV3, Class A11,
1 mo. USD LIBOR + 1.000%,
1.135%, due 08/25/492,4 | | | 506,240 | | | | 504,812 | | |
Commercial Mortgage
Pass-Through Certificates,
Series 2013-GAM, Class A2,
3.367%, due 02/10/282 | | | 1,090,000 | | | | 1,035,647 | | |
Series 2014-CR16, Class A4,
4.051%, due 04/10/47 | | | 145,000 | | | | 159,234 | | |
Series 2015-CR25, Class A3,
3.505%, due 08/10/48 | | | 283,336 | | | | 306,958 | | |
Series 2018-COR3, Class A3,
4.228%, due 05/10/51 | | | 589,000 | | | | 699,143 | | |
Credit Suisse Mortgage Trust
2.257%, due 08/15/37 | | | 383,000 | | | | 394,490 | | |
CSMC Trust,
Series 2017-CALI, Class A,
3.431%, due 11/10/322 | | | 260,000 | | | | 278,975 | | |
DBGS BIOD Mortgage Trust,
Series 2018-C1, Class A4,
4.466%, due 10/15/51 | | | 480,000 | | | | 577,776 | | |
DBWF GLKS Mortgage Trust,
Series 2018-GLKS, Class A,
1 mo. USD LIBOR + 1.030%,
1.217%, due 12/19/302,4 | | | 497,000 | | | | 478,052 | | |
FHLMC Multifamily Structured
Pass-Through Certificates,
Series K038, Class X1, IO,
1.123%, due 03/25/243 | | | 2,433,350 | | | | 83,231 | | |
Series K075, Class A2,
3.650%, due 02/25/283 | | | 230,000 | | | | 272,425 | | |
Series K076, Class A2,
3.900%, due 04/25/28 | | | 740,000 | | | | 892,007 | | |
Series K083, Class A2,
4.050%, due 09/25/283 | | | 820,000 | | | | 1,002,272 | | |
Series K084, Class A2,
3.780%, due 10/25/283 | | | 548,000 | | | | 652,807 | | |
Series K087, Class A2,
3.771%, due 12/25/28 | | | 203,000 | | | | 245,190 | | |
| | | Face
amount1 | | Value | |
Mortgage-backed securities—(continued) | |
Series KC02, Class A2,
3.370%, due 07/25/25 | | | 670,000 | | | $ | 728,543 | | |
FHLMC REMIC Trust,
Series 2626, Class A,
4.000%, due 06/15/33 | | | 87,637 | | | | 96,519 | | |
Series 3990, Class VA,
3.500%, due 01/15/25 | | | 167,220 | | | | 168,045 | | |
Series 4213, Class VE,
3.500%, due 06/15/26 | | | 176,333 | | | | 182,513 | | |
Series 4248, Class FL,
1 mo. USD LIBOR + 0.450%,
0.625%, due 05/15/414 | | | 183,186 | | | | 183,919 | | |
Series 4316, Class XZ,
4.500%, due 03/15/44 | | | 405,361 | | | | 484,350 | | |
Series 4323, Class CA,
4.000%, due 03/15/40 | | | 110,614 | | | | 113,465 | | |
Series 4325, Class MA,
4.000%, due 09/15/39 | | | 349,275 | | | | 356,929 | | |
Series 4328, Class DA,
4.000%, due 01/15/36 | | | 392,606 | | | | 402,386 | | |
Series 4336, Class MA,
4.000%, due 01/15/40 | | | 283,980 | | | | 289,756 | | |
Series 4443, Class BA,
3.500%, due 04/15/41 | | | 61,584 | | | | 63,169 | | |
Series 4447, Class PA,
3.000%, due 12/15/44 | | | 68,553 | | | | 73,494 | | |
Series 4606, Class FB,
1 mo. USD LIBOR + 0.500%,
0.675%, due 08/15/464 | | | 289,708 | | | | 290,770 | | |
Flagstar Mortgage Trust,
Series 2019-1INV, Class A11,
1 mo. USD LIBOR + 0.950%,
1.122%, due 10/25/492,4 | | | 405,697 | | | | 402,619 | | |
Series 2020-1INV, Class A11,
1 mo. USD LIBOR + 0.850%,
1.022%, due 03/25/502,4 | | | 479,975 | | | | 467,953 | | |
FNMA REMIC Trust,
Series 2011-8, Class ZA,
4.000%, due 02/25/41 | | | 1,466,522 | | | | 1,605,682 | | |
Series 2013-112, Class HQ,
4.000%, due 11/25/43 | | | 51,460 | | | | 57,779 | | |
Series 2014-12, Class GV,
3.500%, due 03/25/27 | | | 112,162 | | | | 117,732 | | |
Series 2014-48, Class AB,
4.000%, due 10/25/40 | | | 77,104 | | | | 78,814 | | |
Series 2015-20, Class EV,
3.500%, due 07/25/26 | | | 200,248 | | | | 214,533 | | |
Series 2015-28, Class IO,
5.500%, due 05/25/45 | | | 1,054,869 | | | | 202,220 | | |
Series 2015-58, Class JP,
2.500%, due 03/25/37 | | | 92,808 | | | | 97,723 | | |
Series 2015-62, Class VA,
4.000%, due 10/25/26 | | | 60,440 | | | | 64,080 | | |
Series 2016-48, Class UF,
1 mo. USD LIBOR + 0.400%,
0.572%, due 08/25/464 | | | 447,256 | | | | 447,563 | | |
50
PACE Intermediate Fixed Income Investments
Portfolio of investments—July 31, 2020
| | | Face
amount1 | | Value | |
Mortgage-backed securities—(continued) | |
Series 2016-62, Class FC,
1 mo. USD LIBOR + 0.500%,
0.672%, due 09/25/464 | | | 226,971 | | | | $227,752 | | |
Series 2016-74, Class GF,
1 mo. USD LIBOR + 0.500%,
0.672%, due 10/25/464 | | | 279,268 | | | | 279,951 | | |
FREMF Mortgage Trust,
Series 2012-K19, Class B,
4.023%, due 05/25/452,3 | | | 145,000 | | | | 150,913 | | |
Series 2013-K25, Class B,
3.619%, due 11/25/452,3 | | | 347,000 | | | | 364,736 | | |
FRESB Mortgage Trust,
Series 2019,
3.500%, due 01/25/393 | | | 249,114 | | | | 267,523 | | |
GNMA
4.500%, due 04/20/50 | | | 427,083 | | | | 458,368 | | |
GNMA Trust,
Series 2014-131, Class BW,
4.049%, due 05/20/413 | | | 47,797 | | | | 49,956 | | |
Series 2015-167, Class SA,
1 mo. USD LIBOR + 6.250%,
6.063%, due 11/20/454 | | | 386,152 | | | | 74,937 | | |
Series 2015-3, Class ZD,
4.000%, due 01/20/45 | | | 716,232 | | | | 868,270 | | |
GS Mortgage Securities Corp. Trust,
Series 2019-SOHO, Class B,
1 mo. USD LIBOR + 1.150%,
1.325%, due 06/15/362,4 | | | 345,000 | | | | 332,095 | | |
GS Mortgage Securities Trust,
Series 2017-GS7, Class A4,
3.430%, due 08/10/50 | | | 330,000 | | | | 371,508 | | |
JP Morgan Chase Commercial
Mortgage Securities Trust,
Series 2015-JP1, Class A5,
3.914%, due 01/15/49 | | | 800,000 | | | | 903,464 | | |
Series 2019-BKWD, Class A,
1 mo. USD LIBOR + 1.000%,
1.175%, due 09/15/292,4 | | | 130,000 | | | | 126,186 | | |
JP Morgan Mortgage Trust,
Series 2017-1, Class A4,
3.500%, due 01/25/472,3 | | | 366,199 | | | | 371,208 | | |
Series 2017-2, Class A6,
3.000%, due 05/25/472,3 | | | 295,397 | | | | 299,530 | | |
Series 2019-INV2, Class A11,
1 mo. USD LIBOR + 0.900%,
1.072%, due 02/25/502,4 | | | 523,020 | | | | 518,806 | | |
Series 2019-LTV3, Class A11,
1 mo. USD LIBOR + 0.850%,
1.035%, due 03/25/502,4 | | | 418,904 | | | | 415,747 | | |
Morgan Stanley Capital I Trust,
Series 2014-CPT, Class A,
3.350%, due 07/13/292 | | | 195,000 | | | | 198,356 | | |
Series 2014-MP, Class A,
3.469%, due 08/11/332 | | | 575,000 | | | | 586,700 | | |
Series 2015-MS1, Class A4,
3.779%, due 05/15/483 | | | 520,000 | | | | 574,630 | | |
| | | Face
amount1 | | Value | |
Mortgage-backed securities—(concluded) | |
Series 2019-NUGS, Class A,
1 mo. USD LIBOR + 0.950%,
2.450%, due 12/15/362,4 | | | 241,000 | | | | $236,422 | | |
New Residential Mortgage Loan Trust,
Series 2016-4A, Class A1,
3.750%, due 11/25/562,3 | | | 97,755 | | | | 104,203 | | |
SFAVE Commercial Mortgage Securities Trust,
Series 2015-5AVE, Class A2B,
4.144%, due 01/05/432,3 | | | 515,000 | | | | 488,550 | | |
Shellpoint Co-Originator Trust,
Series 2016-1, Class 2A3,
3.000%, due 10/25/312,3 | | | 167,255 | | | | 171,046 | | |
Starwood Mortgage Residential Trust,
Series 2020-2, Class A1,
2.718%, due 04/25/602,3 | | | 379,520 | | | | 386,185 | | |
Tharaldson Hotel Portfolio Trust,
Series 2018-THL, Class A,
1 mo. USD LIBOR + 0.750%,
0.913%, due 11/11/342,4 | | | 81,008 | | | | 77,339 | | |
Wells Fargo Commercial Mortgage Trust,
Series 2018-C44, Class A5,
4.212%, due 05/15/51 | | | 445,000 | | | | 525,551 | | |
Series 2018-C46, Class A4,
4.152%, due 08/15/51 | | | 170,000 | | | | 200,500 | | |
Total mortgage-backed securities
(cost—$27,706,971) | | | 28,431,218 | | |
Municipal bonds—1.4% | |
California—0.1% | |
San Diego Community College,
District, GO Bonds, (Taxable Refunding),
Series A,
3.336%, due 08/01/43 | | | 180,000 | | | | 195,500 | | |
State of California, GO Bonds,
(Build America Bonds)
7.625%, due 03/01/40 | | | 25,000 | | | | 45,003 | | |
| | | | | | 240,503 | | |
Delaware—0.0%† | |
State of Delaware, GO Bonds,
Series A,
5.000%, due 01/01/30 | | | 80,000 | | | | 111,713 | | |
Florida—0.0%† | |
County of Miami-Dade Aviation
Revenue Bonds, (Taxable Refunding),
Series B,
3.275%, due 10/01/29 | | | 20,000 | | | | 20,367 | | |
County of Miami-Dade Water & Sewer
System Revenue Bonds,
(Taxable Refunding),
Series C,
3.490%, due 10/01/42 | | | 90,000 | | | | 98,402 | | |
| | | | | | 118,769 | | |
51
PACE Intermediate Fixed Income Investments
Portfolio of investments—July 31, 2020
| | | Face
amount1 | | Value | |
Municipal bonds—(continued) | |
Louisiana—0.1% | |
State of Louisiana, GO Bonds,
Series A,
5.000%, due 03/01/27 | | | 130,000 | | | $ | 166,482 | | |
Series A,
5.000%, due 03/01/28 | | | 130,000 | | | | 171,183 | | |
| | | | | | 337,665 | | |
Maryland—0.3% | |
State of Maryland, GO Bonds,
Series A,
5.000%, due 03/15/27 | | | 100,000 | | | | 129,627 | | |
Series A,
5.000%, due 03/15/28 | | | 400,000 | | | | 533,572 | | |
Series A,
5.000%, due 03/15/29 | | | 255,000 | | | | 349,404 | | |
| | | | | | 1,012,603 | | |
Massachusetts—0.1% | |
Commonwealth of Massachusetts, GO Bonds,
Series A,
5.000%, due 03/01/29 | | | 100,000 | | | | 136,382 | | |
Massachusetts Water Resources Authority
Revenue Bonds, (Taxable Refunding),
Series F,
3.104%, due 08/01/39 | | | 300,000 | | | | 320,751 | | |
| | | | | | 457,133 | | |
Michigan—0.1% | |
University of Michigan Revenue Bonds,
Series B,
2.437%, due 04/01/40 | | | 180,000 | | | | 192,933 | | |
Minnesota—0.1% | |
State of Minnesota, GO Bonds,
Series A,
5.000%, due 08/01/29 | | | 110,000 | | | | 147,523 | | |
Nebraska—0.1% | |
University of Nebraska Facilities
Corporation Revenue Bonds,
(Taxable Refunding),
Series A,
3.037%, due 10/01/49 | | | 200,000 | | | | 233,342 | | |
New Jersey—0.1% | |
New Jersey Transportation Trust
Fund Authority Revenue Bonds,
(Build America Bonds)
6.561%, due 12/15/40 | | | 105,000 | | | | 135,502 | | |
Rutgers The State University of
New Jersey Revenue Bonds,
(Taxable Refunding),
Series R,
3.270%, due 05/01/43 | | | 60,000 | | | | 67,312 | | |
| | | | | | 202,814 | | |
| | | Face
amount1 | | Value | |
Municipal bonds—(concluded) | |
New York—0.2% | |
City of New York, GO Bonds,
Series C-1,
5.000%, due 08/01/30 | | | 230,000 | | | $ | 313,794 | | |
New York State Thruway Authority
Revenue Bonds, (Taxable Refunding),
Series M,
2.900%, due 01/01/35 | | | 150,000 | | | | 163,599 | | |
Port Authority of New York &
New Jersey Revenue Bonds
4.458%, due 10/01/62 | | | 200,000 | | | | 277,348 | | |
| | | | | | 754,741 | | |
North Carolina—0.2% | |
County of Mecklenburg North
Carolina, GO Bonds
5.000%, due 03/01/30 | | | 70,000 | | | | 95,551 | | |
State of North Carolina Public
Improvement, GO Bonds,
Series B,
5.000%, due 06/01/30 | | | 300,000 | | | | 412,341 | | |
| | | | | | 507,892 | | |
Ohio—0.0%† | |
City of Cleveland Airport System
Revenue Bonds, (Taxable Refunding),
Series A,
2.882%, due 01/01/31 | | | 90,000 | | | | 92,570 | | |
Oregon—0.0%† | |
Oregon State Department of
Transportation Revenue Bonds,
(Taxable Refunding),
Series B,
3.168%, due 11/15/38 | | | 105,000 | | | | 116,346 | | |
Pennsylvania—0.0%† | |
Pennsylvania State University
Revenue Bonds, (Taxable),
Series D,
2.840%, due 09/01/50 | | | 95,000 | | | | 104,682 | | |
Total municipal bonds
(cost—$4,364,402) | | | 4,631,229 | | |
Non-U.S. government agency obligations—2.2% | |
Argentine Republic Government International Bond
5.875%, due 01/11/288 | | | 997,000 | | | | 418,740 | | |
Chile Government International Bond
3.240%, due 02/06/28 | | | 130,000 | | | | 145,966 | | |
Colombia Government International Bond
3.000%, due 01/30/306 | | | 690,000 | | | | 710,269 | | |
3.875%, due 04/25/276 | | | 570,000 | | | | 620,445 | | |
4.500%, due 03/15/29 | | | 75,000 | | | | 85,102 | | |
Corp. Financiera de Desarrollo SA
4.750%, due 07/15/252 | | | 325,000 | | | | 359,836 | | |
Indonesia Government International Bond
2.850%, due 02/14/30 | | | 240,000 | | | | 253,200 | | |
4.100%, due 04/24/28 | | | 111,000 | | | | 127,095 | | |
52
PACE Intermediate Fixed Income Investments
Portfolio of investments—July 31, 2020
| | | Face
amount1 | | Value | |
Non-U.S. government agency obligations—(concluded) | |
Mexico Government International Bond
3.250%, due 04/16/306 | | | 655,000 | | | $ | 670,720 | | |
3.750%, due 01/11/28 | | | 771,000 | | | | 826,898 | | |
4.125%, due 01/21/26 | | | 523,000 | | | | 577,131 | | |
4.150%, due 03/28/276 | | | 226,000 | | | | 248,487 | | |
4.500%, due 04/22/29 | | | 460,000 | | | | 514,481 | | |
Panama Government International Bond
3.160%, due 01/23/30 | | | 125,000 | | | | 139,531 | | |
3.750%, due 03/16/25 | | | 250,000 | | | | 276,328 | | |
3.875%, due 03/17/28 | | | 190,000 | | | | 220,459 | | |
Philippine Government International Bond
3.000%, due 02/01/28 | | | 600,000 | | | | 670,608 | | |
Uruguay Government International Bond
4.375%, due 10/27/27 | | | 375,000 | | | | 442,148 | | |
4.500%, due 08/14/24 | | | 85,000 | | | | 93,792 | | |
Total non-U.S. government agency obligations
(cost—$6,989,205) | | | 7,401,236 | | |
U.S. government agency obligations—31.5% | |
FHLB
4.000%, due 09/01/28 | | | 680,000 | | | | 849,999 | | |
FHLMC
3.000%, due 09/01/27 | | | 39,193 | | | | 41,151 | | |
3.000%, due 07/01/28 | | | 20,798 | | | | 21,837 | | |
3.000%, due 10/01/43 | | | 406,330 | | | | 441,875 | | |
3.000%, due 10/01/46 | | | 1,887,008 | | | | 2,044,188 | | |
3.500%, due 04/01/42 | | | 16,390 | | | | 18,025 | | |
3.500%, due 08/01/42 | | | 22,937 | | | | 25,110 | | |
3.500%, due 11/01/42 | | | 9,555 | | | | 10,369 | | |
3.500%, due 06/01/44 | | | 8,119 | | | | 8,926 | | |
3.500%, due 07/01/47 | | | 13,578 | | | | 15,102 | | |
3.500%, due 10/01/47 | | | 72,176 | | | | 80,759 | | |
3.500%, due 12/01/47 | | | 64,626 | | | | 72,310 | | |
3.500%, due 01/01/48 | | | 316,662 | | | | 344,249 | | |
4.000%, due 09/01/40 | | | 33,121 | | | | 36,560 | | |
4.000%, due 07/01/44 | | | 30,635 | | | | 33,696 | | |
4.000%, due 07/01/46 | | | 36,506 | | | | 40,111 | | |
4.000%, due 08/01/46 | | | 18,032 | | | | 19,812 | | |
4.000%, due 09/01/46 | | | 2,529 | | | | 2,774 | | |
4.000%, due 10/01/46 | | | 5,869 | | | | 6,448 | | |
4.000%, due 01/01/47 | | | 776,418 | | | | 860,155 | | |
4.000%, due 02/01/47 | | | 83,076 | | | | 91,232 | | |
4.500%, due 07/01/47 | | | 388,524 | | | | 435,287 | | |
4.500%, due 08/01/48 | | | 195,191 | | | | 216,077 | | |
5.000%, due 02/01/42 | | | 518,255 | | | | 595,396 | | |
5.000%, due 09/01/43 | | | 186,708 | | | | 208,046 | | |
6.250%, due 07/15/32 | | | 302,000 | | | | 478,394 | | |
6.750%, due 03/15/31 | | | 82,000 | | | | 129,726 | | |
FNMA
2.000%, due 10/01/31 | | | 18,624 | | | | 19,464 | | |
2.000%, due 11/01/31 | | | 235,076 | | | | 245,666 | | |
2.000%, due 12/01/31 | | | 25,357 | | | | 26,501 | | |
2.000%, due 03/01/32 | | | 157,418 | | | | 164,531 | | |
2.500%, due 04/01/32 | | | 4,365,045 | | | | 4,637,382 | | |
3.000%, due 07/01/29 | | | 408,791 | | | | 436,098 | | |
3.000%, due 10/01/29 | | | 37,184 | | | | 39,707 | | |
3.000%, due 01/01/30 | | | 224,655 | | | | 238,982 | | |
| | | Face
amount1 | | Value | |
U.S. government agency obligations—(continued) | |
3.000%, due 01/01/31 | | | 1,083,336 | | | $ | 1,154,399 | | |
3.000%, due 09/01/31 | | | 37,036 | | | | 39,567 | | |
3.000%, due 04/01/32 | | | 24,200 | | | | 25,463 | | |
3.000%, due 09/01/32 | | | 437,655 | | | | 470,014 | | |
3.000%, due 03/01/33 | | | 435,656 | | | | 464,319 | | |
3.000%, due 11/01/39 | | | 307,477 | | | | 325,600 | | |
3.000%, due 01/01/40 | | | 29,169 | | | | 30,903 | | |
3.000%, due 02/01/40 | | | 1,103,213 | | | | 1,168,238 | | |
3.000%, due 03/01/47 | | | 5,425,384 | | | | 5,929,143 | | |
3.000%, due 04/01/47 | | | 2,410,403 | | | | 2,602,645 | | |
3.000%, due 05/01/50 | | | 140,108 | | | | 151,329 | | |
3.000%, due 08/01/50 | | | 2,632,764 | | | | 2,788,914 | | |
3.000%, due 08/01/5010 | | | 238,129 | | | | 252,165 | | |
3.500%, due 12/01/29 | | | 38,658 | | | | 41,250 | | |
3.500%, due 08/01/30 | | | 172,901 | | | | 184,523 | | |
3.500%, due 02/01/32 | | | 352,331 | | | | 377,783 | | |
3.500%, due 04/01/32 | | | 847,460 | | | | 916,584 | | |
3.500%, due 05/01/32 | | | 609,425 | | | | 657,137 | | |
3.500%, due 05/01/39 | | | 26,416 | | | | 27,947 | | |
3.500%, due 12/01/39 | | | 81,394 | | | | 86,254 | | |
3.500%, due 01/01/40 | | | 300,932 | | | | 318,387 | | |
3.500%, due 02/01/40 | | | 93,707 | | | | 98,981 | | |
3.500%, due 04/01/42 | | | 2,705 | | | | 2,933 | | |
3.500%, due 12/01/42 | | | 5,090 | | | | 5,514 | | |
3.500%, due 05/01/43 | | | 7,410 | | | | 8,148 | | |
3.500%, due 07/01/43 | | | 49,973 | | | | 55,341 | | |
3.500%, due 11/01/43 | | | 10,181 | | | | 11,022 | | |
3.500%, due 12/01/43 | | | 10,831,267 | | | | 11,734,026 | | |
3.500%, due 02/01/45 | | | 5,762 | | | | 6,274 | | |
3.500%, due 07/01/45 | | | 28,653 | | | | 32,066 | | |
3.500%, due 08/01/45 | | | 5,806 | | | | 6,296 | | |
3.500%, due 10/01/45 | | | 45,546 | | | | 48,974 | | |
3.500%, due 11/01/45 | | | 69,250 | | | | 77,002 | | |
3.500%, due 12/01/45 | | | 29,806 | | | | 33,357 | | |
3.500%, due 03/01/46 | | | 393,115 | | | | 430,609 | | |
3.500%, due 04/01/46 | | | 55,000 | | | | 59,356 | | |
3.500%, due 06/01/46 | | | 37,122 | | | | 40,440 | | |
3.500%, due 11/01/46 | | | 370,876 | | | | 405,002 | | |
3.500%, due 12/01/46 | | | 79,831 | | | | 87,513 | | |
3.500%, due 01/01/47 | | | 29,959 | | | | 33,451 | | |
3.500%, due 02/01/47 | | | 447,873 | | | | 489,788 | | |
3.500%, due 03/01/47 | | | 41,058 | | | | 44,759 | | |
3.500%, due 04/01/47 | | | 569,076 | | | | 622,730 | | |
3.500%, due 05/01/47 | | | 273,075 | | | | 299,250 | | |
3.500%, due 06/01/47 | | | 86,777 | | | | 94,764 | | |
3.500%, due 07/01/47 | | | 31,612 | | | | 34,922 | | |
3.500%, due 11/01/47 | | | 45,724 | | | | 51,149 | | |
3.500%, due 12/01/47 | | | 389,576 | | | | 430,356 | | |
3.500%, due 01/01/48 | | | 283,067 | | | | 314,291 | | |
3.500%, due 02/01/50 | | | 81,385 | | | | 88,073 | | |
4.000%, due 09/01/33 | | | 20,777 | | | | 22,453 | | |
4.000%, due 10/01/33 | | | 314,171 | | | | 338,079 | | |
4.000%, due 11/01/33 | | | 409,695 | | | | 437,324 | | |
4.000%, due 01/01/42 | | | 549,128 | | | | 604,338 | | |
4.000%, due 02/01/42 | | | 2,433,636 | | | | 2,677,047 | | |
4.000%, due 03/01/43 | | | 38,029 | | | | 42,048 | | |
4.000%, due 10/01/43 | | | 125,851 | | | | 138,253 | | |
53
PACE Intermediate Fixed Income Investments
Portfolio of investments—July 31, 2020
| | | Face
amount1 | | Value | |
U.S. government agency obligations—(continued) | |
4.000%, due 07/01/46 | | | 1,606,358 | | | $ | 1,759,381 | | |
4.000%, due 11/01/46 | | | 28,972 | | | | 32,902 | | |
4.000%, due 03/01/47 | | | 560,443 | | | | 620,745 | | |
4.000%, due 05/01/47 | | | 51,797 | | | | 56,850 | | |
4.000%, due 07/01/47 | | | 180,227 | | | | 194,595 | | |
4.000%, due 08/01/47 | | | 106,744 | | | | 117,003 | | |
4.000%, due 02/01/48 | | | 25,595 | | | | 28,214 | | |
4.000%, due 04/01/48 | | | 570,698 | | | | 633,284 | | |
4.500%, due 04/01/41 | | | 2,767,638 | | | | 3,076,678 | | |
4.500%, due 11/01/45 | | | 11,902 | | | | 13,516 | | |
4.500%, due 12/01/45 | | | 58,584 | | | | 65,167 | | |
4.500%, due 07/01/46 | | | 132,510 | | | | 151,550 | | |
4.500%, due 10/01/47 | | | 42,367 | | | | 48,093 | | |
4.500%, due 12/01/47 | | | 85,444 | | | | 94,500 | | |
4.500%, due 05/01/48 | | | 621,461 | | | | 688,202 | | |
5.000%, due 09/01/31 | | | 298,883 | | | | 335,007 | | |
5.000%, due 01/01/44 | | | 71,853 | | | | 80,618 | | |
5.000%, due 03/01/44 | | | 153,435 | | | | 172,162 | | |
GNMA
3.000%, due 02/15/4511 | | | 99,265 | | | | 104,688 | | |
3.000%, due 04/20/45 | | | 232,224 | | | | 247,092 | | |
3.000%, due 07/20/45 | | | 35,577 | | | | 37,812 | | |
3.000%, due 10/20/45 | | | 63,947 | | | | 67,926 | | |
3.000%, due 05/20/46 | | | 15,407 | | | | 16,350 | | |
3.000%, due 06/20/4611 | | | 199,887 | | | | 211,896 | | |
3.000%, due 07/20/4611 | | | 404,884 | | | | 430,034 | | |
3.000%, due 09/20/4611 | | | 815,624 | | | | 864,568 | | |
3.000%, due 11/20/46 | | | 16,767 | | | | 17,776 | | |
3.000%, due 12/20/46 | | | 48,201 | | | | 51,129 | | |
3.000%, due 07/20/5011 | | | 1,912,000 | | | | 2,025,705 | | |
3.500%, due 04/20/43 | | | 64,168 | | | | 69,551 | | |
3.500%, due 05/20/43 | | | 64,084 | | | | 69,371 | | |
3.500%, due 05/20/45 | | | 324,940 | | | | 346,730 | | |
3.500%, due 03/20/46 | | | 3,179,763 | | | | 3,393,489 | | |
3.500%, due 04/20/46 | | | 2,097,396 | | | | 2,241,754 | | |
3.500%, due 05/20/46 | | | 394,231 | | | | 420,932 | | |
3.500%, due 07/20/46 | | | 149,671 | | | | 159,598 | | |
4.000%, due 04/20/39 | | | 3,632 | | | | 3,988 | | |
4.000%, due 04/20/42 | | | 73,460 | | | | 80,878 | | |
4.000%, due 08/20/44 | | | 591,590 | | | | 645,192 | | |
4.000%, due 06/15/47 | | | 21,223 | | | | 22,569 | | |
4.000%, due 06/20/47 | | | 660,969 | | | | 711,403 | | |
4.000%, due 09/15/47 | | | 39,851 | | | | 42,404 | | |
4.000%, due 10/15/47 | | | 155,927 | | | | 166,216 | | |
4.000%, due 11/15/47 | | | 28,992 | | | | 31,397 | | |
4.000%, due 12/15/47 | | | 85,724 | | | | 91,315 | | |
4.000%, due 01/15/48 | | | 177,980 | | | | 189,464 | | |
4.000%, due 05/20/50 | | | 416,943 | | | | 444,376 | | |
4.500%, due 07/20/40 | | | 7,369 | | | | 8,118 | | |
4.500%, due 08/20/40 | | | 7,060 | | | | 7,776 | | |
4.500%, due 09/20/40 | | | 11,878 | | | | 13,093 | | |
4.500%, due 10/20/40 | | | 12,789 | | | | 14,089 | | |
4.500%, due 06/20/44 | | | 360,175 | | | | 397,058 | | |
4.500%, due 03/15/47 | | | 29,471 | | | | 32,876 | | |
| | | Face
amount1 | | Value | |
U.S. government agency obligations—(concluded) | | | |
4.500%, due 04/15/47 | | | 75,406 | | | $ | 84,449 | | |
4.500%, due 05/15/47 | | | 24,585 | | | | 27,614 | | |
4.500%, due 09/20/48 | | | 114,616 | | | | 124,271 | | |
4.500%, due 03/20/49 | | | 200,965 | | | | 215,072 | | |
4.500%, due 01/20/50 | | | 191,947 | | | | 204,869 | | |
4.500%, due 02/20/50 | | | 275,360 | | | | 294,168 | | |
4.500%, due 03/20/50 | | | 284,190 | | | | 303,559 | | |
GNMA TBA
3.000% | | | 7,039,500 | | | | 7,440,911 | | |
| 3.500% | | | 897,200 | | | | 943,847 | | |
| 4.000% | | | 2,983,500 | | | | 3,166,822 | | |
| 5.000% | | | 1,200,000 | | | | 1,307,215 | | |
UMBS TBA
2.500%11 | | | 6,133,000 | | | | 6,442,764 | | |
| 3.000%11 | | | 7,180,852 | | | | 7,580,024 | | |
| 4.000%11 | | | 4,857,000 | | | | 5,163,108 | | |
| 4.500%11 | | | 53,000 | | | | 56,979 | | |
| 5.000% | | | 110,000 | | | | 120,339 | | |
Total U.S. government agency obligations
(cost—$102,068,839) | | | 106,177,529 | | |
U.S. Treasury obligations—15.1% | | | |
U.S. Treasury Bonds
1.125%, due 05/15/40 | | | 1,730,000 | | | | 1,775,615 | | |
1.250%, due 05/15/50 | | | 3,150,000 | | | | 3,187,652 | | |
2.000%, due 02/15/50 | | | 955,000 | | | | 1,146,746 | | |
2.250%, due 08/15/49 | | | 45,000 | | | | 56,688 | | |
2.875%, due 05/15/49 | | | 605,000 | | | | 855,295 | | |
3.000%, due 11/15/45 | | | 660,000 | | | | 926,707 | | |
3.000%, due 02/15/47 | | | 6,234,000 | | | | 8,849,358 | | |
3.000%, due 02/15/48 | | | 1,030,000 | | | | 1,472,296 | | |
3.000%, due 08/15/48 | | | 695,000 | | | | 997,542 | | |
3.000%, due 02/15/49 | | | 275,000 | | | | 396,462 | | |
3.125%, due 11/15/41 | | | 3,015,000 | | | | 4,227,949 | | |
3.625%, due 08/15/43 | | | 980,000 | | | | 1,485,198 | | |
3.625%, due 02/15/44 | | | 3,535,000 | | | | 5,374,995 | | |
4.750%, due 02/15/37 | | | 2,175,000 | | | | 3,534,120 | | |
U.S. Treasury Inflation Index Bonds (TIPS)
0.250%, due 02/15/50 | | | 130 | | | | 159 | | |
1.000%, due 02/15/48 | | | 1,039,665 | | | | 1,474,994 | | |
U.S. Treasury Inflation Index Notes (TIPS)
0.125%, due 04/15/25 | | | 34,742 | | | | 36,994 | | |
0.125%, due 01/15/30 | | | 687,613 | | | | 762,571 | | |
U.S. Treasury Notes
0.250%, due 05/31/25 | | | 490,000 | | | | 490,995 | | |
0.250%, due 06/30/25 | | | 1,365,000 | | | | 1,367,186 | | |
0.250%, due 07/31/25 | | | 1,630,000 | | | | 1,632,865 | | |
0.375%, due 04/30/25 | | | 2,070,800 | | | | 2,087,302 | | |
0.375%, due 07/31/27 | | | 1,700,000 | | | | 1,697,809 | | |
0.625%, due 05/15/30 | | | 6,930,000 | | | | 6,986,036 | | |
Total U.S. Treasury obligations
(cost—$42,371,116) | | | 50,823,534 | | |
54
PACE Intermediate Fixed Income Investments
Portfolio of investments—July 31, 2020
| | | Number of
shares | | Value | |
Short-term investments—3.7% | |
Investment companies—3.7% | |
State Street Institutional
U.S. Government Money Market
Fund, 0.09%12
(cost—$12,452,224) | | | 12,452,224 | | | $ | 12,452,224 | | |
Investment of cash collateral from securities loaned—2.9% | |
Money market funds—2.9% | |
State Street Navigator Securities Lending
Government Money Market Portfolio, 0.12%12
(cost—$9,847,323) | | | 9,847,323 | | | | 9,847,323 | | |
| | | Number of
contracts | | Notional
amount | | | |
Options purchased—0.0%† | |
Call options—0.0%† | |
90-Day Eurodollar Futures,
strike @ $99.75,
expires 12/13/21 | | | 134 | | | EUR | 3,341,625 | | | | 57,787 | | |
U.S. Treasury Note 10 Year
Futures, strike @ $140,
expires 08/21/20 | | | 7,000 | | | USD | 980,000 | | | | 3,172 | | |
Total | | | | | | | 60,959 | | |
Put options—0.0%† | |
U.S. Bond Future Option Futures,
strike @ $178 expires 08/21/20 | | | 9,000 | | | USD | 1,602,000 | | | | 2,672 | | |
Total options purchased
(cost—$29,647) | | | | | | | 63,631 | | |
Swaptions purchased—0.6% | |
Call swaptions—0.5% | |
3 Month USD LIBOR
Interest Rate Swap,
strike @ 0.390%
expires 05/22/23
(Counterparty: BOA;
pay floating rate);
underlying swap
terminates 05/24/24 | | | 3,850,000 | | | USD | 3,850,000 | | | | 13,927 | | |
3 Month USD LIBOR
Interest Rate Swap,
strike @ 0.773%
expires 11/23/20
(Counterparty: GS;
pay floating rate);
underlying swap
terminates 11/25/50 | | | 340,000 | | | USD | 340,000 | | | | 14,081 | | |
| | | Number of
contracts | | Notional
amount | | Value | |
Swaptions purchased—(continued) | |
Call swaptions—(continued) | |
3 Month USD LIBOR
Interest Rate Swap,
strike @ 0.890%
expires 04/30/25
(Counterparty: BOA;
pay floating rate);
underlying swap
terminates 05/02/35 | | | 440,000 | | | USD | 440,000 | | | $ | 23,805 | | |
3 Month USD LIBOR
Interest Rate Swap,
strike @ 1.200%
expires 09/23/20
(Counterparty: BOA;
pay floating rate);
underlying swap
terminates 09/25/22 | | | 11,900,000 | | | USD | 11,900,000 | | | | 244,560 | | |
3 Month USD LIBOR
Interest Rate Swap,
strike @ 1.250%
expires 08/10/20
(Counterparty: BOA;
pay floating rate);
underlying swap
terminates 08/12/22 | | | 7,970,000 | | | USD | 7,970,000 | | | | 170,624 | | |
3 Month USD LIBOR
Interest Rate Swap,
strike @ 1.283%
expires 06/04/25
(Counterparty: GS;
pay floating rate);
underlying swap
terminates 06/06/35 | | | 310,000 | | | USD | 310,000 | | | | 23,578 | | |
3 Month USD LIBOR
Interest Rate Swap,
strike @ 1.420%
expires 06/04/25
(Counterparty: BOA;
pay floating rate);
underlying swap
terminates 06/06/35 | | | 310,000 | | | USD | 310,000 | | | | 26,253 | | |
3 Month USD LIBOR
Interest Rate Swap,
strike @ 1.465%
expires 08/16/21
(Counterparty: BOA;
pay floating rate);
underlying swap
terminates 08/18/31 | | | 1,220,000 | | | USD | 1,220,000 | | | | 107,058 | | |
3 Month USD LIBOR
Interest Rate Swap,
strike @ 1.495%
expires 02/25/25
(Counterparty: BOA;
pay floating rate);
underlying swap
terminates 02/27/35 | | | 680,000 | | | USD | 680,000 | | | | 60,693 | | |
55
PACE Intermediate Fixed Income Investments
Portfolio of investments—July 31, 2020
| | | Number of
contracts | | Notional
amount | | Value | |
Swaptions purchased—(continued) | |
Call swaptions—(continued) | |
3 Month USD LIBOR
Interest Rate Swap,
strike @ 1.772%
expires 11/05/24
(Counterparty: JPMCB;
pay floating rate);
underlying swap
terminates 11/07/25 | | | 6,610,000 | | | USD | 6,610,000 | | | $ | 90,514 | | |
3 Month USD LIBOR
Interest Rate Swap,
strike @ 2.730%
expires 12/07/27
(Counterparty: BOA;
pay floating rate);
underlying swap
terminates 12/09/37 | | | 1,050,000 | | | USD | 1,050,000 | | | | 193,162 | | |
3 Month USD LIBOR
Interest Rate Swap,
strike @ 2.860%
expires 02/22/39
(Counterparty: JPMCB;
pay floating rate);
underlying swap
terminates 02/24/49 | | | 290,000 | | | USD | 290,000 | | | | 59,258 | | |
3 Month USD LIBOR
Interest Rate Swap,
strike @ 2.950%
expires 03/12/24
(Counterparty: BOA;
pay floating rate);
underlying swap
terminates 03/14/34 | | | 1,090,000 | | | USD | 1,090,000 | | | | 231,021 | | |
3 Month USD LIBOR
Interest Rate Swap,
strike @ 2.980%
expires 03/07/24
(Counterparty: BOA;
pay floating rate);
underlying swap
terminates 03/11/24 | | | 1,086,500 | | | USD | 1,086,500 | | | | 233,466 | | |
3 Month USD LIBOR
Interest Rate Swap,
strike @ 2.985%
expires 04/27/38
(Counterparty: JPMCB;
pay floating rate);
underlying swap
terminates 04/29/48 | | | 315,000 | | | USD | 315,000 | | | | 67,104 | | |
3 Month USD LIBOR
Interest Rate Swap,
strike @ 3.040%
expires 01/11/29
(Counterparty: BOA;
pay floating rate);
underlying swap
terminates 01/16/39 | | | 320,000 | | | USD | 320,000 | | | | 67,011 | | |
| | | Number of
contracts | | Notional
amount | | Value | |
Swaptions purchased—(continued) | |
Call swaptions—(concluded) | |
3 Month USD LIBOR
Interest Rate Swap,
strike @ 3.053%
expires 01/10/29
(Counterparty: BOA;
pay floating rate);
underlying swap
terminates 01/12/39 | | | 320,000 | | | USD | 320,000 | | | $ | 67,313 | | |
3 Month USD LIBOR
Interest Rate Swap,
strike @ 3.083%
expires 01/29/29
(Counterparty: GS;
pay floating rate);
underlying swap
terminates 01/31/39 | | | 320,000 | | | USD | 320,000 | | | | 68,135 | | |
5 Year Constant Maturity
Swaps, strike @ 0.300%
expires 02/14/22
(Counterparty: BOA;
pay floating rate);
underlying swap
terminates 02/14/22 | | | 21,650,000 | | | USD | 21,650,000 | | | | 69,146 | | |
6 Month EURIBOR
Interest Rate Swap,
strike @ 0.780%
expires 04/16/21
(Counterparty: JPMCB;
pay floating rate);
underlying swap
terminates 04/20/41 | | | 36,200,000 | | | JPY | 36,200,000 | | | | 41,331 | | |
Total | | | | | | | 1,872,040 | | |
Put swaptions—0.1% | |
3 Month USD LIBOR
Interest Rate Swap,
strike @ 0.773%
expires 11/23/20
(Counterparty: GS;
pay floating rate);
underlying swap
terminates 11/25/50 | | | 340,000 | | | USD | 340,000 | | | | 14,993 | | |
3 Month USD LIBOR
Interest Rate Swap,
strike @ 0.890%
expires 04/30/25
(Counterparty: BOA;
pay floating rate);
underlying swap
terminates 05/02/35 | | | 440,000 | | | USD | 440,000 | | | | 23,530 | | |
56
PACE Intermediate Fixed Income Investments
Portfolio of investments—July 31, 2020
| | | Number of
contracts | | Notional
amount | | Value | |
Swaptions purchased—(continued) | |
Put swaptions—(continued) | |
3 Month USD LIBOR
Interest Rate Swap,
strike @ 1.283%
expires 06/04/25
(Counterparty: GS;
pay floating rate);
underlying swap
terminates 06/06/35 | | | 310,000 | | | USD | 310,000 | | | $ | 11,761 | | |
3 Month USD LIBOR
Interest Rate Swap,
strike @ 1.350%
expires 09/04/20
(Counterparty: GS;
pay floating rate);
underlying swap
terminates 09/08/50 | | | 285,000 | | | USD | 285,000 | | | | 44 | | |
3 Month USD LIBOR
Interest Rate Swap,
strike @ 1.420%
expires 06/04/25
(Counterparty: BOA;
pay floating rate);
underlying swap
terminates 06/06/35 | | | 310,000 | | | USD | 310,000 | | | | 10,316 | | |
3 Month USD LIBOR
Interest Rate Swap,
strike @ 1.465%
expires 08/16/21
(Counterparty: BOA;
pay floating rate);
underlying swap
terminates 08/18/31 | | | 1,220,000 | | | USD | 1,220,000 | | | | 4,380 | | |
3 Month USD LIBOR
Interest Rate Swap,
strike @ 1.495%
expires 02/25/25
(Counterparty: BOA;
pay floating rate);
underlying swap
terminates 02/27/35 | | | 680,000 | | | USD | 680,000 | | | | 19,839 | | |
3 Month USD LIBOR
Interest Rate
Swap, strike @ 1.772%
expires 11/05/24
(Counterparty: JPMCB;
pay floating rate);
underlying swap
terminates 11/07/25 | | | 6,610,000 | | | USD | 6,610,000 | | | | 6,719 | | |
3 Month USD LIBOR
Interest Rate Swap,
strike @ 2.250%
expires 08/02/22
(Counterparty: JPMCB;
pay floating rate);
underlying swap
terminates 08/04/32 | | | 1,170,000 | | | USD | 1,170,000 | | | | 3,586 | | |
| | | Number of
contracts | | Notional
amount | | Value | |
Swaptions purchased—(continued) | |
Put swaptions—(continued) | |
3 Month USD LIBOR
Interest Rate Swap,
strike @ 2.250%
expires 08/08/22
(Counterparty: JPMCB;
pay floating rate);
underlying swap
terminates 08/10/32 | | | 1,190,000 | | | USD | 1,190,000 | | | $ | 3,709 | | |
3 Month USD LIBOR
Interest Rate Swap,
strike @ 2.500%
expires 06/13/24
(Counterparty: GS;
pay floating rate);
underlying swap
terminates 06/17/34 | | | 1,150,000 | | | USD | 1,150,000 | | | | 9,061 | | |
3 Month USD LIBOR
Interest Rate Swap,
strike @ 2.500%
expires 06/20/24
(Counterparty: GS;
pay floating rate);
underlying swap
terminates 06/24/34 | | | 1,150,000 | | | USD | 1,150,000 | | | | 9,143 | | |
3 Month USD LIBOR
Interest Rate Swap,
strike @ 2.730%
expires 12/07/27
(Counterparty: BOA;
pay floating rate);
underlying swap
terminates 12/09/37 | | | 1,050,000 | | | USD | 1,050,000 | | | | 17,167 | | |
3 Month USD LIBOR
Interest Rate Swap,
strike @ 2.850%
expires 05/09/22
(Counterparty: BOA;
pay floating rate);
underlying swap
terminates 05/11/52 | | | 1,430,000 | | | USD | 1,430,000 | | | | 5,158 | | |
3 Month USD LIBOR
Interest Rate Swap,
strike @ 2.860%
expires 02/22/39
(Counterparty: JPMCB;
pay floating rate);
underlying swap
terminates 02/24/49 | | | 290,000 | | | USD | 290,000 | | | | 8,730 | | |
3 Month USD LIBOR
Interest Rate Swap,
strike @ 2.950%
expires 03/12/24
(Counterparty: BOA;
pay floating rate);
underlying swap
terminates 03/14/34 | | | 1,090,000 | | | USD | 1,090,000 | | | | 4,495 | | |
57
PACE Intermediate Fixed Income Investments
Portfolio of investments—July 31, 2020
| | | Number of
contracts | | Notional
amount | | Value | |
Swaptions purchased—(continued) | |
Put swaptions—(continued) | |
3 Month USD LIBOR
Interest Rate Swap,
strike @ 2.980%
expires 03/07/24
(Counterparty: BOA;
pay floating rate);
underlying swap
terminates 03/11/34 | | | 1,086,500 | | | USD | 1,086,500 | | | $ | 4,303 | | |
3 Month USD LIBOR
Interest Rate Swap,
strike @ 2.985%
expires 04/27/38
(Counterparty: JPMCB;
pay floating rate);
underlying swap
terminates 04/29/48 | | | 315,000 | | | USD | 315,000 | | | | 8,775 | | |
3 Month USD LIBOR
Interest Rate Swap,
strike @ 3.040%
expires 01/11/29
(Counterparty: BOA;
pay floating rate);
underlying swap
terminates 01/16/39 | | | 320,000 | | | USD | 320,000 | | | | 4,836 | | |
3 Month USD LIBOR
Interest Rate Swap,
strike @ 3.053%
expires 01/10/29
(Counterparty: BOA;
pay floating rate);
underlying swap
terminates 01/12/39 | | | 320,000 | | | USD | 320,000 | | | | 4,787 | | |
3 Month USD LIBOR
Interest Rate Swap,
strike @ 3.083%
expires 01/29/29
(Counterparty: GS;
pay floating rate);
underlying swap
terminates 01/31/39 | | | 320,000 | | | USD | 320,000 | | | | 4,715 | | |
| | | Number of
contracts | | Notional
amount | | Value | |
Swaptions purchased—(concluded) | |
Put swaptions—(concluded) | |
3 Month USD LIBOR
Interest Rate Swap,
strike @ 3.800%
expires 06/07/21
(Counterparty: GS;
pay floating rate);
underlying swap
terminates 06/09/51 | | | 1,230,000 | | | USD | 1,230,000 | | | $ | 41 | | |
6 Month EURIBOR
Interest Rate Swap,
strike @ 0.780%
expires 04/16/21
(Counterparty: JPMCB;
pay floating rate);
underlying swap
terminates 04/20/41 | | | 36,200,000 | | | JPY | 36,200,000 | | | | 163 | | |
Total | | | 180,251 | | |
Total swaptions purchased
(cost—$1,345,387) | | | 2,052,291 | | |
Total investments before
investments sold short
(cost—$365,726,981)—115.8% | | | 390,731,665 | | |
| | | Face
amount1 | | | |
Investments sold short—(7.4)% | | | |
U.S. government agency obligations—(7.4)% | | | |
GNMA TBA
3.000%, due 12/31/99 | | | (3,302,000 | ) | | | (3,482,202 | ) | |
UMBS TBA
2.500% | | | (2,287,000 | ) | | | (2,400,278 | ) | |
| 3.000% | | | (14,460,704 | ) | | | (15,249,534 | ) | |
| 3.500% | | | (2,539,452 | ) | | | (2,672,438 | ) | |
| 4.000% | | | (330,000 | ) | | | (349,574 | ) | |
| 4.500% | | | (720,000 | ) | | | (774,056 | ) | |
Total investments sold short
(proceeds—$24,866,757) | | | (24,928,082 | ) | |
Liabilities in excess of other assets—(8.4)% | | | | | (28,238,456 | ) | |
Net assets—100.0% | | $ | 337,565,127 | | |
For a listing of defined portfolio acronyms, counterparty acronyms and currency abbreviations that are used throughout the Portfolio of investments as well as the tables that follow, please refer to page 267.
Options written
Notional
amount | | Number of
contracts | | Call options | | Expiration
date | | Premiums
received | | Current
value | | Unrealized
appreciation
(depreciation) | |
USD | 987,000 | | | | 7,000 | | | U.S. Treasury Note 10 Year Futures, strike @ 141.00 | | 08/21/20 | | $ | 974 | | | $ | (875 | ) | | $ | 99 | | |
Notional
amount | | Number of
contracts | | Put options | | Expiration
date | | Premiums
received | | Current
value | | Unrealized
appreciation
(depreciation) | |
USD | 16,646,150 | | | | 67 | | | Eurodollar 1 Year Mid-Curve Options, strike @ 99.38 | | 12/13/21 | | $ | 29,203 | | | $ | (82,494 | ) | | $ | (53,291 | ) | |
Total options written | | | | | | | | $ | 30,177 | | | $ | (83,369 | ) | | $ | (53,192 | ) | |
58
PACE Intermediate Fixed Income Investments
Portfolio of investments—July 31, 2020
Swaptions written
Notional
amount
(000) | | Number of
contracts | | Call swaptions | | Counterparty | | Pay/
receive
floating
rate | | Expiration
date | | Premiums
received | | Current
value | | Unrealized
appreciation
(depreciation) | |
USD | 930 | | | | 930,000 | | | 3 Month USD LIBOR Interest Rate Swap
strike @ 0.15%, terminating 10/15/25 | | BOA | | Receive | | 10/13/20 | | $ | 1,153 | | | $ | (821 | ) | | $ | 332 | | |
USD | 760 | | | | 760,000 | | | 3 Month USD LIBOR Interest Rate Swap
strike @ 0.20%, terminating 09/24/25 | | BOA | | Receive | | 09/22/20 | | | 1,064 | | | | (813 | ) | | | 251 | | |
USD | 760 | | | | 760,000 | | | 3 Month USD LIBOR Interest Rate Swap
strike @ 0.20%, terminating 09/28/25 | | BOA | | Receive | | 09/24/20 | | | 912 | | | | (852 | ) | | | 60 | | |
USD | 6,015 | | | | 6,015,000 | | | 3 Month USD LIBOR Interest Rate Swap
strike @ 0.25%, terminating 07/01/26 | | GS | | Receive | | 06/29/21 | | | 37,293 | | | | (38,880 | ) | | | (1,587 | ) | |
USD | 6,610 | | | | 6,610,000 | | | 3 Month USD LIBOR Interest Rate Swap
strike @ 0.37%, terminating 03/19/22 | | BOA | | Receive | | 03/17/21 | | | 10,906 | | | | (14,879 | ) | | | (3,973 | ) | |
USD | 2,190 | | | | 2,190,000 | | | 3 Month USD LIBOR Interest Rate Swap
strike @ 0.61%, terminating 04/12/24 | | BOA | | Receive | | 04/06/23 | | | 8,103 | | | | (10,971 | ) | | | (2,868 | ) | |
USD | 1,880 | | | | 1,880,000 | | | 3 Month USD LIBOR Interest Rate Swap
strike @ 0.61%, terminating 06/17/27 | | BOA | | Receive | | 06/15/22 | | | 28,200 | | | | (34,542 | ) | | | (6,342 | ) | |
USD | 680 | | | | 680,000 | | | 3 Month USD LIBOR Interest Rate Swap
strike @ 0.67%, terminating 07/16/31 | | BOA | | Receive | | 07/14/21 | | | 17,374 | | | | (18,109 | ) | | | (735 | ) | |
USD | 340 | | | | 340,000 | | | 3 Month USD LIBOR Interest Rate Swap
strike @ 0.68%, terminating 04/08/31 | | BOA | | Receive | | 04/06/21 | | | 9,282 | | | | (8,479 | ) | | | 803 | | |
USD | 3,850 | | | | 3,850,000 | | | 3 Month USD LIBOR Interest Rate Swap
strike @ 0.69%, terminating 04/13/24 | | JPMCB | | Receive | | 04/11/23 | | | 14,823 | | | | (21,541 | ) | | | (6,718 | ) | |
USD | 670 | | | | 670,000 | | | 3 Month USD LIBOR Interest Rate Swap
strike @ 0.69%, terminating 05/17/31 | | GS | | Receive | | 05/13/21 | | | 17,060 | | | | (17,651 | ) | | | (591 | ) | |
USD | 23,800 | | | | 23,800,000 | | | 3 Month USD LIBOR Interest Rate Swap
strike @ 0.70%, terminating 09/25/22 | | BOA | | Receive | | 09/23/20 | | | 34,618 | | | | (250,818 | ) | | | (216,200 | ) | |
USD | 678 | | | | 677,500 | | | 3 Month USD LIBOR Interest Rate Swap
strike @ 0.71%, terminating 04/07/31 | | BOA | | Receive | | 04/01/21 | | | 19,309 | | | | (17,914 | ) | | | 1,395 | | |
USD | 320 | | | | 320,000 | | | 3 Month USD LIBOR Interest Rate Swap
strike @ 0.72%, terminating 04/20/31 | | BOA | | Receive | | 04/16/21 | | | 8,832 | | | | (8,801 | ) | | | 31 | | |
USD | 670 | | | | 670,000 | | | 3 Month USD LIBOR Interest Rate Swap
strike @ 0.72%, terminating 07/01/31 | | GS | | Receive | | 06/29/21 | | | 17,512 | | | | (19,509 | ) | | | (1,997 | ) | |
USD | 1,020 | | | | 1,020,000 | | | 3 Month USD LIBOR Interest Rate Swap
strike @ 0.74%, terminating 04/07/31 | | BOA | | Receive | | 04/01/21 | | | 28,445 | | | | (28,688 | ) | | | (243 | ) | |
USD | 400 | | | | 400,000 | | | 3 Month USD LIBOR Interest Rate Swap
strike @ 0.74%, terminating 04/08/31 | | BOA | | Receive | | 04/06/21 | | | 10,480 | | | | (11,421 | ) | | | (941 | ) | |
USD | 1,040 | | | | 1,040,000 | | | 3 Month USD LIBOR Interest Rate Swap
strike @ 0.74%, terminating 04/21/31 | | BOA | | Receive | | 04/19/21 | | | 28,860 | | | | (30,246 | ) | | | (1,386 | ) | |
USD | 690 | | | | 690,000 | | | 3 Month USD LIBOR Interest Rate Swap
strike @ 0.74%, terminating 05/04/32 | | BOA | | Receive | | 04/29/22 | | | 23,874 | | | | (24,630 | ) | | | (756 | ) | |
USD | 670 | | | | 670,000 | | | 3 Month USD LIBOR Interest Rate Swap
strike @ 0.74%, terminating 06/29/31 | | BOA | | Receive | | 06/25/21 | | | 17,621 | | | | (20,541 | ) | | | (2,920 | ) | |
USD | 1,330 | | | | 1,330,000 | | | 3 Month USD LIBOR Interest Rate Swap
strike @ 0.75%, terminating 06/04/31 | | BOA | | Receive | | 06/02/21 | | | 33,350 | | | | (40,403 | ) | | | (7,053 | ) | |
USD | 15,950 | | | | 15,950,000 | | | 3 Month USD LIBOR Interest Rate Swap
strike @ 0.75%, terminating 08/12/22 | | BOA | | Receive | | 08/10/20 | | | 32,897 | | | | (181,988 | ) | | | (149,091 | ) | |
USD | 320 | | | | 320,000 | | | 3 Month USD LIBOR Interest Rate Swap
strike @ 0.77%, terminating 04/19/31 | | BOA | | Receive | | 04/15/21 | | | 8,816 | | | | (9,734 | ) | | | (918 | ) | |
USD | 370 | | | | 370,000 | | | 3 Month USD LIBOR Interest Rate Swap
strike @ 0.80%, terminating 04/19/31 | | BOA | | Receive | | 04/15/21 | | | 10,008 | | | | (12,006 | ) | | | (1,998 | ) | |
59
PACE Intermediate Fixed Income Investments
Portfolio of investments—July 31, 2020
Swaptions written—(continued)
Notional
amount
(000) | | Number of
contracts | | Call swaptions | | Counterparty | | Pay/
receive
floating
rate | | Expiration
date | | Premiums
received | | Current
value | | Unrealized
appreciation
(depreciation) | |
USD | 273 | | | | 272,500 | | | 3 Month USD LIBOR Interest Rate Swap
strike @ 0.85%, terminating 04/09/31 | | BOA | | Receive | | 04/07/21 | | $ | 7,139 | | | $ | (9,803 | ) | | $ | (2,664 | ) | |
USD | 680 | | | | 680,000 | | | 3 Month USD LIBOR Interest Rate Swap
strike @ 0.88%, terminating 04/12/31 | | BOA | | Receive | | 04/08/21 | | | 18,462 | | | | (26,097 | ) | | | (7,635 | ) | |
USD | 340 | | | | 340,000 | | | 3 Month USD LIBOR Interest Rate Swap
strike @ 0.88%, terminating 04/16/31 | | BOA | | Receive | | 04/14/21 | | | 9,265 | | | | (12,949 | ) | | | (3,684 | ) | |
USD | 1,530 | | | | 1,530,000 | | | 3 Month USD LIBOR Interest Rate Swap
strike @ 1.20%, terminating 08/19/30 | | JPMCB | | Receive | | 08/17/20 | | | 28,458 | | | | (100,697 | ) | | | (72,239 | ) | |
USD | 1,445 | | | | 1,445,000 | | | 3 Month USD LIBOR Interest Rate Swap
strike @ 1.39%, terminating 08/25/50 | | GS | | Receive | | 08/21/20 | | | 46,240 | | | | (246,339 | ) | | | (200,099 | ) | |
USD | 1,220 | | | | 1,220,000 | | | 3 Month USD LIBOR Interest Rate Swap
strike @ 1.42%, terminating 08/19/30 | | BOA | | Receive | | 08/17/20 | | | 31,720 | | | | (107,201 | ) | | | (75,481 | ) | |
USD | 3,500 | | | | 3,500,000 | | | 3 Month USD LIBOR Interest Rate Swap
strike @ 1.51%, terminating 12/16/22 | | BOA | | Receive | | 12/14/20 | | | 16,713 | | | | (93,605 | ) | | | (76,892 | ) | |
USD | 3,498 | | | | 3,497,500 | | | 3 Month USD LIBOR Interest Rate Swap
strike @ 1.54%, terminating 12/15/22 | | GS | | Receive | | 12/11/20 | | | 16,701 | | | | (95,631 | ) | | | (78,930 | ) | |
USD | 6,610 | | | | 6,610,000 | | | 3 Month USD LIBOR Interest Rate Swap
strike @ 1.58%, terminating 11/09/21 | | JPMCB | | Receive | | 11/05/20 | | | 15,633 | | | | (92,197 | ) | | | (76,564 | ) | |
USD | 1,490 | | | | 1,490,000 | | | 3 Month USD LIBOR Interest Rate Swap
strike @ 1.73%, terminating 11/23/30 | | BOA | | Receive | | 11/19/20 | | | 35,909 | | | | (173,895 | ) | | | (137,986 | ) | |
USD | 1,630 | | | | 1,629,500 | | | 3 Month USD LIBOR Interest Rate Swap
strike @ 2.78%, terminating 03/10/31 | | BOA | | Receive | | 03/08/21 | | | 48,922 | | | | (355,159 | ) | | | (306,237 | ) | |
USD | 870 | | | | 870,000 | | | 3 Month USD LIBOR Interest Rate Swap
strike @ 3.05%, terminating 03/14/39 | | BOA | | Receive | | 03/12/29 | | | 46,154 | | | | (182,788 | ) | | | (136,634 | ) | |
USD | 10,825 | | | | 10,825,000 | | | 5 Year Constant Maturity Swaps
strike @ 0.55%, terminating 02/14/22 | | JPMCB | | Receive | | 02/14/22 | | | 8,768 | | | | (19,305 | ) | | | (10,537 | ) | |
USD | 10,825 | | | | 10,825,000 | | | 5 Year Constant Maturity Swaps
strike @ 0.55%, terminating 02/14/22 | | GS | | Receive | | 02/14/22 | | | 11,231 | | | | (19,306 | ) | | | (8,075 | ) | |
EUR | 1,690 | | | | 1,690,000 | | | 6 Month EURIBOR Interest Rate Swap
strike @ 0.02%, terminating 04/11/27 | | BOA | | Receive | | 04/07/22 | | | 22,899 | | | | (40,310 | ) | | | (17,411 | ) | |
EUR | 760 | | | | 760,000 | | | 6 Month EURIBOR Interest Rate Swap
strike @ 0.04%, terminating 09/15/27 | | BOA | | Receive | | 09/13/22 | | | 12,206 | | | | (17,838 | ) | | | (5,632 | ) | |
EUR | 755 | | | | 755,000 | | | 6 Month EURIBOR Interest Rate Swap
strike @ 0.11%, terminating 09/14/27 | | BOA | | Receive | | 09/12/22 | | | 11,570 | | | | (15,558 | ) | | | (3,988 | ) | |
EUR | 1,460 | | | | 1,460,000 | | | 6 Month EURIBOR Interest Rate Swap
strike @ 0.12%, terminating 04/06/27 | | BOA | | Receive | | 04/04/22 | | | 19,768 | | | | (28,541 | ) | | | (8,773 | ) | |
| | Total | | | | | | | | | | | | | | | | | | | | | | | $ | 828,550 | | | $ | (2,461,456 | ) | | $ | (1,632,906 | ) | |
| | | | | Put swaptions | | | | | | | | | | | | | |
USD | 6,610 | | | | 6,610,000 | | | 3 Month USD LIBOR Interest Rate Swap
strike @ 0.37%, terminating 03/19/22 | | BOA | | Pay | | 03/17/21 | | $ | 10,906 | | | $ | (770 | ) | | $ | 10,136 | | |
USD | 1,860 | | | | 1,860,000 | | | 3 Month USD LIBOR Interest Rate Swap
strike @ 0.45%, terminating 10/15/25 | | BOA | | Pay | | 10/13/20 | | | 3,068 | | | | (944 | ) | | | 2,124 | | |
USD | 760 | | | | 760,000 | | | 3 Month USD LIBOR Interest Rate Swap
strike @ 0.50%, terminating 09/24/25 | | BOA | | Pay | | 09/22/20 | | | 1,444 | | | | (84 | ) | | | 1,360 | | |
USD | 760 | | | | 760,000 | | | 3 Month USD LIBOR Interest Rate Swap
strike @ 0.50%, terminating 09/28/25 | | BOA | | Pay | | 09/24/20 | | | 1,805 | | | | (99 | ) | | | 1,706 | | |
USD | 5,860 | | | | 5,860,000 | | | 3 Month USD LIBOR Interest Rate Swap
strike @ 0.60%, terminating 09/28/22 | | GS | | Pay | | 09/24/20 | | | 7,765 | | | | (1 | ) | | | 7,764 | | |
60
PACE Intermediate Fixed Income Investments
Portfolio of investments—July 31, 2020
Swaptions written—(continued)
Notional
amount
(000) | | Number of
contracts | | Put swaptions | | Counterparty | | Pay/
receive
floating
rate | | Expiration
date | | Premiums
received | | Current
value | | Unrealized
appreciation
(depreciation) | |
USD | 2,190 | | | | 2,190,000 | | | 3 Month USD LIBOR Interest Rate Swap
strike @ 0.61%, terminating 04/12/24 | | BOA | | Pay | | 04/06/23 | | $ | 8,102 | | | $ | (3,314 | ) | | $ | 4,788 | | |
USD | 1,880 | | | | 1,880,000 | | | 3 Month USD LIBOR Interest Rate Swap
strike @ 0.61%, terminating 06/17/27 | | BOA | | Pay | | 06/15/22 | | | 28,200 | | | | (19,531 | ) | | | 8,669 | | |
USD | 680 | | | | 680,000 | | | 3 Month USD LIBOR Interest Rate Swap
strike @ 0.67%, terminating 07/16/31 | | BOA | | Pay | | 07/14/21 | | | 17,374 | | | | (14,090 | ) | | | 3,284 | | |
USD | 340 | | | | 340,000 | | | 3 Month USD LIBOR Interest Rate Swap
strike @ 0.68%, terminating 04/08/31 | | BOA | | Pay | | 04/06/21 | | | 9,282 | | | | (5,218 | ) | | | 4,064 | | |
USD | 3,850 | | | | 3,850,000 | | | 3 Month USD LIBOR Interest Rate Swap
strike @ 0.69%, terminating 04/13/24 | | JPMCB | | Pay | | 04/11/23 | | | 14,823 | | | | (5,129 | ) | | | 9,694 | | |
USD | 670 | | | | 670,000 | | | 3 Month USD LIBOR Interest Rate Swap
strike @ 0.69%, terminating 05/17/31 | | GS | | Pay | | 05/13/21 | | | 17,060 | | | | (11,471 | ) | | | 5,589 | | |
USD | 678 | | | | 677,500 | | | 3 Month USD LIBOR Interest Rate Swap
strike @ 0.71%, terminating 04/07/31 | | BOA | | Pay | | 04/01/21 | | | 19,309 | | | | (9,559 | ) | | | 9,750 | | |
USD | 320 | | | | 320,000 | | | 3 Month USD LIBOR Interest Rate Swap
strike @ 0.72%, terminating 04/20/31 | | BOA | | Pay | | 04/16/21 | | | 8,832 | | | | (4,629 | ) | | | 4,203 | | |
USD | 670 | | | | 670,000 | | | 3 Month USD LIBOR Interest Rate Swap
strike @ 0.72%, terminating 07/01/31 | | GS | | Pay | | 06/29/21 | | | 17,512 | | | | (12,012 | ) | | | 5,500 | | |
USD | 1,020 | | | | 1,020,000 | | | 3 Month USD LIBOR Interest Rate Swap
strike @ 0.74%, terminating 04/07/31 | | BOA | | Pay | | 04/01/21 | | | 28,445 | | | | (13,336 | ) | | | 15,109 | | |
USD | 400 | | | | 400,000 | | | 3 Month USD LIBOR Interest Rate Swap
strike @ 0.74%, terminating 04/08/31 | | BOA | | Pay | | 04/06/21 | | | 10,480 | | | | (5,210 | ) | | | 5,270 | | |
USD | 1,040 | | | | 1,040,000 | | | 3 Month USD LIBOR Interest Rate Swap
strike @ 0.74%, terminating 04/21/31 | | BOA | | Pay | | 04/19/21 | | | 28,860 | | | | (14,133 | ) | | | 14,727 | | |
USD | 690 | | | | 690,000 | | | 3 Month USD LIBOR Interest Rate Swap
strike @ 0.74%, terminating 05/04/32 | | BOA | | Pay | | 04/29/22 | | | 23,874 | | | | (20,059 | ) | | | 3,815 | | |
USD | 670 | | | | 670,000 | | | 3 Month USD LIBOR Interest Rate Swap
strike @ 0.74%, terminating 06/29/31 | | BOA | | Pay | | 06/25/21 | | | 17,621 | | | | (11,214 | ) | | | 6,407 | | |
USD | 1,330 | | | | 1,330,000 | | | 3 Month USD LIBOR Interest Rate Swap
strike @ 0.75%, terminating 06/04/31 | | BOA | | Pay | | 06/02/21 | | | 33,350 | | | | (20,625 | ) | | | 12,725 | | |
USD | 320 | | | | 320,000 | | | 3 Month USD LIBOR Interest Rate Swap
strike @ 0.77%, terminating 04/19/31 | | BOA | | Pay | | 04/15/21 | | | 8,816 | | | | (4,054 | ) | | | 4,762 | | |
USD | 370 | | | | 370,000 | | | 3 Month USD LIBOR Interest Rate Swap
strike @ 0.80%, terminating 04/19/31 | | BOA | | Pay | | 04/15/21 | | | 10,008 | | | | (4,303 | ) | | | 5,705 | | |
USD | 273 | | | | 272,500 | | | 3 Month USD LIBOR Interest Rate Swap
strike @ 0.85%, terminating 04/09/31 | | BOA | | Pay | | 04/07/21 | | | 7,139 | | | | (2,614 | ) | | | 4,525 | | |
USD | 680 | | | | 680,000 | | | 3 Month USD LIBOR Interest Rate Swap
strike @ 0.88%, terminating 04/12/31 | | BOA | | Pay | | 04/08/21 | | | 18,462 | | | | (5,986 | ) | | | 12,476 | | |
USD | 340 | | | | 340,000 | | | 3 Month USD LIBOR Interest Rate Swap
strike @ 0.88%, terminating 04/16/31 | | BOA | | Pay | | 04/14/21 | | | 9,265 | | | | (3,123 | ) | | | 6,142 | | |
USD | 2,850 | | | | 2,850,000 | | | 3 Month USD LIBOR Interest Rate Swap
strike @ 1.00%, terminating 06/03/31 | | BOA | | Pay | | 06/01/21 | | | 42,964 | | | | (23,016 | ) | | | 19,948 | | |
USD | 2,960 | | | | 2,960,000 | | | 3 Month USD LIBOR Interest Rate Swap
strike @ 1.00%, terminating 10/07/22 | | GS | | Pay | | 10/05/20 | | | 3,552 | | | | — | | | | 3,552 | | |
USD | 660 | | | | 660,000 | | | 3 Month USD LIBOR Interest Rate Swap
strike @ 1.05%, terminating 06/15/31 | | BOA | | Pay | | 06/11/21 | | | 9,735 | | | | (4,912 | ) | | | 4,823 | | |
USD | 3,200 | | | | 3,200,000 | | | 3 Month USD LIBOR Interest Rate Swap
strike @ 1.05%, terminating 10/06/22 | | GS | | Pay | | 10/02/20 | | | 5,632 | | | | — | | | | 5,632 | | |
61
PACE Intermediate Fixed Income Investments
Portfolio of investments—July 31, 2020
Swaptions written—(continued)
Notional
amount
(000) | | Number of
contracts | | Put swaptions | | Counterparty | | Pay/
receive
floating
rate | | Expiration
date | | Premiums
received | | Current
value | | Unrealized
appreciation
(depreciation) | |
USD | 3,200 | | | | 3,200,000 | | | 3 Month USD LIBOR Interest Rate Swap
strike @ 1.05%, terminating 10/06/22 | | GS | | Pay | | 10/02/20 | | $ | 3,760 | | | $ | — | | | $ | 3,760 | | |
USD | 410 | | | | 410,000 | | | 3 Month USD LIBOR Interest Rate Swap
strike @ 1.10%, terminating 07/16/31 | | BOA | | Pay | | 07/14/21 | | | 4,325 | | | | (3,058 | ) | | | 1,267 | | |
USD | 420 | | | | 420,000 | | | 3 Month USD LIBOR Interest Rate Swap
strike @ 1.10%, terminating 07/20/31 | | JPMCB | | Pay | | 07/16/21 | | | 4,158 | | | | (3,172 | ) | | | 986 | | |
USD | 380 | | | | 380,000 | | | 3 Month USD LIBOR Interest Rate Swap
strike @ 1.15%, terminating 01/12/32 | | BOA | | Pay | | 01/10/22 | | | 5,738 | | | | (4,402 | ) | | | 1,336 | | |
USD | 1,220 | | | | 1,220,000 | | | 3 Month USD LIBOR Interest Rate Swap
strike @ 1.42%, terminating 08/19/30 | | BOA | | Pay | | 08/17/20 | | | 31,720 | | | | — | | | | 31,720 | | |
USD | 3,500 | | | | 3,500,000 | | | 3 Month USD LIBOR Interest Rate Swap
strike @ 1.51%, terminating 12/16/22 | | BOA | | Pay | | 12/14/20 | | | 16,713 | | | | (1 | ) | | | 16,712 | | |
USD | 3,498 | | | | 3,497,500 | | | 3 Month USD LIBOR Interest Rate Swap
strike @ 1.54%, terminating 12/15/22 | | GS | | Pay | | 12/11/20 | | | 16,701 | | | | (1 | ) | | | 16,700 | | |
USD | 6,610 | | | | 6,610,000 | | | 3 Month USD LIBOR Interest Rate Swap
strike @ 1.58%, terminating 11/09/21 | | JPMCB | | Pay | | 11/05/20 | | | 15,633 | | | | (1 | ) | | | 15,632 | | |
USD | 750 | | | | 750,000 | | | 3 Month USD LIBOR Interest Rate Swap
strike @ 1.60%, terminating 03/02/32 | | BOA | | Pay | | 02/28/22 | | | 13,688 | | | | (4,240 | ) | | | 9,448 | | |
USD | 750 | | | | 750,000 | | | 3 Month USD LIBOR Interest Rate Swap
strike @ 1.60%, terminating 03/07/32 | | BOA | | Pay | | 03/03/22 | | | 13,350 | | | | (4,300 | ) | | | 9,050 | | |
USD | 1,185 | | | | 1,185,000 | | | 3 Month USD LIBOR Interest Rate Swap
strike @ 1.60%, terminating 03/08/32 | | GS | | Pay | | 03/04/22 | | | 20,145 | | | | (6,820 | ) | | | 13,325 | | |
USD | 743 | | | | 743,000 | | | 3 Month USD LIBOR Interest Rate Swap
strike @ 1.60%, terminating 03/08/32 | | BOA | | Pay | | 03/04/22 | | | 12,260 | | | | (4,277 | ) | | | 7,983 | | |
USD | 1,530 | | | | 1,530,000 | | | 3 Month USD LIBOR Interest Rate Swap
strike @ 1.60%, terminating 08/19/30 | | JPMCB | | Pay | | 08/17/20 | | | 28,458 | | | | — | | | | 28,458 | | |
USD | 750 | | | | 750,000 | | | 3 Month USD LIBOR Interest Rate Swap
strike @ 1.61%, terminating 09/16/30 | | BOA | | Pay | | 09/14/20 | | | 18,611 | | | | (1 | ) | | | 18,610 | | |
USD | 750 | | | | 750,000 | | | 3 Month USD LIBOR Interest Rate Swap
strike @ 1.63%, terminating 11/04/30 | | BOA | | Pay | | 11/02/20 | | | 18,282 | | | | (25 | ) | | | 18,257 | | |
USD | 750 | | | | 750,000 | | | 3 Month USD LIBOR Interest Rate Swap
strike @ 1.64%, terminating 11/04/30 | | JPMCB | | Pay | | 11/02/20 | | | 18,094 | | | | (23 | ) | | | 18,071 | | |
USD | 1,490 | | | | 1,490,000 | | | 3 Month USD LIBOR Interest Rate Swap
strike @ 1.73%, terminating 11/23/30 | | BOA | | Pay | | 11/19/20 | | | 35,909 | | | | (57 | ) | | | 35,852 | | |
USD | 570 | | | | 570,000 | | | 3 Month USD LIBOR Interest Rate Swap
strike @ 1.75%, terminating 08/11/30 | | BOA | | Pay | | 08/07/20 | | | 9,590 | | | | — | | | | 9,590 | | |
USD | 1,480 | | | | 1,480,000 | | | 3 Month USD LIBOR Interest Rate Swap
strike @ 1.76%, terminating 09/18/30 | | BOA | | Pay | | 09/16/20 | | | 37,222 | | | | (1 | ) | | | 37,221 | | |
USD | 800 | | | | 800,000 | | | 3 Month USD LIBOR Interest Rate Swap
strike @ 1.85%, terminating 02/24/32 | | BOA | | Pay | | 02/22/22 | | | 13,680 | | | | (2,790 | ) | | | 10,890 | | |
USD | 800 | | | | 800,000 | | | 3 Month USD LIBOR Interest Rate Swap
strike @ 1.85%, terminating 02/24/32 | | BOA | | Pay | | 02/22/22 | | | 14,080 | | | | (2,790 | ) | | | 11,290 | | |
USD | 1,100 | | | | 1,100,000 | | | 3 Month USD LIBOR Interest Rate Swap
strike @ 1.95%, terminating 02/01/32 | | BOA | | Pay | | 01/28/22 | | | 25,713 | | | | (2,870 | ) | | | 22,843 | | |
USD | 640 | | | | 640,000 | | | 3 Month USD LIBOR Interest Rate Swap
strike @ 2.00%, terminating 08/05/30 | | JPMCB | | Pay | | 08/03/20 | | | 9,536 | | | | — | | | | 9,536 | | |
USD | 7,190 | | | | 7,190,000 | | | 3 Month USD LIBOR Interest Rate Swap
strike @ 2.00%, terminating 12/01/22 | | JPMCB | | Pay | | 11/27/20 | | | 9,347 | | | | (1 | ) | | | 9,346 | | |
62
PACE Intermediate Fixed Income Investments
Portfolio of investments—July 31, 2020
Swaptions written—(continued)
Notional
amount
(000) | | Number of
contracts | | Put swaptions | | Counterparty | | Pay/
receive
floating
rate | | Expiration
date | | Premiums
received | | Current
value | | Unrealized
appreciation
(depreciation) | |
USD | 1,110 | | | | 1,110,000 | | | 3 Month USD LIBOR Interest Rate Swap
strike @ 2.10%, terminating 01/10/32 | | BOA | | Pay | | 01/06/22 | | $ | 25,461 | | | $ | (2,014 | ) | | $ | 23,447 | | |
USD | 1,090 | | | | 1,090,000 | | | 3 Month USD LIBOR Interest Rate Swap
strike @ 2.15%, terminating 01/12/32 | | BOA | | Pay | | 01/10/22 | | | 25,424 | | | | (1,819 | ) | | | 23,605 | | |
USD | 18,330 | | | | 18,330,000 | | | 3 Month USD LIBOR Interest Rate Swap
strike @ 2.15%, terminating 06/01/22 | | BOA | | Pay | | 05/27/21 | | | 50,866 | | | | (9 | ) | | | 50,857 | | |
USD | 1,220 | | | | 1,220,000 | | | 3 Month USD LIBOR Interest Rate Swap
strike @ 2.25%, terminating 08/22/34 | | BOA | | Pay | | 08/20/24 | | | 36,173 | | | | (13,729 | ) | | | 22,444 | | |
USD | 13,480 | | | | 13,480,000 | | | 3 Month USD LIBOR Interest Rate Swap
strike @ 2.35%, terminating 05/19/22 | | GS | | Pay | | 05/17/21 | | | 27,634 | | | | (4 | ) | | | 27,630 | | |
USD | 22,730 | | | | 22,730,000 | | | 3 Month USD LIBOR Interest Rate Swap
strike @ 2.40%, terminating 06/03/22 | | BOA | | Pay | | 06/01/21 | | | 40,573 | | | | (11 | ) | | | 40,562 | | |
USD | 3,130 | | | | 3,130,000 | | | 3 Month USD LIBOR Interest Rate Swap
strike @ 2.75%, terminating 05/11/32 | | BOA | | Pay | | 05/09/22 | | | 92,405 | | | | (3,209 | ) | | | 89,196 | | |
USD | 1,170 | | | | 1,170,000 | | | 3 Month USD LIBOR Interest Rate Swap
strike @ 2.75%, terminating 08/04/32 | | JPMCB | | Pay | | 08/02/22 | | | 16,029 | | | | (1,708 | ) | | | 14,321 | | |
USD | 1,190 | | | | 1,190,000 | | | 3 Month USD LIBOR Interest Rate Swap
strike @ 2.75%, terminating 08/10/32 | | JPMCB | | Pay | | 08/08/22 | | | 14,340 | | | | (1,769 | ) | | | 12,571 | | |
USD | 1,630 | | | | 1,629,500 | | | 3 Month USD LIBOR Interest Rate Swap
strike @ 2.78%, terminating 03/10/31 | | BOA | | Pay | | 03/08/21 | | | 49,513 | | | | (12 | ) | | | 49,501 | | |
USD | 1,150 | | | | 1,150,000 | | | 3 Month USD LIBOR Interest Rate Swap
strike @ 3.00%, terminating 06/17/34 | | GS | | Pay | | 06/13/24 | | | 31,407 | | | | (5,181 | ) | | | 26,226 | | |
USD | 1,150 | | | | 1,150,000 | | | 3 Month USD LIBOR Interest Rate Swap
strike @ 3.00%, terminating 06/24/34 | | GS | | Pay | | 06/20/24 | | | 28,664 | | | | (5,236 | ) | | | 23,428 | | |
USD | 870 | | | | 870,000 | | | 3 Month USD LIBOR Interest Rate Swap
strike @ 3.05%, terminating 03/14/39 | | BOA | | Pay | | 03/12/29 | | | 46,154 | | | | (13,319 | ) | | | 32,835 | | |
USD | 1,170 | | | | 1,170,000 | | | 3 Month USD LIBOR Interest Rate Swap
strike @ 3.25%, terminating 08/04/32 | | JPMCB | | Pay | | 08/02/22 | | | 7,663 | | | | (874 | ) | | | 6,789 | | |
USD | 1,190 | | | | 1,190,000 | | | 3 Month USD LIBOR Interest Rate Swap
strike @ 3.25%, terminating 08/10/32 | | JPMCB | | Pay | | 08/08/22 | | | 7,080 | | | | (907 | ) | | | 6,173 | | |
USD | 4,590 | | | | 4,590,000 | | | 3 Month USD LIBOR Interest Rate Swap
strike @ 3.25%, terminating 12/31/22 | | GS | | Pay | | 12/29/20 | | | 16,639 | | | | (1 | ) | | | 16,638 | | |
USD | 1,150 | | | | 1,150,000 | | | 3 Month USD LIBOR Interest Rate Swap
strike @ 3.50%, terminating 06/17/34 | | GS | | Pay | | 06/13/24 | | | 18,819 | | | | (3,025 | ) | | | 15,794 | | |
USD | 1,150 | | | | 1,150,000 | | | 3 Month USD LIBOR Interest Rate Swap
strike @ 3.50%, terminating 06/24/34 | | GS | | Pay | | 06/20/24 | | | 17,279 | | | | (3,060 | ) | | | 14,219 | | |
USD | 5,280 | | | | 5,280,000 | | | 3 Month USD LIBOR Interest Rate Swap
strike @ 3.50%, terminating 08/26/22 | | GS | | Pay | | 08/24/20 | | | 17,820 | | | | (1 | ) | | | 17,819 | | |
USD | 2,600 | | | | 2,600,000 | | | 3 Month USD LIBOR Interest Rate Swap
strike @ 3.87%, terminating 06/09/31 | | GS | | Pay | | 06/07/21 | | | 50,575 | | | | (12 | ) | | | 50,563 | | |
EUR | 1,290 | | | | 1,290,000 | | | 6 Month EURIBOR Interest Rate Swap
strike @ 0.00%, terminating 06/16/23 | | BOA | | Pay | | 06/14/21 | | | 3,563 | | | | (358 | ) | | | 3,205 | | |
EUR | 1,250 | | | | 1,250,000 | | | 6 Month EURIBOR Interest Rate Swap
strike @ 0.00%, terminating 06/16/23 | | BOA | | Pay | | 06/14/21 | | | 3,457 | | | | (347 | ) | | | 3,110 | | |
EUR | 1,290 | | | | 1,290,000 | | | 6 Month EURIBOR Interest Rate Swap
strike @ 0.00%, terminating 06/22/23 | | GS | | Pay | | 06/18/21 | | | 2,989 | | | | (369 | ) | | | 2,620 | | |
EUR | 1,510 | | | | 1,510,000 | | | 6 Month EURIBOR Interest Rate Swap
strike @ 0.00%, terminating 06/23/23 | | GS | | Pay | | 06/21/21 | | | 3,662 | | | | (435 | ) | | | 3,227 | | |
63
PACE Intermediate Fixed Income Investments
Portfolio of investments—July 31, 2020
Swaptions written—(concluded)
Notional
amount
(000) | | Number of
contracts | | Put swaptions | | Counterparty | | Pay/
receive
floating
rate | | Expiration
date | | Premiums
received | | Current
value | | Unrealized
appreciation
(depreciation) | |
EUR | 1,400 | | | | 1,400,000 | | | 6 Month EURIBOR Interest Rate Swap
strike @ 0.00%, terminating 06/29/23 | | BOA | | Pay | | 06/25/21 | | $ | 3,342 | | | $ | (416 | ) | | $ | 2,926 | | |
EUR | 1,500 | | | | 1,500,000 | | | 6 Month EURIBOR Interest Rate Swap
strike @ 0.00%, terminating 07/05/23 | | JPMCB | | Pay | | 07/01/21 | | | 3,047 | | | | (458 | ) | | | 2,589 | | |
EUR | 1,520 | | | | 1,520,000 | | | 6 Month EURIBOR Interest Rate Swap
strike @ 0.00%, terminating 07/21/23 | | GS | | Pay | | 07/19/21 | | | 2,862 | | | | (503 | ) | | | 2,359 | | |
EUR | 1,690 | | | | 1,690,000 | | | 6 Month EURIBOR Interest Rate Swap
strike @ 0.02%, terminating 04/11/27 | | BOA | | Pay | | 04/07/22 | | | 22,899 | | | | (9,501 | ) | | | 13,398 | | |
EUR | 760 | | | | 760,000 | | | 6 Month EURIBOR Interest Rate Swap
strike @ 0.04%, terminating 09/15/27 | | BOA | | Pay | | 09/13/22 | | | 12,206 | | | | (6,293 | ) | | | 5,913 | | |
EUR | 2,840 | | | | 2,840,000 | | | 6 Month EURIBOR Interest Rate Swap
strike @ 0.05%, terminating 06/14/23 | | BOA | | Pay | | 06/10/21 | | | 7,312 | | | | (668 | ) | | | 6,644 | | |
EUR | 1,460 | | | | 1,460,000 | | | 6 Month EURIBOR Interest Rate Swap
strike @ 0.05%, terminating 07/06/23 | | JPMCB | | Pay | | 07/02/21 | | | 3,046 | | | | (529 | ) | | | 2,517 | | |
EUR | 1,840 | | | | 1,840,000 | | | 6 Month EURIBOR Interest Rate Swap
strike @ 0.08%, terminating 06/03/23 | | BOA | | Pay | | 06/01/21 | | | 5,511 | | | | (378 | ) | | | 5,133 | | |
EUR | 5,550 | | | | 5,550,000 | | | 6 Month EURIBOR Interest Rate Swap
strike @ 0.10%, terminating 03/31/23 | | GS | | Pay | | 03/29/21 | | | 20,872 | | | | (764 | ) | | | 20,108 | | |
EUR | 4,290 | | | | 4,290,000 | | | 6 Month EURIBOR Interest Rate Swap
strike @ 0.10%, terminating 04/14/23 | | GS | | Pay | | 04/12/21 | | | 14,310 | | | | (627 | ) | | | 13,683 | | |
EUR | 2,778 | | | | 2,777,600 | | | 6 Month EURIBOR Interest Rate Swap
strike @ 0.11%, terminating 06/01/23 | | GS | | Pay | | 05/28/21 | | | 7,817 | | | | (518 | ) | | | 7,299 | | |
EUR | 755 | | | | 755,000 | | | 6 Month EURIBOR Interest Rate Swap
strike @ 0.11%, terminating 09/14/27 | | BOA | | Pay | | 09/12/22 | | | 11,571 | | | | (7,200 | ) | | | 4,371 | | |
EUR | 1,460 | | | | 1,460,000 | | | 6 Month EURIBOR Interest Rate Swap
strike @ 0.12%, terminating 04/06/27 | | BOA | | Pay | | 04/04/22 | | | 19,768 | | | | (10,267 | ) | | | 9,501 | | |
EUR | 8,560 | | | | 8,560,000 | | | 6 Month EURIBOR Interest Rate Swap
strike @ 0.12%, terminating 04/12/23 | | GS | | Pay | | 04/08/21 | | | 32,104 | | | | (1,175 | ) | | | 30,929 | | |
EUR | 4,250 | | | | 4,250,000 | | | 6 Month EURIBOR Interest Rate Swap
strike @ 0.15%, terminating 04/21/23 | | GS | | Pay | | 04/19/21 | | | 15,273 | | | | (572 | ) | | | 14,701 | | |
EUR | 3,450 | | | | 3,450,000 | | | 6 Month EURIBOR Interest Rate Swap
strike @ 0.15%, terminating 08/11/23 | | GS | | Pay | | 08/09/21 | | | 5,102 | | | | (2,139 | ) | | | 2,963 | | |
EUR | 1,940 | | | | 1,940,000 | | | 6 Month EURIBOR Interest Rate Swap
strike @ 0.15%, terminating 08/11/23 | | BOA | | Pay | | 08/09/21 | | | 2,880 | | | | (1,203 | ) | | | 1,677 | | |
EUR | 4,290 | | | | 4,290,000 | | | 6 Month EURIBOR Interest Rate Swap
strike @ 0.16%, terminating 04/14/23 | | GS | | Pay | | 04/12/21 | | | 14,444 | | | | (547 | ) | | | 13,897 | | |
EUR | 6,270 | | | | 6,270,000 | | | 6 Month EURIBOR Interest Rate Swap
strike @ 0.25%, terminating 09/07/23 | | BOA | | Pay | | 09/03/21 | | | 11,072 | | | | (6,562 | ) | | | 4,510 | | |
| | Total | | | | | | | | | | | | | | | | | | | | | | | $ | 1,670,025 | | | $ | (365,995 | ) | | $ | 1,304,030 | | |
| | Total swaptions written | | | | | | | | | | | | | | | | | | | | | | | $ | 2,498,575 | | | $ | (2,827,451 | ) | | $ | (328,876 | ) | |
Futures contracts
Number of
contracts | | Currency | | | | Expiration
date | | Current
notional
amount | | Value | | Unrealized
appreciation
(depreciation) | |
Interest rate futures buy contracts: | | | |
| | 7 | | | | EUR | | | Italian Government Bond Futures | | September 2020 | | $ | 1,151,677 | | | $ | 1,212,029 | | | $ | 60,352 | | |
64
PACE Intermediate Fixed Income Investments
Portfolio of investments—July 31, 2020
Futures contracts—(concluded)
Number of
contracts | | Currency | | | | Expiration
date | | Current
notional
amount | | Value | | Unrealized
appreciation
(depreciation) | |
U.S. Treasury futures buy contracts: | | | |
| | 1 | | | | USD | | | U.S. Long Bond Futures | | September 2020 | | $ | 177,356 | | | $ | 182,281 | | | $ | 4,925 | | |
| | 237 | | | | USD | | | U.S. Treasury Note 2 Year Futures | | September 2020 | | | 52,321,417 | | | | 52,373,297 | | | | 51,880 | | |
| | 116 | | | | USD | | | U.S. Treasury Note 5 Year Futures | | September 2020 | | | 14,565,752 | | | | 14,630,500 | | | | 64,748 | | |
| | 9 | | | | USD | | | U.S. Ultra Bond Futures | | September 2020 | | | 1,941,093 | | | | 2,049,188 | | | | 108,095 | | |
| | Total | | | | | | | | | | | | | | | $ | 70,157,295 | | | $ | 70,447,295 | | | $ | 290,000 | | |
Interest rate futures sell contracts: | | | |
| | 45 | | | | EUR | | | German Euro BOBL Futures | | September 2020 | | $ | (7,116,978 | ) | | $ | (7,168,772 | ) | | $ | (51,794 | ) | |
| | 23 | | | | EUR | | | German Euro Bund Futures | | September 2020 | | | (4,728,106 | ) | | | (4,809,525 | ) | | | (81,419 | ) | |
| | 12 | | | | EUR | | | German Euro Buxl 30 Year Futures | | September 2020 | | | (3,056,864 | ) | | | (3,178,205 | ) | | | (121,341 | ) | |
| | 55 | | | | EUR | | | German Euro Schatz Futures | | September 2020 | | | (7,259,771 | ) | | | (7,267,190 | ) | | | (7,419 | ) | |
U.S. Treasury futures sell contracts: | | | |
| | 3 | | | | USD | | | U.S. Long Bond Futures | | September 2020 | | $ | (543,780 | ) | | $ | (546,844 | ) | | $ | (3,064 | ) | |
| | 69 | | | | USD | | | U.S. Treasury Note 10 Year Futures | | September 2020 | | | (9,584,025 | ) | | | (9,665,391 | ) | | | (81,366 | ) | |
| | 85 | | | | USD | | | U.S. Ultra Treasury Note 10 Year Futures | | September 2020 | | | (13,338,160 | ) | | | (13,536,243 | ) | | | (198,083 | ) | |
| | Total | | | | | | | | | | | | | | | $ | (45,627,684 | ) | | $ | (46,172,170 | ) | | $ | (544,486 | ) | |
| | Net unrealized appreciation (depreciation) | | | | | | | | | | | | | | | | | | | | | $ | (254,486 | ) | |
Centrally cleared interest rate swap agreements
Notional
amount
(000) | | Maturity
date | | Payment
frequency | | Payments
made by
the Portfolio13 | | Payments
received by
the Portfolio13 | | Value | | Unrealized
appreciation
(depreciation) | |
GBP | 2,120 | | | 10/15/23 | | Maturity | | | 3.413 | % | | 12 Month UK RPI | | $ | (127,777 | ) | | $ | (127,843 | ) | |
GBP | 2,120 | | | 10/15/23 | | Maturity | | | 3.450 | | | 12 Month UK RPI | | | (133,749 | ) | | | (133,813 | ) | |
USD | 4,025 | | | 10/30/28 | | Maturity | | | 2.249 | | | 12 Month US CPI | | | (307,861 | ) | | | (307,996 | ) | |
USD | 3,560 | | | 02/07/25 | | Quarterly | | | 2.572 | | | 3 Month USD LIBOR | | | (415,791 | ) | | | (418,923 | ) | |
JPY | 9,730 | | | 02/08/34 | | Semi-Annual | | | 0.336 | | | 6 Month USD LIBOR | | | (3,570 | ) | | | (3,572 | ) | |
JPY | 5,530 | | | 03/21/44 | | Semi-Annual | | | 0.715 | | | 6 Month USD LIBOR | | | (4,980 | ) | | | (4,981 | ) | |
USD | 2,120 | | | 04/27/25 | | Quarterly | | | 2.350 | | | 3 Month USD LIBOR | | | (224,468 | ) | | | (224,498 | ) | |
USD | 7,060 | | | 06/02/22 | | Quarterly | | | 1.870 | | | 3 Month USD LIBOR | | | (120,883 | ) | | | (120,950 | ) | |
USD | 6,670 | | | 06/15/21 | | Quarterly | | | 1.770 | | | 3 Month USD LIBOR | | | (101,788 | ) | | | (101,833 | ) | |
USD | 460 | | | 06/15/50 | | Quarterly | | | 2.350 | | | 3 Month USD LIBOR | | | (202,286 | ) | | | (202,298 | ) | |
JPY | 7,900 | | | 06/17/39 | | Semi-Annual | | | 0.295 | | | 6 Month USD LIBOR | | | (2,172 | ) | | | (2,174 | ) | |
JPY | 7,900 | | | 06/17/39 | | Semi-Annual | | | 6 Month EURIBOR | | | | 0.295 | % | | | (1 | ) | | | (1 | ) | |
USD | 180 | | | 07/05/49 | | Quarterly | | | 2.378 | | | 3 Month USD LIBOR | | | (23,818 | ) | | | (23,822 | ) | |
USD | 11,610 | | | 07/12/23 | | Quarterly | | | 1.771 | | | 3 Month USD LIBOR | | | (184,083 | ) | | | (184,217 | ) | |
EUR | 4,430 | | | 07/26/23 | | Semi-Annual | | | 0.290 | | | 6 Month EURIBOR | | | (15,771 | ) | | | (15,841 | ) | |
EUR | 3,850 | | | 07/25/23 | | Semi-Annual | | | 0.300 | | | 6 Month EURIBOR | | | (12,772 | ) | | | (12,833 | ) | |
JPY | 5,850 | | | 08/08/39 | | Semi-Annual | | | 0.167 | | | 6 Month USD LIBOR | | | (277 | ) | | | (278 | ) | |
USD | 160 | | | 08/16/49 | | Quarterly | | | 1.709 | | | 3 Month USD LIBOR | | | (11,843 | ) | | | (11,846 | ) | |
USD | 130 | | | 08/17/49 | | Quarterly | | | 1.667 | | | 3 Month USD LIBOR | | | (9,141 | ) | | | (9,144 | ) | |
USD | 375 | | | 08/22/34 | | Quarterly | | | 1.645 | | | 3 Month USD LIBOR | | | (29,349 | ) | | | (29,356 | ) | |
JPY | 3,020 | | | 08/28/44 | | Semi-Annual | | | 0.201 | | | 6 Month USD LIBOR | | | 261 | | | | 260 | | |
USD | 6,500 | | | 03/27/21 | | Quarterly | | | 1.560 | | | 3 Month USD LIBOR | | | (89,234 | ) | | | (89,278 | ) | |
USD | 1,750 | | | 03/30/21 | | Quarterly | | | 1.560 | | | 3 Month USD LIBOR | | | (23,870 | ) | | | (23,882 | ) | |
65
PACE Intermediate Fixed Income Investments
Portfolio of investments—July 31, 2020
Centrally cleared interest rate swap agreements—(continued)
Notional
amount
(000) | | Maturity
date | | Payment
frequency | | Payments
made by
the Portfolio13 | | Payments
received by
the Portfolio13 | | Value | | Unrealized
appreciation
(depreciation) | |
USD | 380 | | | 10/21/34 | | Quarterly | | | 1.907 | % | | | 3 Month USD LIBOR | | | $ | (39,033 | ) | | $ | (39,040 | ) | |
USD | 380 | | | 10/22/34 | | Quarterly | | | 1.933 | | | | 3 Month USD LIBOR | | | | (39,977 | ) | | | (39,984 | ) | |
USD | 175 | | | 10/23/34 | | Quarterly | | | 1.982 | | | | 3 Month USD LIBOR | | | | (19,227 | ) | | | (19,230 | ) | |
USD | 175 | | | 10/23/34 | | Quarterly | | | 1.976 | | | | 3 Month USD LIBOR | | | | (19,134 | ) | | | (19,137 | ) | |
USD | 220 | | | 10/23/39 | | Quarterly | | | 2.098 | | | | 3 Month USD LIBOR | | | | (23,048 | ) | | | (23,052 | ) | |
USD | 410 | | | 11/07/34 | | Quarterly | | | 1.998 | | | | 3 Month USD LIBOR | | | | (45,594 | ) | | | (45,602 | ) | |
EUR | 330 | | | 11/11/24 | | Semi-Annual | | | 0.173 | | | | 6 Month EURIBOR | | | | (3,777 | ) | | | (3,783 | ) | |
EUR | 330 | | | 11/11/24 | | Annual | | | 6 Month EURIBOR | | | | 0.173 | % | | | (692 | ) | | | (692 | ) | |
USD | 410 | | | 11/12/34 | | Quarterly | | | 2.111 | | | | 3 Month USD LIBOR | | | | (50,050 | ) | | | (50,058 | ) | |
USD | 450 | | | 11/15/39 | | Quarterly | | | 2.137 | | | | 3 Month USD LIBOR | | | | (48,746 | ) | | | (48,755 | ) | |
EUR | 1,450 | | | 12/13/23 | | Semi-Annual | | | 0.167 | | | | 6 Month EURIBOR | | | | (9,282 | ) | | | (9,308 | ) | |
EUR | 1,450 | | | 12/13/23 | | Annual | | | 6 Month EURIBOR | | | | 0.166 | | | | — | | | | (1,850 | ) | |
EUR | 1,510 | | | 12/16/21 | | Semi-Annual | | | 0.450 | | | | 6 Month EURIBOR | | | | 2,135 | | | | 2,115 | | |
EUR | 1,510 | | | 12/16/21 | | Annual | | | 6 Month EURIBOR | | | | 0.450 | | | | (3,309 | ) | | | (3,305 | ) | |
EUR | 75 | | | 03/18/25 | | Annual | | | 0.175 | | | | 6 Month EURIBOR | | | | (969 | ) | | | (971 | ) | |
EUR | 75 | | | 03/18/25 | | Annual | | | 6 Month EURIBOR | | | | 0.175 | | | | 54 | | | | 54 | | |
EUR | 760 | | | 01/03/24 | | Semi-Annual | | | 0.056 | | | | 6 Month EURIBOR | | | | (6,856 | ) | | | (6,870 | ) | |
EUR | 760 | | | 01/03/24 | | Annual | | | 6 Month EURIBOR | | | | 0.056 | | | | — | | | | (2 | ) | |
EUR | 760 | | | 01/03/24 | | Semi-Annual | | | 0.050 | | | | 6 Month EURIBOR | | | | (6,975 | ) | | | (6,989 | ) | |
EUR | 760 | | | 01/03/24 | | Annual | | | 6 Month EURIBOR | | | | 0.050 | | | | — | | | | (2 | ) | |
USD | 405 | | | 07/09/30 | | Quarterly | | | 1.760 | | | | 3 Month USD LIBOR | | | | (49,612 | ) | | | (49,620 | ) | |
EUR | 630 | | | 01/16/30 | | Semi-Annual | | | 0.185 | | | | 6 Month EURIBOR | | | | (32,531 | ) | | | (32,660 | ) | |
EUR | 630 | | | 01/16/30 | | Annual | | | 6 Month EURIBOR | | | | 0.185 | | | | (108 | ) | | | (101 | ) | |
JPY | 4,450 | | | 01/30/45 | | Semi-Annual | | | 0.371 | | | | 6 Month USD LIBOR | | | | (963 | ) | | | (964 | ) | |
USD | 370 | | | 02/10/30 | | Quarterly | | | 1.631 | | | | 3 Month USD LIBOR | | | | (41,726 | ) | | | (41,733 | ) | |
USD | 1,210 | | | 08/27/30 | | Quarterly | | | 1.315 | | | | 3 Month USD LIBOR | | | | (93,672 | ) | | | (93,696 | ) | |
USD | 740 | | | 02/27/30 | | Quarterly | | | 1.313 | | | | 3 Month USD LIBOR | | | | (59,952 | ) | | | (59,967 | ) | |
USD | 6,480 | | | 02/28/22 | | Quarterly | | | 2.455 | | | | 3 Month USD LIBOR | | | | (293,763 | ) | | | (293,849 | ) | |
USD | 680 | | | 09/08/25 | | Quarterly | | | 0.820 | | | | 3 Month USD LIBOR | | | | (18,848 | ) | | | (18,860 | ) | |
USD | 190 | | | 03/11/30 | | Quarterly | | | 0.663 | | | | 3 Month USD LIBOR | | | | (3,119 | ) | | | (3,123 | ) | |
EUR | 1,620 | | | 06/19/22 | | Semi-Annual | | | 1.000 | | | | 6 Month EURIBOR | | | | (2,623 | ) | | | (2,649 | ) | |
EUR | 1,620 | | | 06/19/22 | | Annual | | | 6 Month EURIBOR | | | | 0.378 | | | | 338 | | | | 338 | | |
EUR | 770 | | | 03/20/22 | | Semi-Annual | | | 1.000 | | | | 6 Month EURIBOR | | | | (985 | ) | | | (997 | ) | |
EUR | 770 | | | 03/20/22 | | Annual | | | 6 Month EURIBOR | | | | 0.354 | | | | 1,100 | | | | 1,100 | | |
EUR | 770 | | | 03/20/22 | | Semi-Annual | | | 1.000 | | | | 6 Month EURIBOR | | | | (1,270 | ) | | | (1,282 | ) | |
EUR | 770 | | | 03/20/22 | | Annual | | | 6 Month EURIBOR | | | | 0.335 | | | | 1,041 | | | | 1,041 | | |
EUR | 3,120 | | | 03/23/22 | | Semi-Annual | | | 1.000 | | | | 6 Month EURIBOR | | | | (7,311 | ) | | | (7,357 | ) | |
EUR | 3,120 | | | 03/23/22 | | Annual | | | 6 Month EURIBOR | | | | 0.298 | | | | 3,672 | | | | 3,672 | | |
EUR | 1,510 | | | 09/22/22 | | Semi-Annual | | | 1.000 | | | | 6 Month EURIBOR | | | | (6,330 | ) | | | (6,354 | ) | |
EUR | 3,145 | | | 03/24/23 | | Semi-Annual | | | 1.000 | | | | 6 Month EURIBOR | | | | (20,460 | ) | | | (20,511 | ) | |
EUR | 3,145 | | | 03/24/23 | | Semi-Annual | | | 1.000 | | | | 6 Month EURIBOR | | | | (19,992 | ) | | | (20,043 | ) | |
EUR | 3,150 | | | 03/24/23 | | Semi-Annual | | | 1.000 | | | | 6 Month EURIBOR | | | | (19,648 | ) | | | (19,699 | ) | |
USD | 1,060 | | | 04/14/25 | | Quarterly | | | 0.626 | | | | 3 Month USD LIBOR | | | | (20,816 | ) | | | (20,834 | ) | |
USD | 3,530 | | | 04/16/22 | | Quarterly | | | 2.878 | | | | 3 Month USD LIBOR | | | | (191,890 | ) | | | (191,941 | ) | |
USD | 140 | | | 04/20/27 | | Quarterly | | | 0.652 | | | | 3 Month USD LIBOR | | | | (1,639 | ) | | | (1,641 | ) | |
66
PACE Intermediate Fixed Income Investments
Portfolio of investments—July 31, 2020
Centrally cleared interest rate swap agreements—(continued)
Notional
amount
(000) | | Maturity
date | | Payment
frequency | | Payments
made by
the Portfolio13 | | Payments
received by
the Portfolio13 | | Value | | Unrealized
appreciation
(depreciation) | |
USD | 710 | | | 07/22/30 | | Quarterly | | | 0.700 | % | | | 3 Month USD LIBOR | | | $ | (12,172 | ) | | $ | (12,186 | ) | |
EUR | 575 | | | 02/15/29 | | Annual | | | 6 Month EURIBOR | | | | 0.070 | % | | | 65 | | | | 65 | | |
USD | 980 | | | 05/03/32 | | Quarterly | | | 0.760 | | | | 3 Month USD LIBOR | | | | (9,028 | ) | | | (9,048 | ) | |
USD | 1,000 | | | 05/04/32 | | Quarterly | | | 0.765 | | | | 3 Month USD LIBOR | | | | (9,689 | ) | | | (9,709 | ) | |
USD | 640 | | | 05/06/32 | | Quarterly | | | 0.000 | | | | 3 Month USD LIBOR | | | | (6,489 | ) | | | (6,502 | ) | |
USD | 17,970 | | | 05/12/22 | | Quarterly | | | 0.435 | | | | 3 Month USD LIBOR | | | | (1,019,412 | ) | | | (1,019,680 | ) | |
USD | 6,125 | | | 06/02/22 | | Quarterly | | | 0.344 | | | | 3 Month USD LIBOR | | | | (330,191 | ) | | | (330,285 | ) | |
USD | 540 | | | 06/02/30 | | Quarterly | | | 0.344 | | | | 3 Month USD LIBOR | | | | (6,847 | ) | | | (6,858 | ) | |
USD | 8,618 | | | 06/03/22 | | Quarterly | | | 0.337 | | | | 3 Month USD LIBOR | | | | (136,815 | ) | | | (136,948 | ) | |
USD | 978 | | | 06/03/31 | | Quarterly | | | 0.000 | | | | 3 Month USD LIBOR | | | | (16,459 | ) | | | (16,479 | ) | |
USD | 20 | | | 06/05/50 | | Quarterly | | | 0.327 | | | | 3 Month USD LIBOR | | | | (1,717 | ) | | | (1,718 | ) | |
USD | 440 | | | 07/17/30 | | Quarterly | | | 0.273 | | | | 3 Month USD LIBOR | | | | (6,258 | ) | | | (6,267 | ) | |
USD | 2,580 | | | 06/15/22 | | Quarterly | | | 1.000 | | | | 3 Month USD LIBOR | | | | (2,893 | ) | | | (2,934 | ) | |
USD | 195 | | | 06/20/52 | | Quarterly | | | 0.000 | | | | 3 Month USD LIBOR | | | | (17,338 | ) | | | (17,343 | ) | |
USD | 195 | | | 06/20/52 | | Quarterly | | | 0.000 | | | | 3 Month USD LIBOR | | | | (14,863 | ) | | | (14,868 | ) | |
EUR | 510 | | | 06/23/50 | | Semi-Annual | | | 0.000 | | | | 6 Month EURIBOR | | | | (22,021 | ) | | | (22,040 | ) | |
USD | 770 | | | 09/16/30 | | Quarterly | | | 1.000 | | | | 3 Month USD LIBOR | | | | (10,846 | ) | | | (10,862 | ) | |
USD | 770 | | | 11/04/30 | | Quarterly | | | 1.000 | | | | 3 Month USD LIBOR | | | | (7,991 | ) | | | (8,007 | ) | |
USD | 210 | | | 07/03/30 | | Quarterly | | | 0.299 | | | | 3 Month USD LIBOR | | | | (2,725 | ) | | | (2,729 | ) | |
USD | 170 | | | 07/06/30 | | Quarterly | | | 0.276 | | | | 3 Month USD LIBOR | | | | (2,693 | ) | | | (2,697 | ) | |
USD | 170 | | | 07/06/30 | | Quarterly | | | 0.276 | | | | 3 Month USD LIBOR | | | | (2,626 | ) | | | (2,630 | ) | |
USD | 760 | | | 10/09/30 | | Quarterly | | | 1.000 | | | | 3 Month USD LIBOR | | | | (9,783 | ) | | | (9,799 | ) | |
USD | 5,380 | | | 06/15/22 | | Quarterly | | | 1.000 | | | | 3 Month USD LIBOR | | | | (2,445 | ) | | | (2,533 | ) | |
USD | 200 | | | 07/12/53 | | Quarterly | | | 1.000 | | | | 3 Month USD LIBOR | | | | (2,628 | ) | | | (2,634 | ) | |
EUR | 1,470 | | | 07/21/22 | | Semi-Annual | | | 1.000 | | | | 6 Month EURIBOR | | | | (651 | ) | | | (680 | ) | |
EUR | 1,470 | | | 07/21/22 | | Annual | | | 6 Month EURIBOR | | | | 0.397 | | | | 41 | | | | 49 | | |
USD | 1,200 | | | 11/30/24 | | Quarterly | | | 1.000 | | | | 3 Month USD LIBOR | | | | (2,038 | ) | | | (2,060 | ) | |
USD | 640 | | | 07/27/50 | | Quarterly | | | 0.247 | | | | 3 Month USD LIBOR | | | | (4,865 | ) | | | (4,883 | ) | |
EUR | 1,360 | | | 09/29/22 | | Annual | | | 6 Month EURIBOR | | | | 0.000 | | | | 3,804 | | | | 3,781 | | |
USD | 430 | | | 02/20/53 | | Semi-Annual | | | 3 Month USD LIBOR | | | | 3.080 | | | | 266,316 | | | | 266,305 | | |
GBP | 2,120 | | | 10/15/28 | | Maturity | | | 12 Month UK RPI | | | | 3.485 | | | | 129,291 | | | | 129,198 | | |
GBP | 2,120 | | | 10/15/28 | | Maturity | | | 12 Month UK RPI | | | | 3.505 | | | | 136,852 | | | | 136,761 | | |
USD | 4,025 | | | 10/30/23 | | Maturity | | | 12 Month US CPI | | | | 2.164 | | | | 175,646 | | | | 175,552 | | |
USD | 30,300 | | | 02/07/22 | | Semi-Annual | | | 3 Month USD LIBOR | | | | 2.526 | | | | 1,406,026 | | | | 1,417,798 | | |
USD | 710 | | | 03/26/29 | | Semi-Annual | | | 3 Month USD LIBOR | | | | 2.600 | | | | 136,544 | | | | 136,532 | | |
USD | 6,610 | | | 04/27/22 | | Semi-Annual | | | 3 Month USD LIBOR | | | | 2.250 | | | | 275,465 | | | | 275,401 | | |
USD | 2,470 | | | 10/25/21 | | Semi-Annual | | | 3 Month USD LIBOR | | | | 2.318 | | | | 79,338 | | | | 79,387 | | |
USD | 250 | | | 05/18/31 | | Semi-Annual | | | 3 Month USD LIBOR | | | | 2.447 | | | | 45,974 | | | | 45,969 | | |
USD | 120 | | | 06/22/31 | | Semi-Annual | | | 3 Month USD LIBOR | | | | 2.102 | | | | 17,872 | | | | 17,870 | | |
USD | 11,430 | | | 07/13/22 | | Semi-Annual | | | 3 Month USD LIBOR | | | | 1.713 | | | | 177,646 | | | | 177,530 | | |
EUR | 480 | | | 08/11/23 | | Annual | | | 6 Month EURIBOR | | | | 0.454 | | | | (174 | ) | | | (182 | ) | |
EUR | 490 | | | 08/17/23 | | Annual | | | 6 Month EURIBOR | | | | 0.577 | | | | (1,621 | ) | | | (1,629 | ) | |
USD | 3,410 | | | 11/22/20 | | Semi-Annual | | | 3 Month USD LIBOR | | | | 1.528 | | | | 20,924 | | | | 20,911 | | |
EUR | 660 | | | 09/14/23 | | Annual | | | 6 Month EURIBOR | | | | 0.500 | | | | (987 | ) | | | (998 | ) | |
EUR | 660 | | | 09/14/23 | | Semi-Annual | | | 0.500 | | | | 6 Month EURIBOR | | | | — | | | | 13 | | |
67
PACE Intermediate Fixed Income Investments
Portfolio of investments—July 31, 2020
Centrally cleared interest rate swap agreements—(continued)
Notional
amount
(000) | | Maturity
date | | Payment
frequency | | Payments
made by
the Portfolio13 | | Payments
received by
the Portfolio13 | | Value | | Unrealized
appreciation
(depreciation) | |
EUR | 390 | | | 09/14/23 | | Annual | | | 6 Month EURIBOR | | | | 0.433 | % | | $ | 47 | | | $ | 40 | | |
EUR | 390 | | | 09/14/23 | | Semi-Annual | | | 0.433 | % | | | 6 Month EURIBOR | | | | — | | | | 8 | | |
EUR | 380 | | | 09/28/23 | | Annual | | | 6 Month EURIBOR | | | | 0.450 | | | | (113 | ) | | | (119 | ) | |
EUR | 380 | | | 09/28/23 | | Semi-Annual | | | 0.000 | | | | 6 Month EURIBOR | | | | — | | | | 832 | | |
EUR | 390 | | | 10/06/23 | | Annual | | | 6 Month EURIBOR | | | | 0.436 | | | | 12 | | | | 5 | | |
EUR | 390 | | | 10/06/23 | | Semi-Annual | | | 0.436 | | | | 6 Month EURIBOR | | | | — | | | | (3 | ) | |
USD | 6,170 | | | 11/29/24 | | Semi-Annual | | | 3 Month USD LIBOR | | | | 3.083 | | | | 791,349 | | | | 791,252 | | |
USD | 30 | | | 12/01/56 | | Semi-Annual | | | 3 Month USD LIBOR | | | | 1.929 | | | | 8,630 | | | | 8,629 | | |
USD | 380 | | | 01/07/30 | | Semi-Annual | | | 3 Month USD LIBOR | | | | 1.797 | | | | 46,377 | | | | 46,369 | | |
USD | 370 | | | 01/08/30 | | Semi-Annual | | | 3 Month USD LIBOR | | | | 1.726 | | | | 42,653 | | | | 42,646 | | |
EUR | 3,070 | | | 01/16/22 | | Annual | | | 6 Month EURIBOR | | | | 0.000 | | | | 5,330 | | | | 5,252 | | |
EUR | 3,070 | | | 01/16/22 | | Semi-Annual | | | 0.330 | | | | 6 Month EURIBOR | | | | (5,212 | ) | | | (5,413 | ) | |
USD | 400 | | | 01/23/30 | | Semi-Annual | | | 3 Month USD LIBOR | | | | 1.750 | | | | 46,944 | | | | 46,936 | | |
USD | 370 | | | 01/28/30 | | Semi-Annual | | | 3 Month USD LIBOR | | | | 1.694 | | | | 41,439 | | | | 41,432 | | |
USD | 370 | | | 01/29/30 | | Semi-Annual | | | 3 Month USD LIBOR | | | | 1.580 | | | | 39,601 | | | | 39,594 | | |
USD | 420 | | | 04/29/30 | | Semi-Annual | | | 3 Month USD LIBOR | | | | 1.570 | | | | 43,514 | | | | 43,506 | | |
USD | 470 | | | 01/30/30 | | Semi-Annual | | | 3 Month USD LIBOR | | | | 1.580 | | | | 50,350 | | | | 50,341 | | |
USD | 370 | | | 01/30/30 | | Semi-Annual | | | 3 Month USD LIBOR | | | | 1.606 | | | | 40,575 | | | | 40,568 | | |
USD | 65 | | | 05/07/50 | | Semi-Annual | | | 3 Month USD LIBOR | | | | 1.805 | | | | 18,717 | | | | 18,715 | | |
USD | 150 | | | 02/10/50 | | Semi-Annual | | | 3 Month USD LIBOR | | | | 1.828 | | | | 44,489 | | | | 44,485 | | |
EUR | 470 | | | 02/12/23 | | Annual | | | 6 Month EURIBOR | | | | 1.000 | | | | 1,190 | | | | 1,182 | | |
USD | 370 | | | 02/25/30 | | Semi-Annual | | | 3 Month USD LIBOR | | | | 1.432 | | | | 34,386 | | | | 34,379 | | |
USD | 370 | | | 02/26/30 | | Semi-Annual | | | 3 Month USD LIBOR | | | | 1.319 | | | | 30,224 | | | | 30,217 | | |
USD | 430 | | | 02/26/30 | | Semi-Annual | | | 3 Month USD LIBOR | | | | 1.313 | | | | 34,869 | | | | 34,860 | | |
USD | 3,570 | | | 03/01/23 | | Semi-Annual | | | 3 Month USD LIBOR | | | | 1.095 | | | | 66,207 | | | | 66,155 | | |
USD | 360 | | | 02/28/30 | | Semi-Annual | | | 3 Month USD LIBOR | | | | 1.315 | | | | 29,273 | | | | 29,266 | | |
USD | 2,960 | | | 02/28/25 | | Semi-Annual | | | 3 Month USD LIBOR | | | | 2.515 | | | | 337,826 | | | | 337,776 | | |
USD | 370 | | | 03/02/30 | | Semi-Annual | | | 3 Month USD LIBOR | | | | 1.239 | | | | 27,292 | | | | 27,285 | | |
EUR | 1,750 | | | 03/02/23 | | Annual | | | 6 Month EURIBOR | | | | 1.000 | | | | 1,101 | | | | 1,072 | | |
USD | 895 | | | 03/02/23 | | Semi-Annual | | | 3 Month USD LIBOR | | | | 0.988 | | | | 14,676 | | | | 14,663 | | |
USD | 895 | | | 03/02/23 | | Semi-Annual | | | 3 Month USD LIBOR | | | | 0.979 | | | | 14,523 | | | | 14,510 | | |
USD | 895 | | | 03/02/23 | | Semi-Annual | | | 3 Month USD LIBOR | | | | 0.904 | | | | 13,181 | | | | 13,168 | | |
USD | 5 | | | 03/02/23 | | Semi-Annual | | | 3 Month USD LIBOR | | | | 0.878 | | | | 71 | | | | 71 | | |
USD | 1,780 | | | 03/02/23 | | Semi-Annual | | | 3 Month USD LIBOR | | | | 0.882 | | | | 25,413 | | | | 25,387 | | |
USD | 1,290 | | | 03/02/23 | | Semi-Annual | | | 3 Month USD LIBOR | | | | 0.873 | | | | 18,185 | | | | 18,166 | | |
USD | 1,790 | | | 03/02/23 | | Semi-Annual | | | 3 Month USD LIBOR | | | | 0.878 | | | | 25,431 | | | | 25,405 | | |
USD | 3,550 | | | 09/04/22 | | Semi-Annual | | | 3 Month USD LIBOR | | | | 0.730 | | | | 38,874 | | | | 38,824 | | |
USD | 1,790 | | | 09/04/22 | | Semi-Annual | | | 3 Month USD LIBOR | | | | 0.733 | | | | 19,727 | | | | 19,702 | | |
EUR | 790 | | | 03/04/23 | | Annual | | | 6 Month EURIBOR | | | | 1.000 | | | | (634 | ) | | | (647 | ) | |
EUR | 1,570 | | | 03/05/22 | | Annual | | | 6 Month EURIBOR | | | | 1.000 | | | | 5,440 | | | | 5,416 | | |
EUR | 1,570 | | | 03/05/22 | | Semi-Annual | | | 0.479 | | | | 6 Month EURIBOR | | | | (3,381 | ) | | | (3,381 | ) | |
USD | 505 | | | 09/08/30 | | Semi-Annual | | | 3 Month USD LIBOR | | | | 1.020 | | | | 24,210 | | | | 24,200 | | |
USD | 345 | | | 09/08/22 | | Semi-Annual | | | 3 Month USD LIBOR | | | | 0.692 | | | | 3,512 | | | | 3,507 | | |
USD | 1,070 | | | 09/08/22 | | Semi-Annual | | | 3 Month USD LIBOR | | | | 0.702 | | | | 11,107 | | | | 11,092 | | |
EUR | 850 | | | 03/06/22 | | Annual | | | 6 Month EURIBOR | | | | 1.000 | | | | 2,981 | | | | 2,968 | | |
68
PACE Intermediate Fixed Income Investments
Portfolio of investments—July 31, 2020
Centrally cleared interest rate swap agreements—(continued)
Notional
amount
(000) | | Maturity
date | | Payment
frequency | | Payments
made by
the Portfolio13 | | Payments
received by
the Portfolio13 | | Value | | Unrealized
appreciation
(depreciation) | |
EUR | 850 | | | 03/06/22 | | Semi-Annual | | | 0.477 | % | | | 6 Month EURIBOR | | | $ | (1,812 | ) | | $ | (1,812 | ) | |
USD | 750 | | | 03/06/22 | | Semi-Annual | | | 3 Month USD LIBOR | | | | 0.679 | % | | | 7,463 | | | | 7,453 | | |
USD | 117 | | | 09/08/50 | | Semi-Annual | | | 3 Month USD LIBOR | | | | 1.250 | | | | 15,383 | | | | 15,380 | | |
EUR | 1,110 | | | 03/09/22 | | Annual | | | 6 Month EURIBOR | | | | 1.000 | | | | 3,427 | | | | 3,410 | | |
EUR | 1,110 | | | 03/09/22 | | Semi-Annual | | | 1.000 | | | | 6 Month EURIBOR | | | | (4,857 | ) | | | (4,857 | ) | |
USD | 354 | | | 09/08/25 | | Semi-Annual | | | 3 Month USD LIBOR | | | | 0.760 | | | | 8,750 | | | | 8,744 | | |
USD | 900 | | | 09/11/22 | | Semi-Annual | | | 3 Month USD LIBOR | | | | 0.508 | | | | 5,858 | | | | 5,845 | | |
USD | 70 | | | 03/11/50 | | Semi-Annual | | | 3 Month USD LIBOR | | | | 0.693 | | | | (1,467 | ) | | | (1,469 | ) | |
USD | 370 | | | 04/15/30 | | Semi-Annual | | | 3 Month USD LIBOR | | | | 0.733 | | | | 8,444 | | | | 8,437 | | |
USD | 260 | | | 08/21/50 | | Semi-Annual | | | 3 Month USD LIBOR | | | | 1.103 | | | | 23,519 | | | | 23,511 | | |
EUR | 733 | | | 06/24/22 | | Semi-Annual | | | 0.250 | | | | 6 Month EURIBOR | | | | (214 | ) | | | (214 | ) | |
USD | 350 | | | 03/25/30 | | Semi-Annual | | | 3 Month USD LIBOR | | | | 0.706 | | | | 7,165 | | | | 7,158 | | |
USD | 810 | | | 09/28/22 | | Semi-Annual | | | 3 Month USD LIBOR | | | | 0.383 | | | | 3,283 | | | | 3,271 | | |
EUR | 275 | | | 06/26/22 | | Semi-Annual | | | 0.280 | | | | 6 Month EURIBOR | | | | (85 | ) | | | (85 | ) | |
USD | 880 | | | 09/29/22 | | Semi-Annual | | | 3 Month USD LIBOR | | | | 0.428 | | | | 4,370 | | | | 4,357 | | |
USD | 1,570 | | | 09/29/22 | | Semi-Annual | | | 3 Month USD LIBOR | | | | 0.370 | | | | 5,976 | | | | 5,953 | | |
EUR | 275 | | | 06/30/22 | | Semi-Annual | | | 0.275 | | | | 6 Month EURIBOR | | | | (74 | ) | | | (74 | ) | |
USD | 830 | | | 09/29/22 | | Semi-Annual | | | 3 Month USD LIBOR | | | | 0.356 | | | | 2,919 | | | | 2,907 | | |
USD | 2,980 | | | 09/29/22 | | Semi-Annual | | | 3 Month USD LIBOR | | | | 0.345 | | | | 9,823 | | | | 9,780 | | |
EUR | 1,500 | | | 10/02/22 | | Annual | | | 6 Month EURIBOR | | | | 1.000 | | | | 3,276 | | | | 3,251 | | |
USD | 430 | | | 05/04/30 | | Semi-Annual | | | 3 Month USD LIBOR | | | | 0.619 | | | | 4,219 | | | | 4,210 | | |
EUR | 1,370 | | | 10/02/22 | | Annual | | | 6 Month EURIBOR | | | | 0.000 | | | | 3,433 | | | | 3,410 | | |
USD | 1,690 | | | 10/02/22 | | Semi-Annual | | | 3 Month USD LIBOR | | | | 0.353 | | | | 5,867 | | | | 5,842 | | |
USD | 550 | | | 04/07/30 | | Semi-Annual | | | 3 Month USD LIBOR | | | | 0.639 | | | | 7,521 | | | | 7,510 | | |
USD | 550 | | | 04/14/30 | | Semi-Annual | | | 3 Month USD LIBOR | | | | 0.820 | | | | 17,318 | | | | 17,307 | | |
EUR | 1,060 | | | 07/16/22 | | Annual | | | 6 Month EURIBOR | | | | 1.000 | | | | 2,858 | | | | 2,840 | | |
EUR | 1,060 | | | 07/16/22 | | Semi-Annual | | | 0.296 | | | | 6 Month EURIBOR | | | | (151 | ) | | | (151 | ) | |
EUR | 1,590 | | | 07/20/22 | | Annual | | | 6 Month EURIBOR | | | | 1.000 | | | | 4,888 | | | | 4,862 | | |
EUR | 1,590 | | | 07/20/22 | | Semi-Annual | | | 0.300 | | | | 6 Month EURIBOR | | | | (169 | ) | | | (177 | ) | |
EUR | 1,560 | | | 07/20/22 | | Annual | | | 6 Month EURIBOR | | | | 1.000 | | | | 4,133 | | | | 4,108 | | |
EUR | 1,560 | | | 07/20/22 | | Semi-Annual | | | 0.303 | | | | 6 Month EURIBOR | | | | (168 | ) | | | (168 | ) | |
EUR | 2,590 | | | 03/11/22 | | Semi-Annual | | | 0.228 | | | | 6 Month EURIBOR | | | | (932 | ) | | | (932 | ) | |
EUR | 1,630 | | | 04/29/23 | | Annual | | | 6 Month EURIBOR | | | | 1.000 | | | | 5,233 | | | | 5,205 | | |
USD | 340 | | | 04/29/30 | | Semi-Annual | | | 3 Month USD LIBOR | | | | 0.661 | | | | 4,597 | | | | 4,590 | | |
USD | 1,070 | | | 07/30/22 | | Semi-Annual | | | 3 Month USD LIBOR | | | | 0.297 | | | | 2,307 | | | | 2,291 | | |
USD | 340 | | | 04/30/30 | | Semi-Annual | | | 3 Month USD LIBOR | | | | 0.654 | | | | 4,355 | | | | 4,348 | | |
USD | 340 | | | 05/01/30 | | Semi-Annual | | | 3 Month USD LIBOR | | | | 0.593 | | | | 2,362 | | | | 2,355 | | |
EUR | 980 | | | 05/03/23 | | Annual | | | 6 Month EURIBOR | | | | 1.000 | | | | 2,315 | | | | 2,298 | | |
EUR | 980 | | | 11/02/22 | | Annual | | | 6 Month EURIBOR | | | | 1.000 | | | | 2,080 | | | | 2,063 | | |
USD | 1,600 | | | 05/05/23 | | Semi-Annual | | | 3 Month USD LIBOR | | | | 0.297 | | | | 4,155 | | | | 4,130 | | |
EUR | 930 | | | 05/04/23 | | Annual | | | 6 Month EURIBOR | | | | 1.000 | | | | 1,318 | | | | 1,302 | | |
EUR | 530 | | | 05/06/23 | | Annual | | | 6 Month EURIBOR | | | | 1.000 | | | | 930 | | | | 921 | | |
USD | 1,880 | | | 08/10/22 | | Semi-Annual | | | 3 Month USD LIBOR | | | | 0.295 | | | | 4,095 | | | | 4,067 | | |
USD | 140 | | | 05/18/30 | | Semi-Annual | | | 3 Month USD LIBOR | | | | 0.599 | | | | 1,113 | | | | 1,110 | | |
USD | 1,060 | | | 06/02/25 | | Semi-Annual | | | 3 Month USD LIBOR | | | | 0.358 | | | | 5,404 | | | | 5,385 | | |
USD | 500 | | | 06/03/30 | | Semi-Annual | | | 3 Month USD LIBOR | | | | 0.665 | | | | 7,187 | | | | 7,177 | | |
69
PACE Intermediate Fixed Income Investments
Portfolio of investments—July 31, 2020
Centrally cleared interest rate swap agreements—(concluded)
Notional
amount
(000) | | Maturity
date | | Payment
frequency | | Payments
made by the
Portfolio13 | | Payments
received by
the Portfolio13 | | Value | | Unrealized
appreciation
(depreciation) | |
USD | 1,125 | | | 06/14/23 | | Semi-Annual | | | 3 Month USD LIBOR | | | | 0.307 | % | | $ | 3,091 | | | $ | 3,072 | | |
USD | 1,125 | | | 06/14/23 | | Semi-Annual | | | 3 Month USD LIBOR | | | | 0.294 | | | | 2,798 | | | | 2,780 | | |
USD | 170 | | | 06/16/30 | | Semi-Annual | | | 3 Month USD LIBOR | | | | 0.703 | | | | 3,049 | | | | 3,046 | | |
USD | 100 | | | 06/17/30 | | Semi-Annual | | | 3 Month USD LIBOR | | | | 0.664 | | | | 1,411 | | | | 1,409 | | |
USD | 1,065 | | | 06/20/27 | | Semi-Annual | | | 3 Month USD LIBOR | | | | 0.680 | | | | 12,843 | | | | 12,824 | | |
USD | 1,065 | | | 06/20/27 | | Semi-Annual | | | 3 Month USD LIBOR | | | | 0.652 | | | | 11,382 | | | | 11,363 | | |
EUR | 1,565 | | | 06/23/30 | | Annual | | | 6 Month EURIBOR | | | | 0.000 | | | | 16,594 | | | | 16,556 | | |
EUR | 1,565 | | | 06/23/30 | | Semi-Annual | | | 1.000 | % | | | 6 Month EURIBOR | | | | (276 | ) | | | (276 | ) | |
USD | 240 | | | 06/23/30 | | Semi-Annual | | | 3 Month USD LIBOR | | | | 0.702 | | | | 4,266 | | | | 4,261 | | |
EUR | 1,380 | | | 12/24/22 | | Annual | | | 6 Month EURIBOR | | | | 0.000 | | | | 568 | | | | 960 | | |
EUR | 740 | | | 06/24/23 | | Annual | | | 6 Month EURIBOR | | | | 0.000 | | | | 433 | | | | 406 | | |
USD | 1,010 | | | 02/15/30 | | Semi-Annual | | | 3 Month USD LIBOR | | | | 0.682 | | | | 15,838 | | | | 15,817 | | |
EUR | 740 | | | 06/25/23 | | Annual | | | 6 Month EURIBOR | | | | 0.000 | | | | 787 | | | | 788 | | |
USD | 60 | | | 06/30/30 | | Semi-Annual | | | 3 Month USD LIBOR | | | | 0.662 | | | | 819 | | | | 818 | | |
USD | 110 | | | 07/01/30 | | Semi-Annual | | | 3 Month USD LIBOR | | | | 0.637 | | | | 1,226 | | | | 1,224 | | |
EUR | 800 | | | 07/02/23 | | Annual | | | 6 Month EURIBOR | | | | 1.000 | | | | 391 | | | | 358 | | |
EUR | 800 | | | 07/02/23 | | Semi-Annual | | | 1.000 | | | | 6 Month EURIBOR | | | | — | | | | 1 | | |
USD | 360 | | | 07/02/30 | | Semi-Annual | | | 3 Month USD LIBOR | | | | 0.639 | | | | 4,087 | | | | 4,080 | | |
EUR | 710 | | | 07/08/23 | | Annual | | | 6 Month EURIBOR | | | | 0.000 | | | | 665 | | | | 633 | | |
EUR | 710 | | | 07/08/23 | | Semi-Annual | | | 1.000 | | | | 6 Month EURIBOR | | | | — | | | | (6 | ) | |
USD | 1,470 | | | 07/08/23 | | Semi-Annual | | | 3 Month USD LIBOR | | | | 0.250 | | | | 958 | | | | 935 | | |
USD | 210 | | | 07/10/30 | | Semi-Annual | | | 3 Month USD LIBOR | | | | 0.637 | | | | 2,326 | | | | 2,322 | | |
USD | 340 | | | 07/10/30 | | Semi-Annual | | | 3 Month USD LIBOR | | | | 0.625 | | | | 3,362 | | | | 3,354 | | |
USD | 580 | | | 02/15/30 | | Semi-Annual | | | 3 Month USD LIBOR | | | | 0.615 | | | | 5,492 | | | | 5,480 | | |
USD | 170 | | | 07/14/30 | | Semi-Annual | | | 3 Month USD LIBOR | | | | 0.580 | | | | 902 | | | | 898 | | |
USD | 1,070 | | | 07/12/28 | | Semi-Annual | | | 3 Month USD LIBOR | | | | 0.654 | | | | 4,254 | | | | 4,234 | | |
USD | 80 | | | 07/15/30 | | Semi-Annual | | | 3 Month USD LIBOR | | | | 0.613 | | | | 688 | | | | 686 | | |
EUR | 1,610 | | | 07/20/23 | | Annual | | | 6 Month EURIBOR | | | | 0.000 | | | | 1,131 | | | | 1,100 | | |
EUR | 1,610 | | | 07/20/23 | | Semi-Annual | | | 1.000 | | | | 6 Month EURIBOR | | | | — | | | | (13 | ) | |
EUR | 580 | | | 07/20/26 | | Annual | | | 6 Month EURIBOR | | | | 0.000 | | | | 1,052 | | | | 1,039 | | |
EUR | 580 | | | 07/20/26 | | Semi-Annual | | | 1.000 | | | | 6 Month EURIBOR | | | | — | | | | (6 | ) | |
USD | 50 | | | 07/23/30 | | Semi-Annual | | | 3 Month USD LIBOR | | | | 0.602 | | | | 368 | | | | 367 | | |
USD | 90 | | | 07/24/30 | | Semi-Annual | | | 3 Month USD LIBOR | | | | 0.578 | | | | 449 | | | | 447 | | |
CAD | 910 | | | 07/23/50 | | Semi-Annual | | | 6 Month EURIBOR | | | | 1.343 | | | | 12,695 | | | | 12,687 | | |
USD | 340 | | | 07/27/30 | | Semi-Annual | | | 3 Month USD LIBOR | | | | 0.572 | | | | 1,484 | | | | 1,477 | | |
EUR | 720 | | | 07/27/23 | | Annual | | | 6 Month EURIBOR | | | | 0.000 | | | | 478 | | | | 464 | | |
EUR | 720 | | | 07/27/23 | | Semi-Annual | | | 1.000 | | | | 6 Month EURIBOR | | | | — | | | | 4 | | |
USD | 460 | | | 07/28/30 | | Semi-Annual | | | 3 Month USD LIBOR | | | | 0.576 | | | | 2,184 | | | | 2,174 | | |
USD | 80 | | | 07/29/30 | | Semi-Annual | | | 3 Month USD LIBOR | | | | 0.570 | | | | 329 | | | | 327 | | |
USD | 460 | | | 07/31/30 | | Semi-Annual | | | 3 Month USD LIBOR | | | | 0.576 | | | | 2,125 | | | | 2,115 | | |
USD | 165 | | | 08/03/30 | | Semi-Annual | | | 3 Month USD LIBOR | | | | 0.555 | | | | 416 | | �� | | 412 | | |
USD | 165 | | | 08/03/30 | | Semi-Annual | | | 3 Month USD LIBOR | | | | 0.540 | | | | 170 | | | | 166 | | |
USD | 60 | | | 08/04/30 | | Semi-Annual | | | 3 Month USD LIBOR | | | | 0.537 | | | | 41 | | | | 40 | | |
USD | 165 | | | 08/04/30 | | Semi-Annual | | | 3 Month USD LIBOR | | | | 0.532 | | | | 31 | | | | 27 | | |
USD | 165 | | | 08/04/30 | | Semi-Annual | | | 3 Month USD LIBOR | | | | 0.529 | | | | (10 | ) | | | (14 | ) | |
| | Total | | | | | | | | | | | $ | 275,427 | | | $ | 278,627 | | |
70
PACE Intermediate Fixed Income Investments
Portfolio of investments—July 31, 2020
OTC credit default swap agreements on corporate issues—sell protection14
Counterparty | | Referenced obligations | | Notional
amount
(000) | | Maturity
date | | Payment
frequency | | Payments
received
by the
Portfolio13 | | Upfront
payments
received
(made) | | Value | | Unrealized
appreciation
(depreciation) | |
JPMCB | | Berkshire Hathaway, Inc., bond 2.75%, due 03/15/23 | | USD | 130,000 | | | 12/20/22 | | Quarterly | | | 1.000 | % | | $ | (1,434 | ) | | $ | 2,860 | | | $ | 1,426 | | |
JPMCB | | Bristol-Myers Squibb Co., bond, 6.80%, due 11/15/26 | | USD | 25,000 | | | 12/20/22 | | Quarterly | | | 1.000 | | | | (450 | ) | | | 567 | | | | 117 | | |
BOA | | Honeywell International, Inc., bond, 5.70%, due 03/15/36 | | USD | 40,000 | | | 12/20/22 | | Quarterly | | | 1.000 | | | | (655 | ) | | | 914 | | | | 259 | | |
JPMCB | | Johnson & Johnson, bond, 1.65%, due 03/01/21 | | USD | 65,000 | | | 12/20/22 | | Quarterly | | | 1.000 | | | | (1,263 | ) | | | 1,483 | | | | 220 | | |
JPMCB | | Pfizer, Inc., bond, 2.20%, due 12/15/21 | | USD | 90,000 | | | 12/20/22 | | Quarterly | | | 1.000 | | | | (1,642 | ) | | | 2,071 | | | | 429 | | |
JPMCB | | The Procter & Gamble Co., bond, 1.60%, due 11/15/18 | | USD | 90,000 | | | 12/20/22 | | Quarterly | | | 1.000 | | | | (1,643 | ) | | | 2,076 | | | | 433 | | |
JPMCB | | The Sherwin-Williams Co., bond, 7.38%, due 02/01/27 | | USD | 40,000 | | | 12/20/22 | | Quarterly | | | 1.000 | | | | (377 | ) | | | 834 | | | | 457 | | |
Total | | | | | | | | | | | | $ | (7,464 | ) | | $ | 10,805 | | | $ | 3,341 | | |
OTC Interest rate swap agreements
Counterparty | | Notional
amount
(000) | | Maturity
date | | Payment
frequency | | Payments
made by
the Portfolio | | Payments
received by
the Portfolio13 | | Upfront
payments
received
(made) | | Value | | Unrealized
appreciation
(depreciation) | |
MSCI | | EUR | 1,360 | | | 09/29/22 | | Semi-Annual | | 6 Month
EURIBOR | | | 0.316 | % | | $ | 20 | | | $ | — | | | $ | 20 | | |
MSCI | | EUR | 1,370 | | | 10/02/22 | | Annual | | 6 Month
EURIBOR | | | 0.329 | | | | (19 | ) | | | — | | | | (19 | ) | |
Total | | | | | | | | | | | | $ | 1 | | | $ | — | | | $ | 1 | | |
Forward foreign currency contracts
Counterparty | | Sell | | Purchase | | Settlement
date | | Unrealized
appreciation
(depreciation) | |
ANZ | | EUR | 84,000 | | | USD | 98,764 | | | 09/03/20 | | $ | (247 | ) | |
BNP | | EUR | 150,000 | | | USD | 174,187 | | | 08/05/20 | | | (2,509 | ) | |
BNP | | EUR | 21,870,000 | | | USD | 25,859,694 | | | 09/03/20 | | | 81,620 | | |
BNP | | EUR | 21,870,000 | | | USD | 25,843,880 | | | 08/05/20 | | | (81,568 | ) | |
CIBC | | EUR | 167,000 | | | USD | 190,952 | | | 08/05/20 | | | (5,770 | ) | |
CITI | | EUR | 20,998,000 | | | USD | 23,593,315 | | | 08/05/20 | | | (1,141,802 | ) | |
HSBC | | EUR | 185,000 | | | USD | 208,851 | | | 08/05/20 | | | (9,074 | ) | |
JPMCB | | EUR | 21,000 | | | USD | 24,731 | | | 08/05/20 | | | (6 | ) | |
WBC | | EUR | 349,000 | | | USD | 395,351 | | | 08/05/20 | | | (15,762 | ) | |
Net unrealized appreciation (depreciation) | | $ | (1,175,118 | ) | |
71
PACE Intermediate Fixed Income Investments
Portfolio of investments—July 31, 2020
Fair valuation summary
The following is a summary of the fair valuations according to the inputs used as of July 31, 2020 in valuing the Portfolio's investments. In the event the Portfolio holds investments for which fair value is measured using the NAV per share practical expedient (or its equivalent), a separate column will be added to the fair value hierarchy table; this is intended to permit reconciliation to the amounts presented in the Portfolio of investments:
Assets
Description | | Unadjusted
quoted prices in
active markets for
identical investments
(Level 1) | | Other significant
observable inputs
(Level 2) | | Unobservable
inputs
(Level 3) | | Total | |
Asset-backed securities | | $ | — | | | $ | 13,977,806 | | | $ | — | | | $ | 13,977,806 | | |
Corporate bonds | | | — | | | | 154,873,644 | | | | — | | | | 154,873,644 | | |
Mortgage-backed securities | | | — | | | | 28,431,218 | | | | — | | | | 28,431,218 | | |
Municipal bonds | | | — | | | | 4,631,229 | | | | — | | | | 4,631,229 | | |
Non-U.S. government agency obligations | | | — | | | | 7,401,236 | | | | — | | | | 7,401,236 | | |
U.S. government agency obligations | | | — | | | | 106,177,529 | | | | — | | | | 106,177,529 | | |
U.S. Treasury obligations | | | — | | | | 50,823,534 | | | | — | | | | 50,823,534 | | |
Short-term investments | | | — | | | | 12,452,224 | | | | — | | | | 12,452,224 | | |
Investment of cash collateral from securities loaned | | | — | | | | 9,847,323 | | | | — | | | | 9,847,323 | | |
Options purchased | | | 63,631 | | | | — | | | | — | | | | 63,631 | | |
Swaptions purchased | | | — | | | | 2,052,291 | | | | — | | | | 2,052,291 | | |
Swaptions written | | | — | | | | — | | | | — | | | | — | | |
Futures contracts | | | 290,000 | | | | — | | | | — | | | | 290,000 | | |
Swap agreements | | | — | | | | 5,219,463 | | | | — | | | | 5,219,463 | | |
Forward foreign currency contracts | | | — | | | | 81,620 | | | | — | | | | 81,620 | | |
Total | | $ | 353,631 | | | $ | 395,969,117 | | | $ | — | | | $ | 396,322,748 | | |
Liabilities | |
Investments sold short | | $ | — | | | $ | (24,928,082 | ) | | $ | — | | | $ | (24,928,082 | ) | |
Options written | | | (83,369 | ) | | | — | | | | — | | | | (83,369 | ) | |
Swaptions written | | | — | | | | (2,827,451 | ) | | | — | | | | (2,827,451 | ) | |
Futures contracts | | | (544,486 | ) | | | — | | | | — | | | | (544,486 | ) | |
Swap agreements | | | — | | | | (4,933,221 | ) | | | — | | | | (4,933,221 | ) | |
Forward foreign currency contracts | | | — | | | | (1,256,738 | ) | | | — | | | | (1,256,738 | ) | |
Total | | $ | (627,855 | ) | | $ | (33,945,492 | ) | | $ | — | | | $ | (34,573,347 | ) | |
At July 31, 2020, there were no transfers in or out of Level 3.
Portfolio footnotes
† Amount represents less than 0.05% or (0.05)%.
1 In US dollars unless otherwise indicated.
2 Security exempt from registration pursuant to Rule 144A under the Securities Act of 1933. These securities are considered liquid, unless noted otherwise, and may be resold in transactions exempt from registration, normally to qualified institutional buyers. Securities exempt from registration pursuant to Rule 144A, in the amount of $48,183,789, represented 14.7% of the Portfolio's net assets at period end.
3 Variable or floating rate security for which the interest rate adjusts periodically based on changes in current interest rates and prepayments on the underlying pool of assets. Rate shown is the rate in effect as of period end.
4 Variable or floating rate security. The interest rate shown is the rate in effect as of period end and changes periodically.
5 Security was purchased pursuant to Regulation S under the Securities Act of 1933, which exempts from registration securities offered and sold outside of the United States. Such a security cannot be sold in the United States without either an effective registration statement filed pursuant to the Securities Act of 1933, or pursuant to an exemption from registration.
6 Security, or portion thereof, was on loan at the period end.
7 Perpetual investment. Date shown reflects the next call date.
8 Zero coupon bond.
72
PACE Intermediate Fixed Income Investments
Portfolio of investments—July 31, 2020
Portfolio footnotes—(concluded)
9 Step bond—coupon rate increases in increments to maturity. The rate disclosed is the rate at the period end; the maturity date disclosed is the ultimate maturity date.
10 Security purchased on a when-issued basis. When-issued refers to a transaction made conditionally because a security, although authorized, has not yet been issued.
11 Security, or portion thereof, pledged as collateral for investments sold short, written options or futures.
12 Rates shown reflect yield at July 31, 2020.
13 Payments made or received are based on the notional amount.
14 If the Portfolio is a seller of protection and a credit event occurs, as defined under the terms of that particular swap agreement, the Portfolio will either (i) pay to the buyer of protection an amount equal to the notional amount of the swap and take delivery of the referenced obligation or underlying securities comprising the referenced obligation or (ii) pay a net settlement amount in the form of cash or securities equal to the notional amount of the swap less the recovery value of the referenced obligation or underlying securities comprising the referenced obligation.
See accompanying notes to financial statements.
73
PACE Strategic Fixed Income Investments
Performance
For the 12-months ended July 31, 2020, the Portfolio's Class P shares returned 10.76% before the deduction of the maximum PACE Select program fee.1 In comparison, the Bloomberg Barclays US Government/Credit Index (the "benchmark") returned 12.06%. (Returns for all share classes over various time periods are shown in the "Performance at a glance" table on page 76. Please note that the returns shown do not reflect the deduction of taxes that a shareholder would pay on Portfolio distributions or the redemption of Portfolio shares.) For a detailed commentary on the market environment in general during the reporting period, please refer to page 2.
Investment Manager's comments2
The Portfolio underperformed the benchmark for the period. This was primarily due to a duration underweight relative to the benchmark, as interest rates rallied meaningfully over the period. However, this was partially offset by a positive effect from yield curve positioning. An allocation to emerging markets was also a significant detractor from results due to the widespread selloff driven by the impact of the global pandemic. Other detractors included an overweight to agency mortgage-backed securities (MBS) relative to the benchmark as the sector underperformed like-duration Treasuries over the period.
On the positive side, exposure within spread sectors was additive for performance. Specifically, security selection and allocation within investment-grade credit as well as security selection within agency MBS were notable contributors to relative returns.
Overall, derivative usage was negative during the period. The use of interest rate swaps to reduce long-end U.S. interest rate exposure was a headwind for returns, as swap rates outperformed relative to Treasury rates. The Portfolio used interest rate swaps and constant maturity swaps to adjust interest rate and yield curve exposures, as well as to substitute for physical securities. The Portfolio benefited from the income generated from selling mortgage pool options as a way to manage interest rate and volatility risk within the sector. Additionally, options on swaps were primarily used to manage interest rate exposure and volatility. The purchase of options on swaps detracted from performance due to premium payments made. Total return swaps used to replicate broad exposure to interest only agency mortgages, while limiting idiosyncratic risk of owning individual bonds, was neutral for returns. The use of government futures to adjust interest rate exposures and replicate government bond positions was also neutral for performance.
1 Class P shares held through the PACE Select Advisors Program are subject to a maximum Program fee of 2.50%, which, if included, would have reduced performance. Class P shares held through other advisory programs also may be subject to a program fee, which, if included, would have reduced performance.
2 Performance is discussed on a gross-of-fees basis—meaning that no fees or expenses are reflected when discussed at the level of a subadvisor's sleeve (or subadvisors' sleeves, if applicable). Alternatively, performance at the overall Portfolio level is shown net of fees, which does factor in fees and expenses associated with the Portfolio.
PACE Select Advisors Trust – PACE Strategic Fixed Income Investments
Investment Manager:
UBS Asset Management (Americas) Inc. ("UBS AM")
Investment Subadvisors:
Pacific Investment Management Company LLC ("PIMCO");
Neuberger Berman Investment Advisers LLC ("Neuberger Berman")
Portfolio Management Team:
UBS AM: Mabel Lung, CFA, Gina Toth, CFA, Fred Lee, CFA, Joseph Sciortino and Steve Bienashski
PIMCO: Scott Mather;
Neuberger Berman: Thanos Bardas, David M. Brown, Adam Grotzinger, Bradley C. Tank and Ashok Bhatia
Objective:
Total return consisting of income and capital appreciation
Investment process:
The main strategies of the subadvisors include:
• A strategy that focuses on those areas of the bond market that the subadvisor considers undervalued.
• An "opportunistic fixed income" strategy that employs a consistently applied, risk managed approach to portfolio management that leverages the subadvisor's proprietary fundamental research capabilities, decision making frameworks and quantitative risk management tools.
74
PACE Strategic Fixed Income Investments
Mutual funds are sold by prospectus only. You should read it carefully and consider a fund's investment objectives, risks, charges, expenses and other important information contained in the prospectus before investing. Prospectuses for most of our funds can be obtained from your financial advisor, by calling UBS Funds at 800-647 1568 or by visiting our Website at www.ubs.com/am-us.
Special considerations
The Portfolio may be appropriate for long-term investors seeking total return consisting of income and capital appreciation and who are able to withstand short-term fluctuations in the fixed income markets in return for potentially higher returns over the long term. The value of the Portfolio changes every day and can be affected by changes in interest rates, general market conditions, and other political, social and economic developments, as well as specific matters relating to the companies in whose securities the Portfolio invests. In addition, investments in foreign bonds involve special risks. It is important to note that an investment in the Portfolio is only one component of a balanced investment plan.
75
PACE Strategic Fixed Income Investments
Performance at a glance (unaudited)
Average annual total returns for periods ended 07/31/20 | | 1 year | | 5 years | | 10 years | |
Before deducting maximum sales charge | |
Class A1 | | | 10.56 | % | | | 4.80 | % | | | 4.45 | % | |
Class Y2 | | | 10.78 | | | | 5.05 | | | | 4.69 | | |
Class P3 | | | 10.76 | | | | 5.06 | | | | 4.71 | | |
After deducting maximum sales charge | |
Class A1 | | | 6.42 | | | | 4.01 | | | | 4.05 | | |
Bloomberg Barclays US Government/Credit Index4 | | | 12.06 | | | | 5.01 | | | | 4.22 | | |
Most recent calendar quarter-end returns (unaudited)
Average annual total returns for periods ended 06/30/20 | | 1 year | | 5 years | | 10 years | |
Before deducting maximum sales charge | |
Class A1 | | | 8.10 | % | | | 4.45 | % | | | 4.37 | % | |
Class Y2 | | | 8.39 | | | | 4.70 | | | | 4.61 | | |
Class P3 | | | 8.38 | | | | 4.71 | | | | 4.63 | | |
After deducting maximum sales charge | |
Class A1 | | | 4.07 | | | | 3.66 | | | | 3.98 | | |
The annualized gross and net expense ratios, respectively, for each class of shares as in the November 27, 2019 prospectuses, supplemented from time to time, were as follows: Class A—1.56% and 1.48%; Class Y—1.42% and 1.21%; and Class P—1.32% and 1.20%. Net expenses reflect fee waivers and/or expense reimbursements, if any, pursuant to an agreement that is in effect to cap the expenses. The Portfolio and UBS Asset Management (Americas) Inc. ("UBS AM") have entered into a written fee waiver/expense reimbursement agreement pursuant to which UBS AM is contractually obligated to waive its management fees and/or reimburse expenses so that the Portfolio's ordinary total operating expenses of each class through November 30, 2020 (excluding dividend expense, borrowing costs, and interest expense relating to short sales, and expenses attributable to investment in other investment companies, interest, taxes, brokerage commissions and extraordinary expenses) would not exceed Class A—0.93%; Class Y—0.68%; and Class P—0.68%. The Portfolio has agreed to repay UBS AM for any waived fees/reimbursed expenses to the extent that it can do so over the following three fiscal years without causing the Portfolio's expenses in any of those three years to exceed these expense caps and that UBS AM has not waived the right to do so. The fee waiver/expense reimbursement agreement may be terminated by the Portfolio's board at any time and also will terminate automatically upon the expiration or termination of the Portfolio's advisory contract with UBS AM. Upon termination of the agreement, however, UBS AM's three year recoupment rights will survive.
1 Maximum sales charge for Class A shares is 3.75%. Class A shares bear ongoing 12b-1 service fees of 0.25% annually.
2 The Portfolio offers Class Y shares to a limited group of eligible investors, including certain qualifying retirement plans. Class Y shares do not bear initial or contingent deferred sales charges or ongoing 12b-1 service and distribution fees.
3 Class P shares do not bear initial or contingent deferred sales charges or ongoing 12b-1 service and distribution fees, but Class P shares held through advisory programs may be subject to a program fee, which, if included, would have reduced performance.
4 The Bloomberg Barclays US Government/Credit Index is an unmanaged index composed of US government, government-related and investment-grade US corporate issues and non-corporate foreign debentures, denominated in US dollars with at least one year to maturity. Investors should note that indices do not reflect the deduction of fees and expenses.
Prior to August 3, 2015, a 1% redemption fee was imposed on sales or exchanges of any class of shares of the Portfolio made during the specified holding period.
Past performance does not predict future performance, and the performance information provided does not reflect the deduction of taxes that a shareholder would pay on Portfolio distributions or the redemption of Portfolio shares. The return and principal value of an investment will fluctuate, so that an investor's shares, when redeemed, may be worth more or less than their original cost. Performance results assume reinvestment of all dividends and capital gain distributions at net asset value on the ex-dividend dates. Current performance may be higher or lower than the performance data quoted. For month-end performance figures, please visit www.ubs.com/us-mutualfundperformance.
76
PACE Strategic Fixed Income Investments
Illustration of an assumed investment of $10,000 in Class P shares of the Portfolio (unaudited)
The following graph depicts the performance of PACE Strategic Fixed Income Investments Class P shares versus the Bloomberg Barclays US Government/Credit Index over the 10 years ended July 31, 2020. Class P shares held through advisory programs may be subject to a program fee, which, if included, would have reduced performance. The performance of the other classes will vary based upon the different class specific expenses and sales charges. The performance provided does not reflect the deduction of taxes that a shareholder would pay on Portfolio distributions or the redemption of Portfolio shares. Past performance is no guarantee of future results. Share price and returns will vary with market conditions; investors may realize a gain or loss upon redemption. It is important to note that PACE Strategic Fixed Income Investments is a professionally managed portfolio while the Index is not available for investment and is unmanaged. The comparison is shown for illustration purposes only.
PACE Strategic Fixed Income Investments

77
PACE Strategic Fixed Income Investments
Portfolio statistics—July 31, 2020 (unaudited)
Characteristics | |
Weighted average duration | | | 6.84 yrs. | | |
Weighted average maturity | | | 8.82 yrs. | | |
Average coupon | | | 3.29 | % | |
Top ten holdings1 | | Percentage of
net assets | |
U.S. Treasury Bonds, 2.500% due 02/15/45 | | | 9.6 | % | |
UMBS TBA, 2.500% | | | 7.3 | | |
UMBS TBA, 2.000% | | | 4.2 | | |
U.S. Treasury Notes, 2.125% due 09/30/21 | | | 3.9 | | |
U.S. Treasury Notes, 2.000% due 02/28/21 | | | 2.4 | | |
GNMA II, 5.000% | | | 2.1 | | |
UMBS TBA, 3.000% | | | 2.0 | | |
U.S. Treasury Notes, 2.125% due 09/30/24 | | | 1.7 | | |
U.S. Treasury Notes, 1.875% due 08/31/22 | | | 1.4 | | |
GNMA REMIC, 5.500% due 01/20/35 | | | 1.1 | | |
Total | | | 35.7 | % | |
Top five issuer breakdown by country or territory of origin1 | | Percentage of
net assets | |
United States | | | 93.6 | % | |
United Kingdom | | | 6.9 | | |
Germany | | | 3.0 | | |
Japan | | | 2.3 | | |
Cayman Islands | | | 2.0 | | |
Total | | | 107.8 | % | |
Asset allocation1 | | Percentage of
net assets | |
Corporate bonds | | | 54.6 | % | |
U.S. Treasury obligations | | | 26.0 | | |
U.S. government agency obligations | | | 16.9 | | |
Mortgage-backed securities | | | 11.3 | | |
Asset-backed securities | | | 6.0 | | |
Non-U.S. government agency obligations | | | 2.2 | | |
Exchange traded funds | | | 0.7 | | |
Short-term U.S. Treasury obligations | | | 0.6 | | |
Loan assignments | | | 0.5 | | |
Short-term investments | | | 0.4 | | |
Municipal bonds | | | 0.3 | | |
Cash equivalents and liabilities in excess of the other assets | | | (19.5 | ) | |
Total | | | 100.0 | % | |
1 The Portfolio is actively managed and its composition will vary over time.
78
PACE Strategic Fixed Income Investments
Portfolio of investments—July 31, 2020
| | | Face
amount1 | | Value | |
Asset-backed securities—6.0% | |
Accredited Mortgage Loan Trust,
Series 2004-2, Class A1, | |
1 mo. USD LIBOR + 0.580%,
0.752%, due 07/25/342 | | | 739,685 | | | $ | 719,620 | | |
AM Capital Funding LLC,
Series 2018-1, Class A,
4.980%, due 12/15/233 | | | 440,000 | | | | 462,356 | | |
Avery Point IV CLO Ltd.,
Series 2014-1A, Class AR, | |
3 mo. USD LIBOR + 1.100%,
1.345%, due 04/25/262,3 | | | 255,302 | | | | 255,064 | | |
California Street CLO XII Ltd.,
Series 2013-12A, Class AR, | |
3 mo. USD LIBOR + 1.030%,
1.305%, due 10/15/252,3 | | | 846,953 | | | | 844,006 | | |
CHEC Loan Trust,
Series 2004-2, Class M1, | |
1 mo. USD LIBOR + 0.640%,
0.812%, due 06/25/342 | | | 381,943 | | | | 367,465 | | |
Chesapeake Funding II LLC,
Series 2018-2A, Class A1,
3.230%, due 08/15/303 | | | 1,031,459 | | | | 1,051,265 | | |
Series 2018-2A, Class A2, | |
1 mo. USD LIBOR + 0.370%,
0.545%, due 08/15/302,3 | | | 1,031,459 | | | | 1,014,383 | | |
Cork Street CLO Designated Activity Co.,
Series 1A, Class A1BE, | |
3 mo. Euribor + 0.760%,
0.760%, due 11/27/282,3 | | EUR | 2,310,928 | | | | 2,709,509 | | |
CSAB Mortgage Backed Trust,
Series 2006-1, Class A6A,
6.172%, due 06/25/364 | | | 291,944 | | | | 114,075 | | |
Delta Funding Home Equity Loan Trust,
Series 1999-003, Class A1A, | |
1 mo. USD LIBOR + 0.820%,
0.995%, due 09/15/292 | | | 42,554 | | | | 41,074 | | |
Evans Grove CLO Ltd.,
Series 2018-1A, Class A1, | |
3 mo. USD LIBOR + 0.920%,
1.291%, due 05/28/282,3 | | | 1,586,440 | | | | 1,567,639 | | |
Figueroa CLO Ltd.,
Series 2014-1A, Class AR, | |
3 mo. USD LIBOR + 0.900%,
1.175%, due 01/15/272,3 | | | 347,194 | | | | 345,656 | | |
First Frankin Mortgage Loan Trust,
Series 2005-FFH3, Class M2, | |
1 mo. USD LIBOR + 0.795%,
0.967%, due 09/25/352 | | | 169,175 | | | | 169,052 | | |
Gallatin CLO IX Ltd.,
Series 2018-1A, Class A, | |
3 mo. USD LIBOR + 1.050%,
1.321%, due 01/21/282,3 | | | 1,583,678 | | | | 1,573,809 | | |
GMF Floorplan Owner Revolving Trust,
Series 2018-2, Class A2, | |
1 mo. USD LIBOR + 0.380%,
0.555%, due 03/15/232,3 | | | 1,900,000 | | | | 1,899,831 | | |
| | | Face
amount1 | | Value | |
Asset-backed securities—(continued) | |
GSAMP Trust,
Series 2006-HE4, Class A1, | |
1 mo. USD LIBOR + 0.140%,
0.312%, due 06/25/362 | | | 1,396,406 | | | $ | 1,360,435 | | |
Home Equity Asset Trust,
Series 2005-2, Class M5, | |
1 mo. USD LIBOR + 1.095%,
1.267%, due 07/25/352 | | | 668,695 | | | | 667,889 | | |
Jamestown CLO V Ltd.,
Series 2014-5A, Class AR, | |
3 mo. USD LIBOR + 1.220%,
1.493%, due 01/17/272,3 | | | 417,123 | | | | 416,352 | | |
JPMorgan Mortgage Acquisition Corp.,
Series 2006-FRE1, Class M1, | |
1 mo. USD LIBOR + 0.390%,
0.562%, due 05/25/352 | | | 2,400,000 | | | | 2,356,198 | | |
JPMorgan Mortgage Acquisition Trust,
Series 2006-NC1, Class A1, | |
1 mo. USD LIBOR + 0.170%,
0.342%, due 04/25/362 | | | 42,422 | | | | 42,388 | | |
Series 2007-CH1, Class MV2, | |
1 mo. USD LIBOR + 0.280%,
0.452%, due 11/25/362 | | | 1,375,950 | | | | 1,373,249 | | |
LoanCore Issuer Ltd.,
Series 2018-CRE1, Class A, | |
1 mo. USD LIBOR + 1.130%,
1.305%, due 05/15/282,3 | | | 1,431,155 | | | | 1,416,959 | | |
Loomis Sayles CLO II Ltd.,
Series 2015-2A, Class A1R, | |
3 mo. USD LIBOR + 0.900%,
1.175%, due 04/15/282,3 | | | 1,773,538 | | | | 1,752,026 | | |
LP Credit Card ABS Master Trust,
Series 2018-1, Class A, | |
1 mo. USD LIBOR + 1.550%,
1.740%, due 08/20/242,3 | | | 1,175,784 | | | | 1,198,234 | | |
M360 LLC,
Series 2018-CRE1, Class A,
4.395%, due 07/24/283 | | | 657,033 | | | | 654,600 | | |
Morgan Stanley ABS Capital I, Inc. Trust,
Series 2005-HE1, Class M2, | |
1 mo. USD LIBOR + 0.705%,
0.877%, due 12/25/342 | | | 191,924 | | | | 173,080 | | |
Morgan Stanley Dean Witter Capital I, Inc. Trust,
Series 2003-NC1, Class M1, | |
1 mo. USD LIBOR + 1.575%,
1.747%, due 11/25/322 | | | 437,278 | | | | 435,498 | | |
Mountain View CLO Ltd.,
Series 2014-1A, Class ARR, | |
3 mo. USD LIBOR + 0.800%,
1.075%, due 10/15/262,3 | | | 531,302 | | | | 527,274 | | |
Navient Private Education Refi Loan Trust,
Series 2018-CA, Class A1,
3.010%, due 06/16/423 | | | 59,889 | | | | 59,954 | | |
Nelnet Student Loan Trust,
Series 2019-7A, Class A1, | |
1 mo. USD LIBOR + 0.500%,
0.672%, due 01/25/682,3 | | | 375,482 | | | | 373,907 | | |
79
PACE Strategic Fixed Income Investments
Portfolio of investments—July 31, 2020
| | | Face
amount1 | | Value | |
Asset-backed securities—(continued) | |
New Century Home Equity Loan Trust,
Series 2005-B, Class M1, | |
1 mo. USD LIBOR + 0.480%,
0.652%, due 10/25/352 | | | 1,900,000 | | | $ | 1,815,462 | | |
Series 2005-D, Class A2D, | |
1 mo. USD LIBOR + 0.330%,
0.502%, due 02/25/362 | | | 689,298 | | | | 681,594 | | |
OneMain Direct Auto Receivables Trust,
Series 2018-1A, Class A,
3.430%, due 12/16/243 | | | 1,600,000 | | | | 1,619,079 | | |
RASC Trust,
Series 2005-KS11, Class M2, | |
1 mo. USD LIBOR + 0.420%,
0.592%, due 12/25/352 | | | 1,100,000 | | | | 1,067,644 | | |
SASCO Mortgage Loan Trust,
Series 2005-GEL1, Class M2, | |
1 mo. USD LIBOR + 1.350%,
1.522%, due 12/25/342 | | | 646,765 | | | | 645,081 | | |
Saxon Asset Securities Trust,
Series 2004-1, Class M1, | |
1 mo. USD LIBOR + 0.795%,
0.967%, due 03/25/352 | | | 232,056 | | | | 224,642 | | |
Series 2006-1, Class M1, | |
1 mo. USD LIBOR + 0.465%,
0.637%, due 03/25/362 | | | 1,739,703 | | | | 1,674,578 | | |
Sound Point CLO X Ltd.,
Series 2015-3A, Class AR, | |
3 mo. USD LIBOR + 0.890%,
1.162%, due 01/20/282,3 | | | 715,599 | | | | 710,184 | | |
Soundview Home Loan Trust,
Series 2006-OPT2, Class A3, | |
1 mo. USD LIBOR + 0.180%,
0.352%, due 05/25/362 | | | 143,751 | | | | 143,502 | | |
Series 2006-OPT3, Class 2A4, | |
1 mo. USD LIBOR + 0.250%,
0.422%, due 06/25/362 | | | 2,675,000 | | | | 2,501,041 | | |
Structured Asset Securities Corp.,
Series 2001-SB1, Class A2,
3.375%, due 08/25/31 | | | 166,787 | | | | 158,734 | | |
Series 2005-WF1, Class M1, | |
1 mo. USD LIBOR + 0.660%,
0.832%, due 02/25/352 | | | 148,388 | | | | 146,920 | | |
Telos CLO Ltd.,
Series 2014-6A, Class A1R, | |
3 mo. USD LIBOR + 1.270%,
2.405%, due 01/17/272,3 | | | 791,600 | | | | 787,863 | | |
TICP CLO III-2 Ltd.,
Series 2018-3R, Class A, | |
3 mo. USD LIBOR + 0.840%,
1.112%, due 04/20/282,3 | | | 1,276,238 | | | | 1,266,108 | | |
TRTX Issuer Ltd.,
Series 2019-FL3, Class A, | |
1 mo. USD LIBOR + 1.150%,
1.331%, due 10/15/342,3 | | | 1,500,000 | | | | 1,464,391 | | |
United States Small Business Administration,
Series 2002-20K, Class 1,
5.080%, due 11/01/22 | | | 77,734 | | | | 80,330 | | |
| | | Face
amount1 | | Value | |
Asset-backed securities—(concluded) | |
Series 2005-20H, Class 1,
5.110%, due 08/01/25 | | | 129,259 | | | $ | 137,534 | | |
Series 2007-20D, Class 1,
5.320%, due 04/01/27 | | | 508,608 | | | | 548,014 | | |
Utah State Board of Regents,
Series 2017-1, Class A, | |
1 mo. USD LIBOR + 0.750%,
0.917%, due 01/25/572 | | | 617,674 | | | | 607,056 | | |
WhiteHorse X Ltd.,
Series 2015-10A, Class A1R, | |
3 mo. USD LIBOR + 0.930%,
1.203%, due 04/17/272,3 | | | 557,504 | | | | 552,997 | | |
Total asset-backed securities
(cost—$40,831,785) | | | 42,775,601 | | |
Corporate bonds—54.6% | |
Advertising—0.0%† | |
Lamar Media Corp.
3.750%, due 02/15/283 | | | 70,000 | | | | 70,612 | | |
Outfront Media Capital LLC/Outfront Media
Capital Corp.
4.625%, due 03/15/303 | | | 25,000 | | | | 23,375 | | |
5.000%, due 08/15/273 | | | 46,000 | | | | 45,040 | | |
| | | | | | 139,027 | | |
Aerospace & defense—0.5% | |
Boeing Co./The
3.750%, due 02/01/505 | | | 55,000 | | | | 49,670 | | |
3.900%, due 05/01/495 | | | 130,000 | | | | 122,106 | | |
5.150%, due 05/01/30 | | | 55,000 | | | | 60,234 | | |
5.805%, due 05/01/50 | | | 660,000 | | | | 775,239 | | |
Howmet Aerospace, Inc.
5.900%, due 02/01/27 | | | 35,000 | | | | 38,938 | | |
6.875%, due 05/01/25 | | | 145,000 | | | | 164,644 | | |
Signature Aviation US Holdings, Inc.
5.375%, due 05/01/263 | | | 135,000 | | | | 140,117 | | |
Spirit AeroSystems, Inc.
3.950%, due 06/15/23 | | | 1,500,000 | | | | 1,265,625 | | |
TransDigm, Inc.
6.250%, due 03/15/263 | | | 330,000 | | | | 348,150 | | |
6.375%, due 06/15/26 | | | 210,000 | | | | 205,876 | | |
7.500%, due 03/15/275 | | | 130,000 | | | | 132,600 | | |
| | | | | | 3,303,199 | | |
Agriculture—0.9% | |
BAT Capital Corp.
4.906%, due 04/02/30 | | | 485,000 | | | | 585,447 | | |
Imperial Brands Finance PLC
3.500%, due 02/11/233 | | | 3,755,000 | | | | 3,926,245 | | |
3.750%, due 07/21/223 | | | 1,600,000 | | | | 1,672,321 | | |
| | | | | | 6,184,013 | | |
Airlines—1.1% | |
Air Canada Pass-Through Trust,
Series 2013-1, Class B,
5.375%, due 05/15/213 | | | 1,151,460 | | | | 1,048,497 | | |
80
PACE Strategic Fixed Income Investments
Portfolio of investments—July 31, 2020
| | | Face
amount1 | | Value | |
Corporate bonds—(continued) | |
Airlines—(concluded) | |
American Airlines Pass-Through Trust,
Series 2013-2, Class A,
4.950%, due 01/15/23 | | | 1,162,250 | | | $ | 942,942 | | |
Series 2016-2, Class AA,
3.200%, due 06/15/28 | | | 1,081,600 | | | | 1,017,208 | | |
Series 2017-2, Class A,
3.600%, due 10/15/29 | | | 891,755 | | | | 731,670 | | |
Continental Airlines Pass-Through Trust,
Series 2012-2, Class A,
4.000%, due 10/29/24 | | | 1,079,214 | | | | 1,010,257 | | |
Delta Air Lines, Inc.
7.375%, due 01/15/265 | | | 245,000 | | | | 242,830 | | |
JetBlue Pass Through Trust,
Series 2019-1, Class A,
2.950%, due 05/15/28 | | | 2,173,176 | | | | 1,920,207 | | |
Mileage Plus Holdings LLC/Mileage Plus
Intellectual Property Assets Ltd.
6.500%, due 06/20/273 | | | 385,000 | | | | 398,475 | | |
Spirit Airlines Pass Through Trust,
Series 2015-1, Class A,
4.100%, due 04/01/28 | | | 439,340 | | | | 379,364 | | |
| | | | | | 7,691,450 | | |
Apparel—0.0%† | |
Hanesbrands, Inc.
5.375%, due 05/15/253 | | | 20,000 | | | | 21,500 | | |
William Carter Co./The
5.625%, due 03/15/273,5 | | | 85,000 | | | | 90,525 | | |
| | | | | | 112,025 | | |
Auto manufacturers—3.1% | |
Daimler Finance North America LLC | |
3 mo. USD LIBOR + 0.880%,
1.238%, due 02/22/222,3 | | | 1,800,000 | | | | 1,796,853 | | |
2.550%, due 08/15/223 | | | 1,800,000 | | | | 1,860,621 | | |
Ford Motor Co.
4.750%, due 01/15/43 | | | 105,000 | | | | 96,075 | | |
5.291%, due 12/08/46 | | | 105,000 | | | | 99,782 | | |
9.000%, due 04/22/25 | | | 225,000 | | | | 265,078 | | |
Ford Motor Credit Co. LLC
5.125%, due 06/16/255 | | | 1,900,000 | | | | 2,025,533 | | |
5.750%, due 02/01/21 | | | 970,000 | | | | 982,125 | | |
Ford Motor Credit Co. LLC GMTN
4.389%, due 01/08/26 | | | 525,000 | | | | 539,269 | | |
General Motors Co.
6.125%, due 10/01/255 | | | 525,000 | | | | 612,056 | | |
General Motors Financial Co., Inc. | |
3 mo. USD LIBOR + 0.540%,
1.041%, due 11/06/202 | | | 1,500,000 | | | | 1,497,564 | | |
3.550%, due 04/09/21 | | | 1,600,000 | | | | 1,624,837 | | |
5.100%, due 01/17/24 | | | 1,725,000 | | | | 1,892,866 | | |
General Motors Financial Co., Inc. EMTN | |
3 mo. Euribor + 0.550%,
0.152%, due 03/26/222,6 | | EUR | 1,200,000 | | | | 1,369,283 | | |
Harley-Davidson Financial Services, Inc.
2.550%, due 06/09/223 | | | 1,100,000 | | | | 1,114,140 | | |
| | | Face
amount1 | | Value | |
Corporate bonds—(continued) | |
Auto manufacturers—(concluded) | |
Volkswagen Bank GmbH EMTN
2.500%, due 07/31/266 | | EUR | 1,200,000 | | | $ | 1,544,177 | | |
Volkswagen Group of America Finance LLC | |
3 mo. USD LIBOR + 0.860%,
1.157%, due 09/24/212,3 | | | 1,500,000 | | | | 1,496,875 | | |
3 mo. USD LIBOR + 0.940%,
1.375%, due 11/12/212,3 | | | 1,500,000 | | | | 1,499,524 | | |
2.850%, due 09/26/243 | | | 1,500,000 | | | | 1,605,346 | | |
3.350%, due 05/13/253 | | | 460,000 | | | | 501,936 | | |
| | | | | | 22,423,940 | | |
Auto parts & equipment—0.1% | |
American Axle & Manufacturing, Inc.
6.875%, due 07/01/28 | | | 40,000 | | | | 40,789 | | |
Dana, Inc.
5.375%, due 11/15/27 | | | 10,000 | | | | 10,540 | | |
5.625%, due 06/15/28 | | | 15,000 | | | | 15,750 | | |
Goodyear Tire & Rubber Co./The
5.125%, due 11/15/235 | | | 40,000 | | | | 40,200 | | |
9.500%, due 05/31/25 | | | 35,000 | | | | 39,331 | | |
IHO Verwaltungs GmbH | |
4.750% Cash or 5.500 PIK,
4.750%, due 09/15/263,7 | | | 200,000 | | | | 203,500 | | |
Meritor, Inc.
6.250%, due 06/01/253 | | | 20,000 | | | | 21,200 | | |
| | | | | | 371,310 | | |
Banks—12.2% | |
Banco Santander SA
2.746%, due 05/28/25 | | | 200,000 | | | | 211,611 | | |
3.490%, due 05/28/30 | | | 200,000 | | | | 221,557 | | |
Bank of America Corp. | |
(fixed, converts to FRN on 04/24/27),
3.705%, due 04/24/28 | | | 530,000 | | | | 606,255 | | |
(fixed, converts to FRN on 06/20/24),
5.125%, due 06/20/248 | | | 86,000 | | | | 88,694 | | |
(fixed, converts to FRN on 09/05/24),
6.250%, due 09/05/248 | | | 102,000 | | | | 110,845 | | |
Bank of America Corp. MTN | |
(fixed, converts to FRN on 02/13/30),
2.496%, due 02/13/31 | | | 290,000 | | | | 308,115 | | |
(fixed, converts to FRN on 03/05/28),
3.970%, due 03/05/295 | | | 405,000 | | | | 471,390 | | |
4.000%, due 01/22/25 | | | 1,500,000 | | | | 1,676,357 | | |
(fixed, converts to FRN on 03/20/50),
4.083%, due 03/20/51 | | | 280,000 | | | | 365,837 | | |
4.125%, due 01/22/24 | | | 3,700,000 | | | | 4,128,181 | | |
Bank of New York Mellon Corp./The,
Series F, | |
(fixed, converts to FRN on 09/20/26),
4.625%, due 09/20/265,8 | | | 82,000 | | | | 84,660 | | |
Barclays Bank PLC
7.625%, due 11/21/22 | | | 1,600,000 | | | | 1,758,631 | | |
81
PACE Strategic Fixed Income Investments
Portfolio of investments—July 31, 2020
| | | Face
amount1 | | Value | |
Corporate bonds—(continued) | |
Banks—(continued) | |
Barclays PLC | |
3 mo. USD LIBOR + 1.625%,
1.898%, due 01/10/232,5 | | | 2,000,000 | | | $ | 2,009,472 | | |
(fixed, converts to FRN on 02/15/22),
4.610%, due 02/15/23 | | | 1,100,000 | | | | 1,159,754 | | |
4.836%, due 05/09/28 | | | 535,000 | | | | 602,943 | | |
(fixed, converts to FRN on 05/16/28),
4.972%, due 05/16/29 | | | 1,100,000 | | | | 1,318,978 | | |
(fixed, converts to FRN on 12/15/20),
8.000%, due 12/15/208 | | EUR | 1,000,000 | | | | 1,187,789 | | |
BNP Paribas SA | |
(fixed, converts to FRN on 01/31/30),
3.052%, due 01/13/313 | | | 445,000 | | | | 485,485 | | |
CIT Group, Inc.
4.750%, due 02/16/24 | | | 55,000 | | | | 56,925 | | |
5.000%, due 08/15/22 | | | 535,000 | | | | 552,387 | | |
5.250%, due 03/07/25 | | | 45,000 | | | | 48,150 | | |
Citigroup, Inc. | |
3 mo. USD LIBOR + 0.960%,
1.205%, due 04/25/222 | | | 355,000 | | | | 358,558 | | |
(fixed, converts to FRN on 11/05/29),
2.976%, due 11/05/30 | | | 375,000 | | | | 411,000 | | |
(fixed, converts to FRN on 10/27/27),
3.520%, due 10/27/28 | | | 280,000 | | | | 315,546 | | |
(fixed, converts to FRN on 01/10/27),
3.887%, due 01/10/28 | | | 755,000 | | | | 863,047 | | |
4.400%, due 06/10/25 | | | 980,000 | | | | 1,112,253 | | |
(fixed, converts to FRN on 01/30/25),
4.700%, due 01/30/258 | | | 52,000 | | | | 50,635 | | |
(fixed, converts to FRN on 02/15/23),
5.900%, due 02/15/238 | | | 73,000 | | | | 76,688 | | |
Series U, | |
(fixed, converts to FRN on 09/12/24),
5.000%, due 09/12/248 | | | 89,000 | | | | 89,222 | | |
Citizens Financial Group, Inc.,
Series B, | |
(fixed, converts to FRN on 07/06/23),
6.000%, due 07/06/238 | | | 60,000 | | | | 54,225 | | |
Series C, | |
(fixed, converts to FRN on 04/06/24),
6.375%, due 04/06/248 | | | 80,000 | | | | 77,144 | | |
Comerica, Inc. | |
(fixed, converts to FRN on 07/01/25),
5.625%, due 07/01/255,8 | | | 50,000 | | | | 53,390 | | |
Cooperatieve Rabobank UA
3.875%, due 09/26/233 | | | 1,500,000 | | | | 1,650,628 | | |
Credit Suisse AG
6.500%, due 08/08/233 | | | 500,000 | | | | 559,375 | | |
Credit Suisse Group AG | |
3 mo. USD LIBOR + 1.240%,
1.558%, due 06/12/242,3 | | | 1,600,000 | | | | 1,604,951 | | |
(fixed, converts to FRN on 04/01/30),
4.194%, due 04/01/313 | | | 370,000 | | | | 432,137 | | |
(fixed, converts to FRN on 06/12/23),
4.207%, due 06/12/243 | | | 1,600,000 | | | | 1,736,302 | | |
| | | Face
amount1 | | Value | |
Corporate bonds—(continued) | |
Banks—(continued) | |
(fixed, converts to FRN on 12/18/24),
6.250%, due 12/18/243,8 | | | 800,000 | | | $ | 852,000 | | |
(fixed, converts to FRN on 12/11/23),
7.500%, due 12/11/233,8 | | | 700,000 | | | | 767,375 | | |
Credit Suisse Group Funding Guernsey Ltd.
3.800%, due 09/15/22 | | | 1,900,000 | | | | 2,019,417 | | |
Deutsche Bank AG
3.300%, due 11/16/22 | | | 1,900,000 | | | | 1,965,061 | | |
3.950%, due 02/27/23 | | | 1,300,000 | | | | 1,367,970 | | |
(fixed, converts to FRN on 11/26/24),
3.961%, due 11/26/255 | | | 1,500,000 | | | | 1,599,669 | | |
4.250%, due 10/14/21 | | | 1,100,000 | | | | 1,135,656 | | |
Discover Bank
4.200%, due 08/08/23 | | | 1,600,000 | | | | 1,763,695 | | |
Fifth Third Bancorp | |
(fixed, converts to FRN on 06/30/23),
5.100%, due 06/30/235,8 | | | 115,000 | | | | 106,053 | | |
Series L, | |
(fixed, converts to FRN on 09/30/25),
4.500%, due 09/30/258 | | | 25,000 | | | | 25,437 | | |
Goldman Sachs Group, Inc./The | |
3 mo. USD LIBOR + 0.750%,
1.110%, due 02/23/232 | | | 740,000 | | | | 741,326 | | |
(fixed, converts to FRN on 04/23/28),
3.814%, due 04/23/29 | | | 470,000 | | | | 542,957 | | |
(fixed, converts to FRN on 10/31/37),
4.017%, due 10/31/38 | | | 455,000 | | | | 555,490 | | |
(fixed, converts to FRN on 02/10/25),
4.950%, due 02/10/258 | | | 39,000 | | | | 39,120 | | |
Series O, | |
(fixed, converts to FRN on 11/10/26),
5.300%, due 11/10/268 | | | 104,000 | | | | 111,025 | | |
Series Q, | |
(fixed, converts to FRN on 08/10/24),
5.500%, due 08/10/245,8 | | | 43,000 | | | | 46,171 | | |
HSBC Holdings PLC | |
(fixed, converts to FRN on 05/22/27),
6.000%, due 05/22/278 | | | 870,000 | | | | 860,865 | | |
Huntington Bancshares, Inc.,
Series E, | |
(fixed, converts to FRN on 04/15/23),
5.700%, due 04/15/238 | | | 124,000 | | | | 115,320 | | |
Intesa Sanpaolo SpA,
Series XR,
4.000%, due 09/23/293 | | | 1,500,000 | | | | 1,630,993 | | |
JPMorgan Chase & Co. | |
3 mo. USD LIBOR + 0.900%,
1.145%, due 04/25/232 | | | 690,000 | | | | 695,479 | | |
(fixed, converts to FRN on 05/13/30),
2.956%, due 05/13/31 | | | 435,000 | | | | 474,017 | | |
(fixed, converts to FRN on 04/22/40),
3.109%, due 04/22/41 | | | 470,000 | | | | 532,753 | | |
3.300%, due 04/01/26 | | | 1,200,000 | | | | 1,350,048 | | |
(fixed, converts to FRN on 07/23/23),
3.797%, due 07/23/24 | | | 1,600,000 | | | | 1,745,275 | | |
82
PACE Strategic Fixed Income Investments
Portfolio of investments—July 31, 2020
| | | Face
amount1 | | Value | |
Corporate bonds—(continued) | |
Banks—(continued) | |
(fixed, converts to FRN on 01/23/48),
3.897%, due 01/23/49 | | | 340,000 | | | $ | 437,872 | | |
(fixed, converts to FRN on 04/23/28),
4.005%, due 04/23/29 | | | 650,000 | | | | 764,231 | | |
(fixed, converts to FRN on 03/24/30),
4.493%, due 03/24/31 | | | 190,000 | | | | 235,601 | | |
(fixed, converts to FRN on 02/01/25),
4.600%, due 02/01/258 | | | 41,000 | | | | 39,672 | | |
Series CC, | |
(fixed, converts to FRN on 11/01/22),
4.625%, due 11/01/228 | | | 100,000 | | | | 97,500 | | |
Series FF, | |
(fixed, converts to FRN on 08/01/24),
5.000%, due 08/01/245,8 | | | 95,000 | | | | 95,594 | | |
Lloyds Bank PLC EMTN
7.500%, due 04/02/324,6 | | | 2,200,000 | | | | 1,805,131 | | |
Lloyds Banking Group PLC
3.000%, due 01/11/22 | | | 1,300,000 | | | | 1,345,513 | | |
Lloyds Banking Group PLC MTN
4.000%, due 03/07/25 | | AUD | 1,700,000 | | | | 1,320,376 | | |
M&T Bank Corp.,
Series G, | |
(fixed, converts to FRN on 08/01/24),
5.000%, due 08/01/248 | | | 56,000 | | | | 57,193 | | |
Mitsubishi UFJ Financial Group, Inc. | |
3 mo. USD LIBOR + 0.740%,
1.084%, due 03/02/232 | | | 1,600,000 | | | | 1,602,744 | | |
3.455%, due 03/02/23 | | | 1,900,000 | | | | 2,032,932 | | |
Mizuho Financial Group, Inc. | |
(fixed, converts to FRN on 09/11/23),
3.922%, due 09/11/24 | | | 1,100,000 | | | | 1,194,795 | | |
Morgan Stanley | |
(fixed, converts to FRN on 07/22/27),
3.591%, due 07/22/28 | | | 1,330,000 | | | | 1,519,351 | | |
Series H, | |
(fixed, converts to FRN on 10/15/20),
3.885%, due 10/15/208 | | | 395,000 | | | | 374,248 | | |
Morgan Stanley GMTN | |
SOFR + 0.700%,
0.791%, due 01/20/232 | | | 590,000 | | | | 591,032 | | |
Morgan Stanley MTN | |
(fixed, converts to FRN on 04/01/30),
3.622%, due 04/01/31 | | | 190,000 | | | | 222,182 | | |
Natwest Group PLC | |
(fixed, converts to FRN on 08/10/20),
7.500%, due 08/10/205,8 | | | 1,100,000 | | | | 1,099,956 | | |
(fixed, converts to FRN on 08/15/21),
8.625%, due 08/15/215,8 | | | 1,400,000 | | | | 1,462,706 | | |
PNC Financial Services Group, Inc./The
2.200%, due 11/01/24 | | | 1,800,000 | | | | 1,919,329 | | |
Series S, | |
(fixed, converts to FRN on 11/01/26),
5.000%, due 11/01/265,8 | | | 67,000 | | | | 69,930 | | |
| | | Face
amount1 | | Value | |
Corporate bonds—(continued) | |
Banks—(concluded) | |
Regions Financial Corp.,
Series D, | |
(fixed, converts to FRN on 06/15/25),
5.750%, due 06/15/255,8 | | | 25,000 | | | $ | 26,625 | | |
Santander UK Group Holdings PLC
2.875%, due 08/05/21 | | | 1,700,000 | | | | 1,740,157 | | |
3.125%, due 01/08/21 | | | 1,700,000 | | | | 1,719,627 | | |
Societe Generale S.A.
4.250%, due 09/14/233 | | | 1,500,000 | | | | 1,632,145 | | |
Standard Chartered PLC | |
(fixed, converts to FRN on 05/21/24),
3.785%, due 05/21/253 | | | 1,500,000 | | | | 1,600,950 | | |
Sumitomo Mitsui Financial Group, Inc.
2.696%, due 07/16/245 | | | 1,400,000 | | | | 1,494,538 | | |
Synchrony Bank
3.650%, due 05/24/21 | | | 1,600,000 | | | | 1,624,836 | | |
Truist Financial Corp.,
Series L, | |
(fixed, converts to FRN on 12/15/24),
5.050%, due 12/15/248 | | | 73,000 | | | | 67,429 | | |
Series N, | |
(fixed, converts to FRN on 09/01/24),
4.800%, due 09/01/248 | | | 130,000 | | | | 131,058 | | |
Series Q, | |
(fixed, converts to FRN on 03/01/30),
5.100%, due 03/01/308 | | | 25,000 | | | | 27,125 | | |
UniCredit SpA
7.830%, due 12/04/233 | | | 3,300,000 | | | | 3,866,410 | | |
United Overseas Bank Ltd.
3.200%, due 04/23/213 | | | 1,600,000 | | | | 1,627,551 | | |
Wells Fargo & Co. | |
3 mo. USD LIBOR + 1.110%,
1.374%, due 01/24/232 | | | 645,000 | | | | 651,059 | | |
3 mo. USD LIBOR + 1.230%,
1.491%, due 10/31/232 | | | 1,400,000 | | | | 1,415,204 | | |
Series S, | |
(fixed, converts to FRN on 06/15/24),
5.900%, due 06/15/248 | | | 84,000 | | | | 85,341 | | |
Series U, | |
(fixed, converts to FRN on 06/15/25),
5.875%, due 06/15/258 | | | 69,000 | | | | 74,692 | | |
Wells Fargo & Co. MTN | |
(fixed, converts to FRN on 02/11/30),
2.572%, due 02/11/31 | | | 625,000 | | | | 663,328 | | |
(fixed, converts to FRN on 06/17/26),
3.196%, due 06/17/27 | | | 1,500,000 | | | | 1,643,944 | | |
(fixed, converts to FRN on 04/04/50),
5.013%, due 04/04/51 | | | 190,000 | | | | 274,206 | | |
Wells Fargo Bank N.A.
3.550%, due 08/14/23 | | | 735,000 | | | | 798,690 | | |
| | | | | | 87,395,092 | | |
83
PACE Strategic Fixed Income Investments
Portfolio of investments—July 31, 2020
| | | Face
amount1 | | Value | |
Corporate bonds—(continued) | |
Beverages—0.7% | |
Anheuser-Busch InBev Worldwide, Inc.
4.600%, due 04/15/48 | | | 325,000 | | | $ | 402,057 | | |
4.600%, due 06/01/605 | | | 1,400,000 | | | | 1,803,339 | | |
4.750%, due 04/15/58 | | | 555,000 | | | | 718,759 | | |
5.800%, due 01/23/59 | | | 395,000 | | | | 593,035 | | |
Suntory Holdings Ltd.
2.250%, due 10/16/243 | | | 1,500,000 | | | | 1,569,440 | | |
| | | | | | 5,086,630 | | |
Building materials—0.3% | |
Builders FirstSource, Inc.
5.000%, due 03/01/303 | | | 35,000 | | | | 36,708 | | |
Forterra Finance LLC/FRTA Finance Corp.
6.500%, due 07/15/253 | | | 50,000 | | | | 53,000 | | |
Fortune Brands Home & Security, Inc.
3.250%, due 09/15/29 | | | 1,400,000 | | | | 1,565,412 | | |
JELD-WEN, Inc.
4.625%, due 12/15/253 | | | 85,000 | | | | 85,850 | | |
4.875%, due 12/15/273,5 | | | 135,000 | | | | 137,362 | | |
Masonite International Corp.
5.375%, due 02/01/283,5 | | | 75,000 | | | | 79,875 | | |
5.750%, due 09/15/263 | | | 125,000 | | | | 130,985 | | |
Standard Industries, Inc.
4.375%, due 07/15/303 | | | 205,000 | | | | 221,400 | | |
4.750%, due 01/15/283 | | | 55,000 | | | | 58,781 | | |
5.000%, due 02/15/273 | | | 35,000 | | | | 37,377 | | |
| | | | | | 2,406,750 | | |
Chemicals—0.5% | |
CF Industries, Inc.
5.375%, due 03/15/44 | | | 30,000 | | | | 36,612 | | |
Element Solutions, Inc.
5.875%, due 12/01/253 | | | 120,000 | | | | 123,900 | | |
HB Fuller Co.
4.000%, due 02/15/27 | | | 75,000 | | | | 73,500 | | |
Huntsman International LLC
5.125%, due 11/15/225 | | | 1,300,000 | | | | 1,388,085 | | |
Minerals Technologies, Inc.
5.000%, due 07/01/283 | | | 35,000 | | | | 36,323 | | |
NOVA Chemicals Corp.
4.875%, due 06/01/243,5 | | | 85,000 | | | | 84,787 | | |
Olin Corp.
5.625%, due 08/01/29 | | | 80,000 | | | | 76,808 | | |
Syngenta Finance N.V.
4.441%, due 04/24/233 | | | 1,600,000 | | | | 1,682,527 | | |
Tronox, Inc.
6.500%, due 04/15/263,5 | | | 45,000 | | | | 45,113 | | |
Valvoline, Inc.
4.250%, due 02/15/303,5 | | | 55,000 | | | | 57,819 | | |
4.375%, due 08/15/253 | | | 70,000 | | | | 72,363 | | |
WR Grace & Co-Conn
4.875%, due 06/15/273,5 | | | 35,000 | | | | 37,275 | | |
5.625%, due 10/01/243 | | | 15,000 | | | | 16,238 | | |
| | | | | | 3,731,350 | | |
| | | Face
amount1 | | Value | |
Corporate bonds—(continued) | |
Commercial services—1.5% | |
ADT Security Corp./The
4.875%, due 07/15/323 | | | 100,000 | | | $ | 100,119 | | |
APX Group, Inc.
6.750%, due 02/15/273 | | | 105,000 | | | | 104,685 | | |
ASGN, Inc.
4.625%, due 05/15/283 | | | 155,000 | | | | 158,487 | | |
Avis Budget Car Rental LLC/Avis Budget
Finance, Inc.
5.750%, due 07/15/273,5 | | | 70,000 | | | | 65,450 | | |
Duke University
2.682%, due 10/01/44 | | | 1,700,000 | | | | 1,847,065 | | |
Emory University
2.143%, due 09/01/305 | | | 1,400,000 | | | | 1,462,892 | | |
Garda World Security Corp.
4.625%, due 02/15/273 | | | 165,000 | | | | 169,524 | | |
Gartner, Inc.
5.125%, due 04/01/253 | | | 65,000 | | | | 67,196 | | |
IHS Markit Ltd.
5.000%, due 11/01/223 | | | 901,000 | | | | 969,649 | | |
Jaguar Holding Co. II/PPD Development LP
4.625%, due 06/15/253 | | | 45,000 | | | | 47,025 | | |
5.000%, due 06/15/283 | | | 100,000 | | | | 106,500 | | |
Korn Ferry
4.625%, due 12/15/273 | | | 90,000 | | | | 92,340 | | |
Moody's Corp.
2.625%, due 01/15/23 | | | 1,700,000 | | | | 1,784,545 | | |
Nielsen Co. Luxembourg SARL/The
5.000%, due 02/01/253,5 | | | 180,000 | | | | 184,729 | | |
Nielsen Finance LLC/Nielsen Finance Co.
5.000%, due 04/15/223 | | | 160,000 | | | | 160,704 | | |
PayPal Holdings, Inc.
2.850%, due 10/01/29 | | | 1,800,000 | | | | 2,031,050 | | |
Prime Security Services Borrower LLC/Prime
Finance, Inc.
5.750%, due 04/15/263 | | | 405,000 | | | | 449,550 | | |
6.250%, due 01/15/283 | | | 120,000 | | | | 125,100 | | |
Ritchie Bros Auctioneers, Inc.
5.375%, due 01/15/253 | | | 220,000 | | | | 227,654 | | |
Service Corp. International
5.125%, due 06/01/29 | | | 50,000 | | | | 55,250 | | |
5.375%, due 05/15/24 | | | 90,000 | | | | 91,781 | | |
ServiceMaster Co. LLC/The
5.125%, due 11/15/243 | | | 195,000 | | | | 200,850 | | |
United Rentals North America, Inc.
3.875%, due 02/15/319 | | | 120,000 | | | | 120,000 | | |
5.250%, due 01/15/30 | | | 35,000 | | | | 38,325 | | |
| | | | | | 10,660,470 | | |
Computers—0.7% | |
Apple, Inc.
2.450%, due 08/04/26 | | | 610,000 | | | | 670,135 | | |
4.650%, due 02/23/465 | | | 455,000 | | | | 655,940 | | |
Dell International LLC/EMC Corp.
4.420%, due 06/15/213 | | | 1,509,000 | | | | 1,550,646 | | |
5.450%, due 06/15/233 | | | 845,000 | | | | 931,115 | | |
84
PACE Strategic Fixed Income Investments
Portfolio of investments—July 31, 2020
| | | Face
amount1 | | Value | |
Corporate bonds—(continued) | |
Computers—(concluded) | |
6.100%, due 07/15/273 | | | 60,000 | | | $ | 70,926 | | |
6.200%, due 07/15/303 | | | 55,000 | | | | 66,980 | | |
International Business Machines Corp.
4.250%, due 05/15/49 | | | 265,000 | | | | 348,892 | | |
Presidio Holdings, Inc.
4.875%, due 02/01/273 | | | 70,000 | | | | 71,400 | | |
Science Applications International Corp.
4.875%, due 04/01/283,5 | | | 25,000 | | | | 26,187 | | |
Western Digital Corp.
4.750%, due 02/15/265 | | | 250,000 | | | | 271,875 | | |
| | | | | | 4,664,096 | | |
Cosmetics & personal Care—0.0%† | |
Edgewell Personal Care Co.
5.500%, due 06/01/283 | | | 250,000 | | | | 270,625 | | |
Distribution & wholesale—0.1% | |
HD Supply, Inc.
5.375%, due 10/15/263,5 | | | 95,000 | | | | 99,554 | | |
IAA, Inc.
5.500%, due 06/15/273 | | | 110,000 | | | | 117,288 | | |
KAR Auction Services, Inc.
5.125%, due 06/01/253 | | | 185,000 | | | | 185,925 | | |
Performance Food Group, Inc.
5.500%, due 10/15/273 | | | 50,000 | | | | 51,625 | | |
6.875%, due 05/01/253,5 | | | 20,000 | | | | 21,550 | | |
Resideo Funding, Inc.
6.125%, due 11/01/263 | | | 120,000 | | | | 122,400 | | |
Univar Solutions USA, Inc.
5.125%, due 12/01/273 | | | 80,000 | | | | 84,600 | | |
| | | | | | 682,942 | | |
Diversified financial services—2.6% | |
AerCap Ireland Capital DAC/AerCap | |
Global Aviation Trust
4.450%, due 10/01/25 | | | 650,000 | | | | 636,911 | | |
4.450%, due 04/03/26 | | | 1,200,000 | | | | 1,172,409 | | |
Air Lease Corp. MTN
2.300%, due 02/01/25 | | | 475,000 | | | | 455,492 | | |
Aircastle Ltd.
5.500%, due 02/15/22 | | | 1,500,000 | | | | 1,530,284 | | |
Avolon Holdings Funding Ltd.
3.950%, due 07/01/243 | | | 1,400,000 | | | | 1,273,953 | | |
BGC Partners, Inc.
5.375%, due 07/24/23 | | | 1,400,000 | | | | 1,454,471 | | |
Capital One Financial Corp. | |
3 mo. USD LIBOR + 0.950%,
1.263%, due 03/09/222 | | | 185,000 | | | | 186,215 | | |
Charles Schwab Corp./The,
Series G, | |
(fixed, converts to FRN on 06/01/25),
5.375%, due 06/01/258 | | | 40,000 | | | | 43,800 | | |
| | | Face
amount1 | | Value | |
Corporate bonds—(continued) | |
Diversified financial services—(concluded) | |
Depository Trust & Clearing Corp./The,
Series C, | |
(fixed, converts to FRN on 09/15/20),
3.480%, due 09/15/203,8 | | | 2,000,000 | | | $ | 1,945,000 | | |
Discover Financial Services,
Series C, | |
(fixed, converts to FRN on 10/30/27),
5.500%, due 10/30/278 | | | 125,000 | | | | 114,051 | | |
Series D, | |
(fixed, converts to FRN on 06/23/25),
6.125%, due 06/23/258 | | | 25,000 | | | | 26,570 | | |
Doric Nimrod Air Finance Alpha Ltd.
Pass-Through Trust,
Series 2012 Class 1A,
5.125%, due 11/30/223 | | | 207,985 | | | | 192,554 | | |
Emerald Bay SA
0.000%, due 10/08/203,10 | | EUR | 1,553,000 | | | | 1,791,405 | | |
GE Capital Funding LLC
4.400%, due 05/15/303 | | | 1,700,000 | | | | 1,791,377 | | |
Global Aircraft Leasing Co. Ltd. | |
6.500% Cash or 7.250% PIK,
6.500%, due 09/15/243,7 | | | 70,000 | | | | 43,575 | | |
Lazard Group LLC
4.375%, due 03/11/29 | | | 400,000 | | | | 460,187 | | |
LeasePlan Corp. N.V.
2.875%, due 10/24/243 | | | 1,500,000 | | | | 1,554,197 | | |
Lehman Brothers Holdings, Inc. MTN
0.000%, due 12/30/1611 | | | 1,900,000 | | | | 22,800 | | |
1.000%, due 12/30/1611 | | | 900,000 | | | | 10,800 | | |
1.000%, due 01/24/4911 | | | 4,500,000 | | | | 54,000 | | |
LPL Holdings, Inc.
4.625%, due 11/15/273 | | | 60,000 | | | | 61,800 | | |
5.750%, due 09/15/253 | | | 293,000 | | | | 304,720 | | |
Navient Corp.
5.875%, due 10/25/24 | | | 25,000 | | | | 25,625 | | |
Navient Corp. MTN
6.125%, due 03/25/245 | | | 70,000 | | | | 72,450 | | |
Series A,
5.625%, due 01/25/25 | | | 500,000 | | | | 446,828 | | |
OneMain Finance Corp.
6.125%, due 03/15/24 | | | 35,000 | | | | 38,088 | | |
6.875%, due 03/15/25 | | | 1,345,000 | | | | 1,503,037 | | |
7.125%, due 03/15/26 | | | 105,000 | | | | 123,095 | | |
Synchrony Financial
2.850%, due 07/25/22 | | | 1,150,000 | | | | 1,176,147 | | |
| | | | | | 18,511,841 | | |
Electric—5.8% | |
Adani Electricity Mumbai Ltd.
3.949%, due 02/12/303 | | | 1,800,000 | | | | 1,777,779 | | |
American Transmission Systems, Inc.
5.250%, due 01/15/223 | | | 900,000 | | | | 955,880 | | |
Avangrid, Inc.
3.800%, due 06/01/29 | | | 1,600,000 | | | | 1,906,544 | | |
85
PACE Strategic Fixed Income Investments
Portfolio of investments—July 31, 2020
| | | Face
amount1 | | Value | |
Corporate bonds—(continued) | |
Electric—(continued) | |
Berkshire Hathaway Energy Co.
4.250%, due 10/15/503 | | | 255,000 | | | $ | 348,804 | | |
Black Hills Corp.
2.500%, due 06/15/305 | | | 1,400,000 | | | | 1,481,377 | | |
Calpine Corp.
4.500%, due 02/15/283 | | | 370,000 | | | | 382,025 | | |
4.625%, due 02/01/293,9 | | | 133,000 | | | | 134,327 | | |
5.000%, due 02/01/313,9 | | | 184,000 | | | | 188,578 | | |
5.125%, due 03/15/283 | | | 95,000 | | | | 98,681 | | |
5.750%, due 01/15/255 | | | 135,000 | | | | 138,915 | | |
Clearway Energy Operating LLC
4.750%, due 03/15/283 | | | 35,000 | | | | 37,406 | | |
Commonwealth Edison Co.
3.700%, due 03/01/45 | | | 745,000 | | | | 927,050 | | |
Dominion Energy, Inc.,
Series B, | |
(fixed, converts to FRN on 12/15/24),
4.650%, due 12/15/248 | | | 55,000 | | | | 56,012 | | |
Duke Energy Corp.
3.750%, due 04/15/24 | | | 1,700,000 | | | | 1,885,764 | | |
Edison International
2.950%, due 03/15/235 | | | 1,500,000 | | | | 1,541,935 | | |
Enel Finance International N.V.
4.250%, due 09/14/233 | | | 1,600,000 | | | | 1,744,426 | | |
Entergy Gulf States Louisiana LLC
5.590%, due 10/01/24 | | | 2,207,000 | | | | 2,639,656 | | |
Exelon Corp.
4.700%, due 04/15/50 | | | 350,000 | | | | 483,575 | | |
Idaho Power Co.,
Series K,
4.200%, due 03/01/48 | | | 1,400,000 | | | | 1,846,843 | | |
LG&E and KU Energy LLC
4.375%, due 10/01/21 | | | 1,440,000 | | | | 1,486,356 | | |
MidAmerican Energy Co.
3.650%, due 04/15/295 | | | 1,400,000 | | | | 1,702,484 | | |
Monongahela Power Co.
3.550%, due 05/15/273 | | | 1,800,000 | | | | 2,028,304 | | |
NextEra Energy Capital Holdings, Inc.
3.200%, due 02/25/22 | | | 1,500,000 | | | | 1,563,634 | | |
3.550%, due 05/01/27 | | | 1,700,000 | | | | 1,972,285 | | |
Niagara Mohawk Power Corp.
4.278%, due 12/15/283 | | | 2,100,000 | | | | 2,527,324 | | |
NRG Energy, Inc.
5.250%, due 06/15/293 | | | 180,000 | | | | 199,021 | | |
7.250%, due 05/15/26 | | | 105,000 | | | | 113,244 | | |
Ohio Power Co.,
Series M,
5.375%, due 10/01/21 | | | 480,000 | | | | 508,215 | | |
Pacific Gas and Electric Co.
1.750%, due 06/16/225 | | | 900,000 | | | | 903,351 | | |
3.300%, due 08/01/405 | | | 225,000 | | | | 229,335 | | |
3.400%, due 08/15/245 | | | 1,400,000 | | | | 1,473,149 | | |
3.750%, due 02/15/245 | | | 1,600,000 | | | | 1,691,803 | | |
PPL Capital Funding, Inc.
3.500%, due 12/01/225 | | | 1,700,000 | | | | 1,797,190 | | |
| | | Face
amount1 | | Value | |
Corporate bonds—(continued) | |
Electric—(concluded) | |
Sempra Energy
2.900%, due 02/01/23 | | | 2,178,000 | | | $ | 2,300,344 | | |
Talen Energy Supply LLC
6.625%, due 01/15/283 | | | 150,000 | | | | 150,620 | | |
7.250%, due 05/15/273 | | | 115,000 | | | | 119,600 | | |
7.625%, due 06/01/283 | | | 35,000 | | | | 36,575 | | |
Vistra Operations Co. LLC
5.000%, due 07/31/273 | | | 125,000 | | | | 133,438 | | |
5.500%, due 09/01/263 | | | 60,000 | | | | 63,225 | | |
5.625%, due 02/15/273 | | | 90,000 | | | | 96,616 | | |
Xcel Energy, Inc.
3.400%, due 06/01/30 | | | 1,600,000 | | | | 1,879,842 | | |
| | | | | | 41,551,532 | | |
Electrical components & equipment—0.1% | |
Energizer Holdings, Inc.
4.750%, due 06/15/283,5 | | | 280,000 | | | | 300,328 | | |
6.375%, due 07/15/263 | | | 70,000 | | | | 74,615 | | |
7.750%, due 01/15/273 | | | 70,000 | | | | 77,700 | | |
EnerSys
4.375%, due 12/15/273 | | | 45,000 | | | | 45,464 | | |
| | | | | | 498,107 | | |
Electronics—0.0%† | |
Sensata Tech, Inc.
4.375%, due 02/15/303 | | | 20,000 | | | | 21,374 | | |
Sensata Technologies BV
4.875%, due 10/15/233 | | | 145,000 | | | | 152,431 | | |
| | | | | | 173,805 | | |
Energy-Alternate Sources—0.4% | |
Azure Power Solar Energy Pvt Ltd.
5.650%, due 12/24/243 | | | 1,500,000 | | | | 1,529,625 | | |
Greenko Solar Mauritius Ltd.
5.950%, due 07/29/263 | | | 1,300,000 | | | | 1,317,891 | | |
| | | | | | 2,847,516 | | |
Engineering & construction—0.3% | |
AECOM
5.875%, due 10/15/24 | | | 35,000 | | | | 38,631 | | |
frontdoor, Inc.
6.750%, due 08/15/263 | | | 185,000 | | | | 199,569 | | |
Sydney Airport Finance Co. Pty Ltd.
3.375%, due 04/30/253 | | | 1,800,000 | | | | 1,949,613 | | |
| | | | | | 2,187,813 | | |
Entertainment—0.2% | |
Cedar Fair LP
5.250%, due 07/15/295 | | | 25,000 | | | | 23,618 | | |
Cedar Fair LP/Canada's Wonderland Co./
Magnum Management Corp./Millennium Op
5.375%, due 04/15/27 | | | 35,000 | | | | 33,775 | | |
5.500%, due 05/01/253 | | | 275,000 | | | | 280,844 | | |
Churchill Downs, Inc.
5.500%, due 04/01/273 | | | 295,000 | | | | 308,644 | | |
86
PACE Strategic Fixed Income Investments
Portfolio of investments—July 31, 2020
| | | Face
amount1 | | Value | |
Corporate bonds—(continued) | |
Entertainment—(concluded) | |
Live Nation Entertainment, Inc.
4.750%, due 10/15/273,5 | | | 250,000 | | | $ | 231,250 | | |
4.875%, due 11/01/243 | | | 155,000 | | | | 146,475 | | |
6.500%, due 05/15/273 | | | 285,000 | | | | 306,375 | | |
Six Flags Entertainment Corp.
4.875%, due 07/31/243 | | | 55,000 | | | | 52,233 | | |
Six Flags Theme Parks, Inc.
7.000%, due 07/01/253,5 | | | 220,000 | | | | 236,128 | | |
Vail Resorts, Inc.
6.250%, due 05/15/253 | | | 70,000 | | | | 75,425 | | |
| | | | | | 1,694,767 | | |
Environmental control—0.0%† | |
Clean Harbors, Inc.
4.875%, due 07/15/273 | | | 30,000 | | | | 31,803 | | |
5.125%, due 07/15/293 | | | 15,000 | | | | 16,050 | | |
Harsco Corp.
5.750%, due 07/31/273 | | | 125,000 | | | | 131,143 | | |
| | | | | | 178,996 | | |
Food—0.8% | |
Danone SA
2.077%, due 11/02/213 | | | 1,500,000 | | | | 1,525,805 | | |
Grupo Bimbo SAB de CV
4.700%, due 11/10/473 | | | 705,000 | | | | 818,020 | | |
Kraft Heinz Foods Co.
4.375%, due 06/01/46 | | | 90,000 | | | | 93,727 | | |
4.875%, due 10/01/493 | | | 150,000 | | | | 165,667 | | |
5.000%, due 06/04/42 | | | 85,000 | | | | 95,120 | | |
5.200%, due 07/15/45 | | | 125,000 | | | | 142,548 | | |
7.125%, due 08/01/393 | | | 1,200,000 | | | | 1,623,811 | | |
Kroger Co./The
5.400%, due 01/15/495 | | | 115,000 | | | | 166,976 | | |
Lamb Weston Holdings, Inc.
4.875%, due 05/15/283,5 | | | 20,000 | | | | 22,475 | | |
Post Holdings, Inc.
4.625%, due 04/15/303,5 | | | 115,000 | | | | 121,037 | | |
5.000%, due 08/15/263 | | | 30,000 | | | | 31,439 | | |
5.500%, due 12/15/293 | | | 295,000 | | | | 323,748 | | |
5.625%, due 01/15/283 | | | 95,000 | | | | 103,816 | | |
5.750%, due 03/01/273 | | | 20,000 | | | | 21,300 | | |
US Foods, Inc.
6.250%, due 04/15/253 | | | 245,000 | | | | 262,762 | | |
| | | | | | 5,518,251 | | |
Food Service—0.1% | |
Aramark Services, Inc.
5.000%, due 04/01/253 | | | 70,000 | | | | 71,925 | | |
5.000%, due 02/01/283,5 | | | 380,000 | | | | 382,375 | | |
6.375%, due 05/01/253 | | | 100,000 | | | | 105,633 | | |
| | | | | | 559,933 | | |
Gas—0.1% | |
Piedmont Natural Gas Co., Inc.
3.350%, due 06/01/50 | | | 430,000 | | | | 514,079 | | |
| | | Face
amount1 | | Value | |
Corporate bonds—(continued) | |
Hand & machine tools—0.0%† | |
Colfax Corp. | |
6.000%, due 02/15/243 | | | 35,000 | | | $ | 36,837 | | |
6.375%, due 02/15/263,5 | | | 70,000 | | | | 75,600 | | |
| | | | | | 112,437 | | |
Healthcare-products—0.2% | |
Abbott Laboratories
3.750%, due 11/30/26 | | | 375,000 | | | | 441,406 | | |
Avantor Funding, Inc.
4.625%, due 07/15/283,5 | | | 75,000 | | | | 79,335 | | |
Hologic, Inc.
4.375%, due 10/15/253 | | | 90,000 | | | | 92,250 | | |
Zimmer Biomet Holdings, Inc.
3.550%, due 04/01/25 | | | 385,000 | | | | 425,690 | | |
| | | | | | 1,038,681 | | |
Healthcare-services—1.0% | |
Aetna, Inc.
2.750%, due 11/15/22 | | | 1,600,000 | | | | 1,668,927 | | |
Centene Corp.
4.250%, due 12/15/27 | | | 110,000 | | | | 116,875 | | |
4.625%, due 12/15/29 | | | 175,000 | | | | 195,170 | | |
5.250%, due 04/01/253 | | | 35,000 | | | | 36,400 | | |
5.375%, due 08/15/263 | | | 165,000 | | | | 176,550 | | |
CVS Pass-Through Trust
4.704%, due 01/10/363 | | | 2,883,470 | | | | 3,109,429 | | |
DaVita, Inc.
4.625%, due 06/01/303,5 | | | 45,000 | | | | 47,882 | | |
Fresenius Medical Care US Finance, Inc.
5.750%, due 02/15/213 | | | 600,000 | | | | 614,493 | | |
HCA, Inc.
3.500%, due 09/01/30 | | | 75,000 | | | | 78,813 | | |
5.250%, due 06/15/49 | | | 405,000 | | | | 537,283 | | |
5.375%, due 02/01/25 | | | 95,000 | | | | 107,112 | | |
5.375%, due 09/01/26 | | | 130,000 | | | | 148,850 | | |
5.625%, due 09/01/28 | | | 115,000 | | | | 137,137 | | |
5.875%, due 02/01/29 | | | 140,000 | | | | 170,450 | | |
LifePoint Health, Inc.
4.375%, due 02/15/273 | | | 45,000 | | | | 45,986 | | |
Tenet Healthcare Corp.
4.625%, due 09/01/243 | | | 15,000 | | | | 15,338 | | |
4.625%, due 06/15/283 | | | 35,000 | | | | 36,810 | | |
5.125%, due 11/01/273 | | | 45,000 | | | | 47,812 | | |
| | | | | | 7,291,317 | | |
Home builders—0.7% | |
D.R. Horton, Inc.
4.375%, due 09/15/22 | | | 1,400,000 | | | | 1,492,845 | | |
Lennar Corp.
5.375%, due 10/01/22 | | | 125,000 | | | | 133,125 | | |
Meritage Homes Corp.
7.000%, due 04/01/22 | | | 50,000 | | | | 53,940 | | |
NVR, Inc.
3.950%, due 09/15/22 | | | 1,800,000 | | | | 1,911,227 | | |
87
PACE Strategic Fixed Income Investments
Portfolio of investments—July 31, 2020
| | | Face
amount1 | | Value | |
Corporate bonds—(continued) | |
Home builders—(concluded) | |
Shea Homes LP/Shea Homes Funding Corp.
4.750%, due 02/15/283 | | | 35,000 | | | $ | 36,720 | | |
Taylor Morrison Communities, Inc.
5.125%, due 08/01/303 | | | 180,000 | | | | 196,650 | | |
5.750%, due 01/15/283 | | | 80,000 | | | | 89,817 | | |
5.875%, due 06/15/273 | | | 75,000 | | | | 82,875 | | |
Taylor Morrison Communities, Inc./
Taylor Morrison Holdings II, Inc.
5.625%, due 03/01/243 | | | 140,000 | | | | 149,100 | | |
Toll Brothers Finance Corp.
4.350%, due 02/15/285 | | | 65,000 | | | | 70,363 | | |
5.625%, due 01/15/245 | | | 105,000 | | | | 115,500 | | |
TRI Pointe Group, Inc.
5.250%, due 06/01/27 | | | 85,000 | | | | 89,250 | | |
5.700%, due 06/15/285 | | | 195,000 | | | | 214,500 | | |
TRI Pointe Group, Inc./TRI Pointe Homes, Inc.
5.875%, due 06/15/24 | | | 30,000 | | | | 32,331 | | |
| | | | | | 4,668,243 | | |
Household products/wares—0.0%† | |
Spectrum Brands, Inc.
5.000%, due 10/01/293,5 | | | 15,000 | | | | 15,450 | | |
5.500%, due 07/15/303 | | | 25,000 | | | | 25,937 | | |
5.750%, due 07/15/25 | | | 85,000 | | | | 87,550 | | |
| | | | | | 128,937 | | |
Insurance—1.0% | |
Equitable Holdings, Inc.
4.350%, due 04/20/285 | | | 1,700,000 | | | | 1,964,584 | | |
5.000%, due 04/20/48 | | | 485,000 | | | | 611,201 | | |
Fidelity National Financial, Inc.
3.400%, due 06/15/30 | | | 1,500,000 | | | | 1,629,959 | | |
Jackson National Life Global Funding
2.375%, due 09/15/223 | | | 1,500,000 | | | | 1,543,523 | | |
Prudential Financial, Inc. | |
(fixed, converts to FRN on 05/15/25),
5.375%, due 05/15/45 | | | 47,000 | | | | 50,401 | | |
Reliance Standard Life Global Funding II
3.850%, due 09/19/233 | | | 1,400,000 | | | | 1,506,567 | | |
| | | | | | 7,306,235 | | |
Internet—0.4% | |
Expedia Group, Inc.
3.800%, due 02/15/28 | | | 1,400,000 | | | | 1,386,188 | | |
Go Daddy Operating Co. LLC/
GD Finance Co., Inc.
5.250%, due 12/01/273 | | | 140,000 | | | | 149,275 | | |
Match Group Holdings II LLC
4.625%, due 06/01/283 | | | 45,000 | | | | 47,518 | | |
5.625%, due 02/15/293,5 | | | 135,000 | | | | 146,475 | | |
Netflix, Inc.
3.625%, due 06/15/253,5 | | | 25,000 | | | | 26,500 | | |
4.875%, due 04/15/28 | | | 115,000 | | | | 133,678 | | |
5.375%, due 11/15/293,5 | | | 115,000 | | | | 139,294 | | |
5.750%, due 03/01/24 | | | 60,000 | | | | 67,350 | | |
5.875%, due 02/15/25 | | | 25,000 | | | | 28,750 | | |
| | | Face
amount1 | | Value | |
Corporate bonds—(continued) | |
Internet—(concluded) | |
5.875%, due 11/15/285 | | | 125,000 | | | $ | 154,375 | | |
6.375%, due 05/15/295 | | | 165,000 | | | | 209,550 | | |
| | | | | | 2,488,953 | | |
Iron & steel—0.0%† | |
Carpenter Technology Corp.
6.375%, due 07/15/28 | | | 45,000 | | | | 47,264 | | |
Leisure Time—0.1% | |
Carnival Corp.
10.500%, due 02/01/263,5 | | | 80,000 | | | | 82,817 | | |
11.500%, due 04/01/233 | | | 275,000 | | | | 299,247 | | |
Royal Caribbean Cruises Ltd.
11.500%, due 06/01/253,5 | | | 255,000 | | | | 280,968 | | |
| | | | | | 663,032 | | |
Lodging—0.6% | |
Hilton Domestic Operating Co., Inc.
5.125%, due 05/01/26 | | | 80,000 | | | | 82,800 | | |
5.375%, due 05/01/253 | | | 5,000 | | | | 5,227 | | |
5.750%, due 05/01/283 | | | 85,000 | | | | 90,737 | | |
Hilton Worldwide Finance LLC/Hilton
Worldwide Finance Corp.
4.625%, due 04/01/25 | | | 55,000 | | | | 55,894 | | |
4.875%, due 04/01/275 | | | 165,000 | | | | 171,394 | | |
Hyatt Hotels Corp.
5.375%, due 04/23/25 | | | 20,000 | | | | 21,486 | | |
Marriott International, Inc.
3.600%, due 04/15/245 | | | 1,500,000 | | | | 1,529,805 | | |
4.625%, due 06/15/30 | | | 25,000 | | | | 26,800 | | |
Wynn Las Vegas LLC/Wynn
Las Vegas Capital Corp.
5.500%, due 03/01/253 | | | 2,065,000 | | | | 1,941,100 | | |
| | | | | | 3,925,243 | | |
Machinery-construction & mining—0.0%† | |
Terex Corp.
5.625%, due 02/01/253,5 | | | 320,000 | | | | 324,442 | | |
Machinery-diversified—0.1% | |
RBS Global, Inc./Rexnord LLC
4.875%, due 12/15/253 | | | 130,000 | | | | 133,578 | | |
SPX FLOW, Inc.
5.875%, due 08/15/263,5 | | | 100,000 | | | | 104,750 | | |
Stevens Holding Co., Inc.
6.125%, due 10/01/263 | | | 170,000 | | | | 181,900 | | |
| | | | | | 420,228 | | |
Media—2.3% | |
CCO Holdings LLC/CCO Holdings Capital Corp.
4.250%, due 02/01/313 | | | 375,000 | | | | 391,121 | | |
4.500%, due 08/15/303 | | | 100,000 | | | | 105,990 | | |
4.500%, due 05/01/323 | | | 40,000 | | | | 42,200 | | |
4.750%, due 03/01/303 | | | 215,000 | | | | 228,841 | | |
5.000%, due 02/01/283 | | | 210,000 | | | | 222,600 | | |
5.375%, due 05/01/253 | | | 75,000 | | | | 77,344 | | |
5.500%, due 05/01/263 | | | 75,000 | | | | 79,335 | | |
88
PACE Strategic Fixed Income Investments
Portfolio of investments—July 31, 2020
| | | Face
amount1 | | Value | |
Corporate bonds—(continued) | |
Media—(concluded) | |
5.750%, due 02/15/263 | | | 225,000 | | | $ | 235,125 | | |
Charter Communications Operating LLC/
Charter Communications Operating Capital
4.464%, due 07/23/22 | | | 1,700,000 | | | | 1,811,308 | | |
4.800%, due 03/01/50 | | | 765,000 | | | | 920,497 | | |
Clear Channel Worldwide Holdings, Inc.
5.125%, due 08/15/273 | | | 19,000 | | | | 18,620 | | |
CSC Holdings LLC
5.500%, due 05/15/263 | | | 200,000 | | | | 209,750 | | |
5.500%, due 04/15/273 | | | 200,000 | | | | 214,500 | | |
5.750%, due 01/15/303 | | | 470,000 | | | | 521,018 | | |
7.500%, due 04/01/283 | | | 200,000 | | | | 230,060 | | |
Cumulus Media New Holdings, Inc.
6.750%, due 07/01/263 | | | 20,000 | | | | 18,150 | | |
Discovery Communications LLC
3.625%, due 05/15/30 | | | 360,000 | | | | 399,382 | | |
DISH DBS Corp.
5.875%, due 11/15/24 | | | 115,000 | | | | 119,911 | | |
7.375%, due 07/01/283 | | | 60,000 | | | | 63,508 | | |
7.750%, due 07/01/265 | | | 30,000 | | | | 33,828 | | |
Entercom Media Corp.
7.250%, due 11/01/243,5 | | | 1,500,000 | | | | 1,233,750 | | |
Fox Corp.
5.576%, due 01/25/49 | | | 560,000 | | | | 815,647 | | |
Midcontinent Communications/
Midcontinent Finance Corp.
5.375%, due 08/15/273 | | | 35,000 | | | | 36,334 | | |
Nexstar Broadcasting, Inc.
5.625%, due 07/15/273 | | | 135,000 | | | | 144,490 | | |
Sirius XM Radio, Inc.
4.125%, due 07/01/303 | | | 80,000 | | | | 84,424 | | |
4.625%, due 07/15/243 | | | 105,000 | | | | 110,565 | | |
5.000%, due 08/01/273 | | | 80,000 | | | | 85,266 | | |
5.375%, due 07/15/263 | | | 145,000 | | | | 152,785 | | |
5.500%, due 07/01/293 | | | 155,000 | | | | 172,631 | | |
TEGNA, Inc.
5.000%, due 09/15/293 | | | 60,000 | | | | 60,487 | | |
Telenet Finance Luxembourg Notes SARL
5.500%, due 03/01/283 | | | 200,000 | | | | 210,000 | | |
Time Warner Entertainment Co. LP
8.375%, due 03/15/23 | | | 1,200,000 | | | | 1,421,640 | | |
ViacomCBS, Inc.
4.200%, due 05/19/325 | | | 355,000 | | | | 407,613 | | |
4.950%, due 01/15/31 | | | 270,000 | | | | 326,105 | | |
Virgin Media Secured Finance PLC
5.000%, due 04/15/273 | | GBP | 2,200,000 | | | | 3,000,613 | | |
5.500%, due 08/15/263 | | | 200,000 | | | | 212,458 | | |
Walt Disney Co./The
3.600%, due 01/13/51 | | | 1,500,000 | | | | 1,758,820 | | |
| | | | | | 16,176,716 | | |
Metal Fabricate/Hardware—0.0%† | |
Advanced Drainage Systems, Inc.
5.000%, due 09/30/273 | | | 35,000 | | | | 36,050 | | |
| | | Face
amount1 | | Value | |
Corporate bonds—(continued) | |
Mining—0.2% | |
Alcoa Nederland Holding BV
5.500%, due 12/15/273,5 | | | 200,000 | | | $ | 215,560 | | |
Arconic Corp.
6.125%, due 02/15/283,5 | | | 25,000 | | | | 26,656 | | |
Constellium SE
5.625%, due 06/15/283 | | | 50,000 | | | | 52,450 | | |
FMG Resources August 2006 Pty Ltd.
4.750%, due 05/15/223 | | | 20,000 | | | | 20,937 | | |
Freeport-McMoRan, Inc.
4.125%, due 03/01/28 | | | 80,000 | | | | 84,100 | | |
4.250%, due 03/01/30 | | | 80,000 | | | | 83,584 | | |
4.375%, due 08/01/28 | | | 105,000 | | | | 111,331 | | |
4.550%, due 11/14/24 | | | 45,000 | | | | 49,050 | | |
4.625%, due 08/01/30 | | | 95,000 | | | | 101,650 | | |
5.000%, due 09/01/27 | | | 35,000 | | | | 37,268 | | |
5.250%, due 09/01/295 | | | 35,000 | | | | 38,500 | | |
5.400%, due 11/14/34 | | | 30,000 | | | | 33,675 | | |
5.450%, due 03/15/43 | | | 265,000 | | | | 294,812 | | |
Hudbay Minerals, Inc.
7.250%, due 01/15/233,5 | | | 35,000 | | | | 35,438 | | |
7.625%, due 01/15/253 | | | 50,000 | | | | 50,625 | | |
Joseph T Ryerson & Son, Inc.
8.500%, due 08/01/283 | | | 40,000 | | | | 42,800 | | |
Novelis Corp.
4.750%, due 01/30/303 | | | 90,000 | | | | 93,894 | | |
5.875%, due 09/30/263 | | | 80,000 | | | | 85,353 | | |
| | | | | | 1,457,683 | | |
Miscellaneous manufacturers—0.4% | |
Amsted Industries, Inc.
4.625%, due 05/15/303 | | | 45,000 | | | | 45,900 | | |
General Electric Co.
4.250%, due 05/01/40 | | | 1,800,000 | | | | 1,842,971 | | |
4.350%, due 05/01/505 | | | 375,000 | | | | 388,768 | | |
General Electric Co., MTN
5.875%, due 01/14/38 | | | 430,000 | | | | 509,633 | | |
Hillenbrand, Inc.
5.750%, due 06/15/25 | | | 20,000 | | | | 21,500 | | |
| | | | | | 2,808,772 | | |
Office & business equipment—0.0%† | |
CDW LLC/CDW Finance Corp.
4.250%, due 04/01/285 | | | 75,000 | | | | 80,220 | | |
5.000%, due 09/01/25 | | | 70,000 | | | | 72,450 | | |
| | | | | | 152,670 | | |
Oil & gas—2.3% | |
Apache Corp.
4.375%, due 10/15/285 | | | 50,000 | | | | 49,938 | | |
Ascent Resources Utica Holdings LLC/
ARU Finance Corp.
7.000%, due 11/01/263 | | | 85,000 | | | | 54,400 | | |
BG Energy Capital PLC
4.000%, due 10/15/213 | | | 1,400,000 | | | | 1,453,711 | | |
BP Capital Markets America, Inc.
3.633%, due 04/06/305 | | | 225,000 | | | | 261,031 | | |
89
PACE Strategic Fixed Income Investments
Portfolio of investments—July 31, 2020
| | | Face
amount1 | | Value | |
Corporate bonds—(continued) | |
Oil & gas—(concluded) | |
BP Capital Markets PLC | |
(fixed, converts to FRN on 03/22/30),
4.875%, due 03/22/308 | | | 540,000 | | | $ | 579,150 | | |
Canadian Natural Resources Ltd., GMTN
4.950%, due 06/01/47 | | | 255,000 | | | | 308,179 | | |
Chevron Corp.
2.978%, due 05/11/405 | | | 1,700,000 | | | | 1,932,167 | | |
Concho Resources, Inc.
4.875%, due 10/01/47 | | | 440,000 | | | | 529,567 | | |
CrownRock LP/CrownRock Finance, Inc.
5.625%, due 10/15/253 | | | 95,000 | | | | 93,100 | | |
Equinor ASA
3.125%, due 04/06/305 | | | 1,700,000 | | | | 1,935,457 | | |
Exxon Mobil Corp.
3.452%, due 04/15/51 | | | 615,000 | | | | 728,606 | | |
Hilcorp Energy I LP/Hilcorp Finance Co.
5.750%, due 10/01/253 | | | 45,000 | | | | 42,666 | | |
6.250%, due 11/01/283 | | | 45,000 | | | | 41,344 | | |
Marathon Oil Corp.
2.800%, due 11/01/225 | | | 1,900,000 | | | | 1,923,955 | | |
Occidental Petroleum Corp.
2.700%, due 02/15/23 | | | 50,000 | | | | 47,953 | | |
2.900%, due 08/15/24 | | | 80,000 | | | | 75,276 | | |
3.125%, due 02/15/225 | | | 50,000 | | | | 49,235 | | |
3.200%, due 08/15/26 | | | 1,730,000 | | | | 1,574,802 | | |
3.500%, due 08/15/295 | | | 535,000 | | | | 475,492 | | |
4.300%, due 08/15/395 | | | 185,000 | | | | 149,850 | | |
Odebrecht Offshore Drilling Finance Ltd.
6.720%, due 12/01/226 | | | 231,120 | | | | 201,074 | | |
7.720%, due 12/01/266,7 | | | 1,279,411 | | | | 121,160 | | |
Parsley Energy LLC/Parsley Finance Corp.
5.250%, due 08/15/253 | | | 185,000 | | | | 187,775 | | |
5.625%, due 10/15/273 | | | 50,000 | | | | 52,375 | | |
PDC Energy, Inc.
5.750%, due 05/15/265 | | | 180,000 | | | | 180,398 | | |
Precision Drilling Corp.
7.125%, due 01/15/263 | | | 30,000 | | | | 20,700 | | |
7.750%, due 12/15/23 | | | 45,000 | | | | 33,750 | | |
Range Resources Corp.
4.875%, due 05/15/25 | | | 160,000 | | | | 134,000 | | |
9.250%, due 02/01/263 | | | 50,000 | | | | 48,250 | | |
Rio Oil Finance Trust,
Series 2014-1,
9.250%, due 07/06/243 | | | 970,872 | | | | 1,008,493 | | |
Shell International Finance BV
2.750%, due 04/06/305 | | | 1,500,000 | | | | 1,669,755 | | |
WPX Energy, Inc.
5.250%, due 09/15/245 | | | 125,000 | | | | 128,862 | | |
5.250%, due 10/15/27 | | | 45,000 | | | | 44,381 | | |
5.750%, due 06/01/26 | | | 75,000 | | | | 76,500 | | |
5.875%, due 06/15/285 | | | 245,000 | | | | 250,973 | | |
| | | | | | 16,464,325 | | |
| | | Face
amount1 | | Value | |
Corporate bonds—(continued) | |
Oil & gas services—0.0%† | |
Archrock Partners LP/Archrock
Partners Finance Corp.
6.250%, due 04/01/283 | | | 60,000 | | | $ | 60,600 | | |
Odebrecht Oil & Gas Finance Ltd.
0.000%, due 08/31/203,8,10 | | | 174,037 | | | | 870 | | |
USA Compression Partners LP/
USA Compression Finance Corp.
6.875%, due 09/01/27 | | | 45,000 | | | | 46,003 | | |
| | | | | | 107,473 | | |
Packaging & containers—0.5% | |
Ardagh Packaging Finance PLC/
Ardagh Holdings USA, Inc.
4.125%, due 08/15/263 | | | 215,000 | | | | 223,127 | | |
Berry Global, Inc.
4.500%, due 02/15/263,5 | | | 40,000 | | | | 41,015 | | |
4.875%, due 07/15/263 | | | 215,000 | | | | 227,094 | | |
5.125%, due 07/15/235 | | | 55,000 | | | | 55,756 | | |
5.625%, due 07/15/273 | | | 35,000 | | | | 37,450 | | |
Crown Americas LLC/Crown
Americas Capital Corp. V
4.250%, due 09/30/26 | | | 45,000 | | | | 47,717 | | |
Crown Americas LLC/Crown
Americas Capital Corp. VI
4.750%, due 02/01/26 | | | 45,000 | | | | 46,957 | | |
Graphic Packaging International, Inc.
4.875%, due 11/15/22 | | | 40,000 | | | | 41,600 | | |
Mauser Packaging Solutions Holding Co.
5.500%, due 04/15/243,5 | | | 215,000 | | | | 219,210 | | |
Reynolds Group Issuer, Inc./
Reynolds Group Issuer LLC
3 mo. USD LIBOR + 3.500%,
3.775%, due 07/15/212,3 | | | 25,000 | | | | 25,000 | | |
Sealed Air Corp.
4.000%, due 12/01/273 | | | 75,000 | | | | 77,625 | | |
5.250%, due 04/01/233 | | | 75,000 | | | | 79,687 | | |
5.500%, due 09/15/253 | | | 70,000 | | | | 77,350 | | |
Silgan Holdings, Inc.
4.125%, due 02/01/285 | | | 80,000 | | | | 82,000 | | |
4.750%, due 03/15/25 | | | 140,000 | | | | 142,450 | | |
WRKCo, Inc.
4.650%, due 03/15/26 | | | 1,200,000 | | | | 1,418,565 | | |
4.900%, due 03/15/29 | | | 500,000 | | | | 615,868 | | |
| | | | | | 3,458,471 | | |
Pharmaceuticals—2.9% | |
AbbVie, Inc.
2.900%, due 11/06/22 | | | 1,600,000 | | | | 1,683,061 | | |
3.375%, due 11/14/21 | | | 1,900,000 | | | | 1,972,211 | | |
3.450%, due 03/15/223 | | | 1,400,000 | | | | 1,456,075 | | |
4.050%, due 11/21/393,5 | | | 215,000 | | | | 263,330 | | |
4.700%, due 05/14/45 | | | 450,000 | | | | 590,353 | | |
Bausch Health Americas, Inc.
8.500%, due 01/31/273 | | | 75,000 | | | | 83,437 | | |
Bausch Health Cos., Inc.
5.750%, due 08/15/273 | | | 15,000 | | | | 16,281 | | |
90
PACE Strategic Fixed Income Investments
Portfolio of investments—July 31, 2020
| | | Face
amount1 | | Value | |
Corporate bonds—(continued) | |
Pharmaceuticals—(concluded) | |
6.125%, due 04/15/253 | | | 290,000 | | | $ | 299,425 | | |
7.000%, due 01/15/283 | | | 55,000 | | | | 59,812 | | |
Bayer US Finance II LLC
3 mo. USD LIBOR + 0.630%,
0.927%, due 06/25/212,3 | | | 700,000 | | | | 701,753 | | |
3 mo. USD LIBOR + 1.010%,
1.323%, due 12/15/232,3 | | | 1,900,000 | | | | 1,907,691 | | |
3.500%, due 06/25/213 | | | 1,600,000 | | | | 1,638,633 | | |
Cigna Corp.
3 mo. USD LIBOR + 0.890%,
1.165%, due 07/15/232 | | | 800,000 | | | | 807,162 | | |
CVS Health Corp.
3.700%, due 03/09/23 | | | 1,500,000 | | | | 1,614,277 | | |
4.750%, due 12/01/22 | | | 1,500,000 | | | | 1,627,683 | | |
5.050%, due 03/25/48 | | | 470,000 | | | | 647,540 | | |
Mylan N.V.
3.150%, due 06/15/21 | | | 1,200,000 | | | | 1,224,645 | | |
Mylan, Inc.
4.550%, due 04/15/28 | | | 420,000 | | | | 498,834 | | |
Takeda Pharmaceutical
3.375%, due 07/09/60 | | | 390,000 | | | | 433,214 | | |
Takeda Pharmaceutical Co. Ltd.
4.400%, due 11/26/23 | | | 1,800,000 | | | | 2,012,994 | | |
Teva Pharmaceutical Finance Netherlands II BV
3.250%, due 04/15/22 | | EUR | 1,200,000 | | | | 1,416,820 | | |
Vizient, Inc.
6.250%, due 05/15/273 | | | 55,000 | | | | 58,575 | | |
| | | | | | 21,013,806 | | |
Pipelines—1.7% | |
Buckeye Partners LP
3.950%, due 12/01/26 | | | 180,000 | | | | 178,650 | | |
4.125%, due 03/01/253 | | | 100,000 | | | | 100,500 | | |
4.125%, due 12/01/27 | | | 65,000 | | | | 63,375 | | |
4.500%, due 03/01/283 | | | 110,000 | | | | 109,450 | | |
Cheniere Corpus Christi Holdings LLC
7.000%, due 06/30/24 | | | 1,600,000 | | | | 1,847,367 | | |
Cheniere Energy Partners LP
4.500%, due 10/01/29 | | | 360,000 | | | | 380,808 | | |
5.250%, due 10/01/25 | | | 200,000 | | | | 205,000 | | |
5.625%, due 10/01/26 | | | 115,000 | | | | 121,469 | | |
DCP Midstream Operating LP
5.125%, due 05/15/29 | | | 105,000 | | | | 105,695 | | |
5.375%, due 07/15/25 | | | 50,000 | | | | 52,651 | | |
5.600%, due 04/01/445 | | | 5,000 | | | | 4,374 | | |
5.625%, due 07/15/27 | | | 80,000 | | | | 83,000 | | |
(fixed, converts to FRN on 05/21/23),
5.850%, due 05/21/433 | | | 30,000 | | | | 22,800 | | |
6.750%, due 09/15/373 | | | 30,000 | | | | 29,100 | | |
Energy Transfer Operating LP
3.750%, due 05/15/30 | | | 325,000 | | | | 321,366 | | |
5.250%, due 04/15/29 | | | 1,500,000 | | | | 1,629,133 | | |
6.250%, due 04/15/49 | | | 370,000 | | | | 399,002 | | |
(fixed, converts to FRN on 02/15/28),
6.625%, due 02/15/285,8 | | | 750,000 | | | | 540,000 | | |
| | | Face
amount1 | | Value | |
Corporate bonds—(continued) | |
Pipelines—(concluded) | |
Series G,
(fixed, converts to FRN on 05/15/30),
7.125%, due 05/15/308 | | | 760,000 | | | $ | 631,750 | | |
EQM Midstream Partners LP
4.000%, due 08/01/24 | | | 35,000 | | | | 35,091 | | |
4.125%, due 12/01/26 | | | 40,000 | | | | 38,900 | | |
4.750%, due 07/15/235 | | | 35,000 | | | | 35,490 | | |
5.500%, due 07/15/28 | | | 160,000 | | | | 165,888 | | |
6.000%, due 07/01/253,5 | | | 40,000 | | | | 42,426 | | |
6.500%, due 07/01/273 | | | 50,000 | | | | 55,130 | | |
Genesis Energy LP/Genesis Energy Finance Corp.
6.000%, due 05/15/23 | | | 75,000 | | | | 70,500 | | |
6.250%, due 05/15/26 | | | 35,000 | | | | 32,900 | | |
6.500%, due 10/01/25 | | | 40,000 | | | | 37,050 | | |
Global Partners LP/GLP Finance Corp.
7.000%, due 08/01/27 | | | 50,000 | | | | 48,375 | | |
Kinder Morgan, Inc.
5.550%, due 06/01/45 | | | 753,000 | | | | 979,063 | | |
MPLX LP
4.000%, due 03/15/285 | | | 110,000 | | | | 119,757 | | |
4.700%, due 04/15/48 | | | 770,000 | | | | 829,384 | | |
NuStar Logistics LP
4.800%, due 09/01/20 | | | 25,000 | | | | 24,875 | | |
5.625%, due 04/28/27 | | | 30,000 | | | | 29,286 | | |
6.000%, due 06/01/265 | | | 35,000 | | | | 35,875 | | |
Plains All American Pipeline LP/
PAA Finance Corp.
3.550%, due 12/15/29 | | | 1,049,000 | | | | 1,036,048 | | |
4.650%, due 10/15/25 | | | 379,000 | | | | 408,623 | | |
Tallgrass Energy Partners LP/Tallgrass
Energy Finance Corp.
5.500%, due 09/15/243 | | | 35,000 | | | | 33,567 | | |
6.000%, due 03/01/273 | | | 55,000 | | | | 49,967 | | |
Targa Resources Partners LP/Targa
Resources Partners Finance Corp.
4.250%, due 11/15/23 | | | 120,000 | | | | 120,900 | | |
5.000%, due 01/15/28 | | | 10,000 | | | | 10,200 | | |
5.125%, due 02/01/25 | | | 10,000 | | | | 10,150 | | |
5.375%, due 02/01/27 | | | 10,000 | | | | 10,332 | | |
5.500%, due 03/01/303 | | | 200,000 | | | | 210,000 | | |
5.875%, due 04/15/265 | | | 70,000 | | | | 74,395 | | |
6.500%, due 07/15/275 | | | 10,000 | | | | 10,700 | | |
6.875%, due 01/15/29 | | | 10,000 | | | | 11,281 | | |
Western Midstream Operating LP
3.100%, due 02/01/25 | | | 65,000 | | | | 64,844 | | |
4.050%, due 02/01/305 | | | 295,000 | | | | 298,726 | | |
| | | | | | 11,755,213 | | |
Private Equity—0.2% | |
Carlyle Finance Subsidiary LLC
3.500%, due 09/19/293 | | | 1,500,000 | | | | 1,603,275 | | |
Real estate—0.4% | |
Ontario Teachers' Cadillac Fairview Properties Trust
3.125%, due 03/20/223,5 | | | 300,000 | | | | 307,317 | | |
91
PACE Strategic Fixed Income Investments
Portfolio of investments—July 31, 2020
| | | Face
amount1 | | Value | |
Corporate bonds—(continued) | |
Real estate—(concluded) | |
Realogy Group LLC/Realogy Co-Issuer Corp.
4.875%, due 06/01/233 | | | 35,000 | | | $ | 35,000 | | |
Tesco Property Finance 5 PLC
5.661%, due 10/13/416 | | GBP | 685,533 | | | | 1,224,065 | | |
Vesteda Finance BV EMTN
2.500%, due 10/27/226 | | EUR | 1,000,000 | | | | 1,220,216 | | |
| | | | | | 2,786,598 | | |
Real estate investment trusts—0.3% | |
ESH Hospitality, Inc.
4.625%, due 10/01/273 | | | 95,000 | | | | 91,418 | | |
5.250%, due 05/01/253,5 | | | 235,000 | | | | 240,048 | | |
Healthcare Trust of America Holdings LP
3.100%, due 02/15/30 | | | 290,000 | | | | 305,753 | | |
Iron Mountain US Holdings, Inc.
5.375%, due 06/01/263 | | | 145,000 | | | | 150,075 | | |
Iron Mountain, Inc.
4.875%, due 09/15/273 | | | 60,000 | | | | 62,325 | | |
4.875%, due 09/15/293 | | | 100,000 | | | | 104,175 | | |
5.000%, due 07/15/283,5 | | | 30,000 | | | | 31,050 | | |
5.250%, due 03/15/283 | | | 415,000 | | | | 435,750 | | |
5.250%, due 07/15/303 | | | 55,000 | | | | 57,681 | | |
5.625%, due 07/15/323 | | | 235,000 | | | | 252,331 | | |
MPT Operating Partnership LP/MPT Finance Corp.
5.250%, due 08/01/26 | | | 40,000 | | | | 42,000 | | |
RHP Hotel Properties LP/RHP Finance Corp.
4.750%, due 10/15/27 | | | 100,000 | | | | 93,000 | | |
5.000%, due 04/15/23 | | | 65,000 | | | | 63,213 | | |
SBA Communications Corp.
3.875%, due 02/15/273 | | | 165,000 | | | | 170,775 | | |
Starwood Property Trust, Inc.
4.750%, due 03/15/25 | | | 40,000 | | | | 38,500 | | |
5.000%, due 12/15/215 | | | 75,000 | | | | 75,797 | | |
VICI Properties LP/VICI Note Co., Inc.
4.250%, due 12/01/263 | | | 75,000 | | | | 77,250 | | |
4.625%, due 12/01/293 | | | 75,000 | | | | 78,937 | | |
| | | | | | 2,370,078 | | |
Retail—0.5% | |
1011778 BC ULC/New Red Finance, Inc.
4.250%, due 05/15/243 | | | 135,000 | | | | 137,700 | | |
5.000%, due 10/15/253 | | | 130,000 | | | | 133,459 | | |
5.750%, due 04/15/253 | | | 30,000 | | | | 32,097 | | |
Asbury Automotive Group, Inc.
4.500%, due 03/01/283 | | | 29,000 | | | | 29,736 | | |
4.750%, due 03/01/303 | | | 24,000 | | | | 24,600 | | |
Beacon Roofing Supply, Inc.
4.875%, due 11/01/253 | | | 190,000 | | | | 185,985 | | |
KFC Holding Co./Pizza Hut Holdings LLC/
Taco Bell of America LLC
5.000%, due 06/01/243,5 | | | 40,000 | | | | 40,972 | | |
5.250%, due 06/01/263 | | | 155,000 | | | | 162,704 | | |
McDonald's Corp. MTN
3.600%, due 07/01/305 | | | 300,000 | | | | 351,872 | | |
3.625%, due 09/01/495 | | | 130,000 | | | | 152,792 | | |
| | | Face
amount1 | | Value | |
Corporate bonds—(continued) | |
Retail—(concluded) | |
Penske Automotive Group, Inc.
5.500%, due 05/15/26 | | | 170,000 | | | $ | 177,650 | | |
Staples, Inc.
7.500%, due 04/15/263 | | | 225,000 | | | | 197,392 | | |
Starbucks Corp.
2.550%, due 11/15/30 | | | 1,700,000 | | | | 1,823,064 | | |
Yum! Brands, Inc. | |
4.750%, due 01/15/303 | | | 130,000 | | | | 141,050 | | |
7.750%, due 04/01/253 | | | 20,000 | | | | 22,450 | | |
| | | | | | 3,613,523 | | |
Semiconductors—2.3% | |
Amkor Technology, Inc.
6.625%, due 09/15/273 | | | 100,000 | | | | 110,000 | | |
Broadcom, Inc.
3.459%, due 09/15/263,5 | | | 2,986,000 | | | | 3,271,004 | | |
4.110%, due 09/15/283 | | | 1,894,000 | | | | 2,145,414 | | |
4.150%, due 11/15/303,5 | | | 565,000 | | | | 634,507 | | |
Microchip Technology, Inc.
3.922%, due 06/01/215 | | | 1,300,000 | | | | 1,330,846 | | |
Micron Technology, Inc.
4.975%, due 02/06/26 | | | 1,400,000 | | | | 1,643,339 | | |
NXP BV/NXP Funding LLC
4.125%, due 06/01/213 | | | 1,800,000 | | | | 1,849,501 | | |
4.625%, due 06/15/223 | | | 700,000 | | | | 747,668 | | |
4.875%, due 03/01/243 | | | 1,500,000 | | | | 1,687,300 | | |
QUALCOMM, Inc.
4.800%, due 05/20/455 | | | 2,000,000 | | | | 2,855,828 | | |
Sensata Technologies UK Financing Co. PLC
6.250%, due 02/15/263 | | | 65,000 | | | | 68,419 | | |
| | | | | | 16,343,826 | | |
Software—0.7% | |
BY Crown Parent LLC/BY Bond Finance, Inc.
4.250%, due 01/31/263 | | | 56,000 | | | | 58,047 | | |
CDK Global, Inc.
4.875%, due 06/01/27 | | | 80,000 | | | | 85,499 | | |
5.875%, due 06/15/26 | | | 35,000 | | | | 37,403 | | |
Fair Isaac Corp.
4.000%, due 06/15/283 | | | 105,000 | | | | 109,830 | | |
j2 Cloud Services LLC/j2 Cloud Co-Obligor, Inc.
6.000%, due 07/15/253 | | | 130,000 | | | | 135,525 | | |
MSCI, Inc.
4.000%, due 11/15/293 | | | 75,000 | | | | 80,625 | | |
Nuance Communications, Inc.
5.625%, due 12/15/26 | | | 145,000 | | | | 154,606 | | |
Open Text Corp.
5.875%, due 06/01/263 | | | 190,000 | | | | 201,818 | | |
Oracle Corp.
3.600%, due 04/01/50 | | | 235,000 | | | | 279,953 | | |
3.850%, due 04/01/60 | | | 1,615,000 | | | | 2,016,592 | | |
4.000%, due 07/15/46 | | | 150,000 | | | | 187,125 | | |
PTC, Inc.
4.000%, due 02/15/283 | | | 125,000 | | | | 131,294 | | |
SS&C Technologies, Inc.
5.500%, due 09/30/273 | | | 245,000 | | | | 263,375 | | |
92
PACE Strategic Fixed Income Investments
Portfolio of investments—July 31, 2020
| | | Face
amount1 | | Value | |
Corporate bonds—(continued) | |
Software—(concluded) | |
VMware, Inc.
2.950%, due 08/21/22 | | | 1,500,000 | | | $ | 1,565,561 | | |
| | | | | | 5,307,253 | | |
Telecommunications—2.1% | |
Altice France SA
5.500%, due 01/15/283 | | | 200,000 | | | | 211,000 | | |
5.875%, due 02/01/273 | | EUR | 1,100,000 | | | | 1,381,641 | | |
7.375%, due 05/01/263 | | | 800,000 | | | | 853,320 | | |
8.125%, due 02/01/273 | | | 215,000 | | | | 240,308 | | |
AT&T, Inc.
3 mo. USD LIBOR + 0.750%,
1.100%, due 06/01/212 | | | 670,000 | | | | 672,849 | | |
2.750%, due 06/01/31 | | | 350,000 | | | | 374,647 | | |
3.650%, due 06/01/51 | | | 670,000 | | | | 730,847 | | |
4.350%, due 06/15/45 | | | 160,000 | | | | 189,358 | | |
4.500%, due 03/09/48 | | | 515,000 | | | | 629,337 | | |
5.450%, due 03/01/47 | | | 770,000 | | | | 1,046,597 | | |
British Telecommunications PLC
4.500%, due 12/04/23 | | | 1,500,000 | | | | 1,676,251 | | |
CenturyLink, Inc.
4.000%, due 02/15/273 | | | 70,000 | | | | 73,111 | | |
CommScope Technologies LLC
5.000%, due 03/15/273,5 | | | 55,000 | | | | 53,121 | | |
6.000%, due 06/15/253 | | | 65,000 | | | | 66,411 | | |
CommScope, Inc.
6.000%, due 03/01/263 | | | 290,000 | | | | 309,392 | | |
7.125%, due 07/01/283 | | | 100,000 | | | | 105,865 | | |
8.250%, due 03/01/273,5 | | | 60,000 | | | | 64,704 | | |
Hughes Satellite Systems Corp.
7.625%, due 06/15/21 | | | 40,000 | | | | 42,000 | | |
Level 3 Financing, Inc.
4.625%, due 09/15/273 | | | 100,000 | | | | 105,125 | | |
5.125%, due 05/01/23 | | | 135,000 | | | | 135,570 | | |
Sprint Capital Corp.
6.875%, due 11/15/285 | | | 50,000 | | | | 64,835 | | |
8.750%, due 03/15/32 | | | 150,000 | | | | 231,375 | | |
Sprint Communications, Inc.
6.000%, due 11/15/22 | | | 1,200,000 | | | | 1,294,500 | | |
Sprint Corp.
7.125%, due 06/15/24 | | | 210,000 | | | | 244,976 | | |
7.625%, due 03/01/26 | | | 80,000 | | | | 99,998 | | |
7.875%, due 09/15/23 | | | 125,000 | | | | 145,000 | | |
T-Mobile USA, Inc.
2.550%, due 02/15/313,5 | | | 1,000,000 | | | | 1,038,890 | | |
4.375%, due 04/15/403 | | | 185,000 | | | | 226,484 | | |
4.500%, due 04/15/503 | | | 485,000 | | | | 608,467 | | |
5.375%, due 04/15/275 | | | 45,000 | | | | 49,106 | | |
6.500%, due 01/15/26 | | | 95,000 | | | | 100,144 | | |
Telecom Italia Capital SA
6.000%, due 09/30/34 | | | 40,000 | | | | 48,577 | | |
Verizon Communications, Inc.
3.376%, due 02/15/25 | | | 866,000 | | | | 972,217 | | |
4.522%, due 09/15/48 | | | 290,000 | | | | 404,018 | | |
| | | Face
amount1 | | Value | |
Corporate bonds—(concluded) | |
Telecommunications—(concluded) | |
Vodafone Group PLC
3.750%, due 01/16/24 | | | 455,000 | | | $ | 499,561 | | |
| | | | | | 14,989,602 | | |
Transportation—0.2% | |
AP Moller—Maersk A/S
4.500%, due 06/20/293 | | | 1,500,000 | | | | 1,665,015 | | |
Trucking & leasing—1.4% | |
Aviation Capital Group Corp.
6.750%, due 04/06/213 | | | 3,320,000 | | | | 3,373,041 | | |
NTT Finance Corp. EMTN
1.900%, due 07/21/216 | | | 2,000,000 | | | | 2,023,029 | | |
Penske Truck Leasing Co. LP/PTL Finance Corp.
3.900%, due 02/01/243 | | | 1,200,000 | | | | 1,302,030 | | |
4.250%, due 01/17/233 | | | 1,300,000 | | | | 1,400,155 | | |
SMBC Aviation Capital Finance DAC
2.650%, due 07/15/213,5 | | | 400,000 | | | | 402,392 | | |
4.125%, due 07/15/233 | | | 1,600,000 | | | | 1,678,643 | | |
| | | | | | 10,179,290 | | |
Total corporate bonds
(cost—$370,607,653) | | | 390,064,210 | | |
Loan assignments—0.5% | |
Broadcast—0.5% | |
Hilton Worldwide Finance, LLC 2019 Term Loan B2
1 mo. USD LIBOR + 1.750%,
1.922%, due 06/22/262
(cost—$3,497,868) | | | 3,524,014 | | | | 3,384,040 | | |
Mortgage-backed securities—11.3% | |
Adjustable Rate Mortgage Trust,
Series 2005-5, Class 2A1,
3.827%, due 09/25/3512 | | | 80,079 | | | | 73,640 | | |
Alba PLC,
Series 2007-1, Class A3, | |
3 mo. LIBOR GBP + 0.170%,
0.342%, due 03/17/392,6 | | GBP | 412,888 | | | | 507,376 | | |
Alternative Loan Trust,
Series 2003-J3, Class 2A1,
6.250%, due 12/25/33 | | | 19,704 | | | | 20,078 | | |
Series 2005-62, Class 2A1,
12 mo. MTA + 1.000%,
2.322%, due 12/25/352 | | | 139,519 | | | | 124,723 | | |
Series 2006-14CB, Class A1,
6.000%, due 06/25/36 | | | 1,603,619 | | | | 1,271,634 | | |
Series 2006-41CB, Class 1A9,
6.000%, due 01/25/37 | | | 417,142 | | | | 336,400 | | |
Ashford Hospitality Trust,
Series 2018-KEYS, Class A, | |
1 mo. USD LIBOR + 1.000%,
1.175%, due 06/15/352,3 | | | 1,500,000 | | | | 1,409,723 | | |
BAMLL Commercial Mortgage Securities Trust,
Series 2012-PARK, Class A,
2.959%, due 12/10/303 | | | 1,000,000 | | | | 1,045,179 | | |
93
PACE Strategic Fixed Income Investments
Portfolio of investments—July 31, 2020
| | | Face
amount1 | | Value | |
Mortgage-backed securities—(continued) | |
Banc of America Funding Trust,
Series 2005-D, Class A1,
3.913%, due 05/25/3512 | | | 323,278 | | | $ | 322,013 | | |
Bank of America Mortgage Trust,
Series 2002-G, Class 1A3,
3.611%, due 07/20/3212 | | | 554 | | | | 545 | | |
BBCCRE Trust,
Series 2015-GTP, Class A,
3.966%, due 08/10/333 | | | 3,600,000 | | | | 3,940,880 | | |
BCAP LLC Trust,
Series 2014-RR5, Class 1A3,
1 mo. USD LIBOR + 0.225%,
0.635%, due 01/26/362,3 | | | 56,639 | | | | 56,543 | | |
Bear Stearns Alternative Loan Trust-A Trust,
Series 2003-3, Class 1A,
3.544%, due 10/25/3312 | | | 3,761 | | | | 3,646 | | |
Series 2004-9, Class 2A1,
3.911%, due 09/25/3412 | | | 206,543 | | | | 202,387 | | |
Series 2005-7, Class 22A1,
3.554%, due 09/25/3512 | | | 388,946 | | | | 303,703 | | |
Series 2006-1, Class 21A2,
3.311%, due 02/25/3612 | | | 510,196 | | | | 420,220 | | |
Bear Stearns ARM Trust,
Series 2003-1, Class 6A1,
4.016%, due 04/25/3312 | | | 9,784 | | | | 9,953 | | |
Series 2003-5, Class 2A1,
3.127%, due 08/25/3312 | | | 69,158 | | | | 67,108 | | |
Series 2004-3, Class 1A2,
3.398%, due 07/25/3412 | | | 63,898 | | | | 58,259 | | |
Series 2004-6, Class 2A1,
3.736%, due 09/25/3412 | | | 360,639 | | | | 351,539 | | |
Series 2004-7, Class 1A1,
4.250%, due 10/25/3412 | | | 137,938 | | | | 125,909 | | |
Chase Mortgage Finance Corp.,
Series 2005-S3, Class A10,
5.500%, due 11/25/35 | | | 1,386,002 | | | | 1,302,889 | | |
Series 2007-S6, Class 2A1,
5.500%, due 12/25/22 | | | 598,377 | | | | 378,793 | | |
Citigroup Commercial Mortgage Trust,
Series 2015-GC27, Class XA, IO,
1.342%, due 02/10/4812 | | | 3,286,894 | | | | 158,285 | | |
Citigroup Mortgage Loan Trust, Inc.,
Series 2005-11, Class A1A,
1 year CMT + 2.400%,
2.570%, due 05/25/352 | | | 96,826 | | | | 95,758 | | |
Series 2005-4, Class A,
3.721%, due 08/25/3512 | | | 239,779 | | | | 245,710 | | |
Series 2005-6, Class A2,
1 year CMT + 2.150%,
2.290%, due 09/25/352 | | | 19,503 | | | | 19,360 | | |
Series 2005-6, Class A3,
1 year CMT + 1.800%,
1.940%, due 09/25/352 | | | 3,375 | | | | 3,218 | | |
COMM Mortgage Trust,
Series 2014-LC15, Class XA, IO,
1.092%, due 04/10/4712 | | | 9,376,784 | | | | 301,394 | | |
| | | Face
amount1 | | Value | |
Mortgage-backed securities—(continued) | |
Series 2014-UBS3, Class XA, IO,
1.075%, due 06/10/4712 | | | 2,820,459 | | | $ | 96,538 | | |
Countrywide Home Loan Mortgage
Pass-Through Trust,
Series 2003-R4, Class 2A,
4.937%, due 01/25/343,12 | | | 540,069 | | | | 536,939 | | |
Series 2004-12, Class 11A1
3.019%, due 08/25/3412 | | | 76,471 | | | | 74,325 | | |
Series 2004-12, Class 11A2,
3.019%, due 08/25/3412 | | | 48,930 | | | | 48,354 | | |
Series 2004-12, Class 12A1,
3.012%, due 08/25/3412 | | | 8,349 | | | | 8,529 | | |
Series 2005-HYB9, Class 5A1,
12 mo. USD LIBOR + 1.750%,
3.793%, due 02/20/362 | | | 154,928 | | | | 146,863 | | |
CSAIL Commercial Mortgage Trust,
Series 2019-C16, Class A3,
3.329%, due 06/15/52 | | | 310,000 | | | | 347,970 | | |
DSLA Mortgage Loan Trust,
Series 2005-AR4, Class 2A1A,
1 mo. USD LIBOR + 0.260%,
0.447%, due 08/19/452 | | | 184,719 | | | | 170,436 | | |
FHLMC REMIC,
Series 1278, Class K,
7.000%, due 05/15/22 | | | 1,033 | | | | 1,053 | | |
Series 1367, Class KA,
6.500%, due 09/15/22 | | | 122 | | | | 127 | | |
Series 1502, Class PX,
7.000%, due 04/15/23 | | | 47,744 | | | | 50,424 | | |
Series 1503, Class PZ,
7.000%, due 05/15/23 | | | 12,707 | | | | 13,496 | | |
Series 1534, Class Z,
5.000%, due 06/15/23 | | | 15,323 | | | | 15,847 | | |
Series 1548, Class Z
7.000%, due 07/15/23 | | | 9,493 | | | | 10,028 | | |
Series 1562, Class Z,
7.000%, due 07/15/23 | | | 16,644 | | | | 17,754 | | |
Series 1694, Class Z,
6.500%, due 03/15/24 | | | 10,932 | | | | 11,795 | | |
Series 2061, Class Z,
6.500%, due 06/15/28 | | | 42,604 | | | | 48,850 | | |
Series 2400, Class FQ,
1 mo. USD LIBOR + 0.500%,
0.675%, due 01/15/322 | | | 25,612 | | | | 25,628 | | |
Series 2764, Class LZ,
4.500%, due 03/15/34 | | | 422,724 | | | | 456,498 | | |
Series 2764, Class ZG,
5.500%, due 03/15/34 | | | 1,329,714 | | | | 1,533,654 | | |
Series 2835, Class JZ,
5.000%, due 08/15/34 | | | 268,722 | | | | 307,946 | | |
Series 2921, Class PG,
5.000%, due 01/15/35 | | | 1,364,310 | | | | 1,569,718 | | |
Series 2983, Class TZ,
6.000%, due 05/15/35 | | | 882,171 | | | | 1,014,949 | | |
Series 3149, Class CZ,
6.000%, due 05/15/36 | | | 1,107,749 | | | | 1,321,776 | | |
Series G23, Class KZ,
6.500%, due 11/25/23 | | | 13,494 | | | | 14,331 | | |
94
PACE Strategic Fixed Income Investments
Portfolio of investments—July 31, 2020
| | | Face
amount1 | | Value | |
Mortgage-backed securities—(continued) | |
FHLMC Structured Agency Credit Risk Debt Notes,
Series 2017-DNA1, Class M2,
1 mo. USD LIBOR + 3.250%,
3.422%, due 07/25/292 | | | 503,144 | | | $ | 504,090 | | |
Series 2017-DNA2, Class M2,
1 mo. USD LIBOR + 3.450%,
3.622%, due 10/25/292 | | | 1,190,000 | | | | 1,200,002 | | |
Series 2017-DNA3, Class M2,
1 mo. USD LIBOR + 2.500%,
2.672%, due 03/25/302 | | | 320,000 | | | | 317,171 | | |
Series 2017-HQA2, Class M2,
1 mo. USD LIBOR + 2.650%,
2.822%, due 12/25/292 | | | 1,242,606 | | | | 1,197,821 | | |
Series 2018-HQA1, Class M2,
1 mo. USD LIBOR + 2.300%,
2.472%, due 09/25/302 | | | 695,562 | | | | 661,929 | | |
Series 2020-RR04, Class X, IO,
2.126%, due 02/27/2912 | | | 3,460,000 | | | | 515,222 | | |
FHLMC Structured Pass-Through Certificates,
Series T-054, Class 2A,
6.500%, due 02/25/43 | | | 410,728 | | | | 507,990 | | |
Series T-058, Class 2A,
6.500%, due 09/25/43 | | | 255,515 | | | | 297,800 | | |
First Horizon Mortgage Pass-Through Trust,
Series 2005-AR3, Class 2A1,
3.117%, due 08/25/3512 | | | 15,441 | | | | 12,767 | | |
FNMA Connecticut Avenue Securities,
Series 2017-C02, Class 2M2,
1 mo. USD LIBOR + 3.650%,
3.822%, due 09/25/292 | | | 1,304,294 | | | | 1,307,920 | | |
Series 2017-C03, Class 1M2,
1 mo. USD LIBOR + 3.000%,
3.172%, due 10/25/292 | | | 680,000 | | | | 674,035 | | |
Series 2017-C03, Class 2M2,
1 mo. USD LIBOR + 2.800%,
2.972%, due 02/25/302 | | | 280,181 | | | | 272,247 | | |
Series 2017-C04, Class 2M2,
1 mo. USD LIBOR + 2.850%,
3.022%, due 11/25/292 | | | 1,195,678 | | | | 1,164,557 | | |
Series 2017-C05, Class 1M2,
1 mo. USD LIBOR + 2.200%,
2.372%, due 01/25/302 | | | 425,994 | | | | 412,338 | | |
Series 2017-C06, Class 1M2,
1 mo. USD LIBOR + 2.650%,
2.822%, due 02/25/302 | | | 258,062 | | | | 251,951 | | |
Series 2017-C07, Class 2M2,
1 mo. USD LIBOR + 2.500%,
2.672%, due 05/25/302 | | | 711,372 | | | | 689,282 | | |
Series 2018-C01, Class 1M2,
1 mo. USD LIBOR + 2.250%,
2.422%, due 07/25/302 | | | 642,316 | | | | 619,394 | | |
Series 2018-C02, Class 2M2,
1 mo. USD LIBOR + 2.200%,
2.372%, due 08/25/302 | | | 202,214 | | | | 192,657 | | |
FNMA REMIC,
Series 1991-065, Class Z,
6.500%, due 06/25/21 | | | 78 | | | | 79 | | |
| | | Face
amount1 | | Value | |
Mortgage-backed securities—(continued) | |
Series 1992-040, Class ZC,
7.000%, due 07/25/22 | | | 1,052 | | | $ | 1,086 | | |
Series 1992-129, Class L,
6.000%, due 07/25/22 | | | 461 | | | | 474 | | |
Series 1993-037, Class PX,
7.000%, due 03/25/23 | | | 2,353 | | | | 2,466 | | |
Series 1993-060, Class Z,
7.000%, due 05/25/23 | | | 12,211 | | | | 12,914 | | |
Series 1993-070, Class Z,
6.900%, due 05/25/23 | | | 1,972 | | | | 2,087 | | |
Series 1993-096, Class PZ,
7.000%, due 06/25/23 | | | 9,530 | | | | 10,105 | | |
Series 1993-160, Class ZB,
6.500%, due 09/25/23 | | | 4,616 | | | | 4,853 | | |
Series 1993-163, Class ZA,
7.000%, due 09/25/23 | | | 1,049 | | | | 1,114 | | |
Series 1998-066, Class FG,
1 mo. USD LIBOR + 0.300%,
0.472%, due 12/25/282 | | | 4,600 | | | | 4,574 | | |
Series 1999-W4, Class A9,
6.250%, due 02/25/29 | | | 129,510 | | | | 145,657 | | |
Series 2000-034, Class F,
1 mo. USD LIBOR + 0.450%,
0.622%, due 10/25/302 | | | 1,863 | | | | 1,862 | | |
Series 2002-080, Class A1,
6.500%, due 11/25/42 | | | 511,942 | | | | 587,892 | | |
Series 2003-64, Class AH,
6.000%, due 07/25/33 | | | 1,193,641 | | | | 1,402,470 | | |
Series 2003-W8, Class 2A,
7.000%, due 10/25/42 | | | 22,126 | | | | 26,600 | | |
Series 2004-T1, Class 1A1,
6.000%, due 01/25/44 | | | 313,987 | | | | 367,220 | | |
Series 2004-W8, Class 2A,
6.500%, due 06/25/44 | | | 381,284 | | | | 449,327 | | |
Series 2005-024, Class ZE,
5.000%, due 04/25/35 | | | 504,123 | | | | 575,716 | | |
Series 2005-120, Class ZU,
5.500%, due 01/25/36 | | | 1,299,599 | | | | 1,536,107 | | |
Series 2006-065, Class GD,
6.000%, due 07/25/26 | | | 394,601 | | | | 430,347 | | |
GNMA REMIC, | |
Trust Series 2003-98, Class Z,
6.000%, due 11/20/33 | | | 3,347,885 | | | | 3,854,454 | | |
Trust Series 2005-26, Class ZA,
5.500%, due 01/20/35 | | | 7,107,841 | | | | 8,018,678 | | |
Trust Series 2015-H20, Class FB,
1 mo. USD LIBOR + 0.600%,
0.778%, due 08/20/652 | | | 1,291,937 | | | | 1,293,100 | | |
Trust Series 2016-H11, Class F,
1 mo. USD LIBOR + 0.800%,
0.978%, due 05/20/662 | | | 941,946 | | | | 949,964 | | |
Trust Series 2016-H15, Class FA,
1 mo. USD LIBOR + 0.800%,
0.978%, due 07/20/662 | | | 1,767,746 | | | | 1,782,310 | | |
Trust Series 2017-182, Class FW,
1 mo. USD LIBOR + 0.350%,
0.521%, due 05/20/472 | | | 575,976 | | | | 577,147 | | |
95
PACE Strategic Fixed Income Investments
Portfolio of investments—July 31, 2020
| | | Face
amount1 | | Value | |
Mortgage-backed securities—(continued) | |
Trust Series 2018-38, Class WF,
1 mo. USD LIBOR + 0.300%,
0.471%, due 10/20/432 | | | 1,586,057 | | | $ | 1,582,467 | | |
GS Residential Mortgage Loan Trust,
Series 2005-AR6, Class 2A1,
3.987%, due 09/25/3512 | | | 176,880 | | | | 177,110 | | |
Harborview Mortgage Loan Trust,
Series 2004-11, Class 3A1A, | |
1 mo. USD LIBOR + 0.700%,
0.887%, due 01/19/352 | | | 32,381 | | | | 29,086 | | |
Series 2005-4, Class 3A1,
3.614%, due 07/19/3512 | | | 167,384 | | | | 139,184 | | |
JPMorgan Chase Commercial
Mortgage Securities Trust,
Series 2018-LAQ, Class A, | |
1 mo. USD LIBOR + 1.000%,
1.175%, due 06/15/322,3 | | | 1,545,112 | | | | 1,459,857 | | |
Series 2018-PHH, Class A,
1 mo. USD LIBOR + 0.910%,
2.410%, due 06/15/352,3 | | | 1,550,537 | | | | 1,452,494 | | |
JPMorgan Mortgage Trust,
Series 2005-A8, Class 1A1,
3.924%, due 11/25/3512 | | | 531,617 | | | | 461,922 | | |
Series 2006-A4, Class 2A2,
3.440%, due 06/25/3612 | | | 245,054 | | | | 206,754 | | |
Ludgate Funding PLC,
Series 2007-1, Class A2A,
3 mo. LIBOR GBP + 0.160%,
0.311%, due 01/01/612,6 | | GBP | 1,486,529 | | | | 1,819,811 | | |
Series 2008-W1X, Class A1,
3 mo. LIBOR GBP + 0.600%,
0.751%, due 01/01/612,6 | | GBP | 640,506 | | | | 803,534 | | |
Mansard Mortgages,
Series 2007-1X, Class A2, | |
3 mo. LIBOR GBP + 0.180%,
0.260%, due 04/15/472,6 | | GBP | 953,794 | | | | 1,174,682 | | |
Morgan Stanley Capital I Trust,
Series 2014-CPT, Class B,
3.446%, due 07/13/293,12 | | | 1,800,000 | | | | 1,832,640 | | |
NAAC Reperforming Loan REMIC Trust,
Series 2004-R3, Class A1,
6.500%, due 02/25/353 | | | 602,985 | | | | 602,908 | | |
Nomura Resecuritization Trust,
Series 2014-7R, Class 2A3, | |
1 mo. USD LIBOR + 0.200%,
0.385%, due 12/26/352,3 | | | 377,325 | | | | 368,159 | | |
OBX Trust,
Series 2019-EXP2, Class 2A1A, | |
1 mo. USD LIBOR + 0.900%,
1.072%, due 06/25/592,3 | | | 265,309 | | | | 264,430 | | |
Reperforming Loan REMIC Trust,
Series 2006-R1, Class AF1, | |
1 mo. USD LIBOR + 0.340%,
0.512%, due 01/25/362,3 | | | 668,017 | | | | 632,231 | | |
Residential Funding Mortgage Security I,
Series 2004-S9, Class 1A23,
5.500%, due 12/25/34 | | | 369,468 | | | | 378,169 | | |
| | | Face
amount1 | | Value | |
Mortgage-backed securities—(concluded) | |
Sequoia Mortgage Trust,
Series 2007-3, Class 1A1, | |
1 mo. USD LIBOR + 0.200%,
0.387%, due 07/20/362 | | | 103,224 | | | $ | 97,115 | | |
Structured ARM Loan Trust,
Series 2004-8, Class 3A,
3.106%, due 07/25/3412 | | | 251,856 | | | | 255,830 | | |
Structured Asset Mortgage Investments, Inc.,
Series 2002-AR3, Class A1, | |
1 mo. USD LIBOR + 0.660%,
0.847%, due 09/19/322 | | | 57,884 | | | | 55,823 | | |
Series 2006-AR3, Class 11A1,
1 mo. USD LIBOR + 0.210%,
0.382%, due 04/25/362 | | | 1,084,390 | | | | 1,084,211 | | |
Thornburg Mortgage Securities Trust,
Series 2007-4, Class 2A1,
3.109%, due 09/25/3712 | | | 604,292 | | | | 600,173 | | |
Towd Point Mortgage Funding,
Series 2019-A13A, Class A1, | |
3 mo. Sonia + 0.900%,
0.965%, due 07/20/452,3 | | GBP | 4,816,552 | | | | 6,277,453 | | |
Uropa Securities PLC,
Series 2007-1, Class A3A, | |
3 mo. LIBOR GBP + 0.200%,
0.293%, due 10/10/402,6 | | GBP | 2,576,169 | | | | 3,155,676 | | |
WaMu Mortgage Pass-Through Certificates,
Series 2002-AR6, Class A, | |
12 mo. MTA + 1.400%,
2.722%, due 06/25/422 | | | 13,616 | | | | 12,691 | | |
Series 2005-AR13, Class A1A1,
1 mo. USD LIBOR + 0.290%,
0.462%, due 10/25/452 | | | 436,122 | | | | 424,589 | | |
Series 2006-AR2, Class 2A1,
3.553%, due 03/25/3612 | | | 522,961 | | | | 461,598 | | |
Series 2006-AR9, Class 1A,
12 mo. MTA + 1.000%,
2.322%, due 08/25/462 | | | 502,210 | | | | 480,333 | | |
WFRBS Commercial Mortgage Trust,
Series 2014-C22, Class XA, IO,
0.807%, due 09/15/5712 | | | 6,407,164 | | | | 166,020 | | |
Series 2014-LC14, Class XA, IO,
1.195%, due 03/15/4712 | | | 3,306,391 | | | | 106,240 | | |
Total mortgage-backed securities
(cost—$77,605,573) | | | 80,401,659 | | |
Municipal bonds—0.3% | |
Illinois—0.1% | |
Sales Tax Securitization Corp.,
Series B,
3.057%, due 01/01/34 | | | 1,400,000 | | | | 1,434,426 | | |
New York—0.1% | |
New York State Dormitory Authority,
Personal Income Tax Revenue Bonds,
Series D,
4.000%, due 02/15/47 | | | 180,000 | | | | 210,687 | | |
96
PACE Strategic Fixed Income Investments
Portfolio of investments—July 31, 2020
| | | Face
amount1 | | Value | |
Municipal bonds—(concluded) | |
New York—(concluded) | |
New York State Urban Development Corp.,
Sale Tax Revenue Bonds,
Series A,
4.000%, due 03/15/43 | | | 180,000 | | | $ | 210,895 | | |
| | | | | | 421,582 | | |
Texas—0.1% | |
Texas Water Development Board, Water
Implementation Revenue Bonds
4.000%, due 10/15/54 | | | 115,000 | | | | 137,814 | | |
Waller Consolidated Independent
School District, GO Bonds,
(PSF-GTD),
4.000%, due 02/15/50 | | | 180,000 | | | | 217,382 | | |
Ysleta Independent School District, Go Bonds,
(PSF-GTD),
4.000%, due 08/15/52 | | | 105,000 | | | | 126,278 | | |
| | | | | | 481,474 | | |
Total municipal bonds
(cost—$2,300,929) | | | 2,337,482 | | |
Non-U.S. government agency obligations—2.2% | |
Israel Government International Bond
3.875%, due 07/03/50 | | | 1,700,000 | | | | 2,114,906 | | |
4.125%, due 01/17/48 | | | 1,600,000 | | | | 2,066,500 | | |
Japan Bank for International Cooperation
2.875%, due 07/21/27 | | | 2,200,000 | | | | 2,513,888 | | |
Japan International Cooperation Agency
2.750%, due 04/27/27 | | | 1,300,000 | | | | 1,459,679 | | |
Kuwait International Government Bond
2.750%, due 03/20/226 | | | 1,700,000 | | | | 1,757,375 | | |
Peruvian Government International Bond
5.940%, due 02/12/293 | | PEN | 5,100,000 | | | | 1,724,533 | | |
Qatar Government International Bond
4.500%, due 04/23/286 | | | 1,700,000 | | | | 2,059,125 | | |
5.103%, due 04/23/486 | | | 1,600,000 | | | | 2,355,500 | | |
Total non-U.S. government agency
obligations
(cost—$13,268,141) | | | 16,051,506 | | |
U.S. government agency obligations—16.9% | |
FHLMC
7.645%, due 05/01/25 | | | 632,004 | | | | 726,693 | | |
FHLMC ARM
12 mo. USD LIBOR + 1.815%,
3.785%, due 03/01/362 | | | 12,664 | | | | 12,733 | | |
FNMA
4.500%, due 04/01/29 | | | 105,975 | | | | 114,720 | | |
5.153%, due 11/01/3412 | | | 2,768,568 | | | | 2,764,782 | | |
FNMA ARM
6 mo. USD LIBOR + 1.538%,
2.449%, due 01/01/362 | | | 21,693 | | | | 21,904 | | |
12 mo. MTA + 1.400%,
2.723%, due 08/01/402 | | | 20,136 | | | | 20,230 | | |
12 mo. USD LIBOR + 2.015%,
3.015%, due 06/01/362 | | | 7,697 | | | | 7,710 | | |
| | | Face
amount1 | | Value | |
U.S. government agency obligations—(concluded) | | | |
12 mo. USD LIBOR + 1.420%,
3.420%, due 03/01/362 | | | 9,552 | | | $ | 9,631 | | |
12 mo. USD LIBOR + 1.588%,
3.588%, due 12/01/352 | | | 21,856 | | | | 21,993 | | |
1 year CMT + 2.102%,
3.685%, due 05/01/302 | | | 25,075 | | | | 25,119 | | |
1 year CMT + 2.224%,
3.692%, due 04/01/272 | | | 7,099 | | | | 7,152 | | |
1 year CMT + 2.250%,
3.750%, due 05/01/272 | | | 4,410 | | | | 4,438 | | |
12 mo. USD LIBOR + 1.815%,
3.815%, due 03/01/362 | | | 18,380 | | | | 18,496 | | |
12 mo. USD LIBOR + 1.879%,
3.879%, due 03/01/362 | | | 26,647 | | | | 26,863 | | |
12 mo. USD LIBOR + 1.780%,
3.905%, due 11/01/352 | | | 3,952 | | | | 3,969 | | |
12 mo. USD LIBOR + 1.912%,
3.912%, due 02/01/362 | | | 24,376 | | | | 24,531 | | |
12 mo. USD LIBOR + 1.912%,
3.912%, due 03/01/362 | | | 21,824 | | | | 21,967 | | |
12 mo. USD LIBOR + 1.942%,
4.192%, due 09/01/352 | | | 6,021 | | | | 6,042 | | |
1 year CMT + 2.645%,
4.270%, due 01/01/362 | | | 22,797 | | | | 22,928 | | |
FNMA ARM COFI
3.250%, due 11/01/2613,14 | | | 10,255 | | | | 9,482 | | |
GNMA II
5.000%, due 07/20/49 | | | 13,669,955 | | | | 14,817,268 | | |
5.000%, due 11/20/49 | | | 563,094 | | | | 610,289 | | |
5.000%, due 12/20/49 | | | 253,505 | | | | 274,528 | | |
5.000%, due 01/20/50 | | | 197,749 | | | | 214,501 | | |
GNMA II ARM
1 year CMT + 1.500%,
2.875%, due 05/20/262 | | | 5,794 | | | | 5,954 | | |
1 year CMT + 1.500%,
3.000%, due 01/20/262 | | | 2,918 | | | | 2,973 | | |
1 year CMT + 1.500%,
3.125%, due 11/20/232 | | | 916 | | | | 939 | | |
1 year CMT + 1.500%,
3.250%, due 07/20/252 | | | 1,610 | | | | 1,660 | | |
GNMA II TBA
4.500%, | | | 2,000,000 | | | | 2,135,781 | | |
UMBS TBA
2.000% | | | 28,350,000 | | | | 29,261,164 | | |
| 2.500% | | | 50,135,000 | | | | 52,510,676 | | |
| 3.000% | | | 13,805,000 | | | | 14,566,234 | | |
| 3.500% | | | 1,000,000 | | | | 1,049,414 | | |
| 4.000% | | | 200,000 | | | | 212,453 | | |
| 4.500% | | | 1,000,000 | | | | 1,075,078 | | |
Total U.S. government agency obligations
(cost—$119,736,285) | | | 120,610,295 | | |
U.S. Treasury obligations—26.0% | | | |
U.S. Treasury Bonds
2.500%, due 02/15/45 | | | 53,400,000 | | | | 68,708,695 | | |
2.750%, due 08/15/42 | | | 2,995,000 | | | | 3,988,498 | | |
2.875%, due 08/15/45 | | | 2,600,000 | | | | 3,570,227 | | |
97
PACE Strategic Fixed Income Investments
Portfolio of investments—July 31, 2020
| | | Face
amount1 | | Value | |
U.S. Treasury obligations—(concluded) | |
3.000%, due 11/15/44 | | | 2,600,000 | | | $ | 3,624,867 | | |
3.000%, due 05/15/45 | | | 200,000 | | | | 279,719 | | |
3.000%, due 02/15/48 | | | 500,000 | | | | 714,707 | | |
3.125%, due 02/15/43 | | | 1,355,000 | | | | 1,907,639 | | |
U.S. Treasury Inflation Index Bonds (TIPS)
1.000%, due 02/15/46 | | | 1,385,062 | | | | 1,917,947 | | |
1.000%, due 02/15/48 | | | 2,458,961 | | | | 3,488,577 | | |
U.S. Treasury Notes
1.625%, due 02/15/26 | | | 845,000 | | | | 907,484 | | |
1.750%, due 06/30/24 | | | 5,400,000 | | | | 5,732,438 | | |
1.750%, due 11/15/29 | | | 580,000 | | | | 645,680 | | |
1.875%, due 08/31/22 | | | 9,600,000 | | | | 9,949,125 | | |
2.000%, due 02/28/21 | | | 16,900,000 | | | | 17,082,203 | | |
2.000%, due 10/31/2215 | | | 1,000,000 | | | | 1,042,031 | | |
2.125%, due 09/30/21 | | | 27,500,000 | | | | 28,135,938 | | |
2.125%, due 09/30/24 | | | 10,900,000 | | | | 11,779,238 | | |
2.250%, due 04/30/2115 | | | 6,500,000 | | | | 6,602,578 | | |
2.250%, due 04/15/22 | | | 645,000 | | | | 668,205 | | |
2.250%, due 08/15/27 | | | 5,000,000 | | | | 5,645,703 | | |
2.625%, due 02/15/29 | | | 6,700,000 | | | | 7,903,383 | | |
2.875%, due 05/31/25 | | | 1,035,000 | | | | 1,167,084 | | |
Total U.S. Treasury obligations
(cost—$161,250,530) | | | 185,461,966 | | |
| | | Number of
shares | | | |
Exchange traded funds—0.7% | |
Invesco Senior Loan ETF5
(cost—$5,003,936) | | | 217,988 | | | | 4,717,260 | | |
Short-term investments—0.4% | |
Investment companies—0.4% | |
State Street Institutional U.S. Government
Money Market Fund, 0.09%
(cost—$3,258,423) | | | 3,258,423 | | | | 3,258,423 | | |
| | | Face
amount1 | | Value | |
Short-term U.S. Treasury obligations—0.6% | |
U.S. Treasury Bills
0.138%, due 05/20/2116 | | | 3,500,000 | | | $ | 3,496,139 | | |
0.159%, due 10/22/2016 | | | 750,000 | | | | 749,732 | | |
Total short-term U.S. Treasury obligations
(cost—$4,245,871) | | | 4,245,871 | | |
| | | Number of
shares | | | |
Investment of cash collateral from securities loaned—4.1% | |
Money market funds—4.1% | |
State Street Navigator Securities Lending
Government Money Market Portfolio, 0.12%
(cost—$29,099,463) | | | 29,099,463 | | | | 29,099,463 | | |
| | | Face
amount1 | | | |
Repurchase agreements—0.3% | |
Repurchase agreement dated
07/31/20 with Toronto Dominion Bank,
0.120% due 08/03/20, collateralized
by $1,585,000 US Treasury Note, 3.000%
due 05/15/47; (value—$2,254,322);
proceeds: $2,200,000
(cost—$2,200,000) | | | 2,200,000 | | | | 2,200,000 | | |
Total investments
(cost—$832,906,457)—123.9% | | | 884,607,776 | | |
Liabilities in excess of other assets—(23.9)% | | | | | (170,854,585 | ) | |
Net assets—100.0% | | $ | 713,753,191 | | |
For a listing of defined portfolio acronyms that are used throughout the Portfolio of investments as well as the tables that follow, please refer to page 267.
| | Face
amount | | Value | |
Reverse repurchase agreements—(0.2)% | |
Reverse repurchase agreement dated 06/16/20 with Reverse Repo Credit Suisse, (0.250%), to be repurchased 06/16/22 for
$(1,641,371), collateralized by 1,600,000 United Overseas Bank Ltd. obligation, 3.200% due 04/23/21; (value—$(1,627,141))
(cost—$(1,633,600)) | | | (1,633,600 | ) | | $ | (1,633,600 | ) | |
98
PACE Strategic Fixed Income Investments
Portfolio of investments—July 31, 2020
Foreign exchange options written
Notional
amount | | Number of
contracts | | Put options | | Expiration
date | | Premiums
received | | Current
value | | Unrealized
appreciation
(depreciation) | |
EUR | 1,800,000 | | | | 1,800,000 | | | EUR Put/USD Call, strike @ 1.15 (Counterparty BOA) | | 09/28/20 | | $ | 9,518 | | | $ | (9,402 | ) | | $ | 116 | | |
EUR | 1,800,000 | | | | 1,800,000 | | | EUR Put/USD Call, strike @ 1.16 (Counterparty BOA) | | 08/27/20 | | | 6,842 | | | | (6,093 | ) | | | 749 | | |
Total foreign exchange options written | | | | | | $16,360 | | $(15,495) | | $865 | |
Options written
Notional
amount | | Number of
contracts | | Put options | | Expiration
date | | Premiums
received | | Current
value | | Unrealized
appreciation
(depreciation) | |
USD | 815,184,000 | | | | 8,100,000 | | | FNMA TBA, 2.000%, strike @ 100.64 (Counterparty JPMCB) | | 08/06/20 | | $ | 60,750 | | | $ | — | | | $ | 60,750 | | |
USD | 51,280,000 | | | | 500,000 | | | FNMA TBA, 2.500%, strike @ 102.56 (Counterparty JPMCB) | | 08/06/20 | | | 2,656 | | | | — | | | | 2,656 | | |
USD | 40,820,000 | | | | 400,000 | | | FNMA TBA, 2.500%, strike @ 102.05 (Counterparty GS) | | 08/06/20 | | | 1,625 | | | | — | | | | 1,625 | | |
USD | 459,360,000 | | | | 4,500,000 | | | FNMA TBA, 2.500%, strike @ 102.08 (Counterparty GS) | | 08/06/20 | | | 18,985 | | | | — | | | | 18,985 | | |
| | Total options written | | | | | | | | | | | | | | | $ | 84,016 | | | $ | — | | | $ | 84,016 | | |
Futures contracts
Number of
contracts | | Currency | | | | Expiration
date | | Current
notional
amount | | Value | | Unrealized
appreciation
(depreciation) | |
Interest rate futures buy contracts: | | | |
| | 3 | | | EUR | | | | German Euro Buxl 30 Year Futures | | September 2020 | | $ | 643,848 | | | $ | 674,520 | | | $ | 30,672 | | |
| | 2 | | | USD | | | | Australian Dollar Futures | | September 2020 | | | 137,808 | | | | 142,940 | | | | 5,132 | | |
| | 4 | | | USD | | | | British Pound Futures | | September 2020 | | | 315,734 | | | | 327,700 | | | | 11,966 | | |
| | 2 | | | USD | | | | Canadian Dollar Futures | | September 2020 | | | 147,436 | | | | 149,440 | | | | 2,004 | | |
U.S. Treasury futures buy contracts: | | | |
| | 13 | | | USD | | | | U.S. Long Bond Futures | | September 2020 | | $ | 2,312,858 | | | $ | 2,369,656 | | | $ | 56,798 | | |
| | 297 | | | USD | | | | U.S. Treasury Note 10 Year Futures | | September 2020 | | | 41,178,726 | | | | 41,603,203 | | | | 424,477 | | |
| | 854 | | | USD | | | | U.S. Treasury Note 5 Year Futures | | September 2020 | | | 107,162,081 | | | | 107,710,750 | | | | 548,669 | | |
| | Total | | | | | | | | | $ | 151,898,491 | | | $ | 152,978,209 | | | $ | 1,079,718 | | |
Interest rate futures sell contracts: | | | |
| | 2 | | | USD | | | | Euro Fx Futures with American Style Options | | September 2020 | | $ | (284,731 | ) | | $ | (294,987 | ) | | $ | (10,256 | ) | |
| | 8 | | | EUR | | | | German Euro Bund Futures | | September 2020 | | | (1,394,685 | ) | | | (1,420,160 | ) | | | (25,475 | ) | |
| | 15 | | | GBP | | | | United Kingdom Long Gilt Bond Futures | | September 2020 | | | (2,066,453 | ) | | | (2,078,250 | ) | | | (11,797 | ) | |
U.S. Treasury futures sell contracts: | | | |
| | 1 | | | USD | | | | U.S. Long Bond Futures | | September 2020 | | $ | (176,352 | ) | | $ | (182,281 | ) | | $ | (5,929 | ) | |
| | 69 | | | USD | | | | U.S. Treasury Note 10 Year Futures | | September 2020 | | | (9,581,785 | ) | | | (9,665,391 | ) | | | (83,606 | ) | |
| | 31 | | | USD | | | | U.S. Ultra Long Treasury Bond Futures | | September 2020 | | | (6,754,923 | ) | | | (7,058,313 | ) | | | (303,390 | ) | |
| | 81 | | | USD | | | | U.S. Ultra Treasury Note 10 Year Futures | | September 2020 | | | (12,709,133 | ) | | | (12,899,250 | ) | | | (190,117 | ) | |
| | Total | | | | | | | | | $ | (32,968,062 | ) | | $ | (33,598,632 | ) | | $ | (630,570 | ) | |
| | Net unrealized appreciation (depreciation) | | | | | | | | | | | | | $ | 449,148 | | |
99
PACE Strategic Fixed Income Investments
Portfolio of investments—July 31, 2020
Centrally cleared credit default swap agreements on corporate issues—sell protection18
Referenced obligations | | Notional
amount
(000) | | Maturity
date | | Payment
frequency | | Payments
received
by the
Portfolio17 | | Upfront
payments
received
(made) | | Value | | Unrealized
appreciation
(depreciation) | |
Exelon Generation Co. LLC, bond,
6.200%, due 10/01/17 | | USD | 2,000 | | | 12/20/21 | | Quarterly | | | 1.000 | % | | $ | 24,854 | | | $ | 23,297 | | | $ | 48,151 | | |
General Electric Co., bond,
5.000% due 06/15/21 | | USD | 1,000 | | | 06/20/24 | | Quarterly | | | 1.000 | | | | 9,054 | | | | (19,506 | ) | | | (10,452 | ) | |
Rolls-Royce PLC, bond,
2.125%, due 06/08/21 | | EUR | 1,400 | | | 06/20/24 | | Quarterly | | | 1.000 | | | | (2,694 | ) | | | (179,973 | ) | | | (182,667 | ) | |
Verizon Communications, Inc., bond,
2.550%, due 06/17/19 | | USD | 1,600 | | | 12/20/22 | | Quarterly | | | 1.000 | | | | (14,998 | ) | | | 25,847 | | | | 10,849 | | |
Total | | | | | | | | | | $ | 16,216 | | | $ | (150,335 | ) | | $ | (134,119 | ) | |
Centrally cleared interest rate swap agreements
Notional
amount
(000) | | Maturity
date | | Payment
frequency | | Payments
made by the
Portfolio17 | | Payments
received by
the Portfolio17 | | Value | | Unrealized
appreciation
(depreciation) | |
JPY | 3,240,000 | | | 03/18/26 | | Semi-Annual | | | 0.300 | % | | | 6 Month JPY LIBOR | | | $ | (652,300 | ) | | $ | (546,425 | ) | |
JPY | 1,800,000 | | | 03/18/26 | | Semi-Annual | | | 0.300 | | | | 6 Month JPY LIBOR | | | | (368,255 | ) | | | (318,056 | ) | |
JPY | 230,000 | | | 03/20/29 | | Semi-Annual | | | 0.450 | | | | 6 Month JPY LIBOR | | | | (92,681 | ) | | | (79,071 | ) | |
JPY | 580,000 | | | 09/20/27 | | Semi-Annual | | | 0.300 | | | | 6 Month JPY LIBOR | | | | (141,660 | ) | | | (120,918 | ) | |
JPY | 310,000 | | | 03/20/28 | | Semi-Annual | | | 0.300 | | | | 6 Month JPY LIBOR | | | | (79,271 | ) | | | (96,020 | ) | |
JPY | 756,000 | | | 03/20/38 | | Semi-Annual | | | 0.750 | | | | 6 Month JPY LIBOR | | | | (806,019 | ) | | | (829,141 | ) | |
JPY | 220,000 | | | 06/18/28 | | Semi-Annual | | | 0.399 | | | | 6 Month JPY LIBOR | | | | (72,293 | ) | | | (72,151 | ) | |
JPY | 736,400 | | | 12/20/38 | | Semi-Annual | | | 0.750 | | | | 6 Month JPY LIBOR | | | | (791,512 | ) | | | (831,737 | ) | |
JPY | 60,000 | | | 10/22/38 | | Semi-Annual | | | 0.800 | | | | 6 Month JPY LIBOR | | | | (70,006 | ) | | | (69,971 | ) | |
JPY | 200,000 | | | 10/31/38 | | Semi-Annual | | | 0.705 | | | | 6 Month JPY LIBOR | | | | (199,982 | ) | | | (211,609 | ) | |
GBP | 1,600 | | | 09/16/50 | | Semi-Annual | | | 0.500 | | | | 6 Month GBP LIBOR | | | | (52,867 | ) | | | (19,080 | ) | |
GBP | 5,300 | | | 12/16/50 | | Annual | | | 0.500 | | | | 12 Month SONIA | | | | (720,305 | ) | | | (53,122 | ) | |
JPY | 60,000 | | | 03/21/48 | | Semi-Annual | | | 6 Month JPY LIBOR | | | | 1.000 | % | | | 123,532 | | | | (12,304 | ) | |
JPY | 1,810,000 | | | 06/18/28 | | Semi-Annual | | | 6 Month JPY LIBOR | | | | 0.380 | | | | 568,639 | | | | 510,231 | | |
USD | 7,900 | | | 08/22/23 | | Semi-Annual | | | 3 Month USD LIBOR | | | | 2.800 | | | | 722,504 | | | | 722,504 | | |
JPY | 430,000 | | | 08/22/39 | | Semi-Annual | | | 6 Month JPY LIBOR | | | | 0.122 | | | | (15,528 | ) | | | (39,366 | ) | |
JPY | 600,000 | | | 08/22/39 | | Semi-Annual | | | 6 Month JPY LIBOR | | | | 0.123 | | | | (21,114 | ) | | | (40,682 | ) | |
JPY | 60,000 | | | 08/28/39 | | Semi-Annual | | | 6 Month JPY LIBOR | | | | 0.103 | | | | (4,216 | ) | | | (4,216 | ) | |
JPY | 430,000 | | | 09/13/26 | | Semi-Annual | | | 6 Month JPY LIBOR | | | | (0.095 | ) | | | (8,097 | ) | | | (8,097 | ) | |
JPY | 210,000 | | | 09/13/26 | | Semi-Annual | | | 6 Month JPY LIBOR | | | | (0.092 | ) | | | (3,611 | ) | | | (3,611 | ) | |
JPY | 350,000 | | | 09/18/26 | | Semi-Annual | | | 6 Month JPY LIBOR | | | | (0.068 | ) | | | (317 | ) | | | 799 | | |
JPY | 560,000 | | | 09/18/26 | | Semi-Annual | | | 6 Month JPY LIBOR | | | | (0.062 | ) | | | 1,289 | | | | 3,294 | | |
JPY | 215,000 | | | 09/19/26 | | Semi-Annual | | | 6 Month JPY LIBOR | | | | (0.063 | ) | | | 74 | | | | (206 | ) | |
JPY | 215,000 | | | 09/19/26 | | Semi-Annual | | | 6 Month JPY LIBOR | | | | (0.064 | ) | | | (553 | ) | | | (553 | ) | |
JPY | 215,000 | | | 09/19/26 | | Semi-Annual | | | 0.068 | | | | 6 Month JPY LIBOR | | | | 507 | | | | 227 | | |
JPY | 108,000 | | | 09/20/26 | | Semi-Annual | | | 6 Month JPY LIBOR | | | | 0.087 | | | | (1,658 | ) | | | (1,658 | ) | |
JPY | 262,000 | | | 09/24/26 | | Semi-Annual | | | 6 Month JPY LIBOR | | | | (0.097 | ) | | | (6,382 | ) | | | (6,691 | ) | |
JPY | 73,000 | | | 03/10/38 | | Semi-Annual | | | 6 Month JPY LIBOR | | | | 0.040 | | | | (10,352 | ) | | | (10,352 | ) | |
JPY | 73,000 | | | 03/10/38 | | Semi-Annual | | | 6 Month JPY LIBOR | | | | 0.036 | | | | (10,858 | ) | | | (10,858 | ) | |
| | Total | | | | | | | | | | | $ | (2,713,292 | ) | | $ | (2,148,840 | ) | |
100
PACE Strategic Fixed Income Investments
Portfolio of investments—July 31, 2020
OTC credit default swap agreements on corporate issues—sell protection18
Counterparty | | Referenced obligations | | Notional
amount
(000) | | Maturity
date | | Payment
frequency | | Payments
received
by the
Portfolio17 | | Upfront
payments
received
(made) | | Value | | Unrealized
appreciation
(depreciation) | |
GSI | | Republic of South Africa,
bond, 5.500%, due 03/09/20 | | USD | 1,600 | | | 06/20/2024 | | Quarterly | | | 1.000 | % | | $ | 49,531 | | | $ | (107,693 | ) | | $ | (58,162 | ) | |
Forward foreign currency contracts
Counterparty | | Sell | | Purchase | | Settlement
date | | Unrealized
appreciation
(depreciation) | |
BB | | MYR | 2,596,159 | | | USD | 603,604 | | | 09/17/20 | | $ | (7,599 | ) | |
BNP | | USD | 570,176 | | | EUR | 492,000 | | | 08/04/20 | | | 9,376 | | |
CITI | | AUD | 1,870,000 | | | USD | 1,200,981 | | | 08/17/20 | | | (135,102 | ) | |
CITI | | EUR | 11,186,000 | | | USD | 12,541,602 | | | 08/04/20 | | | (634,954 | ) | |
CITI | | GBP | 14,370,000 | | | USD | 17,831,497 | | | 08/04/20 | | | (978,831 | ) | |
CITI | | JPY | 32,100,000 | | | USD | 300,407 | | | 08/17/20 | | | (2,880 | ) | |
HSBC | | CAD | 355,000 | | | USD | 261,423 | | | 08/04/20 | | | (3,611 | ) | |
Net unrealized appreciation (depreciation) | | | | | | | | $ | (1,753,601 | ) | |
Fair valuation summary
The following is a summary of the fair valuations according to the inputs used as of July 31, 2020 in valuing the Portfolio's investments. In the event a Portfolio holds investments for which fair value is measured using the NAV per share practical expedient (or its equivalent), a separate column will be added to the fair value hierarchy table; this is intended to permit reconciliation to the amounts presented in the Portfolio of investments:
Assets
Description | | Unadjusted
quoted prices in
active markets for
identical investments
(Level 1) | | Other significant
observable inputs
(Level 2) | | Unobservable
inputs
(Level 3) | | Total | |
Asset-backed securities | | $ | — | | | $ | 42,775,601 | | | $ | — | | | $ | 42,775,601 | | |
Corporate bonds | | | — | | | | 390,064,210 | | | | — | | | | 390,064,210 | | |
Loan assignments | | | — | | | | 3,384,040 | | | | — | | | | 3,384,040 | | |
Mortgage-backed securities | | | — | | | | 80,401,659 | | | | — | | | | 80,401,659 | | |
Municipal bonds | | | — | | | | 2,337,482 | | | | — | | | | 2,337,482 | | |
Non-U.S. government agency obligations | | | — | | | | 16,051,506 | | | | — | | | | 16,051,506 | | |
U.S. government agency obligations | | | — | | | | 120,600,813 | | | | 9,482 | | | | 120,610,295 | | |
U.S. Treasury obligations | | | — | | | | 185,461,966 | | | | — | | | | 185,461,966 | | |
Exchange traded funds | | | 4,717,260 | | | | — | | | | — | | | | 4,717,260 | | |
Short-term investments | | | — | | | | 3,258,423 | | | | — | | | | 3,258,423 | | |
Short-term U.S. Treasury obligations | | | — | | | | 4,245,871 | | | | — | | | | 4,245,871 | | |
Investment of cash collateral from securities loaned | | | — | | | | 29,099,463 | | | | — | | | | 29,099,463 | | |
Repurchase agreements | | | — | | | | 2,200,000 | | | | — | | | | 2,200,000 | | |
Futures contracts | | | 1,079,718 | | | | — | | | | — | | | | 1,079,718 | | |
Swap agreements | | | — | | | | 1,465,689 | | | | — | | | | 1,465,689 | | |
Forward foreign currency contracts | | | — | | | | 9,376 | | | | — | | | | 9,376 | | |
Total | | $ | 5,796,978 | | | $ | 881,356,099 | | | $ | 9,482 | | | $ | 887,162,559 | | |
101
PACE Strategic Fixed Income Investments
Portfolio of investments—July 31, 2020
Fair valuation summary—(concluded)
Liabilities
Description | | Unadjusted
quoted prices in
active markets for
identical investments
(Level 1) | | Other significant
observable inputs
(Level 2) | | Unobservable
inputs
(Level 3) | | Total | |
Reverse repurchase agreements | | $ | — | | | $ | (1,633,600 | ) | | $ | — | | | $ | (1,633,600 | ) | |
Foreign exchange options written | | | — | | | | (15,495 | ) | | | — | | | | (15,495 | ) | |
Futures contracts | | | (630,570 | ) | | | — | | | | — | | | | (630,570 | ) | |
Swap agreements | | | — | | | | (4,437,009 | ) | | | — | | | | (4,437,009 | ) | |
Forward foreign currency contracts | | | — | | | | (1,762,977 | ) | | | — | | | | (1,762,977 | ) | |
Total | | $ | (630,570 | ) | | $ | (7,849,081 | ) | | $ | — | | | $ | (8,479,651 | ) | |
At July 31, 2020, there were no transfers in or out of Level 3.
Securities valued using unobservable inputs, i.e. Level 3, were not considered significant to the Fund.
Portfolio footnotes
† Amount represents less than 0.05%.
1 In US dollars unless otherwise indicated.
2 Variable or floating rate security. The interest rate shown is the rate in effect as of period end and changes periodically.
3 Security exempt from registration pursuant to Rule 144A under the Securities Act of 1933. These securities are considered liquid, unless noted otherwise, and may be resold in transactions exempt from registration, normally to qualified institutional buyers. Securities exempt from registration pursuant to Rule 144A, in the amount of $190,523,683, represented 26.7% of the Portfolio's net assets at period end.
4 Step bond—coupon rate increases in increments to maturity. The rate disclosed is the rate at the period end; the maturity date disclosed is the ultimate maturity date.
5 Security, or portion thereof, was on loan at the period end.
6 Security was purchased pursuant to Regulation S under the Securities Act of 1933, which exempts from registration securities offered and sold outside of the United States. Such a security cannot be sold in the United States without either an effective registration statement filed pursuant to the Securities Act of 1933, or pursuant to an exemption from registration.
7 Payment-in-kind security for which interest may be paid in cash or additional principal, at the discretion of the issuer.
8 Perpetual investment. Date shown reflects the next call date.
9 Security purchased on a when-issued basis. When-issued refers to a transaction made conditionally because a security, although authorized, has not yet been issued.
10 Rate shown reflects annualized yield at the period end on zero coupon bond.
11 Bond interest in default.
12 Variable or floating rate security for which the interest rate adjusts periodically based on changes in current interest rates and prepayments on the underlying pool of assets. Rate shown is the rate in effect as of period end.
13 Security fair valued by a Valuation Committee under the direction of the Board of Trustees.
14 Significant unobservable inputs were used in the valuation of this security; i.e. Level 3.
15 Security, or portion thereof, pledged as collateral for investments sold short, written options or futures.
16 Rate shown is the discount rate at the date of purchase unless otherwise noted.
17 Payments made or received are based on the notional amount.
18 If the Portfolio is a seller of protection and a credit event occurs, as defined under the terms of that particular swap agreement, the Portfolio will either (i) pay to the buyer of protection an amount equal to the notional amount of the swap and take delivery of the referenced obligation or underlying securities comprising the referenced obligation or (ii) pay a net settlement amount in the form of cash or securities equal to the notional amount of the swap less the recovery value of the referenced obligation or underlying securities comprising the referenced obligation.
See accompanying notes to financial statements.
102
PACE Municipal Fixed Income Investments
Performance
For the 12-months ended July 31, 2020, the Portfolio's Class P shares returned 3.92% before the deduction of the maximum PACE Select program fee.1 In comparison, the Bloomberg Barclays US Municipal 3-15 Year Blend Index (the "benchmark") returned 5.08%. (Returns for all share classes over various time periods are shown in the "Performance at a glance" table on page 105. Please note that the returns shown do not reflect the deduction of taxes that a shareholder would pay on Portfolio distributions or the redemption of Portfolio shares.) For a detailed commentary on the market environment in general during the reporting period, please refer to page 2.
Subadvisor's comments2
The Portfolio underperformed its benchmark during the reporting period. This was primarily driven by sector and security selection, whereas duration positioning contributed to results.
The municipal bond market benefited from favorable technical tailwinds during the first half of the reporting period, fueled by steady demand, strong fund flows and limited supply. The appearance of the COVID-19 pandemic was disruptive to the broader economy, creating a challenged municipal credit landscape and negative municipal bond market performance in March 2020. While municipal bond demand improved the latter portion of the reporting period, the Portfolio's sector performance was mixed, with weaker returns among the more COVID-stressed sectors.
From an asset allocation standpoint, an overweight to revenue bonds detracted from performance. Within the revenue sector, the Portfolio was overweight to hospital, airport and transportation bonds which lagged the benchmark. Marginally offsetting this was stronger performance among essential service power and housing bonds. The overall impact from security selection detracted from returns, particularly Michigan Department of Transportation and Birmingham Convention Center revenue bonds.
Fundamental credit conditions for state and local governments remained challenged by the fallout from the COVID-19 pandemic, although the robust technical environment has been a mitigating factor from a performance perspective. From a quality perspective, spread widening was most severe among lower-rated issuers, while highest rated AAA and AA bonds outperformed. The Portfolio benefited relative to the benchmark from a modest underweight to BBB-rated bonds. However, the impact was offset by an overweight to lower investment-grade A-rated issues, mostly within the revenue bond sector.
A modestly long duration posture contributed to performance, as interest rates mover lower. Yields for AAA-rated municipal bonds within the two- and fifteen-year portions on the yield curve fell by 90 to 100 basis points. The
PACE Select Advisors Trust – PACE Municipal Fixed Income Investments
Investment Manager:
UBS Asset Management (Americas) Inc. ("UBS AM")
Investment Subadvisor:
Mellon Investments Corporation (f/k/a BNY Mellon Asset Management Company LLC ("Mellon"))
Portfolio Management Team:
UBS AM: Mabel Lung, CFA, Gina Toth, CFA, Fred Lee, CFA, Joseph Sciortino and Steve Bienashski
Mellon: Daniel Marques, CFA and Daniel Rabasco, CFA
Objective:
High current income exempt from federal income tax
Investment process:
The subadvisor utilizes a strategy that involves investing
in undervalued sectors, geographical regions or individual
securities.
1 Class P shares held through the PACE Select Advisors Program are subject to a maximum Program fee of 2.50%, which, if included, would have reduced performance. Class P shares held through other advisory programs also may be subject to a program fee, which, if included, would have reduced performance.
2 Performance is discussed on a gross-of-fees basis—meaning that no fees or expenses are reflected when discussed at the level of a subadvisor's sleeve (or subadvisors' sleeves, if applicable). Alternatively, performance at the overall Portfolio level is shown net of fees, which does factor in fees and expenses associated with the Portfolio.
103
PACE Municipal Fixed Income Investments
Subadvisor's comments – concluded
shape of the high-grade yield curve steepened 11 basis points from to 2 to 10 years (ending the reporting period at 52 basis points). Curve distribution of the Portfolio relative to the benchmark had a neutral impact during the period.
No derivatives were used during the reporting period.
Mutual funds are sold by prospectus only. You should read it carefully and consider a fund's investment objectives, risks, charges, expenses and other important information contained in the prospectus before investing. Prospectuses for most of our funds can be obtained from your financial advisor, by calling UBS Funds at 800-647 1568 or by visiting our Website at www.ubs.com/am-us.
Special considerations
The Portfolio may be appropriate for long-term investors seeking high current income exempt from federal income taxes. Investors should be able to withstand short-term fluctuations in the fixed income markets in return for potentially higher returns over the long term. The yield and value of the Portfolio change every day and can be affected by changes in interest rates, general market conditions, and other political, social and economic developments, as well as specific matters relating to the issuers in which the Portfolio invests. It is important to note that an investment in the Portfolio is only one component of a balanced investment plan.
104
PACE Municipal Fixed Income Investments
Performance at a glance (unaudited)
Average annual total returns for periods ended 07/31/20 | | 1 year | | 5 years | | 10 years | |
Before deducting maximum sales charge | |
Class A1 | | | 3.66 | % | | | 3.27 | % | | | 3.25 | % | |
Class Y2 | | | 4.00 | | | | 3.51 | | | | 3.50 | | |
Class P3 | | | 3.92 | | | | 3.52 | | | | 3.50 | | |
After deducting maximum sales charge | |
Class A1 | | | 1.37 | | | | 2.80 | | | | 3.01 | | |
Bloomberg Barclays US Municipal 3-15 Year Blend Index4 | | | 5.08 | | | | 3.80 | | | | 3.86 | | |
Most recent calendar quarter-end returns (unaudited)
Average annual total returns for periods ended 06/30/20 | | 1 year | | 5 years | | 10 years | |
Before deducting maximum sales charge | |
Class A1 | | | 2.93 | % | | | 3.11 | % | | | 3.25 | % | |
Class Y2 | | | 3.27 | | | | 3.35 | | | | 3.50 | | |
Class P3 | | | 3.27 | | | | 3.38 | | | | 3.50 | | |
After deducting maximum sales charge | |
Class A1 | | | 0.64 | | | | 2.64 | | | | 3.02 | | |
The annualized gross and net expense ratios, respectively, for each class of shares as in the November 27, 2019 prospectuses, were as follows: Class A—0.92% and 0.82%; Class Y—0.73% and 0.57%; and Class P—0.67% and 0.57%. Net expenses reflect fee waivers and/or expense reimbursements, if any, pursuant to an agreement that is in effect to cap the expenses. The Portfolio and UBS Asset Management (Americas) Inc. ("UBS AM") have entered into a written fee waiver/expense reimbursement agreement pursuant to which UBS AM is contractually obligated to waive its management fees and/or reimburse expenses so that the Portfolio's ordinary total operating expenses of each class through November 30, 2020 (excluding dividend expense, borrowing costs, and interest expense relating to short sales, and expenses attributable to investment in other investment companies, interest, taxes, brokerage commissions and extraordinary expenses) would not exceed Class A—0.82%; Class Y—0.57%; and Class P—0.57%. The Portfolio has agreed to repay UBS AM for any waived fees/reimbursed expenses to the extent that it can do so over the following three fiscal years without causing the Portfolio's expenses in any of those three years to exceed these expense caps and that UBS AM has not waived the right to do so. The fee waiver/ expense reimbursement agreement may be terminated by the Portfolio's board at any time and also will terminate automatically upon the expiration or termination of the Portfolio's advisory contract with UBS AM. Upon termination of the agreement, however, UBS AM's three year recoupment rights will survive.
1 Maximum sales charge for Class A shares is 2.25%. Class A shares bear ongoing 12b-1 service fees of 0.25% annually.
2 The Portfolio offers Class Y shares to a limited group of eligible investors, including certain qualifying retirement plans. Class Y shares do not bear initial or contingent deferred sales charges or ongoing 12b-1 service and distribution fees.
3 Class P shares do not bear initial or contingent deferred sales charges or ongoing 12b-1 service and distribution fees, but Class P shares held through advisory programs may be subject to a program fee, which, if included, would have reduced performance.
4 The Bloomberg Barclays US Municipal 3-15 Year Blend Index is an unmanaged index for the tax-exempt bond market. The Index includes investment-grade municipal bonds with an effective maturity between 2 and 17 years that have at least one year to maturity. Sectors include general obligation, revenue, insured and pre-refunded bonds. Investors should note that indices do not reflect the deduction of fees and expenses.
Prior to August 3, 2015, a 1% redemption fee was imposed on sales or exchanges of any class of shares of the Portfolio made during the specified holding period.
Past performance does not predict future performance, and the performance information provided does not reflect the deduction of taxes that a shareholder could pay on Portfolio distributions or the redemption of Portfolio shares. The return and principal value of an investment will fluctuate, so that an investor's shares, when redeemed, may be worth more or less than their original cost. Performance results assume reinvestment of all dividends and capital gain distributions at net asset value on the ex-dividend dates. Current performance may be higher or lower than the performance data quoted. For month-end performance figures, please visit www.ubs.com/us-mutualfundperformance.
105
PACE Municipal Fixed Income Investments
Illustration of an assumed investment of $10,000 in Class P shares of the Portfolio (unaudited)
The following graph depicts the performance of PACE Municipal Fixed Income Investments Class P shares versus the Bloomberg Barclays US Municipal 3-15 Year Blend Index over the 10 years ended July 31, 2020. Class P shares held through advisory programs may be subject to a program fee, which, if included, would have reduced performance. The performance of the other classes will vary based upon the different class specific expenses and sales charges. The performance provided does not reflect the deduction of taxes that a shareholder could pay on Portfolio distributions or the redemption of Portfolio shares. Past performance is no guarantee of future results. Share price and returns will vary with market conditions; investors may realize a gain or loss upon redemption. It is important to note that PACE Municipal Fixed Income Investments is a professionally managed portfolio while the Index is not available for investment and is unmanaged. The comparison is shown for illustration purposes only.
PACE Municipal Fixed Income Investments
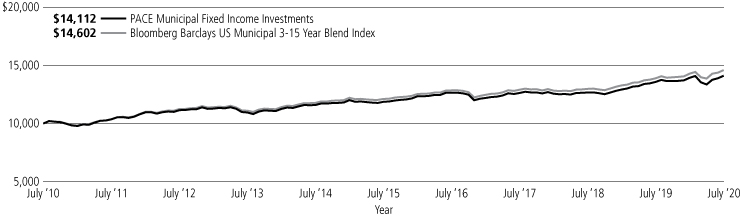
106
PACE Municipal Fixed Income Investments
Portfolio statistics—July 31, 2020 (unaudited)
Characteristics | |
Weighted average duration | | | 4.64 yrs. | | |
Weighted average maturity | | | 8.60 yrs. | | |
Average coupon | | | 4.81 | % | |
Top five states1 | | Percentage of
net assets | |
Illinois | | | 11.7 | % | |
Texas | | | 10.7 | | |
New Jersey | | | 7.8 | | |
Pennsylvania | | | 7.5 | | |
New York | | | 5.3 | | |
Total | | | 43.0 | % | |
Credit rating2 | | Percentage of
net assets | |
SP-2 | | | 0.2 | % | |
AAA | | | 1.8 | | |
AA | | | 32.0 | | |
A | | | 41.6 | | |
BBB | | | 5.5 | | |
Non-rated | | | 17.5 | | |
Cash equivalents and other assets in excess of liabilities | | | 1.4 | | |
Total | | | 100.0 | % | |
1 The Portfolio is actively managed and its composition will vary over time.
2 Credit ratings shown are based on the ratings assigned to portfolio holdings by Standard & Poor's Financial Services LLC, an independent rating agency.
107
PACE Municipal Fixed Income Investments
Portfolio of investments—July 31, 2020
| | | Face
amount | | Value | |
Municipal bonds—98.6% | |
Alabama—3.1% | |
Alabama Federal Aid Highway Finance Authority,
Series A,
5.000%, due 09/01/29 | | $ | 2,000,000 | | | $ | 2,587,060 | | |
Black Belt Energy Gas District Revenue,
Series A-1,
4.000%, VRD | | | 2,000,000 | | | | 2,341,420 | | |
Lower Alabama Gas District Gas Project Revenue
4.000%, VRD | | | 2,500,000 | | | | 2,879,125 | | |
Series A,
5.000%, due 09/01/31 | | | 1,500,000 | | | | 1,971,750 | | |
| | | | | | 9,779,355 | | |
Alaska—0.5% | |
City of Anchorage AK Wastewater Revenue
Refunding,
Series B,
5.000%, due 05/01/31 | | | 1,395,000 | | | | 1,767,242 | | |
Arizona—2.3% | |
Arizona Industrial Development Authority,
Series 2019-2, Class A,
3.625%, due 05/20/33 | | | 987,491 | | | | 1,040,974 | | |
City of Phoenix Civic Improvement Corp.
Revenue Refunding,
Series B, AMT,
5.000%, due 07/01/30 | | | 1,000,000 | | | | 1,274,850 | | |
Maricopa County Industrial Development Authority
(Banner Health Obligation Group),
Series A,
5.000%, due 01/01/31 | | | 3,000,000 | | | | 3,671,100 | | |
Salt Verde Financial Corp. Revenue Bonds
5.000%, due 12/01/32 | | | 1,000,000 | | | | 1,331,140 | | |
| | | | | | 7,318,064 | | |
Arkansas—1.0% | |
City of Fort Smith AR Water & Sewer Revenue
Refunding
5.000%, due 10/01/34 | | | 1,320,000 | | | | 1,691,976 | | |
University of Arkansas, (Fayetteville Campus),
Series A,
5.000%, due 11/01/29 | | | 1,385,000 | | | | 1,622,223 | | |
| | | | | | 3,314,199 | | |
California—3.0% | |
California State
5.000%, due 10/01/30 | | | 2,815,000 | | | | 3,774,324 | | |
5.000%, due 04/01/33 | | | 2,710,000 | | | | 3,629,801 | | |
Los Angeles Department of Airports (Los Angeles
International Airport),
Series A, AMT,
5.000%, due 05/15/32 | | | 2,000,000 | | | | 2,195,580 | | |
| | | | | | 9,599,705 | | |
Colorado—4.4% | |
Colorado Health Facilities Authority,
Series A,
5.000%, due 01/01/30 | | | 1,500,000 | | | | 1,990,035 | | |
| | | Face
amount | | Value | |
Municipal bonds—(continued) | |
Colorado—(concluded) | |
Colorado Health Facilities Authority, Revenue
Refunding Adventhealth Obligated Group
5.000%, VRD | | $ | 1,500,000 | | | $ | 1,878,270 | | |
Denver City & County Airport Revenue,
Subseries A, AMT,
5.500%, due 11/15/26 | | | 7,000,000 | | | | 8,007,440 | | |
University of Colorado Revenue Refunding,
Series A-2,
5.000%, due 06/01/30 | | | 1,750,000 | | | | 2,303,192 | | |
| | | | | | 14,178,937 | | |
Connecticut—2.5% | |
Connecticut Special Tax Revenue,
Series B,
5.000%, due 10/01/30 | | | 2,000,000 | | | | 2,596,920 | | |
Connecticut State (Gaap Conversion
Bonds—2013),
Series A,
5.000%, due 10/15/25 | | | 2,900,000 | | | | 3,304,724 | | |
Hartford County Metropolitan District Revenue
(Green Bonds),
Series A,
5.000%, due 11/01/29 | | | 1,870,000 | | | | 2,166,301 | | |
| | | | | | 8,067,945 | | |
District of Columbia—1.7% | |
Metropolitan Washington, Airport Authority
Airport System Revenue,
Series A, AMT,
5.000%, due 10/01/22 | | | 2,000,000 | | | | 2,186,380 | | |
AMT,
5.000%, due 10/01/28 | | | 2,500,000 | | | | 3,147,875 | | |
| | | | | | 5,334,255 | | |
Florida—4.8% | |
Citizens Property Insurance Corp. Revenue,
Series A-1,
5.000%, due 06/01/25 | | | 7,000,000 | | | | 8,267,700 | | |
County of Broward FL Port Facilities Revenue
Unrefunded,
Series B, AMT,
5.000%, due 09/01/21 | | | 660,000 | | | | 684,968 | | |
County of Polk FL Utility System Revenue
5.000%, due 10/01/35 | | | 625,000 | | | | 852,456 | | |
JEA Electric System Revenue,
Series 3-A,
5.000%, due 10/01/34 | | | 1,630,000 | | | | 2,159,815 | | |
Miami Beach Redevelopment Agency Tax
Increment Revenue Refunding
5.000%, due 02/01/28 | | | 1,000,000 | | | | 1,151,570 | | |
Orange County Florida Tourist Development Tax
Revenue Refunding,
Series B,
5.000%, due 10/01/30 | | | 1,885,000 | | | | 2,242,867 | | |
| | | | | | 15,359,376 | | |
108
PACE Municipal Fixed Income Investments
Portfolio of investments—July 31, 2020
| | | Face
amount | | Value | |
Municipal bonds—(continued) | |
Georgia—2.6% | |
Fulton County Development Authority of Georgia
Revenue (Anticipation CTFS-Wellstar Health
System, Inc. Project),
Series A,
5.000%, due 04/01/36 | | $ | 1,000,000 | | | $ | 1,209,470 | | |
Fulton County Development Authority of Georgia
Revenue (Piedmont Healthcare, Inc. Project),
Series A,
5.000%, due 07/01/27 | | | 1,500,000 | | | | 1,837,305 | | |
Main Street Natural Gas, Inc. Revenue,
Series A,
5.500%, due 09/15/28 | | | 1,500,000 | | | | 1,953,120 | | |
Series B, | |
1 mo. USD LIBOR + 0.750%,
0.865%, due 04/01/48 1 | | | 1,000,000 | | | | 993,660 | | |
Municipal Electric Authority of Georgia Revenue
Bonds (Nuclear Power Plants)
5.000%, due 01/01/33 | | | 1,000,000 | | | | 1,244,520 | | |
Savannah Economic Development Authority
(International Paper Company)
1.900%, due 08/01/24 | | | 1,000,000 | | | | 1,031,550 | | |
| | | | | | 8,269,625 | | |
Hawaii—0.4% | |
Hawaii Airports System Revenue,
Series A, AMT,
5.000%, due 07/01/29 | | | 1,000,000 | | | | 1,270,870 | | |
Illinois—11.7% | |
Illinois County of Cook Sale Tax Revenue Refunding
5.000%, due 11/15/35 | | | 2,500,000 | | | | 2,980,850 | | |
Chicago Waterworks Revenue Senior Lien,
Series A-1,
5.000%, due 11/01/29 | | | 1,920,000 | | | | 2,306,611 | | |
Series 2017-2, (AGM Insured),
5.000%, due 11/01/31 | | | 1,000,000 | | | | 1,205,600 | | |
State of Illinois Sales Tax Revenue,
Series A, (BAM Insured),
5.000%, due 06/15/27 | | | 3,000,000 | | | | 3,551,340 | | |
Regional Transportation Authority Revenue
Refunding,
(AGM Insured),
6.000%, due 06/01/25 | | | 2,000,000 | | | | 2,366,740 | | |
Illinois Sports Facilities Authority,
(BAM Insured),
5.000%, due 06/15/28 | | | 1,000,000 | | | | 1,234,180 | | |
Sales Tax Securitization Corp. Revenue Refunding
Senior Lien,
Series A,
5.000%, due 01/01/36 | | | 1,770,000 | | | | 2,160,497 | | |
Illinois Finance Authority Revenue University of
Chicago,
Series A,
5.000%, due 10/01/29 | | | 2,440,000 | | | | 2,567,758 | | |
| | | Face
amount | | Value | |
Municipal bonds—(continued) | |
Illinois—(concluded) | |
Chicago O'Hare International Airport Revenue,
Series A, AMT,
5.000%, due 01/01/23 | | $ | 1,150,000 | | | $ | 1,217,413 | | |
University of Illinois, (Auxiliary Facilities System),
Series A,
5.000%, due 04/01/27 | | | 4,000,000 | | | | 4,410,600 | | |
University of Illinois,
Series A,
5.000%, due 04/01/30 | | | 1,000,000 | | | | 1,124,950 | | |
Chicago O'Hare International Airport Revenue
Refunding,
Series A, AMT,
5.000%, due 01/01/29 | | | 2,500,000 | | | | 2,872,500 | | |
Illinois Municipal Electric Agency Power Supply
System Revenue Refunding,
Series A,
5.000%, due 02/01/32 | | | 2,500,000 | | | | 2,966,475 | | |
Chicago O'Hare International Airport Revenue
Senior Lien,
Series B,
5.000%, due 01/01/35 | | | 1,750,000 | | | | 2,046,643 | | |
Illinois Finance Authority
5.000%, due 06/01/27 | | | 2,595,000 | | | | 2,894,489 | | |
Regional Transportation Authority
6.500%, due 07/01/30 | | | 1,000,000 | | | | 1,387,670 | | |
| | | | | | 37,294,316 | | |
Indiana—3.5% | |
Indiana Finance Authority Revenue Refunding
(Stadium Project),
Series A,
5.250%, due 02/01/35 | | | 1,000,000 | | | | 1,166,600 | | |
Indiana Finance Authority Revenue University
Health Obligated Group,
Series B,
2.250%, VRD | | | 5,250,000 | | | | 5,564,422 | | |
Richmond Hospital Authority Revenue Refunding
Reid Hospital & Health Care,
Series A,
5.000%, due 01/01/30 | | | 2,055,000 | | | | 2,353,160 | | |
Whiting City Revenue (BP Products North America,
Inc. Project), AMT,
5.000%, VRD | | | 1,840,000 | | | | 2,149,065 | | |
| | | | | | 11,233,247 | | |
Kentucky—2.1% | |
Kentucky Public Energy Authority Revenue,
Series A,
4.000%, VRD | | | 2,250,000 | | | | 2,536,520 | | |
Series B,
4.000%, VRD | | | 3,750,000 | | | | 4,185,038 | | |
| | | | | | 6,721,558 | | |
109
PACE Municipal Fixed Income Investments
Portfolio of investments—July 31, 2020
| | | Face
amount | | Value | |
Municipal bonds—(continued) | |
Louisiana—3.2% | |
East Baton Rouge Sewerage Commission Revenue
Refunding,
Series B,
5.000%, due 02/01/28 | | $ | 1,000,000 | | | $ | 1,192,020 | | |
Jefferson Sales Tax District,
Series B, (AGM Insured),
4.000%, due 12/01/32 | | | 1,895,000 | | | | 2,269,736 | | |
New Orleans Aviation Board Revenue,
Series B, (AGM Insured), AMT,
5.000%, due 01/01/28 | | | 1,500,000 | | | | 1,740,900 | | |
Parish of St John the Baptist LA (Marathon Oil
Corporation)
2.200%, VRD | | | 1,000,000 | | | | 966,460 | | |
State of Louisiana State Highway Improvement
Revenue,
Series A,
5.000%, due 06/15/29 | | | 3,500,000 | | | | 4,076,905 | | |
| | | | | | 10,246,021 | | |
Maryland—0.6% | |
Maryland State Transportation Authority Revenue
Baltimore/Washington International,
AMT,
5.000%, due 06/01/24 | | | 1,700,000 | | | | 1,939,292 | | |
Massachusetts—1.6% | |
Commonwealth of Massachusetts,
Series D,
4.000%, due 05/01/34 | | | 2,000,000 | | | | 2,473,840 | | |
Massachusetts Educational Financing Authority,
Series K, AMT,
5.000%, due 07/01/22 | | | 2,500,000 | | | | 2,658,025 | | |
| | | | | | 5,131,865 | | |
Michigan—4.6% | |
Great Lakes Water Authority Water Supply System
Revenue Refunding Senior Lien,
Series A,
5.000%, due 07/01/23 | | | 1,000,000 | | | | 1,120,110 | | |
Series D,
5.000%, due 07/01/26 | | | 1,100,000 | | | | 1,348,446 | | |
Michigan State Finance Authority Revenue
Refunding (Beaumont Health Credit Group)
5.000%, due 08/01/33 | | | 2,415,000 | | | | 2,753,462 | | |
Michigan State Finance Authority Revenue
Refunding (Detroit School District),
Series A,
5.000%, due 05/01/22 | | | 1,485,000 | | | | 1,606,147 | | |
Michigan State Finance Authority Revenue
Refunding Senior Lien (Detroit Water And
Sewerage),
Series C-3, (AGM Insured),
5.000%, due 07/01/30 | | | 1,500,000 | | | | 1,717,875 | | |
| | | Face
amount | | Value | |
Municipal bonds—(continued) | |
Michigan—(concluded) | |
Michigan Strategic Fund Revenue, (Improvement
Project),
AMT,
5.000%, due 06/30/32 | | $ | 3,300,000 | | | $ | 3,863,541 | | |
Saginaw Hospital Finance Authority Revenue
5.000%, due 07/01/28 | | | 1,000,000 | | | | 1,281,040 | | |
Utica Community Schools, (School Building
And Site)
4.000%, due 05/01/23 | | | 1,000,000 | | | | 1,100,640 | | |
| | | | | | 14,791,261 | | |
Missouri—3.8% | |
City of Kansas City, Missouri Airport Revenue,
Series A, AMT,
5.000%, due 09/01/23 | | | 5,000,000 | | | | 5,212,650 | | |
Missouri Joint Municipal Electric Utility Commission
Revenue Refunding Prairie State Project,
Series A,
5.000%, due 12/01/25 | | | 1,300,000 | | | | 1,574,287 | | |
Missouri State Health & Educational Facilities
Authority Health Facilities Revenue Coxhealth,
Series A,
5.000%, due 11/15/34 | | | 2,000,000 | | | | 2,318,940 | | |
Missouri State Health & Educational Facilities
Authority Health Facilities Revenue Saint Luke's
Health System
5.000%, due 11/15/28 | | | 1,000,000 | | | | 1,201,250 | | |
Missouri State Health & Educational Facilities
Authority Health Facilities Revenue
SSM Health Care,
Series A,
5.000%, due 06/01/27 | | | 1,500,000 | | | | 1,713,300 | | |
| | | | | | 12,020,427 | | |
Nebraska—1.4% | |
Nebraska Public Power District Revenue Refunding,
Series B,
5.000%, due 01/01/31 | | | 1,300,000 | | | | 1,677,403 | | |
Public Power Generation Agency Revenue
Refunding Whelan Energy Center Unit 2,
Series A,
5.000%, due 01/01/30 | | | 2,500,000 | | | | 2,950,375 | | |
| | | | | | 4,627,778 | | |
Nevada—0.2% | |
Reno Sales Tax Revenue Refunding, First Lien,
Series 2018A,
5.000%, due 06/01/33 | | | 500,000 | | | | 577,685 | | |
New Jersey—7.8% | |
New Jersey Economic Development Authority
Revenue Refunding,
Series WW,
5.250%, due 06/15/31 | | | 2,100,000 | | | | 2,375,814 | | |
Series XX,
5.000%, due 06/15/26 | | | 1,600,000 | | | | 1,831,888 | | |
110
PACE Municipal Fixed Income Investments
Portfolio of investments—July 31, 2020
| | | Face
amount | | Value | |
Municipal bonds—(continued) | |
New Jersey—(concluded) | |
New Jersey Health Care Facilities Financing
Authority Revenue Refunding
5.000%, due 07/01/33 | | $ | 1,000,000 | | | $ | 1,257,310 | | |
New Jersey Health Care Facilities Financing
Authority Revenue Refunding (Virtua Health)
5.000%, due 07/01/25 | | | 1,500,000 | | | | 1,736,295 | | |
New Jersey State Higher Education Assistance
Authority Revenue,
Series 1A, AMT,
5.000%, due 12/01/21 | | | 2,550,000 | | | | 2,672,323 | | |
Series B, AMT,
5.000%, due 12/01/23 | | | 2,000,000 | | | | 2,226,260 | | |
New Jersey Transportation Trust Fund Authority
Revenue Bonds,
Series S,
5.000%, due 06/15/30 | | | 1,000,000 | | | | 1,204,600 | | |
New Jersey Turnpike Authority Revenue,
Series E,
5.000%, due 01/01/30 | | | 1,350,000 | | | | 1,700,636 | | |
Tobacco Settlement Financing Corp. Tobacco
Settlement Revenue Refunding,
Series A,
5.000%, due 06/01/34 | | | 8,000,000 | | | | 9,889,840 | | |
| | | | | | 24,894,966 | | |
New York—5.3% | |
Metropolitan Transportation Authority
Revenue Bonds,
Series A-1,
5.000%, due 02/01/23 | | | 605,000 | | | | 635,214 | | |
Series B,
5.000%, due 11/15/22 | | | 895,000 | | | | 942,131 | | |
Nassau County New York Industrial Development,
Series B,
5.000%, due 10/01/21 | | | 3,045,000 | | | | 3,208,151 | | |
New York City,
Series H,
5.000%, due 08/01/25 | | | 2,990,000 | | | | 3,466,845 | | |
New York State Urban Development Corp. Empire
State Development State Personal Income Tax
Revenue Bonds,
Series E,
5.000%, due 03/15/31 | | | 2,000,000 | | | | 2,226,800 | | |
New York Transportation Development Corp.
Special Facility Revenue Refunding (Laguardia
Airport Terminal B Redevelopment),
Series A, AMT,
5.000%, due 07/01/34 | | | 1,000,000 | | | | 1,103,120 | | |
New York Transportation Development Corp.
Special Facility Revenue Refunding (Terminal
One Group Association),
AMT,
5.000%, due 01/01/22 | | | 1,500,000 | | | | 1,560,120 | | |
| | | Face
amount | | Value | |
Municipal bonds—(continued) | |
New York—(concluded) | |
Port Authority of New York & New Jersey Revenue
Consolidated (One Hundred Eighty-Fifth),
AMT,
5.000%, due 09/01/22 | | $ | 2,400,000 | | | $ | 2,624,544 | | |
TSASC, Inc. Tobacco Settlement Bonds,
Series A,
5.000%, due 06/01/34 | | | 1,000,000 | | | | 1,187,670 | | |
| | | | | | 16,954,595 | | |
North Carolina—1.0% | |
North Carolina Medical Care Commission Health
Care Facilities Revenue Refunding (Vidant Health)
5.000%, due 06/01/32 | | | 1,500,000 | | | | 1,737,645 | | |
North Carolina Turnpike Authority Senior Lien,
(AGM Insured),
5.000%, due 01/01/26 | | | 1,250,000 | | | | 1,503,750 | | |
| | | | | | 3,241,395 | | |
Ohio—0.6% | |
American Municipal Power, Inc. Revenue,
Series A,
5.000%, due 02/15/27 | | | 1,000,000 | | | | 1,149,370 | | |
Sycamore Community City School District
4.000%, due 12/01/26 | | | 750,000 | | | | 907,275 | | |
| | | | | | 2,056,645 | | |
Pennsylvania—7.5% | |
Allegheny County Hospital Development Authority
(Allegheny Health Network Obligated Group
Issue) Revenue,
Series A,
5.000%, due 04/01/29 | | | 3,190,000 | | | | 3,989,924 | | |
Allegheny County Port Authority Special Revenue
Refunding Transportation
5.000%, due 03/01/25 | | | 1,000,000 | | | | 1,026,270 | | |
Commonwealth Financing Authority Tobacco
Master Settlement Payment Revenue
5.000%, due 06/01/31 | | | 1,500,000 | | | | 1,896,810 | | |
Delaware Valley Regional Finance Authority,
Pennsylvania Local Government Revenue Bonds,
Series B, , SIFMA + 0.420%
0.580%, due 09/01/481 | | | 3,500,000 | | | | 3,475,430 | | |
Pennsylvania Turnpike Commission Motor License
Fund-Enhanced Turnpike Subordinate Special
Revenue
5.000%, due 12/01/33 | | | 1,500,000 | | | | 1,867,545 | | |
Pennsylvania Turnpike Commission Turnpike
Refunding Subordinated Revenue,
Series B,
5.000%, due 06/01/28 | | | 2,000,000 | | | | 2,399,960 | | |
Pennsylvania Turnpike Commission Turnpike
Revenue,
Series B,
5.000%, due 12/01/32 | | | 1,250,000 | | | | 1,478,150 | | |
111
PACE Municipal Fixed Income Investments
Portfolio of investments—July 31, 2020
| | | Face
amount | | Value | |
Municipal bonds—(continued) | |
Pennsylvania—(concluded) | |
Philadelphia Airport Revenue,
Series B, AMT,
5.000%, due 07/01/32 | | $ | 1,250,000 | | | $ | 1,492,212 | | |
Philadelphia School District,
Series A,
4.000%, due 09/01/35 | | | 1,500,000 | | | | 1,769,370 | | |
Series A,
5.000%, due 09/01/31 | | | 1,000,000 | | | | 1,277,750 | | |
Philadelphia School District Prerefunded,
Series F,
5.000%, due 09/01/30 | | | 10,000 | | | | 12,779 | | |
Philadelphia School District Unrefunded,
Series F,
5.000%, due 09/01/30 | | | 2,640,000 | | | | 3,225,394 | | |
| | | | | | 23,911,594 | | |
Tennessee—1.1% | |
Metropolitan Government Nashville & Davidson
County Health & Educational Facilities Board
Revenue (Lipscomb University Projects),
Series S,
5.000%, due 10/01/35 | | | 1,350,000 | | | | 1,528,187 | | |
Tennessee Energy Acquisition Corp. Gas Revenue,
Series A,
5.250%, due 09/01/26 | | | 1,500,000 | | | | 1,856,490 | | |
| | | | | | 3,384,677 | | |
Texas—10.7% | |
Brazos Higher Education Authority Inc Revenue,
Series A-1, AMT,
5.000%, due 04/01/30 | | | 1,000,000 | | | | 1,255,450 | | |
Central Texas Regional Mobility Authority Senior
Lien Revenue,
Series A,
5.000%, due 01/01/35 | | | 1,100,000 | | | | 1,260,435 | | |
Central Texas Turnpike System,
Series C,
5.000%, due 08/15/31 | | | 2,000,000 | | | | 2,233,460 | | |
City of Brownsville, Texas Utilities System Revenue,
Series A,
5.000%, due 09/01/28 | | | 2,225,000 | | | | 2,531,805 | | |
Clifton Higher Education Finance Corp. Revenue
Refunding Idea Public Schools,
(PSF-GTD),
5.000%, due 08/15/28 | | | 1,100,000 | | | | 1,297,615 | | |
El Paso Texas
5.000%, due 08/15/34 | | | 2,000,000 | | | | 2,461,760 | | |
Grand Parkway Transportation Corporation Bond
Anticipation Notes Revenue
5.000%, due 02/01/23 | | | 500,000 | | | | 551,860 | | |
Harris County Cultural Education Facilities Finance
Corp. Revenue Refunding Children's Hospital
4.000%, due 10/01/35 | | | 1,750,000 | | | | 2,110,342 | | |
| | | Face
amount | | Value | |
Municipal bonds—(continued) | |
Texas—(concluded) | |
Harris County Toll Road Authority Revenue
Refunding Senior Lien,
Series A,
5.000%, due 08/15/29 | | $ | 2,025,000 | | | $ | 2,634,768 | | |
Harris County-Houston Sports Authority Revenue
Refunding Senior Lien,
Series A,
5.000%, due 11/15/29 | | | 1,000,000 | | | | 1,046,530 | | |
Houston Airport System Revenue Refunding,
Series B,
5.000%, due 07/01/29 | | | 2,000,000 | | | | 2,576,340 | | |
North Texas Tollway Authority Revenue Refunding,
Series A,
5.000%, due 01/01/31 | | | 2,750,000 | | | | 3,210,955 | | |
Series A,
5.000%, due 01/01/34 | | | 2,775,000 | | | | 3,202,600 | | |
Socorro Independent School District Refunding,
Series A, (PSF-GTD),
5.000%, due 08/15/28 | | | 2,385,000 | | | | 2,825,009 | | |
Tarrant County Cultural Education Facilities Finance
Corp. Hospital Revenue Refunding (Baylor Scott
and White Memorial Hospital),
Series B,
5.000%, due 11/15/32 | | | 1,000,000 | | | | 1,197,700 | | |
University of Houston Revenue Refunding,
Series C,
5.000%, due 02/15/29 | | | 2,000,000 | | | | 2,452,120 | | |
West Travis County Public Utility Agency Revenue,
(BAM Insured),
5.000%, due 08/15/30 | | | 1,000,000 | | | | 1,271,980 | | |
| | | | | | 34,120,729 | | |
Virginia—1.3% | |
Virginia College Building Authority Virginia
Educational Facilities Revenue Bonds, (21st
Century College),
Series C,
5.000%, due 02/01/31 | | | 1,825,000 | | | | 2,310,122 | | |
Virginia Small Business Financing Authority Senior
Lien Revenue Bonds, (95 Express Lanes LLC
Project),
AMT,
5.000%, due 07/01/34 | | | 1,700,000 | | | | 1,767,728 | | |
| | | | | | 4,077,850 | | |
Washington—2.0% | |
Central Puget Sound Regional Transit Authority
Revenue (Green Bonds),
Series S-1,
5.000%, due 11/01/26 | | | 800,000 | | | | 1,017,704 | | |
Port of Seattle Revenue,
Series C, AMT,
5.000%, due 04/01/32 | | | 1,955,000 | | | | 2,209,248 | | |
112
PACE Municipal Fixed Income Investments
Portfolio of investments—July 31, 2020
| | | Face
amount | | Value | |
Municipal bonds—(concluded) | |
Washington—(concluded) | |
Port of Seattle Revenue, Intermediate Lien,
AMT,
5.000%, due 04/01/28 | | $ | 2,500,000 | | | $ | 3,140,425 | | |
| | | | | | 6,367,377 | | |
Wisconsin—2.3% | |
Public Finance Authority lease Development
Revenue (Central District Development Project)
5.000%, due 03/01/34 | | | 1,500,000 | | | | 1,766,700 | | |
Wisconsin Health & Educational Facilities Authority
Revenue (Aspirus, Inc. Obligated Group)
5.000%, due 08/15/27 | | | 1,000,000 | | | | 1,114,600 | | |
Wisconsin Health & Educational Facilities Authority
Revenue (Unitypoint Health),
Series A,
5.000%, due 12/01/26 | | | 1,175,000 | | | | 1,365,197 | | |
WPPI Energy Power Supply Revenue,
Series A,
5.000%, due 07/01/32 | | | 2,760,000 | | | | 3,107,677 | | |
| | | | | | 7,354,174 | | |
Total municipal bonds
(cost—$292,634,030) | | | 315,207,025 | | |
| | | Number of
shares | | Value | |
Short-term investments—0.5% | |
Investment companies—0.5% | |
State Street Institutional U.S. Government Money
Market Fund, 0.09%2
(cost—$1,545,950) | | | 1,545,950 | | | $ | 1,545,950 | | |
Total investments
(cost—$294,179,980)—99.1% | | | 316,752,975 | | |
Other assets in excess of liabilities—0.9% | | | | | 2,783,745 | | |
Net assets—100.0% | | $ | 319,536,720 | | |
For a listing of defined portfolio acronyms that are used throughout the Portfolio of investments as well as the tables that follow, please refer to page 267.
Fair valuation summary
The following is a summary of the fair valuations according to the inputs used as of July 31, 2020 in valuing the Portfolio's investments. In the event a Portfolio holds investments for which fair value is measured using the NAV per share practical expedient (or its equivalent), a separate column will be added to the fair value hierarchy table; this is intended to permit reconciliation to the amounts presented in a Portfolio of investments:
Assets
Description | | Unadjusted
quoted prices in
active markets for
identical investments
(Level 1) | | Other significant
observable inputs
(Level 2) | | Unobservable
inputs
(Level 3) | | Total | |
Municipal bonds | | $ | — | | | $ | 315,207,025 | | | $ | — | | | $ | 315,207,025 | | |
Short-term investments | | | — | | | | 1,545,950 | | | | — | | | | 1,545,950 | | |
Total | | $ | — | | | $ | 316,752,975 | | | $ | — | | | $ | 316,752,975 | | |
At July 31, 2020, there were no transfers in or out of Level 3.
Portfolio footnotes
1 Variable or floating rate security. The interest rate shown is the rate in effect as of period end and changes periodically.
2 Rates shown reflect yield at July 31, 2020.
See accompanying notes to financial statements.
113
PACE Global Fixed Income Investments
Performance
For the 12-months ended July 31, 2020, the Portfolio's Class P shares returned 7.54% before the deduction of the maximum PACE Select program fee.1 In comparison, the Bloomberg Barclays Global Aggregate Index (the "benchmark") returned 7.85%, the Bloomberg Barclays Global Aggregate ex-USD 50% Hedged Index returned 4.74%. (Returns for all share classes over various time periods are shown in the "Performance at a glance" table on page 116. Please note that the returns shown do not reflect the deduction of taxes that a shareholder would pay on Portfolio distributions or the redemption of Portfolio shares.) For a detailed commentary on the market environment in general during the reporting period, please refer to page 2.
Subadvisor's comments2
(Please note that while the subadvisor outperformed the benchmark on a gross-of-fees basis, the Portfolio underperformed net of fees, as reported in the "Performance at a glance" table. As stated in footnote two, the comments that follow address performance on a gross-of-fees basis.)
The Portfolio outperformed its benchmark during the reporting period. Our overweight investment-grade corporate credit allocation and security selection was one of the largest contributors to performance over the period. This allocation detracted from results during the first quarter of 2020, as global investment-grade spreads widened 20 basis points (bps) in February and an additional 190 bps in March, as volatility entered the market in full force. We rotated out of cyclical sectors into defensive sectors. Towards the end of the first quarter, we started adding back our investment-grade corporate exposure via high quality securities, as attractive spread levels, combined with positive technicals on the back of central bank buying, overwhelmed the weak fundamentals. The resulting spread compression was the largest driver of positive returns.
US duration positioning detracted from results relative to the benchmark. We were underweight US duration at the start of 2020, driven by our expectations of higher yields due to improvement in risk appetite post US-China phase one deal. This positioning was not rewarded due to the flight to safety driven rally in US Treasurys and was closed in February 2020. Our overweight to US Treasury Inflation-Protected Securities (TIPS) also detracted from results, due to the fall in inflation expectations amidst the sharp fall in oil prices in the first quarter of the year.
Elsewhere, European spread exposure detracted from performance. We initiated an overweight to Italy in mid-2019, as extended valuations were coupled with better-than-expected budget execution, and the prospect of quantitative easing from the European Central Bank (ECB). However, the positioning was a headwind for returns due to spread widening on the back of political instability in the fourth quarter of 2019 and further in the first quarter of 2020 due to ECB's policy response, which initially fell short of market expectations. We subsequently scaled back our exposures in Italy. However, we continue to remain engaged as the ECB and European Union have demonstrated that they will backstop spreads in periphery countries.
PACE Select Advisors Trust – PACE Global Fixed Income Investments
Investment Manager:
UBS Asset Management (Americas) Inc. ("UBS AM")
Investment Subadvisor:
J.P. Morgan Investment Management, Inc. ("J.P. Morgan")
Portfolio Management Team:
UBS AM: Mabel Lung, CFA, Gina Toth, CFA, Fred Lee, CFA, Joseph Sciortino and Steve Bienashski
J.P. Morgan: Iain Stealey, CFA, Linda Raggi, CFA and Myles Bradshaw, CFA
Objective:
High total return
Investment process:
The subadvisor utilizes a strategy that involves investing
primarily in global fixed income securities either directly
or through the use of financial derivative instruments
where appropriate.
1 Class P shares held through the PACE Select Advisors Program are subject to a maximum Program fee of 2.50%, which, if included, would have reduced performance. Class P shares held through other advisory programs also may be subject to a program fee, which, if included, would have reduced performance.
2 Performance is discussed on a gross-of-fees basis—meaning that no fees or expenses are reflected when discussed at the level of a subadvisor's sleeve (or subadvisors' sleeves, if applicable). Alternatively, performance at the overall Portfolio level is shown net of fees, which does factor in fees and expenses associated with the Portfolio.
114
PACE Global Fixed Income Investments
Subadvisor's comments – concluded
We utilized derivatives over the period for efficient portfolio management purposes. The main types of financial derivative contracts we use are interest rate futures and foreign exchange currency forwards contracts. This allows us to implement our strategy as well as to hedge or take currency risk. For example, we used interest rate futures to take a short position in US and Germany in the front end of the yield curve. Overall, the use of derivatives was beneficial to our portfolio management process.
Mutual funds are sold by prospectus only. You should read it carefully and consider a fund's investment objectives, risks, charges, expenses and other important information contained in the prospectus before investing. Prospectuses for most of our funds can be obtained from your financial advisor, by calling UBS Funds at 800-647 1568 or by visiting our Website at www.ubs.com/am-us.
Special considerations
The Portfolio may be appropriate for long-term investors seeking high total return and who are able to withstand short-term fluctuations in the fixed income markets in return for potentially higher returns over the long term. The yield and value of the Portfolio change every day and can be affected by changes in interest rates, general market conditions, and other political, social and economic developments, as well as specific matters relating to the issuers in which the Portfolio invests. It is important to note that an investment in the Portfolio is only one component of a balanced investment plan. The value of the Portfolio's investments in foreign securities may fall due to adverse political, social and economic developments abroad and due to decreases in foreign currency values relative to the US dollar. These risks are greater for investments in emerging markets than in more developed countries.
115
PACE Global Fixed Income Investments
Performance at a glance (unaudited)
Average annual total returns for periods ended 07/31/20 | | 1 year | | 5 years | | 10 years | |
Before deducting maximum sales charge | |
Class A1 | | | 7.36 | % | | | 3.29 | % | | | 2.04 | % | |
Class Y2 | | | 7.47 | | | | 3.45 | | | | 2.22 | | |
Class P3 | | | 7.54 | | | | 3.48 | | | | 2.24 | | |
After deducting maximum sales charge | |
Class A1 | | | 3.34 | | | | 2.50 | | | | 1.65 | | |
Bloomberg Barclays Global Aggregate Index4 | | | 7.85 | | | | 4.16 | | | | 2.79 | | |
Bloomberg Barclays Global Aggregate ex USD 50% Hedged Index5 | | | 4.74 | | | | 4.14 | | | | 3.11 | | |
Most recent calendar quarter-end returns (unaudited)
Average annual total returns for periods ended 06/30/20 | | 1 year | | 5 years | | 10 years | |
Before deducting maximum sales charge | |
Class A1 | | | 2.59 | % | | | 2.51 | % | | | 2.16 | % | |
Class Y2 | | | 2.76 | | | | 2.68 | | | | 2.35 | | |
Class P3 | | | 2.75 | | | | 2.69 | | | | 2.36 | | |
After deducting maximum sales charge | |
Class A1 | | | (1.23 | ) | | | 1.72 | | | | 1.78 | | |
The annualized gross and net expense ratios, respectively, for each class of shares as in the November 27, 2019 prospectuses, supplemented from time to time, were as follows: Class A—1.27% and 1.04%; Class Y—1.11% and 0.88%; and Class P—1.10% and 0.85% Net expenses reflect fee waivers and/or expense reimbursements, if any, pursuant to an agreement that is in effect to cap the expenses. The Portfolio and UBS Asset Management (Americas) Inc. ("UBS AM") have entered into a written fee waiver/expense reimbursement agreement pursuant to which UBS AM is contractually obligated to waive its management fees and/or reimburse expenses so that the Portfolio's ordinary total operating expenses of each class through November 30, 2020 (excluding dividend expense, borrowing costs, and interest expense relating to short sales, and expenses attributable to investment in other investment companies, interest, taxes, brokerage commissions and extraordinary expenses) would not exceed Class A—1.03%; Class Y—0.87%; and Class P—0.84% "Management fee waiver/expense reimbursements" are based on estimated amounts for the current fiscal year. The Portfolio has agreed to repay UBS AM for any waived fees/reimbursed expenses to the extent that it can do so over the following three fiscal years without causing the Portfolio's expenses in any of those three years to exceed these expense caps and that UBS AM has not waived the right to do so. The fee waiver/expense reimbursement agreement may be terminated by the Portfolio's board at any time and also will terminate automatically upon the expiration or termination of the Portfolio's advisory contract with UBS AM. Upon termination of the agreement, however, UBS AM's three year recoupment rights will survive.
1 Maximum sales charge for Class A shares is 3.75%. Class A shares bear ongoing 12b-1 service fees of 0.25% annually.
2 The Portfolio offers Class Y shares to a limited group of eligible investors, including certain qualifying retirement plans. Class Y shares do not bear initial or contingent deferred sales charges or ongoing 12b-1 service and distribution fees.
3 Class P shares do not bear initial or contingent deferred sales charges or ongoing 12b-1 service and distribution fees, but Class P shares held through advisory programs may be subject to a program fee, which, if included, would have reduced performance.
4 The Bloomberg Barclays Global Aggregate Index is an unmanaged broad-based, market capitalization-weighted index which is designed to measure the broad investment-grade global fixed income markets for US and non-US government, government-related, corporate and securitized sectors. Investors should note that indices do not reflect the deduction of fees and expenses.
5 The Bloomberg Barclays Global Aggregate ex USD 50% Hedged Index, is an index which provides a broad-based measure of the global investment grade fixed income markets excluding US dollar-denominated debt and provides 50% of its currency exposure in the US dollar. The other major currency exposures in this index are the Euro, the Japanese yen and, to a lesser extent, the British pound and the Canadian dollar. The two major components of this index are the Pan-European Aggregate and the Asian-Pacific Aggregate indices. The index also includes Canadian, Euro-yen, and other non-USD-denominated investment grade aggregate index eligible securities not already in the indices already noted. Investors should note that indices do not reflect the deduction of fees and expenses.
Prior to August 3, 2015, a 1% redemption fee was imposed on sales or exchanges of any class of shares of the Portfolio made during the specified holding period.
Past performance does not predict future performance, and the performance information provided does not reflect the deduction of taxes that a shareholder would pay on Portfolio distributions or the redemption of Portfolio shares. The return and principal value of an investment will fluctuate, so that an investor's shares, when redeemed, may be worth more or less than their original cost. Performance results assume reinvestment of all dividends and capital gain distributions at net asset value on the ex-dividend dates. Current performance may be higher or lower than the performance data quoted. For month-end performance figures, please visit www.ubs.com/us-mutualfundperformance.
116
PACE Global Fixed Income Investments
Illustration of an assumed investment of $10,000 in Class P shares of the Portfolio (unaudited)
The following graph depicts the performance of PACE Global Fixed Income Investments Class P shares versus the Bloomberg Barclays Global Aggregate Index and the Bloomberg Barclays Global Aggregate ex USD 50% Hedged Index over the 10 years ended July 31, 2020. Class P shares held through advisory programs may be subject to a program fee, which, if included, would have reduced performance. The performance of the other classes will vary based upon the different class specific expenses and sales charges. The performance provided does not reflect the deduction of taxes that a shareholder would pay on Portfolio distributions or the redemption of Portfolio shares. Past performance is no guarantee of future results. Share price and returns will vary with market conditions; investors may realize a gain or loss upon redemption. It is important to note that PACE Global Fixed Income Investments is a professionally managed portfolio while the Indices are not available for investment and are unmanaged. The comparison is shown for illustration purposes only.
PACE Global Fixed Income Investments
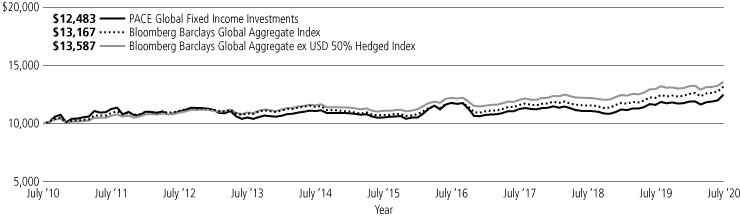
117
PACE Global Fixed Income Investments
Portfolio statistics—July 31, 2020 (unaudited)
Characteristics | |
Weighted average duration | | | 8.05 yrs. | | |
Weighted average maturity | | | 10.01 yrs. | | |
Average coupon | | | 2.94 | % | |
| Top ten holdings1 | | Percentage of
net assets | |
Bundesrepublik Deutschland Bundesanleihe, 0.010% due 02/15/30 | | | 2.6 | % | |
UMBS TBA, 3.000% | | | 2.1 | | |
UMBS TBA, 2.500% | | | 2.0 | | |
Romanian Government International Bond, 3.624% due 05/26/30 | | | 1.9 | | |
Australia Government Bond, 3.000% due 03/21/47 | | | 1.7 | | |
Korea Treasury Bond, 3.000% due 09/10/24 | | | 1.6 | | |
FHLMC, 2.500% due 08/01/50 | | | 1.6 | | |
Japan Government Forty Year Bond, 2.200% due 03/20/51 | | | 1.6 | | |
U.S. Treasury Notes, 0.250% due 06/30/25 | | | 1.6 | | |
Japan Government Twenty Year Bond, 0.300% due 12/20/39 | | | 1.5 | | |
Total | | | 18.2 | % | |
Top five issuer breakdown by country or territory of origin1 | | Percentage of
net assets | |
United States | | | 46.3 | % | |
United Kingdom | | | 7.2 | | |
Japan | | | 7.1 | | |
Italy | | | 6.0 | | |
Canada | | | 3.8 | | |
Total | | | 70.4 | % | |
Investments by type of issuer1 | | Percentage of
net assets | |
Government and other public issuers | | | 46.4 | % | |
Industrial | | | 29.9 | | |
Banks and other financial institutions | | | 21.5 | | |
Investment companies | | | 3.9 | | |
Cash equivalents and liabilities in excess of other assets | | | (1.7 | ) | |
Total | | | 100.0 | % | |
1 The Portfolio is actively managed and its composition will vary over time.
118
PACE Global Fixed Income Investments
Portfolio of investments—July 31, 2020
| | Face
amount | | Value | |
Asset-backed securities—1.0% | |
United Kingdom—0.7% | |
Penarth Master Issuer PLC,
Series 2018-2A, Class A1, | |
1 mo. USD LIBOR + 0.450%,
0.637%, due 09/18/221,2 | | USD | 1,480,000 | | | $ | 1,479,475 | | |
Series 2019-1A, Class A1, | |
1 mo. USD LIBOR + 0.540%,
0.727%, due 07/18/231,2 | | USD | 900,000 | | | | 897,916 | | |
| | | | | | 2,377,391 | | |
United States—0.3% | |
CF Hippolyta LLC,
Series 2020-1, Class A2, | |
1.990%, due 07/15/601 | | USD | 1,070,000 | | | | 1,081,550 | | |
Total asset-backed securities
(cost—$1,707,051) | | | 3,458,941 | | |
Corporate bonds—41.4% | |
Australia—0.2% | |
BHP Billiton Finance Ltd. | |
(fixed, converts to FRN on 10/22/24),
5.625%, due 10/22/793 | | EUR | 300,000 | | | | 413,489 | | |
Newcrest Finance Pty Ltd.
3.250%, due 05/13/301 | | USD | 100,000 | | | | 110,800 | | |
| | | | | | 524,289 | | |
Belgium—1.6% | |
Anheuser-Busch Cos. LLC/Anheuser-Busch
InBev Worldwide, Inc.
4.700%, due 02/01/36 | | USD | 340,000 | | | | 417,782 | | |
Anheuser-Busch InBev SA/N.V. EMTN
2.000%, due 03/17/283 | | EUR | 800,000 | | | | 1,044,196 | | |
Anheuser-Busch InBev Worldwide, Inc.
4.439%, due 10/06/48 | | USD | 630,000 | | | | 764,492 | | |
4.600%, due 04/15/48 | | USD | 170,000 | | | | 210,307 | | |
4.750%, due 01/23/29 | | USD | 135,000 | | | | 165,873 | | |
4.900%, due 01/23/31 | | USD | 225,000 | | | | 288,389 | | |
KBC Group N.V. | |
(fixed, converts to FRN on 03/05/24),
4.750%, due 03/05/243,4 | | EUR | 2,000,000 | | | | 2,379,460 | | |
| | | | | | 5,270,499 | | |
Brazil—0.6% | |
Braskem Netherlands Finance BV
4.500%, due 01/31/301 | | USD | 429,000 | | | | 397,361 | | |
Petrobras Global Finance BV
5.600%, due 01/03/31 | | USD | 1,360,000 | | | | 1,428,000 | | |
| | | | | | 1,825,361 | | |
Canada—1.2% | |
Emera U.S. Finance LP
4.750%, due 06/15/46 | | USD | 265,000 | | | | 344,101 | | |
Enbridge, Inc.
3.700%, due 07/15/27 | | USD | 366,000 | | | | 407,970 | | |
Fortis, Inc.
3.055%, due 10/04/26 | | USD | 1,516,000 | | | | 1,661,337 | | |
HSBC Bank Canada
0.950%, due 05/14/231 | | USD | 1,300,000 | | | | 1,313,863 | | |
| | Face
amount | | Value | |
Corporate bonds—(continued) | |
Canada—(concluded) | |
MEG Energy Corp.
6.500%, due 01/15/251 | | USD | 55,000 | | | $ | 54,037 | | |
NOVA Chemicals Corp.
5.250%, due 06/01/271 | | USD | 40,000 | | | | 37,850 | | |
Videotron Ltd.
5.375%, due 06/15/241 | | USD | 45,000 | | | | 48,825 | | |
| | | | | | 3,867,983 | | |
Chile—0.1% | |
Empresa de Transporte de Pasajeros
Metro SA
4.700%, due 05/07/501,5 | | USD | 390,000 | | | | 487,988 | | |
Denmark—0.1% | |
Orsted A/S | |
(fixed, converts to FRN on 08/24/24),
2.250%, due 11/24/173 | | EUR | 400,000 | | | | 484,390 | | |
France—3.5% | |
Air Liquide Finance SA
2.250%, due 09/27/231 | | USD | 410,000 | | | | 430,054 | | |
BPCE SA
2.700%, due 10/01/291,5 | | USD | 1,060,000 | | | | 1,155,174 | | |
5.700%, due 10/22/231 | | USD | 1,910,000 | | | | 2,143,510 | | |
Credit Agricole SA | |
(fixed, converts to FRN on 12/23/25),
8.125%, due 12/23/251,4 | | USD | 700,000 | | | | 815,500 | | |
Engie SA
2.875%, due 10/10/223 | | USD | 2,369,000 | | | | 2,458,357 | | |
(fixed, converts to FRN on 06/02/24),
3.875%, due 06/02/243,4 | | EUR | 400,000 | | | | 508,286 | | |
Orange SA EMTN | |
(fixed, converts to FRN on 04/01/23),
5.750%, due 04/01/233,4 | | GBP | 300,000 | | | | 428,534 | | |
Societe Generale SA | |
(fixed, converts to FRN on 04/06/28),
6.750%, due 04/06/283,4 | | USD | 928,000 | | | | 932,064 | | |
Societe Generale SA EMTN
5.200%, due 04/15/213 | | USD | 800,000 | | | | 826,902 | | |
Total Capital International SA
3.461%, due 07/12/49 | | USD | 200,000 | | | | 239,049 | | |
Total Capital SA EMTN
5.125%, due 03/26/243 | | EUR | 550,000 | | | | 771,014 | | |
TOTAL SE EMTN | |
(fixed, converts to FRN on 04/04/24),
1.750%, due 04/04/243,4 | | EUR | 700,000 | | | | 825,125 | | |
| | | | | | 11,533,569 | | |
Ireland—0.1% | |
AerCap Ireland Capital DAC/AerCap
Global Aviation Trust
6.500%, due 07/15/25 | | USD | 150,000 | | | | 160,940 | | |
119
PACE Global Fixed Income Investments
Portfolio of investments—July 31, 2020
| | Face
amount | | Value | |
Corporate bonds—(continued) | |
Italy—0.3% | |
Enel Finance International N.V. EMTN
1.966%, due 01/27/253 | | EUR | 264,000 | | | $ | 337,696 | | |
Telecom Italia Capital SA
6.000%, due 09/30/34 | | USD | 75,000 | | | | 91,082 | | |
UniCredit SpA EMTN | |
(fixed, converts to FRN on 06/03/27),
3.875%, due 06/03/273,4 | | EUR | 740,000 | | | | 643,956 | | |
| | | | | | 1,072,734 | | |
Japan—0.6% | |
Mitsubishi UFJ Financial Group, Inc.
3.218%, due 03/07/22 | | USD | 1,145,000 | | | | 1,193,511 | | |
Sumitomo Mitsui Banking Corp.
3.200%, due 07/18/22 | | USD | 580,000 | | | | 609,030 | | |
Takeda Pharmaceutical Co. Ltd.
3.025%, due 07/09/40 | | USD | 200,000 | | | | 217,384 | | |
| | | | | | 2,019,925 | | |
Luxembourg—0.2% | |
SELP Finance SARL
1.500%, due 11/20/253 | | EUR | 520,000 | | | | 620,007 | | |
Mexico—0.4% | |
Petroleos Mexicanos
5.350%, due 02/12/28 | | USD | 950,000 | | | | 833,625 | | |
5.950%, due 01/28/313 | | USD | 500,000 | | | | 430,000 | | |
| | | | | | 1,263,625 | | |
Netherlands—2.2% | |
ABN AMRO Bank N.V. | |
(fixed, converts to FRN on 09/22/25),
4.375%, due 09/22/253,4 | | EUR | 1,000,000 | | | | 1,145,557 | | |
ABN AMRO Bank N.V. EMTN
6.375%, due 04/27/213 | | EUR | 1,950,000 | | | | 2,400,369 | | |
ING Groep N.V. EMTN | |
(fixed, converts to FRN on 04/11/23),
3.000%, due 04/11/28 | | EUR | 1,600,000 | | | | 1,988,363 | | |
(fixed, converts to FRN on 09/26/24),
1.625%, due 09/26/293 | | EUR | 300,000 | | | | 360,628 | | |
Shell International Finance BV
2.375%, due 04/06/25 | | USD | 740,000 | | | | 794,312 | | |
3.125%, due 11/07/49 | | USD | 140,000 | | | | 155,246 | | |
Volkswagen International Finance N.V. | |
(fixed, converts to FRN on 03/20/22),
2.500%, due 03/20/223,4 | | EUR | 400,000 | | | | 466,233 | | |
| | | | | | 7,310,708 | | |
Portugal—0.6% | |
EDP Finance BV EMTN
1.125%, due 02/12/243 | | EUR | 800,000 | | | | 973,760 | | |
2.000%, due 04/22/253 | | EUR | 910,000 | | | | 1,157,140 | | |
| | | | | | 2,130,900 | | |
Spain—0.5% | |
Banco Santander SA EMTN
3.250%, due 04/04/263 | | EUR | 300,000 | | | | 385,540 | | |
| | Face
amount | | Value | |
Corporate bonds—(continued) | |
Spain—(concluded) | |
CaixaBank SA | |
(fixed, converts to FRN on 06/13/24),
6.750%, due 06/13/243,4 | | EUR | 600,000 | | | $ | 710,304 | | |
Iberdrola International BV EMTN
0.375%, due 09/15/253 | | EUR | 500,000 | | | | 597,957 | | |
| | | | | | 1,693,801 | | |
Switzerland—1.1% | |
Credit Suisse AG
2.800%, due 04/08/22 | | USD | 390,000 | | | | 405,309 | | |
2.950%, due 04/09/25 | | USD | 440,000 | | | | 482,785 | | |
Credit Suisse Group AG | |
(fixed, converts to FRN on 09/12/24),
2.125%, due 09/12/253 | | GBP | 600,000 | | | | 807,902 | | |
(fixed, converts to FRN on 04/01/30),
4.194%, due 04/01/311 | | USD | 690,000 | | | | 805,878 | | |
(fixed, converts to FRN on 08/21/26),
6.375%, due 08/21/261,4 | | USD | 780,000 | | | | 821,441 | | |
(fixed, converts to FRN on 07/17/23),
7.500%, due 07/17/231,4 | | USD | 400,000 | | | | 421,816 | | |
| | | | | | 3,745,131 | | |
United Kingdom—4.8% | |
AstraZeneca PLC
4.000%, due 09/18/42 | | USD | 530,000 | | | | 698,083 | | |
BAE Systems PLC
3.400%, due 04/15/301,5 | | USD | 170,000 | | | | 191,641 | | |
BAT Capital Corp.
4.390%, due 08/15/37 | | USD | 195,000 | | | | 222,760 | | |
4.700%, due 04/02/27 | | USD | 1,840,000 | | | | 2,144,383 | | |
Centrica PLC EMTN
4.375%, due 03/13/293 | | GBP | 200,000 | | | | 315,349 | | |
Diageo Capital PLC
2.000%, due 04/29/30 | | USD | 200,000 | | | | 212,123 | | |
Eversholt Funding PLC EMTN
6.359%, due 12/02/253 | | GBP | 430,000 | | | | 695,183 | | |
GlaxoSmithKline Capital PLC
3.000%, due 06/01/24 | | USD | 365,000 | | | | 397,826 | | |
Heathrow Funding Ltd. EMTN
1.875%, due 07/12/323 | | EUR | 290,000 | | | | 352,152 | | |
6.750%, due 12/03/263 | | GBP | 600,000 | | | | 992,350 | | |
HSBC Holdings PLC | |
(fixed, converts to FRN on 11/22/22),
3.033%, due 11/22/23 | | USD | 1,200,000 | | | | 1,257,731 | | |
(fixed, converts to FRN on 03/13/27),
4.041%, due 03/13/28 | | USD | 1,010,000 | | | | 1,127,234 | | |
Imperial Brands Finance PLC
3.125%, due 07/26/241 | | USD | 440,000 | | | | 467,282 | | |
Nationwide Building Society | |
(fixed, converts to FRN on 06/20/27),
1.000%, due 06/20/273,4,6 | | GBP | 900,000 | | | | 1,200,189 | | |
(fixed, converts to FRN on 12/20/24),
5.875%, due 12/20/243,4 | | GBP | 200,000 | | | | 265,233 | | |
120
PACE Global Fixed Income Investments
Portfolio of investments—July 31, 2020
| | Face
amount | | Value | |
Corporate bonds—(continued) | |
United Kingdom—(concluded) | |
Natwest Group PLC | |
(fixed, converts to FRN on 05/15/22),
3.498%, due 05/15/23 | | USD | 985,000 | | | $ | 1,029,947 | | |
(fixed, converts to FRN on 03/22/24),
4.269%, due 03/22/25 | | USD | 380,000 | | | | 418,404 | | |
Reynolds American, Inc.
4.850%, due 09/15/23 | | USD | 960,000 | | | | 1,077,604 | | |
Sky Ltd. GMTN
2.250%, due 11/17/253 | | EUR | 510,000 | | | | 671,734 | | |
Standard Chartered PLC | |
(fixed, converts to FRN on 04/01/30),
4.644%, due 04/01/311 | | USD | 945,000 | | | | 1,101,803 | | |
Vodafone Group PLC
4.125%, due 05/30/25 | | USD | 425,000 | | | | 486,240 | | |
5.000%, due 05/30/38 | | USD | 315,000 | | | | 408,247 | | |
5.250%, due 05/30/48 | | USD | 170,000 | | | | 230,988 | | |
| | | | | | 15,964,486 | | |
United States—23.3% | |
Abbott Ireland Financing DAC
0.375%, due 11/19/273 | | EUR | 400,000 | | | | 476,171 | | |
AbbVie, Inc.
3.200%, due 11/21/291 | | USD | 1,350,000 | | | | 1,517,289 | | |
4.250%, due 11/21/491 | | USD | 240,000 | | | | 306,789 | | |
4.875%, due 11/14/48 | | USD | 165,000 | | | | 227,194 | | |
ACCO Brands Corp.
5.250%, due 12/15/241,5 | | USD | 35,000 | | | | 35,875 | | |
AES Corp./The
6.000%, due 05/15/265 | | USD | 30,000 | | | | 31,725 | | |
Albertsons Cos., Inc./
Safeway, Inc./New Albertsons LP/
Albertson's LLC
4.875%, due 02/15/301,5 | | USD | 125,000 | | | | 135,375 | | |
Ally Financial, Inc.
4.625%, due 03/30/25 | | USD | 65,000 | | | | 71,946 | | |
Altria Group, Inc.
2.350%, due 05/06/25 | | USD | 100,000 | | | | 106,336 | | |
3.400%, due 05/06/30 | | USD | 140,000 | | | | 156,319 | | |
4.250%, due 08/09/42 | | USD | 45,000 | | | | 50,661 | | |
Ameren Corp.
3.500%, due 01/15/31 | | USD | 380,000 | | | | 439,304 | | |
American Electric Power Co., Inc.,
Series F,
2.950%, due 12/15/22 | | USD | 400,000 | | | | 419,514 | | |
American Tower Corp.
1.375%, due 04/04/25 | | EUR | 300,000 | | | | 368,193 | | |
3.125%, due 01/15/27 | | USD | 530,000 | | | | 586,609 | | |
3.950%, due 03/15/29 | | USD | 290,000 | | | | 342,354 | | |
American Water Capital Corp.
2.800%, due 05/01/30 | | USD | 960,000 | | | | 1,082,235 | | |
AmeriGas Partners LP/AmeriGas
Finance Corp.
5.875%, due 08/20/26 | | USD | 45,000 | | | | 49,655 | | |
Amgen, Inc.
2.300%, due 02/25/31 | | USD | 100,000 | | | | 106,653 | | |
| | Face
amount | | Value | |
Corporate bonds—(continued) | |
United States—(continued) | |
Apple, Inc.
4.650%, due 02/23/46 | | USD | 420,000 | | | $ | 605,483 | | |
Arconic Corp.
6.125%, due 02/15/281,5 | | USD | 100,000 | | | | 106,625 | | |
AT&T, Inc.
2.050%, due 05/19/32 | | EUR | 200,000 | | | | 254,758 | | |
2.250%, due 02/01/326 | | USD | 240,000 | | | | 246,079 | | |
2.300%, due 06/01/27 | | USD | 265,000 | | | | 280,653 | | |
2.750%, due 06/01/31 | | USD | 425,000 | | | | 454,929 | | |
3.500%, due 06/01/41 | | USD | 230,000 | | | | 249,579 | | |
4.300%, due 12/15/42 | | USD | 15,000 | | | | 17,757 | | |
Baker Hughes a GE Co. LLC/Baker Hughes
Co-Obligor, Inc.
3.337%, due 12/15/27 | | USD | 360,000 | | | | 397,973 | | |
Bank of America Corp. | |
(fixed, converts to FRN on 12/20/22),
3.004%, due 12/20/23 | | USD | 915,000 | | | | 964,471 | | |
(fixed, converts to FRN on 12/20/27),
3.419%, due 12/20/28 | | USD | 910,000 | | | | 1,028,816 | | |
Bank of America Corp. EMTN | |
(fixed, converts to FRN on 02/07/24),
1.379%, due 02/07/253 | | EUR | 800,000 | | | | 978,227 | | |
2.300%, due 07/25/253 | | GBP | 490,000 | | | | 682,966 | | |
Bank of America Corp. MTN | |
(fixed, converts to FRN on 10/22/24),
2.456%, due 10/22/25 | | USD | 280,000 | | | | 297,087 | | |
Bausch Health Americas, Inc.
9.250%, due 04/01/261,5 | | USD | 65,000 | | | | 73,105 | | |
Bausch Health Cos., Inc.
5.000%, due 01/30/281 | | USD | 235,000 | | | | 236,170 | | |
Becton Dickinson and Co.
2.823%, due 05/20/30 | | USD | 720,000 | | | | 791,024 | | |
3.700%, due 06/06/27 | | USD | 196,000 | | | | 224,279 | | |
3.794%, due 05/20/50 | | USD | 150,000 | | | | 182,634 | | |
Berkshire Hathaway Energy Co.
4.450%, due 01/15/495 | | USD | 150,000 | | | | 208,927 | | |
Berry Global, Inc.
4.875%, due 07/15/261 | | USD | 45,000 | | | | 47,531 | | |
Biogen, Inc.
2.250%, due 05/01/30 | | USD | 150,000 | | | | 157,082 | | |
Boeing Co./The
3.500%, due 03/01/39 | | USD | 90,000 | | | | 81,279 | | |
5.040%, due 05/01/27 | | USD | 535,000 | | | | 578,622 | | |
5.705%, due 05/01/40 | | USD | 260,000 | | | | 293,946 | | |
Boston Scientific Corp.
4.700%, due 03/01/49 | | USD | 20,000 | | | | 28,178 | | |
BP Capital Markets America, Inc.
3.000%, due 02/24/50 | | USD | 60,000 | | | | 64,775 | | |
3.410%, due 02/11/26 | | USD | 220,000 | | | | 246,140 | | |
3.588%, due 04/14/27 | | USD | 690,000 | | | | 781,539 | | |
Brink's Co./The
4.625%, due 10/15/271,5 | | USD | 35,000 | | | | 35,604 | | |
Bristol-Myers Squibb Co.
4.250%, due 10/26/495 | | USD | 305,000 | | | | 433,455 | | |
Broadcom, Inc.
3.150%, due 11/15/251 | | USD | 650,000 | | | | 700,847 | | |
121
PACE Global Fixed Income Investments
Portfolio of investments—July 31, 2020
| | Face
amount | | Value | |
Corporate bonds—(continued) | |
United States—(continued) | |
Buckeye Partners LP
4.125%, due 03/01/251 | | USD | 35,000 | | | $ | 35,175 | | |
Burlington Northern Santa Fe LLC
3.050%, due 02/15/515 | | USD | 690,000 | | | | 805,204 | | |
4.150%, due 12/15/48 | | USD | 75,000 | | | | 102,285 | | |
CCO Holdings LLC/CCO Holdings
Capital Corp.
4.750%, due 03/01/301 | | USD | 250,000 | | | | 266,094 | | |
CDK Global, Inc.
5.250%, due 05/15/291 | | USD | 30,000 | | | | 32,852 | | |
CDW LLC/CDW Finance Corp.
4.250%, due 04/01/285 | | USD | 50,000 | | | | 53,480 | | |
Centene Corp.
4.250%, due 12/15/27 | | USD | 125,000 | | | | 132,812 | | |
CenturyLink, Inc.
5.125%, due 12/15/261,5 | | USD | 80,000 | | | | 83,900 | | |
Charter Communications
Operating LLC/Charter
Communications Operating Capital
2.800%, due 04/01/31 | | USD | 500,000 | | | | 524,518 | | |
3.700%, due 04/01/51 | | USD | 485,000 | | | | 512,302 | | |
Cheniere Energy Partners LP
5.625%, due 10/01/26 | | USD | 30,000 | | | | 31,688 | | |
Chevron Corp.
1.554%, due 05/11/25 | | USD | 580,000 | | | | 604,448 | | |
2.236%, due 05/11/30 | | USD | 250,000 | | | | 270,280 | | |
Citigroup, Inc. | |
(fixed, converts to FRN on 06/03/30),
2.572%, due 06/03/31 | | USD | 730,000 | | | | 775,241 | | |
(fixed, converts to FRN on 07/24/22),
2.876%, due 07/24/23 | | USD | 3,580,000 | | | | 3,734,659 | | |
(fixed, converts to FRN on 04/08/25),
3.106%, due 04/08/26 | | USD | 1,100,000 | | | | 1,195,572 | | |
(fixed, converts to FRN on 01/24/22),
3.142%, due 01/24/23 | | USD | 345,000 | | | | 357,165 | | |
Series Q, | |
(fixed, converts to FRN on 11/15/20),
5.950%, due 11/15/204 | | USD | 330,000 | | | | 324,073 | | |
Claremont Mckenna College,
Series 2019,
3.378%, due 01/01/50 | | USD | 620,000 | | | | 705,116 | | |
Clear Channel Worldwide Holdings, Inc.
5.125%, due 08/15/271 | | USD | 85,000 | | | | 83,300 | | |
Clearway Energy Operating LLC
5.000%, due 09/15/26 | | USD | 30,000 | | | | 31,463 | | |
Cleveland Electric Illuminating Co./The
3.500%, due 04/01/281 | | USD | 420,000 | | | | 453,193 | | |
Coca-Cola Co./The
1.650%, due 06/01/30 | | USD | 345,000 | | | | 360,971 | | |
Comcast Corp.
3.900%, due 03/01/38 | | USD | 395,000 | | | | 494,294 | | |
3.969%, due 11/01/47 | | USD | 400,000 | | | | 512,520 | | |
4.000%, due 03/01/48 | | USD | 355,000 | | | | 463,064 | | |
CommScope, Inc.
6.000%, due 03/01/261 | | USD | 95,000 | | | | 101,353 | | |
| | Face
amount | | Value | |
Corporate bonds—(continued) | |
United States—(continued) | |
Constellation Brands, Inc.
4.500%, due 05/09/47 | | USD | 80,000 | | | $ | 103,422 | | |
Costco Wholesale Corp.
1.750%, due 04/20/32 | | USD | 240,000 | | | | 251,204 | | |
Cox Communications, Inc.
3.500%, due 08/15/271 | | USD | 65,000 | | | | 73,526 | | |
Crown Castle International Corp.
3.300%, due 07/01/30 | | USD | 760,000 | | | | 859,138 | | |
CSX Corp.
2.400%, due 02/15/30 | | USD | 236,000 | | | | 254,950 | | |
Dana Financing Luxembourg SARL
6.500%, due 06/01/261 | | USD | 100,000 | | | | 104,750 | | |
Darling Ingredients, Inc.
5.250%, due 04/15/271 | | USD | 25,000 | | | | 26,688 | | |
Deere & Co.
2.750%, due 04/15/25 | | USD | 260,000 | | | | 284,982 | | |
3.750%, due 04/15/50 | | USD | 55,000 | | | | 72,276 | | |
Dell International LLC/EMC Corp.
7.125%, due 06/15/241,5 | | USD | 60,000 | | | | 62,293 | | |
Delphi Technologies PLC
5.000%, due 10/01/251 | | USD | 30,000 | | | | 33,225 | | |
Discovery Communications LLC
3.625%, due 05/15/30 | | USD | 580,000 | | | | 643,448 | | |
DISH DBS Corp.
6.750%, due 06/01/21 | | USD | 100,000 | | | | 103,375 | | |
Edison International
2.950%, due 03/15/235 | | USD | 1,060,000 | | | | 1,089,634 | | |
Energizer Holdings, Inc.
6.375%, due 07/15/261 | | USD | 45,000 | | | | 47,967 | | |
Entergy Louisiana LLC
3.120%, due 09/01/27 | | USD | 600,000 | | | | 670,268 | | |
4.950%, due 01/15/45 | | USD | 208,000 | | | | 231,309 | | |
Enterprise Products Operating LLC
2.800%, due 01/31/305 | | USD | 205,000 | | | | 219,572 | | |
ESH Hospitality, Inc.
4.625%, due 10/01/271 | | USD | 35,000 | | | | 33,681 | | |
Exelon Corp.
4.450%, due 04/15/46 | | USD | 240,000 | | | | 311,667 | | |
5.150%, due 12/01/20 | | USD | 1,300,000 | | | | 1,304,663 | | |
Exxon Mobil Corp.
2.610%, due 10/15/30 | | USD | 340,000 | | | | 374,652 | | |
FirstEnergy Corp.
2.650%, due 03/01/306 | | USD | 110,000 | | | | 112,611 | | |
Series B,
2.250%, due 09/01/30 | | USD | 913,000 | | | | 904,690 | | |
Series B,
3.900%, due 07/15/276 | | USD | 306,000 | | | | 337,004 | | |
Ford Motor Co.
9.000%, due 04/22/25 | | USD | 120,000 | | | | 141,375 | | |
Fox Corp.
3.500%, due 04/08/30 | | USD | 790,000 | | | | 898,953 | | |
GE Capital International Funding Co.
Unlimited Co.
3.373%, due 11/15/25 | | USD | 410,000 | | | | 433,087 | | |
Global Payments, Inc.
2.900%, due 05/15/30 | | USD | 410,000 | | | | 449,083 | | |
122
PACE Global Fixed Income Investments
Portfolio of investments—July 31, 2020
| | Face
amount | | Value | |
Corporate bonds—(continued) | |
United States—(continued) | |
Goldman Sachs Group, Inc./The | |
(fixed, converts to FRN on 10/31/21),
2.876%, due 10/31/22 | | USD | 1,520,000 | | | $ | 1,560,603 | | |
(fixed, converts to FRN on 06/05/22),
2.908%, due 06/05/23 | | USD | 185,000 | | | | 192,241 | | |
3.500%, due 11/16/26 | | USD | 605,000 | | | | 674,934 | | |
Goldman Sachs Group, Inc./The EMTN
1.625%, due 07/27/263 | | EUR | 600,000 | | | | 749,592 | | |
4.250%, due 01/29/263 | | GBP | 440,000 | | | | 663,839 | | |
Hanesbrands, Inc.
4.875%, due 05/15/261,5 | | USD | 50,000 | | | | 54,500 | | |
HCA, Inc.
3.500%, due 09/01/30 | | USD | 200,000 | | | | 210,168 | | |
Hilton Domestic Operating Co., Inc.
5.125%, due 05/01/26 | | USD | 100,000 | | | | 103,500 | | |
Home Depot, Inc./The
3.125%, due 12/15/49 | | USD | 260,000 | | | | 306,481 | | |
Howmet Aerospace, Inc.
5.125%, due 10/01/24 | | USD | 65,000 | | | | 69,070 | | |
Hughes Satellite Systems Corp.
5.250%, due 08/01/26 | | USD | 30,000 | | | | 32,936 | | |
Huntsman International LLC
4.250%, due 04/01/25 | | EUR | 200,000 | | | | 250,828 | | |
iHeartCommunications, Inc.
6.375%, due 05/01/26 | | USD | 75,000 | | | | 78,937 | | |
International Business Machines Corp.
2.850%, due 05/15/40 | | USD | 220,000 | | | | 240,796 | | |
ITC Holdings Corp.
2.950%, due 05/14/301 | | USD | 990,000 | | | | 1,097,580 | | |
John Deere Cash Management SA EMTN
2.200%, due 04/02/323 | | EUR | 300,000 | | | | 419,532 | | |
Kaiser Aluminum Corp.
6.500%, due 05/01/251 | | USD | 315,000 | | | | 333,900 | | |
Keurig Dr. Pepper, Inc.
3.200%, due 05/01/30 | | USD | 360,000 | | | | 408,580 | | |
3.430%, due 06/15/27 | | USD | 455,000 | | | | 514,350 | | |
Kraft Heinz Foods Co.
4.625%, due 01/30/29 | | USD | 60,000 | | | | 68,350 | | |
Kroger Co./The
2.200%, due 05/01/30 | | USD | 245,000 | | | | 262,066 | | |
3.875%, due 10/15/46 | | USD | 290,000 | | | | 349,133 | | |
Lamar Media Corp.
4.000%, due 02/15/301 | | USD | 75,000 | | | | 75,750 | | |
Lamb Weston Holdings, Inc.
4.875%, due 05/15/281,5 | | USD | 35,000 | | | | 39,331 | | |
Lennar Corp.
4.750%, due 11/29/27 | | USD | 35,000 | | | | 39,988 | | |
Level 3 Financing, Inc.
5.375%, due 05/01/25 | | USD | 95,000 | | | | 98,087 | | |
Live Nation Entertainment, Inc.
6.500%, due 05/15/271 | | USD | 45,000 | | | | 48,375 | | |
Lowe's Cos., Inc.
3.700%, due 04/15/46 | | USD | 380,000 | | | | 450,448 | | |
5.000%, due 04/15/40 | | USD | 190,000 | | | | 259,638 | | |
Magellan Midstream Partners LP
4.200%, due 03/15/45 | | USD | 360,000 | | | | 375,045 | | |
| | Face
amount | | Value | |
Corporate bonds—(continued) | |
United States—(continued) | |
Mattel, Inc.
5.875%, due 12/15/271 | | USD | 100,000 | | | $ | 107,625 | | |
Mauser Packaging Solutions Holding Co.
5.500%, due 04/15/241,5 | | USD | 50,000 | | | | 50,979 | | |
Medtronic Global Holdings SCA
1.000%, due 07/02/31 | | EUR | 200,000 | | | | 249,824 | | |
1.125%, due 03/07/27 | | EUR | 430,000 | | | | 537,229 | | |
Medtronic, Inc.
4.375%, due 03/15/35 | | USD | 220,000 | | | | 298,585 | | |
MetLife, Inc.,
Series C, | |
3 mo. USD LIBOR + 3.575%,
3.888%, due 08/31/202,4 | | USD | 350,000 | | | | 338,187 | | |
MGM Resorts International
5.750%, due 06/15/25 | | USD | 55,000 | | | | 56,788 | | |
MidAmerican Energy Co.
4.250%, due 05/01/46 | | USD | 170,000 | | | | 232,488 | | |
Midcontinent Communications/
Midcontinent Finance Corp.
5.375%, due 08/15/271 | | USD | 30,000 | | | | 31,144 | | |
Morgan Stanley | |
(fixed, converts to FRN on 04/24/23),
3.737%, due 04/24/24 | | USD | 990,000 | | | | 1,070,482 | | |
Series J, | |
3 mo. USD LIBOR + 3.81%,
4.085%, due 10/15/202,4 | | USD | 255,000 | | | | 247,674 | | |
Morgan Stanley GMTN
1.875%, due 04/27/27 | | EUR | 670,000 | | | | 865,798 | | |
(fixed, converts to FRN on 01/22/30),
2.699%, due 01/22/31 | | USD | 15,000 | | | | 16,344 | | |
Morgan Stanley MTN | |
(fixed, converts to FRN on 04/01/30),
3.622%, due 04/01/31 | | USD | 560,000 | | | | 654,852 | | |
MPLX LP
4.500%, due 04/15/38 | | USD | 130,000 | | | | 138,457 | | |
National Rural Utilities Cooperative
Finance Corp. MTN
3.250%, due 11/01/25 | | USD | 488,000 | | | | 546,495 | | |
NCR Corp.
5.750%, due 09/01/271 | | USD | 100,000 | | | | 103,250 | | |
Netflix, Inc.
5.875%, due 11/15/28 | | USD | 150,000 | | | | 185,250 | | |
Nexstar Broadcasting, Inc.
5.625%, due 07/15/271 | | USD | 75,000 | | | | 80,272 | | |
NextEra Energy Capital Holdings, Inc.
2.750%, due 05/01/25 | | USD | 300,000 | | | | 328,630 | | |
2.900%, due 04/01/22 | | USD | 549,000 | | | | 572,275 | | |
NiSource, Inc.
2.950%, due 09/01/29 | | USD | 340,000 | | | | 378,870 | | |
Noble Energy, Inc.
3.900%, due 11/15/245 | | USD | 171,000 | | | | 190,399 | | |
Norfolk Southern Corp.
3.050%, due 05/15/50 | | USD | 180,000 | | | | 202,874 | | |
3.942%, due 11/01/47 | | USD | 305,000 | | | | 381,418 | | |
NRG Energy, Inc.
5.250%, due 06/15/291 | | USD | 60,000 | | | | 66,340 | | |
123
PACE Global Fixed Income Investments
Portfolio of investments—July 31, 2020
| | Face
amount | | Value | |
Corporate bonds—(continued) | |
United States—(continued) | |
Oasis Petroleum, Inc.
6.875%, due 01/15/23 | | USD | 60,000 | | | $ | 11,550 | | |
Occidental Petroleum Corp.
2.700%, due 08/15/22 | | USD | 20,000 | | | | 19,308 | | |
OneMain Finance Corp.
6.875%, due 03/15/25 | | USD | 35,000 | | | | 39,113 | | |
Oracle Corp.
2.950%, due 04/01/30 | | USD | 1,040,000 | | | | 1,184,624 | | |
3.600%, due 04/01/50 | | USD | 145,000 | | | | 172,737 | | |
4.000%, due 07/15/46 | | USD | 165,000 | | | | 205,838 | | |
PacifiCorp
3.300%, due 03/15/51 | | USD | 310,000 | | | | 380,855 | | |
Parsley Energy LLC/Parsley Finance Corp.
5.250%, due 08/15/251 | | USD | 20,000 | | | | 20,300 | | |
5.625%, due 10/15/271 | | USD | 60,000 | | | | 62,850 | | |
PBF Holding Co. LLC/PBF Finance Corp.
9.250%, due 05/15/251 | | USD | 20,000 | | | | 22,350 | | |
PECO Energy Co.
2.800%, due 06/15/50 | | USD | 104,000 | | | | 118,972 | | |
PetSmart, Inc.
5.875%, due 06/01/251 | | USD | 50,000 | | | | 51,250 | | |
Pfizer, Inc.
2.550%, due 05/28/40 | | USD | 230,000 | | | | 254,557 | | |
2.625%, due 04/01/30 | | USD | 80,000 | | | | 90,730 | | |
4.000%, due 03/15/49 | | USD | 95,000 | | | | 128,947 | | |
Philip Morris International, Inc.
4.125%, due 03/04/43 | | USD | 385,000 | | | | 482,285 | | |
Post Holdings, Inc.
5.750%, due 03/01/271 | | USD | 60,000 | | | | 63,900 | | |
Presidio Holdings, Inc.
4.875%, due 02/01/271 | | USD | 35,000 | | | | 35,700 | | |
Prime Security Services
Borrower LLC/Prime Finance, Inc.
5.750%, due 04/15/261 | | USD | 60,000 | | | | 66,600 | | |
Public Service Co. of Colorado
1.900%, due 01/15/31 | | USD | 440,000 | | | | 465,993 | | |
2.700%, due 01/15/51 | | USD | 215,000 | | | | 238,266 | | |
Qorvo, Inc.
5.500%, due 07/15/26 | | USD | 25,000 | | | | 26,832 | | |
Range Resources Corp.
5.000%, due 08/15/22 | | USD | 20,000 | | | | 19,200 | | |
Raytheon Technologies Corp.
3.950%, due 08/16/25 | | USD | 22,000 | | | | 25,480 | | |
4.125%, due 11/16/28 | | USD | 260,000 | | | | 312,384 | | |
Roper Technologies, Inc.
2.950%, due 09/15/29 | | USD | 360,000 | | | | 402,699 | | |
San Diego Gas & Electric Co.,
Series UUU,
3.320%, due 04/15/50 | | USD | 80,000 | | | | 95,542 | | |
Schlumberger Holdings Corp.
3.750%, due 05/01/241 | | USD | 190,000 | | | | 206,455 | | |
3.900%, due 05/17/281 | | USD | 585,000 | | | | 645,775 | | |
Scientific Games International, Inc.
5.000%, due 10/15/251 | | USD | 50,000 | | | | 49,563 | | |
Shire Acquisitions Investments Ireland DAC
3.200%, due 09/23/26 | | USD | 630,000 | | | | 707,755 | | |
| | Face
amount | | Value | |
Corporate bonds—(continued) | |
United States—(continued) | |
Six Flags Theme Parks, Inc.
7.000%, due 07/01/251,5 | | USD | 55,000 | | | $ | 59,032 | | |
Southwestern Electric Power Co.,
Series J,
3.900%, due 04/01/45 | | USD | 55,000 | | | | 63,789 | | |
Southwestern Energy Co.
6.450%, due 01/23/257 | | USD | 25,000 | | | | 23,092 | | |
Spectra Energy Partners LP
4.500%, due 03/15/45 | | USD | 165,000 | | | | 195,033 | | |
Spectrum Brands, Inc.
5.000%, due 10/01/291,5 | | USD | 70,000 | | | | 72,100 | | |
Sprint Corp.
7.125%, due 06/15/24 | | USD | 100,000 | | | | 116,655 | | |
Standard Industries, Inc.
5.000%, due 02/15/271 | | USD | 65,000 | | | | 69,413 | | |
State Street Corp. | |
(fixed, converts to FRN on 03/30/22),
2.825%, due 03/30/231 | | USD | 325,000 | | | | 337,329 | | |
Sunoco Logistics Partners Operations LP
5.350%, due 05/15/45 | | USD | 360,000 | | | | 354,095 | | |
Sysco Corp.
5.950%, due 04/01/30 | | USD | 25,000 | | | | 31,723 | | |
T-Mobile USA, Inc.
3.750%, due 04/15/271 | | USD | 1,070,000 | | | | 1,215,745 | | |
3.875%, due 04/15/301 | | USD | 400,000 | | | | 457,872 | | |
4.500%, due 04/15/501 | | USD | 115,000 | | | | 144,276 | | |
Targa Resources Partners LP/Targa
Resources Partners
Finance Corp.
6.500%, due 07/15/27 | | USD | 95,000 | | | | 101,650 | | |
Tempur Sealy International, Inc.
5.500%, due 06/15/26 | | USD | 45,000 | | | | 47,030 | | |
Tenet Healthcare Corp.
7.500%, due 04/01/251 | | USD | 150,000 | | | | 165,937 | | |
Tyson Foods, Inc.
3.900%, due 09/28/23 | | USD | 990,000 | | | | 1,086,130 | | |
UDR, Inc. MTN
3.200%, due 01/15/30 | | USD | 330,000 | | | | 371,830 | | |
Union Electric Co.
3.500%, due 03/15/29 | | USD | 55,000 | | | | 64,803 | | |
United Rentals North America, Inc.
6.500%, due 12/15/26 | | USD | 140,000 | | | | 155,400 | | |
UnitedHealth Group, Inc.
2.750%, due 05/15/40 | | USD | 144,000 | | | | 161,414 | | |
Verizon Communications, Inc.
4.329%, due 09/21/285 | | USD | 1,295,000 | | | | 1,596,542 | | |
5.012%, due 04/15/49 | | USD | 280,000 | | | | 415,232 | | |
VICI Properties LP/VICI Note Co., Inc.
4.125%, due 08/15/301 | | USD | 50,000 | | | | 50,600 | | |
4.250%, due 12/01/261 | | USD | 70,000 | | | | 72,100 | | |
Vistra Operations Co. LLC
5.000%, due 07/31/271 | | USD | 60,000 | | | | 64,050 | | |
Wells Fargo & Co. | |
(fixed, converts to FRN on 04/30/25),
2.188%, due 04/30/26 | | USD | 960,000 | | | | 1,001,997 | | |
124
PACE Global Fixed Income Investments
Portfolio of investments—July 31, 2020
| | Face
amount | | Value | |
Corporate bonds—(concluded) | |
United States—(concluded) | |
Wells Fargo & Co. MTN | |
(fixed, converts to FRN on 06/02/27),
2.393%, due 06/02/28 | | USD | 250,000 | | | $ | 262,649 | | |
(fixed, converts to FRN on 02/11/30),
2.572%, due 02/11/31 | | USD | 555,000 | | | | 589,035 | | |
Xcel Energy, Inc.
3.400%, due 06/01/30 | | USD | 220,000 | | | | 258,478 | | |
XPO Logistics, Inc.
6.750%, due 08/15/241 | | USD | 45,000 | | | | 48,396 | | |
Zoetis, Inc.
2.000%, due 05/15/30 | | USD | 970,000 | | | | 1,024,502 | | |
3.000%, due 05/15/50 | | USD | 95,000 | | | | 107,430 | | |
| | | | | | 77,076,128 | | |
Total corporate bonds
(cost—$128,875,309) | | | 137,052,464 | | |
Mortgage-backed securities—6.0% | |
Spain—0.6% | |
Bankinter 10 FTA,
Series 10, Class A2, | |
3 mo. Euribor + 0.160%,
0.000%, due 06/21/432,3 | | EUR | 1,057,338 | | | | 1,211,505 | | |
Fondo de Titulizacion de Activos
Santander Hipotecario,
Series 2, Class A, | |
3 mo. Euribor + 0.150%,
0.000%, due 01/18/492,3 | | EUR | 792,419 | | | | 915,558 | | |
| | | | | | 2,127,063 | | |
United Kingdom—1.7% | |
Finsbury Square PLC,
Series 2020-1A, Class A, | |
3 mo. SONIA + 0.800%,
1.023%, due 03/16/701,2 | | GBP | 465,168 | | | | 605,436 | | |
Series 2020-2A, Class A, | |
3 mo. SONIA + 1.300%,
1.359%, due 06/16/701,2 | | GBP | 334,000 | | | | 439,848 | | |
Gosforth Funding PLC,
Series 2018-1A, Class A1, | |
3 mo. USD LIBOR + 0.450%,
0.810%, due 08/25/601,2 | | USD | 459,020 | | | | 458,466 | | |
Holmes Master Issuer PLC,
Series 2018-1A, Class A2, | |
3 mo. USD LIBOR + 0.360%,
0.635%, due 10/15/541,2 | | USD | 178,286 | | | | 178,266 | | |
Lanark Master Issuer PLC,
Series 2018-1A,Class 1A, | |
3 mo. USD LIBOR + 0.420%,
0.778%, due 12/22/691,2 | | USD | 591,300 | | | | 591,287 | | |
Series 2020-1A, Class 2A, | |
3 mo. SONIA + 0.570%,
0.922%, due 12/22/691,2 | | GBP | 615,000 | | | | 804,876 | | |
Permanent Master Issuer PLC,
Series 2018-1A, Class 1A1, | |
3 mo. USD LIBOR + 0.380%,
0.655%, due 07/15/581,2 | | USD | 283,500 | | | | 283,392 | | |
| | Face
amount | | Value | |
Mortgage-backed securities—(concluded) | |
United Kingdom—(concluded) | |
Silverstone Master Issuer PLC,
Series 2018-1A, Class 1A, | |
3 mo. USD LIBOR + 0.390%,
0.661%, due 01/21/701,2 | | USD | 728,000 | | | $ | 724,998 | | |
Series 2019-1A, Class 1A, | |
3 mo. USD LIBOR + 0.570%,
0.841%, due 01/21/701,2 | | USD | 288,000 | | | | 287,799 | | |
Series 2020-1A, Class 1A, | |
3 mo. SONIA + 0.470%,
0.535%, due 01/21/701,2 | | GBP | 900,000 | | | | 1,177,894 | | |
| | | | | | 5,552,262 | | |
United States—3.7% | |
Angel Oak Mortgage Trust,
Series 2020-1, Class A1,
2.466%, due 12/25/591,8 | | USD | 493,556 | | | | 496,746 | | |
BANK, | |
Series 2019-BN19, Class A3,
3.183%, due 08/15/61 | | USD | 870,000 | | | | 986,574 | | |
Series 2019-BN24, Class A3,
2.960%, due 11/15/62 | | USD | 440,000 | | | | 493,131 | | |
BX Commercial Mortgage Trust,
Series 2020-BXLP, Class A, | |
1 mo. USD LIBOR + 0.800%,
0.975%, due 12/15/361,2 | | USD | 1,054,035 | | | | 1,047,797 | | |
Citigroup Commercial Mortgage Trust, | |
Series 2017-P7, Class A4,
3.712%, due 04/14/50 | | USD | 807,500 | | | | 919,310 | | |
COMM Mortgage Trust, | |
Series 2014-UBS4, Class A5,
3.694%, due 08/10/47 | | USD | 810,000 | | | | 881,472 | | |
Deephaven Residential Mortgage Trust, | |
Series 2020-1, Class A1,
2.339%, due 01/25/601,8 | | USD | 1,506,381 | | | | 1,523,318 | | |
GRACE Mortgage Trust, | |
Series 2014-GRCE,Class A,
3.369%, due 06/10/281 | | USD | 2,550,000 | | | | 2,562,135 | | |
GS Mortgage Securities Trust, | |
Series 2015-GC30, Class A3,
3.119%, due 05/10/50 | | USD | 1,025,880 | | | | 1,091,740 | | |
Series 2020-GC45, Class A5,
2.911%, due 02/13/53 | | USD | 559,000 | | | | 622,239 | | |
OBX Trust,
Series 2020-EXP1, Class 2A1, | |
1 mo. USD LIBOR + 0.750%,
0.922%, due 02/25/601,2 | | USD | 462,280 | | | | 458,266 | | |
Starwood Mortgage Residential Trust, | |
Series 2020-1, Class A1,
2.275%, due 02/25/501,8 | | USD | 489,947 | | | | 494,384 | | |
Verus Securitization Trust, | |
Series 2020-1, Class A1,
2.417%, due 01/25/601,7 | | USD | 757,373 | | | | 768,567 | | |
| | | | | | 12,345,679 | | |
Total mortgage-backed securities
(cost—$19,559,256) | | | 20,025,004 | | |
125
PACE Global Fixed Income Investments
Portfolio of investments—July 31, 2020
| | Face
amount | | Value | |
Municipal bonds—0.9% | |
District of Columbia—0.2% | |
District of Columbia Water & Sewer Authority
3.207%, due 10/01/48 | | | 810,000 | | | $ | 848,459 | | |
Massachusetts—0.1% | |
Commonwealth of Massachusetts,
Consolidated Loan, GO Bonds,
Series H,
2.900%, due 09/01/49 | | | 280,000 | | | | 318,248 | | |
Missouri—0.3% | |
Health & Educational Facilities Authority of
the State of Missouri,
Series A,
3.229%, due 05/15/50 | | | 700,000 | | | | 852,873 | | |
Texas—0.3% | |
Texas A&M University,
Series B,
3.480%, due 05/15/49 | | | 810,000 | | | | 874,865 | | |
Total municipal bonds
(cost—$2,668,481) | | | 2,894,445 | | |
Non-U.S. government agency obligations—34.3% | |
Australia—2.4% | |
Australia Government Bond
3.000%, due 03/21/473 | | AUD | 6,120,000 | | | | 5,628,884 | | |
New South Wales Treasury Corp.
3.000%, due 02/20/303 | | AUD | 1,300,000 | | | | 1,071,592 | | |
Queensland Treasury Corp.
1.750%, due 08/21/311,3 | | AUD | 1,540,000 | | | | 1,131,014 | | |
| | | | | | 7,831,490 | | |
Bermuda—0.3% | |
Bermuda Government International Bond
4.750%, due 02/15/291 | | USD | 910,000 | | | | 1,070,615 | | |
Brazil—0.4% | |
Brazilian Government International Bond
2.875%, due 06/06/25 | | USD | 1,330,000 | | | | 1,347,303 | | |
Canada—2.6% | |
Hydro-Quebec
6.500%, due 02/15/35 | | CAD | 750,000 | | | | 914,978 | | |
Province of British Columbia Canada
2.800%, due 06/18/48 | | CAD | 300,000 | | | | 274,604 | | |
Province of Ontario Canada
2.400%, due 06/02/26 | | CAD | 4,050,000 | | | | 3,286,292 | | |
2.700%, due 06/02/29 | | CAD | 1,672,000 | | | | 1,409,575 | | |
Province of Quebec Canada
2.300%, due 09/01/29 | | CAD | 1,754,000 | | | | 1,443,048 | | |
5.000%, due 12/01/41 | | CAD | 1,100,000 | | | | 1,290,945 | | |
| | | | | | 8,619,442 | | |
Chile—0.3% | |
Chile Government International Bond
2.450%, due 01/31/31 | | USD | 980,000 | | | | 1,052,030 | | |
| | Face
amount | | Value | |
Non-U.S. government agency obligations—(continued) | |
China—2.4% | |
China Government Bond
3.160%, due 06/27/233 | | CNY | 4,500,000 | | | $ | 657,586 | | |
3.380%, due 11/21/243 | | CNY | 8,000,000 | | | | 1,194,366 | | |
3.480%, due 06/29/273 | | CNY | 13,000,000 | | | | 1,965,767 | | |
4.100%, due 12/04/223 | | CNY | 2,000,000 | | | | 298,231 | | |
4.290%, due 05/22/293 | | CNY | 17,000,000 | | | | 2,727,112 | | |
4.500%, due 05/22/343 | | CNY | 6,000,000 | | | | 994,068 | | |
| | | | | | 7,837,130 | | |
Colombia—0.4% | |
Colombia Government International Bond
3.125%, due 04/15/31 | | USD | 1,300,000 | | | | 1,347,450 | | |
Croatia—0.5% | |
Croatia Government International Bond
1.500%, due 06/17/313,6 | | EUR | 1,450,000 | | | | 1,774,590 | | |
Denmark—0.5% | |
Denmark Government Bond
1.500%, due 11/15/23 | | DKK | 10,250,000 | | | | 1,735,841 | | |
Germany—2.8% | |
Bundesrepublik Deutschland Bundesanleihe
0.010%, due 02/15/303 | | EUR | 6,920,000 | | | | 8,603,822 | | |
State of North Rhine-Westphalia
Germany EMTN
2.150%, due 03/21/193 | | EUR | 400,000 | | | | 829,422 | | |
| | | | | | 9,433,244 | | |
Hungary—0.6% | |
Hungary Government International Bond
1.750%, due 06/05/353 | | EUR | 1,300,000 | | | | 1,605,988 | | |
5.375%, due 03/25/24 | | USD | 234,000 | | | | 268,881 | | |
| | | | | | 1,874,869 | | |
Indonesia—0.3% | |
Indonesia Treasury Bond
7.000%, due 05/15/27 | | IDR | 16,042,000,000 | | | | 1,122,391 | | |
Israel—0.2% | |
Israel Government International Bond
3.875%, due 07/03/50 | | USD | 570,000 | | | | 709,116 | | |
Italy—5.6% | |
Italy Buoni Poliennali Del Tesoro
0.950%, due 08/01/303 | | EUR | 3,050,000 | | | | 3,571,732 | | |
1.350%, due 04/01/303 | | EUR | 3,760,000 | | | | 4,578,266 | | |
1.450%, due 11/15/243 | | EUR | 3,300,000 | | | | 4,066,439 | | |
2.000%, due 02/01/283 | | EUR | 610,000 | | | | 781,364 | | |
3.000%, due 08/01/293 | | EUR | 490,000 | | | | 680,652 | | |
5.000%, due 09/01/401,3 | | EUR | 1,100,000 | | | | 2,013,221 | | |
Republic of Italy Government
International Bond
2.375%, due 10/17/24 | | USD | 2,990,000 | | | | 3,049,894 | | |
| | | | | | 18,741,568 | | |
126
PACE Global Fixed Income Investments
Portfolio of investments—July 31, 2020
| | Face
amount | | Value | |
Non-U.S. government agency obligations—(continued) | |
Japan—6.5% | |
Japan Government Forty Year Bond
2.200%, due 03/20/51 | | JPY | 379,700,000 | | | $ | 5,277,957 | | |
Japan Government Ten Year Bond
0.100%, due 03/20/30 | | JPY | 276,150,000 | | | | 2,633,619 | | |
Japan Government Thirty Year Bond
0.400%, due 03/20/50 | | JPY | 84,850,000 | | | | 774,299 | | |
1.700%, due 06/20/44 | | JPY | 128,500,000 | | | | 1,556,518 | | |
2.300%, due 12/20/36 | | JPY | 269,400,000 | | | | 3,359,515 | | |
Japan Government Twenty Year Bond | |
0.300%, due 12/20/39 | | JPY | 528,700,000 | | | | 4,926,892 | | |
0.700%, due 03/20/37 | | JPY | 294,150,000 | | | | 2,955,755 | | |
| | | | | | 21,484,555 | | |
Mexico—0.5% | |
Mexico Government International Bond
4.500%, due 04/22/29 | | USD | 1,490,000 | | | | 1,666,472 | | |
New Zealand—0.7% | |
New Zealand Government Bond
1.750%, due 05/15/41 | | NZD | 3,400,000 | | | | 2,401,018 | | |
Qatar—0.6% | |
Qatar Government International Bond
4.400%, due 04/16/503 | | USD | 1,360,000 | | | | 1,846,200 | | |
Romania—1.9% | |
Romanian Government International Bond
3.624%, due 05/26/301 | | EUR | 4,830,000 | | | | 6,289,767 | | |
Saudi Arabia—0.6% | |
Saudi Government International Bond
5.000%, due 04/17/493 | | USD | 1,390,000 | | | | 1,904,734 | | |
Slovenia—0.2% | |
Slovenia Government International Bond
5.250%, due 02/18/243 | | USD | 510,000 | | | | 588,193 | | |
South Korea—2.5% | |
Korea Housing Finance Corp.
0.010%, due 02/05/251 | | EUR | 1,590,000 | | | | 1,880,433 | | |
0.100%, due 06/18/241 | | EUR | 724,000 | | | | 859,062 | | |
Korea Treasury Bond
3.000%, due 09/10/24 | | KRW | 5,964,350,000 | | | | 5,407,453 | | |
| | | | | | 8,146,948 | | |
Spain—0.5% | |
Spain Government Bond
1.200%, due 10/31/401,3 | | EUR | 1,340,000 | | | | 1,666,462 | | |
Turkey—0.1% | |
Turkey Government International Bond
5.750%, due 05/11/47 | | USD | 450,000 | | | | 355,359 | | |
United Arab Emirates—0.9% | |
Abu Dhabi Government International Bond
3.125%, due 10/11/271 | | USD | 1,100,000 | | | | 1,232,000 | | |
3.875%, due 04/16/501,5 | | USD | 610,000 | | | | 772,407 | | |
| | Face
amount | | Value | |
Non-U.S. government agency obligations—(concluded) | |
United Arab Emirates—(concluded) | |
Finance Department Government of Sharjah
4.000%, due 07/28/501 | | USD | 820,000 | | | $ | 861,541 | | |
| | | | | | 2,865,948 | | |
Total non-U.S. government agency obligations
(cost—$108,260,036) | | | 113,712,735 | | |
U.S. government agency obligations—10.3% | |
United States—10.3% | |
FHLMC
2.500%, due 08/01/50 | | USD | 5,110,000 | | | | 5,366,525 | | |
3.000%, due 03/01/31 | | USD | 2,820,068 | | | | 2,962,920 | | |
FNMA
2.500%, due 08/01/50 | | USD | 780,000 | | | | 819,157 | | |
3.500%, due 09/01/32 | | USD | 3,330,586 | | | | 3,508,516 | | |
3.500%, due 08/01/47 | | USD | 2,713,550 | | | | 3,016,735 | | |
3.500%, due 05/01/58 | | USD | 2,089,043 | | | | 2,283,364 | | |
4.000%, due 04/01/59 | | USD | 2,459,005 | | | | 2,717,080 | | |
UMBS TBA
2.500% | | USD | 6,300,000 | | | | 6,618,199 | | |
| 3.000% | | USD | 6,560,000 | | | | 6,940,901 | | |
Total U.S. government agency obligations
(cost—$33,768,406) | | | 34,233,397 | | |
U.S. Treasury obligations—3.9% | |
United States—3.9% | |
U.S. Treasury Inflation Index Bonds (TIPS)
0.250%, due 02/15/50 | | USD | 747,953 | | | | 912,620 | | |
U.S. Treasury Inflation Index Note (TIPS)
0.875%, due 01/15/29 | | USD | 1,045,872 | | | | 1,219,364 | | |
U.S. Treasury Notes
0.250%, due 06/30/25 | | USD | 5,140,000 | | | | 5,148,232 | | |
0.500%, due 03/31/25 | | USD | 1,060,000 | | | | 1,074,575 | | |
0.625%, due 05/15/30 | | USD | 3,710,000 | | | | 3,739,999 | | |
2.375%, due 02/29/24 | | USD | 654,400 | | | | 706,266 | | |
Total U.S. Treasury obligations
(cost—$12,569,409) | | | 12,801,056 | | |
| | Number of
shares | | | |
Short-term investments—3.9% | |
Investment companies—3.9% | |
State Street Institutional U.S. Government
Money Market Fund, 0.09%9
(cost—$12,986,764) | | | 12,986,764 | | | | 12,986,764 | | |
Investment of cash collateral from securities loaned—1.7% | |
Money market funds—1.7% | |
State Street Navigator Securities Lending
Government Money Market Portfolio, 0.12%9
(cost—$5,453,783) | | | 5,453,783 | | | | 5,453,783 | | |
Total investments
(cost—$325,848,495)—103.4% | | | 342,618,589 | | |
Liabilities in excess of other assets—(3.4)% | | | | | (11,168,975 | ) | |
Net assets—100.0% | | $ | 331,449,614 | | |
127
PACE Global Fixed Income Investments
Portfolio of investments—July 31, 2020
For a listing of defined portfolio acronyms, counterparty acronyms and currency abbreviations that are used throughout the Portfolio of investments as well as the tables that follow, please refer to page 267.
Futures contracts
Number of
contracts | | Currency | | | | Expiration
date | | Current
notional
amount | | Value | | Unrealized
appreciation
(depreciation) | |
Interest rate futures buy contracts: | | | |
53 | | AUD | | | | Australian Bond 10 Year Futures | | September 2020 | | $ | 5,563,835 | | | $ | 5,659,209 | | | $ | 95,374 | | |
5 | | EUR | | | | German Euro BOBL Futures | | September 2020 | | | 790,117 | | | | 796,530 | | | | 6,413 | | |
52 | | EUR | | | | German Euro Bund Futures | | September 2020 | | | 10,727,542 | | | | 10,873,710 | | | | 146,168 | | |
10 | | JPY | | | | Japan Government Bond 10 Year Futures | | September 2020 | | | 14,357,413 | | | | 14,394,218 | | | | 36,805 | | |
107 | | GBP | | | | United Kingdom Long Gilt Bond Futures | | September 2020 | | | 19,384,668 | | | | 19,405,727 | | | | 21,059 | | |
U.S. Treasury futures buy contracts: | | | |
204 | | USD | | | | U.S. Treasury Note 5 Year Futures | | September 2020 | | $ | 25,662,920 | | | $ | 25,729,500 | | | $ | 66,580 | | |
11 | | USD | | | | U.S. Ultra Bond Futures | | September 2020 | | | 2,488,460 | | | | 2,504,563 | | | | 16,103 | | |
Total | | | | | | | | | | | | | | $ | 78,974,955 | | | $ | 79,363,457 | | | $ | 388,502 | | |
Interest rate futures sell contracts: | | | |
45 | | CAD | | | | Canada Government Bond 10 Year Futures | | September 2020 | | $ | (5,185,918 | ) | | $ | (5,197,282 | ) | | $ | (11,364 | ) | |
24 | | EUR | | | | German Euro Buxl 30 Year Futures | | September 2020 | | | (6,112,073 | ) | | | (6,356,410 | ) | | | (244,337 | ) | |
88 | | EUR | | | | German Euro Schatz Futures | | September 2020 | | | (11,617,550 | ) | | | (11,627,504 | ) | | | (9,954 | ) | |
4 | | EUR | | | | Italian Government Bond Futures | | September 2020 | | | (662,474 | ) | | | (692,588 | ) | | | (30,114 | ) | |
U.S. Treasury futures sell contracts: | | | |
14 | | USD | | | | U.S. Long Bond Futures | | September 2020 | | $ | (2,477,697 | ) | | $ | (2,551,938 | ) | | $ | (74,241 | ) | |
3 | | USD | | | | U.S. Treasury Note 2 Year Futures | | September 2020 | | | (662,384 | ) | | | (662,953 | ) | | | (569 | ) | |
1 | | USD | | | | U.S. Treasury Note 10 Year Futures | | September 2020 | | | (139,420 | ) | | | (140,078 | ) | | | (658 | ) | |
94 | | USD | | | | U.S. Ultra Treasury Note 10 Year Futures | | September 2020 | | | (14,750,505 | ) | | | (14,969,500 | ) | | | (218,995 | ) | |
Total | | | | | | | | | | | | | | $ | (41,608,021 | ) | | $ | (42,198,253 | ) | | $ | (590,232 | ) | |
Net unrealized appreciation (depreciation) | | | | | | | | | | | | | | | | | | | | | | $ | (201,730 | ) | |
Forward foreign currency contracts
Counterparty | |
Sell | |
Purchase | |
Settlement
date | | Unrealized
appreciation
(depreciation) | |
BB | | NZD | 8,948,092 | | | USD | 5,841,256 | | | 08/24/20 | | $ | (93,305 | ) | |
BB | | TRY | 36,525,094 | | | USD | 5,235,765 | | | 08/24/20 | | | 106,769 | | |
BB | | USD | 1,887,072 | | | CHF | 1,770,515 | | | 08/24/20 | | | 49,973 | | |
BB | | USD | 3,657,328 | | | EUR | 3,242,743 | | | 08/24/20 | | | 164,068 | | |
BB | | USD | 3,918,793 | | | GBP | 3,129,928 | | | 08/24/20 | | | 178,726 | | |
BB | | USD | 337,456 | | | NOK | 3,187,922 | | | 08/24/20 | | | 12,831 | | |
BB | | USD | 452,038 | | | ZAR | 7,583,610 | | | 08/24/20 | | | (9,358 | ) | |
BNP | | CZK | 9,448,905 | | | EUR | 357,805 | | | 08/24/20 | | | (2,473 | ) | |
BNP | | EUR | 715,984 | | | HUF | 251,251,055 | | | 08/24/20 | | | 15,479 | | |
BNP | | EUR | 1,279,249 | | | USD | 1,462,045 | | | 08/24/20 | | | (45,481 | ) | |
BNP | | HUF | 122,038,191 | | | USD | 413,210 | | | 08/24/20 | | | (4,136 | ) | |
BNP | | NZD | 3,571,071 | | | USD | 2,378,637 | | | 08/24/20 | | | 10,229 | | |
BNP | | PLN | 1,565,341 | | | EUR | 355,465 | | | 08/24/20 | | | 894 | | |
BNP | | USD | 830,587 | | | CAD | 1,117,067 | | | 08/24/20 | | | 3,427 | | |
BNP | | USD | 2,451,259 | | | EUR | 2,147,044 | | | 08/24/20 | | | 78,916 | | |
128
PACE Global Fixed Income Investments
Portfolio of investments—July 31, 2020
Forward foreign currency contracts—(continued)
Counterparty | |
Sell | |
Purchase | |
Settlement
date | | Unrealized
appreciation
(depreciation) | |
BNP | | USD | 621,602 | | | HUF | 190,091,125 | | | 08/24/20 | | $ | 28,471 | | |
BNP | | USD | 2,786,569 | | | PLN | 11,011,741 | | | 08/24/20 | | | 153,954 | | |
BNP | | USD | 3,274,628 | | | TRY | 22,601,601 | | | 08/24/20 | | | (100,823 | ) | |
BOA | | GBP | 155,213 | | | USD | 195,907 | | | 08/24/20 | | | (7,289 | ) | |
BOA | | JPY | 25,509,284 | | | USD | 243,249 | | | 08/24/20 | | | 2,214 | | |
CITI | | AUD | 1,215,000 | | | USD | 867,729 | | | 08/24/20 | | | (390 | ) | |
CITI | | AUD | 7,484,159 | | | USD | 5,354,228 | | | 08/24/20 | | | 6,788 | | |
CITI | | CHF | 5,727,908 | | | USD | 6,193,940 | | | 08/24/20 | | | (72,721 | ) | |
CITI | | EUR | 1,066,394 | | | USD | 1,251,469 | | | 08/24/20 | | | (5,218 | ) | |
CITI | | NZD | 5,595,123 | | | USD | 3,659,155 | | | 08/24/20 | | | (51,647 | ) | |
CITI | | USD | 8,196,943 | | | CNY | 57,652,093 | | | 08/24/20 | | | 51,459 | | |
CITI | | USD | 1,608,608 | | | CZK | 37,775,107 | | | 08/24/20 | | | 86,977 | | |
CITI | | USD | 538,131 | | | ILS | 1,850,463 | | | 08/24/20 | | | 5,493 | | |
CITI | | USD | 26,241,963 | | | JPY | 2,815,454,061 | | | 08/24/20 | | | 361,013 | | |
CITI | | USD | 3,668,131 | | | NZD | 5,578,524 | | | 08/24/20 | | | 31,662 | | |
GS | | AUD | 231,856 | | | NZD | 248,796 | | | 08/24/20 | | | (654 | ) | |
GS | | CHF | 164,626 | | | USD | 175,586 | | | 08/24/20 | | | (4,524 | ) | |
GS | | DKK | 5,660,941 | | | USD | 864,412 | | | 08/24/20 | | | (31,424 | ) | |
GS | | EUR | 5,404,296 | | | CHF | 5,770,437 | | | 08/24/20 | | | (55,479 | ) | |
GS | | EUR | 5,874,201 | | | USD | 6,741,113 | | | 08/24/20 | | | (181,313 | ) | |
GS | | JPY | 393,913,740 | | | CAD | 4,966,760 | | | 08/24/20 | | | (13,824 | ) | |
GS | | MXN | 9,101,750 | | | USD | 414,694 | | | 08/24/20 | | | 6,784 | | |
GS | | TRY | 2,835,770 | | | EUR | 357,645 | | | 08/24/20 | | | 23,256 | | |
GS | | TRY | 2,904,921 | | | USD | 415,434 | | | 08/24/20 | | | 7,514 | | |
GS | | USD | 3,683,957 | | | CAD | 4,965,609 | | | 08/24/20 | | | 23,416 | | |
GS | | USD | 8,612,704 | | | EUR | 7,525,686 | | | 08/24/20 | | | 255,907 | | |
GS | | USD | 229,252 | | | MXN | 5,224,169 | | | 08/24/20 | | | 4,879 | | |
GS | | USD | 415,293 | | | MXN | 9,244,638 | | | 08/24/20 | | | (979 | ) | |
GS | | USD | 1,195,960 | | | THB | 37,775,590 | | | 08/24/20 | | | 15,375 | | |
GS | | USD | 4,071,165 | | | ZAR | 68,742,203 | | | 08/24/20 | | | (58,461 | ) | |
HSBC | | MXN | 3,799,875 | | | EUR | 147,772 | | | 08/24/20 | | | 3,843 | | |
HSBC | | MXN | 130,722,857 | | | USD | 5,700,083 | | | 08/24/20 | | | (158,486 | ) | |
HSBC | | USD | 7,353,343 | | | EUR | 6,443,257 | | | 08/24/20 | | | 239,685 | | |
HSBC | | USD | 9,732,574 | | | MXN | 221,750,247 | | | 08/24/20 | | | 205,544 | | |
HSBC | | USD | 650,274 | | | SEK | 5,954,545 | | | 08/24/20 | | | 28,038 | | |
HSBC | | USD | 748,866 | | | SGD | 1,043,514 | | | 08/24/20 | | | 10,627 | | |
HSBC | | ZAR | 55,904,318 | | | USD | 3,257,190 | | | 08/24/20 | | | (6,124 | ) | |
HSBC | | ZAR | 27,229,455 | | | USD | 1,631,468 | | | 08/24/20 | | | 41,997 | | |
RBC | | EUR | 1,086,170 | | | USD | 1,259,628 | | | 08/24/20 | | | (20,364 | ) | |
RBC | | EUR | 1,493,067 | | | USD | 1,766,813 | | | 8/3/2020 | | | 7,315 | | |
RBC | | USD | 9,533,108 | | | AUD | 13,720,295 | | | 08/24/20 | | | 270,059 | | |
RBC | | USD | 2,069,583 | | | EUR | 1,826,048 | | | 08/24/20 | | | 82,316 | | |
SCB | | USD | 3,257,190 | | | JPY | 350,069,303 | | | 08/24/20 | | | 50,583 | | |
SSC | | AUD | 6,983,510 | | | USD | 4,995,297 | | | 08/24/20 | | | 5,571 | | |
SSC | | CAD | 14,253,112 | | | USD | 10,463,829 | | | 08/24/20 | | | (177,687 | ) | |
SSC | | CNY | 1,422,439 | | | USD | 202,258 | | | 08/24/20 | | | (1,254 | ) | |
SSC | | EUR | 4,713,886 | | | USD | 5,491,036 | | | 08/24/20 | | | (64,022 | ) | |
129
PACE Global Fixed Income Investments
Portfolio of investments—July 31, 2020
Forward foreign currency contracts—(concluded)
Counterparty | |
Sell | |
Purchase | |
Settlement
date | | Unrealized
appreciation
(depreciation) | |
SSC | | USD | 22,141,621 | | | EUR | 19,455,114 | | | 08/24/20 | | $ | 785,172 | | |
TD | | AUD | 3,492,159 | | | CAD | 3,330,664 | | | 08/24/20 | | | (8,445 | ) | |
TD | | EUR | 1,066,394 | | | USD | 1,254,094 | | | 08/24/20 | | | (2,593 | ) | |
TD | | NZD | 5,641,233 | | | CAD | 5,064,287 | | | 08/24/20 | | | 39,664 | | |
TD | | USD | 3,745,214 | | | CAD | 5,022,643 | | | 08/24/20 | | | 4,741 | | |
Net unrealized appreciation (depreciation) | | $ | 2,283,155 | | |
Fair valuation summary
The following is a summary of the fair valuations according to the inputs used as of July 31, 2020 in valuing the Portfolio's investments. In the event a Portfolio holds investments for which fair value is measured using the NAV per share practical expedient (or its equivalent), a separate column will be added to the fair value hierarchy table; this is intended to permit reconciliation to the amounts presented in the Portfolio of investments:
Assets
Description | | Unadjusted
quoted prices in
active markets for
identical investments
(Level 1) | | Other significant
observable inputs
(Level 2) | | Unobservable
inputs
(Level 3) | | Total | |
Asset-backed securities | | $ | — | | | $ | 3,458,941 | | | $ | — | | | $ | 3,458,941 | | |
Corporate bonds | | | — | | | | 137,052,464 | | | | — | | | | 137,052,464 | | |
Mortgage-backed securities | | | — | | | | 20,025,004 | | | | — | | | | 20,025,004 | | |
Municipal bonds | | | — | | | | 2,894,445 | | | | — | | | | 2,894,445 | | |
Non-U.S. government agency obligations | | | — | | | | 113,712,735 | | | | — | | | | 113,712,735 | | |
U.S. government agency obligations | | | — | | | | 34,233,397 | | | | — | | | | 34,233,397 | | |
U.S. Treasury obligations | | | — | | | | 12,801,056 | | | | — | | | | 12,801,056 | | |
Short-term investments | | | — | | | | 12,986,764 | | | | — | | | | 12,986,764 | | |
Investment of cash collateral from securities loaned | | | — | | | | 5,453,783 | | | | — | | | | 5,453,783 | | |
Futures contracts | | | 388,502 | | | | — | | | | — | | | | 388,502 | | |
Forward foreign currency contracts | | | — | | | | 3,461,629 | | | | — | | | | 3,461,629 | | |
Total | | $ | 388,502 | | | $ | 346,080,218 | | | $ | — | | | $ | 346,468,720 | | |
Liabilities | |
Futures contracts | | | (590,232 | ) | | | — | | | | — | | | | (590,232 | ) | |
Forward foreign currency contracts | | | — | | | | (1,178,474 | ) | | | — | | | | (1,178,474 | ) | |
Total | | $ | (590,232 | ) | | $ | (1,178,474 | ) | | $ | — | | | $ | (1,768,706 | ) | |
At July 31, 2020, there were no transfers in or out of Level 3.
130
PACE Global Fixed Income Investments
Portfolio of investments—July 31, 2020
Portfolio footnotes
1 Security exempt from registration pursuant to Rule 144A under the Securities Act of 1933. These securities are considered liquid, unless noted otherwise, and may be resold in transactions exempt from registration, normally to qualified institutional buyers. Securities exempt from registration pursuant to Rule 144A, in the amount of $55,647,607, represented 16.8% of the Portfolio's net assets at period end.
2 Variable or floating rate security. The interest rate shown is the rate in effect as of period end and changes periodically.
3 Security was purchased pursuant to Regulation S under the Securities Act of 1933, which exempts from registration securities offered and sold outside of the United States. Such a security cannot be sold in the United States without either an effective registration statement filed pursuant to the Securities Act of 1933, or pursuant to an exemption from registration.
4 Perpetual investment. Date shown reflects the next call date.
5 Security, or portion thereof, was on loan at the period end.
6 Security purchased on a when-issued basis. When-issued refers to a transaction made conditionally because a security, although authorized, has not yet been issued.
7 Step bond—coupon rate increases in increments to maturity. The rate disclosed is the rate at the period end; the maturity date disclosed is the ultimate maturity date.
8 Variable or floating rate security for which the interest rate adjusts periodically based on changes in current interest rates and prepayments on the underlying pool of assets. Rate shown is the rate in effect as of period end.
9 Rates shown reflect yield at July 31, 2020.
See accompanying notes to financial statements.
131
PACE High Yield Investments
Performance
For the 12-months ended July 31, 2020, the Portfolio's Class P shares returned 1.40% before the deduction of the maximum PACE Select program fee.1 In comparison, the ICE BofA Global High Yield Index (hedged in USD) (the "benchmark") returned 3.17%. (Returns for all share classes over various time periods are shown in the "Performance at a glance" table on page 134. Please note that the returns shown do not reflect the deduction of taxes that a shareholder would pay on Portfolio distributions or the redemption of Portfolio shares.) For a detailed commentary on the market environment in general during the reporting period, please refer to page 2.
Subadvisor's comments2
The Portfolio underperformed its benchmark during the reporting period. From a sector positioning perspective, overweights and security selection in the oil field equipment & services, energy—exploration & production, and gaming sectors detracted from performance. In contrast, underweights in integrated energy and packaging, as well as an overweight in metals/mining excluding steel, contributed the most to results relative to the benchmark. From a ratings perspective, an overweight and security selection of B-rated issuers detracted the most from relative performance. Conversely, an underweight and security selection in BB-rated issuers were the largest contributors to returns.
Looking ahead, we remain focused on the path of the pandemic and have been encouraged that several states in the US have managed to improve conditions without resorting to large-scale lockdowns like those we saw earlier in the year. While some indicators pointed toward a flattening of the recovery in July, overall, the landscape seems to be healthier with the improving trends in the virus. Global central banks are very likely to remain supportive for the foreseeable future, and we expect additional fiscal stimulus, particularly in the US, even if it takes a bit longer than the market had initially hoped. While defaults have picked up, mostly in the US, we expect them to fall from current levels, as many companies have created liquidity and pushed off maturities.
Currency forwards were used during the reporting period to hedge the currency exposure of the Portfolio into US dollars. The use of currency forwards contributed to the Portfolio's performance.
PACE Select Advisors Trust – PACE High Yield Investments
Investment Manager:
UBS Asset Management (Americas) Inc. ("UBS AM")
Investment Subadvisor:
Nomura Corporate Research and Asset Management Inc. ("NCRAM") (NCRAM has retained Nomura Asset Management Singapore Limited "NAM Singapore" and together with NCRAM "Nomura" to serve as a sub-manager to provide certain investment advisory services pursuant to a sub-management contract between NCRAM and NAM Singapore.)
Portfolio Management Team:
UBS AM: Mabel Lung, CFA, Gina Toth, CFA, Fred Lee, CFA, Joseph Sciortino and Steve Bienashski
Nomura: David Crall, CFA, Stephen Kotsen, CFA, Steven Rosenthal, CFA, Eric Torres, Simon Tan, CFA
Objective:
Total return
Investment process:
The subadvisor utilizes a "total return" strategy driven
by credit research and a team effort to generate alpha in high yield.
1 Class P shares held through the PACE Select Advisors Program are subject to a maximum Program fee of 2.50%, which, if included, would have reduced performance. Class P shares held through other advisory programs also may be subject to a program fee, which, if included, would have reduced performance.
2 Performance is discussed on a gross-of-fees basis—meaning that no fees or expenses are reflected when discussed at the level of a subadvisor's sleeve (or subadvisors' sleeves, if applicable). Alternatively, performance at the overall Portfolio level is shown net of fees, which does factor in fees and expenses associated with the Portfolio.
132
PACE High Yield Investments
Mutual funds are sold by prospectus only. You should read it carefully and consider a fund's investment objectives, risks, charges, expenses and other important information contained in the prospectus before investing. Prospectuses for most of our funds can be obtained from your financial advisor, by calling UBS Funds at 800-647 1568 or by visiting our Website at www.ubs.com/am-us.
Special considerations
The Portfolio may be appropriate for long-term investors seeking total return and who are able to withstand short-term fluctuations in the fixed income markets in return for potentially higher returns over the long term. The Portfolio seeks to achieve its objective by investing primarily in a professionally managed, diversified portfolio of fixed income securities rated below investment grade or considered to be of comparable quality (commonly referred to as "junk bonds"). These securities are subject to higher risks than investment grade securities, including greater price volatility and a greater risk of loss of principal and nonpayment of interest. Issuers of such securities are typically in poor financial health, and their ability to pay interest and principal is uncertain. The prices of such securities may be more vulnerable to bad economic news, or even the expectation of bad news, than higher rated or investment grade bonds and other fixed income securities. The value of the Portfolio changes every day and can be affected by changes in interest rates, general market conditions and other political, social and economic developments, as well as specific matters relating to the issuers in which the Portfolio invests. In addition, investments in foreign bonds involve special risks. It is important to note that an investment in the Portfolio is only one component of a balanced investment plan.
133
PACE High Yield Investments
Performance at a glance (unaudited)
Average annual total returns for periods ended 07/31/20 | | 1 year | | 5 years | | 10 years | |
Before deducting maximum sales charge | |
Class A1 | | | 1.25 | % | | | 4.85 | % | | | 5.55 | % | |
Class Y2 | | | 1.49 | | | | 5.08 | | | | 5.79 | | |
Class P3 | | | 1.40 | | | | 5.00 | | | | 5.74 | | |
After deducting maximum sales charge | |
Class A1 | | | (2.56 | ) | | | 4.04 | | | | 5.14 | | |
ICE BofA Global High Yield Index (Hedged in USD)4 | | | 3.17 | | | | 5.99 | | | | 6.99 | | |
Most recent calendar quarter-end returns (unaudited)
Average annual total returns for periods ended 06/30/20 | | 1 year | | 5 years | | 10 years | |
Before deducting maximum sales charge | |
Class A2 | | | (2.09 | )% | | | 3.97 | % | | | 5.54 | % | |
Class Y3 | | | (1.76 | ) | | | 4.20 | | | | 5.80 | | |
Class P4 | | | (1.94 | ) | | | 4.13 | | | | 5.74 | | |
After deducting maximum sales charge | |
Class A2 | | | (5.78 | ) | | | 3.18 | | | | 5.14 | | |
The annualized gross and net expense ratios, respectively, for each class of shares as in the November 27, 2019 prospectuses, were as follows: Class A—1.23% and 1.06%; Class Y—0.92% and 0.88%; and Class P—1.09% and 0.91% Net expenses reflect fee waivers and/or expense reimbursements, if any, pursuant to an agreement that is in effect to cap the expenses. The Portfolio and UBS Asset Management (Americas) Inc. ("UBS AM") have entered into a written fee waiver/expense reimbursement agreement pursuant to which UBS AM is contractually obligated to waive its management fees and/or reimburse expenses so that the Portfolio's ordinary total operating expenses of each class through November 30, 2020 (excluding dividend expense, borrowing costs, and interest expense relating to short sales, and expenses attributable to investment in other investment companies, interest, taxes, brokerage commissions and extraordinary expenses) would not exceed Class A—1.06%; Class Y—0.88%; and Class P—0.91% The Portfolio has agreed to repay UBS AM for any waived fees/reimbursed expenses to the extent that it can do so over the following three fiscal years without causing the Portfolio's expenses in any of those three years to exceed these expense caps and that UBS AM has not waived the right to do so. The fee waiver/ expense reimbursement agreement may be terminated by the Portfolio's board at any time and also will terminate automatically upon the expiration or termination of the Portfolio's advisory contract with UBS AM. Upon termination of the agreement, however, UBS AM's three year recoupment rights will survive.
1 Maximum sales charge for Class A shares is 3.75%. Class A shares bear ongoing 12b-1 service fees of 0.25% annually.
2 The Portfolio offers Class Y shares to a limited group of eligible investors, including certain qualifying retirement plans. Class Y shares do not bear initial or contingent deferred sales charges or ongoing 12b-1 service and distribution fees.
3 Class P shares do not bear initial or contingent deferred sales charges or ongoing 12b-1 service and distribution fees, but Class P shares held through advisory programs may be subject to a program fee, which, if included, would have reduced performance.
4 The ICE BofA Global High Yield Index (hedged in USD) is an unmanaged index which covers US dollar, Canadian dollar, British pound and Euro denominated below investment-grade corporate debt publicly issued in the major domestic or eurobond markets. Securities must have at least 18 months before final maturity at the time of issuance and have at least one year remaining to final maturity. Callable perpetuals, original issue zero-coupon bonds, eurodollar bonds and 144A securities (with and without registration rights), as well as pay-in-kind securitiies, are included in the index. Contingent capital securities ("cocos") are excluded from the index, but capital securities where conversion can be mandated by a regulatory authority but with no specific trigger are included. Investors should note that indices do not reflect the deduction of fees and expenses.
Prior to August 3, 2015, a 1% redemption fee was imposed on sales or exchanges of any class of shares of the Portfolio made during the specified holding period.
Past performance does not predict future performance, and the performance information provided does not reflect the deduction of taxes that a shareholder would pay on Portfolio distributions or the redemption of Portfolio shares. The return and principal value of an investment will fluctuate, so that an investor's shares, when redeemed, may be worth more or less than their original cost. Performance results assume reinvestment of all dividends and capital gain distributions at net asset value on the ex-dividend dates. Current performance may be higher or lower than the performance data quoted. For month-end performance figures, please visit www.ubs.com/us-mutualfundperformance.
134
PACE High Yield Investments
Illustration of an assumed investment of $10,000 in Class P shares of the Portfolio (unaudited)
The following graph depicts the performance of PACE High Yield Investments Class P shares versus the ICE BofA Global High Yield Index (Hedged in USD) over the 10 years ended July 31, 2020. Class P shares held through advisory programs may be subject to a program fee, which, if included, would have reduced performance. The performance of the other classes will vary based upon the different class specific expenses and sales charges. The performance provided does not reflect the deduction of taxes that a shareholder would pay on Portfolio distributions or the redemption of Portfolio shares. Past performance is no guarantee of future results. Share price and returns will vary with market conditions; investors may realize a gain or loss upon redemption. It is important to note that PACE High Yield Investments is a professionally managed portfolio while the Index is not available for investment and is unmanaged. The comparison is shown for illustration purposes only.
PACE High Yield Investments

135
PACE High Yield Investments
Portfolio statistics—July 31, 2020 (unaudited)
Characteristics | |
Weighted average duration | | | 3.72 yrs. | | |
Weighted average maturity | | | 6.41 yrs. | | |
Average coupon | | | 6.25 | % | |
Top ten holdings1 | | Percentage of
net assets | |
Petrobras Global Finance BV, 8.750% due 05/23/26 | | | 0.6 | % | |
Teva Pharmaceutical Finance Netherlands III BV, 6.000% due 04/15/24 | | | 0.6 | | |
Bausch Health Cos., Inc., 9.000% due 12/15/25 | | | 0.5 | | |
Telecom Italia Finance SA, 7.750% due 01/24/33 | | | 0.5 | | |
Freeport-McMoRan, Inc., 5.450% due 03/15/43 | | | 0.4 | | |
Petroleos Mexicanos, 7.690% due 01/23/50 | | | 0.4 | | |
Petroleos Mexicanos, 6.840% due 01/23/30 | | | 0.4 | | |
Turkiye Ihracat Kredi Bankasi AS, 5.375% due 10/24/23 | | | 0.4 | | |
Ukreximbank Via Biz Finance PLC, 9.750% due 01/22/25 | | | 0.4 | | |
TransDigm, Inc., 5.500% due 11/15/27 | | | 0.4 | | |
Total | | | 4.6 | % | |
Top five issuer breakdown by country or territory of origin1 | | Percentage of
net assets | |
United States | | | 52.7 | % | |
Mexico | | | 4.4 | | |
China | | | 4.3 | | |
Luxembourg | | | 3.6 | | |
United Kingdom | | | 3.5 | | |
Total | | | 68.5 | % | |
Credit rating2 | | Percentage of
net assets | |
BBB and higher | | | 5.5 | % | |
BB | | | 39.9 | | |
B | | | 28.9 | | |
CCC & below | | | 13.9 | | |
Not rated | | | 10.8 | | |
Cash equivalents and other assets less liabilities | | | 1.0 | | |
Total | | | 100.0 | % | |
1 The Portfolio is actively managed and its composition will vary over time.
2 Credit ratings shown are based on the ratings assigned to portfolio holdings by Standard & Poor's Financial Services LLC, an independent rating agency.
136
PACE High Yield Investments
Portfolio of investments—July 31, 2020
| | | Face
amount1 | | Value | |
Corporate bonds—96.6% | |
Advertising—0.5% | |
Clear Channel International BV
6.625%, due 08/01/252,3 | | | 200,000 | | | $ | 204,500 | | |
Lamar Media Corp.
3.750%, due 02/15/282 | | | 25,000 | | | | 25,219 | | |
4.000%, due 02/15/302 | | | 100,000 | | | | 101,000 | | |
4.875%, due 01/15/292 | | | 50,000 | | | | 52,375 | | |
5.000%, due 05/01/234 | | | 25,000 | | | | 25,250 | | |
National CineMedia LLC
5.750%, due 08/15/26 | | | 25,000 | | | | 16,182 | | |
Outfront Media Capital LLC/Outfront Media
Capital Corp.
5.000%, due 08/15/272 | | | 250,000 | | | | 244,780 | | |
Summer BC Holdco A SARL
9.250%, due 10/31/275 | | EUR | 428,000 | | | | 447,164 | | |
Summer BC Holdco B SARL
5.750%, due 10/31/265 | | EUR | 200,000 | | | | 226,593 | | |
| | | | | | 1,343,063 | | |
Aerospace & defense—2.0% | |
Bombardier, Inc.
6.000%, due 10/15/222 | | | 525,000 | | | | 486,938 | | |
6.125%, due 05/15/215 | | EUR | 400,000 | | | | 459,990 | | |
6.125%, due 01/15/232 | | | 250,000 | | | | 215,000 | | |
7.500%, due 12/01/242 | | | 325,000 | | | | 263,250 | | |
7.500%, due 03/15/252 | | | 125,000 | | | | 100,938 | | |
Howmet Aerospace, Inc.
5.125%, due 10/01/24 | | | 100,000 | | | | 106,262 | | |
5.950%, due 02/01/37 | | | 550,000 | | | | 619,765 | | |
6.875%, due 05/01/25 | | | 25,000 | | | | 28,387 | | |
Spirit AeroSystems, Inc.
7.500%, due 04/15/252 | | | 225,000 | | | | 221,130 | | |
TransDigm UK Holdings PLC
6.875%, due 05/15/26 | | | 200,000 | | | | 200,000 | | |
TransDigm, Inc.
5.500%, due 11/15/27 | | | 1,125,000 | | | | 1,067,287 | | |
6.250%, due 03/15/262 | | | 375,000 | | | | 395,625 | | |
6.375%, due 06/15/26 | | | 125,000 | | | | 122,545 | | |
6.500%, due 05/15/25 | | | 530,000 | | | | 519,400 | | |
7.500%, due 03/15/274 | | | 500,000 | | | | 510,000 | | |
Triumph Group, Inc.
6.250%, due 09/15/242 | | | 50,000 | | | | 44,125 | | |
7.750%, due 08/15/25 | | | 125,000 | | | | 80,981 | | |
| | | | | | 5,441,623 | | |
Agriculture—0.9% | |
Camposol SA
6.000%, due 02/03/272 | | | 300,000 | | | | 295,800 | | |
Cooke Omega Investments, Inc./Alpha
VesselCo Holdings, Inc.
8.500%, due 12/15/222 | | | 275,000 | | | | 275,000 | | |
Darling Ingredients, Inc.
5.250%, due 04/15/272 | | | 75,000 | | | | 80,062 | | |
JBS Investments II GmbH
5.750%, due 01/15/282 | | | 500,000 | | | | 530,900 | | |
7.000%, due 01/15/262 | | | 600,000 | | | | 645,000 | | |
| | | Face
amount1 | | Value | |
Corporate bonds—(continued) | |
Agriculture—(concluded) | |
Tereos Finance Groupe I SA
4.125%, due 06/16/235 | | EUR | 400,000 | | | $ | 438,669 | | |
Vector Group Ltd.
10.500%, due 11/01/262 | | | 225,000 | | | | 230,625 | | |
| | | | | | 2,496,056 | | |
Airlines—0.7% | |
Air Canada
7.750%, due 04/15/212 | | | 225,000 | | | | 227,250 | | |
American Airlines Group, Inc.
5.000%, due 06/01/222 | | | 225,000 | | | | 125,665 | | |
American Airlines, Inc.
11.750%, due 07/15/252 | | | 300,000 | | | | 261,078 | | |
Delta Air Lines, Inc.
3.400%, due 04/19/21 | | | 75,000 | | | | 74,747 | | |
3.625%, due 03/15/22 | | | 125,000 | | | | 122,773 | | |
3.800%, due 04/19/23 | | | 75,000 | | | | 69,800 | | |
7.000%, due 05/01/252 | | | 125,000 | | | | 133,594 | | |
7.375%, due 01/15/26 | | | 75,000 | | | | 74,336 | | |
Gol Finance SA
7.000%, due 01/31/255 | | | 580,000 | | | | 313,200 | | |
Transportes Aereos Portugueses SA
5.625%, due 12/02/245 | | EUR | 200,000 | | | | 160,762 | | |
5.625%, due 12/02/242 | | EUR | 200,000 | | | | 160,762 | | |
United Airlines Holdings, Inc.
4.250%, due 10/01/224 | | | 75,000 | | | | 66,956 | | |
5.000%, due 02/01/24 | | | 25,000 | | | | 20,875 | | |
6.000%, due 12/01/204 | | | 75,000 | | | | 74,812 | | |
| | | | | | 1,886,610 | | |
Apparel—0.4% | |
CBR Fashion Finance BV
5.125%, due 10/01/225 | | EUR | 100,000 | | | | 103,271 | | |
IM Group SAS
6.625%, due 03/01/252 | | EUR | 150,000 | | | | 149,314 | | |
PB International BV
7.625%, due 01/26/225 | | | 400,000 | | | | 302,875 | | |
PVH Corp.
3.125%, due 12/15/275 | | EUR | 200,000 | | | | 227,604 | | |
Takko Luxembourg 2 SCA MTN
5.375%, due 11/15/235 | | EUR | 425,000 | | | | 310,330 | | |
| | | | | | 1,093,394 | | |
Auto manufacturers—1.8% | |
BCD Acquisition, Inc.
9.625%, due 09/15/232 | | | 125,000 | | | | 122,500 | | |
Ford Motor Co.
8.500%, due 04/21/23 | | | 525,000 | | | | 582,839 | | |
9.000%, due 04/22/25 | | | 375,000 | | | | 441,797 | | |
Ford Motor Credit Co. LLC
1.514%, due 02/17/23 | | EUR | 200,000 | | | | 227,657 | | |
3.815%, due 11/02/27 | | | 200,000 | | | | 196,250 | | |
4.063%, due 11/01/24 | | | 200,000 | | | | 204,440 | | |
4.134%, due 08/04/25 | | | 200,000 | | | | 204,980 | | |
5.113%, due 05/03/29 | | | 600,000 | | | | 639,750 | | |
137
PACE High Yield Investments
Portfolio of investments—July 31, 2020
| | | Face
amount1 | | Value | |
Corporate bonds—(continued) | |
Auto manufacturers—(concluded) | |
5.125%, due 06/16/25 | | | 200,000 | | | $ | 213,214 | | |
5.875%, due 08/02/21 | | | 200,000 | | | | 205,250 | | |
Ford Motor Credit Co. LLC EMTN
3 mo. Euribor + 0.370%,
0.080%, due 12/01/216 | | EUR | 150,000 | | | | 167,838 | | |
3 mo. Euribor + 0.730%,
0.477%, due 11/15/236 | | EUR | 100,000 | | | | 105,853 | | |
1.744%, due 07/19/24 | | EUR | 100,000 | | | | 110,913 | | |
4.535%, due 03/06/25 | | GBP | 150,000 | | | | 193,843 | | |
Mclaren Finance PLC
5.750%, due 08/01/222 | | | 200,000 | | | | 170,000 | | |
Navistar International Corp.
6.625%, due 11/01/252 | | | 175,000 | | | | 179,375 | | |
9.500%, due 05/01/252 | | | 100,000 | | | | 114,125 | | |
Renault SA EMTN
1.000%, due 03/08/235 | | EUR | 200,000 | | | | 229,111 | | |
Tesla, Inc.
5.300%, due 08/15/252 | | | 425,000 | | | | 439,875 | | |
| | | | | | 4,749,610 | | |
Auto parts & equipment—2.1% | |
Adient Global Holdings Ltd.
3.500%, due 08/15/245 | | EUR | 350,000 | | | | 377,820 | | |
4.875%, due 08/15/262 | | | 200,000 | | | | 186,500 | | |
Adient U.S. LLC
9.000%, due 04/15/252 | | | 125,000 | | | | 139,219 | | |
Clarios Global LP
6.750%, due 05/15/252 | | | 125,000 | | | | 134,375 | | |
Clarios Global LP/Clarios US Finance Co.
4.375%, due 05/15/265 | | EUR | 300,000 | | | | 353,385 | | |
8.500%, due 05/15/272 | | | 550,000 | | | | 578,050 | | |
Cooper-Standard Automotive, Inc.
5.625%, due 11/15/262 | | | 275,000 | | | | 151,250 | | |
Dana, Inc.
5.625%, due 06/15/28 | | | 50,000 | | | | 52,500 | | |
Dealer Tire LLC/DT Issuer LLC
8.000%, due 02/01/282 | | | 100,000 | | | | 98,250 | | |
Garrett LX I SARL/Garrett Borrowing LLC
5.125%, due 10/15/265 | | EUR | 175,000 | | | | 163,281 | | |
Goodyear Tire & Rubber Co./The
9.500%, due 05/31/25 | | | 600,000 | | | | 674,250 | | |
IHO Verwaltungs GmbH
3.625% Cash or 4.375% PIK,
3.625%, due 05/15/25 5,7 | | EUR | 100,000 | | | | 118,341 | | |
3.875% Cash or 4.625% PIK,
3.875%, due 05/15/27 5,7 | | EUR | 100,000 | | | | 118,486 | | |
Metalsa SA de CV
4.900%, due 04/24/235 | | | 575,000 | | | | 564,219 | | |
Schaeffler AG EMTN
2.875%, due 03/26/275 | | EUR | 100,000 | | | | 118,961 | | |
Schaeffler Finance BV
3.250%, due 05/15/255 | | EUR | 325,000 | | | | 386,892 | | |
Superior Industries International, Inc.
6.000%, due 06/15/252 | | EUR | 300,000 | | | | 288,703 | | |
Tenneco, Inc.
5.000%, due 07/15/245 | | EUR | 325,000 | | | | 352,179 | | |
| | | Face
amount1 | | Value | |
Corporate bonds—(continued) | |
Auto parts & equipment—(concluded) | |
5.000%, due 07/15/26 | | | 250,000 | | | $ | 167,500 | | |
Titan International, Inc.
6.500%, due 11/30/23 | | | 150,000 | | | | 99,750 | | |
ZF Europe Finance BV
2.000%, due 02/23/265 | | EUR | 200,000 | | | | 223,222 | | |
2.500%, due 10/23/275 | | EUR | 100,000 | | | | 110,715 | | |
3.000%, due 10/23/295 | | EUR | 200,000 | | | | 219,099 | | |
| | | | | | 5,676,947 | | |
Banks—3.5% | |
Akbank T.A.S.
5.000%, due 10/24/225 | | | 550,000 | | | | 537,281 | | |
Akbank T.A.S. MTN
5.125%, due 03/31/255 | | | 400,000 | | | | 371,000 | | |
Banco de Bogota SA
5.375%, due 02/19/232 | | | 250,000 | | | | 259,766 | | |
Banco de Sabadell SA
(fixed, converts to FRN on 11/23/22),
6.125%, due 11/23/225,6,8 | | EUR | 400,000 | | | | 380,478 | | |
Banco do Brasil SA
5.875%, due 01/26/225 | | | 350,000 | | | | 366,520 | | |
5.875%, due 01/26/222 | | | 450,000 | | | | 469,687 | | |
Bank of America Corp.
(fixed, converts to FRN on 06/20/24),
5.125%, due 06/20/246,8 | | | 100,000 | | | | 103,133 | | |
(fixed, converts to FRN on 09/05/24),
6.250%, due 09/05/246,8 | | | 350,000 | | | | 380,350 | | |
(fixed, converts to FRN on 03/10/26),
6.300%, due 03/10/266,8 | | | 175,000 | | | | 201,219 | | |
Barclays PLC
(fixed, converts to FRN on 06/15/24),
8.000%, due 06/15/246,8 | | | 400,000 | | | | 423,500 | | |
(fixed, converts to FRN on 12/15/20),
8.000%, due 12/15/206,8 | | EUR | 600,000 | | | | 712,673 | | |
CaixaBank SA
(fixed, converts to FRN on 06/13/24),
6.750%, due 06/13/245,6,8 | | EUR | 400,000 | | | | 473,536 | | |
CIT Group, Inc.
4.125%, due 03/09/21 | | | 25,000 | | | | 25,094 | | |
Citigroup, Inc.
(fixed, converts to FRN on 01/30/25),
4.700%, due 01/30/256,8 | | | 225,000 | | | | 219,094 | | |
(fixed, converts to FRN on 02/15/23),
5.900%, due 02/15/236,8 | | | 75,000 | | | | 78,789 | | |
(fixed, converts to FRN on 11/15/20),
5.950%, due 11/15/206,8 | | | 175,000 | | | | 171,857 | | |
Credit Suisse Group AG
(fixed, converts to FRN on 12/18/24),
6.250%, due 12/18/242,6,8 | | | 400,000 | | | | 426,000 | | |
Goldman Sachs Group, Inc./The
(fixed, converts to FRN on 08/31/20),
4.370%, due 08/31/206,8 | | | 375,000 | | | | 364,219 | | |
Goldman Sachs Group, Inc./The
(fixed, converts to FRN on 02/10/25),
4.950%, due 02/10/254,6,8 | | | 75,000 | | | | 75,230 | | |
138
PACE High Yield Investments
Portfolio of investments—July 31, 2020
| | | Face
amount1 | | Value | |
Corporate bonds—(continued) | |
Banks—(concluded) | |
Intesa Sanpaolo SpA EMTN
3.928%, due 09/15/265 | | EUR | 500,000 | | | $ | 636,413 | | |
JPMorgan Chase & Co.
(fixed, converts to FRN on 02/01/25),
4.600%, due 02/01/256,8 | | | 150,000 | | | | 145,140 | | |
Natwest Group PLC
(fixed, converts to FRN on 08/10/25),
8.000%, due 08/10/256,8 | | | 200,000 | | | | 225,500 | | |
(fixed, converts to FRN on 08/15/21),
8.625%, due 08/15/216,8 | | | 200,000 | | | | 208,958 | | |
Provident Funding Associates LP/PFG
Finance Corp.
6.375%, due 06/15/252 | | | 75,000 | | | | 71,625 | | |
Turkiye Vakiflar Bankasi TAO
8.125%, due 03/28/242 | | | 250,000 | | | | 251,250 | | |
Ukreximbank Via Biz Finance PLC
9.625%, due 04/27/225 | | | 166,667 | | | | 170,573 | | |
9.750%, due 01/22/255 | | | 1,050,000 | | | | 1,084,125 | | |
UniCredit SpA EMTN
(fixed, converts to FRN on 01/03/22),
4.375%, due 01/03/275,6 | | EUR | 300,000 | | | | 362,752 | | |
Yapi ve Kredi Bankasi AS
8.250%, due 10/15/242 | | | 200,000 | | | | 203,563 | | |
| | | | | | 9,399,325 | | |
Beverages—0.7% | |
Ajecorp BV
6.500%, due 05/14/225 | | | 531,000 | | | | 525,690 | | |
Central American Bottling Corp.
5.750%, due 01/31/275 | | | 450,000 | | | | 472,360 | | |
5.750%, due 01/31/272 | | | 400,000 | | | | 415,250 | | |
Coca-Cola Icecek AS
4.215%, due 09/19/245 | | | 200,000 | | | | 200,200 | | |
Sunshine Mid BV
6.500%, due 05/15/265 | | EUR | 225,000 | | | | 272,958 | | |
| | | | | | 1,886,458 | | |
Building materials—2.3% | |
BMC East LLC
5.500%, due 10/01/242 | | | 175,000 | | | | 178,938 | | |
Builders FirstSource, Inc.
5.000%, due 03/01/302 | | | 100,000 | | | | 104,880 | | |
6.750%, due 06/01/272 | | | 225,000 | | | | 247,500 | | |
Cemex SAB de CV
3.125%, due 03/19/265 | | EUR | 125,000 | | | | 137,814 | | |
3.125%, due 03/19/262 | | EUR | 400,000 | | | | 441,143 | | |
5.450%, due 11/19/292 | | | 400,000 | | | | 387,684 | | |
5.700%, due 01/11/255 | | | 250,000 | | | | 251,719 | | |
7.750%, due 04/16/262,4 | | | 400,000 | | | | 422,750 | | |
Griffon Corp.
5.750%, due 03/01/28 | | | 225,000 | | | | 235,125 | | |
5.750%, due 03/01/282 | | | 25,000 | | | | 26,125 | | |
Grupo Cementos de Chihuahua SAB de CV
5.250%, due 06/23/245 | | | 1,000,000 | | | | 1,014,062 | | |
HT Troplast GmbH
9.250%, due 07/15/252 | | EUR | 100,000 | | | | 120,445 | | |
| | | Face
amount1 | | Value | |
Corporate bonds—(continued) | |
Building materials—(concluded) | |
James Hardie International Finance DAC
3.625%, due 10/01/262 | | EUR | 150,000 | | | $ | 179,431 | | |
JELD-WEN, Inc.
4.625%, due 12/15/252 | | | 125,000 | | | | 126,250 | | |
6.250%, due 05/15/252 | | | 100,000 | | | | 107,000 | | |
Masonite International Corp.
5.750%, due 09/15/262 | | | 75,000 | | | | 78,591 | | |
NWH Escrow Corp.
7.500%, due 08/01/212 | | | 250,000 | | | | 87,188 | | |
Patrick Industries, Inc.
7.500%, due 10/15/272 | | | 225,000 | | | | 239,454 | | |
PGT Innovations, Inc.
6.750%, due 08/01/262 | | | 175,000 | | | | 182,000 | | |
Standard Industries, Inc.
2.250%, due 11/21/262 | | EUR | 275,000 | | | | 312,967 | | |
5.000%, due 02/15/272 | | | 50,000 | | | | 53,395 | | |
Summit Materials LLC/Summit Materials
Finance Corp.
5.250%, due 01/15/292,3 | | | 125,000 | | | | 129,688 | | |
6.125%, due 07/15/23 | | | 25,000 | | | | 25,015 | | |
6.500%, due 03/15/272 | | | 50,000 | | | | 55,081 | | |
Tecnoglass, Inc.
8.200%, due 01/31/225 | | | 600,000 | | | | 608,280 | | |
US Concrete, Inc.
6.375%, due 06/01/24 | | | 450,000 | | | | 459,000 | | |
| | | | | | 6,211,525 | | |
Chemicals—2.0% | |
Atotech Alpha 2 BV
8.750% Cash or 9.500% PIK,
8.750%, due 06/01/232,7 | | | 200,000 | | | | 202,000 | | |
Atotech Alpha 3 BV/Alpha US Bidco, Inc.
6.250%, due 02/01/252 | | | 200,000 | | | | 205,750 | | |
Avient Corp.
5.750%, due 05/15/252 | | | 150,000 | | | | 162,823 | | |
Axalta Coating Systems Dutch Holding B BV
3.750%, due 01/15/255 | | EUR | 300,000 | | | | 352,855 | | |
Blue Cube Spinco LLC
10.000%, due 10/15/25 | | | 25,000 | | | | 26,688 | | |
Braskem Netherlands Finance BV
(fixed, converts to FRN on 10/24/25),
8.500%, due 01/23/812,6 | | | 250,000 | | | | 252,515 | | |
Chemours Co./The
5.375%, due 05/15/27 | | | 50,000 | | | | 48,994 | | |
7.000%, due 05/15/254 | | | 75,000 | | | | 76,312 | | |
Cornerstone Chemical Co.
6.750%, due 08/15/242 | | | 125,000 | | | | 115,000 | | |
Element Solutions, Inc.
5.875%, due 12/01/252 | | | 25,000 | | | | 25,813 | | |
INEOS Finance PLC
2.875%, due 05/01/265 | | EUR | 200,000 | | | | 228,522 | | |
Innophos Holdings, Inc.
9.375%, due 02/15/282 | | | 175,000 | | | | 178,500 | | |
Kraton Polymers LLC/Kraton Polymers
Capital Corp.
5.250%, due 05/15/262 | | EUR | 250,000 | | | | 298,169 | | |
139
PACE High Yield Investments
Portfolio of investments—July 31, 2020
| | | Face
amount1 | | Value | |
Corporate bonds—(continued) | |
Chemicals—(concluded) | |
5.250%, due 05/15/265 | | EUR | 100,000 | | | $ | 119,267 | | |
7.000%, due 04/15/252,4 | | | 100,000 | | | | 103,500 | | |
Minerals Technologies, Inc.
5.000%, due 07/01/282 | | | 100,000 | | | | 103,780 | | |
Monitchem HoldCo 2 SA
9.500%, due 09/15/262 | | EUR | 150,000 | | | | 180,085 | | |
Monitchem HoldCo 3 SA
5.250%, due 03/15/255 | | EUR | 100,000 | | | | 120,660 | | |
NOVA Chemicals Corp.
5.000%, due 05/01/252 | | | 50,000 | | | | 48,813 | | |
5.250%, due 06/01/272 | | | 150,000 | | | | 141,937 | | |
Nufarm Australia Ltd./Nufarm Americas, Inc.
5.750%, due 04/30/262,4 | | | 50,000 | | | | 49,750 | | |
OCI NV
3.125%, due 11/01/242 | | EUR | 250,000 | | | | 290,201 | | |
5.250%, due 11/01/242 | | | 200,000 | | | | 201,000 | | |
6.625%, due 04/15/232 | | | 200,000 | | | | 207,466 | | |
Olin Corp.
5.000%, due 02/01/30 | | | 125,000 | | | | 117,500 | | |
5.625%, due 08/01/29 | | | 75,000 | | | | 72,008 | | |
9.500%, due 06/01/252 | | | 150,000 | | | | 171,000 | | |
SPCM SA
4.875%, due 09/15/252 | | | 200,000 | | | | 205,754 | | |
Synthomer PLC
3.875%, due 07/01/252 | | EUR | 100,000 | | | | 120,979 | | |
TPC Group, Inc.
10.500%, due 08/01/242 | | | 225,000 | | | | 200,250 | | |
Trinseo Materials Operating SCA/Trinseo
Materials Finance, Inc.
5.375%, due 09/01/252 | | | 250,000 | | | | 246,875 | | |
Tronox Finance PLC
5.750%, due 10/01/252 | | | 225,000 | | | | 222,750 | | |
Tronox, Inc.
6.500%, due 04/15/262 | | | 75,000 | | | | 75,188 | | |
WR Grace & Co-Conn
4.875%, due 06/15/272 | | | 150,000 | | | | 159,750 | | |
| | | | | | 5,332,454 | | |
Coal—0.1% | |
Cloud Peak Energy Resources LLC/Cloud Peak
Energy Finance Corp.
3.000%, due 03/15/249,10 | | | 550,000 | | | | 5,500 | | |
12.000%, due 11/21/219,10 | | | 66,000 | | | | — | | |
Indo Energy Finance II BV
6.375%, due 01/24/235 | | | 228,000 | | | | 218,310 | | |
Murray Energy Corp.
12.000%, due 04/15/242,11 | | | 1,268,693 | | | | 13 | | |
| | | | | | 223,823 | | |
Commercial banks—1.0% | |
Banco de Bogota SA
6.250%, due 05/12/265 | | | 500,000 | | | | 532,500 | | |
Banco Votorantim SA
4.375%, due 07/29/252 | | | 200,000 | | | | 200,876 | | |
| | | Face
amount1 | | Value | |
Corporate bonds—(continued) | |
Commercial banks—(concluded) | |
Barclays PLC
(fixed, converts to FRN on 06/15/25),
7.125%, due 06/15/256,8 | | GBP | 200,000 | | | $ | 266,040 | | |
Citigroup, Inc.
(fixed, converts to FRN on 08/15/26),
6.250%, due 08/15/266,8 | | | 150,000 | | | | 166,125 | | |
Itau Unibanco Holding SA
2.900%, due 01/24/235 | | | 400,000 | | | | 399,504 | | |
JPMorgan Chase & Co.
(fixed, converts to FRN on 04/30/24),
6.125%, due 04/30/246,8 | | | 150,000 | | | | 158,796 | | |
(fixed, converts to FRN on 02/01/24),
6.750%, due 02/01/24 6,8 | | | 300,000 | | | | 332,499 | | |
UniCredit SpA
(fixed, converts to FRN on 01/15/27),
2.731%, due 01/15/325,6 | | EUR | 325,000 | | | | 358,634 | | |
UniCredit SpA EMTN
(fixed, converts to FRN on 09/23/24),
2.000%, due 09/23/295,6 | | EUR | 200,000 | | | | 221,455 | | |
Unione di Banche Italiane SpA EMTN
(fixed, converts to FRN on 03/04/24),
5.875%, due 03/04/295,6 | | EUR | 100,000 | | | | 129,417 | | |
| | | | | | 2,765,846 | | |
Commercial services—2.6% | |
AA Bond Co. Ltd.
5.500%, due 07/31/225 | | GBP | 375,000 | | | | 435,485 | | |
Ahern Rentals, Inc.
7.375%, due 05/15/232 | | | 400,000 | | | | 178,000 | | |
Algeco Global Finance PLC
8.000%, due 02/15/232 | | | 200,000 | | | | 199,000 | | |
Allied Universal Holdco LLC/Allied Universal
Finance Corp.
6.625%, due 07/15/262 | | | 375,000 | | | | 401,250 | | |
9.750%, due 07/15/272 | | | 450,000 | | | | 500,184 | | |
Arena Luxembourg Finance SARL
1.875%, due 02/01/282 | | EUR | 100,000 | | | | 107,870 | | |
ASGN, Inc.
4.625%, due 05/15/282 | | | 150,000 | | | | 153,375 | | |
Atlantia SpA EMTN
1.875%, due 07/13/275 | | EUR | 200,000 | | | | 228,673 | | |
Avis Budget Car Rental LLC/Avis Budget
Finance, Inc.
5.250%, due 03/15/252 | | | 25,000 | | | | 23,500 | | |
5.750%, due 07/15/272,4 | | | 125,000 | | | | 116,875 | | |
6.375%, due 04/01/242,4 | | | 75,000 | | | | 71,625 | | |
Brink's Co/The
5.500%, due 07/15/252 | | | 75,000 | | | | 79,687 | | |
Cardtronics, Inc./Cardtronics USA, Inc.
5.500%, due 05/01/252,4 | | | 50,000 | | | | 50,125 | | |
Europcar Mobility Group.
4.000%, due 04/30/265 | | EUR | 225,000 | | | | 139,145 | | |
Gartner, Inc.
4.500%, due 07/01/282 | | | 25,000 | | | | 26,250 | | |
Graham Holdings Co.
5.750%, due 06/01/262 | | | 175,000 | | | | 185,500 | | |
140
PACE High Yield Investments
Portfolio of investments—July 31, 2020
| | | Face
amount1 | | Value | |
Corporate bonds—(continued) | |
Commercial services—(concluded) | |
Hertz Corp./The
5.500%, due 10/15/242,11 | | | 125,000 | | | $ | 49,375 | | |
6.000%, due 01/15/282,11 | | | 350,000 | | | | 138,250 | | |
6.250%, due 10/15/2211 | | | 25,000 | | | | 9,875 | | |
7.125%, due 08/01/262,11 | | | 375,000 | | | | 145,691 | | |
Hurricane Finance PLC
8.000%, due 10/15/252,3 | | GBP | 100,000 | | | | 130,900 | | |
La Financiere Atalian SASU
4.000%, due 05/15/245 | | EUR | 150,000 | | | | 147,496 | | |
5.125%, due 05/15/255 | | EUR | 125,000 | | | | 123,200 | | |
Midas Intermediate Holdco II LLC/Midas
Intermediate Holdco II Finance, Inc.
7.875%, due 10/01/222,4 | | | 300,000 | | | | 232,500 | | |
MPH Acquisition Holdings LLC
7.125%, due 06/01/242 | | | 200,000 | | | | 205,250 | | |
Nassa Topco AS
2.875%, due 04/06/245 | | EUR | 525,000 | | | | 575,073 | | |
Nielsen Finance LLC/Nielsen Finance Co.
5.000%, due 04/15/222 | | | 25,000 | | | | 25,110 | | |
Prime Security Services Borrower LLC/Prime
Finance, Inc.
5.250%, due 04/15/242 | | | 75,000 | | | | 80,625 | | |
6.250%, due 01/15/282 | | | 75,000 | | | | 78,187 | | |
Q-Park Holding I BV
2.000%, due 03/01/272 | | EUR | 100,000 | | | | 109,089 | | |
Refinitiv US Holdings, Inc.
4.500%, due 05/15/265 | | EUR | 225,000 | | | | 277,604 | | |
6.875%, due 11/15/265 | | EUR | 250,000 | | | | 315,141 | | |
8.250%, due 11/15/262 | | | 275,000 | | | | 303,424 | | |
Rekeep SpA
9.000%, due 06/15/225 | | EUR | 200,000 | | | | 229,936 | | |
Ritchie Bros Auctioneers, Inc.
5.375%, due 01/15/252 | | | 175,000 | | | | 181,088 | | |
TMS International Holding Corp.
7.250%, due 08/15/252 | | | 125,000 | | | | 103,750 | | |
United Rentals North America, Inc.
3.875%, due 02/15/313 | | | 175,000 | | | | 175,000 | | |
6.500%, due 12/15/26 | | | 25,000 | | | | 27,750 | | |
Verscend Escrow Corp.
9.750%, due 08/15/262 | | | 250,000 | | | | 276,822 | | |
| | | | | | 6,837,680 | | |
Computers—1.3% | |
Banff Merger Sub, Inc.
9.750%, due 09/01/262 | | | 325,000 | | | | 343,973 | | |
Dell International LLC/EMC Corp.
7.125%, due 06/15/242 | | | 325,000 | | | | 337,418 | | |
Diebold Nixdorf Dutch Holding BV
9.000%, due 07/15/252 | | EUR | 100,000 | | | | 120,799 | | |
Diebold Nixdorf, Inc.
8.500%, due 04/15/244 | | | 150,000 | | | | 136,125 | | |
9.375%, due 07/15/252 | | | 100,000 | | | | 105,780 | | |
Everi Payments, Inc.
7.500%, due 12/15/252,4 | | | 116,000 | | | | 112,520 | | |
Exela Intermediate LLC/Exela Finance, Inc.
10.000%, due 07/15/232 | | | 325,000 | | | | 81,153 | | |
| | | Face
amount1 | | Value | |
Corporate bonds—(continued) | |
Computers—(concluded) | |
MTS Systems Corp.
5.750%, due 08/15/272 | | | 100,000 | | | $ | 97,345 | | |
NCR Corp.
5.750%, due 09/01/272 | | | 225,000 | | | | 232,313 | | |
6.125%, due 09/01/292 | | | 300,000 | | | | 328,635 | | |
6.375%, due 12/15/23 | | | 100,000 | | | | 103,000 | | |
8.125%, due 04/15/252 | | | 50,000 | | | | 55,485 | | |
Presidio Holdings, Inc.
4.875%, due 02/01/272 | | | 125,000 | | | | 127,500 | | |
8.250%, due 02/01/282,4 | | | 250,000 | | | | 260,000 | | |
Science Applications International Corp.
4.875%, due 04/01/282 | | | 200,000 | | | | 209,500 | | |
Tempo Acquisition LLC/Tempo Acquisition
Finance Corp.
6.750%, due 06/01/252,3 | | | 325,000 | | | | 335,562 | | |
Vericast Corp.
8.375%, due 08/15/222 | | | 325,000 | | | | 265,687 | | |
9.250%, due 03/01/212,4 | | | 175,000 | | | | 176,094 | | |
| | | | | | 3,428,889 | | |
Construction materials—0.2% | |
CEMEX Finance LLC
4.625%, due 06/15/245 | | EUR | 225,000 | | | | 266,364 | | |
James Hardie International Finance DAC
3.625%, due 10/01/265 | | EUR | 125,000 | | | | 149,526 | | |
| | | | | | 415,890 | | |
Cosmetics & personal care—0.1% | |
Avon International Capital PLC
6.500%, due 08/15/222 | | | 75,000 | | | | 74,625 | | |
Edgewell Personal Care Co.
5.500%, due 06/01/282 | | | 125,000 | | | | 135,313 | | |
Revlon Consumer Products Corp.
6.250%, due 08/01/24 | | | 200,000 | | | | 36,542 | | |
| | | | | | 246,480 | | |
Distribution & wholesale—0.6% | |
H&E Equipment Services, Inc.
5.625%, due 09/01/25 | | | 275,000 | | | | 286,344 | | |
IAA, Inc.
5.500%, due 06/15/272 | | | 125,000 | | | | 133,281 | | |
KAR Auction Services, Inc.
5.125%, due 06/01/252 | | | 125,000 | | | | 125,625 | | |
Matalan Finance PLC
6.750%, due 01/31/232 | | GBP | 450,000 | | | | 397,785 | | |
Performance Food Group, Inc.
5.500%, due 06/01/242 | | | 275,000 | | | | 277,406 | | |
5.500%, due 10/15/272 | | | 100,000 | | | | 103,250 | | |
Resideo Funding, Inc.
6.125%, due 11/01/262,4 | | | 75,000 | | | | 76,500 | | |
Univar Solutions USA, Inc.
5.125%, due 12/01/272 | | | 225,000 | | | | 237,938 | | |
| | | | | | 1,638,129 | | |
141
PACE High Yield Investments
Portfolio of investments—July 31, 2020
| | | Face
amount1 | | Value | |
Corporate bonds—(continued) | |
Diversified financial services—3.3% | |
AerCap Ireland Capital DAC/AerCap Global
Aviation Trust
6.500%, due 07/15/25 | | | 150,000 | | | $ | 160,940 | | |
AG Issuer LLC
6.250%, due 03/01/282 | | | 150,000 | | | | 151,875 | | |
Ally Financial, Inc.
8.000%, due 11/01/31 | | | 250,000 | | | | 345,710 | | |
8.000%, due 11/01/31 | | | 285,000 | | | | 383,670 | | |
Amigo Luxembourg SA
7.625%, due 01/15/245 | | GBP | 225,000 | | | | 147,262 | | |
Credit Acceptance Corp.
5.125%, due 12/31/242 | | | 50,000 | | | | 50,900 | | |
6.625%, due 03/15/264 | | | 50,000 | | | | 52,625 | | |
Credito Real SAB de CV
5.000%, due 02/01/272 | | EUR | 100,000 | | | | 100,936 | | |
5.000%, due 02/01/275 | | EUR | 175,000 | | | | 175,923 | | |
9.500%, due 02/07/265 | | | 300,000 | | | | 294,750 | | |
9.500%, due 02/07/262 | | | 300,000 | | | | 294,750 | | |
doValue S.p.A
5.000%, due 08/04/252 | | EUR | 325,000 | | | | 378,673 | | |
Fairstone Financial, Inc.
7.875%, due 07/15/242 | | | 200,000 | | | | 202,000 | | |
Garfunkelux Holdco 3 SA
3 mo. Euribor + 4.500%,
4.500%, due 09/01/235,6 | | EUR | 625,000 | | | | 636,682 | | |
7.500%, due 08/01/225 | | EUR | 400,000 | | | | 440,073 | | |
8.500%, due 11/01/225 | | GBP | 100,000 | | | | 121,304 | | |
Global Aircraft Leasing Co. Ltd.
6.500% Cash or 7.250% PIK,
6.500%, due 09/15/242,7 | | | 375,000 | | | | 233,438 | | |
Intrum AB
4.875%, due 08/15/252,3 | | EUR | 200,000 | | | | 233,234 | | |
Jefferies Finance LLC/JFIN Co-Issuer Corp.
6.250%, due 06/03/262 | | | 200,000 | | | | 195,000 | | |
LPL Holdings, Inc.
4.625%, due 11/15/272 | | | 75,000 | | | | 77,250 | | |
Motion Finco SARL
7.000%, due 05/15/252 | | EUR | 100,000 | | | | 120,740 | | |
Mulhacen Pte Ltd.
6.500% Cash or 7.250% PIK,
6.500%, due 08/01/235,7 | | EUR | 600,000 | | | | 291,825 | | |
Nationstar Mortgage Holdings, Inc.
8.125%, due 07/15/232 | | | 100,000 | | | | 104,250 | | |
9.125%, due 07/15/262 | | | 125,000 | | | | 135,975 | | |
Nationstar Mortgage Holdings, Inc.
6.000%, due 01/15/272 | | | 75,000 | | | | 76,500 | | |
Navient Corp.
5.000%, due 03/15/27 | | | 25,000 | | | | 23,938 | | |
5.875%, due 03/25/21 | | | 75,000 | | | | 76,140 | | |
6.500%, due 06/15/22 | | | 100,000 | | | | 104,500 | | |
6.625%, due 07/26/21 | | | 75,000 | | | | 76,875 | | |
6.750%, due 06/25/25 | | | 325,000 | | | | 339,828 | | |
6.750%, due 06/15/26 | | | 200,000 | | | | 208,000 | | |
7.250%, due 09/25/23 | | | 25,000 | | | | 26,399 | | |
Navient Corp. MTN
6.125%, due 03/25/24 | | | 350,000 | | | | 362,250 | | |
| | | Face
amount1 | | Value | |
Corporate bonds—(continued) | |
Diversified financial services—(concluded) | |
Newday Bondco PLC
7.375%, due 02/01/245 | | GBP | 200,000 | | | $ | 239,547 | | |
NFP Corp.
6.875%, due 07/15/252 | | | 325,000 | | | | 336,407 | | |
8.000%, due 07/15/252 | | | 125,000 | | | | 129,813 | | |
OneMain Finance Corp.
5.375%, due 11/15/29 | | | 50,000 | | | | 52,755 | | |
6.625%, due 01/15/28 | | | 200,000 | | | | 229,191 | | |
6.875%, due 03/15/25 | | | 275,000 | | | | 307,312 | | |
7.125%, due 03/15/26 | | | 475,000 | | | | 556,857 | | |
8.875%, due 06/01/25 | | | 50,000 | | | | 56,375 | | |
Oxford Finance LLC/Oxford Finance
Co-Issuer II, Inc.
6.375%, due 12/15/222 | | | 100,000 | | | | 93,000 | | |
Park Aerospace Holdings Ltd.
5.250%, due 08/15/222 | | | 75,000 | | | | 72,266 | | |
| | | | | | 8,697,738 | | |
Electric—3.0% | |
AES Andres BV/Dominican Power Partners/
Empresa Generadora de Electricidad It
7.950%, due 05/11/265 | | | 500,000 | | | | 513,125 | | |
AES El Salvador Trust II
6.750%, due 03/28/235 | | | 450,000 | | | | 418,359 | | |
Calpine Corp.
4.500%, due 02/15/282 | | | 275,000 | | | | 283,938 | | |
4.625%, due 02/01/292,3 | | | 125,000 | | | | 126,248 | | |
5.000%, due 02/01/312,3 | | | 125,000 | | | | 128,110 | | |
5.125%, due 03/15/282 | | | 300,000 | | | | 311,625 | | |
Capex SA
6.875%, due 05/15/245 | | | 200,000 | | | | 158,000 | | |
6.875%, due 05/15/242 | | | 225,000 | | | | 174,023 | | |
Centrais Eletricas Brasileiras SA
3.625%, due 02/04/252 | | | 200,000 | | | | 198,790 | | |
Clearway Energy Operating LLC
4.750%, due 03/15/282 | | | 50,000 | | | | 53,438 | | |
5.000%, due 09/15/264 | | | 225,000 | | | | 235,969 | | |
5.750%, due 10/15/25 | | | 175,000 | | | | 186,813 | | |
ContourGlobal Power Holdings SA
4.125%, due 08/01/252 | | EUR | 675,000 | | | | 811,114 | | |
Drax Finco PLC
6.625%, due 11/01/252 | | | 200,000 | | | | 208,500 | | |
Eskom Holdings SOC Ltd.
6.350%, due 08/10/285 | | | 400,000 | | | | 400,375 | | |
6.750%, due 08/06/235 | | | 410,000 | | | | 392,903 | | |
GenOn Energy, Inc.
3.000%, due 06/15/499,10,12 | | | 75,000 | | | | 0 | | |
Mong Duong Finance Holdings BV
5.125%, due 05/07/292 | | | 375,000 | | | | 376,140 | | |
NextEra Energy Operating Partners LP
3.875%, due 10/15/262 | | | 275,000 | | | | 287,375 | | |
NRG Energy, Inc.
6.625%, due 01/15/27 | | | 150,000 | | | | 159,750 | | |
Orano SA EMTN
3.375%, due 04/23/265 | | EUR | 500,000 | | | | 606,279 | | |
142
PACE High Yield Investments
Portfolio of investments—July 31, 2020
| | | Face
amount1 | | Value | |
Corporate bonds—(continued) | |
Electric—(concluded) | |
Pacific Gas and Electric Co.
4.550%, due 07/01/30 | | | 125,000 | | | $ | 143,551 | | |
4.950%, due 07/01/50 | | | 175,000 | | | | 211,974 | | |
PG&E Corp.
5.000%, due 07/01/28 | | | 100,000 | | | | 102,895 | | |
5.250%, due 07/01/30 | | | 125,000 | | | | 130,000 | | |
SMC Global Power Holdings Corp.
(fixed, converts to FRN on 05/05/25),
5.950%, due 05/05/255,6,8 | | | 300,000 | | | | 284,941 | | |
(fixed, converts to FRN on 04/25/24),
6.500%, due 04/25/245,6,8 | | | 200,000 | | | | 196,251 | | |
Star Energy Geothermal Wayang Windu Ltd.
6.750%, due 04/24/335 | | | 226,750 | | | | 243,273 | | |
Talen Energy Supply LLC
6.625%, due 01/15/282 | | | 75,000 | | | | 75,310 | | |
7.250%, due 05/15/272 | | | 25,000 | | | | 26,000 | | |
10.500%, due 01/15/262 | | | 250,000 | | | | 193,725 | | |
Vistra Operations Co. LLC
5.500%, due 09/01/262 | | | 300,000 | | | | 316,125 | | |
| | | | | | 7,954,919 | | |
Electrical components & equipment—0.4% | |
Energizer Gamma Acquisition BV
4.625%, due 07/15/262 | | EUR | 500,000 | | | | 605,148 | | |
Energizer Holdings, Inc.
6.375%, due 07/15/262 | | | 175,000 | | | | 186,538 | | |
Senvion Holding GmbH
3.875%, due 10/25/225,11 | | EUR | 400,000 | | | | 13,193 | | |
WESCO Distribution, Inc.
7.125%, due 06/15/252 | | | 125,000 | | | | 137,174 | | |
7.250%, due 06/15/282 | | | 150,000 | | | | 163,875 | | |
| | | | | | 1,105,928 | | |
Electronics—0.1% | |
TTM Technologies, Inc.
5.625%, due 10/01/252 | | | 175,000 | | | | 178,446 | | |
Energy-alternate sources—0.5% | |
Azure Power Solar Energy Pvt Ltd.
5.650%, due 12/24/242 | | | 300,000 | | | | 305,925 | | |
Pattern Energy Group, Inc.
5.875%, due 02/01/242 | | | 75,000 | | | | 77,250 | | |
ReNew Power Pvt Ltd.
5.875%, due 03/05/272 | | | 300,000 | | | | 299,514 | | |
ReNew Power Synthetic
6.670%, due 03/12/242 | | | 200,000 | | | | 206,562 | | |
TerraForm Power Operating LLC
4.250%, due 01/31/232 | | | 125,000 | | | | 131,038 | | |
4.750%, due 01/15/302 | | | 125,000 | | | | 135,625 | | |
5.000%, due 01/31/282 | | | 50,000 | | | | 55,125 | | |
| | | | | | 1,211,039 | | |
Engineering & construction—1.2% | |
Aeropuertos Argentina 2000 SA
9.375% Cash or 9.375% PIK,
9.375%, due 02/01/275,7 | | | 685,199 | | | | 543,020 | | |
| | | Face
amount1 | | Value | |
Corporate bonds—(continued) | |
Engineering & construction—(concluded) | |
Aeropuertos Dominicanos Siglo XXI SA
6.750%, due 03/30/295 | | | 810,000 | | | $ | 708,749 | | |
6.750%, due 03/30/292 | | | 200,000 | | | | 175,000 | | |
Brand Industrial Services, Inc.
8.500%, due 07/15/252 | | | 275,000 | | | | 254,375 | | |
Cellnex Telecom SA
1.000%, due 04/20/275 | | EUR | 100,000 | | | | 114,453 | | |
New Enterprise Stone & Lime Co., Inc.
6.250%, due 03/15/262 | | | 175,000 | | | | 180,250 | | |
9.750%, due 07/15/282 | | | 75,000 | | | | 78,562 | | |
Novafives SAS
3 mo. Euribor + 4.500%,
4.500%, due 06/15/255,6 | | EUR | 250,000 | | | | 211,327 | | |
SPIE SA
2.625%, due 06/18/265 | | EUR | 200,000 | | | | 235,474 | | |
Swissport Financing SARL
5.250%, due 08/15/242 | | EUR | 100,000 | | | | 94,708 | | |
9.000%, due 02/15/252 | | EUR | 125,000 | | | | 30,927 | | |
9.000%, due 02/15/255 | | EUR | 150,000 | | | | 37,112 | | |
TopBuild Corp.
5.625%, due 05/01/262 | | | 200,000 | | | | 207,000 | | |
Weekley Homes LLC/Weekley Finance Corp.
6.000%, due 02/01/23 | | | 175,000 | | | | 175,000 | | |
6.625%, due 08/15/25 | | | 200,000 | | | | 209,750 | | |
| | | | | | 3,255,707 | | |
Entertainment—3.4% | |
Allen Media LLC / Allen Media Co-Issuer, Inc.
10.500%, due 02/15/282 | | | 175,000 | | | | 161,875 | | |
AMC Entertainment Holdings, Inc.
10.500%, due 04/24/262 | | | 28,000 | | | | 26,590 | | |
12.000%, due 06/15/262 | | | 239,000 | | | | 111,135 | | |
ASR Media & Sponsorship SpA
5.125%, due 08/01/242 | | EUR | 275,000 | | | | 300,676 | | |
5.125%, due 08/01/245 | | EUR | 100,000 | | | | 109,337 | | |
Boyne USA, Inc.
7.250%, due 05/01/252 | | | 75,000 | | | | 80,156 | | |
Caesars Resort Collection LLC/CRC Finco, Inc.
5.250%, due 10/15/252 | | | 325,000 | | | | 293,026 | | |
CCM Merger, Inc.
6.000%, due 03/15/222 | | | 150,000 | | | | 147,000 | | |
Churchill Downs, Inc.
4.750%, due 01/15/282 | | | 75,000 | | | | 76,500 | | |
5.500%, due 04/01/272 | | | 125,000 | | | | 130,781 | | |
Cinemark USA, Inc.
4.875%, due 06/01/23 | | | 25,000 | | | | 21,250 | | |
5.125%, due 12/15/22 | | | 300,000 | | | | 261,000 | | |
Cirsa Finance International SARL
4.750%, due 05/22/255 | | EUR | 350,000 | | | | 362,316 | | |
Codere Finance 2 Luxembourg SA
6.750%, due 11/01/215 | | EUR | 450,000 | | | | 322,011 | | |
Colt Merger Sub, Inc.
5.750%, due 07/01/252 | | | 25,000 | | | | 26,031 | | |
6.250%, due 07/01/252 | | | 175,000 | | | | 183,225 | | |
8.125%, due 07/01/272 | | | 425,000 | | | | 432,969 | | |
143
PACE High Yield Investments
Portfolio of investments—July 31, 2020
| | | Face
amount1 | | Value | |
Corporate bonds—(continued) | |
Entertainment—(continued) | |
Downstream Development Authority of the
Quapaw Tribe of Oklahoma
10.500%, due 02/15/232 | | | 125,000 | | | $ | 99,375 | | |
Enterprise Development Authority/The
12.000%, due 07/15/242 | | | 300,000 | | | | 296,313 | | |
Gamma Bidco SpA
3 mo. Euribor + 6.000%,
6.000%, due 07/15/252,6 | | EUR | 325,000 | | | | 368,719 | | |
6.250%, due 07/15/252 | | EUR | 250,000 | | | | 293,383 | | |
Gateway Casinos & Entertainment Ltd.
8.250%, due 03/01/242 | | | 225,000 | | | | 175,500 | | |
Golden Entertainment, Inc.
7.625%, due 04/15/262 | | | 175,000 | | | | 152,250 | | |
International Game Technology PLC
3.500%, due 06/15/262 | | EUR | 250,000 | | | | 280,431 | | |
Intralot Capital Luxembourg SA
5.250%, due 09/15/245 | | EUR | 225,000 | | | | 66,179 | | |
Jacobs Entertainment, Inc.
7.875%, due 02/01/242 | | | 225,000 | | | | 204,187 | | |
Juventus Football Club SpA
3.375%, due 02/19/245 | | EUR | 225,000 | | | | 258,372 | | |
Lions Gate Capital Holdings LLC
5.875%, due 11/01/242 | | | 125,000 | | | | 124,687 | | |
6.375%, due 02/01/242 | | | 75,000 | | | | 75,706 | | |
Live Nation Entertainment, Inc.
5.625%, due 03/15/262 | | | 100,000 | | | | 95,020 | | |
Merlin Entertainments Ltd.
5.750%, due 06/15/262 | | | 219,000 | | | | 208,050 | | |
Mohegan Gaming & Entertainment
7.875%, due 10/15/242 | | | 475,000 | | | | 401,375 | | |
Motion Bondco DAC
4.500%, due 11/15/275 | | EUR | 175,000 | | | | 178,715 | | |
Powdr Corp.
6.000%, due 08/01/252 | | | 25,000 | | | | 25,563 | | |
Sazka Group AS
3.875%, due 02/15/272 | | EUR | 350,000 | | | | 358,686 | | |
3.875%, due 02/15/275 | | EUR | 150,000 | | | | 154,237 | | |
Scientific Games International, Inc.
3.375%, due 02/15/262 | | EUR | 175,000 | | | | 191,052 | | |
3.375%, due 02/15/265 | | EUR | 250,000 | | | | 272,931 | | |
5.500%, due 02/15/262 | | EUR | 425,000 | | | | 414,521 | | |
7.000%, due 05/15/282 | | | 300,000 | | | | 276,000 | | |
7.250%, due 11/15/292 | | | 25,000 | | | | 22,875 | | |
SeaWorld Parks & Entertainment, Inc.
9.500%, due 08/01/252,3 | | | 225,000 | | | | 228,094 | | |
Speedway Motorsports LLC/Speedway
Funding II, Inc.
4.875%, due 11/01/272 | | | 75,000 | | | | 68,250 | | |
Twin River Worldwide Holdings, Inc.
6.750%, due 06/01/272 | | | 75,000 | | | | 72,937 | | |
William Hill PLC
4.875%, due 09/07/235 | | GBP | 125,000 | | | | 164,450 | | |
WMG Acquisition Corp.
3.625%, due 10/15/265 | | EUR | 175,000 | | | | 213,336 | | |
| | | Face
amount1 | | Value | |
Corporate bonds—(continued) | |
Entertainment—(concluded) | |
Wynn Resorts Finance LLC/Wynn Resorts
Capital Corp.
5.125%, due 10/01/292 | | | 75,000 | | | $ | 71,813 | | |
7.750%, due 04/15/252 | | | 150,000 | | | | 157,560 | | |
| | | | | | 9,016,445 | | |
Environmental control—0.0%† | |
Clean Harbors, Inc.
4.875%, due 07/15/272 | | | 75,000 | | | | 79,508 | | |
5.125%, due 07/15/292 | | | 25,000 | | | | 26,750 | | |
| | | | | | 106,258 | | |
Food—3.0% | |
Albertsons Cos., Inc./Safeway, Inc./New
Albertsons LP/Albertson's LLC
4.625%, due 01/15/272 | | | 150,000 | | | | 158,625 | | |
6.625%, due 06/15/24 | | | 125,000 | | | | 130,075 | | |
Albertsons Cos., Inc./Safeway, Inc./New
Albertsons LP/Albertsons LLC
5.750%, due 03/15/25 | | | 250,000 | | | | 258,750 | | |
Casino Guichard Perrachon SA EMTN
3.580%, due 02/07/255,13 | | EUR | 100,000 | | | | 92,646 | | |
4.048%, due 08/05/265,13 | | EUR | 100,000 | | | | 91,733 | | |
4.498%, due 03/07/245,13 | | EUR | 100,000 | | | | 98,630 | | |
Casino Guichard-Perrachon SA EMTN
4.561%, due 01/25/235,13 | | EUR | 200,000 | | | | 216,390 | | |
Chobani LLC/Chobani Finance Corp., Inc.
7.500%, due 04/15/252 | | | 200,000 | | | | 208,500 | | |
Clearwater Seafoods, Inc.
6.875%, due 05/01/252 | | | 25,000 | | | | 25,375 | | |
Grupo KUO SAB De CV
5.750%, due 07/07/275 | | | 750,000 | | | | 704,109 | | |
HJ Heinz Finance UK PLC
6.250%, due 02/18/30 | | GBP | 100,000 | | | | 159,986 | | |
Iceland Bondco PLC
4.625%, due 03/15/255 | | GBP | 100,000 | | | | 119,543 | | |
JBS USA LUX SA/JBS USA Finance, Inc.
5.750%, due 06/15/252 | | | 75,000 | | | | 76,969 | | |
5.875%, due 07/15/242 | | | 50,000 | | | | 51,031 | | |
JBS USA LUX SA/JBS USA Food Co./JBS
USA Finance, Inc.
6.500%, due 04/15/292 | | | 125,000 | | | | 141,562 | | |
Kraft Heinz Foods Co.
4.125%, due 07/01/275 | | GBP | 100,000 | | | | 140,119 | | |
4.375%, due 06/01/46 | | | 550,000 | | | | 572,776 | | |
4.875%, due 10/01/492 | | | 375,000 | | | | 414,167 | | |
5.000%, due 07/15/35 | | | 250,000 | | | | 292,835 | | |
5.000%, due 06/04/42 | | | 150,000 | | | | 167,859 | | |
5.200%, due 07/15/45 | | | 250,000 | | | | 285,097 | | |
5.500%, due 06/01/502 | | | 75,000 | | | | 87,950 | | |
6.500%, due 02/09/40 | | | 275,000 | | | | 346,698 | | |
6.875%, due 01/26/39 | | | 100,000 | | | | 133,890 | | |
MARB BondCo PLC
7.000%, due 03/15/245 | | | 250,000 | | | | 260,127 | | |
144
PACE High Yield Investments
Portfolio of investments—July 31, 2020
| | | Face
amount1 | | Value | |
Corporate bonds—(continued) | |
Food—(concluded) | |
Minerva Luxembourg SA
6.500%, due 09/20/265 | | | 250,000 | | | $ | 262,109 | | |
6.500%, due 09/20/262 | | | 550,000 | | | | 576,641 | | |
Nathan's Famous, Inc.
6.625%, due 11/01/252 | | | 150,000 | | | | 153,750 | | |
NBM US Holdings, Inc.
7.000%, due 05/14/265 | | | 500,000 | | | | 537,225 | | |
Pilgrim's Pride Corp.
5.750%, due 03/15/252 | | | 300,000 | | | | 307,500 | | |
Post Holdings, Inc.
5.750%, due 03/01/272 | | | 375,000 | | | | 399,375 | | |
Quatrim SASU
5.875%, due 01/15/245 | | EUR | 300,000 | | | | 352,502 | | |
US Foods, Inc.
5.875%, due 06/15/242,4 | | | 50,000 | | | | 49,906 | | |
6.250%, due 04/15/252 | | | 25,000 | | | | 26,813 | | |
| | | | | | 7,901,263 | | |
Food service—0.1% | |
Aramark International Finance SARL
3.125%, due 04/01/255 | | EUR | 125,000 | | | | 139,564 | | |
Aramark Services, Inc.
5.000%, due 04/01/252 | | | 25,000 | | | | 25,687 | | |
5.000%, due 02/01/282 | | | 75,000 | | | | 75,469 | | |
| | | | | | 240,720 | | |
Forest products & paper—0.1% | |
Mercer International, Inc.
6.500%, due 02/01/24 | | | 175,000 | | | | 172,412 | | |
7.375%, due 01/15/25 | | | 125,000 | | | | 125,937 | | |
Schweitzer-Mauduit International, Inc.
6.875%, due 10/01/262 | | | 100,000 | | | | 106,163 | | |
| | | | | | 404,512 | | |
Gas—0.2% | |
AmeriGas Partners LP/AmeriGas Finance Corp.
5.500%, due 05/20/25 | | | 250,000 | | | | 270,000 | | |
5.625%, due 05/20/24 | | | 75,000 | | | | 80,625 | | |
5.750%, due 05/20/27 | | | 150,000 | | | | 164,250 | | |
| | | | | | 514,875 | | |
Hand & machine tools—0.2% | |
Colfax Corp.
6.000%, due 02/15/242 | | | 100,000 | | | | 105,250 | | |
6.375%, due 02/15/262 | | | 25,000 | | | | 27,000 | | |
Norican A/S
4.500%, due 05/15/235 | | EUR | 100,000 | | | | 87,881 | | |
Werner FinCo LP/Werner FinCo, Inc.
8.750%, due 07/15/252 | | | 375,000 | | | | 322,500 | | |
| | | | | | 542,631 | | |
Healthcare-products—0.1% | |
Ortho-Clinical Diagnostics, Inc./
Ortho-Clinical Diagnostics SA
7.375%, due 06/01/252 | | | 125,000 | | | | 133,125 | | |
| | | Face
amount1 | | Value | |
Corporate bonds—(continued) | |
Healthcare-products—(concluded) | |
Ortho-Clinical Diagnostics, Inc./
Ortho-Clinical Diagnostics SA
7.250%, due 02/01/282 | | | 175,000 | | | $ | 183,094 | | |
| | | | | | 316,219 | | |
Healthcare-services—1.7% | |
Acadia Healthcare Co., Inc.
5.500%, due 07/01/282 | | | 125,000 | | | | 131,719 | | |
Air Methods Corp.
8.000%, due 05/15/252 | | | 225,000 | | | | 158,062 | | |
Centene Corp.
4.250%, due 12/15/27 | | | 225,000 | | | | 239,062 | | |
4.750%, due 01/15/25 | | | 200,000 | | | | 207,264 | | |
5.375%, due 06/01/262 | | | 175,000 | | | | 187,147 | | |
Charles River Laboratories International, Inc.
5.500%, due 04/01/262 | | | 25,000 | | | | 26,406 | | |
CHS/Community Health Systems, Inc.
6.625%, due 02/15/252 | | | 300,000 | | | | 303,090 | | |
6.875%, due 02/01/22 | | | 188,000 | | | | 144,760 | | |
6.875%, due 04/01/282 | | | 148,000 | | | | 52,540 | | |
8.000%, due 03/15/262 | | | 300,000 | | | | 307,281 | | |
8.000%, due 12/15/272 | | | 50,000 | | | | 50,250 | | |
8.125%, due 06/30/242 | | | 409,000 | | | | 259,212 | | |
9.875%, due 06/30/232,13 | | | 125,000 | | | | 98,750 | | |
Encompass Health Corp.
4.750%, due 02/01/30 | | | 100,000 | | | | 105,662 | | |
Envision Healthcare Corp.
8.750%, due 10/15/262 | | | 275,000 | | | | 110,000 | | |
IQVIA, Inc.
2.875%, due 06/15/282 | | EUR | 225,000 | | | | 270,402 | | |
5.000%, due 05/15/272 | | | 125,000 | | | | 133,398 | | |
LifePoint Health, Inc.
4.375%, due 02/15/272 | | | 25,000 | | | | 25,548 | | |
6.750%, due 04/15/252 | | | 100,000 | | | | 107,750 | | |
Polaris Intermediate Corp.
8.500% Cash or 9.250% PIK,
8.500%, due 12/01/222,7 | | | 250,000 | | | | 254,310 | | |
Surgery Center Holdings, Inc.
10.000%, due 04/15/272 | | | 25,000 | | | | 26,508 | | |
Tenet Healthcare Corp.
4.625%, due 07/15/24 | | | 125,000 | | | | 127,812 | | |
4.625%, due 09/01/242 | | | 125,000 | | | | 127,813 | | |
4.625%, due 06/15/282 | | | 100,000 | | | | 105,170 | | |
4.875%, due 01/01/262 | | | 75,000 | | | | 78,447 | | |
5.125%, due 11/01/272 | | | 50,000 | | | | 53,125 | | |
6.250%, due 02/01/272 | | | 50,000 | | | | 53,111 | | |
6.750%, due 06/15/23 | | | 75,000 | | | | 79,125 | | |
6.875%, due 11/15/31 | | | 87,000 | | | | 83,085 | | |
7.000%, due 08/01/254 | | | 375,000 | | | | 387,109 | | |
West Street Merger Sub, Inc.
6.375%, due 09/01/252 | | | 125,000 | | | | 126,875 | | |
| | | | | | 4,420,793 | | |
Holding companies-divers—0.5% | |
KOC Holding AS
5.250%, due 03/15/235 | | | 500,000 | | | | 497,500 | | |
145
PACE High Yield Investments
Portfolio of investments—July 31, 2020
| | | Face
amount1 | | Value | |
Corporate bonds—(continued) | |
Holding companies-divers—(concluded) | |
6.500%, due 03/11/252 | | | 200,000 | | | $ | 203,400 | | |
6.500%, due 03/11/255 | | | 400,000 | | | | 406,800 | | |
VistaJet Malta Finance PLC/XO Management
Holding, Inc.
10.500%, due 06/01/242 | | | 150,000 | | | | 135,000 | | |
| | | | | | 1,242,700 | | |
Home builders—1.5% | |
Adams Homes, Inc.
7.500%, due 02/15/252 | | | 150,000 | | | | 147,000 | | |
Ashton Woods USA LLC/Ashton Woods
Finance Co.
6.625%, due 01/15/282 | | | 100,000 | | | | 100,750 | | |
6.750%, due 08/01/252 | | | 175,000 | | | | 177,625 | | |
Beazer Homes USA, Inc.
6.750%, due 03/15/25 | | | 225,000 | | | | 231,750 | | |
7.250%, due 10/15/29 | | | 100,000 | | | | 107,250 | | |
Brookfield Residential Properties, Inc./Brookfield
Residential U.S. Corp.
4.875%, due 02/15/302 | | | 150,000 | | | | 136,125 | | |
Brookfield Residential Properties, Inc./Brookfield
Residential US Corp.
6.375%, due 05/15/252 | | | 150,000 | | | | 152,250 | | |
Century Communities, Inc.
5.875%, due 07/15/25 | | | 300,000 | | | | 308,724 | | |
Forestar Group, Inc.
5.000%, due 03/01/282 | | | 75,000 | | | | 75,000 | | |
8.000%, due 04/15/242 | | | 275,000 | | | | 295,036 | | |
Installed Building Products, Inc.
5.750%, due 02/01/282 | | | 150,000 | | | | 157,875 | | |
KB Home
6.875%, due 06/15/27 | | | 100,000 | | | | 113,000 | | |
7.625%, due 05/15/23 | | | 50,000 | | | | 55,000 | | |
Mattamy Group Corp.
4.625%, due 03/01/302 | | | 150,000 | | | | 151,688 | | |
Meritage Homes Corp.
6.000%, due 06/01/25 | | | 515,000 | | | | 591,117 | | |
Picasso Finance Sub, Inc.
6.125%, due 06/15/252 | | | 75,000 | | | | 79,688 | | |
Shea Homes LP/Shea Homes Funding Corp.
4.750%, due 02/15/282 | | | 100,000 | | | | 104,915 | | |
Taylor Morrison Communities, Inc.
5.875%, due 01/31/252 | | | 50,000 | | | | 51,500 | | |
6.000%, due 09/01/232 | | | 26,000 | | | | 26,780 | | |
6.625%, due 07/15/272 | | | 100,000 | | | | 109,000 | | |
TRI Pointe Group, Inc.
5.700%, due 06/15/28 | | | 75,000 | | | | 82,500 | | |
TRI Pointe Group, Inc./TRI Pointe Homes, Inc.
5.875%, due 06/15/24 | | | 400,000 | | | | 431,084 | | |
Williams Scotsman International, Inc.
6.875%, due 08/15/232 | | | 250,000 | | | | 258,177 | | |
Winnebago Industries, Inc.
6.250%, due 07/15/282 | | | 100,000 | | | | 105,750 | | |
| | | | | | 4,049,584 | | |
| | | Face
amount1 | | Value | |
Corporate bonds—(continued) | |
Household products/wares—0.5% | |
Central Garden & Pet Co.
6.125%, due 11/15/23 | | | 275,000 | | | $ | 282,906 | | |
Kronos Acquisition Holdings, Inc.
9.000%, due 08/15/232 | | | 100,000 | | | | 101,750 | | |
Prestige Brands, Inc.
5.125%, due 01/15/282 | | | 100,000 | | | | 104,929 | | |
6.375%, due 03/01/242 | | | 150,000 | | | | 155,250 | | |
Spectrum Brands, Inc.
4.000%, due 10/01/265 | | EUR | 100,000 | | | | 115,376 | | |
4.000%, due 10/01/262 | | EUR | 325,000 | | | | 374,970 | | |
5.500%, due 07/15/302 | | | 50,000 | | | | 51,875 | | |
5.750%, due 07/15/25 | | | 75,000 | | | | 77,250 | | |
| | | | | | 1,264,306 | | |
Housewares—0.3% | |
Newell Brands, Inc.
4.700%, due 04/01/2613 | | | 275,000 | | | | 297,770 | | |
5.875%, due 04/01/3613 | | | 350,000 | | | | 395,500 | | |
6.000%, due 04/01/4613 | | | 50,000 | | | | 55,125 | | |
| | | | | | 748,395 | | |
Insurance—0.9% | |
Acrisure LLC/Acrisure Finance, Inc.
7.000%, due 11/15/252 | | | 325,000 | | | | 328,812 | | |
8.125%, due 02/15/242 | | | 225,000 | | | | 239,062 | | |
10.125%, due 08/01/262 | | | 75,000 | | | | 82,875 | | |
AssuredPartners, Inc.
7.000%, due 08/15/252 | | | 150,000 | | | | 152,250 | | |
Genworth Holdings, Inc.
4.900%, due 08/15/23 | | | 250,000 | | | | 222,500 | | |
7.625%, due 09/24/214 | | | 100,000 | | | | 100,250 | | |
HUB International Ltd.
7.000%, due 05/01/262 | | | 300,000 | | | | 314,250 | | |
MGIC Investment Corp.
5.750%, due 08/15/23 | | | 275,000 | | | | 288,750 | | |
NMI Holdings, Inc.
7.375%, due 06/01/252 | | | 150,000 | | | | 163,067 | | |
Radian Group, Inc.
4.500%, due 10/01/24 | | | 200,000 | | | | 201,000 | | |
4.875%, due 03/15/27 | | | 175,000 | | | | 170,188 | | |
USIS, Inc.
6.875%, due 05/01/252 | | | 50,000 | | | | 51,250 | | |
| | | | | | 2,314,254 | | |
Internet—1.3% | |
Cogent Communications Group, Inc.
4.375%, due 06/30/245 | | EUR | 220,000 | | | | 261,704 | | |
4.375%, due 06/30/242 | | EUR | 100,000 | | | | 118,956 | | |
Go Daddy Operating Co. LLC/GD Finance
Co., Inc.
5.250%, due 12/01/272 | | | 225,000 | | | | 239,906 | | |
Match Group Holdings II LLC
5.000%, due 12/15/272,4 | | | 50,000 | | | | 52,500 | | |
Netflix, Inc.
3.625%, due 06/15/302 | | EUR | 350,000 | | | | 449,236 | | |
3.625%, due 06/15/305 | | EUR | 350,000 | | | | 449,236 | | |
146
PACE High Yield Investments
Portfolio of investments—July 31, 2020
| | | Face
amount1 | | Value | |
Corporate bonds—(continued) | |
Internet—(concluded) | |
5.375%, due 11/15/292 | | | 25,000 | | | $ | 30,281 | | |
6.375%, due 05/15/29 | | | 375,000 | | | | 476,250 | | |
Uber Technologies, Inc.
7.500%, due 11/01/232 | | | 450,000 | | | | 466,875 | | |
7.500%, due 09/15/272 | | | 75,000 | | | | 78,750 | | |
8.000%, due 11/01/262 | | | 275,000 | | | | 288,626 | | |
United Group BV
3 mo. Euribor + 3.250%,
3.250%, due 02/15/262,6 | | EUR | 100,000 | | | | 113,430 | | |
3.625%, due 02/15/282 | | EUR | 200,000 | | | | 225,726 | | |
Yell Bondco PLC
8.500%, due 05/02/232 | | GBP | 250,000 | | | | 118,382 | | |
| | | | | | 3,369,858 | | |
Investment companies—0.6% | |
Icahn Enterprises LP/Icahn Enterprises
Finance Corp.
4.750%, due 09/15/24 | | | 425,000 | | | | 433,500 | | |
5.250%, due 05/15/27 | | | 375,000 | | | | 386,250 | | |
6.250%, due 05/15/26 | | | 425,000 | | | | 449,127 | | |
6.375%, due 12/15/25 | | | 150,000 | | | | 156,000 | | |
Mangrove Luxco III SARL
7.775%, due 10/09/252,7 | | EUR | 295,708 | | | | 313,497 | | |
| | | | | | 1,738,374 | | |
Iron & steel—0.7% | |
ABJA Investment Co. Pte Ltd.
5.450%, due 01/24/285 | | | 300,000 | | | | 286,385 | | |
Allegheny Technologies, Inc.
5.875%, due 12/01/274 | | | 150,000 | | | | 142,125 | | |
ArcelorMittal SA
4.550%, due 03/11/26 | | | 50,000 | | | | 54,276 | | |
Baffinland Iron Mines Corp./Baffinland
Iron Mines LP
8.750%, due 07/15/262 | | | 175,000 | | | | 181,627 | | |
Big River Steel LLC/BRS Finance Corp.
7.250%, due 09/01/252 | | | 125,000 | | | | 126,172 | | |
Carpenter Technology Corp.
6.375%, due 07/15/28 | | | 200,000 | | | | 210,062 | | |
Cleveland-Cliffs, Inc.
5.750%, due 03/01/254 | | | 125,000 | | | | 107,813 | | |
5.875%, due 06/01/274 | | | 275,000 | | | | 236,494 | | |
6.750%, due 03/15/262 | | | 100,000 | | | | 100,500 | | |
9.875%, due 10/17/252 | | | 25,000 | | | | 27,313 | | |
GUSAP III LP
4.250%, due 01/21/302 | | | 250,000 | | | | 254,292 | | |
Mineral Resources Ltd.
8.125%, due 05/01/272 | | | 175,000 | | | | 193,158 | | |
| | | | | | 1,920,217 | | |
Leisure time—1.3% | |
Carlson Travel, Inc.
9.500%, due 12/15/242 | | | 200,000 | | | | 107,750 | | |
Carnival Corp.
1.875%, due 11/07/22 | | EUR | 100,000 | | | | 90,113 | | |
1.875%, due 11/07/22 | | EUR | 100,000 | | | | 90,113 | | |
| | | Face
amount1 | | Value | |
Corporate bonds—(continued) | |
Leisure time—(concluded) | |
3.950%, due 10/15/204 | | | 50,000 | | | $ | 49,500 | | |
10.125%, due 02/01/262 | | EUR | 250,000 | | | | 295,798 | | |
10.500%, due 02/01/262,4 | | | 250,000 | | | | 258,802 | | |
11.500%, due 04/01/232 | | | 375,000 | | | | 408,064 | | |
Carnival PLC
1.000%, due 10/28/29 | | EUR | 100,000 | | | | 62,431 | | |
LTF Merger Sub, Inc.
8.500%, due 06/15/232 | | | 1,067,000 | | | | 904,282 | | |
NCL Corp. Ltd.
3.625%, due 12/15/242 | | | 25,000 | | | | 16,523 | | |
Royal Caribbean Cruises Ltd.
5.250%, due 11/15/22 | | | 175,000 | | | | 148,831 | | |
9.125%, due 06/15/232 | | | 125,000 | | | | 127,813 | | |
11.500%, due 06/01/252,4 | | | 175,000 | | | | 192,821 | | |
Sabre GLBL, Inc.
9.250%, due 04/15/252 | | | 150,000 | | | | 165,187 | | |
Viking Cruises Ltd.
5.875%, due 09/15/272 | | | 325,000 | | | | 208,000 | | |
6.250%, due 05/15/252 | | | 25,000 | | | | 16,438 | | |
13.000%, due 05/15/252 | | | 175,000 | | | | 190,365 | | |
VOC Escrow Ltd.
5.000%, due 02/15/282 | | | 25,000 | | | | 20,313 | | |
| | | | | | 3,353,144 | | |
Lodging—1.5% | |
Arrow Bidco LLC
9.500%, due 03/15/242 | | | 50,000 | | | | 39,136 | | |
Boyd Gaming Corp.
6.000%, due 08/15/26 | | | 400,000 | | | | 405,000 | | |
8.625%, due 06/01/252 | | | 100,000 | | | | 110,238 | | |
Fortune Star BVI Ltd.
6.850%, due 07/02/245 | | | 200,000 | | | | 205,589 | | |
Hilton Domestic Operating Co., Inc.
5.125%, due 05/01/26 | | | 350,000 | | | | 362,250 | | |
5.375%, due 05/01/252 | | | 100,000 | | | | 104,550 | | |
5.750%, due 05/01/282 | | | 100,000 | | | | 106,750 | | |
Inn of the Mountain Gods Resort & Casino
9.250%, due 11/30/207 | | | 64,354 | | | | 55,988 | | |
Marriott Ownership Resorts, Inc.
4.750%, due 01/15/282 | | | 50,000 | | | | 46,500 | | |
Marriott Ownership Resorts, Inc./ILG LLC
6.500%, due 09/15/26 | | | 25,000 | | | | 25,625 | | |
Melco Resorts Finance Ltd.
5.250%, due 04/26/262,4 | | | 200,000 | | | | 202,489 | | |
5.375%, due 12/04/292 | | | 200,000 | | | | 200,902 | | |
MGM Resorts International
6.000%, due 03/15/23 | | | 175,000 | | | | 182,875 | | |
6.750%, due 05/01/25 | | | 25,000 | | | | 26,000 | | |
7.750%, due 03/15/22 | | | 640,000 | | | | 680,800 | | |
Studio City Finance Ltd.
6.000%, due 07/15/252 | | | 200,000 | | | | 203,202 | | |
6.500%, due 01/15/282 | | | 200,000 | | | | 207,060 | | |
Wyndham Destinations, Inc.
4.625%, due 03/01/302 | | | 75,000 | | | | 69,000 | | |
6.625%, due 07/31/262 | | | 200,000 | | | | 206,431 | | |
147
PACE High Yield Investments
Portfolio of investments—July 31, 2020
| | | Face
amount1 | | Value | |
Corporate bonds—(continued) | |
Lodging—(concluded) | |
Wynn Las Vegas LLC/Wynn Las Vegas Capital Corp.
5.250%, due 05/15/272 | | | 550,000 | | | $ | 489,802 | | |
| | | | | | 3,930,187 | | |
Machinery-construction & mining—0.0%† | |
Manitowoc Co., Inc./The
9.000%, due 04/01/262 | | | 75,000 | | | | 76,781 | | |
Machinery-diversified—0.7% | |
Clark Equipment Co.
5.875%, due 06/01/252 | | | 50,000 | | | | 52,563 | | |
Galapagos SA
5.375%, due 06/15/215,11 | | EUR | 27,500 | | | | 343 | | |
Granite US Holdings Corp.
11.000%, due 10/01/272,4 | | | 75,000 | | | | 72,000 | | |
Husky III Holding Ltd.
13.000%, due 02/15/252,7 | | | 125,000 | | | | 125,625 | | |
JPW Industries Holding Corp.
9.000%, due 10/01/242 | | | 150,000 | | | | 126,000 | | |
Maxim Crane Works Holdings Capital LLC
10.125%, due 08/01/242 | | | 150,000 | | | | 146,813 | | |
Rebecca Bidco GmbH
5.750%, due 07/15/252 | | EUR | 100,000 | | | | 118,849 | | |
Selecta Group BV
5.875%, due 02/01/245 | | EUR | 400,000 | | | | 160,162 | | |
SPX FLOW, Inc.
5.875%, due 08/15/262 | | | 175,000 | | | | 183,312 | | |
Tennant Co.
5.625%, due 05/01/25 | | | 125,000 | | | | 129,375 | | |
Titan Acquisition Ltd./Titan Co-Borrower LLC
7.750%, due 04/15/262,4 | | | 175,000 | | | | 172,812 | | |
Vertical Midco GmbH
4.375%, due 07/15/272 | | EUR | 500,000 | | | | 591,838 | | |
| | | | | | 1,879,692 | | |
Media—4.4% | |
Altice Financing SA
3.000%, due 01/15/285 | | EUR | 200,000 | | | | 221,426 | | |
5.000%, due 01/15/282 | | | 400,000 | | | | 410,620 | | |
7.500%, due 05/15/262 | | | 200,000 | | | | 215,050 | | |
Altice Finco SA
4.750%, due 01/15/285 | | EUR | 500,000 | | | | 546,861 | | |
Cable Onda SA
4.500%, due 01/30/302 | | | 300,000 | | | | 314,961 | | |
CCO Holdings LLC/CCO Holdings Capital Corp.
4.250%, due 02/01/312 | | | 50,000 | | | | 52,149 | | |
4.500%, due 05/01/322 | | | 175,000 | | | | 184,625 | | |
5.375%, due 05/01/252 | | | 25,000 | | | | 25,781 | | |
Clear Channel Worldwide Holdings, Inc.
5.125%, due 08/15/272 | | | 425,000 | | | | 416,500 | | |
9.250%, due 02/15/24 | | | 81,000 | | | | 73,513 | | |
CSC Holdings LLC
4.125%, due 12/01/302 | | | 200,000 | | | | 210,750 | | |
Diamond Sports Group LLC/Diamond Sports
Finance Co.
5.375%, due 08/15/262 | | | 450,000 | | | | 346,532 | | |
| | | Face
amount1 | | Value | |
Corporate bonds—(continued) | |
Media—(continued) | |
6.625%, due 08/15/272 | | | 200,000 | | | $ | 109,500 | | |
Dish DBS Corp.
5.875%, due 07/15/22 | | | 25,000 | | | | 26,375 | | |
DISH DBS Corp.
5.875%, due 11/15/24 | | | 100,000 | | | | 104,270 | | |
6.750%, due 06/01/21 | | | 50,000 | | | | 51,688 | | |
7.375%, due 07/01/282 | | | 175,000 | | | | 185,231 | | |
EW Scripps Co./The
5.125%, due 05/15/252 | | | 225,000 | | | | 221,063 | | |
GCI LLC
6.625%, due 06/15/242 | | | 100,000 | | | | 105,271 | | |
Gray Television, Inc.
5.125%, due 10/15/242 | | | 225,000 | | | | 231,140 | | |
5.875%, due 07/15/262,4 | | | 575,000 | | | | 594,906 | | |
iHeartCommunications, Inc.
4.750%, due 01/15/282 | | | 125,000 | | | | 124,100 | | |
5.250%, due 08/15/272 | | | 225,000 | | | | 227,250 | | |
6.375%, due 05/01/26 | | | 180,117 | | | | 189,573 | | |
8.375%, due 05/01/27 | | | 59,591 | | | | 59,144 | | |
LCPR Senior Secured Financing DAC
6.750%, due 10/15/272 | | | 200,000 | | | | 216,100 | | |
Midcontinent Communications/Midcontinent
Finance Corp.
5.375%, due 08/15/272 | | | 100,000 | | | | 103,812 | | |
Nexstar Broadcasting, Inc.
5.625%, due 08/01/242 | | | 475,000 | | | | 488,062 | | |
Quebecor Media, Inc.
5.750%, due 01/15/23 | | | 275,000 | | | | 299,833 | | |
Salem Media Group, Inc.
6.750%, due 06/01/242 | | | 100,000 | | | | 85,000 | | |
Scripps Escrow, Inc.
5.875%, due 07/15/272 | | | 25,000 | | | | 25,125 | | |
Sinclair Television Group, Inc.
5.125%, due 02/15/272 | | | 150,000 | | | | 146,813 | | |
5.500%, due 03/01/302 | | | 50,000 | | | | 49,985 | | |
5.875%, due 03/15/262 | | | 200,000 | | | | 200,500 | | |
Sirius XM Radio, Inc.
4.625%, due 07/15/242 | | | 100,000 | | | | 105,300 | | |
5.500%, due 07/01/292 | | | 200,000 | | | | 222,750 | | |
Summer BidCo BV
9.000% Cash or 9.750% PIK,
9.750%, due 11/15/252,7 | | EUR | 256,703 | | | | 297,092 | | |
TEGNA, Inc.
4.625%, due 03/15/282 | | | 425,000 | | | | 419,687 | | |
5.000%, due 09/15/292 | | | 100,000 | | | | 100,812 | | |
Tele Columbus AG
3.875%, due 05/02/255 | | EUR | 225,000 | | | | 250,759 | | |
Townsquare Media, Inc.
6.500%, due 04/01/232 | | | 275,000 | | | | 246,125 | | |
Univision Communications, Inc.
5.125%, due 02/15/252 | | | 50,000 | | | | 48,500 | | |
6.625%, due 06/01/272 | | | 175,000 | | | | 175,490 | | |
9.500%, due 05/01/252 | | | 100,000 | | | | 109,250 | | |
UPC Holding BV
3.875%, due 06/15/295 | | EUR | 100,000 | | | | 112,163 | | |
148
PACE High Yield Investments
Portfolio of investments—July 31, 2020
| | | Face
amount1 | | Value | |
Corporate bonds—(continued) | |
Media—(concluded) | |
UPCB Finance VII Ltd.
3.625%, due 06/15/295 | | EUR | 625,000 | | | $ | 728,421 | | |
Virgin Media Finance PLC
3.750%, due 07/15/302 | | EUR | 100,000 | | | | 115,292 | | |
5.000%, due 07/15/302 | | | 200,000 | | | | 208,968 | | |
Virgin Media Secured Finance PLC
4.125%, due 08/15/302 | | GBP | 300,000 | | | | 392,700 | | |
5.000%, due 04/15/275 | | GBP | 400,000 | | | | 545,566 | | |
Virgin Media Vendor Financing Notes III DAC
4.875%, due 07/15/282 | | GBP | 100,000 | | | | 132,595 | | |
VTR Finance NV
6.375%, due 07/15/282 | | | 200,000 | | | | 213,104 | | |
Ziggo Bond Co. BV
3.375%, due 02/28/302 | | EUR | 150,000 | | | | 168,491 | | |
6.000%, due 01/15/272 | | | 350,000 | | | | 371,000 | | |
| | | | | | 11,827,574 | | |
Metal Fabricate/Hardware—0.3% | |
Advanced Drainage Systems, Inc.
5.000%, due 09/30/272 | | | 75,000 | | | | 77,250 | | |
Grinding Media, Inc./Moly-Cop AltaSteel Ltd.
7.375%, due 12/15/232 | | | 175,000 | | | | 177,844 | | |
Hillman Group, Inc./The
6.375%, due 07/15/222 | | | 200,000 | | | | 196,000 | | |
Park-Ohio Industries, Inc.
6.625%, due 04/15/27 | | | 125,000 | | | | 109,687 | | |
Vallourec SA
2.250%, due 09/30/245 | | EUR | 100,000 | | | | 52,186 | | |
6.375%, due 10/15/232 | | EUR | 125,000 | | | | 73,502 | | |
6.375%, due 10/15/235 | | EUR | 275,000 | | | | 161,968 | | |
| | | | | | 848,437 | | |
Mining—2.8% | |
Alcoa Nederland Holding BV
7.000%, due 09/30/262 | | | 400,000 | | | | 428,000 | | |
Arconic Corp.
6.000%, due 05/15/252 | | | 150,000 | | | | 161,718 | | |
6.125%, due 02/15/282 | | | 25,000 | | | | 26,656 | | |
Coeur Mining, Inc.
5.875%, due 06/01/24 | | | 150,000 | | | | 151,125 | | |
Compass Minerals International, Inc.
6.750%, due 12/01/272 | | | 150,000 | | | | 162,766 | | |
Constellium SE
6.625%, due 03/01/252 | | | 500,000 | | | | 516,250 | | |
First Quantum Minerals Ltd.
6.500%, due 03/01/242 | | | 800,000 | | | | 771,208 | | |
7.500%, due 04/01/252 | | | 200,000 | | | | 202,000 | | |
7.500%, due 04/01/255 | | | 400,000 | | | | 404,000 | | |
Freeport-McMoRan, Inc.
3.875%, due 03/15/23 | | | 125,000 | | | | 132,188 | | |
4.125%, due 03/01/28 | | | 200,000 | | | | 210,250 | | |
4.250%, due 03/01/30 | | | 300,000 | | | | 313,440 | | |
4.375%, due 08/01/28 | | | 150,000 | | | | 159,045 | | |
4.625%, due 08/01/30 | | | 125,000 | | | | 133,750 | | |
5.000%, due 09/01/27 | | | 250,000 | | | | 266,197 | | |
5.450%, due 03/15/43 | | | 1,000,000 | | | | 1,112,500 | | |
| | | Face
amount1 | | Value | |
Corporate bonds—(continued) | |
Mining—(concluded) | |
Hudbay Minerals, Inc.
7.250%, due 01/15/232 | | | 125,000 | | | $ | 126,563 | | |
7.625%, due 01/15/252 | | | 50,000 | | | | 50,625 | | |
IAMGOLD Corp.
7.000%, due 04/15/252 | | | 175,000 | | | | 182,000 | | |
Joseph T Ryerson & Son, Inc.
8.500%, due 08/01/282 | | | 50,000 | | | | 53,500 | | |
Kaiser Aluminum Corp.
4.625%, due 03/01/282 | | | 125,000 | | | | 124,438 | | |
6.500%, due 05/01/252 | | | 275,000 | | | | 291,500 | | |
KME SE
6.750%, due 02/01/235 | | EUR | 100,000 | | | | 78,781 | | |
Mountain Province Diamonds, Inc.
8.000%, due 12/15/222 | | | 100,000 | | | | 59,000 | | |
New Gold, Inc.
7.500%, due 07/15/272 | | | 75,000 | | | | 81,563 | | |
Novelis Corp.
4.750%, due 01/30/302 | | | 350,000 | | | | 365,144 | | |
5.875%, due 09/30/262 | | | 175,000 | | | | 186,709 | | |
Petra Diamonds US Treasury PLC
7.250%, due 05/01/222,11 | | | 200,000 | | | | 73,360 | | |
Taseko Mines Ltd.
8.750%, due 06/15/222 | | | 175,000 | | | | 149,188 | | |
Vedanta Resources Ltd.
6.125%, due 08/09/245 | | | 200,000 | | | | 130,101 | | |
6.375%, due 07/30/222 | | | 300,000 | | | | 213,937 | | |
7.125%, due 05/31/235 | | | 200,000 | | | | 135,250 | | |
| | | | | | 7,452,752 | | |
Miscellaneous manufacturers—0.2% | |
Amsted Industries, Inc.
5.625%, due 07/01/272 | | | 75,000 | | | | 79,125 | | |
EnPro Industries, Inc.
5.750%, due 10/15/26 | | | 150,000 | | | | 155,250 | | |
FXI Holdings, Inc.
12.250%, due 11/15/262 | | | 369,000 | | | | 361,989 | | |
Hillenbrand, Inc.
5.750%, due 06/15/25 | | | 25,000 | | | | 26,875 | | |
| | | | | | 623,239 | | |
Office & business equipment—0.1% | |
CDW LLC/CDW Finance Corp.
4.125%, due 05/01/25 | | | 75,000 | | | | 79,290 | | |
5.000%, due 09/01/25 | | | 140,000 | | | | 144,900 | | |
| | | | | | 224,190 | | |
Oil & gas—11.0% | |
Antero Resources Corp.
5.000%, due 03/01/25 | | | 25,000 | | | | 15,844 | | |
5.125%, due 12/01/22 | | | 100,000 | | | | 80,250 | | |
5.375%, due 11/01/214 | | | 25,000 | | | | 23,938 | | |
5.625%, due 06/01/234 | | | 25,000 | | | | 17,942 | | |
Apache Corp.
3.250%, due 04/15/22 | | | 25,000 | | | | 25,136 | | |
4.250%, due 01/15/30 | | | 175,000 | | | | 168,490 | | |
4.750%, due 04/15/43 | | | 425,000 | | | | 403,750 | | |
149
PACE High Yield Investments
Portfolio of investments—July 31, 2020
| | | Face
amount1 | | Value | |
Corporate bonds—(continued) | |
Oil & gas—(continued) | |
5.100%, due 09/01/40 | | | 475,000 | | | $ | 461,937 | | |
5.250%, due 02/01/42 | | | 25,000 | | | | 23,844 | | |
5.350%, due 07/01/49 | | | 125,000 | | | | 120,622 | | |
Ascent Resources Utica Holdings LLC/ARU
Finance Corp.
7.000%, due 11/01/262 | | | 25,000 | | | | 16,000 | | |
10.000%, due 04/01/222 | | | 375,000 | | | | 309,956 | | |
Bruin E&P Partners LLC
8.875%, due 08/01/232,11 | | | 400,000 | | | | 200 | | |
Callon Petroleum Co.
6.125%, due 10/01/24 | | | 325,000 | | | | 99,070 | | |
6.250%, due 04/15/23 | | | 150,000 | | | | 48,750 | | |
6.375%, due 07/01/26 | | | 25,000 | | | | 7,750 | | |
Cenovus Energy, Inc.
3.000%, due 08/15/22 | | | 125,000 | | | | 126,246 | | |
5.250%, due 06/15/37 | | | 50,000 | | | | 45,900 | | |
5.375%, due 07/15/25 | | | 100,000 | | | | 100,128 | | |
5.400%, due 06/15/47 | | | 125,000 | | | | 112,516 | | |
6.750%, due 11/15/39 | | | 100,000 | | | | 104,290 | | |
Centennial Resource Production LLC
5.375%, due 01/15/262 | | | 150,000 | | | | 67,125 | | |
6.875%, due 04/01/272 | | | 100,000 | | | | 45,250 | | |
Chaparral Energy, Inc.
8.750%, due 07/15/232 | | | 150,000 | | | | 12,000 | | |
Cimarex Energy Co.
4.375%, due 03/15/29 | | | 25,000 | | | | 26,041 | | |
Citgo Holding, Inc.
9.250%, due 08/01/242 | | | 575,000 | | | | 575,000 | | |
CITGO Petroleum Corp.
6.250%, due 08/15/222,4 | | | 50,000 | | | | 50,235 | | |
7.000%, due 06/15/252 | | | 225,000 | | | | 231,187 | | |
CNX Resources Corp.
5.875%, due 04/15/22 | | | 190,000 | | | | 188,100 | | |
7.250%, due 03/14/272,4 | | | 200,000 | | | | 195,992 | | |
Comstock Resources, Inc.
7.500%, due 05/15/252 | | | 100,000 | | | | 94,000 | | |
9.750%, due 08/15/26 | | | 50,000 | | | | 50,000 | | |
9.750%, due 08/15/26 | | | 25,000 | | | | 24,992 | | |
Continental Resources, Inc.
4.375%, due 01/15/28 | | | 50,000 | | | | 46,640 | | |
4.500%, due 04/15/23 | | | 50,000 | | | | 49,942 | | |
5.000%, due 09/15/22 | | | 400,000 | | | | 400,000 | | |
CrownRock LP/CrownRock Finance, Inc.
5.625%, due 10/15/252 | | | 275,000 | | | | 269,500 | | |
Denbury Resources, Inc.
6.375%, due 12/31/242,11 | | | 118,000 | | | | 16,048 | | |
7.750%, due 02/15/242,11 | | | 50,000 | | | | 21,073 | | |
9.000%, due 05/15/212,11 | | | 335,000 | | | | 141,326 | | |
Diamond Offshore Drilling, Inc.
3.450%, due 11/01/2311 | | | 75,000 | | | | 8,266 | | |
5.700%, due 10/15/3911 | | | 50,000 | | | | 5,446 | | |
7.875%, due 08/15/2511 | | | 250,000 | | | | 27,813 | | |
Endeavor Energy Resources LP/EER Finance, Inc.
5.500%, due 01/30/262 | | | 50,000 | | | | 50,250 | | |
5.750%, due 01/30/282 | | | 200,000 | | | | 205,250 | | |
6.625%, due 07/15/252 | | | 75,000 | | | | 78,797 | | |
| | | Face
amount1 | | Value | |
Corporate bonds—(continued) | |
Oil & gas—(continued) | |
Ensign Drilling, Inc.
9.250%, due 04/15/242 | | | 275,000 | | | $ | 110,000 | | |
EP Energy LLC/EP Energy Finance, Inc.
9.375%, due 05/01/2011 | | | 492,000 | | | | 49 | | |
EP Energy LLC/Everest Acquisition Finance, Inc.
9.375%, due 05/01/242,11 | | | 186,000 | | | | 19 | | |
EQT Corp.
3.900%, due 10/01/27 | | | 175,000 | | | | 164,902 | | |
4.875%, due 11/15/21 | | | 50,000 | | | | 50,625 | | |
6.125%, due 02/01/254,13 | | | 75,000 | | | | 82,687 | | |
7.000%, due 02/01/3013 | | | 150,000 | | | | 173,670 | | |
Gazprom PJSC Via Gaz Capital SA
4.950%, due 07/19/225 | | | 400,000 | | | | 421,250 | | |
Geopark Ltd.
5.500%, due 01/17/272 | | | 300,000 | | | | 262,500 | | |
Global Marine, Inc.
7.000%, due 06/01/28 | | | 100,000 | | | | 41,500 | | |
Gulfport Energy Corp.
6.000%, due 10/15/24 | | | 50,000 | | | | 26,181 | | |
6.375%, due 05/15/25 | | | 100,000 | | | | 48,000 | | |
6.375%, due 01/15/26 | | | 175,000 | | | | 87,500 | | |
HighPoint Operating Corp.
7.000%, due 10/15/22 | | | 125,000 | | | | 31,250 | | |
Hilcorp Energy I LP/Hilcorp Finance Co.
6.250%, due 11/01/282 | | | 325,000 | | | | 298,594 | | |
Indigo Natural Resources LLC
6.875%, due 02/15/262 | | | 225,000 | | | | 216,830 | | |
Jagged Peak Energy LLC
5.875%, due 05/01/26 | | | 125,000 | | | | 127,500 | | |
KazMunayGas National Co. JSC
4.400%, due 04/30/235 | | | 425,000 | | | | 447,916 | | |
4.400%, due 04/30/235 | | | 400,000 | | | | 421,500 | | |
4.750%, due 04/19/275 | | | 250,000 | | | | 279,525 | | |
Laredo Petroleum, Inc.
9.500%, due 01/15/25 | | | 125,000 | | | | 90,350 | | |
Magnolia Oil & Gas Operating LLC/Magnolia
Oil & Gas Finance Corp.
6.000%, due 08/01/262 | | | 100,000 | | | | 96,375 | | |
Marathon Oil Corp.
6.600%, due 10/01/37 | | | 100,000 | | | | 104,840 | | |
6.800%, due 03/15/32 | | | 125,000 | | | | 136,415 | | |
Matador Resources Co.
5.875%, due 09/15/26 | | | 125,000 | | | | 95,155 | | |
Medco Bell Pte Ltd.
6.375%, due 01/30/272 | | | 250,000 | | | | 227,721 | | |
MEG Energy Corp.
7.000%, due 03/31/242 | | | 90,000 | | | | 85,725 | | |
7.125%, due 02/01/272 | | | 125,000 | | | | 111,250 | | |
Moss Creek Resources Holdings, Inc.
7.500%, due 01/15/262 | | | 125,000 | | | | 72,813 | | |
10.500%, due 05/15/272 | | | 75,000 | | | | 45,000 | | |
Murphy Oil Corp.
5.750%, due 08/15/25 | | | 250,000 | | | | 235,305 | | |
5.875%, due 12/01/27 | | | 150,000 | | | | 138,000 | | |
6.375%, due 12/01/4213 | | | 125,000 | | | | 99,375 | | |
150
PACE High Yield Investments
Portfolio of investments—July 31, 2020
| | | Face
amount1 | | Value | |
Corporate bonds—(continued) | |
Oil & gas—(continued) | |
Nabors Industries Ltd.
7.250%, due 01/15/262 | | | 150,000 | | | $ | 94,734 | | |
7.500%, due 01/15/282 | | | 150,000 | | | | 95,295 | | |
Nabors Industries, Inc.
5.750%, due 02/01/25 | | | 400,000 | | | | 158,000 | | |
Noble Holding International Ltd.
6.200%, due 08/01/4011 | | | 50,000 | | | | 750 | | |
7.750%, due 01/15/2411 | | | 155,000 | | | | 2,325 | | |
7.875%, due 02/01/262,11 | | | 200,000 | | | | 47,000 | | |
8.950%, due 04/01/4511,13 | | | 50,000 | | | | 750 | | |
Oasis Petroleum, Inc.
6.250%, due 05/01/262 | | | 25,000 | | | | 4,438 | | |
Occidental Petroleum Corp.
2.600%, due 08/13/21 | | | 119,000 | | | | 118,084 | | |
2.600%, due 04/15/22 | | | 125,000 | | | | 121,382 | | |
2.700%, due 08/15/22 | | | 50,000 | | | | 48,269 | | |
3.200%, due 08/15/26 | | | 100,000 | | | | 91,029 | | |
3.400%, due 04/15/26 | | | 75,000 | | | | 67,875 | | |
3.500%, due 06/15/25 | | | 75,000 | | | | 70,833 | | |
4.300%, due 08/15/39 | | | 100,000 | | | | 81,000 | | |
5.550%, due 03/15/26 | | | 300,000 | | | | 301,050 | | |
6.200%, due 03/15/40 | | | 100,000 | | | | 97,000 | | |
6.450%, due 09/15/36 | | | 575,000 | | | | 575,121 | | |
6.950%, due 07/01/24 | | | 75,000 | | | | 78,563 | | |
7.125%, due 10/15/27 | | | 50,000 | | | | 46,592 | | |
7.500%, due 05/01/31 | | | 400,000 | | | | 423,000 | | |
7.875%, due 09/15/31 | | | 175,000 | | | | 186,156 | | |
7.950%, due 06/15/39 | | | 50,000 | | | | 50,188 | | |
8.000%, due 07/15/254 | | | 75,000 | | | | 81,937 | | |
8.500%, due 07/15/27 | | | 125,000 | | | | 139,200 | | |
8.875%, due 07/15/30 | | | 175,000 | | | | 196,875 | | |
Parkland Corp.
5.875%, due 07/15/272 | | | 150,000 | | | | 159,000 | | |
6.000%, due 04/01/262 | | | 75,000 | | | | 79,515 | | |
Parsley Energy LLC/Parsley Finance Corp.
5.250%, due 08/15/252 | | | 275,000 | | | | 279,125 | | |
PBF Holding Co. LLC/PBF Finance Corp.
6.000%, due 02/15/282 | | | 75,000 | | | | 60,375 | | |
9.250%, due 05/15/252 | | | 100,000 | | | | 111,748 | | |
PDC Energy, Inc.
6.125%, due 09/15/24 | | | 75,000 | | | | 75,911 | | |
Petrobras Global Finance BV
4.750%, due 01/14/25 | | EUR | 100,000 | | | | 127,784 | | |
5.093%, due 01/15/302 | | | 200,000 | | | | 206,000 | | |
5.093%, due 01/15/305 | | | 300,000 | | | | 309,000 | | |
5.750%, due 02/01/29 | | | 250,000 | | | | 270,075 | | |
5.999%, due 01/27/28 | | | 125,000 | | | | 137,669 | | |
6.125%, due 01/17/22 | | | 360,000 | | | | 378,337 | | |
6.850%, due 06/05/15 | | | 475,000 | | | | 502,550 | | |
6.900%, due 03/19/49 | | | 315,000 | | | | 350,595 | | |
8.750%, due 05/23/26 | | | 1,375,000 | | | | 1,711,016 | | |
Petroleos Mexicanos
4.500%, due 01/23/26 | | | 1,000,000 | | | | 916,000 | | |
4.625%, due 09/21/23 | | | 550,000 | | | | 535,012 | | |
4.750%, due 02/26/295 | | EUR | 100,000 | | | | 99,513 | | |
6.500%, due 03/13/27 | | | 760,000 | | | | 723,900 | | |
| | | Face
amount1 | | Value | |
Corporate bonds—(continued) | |
Oil & gas—(continued) | |
6.500%, due 06/02/41 | | | 1,250,000 | | | $ | 1,012,109 | | |
6.625%, due 06/15/35 | | | 227,000 | | | | 193,381 | | |
6.750%, due 09/21/47 | | | 500,000 | | | | 406,250 | | |
6.840%, due 01/23/305 | | | 1,175,000 | | | | 1,092,750 | | |
7.690%, due 01/23/505 | | | 1,250,000 | | | | 1,099,125 | | |
Petroleos Mexicanos EMTN
2.750%, due 04/21/275 | | EUR | 475,000 | | | | 446,222 | | |
4.875%, due 02/21/285 | | EUR | 100,000 | | | | 101,820 | | |
5.125%, due 03/15/235 | | EUR | 300,000 | | | | 351,074 | | |
Precision Drilling Corp.
5.250%, due 11/15/24 | | | 75,000 | | | | 52,688 | | |
7.125%, due 01/15/262 | | | 200,000 | | | | 138,000 | | |
7.750%, due 12/15/23 | | | 75,000 | | | | 56,250 | | |
Range Resources Corp.
5.875%, due 07/01/22 | | | 188,000 | | | | 176,720 | | |
Sanchez Energy Corp.
6.125%, due 01/15/239 | | | 350,000 | | | | 1,750 | | |
7.750%, due 06/15/219 | | | 475,000 | | | | 2,375 | | |
Sandridge Energy, Inc.
7.500%, due 03/15/219,10,12 | | | 1,425,000 | | | | 0 | | |
Seven Generations Energy Ltd.
5.375%, due 09/30/252 | | | 100,000 | | | | 93,000 | | |
6.875%, due 06/30/232 | | | 175,000 | | | | 172,476 | | |
Shelf Drilling Holdings Ltd.
8.250%, due 02/15/252 | | | 275,000 | | | | 104,500 | | |
SM Energy Co.
5.000%, due 01/15/24 | | | 25,000 | | | | 13,750 | | |
5.625%, due 06/01/25 | | | 175,000 | | | | 91,000 | | |
6.125%, due 11/15/22 | | | 75,000 | | | | 55,500 | | |
6.625%, due 01/15/27 | | | 75,000 | | | | 36,938 | | |
6.750%, due 09/15/26 | | | 150,000 | | | | 75,000 | | |
Southwestern Energy Co.
6.450%, due 01/23/254,13 | | | 225,000 | | | | 207,823 | | |
7.750%, due 10/01/274 | | | 25,000 | | | | 23,508 | | |
State Oil Co. of the Azerbaijan Republic
6.950%, due 03/18/305 | | | 300,000 | | | | 360,144 | | |
State Oil Co. of the Azerbaijan Republic EMTN
4.750%, due 03/13/235 | | | 300,000 | | | | 313,969 | | |
Sunoco LP/Sunoco Finance Corp.
4.875%, due 01/15/23 | | | 250,000 | | | | 254,062 | | |
5.500%, due 02/15/26 | | | 25,000 | | | | 25,625 | | |
6.000%, due 04/15/27 | | | 150,000 | | | | 158,250 | | |
Transocean Guardian Ltd.
5.875%, due 01/15/242 | | | 175,500 | | | | 154,879 | | |
Transocean Pontus Ltd.
6.125%, due 08/01/252 | | | 83,500 | | | | 77,029 | | |
Transocean Poseidon Ltd.
6.875%, due 02/01/272 | | | 100,000 | | | | 90,250 | | |
Transocean Sentry Ltd.
5.375%, due 05/15/232 | | | 100,000 | | | | 87,750 | | |
Transocean, Inc.
5.800%, due 10/15/2213 | | | 175,000 | | | | 82,250 | | |
6.800%, due 03/15/38 | | | 25,000 | | | | 6,406 | | |
7.250%, due 11/01/252 | | | 50,000 | | | | 24,500 | | |
7.500%, due 04/15/31 | | | 200,000 | | | | 53,500 | | |
8.000%, due 02/01/272 | | | 225,000 | | | | 109,755 | | |
151
PACE High Yield Investments
Portfolio of investments—July 31, 2020
| | | Face
amount1 | | Value | |
Corporate bonds—(continued) | |
Oil & gas—(concluded) | |
9.350%, due 12/15/4113 | | | 450,000 | | | $ | 126,000 | | |
Tullow Oil PLC
6.250%, due 04/15/222 | | | 200,000 | | | | 136,000 | | |
Vine Oil & Gas LP/Vine Oil & Gas Finance Corp.
8.750%, due 04/15/232 | | | 200,000 | | | | 112,500 | | |
9.750%, due 04/15/232 | | | 225,000 | | | | 130,500 | | |
Whiting Petroleum Corp.
5.750%, due 03/15/2111 | | | 75,000 | | | | 12,750 | | |
6.250%, due 04/01/2311 | | | 150,000 | | | | 27,000 | | |
6.625%, due 01/15/2611 | | | 150,000 | | | | 25,875 | | |
WPX Energy, Inc.
4.500%, due 01/15/30 | | | 100,000 | | | | 93,090 | | |
5.875%, due 06/15/284 | | | 150,000 | | | | 153,657 | | |
YPF SA
6.950%, due 07/21/275 | | | 600,000 | | | | 448,500 | | |
| | | | | | 29,301,975 | | |
Oil & gas services—0.7% | |
Anton Oilfield Services Group
7.500%, due 12/02/225 | | | 500,000 | | | | 313,760 | | |
Archrock Partners LP/Archrock Partners
Finance Corp.
6.250%, due 04/01/282 | | | 175,000 | | | | 176,750 | | |
6.875%, due 04/01/272 | | | 75,000 | | | | 76,760 | | |
ChampionX Corp.
6.375%, due 05/01/26 | | | 150,000 | | | | 140,625 | | |
Exterran Energy Solutions LP/EES Finance Corp.
8.125%, due 05/01/25 | | | 325,000 | | | | 275,437 | | |
FTS International, Inc.
6.250%, due 05/01/22 | | | 300,000 | | | | 84,750 | | |
Honghua Group Ltd.
6.375%, due 08/01/225 | | | 400,000 | | | | 391,069 | | |
Nine Energy Service, Inc.
8.750%, due 11/01/232 | | | 75,000 | | | | 34,500 | | |
SESI LLC
7.125%, due 12/15/212 | | | 100,000 | | | | 40,000 | | |
7.750%, due 09/15/24 | | | 150,000 | | | | 54,750 | | |
USA Compression Partners LP/USA
Compression Finance Corp.
6.875%, due 04/01/26 | | | 150,000 | | | | 153,750 | | |
6.875%, due 09/01/27 | | | 100,000 | | | | 102,229 | | |
| | | | | | 1,844,380 | | |
Packaging & containers—1.6% | |
ARD Finance SA
5.000% Cash or 5.750% PIK,
5.000%, due 06/30/27 5,7 | | EUR | 150,000 | | | | 172,107 | | |
6.500% Cash or 7.250% PIK,
6.500%, due 06/30/27 2,7 | | | 400,000 | | | | 409,000 | | |
Ardagh Packaging Finance PLC / Ardagh
Holdings USA, Inc.
5.250%, due 08/15/272 | | | 250,000 | | | | 261,692 | | |
Cascades Inc/Cascades USA, Inc.
5.375%, due 01/15/282 | | | 50,000 | | | | 51,750 | | |
Cascades, Inc./Cascades USA, Inc.
5.125%, due 01/15/262 | | | 50,000 | | | | 51,625 | | |
| | | Face
amount1 | | Value | |
Corporate bonds—(continued) | |
Packaging & containers—(concluded) | |
Flex Acquisition Co., Inc.
6.875%, due 01/15/252 | | | 150,000 | | | $ | 152,250 | | |
7.875%, due 07/15/262 | | | 175,000 | | | | 181,421 | | |
GPC Merger Sub, Inc.
7.125%, due 08/15/282,3 | | | 25,000 | | | | 26,000 | | |
Greif, Inc.
6.500%, due 03/01/272,4 | | | 175,000 | | | | 185,937 | | |
Kleopatra Holdings 1 SCA
9.250%, due 06/30/235,7 | | EUR | 509,250 | | | | 443,905 | | |
Matthews International Corp.
5.250%, due 12/01/252,4 | | | 125,000 | | | | 114,688 | | |
Mauser Packaging Solutions Holding Co.
7.250%, due 04/15/252,4 | | | 675,000 | | | | 648,000 | | |
OI European Group BV
3.125%, due 11/15/242 | | EUR | 125,000 | | | | 149,637 | | |
Owens-Brockway Glass Container, Inc.
6.375%, due 08/15/252 | | | 242,000 | | | | 258,940 | | |
6.625%, due 05/13/272 | | | 50,000 | | | | 54,125 | | |
Plastipak Holdings, Inc.
6.250%, due 10/15/252,4 | | | 100,000 | | | | 99,875 | | |
Reynolds Group Issuer, Inc./Reynolds Group
Issuer LLC/Reynolds Group Issuer Lu
5.125%, due 07/15/232 | | | 175,000 | | | | 177,677 | | |
Schoeller Packaging BV
6.375%, due 11/01/242 | | EUR | 125,000 | | | | 139,895 | | |
Sealed Air Corp.
4.000%, due 12/01/272 | | | 131,000 | | | | 135,585 | | |
Silgan Holdings, Inc.
2.250%, due 06/01/28 | | EUR | 100,000 | | | | 115,734 | | |
4.125%, due 02/01/28 | | | 75,000 | | | | 76,875 | | |
Trident TPI Holdings, Inc.
6.625%, due 11/01/252 | | | 100,000 | | | | 98,250 | | |
9.250%, due 08/01/242,4 | | | 125,000 | | | | 132,658 | | |
Trivium Packaging Finance BV
5.500%, due 08/15/262 | | | 200,000 | | | | 213,060 | | |
| | | | | | 4,350,686 | | |
Pharmaceuticals—2.9% | |
AdaptHealth LLC
6.125%, due 08/01/282 | | | 50,000 | | | | 52,107 | | |
Bausch Health Americas, Inc.
8.500%, due 01/31/272 | | | 250,000 | | | | 278,125 | | |
Bausch Health Cos., Inc.
4.500%, due 05/15/235 | | EUR | 300,000 | | | | 352,099 | | |
5.000%, due 01/30/282 | | | 250,000 | | | | 251,245 | | |
5.250%, due 01/30/302 | | | 75,000 | | | | 76,594 | | |
5.500%, due 03/01/232 | | | 20,000 | | | | 20,000 | | |
5.875%, due 05/15/232 | | | 54,000 | | | | 54,000 | | |
6.125%, due 04/15/252 | | | 25,000 | | | | 25,813 | | |
7.000%, due 01/15/282 | | | 75,000 | | | | 81,562 | | |
7.250%, due 05/30/292 | | | 200,000 | | | | 220,000 | | |
9.000%, due 12/15/252 | | | 1,225,000 | | | | 1,353,625 | | |
Endo Dac / Endo Finance LLC / Endo Finco, Inc.
6.000%, due 06/30/282 | | | 354,000 | | | | 269,925 | | |
9.500%, due 07/31/272 | | | 265,000 | | | | 285,537 | | |
152
PACE High Yield Investments
Portfolio of investments—July 31, 2020
| | | Face
amount1 | | Value | |
Corporate bonds—(continued) | |
Pharmaceuticals—(concluded) | |
Herbalife Nutrition Ltd./HLF Financing, Inc.
7.875%, due 09/01/252 | | | 200,000 | | | $ | 217,500 | | |
HLF Financing SARL LLC/Herbalife
International, Inc.
7.250%, due 08/15/262 | | | 50,000 | | | | 52,500 | | |
Mallinckrodt International Finance SA/
Mallinckrodt CB LLC
5.625%, due 10/15/232 | | | 150,000 | | | | 24,000 | | |
5.750%, due 08/01/222 | | | 50,000 | | | | 8,500 | | |
Par Pharmaceutical, Inc.
7.500%, due 04/01/272 | | | 398,000 | | | | 423,325 | | |
Teva Pharmaceutical Finance
Netherlands II BV
1.125%, due 10/15/245 | | EUR | 725,000 | | | | 764,343 | | |
1.625%, due 10/15/285 | | EUR | 200,000 | | | | 196,497 | | |
1.875%, due 03/31/275 | | EUR | 400,000 | | | | 408,702 | | |
6.000%, due 01/31/255 | | EUR | 200,000 | | | | 251,492 | | |
Teva Pharmaceutical Finance Netherlands III BV
4.100%, due 10/01/46 | | | 475,000 | | | | 405,265 | | |
6.000%, due 04/15/24 | | | 1,450,000 | | | | 1,536,547 | | |
| | | | | | 7,609,303 | | |
Pipelines—3.1% | |
Antero Midstream Partners LP / Antero
Midstream Finance Corp.
5.750%, due 01/15/282 | | | 25,000 | | | | 21,315 | | |
Antero Midstream Partners LP/Antero
Midstream Finance Corp.
5.375%, due 09/15/24 | | | 200,000 | | | | 181,428 | | |
5.750%, due 03/01/272 | | | 175,000 | | | | 152,859 | | |
Cheniere Energy Partners LP
5.250%, due 10/01/25 | | | 25,000 | | | | 25,625 | | |
5.625%, due 10/01/26 | | | 25,000 | | | | 26,406 | | |
CNX Midstream Partners LP/CNX Midstream
Finance Corp.
6.500%, due 03/15/262 | | | 125,000 | | | | 122,188 | | |
Crestwood Midstream Partners LP/Crestwood
Midstream Finance Corp.
6.250%, due 04/01/2313 | | | 445,000 | | | | 430,537 | | |
DCP Midstream Operating LP
3.875%, due 03/15/23 | | | 25,000 | | | | 25,065 | | |
5.125%, due 05/15/29 | | | 175,000 | | | | 176,158 | | |
5.375%, due 07/15/25 | | | 225,000 | | | | 236,929 | | |
Delek Logistics Partners LP/Delek Logistics
Finance Corp.
6.750%, due 05/15/25 | | | 200,000 | | | | 181,750 | | |
Energy Transfer Operating LP
(fixed, converts to FRN on 02/15/28),
6.625%, due 02/15/286,8 | | | 200,000 | | | | 144,000 | | |
EnLink Midstream LLC
5.375%, due 06/01/29 | | | 250,000 | | | | 199,797 | | |
EnLink Midstream Partners LP
4.400%, due 04/01/24 | | | 75,000 | | | | 64,419 | | |
4.850%, due 07/15/26 | | | 150,000 | | | | 116,271 | | |
5.050%, due 04/01/45 | | | 75,000 | | | | 40,500 | | |
5.450%, due 06/01/47 | | | 100,000 | | | | 56,350 | | |
| | | Face
amount1 | | Value | |
Corporate bonds—(continued) | |
Pipelines—(continued) | |
5.600%, due 04/01/44 | | | 150,000 | | | $ | 83,250 | | |
EQM Midstream Partners LP
4.750%, due 07/15/23 | | | 225,000 | | | | 228,150 | | |
5.500%, due 07/15/28 | | | 100,000 | | | | 103,680 | | |
6.000%, due 07/01/252 | | | 125,000 | | | | 132,582 | | |
6.500%, due 07/01/272 | | | 25,000 | | | | 27,565 | | |
6.500%, due 07/15/48 | | | 25,000 | | | | 24,906 | | |
Genesis Energy LP/Genesis Energy
Finance Corp.
6.000%, due 05/15/23 | | | 25,000 | | | | 23,500 | | |
6.500%, due 10/01/25 | | | 75,000 | | | | 69,469 | | |
7.750%, due 02/01/28 | | | 225,000 | | | | 216,992 | | |
Hess Midstream Operations LP
5.125%, due 06/15/282 | | | 300,000 | | | | 303,750 | | |
5.625%, due 02/15/262 | | | 175,000 | | | | 181,526 | | |
Holly Energy Partners LP/Holly Energy
Finance Corp.
5.000%, due 02/01/282 | | | 150,000 | | | | 148,216 | | |
NuStar Logistics LP
6.000%, due 06/01/26 | | | 75,000 | | | | 76,875 | | |
PBF Logistics LP/PBF Logistics Finance Corp.
6.875%, due 05/15/23 | | | 375,000 | | | | 362,812 | | |
Plains All American Pipeline LP | |
(fixed, converts to FRN on 11/15/22),
6.125%, due 11/15/226,8 | | | 525,000 | | | | 366,844 | | |
Rattler Midstream LP
5.625%, due 07/15/252 | | | 75,000 | | | | 79,109 | | |
Rockies Express Pipeline LLC
3.600%, due 05/15/252 | | | 125,000 | | | | 121,250 | | |
4.800%, due 05/15/302 | | | 50,000 | | | | 47,312 | | |
4.950%, due 07/15/292 | | | 25,000 | | | | 24,422 | | |
6.875%, due 04/15/402 | | | 125,000 | | | | 125,625 | | |
7.500%, due 07/15/382 | | | 25,000 | | | | 25,500 | | |
Summit Midstream Holdings LLC/Summit
Midstream Finance Corp.
5.500%, due 08/15/22 | | | 475,000 | | | | 308,750 | | |
5.750%, due 04/15/25 | | | 125,000 | | | | 61,250 | | |
Summit Midstream Partners LP
(fixed, converts to FRN on 12/15/22),
9.500%, due 12/15/226,8 | | | 350,000 | | | | 52,063 | | |
Tallgrass Energy Partners LP/Tallgrass
Energy Finance Corp.
4.750%, due 10/01/232 | | | 125,000 | | | | 120,471 | | |
5.500%, due 09/15/242 | | | 75,000 | | | | 71,930 | | |
Targa Resources Partners LP/Targa Resources
Partners Finance Corp.
4.250%, due 11/15/23 | | | 125,000 | | | | 125,938 | | |
5.000%, due 01/15/284 | | | 300,000 | | | | 306,000 | | |
5.500%, due 03/01/302 | | | 25,000 | | | | 26,250 | | |
5.875%, due 04/15/264 | | | 450,000 | | | | 478,251 | | |
6.750%, due 03/15/24 | | | 100,000 | | | | 102,370 | | |
TransMontaigne Partners LP/TLP Finance Corp.
6.125%, due 02/15/26 | | | 100,000 | | | | 99,038 | | |
Transportadora de Gas del Sur SA
6.750%, due 05/02/255 | | | 150,000 | | | | 130,875 | | |
6.750%, due 05/02/252 | | | 600,000 | | | | 523,500 | | |
153
PACE High Yield Investments
Portfolio of investments—July 31, 2020
| | | Face
amount1 | | Value | |
Corporate bonds—(continued) | |
Pipelines—(concluded) | |
Western Midstream Operating LP
3.100%, due 02/01/2513 | | | 75,000 | | | $ | 74,820 | | |
3.950%, due 06/01/25 | | | 25,000 | | | | 24,875 | | |
4.000%, due 07/01/22 | | | 25,000 | | | | 25,800 | | |
4.500%, due 03/01/28 | | | 125,000 | | | | 125,313 | | |
4.650%, due 07/01/26 | | | 25,000 | | | | 25,563 | | |
4.750%, due 08/15/28 | | | 100,000 | | | | 100,726 | | |
5.300%, due 03/01/48 | | | 225,000 | | | | 200,995 | | |
5.450%, due 04/01/44 | | | 150,000 | | | | 136,875 | | |
5.500%, due 08/15/48 | | | 75,000 | | | | 66,938 | | |
| | | | | | 8,163,523 | | |
Real estate—5.4% | |
ADLER Real Estate AG
1.500%, due 04/17/225 | | EUR | 100,000 | | | | 114,703 | | |
Agile Group Holdings Ltd.
(fixed, converts to FRN on 12/04/23),
8.375%, due 12/04/235,6,8 | | | 400,000 | | | | 407,560 | | |
Aroundtown SA
(fixed, converts to FRN on 01/17/24),
2.125%, due 01/17/245,6,8 | | EUR | 300,000 | | | | 332,188 | | |
Central China Real Estate Ltd.
7.250%, due 04/24/235 | | | 300,000 | | | | 301,953 | | |
Central Plaza Development Ltd. EMTN
(fixed, converts to FRN on 11/14/24),
5.750%, due 11/14/245,6,8 | | | 200,000 | | | | 195,945 | | |
Champion Sincerity Holdings Ltd.
(fixed, converts to FRN on 02/08/22),
8.125%, due 02/08/225,6,8 | | | 200,000 | | | | 206,900 | | |
China Aoyuan Group Ltd.
5.375%, due 09/13/225 | | | 300,000 | | | | 298,737 | | |
7.950%, due 02/19/235 | | | 300,000 | | | | 314,625 | | |
China Evergrande Group
7.500%, due 06/28/235 | | | 200,000 | | | | 176,875 | | |
9.500%, due 04/11/225 | | | 200,000 | | | | 192,752 | | |
9.500%, due 03/29/245 | | | 850,000 | | | | 747,203 | | |
10.000%, due 04/11/235 | | | 200,000 | | | | 189,250 | | |
China SCE Group Holdings Ltd.
7.375%, due 04/09/245 | | | 800,000 | | | | 808,015 | | |
CIFI Holdings Group Co. Ltd.
5.500%, due 01/23/225 | | | 500,000 | | | | 505,525 | | |
6.550%, due 03/28/245 | | | 200,000 | | | | 208,007 | | |
Consus Real Estate AG
9.625%, due 05/15/245 | | EUR | 100,000 | | | | 127,219 | | |
9.625%, due 05/15/242 | | EUR | 300,000 | | | | 381,656 | | |
Dar Al-Arkan Sukuk Co. Ltd. EMTN
6.875%, due 04/10/225 | | | 200,000 | | | | 193,340 | | |
Easy Tactic Ltd.
8.625%, due 02/27/245 | | | 300,000 | | | | 272,629 | | |
9.125%, due 07/28/225 | | | 300,000 | | | | 291,049 | | |
Fantasia Holdings Group Co. Ltd.
7.375%, due 10/04/215 | | | 300,000 | | | | 300,375 | | |
10.875%, due 01/09/235 | | | 300,000 | | | | 313,175 | | |
11.750%, due 04/17/225 | | | 200,000 | | | | 210,505 | | |
| | | Face
amount1 | | Value | |
Corporate bonds—(continued) | |
Real estate—(continued) | |
Five Point Operating Co. LP/Five Point
Capital Corp.
7.875%, due 11/15/252 | | | 125,000 | | | $ | 120,784 | | |
Greystar Real Estate Partners LLC
5.750%, due 12/01/252 | | | 100,000 | | | | 100,750 | | |
Hong Seng Ltd.
9.875%, due 08/27/225 | | | 250,000 | | | | 246,249 | | |
Howard Hughes Corp./The
5.375%, due 03/15/252 | | | 75,000 | | | | 75,755 | | |
Hunt Cos., Inc.
6.250%, due 02/15/262 | | | 175,000 | | | | 163,625 | | |
Jababeka International BV
6.500%, due 10/05/235 | | | 200,000 | | | | 164,312 | | |
Kaisa Group Holdings Ltd.
10.500%, due 01/15/255 | | | 300,000 | | | | 287,752 | | |
11.500%, due 01/30/235 | | | 400,000 | | | | 415,515 | | |
Kennedy-Wilson, Inc.
5.875%, due 04/01/24 | | | 375,000 | | | | 376,406 | | |
KWG Group Holdings Ltd.
7.875%, due 09/01/235 | | | 200,000 | | | | 208,500 | | |
KWG Group Holdings Ltd. EMTN
7.400%, due 03/05/245 | | | 200,000 | | | | 208,824 | | |
Newmark Group, Inc.
6.125%, due 11/15/23 | | | 150,000 | | | | 153,702 | | |
Powerlong Real Estate Holdings Ltd.
6.950%, due 07/23/235 | | | 250,000 | | | | 254,071 | | |
Realogy Group LLC / Realogy Co-Issuer Corp.
7.625%, due 06/15/252 | | | 100,000 | | | | 104,947 | | |
Realogy Group LLC/Realogy Co-Issuer Corp.
9.375%, due 04/01/272 | | | 75,000 | | | | 76,688 | | |
Redsun Properties Group Ltd.
9.700%, due 04/16/235 | | | 250,000 | | | | 251,623 | | |
RKPF Overseas 2019 A Ltd.
6.700%, due 09/30/245 | | | 300,000 | | | | 308,856 | | |
7.875%, due 02/01/235 | | | 300,000 | | | | 315,449 | | |
Ronshine China Holdings Ltd.
8.100%, due 06/09/235 | | | 300,000 | | | | 312,465 | | |
Scenery Journey Ltd.
11.500%, due 10/24/225 | | | 200,000 | | | | 193,257 | | |
13.000%, due 11/06/225 | | | 200,000 | | | | 199,507 | | |
Shimao Group Holdings Ltd.
5.600%, due 07/15/265 | | | 250,000 | | | | 266,382 | | |
Sunac China Holdings Ltd.
6.500%, due 01/10/255 | | | 400,000 | | | | 393,325 | | |
Times China Holdings Ltd.
5.750%, due 04/26/225 | | | 200,000 | | | | 201,468 | | |
6.750%, due 07/16/235 | | | 200,000 | | | | 204,937 | | |
Yango Justice International Ltd.
9.250%, due 04/15/235 | | | 200,000 | | | | 205,716 | | |
Yanlord Land HK Co. Ltd.
5.875%, due 01/23/225 | | | 500,000 | | | | 504,402 | | |
6.800%, due 02/27/245 | | | 200,000 | | | | 202,620 | | |
Yuzhou Group Holdings Co. Ltd.
7.375%, due 01/13/265 | | | 400,000 | | | | 390,921 | | |
8.500%, due 02/26/245 | | | 200,000 | | | | 209,822 | | |
154
PACE High Yield Investments
Portfolio of investments—July 31, 2020
| | | Face
amount1 | | Value | |
Corporate bonds—(continued) | |
Real estate—(concluded) | |
Zhenro Properties Group Ltd.
7.875%, due 04/14/245 | | | 200,000 | | | $ | 197,654 | | |
| | | | | | 14,406,470 | | |
Real estate investment trusts—1.2% | |
ESH Hospitality, Inc.
4.625%, due 10/01/272 | | | 150,000 | | | | 144,345 | | |
5.250%, due 05/01/252 | | | 100,000 | | | | 102,148 | | |
FelCor Lodging LP
6.000%, due 06/01/25 | | | 575,000 | | | | 569,250 | | |
GEO Group, Inc./The
6.000%, due 04/15/264 | | | 200,000 | | | | 154,250 | | |
HAT Holdings I LLC/HAT Holdings II LLC
5.250%, due 07/15/242 | | | 150,000 | | | | 156,281 | | |
Iron Mountain UK PLC
3.875%, due 11/15/255 | | GBP | 100,000 | | | | 129,897 | | |
Iron Mountain, Inc.
4.875%, due 09/15/292 | | | 100,000 | | | | 104,175 | | |
5.000%, due 07/15/282 | | | 50,000 | | | | 51,750 | | |
5.250%, due 07/15/302 | | | 200,000 | | | | 209,750 | | |
Ladder Capital Finance Holdings LLLP/Ladder
Capital Finance Corp.
4.250%, due 02/01/272 | | | 100,000 | | | | 84,500 | | |
5.250%, due 03/15/222 | | | 225,000 | | | | 220,500 | | |
MPT Operating Partnership LP/MPT Finance Corp.
5.500%, due 05/01/24 | | | 100,000 | | | | 101,875 | | |
6.375%, due 03/01/24 | | | 100,000 | | | | 103,125 | | |
Park Intermediate Holdings LLC / PK Domestic
Property LLC / PK Finance Co-Issuer
7.500%, due 06/01/252 | | | 175,000 | | | | 186,287 | | |
SBA Communications Corp.
4.000%, due 10/01/22 | | | 125,000 | | | | 126,688 | | |
Service Properties Trust
4.350%, due 10/01/24 | | | 275,000 | | | | 246,546 | | |
4.375%, due 02/15/30 | | | 25,000 | | | | 20,406 | | |
4.950%, due 02/15/27 | | | 75,000 | | | | 67,898 | | |
4.950%, due 10/01/294 | | | 25,000 | | | | 21,375 | | |
5.250%, due 02/15/26 | | | 25,000 | | | | 22,500 | | |
7.500%, due 09/15/25 | | | 50,000 | | | | 53,012 | | |
The Geo Group, Inc.
5.875%, due 10/15/24 | | | 25,000 | | | | 19,813 | | |
Uniti Group LP/Uniti Fiber Holdings, Inc./CSL
Capital LLC
7.125%, due 12/15/242 | | | 200,000 | | | | 188,500 | | |
7.875%, due 02/15/252 | | | 175,000 | | | | 184,187 | | |
| | | | | | 3,269,058 | | |
Retail—3.5% | |
1011778 BC ULC/New Red Finance, Inc.
4.250%, due 05/15/242 | | | 100,000 | | | | 102,000 | | |
4.375%, due 01/15/282 | | | 275,000 | | | | 286,036 | | |
5.000%, due 10/15/252 | | | 200,000 | | | | 205,322 | | |
Abercrombie & Fitch Management Co.
8.750%, due 07/15/252 | | | 125,000 | | | | 124,688 | | |
Arcos Dorados Holdings, Inc.
5.875%, due 04/04/275 | | | 200,000 | | | | 210,576 | | |
| | | Face
amount1 | | Value | |
Corporate bonds—(continued) | |
Retail—(continued) | |
Asbury Automotive Group, Inc.
4.500%, due 03/01/282 | | | 40,000 | | | $ | 41,015 | | |
Beacon Roofing Supply, Inc.
4.500%, due 11/15/262,4 | | | 75,000 | | | | 76,875 | | |
Burlington Coat Factory Warehouse Corp.
6.250%, due 04/15/252 | | | 50,000 | | | | 53,500 | | |
Carvana Co.
8.875%, due 10/01/232 | | | 50,000 | | | | 52,000 | | |
eG Global Finance PLC
4.375%, due 02/07/255 | | EUR | 300,000 | | | | 333,909 | | |
Ferrellgas LP/Ferrellgas Finance Corp.
6.500%, due 05/01/214 | | | 230,000 | | | | 198,950 | | |
6.750%, due 06/15/234,13 | | | 150,000 | | | | 129,750 | | |
10.000%, due 04/15/252 | | | 50,000 | | | | 54,938 | | |
Ferrellgas Partners LP/Ferrellgas Partners
Finance Corp.
8.625%, due 06/15/20 | | | 100,000 | | | | 29,528 | | |
Gap Inc/The
8.625%, due 05/15/252,4 | | | 125,000 | | | | 137,775 | | |
Golden Nugget, Inc.
6.750%, due 10/15/242 | | | 775,000 | | | | 542,500 | | |
8.750%, due 10/01/252,4 | | | 546,000 | | | | 285,967 | | |
Grupo Unicomer Co. Ltd.
7.875%, due 04/01/245 | | | 600,000 | | | | 554,250 | | |
Hema Bondco I BV
3 mo. Euribor + 6.250%,
6.250%, due 07/15/225,6 | | EUR | 550,000 | | | | 451,464 | | |
Hema Bondco II BV
8.500%, due 01/15/235 | | EUR | 100,000 | | | | 883 | | |
Hornbach Baumarkt AG
3.250%, due 10/25/265 | | EUR | 100,000 | | | | 120,440 | | |
IRB Holding Corp.
6.750%, due 02/15/262,4 | | | 125,000 | | | | 125,625 | | |
7.000%, due 06/15/252 | | | 125,000 | | | | 135,938 | | |
JC Penney Corp., Inc.
6.375%, due 10/15/3611 | | | 150,000 | | | | 675 | | |
8.625%, due 03/15/252,11 | | | 150,000 | | | | 1,500 | | |
L Brands, Inc.
6.750%, due 07/01/36 | | | 625,000 | | | | 603,187 | | |
6.875%, due 07/01/252 | | | 50,000 | | | | 53,849 | | |
6.875%, due 11/01/35 | | | 100,000 | | | | 95,720 | | |
7.500%, due 06/15/29 | | | 50,000 | | | | 51,456 | | |
9.375%, due 07/01/252 | | | 75,000 | | | | 83,625 | | |
Lithia Motors, Inc.
4.625%, due 12/15/272 | | | 75,000 | | | | 79,710 | | |
5.250%, due 08/01/252 | | | 125,000 | | | | 130,000 | | |
Murphy Oil USA, Inc.
4.750%, due 09/15/29 | | | 150,000 | | | | 158,576 | | |
5.625%, due 05/01/27 | | | 25,000 | | | | 26,500 | | |
Penske Automotive Group, Inc.
3.750%, due 08/15/20 | | | 125,000 | | | | 125,000 | | |
PetSmart, Inc.
7.125%, due 03/15/232 | | | 525,000 | | | | 530,250 | | |
Pizzaexpress Financing 2 PLC
6.625%, due 08/01/215 | | GBP | 425,000 | | | | 349,205 | | |
155
PACE High Yield Investments
Portfolio of investments—July 31, 2020
| | | Face
amount1 | | Value | |
Corporate bonds—(continued) | |
Retail—(concluded) | |
Rite Aid Corp.
7.500%, due 07/01/252 | | | 52,000 | | | $ | 52,910 | | |
8.000%, due 11/15/262 | | | 178,000 | | | | 183,322 | | |
Sonic Automotive, Inc.
6.125%, due 03/15/27 | | | 275,000 | | | | 284,625 | | |
Staples, Inc.
7.500%, due 04/15/262 | | | 450,000 | | | | 394,785 | | |
10.750%, due 04/15/272 | | | 475,000 | | | | 301,625 | | |
Stonegate Pub Co. Financing 2019 PLC
8.250%, due 07/31/252 | | GBP | 500,000 | | | | 628,320 | | |
Superior Plus LP/Superior General Partner, Inc.
7.000%, due 07/15/262 | | | 50,000 | | | | 52,875 | | |
Tendam Brands SAU
3 mo. Euribor + 5.250%,
5.250%, due 09/15/245,6 | | EUR | 150,000 | | | | 150,687 | | |
Very Group Funding PLC
7.750%, due 11/15/222 | | GBP | 425,000 | | | | 510,922 | | |
Yum! Brands, Inc.
3.875%, due 11/01/23 | | | 275,000 | | | | 284,969 | | |
| | | | | | 9,388,222 | | |
Savings & loans—0.0%† | |
Washington Mutual, Inc.
0.000%, due 09/21/179,12 | | | 500,000 | | | | 6,250 | | |
Semiconductors—0.2% | |
Amkor Technology, Inc.
6.625%, due 09/15/272 | | | 100,000 | | | | 110,000 | | |
Entegris, Inc.
4.625%, due 02/10/262 | | | 200,000 | | | | 207,576 | | |
Microchip Technology, Inc.
4.250%, due 09/01/252 | | | 175,000 | | | | 184,140 | | |
Qorvo, Inc.
4.375%, due 10/15/292 | | | 100,000 | | | | 107,656 | | |
5.500%, due 07/15/26 | | | 50,000 | | | | 53,665 | | |
| | | | | | 663,037 | | |
Software—1.4% | |
Ascend Learning LLC
6.875%, due 08/01/252 | | | 100,000 | | | | 103,000 | | |
6.875%, due 08/01/252 | | | 75,000 | | | | 76,875 | | |
Boxer Parent Co., Inc.
6.500%, due 10/02/252 | | EUR | 150,000 | | | | 185,545 | | |
7.125%, due 10/02/252 | | | 75,000 | | | | 82,289 | | |
9.125%, due 03/01/262 | | | 75,000 | | | | 79,500 | | |
BY Crown Parent LLC
7.375%, due 10/15/242 | | | 450,000 | | | | 456,187 | | |
BY Crown Parent LLC/BY Bond Finance, Inc.
4.250%, due 01/31/262 | | | 75,000 | | | | 77,741 | | |
Camelot Finance SA
4.500%, due 11/01/262 | | | 125,000 | | | | 131,211 | | |
Castle U.S. Holding Corp.
9.500%, due 02/15/282 | | | 350,000 | | | | 323,750 | | |
CDK Global, Inc.
5.250%, due 05/15/292 | | | 50,000 | | | | 54,753 | | |
5.875%, due 06/15/26 | | | 125,000 | | | | 133,582 | | |
| | | Face
amount1 | | Value | |
Corporate bonds—(continued) | |
Software—(concluded) | |
Donnelley Financial Solutions, Inc.
8.250%, due 10/15/24 | | | 50,000 | | | $ | 50,500 | | |
Dun & Bradstreet Corp./The
10.250%, due 02/15/272 | | | 255,000 | | | | 289,535 | | |
IQVIA, Inc.
3.250%, due 03/15/255 | | EUR | 200,000 | | | | 238,884 | | |
j2 Cloud Services LLC/j2 Cloud Co-Obligor, Inc.
6.000%, due 07/15/252 | | | 200,000 | | | | 208,500 | | |
Open Text Corp.
3.875%, due 02/15/282 | | | 175,000 | | | | 182,821 | | |
5.875%, due 06/01/262 | | | 150,000 | | | | 159,330 | | |
Open Text Holdings, Inc.
4.125%, due 02/15/302 | | | 175,000 | | | | 183,750 | | |
PTC, Inc.
3.625%, due 02/15/252 | | | 100,000 | | | | 103,677 | | |
4.000%, due 02/15/282 | | | 50,000 | | | | 52,518 | | |
Solera LLC/Solera Finance, Inc.
10.500%, due 03/01/242 | | | 125,000 | | | | 132,250 | | |
SS&C Technologies, Inc.
5.500%, due 09/30/272 | | | 325,000 | | | | 349,375 | | |
Veritas US, Inc./Veritas Bermuda Ltd.
10.500%, due 02/01/242 | | | 200,000 | | | | 183,000 | | |
| | | | | | 3,838,573 | | |
Storage/Warehousing—0.1% | |
Algeco Global Finance PLC
6.500%, due 02/15/235 | | EUR | 225,000 | | | | 255,843 | | |
Telecommunications—6.6% | |
Altice France Holding SA
4.000%, due 02/15/285 | | EUR | 225,000 | | | | 243,750 | | |
6.000%, due 02/15/282 | | | 400,000 | | | | 399,516 | | |
8.000%, due 05/15/275 | | EUR | 325,000 | | | | 411,445 | | |
10.500%, due 05/15/272 | | | 400,000 | | | | 457,500 | | |
Altice France SA
3.375%, due 01/15/282 | | EUR | 350,000 | | | | 402,742 | | |
3.375%, due 01/15/285 | | EUR | 400,000 | | | | 460,277 | | |
7.375%, due 05/01/262 | | | 400,000 | | | | 426,660 | | |
CenturyLink, Inc.
5.125%, due 12/15/262 | | | 250,000 | | | | 262,188 | | |
6.750%, due 12/01/23 | | | 175,000 | | | | 194,031 | | |
CommScope Technologies LLC
6.000%, due 06/15/252 | | | 475,000 | | | | 485,307 | | |
CommScope, Inc.
5.500%, due 03/01/242 | | | 150,000 | | | | 155,778 | | |
6.000%, due 03/01/262 | | | 50,000 | | | | 53,344 | | |
7.125%, due 07/01/282 | | | 100,000 | | | | 105,865 | | |
8.250%, due 03/01/272,4 | | | 75,000 | | | | 80,880 | | |
Connect Finco SARL/Connect US Finco LLC
6.750%, due 10/01/262 | | | 200,000 | | | | 205,060 | | |
Digicel Group 0.5 Ltd.
7.000%, due 08/17/202,7,8 | | | 39,909 | | | | 3,592 | | |
5.000% Cash or 8.000% PIK,
8.000%, due 04/01/252,7 | | | 240,960 | | | | 81,926 | | |
8.000% Cash or 2.000% PIK,
10.000%, due 04/01/247 | | | 632,352 | | | | 477,426 | | |
156
PACE High Yield Investments
Portfolio of investments—July 31, 2020
| | | Face
amount1 | | Value | |
Corporate bonds—(continued) | |
Telecommunications—(continued) | |
Digicel International Finance Ltd. / Digicel
Holdings Bermuda Ltd.
8.000%, due 12/31/262 | | | 24,168 | | | $ | 17,341 | | |
8.750%, due 05/25/242 | | | 60,541 | | | | 60,919 | | |
6.000% Cash or 7.000% PIK,
13.000%, due 12/31/252,7 | | | 30,664 | | | | 27,598 | | |
Embarq Corp.
7.995%, due 06/01/36 | | | 375,000 | | | | 439,500 | | |
Frontier Communications Corp.
8.000%, due 04/01/272,11 | | | 100,000 | | | | 103,500 | | |
8.500%, due 04/01/262,11 | | | 50,000 | | | | 49,250 | | |
10.500%, due 09/15/2211 | | | 1,525,000 | | | | 529,937 | | |
Hughes Satellite Systems Corp.
6.625%, due 08/01/26 | | | 300,000 | | | | 333,750 | | |
Intelsat Jackson Holdings SA
8.500%, due 10/15/242,11 | | | 550,000 | | | | 363,000 | | |
9.750%, due 07/15/252,11 | | | 400,000 | | | | 266,000 | | |
Intelsat Luxembourg SA
7.750%, due 06/01/2111 | | | 25,000 | | | | 1,250 | | |
8.125%, due 06/01/2311 | | | 165,000 | | | | 8,250 | | |
Level 3 Financing, Inc.
5.625%, due 02/01/23 | | | 70,000 | | | | 70,294 | | |
Millicom International Cellular SA
6.250%, due 03/25/295 | | | 200,000 | | | | 220,150 | | |
6.250%, due 03/25/292 | | | 250,000 | | | | 275,188 | | |
6.625%, due 10/15/265 | | | 250,000 | | | | 272,500 | | |
Network i2i Ltd.
(fixed, converts to FRN on 01/15/25),
5.650%, due 01/15/255,6,8 | | | 300,000 | | | | 295,875 | | |
Nokia of America Corp.
6.450%, due 03/15/29 | | | 100,000 | | | | 104,411 | | |
Qualitytech LP/QTS Finance Corp.
4.750%, due 11/15/252 | | | 75,000 | | | | 77,625 | | |
RCS & RDS SA
2.500%, due 02/05/252 | | EUR | 200,000 | | | | 227,933 | | |
3.250%, due 02/05/282 | | EUR | 100,000 | | | | 112,642 | | |
SoftBank Group Corp.
3.125%, due 09/19/255 | | EUR | 425,000 | | | | 497,895 | | |
4.000%, due 09/19/295 | | EUR | 200,000 | | | | 243,809 | | |
4.500%, due 04/20/255 | | EUR | 100,000 | | | | 123,181 | | |
5.000%, due 04/15/285 | | EUR | 300,000 | | | | 383,007 | | |
Sprint Capital Corp.
8.750%, due 03/15/32 | | | 445,000 | | | | 686,412 | | |
Sprint Communications, Inc.
6.000%, due 11/15/22 | | | 25,000 | | | | 26,969 | | |
9.250%, due 04/15/22 | | | 225,000 | | | | 249,750 | | |
Sprint Corp.
7.625%, due 03/01/26 | | | 175,000 | | | | 218,747 | | |
7.875%, due 09/15/23 | | | 725,000 | | | | 841,000 | | |
T-Mobile USA, Inc.
6.000%, due 04/15/24 | | | 100,000 | | | | 102,359 | | |
6.375%, due 03/01/25 | | | 325,000 | | | | 333,625 | | |
TalkTalk Telecom Group PLC
3.875%, due 02/20/255 | | GBP | 200,000 | | | | 256,564 | | |
Telecom Argentina SA
6.500%, due 06/15/215 | | | 190,000 | | | | 183,255 | | |
| | | Face
amount1 | | Value | |
Corporate bonds—(continued) | |
Telecommunications—(concluded) | |
6.500%, due 06/15/212 | | | 900,000 | | | $ | 871,875 | | |
Telecom Italia Capital SA
6.000%, due 09/30/34 | | | 350,000 | | | | 425,047 | | |
7.200%, due 07/18/36 | | | 50,000 | | | | 65,675 | | |
Telecom Italia Finance SA EMTN
7.750%, due 01/24/33 | | EUR | 750,000 | | | | 1,267,734 | | |
Telecom Italia SpA
5.303%, due 05/30/242 | | | 25,000 | | | | 27,937 | | |
Telecom Italia SpA EMTN
2.375%, due 10/12/275 | | EUR | 400,000 | | | | 470,880 | | |
Telesat Canada/Telesat LLC
4.875%, due 06/01/272 | | | 100,000 | | | | 101,500 | | |
6.500%, due 10/15/272,4 | | | 125,000 | | | | 128,475 | | |
ViaSat, Inc.
5.625%, due 04/15/272,4 | | | 125,000 | | | | 132,463 | | |
Vodafone Group PLC
(fixed, converts to FRN on 10/03/23),
3.100%, due 01/03/795,6 | | EUR | 500,000 | | | | 596,991 | | |
(fixed, converts to FRN on 07/03/28),
4.200%, due 10/03/785,6 | | EUR | 125,000 | | | | 162,336 | | |
(fixed, converts to FRN on 01/04/29),
7.000%, due 04/04/796 | | | 275,000 | | | | 330,643 | | |
Windstream Services LLC/Windstream
Finance Corp.
10.500%, due 06/30/242,11 | | | 100,000 | | | | 5,000 | | |
Zayo Group Holdings, Inc.
6.125%, due 03/01/282 | | | 100,000 | | | | 103,125 | | |
| | | | | | 17,600,454 | | |
Textiles—0.3% | |
Eagle Intermediate Global Holding BV/Ruyi
US Finance LLC
5.375%, due 05/01/232 | | EUR | 300,000 | | | | 225,835 | | |
5.375%, due 05/01/235 | | EUR | 253,000 | | | | 190,734 | | |
Golden Legacy Pte Ltd.
6.875%, due 03/27/245 | | | 300,000 | | | | 273,871 | | |
| | | | | | 690,440 | | |
Toys/Games/Hobbies—0.1% | |
Mattel, Inc.
5.875%, due 12/15/272 | | | 50,000 | | | | 53,812 | | |
6.750%, due 12/31/252 | | | 125,000 | | | | 133,884 | | |
| | | | | | 187,696 | | |
Transportation—0.5% | |
CMA CGM SA
5.250%, due 01/15/255 | | EUR | 100,000 | | | | 98,771 | | |
Rumo Luxembourg SARL
5.875%, due 01/18/255 | | | 500,000 | | | | 524,895 | | |
Transnet SOC Ltd.
4.000%, due 07/26/225 | | | 250,000 | | | | 247,635 | | |
XPO Logistics, Inc.
6.125%, due 09/01/232 | | | 150,000 | | | | 152,954 | | |
6.250%, due 05/01/252 | | | 275,000 | | | | 297,687 | | |
| | | | | | 1,321,942 | | |
157
PACE High Yield Investments
Portfolio of investments—July 31, 2020
| | | Face
amount1 | | Value | |
Corporate bonds—(concluded) | |
Trucking & leasing—0.3% | |
DAE Funding LLC
5.250%, due 11/15/212 | | | 300,000 | | | $ | 300,000 | | |
Fly Leasing Ltd.
5.250%, due 10/15/24 | | | 200,000 | | | | 158,000 | | |
Fortress Transportation and Infrastructure
Investors LLC
6.500%, due 10/01/252 | | | 175,000 | | | | 164,537 | | |
6.750%, due 03/15/222 | | | 50,000 | | | | 50,756 | | |
9.750%, due 08/01/272 | | | 125,000 | | | | 129,062 | | |
| | | | | | 802,355 | | |
Total corporate bonds
(cost—$266,503,088) | | | 257,505,186 | | |
Loan assignments—1.8% | |
Auto manufacturers—0.0%† | |
Clarios Global LP,
USD Term Loan B,
(1 mo. USD LIBOR + 3.500%),
3.667%, due 04/30/266 | | | 123,253 | | | | 120,145 | | |
Broadcast—0.2% | |
Allen Media LLC,
2020 Term Loan B,
(3 mo. USD LIBOR + 5.500%),
5.808%, due 02/10/276 | | | 174,402 | | | | 168,298 | | |
Spectacle Gary Holdings LLC,
Delayed Draw Term Loan,
11.000%, due 12/23/2514 | | | 16,892 | | | | 15,625 | | |
Term Loan B,
(3 mo. USD LIBOR + 9.000%),
11.000%, due 12/23/256 | | | 233,108 | | | | 215,625 | | |
| | | | | | 399,548 | | |
Chemicals—0.1% | |
Consolidated Energy Finance SA,
Term Loan B,
(1 mo. USD LIBOR + 2.500%),
2.687%, due 05/07/256 | | | 195,564 | | | | 180,163 | | |
Commercial services—0.1% | |
National Intergovernmental Purchasing
Alliance Co.,
1st Lien Term Loan,
(3 mo. USD LIBOR + 3.750%),
4.058%, due 05/23/256 | | | 98,002 | | | | 95,144 | | |
USS Ultimate Holdings, Inc.,
1st Lien Term Loan,
(3 mo. USD LIBOR + 3.750%),
4.750%, due 08/25/246 | | | 145,371 | | | | 136,694 | | |
| | | | | | 231,838 | | |
Containers & packaging—0.1% | |
Flex Acquisition Co., Inc.,
1st Lien Term Loan,
(3 mo. USD LIBOR + 3.000%),
4.000%, due 12/29/236 | | | 286,564 | | | | 277,302 | | |
| | | Face
amount1 | | Value | |
Loan assignments—(continued) | |
Electric—0.1% | |
Pacific Gas & Electric Co.,
2020 Exit Term Loan B,
(3 mo. USD LIBOR + 4.500%),
5.500%, due 06/23/256 | | | 200,000 | | | $ | 197,562 | | |
Engineering & construction—0.0%† | |
MRO Holdings, Inc.,
2019 Term Loan B,
(3 mo. USD LIBOR + 5.000%),
5.308%, due 06/04/266 | | | 148,500 | | | | 108,591 | | |
Entertainment—0.1% | |
Gateway Casinos & Entertainment Ltd.,
2018 Term Loan B,
(3 mo. USD LIBOR + 3.000%),
3.308%, due 03/13/256 | | | 196,000 | | | | 156,310 | | |
Financial services—0.1% | |
Air Methods Corp.,
2017 Term Loan B,
(3 mo. USD LIBOR + 3.500%),
4.500%, due 04/22/246 | | | 119,575 | | | | 95,090 | | |
UFC Holdings LLC,
2019 Term Loan,
(6 mo. USD LIBOR + 3.250%),
4.250%, due 04/29/266 | | | 98,845 | | | | 95,900 | | |
| | | | | | 190,990 | | |
Gaming—0.0%† | |
Boyd Gaming Corp.,
Term Loan B3,
(1 week USD LIBOR + 2.250%),
2.361%, due 09/15/236 | | | 63,304 | | | | 61,097 | | |
Hotels, restaurants & leisure—0.2% | |
Life Time Fitness, Inc.,
2017 Term Loan B,
(3 mo. USD LIBOR + 2.750%),
3.750%, due 06/10/226 | | | 673,162 | | | | 605,624 | | |
Insurance—0.2% | |
Asurion LLC,
2017 Term Loan B4,
(1 mo. USD LIBOR + 3.000%),
3.161%, due 08/04/226 | | | 397,200 | | | | 391,639 | | |
Hub International Ltd.,
2018 Term Loan B,
(3 mo. USD LIBOR + 3.000%),
3.219% - 3.264%, due 04/25/256 | | | 48,564 | | | | 47,100 | | |
| | | | | | 438,739 | | |
Lodging—0.1% | |
Golden Nugget, Inc.,
2017 Incremental Term Loan B,
(1 mo. USD LIBOR + 2.500%),
3.250%, due 10/04/236 | | | 162,627 | | | | 135,668 | | |
158
PACE High Yield Investments
Portfolio of investments—July 31, 2020
| | | Face
amount1 | | Value | |
Loan assignments—(continued) | |
Lodging—(concluded) | |
2020 Initial Term Loan,
(3 mo. USD LIBOR + 12.000%),
13.000%, due 10/04/236 | | | 25,000 | | | $ | 28,125 | | |
| | | | | | 163,793 | | |
Media—0.1% | |
Altice France SA,
2018 Term Loan B13,
(1 mo. USD LIBOR + 4.000%),
4.175%, due 08/14/266 | | | 167,142 | | | | 163,142 | | |
Diamond Sports Group LLC,
Term Loan,
(1 mo. USD LIBOR + 3.250%),
3.420%, due 08/24/266 | | | 99,250 | | | | 79,028 | | |
NASCAR Holdings, Inc,
Term Loan B,
(1 mo. USD LIBOR + 2.750%),
2.922%, due 10/19/266 | | | 66,300 | | | | 64,707 | | |
| | | | | | 306,877 | | |
Media-publishing—0.1% | |
Cengage Learning, Inc.,
2016 Term Loan B,
(6 mo. USD LIBOR + 4.250%),
5.250%, due 06/07/236 | | | 222,680 | | | | 180,186 | | |
Metals & mining—0.0%† | |
Neenah Foundry Co.,
2017 Term Loan,
(2 mo. USD LIBOR + 6.500%),
6.714% - 6.743%, due 12/13/226 | | | 122,774 | | | | 104,358 | | |
Oil & gas—0.3% | |
Apergy Corp.,
2020 Term Loan,
6.000%, due 05/28/27 | | | 400,000 | | | | 394,000 | | |
California Resources Corp.,
2017 1st Lien Term Loan,
(3 mo. USD LIBOR + 4.750%),
5.750%, due 12/31/226 | | | 475,000 | | | | 172,017 | | |
Second Out Term Loan,
(3 mo. USD LIBOR + 10.375%),
11.375%, due 12/31/216 | | | 75,000 | | | | 2,375 | | |
Citgo Holding, Inc.,
2019 Term Loan B,
(3 mo. USD LIBOR + 7.000%),
8.000%, due 08/01/236 | | | 173,688 | | | | 165,003 | | |
Parker Drilling Co.,
2nd Lien PIK Term Loan,
11.000% Cash or 2.000% PIK
11.000%, due 3/26/20247 | | | 26,411 | | | | 23,902 | | |
Prairie ECI Acquiror LP,
Term Loan B,
(1 mo. USD LIBOR + 4.750%),
4.911%, due 03/11/266 | | | 94,842 | | | | 85,290 | | |
| | | | | | 842,587 | | |
| | | Face
amount1 | | Value | |
Loan assignments—(concluded) | |
Retail-restaurants—0.0%† | |
1011778 B.C. Unlimited Liability Co.,
Term Loan B4,
(1 mo. USD LIBOR + 1.750%),
1.911%, due 11/19/266 | | | 133,710 | | | $ | 128,173 | | |
Total loan assignments
(cost—$5,419,359) | | | 4,693,883 | | |
Non-U.S. government agency obligations—0.5% | |
Egypt Government International Bond
7.903%, due 02/21/485 | | | 250,000 | | | | 229,687 | | |
Province of Santa Fe
7.000%, due 03/23/235 | | | 150,000 | | | | 103,125 | | |
Turkiye Ihracat Kredi Bankasi AS
5.375%, due 10/24/232 | | | 200,000 | | | | 189,313 | | |
5.375%, due 10/24/235 | | | 750,000 | | | | 709,922 | | |
5.375%, due 10/24/235 | | | 200,000 | | | | 189,313 | | |
Total non-U.S. government agency obligations
(cost—$1,530,975) | | | 1,421,360 | | |
| | | Number of
shares | | | |
Common stocks—0.1% | |
Chemicals—0.1% | |
Hexion Holdings Corp., Class B* | | | 17,052 | | | | 113,396 | | |
Energy equipment & services—0.0%† | |
Parker Drilling Co.* | | | 1,153 | | | | 5,292 | | |
Weatherford International PLC* | | | 2,438 | | | | 4,218 | | |
| | | | | | 9,510 | | |
Entertainment—0.0%† | |
AMC Entertainment Holdings, Inc., Class A | | | 700 | | | | 2,828 | | |
Metals & mining—0.0%† | |
Aleris International9,10,12 | | | 795 | | | | 15,900 | | |
Elah Holdings, Inc.* | | | 5 | | | | 227 | | |
| | | | | | 16,127 | | |
Oil, gas & consumable fuels—0.0%† | |
Chaparral Energy, Inc., Class A*,4 | | | 3,605 | | | | 1,403 | | |
Software—0.0%† | |
Avaya Holdings Corp.*,4 | | | 5,969 | | | | 75,567 | | |
Specialty retail—0.0%† | |
Rue21, Inc.9,10,12 | | | 16 | | | | 416 | | |
Total common stocks
(cost—$1,085,449) | | | 219,247 | | |
| | | Number of
warrants | | | |
Warrants—0.0%† | |
Media—0.0%† | |
iHeartMedia, Inc. expires 05/01/39*,9 | | | 1,347 | | | | 9,968 | | |
Oil & gas—0.0%† | |
SandRidge Energy, Inc. strike price
$41.34, expires 10/04/22* | | | 2,784 | | | | 179 | | |
159
PACE High Yield Investments
Portfolio of investments—July 31, 2020
| | | Number of
warrants | | Value | |
Warrants—(concluded) | |
Oil & gas—(concluded)† | |
SandRidge Energy, Inc. strike price
$42.03, expires 10/04/22* | | | 1,172 | | | $ | 64 | | |
| | | | | | 243 | | |
Paper & forest products—0.0%† | |
Appvion Holding Corp. expires 06/13/23*,9,10,12 | | USD | 1,264 | | | | — | | |
Total warrants
(cost—$22,593) | | | 10,211 | | |
| | | Number of
shares | | | |
Short-term investments—0.4% | |
Investment companies—0.4% | |
State Street Institutional U.S. Government
Money Market Fund, 0.09%
(cost—$1,039,760) | | | 1,039,760 | | | | 1,039,760 | | |
| | | Number of
shares | | Value | |
Investment of cash collateral from securities loaned—3.3% | |
Money market funds—3.3% | |
State Street Navigator Securities Lending
Government Money Market Portfolio, 0.12%
(cost—$8,857,440) | | | 8,857,440 | | | $ | 8,857,440 | | |
Total investments
(cost—$284,458,664)—102.7% | | | 273,747,087 | | |
Liabilities in excess of other assets—(2.7)% | | | | | (7,326,282 | ) | |
Net assets—100.0% | | | | $ | 266,420,805 | | |
For a listing of defined portfolio acronyms that are used throughout the Portfolio of investments as well as the tables that follow, please refer to page 267.
Forward foreign currency contracts
Counterparty | | Sell | | Purchase | | Settlement
Date | | Unrealized
appreciation
(depreciation) | |
SSC | | EUR | 39,655,199 | | | USD | 44,552,299 | | | 08/06/20 | | $ | (2,161,494 | ) | |
SSC | | GBP | 4,198,768 | | | USD | 5,172,953 | | | 08/06/20 | | | (323,293 | ) | |
SSC | | USD | 353,000 | | | EUR | 313,036 | | | 08/06/20 | | | 15,756 | | |
SSC | | USD | 96,000 | | | EUR | 84,844 | | | 08/06/20 | | | 3,946 | | |
SSC | | USD | 35,000 | | | EUR | 29,611 | | | 08/06/20 | | | (119 | ) | |
Net unrealized appreciation (depreciation) | | $ | (2,465,204 | ) | |
160
PACE High Yield Investments
Portfolio of investments—July 31, 2020
Fair valuation summary
The following is a summary of the fair valuations according to the inputs used as of July 31, 2020 in valuing the Portfolio's investments. In the event a Portfolio holds investments for which fair value is measured using the NAV per share practical expedient (or its equivalent), a separate column will be added to the fair value hierarchy table; this is intended to permit reconciliation to the amounts presented in the Portfolio of investments:
Assets
Description | | Unadjusted
quoted prices in
active markets for
identical investments
(Level 1) | | Other significant
observable inputs
(Level 2) | | Unobservable
inputs
(Level 3) | | Total | |
Corporate bonds | | $ | — | | | $ | 257,499,686 | | | $ | 5,500 | | | $ | 257,505,186 | | |
Loan assignments | | | — | | | | 4,693,883 | | | | — | | | | 4,693,883 | | |
Non-U.S. government agency obligations | | | — | | | | 1,421,360 | | | | — | | | | 1,421,360 | | |
Common stocks | | | 202,931 | | | | 416 | | | | 15,900 | | | | 219,247 | | |
Warrants | | | 10,211 | | | | — | | | | — | | | | 10,211 | | |
Short-term investments | | | — | | | | 1,039,760 | | | | — | | | | 1,039,760 | | |
Investment of cash collateral from securities loaned | | | — | | | | 8,857,440 | | | | — | | | | 8,857,440 | | |
Forward foreign currency contracts | | | — | | | | 19,702 | | | | — | | | | 19,702 | | |
Total | | $ | 213,142 | | | $ | 273,532,247 | | | $ | 21,400 | | | $ | 273,766,789 | | |
Liabilities | |
Forward foreign currency contracts | | $ | — | | | $ | (2,484,906 | ) | | $ | — | | | $ | (2,484,906 | ) | |
At July 31, 2020, there were no transfers in or out of Level 3.
Securities valued using unobservable inputs, i.e. Level 3, were not considered significant to the Fund.
Portfolio footnotes
† Amount represents less than 0.05%
* Non-income producing security.
1 In US dollars unless otherwise indicated.
2 Security exempt from registration pursuant to Rule 144A under the Securities Act of 1933. These securities are considered liquid, unless noted otherwise, and may be resold in transactions exempt from registration, normally to qualified institutional buyers. Securities exempt from registration pursuant to Rule 144A, in the amount of $114,742,562, represented 43.1% of the Portfolio's net assets at period end.
3 Security purchased on a when-issued basis. When-issued refers to a transaction made conditionally because a security, although authorized, has not yet been issued.
4 Security, or portion thereof, was on loan at the period end.
5 Security was purchased pursuant to Regulation S under the Securities Act of 1933, which exempts from registration securities offered and sold outside of the United States. Such a security cannot be sold in the United States without either an effective registration statement filed pursuant to the Securities Act of 1933, or pursuant to an exemption from registration.
6 Variable or floating rate security. The interest rate shown is the rate in effect as of period end and changes periodically.
7 Payment-in-kind security for which interest may be paid in cash or additional principal, at the discretion of the issuer.
8 Perpetual investment. Date shown reflects the next call date.
161
PACE High Yield Investments
Portfolio of investments—July 31, 2020
Portfolio footnotes—(concluded)
9 This security is considered restricted. At period end, the value of restricted securities was $42,159, represented 0.0% of the Portfolio's net assets. The table below provides further information.
Restricted security | | Acquisition
date | | Acquisition
cost | | Acquisition cost
as a percentage
of net asset | | Value at
07/31/20 | | Value as a
percentage of
net assets | |
Aleris International | | 7/30/10 | | $ | 13,981 | | | | 0.0 | % | | $ | 15,900 | | | | 0.0 | % | |
Appvion Holding Corp. expires 06/13/23 | | 8/23/18 | | | — | | | | — | | | | — | | | | — | | |
Cloud Peak Energy 3.000%, due 03/15/24 | | 7/30/15-12/17/19 | | | 418,929 | | | | 0.2 | | | | 5,500 | | | | 0.0 | | |
Cloud Peak Energy 12.000%, due 11/21/21 | | 12/17/19 | | | — | | | | — | | | | — | | | | — | | |
iHeartMedia Inc. expires 05/01/39 | | 7/31/19 | | | 22,593 | | | | 0.0 | | | | 9,968 | | | | 0.0 | | |
Rue21 Inc. | | 12/26/18 | | | 960 | | | | 0.0 | | | | 416 | | | | 0.0 | | |
Sandridge Energy, Inc., 7.500%, due 03/15/21 | | 10/04/16 | | | — | | | | — | | | | — | | | | — | | |
Sanchez Energy Corp. 6.125%, due 01/15/23 | | 10/30/17-12/1/17 | | | 310,233 | | | | 0.1 | | | | 1,750 | | | | 0.0 | | |
Sanchez Energy Corp. 7.750%, due 06/15/21 | | 11/3/17-12/1/17 | | | 462,798 | | | | 0.2 | | | | 2,375 | | | | 0.0 | | |
Washington Mutual, Inc., 0.000%, due 09/21/17 | | 9/21/17 | | | — | | | | — | | | | 6,250 | | | | 0.0 | | |
10 Significant unobservable inputs were used in the valuation of this security; i.e. Level 3.
11 Bond interest in default.
12 Security fair valued by the Valuation Committee under the direction of the Board of Trustees.
13 Step bond—coupon rate increases in increments to maturity. The rate disclosed is the rate at the period end; the maturity date disclosed is the ultimate maturity date.
14 All or a portion of the loan commitment is unfunded.
See accompanying notes to financial statements
162
PACE Large Co Value Equity Investments
Performance
For the 12-months ended July 31, 2020, the Portfolio's Class P shares returned -12.24% before the deduction of the maximum PACE Select program fee.1 In comparison, the Russell 1000 Value Index (the "benchmark") returned -6.01%. (Returns for all share classes over various time periods are shown in the "Performance at a glance" table on page 165. Please note that the returns shown do not reflect the deduction of taxes that a shareholder would pay on Portfolio distributions or the redemption of Portfolio shares.) For a detailed commentary on the market environment in general during the reporting period, please refer to page 2.
Investment Manager's comments2
The Portfolio underperformed its benchmark during the reporting period by a disappointing margin. Risk factors including an overweight to value factors such as earnings yield and dividend yield vs. the benchmark were headwinds during this period. Stock selection and sector allocation also detracted from relative returns. Stock selection was weakest within the Financials, Communication Services and REIT sectors and only partially offset by positive stock selection within Materials and Information Technology. The Portfolio's overweight to the Energy sector also detracted on a relative basis. This was particularly impactful in the first quarter of 2020 when the OPEC plus group of oil producers had failed to agree to supply cuts in the face of reduced demand. This caused oil prices to immediately spike downwards by almost a third in early March, sending shockwaves worldwide and igniting further volatility.
Deeper value managers generally experienced the most severe headwinds this past year, which was exacerbated by the outperformance of larger capitalization and higher P/E, higher growth companies this past year with the onset of COVID-19, and reflected concerns of how smaller market capitalization companies would fare in the new environment. We trimmed exposure to Pzena, a deep value manager in Q2 2020 as the manager's relative performance partially rebounded following a very difficult Q1 2020 where the onset of COVID-19 led investors to generally sell stocks associated with cyclicality. These proceeds were given to LA Capital, a lower tracking error quantitative manager to better diversify risk in the Fund. Disappointingly, the more quality oriented manager, River Road, failed to protect capital in part due to the energy overweight and the associative macro shock due to the aforementioned OPEC developments. We continue to carefully monitor this Portfolio in an effort to improve relative performance.
Derivatives were not used during the reporting period.
1 Class P shares held through the PACE Select Advisors Program are subject to a maximum Program fee of 2.50%, which, if included, would have reduced performance. Class P shares held through other advisory programs also may be subject to a program fee, which, if included, would have reduced performance.
2 Performance is discussed on a gross-of-fees basis—meaning that no fees or expenses are reflected when discussed at the level of a subadvisor's sleeve (or subadvisors' sleeves, if applicable). Alternatively, performance at the overall Portfolio level is shown net of fees, which does factor in fees and expenses associated with the Portfolio.
PACE Select Advisors Trust – PACE Large Co Value Equity Investments
Investment Manager:
UBS Asset Management (Americas) Inc. ("UBS AM")
Investment Subadvisors:
Pzena Investment Management, LLC ("Pzena");
Boston Partners Global Investors, Inc. ("Boston Partners");
Los Angeles Capital Management and Equity Research, Inc. ("Los Angeles Capital");
River Road Asset Management, LLC ("River Road")
Portfolio Management Team:
UBS AM: Mabel Lung, CFA, Fred Lee, CFA, Gina Toth, CFA, Ned Sienko, Vincent Russo and Mayoor Joshi
Pzena: Richard S. Pzena, John J. Flynn and Benjamin Silver;
Boston Partners: Martin P. MacDonnell, CFA, Mark Donovan, CFA, David J. Pyle, David J. Cohen and Stephanie McGirr;
Los Angeles Capital: Thomas D. Stevens, CFA, Hal W. Reynolds, CFA and Daniel E. Allen, CFA;
River Road: Henry W. Sanders III, Thomas S. Forsha, James C. Shircliff and Andrew R. McIntosh
Objective:
Capital appreciation and dividend income
Investment process:
The main strategies of the subadvisors include:
• A "deep value" strategy which follows a disciplined investment process.
163
PACE Large Co Value Equity Investments
Investment process
(concluded)
• A "long/short" or "130/30" equity strategy in which the subadvisor invests in companies with attractive valuations, business fundamentals and business momentum implemented using a blend of quantitative and fundamental analysis.
• A "long/short" or "130/30" equity strategy in which the subadvisor employs a dynamic, quantitative factor based approach to investing.
• A "dividend all cap value" strategy in which the subadvisor invests in a diversified, all-capitalization portfolio of income-producing equity securities.
Mutual funds are sold by prospectus only. You should read it carefully and consider a fund's investment objectives, risks, charges, expenses and other important information contained in the prospectus before investing. Prospectuses for most of our funds can be obtained from your financial advisor, by calling UBS Funds at 800-647 1568 or by visiting our Website at www.ubs.com/am-us.
Special considerations
The Portfolio may be appropriate for long-term investors seeking capital appreciation and dividend income and who are able to withstand short-term fluctuations in the equity markets in return for potentially higher returns over the long term. The value of the Portfolio changes every day and can be affected by changes in interest rates, general market conditions and other political, social and economic developments, as well as specific matters relating to the companies in whose securities the Portfolio invests. It is important to note that an investment in the Portfolio is only one component of a balanced investment plan.
164
PACE Large Co Value Equity Investments
Performance at a glance (unaudited)
Average annual total returns for periods ended 07/31/20 | | 1 year | | 5 years | | 10 years | |
Before deducting maximum sales charge | |
Class A1 | | | (12.41 | )% | | | 2.78 | % | | | 8.21 | % | |
Class Y2 | | | (12.22 | ) | | | 3.04 | | | | 8.48 | | |
Class P3 | | | (12.24 | ) | | | 3.02 | | | | 8.47 | | |
After deducting maximum sales charge | |
Class A1 | | | (17.25 | ) | | | 1.62 | | | | 7.60 | | |
Russell 1000 Value Index4 | | | (6.01 | ) | | | 5.36 | | | | 10.12 | | |
Most recent calendar quarter-end returns (unaudited)
Average annual total returns for periods ended 06/30/20 | | 1 year | | 5 years | | 10 years | |
Before deducting maximum sales charge | |
Class A1 | | | (14.39 | )% | | | 2.26 | % | | | 8.57 | % | |
Class Y2 | | | (14.15 | ) | | | 2.52 | | | | 8.83 | | |
Class P3 | | | (14.18 | ) | | | 2.50 | | | | 8.82 | | |
After deducting maximum sales charge | |
Class A1 | | | (19.08 | ) | | | 1.11 | | | | 7.96 | | |
The annualized gross and net expense ratios, respectively, for each class of shares as in the November 27, 2019 prospectuses, were as follows: Class A—1.44% and 1.44%; Class Y—1.19% and 1.19%; and Class P—1.21% and 1.21% Net expenses reflect fee waivers and/or expense reimbursements, if any, pursuant to an agreement that is in effect to cap the expenses. The Portfolio and UBS Asset Management (Americas) Inc. ("UBS AM") have entered into a written fee waiver/expense reimbursement agreement pursuant to which UBS AM is contractually obligated to waive its management fees and/or reimburse expenses so that the Portfolio's ordinary total operating expenses of each class through November 30, 2020 (excluding dividend expense, borrowing costs, and interest expense relating to short sales, and expenses attributable to investment in other investment companies, interest, taxes, brokerage commissions and extraordinary expenses) would not exceed Class A—1.14%; Class Y—0.89%; and Class P—0.89% "Management fee waiver/expense reimbursements" are based on estimated amounts for the current fiscal year. The Portfolio has agreed to repay UBS AM for any waived fees/reimbursed expenses to the extent that it can do so over the following three fiscal years without causing the Portfolio's expenses in any of those three years to exceed these expense caps and that UBS AM has not waived the right to do so. The fee waiver/expense reimbursement agreement may be terminated by the Portfolio's board at any time and also will terminate automatically upon the expiration or termination of the Portfolio's advisory contract with UBS AM. Upon termination of the agreement, however, UBS AM's three year recoupment rights will survive.
1 Maximum sales charge for Class A shares is 5.5%. Class A shares bear ongoing 12b-1 service fees of 0.25% annually.
2 The Portfolio offers Class Y shares to a limited group of eligible investors, including certain qualifying retirement plans. Class Y shares do not bear initial or contingent deferred sales charges or ongoing 12b-1 service and distribution fees.
3 Class P shares do not bear initial or contingent deferred sales charges or ongoing 12b-1 service and distribution fees, but Class P shares held through advisory programs may be subject to a program fee, which, if included, would have reduced performance.
4 The Russell 1000 Value Index measures the performance of the large-cap value segment of the US equity universe. It includes those Russell 1000 Index companies with lower price-to-book ratios and lower expected growth values. The Russell 1000 Value Index is constructed to provide a comprehensive and unbiased barometer for the large-cap value segment. The Index is completely reconstituted annually to ensure new and growing equities are included and that the represented companies continue to reflect value characteristics. Investors should note that indices do not reflect the deduction of fees and expenses.
Prior to August 3, 2015, a 1% redemption fee was imposed on sales or exchanges of any class of shares of the Portfolio made during the specified holding period.
Past performance does not predict future performance, and the performance information provided does not reflect the deduction of taxes that a shareholder would pay on Portfolio distributions or the redemption of Portfolio shares. The return and principal value of an investment will fluctuate, so that an investor's shares, when redeemed, may be worth more or less than their original cost. Performance results assume reinvestment of all dividends and capital gain distributions at net asset value on the ex-dividend dates. Current performance may be higher or lower than the performance data quoted. For month-end performance figures, please visit www.ubs.com/us-mutualfundperformance.
165
PACE Large Co Value Equity Investments
Illustration of an assumed investment of $10,000 in Class P shares of the Portfolio (unaudited)
The following graph depicts the performance of PACE Large Co Value Equity Investments Class P shares versus the Russell 1000 Value Index over the 10 years ended July 31, 2020. Class P shares held through advisory programs may be subject to a program fee, which, if included, would have reduced performance. The performance of the other classes will vary based upon the different class specific expenses and sales charges. The performance provided does not reflect the deduction of taxes that a shareholder would pay on Portfolio distributions or the redemption of Portfolio shares. Past performance is no guarantee of future results. Share price and returns will vary with market conditions; investors may realize a gain or loss upon redemption. It is important to note that PACE Large Co Value Equity Investments is a professionally managed portfolio while the Index is not available for investment and is unmanaged. The comparison is shown for illustration purposes only.
PACE Large Co Value Equity Investments

166
PACE Large Co Value Equity Investments
Portfolio statistics—July 31, 2020 (unaudited)
Top ten holdings (long holdings)1 | | Percentage of
net assets | |
Cisco Systems, Inc. | | | 2.4 | % | |
JPMorgan Chase & Co. | | | 1.9 | | |
Kimberly-Clark Corp. | | | 1.9 | | |
Pfizer, Inc. | | | 1.8 | | |
Johnson & Johnson | | | 1.8 | | |
Verizon Communications, Inc. | | | 1.7 | | |
Target Corp. | | | 1.7 | | |
Bank of America Corp. | | | 1.7 | | |
Corning, Inc. | | | 1.4 | | |
Bristol-Myers Squibb Co. | | | 1.4 | | |
Total | | | 17.7 | % | |
Top ten holdings (short holdings)1 | | Percentage of
net assets | |
Jacobs Engineering Group, Inc. | | | (0.3 | )% | |
Cree, Inc. | | | (0.2 | ) | |
Williams Cos., Inc./The | | | (0.2 | ) | |
Knight-Swift Transportation Holdings, Inc. | | | (0.2 | ) | |
Trinity Industries, Inc. | | | (0.2 | ) | |
Catalent, Inc. | | | (0.1 | ) | |
Service Corp. International | | | (0.2 | ) | |
Travelers Cos. Inc/The | | | (0.2 | ) | |
Wayfair, Inc., Class A | | | (0.2 | ) | |
Prudential Financial, Inc. | | | (0.1 | ) | |
Total | | | (1.9 | )% | |
Top five issuer breakdown by country
or territory of origin (long holdings)1 | | Percentage of
net assets | |
United States | | | 108.6 | % | |
Canada | | | 1.9 | | |
United Kingdom | | | 1.8 | | |
Netherlands | | | 0.9 | | |
Spain | | | 0.8 | | |
Total | | | 114.0 | % | |
Sectors (long holdings)1 | | Percentage of
net assets | |
Financials | | | 24.6 | % | |
Information Technology | | | 16.0 | | |
Health Care | | | 15.8 | | |
Consumer Discretionary | | | 15.2 | | |
Industrials | | | 12.1 | | |
Energy | | | 8.0 | | |
Consumer Staples | | | 7.8 | | |
Utilities | | | 5.7 | | |
Materials | | | 5.3 | | |
Telecommunication Services | | | 2.4 | | |
Real Estate | | | 0.2 | | |
Communication Services | | | 0.1 | | |
Total | | | 113.2 | % | |
Top five issuer breakdown by country
or territory of origin (short holdings)1 | | Percentage of
net assets | |
United States | | | (14.6 | )% | |
Canada | | | (0.1 | ) | |
United Kingdom | | | (0.1 | ) | |
Netherlands | | | (0.1 | ) | |
Total | | | (14.9 | )% | |
Sectors (short holdings)1 | | Percentage of
net assets | |
Financials | | | (2.8 | )% | |
Information Technology | | | (2.6 | ) | |
Industrials | | | (2.2 | ) | |
Consumer Discretionary | | | (1.5 | ) | |
Energy | | | (1.2 | ) | |
Materials | | | (1.2 | ) | |
Consumer Staples | | | (1.1 | ) | |
Health Care | | | (0.9 | ) | |
Communication Services | | | (0.7 | ) | |
Utilities | | | (0.3 | ) | |
Telecommunication Services | | | (0.2 | ) | |
Real Estate | | | (0.2 | ) | |
Total | | | (14.9 | )% | |
1 The Portfolio is actively managed and its composition will vary over time.
167
PACE Large Co Value Equity Investments
Portfolio of investments—July 31, 2020
| | | Number of
shares | | Value | |
Common stocks—113.2% | |
Aerospace & defense—1.3% | |
Curtiss-Wright Corp. | | | 16,030 | | | $ | 1,428,594 | | |
General Dynamics Corp. | | | 32,385 | | | | 4,752,175 | | |
Hexcel Corp. | | | 27,260 | | | | 1,016,798 | | |
Howmet Aerospace, Inc. | | | 42,463 | | | | 627,603 | | |
Huntington Ingalls Industries, Inc. | | | 8,947 | | | | 1,554,183 | | |
Northrop Grumman Corp. | | | 4,105 | | | | 1,334,166 | | |
| | | | | | 10,713,519 | | |
Air freight & logistics—1.6% | |
Expeditors International of Washington, Inc. | | | 18,832 | | | | 1,591,492 | | |
United Parcel Service, Inc., Class B | | | 82,405 | | | | 11,764,138 | | |
| | | | | | 13,355,630 | | |
Auto components—0.7% | |
Aptiv PLC | | | 5,110 | | | | 397,302 | | |
Gentex Corp. | | | 25,143 | | | | 678,610 | | |
Lear Corp. | | | 47,084 | | | | 5,197,132 | | |
| | | | | | 6,273,044 | | |
Automobiles—0.8% | |
Ford Motor Co. | | | 772,222 | | | | 5,104,388 | | |
Harley-Davidson, Inc. | | | 68,875 | | | | 1,792,816 | | |
| | | | | | 6,897,204 | | |
Banks—9.2% | |
Bank of America Corp.1 | | | 573,715 | | | | 14,274,029 | | |
Citigroup, Inc.1 | | | 208,496 | | | | 10,426,885 | | |
Fifth Third Bancorp | | | 43,355 | | | | 861,030 | | |
First Hawaiian, Inc.2 | | | 45,950 | | | | 798,611 | | |
Huntington Bancshares, Inc. | | | 143,803 | | | | 1,333,054 | | |
JPMorgan Chase & Co.1 | | | 166,312 | | | | 16,072,392 | | |
M&T Bank Corp. | | | 8,410 | | | | 891,039 | | |
Pinnacle Financial Partners, Inc. | | | 10,980 | | | | 435,028 | | |
PNC Financial Services Group, Inc./The | | | 52,868 | | | | 5,639,430 | | |
Popular, Inc. | | | 13,750 | | | | 510,262 | | |
Prosperity Bancshares, Inc.2 | | | 9,830 | | | | 546,155 | | |
Truist Financial Corp. | | | 308,813 | | | | 11,568,135 | | |
U.S. Bancorp1 | | | 211,239 | | | | 7,782,045 | | |
Wells Fargo & Co.1 | | | 278,224 | | | | 6,749,714 | | |
Western Alliance Bancorp | | | 28,970 | | | | 1,041,471 | | |
| | | | | | 78,929,280 | | |
Beverages—1.5% | |
Coca-Cola Co./The1 | | | 60,670 | | | | 2,866,051 | | |
Coca-Cola European Partners PLC | | | 35,203 | | | | 1,449,307 | | |
Keurig Dr Pepper, Inc.1 | | | 45,790 | | | | 1,400,716 | | |
PepsiCo, Inc. | | | 51,551 | | | | 7,096,511 | | |
| | | | | | 12,812,585 | | |
Biotechnology—2.5% | |
AbbVie, Inc.1 | | | 98,922 | | | | 9,388,687 | | |
Amgen, Inc. | | | 34,727 | | | | 8,496,655 | | |
Biogen, Inc.* | | | 4,350 | | | | 1,194,901 | | |
Exelixis, Inc.* | | | 30,300 | | | | 699,627 | | |
Gilead Sciences, Inc. | | | 25,520 | | | | 1,774,406 | | |
| | | | | | 21,554,276 | | |
| | | Number of
shares | | Value | |
Common stocks—(continued) | |
Building products—0.9% | |
Allegion PLC | | | 9,580 | | | $ | 952,827 | | |
Carrier Global Corp. | | | 67,553 | | | | 1,840,144 | | |
Johnson Controls International PLC1 | | | 12,490 | | | | 480,615 | | |
Lennox International, Inc. | | | 2,100 | | | | 563,094 | | |
Masco Corp. | | | 14,660 | | | | 837,965 | | |
Owens Corning | | | 56,178 | | | | 3,397,084 | | |
| | | | | | 8,071,729 | | |
Capital markets—3.2% | |
BlackRock, Inc. | | | 4,990 | | | | 2,869,300 | | |
Cboe Global Markets, Inc. | | | 15,730 | | | | 1,379,521 | | |
Charles Schwab Corp./The | | | 36,862 | | | | 1,221,975 | | |
CME Group, Inc. | | | 6,440 | | | | 1,070,199 | | |
Eaton Vance Corp.1 | | | 36,840 | | | | 1,331,398 | | |
Goldman Sachs Group, Inc./The | | | 21,353 | | | | 4,227,040 | | |
Intercontinental Exchange, Inc. | | | 4,980 | | | | 481,964 | | |
Lazard Ltd., Class A | | | 73,384 | | | | 2,151,619 | | |
LPL Financial Holdings, Inc. | | | 10,040 | | | | 793,361 | | |
Morgan Stanley1 | | | 127,567 | | | | 6,235,475 | | |
S&P Global, Inc. | | | 2,660 | | | | 931,665 | | |
SEI Investments Co. | | | 33,670 | | | | 1,761,951 | | |
State Street Corp. | | | 11,791 | | | | 752,148 | | |
T. Rowe Price Group, Inc.1 | | | 12,680 | | | | 1,751,108 | | |
| | | | | | 26,958,724 | | |
Chemicals—3.3% | |
Air Products and Chemicals, Inc.1 | | | 4,059 | | | | 1,163,431 | | |
Corteva, Inc.* | | | 86,621 | | | | 2,473,896 | | |
Dow, Inc.* | | | 161,038 | | | | 6,612,220 | | |
DuPont de Nemours, Inc.1 | | | 133,057 | | | | 7,115,888 | | |
FMC Corp. | | | 19,658 | | | | 2,084,731 | | |
Linde PLC1 | | | 7,030 | | | | 1,723,123 | | |
LyondellBasell Industries N.V., Class A | | | 7,950 | | | | 497,034 | | |
PPG Industries, Inc. | | | 10,856 | | | | 1,168,649 | | |
Sensient Technologies Corp. | | | 63,945 | | | | 3,338,569 | | |
Valvoline, Inc. | | | 94,643 | | | | 1,942,074 | | |
| | | | | | 28,119,615 | | |
Commercial services & supplies—0.3% | |
Cintas Corp. | | | 2,948 | | | | 889,913 | | |
Clean Harbors, Inc.* | | | 13,451 | | | | 801,680 | | |
Republic Services, Inc. | | | 12,210 | | | | 1,065,322 | | |
| | | | | | 2,756,915 | | |
Communications equipment—2.7% | |
Ciena Corp.* | | | 18,880 | | | | 1,123,549 | | |
Cisco Systems, Inc.1 | | | 435,713 | | | | 20,522,082 | | |
Motorola Solutions, Inc. | | | 12,390 | | | | 1,732,122 | | |
| | | | | | 23,377,753 | | |
Construction & engineering—0.3% | |
AECOM* | | | 15,240 | | | | 551,536 | | |
MasTec, Inc.* | | | 21,375 | | | | 850,297 | | |
Quanta Services, Inc. | | | 34,290 | | | | 1,370,571 | | |
| | | | | | 2,772,404 | | |
168
PACE Large Co Value Equity Investments
Portfolio of investments—July 31, 2020
| | | Number of
shares | | Value | |
Common stocks—(continued) | |
Construction materials—0.4% | |
CRH PLC, ADR2 | | | 49,876 | | | $ | 1,814,988 | | |
Martin Marietta Materials, Inc. | | | 5,050 | | | | 1,046,259 | | |
Vulcan Materials Co. | | | 3,530 | | | | 414,492 | | |
| | | | | | 3,275,739 | | |
Consumer finance—1.0% | |
Capital One Financial Corp. | | | 89,221 | | | | 5,692,300 | | |
OneMain Holdings, Inc. | | | 21,630 | | | | 620,781 | | |
Synchrony Financial1 | | | 99,019 | | | | 2,191,290 | | |
| | | | | | 8,504,371 | | |
Containers & packaging—0.3% | |
Amcor PLC*,2 | | | 63,470 | | | | 653,741 | | |
Sealed Air Corp. | | | 19,820 | | | | 707,177 | | |
Sonoco Products Co.2 | | | 21,647 | | | | 1,120,016 | | |
| | | | | | 2,480,934 | | |
Distributors—0.6% | |
Genuine Parts Co. | | | 50,412 | | | | 4,544,642 | | |
LKQ Corp.* | | | 26,449 | | | | 745,597 | | |
| | | | | | 5,290,239 | | |
Diversified consumer services—0.1% | |
frontdoor, Inc.* | | | 20,750 | | | | 871,396 | | |
H&R Block, Inc.2 | | | 24,330 | | | | 352,785 | | |
| | | | | | 1,224,181 | | |
Diversified financial services—2.1% | |
Berkshire Hathaway, Inc., Class B*,1 | | | 54,926 | | | | 10,753,413 | | |
Equitable Holdings, Inc. | | | 182,237 | | | | 3,728,569 | | |
Voya Financial, Inc. | | | 61,968 | | | | 3,061,219 | | |
| | | | | | 17,543,201 | | |
Diversified telecommunication services—2.1% | |
AT&T, Inc.1 | | | 115,187 | | | | 3,407,231 | | |
Verizon Communications, Inc.1 | | | 250,401 | | | | 14,393,050 | | |
| | | | | | 17,800,281 | | |
Electric utilities—1.6% | |
Edison International1 | | | 63,573 | | | | 3,539,109 | | |
FirstEnergy Corp. | | | 38,541 | | | | 1,117,689 | | |
IDACORP, Inc. | | | 14,560 | | | | 1,357,720 | | |
NextEra Energy, Inc. | | | 6,787 | | | | 1,905,111 | | |
NRG Energy, Inc.1 | | | 157,650 | | | | 5,330,146 | | |
Southern Co./The | | | 13,331 | | | | 728,006 | | |
| | | | | | 13,977,781 | | |
Electrical equipment—1.0% | |
AMETEK, Inc.1 | | | 34,331 | | | | 3,201,365 | | |
Eaton Corp. PLC1 | | | 43,299 | | | | 4,032,436 | | |
nVent Electric PLC | | | 50,500 | | | | 917,080 | | |
Rockwell Automation, Inc. | | | 3,520 | | | | 767,853 | | |
| | | | | | 8,918,734 | | |
| | | Number of
shares | | Value | |
Common stocks—(continued) | |
Electronic equipment, instruments & components—2.0% | |
Arrow Electronics, Inc.* | | | 9,739 | | | $ | 697,507 | | |
Corning, Inc. | | | 392,532 | | | | 12,168,492 | | |
Dolby Laboratories, Inc., Class A1 | | | 13,050 | | | | 908,280 | | |
Jabil, Inc. | | | 30,258 | | | | 1,054,794 | | |
SYNNEX Corp. | | | 18,437 | | | | 2,299,831 | | |
| | | | | | 17,128,904 | | |
Energy equipment & services—1.6% | |
Baker Hughes Co. | | | 238,918 | | | | 3,700,840 | | |
Halliburton Co. | | | 400,695 | | | | 5,741,959 | | |
National Oilwell Varco, Inc. | | | 317,984 | | | | 3,659,996 | | |
Schlumberger Ltd. | | | 25,790 | | | | 467,831 | | |
| | | | | | 13,570,626 | | |
Entertainment—0.5% | |
Activision Blizzard, Inc. | | | 14,226 | | | | 1,175,494 | | |
Electronic Arts, Inc.* | | | 15,301 | | | | 2,166,928 | | |
Live Nation Entertainment, Inc.* | | | 9,850 | | | | 461,079 | | |
| | | | | | 3,803,501 | | |
Equity real estate investment trusts—2.0% | |
Apple Hospitality REIT, Inc. | | | 37,370 | | | | 329,603 | | |
AvalonBay Communities, Inc. | | | 2,510 | | | | 384,331 | | |
Brixmor Property Group, Inc. | | | 42,730 | | | | 491,822 | | |
Equity Lifestyle Properties, Inc. | | | 6,560 | | | | 448,179 | | |
Essex Property Trust, Inc. | | | 3,523 | | | | 777,667 | | |
Highwoods Properties, Inc. | | | 34,580 | | | | 1,325,797 | | |
Host Hotels & Resorts, Inc. | | | 30,460 | | | | 328,359 | | |
Iron Mountain, Inc.2 | | | 254,493 | | | | 7,174,158 | | |
Kimco Realty Corp. | | | 51,260 | | | | 571,549 | | |
Life Storage, Inc. | | | 13,310 | | | | 1,306,110 | | |
Paramount Group, Inc. | | | 31,710 | | | | 226,092 | | |
Prologis, Inc. | | | 3,420 | | | | 360,536 | | |
Public Storage | | | 4,120 | | | | 823,506 | | |
Simon Property Group, Inc. | | | 7,990 | | | | 498,177 | | |
Ventas, Inc. | | | 26,890 | | | | 1,031,501 | | |
WP Carey, Inc. | | | 10,720 | | | | 765,087 | | |
| | | | | | 16,842,474 | | |
Food & staples retailing—1.1% | |
Kroger Co./The | | | 89,947 | | | | 3,129,256 | | |
Sprouts Farmers Market, Inc.* | | | 19,950 | | | | 526,281 | | |
Walgreens Boots Alliance, Inc. | | | 65,941 | | | | 2,684,458 | | |
Walmart, Inc.1 | | | 22,822 | | | | 2,953,167 | | |
| | | | | | 9,293,162 | | |
Food products—0.2% | |
Flowers Foods, Inc. | | | 21,510 | | | | 489,353 | | |
Lamb Weston Holdings, Inc. | | | 8,880 | | | | 533,510 | | |
Nomad Foods Ltd.* | | | 18,107 | | | | 417,547 | | |
| | | | | | 1,440,410 | | |
169
PACE Large Co Value Equity Investments
Portfolio of investments—July 31, 2020
| | | Number of
shares | | Value | |
Common stocks—(continued) | |
Health care equipment & supplies—2.2% | |
Abbott Laboratories1 | | | 31,294 | | | $ | 3,149,428 | | |
Danaher Corp. | | | 5,850 | | | | 1,192,230 | | |
DENTSPLY SIRONA, Inc. | | | 11,130 | | | | 496,398 | | |
Medtronic PLC1 | | | 98,306 | | | | 9,484,563 | | |
STERIS PLC | | | 6,550 | | | | 1,045,577 | | |
West Pharmaceutical Services, Inc. | | | 4,845 | | | | 1,302,675 | | |
Zimmer Biomet Holdings, Inc. | | | 15,491 | | | | 2,089,116 | | |
| | | | | | 18,759,987 | | |
Health care providers & services—4.4% | |
AmerisourceBergen Corp. | | | 28,919 | | | | 2,897,395 | | |
Anthem, Inc. | | | 26,417 | | | | 7,232,974 | | |
Cardinal Health, Inc. | | | 43,950 | | | | 2,400,549 | | |
Cigna Corp.*,1 | | | 34,601 | | | | 5,975,247 | | |
CVS Health Corp.1 | | | 29,220 | | | | 1,839,107 | | |
HCA Healthcare, Inc. | | | 6,790 | | | | 859,886 | | |
Humana, Inc. | | | 3,030 | | | | 1,189,123 | | |
McKesson Corp. | | | 44,454 | | | | 6,675,213 | | |
Premier, Inc., Class A* | | | 12,200 | | | | 426,634 | | |
Quest Diagnostics, Inc. | | | 38,068 | | | | 4,837,301 | | |
UnitedHealth Group, Inc. | | | 10,371 | | | | 3,140,131 | | |
| | | | | | 37,473,560 | | |
Health care technology—0.1% | |
Change Healthcare, Inc.* | | | 59,519 | | | | 693,992 | | |
Hotels, restaurants & leisure—0.7% | |
Carnival Corp.2 | | | 29,503 | | | | 409,502 | | |
Las Vegas Sands Corp. | | | 18,231 | | | | 795,601 | | |
McDonald's Corp.1 | | | 6,880 | | | | 1,336,646 | | |
Wyndham Hotels & Resorts, Inc. | | | 14,898 | | | | 657,896 | | |
Yum China Holdings, Inc. | | | 13,350 | | | | 684,054 | | |
Yum! Brands, Inc. | | | 23,020 | | | | 2,095,971 | | |
| | | | | | 5,979,670 | | |
Household durables—1.8% | |
Garmin Ltd. | | | 15,470 | | | | 1,525,187 | | |
Leggett & Platt, Inc.2 | | | 9,240 | | | | 370,432 | | |
Lennar Corp., Class A | | | 28,093 | | | | 2,032,528 | | |
Mohawk Industries, Inc.* | | | 74,007 | | | | 5,909,459 | | |
Newell Brands, Inc. | | | 272,397 | | | | 4,467,311 | | |
PulteGroup, Inc. | | | 31,060 | | | | 1,354,216 | | |
| | | | | | 15,659,133 | | |
Household products—3.0% | |
Clorox Co./The | | | 2,850 | | | | 674,054 | | |
Colgate-Palmolive Co.1 | | | 33,800 | | | | 2,609,360 | | |
Kimberly-Clark Corp. | | | 103,533 | | | | 15,741,157 | | |
Procter & Gamble Co./The1 | | | 48,079 | | | | 6,304,118 | | |
Reynolds Consumer Products, Inc. | | | 9,900 | | | | 337,194 | | |
| | | | | | 25,665,883 | | |
Independent power and renewable electricity producers—2.1% | |
AES Corp./The | | | 571,857 | | | | 8,709,382 | | |
Atlantica Sustainable Infrastructure PLC | | | 213,667 | | | | 6,403,600 | | |
Vistra Corp.1 | | | 167,185 | | | | 3,119,672 | | |
| | | | | | 18,232,654 | | |
| | | Number of
shares | | Value | |
Common stocks—(continued) | |
Industrial conglomerates—1.9% | |
3M Co. | | | 32,631 | | | $ | 4,909,987 | | |
General Electric Co. | | | 1,067,998 | | | | 6,482,748 | | |
Honeywell International, Inc.1 | | | 21,360 | | | | 3,190,543 | | |
Roper Technologies, Inc.1 | | | 3,520 | | | | 1,522,224 | | |
| | | | | | 16,105,502 | | |
Insurance—7.1% | |
Aflac, Inc. | | | 46,582 | | | | 1,656,922 | | |
American International Group, Inc. | | | 349,160 | | | | 11,222,002 | | |
Arthur J. Gallagher & Co. | | | 5,160 | | | | 554,648 | | |
Assured Guaranty Ltd. | | | 21,955 | | | | 479,278 | | |
Axis Capital Holdings Ltd. | | | 175,120 | | | | 7,025,814 | | |
Brown & Brown, Inc. | | | 41,500 | | | | 1,887,005 | | |
Chubb Ltd.1 | | | 75,364 | | | | 9,589,315 | | |
CNA Financial Corp. | | | 119,541 | | | | 3,980,715 | | |
Everest Re Group Ltd. | | | 12,143 | | | | 2,656,767 | | |
Fidelity National Financial, Inc. | | | 228,328 | | | | 7,388,694 | | |
First American Financial Corp. | | | 14,390 | | | | 734,034 | | |
Hanover Insurance Group, Inc./The | | | 6,332 | | | | 645,104 | | |
Markel Corp.* | | | 400 | | | | 417,816 | | |
Marsh & McLennan Cos., Inc. | | | 16,867 | | | | 1,966,692 | | |
MetLife, Inc. | | | 97,190 | | | | 3,678,642 | | |
Primerica, Inc. | | | 3,890 | | | | 465,477 | | |
Progressive Corp./The | | | 48,219 | | | | 4,356,105 | | |
Reinsurance Group of America, Inc. | | | 6,846 | | | | 583,622 | | |
RenaissanceRe Holdings Ltd. | | | 2,888 | | | | 520,938 | | |
Travelers Cos., Inc./The | | | 9,364 | | | | 1,071,429 | | |
| | | | | | 60,881,019 | | |
Interactive media & services—1.5% | |
Alphabet, Inc., Class A*,1 | | | 4,127 | | | | 6,140,770 | | |
Alphabet, Inc., Class C* | | | 1,816 | | | | 2,693,055 | | |
Facebook, Inc., Class A* | | | 8,985 | | | | 2,279,225 | | |
Yelp, Inc.* | | | 41,064 | | | | 1,025,779 | | |
Zillow Group, Inc., Class C*,2 | | | 8,550 | | | | 584,734 | | |
| | | | | | 12,723,563 | | |
Internet & direct marketing retail—0.4% | |
Booking Holdings, Inc.* | | | 712 | | | | 1,183,437 | | |
eBay, Inc. | | | 34,052 | | | | 1,882,394 | | |
| | | | | | 3,065,831 | | |
IT services—1.7% | |
Akamai Technologies, Inc.* | | | 5,860 | | | | 658,898 | | |
Cognizant Technology Solutions Corp., Class A | | | 91,599 | | | | 6,258,044 | | |
CSG Systems International, Inc. | | | 33,843 | | | | 1,425,806 | | |
International Business Machines Corp.1 | | | 6,110 | | | | 751,163 | | |
Jack Henry & Associates, Inc.2 | | | 4,850 | | | | 864,755 | | |
Science Applications International Corp. | | | 43,662 | | | | 3,492,087 | | |
VeriSign, Inc.* | | | 6,705 | | | | 1,419,314 | | |
| | | | | | 14,870,067 | | |
170
PACE Large Co Value Equity Investments
Portfolio of investments—July 31, 2020
| | | Number of
shares | | Value | |
Common stocks—(continued) | |
Life sciences tools & services—0.5% | |
Avantor, Inc.* | | | 56,316 | | | $ | 1,243,457 | | |
Bruker Corp. | | | 15,018 | | | | 670,103 | | |
IQVIA Holdings, Inc.* | | | 3,570 | | | | 565,453 | | |
Thermo Fisher Scientific, Inc.1 | | | 3,604 | | | | 1,491,876 | | |
| | | | | | 3,970,889 | | |
Machinery—3.5% | |
Caterpillar, Inc. | | | 20,416 | | | | 2,712,878 | | |
Cummins, Inc. | | | 9,476 | | | | 1,831,332 | | |
Deere & Co. | | | 20,628 | | | | 3,636,923 | | |
Dover Corp.1 | | | 26,618 | | | | 2,739,791 | | |
Fortive Corp. | | | 7,600 | | | | 533,444 | | |
Illinois Tool Works, Inc. | | | 24,811 | | | | 4,589,787 | | |
Ingersoll Rand, Inc.* | | | 33,693 | | | | 1,064,362 | | |
ITT, Inc. | | | 19,130 | | | | 1,104,375 | | |
Oshkosh Corp. | | | 8,450 | | | | 665,184 | | |
Otis Worldwide Corp. | | | 47,706 | | | | 2,993,074 | | |
Stanley Black & Decker, Inc. | | | 25,577 | | | | 3,921,466 | | |
Westinghouse Air Brake Technologies Corp. | | | 60,082 | | | | 3,736,499 | | |
| | | | | | 29,529,115 | | |
Media—3.1% | |
Charter Communications, Inc., Class A* | | | 1,390 | | | | 806,200 | | |
Comcast Corp., Class A1 | | | 272,368 | | | | 11,657,351 | | |
Discovery, Inc., Class A*,2 | | | 39,610 | | | | 835,771 | | |
Discovery, Inc., Class C* | | | 49,446 | | | | 937,002 | | |
DISH Network Corp., Class A* | | | 25,980 | | | | 834,218 | | |
Interpublic Group of Cos., Inc./The1 | | | 370,586 | | | | 6,689,077 | | |
Nexstar Media Group, Inc., Class A | | | 5,031 | | | | 440,967 | | |
Omnicom Group, Inc. | | | 65,319 | | | | 3,509,590 | | |
Sirius XM Holdings, Inc. | | | 136,230 | | | | 801,032 | | |
| | | | | | 26,511,208 | | |
Metals & mining—1.4% | |
Barrick Gold Corp.1 | | | 164,217 | | | | 4,747,513 | | |
Kinross Gold Corp.* | | | 111,650 | | | | 1,046,161 | | |
Newmont Corp. | | | 36,350 | | | | 2,515,420 | | |
Reliance Steel & Aluminum Co. | | | 4,835 | | | | 475,087 | | |
Yamana Gold, Inc.2 | | | 447,910 | | | | 2,915,894 | | |
| | | | | | 11,700,075 | | |
Mortgage real estate investment trusts—0.1% | |
AGNC Investment Corp. | | | 32,570 | | | | 442,952 | | |
Annaly Capital Management, Inc. | | | 78,720 | | | | 583,315 | | |
| | | | | | 1,026,267 | | |
Multi-utilities—1.9% | |
Black Hills Corp. | | | 57,700 | | | | 3,338,522 | | |
Centerpoint Energy, Inc. | | | 73,805 | | | | 1,403,033 | | |
Dominion Energy, Inc. | | | 130,687 | | | | 10,589,567 | | |
MDU Resources Group, Inc. | | | 55,461 | | | | 1,163,572 | | |
| | | | | | 16,494,694 | | |
Multiline retail—1.7% | |
Dollar General Corp. | | | 1,730 | | | | 329,392 | | |
Target Corp. | | | 114,143 | | | | 14,368,321 | | |
| | | | | | 14,697,713 | | |
| | | Number of
shares | | Value | |
Common stocks—(continued) | |
Oil, gas & consumable fuels—6.4% | |
Canadian Natural Resources Ltd. | | | 24,882 | | | $ | 439,416 | | |
Cenovus Energy, Inc.2 | | | 274,180 | | | | 1,222,843 | | |
Chevron Corp.1 | | | 36,316 | | | | 3,048,365 | | |
ConocoPhillips1 | | | 105,926 | | | | 3,960,573 | | |
Enterprise Products Partners LP | | | 349,293 | | | | 6,147,557 | | |
EOG Resources, Inc. | | | 17,870 | | | | 837,210 | | |
Exxon Mobil Corp.1,2 | | | 86,140 | | | | 3,624,771 | | |
Kinder Morgan, Inc. | | | 539,939 | | | | 7,613,140 | | |
Magellan Midstream Partners LP | | | 113,923 | | | | 4,612,742 | | |
Marathon Petroleum Corp.1 | | | 217,859 | | | | 8,322,214 | | |
Occidental Petroleum Corp. | | | 20,760 | | | | 326,762 | | |
Royal Dutch Shell PLC, ADR, Class A2 | | | 111,179 | | | | 3,314,246 | | |
TOTAL SE, ADR | | | 38,291 | | | | 1,442,039 | | |
Valero Energy Corp. | | | 80,289 | | | | 4,514,651 | | |
Williams Cos., Inc./The | | | 279,594 | | | | 5,348,633 | | |
| | | | | | 54,775,162 | | |
Personal products—1.3% | |
Herbalife Nutrition Ltd.* | | | 25,640 | | | | 1,313,794 | | |
Unilever PLC, ADR | | | 165,980 | | | | 10,038,470 | | |
| | | | | | 11,352,264 | | |
Pharmaceuticals—6.6% | |
Bristol-Myers Squibb Co.1 | | | 205,582 | | | | 12,059,440 | | |
GlaxoSmithKline PLC, ADR2 | | | 49,872 | | | | 2,010,839 | | |
Jazz Pharmaceuticals PLC* | | | 7,030 | | | | 760,997 | | |
Johnson & Johnson1 | | | 103,288 | | | | 15,055,259 | | |
Merck & Co., Inc.1 | | | 86,819 | | | | 6,966,357 | | |
Novartis AG, ADR | | | 45,137 | | | | 3,707,553 | | |
Pfizer, Inc.1 | | | 399,914 | | | | 15,388,691 | | |
| | | | | | 55,949,136 | | |
Professional services—0.2% | |
Nielsen Holdings PLC | | | 49,690 | | | | 717,027 | | |
Robert Half International, Inc. | | | 10,060 | | | | 511,752 | | |
TransUnion | | | 4,890 | | | | 437,997 | | |
| | | | | | 1,666,776 | | |
Road & rail—0.6% | |
Kansas City Southern | | | 14,775 | | | | 2,539,084 | | |
Lyft, Inc., Class A*,2 | | | 11,671 | | | | 341,143 | | |
Norfolk Southern Corp. | | | 3,190 | | | | 613,150 | | |
Union Pacific Corp.1 | | | 9,326 | | | | 1,616,662 | | |
| | | | | | 5,110,039 | | |
Semiconductors & semiconductor equipment—4.9% | |
Analog Devices, Inc.1 | | | 16,110 | | | | 1,850,234 | | |
Applied Materials, Inc. | | | 54,994 | | | | 3,537,764 | | |
Cirrus Logic, Inc.* | | | 17,340 | | | | 1,188,310 | | |
Intel Corp.1 | | | 86,504 | | | | 4,128,836 | | |
KLA Corp. | | | 13,162 | | | | 2,630,162 | | |
Lam Research Corp.1 | | | 14,236 | | | | 5,369,250 | | |
Maxim Integrated Products, Inc. | | | 30,780 | | | | 2,095,810 | | |
Microchip Technology, Inc. | | | 15,120 | | | | 1,538,158 | | |
Micron Technology, Inc.*,1 | | | 86,231 | | | | 4,316,293 | | |
NXP Semiconductors N.V.1 | | | 33,576 | | | | 3,946,187 | | |
171
PACE Large Co Value Equity Investments
Portfolio of investments—July 31, 2020
| | | Number of
shares | | Value | |
Common stocks—(continued) | |
Semiconductors & semiconductor equipment—(concluded) | |
ON Semiconductor Corp.* | | | 14,792 | | | $ | 304,715 | | |
Qorvo, Inc.* | | | 29,733 | | | | 3,810,284 | | |
QUALCOMM, Inc. | | | 51,508 | | | | 5,439,760 | | |
Skyworks Solutions, Inc. | | | 6,690 | | | | 973,930 | | |
Teradyne, Inc. | | | 12,690 | | | | 1,128,902 | | |
| | | | | | 42,258,595 | | |
Software—1.9% | |
Autodesk, Inc.* | | | 3,310 | | | | 782,583 | | |
Crowdstrike Holdings, Inc., Class A* | | | 5,550 | | | | 628,260 | | |
Manhattan Associates, Inc.* | | | 5,430 | | | | 520,140 | | |
Microsoft Corp. | | | 17,398 | | | | 3,566,764 | | |
Oracle Corp. | | | 148,520 | | | | 8,235,434 | | |
SS&C Technologies Holdings, Inc. | | | 46,757 | | | | 2,688,528 | | |
| | | | | | 16,421,709 | | |
Specialty retail—3.4% | |
Advance Auto Parts, Inc. | | | 3,730 | | | | 560,022 | | |
AutoNation, Inc.* | | | 9,990 | | | | 512,887 | | |
AutoZone, Inc.* | | | 6,920 | | | | 8,355,346 | | |
Best Buy Co., Inc. | | | 51,608 | | | | 5,139,641 | | |
Home Depot, Inc./The1 | | | 25,122 | | | | 6,669,640 | | |
Lowe's Cos., Inc.1 | | | 17,325 | | | | 2,579,866 | | |
Penske Automotive Group, Inc. | | | 9,000 | | | | 403,380 | | |
Ross Stores, Inc. | | | 6,399 | | | | 573,798 | | |
TJX Cos., Inc./The | | | 33,548 | | | | 1,744,160 | | |
Williams-Sonoma, Inc. | | | 24,538 | | | | 2,137,751 | | |
| | | | | | 28,676,491 | | |
Technology hardware, storage & peripherals—0.6% | |
Hewlett Packard Enterprise Co. | | | 431,358 | | | | 4,257,504 | | |
Western Digital Corp. | | | 23,193 | | | | 999,618 | | |
| | | | | | 5,257,122 | | |
Textiles, apparel & luxury goods—1.6% | |
Gildan Activewear, Inc. | | | 348,464 | | | | 6,188,721 | | |
Hanesbrands, Inc. | | | 44,900 | | | | 634,437 | | |
PVH Corp. | | | 73,353 | | | | 3,569,357 | | |
Ralph Lauren Corp. | | | 14,433 | | | | 1,029,073 | | |
Skechers USA, Inc., Class A* | | | 17,580 | | | | 514,742 | | |
Tapestry, Inc. | | | 95,346 | | | | 1,273,822 | | |
| | | | | | 13,210,152 | | |
Thrifts & mortgage finance—0.1% | |
MGIC Investment Corp. | | | 107,963 | | | | 892,854 | | |
Tobacco—0.5% | |
Philip Morris International, Inc.1 | | | 56,644 | | | | 4,350,826 | | |
Trading companies & distributors—0.8% | |
Fastenal Co. | | | 76,440 | | | | 3,595,738 | | |
HD Supply Holdings, Inc.* | | | 26,180 | | | | 918,918 | | |
MSC Industrial Direct Co., Inc., Class A | | | 11,630 | | | | 767,696 | | |
United Rentals, Inc.* | | | 9,254 | | | | 1,437,794 | | |
W.W. Grainger, Inc. | | | 1,420 | | | | 484,973 | | |
| | | | | | 7,205,119 | | |
| | | Number of
shares | | Value | |
Common stocks—(concluded) | |
Wireless telecommunication services—0.3% | |
T-Mobile U.S., Inc.* | | | 25,989 | | | $ | 2,790,699 | | |
Total common stocks
(cost—$945,882,404) | | | 967,644,982 | | |
| | Number of
warrants | | | |
Warrants†—0.0%† | |
Occidental Petroleum Corp.*
(cost—$0) | | | 2,595 | | | | 14,532 | | |
| | Number of
shares | | | |
Short-term investments—2.0% | |
Investment companies—2.0% | |
State Street Institutional U.S. Government
Money Market Fund, 0.09%3
(cost—$17,363,917) | | | 17,363,917 | | | | 17,363,917 | | |
Investment of cash collateral from securities loaned—0.7% | |
Money market funds—0.7% | |
State Street Navigator Securities Lending
Government Money Market Portfolio, 0.12%3
(cost—$6,022,686) | | | 6,022,686 | | | | 6,022,686 | | |
Total investments before investments
sold short
(cost—$969,269,007)—115.9% | | | 991,046,117 | | |
Investments sold short—(14.9)% | |
Common stocks—(14.9)% | |
Aerospace & defense—(0.1)% | |
Virgin Galactic Holdings, Inc. | | | (19,141 | ) | | | (429,715 | ) | |
Air freight & logistics—(0.1)% | |
CH Robinson Worldwide, Inc. | | | (6,780 | ) | | | (635,422 | ) | |
Airlines—(0.1)% | |
Spirit Airlines, Inc. | | | (41,108 | ) | | | (649,917 | ) | |
Banks—(1.1)% | |
Commerce Bancshares Inc. | | | (12,558 | ) | | | (719,071 | ) | |
Community Bank System, Inc. | | | (19,482 | ) | | | (1,095,473 | ) | |
CVB Financial Corp. | | | (41,072 | ) | | | (742,171 | ) | |
First Financial Bankshares, Inc. | | | (32,163 | ) | | | (962,317 | ) | |
First Republic Bank | | | (5,003 | ) | | | (562,737 | ) | |
Glacier Bancorp, Inc. | | | (13,019 | ) | | | (459,701 | ) | |
KeyCorp | | | (73,550 | ) | | | (883,336 | ) | |
Prosperity Bancshares, Inc. | | | (16,591 | ) | | | (921,796 | ) | |
Signature Bank | | | (3,130 | ) | | | (320,919 | ) | |
TCF Financial Corp. | | | (12,870 | ) | | | (353,796 | ) | |
Trustmark Corp. | | | (27,082 | ) | | | (609,887 | ) | |
United Bankshares, Inc. | | | (22,695 | ) | | | (597,332 | ) | |
Westamerica Bancorp | | | (16,263 | ) | | | (981,635 | ) | |
| | | | | | (9,210,171 | ) | |
Beverages—(0.1)% | |
National Beverage Corp. | | | (16,087 | ) | | | (1,031,981 | ) | |
172
PACE Large Co Value Equity Investments
Portfolio of investments—July 31, 2020
| | | Number of
shares | | Value | |
Investments sold short—(continued) | |
Common stocks—(continued) | |
Biotechnology—(0.0)%† | |
Sage Therapeutics, Inc. | | | (6,750 | ) | | $ | (307,598 | ) | |
Building products—(0.3)% | |
A.O. Smith Corp. | | | (16,967 | ) | | | (816,791 | ) | |
AAON, Inc. | | | (20,251 | ) | | | (1,199,872 | ) | |
Trex Co., Inc. | | | (6,996 | ) | | | (974,753 | ) | |
| | | | | | (2,991,416 | ) | |
Capital markets—(0.5)% | |
FactSet Research Systems, Inc. | | | (2,219 | ) | | | (768,440 | ) | |
Interactive Brokers Group, Inc., Class A | | | (21,410 | ) | | | (1,061,936 | ) | |
MarketAxess Holdings, Inc. | | | (1,139 | ) | | | (588,521 | ) | |
Northern Trust Corp. | | | (12,190 | ) | | | (955,086 | ) | |
Raymond James Financial, Inc. | | | (16,870 | ) | | | (1,172,128 | ) | |
| | | | | | (4,546,111 | ) | |
Chemicals—(0.7)% | |
Albemarle Corp. | | | (14,626 | ) | | | (1,206,060 | ) | |
Balchem Corp. | | | (10,616 | ) | | | (1,064,360 | ) | |
Ecolab, Inc. | | | (4,593 | ) | | | (859,258 | ) | |
Element Solutions, Inc. | | | (42,560 | ) | | | (462,202 | ) | |
Huntsman Corp. | | | (35,150 | ) | | | (650,275 | ) | |
International Flavors & Fragrances, Inc. | | | (8,126 | ) | | | (1,023,470 | ) | |
Quaker Chemical Corp. | | | (4,171 | ) | | | (809,174 | ) | |
| | | | | | (6,074,799 | ) | |
Commercial services & supplies—(0.3)% | |
Healthcare Services Group, Inc. | | | (12,887 | ) | | | (337,511 | ) | |
Rollins, Inc. | | | (21,130 | ) | | | (1,107,212 | ) | |
Stericycle, Inc. | | | (20,571 | ) | | | (1,243,208 | ) | |
| | | | | | (2,687,931 | ) | |
Communications equipment—(0.2)% | |
EchoStar Corp., Class A | | | (15,510 | ) | | | (423,423 | ) | |
Juniper Networks, Inc. | | | (23,960 | ) | | | (608,105 | ) | |
ViaSat, Inc. | | | (16,419 | ) | | | (623,265 | ) | |
| | | | | | (1,654,793 | ) | |
Construction & engineering—(0.3)% | |
Jacobs Engineering Group, Inc. | | | (32,504 | ) | | | (2,774,216 | ) | |
Containers & packaging—(0.3)% | |
Amcor PLC | | | (50,283 | ) | | | (517,915 | ) | |
Ball Corp. | | | (11,550 | ) | | | (850,427 | ) | |
Packaging Corp. of America | | | (5,050 | ) | | | (485,406 | ) | |
Sonoco Products Co. | | | (9,853 | ) | | | (509,794 | ) | |
| | | | | | (2,363,542 | ) | |
Distributors—(0.1)% | |
Genuine Parts Co. | | | (7,540 | ) | | | (679,731 | ) | |
Diversified consumer services—(0.2)% | |
Service Corp. International | | | (33,480 | ) | | | (1,451,693 | ) | |
ServiceMaster Global Holdings, Inc. | | | (10,240 | ) | | | (418,713 | ) | |
| | | | | | (1,870,406 | ) | |
| | | Number of
shares | | Value | |
Investments sold short—(continued) | |
Common stocks—(continued) | |
Diversified telecommunication services—(0.3)% | |
CenturyLink, Inc. | | | (126,580 | ) | | $ | (1,221,497 | ) | |
Cogent Communications Holdings, Inc. | | | (6,256 | ) | | | (563,728 | ) | |
GCI Liberty, Inc., Class A | | | (14,210 | ) | | | (1,113,922 | ) | |
| | | | | | (2,899,147 | ) | |
Electric utilities—(0.2)% | |
Alliant Energy Corp. | | | (10,590 | ) | | | (570,272 | ) | |
Xcel Energy, Inc. | | | (14,760 | ) | | | (1,019,030 | ) | |
| | | | | | (1,589,302 | ) | |
Electrical equipment—(0.2)% | |
Generac Holdings, Inc. | | | (7,920 | ) | | | (1,248,033 | ) | |
Sensata Technologies Holding PLC | | | (16,610 | ) | | | (630,848 | ) | |
| | | | | | (1,878,881 | ) | |
Electronic equipment, instruments & components—(0.3)% | |
Cognex Corp. | | | (13,649 | ) | | | (912,709 | ) | |
Corning, Inc. | | | (33,040 | ) | | | (1,024,240 | ) | |
FLIR Systems, Inc. | | | (9,140 | ) | | | (380,772 | ) | |
National Instruments Corp. | | | (13,419 | ) | | | (476,375 | ) | |
| | | | | | (2,794,096 | ) | |
Entertainment—(0.2)% | |
Madison Square Garden Entertainment Corp. | | | (5,470 | ) | | | (387,604 | ) | |
Madison Square Garden Sports Corp. | | | (6,011 | ) | | | (923,831 | ) | |
Roku, Inc. | | | (5,310 | ) | | | (822,466 | ) | |
| | | | | | (2,133,901 | ) | |
Equity real estate investment trusts—(0.1)% | |
Sun Communities, Inc. | | | (4,237 | ) | | | (635,253 | ) | |
Food & staples retailing—(0.3)% | |
BJ's Wholesale Club Holdings, Inc. | | | (16,989 | ) | | | (680,410 | ) | |
Casey's General Stores, Inc. | | | (3,305 | ) | | | (526,123 | ) | |
Kroger Co./The | | | (36,380 | ) | | | (1,265,660 | ) | |
| | | | | | (2,472,193 | ) | |
Food products—(0.6)% | |
Cal-Maine Foods, Inc. | | | (21,870 | ) | | | (961,077 | ) | |
Conagra Brands, Inc. | | | (22,950 | ) | | | (859,478 | ) | |
Hain Celestial Group, Inc./The | | | (15,630 | ) | | | (531,107 | ) | |
Hormel Foods Corp. | | | (12,690 | ) | | | (645,413 | ) | |
Kraft Heinz Co./The | | | (27,931 | ) | | | (960,268 | ) | |
McCormick & Co Inc/MD | | | (3,914 | ) | | | (762,839 | ) | |
Post Holdings, Inc. | | | (5,080 | ) | | | (450,799 | ) | |
| | | | | | (5,170,981 | ) | |
Gas utilities—(0.0)%† | |
UGI Corp. | | | (9,330 | ) | | | (311,062 | ) | |
Health care equipment & supplies—(0.4)% | |
ABIOMED, Inc. | | | (2,540 | ) | | | (761,848 | ) | |
Align Technology, Inc. | | | (2,138 | ) | | | (628,187 | ) | |
Glaukos Corp. | | | (7,944 | ) | | | (347,153 | ) | |
ICU Medical, Inc. | | | (4,020 | ) | | | (738,594 | ) | |
Tandem Diabetes Care, Inc. | | | (9,930 | ) | | | (1,037,288 | ) | |
| | | | | | (3,513,070 | ) | |
173
PACE Large Co Value Equity Investments
Portfolio of investments—July 31, 2020
| | | Number of
shares | | Value | |
Investments sold short—(continued) | |
Common stocks—(continued) | |
Health care providers & services—(0.1)% | |
Tenet Healthcare Corp. | | | (19,264 | ) | | $ | (509,340 | ) | |
Health care technology—(0.1)% | |
Teladoc Health, Inc. | | | (2,077 | ) | | | (493,558 | ) | |
Hotels, restaurants & leisure—(0.5)% | |
Aramark | | | (14,020 | ) | | | (296,102 | ) | |
Hilton Grand Vacations, Inc. | | | (21,940 | ) | | | (445,382 | ) | |
Las Vegas Sands Corp. | | | (16,930 | ) | | | (738,825 | ) | |
Papa John's International, Inc. | | | (9,259 | ) | | | (876,550 | ) | |
Texas Roadhouse, Inc. | | | (11,771 | ) | | | (661,412 | ) | |
Vail Resorts, Inc. | | | (3,850 | ) | | | (739,316 | ) | |
Wynn Resorts Ltd. | | | (9,590 | ) | | | (694,604 | ) | |
| | | | | | (4,452,191 | ) | |
Household durables—(0.0)%† | |
Leggett & Platt, Inc. | | | (10,437 | ) | | | (418,419 | ) | |
Insurance—(1.1)% | |
Athene Holding Ltd., Class A | | | (25,630 | ) | | | (826,568 | ) | |
Erie Indemnity Co., Class A | | | (3,255 | ) | | | (683,941 | ) | |
Lincoln National Corp. | | | (25,740 | ) | | | (959,330 | ) | |
Loews Corp. | | | (29,390 | ) | | | (1,070,090 | ) | |
Old Republic International Corp. | | | (79,190 | ) | | | (1,272,583 | ) | |
Progressive Corp./The | | | (8,000 | ) | | | (722,720 | ) | |
Prudential Financial, Inc. | | | (21,004 | ) | | | (1,331,023 | ) | |
Reinsurance Group of America, Inc. | | | (7,340 | ) | | | (625,735 | ) | |
RLI Corp. | | | (6,901 | ) | | | (608,185 | ) | |
Travelers Cos. Inc/The | | | (12,300 | ) | | | (1,407,366 | ) | |
| | | | | | (9,507,541 | ) | |
Interactive media & services—(0.1)% | |
Zillow Group, Inc., Class C | | | (14,624 | ) | | | (1,000,135 | ) | |
Internet & direct marketing retail—(0.3)% | |
Expedia Group, Inc. | | | (5,243 | ) | | | (424,735 | ) | |
Stitch Fix, Inc., Class A | | | (16,671 | ) | | | (369,263 | ) | |
Wayfair, Inc., Class A | | | (5,065 | ) | | | (1,347,746 | ) | |
| | | | | | (2,141,744 | ) | |
IT services—(0.6)% | |
Automatic Data Processing, Inc. | | | (3,610 | ) | | | (479,805 | ) | |
Fiserv, Inc. | | | (5,433 | ) | | | (542,159 | ) | |
Gartner, Inc. | | | (3,026 | ) | | | (377,161 | ) | |
Jack Henry & Associates, Inc. | | | (4,161 | ) | | | (741,906 | ) | |
MongoDB, Inc. | | | (3,572 | ) | | | (818,274 | ) | |
Shopify, Inc., Class A | | | (1,066 | ) | | | (1,091,584 | ) | |
Western Union Co./The | | | (37,891 | ) | | | (919,993 | ) | |
| | | | | | (4,970,882 | ) | |
Leisure products—(0.1)% | |
Mattel, Inc. | | | (58,646 | ) | | | (651,557 | ) | |
Machinery—(0.4)% | |
Deere & Co. | | | (5,990 | ) | | | (1,056,097 | ) | |
John Bean Technologies Corp. | | | (6,153 | ) | | | (576,905 | ) | |
Trinity Industries, Inc. | | | (77,174 | ) | | | (1,507,208 | ) | |
| | | | | | (3,140,210 | ) | |
| | | Number of
shares | | Value | |
Investments sold short—(continued) | |
Common stocks—(continued) | |
Media—(0.3)% | |
Liberty Broadband Corp., Class C | | | (7,130 | ) | | $ | (978,735 | ) | |
News Corp., Class A | | | (50,160 | ) | | | (638,035 | ) | |
News Corp., Class B | | | (42,760 | ) | | | (545,618 | ) | |
| | | | | | (2,162,388 | ) | |
Metals & mining—(0.2)% | |
Compass Minerals International, Inc. | | | (16,071 | ) | | | (818,657 | ) | |
Freeport-McMoRan, Inc. | | | (30,950 | ) | | | (399,874 | ) | |
United States Steel Corp. | | | (94,650 | ) | | | (630,369 | ) | |
| | | | | | (1,848,900 | ) | |
Multi-utilities—(0.1)% | |
Public Service Enterprise Group, Inc. | | | (16,740 | ) | | | (936,436 | ) | |
Oil, gas & consumable fuels—(1.2)% | |
Apache Corp. | | | (49,622 | ) | | | (761,698 | ) | |
Cabot Oil & Gas Corp. | | | (67,107 | ) | | | (1,254,901 | ) | |
Concho Resources, Inc. | | | (8,062 | ) | | | (423,577 | ) | |
Delek US Holdings, Inc. | | | (35,197 | ) | | | (615,243 | ) | |
EQT Corp. | | | (28,961 | ) | | | (420,514 | ) | |
Equitrans Midstream Corp. | | | (38,670 | ) | | | (373,165 | ) | |
Exxon Mobil Corp. | | | (26,334 | ) | | | (1,108,135 | ) | |
Hess Corp. | | | (17,523 | ) | | | (862,307 | ) | |
Kinder Morgan, Inc. | | | (27,650 | ) | | | (389,865 | ) | |
Murphy Oil Corp. | | | (57,728 | ) | | | (762,587 | ) | |
ONEOK, Inc. | | | (39,180 | ) | | | (1,093,514 | ) | |
Valero Energy Corp. | | | (12,620 | ) | | | (709,623 | ) | |
Williams Cos., Inc./The | | | (96,880 | ) | | | (1,853,314 | ) | |
| | | | | | (10,628,443 | ) | |
Personal products—(0.1)% | |
Nu Skin Enterprises, Inc., Class A | | | (13,366 | ) | | | (599,465 | ) | |
Pharmaceuticals—(0.3)% | |
Catalent, Inc. | | | (16,776 | ) | | | (1,465,216 | ) | |
Mylan N.V. | | | (35,720 | ) | | | (575,449 | ) | |
Nektar Therapeutics | | | (41,137 | ) | | | (911,596 | ) | |
| | | | | | (2,952,261 | ) | |
Real estate management & development—(0.1)% | |
Redfin Corp. | | | (27,181 | ) | | | (1,130,186 | ) | |
Road & rail—(0.3)% | |
JB Hunt Transport Services, Inc. | | | (4,810 | ) | | | (622,414 | ) | |
Knight-Swift Transportation Holdings, Inc. | | | (37,110 | ) | | | (1,613,914 | ) | |
| | | | | | (2,236,328 | ) | |
Semiconductors & semiconductor equipment—(0.4)% | |
Cree, Inc. | | | (27,827 | ) | | | (1,917,837 | ) | |
Marvell Technology Group Ltd. | | | (23,090 | ) | | | (842,092 | ) | |
ON Semiconductor Corp. | | | (25,540 | ) | | | (526,124 | ) | |
| | | | | | (3,286,053 | ) | |
Software—(0.9)% | |
2U, Inc. | | | (11,430 | ) | | | (538,296 | ) | |
Appian Corp. | | | (12,501 | ) | | | (635,926 | ) | |
Blackline, Inc. | | | (12,702 | ) | | | (1,129,335 | ) | |
174
PACE Large Co Value Equity Investments
Portfolio of investments—July 31, 2020
| | | Number of
shares | | Value | |
Investments sold short—(continued) | |
Common stocks—(continued) | |
Software—(concluded) | |
Ceridian HCM Holding, Inc. | | | (6,250 | ) | | $ | (489,312 | ) | |
Guidewire Software, Inc. | | | (7,221 | ) | | | (849,623 | ) | |
HubSpot, Inc. | | | (3,484 | ) | | | (817,381 | ) | |
Proofpoint, Inc. | | | (5,831 | ) | | | (674,472 | ) | |
PTC, Inc. | | | (6,455 | ) | | | (552,290 | ) | |
Q2 Holdings, Inc. | | | (5,343 | ) | | | (502,509 | ) | |
Workday, Inc., Class A | | | (3,710 | ) | | | (671,213 | ) | |
Zendesk, Inc. | | | (9,195 | ) | | | (838,124 | ) | |
| | | | | | (7,698,481 | ) | |
Specialty retail—(0.3)% | |
Carvana Co. | | | (7,788 | ) | | | (1,206,750 | ) | |
Floor & Decor Holdings, Inc., Class A | | | (12,723 | ) | | | (838,446 | ) | |
RH | | | (1,667 | ) | | | (479,146 | ) | |
| | | | | | (2,524,342 | ) | |
| | | Number of
shares | | Value | |
Investments sold short—(concluded) | |
Common stocks—(concluded) | |
Technology hardware, storage & peripherals—(0.2)% | |
Dell Technologies, Class C | | | (11,620 | ) | | $ | (695,225 | ) | |
Hewlett Packard Enterprise Co. | | | (89,190 | ) | | | (880,305 | ) | |
| | | | | | (1,575,530 | ) | |
Trading companies & distributors—(0.2)% | |
SiteOne Landscape Supply, Inc. | | | (4,528 | ) | | | (579,720 | ) | |
United Rentals, Inc. | | | (7,630 | ) | | | (1,185,473 | ) | |
| | | | | | (1,765,193 | ) | |
Total investments sold short
(proceeds—$110,996,532) | | | (127,935,218 | ) | |
Liabilities in excess of other assets—(1.0)% | | | | | (8,255,671 | ) | |
Net assets—100.0% | | | | $ | 854,855,228 | | |
For a listing of defined portfolio acronyms that are used throughout the Portfolio of investments as well as the tables that follow, please refer to page 267.
Fair valuation summary
The following is a summary of the fair valuations according to the inputs used as of July 31, 2020 in valuing the Portfolio's investments. In the event a Portfolio holds investments for which fair value is measured using the NAV per share practical expedient (or its equivalent), a separate column will be added to the fair value hierarchy table; this is intended to permit reconciliation to the amounts presented in a Portfolio of investments:
Assets
Description | | Unadjusted
quoted prices in
active markets for
identical investments
(Level 1) | |
Other significant
observable inputs
(Level 2) | |
Unobservable
inputs
(Level 3) | | Total | |
Common stocks | | $ | 967,644,982 | | | $ | — | | | $ | — | | | $ | 967,644,982 | | |
Warrants | | | 14,532 | | | | — | | | | — | | | | 14,532 | | |
Short-term investments | | | — | | | | 17,363,917 | | | | — | | | | 17,363,917 | | |
Investment of cash collateral from securities loaned | | | — | | | | 6,022,686 | | | | — | | | | 6,022,686 | | |
Total | | $ | 967,659,514 | | | $ | 23,386,603 | | | $ | — | | | $ | 991,046,117 | | |
Liabilities | |
Investments sold short | | $ | (127,935,218 | ) | | $ | — | | | $ | — | | | $ | (127,935,218 | ) | |
At July 31, 2020, there were no transfers in or out of Level 3.
Portfolio footnotes
* Non-income producing security.
† Amount represents less than 0.05% or (0.05)%.
1 Security, or portion thereof, pledged as collateral for investments sold short.
2 Security, or portion thereof, was on loan at the period end.
3 Rates shown reflect yield at July 31, 2020.
See accompanying notes to financial statements.
175
PACE Large Co Growth Equity Investments
Performance
For the 12-months ended July 31, 2020, the Portfolio's Class P shares gained 26.72% before the deduction of the maximum PACE Select program fee.1 In comparison, the Russell 1000 Growth Index (the "benchmark") returned 29.84%. (Returns for all share classes over various time periods are shown in the "Performance at a glance" table on page 178. Please note that the returns shown do not reflect the deduction of taxes that a shareholder would pay on Portfolio distributions or the redemption of Portfolio shares.) For a detailed commentary on the market environment in general during the reporting period, please refer to page 2.
Investment Manager's comments2
The Portfolio underperformed its benchmark during the reporting period. Sector allocation was the primary detractor to relative returns. The Portfolio's significant overweight to the Financials sector detracted as the sector posted a weak return in what was a very strong period for the benchmark. Furthermore, the Portfolio was underweight the Information Technology sector, which was the best performer returning in excess of 40% over the period. The cash allocation was an additional drag on performance.
Stock selection in Consumer Discretionary and Information Technology was positive but partially offset by weak selection within the Financials sector. Companies with secular growth that proved to be resilient were bid up while investments based on attractive valuations were generally not rewarded during the period. With that context, exposure to a subset of high growth businesses that were preferred by investors, in what was a volatile period, drove performance. Underweights to large benchmark constituents such as Apple and Microsoft were significant negative contributors.
Derivatives were not used during the reporting period.
1 Class P shares held through the PACE Select Advisors Program are subject to a maximum Program fee of 2.50%, which, if included, would have reduced performance. Class P shares held through other advisory programs also may be subject to a program fee, which, if included, would have reduced performance.
2 Performance is discussed on a gross-of-fees basis—meaning that no fees or expenses are reflected when discussed at the level of a subadvisor's sleeve (or subadvisors' sleeves, if applicable). Alternatively, performance at the overall Portfolio level is shown net of fees, which does factor in fees and expenses associated with the Portfolio.
PACE Select Advisors Trust – PACE Large Co Growth Equity Investments
Investment Manager:
UBS Asset Management (Americas) Inc. ("UBS AM")
Investment Subadvisors:
Jackson Square Partners, LLC ("JSP");
Mar Vista Investment Partners ("Mar Vista");
J.P. Morgan Investment Management Inc. ("J.P. Morgan")
Portfolio Management Team:
UBS AM: Mabel Lung, CFA, Fred Lee, CFA, Gina Toth, CFA, Ned Sienko, Vincent Russo and Mayoor Joshi
JSP: Jeffrey Van Harte, Christopher Bonavico, Daniel Prislin, Christopher Eriksen and William Montana;
Mar Vista: Brian L. Massey and Silas A. Myers;
J.P. Morgan: Giri Devulapally and Joseph Wilson
Objective:
Capital appreciation
Investment process:
The main strategies of the subadvisors include:
• A strategy in which the subadvisor seeks to identify companies with secular business models and opportunities to generate consistent, long-term growth of intrinsic business value.
• A strategy in which the subadvisor seeks to identify companies with sustainable competitive advantages and ample opportunities to grow
176
PACE Large Co Growth Equity Investments
Investment process
(concluded)
and reinvest capital at high rates of return.
• A strategy in which the subadvisor employs a concentrated, fundamentally driven sustainable growth strategy.
Mutual funds are sold by prospectus only. You should read it carefully and consider a fund's investment objectives, risks, charges, expenses and other important information contained in the prospectus before investing. Prospectuses for most of our funds can be obtained from your financial advisor, by calling UBS Funds at 800-647 1568 or by visiting our Website at www.ubs.com/am-us.
Special considerations
The Portfolio may be appropriate for long-term investors seeking capital appreciation who are able to withstand short-term fluctuations in the equity markets in return for potentially higher returns over the long term. The value of the Portfolio changes every day and can be affected by changes in interest rates, general market conditions, and other political, social and economic developments, as well as specific matters relating to the companies in whose securities the Portfolio invests. Also, to the extent the Portfolio invests a large portion of its assets in a particular sector, the Portfolio may experience greater volatility and risk of loss due to unfavorable developments in that sector. It is important to note that an investment in the Portfolio is only one component of a balanced investment plan.
177
PACE Large Co Growth Equity Investments
Performance at a glance (unaudited)
Average annual total returns for periods ended 07/31/20 | | 1 year | | 5 years | | 10 years | |
Before deducting maximum sales charge | |
Class A1 | | | 26.36 | % | | | 14.15 | % | | | 15.39 | % | |
Class Y2 | | | 26.71 | | | | 14.45 | | | | 15.69 | | |
Class P3 | | | 26.72 | | | | 14.44 | | | | 15.69 | | |
After deducting maximum sales charge | |
Class A1 | | | 19.42 | | | | 12.86 | | | | 14.74 | | |
Russell 1000 Growth Index4 | | | 29.84 | | | | 16.84 | | | | 17.29 | | |
Most recent calendar quarter-end returns (unaudited)
Average annual total returns for periods ended 06/30/20 | | 1 year | | 5 years | | 10 years | |
Before deducting maximum sales charge | |
Class A1 | | | 18.64 | % | | | 13.06 | % | | | 15.30 | % | |
Class Y2 | | | 18.92 | | | | 13.35 | | | | 15.59 | | |
Class P3 | | | 18.93 | | | | 13.34 | | | | 15.59 | | |
After deducting maximum sales charge | |
Class A1 | | | 12.11 | | | | 11.78 | | | | 14.65 | | |
The annualized gross and net expense ratios, respectively, for each class of shares as in the November 27, 2019 prospectuses, were as follows: Class A—1.14% and 1.13%; Class Y—0.88% and 0.88%; and Class P—0.90% and 0.88% Net expenses reflect fee waivers and/or expense reimbursements, if any, pursuant to an agreement that is in effect to cap the expenses. The Portfolio and UBS Asset Management (Americas) Inc. ("UBS AM") have entered into a written fee waiver/expense reimbursement agreement pursuant to which UBS AM is contractually obligated to waive its management fees and/or reimburse expenses so that the Portfolio's ordinary total operating expenses through November 30, 2020 (excluding dividend expense, borrowing costs, and interest expense relating to short sales, and expenses attributable to investment in other investment companies, interest, taxes, brokerage commissions and extraordinary expenses) would not exceed Class A—1.13%; Class Y—0.88%; and Class P—0.88% "Management fee waiver/expense reimbursements" are based on estimated amounts for the current fiscal year. The Portfolio has agreed to repay UBS AM for any waived fees/reimbursed expenses to the extent that it can do so over the following three fiscal years without causing the Portfolio's expenses in any of those three years to exceed this expense cap and that UBS AM has not waived the right to do so. The fee waiver/expense reimbursement agreement may be terminated by the Portfolio's board at any time and also will terminate automatically upon the expiration or termination of the Portfolio's advisory contract with UBS AM. Upon termination of the agreement, however, UBS AM's three year recoupment rights will survive.
1 Maximum sales charge for Class A shares is 5.5%. Class A shares bear ongoing 12b-1 service fees of 0.25% annually.
2 The Portfolio offers Class Y shares to a limited group of eligible investors, including certain qualifying retirement plans. Class Y shares do not bear initial or contingent deferred sales charges or ongoing 12b-1 service and distribution fees.
3 Class P shares do not bear initial or contingent deferred sales charges or ongoing 12b-1 service and distribution fees, but Class P shares held through advisory programs may be subject to a program fee, which, if included, would have reduced performance.
4 The Russell 1000 Growth Index measures the performance of the large-cap growth segment of the US equity universe. It includes those Russell 1000 Index companies with higher price-to-book ratios and higher forecasted growth values. The Russell 1000 Growth Index is constructed to provide a comprehensive and unbiased barometer for the large-cap growth segment. The Index is completely reconstituted annually to ensure new and growing equities are included and that the represented companies continue to reflect growth characteristics. Investors should note that indices do not reflect the deduction of fees and expenses.
Prior to August 3, 2015, a 1% redemption fee was imposed on sales or exchanges of any class of shares of the Portfolio made during the specified holding period.
Past performance does not predict future performance, and the performance information provided does not reflect the deduction of taxes that a shareholder would pay on Portfolio distributions or the redemption of Portfolio shares. The return and principal value of an investment will fluctuate, so that an investor's shares, when redeemed, may be worth more or less than their original cost. Performance results assume reinvestment of all dividends and capital gain distributions at net asset value on the ex-dividend dates. Current performance may be higher or lower than the performance data quoted. For month-end performance figures, please visit www.ubs.com/us-mutualfundperformance.
178
PACE Large Co Growth Equity Investments
Illustration of an assumed investment of $10,000 in Class P shares of the Portfolio (unaudited)
The following graph depicts the performance of PACE Large Co Growth Equity Investments Class P shares versus the Russell 1000 Growth Index over the 10 years ended July 31, 2020. Class P shares held through advisory programs may be subject to a program fee, which, if included, would have reduced performance. The performance of the other classes will vary based upon the different class specific expenses and sales charges. The performance provided does not reflect the deduction of taxes that a shareholder would pay on Portfolio distributions or the redemption of Portfolio shares. Past performance is no guarantee of future results. Share price and returns will vary with market conditions; investors may realize a gain or loss upon redemption. It is important to note that PACE Large Co Growth Equity Investments is a professionally managed portfolio while the Index is not available for investment and is unmanaged. The comparison is shown for illustration purposes only.
PACE Large Co Growth Equity Investments
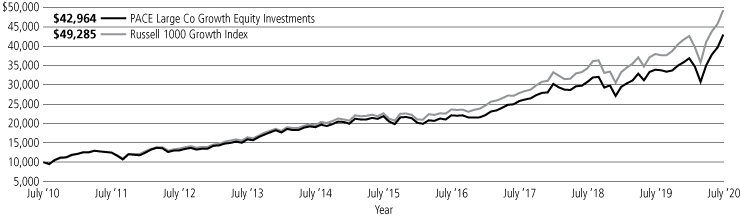
179
PACE Large Co Growth Equity Investments
Portfolio statistics—July 31, 2020 (unaudited)
Top ten holdings1 | | Percentage of
net assets | |
Apple, Inc. | | | 7.5 | % | |
Amazon.com, Inc. | | | 6.8 | | |
Microsoft Corp. | | | 6.3 | | |
Roper Technologies, Inc. | | | 3.3 | | |
Facebook, Inc., Class A | | | 3.3 | | |
Alphabet, Inc., Class C | | | 3.0 | | |
Berkshire Hathaway, Inc., Class B | | | 2.7 | | |
Adobe, Inc. | | | 2.7 | | |
Tesla, Inc. | | | 2.3 | | |
PayPal Holdings, Inc. | | | 2.2 | | |
Total | | | 40.1 | % | |
Top five issuer breakdown by country or territory of origin1 | | Percentage of
net assets | |
United States | | | 94.6 | % | |
Germany | | | 2.0 | | |
United Kingdom | | | 1.2 | | |
Argentina | | | 0.9 | | |
Netherlands | | | 0.6 | | |
Total | | | 99.3 | % | |
Sectors1 | | Percentage of
net assets | |
Information Technology | | | 38.2 | % | |
Consumer Discretionary | | | 16.3 | | |
Health Care | | | 10.0 | | |
Communication Services | | | 9.8 | | |
Industrials | | | 8.5 | | |
Financials | | | 7.1 | | |
Real Estate | | | 2.2 | | |
Consumer Staples | | | 2.0 | | |
Materials | | | 1.5 | | |
Energy | | | 0.2 | | |
Total | | | 95.8 | % | |
1 The Portfolio is actively managed and its composition will vary over time.
180
PACE Large Co Growth Equity Investments
Portfolio of investments—July 31, 2020
| | | Number of
shares | | Value | |
Common stocks—95.8% | |
Aerospace & defense—0.8% | |
TransDigm Group, Inc. | | | 21,546 | | | $ | 9,298,823 | | |
Automobiles—2.3% | |
Tesla, Inc.* | | | 18,836 | | | | 26,949,795 | | |
Beverages—0.6% | |
Monster Beverage Corp.* | | | 87,830 | | | | 6,892,898 | | |
Biotechnology—3.7% | |
Alnylam Pharmaceuticals, Inc.* | | | 10,021 | | | | 1,460,661 | | |
Amgen, Inc. | | | 29,370 | | | | 7,185,958 | | |
Biogen, Inc.* | | | 6,400 | | | | 1,758,016 | | |
BioMarin Pharmaceutical, Inc.* | | | 42,883 | | | | 5,137,812 | | |
Exact Sciences Corp.*,1 | | | 33,429 | | | | 3,167,398 | | |
Moderna, Inc.* | | | 22,990 | | | | 1,703,559 | | |
Regeneron Pharmaceuticals, Inc.* | | | 15,179 | | | | 9,594,191 | | |
Sarepta Therapeutics, Inc.* | | | 19,964 | | | | 3,064,873 | | |
Seattle Genetics, Inc.* | | | 62,042 | | | | 10,315,723 | | |
| | | | | | 43,388,191 | | |
Capital markets—2.9% | |
Blackstone Group, Inc./The, Class A | | | 65,987 | | | | 3,515,787 | | |
Charles Schwab Corp./The | | | 103,124 | | | | 3,418,561 | | |
KKR & Co., Inc. | | | 165,874 | | | | 5,866,963 | | |
MarketAxess Holdings, Inc. | | | 20,314 | | | | 10,496,244 | | |
Morgan Stanley | | | 42,205 | | | | 2,062,981 | | |
MSCI, Inc. | | | 6,492 | | | | 2,440,862 | | |
S&P Global, Inc. | | | 18,128 | | | | 6,349,332 | | |
| | | | | | 34,150,730 | | |
Chemicals—1.0% | |
Air Products and Chemicals, Inc. | | | 23,108 | | | | 6,623,446 | | |
Sherwin-Williams Co./The | | | 8,065 | | | | 5,225,475 | | |
| | | | | | 11,848,921 | | |
Commercial services & supplies—0.5% | |
Waste Management, Inc. | | | 51,460 | | | | 5,640,016 | | |
Communications equipment—0.1% | |
Arista Networks, Inc.* | | | 5,911 | | | | 1,535,500 | | |
Containers & packaging—0.5% | |
Ball Corp. | | | 75,779 | | | | 5,579,608 | | |
Diversified financial services—2.7% | |
Berkshire Hathaway, Inc., Class B* | | | 164,032 | | | | 32,114,185 | | |
Electrical equipment—0.8% | |
Rockwell Automation, Inc. | | | 41,866 | | | | 9,132,649 | | |
Electronic equipment, instruments & components—0.3% | |
Amphenol Corp., Class A | | | 33,685 | | | | 3,562,526 | | |
Entertainment—1.0% | |
Netflix, Inc.* | | | 25,106 | | | | 12,273,821 | | |
Equity real estate investment trusts—2.2% | |
American Tower Corp. | | | 77,441 | | | | 20,242,303 | | |
Equinix, Inc. | | | 6,792 | | | | 5,334,980 | | |
| | | | | | 25,577,283 | | |
| | | Number of
shares | | Value | |
Common stocks—(continued) | |
Health care equipment & supplies—2.3% | |
ABIOMED, Inc.* | | | 7,117 | | | $ | 2,134,673 | | |
DexCom, Inc.* | | | 28,170 | | | | 12,269,162 | | |
Intuitive Surgical, Inc.* | | | 17,715 | | | | 12,142,569 | | |
| | | | | | 26,546,404 | | |
Health care providers & services—0.6% | |
McKesson Corp. | | | 16,611 | | | | 2,494,308 | | |
UnitedHealth Group, Inc. | | | 13,959 | | | | 4,226,506 | | |
| | | | | | 6,720,814 | | |
Health care technology—0.3% | |
Veeva Systems, Inc., Class A* | | | 14,258 | | | | 3,772,239 | | |
Hotels, restaurants & leisure—1.8% | |
Chipotle Mexican Grill, Inc.* | | | 9,753 | | | | 11,266,275 | | |
Las Vegas Sands Corp. | | | 41,417 | | | | 1,807,438 | | |
Starbucks Corp. | | | 107,434 | | | | 8,221,924 | | |
| | | | | | 21,295,637 | | |
Industrial conglomerates—4.9% | |
Honeywell International, Inc. | | | 127,023 | | | | 18,973,426 | | |
Roper Technologies, Inc. | | | 90,456 | | | | 39,117,697 | | |
| | | | | | 58,091,123 | | |
Insurance—1.5% | |
Markel Corp.* | | | 16,417 | | | | 17,148,213 | | |
Interactive media & services—8.1% | |
Alphabet, Inc., Class A* | | | 4,467 | | | | 6,646,673 | | |
Alphabet, Inc., Class C* | | | 23,783 | | | | 35,269,238 | | |
Facebook, Inc., Class A* | | | 150,923 | | | | 38,284,637 | | |
Match Group, Inc.* | | | 106,627 | | | | 10,950,630 | | |
Snap, Inc., Class A* | | | 166,883 | | | | 3,741,517 | | |
| | | | | | 94,892,695 | | |
Internet & direct marketing retail—9.0% | |
Alibaba Group Holding Ltd., ADR* | | | 20,586 | | | | 5,167,498 | | |
Amazon.com, Inc.* | | | 25,298 | | | | 80,060,075 | | |
Booking Holdings, Inc.* | | | 3,558 | | | | 5,913,858 | | |
GrubHub, Inc.* | | | 22,861 | | | | 1,651,479 | | |
MercadoLibre, Inc.* | | | 9,363 | | | | 10,529,817 | | |
Wayfair, Inc., Class A*,1 | | | 8,539 | | | | 2,272,142 | | |
| | | | | | 105,594,869 | | |
IT services—6.2% | |
FleetCor Technologies, Inc.* | | | 9,983 | | | | 2,581,304 | | |
MasterCard, Inc., Class A | | | 65,314 | | | | 20,151,329 | | |
PayPal Holdings, Inc.* | | | 129,241 | | | | 25,340,283 | | |
Shopify, Inc., Class A* | | | 3,567 | | | | 3,652,608 | | |
Square, Inc., Class A* | | | 15,004 | | | | 1,948,269 | | |
Twilio, Inc., Class A* | | | 32,192 | | | | 8,930,705 | | |
Visa, Inc., Class A | | | 52,911 | | | | 10,074,254 | | |
| | | | | | 72,678,752 | | |
Life sciences tools & services—3.1% | |
Illumina, Inc.* | | | 20,929 | | | | 7,998,227 | | |
IQVIA Holdings, Inc.* | | | 44,162 | | | | 6,994,819 | | |
181
PACE Large Co Growth Equity Investments
Portfolio of investments—July 31, 2020
| | | Number of
shares | | Value | |
Common stocks—(continued) | |
Life sciences tools & services—(concluded) | |
Mettler-Toledo International, Inc.* | | | 17,571 | | | $ | 16,428,885 | | |
Thermo Fisher Scientific, Inc. | | | 13,277 | | | | 5,496,014 | | |
| | | | | | 36,917,945 | | |
Media—0.7% | |
Charter Communications, Inc., Class A* | | | 13,680 | | | | 7,934,400 | | |
Oil, gas & consumable fuels—0.2% | |
Phillips 66 | | | 33,846 | | | | 2,099,129 | | |
Personal products—1.4% | |
Estee Lauder Cos., Inc./The, Class A | | | 11,489 | | | | 2,269,537 | | |
Unilever N.V. NY Registered Shares | | | 240,849 | | | | 14,217,317 | | |
| | | | | | 16,486,854 | | |
Professional services—0.3% | |
CoStar Group, Inc.* | | | 4,466 | | | | 3,795,028 | | |
Road & rail—1.2% | |
Lyft, Inc., Class A*,1 | | | 72,044 | | | | 2,105,846 | | |
Norfolk Southern Corp. | | | 23,291 | | | | 4,476,763 | | |
Uber Technologies, Inc.* | | | 234,099 | | | | 7,083,836 | | |
| | | | | | 13,666,445 | | |
Semiconductors & semiconductor equipment—6.2% | |
Advanced Micro Devices, Inc.* | | | 211,514 | | | | 16,377,529 | | |
ASML Holding N.V. NY Registered Shares | | | 20,443 | | | | 7,231,098 | | |
Lam Research Corp. | | | 14,559 | | | | 5,491,073 | | |
Microchip Technology, Inc. 1 | | | 183,458 | | | | 18,663,182 | | |
NVIDIA Corp. | | | 33,237 | | | | 14,112,098 | | |
QUALCOMM, Inc. | | | 34,963 | | | | 3,692,442 | | |
Texas Instruments, Inc. | | | 56,942 | | | | 7,262,952 | | |
| | | | | | 72,830,374 | | |
Software—17.9% | |
Adobe, Inc.* | | | 71,288 | | | | 31,674,684 | | |
Atlassian Corp. PLC, Class A* | | | 17,898 | | | | 3,161,682 | | |
Autodesk, Inc.* | | | 24,347 | | | | 5,756,361 | | |
Coupa Software, Inc.* | | | 18,818 | | | | 5,766,776 | | |
Intuit, Inc. | | | 74,141 | | | | 22,714,578 | | |
Microsoft Corp. | | | 358,162 | | | | 73,426,792 | | |
Paycom Software, Inc.* | | | 12,559 | | | | 3,571,403 | | |
Salesforce.com, Inc.* | | | 69,379 | | | | 13,518,498 | | |
| | | Number of
shares | | Value | |
Common stocks—(concluded) | |
Software—(concluded) | |
SAP SE, ADR | | | 142,582 | | | $ | 22,701,906 | | |
ServiceNow, Inc.* | | | 29,354 | | | | 12,892,277 | | |
SS&C Technologies Holdings, Inc. | | | 41,262 | | | | 2,372,565 | | |
Synopsys, Inc.* | | | 38,710 | | | | 7,711,806 | | |
Trade Desk, Inc./The, Class A* | | | 9,840 | | | | 4,440,989 | | |
| | | | | | 209,710,317 | | |
Specialty retail—0.8% | |
Home Depot, Inc./The | | | 30,261 | | | | 8,033,993 | | |
Ross Stores, Inc. | | | 17,337 | | | | 1,554,609 | | |
| | | | | | 9,588,602 | | |
Technology hardware, storage & peripherals—7.5% | |
Apple, Inc. | | | 207,597 | | | | 88,237,029 | | |
Textiles, apparel & luxury goods—2.4% | |
Lululemon Athletica, Inc.* | | | 19,118 | | | | 6,224,630 | | |
Nike, Inc., Class B | | | 219,548 | | | | 21,430,080 | | |
| | | | | | 27,654,710 | | |
Total common stocks
(cost—$702,126,752) | | | | | 1,123,606,525 | | |
Exchange traded funds—1.1% | |
SPDR S&P 500 ETF Trust
(cost—$12,836,848) | | | 40,000 | | | | 13,060,800 | | |
Short-term investments—3.1% | |
Investment companies—3.1% | |
State Street Institutional U.S. Government
Money Market Fund, 0.09%2
(cost—$36,624,868) | | | 36,624,868 | | | | 36,624,868 | | |
Investment of cash collateral from securities loaned—0.2% | |
Money market funds—0.2% | |
State Street Navigator Securities Lending
Government Money Market
Portfolio, 0.12%2
(cost—$1,775,246) | | | 1,775,246 | | | | 1,775,246 | | |
Total investments
(cost—$753,363,713)—100.2% | | | | | 1,175,067,439 | | |
Liabilities in excess of other assets—(0.2)% | | | | | (1,980,882 | ) | |
Net assets—100.0% | | | | $ | 1,173,086,557 | | |
For a listing of defined portfolio acronyms that are used throughout the Portfolio of investments as well as the tables that follow, please refer to page 267.
182
PACE Large Co Growth Equity Investments
Portfolio of investments—July 31, 2020
Fair valuation summary
The following is a summary of the fair valuations according to the inputs used as of July 31, 2020 in valuing the Portfolio's investments. In the event a Portfolio holds investments for which fair value is measured using the NAV per share practical expedient (or its equivalent), a separate column will be added to the fair value hierarchy table; this is intended to permit reconciliation to the amounts presented in the Portfolio of investments:
Assets
Description | | Unadjusted
quoted prices in
active markets for
identical investments
(Level 1) | | Other significant
observable inputs
(Level 2) | | Unobservable
inputs
(Level 3) | | Total | |
Common stocks | | $ | 1,123,606,525 | | | $ | — | | | $ | — | | | $ | 1,123,606,525 | | |
Exchange traded funds | | | 13,060,800 | | | | — | | | | — | | | | 13,060,800 | | |
Short-term investments | | | — | | | | 36,624,868 | | | | — | | | | 36,624,868 | | |
Investment of cash collateral from securities loaned | | | — | | | | 1,775,246 | | | | — | | | | 1,775,246 | | |
Total | | $ | 1,136,667,325 | | | $ | 38,400,114 | | | $ | — | | | $ | 1,175,067,439 | | |
At July 31, 2020, there were no transfers in or out of Level 3.
Portfolio footnotes
* Non-income producing security.
1 Security, or portion thereof, was on loan at the period end.
2 Rates shown reflect yield at July 31, 2020.
See accompanying notes to financial statements.
183
PACE Small/Medium Co Value Equity Investments
Performance
For the 12-months ended July 31, 2020, the Portfolio's Class P shares returned -9.12% before the deduction of the maximum PACE Select program fee.1 In comparison, the Russell 2500 Value Index (the "benchmark") returned -13.52%. (Returns for all share classes over various time periods are shown in the "Performance at a glance" table on page 186. Please note that the returns shown do not reflect the deduction of taxes that a shareholder would pay on Portfolio distributions or the redemption of Portfolio shares.) For a detailed commentary on the market environment in general during the reporting period, please refer to page 2.
Investment Manager's comments2
The Portfolio outperformed its benchmark during the reporting period. In terms of style, an overweight to profitability and a modest growth tilt vs. the benchmark were tailwinds during this period, offsetting negative contribution from a modest overweight to leverage. Both stock selection and sector allocation were also key drivers of relative returns. Stock selection was strongest within the Financials, Industrials and REIT sectors and only partially offset by weak stock selection within Communication Services and Consumer Discretionary sectors. The Portfolio's overweight to the Information Technology sector was also additive on a relative basis, offsetting negative contribution from an underweight to Health Care and Utilities sectors.
Quality oriented managers generally performed best in this space the past year while relative value and deeper value managers generally struggled. This was exacerbated by the onset of COVID-19, and reflected concerns of how more cyclical, smaller market capitalization companies would fare in the new environment. Kayne Anderson, a quality value manager, performed exceptionally well given their focus on recurring and stable revenues even in adverse market environments and therefore protected capital and was a significant contributor to positive benchmark relative results. This relative performance helped to offset the underperformance of the relative and deep value exposures in the Portfolio.
Derivatives were not used during the reporting period.
1 Class P shares held through the PACE Select Advisors Program are subject to a maximum Program fee of 2.50%, which, if included, would have reduced performance. Class P shares held through other advisory programs also may be subject to a program fee, which, if included, would have reduced performance.
2 Performance is discussed on a gross-of-fees basis—meaning that no fees or expenses are reflected when discussed at the level of a subadvisor's sleeve (or subadvisors' sleeves, if applicable). Alternatively, performance at the overall Portfolio level is shown net of fees, which does factor in fees and expenses associated with the Portfolio.
PACE Select Advisors Trust – PACE Small/Medium Co Value Equity Investments
Investment Manager:
UBS Asset Management (Americas) Inc. ("UBS AM")
Investment Subadvisors:
Kayne Anderson Rudnick, LLC ("Kayne Anderson Rudnick"); Sapience Investments, LLC ("Sapience");
Huber Capital Management LLC ("Huber")
Portfolio Management Team:
UBS AM: Mabel Lung, CFA, Fred Lee, CFA, Gina Toth, CFA, Ned Sienko, Vincent Russo and Mayoor Joshi
Kayne Anderson Rudnick: Julie Kutasov and Craig Stone Sapience: Samir Sikka;
Huber Capital: Joseph Huber
Objective:
Capital appreciation
Investment process:
The main strategies of the subadvisors include:
• A "value equity" strategy in which the subadvisor targets smaller capitalization companies with sustainable business models selling below their perceived value.
• A strategy that employs a fundamental, bottom-up, research-driven investment style and follows a disciplined investment process to identify high-quality companies.
• A "deep value" strategy that seeks long-term total investment return through capital appreciation, generally investing in common stocks of US companies that are considered to be undervalued.
184
PACE Small/Medium Co Value Equity Investments
Mutual funds are sold by prospectus only. You should read it carefully and consider a fund's investment objectives, risks, charges, expenses and other important information contained in the prospectus before investing. Prospectuses for most of our funds can be obtained from your financial advisor, by calling UBS Funds at 800-647 1568 or by visiting our Website at www.ubs.com/am-us.
Special considerations
The Portfolio may be appropriate for long-term investors seeking capital appreciation who are able to withstand short-term fluctuations in the equity markets in return for potentially higher returns over the long term. The value of the Portfolio changes every day and can be affected by changes in interest rates, general market conditions, and other political, social and economic developments, as well as specific matters relating to the companies in whose securities the Portfolio invests. It is important to note that an investment in the Portfolio is only one component of a balanced investment plan. In addition, small- and mid-cap companies are typically subject to a greater degree of change in earnings and business prospects than are larger, more established companies. Therefore, they are considered to have a higher level of volatility and risk.
185
PACE Small/Medium Co Value Equity Investments
Performance at a glance (unaudited)
Average annual total returns for periods ended 07/31/20 | | 1 year | | 5 years | | 10 years | |
Before deducting maximum sales charge | |
Class A1 | | | (9.32 | )% | | | 2.71 | % | | | 8.00 | % | |
Class Y2 | | | (9.08 | ) | | | 2.94 | | | | 8.21 | | |
Class P3 | | | (9.12 | ) | | | 2.88 | | | | 8.17 | | |
After deducting maximum sales charge | |
Class A1 | | | (14.30 | ) | | | 1.55 | | | | 7.39 | | |
Russell 2500 Value Index4 | | | (13.52 | ) | | | 2.76 | | | | 8.36 | | |
Most recent calendar quarter-end returns (unaudited)
Average annual total returns for periods ended 06/30/20 | | 1 year | | 5 years | | 10 years | |
Before deducting maximum sales charge | |
Class A1 | | | (11.15 | )% | | | 1.44 | % | | | 8.11 | | |
Class Y2 | | | (10.94 | ) | | | 1.66 | | | | 8.31 | | |
Class P3 | | | (10.95 | ) | | | 1.60 | | | | 8.27 | | |
After deducting maximum sales charge | |
Class A1 | | | (16.05 | ) | | | 0.30 | | | | 7.50 | | |
The annualized gross and net expense ratios, respectively, for each class of shares as in the November 27, 2019 prospectuses, were as follows: Class A—1.22% and 1.22%; Class Y—0.94% and 0.94%; and Class P—1.07% and 1.04% Net expenses reflect fee waivers and/or expense reimbursements, if any, pursuant to an agreement that is in effect to cap the expenses. The Portfolio and UBS Asset Management (Americas) Inc. ("UBS AM") have entered into a written fee waiver/expense reimbursement agreement pursuant to which UBS AM is contractually obligated to waive its management fees and/or reimburse expenses so that the Portfolio's ordinary total operating expenses through November 30, 2020 (excluding dividend expense, borrowing costs, and interest expense relating to short sales, and expenses attributable to investment in other investment companies, interest, taxes, brokerage commissions and extraordinary expenses) would not exceed Class A—1.29%; Class Y—1.04%; and Class P—1.04% "Management fee waiver/expense reimbursements" are based on estimated amounts for the current fiscal year. The Portfolio has agreed to repay UBS AM for any waived fees/reimbursed expenses to the extent that it can do so over the following three fiscal years without causing the Portfolio's expenses in any of those three years to exceed this expense cap and that UBS AM has not waived the right to do so. The fee waiver/expense reimbursement agreement may be terminated by the Portfolio's board at any time and also will terminate automatically upon the expiration or termination of the Portfolio's advisory contract with UBS AM. Upon termination of the agreement, however, UBS AM's three year recoupment rights will survive.
1 Maximum sales charge for Class A shares is 5.5%. Class A shares bear ongoing 12b-1 service fees of 0.25% annually.
2 The Portfolio offers Class Y shares to a limited group of eligible investors, including certain qualifying retirement plans. Class Y shares do not bear initial or contingent deferred sales charges or ongoing 12b-1 service and distribution fees.
3 Class P shares do not bear initial or contingent deferred sales charges or ongoing 12b-1 service and distribution fees, but Class P shares held through advisory programs may be subject to a program fee, which, if included, would have reduced performance.
4 The Russell 2500 Value Index measures the performance of the small to mid-cap value segment of the US equity universe. It includes those Russell 2500 Index companies with lower price-to-book ratios and lower forecasted growth values. The Russell 2500 Value Index is constructed to provide a comprehensive and unbiased barometer of the small to mid-cap value market. The Index is completely reconstituted annually to ensure larger stocks do not distort the performance and characteristics of the true small to mid-cap opportunity set and that the represented companies continue to reflect value characteristics. Investors should note that indices do not reflect the deduction of fees and expenses.
Prior to August 3, 2015, a 1% redemption fee was imposed on sales or exchanges of any class of shares of the Portfolio made during the specified holding period.
Past performance does not predict future performance, and the performance information provided does not reflect the deduction of taxes that a shareholder would pay on Portfolio distributions or the redemption of Portfolio shares. The return and principal value of an investment will fluctuate, so that an investor's shares, when redeemed, may be worth more or less than their original cost. Performance results assume reinvestment of all dividends and capital gain distributions at net asset value on the ex-dividend dates. Current performance may be higher or lower than the performance data quoted. For month-end performance figures, please visit www.ubs.com/us-mutualfundperformance.
186
PACE Small/Medium Co Value Equity Investments
Illustration of an assumed investment of $10,000 in Class P shares of the Portfolio (unaudited)
The following graph depicts the performance of PACE Small/Medium Co Value Equity Investments Class P shares versus the Russell 2500 Value Index over the 10 years ended July 31, 2020. Class P shares held through advisory programs may be subject to a program fee, which, if included, would have reduced performance. The performance of the other classes will vary based upon the different class specific expenses and sales charges. The performance provided does not reflect the deduction of taxes that a shareholder would pay on Portfolio distributions or the redemption of Portfolio shares. Past performance is no guarantee of future results. Share price and returns will vary with market conditions; investors may realize a gain or loss upon redemption. It is important to note that PACE Small/Medium Co Value Equity Investments is a professionally managed portfolio while the Index is not available for investment and is unmanaged. The comparison is shown for illustration purposes only.
PACE Small/Medium Co Value Equity Investments

187
PACE Small/Medium Co Value Equity Investments
Portfolio statistics—July 31, 2020 (unaudited)
Top ten holdings1 | | Percentage of
net assets | |
Scotts Miracle-Gro Co./The | | | 3.0 | % | |
MSCI, Inc. | | | 2.1 | | |
Thor Industries, Inc. | | | 1.9 | | |
TransUnion | | | 1.8 | | |
WR Berkley Corp. | | | 1.8 | | |
Diebold Nixdorf, Inc. | | | 1.7 | | |
National Beverage Corp. | | | 1.7 | | |
Broadridge Financial Solutions, Inc. | | | 1.6 | | |
Teradyne, Inc. | | | 1.6 | | |
Lamar Advertising Co., Class A | | | 1.6 | | |
Total | | | 18.8 | % | |
Top five issuer breakdown by country or territory of origin1 | | Percentage of
net assets | |
United States | | | 90.7 | % | |
Bermuda | | | 1.6 | | |
Canada | | | 1.6 | | |
United Kingdom | | | 0.6 | | |
India | | | 0.6 | | |
Total | | | 95.1 | % | |
Sectors1 | | Percentage of
net assets | |
Financials | | | 21.0 | % | |
Industrials | | | 18.7 | | |
Information Technology | | | 18.5 | | |
Consumer Discretionary | | | 11.3 | | |
Materials | | | 7.0 | | |
Health Care | | | 6.1 | | |
Consumer Staples | | | 5.8 | | |
Energy | | | 3.3 | | |
Utilities | | | 3.1 | | |
Real Estate | | | 2.5 | | |
Total | | | 97.3 | % | |
1 The Portfolio is actively managed and its composition will vary over time.
188
PACE Small/Medium Co Value Equity Investments
Portfolio of investments—July 31, 2020
| | | Number of
shares | | Value | |
Common stocks—97.3% | |
Auto components—0.4% | |
Adient PLC* | | | 75,750 | | | $ | 1,260,480 | | |
Automobiles—1.9% | |
Thor Industries, Inc.1 | | | 59,477 | | | | 6,779,783 | | |
Banks—8.0% | |
Ameris Bancorp | | | 96,650 | | | | 2,230,199 | | |
Atlantic Capital Bancshares, Inc.* | | | 68,219 | | | | 682,190 | | |
Bank of Hawaii Corp. | | | 53,616 | | | | 3,036,274 | | |
Bank of NT Butterfield & Son Ltd./The | | | 121,630 | | | | 3,166,029 | | |
Bank OZK | | | 55,180 | | | | 1,327,079 | | |
Banner Corp. | | | 59,450 | | | | 2,106,313 | | |
Cathay General Bancorp | | | 82,340 | | | | 1,990,981 | | |
First Citizens BancShares, Inc., Class A | | | 3,300 | | | | 1,405,371 | | |
First Horizon National Corp. | | | 274,702 | | | | 2,546,488 | | |
Glacier Bancorp, Inc. | | | 79,825 | | | | 2,818,621 | | |
Popular, Inc. | | | 56,430 | | | | 2,094,117 | | |
Sterling Bancorp | | | 146,200 | | | | 1,644,750 | | |
Truist Financial Corp. | | | 8,000 | | | | 299,680 | | |
Webster Financial Corp. | | | 102,241 | | | | 2,788,112 | | |
| | | | | | 28,136,204 | | |
Beverages—1.7% | |
National Beverage Corp.*,1 | | | 91,817 | | | | 5,890,061 | | |
Biotechnology—0.9% | |
Anika Therapeutics, Inc.* | | | 83,600 | | | | 3,043,040 | | |
Building products—1.4% | |
Lennox International, Inc. | | | 12,175 | | | | 3,264,604 | | |
Resideo Technologies, Inc.* | | | 128,500 | | | | 1,706,480 | | |
| | | | | | 4,971,084 | | |
Capital markets—3.9% | |
Artisan Partners Asset Management, Inc., Class A | | | 68,850 | | | | 2,494,435 | | |
Brightsphere Investment Group, Inc.* | | | 22,300 | | | | 299,712 | | |
MSCI, Inc. | | | 19,650 | | | | 7,388,007 | | |
Uranium Participation Corp.* | | | 685,300 | | | | 2,512,626 | | |
Virtus Investment Partners, Inc. | | | 8,174 | | | | 1,111,010 | | |
| | | | | | 13,805,790 | | |
Chemicals—5.0% | |
Axalta Coating Systems Ltd.* | | | 170,300 | | | | 3,780,660 | | |
Innospec, Inc. | | | 11,700 | | | | 879,489 | | |
Scotts Miracle-Gro Co./The | | | 66,329 | | | | 10,517,790 | | |
Valvoline, Inc. | | | 109,895 | | | | 2,255,045 | | |
| | | | | | 17,432,984 | | |
Commercial services & supplies—2.5% | |
IAA, Inc.* | | | 50,360 | | | | 2,183,106 | | |
KAR Auction Services, Inc.1 | | | 246,280 | | | | 3,726,216 | | |
Stericycle, Inc.* | | | 46,310 | | | | 2,798,745 | | |
| | | | | | 8,708,067 | | |
| | | Number of
shares | | Value | |
| Common stocks—(continued) | |
Communications equipment—2.6% | |
Comtech Telecommunications Corp. | | | 178,011 | | | $ | 2,922,941 | | |
F5 Networks, Inc.* | | | 4,700 | | | | 638,730 | | |
Plantronics, Inc.1 | | | 278,375 | | | | 5,564,716 | | |
| | | | | | 9,126,387 | | |
Consumer finance—1.2% | |
Enova International, Inc.* | | | 33,427 | | | | 537,840 | | |
Navient Corp. | | | 190,700 | | | | 1,517,972 | | |
SLM Corp. | | | 297,275 | | | | 2,012,552 | | |
| | | | | | 4,068,364 | | |
Containers & packaging—0.7% | |
Sealed Air Corp. | | | 66,850 | | | | 2,385,208 | | |
Diversified consumer services—1.6% | |
Regis Corp.*,1 | | | 58,496 | | | | 449,250 | | |
ServiceMaster Global Holdings, Inc.* | | | 124,307 | | | | 5,082,913 | | |
| | | | | | 5,532,163 | | |
Diversified telecommunication services—0.4% | |
Liberty Latin America Ltd., Class A* | | | 127,350 | | | | 1,309,158 | | |
Electric utilities—2.8% | |
Entergy Corp. | | | 21,700 | | | | 2,281,321 | | |
Evergy, Inc. | | | 33,094 | | | | 2,145,484 | | |
IDACORP, Inc. | | | 26,105 | | | | 2,434,291 | | |
Portland General Electric Co. | | | 65,150 | | | | 2,875,070 | | |
| | | | | | 9,736,166 | | |
Electrical equipment—0.7% | |
EnerSys | | | 34,600 | | | | 2,327,196 | | |
Electronic equipment, instruments & components—3.7% | |
CDW Corp. | | | 33,858 | | | | 3,935,993 | | |
Dolby Laboratories, Inc., Class A | | | 53,304 | | | | 3,709,958 | | |
Zebra Technologies Corp., Class A* | | | 19,600 | | | | 5,502,700 | | |
| | | | | | 13,148,651 | | |
Energy equipment & services—0.6% | |
Championx Corp.* | | | 173,450 | | | | 1,649,510 | | |
Hoegh LNG Partners LP | | | 31,930 | | | | 328,879 | | |
| | | | | | 1,978,389 | | |
Equity real estate investment trusts—7.1% | |
American Campus Communities, Inc. | | | 70,000 | | | | 2,494,800 | | |
CatchMark Timber Trust, Inc., Class A | | | 70,309 | | | | 686,216 | | |
Granite Real Estate Investment Trust | | | 50,600 | | | | 2,944,414 | | |
Lamar Advertising Co., Class A | | | 84,900 | | | | 5,580,477 | | |
MGM Growth Properties LLC, Class A | | | 170,363 | | | | 4,657,724 | | |
Office Properties Income Trust | | | 29,805 | | | | 749,596 | | |
Outfront Media, Inc. | | | 170,297 | | | | 2,453,980 | | |
Physicians Realty Trust | | | 184,420 | | | | 3,326,937 | | |
QTS Realty Trust, Inc., Class A1 | | | 30,420 | | | | 2,188,719 | | |
| | | | | | 25,082,863 | | |
Food & staples retailing—0.6% | |
U.S. Foods Holding Corp.* | | | 112,300 | | | | 2,279,690 | | |
189
PACE Small/Medium Co Value Equity Investments
Portfolio of investments—July 31, 2020
| | | Number of
shares | | Value | |
| Common stocks—(continued) | |
Food products—2.6% | |
Campbell Soup Co. | | | 28,800 | | | $ | 1,427,616 | | |
Conagra Brands, Inc. | | | 17,600 | | | | 659,120 | | |
Lamb Weston Holdings, Inc. | | | 12,900 | | | | 775,032 | | |
Post Holdings, Inc.* | | | 25,270 | | | | 2,242,460 | | |
TreeHouse Foods, Inc.* | | | 83,945 | | | | 3,678,470 | | |
Tyson Foods, Inc., Class A | | | 8,800 | | | | 540,760 | | |
| | | | | | 9,323,458 | | |
Health care equipment & supplies—1.6% | |
CONMED Corp. | | | 7,800 | | | | 643,812 | | |
Envista Holdings Corp.* | | | 113,370 | | | | 2,479,402 | | |
Integra LifeSciences Holdings Corp.* | | | 55,610 | | | | 2,655,377 | | |
| | | | | | 5,778,591 | | |
Health care providers & services—2.8% | |
Acadia Healthcare Co., Inc.* | | | 102,690 | | | | 3,061,189 | | |
CorVel Corp.* | | | 33,579 | | | | 2,669,195 | | |
Hanger Orthopedic Group, Inc.* | | | 178,870 | | | | 3,123,070 | | |
Tenet Healthcare Corp.* | | | 33,300 | | | | 880,452 | | |
| | | | | | 9,733,906 | | |
Hotels, restaurants & leisure—3.3% | |
Cheesecake Factory, Inc./The1 | | | 169,000 | | | | 4,056,000 | | |
Dave & Buster's Entertainment, Inc.1 | | | 119,540 | | | | 1,475,124 | | |
Dunkin' Brands Group, Inc. | | | 47,255 | | | | 3,247,836 | | |
El Pollo Loco Holdings, Inc.* | | | 136,119 | | | | 2,689,711 | | |
| | | | | | 11,468,671 | | |
Household durables—0.0%† | |
Lennar Corp., Class B | | | 1,163 | | | | 62,651 | | |
Household products—0.8% | |
WD-40 Co. | | | 14,850 | | | | 2,918,767 | | |
Insurance—3.2% | |
Argo Group International Holdings Ltd. | | | 47,730 | | | | 1,599,433 | | |
Assured Guaranty Ltd. | | | 49,610 | | | | 1,082,986 | | |
CNO Financial Group, Inc. | | | 151,837 | | | | 2,292,739 | | |
WR Berkley Corp. | | | 100,975 | | | | 6,235,206 | | |
| | | | | | 11,210,364 | | |
Internet & direct marketing retail—0.3% | |
Despegar.com Corp.*,1 | | | 151,620 | | | | 1,168,990 | | |
IT services—6.2% | |
Broadridge Financial Solutions, Inc. | | | 42,450 | | | | 5,702,733 | | |
DXC Technology Co. | | | 99,250 | | | | 1,777,567 | | |
Jack Henry & Associates, Inc. | | | 30,600 | | | | 5,455,980 | | |
KBR, Inc. | | | 201,500 | | | | 4,481,360 | | |
Sabre Corp. | | | 174,500 | | | | 1,319,220 | | |
Science Applications International Corp. | | | 12,100 | | | | 967,758 | | |
WNS Holdings Ltd., ADR* | | | 32,925 | | | | 2,105,883 | | |
| | | | | | 21,810,501 | | |
Life sciences tools & services—0.8% | |
Syneos Health, Inc.* | | | 45,040 | | | | 2,810,046 | | |
| | | Number of
shares | | Value | |
| Common stocks—(continued) | |
Machinery—7.4% | |
Altra Industrial Motion Corp. | | | 59,645 | | | $ | 2,041,648 | | |
EnPro Industries, Inc. | | | 40,340 | | | | 1,925,428 | | |
Gates Industrial Corp. PLC*,1 | | | 178,360 | | | | 1,879,914 | | |
Graco, Inc. | | | 85,800 | | | | 4,567,992 | | |
John Bean Technologies Corp. | | | 21,225 | | | | 1,990,056 | | |
Lincoln Electric Holdings, Inc. | | | 23,206 | | | | 2,097,590 | | |
RBC Bearings, Inc.* | | | 37,676 | | | | 4,612,296 | | |
Terex Corp. | | | 104,735 | | | | 1,974,255 | | |
Toro Co./The | | | 43,000 | | | | 3,068,050 | | |
Watts Water Technologies, Inc., Class A | | | 24,050 | | | | 2,017,555 | | |
| | | | | | 26,174,784 | | |
Marine—0.9% | |
Kirby Corp.* | | | 70,450 | | | | 3,257,608 | | |
Metals & mining—0.4% | |
Allegheny Technologies, Inc.* | | | 176,169 | | | | 1,530,909 | | |
Mortgage real estate investment trust—0.6% | |
Redwood Trust, Inc. | | | 287,150 | | | | 2,047,380 | | |
Multi-utilities—0.3% | |
Black Hills Corp. | | | 17,700 | | | | 1,024,122 | | |
Oil, gas & consumable fuels—2.8% | |
Euronav N.V.* | | | 57,000 | | | | 558,030 | | |
Golar LNG Ltd.* | | | 237,843 | | | | 1,783,822 | | |
Golar LNG Partners LP1 | | | 622,499 | | | | 1,624,722 | | |
Parsley Energy, Inc., Class A | | | 252,170 | | | | 2,768,827 | | |
Teekay Tankers Ltd., Class A* | | | 15,235 | | | | 228,068 | | |
Viper Energy Partners LP | | | 274,850 | | | | 2,841,949 | | |
| | | | | | 9,805,418 | | |
Personal products—0.8% | |
elf Beauty, Inc.* | | | 162,590 | | | | 2,903,857 | | |
Professional services—1.8% | |
TransUnion | | | 70,800 | | | | 6,341,556 | | |
Road & rail—1.4% | |
Landstar System, Inc. | | | 39,200 | | | | 4,773,776 | | |
Semiconductors & semiconductor equipment—1.6% | |
Teradyne, Inc. | | | 62,900 | | | | 5,595,584 | | |
Software—3.9% | |
American Software, Inc. Class A | | | 298,880 | | | | 4,922,554 | | |
Avast PLC2 | | | 79,321 | | | | 596,510 | | |
CDK Global, Inc. | | | 82,000 | | | | 3,727,720 | | |
New Relic, Inc.* | | | 34,500 | | | | 2,446,395 | | |
SailPoint Technologies Holding, Inc.* | | | 66,350 | | | | 2,090,025 | | |
| | | | | | 13,783,204 | | |
Specialty retail—1.2% | |
Gap, Inc./The | | | 18,900 | | | | 252,693 | | |
Michaels Cos., Inc./The*,1 | | | 460,502 | | | | 3,306,404 | | |
Rent-A-Center, Inc. | | | 19,600 | | | | 566,832 | | |
| | | | | | 4,125,929 | | |
190
PACE Small/Medium Co Value Equity Investments
Portfolio of investments—July 31, 2020
| | | Number of
shares | | Value | |
| Common stocks—(concluded) | |
Technology hardware, storage & peripherals—1.7% | |
Diebold Nixdorf, Inc.*,1 | | | 862,670 | | | $ | 6,012,810 | | |
Hewlett Packard Enterprise Co. | | | 4,500 | | | | 44,415 | | |
| | | | | | 6,057,225 | | |
Textiles, apparel & luxury goods—1.4% | |
Capri Holdings Ltd.* | | | 144,700 | | | | 2,167,606 | | |
Samsonite International SA, ADR | | | 617,905 | | | | 2,823,826 | | |
| | | | | | 4,991,432 | | |
Thrifts & mortgage finance—0.5% | |
Essent Group Ltd. | | | 52,440 | | | | 1,878,925 | | |
Trading companies & distributors—1.3% | |
Beacon Roofing Supply, Inc.* | | | 108,330 | | | | 3,375,563 | | |
MSC Industrial Direct Co., Inc., Class A | | | 20,400 | | | | 1,346,604 | | |
| | | | | | 4,722,167 | | |
Total common stocks
(cost—$312,345,235) | | | 342,301,549 | | |
| | | Number of
shares | | Value | |
Short-term investments—3.5% | |
Investment companies—3.5% | |
State Street Institutional U.S. Government
Money Market Fund, 0.09%3
(cost—$12,207,649) | | | 12,207,649 | | | $ | 12,207,649 | | |
Investment of cash collateral from securities loaned—5.5% | |
Money market funds—5.5% | |
State Street Navigator Securities Lending
Government Money Market Portfolio, 0.12%3
(cost—$19,508,290) | | | 19,508,290 | | | | 19,508,290 | | |
Total investments
(cost—$344,061,174) —106.3% | | | 374,017,488 | | |
Liabilities in excess of other assets—(6.3)% | | | | | (22,215,249 | ) | |
Net assets—100.0% | | $ | 351,802,239 | | |
For a listing of defined portfolio acronyms, counterparty acronyms and currency abbreviations that are used throughout the Portfolio of investments as well as the tables that follow, please refer to page 267.
Fair valuation summary
The following is a summary of the fair valuations according to the inputs used as of July 31, 2020 in valuing the Portfolio's investments. In the event a Portfolio holds investments for which fair value is measured using the NAV per share practical expedient (or its equivalent), a separate column will be added to the fair value hierarchy table; this is intended to permit reconciliation to the amounts presented in the Portfolio of investments.
Assets
Description | | Unadjusted
quoted prices in
active markets for
identical investments
(Level 1) | | Other significant
observable inputs
(Level 2) | | Unobservable
inputs
(Level 3) | | Total | |
Common stocks | | $ | 342,301,549 | | | $ | — | | | $ | — | | | $ | 342,301,549 | | |
Short-term investments | | | — | | | | 12,207,649 | | | | — | | | | 12,207,649 | | |
Investment of cash collateral from securities loaned | | | — | | | | 19,508,290 | | | | — | | | | 19,508,290 | | |
Total | | $ | 342,301,549 | | | $ | 31,715,939 | | | $ | — | | | $ | 374,017,488 | | |
At July 31, 2020, there were no transfers in or out of Level 3.
Portfolio footnotes
† Amount represents less than 0.05%
* Non-income producing security.
1 Security, or portion thereof, was on loan at the period end.
2 Security exempt from registration pursuant to Rule 144A under the Securities Act of 1933. These securities are considered liquid, unless noted otherwise, and may be resold in transactions exempt from registration, normally to qualified institutional buyers. Securities exempt from registration pursuant to Rule 144A, in the amount of $596,510, represented 0.2% of the Portfolio's net assets at period end.
3 Rates shown reflect yield at July 31, 2020.
See accompanying notes to financial statements.
191
PACE Small/Medium Co Growth Equity Investments
Performance
For the 12-months ended July 31, 2020, the Portfolio's Class P shares returned 10.64% before the deduction of the maximum PACE Select program fee.1 In comparison, the Russell 2500 Growth Index (the "benchmark") returned 13.42%. (Returns for all share classes over various time periods are shown in the "Performance at a glance" table on page 194. Please note that the returns shown do not reflect the deduction of taxes that a shareholder would pay on Portfolio distributions or the redemption of Portfolio shares.) For a detailed commentary on the market environment in general during the reporting period, please refer to page 2.
Investment Manager's comments2
The Portfolio underperformed its benchmark during the reporting period. Stock selection was the primary detractor to relative returns, despite the majority of sectors posting positive results. Contributions from stock selection in Communication Services and Consumer Discretionary was more than offset by weak selection within the Health Care and Information Technology sectors. In particular, Health Care was weak due to several holdings as well as not holding (or being underweight) several contributors compared to the benchmark's returns, given robust performance in a handful of biotech companies. The Portfolio benefitted from exposure to a handful of companies that experienced robust demand for goods and services based on the COVID-19 pandemic.
The Portfolio's sector positioning was additive on a relative basis, particularly the overweight to Information Technology and underweight to Real Estate. In terms of style, the Portfolio's high beta tilt was offset by lack of momentum exposure and underweight to size leading to muted style impact at the Portfolio level. Investors tended to favor large capitalization businesses that were deemed to be more stable in a very volatile period.
Derivatives were not used during the reporting period.
1 Class P shares held through the PACE Select Advisors Program are subject to a maximum Program fee of 2.50%, which, if included, would have reduced performance. Class P shares held through other advisory programs also may be subject to a program fee, which, if included, would have reduced performance.
2 Performance is discussed on a gross-of-fees basis—meaning that no fees or expenses are reflected when discussed at the level of a subadvisor's sleeve (or subadvisors' sleeves, if applicable). Alternatively, performance at the overall Portfolio level is shown net of fees, which does factor in fees and expenses associated with the Portfolio.
PACE Select Advisors Trust – PACE Small/Medium Co Growth Equity Investments
Investment Manager:
UBS Asset Management (Americas) Inc. ("UBS AM")
Investment Subadvisors:
Riverbridge Partners, LLC ("Riverbridge"); Calamos Advisors LLC ("Calamos"), Jacobs Levy Equity Management, Inc. ("Jacobs Levy")
Portfolio Management Team:
UBS AM: Mabel Lung, CFA, Fred Lee, CFA, Gina Toth, CFA, Ned Sienko, Vincent Russo and Mayoor Joshi
Riverbridge: Mark Thompson;
Calamos: Brandon Nelson
Jacobs Levy: Bruce I. Jacobs and Kenneth N. Levy
Objective:
Capital appreciation
Investment process:
The main strategies of the subadvisors include:
• A growth strategy that focuses on companies viewed as building their earnings power and intrinsic value.
• A strategy in which the subadvisor seeks to identify and exploit the perception gap that exits between a company's business strength and the market's expectation of that strength.
• A strategy in which the subadvisor invests primarily in growth-oriented equity securities of small- and mid-cap companies selected based on a multidimensional quantitative investment process.
192
PACE Small/Medium Co Growth Equity Investments
Mutual funds are sold by prospectus only. You should read it carefully and consider a fund's investment objectives, risks, charges, expenses and other important information contained in the prospectus before investing. Prospectuses for most of our funds can be obtained from your financial advisor, by calling UBS Funds at 800-647 1568 or by visiting our Website at www.ubs.com/am-us.
Special considerations
The Portfolio may be appropriate for long-term investors seeking capital appreciation who are able to withstand short-term fluctuations in the equity markets in return for potentially higher returns over the long term. The value of the Portfolio changes every day and can be affected by changes in interest rates, general market conditions and other political, social and economic developments, as well as specific matters relating to the companies in whose securities the Portfolio invests. It is important to note that an investment in the Portfolio is only one component of a balanced investment plan. In addition, small- and mid-cap companies are typically subject to a greater degree of change in earnings and business prospects than are larger, more established companies. Therefore, they are considered to have a higher level of volatility and risk. Also, to the extent the Portfolio invests a large portion of its assets in a particular sector, the Portfolio may experience greater volatility and risk of loss due to unfavorable developments in that sector.
193
PACE Small/Medium Co Growth Equity Investments
Performance at a glance (unaudited)
Average annual total returns for periods ended 07/31/20 | | 1 year | | 5 years | | 10 years | |
Before deducting maximum sales charge | |
Class A1 | | | 10.43 | % | | | 8.18 | % | | | 12.79 | % | |
Class Y2 | | | 10.60 | | | | 8.40 | | | | 12.98 | | |
Class P3 | | | 10.64 | | | | 8.33 | | | | 12.95 | | |
After deducting maximum sales charge | |
Class A1 | | | 4.35 | | | | 6.96 | | | | 12.16 | | |
Russell 2500 Growth Index4 | | | 13.42 | | | | 10.48 | | | | 14.32 | | |
Most recent calendar quarter-end returns (unaudited)
Average annual total returns for periods ended 06/30/20 | | 1 year | | 5 years | | 10 years | |
Before deducting maximum sales charge | |
Class A1 | | | 5.76 | % | | | 7.40 | % | | | 12.68 | % | |
Class Y2 | | | 5.80 | | | | 7.62 | | | | 12.88 | | |
Class P3 | | | 5.89 | | | | 7.54 | | | | 12.83 | | |
After deducting maximum sales charge | |
Class A1 | | | (0.07 | ) | | | 6.19 | | | | 12.05 | | |
The annualized gross and net expense ratios, respectively, for each class of shares as in the November 27, 2019 prospectuses, were as follows: Class A—1.21% and 1.21%; Class Y—1.08% and 1.08%; and Class P—1.07% and 1.07% Net expenses reflect fee waivers and/or expense reimbursements, if any, pursuant to an agreement that is in effect to cap the expenses. The Portfolio and UBS Asset Management (Americas) Inc. ("UBS AM") have entered into a written fee waiver/expense reimbursement agreement pursuant to which UBS AM is contractually obligated to waive its management fees and/or reimburse expenses so that the Portfolio's ordinary total operating expenses through November 30, 2020 (excluding dividend expense, borrowing costs, and interest expense relating to short sales, and expenses attributable to investment in other investment companies, interest, taxes, brokerage commissions and extraordinary expenses) would not exceed Class A—1.33%; Class Y—1.08%; and Class P—1.08% "Management fee waiver/expense reimbursements" are based on estimated amounts for the current fiscal year. The Portfolio has agreed to repay UBS AM for any waived fees/reimbursed expenses to the extent that it can do so over the following three fiscal years without causing the Portfolio's expenses in any of those three years to exceed this expense cap and that UBS AM has not waived the right to do so. The fee waiver/expense reimbursement agreement may be terminated by the Portfolio's board at any time and also will terminate automatically upon the expiration or termination of the Portfolio's advisory contract with UBS AM. Upon termination of the agreement, however, UBS AM's three year recoupment rights will survive.
1 Maximum sales charge for Class A shares is 5.5%. Class A shares bear ongoing 12b-1 service fees of 0.25% annually.
2 The Portfolio offers Class Y shares to a limited group of eligible investors, including certain qualifying retirement plans. Class Y shares do notbear initial or contingent deferred sales charges or ongoing 12b-1 service and distribution fees.
3 Class P shares do not bear initial or contingent deferred sales charges or ongoing 12b-1 service and distribution fees, but Class P shares held through advisory programs may be subject to a program fee, which, if included, would have reduced performance.
4 The Russell 2500 Growth Index measures the performance of the small to mid-cap growth segment of the US equity universe. It includes those Russell 2500 Index companies with higher price-to-book ratios and higher forecasted growth values. The Russell 2500 Growth Index is constructed to provide a comprehensive and unbiased barometer of the small to mid-cap growth market. The Index is completely reconstituted annually to ensure larger stocks do not distort the performance and characteristics of the true small to mid-cap opportunity set and that the represented companies continue to reflect growth characteristics. Investors should note that indices do not reflect the deduction of fees and expenses.
Prior to August 3, 2015, a 1% redemption fee was imposed on sales or exchanges of any class of shares of the Portfolio made during the specified holding period.
Past performance does not predict future performance, and the performance information provided does not reflect the deduction of taxes that a shareholder would pay on Portfolio distributions or the redemption of Portfolio shares. The return and principal value of an investment will fluctuate, so that an investor's shares, when redeemed, may be worth more or less than their original cost. Performance results assume reinvestment of all dividends and capital gain distributions at net asset value on the ex-dividend dates. Current performance may be higher or lower than the performance data quoted. For month-end performance figures, please visit www.ubs.com/us-mutualfundperformance.
194
PACE Small/Medium Co Growth Equity Investments
Illustration of an assumed investment of $10,000 in Class P shares of the Portfolio (unaudited)
The following graph depicts the performance of PACE Small/Medium Co Growth Equity Investments Class P shares versus the Russell 2500 Growth Index over the 10 years ended July 31, 2020. Class P shares held through advisory programs may be subject to a program fee, which, if included, would have reduced performance. The performance of the other classes will vary based upon the different class specific expenses and sales charges. The performance provided does not reflect the deduction of taxes that a shareholder would pay on Portfolio distributions or the redemption of Portfolio shares. Past performance is no guarantee of future results. Share price and returns will vary with market conditions; investors may realize a gain or loss upon redemption. It is important to note that PACE Small/Medium Co Growth Equity Investments is a professionally managed portfolio while the Index is not available for investment and is unmanaged. The comparison is shown for illustration purposes only.
PACE Small/Medium Co Growth Equity Investments

195
PACE Small/Medium Co Growth Equity Investments
Portfolio statistics—July 31, 2020 (unaudited)
Top ten holdings1 | | Percentage of
net assets | |
Workiva, Inc. | | | 1.3 | % | |
SPS Commerce, Inc. | | | 1.2 | | |
Five Below, Inc. | | | 1.2 | | |
Boston Beer Co., Inc./The, Class A | | | 1.2 | | |
Globant SA | | | 1.1 | | |
Proto Labs, Inc. | | | 1.1 | | |
Inphi Corp. | | | 1.0 | | |
Freshpet, Inc. | | | 1.0 | | |
Varonis Systems, Inc. | | | 0.9 | | |
Amedisys, Inc. | | | 0.9 | | |
Total | | | 10.9 | % | |
Top five issuer breakdown by country or territory of origin1 | | Percentage of
net assets | |
United States | | | 95.1 | % | |
Canada | | | 1.7 | | |
Argentina | | | 1.1 | | |
Israel | | | 1.1 | | |
Bermuda | | | 0.6 | | |
Total | | | 99.6 | % | |
Sectors1 | | Percentage of
net assets | |
Information Technology | | | 31.0 | % | |
Health Care | | | 24.6 | | |
Consumer Discretionary | | | 15.9 | | |
Industrials | | | 13.7 | | |
Financials | | | 5.6 | | |
Consumer Staples | | | 4.3 | | |
Telecommunication Services | | | 2.3 | | |
Materials | | | 1.1 | | |
Communication Services | | | 0.7 | | |
Real Estate | | | 0.3 | | |
Energy | | | 0.1 | | |
Total | | | 99.6 | % | |
1 The Portfolio is actively managed and its composition will vary over time.
196
PACE Small/Medium Co Growth Equity Investments
Portfolio of investments—July 31, 2020
| | | Number of
shares | | Value | |
Common stocks—99.6% | |
Aerospace & defense—0.5% | |
Aerojet Rocketdyne Holdings, Inc.* | | | 8,716 | | | $ | 359,535 | | |
Axon Enterprise, Inc.* | | | 15,365 | | | | 1,277,293 | | |
Vectrus, Inc.* | | | 12,684 | | | | 557,969 | | |
| | | | | | 2,194,797 | | |
Air freight & logistics—0.6% | |
XPO Logistics, Inc.*,1 | | | 34,320 | | | | 2,574,686 | | |
Airlines—0.1% | |
Allegiant Travel Co. | | | 5,260 | | | | 589,278 | | |
Auto components—1.0% | |
Dorman Products, Inc.* | | | 15,938 | | | | 1,302,932 | | |
Gentex Corp. | | | 88,562 | | | | 2,390,288 | | |
Workhorse Group, Inc.* | | | 18,019 | | | | 279,655 | | |
| | | | | | 3,972,875 | | |
Automobiles—0.4% | |
Thor Industries, Inc. | | | 7,518 | | | | 856,977 | | |
Winnebago Industries, Inc. | | | 12,518 | | | | 756,212 | | |
| | | | | | 1,613,189 | | |
Banks—0.1% | |
Altabancorp | | | 4,115 | | | | 77,156 | | |
Baycom Corp.* | | | 813 | | | | 8,358 | | |
Esquire Financial Holdings, Inc.* | | | 1,000 | | | | 15,550 | | |
Hanmi Financial Corp. | | | 25,982 | | | | 239,814 | | |
| | | | | | 340,878 | | |
Beverages—1.5% | |
Boston Beer Co., Inc./The, Class A* | | | 5,954 | | | | 4,825,360 | | |
Coca-Cola Consolidated, Inc. | | | 6,081 | | | | 1,395,954 | | |
| | | | | | 6,221,314 | | |
Biotechnology—7.0% | |
89bio, Inc.* | | | 4,419 | | | | 134,249 | | |
Acceleron Pharma, Inc.* | | | 1,712 | | | | 169,779 | | |
Adamas Pharmaceuticals, Inc.* | | | 16,278 | | | | 40,369 | | |
Aduro Biotech, Inc.* | | | 46,946 | | | | 132,388 | | |
Adverum Biotechnologies, Inc.* | | | 16,100 | | | | 269,997 | | |
Aeglea BioTherapeutics, Inc.* | | | 33,275 | | | | 227,934 | | |
Agenus, Inc.* | | | 43,168 | | | | 131,231 | | |
Agios Pharmaceuticals, Inc.* | | | 6,926 | | | | 313,886 | | |
Akebia Therapeutics, Inc.* | | | 68,258 | | | | 762,442 | | |
Akero Therapeutics, Inc.*,1 | | | 25,149 | | | | 882,981 | | |
Aldeyra Therapeutics, Inc.* | | | 34,265 | | | | 220,324 | | |
Alector, Inc.* | | | 8,554 | | | | 134,041 | | |
Apellis Pharmaceuticals, Inc.* | | | 34,747 | | | | 899,600 | | |
Aravive, Inc.*,1 | | | 2,686 | | | | 15,821 | | |
Atara Biotherapeutics, Inc.* | | | 15,522 | | | | 192,318 | | |
Atreca, Inc. Class A*,1 | | | 3,635 | | | | 47,073 | | |
AVEO Pharmaceuticals, Inc.* | | | 34,050 | | | | 145,053 | | |
Axcella Health, Inc.* | | | 17,105 | | | | 76,801 | | |
Beyondspring, Inc.* | | | 10,775 | | | | 118,848 | | |
Biohaven Pharmaceutical Holding Co. Ltd.* | | | 20,633 | | | | 1,321,337 | | |
Bluebird Bio, Inc.* | | | 9,490 | | | | 576,043 | | |
| | | Number of
shares | | Value | |
Common stocks—(continued) | |
Biotechnology—(continued) | |
Blueprint Medicines Corp.* | | | 4,437 | | | $ | 324,700 | | |
Calithera Biosciences, Inc.* | | | 13,782 | | | | 64,775 | | |
Castle Biosciences, Inc.* | | | 24,784 | | | | 959,636 | | |
Catabasis Pharmaceuticals, Inc.* | | | 5,206 | | | | 30,091 | | |
Catalyst Pharmaceuticals, Inc.* | | | 26,100 | | | | 112,230 | | |
Coherus Biosciences, Inc.*,1 | | | 35,902 | | | | 631,516 | | |
Corbus Pharmaceuticals Holdings, Inc.*,1 | | | 48,280 | | | | 302,716 | | |
Cytokinetics, Inc.*,1 | | | 36,907 | | | | 797,929 | | |
CytomX Therapeutics, Inc.* | | | 59,864 | | | | 419,647 | | |
Dicerna Pharmaceuticals, Inc.* | | | 13,861 | | | | 298,012 | | |
Eagle Pharmaceuticals, Inc.* | | | 18,632 | | | | 864,338 | | |
Editas Medicine, Inc.*,1 | | | 30,697 | | | | 901,264 | | |
Eiger BioPharmaceuticals, Inc.* | | | 41,048 | | | | 412,532 | | |
Enanta Pharmaceuticals, Inc.* | | | 31,577 | | | | 1,447,805 | | |
Esperion Therapeutics, Inc.*,1 | | | 6,500 | | | | 244,595 | | |
Fortress Biotech, Inc.* | | | 13,612 | | | | 37,773 | | |
Frequency Therapeutics, Inc.* | | | 1,859 | | | | 39,299 | | |
G1 Therapeutics, Inc.*,1 | | | 9,136 | | | | 134,025 | | |
Gossamer Bio, Inc.*,1 | | | 40,480 | | | | 482,522 | | |
Halozyme Therapeutics, Inc.* | | | 13,602 | | | | 369,838 | | |
Harpoon Therapeutics, Inc.* | | | 7,461 | | | | 82,146 | | |
Homology Medicines, Inc.* | | | 40,792 | | | | 536,415 | | |
Ideaya Biosciences, Inc.* | | | 5,246 | | | | 66,152 | | |
ImmunoGen, Inc.* | | | 47,900 | | | | 196,869 | | |
Immunomedics, Inc.*,1 | | | 10,235 | | | | 432,224 | | |
Intercept Pharmaceuticals, Inc.*,1 | | | 14,462 | | | | 660,046 | | |
Ionis Pharmaceuticals, Inc.* | | | 31,245 | | | | 1,798,462 | | |
KalVista Pharmaceuticals, Inc.* | | | 7,512 | | | | 73,843 | | |
Kiniksa Pharmaceuticals Ltd., Class A* | | | 9,262 | | | | 180,794 | | |
La Jolla Pharmaceutical Co.*,1 | | | 11,115 | | | | 44,238 | | |
Magenta Therapeutics, Inc.*,1 | | | 6,541 | | | | 45,918 | | |
Minerva Neurosciences, Inc.*,1 | | | 34,918 | | | | 121,689 | | |
Momenta Pharmaceuticals, Inc.* | | | 4,132 | | | | 121,853 | | |
Morphic Holding, Inc.*,1 | | | 7,699 | | | | 173,305 | | |
Mustang Bio, Inc.* | | | 41,907 | | | | 129,074 | | |
Myovant Sciences Ltd.* | | | 23,500 | | | | 357,200 | | |
Natera, Inc.* | | | 7,284 | | | | 349,778 | | |
Oyster Point Pharma, Inc.*,1 | | | 1,872 | | | �� | 41,877 | | |
Pfenex, Inc.* | | | 67,959 | | | | 481,829 | | |
Pieris Pharmaceuticals, Inc.* | | | 23,707 | | | | 60,927 | | |
Precision BioSciences, Inc.* | | | 19,540 | | | | 124,274 | | |
Protagonist Therapeutics, Inc.* | | | 9,677 | | | | 152,219 | | |
PTC Therapeutics, Inc.* | | | 10,393 | | | | 481,508 | | |
Puma Biotechnology, Inc.*,1 | | | 11,883 | | | | 122,514 | | |
Radius Health, Inc.* | | | 81,647 | | | | 1,024,670 | | |
REGENXBIO, Inc.* | | | 11,793 | | | | 390,348 | | |
Retrophin, Inc.* | | | 83,323 | | | | 1,656,461 | | |
Rubius Therapeutics, Inc.*,1 | | | 53,972 | | | | 265,003 | | |
Sage Therapeutics, Inc.* | | | 11,530 | | | | 525,422 | | |
Scholar Rock Holding Corp.*,1 | | | 16,538 | | | | 186,714 | | |
Selecta Biosciences, Inc.*,1 | | | 21,965 | | | | 52,277 | | |
Spero Therapeutics, Inc.*,1 | | | 27,270 | | | | 319,059 | | |
SpringWorks Therapeutics, Inc.* | | | 4,575 | | | | 195,032 | | |
Stoke Therapeutics, Inc.*,1 | | | 1,967 | | | | 49,549 | | |
Sutro Biopharma, Inc.* | | | 2,707 | | | | 21,033 | | |
Syros Pharmaceuticals, Inc.* | | | 11,400 | | | | 108,186 | | |
197
PACE Small/Medium Co Growth Equity Investments
Portfolio of investments—July 31, 2020
| | | Number of
shares | | Value | |
Common stocks—(continued) | |
Biotechnology—(concluded) | |
TCR2 Therapeutics, Inc.*,1 | | | 6,750 | | | $ | 113,063 | | |
Ultragenyx Pharmaceutical, Inc.*,1 | | | 10,364 | | | | 810,050 | | |
UNITY Biotechnology, Inc.*,1 | | | 41,467 | | | | 391,034 | | |
Voyager Therapeutics, Inc.* | | | 6,547 | | | | 72,475 | | |
| | | | | | 28,703,288 | | |
Building products—1.2% | |
Advanced Drainage Systems, Inc. | | | 15,548 | | | | 761,852 | | |
Apogee Enterprises, Inc. | | | 36,942 | | | | 797,578 | | |
AZEK Co., Inc./The* | | | 5,721 | | | | 197,375 | | |
Builders FirstSource, Inc.* | | | 30,715 | | | | 727,638 | | |
Masonite International Corp.* | | | 18,884 | | | | 1,592,865 | | |
Trex Co., Inc.* | | | 4,923 | | | | 685,922 | | |
| | | | | | 4,763,230 | | |
Capital markets—1.2% | |
Brightsphere Investment Group, Inc.* | | | 74,262 | | | | 998,081 | | |
Cowen, Inc., Class A | | | 36,710 | | | | 604,614 | | |
LPL Financial Holdings, Inc. | | | 43,079 | | | | 3,404,103 | | |
| | | | | | 5,006,798 | | |
Chemicals—0.5% | |
Orion Engineered Carbons SA | | | 12,298 | | | | 125,440 | | |
W. R. Grace & Co. | | | 39,400 | | | | 1,817,522 | | |
| | | | | | 1,942,962 | | |
Commercial services & supplies—2.0% | |
Healthcare Services Group, Inc. | | | 113,995 | | | | 2,985,529 | | |
Interface, Inc. | | | 52,148 | | | | 416,141 | | |
Montrose Environmental Group, Inc.* | | | 24,790 | | | | 539,183 | | |
Pitney Bowes, Inc. | | | 199,419 | | | | 666,059 | | |
Ritchie Bros Auctioneers, Inc. | | | 80,761 | | | | 3,737,619 | | |
| | | | | | 8,344,531 | | |
Communications equipment—1.3% | |
AudioCodes Ltd. | | | 19,036 | | | | 687,009 | | |
Calix, Inc.* | | | 26,665 | | | | 546,899 | | |
Casa Systems, Inc.* | | | 59,919 | | | | 336,146 | | |
CommScope Holding Co., Inc.* | | | 70,647 | | | | 655,604 | | |
Extreme Networks, Inc.* | | | 316,911 | | | | 1,441,945 | | |
Infinera Corp.* | | | 107,697 | | | | 849,730 | | |
Plantronics, Inc.1 | | | 37,671 | | | | 753,043 | | |
| | | | | | 5,270,376 | | |
Construction & engineering—1.7% | |
EMCOR Group, Inc. | | | 24,900 | | | | 1,705,650 | | |
MYR Group, Inc.* | | | 24,457 | | | | 896,838 | | |
Primoris Services Corp. | | | 21,149 | | | | 339,018 | | |
Quanta Services, Inc. | | | 32,150 | | | | 1,285,036 | | |
WillScot Mobile Mini Holdings Corp.* | | | 182,565 | | | | 2,749,429 | | |
| | | | | | 6,975,971 | | |
Construction materials—0.0%† | |
Forterra, Inc.* | | | 2,812 | | | | 36,528 | | |
| | | Number of
shares | | Value | |
Common stocks—(continued) | |
Consumer finance—1.1% | |
Green Dot Corp., Class A* | | | 50,767 | | | $ | 2,573,379 | | |
PRA Group, Inc.*,1 | | | 53,563 | | | | 2,118,952 | | |
| | | | | | 4,692,331 | | |
Containers & packaging—0.1% | |
Myers Industries, Inc. | | | 20,182 | | | | 303,941 | | |
Distributors—0.3% | |
Core-Mark Holding Co., Inc. | | | 45,033 | | | | 1,194,275 | | |
Diversified consumer services—2.1% | |
Chegg, Inc.* | | | 10,384 | | | | 840,792 | | |
Grand Canyon Education, Inc.* | | | 38,698 | | | | 3,434,061 | | |
Perdoceo Education Corp.* | | | 85,067 | | | | 1,224,965 | | |
ServiceMaster Global Holdings, Inc.* | | | 56,354 | | | | 2,304,315 | | |
Strategic Education, Inc. | | | 1,922 | | | | 242,576 | | |
Universal Technical Institute, Inc.* | | | 51,550 | | | | 383,016 | | |
| | | | | | 8,429,725 | | |
Diversified telecommunication services—1.0% | |
Bandwidth, Inc., Class A* | | | 3,444 | | | | 498,622 | | |
Cogent Communications Holdings, Inc. | | | 31,964 | | | | 2,880,276 | | |
Ooma, Inc.*,1 | | | 38,637 | | | | 584,964 | | |
| | | | | | 3,963,862 | | |
Electrical equipment—1.0% | |
Allied Motion Technologies, Inc. | | | 7,891 | | | | 297,491 | | |
Atkore International Group, Inc.* | | | 40,535 | | | | 1,081,069 | | |
Generac Holdings, Inc.* | | | 10,397 | | | | 1,638,359 | | |
TPI Composites, Inc.* | | | 42,754 | | | | 1,093,647 | | |
| | | | | | 4,110,566 | | |
Electronic equipment, instruments & components—1.6% | |
II-VI, Inc.* | | | 13,299 | | | | 674,525 | | |
Jabil, Inc. | | | 46,327 | | | | 1,614,959 | | |
Napco Security Technologies, Inc.* | | | 17,062 | | | | 450,096 | | |
National Instruments Corp. | | | 62,008 | | | | 2,201,284 | | |
Rogers Corp.* | | | 12,025 | | | | 1,433,260 | | |
| | | | | | 6,374,124 | | |
Entertainment—0.2% | |
Glu Mobile, Inc.* | | | 85,400 | | | | 806,176 | | |
Sciplay Corp. Class A* | | | 12,006 | | | | 175,528 | | |
| | | | | | 981,704 | | |
Food & staples retailing—0.1% | |
Grocery Outlet Holding Corp.* | | | 4,852 | | | | 213,439 | | |
Food products—1.8% | |
Calavo Growers, Inc. | | | 20,780 | | | | 1,200,461 | | |
Freshpet, Inc.* | | | 42,919 | | | | 4,122,370 | | |
Sanderson Farms, Inc. | | | 16,976 | | | | 1,892,739 | | |
| | | | | | 7,215,570 | | |
198
PACE Small/Medium Co Growth Equity Investments
Portfolio of investments—July 31, 2020
| | | Number of
shares | | Value | |
Common stocks—(continued) | |
Health care equipment & supplies—5.6% | |
Accuray, Inc.* | | | 204,800 | | | $ | 456,704 | | |
Axonics Modulation Technologies, Inc.*,1 | | | 25,529 | | | | 1,081,408 | | |
BioLife Solutions, Inc.* | | | 8,588 | | | | 166,006 | | |
Cardiovascular Systems, Inc.* | | | 39,100 | | | | 1,191,768 | | |
Heska Corp.*,1 | | | 18,085 | | | | 1,740,139 | | |
ICU Medical, Inc.* | | | 11,149 | | | | 2,048,406 | | |
Inogen, Inc.* | | | 16,940 | | | | 520,058 | | |
Itamar Medical Ltd., ADR* | | | 38,184 | | | | 971,783 | | |
Lantheus Holdings, Inc.* | | | 25,572 | | | | 344,711 | | |
LivaNova PLC* | | | 33,962 | | | | 1,580,591 | | |
Merit Medical Systems, Inc.* | | | 46,638 | | | | 2,085,651 | | |
Natus Medical, Inc.* | | | 36,269 | | | | 673,878 | | |
Neogen Corp.* | | | 33,115 | | | | 2,542,239 | | |
Novocure Ltd.* | | | 16,309 | | | | 1,236,059 | | |
OrthoPediatrics Corp.*,1 | | | 31,708 | | | | 1,337,760 | | |
Quidel Corp.* | | | 1,797 | | | | 507,599 | | |
Repro-Med Systems, Inc.*,1 | | | 32,185 | | | | 335,690 | | |
Staar Surgical Co.* | | | 7,336 | | | | 426,882 | | |
Surmodics, Inc.* | | | 18,600 | | | | 879,594 | | |
Tandem Diabetes Care, Inc.* | | | 6,175 | | | | 645,040 | | |
Vapotherm, Inc.* | | | 18,622 | | | | 972,813 | | |
Zynex, Inc.* | | | 53,019 | | | | 1,013,723 | | |
| | | | | | 22,758,502 | | |
Health care providers & services—5.7% | |
1Life Healthcare, Inc.* | | | 19,887 | | | | 588,854 | | |
Addus HomeCare Corp.* | | | 3,191 | | | | 307,644 | | |
Amedisys, Inc.* | | | 16,358 | | | | 3,830,389 | | |
AMN Healthcare Services, Inc.* | | | 50,484 | | | | 2,773,591 | | |
Chemed Corp. | | | 7,181 | | | | 3,534,416 | | |
Ensign Group, Inc./The | | | 43,446 | | | | 1,998,082 | | |
Exagen, Inc.* | | | 8,380 | | | | 104,331 | | |
LHC Group, Inc.* | | | 3,619 | | | | 706,103 | | |
Magellan Health, Inc.* | | | 19,816 | | | | 1,469,753 | | |
Molina Healthcare, Inc.* | | | 18,912 | | | | 3,493,046 | | |
Pennant Group, Inc./The* | | | 8,131 | | | | 203,763 | | |
PetIQ, Inc.*,1 | | | 43,422 | | | | 1,584,469 | | |
Providence Service Corp./The* | | | 9,490 | | | | 768,785 | | |
US Physical Therapy, Inc. | | | 23,191 | | | | 1,926,245 | | |
| | | | | | 23,289,471 | | |
Health care technology—2.2% | |
Health Catalyst, Inc.*,1 | | | 44,854 | | | | 1,565,405 | | |
Icad, Inc.*,1 | | | 19,141 | | | | 176,480 | | |
Inovalon Holdings, Inc., Class A* | | | 97,200 | | | | 2,287,116 | | |
Inspire Medical Systems, Inc.* | | | 22,029 | | | | 2,188,801 | | |
Phreesia, Inc.* | | | 12,136 | | | | 364,808 | | |
Simulations Plus, Inc. | | | 4,339 | | | | 305,466 | | |
Teladoc Health, Inc.* | | | 2,517 | | | | 598,115 | | |
Vocera Communications, Inc.* | | | 50,365 | | | | 1,549,731 | | |
| | | | | | 9,035,922 | | |
Hotels, restaurants & leisure—2.2% | |
DraftKings, Inc., Class A*,1 | | | 8,215 | | | | 274,176 | | |
Everi Holdings, Inc.* | | | 48,045 | | | | 272,896 | | |
GAN Ltd.* | | | 46,736 | | | | 904,342 | | |
Jack in the Box, Inc. | | | 7,988 | | | | 655,895 | | |
| | | Number of
shares | | Value | |
Common stocks—(continued) | |
Hotels, restaurants & leisure—(concluded) | |
Marriott Vacations Worldwide Corp. | | | 7,043 | | | $ | 596,260 | | |
Noodles & Co.* | | | 20,892 | | | | 145,199 | | |
PlayAGS, Inc.* | | | 101,155 | | | | 341,904 | | |
Scientific Games Corp., Class A* | | | 63,281 | | | | 1,111,847 | | |
Twin River Worldwide Holdings, Inc. | | | 39,856 | | | | 859,295 | | |
Wingstop, Inc. | | | 24,330 | | | | 3,801,562 | | |
| | | | | | 8,963,376 | | |
Household durables—3.8% | |
Century Communities, Inc.* | | | 12,619 | | | | 449,489 | | |
GoPro, Inc., Class A* | | | 237,600 | | | | 1,256,904 | | |
Hamilton Beach Brands Holding Co., Class A | | | 9,165 | | | | 139,308 | | |
iRobot Corp.*,1 | | | 19,551 | | | | 1,421,162 | | |
LGI Homes, Inc.*,1 | | | 11,831 | | | | 1,350,035 | | |
Lovesac Co./The*,1 | | | 17,286 | | | | 549,349 | | |
NVR, Inc.* | | | 974 | | | | 3,827,966 | | |
Purple Innovation, Inc.* | | | 23,921 | | | | 582,955 | | |
Sonos, Inc.* | | | 145,414 | | | | 2,326,624 | | |
Tempur Sealy International, Inc.* | | | 18,860 | | | | 1,526,717 | | |
TopBuild Corp.* | | | 10,988 | | | | 1,449,537 | | |
Universal Electronics, Inc.* | | | 15,338 | | | | 706,622 | | |
| | | | | | 15,586,668 | | |
Insurance—2.8% | |
Alleghany Corp. | | | 2,845 | | | | 1,486,000 | | |
Axis Capital Holdings Ltd. | | | 31,905 | | | | 1,280,029 | | |
Goosehead Insurance, Inc., Class A*,1 | | | 24,920 | | | | 2,574,984 | | |
James River Group Holdings Ltd. | | | 22,444 | | | | 1,039,606 | | |
Kinsale Capital Group, Inc. | | | 1,576 | | | | 307,162 | | |
Palomar Holdings, Inc.* | | | 16,105 | | | | 1,471,031 | | |
RenaissanceRe Holdings Ltd. | | | 13,768 | | | | 2,483,472 | | |
Trean Insurance Group, Inc.* | | | 18,564 | | | | 289,598 | | |
Universal Insurance Holdings, Inc. | | | 17,020 | | | | 298,020 | | |
| | | | | | 11,229,902 | | |
Interactive media & services—0.6% | |
EverQuote, Inc., Class A* | | | 14,354 | | | | 781,575 | | |
Travelzoo* | | | 3,462 | | | | 21,222 | | |
Yelp, Inc.* | | | 67,759 | | | | 1,692,620 | | |
| | | | | | 2,495,417 | | |
Internet & direct marketing retail—0.5% | |
CarParts.com, Inc.*,1 | | | 30,239 | | | | 415,635 | | |
Quotient Technology, Inc.* | | | 26,800 | | | | 214,668 | | |
Stamps.com, Inc.* | | | 5,254 | | | | 1,367,511 | | |
| | | | | | 1,997,814 | | |
IT services—1.7% | |
Brightcove, Inc.* | | | 51,025 | | | | 539,844 | | |
Cass Information Systems, Inc. | | | 21,114 | | | | 756,515 | | |
Endurance International Group Holdings, Inc.* | | | 173,538 | | | | 983,960 | | |
ExlService Holdings, Inc.* | | | 22,427 | | | | 1,436,674 | | |
GDS Holdings Ltd., ADR*,1 | | | 8,718 | | | | 699,968 | | |
MAXIMUS, Inc. | | | 29,179 | | | | 2,165,374 | | |
Unisys Corp.* | | | 32,363 | | | | 384,796 | | |
| | | | | | 6,967,131 | | |
199
PACE Small/Medium Co Growth Equity Investments
Portfolio of investments—July 31, 2020
| | | Number of
shares | | Value | |
Common stocks—(continued) | |
Leisure products—0.7% | |
Callaway Golf Co. | | | 18,369 | | | $ | 349,929 | | |
Malibu Boats, Inc., Class A* | | | 7,206 | | | | 423,569 | | |
Sturm Ruger & Co., Inc. | | | 17,784 | | | | 1,447,084 | | |
YETI Holdings, Inc.* | | | 12,253 | | | | 599,049 | | |
| | | | | | 2,819,631 | | |
Life sciences tools & services—1.2% | |
Adaptive Biotechnologies Corp.* | | | 9,885 | | | | 368,908 | | |
Bio-Techne Corp. | | | 13,122 | | | | 3,610,650 | | |
Fluidigm Corp.* | | | 54,871 | | | | 386,292 | | |
Pacific Biosciences of California, Inc.* | | | 19,579 | | | | 73,030 | | |
PRA Health Sciences, Inc.* | | | 2,024 | | | | 215,677 | | |
Repligen Corp.* | | | 2,218 | | | | 334,718 | | |
| | | | | | 4,989,275 | | |
Machinery—2.8% | |
Energy Recovery, Inc.*,1 | | | 23,268 | | | | 176,604 | | |
Kadant, Inc. | | | 13,909 | | | | 1,509,266 | | |
Kornit Digital Ltd.* | | | 46,525 | | | | 2,493,275 | | |
Meritor, Inc.* | | | 90,111 | | | | 2,050,025 | | |
Proto Labs, Inc.* | | | 35,788 | | | | 4,298,855 | | |
REV Group, Inc. | | | 25,753 | | | | 167,394 | | |
Shyft Group Inc/The | | | 33,060 | | | | 624,173 | | |
| | | | | | 11,319,592 | | |
Media—1.4% | |
Altice USA, Inc., Class A* | | | 19,871 | | | | 536,318 | | |
Cable One, Inc. | | | 1,942 | | | | 3,539,412 | | |
Cardlytics, Inc.*,1 | | | 12,674 | | | | 841,807 | | |
iClick Interactive Asia Group Ltd. ADR*,1 | | | 97,978 | | | | 711,320 | | |
| | | | | | 5,628,857 | | |
Multiline retail—0.9% | |
Ollie's Bargain Outlet Holdings, Inc.* | | | 33,378 | | | | 3,508,028 | | |
Oil, gas & consumable fuels—0.1% | |
Dorian LPG Ltd.* | | | 39,728 | | | | 339,277 | | |
Paper & forest products—0.5% | |
Boise Cascade Co. | | | 31,000 | | | | 1,444,290 | | |
Louisiana-Pacific Corp. | | | 23,466 | | | | 743,168 | | |
| | | | | | 2,187,458 | | |
Personal products—1.0% | |
Herbalife Nutrition Ltd.* | | | 16,710 | | | | 856,221 | | |
Lifevantage Corp.* | | | 25,085 | | | | 322,091 | | |
Medifast, Inc. | | | 9,162 | | | | 1,531,245 | | |
Revlon, Inc., Class A*,1 | | | 7,613 | | | | 48,114 | | |
USANA Health Sciences, Inc.* | | | 13,977 | | | | 1,134,653 | | |
| | | | | | 3,892,324 | | |
Pharmaceuticals—2.8% | |
Amphastar Pharmaceuticals, Inc.* | | | 29,164 | | | | 583,863 | | |
Avadel Pharmaceuticals PLC ADR*,1 | | | 21,048 | | | | 164,806 | | |
Axsome Therapeutics, Inc.*,1 | | | 4,540 | | | | 323,838 | | |
Cara Therapeutics, Inc.*,1 | | | 18,879 | | | | 310,371 | | |
Chiasma, Inc.* | | | 47,645 | | | | 208,209 | | |
Corcept Therapeutics, Inc.*,1 | | | 78,317 | | | | 1,170,839 | | |
| | | Number of
shares | | Value | |
Common stocks—(continued) | |
Pharmaceuticals—(concluded) | |
CorMedix, Inc.* | | | 3,913 | | | $ | 17,413 | | |
Endo International PLC* | | | 131,905 | | | | 459,029 | | |
Fulcrum Therapeutics, Inc.*,1 | | | 3,080 | | | | 48,880 | | |
Intersect ENT, Inc.* | | | 28,974 | | | | 498,063 | | |
Kaleido Biosciences, Inc.*,1 | | | 6,318 | | | | 37,718 | | |
Marinus Pharmaceuticals, Inc.*,1 | | | 14,401 | | | | 24,194 | | |
MyoKardia, Inc.* | | | 7,122 | | | | 641,906 | | |
NGM Biopharmaceuticals, Inc.*,1 | | | 41,341 | | | | 756,127 | | |
Odonate Therapeutics, Inc.* | | | 13,979 | | | | 508,416 | | |
Otonomy, Inc.* | | | 15,929 | | | | 55,911 | | |
Pacira BioSciences, Inc.* | | | 36,100 | | | | 1,899,221 | | |
Progenic Pharmaceuticals Inc. | | | 76,855 | | | | 0 | | |
Recro Pharma, Inc.* | | | 59,966 | | | | 245,261 | | |
Revance Therapeutics, Inc.* | | | 7,660 | | | | 179,857 | | |
Strongbridge Biopharma PLC* | | | 41,974 | | | | 141,452 | | |
Supernus Pharmaceuticals, Inc.* | | | 44,076 | | | | 981,352 | | |
Theravance Biopharma, Inc.*,1 | | | 68,899 | | | | 1,338,019 | | |
Tricida, Inc.* | | | 20,613 | | | | 275,802 | | |
WaVe Life Sciences Ltd.*,1 | | | 59,650 | | | | 523,727 | | |
Zogenix, Inc.* | | | 7,964 | | | | 189,463 | | |
| | | | | | 11,583,737 | | |
Professional services—2.2% | |
Barrett Business Services, Inc. | | | 14,500 | | | | 763,860 | | |
Exponent, Inc. | | | 34,404 | | | | 2,892,000 | | |
Insperity, Inc. | | | 33,851 | | | | 2,263,278 | | |
Kforce, Inc. | | | 22,293 | | | | 642,930 | | |
TriNet Group, Inc.* | | | 35,164 | | | | 2,320,824 | | |
| | | | | | 8,882,892 | | |
Real estate management & development—0.3% | |
Altisource Portfolio Solutions SA* | | | 3,476 | | | | 46,683 | | |
Cushman & Wakefield PLC*,1 | | | 10,006 | | | | 107,064 | | |
Redfin Corp.* | | | 27,813 | | | | 1,156,464 | | |
| | | | | | 1,310,211 | | |
Road & rail—1.3% | |
Heartland Express, Inc. | | | 12,992 | | | | 263,543 | | |
Knight-Swift Transportation Holdings, Inc.1 | | | 11,487 | | | | 499,570 | | |
Landstar System, Inc. | | | 25,156 | | | | 3,063,498 | | |
Saia, Inc.* | | | 7,667 | | | | 915,823 | | |
Schneider National, Inc., Class B | | | 16,527 | | | | 415,323 | | |
| | | | | | 5,157,757 | | |
Semiconductors & semiconductor equipment—4.9% | |
ACM Research, Inc., Class A* | | | 7,751 | | | | 743,631 | | |
Advanced Energy Industries, Inc.* | | | 6,499 | | | | 478,131 | | |
Ambarella, Inc.* | | | 20,351 | | | | 921,493 | | |
Cabot Microelectronics Corp. | | | 11,357 | | | | 1,711,727 | | |
Diodes, Inc.* | | | 13,660 | | | | 702,807 | | |
Everspin Technologies, Inc.* | | | 24,977 | | | | 209,557 | | |
Impinj, Inc.*,1 | | | 7,103 | | | | 167,631 | | |
Inphi Corp.* | | | 32,629 | | | | 4,263,305 | | |
Lattice Semiconductor Corp.* | | | 19,413 | | | | 603,550 | | |
NeoPhotonics Corp.* | | | 82,097 | | | | 747,904 | | |
PDF Solutions, Inc.* | | | 18,907 | | | | 464,734 | | |
Pixelworks, Inc.* | | | 47,545 | | | | 151,669 | | |
200
PACE Small/Medium Co Growth Equity Investments
Portfolio of investments—July 31, 2020
| | | Number of
shares | | Value | |
Common stocks—(continued) | |
Semiconductors & semiconductor equipment—(concluded) | |
Power Integrations, Inc. | | | 20,041 | | | $ | 2,445,603 | | |
Silicon Laboratories, Inc.* | | | 16,932 | | | | 1,701,835 | | |
SiTime Corp.* | | | 16,709 | | | | 888,083 | | |
SMART Global Holdings, Inc.* | | | 24,786 | | | | 691,282 | | |
Synaptics, Inc.* | | | 38,849 | | | | 3,108,697 | | |
| | | | | | 20,001,639 | | |
Software—19.9% | |
2U, Inc.*,1 | | | 47,603 | | | | 2,241,863 | | |
A10 Networks, Inc.* | | | 101,699 | | | | 821,728 | | |
Agilysys, Inc.* | | | 47,391 | | | | 993,315 | | |
Alarm.com Holdings, Inc.* | | | 44,540 | | | | 3,119,582 | | |
American Software, Inc. Class A | | | 3,850 | | | | 63,410 | | |
Avaya Holdings Corp.* | | | 113,442 | | | | 1,436,176 | | |
Benefitfocus, Inc.* | | | 24,592 | | | | 287,972 | | |
Bill.Com Holdings, Inc.* | | | 3,412 | | | | 317,691 | | |
Blackline, Inc.* | | | 37,070 | | | | 3,295,894 | | |
Box, Inc., Class A* | | | 145,605 | | | | 2,613,610 | | |
Ceridian HCM Holding, Inc.* | | | 42,870 | | | | 3,356,292 | | |
ChannelAdvisor Corp.* | | | 25,800 | | | | 525,546 | | |
CommVault Systems, Inc.* | | | 53,800 | | | | 2,371,504 | | |
Cornerstone OnDemand, Inc.* | | | 59,506 | | | | 2,113,058 | | |
Descartes Systems Group, Inc./The*,1 | | | 28,677 | | | | 1,615,375 | | |
Domo, Inc., Class B* | | | 9,400 | | | | 302,492 | | |
Dropbox, Inc., Class A* | | | 38,981 | | | | 886,818 | | |
Dynatrace, Inc.* | | | 8,886 | | | | 371,701 | | |
eGain Corp.* | | | 15,651 | | | | 155,101 | | |
Everbridge, Inc.*,1 | | | 5,001 | | | | 714,143 | | |
FireEye, Inc.* | | | 158,600 | | | | 2,394,860 | | |
Five9, Inc.* | | | 30,784 | | | | 3,719,323 | | |
Globant SA* | | | 26,852 | | | | 4,643,785 | | |
MicroStrategy, Inc., Class A* | | | 16,936 | | | | 2,098,709 | | |
Mitek Systems, Inc.* | | | 30,991 | | | | 317,968 | | |
MobileIron, Inc.* | | | 206,745 | | | | 1,288,021 | | |
Model N, Inc.* | | | 24,129 | | | | 928,001 | | |
New Relic, Inc.* | | | 33,952 | | | | 2,407,536 | | |
Paylocity Holding Corp.* | | | 16,279 | | | | 2,168,363 | | |
Pegasystems, Inc. | | | 30,618 | | | | 3,578,938 | | |
Ping Identity Holding Corp.*,1 | | | 22,858 | | | | 785,401 | | |
Pluralsight, Inc., Class A*,1 | | | 72,478 | | | | 1,534,359 | | |
Progress Software Corp. | | | 23,327 | | | | 813,179 | | |
PROS Holdings, Inc.* | | | 31,188 | | | | 1,017,665 | | |
QAD, Inc., Class A | | | 14,500 | | | | 572,895 | | |
Rapid7, Inc.* | | | 20,771 | | | | 1,237,329 | | |
RingCentral, Inc., Class A* | | | 5,591 | | | | 1,622,900 | | |
Rosetta Stone, Inc.* | | | 7,761 | | | | 207,762 | | |
Sapiens International Corp. N.V. | | | 8,043 | | | | 245,794 | | |
Sprout Social, Inc., Class A*,1 | | | 30,155 | | | | 871,178 | | |
SPS Commerce, Inc.* | | | 67,465 | | | | 5,071,344 | | |
SVMK, Inc.* | | | 29,383 | | | | 704,604 | | |
Telenav, Inc.* | | | 50,200 | | | | 260,287 | | |
Tenable Holdings, Inc.* | | | 33,157 | | | | 1,125,017 | | |
Teradata Corp.* | | | 100,546 | | | | 2,111,466 | | |
Varonis Systems, Inc.*,1 | | | 35,679 | | | | 3,865,820 | | |
Verint Systems, Inc.* | | | 18,875 | | | | 847,299 | | |
Workiva, Inc.* | | | 96,773 | | | | 5,409,611 | | |
Xperi Holding Corp. | | | 3,837 | | | | 70,754 | | |
| | | Number of
shares | | Value | |
Common stocks—(concluded) | |
Software—(concluded) | |
Zscaler, Inc.* | | | 12,159 | | | $ | 1,578,846 | | |
| | | | | | 81,102,285 | | |
Specialty retail—3.8% | |
Five Below, Inc.* | | | 45,212 | | | | 4,924,039 | | |
Floor & Decor Holdings, Inc., Class A* | | | 47,073 | | | | 3,102,111 | | |
Lithia Motors, Inc., Class A | | | 9,943 | | | | 2,278,439 | | |
National Vision Holdings, Inc.* | | | 61,579 | | | | 1,969,912 | | |
OneWater Marine, Inc. Class A* | | | 19,517 | | | | 487,925 | | |
Rent-A-Center, Inc. | | | 55,182 | | | | 1,595,863 | | |
Sonic Automotive, Inc., Class A | | | 4,495 | | | | 171,349 | | |
Sportsman's Warehouse Holdings, Inc.* | | | 54,880 | | | | 883,019 | | |
| | | | | | 15,412,657 | | |
Technology hardware, storage & peripherals—1.2% | |
Avid Technology, Inc.* | | | 108,301 | | | | 891,317 | | |
Diebold Nixdorf, Inc.*,1 | | | 13,100 | | | | 91,307 | | |
Pure Storage, Inc., Class A* | | | 133,500 | | | | 2,384,310 | | |
Quantum Corp.*,1 | | | 18,242 | | | | 79,353 | | |
Super Micro Computer, Inc.* | | | 45,013 | | | | 1,364,119 | | |
| | | | | | 4,810,406 | | |
Textiles, apparel & luxury goods—0.3% | |
Deckers Outdoor Corp.* | | | 5,033 | | | | 1,053,155 | | |
Thrifts & mortgage finance—0.3% | |
Axos Financial, Inc.* | | | 25,795 | | | | 578,066 | | |
PennyMac Financial Services, Inc. | | | 13,194 | | | | 636,742 | | |
| | | | | | 1,214,808 | | |
Trading companies & distributors—0.2% | |
Foundation Building Materials, Inc.* | | | 32,331 | | | | 443,905 | | |
Herc Holdings, Inc.* | | | 13,504 | | | | 452,924 | | |
| | | | | | 896,829 | | |
Wireless telecommunication services—0.3% | |
Boingo Wireless, Inc.* | | | 43,258 | | | | 625,078 | | |
Gogo, Inc.*,1 | | | 159,006 | | | | 462,708 | | |
| | | | | | 1,087,786 | | |
Total common stocks
(cost—$326,870,036) | | | 405,553,045 | | |
Short-term investments—0.7% | |
Investment companies—0.7% | |
State Street Institutional U.S. Government
Money Market Fund, 0.09%2
(cost—$2,706,252) | | | 2,706,252 | | | | 2,706,252 | | |
Investment of cash collateral from securities loaned—4.7% | |
Money market funds—4.7% | |
State Street Navigator Securities Lending
Government Money Market Portfolio, 0.12%2
(cost—$19,334,845) | | | 19,334,845 | | | | 19,334,845 | | |
Total investments
(cost—$348,911,133)—105.0% | | | 427,594,142 | | |
Liabilities in excess of other assets—(5.0)% | | | | | (20,350,415 | ) | |
Net assets—100.0% | | $ | 407,243,727 | | |
201
PACE Small/Medium Co Growth Equity Investments
Portfolio of investments—July 31, 2020
For a listing of defined portfolio acronyms that are used throughout the Portfolio of investments as well as the tables that follow, please refer to page 267.
Fair valuation summary
The following is a summary of the fair valuations according to the inputs used as of July 31, 2020 in valuing the Portfolio's investments. In the event the Portfolio holds investments for which fair value is measured using the NAV per share practical expedient (or its equivalent), a separate column will be added to the fair value hierarchy table; this is intended to permit reconciliation to the amounts presented in the Portfolio of investments:
Assets
Description | | Unadjusted
quoted prices in
active markets for
identical investments
(Level 1) | | Other significant
observable inputs
(Level 2) | | Unobservable
inputs
(Level 3) | | Total | |
Common stocks | | $ | 405,553,045 | | | $ | — | | | $ | — | | | $ | 405,553,045 | | |
Short-term investments | | | — | | | | 2,706,252 | | | | — | | | | 2,706,252 | | |
Investment of cash collateral from securities loaned | | | — | | | | 19,334,845 | | | | — | | | | 19,334,845 | | |
Total | | $ | 405,553,045 | | | $ | 22,041,097 | | | $ | — | | | $ | 427,594,142 | | |
At July 31, 2020, there were no transfers in or out of Level 3.
Portfolio footnotes
† Amount represents less than 0.05%
* Non-income producing security.
1 Security, or portion thereof, was on loan at the period end.
2 Rates shown reflect the yields at July 31, 2020.
See accompanying notes to financial statements.
202
PACE International Equity Investments
Performance
For the 12-months ended July 31, 2020, the Portfolio's Class P shares returned 0.30% before the deduction of the maximum PACE Select program fee.1 In comparison, the MSCI EAFE Index (net) (the "benchmark") returned -1.67%. (Returns for all share classes over various time periods are shown in the "Performance at a glance" table on page 205. Please note that the returns shown do not reflect the deduction of taxes that a shareholder would pay on Portfolio distributions or the redemption of Portfolio shares.) For a detailed commentary on the market environment in general during the reporting period, please refer to page 2.
Investment Manager's comments2
The Portfolio outperformed its benchmark during the reporting period. The Portfolio's sector positioning was the primary contributor, particularly the overweight to Information Technology and underweight to Real Estate. The overweight to Health Care was an additional tailwind. The Information Technology and Health Care sectors posted strong absolute and relative results in what was a negative period for the overall benchmark.
Stock selection from a sector perspective also contributed to relative returns. Key positive sectors included Health Care and Consumer Discretionary. Stock selection in Information Technology and Financials was negative but only acted as partial offsets. In terms of style, the Portfolio's momentum, profitability and leverage exposures were helpful in a volatile period. The Portfolio's growth tilt was an additional tailwind as investors rewarded companies that were able to generate attractive growth, despite the environment.
Country allocation, including positioning in several emerging markets was beneficial to relative returns. Stock selection from a country perspective was flat with positive selection in Japan and the Netherlands offset by weak results in Germany.
Derivatives were not used during the reporting period.
1 Class P shares held through the PACE Select Advisors Program are subject to a maximum Program fee of 2.50%, which, if included, would have reduced performance. Class P shares held through other advisory programs also may be subject to a program fee, which, if included, would have reduced performance.
2 Performance is discussed on a gross-of-fees basis—meaning that no fees or expenses are reflected when discussed at the level of a subadvisor's sleeve (or subadvisors' sleeves, if applicable). Alternatively, performance at the overall Portfolio level is shown net of fees, which does factor in fees and expenses associated with the Portfolio.
PACE Select Advisors Trust –
PACE International Equity Investments
Investment Manager:
UBS Asset Management (Americas) Inc. ("UBS AM")
Investment Subadvisors:
Mondrian Investment Partners Limited ("Mondrian");
Chautauqua Capital Management, a division of Robert W. Baird & Co. Incorporated ("Baird");
Los Angeles Capital Management and Equity Research, Inc. ("Los Angeles Capital")
Portfolio Management Team:
UBS AM: Mabel Lung, CFA, Fred Lee, CFA, Gina Toth, CFA, Ned Sienko, Vincent Russo and Mayoor Joshi
Mondrian: Elizabeth A. Desmond, Nigel Bliss and Steve Dutaut;
Baird: Brian M. Beitner, CFA, Jesse Flores, CFA, Haicheng Li, CFA, Nathaniel Velarde;
Los Angeles Capital: Thomas D. Stevens, CFA, Hal W. Reynolds, CFA and Daniel E. Allen, CFA
Objective:
Capital appreciation
Investment process:
The main strategies of the subadvisors include:
• A strategy that invests in durable large-cap franchises that can grow excess returns on capital well into the future and trade at a significant discount to the subadvisor's estimate of the true worth of these operations.
203
PACE International Equity Investments
Investment process
(concluded)
• A "long/short" or "130/30" equity strategy in which the subadvisor will buy securities "long" that it believes will outperform the market or decrease portfolio risk, sells securities "short" that it believes will underperform the market and may invest the proceeds from those sales in additional securities.
• A strategy that involves achieving consistent risk adjusted excess returns by managing a concentrated portfolio of quality, growth companies generally headquartered outside of the United States.
Mutual funds are sold by prospectus only. You should read it carefully and consider a fund's investment objectives, risks, charges, expenses and other important information contained in the prospectus before investing. Prospectuses for most of our funds can be obtained from your financial advisor, by calling UBS Funds at 800-647 1568 or by visiting our Website at www.ubs.com/am-us.
Special considerations
The Portfolio may be appropriate for long-term investors seeking capital appreciation who are able to withstand short-term fluctuations in the equity markets in return for potentially higher returns over the long term. The value of the Portfolio changes every day and can be affected by changes in interest rates, general market conditions, and other political, social and economic developments, as well as specific matters relating to the companies in whose securities the Portfolio invests. It is important to note that an investment in the Portfolio is only one component of a balanced investment plan. The value of the Portfolio's investments in foreign securities may fall due to adverse political, social, and economic developments abroad and due to decreases in foreign currency values relative to the US dollar. These risks are greater for investments in emerging market issuers than for issuers in more developed countries.
204
PACE International Equity Investments
Performance at a glance (unaudited)
Average annual total returns for periods ended 07/31/20 | | 1 year | | 5 years | | 10 years | |
Before deducting maximum sales charge | |
Class A1 | | | 0.00 | % | | | 2.64 | % | | | 5.01 | % | |
Class Y2 | | | 0.29 | | | | 2.93 | | | | 5.30 | | |
Class P3 | | | 0.30 | | | | 2.92 | | | | 5.31 | | |
After deducting maximum sales charge | |
Class A1 | | | (5.48 | ) | | | 1.48 | | | | 4.42 | | |
MSCI EAFE Index (net)4 | | | (1.67 | ) | | | 2.10 | | | | 5.02 | | |
Most recent calendar quarter-end returns (unaudited)
Average annual total returns for periods ended 06/30/20 | | 1 year | | 5 years | | 10 years | |
Before deducting maximum sales charge | |
Class A1 | | | (5.03 | )% | | | 2.26 | % | | | 5.73 | % | |
Class Y2 | | | (4.71 | ) | | | 2.56 | | | | 6.02 | | |
Class P3 | | | (4.78 | ) | | | 2.54 | | | | 6.01 | | |
After deducting maximum sales charge | |
Class A1 | | | (10.24 | ) | | | 1.11 | | | | 5.13 | | |
The annualized gross and net expense ratios, respectively, for each class of shares as in the November 27, 2019 prospectuses, were as follows: Class A—1.88% and 1.88%; Class Y—1.62% and 1.62%; and Class P—1.60% and 1.60% Net expenses reflect fee waivers and/or expense reimbursements, if any, pursuant to an agreement that is in effect to cap the expenses. The Portfolio and UBS Asset Management (Americas) Inc. ("UBS AM") have entered into a written fee waiver/expense reimbursement agreement pursuant to which UBS AM is contractually obligated to waive its management fees and/or reimburse expenses so that the Portfolio's ordinary total operating expenses of each class through November 30, 2020 (excluding dividend expense, borrowing costs, and interest expense relating to short sales, and expenses attributable to investment in other investment companies, interest, taxes, brokerage commissions and extraordinary expenses) would not exceed Class A—1.35%; Class Y—1.10%; and Class P—1.10% "Management fee waiver/expense reimbursements" are based on estimated amounts for the current fiscal year. The Portfolio has agreed to repay UBS AM for any waived fees/reimbursed expenses to the extent that it can do so over the following three fiscal years without causing the Portfolio's expenses in any of those three years to exceed these expense caps and that UBS AM has not waived the right to do so. The fee waiver/expense reimbursement agreement may be terminated by the Portfolio's board at any time and also will terminate automatically upon the expiration or termination of the Portfolio's advisory contract with UBS AM. Upon termination of the agreement, however, UBS AM's three year recoupment rights will survive.
1 Maximum sales charge for Class A shares is 5.5%. Class A shares bear ongoing 12b-1 service fees of 0.25% annually.
2 The Portfolio offers Class Y shares to a limited group of eligible investors, including certain qualifying retirement plans. Class Y shares do not bear initial or contingent deferred sales charges or ongoing 12b-1 service and distribution fees.
3 Class P shares do not bear initial or contingent deferred sales charges or ongoing 12b-1 service and distribution fees, but Class P shares held through advisory programs may be subject to a program fee, which, if included, would have reduced performance.
4 The MSCI EAFE Index (net) is an index of stocks designed to measure the investment returns of developed economies outside of North America. Net total return indices reinvest dividends after the deduction of withholding taxes, using a tax rate applicable to non-resident institutional investors who do not benefit from double taxation treaties. The Index is constructed and managed with a view to being fully investable from the perspective of international institutional investors. Investors should note that indices do not reflect the deduction of fees and expenses.
Prior to August 3, 2015, a 1% redemption fee was imposed on sales or exchanges of any class of shares of the Portfolio made during the specified holding period.
Past performance does not predict future performance, and the performance information provided does not reflect the deduction of taxes that a shareholder would pay on Portfolio distributions or the redemption of Portfolio shares. The return and principal value of an investment will fluctuate, so that an investor's shares, when redeemed, may be worth more or less than their original cost. Performance results assume reinvestment of all dividends and capital gain distributions at net asset value on the ex-dividend dates. Current performance may be higher or lower than the performance data quoted. For month-end performance figures, please visit www.ubs.com/us-mutualfundperformance.
205
PACE International Equity Investments
Illustration of an assumed investment of $10,000 in Class P shares of the Portfolio (unaudited)
The following graph depicts the performance of PACE International Equity Investments Class P shares versus the MSCI EAFE Index (net) over the 10 years ended July 31, 2020. Class P shares held through advisory programs may be subject to a program fee, which, if included, would have reduced performance. The performance of the other classes will vary based upon the different class specific expenses and sales charges. The performance provided does not reflect the deduction of taxes that a shareholder would pay on Portfolio distributions or the redemption of Portfolio shares. Past performance is no guarantee of future results. Share price and returns will vary with market conditions; investors may realize a gain or loss upon redemption. It is important to note that PACE International Equity Investments is a professionally managed portfolio while the Index is not available for investment and is unmanaged. The comparison is shown for illustration purposes only.
PACE International Equity Investments

206
PACE International Equity Investments
Portfolio statistics—July 31, 2020 (unaudited)
Top ten holdings (long holdings)1 | | Percentage of
net assets | |
Keyence Corp. | | | 1.9 | % | |
Genmab A/S | | | 1.7 | | |
Sanofi | | | 1.5 | | |
Roche Holding AG | | | 1.4 | | |
Novo Nordisk A/S, ADR | | | 1.4 | | |
Nestle SA | | | 1.4 | | |
Enel SpA | | | 1.3 | | |
Novartis AG | | | 1.2 | | |
DBS Group Holdings Ltd. | | | 1.2 | | |
CK Hutchison Holdings Ltd. | | | 1.2 | | |
Total | | | 14.2 | % | |
Top ten holdings (short holdings)1 | | Percentage of
net assets | |
Ferrovial SA | | | (0.4 | )% | |
Ocado Group PLC | | | (0.4 | ) | |
Suncorp Group Ltd. | | | (0.4 | ) | |
Shiseido Co. Ltd. | | | (0.3 | ) | |
Svenska Cellulosa AB SCA, Class B | | | (0.3 | ) | |
Nippon Paint Holdings Co. Ltd. | | | (0.3 | ) | |
Boliden AB | | | (0.3 | ) | |
Umicore SA | | | (0.3 | ) | |
Chugoku Electric Power Co., Inc./The | | | (0.3 | ) | |
GMO Payment Gateway, Inc. | | | (0.3 | ) | |
Total | | | (3.3 | )% | |
Top five issuer breakdown by country or territory of origin (long holdings)1 | | Percentage of
net assets | |
Japan | | | 28.1 | % | |
United Kingdom | | | 12.1 | | |
Switzerland | | | 9.8 | | |
France | | | 7.1 | | |
Germany | | | 6.6 | | |
Total | | | 63.7 | % | |
Top five issuer breakdown by country or territory of origin (short holdings)1 | | Percentage of
net assets | |
Japan | | | (5.7 | )% | |
United Kingdom | | | (1.2 | ) | |
France | | | (1.1 | ) | |
Australia | | | (1.1 | ) | |
Sweden | | | (0.8 | ) | |
Total | | | (9.9 | )% | |
1 The Portfolio is actively managed and its composition will vary over time.
207
PACE International Equity Investments
Industry diversification—(unaudited)
As a percentage of net assets as of July 31, 2020
Common stocks | |
Aerospace & defense | | | 0.4 | % | |
Air freight & logistics | | | 0.3 | | |
Auto components | | | 1.7 | | |
Automobiles | | | 1.7 | | |
Banks | | | 7.7 | | |
Beverages | | | 1.4 | | |
Biotechnology | | | 2.5 | | |
Building products | | | 2.8 | | |
Capital markets | | | 2.4 | | |
Chemicals | | | 3.4 | | |
Commercial services & supplies | | | 1.2 | | |
Construction & engineering | | | 0.5 | | |
Construction materials | | | 0.4 | | |
Diversified consumer services | | | 0.9 | | |
Diversified financial services | | | 0.1 | | |
Diversified telecommunication services | | | 3.2 | | |
Electric utilities | | | 3.6 | | |
Electrical equipment | | | 2.4 | | |
Electronic equipment, instruments & components | | | 3.9 | | |
Entertainment | | | 0.8 | | |
Equity real estate investment trusts | | | 0.4 | | |
Food & staples retailing | | | 2.0 | | |
Food products | | | 2.6 | | |
Gas utilities | | | 0.4 | | |
Health care equipment & supplies | | | 1.8 | | |
Health care providers & services | | | 0.3 | | |
Hotels, restaurants & leisure | | | 1.1 | | |
Household durables | | | 1.7 | | |
Independent power and renewable electricity producers | | | 0.2 | | |
Industrial conglomerates | | | 1.8 | | |
Insurance | | | 4.6 | | |
Interactive media & services | | | 0.4 | | |
Internet & direct marketing retail | | | 2.0 | | |
IT services | | | 3.8 | | |
Leisure products | | | 0.9 | | |
Life sciences tools & services | | | 0.7 | | |
Machinery | | | 4.3 | | |
Media | | | 0.8 | | |
Metals & mining | | | 1.8 | | |
Multiline retail | | | 0.3 | | |
Oil, gas & consumable fuels | | | 2.8 | | |
Paper & forest products | | | 0.1 | | |
Personal products | | | 1.3 | | |
Common stocks—(concluded) | |
Pharmaceuticals | | | 11.8 | % | |
Professional services | | | 2.3 | | |
Real estate management & development | | | 0.7 | | |
Road & rail | | | 0.2 | | |
Semiconductors & semiconductor equipment | | | 6.1 | | |
Software | | | 3.9 | | |
Specialty retail | | | 2.7 | | |
Technology hardware, storage & peripherals | | | 1.1 | | |
Textiles, apparel & luxury goods | | | 1.8 | | |
Tobacco | | | 0.6 | | |
Trading companies & distributors | | | 0.9 | | |
Transportation infrastructure | | | 0.0 | † | |
Wireless telecommunication services | | | 1.8 | | |
Total common stocks | | | 111.3 | | |
Preferred stocks | |
Automobiles | | | 0.1 | | |
Chemicals | | | 0.0 | † | |
Total preferred stocks | | | 0.1 | | |
Short-term investments | | | 1.5 | | |
Investment of cash collateral from securities loaned | | | 0.4 | | |
Total investments before investments sold short | | | 113.3 | | |
Investments sold short | |
Aerospace & defense | | | (0.2 | ) | |
Air freight & logistics | | | (0.0 | )† | |
Airlines | | | (0.0 | )† | |
Auto components | | | (0.2 | ) | |
Automobiles | | | (0.1 | ) | |
Banks | | | (0.3 | ) | |
Beverages | | | (0.4 | ) | |
Capital markets | | | (0.2 | ) | |
Chemicals | | | (1.0 | ) | |
Commercial services & supplies | | | (0.1 | ) | |
Communications equipment | | | (0.1 | ) | |
Construction & engineering | | | (0.5 | ) | |
Diversified financial services | | | (0.3 | ) | |
Diversified telecommunication services | | | (0.2 | ) | |
Electric utilities | | | (0.8 | ) | |
Electrical equipment | | | (0.0 | )† | |
Electronic equipment, instruments & components | | | (0.1 | ) | |
Entertainment | | | (0.0 | )† | |
Equity real estate investment trusts | | | (0.7 | ) | |
208
PACE International Equity Investments
Industry diversification—(unaudited) (concluded)
As a percentage of net assets as of July 31, 2020
Investments sold short—(continued) | |
Food & staples retailing | | | (0.1 | )% | |
Food products | | | (0.4 | ) | |
Gas utilities | | | (0.0 | )† | |
Health care equipment & supplies | | | (0.2 | ) | |
Health care providers & services | | | (0.1 | ) | |
Health care technology | | | (0.0 | )† | |
Hotels, restaurants & leisure | | | (0.4 | ) | |
Household durables | | | (0.1 | ) | |
Independent power and renewable electricity producers | | | (0.1 | ) | |
Industrial conglomerates | | | (0.1 | ) | |
Insurance | | | (0.6 | ) | |
Interactive media & services | | | (0.1 | ) | |
Internet & catalog retail | | | (0.4 | ) | |
IT services | | | (0.6 | ) | |
Machinery | | | (0.6 | ) | |
Marine | | | (0.1 | ) | |
Media | | | (0.3 | ) | |
Metals & mining | | | (0.9 | ) | |
Investments sold short—(concluded) | |
Multi-utilities | | | (0.1 | )% | |
Multiline retail | | | (0.2 | ) | |
Oil, gas & consumable fuels | | | (0.4 | ) | |
Paper & forest products | | | (0.4 | ) | |
Personal products | | | (0.3 | ) | |
Pharmaceuticals | | | (0.1 | ) | |
Real estate management & development | | | (0.8 | ) | |
Road & rail | | | (0.2 | ) | |
Semiconductors & semiconductor equipment | | | (0.1 | ) | |
Software | | | (0.0 | )† | |
Specialty retail | | | (0.2 | ) | |
Technology hardware, storage & peripherals | | | (0.2 | ) | |
Trading companies & distributors | | | (0.0 | )† | |
Transportation infrastructure | | | (0.2 | ) | |
Total investments sold short | | | (13.5 | ) | |
Other assets in excess of liabilities | | | 0.2 | | |
Net assets | | | 100.0 | % | |
† Amount represents less than 0.05% or (0.05)%.
209
PACE International Equity Investments
Portfolio of investments—July 31, 2020
| | | Number of
shares | |
Value | |
Common stocks—111.3% | |
Australia—5.2% | |
AMP Ltd.*,1 | | | 539,768 | | | $ | 561,630 | | |
Aristocrat Leisure Ltd. | | | 98,010 | | | | 1,837,639 | | |
Aurizon Holdings Ltd. | | | 250,412 | | | | 798,551 | | |
BHP Group Ltd.2 | | | 283,683 | | | | 7,469,046 | | |
BHP Group PLC | | | 111,603 | | | | 2,413,238 | | |
CIMIC Group Ltd.1 | | | 40,233 | | | | 619,003 | | |
Commonwealth Bank of Australia | | | 22,163 | | | | 1,127,539 | | |
CSL Ltd. | | | 14,606 | | | | 2,840,906 | | |
Glencore PLC | | | 176,892 | | | | 404,827 | | |
Goodman Group | | | 125,113 | | | | 1,521,198 | | |
Insurance Australia Group Ltd. | | | 124,936 | | | | 454,841 | | |
Macquarie Group Ltd. | | | 39,805 | | | | 3,498,140 | | |
Magellan Financial Group Ltd. | | | 14,661 | | | | 636,951 | | |
Medibank Pvt. Ltd.1 | | | 679,440 | | | | 1,356,907 | | |
QBE Insurance Group Ltd. | | | 470,661 | | | | 3,296,261 | | |
REA Group Ltd.1 | | | 29,699 | | | | 2,293,351 | | |
Rio Tinto PLC2 | | | 57,155 | | | | 3,479,150 | | |
Santos Ltd. | | | 511,432 | | | | 1,910,356 | | |
Seek Ltd. | | | 21,753 | | | | 334,573 | | |
Sonic Healthcare Ltd. | | | 90,777 | | | | 2,078,304 | | |
Sydney Airport | | | 111,707 | | | | 418,380 | | |
Telstra Corp. Ltd. | | | 506,749 | | | | 1,213,421 | | |
TPG Telecom Ltd.*,1 | | | 55,984 | | | | 321,582 | | |
Wesfarmers Ltd. | | | 48,280 | | | | 1,605,201 | | |
Woolworths Group Ltd. | | | 74,499 | | | | 2,062,433 | | |
| | | | | | 44,553,428 | | |
Austria—0.6% | |
ams AG* | | | 228,048 | | | | 3,835,907 | | |
Raiffeisen Bank International AG | | | 23,147 | | | | 398,171 | | |
Verbund AG1 | | | 13,097 | | | | 687,260 | | |
| | | | | | 4,921,338 | | |
Belgium—0.9% | |
Anheuser-Busch InBev SA/N.V. | | | 20,051 | | | | 1,088,833 | | |
Galapagos N.V.* | | | 6,343 | | | | 1,177,546 | | |
Galapagos N.V.*,1 | | | 1,922 | | | | 356,955 | | |
KBC Group N.V.2 | | | 19,676 | | | | 1,121,854 | | |
Proximus SADP | | | 12,704 | | | | 261,334 | | |
Telenet Group Holding N.V. | | | 25,369 | | | | 984,125 | | |
UCB SA | | | 20,652 | | | | 2,653,612 | | |
| | | | | | 7,644,259 | | |
Canada—0.9% | |
Constellation Software, Inc. | | | 6,581 | | | | 7,784,344 | | |
China—4.6% | |
Alibaba Group Holding Ltd., ADR* | | | 30,491 | | | | 7,653,851 | | |
BeiGene Ltd., ADR* | | | 10,775 | | | | 2,251,975 | | |
BYD Co. Ltd., Class H1 | | | 187,431 | | | | 1,765,915 | | |
China Mobile Ltd. | | | 870,500 | | | | 5,942,150 | | |
Prosus N.V.* | | | 77,720 | | | | 7,564,251 | | |
Sinopharm Group Co. Ltd., Class H | | | 156,948 | | | | 374,051 | | |
TAL Education Group, ADR* | | | 97,566 | | | | 7,626,734 | | |
| | | Number of
shares | |
Value | |
Common stocks—(continued) | |
China—(concluded) | |
Wuxi Biologics Cayman, Inc.*,3 | | | 246,678 | | | $ | 5,092,382 | | |
Yangzijiang Shipbuilding Holdings Ltd. | | | 1,263,000 | | | | 846,343 | | |
| | | | | | 39,117,652 | | |
Denmark—6.3% | |
Carlsberg A/S, Class B | | | 20,109 | | | | 2,969,888 | | |
Coloplast A/S, Class B | | | 5,129 | | | | 875,506 | | |
DSV Panalpina A/S | | | 12,427 | | | | 1,700,454 | | |
Genmab A/S* | | | 42,946 | | | | 14,782,289 | | |
ISS A/S* | | | 230,757 | | | | 3,561,134 | | |
Novo Nordisk A/S, ADR1 | | | 179,372 | | | | 11,718,373 | | |
Novo Nordisk A/S, Class B2 | | | 121,804 | | | | 7,991,874 | | |
Novozymes A/S, B Shares | | | 27,793 | | | | 1,662,558 | | |
Pandora A/S | | | 42,278 | | | | 2,688,934 | | |
Tryg A/S | | | 26,884 | | | | 791,094 | | |
Vestas Wind Systems A/S2 | | | 36,495 | | | | 4,678,110 | | |
| | | | | | 53,420,214 | | |
Finland—1.5% | |
Fortum Oyj | | | 1,847 | | | | 37,488 | | |
Kone Oyj, Class B2 | | | 84,738 | | | | 6,728,936 | | |
Sampo Oyj, A Shares2 | | | 136,553 | | | | 4,935,607 | | |
UPM-Kymmene Oyj | | | 26,188 | | | | 699,054 | | |
| | | | | | 12,401,085 | | |
France—7.1% | |
Air Liquide SA | | | 4,192 | | | | 689,501 | | |
Airbus SE* | | | 106 | | | | 7,759 | | |
Bureau Veritas SA*,2 | | | 131,028 | | | | 2,882,589 | | |
Capgemini SE | | | 5,965 | | | | 773,627 | | |
Cie de Saint-Gobain* | | | 262,102 | | | | 9,696,472 | | |
CNP Assurances* | | | 28,535 | | | | 346,583 | | |
Dassault Systemes SE2 | | | 11,328 | | | | 2,062,754 | | |
Eiffage SA* | | | 14,767 | | | | 1,290,531 | | |
Hermes International | | | 2,976 | | | | 2,412,761 | | |
Ipsen SA2 | | | 2,701 | | | | 259,032 | | |
Kering SA | | | 1,793 | | | | 1,016,068 | | |
Klepierre SA | | | 24,033 | | | | 416,222 | | |
L'Oreal SA2 | | | 16,420 | | | | 5,511,010 | | |
Legrand SA | | | 9,331 | | | | 721,830 | | |
LVMH Moet Hennessy Louis Vuitton SE2 | | | 19,085 | | | | 8,298,980 | | |
Natixis SA* | | | 100,725 | | | | 246,372 | | |
Pernod Ricard SA | | | 5,359 | | | | 920,943 | | |
Peugeot SA* | | | 53,085 | | | | 853,326 | | |
Renault SA* | | | 1,283 | | | | 30,491 | | |
Safran SA*,2 | | | 18,314 | | | | 1,947,726 | | |
Sanofi | | | 121,097 | | | | 12,714,835 | | |
Sartorius Stedim Biotech | | | 1,481 | | | | 463,230 | | |
Societe Generale SA* | | | 199,434 | | | | 3,070,350 | | |
TOTAL SE | | | 34,913 | | | | 1,321,237 | | |
Ubisoft Entertainment SA* | | | 5,984 | | | | 499,798 | | |
Unibail-Rodamco-Westfield1 | | | 7,772 | | | | 407,582 | | |
Vinci SA | | | 12,478 | | | | 1,073,920 | | |
Wendel SE | | | 1,717 | | | | 161,151 | | |
| | | | | | 60,096,680 | | |
210
PACE International Equity Investments
Portfolio of investments—July 31, 2020
| | | Number of
shares | |
Value | |
Common stocks—(continued) | |
Germany—6.5% | |
Allianz SE2 | | | 43,861 | | | $ | 9,100,029 | | |
Bayer AG | | | 38,688 | | | | 2,570,179 | | |
Brenntag AG | | | 30,323 | | | | 1,871,323 | | |
Carl Zeiss Meditec AG* | | | 6,497 | | | | 679,970 | | |
Continental AG | | | 92,534 | | | | 8,938,669 | | |
Deutsche Boerse AG | | | 851 | | | | 154,834 | | |
Deutsche Post AG* | | | 23,628 | | | | 959,065 | | |
Deutsche Telekom AG | | | 342,486 | | | | 5,717,717 | | |
Evonik Industries AG | | | 208,961 | | | | 5,645,335 | | |
GEA Group AG | | | 23,238 | | | | 838,790 | | |
Hannover Rueck SE | | | 4,580 | | | | 774,800 | | |
Infineon Technologies AG | | | 141,571 | | | | 3,609,406 | | |
KION Group AG | | | 9,417 | | | | 719,703 | | |
Knorr-Bremse AG | | | 26,643 | | | | 3,117,426 | | |
Merck KGaA | | | 2,294 | | | | 293,186 | | |
MTU Aero Engines AG* | | | 4,717 | | | | 817,868 | | |
Nemetschek SE | | | 1,122 | | | | 82,249 | | |
SAP SE2 | | | 41,598 | | | | 6,566,384 | | |
Symrise AG2 | | | 11,397 | | | | 1,424,747 | | |
TeamViewer AG*,3 | | | 7,493 | | | | 405,164 | | |
Telefonica Deutschland Holding AG | | | 428,540 | | | | 1,169,297 | | |
| | | | | | 55,456,141 | | |
Hong Kong—2.4% | |
AIA Group Ltd. | | | 94,400 | | | | 851,199 | | |
CK Asset Holdings Ltd. | | | 653,500 | | | | 3,628,669 | | |
CLP Holdings Ltd. | | | 97,000 | | | | 917,202 | | |
Hang Seng Bank Ltd. | | | 110,723 | | | | 1,742,176 | | |
Hong Kong Exchanges & Clearing Ltd. | | | 44,000 | | | | 2,094,978 | | |
Jardine Matheson Holdings Ltd. | | | 83,700 | | | | 3,423,103 | | |
Sun Hung Kai Properties Ltd. | | | 11,000 | | | | 133,780 | | |
Techtronic Industries Co. Ltd. | | | 31,000 | | | | 324,230 | | |
WH Group Ltd.3 | | | 8,236,500 | | | | 7,331,778 | | |
| | | | | | 20,447,115 | | |
India—1.1% | |
HDFC Bank Ltd., ADR* | | | 121,416 | | | | 5,676,198 | | |
Tata Consultancy Services Ltd. | | | 132,645 | | | | 4,029,840 | | |
| | | | | | 9,706,038 | | |
Indonesia—0.6% | |
Bank Rakyat Indonesia Persero Tbk. PT | | | 22,450,968 | | | | 4,876,690 | | |
Israel—0.2% | |
Check Point Software Technologies Ltd.* | | | 4,198 | | | | 526,219 | | |
Nice Ltd.* | | | 3,690 | | | | 757,877 | | |
Teva Pharmaceutical Industries Ltd., ADR* | | | 16,202 | | | | 186,971 | | |
| | | | | | 1,471,067 | | |
Italy—3.0% | |
Enel SpA | | | 1,244,831 | | | | 11,403,307 | | |
Eni SpA | | | 567,565 | | | | 5,055,759 | | |
Ferrari N.V. | | | 13,642 | | | | 2,439,389 | | |
Intesa Sanpaolo SpA* | | | 1,053,180 | | | | 2,146,744 | | |
Mediobanca Banca di Credito Finanziario SpA | | | 100,308 | | | | 810,094 | | |
Moncler SpA* | | | 15,118 | | | | 584,490 | | |
Snam SpA | | | 302,659 | | | | 1,611,192 | | |
| | | Number of
shares | |
Value | |
Common stocks—(continued) | |
Italy—(concluded) | |
Telecom Italia SpA | | | 84,437 | | | $ | 34,244 | | |
Terna Rete Elettrica Nazionale SpA | | | 153,187 | | | | 1,143,196 | | |
| | | | | | 25,228,415 | | |
Japan—28.1% | |
ABC-Mart, Inc. | | | 9,600 | | | | 505,782 | | |
Advantest Corp. | | | 21,200 | | | | 1,157,500 | | |
Aozora Bank Ltd. | | | 65,900 | | | | 1,054,191 | | |
Asahi Group Holdings Ltd. | | | 15,200 | | | | 495,457 | | |
Asahi Kasei Corp. | | | 35,700 | | | | 256,794 | | |
Astellas Pharma, Inc.2 | | | 222,000 | | | | 3,462,747 | | |
Bandai Namco Holdings, Inc. | | | 30,200 | | | | 1,667,714 | | |
Bank of Kyoto Ltd./The | | | 3,800 | | | | 139,415 | | |
Benesse Holdings, Inc. | | | 16,800 | | | | 438,145 | | |
Calbee, Inc. | | | 23,500 | | | | 746,767 | | |
Casio Computer Co. Ltd. | | | 53,600 | | | | 856,658 | | |
Central Japan Railway Co. | | | 5,600 | | | | 679,333 | | |
Chugai Pharmaceutical Co. Ltd. | | | 25,200 | | | | 1,137,761 | | |
Coca-Cola Bottlers Japan Holdings, Inc. | | | 264,200 | | | | 3,941,687 | | |
Daikin Industries Ltd.2 | | | 27,100 | | | | 4,768,149 | | |
Daito Trust Construction Co. Ltd. | | | 22,800 | | | | 1,788,026 | | |
Dentsu Group, Inc. | | | 12,300 | | | | 274,415 | | |
FANUC Corp. | | | 41,695 | | | | 7,034,910 | | |
Fast Retailing Co. Ltd.2 | | | 8,300 | | | | 4,413,955 | | |
FUJIFILM Holdings Corp. | | | 173,200 | | | | 7,745,943 | | |
Fujitsu Ltd. | | | 41,100 | | | | 5,503,091 | | |
Fukuoka Financial Group, Inc. | | | 89,100 | | | | 1,295,832 | | |
Hikari Tsushin, Inc.2 | | | 12,900 | | | | 2,796,728 | | |
Honda Motor Co. Ltd. | | | 308,300 | | | | 7,516,309 | | |
Hoshizaki Corp. | | | 6,800 | | | | 518,367 | | |
Hoya Corp.2 | | | 35,400 | | | | 3,491,128 | | |
Isuzu Motors Ltd. | | | 241,200 | | | | 1,967,348 | | |
ITOCHU Techno-Solutions Corp. | | | 62,600 | | | | 2,542,493 | | |
Japan Retail Fund Investment Corp. | | | 678 | | | | 815,223 | | |
JGC Holdings Corp. | | | 82,700 | | | | 836,763 | | |
Kakaku.com, Inc. | | | 30,100 | | | | 726,733 | | |
Kao Corp. | | | 15,100 | | | | 1,095,414 | | |
Keyence Corp.2 | | | 38,633 | | | | 16,291,027 | | |
Koito Manufacturing Co. Ltd. | | | 32,800 | | | | 1,284,336 | | |
Kubota Corp. | | | 97,000 | | | | 1,381,277 | | |
Kyocera Corp. | | | 155,300 | | | | 8,648,700 | | |
LIXIL Group Corp. | | | 23,400 | | | | 312,340 | | |
Marubeni Corp. | | | 108,400 | | | | 499,065 | | |
McDonald's Holdings Co. Japan Ltd. | | | 41,800 | | | | 2,000,477 | | |
Mebuki Financial Group, Inc. | | | 153,700 | | | | 341,916 | | |
Mitsubishi Electric Corp. | | | 434,500 | | | | 5,671,992 | | |
Mitsubishi Heavy Industries Ltd. | | | 52,200 | | | | 1,214,359 | | |
Mitsubishi UFJ Financial Group, Inc. | | | 66,200 | | | | 248,072 | | |
Mitsui & Co. Ltd. | | | 14,500 | | | | 216,776 | | |
MonotaRO Co. Ltd. | | | 24,200 | | | | 1,029,201 | | |
Nabtesco Corp. | | | 3,500 | | | | 106,483 | | |
Nintendo Co. Ltd.2 | | | 13,500 | | | | 5,937,437 | | |
Nippon Steel Corp. | | | 71,200 | | | | 583,795 | | |
Nippon Telegraph & Telephone Corp. | | | 176,000 | | | | 4,085,217 | | |
Nissan Chemical Corp. | | | 72,500 | | | | 3,839,699 | | |
Nitori Holdings Co. Ltd. | | | 200 | | | | 43,787 | | |
211
PACE International Equity Investments
Portfolio of investments—July 31, 2020
| | | Number of
shares | |
Value | |
Common stocks—(continued) | |
Japan—(concluded) | |
Nitto Denko Corp.2 | | | 64,800 | | | $ | 3,672,893 | | |
Nomura Research Institute Ltd.2 | | | 134,600 | | | | 3,552,553 | | |
NTT DOCOMO, Inc.2 | | | 97,300 | | | | 2,678,778 | | |
Obayashi Corp. | | | 79,300 | | | | 708,021 | | |
Obic Co. Ltd.2 | | | 12,700 | | | | 2,277,484 | | |
Olympus Corp. | | | 72,400 | | | | 1,302,220 | | |
Omron Corp. | | | 3,400 | | | | 244,901 | | |
Ono Pharmaceutical Co. Ltd. | | | 20,700 | | | | 581,823 | | |
Oracle Corp. | | | 3,400 | | | | 409,572 | | |
Otsuka Corp. | | | 66,100 | | | | 3,446,403 | | |
Otsuka Holdings Co. Ltd. | | | 220,300 | | | | 9,136,619 | | |
Persol Holdings Co. Ltd. | | | 29,100 | | | | 367,892 | | |
Rakuten, Inc. | | | 36,200 | | | | 332,653 | | |
Recruit Holdings Co. Ltd. | | | 207,414 | | | | 6,470,454 | | |
Renesas Electronics Corp.* | | | 220,900 | | | | 1,215,052 | | |
Resona Holdings, Inc. | | | 287,400 | | | | 942,175 | | |
Rinnai Corp. | | | 2,000 | | | | 163,927 | | |
SCSK Corp. | | | 5,000 | | | | 254,482 | | |
Secom Co. Ltd. | | | 25,200 | | | | 2,179,270 | | |
Sekisui Chemical Co. Ltd. | | | 364,300 | | | | 4,958,946 | | |
Sekisui House Ltd.1 | | | 8,700 | | | | 158,895 | | |
Seven & I Holdings Co. Ltd. | | | 21,900 | | | | 661,807 | | |
Seven Bank Ltd. | | | 284,600 | | | | 698,133 | | |
Shimano, Inc.2 | | | 23,700 | | | | 5,146,165 | | |
Shin-Etsu Chemical Co. Ltd.2 | | | 39,700 | | | | 4,646,437 | | |
Shinsei Bank Ltd. | | | 81,700 | | | | 922,985 | | |
Shionogi & Co. Ltd.2 | | | 52,700 | | | | 3,135,172 | | |
SMC Corp. | | | 3,300 | | | | 1,734,312 | | |
Softbank Corp. | | | 137,200 | | | | 1,836,587 | | |
SoftBank Group Corp.2 | | | 72,400 | | | | 4,566,490 | | |
Sohgo Security Services Co. Ltd. | | | 5,400 | | | | 254,745 | | |
Sompo Holdings, Inc. | | | 6,500 | | | | 214,202 | | |
Sony Corp. | | | 62,500 | | | | 4,855,938 | | |
Sumitomo Mitsui Financial Group, Inc.2 | | | 176,900 | | | | 4,713,754 | | |
Sumitomo Mitsui Trust Holdings, Inc. | | | 75,400 | | | | 1,935,827 | | |
Sundrug Co. Ltd. | | | 30,100 | | | | 1,024,331 | | |
Sysmex Corp. | | | 9,000 | | | | 692,069 | | |
T&D Holdings, Inc. | | | 33,500 | | | | 275,755 | | |
Taisei Corp. | | | 1,800 | | | | 61,830 | | |
Takeda Pharmaceutical Co. Ltd. | | | 227,500 | | | | 8,250,698 | | |
Tokio Marine Holdings, Inc. | | | 154,700 | | | | 6,532,200 | | |
Tokyo Electron Ltd.2 | | | 16,500 | | | | 4,565,835 | | |
Toray Industries, Inc. | | | 101,600 | | | | 439,782 | | |
TOTO Ltd. | | | 15,800 | | | | 596,003 | | |
Toyota Industries Corp. | | | 83,700 | | | | 4,252,226 | | |
Trend Micro, Inc. | | | 15,500 | | | | 909,058 | | |
Tsuruha Holdings, Inc. | | | 400 | | | | 55,466 | | |
USS Co. Ltd. | | | 104,900 | | | | 1,555,240 | | |
Welcia Holdings Co. Ltd. | | | 7,000 | | | | 640,841 | | |
West Japan Railway Co. | | | 1,100 | | | | 47,503 | | |
Yakult Honsha Co. Ltd. | | | 1,300 | | | | 74,302 | | |
Yamaha Corp. | | | 21,900 | | | | 1,009,736 | | |
Yokogawa Electric Corp. | | | 41,000 | | | | 629,764 | | |
ZOZO, Inc. | | | 61,900 | | | | 1,674,418 | | |
| | | | | | 239,071,358 | | |
| | | Number of
shares | |
Value | |
Common stocks—(continued) | |
Macau—0.3% | |
Sands China Ltd. | | | 564,000 | | | $ | 2,150,427 | | |
Netherlands—6.1% | |
Adyen N.V.*,3 | | | 5,804 | | | | 9,739,156 | | |
Aegon N.V. | | | 102,491 | | | | 300,339 | | |
Akzo Nobel N.V. | | | 8,373 | | | | 788,941 | | |
ASML Holding N.V.2 | | | 26,727 | | | | 9,502,454 | | |
ASML Holding N.V. NY Registered Shares | | | 20,200 | | | | 7,145,144 | | |
ING Groep N.V. | | | 168,098 | | | | 1,172,127 | | |
Koninklijke Ahold Delhaize N.V.2 | | | 156,367 | | | | 4,503,502 | | |
Koninklijke DSM N.V. | | | 20,043 | | | | 3,067,900 | | |
Koninklijke KPN N.V. | | | 341,112 | | | | 898,627 | | |
Koninklijke Philips N.V.*,2 | | | 89,990 | | | | 4,649,863 | | |
NN Group N.V. | | | 25,719 | | | | 941,369 | | |
Randstad N.V. | | | 1,022 | | | | 49,227 | | |
Royal Dutch Shell PLC, Class A2,4 | | | 83,551 | | | | 1,221,146 | | |
Royal Dutch Shell PLC, Class B | | | 508,211 | | | | 7,133,481 | | |
Wolters Kluwer N.V. | | | 14,195 | | | | 1,120,335 | | |
| | | | | | 52,233,611 | | |
New Zealand—0.5% | |
a2 Milk Co. Ltd.* | | | 125,527 | | | | 1,749,196 | | |
Fisher & Paykel Healthcare Corp. Ltd. | | | 33,809 | | | | 809,875 | | |
Meridian Energy Ltd. | | | 391,798 | | | | 1,272,081 | | |
Spark New Zealand Ltd. | | | 219,482 | | | | 719,272 | | |
| | | | | | 4,550,424 | | |
Norway—0.4% | |
DNB ASA* | | | 117,537 | | | | 1,805,292 | | |
Gjensidige Forsikring ASA* | | | 19,295 | | | | 396,664 | | |
Telenor ASA | | | 71,610 | | | | 1,107,003 | | |
| | | | | | 3,308,959 | | |
Portugal—0.1% | |
Jeronimo Martins, SGPS SA | | | 44,358 | | | | 743,718 | | |
Russia—0.1% | |
Evraz PLC | | | 317,811 | | | | 1,176,840 | | |
Singapore—2.9% | |
Ascendas Real Estate Investment Trust | | | 151,500 | | | | 392,152 | | |
DBS Group Holdings Ltd. | | | 687,019 | | | | 9,924,438 | | |
Genting Singapore Ltd. | | | 2,458,700 | | | | 1,318,980 | | |
Oversea-Chinese Banking Corp. Ltd. | | | 65,200 | | | | 408,397 | | |
Singapore Exchange Ltd. | | | 290,000 | | | | 1,729,944 | | |
Singapore Technologies Engineering Ltd. | | | 88,100 | | | | 210,726 | | |
Singapore Telecommunications Ltd. | | | 1,837,000 | | | | 3,333,921 | | |
United Overseas Bank Ltd. | | | 549,198 | | | | 7,732,439 | | |
Venture Corp. Ltd. | | | 3,100 | | | | 40,484 | | |
| | | | | | 25,091,481 | | |
Spain—1.8% | |
Amadeus IT Group SA | | | 9,194 | | | | 459,105 | | |
Banco Santander SA* | | | 2,408,735 | | | | 5,165,465 | | |
Enagas SA | | | 2,752 | | | | 69,431 | | |
Endesa SA | | | 49,756 | | | | 1,419,384 | | |
Iberdrola SA1 | | | 219,471 | | | | 2,836,725 | | |
212
PACE International Equity Investments
Portfolio of investments—July 31, 2020
| | | Number of
shares | |
Value | |
Common stocks—(continued) | |
Spain—(concluded) | |
Industria de Diseno Textil SA | | | 83,909 | | | $ | 2,223,412 | | |
Naturgy Energy Group SA1 | | | 111,488 | | | | 2,074,567 | | |
Red Electrica Corp. SA | | | 67,606 | | | | 1,317,965 | | |
| | | | | | 15,566,054 | | |
Sweden—4.5% | |
Alfa Laval AB* | | | 21,892 | | | | 518,583 | | |
Assa Abloy AB, Class B | | | 146,199 | | | | 3,227,517 | | |
Atlas Copco AB, A Shares2 | | | 133,175 | | | | 5,911,834 | | |
Epiroc AB, Class A | | | 55,190 | | | | 771,673 | | |
Hennes & Mauritz AB, B Shares1,2 | | | 235,674 | | | | 3,673,539 | | |
Hexagon AB, B Shares* | | | 81,980 | | | | 5,361,278 | | |
Husqvarna AB, B Shares | | | 46,554 | | | | 445,521 | | |
ICA Gruppen AB | | | 1,556 | | | | 76,436 | | |
Lundin Energy AB | | | 36,095 | | | | 841,938 | | |
Sandvik AB*,2 | | | 259,725 | | | | 4,853,878 | | |
Swedbank AB, A Shares* | | | 11,497 | | | | 186,691 | | |
Swedish Match AB2 | | | 63,438 | | | | 4,887,818 | | |
Telia Co. AB | | | 2,010,986 | | | | 7,836,266 | | |
| | | | | | 38,592,972 | | |
Switzerland—9.8% | |
ABB Ltd. | | | 366,296 | | | | 9,198,920 | | |
Coca-Cola HBC AG | | | 58,320 | | | | 1,518,289 | | |
EMS-Chemie Holding AG1 | | | 2,009 | | | | 1,734,913 | | |
Geberit AG | | | 9,198 | | | | 5,076,529 | | |
Givaudan SA | | | 13 | | | | 53,842 | | |
Julius Baer Group Ltd. | | | 124,799 | | | | 5,478,662 | | |
LafargeHolcim Ltd. | | | 54,053 | | | | 2,557,271 | | |
Logitech International SA | | | 24,942 | | | | 1,819,478 | | |
Nestle SA2 | | | 96,911 | | | | 11,524,821 | | |
Novartis AG2 | | | 120,646 | | | | 9,937,276 | | |
Partners Group Holding AG | | | 1,992 | | | | 1,929,665 | | |
Roche Holding AG2 | | | 34,699 | | | | 12,018,224 | | |
SGS SA2 | | | 1,558 | | | | 4,080,177 | | |
Sonova Holding AG* | | | 8,667 | | | | 1,959,643 | | |
STMicroelectronics N.V. | | | 92,804 | | | | 2,607,528 | | |
Swisscom AG | | | 599 | | | | 318,408 | | |
Temenos AG2 | | | 59,277 | | | | 8,760,092 | | |
Zurich Insurance Group AG | | | 6,437 | | | | 2,380,420 | | |
| | | | | | 82,954,158 | | |
Taiwan—1.4% | |
Taiwan Semiconductor Manufacturing Co. Ltd. | | | 502,000 | | | | 7,305,906 | | |
Taiwan Semiconductor Manufacturing Co. Ltd., ADR | | | 59,715 | | | | 4,710,916 | | |
| | | | | | 12,016,822 | | |
United Kingdom—12.1% | |
| 3i Group PLC2 | | | 301,910 | | | | 3,475,129 | | |
Admiral Group PLC | | | 49,556 | | | | 1,545,390 | | |
Associated British Foods PLC2 | | | 27,124 | | | | 621,254 | | |
AstraZeneca PLC2 | | | 38,737 | | | | 4,279,648 | | |
BAE Systems PLC | | | 100,532 | | | | 644,300 | | |
Barclays PLC | | | 127,767 | | | | 165,649 | | |
Barratt Developments PLC | | | 82,055 | | | | 545,064 | | |
Berkeley Group Holdings PLC | | | 9,848 | | | | 571,389 | | |
| | | Number of
shares | |
Value | |
Common stocks—(concluded) | |
United Kingdom—(concluded) | |
| BP PLC | | | 1,722,184 | | | $ | 6,236,896 | | |
British American Tobacco PLC | | | 9,062 | | | | 299,484 | | |
BT Group PLC | | | 63,308 | | | | 81,348 | | |
Bunzl PLC | | | 5,323 | | | | 152,483 | | |
CK Hutchison Holdings Ltd. | | | 1,501,500 | | | | 9,804,489 | | |
Compass Group PLC2 | | | 100,642 | | | | 1,384,753 | | |
Croda International PLC2 | | | 7,630 | | | | 569,460 | | |
DCC PLC | | | 20,063 | | | | 1,784,014 | | |
Diageo PLC | | | 21,727 | | | | 795,004 | | |
Direct Line Insurance Group PLC | | | 797,351 | | | | 3,085,495 | | |
Experian PLC | | | 46,185 | | | | 1,613,247 | | |
Fiat Chrysler Automobiles N.V.* | | | 15,885 | | | | 161,493 | | |
GlaxoSmithKline PLC2 | | | 487,219 | | | | 9,705,553 | | |
Halma PLC | | | 69,578 | | | | 1,976,281 | | |
Hargreaves Lansdown PLC | | | 62,918 | | | | 1,427,907 | | |
HSBC Holdings PLC | | | 62,803 | | | | 282,791 | | |
Imperial Brands PLC | | | 8,708 | | | | 145,082 | | |
InterContinental Hotels Group PLC | | | 21,893 | | | | 1,008,416 | | |
Intertek Group PLC | | | 21,954 | | | | 1,544,003 | | |
ITV PLC | | | 510,627 | | | | 376,546 | | |
JD Sports Fashion PLC | | | 29,801 | | | | 235,588 | | |
Kingfisher PLC | | | 2,241,767 | | | | 7,084,184 | | |
Legal & General Group PLC | | | 308,245 | | | | 853,308 | | |
Lloyds Banking Group PLC | | | 16,111,411 | | | | 5,489,326 | | |
Melrose Industries PLC | | | 231,445 | | | | 255,566 | | |
Next PLC | | | 13,370 | | | | 943,680 | | |
Persimmon PLC* | | | 63,972 | | | | 1,997,218 | | |
Prudential PLC | | | 18,363 | | | | 262,421 | | |
RELX PLC | | | 68,374 | | | | 1,439,421 | | |
Rolls-Royce Holdings PLC | | | 36,443 | | | | 109,324 | | |
Sage Group PLC/The | | | 4,391 | | | | 41,670 | | |
Smith & Nephew PLC | | | 56,209 | | | | 1,109,423 | | |
SSE PLC | | | 547,873 | | | | 9,293,210 | | |
Taylor Wimpey PLC | | | 19,744 | | | | 30,456 | | |
Tesco PLC | | | 2,592,031 | | | | 7,315,599 | | |
Travis Perkins PLC | | | 134,160 | | | | 1,940,450 | | |
Unilever N.V.2 | | | 80,164 | | | | 4,736,913 | | |
Vodafone Group PLC | | | 12,030 | | | | 18,079 | | |
WPP PLC | | | 698,047 | | | | 5,176,921 | | |
| | | | | | 102,615,325 | | |
United States—2.3% | |
Atlassian Corp. PLC, Class A* | | | 25,279 | | | | 4,465,535 | | |
Brookfield Renewable Corp., Class A* | | | 40,575 | | | | 1,823,440 | | |
Ferguson PLC | | | 20,848 | | | | 1,837,823 | | |
James Hardie Industries PLC | | | 45,708 | | | | 943,383 | | |
SolarEdge Technologies, Inc.* | | | 35,948 | | | | 6,294,495 | | |
Waste Connections, Inc. | | | 37,706 | | | | 3,859,963 | | |
| | | | | | 19,224,639 | | |
Total common stocks
(cost—$910,632,831) | | | 946,421,254 | | |
213
PACE International Equity Investments
Portfolio of investments—July 31, 2020
| | | Number of
shares | |
Value | |
Preferred stocks—0.1% | |
Germany—0.1% | |
Bayerische Motoren Werke AG | | | 7,036 | | | $ | 357,591 | | |
FUCHS PETROLUB SE | | | 6,237 | | | | 272,356 | | |
Volkswagen AG* | | | 1,063 | | | | 155,599 | | |
Total preferred stocks
(cost—$968,513) | | | 785,546 | | |
Short-term investments—1.5% | |
Investment companies—1.5% | |
State Street Institutional U.S. Government
Money Market Fund, 0.09%5
(cost—$12,654,551) | | | 12,654,551 | | | | 12,654,551 | | |
Investment of cash collateral from securities loaned—0.4% | |
Money market funds—0.4% | |
State Street Navigator Securities Lending
Government Money Market Portfolio, 0.12%5
(cost—$3,382,598) | | | 3,382,598 | | | | 3,382,598 | | |
Total investments before investments
sold short
(cost—$927,638,493)—113.3% | | | 963,243,949 | | |
Investments sold short—(13.5)% | |
Common stocks—(13.5)% | |
Australia—(1.1)% | |
Afterpay Ltd. | | | (26,688 | ) | | | (1,298,071 | ) | |
AusNet Services | | | (1,036,616 | ) | | | (1,324,497 | ) | |
Coles Group Ltd. | | | (45,410 | ) | | | (588,727 | ) | |
Computershare Ltd. | | | (143,088 | ) | | | (1,369,473 | ) | |
Crown Resorts Ltd. | | | (5,140 | ) | | | (32,861 | ) | |
Fortescue Metals Group Ltd. | | | (8,334 | ) | | | (103,735 | ) | |
Oil Search Ltd. | | | (98,602 | ) | | | (203,515 | ) | |
Suncorp Group Ltd. | | | (550,643 | ) | | | (3,363,226 | ) | |
Tabcorp Holdings Ltd. | | | (292,789 | ) | | | (740,411 | ) | |
WiseTech Global Ltd. | | | (11,989 | ) | | | (176,257 | ) | |
| | | | | | (9,200,773 | ) | |
Austria—(0.2)% | |
voestalpine AG | | | (65,198 | ) | | | (1,445,641 | ) | |
Belgium—(0.4)% | |
Groupe Bruxelles Lambert SA | | | (11,399 | ) | | | (988,756 | ) | |
Umicore SA | | | (51,495 | ) | | | (2,431,960 | ) | |
| | | | | | (3,420,716 | ) | |
China—(0.0)%† | |
Wilmar International Ltd. | | | (20,300 | ) | | | (68,618 | ) | |
Denmark—(0.4)% | |
Ambu A/S, Class B | | | (38,649 | ) | | | (1,349,375 | ) | |
Danske Bank A/S | | | (109,065 | ) | | | (1,766,408 | ) | |
Demant A/S | | | (7,808 | ) | | | (242,382 | ) | |
| | | | | | (3,358,165 | ) | |
Finland—(0.1)% | |
Nokia OYJ | | | (121,542 | ) | | | (583,417 | ) | |
Nordea Bank Abp | | | (7,821 | ) | | | (60,410 | ) | |
Stora Enso Oyj, R Shares | | | (20,673 | ) | | | (259,275 | ) | |
Wartsila Oyj Abp | | | (30,174 | ) | | | (252,371 | ) | |
| | | | | | (1,155,473 | ) | |
| | | Number of
shares | |
Value | |
Investments sold short—(continued) | |
Common stocks—(continued) | |
France—(1.1)% | |
Atos SE | | | (7,650 | ) | | $ | (654,145 | ) | |
Bollore SA | | | (69,756 | ) | | | (234,056 | ) | |
Cie Generale des Etablissements Michelin SCA | | | (3,821 | ) | | | (395,726 | ) | |
Covivio | | | (5,632 | ) | | | (404,760 | ) | |
Dassault Aviation SA | | | (813 | ) | | | (666,685 | ) | |
Getlink SE | | | (41,350 | ) | | | (622,130 | ) | |
ICADE | | | (2,697 | ) | | | (177,494 | ) | |
Iliad SA | | | (7,040 | ) | | | (1,376,823 | ) | |
Ingenico Group SA | | | (3,763 | ) | | | (608,979 | ) | |
JCDecaux SA | | | (46,466 | ) | | | (785,985 | ) | |
Orpea | | | (983 | ) | | | (125,408 | ) | |
Remy Cointreau SA | | | (13,559 | ) | | | (2,174,566 | ) | |
Suez SA | | | (24,966 | ) | | | (329,271 | ) | |
Thales SA | | | (12,939 | ) | | | (935,378 | ) | |
| | | | | | (9,491,406 | ) | |
Germany—(0.3)% | |
E.ON SE | | | (34,638 | ) | | | (406,650 | ) | |
Fraport AG Frankfurt Airport Services Worldwide | | | (8,047 | ) | | | (314,572 | ) | |
Fresenius SE & Co. KGaA | | | (4,180 | ) | | | (208,556 | ) | |
LANXESS AG | | | (19,338 | ) | | | (1,002,979 | ) | |
thyssenkrupp AG | | | (115,323 | ) | | | (896,395 | ) | |
| | | | | | (2,829,152 | ) | |
Hong Kong—(0.3)% | |
Bank of East Asia Ltd./The | | | (30,475 | ) | | | (69,407 | ) | |
Hang Lung Properties Ltd. | | | (431,000 | ) | | | (1,057,398 | ) | |
Jardine Matheson Holdings Ltd. | | | (24,755 | ) | | | (1,012,412 | ) | |
Link REIT | | | (47,100 | ) | | | (365,452 | ) | |
PCCW Ltd. | | | (553,000 | ) | | | (311,756 | ) | |
| | | | | | (2,816,425 | ) | |
Ireland—(0.2)% | |
Flutter Entertainment PLC | | | (2,656 | ) | | | (402,432 | ) | |
Kerry Group PLC, Class A | | | (6,304 | ) | | | (834,942 | ) | |
| | | | | | (1,237,374 | ) | |
Japan—(5.7)% | |
Aeon Co. Ltd. | | | (23,600 | ) | | | (557,988 | ) | |
Aeon Mall Co. Ltd. | | | (53,400 | ) | | | (636,142 | ) | |
Aisin Seiki Co. Ltd. | | | (23,900 | ) | | | (690,262 | ) | |
Alfresa Holdings Corp. | | | (1,900 | ) | | | (38,907 | ) | |
Canon, Inc. | | | (3,900 | ) | | | (62,761 | ) | |
Chubu Electric Power Co., Inc. | | | (25,900 | ) | | | (307,979 | ) | |
Chugoku Electric Power Co., Inc./The | | | (184,500 | ) | | | (2,251,455 | ) | |
Coca-Cola Bottlers Japan Holdings, Inc. | | | (93,100 | ) | | | (1,388,990 | ) | |
CyberAgent, Inc. | | | (9,300 | ) | | | (526,066 | ) | |
Daicel Corp. | | | (12,800 | ) | | | (85,600 | ) | |
Daifuku Co. Ltd. | | | (13,700 | ) | | | (1,248,428 | ) | |
Daiwa House Industry Co. Ltd. | | | (7,600 | ) | | | (167,711 | ) | |
Daiwa House REIT Investment Corp. | | | (400 | ) | | | (1,040,051 | ) | |
Electric Power Development Co. Ltd. | | | (48,100 | ) | | | (656,160 | ) | |
FUJIFILM Holdings Corp. | | | (5,600 | ) | | | (250,446 | ) | |
GMO Payment Gateway, Inc. | | | (21,100 | ) | | | (2,212,027 | ) | |
Hamamatsu Photonics K.K. | | | (14,700 | ) | | | (638,909 | ) | |
214
PACE International Equity Investments
Portfolio of investments—July 31, 2020
| | | Number of
shares | |
Value | |
Investments sold short—(continued) | |
Common stocks—(continued) | |
Japan—(concluded) | |
Hitachi Construction Machinery Co. Ltd. | | | (6,400 | ) | | $ | (185,459 | ) | |
Hitachi Metals Ltd. | | | (134,500 | ) | | | (1,755,656 | ) | |
Honda Motor Co. Ltd. | | | (2,900 | ) | | | (70,702 | ) | |
Hulic Co. Ltd. | | | (70,600 | ) | | | (606,854 | ) | |
Idemitsu Kosan Co. Ltd. | | | (66,900 | ) | | | (1,393,571 | ) | |
Iida Group Holdings Co. Ltd. | | | (8,100 | ) | | | (125,371 | ) | |
Isetan Mitsukoshi Holdings Ltd. | | | (2,500 | ) | | | (11,408 | ) | |
Japan Airport Terminal Co. Ltd. | | | (29,700 | ) | | | (1,019,749 | ) | |
Japan Exchange Group, Inc. | | | (31,800 | ) | | | (755,120 | ) | |
JSR Corp. | | | (93,600 | ) | | | (2,040,977 | ) | |
JTEKT Corp. | | | (21,100 | ) | | | (140,425 | ) | |
Kajima Corp. | | | (76,200 | ) | | | (837,060 | ) | |
Kawasaki Heavy Industries Ltd. | | | (36,200 | ) | | | (493,646 | ) | |
Kintetsu Group Holdings Co. Ltd. | | | (26,900 | ) | | | (1,048,082 | ) | |
Kyushu Electric Power Co., Inc. | | | (214,400 | ) | | | (1,800,614 | ) | |
Kyushu Railway Co. | | | (12,400 | ) | | | (244,961 | ) | |
Lasertec Corp. | | | (2,900 | ) | | | (256,054 | ) | |
M3, Inc. | | | (4,600 | ) | | | (236,222 | ) | |
Marui Group Co. Ltd. | | | (12,100 | ) | | | (175,943 | ) | |
MISUMI Group, Inc. | | | (51,400 | ) | | | (1,216,184 | ) | |
Mitsubishi Corp. | | | (1,700 | ) | | | (34,255 | ) | |
Mitsubishi Estate Co. Ltd. | | | (4,800 | ) | | | (68,953 | ) | |
Mitsubishi Materials Corp. | | | (29,200 | ) | | | (596,978 | ) | |
Nagoya Railroad Co. Ltd. | | | (3,000 | ) | | | (75,918 | ) | |
NGK Insulators Ltd. | | | (12,800 | ) | | | (159,077 | ) | |
NH Foods Ltd. | | | (5,600 | ) | | | (246,130 | ) | |
Nikon Corp. | �� | | (33,300 | ) | | | (232,814 | ) | |
Nippon Express Co. Ltd. | | | (1,700 | ) | | | (80,816 | ) | |
Nippon Paint Holdings Co. Ltd. | | | (38,400 | ) | | | (2,625,839 | ) | |
Nippon Prologis REIT, Inc. | | | (634 | ) | | | (2,188,562 | ) | |
Nippon Yusen KK | | | (51,000 | ) | | | (663,610 | ) | |
Nomura Real Estate Holdings, Inc. | | | (36,200 | ) | | | (598,486 | ) | |
Nomura Real Estate Master Fund, Inc. | | | (29 | ) | | | (35,965 | ) | |
Odakyu Electric Railway Co. Ltd. | | | (15,800 | ) | | | (330,645 | ) | |
Pan Pacific International Holdings Corp. | | | (74,200 | ) | | | (1,681,743 | ) | |
Park24 Co. Ltd. | | | (3,200 | ) | | | (42,633 | ) | |
Ricoh Co. Ltd. | | | (154,900 | ) | | | (997,518 | ) | |
Shiseido Co. Ltd. | | | (50,500 | ) | | | (2,813,667 | ) | |
SUMCO Corp. | | | (11,600 | ) | | | (179,974 | ) | |
Sumitomo Electric Industries Ltd. | | | (3,400 | ) | | | (37,987 | ) | |
Taisho Pharmaceutical Holdings Co. Ltd. | | | (11,300 | ) | | | (642,051 | ) | |
THK Co. Ltd. | | | (24,800 | ) | | | (584,294 | ) | |
Toho Gas Co. Ltd. | | | (1,700 | ) | | | (74,187 | ) | |
Tohoku Electric Power Co., Inc. | | | (48,400 | ) | | | (457,388 | ) | |
Tokyo Century Corp. | | | (5,100 | ) | | | (286,850 | ) | |
Tokyu Fudosan Holdings Corp. | | | (365,600 | ) | | | (1,397,157 | ) | |
Toppan Printing Co. Ltd. | | | (32,100 | ) | | | (481,224 | ) | |
Toyoda Gosei Co. Ltd. | | | (4,200 | ) | | | (82,356 | ) | |
Yamada Denki Co. Ltd. | | | (154,100 | ) | | | (668,578 | ) | |
Yamaha Motor Co. Ltd. | | | (40,800 | ) | | | (594,948 | ) | |
Yamato Holdings Co. Ltd. | | | (7,800 | ) | | | (201,128 | ) | |
Yamazaki Baking Co. Ltd. | | | (56,900 | ) | | | (954,795 | ) | |
Yaskawa Electric Corp. | | | (2,500 | ) | | | (83,118 | ) | |
Z Holdings Corp. | | | (183,400 | ) | | | (975,272 | ) | |
| | | | | | (48,348,856 | ) | |
| | | Number of
shares | |
Value | |
Investments sold short—(concluded) | |
Common stocks—(concluded) | |
Macau—(0.2)% | |
SJM Holdings Ltd. | | | (1,255,000 | ) | | $ | (1,416,093 | ) | |
Netherlands—(0.1)% | |
Koninklijke Vopak N.V. | | | (9,287 | ) | | | (507,700 | ) | |
New Zealand—(0.0)%† | |
Ryman Healthcare Ltd. | | | (12,386 | ) | | | (109,938 | ) | |
Norway—(0.1)% | |
Equinor ASA | | | (27,989 | ) | | | (419,643 | ) | |
Mowi ASA | | | (30,168 | ) | | | (547,885 | ) | |
Norsk Hydro ASA | | | (66,838 | ) | | | (188,799 | ) | |
| | | | | | (1,156,327 | ) | |
Singapore—(0.4)% | |
City Developments Ltd. | | | (204,000 | ) | | | (1,221,678 | ) | |
Singapore Airlines Ltd. | | | (98,300 | ) | | | (245,215 | ) | |
Suntec Real Estate Investment Trust | | | (160,300 | ) | | | (157,290 | ) | |
UOL Group Ltd. | | | (258,500 | ) | | | (1,252,144 | ) | |
| | | | | | (2,876,327 | ) | |
Spain—(0.6)% | |
Banco Bilbao Vizcaya Argentaria SA | | | (278,862 | ) | | | (868,298 | ) | |
CaixaBank SA | | | (41,491 | ) | | | (89,249 | ) | |
Ferrovial SA | | | (150,109 | ) | | | (3,675,717 | ) | |
Repsol SA | | | (90,089 | ) | | | (710,418 | ) | |
Siemens Gamesa Renewable Energy SA | | | (2,633 | ) | | | (62,126 | ) | |
| | | | | | (5,405,808 | ) | |
Sweden—(0.8)% | |
Boliden AB | | | (90,496 | ) | | | (2,471,280 | ) | |
Electrolux AB, Series B | | | (33,290 | ) | | | (625,641 | ) | |
Kinnevik AB, Class B | | | (26,500 | ) | | | (932,812 | ) | |
Svenska Cellulosa AB SCA, Class B | | | (226,000 | ) | | | (2,744,730 | ) | |
| | | | | | (6,774,463 | ) | |
Switzerland—(0.3)% | |
Barry Callebaut AG | | | (476 | ) | | | (991,183 | ) | |
Swiss Re AG | | | (18,688 | ) | | | (1,474,653 | ) | |
| | | | | | (2,465,836 | ) | |
United Kingdom—(1.2)% | |
British Land Co. PLC/The | | | (7,068 | ) | | | (33,729 | ) | |
CNH Industrial N.V. | | | (139,254 | ) | | | (946,215 | ) | |
Kingfisher PLC | | | (310,065 | ) | | | (979,833 | ) | |
Land Securities Group PLC | | | (166,456 | ) | | | (1,253,712 | ) | |
Ocado Group PLC | | | (127,838 | ) | | | (3,424,760 | ) | |
Pearson PLC | | | (125,271 | ) | | | (860,761 | ) | |
SSE PLC | | | (45,572 | ) | | | (773,008 | ) | |
St James's Place PLC | | | (38,469 | ) | | | (470,500 | ) | |
Standard Life Aberdeen PLC | | | (167,393 | ) | | | (544,835 | ) | |
Whitbread PLC | | | (41,756 | ) | | | (1,185,608 | ) | |
| | | | | | (10,472,961 | ) | |
Total investments sold short
(proceeds—$120,275,960) | | | (114,558,052 | ) | |
Other assets in excess of liabilities—0.2% | | | | | 1,573,836 | | |
Net assets—100.0% | | | | $ | 850,259,733 | | |
215
PACE International Equity Investments
Portfolio of investments—July 31, 2020
For a listing of defined portfolio acronyms that are used throughout the Portfolio of investments as well as the tables that follow, please refer to page 267.
Fair valuation summary
The following is a summary of the fair valuations according to the inputs used as of July 31,2020 in valuing the Portfolio's investments. In the event a Portfolio holds investments for which fair value is measured using the NAV per share practical expedient (or its equivalent), a separate column will be added to the fair value hierarchy table; this is intended to permit reconciliation to the amounts presented in the Portfolio of investments:
Assets
Description | | Unadjusted
quoted prices in
active markets for
identical investments
(Level 1) | |
Other significant
observable inputs
(Level 2) | |
Unobservable
inputs
(Level 3) | |
Total | |
Common stocks | | $ | 72,045,740 | | | $ | 874,375,514 | | | $ | — | | | $ | 946,421,254 | | |
Preferred stocks | | | — | | | | 785,546 | | | | — | | | | 785,546 | | |
Short-term investments | | | — | | | | 12,654,551 | | | | — | | | | 12,654,551 | | |
Investment of cash collateral from securities loaned | | | — | | | | 3,382,598 | | | | — | | | | 3,382,598 | | |
Total | | $ | 72,045,740 | | | $ | 891,198,209 | | | $ | — | | | $ | 963,243,949 | | |
Liabilities | |
Investments sold short | | $ | — | | | $ | (114,558,052 | ) | | $ | — | | | $ | (114,558,052 | ) | |
At July 31,2020, there were no transfers in or out of Level 3.
Portfolio footnotes
* Non-income producing security.
† Amount represents less than 0.05% or (0.05)%.
1 Security, or portion thereof, was on loan at the period end.
2 Security, or portion thereof, pledged as collateral for investments sold short.
3 Security exempt from registration pursuant to Rule 144A under the Securities Act of1933. These securities are considered liquid, unless noted otherwise, and may be resold in transactions exempt from registration, normally to qualified institutional buyers. Securities exempt from registration pursuant to Rule 144A, in the amount of $22,568,480, represented 2.7% of the Portfolio's net assets at period end.
4 Security is traded on the Amsterdam Exchange.
5 Rates shown reflect yield at July 31, 2020.
See accompanying notes to financial statements.
216
PACE International Emerging Markets Equity Investments
Performance
For the 12-months ended July 31, 2020, the Portfolio's Class P shares returned 7.24% before the deduction of the maximum PACE Select program fee.1 In comparison, the MSCI Emerging Markets Index (net) (the "benchmark") returned 6.55%. (Returns for all share classes over various time periods are shown in the "Performance at a glance" table on page 219. Please note that the returns shown do not reflect the deduction of taxes that a shareholder would pay on Portfolio distributions or the redemption of Portfolio shares.) For a detailed commentary on the market environment in general during the reporting period, please refer to page 2.
Investment Manager's comments2
The Portfolio outperformed its benchmark during the reporting period. The Portfolio's sector positioning was the primary contributor, particularly the underweight to Financials and Utilities as well as the overweight to Health Care and Consumer Discretionary sectors. The Information Technology and Health Care sectors posted strong absolute and relative results, particularly vs. the Financial and Energy sectors which posted very weak absolute and relative results in comparison to the benchmark. This contributed to the growth style outperforming the value style during this time period. The MSCI Emerging Markets Growth index returned 21.86% vs. the MSCI Emerging Markets Value Index return of -7.90%, a significant divergence of 29.76%.
Stock selection was modestly positive from a sector perspective. Key positive sectors included Communication Services and Information Technology. Stock selection in Financials and Industrials was negative but only acted as partial offsets. In terms of style, the Portfolio's modestly higher beta, liquidity and profitability exposures were helpful in a volatile period. The Portfolio's modest growth tilt was an additional tailwind as investors rewarded companies that were able to generate attractive growth, despite the environment.
Stock selection from a country perspective was positive with strong selection in Taiwan and China offsetting weaker results in Brazil and Thailand. Country allocation was also positive, particularly the opportunistic allocation to Saudi Arabia which contributed to the offset of negative contribution from an overweight to India.
Derivatives were not used during the reporting period.
1 Class P shares held through the PACE Select Advisors Program are subject to a maximum Program fee of 2.50%, which, if included, would have reduced performance. Class P shares held through other advisory programs also may be subject to a program fee, which, if included, would have reduced performance.
2 Performance is discussed on a gross-of-fees basis—meaning that no fees or expenses are reflected when discussed at the level of a subadvisor's sleeve (or subadvisors' sleeves, if applicable). Alternatively, performance at the overall Portfolio level is shown net of fees, which does factor in fees and expenses associated with the Portfolio.
PACE Select Advisors Trust – PACE International Emerging Markets Equity Investments
Investment Manager:
UBS Asset Management (Americas) Inc. ("UBS AM")
Investment Subadvisors:
Mondrian Investment Partners Limited ("Mondrian"); William Blair & Company L.L.C. ("William Blair");
LMCG Investments, LLC, formerly Lee Munder Capital Group ("LMCG")
RWC Asset Advisors (US) LLC ("RWC") (Effective September 11, 2019)
Portfolio Management Team:
UBS AM: Mabel Lung, CFA, Fred Lee, CFA, Gina Toth, CFA, Ned Sienko, Vincent Russo and Mayoor Joshi
Mondrian: Ginny Chong, Gregory Halton and Andrew Miller;
William Blair: Todd M. McClone and Jack Murphy;
LMCG: Gordon Johnson
RWC: John Malloy
Objective:
Capital appreciation
Investment process:
The main strategies of the subadvisors include:
• A strategy using fundamental research to identify companies that are attractive based on a value-oriented dividend discount model and market analysis.
217
PACE International Emerging Markets Equity Investments
Investment process:
(concluded)
• A strategy that invests in mid and large cap companies with a quality growth orientation.
• A strategy that uses a bottom-up quantitative approach.
• A strategy that combines top-down analyses of economic, political and social factors with bottom-up quantitative and qualitative fundamental research to seek to identify countries, sectors and companies with robust growth characteristics.
Mutual funds are sold by prospectus only. You should read it carefully and consider a fund's investment objectives, risks, charges, expenses and other important information contained in the prospectus before investing. Prospectuses for most of our funds can be obtained from your financial advisor, by calling UBS Funds at 800-647 1568 or by visiting our Website at www.ubs.com/am-us.
Special considerations
The Portfolio may be appropriate for long-term investors seeking capital appreciation who are able to withstand short-term fluctuations in the equity markets in return for potentially higher returns over the long term. The value of the Portfolio changes every day and can be affected by changes in interest rates, general market conditions, and other political, social and economic developments, as well as specific matters relating to the companies in whose securities the Portfolio invests. It is important to note that an investment in the Portfolio is only one component of a balanced investment plan. The value of the Portfolio's investments in foreign securities may fall due to adverse political, social and economic developments abroad, and due to decreases in foreign currency values relative to the US dollar. These risks are greater for investments in emerging market issuers than for issuers in more developed countries.
218
PACE International Emerging Markets Equity Investments
Performance at a glance (unaudited)
Average annual total returns for periods ended 07/31/20 | | 1 year | | 5 years | | 10 years | |
Before deducting maximum sales charge | |
Class A1 | | | 6.97 | % | | | 4.10 | % | | | 2.16 | % | |
Class Y2 | | | 7.29 | | | | 4.37 | | | | 2.40 | | |
Class P3 | | | 7.24 | | | | 4.36 | | | | 2.33 | | |
After deducting maximum sales charge | |
Class A1 | | | 1.06 | | | | 2.93 | | | | 1.58 | | |
MSCI Emerging Markets Index (net)4 | | | 6.55 | | | | 6.15 | | | | 3.33 | | |
Most recent calendar quarter-end returns (unaudited)
Average annual total returns for periods ended 06/30/20 | | 1 year | | 5 years | | 10 years | |
Before deducting maximum sales charge | |
Class A1 | | | (4.19 | )% | | | 0.93 | % | | | 2.22 | % | |
Class Y2 | | | (3.88 | ) | | | 1.18 | | | | 2.48 | | |
Class P3 | | | (3.97 | ) | | | 1.18 | | | | 2.40 | | |
After deducting maximum sales charge | |
Class A1 | | | (9.46 | ) | | | (0.21 | ) | | | 1.65 | | |
The annualized gross and net expense ratios, respectively, for each class of shares as in the November 27, 2019 prospectuses, supplemented from time to time, were as follows: Class A—1.71% and 1.65%; Class Y—1.47% and 1.40%; and Class P—1.49% and 1.40% Net expenses reflect fee waivers and/or expense reimbursements, if any, pursuant to an agreement that is in effect to cap the expenses. The Portfolio and UBS Asset Management (Americas) Inc. ("UBS AM") have entered into a written fee waiver/expense reimbursement agreement pursuant to which UBS AM is contractually obligated to waive its management fees and/or reimburse expenses so that the Portfolio's ordinary total operating expenses of each class through November 30, 2020 (excluding dividend expense, borrowing costs, and interest expense relating to short sales, and expenses attributable to investment in other investment companies, interest, taxes, brokerage commissions and extraordinary expenses) would not exceed Class A—1.65%; Class Y—1.40%; and Class P—1.40% The Portfolio has agreed to repay UBS AM for any waived fees/reimbursed expenses to the extent that it can do so over the following three fiscal years without causing the Portfolio's expenses in any of those three years to exceed these expense caps and that UBS AM has not waived the right to do so. The fee waiver/ expense reimbursement agreement may be terminated by the Portfolio's board at any time and also will terminate automatically upon the expiration or termination of the Portfolio's advisory contract with UBS AM. Upon termination of the agreement, however, UBS AM's three year recoupment rights will survive.
1 Maximum sales charge for Class A shares is 5.5%. Class A shares bear ongoing 12b-1 service fees of 0.25% annually.
2 The Portfolio offers Class Y shares to a limited group of eligible investors, including certain qualifying retirement plans. Class Y shares do not bear initial or contingent deferred sales charges or ongoing 12b-1 service and distribution fees.
3 Class P shares do not bear initial or contingent deferred sales charges or ongoing 12b-1 service and distribution fees, but Class P shares held through advisory programs may be subject to a program fee, which, if included, would have reduced performance.
4 The MSCI Emerging Markets Index (net) is a market capitalization-weighted index composed of different emerging market countries in Europe, Latin America, and the Pacific Basin. Net total return indices reinvest dividends after the deduction of withholding taxes, using a tax rate applicable to nonresident institutional investors who do not benefit from double taxation treaties. The index is constructed and managed with a view to being fully investable from the perspective of international institutional investors. Investors should note that indices do not reflect the deduction of fees and expenses.
Prior to August 3, 2015, a 1% redemption fee was imposed on sales or exchanges of any class of shares of the Portfolio made during the specified holding period.
Past performance does not predict future performance, and the performance information provided does not reflect the deduction of taxes that a shareholder would pay on Portfolio distributions or the redemption of Portfolio shares. The return and principal value of an investment will fluctuate, so that an investor's shares, when redeemed, may be worth more or less than their original cost. Performance results assume reinvestment of all dividends and capital gain distributions at net asset value on the ex-dividend dates. Current performance may be higher or lower than the performance data quoted. For month-end performance figures, please visit www.ubs.com/us-mutualfundperformance.
219
PACE International Emerging Markets Equity Investments
Illustration of an assumed investment of $10,000 in Class P shares of the Portfolio (unaudited)
The following graph depicts the performance of PACE International Emerging Markets Equity Investments Class P shares versus the MSCI Emerging Markets Index (net) over the 10 years ended July 31, 2020. Class P shares held through advisory programs may be subject to a program fee, which, if included, would have reduced performance. The performance of the other classes will vary based upon the different class specific expenses and sales charges. The performance provided does not reflect the deduction of taxes that a shareholder would pay on Portfolio distributions or the redemption of Portfolio shares. Past performance is no guarantee of future results. Share price and returns will vary with market conditions; investors may realize a gain or loss upon redemption. It is important to note that PACE International Emerging Markets Equity Investments is a professionally managed portfolio while the Index is not available for investment and are unmanaged. The comparison is shown for illustration purposes only.
PACE International Emerging Markets Equity Investments
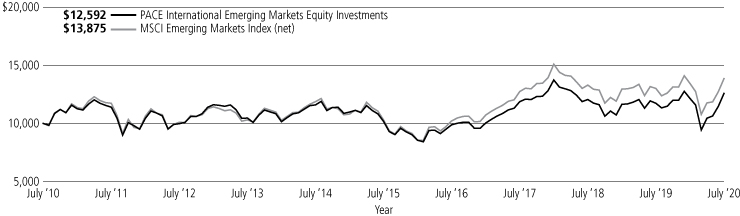
220
PACE International Emerging Markets Equity Investments
Portfolio statistics—July 31, 2020 (unaudited)
Top ten holdings1 | | Percentage of
net assets | |
Tencent Holdings Ltd. | | | 6.3 | % | |
Taiwan Semiconductor Manufacturing Co. Ltd. | | | 4.0 | | |
Alibaba Group Holding Ltd. | | | 3.3 | | |
Alibaba Group Holding Ltd., ADR | | | 2.9 | | |
Taiwan Semiconductor Manufacturing Co. Ltd., ADR | | | 2.7 | | |
Samsung Electronics Co. Ltd. | | | 2.4 | | |
Reliance Industries Ltd. | | | 2.2 | | |
Ping An Insurance Group Co. of China Ltd., Class H | | | 1.8 | | |
MediaTek, Inc. | | | 1.5 | | |
Yandex N.V., Class A | | | 1.5 | | |
Total | | | 28.6 | % | |
Top five issuer breakdown by country or territory of origin1 | | Percentage of
net assets | |
China | | | 38.0 | % | |
Taiwan | | | 12.9 | | |
India | | | 10.2 | | |
South Korea | | | 9.9 | | |
Brazil | | | 6.2 | | |
Total | | | 77.2 | % | |
1 The Portfolio is actively managed and its composition will vary over time.
221
PACE International Emerging Markets Equity Investments
Industry diversification—(unaudited)
As a percentage of net assets as of July 31, 2020
Common stocks | |
Airlines | | | 0.2 | % | |
Auto components | | | 0.6 | | |
Automobiles | | | 1.3 | | |
Banks | | | 8.1 | | |
Beverages | | | 1.3 | | |
Capital markets | | | 1.2 | | |
Chemicals | | | 1.4 | | |
Communications equipment | | | 0.6 | | |
Construction & engineering | | | 0.5 | | |
Construction materials | | | 0.4 | | |
Consumer finance | | | 0.4 | | |
Diversified consumer services | | | 0.5 | | |
Diversified financial services | | | 0.7 | | |
Diversified telecommunication services | | | 1.0 | | |
Electric utilities | | | 0.1 | | |
Electrical equipment | | | 0.5 | | |
Electronic equipment, instruments & components | | | 2.0 | | |
Energy equipment & services | | | 0.2 | | |
Entertainment | | | 2.7 | | |
Equity real estate investment trusts | | | 0.4 | | |
Food & staples retailing | | | 1.3 | | |
Food products | | | 2.8 | | |
Gas utilities | | | 0.2 | | |
Health care equipment & supplies | | | 0.6 | | |
Health care providers & services | | | 0.4 | | |
Hotels, restaurants & leisure | | | 1.1 | | |
Household durables | | | 2.0 | | |
Household products | | | 0.3 | | |
Independent power and renewable electricity producers | | | 0.2 | | |
Industrial conglomerates | | | 0.8 | | |
Insurance | | | 3.4 | | |
Interactive media & services | | | 8.3 | | |
Interactive media & services | | | 1.5 | | |
Internet & direct marketing retail | | | 10.0 | | |
IT services | | | 3.1 | | |
Life sciences tools & services | | | 0.0 | † | |
Machinery | | | 0.7 | | |
Common stocks—(concluded) | |
Media | | | 0.5 | % | |
Metals & mining | | | 3.8 | | |
Multiline retail | | | 0.1 | | |
Oil, gas & consumable fuels | | | 5.1 | | |
Paper & forest products | | | 0.5 | | |
Personal products | | | 1.3 | | |
Pharmaceuticals | | | 2.8 | | |
Real estate management & development | | | 0.9 | | |
Road & rail | | | 0.9 | | |
Semiconductors & semiconductor equipment | | | 9.9 | | |
Software | | | 1.4 | | |
Specialty retail | | | 1.2 | | |
Technology hardware, storage & peripherals | | | 3.0 | | |
Textiles, apparel & luxury goods | | | 0.7 | | |
Thrifts & mortgage finance | | | 1.0 | | |
Transportation infrastructure | | | 0.9 | | |
Wireless telecommunication services | | | 0.9 | | |
Total common stocks | | | 95.7 | | |
Preferred stocks | |
Banks | | | 0.5 | | |
Diversified telecommunication services | | | 0.2 | | |
Multiline retail | | | 0.2 | | |
Technology hardware, storage & peripherals | | | 0.6 | | |
Total preferred stocks | | | 1.5 | | |
Rights | |
Internet | | | 0.0 | † | |
Exchange traded funds | | | 1.0 | | |
Short-term investments | | | 1.5 | | |
Investment of cash collateral from securities loaned | | | 0.9 | | |
Total investments | | | 100.6 | | |
Liabilities in excess of other assets | | | (0.6 | ) | |
Net assets | | | 100.0 | % | |
† Amount represents less than 0.05% or (0.05)%.
222
PACE International Emerging Markets Equity Investments
Portfolio of investments—July 31, 2020
| | | Number of
shares | | Value | |
Common stocks—95.7% | |
Argentina—1.6% | |
Globant SA* | | | 8,657 | | | $ | 1,497,142 | | |
MercadoLibre, Inc.* | | | 3,579 | | | | 4,025,015 | | |
| | | | | | 5,522,157 | | |
Brazil—5.3% | |
B2W Cia Digital* | | | 19,100 | | | | 436,881 | | |
B3 SA—Brasil Bolsa Balcao | | | 208,100 | | | | 2,530,765 | | |
Banco Bradesco SA | | | 124,190 | | | | 493,517 | | |
| BRF SA* | | | 179,233 | | | | 711,222 | | |
Equatorial Energia SA | | | 94,300 | | | | 461,508 | | |
Hypera SA | | | 124,300 | | | | 860,668 | | |
Itau Unibanco Banco Multiplo SA, ADR | | | 22,708 | | | | 115,811 | | |
Localiza Rent A Car SA | | | 50,900 | | | | 496,847 | | |
Minerva SA* | | | 172,500 | | | | 449,061 | | |
MRV Engenharia e Participacoes SA | | | 90,700 | | | | 332,787 | | |
OdontoPrev SA | | | 285,000 | | | | 755,039 | | |
Pagseguro Digital Ltd., Class A*,1 | | | 21,191 | | | | 810,132 | | |
Petrobras Distribuidora SA | | | 198,421 | | | | 863,436 | | |
Petroleo Brasileiro SA, ADR | | | 249,967 | | | | 2,167,214 | | |
Porto Seguro SA | | | 40,500 | | | | 419,476 | | |
Raia Drogasil SA | | | 37,800 | | | | 899,249 | | |
Rumo SA* | | | 597,685 | | | | 2,545,851 | | |
Suzano SA* | | | 71,700 | | | | 577,278 | | |
TIM Participacoes SA | | | 286,900 | | | | 866,219 | | |
TOTVS SA | | | 221,600 | | | | 1,097,263 | | |
WEG SA | | | 83,800 | | | | 1,081,928 | | |
| | | | | | 18,972,152 | | |
Canada—0.1% | |
Ivanhoe Mines Ltd., Class A*,1 | | | 56,263 | | | | 198,262 | | |
China—38.0% | |
Agile Group Holdings Ltd. | | | 464,000 | | | | 588,782 | | |
Alibaba Group Holding Ltd.* | | | 370,932 | | | | 11,638,376 | | |
Alibaba Group Holding Ltd., ADR* | | | 41,230 | | | | 10,349,555 | | |
Anhui Conch Cement Co. Ltd., Class H | | | 88,000 | | | | 665,469 | | |
Baidu, Inc., ADR* | | | 8,759 | | | | 1,045,825 | | |
Bank of China Ltd., Class H | | | 3,175,000 | | | | 1,057,303 | | |
Bank of Communications Co. Ltd., Class H | | | 832,000 | | | | 461,832 | | |
Baozun, Inc., ADR*,1 | | | 11,366 | | | | 478,054 | | |
Beijing Sinnet Technology Co. Ltd. Class H | | | 337,273 | | | | 1,265,214 | | |
Brilliance China Automotive Holdings Ltd. | | | 58,000 | | | | 59,227 | | |
BYD Electronic International Co. Ltd. | | | 155,500 | | | | 545,902 | | |
China Aoyuan Group Ltd. | | | 535,000 | | | | 674,683 | | |
China CITIC Bank Corp. Ltd., Class H | | | 1,524,000 | | | | 664,959 | | |
China Communications Services Corp. Ltd., Class H | | | 708,000 | | | | 458,980 | | |
China Construction Bank Corp., Class H | | | 2,324,000 | | | | 1,694,499 | | |
China Galaxy Securities Co. Ltd., Class H | | | 1,049,500 | | | | 627,779 | | |
China Life Insurance Co. Ltd. Class H | | | 403,000 | | | | 924,446 | | |
China Literature Ltd.*,2 | | | 60,200 | | | | 396,130 | | |
China Medical System Holdings Ltd. | | | 665,000 | | | | 807,473 | | |
China Merchants Bank Co. Ltd., Class H | | | 548,000 | | | | 2,557,508 | | |
China Minsheng Banking Corp. Ltd., Class H | | | 1,002,500 | | | | 631,425 | | |
China Mobile Ltd. | | | 284,000 | | | | 1,938,622 | | |
China National Building Material Co. Ltd., Class H | | | 456,000 | | | | 708,161 | | |
China Petroleum & Chemical Corp., Class H | | | 1,368,000 | | | | 582,796 | | |
China Railway Group Ltd., Class H | | | 1,143,000 | | | | 578,610 | | |
| | | Number of
shares | | Value | |
Common stocks—(continued) | |
China—(continued) | |
China Resources Power Holdings Co. Ltd. | | | 444,000 | | | $ | 566,052 | | |
China Tourism Group Duty Free Corp. Ltd., Class A | | | 101,235 | | | | 3,527,622 | | |
China Traditional Chinese Medicine Holdings Co. Ltd. | | | 1,230,000 | | | | 629,069 | | |
China Unicom Hong Kong Ltd. | | | 1,166,000 | | | | 648,560 | | |
CITIC Ltd. | | | 572,000 | | | | 536,874 | | |
COFCO Meat Holdings Ltd. | | | 1,377,000 | | | | 685,044 | | |
COSCO SHIPPING Energy Transportation Co. Ltd.,
Class H | | | 708,000 | | | | 316,003 | | |
CSPC Pharmaceutical Group Ltd. | | | 624,000 | | | | 1,314,243 | | |
Dongyue Group Ltd. | | | 893,000 | | | | 393,469 | | |
Focus Media Information Technology Co. Ltd.,
Class A | | | 1,528,880 | | | | 1,329,047 | | |
Fosun International Ltd. | | | 615,000 | | | | 701,266 | | |
Geely Automobile Holdings Ltd. | | | 388,000 | | | | 813,940 | | |
GF Securities Co. Ltd., Class H | | | 306,400 | | | | 367,694 | | |
Great Wall Motor Co. Ltd., Class H | | | 1,057,000 | | | | 1,031,882 | | |
Gree Electric Appliances, Inc. of Zhuhai, Class A | | | 42,900 | | | | 349,615 | | |
Guangzhou R&F Properties Co. Ltd., Class H | | | 458,000 | | | | 528,608 | | |
Haitong Securities Co. Ltd., Class H* | | | 695,200 | | | | 646,766 | | |
Hangzhou Hikvision Digital Technology Co. Ltd.,
Class A | | | 147,900 | | | | 784,158 | | |
Hangzhou Robam Appliances Co. Ltd., Class A | | | 223,215 | | | | 1,225,456 | | |
Hangzhou Tigermed Consulting Class H | | | 5,200 | | | | 67,094 | | |
Hengan International Group Co. Ltd. | | | 93,000 | | | | 780,838 | | |
Huazhu Group Ltd. ADR1 | | | 23,734 | | | | 814,788 | | |
Industrial & Commercial Bank of China Ltd.,
Class H | | | 1,002,000 | | | | 587,113 | | |
JD.com, Inc., ADR* | | | 41,584 | | | | 2,652,643 | | |
Jiangsu Hengrui Medicine Co. Ltd., Class A | | | 68,696 | | | | 929,701 | | |
Jiangsu Yanghe Brewery Joint-Stock Co. Ltd.,
Class A | | | 61,400 | | | | 1,189,004 | | |
Jiangxi Copper Co. Ltd., Class H | | | 495,000 | | | | 591,642 | | |
JOYY, Inc., ADR* | | | 16,111 | | | | 1,285,980 | | |
Kunlun Energy Co. Ltd. | | | 788,000 | | | | 660,164 | | |
Kweichow Moutai Co. Ltd., Class A | | | 7,800 | | | | 1,875,960 | | |
Lenovo Group Ltd. | | | 1,218,000 | | | | 734,267 | | |
Li Auto, Inc., ADR* | | | 24,057 | | | | 384,912 | | |
Meituan Dianping, Class B* | | | 121,745 | | | | 3,012,761 | | |
Midea Group Co. Ltd., Class A | | | 393,700 | | | | 4,043,635 | | |
NetEase, Inc., ADR | | | 10,733 | | | | 4,920,222 | | |
New China Life Insurance Co. Ltd., Class H | | | 95,200 | | | | 372,507 | | |
Offshore Oil Engineering Co. Ltd., Class A | | | 929,277 | | | | 641,143 | | |
People's Insurance Co. Group of China Ltd./The,
Class H | | | 2,027,000 | | | | 659,505 | | |
PICC Property & Casualty Co. Ltd., Class H | | | 726,000 | | | | 573,715 | | |
Ping An Insurance Group Co. of China Ltd., Class H | | | 600,500 | | | | 6,336,008 | | |
Sangfor Technologies, Inc., Class A | | | 44,997 | | | | 1,379,778 | | |
Shandong Weigao Group Medical Polymer Co. Ltd.,
Class H | | | 196,000 | | | | 499,129 | | |
Shanghai Pharmaceuticals Holding Co. Ltd., Class H | | | 362,700 | | | | 644,851 | | |
Shenzhen International Holdings Ltd. | | | 301,000 | | | | 491,214 | | |
Shenzhen Sunway Communication Co. Ltd., Class A | | | 188,897 | | | | 1,502,217 | | |
Shenzhou International Group Holdings Ltd. | | | 149,000 | | | | 1,779,764 | | |
Shimao Group Holdings Ltd. | | | 121,000 | | | | 513,443 | | |
Sinotruk Hong Kong Ltd. | | | 175,500 | | | | 547,675 | | |
TAL Education Group, ADR* | | | 23,291 | | | | 1,820,657 | | |
223
PACE International Emerging Markets Equity Investments
Portfolio of investments—July 31, 2020
| | | Number of
shares | | Value | |
Common stocks—(continued) | |
China—(concluded) | |
Tencent Holdings Ltd. | | | 326,202 | | | $ | 22,376,855 | | |
Tencent Music Entertainment Group, ADR* | | | 157,711 | | | | 2,545,456 | | |
Tingyi Cayman Islands Holding Corp. | | | 824,000 | | | | 1,536,098 | | |
Travelsky Technology Ltd., Class H | | | 608,000 | | | | 1,169,479 | | |
Wens Foodstuffs Group Co. Ltd., Class A | | | 292,267 | | | | 995,109 | | |
Yanzhou Coal Mining Co. Ltd., Class H | | | 822,000 | | | | 642,543 | | |
YiChang HEC ChangJiang Pharmaceutical Co. Ltd.,
Class H2 | | | 304,000 | | | | 457,227 | | |
Yum China Holdings, Inc. | | | 12,406 | | | | 635,683 | | |
Zhangzhou Pientzehuang Pharmaceutical Co. Ltd.,
Class A | | | 54,400 | | | | 1,592,505 | | |
Zhejiang Huayou Cobalt Co. Ltd., Class A* | | | 208,756 | | | | 1,282,163 | | |
Zhejiang NHU Co. Ltd., Class A | | | 347,521 | | | | 1,465,678 | | |
Zoomlion Heavy Industry Science and Technology
Co. Ltd., Class H* | | | 484,000 | | | | 499,002 | | |
| | | | | | 135,287,106 | | |
Czech Republic—0.1% | |
Komercni banka A.S.* | | | 15,017 | | | | 348,296 | | |
Egypt—0.1% | |
Commercial International Bank Egypt SAE | | | 85,215 | | | | 335,391 | | |
Germany—0.5% | |
Delivery Hero SE*,2 | | | 15,842 | | | | 1,818,526 | | |
Ghana—0.1% | |
Tullow Oil PLC1 | | | 1,092,745 | | | | 365,405 | | |
Greece—0.4% | |
Alpha Bank AE* | | | 411,255 | | | | 258,623 | | |
Eurobank Ergasias Services and Holdings SA,
Class A* | | | 941,426 | | | | 402,315 | | |
Hellenic Telecommunications Organization SA | | | 27,886 | | | | 410,302 | | |
OPAP SA | | | 39,441 | | | | 357,291 | | |
| | | | | | 1,428,531 | | |
Hong Kong—0.4% | |
Kingboard Laminates Holdings Ltd. | | | 558,000 | | | | 627,736 | | |
WH Group Ltd. 2 | | | 1,078,500 | | | | 960,034 | | |
| | | | | | 1,587,770 | | |
Hungary—0.3% | |
MOL Hungarian Oil & Gas PLC* | | | 79,987 | | | | 471,182 | | |
OTP Bank Nyrt* | | | 17,671 | | | | 632,920 | | |
| | | | | | 1,104,102 | | |
India—10.2% | |
Amara Raja Batteries Ltd. | | | 54,804 | | | | 517,880 | | |
Asian Paints Ltd. | | | 51,130 | | | | 1,170,666 | | |
Bajaj Auto Ltd. | | | 12,155 | | | | 487,592 | | |
Bajaj Finance Ltd. | | | 17,053 | | | | 740,419 | | |
Britannia Industries Ltd. | | | 17,141 | | | | 874,842 | | |
Cipla Ltd. | | | 52,082 | | | | 500,723 | | |
Dabur India Ltd. | | | 982 | | | | 6,741 | | |
Dr Reddy's Laboratories Ltd. | | | 10,151 | | | | 614,735 | | |
Federal Bank Ltd.* | | | 501,505 | | | | 360,370 | | |
HCL Technologies Ltd. | | | 144,902 | | | | 1,362,340 | | |
| | | Number of
shares | | Value | |
Common stocks—(continued) | |
India—(concluded) | |
HDFC Bank Ltd. | | | 142,471 | | | $ | 1,967,977 | | |
Hindalco Industries Ltd. | | | 307,477 | | | | 672,446 | | |
Hindustan Unilever Ltd. | | | 31,886 | | | | 940,612 | | |
Housing Development Finance Corp. Ltd. | | | 141,170 | | | | 3,357,370 | | |
ICICI Lombard General Insurance Co. Ltd.2 | | | 51,382 | | | | 894,041 | | |
IDFC Bank Ltd.* | | | 952,075 | | | | 337,087 | | |
Indiabulls Housing Finance Ltd. | | | 138,619 | | | | 350,855 | | |
Infosys Ltd. | | | 264,837 | | | | 3,405,311 | | |
Infosys Ltd., ADR | | | 96,178 | | | | 1,235,887 | | |
Ipca Laboratories Ltd. | | | 19,738 | | | | 495,881 | | |
Maruti Suzuki India Ltd. | | | 10,213 | | | | 853,603 | | |
Max Financial Services Ltd.* | | | 68,876 | | | | 513,552 | | |
Motherson Sumi Systems Ltd. | | | 1,052,815 | | | | 1,333,791 | | |
REC Ltd. | | | 415,784 | | | | 555,550 | | |
Reliance Industries Ltd. | | | 286,128 | | | | 7,913,036 | | |
Reliance Industries Ltd. | | | 10,216 | | | | 160,766 | | |
SBI Cards & Payment Services Ltd. | | | 52,693 | | | | 512,006 | | |
Tata Consultancy Services Ltd. | | | 28,208 | | | | 856,977 | | |
Tech Mahindra Ltd. | | | 101,901 | | | | 924,703 | | |
United Spirits Ltd.* | | | 88,431 | | | | 686,030 | | |
UPL Ltd.* | | | 288,690 | | | | 1,842,259 | | |
| | | | | | 36,446,048 | | |
Indonesia—1.5% | |
Bank Central Asia Tbk. PT | | | 1,130,700 | | | | 2,421,927 | | |
Bank Rakyat Indonesia Persero Tbk. PT | | | 3,553,200 | | | | 771,809 | | |
Telekomunikasi Indonesia Persero Tbk. PT | | | 9,953,700 | | | | 2,076,142 | | |
| | | | | | 5,269,878 | | |
Kazakhstan—0.1% | |
Halyk Savings Bank of Kazakhstan JSC | | | 25,553 | | | | 285,175 | | |
NAC Kazatomprom JSC | | | 9,612 | | | | 139,761 | | |
| | | | | | 424,936 | | |
Macau—0.3% | |
Galaxy Entertainment Group Ltd. | | | 90,200 | | | | 615,140 | | |
Sands China Ltd. | | | 104,800 | | | | 399,583 | | |
| | | | | | 1,014,723 | | |
Malaysia—0.4% | |
AMMB Holdings Bhd. | | | 11,900 | | | | 8,153 | | |
Supermax Corp. Bhd* | | | 80,400 | | | | 353,087 | | |
Top Glove Corp. Bhd. | | | 199,200 | | | | 1,220,166 | | |
| | | | | | 1,581,406 | | |
Mexico—1.3% | |
Fibra Uno Administracion SA de CV | | | 724,408 | | | | 584,279 | | |
Grupo Aeroportuario del Centro Norte SAB de CV* | | | 96,332 | | | | 396,972 | | |
Grupo Aeroportuario del Pacifico SAB de CV, Class B | | | 183,500 | | | | 1,218,084 | | |
Grupo Bimbo SAB de CV, Series A | | | 357,369 | | | | 643,762 | | |
Grupo Financiero Banorte SAB de CV, Class O* | | | 146,506 | | | | 525,986 | | |
Wal-Mart de Mexico SAB de CV | | | 465,800 | | | | 1,093,180 | | |
| | | | | | 4,462,263 | | |
Peru—0.6% | |
Credicorp Ltd. | | | 15,365 | | | | 1,953,967 | | |
224
PACE International Emerging Markets Equity Investments
Portfolio of investments—July 31, 2020
| | | Number of
shares | | Value | |
Common stocks—(continued) | |
Philippines—0.2% | |
SM Prime Holdings, Inc. | | | 946,000 | | | $ | 580,077 | | |
Poland—0.5% | |
CD Projekt SA* | | | 4,583 | | | | 491,753 | | |
KGHM Polska Miedz SA* | | | 21,634 | | | | 728,327 | | |
Polski Koncern Naftowy ORLEN SA | | | 34,039 | | | | 484,670 | | |
| | | | | | 1,704,750 | | |
Romania—0.0%† | |
Societatea Nationala de Gaze Naturale
ROMGAZ SA, GDR | | | 16,940 | | | | 115,192 | | |
Russia—3.6% | |
Gazprom PJSC, ADR3,4 | | | 249,516 | | | | 1,206,192 | | |
Gazprom PJSC, ADR | | | 215,604 | | | | 1,056,460 | | |
LUKOIL PJSC, ADR3 | | | 13,698 | | | | 937,902 | | |
LUKOIL PJSC, ADR3,4 | | | 15,942 | | | | 1,081,431 | | |
MMC Norilsk Nickel PJSC, ADR | | | 27,694 | | | | 723,417 | | |
Mobile TeleSystems PJSC ADR | | | 49,666 | | | | 440,041 | | |
Sberbank of Russia PJSC, ADR* | | | 11,040 | | | | 131,597 | | |
Sberbank of Russia PJSC, ADR* | | | 121,789 | | | | 1,445,185 | | |
Severstal PAO, GDR | | | 41,418 | | | | 504,405 | | |
Yandex N.V., Class A*,1 | | | 92,072 | | | | 5,297,823 | | |
| | | | | | 12,824,453 | | |
Singapore—0.2% | |
IGG, Inc. | | | 596,000 | | | | 583,915 | | |
South Africa—3.5% | |
African Rainbow Minerals Ltd. | | | 44,455 | | | | 507,542 | | |
AngloGold Ashanti Ltd., ADR | | | 56,461 | | | | 1,817,480 | | |
Aspen Pharmacare Holdings Ltd.* | | | 52,746 | | | | 408,058 | | |
Bid Corp. Ltd. | | | 50,900 | | | | 839,530 | | |
Bidvest Group Ltd./The | | | 102,360 | | | | 790,132 | | |
Capitec Bank Holdings Ltd. | | | 19,297 | | | | 998,450 | | |
Clicks Group Ltd. | | | 67,604 | | | | 902,189 | | |
Exxaro Resources Ltd. | | | 70,276 | | | | 554,385 | | |
FirstRand Ltd. | | | 597,155 | | | | 1,360,056 | | |
Growthpoint Properties Ltd. | | | 848,847 | | | | 661,283 | | |
Impala Platinum Holdings Ltd. | | | 69,536 | | | | 620,749 | | |
Naspers Ltd., N Shares | | | 6,319 | | | | 1,149,750 | | |
Northam Platinum Ltd.* | | | 77,950 | | | | 615,307 | | |
Old Mutual Ltd. | | | 1,013,376 | | | | 680,472 | | |
RMB Holdings Ltd. | | | 161,291 | | | | 12,845 | | |
Sibanye Stillwater Ltd.* | | | 149,377 | | | | 422,557 | | |
| | | | | | 12,340,785 | | |
South Korea—9.3% | |
AMOREPACIFIC Group | | | 8,414 | | | | 376,871 | | |
CJ Corp. | | | 6,680 | | | | 462,493 | | |
Daelim Industrial Co. Ltd. | | | 6,528 | | | | 459,165 | | |
DoubleUGames Co. Ltd. | | | 8,003 | | | | 512,012 | | |
Douzone Bizon Co. Ltd. | | | 12,635 | | | | 1,114,041 | | |
GS Retail Co. Ltd. | | | 10,944 | | | | 315,858 | | |
Hana Financial Group, Inc. | | | 30,211 | | | | 749,692 | | |
Hite Jinro Co. Ltd. | | | 10,134 | | | | 354,472 | | |
Hyundai Mobis Co. Ltd. | | | 3,219 | | | | 557,005 | | |
Hyundai Motor Co. | | | 8,600 | | | | 917,282 | | |
| | | Number of
shares | | Value | |
Common stocks—(continued) | |
South Korea—(concluded) | |
Hyundai Wia Corp. | | | 10,099 | | | $ | 323,135 | | |
Industrial Bank of Korea | | | 69,670 | | | | 475,394 | | |
Kakao Corp. | | | 3,644 | | | | 1,057,180 | | |
KB Financial Group, Inc. | | | 24,701 | | | | 731,033 | | |
Korea Zinc Co. Ltd. | | | 862 | | | | 299,741 | | |
LG Chem Ltd. | | | 874 | | | | 418,506 | | |
LG Household & Health Care Ltd. | | | 2,010 | | | | 2,318,190 | | |
LG Innotek Co. Ltd. | | | 4,309 | | | | 584,876 | | |
LG Uplus Corp. | | | 55,506 | | | | 534,321 | | |
Lotte Shopping Co. Ltd. | | | 5,895 | | | | 386,415 | | |
NAVER Corp. | | | 15,189 | | | | 3,858,791 | | |
NCSoft Corp. | | | 1,650 | | | | 1,124,303 | | |
Samsung Electro-Mechanics Co. Ltd. | | | 11,385 | | | | 1,346,863 | | |
Samsung Electronics Co. Ltd. | | | 175,625 | | | | 8,583,468 | | |
Samsung Fire & Marine Insurance Co. Ltd. | | | 3,216 | | | | 462,911 | | |
Samyang Foods Co. Ltd. | | | 4,040 | | | | 404,843 | | |
SFA Engineering Corp. | | | 19,645 | | | | 582,195 | | |
Shinhan Financial Group Co. Ltd. | | | 62,180 | | | | 1,560,297 | | |
SK Hynix, Inc. | | | 14,819 | | | | 1,037,571 | | |
SK Materials Co. Ltd. | | | 2,993 | | | | 616,776 | | |
Soulbrain Holdings Co. Ltd. | | | 7,774 | | | | 625,757 | | |
| | | | | | 33,151,457 | | |
Taiwan—12.9% | |
ASE Technology Holding Co. Ltd. | | | 449,000 | | | | 1,150,325 | | |
Casetek Holdings Ltd. | | | 154,000 | | | | 365,617 | | |
Chailease Holding Co. Ltd. | | | 106,840 | | | | 447,125 | | |
China Life Insurance Co. Ltd. | | | 487,487 | | | | 338,103 | | |
Compeq Manufacturing Co. Ltd. | | | 328,000 | | | | 543,710 | | |
CTBC Financial Holding Co. Ltd. | | | 657,934 | | | | 435,712 | | |
E Ink Holdings, Inc. | | | 238,000 | | | | 332,448 | | |
E. Sun Financial Holding Co. Ltd. | | | 1,364,125 | | | | 1,262,233 | | |
Elan Microelectronics Corp. | | | 75,000 | | | | 403,040 | | |
Formosa Taffeta Co. Ltd. | | | 322,000 | | | | 332,116 | | |
Globalwafers Co. Ltd. | | | 75,281 | | | | 1,077,629 | | |
Hiwin Technologies Corp. | | | 93,000 | | | | 980,829 | | |
HON HAI Precision Industry Co. Ltd. | | | 340,000 | | | | 908,693 | | |
Makalot Industrial Co. Ltd. | | | 69,000 | | | | 425,556 | | |
MediaTek, Inc. | | | 222,469 | | | | 5,312,127 | | |
Micro-Star International Co. Ltd. | | | 91,000 | | | | 404,840 | | |
Pixart Imaging, Inc. | | | 90,000 | | | | 612,641 | | |
Powertech Technology, Inc. | | | 139,000 | | | | 464,353 | | |
President Chain Store Corp. | | | 7,100 | | | | 67,820 | | |
SinoPac Financial Holdings Co. Ltd. | | | 1,057,000 | | | | 384,226 | | |
Synnex Technology International Corp. | | | 298,000 | | | | 445,125 | | |
Taiwan Semiconductor Manufacturing Co. Ltd. | | | 989,231 | | | | 14,396,870 | | |
Taiwan Semiconductor Manufacturing Co. Ltd., ADR | | | 119,904 | | | | 9,459,227 | | |
Tripod Technology Corp. | | | 106,000 | | | | 460,131 | | |
Uni-President Enterprises Corp. | | | 913,000 | | | | 2,228,316 | | |
Unimicron Technology Corp. | | | 285,000 | | | | 626,105 | | |
Win Semiconductors Corp. | | | 102,000 | | | | 1,099,937 | | |
Wistron Corp. | | | 466,755 | | | | 546,893 | | |
Yageo Corp. | | | 43,000 | | | | 570,984 | | |
| | | | | | 46,082,731 | | |
225
PACE International Emerging Markets Equity Investments
Portfolio of investments—July 31, 2020
| | | Number of
shares | | Value | |
Common stocks—(concluded) | |
Thailand—0.8% | |
Airports of Thailand PCL | | | 770,300 | | | $ | 1,272,202 | | |
Charoen Pokphand Foods PCL | | | 425,800 | | | | 461,403 | | |
Minor International PCL, NVDR* | | | 975,119 | | | | 571,013 | | |
Thanachart Capital PCL, NVDR | | | 382,000 | | | | 426,813 | | |
| | | | | | 2,731,431 | | |
Turkey—1.3% | |
Arcelik A.S.* | | | 177,229 | | | | 587,034 | | |
BIM Birlesik Magazalar A.S. | | | 42,081 | | | | 429,620 | | |
Coca-Cola Icecek A.S. | | | 75,402 | | | | 484,944 | | |
Tekfen Holding A.S. | | | 151,925 | | | | 331,741 | | |
Turk Hava Yollari AO* | | | 366,505 | | | | 557,010 | | |
Turkiye Garanti Bankasi A.S.* | | | 413,966 | | | | 416,112 | | |
Turkiye Halk Bankasi A.S.* | | | 515,482 | | | | 408,298 | | |
Turkiye Is Bankasi A.S Class C* | | | 796,111 | | | | 548,006 | | |
Turkiye Sise ve Cam Fabrikalari A.S. | | | 557,676 | | | | 460,771 | | |
Vestel Elektronik Sanayi ve Ticaret A.S.* | | | 209,462 | | | | 525,793 | | |
| | | | | | 4,749,329 | | |
United Kingdom—0.9% | |
KAZ Minerals PLC | | | 127,938 | | | | 892,031 | | |
Mondi PLC | | | 57,821 | | | | 1,024,165 | | |
Unilever N.V. | | | 12,385 | | | | 731,833 | | |
Unilever PLC | | | 8,370 | | | | 498,392 | | |
| | | | | | 3,146,421 | | |
United States—0.1% | |
Micron Technology, Inc.* | | | 8,245 | | | | 412,704 | | |
Vietnam—0.3% | |
Hoa Phat Group JSC | | | 852,696 | | | | 798,971 | | |
Vincom Retail JSC* | | | 244,850 | �� | | | 265,576 | | |
| | | | | | 1,064,547 | | |
Zambia—0.8% | |
First Quantum Minerals Ltd. | | | 355,824 | | | | 3,007,150 | | |
Total common stocks
(cost—$283,550,495) | | | 340,615,861 | | |
Preferred stocks—1.5% | |
Brazil—0.9% | |
Banco do Estado do Rio Grande do Sul SA, Class B | | | 156,400 | | | | 427,536 | | |
Itausa SA | | | 645,430 | | | | 1,320,171 | | |
Lojas Americanas SA | | | 80,700 | | | | 527,527 | | |
Telefonica Brasil SA | | | 72,900 | | | | 735,771 | | |
| | | | | | 3,011,005 | | |
| | | Number of
shares | | Value | |
Preferred stocks (concluded) | |
South Korea—0.6% | |
Samsung Electronics Co. Ltd. | | | 52,392 | | | $ | 2,188,298 | | |
Total preferred stocks
(cost—$5,777,053) | | | 5,199,303 | | |
Exchange traded funds—1.0% | |
iShares MSCI Emerging Markets ETF
(cost—$3,436,268) | | | 84,951 | | | | 3,677,529 | | |
| | | Number of
rights | | | |
Rights—0.0%† | |
Brazil—0.0%† | |
B2W Cia Digital*
(cost—$0) | | | 1,266 | | | | 1,699 | | |
| | | Number of
shares | | | |
Short-term investments—1.5% | |
Investment companies—1.5% | |
State Street Institutional U.S. Government Money
Market Fund, 0.09%5
(cost—$5,318,225) | | | 5,318,225 | | | | 5,318,225 | | |
Investment of cash collateral from securities loaned—0.9% | |
Money market funds—0.9% | |
State Street Navigator Securities
Lending Government Money Market
Portfolio, 0.12%5
(cost—$3,318,227) | | | 3,318,227 | | | | 3,318,227 | | |
Total investments
(cost—$301,400,268)—100.6% | | | 358,130,844 | | |
Liabilities in excess of other assets—(0.6)% | | | | | (2,027,703 | ) | |
Net assets—100.0% | | $ | 356,103,141 | | |
For a listing of defined portfolio acronyms, counterparty acronyms and currency abbreviations that are used throughout the Portfolio of investments as well as the tables that follow, please refer to page 267.
226
PACE International Emerging Markets Equity Investments
Portfolio of investments—July 31, 2020
Fair valuation summary
The following is a summary of the fair valuations according to the inputs used as of July 31, 2020 in valuing the Portfolio's investments. In the event a Portfolio holds investments for which fair value is measured using the NAV per share practical expedient (or its equivalent), a separate column will be added to the fair value hierarchy table; this is intended to permit reconciliation to the amounts presented in the Portfolio of investments:
Assets
Description | | Unadjusted
quoted prices in
active markets for
identical investments
(Level 1) | | Other significant
observable inputs
(Level 2) | | Unobservable
inputs
(Level 3) | | Total | |
Common stocks | | $ | 83,460,842 | | | $ | 257,155,019 | | | $ | — | | | $ | 340,615,861 | | |
Preferred stocks | | | 3,011,005 | | | | 2,188,298 | | | | — | | | | 5,199,303 | | |
Exchange traded funds | | | 3,677,529 | | | | — | | | | — | | | | 3,677,529 | | |
Rights | | | 1,699 | | | | — | | | | — | | | | 1,699 | | |
Short-term investments | | | — | | | | 5,318,225 | | | | — | | | | 5,318,225 | | |
Investment of cash collateral from securities loaned | | | — | | | | 3,318,227 | | | | — | | | | 3,318,227 | | |
Total | | $ | 90,151,075 | | | $ | 267,979,769 | | | $ | — | | | $ | 358,130,844 | | |
At July 31, 2020, there were no transfers in or out of Level 3.
Portfolio footnotes
* Non-income producing security.
† Amount represents less than 0.05% or (0.05)%.
1 Security, or portion thereof, was on loan at the period end.
2 Security exempt from registration pursuant to Rule 144A under the Securities Act of 1933. These securities are considered liquid, unless noted otherwise, and may be resold in transactions exempt from registration, normally to qualified institutional buyers. Securities exempt from registration pursuant to Rule 144A, in the amount of $4,525,958, represented 1.3% of the Portfolio's net assets at period end.
3 Security is traded on the Turquoise Exchange.
4 Security is traded on the over-the-counter ("OTC") market.
5 Rates shown reflect yield at July 31, 2020.
See accompanying notes to financial statements
227
PACE Global Real Estate Securities Investments
Performance
For the 12-months ended July 31, 2020, the Portfolio's Class P shares returned -16.85% before the deduction of the maximum PACE Select program fee.1 In comparison, the FTSE EPRA/NAREIT Developed Index (the "benchmark") returned -13.40%. (Returns for all share classes over various time periods are shown in the "Performance at a glance" table on page 230. Please note that the returns shown do not reflect the deduction of taxes that a shareholder would pay on Portfolio distributions or the redemption of Portfolio shares.) For a detailed commentary on the market environment in general during the reporting period, please refer to page 2.
Subadvisor's comments2
The Portfolio underperformed its benchmark during the reporting period. This was primarily driven by positions in the US retail, US hotels and US office sectors. Conversely, the Portfolio realized positive performance from positions in the US net lease and data centers sectors, as well as from an underweight exposure to retail (excluding the UK).
We maintained an underweight exposure to retail on a global basis within the Portfolio. However, we held an overweight position to a UK-based retail company, which we believed presented a significant value opportunity, as the company was trading at a significant discount to global retail peers (as well as to private-market values). Government-mandated closures related to COVID-19 led to significant underperformance from this company.
The US hotel sector has clearly been heavily impacted by COVID-19 in the near term, but we believe the sector is undervalued as we take a longer-term view and look forward to an eventual recovery in travel. The sector has underperformed in recent months as travel ground to a halt, but we see long-term value in the space.
Within the US office sector, underweight exposure to an outperforming company focused on pharmaceutical and biotechnology tenants detracted from results. Overweight allocations to select companies focused on coastal markets was also a headwind for relative returns.
On the upside, the Portfolio benefited from an overweight exposure to US net lease companies with high credit-quality tenants. We also experienced positive returns within data centers, where an overweight exposure and positive security selection contributed to returns, particularly in the first and second quarters of 2020. These stocks benefited from increased data needs amid the COVID-19 pandemic.
The Portfolio also realized positive relative returns within the industrial sector. Outside the US we benefited from overweight industrial positions in Japan and Canada. Overall, we benefitted from an underweight exposure to industrial in the US. At the end of the period, however, we maintained overweight exposure amid positive tailwinds for the sector.
The Portfolio did not utilize derivatives during the reporting period.
PACE Select Advisors Trust –
PACE Global Real Estate Securities Investments
Investment Manager:
UBS Asset Management (Americas) Inc. ("UBS AM")
Investment Subadvisor:
Brookfield Public Securities Group LLC (f/k/a Brookfield Investment Management Inc.) ("Brookfield")
Portfolio Management Team:
UBS AM: Mabel Lung, CFA, Fred Lee, CFA, Gina Toth, CFA, Ned Sienko, Vincent Russo and Mayoor Joshi
Brookfield: Jason Baine and Bernhard Krieg
Objective:
Total Return
Investment process:
The subadvisor utilizes a strategy that involves achieving total returns by investing in a diversified portfolio of global securities of companies primarily in the real estate industry.
1 Class P shares held through the PACE Select Advisors Program are subject to a maximum Program fee of 2.50%, which, if included, would have reduced performance. Class P shares held through other advisory programs also may be subject to a program fee, which, if included, would have reduced performance.
2 Performance is discussed on a gross-of-fees basis—meaning that no fees or expenses are reflected when discussed at the level of a subadvisor's sleeve (or subadvisors' sleeves, if applicable). Alternatively, performance at the overall Portfolio level is shown net of fees, which does factor in fees and expenses associated with the Portfolio.
228
PACE Global Real Estate Securities Investments
Mutual funds are sold by prospectus only. You should read it carefully and consider a fund's investment objectives, risks, charges, expenses and other important information contained in the prospectus before investing. Prospectuses for most of our funds can be obtained from your financial advisor, by calling UBS Funds at 800-647 1568 or by visiting our Website at www.ubs.com/am-us.
Special considerations
The Portfolio may be appropriate for long-term investors seeking to diversify a portion of their assets into real estate related investments. Investors should be willing to withstand short-term fluctuations in the equity and real estate markets in return for potentially higher returns over the long term. The value of the Portfolio changes every day and can be affected by changes in interest rates, general market conditions, and other political, social and economic developments, as well as specific matters relating to the companies or issuers in whose securities the Portfolio invests. The value of the Portfolio's investments in foreign securities may fall due to adverse political, social, and economic developments abroad, and due to decreases in foreign currency values relative to the US dollar. These risks are greater for investments in emerging market issuers than for issuers in more developed countries. There are certain risks associated with investing in real estate-related investments, including sensitivity to economic downturns, interest rates, declines in property values and variation in property management.
229
PACE Global Real Estate Securities Investments
Performance at a glance (unaudited)
Average annual total returns for periods ended 07/31/20 | | 1 year | | 5 years | | 10 years | |
Before deducting maximum sales charge | |
Class A1 | | | (17.00 | )% | | | (0.30 | )% | | | 5.00 | % | |
Class P2 | | | (16.85 | ) | | | (0.04 | ) | | | 5.26 | | |
After deducting maximum sales charge | |
Class A1 | | | (21.56 | ) | | | (1.43 | ) | | | 4.40 | | |
FTSE EPRA Nareit Developed Index3 | | | (13.40 | ) | | | 2.09 | | | | 6.49 | | |
Most recent calendar quarter-end returns (unaudited)
Average annual total returns for periods ended 06/30/20 | | 1 year | | 5 years | | 10 years | |
Before deducting maximum sales charge | |
Class A1 | | | (19.04 | )% | | | (0.10 | )% | | | 5.76 | % | |
Class P2 | | | (18.87 | ) | | | 0.16 | | | | 6.04 | | |
After deducting maximum sales charge | |
Class A1 | | | (23.47 | ) | | | (1.21 | ) | | | 5.17 | | |
The annualized gross and net expense ratios, respectively, for each class of shares as in the November 27, 2019 prospectuses, were as follows: Class A—1.56% and 1.45%; and Class P—1.57% and 1.20% Net expenses reflect fee waivers and/or expense reimbursements, if any, pursuant to an agreement that is in effect to cap the expenses. The Portfolio and UBS Asset Management (Americas) Inc. ("UBS AM") have entered into a written fee waiver/expense reimbursement agreement pursuant to which UBS AM is contractually obligated to waive its management fees and/or reimburse expenses so that the Portfolio's ordinary total operating expenses of each class through November 30, 2020 (excluding dividend expense, borrowing costs, and interest expense relating to short sales, and expenses attributable to investment in other investment companies, interest, taxes, brokerage commissions and extraordinary expenses) would not exceed Class A—1.45%; and Class P—1.20% The Portfolio has agreed to repay UBS AM for any waived fees/reimbursed expenses to the extent that it can do so over the following three fiscal years without causing the Portfolio's expenses in any of those three years to exceed these expense caps and that UBS AM has not waived the right to do so. The fee waiver/expense reimbursement agreement may be terminated by the Portfolio's board at any time and also will terminate automatically upon the expiration or termination of the Portfolio's advisory contract with UBS AM. Upon termination of the agreement, however, UBS AM's three year recoupment rights will survive.
1 Maximum sales charge for Class A shares is 5.5%. Class A shares bear ongoing 12b-1 service fees of 0.25% annually.
2 Class P shares do not bear initial or contingent deferred sales charges or ongoing 12b-1 service and distribution fees, but Class P shares held through advisory programs may be subject to a program fee, which, if included, would have reduced performance.
3 The FTSE EPRA Nareit Developed Index is designed to measure the stock performance of companies engaged in certain real estate activities of the North American, UK, European and Asian real estate markets. Relevant real estate activities are defined as the ownership, trading and development of income-producing real estate. Investors should note that indices do not reflect the deduction of fees and expenses.
Prior to August 3, 2015, a 1% redemption fee was imposed on sales or exchanges of any class of shares of the Portfolio made during the specified holding period.
Past performance does not predict future performance, and the performance information provided does not reflect the deduction of taxes that a shareholder would pay on Portfolio distributions or the redemption of Portfolio shares. The return and principal value of an investment will fluctuate, so that an investor's shares, when redeemed, may be worth more or less than their original cost. Performance results assume reinvestment of all dividends and capital gain distributions at net asset value on the ex-dividend dates. Current performance may be higher or lower than the performance data quoted. For month-end performance figures, please visit www.ubs.com/us-mutualfundperformance.
230
PACE Global Real Estate Securities Investments
Illustration of an assumed investment of $10,000 in Class P shares of the Portfolio (unaudited)
The following graph depicts the performance of PACE Global Real Estate Securities Investments Class P shares versus the FTSE EPRA Nareit Developed Index over the 10 years ended July 31, 2020. Class P shares held through advisory programs may be subject to a program fee, which, if included, would have reduced performance. The performance of the other classes will vary based upon the different class specific expenses and sales charges. The performance provided does not reflect the deduction of taxes that a shareholder would pay on Portfolio distributions or the redemption of Portfolio shares. Past performance is no guarantee of future results. Share price and returns will vary with market conditions; investors may realize a gain or loss upon redemption. It is important to note that PACE Global Real Estate Securities Investments is a professionally managed portfolio while the Index is not available for investment and is unmanaged. The comparison is shown for illustration purposes only.
PACE Global Real Estate Securities Investments
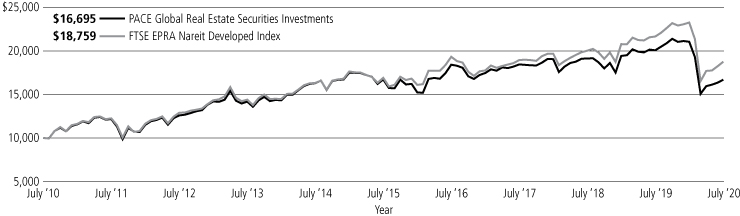
* The performance graph has been changed from Class A to Class P as Class P shares hold the most assets out of the Portfolio.
231
PACE Global Real Estate Securities Investments
Portfolio statistics—July 31, 2020 (unaudited)
Top ten equity holdings1 | | Percentage of
net assets | |
Prologis, Inc. | | | 7.9 | % | |
Vonovia SE | | | 3.1 | | |
Welltower, Inc. | | | 2.9 | | |
Dexus | | | 2.9 | | |
Digital Realty Trust, Inc. | | | 2.6 | | |
AvalonBay Communities, Inc. | | | 2.6 | | |
Mitsui Fudosan Co. Ltd. | | | 2.6 | | |
Mid-America Apartment Communities, Inc. | | | 2.4 | | |
Physicians Realty Trust | | | 2.4 | | |
Duke Realty Corp. | | | 2.4 | | |
Total | | | 31.8 | % | |
Top five issuer breakdown by country or territory of origin1 | | Percentage of
net assets | |
United States | | | 55.3 | % | |
Japan | | | 10.1 | | |
Hong Kong | | | 6.4 | | |
Germany | | | 6.1 | | |
United Kingdom | | | 5.6 | | |
Total | | | 83.5 | % | |
1 The Portfolio is actively managed and its composition will vary over time.
232
PACE Global Real Estate Securities Investments
Industry diversification—(unaudited)
As a percentage of net assets as of July 31, 2020
Common stocks | |
Apartments | | | 10.0 | % | |
Diversified | | | 20.4 | | |
Health care | | | 8.4 | | |
Hotels | | | 5.6 | | |
Hotels & motels | | | 2.6 | | |
Manufactured homes | | | 1.4 | | |
Office property | | | 10.4 | | |
Real estate management/service | | | 8.0 | | |
Real estate operations/development | | | 12.4 | | |
Regional malls | | | 1.3 | | |
Shopping centers | | | 2.4 | | |
Single Tenant | | | 1.5 | | |
Warehouse/industrial | | | 15.4 | | |
Total common stocks | | | 99.8 | | |
Short-term investments | | | 0.7 | | |
Investment of cash collateral from securities loaned | | | 1.1 | | |
Total investments | | | 101.6 | | |
Liabilities in excess of other assets | | | (1.6 | ) | |
Net assets | | | 100.0 | % | |
233
PACE Global Real Estate Securities Investments
Portfolio of investments—July 31, 2020
| | | Number of
shares | | Value | |
Common stocks—99.8% | |
Australia—3.9% | |
Dexus | | | 424,231 | | | $ | 2,575,241 | | |
Mirvac Group | | | 561,493 | | | | 835,562 | | |
| | | | | | 3,410,803 | | |
Canada—3.4% | |
Allied Properties REIT | | | 43,600 | | | | 1,305,608 | | |
Boardwalk REIT | | | 31,008 | | | | 709,078 | | |
Granite REIT | | | 13,286 | | | | 772,690 | | |
InterRent REIT | | | 18,788 | | | | 191,604 | | |
| | | | | | 2,978,980 | | |
France—2.3% | |
Gecina SA | | | 6,963 | | | | 903,256 | | |
Unibail-Rodamco-Westfield1 | | | 21,838 | | | | 1,145,236 | | |
| | | | | | 2,048,492 | | |
Germany—6.1% | |
Alstria Office REIT-AG* | | | 42,071 | | | | 629,341 | | |
Deutsche Wohnen SE | | | 41,535 | | | | 2,020,945 | | |
Vonovia SE | | | 41,398 | | | | 2,675,794 | | |
| | | | | | 5,326,080 | | |
Hong Kong—6.4% | |
CK Asset Holdings Ltd. | | | 219,222 | | | | 1,217,267 | | |
Hang Lung Properties Ltd. | | | 439,766 | | | | 1,078,904 | | |
Sun Hung Kai Properties Ltd. | | | 136,965 | | | | 1,665,740 | | |
Swire Properties Ltd. | | | 404,128 | | | | 933,936 | | |
Wharf Real Estate Investment Co. Ltd.1 | | | 200,802 | | | | 710,208 | | |
| | | | | | 5,606,055 | | |
Japan—10.1% | |
Daiwa Office Investment Corp. | | | 152 | | | | 796,882 | | |
GLP J-Reit | | | 973 | | | | 1,622,895 | | |
Invesco Office J-Reit, Inc. | | | 8,775 | | | | 1,035,261 | | |
Japan Hotel REIT Investment Corp. | | | 2,080 | | | | 754,497 | | |
LaSalle Logiport REIT | | | 577 | | | | 1,050,610 | | |
MCUBS MidCity Investment Corp. | | | 2,169 | | | | 1,413,304 | | |
Mitsui Fudosan Co. Ltd. | | | 144,991 | | | | 2,266,784 | | |
| | | | | | 8,940,233 | | |
Singapore—4.3% | |
City Developments Ltd. | | | 281,704 | | | | 1,687,017 | | |
Keppel DC REIT | | | 464,550 | | | | 1,009,633 | | |
Keppel REIT | | | 1,341,737 | | | | 1,079,796 | | |
| | | | | | 3,776,446 | | |
Spain—0.9% | |
Merlin Properties Socimi SA | | | 97,300 | | | | 805,011 | | |
Sweden—1.5% | |
Hufvudstaden AB, Class A | | | 101,549 | | | | 1,318,780 | | |
| | | Number of
shares | | Value | |
| Common stocks—(concluded) | |
United Kingdom—5.6% | |
Capital & Counties Properties PLC | | | 614,205 | | | $ | 1,124,185 | | |
Derwent London PLC | | | 48,658 | | | | 1,830,638 | | |
Tritax Big Box REIT PLC | | | 1,018,285 | | | | 2,013,745 | | |
| | | | | | 4,968,568 | | |
United States—55.3% | |
Apple Hospitality REIT, Inc. | | | 79,001 | | | | 696,789 | | |
AvalonBay Communities, Inc. | | | 15,093 | | | | 2,311,040 | | |
Boston Properties, Inc. | | | 15,893 | | | | 1,415,907 | | |
Camden Property Trust | | | 21,300 | | | | 1,934,253 | | |
Cousins Properties, Inc. | | | 55,799 | | | | 1,714,145 | | |
CyrusOne, Inc. | | | 22,126 | | | | 1,845,751 | | |
Digital Realty Trust, Inc. | | | 14,400 | | | | 2,311,776 | | |
Douglas Emmett, Inc. | | | 28,688 | | | | 835,968 | | |
Duke Realty Corp. | | | 51,779 | | | | 2,080,998 | | |
Equinix, Inc. | | | 1,314 | | | | 1,032,121 | | |
Essex Property Trust, Inc. | | | 7,042 | | | | 1,554,451 | | |
Four Corners Property Trust, Inc. | | | 40,563 | | | | 1,022,188 | | |
Healthpeak Properties, Inc. | | | 42,739 | | | | 1,166,347 | | |
Host Hotels & Resorts, Inc. | | | 166,392 | | | | 1,793,706 | | |
Hudson Pacific Properties, Inc. | | | 36,300 | | | | 855,591 | | |
Kilroy Realty Corp. | | | 14,807 | | | | 862,804 | | |
MGM Growth Properties LLC, Class A | | | 62,844 | | | | 1,718,155 | | |
Mid-America Apartment Communities, Inc. | | | 17,876 | | | | 2,130,641 | | |
National Retail Properties, Inc. | | | 36,482 | | | | 1,293,287 | | |
Pebblebrook Hotel Trust | | | 59,712 | | | | 632,947 | | |
Physicians Realty Trust | | | 115,370 | | | | 2,081,275 | | |
Prologis, Inc. | | | 65,746 | | | | 6,930,943 | | |
Regency Centers Corp. | | | 24,000 | | | | 984,720 | | |
Rexford Industrial Realty, Inc. | | | 25,031 | | | | 1,174,705 | | |
Simon Property Group, Inc. | | | 18,635 | | | | 1,161,892 | | |
Sun Communities, Inc. | | | 8,152 | | | | 1,222,229 | | |
Ventas, Inc. | | | 39,500 | | | | 1,515,220 | | |
VICI Properties, Inc. | | | 86,936 | | | | 1,887,381 | | |
Welltower, Inc. | | | 48,512 | | | | 2,598,303 | | |
| | | | | | 48,765,533 | | |
Total common stocks
(cost—$92,720,790) | | | | | 87,944,981 | | |
Short-term investments—0.7% | |
Investment companies—0.7% | |
State Street Institutional U.S. Government
Money Market Fund, 0.09%2
(cost—$618,996) | | | 618,996 | | | | 618,996 | | |
Investment of cash collateral from securities loaned—1.1% | |
Money market funds—1.1% | |
State Street Navigator Securities Lending
Government Money Market Portfolio, 0.12%2
(cost—$963,819) | | | 963,819 | | | | 963,819 | | |
Total investments
(cost—$94,303,605)—101.6% | | | | | 89,527,796 | | |
Liabilities in excess of other assets—(1.6)% | | | | | (1,354,873 | ) | |
Net assets—100.0% | | | | $ | 88,172,923 | | |
For a listing of defined portfolio acronyms that are used throughout the Portfolio of investments as well as the tables that follow, please refer to page 267.
234
PACE Global Real Estate Securities Investments
Portfolio of investments—July 31, 2020
Fair valuation summary
The following is a summary of the fair valuations according to the inputs used as of July 31, 2020 in valuing the Portfolio's investments. In the event a Portfolio holds investments for which fair value is measured using the NAV per share practical expedient (or its equivalent), a separate column will be added to the fair value hierarchy table; this is intended to permit reconciliation to the amounts presented in a Portfolio of investments:
Assets
Description | | Unadjusted
quoted prices in
active markets for
identical investments
(Level 1) | | Other significant
observable inputs
(Level 2) | | Unobservable
inputs
(Level 3) | | Total | |
Common stocks | | $ | 51,744,513 | | | $ | 36,200,468 | | | $ | — | | | $ | 87,944,981 | | |
Short-term investments | | | — | | | | 618,996 | | | | — | | | | 618,996 | | |
Investment of cash collateral from securities loaned | | | — | | | | 963,819 | | | | — | | | | 963,819 | | |
Total | | $ | 51,744,513 | | | $ | 37,783,283 | | | $ | — | | | $ | 89,527,796 | | |
At July 31, 2020, there were no transfers in or out of Level 3.
Portfolio footnotes
* Non-income producing security.
1 Security, or portion thereof, was on loan at the period end.
2 Rates shown reflect yield at July 31, 2020.
See accompanying notes to financial statements.
235
PACE Alternative Strategies Investments
Performance
For the 12-months ended July 31, 2020, the Portfolio's Class P shares returned 4.46% before the deduction of the maximum PACE Select program fee.1 In comparison, the FTSE Three-Month US Treasury Bill Index (the "benchmark") returned 1.36%, the Bloomberg Barclays Global Aggregate Index returned 7.85%, the MSCI World Index (net) returned 7.23%, the HFRI Fund of Funds Composite Index (net) returned 2.55%. (Returns for all share classes over various time periods are shown in the "Performance at a glance" table on page 239. Please note that the returns shown do not reflect the deduction of taxes that a shareholder would pay on Portfolio distributions or the redemption of Portfolio shares.) For a detailed commentary on the market environment in general during the reporting period, please refer to page 2.
Investment Manager's comments2,3
The Portfolio outperformed its benchmark during the reporting period. This was primarily driven by allocations to equity-hedged strategies and a tactical currency strategy. After producing positive returns from July 2019 onward into calendar year-end, equity markets plunged in the first quarter of 2020 in response to the global coronavirus pandemic and concerns about the economic impact of widespread business closures and personal movement restrictions. Investors were also concerned about an ill-timed oil price war that was concurrent with an oil supply glut resulting from the pandemic-related shutdown. Following the swift global policy response to support individuals and economies during the crisis, equity markets began to recover, with technology stocks leading the way.
Equity hedged strategies benefited from having exposure to equities in general but also from stock selection, particularly since the end of the first quarter of 2020 as many strategies sought to reposition themselves based on the opportunities presented by the pandemic-related sell-off. Of particular note was the strong performance of a long/short equity strategy that focuses on small- and mid-cap stocks and an allocation to a market neutral strategy. Key contributors to the performance of the long/short equity strategy included long exposure to a furniture and home furnishings retailer with a strong online/catalog business and short exposure to a major aerospace manufacturer that came under pressure as the demand for commercial aircraft declined due to the pandemic. Performance drivers for the market neutral strategy were diverse across many sectors, with notable contributions coming from the consumer discretionary sector, and several sectors related to the strategy's US housing recovery theme.
1 Class P shares held through the PACE Select Advisors Program are subject to a maximum Program fee of 2.50%, which, if included, would have reduced performance. Class P shares held through other advisory programs also may be subject to a program fee, which, if included, would have reduced performance.
2 A long position in a security is implemented by purchasing a security with the expectation that it will rise in value. A short position in a security may be taken when an investor believes that a security, or investment, is overpriced and expects it to fall in value. A short position is typically implemented by first borrowing the investment and then selling it. The investor then seeks to buy the investment at a later date ideally at a lower price to replace the security that had been borrowed, thereby earning a profit on the transaction.
3 Performance is discussed on a gross-of-fees basis—meaning that no fees or expenses are reflected when discussed at the level of a subadvisor's sleeve (or subadvisors' sleeves, if applicable). Alternatively, performance at the overall Portfolio level is shown net of fees, which does factor in fees and expenses associated with the Portfolio.
PACE Select Advisors Trust –
PACE Alternative Strategies Investments
Investment Manager and Portfolio Sleeve Advisor:
UBS Asset Management (Americas) Inc. ("UBS AM")
Investment Subadvisors:
Wells Capital Management Incorporated (f/k/a Analytic Investors, LLC) ("WellsCap"); First Quadrant L.P. ("First Quadrant");
Standard Life Investments (Corporate Funds) Limited ("Aberdeen Standard Investments") (Terminated
effective 7/31/2020);
Sirios Capital Management, L.P. ("Sirios");
Aviva Investors Americas, LLC ("Aviva");
PCJ Investment Counsel LTD ("PCJ")
Kettle Hill Capital Management, LLC ("Kettle Hill")
Magnetar Asset Management, LLC ("Magnetar") (Effective February 14, 2020);
DLD Asset Management, L.P. ("DLD") (Effective February 14, 2020)
Portfolio Management Team:
UBS AM: Mabel Lung, CFA, Gina Toth, CFA, Fred Lee CFA, and Russell Sinder
WellsCap: Dennis Bein, David Krider and Harindra de Silva;
First Quadrant: Dori Levanoni and Jeppe Ladekarl;
236
PACE Alternative Strategies Investments
Investment Manager's comments – concluded
The tactical currency strategy performed well in both up and down equity markets over the period, and produced particularly strong gains when equity markets were stressed in early 2020. The strongest contributor was short positioning in the Norwegian krone, which was particularly successful during the first quarter of 2020. The strategy tactically traded positons in that currency and benefited as the currency devalued along with oil prices but also as it later recovered since the strategy moved to neutralize its position after the strategy's models no longer found the currency to be overvalued. Thematically, the strategy had success across a broad variety of identified drivers, with several components to their models adding value. For example, the strategy's investment flow ideas fared the best in the last four months of 2019, whereas its macroeconomic models shined during the equity downturn in early 2020, and its behavioral biases models did well as volatility stabilized, anticipating how behavior would shift as the risk environment became more constructive.
An allocation to a global macro strategy also added to performance for the period. The strategy benefited from defensive positioning during the first quarter of 2020 such as a long US vs German interest rates position and a long position in the 30-year US Treasury, along with certain equity positions with the US and Swiss markets. The main detractor for the period was the strategy's exposure to US inflation, which declined over the period.
Allocations to a merger arbitrage strategy detracted from performance for the period. The primary detractors from returns were merger and acquisition (M&A) deals that were announced prior to the pandemic-related shutdowns where acquirers either positioned for price cuts in deal terms through threatened and actualized litigation or withdrew their tender offers completely.
There is significant use of derivatives in the Fund, including but not limited to options, futures, forwards, and swaps. Derivatives were used for risk management and efficient implementation purposes. In general, derivatives were used in the Portfolio to gain economic exposure and for hedging or risk management purposes mostly across currencies, fixed income and equity markets. Derivatives are the primary instrument to implement currency strategies because of their high degree of liquidity, low cost and trading efficiency. The instruments utilized in the Portfolio over the period primarily included currency forwards, both deliverable and non-deliverable, swaps and options across equities, fixed income and currencies.
Portfolio Management
Team (concluded)
Aberdeen Standard Investments (Terminated effective 7/31/2020): Neil Richardson, Adam Rudd, CFA, Katy Forbes, Scott Smith, CFA, and David Sol;
Magnetar: Devin Dallaire
DLD: Sudeep Duttaroy and Mark Friedman
Aviva: Peter Fitzgerald, James McAlevey and Mark Robertson
PCJ: Nereo Piticco, Adam Posman, Heiki Altosaar, Kevin Kingsley and Jenny Yan
Kettle Hill: Andrew Y. Kurita
UBS AM sleeve: Mabel Lung, Gina Toth, Fred Lee, and Russell Sinder;
Sirios: John F. Brennan, Jr.
Objective:
Long-term capital appreciation
237
PACE Alternative Strategies Investments
Investment process
The main strategies of the subadvisors include:
• An "opportunistic strategy" in which UBS AM allocates a portion of the fund's assets primarily to unaffiliated actively- and passively- managed pooled investment vehicles that UBS AM believes are suitable for return generation, risk management or both.
• A "long/short global equity" strategy in which the subadvisor buys securities "long" that the subadvisor believes will out-perform the market, and sells securities "short" that the subadvisor believes will underperform the market.
• A "currency strategy" that seeks to produce absolute return from investing in currency markets.
• A "global multi-asset strategy" that involves achieving a total return by delivering a diversified global portfolio that makes use of multiple strategies across various asset classes.
• A "managed futures strategy" in which the subadvisor takes both long and short positions in a portfolio of futures contracts, futures related instruments, forward contracts and swaps across different asset classes.
• A "liquid alternative long/short equity strategy" in which the subadvisor generally utilizes long positions that the subadvisor believes are attractively-valued, growth-oriented companies of mid to large capitalization and short positions that the subadvisor believes have deteriorating fundamentals or appear overvalued.
• A "global unconstrained multi-strategy" strategy that identifies and pursues diverse strategies across asset classes, sectors, currencies, interest rates, inflation and volatility that are expected to work well together whether markets are rising or falling.
• An "absolute return equity market neutral" strategy that aims to earn a positive absolute and attractive risk adjusted return while demonstrating low correlation with, and lower volatility than, traditional long only investment portfolios.
• A "diversified currency strategy" that seeks to produce absolute returns from a blend of a fundamental discretionary process and a fundamental systematic process by investing in developed market currency instruments.
• A "long/short US, small cap equity" strategy in which the subadvisor primarily buys securities of US small capitalization companies "long" that the subadvisor believes will out-perform the market, and sells securities of US small capitalization companies "short" that the subadvisor believes will underperform the market.
Mutual funds are sold by prospectus only. You should read it carefully and consider a fund's investment objectives, risks, charges, expenses and other important information contained in the prospectus before investing. Prospectuses for most of our funds can be obtained from your financial advisor, by calling UBS Funds at 800-647 1568 or by visiting our Website at www.ubs.com/am-us.
Special considerations
The Portfolio may be appropriate for investors seeking long-term capital appreciation who are able to withstand short-term fluctuations in the equity markets and fixed income markets in return for potentially higher returns over the long term. The Portfolio may employ investment strategies that involve greater risks than the strategies used by many other mutual funds, including increased use of short sales (which involve the risk of an unlimited increase in the market value of the security sold short, which could result in a theoretically unlimited loss), leverage and derivative transactions, and hedging strategies. The value of the Portfolio changes every day and can be affected by changes in interest rates, general market conditions, and other political, social and economic developments, as well as specific matters relating to the issuers of securities in which the Portfolio invests. The value of the Portfolio's investments in foreign securities may fall due to adverse political, social and economic developments abroad, and due to decreases in foreign currency values relative to the US dollar. It is important to note that an investment in the Portfolio is only one component of a balanced investment plan.
238
PACE Alternative Strategies Investments
Performance at a glance (unaudited)
Average annual total returns for periods ended 07/31/20 | | 1 year | | 5 years | | 10 years | |
Before deducting maximum sales charge | |
Class A1 | | | 4.25 | % | | | 0.91 | % | | | 2.73 | % | |
Class Y2 | | | 4.56 | | | | 1.20 | | | | 3.00 | | |
Class P3 | | | 4.46 | | | | 1.16 | | | | 3.00 | | |
After deducting maximum sales charge | |
Class A1 | | | (1.51 | ) | | | (0.24 | ) | | | 2.15 | | |
FTSE Three-Month US Treasury Bill Index4 | | | 1.36 | | | | 1.15 | | | | 0.61 | | |
Bloomberg Barclays Global Aggregate Index5 | | | 7.85 | | | | 4.16 | | | | 2.79 | | |
MSCI World Index (net)6 | | | 7.23 | | | | 7.52 | | | | 9.61 | | |
HFRI Fund of Funds Composite Index (net)7 | | | 2.55 | | | | 1.92 | | | | 2.95 | | |
Most recent calendar quarter-end returns (unaudited)
Average annual total returns for periods ended 06/30/20 | | 1 year | | 5 years | | 10 years | |
Before deducting maximum sales charge | |
Class A1 | | | 1.71 | % | | | 0.62 | % | | | 2.58 | % | |
Class Y2 | | | 2.02 | | | | 0.90 | | | | 2.82 | | |
Class P3 | | | 2.00 | | | | 0.87 | | | | 2.84 | | |
After deducting maximum sales charge | |
Class A1 | | | (3.86 | ) | | | (0.52 | ) | | | 2.00 | | |
The annualized gross and net expense ratios, respectively, for each class of shares as in the November 27, 2019 prospectuses, were as follows: Class A—2.82% and 2.75%; Class Y—2.55% and 2.48%; and Class P—2.59% and 2.52% Net expenses reflect fee waivers and/or expense reimbursements, if any, pursuant to an agreement that is in effect to cap the expenses. The Portfolio and UBS Asset Management (Americas) Inc. ("UBS AM") have entered into a written fee waiver/expense reimbursement agreement pursuant to which UBS AM is contractually obligated to waive its management fees through November 30, 2020 to the extent necessary to offset the cost savings to UBS AM for allocating a portion of the Portfolio's assets to other unaffiliated pooled investment vehicles and index futures. The fee waiver/expense reimbursement agreement may be terminated by the Portfolio's board at any time and also will terminate automatically upon the expiration or termination of the Portfolio's advisory contract with UBS AM. Class A—1.88%; Class Y—1.63%; and Class P—1.63% The Portfolio has agreed to repay UBS AM for any waived fees/reimbursed expenses (pursuant to item (2)) to the extent that it can do so over the following three fiscal years without causing the Portfolio's expenses in any of those three years to exceed this expense cap and that UBS AM has not waived the right to do so. The fee waiver/expense reimbursement agreement may be terminated by the Portfolio's board at any time and also will terminate automatically upon the expiration or termination of the Portfolio's advisory contract with UBS AM.
1 Maximum sales charge for Class A shares is 5.5%. Class A shares bear ongoing 12b-1 service fees of 0.25% annually.
2 The Portfolio offers Class Y shares to a limited group of eligible investors, including certain qualifying retirement plans. Class Y shares do not bear initial or contingent deferred sales charges or ongoing 12b-1 service and distribution fees.
3 Class P shares do not bear initial or contingent deferred sales charges or ongoing 12b-1 service and distribution fees, but Class P shares held through advisory programs may be subject to a program fee, which, if included, would have reduced performance.
4 The FTSE Three-Month US Treasury Bill Index is an unmanaged index reflecting monthly return equivalents of yield averages that are not marked to the market and an average of the last three 3-month T-bill month-end rates. 3-month T-bills are the short-term debt obligations of the US government. Investors should note that indices do not reflect the deduction of fees and expenses.
5 The Bloomberg Barclays Global Aggregate Index is an unmanaged broad-based, market capitalization-weighted index which is designed to measure the broad investment-grade global fixed income markets for US and non-US government, government-related, corporate and securitized sectors. Investors should note that indices do not reflect the deduction of fees and expenses.
6 The MSCI World Index (net) is a free float-adjusted market capitalization weighted index that is designed to measure the equity market performance of developed markets. Net total return indices reinvest dividends after the deduction of withholding taxes, using a tax rate applicable to non-resident institutional investors who do not benefit from double taxation treaties. The index is constructed and managed with a view to being fully investable from the perspective of international institutional investors. Investors should note that indices do not reflect the deduction of fees and expenses.
7 The HFRI Fund of Funds Composite Index is an index of Fund of Funds strategies which invest with multiple managers through funds or managed accounts. The strategy designs a diversified portfolio of managers with the objective of significantly lowering the risk (volatility) of vesting with an individual manager. The Fund of Funds manager has discretion in choosing which strategies to invest in for the portfolio. A manager may allocate funds to numerous managers within a single strategy, or with numerous managers in multiple strategies. The minimum investment in a Fund of Funds may be lower than an investment in an individual hedge fund or managed account. The investor has the advantage of diversification among managers and styles with significantly less capital than investing with separate managers. Investors should note that indices do not reflect the deduction of fees and expenses.
Prior to August 3, 2015, a 1% redemption fee was imposed on sales or exchanges of any class of shares of the Portfolio made during the specified holding period.
Past performance does not predict future performance, and the performance information provided does not reflect the deduction of taxes that a shareholder would pay on Portfolio distributions or the redemption of Portfolio shares. The return and principal value of an investment will fluctuate, so that an investor's shares, when redeemed, may be worth more or less than their original cost. Performance results assume reinvestment of all dividends and capital gain distributions at net asset value on the ex-dividend dates. Current performance may be higher or lower than the performance data quoted. For month-end performance figures, please visit www.ubs.com/us-mutualfundperformance.
239
PACE Alternative Strategies Investments
Illustration of an assumed investment of $10,000 in Class P shares of the Portfolio (unaudited)
The following graph depicts the performance of PACE Alternative Strategies Investments Class P shares versus the FTSE Three-Month US Treasury Bill Index, the Bloomberg Barclays Global Aggregate Index, the MSCI World Index (net) and the HFRI Fund of Funds Composite Index (net) over the 10 years ended July 31, 2020. Class P shares held through advisory programs may be subject to a program fee, which, if included, would have reduced performance. The performance of the other classes will vary based upon the different class specific expenses and sales charges. The performance provided does not reflect the deduction of taxes that a shareholder would pay on Portfolio distributions or the redemption of Portfolio shares. Past performance is no guarantee of future results. Share price and returns will vary with market conditions; investors may realize a gain or loss upon redemption. It is important to note that PACE Alternative Strategies Investments is a professionally managed portfolio while the Indices are not available for investment and are unmanaged. The comparison is shown for illustration purposes only.
PACE Alternative Strategies Investments
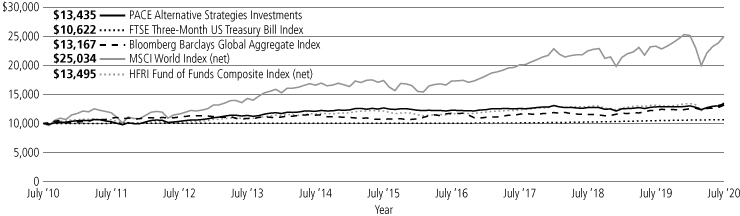
240
PACE Alternative Strategies Investments
Portfolio statistics—July 31, 2020 (unaudited)
Top ten equity holdings (long holdings)1 | | Percentage of
net assets | |
Lowe's Cos., Inc. | | | 0.9 | % | |
Microsoft Corp. | | | 0.7 | | |
Berkshire Hathaway, Inc., Class B | | | 0.7 | | |
Apple, Inc. | | | 0.6 | | |
Amazon.com, Inc. | | | 0.6 | | |
Louisiana-Pacific Corp. | | | 0.6 | | |
Alcon, Inc. | | | 0.5 | | |
Canadian Pacific Railway Ltd. | | | 0.5 | | |
JPMorgan Chase & Co. | | | 0.4 | | |
Abbott Laboratories | | | 0.4 | | |
Total | | | 5.9 | % | |
Top ten equity holdings (short holdings)1 | | Percentage of
net assets | |
Akamai Technologies, Inc. | | | (0.7 | )% | |
Match Group, Inc. | | | (0.7 | ) | |
Home Depot, Inc./The | | | (0.4 | ) | |
Anthem, Inc. | | | (0.4 | ) | |
American Eagle Outfitters, Inc. | | | (0.4 | ) | |
NIO, Inc., ADR | | | (0.4 | ) | |
World Wrestling Entertainment, Inc., Class A | | | (0.3 | ) | |
Bandwidth, Inc., Class A | | | (0.3 | ) | |
Norwegian Cruise Line Holdings Ltd. | | | (0.3 | ) | |
Carnival Corp. | | | (0.3 | ) | |
Total | | | (4.2 | )% | |
Top ten long-term income holdings1 | | Percentage of
net assets | |
Akamai Technologies, Inc., 0.125% due 05/01/25 | | | 1.1 | % | |
Match Group Financeco, Inc., 0.875% due 10/01/22 | | | 0.8 | | |
American Eagle Outfitters, Inc., 3.750% due 04/15/25 | | | 0.6 | | |
United States Steel Corp., 5.000% due 11/01/26 | | | 0.6 | | |
Air Canada, 4.000% due 07/01/25 | | | 0.5 | | |
Bandwidth, Inc., 0.250% due 03/01/26 | | | 0.5 | | |
NIO, Inc., 4.500% due 02/01/24 | | | 0.5 | | |
U.S. Treasury Bills, 0.152% due 09/10/20 | | | 0.4 | | |
World Wrestling Entertainment, Inc., 3.375%, due 12/15/23 | | | 0.4 | | |
Anthem, Inc., 2.750%, due 10/15/42 | | | 0.4 | | |
Total | | | 5.8 | % | |
Top five issuer breakdown by country
or territory of origin (long holdings)1 | | Percentage of
net assets | |
United States | | | 79.9 | % | |
Canada | | | 6.5 | | |
Japan | | | 2.5 | | |
France | | | 1.6 | | |
Switzerland | | | 1.0 | | |
Total | | | 91.5 | % | |
Top five issuer breakdown by country
or territory of origin (short holdings)1 | | Percentage of
net assets | |
United States | | | (13.7 | )% | |
Canada | | | (5.9 | ) | |
Japan | | | (1.1 | ) | |
China | | | (0.4 | ) | |
United Kingdom | | | (0.3 | ) | |
Total | | | (21.4 | )% | |
1 The Portfolio is actively managed and its composition will vary over time.
241
PACE Alternative Strategies Investments
Industry diversification—(unaudited)
As a percentage of net assets as of July 31, 2020
Common stocks | |
Aerospace & defense | | | 0.7 | % | |
Air freight & logistics | | | 0.0 | † | |
Airlines | | | 0.4 | | |
Auto components | | | 0.1 | | |
Automobiles | | | 0.5 | | |
Banks | | | 1.6 | | |
Beverages | | | 0.6 | | |
Biotechnology | | | 1.7 | | |
Building products | | | 1.2 | | |
Capital markets | | | 0.6 | | |
Chemicals | | | 1.0 | | |
Commercial services & supplies | | | 0.9 | | |
Communications equipment | | | 0.4 | | |
Construction & engineering | | | 0.1 | | |
Construction materials | | | 0.1 | | |
Consumer finance | | | 0.5 | | |
Containers & packaging | | | 0.0 | † | |
Distributors | | | 0.0 | † | |
Diversified consumer services | | | 0.0 | † | |
Diversified financial services | | | 1.0 | | |
Diversified telecommunication services | | | 0.6 | | |
Electric utilities | | | 0.1 | | |
Electrical equipment | | | 0.6 | | |
Electronic equipment, instruments & components | | | 0.7 | | |
Energy equipment & services | | | 0.0 | † | |
Entertainment | | | 0.9 | | |
Equity real estate investment trusts | | | 1.9 | | |
Food & staples retailing | | | 1.5 | | |
Food products | | | 0.6 | | |
Gas utilities | | | 0.0 | † | |
Health care equipment & supplies | | | 3.0 | | |
Health care providers & services | | | 1.3 | | |
Health care technology | | | 0.4 | | |
Hotels, restaurants & leisure | | | 2.1 | | |
Household durables | | | 0.7 | | |
Household products | | | 0.3 | | |
Independent power and renewable electricity producers | | | 0.4 | | |
Industrial conglomerates | | | 0.2 | | |
Insurance | | | 0.8 | | |
Interactive media & services | | | 1.1 | | |
Internet & direct marketing retail | | | 1.2 | | |
IT services | | | 1.6 | | |
Leisure products | | | 0.3 | | |
Common stocks—(concluded) | |
Life sciences tools & services | | | 0.9 | % | |
Machinery | | | 0.9 | | |
Media | | | 0.5 | | |
Metals & mining | | | 2.3 | | |
Multi-utilities | | | 0.2 | | |
Multiline retail | | | 0.2 | | |
Oil, gas & consumable fuels | | | 1.5 | | |
Paper & forest products | | | 1.3 | | |
Personal products | | | 0.1 | | |
Pharmaceuticals | | | 1.0 | | |
Professional services | | | 0.9 | | |
Real estate management & development | | | 0.5 | | |
Road & rail | | | 1.2 | | |
Semiconductors & semiconductor equipment | | | 3.0 | | |
Software | | | 3.5 | | |
Specialty retail | | | 2.3 | | |
Technology hardware, storage & peripherals | | | 1.4 | | |
Textiles, apparel & luxury goods | | | 0.4 | | |
Thrifts & mortgage finance | | | 0.1 | | |
Trading companies & distributors | | | 0.2 | | |
Transportation infrastructure | | | 0.0 | † | |
Wireless telecommunication services | | | 0.2 | | |
Total common stocks | | | 54.3 | | |
Preferred stocks | |
Aerospace & defense | | | 0.0 | † | |
Automobiles | | | 0.1 | | |
Chemicals | | | 0.0 | † | |
Health care equipment & supplies | | | 0.0 | † | |
Total preferred stocks | | | 0.1 | | |
Investment companies | | | 5.3 | | |
Warrants | | | 0.0 | † | |
Corporate bonds | |
Advertising | | | 0.0 | † | |
Airlines | | | 0.5 | | |
Auto manufacturers | | | 0.5 | | |
Auto parts & equipment | | | 0.0 | † | |
Banks | | | 0.0 | † | |
Beverages | | | 0.0 | † | |
Biotechnology | | | 0.3 | | |
Building materials | | | 0.0 | † | |
Chemicals | | | 0.0 | † | |
242
PACE Alternative Strategies Investments
Industry diversification—(unaudited) (continued)
As a percentage of net assets as of July 31, 2020
Corporate bonds—(concluded) | |
Commercial services | | | 0.1 | % | |
Computers | | | 0.0 | † | |
Diversified financial services | | | 0.1 | | |
Electric | | | 0.0 | † | |
Electrical components & equipment | | | 0.0 | † | |
Engineering & construction | | | 0.3 | | |
Entertainment | | | 0.0 | † | |
Environmental control | | | 0.0 | † | |
Food | | | 0.0 | † | |
Food Service | | | 0.0 | † | |
Healthcare-products | | | 0.3 | | |
Healthcare-services | | | 0.6 | | |
Home builders | | | 0.0 | † | |
Household products/wares | | | 0.0 | † | |
Housewares | | | 0.0 | † | |
Insurance | | | 0.0 | † | |
Internet | | | 1.0 | | |
Investment companies | | | 0.0 | † | |
Iron & steel | | | 0.5 | | |
Leisure Time | | | 0.7 | | |
Lodging | | | 0.0 | † | |
Media | | | 0.9 | | |
Mining | | | 0.1 | | |
Oil & gas | | | 0.1 | | |
Oil & gas services | | | 0.0 | † | |
Packaging & containers | | | 0.1 | | |
Pharmaceuticals | | | 0.1 | | |
Pipelines | | | 0.1 | | |
Real estate investment trusts | | | 0.0 | † | |
Retail | | | 0.8 | | |
Software | | | 1.7 | | |
Telecommunications | | | 0.1 | | |
Toys/Games/Hobbies | | | 0.0 | † | |
Total corporate bonds | | | 8.9 | | |
Short-term U.S. Treasury obligations | | | 5.2 | | |
Short-term investments | | | 25.2 | | |
Equity and foreign exchange options purchased | |
Call options | | | 0.2 | | |
Put options | | | 0.1 | | |
Total equity and foreign exchange options purchased | | | 0.3 | | |
Investments sold short
Common stocks | |
Aerospace & defense | | | (0.6 | )% | |
Airlines | | | (0.4 | ) | |
Automobiles | | | (0.7 | ) | |
Banks | | | (0.7 | ) | |
Biotechnology | | | (0.6 | ) | |
Capital markets | | | (0.4 | ) | |
Chemicals | | | (0.2 | ) | |
Commercial services & supplies | | | (0.1 | ) | |
Communications equipment | | | (0.1 | ) | |
Construction & engineering | | | (0.1 | ) | |
Consumer finance | | | (0.0 | )† | |
Containers & packaging | | | (0.5 | ) | |
Diversified financial services | | | (0.2 | ) | |
Diversified telecommunication services | | | (0.6 | ) | |
Electric utilities | | | (0.4 | ) | |
Energy equipment & services | | | (0.1 | ) | |
Entertainment | | | (0.5 | ) | |
Equity real estate investment trusts | | | (0.9 | ) | |
Food & staples retailing | | | (0.2 | ) | |
Food products | | | (0.4 | ) | |
Health care equipment & supplies | | | (0.4 | ) | |
Health care providers & services | | | (0.5 | ) | |
Hotels, restaurants & leisure | | | (1.8 | ) | |
Household durables | | | (0.1 | ) | |
Industrial conglomerates | | | (0.1 | ) | |
Insurance | | | (0.2 | ) | |
Interactive media & services | | | (0.7 | ) | |
Internet & direct marketing retail | | | (0.1 | ) | |
IT services | | | (0.8 | ) | |
Leisure products | | | (0.1 | ) | |
Machinery | | | (0.2 | ) | |
Media | | | (0.5 | ) | |
Metals & mining | | | (1.0 | ) | |
Mortgage real estate investment | | | (0.1 | ) | |
Multiline retail | | | (0.4 | ) | |
Oil, gas & consumable fuels | | | (1.3 | ) | |
Paper & forest products | | | (0.1 | ) | |
Personal products | | | (0.1 | ) | |
Pharmaceuticals | | | (0.5 | ) | |
Real estate management & development | | | (0.0 | )† | |
Semiconductors & semiconductor equipment | | | (0.3 | ) | |
243
PACE Alternative Strategies Investments
Industry diversification—(unaudited) (concluded)
As a percentage of net assets as of July 31, 2020
Investments sold short—(concluded)
Common stocks—(concluded) | |
Software | | | (0.4 | )% | |
Specialty retail | | | (1.1 | ) | |
Trading companies & distributors | | | (0.1 | ) | |
Wireless telecommunication services | | | (0.4 | ) | |
Corporate bonds | |
Iron & steel | | | (0.2 | ) | |
Investment companies | | | (3.3 | ) | |
Warrants | | | (0.0 | )† | |
Other assets in excess of liabilities | | | 23.2 | | |
Net assets | | | 100.0 | % | |
† Amount represents less than 0.05% or (0.05)%.
244
PACE Alternative Strategies Investments
Portfolio of investments—July 31, 2020
| | | Number of
shares | | Value | |
Common stocks—54.3% | |
Australia—0.7% | |
BHP Group PLC | | | 22,964 | | | $ | 496,560 | | |
Fortescue Metals Group Ltd. | | | 56,950 | | | | 708,868 | | |
Glencore PLC* | | | 118,138 | | | | 270,365 | | |
Kogan.com Ltd. | | | 44,547 | | | | 529,956 | | |
Qantas Airways Ltd. | | | 168,674 | | | | 386,730 | | |
Rio Tinto Ltd. | | | 5,609 | | | | 410,515 | | |
Rio Tinto PLC | | | 6,469 | | | | 393,782 | | |
| | | | | | 3,196,776 | | |
Austria—0.0%† | |
Erste Group Bank AG* | | | 567 | | | | 12,691 | | |
OMV AG* | | | 275 | | | | 8,685 | | |
| | | | | | 21,376 | | |
Belgium—0.1% | |
Ageas SA/N.V. | | | 333 | | | | 12,466 | | |
Galapagos N.V.* | | | 686 | | | | 127,370 | | |
Groupe Bruxelles Lambert SA | | | 206 | | | | 17,868 | | |
Proximus SADP | | | 300 | | | | 6,171 | | |
Solvay SA | | | 141 | | | | 10,943 | | |
UCB SA | | | 994 | | | | 127,721 | | |
Umicore SA | | | 6,114 | | | | 288,747 | | |
| | | | | | 591,286 | | |
Canada—6.0% | |
Advantage Oil & Gas Ltd.*,1 | | | 295,080 | | | | 352,479 | | |
Agnico Eagle Mines Ltd. | | | 4,000 | | | | 425,480 | | |
Algonquin Power & Utilities Corp.1 | | | 51,860 | | | | 715,497 | | |
Alimentation Couche-Tard, Inc., Class B 1 | | | 15,180 | | | | 527,552 | | |
ARC Resources Ltd.1 | | | 78,670 | | | | 334,191 | | |
ATS Automation Tooling Systems, Inc.*,1 | | | 45,840 | | | | 593,427 | | |
AutoCanada, Inc.1 | | | 15,690 | | | | 164,578 | | |
B2Gold Corp. | | | 99,600 | | | | 690,050 | | |
Barrick Gold Corp. | | | 27,800 | | | | 803,418 | | |
Battle North Gold Corp.*,1 | | | 118,190 | | | | 175,593 | | |
Birchcliff Energy Ltd.1 | | | 279,500 | | | | 250,401 | | |
Boyd Group Services, Inc.1 | | | 5,060 | | | | 738,875 | | |
Canadian Natural Resources Ltd.1 | | | 17,930 | | | | 316,644 | | |
Canadian Pacific Railway Ltd.1 | | | 7,480 | | | | 2,057,119 | | |
Capstone Mining Corp.*,1 | | | 76,010 | | | | 60,152 | | |
Cenovus Energy, Inc.1 | | | 101,340 | | | | 450,921 | | |
Constellation Software, Inc. | | | 100 | | | | 118,285 | | |
Descartes Systems Group, Inc./The*,1 | | | 18,140 | | | | 1,021,268 | | |
ERO Copper Corp.*,1 | | | 12,980 | | | | 156,212 | | |
European Residential Real Estate Investment Trust1 | | | 368,660 | | | | 1,142,214 | | |
FirstService Corp.1 | | | 5,054 | | | | 604,465 | | |
Freehold Royalties Ltd.1 | | | 185,500 | | | | 495,793 | | |
GDI Integrated Facility Services, Inc.*,1 | | | 11,780 | | | | 267,182 | | |
Goodfood Market Corp.*,2 | | | 20,760 | | | | 110,662 | | |
Hardwoods Distribution, Inc.1 | | | 52,080 | | | | 670,708 | | |
Interfor Corp.*,1 | | | 145,600 | | | | 1,690,306 | | |
Kinaxis, Inc.*,1 | | | 3,120 | | | | 473,783 | | |
Kinross Gold Corp.* | | | 105,600 | | | | 985,479 | | |
Kirkland Lake Gold Ltd.1 | | | 19,160 | | | | 1,046,136 | | |
Liberty Gold Corp.*,1 | | | 111,240 | | | | 182,708 | | |
Major Drilling Group International, Inc.*,1 | | | 78,100 | | | | 355,093 | | |
| | | Number of
shares | | Value | |
Common stocks—(continued) | |
Canada—(concluded) | |
Maple Leaf Foods, Inc. | | | 2,980 | | | $ | 65,542 | | |
Minto Apartment Real Estate Investment Trust 1 | | | 31,300 | | | | 435,576 | | |
Norbord, Inc.1 | | | 49,499 | | | | 1,612,182 | | |
Northland Power, Inc.1 | | | 24,390 | | | | 668,269 | | |
Novagold Resources, Inc.* | | | 4,075 | | | | 37,164 | | |
Pan American Silver Corp. | | | 18,100 | | | | 676,326 | | |
Pan American Silver Corp.1 | | | 21,400 | | | | 799,504 | | |
Profound Medical Corp.*,1 | | | 10,880 | | | | 173,014 | | |
Quisitive Technology Solutions, Inc.*,1 | | | 563,470 | | | | 197,716 | | |
Restaurant Brands International, Inc.1 | | | 7,590 | | | | 428,671 | | |
Sangoma Technologies Corp.*,1 | | | 205,700 | | | | 368,569 | | |
Sleep Country Canada Holdings, Inc.1,3 | | | 10,170 | | | | 145,855 | | |
Suncor Energy, Inc.1 | | | 56,970 | | | | 896,157 | | |
TECSYS, Inc.1 | | | 9,070 | | | | 202,127 | | |
Tourmaline Oil Corp.1 | | | 25,250 | | | | 256,751 | | |
TransAlta Corp.1 | | | 168,484 | | | | 1,101,885 | | |
Trisura Group Ltd.*,1 | | | 7,850 | | | | 467,267 | | |
Troilus Gold Corp.*,1 | | | 157,530 | | | | 168,179 | | |
Well Health Technologies Corp.*,1 | | | 125,790 | | | | 349,352 | | |
Wesdome Gold Mines Ltd.*,1 | | | 15,600 | | | | 159,675 | | |
| | | | | | 27,186,452 | | |
China—0.1% | |
NetEase, Inc., ADR | | | 513 | | | | 235,169 | | |
Prosus N.V.* | | | 468 | | | | 45,549 | | |
Yum China Holdings, Inc. | | | 733 | | | | 37,559 | | |
| | | | | | 318,277 | | |
Denmark—0.4% | |
Coloplast A/S, Class B | | | 9,752 | | | | 1,664,640 | | |
Genmab A/S* | | | 224 | | | | 77,102 | | |
| | | | | | 1,741,742 | | |
Finland—0.4% | |
Elisa Oyj | | | 2,185 | | | | 129,589 | | |
Fortum Oyj | | | 836 | | | | 16,968 | | |
Kesko Oyj, B Shares | | | 517 | | | | 10,963 | | |
Kone Oyj, Class B | | | 5,601 | | | | 444,768 | | |
Neles Oyj | | | 247 | | | | 3,523 | | |
Nokia Oyj, ADR | | | 196,031 | | | | 937,028 | | |
Orion Oyj, Class B | | | 2,613 | | | | 114,003 | | |
Stora Enso Oyj, R Shares | | | 1,171 | | | | 14,686 | | |
Wartsila Oyj Abp | | | 940 | | | | 7,862 | | |
| | | | | | 1,679,390 | | |
France—1.6% | |
Accor SA* | | | 370 | | | | 9,314 | | |
Air Liquide SA | | | 802 | | | | 131,913 | | |
Airbus SE* | | | 16,130 | | | | 1,180,651 | | |
Alstom SA* | | | 368 | | | | 20,506 | | |
Amundi SA*,3 | | | 429 | | | | 32,639 | | |
Arkema SA | | | 134 | | | | 13,941 | | |
Atos SE* | | | 186 | | | | 15,905 | | |
AXA SA | | | 5,862 | | | | 117,613 | | |
BioMerieux | | | 884 | | | | 142,475 | | |
Bouygues SA* | | | 10,748 | | | | 379,690 | | |
245
PACE Alternative Strategies Investments
Portfolio of investments—July 31, 2020
| | | Number of
shares | | Value | |
Common stocks—(continued) | |
France—(concluded) | |
Bureau Veritas SA* | | | 557 | | | $ | 12,254 | | |
Capgemini SE | | | 1,067 | | | | 138,384 | | |
Carrefour SA | | | 25,431 | | | | 404,173 | | |
Cie de Saint-Gobain* | | | 8,613 | | | | 318,638 | | |
Cie Generale des Etablissements Michelin SCA | | | 2,520 | | | | 260,987 | | |
Danone SA | | | 1,747 | | | | 116,932 | | |
Dassault Systemes SE | | | 682 | | | | 124,188 | | |
Eiffage SA* | | | 191 | | | | 16,692 | | |
Electricite de France SA | | | 974 | | | | 9,863 | | |
EssilorLuxottica SA* | | | 902 | | | | 120,142 | | |
Gecina SA | | | 91 | | | | 11,805 | | |
Getlink SE* | | | 836 | | | | 12,578 | | |
Hermes International | | | 138 | | | | 111,882 | | |
ICADE | | | 5,711 | | | | 375,852 | | |
Ingenico Group SA* | | | 116 | | | | 18,773 | | |
Kering SA | | | 216 | | | | 122,404 | | |
Klepierre SA | | | 40,862 | | | | 707,679 | | |
L'Oreal SA | | | 371 | | | | 124,518 | | |
Legrand SA | | | 1,531 | | | | 118,436 | | |
LVMH Moet Hennessy Louis Vuitton SE | | | 265 | | | | 115,233 | | |
Orpea* | | | 99 | | | | 12,630 | | |
Pernod Ricard SA | | | 752 | | | | 129,231 | | |
Peugeot SA* | | | 35,077 | | | | 563,853 | | |
Publicis Groupe SA | | | 428 | | | | 13,686 | | |
Remy Cointreau SA | | | 835 | | | | 133,916 | | |
Renault SA* | | | 396 | | | | 9,411 | | |
Rubis SCA | | | 183 | | | | 8,632 | | |
Safran SA* | | | 2,416 | | | | 256,946 | | |
Sanofi | | | 1,171 | | | | 122,952 | | |
Sartorius Stedim Biotech | | | 484 | | | | 151,387 | | |
Schneider Electric SE | | | 3,702 | | | | 424,484 | | |
SCOR SE* | | | 327 | | | | 8,416 | | |
Sodexho SA | | | 163 | | | | 11,249 | | |
Suez SA | | | 749 | | | | 9,878 | | |
Teleperformance | | | 472 | | | | 138,138 | | |
Thales SA | | | 203 | | | | 14,675 | | |
Ubisoft Entertainment SA* | | | 194 | | | | 16,203 | | |
Unibail-Rodamco-Westfield | | | 265 | | | | 13,897 | | |
Valeo SA | | | 427 | | | | 10,958 | | |
Worldline SA*,3 | | | 1,354 | | | | 116,484 | | |
| | | | | | 7,453,086 | | |
Germany—0.8% | |
Aroundtown SA* | | | 2,306 | | | | 13,886 | | |
Bechtle AG | | | 52 | | | | 10,120 | | |
Beiersdorf AG | | | 1,095 | | | | 130,749 | | |
Brenntag AG | | | 296 | | | | 18,267 | | |
Carl Zeiss Meditec AG* | | | 1,173 | | | | 122,765 | | |
Commerzbank AG* | | | 1,901 | | | | 9,770 | | |
Corestate Capital Holding SA* | | | 6,024 | | | | 128,407 | | |
Covestro AG3 | | | 326 | | | | 12,651 | | |
Delivery Hero SE*,3 | | | 1,053 | | | | 120,875 | | |
Evonik Industries AG | | | 369 | | | | 9,969 | | |
GEA Group AG | | | 283 | | | | 10,215 | | |
Hannover Rueck SE | | | 115 | | | | 19,455 | | |
HeidelbergCement AG | | | 283 | | | | 15,705 | | |
| | | Number of
shares | | Value | |
Common stocks—(continued) | |
German—(concluded) | |
HelloFresh SE* | | | 7,654 | | | $ | 415,473 | | |
Infineon Technologies AG | | | 15,863 | | | | 404,433 | | |
Knorr-Bremse AG | | | 11,597 | | | | 1,356,934 | | |
LANXESS AG* | | | 157 | | | | 8,143 | | |
LEG Immobilien AG* | | | 132 | | | | 18,406 | | |
Nemetschek SE | | | 105 | | | | 7,697 | | |
Puma SE* | | | 161 | | | | 12,532 | | |
Rheinmetall AG | | | 84 | | | | 7,942 | | |
Scout24 AG3 | | | 1,663 | | | | 142,947 | | |
Siemens Healthineers AG3 | | | 2,184 | | | | 113,702 | | |
Symrise AG | | | 995 | | | | 124,386 | | |
TeamViewer AG*,3 | | | 233 | | | | 12,599 | | |
Uniper SE | | | 211 | | | | 7,284 | | |
United Internet AG | | | 211 | | | | 9,575 | | |
Zalando SE*,3 | | | 6,529 | | | | 471,330 | | |
| | | | | | 3,736,217 | | |
Ghana—0.1% | |
Kosmos Energy Ltd. | | | 245,503 | | | | 395,260 | | |
Hong Kong—0.3% | |
NWS Holdings Ltd. | | | 273,000 | | | | 211,614 | | |
WH Group Ltd.3 | | | 1,221,500 | | | | 1,087,327 | | |
| | | | | | 1,298,941 | | |
India—0.0%† | |
Reliance Industries Ltd. | | | 7,321 | | | | 202,467 | | |
Ireland—0.1% | |
Flutter Entertainment PLC* | | | 884 | | | | 133,942 | | |
Kerry Group PLC, Class A | | | 991 | | | | 131,255 | | |
Kingspan Group PLC | | | 4,756 | | | | 341,195 | | |
Smurfit Kappa Group PLC | | | 424 | | | | 14,324 | | |
| | | | | | 620,716 | | |
Italy—0.5% | |
Davide Campari-Milano N.V. | | | 932 | | | | 9,409 | | |
DiaSorin SpA | | | 5,096 | | | | 1,005,189 | | |
Ferrari N.V. | | | 686 | | | | 122,667 | | |
FinecoBank Banca Fineco SpA* | | | 1,165 | | | | 16,983 | | |
Infrastrutture Wireless Italiane SpA3 | | | 11,406 | | | | 115,095 | | |
Intesa Sanpaolo SpA* | | | 246,901 | | | | 503,269 | | |
Mediobanca Banca di Credito Finanziario SpA | | | 1,201 | | | | 9,699 | | |
Moncler SpA* | | | 383 | | | | 14,807 | | |
Nexi SpA*,3 | | | 577 | | | | 10,366 | | |
Poste Italiane SpA3 | | | 893 | | | | 8,205 | | |
Prysmian SpA | | | 513 | | | | 13,118 | | |
Recordati SpA | | | 193 | | | | 10,366 | | |
Telecom Italia SpA | | | 19,421 | | | | 7,876 | | |
Terna Rete Elettrica Nazionale SpA | | | 2,696 | | | | 20,120 | | |
UniCredit SpA* | | | 52,173 | | | | 478,841 | | |
| | | | | | 2,346,010 | | |
Japan—2.5% | |
Advantest Corp. | | | 15,100 | | | | 824,446 | | |
AI inside, Inc.* | | | 1,500 | | | | 454,601 | | |
Cybozu, Inc. | | | 16,300 | | | | 483,057 | | |
Daikin Industries Ltd. | | | 2,500 | | | | 439,866 | | |
246
PACE Alternative Strategies Investments
Portfolio of investments—July 31, 2020
| | | Number of
shares | | Value | |
Common stocks—(continued) | |
Japan—(concluded) | |
Daito Trust Construction Co.Ltd. | | | 21,100 | | | $ | 1,654,708 | | |
Dip Corp. | | | 3,300 | | | | 62,103 | | |
IR Japan Holdings Ltd. | | | 2,800 | | | | 309,241 | | |
Kobe Bussan Co.Ltd. | | | 21,700 | | | | 1,346,780 | | |
Lasertec Corp. | | | 11,000 | | | | 971,240 | | |
McDonald's Holdings Co.Japan Ltd. | | | 200 | | | | 9,572 | | |
Murata Manufacturing Co.Ltd. | | | 7,600 | | | | 488,153 | | |
Nintendo Co.Ltd. | | | 300 | | | | 131,943 | | |
Relia, Inc. | | | 26,800 | | | | 283,674 | | |
Tokyo Electron Ltd. | | | 6,000 | | | | 1,660,303 | | |
Toyota Motor Corp. | | | 4,200 | | | | 249,329 | | |
Uchida Yoko Co.Ltd. | | | 11,300 | | | | 684,095 | | |
Welcia Holdings Co.Ltd. | | | 13,400 | | | | 1,226,752 | | |
| | | | | | 11,279,863 | | |
Jordan—0.4% | |
Hikma Pharmaceuticals PLC | | | 59,157 | | | | 1,657,634 | | |
Luxembourg—0.3% | |
ArcelorMittal SA* | | | 35,275 | | | | 390,557 | | |
Eurofins Scientific SE* | | | 1,620 | | | | 1,060,332 | | |
| | | | | | 1,450,889 | | |
Netherlands—0.5% | |
ABN AMRO Bank N.V.3 | | | 909 | | | | 7,550 | | |
Adyen N.V.*,3 | | | 706 | | | | 1,184,673 | | |
Aegon N.V. | | | 3,440 | | | | 10,081 | | |
Akzo Nobel N.V. | | | 1,290 | | | | 121,549 | | |
Argenx SE* | | | 82 | | | | 18,922 | | |
ASM International N.V. | | | 93 | | | | 14,226 | | |
ASML Holding N.V. | | | 308 | | | | 109,506 | | |
ASR Nederland N.V. | | | 270 | | | | 8,723 | | |
Euronext N.V.3 | | | 102 | | | | 11,783 | | |
EXOR N.V. | | | 217 | | | | 12,186 | | |
Heineken Holding N.V. | | | 179 | | | | 15,457 | | |
Heineken N.V. | | | 1,267 | | | | 122,717 | | |
IMCD N.V. | | | 100 | | | | 10,341 | | |
Just Eat Takeaway.com N.V.*,3 | | | 1,118 | | | | 120,651 | | |
Koninklijke DSM N.V. | | | 845 | | | | 129,341 | | |
Koninklijke KPN N.V. | | | 6,744 | | | | 17,766 | | |
Koninklijke Philips N.V.* | | | 2,503 | | | | 129,332 | | |
Koninklijke Vopak N.V. | | | 2,191 | | | | 119,777 | | |
Randstad N.V. | | | 238 | | | | 11,464 | | |
Signify N.V.*,3 | | | 5,585 | | | | 167,568 | | |
Wolters Kluwer N.V. | | | 1,503 | | | | 118,624 | | |
| | | | | | 2,462,237 | | |
New Zealand—0.2% | |
a2 Milk Co.Ltd.* | | | 31,362 | | | | 437,024 | | |
Fisher & Paykel Healthcare Corp.Ltd. | | | 18,526 | | | | 443,779 | | |
| | | | | | 880,803 | | |
Peru—0.0%† | |
Credicorp Ltd. | | | 897 | | | | 114,071 | | |
Portugal—0.0%† | |
Galp Energia SGPS SA | | | 938 | | | | 9,822 | | |
| | | Number of
shares | | Value | |
Common stocks—(continued) | |
South Africa—0.1% | |
Anglo American PLC | | | 20,423 | | | $ | 494,402 | | |
South Korea—0.3% | |
LG Chem Ltd. | | | 599 | | | | 286,825 | | |
Samsung Electronics Co.Ltd. | | | 9,614 | | | | 469,873 | | |
SK Hynix, Inc. | | | 5,888 | | | | 412,256 | | |
| | | | | | 1,168,954 | | |
Spain—0.2% | |
ACS Actividades de Construccion y Servicios SA | | | 465 | | | | 10,786 | | |
Banco Santander SA* | | | 215,567 | | | | 462,277 | | |
CaixaBank SA | | | 6,862 | | | | 14,761 | | |
Cellnex Telecom SA3 | | | 1,873 | | | | 117,876 | | |
Enagas SA | | | 451 | | | | 11,378 | | |
Endesa SA | | | 605 | | | | 17,259 | | |
Grifols SA | | | 4,568 | | | | 133,091 | | |
Industria de Diseno Textil SA | | | 4,540 | | | | 120,301 | | |
Naturgy Energy Group SA | | | 658 | | | | 12,244 | | |
Red Electrica Corp.SA | | | 7,096 | | | | 138,335 | | |
| | | | | | 1,038,308 | | |
Sweden—0.5% | |
Assa Abloy AB, Class B | | | 20,034 | | | | 442,274 | | |
Epiroc AB, Class A | | | 7,336 | | | | 102,573 | | |
Essity AB, Class B* | | | 36,239 | | | | 1,195,684 | | |
Evolution Gaming Group AB3 | | | 9,978 | | | | 677,115 | | |
| | | | | | 2,417,646 | | |
Switzerland—1.0% | |
Alcon, Inc.* | | | 38,198 | | | | 2,291,116 | | |
Logitech International SA | | | 20,255 | | | | 1,477,569 | | |
Schindler Holding AG | | | 3,306 | | | | 840,336 | | |
STMicroelectronics N.V. | | | 4,683 | | | | 131,579 | | |
| | | | | | 4,740,600 | | |
Taiwan—0.2% | |
MediaTek, Inc. | | | 15,000 | | | | 358,171 | | |
Win Semiconductors Corp. | | | 30,000 | | | | 323,511 | | |
| | | | | | 681,682 | | |
United Kingdom—1.0% | |
boohoo Group PLC* | | | 146,963 | | | | 497,232 | | |
| BP PLC | | | 103,917 | | | | 376,336 | | |
CNH Industrial N.V.* | | | 1,907 | | | | 12,958 | | |
Experian PLC | | | 11,263 | | | | 393,418 | | |
Go-Ahead Group PLC/The | | | 10,019 | | | | 82,071 | | |
J Sainsbury PLC | | | 496,605 | | | | 1,210,394 | | |
Johnson Matthey PLC | | | 13,797 | | | | 402,882 | | |
London Stock Exchange Group PLC | | | 1,221 | | | | 134,870 | | |
Standard Chartered PLC | | | 19,723 | | | | 98,613 | | |
TechnipFMC PLC | | | 855 | | | | 6,695 | | |
Unilever N.V. | | | 2,272 | | | | 134,253 | | |
Vodafone Group PLC | | | 669,556 | | | | 1,006,241 | | |
| | | | | | 4,355,963 | | |
247
PACE Alternative Strategies Investments
Portfolio of investments—July 31, 2020
| | | Number of
shares | | Value | |
Common stocks—(continued) | |
United States—36.0% | |
10X Genomics, Inc., Class A* | | | 424 | | | $ | 41,709 | | |
3M Co. | | | 1,718 | | | | 258,507 | | |
A.O.Smith Corp. | | | 773 | | | | 37,212 | | |
AAON, Inc. | | | 669 | | | | 39,638 | | |
Aaron's, Inc. | | | 1,182 | | | | 61,677 | | |
Abbott Laboratories | | | 19,603 | | | | 1,972,846 | | |
AbbVie, Inc.1 | | | 10,658 | | | | 1,011,551 | | |
ABIOMED, Inc.* | | | 149 | | | | 44,691 | | |
Acacia Communications, Inc.* | | | 528 | | | | 35,893 | | |
ACADIA Pharmaceuticals, Inc.* | | | 745 | | | | 30,970 | | |
Acceleron Pharma, Inc.* | | | 373 | | | | 36,990 | | |
Acuity Brands, Inc. | | | 961 | | | | 95,235 | | |
Adobe, Inc.* | | | 579 | | | | 257,261 | | |
Advanced Disposal Services, Inc.* | | | 1,190 | | | | 35,890 | | |
Advanced Micro Devices, Inc.*,1 | | | 13,793 | | | | 1,067,992 | | |
AeroVironment, Inc.* | | | 458 | | | | 35,060 | | |
Agilent Technologies, Inc. | | | 411 | | | | 39,592 | | |
Agios Pharmaceuticals, Inc.* | | | 677 | | | | 30,682 | | |
Akamai Technologies, Inc.* | | | 342 | | | | 38,454 | | |
Alarm.com Holdings, Inc.* | | | 563 | | | | 39,433 | | |
Albemarle Corp. | | | 3,123 | | | | 257,523 | | |
Alexandria Real Estate Equities, Inc. | | | 1,344 | | | | 238,627 | | |
Alexion Pharmaceuticals, Inc.*,1 | | | 7,987 | | | | 818,588 | | |
Allakos, Inc.* | | | 493 | | | | 37,010 | | |
Allegion PLC | | | 5,609 | | | | 557,871 | | |
Allogene Therapeutics, Inc.* | | | 858 | | | | 31,463 | | |
Alnylam Pharmaceuticals, Inc.* | | | 243 | | | | 35,420 | | |
Alphabet, Inc., Class A*,1 | | | 402 | | | | 598,156 | | |
Alphabet, Inc., Class C*,1 | | | 81 | | | | 120,120 | | |
Altice USA, Inc., Class A* | | | 5,707 | | | | 154,032 | | |
Amazon.com, Inc.*,1 | | | 834 | | | | 2,639,343 | | |
Ambarella, Inc.* | | | 808 | | | | 36,586 | | |
Amdocs Ltd. | | | 596 | | | | 37,012 | | |
Amedisys, Inc.* | | | 182 | | | | 42,617 | | |
American Homes 4 Rent, Class A 1 | | | 36,720 | | | | 1,064,880 | | |
AMETEK, Inc. | | | 407 | | | | 37,953 | | |
AMN Healthcare Services, Inc.* | | | 20,341 | | | | 1,117,535 | | |
Amphenol Corp., Class A | | | 377 | | | | 39,872 | | |
Analog Devices, Inc. | | | 5,111 | | | | 586,998 | | |
ANSYS, Inc.* | | | 127 | | | | 39,446 | | |
Anterix, Inc.* | | | 808 | | | | 35,213 | | |
Aon PLC, Class A | | | 1,468 | | | | 301,263 | | |
Apache Corp. | | | 78,217 | | | | 1,200,631 | | |
Appfolio, Inc., Class A* | | | 224 | | | | 31,185 | | |
Apple, Inc.1 | | | 6,891 | | | | 2,928,951 | | |
AptarGroup, Inc. | | | 329 | | | | 37,901 | | |
Aptiv PLC | | | 3,323 | | | | 258,363 | | |
Arch Capital Group Ltd.* | | | 7,751 | | | | 238,343 | | |
Arena Pharmaceuticals, Inc.* | | | 572 | | | | 35,115 | | |
Arthur J.Gallagher & Co. | | | 5,462 | | | | 587,110 | | |
Aspen Technology, Inc.* | | | 347 | | | | 33,749 | | |
Atkore International Group, Inc.*,1 | | | 9,127 | | | | 243,417 | | |
AtriCure, Inc.* | | | 807 | | | | 32,934 | | |
Atrion Corp. | | | 57 | | | | 35,346 | | |
Autodesk, Inc.* | | | 3,626 | | | | 857,295 | | |
Avalara, Inc.* | | | 269 | | | | 36,167 | | |
| | | Number of
shares | | Value | |
Common stocks—(continued) | |
United States—(continued) | |
Axonics Modulation Technologies, Inc.* | | | 1,041 | | | $ | 44,097 | | |
Badger Meter, Inc. | | | 588 | | | | 36,809 | | |
Baker Hughes Co. | | | 8,134 | | | | 125,996 | | |
Balchem Corp. | | | 381 | | | | 38,199 | | |
Bandwidth, Inc., Class A* | | | 285 | | | | 41,262 | | |
Bank of America Corp. | | | 31,984 | | | | 795,762 | | |
BellRing Brands, Inc., Class A* | | | 1,908 | | | | 37,912 | | |
Berkshire Hathaway, Inc., Class B* | | | 15,022 | | | | 2,941,007 | | |
Best Buy Co., Inc.1 | | | 7,950 | | | | 791,740 | | |
Bio-Rad Laboratories, Inc., Class A*,1 | | | 2,276 | | | | 1,194,650 | | |
Bio-Techne Corp. | | | 141 | | | | 38,798 | | |
Biogen, Inc.*,1 | | | 3,573 | | | | 981,467 | | |
BioMarin Pharmaceutical, Inc.* | | | 294 | | | | 35,224 | | |
BJ's Wholesale Club Holdings, Inc.* | | | 12,995 | | | | 520,450 | | |
Black Knight, Inc.* | | | 499 | | | | 37,385 | | |
Blackline, Inc.* | | | 434 | | | | 38,587 | | |
Bloomin' Brands, Inc. | | | 21,344 | | | | 245,883 | | |
Booz Allen Hamilton Holding Corp.1 | | | 12,885 | | | | 1,053,478 | | |
Boston Beer Co., Inc./The, Class A* | | | 66 | | | | 53,489 | | |
Boston Scientific Corp.*,1 | | | 43,260 | | | | 1,668,538 | | |
Brady Corp., Class A | | | 768 | | | | 35,305 | | |
Broadcom, Inc. | | | 1,132 | | | | 358,561 | | |
Broadridge Financial Solutions, Inc. | | | 285 | | | | 38,287 | | |
Brown & Brown, Inc. | | | 2,341 | | | | 106,445 | | |
Brown-Forman Corp., Class B | | | 568 | | | | 39,385 | | |
| BRP, Inc.1 | | | 9,270 | | | | 415,245 | | |
Brunswick Corp. | | | 9,318 | | | | 624,120 | | |
Burlington Stores, Inc.* | | | 1,095 | | | | 205,860 | | |
C.H.Robinson Worldwide, Inc. | | | 462 | | | | 43,299 | | |
Cable One, Inc. | | | 20 | | | | 36,451 | | |
Cadence Design Systems, Inc.* | | | 382 | | | | 41,733 | | |
Cal-Maine Foods, Inc.* | | | 816 | | | | 35,859 | | |
Calavo Growers, Inc. | | | 583 | | | | 33,680 | | |
Capital One Financial Corp. | | | 17,292 | | | | 1,103,230 | | |
Cardiovascular Systems, Inc.* | | | 1,159 | | | | 35,326 | | |
Cargurus, Inc.* | | | 1,465 | | | | 42,324 | | |
Carnival PLC | | | 33,150 | | | | 358,537 | | |
Carrier Global Corp.1 | | | 56,234 | | | | 1,531,814 | | |
Cboe Global Markets, Inc.1 | | | 8,164 | | | | 715,983 | | |
CDW Corp.1 | | | 6,613 | | | | 768,761 | | |
CenturyLink, Inc.1 | | | 69,791 | | | | 673,483 | | |
Cerner Corp. | | | 528 | | | | 36,670 | | |
Change Healthcare, Inc.* | | | 133,426 | | | | 1,555,747 | | |
Charter Communications, Inc., Class A* | | | 971 | | | | 563,180 | | |
Chegg, Inc.* | | | 538 | | | | 43,562 | | |
Chemed Corp. | | | 81 | | | | 39,867 | | |
Chevron Corp. | | | 3,161 | | | | 265,334 | | |
Chipotle Mexican Grill, Inc.* | | | 34 | | | | 39,275 | | |
Church & Dwight Co., Inc. | | | 468 | | | | 45,082 | | |
Cigna Corp.1 | | | 4,879 | | | | 842,555 | | |
Cintas Corp.1 | | | 4,446 | | | | 1,342,114 | | |
Citizens Financial Group, Inc. | | | 47,775 | | | | 1,185,298 | | |
Citrix Systems, Inc. | | | 248 | | | | 35,404 | | |
Clorox Co./The 1 | | | 1,150 | | | | 271,986 | | |
Cloudflare, Inc., Class A* | | | 1,023 | | | | 42,577 | | |
Coca-Cola Co./The | | | 20,395 | | | | 963,460 | | |
248
PACE Alternative Strategies Investments
Portfolio of investments—July 31, 2020
| | | Number of
shares | | Value | |
Common stocks—(continued) | |
United States—(continued) | |
Codexis, Inc.* | | | 3,237 | | | $ | 38,294 | | |
Cognex Corp. | | | 612 | | | | 40,924 | | |
Columbia Sportswear Co. | | | 450 | | | | 34,128 | | |
Comcast Corp., Class A | | | 12,530 | | | | 536,284 | | |
ConocoPhillips | | | 6,137 | | | | 229,462 | | |
Constellation Brands, Inc., Class A | | | 6,815 | | | | 1,214,433 | | |
Cooper Cos., Inc./The | | | 133 | | | | 37,630 | | |
Copart, Inc.* | | | 3,185 | | | | 297,001 | | |
Corcept Therapeutics, Inc.* | | | 2,143 | | | | 32,038 | | |
Corteva, Inc.1 | | | 30,733 | | | | 877,734 | | |
CoStar Group, Inc.* | | | 52 | | | | 44,188 | | |
Covetrus, Inc.* | | | 18,242 | | | | 404,243 | | |
Crowdstrike Holdings, Inc., Class A* | | | 366 | | | | 41,431 | | |
CryoPort, Inc.* | | | 1,241 | | | | 41,127 | | |
CSW Industrials, Inc. | | | 524 | | | | 34,998 | | |
CVS Health Corp.1 | | | 15,027 | | | | 945,799 | | |
D.R.Horton, Inc.1 | | | 16,690 | | | | 1,104,210 | | |
Danaher Corp.1 | | | 6,169 | | | | 1,257,242 | | |
Datadog, Inc., Class A* | | | 429 | | | | 40,266 | | |
Deciphera Pharmaceuticals, Inc.* | | | 613 | | | | 28,425 | | |
Deckers Outdoor Corp.* | | | 184 | | | | 38,502 | | |
DexCom, Inc.*,1 | | | 1,597 | | | | 695,557 | | |
Discover Financial Services | | | 22,199 | | | | 1,097,297 | | |
Discovery, Inc., Class A*,1 | | | 10,762 | | | | 227,078 | | |
DocuSign, Inc.*,1 | | | 420 | | | | 91,069 | | |
Dolby Laboratories, Inc., Class A | | | 543 | | | | 37,793 | | |
Dollar General Corp.1 | | | 5,365 | | | | 1,021,496 | | |
Domino's Pizza, Inc.1 | | | 2,324 | | | | 898,482 | | |
Donaldson Co., Inc. | | | 783 | | | | 37,850 | | |
Dorman Products, Inc.* | | | 537 | | | | 43,900 | | |
Dropbox, Inc., Class A*,1 | | | 62,322 | | | | 1,417,825 | | |
DSP Group, Inc.* | | | 2,296 | | | | 34,096 | | |
Eagle Pharmaceuticals, Inc.* | | | 748 | | | | 34,700 | | |
Eidos Therapeutics, Inc.* | | | 800 | | | | 32,080 | | |
Eiger BioPharmaceuticals, Inc.* | | | 4,712 | | | | 47,356 | | |
Electronic Arts, Inc.* | | | 2,900 | | | | 410,698 | | |
Enanta Pharmaceuticals, Inc.* | | | 732 | | | | 33,562 | | |
Encore Wire Corp. | | | 739 | | | | 37,090 | | |
Ennis, Inc. | | | 2,028 | | | | 35,084 | | |
EPAM Systems, Inc.* | | | 146 | | | | 42,352 | | |
Equifax, Inc. | | | 2,524 | | | | 410,301 | | |
Equitable Holdings, Inc.1 | | | 38,568 | | | | 789,101 | | |
Evercore, Inc., Class A | | | 8,331 | | | | 460,704 | | |
Exelixis, Inc.* | | | 1,580 | | | | 36,482 | | |
Exponent, Inc. | | | 453 | | | | 38,079 | | |
F5 Networks, Inc.* | | | 261 | | | | 35,470 | | |
Facebook, Inc., Class A*,1 | | | 6,782 | | | | 1,720,390 | | |
Fair Isaac Corp.* | | | 88 | | | | 38,649 | | |
Fastenal Co. | | | 856 | | | | 40,266 | | |
Fastly, Inc., Class A* | | | 459 | | | | 44,289 | | |
Fidelity National Information Services, Inc.1 | | | 5,190 | | | | 759,349 | | |
Five Below, Inc.*,1 | | | 10,140 | | | | 1,104,347 | | |
Five9, Inc.* | | | 333 | | | | 40,233 | | |
Flowers Foods, Inc. | | | 1,617 | | | | 36,787 | | |
Fortinet, Inc.*,1 | | | 5,340 | | | | 738,522 | | |
Fox Corp, Class A 1 | | | 15,147 | | | | 390,338 | | |
| | | Number of
shares | | Value | |
Common stocks—(continued) | |
United States—(continued) | |
Fox Factory Holding Corp.* | | | 440 | | | $ | 39,160 | | |
Freshpet, Inc.* | | | 440 | | | | 42,262 | | |
Garmin Ltd. | | | 3,613 | | | | 356,206 | | |
Generac Holdings, Inc.*,1 | | | 10,100 | | | | 1,591,558 | | |
General Mills, Inc. | | | 4,169 | | | | 263,773 | | |
Gentex Corp. | | | 1,393 | | | | 37,597 | | |
Global Blood Therapeutics, Inc.* | | | 540 | | | | 36,439 | | |
Globus Medical, Inc., Class A* | | | 757 | | | | 36,472 | | |
Graco, Inc. | | | 756 | | | | 40,249 | | |
Grand Canyon Education, Inc.* | | | 397 | | | | 35,230 | | |
Gray Television, Inc.* | | | 18,098 | | | | 259,525 | | |
Grid Dynamics Holdings, Inc.* | | | 5,532 | | | | 36,954 | | |
Guardant Health, Inc.* | | | 449 | | | | 38,246 | | |
Guidewire Software, Inc.* | | | 329 | | | | 38,710 | | |
Haemonetics Corp.* | | | 408 | | | | 35,765 | | |
Halozyme Therapeutics, Inc.* | | | 1,391 | | | | 37,821 | | |
Hamilton Thorne Ltd.*,1 | | | 51,150 | | | | 51,171 | | |
Harley-Davidson, Inc. | | | 24,450 | | | | 636,433 | | |
Hasbro, Inc. | | | 7,163 | | | | 521,180 | | |
HCA Healthcare, Inc. | | | 12,783 | | | | 1,618,839 | | |
HealthStream, Inc.* | | | 1,675 | | | | 36,775 | | |
Heartland Express, Inc. | | | 1,752 | | | | 35,539 | | |
HEICO Corp. | | | 357 | | | | 34,315 | | |
HEICO Corp., Class A | | | 4,201 | | | | 321,587 | | |
Hershey Co./The | | | 284 | | | | 41,296 | | |
HMS Holdings Corp.* | | | 1,140 | | | | 37,050 | | |
Hormel Foods Corp. | | | 743 | | | | 37,789 | | |
HP, Inc.1 | | | 30,396 | | | | 534,362 | | |
Hubbell, Inc. | | | 1,165 | | | | 157,240 | | |
Hudson Pacific Properties, Inc. | | | 48,289 | | | | 1,138,172 | | |
Humana, Inc.1 | | | 1,550 | | | | 608,297 | | |
ICU Medical, Inc.* | | | 199 | | | | 36,562 | | |
IDEX Corp. | | | 233 | | | | 38,403 | | |
IDEXX Laboratories, Inc.* | | | 109 | | | | 43,355 | | |
IHS Markit Ltd. | | | 493 | | | | 39,800 | | |
Immunovant, Inc.* | | | 1,411 | | | | 31,903 | | |
Incyte Corp.* | | | 350 | | | | 34,566 | | |
Inspire Medical Systems, Inc.* | | | 424 | | | | 42,129 | | |
Insulet Corp.* | | | 192 | | | | 39,045 | | |
Intel Corp.1 | | | 12,169 | | | | 580,826 | | |
Intuit, Inc.1 | | | 2,899 | | | | 888,167 | | |
Invitation Homes, Inc.1 | | | 41,760 | | | | 1,245,283 | | |
Ionis Pharmaceuticals, Inc.* | | | 604 | | | | 34,766 | | |
IPG Photonics Corp.* | | | 228 | | | | 40,814 | | |
IQVIA Holdings, Inc.* | | | 2,309 | | | | 365,723 | | |
iRhythm Technologies, Inc.* | | | 312 | | | | 38,838 | | |
J&J Snack Foods Corp. | | | 288 | | | | 35,461 | | |
J.B.Hunt Transport Services, Inc.1 | | | 6,110 | | | | 790,634 | | |
Jack Henry & Associates, Inc. | | | 198 | | | | 35,303 | | |
Jack in the Box, Inc. | | | 7,937 | | | | 651,707 | | |
John B Sanfilippo & Son, Inc. | | | 430 | | | | 37,913 | | |
Johnson Controls International PLC | | | 3,347 | | | | 128,793 | | |
JPMorgan Chase & Co.1 | | | 20,512 | | | | 1,982,280 | | |
KeyCorp | | | 89,154 | | | | 1,070,740 | | |
Keysight Technologies, Inc.* | | | 12,279 | | | | 1,226,549 | | |
Kimco Realty Corp. | | | 44,499 | | | | 496,164 | | |
249
PACE Alternative Strategies Investments
Portfolio of investments—July 31, 2020
| | | Number of
shares | | Value | |
Common stocks—(continued) | |
United States—(continued) | |
Kinder Morgan, Inc. | | | 34,901 | | | $ | 492,104 | | |
Kroger Co./The1 | | | 26,349 | | | | 916,682 | | |
Krystal Biotech, Inc.* | | | 869 | | | | 35,881 | | |
Kura Oncology, Inc.* | | | 2,164 | | | | 35,576 | | |
Lam Research Corp.1 | | | 2,391 | | | | 901,790 | | |
Lancaster Colony Corp. | | | 237 | | | | 37,586 | | |
Landstar System, Inc. | | | 325 | | | | 39,579 | | |
Las Vegas Sands Corp. | | | 23,293 | | | | 1,016,507 | | |
LeMaitre Vascular, Inc. | | | 1,382 | | | | 40,534 | | |
Lennar Corp., Class A1 | | | 7,087 | | | | 512,744 | | |
Lennox International, Inc. | | | 639 | | | | 171,341 | | |
LHC Group, Inc.* | | | 209 | | | | 40,778 | | |
Liberty Broadband Corp., Class A* | | | 292 | | | | 39,423 | | |
Liberty Broadband Corp., Class C* | | | 287 | | | | 39,396 | | |
Lincoln Electric Holdings, Inc. | | | 433 | | | | 39,139 | | |
Live Nation Entertainment, Inc.* | | | 15,461 | | | | 723,729 | | |
LiveRamp Holdings, Inc.* | | | 849 | | | | 38,689 | | |
Livongo Health, Inc.* | | | 502 | | | | 63,879 | | |
LogMeIn, Inc. | | | 421 | | | | 36,126 | | |
Louisiana-Pacific Corp.1 | | | 80,930 | | | | 2,563,053 | | |
Lowe's Cos., Inc.1 | | | 28,555 | | | | 4,252,125 | | |
Lululemon Athletica, Inc.*,1 | | | 3,098 | | | | 1,008,678 | | |
Lumentum Holdings, Inc.* | | | 3,979 | | | | 369,371 | | |
Luminex Corp. | | | 1,192 | | | | 43,389 | | |
Madrigal Pharmaceuticals, Inc.* | | | 349 | | | | 35,811 | | |
Magnite, Inc.* | | | 78,135 | | | | 469,201 | | |
Manhattan Associates, Inc.* | | | 382 | | | | 36,592 | | |
Marsh & McLennan Cos., Inc. | | | 2,610 | | | | 304,326 | | |
Masco Corp.1 | | | 15,908 | | | | 909,301 | | |
Masimo Corp.* | | | 163 | | | | 35,880 | | |
MasterCard, Inc., Class A1 | | | 3,027 | | | | 933,920 | | |
Match Group, Inc.* | | | 6,997 | | | | 718,592 | | |
Maxim Integrated Products, Inc. | | | 602 | | | | 40,990 | | |
MAXIMUS, Inc. | | | 505 | | | | 37,476 | | |
McCormick & Co., Inc.\MD | | | 200 | | | | 38,980 | | |
MDC Holdings, Inc.1 | | | 30,360 | | | | 1,361,039 | | |
Medtronic PLC | | | 2,512 | | | | 242,358 | | |
Merck & Co., Inc. | | | 2,923 | | | | 234,542 | | |
Mercury Systems, Inc.* | | | 460 | | | | 35,618 | | |
Mesa Laboratories, Inc. | | | 169 | | | | 40,043 | | |
Mettler-Toledo International, Inc.* | | | 46 | | | | 43,010 | | |
Micron Technology, Inc.* | | | 8,672 | | | | 434,077 | | |
Microsoft Corp.1 | | | 16,109 | | | | 3,302,506 | | |
Mirati Therapeutics, Inc.* | | | 313 | | | | 37,970 | | |
Mitek Systems, Inc.* | | | 3,873 | | | | 39,737 | | |
Moderna, Inc.*,1 | | | 10,380 | | | | 769,158 | | |
Monolithic Power Systems, Inc. | | | 156 | | | | 41,342 | | |
MSC Industrial Direct Co., Inc., Class A | | | 505 | | | | 33,335 | | |
Mylan N.V.* | | | 30,224 | | | | 486,909 | | |
MyoKardia, Inc.* | | | 371 | | | | 33,438 | | |
National Beverage Corp.* | | | 588 | | | | 37,720 | | |
National Instruments Corp. | | | 945 | | | | 33,548 | | |
National Presto Industries, Inc. | | | 420 | | | | 35,864 | | |
Neogen Corp.* | | | 477 | | | | 36,619 | | |
NeoPhotonics Corp.*,1 | | | 35,727 | | | | 325,473 | | |
Neurocrine Biosciences, Inc.* | | | 286 | | | | 34,423 | | |
| | | Number of
shares | | Value | |
Common stocks—(continued) | |
United States—(continued) | |
Nevro Corp.* | | | 304 | | | $ | 40,420 | | |
New York Times Co./The, Class A | | | 851 | | | | 39,265 | | |
NewMarket Corp. | | | 90 | | | | 33,733 | | |
NIC, Inc. | | | 1,567 | | | | 34,349 | | |
Nielsen Holdings PLC | | | 103,526 | | | | 1,493,880 | | |
NMI Holdings, Inc., Class A* | | | 6,776 | | | | 105,164 | | |
Nordson Corp. | | | 194 | | | | 37,564 | | |
NortonLifeLock, Inc.1 | | | 32,442 | | | | 695,881 | | |
Norwegian Cruise Line Holdings Ltd.* | | | 59,558 | | | | 812,371 | | |
Novocure Ltd.* | | | 622 | | | | 47,141 | | |
NVIDIA Corp.1 | | | 2,620 | | | | 1,112,426 | | |
Okta, Inc.* | | | 180 | | | | 39,776 | | |
Old Dominion Freight Line, Inc. | | | 218 | | | | 39,855 | | |
OrthoPediatrics Corp.* | | | 822 | | | | 34,680 | | |
Otis Worldwide Corp. | | | 7,120 | | | | 446,709 | | |
Oyster Point Pharma, Inc.* | | | 1,258 | | | | 28,141 | | |
Park Hotels & Resorts, Inc. | | | 11,925 | | | | 98,620 | | |
Parsley Energy, Inc., Class A | | | 23,341 | | | | 256,284 | | |
PayPal Holdings, Inc.* | | | 4,506 | | | | 883,491 | | |
Pegasystems, Inc. | | | 368 | | | | 43,016 | | |
PennyMac Financial Services, Inc.1 | | | 7,600 | | | | 366,776 | | |
Penumbra, Inc.* | | | 208 | | | | 46,157 | | |
PerkinElmer, Inc. | | | 375 | | | | 44,591 | | |
Pershing Square Tontine Holdings Ltd.* | | | 28,261 | | | | 594,611 | | |
PetMed Express, Inc.1 | | | 6,965 | | | | 217,308 | | |
Pfizer, Inc. | | | 42,626 | | | | 1,640,248 | | |
Pinterest, Inc., Class A* | | | 31,148 | | | | 1,068,065 | | |
Pool Corp. | | | 135 | | | | 42,754 | | |
PotlatchDeltic Corp.1 | | | 19,350 | | | | 828,373 | | |
Power Integrations, Inc. | | | 310 | | | | 37,829 | | |
Principia Biopharma, Inc.* | | | 638 | | | | 53,337 | | |
Progressive Corp./The 1 | | | 12,630 | | | | 1,140,994 | | |
Proto Labs, Inc.* | | | 314 | | | | 37,718 | | |
PTC, Inc.* | | | 5,208 | | | | 445,596 | | |
Qorvo, Inc.* | | | 3,783 | | | | 484,791 | | |
QUALCOMM, Inc. | | | 13,282 | | | | 1,402,712 | | |
Qualys, Inc.* | | | 356 | | | | 43,959 | | |
Quidel Corp.*,1 | | | 1,656 | | | | 467,770 | | |
Raven Industries, Inc. | | | 1,719 | | | | 37,148 | | |
Raytheon Technologies Corp. | | | 17,987 | | | | 1,019,503 | | |
Regency Centers Corp. | | | 11,400 | | | | 467,742 | | |
Regeneron Pharmaceuticals, Inc.*,1 | | | 1,884 | | | | 1,190,820 | | |
Repligen Corp.* | | | 301 | | | | 45,424 | | |
Republic Services, Inc. | | | 443 | | | | 38,652 | | |
ResMed, Inc. | | | 191 | | | | 38,679 | | |
Rexford Industrial Realty, Inc. | | | 5,539 | | | | 259,945 | | |
RH* | | | 5,271 | | | | 1,515,044 | | |
Rhythm Pharmaceuticals, Inc.* | | | 1,648 | | | | 31,675 | | |
RingCentral, Inc., Class A* | | | 133 | | | | 38,606 | | |
Rite Aid Corp.*,1 | | | 13,089 | | | | 198,429 | | |
Robert Half International, Inc.1 | | | 14,194 | | | | 722,049 | | |
Rollins, Inc. | | | 862 | | | | 45,169 | | |
Roper Technologies, Inc. | | | 1,290 | | | | 557,860 | | |
Royal Caribbean Cruises Ltd. | | | 9,730 | | | | 473,948 | | |
Royal Gold, Inc. | | | 298 | | | | 41,699 | | |
Sabre Corp. | | | 126,354 | | | | 955,236 | | |
250
PACE Alternative Strategies Investments
Portfolio of investments—July 31, 2020
| | | Number of
shares | | Value | |
Common stocks—(continued) | |
United States—(continued) | |
Salesforce.com, Inc.*,1 | | | 1,590 | | | $ | 309,811 | | |
Sanderson Farms, Inc. | | | 317 | | | | 35,344 | | |
Schneider National, Inc., Class B | | | 1,488 | | | | 37,393 | | |
Scientific Games Corp., Class A* | | | 37,970 | | | | 667,133 | | |
Seagate Technology PLC1 | | | 15,707 | | | | 710,271 | | |
Seattle Genetics, Inc.* | | | 218 | | | | 36,247 | | |
SEI Investments Co.1 | | | 4,532 | | | | 237,160 | | |
Seritage Growth Properties, Class A* | | | 25,257 | | | | 235,143 | | |
Sherwin-Williams Co./The1 | | | 1,828 | | | | 1,184,398 | | |
Shockwave Medical, Inc.* | | | 775 | | | | 38,223 | | |
Simpson Manufacturing Co., Inc. | | | 434 | | | | 41,907 | | |
Simulations Plus, Inc. | | | 614 | | | | 43,226 | | |
Skyworks Solutions, Inc. | | | 2,769 | | | | 403,111 | | |
Smartsheet, Inc., Class A* | | | 721 | | | | 34,421 | | |
Snap, Inc., Class A* | | | 21,552 | | | | 483,196 | | |
Southwest Airlines Co. | | | 21,335 | | | | 659,038 | | |
Spirit Airlines, Inc.* | | | 36,100 | | | | 570,741 | | |
Spotify Technology SA* | | | 135 | | | | 34,806 | | |
SPS Commerce, Inc.* | | | 480 | | | | 36,082 | | |
Staar Surgical Co.* | | | 585 | | | | 34,041 | | |
Steel Dynamics, Inc.1 | | | 26,761 | | | | 733,519 | | |
STERIS PLC | | | 240 | | | | 38,311 | | |
Strategic Education, Inc. | | | 234 | | | | 29,533 | | |
Super Micro Computer, Inc.*,1 | | | 11,704 | | | | 354,690 | | |
SYNNEX Corp.1 | | | 2,450 | | | | 305,613 | | |
Synopsys, Inc.* | | | 189 | | | | 37,653 | | |
T.Rowe Price Group, Inc.1 | | | 6,249 | | | | 862,987 | | |
Tactile Systems Technology, Inc.* | | | 870 | | | | 35,653 | | |
Take-Two Interactive Software, Inc.*,1 | | | 8,782 | | | | 1,440,424 | | |
Tandem Diabetes Care, Inc.* | | | 409 | | | | 42,724 | | |
TechTarget, Inc.* | | | 1,197 | | | | 43,439 | | |
Teladoc Health, Inc.* | | | 192 | | | | 45,625 | | |
Teledyne Technologies, Inc.* | | | 118 | | | | 36,191 | | |
Teleflex, Inc. | | | 101 | | | | 37,683 | | |
Teradyne, Inc.1 | | | 5,643 | | | | 502,001 | | |
Tesla, Inc.*,1 | | | 619 | | | | 885,640 | | |
Texas Roadhouse, Inc. | | | 4,686 | | | | 263,306 | | |
Thermo Fisher Scientific, Inc.1 | | | 1,896 | | | | 784,849 | | |
Tiffany & Co. | | | 298 | | | | 37,357 | | |
TJX Cos., Inc./The | | | 4,823 | | | | 250,748 | | |
Tootsie Roll Industries, Inc. | | | 1,069 | | | | 33,887 | | |
Toro Co./The | | | 542 | �� | | | 38,672 | | |
Tractor Supply Co. | | | 273 | | | | 38,968 | | |
Tradeweb Markets, Inc., Class A | | | 6,557 | | | | 354,537 | | |
Trane Technologies PLC | | | 3,999 | | | | 447,368 | | |
TransUnion | | | 4,564 | | | | 408,797 | | |
Trex Co., Inc.*,1 | | | 1,570 | | | | 218,748 | | |
Turning Point Therapeutics, Inc.* | | | 561 | | | | 33,228 | | |
Twilio, Inc., Class A* | | | 170 | | | | 47,161 | | |
Tyler Technologies, Inc.*,1 | | | 2,955 | | | | 1,055,674 | | |
Ulta Beauty, Inc.* | | | 7,238 | | | | 1,396,862 | | |
UniFirst Corp. | | | 204 | | | | 38,042 | | |
Union Pacific Corp.1 | | | 9,790 | | | | 1,697,096 | | |
United Therapeutics Corp.* | | | 299 | | | | 33,330 | | |
Universal Display Corp. | | | 244 | | | | 42,566 | | |
Universal Logistics Holdings, Inc.1 | | | 27,850 | | | | 511,604 | | |
| | | Number of
shares | | Value | |
Common stocks—(concluded) | |
United States—(concluded) | |
Urban Outfitters, Inc.* | | | 3,790 | | | $ | 62,687 | | |
Vail Resorts, Inc. | | | 7,512 | | | | 1,442,529 | | |
Valmont Industries, Inc. | | | 830 | | | | 100,596 | | |
Valvoline, Inc. | | | 27,547 | | | | 565,264 | | |
Varian Medical Systems, Inc.* | | | 298 | | | | 42,531 | | |
Varonis Systems, Inc.* | | | 9,539 | | | | 1,033,551 | | |
Veeva Systems, Inc., Class A* | | | 156 | | | | 41,273 | | |
Veracyte, Inc.* | | | 1,468 | | | | 52,364 | | |
VeriSign, Inc.* | | | 176 | | | | 37,256 | | |
Verisk Analytics, Inc. | | | 218 | | | | 41,139 | | |
Verizon Communications, Inc. | | | 17,161 | | | | 986,414 | | |
Verra Mobility Corp.* | | | 26,406 | | | | 270,133 | | |
Vertex Pharmaceuticals, Inc.*,1 | | | 4,623 | | | | 1,257,456 | | |
Vicor Corp.* | | | 500 | | | | 40,735 | | |
Viking Therapeutics, Inc.* | | | 4,945 | | | | 34,714 | | |
VirnetX Holding Corp. | | | 5,654 | | | | 29,231 | | |
Visa, Inc., A Shares | | | 1,154 | | | | 219,722 | | |
Vivint Smart Home, Inc.* | | | 2,181 | | | | 33,478 | | |
Vonage Holdings Corp.* | | | 54,288 | | | | 648,742 | | |
Vulcan Materials Co. | | | 3,025 | | | | 355,195 | | |
Walgreens Boots Alliance, Inc.1 | | | 16,592 | | | | 675,460 | | |
Waste Connections, Inc. | | | 3,783 | | | | 387,266 | | |
Waters Corp.* | | | 203 | | | | 43,269 | | |
Watsco, Inc. | | | 840 | | | | 198,299 | | |
WD-40 Co. | | | 181 | | | | 35,576 | | |
West Pharmaceutical Services, Inc. | | | 163 | | | | 43,826 | | |
Williams-Sonoma, Inc. | | | 5,935 | | | | 517,057 | | |
Willis Towers Watson PLC | | | 1,437 | | | | 301,784 | | |
Wingstop, Inc. | | | 263 | | | | 41,094 | | |
Winmark Corp. | | | 213 | | | | 33,863 | | |
World Wrestling Entertainment, Inc., Class A | | | 23,560 | | | | 1,098,132 | | |
Wynn Resorts Ltd. | | | 19,843 | | | | 1,437,228 | | |
Xilinx, Inc. | | | 390 | | | | 41,866 | | |
Y-mAbs Therapeutics, Inc.* | | | 786 | | | | 27,612 | | |
Zions Bancorp N.A. | | | 14,746 | | | | 478,803 | | |
Zoom Video Communications, Inc., Class A*,1 | | | 2,527 | | | | 641,631 | | |
Zscaler, Inc.* | | | 341 | | | | 44,279 | | |
Zynga, Inc., Class A* | | | 3,756 | | | | 36,922 | | |
| | | | | | 164,797,652 | | |
Total common stocks
(cost—$228,225,552) | | | 248,338,522 | | |
Preferred stocks—0.1% | |
France—0.0%† | |
Safran SA | | | 461 | | | | 49,028 | | |
Germany—0.1% | |
FUCHS PETROLUB SE | | | 2,856 | | | | 124,715 | | |
Porsche Automobil Holding SE | | | 2,317 | | | | 131,149 | | |
Sartorius AG | | | 336 | | | | 129,280 | | |
Volkswagen AG* | | | 1,697 | | | | 248,402 | | |
| | | | | | 633,546 | | |
Total preferred stocks
(cost—$687,754) | | | 682,574 | | |
251
PACE Alternative Strategies Investments
Portfolio of investments—July 31, 2020
| | | Number of
shares | | Value | |
Investment companies—5.3% | |
AlphaSimplex Managed Futures Strategy Fund,
Class Y | | | 591,860 | | | $ | 5,965,945 | | |
Carillon Reams Unconstrained Bond Fund,
Class I | | | 1,425,474 | | | | 18,260,327 | | |
Total investment companies
(cost—$22,591,544) | | | 24,226,272 | | |
| | | Number of
warrants | | | |
Warrants—0.0%† | |
Canada—0.0%† | |
Quisitive Technology Solutions, Inc.expires 06/26/22*
(cost—$0) | | | 226,000 | | | | 13,498 | | |
| | | Face
amount | | | |
Corporate bonds—8.9% | |
Australia—0.0%† | |
FMG Resources August 2006 Pty Ltd.
4.500%, due 09/15/273 | | $ | 55,000 | | | $ | 59,845 | | |
5.125%, due 03/15/233 | | | 70,000 | | | | 73,850 | | |
| | | | | | 133,695 | | |
Canada—0.5% | |
Air Canada
4.000%, due 07/01/253 | | | 2,000,000 | | | | 2,136,500 | | |
Baytex Energy Corp.
8.750%, due 04/01/273 | | | 55,000 | | | | 28,462 | | |
Cott Holdings, Inc.
5.500%, due 04/01/253 | | | 25,000 | | | | 25,969 | | |
Garda World Security Corp.
4.625%, due 02/15/273 | | | 25,000 | | | | 25,686 | | |
9.500%, due 11/01/273 | | | 25,000 | | | | 27,250 | | |
goeasy Ltd.
5.375%, due 12/01/243 | | | 30,000 | | | | 31,083 | | |
New Gold, Inc.
7.500%, due 07/15/273 | | | 30,000 | | | | 32,625 | | |
Norbord, Inc.
5.750%, due 07/15/273 | | | 55,000 | | | | 58,575 | | |
Open Text Corp.
3.875%, due 02/15/283 | | | 35,000 | | | | 36,564 | | |
Open Text Holdings, Inc.
4.125%, due 02/15/303 | | | 25,000 | | | | 26,250 | | |
Videotron Ltd.
5.375%, due 06/15/243 | | | 25,000 | | | | 27,125 | | |
| | | | | | 2,456,089 | | |
China—0.5% | |
NIO, Inc.
4.500%, due 02/01/24 | | | 1,439,000 | | | | 2,016,471 | | |
Luxembourg—0.0%† | |
ArcelorMittal SA
4.550%, due 03/11/26 | | | 15,000 | | | | 16,283 | | |
| | | Face
amount | | Value | |
Corporate bonds—(continued) | |
United States—7.9% | |
Acadia Healthcare Co., Inc.
5.500%, due 07/01/283 | | $ | 5,000 | | | $ | 5,269 | | |
5.625%, due 02/15/23 | | | 55,000 | | | | 55,865 | | |
Acorda Therapeutics, Inc.
6.000%, due 12/01/243 | | | 922,000 | | | | 512,693 | | |
Adient U.S.LLC
9.000%, due 04/15/253 | | | 3,000 | | | | 3,341 | | |
Akamai Technologies, Inc.
0.125%, due 05/01/25 | | | 3,625,000 | | | | 4,681,289 | | |
Albertsons Cos., Inc./Safeway, Inc./
New Albertsons LP/Albertsons LLC
5.750%, due 03/15/25 | | | 25,000 | | | | 25,875 | | |
5.875%, due 02/15/283 | | | 25,000 | | | | 27,373 | | |
Allied Universal Holdco LLC/
Allied Universal Finance Corp.
6.625%, due 07/15/263 | | | 25,000 | | | | 26,750 | | |
9.750%, due 07/15/273 | | | 25,000 | | | | 27,788 | | |
Allison Transmission, Inc.
5.875%, due 06/01/293 | | | 20,000 | | | | 22,095 | | |
Ally Financial, Inc.
5.750%, due 11/20/25 | | | 60,000 | | | | 67,735 | | |
American Airlines, Inc.
11.750%, due 07/15/253 | | | 37,000 | | | | 32,200 | | |
American Axle & Manufacturing, Inc.
6.250%, due 03/15/26 | | | 40,000 | | | | 40,315 | | |
6.875%, due 07/01/28 | | | 30,000 | | | | 30,591 | | |
American Eagle Outfitters, Inc.
3.750%, due 04/15/253 | | | 1,740,000 | | | | 2,366,122 | | |
Antero Midstream Partners LP/
Antero Midstream Finance Corp.
5.750%, due 03/01/273 | | | 70,000 | | | | 61,144 | | |
Anthem, Inc.
2.750%, due 10/15/42 | | | 500,000 | | | | 1,920,400 | | |
Aramark Services, Inc.
6.375%, due 05/01/253 | | | 30,000 | | | | 31,690 | | |
Archrock Partners LP/Archrock Partners
Finance Corp.
6.875%, due 04/01/273 | | | 25,000 | | | | 25,587 | | |
Arconic Corp.
6.000%, due 05/15/253 | | | 10,000 | | | | 10,781 | | |
Asbury Automotive Group, Inc.
4.500%, due 03/01/283 | | | 14,000 | | | | 14,355 | | |
Ascent Resources Utica Holdings LLC/ARU
Finance Corp.
7.000%, due 11/01/263 | | | 25,000 | | | | 16,000 | | |
ASGN, Inc.
4.625%, due 05/15/283 | | | 40,000 | | | | 40,900 | | |
Avadel Finance Cayman Ltd.
4.500%, due 02/01/233 | | | 390,000 | | | | 405,194 | | |
Avantor Funding, Inc.
4.625%, due 07/15/283 | | | 15,000 | | | | 15,867 | | |
Avis Budget Car Rental LLC/Avis Budget Finance, Inc.
5.750%, due 07/15/273 | | | 20,000 | | | | 18,700 | | |
10.500%, due 05/15/253 | | | 15,000 | | | | 17,400 | | |
Bandwidth, Inc.
0.250%, due 03/01/263 | | | 1,250,000 | | | | 2,116,125 | | |
252
PACE Alternative Strategies Investments
Portfolio of investments—July 31, 2020
| | | Face
amount | | Value | |
Corporate bonds—(continued) | |
United States—(continued) | |
Bausch Health Americas, Inc.
8.500%, due 01/31/273 | | $ | 15,000 | | | $ | 16,688 | | |
Bausch Health Cos., Inc.
5.000%, due 01/30/283 | | | 30,000 | | | | 30,149 | | |
5.250%, due 01/30/303 | | | 55,000 | | | | 56,169 | | |
6.250%, due 02/15/293 | | | 15,000 | | | | 15,935 | | |
Berry Global, Inc.
4.875%, due 07/15/263 | | | 25,000 | | | | 26,406 | | |
Boise Cascade Co.
4.875%, due 07/01/303 | | | 5,000 | | | | 5,300 | | |
Boyd Gaming Corp.
4.750%, due 12/01/273 | | | 25,000 | | | | 24,031 | | |
8.625%, due 06/01/253 | | | 5,000 | | | | 5,512 | | |
Brink's Co./The
4.625%, due 10/15/273 | | | 55,000 | | | | 55,949 | | |
Burlington Coat Factory Warehouse Corp.
6.250%, due 04/15/253 | | | 5,000 | | | | 5,350 | | |
Calpine Corp.
4.500%, due 02/15/283 | | | 25,000 | | | | 25,813 | | |
4.625%, due 02/01/292,3 | | | 10,000 | | | | 10,100 | | |
Cantel Medical Corp.
3.250%, due 05/15/253 | | | 1,030,000 | | | | 1,392,972 | | |
Carnival Corp.
5.750%, due 04/01/233 | | | 1,000,000 | | | | 1,457,000 | | |
Catalent Pharma Solutions, Inc.
5.000%, due 07/15/273 | | | 60,000 | | | | 63,847 | | |
CCO Holdings LLC/CCO Holdings Capital Corp.
4.500%, due 08/15/303 | | | 70,000 | | | | 74,193 | | |
5.500%, due 05/01/263 | | | 55,000 | | | | 58,179 | | |
Centene Corp.
4.625%, due 12/15/29 | | | 60,000 | | | | 66,916 | | |
5.375%, due 08/15/263 | | | 60,000 | | | | 64,200 | | |
Century Communities, Inc.
5.875%, due 07/15/25 | | | 25,000 | | | | 25,727 | | |
Charles River Laboratories International, Inc.
4.250%, due 05/01/283 | | | 55,000 | | | | 58,162 | | |
Cheniere Energy Partners LP
4.500%, due 10/01/29 | | | 25,000 | | | | 26,445 | | |
CHS/Community Health Systems, Inc.
6.250%, due 03/31/23 | | | 25,000 | | | | 25,188 | | |
CIT Group, Inc.
5.250%, due 03/07/25 | | | 55,000 | | | | 58,850 | | |
Colt Merger Sub, Inc.
5.750%, due 07/01/253 | | | 5,000 | | | | 5,206 | | |
6.250%, due 07/01/253 | | | 10,000 | | | | 10,470 | | |
CommScope, Inc.
6.000%, due 03/01/263 | | | 25,000 | | | | 26,672 | | |
8.250%, due 03/01/273 | | | 25,000 | | | | 26,960 | | |
Comstock Resources, Inc.
9.750%, due 08/15/26 | | | 25,000 | | | | 24,992 | | |
Consolidated Communications, Inc.
6.500%, due 10/01/22 | | | 35,000 | | | | 34,344 | | |
Continental Resources, Inc.
5.000%, due 09/15/22 | | | 15,000 | | | | 15,000 | | |
CSC Holdings LLC
5.750%, due 01/15/303 | | | 200,000 | | | | 221,710 | | |
| | | Face
amount | | Value | |
Corporate bonds—(continued) | |
United States—(continued) | |
CVR Partners LP/CVR Nitrogen Finance Corp.
9.250%, due 06/15/233 | | $ | 25,000 | | | $ | 24,500 | | |
Dana, Inc.
5.625%, due 06/15/28 | | | 5,000 | | | | 5,250 | | |
DaVita, Inc.
4.625%, due 06/01/303 | | | 10,000 | | | | 10,641 | | |
5.000%, due 05/01/25 | | | 60,000 | | | | 61,650 | | |
DCP Midstream Operating LP
5.375%, due 07/15/25 | | | 25,000 | | | | 26,325 | | |
5.625%, due 07/15/27 | | | 20,000 | | | | 20,750 | | |
Dell International LLC/EMC Corp.
7.125%, due 06/15/243 | | | 25,000 | | | | 25,955 | | |
Dick's Sporting Goods, Inc.
3.250%, due 04/15/253 | | | 673,000 | | | | 1,010,072 | | |
DISH DBS Corp.
6.750%, due 06/01/21 | | | 25,000 | | | | 25,844 | | |
7.375%, due 07/01/283 | | | 20,000 | | | | 21,169 | | |
Encompass Health Corp.
4.750%, due 02/01/30 | | | 30,000 | | | | 31,699 | | |
Endeavor Energy Resources LP/EER Finance, Inc.
6.625%, due 07/15/253 | | | 33,000 | | | | 34,671 | | |
Energizer Holdings, Inc.
7.750%, due 01/15/273 | | | 60,000 | | | | 66,600 | | |
Enterprise Development Authority/The
12.000%, due 07/15/243 | | | 30,000 | | | | 29,631 | | |
Expedia Group, Inc.
6.250%, due 05/01/253 | | | 10,000 | | | | 10,927 | | |
7.000%, due 05/01/253 | | | 5,000 | | | | 5,413 | | |
Flex Acquisition Co., Inc.
6.875%, due 01/15/253 | | | 65,000 | | | | 65,975 | | |
Ford Motor Co.
8.500%, due 04/21/23 | | | 20,000 | | | | 22,203 | | |
9.000%, due 04/22/25 | | | 25,000 | | | | 29,453 | | |
Gartner, Inc.
4.500%, due 07/01/283 | | | 10,000 | | | | 10,500 | | |
Genesis Energy LP/Genesis Energy Finance Corp.
6.500%, due 10/01/25 | | | 55,000 | | | | 50,944 | | |
GPC Merger Sub, Inc.
7.125%, due 08/15/282,3 | | | 5,000 | | | | 5,200 | | |
Graham Holdings Co.
5.750%, due 06/01/263 | | | 25,000 | | | | 26,500 | | |
Gray Television, Inc.
7.000%, due 05/15/273 | | | 25,000 | | | | 27,312 | | |
Greif, Inc.
6.500%, due 03/01/273 | | | 60,000 | | | | 63,750 | | |
HCA, Inc.
3.500%, due 09/01/30 | | | 105,000 | | | | 110,338 | | |
5.375%, due 02/01/25 | | | 25,000 | | | | 28,187 | | |
Hecla Mining Co.
7.250%, due 02/15/28 | | | 20,000 | | | | 21,250 | | |
Hilton Domestic Operating Co., Inc.
5.375%, due 05/01/253 | | | 5,000 | | | | 5,228 | | |
5.750%, due 05/01/283 | | | 5,000 | | | | 5,338 | | |
HUB International Ltd.
7.000%, due 05/01/263 | | | 25,000 | | | | 26,187 | | |
253
PACE Alternative Strategies Investments
Portfolio of investments—July 31, 2020
| | | Face
amount | | Value | |
Corporate bonds—(continued) | |
United States—(continued) | |
Icahn Enterprises LP/Icahn Enterprises
Finance Corp.
6.250%, due 05/15/26 | | $ | 60,000 | | | $ | 63,406 | | |
Intercept Pharmaceuticals, Inc.
2.000%, due 05/15/26 | | | 1,000,000 | | | | 740,231 | | |
IRB Holding Corp.
7.000%, due 06/15/253 | | | 20,000 | | | | 21,750 | | |
Iron Mountain, Inc.
4.875%, due 09/15/273 | | | 70,000 | | | | 72,712 | | |
Joseph T Ryerson & Son, Inc.
8.500%, due 08/01/283 | | | 10,000 | | | | 10,700 | | |
KBR, Inc.
2.500%, due 11/01/23 | | | 1,000,000 | | | | 1,134,890 | | |
KFC Holding Co./Pizza Hut Holdings LLC/
Taco Bell of America LLC
5.000%, due 06/01/243 | | | 25,000 | | | | 25,608 | | |
Kraft Heinz Foods Co.
3.875%, due 05/15/273 | | | 10,000 | | | | 10,770 | | |
5.000%, due 07/15/35 | | | 50,000 | | | | 58,567 | | |
Lamar Media Corp.
3.750%, due 02/15/283 | | | 25,000 | | | | 25,219 | | |
Lamb Weston Holdings, Inc.
4.875%, due 05/15/283 | | | 9,000 | | | | 10,114 | | |
Lennar Corp.
8.375%, due 01/15/21 | | | 25,000 | | | | 25,750 | | |
Level 3 Financing, Inc.
4.250%, due 07/01/283 | | | 20,000 | | | | 20,850 | | |
4.625%, due 09/15/273 | | | 55,000 | | | | 57,819 | | |
Liberty Media Corp.
1.375%, due 10/15/23 | | | 1,228,000 | | | | 1,350,849 | | |
M/I Homes, Inc.
4.950%, due 02/01/28 | | | 35,000 | | | | 35,962 | | |
MasTec, Inc.
4.500%, due 08/15/282,3 | | | 35,000 | | | | 36,575 | | |
4.875%, due 03/15/23 | | | 55,000 | | | | 55,484 | | |
Match Group Financeco, Inc.
0.875%, due 10/01/223 | | | 1,400,000 | | | | 3,308,900 | | |
Match Group Holdings II LLC
4.125%, due 08/01/303 | | | 60,000 | | | | 61,800 | | |
Mattel, Inc.
5.875%, due 12/15/273 | | | 20,000 | | | | 21,525 | | |
6.750%, due 12/31/253 | | | 25,000 | | | | 26,777 | | |
Meredith Corp.
6.875%, due 02/01/26 | | | 60,000 | | | | 52,122 | | |
Meritor, Inc.
6.250%, due 06/01/253 | | | 5,000 | | | | 5,300 | | |
MGM Growth Properties Operating Partnership LP/
MGP Finance Co-Issuer, Inc.
4.625%, due 06/15/253 | | | 5,000 | | | | 5,256 | | |
5.625%, due 05/01/24 | | | 25,000 | | | | 27,125 | | |
MGM Resorts International
5.500%, due 04/15/27 | | | 46,000 | | | | 46,230 | | |
6.750%, due 05/01/25 | | | 15,000 | | | | 15,600 | | |
Molina Healthcare, Inc.
4.375%, due 06/15/283 | | | 15,000 | | | | 15,938 | | |
| | | Face
amount | | Value | |
Corporate bonds—(continued) | |
United States—(continued) | |
Moss Creek Resources Holdings, Inc.
7.500%, due 01/15/263 | | $ | 55,000 | | | $ | 32,037 | | |
MPT Operating Partnership LP/MPT Finance Corp.
4.625%, due 08/01/29 | | | 25,000 | | | | 26,414 | | |
Murphy Oil USA, Inc.
4.750%, due 09/15/29 | | | 25,000 | | | | 26,429 | | |
NCL Corp.Ltd.
6.000%, due 05/15/243 | | | 1,240,000 | | | | 1,464,626 | | |
10.250%, due 02/01/263 | | | 20,000 | | | | 19,925 | | |
12.250%, due 05/15/243 | | | 20,000 | | | | 21,700 | | |
NCR Corp.
6.125%, due 09/01/293 | | | 25,000 | | | | 27,386 | | |
Netflix, Inc.
5.375%, due 11/15/293 | | | 20,000 | | | | 24,225 | | |
5.750%, due 03/01/24 | | | 25,000 | | | | 28,062 | | |
Newell Brands, Inc.
4.700%, due 04/01/264 | | | 70,000 | | | | 75,796 | | |
4.875%, due 06/01/25 | | | 5,000 | | | | 5,438 | | |
Nexstar Broadcasting, Inc.
5.625%, due 07/15/273 | | | 60,000 | | | | 64,218 | | |
NFP Corp.
6.875%, due 08/15/282,3 | | | 25,000 | | | | 25,125 | | |
NGL Energy Partners LP/NGL Energy Finance Corp.
7.500%, due 11/01/23 | | | 60,000 | | | | 47,400 | | |
Nine Energy Service, Inc.
8.750%, due 11/01/233 | | | 25,000 | | | | 11,500 | | |
NRG Energy, Inc.
5.750%, due 01/15/28 | | | 70,000 | | | | 76,938 | | |
Nuance Communications, Inc.
1.000%, due 12/15/35 | | | 440,000 | | | | 550,554 | | |
5.625%, due 12/15/26 | | | 60,000 | | | | 63,975 | | |
Occidental Petroleum Corp.
2.600%, due 08/13/21 | | | 10,000 | | | | 9,923 | | |
2.700%, due 08/15/22 | | | 10,000 | | | | 9,654 | | |
2.900%, due 08/15/24 | | | 10,000 | | | | 9,410 | | |
3.200%, due 08/15/26 | | | 20,000 | | | | 18,206 | | |
3.500%, due 08/15/29 | | | 10,000 | | | | 8,888 | | |
4.100%, due 02/15/47 | | | 15,000 | | | | 11,775 | | |
Oceaneering International, Inc.
6.000%, due 02/01/28 | | | 45,000 | | | | 28,451 | | |
OneMain Finance Corp.
6.125%, due 03/15/24 | | | 60,000 | | | | 65,294 | | |
6.625%, due 01/15/28 | | | 30,000 | | | | 34,379 | | |
8.875%, due 06/01/25 | | | 10,000 | | | | 11,275 | | |
Owens-Brockway Glass Container, Inc.
5.875%, due 08/15/233 | | | 65,000 | | | | 68,620 | | |
6.625%, due 05/13/273 | | | 10,000 | | | | 10,825 | | |
Pandora Media LLC
1.750%, due 12/01/23 | | | 828,000 | | | | 927,625 | | |
Parsley Energy LLC/Parsley Finance Corp.
5.625%, due 10/15/273 | | | 60,000 | | | | 62,850 | | |
PBF Holding Co.LLC/PBF Finance Corp.
7.250%, due 06/15/25 | | | 25,000 | | | | 22,482 | | |
9.250%, due 05/15/253 | | | 10,000 | | | | 11,175 | | |
PDC Energy, Inc.
6.125%, due 09/15/24 | | | 25,000 | | | | 25,304 | | |
254
PACE Alternative Strategies Investments
Portfolio of investments—July 31, 2020
| | | Face
amount | | Value | |
Corporate bonds—(continued) | |
United States—(continued) | |
Penske Automotive Group, Inc.
5.500%, due 05/15/26 | | $ | 25,000 | | | $ | 26,125 | | |
PG&E Corp.
5.000%, due 07/01/28 | | | 10,000 | | | | 10,290 | | |
5.250%, due 07/01/30 | | | 15,000 | | | | 15,600 | | |
Plastipak Holdings, Inc.
6.250%, due 10/15/253 | | | 55,000 | | | | 54,931 | | |
Powdr Corp.
6.000%, due 08/01/253 | | | 5,000 | | | | 5,113 | | |
Presidio Holdings, Inc.
4.875%, due 02/01/273 | | | 55,000 | | | | 56,100 | | |
8.250%, due 02/01/283 | | | 35,000 | | | | 36,400 | | |
PTC, Inc.
4.000%, due 02/15/283 | | | 55,000 | | | | 57,769 | | |
Radiology Partners, Inc.
9.250%, due 02/01/283 | | | 35,000 | | | | 35,175 | | |
Rattler Midstream LP
5.625%, due 07/15/253 | | | 15,000 | | | | 15,822 | | |
Scientific Games International, Inc.
7.000%, due 05/15/283 | | | 70,000 | | | | 64,400 | | |
Scotts Miracle-Gro Co./The
4.500%, due 10/15/29 | | | 40,000 | | | | 42,350 | | |
Select Medical Corp.
6.250%, due 08/15/263 | | | 50,000 | | | | 53,875 | | |
Service Corp.International
5.125%, due 06/01/29 | | | 55,000 | | | | 60,775 | | |
Shea Homes LP/Shea Homes Funding Corp.
4.750%, due 02/15/283 | | | 25,000 | | | | 26,229 | | |
Sirius XM Radio, Inc.
4.125%, due 07/01/303 | | | 25,000 | | | | 26,382 | | |
5.500%, due 07/01/293 | | | 55,000 | | | | 61,256 | | |
Spectrum Brands, Inc.
5.750%, due 07/15/25 | | | 55,000 | | | | 56,650 | | |
Sprint Corp.
7.875%, due 09/15/23 | | | 105,000 | | | | 121,800 | | |
Standard Industries, Inc.
4.375%, due 07/15/303 | | | 15,000 | | | | 16,200 | | |
Stericycle, Inc.
5.375%, due 07/15/243 | | | 70,000 | | | | 73,675 | | |
StoneX Group, Inc.
8.625%, due 06/15/253 | | | 10,000 | | | | 10,713 | | |
Summit Materials LLC/Summit Materials
Finance Corp.
5.125%, due 06/01/253 | | | 20,000 | | | | 20,450 | | |
5.250%, due 01/15/292,3 | | | 10,000 | | | | 10,375 | | |
6.500%, due 03/15/273 | | | 25,000 | | | | 27,540 | | |
T-Mobile USA, Inc.
6.500%, due 01/15/26 | | | 70,000 | | | | 73,790 | | |
Targa Resources Partners LP/Targa Resources
Partners Finance Corp.
6.875%, due 01/15/29 | | | 70,000 | | | | 78,968 | | |
Teleflex, Inc.
4.250%, due 06/01/283 | | | 5,000 | | | | 5,356 | | |
4.625%, due 11/15/27 | | | 25,000 | | | | 27,032 | | |
| | | Face
amount | | Value | |
Corporate bonds—(concluded) | |
United States—(concluded) | |
Tenet Healthcare Corp.
5.125%, due 05/01/25 | | $ | 60,000 | | | $ | 61,723 | | |
5.125%, due 11/01/273 | | | 25,000 | | | | 26,562 | | |
8.125%, due 04/01/22 | | | 20,000 | | | | 21,550 | | |
Twitter, Inc.
3.875%, due 12/15/273 | | | 35,000 | | | | 37,444 | | |
United Rentals North America, Inc.
3.875%, due 02/15/312 | | | 10,000 | | | | 10,000 | | |
6.500%, due 12/15/26 | | | 60,000 | | | | 66,600 | | |
United States Steel Corp.
5.000%, due 11/01/263 | | | 3,000,000 | | | | 2,363,316 | | |
US Foods, Inc.
6.250%, due 04/15/253 | | | 20,000 | | | | 21,450 | | |
USA Compression Partners LP/USA
Compression Finance Corp.
6.875%, due 09/01/27 | | | 60,000 | | | | 61,337 | | |
Verscend Escrow Corp.
9.750%, due 08/15/263 | | | 30,000 | | | | 33,219 | | |
ViaSat, Inc.
5.625%, due 09/15/253 | | | 20,000 | | | | 20,150 | | |
5.625%, due 04/15/273 | | | 25,000 | | | | 26,492 | | |
6.500%, due 07/15/283 | | | 15,000 | | | | 15,408 | | |
VICI Properties LP/VICI Note Co., Inc.
4.125%, due 08/15/303 | | | 55,000 | | | | 55,660 | | |
Vistra Operations Co.LLC
5.625%, due 02/15/273 | | | 60,000 | | | | 64,411 | | |
WESCO Distribution, Inc.
5.375%, due 06/15/24 | | | 25,000 | | | | 25,555 | | |
7.125%, due 06/15/253 | | | 5,000 | | | | 5,487 | | |
7.250%, due 06/15/283 | | | 15,000 | | | | 16,388 | | |
Western Digital Corp.
4.750%, due 02/15/26 | | | 30,000 | | | | 32,625 | | |
World Wrestling Entertainment, Inc.
3.375%, due 12/15/23 | | | 978,000 | | | | 1,941,330 | | |
WPX Energy, Inc.
5.250%, due 10/15/27 | | | 55,000 | | | | 54,244 | | |
5.875%, due 06/15/28 | | | 5,000 | | | | 5,122 | | |
Yum! Brands, Inc.
7.750%, due 04/01/253 | | | 5,000 | | | | 5,613 | | |
Zayo Group Holdings, Inc.
4.000%, due 03/01/273 | | | 25,000 | | | | 25,055 | | |
6.125%, due 03/01/283 | | | 10,000 | | | | 10,313 | | |
| | | | | | 35,993,249 | | |
Total corporate bonds
(cost—$40,480,858) | | | 40,615,787 | | |
| | | Number of
shares | | | |
Short-term investments—25.2% | |
Investment companies—25.2% | |
State Street Institutional U.S.Government
Money Market Fund
(cost—$115,047,790) | | | 115,047,790 | | | | 115,047,790 | | |
255
PACE Alternative Strategies Investments
Portfolio of investments—July 31, 2020
| | | Face
amount | | Value | |
Short-term U.S.Treasury obligations—5.2% | |
U.S.Treasury Bills
0.099%, due 08/13/201,5 | | $ | 12,000,000 | | | $ | 11,999,610 | | |
0.132%, due 10/29/201,5 | | | 10,000,000 | | | | 9,996,774 | | |
0.152%, due 09/10/201,5 | | | 2,000,000 | | | | 1,999,666 | | |
Total short-term U.S.Treasury obligations
(cost—$23,996,050) | | | 23,996,050 | | |
| | | Number of
contracts | | Notional
amount | | | |
Equity and foreign exchange options purchased—0.3% | |
Call options—0.2% | |
Call Euro STOXX 50, strike @
$3,425 expires 10/16/20
(Counterparty: JPMCB) | | | 119 | | | | 4,075,750 | | | | 52,987 | | |
Call Russell 2000 Index, strike @
$1,500 expires 09/18/20
(Counterparty: JPMCB) | | | 126 | | | | 18,900,000 | | | | 677,880 | | |
Call Swiss Market Index strike @
$10,100 expires 09/18/20
(Counterparty: JPMCB) | | | 34 | | | | 3,434,000 | | | | 80,413 | | |
Call Swiss Market Index, strike @
$10,200 expires 09/18/20
(Counterparty: JPMCB) | | | 6 | | | | 612,000 | | | | 10,805 | | |
Call Swiss Market Index, strike @
$10,400 expires 09/18/20
(Counterparty: JPMCB) | | | 7 | | | | 728,000 | | | | 6,736 | | |
Call Swiss Market Index, strike @
$10,400 expires 10/16/20
(Counterparty: JPMCB) | | | 7 | | | | 728,000 | | | | 10,700 | | |
Total | | | | 839,521 | |
Put options—0.1% | |
Put American Eagle Outfitters, Inc.,
strike @ $7, expires 01/15/21
(Counterparty: MSCI) | | | 85 | | | | 59,500 | | | | 5,525 | | |
Put Avadel Pharmaceuticals PLC,
strike @ $5, expires 09/18/20
(Counterparty: MSCI) | | | 815 | | | | 407,500 | | | | 8,150 | | |
Put Burlington Stores, Inc.,
strike @ $135, expires 01/15/21
(Counterparty: MSCI) | | | 15 | | | | 202,500 | | | | 7,800 | | |
Put Carnival Corp.,
strike @ $5, expires 01/15/21
(Counterparty: MSCI) | | | 100 | | | | 50,000 | | | | 3,500 | | |
Put Intercept Pharmaceuticals, Inc.,
strike @ $25, expires 09/18/20
(Counterparty: MSCI) | | | 100 | | | | 250,000 | | | | 1,500 | | |
Put NIO, Inc., strike @ $1.50,
expires 01/15/21
(Counterparty: MSCI) | | | 1675 | | | | 335,000 | | | | 13,400 | | |
Put NIO, Inc., strike @ $1.50,
expires 08/21/20
(Counterparty: MSCI) | | | 325 | | | | 65,000 | | | | 325 | | |
Put NIO, Inc., strike @ $3.00,
expires 08/21/20
(Counterparty: MSCI) | | | 600 | | | | 180,000 | | | | 1,800 | | |
| | | Number of
contracts | | Notional
amount | | Value | |
Equity and foreign exchange options purchased—(concluded) | |
Put options—(concluded) | |
Put Norwegian Cruise Line
Holdings, strike @ $10.00,
expires 06/18/21
(Counterparty: MSCI) | | | 100 | | | | 100,000 | | | $ | 33,000 | | |
Put Retrophin, Inc.,
strike @ $7.50, expires 09/18/20
(Counterparty: MSCI) | | | 490 | | | | 392,000 | | | | 2,450 | | |
Put S&P 500 Index,
strike @ $2,550, expires 09/04/20
(Counterparty: JPMCB) | | | 8 | | | | 2,040,000 | | | | 3,200 | | |
Put S&P 500 Index, strike @ $2,550,
expires 09/18/20
(Counterparty: JPMCB) | | | 8 | | | | 2,040,000 | | | | 5,840 | | |
Put S&P 500 Index,
strike @ $3,175, expires 09/18/20
(Counterparty: JPMCB) | | | 10 | | | | 3,175,000 | | | | 79,000 | | |
Put S&P 500 Index,
strike @ $3,175, expires 10/16/20
(Counterparty: JPMCB) | | | 10 | | | | 3,175,000 | | | | 114,360 | | |
Put United States Steel Corp.,
strike @ $3, expires 01/21/22
(Counterparty: MSCI) | | | 265 | | | | 79,500 | | | | 15,635 | | |
Put United States Steel Corp.,
strike @ $5, expires 01/21/22
(Counterparty: MSCI) | | | 1050 | | | | 525,000 | | | | 141,750 | | |
Total | | | | | | | 437,235 | | |
Total equity and foreign exchange options
purchased
(cost—$2,024,982) | | | | | | | 1,276,756 | | |
Total investments before
investments sold short
(cost—$433,054,530)—99.3% | | | | | | | 454,197,249 | | |
| | | Number of
shares | | | |
Investments sold short—(22.5)% | |
Common stocks—(19.0)% | |
Austria—(0.1)% | |
voestalpine AG | | | (22,500 | ) | | | (498,895 | ) | |
Canada—(4.2)% | |
Aecon Group, Inc. | | | (12,620 | ) | | | (132,470 | ) | |
Air Canada | | | (107,500 | ) | | | (1,213,675 | ) | |
Allied Properties Real Estate Investment Trust | | | (25,200 | ) | | | (754,617 | ) | |
Bank of Montreal | | | (5,170 | ) | | | (282,846 | ) | |
Canaccord Genuity Group, Inc. | | | (52,230 | ) | | | (303,370 | ) | |
CanWel Building Materials Group Ltd. | | | (50,610 | ) | | | (220,659 | ) | |
Cascades, Inc. | | | (81,040 | ) | | | (923,872 | ) | |
Cenovus Energy, Inc. | | | (142,000 | ) | | | (631,841 | ) | |
Chartwell Retirement Residences | | | (56,490 | ) | | | (416,258 | ) | |
Choice Properties Real Estate Investment Trust | | | (52,520 | ) | | | (497,184 | ) | |
CI Financial Corp. | | | (9,450 | ) | | | (129,885 | ) | |
Crescent Point Energy Corp. | | | (151,920 | ) | | | (234,779 | ) | |
Crombie Real Estate Investment Trust | | | (30,420 | ) | | | (296,376 | ) | |
Enerplus Corp. | | | (85,700 | ) | | | (211,779 | ) | |
256
PACE Alternative Strategies Investments
Portfolio of investments—July 31, 2020
| | | Number of
shares | | Value | |
Investments sold short—(continued) | |
Common stocks—(continued) | |
First Capital Real Estate Investment Trust | | | (22,800 | ) | | $ | (231,158 | ) | |
Fortis, Inc. | | | (24,900 | ) | | | (1,014,069 | ) | |
Franco-Nevada Corp. | | | (5,190 | ) | | | (829,579 | ) | |
Husky Energy, Inc. | | | (113,620 | ) | | | (365,599 | ) | |
Hydro One Ltd. | | | (36,040 | ) | | | (767,913 | ) | |
IGM Financial, Inc. | | | (19,450 | ) | | | (478,173 | ) | |
Imperial Oil Ltd. | | | (78,280 | ) | | | (1,224,358 | ) | |
Inter Pipeline Ltd. | | | (62,200 | ) | | | (582,784 | ) | |
International Petroleum Corp. | | | (1 | ) | | | (2 | ) | |
Jamieson Wellness, Inc. | | | (6,490 | ) | | | (186,834 | ) | |
Laurentian Bank of Canada | | | (16,530 | ) | | | (327,651 | ) | |
MAG Silver Corp. | | | (8,800 | ) | | | (148,676 | ) | |
Manulife Financial Corp. | | | (30,780 | ) | | | (412,483 | ) | |
MTY Food Group, Inc. | | | (15,680 | ) | | | (338,312 | ) | |
Novagold Resources, Inc. | | | (20,600 | ) | | | (188,398 | ) | |
Nutrien Ltd. | | | (26,010 | ) | | | (847,666 | ) | |
PrairieSky Royalty Ltd. | | | (52,450 | ) | | | (329,318 | ) | |
RioCan Real Estate Investment Trust | | | (47,320 | ) | | | (528,506 | ) | |
Rogers Communications, Inc., Class B | | | (24,360 | ) | | | (994,805 | ) | |
Saputo, Inc. | | | (10,330 | ) | | | (252,803 | ) | |
Savaria Corp. | | | (12,850 | ) | | | (129,800 | ) | |
Sierra Wireless, Inc. | | | (42,990 | ) | | | (571,938 | ) | |
Teck Resources Ltd., Class B | | | (72,770 | ) | | | (737,235 | ) | |
Toromont Industries Ltd. | | | (4,550 | ) | | | (248,043 | ) | |
Transcontinental, Inc., Class A | | | (28,240 | ) | | | (325,526 | ) | |
Vermilion Energy, Inc. | | | (50,740 | ) | | | (206,831 | ) | |
Whitecap Resources, Inc. | | | (309,080 | ) | | | (509,961 | ) | |
| | | | | | (19,028,032 | ) | |
China—(0.4)% | |
NIO, Inc., ADR | | | (139,200 | ) | | | (1,662,048 | ) | |
Denmark—(0.1)% | |
Tryg A/S | | | (15,647 | ) | | | (460,431 | ) | |
France—(0.3)% | |
Ipsen SA | | | (6,830 | ) | | | (655,014 | ) | |
Renault SA | | | (23,209 | ) | | | (551,567 | ) | |
| | | | | | (1,206,581 | ) | |
Germany—(0.2)% | |
Commerzbank AG | | | (101,028 | ) | | | (519,198 | ) | |
thyssenkrupp AG | | | (32,950 | ) | | | (256,117 | ) | |
| | | | | | (775,315 | ) | |
Japan—(1.1)% | |
Dentsu Group, Inc. | | | (36,800 | ) | | | (821,015 | ) | |
Isetan Mitsukoshi Holdings Ltd. | | | (182,800 | ) | | | (834,119 | ) | |
JFE Holdings, Inc. | | | (173,600 | ) | | | (1,139,491 | ) | |
Nissan Motor Co.Ltd. | | | (309,200 | ) | | | (1,057,638 | ) | |
SoftBank Group Corp. | | | (16,000 | ) | | | (1,009,169 | ) | |
Toshiba Corp. | | | (1,800 | ) | | | (55,046 | ) | |
| | | | | | (4,916,478 | ) | |
Netherlands—(0.1)% | |
Altice Europe N.V. | | | (107,549 | ) | | | (509,918 | ) | |
| | | Number of
shares | | Value | |
Investments sold short—(continued) | |
Common stocks—(continued) | |
Singapore—(0.1)% | |
Singapore Airlines Ltd. | | | (218,700 | ) | | $ | (545,560 | ) | |
Sweden—(0.2)% | |
Aprea Therapeutics, Inc. | | | (9,622 | ) | | | (263,932 | ) | |
Industrivarden AB, Shares C | | | (27,739 | ) | | | (684,251 | ) | |
| | | | | | (948,183 | ) | |
Switzerland—(0.0)%† | |
IWG PLC | | | (8,218 | ) | | | (24,706 | ) | |
United Kingdom—(0.3)% | |
Rolls-Royce Holdings PLC | | | (248,525 | ) | | | (745,538 | ) | |
Whitbread PLC | | | (31,443 | ) | | | (892,784 | ) | |
| | | | | | (1,638,322 | ) | |
United States—(11.9)% | |
3M Co. | | | (1,810 | ) | | | (272,351 | ) | |
Acorda Therapeutics, Inc. | | | (171,220 | ) | | | (107,663 | ) | |
Akamai Technologies, Inc. | | | (27,825 | ) | | | (3,128,643 | ) | |
Align Technology, Inc. | | | (1,696 | ) | | | (498,319 | ) | |
American Airlines Group, Inc. | | | (6,430 | ) | | | (71,502 | ) | |
American Eagle Outfitters, Inc. | | | (169,062 | ) | | | (1,690,620 | ) | |
Antero Midstream Corp. | | | (35,104 | ) | | | (199,040 | ) | |
Anthem, Inc. | | | (6,975 | ) | | | (1,909,755 | ) | |
Arrowhead Pharmaceuticals, Inc. | | | (6,519 | ) | | | (280,773 | ) | |
Avadel Pharmaceuticals PLC, ADR | | | (39,107 | ) | | | (306,208 | ) | |
Axsome Therapeutics, Inc. | | | (2,251 | ) | | | (160,564 | ) | |
Bandwidth, Inc., Class A | | | (11,183 | ) | | | (1,619,075 | ) | |
Boeing Co./The | | | (6,712 | ) | | | (1,060,496 | ) | |
Brinker International, Inc. | | | (5,110 | ) | | | (137,408 | ) | |
Brunswick Corp. | | | (3,714 | ) | | | (248,764 | ) | |
Caesars Entertainment, Inc. | | | (11,791 | ) | | | (366,111 | ) | |
Campbell Soup Co. | | | (16,204 | ) | | | (803,232 | ) | |
Camping World Holdings, Inc., Class A | | | (6,467 | ) | | | (236,822 | ) | |
Cantel Medical Corp. | | | (20,155 | ) | | | (952,324 | ) | |
Cara Therapeutics, Inc. | | | (14,480 | ) | | | (238,051 | ) | |
Carnival Corp. | | | (92,000 | ) | | | (1,276,960 | ) | |
Caterpillar, Inc. | | | (3,738 | ) | | | (496,705 | ) | |
CenturyLink, Inc. | | | (51,289 | ) | | | (494,939 | ) | |
Citizens Financial Group, Inc. | | | (13,000 | ) | | | (322,530 | ) | |
Cracker Barrel Old Country Store, Inc. | | | (2,600 | ) | | | (287,222 | ) | |
Cummins, Inc. | | | (1,900 | ) | | | (367,194 | ) | |
D.R.Horton, Inc. | | | (7,630 | ) | | | (504,801 | ) | |
Dave & Buster's Entertainment, Inc. | | | (13,000 | ) | | | (160,420 | ) | |
Deluxe Corp. | | | (7,800 | ) | | | (220,194 | ) | |
Dick's Sporting Goods, Inc. | | | (14,120 | ) | | | (644,154 | ) | |
Domtar Corp. | | | (19,038 | ) | | | (399,608 | ) | |
Dycom Industries, Inc. | | | (5,200 | ) | | | (222,716 | ) | |
Electronic Arts, Inc. | | | (3,549 | ) | | | (502,609 | ) | |
elf Beauty, Inc. | | | (6,249 | ) | | | (111,607 | ) | |
Ellington Financial, Inc. | | | (19,519 | ) | | | (229,543 | ) | |
Equity Residential | | | (10,100 | ) | | | (541,663 | ) | |
Everi Holdings, Inc. | | | (49,060 | ) | | | (278,661 | ) | |
EW Scripps Co./The, Class A | | | (4,108 | ) | | | (46,749 | ) | |
257
PACE Alternative Strategies Investments
Portfolio of investments—July 31, 2020
| | | Number of
shares | | Value | |
Investments sold short—(continued) | |
Common stocks—(continued) | |
United States—(continued) | |
Exact Sciences Corp. | | | (7,245 | ) | | | (686,464 | ) | |
Expedia Group, Inc. | | | (5,424 | ) | | | (439,398 | ) | |
First Solar, Inc. | | | (4,150 | ) | | | (247,132 | ) | |
Franklin Resources, Inc. | | | (12,640 | ) | | | (266,072 | ) | |
G1 Therapeutics, Inc. | | | (18,967 | ) | | | (278,246 | ) | |
Gap, Inc./The | | | (10,100 | ) | | | (135,037 | ) | |
General Mills, Inc. | | | (7,888 | ) | | | (499,074 | ) | |
Halliburton Co. | | | (20,637 | ) | | | (295,728 | ) | |
HEICO Corp. | | | (4,883 | ) | | | (469,354 | ) | |
Hess Corp. | | | (11,978 | ) | | | (589,437 | ) | |
Hexcel Corp. | | | (9,894 | ) | | | (369,046 | ) | |
Home Depot, Inc./The | | | (7,810 | ) | | | (2,073,477 | ) | |
Inphi Corp. | | | (1,896 | ) | | | (247,731 | ) | |
Intercept Pharmaceuticals, Inc. | | | (5,560 | ) | | | (253,758 | ) | |
International Paper Co. | | | (15,190 | ) | | | (528,460 | ) | |
Intersect ENT, Inc. | | | (2,814 | ) | | | (48,373 | ) | |
Intra-Cellular Therapies, Inc. | | | (7,103 | ) | | | (140,817 | ) | |
Invesco Ltd. | | | (25,280 | ) | | | (253,811 | ) | |
iRhythm Technologies, Inc. | | | (2,192 | ) | | | (272,860 | ) | |
Iron Mountain, Inc. | | | (39,430 | ) | | | (1,111,532 | ) | |
J.M.Smucker Co./The | | | (2,570 | ) | | | (281,029 | ) | |
KBR, Inc. | | | (24,533 | ) | | | (545,614 | ) | |
Kohl's Corp. | | | (12,910 | ) | | | (245,806 | ) | |
Kroger Co./The | | | (24,557 | ) | | | (854,338 | ) | |
Lam Research Corp. | | | (1,315 | ) | | | (495,965 | ) | |
Las Vegas Sands Corp. | | | (11,346 | ) | | | (495,139 | ) | |
Lattice Semiconductor Corp. | | | (15,862 | ) | | | (493,150 | ) | |
LendingTree, Inc. | | | (54 | ) | | | (18,700 | ) | |
Liberty Media Corp-Liberty Braves, Class A | | | (1,968 | ) | | | (37,215 | ) | |
Liberty Media Corp-Liberty SiriusXM, Class A | | | (18,420 | ) | | | (640,832 | ) | |
Liberty Media Corp.-Liberty Formula One, Class A | | | (4,529 | ) | | | (149,865 | ) | |
M&T Bank Corp. | | | (9,926 | ) | | | (1,051,660 | ) | |
Macy's, Inc. | | | (54,220 | ) | | | (328,573 | ) | |
Madrigal Pharmaceuticals, Inc. | | | (2,848 | ) | | | (292,233 | ) | |
Marathon Petroleum Corp. | | | (19,814 | ) | | | (756,895 | ) | |
Markel Corp. | | | (181 | ) | | | (189,062 | ) | |
Match Group, Inc. | | | (30,240 | ) | | | (3,105,648 | ) | |
MGM Resorts International | | | (15,392 | ) | | | (247,657 | ) | |
Mirati Therapeutics, Inc. | | | (2,942 | ) | | | (356,894 | ) | |
Monro, Inc. | | | (5,120 | ) | | | (288,256 | ) | |
Nektar Therapeutics | | | (1,600 | ) | | | (35,456 | ) | |
New Relic, Inc. | | | (7,111 | ) | | | (504,241 | ) | |
Nordstrom, Inc. | | | (41,551 | ) | | | (568,833 | ) | |
Norwegian Cruise Line Holdings Ltd. | | | (104,975 | ) | | | (1,431,859 | ) | |
Nuance Communications, Inc. | | | (12,770 | ) | | | (349,259 | ) | |
Omeros Corp. | | | (16,037 | ) | �� | | (205,755 | ) | |
Packaging Corp.of America | | | (5,060 | ) | | | (486,367 | ) | |
PennyMac Mortgage Investment Trust | | | (18,097 | ) | | | (341,128 | ) | |
Polaris, Inc. | | | (2,421 | ) | | | (250,888 | ) | |
Reata Pharmaceuticals, Inc., Class A | | | (2,128 | ) | | | (314,306 | ) | |
Regions Financial Corp. | | | (25,370 | ) | | | (275,518 | ) | |
Royal Caribbean Cruises Ltd. | | | (13,272 | ) | | | (646,479 | ) | |
Scientific Games Corp., Class A | | | (25,889 | ) | | | (454,870 | ) | |
SEI Investments Co. | | | (10,110 | ) | | | (529,056 | ) | |
| | | Number of
shares | | Value | |
Investments sold short—(concluded) | |
Common stocks—(concluded) | |
United States—(concluded) | |
Shake Shack, Inc., Class A | | | (3,900 | ) | | $ | (189,345 | ) | |
Sirius XM Holdings, Inc. | | | (50,300 | ) | | | (295,764 | ) | |
Slack Technologies, Inc., Class A | | | (24,679 | ) | | | (729,264 | ) | |
Teradata Corp. | | | (7,800 | ) | | | (163,800 | ) | |
Tricida, Inc. | | | (12,553 | ) | | | (167,959 | ) | |
United States Steel Corp. | | | (128,000 | ) | | | (852,480 | ) | |
ViacomCBS, Inc., Class B | | | (19,256 | ) | | | (502,004 | ) | |
Westrock Co. | | | (20,250 | ) | | | (543,915 | ) | |
Wingstop, Inc. | | | (2,271 | ) | | | (354,844 | ) | |
World Wrestling Entertainment, Inc., Class A | | | (34,750 | ) | | | (1,619,698 | ) | |
Wynn Resorts Ltd. | | | (7,955 | ) | | | (576,181 | ) | |
Yum! Brands, Inc. | | | (3,400 | ) | | | (309,570 | ) | |
Zions Bancorp N.A. | | | (12,910 | ) | | | (419,188 | ) | |
| | | | | | (54,594,361 | ) | |
Total common stocks
(cost—$(86,873,820)) | | | (86,808,830 | ) | |
| | | Number of
warrants | | | |
Warrants—(0.0)%† | |
United States—(0.0)%† | |
Occidental Petroleum Corp.expires 08/03/27 | | | (1,972 | ) | | | (11,042 | ) | |
Total warrants
(cost—$0) | | | (11,042 | ) | |
| | | Face
amount | | | |
Corporate bonds—(0.2)% | |
United States—(0.2)% | |
United States Steel Corp.
6.250%, due 03/15/26 | | $ | (1,500,000 | ) | | | (1,001,250 | ) | |
Total corporate bonds
(cost—$(1,087,500)) | | | (1,001,250 | ) | |
| | | Number of
shares | | | |
Investment companies—(3.3)% | |
Horizon S&P/TSX 60 Index ETF | | | (113,580 | ) | | | (3,114,557 | ) | |
Invesco QQQ Trust, Series 1 | | | (4,060 | ) | | | (1,079,108 | ) | |
iShares Edge MSCI USA Momentum Factor ETF | | | (8,870 | ) | | | (1,243,485 | ) | |
iShares Russell 2000 ETF | | | (5,745 | ) | | | (846,583 | ) | |
iShares S&P/TSX 60 Index ETF | | | (265,587 | ) | | | (4,861,841 | ) | |
SPDR Dow Jones Industrial Average ETF Trust | | | (1,560 | ) | | | (412,386 | ) | |
SPDR S&P 500 ETF Trust | | | (11,519 | ) | | | (3,761,184 | ) | |
Total investment companies
(cost—$(13,836,585)) | | | (15,319,144 | ) | |
Total investments sold short
(proceeds—$101,797,905) | | | (103,140,266 | ) | |
Other assets in excess of liabilities—23.2% | | | | | 106,207,422 | | |
Net assets—100.0% | | $ | 457,264,405 | | |
For a listing of defined portfolio acronyms, counterparty acronyms and currency abbreviations that are used throughout the Portfolio of investments as well as the tables that follow, please refer to page 267.
258
PACE Alternative Strategies Investments
Portfolio of investments—July 31, 2020
Equity options written
Notional
amount | | Number of
contracts | | Call options | | Expiration
date | | Premiums
received | | Current
value | | Unrealized
appreciation
(depreciation) | |
EUR | 4,254,250 | | | | 119 | | | Call Euro STOXX 50, strike @ 3,575.00 | | 10/16/20 | | $ | 66,299 | | | $ | (12,055 | ) | | $ | 54,244 | | |
USD | 19,278,000 | | | | 126 | | | Call Russell 2000 Index, strike @ 1,530.00 | | 09/18/20 | | | 741,204 | | | | (464,814 | ) | | | 276,390 | | |
CHF | 756,000 | | | | 7 | | | Call Swiss Market Index, strike @ 10,800.00 | | 09/18/20 | | | 2,712 | | | | (980 | ) | | | 1,732 | | |
CHF | 756,000 | | | | 7 | | | Call Swiss Market Index, strike @ 10,800.00 | | 10/16/20 | | | 7,491 | | | | (2,824 | ) | | | 4,667 | | |
| | Total | | | | | | | | | $ | 817,706 | | | $ | (480,673 | ) | | $ | 337,033 | | |
| | | | | Put options | | | | | | | | | |
EUR | 2,488,500 | | | | 79 | | | Put Euro STOXX 50, strike @ 3,150.00 | | 10/16/20 | | $ | 73,686 | | | $ | (120,231 | ) | | $ | (46,545 | ) | |
USD | 2,730,000 | | | | 21 | | | Put Russell 2000 Index, strike @ 1,300.00 | | 09/18/20 | | | 130,922 | | | | (44,394 | ) | | | 86,528 | | |
USD | 3,000,000 | | | | 10 | | | Put S&P 500 Index, strike @ 3,000.00 | | 09/18/20 | | | 59,653 | | | | (37,500 | ) | | | 22,153 | | |
USD | 3,000,000 | | | | 10 | | | Put S&P 500 Index, strike @ 3,000.00 | | 10/16/20 | | | 87,983 | | | | (68,660 | ) | | | 19,323 | | |
CHF | 3,434,000 | | | | 34 | | | Put Swiss Market Index, strike @ 10,100.00 | | 09/18/20 | | | 165,612 | | | | (115,062 | ) | | | 50,550 | | |
CHF | 612,000 | | | | 6 | | | Put Swiss Market Index, strike @ 10,200.00 | | 09/19/20 | | | 24,604 | | | | (23,481 | ) | | | 1,123 | | |
CHF | 582,000 | | | | 6 | | | Put Swiss Market Index, strike @ 9,700.00 | | 09/20/20 | | | 8,508 | | | | (10,103 | ) | | | (1,595 | ) | |
CHF | 582,000 | | | | 6 | | | Put Swiss Market Index, strike @ 9,700.00 | | 10/16/20 | | | 12,384 | | | | (13,646 | ) | | | (1,262 | ) | |
| | Total | | | | | | | | | | | $ | 563,352 | | | $ | (433,077 | ) | | $ | 130,275 | | |
Total equity options written | | | | $1,381,058 | | $(913,750) | | $467,308 | |
Options written
Notional
amount | | Number of
contracts | | Call options | | Expiration
date | | Premiums
received | | Current
value | | Unrealized
appreciation
(depreciation) | |
USD | 16,000 | | | | 20 | | | Avadel Pharmaceuticals PLC, strike @ 7.50 | | 09/18/20 | | $ | 1,272 | | | $ | (1,500 | ) | | $ | (228 | ) | |
Futures contracts
Number of
contracts | | Currency | |
| | Expiration
date | | Current
notional
amount | | Value | | Unrealized
appreciation
(depreciation) | |
Index futures buy contracts: | | | |
| | 18 | | | EUR | | | | EURO STOXX 50 Index Futures | | September 2020 | | $ | 695,064 | | | $ | 674,892 | | | $ | (20,172 | ) | |
| | 69 | | | USD | | | | Mini MSCI Emerging Markets (EM) Index Futures | | September 2020 | | | 3,297,965 | | | | 3,689,085 | | | | 391,120 | | |
| | 53 | | | USD | | | | S&P 500 E-Mini Index Futures | | September 2020 | | | 8,209,882 | | | | 8,648,275 | | | | 438,393 | | |
| | 50 | | | USD | | | | S&P 500 E-Mini Index Futures | | December 2021 | | | 618,125 | | | | 633,125 | | | | 15,000 | | |
| | 50 | | | USD | | | | S&P 500 E-Mini Index Futures | | December 2022 | | | 631,250 | | | | 633,750 | | | | 2,500 | | |
U.S. Treasury futures buy contracts: | | | |
| | 487 | | | USD | | | | U.S. Treasury Note 10 Year Futures | | September 2020 | | | 67,155,246 | | | | 68,218,047 | | | | 1,062,801 | | |
| | Total | | | | | | | | | $ | 80,607,532 | | | $ | 82,497,174 | | | $ | 1,889,642 | | |
Index futures sell contracts: | | | |
| | 284 | | | EUR | | | | EURO STOXX 600 Index Futures | | September 2020 | | | (6,007,604 | ) | | | (5,959,794 | ) | | | 47,810 | | |
| | 25 | | | JPY | | | | TOPIX Index Futures | | September 2020 | | | (3,740,805 | ) | | | (3,534,316 | ) | | | 206,489 | | |
| | 138 | | | USD | | | | MSCI ACWI Index Futures | | September 2020 | | | (3,619,815 | ) | | | (3,828,120 | ) | | | (208,305 | ) | |
259
PACE Alternative Strategies Investments
Portfolio of investments—July 31, 2020
Futures contracts—(concluded)
Number of
contracts | | Currency | |
| | Expiration
date | | Current
notional
amount | | Value | | Unrealized
appreciation
(depreciation) | |
| Index futures sell contracts—(concluded) | | | |
| | 61 | | | USD | | | | MSCI Industrials Index Futures | | September 2020 | | $ | (2,044,942 | ) | | $ | (2,126,991 | ) | | $ | (82,049 | ) | |
| | 74 | | | USD | | | | MSCI World Index Futures | | September 2020 | | | (4,752,200 | ) | | | (5,029,780 | ) | | | (277,580 | ) | |
| | 127 | | | USD | | | | Russell 2000 Mini Index Futures | | September 2020 | | | (8,789,676 | ) | | | (9,384,030 | ) | | | (594,354 | ) | |
| | Total | | | | | | | | | $ | (28,955,042 | ) | | $ | (29,863,031 | ) | | $ | (907,989 | ) | |
| | Net unrealized appreciation (depreciation) | | | | | | | | | | | | | $ | 981,653 | | |
Centrally cleared credit default swap agreements on credit indices—sell protection7
Referenced obligations | | Notional
amount
(000) | | Maturity
date | | Payment
frequency | | Payments
received
by the
Portfolio6 | | Upfront
payments
received
(made) | | Value | | Unrealized
appreciation
(depreciation) | |
iTraxx Europe Crossover Series 33 Index | | EUR | 7,407 | | | 06/20/25 | | Quarterly | | | 5.000 | % | | $ | (260,087 | ) | | $ | 517,321 | | | $ | 257,234 | | |
Centrally cleared interest rate swap agreements
Notional
amount
(000) | | Maturity
date | | Payment
frequency | | Payments
made by the
Portfolio6 | | Payments
received by
the Portfolio6 | | Value | | Unrealized
appreciation
(depreciation) | |
CNY | 8,800 | | | 03/18/25 | | Quarterly | | | 6 Month GBP LIBOR | | | | 2.300 | % | | $ | (15,422 | ) | | $ | (15,422 | ) | |
CNY | 46,000 | | | 06/17/25 | | Quarterly | | | 6 Month GBP LIBOR | | | | 0.020 | | | | (190,899 | ) | | | (190,899 | ) | |
CNY | 12,000 | | | 06/17/25 | | Quarterly | | | 6 Month GBP LIBOR | | | | 0.226 | | | | (26,382 | ) | | | (26,382 | ) | |
CNY | 29,000 | | | 06/17/25 | | Quarterly | | | 6 Month GBP LIBOR | | | | 0.023 | | | | (64,752 | ) | | | (64,752 | ) | |
CNY | 25,500 | | | 03/18/25 | | Quarterly | | | 6 Month GBP LIBOR | | | | 2.975 | | | | 67,946 | | | | 67,946 | | |
CNY | 12,700 | | | 03/18/25 | | Quarterly | | | 6 Month GBP LIBOR | | | | 2.998 | | | | 35,627 | | | | 35,627 | | |
USD | 3,282 | | | 01/14/25 | | Annual | | | 1.808 | % | | | 12 Month US CPI | | | | (84,418 | ) | | | (84,418 | ) | |
USD | 9,679 | | | 01/15/25 | | Annual | | | 1.821 | | | | 12 Month US CPI | | | | (256,178 | ) | | | (256,178 | ) | |
CNY | 41,300 | | | 09/16/25 | | Quarterly | | | 6 Month GBP LIBOR | | | | 2.660 | | | | 13,454 | | | | 13,454 | | |
GBP | 4,284 | | | 05/15/29 | | Annual | | | 12 Month GBP LIBOR | | | | 3.591 | | | | 239,529 | | | | 239,529 | | |
GBP | 2,667 | | | 12/15/29 | | Annual | | | 12 Month GBP LIBOR | | | | 3.513 | | | | 95,939 | | | | 95,939 | | |
GBP | 1,100 | | | 12/15/29 | | Annual | | | 12 Month GBP LIBOR | | | | 3.538 | | | | 55,175 | | | | 55,175 | | |
USD | 488 | | | 07/28/50 | | Annual | | | 1.828 | | | | 12 Month US CPI | | | | (54,100 | ) | | | (54,100 | ) | |
USD | 487 | | | 07/29/50 | | Annual | | | 1.810 | | | | 12 Month US CPI | | | | (50,434 | ) | | | (50,434 | ) | |
USD | 488 | | | 07/28/50 | | Annual | | | 1.828 | | | | 12 Month US CPI | | | | (49,847 | ) | | | (49,847 | ) | |
| | Total | | | | | | | | | | | $ | (284,762 | ) | | $ | (284,762 | ) | |
260
PACE Alternative Strategies Investments
Portfolio of investments—July 31, 2020
OTC Total return swap agreements
Counterparty | | Notional
amount
(000) | | Maturity
date | | Payment
frequency | | Payments
made by the
Portfolio6 | | Payments
received by
the Portfolio6 | | Upfront
payments
received
(made) | | Value | | Unrealized
appreciation
(depreciation) | |
BOA | | EUR | 4,288 | | | 07/09/21 | | Monthly | | MSCI World Net
Total Return USD Index | | 1 Month EURIBOR
minus 33 bps | | $ | — | | | $ | 119,698 | | | $ | 119,698 | | |
CITI | | USD | 2,324 | | | 09/08/20 | | Monthly | | MSCI World Net
Total Return USD Index | | 1 Month USD
LIBOR minus 30 bps | | | — | | | | (57,316 | ) | | | (57,316 | ) | |
CITI | | USD | 1,282 | | | 11/04/20 | | Monthly | | USTN.S Index | | 1 Month USD
LIBOR plus 30 bps | | | — | | | | (110,270 | ) | | | (110,270 | ) | |
MSCI | | EUR | 31 | | | 12/19/22 | | At Maturity | | 1 Day Federal Fund
Rate plus 55 bps | | Cellnex Telecom N.A.,
Common Stock | | | — | | | | 571,412 | | | | 571,412 | | |
MSCI | | USD | 2,900 | | | 10/27/22 | | At Maturity | | Technology Select
Sector Index | | 1 Day Federal Fund
Rate minus 10 bps | | | — | | | | (778,188 | ) | | | (778,188 | ) | |
MSCI | | USD | 3,242 | | | 10/27/22 | | At Maturity | | Industrial Select
Sector Index | | 1 Day Federal Fund
Rate minus 35 bps | | | — | | | | (225,024 | ) | | | (225,024 | ) | |
MSCI | | USD | 1,507 | | | 10/27/22 | | At Maturity | | Consumer Discretionary
Select Sector Index | | 1 Day Federal Fund
Rate minus 25 bps | | | — | | | | (253,994 | ) | | | (253,994 | ) | |
MSCI | | USD | 7,068 | | | 10/27/22 | | At Maturity | | S&P 500 Index | | 1 Day Federal Fund
Rate minus 25 bps | | | — | | | | (1,835,721 | ) | | | (1,835,721 | ) | |
MSCI | | USD | 225 | | | 10/27/22 | | At Maturity | | Dow Jones U.S.
Real Estate Index | | 1 Day Federal Fund
Rate minus 20 bps | | | — | | | | 28,263 | | | | 28,263 | | |
MSCI | | USD | 1,058 | | | 10/27/22 | | At Maturity | | Financial Select
Sector Index | | 1 Day Federal Fund
Rate minus 35 bps | | | — | | | | 158,344 | | | | 158,344 | | |
MSCI | | USD | 1,354 | | | 10/27/22 | | At Maturity | | Health Care Select
Sector Index | | 1 Day Federal Fund
Rate minus 25 bps | | | — | | | | (183,508 | ) | | | (183,508 | ) | |
MSCI | | USD | 233 | | | 10/27/22 | | At Maturity | | Gilead Sciences, Inc.,
Common Stock | | 1 Day Federal Fund
Rate minus 30 bps | | | — | | | | 18,293 | | | | 18,293 | | |
MSCI | | USD | 31 | | | 12/19/22 | | At Maturity | | 1 Day Federal Fund Rate | | Cellnex Telecom SA,
Common Stock | | | — | | | | 128,881 | | | | 128,881 | | |
MSCI | | USD | 11 | | | 02/03/23 | | At Maturity | | 1 Day Federal Fund
Rate plus 50 bps | | Becton Dickinson and
Co., Common Stock | | | — | | | | 525,803 | | | | 525,803 | | |
SG | | USD | 262 | | | 01/15/21 | | Monthly | | AT&T,Inc. Common Stock | | 1 Month USD LIBOR | | | — | | | | 58,880 | | | | 58,880 | | |
SG | | USD | 266 | | | 01/15/21 | | Monthly | | Verizon Communications, | | 1 Month USD | | | —
Inc. Common Stock | | | | 7,109
LIBOR | | | | 7,109 | | |
SG | | USD | 133 | | | 01/15/21 | | Monthly | | Walt Disney Co./
The Common Stock | | 1 Month USD
LIBOR plus 15 bps | | | — | | | | 25,040 | | | | 25,040 | | |
SG | | USD | 133 | | | 01/15/21 | | Monthly | | CenturyLink, Inc.,
Common Stock | | 1 Month USD
LIBOR plus 15 bps | | | — | | | | 34,603 | | | | 34,603 | | |
SG | | USD | 134 | | | 01/15/21 | | Monthly | | Netflix, Inc.,
Common Stock | | 1 Month USD
LIBOR plus 15 bps | | | — | | | | (60,551 | ) | | | (60,551 | ) | |
SG | | USD | 133 | | | 01/15/21 | | Monthly | | Fox, Corp. Class B,
Common Stock | | 1 Month USD
LIBOR plus 15 bps | | | — | | | | 38,355 | | | | 38,355 | | |
SG | | USD | 132 | | | 01/15/21 | | Monthly | | Discovery, Inc.
Common Stock | | 1 Month USD
LIBOR plus 5 bps | | | — | | | | 44,139 | | | | 44,139 | | |
SG | | USD | 134 | | | 01/15/21 | | Monthly | | ViacomCBS, Inc.,
Common Stock | | 1 Month USD
LIBOR plus 15 bps | | | — | | | | 48,052 | | | | 48,052 | | |
JPMCB | | CAD | 27 | | | 2/22/21 | | Monthly | | | 0.30 | | | Cineplex, Inc. | | | — | | | | (506,045 | ) | | | (506,045 | ) | |
JPMCB | | EUR | 23 | | | 2/22/21 | | Monthly | | | 0.42 | | | Ingenico Group SA | | | — | | | | 84,770 | | | | 84,770 | | |
JPMCB | | EUR | 41 | | | 6/16/21 | | Monthly | | | 0.30 | | | Unilever N.V. | | | — | | | | 87,405 | | | | 87,405 | | |
JPMCB | | EUR | 36 | | | 2/22/21 | | Monthly | | Worldline SA | | | 0.30 | | | | — | | | | (67,866 | ) | | | (67,866 | ) | |
JPMCB | | EUR | 17 | | | 6/15/21 | | Monthly | | Just Eat
Takeaway.com N.V | | | 0.31 | | | | — | | | | (100,570 | ) | | | (100,570 | ) | |
261
PACE Alternative Strategies Investments
Portfolio of investments—July 31, 2020
OTC Total return swap agreements—(concluded)
| Counterparty | | Notional
amount
(000) | | Maturity
date | | Payment
frequency | | Payments
made by the
Portfolio6 | | Payments
received by
the Portfolio6 | | Upfront
payments
received
(made) | | Value | | Unrealized
appreciation
(depreciation) | |
JPMCB | | EUR | 41 | | | 3/5/21 | | Monthly | | | 0.30 | | | Qiagen N.V. | | $ | — | | | $ | 268,000 | | | $ | 268,000 | | |
JPMCB | | GBP | 41 | | | 6/16/21 | | Monthly | | Unilever N.V. | | | 0.30 | | | | — | | | | (84,633 | ) | | | (84,633 | ) | |
JPMCB | | SEK | 21 | | | 6/28/21 | | Monthly | | Evolution Gaming
Group A | | | 1.07 | | | | — | | | | 34,980 | | | | 34,980 | | |
JPMCB | | SEK | 162 | | | 6/28/21 | | Monthly | | | 0.30 | | | NetEnt AB | | | — | | | | (48,207 | ) | | | (48,207 | ) | |
JPMCB | | USD | 31 | | | 7/15/21 | | Monthly | | Analog Devices, Inc | | | 0.30 | | | | — | | | | 67,365 | | | | 67,365 | | |
JPMCB | | USD | 25 | | | 2/22/21 | | Monthly | | Borgwarner, Inc. | | | 0.30 | | | | — | | | | (175,076 | ) | | | (175,076 | ) | |
JPMCB | | USD | 76 | | | 2/24/21 | | Monthly | | Morgan Stanley | | | 0.30 | | | | — | | | | (88,503 | ) | | | (88,503 | ) | |
JPMCB | | USD | 75 | | | 2/24/21 | | Monthly | | | 0.30 | | | E*TRADE
Financial Corp | | | — | | | | 173,181 | | | | 173,181 | | |
JPMCB | | USD | 52 | | | 7/15/21 | | Monthly | | | 0.30 | | | Maxim Integrated
Products, Inc. | | | — | | | | (106,587 | ) | | | (106,587 | ) | |
JPMCB | | USD | 78 | | | 2/22/21 | | Monthly | | Schwab (Charles) Corp. | | | 0.30 | | | | — | | | | 1,024,553 | | | | 1,024,553 | | |
JPMCB | | USD | 16 | | | 2/22/21 | | Monthly | | | 0.30 | | | Tiffany & Co. | | | — | | | | (127,163 | ) | | | (127,163 | ) | |
JPMCB | | USD | 74 | | | 2/22/21 | | Monthly | | | 0.30 | | | TD Ameritrade
Holding Corp. | | | — | | | | (950,927 | ) | | | (950,927 | ) | |
JPMCB | | USD | 8 | | | 3/19/21 | | Monthly | | Brookfield
Renewable Partner | | | 4.52 | | | | — | | | | (37,588 | ) | | | (37,588 | ) | |
JPMCB | | USD | 65 | | | 2/22/21 | | Monthly | | | 0.30 | | | Delphi
Technologies PLC | | | — | | | | 76,760 | | | | 76,760 | | |
JPMCB | | USD | 21 | | | 3/11/21 | | Monthly | | | 0.30 | | | Willis Towers
Watson PLC | | | — | | | | 781,695 | | | | 781,695 | | |
JPMCB | | USD | 25 | | | 6/15/21 | | Monthly | | | 0.30 | | | GrubHub, Inc. | | | — | | | | 181,340 | | | | 181,340 | | |
JPMCB | | USD | 20 | | | 4/1/21 | | Monthly | | Aon PLC | | | 0.30 | | | | — | | | | (3,145,324 | ) | | | (3,145,324 | ) | |
JPMCB | | USD | 2 | | | 8/3/21 | | Monthly | | Brookfield
Renewable Partner | | | 0.00 | | | | — | | | | (93,385 | ) | | | (93,385 | ) | |
JPMCB | | USD | 59 | | | | 44249.00 | | | Monthly | | | 0.30 | | | Advanced Disposal
Services, Inc. | | | — | | | | (165,863 | ) | | | (165,863 | ) | |
JPMCB | | USD | 36 | | | | 44249.00 | | | Monthly | | | 0.30 | | | Acacia
Communications Inc. | | | — | | | | (24,671 | ) | | | (24,671 | ) | |
JPMCB | | USD | 244 | | | | 44249.00 | | | Monthly | | | 0.30 | | | Fitbit, Inc., Class A | | | — | | | | 26,297 | | | | 26,297 | | |
JPMCB | | USD | 22 | | | | 44274.00 | | | Monthly | | | 0.30 | | | Terraform
Power Inc. — A | | | — | | | | 113,332 | | | | 113,332 | | |
JPMCB | | USD | 115 | | | | 44249.00 | | | Monthly | | | 0.30 | | | Wright Medical
Group N.V. | | | — | | | | (33,378 | ) | | | (33,378 | ) | |
| | | | | | | | | | | | $ | — | | | $ | (4,533,808 | ) | | $ | (4,533,808 | ) | |
262
PACE Alternative Strategies Investments
Portfolio of investments—July 31, 2020
Forward foreign currency contracts
Counterparty | | Sell | | Purchase | | Settlement
date | | Unrealized
appreciation
(depreciation) | |
BB | | AUD | 6,463,133 | | | USD | 4,483,443 | | | 09/16/20 | | $ | (134,853 | ) | |
BB | | CAD | 7,823,613 | | | USD | 5,757,941 | | | 09/16/20 | | | (83,551 | ) | |
BB | | EUR | 1,391,876 | | | USD | 1,573,481 | | | 09/16/20 | | | (67,577 | ) | |
BB | | GBP | 5,903,681 | | | USD | 7,439,569 | | | 09/16/20 | | | (290,151 | ) | |
BB | | JPY | 63,326,555 | | | USD | 593,853 | | | 09/16/20 | | | (4,688 | ) | |
BB | | JPY | 1,435,464 | | | USD | 13,646 | | | 09/16/20 | | | 79 | | |
BB | | NOK | 195,461,772 | | | USD | 21,082,518 | | | 09/16/20 | | | (396,356 | ) | |
BB | | NZD | 22,686,575 | | | USD | 14,556,120 | | | 09/16/20 | | | (490,294 | ) | |
BB | | SEK | 140,406,406 | | | USD | 15,319,415 | | | 09/16/20 | | | (678,876 | ) | |
BB | | SGD | 9,824,535 | | | USD | 7,059,493 | | | 09/16/20 | | | (91,351 | ) | |
BB | | USD | 21,247,699 | | | AUD | 31,346,334 | | | 09/16/20 | | | 1,151,140 | | |
BB | | USD | 2,875,841 | | | CAD | 3,862,469 | | | 09/16/20 | | | 8,067 | | |
BB | | USD | 38,393,814 | | | EUR | 34,402,673 | | | 09/16/20 | | | 2,167,842 | | |
BB | | USD | 9,908,323 | | | GBP | 7,888,576 | | | 09/16/20 | | | 420,229 | | |
BB | | USD | 7,083,993 | | | JPY | 768,181,140 | | | 09/16/20 | | | 176,594 | | |
BB | | USD | 4,088,154 | | | NZD | 6,255,685 | | | 09/16/20 | | | 60,802 | | |
BB | | USD | 450,322 | | | NZD | 674,238 | | | 09/16/20 | | | (3,147 | ) | |
BB | | USD | 4,682,260 | | | SEK | 43,985,906 | | | 09/16/20 | | | 329,614 | | |
BB | | USD | 3,232,058 | | | SGD | 4,520,003 | | | 09/16/20 | | | 57,852 | | |
BNP | | CHF | 169,000 | | | USD | 179,193 | | | 08/19/20 | | | (5,676 | ) | |
BNP | | GBP | 1,068,262 | | | USD | 1,361,447 | | | 08/19/20 | | | (37,022 | ) | |
BNP | | INR | 12,823,950 | | | USD | 170,000 | | | 08/19/20 | | | (1,169 | ) | |
BNP | | SGD | 4,180,000 | | | USD | 3,010,950 | | | 08/19/20 | | | (31,314 | ) | |
BOA | | AUD | 4,300,000 | | | USD | 2,992,779 | | | 08/19/20 | | | (79,521 | ) | |
BOA | | CHF | 250,000 | | | USD | 263,518 | | | 08/19/20 | | | (9,957 | ) | |
BOA | | EUR | 5,657,332 | | | USD | 6,479,053 | | | 08/19/20 | | | (187,098 | ) | |
BOA | | EUR | 4,948,787 | | | USD | 5,659,775 | | | 10/21/20 | | | (179,245 | ) | |
BOA | | JPY | 44,258,304 | | | USD | 409,265 | | | 08/19/20 | | | (8,905 | ) | |
BOA | | SEK | 558,000 | | | USD | 61,685 | | | 08/19/20 | | | (1,876 | ) | |
BOA | | USD | 151,834 | | | CHF | 141,000 | | | 08/19/20 | | | 2,406 | | |
BOA | | USD | 2,744,322 | | | EUR | 2,402,833 | | | 08/19/20 | | | 86,985 | | |
BOA | | USD | 263,712 | | | MXN | 5,926,962 | | | 10/15/20 | | | 197 | | |
BOA | | USD | 155,858 | | | SEK | 1,380,000 | | | 08/19/20 | | | 1,336 | | |
CITI | | CNY | 49,250,000 | | | USD | 6,948,489 | | | 10/15/20 | | | (74,376 | ) | |
CITI | | GBP | 2,057,264 | | | USD | 2,631,560 | | | 08/19/20 | | | (61,618 | ) | |
CITI | | JPY | 81,746,890 | | | AUD | 1,090,789 | | | 08/19/20 | | | 6,979 | | |
CITI | | USD | 120,943 | | | CAD | 162,137 | | | 08/19/20 | | | 109 | | |
CITI | | USD | 2,123,793 | | | CNY | 14,900,000 | | | 10/15/20 | | | 891 | | |
CITI | | USD | 763,172 | | | EUR | 667,500 | | | 08/19/20 | | | 23,357 | | |
GS | | KRW | 3,661,232,000 | | | USD | 3,066,564 | | | 09/14/20 | | | (6,823 | ) | |
GS | | USD | 1,835,899 | | | CNY | 13,000,000 | | | 10/15/20 | | | 17,852 | | |
GSI | | AUD | 8,740,000 | | | JPY | 666,924,054 | | | 08/19/20 | | | 56,736 | | |
GSI | | EUR | 104,000 | | | USD | 118,872 | | | 08/19/20 | | | (3,673 | ) | |
GSI | | JPY | 163,721,952 | | | AUD | 2,184,308 | | | 08/19/20 | | | 13,752 | | |
GSI | | JPY | 38,543,163 | | | USD | 358,422 | | | 08/19/20 | | | (5,749 | ) | |
263
PACE Alternative Strategies Investments
Portfolio of investments—July 31, 2020
Forward foreign currency contracts—(continued)
Counterparty | | Sell | | Purchase | | Settlement
date | | Unrealized
appreciation
(depreciation) | |
GSI | | KRW | 736,500,000 | | | USD | 616,876 | | | 09/14/20 | | $ | (1,373 | ) | |
GSI | | SEK | 3,470,000 | | | USD | 372,400 | | | 08/19/20 | | | (22,863 | ) | |
GSI | | USD | 763,048 | | | EUR | 665,584 | | | 08/19/20 | | | 21,223 | | |
GSI | | USD | 6,155,000 | | | JPY | 661,882,233 | | | 08/19/20 | | | 98,726 | | |
GSI | | USD | 1,668,864 | | | MXN | 37,502,363 | | | 10/15/20 | | | 1,000 | | |
GSI | | USD | 527,424 | | | MXN | 11,837,491 | | | 10/15/20 | | | (337 | ) | |
JPMCB | | CAD | 633,654 | | | USD | 471,517 | | | 08/19/20 | | | (1,571 | ) | |
JPMCB | | EUR | 611,516 | | | USD | 689,944 | | | 08/19/20 | | | (30,618 | ) | |
JPMCB | | EUR | 337,641 | | | USD | 368,202 | | | 09/30/20 | | | (30,007 | ) | |
JPMCB | | EUR | 1,483,856 | | | USD | 1,678,714 | | | 10/21/20 | | | (72,072 | ) | |
JPMCB | | EUR | 1,454,897 | | | USD | 1,655,393 | | | 02/26/21 | | | (66,199 | ) | |
JPMCB | | EUR | 114,927 | | | USD | 125,983 | | | 03/31/21 | | | (10,101 | ) | |
JPMCB | | EUR | 120,808 | | | USD | 143,609 | | | 03/31/21 | | | 562 | | |
JPMCB | | GBP | 169,600 | | | USD | 213,102 | | | 08/19/20 | | | (8,922 | ) | |
JPMCB | | GBP | 259,746 | | | USD | 337,904 | | | 08/28/20 | | | (2,148 | ) | |
JPMCB | | GBP | 354,752 | | | USD | 463,395 | | | 08/28/20 | | | (1,036 | ) | |
JPMCB | | GBP | 1,825,957 | | | USD | 2,279,835 | | | 11/30/20 | | | (111,853 | ) | |
JPMCB | | JPY | 81,748,777 | | | AUD | 1,093,593 | | | 08/19/20 | | | 8,964 | | |
JPMCB | | JPY | 22,900,000 | | | USD | 212,677 | | | 08/19/20 | | | (3,691 | ) | |
JPMCB | | TWD | 8,600,000 | | | USD | 294,087 | | | 08/19/20 | | | 497 | | |
JPMCB | | USD | 219,674 | | | CAD | 298,035 | | | 08/19/20 | | | 2,840 | | |
JPMCB | | USD | 498,537 | | | CAD | 676,920 | | | 09/30/20 | | | 6,903 | | |
JPMCB | | USD | 3,053,102 | | | EUR | 2,669,083 | | | 08/19/20 | | | 91,935 | | |
JPMCB | | USD | 410,371 | | | EUR | 377,665 | | | 09/30/20 | | | 35,041 | | |
JPMCB | | USD | 9,374 | | | EUR | 8,000 | | | 10/21/20 | | | 65 | | |
JPMCB | | USD | 2,253,824 | | | EUR | 1,992,307 | | | 11/30/20 | | | 98,983 | | |
JPMCB | | USD | 505,576 | | | GBP | 400,000 | | | 08/19/20 | | | 18,067 | | |
JPMCB | | USD | 763,897 | | | GBP | 614,498 | | | 08/28/20 | | | 40,585 | | |
JPMCB | | USD | 53,269 | | | JPY | 5,709,000 | | | 08/19/20 | | | 672 | | |
MSCI | | AUD | 29,760,353 | | | USD | 20,167,883 | | | 09/16/20 | | | (1,097,678 | ) | |
MSCI | | CAD | 31,735,702 | | | USD | 23,382,843 | | | 09/16/20 | | | (312,586 | ) | |
MSCI | | CAD | 535,154 | | | USD | 400,183 | | | 09/16/20 | | | 612 | | |
MSCI | | EUR | 25,553,468 | | | USD | 28,701,926 | | | 09/16/20 | | | (1,426,287 | ) | |
MSCI | | GBP | 11,510,355 | | | USD | 14,514,918 | | | 09/16/20 | | | (555,646 | ) | |
MSCI | | GBP | 1,397,663 | | | USD | 1,837,653 | | | 09/16/20 | | | 7,686 | | |
MSCI | | JPY | 1,216,869,218 | | | USD | 11,369,477 | | | 09/16/20 | | | (131,958 | ) | |
MSCI | | JPY | 122,134,952 | | | USD | 1,160,143 | | | 09/16/20 | | | 5,766 | | |
MSCI | | NOK | 85,143,537 | | | USD | 9,195,010 | | | 09/16/20 | | | (161,231 | ) | |
MSCI | | NOK | 9,046,998 | | | USD | 996,893 | | | 09/16/20 | | | 2,737 | | |
MSCI | | NZD | 7,784,479 | | | USD | 5,005,014 | | | 09/16/20 | | | (157,886 | ) | |
MSCI | | SEK | 108,291,803 | | | USD | 11,911,449 | | | 09/16/20 | | | (427,616 | ) | |
MSCI | | SEK | 34,487,127 | | | USD | 3,941,158 | | | 09/16/20 | | | 11,601 | | |
MSCI | | SGD | 4,784,734 | | | USD | 3,437,328 | | | 09/16/20 | | | (45,266 | ) | |
MSCI | | USD | 12,999,080 | | | AUD | 18,872,778 | | | 09/16/20 | | | 486,653 | | |
MSCI | | USD | 1,584,515 | | | AUD | 2,213,212 | | | 09/16/20 | | | (3,042 | ) | |
264
PACE Alternative Strategies Investments
Forward foreign currency contracts—(concluded)
Counterparty | | Sell | | Purchase | | Settlement
date | | Unrealized
appreciation
(depreciation) | |
MSCI | | USD | 7,055,187 | | | CAD | 9,528,817 | | | 09/16/20 | | $ | 59,495 | | |
MSCI | | USD | 390,380 | | | CAD | 522,040 | | | 09/16/20 | | | (599 | ) | |
MSCI | | USD | 9,416,568 | | | EUR | 8,272,420 | | | 09/16/20 | | | 336,833 | | |
MSCI | | USD | 541,328 | | | EUR | 458,711 | | | 09/16/20 | | | (496 | ) | |
MSCI | | USD | 7,006,600 | | | GBP | 5,560,211 | | | 09/16/20 | | | 273,414 | | |
MSCI | | USD | 51,176 | | | GBP | 39,000 | | | 09/16/20 | | | (113 | ) | |
MSCI | | USD | 15,012,532 | | | JPY | 1,622,608,360 | | | 09/16/20 | | | 323,813 | | |
MSCI | | USD | 151,835 | | | JPY | 15,963,285 | | | 09/16/20 | | | (955 | ) | |
MSCI | | USD | 23,478,577 | | | NOK | 224,450,367 | | | 09/16/20 | | | 1,185,792 | | |
MSCI | | USD | 12,249,938 | | | NZD | 18,939,151 | | | 09/16/20 | | | 311,073 | | |
MSCI | | USD | 2,247,777 | | | NZD | 3,376,356 | | | 09/16/20 | | | (8,476 | ) | |
MSCI | | USD | 28,933,069 | | | SEK | 267,382,121 | | | 09/16/20 | | | 1,533,183 | | |
MSCI | | USD | 3,782,457 | | | SGD | 5,260,557 | | | 09/16/20 | | | 46,469 | | |
SG | | JPY | 327,350,827 | | | AUD | 4,371,310 | | | 08/19/20 | | | 30,308 | | |
SG | | JPY | 38,543,163 | | | USD | 358,256 | | | 08/19/20 | | | (5,916 | ) | |
SG | | TWD | 9,150,300 | | | USD | 311,695 | | | 08/19/20 | | | (682 | ) | |
SG | | USD | 6,155,000 | | | JPY | 662,189,368 | | | 08/19/20 | | | 101,628 | | |
Net unrealized appreciation (depreciation) | | $ | 2,091,855 | | |
Fair valuation summary
The following is a summary of the fair valuations according to the inputs used as of July 31, 2020 in valuing the Fund's investments. In the event a Fund holds investments for which fair value is measured using the NAV per share practical expedient (or its equivalent), a separate column will be added to the fair value hierarchy table; this is intended to permit reconciliation to the amounts presented in the portfolio of investments.
Assets
Description | | Unadjusted
quoted prices in
active markets for
identical investments
(Level 1) | | Other significant
observable inputs
(Level 2) | | Unobservable
inputs
(Level 3) | | Total | |
Common stocks | | $ | 195,635,770 | | | $ | 52,702,752 | | | $ | — | | | $ | 248,338,522 | | |
Preferred stocks | | | — | | | | 682,574 | | | | — | | | | 682,574 | | |
Investment companies | | | 24,226,272 | | | | — | | | | — | | | | 24,226,272 | | |
Warrants | | | 13,498 | | | | — | | | | — | | | | 13,498 | | |
Corporate bonds | | | — | | | | 40,615,787 | | | | — | | | | 40,615,787 | | |
Short-term investments | | | — | | | | 115,047,790 | | | | — | | | | 115,047,790 | | |
Short-term U.S. Treasury obligations | | | — | | | | 23,996,050 | | | | — | | | | 23,996,050 | | |
Equity and foreign exchange options purchased | | | 1,276,756 | | | | — | | | | — | | | | 1,276,756 | | |
Futures contracts | | | 1,909,814 | | | | 254,299 | | | | — | | | | 2,164,113 | | |
Swap agreements | | | — | | | | 5,751,541 | | | | — | | | | 5,751,541 | | |
Forward foreign currency contracts | | | — | | | | 9,725,945 | | | | — | | | | 9,725,945 | | |
Total | | $ | 223,062,110 | | | $ | 248,776,738 | | | $ | — | | | $ | 471,838,848 | | |
265
PACE Alternative Strategies Investments
Portfolio of investments—July 31, 2020
Fair valuation summary—(concluded)
Liabilities
Description | | Unadjusted
quoted prices in
active markets for
identical investments
(Level 1) | | Other significant
observable inputs
(Level 2) | | Unobservable
inputs
(Level 3) | | Total | |
Investments sold short | | $ | (90,878,557 | ) | | $ | (12,261,709 | ) | | $ | — | | | $ | (103,140,266 | ) | |
Equity options written | | | (913,750 | ) | | | — | | | | — | | | | (913,750 | ) | |
Options written | | | (1,500 | ) | | | — | | | | — | | | | (1,500 | ) | |
Futures contracts | | | (1,162,288 | ) | | | (20,172 | ) | | | — | | | | (1,182,460 | ) | |
Swap agreements | | | — | | | | (10,052,790 | ) | | | — | | | | (10,052,790 | ) | |
Forward foreign currency contracts | | | — | | | | (7,634,090 | ) | | | — | | | | (7,634,090 | ) | |
Total | | $ | (92,956,095 | ) | | $ | (29,968,761 | ) | | $ | — | | | $ | (122,924,856 | ) | |
At July 31, 2020, there were no transfers in or out of Level 3.
Portfolio footnotes
* Non-income producing security.
† Amount represents less than 0.05% or (0.05)%.
1 Security, or portion thereof, pledged as collateral for investments sold short, written options, futures and/or swap agreements.
2 Security purchased on a when-issued basis. When-issued refers to a transaction made conditionally because a security, although authorized, has not yet been issued.
3 Security exempt from registration pursuant to Rule 144A under the Securities Act of 1933. These securities are considered liquid, unless noted otherwise, and may be resold in transactions exempt from registration, normally to qualified institutional buyers. Securities exempt from registration pursuant to Rule 144A, in the amount of $27,243,545, represented 6.0% of the Portfolio's net assets at period end.
4 Step bond—coupon rate increases in increments to maturity. The rate disclosed is the rate at the period end; the maturity date disclosed is the ultimate maturity date.
5 Rate shown is the discount rate at the date of purchase unless otherwise noted.
6 Payments made or received are based on the notional amount.
7 If the Fund is a seller of protection and a credit event occurs, as defined under the terms of that particular swap agreement, the Fund will either (i) pay to the buyer of protection an amount equal to the notional amount of the swap and take delivery of the referenced obligation or underlying securities comprising the referenced obligation or (ii) pay a net settlement amount in the form of cash or securities equal to the notional amount of the swap less the recovery value of the referenced obligation or underlying securities comprising the referenced obligation.
See accompanying notes to financial statements.
266
PACE Select Advisors Trust
Portfolio acronyms:
ABS Asset-backed Security
ADR American Depositary Receipt
AGM Assured Guaranty Municipal
AMT Alternative Minimum Tax
ARM Adjustable Rate Mortgage
BOBL Bundesobligationen
CLO Collateralized Loan Obligation
CMT Constant Maturity Treasury Index
COFI Cost of Funds Index
CPI Consumer Price Index
DAC Designated Activity Company
EMTN Euro Medium Term Note
ETF Exchange Traded Fund
EURIBOR Euro Interbank Offered Rate
FHLB Federal Home Loan Bank
FHLMC Federal Home Loan Mortgage Corporation
FNMA Federal National Mortgage Association
FRN Floating Rate Note
GDR Global Depositary Receipt
GMTN Global Medium Term Note
GNMA Government National Mortgage Association
GSAMP Goldman Sachs Asset Mortgage Passthrough
GTD Guaranteed
IO Interest Only
JSC Joint Stock Company
LIBOR London Interbank Offered Rate
MTA Monthly Treasury Average Index
MTN Medium Term Note
NVDR Non-Voting Depository Receipt
OTC Over The Counter
PJSC Private Joint Stock Company
PO Principal Only
PSF Permanent School Fund
REIT Real Estate Investment Trust
REMIC Real Estate Mortgage Investment Conduit
RPI Retail Price Index
SBA Small Business Administration
SIFMA Municipal Swap Index Yield
SOFR Secured Overnight Financing Rate
SONIA Sterling Overnight Interbank Average Rate
SPDR Standard and Poor's Depository Receipts
STRIP Separate Trading of Registered Interest and Principal of Securities
TBA To-Be-Announced Security
TIPS Treasury inflation protected securities
UMBS Uniform Mortgage Backed Securities
VRD Variable rate demand notes are payable on demand. The interest rates shown are the current rates as of period end and reset periodically.
Currency type abbreviations:
AUD Australian Dollar
CAD Canadian Dollar
CHF Swiss Franc
CNY Chinese Yuan Renminbi
CZK Czech Koruna
DKK Danish Krone
EUR Euro
GBP Great Britain Pound
HUF Hungarian Forint
IDR Indonesian Rupiah
ILS Israeli Shekel
INR Indian Rupee
JPY Japanese Yen
KRW South Korean Won
MXN Mexican Peso
MYR Malaysian Ringgit
NOK Norwegian Krone
NZD New Zealand Dollar
PEN Peruvian Sol
PLN Polish Zloty
SEK Swedish Krona
SGD Singapore Dollar
THB Thai Baht
TRY Turkish Lira
TWD Taiwan Dollar
USD United States Dollar
ZAR South African Rand
Counterparty acronyms:
ANZ Australia and New Zealand Banking Group
BB Barclays Bank PLC
BNP BNP Paribas
BOA Bank of America
CITI Citibank NA
DB Deutsche Bank AG
GS Goldman Sachs
GSI Goldman Sachs International
HSBC HSBC Bank PLC
JPMCB JPMorgan Chase Bank
MSCI Morgan Stanley & Co. International PLC
RBC Royal Bank of Canada
SCB Standard Chartered Bank
SG Societe Generale
SSC State Street Bank and Trust Co.
TD Toronto-Dominion Bank
See accompanying notes to financial statements.
267
PACE Select Advisors Trust
Understanding your Portfolio's expenses (unaudited)
As a shareholder of a Portfolio, you incur two types of costs: (1) transactional costs (as applicable), including sales charges (loads), or ongoing program fees; and (2) ongoing Portfolio costs, including management fees; service and/or distribution (12b-1) fees (if applicable); and other Portfolio expenses. These examples are intended to help you understand your ongoing costs (in dollars) of investing in each Portfolio and to compare these costs with the ongoing costs of investing in other mutual funds.
The examples below are based on an investment of $1,000 invested at the beginning of the period and held for the entire period, February 1, 2020 to July 31, 2020.
Actual expenses (unaudited)
The first line for each class of shares in the table below for each Portfolio provides information about its actual account values and actual expenses. You may use the information in this line, together with the amount you invested, to estimate the expenses that you paid over a period. Simply divide your account value by $1,000 (for example, an $8,600 account value divided by $1,000 = 8.6), then multiply the result by the number in the first line for each class of shares for each respective Portfolio under the heading entitled "Expenses paid during period" to estimate the expenses you paid on your account during the period.
Hypothetical example for comparison purposes (unaudited)
The second line for each class of shares in the table below for each Portfolio provides information about hypothetical account values and hypothetical expenses based on that Portfolio's actual expense ratios for each class of shares and an assumed rate of return of 5% per year before expenses, which is not that Portfolio's actual return for each class of shares. The hypothetical account values and expenses may not be used to estimate the actual ending account balance or expenses you paid for the period. You may use this information to compare the ongoing costs of investing in a Portfolio and other funds. To do so, compare this 5% hypothetical example with the 5% hypothetical examples that appear in the shareholder reports of other funds.
Please note that the expenses shown in the table are meant to highlight your ongoing Portfolio costs only and do not reflect any transactional costs (as applicable), such as sales charges (loads), or program fees. Therefore, the second line in the table for each class of shares for each Portfolio is useful in comparing ongoing Portfolio costs only, and will not help you determine the relative total costs of owning different funds. In addition, if these transactional costs or program fees were included, your costs would have been higher.
268
PACE Select Advisors Trust
| | | | | Beginning
account value
February 1, 2020 | | Ending
account value
July 31, 2020 | | Expenses paid
during period1
02/01/20 to 07/31/20 | | Expense
ratio during
the period | |
UBS Government Money Market Investments Fund | |
Class P | | Actual | | $ | 1,000.00 | | | $ | 1,001.20 | | | $ | 2.14 | | | | 0.43 | % | |
| | | Hypothetical (5% annual return before expenses) | | | 1,000.00 | | | | 1,022.72 | | | | 2.16 | | | | 0.43 | | |
PACE Mortgage-Backed Securities Fixed Income Investments | |
Class A | | Actual | | | 1,000.00 | | | | 1,037.40 | | | | 5.42 | | | | 1.07 | | |
| | | Hypothetical (5% annual return before expenses) | | | 1,000.00 | | | | 1,019.54 | | | | 5.37 | | | | 1.07 | | |
Class Y | | Actual | | | 1,000.00 | | | | 1,038.70 | | | | 4.16 | | | | 0.82 | | |
| | | Hypothetical (5% annual return before expenses) | | | 1,000.00 | | | | 1,020.79 | | | | 4.12 | | | | 0.82 | | |
Class P | | Actual | | | 1,000.00 | | | | 1,037.90 | | | | 4.15 | | | | 0.82 | | |
| | | Hypothetical (5% annual return before expenses) | | | 1,000.00 | | | | 1,020.79 | | | | 4.12 | | | | 0.82 | | |
PACE Intermediate Fixed Income Investments | |
Class A | | Actual | | | 1,000.00 | | | | 1,056.50 | | | | 4.65 | | | | 0.91 | | |
| | | Hypothetical (5% annual return before expenses) | | | 1,000.00 | | | | 1,020.34 | | | | 4.57 | | | | 0.91 | | |
Class Y | | Actual | | | 1,000.00 | | | | 1,057.90 | | | | 3.38 | | | | 0.66 | | |
| | | Hypothetical (5% annual return before expenses) | | | 1,000.00 | | | | 1,021.58 | | | | 3.32 | | | | 0.66 | | |
Class P | | Actual | | | 1,000.00 | | | | 1,057.00 | | | | 3.38 | | | | 0.66 | | |
| | | Hypothetical (5% annual return before expenses) | | | 1,000.00 | | | | 1,021.58 | | | | 3.32 | | | | 0.66 | | |
PACE Strategic Fixed Income Investments | |
Class A | | Actual | | | 1,000.00 | | | | 1,052.20 | | | | 5.56 | | | | 1.09 | | |
| | | Hypothetical (5% annual return before expenses) | | | 1,000.00 | | | | 1,019.44 | | | | 5.47 | | | | 1.09 | | |
Class Y | | Actual | | | 1,000.00 | | | | 1,053.70 | | | | 4.24 | | | | 0.83 | | |
| | | Hypothetical (5% annual return before expenses) | | | 1,000.00 | | | | 1,020.74 | | | | 4.17 | | | | 0.83 | | |
Class P | | Actual | | | 1,000.00 | | | | 1,053.60 | | | | 4.29 | | | | 0.84 | | |
| | | Hypothetical (5% annual return before expenses) | | | 1,000.00 | | | | 1,020.69 | | | | 4.22 | | | | 0.84 | | |
PACE Municipal Fixed Income Investments | |
Class A | | Actual | | | 1,000.00 | | | | 1,011.50 | | | | 4.10 | | | | 0.82 | | |
| | | Hypothetical (5% annual return before expenses) | | | 1,000.00 | | | | 1,020.79 | | | | 4.12 | | | | 0.82 | | |
Class Y | | Actual | | | 1,000.00 | | | | 1,012.80 | | | | 2.85 | | | | 0.57 | | |
| | | Hypothetical (5% annual return before expenses) | | | 1,000.00 | | | | 1,022.03 | | | | 2.87 | | | | 0.57 | | |
Class P | | Actual | | | 1,000.00 | | | | 1,012.80 | | | | 2.85 | | | | 0.57 | | |
| | | Hypothetical (5% annual return before expenses) | | | 1,000.00 | | | | 1,022.03 | | | | 2.87 | | | | 0.57 | | |
PACE Global Fixed Income Investments | |
Class A | | Actual | | | 1,000.00 | | | | 1,048.30 | | | | 5.25 | | | | 1.03 | | |
| | | Hypothetical (5% annual return before expenses) | | | 1,000.00 | | | | 1,019.74 | | | | 5.17 | | | | 1.03 | | |
Class Y | | Actual | | | 1,000.00 | | | | 1,049.00 | | | | 4.43 | | | | 0.87 | | |
| | | Hypothetical (5% annual return before expenses) | | | 1,000.00 | | | | 1,020.54 | | | | 4.37 | | | | 0.87 | | |
Class P | | Actual | | | 1,000.00 | | | | 1,049.70 | | | | 4.28 | | | | 0.84 | | |
| | | Hypothetical (5% annual return before expenses) | | | 1,000.00 | | | | 1,020.69 | | | | 4.22 | | | | 0.84 | | |
269
PACE Select Advisors Trust
| | | | | Beginning
account value
February 1, 2020 | | Ending
account value
July 31, 2020 | | Expenses paid
during period1
02/01/20 to 07/31/20 | | Expense
ratio during
the period | |
PACE High Yield Investments | |
Class A | | Actual | | $ | 1,000.00 | | | $ | 979.80 | | | $ | 5.22 | | | | 1.06 | % | |
| | | Hypothetical (5% annual return before expenses) | | | 1,000.00 | | | | 1,019.59 | | | | 5.32 | | | | 1.06 | | |
Class Y | | Actual | | | 1,000.00 | | | | 981.10 | | | | 4.33 | | | | 0.88 | | |
| | | Hypothetical (5% annual return before expenses) | | | 1,000.00 | | | | 1,020.49 | | | | 4.42 | | | | 0.88 | | |
Class P | | Actual | | | 1,000.00 | | | | 980.10 | | | | 4.48 | | | | 0.91 | | |
| | | Hypothetical (5% annual return before expenses) | | | 1,000.00 | | | | 1,020.34 | | | | 4.57 | | | | 0.91 | | |
PACE Large Co Value Equity Investments | |
Class A | | Actual | | | 1,000.00 | | | | 851.40 | | | | 6.90 | | | | 1.50 | | |
| | | Hypothetical (5% annual return before expenses) | | | 1,000.00 | | | | 1,017.40 | | | | 7.52 | | | | 1.50 | | |
Class Y | | Actual | | | 1,000.00 | | | | 852.50 | | | | 5.90 | | | | 1.28 | | |
| | | Hypothetical (5% annual return before expenses) | | | 1,000.00 | | | | 1,018.50 | | | | 6.42 | | | | 1.28 | | |
Class P | | Actual | | | 1,000.00 | | | | 852.20 | | | | 5.76 | | | | 1.25 | | |
| | | Hypothetical (5% annual return before expenses) | | | 1,000.00 | | | | 1,018.65 | | | | 6.27 | | | | 1.25 | | |
PACE Large Co Growth Equity Investments | |
Class A | | Actual | | | 1,000.00 | | | | 1,163.50 | | | | 6.08 | | | | 1.13 | | |
| | | Hypothetical (5% annual return before expenses) | | | 1,000.00 | | | | 1,019.24 | | | | 5.67 | | | | 1.13 | | |
Class Y | | Actual | | | 1,000.00 | | | | 1,165.40 | | | | 4.74 | | | | 0.88 | | |
| | | Hypothetical (5% annual return before expenses) | | | 1,000.00 | | | | 1,020.49 | | | | 4.42 | | | | 0.88 | | |
Class P | | Actual | | | 1,000.00 | | | | 1,165.50 | | | | 4.74 | | | | 0.88 | | |
| | | Hypothetical (5% annual return before expenses) | | | 1,000.00 | | | | 1,020.49 | | | | 4.42 | | | | 0.88 | | |
PACE Small/Medium Co Value Equity Investments | |
Class A | | Actual | | | 1,000.00 | | | | 895.50 | | | | 5.89 | | | | 1.25 | | |
| | | Hypothetical (5% annual return before expenses) | | | 1,000.00 | | | | 1,018.65 | | | | 6.27 | | | | 1.25 | | |
Class Y | | Actual | | | 1,000.00 | | | | 896.60 | | | | 5.00 | | | | 1.06 | | |
| | | Hypothetical (5% annual return before expenses) | | | 1,000.00 | | | | 1,019.59 | | | | 5.32 | | | | 1.06 | | |
Class P | | Actual | | | 1,000.00 | | | | 896.20 | | | | 4.90 | | | | 1.04 | | |
| | | Hypothetical (5% annual return before expenses) | | | 1,000.00 | | | | 1,019.69 | | | | 5.22 | | | | 1.04 | | |
PACE Small/Medium Co Growth Equity Investments | |
Class A | | Actual | | | 1,000.00 | | | | 1,077.70 | | | | 6.41 | | | | 1.24 | | |
| | | Hypothetical (5% annual return before expenses) | | | 1,000.00 | | | | 1,018.70 | | | | 6.22 | | | | 1.24 | | |
Class Y | | Actual | | | 1,000.00 | | | | 1,078.50 | | | | 5.58 | | | | 1.08 | | |
| | | Hypothetical (5% annual return before expenses) | | | 1,000.00 | | | | 1,019.49 | | | | 5.42 | | | | 1.08 | | |
Class P | | Actual | | | 1,000.00 | | | | 1,078.10 | | | | 5.58 | | | | 1.08 | | |
| | | Hypothetical (5% annual return before expenses) | | | 1,000.00 | | | | 1,019.49 | | | | 5.42 | | | | 1.08 | | |
PACE International Equity Investments | |
Class A | | Actual | | | 1,000.00 | | | | 948.80 | | | | 9.01 | | | | 1.86 | | |
| | | Hypothetical (5% annual return before expenses) | | | 1,000.00 | | | | 1,015.61 | | | | 9.32 | | | | 1.86 | | |
Class Y | | Actual | | | 1,000.00 | | | | 949.80 | | | | 7.42 | | | | 1.53 | | |
| | | Hypothetical (5% annual return before expenses) | | | 1,000.00 | | | | 1,017.25 | | | | 7.67 | | | | 1.53 | | |
Class P | | Actual | | | 1,000.00 | | | | 950.30 | | | | 7.61 | | | | 1.57 | | |
| | | Hypothetical (5% annual return before expenses) | | | 1,000.00 | | | | 1,017.06 | | | | 7.87 | | | | 1.57 | | |
270
PACE Select Advisors Trust
| | | | | Beginning
account value
February 1, 2020 | | Ending
account value
July 31, 2020 | | Expenses paid
during period1
02/01/20 to 07/31/20 | | Expense
ratio during
the period | |
PACE International Emerging Markets Equity Investments | |
Class A | | Actual | | $ | 1,000.00 | | | $ | 1,033.70 | | | $ | 8.34 | | | | 1.65 | % | |
| | | Hypothetical (5% annual return before expenses) | | | 1,000.00 | | | | 1,016.66 | | | | 8.27 | | | | 1.65 | | |
Class Y | | Actual | | | 1,000.00 | | | | 1,034.90 | | | | 7.08 | | | | 1.40 | | |
| | | Hypothetical (5% annual return before expenses) | | | 1,000.00 | | | | 1,017.90 | | | | 7.02 | | | | 1.40 | | |
Class P | | Actual | | | 1,000.00 | | | | 1,035.10 | | | | 7.08 | | | | 1.40 | | |
| | | Hypothetical (5% annual return before expenses) | | | 1,000.00 | | | | 1,017.90 | | | | 7.02 | | | | 1.40 | | |
PACE Global Real Estate Securities Investments | |
Class A | | Actual | | | 1,000.00 | | | | 791.00 | | | | 6.46 | | | | 1.45 | | |
| | | Hypothetical (5% annual return before expenses) | | | 1,000.00 | | | | 1,017.65 | | | | 7.27 | | | | 1.45 | | |
Class P | | Actual | | | 1,000.00 | | | | 792.70 | | | | 5.35 | | | | 1.20 | | |
| | | Hypothetical (5% annual return before expenses) | | | 1,000.00 | | | | 1,018.90 | | | | 6.02 | | | | 1.20 | | |
PACE Alternative Strategies Investments | |
Class A | | Actual | | | 1,000.00 | | | | 1,029.80 | | | | 13.53 | | | | 2.68 | | |
| | | Hypothetical (5% annual return before expenses) | | | 1,000.00 | | | | 1,011.54 | | | | 13.40 | | | | 2.68 | | |
Class Y | | Actual | | | 1,000.00 | | | | 1,031.70 | | | | 12.33 | | | | 2.44 | | |
| | | Hypothetical (5% annual return before expenses) | | | 1,000.00 | | | | 1,012.73 | | | | 12.21 | | | | 2.44 | | |
Class P | | Actual | | | 1,000.00 | | | | 1,030.90 | | | | 12.32 | | | | 2.44 | | |
| | | Hypothetical (5% annual return before expenses) | | | 1,000.00 | | | | 1,012.73 | | | | 12.21 | | | | 2.44 | | |
1 Expenses are equal to the Portfolios' annualized net expense ratios, multiplied by the average account value over the period, multiplied by 182 divided by 366 (to reflect the one-half year period).
271
PACE Select Advisors Trust
Statement of assets and liabilities
July 31, 2020
| | | UBS
Government
Money Market
Investments Fund | | PACE
Mortgage-Backed
Securities
Fixed Income
Investments | | PACE
Intermediate
Fixed Income
Investments | | PACE
Strategic
Fixed Income
Investments | |
Assets: | |
Investments, at cost | |
Investments | | $ | 265,254,472 | | | $ | 571,576,468 | | | $ | 365,726,981 | | | $ | 830,706,457 | | |
Repurchase agreements | | | 51,367,000 | | | | 3,800,000 | | | | — | | | | 2,200,000 | | |
Foreign currency | | | — | | | | — | | | | 47,697 | | | | 1,314,393 | | |
Investments, at value | |
Investments1 | | $ | 265,254,472 | | | $ | 582,305,015 | | | $ | 390,731,665 | | | $ | 882,407,776 | | |
Repurchase agreements | | | 51,367,000 | | | | 3,800,000 | | | | — | | | | 2,200,000 | | |
Foreign currency | | | — | | | | — | | | | 48,135 | | | | 1,342,305 | | |
Cash | | | 531 | | | | — | | | | 7 | | | | — | | |
Cash collateral on futures | | | — | | | | 504,000 | | | | 493,440 | | | | 467,000 | | |
Cash collateral on swap agreements | | | — | | | | 1,337,000 | | | | 388,120 | | | | 844,000 | | |
Cash collateral for forward foreign currency contracts | | | — | | | | — | | | | 585,000 | | | | — | | |
Due from broker | | | — | | | | 400,559 | | | | — | | | | 533,374 | | |
Receivable for investments sold | | | — | | | | — | | | | 1,014,876 | | | | 216,405 | | |
Receivable for investments sold short | | | — | | | | 90,269,725 | | | | 24,895,530 | | | | 3,832,086 | | |
Receivable for when issued TBA securities | | | — | | | | 427,361,189 | | | | 13,898,735 | | | | 194,123,605 | | |
Receivable for interest | | | 87,621 | | | | 1,127,144 | | | | 2,001,841 | | | | 5,693,782 | | |
Receivable for foreign tax reclaims | | | — | | | | — | | | | 888 | | | | 374 | | |
Receivable from affiliate | | | 85,481 | | | | — | | | | — | | | | — | | |
Receivable for fund shares sold | | | 2,288,363 | | | | 173,712 | | | | 155,616 | | | | 316,220 | | |
Receivable for variation margin on futures contracts | | | — | | | | — | | | | — | | | | 973,941 | | |
Receivable for variation margin on centrally cleared swap agreements | | | — | | | | 67,728 | | | | 14,973 | | | | 298,193 | | |
OTC swap agreements, at value2 | | | — | | | | — | | | | 10,805 | | | | — | | |
Unrealized appreciation on forward foreign currency contracts | | | — | | | | — | | | | 81,620 | | | | 9,376 | | |
Other assets | | | 33,344 | | | | 20,023 | | | | 21,138 | | | | 22,314 | | |
Total assets | | | 319,116,812 | | | | 1,107,366,095 | | | | 434,342,389 | | | | 1,093,280,751 | | |
Liabilities: | |
Investments sold short, at value (proceeds—$0; $8,999,178; $24,866,757; $0; $0; $0 and $0, respectively) | | | — | | | | 9,019,403 | | | | 24,928,082 | | | | — | | |
Reverse repurchase agreements, at value (cost—$0; $21,219,427; $0; $1,633,600; $0;
$0 and $0, respectively) | | | — | | | | 21,219,427 | | | | — | | | | 1,633,600 | | |
Options and swaptions written, at value (premiums received $0; $347,672; $2,528,752; $100,376; $0;
$0 and $0, respectively) | | | — | | | | 76,501 | | | | 2,910,820 | | | | 15,495 | | |
Due to broker | | | — | | | | 1,671,110 | | | | 276,264 | | | | 1,243,943 | | |
Payable for cash collateral from securities loaned | | | — | | | | — | | | | 9,847,323 | | | | 29,099,463 | | |
Payable for investments purchased | | | 1,999,414 | | | | 111,283,969 | | | | 10,148,306 | | | | 4,326,717 | | |
Unfunded loan commitments | | | — | | | | — | | | | — | | | | — | | |
Payable for when issued TBA securities | | | — | | | | 634,330,706 | | | | 46,006,121 | | | | 293,779,948 | | |
Payable for fund shares redeemed | | | 433,179 | | | | 636,521 | | | | 720,958 | | | | 1,274,004 | | |
Payable for dividend and interest expense on investments sold short | | | — | | | | 2,228 | | | | 33,251 | | | | — | | |
Dividends payable to shareholders | | | 1,409 | | | | — | | | | — | | | | — | | |
Payable to affiliate | | | — | | | | 112,883 | | | | 25,548 | | | | 308,280 | | |
Payable to custodian | | | 39 | | | | 61,862 | | | | 43,303 | | | | 89,303 | | |
Payable for foreign withholding taxes and foreign capital gains taxes | | | — | | | | — | | | | — | | | | 1,668 | | |
Payable for treasury roll transactions | | | — | | | | — | | | | — | | | | 44,961,180 | | |
Deferred payable for treasury roll transactions | | | — | | | | — | | | | — | | | | 4,356 | | |
Payable for variation margin on futures contracts | | | — | | | | 254,375 | | | | 253,906 | | | | 516,927 | | |
Payable for variation margin on centrally cleared swap agreements | | | — | | | | — | | | | — | | | | 1,686 | | |
OTC swap agreements, at value2 | | | — | | | | 2,984 | | | | — | | | | 107,693 | | |
Unrealized depreciation on forward foreign currency contracts | | | — | | | | — | | | | 1,256,738 | | | | 1,762,977 | | |
Accrued expenses and other liabilities | | | 579,405 | | | | 364,251 | | | | 326,642 | | | | 400,320 | | |
Total liabilities | | | 3,013,446 | | | | 779,036,220 | | | | 96,777,262 | | | | 379,527,560 | | |
Net assets | | $ | 316,103,366 | | | $ | 328,329,875 | | | $ | 337,565,127 | | | $ | 713,753,191 | | |
1 Includes $0; $0; $10,292,018; $31,264,108; $0; $5,342,193 and $9,074,664, respectively of investments in securities on loan, at value, plus accrued interest and dividends, if any.
2 Net upfront payments received by PACE Mortgage-Backed Securities Fixed Income Investments and PACE Strategic Fixed Income Investments were $3,023 and $65,747, respectively. Net upfront payment made by PACE Intermediate Fixed Income Investments was $7,463.
272
PACE Select Advisors Trust
| | | PACE
Municipal
Fixed Income
Investments | | PACE
Global
Fixed Income
Investments | | PACE
High Yield
Investments | |
Assets: | |
Investments, at cost | |
Investments | | $ | 294,179,980 | | | $ | 325,848,495 | | | $ | 284,458,664 | | |
Repurchase agreements | | | — | | | | — | | | | — | | |
Foreign currency | | | — | | | | 845,065 | | | | 1,111,545 | | |
Investments, at value | |
Investments1 | | $ | 316,752,975 | | | $ | 342,618,589 | | | $ | 273,747,087 | | |
Repurchase agreements | | | — | | | | — | | | | — | | |
Foreign currency | | | — | | | | 846,773 | | | | 1,112,154 | | |
Cash | | | — | | | | — | | | | — | | |
Cash collateral on futures | | | — | | | | 1,129,906 | | | | — | | |
Cash collateral on swap agreements | | | — | | | | — | | | | — | | |
Cash collateral for forward foreign currency contracts | | | — | | | | — | | | | — | | |
Due from broker | | | — | | | | — | | | | — | | |
Receivable for investments sold | | | — | | | | 5,794,924 | | | | 3,029,877 | | |
Receivable for investments sold short | | | — | | | | — | | | | — | | |
Receivable for when issued TBA securities | | | — | | | | 6,835,875 | | | | — | | |
Receivable for interest | | | 3,114,825 | | | | 1,975,932 | | | | 4,392,550 | | |
Receivable for foreign tax reclaims | | | — | | | | 13,069 | | | | 1,648 | | |
Receivable from affiliate | | | — | | | | — | | | | — | | |
Receivable for fund shares sold | | | 104,040 | | | | 69,443 | | | | 100,341 | | |
Receivable for variation margin on futures contracts | | | — | | | | 146,108 | | | | — | | |
Receivable for variation margin on centrally cleared swap agreements | | | — | | | | — | | | | — | | |
OTC swap agreements, at value2 | | | — | | | | — | | | | — | | |
Unrealized appreciation on forward foreign currency contracts | | | — | | | | 3,461,629 | | | | 19,702 | | |
Other assets | | | 20,995 | | | | 22,591 | | | | 25,078 | | |
Total assets | | | 319,992,835 | | | | 362,914,839 | | | | 282,428,437 | | |
Liabilities: | |
Investments sold short, at value (proceeds—$0; $8,999,178; $24,866,757; $0; $0; $0 and $0, respectively) | | | — | | | | — | | | | — | | |
Reverse repurchase agreements, at value (cost—$0; $21,219,427; $0; $1,633,600; $0;
$0 and $0, respectively) | | | — | | | | — | | | | — | | |
Options and swaptions written, at value (premiums received $0; $347,672; $2,528,752; $100,376; $0;
$0 and $0, respectively) | | | — | | | | — | | | | — | | |
Due to broker | | | — | | | | — | | | | — | | |
Payable for cash collateral from securities loaned | | | — | | | | 5,453,783 | | | | 8,857,440 | | |
Payable for investments purchased | | | — | | | | 3,324,149 | | | | 3,112,955 | | |
Unfunded loan commitments | | | — | | | | — | | | | 16,892 | | |
Payable for when issued TBA securities | | | — | | | | 20,272,100 | | | | — | | |
Payable for fund shares redeemed | | | 132,597 | | | | 544,586 | | | | 549,458 | | |
Payable for dividend and interest expense on investments sold short | | | — | | | | — | | | | — | | |
Dividends payable to shareholders | | | — | | | | — | | | | — | | |
Payable to affiliate | | | 124,186 | | | | 211,084 | | | | 148,032 | | |
Payable to custodian | | | 43,792 | | | | 90,792 | | | | 530,580 | | |
Payable for foreign withholding taxes and foreign capital gains taxes | | | — | | | | 11,062 | | | | 295 | | |
Payable for treasury roll transactions | | | — | | | | — | | | | — | | |
Deferred payable for treasury roll transactions | | | — | | | | — | | | | — | | |
Payable for variation margin on futures contracts | | | — | | | | — | | | | — | | |
Payable for variation margin on centrally cleared swap agreements | | | — | | | | — | | | | — | | |
OTC swap agreements, at value2 | | | — | | | | — | | | | — | | |
Unrealized depreciation on forward foreign currency contracts | | | — | | | | 1,178,474 | | | | 2,484,906 | | |
Accrued expenses and other liabilities | | | 155,540 | | | | 379,195 | | | | 307,074 | | |
Total liabilities | | | 456,115 | | | | 31,465,225 | | | | 16,007,632 | | |
Net assets | | $ | 319,536,720 | | | $ | 331,449,614 | | | $ | 266,420,805 | | |
See accompanying notes to financial statements.
273
PACE Select Advisors Trust
Statement of assets and liabilities (continued)
July 31, 2020
| | | UBS
Government
Money Market
Investments Fund | | PACE
Mortgage-Backed
Securities
Fixed Income
Investments | | PACE
Intermediate
Fixed Income
Investments | | PACE
Strategic
Fixed Income
Investments | |
Net assets consist of: | |
Beneficial interest shares of $0.001 par value (unlimited amount authorized) | | $ | 316,104,929 | | | $ | 338,744,092 | | | $ | 308,581,433 | | | $ | 667,596,386 | | |
Distributable earnings (losses) | | | (1,563 | ) | | | (10,414,217 | ) | | | 28,983,694 | | | | 46,156,805 | | |
Net assets | | $ | 316,103,366 | | | $ | 328,329,875 | | | $ | 337,565,127 | | | $ | 713,753,191 | | |
Class A | |
Net assets | | $ | — | | | $ | 31,498,133 | | | $ | 13,475,132 | | | $ | 18,979,507 | | |
Shares outstanding | | | — | | | | 2,416,450 | | | | 1,008,756 | | | | 1,272,883 | | |
Net asset value per share | | $ | — | | | $ | 13.03 | | | $ | 13.36 | | | $ | 14.91 | | |
Maximum offering price per share | | $ | — | | | $ | 13.54 | | | $ | 13.88 | | | $ | 15.49 | | |
Class Y | |
Net assets | | $ | — | | | $ | 15,307,756 | | | $ | 270,545 | | | $ | 1,110,034 | | |
Shares outstanding | | | — | | | | 1,174,116 | | | | 20,252 | | | | 74,599 | | |
Net asset value, offering price and redemption value per share3 | | $ | — | | | $ | 13.04 | | | $ | 13.36 | | | $ | 14.88 | | |
Class P | |
Net assets | | $ | 316,103,366 | | | $ | 281,523,986 | | | $ | 323,819,450 | | | $ | 693,663,650 | | |
Shares outstanding | | | 316,103,739 | | | | 21,588,314 | | | | 24,233,808 | | | | 46,551,525 | | |
Net asset value, offering price and redemption value per share3 | | $ | 1.00 | | | $ | 13.04 | | | $ | 13.36 | | | $ | 14.90 | | |
* Actual net asset value per share presented differs from calculated net asset value per share due to rounding.
3 Assumes shares were held a sufficient period or are otherwise not subject to a redemption fee.
274
PACE Select Advisors Trust
| | | PACE
Municipal
Fixed Income
Investments | | PACE
Global
Fixed Income
Investments | | PACE
High Yield
Investments | |
Net assets consist of: | |
Beneficial interest shares of $0.001 par value (unlimited amount authorized) | | $ | 295,030,330 | | | $ | 317,338,932 | | | $ | 293,306,250 | | |
Distributable earnings (losses) | | | 24,506,390 | | | | 14,110,682 | | | | (26,885,445 | ) | |
Net assets | | $ | 319,536,720 | | | $ | 331,449,614 | | | $ | 266,420,805 | | |
Class A | |
Net assets | | $ | 40,354,600 | | | $ | 28,811,419 | | | $ | 7,507,262 | | |
Shares outstanding | | | 3,011,540 | | | | 2,723,746 | | | | 809,206 | | |
Net asset value per share | | $ | 13.40 | | | $ | 10.58 | | | $ | 9.28 | | |
Maximum offering price per share | | $ | 13.71 | | | $ | 10.99 | | | $ | 9.64 | | |
Class Y | |
Net assets | | $ | 3,894 | | | $ | 1,943,214 | | | $ | 568,120 | | |
Shares outstanding | | | 290 | | | | 184,840 | | | | 60,926 | | |
Net asset value, offering price and redemption value per share3 | | $ | 13.41 | * | | $ | 10.51 | | | $ | 9.32 | | |
Class P | |
Net assets | | $ | 279,178,226 | | | $ | 300,694,981 | | | $ | 258,345,423 | | |
Shares outstanding | | | 20,820,800 | | | | 28,477,758 | | | | 27,841,690 | | |
Net asset value, offering price and redemption value per share3 | | $ | 13.41 | | | $ | 10.56 | | | $ | 9.28 | | |
See accompanying notes to financial statements.
275
PACE Select Advisors Trust
Statement of assets and liabilities (continued)
July 31, 2020
| | | PACE
Large Co
Value Equity
Investments | | PACE
Large Co
Growth Equity
Investments | | PACE
Small/Medium Co
Value Equity
Investments | | PACE
Small/Medium Co
Growth Equity
Investments | |
Assets: | |
Investments, at cost | |
Investments | | $ | 969,269,007 | | | $ | 753,363,713 | | | $ | 344,061,174 | | | $ | 348,911,133 | | |
Foreign currency | | | — | | | | — | | | | — | | | | — | | |
Investments, at value | |
Investments1 | | $ | 991,046,117 | | | $ | 1,175,067,439 | | | $ | 374,017,488 | | | $ | 427,594,142 | | |
Foreign currency | | | — | | | | — | | | | — | | | | — | | |
Cash | | | — | | | | — | | | | — | | | | — | | |
Cash collateral on options | | | — | | | | — | | | | — | | | | — | | |
Cash collateral on futures | | | — | | | | — | | | | — | | | | — | | |
Cash collateral on swap agreements | | | — | | | | — | | | | — | | | | — | | |
Cash collateral on investments sold short | | | 2,097,547 | | | | — | | | | — | | | | — | | |
Cash collateral for forward foreign currency contracts | | | — | | | | — | | | | — | | | | — | | |
Receivable for investments sold | | | 531,912 | | | | 8,566,990 | | | | 2,429,005 | | | | 1,325,508 | | |
Receivable for investments sold short | | | — | | | | — | | | | — | | | | — | | |
Receivable for dividends and interest | | | 1,595,939 | | | | 160,975 | | | | 116,212 | | | | 45,230 | | |
Receivable for foreign tax reclaims | | | 20,310 | | | | 37,390 | | | | 13,990 | | | | — | | |
Receivable from affiliate | | | — | | | | — | | | | — | | | | — | | |
Receivable for fund shares sold | | | 386,399 | | | | 970,358 | | | | 171,372 | | | | 64,436 | | |
Receivable for variation margin on futures contracts | | | — | | | | — | | | | — | | | | — | | |
Receivable for variation margin on centrally cleared swap agreements | | | — | | | | — | | | | — | | | | — | | |
OTC swap agreements, at value | | | — | | | | — | | | | — | | | | — | | |
Unrealized appreciation on forward foreign currency contracts | | | — | | | | — | | | | — | | | | — | | |
Other assets | | | 22,745 | | | | 22,805 | | | | 20,138 | | | | 20,093 | | |
Total assets | | | 995,700,969 | | | | 1,184,825,957 | | | | 376,768,205 | | | | 429,049,409 | | |
Liabilities: | |
Investments sold short, at value (proceeds—$110,996,532; $0; $0; $0; $120,275,960; $0;
$0 and $101,797,905, respectively) | | | 127,935,218 | | | | — | | | | — | | | | — | | |
Options and swaptions written, at value (premiums received $0; $0; $0; $0; $0; $0;
$0 and $1,382,330, respectively) | | | — | | | | — | | | | — | | | | — | | |
Due to broker | | | — | | | | — | | | | — | | | | — | | |
Payable for bank loan | | | — | | | | 1,432,228 | | | | — | | | | — | | |
Payable for cash collateral from securities loaned | | | 8,120,233 | | | | 1,775,246 | | | | 19,508,290 | | | | 19,334,845 | | |
Payable for investments purchased | | | 1,374,587 | | | | 5,320,640 | | | | 4,172,735 | | | | 1,058,128 | | |
Payable for fund shares redeemed | | | 2,123,597 | | | | 2,059,961 | | | | 607,300 | | | | 672,102 | | |
Payable for dividend and interest expense on investments sold short | | | 91,606 | | | | — | | | | — | | | | — | | |
Payable to affiliate | | | 489,975 | | | | 589,767 | | | | 236,320 | | | | 335,339 | | |
Payable to custodian | | | 128,905 | | | | 151,791 | | | | 63,216 | | | | 43,714 | | |
Payable for foreign withholding taxes and foreign capital gains taxes | | | — | | | | — | | | | 1,366 | | | | — | | |
OTC swap agreements, at value | | | — | | | | — | | | | — | | | | — | | |
Unrealized depreciation on forward foreign currency contracts | | | — | | | | — | | | | — | | | | — | | |
Accrued expenses and other liabilities | | | 581,620 | | | | 409,767 | | | | 376,739 | | | | 361,554 | | |
Total liabilities | | | 140,845,741 | | | | 11,739,400 | | | | 24,965,966 | | | | 21,805,682 | | |
Net assets | | $ | 854,855,228 | | | $ | 1,173,086,557 | | | $ | 351,802,239 | | | $ | 407,243,727 | | |
1 Includes $15,862,773; $6,903,524; $35,400,623; $30,096,336; $10,229,707; $3,576,276; $1,651,860 and $0, respectively of investments in securities on loan, at value, plus accrued interest and dividends, if any.
276
PACE Select Advisors Trust
| | | PACE
International
Equity
Investments | | PACE
International
Emerging
Markets Equity
Investments | | PACE
Global
Real Estate
Securities
Investments | | PACE
Alternative
Strategies
Investments | |
Assets: | |
Investments, at cost | |
Investments | | $ | 927,638,493 | | | $ | 301,400,268 | | | $ | 94,303,605 | | | $ | 433,054,530 | | |
Foreign currency | | | 808,224 | | | | 345,871 | | | | — | | | | 4,203,710 | | |
Investments, at value | |
Investments1 | | $ | 963,243,949 | | | $ | 358,130,844 | | | $ | 89,527,796 | | | $ | 454,197,249 | | |
Foreign currency | | | 804,458 | | | | 344,884 | | | | — | | | | 4,210,461 | | |
Cash | | | — | | | | — | | | | — | | | | 360,394 | | |
Cash collateral on options | | | — | | | | — | | | | — | | | | 12,085,040 | | |
Cash collateral on futures | | | — | | | | — | | | | — | | | | 3,190,802 | | |
Cash collateral on swap agreements | | | — | | | | — | | | | — | | | | 20,152,357 | | |
Cash collateral on investments sold short | | | 998,289 | | | | — | | | | — | | | | 56,678,640 | | |
Cash collateral for forward foreign currency contracts | | | — | | | | — | | | | — | | | | 13,241,000 | | |
Receivable for investments sold | | | 12,648,813 | | | | 2,156,668 | | | | 211,376 | | | | 24,299,432 | | |
Receivable for investments sold short | | | — | | | | — | | | | — | | | | 12,902,660 | | |
Receivable for dividends and interest | | | 673,921 | | | | 1,516,921 | | | | 200,297 | | | | 161,753 | | |
Receivable for foreign tax reclaims | | | 4,947,762 | | | | 8,541 | | | | 21,488 | | | | 166,239 | | |
Receivable from affiliate | | | — | | | | — | | | | — | | | | 13,467 | | |
Receivable for fund shares sold | | | 316,532 | | | | 124,175 | | | | 65,450 | | | | 114,978 | | |
Receivable for variation margin on futures contracts | | | — | | | | — | | | | — | | | | 983,446 | | |
Receivable for variation margin on centrally cleared swap agreements | | | — | | | | — | | | | — | | | | 25,149 | | |
OTC swap agreements, at value | | | — | | | | — | | | | — | | | | 4,726,550 | | |
Unrealized appreciation on forward foreign currency contracts | | | — | | | | — | | | | — | | | | 9,725,945 | | |
Other assets | | | 22,599 | | | | 20,090 | | | | 8,579 | | | | 22,800 | | |
Total assets | | | 983,656,323 | | | | 362,302,123 | | | | 90,034,986 | | | | 617,258,362 | | |
Liabilities: | |
Investments sold short, at value (proceeds—$110,996,532; $0; $0; $0; $120,275,960; $0;
$0 and $101,797,905, respectively) | | | 114,558,052 | | | | — | | | | — | | | | 103,140,266 | | |
Options and swaptions written, at value (premiums received $0; $0; $0; $0; $0; $0;
$0 and $1,382,330, respectively) | | | — | | | | — | | | | — | | | | 915,250 | | |
Due to broker | | | — | | | | — | | | | — | | | | 799,579 | | |
Payable for bank loan | | | — | | | | — | | | | — | | | | — | | |
Payable for cash collateral from securities loaned | | | 4,380,887 | | | | 3,318,227 | | | | 963,819 | | | | — | | |
Payable for investments purchased | | | 11,205,211 | | | | 707,014 | | | | 191,189 | | | | 36,206,311 | | |
Payable for fund shares redeemed | | | 1,741,237 | | | | 737,725 | | | | 214,027 | | | | 1,465,044 | | |
Payable for dividend and interest expense on investments sold short | | | 125,844 | | | | — | | | | — | | | | 162,676 | | |
Payable to affiliate | | | 652,343 | | | | 335,624 | | | | 49,926 | | | | — | | |
Payable to custodian | | | 117,210 | | | | 188,521 | | | | 41,643 | | | | 325 | | |
Payable for foreign withholding taxes and foreign capital gains taxes | | | 62,822 | | | | 509,274 | | | | 44,583 | | | | 11,271 | | |
OTC swap agreements, at value | | | — | | | | — | | | | — | | | | 9,260,358 | | |
Unrealized depreciation on forward foreign currency contracts | | | — | | | | — | | | | — | | | | 7,634,090 | | |
Accrued expenses and other liabilities | | | 552,984 | | | | 402,597 | | | | 356,876 | | | | 398,787 | | |
Total liabilities | | | 133,396,590 | | | | 6,198,982 | | | | 1,862,063 | | | | 159,993,957 | | |
Net assets | | $ | 850,259,733 | | | $ | 356,103,141 | | | $ | 88,172,923 | | | $ | 457,264,405 | | |
See accompanying notes to financial statements.
277
PACE Select Advisors Trust
Statement of assets and liabilities (concluded)
July 31, 2020
| | | PACE
Large Co
Value Equity
Investments | | PACE
Large Co
Growth Equity
Investments | | PACE
Small/Medium Co
Value Equity
Investments | | PACE
Small/Medium Co
Growth Equity
Investments | |
Net assets consist of: | |
Beneficial interest shares of $0.001 par value (unlimited amount authorized) | | $ | 899,197,731 | | | $ | 620,559,349 | | | $ | 347,313,829 | | | $ | 313,287,197 | | |
Distributable earnings (losses) | | | (44,342,503 | ) | | | 552,527,208 | | | | 4,488,410 | | | | 93,956,530 | | |
Net assets | | $ | 854,855,228 | | | $ | 1,173,086,557 | | | $ | 351,802,239 | | | $ | 407,243,727 | | |
Class A | |
Net assets | | $ | 81,189,904 | | | $ | 54,124,278 | | | $ | 13,279,349 | | | $ | 23,754,800 | | |
Shares outstanding | | | 4,544,465 | | | | 2,072,642 | | | | 786,572 | | | | 1,501,615 | | |
Net asset value per share | | $ | 17.87 | | | $ | 26.11 | | | $ | 16.88 | | | $ | 15.82 | | |
Maximum offering price per share | | $ | 18.91 | | | $ | 27.63 | | | $ | 17.86 | | | $ | 16.74 | | |
Class Y | |
Net assets | | $ | 13,059,024 | | | $ | 19,149,241 | | | $ | 104,745 | | | $ | 28,304 | | |
Shares outstanding | | | 729,004 | | | | 688,166 | | | | 5,923 | | | | 1,584 | | |
Net asset value, offering price and redemption value per share2 | | $ | 17.91 | | | $ | 27.83 | | | $ | 17.69 | * | | $ | 17.87 | | |
Class P | |
Net assets | | $ | 760,606,300 | | | $ | 1,099,813,038 | | | $ | 338,418,145 | | | $ | 383,460,623 | | |
Shares outstanding | | | 42,699,906 | | | | 39,957,149 | | | | 19,395,138 | | | | 22,054,630 | | |
Net asset value, offering price and redemption value per share2 | | $ | 17.81 | | | $ | 27.52 | | | $ | 17.45 | | | $ | 17.39 | | |
* Actual net asset value per share presented differs from calculated net asset value per share due to rounding.
278
PACE Select Advisors Trust
| | | PACE
International
Equity
Investments | | PACE
International
Emerging
Markets Equity
Investments | | PACE
Global
Real Estate
Securities
Investments | | PACE
Alternative
Strategies
Investments | |
Net assets consist of: | |
Beneficial interest shares of $0.001 par value (unlimited amount authorized) | | $ | 862,814,067 | | | $ | 348,192,061 | | | $ | 113,005,031 | | | $ | 443,242,200 | | |
Distributable earnings (losses) | | | (12,554,334 | ) | | | 7,911,080 | | | | (24,832,108 | ) | | | 14,022,205 | | |
Net assets | | $ | 850,259,733 | | | $ | 356,103,141 | | | $ | 88,172,923 | | | $ | 457,264,405 | | |
Class A | |
Net assets | | $ | 23,422,157 | | | $ | 4,604,961 | | | $ | 307,033 | | | $ | 6,460,063 | | |
Shares outstanding | | | 1,600,052 | | | | 333,976 | | | | 50,073 | | | | 584,541 | | |
Net asset value per share | | $ | 14.64 | | | $ | 13.79 | | | $ | 6.13 | | | $ | 11.05 | | |
Maximum offering price per share | | $ | 15.49 | | | $ | 14.59 | | | $ | 6.49 | | | $ | 11.69 | | |
Class Y | |
Net assets | | $ | 11,053,059 | | | $ | 6,067,199 | | | $ | — | | | $ | 402,414 | | |
Shares outstanding | | | 758,126 | | | | 435,856 | | | | — | | | | 36,395 | | |
Net asset value, offering price and redemption value per share2 | | $ | 14.58 | | | $ | 13.92 | | | $ | — | | | $ | 11.06 | | |
Class P | |
Net assets | | $ | 815,784,517 | | | $ | 345,430,981 | | | $ | 87,865,890 | | | $ | 450,401,928 | | |
Shares outstanding | | | 56,116,987 | | | | 24,944,731 | | | | 14,916,805 | | | | 40,902,164 | | |
Net asset value, offering price and redemption value per share2 | | $ | 14.54 | | | $ | 13.85 | | | $ | 5.89 | | | $ | 11.01 | | |
See accompanying notes to financial statements.
279
PACE Select Advisors Trust
Statement of operations
For the year ended July 31, 2020
| | | UBS
Government
Money Market
Investments
Fund | | PACE
Mortgage-Backed
Securities
Fixed Income
Investments | | PACE
Intermediate
Fixed Income
Investments | | PACE
Strategic
Fixed Income
Investments | |
Investment income: | |
Dividends | | $ | — | | | $ | — | | | $ | — | | | $ | 258,149 | | |
Interest | | | 2,943,264 | | | | 11,151,424 | | | | 9,400,731 | | | | 27,835,611 | | |
Securities lending | | | — | | | | — | | | | 12,183 | | | | 32,509 | | |
Foreign tax withheld | | | — | | | | — | | | | 1,041 | | | | 6,955 | | |
Total income | | | 2,943,264 | | | | 11,151,424 | | | | 9,413,955 | | | | 28,133,224 | | |
Expenses: | |
Investment management and administration fees | | | 734,790 | | | | 2,202,839 | | | | 1,844,586 | | | | 4,445,443 | | |
Service fees–Class A | | | — | | | | 80,673 | | | | 33,415 | | | | 44,815 | | |
Transfer agency and related services fees | | | 933,772 | | | | 581,265 | | | | 497,067 | | | | 656,761 | | |
Custody and fund accounting fees | | | 16,003 | | | | 154,150 | | | | 210,009 | | | | 224,092 | | |
Trustees fees | | | 19,666 | | | | 21,390 | | | | 21,354 | | | | 25,285 | | |
Professional services fees | | | 141,739 | | | | 161,143 | | | | 162,361 | | | | 174,696 | | |
Printing and shareholder report fees | | | 65,238 | | | | 36,415 | | | | 28,780 | | | | 43,297 | | |
Federal and state registration fees | | | 38,722 | | | | 50,354 | | | | 51,089 | | | | 54,025 | | |
Insurance expense | | | 1,361 | | | | 2,788 | | | | 2,696 | | | | 5,791 | | |
Interest expense | | | — | | | | 808,403 | | | | 4,672 | | | | 2,547,307 | | |
Other expenses | | | 60,240 | | | | 61,822 | | | | 63,135 | | | | 65,945 | | |
Total expenses | | | 2,011,531 | | | | 4,161,242 | | | | 2,919,164 | | | | 8,287,457 | | |
Fee waivers and/or expense reimbursements by investment manager and administrator | | | (677,323 | ) | | | (778,759 | ) | | | (611,224 | ) | | | (735,584 | ) | |
Net expenses | | | 1,334,208 | | | | 3,382,483 | | | | 2,307,940 | | | | 7,551,873 | | |
Net investment income (loss) | | | 1,609,056 | | | | 7,768,941 | | | | 7,106,015 | | | | 20,581,351 | | |
Net realized and unrealized gains (loss) from investment activities: | |
Net realized gain (loss) on: | |
Investments | | | — | | | | 12,628,132 | | | | 12,585,073 | | | | 23,065,688 | | |
Securities sold short | | | — | | | | (767,459 | ) | | | — | | | | 617,453 | | |
Options and swaptions written | | | — | | | | 871,217 | | | | 823,876 | | | | 355,981 | | |
Futures contracts | | | — | | | | (3,177,801 | ) | | | 1,348,866 | | | | 2,874,522 | | |
Swap agreements | | | — | | | | (2,742,035 | ) | | | (2,819,180 | ) | | | (3,095,962 | ) | |
Forward foreign currency contracts | | | — | | | | — | | | | (145,681 | ) | | | 585,293 | | |
Foreign currency transactions | | | — | | | | — | | | | (10,299 | ) | | | (599,578 | ) | |
Net realized gain (loss) | | | — | | | | 6,812,054 | | | | 11,782,655 | | | | 23,803,397 | | |
Change in net unrealized appreciation (depreciation) on: | |
Investments | | | — | | | | 5,234,422 | | | | 14,758,505 | | | | 30,617,665 | | |
Investments sold short | | | — | | | | (10,247 | ) | | | 46,197 | | | | 3,265 | | |
Options and swaptions written | | | — | | | | 228,763 | | | | (491,657 | ) | | | 55,520 | | |
Futures contracts | | | — | | | | 293,430 | | | | (452,101 | ) | | | 724,694 | | |
Swap agreements | | | — | | | | 223,098 | | | | 402,372 | | | | 590,851 | | |
Forward foreign currency contracts | | | — | | | | — | | | | (1,180,151 | ) | | | (2,703,442 | ) | |
Translation of other assets and liabilities denominated in foreign currency | | | — | | | | — | | | | 16,544 | | | | 191,535 | | |
Net change in unrealized appreciation (depreciation) | | | — | | | | 5,969,466 | | | | 13,099,709 | | | | 29,480,088 | | |
Net realized and unrealized gain (loss) | | | — | | | | 12,781,520 | | | | 24,882,364 | | | | 53,283,485 | | |
Net increase (decrease) in net assets resulting from operations | | $ | 1,609,056 | | | $ | 20,550,461 | | | $ | 31,988,379 | | | $ | 73,864,836 | | |
280
PACE Select Advisors Trust
| | PACE
Municipal
Fixed Income
Investments | | PACE
Global
Fixed Income
Investments | | PACE
High Yield
Investments | |
Investment income: | |
Dividends | | $ | — | | | $ | — | | | $ | — | | |
Interest | | | 9,600,526 | | | | 6,568,346 | | | | 18,105,359 | | |
Securities lending | | | — | | | | 4,638 | | | | 49,272 | | |
Foreign tax withheld | | | — | | | | (35,788 | ) | | | 693 | | |
Total income | | | 9,600,526 | | | | 6,537,196 | | | | 18,155,324 | | |
Expenses: | |
Investment management and administration fees | | | 1,795,891 | | | | 2,564,498 | | | | 2,255,079 | | |
Service fees–Class A | | | 107,267 | | | | 72,123 | | | | 13,416 | | |
Transfer agency and related services fees | | | 108,290 | | | | 588,014 | | | | 484,347 | | |
Custody and fund accounting fees | | | 59,797 | | | | 171,660 | | | | 73,519 | | |
Trustees fees | | | 21,250 | | | | 21,321 | | | | 20,689 | | |
Professional services fees | | | 128,552 | | | | 199,762 | | | | 128,356 | | |
Printing and shareholder report fees | | | 18,719 | | | | 31,398 | | | | 27,838 | | |
Federal and state registration fees | | | 53,484 | | | | 49,853 | | | | 47,536 | | |
Insurance expense | | | 2,593 | | | | 2,808 | | | | 2,443 | | |
Interest expense | | | — | | | | — | | | | — | | |
Other expenses | | | 41,150 | | | | 49,001 | | | | 67,755 | | |
Total expenses | | | 2,336,993 | | | | 3,750,438 | | | | 3,120,978 | | |
Fee waivers and/or expense reimbursements by investment manager and administrator | | | (324,910 | ) | | | (825,533 | ) | | | (547,943 | ) | |
Net expenses | | | 2,012,083 | | | | 2,924,905 | | | | 2,573,035 | | |
Net investment income (loss) | | | 7,588,443 | | | | 3,612,291 | | | | 15,582,289 | | |
Net realized and unrealized gains (loss) from investment activities: | |
Net realized gain (loss) on: | |
Investments | | | 1,509,247 | | | | 4,880,495 | | | | (9,134,926 | ) | |
Securities sold short | | | — | | | | — | | | | — | | |
Options and swaptions written | | | — | | | | — | | | | — | | |
Futures contracts | | | — | | | | 1,299,486 | | | | — | | |
Swap agreements | | | — | | | | — | | | | — | | |
Forward foreign currency contracts | | | — | | | | 2,007,164 | | | | 1,657,578 | | |
Foreign currency transactions | | | — | | | | 1,312,080 | | | | 533,795 | | |
Net realized gain (loss) | | | 1,509,247 | | | | 9,499,225 | | | | (6,943,553 | ) | |
Change in net unrealized appreciation (depreciation) on: | |
Investments | | | 3,037,035 | | | | 9,593,420 | | | | (2,157,443 | ) | |
Investments sold short | | | — | | | | — | | | | — | | |
Options and swaptions written | | | — | | | | — | | | | — | | |
Futures contracts | | | — | | | | (764,064 | ) | | | — | | |
Swap agreements | | | — | | | | — | | | | — | | |
Forward foreign currency contracts | | | — | | | | 1,923,754 | | | | (4,597,736 | ) | |
Translation of other assets and liabilities denominated in foreign currency | | | — | | | | 78,069 | | | | 363,239 | | |
Net change in unrealized appreciation (depreciation) | | | 3,037,035 | | | | 10,831,179 | | | | (6,391,940 | ) | |
Net realized and unrealized gain (loss) | | | 4,546,282 | | | | 20,330,404 | | | | (13,335,493 | ) | |
Net increase (decrease) in net assets resulting from operations | | $ | 12,134,725 | | | $ | 23,942,695 | | | $ | 2,246,796 | | |
See accompanying notes to financial statements
281
PACE Select Advisors Trust
Statement of operations (concluded)
For the year ended July 31, 2020
| | | PACE
Large Co
Value Equity
Investments | | PACE
Large Co
Growth Equity
Investments | | PACE
Small/Medium Co
Value Equity
Investments | | PACE
Small/Medium Co
Growth Equity
Investments | |
Investment income: | |
Dividends | | $ | 33,486,829 | | | $ | 11,458,784 | | | $ | 6,200,372 | | | $ | 2,093,305 | | |
Interest | | | 163,342 | | | | 359,521 | | | | 175,732 | | | | 55,807 | | |
Securities lending | | | 73,972 | | | | 215,327 | | | | 99,790 | | | | 243,324 | | |
Foreign tax withheld | | | (131,679 | ) | | | (115,107 | ) | | | (64,352 | ) | | | (13,015 | ) | |
Total income | | | 33,592,464 | | | | 11,918,525 | | | | 6,411,542 | | | | 2,379,421 | | |
Expenses: | |
Investment management and administration fees | | | 7,488,442 | | | | 8,911,887 | | | | 3,037,686 | | | | 3,242,758 | | |
Service fees–Class A | | | 234,515 | | | | 117,450 | | | | 36,618 | | | | 55,740 | | |
Transfer agency and related services fees | | | 813,753 | | | | 733,549 | | | | 693,962 | | | | 695,403 | | |
Custody and fund accounting fees | | | 207,500 | | | | 227,283 | | | | 101,473 | | | | 110,597 | | |
Trustees fees | | | 27,788 | | | | 29,225 | | | | 21,662 | | | | 21,851 | | |
Professional services fees | | | 151,165 | | | | 278,783 | | | | 131,337 | | | | 135,394 | | |
Printing and shareholder report fees | | | 50,844 | | | | 46,535 | | | | 55,164 | | | | 84,036 | | |
Federal and state registration fees | | | 53,164 | | | | 52,685 | | | | 50,122 | | | | 49,834 | | |
Insurance expense | | | 9,136 | | | | 9,468 | | | | 3,495 | | | | 3,606 | | |
Interest expense | | | 2,292 | | | | 4,068 | | | | 75 | | | | 171 | | |
Dividend expense | | | 3,400,713 | | | | — | | | | — | | | | — | | |
Other expenses | | | 97,821 | | | | 128,734 | | | | 44,903 | | | | 59,644 | | |
Total expenses | | | 12,537,133 | | | | 10,539,667 | | | | 4,176,497 | | | | 4,459,034 | | |
Fee waivers and/or expense reimbursements by investment manager and administrator | | | (88,857 | ) | | | (399,855 | ) | | | (199,089 | ) | | | (47,892 | ) | |
Net expenses | | | 12,448,276 | | | | 10,139,812 | | | | 3,977,408 | | | | 4,411,142 | | |
Net investment income (loss) | | | 21,144,188 | | | | 1,778,713 | | | | 2,434,134 | | | | (2,031,721 | ) | |
Net realized and unrealized gains (loss) from investment activities: | |
Net realized gain (loss) on: | |
Investments | | | (37,281,747 | ) | | | 204,404,402 | | | | (18,545,654 | ) | | | 22,585,591 | | |
Securities sold short | | | (450,803 | ) | | | — | | | | — | | | | — | | |
Options and swaptions written | | | — | | | | — | | | | — | | | | — | | |
Futures contracts | | | — | | | | — | | | | — | | | | — | | |
Swap agreements | | | — | | | | — | | | | — | | | | — | | |
Forward foreign currency contracts | | | — | | | | — | | | | — | | | | — | | |
Foreign currency transactions | | | (97 | ) | | | — | | | | (141 | ) | | | — | | |
Net realized gain (loss) | | | (37,732,647 | ) | | | 204,404,402 | | | | (18,545,795 | ) | | | 22,585,591 | | |
Change in net unrealized appreciation (depreciation) on: | |
Investments (net of change in deferred foreign capital gain taxes of $0; $0; $0; $0;
$(32,216); $(284,077); $0 and $(6,940), respectively) | | | (112,911,082 | ) | | | 54,481,926 | | | | (23,649,285 | ) | | | 14,802,629 | | |
Investments sold short | | | (1,898,035 | ) | | | — | | | | — | | | | — | | |
Options and swaptions written | | | — | | | | — | | | | — | | | | — | | |
Futures contracts | | | — | | | | — | | | | — | | | | — | | |
Swap agreements | | | — | | | | — | | | | — | | | | — | | |
Forward foreign currency contracts | | | — | | | | — | | | | — | | | | — | | |
Translation of other assets and liabilities denominated in foreign currency | | | — | | | | — | | | | 38 | | | | — | | |
Net change in unrealized appreciation (depreciation) | | | (114,809,117 | ) | | | 54,481,926 | | | | (23,649,247 | ) | | | 14,802,629 | | |
Net realized and unrealized gain (loss) | | | (152,541,764 | ) | | | 258,886,328 | | | | (42,195,042 | ) | | | 37,388,220 | | |
Net increase (decrease) in net assets resulting from operations | | $ | (131,397,576 | ) | | $ | 260,665,041 | | | $ | (39,760,908 | ) | | $ | 35,356,499 | | |
282
PACE Select Advisors Trust
| | | PACE
International
Equity
Investments | | PACE
International
Emerging
Markets Equity
Investments | | PACE
Global
Real Estate
Securities
Investments | | PACE
Alternative
Strategies
Investments | |
Investment income: | |
Dividends | | $ | 30,760,083 | | | $ | 9,876,244 | | | $ | 3,523,958 | | | $ | 5,681,039 | | |
Interest | | | 94,774 | | | | 74,130 | | | | 7,719 | | | | 4,439,632 | | |
Securities lending | | | 276,666 | | | | 17,333 | | | | 9,179 | | | | — | | |
Foreign tax withheld | | | (2,132,211 | ) | | | (911,347 | ) | | | (126,822 | ) | | | (215,856 | ) | |
Total income | | | 28,999,312 | | | | 9,056,360 | | | | 3,414,034 | | | | 9,904,815 | | |
Expenses: | |
Investment management and administration fees | | | 8,077,287 | | | | 3,917,206 | | | | 861,262 | | | | 6,828,840 | | |
Service fees–Class A | | | 61,465 | | | | 10,769 | | | | 899 | | | | 18,395 | | |
Transfer agency and related services fees | | | 703,128 | | | | 630,640 | | | | 495,258 | | | | 342,519 | | |
Custody and fund accounting fees | | | 361,330 | | | | 351,836 | | | | 81,069 | | | | 1,117,237 | | |
Trustees fees | | | 27,001 | | | | 21,411 | | | | 18,935 | | | | 22,766 | | |
Professional services fees | | | 180,847 | | | | 238,209 | | | | 142,546 | | | | 325,187 | | |
Printing and shareholder report fees | | | 41,158 | | | | 81,607 | | | | 29,316 | | | | 48,104 | | |
Federal and state registration fees | | | 54,828 | | | | 50,711 | | | | 32,409 | | | | 54,601 | | |
Insurance expense | | | 7,982 | | | | 3,051 | | | | 1,019 | | | | 4,351 | | |
Interest expense | | | 6,177 | | | | 2,071 | | | | 64 | | | | 8,323 | | |
Dividend expense | | | 4,014,488 | | | | — | | | | — | | | | 3,626,232 | | |
Other expenses | | | 116,064 | | | | 77,027 | | | | 50,220 | | | | 125,661 | | |
Total expenses | | | 13,651,755 | | | | 5,384,538 | | | | 1,712,997 | | | | 12,522,216 | | |
Fee waivers and/or expense reimbursements by investment manager and administrator | | | — | | | | (386,163 | ) | | | (420,141 | ) | | | (914,534 | ) | |
Net expenses | | | 13,651,755 | | | | 4,998,375 | | | | 1,292,856 | | | | 11,607,682 | | |
Net investment income (loss) | | | 15,347,557 | | | | 4,057,985 | | | | 2,121,178 | | | | (1,702,867 | ) | |
Net realized and unrealized gains (loss) from investment activities: | |
Net realized gain (loss) on: | |
Investments | | | (38,115,455 | ) | | | (9,207,522 | ) | | | (11,225,293 | ) | | | 3,094,994 | | |
Securities sold short | | | 5,583,926 | | | | — | | | | — | | | | 3,789,470 | | |
Options and swaptions written | | | — | | | | — | | | | — | | | | (4,451,948 | ) | |
Futures contracts | | | — | | | | — | | | | — | | | | 3,167,532 | | |
Swap agreements | | | — | | | | — | | | | — | | | | 7,749,469 | | |
Forward foreign currency contracts | | | 12,766 | | | | (50 | ) | | | — | | | | 3,684,126 | | |
Foreign currency transactions | | | (73,114 | ) | | | (561,738 | ) | | | (35,271 | ) | | | (105,137 | ) | |
Net realized gain (loss) | | | (32,591,877 | ) | | | (9,769,310 | ) | | | (11,260,564 | ) | | | 16,928,506 | | |
Change in net unrealized appreciation (depreciation) on: | |
Investments (net of change in deferred foreign capital gain taxes of $0; $0; $0; $0;
$(32,216); $(284,077); $0 and $(6,940), respectively) | | | 16,739,168 | | | | 27,855,409 | | | | (9,934,567 | ) | | | 9,259,225 | | |
Investments sold short | | | (2,676,944 | ) | | | — | | | | — | | | | 51,619 | | |
Options and swaptions written | | | — | | | | — | | | | — | | | | 441,044 | | |
Futures contracts | | | — | | | | — | | | | — | | | | 1,166,684 | | |
Swap agreements | | | — | | | | — | | | | — | | | | (5,048,247 | ) | |
Forward foreign currency contracts | | | — | | | | — | | | | — | | | | 903,968 | | |
Translation of other assets and liabilities denominated in foreign currency | | | 375,531 | | | | (13,089 | ) | | | 9,492 | | | | (2,926,536 | ) | |
Net change in unrealized appreciation (depreciation) | | | 14,437,755 | | | | 27,842,320 | | | | (9,925,075 | ) | | | 3,847,757 | | |
Net realized and unrealized gain (loss) | | | (18,154,122 | ) | | | 18,073,010 | | | | (21,185,639 | ) | | | 20,776,263 | | |
Net increase (decrease) in net assets resulting from operations | | $ | (2,806,565 | ) | | $ | 22,130,995 | | | $ | (19,064,461 | ) | | $ | 19,073,396 | | |
See accompanying notes to financial statements
283
PACE Select Advisors Trust
Statement of changes in net assets
| | | UBS
Government Money Market
Investments Fund | | PACE
Mortgage-Backed Securities
Fixed Income Investments | | PACE
Intermediate Fixed Income
Investments | |
| | | For the years ended July 31, | | For the years ended July 31, | | For the years ended July 31, | |
| | | 2020 | | 2019 | | 2020 | | 2019 | | 2020 | | 2019 | |
From operations: | |
Net investment income (loss) | | $ | 1,609,056 | | | $ | 3,456,399 | | | $ | 7,768,941 | | | $ | 9,881,951 | | | $ | 7,106,015 | | | $ | 9,769,269 | | |
Net realized gain (loss) | | | — | | | | 135 | | | | 6,812,054 | | | | 3,933,051 | | | | 11,782,655 | | | | (569,154 | ) | |
Net change in unrealized appreciation (depreciation) | | | — | | | | — | | | | 5,969,466 | | | | 9,283,143 | | | | 13,099,709 | | | | 16,323,314 | | |
Net increase (decrease) in net assets resulting from operations | | | 1,609,056 | | | | 3,456,534 | | | | 20,550,461 | | | | 23,098,145 | | | | 31,988,379 | | | | 25,523,429 | | |
Total distributions–Class A | | | — | | | | — | | | | (1,004,518 | ) | | | (1,144,300 | ) | | | (271,893 | ) | | | (366,787 | ) | |
Total distributions–Class C | | | — | | | | — | | | | — | | | | (47,220 | ) | | | — | | | | (3,870 | ) | |
Total distributions–Class Y | | | — | | | | — | | | | (667,873 | ) | | | (949,248 | ) | | | (7,184 | ) | | | (8,615 | ) | |
Total distributions–Class P | | | (1,609,056 | ) | | | (3,456,399 | ) | | | (9,892,444 | ) | | | (10,987,771 | ) | | | (7,543,874 | ) | | | (9,771,060 | ) | |
Total distributions | | | (1,609,056 | ) | | | (3,456,399 | ) | | | (11,564,835 | ) | | | (13,128,539 | ) | | | (7,822,951 | ) | | | (10,150,332 | ) | |
From beneficial interest transactions: | |
Proceeds from shares sold | | | 616,957,497 | | | | 241,670,811 | | | | 43,911,461 | | | | 66,071,764 | | | | 37,563,856 | | | | 54,599,176 | | |
Cost of shares redeemed | | | (487,035,778 | ) | | | (248,947,713 | ) | | | (96,976,344 | ) | | | (118,655,865 | ) | | | (79,399,295 | ) | | | (99,349,800 | ) | |
Shares issued on reinvestment of dividends and distributions | | | 1,579,719 | | | | 3,084,709 | | | | 10,441,434 | | | | 11,965,517 | | | | 7,054,164 | | | | 9,164,442 | | |
Net increase (decrease) in net assets from beneficial interest
transactions | | | 131,501,438 | | | | (4,192,193 | ) | | | (42,623,449 | ) | | | (40,618,584 | ) | | | (34,781,275 | ) | | | (35,586,182 | ) | |
Net increase (decrease) in net assets | | | 131,501,438 | | | | (4,192,058 | ) | | | (33,637,823 | ) | | | (30,648,978 | ) | | | (10,615,847 | ) | | | (20,213,085 | ) | |
Net assets: | |
Beginning of year | | | 184,601,928 | | | | 188,793,986 | | | | 361,967,698 | | | | 392,616,676 | | | | 348,180,974 | | | | 368,394,059 | | |
End of year | | $ | 316,103,366 | | | $ | 184,601,928 | | | $ | 328,329,875 | | | $ | 361,967,698 | | | $ | 337,565,127 | | | $ | 348,180,974 | | |
284
PACE Select Advisors Trust
| | | PACE
Strategic Fixed Income
Investments | | PACE
Municipal Fixed Income
Investments | |
| | | For the years ended July 31, | | For the years ended July 31, | |
| | | 2020 | | 2019 | | 2020 | | 2019 | |
From operations: | |
Net investment income (loss) | | $ | 20,581,351 | | | $ | 24,242,953 | | | $ | 7,588,443 | | | $ | 9,812,273 | | |
Net realized gain (loss) | | | 23,803,397 | | | | 4,576,634 | | | | 1,509,247 | | | | 1,535,082 | | |
Net change in unrealized appreciation (depreciation) | | | 29,480,088 | | | | 27,846,943 | | | | 3,037,035 | | | | 12,208,941 | | |
Net increase (decrease) in net assets resulting from operations | | | 73,864,836 | | | | 56,666,530 | | | | 12,134,725 | | | | 23,556,296 | | |
Total distributions–Class A | | | (536,516 | ) | | | (562,397 | ) | | | (1,010,621 | ) | | | (1,258,943 | ) | |
Total distributions–Class C | | | — | | | | (30,876 | ) | | | — | | | | (31,869 | ) | |
Total distributions–Class Y | | | (41,807 | ) | | | (45,893 | ) | | | (1,726 | ) | | | (2,020 | ) | |
Total distributions–Class P | | | (23,157,321 | ) | | | (24,675,116 | ) | | | (7,515,389 | ) | | | (9,230,952 | ) | |
Total distributions | | | (23,735,644 | ) | | | (25,314,282 | ) | | | (8,527,736 | ) | | | (10,523,784 | ) | |
From beneficial interest transactions: | |
Proceeds from shares sold | | | 55,865,815 | | | | 96,910,928 | | | | 34,307,390 | | | | 54,221,132 | | |
Cost of shares redeemed | | | (158,424,420 | ) | | | (186,962,857 | ) | | | (69,883,979 | ) | | | (88,047,907 | ) | |
Shares issued on reinvestment of dividends and distributions | | | 21,691,844 | | | | 23,271,484 | | | | 7,191,061 | | | | 8,857,921 | | |
Net increase (decrease) in net assets from beneficial interest
transactions | | | (80,866,761 | ) | | | (66,780,445 | ) | | | (28,385,528 | ) | | | (24,968,854 | ) | |
Net increase (decrease) in net assets | | | (30,737,569 | ) | | | (35,428,197 | ) | | | (24,778,539 | ) | | | (11,936,342 | ) | |
Net assets: | |
Beginning of year | | | 744,490,760 | | | | 779,918,957 | | | | 344,315,259 | | | | 356,251,601 | | |
End of year | | $ | 713,753,191 | | | $ | 744,490,760 | | | $ | 319,536,720 | | | $ | 344,315,259 | | |
See accompanying notes to financial statements.
285
PACE Select Advisors Trust
Statement of changes in net assets (continued)
| | | PACE
Global Fixed Income
Investments | | PACE
High Yield
Investments | | PACE
Large Co Value Equity
Investments | |
| | | For the years ended July 31, | | For the years ended July 31, | | For the years ended July 31, | |
| | | 2020 | | 2019 | | 2020 | | 2019 | | 2020 | | 2019 | |
From operations: | |
Net investment income (loss) | | $ | 3,612,291 | | | $ | 4,900,494 | | | $ | 15,582,289 | | | $ | 18,329,796 | | | $ | 21,144,188 | | | $ | 23,616,661 | | |
Net realized gain (loss) | | | 9,499,225 | | | | 1,286,961 | | | | (6,943,553 | ) | | | (1,756,794 | ) | | | (37,732,647 | ) | | | 49,880,376 | | |
Net change in unrealized appreciation (depreciation) | | | 10,831,179 | | | | 10,359,942 | | | | (6,391,940 | ) | | | (2,479,715 | ) | | | (114,809,117 | ) | | | (67,830,561 | ) | |
Net increase (decrease) in net assets resulting from operations | | | 23,942,695 | | | | 16,547,397 | | | | 2,246,796 | | | | 14,093,287 | | | | (131,397,576 | ) | | | 5,666,476 | | |
Total distributions–Class A | | | (450,741 | ) | | | (481,587 | ) | | | (317,287 | ) | | | (295,930 | ) | | | (5,895,712 | ) | | | (10,677,488 | ) | |
Total distributions–Class C | | | — | | | | (5,664 | ) | | | — | | | | (20,164 | ) | | | — | | | | — | | |
Total distributions–Class Y | | | (36,042 | ) | | | (40,844 | ) | | | (32,890 | ) | | | (30,663 | ) | | | (964,841 | ) | | | (1,544,626 | ) | |
Total distributions–Class P | | | (5,641,491 | ) | | | (6,175,404 | ) | | | (16,750,587 | ) | | | (18,032,533 | ) | | | (57,764,572 | ) | | | (105,011,399 | ) | |
Total distributions | | | (6,128,274 | ) | | | (6,703,499 | ) | | | (17,100,764 | ) | | | (18,379,290 | ) | | | (64,625,125 | ) | | | (117,233,513 | ) | |
From beneficial interest transactions: | |
Proceeds from shares sold | | | 17,941,404 | | | | 33,467,627 | | | | 20,352,778 | | | | 27,862,204 | | | | 83,077,749 | | | | 90,280,427 | | |
Cost of shares redeemed | | | (70,808,253 | ) | | | (94,046,619 | ) | | | (63,060,315 | ) | | | (85,967,320 | ) | | | (225,376,440 | ) | | | (280,131,233 | ) | |
Shares issued on reinvestment of dividends and distributions | | | 5,592,944 | | | | 6,159,499 | | | | 15,593,860 | | | | 16,839,585 | | | | 60,176,778 | | | | 109,458,117 | | |
Net increase (decrease) in net assets from beneficial interest
transactions | | | (47,273,905 | ) | | | (54,419,493 | ) | | | (27,113,677 | ) | | | (41,265,531 | ) | | | (82,121,913 | ) | | | (80,392,689 | ) | |
Net increase (decrease) in net assets | | | (29,459,484 | ) | | | (44,575,595 | ) | | | (41,967,645 | ) | | | (45,551,534 | ) | | | (278,144,614 | ) | | | (191,959,726 | ) | |
Net assets: | |
Beginning of year | | | 360,909,098 | | | | 405,484,693 | | | | 308,388,450 | | | | 353,939,984 | | | | 1,132,999,842 | | | | 1,324,959,568 | | |
End of year | | $ | 331,449,614 | | | $ | 360,909,098 | | | $ | 266,420,805 | | | $ | 308,388,450 | | | $ | 854,855,228 | | | $ | 1,132,999,842 | | |
286
PACE Select Advisors Trust
| | | PACE
Large Co Growth Equity
Investments | | PACE
Small/Medium Co Value
Equity Investments | |
| | | For the years ended July 31, | | For the years ended July 31, | |
| | | 2020 | | 2019 | | 2020 | | 2019 | |
From operations: | |
Net investment income (loss) | | $ | 1,778,713 | | | $ | (304,711 | ) | | $ | 2,434,134 | | | $ | 3,162,361 | | |
Net realized gain (loss) | | | 204,404,402 | | | | 136,862,989 | | �� | | (18,545,795 | ) | | | (4,606,137 | ) | |
Net change in unrealized appreciation (depreciation) | | | 54,481,926 | | | | (27,394,239 | ) | | | (23,649,247 | ) | | | (27,930,301 | ) | |
Net increase (decrease) in net assets resulting from operations | | | 260,665,041 | | | | 109,164,039 | | | | (39,760,908 | ) | | | (29,374,077 | ) | |
Total distributions–Class A | | | (7,086,365 | ) | | | (7,964,249 | ) | | | (112,471 | ) | | | (1,095,342 | ) | |
Total distributions–Class C | | | — | | | | — | | | | — | | | | — | | |
Total distributions–Class Y | | | (2,366,065 | ) | | | (2,400,843 | ) | | | (1,544 | ) | | | (12,339 | ) | |
Total distributions–Class P | | | (161,282,475 | ) | | | (197,906,705 | ) | | | (3,450,140 | ) | | | (25,959,793 | ) | |
Total distributions | | | (170,734,905 | ) | | | (208,271,797 | ) | | | (3,564,155 | ) | | | (27,067,474 | ) | |
From beneficial interest transactions: | |
Proceeds from shares sold | | | 48,670,686 | | | | 79,356,146 | | | | 37,452,012 | | | | 43,735,225 | | |
Cost of shares redeemed | | | (347,217,530 | ) | | | (348,807,331 | ) | | | (83,949,503 | ) | | | (113,780,668 | ) | |
Shares issued on reinvestment of dividends and distributions | | | 161,015,785 | | | | 195,975,184 | | | | 3,298,445 | | | | 25,341,673 | | |
Net increase (decrease) in net assets from beneficial interest
transactions | | | (137,531,059 | ) | | | (73,476,001 | ) | | | (43,199,046 | ) | | | (44,703,770 | ) | |
Net increase (decrease) in net assets | | | (47,600,923 | ) | | | (172,583,759 | ) | | | (86,524,109 | ) | | | (101,145,321 | ) | |
Net assets: | |
Beginning of year | | | 1,220,687,480 | | | | 1,393,271,239 | | | | 438,326,348 | | | | 539,471,669 | | |
End of year | | $ | 1,173,086,557 | | | $ | 1,220,687,480 | | | $ | 351,802,239 | | | $ | 438,326,348 | | |
See accompanying notes to financial statements.
287
PACE Select Advisors Trust
Statement of changes in net assets (concluded)
| | PACE
Small/Medium Co Growth
Equity Investments | | PACE
International Equity
Investments | | PACE
International Emerging Markets
Equity Investments | |
| | | For the years ended July 31, | | For the years ended July 31, | | For the years ended July 31, | |
| | | 2020 | | 2019 | | 2020 | | 2019 | | 2020 | | 2019 | |
From operations: | |
Net investment income (loss) | | $ | (2,031,721 | ) | | $ | (2,599,534 | ) | | $ | 15,347,557 | | | $ | 19,717,975 | | | $ | 4,057,985 | | | $ | 5,817,942 | | |
Net realized gain (loss) | | | 22,585,591 | | | | 73,166,553 | | | | (32,591,877 | ) | | | 6,537,897 | | | | (9,769,310 | ) | | | (8,970,521 | ) | |
Net change in unrealized appreciation (depreciation) | | | 14,802,629 | | | | (50,425,239 | ) | | | 14,437,755 | | | | (81,988,829 | ) | | | 27,842,320 | | | | (10,809,704 | ) | |
Net increase (decrease) in net assets resulting from operations | | | 35,356,499 | | | | 20,141,780 | | | | (2,806,565 | ) | | | (55,732,957 | ) | | | 22,130,995 | | | | (13,962,283 | ) | |
Total distributions–Class A | | | (3,576,830 | ) | | | (4,123,129 | ) | | | (642,744 | ) | | | (2,109,966 | ) | | | (39,959 | ) | | | (69,068 | ) | |
Total distributions–Class Y | | | (6,744 | ) | | | (6,763 | ) | | | (335,379 | ) | | | (948,854 | ) | | | (67,299 | ) | | | (115,455 | ) | |
Total distributions–Class P | | | (56,800,533 | ) | | | (70,841,505 | ) | | | (26,308,470 | ) | | | (76,207,011 | ) | | | (4,028,749 | ) | | | (6,751,933 | ) | |
Total distributions | | | (60,384,107 | ) | | | (74,971,397 | ) | | | (27,286,593 | ) | | | (79,265,831 | ) | | | (4,136,007 | ) | | | (6,936,456 | ) | |
From beneficial interest transactions: | |
Proceeds from shares sold | | | 22,443,525 | | | | 35,303,209 | | | | 69,829,257 | | | | 96,051,344 | | | | 29,516,112 | | | | 46,791,346 | | |
Cost of shares redeemed | | | (105,068,542 | ) | | | (139,526,417 | ) | | | (203,050,199 | ) | | | (232,785,886 | ) | | | (82,941,672 | ) | | | (94,525,862 | ) | |
Shares issued on reinvestment of dividends and distributions | | | 57,118,726 | | | | 70,492,766 | | | | 25,376,653 | | | | 74,647,186 | | | | 3,876,013 | | | | 6,517,391 | | |
Net increase (decrease) in net assets from beneficial interest
transactions | | | (25,506,291 | ) | | | (33,730,442 | ) | | | (107,844,289 | ) | | | (62,087,356 | ) | | | (49,549,547 | ) | | | (41,217,125 | ) | |
Net increase (decrease) in net assets | | | (50,533,899 | ) | | | (88,560,059 | ) | | | (137,937,447 | ) | | | (197,086,144 | ) | | | (31,554,559 | ) | | | (62,115,864 | ) | |
Net assets: | |
Beginning of year | | | 457,777,626 | | | | 546,337,685 | | | | 988,197,180 | | | | 1,185,283,324 | | | | 387,657,700 | | | | 449,773,564 | | |
End of year | | $ | 407,243,727 | | | $ | 457,777,626 | | | $ | 850,259,733 | | | $ | 988,197,180 | | | $ | 356,103,141 | | | $ | 387,657,700 | | |
288
PACE Select Advisors Trust
| | | PACE
Global Real Estate Securities
Investments | | PACE
Alternative Strategies
Investments | |
| | | For the years ended July 31, | | For the years ended July 31, | |
| | | 2020 | | 2019 | | 2020 | | 2019 | |
From operations: | |
Net investment income (loss) | | $ | 2,121,178 | | | $ | 2,802,674 | | | $ | (1,702,867 | ) | | $ | 1,835,557 | | |
Net realized gain (loss) | | | (11,260,564 | ) | | | (621,415 | ) | | | 16,928,506 | | | | (1,442,342 | ) | |
Net change in unrealized appreciation (depreciation) | | | (9,925,075 | ) | | | 3,374,327 | | | | 3,847,757 | | | | 1,484,913 | | |
Net increase (decrease) in net assets resulting from operations | | | (19,064,461 | ) | | | 5,555,586 | | | | 19,073,396 | | | | 1,878,128 | | |
Total distributions–Class A | | | (17,533 | ) | | | (13,841 | ) | | | — | | | | (296,208 | ) | |
Total distributions–Class Y | | | — | | | | — | | | | (801 | ) | | | (11,917 | ) | |
Total distributions–Class P | | | (6,001,633 | ) | | | (4,369,167 | ) | | | (929,309 | ) | | | (15,403,019 | ) | |
Total distributions | | | (6,019,166 | ) | | | (4,383,008 | ) | | | (930,110 | ) | | | (15,711,144 | ) | |
From beneficial interest transactions: | |
Proceeds from shares sold | | | 10,962,652 | | | | 11,797,080 | | | | 31,884,494 | | | | 61,172,508 | | |
Cost of shares redeemed | | | (24,961,674 | ) | | | (32,966,140 | ) | | | (122,937,832 | ) | | | (162,383,481 | ) | |
Shares issued on reinvestment of dividends and distributions | | | 5,577,573 | | | | 4,066,593 | | | | 863,693 | | | | 14,724,015 | | |
Net increase (decrease) in net assets from beneficial interest
transactions | | | (8,421,449 | ) | | | (17,102,467 | ) | | | (90,189,645 | ) | | | (86,486,958 | ) | |
Net increase (decrease) in net assets | | | (33,505,076 | ) | | | (15,929,889 | ) | | | (72,046,359 | ) | | | (100,319,974 | ) | |
Net assets: | |
Beginning of year | | | 121,677,999 | | | | 137,607,888 | | | | 529,310,764 | | | | 629,630,738 | | |
End of year | | $ | 88,172,923 | | | $ | 121,677,999 | | | $ | 457,264,405 | | | $ | 529,310,764 | | |
See accompanying notes to financial statements.
289
Statement of cash flows
For the period ended July 31, 2020
| | | PACE Large Co Value
Equity Investments | |
Cash flows from operating activities | |
Net decrease in net assets resulting from operations | | $ | (131,397,576 | ) | |
Adjustments to reconcile net increase (decrease) in net assets resulting from
operations to net cash used/provided for operating activities: | |
Purchases of long-term investments | | | (599,724,696 | ) | |
Purchases to cover investments sold short | | | (148,078,489 | ) | |
Proceeds from disposition of long-term investments | | | 754,927,752 | | |
Sales of investments sold short | | | 125,299,500 | | |
Net purchases from short-term investments | | | (8,527,697 | ) | |
Net realized losses from investments in securities | | | 37,281,747 | | |
Net realized losses from investments sold short | | | 450,803 | | |
Net change in unrealized appreciation/depreciation of investments in securities | | | 112,911,082 | | |
Net change in unrealized appreciation/depreciation of investments sold short | | | 1,898,035 | | |
Changes in assets and liabilities: | |
(Increase) decrease in assets: | |
Cash collateral on deposit at custodian for securities loaned | | | (89,786 | ) | |
Receivable for interest | | | (223,110 | ) | |
Receivable for foreign tax reclaims | | | (8,746 | ) | |
Other assets | | | 699 | | |
Increase (decrease) in liabilities: | |
Payable for cash collateral from securities loaned | | | 1,751,906 | | |
Payable to affiliate | | | (259,717 | ) | |
Payable for dividends and interest on investments sold short | | | (35,659 | ) | |
Payable to custodian | | | (273,322 | ) | |
Accrued expenses and other liabilities | | | 51,148 | | |
Net cash provided from operating activities | | | 145,953,874 | | |
Cash flows from financing activities | |
Proceeds from borrowings | | | 5,664,962 | | |
Payments from borrowings | | | (5,664,962 | ) | |
Proceeds from shares sold | | | 83,334,815 | | |
Cost of shares repurchased | | | (224,840,342 | ) | |
Dividends paid to shareholders | | | (4,448,347 | ) | |
Net cash used in financing activities | | | (145,953,874 | ) | |
Net increase in cash and foreign currency | | | — | | |
Cash and foreign currency, beginning of period | | | — | | |
Cash and foreign currency, end of period | | $ | 0 | | |
Supplemental disclosure of cash flow information: | |
Reinvestment of dividends | | $ | (60,176,778 | ) | |
Cash paid during the period for interest | | $ | 2,292 | | |
See accompanying notes to financial statements.
290
Statement of cash flows (continued)
For the period ended July 31, 2020
| | | PACE International
Equity Investments | |
Cash flows from operating activites | |
Net increase (decrease) in net assets resulting from operations | | $ | (2,806,565 | ) | |
Adjustments to reconcile net increase (decrease) in net assets resulting from
operations to net cash used/provided from operating activities: | |
Purchases of long-term investments | | | (330,141,811 | ) | |
Purchases to cover investments sold short | | | (113,675,992 | ) | |
Proceeds from disposition of long-term investments | | | 471,669,133 | | |
Sales of investments sold short | | | 98,912,547 | | |
Net purchases from short-term investments | | | (2,847,123 | ) | |
Net realized (gains) losses from investments in securities | | | 38,115,455 | | |
Net realized (gains) losses from investments sold short | | | (5,583,926 | ) | |
Net change in unrealized appreciation/depreciation of investments in securities | | | (16,739,168 | ) | |
Net change in unrealized appreciation/depreciation of investments sold short | | | 2,676,944 | | |
Changes in assets and liabilities: | |
(Increase) decrease in assets: | |
Cash collateral on investments sold short | | | 1,345,507 | | |
Receivable for interest and dividends | | | 895,414 | | |
Receivable for foreign tax reclaims | | | (1,055,245 | ) | |
Other assets | | | (32 | ) | |
Increase (decrease) in liabilities: | |
Payable for cash collateral from securities loaned | | | (5,780,818 | ) | |
Payable for foreign withholding taxes and foreign capital gains taxes | | | (21,480 | ) | |
Payable to affiliate | | | (118,325 | ) | |
Payable for dividends and interest on investments sold short | | | 31,373 | | |
Payable to custodian | | | (84,682 | ) | |
Accrued expenses and other liabilities | | | (41,503 | ) | |
Net cash provided from operating activities | | | 134,749,703 | | |
Cash flows from financing activities | |
Proceeds from borrowings | | | 19,057,310 | | |
Payments from borrowings | | | (19,057,310 | ) | |
Proceeds from shares sold | | | 70,324,848 | | |
Cost of shares repurchased | | | (202,509,469 | ) | |
Dividends paid to shareholders | | | (1,909,940 | ) | |
Net cash used in financing activities | | | (134,094,561 | ) | |
Net increase (decrease) in cash and foreign currency | | | 655,142 | | |
Cash and foreign currency, beginning of period | | $ | 149,316 | | |
Cash and foreign currency, end of period | | $ | 804,458 | | |
Supplemental disclosure of cash flow information: | |
Reinvestment of dividends | | $ | (25,376,653 | ) | |
Cash paid during the period for interest | | $ | 6,177 | | |
See accompanying notes to financial statements.
291
Statement of cash flows (concluded)
For the period ended July 31, 2020
| | PACE Strategic Fixed
Income Investments | |
Cash flows from operating activities | |
Net increase in net assets resulting from operations | | $ | 73,864,836 | | |
Adjustments to reconcile net increase/(decrease) in net assets resulting from
operations to net cash used/provided for operating activities: | |
Purchases of long-term investments | | | (10,383,125,598 | ) | |
Purchases to cover investments sold short | | | (242,044,551 | ) | |
Proceeds from disposition of long-term investments | | | 10,552,156,116 | | |
Sales of investments sold short | | | 313,485,221 | | |
Net proceeds from short-term investments | | | (31,956,680 | ) | |
Net proceeds from repurchase agreements | | | (2,200,000 | ) | |
Net proceeds from reverse repurchase agreements | | | 1,633,600 | | |
Net realized (gains) from investments in securities | | | (23,065,688 | ) | |
Net realized (gains) from investments sold short | | | (617,453 | ) | |
Net amortization of bond discount and amortization of bond premium | | | 1,149,108 | | |
Net change in unrealized appreciation/depreciation of investments in securities | | | (30,617,665 | ) | |
Net change in unrealized appreciation/depreciation of investments sold short | | | (3,265 | ) | |
Net change in unrealized appreciation/depreciation of forward foreign currency contracts | | | 2,703,442 | | |
Changes in assets and liabilities: | |
(Increase) decrease in assets: | |
Cash collateral on futures | | | 358,000 | | |
Cash Collateral on swaps agreements | | | 1,544,808 | | |
Due from broker | | | (54,094 | ) | |
Receivable for interest | | | 763,263 | | |
OTC swap agreements, at value | | | 48,747 | | |
Receivable for variation margin on futures contracts | | | (738,989 | ) | |
Receivable for variation margin on centrally cleared swap agreements | | | (113,895 | ) | |
Receivable for foreign tax reclaims | | | 12,755 | | |
Other assets | | | (1,491 | ) | |
Increase (decrease) in liabilities: | |
Due to broker | | | (792,001 | ) | |
Payable for cash collateral from securities loaned | | | 28,990,963 | | |
Payable for variation margin on centrally cleared swap agreements | | | (26,920 | ) | |
Options and swaptions written, at value | | | 15,444 | | |
OTC swap agreements, at value | | | 55,930 | | |
Payable for variation margin on futures contracts | | | (50,908 | ) | |
Payable to affiliate | | | 122,626 | | |
Payable to custodian | | | (78,633 | ) | |
Deferred payable for dollar roll transactions | | | (31,237 | ) | |
Payable for dividend and interest expense on investments sold short | | | (7,008 | ) | |
Accrued expenses and other liabilities | | | (29,137 | ) | |
Net cash provided for operating activities | | | 261,349,646 | | |
Cash flows from financing activities | |
Proceeds from dollar roll transactions | | | 19,653,507 | | |
Repayments of dollar roll transactions | | | (179,806,524 | ) | |
Proceeds from shares sold | | | 56,014,946 | | |
Cost of shares repurchased | | | (158,104,008 | ) | |
Dividends paid to shareholders | | | (2,043,800 | ) | |
Net cash used in financing activities | | | (264,285,879 | ) | |
Net increase (decrease) in cash and foreign currency | | | (2,936,233 | ) | |
Cash and foreign currency, beginning of period | | | 4,278,538 | | |
Cash and foreign currency, end of period | | $ | 1,342,305 | | |
Supplemental disclosure of cash flow information: | |
Reinvestment of dividends | | $ | (21,691,844 | ) | |
Cash paid during the period for interest | | $ | 2,547,307 | | |
See accompanying notes to financial statements.
292
UBS Government Money Market Investments Fund
Financial highlights
Selected data for a share of beneficial interest outstanding throughout each year is presented below:
Class P
| | | Years ended July 31, | |
| | | 2020 | | 2019 | | 2018 | | 2017 | | 2016 | |
Net asset value, beginning of year | | $ | 1.00 | | | $ | 1.00 | | | $ | 1.00 | | | $ | 1.00 | | | $ | 1.00 | | |
Net investment income (loss) | | | 0.008 | | | | 0.017 | | | | 0.008 | | | | 0.001 | | | | 0.0001 | | |
Net realized gain (loss) | | | — | | | | 0.0001 | | | | 0.0001 | | | | (0.000 | )1 | | | 0.0001 | | |
Net increase (decrease) from operations | | | 0.008 | | | | 0.017 | | | | 0.008 | | | | 0.001 | | | | 0.0001 | | |
Dividends from net investment income | | | (0.008 | ) | | | (0.017 | ) | | | (0.008 | ) | | | (0.001 | ) | | | (0.000 | )1 | |
Distributions from net realized gains | | | — | | | | — | | | | — | | | | — | | | | (0.000 | )1 | |
Total dividends and distributions | | | (0.008 | ) | | | (0.017 | ) | | | (0.008 | ) | | | (0.001 | ) | | | (0.000 | )1 | |
Net asset value, end of year | | $ | 1.00 | | | $ | 1.00 | | | $ | 1.00 | | | $ | 1.00 | | | $ | 1.00 | | |
Total investment return2 | | | 0.76 | % | | | 1.72 | % | �� | | 0.83 | % | | | 0.11 | % | | | 0.01 | % | |
Ratios to average net assets: | |
Expenses before fee waivers and/or expense reimbursements | | | 0.75 | % | | | 0.90 | % | | | 0.89 | % | | | 0.95 | % | | | 0.96 | % | |
Expenses after fee waivers and/or expense reimbursements | | | 0.49 | % | | | 0.60 | % | | | 0.60 | % | | | 0.52 | % | | | 0.26 | % | |
Net investment income (loss) | | | 0.60 | % | | | 1.71 | % | | | 0.82 | % | | | 0.12 | % | | | 0.01 | % | |
Supplemental data: | |
Net assets, end of year (000's) | | $ | 316,103 | | | $ | 184,602 | | | $ | 188,794 | | | $ | 199,585 | | | $ | 182,977 | | |
1 Amount represents less than $0.0005 per share.
2 Total investment return is calculated assuming a $10,000 investment on the first day of each year reported, reinvestment of all dividends and other distributions, if any, at net asset value on the payable dates, and a sale at net asset value on the last day of each year reported. The figures do not include program fees; results would be lower if these fees were included. Returns do not reflect the deduction of taxes that a shareholder would pay on Portfolio distributions.
See accompanying notes to financial statements
293
PACE Mortgage-Backed Securities Fixed Income Investments
Financial highlights
Selected data for a share of beneficial interest outstanding throughout each year is presented below:
Class A
| | | Years ended July 31, | |
| | | 2020 | | 2019 | | 2018 | | 2017 | | 2016 | |
Net asset value, beginning of year | | $ | 12.69 | | | $ | 12.34 | | | $ | 12.85 | | | $ | 13.15 | | | $ | 12.96 | | |
Net investment income (loss)1 | | | 0.26 | | | | 0.30 | | | | 0.24 | | | | 0.17 | | | | 0.19 | | |
Net realized and unrealized gain (loss) | | | 0.48 | | | | 0.46 | | | | (0.38 | ) | | | (0.13 | ) | | | 0.29 | | |
Net increase (decrease) from operations | | | 0.74 | | | | 0.76 | | | | (0.14 | ) | | | 0.04 | | | | 0.48 | | |
Dividends from net investment income | | | (0.40 | ) | | | (0.41 | ) | | | (0.37 | ) | | | (0.34 | ) | | | (0.29 | ) | |
Net asset value, end of year | | $ | 13.03 | | | $ | 12.69 | | | $ | 12.34 | | | $ | 12.85 | | | $ | 13.15 | | |
Total investment return2 | | | 6.02 | % | | | 6.27 | % | | | (1.12 | )% | | | 0.30 | % | | | 3.76 | % | |
Ratios to average net assets: | |
Expenses before fee waivers and/or expense reimbursements/
recoupments, including interest expense | | | 1.36 | % | | | 1.38 | % | | | 1.09 | %3 | | | 1.08 | % | | | 1.07 | %3 | |
Expenses after fee waivers and/or expense reimbursements/
recoupments, including interest expense | | | 1.20 | % | | | 1.25 | % | | | 0.97 | %3 | | | 0.97 | % | | | 0.97 | %3 | |
Expenses after fee waivers and/or expense reimbursements,
excluding interest expense | | | 0.97 | % | | | 0.97 | % | | | 0.97 | % | | | 0.97 | % | | | 0.97 | % | |
Net investment income (loss) | | | 2.02 | % | | | 2.42 | % | | | 1.88 | % | | | 1.33 | % | | | 1.47 | % | |
Supplemental data: | |
Net assets, end of year (000's) | | $ | 31,498 | | | $ | 34,380 | | | $ | 30,489 | | | $ | 36,239 | | | $ | 41,260 | | |
Portfolio turnover | | | 765 | % | | | 905 | % | | | 887 | % | | | 1,255 | % | | | 1,383 | % | |
Class Y
| | | Years ended July 31, | |
| | | 2020 | | 2019 | | 2018 | | 2017 | | 2016 | |
Net asset value, beginning of year | | $ | 12.69 | | | $ | 12.35 | | | $ | 12.86 | | | $ | 13.16 | | | $ | 12.96 | | |
Net investment income (loss)1 | | | 0.30 | | | | 0.33 | | | | 0.27 | | | | 0.19 | | | | 0.23 | | |
Net realized and unrealized gain (loss) | | | 0.48 | | | | 0.45 | | | | (0.38 | ) | | | (0.12 | ) | | | 0.29 | | |
Net increase (decrease) from operations | | | 0.78 | | | | 0.78 | | | | (0.11 | ) | | | 0.07 | | | | 0.52 | | |
Dividends from net investment income | | | (0.43 | ) | | | (0.44 | ) | | | (0.40 | ) | | | (0.37 | ) | | | (0.32 | ) | |
Net asset value, end of year | | $ | 13.04 | | | $ | 12.69 | | | $ | 12.35 | | | $ | 12.86 | | | $ | 13.16 | | |
Total investment return2 | | | 6.28 | % | | | 6.44 | % | | | (0.87 | )% | | | 0.63 | % | | | 4.03 | % | |
Ratios to average net assets: | |
Expenses before fee waivers and/or expense reimbursements/
recoupments, including interest expense | | | 1.23 | % | | | 1.25 | % | | | 1.01 | %3 | | | 0.99 | % | | | 0.89 | %3 | |
Expenses after fee waivers and/or expense reimbursements/
recoupments, including interest expense | | | 0.97 | % | | | 0.98 | % | | | 0.72 | %3 | | | 0.72 | % | | | 0.72 | %3 | |
Expenses after fee waivers and/or expense reimbursements/
recoupments, excluding interest expense | | | 0.72 | % | | | 0.72 | % | | | 0.72 | % | | | 0.72 | % | | | 0.72 | % | |
Net investment income (loss) | | | 2.35 | % | | | 2.66 | % | | | 2.12 | % | | | 1.49 | % | | | 1.73 | % | |
Supplemental data: | |
Net assets, end of year (000's) | | $ | 15,308 | | | $ | 25,481 | | | $ | 30,542 | | | $ | 45,658 | | | $ | 51,823 | | |
Portfolio turnover | | | 765 | % | | | 905 | % | | | 887 | % | | | 1,255 | % | | | 1,383 | % | |
1 Calculated using the average shares method.
2 Total investment return is calculated assuming a $10,000 investment on the first day of each year reported, reinvestment of all dividends and other distributions, if any, at net asset value on the ex-dividend dates, and a sale at net asset value on the last day of each year reported. The figures do not include any applicable sales charges, redemption fees or program fees; results would be lower if they were included. Returns do not reflect the deduction of taxes that a shareholder would pay on Portfolio distributions or the redemption of Portfolio shares.
3 Includes interest expense representing less than 0.005%.
294
PACE Mortgage-Backed Securities Fixed Income Investments
Financial highlights (continued)
Class P
| | | Years ended July 31, | |
| | | 2020 | | 2019 | | 2018 | | 2017 | | 2016 | |
Net asset value, beginning of year | | $ | 12.70 | | | $ | 12.35 | | | $ | 12.86 | | | $ | 13.16 | | | $ | 12.96 | | |
Net investment income (loss)1 | | | 0.29 | | | | 0.33 | | | | 0.27 | | | | 0.21 | | | | 0.22 | | |
Net realized and unrealized gain (loss) | | | 0.48 | | | | 0.46 | | | | (0.38 | ) | | | (0.14 | ) | | | 0.30 | | |
Net increase (decrease) from operations | | | 0.77 | | | | 0.79 | | | | (0.11 | ) | | | 0.07 | | | | 0.52 | | |
Dividends from net investment income | | | (0.43 | ) | | | (0.44 | ) | | | (0.40 | ) | | | (0.37 | ) | | | (0.32 | ) | |
Net asset value, end of year | | $ | 13.04 | | | $ | 12.70 | | | $ | 12.35 | | | $ | 12.86 | | | $ | 13.16 | | |
Total investment return2 | | | 6.20 | % | | | 6.53 | % | | | (0.87 | )% | | | 0.55 | % | | | 4.10 | % | |
Ratios to average net assets: | |
Expenses before fee waivers and/or expense reimbursements/
recoupments, including interest expense | | | 1.18 | % | | | 1.22 | % | | | 0.93 | %3 | | | 0.92 | % | | | 0.91 | %3 | |
Expenses after fee waivers and/or expense reimbursements/
recoupments, including interest expense | | | 0.95 | % | | | 1.00 | % | | | 0.72 | %3 | | | 0.72 | % | | | 0.72 | %3 | |
Expenses after fee waivers and/or expense reimbursements/
recoupments, excluding interest expense | | | 0.72 | % | | | 0.72 | % | | | 0.72 | % | | | 0.72 | % | | | 0.72 | % | |
Net investment income (loss) | | | 2.26 | % | | | 2.66 | % | | | 2.14 | % | | | 1.60 | % | | | 1.72 | % | |
Supplemental data: | |
Net assets, end of year (000's) | | $ | 281,524 | | | $ | 302,107 | | | $ | 321,912 | | | $ | 352,789 | | | $ | 405,253 | | |
Portfolio turnover | | | 765 | % | | | 905 | % | | | 887 | % | | | 1,255 | % | | | 1,383 | % | |
See accompanying notes to financial statements.
295
PACE Intermediate Fixed Income Investments
Financial highlights
Selected data for a share of beneficial interest outstanding throughout each year is presented below:
Class A
| | | Years ended July 31, | |
| | | 2020 | | 2019 | | 2018 | | 2017 | | 2016 | |
Net asset value, beginning of year | | $ | 12.44 | | | $ | 11.90 | | | $ | 12.34 | | | $ | 12.45 | | | $ | 12.36 | | |
Net investment income (loss)1 | | | 0.23 | | | | 0.30 | | | | 0.24 | | | | 0.16 | | | | 0.16 | | |
Net realized and unrealized gain (loss) | | | 0.95 | | | | 0.56 | | | | (0.42 | ) | | | (0.06 | ) | | | 0.18 | | |
Net increase (decrease) from operations | | | 1.18 | | | | 0.86 | | | | (0.18 | ) | | | 0.10 | | | | 0.34 | | |
Dividends from net investment income | | | (0.26 | ) | | | (0.32 | ) | | | (0.26 | ) | | | (0.17 | ) | | | (0.17 | ) | |
Distributions from net realized gains | | | — | | | | — | | | | — | | | | (0.04 | ) | | | (0.08 | ) | |
Total dividends and distributions | | | (0.26 | ) | | | (0.32 | ) | | | (0.26 | ) | | | (0.21 | ) | | | (0.25 | ) | |
Net asset value, end of year | | $ | 13.36 | | | $ | 12.44 | | | $ | 11.90 | | | $ | 12.34 | | | $ | 12.45 | | |
Total investment return2 | | | 9.61 | % | | | 7.33 | % | | | (1.43 | )% | | | 0.84 | % | | | 2.85 | % | |
Ratios to average net assets: | |
Expenses before fee waivers and/or expense reimbursements | | | 1.04 | %3 | | | 1.05 | %3 | | | 1.00 | %3 | | | 1.01 | %3 | | | 1.03 | %3 | |
Expenses after fee waivers and/or expense reimbursements | | | 0.91 | %3 | | | 0.91 | %3 | | | 0.93 | %3 | | | 0.93 | %3 | | | 0.93 | %3 | |
Net investment income (loss) | | | 1.82 | % | | | 2.52 | % | | | 1.97 | % | | | 1.32 | % | | | 1.31 | % | |
Supplemental data: | |
Net assets, end of year (000's) | | $ | 13,475 | | | $ | 13,652 | | | $ | 14,254 | | | $ | 16,884 | | | $ | 18,681 | | |
Portfolio turnover | | | 403 | % | | | 511 | % | | | 537 | % | | | 437 | % | | | 284 | % | |
Class Y
| | | Years ended July 31, | |
| | | 2020 | | 2019 | | 2018 | | 2017 | | 2016 | |
Net asset value, beginning of year | | $ | 12.44 | | | $ | 11.90 | | | $ | 12.34 | | | $ | 12.45 | | | $ | 12.36 | | |
Net investment income (loss)1 | | | 0.26 | | | | 0.33 | | | | 0.27 | | | | 0.19 | | | | 0.19 | | |
Net realized and unrealized gain (loss) | | | 0.95 | | | | 0.56 | | | | (0.42 | ) | | | (0.05 | ) | | | 0.18 | | |
Net increase (decrease) from operations | | | 1.21 | | | | 0.89 | | | | (0.15 | ) | | | 0.14 | | | | 0.37 | | |
Dividends from net investment income | | | (0.29 | ) | | | (0.35 | ) | | | (0.29 | ) | | | (0.21 | ) | | | (0.20 | ) | |
Distributions from net realized gains | | | — | | | | — | | | | — | | | | (0.04 | ) | | | (0.08 | ) | |
Total dividends and distributions | | | (0.29 | ) | | | (0.35 | ) | | | (0.29 | ) | | | (0.25 | ) | | | (0.28 | ) | |
Net asset value, end of year | | $ | 13.36 | | | $ | 12.44 | | | $ | 11.90 | | | $ | 12.34 | | | $ | 12.45 | | |
Total investment return2 | | | 9.89 | % | | | 7.60 | % | | | (1.20 | )% | | | 1.09 | % | | | 3.11 | % | |
Ratios to average net assets: | |
Expenses before fee waivers and/or expense reimbursements | | | 0.87 | %3 | | | 0.98 | %3 | | | 0.95 | %3 | | | 0.93 | %3 | | | 0.94 | %3 | |
Expenses after fee waivers and/or expense reimbursements | | | 0.66 | %3 | | | 0.66 | %3 | | | 0.68 | %3 | | | 0.68 | %3 | | | 0.68 | %3 | |
Net investment income (loss) | | | 2.08 | % | | | 2.77 | % | | | 2.23 | % | | | 1.57 | % | | | 1.56 | % | |
Supplemental data: | |
Net assets, end of year (000's) | | $ | 271 | | | $ | 325 | | | $ | 293 | | | $ | 337 | | | $ | 401 | | |
Portfolio turnover | | | 403 | % | | | 511 | % | | | 537 | % | | | 437 | % | | | 284 | % | |
1 Calculated using the average shares method.
2 Total investment return is calculated assuming a $ 10,000 investment on the first day of each year reported, reinvestment of all dividends and other distributions, if any, at net asset value on the ex-dividend dates, and a sale at net asset value on the last day of each year reported. The figures do not include any applicable sales charges, redemption fees or program fees; results would be lower if they were included. Returns do not reflect the deduction of taxes that a shareholder would pay on Portfolio distributions or the redemption of Portfolio shares.
3 Includes interest expense representing less than 0.005%.
296
PACE Intermediate Fixed Income Investments
Financial highlights (continued)
Class P
| | | Years ended July 31, | |
| | | 2020 | | 2019 | | 2018 | | 2017 | | 2016 | |
Net asset value, beginning of year | | $ | 12.44 | | | $ | 11.90 | | | $ | 12.34 | | | $ | 12.45 | | | $ | 12.36 | | |
Net investment income (loss)1 | | | 0.26 | | | | 0.33 | | | | 0.27 | | | | 0.19 | | | | 0.19 | | |
Net realized and unrealized gain (loss) | | | 0.95 | | | | 0.56 | | | | (0.42 | ) | | | (0.05 | ) | | | 0.18 | | |
Net increase (decrease) from operations | | | 1.21 | | | | 0.89 | | | | (0.15 | ) | | | 0.14 | | | | 0.37 | | |
Dividends from net investment income | | | (0.29 | ) | | | (0.35 | ) | | | (0.29 | ) | | | (0.21 | ) | | | (0.20 | ) | |
Distributions from net realized gains | | | — | | | | — | | | | — | | | | (0.04 | ) | | | (0.08 | ) | |
Total dividends and distributions | | | (0.29 | ) | | | (0.35 | ) | | | (0.29 | ) | | | (0.25 | ) | | | (0.28 | ) | |
Net asset value, end of year | | $ | 13.36 | | | $ | 12.44 | | | $ | 11.90 | | | $ | 12.34 | | | $ | 12.45 | | |
Total investment return2 | | | 9.89 | % | | | 7.60 | % | | | (1.20 | )% | | | 1.09 | % | | | 3.11 | % | |
Ratios to average net assets: | |
Expenses before fee waivers and/or expense reimbursements | | | 0.84 | %3 | | | 0.86 | %3 | | | 0.81 | %3 | | | 0.82 | %3 | | | 0.83 | %3 | |
Expenses after fee waivers and/or expense reimbursements | | | 0.66 | %3 | | | 0.66 | %3 | | | 0.68 | %3 | | | 0.68 | %3 | | | 0.68 | %3 | |
Net investment income (loss) | | | 2.08 | % | | | 2.77 | % | | | 2.23 | % | | | 1.57 | % | | | 1.56 | % | |
Supplemental data: | |
Net assets, end of year (000's) | | $ | 323,819 | | | $ | 334,203 | | | $ | 352,865 | | | $ | 374,144 | | | $ | 411,148 | | |
Portfolio turnover | | | 403 | % | | | 511 | % | | | 537 | % | | | 437 | % | | | 284 | % | |
See accompanying notes to financial statements.
297
PACE Strategic Fixed Income Investments
Financial highlights
Selected data for a share of beneficial interest outstanding throughout each year is presented below:
Class A
| | | Years ended July 31, | |
| | | 2020 | | 2019 | | 2018 | | 2017 | | 2016 | |
Net asset value, beginning of year | | $ | 13.91 | | | $ | 13.32 | | | $ | 13.81 | | | $ | 14.21 | | | $ | 13.93 | | |
Net investment income (loss)1 | | | 0.37 | | | | 0.40 | | | | 0.35 | | | | 0.36 | | | | 0.37 | | |
Net realized and unrealized gain (loss) | | | 1.06 | | | | 0.61 | | | | (0.47 | ) | | | (0.15 | ) | | | 0.38 | | |
Net increase (decrease) from operations | | | 1.43 | | | | 1.01 | | | | (0.12 | ) | | | 0.21 | | | | 0.75 | | |
Dividends from net investment income | | | (0.43 | ) | | | (0.42 | ) | | | (0.37 | ) | | | (0.39 | ) | | | (0.37 | ) | |
Distributions from net realized gains | | | — | | | | — | | | | — | | | | (0.22 | ) | | | (0.10 | ) | |
Total dividends and distributions | | | (0.43 | ) | | | (0.42 | ) | | | (0.37 | ) | | | (0.61 | ) | | | (0.47 | ) | |
Net asset value, end of year | | $ | 14.91 | | | $ | 13.91 | | | $ | 13.32 | | | $ | 13.81 | | | $ | 14.21 | | |
Total investment return2 | | | 10.56 | % | | | 7.69 | % | | | (0.89 | )% | | | 1.61 | % | | | 5.43 | % | |
Ratios to average net assets: | |
Expenses before fee waivers and/or expense reimbursements, including interest expense | | | 1.35 | % | | | 1.56 | % | | | 1.05 | % | | | 1.12 | % | | | 1.10 | % | |
Expenses after fee waivers and/or expense reimbursements, including interest expense | | | 1.28 | % | | | 1.51 | % | | | 1.01 | % | | | 1.06 | % | | | 1.01 | % | |
Expenses after fee waivers and/or expense reimbursements, excluding interest expense | | | 0.93 | % | | | 0.96 | % | | | 0.96 | % | | | 0.96 | % | | | 0.95 | % | |
Net investment income (loss) | | | 2.57 | % | | | 2.98 | % | | | 2.57 | % | | | 2.59 | % | | | 2.69 | % | |
Supplemental data: | |
Net assets, end of year (000's) | | $ | 18,980 | | | $ | 18,074 | | | $ | 13,652 | | | $ | 13,605 | | | $ | 13,480 | | |
Portfolio turnover | | | 248 | % | | | 308 | % | | | 243 | % | | | 212 | % | | | 133 | % | |
Class Y
| | | Years ended July 31, | |
| | | 2020 | | 2019 | | 2018 | | 2017 | | 2016 | |
Net asset value, beginning of year | | $ | 13.88 | | | $ | 13.29 | | | $ | 13.79 | | | $ | 14.19 | | | $ | 13.91 | | |
Net investment income (loss)1 | | | 0.40 | | | | 0.43 | | | | 0.38 | | | | 0.39 | | | | 0.39 | | |
Net realized and unrealized gain (loss) | | | 1.06 | | | | 0.62 | | | | (0.48 | ) | | | (0.15 | ) | | | 0.38 | | |
Net increase (decrease) from operations | | | 1.46 | | | | 1.05 | | | | (0.10 | ) | | | 0.24 | | | | 0.77 | | |
Dividends from net investment income | | | (0.46 | ) | | | (0.46 | ) | | | (0.40 | ) | | | (0.42 | ) | | | (0.39 | ) | |
Distributions from net realized gains | | | — | | | | — | | | | — | | | | (0.22 | ) | | | (0.10 | ) | |
Total dividends and distributions | | | (0.46 | ) | | | (0.46 | ) | | | (0.40 | ) | | | (0.64 | ) | | | (0.49 | ) | |
Net asset value, end of year | | $ | 14.88 | | | $ | 13.88 | | | $ | 13.29 | | | $ | 13.79 | | | $ | 14.19 | | |
Total investment return2 | | | 10.78 | % | | | 8.05 | % | | | (0.71 | )% | | | 1.87 | % | | | 5.68 | % | |
Ratios to average net assets: | |
Expenses before fee waivers and/or expense reimbursements, including interest expense | | | 1.30 | % | | | 1.42 | % | | | 0.93 | % | | | 1.03 | % | | | 0.97 | % | |
Expenses after fee waivers and/or expense reimbursements, including interest expense | | | 1.03 | % | | | 1.24 | % | | | 0.76 | % | | | 0.81 | % | | | 0.87 | % | |
Expenses after fee waivers and/or expense reimbursements, excluding interest expense | | | 0.68 | % | | | 0.71 | % | | | 0.71 | % | | | 0.71 | % | | | 0.81 | % | |
Net investment income (loss) | | | 2.83 | % | | | 3.24 | % | | | 2.81 | % | | | 2.84 | % | | | 2.82 | % | |
Supplemental data: | |
Net assets, end of year (000's) | | $ | 1,110 | | | $ | 1,364 | | | $ | 1,370 | | | $ | 1,599 | | | $ | 2,283 | | |
Portfolio turnover | | | 248 | % | | | 308 | % | | | 243 | % | | | 212 | % | | | 133 | % | |
1 Calculated using the average shares method.
2 Total investment return is calculated assuming a $10,000 investment on the first day of each year reported, reinvestment of all dividends and other distributions, if any, at net asset value on the ex-dividend dates, and a sale at net asset value on the last day of each year reported. The figures do not include any applicable sales charges, redemption fees or program fees; results would be lower if they were included. Returns do not reflect the deduction of taxes that a shareholder would pay on Portfolio distributions or the redemption of Portfolio shares.
298
PACE Strategic Fixed Income Investments
Financial highlights (continued)
Class P
| | | Years ended July 31, | |
| | | 2020 | | 2019 | | 2018 | | 2017 | | 2016 | |
Net asset value, beginning of year | | $ | 13.90 | | | $ | 13.31 | | | $ | 13.81 | | | $ | 14.20 | | | $ | 13.92 | | |
Net investment income (loss)1 | | | 0.40 | | | | 0.44 | | | | 0.38 | | | | 0.39 | | | | 0.40 | | |
Net realized and unrealized gain (loss) | | | 1.06 | | | | 0.61 | | | | (0.48 | ) | | | (0.14 | ) | | | 0.38 | | |
Net increase (decrease) from operations | | | 1.46 | | | | 1.05 | | | | (0.10 | ) | | | 0.25 | | | | 0.78 | | |
Dividends from net investment income | | | (0.46 | ) | | | (0.46 | ) | | | (0.40 | ) | | | (0.42 | ) | | | (0.40 | ) | |
Distributions from net realized gains | | | — | | | | — | | | | — | | | | (0.22 | ) | | | (0.10 | ) | |
Total dividends and distributions | | | (0.46 | ) | | | (0.46) | | | | (0.40 | ) | | | (0.64 | ) | | | (0.50 | ) | |
Net asset value, end of year | | $ | 14.90 | | | $ | 13.90 | | | $ | 13.31 | | | $ | 13.81 | | | $ | 14.20 | | |
Total investment return2 | | | 10.76 | % | | | 8.04 | % | | | (0.71 | )% | | | 1.94 | % | | | 5.68 | % | |
Ratios to average net assets: | |
Expenses before fee waivers and/or expense reimbursements, including interest expense | | | 1.13 | % | | | 1.32 | % | | | 0.84 | % | | | 0.90 | % | | | 0.88 | % | |
Expenses after fee waivers and/or expense reimbursements, including interest expense | | | 1.03 | % | | | 1.23 | % | | | 0.76 | % | | | 0.81 | % | | | 0.79 | % | |
Expenses after fee waivers and/or expense reimbursements, excluding interest expense | | | 0.68 | % | | | 0.71 | % | | | 0.71 | % | | | 0.71 | % | | | 0.72 | % | |
Net investment income (loss) | | | 2.83 | % | | | 3.25 | % | | | 2.82 | % | | | 2.84 | % | | | 2.92 | % | |
Supplemental data: | |
Net assets, end of year (000's) | | $ | 693,664 | | | $ | 725,052 | | | $ | 758,303 | | | $ | 808,009 | | | $ | 856,301 | | |
Portfolio turnover | | | 248 | % | | | 308 | % | | | 243 | % | | | 212 | % | | | 133 | % | |
See accompanying notes to financial statements.
299
PACE Municipal Fixed Income Investments
Financial highlights
Selected data for a share of beneficial interest outstanding throughout each year is presented below:
Class A
| | | Years ended July 31, | |
| | | 2020 | | 2019 | | 2018 | | 2017 | | 2016 | |
Net asset value, beginning of year | | $ | 13.23 | | | $ | 12.73 | | | $ | 13.08 | | | $ | 13.55 | | | $ | 13.14 | | |
Net investment income (loss)1 | | | 0.27 | | | | 0.34 | | | | 0.33 | | | | 0.32 | | | | 0.33 | | |
Net realized and unrealized gain (loss) | | | 0.20 | | | | 0.53 | | | | (0.32 | ) | | | (0.37 | ) | | | 0.48 | | |
Net increase (decrease) from operations | | | 0.47 | | | | 0.87 | | | | 0.01 | | | | (0.05 | ) | | | 0.81 | | |
Dividends from net investment income | | | (0.25 | ) | | | (0.34 | ) | | | (0.34 | ) | | | (0.32 | ) | | | (0.33 | ) | |
Distributions from net realized gains | | | (0.05 | ) | | | (0.03 | ) | | | (0.02 | ) | | | (0.10 | ) | | | (0.07 | ) | |
Total dividends and distributions | | | (0.30 | ) | | | (0.37 | ) | | | (0.36 | ) | | | (0.42 | ) | | | (0.40 | ) | |
Net asset value, end of year | | $ | 13.40 | | | $ | 13.23 | | | $ | 12.73 | | | $ | 13.08 | | | $ | 13.55 | | |
Total investment return2 | | | 3.66 | % | | | 6.92 | % | | | 0.03 | % | | | (0.29 | )% | | | 6.26 | % | |
Ratios to average net assets: | |
Expenses before fee waivers and/or expense reimbursements | | | 0.92 | % | | | 0.92 | % | | | 0.91 | % | | | 0.92 | % | | | 0.92 | % | |
Expenses after fee waivers and/or expense reimbursements | | | 0.82 | % | | | 0.82 | % | | | 0.82 | % | | | 0.85 | % | | | 0.85 | % | |
Net investment income (loss) | | | 2.07 | % | | | 2.62 | % | | | 2.58 | % | | | 2.47 | % | | | 2.49 | % | |
Supplemental data: | |
Net assets, end of year (000's) | | $ | 40,355 | | | $ | 45,403 | | | $ | 38,714 | | | $ | 46,784 | | | $ | 51,397 | | |
Portfolio turnover | | | 10 | % | | | 21 | % | | | 19 | % | | | 14 | % | | | 15 | % | |
Class Y
| | | Years ended July 31, | |
| | | 2020 | | 2019 | | 2018 | | 2017 | | 2016 | |
Net asset value, beginning of year | | $ | 13.23 | | | $ | 12.74 | | | $ | 13.08 | | | $ | 13.56 | | | $ | 13.15 | | |
Net investment income (loss)1 | | | 0.30 | | | | 0.37 | | | | 0.37 | | | | 0.35 | | | | 0.36 | | |
Net realized and unrealized gain (loss) | | | 0.22 | | | | 0.52 | | | | (0.32 | ) | | | (0.38 | ) | | | 0.48 | | |
Net increase (decrease) from operations | | | 0.52 | | | | 0.89 | | | | 0.05 | | | | (0.03 | ) | | | 0.84 | | |
Dividends from net investment income | | | (0.29 | ) | | | (0.37 | ) | | | (0.37 | ) | | | (0.35 | ) | | | (0.36 | ) | |
Distributions from net realized gains | | | (0.05 | ) | | | (0.03 | ) | | | (0.02 | ) | | | (0.10 | ) | | | (0.07 | ) | |
Total dividends and distributions | | | (0.34 | ) | | | (0.40 | ) | | | (0.39 | ) | | | (0.45 | ) | | | (0.43 | ) | |
Net asset value, end of year | | $ | 13.41 | | | $ | 13.23 | | | $ | 12.74 | | | $ | 13.08 | | | $ | 13.56 | | |
Total investment return2 | | | 4.00 | % | | | 7.10 | % | | | 0.34 | % | | | (0.16 | )% | | | 6.49 | % | |
Ratios to average net assets: | |
Expenses before fee waivers and/or expense reimbursements | | | 0.73 | % | | | 0.73 | % | | | 0.71 | % | | | 0.71 | % | | | 0.72 | % | |
Expenses after fee waivers and/or expense reimbursements | | | 0.57 | % | | | 0.57 | % | | | 0.57 | % | | | 0.64 | % | | | 0.65 | % | |
Net investment income (loss) | | | 2.31 | % | | | 2.87 | % | | | 2.83 | % | | | 2.67 | % | | | 2.69 | % | |
Supplemental data: | |
Net assets, end of year (000's) | | $ | 4 | | | $ | 68 | | | $ | 65 | | | $ | 91 | | | $ | 70 | | |
Portfolio turnover | | | 10 | % | | | 21 | % | | | 19 | % | | | 14 | % | | | 15 | % | |
1 Calculated using the average shares method.
2 Total investment return is calculated assuming a $ 10,000 investment on the first day of each year reported, reinvestment of all dividends and other distributions, if any, at net asset value on the ex-dividend dates, and a sale at net asset value on the last day of each year reported. The figures do not include any applicable sales charges, redemption fees or program fees; results would be lower if they were included. Returns do not reflect the deduction of taxes that a shareholder would pay on Portfolio distributions or the redemption of Portfolio shares.
300
PACE Municipal Fixed Income Investments
Financial highlights (continued)
Class P
| | | Years ended July 31, | |
| | | 2020 | | 2019 | | 2018 | | 2017 | | 2016 | |
Net asset value, beginning of year | | $ | 13.24 | | | $ | 12.74 | | | $ | 13.08 | | | $ | 13.56 | | | $ | 13.15 | | |
Net investment income (loss)1 | | | 0.30 | | | | 0.37 | | | | 0.37 | | | | 0.35 | | | | 0.36 | | |
Net realized and unrealized gain (loss) | | | 0.21 | | | | 0.53 | | | | (0.32 | ) | | | (0.38 | ) | | | 0.49 | | |
Net increase (decrease) from operations | | | 0.51 | | | | 0.90 | | | | 0.05 | | | | (0.03 | ) | | | 0.85 | | |
Dividends from net investment income | | | (0.29 | ) | | | (0.37 | ) | | | (0.37 | ) | | | (0.35 | ) | | | (0.37 | ) | |
Distributions from net realized gains | | | (0.05 | ) | | | (0.03 | ) | | | (0.02 | ) | | | (0.10 | ) | | | (0.07 | ) | |
Total dividends and distributions | | | (0.34 | ) | | | (0.40 | ) | | | (0.39 | ) | | | (0.45 | ) | | | (0.44 | ) | |
Net asset value, end of year | | $ | 13.41 | | | $ | 13.24 | | | $ | 12.74 | | | $ | 13.08 | | | $ | 13.56 | | |
Total investment return2 | | | 3.92 | % | | | 7.18 | % | | | 0.34 | % | | | (0.13 | )% | | | 6.51 | % | |
Ratios to average net assets: | |
Expenses before fee waivers and/or expense reimbursements | | | 0.67 | % | | | 0.67 | % | | | 0.67 | % | | | 0.67 | % | | | 0.67 | % | |
Expenses after fee waivers and/or expense reimbursements | | | 0.57 | % | | | 0.57 | % | | | 0.57 | % | | | 0.61 | % | | | 0.60 | % | |
Net investment income (loss) | | | 2.30 | % | | | 2.87 | % | | | 2.84 | % | | | 2.71 | % | | | 2.73 | % | |
Supplemental data: | |
Net assets, end of year (000's) | | $ | 279,178 | | | $ | 298,844 | | | $ | 309,878 | | | $ | 323,715 | | | $ | 350,137 | | |
Portfolio turnover | | | 10 | % | | | 21 | % | | | 19 | % | | | 14 | % | | | 15 | % | |
See accompanying notes to financial statements.
301
PACE Global Fixed Income Investments
Financial highlights
Selected data for a share of beneficial interest outstanding throughout each year is presented below:
Class A
| | | Years ended July 31, | |
| | | 2020 | | 2019 | | 2018 | | 2017 | | 2016 | |
Net asset value, beginning of year | | $ | 10.01 | | | $ | 9.73 | | | $ | 10.04 | | | $ | 10.79 | | | $ | 9.94 | | |
Net investment income (loss)1 | | | 0.09 | | | | 0.11 | | | | 0.09 | | | | 0.11 | | | | 0.14 | | |
Net realized and unrealized gain (loss) | | | 0.64 | | | | 0.32 | | | | (0.26 | ) | | | (0.61 | ) | | | 1.00 | | |
Net increase (decrease) from operations | | | 0.73 | | | | 0.43 | | | | (0.17 | ) | | | (0.50 | ) | | | 1.14 | | |
Dividends from net investment income | | | (0.16 | ) | | | (0.15 | ) | | | — | | | | (0.18 | ) | | | (0.29 | ) | |
Return of capital | | | — | | | | — | | | | (0.14 | ) | | | (0.07 | ) | | | — | | |
Total dividends and return of capital | | | (0.16 | ) | | | (0.15 | ) | | | (0.14 | ) | | | (0.25 | ) | | | (0.29 | ) | |
Net asset value, end of year | | $ | 10.58 | | | $ | 10.01 | | | $ | 9.73 | | | $ | 10.04 | | | $ | 10.79 | | |
Total investment return2 | | | 7.36 | % | | | 4.48 | % | | | (1.72 | )% | | | (4.59 | )% | | | 11.77 | % | |
Ratios to average net assets: | |
Expenses before fee waivers and/or expense reimbursements/recoupments | | | 1.27 | % | | | 1.26 | %3 | | | 1.27 | %3 | | | 1.29 | %3 | | | 1.28 | %3 | |
Expenses after fee waivers and/or expense reimbursements/recoupments | | | 1.03 | % | | | 1.03 | %3 | | | 1.09 | %3 | | | 1.10 | %3 | | | 1.04 | %3 | |
Net investment income (loss) | | | 0.88 | % | | | 1.12 | % | | | 0.93 | % | | | 1.11 | % | | | 1.33 | % | |
Supplemental data: | |
Net assets, end of year (000's) | | $ | 28,811 | | | $ | 30,448 | | | $ | 31,480 | | | $ | 38,368 | | | $ | 45,624 | | |
Portfolio turnover | | | 136 | % | | | 54 | % | | | 221 | % | | | 199 | % | | | 38 | % | |
Class Y
| | | Years ended July 31, | |
| | | 2020 | | 2019 | | 2018 | | 2017 | | 2016 | |
Net asset value, beginning of year | | $ | 9.96 | | | $ | 9.69 | | | $ | 10.00 | | | $ | 10.75 | | | $ | 9.91 | | |
Net investment income (loss)1 | | | 0.10 | | | | 0.12 | | | | 0.11 | | | | 0.13 | | | | 0.16 | | |
Net realized and unrealized gain (loss) | | | 0.63 | | | | 0.32 | | | | (0.26 | ) | | | (0.62 | ) | | | 0.99 | | |
Net increase (decrease) from operations | | | 0.73 | | | | 0.44 | | | | (0.15 | ) | | | (0.49 | ) | | | 1.15 | | |
Dividends from net investment income | | | (0.18 | ) | | | (0.17 | ) | | | — | | | | (0.18 | ) | | | (0.31 | ) | |
Return of capital | | | — | | | | — | | | | (0.16 | ) | | | (0.08 | ) | | | — | | |
Total dividends and return of capital | | | (0.18 | ) | | | (0.17 | ) | | | (0.16 | ) | | | (0.26 | ) | | | (0.31 | ) | |
Net asset value, end of year | | $ | 10.51 | | | $ | 9.96 | | | $ | 9.69 | | | $ | 10.00 | | | $ | 10.75 | | |
Total investment return2 | | | 7.47 | % | | | 4.66 | % | | | (1.51 | )% | | | (4.45 | )% | | | 11.93 | % | |
Ratios to average net assets: | |
Expenses before fee waivers and/or expense reimbursements | | | 1.05 | % | | | 1.10 | %3 | | | 1.15 | %3 | | | 1.13 | %3 | | | 1.07 | %3 | |
Expenses after fee waivers and/or expense reimbursements | | | 0.87 | % | | | 0.87 | %3 | | | 0.94 | %3 | | | 0.94 | %3 | | | 0.84 | %3 | |
Net investment income (loss) | | | 1.04 | % | | | 1.28 | % | | | 1.08 | % | | | 1.28 | % | | | 1.54 | % | |
Supplemental data: | |
Net assets, end of year (000's) | | $ | 1,943 | | | $ | 2,182 | | | $ | 2,324 | | | $ | 2,592 | | | $ | 4,040 | | |
Portfolio turnover | | | 136 | % | | | 54 | % | | | 221 | % | | | 199 | % | | | 38 | % | |
1 Calculated using the average shares method.
2 Total investment return is calculated assuming a $ 10,000 investment on the first day of each year reported, reinvestment of all dividends and other distributions, if any, at net asset value on the ex-dividend dates, and a sale at net asset value on the last day of each year reported. The figures do not include any applicable sales charges, redemption fees or program fees; results would be lower if they were included. Returns do not reflect the deduction of taxes that a shareholder would pay on Portfolio distributions or the redemption of Portfolio shares.
3 Includes interest expense representing less than 0.005%.
302
PACE Global Fixed Income Investments
Financial highlights (continued)
Class P
| | | Years ended July 31, | |
| | | 2020 | | 2019 | | 2018 | | 2017 | | 2016 | |
Net asset value, beginning of year | | $ | 10.00 | | | $ | 9.72 | | | $ | 10.03 | | | $ | 10.79 | | | $ | 9.94 | | |
Net investment income (loss)1 | | | 0.11 | | | | 0.13 | | | | 0.11 | | | | 0.13 | | | | 0.15 | | |
Net realized and unrealized gain (loss) | | | 0.63 | | | | 0.32 | | | | (0.26 | ) | | | (0.63 | ) | | | 1.01 | | |
Net increase (decrease) from operations | | | 0.74 | | | | 0.45 | | | | (0.15 | ) | | | (0.50 | ) | | | 1.16 | | |
Dividends from net investment income | | | (0.18 | ) | | | (0.17 | ) | | | — | | | | (0.18 | ) | | | (0.31 | ) | |
Return of capital | | | — | | | | — | | | | (0.16 | ) | | | (0.08 | ) | | | — | | |
Total dividends and return of capital | | | (0.18 | ) | | | (0.17 | ) | | | (0.16 | ) | | | (0.26 | ) | | | (0.31 | ) | |
Net asset value, end of year | | $ | 10.56 | | | $ | 10.00 | | | $ | 9.72 | | | $ | 10.03 | | | $ | 10.79 | | |
Total investment return2 | | | 7.54 | % | | | 4.75 | % | | | (1.50 | )% | | | (4.51 | )% | | | 11.99 | % | |
Ratios to average net assets: | |
Expenses before fee waivers and/or expense reimbursements | | | 1.08 | % | | | 1.09 | %3 | | | 1.09 | %3 | | | 1.11 | %3 | | | 1.08 | %3 | |
Expenses after fee waivers and/or expense reimbursements | | | 0.84 | % | | | 0.84 | %3 | | | 0.90 | %3 | | | 0.92 | %3 | | | 0.85 | %3 | |
Net investment income (loss) | | | 1.07 | % | | | 1.31 | % | | | 1.12 | % | | | 1.29 | % | | | 1.52 | % | |
Supplemental data: | |
Net assets, end of year (000's) | | $ | 300,695 | | | $ | 328,278 | | | $ | 369,353 | | | $ | 403,015 | | | $ | 512,631 | | |
Portfolio turnover | | | 136 | % | | | 54 | % | | | 221 | % | | | 199 | % | | | 38 | % | |
See accompanying notes to financial statements.
303
PACE High Yield Investments
Financial highlights
Selected data for a share of beneficial interest outstanding throughout each year is presented below:
Class A
| | | Years ended July 31, | |
| | | 2020 | | 2019 | | 2018 | | 2017 | | 2016 | |
Net asset value, beginning of year | | $ | 9.72 | | | $ | 9.81 | | | $ | 10.07 | | | $ | 9.59 | | | $ | 9.70 | | |
Net investment income (loss)1 | | | 0.50 | | | | 0.53 | | | | 0.53 | | | | 0.54 | | | | 0.54 | | |
Net realized and unrealized gain (loss) | | | (0.40 | ) | | | (0.09 | ) | | | (0.26 | ) | | | 0.48 | | | | (0.11 | ) | |
Net increase (decrease) from operations | | | 0.10 | | | | 0.44 | | | | 0.27 | | | | 1.02 | | | | 0.43 | | |
Dividends from net investment income | | | (0.54 | ) | | | (0.53 | ) | | | (0.53 | ) | | | (0.54 | ) | | | (0.47 | ) | |
Return of capital | | | — | | | | — | | | | — | | | | — | | | | (0.07 | ) | |
Total dividends, distributions and return of capital | | | (0.54 | ) | | | (0.53 | ) | | | (0.53 | ) | | | (0.54 | ) | | | (0.54 | ) | |
Net asset value, end of year | | $ | 9.28 | | | $ | 9.72 | | | $ | 9.81 | | | $ | 10.07 | | | $ | 9.59 | | |
Total investment return2 | | | 1.25 | % | | | 4.66 | % | | | 2.76 | % | | | 10.93 | % | | | 4.88 | % | |
Ratios to average net assets: | |
Expenses before fee waivers and/or expense reimbursements/recoupments | | | 1.24 | % | | | 1.23 | %3 | | | 1.22 | % | | | 1.25 | % | | | 1.26 | % | |
Expenses after fee waivers and/or expense reimbursements/recoupments | | | 1.06 | % | | | 1.06 | %3 | | | 1.06 | % | | | 1.07 | % | | | 1.08 | % | |
Net investment income (loss) | | | 5.39 | % | | | 5.52 | % | | | 5.29 | % | | | 5.43 | % | | | 5.84 | % | |
Supplemental data: | |
Net assets, end of year (000's) | | $ | 7,507 | | | $ | 5,813 | | | $ | 3,748 | | | $ | 4,251 | | | $ | 3,764 | | |
Portfolio turnover | | | 82 | % | | | 62 | % | | | 63 | % | | | 91 | % | | | 103 | % | |
Class Y
| | | Years ended July 31, | |
| | | 2020 | | 2019 | | 2018 | | 2017 | | 2016 | |
Net asset value, beginning of year | | $ | 9.76 | | | $ | 9.86 | | | $ | 10.10 | | | $ | 9.62 | | | $ | 9.73 | | |
Net investment income (loss)1 | | | 0.52 | | | | 0.55 | | | | 0.56 | | | | 0.56 | | | | 0.56 | | |
Net realized and unrealized gain (loss) | | | (0.40 | ) | | | (0.10 | ) | | | (0.25 | ) | | | 0.48 | | | | (0.10 | ) | |
Net increase (decrease) from operations | | | 0.12 | | | | 0.45 | | | | 0.31 | | | | 1.04 | | | | 0.46 | | |
Dividends from net investment income | | | (0.56 | ) | | | (0.55 | ) | | | (0.55 | ) | | | (0.56 | ) | | | (0.49 | ) | |
Return of capital | | | — | | | | — | | | | — | | | | — | | | | (0.08 | ) | |
Total dividends, distributions and return of capital | | | (0.56 | ) | | | (0.55 | ) | | | (0.55 | ) | | | (0.56 | ) | | | (0.57 | ) | |
Net asset value, end of year | | $ | 9.32 | | | $ | 9.76 | | | $ | 9.86 | | | $ | 10.10 | | | $ | 9.62 | | |
Total investment return2 | | | 1.49 | % | | | 4.79 | % | | | 3.06 | % | | | 11.21 | % | | | 5.11 | % | |
Ratios to average net assets: | |
Expenses before fee waivers and/or expense reimbursements/recoupments | | | 0.93 | % | | | 0.92 | %3 | | | 0.85 | % | | | 1.05 | % | | | 1.03 | % | |
Expenses after fee waivers and/or expense reimbursements/recoupments | | | 0.88 | % | | | 0.88 | %3 | | | 0.79 | % | | | 0.88 | % | | | 0.86 | % | |
Net investment income (loss) | | | 5.58 | % | | | 5.69 | % | | | 5.57 | % | | | 5.66 | % | | | 6.09 | % | |
Supplemental data: | |
Net assets, end of year (000's) | | $ | 568 | | | $ | 560 | | | $ | 534 | | | $ | 518 | | | $ | 874 | | |
Portfolio turnover | | | 82 | % | | | 62 | % | | | 63 | % | | | 91 | % | | | 103 | % | |
1 Calculated using the average shares method.
2 Total investment return is calculated assuming a $ 10,000 investment on the first day of each year reported, reinvestment of all dividends and other distributions, if any, at net asset value on the ex-dividend dates, and a sale at net asset value on the last day of each year reported. The figures do not include any applicable sales charges, redemption fees or program fees; results would be lower if they were included. Returns do not reflect the deduction of taxes that a shareholder would pay on Portfolio distributions or the redemption of Portfolio shares.
3 Includes interest expense representing less than 0.005%.
304
PACE High Yield Investments
Financial highlights (continued)
Class P
| | | Years ended July 31, | |
| | | 2020 | | 2019 | | 2018 | | 2017 | | 2016 | |
Net asset value, beginning of year | | $ | 9.73 | | | $ | 9.83 | | | $ | 10.09 | | | $ | 9.61 | | | $ | 9.72 | | |
Net investment income (loss)1 | | | 0.52 | | | | 0.55 | | | | 0.54 | | | | 0.55 | | | | 0.56 | | |
Net realized and unrealized gain (loss) | | | (0.40 | ) | | | (0.10 | ) | | | (0.25 | ) | | | 0.49 | | | | (0.11 | ) | |
Net increase (decrease) from operations | | | 0.12 | | | | 0.45 | | | | 0.29 | | | | 1.04 | | | | 0.45 | | |
Dividends from net investment income | | | (0.57 | ) | | | (0.55 | ) | | | (0.55 | ) | | | (0.56 | ) | | | (0.49 | ) | |
Return of capital | | | — | | | | — | | | | — | | | | — | | | | (0.07 | ) | |
Total dividends, distributions and return of capital | | | (0.57 | ) | | | (0.55 | ) | | | (0.55 | ) | | | (0.56 | ) | | | (0.56 | ) | |
Net asset value, end of year | | $ | 9.28 | | | $ | 9.73 | | | $ | 9.83 | | | $ | 10.09 | | | $ | 9.61 | | |
Total investment return2 | | | 1.40 | % | | | 4.80 | % | | | 2.96 | % | | | 11.07 | % | | | 5.03 | % | |
Ratios to average net assets: | |
Expenses before fee waivers and/or expense reimbursements/recoupments | | | 1.10 | % | | | 1.09 | %3 | | | 1.07 | % | | | 1.10 | % | | | 1.11 | % | |
Expenses after fee waivers and/or expense reimbursements/recoupments | | | 0.91 | % | | | 0.91 | %3 | | | 0.91 | % | | | 0.92 | % | | | 0.94 | % | |
Net investment income (loss) | | | 5.53 | % | | | 5.66 | % | | | 5.44 | % | | | 5.59 | % | | | 6.00 | % | |
Supplemental data: | |
Net assets, end of year (000's) | | $ | 258,345 | | | $ | 302,015 | | | $ | 347,364 | | | $ | 376,424 | | | $ | 412,789 | | |
Portfolio turnover | | | 82 | % | | | 62 | % | | | 63 | % | | | 91 | % | | | 103 | % | |
See accompanying notes to financial statements.
305
PACE Large Co Value Equity Investments
Financial highlights
Selected data for a share of beneficial interest outstanding throughout each year is presented below:
Class A
| | | Years ended July 31, | |
| | | 2020 | | 2019 | | 2018 | | 2017 | | 2016 | |
Net asset value, beginning of year | | $ | 21.57 | | | $ | 23.76 | | | $ | 23.70 | | | $ | 21.35 | | | $ | 23.72 | | |
Net investment income (loss)1 | | | 0.38 | | | | 0.38 | | | | 0.35 | | | | 0.33 | | | | 0.34 | | |
Net realized and unrealized gain (loss) | | | (2.83 | ) | | | (0.40 | ) | | | 1.73 | | | | 2.99 | | | | 0.11 | | |
Net increase (decrease) from operations | | | (2.45 | ) | | | (0.02 | ) | | | 2.08 | | | | 3.32 | | | | 0.45 | | |
Dividends from net investment income | | | (0.39 | ) | | | (0.35 | ) | | | (0.32 | ) | | | (0.35 | ) | | | (0.32 | ) | |
Distributions from net realized gains | | | (0.86 | ) | | | (1.82 | ) | | | (1.70 | ) | | | (0.62 | ) | | | (2.50 | ) | |
Total dividends and distributions | | | (1.25 | ) | | | (2.17 | ) | | | (2.02 | ) | | | (0.97 | ) | | | (2.82 | ) | |
Net asset value, end of year | | $ | 17.87 | | | $ | 21.57 | | | $ | 23.76 | | | $ | 23.70 | | | $ | 21.35 | | |
Total investment return2 | | | (12.41 | )% | | | 1.06 | % | | | 8.83 | % | | | 15.74 | % | | | 2.87 | % | |
Ratios to average net assets: | |
Expenses before fee waivers and/or expense reimbursements/recoupments | | | 1.47 | % | | | 1.44 | % | | | 1.46 | % | | | 1.45 | % | | | 1.48 | % | |
Expenses after fee waivers and/or expense reimbursements/recoupments, including dividend
expense, interest expense and other borrowing costs for investments sold short | | | 1.47 | % | | | 1.44 | % | | | 1.46 | % | | | 1.44 | % | | | 1.47 | % | |
Expenses after fee waivers and/or expense reimbursements/recoupments, excluding dividend
expense, interest expense and other borrowing costs for investments sold short | | | 1.13 | % | | | 1.11 | % | | | 1.10 | % | | | 1.11 | % | | | 1.13 | % | |
Net investment income (loss) | | | 1.91 | % | | | 1.77 | % | | | 1.46 | % | | | 1.47 | % | | | 1.63 | % | |
Supplemental data: | |
Net assets, end of year (000's) | | $ | 81,190 | | | $ | 107,796 | | | $ | 111,759 | | | $ | 117,223 | | | $ | 111,716 | | |
Portfolio turnover | | | 72 | % | | | 81 | % | | | 68 | % | | | 71 | % | | | 65 | % | |
Class Y
| | | Years ended July 31, | |
| | | 2020 | | 2019 | | 2018 | | 2017 | | 2016 | |
Net asset value, beginning of year | | $ | 21.64 | | | $ | 23.83 | | | $ | 23.77 | | | $ | 21.41 | | | $ | 23.78 | | |
Net investment income (loss)1 | | | 0.42 | | | | 0.44 | | | | 0.41 | | | | 0.39 | | | | 0.40 | | |
Net realized and unrealized gain (loss) | | | (2.84 | ) | | | (0.40 | ) | | | 1.73 | | | | 3.00 | | | | 0.11 | | |
Net increase (decrease) from operations | | | (2.42 | ) | | | 0.04 | | | | 2.14 | | | | 3.39 | | | | 0.51 | | |
Dividends from net investment income | | | (0.45 | ) | | | (0.41 | ) | | | (0.38 | ) | | | (0.41 | ) | | | (0.38 | ) | |
Distributions from net realized gains | | | (0.86 | ) | | | (1.82 | ) | | | (1.70 | ) | | | (0.62 | ) | | | (2.50 | ) | |
Total dividends and distributions | | | (1.31 | ) | | | (2.23 | ) | | | (2.08 | ) | | | (1.03 | ) | | | (2.88 | ) | |
Net asset value, end of year | | $ | 17.91 | | | $ | 21.64 | | | $ | 23.83 | | | $ | 23.77 | | | $ | 21.41 | | |
Total investment return2 | | | (12.22 | )% | | | 1.35 | % | | | 9.08 | % | | | 16.02 | % | | | 3.16 | % | |
Ratios to average net assets: | |
Expenses before fee waivers and/or expense reimbursements | | | 1.55 | % | | | 1.19 | % | | | 1.21 | % | | | 1.20 | % | | | 1.23 | % | |
Expenses after fee waivers and/or expense reimbursements/recoupments, including dividend
expense, interest expense and other borrowing costs for investments sold short | | | 1.23 | % | | | 1.19 | % | | | 1.21 | % | | | 1.19 | % | | | 1.21 | % | |
Expenses after fee waivers and/or expense reimbursements/recoupments, excluding dividend
expense, interest expense and other borrowing costs for investments sold short | | | 0.89 | % | | | 0.86 | % | | | 0.85 | % | | | 0.86 | % | | | 0.88 | % | |
Net investment income (loss) | | | 2.15 | % | | | 2.01 | % | | | 1.71 | % | | | 1.73 | % | | | 1.89 | % | |
Supplemental data: | |
Net assets, end of year (000's) | | $ | 13,059 | | | $ | 16,463 | | | $ | 17,206 | | | $ | 17,451 | | | $ | 17,870 | | |
Portfolio turnover | | | 72 | % | | | 81 | % | | | 68 | % | | | 71 | % | | | 65 | % | |
1 Calculated using the average shares method.
2 Total investment return is calculated assuming a $ 10,000 investment on the first day of each year reported, reinvestment of all dividends and other distributions, if any, at net asset value on the ex-dividend dates, and a sale at net asset value on the last day of each year reported. The figures do not include any applicable sales charges, redemption fees or program fees; results would be lower if they were included. Returns do not reflect the deduction of taxes that a shareholder would pay on Portfolio distributions or the redemption of Portfolio shares.
306
PACE Large Co Value Equity Investments
Financial highlights (continued)
Class P
| | | Years ended July 31, | |
| | | 2020 | | 2019 | | 2018 | | 2017 | | 2016 | |
Net asset value, beginning of year | | $ | 21.51 | | | $ | 23.71 | | | $ | 23.66 | | | $ | 21.31 | | | $ | 23.68 | | |
Net investment income (loss)1 | | | 0.42 | | | | 0.44 | | | | 0.40 | | | | 0.38 | | | | 0.39 | | |
Net realized and unrealized gain (loss) | | | (2.82 | ) | | | (0.42 | ) | | | 1.72 | | | | 2.99 | | | | 0.12 | | |
Net increase (decrease) from operations | | | (2.40 | ) | | | 0.02 | | | | 2.12 | | | | 3.37 | | | | 0.51 | | |
Dividends from net investment income | | | (0.44 | ) | | | (0.40 | ) | | | (0.37 | ) | | | (0.40 | ) | | | (0.38 | ) | |
Distributions from net realized gains | | | (0.86 | ) | | | (1.82 | ) | | | (1.70 | ) | | | (0.62 | ) | | | (2.50 | ) | |
Total dividends and distributions | | | (1.30 | ) | | | (2.22 | ) | | | (2.07 | ) | | | (1.02 | ) | | | (2.88 | ) | |
Net asset value, end of year | | $ | 17.81 | | | $ | 21.51 | | | $ | 23.71 | | | $ | 23.66 | | | $ | 21.31 | | |
Total investment return2 | | | (12.24 | )% | | | 1.28 | % | | | 9.06 | % | | | 16.03 | % | | | 3.17 | % | |
Ratios to average net assets: | |
Expenses before fee waivers and/or expense reimbursements | | | 1.24 | % | | | 1.21 | % | | | 1.23 | % | | | 1.22 | % | | | 1.24 | % | |
Expenses after fee waivers and/or expense reimbursements/recoupments, including
dividend expense, interest expense and other borrowing costs for investments sold short | | | 1.23 | % | | | 1.21 | % | | | 1.22 | % | | | 1.20 | % | | | 1.23 | % | |
Expenses after fee waivers and/or expense reimbursements/recoupments, excluding dividend
expense, interest expense and other borrowing costs for investments sold short | | | 0.89 | % | | | 0.88 | % | | | 0.87 | % | | | 0.88 | % | | | 0.89 | % | |
Net investment income (loss) | | | 2.16 | % | | | 2.01 | % | | | 1.69 | % | | | 1.70 | % | | | 1.87 | % | |
Supplemental data: | |
Net assets, end of year (000's) | | $ | 760,606 | | | $ | 1,008,741 | | | $ | 1,184,977 | | | $ | 1,197,155 | | | $ | 1,160,287 | | |
Portfolio turnover | | | 72 | % | | | 81 | % | | | 68 | % | | | 71 | % | | | 65 | % | |
See accompanying notes to financial statements.
307
PACE Large Co Growth Equity Investments
Financial highlights
Selected data for a share of beneficial interest outstanding throughout each year is presented below:
Class A
| | | Years ended July 31, | |
| | | 2020 | | 2019 | | 2018 | | 2017 | | 2016 | |
Net asset value, beginning of year | | $ | 24.27 | | | $ | 27.06 | | | $ | 25.18 | | | $ | 22.37 | | | $ | 26.24 | | |
Net investment income (loss)1 | | | (0.02 | ) | | | (0.06 | ) | | | (0.06 | ) | | | 0.02 | | | | (0.05 | ) | |
Net realized and unrealized gain (loss) | | | 5.61 | | | | 1.74 | | | | 4.55 | | | | 3.54 | | | | 0.10 | | |
Net increase (decrease) from operations | | | 5.59 | | | | 1.68 | | | | 4.49 | | | | 3.56 | | | | 0.05 | | |
Dividends from net investment income | | | — | | | | — | | | | — | | | | (0.03 | ) | | | — | | |
Distributions from net realized gains | | | (3.75 | ) | | | (4.47 | ) | | | (2.61 | ) | | | (0.72 | ) | | | (3.92 | ) | |
Total dividends and distributions | | | (3.75 | ) | | | (4.47 | ) | | | (2.61 | ) | | | (0.75 | ) | | | (3.92 | ) | |
Net asset value, end of year | | $ | 26.11 | | | $ | 24.27 | | | $ | 27.06 | | | $ | 25.18 | | | $ | 22.37 | | |
Total investment return2 | | | 26.36 | % | | | 10.08 | % | | | 18.72 | % | | | 16.50 | % | | | 0.73 | % | |
Ratios to average net assets: | |
Expenses before fee waivers and/or expense reimbursements/recoupments | | | 1.16 | %3 | | | 1.14 | %3 | | | 1.14 | %3 | | | 1.18 | %3 | | | 1.19 | %3 | |
Expenses after fee waivers and/or expense reimbursements/recoupments | | | 1.13 | %3 | | | 1.13 | %3 | | | 1.14 | %3 | | | 1.17 | %3 | | | 1.18 | %3 | |
Net investment income (loss) | | | (0.10 | )% | | | (0.27 | )% | | | (0.22 | )% | | | 0.07 | % | | | (0.24 | )% | |
Supplemental data: | |
Net assets, end of year (000's) | | $ | 54,124 | | | $ | 48,197 | | | $ | 47,549 | | | $ | 45,095 | | | $ | 42,862 | | |
Portfolio turnover | | | 42 | % | | | 34 | % | | | 41 | % | | | 40 | % | | | 33 | % | |
Class Y
| | | Years ended July 31, | |
| | | 2020 | | 2019 | | 2018 | | 2017 | | 2016 | |
Net asset value, beginning of year | | $ | 25.61 | | | $ | 28.23 | | | $ | 26.12 | | | $ | 23.19 | | | $ | 26.98 | | |
Net investment income (loss)1 | | | 0.04 | | | | (0.01 | ) | | | 0.01 | | | | 0.08 | | | | 0.01 | | |
Net realized and unrealized gain (loss) | | | 5.97 | | | | 1.87 | | | | 4.74 | | | | 3.66 | | | | 0.12 | | |
Net increase (decrease) from operations | | | 6.01 | | | | 1.86 | | | | 4.75 | | | | 3.74 | | | | 0.13 | | |
Dividends from net investment income | | | (0.04 | ) | | | (0.01 | ) | | | (0.03 | ) | | | (0.09 | ) | | | — | | |
Distributions from net realized gains | | | (3.75 | ) | | | (4.47 | ) | | | (2.61 | ) | | | (0.72 | ) | | | (3.92 | ) | |
Total dividends and distributions | | | (3.79 | ) | | | (4.48 | ) | | | (2.64 | ) | | | (0.81 | ) | | | (3.92 | ) | |
Net asset value, end of year | | $ | 27.83 | | | $ | 25.61 | | | $ | 28.23 | | | $ | 26.12 | | | $ | 23.19 | | |
Total investment return2 | | | 26.71 | % | | | 10.38 | % | | | 19.03 | % | | | 16.73 | % | | | 1.04 | % | |
Ratios to average net assets: | |
Expenses before fee waivers and/or expense reimbursements | | | 0.88 | %3 | | | 0.88 | %3 | | | 0.88 | %3 | | | 0.92 | %3 | | | 0.92 | %3 | |
Expenses after fee waivers and/or expense reimbursements | | | 0.88 | %3 | | | 0.88 | %3 | | | 0.88 | %3 | | | 0.91 | %3 | | | 0.91 | %3 | |
Net investment income (loss) | | | 0.15 | % | | | (0.02 | )% | | | 0.05 | % | | | 0.33 | % | | | 0.02 | % | |
Supplemental data: | |
Net assets, end of year (000's) | | $ | 19,149 | | | $ | 16,329 | | | $ | 15,715 | | | $ | 14,238 | | | $ | 13,989 | | |
Portfolio turnover | | | 42 | % | | | 34 | % | | | 41 | % | | | 40 | % | | | 33 | % | |
1 Calculated using the average shares method.
2 Total investment return is calculated assuming a $10,000 investment on the first day of each year reported, reinvestment of all dividends and other distributions, if any, at net asset value on the ex-dividend dates, and a sale at net asset value on the last day of each year reported. The figures do not include any applicable sales charges, redemption fees or program fees; results would be lower if they were included. Returns do not reflect the deduction of taxes that a shareholder would pay on Portfolio distributions or the redemption of Portfolio shares.
3 Includes interest expense representing less than 0.005%.
4 Amount represents less than $0.005 per share.
308
PACE Large Co Growth Equity Investments
Financial highlights (continued)
Class P
| | | Years ended July 31, | |
| | | 2020 | | 2019 | | 2018 | | 2017 | | 2016 | |
Net asset value, beginning of year | | $ | 25.37 | | | $ | 28.01 | | | $ | 25.94 | | | $ | 23.03 | | | $ | 26.83 | | |
Net investment income (loss)1 | | | 0.04 | | | | (0.00 | )4 | | | 0.01 | | | | 0.07 | | | | 0.004 | | |
Net realized and unrealized gain (loss) | | | 5.90 | | | | 1.84 | | | | 4.70 | | | | 3.64 | | | | 0.12 | | |
Net increase (decrease) from operations | | | 5.94 | | | | 1.84 | | | | 4.71 | | | | 3.71 | | | | 0.12 | | |
Dividends from net investment income | | | (0.04 | ) | | | (0.01 | ) | | | (0.03 | ) | | | (0.08 | ) | | | — | | |
Distributions from net realized gains | | | (3.75 | ) | | | (4.47 | ) | | | (2.61 | ) | | | (0.72 | ) | | | (3.92 | ) | |
Total dividends and distributions | | | (3.79 | ) | | | (4.48 | ) | | | (2.64 | ) | | | (0.80 | ) | | | (3.92 | ) | |
Net asset value, end of year | | $ | 27.52 | | | $ | 25.37 | | | $ | 28.01 | | | $ | 25.94 | | | $ | 23.03 | | |
Total investment return2 | | | 26.72 | % | | | 10.34 | % | | | 19.03 | % | | | 16.75 | % | | | 1.01 | % | |
Ratios to average net assets: | |
Expenses before fee waivers and/or expense reimbursements | | | 0.92 | %3 | | | 0.90 | %3 | | | 0.90 | %3 | | | 0.93 | %3 | | | 0.93 | %3 | |
Expenses after fee waivers and/or expense reimbursements | | | 0.88 | %3 | | | 0.88 | %3 | | | 0.89 | %3 | | | 0.92 | %3 | | | 0.92 | %3 | |
Net investment income (loss) | | | 0.17 | % | | | (0.01 | )% | | | 0.03 | % | | | 0.32 | % | | | 0.01 | % | |
Supplemental data: | |
Net assets, end of year (000's) | | $ | 1,099,813 | | | $ | 1,156,162 | | | $ | 1,327,262 | | | $ | 1,270,696 | | | $ | 1,214,069 | | |
Portfolio turnover | | | 42 | % | | | 34 | % | | | 41 | % | | | 40 | % | | | 33 | % | |
See accompanying notes to financial statements.
309
PACE Small/Medium Co Value Equity Investments
Financial highlights
Selected data for a share of beneficial interest outstanding throughout each year is presented below:
Class A
| | | Years ended July 31, | |
| | | 2020 | | 2019 | | 2018 | | 2017 | | 2016 | |
Net asset value, beginning of year | | $ | 18.74 | | | $ | 21.05 | | | $ | 20.90 | | | $ | 18.86 | | | $ | 20.81 | | |
Net investment income (loss)1 | | | 0.08 | | | | 0.10 | | | | 0.07 | | | | 0.13 | | | | 0.07 | | |
Net realized and unrealized gain (loss) | | | (1.81 | ) | | | (1.29 | ) | | | 2.49 | | | | 2.75 | | | | 0.08 | | |
Net increase (decrease) from operations | | | (1.73 | ) | | | (1.19 | ) | | | 2.56 | | | | 2.88 | | | | 0.15 | | |
Dividends from net investment income | | | (0.13 | ) | | | (0.13 | ) | | | (0.02 | ) | | | (0.28 | ) | | | (0.11 | ) | |
Distributions from net realized gains | | | — | | | | (0.99 | ) | | | (2.39 | ) | | | (0.56 | ) | | | (1.99 | ) | |
Total dividends and distributions | | | (0.13 | ) | | | (1.12 | ) | | | (2.41 | ) | | | (0.84 | ) | | | (2.10 | ) | |
Net asset value, end of year | | $ | 16.88 | | | $ | 18.74 | | | $ | 21.05 | | | $ | 20.90 | | | $ | 18.86 | | |
Total investment return2 | | | (9.32 | )% | | | (4.68 | )% | | | 12.93 | % | | | 15.25 | % | | | 1.60 | % | |
Ratios to average net assets: | |
Expenses before fee waivers and/or expense reimbursements | | | 1.23 | %3 | | | 1.22 | %3 | | | 1.21 | % | | | 1.23 | %3 | | | 1.24 | % | |
Expenses after fee waivers and/or expense reimbursements | | | 1.23 | %3 | | | 1.22 | %3 | | | 1.21 | % | | | 1.21 | %3 | | | 1.24 | % | |
Net investment income (loss) | | | 0.47 | % | | | 0.52 | % | | | 0.34 | % | | | 0.66 | % | | | 0.41 | % | |
Supplemental data: | |
Net assets, end of year (000's) | | $ | 13,279 | | | $ | 17,094 | | | $ | 18,342 | | | $ | 17,627 | | | $ | 16,670 | | |
Portfolio turnover | | | 59 | % | | | 68 | % | | | 60 | % | | | 102 | % | | | 74 | % | |
Class Y
| | | Years ended July 31, | |
| | | 2020 | | 2019 | | 2018 | | 2017 | | 2016 | |
Net asset value, beginning of year | | $ | 19.63 | | | $ | 22.00 | | | $ | 21.71 | | | $ | 19.55 | | | $ | 21.48 | | |
Net investment income (loss)1 | | | 0.14 | | | | 0.16 | | | | 0.15 | | | | 0.30 | | | | 0.12 | | |
Net realized and unrealized gain (loss) | | | (1.90 | ) | | | (1.35 | ) | | | 2.58 | | | | 2.70 | | | | 0.09 | | |
Net increase (decrease) from operations | | | (1.76 | ) | | | (1.19 | ) | | | 2.73 | | | | 3.00 | | | | 0.21 | | |
Dividends from net investment income | | | (0.18 | ) | | | (0.19 | ) | | | (0.05 | ) | | | (0.28 | ) | | | (0.15 | ) | |
Distributions from net realized gains | | | — | | | | (0.99 | ) | | | (2.39 | ) | | | (0.56 | ) | | | (1.99 | ) | |
Total dividends and distributions | | | (0.18 | ) | | | (1.18 | ) | | | (2.44 | ) | | | (0.84 | ) | | | (2.14 | ) | |
Net asset value, end of year | | $ | 17.69 | | | $ | 19.63 | | | $ | 22.00 | | | $ | 21.71 | | | $ | 19.55 | | |
Total investment return2 | | | (9.08 | )% | | | (4.44 | )% | | | 13.26 | % | | | 15.35 | % | | | 1.81 | % | |
Ratios to average net assets: | |
Expenses before fee waivers and/or expense reimbursements/recoupments | | | 1.04 | %3 | | | 0.94 | %3 | | | 0.89 | % | | | 1.13 | %3 | | | 1.07 | % | |
Expenses after fee waivers and/or expense reimbursements/recoupments | | | 1.04 | %3 | | | 0.94 | %3 | | | 0.89 | % | | | 1.10 | %3 | | | 1.07 | % | |
Net investment income (loss) | | | 0.77 | % | | | 0.79 | % | | | 0.70 | % | | | 1.43 | % | | | 0.63 | % | |
Supplemental data: | |
Net assets, end of year (000's) | | $ | 105 | | | $ | 178 | | | $ | 232 | | | $ | 297 | | | $ | 697 | | |
Portfolio turnover | | | 59 | % | | | 68 | % | | | 60 | % | | | 102 | % | | | 74 | % | |
1 Calculated using the average shares method.
2 Total investment return is calculated assuming a $ 10,000 investment on the first day of each year reported, reinvestment of all dividends and other distributions, if any, at net asset value on the ex-dividend dates, and a sale at net asset value on the last day of each year reported. The figures do not include any applicable sales charges, redemption fees or program fees; results would be lower if they were included. Returns do not reflect the deduction of taxes that a shareholder would pay on Portfolio distributions or the redemption of Portfolio shares.
3 Includes interest expense representing less than 0.005%.
310
PACE Small/Medium Co Value Equity Investments
Financial highlights (continued)
Class P
| | | Years ended July 31, | |
| | | 2020 | | 2019 | | 2018 | | 2017 | | 2016 | |
Net asset value, beginning of year | | $ | 19.36 | | | $ | 21.69 | | | $ | 21.47 | | | $ | 19.35 | | | $ | 21.30 | | |
Net investment income (loss)1 | | | 0.12 | | | | 0.13 | | | | 0.11 | | | | 0.17 | | | | 0.10 | | |
Net realized and unrealized gain (loss) | | | (1.86 | ) | | | (1.31 | ) | | | 2.55 | | | | 2.81 | | | | 0.08 | | |
Net increase (decrease) from operations | | | (1.74 | ) | | | (1.18 | ) | | | 2.66 | | | | 2.98 | | | | 0.18 | | |
Dividends from net investment income | | | (0.17 | ) | | | (0.16 | ) | | | (0.05 | ) | | | (0.30 | ) | | | (0.14 | ) | |
Distributions from net realized gains | | | — | | | | (0.99 | ) | | | (2.39 | ) | | | (0.56 | ) | | | (1.99 | ) | |
Total dividends and distributions | | | (0.17 | ) | | | (1.15 | ) | | | (2.44 | ) | | | (0.86 | ) | | | (2.13 | ) | |
Net asset value, end of year | | $ | 17.45 | | | $ | 19.36 | | | $ | 21.69 | | | $ | 21.47 | | | $ | 19.35 | | |
Total investment return2 | | | (9.12 | )% | | | (4.49 | )% | | | 13.07 | % | | | 15.41 | % | | | 1.77 | % | |
Ratios to average net assets: | |
Expenses before fee waivers and/or expense reimbursements/recoupments | | | 1.09 | %3 | | | 1.07 | %3 | | | 1.07 | % | | | 1.09 | %3 | | | 1.11 | % | |
Expenses after fee waivers and/or expense reimbursements/recoupments | | | 1.04 | %3 | | | 1.04 | %3 | | | 1.06 | % | | | 1.07 | %3 | | | 1.11 | % | |
Net investment income (loss) | | | 0.65 | % | | | 0.69 | % | | | 0.50 | % | | | 0.82 | % | | | 0.53 | % | |
Supplemental data: | |
Net assets, end of year (000's) | | $ | 338,418 | | | $ | 421,054 | | | $ | 517,363 | | | $ | 503,464 | | | $ | 490,762 | | |
Portfolio turnover | | | 59 | % | | | 68 | % | | | 60 | % | | | 102 | % | | | 74 | % | |
See accompanying notes to financial statements.
311
PACE Small/Medium Co Growth Equity Investments
Financial highlights
Selected data for a share of beneficial interest outstanding throughout each year is presented below:
Class A
| | | Years ended July 31, | |
| | | 2020 | | 2019 | | 2018 | | 2017 | | 2016 | |
Net asset value, beginning of year | | $ | 16.82 | | | $ | 19.54 | | | $ | 16.79 | | | $ | 14.34 | | | $ | 20.45 | | |
Net investment income (loss)1 | | | (0.10 | ) | | | (0.12 | ) | | | (0.12 | ) | | | (0.09 | ) | | | (0.10 | ) | |
Net realized and unrealized gain (loss) | | | 1.65 | | | | 0.45 | | | | 3.88 | | | | 2.54 | | | | (2.23 | ) | |
Net increase (decrease) from operations | | | 1.55 | | | | 0.33 | | | | 3.76 | | | | 2.45 | | | | (2.33 | ) | |
Distributions from net realized gains | | | (2.55 | ) | | | (3.05 | ) | | | (1.01 | ) | | | — | | | | (3.78 | ) | |
Net asset value, end of year | | $ | 15.82 | | | $ | 16.82 | | | $ | 19.54 | | | $ | 16.79 | | | $ | 14.34 | | |
Total investment return2 | | | 10.43 | % | | | 4.67 | % | | | 23.29 | % | | | 17.09 | % | | | (11.20 | )% | |
Ratios to average net assets: | |
Expenses before fee waivers and/or expense reimbursements/recoupments | | | 1.23 | %3 | | | 1.21 | %3 | | | 1.20 | %3 | | | 1.23 | % | | | 1.25 | %4 | |
Expenses after fee waivers and/or expense reimbursements/recoupments | | | 1.23 | %3 | | | 1.21 | %3 | | | 1.19 | %3 | | | 1.19 | % | | | 1.21 | %4 | |
Net investment income (loss) | | | (0.64 | )% | | | (0.67 | )% | | | (0.66 | )% | | | (0.61 | )% | | | (0.64 | )% | |
Supplemental data: | |
Net assets, end of year (000's) | | $ | 23,755 | | | $ | 24,675 | | | $ | 24,749 | | | $ | 22,681 | | | $ | 21,912 | | |
Portfolio turnover | | | 89 | % | | | 135 | % | | | 99 | % | | | 93 | % | | | 98 | % | |
Class Y
| | | Years ended July 31, | |
| | | 2020 | | 2019 | | 2018 | | 2017 | | 2016 | |
Net asset value, beginning of year | | $ | 18.65 | | | $ | 21.26 | | | $ | 18.08 | | | $ | 15.44 | | | $ | 21.67 | | |
Net investment income (loss)1 | | | (0.08 | ) | | | (0.10 | ) | | | (0.02 | ) | | | (0.08 | ) | | | (0.09 | ) | |
Net realized and unrealized gain (loss) | | | 1.85 | | | | 0.54 | | | | 4.21 | | | | 2.72 | | | | (2.36 | ) | |
Net increase (decrease) from operations | | | 1.77 | | | | 0.44 | | | | 4.19 | | | | 2.64 | | | | (2.45 | ) | |
Distributions from net realized gains | | | (2.55 | ) | | | (3.05 | ) | | | (1.01 | ) | | | — | | | | (3.78 | ) | |
Net asset value, end of year | | $ | 17.87 | | | $ | 18.65 | | | $ | 21.26 | | | $ | 18.08 | | | $ | 15.44 | | |
Total investment return2 | | | 10.60 | % | | | 4.82 | % | | | 23.97 | % | | | 17.16 | % | | | (11.11 | )% | |
Ratios to average net assets: | |
Expenses before fee waivers and/or expense reimbursements | | | 1.21 | %3 | | | 0.92 | %3 | | | 0.69 | %3 | | | 1.24 | % | | | 1.09 | %3,4 | |
Expenses after fee waivers and/or expense reimbursements | | | 1.08 | %3 | | | 1.08 | %3,4 | | | 0.67 | %3 | | | 1.13 | % | | | 1.12 | %3,4 | |
Net investment income (loss) | | | (0.49 | )% | | | (0.54 | )% | | | (0.12 | )% | | | (0.48 | )% | | | (0.55 | )% | |
Supplemental data: | |
Net assets, end of year (000's) | | $ | 28 | | | $ | 49 | | | $ | 47 | | | $ | 100 | | | $ | 488 | | |
Portfolio turnover | | | 89 | % | | | 135 | % | | | 99 | % | | | 93 | % | | | 98 | % | |
1 Calculated using the average shares method.
2 Total investment return is calculated assuming a $10,000 investment on the first day of each year reported, reinvestment of all dividends and other distributions, if any, at net asset value on the ex-dividend dates, and a sale at net asset value on the last day of each year reported. The figures do not include any applicable sales charges, redemption fees or program fees; results would be lower if they were included. Returns do not reflect the deduction of taxes that a shareholder would pay on Portfolio distributions or the redemption of Portfolio shares.
3 Includes interest expense representing less than 0.005%.
312
PACE Small/Medium Co Growth Equity Investments
Financial highlights (continued)
Class P
| | | Years ended July 31, | |
| | | 2020 | | 2019 | | 2018 | | 2017 | | 2016 | |
Net asset value, beginning of year | | $ | 18.21 | | | $ | 20.85 | | | $ | 17.82 | | | $ | 15.21 | | | $ | 21.40 | | |
Net investment income (loss)1 | | | (0.08 | ) | | | (0.10 | ) | | | (0.10 | ) | | | (0.08 | ) | | | (0.08 | ) | |
Net realized and unrealized gain (loss) | | | 1.81 | | | | 0.51 | | | | 4.14 | | | | 2.69 | | | | (2.33 | ) | |
Net increase (decrease) from operations | | | 1.73 | | | | 0.41 | | | | 4.04 | | | | 2.61 | | | | (2.41 | ) | |
Distributions from net realized gains | | | (2.55 | ) | | | (3.05 | ) | | | (1.01 | ) | | | — | | | | (3.78 | ) | |
Net asset value, end of year | | $ | 17.39 | | | $ | 18.21 | | | $ | 20.85 | | | $ | 17.82 | | | $ | 15.21 | | |
Total investment return2 | | | 10.64 | % | | | 4.83 | % | | | 23.46 | % | | | 17.16 | % | | | (11.07 | )% | |
Ratios to average net assets: | |
Expenses before fee waivers and/or expense reimbursements | | | 1.09 | %3 | | | 1.07 | %3 | | | 1.06 | %3 | | | 1.11 | % | | | 1.13 | %4 | |
Expenses after fee waivers and/or expense reimbursements | | | 1.08 | %3 | | | 1.07 | %3 | | | 1.05 | %3 | | | 1.07 | % | | | 1.09 | %4 | |
Net investment income (loss) | | | (0.49 | )% | | | (0.52 | )% | | | (0.52 | )% | | | (0.49 | )% | | | (0.52 | )% | |
Supplemental data: | |
Net assets, end of year (000's) | | $ | 383,461 | | | $ | 433,053 | | | $ | 518,869 | | | $ | 469,557 | | | $ | 444,300 | | |
Portfolio turnover | | | 89 | % | | | 135 | % | | | 99 | % | | | 93 | % | | | 98 | % | |
4 The investment manager recouped expenses previously reimbursed by the investment manager on behalf of the Portfolio, not to exceed the expense cap.
See accompanying notes to financial statements.
313
PACE International Equity Investments
Financial highlights
Selected data for a share of beneficial interest outstanding throughout each year is presented below:
Class A
| | | Years ended July 31, | |
| | | 2020 | | 2019 | | 2018 | | 2017 | | 2016 | |
Net asset value, beginning of year | | $ | 15.00 | | | $ | 17.03 | | | $ | 16.23 | | | $ | 14.19 | | | $ | 15.04 | | |
Net investment income (loss)1 | | | 0.21 | | | | 0.24 | | | | 0.23 | | | | 0.26 | | | | 0.22 | | |
Net realized and unrealized gain (loss) | | | (0.18 | ) | | | (1.13 | ) | | | 0.88 | | | | 2.06 | | | | (0.87 | ) | |
Net increase (decrease) from operations | | | 0.03 | | | | (0.89 | ) | | | 1.11 | | | | 2.32 | | | | (0.65 | ) | |
Dividends from net investment income | | | (0.36 | ) | | | (0.26 | ) | | | (0.31 | ) | | | (0.28 | ) | | | (0.20 | ) | |
Distributions from net realized gains | | | (0.03 | ) | | | (0.88 | ) | | | — | | | | — | | | | — | | |
Total dividends and distributions | | | (0.39 | ) | | | (1.14 | ) | | | (0.31 | ) | | | (0.28 | ) | | | (0.20 | ) | |
Net asset value, end of year | | $ | 14.64 | | | $ | 15.00 | | | $ | 17.03 | | | $ | 16.23 | | | $ | 14.19 | | |
Total investment return2 | | | 0.00 | % | | | (4.56 | )% | | | 6.88 | % | | | 16.71 | % | | | (4.30 | )% | |
Ratios to average net assets: | |
Expenses before fee waivers and/or expense reimbursements/recoupments,
including dividend expense, interest expense and other borrowing costs for
investments sold short | | | 1.78 | % | | | 1.88 | % | | | 1.86 | %3 | | | 1.79 | %3 | | | 1.86 | %3 | |
Expenses after fee waivers and/or expense reimbursements/recoupments,
including dividend expense, interest expense and other borrowing costs for
investments sold short | | | 1.78 | % | | | 1.88 | % | | | 1.85 | %3 | | | 1.76 | %3 | | | 1.82 | %3 | |
Expenses after fee waivers and/or expense reimbursements/recoupments,
excluding dividend expense, interest expense and other borrowing costs for
investments sold short | | | 1.34 | % | | | 1.34 | % | | | 1.31 | % | | | 1.37 | % | | | 1.38 | % | |
Net investment income (loss) | | | 1.42 | % | | | 1.60 | % | | | 1.37 | % | | | 1.77 | % | | | 1.61 | % | |
Supplemental data: | |
Net assets, end of year (000's) | | $ | 23,422 | | | $ | 27,264 | | | $ | 31,165 | | | $ | 31,113 | | | $ | 29,788 | | |
Portfolio turnover | | | 32 | % | | | 46 | % | | | 78 | % | | | 81 | % | | | 80 | % | |
Class Y
| | | Years ended July 31, | |
| | | 2020 | | 2019 | | 2018 | | 2017 | | 2016 | |
Net asset value, beginning of year | | $ | 14.93 | | | $ | 16.98 | | | $ | 16.17 | | | $ | 14.14 | | | $ | 15.00 | | |
Net investment income (loss)1 | | | 0.25 | | | | 0.29 | | | | 0.28 | | | | 0.30 | | | | 0.26 | | |
Net realized and unrealized gain (loss) | | | (0.17 | ) | | | (1.15 | ) | | | 0.89 | | | | 2.05 | | | | (0.88 | ) | |
Net increase (decrease) from operations | | | 0.08 | | | | (0.86 | ) | | | 1.17 | | | | 2.35 | | | | (0.62 | ) | |
Dividends from net investment income | | | (0.40 | ) | | | (0.31 | ) | | | (0.36 | ) | | | (0.32 | ) | | | (0.24 | ) | |
Distributions from net realized gains | | | (0.03 | ) | | | (0.88 | ) | | | — | | | | — | | | | — | | |
Total dividends and distributions | | | (0.43 | ) | | | (1.19 | ) | | | (0.36 | ) | | | (0.32 | ) | | | (0.24 | ) | |
Net asset value, end of year | | $ | 14.58 | | | $ | 14.93 | | | $ | 16.98 | | | $ | 16.17 | | | $ | 14.14 | | |
Total investment return2 | | | 0.29 | % | | | (4.32 | )% | | | 7.24 | % | | | 17.04 | % | | | (4.09 | )% | |
Ratios to average net assets: | |
Expenses before fee waivers and/or reimbursements/recoupments,
including dividend expense, interest expense and other borrowing costs for
investments sold short | | | 1.47 | % | | | 1.62 | % | | | 1.59 | %3 | | | 1.51 | %3 | | | 1.56 | %3 | |
Expenses after fee waivers and/or expense reimbursements/recoupments,
including dividend expense, interest expense and other borrowing costs for
investments sold short | | | 1.47 | % | | | 1.62 | % | | | 1.58 | %3 | | | 1.48 | %3 | | | 1.53 | %3 | |
Expenses after fee waivers and/or expense reimbursements/recoupments,
excluding dividend expense, interest expense and other borrowing costs for
investments sold short | | | 1.03 | % | | | 1.07 | % | | | 1.04 | % | | | 1.09 | % | | | 1.09 | % | |
Net investment income (loss) | | | 1.71 | % | | | 1.90 | % | | | 1.63 | % | | | 2.04 | % | | | 1.86 | % | |
Supplemental data: | |
Net assets, end of year (000's) | | $ | 11,053 | | | $ | 11,977 | | | $ | 13,966 | | | $ | 14,726 | | | $ | 15,900 | | |
Portfolio turnover | | | 32 | % | | | 46 | % | | | 78 | % | | | 81 | % | | | 80 | % | |
1 Calculated using the average shares method.
2 Total investment return is calculated assuming a $ 10,000 investment on the first day of each year reported, reinvestment of all dividends and other distributions, if any, at net asset value on the ex-dividend dates, and a sale at net asset value on the last day of each year reported. The figures do not include any applicable sales charges, redemption fees or program fees; results would be lower if they were included. Returns do not reflect the deduction of taxes that a shareholder would pay on Portfolio distributions or the redemption of Portfolio shares.
314
PACE International Equity Investments
Financial highlights (continued)
Class P
| | | Years ended July 31, | |
| | | 2020 | | 2019 | | 2018 | | 2017 | | 2016 | |
Net asset value, beginning of year | | $ | 14.90 | | | $ | 16.93 | | | $ | 16.13 | | | $ | 14.11 | | | $ | 14.97 | | |
Net investment income (loss)1 | | | 0.24 | | | | 0.29 | | | | 0.28 | | | | 0.31 | | | | 0.26 | | |
Net realized and unrealized gain (loss) | | | (0.17 | ) | | | (1.13 | ) | | | 0.88 | | | | 2.03 | | | | (0.88 | ) | |
Net increase (decrease) from operations | | | 0.07 | | | | (0.84 | ) | | | 1.16 | | | | 2.34 | | | | (0.62 | ) | |
Dividends from net investment income | | | (0.40 | ) | | | (0.31 | ) | | | (0.36 | ) | | | (0.32 | ) | | | (0.24 | ) | |
Distributions from net realized gains | | | (0.03 | ) | | | (0.88 | ) | | | — | | | | — | | | | — | | |
Total dividends and distributions | | | (0.43 | ) | | | (1.19 | ) | | | (0.36 | ) | | | (0.32 | ) | | | (0.24 | ) | |
Net asset value, end of year | | $ | 14.54 | | | $ | 14.90 | | | $ | 16.93 | | | $ | 16.13 | | | $ | 14.11 | | |
Total investment return2 | | | 0.30 | % | | | (4.27 | )% | | | 7.14 | % | | | 17.08 | % | | | (4.09 | )% | |
Ratios to average net assets: | |
Expenses before fee waivers and/or reimbursements/recoupments,
including dividend expense, interest expense and other borrowing costs for
investments sold short | | | 1.49 | % | | | 1.60 | % | | | 1.59 | %3 | | | 1.51 | %3 | | | 1.58 | %3 | |
Expenses after fee waivers and/or expense reimbursements/recoupments,
including dividend expense, interest expense and other borrowing costs for
investments sold short | | | 1.49 | % | | | 1.60 | % | | | 1.58 | %3 | | | 1.48 | %3 | | | 1.54 | %3 | |
Expenses after fee waivers and/or expense reimbursements/recoupments,
excluding dividend expense, interest expense and other borrowing costs for
investments sold short | | | 1.05 | % | | | 1.05 | % | | | 1.03 | % | | | 1.09 | % | | | 1.10 | % | |
Net investment income (loss) | | | 1.70 | % | | | 1.89 | % | | | 1.66 | % | | | 2.10 | % | | | 1.90 | % | |
Supplemental data: | |
Net assets, end of year (000's) | | $ | 815,785 | | | $ | 948,956 | | | $ | 1,138,165 | | | $ | 1,104,550 | | | $ | 924,833 | | |
Portfolio turnover | | | 32 | % | | | 46 | % | | | 78 | % | | | 81 | % | | | 80 | % | |
3 Includes interest expense representing less than 0.005%.
See accompanying notes to financial statements.
315
PACE International Emerging Markets Equity Investments
Financial highlights
Selected data for a share of beneficial interest outstanding throughout each year is presented below:
Class A
| | | Years ended July 31, | |
| | | 2020 | | 2019 | | 2018 | | 2017 | | 2016 | |
Net asset value, beginning of year | | $ | 12.99 | | | $ | 13.61 | | | $ | 13.59 | | | $ | 11.41 | | | $ | 11.81 | | |
Net investment income (loss)1 | | | 0.12 | | | | 0.16 | | | | 0.13 | | | | 0.13 | | | | 0.09 | | |
Net realized and unrealized gain (loss) | | | 0.80 | | | | (0.58 | ) | | | 0.03 | | | | 2.14 | | | | (0.46 | ) | |
Net increase (decrease) from operations | | | 0.92 | | | | (0.42 | ) | | | 0.16 | | | | 2.27 | | | | (0.37 | ) | |
Dividends from net investment income | | | (0.12 | ) | | | (0.20 | ) | | | (0.14 | ) | | | (0.09 | ) | | | (0.03 | ) | |
Net asset value, end of year | | $ | 13.79 | | | $ | 12.99 | | | $ | 13.61 | | | $ | 13.59 | | | $ | 11.41 | | |
Total investment return2 | | | 6.97 | % | | | (2.91 | )% | | | 1.11 | % | | | 19.95 | % | | | (3.08 | )% | |
Ratios to average net assets: | |
Expenses before fee waivers and/or expense reimbursements | | | 1.72 | %3 | | | 1.71 | %3 | | | 1.72 | %3 | | | 1.80 | %3 | | | 1.90 | %3 | |
Expenses after fee waivers and/or expense reimbursements | | | 1.65 | %3 | | | 1.70 | %3 | | | 1.70 | %3 | | | 1.75 | %3 | | | 1.80 | %3 | |
Net investment income (loss) | | | 0.92 | % | | | 1.24 | % | | | 0.89 | % | | | 1.06 | % | | | 0.86 | % | |
Supplemental data: | |
Net assets, end of year (000's) | | $ | 4,605 | | | $ | 4,512 | | | $ | 3,811 | | | $ | 4,076 | | | $ | 3,931 | | |
Portfolio turnover | | | 79 | % | | | 52 | % | | | 65 | % | | | 65 | % | | | 65 | % | |
Class Y
| | | Years ended July 31, | |
| | | 2020 | | 2019 | | 2018 | | 2017 | | 2016 | |
Net asset value, beginning of year | | $ | 13.11 | | | $ | 13.73 | | | $ | 13.70 | | | $ | 11.51 | | | $ | 11.97 | | |
Net investment income (loss)1 | | | 0.15 | | | | 0.19 | | | | 0.17 | | | | 0.16 | | | | 0.12 | | |
Net realized and unrealized gain (loss) | | | 0.81 | | | | (0.59 | ) | | | 0.03 | | | | 2.15 | | | | (0.47 | ) | |
Net increase (decrease) from operations | | | 0.96 | | | | (0.40 | ) | | | 0.20 | | | | 2.31 | | | | (0.35 | ) | |
Dividends from net investment income | | | (0.15 | ) | | | (0.22 | ) | | | (0.17 | ) | | | (0.12 | ) | | | (0.11 | ) | |
Net asset value, end of year | | $ | 13.92 | | | $ | 13.11 | | | $ | 13.73 | | | $ | 13.70 | | | $ | 11.51 | | |
Total investment return2 | | | 7.29 | % | | | (2.74 | )% | | | 1.41 | % | | | 20.21 | % | | | (2.80 | )% | |
Ratios to average net assets: | |
Expenses before fee waivers and/or expense reimbursements | | | 1.40 | %3 | | | 1.47 | %3 | | | 1.45 | %3 | | | 1.54 | %3 | | | 1.63 | %3 | |
Expenses after fee waivers and/or expense reimbursements | | | 1.40 | %3 | | | 1.45 | %3 | | | 1.45 | %3 | | | 1.50 | %3 | | | 1.54 | %3 | |
Net investment income (loss) | | | 1.16 | % | | | 1.45 | % | | | 1.15 | % | | | 1.30 | % | | | 1.14 | % | |
Supplemental data: | |
Net assets, end of year (000's) | | $ | 6,067 | | | $ | 6,424 | | | $ | 7,419 | | | $ | 7,795 | | | $ | 7,923 | | |
Portfolio turnover | | | 79 | % | | | 52 | % | | | 65 | % | | | 65 | % | | | 65 | % | |
1 Calculated using the average shares method.
2 Total investment return is calculated assuming a $10,000 investment on the first day of each year reported, reinvestment of all dividends and other distributions, if any, at net asset value on the ex-dividend dates, and a sale at net asset value on the last day of each year reported. The figures do not include any applicable sales charges, redemption fees or program fees; results would be lower if they were included. Returns do not reflect the deduction of taxes that a shareholder would pay on Portfolio distributions or the redemption of Portfolio shares.
3 Includes interest expense representing less than 0.005%.
316
PACE International Emerging Markets Equity Investments
Financial highlights (continued)
Class P
| | | Years ended July 31, | |
| | | 2020 | | 2019 | | 2018 | | 2017 | | 2016 | |
Net asset value, beginning of year | | $ | 13.04 | | | $ | 13.65 | | | $ | 13.63 | | | $ | 11.45 | | | $ | 11.91 | | |
Net investment income (loss)1 | | | 0.15 | | | | 0.19 | | | | 0.16 | | | | 0.16 | | | | 0.12 | | |
Net realized and unrealized gain (loss) | | | 0.81 | | | | (0.58 | ) | | | 0.03 | | | | 2.14 | | | | (0.47 | ) | |
Net increase (decrease) from operations | | | 0.96 | | | | (0.39 | ) | | | 0.19 | | | | 2.30 | | | | (0.35 | ) | |
Dividends from net investment income | | | (0.15 | ) | | | (0.22 | ) | | | (0.17 | ) | | | (0.12 | ) | | | (0.11 | ) | |
Net asset value, end of year | | $ | 13.85 | | | $ | 13.04 | | | $ | 13.65 | | | $ | 13.63 | | | $ | 11.45 | | |
Total investment return2 | | | 7.24 | % | | | (2.70 | )% | | | 1.42 | % | | | 20.18 | % | | | (2.82 | )% | |
Ratios to average net assets: | |
Expenses before fee waivers and/or expense reimbursements | | | 1.51 | %3 | | | 1.49 | %3 | | | 1.50 | %3 | | | 1.59 | %3 | | | 1.69 | %3 | |
Expenses after fee waivers and/or expense reimbursements | | | 1.40 | %3 | | | 1.45 | %3 | | | 1.45 | %3 | | | 1.50 | %3 | | | 1.60 | %3 | |
Net investment income (loss) | | | 1.14 | % | | | 1.45 | % | | | 1.14 | % | | | 1.33 | % | | | 1.10 | % | |
Supplemental data: | |
Net assets, end of year (000's) | | $ | 345,431 | | | $ | 376,722 | | | $ | 437,363 | | | $ | 454,178 | | | $ | 394,346 | | |
Portfolio turnover | | | 79 | % | | | 52 | % | | | 65 | % | | | 65 | % | | | 65 | % | |
See accompanying notes to financial statements.
317
This page intentionally left blank.
318
PACE Global Real Estate Securities Investments
Financial highlights
Selected data for a share of beneficial interest outstanding throughout each year is presented below:
Class A
| | | Years ended July 31, | |
| | | 2020 | | 2019 | | 2018 | | 2017 | | 2016 | |
Net asset value, beginning of year | | $ | 7.74 | | | $ | 7.65 | | | $ | 7.69 | | | $ | 8.03 | | | $ | 7.51 | | |
Net investment income (loss)1 | | | 0.12 | | | | 0.14 | | | | 0.21 | | | | 0.17 | | | | 0.13 | | |
Net realized and unrealized gain (loss) | | | (1.37 | ) | | | 0.18 | | | | 0.06 | | | | (0.21 | ) | | | 0.58 | | |
Net increase (decrease) from operations | | | (1.25 | ) | | | 0.32 | | | | 0.27 | | | | (0.04 | ) | | | 0.71 | | |
Dividends from net investment income | | | (0.36 | ) | | | (0.23 | ) | | | (0.27 | ) | | | (0.30 | ) | | | (0.19 | ) | |
Distributions from net realized gains | | | — | | | | — | | | | (0.04 | ) | | | — | | | | — | | |
Total dividends and distributions | | | (0.36 | ) | | | (0.23 | ) | | | (0.31 | ) | | | (0.30 | ) | | | (0.19 | ) | |
Net asset value, end of year | | $ | 6.13 | | | $ | 7.74 | | | $ | 7.65 | | | $ | 7.69 | | | $ | 8.03 | | |
Total investment return2 | | | (17.00 | )% | | | 4.53 | % | | | 3.50 | % | | | (0.15 | )% | | | 9.86 | % | |
Ratios to average net assets: | |
Expenses before fee waivers and/or expense reimbursements | | | 1.59 | %3 | | | 1.56 | %3 | | | 1.50 | %3 | | | 1.54 | %3 | | | 1.65 | % | |
Expenses after fee waivers and/or expense reimbursements | | | 1.45 | %3 | | | 1.45 | %3 | | | 1.45 | %3 | | | 1.46 | %3 | | | 1.45 | % | |
Net investment income (loss) | | | 1.69 | % | | | 1.81 | % | | | 2.82 | % | | | 2.28 | % | | | 1.79 | % | |
Supplemental data: | |
Net assets, end of year (000's) | | $ | 307 | | | $ | 491 | | | $ | 370 | | | $ | 458 | | | $ | 373 | | |
Portfolio turnover | | | 111 | % | | | 68 | % | | | 73 | % | | | 98 | % | | | 75 | % | |
Class P
| | | Years ended July 31, | |
| | | 2020 | | 2019 | | 2018 | | 2017 | | 2016 | |
Net asset value, beginning of year | | $ | 7.46 | | | $ | 7.37 | | | $ | 7.42 | | | $ | 7.76 | | | $ | 7.28 | | |
Net investment income (loss)1 | | | 0.13 | | | | 0.16 | | | | 0.22 | | | | 0.19 | | | | 0.14 | | |
Net realized and unrealized gain (loss) | | | (1.31 | ) | | | 0.18 | | | | 0.07 | | | | (0.21 | ) | | | 0.56 | | |
Net increase (decrease) from operations | | | (1.18 | ) | | | 0.34 | | | | 0.29 | | | | (0.02 | ) | | | 0.70 | | |
Dividends from net investment income | | | (0.39 | ) | | | (0.25 | ) | | | (0.30 | ) | | | (0.32 | ) | | | (0.22 | ) | |
Distributions from net realized gains | | | — | | | | — | | | | (0.04 | ) | | | — | | | | — | | |
Total dividends and distributions | | | (0.39 | ) | | | (0.25 | ) | | | (0.34 | ) | | | (0.32 | ) | | | (0.22 | ) | |
Net asset value, end of year | | $ | 5.89 | | | $ | 7.46 | | | $ | 7.37 | | | $ | 7.42 | | | $ | 7.76 | | |
Total investment return2 | | | (16.85 | )% | | | 4.92 | % | | | 3.68 | % | | | 0.19 | % | | | 10.13 | % | |
Ratios to average net assets: | |
Expenses before fee waivers and/or expense reimbursements | | | 1.59 | %3 | | | 1.57 | %3 | | | 1.53 | %3 | | | 1.58 | %3 | | | 1.59 | % | |
Expenses after fee waivers and/or expense reimbursements | | | 1.20 | %3 | | | 1.20 | %3 | | | 1.20 | %3 | | | 1.21 | %3 | | | 1.20 | % | |
Net investment income (loss) | | | 1.97 | % | | | 2.20 | % | | | 3.08 | % | | | 2.58 | % | | | 2.07 | % | |
Supplemental data: | |
Net assets, end of year (000's) | | $ | 87,866 | | | $ | 121,187 | | | $ | 137,069 | | | $ | 140,262 | | | $ | 151,565 | | |
Portfolio turnover | | | 111 | % | | | 68 | % | | | 73 | % | | | 98 | % | | | 75 | % | |
1 Calculated using the average shares method.
2 Total investment return is calculated assuming a $ 10,000 investment on the first day of each year reported, reinvestment of all dividends and other distributions, if any, at net asset value on the ex-dividend dates, and a sale at net asset value on the last day of each year reported. The figures do not include any applicable sales charges, redemption fees or program fees; results would be lower if they were included. Returns do not reflect the deduction of taxes that a shareholder would pay on Portfolio distributions or the redemption of Portfolio shares.
3 Includes interest expense representing less than 0.005%.
See accompanying notes to financial statements
319
PACE Alternative Strategies Investments
Financial highlights
Selected data for a share of beneficial interest outstanding throughout each year is presented below:
Class A
| | | Years ended July 31, | |
| | | 2020 | | 2019 | | 2018 | | 2017 | | 2016 | |
Net asset value, beginning of year | | $ | 10.60 | | | $ | 10.85 | | | $ | 10.71 | | | $ | 10.49 | | | $ | 11.10 | | |
Net investment income (loss)1 | | | (0.06 | ) | | | 0.01 | | | | (0.02 | ) | | | (0.07 | ) | | | (0.06 | ) | |
Net realized and unrealized gain (loss) | | | 0.51 | | | | 0.03 | | | | 0.16 | | | | 0.29 | | | | (0.32 | ) | |
Net increase (decrease) from operations | | | 0.45 | | | | 0.04 | | | | 0.14 | | | | 0.22 | | | | (0.38 | ) | |
Dividends from net investment income | | | — | | | | — | | | | — | | | | — | | | | (0.23 | ) | |
Distributions from net realized gains | | | — | | | | (0.29 | ) | | | — | | | | — | | | | — | | |
Total dividends and distributions | | | — | | | | (0.29 | ) | | | — | | | | — | | | | (0.23 | ) | |
Net asset value, end of year | | $ | 11.05 | | | $ | 10.60 | | | $ | 10.85 | | | $ | 10.71 | | | $ | 10.49 | | |
Total investment return2 | | | 4.25 | % | | | 0.52 | % | | | 1.21 | % | | | 2.19 | % | | | (3.47 | )% | |
Ratios to average net assets: | |
Expenses before fee waivers and/or expense reimbursements/recoupments,
including dividend expense, interest expense and other borrowing costs for
investments sold short | | | 2.80 | % | | | 2.65 | % | | | 2.36 | % | | | 2.26 | % | | | 2.02 | % | |
Expenses after fee waivers and/or expense reimbursements/recoupments,
including dividend expense, interest expense and other borrowing costs for
investments sold short | | | 2.62 | % | | | 2.58 | % | | | 2.27 | % | | | 2.17 | % | | | 1.95 | % | |
Expenses after fee waivers and/or expense reimbursements/recoupments,
excluding dividend expense, interest expense and other borrowing costs for
investments sold short | | | 1.88 | % | | | 1.85 | % | | | 1.76 | % | | | 1.75 | % | | | 1.79 | % | |
Net investment income (loss) | | | (0.57 | )% | | | 0.10 | % | | | (0.16 | )% | | | (0.71 | )% | | | (0.53 | )% | |
Supplemental data: | |
Net assets, end of year (000's) | | $ | 6,460 | | | $ | 8,394 | | | $ | 7,208 | | | $ | 8,702 | | | $ | 9,800 | | |
Portfolio turnover | | | 491 | % | | | 447 | % | | | 346 | % | | | 292 | % | | | 221 | % | |
Class Y
| | | Years ended July 31, | |
| | | 2020 | | 2019 | | 2018 | | 2017 | | 2016 | |
Net asset value, beginning of year | | $ | 10.60 | | | $ | 10.82 | | | $ | 10.65 | | | $ | 10.42 | | | $ | 11.12 | | |
Net investment income (loss)1 | | | (0.04 | ) | | | 0.04 | | | | 0.01 | | | | (0.06 | ) | | | (0.02 | ) | |
Net realized and unrealized gain (loss) | | | 0.52 | | | | 0.03 | | | | 0.16 | | | | 0.29 | | | | (0.31 | ) | |
Net increase (decrease) from operations | | | 0.48 | | | | 0.07 | | | | 0.17 | | | | 0.23 | | | | (0.33 | ) | |
Dividends from net investment income | | | (0.02 | ) | | �� | — | | | | — | | | | — | | | | (0.37 | ) | |
Distributions from net realized gains | | | — | | | | (0.29 | ) | | | — | | | | — | | | | — | | |
Total dividends and distributions | | | (0.02 | ) | | | (0.29 | ) | | | — | | | | — | | | | (0.37 | ) | |
Net asset value, end of year | | $ | 11.06 | | | $ | 10.60 | | | $ | 10.82 | | | $ | 10.65 | | | $ | 10.42 | | |
Total investment return2 | | | 4.56 | % | | | 0.80 | % | | | 1.41 | % | | | 2.40 | % | | | (2.99 | )% | |
Ratios to average net assets: | |
Expenses before fee waivers and/or reimbursements/recoupments,
including dividend expense, interest expense and other borrowing costs for
investments sold short | | | 2.56 | % | | | 2.38 | % | | | 2.11 | % | | | 2.06 | % | | | 1.69 | % | |
Expenses after fee waivers and/or expense reimbursements/recoupments,
including dividend expense, interest expense and other borrowing costs for
investments sold short | | | 2.38 | % | | | 2.31 | % | | | 2.02 | % | | | 1.96 | % | | | 1.62 | % | |
Expenses after fee waivers and/or expense reimbursements/recoupments,
excluding dividend expense, interest expense and other borrowing costs for
investments sold short | | | 1.63 | % | | | 1.59 | % | | | 1.51 | % | | | 1.57 | % | | | 1.48 | % | |
Net investment income (loss) | | | (0.38 | )% | | | 0.36 | % | | | 0.09 | % | | | (0.54 | )% | | | (0.17 | )% | |
Supplemental data: | |
Net assets, end of year (000's) | | $ | 402 | | | $ | 386 | | | $ | 544 | | | $ | 646 | | | $ | 1,926 | | |
Portfolio turnover | | | 491 | % | | | 447 | % | | | 346 | % | | | 292 | % | | | 221 | % | |
1 Calculated using the average shares method.
2 Total investment return is calculated assuming a $ 10,000 investment on the first day of each year reported, reinvestment of all dividends and other distributions, if any, at net asset value on the ex-dividend dates, and a sale at net asset value on the last day of each year reported. The figures do not include any applicable sales charges, redemption fees or program fees; results would be lower if they were included. Returns do not reflect the deduction of taxes that a shareholder would pay on Portfolio distributions or the redemption of Portfolio shares.
320
PACE Alternative Strategies Investments
Financial highlights (concluded)
Class P
| | | Years ended July 31, | |
| | | 2020 | | 2019 | | 2018 | | 2017 | | 2016 | |
Net asset value, beginning of year | | $ | 10.55 | | | $ | 10.78 | | | $ | 10.61 | | | $ | 10.38 | | | $ | 11.09 | | |
Net investment income (loss)1 | | | (0.04 | ) | | | 0.03 | | | | 0.01 | | | | (0.05 | ) | | | (0.03 | ) | |
Net realized and unrealized gain (loss) | | | 0.52 | | | | 0.03 | | | | 0.16 | | | | 0.28 | | | | (0.31 | ) | |
Net increase (decrease) from operations | | | 0.48 | | | | 0.06 | | | | 0.17 | | | | 0.23 | | | | (0.34 | ) | |
Dividends from net investment income | | | (0.02 | ) | | | — | | | | — | | | | — | | | | (0.37 | ) | |
Distributions from net realized gains | | | — | | | | (0.29 | ) | | | — | | | | — | | | | — | | |
Total dividends and distributions | | | (0.02 | ) | | | (0.29 | ) | | | — | | | | — | | | | (0.37 | ) | |
Net asset value, end of year | | $ | 11.01 | | | $ | 10.55 | | | $ | 10.78 | | | $ | 10.61 | | | $ | 10.38 | | |
Total investment return2 | | | 4.46 | % | | | 0.90 | % | | | 1.32 | % | | | 2.41 | % | | | (3.13 | )% | |
Ratios to average net assets: | |
Expenses before fee waivers and/or reimbursements/recoupments,
including dividend expense, interest expense and other borrowing costs for
investments sold short | | | 2.56 | % | | | 2.42 | % | | | 2.13 | % | | | 2.04 | % | | | 1.77 | % | |
Expenses after fee waivers and/or expense reimbursements/recoupments,
including dividend expense, interest expense and other borrowing costs for
investments sold short | | | 2.38 | % | | | 2.35 | % | | | 2.04 | % | | | 1.94 | % | | | 1.69 | % | |
Expenses after fee waivers and/or expense reimbursements/recoupments,
excluding dividend expense, interest expense and other borrowing costs for
investments sold short | | | 1.63 | % | | | 1.62 | % | | | 1.53 | % | | | 1.52 | % | | | 1.53 | % | |
Net investment income (loss) | | | (0.35 | )% | | | 0.33 | % | | | 0.08 | % | | | (0.48 | )% | | | (0.30 | )% | |
Supplemental data: | |
Net assets, end of year (000's) | | $ | 450,402 | | | $ | 520,531 | | | $ | 615,778 | | | $ | 650,347 | | | $ | 712,676 | | |
Portfolio turnover | | | 491 | % | | | 447 | % | | | 346 | % | | | 292 | % | | | 221 | % | |
See accompanying notes to financial statements.
321
PACE Select Advisors Trust
Notes to financial statements
Organization and significant accounting policies
PACE Select Advisors Trust (the "Trust") is an open-end management investment company registered with the US Securities and Exchange Commission ("SEC") under the Investment Company Act of 1940, as amended (the "1940 Act"), currently offering multiple series representing separate investment portfolios. The Trust is a Delaware statutory trust organized under the laws of the State of Delaware by Certificate of Trust dated September 9, 1994, as amended June 9, 1995 and thereafter. The trustees of the Trust have authority to issue an unlimited number of shares of beneficial interest at par value of $0.001 per share.
The Trust has fifteen series available for investment, each having its own investment objectives and policies: UBS Government Money Market Investments Fund, PACE Mortgage-Backed Securities Fixed Income Investments, PACE Intermediate Fixed Income Investments, PACE Strategic Fixed Income Investments, PACE Municipal Fixed Income Investments, PACE Global Fixed Income Investments, PACE High Yield Investments, PACE Large Co Value Equity Investments, PACE Large Co Growth Equity Investments, PACE Small/Medium Co Value Equity Investments, PACE Small/Medium Co Growth Equity Investments, PACE International Equity Investments, PACE International Emerging Markets Equity Investments, PACE Global Real Estate Securities Investments and PACE Alternative Strategies Investments (each a "Portfolio" and collectively, the "Portfolios"). Each of the Portfolios is classified as a diversified investment company for purposes of the 1940 Act.
UBS Asset Management (Americas) Inc. ("UBS AM") serves as the investment manager and administrator for the Portfolios and also as the investment advisor for UBS Government Money Market Investments Fund and a portion of PACE Alternative Strategies Investments' assets. Subject to the approval and oversight of the Portfolios' Board of Trustees (the "Board"), UBS AM selects and oversees other investment subadvisors, who provide advisory services for the other Portfolios. UBS Asset Management (US) Inc. ("UBS AM (US)") serves as principal underwriter for the Portfolios. UBS AM and UBS AM (US) are indirect wholly owned subsidiaries of UBS Group AG. UBS Group AG is an internationally diversified organization with headquarters in Zurich, Switzerland. UBS Group AG operates in many areas of the financial services industry.
Each Portfolio currently offers Class A, Class Y, and Class P shares, with the exception of UBS Government Money Market Investments Fund, which currently offers Class P shares only, and PACE Global Real Estate Securities Investments, which, effective January 25, 2018, only offers Class A and Class P shares. Each class represents interests in the same assets of the applicable Portfolio and the classes are identical except for differences in their sales charge structures, ongoing service and distribution charges and certain transfer agency and related services expenses. All classes of shares have equal voting privileges except that each class has exclusive voting rights with respect to its service and/or distribution plan, if any. Class Y and Class P shares have no service or distribution plan. The Portfolios' Class P shares currently are available for purchase only to participants in the PACESM Select Advisors Program and certain other advisory programs offered through select sponsors, except that UBS Government Money Market Investments Fund shares are also available to participants in the PACESM Multi Advisor Program.
Prior to July 12, 2018, the Portfolios offered Class C shares. At the recommendation of UBS Asset Management (Americas) Inc., each Portfolio's investment advisor, the Board of Trustees of the Trust approved the closure of Class C of each Portfolio and the automatic conversion of Class C shares of each Portfolio into Class A shares of the same Portfolio (the "Conversion").
Effective on July 12, 2018 (the "Closure Date"), the Portfolios ceased offering Class C shares. New or additional investments into Class C shares, including investments through an automatic investment plan, were not permitted after the Closure Date.
On October 12, 2018 (the "Conversion Date"), all outstanding Class C shares of each Portfolio were automatically converted into Class A shares of the same Portfolio. From the Closure Date to the Conversion Date (the "Conversion Period"), the 12b-1 distribution fees (0.50% of average net assets for for PACE Mortgage-Backed Securities Fixed
322
PACE Select Advisors Trust
Notes to financial statements
Income Investments, PACE Intermediate Fixed Income Investments, PACE Strategic Fixed Income Investments, PACE Municipal Fixed Income Investments, PACE Global Fixed Income Investments and PACE High Yield Investments, and 0.75% of average net assets for all other Portfolios) and any contingent deferred sales charges applicable to Class C shares were waived; 12b-1 service fees (0.25% of average net assets) continued to be assessed. During the Conversion Period, automatic reinvestment of Class C share dividend and capital gain distributions continued. Upon the conversion of Class C shares into Class A shares, each Class C shareholder owned Class A shares having an aggregate value equal to the aggregate value of Class C shares held by that shareholder as of the close of business on the Conversion Date. Any contingent deferred sales charges applicable to Class C shares were waived in connection with the conversion to Class A shares. The 12b-1 service fee applicable to Class A shares applies to the converted shares. Class C shares converted into Class A shares as a tax-free event for federal income tax purposes.
The Trust accounts separately for the assets, liabilities and operations of each Portfolio. Expenses directly attributable to each Portfolio are charged to that Portfolio's operations; expenses which are applicable to all Portfolios are allocated among them on a pro rata basis.
In the normal course of business, the Portfolios may enter into contracts that contain a variety of representations that provide indemnification for certain liabilities. The Portfolios' maximum exposure under these arrangements is unknown, as this would involve future claims that may be made against the Portfolios that have not yet occurred. However, the Portfolios have not had any prior claims or losses pursuant to these contracts and expect the risk of loss to be remote.
UBS Government Money Market Investments Fund attempts to maintain a stable net asset value of $1.00 per share. There is no assurance, however, that the Portfolio will be able to maintain a stable net asset value of $1.00 per share. The Portfolio has adopted certain investment, portfolio valuation and dividend/distribution policies in an attempt to enable it to do so. The Portfolio has adopted a policy to operate as a "government money market fund" and as such the Portfolio is permitted to seek to maintain a stable price per share. In addition, by operating as a "government money market fund", the Portfolio is exempt from requirements that permit the imposition of a liquidity fee and/or temporary redemption gates. While the Portfolio's Board may elect to subject the Portfolio to liquidity fee and gate requirements in the future, the Board has not elected to do so at this time.
The Financial Accounting Standards Board ("FASB") Accounting Standards Codification ("ASC") is the exclusive reference of authoritative US generally accepted accounting principles ("US GAAP") recognized by the FASB to be applied by nongovernmental entities. Rules and interpretive releases of the SEC under authority of federal laws are also sources of authoritative US GAAP for SEC registrants. The Portfolios' financial statements are prepared in accordance with US GAAP, which may require the use of management estimates and assumptions. Actual results could differ from those estimates.
In March 2017, the FASB issued Accounting Standards Update ("ASU") 2017-08, Receivables—Nonrefundable Fees and Other Costs (Subtopic 310-20): Premium Amortization On Purchased Callable Debt Securities ("ASU 2017-08"). The update provides guidance related to the amortization period for certain purchased callable debt securities held at a premium. ASU 2017-08 is effective for annual periods, and interim periods within those annual periods, beginning after December 15, 2018. Management has assessed the impact of these changes, and the changes are incorporated within the financial statements.
In August 2018, the FASB issued ("ASU") 2018-13, Fair Value Measurement (Topic 820): Disclosure Framework—Changes to the Disclosure Requirements for Fair Value Measurement ("ASU 2018-13"). The update introduces new fair value disclosure requirements, eliminates some prior fair value disclosure requirements, and modifies certain existing fair value disclosure requirements. ASU 2018-13 is effective for fiscal years beginning after December 15, 2019, including interim periods within those fiscal years. Management has assessed the potential impact of these changes and the changes are incorporated within the financial statements.
323
PACE Select Advisors Trust
Notes to financial statements
The following is a summary of significant accounting policies:
Investment transactions, investment income and expenses—Investment transactions are recorded on the trade date. Realized gains and losses from investment transactions and foreign exchange transactions are calculated using the identified cost method. Dividend income and expense are recorded net of withholding taxes on the ex-dividend date ("ex-date") except in the case of certain dividends from foreign securities which are recorded as soon after the ex-date as the respective Portfolio, using reasonable diligence, becomes aware of such dividends. Interest income is recorded on an accrual basis. Discounts are accreted and premiums are amortized as adjustments to interest income and the identified cost of investments.
Income, expenses (excluding class-specific expenses) and realized/unrealized gains/losses are allocated proportionately to each class of shares based upon the relative net asset value of outstanding shares (or the value of dividend eligible shares, as appropriate) of each class at the beginning of the day after adjusting for current capital share activity of the respective classes. Class specific expenses are charged directly to the applicable class of shares.
Dividends and distributions—Dividends and distributions to shareholders are recorded on the ex-dividend date. The amount of dividends from net investment income and distributions from net realized capital gains and/or return of capital are determined in accordance with US federal income tax regulations, which may differ from US GAAP. These "book/tax" differences are either considered temporary or permanent in nature. To the extent these differences are permanent in nature, such amounts are reclassified within the capital accounts based on their federal tax-basis treatment; temporary differences do not require reclassification.
Foreign currency translation—The books and records of the Portfolios are maintained in US dollars. Foreign currency amounts are translated into US dollars as follows: (1) the foreign currency market value of investment securities and other assets and liabilities stated in foreign currencies are translated into US dollars based on the current exchange rates each business day; and (2) purchases and sales of investment securities and income and expenses are translated at the rate of exchange prevailing on the respective dates of such transactions. The resulting exchange gains and losses are included in the Statement of operations.
The Portfolios do not generally isolate the effect of fluctuations in foreign exchange rates from the effect of the changes in the market prices of securities. However, the Portfolios do isolate the effect of fluctuations in foreign exchange rates when determining the realized gain or loss upon the sale or maturity of foreign currency-denominated securities pursuant to US federal income tax regulations. Net realized foreign currency transaction gain (loss) is treated as ordinary income (loss) for income tax reporting purposes.
Concentration of risk—Investing in securities of foreign issuers and currency transactions may involve certain considerations and risks not typically associated with investments in the United States. These risks include revaluation of currencies, adverse fluctuations in foreign currency values and possible adverse political, social and economic developments, including those particular to a specific industry, country or region, which could cause the securities and their markets to be less liquid and prices more volatile than those of comparable US companies and US government securities. These risks are greater with respect to securities of issuers located in emerging market countries in which some Funds in the Trust invest.
Small capitalization ("small cap") companies may be more vulnerable than larger capitalization ("large cap") companies to adverse business or economic developments. Small cap companies may also have limited product lines, markets or financial resources, and may be dependent on a relatively small management group. Securities of such companies may be less liquid and more volatile than securities of larger capitalization companies or the market averages in general and therefore may involve greater risk than investing in large cap companies. In addition, small cap companies may not be well-known to the investing public, may not have institutional ownership and may have only cyclical, static or moderate growth prospects.
324
PACE Select Advisors Trust
Notes to financial statements
The ability of the issuers of debt securities held by the Portfolios' to meet their obligations may be affected by economic and political developments particular to a specific industry, country, state or region.
Investments in bonds with ratings of BB (Standard & Poor's Financial Services LLC or Fitch Ratings, Inc.) or Ba (Moody's Investors Service, Inc.) or below (commonly referred to as "high yield" bonds), or deemed of equivalent quality, have an increased risk of defaulting or otherwise being unable to honor a financial obligation. These securities are considered to be predominantly speculative with respect to an issuer's capacity to pay interest and repay principal in accordance with the terms of the obligations. Lower-quality bonds are more likely to be subject to an issuer's default or downgrade than investment grade (higher-quality) bonds.
Many financial instruments, financings or other transactions to which a Fund may be a party use or may use a floating rate based on the London Interbank Offered Rate ("LIBOR"). LIBOR is widely used in financial markets. In July 2017, the United Kingdom's financial regulatory body announced that after 2021 it will cease its active encouragement of banks to provide the quotations needed to sustain LIBOR. That announcement suggests that LIBOR may cease to be published or utilized after that time. Various financial industry groups have begun planning for that transition, but the effect of the transition process and its ultimate success cannot yet be determined. The transition process may lead to increased volatility and illiquidity in markets for instruments the terms of which are based on LIBOR. It could also lead to a reduction in the value of some LIBOR-based investments and reduce the effectiveness of new hedges placed against existing LIBOR-based investments. Since the usefulness of LIBOR as a benchmark could deteriorate during the transition period, these effects could occur prior to the end of 2021. The willingness and ability of issuers to include enhanced provisions in new and existing contracts or instruments also remains uncertain. Any of these factors may adversely affect the Fund's performance or NAV.
Certain impacts to public health conditions particular to the coronavirus (COVID-19) outbreak that occurred may have a significant negative impact on the operations and profitability of the Portfolios' investments. The extent of the impact to the financial performance of the Portfolio will depend on future developments, including (i) the duration and spread of the outbreak, (ii) the restrictions and advisories, (iii) the effects on the financial markets, and (iv) the effects on the economy overall, all of which are highly uncertain and cannot be predicted.
Valuation of investments
Each Portfolio generally calculates its net asset value on days that the New York Stock Exchange ("NYSE") is open. A Portfolio calculates net asset value separately for each class as of the close of regular trading on the NYSE (generally, 4:00 p.m., Eastern time). The NYSE normally is not open, and the Portfolios do not price their shares, on most national holidays and Good Friday. To the extent that a Portfolio's assets are traded in other markets on days when the NYSE is not open, the value of a Portfolio's assets may be affected on those days. If trading on the NYSE is halted for the day before 4:00 p.m., Eastern Time, a Portfolio's net asset value per share generally will still be calculated as of the close of regular trading on the NYSE. The time at which a Portfolio calculates its net asset value and until which purchase, sale or exchange orders are accepted may be changed as permitted by the SEC.
Under Rule 2a-7 under the 1940 Act, as amended ("Rule 2a-7"), UBS Government Money Market Investments Fund has adopted a policy to operate as a "government money market fund". Under Rule 2a-7, a "government money market fund" invests 99.5% or more of its total assets in cash, government securities, and/or repurchase agreements that are collateralized fully (i.e., collateralized by cash and/or government securities). As a "government money market fund", UBS Government Money Market Investments Fund values its investments at amortized cost unless the Portfolio's Board determines that this does not represent fair value. Periodic review and monitoring of the valuation of the securities held by the Portfolio is performed in an effort to ensure that amortized cost approximates market value.
Each Portfolio (other than UBS Government Money Market Investments Fund) calculates its net asset value based on the current market value, where available, for its Portfolio investments. The Portfolios normally obtain market values
325
PACE Select Advisors Trust
Notes to financial statements
for their investments from independent pricing sources and broker-dealers. Independent pricing sources may use reported last sale prices, official market closing prices, current market quotations or valuations from computerized "evaluation" systems that derive values based on comparable investments. An evaluation system incorporates parameters such as security quality, maturity and coupon, and/ or research and evaluations by its staff, including review of broker- dealer market price quotations, if available, in determining the valuation of the portfolio investments. Investments also may be valued based on appraisals derived from information concerning the investment or similar investments received from recognized dealers in those holdings.
Investments traded in the over-the-counter ("OTC") market and listed on The NASDAQ Stock Market, Inc. ("NASDAQ") normally are valued at the NASDAQ Official Closing Price. Other OTC securities are valued at the last bid price on the valuation date available prior to valuation. Investments which are listed on US and foreign stock exchanges normally are valued at the market closing price, the last sale price on the day the securities are valued or, lacking any sales on such day, at the last available bid price. Investments listed on foreign stock exchanges may be fair valued based on significant events that have occurred subsequent to the close of the foreign markets. In cases where investments are traded on more than one exchange, the investments are valued on the exchange designated as the primary market by UBS AM. If a market value is not readily available from an independent pricing source for a particular investment, that investment is valued at fair value as determined in good faith by or under the direction of the Board. Foreign currency exchange rates are generally determined as of the close of the NYSE.
Certain investments in which the Portfolios invest are traded in markets that close before 4:00 p.m., Eastern time. Normally, developments that occur between the close of the foreign markets and 4:00 p.m., Eastern time, will not be reflected in a Portfolio's net asset value. However, if any of the Portfolios determine that such developments are so significant that they will materially affect the value of the Portfolio's investments, the Portfolio may adjust the previous closing prices to reflect what is believed to be the fair value of these investments as of 4:00 p.m., Eastern time.
Certain Portfolios may use a systematic fair valuation model provided by an independent third party to value investments principally traded in foreign markets in order to adjust for possible stale pricing that may occur between the close of the foreign exchanges and the time for valuation. The systematic fair valuation model may use calculations based on indices of domestic securities and other appropriate indicators, such as prices of relevant ADRs and futures contracts. If an investment is valued at "fair value," that value is likely to be different from the last quoted market price for the investment. The use of the fair valuation model may result in securities being transferred between Level 1 and Level 2 of the fair valuation hierarchy at the end of the reporting period.
The amortized cost method of valuation, which approximates market value, generally is used to value short-term debt instruments with 60 days or less remaining to maturity, unless the Board determines that this does not represent fair value.
Investments in open-end investment companies are valued at the daily closing net asset value of the respective investment company. Pursuant to the Portfolios' use of the practical expedient within ASC Topic 820, Fair Value Measurement, investments in investment companies without publicly published prices are also valued at the daily net asset value.
All investments quoted in foreign currencies are valued daily in US dollars on the basis of the foreign currency exchange rates prevailing at the time such valuation is determined by the Portfolio's custodian.
Futures contracts are generally valued at the settlement price established each day on the exchange on which they are traded. Forward foreign currency contracts are valued daily using forward exchange rates quoted by independent pricing services.
326
PACE Select Advisors Trust
Notes to financial statements
OTC swaps are marked-to-market daily based upon values from third party vendors or quotations from market makers to the extent available. In the event that market quotations are not readily available or deemed unreliable, the swap is valued at fair value as determined in good faith by or under the direction of the Board. Centrally cleared swaps are valued using prices from the counterparty clearing houses.
The Board has delegated to the Equities, Fixed Income, and Multi-Asset Valuation Committee ("VC") the responsibility for making fair value determinations with respect to the Portfolios' portfolio holdings. The VC is comprised of representatives of management. The VC provides reports to the Board at each quarterly meeting regarding any investments that have been fair valued, valued pursuant to standing instructions approved by the VC, or where non-vendor pricing sources had been used to make fair value determinations when sufficient information exists during the prior quarter. Fair valuation determinations are subject to review at least monthly by the VC during scheduled meetings. Pricing decisions, processes, and controls over fair value determinations are subject to internal and external reviews, including annual internal compliance reviews and periodic internal audit reviews.
The types of investments for which such fair value pricing may be necessary include, but are not limited to: foreign investments under some circumstances; securities of an issuer that has entered into a restructuring; investments whose trading has been halted or suspended; fixed income securities that are in default and for which there is no current market value quotation; and investments that are restricted as to transfer or resale. The need to fair value a Portfolio's portfolio investments may also result from low trading volume in foreign markets or thinly traded domestic investments, and when a security that is subject to a trading limit or collar on the exchange or market on which it is primarily traded reaches the "limit up" or "limit down" price and no trading has taken place at that price. Various factors may be reviewed in order to make a good faith determination of an investment's fair value. These factors include, but are not limited to, fundamental analytical data relating to the investment; the nature and duration of restrictions on disposition of the investment; and the evaluation of forces which influence the market in which the investment is purchased and sold. Valuing investments at fair value involves greater reliance on judgment than valuing investments that have readily available market quotations. Fair value determinations can also involve reliance on quantitative models employed by a fair value pricing service.
US GAAP requires disclosure regarding the various inputs that are used in determining the value of each Portfolio's investments. These inputs are summarized into the three broad levels listed below:
Level 1—Unadjusted quoted prices in active markets for identical investments.
Level 2—Other significant observable inputs, including but not limited to, quoted prices for similar investments, interest rates, prepayment speeds and credit risks.
Level 3—Unobservable inputs inclusive of each Portfolio's own assumptions in determining the fair value of investments.
A fair value hierarchy table has been included near the end of each Portfolio's Portfolio of investments.
Investments
Asset-backed securities—Certain Portfolios may invest in asset-backed securities ("ABS"), representing interests in pools of certain types of underlying installment loans, home equity loans, leases of various types of real and personal property and receivables from revolving lines of credit (credit cards). Such assets are securitized through the use of trusts or special purpose corporations. The yield characteristics of ABS differ from those of traditional debt securities. One such major difference is that principal may be prepaid at any time because the underlying obligations generally may be prepaid at any time. ABS may decrease in value as a result of increases in interest rates and may benefit less than other fixed-income securities from declining interest rates because of the risk of prepayment.
327
PACE Select Advisors Trust
Notes to financial statements
Loan assignments and participations—Certain Portfolios may invest in secured or unsecured fixed or floating rate loans ("Loans") arranged through private negotiations between a borrowing corporation, government or other entity and one or more financial institutions ("Lenders") which may be in the form of participations ("Participations") in Loans or assignments ("Assignments") of all or a portion of Loans from third parties. A Portfolio may invest in multiple series or tranches of a Loan, which may have varying terms and carry different associated risks. Participations typically result in a Portfolio having a contractual relationship only with the Lender, not with the borrower. A Portfolio has the right to receive payments of principal, interest and any fees to which it is entitled only from the Lender selling the Participation and only upon receipt by the Lender of the payments from the borrower. In connection with purchasing Participations, a Portfolio generally has no direct right to enforce compliance by the borrower with the terms of the loan agreement relating to the Loan, or any rights of set-off against the borrower, and a Portfolio may not directly benefit from any collateral supporting the Loan in which it has purchased the Participation. As a result, a Portfolio assumes the credit risk of both the borrower and the Lender that is selling the Participation. In the event of the insolvency of the selling Lender, the Portfolio may be treated as a general creditor of that Lender and may not benefit from any set-off between the Lender and the borrower. A Portfolio will acquire Participations only if its subadvisor determines that the selling Lender is creditworthy. When a Portfolio purchases Assignments from Lenders, it acquires direct rights against the borrower on the Loan. In an Assignment, the Portfolio is entitled to receive payments directly from the borrower and, therefore, does not depend on the selling bank to pass these payments onto the Portfolio. However, because Assignments are arranged through private negotiations between potential assignees and assignors, the rights and obligations acquired by a Portfolio as the purchaser of an Assignment may differ from, and be more limited than, those held by the assigning Lender.
Mortgage-backed securities—Certain Portfolios may invest in mortgage-backed securities ("MBS"), representing direct or indirect interests in pools of underlying mortgage loans that are secured by real property. These securities provide investors with payments consisting of both principal and interest as the mortgages in the underlying mortgage pools are paid.
The timely payment of principal and interest (but not the market value) on MBS issued or guaranteed by Ginnie Mae (formally known as the Government National Mortgage Association or GNMA) is backed by Ginnie Mae and the full faith and credit of the US government. Obligations issued by Fannie Mae (formally known as the Federal National Mortgage Association or FNMA) and Freddie Mac (formally known as the Federal Home Loan Mortgage Company or FHLMC) are historically supported only by the credit of the issuer, but currently are guaranteed by the US government in connection with such agencies being placed temporarily into conservatorship by the US government.
Some MBS are sponsored or issued by private entities. Payments of principal and interest (but not the market value) of such private MBS may be supported by pools of mortgage loans or other MBS that are guaranteed, directly or indirectly, by the US government or one of its agencies or instrumentalities, or they may be issued without any government guarantee of the underlying mortgage assets but with some form of non-government credit enhancement.
Collateralized mortgage obligations ("CMO") are a type of MBS. A CMO is a debt security that may be collateralized by whole mortgage loans or mortgage pass-through securities. The mortgage loans or mortgage pass-through securities are divided into classes or tranches with each class having its own characteristics. Investors typically receive payments out of the interest and principal on the underlying mortgages. The portions of these payments that investors receive, as well as the priority of their rights to receive payments, are determined by the specific terms of the CMO class.
The yield characteristics of MBS differ from those of traditional debt securities. Among the major differences are that interest and principal payments are made more frequently, usually monthly, and that principal may be prepaid at any time because the underlying mortgage loans or other obligations generally may be prepaid at any time. Prepayments on a pool of mortgage loans are influenced by a variety of economic, geographic, social and other factors. Generally,
328
PACE Select Advisors Trust
Notes to financial statements
prepayments on fixed-rate mortgage loans will increase during a period of falling interest rates and decrease during a period of rising interest rates. Certain classes of CMOs and other MBS are structured in a manner that makes them extremely sensitive to changes in prepayment rates. Such classes include interest-only ("IO") and principal-only ("PO") classes. IOs are entitled to receive all or a portion of the interest, but none (or only a nominal amount) of the principal payments, from the underlying mortgage assets. If the mortgage assets underlying an IO experience greater than anticipated principal prepayments, then the total amount of interest payments allocable to the IO class, and therefore the yield to investors, generally will be reduced. Conversely, PO classes are entitled to receive all or a portion of the principal payments, but none of the interest, from the underlying mortgage assets. PO classes are purchased at substantial discounts from par, and the yield to investors will be reduced if principal payments are slower than expected.
Real estate investment trusts—Certain Portfolios may invest in real estate investment trusts ("REITs"). Distributions from a REIT are initially recorded as dividend income and may subsequently be recharacterized by the REIT at the end of its tax year as a return of capital and/or capital gains. The Portfolio estimates the character of dividends received from REITs for financial reporting purposes based on the distribution history of each REIT. Once actual distribution characterizations are made available by the REITs, typically after calendar year end, the Portfolio updates its accounting and/or tax books and records.
Repurchase agreements—The Portfolios may purchase securities or other obligations from a bank or securities dealer (or its affiliate), subject to the seller's agreement to repurchase them at an agreed upon date (or upon demand) and price. The Portfolios maintain custody of the underlying obligations prior to their repurchase, either through their regular custodian or through a special "tri-party" custodian or sub-custodian that maintains a separate account for both the Portfolios and their counterparty. The underlying collateral is valued daily in an effort to ensure that the value, including accrued interest, is at least equal to the repurchase price. Certain Portfolios obtain securities on terms that allow it to resell or repledge the securities to others.
Repurchase agreements carry certain risks not associated with direct investments in securities, including a possible decline in the market value of the underlying obligations. If their value becomes less than the repurchase price, plus any agreed-upon additional amount, the counterparty must provide additional collateral so that the collateral is at least equal to the repurchase price plus any agreed-upon additional amount. The difference between the total amount to be received upon repurchase of the obligations and the price that was paid by a Portfolios upon acquisition is accrued as interest and included in its net investment income. In the event of default of the obligation to repurchase, the Portfolios generally have the right to liquidate the collateral and apply the proceeds in satisfaction of the obligation. Repurchase agreements involving obligations other than US government securities (such as commercial paper, corporate bonds, equities and mortgage loans) may be subject to special risks and may not have the benefit of certain protections in the event of counterparty insolvency. Moreover, repurchase agreements secured by obligations that are not eligible for direct investment under Rule 2a-7 or a Portfolio's investment strategies and limitations, may require the Portfolios to promptly dispose of such collateral if the seller or guarantor becomes insolvent. If the seller (or seller's guarantor, if any) becomes insolvent, the Portfolios may suffer delays, costs and possible losses in connection with the disposition or retention of the collateral. Under certain circumstances, in the event of default or bankruptcy by the other party to the agreement, realization and/or retention of the collateral may be subject to legal proceedings. Each Portfolio intends to enter into repurchase agreements only in transactions with counterparties believed by UBS AM and the applicable subadvisor to present minimal credit risks .
Each Portfolio may participate in joint repurchase agreement transactions with other Portfolios managed, advised or subadvised by UBS AM. Under certain circumstances, the Portfolios may engage in a repurchase agreement transaction with a yield of zero in order to invest cash amounts remaining in its Portfolios at the end of the day in order to avoid having the Portfolios potentially exposed to a fee for uninvested cash held in a business account at a bank.
329
PACE Select Advisors Trust
Notes to financial statements
Restricted securities—The Portfolios may invest in securities that are subject to legal or contractual restrictions on resale. These securities generally may be resold in transactions exempt from registration or to the public if the securities are registered. Disposal of these securities may involve time-consuming negotiations and expense, and prompt sale at an acceptable price may be difficult. Information regarding restricted securities, if any, is included in each Portfolio's portfolio footnotes.
Reverse repurchase agreements—Certain Portfolios may enter into reverse repurchase agreements with qualified third party banks, securities dealers or their affiliates. Interest on the value of reverse repurchase agreements issued and outstanding is based upon competitive market rates at the time of issuance. At the time a Portfolio enters into a reverse repurchase agreement, the Portfolio establishes and maintains a segregated account with the Portfolio's custodian containing liquid securities having a value not less than the repurchase price, including accrued interest, of the reverse repurchase agreement.
During the period ended July 31, 2020, only PACE Mortgage-Backed Securities Fixed Income Investments and PACE Strategic Fixed Income Investments utilized reverse repurchase agreement transactions.
The table below represents the remaining contractual maturity as of July 31, 2020, of the reverse repurchase agreement transactions accounted for as secured borrowings.
PACE Mortgage-Backed Securities Fixed Income Investments
Types of securities being bought back | | Overnight and
continuous | | Up to 30 days | | 31-90 days | | Greater than
90 days | | Total | |
Reverse repurchase agreements | | $ | — | | | $ | 21,219,427 | | | $ | — | | | $ | — | | | $ | 21,219,427 | | |
PACE Strategic Fixed Income Investments
| Types of securities being bought back | | Overnight and
continuous | | Up to 30 days | | 31-90 days | | Greater than
90 days | | Total | |
Reverse repurchase agreements | | $ | — | | | $ | — | | | $ | — | | | $ | 1,633,600 | | | $ | 1,633,600 | | |
Securities traded on to-be-announced basis—Certain Portfolios may from time to time purchase, or short sell, securities on a to-be-announced ("TBA") basis. In a TBA transaction, the Portfolio commits to purchasing securities for which all specific information is not yet known at the time of the trade, particularly the face amount and maturity date of the underlying securities. Securities purchased on a TBA basis are not settled until they are delivered to the Portfolio , normally 15 to 45 days later. Beginning on the date the Portfolio enters into a TBA transaction, cash, U.S. government securities or other liquid securities are segregated in an amount equal in value to the purchase price of the TBA security. These transactions are subject to market fluctuations and their current value is determined in the same manner as for other securities.
Short sales "against the box"—Each Portfolio (other than UBS Government Money Market Investments Fund and PACE Municipal Fixed Income Investments) may engage in short sale transactions of securities it owns or has the right to acquire at no added cost through conversion or exchange of other securities it owns (short sales "against the box"). A Portfolio might make a short sale "against the box" to hedge against market risks when its subadvisor believes that the price of a security may decline, thereby causing a decline in the value of a security owned by the Portfolio or a security convertible into or exchangeable for a security owned by the Portfolio .
The Portfolio must borrow the security to make delivery to the buyer. The initial amount of a short sale is recorded as a liability which is marked to market daily. Fluctuations in the value of this liability are recorded as unrealized appreciation or depreciation on the Statement of operations. Any loss in the Portfolio's long position after the short sale should be reduced by a corresponding gain in the short position. Conversely, any gain in the long position after the
330
PACE Select Advisors Trust
Notes to financial statements
short sale should be reduced by a corresponding loss in the short position. When a Portfolio sells short, it establishes a margin account with the broker effecting the short sale and deposits collateral with the broker. In addition, the Portfolio maintains, in a segregated account with its custodian, the securities that could be used to cover the short sale. Each Portfolio incurs transaction costs, including dividend expense, borrowing costs and interest expense, in connection with opening, maintaining and closing short sales "against the box". These dividends and interest are booked as an expense or liability to the Portfolio .
Treasury Inflation Protected Securities—The Portfolios may purchase Treasury inflation protected securities ("TIPS") which are debt securities issued by the US Treasury. TIPS adjust for inflation based on changes in the published Consumer Price Index ("CPI"). During periods of inflation when the CPI index increases, the principal amount of the debt to which the rate of interest is applied increases, which in turn increases the yield. During periods of deflation when the CPI index decreases, the principal amount of the debt to which the rate of interest is applied decreases, which in turn lowers the yield. At maturity, TIPS return the higher of the principal amount at maturity or the initial face amount of the debt.
Treasury roll transactions—Certain Portfolios may enter into treasury roll transactions. In a treasury roll transaction, a Portfolio sells a Treasury security to a counterparty with a simultaneous agreement to repurchase the same security at an agreed upon price and date. The Portfolio receives cash from the sale of the Treasury security to use for other investment purposes. For US GAAP purposes, a treasury roll transaction is accounted for as a secured borrowing and not as a purchase and sale. The difference between the sale price and repurchase price represents net interest income or net interest expense reflective of an agreed upon rate between the Portfolio and the counterparty over the term of the borrowing. The Portfolio will benefit from the transaction if the income earned on the investment purchased with the cash received in the treasury roll transaction exceeds the interest expense incurred by the Portfolio. If the interest expense exceeds the income earned, the Portfolio's net investment income and dividends to shareholders may be adversely impacted.
Treasury roll transactions involve the risk that the market value of the securities that the Portfolio is required to repurchase may decline below the agreed upon repurchase price of those securities. During the period ended July 31, 2020, only PACE Mortgage-Backed Securities Fixed Income Investments and PACE Strategic Fixed Income Investments utilized treasury roll transactions.
The table below represents the remaining contractual maturity as of July 31, 2020, of the treasury roll transactions accounted for as secured borrowings.
PACE Strategic Fixed Income Investments
Types of securities being bought back | | Overnight and
continuous | | Up to 30 days | | 31-90 days | | Greater than
90 days | | Total | |
US government obligations | | $ | — | | | $ | 44,961,180 | | | $ | — | | | $ | — | | | $ | 44,961,180 | | |
Uncovered short sales—PACE Mortgage-Backed Securities Fixed Income Investments (with respect to securities issued by the US Treasury and TBA securities coupon trades), PACE Large Co Value Equity Investments, PACE International Equity Investments, PACE Global Real Estate Securities Investments and PACE Alternative Strategies Investments may engage in short sale transactions in which the Portfolio sells a security it does not own (or does not have the right to acquire at no added cost), in anticipation of a decline in the security's price.
The Portfolio must borrow the security to make delivery to the buyer. The initial amount of a short sale is recorded as a liability which is marked to market daily. Fluctuations in the value of this liability are recorded as unrealized appreciation or depreciation on the Statement of operations. The Portfolio will realize a loss as a result of the short sale if the price of the security increases between the date of the short sale and the date on which the Portfolio replaces the borrowed security, and the Portfolio will realize a gain if the security declines in price between those same dates.
331
PACE Select Advisors Trust
Notes to financial statements
Each Portfolio segregates collateral, consisting of cash or liquid assets, sufficient to collateralize the market value of the investments sold short. Each Portfolio incurs transaction costs, including dividend expense, borrowing costs and interest expenses in connection with opening, maintaining and closing short sales. These dividends and interest are booked as an expense or liability to the Portfolio.
Because a Portfolio's loss on a short sale arises from increases in the value of the investment sold short, such loss, like the potential increase in price of the security sold short, is theoretically unlimited. The Portfolio's investments held long could also decline in value at the same time the value of the investment sold short increases, thereby increasing the Portfolio's potential for loss. There is also the risk that the counterparty to a short sale transaction may fail to honor its contract terms, causing a loss to the Portfolio. In addition, PACE Large Co Value Equity Investments and PACE International Equity Investments may invest the proceeds received upon the initial sale of the security, resulting in leverage and increasing each Portfolio's return and loss potential. PACE Large Co Value Equity Investments and PACE International Equity Investments may also engage in short sale transactions that are effected through their custodian and may deliver cash received in connection with its securities lending activity to the custodian as collateral to secure the short sale transactions.
For the period ended July 31, 2020, PACE Global Real Estate Securities Investments did not engage in uncovered short sale transactions.
Unfunded loan commitments—A Portfolio may enter into unfunded loan commitments, which are contractual obligations for future funding at the option of the borrower. Unfunded loan commitments represent a future obligation, in full, even though a percentage of the committed amount may not be utilized by the borrower. Unfunded loan commitments, and the obligation for future funding, are recorded as a liability on the Statement of assets and liabilities at par value at the time the commitment is entered into. Purchases of unfunded loan commitments may have a similar effect on the Portfolio's NAV as if the Portfolio had created a degree of leverage in the portfolio. Market risk exists with these commitments to the same extent as if the securities were owned on a settled basis. Losses may arise due to changes in the value of the unfunded loan commitments.
As of July 31, 2020, PACE High Yield Investments had unfunded loan commitments reflected on the Statement of assets and liabilities, which could be extended at the option of the borrower, pursuant to loan agreements with the following borrowers:
Borrower | | Type | | Principal
Amount | |
Spectacle Gary Holdings LLC | | 2020 Delayed Draw Term loan | | $ | 16,892 | | |
Under the terms of the contract, the Portfolio has the option to assign (sell) all or portion of the unfunded loan commitment. Upon the completion of such assignment, the Portfolio is released from its rights and obligations pertaining to the portion of the unfunded loan commitment assigned. When the Portfolio sells a portion of an unfunded loan commitment, the portion sold is removed from the Portfolio of investments and the unsettled amount is reflected as unfunded loan commitments sold on the Statement of assets and liabilities until settlement date. Once settled, the portion of the unfunded loan commitment assigned is relieved from the Portfolio's unfunded loan commitments liability.
Derivative instruments
Purchased options—Certain Portfolios may purchase put and call options, including, but not limited to, options on foreign or US securities, indices, foreign currencies, options on futures contracts and options on swap agreements (commonly referred to as swaptions), in order to gain exposure to or protect against changes in the markets or in an attempt to enhance income or gains. Purchasing call options tends to increase exposure to the underlying instrument. Purchasing put options tends to decrease exposure to the underlying instrument.
332
PACE Select Advisors Trust
Notes to financial statements
The Portfolios pay a premium which is included on the Statement of assets and liabilities as an investment and subsequently marked to market to reflect the current value of the option. Premiums paid for purchasing options which expire are treated as realized losses. Purchased options are shown as portfolio holdings within the Portfolio of investments and are included in the Statement of assets and liabilities in investments, at value.
The risk associated with purchasing put and call options is limited to the premium paid. Premiums paid for purchasing options which are exercised or closed are added to the amounts paid or offset against the proceeds on the underlying future, security or currency transaction to determine the realized gain or loss.
Option writing—Certain Portfolios may write (sell) put and call options, including, but not limited to, options on foreign or US securities, indices, foreign currencies, options on futures contracts and options on swap agreements (commonly referred to as swaptions), in order to gain exposure to or protect against changes in the markets or in an attempt to enhance income or gains.
When a Portfolio writes a call or a put option, an amount equal to the premium received by the Portfolio is included on the Portfolio's Statement of assets and liabilities as a liability. The amount of the liability is subsequently marked-to-market to reflect the current market value of the option written. If an option which the Portfolio has written either expires on its stipulated expiration date or the Portfolio enters into a closing purchase transaction, the Portfolio realizes a gain (or loss if the cost of a closing purchase transaction exceeds the premium received when the option was written) without regard to any unrealized gain or loss on the underlying security or derivative instrument, and the liability related to such option is extinguished. If a call option, which a Portfolio has written, is exercised, the Portfolio recognizes a realized gain or loss (long-term or short-term, depending on the holding period of the underlying security) from the sale of the underlying security or derivative instrument and the proceeds from the sale are increased by the premium originally received. If a put option, which a Portfolio has written, is exercised, the amount of the premium originally received reduces the cost of the security or derivative instrument which the Portfolio purchases upon exercise of the option.
In writing an option, a Portfolio bears the market risk of an unfavorable change in the price of the derivative instrument, security, or currency underlying the written option. Exercise of an option written by a Portfolio could result in the Portfolio selling or buying a derivative instrument, security or currency at a price different from current market value.
In the normal course of trading activities, the Portfolio trades and holds certain fair valued derivative contracts that constitute guarantees. Such contracts include written put options, where the Portfolio will be obligated to purchase securities at specified prices (i.e. the options are exercised by the counterparties). It also includes written swaptions, where the Portfolio will be obligated to enter into a swap agreement.
The maximum payout for written put options is limited to the number of put option contracts written and the related strike prices, respectively. Maximum payout amounts could be offset by the subsequent sale, if any, of assets obtained via the execution of a payout event. At July 31, 2020, PACE Mortgage-Backed Securities Fixed Income Investments, PACE Intermediate Fixed Income Investments, PACE Strategic Fixed Income Investments, and PACE Alternative Strategies Investments had maximum payout amounts of approximately $5,909,045,000, $16,646,150, $1,366,644,000 and $17,358,121 respectively, relating to written put option contracts.
Futures contracts—Certain Portfolios may purchase or sell futures contracts to increase or reduce their exposure to an asset class without purchasing or selling the underlying securities, either as a hedge or to enhance income or realized gains. Generally, a futures contract is a standard binding agreement to buy or sell a specified quantity of an underlying reference asset, such as a specific security or currency, at a specified price at a specified later date.
333
PACE Select Advisors Trust
Notes to financial statements
Upon entering into a futures contract, a Portfolio is required to deliver to a broker an amount of cash and/or US government securities equal to a certain percentage of the contract amount. This amount is known as the "initial margin". Subsequent payments, known as "variation margin", generally are made or received by a Portfolio , depending on the daily fluctuations in the value of the underlying futures contracts, except that in the case of certain futures contracts that are held through swap contracts. Such variation margin is recorded for financial statement purposes on a daily basis as an unrealized appreciation or depreciation on futures until the futures contract is closed or expires, at which time the net gain or loss is reclassified to realized gain or loss on futures.
Using futures contracts involves various risks, including market interest rate and equity risks. Risks of entering into futures contracts include the possibility that there may be an illiquid market or that a change in the value of the contract may not correlate with changes in the value of the underlying securities. To the extent that market prices move in an unexpected direction, there is a risk that a Portfolio will not achieve the anticipated benefits of the futures contract or may realize a loss.
Swap agreements—Certain Portfolios may engage in swap agreements, including, but not limited to, interest rate, credit default, total return. A Portfolio expects to enter into these transactions to preserve a return or spread on a particular investment or to hedge a portion of the Portfolio's duration, to protect against any increase in the price of securities the Portfolio anticipates purchasing at a later date, to gain exposure to certain markets in the most economical way possible or in an attempt to enhance income or gains.
The Portfolios accrue for interim payments on swap agreements on a daily basis, with the net amount recorded within unrealized appreciation or depreciation of swap agreements. Once interim payments are settled in cash, the net amount is recorded as realized gain/loss on swap agreements, in addition to realized gain/loss recorded upon the termination of swap agreements on the Statement of operations. Fluctuations in the value of swap agreements are recorded for financial statement purposes as unrealized appreciation or depreciation on swap agreements.
Certain Portfolios may enter into interest rate swap agreements with another party to receive or pay interest (e.g., an exchange of fixed rate payments for floating rate payments) to protect themselves from interest rate fluctuations. This type of swap is an agreement that obligates two parties to exchange a series of cash flows at specified intervals based upon or calculated by reference to a specified interest rate(s) for a specified amount. The payment flows are usually netted against each other, with the difference being paid by one party to the other. Interest rate swap agreements are subject to general market risk, liquidity risk, counterparty risk and interest rate risk.
Credit default swap agreements involve commitments to make or receive payments in the event of a default of a security or other credit event of the referenced obligation. As a buyer, the Portfolio would make periodic payments to the counterparty, and the Portfolio would receive payments only upon the occurrence of a default or credit event. If no default or credit event occurs, the Portfolio will lose its periodic stream of payments over the term of the contract. However, if a default or a credit event does occur, the Portfolio typically would receive full notional value for the referenced obligation that may have little or no value. As a seller, the Portfolio would receive periodic payments from the counterparty, and the Portfolio would make payments only upon the occurrence of a default or a credit event. If no default or credit event occurs, the Portfolio will gain the periodic stream of payments it received over the term of the contract and the counterparty will lose its periodic stream of payments over the term of the contract. However, if a default or credit event occurs, the Portfolio typically would pay full notional value for the referenced obligation that may have little or no value. Credit default swap agreements may involve greater risks than if the Portfolio had invested in the referenced obligation directly and are subject to general market risk, liquidity risk and credit risk.
Credit default swap agreements on credit indices involve one party making a stream of payments to another party in exchange for the right to receive a specified return in the event of a write-down, principal shortfall, interest shortfall or default of all or part of the referenced entities comprising the credit index. A credit index is a list of a basket of credit instruments or exposures designed to be representative of some part of the credit market as a whole. These
334
PACE Select Advisors Trust
Notes to financial statements
indices are made up of referenced credits that are judged by a poll of dealers to be the most liquid entities in the credit default swap market based on the sector of the index. Components of the indices may include, but are not limited to, investment grade securities, high yield securities, asset backed securities, emerging markets, and/or various credit ratings within each sector. Credit indices are traded using credit default swaps with standardized terms including a fixed spread and standard maturity dates. An index credit default swap references all the names in the index, and if there is a default, the credit event is settled based on that name's weight in the index. The composition of the indices changes periodically, usually every six months, and for most indices, each name has an equal weight in the index. A Portfolio may use credit default swap agreements on credit indices to hedge a portfolio of credit default swaps or bonds with a credit default swap on indices which is less expensive than it would be to buy many credit default swaps to achieve a similar effect. Credit default swap agreements on credit indices are benchmarks for protecting investors owning bonds against default, and traders use them to speculate on changes in credit quality.
Credit default swap agreements on corporate issues or sovereign issues of an emerging market country involve one party making a stream of payments to another party in exchange for the right to receive a specified return in the event of a default or other credit event. If a credit event occurs and cash settlement is not elected, a variety of other obligations may be delivered in lieu of the specific referenced obligation. The ability to deliver other obligations may result in a cheapest-to-deliver option (the buyer of protection's right to choose the deliverable obligation with the lowest value following a credit event). A Portfolio may use credit default swap agreements on corporate issues or sovereign issues of an emerging market country to provide a measure of protection against defaults of the issuers (i.e., to reduce risk where the Portfolio owns or has exposure to the referenced obligation) or to take an active long or short position with respect to the likelihood of a particular issuer's default.
The maximum potential amount of future payments (undiscounted) that a Portfolio as a seller of protection could be required to make under a credit default swap agreement would be an amount equal to the notional amount of the agreement, which may exceed the amount of the value reflected on the Statement of assets and liabilities. Notional amounts of all credit default swap agreements outstanding as of the period end for which a Portfolio is the seller of protection are disclosed under the section "Credit default swap agreements on corporate issues and credit indices—sell protection" in the Portfolio of investments. These potential amounts would be partially offset by any recovery values of the respective referenced obligations, upfront payments received upon entering into the agreement, or net amounts received from the settlement of buy protection credit default swap agreements entered into, if any, by a Portfolio for the same referenced entity or entities.
Total return swap agreements involve commitments to pay or receive interest in exchange for a market-linked return based on a notional amount. To the extent the total return of the security or index underlying the transactions exceeds or falls short of the offsetting interest rate obligation, the Portfolio will receive a payment from or make a payment to the counterparty, respectively. Total return swap agreements are marked-to-market daily, and the change, if any, is recorded as unrealized appreciation or depreciation. Total return swap agreements are subject to general market risk, liquidity risk, counterparty risk, interest rate risk, credit risk and the risk that there may be unfavorable changes in the underlying investments or instruments.
Variance swap agreements involve two parties agreeing to exchange cash flows based on the measured variance (or square of volatility) of a specified underlying asset. One party agrees to exchange a "fixed rate" or strike price payment for the "floating rate" or realized price variance on the underlying asset with respect to the notional amount. At inception, the strike price is generally chosen such that the fair value of the swap is zero. At the maturity date, a net cash flow is exchanged, where the payoff amount is equivalent to the difference between the realized price variance of the underlying asset and the strike price multiplied by the notional amount. As a receiver of the realized price variance, the Portfolio would receive the payoff amount when the realized price variance of the underlying asset is greater than the strike price and would owe the payoff amount when the realized price variance of the underlying asset is less than the strike price. As a payer of the realized price variance the Portfolio would owe the payoff amount
335
PACE Select Advisors Trust
Notes to financial statements
when the realized price variance of the underlying asset is greater than the strike price and would receive the payoff amount when the variance is less than the strike price.
The use of swap agreements involves investment techniques, risks, and transaction costs different from those associated with ordinary portfolio security transactions, including assumptions about market conditions, interest rates, and other applicable factors. As a result, the performance of the Portfolio will be different than if it had used ordinary portfolio security transactions. OTC swap agreements do not involve the delivery of securities and are subject to counterparty risk. If the other party to a swap agreement defaults and fails to consummate the transaction, the Portfolio's risk of loss will consist of the net amount of interest or other payments that the Portfolio is contractually entitled to receive. Therefore, the Portfolio would consider the creditworthiness of the counterparty to a swap agreement in evaluating potential credit risk.
Certain clearinghouses offer clearing for limited types of derivatives transactions, such as interest rate and credit default swap agreements. Centrally cleared swap agreements must be transacted through a futures commission merchant ("FCM") and cleared through a clearinghouse that serves as a central counterparty. The performance of a centrally cleared swap transaction is effectively guaranteed by a central clearinghouse, thereby reducing the Portfolio's exposure to the credit risk of its original counterparty. The Portfolio will be required to post specified levels of margin with the clearinghouse or at the instruction of the clearinghouse; the margin required by a clearinghouse may be greater than the margin the Portfolio would be required to post in an uncleared transaction. Centrally cleared swap agreements, if any, are reported on the Statement of assets and liabilities based on variation margin received or paid, if any.
Forward foreign currency contracts—Certain Portfolios may enter into forward foreign currency contracts as part of their investment objective, for purposes of risk management or to hedge the US dollar value of portfolio securities denominated in a particular currency. Generally, a forward foreign currency contract is a commitment to purchase or sell a foreign currency at a future date at a negotiated forward rate. Non-deliverable forward foreign currency contracts are settled with the counterparty in US dollars, or another fully convertible currency, without the physical delivery of foreign currency.
Fluctuations in the value of open forward foreign currency contracts are recorded daily for book purposes as unrealized appreciation or depreciation on forward foreign currency contracts by the Portfolios. Realized gains and losses on forward foreign currency contracts include net gains or losses recognized by the Portfolios on contracts which have been sold or matured.
Risks may arise upon entering into forward foreign currency contracts from the potential inability of counterparties to meet the terms of their contracts and from unanticipated movements in the value of foreign currencies relative to the US dollar or each other.
Derivatives by underlying risk—Investment companies value their derivatives at fair value and recognize changes in fair value through the Statement of operations. Under US GAAP, investment companies do not qualify for hedge accounting. Accordingly, even though Portfolio's investments in derivatives may represent economic hedges, they are considered to be non-hedge transactions for purposes of disclosure under US GAAP.
The volume of derivatives as disclosed in each Portfolio's Portfolio of investments is representative of the volume of derivatives outstanding during the period ended July 31, 2020.
Swap agreements, forward foreign currency contracts, swaptions and options written entered into by the Portfolios may contain credit-risk related contingent features that could be triggered subject to certain circumstances. Such circumstances include agreed upon net asset value thresholds. If triggered, the derivative counterparty could request additional cash margin and/or terminate the derivative contract. The aggregate fair value of the derivative contracts
336
PACE Select Advisors Trust
Notes to financial statements
that are in a net liability position that contain these triggers can be found in the Portfolio's Portfolio of investments. The aggregate fair value of assets that are already posted as collateral as of July 31, 2020 is reflected in the Statement of assets and liabilities.
At July 31, 2020, the Funds had the following derivatives categorized by underlying risk:
Asset derivatives1
| | | Interest
rate risk | | Foreign
exchange
risk | | Credit
risk | | Equity
risk | | Total
value | |
PACE Mortgage-Backed Securities Fixed Income Investments | |
Options and swaptions purchased | | $ | 9,173 | | | $ | — | | | $ | — | | | $ | — | | | $ | 9,173 | | |
Swap agreements | | | 911,054 | | | | — | | | | — | | | | — | | | | 911,054 | | |
Total value | | $ | 920,227 | | | $ | — | | | $ | — | | | $ | — | | | $ | 920,227 | | |
PACE Intermediate Fixed Income Investments | |
Options and swaptions purchased | | $ | 2,115,922 | | | $ | — | | | $ | — | | | $ | — | | | $ | 2,115,922 | | |
Futures contracts | | | 290,000 | | | | — | | | | — | | | | — | | | | 290,000 | | |
Swap agreements | | | 5,208,658 | | | | — | | | | 10,805 | | | | — | | | | 5,219,463 | | |
Forward foreign currency contracts | | | — | | | | 81,620 | | | | — | | | | — | | | | 81,620 | | |
Total value | | $ | 7,614,580 | | | $ | 81,620 | | | $ | 10,805 | | | $ | — | | | $ | 7,707,005 | | |
PACE Strategic Fixed Income Investments | |
Futures contracts | | $ | 1,060,618 | | | $ | 19,100 | | | $ | — | | | $ | — | | | $ | 1,079,718 | | |
Swap agreements | | | 1,416,545 | | | | — | | | | 49,144 | | | | — | | | | 1,465,689 | | |
Forward foreign currency contracts | | | — | | | | 9,376 | | | | — | | | | — | | | | 9,376 | | |
Total value | | $ | 2,477,163 | | | $ | 28,476 | | | $ | 49,144 | | | $ | — | | | $ | 2,554,783 | | |
PACE Global Fixed Income Investments | |
Futures contracts | | $ | 388,502 | | | $ | — | | | $ | — | | | $ | — | | | $ | 388,502 | | |
Forward foreign currency contracts | | | — | | | | 3,461,629 | | | | — | | | | — | | | | 3,461,629 | | |
Total value | | $ | 388,502 | | | $ | 3,461,629 | | | $ | — | | | $ | — | | | $ | 3,850,131 | | |
PACE High Yield Investments | |
Forward foreign currency contracts | | $ | — | | | $ | 19,702 | | | $ | — | | | $ | — | | | $ | 19,702 | | |
PACE Alternative Strategies Investments | |
Options and swaptions purchased | | $ | — | | | $ | — | | | $ | — | | | $ | 1,276,756 | | | $ | 1,276,756 | | |
Futures contracts | | | 1,062,801 | | | | — | | | | — | | | | 1,101,312 | | | | 2,164,113 | | |
Swap agreements | | | 506,160 | | | | — | | | | 517,321 | | | | 4,728,060 | | | | 5,751,541 | | |
Forward foreign currency contracts | | | — | | | | 9,725,945 | | | | — | | | | — | | | | 9,725,945 | | |
Total value | | $ | 1,568,961 | | | $ | 9,725,945 | | | $ | 517,321 | | | $ | 7,106,128 | | | $ | 18,918,355 | | |
Table footnotes begin on page 340
337
PACE Select Advisors Trust
Notes to financial statements
Liability derivatives2
| | | Interest
rate risk | | Foreign
exchange
risk | | Credit
risk | | Equity
risk | | Total
value | |
PACE Mortgage-Backed Securities Fixed Income Investments | |
Options and swaptions written | | $ | (76,501 | ) | | $ | — | | | $ | — | | | $ | — | | | $ | (76,501 | ) | |
Futures contracts | | | (254,405 | ) | | | — | | | | — | | | | — | | | | (254,405 | ) | |
Swap agreements | | | (1,945,569 | ) | | | — | | | | — | | | | — | | | | (1,945,569 | ) | |
Total value | | $ | (2,276,475 | ) | | $ | — | | | $ | — | | | $ | — | | | $ | (2,276,475 | ) | |
PACE Intermediate Fixed Income Investments | |
Options and swaptions written | | $ | (2,910,820 | ) | | $ | — | | | $ | — | | | $ | — | | | $ | (2,910,820 | ) | |
Futures contracts | | | (544,486 | ) | | | — | | | | — | | | | — | | | | (544,486 | ) | |
Swap agreements | | | (4,933,231 | ) | | | — | | | | — | | | | — | | | | (4,933,231 | ) | |
Forward foreign currency contracts | | | — | | | | (1,256,738 | ) | | | — | | | | — | | | | (1,256,738 | ) | |
Total value | | $ | (8,388,537 | ) | | $ | (1,256,738 | ) | | $ | — | | | $ | — | | | $ | (9,645,275 | ) | |
PACE Strategic Fixed Income Investments | |
Options and swaptions written | | $ | — | | | $ | (15,495 | ) | | $ | — | | | $ | — | | | $ | (15,495 | ) | |
Futures contracts | | | (620,314 | ) | | | (10,256 | ) | | | — | | | | — | | | | (630,570 | ) | |
Swap agreements | | | (4,129,837 | ) | | | — | | | | (307,172 | ) | | | — | | | | (4,437,009 | ) | |
Forward foreign currency contracts | | | — | | | | (1,762,977 | ) | | | — | | | | — | | | | (1,762,977 | ) | |
Total value | | $ | (4,750,151 | ) | | $ | (1,788,728 | ) | | $ | (307,172 | ) | | $ | — | | | $ | (6,846,051 | ) | |
PACE Global Fixed Income Investments | |
Futures contracts | | $ | (590,232 | ) | | $ | — | | | $ | — | | | $ | — | | | $ | (590,232 | ) | |
Forward foreign currency contracts | | | — | | | | (1,178,474 | ) | | | — | | | | — | | | | (1,178,474 | ) | |
Total value | | $ | (590,232 | ) | | $ | (1,178,474 | ) | | $ | — | | | $ | — | | | $ | (1,768,706 | ) | |
PACE High Yield Investments | |
Forward foreign currency contracts | | $ | — | | | $ | (2,484,906 | ) | | $ | — | | | $ | — | | | $ | (2,484,906 | ) | |
PACE Alternative Strategies Investments | |
Options ans swaptions written | | $ | — | | | $ | — | | | $ | — | | | $ | (915,250 | ) | | $ | (915,250 | ) | |
Futures contracts | | | — | | | | — | | | | — | | | | (1,182,460 | ) | | | (1,182,460 | ) | |
Swap agreements | | | (790,922 | ) | | | — | | | | — | | | | (9,261,868 | ) | | | (10,052,790 | ) | |
Forward foreign currency contracts | | | — | | | | (7,634,090 | ) | | | — | | | | — | | | | (7,634,090 | ) | |
Total value | | $ | (790,922 | ) | | $ | (7,634,090 | ) | | $ | — | | | $ | (11,359,578 | ) | | $ | (19,784,590 | ) | |
Table footnotes begin on page 340
338
PACE Select Advisors Trust
Notes to financial statements
During the period ended July 31, 2020, net realized gain (loss) from derivatives were as follows:
Realized gain (loss)3
| | | Interest
rate risk | | Foreign
exchange
risk | | Credit
risk | | Equity
risk | | Total
value | |
PACE Mortgage-Backed Securities Fixed Income Investments | |
Options and swaptions purchased | | $ | (297,166 | ) | | $ | — | | | $ | — | | | $ | — | | | $ | (297,166 | ) | |
Options and swaptions written | | | 871,217 | | | | — | | | | — | | | | — | | | | 871,217 | | |
Futures contracts | | | (3,177,801 | ) | | | — | | | | — | | | | — | | | | (3,177,801 | ) | |
Swap agreements | | | (2,742,035 | ) | | | — | | | | — | | | | — | | | | (2,742,035 | ) | |
Total net realized gains (loss) | | $ | (5,345,785 | ) | | $ | — | | | $ | — | | | $ | — | | | $ | (5,345,785 | ) | |
PACE Intermediate Fixed Income Investments | |
Options and swaptions purchased | | $ | (322,794 | ) | | $ | — | | | $ | — | | | $ | — | | | $ | (322,794 | ) | |
Options and swaptions written | | | 823,876 | | | | — | | | | — | | | | — | | | | 823,876 | | |
Futures contracts | | | 1,348,866 | | | | — | | | | — | | | | — | | | | 1,348,866 | | |
Swap agreements | | | (1,635,866 | ) | | | — | | | | (1,183,314 | ) | | | — | | | | (2,819,180 | ) | |
Forward foreign currency contracts | | | — | | | | (145,681 | ) | | | — | | | | — | | | | (145,681 | ) | |
Total net realized gains (loss) | | $ | 214,082 | | | $ | (145,681 | ) | | $ | (1,183,314 | ) | | $ | — | | | $ | (1,114,913 | ) | |
PACE Strategic Fixed Income Investments | |
Options and swaptions purchased | | $ | 33,148 | | | $ | — | | | $ | — | | | $ | — | | | $ | 33,148 | | |
Options and swaptions written | | | 252,034 | | | | 103,947 | | | | — | | | | — | | | | 355,981 | | |
Futures contracts | | | 2,868,839 | | | | 5,683 | | | | — | | | | — | | | | 2,874,522 | | |
Swap agreements | | | (2,858,994 | ) | | | — | | | | (236,968 | ) | | | — | | | | (3,095,962 | ) | |
Forward foreign currency contracts | | | — | | | | 585,293 | | | | — | | | | — | | | | 585,293 | | |
Total net realized gains (loss) | | $ | 295,027 | | | $ | 694,923 | | | $ | (236,968 | ) | | $ | — | | | $ | 752,982 | | |
PACE Global Fixed Income Investments | |
Futures contracts | | $ | 1,299,486 | | | $ | — | | | $ | — | | | $ | — | | | $ | 1,299,486 | | |
Forward foreign currency contracts | | | — | | | | 2,007,164 | | | | — | | | | — | | | | 2,007,164 | | |
Total net realized gains (loss) | | $ | 1,299,486 | | | $ | 2,007,164 | | | $ | — | | | $ | — | | | $ | 3,306,650 | | |
PACE High Yield Investments | |
Forward foreign currency contracts | | $ | — | | | $ | 1,657,578 | | | $ | — | | | $ | — | | | $ | 1,657,578 | | |
PACE International Equity Investments | |
Forward foreign currency contracts | | $ | — | | | $ | 12,766 | | | $ | — | | | $ | — | | | $ | 12,766 | | |
PACE International Emerging Markets Equity Investments | |
Forward foreign currency contracts | | $ | — | | | $ | (50 | ) | | $ | — | | | $ | — | | | $ | (50 | ) | |
PACE Alternative Strategies Investments | |
Options and swaptions purchased | | $ | 1,887,099 | | | $ | (51,524 | ) | | $ | — | | | $ | 1,932,693 | | | $ | 3,768,268 | | |
Options and swaptions written | | | (4,232,725 | ) | | | — | | | | — | | | | (219,223 | ) | | | (4,451,948 | ) | |
Futures contracts | | | 5,642,890 | | | | — | | | | — | | | | (2,475,358 | ) | | | 3,167,532 | | |
Swap agreements | | | 1,835,441 | | | | — | | | | 3,233,493 | | | | 2,680,535 | | | | 7,749,469 | | |
Forward foreign currency contracts | | | — | | | | 3,684,126 | | | | — | | | | — | | | | 3,684,126 | | |
Total net realized gains (loss) | | $ | 5,132,705 | | | $ | 3,632,602 | | | $ | 3,233,493 | | | $ | 1,918,647 | | | $ | 13,917,447 | | |
Table footnotes begin on page 340
339
PACE Select Advisors Trust
Notes to financial statements
During the period ended July 31, 2020, net change in unrealized appreciation (depreciation) from derivatives were as follows:
Net change in unrealized appreciation (depreciation)4
| | | Interest
rate risk | | Foreign
exchange
risk | | Credit
risk | | Equity
risk | | Total
value | |
PACE Mortgage-Backed Securities Fixed Income Investments | |
Options and swaptions purchased | | $ | (142,386 | ) | | $ | — | | | $ | — | | | $ | — | | | $ | (142,386 | ) | |
Options and swaptions written | | | 228,763 | | | | — | | | | — | | | | — | | | | 228,763 | | |
Futures contracts | | | 293,430 | | | | — | | | | — | | | | — | | | | 293,430 | | |
Swap agreements | | | 223,098 | | | | — | | | | — | | | | — | | | | 223,098 | | |
Net change in appreciation (depreciation) | | $ | 602,905 | | | $ | — | | | $ | — | | | $ | — | | | $ | 602,905 | | |
PACE Intermediate Fixed Income Investments | |
Options and swaptions purchased | | $ | 361,948 | | | $ | — | | | $ | — | | | $ | — | | | $ | 361,948 | | |
Options and swaptions written | | | (491,657 | ) | | | — | | | | — | | | | — | | | | (491,657 | ) | |
Futures contracts | | | (452,101 | ) | | | — | | | | — | | | | — | | | | (452,101 | ) | |
Swap agreements | | | 298,053 | | | | — | | | | 104,319 | | | | — | | | | 402,372 | | |
Forward foreign currency contracts | | | — | | | | (1,180,151 | ) | | | — | | | | — | | | | (1,180,151 | ) | |
Net change in appreciation (depreciation) | | $ | (283,757 | ) | | $ | (1,180,151 | ) | | $ | 104,319 | | | $ | — | | | $ | (1,359,589 | ) | |
PACE Strategic Fixed Income Investments | |
Options and swaptions purchased | | $ | (37,591 | ) | | $ | — | | | $ | — | | | $ | — | | | $ | (37,591 | ) | |
Options and swaptions written | | | 54,655 | | | | 865 | | | | — | | | | — | | | | 55,520 | | |
Futures contracts | | | 707,654 | | | | 17,040 | | | | — | | | | — | | | | 724,694 | | |
Swap agreements | | | 1,616,248 | | | | — | | | | (1,025,397 | ) | | | — | | | | 590,851 | | |
Forward foreign currency contracts | | | — | | | | (2,703,442 | ) | | | — | | | | — | | | | (2,703,442 | ) | |
Net change in appreciation (depreciation) | | $ | 2,340,966 | | | $ | (2,685,537 | ) | | $ | (1,025,397 | ) | | $ | — | | | $ | (1,369,968 | ) | |
PACE Global Fixed Income Investments | |
Futures contracts | | $ | (764,064 | ) | | $ | — | | | $ | — | | | $ | — | | | $ | (764,064 | ) | |
Forward foreign currency contracts | | | — | | | | 1,923,754 | | | | — | | | | — | | | | 1,923,754 | | |
Net change in appreciation (depreciation) | | $ | (764,064 | ) | | $ | 1,923,754 | | | $ | — | | | $ | — | | | $ | 1,159,690 | | |
PACE High Yield Investments | |
Forward foreign currency contracts | | $ | — | | | $ | (4,597,736 | ) | | $ | — | | | $ | — | | | $ | (4,597,736 | ) | |
PACE Alternative Strategies Investments | |
Options and swaptions purchased | | $ | — | | | $ | (708,818 | ) | | $ | — | | | $ | 309,653 | | | $ | (399,165 | ) | |
Options and swaptions written | | | — | | | | — | | | | — | | | | 441,044 | | | | 441,044 | | |
Futures contracts | | | 896,556 | | | | — | | | | — | | | | 270,128 | | | | 1,166,684 | | |
Swap agreements | | | (878,238 | ) | | | — | | | | (16,930 | ) | | | (4,153,079 | ) | | | (5,048,247 | ) | |
Forward foreign currency contracts | | | — | | | | 903,968 | | | | — | | | | — | | | | 903,968 | | |
Net change in appreciation (depreciation) | | $ | 18,318 | | | $ | 195,150 | | | $ | (16,930 | ) | | $ | (3,132,254 | ) | | $ | (2,935,716 | ) | |
1 In the Statement of assets and liabilities, options purchased are shown within investments of unaffiliated issuers, at value, swap agreements (except centrally cleared swap agreements) are shown within outstanding swap agreements, at value, while forward foreign currency contracts are shown within unrealized appreciation on forward foreign currency contracts. Futures contracts are reported in the table above using cumulative appreciation on futures contracts and centrally cleared swap agreements, if any, are reported at value, as reported in the
340
PACE Select Advisors Trust
Notes to financial statements
futures contracts and centrally cleared swap agreements tables at the end of the Portfolio of investments, respectively, but only the variation margin to be received, if any, is reported within the Statement of assets and liabilities.
2 In the Statement of assets and liabilities, options written are shown within options and swaptions written, at value, swap agreements (except centrally cleared swap agreements) are shown within OTC swap agreements, at value, while forward foreign currency contracts are shown within unrealized appreciation/depreciation on forward foreign currency contracts. Futures contracts are reported in the table above using cumulative depreciation of futures contracts and centrally cleared swap agreements, if any, are reported at value, as reported in the futures contracts and centrally cleared swap agreements tables at the end of the Portfolio of investments, respectively, but only the variation margin to be paid, if any, is reported within the Statement of assets and liabilities.
3 The net realized gain (loss) is shown in the Statement of operations in net realized gain (loss) on futures contracts, options and swaptions written, swap agreements and forward foreign currency contracts, unless otherwise noted. The net realized gain (loss) on options purchased is shown in the Statement of operations in net realized gain (loss) on investments in unaffiliated issuers.
4 The change in net unrealized appreciation (depreciation) is shown in the Statement of operations in change in net unrealized appreciation (depreciation) on futures contracts, options and swaptions written, swap agreements and forward foreign currency contracts, unless otherwise noted. The change in net unrealized appreciation (depreciation) of options and swaptions purchased is shown in the Statement of operations in change in net unrealized appreciation (depreciation) on investments.
Offsetting of certain derivatives—The Portfolios typically enter into International Swaps and Derivatives Association, Inc. Master Agreements ("ISDA Master Agreements") or similar master agreements with its OTC derivative contract counterparties in order to, among other things, reduce its credit risk to counterparties. ISDA Master Agreements include provisions for general obligations, representations, collateral and events of default or termination. Under an ISDA Master Agreement, the Portfolios typically may offset with the counterparty certain derivative financial instrument's payables and/or receivables with collateral held and/or posted and create one single net payment (close-out netting) in the event of default or termination. The Statement of assets and liabilities is presented gross of any netting.
At July 31, 2020, derivative assets and liabilities (by type) on a gross basis and derivatives subject to an enforceable master netting arrangement ("MNA") or similar were as follows:
PACE Mortgage-Backed Securities Fixed Income Investments
Derivative Financial Instruments: | | Assets | | Liabilities | |
Total gross amount of derivative assets and liabilities in the Statement of assets and liabilities1 | | $ | 920,227 | | | $ | (2,276,475 | ) | |
Derivatives not subject to a MNA or similar agreements | | | (911,054 | ) | | | 2,196,990 | | |
Total gross amount of assets and liabilities subject to MNA or similar agreements | | $ | 9,173 | | | $ | (79,485 | ) | |
The following tables present the Portfolio's derivative assets and liabilities by counterparty net of amounts available for offset under a MNA and net of the related collateral received/pledged by the Portfolio as of the period end.
PACE Mortgage-Backed Securities Fixed Income Investments
Counterparty | | Gross amount of
assets | | Financial
instruments
and derivatives
available for
offset | | Collateral
received2 | | Net amount
of assets | |
BNP | | $ | 3,053 | | | $ | — | | | $ | — | | | $ | 3,053 | | |
CITI | | | 1 | | | | — | | | | — | | | | 1 | | |
DB | | | 5,031 | | | | (2,984 | ) | | | — | | | | 2,047 | | |
GS | | | 1,087 | | | | — | | | | — | | | | 1,087 | | |
JPMCB | | | 1 | | | | (1 | ) | | | — | | | | — | | |
Total | | $ | 9,173 | | | $ | (2,985 | ) | | $ | — | | | $ | 6,188 | | |
Table footnotes begin on page 345
341
PACE Select Advisors Trust
Notes to financial statements
Counterparty | | Gross amount of
liabilities | | Financial
instruments
and derivatives
available for
offset | | Collateral
pledged2 | | Net amount
of liabilities | |
DB | | $ | (2,984 | ) | | $ | 2,984 | | | $ | — | | | $ | — | | |
JPMCB | | | (73,258 | ) | | | 1 | | | | — | | | | (73,257 | ) | |
MSCI | | | (3,243 | ) | | | — | | | | — | | | | (3,243 | ) | |
Total | | $ | (79,485 | ) | | $ | 2,985 | | | $ | — | | | $ | (76,500 | ) | |
At July 31, 2020, derivative assets and liabilities (by type) on a gross basis and derivatives subject to an enforceable master netting arrangement ("MNA") or similar were as follows:
PACE Intermediate Fixed Income Investments
Derivative Financial Instruments: | | Assets | | Liabilities | |
Total gross amount of derivative assets and liabilities in the Statement of assets and liabilities1 | | $ | 7,707,005 | | | $ | (9,645,275 | ) | |
Derivatives not subject to a MNA or similar agreements | | | (5,562,289 | ) | | | 5,561,086 | | |
Total gross amount of assets and liabilities subject to MNA or similar agreements | | $ | 2,144,716 | | | $ | (4,084,189 | ) | |
The following tables present the Portfolio's derivative liabilities by counterparty net of amounts available for offset under a MNA and net of the related collateral received/pledged by the Portfolio as of the period end.
PACE Intermediate Fixed Income Investments
Counterparty | | Gross amount of
assets | | Financial
instruments
and derivatives
available for
offset | | Collateral
received2 | | Net amount
of assets | |
BNP | | $ | 81,620 | | | $ | (81,620 | ) | | $ | — | | | $ | — | | |
BOA | | | 1,607,764 | | | | (1,607,764 | ) | | | — | | | | — | | |
GS | | | 155,552 | | | | (155,552 | ) | | | — | | | | — | | |
JPMCB | | | 299,780 | | | | (248,317 | ) | | | (51,463 | ) | | | — | | |
Total | | $ | 2,144,716 | | | $ | (2,093,253 | ) | | $ | (51,463 | ) | | $ | — | | |
Counterparty | | Gross amount of
liabilities | | Financial
instruments
and derivatives
available for
offset | | Collateral
pledged2 | | Net amount
of liabilities | |
ANZ | | $ | (247 | ) | | $ | — | | | $ | — | | | $ | (247 | ) | |
BNP | | | (84,077 | ) | | | 81,620 | | | | — | | | | (2,457 | ) | |
BOA | | | (2,087,350 | ) | | | 1,607,764 | | | | 357,000 | | | | (122,586 | ) | |
CIBC | | | (5,770 | ) | | | — | | | | — | | | | (5,770 | ) | |
CITI | | | (1,141,802 | ) | | | — | | | | — | | | | (1,141,802 | ) | |
GS | | | (491,790 | ) | | | 155,552 | | | | 228,000 | | | | (108,238 | ) | |
HSBC | | | (9,074 | ) | | | — | | | | — | | | | (9,074 | ) | |
JPMCB | | | (248,317 | ) | | | 248,317 | | | | — | | | | — | | |
WBC | | | (15,762 | ) | | | — | | | | — | | | | (15,762 | ) | |
Total | | $ | (4,084,189 | ) | | $ | 2,093,253 | | | $ | 585,000 | | | $ | (1,405,936 | ) | |
Table footnotes begin on page 345
342
PACE Select Advisors Trust
Notes to financial statements
At July 31, 2020, derivative assets and liabilities (by type) on a gross basis and derivatives subject to an enforceable master netting arrangement ("MNA") or similar were as follows:
PACE Strategic Fixed Income Investments
Derivative Financial Instruments: | | Assets | | Liabilities | |
Total gross amount of derivative assets and liabilities in the Statement of assets and liabilities1 | | $ | 2,554,783 | | | $ | (6,846,051 | ) | |
Derivatives not subject to a MNA or similar agreements | | | (2,545,407 | ) | | | 4,959,886 | | |
Total gross amount of assets and liabilities subject to MNA or similar agreements | | $ | 9,376 | | | $ | (1,886,165 | ) | |
The following tables present the Portfolio's derivative assets and liabilities by counterparty net of amounts available for offset under a MNA and net of the related collateral received/pledged by the Portfolio as of the year end.
PACE Strategic Fixed Income Investments
Counterparty | | Gross amount of
assets | | Financial
instruments
and derivatives
available for
offset | | Collateral
received2 | | Net amount
of assets | |
BNP | | $ | 9,376 | | | $ | — | | | $ | — | | | $ | 9,376 | | |
Counterparty | | Gross amount of
liabilities | | Financial
instruments
and derivatives
available for
offset | | Collateral
pledged2 | | Net amount
of liabilities | |
BB | | $ | (7,599 | ) | | $ | — | | | $ | — | | | $ | (7,599 | ) | |
BOA | | | (15,495 | ) | | | — | | | | — | | | | (15,495 | ) | |
CITI | | | (1,751,767 | ) | | | — | | | | — | | | | (1,751,767 | ) | |
GSI | | | (107,693 | ) | | | — | | | | — | | | | (107,693 | ) | |
HSBC | | | (3,611 | ) | | | — | | | | — | | | | (3,611 | ) | |
Total | | $ | (1,886,165 | ) | | $ | — | | | $ | — | | | $ | (1,886,165 | ) | |
At July 31, 2020, derivative assets and liabilities (by type) on a gross basis and derivatives subject to an enforceable master netting arrangement ("MNA") or similar were as follows:
PACE Global Fixed Income Investments
Derivative Financial Instruments: | | Assets | | Liabilities | |
Total gross amount of derivative assets and liabilities in the Statement of assets and liabilities1 | | $ | 3,850,131 | | | $ | (1,768,706 | ) | |
Derivatives not subject to MNA or similar agreements | | | (388,502 | ) | | | 590,232 | | |
Total gross amount of assets and liabilities subject to MNA or similar agreements | | $ | 3,461,629 | | | $ | (1,178,474 | ) | |
Table footnotes begin on page 345
343
PACE Select Advisors Trust
Notes to financial statements
The following tables present the Portfolio's derivative assets and liabilities by counterparty net of amounts available for offset under a MNA and net of the related collateral received/pledged by the Portfolio as of the period end.
PACE Global Fixed Income Investments
Counterparty | | Gross amount of
assets | | Financial
instruments
and derivatives
available for
offset | | Collateral
received2 | | Net amount
of assets | |
BB | | $ | 512,367 | | | $ | (102,663 | ) | | $ | — | | | $ | 409,704 | | |
BNP | | | 291,370 | | | | (152,913 | ) | | | — | | | | 138,457 | | |
BOA | | | 2,214 | | | | (2,214 | ) | | | — | | | | — | | |
CITI | | | 543,392 | | | | (129,976 | ) | | | — | | | | 413,416 | | |
GS | | | 337,131 | | | | (337,131 | ) | | | — | | | | — | | |
HSBC | | | 529,734 | | | | (164,610 | ) | | | — | | | | 365,124 | | |
RBC | | | 359,690 | | | | (20,364 | ) | | | — | | | | 339,326 | | |
SCB | | | 50,583 | | | | — | | | | — | | | | 50,583 | | |
SSC | | | 790,743 | | | | (242,963 | ) | | | — | | | | 547,780 | | |
TD | | | 44,405 | | | | (11,038 | ) | | | — | | | | 33,367 | | |
Total | | $ | 3,461,629 | | | $ | (1,163,872 | ) | | $ | — | | | $ | 2,297,757 | | |
Counterparty | | Gross amount of
liabilities | | Financial
instruments
and derivatives
available for
offset | | Collateral
pledged2 | | Net amount
of liabilities | |
BB | | $ | (102,663 | ) | | $ | 102,663 | | | $ | — | | | $ | — | | |
BNP | | | (152,913 | ) | | | 152,913 | | | | — | | | | — | | |
BOA | | | (7,289 | ) | | | 2,214 | | | | — | | | | (5,075 | ) | |
CITI | | | (129,976 | ) | | | 129,976 | | | | — | | | | — | | |
GS | | | (346,658 | ) | | | 337,131 | | | | — | | | | (9,527 | ) | |
HSBC | | | (164,610 | ) | | | 164,610 | | | | — | | | | — | | |
RBC | | | (20,364 | ) | | | 20,364 | | | | — | | | | — | | |
SSC | | | (242,963 | ) | | | 242,963 | | | | — | | | | — | | |
TD | | | (11,038 | ) | | | 11,038 | | | | — | | | | — | | |
Total | | $ | (1,178,474 | ) | | $ | 1,163,872 | | | $ | — | | | $ | (14,602 | ) | |
At July 31, 2020, derivative assets and liabilities (by type) on a gross basis and derivatives subject to an enforceable master netting arrangement ("MNA") or similar were as follows:
PACE High Yield Investments
Derivative Financial Instruments: | | Assets | | Liabilities | |
Total gross amount of derivative assets and liabilities in the Statement of assets and liabilities1 | | $ | 19,702 | | | $ | (2,484,906 | ) | |
Derivatives not subject to a MNA or similar agreements | | | (19,702 | ) | | | 2,484,906 | | |
Total gross amount of assets and liabilities subject to MNA or similar agreements | | $ | — | | | $ | — | | |
Table footnotes begin on page 345
344
PACE Select Advisors Trust
Notes to financial statements
At July 31, 2020, derivative assets and liabilities (by type) on a gross basis and derivatives subject to an enforceable master netting arrangement ("MNA") or similar were as follows:
PACE Alternative Strategies Investments
Derivative Financial Instruments: | | Assets | | Liabilities | |
Total gross amount of derivative assets and liabilities in the Statement of Assets and Liabilities1 | | $ | 18,918,355 | | | $ | (19,784,590 | ) | |
Derivatives not subject to a MNA or similar agreements | | | (4,465,860 | ) | | | 2,890,142 | | |
Total gross amount of assets and liabilities subject to MNA or similar agreements | | $ | 14,452,495 | | | $ | (16,894,448 | ) | |
The following tables present the Portfolio's derivative assets and liabilities by counterparty net of amounts available for offset under a MNA and net of the related collateral received/pledged by the Portfolio as of the year end.
PACE Alternative Strategies Investments
Counterparty | | Gross amount of
assets | | Financial
instruments
and derivatives
available for
offset | | Collateral
received2 | | Net amount
of assets | |
BB | | $ | 4,372,219 | | | $ | (2,240,844 | ) | | $ | — | | | $ | 2,131,375 | | |
BOA | | | 210,622 | | | | (210,622 | ) | | | — | | | | — | | |
CITI | | | 31,336 | | | | (31,336 | ) | | | — | | | | — | | |
GS | | | 17,852 | | | | (6,823 | ) | | | — | | | | 11,029 | | |
GSI | | | 762,849 | | | | (33,995 | ) | | | — | | | | 728,854 | | |
JPMCB | | | 3,224,792 | | | | (3,224,792 | ) | | | — | | | | — | | |
MSCI | | | 5,444,711 | | | | (5,444,711 | ) | | | — | | | | — | | |
SG | | | 388,114 | | | | (67,149 | ) | | | — | | | | 320,965 | | |
Total | | $ | 14,452,495 | | | $ | (11,260,272 | ) | | $ | — | | | $ | 3,192,223 | | |
Counterparty | | Gross amount of
liabilities | | Financial
instruments
and derivatives
available for
offset | | Collateral
pledged2 | | Net amount
of liabilities | |
BB | | $ | (2,240,844 | ) | | $ | 2,240,844 | | | $ | — | | | $ | — | | |
BNP | | | (75,181 | ) | | | — | | | | — | | | | (75,181 | ) | |
BOA | | | (466,602 | ) | | | 210,622 | | | | — | | | | (255,980 | ) | |
CITI | | | (303,580 | ) | | | 31,336 | | | | — | | | | (272,244 | ) | |
GS | | | (6,823 | ) | | | 6,823 | | | | — | | | | — | | |
GSI | | | (33,995 | ) | | | 33,995 | | | | — | | | | — | | |
JPMCB | | | (6,092,968 | ) | | | 3,224,792 | | | | 2,868,176 | | | | — | | |
MSCI | | | (7,607,306 | ) | | | 5,444,711 | | | | 2,162,595 | | | | — | | |
SG | | | (67,149 | ) | | | 67,149 | | | | — | | | | — | | |
Total | | $ | (16,894,448 | ) | | $ | 11,260,272 | | | $ | 5,030,771 | | | $ | (603,405 | ) | |
1 In the Statement of assets and liabilities, options purchased are shown within investments of unaffiliated issuers, at value, swap agreements (except centrally cleared swap agreements) are shown within outstanding swap agreements, at value, while forward foreign currency contracts are shown within unrealized appreciation on forward foreign currency contracts. Futures contracts are reported in the table above using cumulative appreciation on futures contracts and centrally cleared swap agreements, if any, are reported at value, as reported in the futures contracts and centrally cleared swap agreements tables at the end of the Portfolio of investments, respectively, but only the variation margin to be received, if any, is reported within the Statement of assets and liabilities.
2 In some instances, the actual collateral received and/or pledged may be more than the amount shown and may be comprised of cash collateral, non-cash collateral or combination of both.
345
PACE Select Advisors Trust
Notes to financial statements
Investment management and administration fees and other transactions with affiliates
The Trust has entered into an investment management and administration contract ("Management Contract") with UBS AM. In accordance with the Management Contract, each Portfolio paid UBS AM investment management and administration fees, which were accrued daily and paid monthly, in accordance with the following schedule as of July 31, 2020:
Portfolio | | Annual rate as a percentage of
each Portfolio's average daily net assets | |
UBS Government Money Market Investments Fund | | 0.250%* | |
PACE Mortgage-Backed Securities Fixed Income Investments | | 0.650% up to $250 million
0.600% above $250 million up to $500 million
0.575% above $500 million up to $750 million
0.550% above $750 million up to $1 billion
0.525% above $1 billion | |
PACE Intermediate Fixed Income Investments | | 0.550% up to $250 million
0.500% above $250 million up to $500 million
0.475% above $500 million up to $750 million
0.450% above $750 million up to $1 billion
0.425% above $1 billion | |
PACE Strategic Fixed Income Investments | | 0.650% up to $250 million
0.600% above $250 million up to $500 million
0.575% above $500 million up to $750 million
0.550% above $750 million up to $1 billion
0.525% above $1 billion up to $1.25 billion
0.500% above $1.25 billion | |
PACE Municipal Fixed Income Investments | | 0.550% up to $250 million
0.500% above $250 million up to $500 million
0.475% above $500 million up to $750 million
0.450% above $750 million up to $1 billion
0.425% above $1 billion | |
PACE Global Fixed Income Investments | | 0.750% up to $500 million
0.725% above $500 million up to $1 billion
0.700% above $1 billion | |
PACE High Yield Investments | | 0.800% up to $500 million
0.750% above $500 million up to $1 billion
0.725% above $1 billion up to $1.5 billion
0.700% above $1.5 billion up to $2 billion
0.675% above $2 billion | |
PACE Large Co Value Equity Investments | | 0.800% up to $250 million
0.770% above $250 million up to $500 million
0.730% above $500 million up to $1 billion
0.700% above $1 billion | |
PACE Large Co Growth Equity Investments | | 0.800% up to $500 million
0.775% above $500 million up to $1 billion
0.750% above $1 billion up to $1.5 billion
0.725% above $1.5 billion up to $2 billion
0.700% above $2 billion | |
346
PACE Select Advisors Trust
Notes to financial statements
Portfolio | | Annual rate as a percentage of
each Portfolio's average daily net assets | |
PACE Small/Medium Co Value Equity Investments | | 0.800% up to $500 million
0.775% above $500 million | |
PACE Small/Medium Co Growth Equity Investments | | 0.800% up to $500 million
0.775% above $500 million | |
PACE International Equity Investments | | 0.900% up to $500 million
0.875% above $500 million up to $1 billion
0.850% above $1 billion up to $1.5 billion
0.825% above $1.5 billion up to $2 billion
0.800% above $2 billion | |
PACE International Emerging Markets Equity Investments | | 1.100% up to $500 million
1.075% above $500 million up to $1 billion
1.050% above $1 billion up to $1.5 billion
1.025% above $1.5 billion up to $2 billion
1.000% above $2 billion | |
PACE Global Real Estate Securities Investments | | 0.800% up to $500 million
0.750% above $500 million up to $1 billion
0.725% above $1 billion up to $1.5 billion
0.700% above $1.5 billion up to $2 billion
0.675% above $2 billion | |
PACE Alternative Strategies Investments | | 1.400% up to $500 million
1.350% above $500 million up to $1 billion
1.300% above $1 billion up to $1.5 billion
1.275% above $1.5 billion up to $2 billion
1.250% above $2 billion | |
* For the period August 1, 2019 to November 26, 2019 the rate was 0.35%.
Under separate Subdvisory Agreements, with the exception of UBS Government Money Market Investments Fund, UBS AM (not the Portfolios) pays the following investment subadvisors a fee from the investment management and administration fees which UBS AM receives, which is accrued daily and paid monthly:
Portfolio | | Investment subadvisor | |
PACE Mortgage-Backed Securities Fixed Income Investments | | Pacific Investment Management Company LLC | |
PACE Intermediate Fixed Income Investments | | BlackRock Financial Management, Inc. | |
PACE Strategic Fixed Income Investments | | Neuberger Berman Investment Advisers LLC
Pacific Investment Management Company LLC | |
PACE Municipal Fixed Income Investments | | Mellon Investments Corporation | |
PACE Global Fixed Income Investments | | J.P. Morgan Investment Management Inc. | |
PACE High Yield Investments | | Nomura Corporate Research and Asset Management, Inc. | |
PACE Large Co Value Equity Investments | | Boston Partners Global Investors Inc.
Los Angeles Capital Management and Equity Research, Inc.
Pzena Investment Management, LLC
River Road Asset Management, LLC | |
PACE Large Co Growth Equity Investments | | Jackson Square Partners, LLC
J.P. Morgan Investment Management Inc.
Mar Vista Investment Partners, LLC | |
347
PACE Select Advisors Trust
Notes to financial statements
Portfolio | | Investment subadvisor | |
PACE Small/Medium Co Value Equity Investments | | Huber Capital Management LLC
Kayne Anderson Rudnick, LLC
Sapience Investments, LLC | |
PACE Small/Medium Co Growth Equity Investments | | Calamos Advisors LLC
Jacobs Levy Equity Management, Inc
Riverbridge Partners, LLC | |
PACE International Equity Investments | | Los Angeles Capital Management and Equity Research, Inc.
Mondrian Investment Partners Ltd.
Robert W. Baird & Co. Incorporated | |
PACE International Emerging Markets Equity Investments | | LMCG Investments, LLC
Mondrian Investment Partners Ltd.
RWC Asset Advisors (US) LLC
William Blair & Company LLC | |
PACE Global Real Estate Securities Investments | | Brookfield Public Securities Group LLC | |
PACE Alternative Strategies Investments1 | | Aviva Investors Americas, LLC
DLD Asset Management LP
First Quadrant L.P.
Kettle Hill Capital Management, LLC
Magnetar Asset Management LLC
PCJ Investment Counsel Ltd.
Sirios Capital Management, L.P.
Wells Capital Management Incorporated | |
1 UBS Asset Management (Americas) Inc. has the authority to allocate a portion of the Portfolio's assets to unaffiliated actively- and passively-managed pooled investment vehicles and index futures.
At July 31, 2020, certain Portfolios owe or are owed by UBS AM for investment management and administration fees, net of fee waivers/expense reimbursements and/or recoupments as follows:
Portfolio | | Amounts due
to (owed by)
UBS AM | |
UBS Government Money Market Investments Fund | | $ | 10,377 | | |
PACE Mortgage-Backed Securities Fixed Income Investments | | | 106,245 | | |
PACE Intermediate Fixed Income Investments | | | 22,718 | | |
PACE Strategic Fixed Income Investments | | | 304,322 | | |
PACE Municipal Fixed Income Investments | | | 115,697 | | |
PACE Global Fixed Income Investments | | | 205,134 | | |
PACE High Yield Investments | | | 146,605 | | |
PACE Large Co Value Equity Investments | | | 473,051 | | |
PACE Large Co Growth Equity Investments | | | 578,696 | | |
PACE Small/Medium Co Value Equity Investments | | | 233,567 | | |
PACE Small/Medium Co Growth Equity Investments | | | 330,450 | | |
PACE International Equity Investments | | | 647,348 | | |
PACE International Emerging Markets Equity Investments | | | 334,676 | | |
PACE Global Real Estate Securities Investments | | | 49,862 | | |
PACE Alternative Strategies Investments | | | (14,851 | ) | |
PACE Alternative Strategies Investments and UBS AM have entered into a written fee waiver agreement pursuant to which UBS AM is voluntarily obligated to waive its management fees to the extent necessary to offset the cost sav-
348
PACE Select Advisors Trust
Notes to financial statements
ings to UBS AM for allocating a portion of the Portfolio's assets to other unaffiliated pooled investment vehicles and index futures. The fee waiver agreement may be terminated by the Portfolio's Board at any time and also will be terminated automatically upon the expiration or termination of the Portfolio's advisory contract with UBS AM. For the period ended July 31, 2020, UBS AM was contractually obligated to waive $287,148 in investment management and administration fees. This management fee waiver will not be subject to future recoupment.
UBS AM is contractually obligated to waive all or a portion of its investment management and administration fees and/or to reimburse the Portfolios for certain operating expenses in order to maintain the total annual ordinary operating expenses of each class (with certain exclusions such as dividend expense, borrowing costs and interest expense, relating to short sales, and expenses attributable to investment in other companies, interest, taxes, brokerage commissions and extraordinary expenses) through November 30, 2020 at a level not to exceed the amounts in the table below.
UBS AM may voluntarily undertake to waive fees and/or reimburse expenses in the event that the yields on UBS Government Money Market Investments Fund drop below a certain level. This undertaking is voluntary and not contractual and may be terminated at any time. At July 31, 2020, and for the period ended July 31, 2020, UBS AM voluntarily waived in the amount of $284,845, and which is not subject to future recoupment, and the amount owed by UBS AM is $95,858.
Each Portfolio will repay UBS AM for any such waived fees/reimbursed expenses during a three-year period following July 31, 2017, to the extent that ordinary operating expenses (with certain exclusions such as dividend expense, borrowing costs and interest expense) are otherwise below the applicable expense cap in effect at the time the fees or expenses were waived/reimbursed. For the period ended July 31, 2020, UBS AM had the following voluntary fee waivers/expense reimbursements, and recoupments. The fee waivers/expense reimbursements, portions of which are subject to repayment by the Portfolios through July 31, 2023, and recoupments for the period ended July 31, 2020, were as follows:
Portfolio | | Class A
expense
cap | | Class Y
expense
cap | | Class P
expense
cap | | Fee waivers/
expense
reimbursements | | Recoupments | |
UBS Government Money Market Investments Fund | | | N/A | | | | N/A | | | | 0.60 | % | | $ | 330,288 | | | $ | — | | |
PACE Mortgage-Backed Securities Fixed Income Investments | | | 0.97 | % | | | 0.72 | % | | | 0.72 | | | | 778,759 | | | | — | | |
PACE Intermediate Fixed Income Investments | | | 0.91 | | | | 0.66 | | | | 0.66 | | | | 611,224 | | | | — | | |
PACE Strategic Fixed Income Investments | | | 0.93 | | | | 0.68 | | | | 0.68 | | | | 735,584 | | | | — | | |
PACE Municipal Fixed Income Investments | | | 0.82 | | | | 0.57 | | | | 0.57 | | | | 324,910 | | | | — | | |
PACE Global Fixed Income Investments | | | 1.03 | | | | 0.87 | | | | 0.84 | | | | 825,533 | | | | — | | |
PACE High Yield Investments | | | 1.06 | | | | 0.88 | | | | 0.91 | | | | 547,943 | | | | — | | |
PACE Large Co Value Equity Investments | | | 1.14 | | | | 0.89 | | | | 0.89 | | | | 88,857 | | | | — | | |
PACE Large Co Growth Equity Investments | | | 1.13 | | | | 0.88 | | | | 0.88 | | | | 399,855 | | | | — | | |
PACE Small/Medium Co Value Equity Investments | | | 1.29 | | | | 1.04 | | | | 1.04 | | | | 199,089 | | | | — | | |
PACE Small/Medium Co Growth Equity Investments | | | 1.33 | | | | 1.08 | | | | 1.08 | | | | 47,892 | | | | — | | |
PACE International Equity Investments | | | 1.35 | | | | 1.10 | | | | 1.10 | | | | — | | | | — | | |
PACE International Emerging Markets Equity Investments | | | 1.65 | | | | 1.40 | | | | 1.40 | | | | 386,163 | | | | — | | |
PACE Global Real Estate Securities Investments | | | 1.45 | | | | N/A | | | | 1.20 | | | | 420,141 | | | | — | | |
PACE Alternative Strategies Investments | | | 1.88 | | | | 1.63 | | | | 1.63 | | | | 914,534 | | | | — | | |
349
PACE Select Advisors Trust
Notes to financial statements
At July 31, 2020, the following Portfolios had remaining fee waivers/expense reimbursements subject to repayment to UBS AM and respective dates of expiration as follows:
Portfolio | | Fee waivers/
expenses
reimbursements
subject to
repayment | | Expires
July 31,
2021 | | Expires
July 31,
2022 | | Expires
July 31,
2023 | |
UBS Government Money Market Investments Fund | | $ | 1,143,774 | | | $ | 409,180 | | | $ | 404,306 | | | $ | 330,288 | | |
PACE Mortgage-Backed Fixed Income Investments—Class A | | | 129,002 | | | | 33,822 | | | | 44,908 | | | | 50,272 | | |
PACE Mortgage-Backed Fixed Income Investments—Class Y | | | 227,729 | | | | 103,082 | | | | 72,601 | | | | 52,046 | | |
PACE Mortgage-Backed Fixed Income Investments—Class P | | | 2,064,154 | | | | 674,781 | | | | 712,932 | | | | 676,441 | | |
PACE Intermediate Fixed Income Investments—Class A | | | 47,671 | | | | 10,428 | | | | 19,588 | | | | 17,655 | | |
PACE Intermediate Fixed Income Investments—Class Y | | | 2,467 | | | | 836 | | | | 970 | | | | 661 | | |
PACE Intermediate Fixed Income Investments—Class P | | | 1,720,645 | | | | 453,439 | | | | 674,298 | | | | 592,908 | | |
PACE Strategic Fixed Income Investments—Class A | | | 28,987 | | | | 5,764 | | | | 10,171 | | | | 13,052 | | |
PACE Strategic Fixed Income Investments—Class Y | | | 8,487 | | | | 2,478 | | | | 2,492 | | | | 3,517 | | |
PACE Strategic Fixed Income Investments—Class P | | | 2,049,442 | | | | 636,066 | | | | 694,361 | | | | 719,015 | | |
PACE Municipal Fixed Income Investments—Class A | | | 124,253 | | | | 39,809 | | | | 42,654 | | | | 41,790 | | |
PACE Municipal Fixed Income Investments—Class Y | | | 320 | | | | 109 | | | | 106 | | | | 105 | | |
PACE Municipal Fixed Income Investments—Class P | | | 885,572 | | | | 304,642 | | | | 297,915 | | | | 283,015 | | |
PACE Global Fixed Income Investments—Class A | | | 183,218 | | | | 43,394 | | | | 71,630 | | | | 68,194 | | |
PACE Global Fixed Income Investments—Class Y | | | 12,802 | | | | 3,952 | | | | 5,211 | | | | 3,639 | | |
PACE Global Fixed Income Investments—Class P | | | 2,112,681 | | | | 509,644 | | | | 849,337 | | | | 753,700 | | |
PACE High Yield Investments—Class A | | | 22,316 | | | | 3,597 | | | | 8,934 | | | | 9,785 | | |
PACE High Yield Investments—Class Y | | | 2,126 | | | | 1,613 | | | | 241 | | | | 272 | | |
PACE High Yield Investments—Class P | | | 1,462,644 | | | | 353,363 | | | | 571,395 | | | | 537,886 | | |
PACE Large Co Value Equity Investments—Class Y | | | 47,683 | | | | — | | | | — | | | | 47,683 | | |
PACE Large Co Value Equity Investments—Class P | | | 41,174 | | | | — | | | | — | | | | 41,174 | | |
PACE Large Co Growth Equity Investments—Class A | | | 20,642 | | | | — | | | | 5,232 | | | | 15,410 | | |
PACE Large Co Growth Equity Investments—Class Y | | | 278 | | | | — | | | | 278 | | | | — | | |
PACE Large Co Growth Equity Investments—Class P | | | 559,669 | | | | — | | | | 175,224 | | | | 384,445 | | |
PACE Small/Medium Co Value Equity Investments—Class Y | | | 4 | | | | — | | | | — | | | | 4 | | |
PACE Small/Medium Co Value Equity Investments—Class P | | | 401,922 | | | | 63,558 | | | | 139,279 | | | | 199,085 | | |
PACE Small/Medium Co Growth Equity Investments—Class Y | | | 122 | | | | 68 | | | | — | | | | 54 | | |
PACE Small/Medium Co Growth Equity Investments—Class P | | | 47,832 | | | | — | | | | — | | | | 47,832 | | |
PACE International Emerging Markets Equity Investments—Class A | | | 3,949 | | | | 788 | | | | 245 | | | | 2,916 | | |
PACE International Emerging Markets Equity Investments—Class Y | | | 1,541 | | | | 209 | | | | 1,082 | | | | 250 | | |
PACE International Emerging Markets Equity Investments—Class P | | | 769,392 | | | | 215,761 | | | | 170,634 | | | | 382,997 | | |
PACE Global Real Estate Securities Investments—Class A | | | 1,153 | | | | 198 | | | | 462 | | | | 493 | | |
PACE Global Real Estate Securities Investments—Class P | | | 1,344,250 | | | | 449,612 | | | | 474,990 | | | | 419,648 | | |
PACE Alternative Strategies Investments—Class A | | | 8,710 | | | | — | | | | — | | | | 8,710 | | |
PACE Alternative Strategies Investments—Class Y | | | 463 | | | | — | | | | — | | | | 463 | | |
PACE Alternative Strategies Investments—Class P | | | 618,213 | | | | — | | | | — | | | | 618,213 | | |
For the period ended July 31, 2020, the Portfolios listed below paid broker commissions to affiliates of the investment manager as detailed in the below table. These broker commissions are reflected in the Statement of assets and liabilities within cost of investments, and the Statement of operations within net realized gains (losses) from, and/or net change in unrealized appreciation/depreciation of investments and/or futures.
350
PACE Select Advisors Trust
Notes to financial statements
Affiliated broker | | PACE
Intermediate
Fixed Income
Investments | | PACE
Small/Medium
Co Value Equity
Investments | | PACE
Small/Medium
Co Growth Equity
Investments | | PACE
International
Emerging Markets
Equity
Investments | | PACE
Global
Real Estate
Securities
Investments | |
UBS AG | | $ | — | | | $ | — | | | $ | — | | | $ | 1,484 | | | $ | 1,753 | | |
UBS Securities Asia Ltd. | | | — | | | | — | | | | — | | | | 328 | | | | 2,442 | | |
UBS Securities Canada Inc. | | | — | | | | 96 | | | | — | | | | — | | | | — | | |
UBS Securities LLC | | | 21 | | | | 22,697 | | | | 1,090 | | | | — | | | | — | | |
UBS Securities Pte Ltd., Seoul | | | — | | | | — | | | | — | | | | 1,874 | | | | — | | |
During the period ended, July 31, 2020, some of the Funds engaged in purchase and sale transactions where an affiliate was underwriter. In such cases, the affiliate underwriter was not compensated and each trade was approved by the board.
Service and distribution plans
UBS AM (US) is the principal underwriter of each Portfolio's shares. The Portfolios (with the exception of UBS Government Money Market Investments Fund, which only offers Class P shares) have adopted service and/or distribution plans (the "Plans") pursuant to Rule 12b-1 under the 1940 Act for Class A shares. The Plans govern payments made for the expenses incurred in the service and/or distribution of Class A shares. Annual fees under the Plans as a percentage of the average daily net assets of each representative class of each of the Portfolios are as follows:
Portfolio | | Class A | |
PACE Mortgage-Backed Securities Fixed Income Investments | | | 0.25 | % | |
PACE Intermediate Fixed Income Investments | | | 0.25 | | |
PACE Strategic Fixed Income Investments | | | 0.25 | | |
PACE Municipal Fixed Income Investments | | | 0.25 | | |
PACE Global Fixed Income Investments | | | 0.25 | | |
PACE High Yield Investments | | | 0.25 | | |
PACE Large Co Value Equity Investments | | | 0.25 | | |
PACE Large Co Growth Equity Investments | | | 0.25 | | |
PACE Small/Medium Co Value Equity Investments | | | 0.25 | | |
PACE Small/Medium Co Growth Equity Investments | | | 0.25 | | |
PACE International Equity Investments | | | 0.25 | | |
PACE International Emerging Markets Equity Investments | | | 0.25 | | |
PACE Global Real Estate Securities Investments | | | 0.25 | | |
PACE Alternative Strategies Investments | | | 0.25 | | |
UBS AM (US) also receives the proceeds of the initial sales charges paid upon purchase of Class A shares and the contingent deferred sales charges paid by shareholders upon certain redemptions of Class A.
At July 31, 2020, certain Portfolios owed UBS AM (US) service and distribution fees, and for the period ended July 31, 2020, certain Portfolios were informed by UBS AM (US) that it had earned sales charges as follows:
Portfolio | | Service and
distribution
fees owed | | Sales charges
earned by
distributor | |
PACE Mortgage-Backed Securities Fixed Income Investments—Class A | | $ | 6,638 | | | $ | 143 | | |
PACE Intermediate Fixed Income Investments—Class A | | | 2,830 | | | | — | | |
PACE Strategic Fixed Income Investments—Class A | | | 3,958 | | | | 10,511 | | |
PACE Municipal Fixed Income Investments—Class A | | | 8,489 | | | | 3,004 | | |
PACE Global Fixed Income Investments—Class A | | | 5,950 | | | | 553 | | |
351
PACE Select Advisors Trust
Notes to financial statements
Portfolio | | Service and
distribution
fees owed | | Sales charges
earned by
distributor | |
PACE High Yield Investments—Class A | | $ | 1,427 | | | $ | 5,482 | | |
PACE Large Co Value Equity Investments—Class A | | | 16,924 | | | | 1,002 | | |
PACE Large Co Growth Equity Investments—Class A | | | 11,071 | | | | 1,322 | | |
PACE Small/Medium Co Value Equity Investments—Class A | | | 2,753 | | | | 339 | | |
PACE Small/Medium Co Growth Equity Investments—Class A | | | 4,889 | | | | 75 | | |
PACE International Equity Investments—Class A | | | 4,995 | | | | 77 | | |
PACE International Emerging Markets Equity Investments—Class A | | | 948 | | | | 209 | | |
PACE Global Real Estate Securities Investments—Class A | | | 64 | | | | 700 | | |
PACE Alternative Strategies Investments—Class A | | | 1,384 | | | | — | | |
Transfer agency and related services fees
UBS Financial Services Inc. provides certain services to the Portfolios pursuant to a delegation of authority from BNY Mellon Investment Servicing (US) Inc. ("BNY Mellon"), the Portfolios ' transfer agent, and is compensated for these services by BNY Mellon, not the Portfolios .
UBS Financial Services Inc. has voluntarily agreed to waive a portion of the fee that it would otherwise have received from BNY Mellon with respect to UBS Government Money Market Investments Fund so that BNY Mellon would correspondingly reduce the fees it would have charged to that Portfolio. Given that UBS AM has voluntarily undertaken to reduce its fees and/or reimburse expenses to keep the Portfolio's yield at or above a certain level, and that such amount exceeds the reduction in BNY Mellon's fees, the net effect of BNY Mellon's pass through of the waiver by UBS Financial Services Inc. is to partially reduce the amount that UBS AM would have otherwise voluntarily waived/reimbursed. For the period ended July 31, 2020, the amount of the reduction in transfer agency and related services fees charged by BNY Mellon to the Portfolios was $62,190 which reflected an equal amount of compensation that was voluntarily waived by UBS Financial Services Inc. Voluntary fee waiver/expense reimbursement arrangements may end at any time.
For the period ended July 31, 2020, UBS Financial Services Inc. received from BNY Mellon, not the Portfolios, total delegated services fees as follows:
| Portfolio | | Delegated
services
fees earned | |
UBS Government Money Market Investments Fund | | $ | 368,215 | | |
PACE Mortgage-Backed Securities Fixed Income Investments | | | 301,499 | | |
PACE Intermediate Fixed Income Investments | | | 282,076 | | |
PACE Strategic Fixed Income Investments | | | 365,614 | | |
PACE Municipal Fixed Income Investments | | | 56,596 | | |
PACE Global Fixed Income Investments | | | 327,698 | | |
PACE High Yield Investments | | | 276,525 | | |
PACE Large Co Value Equity Investments | | | 415,871 | | |
PACE Large Co Growth Equity Investments | | | 402,662 | | |
PACE Small/Medium Co Value Equity Investments | | | 391,392 | | |
PACE Small/Medium Co Growth Equity Investments | | | 392,506 | | |
PACE International Equity Investments | | | 389,884 | | |
PACE International Emerging Markets Equity Investments | | | 358,286 | | |
PACE Global Real Estate Securities Investments | | | 283,236 | | |
PACE Alternative Strategies Investments | | | 192,704 | | |
352
PACE Select Advisors Trust
Notes to financial statements
Securities lending
Each Portfolio may lend securities up to 331/3% of its total assets to qualified broker-dealers or institutional investors. The loans are initially secured at all times by cash, US government securities and irrevocable letters of credit in an amount at least equal to 102% of the market value of the securities loaned with respect to domestic securities and 105% of the market value of the securities loaned with respect to foreign securities. In the event that the market value of the cash, US government securities, and irrevocable letters of credit securing the loan falls below 100% for domestic securities, and 103% for foreign securities, the borrower must provide additional cash, US government securities, and irrevocable letters of credit so that the total securing the loan is at least 102% of the market value for domestic securities and 105% of the market value for foreign securities.
Each Portfolio will regain ownership of loaned securities to exercise certain beneficial rights; however, each Portfolio may bear the risk of delay in recovery of, or even loss of rights in, the securities loaned should the borrower fail financially. Each Portfolio receives compensation for lending its securities from interest or dividends earned on the cash, US government securities and irrevocable letters of credit held as collateral, net of fee rebates paid to the borrower plus reasonable administrative and custody fees. Cash collateral received is invested in State Street Navigator Securities Lending Government Money Market Portfolio, which is included in each Portfolio of investments. State Street Bank and Trust Company serves as the Portfolios' lending agent.
In addition, PACE Large Co Value Equity Investments, PACE International Equity Investments and PACE Alternative Strategies Investments participate in State Street's enhanced custody program. Through this program, State Street is capable of facilitating the Portfolios' short selling activity at a lower cost. A portion of the cash collateral received in connection with the Portfolios' securities lending activity is pledged back to State Street for the financing of short sales. This amount is shown as cash collateral on investments sold short in the Statement of assets and liabilities.
At July 31, 2020, the following Portfolios had securities on loan at value, cash collateral and non-cash collateral as follows:
Portfolio | | Value of
securities
on loan | | Cash
collateral | | Non-cash
collateral* | | Total
collateral | | Security types
held as non-cash collateral | |
PACE Intermediate Fixed Income Investments | | $ | 10,292,018 | | | $ | 9,847,323 | | | $ | 666,601 | | | $ | 10,513,924 | | | U.S. Treasury Notes and U.S. Treasury Bills | |
PACE Strategic Fixed Income Investments | | | 31,264,108 | | | | 29,099,463 | | | | 2,835,610 | | | | 31,935,073 | | | U.S. Treasury Notes and U.S. Treasury Bills | |
PACE Global Fixed Income Investments | | | 5,342,193 | | | | 5,453,783 | | | | — | | | | 5,453,783 | | | | — | | |
PACE High Yield Investments | | | 9,074,664 | | | | 8,857,440 | | | | 411,457 | | | | 9,268,897 | | | U.S. Treasury Notes and U.S. Treasury Bills | |
PACE Large Co Value Equity Investments** | | | 15,862,773 | | | | 8,120,233 | | | | 8,081,962 | | | | 16,202,195 | | | U.S. Treasury Notes and U.S. Treasury Bills | |
PACE Large Co Growth Equity Investments | | | 6,903,524 | | | | 1,775,246 | | | | 5,171,547 | | | | 6,946,793 | | | U.S. Treasury Notes and U.S. Treasury Bills | |
PACE Small/Medium Co Value Equity Investments | | | 35,400,623 | | | | 19,508,290 | | | | 17,843,362 | | | | 37,351,652 | | | U.S. Treasury Notes and U.S. Treasury Bills | |
PACE Small/Medium Co Growth Equity Investments | | | 30,096,336 | | | | 19,334,845 | | | | 11,550,291 | | | | 30,885,136 | | | U.S. Treasury Notes and U.S. Treasury Bills | |
PACE International Equity Investments** | | | 10,229,707 | | | | 4,380,887 | | | | 6,346,166 | | | | 10,727,053 | | | U.S. Treasury Notes and U.S. Treasury Bills | |
PACE International Emerging Markets Investments | | | 3,576,276 | | | | 3,318,228 | | | | 361,720 | | | | 3,679,948 | | | U.S. Treasury Notes and U.S. Treasury Bills | |
PACE Global Real Estate Securities Investments | | | 1,651,860 | | | | 963,819 | | | | 844,553 | | | | 1,808,372 | | | U.S. Treasury Notes and U.S. Treasury Bills | |
* These securities are held for the benefit of the Portfolio's custodian. The Portfolio cannot repledge or resell this collateral. As such, this collateral is excluded from the Statement of assets and liabilities.
** This Portfolio participates in the enhanced custody program which permits self-borrow transactions that does not require any collateral for the securities on loan under those transactions.
The table below represents the disaggregation at July 31, 2020 of the gross amount of recognized liabilities for securities lending transactions. As the securities loaned are subject to termination by the Portfolios or the borrower at any
353
PACE Select Advisors Trust
Notes to financial statements
time, the remaining contractual maturities of the transactions presented below are considered to be overnight and continuous.
| | | Type of securities loaned | | Total gross
amount of
recognized
liabilities for | |
Portfolio | | Equity
securities | | Corporate
bonds | | securities lending
transactions | |
PACE Intermediate Fixed Income Investments | | $ | — | | | $ | 9,847,323 | | | $ | 9,847,323 | | |
PACE Global Fixed Income Investments | | | — | | | | 5,453,783 | | | | 5,453,783 | | |
PACE Strategic Fixed Income Investments | | | — | | | | 29,099,463 | | | | 29,099,463 | | |
PACE High Yield Investments | | | 3,568 | | | | 8,853,872 | | | | 8,857,440 | | |
PACE Large Co Value Equity Investments | | | 8,120,233 | | | | — | | | | 8,120,233 | | |
PACE Large Co Growth Equity Investments | | | 1,775,246 | | | | — | | | | 1,775,246 | | |
PACE Small/Medium Co Value Equity Investments | | | 19,508,290 | | | | — | | | | 19,508,290 | | |
PACE Small/Medium Co Growth Equity Investments | | | 19,334,845 | | | | — | | | | 19,334,845 | | |
PACE International Equity Investments | | | 4,380,887 | | | | — | | | | 4,380,887 | | |
PACE International Emerging Markets Equity Investments | | | 3,318,228 | | | | — | | | | 3,318,228 | | |
PACE Global Real Estate Securities Investments | | | 963,819 | | | | — | | | | 963,819 | | |
Bank line of credit
With the exception of UBS Government Money Market Investments Fund, the Portfolios participate with other Portfolios managed, advised or subadvised by UBS AM in a $185 million committed credit facility (the " Committed Credit Facility") with State Street Bank and Trust Company. The Committed Credit Facility is to be utilized for temporary financing until the settlement of sales or purchases of portfolio securities, the repurchase or redemption of shares of a participating Portfolio at the request of shareholders and other temporary or emergency purposes.
Interest on amounts borrowed is calculated based on the prevailing rates in effect at the time of borrowing. Each Portfolio covered by the Committed Credit Facility has agreed to pay commitment fees on the average daily balance of the Committed Credit Facility not utilized. Commitment fees have been allocated among the Portfolios in the Committed Credit Facility as follows: 50% of the allocation is based on the relative asset size of Portfolios and the other 50% of the allocation is based on utilization. For the period ended July 31, 2020, the following Portfolios had borrowings as follows:
| Portfolio | | Average daily
amount of
borrowing
outstanding | | Days
outstanding | | Interest
expense | | Weighted average
annualized
interest rate | |
PACE Large Co Value Equity Investments | | $ | 1,115,282 | | | | 33 | | | $ | 2,292 | | | | 2.305 | % | |
PACE Large Co Growth Equity Investments | | | 2,510,123 | | | | 38 | | | | 4,068 | | | | 1.535 | | |
PACE Small/Medium Co Value Equity Investments | | | 490,055 | | | | 2 | | | | 75 | | | | 2.760 | | |
PACE Small/Medium Co Growth Equity Investments | | | 1,481,618 | | | | 2 | | | | 171 | | | | 2.078 | | |
PACE International Equity Investments | | | 1,053,830 | | | | 86 | | | | 6,177 | | | | 2.454 | | |
PACE International Emerging Markets Equity Investments | | | 591,884 | | | | 57 | | | | 2,071 | | | | 2.309 | | |
PACE Global Real Estate Securities Investments | | | 1,185,183 | | | | 1 | | | | 64 | | | | 1.947 | | |
PACE Alternative Strategies Investments | | | 2,360,965 | | | | 63 | | | | 8,323 | | | | 2.022 | | |
At July 31, 2020, PACE Large Co Growth Equity Investments had an outstanding borrowing of $1,432,228.
354
PACE Select Advisors Trust
Notes to financial statements
Commission recapture program
Certain Portfolios participate in a brokerage commission recapture program. These Portfolios have established commission recapture arrangements with certain participating brokers or dealers. If a Portfolio's investment subadvisor chooses to execute a transaction through a participating broker subject to best price and execution, the broker will rebate a portion of the commission back to the Portfolio. Any collateral benefit received through participation in the commission recapture program is directed exclusively to the Portfolios. For the period ended July 31, 2020, the following Portfolios recorded recaptured commissions which are reflected in the Statement of operations within the net realized gains (losses) from investments:
Portfolio | | Amount | |
PACE Large Co Value Equity Investments | | $ | 23,710 | | |
PACE Large Co Growth Equity Investments | | | 30,002 | | |
PACE Small/Medium Co Value Equity Investments | | | 70,148 | | |
PACE Small/Medium Co Growth Equity Investments | | | 31,992 | | |
PACE International Equity Investments | | | 11,999 | | |
PACE International Emerging Markets Equity Investments | | | 4,798 | | |
PACE Global Real Estate Securities Investments | | | 5,612 | | |
PACE Alternative Strategies Investments | | | 34,836 | | |
Additional information regarding compensation to affiliate of a board member
Professor Meyer Feldberg serves as a senior advisor to Morgan Stanley, a financial services firm with which the Portfolios may conduct transactions, resulting in him being an interested trustee of the Portfolio. The Portfolios have been informed that Professor Feldberg's role at Morgan Stanley does not involve matters directly affecting any UBS funds. Portfolio transactions are executed through Morgan Stanley based on that firm's ability to provide best execution of the transactions. For the period ended July 31, 2020, the following Portfolios paid brokerage commissions to Morgan Stanley in the amounts as follows:
Portfolio | | Amount | |
PACE Strategic Fixed Income Investments | | $ | 9,383 | | |
PACE Large Co Value Equity Investments | | | 140,375 | | |
PACE Large Co Growth Equity Investments | | | 23,758 | | |
PACE Small/Medium Co Value Equity Investments | | | 27,684 | | |
PACE Small/Medium Co Growth Equity Investments | | | 1,902 | | |
PACE International Equity Investments | | | 21,967 | | |
PACE International Emerging Markets Equity Investments | | | 15,471 | | |
PACE Global Real Estate Securities Investments | | | 14,035 | | |
PACE Alternative Strategies Investments | | | 30,606 | | |
For the period ended July 31, 2020, the following Portfolios purchased and sold certain securities (e.g., fixed income securities) in principal trades with Morgan Stanley having aggregate values as follows:
Portfolio | | Amount | |
UBS Government Money Market Investments Fund | | $ | 3,684,549 | | |
PACE Intermediate Fixed Income Investments | | | 3,055,543,080 | | |
PACE Strategic Fixed Income Investments | | | 2,735,839,434 | | |
PACE Municipal Fixed Income Investments | | | 10,484,451 | | |
PACE Global Fixed Income Investments | | | 68,341,408 | | |
PACE High Yield Investments | | | 28,180,997 | | |
PACE Large Co Value Equity Investments | | | 268,966,828 | | |
PACE Large Co Growth Equity Investments | | | 2,049,489 | | |
PACE Small/Medium Co Growth Equity Investments | | | 10,296,499 | | |
355
PACE Select Advisors Trust
Notes to financial statements
Portfolio | | Amount | |
PACE International Emerging Markets Equity Investments | | $ | 7,628,492 | | |
PACE Global Real Estate Securities Investments | | | 10,907,611 | | |
PACE Alternative Strategies Investments | | | 117,411,633 | | |
Morgan Stanley received compensation in connection with these trades, which may have been in the form of a "mark-up" or "mark-down" of the price of the securities, a fee from the issuer for maintaining a commercial paper program, or some other form of compensation. Although the precise amount of this compensation is not generally known by the investment manager, it is believed that under normal circumstances it represents a small portion of the total value of the transactions.
Change in accounting principle
In March 2017, the Financial Accounting Standards Board Accounting Standards Update 2017-08 ("ASU 2017-08"), "Receivables-Nonrefundable fees and Other Costs (Subtopic 310-20): Premium Amortization on Purchased Callable Debt Securities." ASU 2017-08 changed the amortization period for certain callable debt securities held at a premium. Specifically, it required the premium to be amortized to the earliest call date. The Portfolios have adopted and applied ASU 2017-08 on a modified retrospective basis through a cumulative-effect adjustment as of the beginning of the period of adoption. As a result of the adoption of ASU 2017-08, as of January 1, 2019, the amortized cost basis of investments was reduced and the unrealized appreciation (depreciation) of investments was increased. The adoption of ASU 2017-08 had no impact on beginning net assets, the current period results from operations, or any prior period information presented in the financial statements.
The table below details the adjustments explained above. Portfolios not in the table were not impacted by ASU 2017-08.
| | | Amount of
cumulative-effect
adjustment | |
PACE Intermediate Fixed Income Investments | | $ | 27,729 | | |
PACE Strategic Fixed Income Investments | | | 207,512 | | |
PACE Municipal Fixed Income Investments | | | 3,797,195 | | |
PACE Global Fixed Income Investments | | | 144,693 | | |
PACE High Yield Investments | | | 213,832 | | |
Purchases and sales of securities
For the period ended July 31, 2020, aggregate purchases and sales of portfolio securities, excluding short-term securities, were as follows:
Portfolio | | Purchases | | Sales | |
PACE Mortgage-Backed Securities Fixed Income Investments | | $ | 5,034,529,784 | | | $ | 5,037,419,830 | | |
PACE Intermediate Fixed Income Investments | | | 1,515,557,866 | | | | 1,523,163,824 | | |
PACE Strategic Fixed Income Investments | | | 2,360,404,707 | | | | 2,604,975,245 | | |
PACE Municipal Fixed Income Investments | | | 33,097,718 | | | | 59,916,036 | | |
PACE Global Fixed Income Investments | | | 425,949,026 | | | | 470,092,443 | | |
PACE High Yield Investments | | | 223,683,588 | | | | 248,270,921 | | |
PACE Large Co Value Equity Investments (long transactions) | | | 551,772,524 | | | | 704,092,330 | | |
PACE Large Co Value Equity Investments (short transactions) | | | 146,120,140 | | | | 123,432,578 | | |
PACE Large Co Growth Equity Investments | | | 461,268,354 | | | | 783,419,071 | | |
PACE Small/Medium Co Value Equity Investments | | | 218,434,627 | | | | 257,443,033 | | |
PACE Small/Medium Co Growth Equity Investments | | | 359,105,667 | | | | 443,388,392 | | |
PACE International Equity Investments (long transactions) | | | 330,342,582 | | | | 476,678,459 | | |
356
PACE Select Advisors Trust
Notes to financial statements
Portfolio | | Purchases | | Sales | |
PACE International Equity Investments (short transactions) | | $ | 110,244,012 | | | $ | 95,846,309 | | |
PACE International Emerging Markets Equity Investments | | | 288,427,571 | | | | 276,977,845 | | |
PACE Global Real Estate Securities Investments | | | 119,599,572 | | | | 131,175,288 | | |
PACE Alternative Strategies Investments (long transactions) | | | 1,575,448,820 | | | | 1,625,503,733 | | |
PACE Alternative Strategies Investments (short transactions) | | | 969,316,504 | | | | 988,451,030 | | |
Shares of beneficial interest
There are an unlimited number of $0.001 par value shares of beneficial interest authorized. Transactions in shares of beneficial interest for each of the Portfolios, except UBS Government Money Market Investments Fund, which transacts at $1.00 per share, were as follows:
PACE Mortgage-Backed Securities Fixed Income Investments
For the year ended July 31, 2020:
| | | Class A | |
| | | Shares | | Amount | |
Shares sold | | | 11,404 | | | $ | 147,164 | | |
Shares repurchased | | | (362,002 | ) | | | (4,625,222 | ) | |
Dividends reinvested | | | 58,411 | | | | 744,097 | | |
Net increase (decrease) | | | (292,187 | ) | | $ | (3,733,961 | ) | |
| | | Class Y | | Class P | |
| | | Shares | | Amount | | Shares | | Amount | |
Shares sold | | | 539,281 | | | $ | 6,916,618 | | | | 2,879,169 | | | $ | 36,847,679 | | |
Shares repurchased | | | (1,425,003 | ) | | | (18,189,732 | ) | | | (5,790,659 | ) | | | (74,161,390 | ) | |
Dividends reinvested | | | 52,454 | | | | 667,872 | | | | 708,463 | | | | 9,029,465 | | |
Net increase (decrease) | | | (833,268 | ) | | $ | (10,605,242 | ) | | | (2,203,027 | ) | | $ | (28,284,246 | ) | |
For the year ended July 31, 2019:
| | | Class A | | Class C | |
| | | Shares | | Amount | | Shares | | Amount | |
Shares sold | | | 3,944 | | | $ | 51,068 | | | | 15 | | | $ | 1,297 | | |
Shares repurchased | | | (572,537 | ) | | | (7,092,056 | ) | | | (51,808 | ) | | | (602,961 | ) | |
Shares converted | | | 738,043 | | | | 8,996,742 | | | | (734,315 | ) | | | (8,996,742 | ) | |
Dividends reinvested | | | 69,153 | | | | 858,627 | | | | 3,229 | | | | 39,822 | | |
Net increase (decrease) | | | 238,603 | | | $ | 2,814,381 | | | | (782,879 | ) | | $ | (9,558,584 | ) | |
| | | Class Y | | Class P | |
| | | Shares | | Amount | | Shares | | Amount | |
Shares sold | | | 943,934 | | | $ | 11,704,732 | | | | 4,372,262 | | | $ | 54,314,667 | | |
Shares repurchased | | | (1,486,964 | ) | | | (18,383,415 | ) | | | (7,462,173 | ) | | | (92,577,433 | ) | |
Dividends reinvested | | | 76,474 | | | | 949,041 | | | | 814,585 | | | | 10,118,027 | | |
Net increase (decrease) | | | (466,556 | ) | | $ | (5,729,642 | ) | | | (2,275,326 | ) | | $ | (28,144,739 | ) | |
357
PACE Select Advisors Trust
Notes to financial statements
PACE Intermediate Fixed Income Investments
For the year ended July 31, 2020:
| | | Class A | |
| | | Shares | | Amount | |
Shares sold | | | 7,291 | | | $ | 95,182 | | |
Shares repurchased | | | (110,533 | ) | | | (1,401,491 | ) | |
Dividends reinvested | | | 14,590 | | | | 185,173 | | |
Net increase (decrease) | | | (88,652 | ) | | $ | (1,121,136 | ) | |
| | | Class Y | | Class P | |
| | | Shares | | Amount | | Shares | | Amount | |
Shares sold | | | — | | | $ | — | | | | 2,936,920 | | | $ | 37,468,674 | | |
Shares repurchased | | | (6,467 | ) | | | (84,368 | ) | | | (6,099,325 | ) | | | (77,913,436 | ) | |
Dividends reinvested | | | 566 | | | | 7,184 | | | | 540,498 | | | | 6,861,807 | | |
Net increase (decrease) | | | (5,901 | ) | | $ | (77,184 | ) | | | (2,621,907 | ) | | $ | (33,582,955 | ) | |
For the year ended July 31, 2019:
| | | Class A | | Class C | |
| | | Shares | | Amount | | Shares | | Amount | |
Shares sold | | | 19,974 | | | $ | 241,926 | | | | — | | | $ | — | | |
Shares repurchased | | | (222,569 | ) | | | (2,658,046 | ) | | | (1,870 | ) | | | (22,144 | ) | |
Shares converted | | | 80,945 | | | | 951,101 | | | | (80,807 | ) | | | (951,101 | ) | |
Dividends reinvested | | | 20,916 | | | | 250,847 | | | | 248 | | | | 2,955 | | |
Net increase (decrease) | | | (100,734 | ) | | $ | (1,214,172 | ) | | | (82,429 | ) | | $ | (970,290 | ) | |
| | | Class Y | | Class P | |
| | | Shares | | Amount | | Shares | | Amount | |
Shares sold | | | 8,682 | | | $ | 104,000 | | | | 4,526,506 | | | $ | 54,253,250 | | |
Shares repurchased | | | (7,885 | ) | | | (94,068 | ) | | | (8,063,799 | ) | | | (96,575,542 | ) | |
Dividends reinvested | | | 717 | | | | 8,615 | | | | 741,755 | | | | 8,902,025 | | |
Net increase (decrease) | | | 1,514 | | | $ | 18,547 | | | | (2,795,538 | ) | | $ | (33,420,267 | ) | |
PACE Strategic Fixed Income Investments
For the year ended July 31, 2020:
| | | Class A | |
| | | Shares | | Amount | |
Shares sold | | | 95,826 | | | $ | 1,349,406 | | |
Shares repurchased | | | (151,488 | ) | | | (2,145,922 | ) | |
Dividends reinvested | | | 28,666 | | | | 405,615 | | |
Net increase (decrease) | | | (26,996 | ) | | $ | (390,901 | ) | |
| | | Class Y | | Class P | |
| | | Shares | | Amount | | Shares | | Amount | |
Shares sold | | | 616 | | | $ | 8,774 | | | | 3,831,133 | | | $ | 54,507,635 | | |
Shares repurchased | | | (27,277 | ) | | | (391,865 | ) | | | (10,959,181 | ) | | | (155,886,633 | ) | |
Dividends reinvested | | | 2,962 | | | | 41,807 | | | | 1,502,913 | | | | 21,244,422 | | |
Net increase (decrease) | | | (23,699 | ) | | $ | (341,284 | ) | | | (5,625,135 | ) | | $ | (80,134,576 | ) | |
358
PACE Select Advisors Trust
Notes to financial statements
For the year ended July 31, 2019:
| | | Class A | | Class C | |
| | | Shares | | Amount | | Shares | | Amount | |
Shares sold | | | 103,374 | | | $ | 1,393,368 | | | | 206 | | | $ | 4,122 | | |
Shares repurchased | | | (326,848 | ) | | | (4,387,096 | ) | | | (29,634 | ) | | | (394,503 | ) | |
Shares converted | | | 467,476 | | | | 6,184,714 | | | | (467,476 | ) | | | (6,184,714 | ) | |
Dividends reinvested | | | 30,665 | | | | 411,642 | | | | 1,759 | | | | 23,406 | | |
Net increase (decrease) | | | 274,667 | | | $ | 3,602,628 | | | | (495,145 | ) | | $ | (6,551,689 | ) | |
| | | Class Y | | Class P | |
| | | Shares | | Amount | | Shares | | Amount | |
Shares sold | | | 764 | | | $ | 10,233 | | | | 7,121,532 | | | $ | 95,503,205 | | |
Shares repurchased | | | (8,939 | ) | | | (119,853 | ) | | | (13,620,231 | ) | | | (182,061,405 | ) | |
Dividends reinvested | | | 3,426 | | | | 45,893 | | | | 1,699,846 | | | | 22,790,543 | | |
Net increase (decrease) | | | (4,749 | ) | | $ | (63,727 | ) | | | (4,798,853 | ) | | $ | (63,767,657 | ) | |
PACE Municipal Fixed Income Investments
For the year ended July 31, 2020:
| | | Class A | |
| | | Shares | | Amount | |
Shares sold | | | 21,383 | | | $ | 284,883 | | |
Shares repurchased | | | (493,753 | ) | | | (6,472,045 | ) | |
Dividends reinvested | | | 51,173 | | | | 673,560 | | |
Net increase (decrease) | | | (421,197 | ) | | $ | (5,513,602 | ) | |
| | | Class Y | | Class P | |
| | | Shares | | Amount | | Shares | | Amount | |
Shares sold | | | — | | | $ | — | | | | 2,571,629 | | | $ | 34,022,507 | | |
Shares repurchased | | | (4,866 | ) | | | (65,037 | ) | | | (4,825,704 | ) | | | (63,346,897 | ) | |
Dividends reinvested | | | 28 | | | | 371 | | | | 495,230 | | | | 6,517,130 | | |
Net increase (decrease) | | | (4,838 | ) | | $ | (64,666 | ) | | | (1,758,845 | ) | | $ | (22,807,260 | ) | |
For the year ended July 31, 2019:
| | | Class A | | Class C | |
| | | Shares | | Amount | | Shares | | Amount | |
Shares sold | | | 76,464 | | | $ | 975,442 | | | | — | | | $ | — | | |
Shares repurchased | | | (324,877 | ) | | | (4,184,860 | ) | | | (26,195 | ) | | | (332,457 | ) | |
Shares converted | | | 571,955 | | | | 7,160,878 | | | | (571,955 | ) | | | (7,160,878 | ) | |
Dividends reinvested | | | 68,695 | | | | 879,247 | | | | 1,494 | | | | 18,907 | | |
Net increase (decrease) | | | 392,237 | | | $ | 4,830,707 | | | | (596,656 | ) | | $ | (7,474,428 | ) | |
| | | Class Y | | Class P | |
| | | Shares | | Amount | | Shares | | Amount | |
Shares sold | | | — | | | $ | — | | | | 4,163,878 | | | $ | 53,245,690 | | |
Shares repurchased | | | — | | | | — | | | | (6,529,515 | ) | | | (83,530,590 | ) | |
Dividends reinvested | | | 34 | | | | 439 | | | | 621,597 | | | | 7,959,328 | | |
Net increase (decrease) | | | 34 | | | $ | 439 | | | | (1,744,040 | ) | | $ | (22,325,572 | ) | |
359
PACE Select Advisors Trust
Notes to financial statements
PACE Global Fixed Income Investments
For the year ended July 31, 2020:
| | | Class A | |
| | | Shares | | Amount | |
Shares sold | | | 9,131 | | | $ | 92,524 | | |
Shares repurchased | | | (362,801 | ) | | | (3,662,642 | ) | |
Dividends reinvested | | | 36,169 | | | | 363,355 | | |
Net increase (decrease) | | | (317,501 | ) | | $ | (3,206,763 | ) | |
| | | Class Y | | Class P | |
| | | Shares | | Amount | | Shares | | Amount | |
Shares sold | | | 672 | | | $ | 6,739 | | | | 1,766,129 | | | $ | 17,842,141 | | |
Shares repurchased | | | (38,508 | ) | | | (387,033 | ) | | | (6,633,320 | ) | | | (66,758,578 | ) | |
Dividends reinvested | | | 3,564 | | | | 35,609 | | | | 517,816 | | | | 5,193,980 | | |
Net increase (decrease) | | | (34,272 | ) | | $ | (344,685 | ) | | | (4,349,375 | ) | | $ | (43,722,457 | ) | |
For the year ended July 31, 2019:
| | | Class A | | Class C | |
| | | Shares | | Amount | | Shares | | Amount | |
Shares sold | | | 4,548 | | | $ | 44,784 | | | | — | | | $ | — | | |
Shares repurchased | | | (474,557 | ) | | | (4,596,044 | ) | | | (5,315 | ) | | | (51,730 | ) | |
Shares converted | | | 234,309 | | | | 2,244,679 | | | | (234,309 | ) | | | (2,244,679 | ) | |
Dividends reinvested | | | 40,288 | | | | 390,860 | | | | 472 | | | | 4,578 | | |
Net increase (decrease) | | | (195,412 | ) | | $ | (1,915,721 | ) | | | (239,152 | ) | | $ | (2,291,831 | ) | |
| | | Class Y | | Class P | |
| | | Shares | | Amount | | Shares | | Amount | |
Shares sold | | | 1,082 | | | $ | 10,460 | | | | 3,449,427 | | | $ | 33,412,383 | | |
Shares repurchased | | | (26,046 | ) | | | (253,340 | ) | | | (9,208,762 | ) | | | (89,145,505 | ) | |
Dividends reinvested | | | 4,159 | | | | 40,162 | | | | 590,533 | | | | 5,723,899 | | |
Net increase (decrease) | | | (20,805 | ) | | $ | (202,718 | ) | | | (5,168,802 | ) | | $ | (50,009,223 | ) | |
PACE High Yield Investments
For the year ended July 31, 2020:
| | | Class A | |
| | | Shares | | Amount | |
Shares sold | | | 309,377 | | | $ | 2,821,945 | | |
Shares repurchased | | | (119,102 | ) | | | (1,097,393 | ) | |
Dividends reinvested | | | 20,879 | | | | 193,337 | | |
Net increase (decrease) | | | 211,154 | | | $ | 1,917,889 | | |
| | | Class Y | | Class P | |
| | | Shares | | Amount | | Shares | | Amount | |
Shares sold | | | — | | | $ | — | | | | 1,875,026 | | | $ | 17,530,833 | | |
Shares repurchased | | | — | | | | — | | | | (6,729,553 | ) | | | (61,962,922 | ) | |
Dividends reinvested | | | 3,541 | | | | 32,890 | | | | 1,658,106 | | | | 15,367,633 | | |
Net increase (decrease) | | | 3,541 | | | $ | 32,890 | | | | (3,196,421 | ) | | $ | (29,064,456 | ) | |
360
PACE Select Advisors Trust
Notes to financial statements
For the year ended July 31, 2019:
| | | Class A | | Class C | |
| | | Shares | | Amount | | Shares | | Amount | |
Shares sold | | | 84,657 | | | $ | 812,348 | | | | 106 | | | $ | 2,177 | | |
Shares repurchased | | | (119,346 | ) | | | (1,139,306 | ) | | | (3,075 | ) | | | (30,011 | ) | |
Shares converted | | | 231,878 | | | | 2,260,808 | | | | (232,116 | ) | | | (2,260,808 | ) | |
Dividends reinvested | | | 18,834 | | | | 180,296 | | | | 1,021 | | | | 9,961 | | |
Net increase (decrease) | | | 216,023 | | | $ | 2,114,146 | | | | (234,064 | ) | | $ | (2,278,681 | ) | |
| | | Class Y | | Class P | |
| | | Shares | | Amount | | Shares | | Amount | |
Shares sold | | | 1,797 | | | $ | 17,322 | | | | 2,801,144 | | | $ | 27,030,357 | | |
Shares repurchased | | | (1,806 | ) | | | (17,589 | ) | | | (8,833,556 | ) | | | (84,780,414 | ) | |
Dividends reinvested | | | 3,185 | | | | 30,663 | | | | 1,731,661 | | | | 16,618,665 | | |
Net increase (decrease) | | | 3,176 | | | $ | 30,396 | | | | (4,300,751 | ) | | $ | (41,131,392 | ) | |
PACE Large Co Value Equity Investments
For the year ended July 31, 2020:
| | | Class A | |
| | | Shares | | Amount | |
Shares sold | | | 16,893 | | | $ | 313,533 | | |
Shares repurchased | | | (709,870 | ) | | | (13,692,362 | ) | |
Dividends reinvested | | | 240,530 | | | | 5,236,332 | | |
Net increase (decrease) | | | (452,447 | ) | | $ | (8,142,497 | ) | |
| | | Class Y | | Class P | |
| | | Shares | | Amount | | Shares | | Amount | |
Shares sold | | | 25,222 | | | $ | 501,660 | | | | 4,545,547 | | | $ | 82,262,556 | | |
Shares repurchased | | | (101,357 | ) | | | (2,065,766 | ) | | | (11,229,003 | ) | | | (209,618,312 | ) | |
Dividends reinvested | | | 44,229 | | | | 964,187 | | | | 2,490,829 | | | | 53,976,259 | | |
Net increase (decrease) | | | (31,906 | ) | | $ | (599,919 | ) | | | (4,192,627 | ) | | $ | (73,379,497 | ) | |
For the year ended July 31, 2019:
| | | Class A | | Class C | |
| | | Shares | | Amount | | Shares | | Amount | |
Shares sold | | | 42,928 | | | $ | 856,514 | | | | — | | | $ | — | | |
Shares repurchased | | | (700,405 | ) | | | (15,004,288 | ) | | | (10,339 | ) | | | (249,572 | ) | |
Shares converted | | | 453,282 | | | | 10,475,342 | | | | (452,890 | ) | | | (10,475,342 | ) | |
Dividends reinvested | | | 497,284 | | | | 9,513,035 | | | | — | | | | — | | |
Net increase (decrease) | | | 293,089 | | | $ | 5,840,603 | | | | (463,229 | ) | | $ | (10,724,914 | ) | |
| | | Class Y | | Class P | |
| | | Shares | | Amount | | Shares | | Amount | |
Shares sold | | | 10,208 | | | $ | 215,995 | | | | 4,207,759 | | | $ | 89,207,918 | | |
Shares repurchased | | | (51,946 | ) | | | (1,175,169 | ) | | | (12,467,562 | ) | | | (263,702,204 | ) | |
Dividends reinvested | | | 80,631 | | | | 1,544,086 | | | | 5,165,407 | | | | 98,400,996 | | |
Net increase (decrease) | | | 38,893 | | | $ | 584,912 | | | | (3,094,396 | ) | | $ | (76,093,290 | ) | |
361
PACE Select Advisors Trust
Notes to financial statements
PACE Large Co Growth Equity Investments
For the year ended July 31, 2020:
| | | Class A | |
| | | Shares | | Amount | |
Shares sold | | | 22,262 | | | $ | 513,654 | | |
Shares repurchased | | | (242,347 | ) | | | (5,499,856 | ) | |
Dividends reinvested | | | 307,069 | | | | 6,598,913 | | |
Net increase (decrease) | | | 86,984 | | | $ | 1,612,711 | | |
| | | Class Y | | Class P | |
| | | Shares | | Amount | | Shares | | Amount | |
Shares sold | | | 11,269 | | | $ | 275,505 | | | | 2,015,476 | | | $ | 47,881,527 | | |
Shares repurchased | | | (64,143 | ) | | | (1,567,840 | ) | | | (14,349,374 | ) | | | (340,149,834 | ) | |
Dividends reinvested | | | 103,502 | | | | 2,366,066 | | | | 6,724,936 | | | | 152,050,806 | | |
Net increase (decrease) | | | 50,628 | | | $ | 1,073,731 | | | | (5,608,962 | ) | | $ | (140,217,501 | ) | |
For the year ended July 31, 2019:
| | | Class A | | Class C | |
| | | Shares | | Amount | | Shares | | Amount | |
Shares sold | | | 30,549 | | | $ | 668,045 | | | | — | | | $ | — | | |
Shares repurchased | | | (272,878 | ) | | | (6,321,470 | ) | | | (7,623 | ) | | | (168,838 | ) | |
Shares converted | | | 95,323 | | | | 2,503,193 | | | | (118,973 | ) | | | (2,503,193 | ) | |
Dividends reinvested | | | 375,371 | | | | 7,376,046 | | | | — | | | | — | | |
Net increase (decrease) | | | 228,365 | | | $ | 4,225,814 | | | | (126,596 | ) | | $ | (2,672,031 | ) | |
| | | Class Y | | Class P | |
| | | Shares | | Amount | | Shares | | Amount | |
Shares sold | | | 8,949 | | | $ | 208,944 | | | | 3,285,826 | | | $ | 78,479,157 | | |
Shares repurchased | | | (44,108 | ) | | | (1,150,460 | ) | | | (14,191,463 | ) | | | (341,166,563 | ) | |
Dividends reinvested | | | 115,927 | | | | 2,400,843 | | | | 9,078,415 | | | | 186,198,295 | | |
Net increase (decrease) | | | 80,768 | | | $ | 1,459,327 | | | | (1,827,222 | ) | | $ | (76,489,111 | ) | |
PACE Small/Medium Co Value Equity Investments
For the year ended July 31, 2020:
| | | Class A | |
| | | Shares | | Amount | |
Shares sold | | | 6,482 | | | $ | 107,910 | | |
Shares repurchased | | | (137,278 | ) | | | (2,311,688 | ) | |
Dividends reinvested | | | 5,140 | | | | 99,619 | | |
Net increase (decrease) | | | (125,656 | ) | | $ | (2,104,159 | ) | |
| | | Class Y | | Class P | |
| | | Shares | | Amount | | Shares | | Amount | |
Shares sold | | | — | | | $ | — | | | | 2,239,010 | | | $ | 37,344,102 | | |
Shares repurchased | | | (3,235 | ) | | | (54,138 | ) | | | (4,752,952 | ) | | | (81,583,677 | ) | |
Dividends reinvested | | | 71 | | | | 1,447 | | | | 159,879 | | | | 3,197,379 | | |
Net increase (decrease) | | | (3,164 | ) | | $ | (52,691 | ) | | | (2,354,063 | ) | | $ | (41,042,196 | ) | |
362
PACE Select Advisors Trust
Notes to financial statements
For the year ended July 31, 2019:
| | | Class A | | Class C | |
| | | Shares | | Amount | | Shares | | Amount | |
Shares sold | | | 3,369 | | | $ | 56,989 | | | | — | | | $ | — | | |
Shares repurchased | | | (187,425 | ) | | | (3,450,785 | ) | | | (7,006 | ) | | | (121,946 | ) | |
Shares converted | | | 162,283 | | | | 3,190,489 | | | | (198,660 | ) | | | (3,190,489 | ) | |
Dividends reinvested | | | 62,494 | | | | 994,908 | | | | — | | | | — | | |
Net increase (decrease) | | | 40,721 | | | $ | 791,601 | | | | (205,666 | ) | | $ | (3,312,435 | ) | |
| | | Class Y | | Class P | |
| | | Shares | | Amount | | Shares | | Amount | |
Shares sold | | | 1,938 | | | $ | 36,280 | | | | 2,328,781 | | | $ | 43,641,955 | | |
Shares repurchased | | | (4,105 | ) | | | (76,022 | ) | | | (5,911,099 | ) | | | (110,131,915 | ) | |
Dividends reinvested | | | 703 | | | | 11,697 | | | | 1,481,136 | | | | 24,335,068 | | |
Net increase (decrease) | | | (1,464 | ) | | $ | (28,045 | ) | | | (2,101,182 | ) | | $ | (42,154,892 | ) | |
PACE Small/Medium Co Growth Equity Investments
For the year ended July 31, 2020:
| | | Class A | |
| | | Shares | | Amount | |
Shares sold | | | 14,245 | | | $ | 208,969 | | |
Shares repurchased | | | (199,079 | ) | | | (2,839,160 | ) | |
Dividends reinvested | | | 219,194 | | | | 3,206,806 | | |
Net increase (decrease) | | | 34,360 | | | $ | 576,615 | | |
| | | Class Y | | Class P | |
| | | Shares | | Amount | | Shares | | Amount | |
Shares sold | | | — | | | $ | — | | | | 1,417,765 | | | $ | 22,234,556 | | |
Shares repurchased | | | (1,472 | ) | | | (25,002 | ) | | | (6,498,483 | ) | | | (102,204,380 | ) | |
Dividends reinvested | | | 408 | | | | 6,744 | | | | 3,356,487 | | | | 53,905,176 | | |
Net increase (decrease) | | | (1,064 | ) | | $ | (18,258 | ) | | | (1,724,231 | ) | | $ | (26,064,648 | ) | |
For the year ended July 31, 2019:
| | | Class A | | Class C | |
| | | Shares | | Amount | | Shares | | Amount | |
Shares sold | | | 27,525 | | | $ | 399,835 | | | | — | | | $ | — | | |
Shares repurchased | | | (222,595 | ) | | | (3,753,894 | ) | | | (2,904 | ) | | | (47,633 | ) | |
Shares converted | | | 134,528 | | | | 2,546,611 | | | | (176,725 | ) | | | (2,546,611 | ) | |
Dividends reinvested | | | 261,497 | | | | 3,687,103 | | | | — | | | | — | | |
Net increase (decrease) | | | 200,955 | | | $ | 2,879,655 | | | | (179,629 | ) | | $ | (2,594,244 | ) | |
| | | Class Y | | Class P | |
| | | Shares | | Amount | | Shares | | Amount | |
Shares sold | | | — | | | $ | — | | | | 1,968,714 | | | $ | 34,903,374 | | |
Shares repurchased | | | — | | | | — | | | | (7,455,292 | ) | | | (135,724,890 | ) | |
Dividends reinvested | | | 432 | | | | 6,763 | | | | 4,380,256 | | | | 66,798,900 | | |
Net increase (decrease) | | | 432 | | | $ | 6,763 | | | | (1,106,322 | ) | | $ | (34,022,616 | ) | |
363
PACE Select Advisors Trust
Notes to financial statements
PACE International Equity Investments
For the year ended July 31, 2020:
| | | Class A | |
| | | Shares | | Amount | |
Shares sold | | | 12,140 | | | $ | 172,359 | | |
Shares repurchased | | | (267,074 | ) | | | (3,995,522 | ) | |
Dividends reinvested | | | 36,877 | | | | 578,238 | | |
Net increase (decrease) | | | (218,057 | ) | | $ | (3,244,925 | ) | |
| | | Class Y | | Class P | |
| | | Shares | | Amount | | Shares | | Amount | |
Shares sold | | | 12,623 | | | $ | 185,373 | | | | 4,898,926 | | | $ | 69,471,525 | | |
Shares repurchased | | | (77,736 | ) | | | (1,143,478 | ) | | | (14,061,898 | ) | | | (197,911,199 | ) | |
Dividends reinvested | | | 21,225 | | | | 330,678 | | | | 1,574,500 | | | | 24,467,737 | | |
Net increase (decrease) | | | (43,888 | ) | | $ | (627,427 | ) | | | (7,588,472 | ) | | $ | (103,971,937 | ) | |
For the year ended July 31, 2019:
| | | Class A | | Class C | |
| | | Shares | | Amount | | Shares | | Amount | |
Shares sold | | | 10,712 | | | $ | 166,889 | | | | — | | | $ | — | | |
Shares repurchased | | | (276,625 | ) | | | (4,207,906 | ) | | | (1,594 | ) | | | (26,813 | ) | |
Shares converted | | | 115,113 | | | | 1,816,483 | | | | (117,648 | ) | | | (1,816,483 | ) | |
Dividends reinvested | | | 139,119 | | | | 1,893,415 | | | | — | | | | — | | |
Net increase (decrease) | | | (11,681 | ) | | $ | (331,119 | ) | | | (119,242 | ) | | $ | (1,843,296 | ) | |
| | | Class Y | | Class P | |
| | | Shares | | Amount | | Shares | | Amount | |
Shares sold | | | 6,764 | | | $ | 100,731 | | | | 6,333,654 | | | $ | 95,783,724 | | |
Shares repurchased | | | (96,733 | ) | | | (1,473,949 | ) | | | (15,156,492 | ) | | | (227,077,218 | ) | |
Dividends reinvested | | | 69,246 | | | | 936,899 | | | | 5,319,768 | | | | 71,816,872 | | |
Net increase (decrease) | | | (20,723 | ) | | $ | (436,319 | ) | | | (3,503,070 | ) | | $ | (59,476,622 | ) | |
PACE International Emerging Markets Equity Investments
For the year ended July 31, 2020:
| | | Class A | |
| | | Shares | | Amount | |
Shares sold | | | 18,428 | | | $ | 219,397 | | |
Shares repurchased | | | (34,291 | ) | | | (422,097 | ) | |
Dividends reinvested | | | 2,597 | | | | 36,093 | | |
Net increase (decrease) | | | (13,266 | ) | | $ | (166,607 | ) | |
| | | Class Y | | Class P | |
| | | Shares | | Amount | | Shares | | Amount | |
Shares sold | | | 14,134 | | | $ | 180,544 | | | | 2,315,990 | | | $ | 29,116,171 | | |
Shares repurchased | | | (73,009 | ) | | | (946,501 | ) | | | (6,521,943 | ) | | | (81,573,074 | ) | |
Dividends reinvested | | | 4,804 | | | | 67,299 | | | | 270,633 | | | | 3,772,621 | | |
Net increase (decrease) | | | (54,071 | ) | | $ | (698,658 | ) | | | (3,935,320 | ) | | $ | (48,684,282 | ) | |
364
PACE Select Advisors Trust
Notes to financial statements
For the year ended July 31, 2019:
| | | Class A | | Class C | |
| | | Shares | | Amount | | Shares | | Amount | |
Shares sold | | | 18,718 | | | $ | 240,569 | | | | — | | | $ | — | | |
Shares repurchased | | | (41,844 | ) | | | (533,944 | ) | | | (1,533 | ) | | | (18,743 | ) | |
Shares converted | | | 85,379 | | | | 1,051,873 | | | | (92,758 | ) | | | (1,051,873 | ) | |
Dividends reinvested | | | 4,949 | | | | 58,692 | | | | — | | | | — | | |
Net increase (decrease) | | | 67,202 | | | $ | 817,190 | | | | (94,291 | ) | | $ | (1,070,616 | ) | |
| | | Class Y | | Class P | |
| | | Shares | | Amount | | Shares | | Amount | |
Shares sold | | | 12,476 | | | $ | 161,834 | | | | 3,617,354 | | | $ | 46,388,943 | | |
Shares repurchased | | | (72,734 | ) | | | (960,362 | ) | | | (7,302,729 | ) | | | (93,012,813 | ) | |
Dividends reinvested | | | 9,670 | | | | 115,455 | | | | 533,943 | | | | 6,343,244 | | |
Net increase (decrease) | | | (50,588 | ) | | $ | (683,073 | ) | | | (3,151,432 | ) | | $ | (40,280,626 | ) | |
PACE Global Real Estate Securities Investments
For the year ended July 31, 2020:
| | | Class A | | Class P | |
| | | Shares | | Amount | | Shares | | Amount | |
Shares sold | | | 5,443 | | | $ | 32,584 | | | | 1,692,722 | | | $ | 10,930,068 | | |
Shares repurchased | | | (20,714 | ) | | | (159,603 | ) | | | (3,792,476 | ) | | | (24,802,071 | ) | |
Dividends reinvested | | | 1,937 | | | | 14,699 | | | | 764,131 | | | | 5,562,874 | | |
Net increase (decrease) | | | (13,334 | ) | | $ | (112,320 | ) | | | (1,335,623 | ) | | $ | (8,309,129 | ) | |
For the year ended July 31, 2019:
| | | Class A | | Class C | |
| | | Shares | | Amount | | Shares | | Amount | |
Shares sold | | | 10,035 | | | $ | 78,076 | | | | — | | | $ | — | | |
Shares repurchased | | | (18,188 | ) | | | (137,219 | ) | | | (527 | ) | | | (3,840 | ) | |
Shares converted | | | 21,450 | | | | 151,439 | | | | (22,402 | ) | | | (151,439 | ) | |
Dividends reinvested | | | 1,719 | | | | 12,036 | | | | — | | | | — | | |
Net increase (decrease) | | | 15,016 | | | $ | 104,332 | | | | (22,929 | ) | | $ | (155,279 | ) | |
| | | Class P | |
| | | Shares | | Amount | |
Shares sold | | | 1,626,329 | | | $ | 11,719,004 | | |
Shares repurchased | | | (4,564,600 | ) | | | (32,825,081 | ) | |
Dividends reinvested | | | 602,460 | | | | 4,054,557 | | |
Net increase (decrease) | | | (2,335,811 | ) | | $ | (17,051,520 | ) | |
365
PACE Select Advisors Trust
Notes to financial statements
PACE Alternative Strategies Investments
For the year ended July 31, 2020:
| | | Class A | |
| | | Shares | | Amount | |
Shares sold | | | 14,337 | | | $ | 152,671 | | |
Shares repurchased | | | (221,787 | ) | | | (2,347,399 | ) | |
Dividends reinvested | | | — | | | | — | | |
Net increase (decrease) | | | (207,450 | ) | | $ | (2,194,728 | ) | |
| | | Class Y | | Class P | |
| | | Shares | | Amount | | Shares | | Amount | |
Shares sold | | | 1,128 | | | $ | 12,037 | | | | 2,995,248 | | | $ | 31,719,786 | | |
Shares repurchased | | | (1,221 | ) | | | (12,761 | ) | | | (11,497,815 | ) | | | (120,577,672 | ) | |
Dividends reinvested | | | 75 | | | | 801 | | | | 81,482 | | | | 862,892 | | |
Net increase (decrease) | | | (18 | ) | | $ | 77 | | | | (8,421,085 | ) | | $ | (87,994,994 | ) | |
For the year ended July 31, 2019:
| | | Class A | | Class C | |
| | | Shares | | Amount | | Shares | | Amount | |
Shares sold | | | 71,875 | | | $ | 747,005 | | | | — | | | $ | — | | |
Shares repurchased | | | (498,434 | ) | | | (5,167,853 | ) | | | (38,283 | ) | | | (386,068 | ) | |
Shares converted | | | 526,736 | | | | 5,615,005 | | | | (564,890 | ) | | | (5,615,005 | ) | |
Dividends reinvested | | | 27,418 | | | | 275,555 | | | | — | | | | — | | |
Net increase (decrease) | | | 127,595 | | | $ | 1,469,712 | | | | (603,173 | ) | | $ | (6,001,073 | ) | |
| | | Class Y | | Class P | |
| | | Shares | | Amount | | Shares | | Amount | |
Shares sold | | | 2,648 | | | $ | 27,560 | | | | 5,803,947 | | | $ | 60,397,943 | | |
Shares repurchased | | | (17,701 | ) | | | (186,333 | ) | | | (15,061,398 | ) | | | (156,643,227 | ) | |
Dividends reinvested | | | 1,188 | | | | 11,917 | | | | 1,445,099 | | | | 14,436,543 | | |
Net increase (decrease) | | | (13,865 | ) | | $ | (146,856 | ) | | | (7,812,352 | ) | | $ | (81,808,741 | ) | |
Federal tax status
Each of the Portfolios intends to distribute substantially all of its income and to comply with the other requirements of the Internal Revenue Code applicable to regulated investment companies. Accordingly, no provision for federal income taxes is required. In addition, by distributing during each calendar year substantially all of its net investment income, net realized capital gains and certain other amounts, if any, each Portfolio intends not to be subject to a federal excise tax.
366
PACE Select Advisors Trust
Notes to financial statements
The tax character of distributions paid during the fiscal years ended July 31, 2020 and July 31, 2019 were as follows:
| | 2020 | | 2019 | |
| Portfolio | | Tax-
exempt
income | | Ordinary
income | | Long term
realized
capital gains | | Return
of
capital | | Tax-
exempt
income | | Ordinary
income | | Long term
realized
capital gains | | Return
of
capital | |
UBS Government Money Market
Investments Fund | | $ | — | | | $ | 1,609,056 | | | $ | — | | | $ | — | | | $ | — | | | $ | 3,456,399 | | | $ | — | | | $ | — | | |
PACE Mortgage-Backed Securities
Fixed Income Investments | | | — | | | | 11,564,835 | | | | — | | | | — | | | | — | | | | 13,128,539 | | | | — | | | | — | | |
PACE Intermediate Fixed Income
Investments | | | — | | | | 7,822,951 | | | | — | | | | — | | | | — | | | | 10,150,332 | | | | — | | | | — | | |
PACE Strategic Fixed Income
Investments | | | — | | | | 23,735,644 | | | | — | | | | — | | | | — | | | | 25,314,282 | | | | — | | | | — | | |
PACE Municipal Fixed Income
Investments | | | 7,138,059 | | | | 121,841 | | | | 1,267,836 | | | | — | | | | 9,779,044 | | | | 185,452 | | | | 559,288 | | | | — | | |
PACE Global Fixed Income
Investments | | | — | | | | 6,128,274 | | | | — | | | | — | | | | — | | | | 6,703,499 | | | | — | | | | — | | |
PACE High Yield Investments | | | — | | | | 17,100,764 | | | | — | | | | — | | | | — | | | | 18,379,290 | | | | — | | | | — | | |
PACE Large Co Value Equity
Investments | | | — | | | | 24,117,486 | | | | 40,507,639 | | | | — | | | | — | | | | 20,996,921 | | | | 96,236,592 | | | | — | | |
PACE Large Co Growth Equity
Investments | | | — | | | | 8,917,091 | | | | 161,817,814 | | | | — | | | | — | | | | 11,975,253 | | | | 196,296,544 | | | | — | | |
PACE Small/Medium Co Value
Equity Investments | | | — | | | | 3,564,155 | | | | — | | | | — | | | | — | | | | 14,884,474 | | | | 12,183,000 | | | | — | | |
PACE Small/Medium Co Growth
Equity Investments | | | — | | | | — | | | | 60,384,107 | | | | — | | | | — | | | | 19,217,846 | | | | 55,753,551 | | | | — | | |
PACE International Equity
Investments | | | — | | | | 16,821,013 | | | | 1,865,082 | | | | — | | | | — | | | | 37,385,211 | | | | 41,880,620 | | | | — | | |
PACE International Emerging
Markets Equity Investments | | | — | | | | 4,136,007 | | | | — | | | | — | | | | — | | | | 6,936,456 | | | | — | | | | — | | |
PACE Global Real Estate Securities
Investments | | | — | | | | 6,019,165 | | | | — | | | | — | | | | — | | | | 4,383,008 | | | | — | | | | — | | |
PACE Alternative Strategies
Investments | | | — | | | | 930,110 | | | | — | | | | — | | | | — | | | | 12,689,145 | | | | 3,021,999 | | | | — | | |
For federal income tax purposes, the estimated cost and unrealized appreciation (depreciation) in value of investments, including derivatives, held at July 31, 2020 were as follows:
| Portfolio | | Cost of
investments | | Gross unrealized
appreciation | | Gross unrealized
depreciation | | Net unrealized
appreciation
(depreciation) on
investments | |
UBS Government Money Market Investments Fund | | $ | 316,621,472 | | | $ | — | | | $ | — | | | $ | — | | |
PACE Mortgage-Backed Securities Fixed Income Investments | | | 567,603,077 | | | | 15,276,487 | | | | (5,800,004 | ) | | | 9,476,483 | | |
PACE Intermediate Fixed Income Investments | | | 341,067,877 | | | | 39,536,476 | | | | (15,022,416 | ) | | | 24,514,060 | | |
PACE Strategic Fixed Income Investments | | | 853,472,226 | | | | 30,645,970 | | | | (1,599,848 | ) | | | 29,046,122 | | |
PACE Municipal Fixed Income Investments | | | 294,179,980 | | | | 22,887,314 | | | | (314,319 | ) | | | 22,572,995 | | |
PACE Global Fixed Income Investments | | | 327,611,599 | | | | 18,862,192 | | | | (3,739,809 | ) | | | 15,122,383 | | |
PACE High Yield Investments | | | 285,284,079 | | | | 11,210,998 | | | | (22,748,107 | ) | | | (11,537,109 | ) | |
PACE Large Co Value Equity Investments | | | 874,967,782 | | | | 103,394,782 | | | | (115,251,665 | ) | | | (11,856,883 | ) | |
PACE Large Co Growth Equity Investments | | | 756,694,987 | | | | 423,006,456 | | | | (4,634,004 | ) | | | 418,372,452 | | |
PACE Small/Medium Co Value Equity Investments | | | 350,623,398 | | | | 59,050,993 | | | | (37,169,789 | ) | | | 21,881,204 | | |
PACE Small/Medium Co Growth Equity Investments | | | 351,163,440 | | | | 92,104,230 | | | | (16,245,879 | ) | | | 75,858,351 | | |
367
PACE Select Advisors Trust
Notes to financial statements
Portfolio | | Cost of
investments | | Gross unrealized
appreciation | | Gross unrealized
depreciation | | Net unrealized
appreciation
(depreciation) on
investments | |
PACE International Equity Investments | | $ | 816,796,194 | | | $ | 159,718,189 | | | $ | (127,828,532 | ) | | $ | 31,889,657 | | |
PACE International Emerging Markets Equity Investments | | | 304,305,860 | | | | 80,571,083 | | | | (26,748,640 | ) | | | 53,822,443 | | |
PACE Global Real Estate Securities Investments | | | 96,376,559 | | | | 6,832,459 | | | | (13,756,489 | ) | | | (6,924,030 | ) | |
PACE Alternative Strategies Investments | | | 343,572,262 | | | | 27,804,297 | | | | (20,466,986 | ) | | | 7,337,311 | | |
The difference between book and tax basis appreciation (depreciation) on investments is primarily attributed to tax deferral of losses on wash sales, tax treatment of certain derivatives, mark-to-market of passive foreign investment companies and non-taxable special dividends.
At July 31, 2020, the components of accumulated earnings (deficit) on a tax basis were as follows:
| Portfolio | | Undistributed
tax-exempt
income | | Undistributed
ordinary
income | | Undistributed
long-term
capital gains | | Accumulated
realized
capital and
other losses | | Unrealized
appreciation
(depreciation) | | Other
temporary
differences | | Total | |
UBS Government Money Market
Investments Fund | | $ | — | | | $ | 818 | | | $ | — | | | $ | (971 | ) | | $ | — | | | $ | (1,410 | ) | | $ | (1,563 | ) | |
PACE Mortgage-Backed Securities
Fixed Income Investments | | | — | | | | 189,459 | | | | — | | | | (20,069,530 | ) | | | 9,476,479 | | | | (10,625 | ) | | | (10,414,217 | ) | |
PACE Intermediate Fixed Income
Investments | | | — | | | | 3,156,185 | | | | 1,418,973 | | | | (119,765 | ) | | | 24,528,301 | | | | — | | | | 28,983,694 | | |
PACE Strategic Fixed Income
Investments | | | — | | | | 20,255,776 | | | | — | | | | (3,254,175 | ) | | | 29,155,204 | | | | — | | | | 46,156,805 | | |
PACE Municipal Fixed Income
Investments | | | 433,654 | | | | 1,059,559 | | | | 440,182 | | | | — | | | | 22,572,995 | | | | — | | | | 24,506,390 | | |
PACE Global Fixed Income Investments | | | — | | | | 1,161,441 | | | | — | | | | (2,203,050 | ) | | | 15,152,290 | | | | 1 | | | | 14,110,682 | | |
PACE High Yield Investments | | | — | | | | 812 | | | | — | | | | (15,196,271 | ) | | | (11,501,550 | ) | | | (188,436 | ) | | | (26,885,445 | ) | |
PACE Large Co Value Equity
Investments | | | — | | | | 7,771,791 | | | | — | | | | (40,257,406 | ) | | | (11,856,883 | ) | | | (5 | ) | | | (44,342,503 | ) | |
PACE Large Co Growth Equity
Investments | | | — | | | | 14,753,472 | | | | 119,401,270 | | | | — | | | | 418,372,466 | | | | — | | | | 552,527,208 | | |
PACE Small/Medium Co Value Equity
Investments | | | — | | | | 1,074,384 | | | | — | | | | (18,467,203 | ) | | | 21,881,231 | | | | (2 | ) | | | 4,488,410 | | |
PACE Small/Medium Co Growth Equity
Investments | | | — | | | | — | | | | 19,394,133 | | | | (1,295,952 | ) | | | 75,858,351 | | | | (2 | ) | | | 93,956,530 | | |
PACE International Equity Investments | | | — | | | | — | | | | — | | | | (44,638,968 | ) | | | 32,084,634 | | | | — | | | | (12,554,334 | ) | |
PACE International Emerging Markets
Equity Investments | | | — | | | | 4,499,112 | | | | — | | | | (50,113,253 | ) | | | 53,525,221 | | | | — | | | | 7,911,080 | | |
PACE Global Real Estate Securities
Investments | | | — | | | | 1,529,285 | | | | — | | | | (19,440,717 | ) | | | (6,920,676 | ) | | | — | | | | (24,832,108 | ) | |
PACE Alternative Strategies Investments | | | — | | | | 10,764,922 | | | | — | | | | (1,183,199 | ) | | | 4,440,482 | | | | — | | | | 14,022,205 | | |
368
PACE Select Advisors Trust
Notes to financial statements
Under the Regulated Investment Company Modernization Act of 2010 (the "Act"), net capital losses recognized by the Portfolios after December 22, 2010, may be carried forward indefinitely, and retain their character as short-term and/or long-term losses. Capital losses incurred that will be carried forward indefinitely are as follows:
Portfolio | | Short-term | | Long-term | | Total | |
UBS Government Money Market Investments Fund | | $ | 971 | | | $ | — | | | $ | 971 | | |
PACE Mortgage-Backed Securities Fixed Income Investments | | | — | | | | 20,069,530 | | | | 20,069,530 | | |
PACE Global Fixed Income Investments | | | 1,631,834 | | | | — | | | | 1,631,834 | | |
PACE High Yield Investments | | | 1,831,643 | | | | 13,364,628 | | | | 15,196,271 | | |
PACE Small/Medium Co Value Equity Investments | | | 18,467,203 | | | | — | | | | 18,467,203 | | |
PACE International Emerging Markets Equity Investments | | | 50,113,253 | | | | — | | | | 50,113,253 | | |
PACE Global Real Estate Securities Investments | | | 10,678,954 | | | | 8,761,763 | | | | 19,440,717 | | |
During the fiscal year, the following Portfolios utilized capital loss carryforwards to offset current year realized gains:
| Portfolio | | Capital loss
carryforwards
utilized | |
PACE Global Fixed Income Investments | | $ | 6,453,750 | | |
PACE Mortgage-Backed Securities Fixed Income Investments | | | 2,025,990 | | |
PACE Intermediate Fixed Income Investments | | | 6,413,156 | | |
PACE Strategic Fixed Income Investments | | | 20,079,228 | | |
Qualified late year losses are deemed to arise on the first business day of a Portfolio's next taxable year. For the period ended July 31, 2020, the following Portfolios incurred, and elected to defer the following losses:
| | | | Post-October capital losses | |
Portfolio | | Late year ordinary losses | | Short-term | | Long-term | |
PACE Strategic Fixed Income Investments | | $ | 1,077,021 | | | $ | — | | | $ | — | | |
PACE Large Co Value Equity Investments | | | — | | | | 29,764,703 | | | | 8,124,767 | | |
PACE Small/Medium Co Growth Equity Investments | | | 1,295,952 | | | | — | | | | — | | |
PACE International Equity Investments | | | 630,147 | | | | 7,133,956 | | | | 34,014,272 | | |
At July 31, 2020, the effect of permanent "book/tax" reclassifications resulted in increases and decreases to components of the Portfolios' net assets as follows:
| Portfolio | | Distributable
earnings (losses) | | Beneficial
interest | |
PACE Municipal Fixed Income Investments | | $ | 3,797,195 | | | $ | (3,797,195 | ) | |
PACE Large Co Growth Equity Investments | | | 49,740 | | | | (49,740 | ) | |
PACE Small/Medium Co Growth Equity Investments | | | 2,282,025 | | | | (2,282,025 | ) | |
PACE International Equity Investments | | | 8,600,502 | | | | (8,600,502 | ) | |
PACE Global Real Estate Securities Investments | | | 143,305 | | | | (143,305 | ) | |
PACE Alternative Strategies Investments | | | 3,328 | | | | (3,328 | ) | |
369
PACE Select Advisors Trust
Notes to financial statements
These differences are primarily due to net operating losses and distributions in excess of net investment income.
ASC 740-10 "Income Taxes—Overall" sets forth a minimum threshold for financial statement recognition of the benefit of a tax position taken or expected to be taken. The Portfolios have conducted an analysis and concluded as of July 31, 2020, there are no significant uncertain tax positions taken or expected to be taken that would require recognition in the financial statements. It is each Portfolio's policy to record any significant foreign tax exposures in the financial statements. The Portfolios recognize interest and penalties, if any, related to uncertain tax positions as income tax expense in the Statement of operations. During the period ended July 31, 2020, the Portfolios did not incur any interest or penalties. Capital gains realized by the Portfolios on securities issued in or by certain foreign countries may be subject to capital gains tax imposed by those countries.
Under the applicable foreign tax laws, gains on certain securities held in certain foreign countries may be subject to taxes will be paid by the Portfolios.
Each of the tax years in the four year period ended July 31, 2020, remains subject to examination by the Internal Revenue Service and state taxing authorities.
Subsequent Event
Effective August 1, 2020, PACE International Equity Investments lowered its expense cap so that the Portfolio's ordinary total operating expenses of each class (excluding dividend expense, borrowing costs, and interest expense relating to short sales, and expenses attributable to investment in other investment companies, interest, taxes, brokerage commissions and extraordinary expenses) would not exceed 1.25% for Class A, and 1.00% for both Class Y and Class P. In addition, effective August 1, 2020, PACE International Emerging Markets Equity Investments lowered its expense cap so that the Portfolio's ordinary total operating expenses of each class (excluding dividend expense, borrowing costs, and interest expense relating to short sales, and expenses attributable to investment in other investment companies, interest, taxes, brokerage commissions and extraordinary expenses) would not exceed 1.55% for Class A, and 1.30% for both Class Y and Class P.
370
PACE Select Advisors Trust
Report of Independent Registered Public Accounting Firm
To the Shareholders and the Board of Trustees of
PACE Select Advisors Trust
Opinion on the Financial Statements
We have audited the accompanying statements of assets and liabilities of PACE Select Advisors Trust (the "Trust"), (comprising UBS Government Money Market Investments Fund, PACE Mortgage-Backed Securities Fixed Income Investments, PACE Intermediate Fixed Income Investments, PACE Strategic Fixed Income Investments, PACE Municipal Fixed Income Investments, PACE Global Fixed Income Investments, PACE High Yield Investments, PACE Large Co Value Equity Investments, PACE Large Co Growth Equity Investments, PACE Small/Medium Co Value Equity Investments, PACE Small/Medium Co Growth Equity Investments, PACE International Equity Investments, PACE International Emerging Markets Equity Investments, PACE Global Real Estate Securities Investments and PACE Alternative Strategies Investments (collectively referred to as the "Funds")), including the portfolios of investments, as of July 31, 2020, and the related statements of operations and cash flows (for PACE Strategic Fixed Income Investments, PACE Large Co Value Equity Investments and PACE International Equity Investments) for the year then ended, the statements of changes in net assets for each of the two years in the period then ended, the financial highlights for each of the five years in the period then ended and the related notes (collectively referred to as the "financial statements"). In our opinion, the financial statements present fairly, in all material respects, the financial position of each of the Funds comprising PACE Select Advisors Trust at July 31, 2020, the results of their operations and their cash flows (for PACE Strategic Fixed Income Investments, PACE Large Co Value Equity Investments and PACE International Equity Investments) for the year then ended, the changes in their net assets for each of the two years in the period then ended and their financial highlights for each of the five years in the period then ended, in conformity with U.S. generally accepted accounting principles.
Basis for Opinion
These financial statements are the responsibility of the Trust's management. Our responsibility is to express an opinion on each of the Funds' financial statements based on our audits. We are a public accounting firm registered with the Public Company Accounting Oversight Board (United States) ("PCAOB") and are required to be independent with respect to the Trust in accordance with the U.S. federal securities laws and the applicable rules and regulations of the Securities and Exchange Commission and the PCAOB.
We conducted our audits in accordance with the standards of the PCAOB. Those standards require that we plan and perform the audit to obtain reasonable assurance about whether the financial statements are free of material misstatement, whether due to error or fraud. The Trust is not required to have, nor were we engaged to perform, an audit of the Trust's internal control over financial reporting. As part of our audits we are required to obtain an understanding of internal control over financial reporting but not for the purpose of expressing an opinion on the effectiveness of the Trust's internal control over financial reporting. Accordingly, we express no such opinion.
Our audits included performing procedures to assess the risks of material misstatement of the financial statements, whether due to error or fraud, and performing procedures that respond to those risks. Such procedures included examining, on a test basis, evidence regarding the amounts and disclosures in the financial statements. Our procedures included confirmation of securities owned as of July 31, 2020, by correspondence with the custodian and brokers or by other appropriate auditing procedures where replies from brokers were not received. Our audits also included evaluating the accounting principles used and significant estimates made by management, as well as evaluating the overall presentation of the financial statements. We believe that our audits provide a reasonable basis for our opinion.

We have served as the auditor of one or more UBS investment companies since 1978.
New York, New York
September 29, 2020
371
PACE Select Advisors Trust
Tax information (unaudited)
We are required by Subchapter M of the Internal Revenue Code of 1986, as amended, to advise you in writing as to the federal tax status of distributions received by shareholders during the fiscal year. Accordingly, the percentage of ordinary dividends paid that qualify for the dividends received deduction for corporate shareholders and the amount of foreign tax credit to be passed through to shareholders are as follows:
| Portfolio | | Dividends
received
deduction | | Long-term
capital
gain | | Foreign
tax
credit | |
PACE Municipal Fixed Income Investments | | $ | — | | | $ | 1,267,836 | | | $ | — | | |
PACE Large Co Value Equity Investments | | | 21,901,620 | | | | 40,507,639 | | | | — | | |
PACE Large Co Growth Equity Investments | | | 3,804,744 | | | | 161,817,814 | | | | — | | |
PACE Small/Medium Co Value Equity Investments | | | 3,564,155 | | | | — | | | | — | | |
PACE Small/Medium Co Growth Equity Investments | | | — | | | | 60,384,107 | | | | — | | |
PACE International Equity Investments | | | — | | | | 1,865,082 | | | | 1,761,874 | | |
PACE International Emerging Markets Equity Investments | | | 34,937 | | | | — | | | | 832,403 | | |
PACE Alternative Strategies Investments | | | 123,481 | | | | — | | | | — | | |
Also, for the fiscal year ended July 31, 2020, the foreign source income for information reporting purposes for PACE International Equity Investments and PACE International Emerging Markets Equity Investments is $17,111,373 and $2,983,318, respectively.
For the taxable year ended July 31, 2020, the Portfolios designate the amounts below as the maximum amount that may be considered qualified dividend income for individual shareholders.
| Portfolio | | Maximum amount
considered qualified
dividend income | |
PACE Large Co Value Equity Investments | | $ | 21,901,620 | | |
PACE Large Co Growth Equity Investments | | | 4,092,142 | | |
PACE Small/Medium Co Value Equity Investments | | | 3,564,155 | | |
PACE International Equity Investments | | | 27,179,331 | | |
PACE International Emerging Markets Equity Investments | | | 4,968,410 | | |
PACE Global Real Estate Securities Investments | | | 1,124,492 | | |
PACE Alternative Strategies Investments | | | 231,337 | | |
Dividends received by tax-exempt recipients (e.g., IRAs and Keoghs) need not be reported as taxable income. Some retirement trusts (e.g., corporate, Keogh and 403(b)(7) plans) may need this information for their annual information reporting.
Shareholders should not use the above information to prepare their tax returns. Since each Portfolio's fiscal year is not the calendar year, another notification will be sent with respect to calendar year 2020. Such notification, which will reflect the amount to be used by calendar year taxpayers on their federal income tax returns, will be made in conjunction with Form 1099 DIV and will be mailed in February 2021. Shareholders are advised to consult their own tax advisers with respect to the tax consequences of their investment in each of the Portfolios.
372
PACE Select Advisors Trust
General information (unaudited)
Monthly and quarterly portfolio holdings disclosure
The Portfolios, except UBS Government Money Market Investments Fund, filed their complete schedules of portfolio holdings with the US Securities and Exchange Commission ("SEC") for the first and third quarters of each fiscal year as an exhibit to their reports on Form N-PORT. The Form N-PORT reports are available on the SEC's Web site at http://www.sec.gov. (Please note that on the SEC's Web site, the "filing type" designation for this information may be "NPORTEX.") Additionally, you may obtain copies of Form N-PORT for the first and third quarters of each fiscal year from the Funds upon request by calling 1-800-647 1568. UBS Government Money Market Investments Fund, filed its complete schedule of portfolio holdings with the SEC for the first and third quarters of each fiscal year through August 1, 2019 on Form N-Q. Effective August 1, 2019, Form N-Q is no longer required to be filed. The Portfolio's historical filings on Form N-Q are available on the SEC's Web site at http://www.sec.gov. Additionally, you may obtain copies of Forms N-Q from the Portfolio upon request by calling 1-800-647 1568.
In addition, UBS Government Money Market Investments Fund discloses, on a monthly basis: (a) a complete schedule of its portfolio holdings; and (b) information regarding its weighted average maturity and weighted average life on UBS Web site at the following internet address: www.ubs.com/usmoneymarketfunds. In addition, at this location, you will find a link to more detailed Portfolio information appearing in filings with the SEC on Form N-MFP. Investors also may find additional information about this Portfolio at the above referenced UBS Website internet address.
Proxy voting policies, procedures and record
You may obtain a description of each Portfolio's (1) proxy voting policies, (2) proxy voting procedures and (3) information regarding how a Portfolio voted any proxies related to portfolio securities during the most recent 12-month period ended June 30 for which an SEC filing has been made, without charge, upon request by contacting a Portfolio directly at 1-800-647 1568, online on a Portfolio's Web site: www.ubs.com/ubsam-proxy, or on the EDGAR Database on the SEC's Web site (http://www.sec.gov).
Liquidity Risk Management Program
Pursuant to Rule 22e-4 under the Investment Company Act of 1940, as amended (the "1940 Act"), PACE Select Advisors Trust (the "Trust") has adopted a liquidity risk management program (the "program") with respect to each of its series, except UBS Government Money Market Investments Fund (formerly, PACE Government Money Market Investments), which is subject to extensive liquidity requirements under a different 1940 Act rule. (Each series of the Trust subject to the program is referred to as a "Fund.")
UBS Asset Management (Americas) Inc. ("UBS AM") has been designated by the Trust's Board to administer the program, and UBS AM has delegated the responsibility to carry out certain functions described in the program to an internal group which is comprised of representatives of various investment and non-investment areas of the firm. Liquidity risk is defined as the risk that a Fund could not meet redemption requests without significant dilution of remaining shareholders' interests in that Fund. The program is intended to provide a framework for the assessment, management and periodic review of each Fund's liquidity risks, taking into consideration, as applicable, the Fund's investment strategy and liquidity of portfolio investments during both normal and reasonably foreseeable stressed conditions; short-term and long-term cash flow projections during both normal and reasonably foreseeable stressed conditions; and holdings of cash and cash equivalents, as well as borrowing arrangements and other funding sources. The provisions of the program shall be administered for each Fund in a manner that is appropriately tailored to reflect the Fund's particular liquidity risks. UBS AM's process of determining the degree of liquidity of a Fund's investments is supported by a third-party liquidity assessment vendor. In May 2020, UBS AM provided the Board with a report addressing the operation of the program and assessing its adequacy and effectiveness of implementation (the "report"). The report covered the period from December 1, 2018 through May 1, 2020.
373
PACE Select Advisors Trust
General information (unaudited)
UBS AM's report concluded that the program was reasonably designed to assess and manage each Fund's liquidity risk, including during periods of market volatility and net redemptions. UBS AM reported that the program, including any applicable highly liquid investment minimum, operated adequately and has been implemented effectively to assess and manage each Fund's liquidity risk.
There can be no assurance that the program will achieve its objectives in the future. Please refer to a Fund's prospectus for more information regarding a Fund's exposure to liquidity risk and other risks to which an investment in a Fund may be subject.
374
PACE Select Advisors Trust
Board approvals of investment management and administration
agreement and subadvisory agreements (unaudited)
Background—At a meeting of the board of PACE Select Advisors Trust (the "Trust") on July 21-22, 2020, the members of the board, including the trustees who are not "interested persons," as defined in the Investment Company Act of 1940, as amended, of the Trust (the "Independent Trustees"), considered and approved the continuance of the investment management and administration agreement (the "Investment Management and Administration Agreement") between UBS Asset Management (Americas) Inc. ("UBS AM") and the Trust, on behalf of each series of the Trust (each a "Portfolio" and together the "Portfolios"), and, for those Portfolios with subadvisors/sub-manager(s), the subadvisory/sub-management agreements for the Portfolios. (Throughout this discussion, each subadvisor/sub-manager to a Portfolio is referred to as a "Subadvisor" and each subadvisory/sub-management agreement is referred to as a "Subadvisory Agreement.") In preparing for the meeting, the Independent Trustees had requested and received extensive information from UBS AM to assist them, including information about UBS AM and the Portfolios' Subadvisors, as well as the management, subadvisory, administrative and distribution arrangements for the Portfolios. The board reviewed and discussed with management the materials initially provided by UBS AM prior to the scheduled board meeting. The Independent Trustees also met in executive session to review the disclosure that had been made to them. At these sessions the Independent Trustees were joined by their independent legal counsel. The Independent Trustees also received a memorandum from their independent legal counsel discussing the duties of board members in considering the approval of management, subadvisory/sub-management, administration and distribution agreements.
In its consideration of the approval of the Investment Management and Administration Agreement and the Subadvisory Agreements, the board considered the following factors:
Nature, extent and quality of the services under the Investment Management and Administration Agreement and the Subadvisory Agreements—The board received and considered information regarding the nature, extent and quality of management services provided to the Portfolios by UBS AM and, for those Portfolios with Subadvisor(s), subadvisory services provided by each Subadvisor during the past year. The board also considered the nature, extent and quality of administrative, distribution and shareholder services performed by UBS AM and its affiliates for the Portfolios and the resources devoted to, and the record of compliance with, each Portfolio's compliance policies and procedures. The board noted that it received information at regular meetings throughout the year regarding the services rendered by UBS AM concerning the management of each Portfolio's affairs and UBS AM's role in coordinating and overseeing providers of other services to the Portfolios. The board noted the complexity of this process for the Portfolios, given their broad range of investment strategies. The board noted that UBS AM provided extensive oversight of the Subadvisors for the Portfolios and reported to the board at each regular meeting on the Subadvisors' performance and compliance with applicable requirements and made recommendations with respect to Subadvisor changes (both in terms of the allocation of Portfolio assets to Subadvisors and their hiring and termination) from time to time based on the performance of the Subadvisors and other relevant factors. The board's evaluation of the services provided by UBS AM and the Subadvisors took into account the board's knowledge and familiarity gained as board members of funds in the UBS New York fund complex, including the scope and quality of UBS AM's investment management and other capabilities and the quality of its administrative and other services. The board observed that the scope of services provided by UBS AM had expanded over time as a result of regulatory and other developments, including (i) maintaining and monitoring its own and the Portfolios' expanded compliance programs and (ii) hiring and replacing Subadvisors, monitoring current Subadvisors (including adjusting their Portfolio asset allocations) and coordinating strategies among Subadvisors to continue to optimize the implementation and effectuation of the Portfolios' investment strategies. It also was noted that the Investment Management and Administration Agreement under consideration had been approved by shareholders at a special meeting of shareholders of the Trust held in 2008.
The board had available to it the qualifications, backgrounds and responsibilities of the senior personnel at UBS AM responsible for the Portfolios and had previously met with and received information regarding the person(s) or portfolio management team from each Subadvisor and/or UBS AM primarily responsible for the day-to-day management of each Portfolio. The board recognized that several senior personnel at UBS AM report to the board regularly,
375
PACE Select Advisors Trust
Board approvals of investment management and administration
agreement and subadvisory agreements (unaudited)
and that at each regular meeting the board receives a detailed report from UBS AM on each Portfolio's performance and receives more extensive information periodically from each Subadvisor. The board also considered, based on its knowledge of UBS AM and its affiliates, the financial resources available to UBS AM and its parent organization, UBS Group AG. In that regard, the board received extensive financial information regarding UBS AM and noted that it was a wholly owned, indirect subsidiary of one of the largest financial services firms in the world. It also was noted that UBS AM had approximately $206 billion in assets under management as of March 31, 2020 and was part of the UBS Asset Management Division, which had approximately $903 billion in assets under management worldwide as of March 31, 2020. The board also was cognizant of, and considered, the regulatory and litigation actions and investigations occurring in the past few years involving UBS Group AG, UBS AM and certain of their affiliates.
The board concluded that, overall, it was satisfied with the nature, extent and quality of services provided (and expected to be provided) to the Portfolios under the Investment Management and Administration Agreement as well as under the Subadvisory Agreements.
Management and subadvisory fees and expense ratios—For each Portfolio, the board reviewed and considered the contractual management fee (the "Contractual Management Fee") payable by the Portfolio to UBS AM in light of the nature, extent and quality of the services provided by UBS AM pursuant to the Investment Management and Administration Agreement. The board also reviewed and considered the fee waiver and/or expense reimbursement arrangements for each Portfolio (if any) and considered the actual fee rate (after taking any waivers and reimbursements into account) (the "Actual Management Fee") payable by the Portfolio. The board considered whether UBS AM had entered into one or more fee waiver and/or expense reimbursement agreements with a Portfolio under which UBS AM was contractually obligated to waive its management fees and/or reimburse the Portfolio so that the total ordinary operating expenses of certain or all classes of that Portfolio through November 30, 2020 (excluding dividend expense, borrowing costs, interest expense relating to short sales, expenses attributable to investment in other investment companies, interest, taxes, brokerage commissions and extraordinary expenses) would not exceed specified limits for each class (or, with respect to certain Portfolios, an agreement to waive a portion of its management fee). The board also considered that each Portfolio with such a fee waiver/reimbursement agreement had agreed to repay UBS AM for those waived fees and/or reimbursed expenses if the Portfolio can do so over the following three fiscal years without causing its expenses in any of those years to exceed the expense caps. Moreover, the board considered that, in addition to continuing to waive certain fees and/or reimbursing certain expenses as in past years, UBS AM also offered specific new expense caps for certain Portfolios as discussed below. Additionally, the board received and considered information comparing each Portfolio's Contractual Management Fee, Actual Management Fee and overall expenses with those of funds in a group of funds selected and provided by Broadridge, an independent provider of investment company data (the "Expense Group"). The board also received from Broadridge comparative data on a supplemental expense group of subadvised peers (which may include certain of the subadvised peers contained within the primary Expense Group) (the "Supplemental Expense Group"). A discussion of the board's considerations with respect to each Portfolio's fees is set forth below.
In connection with its consideration of each Portfolio's management fees, the board also received information on UBS AM's standard institutional account fees for accounts of a similar investment type to each of the Portfolios. The board noted management's explanation that comparisons with such accounts may be of limited relevance given the different structures and regulatory requirements of mutual funds, such as the Portfolios, versus those accounts and the differences in the levels of services required by the Portfolios and those accounts. The board also received information on fees charged to other mutual funds managed by UBS AM. The board observed that it had received certain information regarding fees, compensation from other similar funds, and economies of scale from certain Subadvisors as part of the summary of each Subadvisor's responses to requests for due diligence materials in connection with the board's annual reconsideration of the Subadvisory Agreements; however, the board also observed that the compensation paid to a Subadvisor is paid by UBS AM, not by the particular Portfolio, and, accordingly,
376
PACE Select Advisors Trust
Board approvals of investment management and administration
agreement and subadvisory agreements (unaudited)
that the retention of a Subadvisor generally does not increase the fees otherwise incurred by a Portfolio's shareholders (unless a management fee waiver level was affected by a subadvisory fee increase or a reallocation of assets).
Portfolio performance—For each Portfolio, the board received and considered (a) annualized total return information of the Portfolio compared to other funds (the "Performance Universe") selected by Broadridge over the one-, three-, five-, ten-year and since inception periods ended April 30, 2020, and (b) annualized performance information for each year in the ten-year period ended April 30, 2020. The board was provided with a description of the methodology Broadridge used to determine the similarity of a Portfolio with the funds included in its Performance Universe. The board also considered UBS AM's emphasis on longer-term performance, such as three- and five-year periods, as well as UBS AM's statement that while management believed that the Broadridge peer groups were useful in evaluating Portfolio expenses relative to peers, they were less useful in evaluating performance, as in many cases they were broad-based and consisted of funds that did not necessarily have similar investment parameters to the applicable Portfolio. The board also noted that it had received information throughout the year at periodic intervals with respect to each Portfolio's performance, in most cases with respect to certain benchmark indices, including with respect to each Subadvisor's performance. Further discussion of the board's considerations with respect to each Portfolio's performance is set forth below.
Advisor profitability—The board received and considered a profitability analysis of UBS AM and its affiliates in providing services to each Portfolio and was provided information on UBS AM's expense allocation methodology. The board also received profitability information with respect to the UBS New York fund cluster as a whole. The board observed that the profitability and expense analyses are substantially similar to those used by UBS AM for many internal purposes, and are subject to regular review with respect to how certain revenue and expenses should be allocated. UBS AM's profitability was considered not excessive in light of the nature, extent and quality of the services provided to the Portfolios. A Subadvisor's profitability in providing services to a Portfolio was not a significant factor considered by the board, as the subadvisory fees are paid by UBS AM, not by the relevant Portfolio.
Economies of scale—The board received and considered information from management regarding whether UBS AM realized economies of scale as the Portfolios' assets grew, whether the Portfolios have appropriately benefited from any economies of scale, and whether there is potential for realization of any further economies of scale for the Portfolios. The board considered whether economies of scale in the provision of services to the Portfolios were being passed along to the shareholders. The board noted that each Portfolio's Contractual Management Fee contained breakpoints, with the exception of UBS Government Money Market Investments Fund (formerly, PACE Government Money Market Investments). The board also noted that as of April 30, 2020, with the exception of PACE Alternative Strategies Investments, PACE Global Fixed Income Investments, PACE Global Real Estate Securities Investments, PACE High Yield Investments, PACE International Emerging Markets Equity Investments, PACE Small/Medium Co Value Equity Investments and PACE Small/Medium Co Growth Equity Investments, for those Portfolios having breakpoints, each Portfolio's asset level exceeded at least its first breakpoint. Accordingly, the board determined that actual economies of scale existed for those Portfolios whose assets had reached the first breakpoint level and potential economies of scale existed for those Portfolios whose assets had not yet reached their first breakpoint level. The board also noted that to the extent a Portfolio's assets have increased over time, it has realized other economies of scale as certain expenses, such as fees for trustees, auditor and legal fees and printing and postage, become a smaller percentage of overall assets. The board also took note of the relationship between any breakpoints in a subadvisory fee and the breakpoints in fees paid by the Portfolios to UBS AM.
Generally, in light of UBS AM's profitability data, the Actual Management Fees, the Contractual Management Fees, the breakpoints currently in place for the Portfolios and the current assets of the Portfolios, the board believed that UBS AM's sharing of potential and current economies of scale with the Portfolios was acceptable.
Other benefits to UBS AM and the Subadvisors—The board was informed by management that the Subadvisors' relationships with the Portfolios were limited to their provision of subadvisory services to these
377
PACE Select Advisors Trust
Board approvals of investment management and administration
agreement and subadvisory agreements (unaudited)
Portfolios, and that therefore, management believed that the Subadvisors and their affiliates did not receive tangible ancillary benefits as a result of the Subadvisors' relationships with the Portfolios, with the exception of possible benefits from soft dollars (e.g., research credits related to transaction commissions) for the equity Portfolios (which also would potentially benefit such Portfolios) and possible limited benefits to certain affiliates of a Subadvisor, such as broker-dealers (e.g., an affiliate's execution of portfolio transactions subject to detailed restrictions in SEC rules and board oversight procedures). The board recognized that certain Subadvisors could receive intangible benefits from their association with the Trust, such as increased name recognition or publicity from being selected as Subadvisors to the Trust after an extensive review process. Similarly, a Portfolio could benefit from having a Subadvisor with an established or well-regarded reputation. In light of the costs of providing investment management, administrative and other services to the Portfolios and UBS AM's ongoing commitment to the Portfolios, the profits and other ancillary benefits that UBS AM and its affiliates received were considered reasonable.
In the discussions that follow, reference is made to the "median" in the Broadridge Expense Group, Supplemental Expense Group and Broadridge Performance Universe categories. With respect to expenses, below median fees or expenses represent fees or expenses that are lower relative to the median, and above median fees or expenses represent fees or expenses that are higher relative to the median of the funds in the relevant Expense Group. With respect to performance, below median performance represents performance that is worse relative to the median, and above median performance represents performance that is better relative to the median of the funds in the relevant Performance Universe. Broadridge information is calculated on a share class basis. References appearing below relate to Class A shares; the board also had information relevant to other share classes (e.g., Class P shares) during its considerations.
PACE Large Co Growth Equity Investments
In approving the Investment Management and Administration Agreement and the Subadvisory Agreements with each of J.P. Morgan Investment Management, Inc. ("J.P. Morgan"), Jackson Square Partners, LLC ("JSP"), and Mar Vista Investment Partners, LLC, the board, including the Independent Trustees, also considered the following factors:
Portfolio performance—The comparative Broadridge information showed that the Portfolio's performance was below the Performance Universe median for the one-, three-, five- and ten-year periods and since inception. Management discussed the reasons behind the Portfolio's recent underperformance, and noted that one Subadvisor is a valuation-focused manager with a defensive strategy that did not keep pace with the relatively strong benchmark return. Management also proposed the the future termination of one Subadvisor, which had regularly underperformed the benchmark, and to restructure the Portfolio, including allocating assets to UBS AM for direct management in accordance with a planned future transition.
Management and subadvisory fees and expense ratios—The comparative Broadridge information showed that the Portfolio's Contractual Management Fee and Actual Management Fee were above the median in the Portfolio's Expense Group, and the Portfolio's total expenses were slightly below the Expense Group median for the comparison periods utilized in the Broadridge report. Management noted that the Portfolio's Contractual Management Fee and Actual Management Fee, although above the median, were reasonably close to the Expense Group median (within five basis points (that is, hundredths of a percentage point)—i.e., 0.05% and eight basis points—i.e., 0.08%, respectively). Management further noted that, compared to the Supplemental Expense Group, consisting of other subadvised funds, the Portfolio's Contractual Management Fee and Actual Management Fee were more closely aligned with the Portfolio's peers. Management also noted that, if a proposal to allocate certain of the Portfolio's assets to UBS AM in the future for direct management was approved by the board, UBS AM would waive a portion of the Contractual Management Fee it receives from the Portfolio in order to pass through to shareholders the benefit gained from UBS AM's reduced sub-advisory costs.
378
PACE Select Advisors Trust
Board approvals of investment management and administration
agreement and subadvisory agreements (unaudited)
PACE Large Co Value Equity Investments
In approving the Investment Management and Administration Agreement and the Subadvisory Agreements with each of Boston Partners Global Investors, Inc., Los Angeles Capital Management and Equity Research, Inc. ("Los Angeles Capital"), Pzena Investment Management, LLC and River Road Asset Management, LLC, the board, including the Independent Trustees, also considered the following factors:
Portfolio performance—The comparative Broadridge information showed that the Portfolio's performance was below the Performance Universe median for the one-, three-, five- and ten-year periods and since inception. Management discussed the reasons behind the Portfolio's recent underperformance, both at a market level and with respect to specific Subadvisors. Management also discussed recent adjustments in asset allocations among the Subadvisors and noted it was continuing to closely evaluate the Subadvisors and opportunities to restructure the Portfolio to seek to improve performance going forward.
Management and subadvisory fees and expense ratios—The comparative Broadridge information showed that the Portfolio's Contractual Management Fee, Actual Management Fee and total expenses were slightly above the median in the Portfolio's Expense Group for the comparison periods utilized in the Broadridge report. Management noted that, compared to the Supplemental Expense Group, consisting of other subadvised funds, the Portfolio's Contractual Management Fee, Actual Management Fee and total expenses were more closely aligned with its peers, and the Portfolio's total expenses were within one basis point (i.e., 0.01%) of the Expense Group median.
PACE Small/Medium Co Growth Equity Investments
In approving the Investment Management and Administration Agreement and the Subadvisory Agreements with each of Calamos Advisors LLC, Jacobs Levy Equity Management, Inc. and Riverbridge Partners, LLC, the board, including the Independent Trustees, also considered the following factors:
Portfolio performance—The comparative Broadridge information showed that the Portfolio's performance was above the Performance Universe median for the three-year period, but below the Performance Universe median for the one-, five- and ten-year periods and since inception, ranking in the third quintile of performance in the Performance Universe in the one-year period.
Management and subadvisory fees and expense ratios—The comparative Broadridge information showed that the Portfolio's Contractual Management Fee, Actual Management Fee and total expenses were below the median in the Portfolio's Expense Group, as well as the Supplemental Expense Group, for the comparison periods utilized in the Broadridge report.
PACE Small/Medium Co Value Equity Investments
In approving the Investment Management and Administration Agreement and the Subadvisory Agreements with each of Huber Capital Management LLC, Kayne Anderson Rudnick Investment Management, LLC and Sapience Investments, LLC, the board, including the Independent Trustees, also considered the following factors:
Portfolio performance—The comparative Broadridge information showed that the Portfolio's performance was above the Performance Universe median for the one-, three-, five- and ten-year periods, but below the Performance Universe median since inception.
379
PACE Select Advisors Trust
Board approvals of investment management and administration
agreement and subadvisory agreements (unaudited)
Management and subadvisory fees and expense ratios—The comparative Broadridge information showed that the Portfolio's Contractual Management Fee was above the median in the Portfolio's Expense Group, the Portfolio's Actual Management Fee was at the median in the Portfolio's Expense Group and total expenses were below the median in the Portfolio's Expense Group for the comparison periods utilized in the Broadridge report. Management explained that the Portfolio's Contractual Management Fee, although above the median, was reasonably close to the Expense Group median (within one basis point—i.e., 0.01%).
PACE International Equity Investments
In approving the Investment Management and Administration Agreement and the Subadvisory Agreements with each of Chautauqua Capital Management—a division of Robert W. Baird & Co. Incorporated, Los Angeles Capital and Mondrian Investment Partners Limited ("Mondrian"), the board, including the Independent Trustees, also considered the following factors:
Portfolio performance—The comparative Broadridge information showed that the Portfolio's performance was below the Performance Universe median for the one-, three-, five- and ten-year periods and since inception. Management explained that although the Portfolio's benchmark is a large cap core index, the Portfolio continues to be classified in the Lipper International Multi-Cap Growth category and in addition, the Portfolio's value allocation (as compared to growth) resulted in underperformance against the Performance Universe. Management discussed the Portfolio's better relative performance when compared to foreign large cap blend funds, which it believes is a more appropriate comparison.
Management and subadvisory fees and expense ratios—The comparative Broadridge information showed that the Portfolio's Contractual Management Fee, Actual Management Fee and total expenses were above the median in the Portfolio's Expense Group for the comparison periods utilized in the Broadridge report. Management explained the composition of the Expense Group changed during the comparison period, and noted the Portfolio's total expense ratio was generally close to the Expense Group median and reminded the board of prior actions to voluntarily lower the Portfolio's total expenses. Management proposed to voluntarily further lower the Portfolio's expense cap by ten basis points (i.e., 0.10%).
PACE International Emerging Markets Equity Investments
In approving the Investment Management and Administration Agreement and the Subadvisory Agreements with each of LMCG Investments, LLC, Mondrian, RWC Asset Advisors (US) LLC, and William Blair Investment Management, LLC, the board, including the Independent Trustees, also considered the following factors:
Portfolio performance—The comparative Broadridge information showed that the Portfolio's performance was below the Performance Universe median for the one-, three-, five- and ten-year periods and since inception. Management noted that, during the one-year period, the Portfolio's value allocation (as compared to growth) resulted in underperformance against the Performance Universe. Management also discussed their expectations for Subadvisor performance on a longer-term basis.
Management and subadvisory fees and expense ratios—The comparative Broadridge information showed that the Portfolio's Contractual Management Fee, Actual Management Fee and total expenses were above the median in the Portfolio's Expense Group for the comparison periods utilized in the Broadridge report. Management noted the downward trend in the Portfolio's expenses, including prior actions by management to voluntarily lower the Portfolio's total expenses. Management proposed to voluntarily further lower the Portfolio's expense cap by ten basis points (i.e., 0.10%).
380
PACE Select Advisors Trust
Board approvals of investment management and administration
agreement and subadvisory agreements (unaudited)
PACE Alternative Strategies Investments
In approving the Investment Management and Administration Agreement and the Subadvisory Agreements with each of Aviva Investors Americas LLC, DLD Asset Management, LP, First Quadrant L.P., Kettle Hill Capital Management, LLC, Magnetar Asset Management, LLC. PCJ Investment Counsel Ltd., Sirios Capital Management, L.P., Standard Life Investments (Corporate Funds) Limited and Wells Capital Management Incorporated (formerly, Analytic Investors, LLC), the board, including the Independent Trustees, also considered the following factors:
Portfolio performance—The comparative Broadridge information showed that the Portfolio's performance was above the Performance Universe median for the one-, three- and five-year periods and below the Performance Universe median for the ten-year period and since inception.
Management and subadvisory fees and expense ratios—The comparative Broadridge information showed that the Portfolio's Contractual Management Fee, Actual Management Fee and total expenses were above the median in the Portfolio's Expense Group for the comparison periods utilized in the Broadridge report. Management noted that the Portfolio's total expenses, although above the median, were reasonably close to the Expense Group median (approximately five basis points i.e., 0.05% above the median). With respect to the Supplemental Expense Group, management noted that the Portfolio's Contractual Management Fee, Actual Management Fee and total expenses were below the median.
PACE Global Real Estate Securities Investments
In approving the Investment Management and Administration Agreement and the Subadvisory Agreement with Brookfield Public Securities Group, Brookfield Public Securities Group, LLC, the board, including the Independent Trustees, also considered the following factors:
Portfolio performance—The comparative Broadridge information showed that the Portfolio's performance was below the Performance Universe median for the one-, three-, five- and ten-year periods and since inception. Management noted that, during the one-year period, the Portfolio's value focus resulted in underperformance against the Performance Universe. Management noted that they would continue to evaluate the Portfolio's portfolio construction going forward.
Management and subadvisory fees and expense ratios—The comparative Broadridge information showed that the Portfolio's Contractual Management Fee and Actual Management Fee were below the median, each ranking in the first quintile of expenses in the Expense Group, and its total expenses were above the median in the Portfolio's Expense Group for the comparison periods utilized in the Broadridge report. Similarly, the Portfolio's Contractual Management Fee and Actual Management Fee were below each of their respective medians in the Supplemental Expense Group and the Portfolio's total expenses were at the median. Management explained that the Portfolio's total expenses, although above the median, were reasonably close to the Expense Group median (within eight basis points—i.e., 0.08%).
PACE Mortgage-Backed Securities Fixed Income Investments
In approving the Investment Management and Administration Agreement and the Subadvisory Agreement with Pacific Investment Management Company LLC ("PIMCO"), the board, including the Independent Trustees, also considered the following factors:
381
PACE Select Advisors Trust
Board approvals of investment management and administration
agreement and subadvisory agreements (unaudited)
Portfolio performance—The comparative Broadridge information showed that the Portfolio's performance was above the Performance Universe median for the one- three-, five-year periods and since inception, but below the Performance Universe median for the ten-year period.
Management and subadvisory fees and expense ratios—The comparative Broadridge information showed that the Portfolio's Contractual Management Fee, Actual Management Fee and total expenses were above the median (with the Portfolio's Contractual Management Fee the highest in the Expense Group) for the comparison periods utilized in the Broadridge report. Management noted that, compared to the Supplemental Expense Group, the Portfolio's Contractual Management Fee and total expenses were more closely aligned to its peers, and the Actual Management Fee was at the Supplemental Expense Group median.
PACE High Yield Investments
In approving the Investment Management and Administration Agreement and the Subadvisory Agreements with each of Nomura Corporate Research and Asset Management Inc. ("NCRAM") and Nomura Asset Management Singapore Limited (the latter being a sub-manager to NCRAM for Asia), the board, including the Independent Trustees, also considered the following factors:
Portfolio performance—The comparative Broadridge information showed that the Portfolio's performance was above the Performance Universe median for the five-year period and since inception, but was below the Performance Universe median for the one-, three- and ten-year periods. Management noted that greater-than-benchmark exposure to securities in the energy sector and lower-rated securities (i.e., CCC-rated) detracted from the Portfolio's relative performance during the one-year period.
Management and subadvisory fees and expense ratios—The comparative Broadridge information showed that the Portfolio's Contractual Management Fee, Actual Management Fee and total expenses were above the median in the Portfolio's Expense Group for the comparison periods utilized in the Broadridge report. Management explained that the Actual Management Fee and total expenses, although above the median, were reasonably close to the Expense Group median (each within two basis points—i.e., 0.02%). Management noted that the Portfolio's Actual Management Fee and total expenses were at the Supplemental Expense Group medians.
PACE Intermediate Fixed Income Investments
In approving the Investment Management and Administration Agreement and the Subadvisory Agreement with BlackRock Financial Management, Inc., the board, including the Independent Trustees, also considered the following factors:
Portfolio performance—The comparative Broadridge information showed that the Portfolio's performance was below the Performance Universe median for the three-, five- and ten-year periods and since inception, but was above the Performance Universe median for the one-year period.
Management and subadvisory fees and expense ratios—The comparative Broadridge information showed that the Portfolio's Contractual Management Fee, Actual Management Fee and total expenses were above the median in the Portfolio's Expense Group for the comparison periods utilized in the Broadridge report. Management noted that, compared to the funds in the Supplemental Expense Group that, like the Portfolio, do not utilize affiliated subadvisors, the Portfolio's Actual Management Fee and total expenses were more closely aligned to its peers.
382
PACE Select Advisors Trust
Board approvals of investment management and administration
agreement and subadvisory agreements (unaudited)
PACE Global Fixed Income Investments
In approving the Investment Management and Administration Agreement and the Subadvisory Agreement with J.P. Morgan, the board, including the Independent Trustees, also considered the following factors:
Portfolio performance—The comparative Broadridge information showed that the Portfolio's performance was below the Performance Universe median for the three-, five- and ten-year periods and since inception, but above the Performance Universe median for the one-year period.
Management and subadvisory fees and expense ratios—The comparative Broadridge information showed that the Portfolio's Contractual Management Fee, Actual Management Fee and total expenses were above the median (with the Portfolio's Contractual Management Fee the highest in the Expense Group) for the comparison periods utilized in the Broadridge report. Management noted that the Portfolio's Actual Management Fee and total expenses were reasonably close to the Expense Group median (within five basis points—i.e., 0.05% and four basis points—i.e., 0.04%, respectively).
PACE Municipal Fixed Income Investments
In approving the Investment Management and Administration Agreement and the Subadvisory Agreement with Mellon Investments Corporation, the board, including the Independent Trustees, also considered the following factors:
Portfolio performance—The comparative Broadridge information showed that the Portfolio's performance was above the Performance Universe median for the one-, three- and five-year periods, but below the Performance Universe median for the ten-year period and since inception.
Management and subadvisory fees and expense ratios—The comparative Broadridge information showed that the Portfolio's Contractual Management Fee, Actual Management Fee and total expenses were above the median in the Portfolio's Expense Group for the comparison periods utilized in the Broadridge report. Management noted that the Portfolio's Contractual Management Fee, Actual Management Fee and total expenses, although all above the respective median, were reasonably close to the Expense Group medians (within four basis points—i.e., 0.04%, nine basis points—i.e., 0.09% and eight basis points—i.e., 0.08%, respectively). Management further noted that, compared to the Supplemental Expense Group, the Portfolio's Contractual Management Fee, Actual Management Fee and total expenses were more closely aligned to its peers, and, compared to the funds in the Supplemental Expense Group that, like the Portfolio, do not utilize affiliated subadvisors, the Portfolio's Actual Management Fee and total expenses were at the median.
PACE Strategic Fixed Income Investments
In approving the Investment Management and Administration Agreement and the Subadvisory Agreement with Neuberger Berman Investment Advisers LLC and PIMCO, the board, including the Independent Trustees, also considered the following factors:
Portfolio performance—The comparative Broadridge information showed that the Portfolio's performance was above the Performance Universe median for the one-, three-, five- and ten-year periods and since inception.
Management and subadvisory fees and expense ratios—The comparative Broadridge information showed that the Portfolio's Contractual Management Fee, Actual Management Fee and total expenses were above the median in the Portfolio's Expense Group for the comparison periods utilized in the Broadridge report. Management
383
PACE Select Advisors Trust
Board approvals of investment management and administration
agreement and subadvisory agreements (unaudited)
noted the downward trend in the Portfolio's expenses and reminded the board that management voluntarily lowered the Portfolio's expense cap in 2019.
UBS Government Money Market Investments Fund (formerly, PACE Government Market Investments)
In approving the Investment Management and Administration Agreement, the board, including the Independent Trustees, also considered the following factors:
Portfolio performance—The comparative Broadridge information showed that the Portfolio's performance was at or slightly above the Performance Universe median for the ten-year period and since inception, but slightly below the Performance Universe median for the one-, three- and five-year periods. Management noted that during the third quarter of 2019, the Portfolio began holding more liquid investments, reducing yield, as part of an expansion of the Portfolio's potential investor base.
Management fees and expense ratios—The comparative Broadridge information showed that the Portfolio's Actual Management Fee was below the median, and its Contractual Management Fee and total expenses were at the median in the Portfolio's Expense Group for the comparison periods utilized in the Broadridge report.
Conclusion
Based on its review and, in certain instances, management's explanations upon further questioning, the board concluded that each Portfolio's investment performance was satisfactory or acceptable and that each management fee and subadvisory fee, as proposed by management after questions and/or suggestions posed by the board, continued to be appropriate under the circumstances and in light of the nature, extent and quality of the services provided to the Portfolio under the applicable Investment Management and Administration Agreement and Subadvisory Agreement or Subadvisory Agreements, respectively.
In light of all of the foregoing, the board, including a majority of the Independent Trustees, approved the Investment Management and Administration Agreement for each Portfolio and, for those Portfolios with Subadvisors, the Subadvisory Agreement(s). No single factor reviewed by the board was identified by the board as the principal factor in determining whether to approve the Investment Management and Administration Agreement or, for the subadvised Portfolios, the Subadvisory Agreement(s). The Independent Trustees were advised by separate independent legal counsel throughout the process. The board discussed the proposed continuance of the Investment Management and Administration Agreement and the Subadvisory Agreements in private sessions with their independent legal counsel at which no representatives of UBS AM or the Subadvisors were present.
384
PACE Select Advisors Trust
PACE Intermediate Fixed Income Investments
Blackrock Financial Management, Inc. and BlackRock International Limited
Background—At a meeting of the board of PACE Select Advisors Trust (the "Trust") on July 21-22, 2020, the members of the board, including the trustees who are not "interested persons" of the Trust (the "Independent Trustees") as defined in the Investment Company Act of 1940, as amended, considered and approved (i) the proposed amendment ("Amendment") to the sub-advisory agreement (the "Sub-Advisory Agreement") between UBS Asset Management (Americas) Inc. ("UBS AM") and BlackRock Financial Management, Inc. ("BlackRock Financial") with respect to PACE Intermediate Fixed Income Investments (the "Portfolio") and (ii) a new sub-sub-advisory agreement (the "Sub-Sub-Advisory Agreement") between BlackRock Financial and BlackRock International Limited ("BlackRock International", and together with BlackRock Financial, "BlackRock"), relating to the proposed appointment of BlackRock International as a new sub-sub-advisor to the Portfolio. Management noted that the allocation of the Portfolio's assets to Blackrock Financial and the investment strategy utilized by BlackRock with respect to the Portfolio will not change as a result of the proposals. The board recognized its familiarity with UBS AM and the investment management and sub-advisory agreements for this and the other portfolios of the Trust, including the extensive materials the board had previously reviewed in connection with the annual reconsideration of the contracts for the portfolios. The board also received a memorandum from UBS AM discussing UBS AM's reasons for recommending approval of the Amendment and the appointment of BlackRock International as a sub-sub-advisor to the Portfolio.
In its consideration of the approval of the Amendment and the Sub-Advisory Agreement, the board considered the following factors:
Nature, extent and quality of the services under the Amendment and the Sub-Advisory Agreement—The board's evaluation of the services to be provided by BlackRock to the Portfolio took into account the board's knowledge and familiarity gained as board members of funds in the UBS New York fund complex, including the Trust and its portfolios. The board considered management's reasons for recommending the approval of the Amendment and that BlackRock International be added as sub-sub-advisor to the Portfolio, including its belief that the Sub-Sub-Advisory Agreement would facilitate the provision of advice and trading out of non-U.S. jurisdictions, including more timely execution, and allow BlackRock Financial and BlackRock International to better leverage their integrated investment process and local footprint with respect to the implementation of the investment strategy for the Portfolio. The board noted that the operations of BlackRock Financial and BlackRock International are closely integrated, including centralized trade execution and compliance functions, and that the proposed appointment of BlackRock International as a sub-sub-advisor is not expected to result in changes to the services currently provided by BlackRock Financial to the Portfolio. The board also noted that the Amendment was necessary in order to provide explicit authority for BlackRock Financial to engage BlackRock International as a sub-sub-adviser under the Sub-Advisory Agreement. The board concluded that, overall, it was satisfied with the nature, extent and quality of services expected to be provided to the Portfolio under the Sub-Advisory Agreement with the Amendment and the proposed Sub-Sub-Advisory Agreement.
Sub-advisory fee and sub-sub-advisory fee—The board reviewed and considered the contractual sub-advisory fee payable to BlackRock Financial under the Sub-Advisory Agreement and the proposed contractual sub-sub-advisory fee payable to BlackRock International under the Sub-Sub-Advisory Agreement in light of the nature, extent and quality of the sub-advisory services and sub-sub-advisory services anticipated to be provided by BlackRock Financial and BlackRock International, respectively. The board noted that the contractual sub-advisory fee in the Sub-Advisory Agreement was not being changed by the Amendment and that such fee would continue to be paid by UBS AM, and not the Portfolio, to BlackRock Financial. The board also noted that the sub-sub-advisory fee to be received by BlackRock International will be paid by BlackRock Financial. The board determined that each of the contractual sub-advisory fee and the proposed contractual sub-sub-advisory fee was reasonable in light of the nature, extent and quality of the services proposed to be provided to the Portfolio under the Sub-Advisory Agreement with the Amendment and the Sub-Sub-Advisory Agreement, respectively.
385
PACE Select Advisors Trust
PACE Intermediate Fixed Income Investments
Fund performance—The board noted that it previously received and considered performance information provided by UBS AM, including relative performance information from independent providers of investment company data. The board also noted that UBS AM believes that the Portfolio's investment team would continue to perform at the same level as it did prior to approval of the Agreements, and further considered the anticipated benefits to the Portfolio by adding BlackRock International as a sub-sub-adviser. The board concluded that, overall, it was satisfied with the performance of the Portfolio.
Advisor profitability—Profitability of BlackRock Financial, BlackRock International or their affiliates or UBS AM or its affiliates in providing services to the Portfolio was not a significant factor considered by the board, as the sub-advisory fee would be paid by UBS AM to BlackRock Financial out of the management fee paid to it by the Fund, and the sub-sub-advisory fee would be paid by BlackRock Financial out of the sub-advisory fee paid to it by UBS AM, and not by the Portfolio. As noted above, the board observed that the contractual sub-advisory fee paid by UBS AM to Blackrock Financial under the Sub-Advisory Agreement was unchanged by the Amendment.
Economies of scale—The board noted that, as the sub-advisory fee for the Portfolio would continue to be paid by UBS AM and the sub-sub-advisory fee for the Portfolio would be paid by BlackRock Financial, and neither fee would be paid by the Portfolio, consideration of economies of scale with respect specifically to the sub-advisory fee and sub-sub-advisory fee was not relevant.
Other benefits to BlackRock—The board was informed by management that the relationship of BlackRock Financial and BlackRock International with the Portfolio would be limited to their provision of sub-advisory or sub-sub-advisory services, respectively, to the Portfolio, and that therefore management believed that BlackRock would not receive tangible ancillary benefits as a result of its relationship with the Portfolio, with the exception of possible benefits from soft dollars (e.g., research credits related to transaction commissions) for the Portfolio (which would also potentially benefit the Portfolio). The board recognized that BlackRock Financial and BlackRock International could receive intangible benefits from their association with the Portfolio, such as increased name recognition or publicity from being retained or selected as the Portfolio's sub-adviser and sub-sub-advisor, respectively, to the Portfolio after an extensive review process. Similarly, the Portfolio could benefit from having a sub-adviser and sub-sub-advisor with an established or well-regarded reputation.
In light of all of the foregoing, the board, including a majority of the Independent Trustees, approved the proposed Amendment and Sub-Sub-Advisory Agreement. No single factor reviewed by the board was identified by the board as the principal factor in determining whether to approve the Amendment and Sub-Sub-Advisory Agreement. The Independent Trustees were advised by separate independent legal counsel throughout the process.
386
PACE Select Advisors Trust
Supplemental information (unaudited)
Board of Trustees & Officers
The Trust is governed by a Board of Trustees which oversees the Portfolios' operations. Each Trustee serves an indefinite term of office. Officers are appointed by the trustees and serve at the pleasure of the Board. The table below shows, for each trustee and officer, his or her name, address and age, the position held with the Trust, the length of time served as a trustee or officer of the Trust, the trustee's or officer's principal occupations during the last five years, the number of portfolios in the UBS fund complex overseen by the trustee or for which a person served as an officer, and other directorships held by the trustee.
The Trust's Statement of Additional Information contains additional information about the trustees and is available, without charge, upon request by calling 1-800-647 1568.
Interested Trustees:
Name,
address,
and age | | Position(s)
held with
Trust | | Term of office1
and length of
time served | | Principal
occupation(s)
during past
5 years | | Number of
portfolios in fund
complex overseen
by Trustee | | Other
directorships
held by
Trustee | |
Meyer Feldberg2;
78
Morgan Stanley
1585 Broadway
36th Floor
New York, NY 10036 | | Trustee | | Since 2001 (Trustee); Since 2017 (Chairman of the Board of Trustees) | | Professor Feldberg is Dean Emeritus and Professor of Leadership and Ethics at Columbia Business School, although on an extended leave of absence. He is also a senior advisor to Morgan Stanley (financial services) (since 2005). Professor Feldberg also served as president of New York City Global Partners (an organization located in part of the Office of the Mayor of the City of New York that promoted interaction with other cities around the world) (2007-2014). Prior to 2004, he was Dean and Professor of Management and Ethics of the Graduate School of Business at Columbia University (since 1989). From 1992 to 2016, Professor Feldberg was a director of Macy's, Inc. (operator of department stores). From 1997 to 2017, Professor Feldberg was a director of Revlon, Inc. (cosmetics). | | Professor Feldberg is a director or trustee of 9 investment companies (consisting of 51 portfolios) for which UBS Asset Management (Americas) Inc. ("UBS AM") or one of its affiliates serves as investment advisor or manager. | | Professor Feldberg is also a director of the New York City Ballet. | |
387
PACE Select Advisors Trust
Supplemental information (unaudited)
Independent Trustees:
Name,
address,
and age | | Position(s)
held with
Trust | | Term of office1
and length of
time served | | Principal
occupation(s)
during past
5 years | | Number of
portfolios in fund
complex overseen
by Trustee | | Other
directorships
held by
Trustee | |
Alan S. Bernikow;
79
207 Benedict Ave.
Staten Island, NY 10314 | | Trustee | | Since 2005 | | Mr. Bernikow is retired. Previously, he was deputy chief executive officer at Deloitte & Touche (international accounting and consulting firm). From 2003 to March 2017, Mr. Bernikow was also a director of Destination XL Group, Inc. (menswear) (and served as a member of its nominating and corporate governance committee). | | Mr. Bernikow is a director or trustee of 5 investment companies (consisting of 47 portfolios) for which UBS AM serves as investment advisor or manager. | | Mr. Bernikow is also a director of Revlon, Inc. (cosmetics) (and serves as the chair of its audit committee and as the chair of the compensation committee), the lead director of Mack-Cali Realty Corporation (real estate investment trust) (and serves as the chair of its audit committee). | |
Richard R. Burt;
73
McLarty Associates
900 17th Street
Washington, D.C. 20006 | | Trustee | | Since 2001 | | Mr. Burt is a managing partner of McLarty Associates (a consulting firm) (since 2007). He was chairman of IEP Advisors (international investments and consulting firm) until 2009. | | Mr. Burt is a director or trustee of 5 investment companies (consisting of 47 portfolios) for which UBS AM serves as investment advisor or manager. | | Mr. Burt is also a director of The Central Europe, Russia and Turkey Fund, Inc., The European Equity Fund, Inc. and The New Germany Fund, Inc. (and serves as a member of each such fund's audit, nominating and governance committee). | |
Bernard H. Garil;
80
6754 Casa Grande Way
Delray Beach, FL 33446 | | Trustee | | Since 2005 | | Mr. Garil is retired (since 2001). He was a managing director at PIMCO Advisory Services (from 1999 to 2001) where he served as president of closed-end funds and vice-president of the variable insurance product funds advised by OpCap Advisors (until 2001). | | Mr. Garil is a director or trustee of 5 investment companies (consisting of 47 portfolios) for which UBS AM serves as investment advisor or manager. | | Mr. Garil is also a director of The Leukemia and Lymphoma Society (voluntary health organization) and a trustee for the Brooklyn College Foundation, Inc. (charitable foundation). | |
388
PACE Select Advisors Trust
Supplemental information (unaudited)
Independent Trustees (concluded):
Name,
address,
and age | | Position(s)
held with
Trust | | Term of office1
and length of
time served | | Principal
occupation(s)
during past
5 years | | Number of
portfolios in fund
complex overseen
by Trustee | | Other
directorships
held by
Trustee | |
Heather R. Higgins;
61
c/o Keith A. Weller
Fund Secretary
UBS Asset Management (Americas) Inc.
One North Wacker Drive
Chicago, IL 60606 | | Trustee | | Since 2005 | | Ms. Higgins is the president and director of The Randolph Foundation (charitable foundation) (since 1991). Ms. Higgins also serves (or has served) on the boards of several non-profit charitable groups, including the Independent Women's Forum (chairman) and the Philanthropy Roundtable (vice chairman). She also serves on the board of the Hoover Institution (from 2001 to 2007 and since 2009). | | Ms. Higgins is a director or trustee of 5 investment companies (consisting of 47 portfolios) for which UBS AM serves as investment advisor or manager. | | None | |
389
PACE Select Advisors Trust
Supplemental information (unaudited)
Officers:
Name,
address
and age | | Position(s)
held with
Trust | | Term of office1
and length of
time served | | Principal occupation(s) during past 5 years;
number of portfolios in fund complex
for which person serves as officer | |
Rose Ann Bubloski*;
52 | | Vice President and Assistant Treasurer | | Since 2011 | | Ms. Bubloski is a director (since 2012) (prior to which she was an associate director (from 2008 to 2012)) and a senior manager of product control and investment support of UBS AM—Americas region. Ms. Bubloski is vice president and assistant treasurer of 8 investment companies (consisting of 62 portfolios) for which UBS AM serves as investment advisor or manager. | |
Franklin P. Dickson*;
42 | | Vice President | | Since 2017 | | Mr. Dickson is an associate director (since 2015) and tax compliance manager (since 2017) (prior to which he was a product controller (from 2015 to 2017) of product control and investment support of UBS AM—Americas region. From 2013 through 2015, Mr. Dickson was fund administration and compliance manager for U.S. Bancorp Fund Services, LLC, and from 2008 through 2013, Mr. Dickson was vice president, client service manager at BNY Mellon Asset Servicing. Mr. Dickson is a vice president of 8 investment companies (consisting of 62 portfolios) for which UBS AM serves as investment advisor or manager. | |
Mark F. Kemper**;
62 | | Vice President and
Assistant Secretary | | Since 1999 and March
2019, respectively | | Mr. Kemper is a managing director (since 2006) and senior legal counsel (since October 2019) (prior to which he was Interim head of Compliance and Operational Risk Control (from June 2019 through September 2019) and general counsel (from 2004 through May 2019) of UBS AM—Americas region. He has been secretary of UBS AM—Americas region (since 2004) and secretary of UBS Asset Management Trust Company (since 1993). Mr. Kemper is vice president and assistant secretary of 8 investment companies (consisting of 62 portfolios) for which UBS AM serves as investment advisor or manager. Mr. Kemper is employed by UBS Business Solutions US LLC (since 2017). | |
Joanne M. Kilkeary*;
52 | | Vice President, Treasurer and Principal Accounting Officer | | Since 1999 (Vice President); since 2017 (Treasurer and Principal Accounting Officer) | | Ms. Kilkeary is an executive director (since 2013) (prior to which she was a director) (from 2008 to 2013)) and head of regulatory, tax, audit and board governance for product control and investment support (since 2017) (prior to which she was a senior manager of registered fund product control of UBS AM—Americas region (from 2004 to 2017)). Ms. Kilkeary is a vice president and assistant treasurer of 8 investment companies (consisting of 62 portfolios) for which UBS AM serves as investment advisor or manager. | |
Igor Lasun2;
41 | | President | | Since 2018 | | Mr. Lasun is an executive director and head of fund development and management for UBS AM—Americas region (since 2018) (prior to which he was a senior fixed income product specialist from 2007 to 2018, and had joined the firm in 2005). In this role, he oversees development and management for both wholesale and institutional businesses. Mr. Lasun serves as president of 7 investment companies (consisting of 61 portfolios) for which UBS AM serves as investment advisor or manager. | |
William Lawlor**;
33 | | Vice President and Assistant Secretary | | Since 2018 | | Mr. Lawlor is a director and associate general counsel with UBS Business Solutions US LLC (since 2017) and also with UBS AM—Americas region since 2013. Prior to joining UBS AM—Americas region, Mr. Lawlor attended Kent College of Law, where he graduated in 2013. Mr. Lawlor is a vice president and assistant secretary of 7 investment companies (consisting of 61 portfolios) for which UBS AM serves as investment advisor or manager. | |
Mabel Lung***;
62 | | Vice President | | Since 2016 | | Ms. Lung is a managing director and portfolio manager, Multi-Component Portfolios, of UBS AM—Americas region which she joined in 1995. Ms. Lung is a vice president of one investment company (consisting of 15 portfolios) for which UBS AM serves as investment advisor or manager. | |
390
PACE Select Advisors Trust
Supplemental information (unaudited)
Officers (concluded):
Name,
address
and age | | Position(s)
held with
Trust | | Term of office1
and length of
time served | | Principal occupation(s) during past 5 years;
number of portfolios in fund complex
for which person serves as officer | |
Frank S.
Pluchino***,
61 | | Chief Compliance Officer | | Since 2017 | | Mr. Pluchino is an executive director with UBS AM—Americas region and is also the chief compliance officer of UBS Hedge Fund Solutions LLC (since 2010). Mr. Pluchino serves as chief compliance officer of 12 investment companies (consisting of 66 portfolios) for which UBS AM or one of its affiliates serves as investment advisor or manager. | |
Robert Sabatino**;
47 | | Vice President | | Since 2001 | | Mr. Sabatino is a managing director (since 2010) (prior to which he was an executive director) (from 2007 to 2010)), global head of liquidity portfolio management (since 2015), head of US taxable money markets (from 2009 to 2015), and portfolio manager of UBS AM—Americas region in the short duration fixed income group (since 2001). Mr. Sabatino is a vice president of three investment companies (consisting of 45 portfolios) for which UBS AM serves as investment advisor or manager. | |
Eric Sanders**;
54 | | Vice President and Assistant Secretary | | Since 2005 | | Mr. Sanders is a director and associate general counsel with UBS Business Solutions US LLC (since 2017) and also with UBS AM—Americas region (since 2005). Mr. Sanders is a vice president and assistant secretary of 8 investment companies (consisting of 62 portfolios) for which UBS AM serves as investment advisor or manager. | |
Philip Stacey**;
35 | | Vice President and Assistant Secretary | | Since 2018 | | Mr. Stacey is an executive director and associate general counsel with UBS Business Solutions US LLC (Since 2017) and also with UBS AM—Americas region since 2015. Prior to joining UBS AM—Americas region. Mr. Stacey was a legal associate with the Chicago-based investment manager HFR Asset Management, LLC from 2009 through 2015. Mr. Stacey is a vice president and assistant secretary of 7 investment companies (consisting of 61 portfolios) for which UBS AM serves as investment advisor or manager. | |
Gina M. Toth***;
56 | | Vice President | | Since 2016 | | Ms. Toth is an executive director and portfolio manager in the Multi-Manager Solutions team of UBS AM—Americas region (since 2013). Prior to joining UBS AM—Americas region, Ms. Toth was a senior portfolio manager at Alliance Bernstein (from 1993 to 2012). Ms. Toth is a vice president of one investment company (consisting of 15 portfolios) for which UBS AM serves as investment advisor or manager. | |
David Walczak**;
37 | | Vice President | | Since 2016 | | Mr. Walczak is an executive director (since 2016), head of US taxable money markets (since 2015) and portfolio manager of UBS AM—Americas region. Mr. Walczak is a vice president of three investment companies (consisting of 41 portfolios) for which UBS AM serves as investment advisor or manager. | |
Keith A. Weller**;
59 | | Vice President and Secretary | | Since 2000 and March 2019, respectively | | Mr. Weller is an executive director and deputy general counsel (since February 2019, prior to which he was senior associate general counsel) with UBS Business Solutions US LLC (since 2017) and also with UBS AM—Americas region (since 2005) and has been an attorney with affiliated entities since 1995. Mr. Weller is a vice president and secretary of 8 investment companies (consisting of 62 portfolios) for which UBS AM serves as investment advisor or manager. | |
1 Each trustee holds office for an indefinite term. Officers are appointed by the trustees and serve at the pleasure of the Board.
2 Professor Feldberg is deemed an "interested person" of the Trust as defined in the Investment Company Act of 1940, as amended, because he is a senior advisor to Morgan Stanley, a financial services firm with which the Trust may conduct transactions.
* This person's business address is 1285 Avenue of the Americas, New York, New York 10019-6028.
** This person's business address is One North Wacker Drive, Chicago, Illinois 60606.
*** This person's business address is 787 Seventh Avenue, New York, New York 10019.
391
Trustees
Meyer Feldberg
Chairman
Alan S. Bernikow
Richard R. Burt
Bernard H. Garil
Heather R. Higgins
Investment Manager and
Administrator
UBS Asset Management (Americas) Inc.
1285 Avenue of the Americas
New York, New York 10019-6028
Principal Underwriter
UBS Asset Management (US) Inc.
1285 Avenue of the Americas
New York, New York 10019-6028
This report is not to be used in connection with the offering of shares of the Portfolios unless accompanied or preceded by an effective prospectus.
©UBS 2020. All rights reserved.
UBS Asset Management (Americas) Inc.
PRESORTED
STANDARD
U.S. POSTAGE
PAID
COMPUTERSHARE

UBS Asset Management (Americas) Inc.
1285 Avenue of the Americas
New York, NY 10019-6028

UBS Government Money Market Investments Fund
Annual Report | July 31, 2020
UBS Government Money Market Investments Fund
September 11, 2020
Dear Shareholder,
We present you with the annual report for UBS Government Money Market Investments Fund (the "Portfolio") for the 12 months ended July 31, 2020 (the "reporting period").
Performance
The seven-day current yield for the Fund as of July 31, 2020 was 0.01% (after fee waivers/expense reimbursements).1 For more information on the Portfolio performance, refer to "Yields and characteristics at a glance" on page 5. Please remember that the PACE program fee, or other advisory fee to which your account is subject, is assessed outside the Portfolio at the account level. The program fee does not impact the determination of the Fund's net asset value per share.
Advisor's Comments
The US Federal Reserve Board (the "Fed") took a number of unprecedented actions to support the economy and maintain the proper functioning of the financial markets.
1 Class P shares held through the PACE Select Advisors Program are subject to a maximum Program fee of 2.50%, which, if included, would have reduced performance. Class P shares held through other advisory programs also may be subject to a program fee, which, if included, would have reduced performance.
PACE Select Advisors Trust—UBS Government Money Market Investments Fund (formerly, PACE Government Money Market Investments)
Investment Advisor:
UBS Asset Management (Americas) Inc.
Portfolio Manager:
Robert Sabatino
Objective:
Current income consistent with preservation of capital and liquidity
Investment process:
The Portfolio is a money market mutual fund and seeks to maintain a stable price of $1.00 per share, although it may be possible to lose money by investing in this Portfolio. The Portfolio invests in a diversified portfolio of highquality money market instruments of governmental issuers. Security selection is based on the assessment of relative values and changes in market and economic conditions.
1
UBS Government Money Market Investments Fund
After lowering the federal funds rate three times in 2019, the Fed moved decisively in March 2020. On March 3, 2020, it lowered the federal funds rate to a range between 1.00% and 1.25% and, on March 15, this was reduced to a range between 0.00% and 0.25%. As a result, the Portfolio's yield also remained low during the reporting period.
We tactically adjusted the Portfolio's weighted average maturity ("WAM") which is the weighted average maturity of the securities in the portfolio throughout the 12-month review period. When the reporting period began, the Portfolio had a WAM of 34 days. This was 53 days at the end of the reporting period.
A number of adjustments were made to the Portfolio's sector and issuer positioning during the 12-month period. We reduced the Portfolio's exposures to US government and agency obligations and repurchase agreements, while initiating a position in US Treasury obligations. (Repurchase agreements are transactions in which the seller of a security agrees to buy it back at a predetermined time and price or upon demand.)
Sincerely,

| | 
| |
Igor Lasun
President
PACE Select Advisors Trust
Executive Director
UBS Asset Management
(Americas) Inc. | | Robert Sabatino
Portfolio Manager,
UBS Government Money Market
Investments Fund
Managing Director,
UBS Asset Management
(Americas) Inc. | |
2
UBS Government Money Market Investments Fund
This letter is intended to assist shareholders in understanding how the Portfolio performed during the 12-month period ended July 31, 2020. The views and opinions in the letter were current as of September 11, 2020. They are not guarantees of future performance or investment results and should not be taken as investment advice. Investment decisions reflect a variety of factors, and we reserve the right to change our views about individual securities, sectors and markets at any time. As a result, the views expressed should not be relied upon as a forecast of the Portfolio's future investment intent. We encourage you to consult your financial advisor regarding your personal investment program.
Mutual funds are sold by prospectus only. You should read it carefully and consider a fund's investment objectives, risks, charges, expenses and other important information contained in the prospectus before investing. Prospectuses for most of our funds can be obtained from your financial advisor, by calling UBS Funds at 800-647 1568 or by visiting our Website at www.ubs.com/am-us.
3
UBS Government Money Market Investments Fund
Understanding your Portfolio's expenses (unaudited)
As a shareholder of the Portfolio, you incur two types of costs: (1) on-going program fees; and (2) ongoing Portfolio costs, including management fees and other Portfolio expenses. This example is intended to help you understand your ongoing costs (in dollars) of investing in the Portfolio and to compare these costs with the ongoing costs of investing in other mutual funds.
The example below is based on an investment of $1,000 invested at the beginning of the period and held for the entire period, February 1, 2020 to July 31, 2020.
Actual expenses
The first line in the table below provides information about actual account values and actual expenses. You may use the information in this line, together with the amount you invested, to estimate the expenses that you paid over a period. Simply divide your account value by $1,000 (for example, an $8,600 account value divided by $1,000 = 8.6), then multiply the result by the number in the first line under the heading "Expenses paid during period" to estimate the expenses you paid on your account during this period.
Hypothetical example for comparison purposes
The second line in the table below provides information about hypothetical account values and hypothetical expenses based on the Portfolio's actual expense ratio and an assumed rate of return of 5% per year before expenses, which is not the Portfolio's actual return. The hypothetical account values and expenses may not be used to estimate your actual ending account balance or expenses you paid for the period. You may use this information to compare the ongoing costs of investing in the Portfolio and other funds. To do so, compare this 5% hypothetical example with the 5% hypothetical examples that appear in the shareholder reports of other funds.
4
UBS Government Money Market Investments Fund
Understanding your Portfolio's expenses (unaudited) (concluded)
Please note that the expenses shown in the table are meant to highlight your ongoing Portfolio costs only and do not reflect any program fees. Therefore, the second line in the table is useful in comparing ongoing Portfolio costs only, and will not help you determine the relative total costs of owning different funds. In addition, if program fees were included, your costs would have been higher.
| | | Beginning
account value
February 1,
2020 | | Ending
account value
July 31,
2020 | | Expenses paid
during period1
02/01/20 to
07/31/20 | | Expense
ratio
during the
period | |
Actual | | $ | 1,000.00 | | | $ | 1,001.20 | | | $ | 2.14 | | | | 0.43 | % | |
Hypothetical
(5% annual return
before expenses) | | | 1,000.00 | | | | 1,022.72 | | | | 2.16 | | | | 0.43 | | |
1 Expenses are equal to the Portfolio's annualized net expense ratios, multiplied by the average account value over the period, multiplied by 182 divided by 366 (to reflect the one-half year period).
5
UBS Government Money Market Investments Fund
Yields and characteristics at a glance—July 31, 2020
(unaudited)
Yields and Characteristics | |
Seven-Day current yield after fee waivers and/or expense reimbursements1 | | | 0.01 | % | |
Seven-Day effective yield after fee waivers and/or expense reimbursements1 | | | 0.01 | | |
Seven-Day current yield before fee waivers and/or expense reimbursements1 | | | (1.01 | ) | |
Seven-Day effective yield before fee waivers and/or expense reimbursements1 | | | (1.01 | ) | |
Weighted average maturity2 | | | 53 days | | |
Portfolio composition3 | |
U.S. government agency obligations | | | 67.0 | % | |
U.S. Treasury obligations | | | 16.9 | | |
Repurchase agreements | | | 16.3 | | |
Other assets less liabilities | | | (0.2 | ) | |
Total | | | 100.0 | % | |
You could lose money by investing in UBS Government Money Market Investments Fund. Although the portfolio seeks to preserve the value of your investment at $1.00 per share, the portfolio cannot guarantee it will do so. An investment in UBS Government Money Market Investments Fund is not insured or guaranteed by the Federal Deposit Insurance Corporation ("FDIC") or any other government agency. UBS Government Money Market Investments Fund's sponsor has no legal obligation to provide financial support to UBS Government Money Market Investments Fund, and you should not expect that the portfolio's sponsor will provide financial support to UBS Government Money Market Investments Fund at any time.
Not FDIC insured. May lose value. No bank guarantee.
1 Yields will fluctuate and reflect fee waivers and/or expense reimbursements, if any, unless otherwise noted. Performance data quoted represents past performance. Past performance does not guarantee future results. Current performance may be higher or lower than the performance data quoted.
2 The Portfolio's actively managed and its weighted average maturity will differ over time.
3 Weightings represent percentages of the Portfolio's net assets as of the date indicated. The Portfolio's actively managed and its composition will vary over time.
6
UBS Government Money Market Investments Fund
Portfolio of investments—July 31, 2020
| | | Face
amount | | Value | |
U.S. government agency obligations—67.0% | |
Federal Farm Credit Bank | |
0.080%, due 10/02/201 | | $ | 4,000,000 | | | $ | 3,999,449 | | |
0.150%, due 03/02/211 | | | 1,750,000 | | | | 1,748,447 | | |
0.150%, due 05/26/21 | | | 1,000,000 | | | | 999,943 | | |
0.180%, due 07/13/21 | | | 1,000,000 | | | | 1,000,000 | | |
SOFR + 0.080%, | |
0.180%, due 11/27/202 | | | 1,000,000 | | | | 1,000,000 | | |
0.200%, due 11/06/201 | | | 3,000,000 | | | | 2,998,383 | | |
1 mo. USD LIBOR + 0.020%, | |
0.203%, due 09/09/202 | | | 2,000,000 | | | | 1,999,889 | | |
SOFR + 0.110%, | |
0.210%, due 05/18/212 | | | 2,000,000 | | | | 2,000,000 | | |
0.520%, due 09/11/201 | | | 3,000,000 | | | | 2,998,223 | | |
0.520%, due 10/16/201 | | | 1,500,000 | | | | 1,498,353 | | |
0.520%, due 10/28/201 | | | 1,500,000 | | | | 1,498,093 | | |
1.550%, due 08/04/201 | | | 2,000,000 | | | | 1,999,742 | | |
Federal Home Loan Bank | |
0.105%, due 12/18/201 | | | 2,000,000 | | | | 1,999,189 | | |
0.110%, due 09/15/201 | | | 2,900,000 | | | | 2,899,601 | | |
0.110%, due 09/18/201 | | | 2,800,000 | | | | 2,799,589 | | |
0.119%, due 10/21/201 | | | 5,000,000 | | | | 4,998,661 | | |
SOFR + 0.020%, | |
0.120%, due 08/19/202 | | | 1,000,000 | | | | 1,000,000 | | |
1 mo. USD LIBOR - 0.050%, | |
0.122%, due 01/27/212 | | | 1,000,000 | | | | 1,000,000 | | |
SOFR + 0.030%, | |
0.130%, due 08/21/202 | | | 1,000,000 | | | | 1,000,000 | | |
SOFR + 0.030%, | |
0.130%, due 09/04/202 | | | 6,500,000 | | | | 6,498,961 | | |
0.140%, due 10/02/201 | | | 2,500,000 | | | | 2,499,397 | | |
0.140%, due 10/14/201 | | | 6,000,000 | | | | 5,998,273 | | |
0.140%, due 11/19/201 | | | 1,000,000 | | | | 999,572 | | |
1 mo. USD LIBOR - 0.040%, | |
0.141%, due 12/17/202 | | | 1,250,000 | | | | 1,250,000 | | |
7
UBS Government Money Market Investments Fund
Portfolio of investments—July 31, 2020
| | | Face
amount | | Value | |
U.S. government agency obligations—(continued) | |
1 mo. USD LIBOR - 0.040%, | |
0.143%, due 01/08/212 | | $ | 2,500,000 | | | $ | 2,500,000 | | |
0.144%, due 09/25/201 | | | 3,000,000 | | | | 2,999,340 | | |
0.147%, due 12/18/202 | | | 2,000,000 | | | | 2,000,000 | | |
0.148%, due 08/28/201 | | | 5,000,000 | | | | 4,999,445 | | |
1 mo. USD LIBOR - 0.030%, | |
0.148%, due 02/12/212 | | | 1,500,000 | | | | 1,500,000 | | |
0.150%, due 08/19/201 | | | 3,000,000 | | | | 2,999,775 | | |
0.158%, due 12/30/201 | | | 6,000,000 | | | | 5,996,036 | | |
0.160%, due 09/18/201 | | | 4,000,000 | | | | 3,999,147 | | |
0.164%, due 12/30/201 | | | 2,000,000 | | | | 1,998,624 | | |
0.170%, due 08/31/201 | | | 3,000,000 | | | | 2,999,575 | | |
0.170%, due 12/02/201 | | | 3,000,000 | | | | 2,998,258 | | |
0.174%, due 12/18/201 | | | 1,000,000 | | | | 999,328 | | |
0.174%, due 12/23/201 | | | 3,000,000 | | | | 2,997,912 | | |
0.185%, due 05/26/211 | | | 1,500,000 | | | | 1,497,703 | | |
0.185%, due 06/24/211 | | | 1,500,000 | | | | 1,497,480 | | |
0.190%, due 10/02/201 | | | 3,000,000 | | | | 2,999,018 | | |
0.190%, due 11/03/201 | | | 4,000,000 | | | | 3,998,016 | | |
0.200%, due 09/18/201 | | | 1,000,000 | | | | 999,733 | | |
0.200%, due 11/06/201 | | | 13,000,000 | | | | 12,992,995 | | |
SOFR + 0.100%, | |
0.200%, due 10/06/202 | | | 3,000,000 | | | | 3,000,000 | | |
0.200%, due 10/09/202 | | | 3,000,000 | | | | 3,000,000 | | |
SOFR + 0.120%, | |
0.220%, due 10/07/202 | | | 1,000,000 | | | | 1,000,000 | | |
0.240%, due 01/06/211 | | | 2,000,000 | | | | 1,997,893 | | |
SOFR + 0.140%, | |
0.240%, due 01/08/212 | | | 3,000,000 | | | | 3,000,000 | | |
SOFR + 0.160%, | |
0.260%, due 01/07/212 | | | 3,000,000 | | | | 3,000,000 | | |
0.280%, due 11/24/201 | | | 2,000,000 | | | | 1,998,211 | | |
8
UBS Government Money Market Investments Fund
Portfolio of investments—July 31, 2020
| | | Face
amount | | Value | |
U.S. government agency obligations—(continued) | |
0.290%, due 09/01/201 | | $ | 5,000,000 | | | $ | 4,998,752 | | |
0.310%, due 09/11/20 | | | 2,000,000 | | | | 1,999,939 | | |
SOFR + 0.230%, | |
0.330%, due 09/25/202 | | | 3,000,000 | | | | 3,000,000 | | |
0.330%, due 04/13/212 | | | 6,500,000 | | | | 6,500,000 | | |
0.340%, due 11/16/201 | | | 3,000,000 | | | | 2,996,968 | | |
SOFR + 0.240%, | |
0.340%, due 04/07/212 | | | 4,000,000 | | | | 4,000,276 | | |
0.520%, due 08/03/201 | | | 2,500,000 | | | | 2,499,928 | | |
1.590%, due 08/10/201 | | | 1,000,000 | | | | 999,603 | | |
Federal Home Loan Bank Discount Notes, | |
0.120%, due 08/21/201 | | | 6,000,000 | | | | 5,999,600 | | |
0.150%, due 09/04/201 | | | 3,000,000 | | | | 2,999,575 | | |
0.320%, due 10/26/201 | | | 3,000,000 | | | | 2,997,707 | | |
Federal Home Loan Banks | |
0.160%, due 02/16/21 | | | 1,000,000 | | | | 999,980 | | |
0.160%, due 04/05/21 | | | 2,000,000 | | | | 1,999,831 | | |
0.200%, due 01/19/21 | | | 1,000,000 | | | | 1,000,006 | | |
SOFR + 0.150%, | |
0.250%, due 11/15/212 | | | 2,500,000 | | | | 2,500,000 | | |
Federal Home Loan Mortgage Corp. | |
SOFR + 0.010%, | |
0.110%, due 08/25/202 | | | 2,000,000 | | | | 2,000,000 | | |
SOFR + 0.025%, | |
0.125%, due 02/26/212 | | | 2,600,000 | | | | 2,600,000 | | |
0.130%, due 08/19/201 | | | 3,000,000 | | | | 2,999,805 | | |
SOFR + 0.050%, | |
0.150%, due 03/05/212 | | | 3,000,000 | | | | 3,000,000 | | |
SOFR + 0.100%, | |
0.200%, due 07/29/222 | | | 3,000,000 | | | | 3,000,000 | | |
9
UBS Government Money Market Investments Fund
Portfolio of investments—July 31, 2020
| | | Face
amount | | Value | |
U.S. government agency obligations—(concluded) | |
SOFR + 0.190%, | |
0.290%, due 05/11/222 | | $ | 2,000,000 | | | $ | 2,000,000 | | |
0.810%, due 08/19/201 | | | 4,000,000 | | | | 3,998,380 | | |
Federal National Mortgage Association | |
SOFR + 0.040%, | |
0.140%, due 09/11/202 | | | 1,500,000 | | | | 1,500,000 | | |
0.190%, due 09/16/201 | | | 2,000,000 | | | | 1,999,515 | | |
SOFR + 0.130%, | |
0.230%, due 06/11/212 | | | 2,000,000 | | | | 2,000,086 | | |
SOFR + 0.180%, | |
0.280%, due 05/13/222 | | | 2,000,000 | | | | 2,000,000 | | |
SOFR + 0.200%, | |
0.300%, due 06/15/222 | | | 2,500,000 | | | | 2,500,000 | | |
Total U.S. government agency obligations
(cost—$211,742,205) | | | 211,742,205 | | |
U.S. Treasury obligations—16.9% | |
U.S. Treasury Bills | |
0.102%, due 11/17/201 | | | 2,000,000 | | | | 1,999,414 | | |
0.102%, due 12/15/201 | | | 2,000,000 | | | | 1,999,237 | | |
0.103%, due 10/29/201 | | | 10,000,000 | | | | 9,997,489 | | |
0.109%, due 04/22/211 | | | 2,000,000 | | | | 1,998,431 | | |
0.137%, due 10/06/201 | | | 3,000,000 | | | | 2,999,257 | | |
0.138%, due 08/25/201 | | | 2,000,000 | | | | 1,999,819 | | |
0.150%, due 09/03/201 | | | 2,000,000 | | | | 1,999,730 | | |
0.153%, due 11/05/201 | | | 2,000,000 | | | | 1,999,197 | | |
0.173%, due 09/10/201 | | | 2,000,000 | | | | 1,999,621 | | |
0.175%, due 09/17/201 | | | 2,000,000 | | | | 1,999,550 | | |
0.178%, due 10/27/201 | | | 2,000,000 | | | | 1,999,152 | | |
0.179%, due 10/15/201 | | | 3,000,000 | | | | 2,998,897 | | |
0.185%, due 10/20/201 | | | 3,000,000 | | | | 2,998,787 | | |
0.188%, due 10/08/201 | | | 2,000,000 | | | | 1,999,301 | | |
U.S. Treasury Notes | |
3 mo.Treasury money market yield + 0.220%, | |
0.325%, due 07/31/212 | | | 2,000,000 | | | | 1,999,132 | | |
10
UBS Government Money Market Investments Fund
Portfolio of investments—July 31, 2020
| | | Face
amount | | Value | |
U.S. Treasury obligations—(concluded) | |
3 mo.Treasury money market yield + 0.300%, | |
0.405%, due 10/31/212 | | $ | 500,000 | | | $ | 500,365 | | |
1.375%, due 08/31/20 | | | 1,000,000 | | | | 999,780 | | |
1.375%, due 09/30/20 | | | 1,000,000 | | | | 999,534 | | |
1.375%, due 10/31/20 | | | 2,000,000 | | | | 2,002,992 | | |
1.625%, due 10/15/20 | | | 1,500,000 | | | | 1,502,492 | | |
2.000%, due 09/30/20 | | | 2,000,000 | | | | 2,003,790 | | |
2.000%, due 11/30/20 | | | 1,000,000 | | | | 1,005,206 | | |
2.000%, due 01/15/21 | | | 1,000,000 | | | | 1,007,318 | | |
2.625%, due 08/15/20 | | | 1,000,000 | | | | 1,000,375 | | |
2.750%, due 09/30/20 | | | 1,500,000 | | | | 1,503,401 | | |
| Total U.S. Treasury obligations (cost—$53,512,267) | | | 53,512,267 | | |
Repurchase agreements—16.3% | |
Repurchase agreement dated 07/31/20 with
Fixed Income Clearing Corp., 0.080% due 08/03/20,
collateralized by $170,400 U.S. Treasury Note, 0.160%
due 07/31/22; (value—$170,370); proceeds: $167,001 | | | 167,000 | | | | 167,000 | | |
Repurchase agreement dated 07/31/20 with Goldman
Sachs & Co., 0.060% due 08/03/20, collateralized by $2,741,000
Federal Home Loan Bank obligations, zero coupon due 08/04/20,
$280,000 Federal Home Loan Mortgage Corp., 6.250% due
07/15/32, $780,000 Federal National Mortgage Association,
1.250% due 08/17/21, $4,419,800 U.S. Treasury Bill, zero coupon
due 08/20/20 to 09/15/20, $37,277,700 U.S. Treasury Inflation
Index Note, 0.750 to 1.125% due on 01/15/21 to 7/15/28;
(value—$52,224,028); proceeds: $51,200,256 | | | 51,200,000 | | | | 51,200,000 | | |
| Total repurchase agreements (cost—$51,367,000) | | | 51,367,000 | | |
Total investments (cost—$316,621,472 which approximates
cost for federal income tax purposes)—100.2% | | | 316,621,472 | | |
Liabilities in excess of other assets—(0.2)% | | | (518,106 | ) | |
Net assets—100.0% | | $ | 316,103,366 | | |
For a listing of defined portfolio acronyms that are used throughout the Portfolio of investments as well as the tables that follow, please refer to page 12.
11
UBS Government Money Market Investments Fund
Portfolio of investments—July 31, 2020
Fair valuation summary
The following is a summary of the fair valuations according to the inputs used as of July 31, 2020 in valuing the Portfolio's investments. In the event the Portfolio holds investments for which fair value is measured using the NAV per share practical expedient (or its equivalent), a separate column will be added to the fair value hierarchy table; this is intended to permit reconciliation to the amounts presented in the Portfolio of investments:
Description | | Unadjusted
quoted prices
in active
markets for
identical
investments
(Level 1) | | Other
significant
observable
inputs
(Level 2) | | Unobservable
inputs
(Level 3) | | Total | |
U.S. government
agency obligations | | $ | — | | | $ | 211,742,205 | | | $ | — | | | $ | 211,742,205 | | |
U.S. Treasury obligations | | | — | | | | 53,512,267 | | | | — | | | | 53,512,267 | | |
Repurchase agreements | | | — | | | | 51,367,000 | | | | — | | | | 51,367,000 | | |
Total | | $ | — | | | $ | 316,621,472 | | | $ | — | | | $ | 316,621,472 | | |
At July 31, 2020, there were no transfers in or out of Level 3.
Portfolio footnotes
1 Rate shown is the discount rate at the date of purchase unless otherwise noted.
2 Variable or floating rate security. The interest rate shown is the rate in effect as of period end and changes periodically.
Portfolio acronyms
LIBOR London Interbank Offered Rate
OTC Over The Counter
SOFR Secured Overnight Financing Rate
Currency type abbreviations
USD United States Dollar
See accompanying notes to financial statements
12
UBS Government Money Market Investments Fund
Statement of assets and liabilities—July 31, 2020
Assets: | |
Investments at value (cost—$265,254,472) | | $ | 265,254,472 | | |
Repurchase agreements at value (cost—$51,367,000) | | | 51,367,000 | | |
Total investments in securities, at value (cost—$316,621,472) | | $ | 316,621,472 | | |
Cash | | | 531 | | |
Receivable for fund shares sold | | | 2,288,363 | | |
Receivable for interest | | | 87,621 | | |
Receivable from affiliate | | | 85,481 | | |
Other assets | | | 33,344 | | |
Total assets | | | 319,116,812 | | |
Liabilities: | |
Payable for investments purchased | | | 1,999,414 | | |
Payable for fund shares redeemed | | | 433,179 | | |
Dividends payable to shareholders | | | 1,409 | | |
Payable to custodian | | | 39 | | |
Accrued expenses and other liabilities | | | 579,405 | | |
Total liabilities | | | 3,013,446 | | |
Net assets | | $ | 316,103,366 | | |
Net assets: | |
Beneficial interest shares of $0.001 par value (unlimited amount authorized) | | $ | 316,104,929 | | |
Distributable earnings (losses) | | | (1,563 | ) | |
Net assets | | $ | 316,103,366 | | |
Shares outstanding | | | 316,103,739 | | |
Net asset value | | $ | 1.00 | | |
See accompanying notes to financial statements
13
UBS Government Money Market Investments Fund
Statement of operations
| | | For the
year ended
July 31, 2020 | |
Investment income: | |
Interest | | $ | 2,943,264 | | |
Expenses: | |
Investment management and administration fees | | | 734,790 | | |
Transfer agency and related services fees | | | 933,772 | | |
Custody and fund accounting fees | | | 16,003 | | |
Trustees fees | | | 19,666 | | |
Professional services fees | | | 141,739 | | |
Printing and shareholder report fees | | | 65,238 | | |
Federal and state registration fees | | | 38,722 | | |
Insurance expense | | | 1,361 | | |
Other expenses | | | 60,240 | | |
| | | | 2,011,531 | | |
Fee waivers and/or expense reimbursements by investment manager and administrator | | | (677,323 | ) | |
Net expenses | | | 1,334,208 | | |
Net investment income (loss) | | | 1,609,056 | | |
Net increase (decrease) in net assets resulting from operations | | $ | 1,609,056 | | |
See accompanying notes to financial statements
14
UBS Government Money Market Investments Fund
Statement of changes in net assets
| | | For the years ended July 31, | |
| | | 2020 | | 2019 | |
From operations: | |
Net investment income (loss) | | $ | 1,609,056 | | | $ | 3,456,399 | | |
Net realized gain (loss) | | | — | | | | 135 | | |
Net increase (decrease) in net assets resulting
from operations | | | 1,609,056 | | | | 3,456,534 | | |
Total distributions—Class P | | | (1,609,056 | ) | | | (3,456,399 | ) | |
Net increase (decrease) in net assets from beneficial
interest transactions | | | 131,501,438 | | | | (4,192,193 | ) | |
Net increase (decrease) in net assets | | | 131,501,438 | | | | (4,192,058 | ) | |
Net assets: | |
Beginning of year | | | 184,601,928 | | | | 188,793,986 | | |
End of year | | $ | 316,103,366 | | | $ | 184,601,928 | | |
See accompanying notes to financial statements
15
UBS Government Money Market Investments Fund
Financial highlights
Selected data for a share of beneficial interest outstanding throughout each year is presented below:
Class P
| | | Years ended July 31, | |
| | | 2020 | | 2019 | | 2018 | | 2017 | | 2016 | |
Net asset value,
beginning of year | | $ | 1.00 | | | $ | 1.00 | | | $ | 1.00 | | | $ | 1.00 | | | $ | 1.00 | | |
Net investment income (loss) | | | 0.008 | | | | 0.017 | | | | 0.008 | | | | 0.001 | | | | 0.0001 | | |
Net realized gain (loss) | | | — | | | | 0.0001 | | | | 0.0001 | | | | (0.000 | )1 | | | 0.0001 | | |
Net increase (decrease) from
operations | | | 0.008 | | | | 0.017 | | | | 0.008 | | | | 0.001 | | | | 0.0001 | | |
Dividends from net
investment income | | | (0.008 | ) | | | (0.017 | ) | | | (0.008 | ) | | | (0.001 | ) | | | (0.000 | )1 | |
Distributions from net
realized gains | | | — | | | | — | | | | — | | | | — | | | | (0.000 | )1 | |
Total dividends and distributions | | | (0.008 | ) | | | (0.017 | ) | | | (0.008 | ) | | | (0.001 | ) | | | (0.000 | )1 | |
Net asset value, end of year | | $ | 1.00 | | | $ | 1.00 | | | $ | 1.00 | | | $ | 1.00 | | | $ | 1.00 | | |
Total investment return2 | | | 0.76 | % | | | 1.72 | % | | | 0.83 | % | | | 0.11 | % | | | 0.01 | % | |
Ratios to average net assets: | |
Expenses before fee waivers and/or
expense reimbursements | | | 0.75 | % | | | 0.90 | % | | | 0.89 | % | | | 0.95 | % | | | 0.96 | % | |
Expenses after fee waivers and/or
expense reimbursements | | | 0.49 | % | | | 0.60 | % | | | 0.60 | % | | | 0.52 | % | | | 0.26 | % | |
Net investment income (loss) | | | 0.60 | % | | | 1.71 | % | | | 0.82 | % | | | 0.12 | % | | | 0.01 | % | |
Supplemental data: | |
Net assets, end of year (000's) | | $ | 316,103 | | | $ | 184,602 | | | $ | 188,794 | | | $ | 199,585 | | | $ | 182,977 | | |
1 Amount represents less than $0.0005 per share.
2 Total investment return is calculated assuming a $10,000 investment on the first day of each year reported, reinvestment of all dividends and other distributions, if any, at net asset value on the payable dates, and a sale at net asset value on the last day of each year reported. The figures do not include program fees; results would be lower if these fees were included. Returns do not reflect the deduction of taxes that a shareholder would pay on Portfolio distributions.
See accompanying notes to financial statements
16
UBS Government Money Market Investments Fund
Notes to financial statements
Organization and significant accounting policies
UBS Government Money Market Investments Fund (the "Portfolio") is registered with the US Securities and Exchange Commission ("SEC") under the Investment Company Act of 1940, as amended (the "1940 Act"), as a diversified series of PACE Select Advisors Trust (the "Trust"), an open-end management investment company organized as a Delaware statutory trust under the laws of the State of Delaware by Certificate of Trust dated September 9, 1994, as amended June 9, 1995 and thereafter. The trustees of the Trust have authority to issue an unlimited number of shares of beneficial interest, par value $0.001 per share.
The Trust has fifteen series available for investment, each having its own investment objectives and policies. The financial statements for the other series of the Trust are not included herein. Shares of the Portfolio currently are available only to participants in the PACESM Select Advisors Program and the PACESM Multi Advisor Program.
UBS Asset Management (Americas) Inc. ("UBS AM") serves as the investment manager, investment advisor and administrator for the Portfolio. UBS AM is an indirect wholly owned subsidiary of UBS Group AG. UBS Group AG is an internationally diversified organization with headquarters in Zurich, Switzerland. UBS Group AG operates in many areas of the financial services industry.
The Trust accounts separately for the assets, liabilities and operations of each Portfolio. Expenses directly attributable to each Portfolio are charged to that Portfolio's operations; expenses which are applicable to all Portfolios are allocated among them on a pro rata basis.
In the normal course of business, the Portfolio may enter into contracts that contain a variety of representations that provide indemnification for certain liabilities. The Portfolio's maximum exposure under these arrangements is unknown, as this would involve future claims that may be made against the Portfolio that have not yet occurred. However, the Portfolio has not had any prior claims or losses pursuant to these contracts and expects the risk of loss to be remote.
17
UBS Government Money Market Investments Fund
Notes to financial statements
The Financial Accounting Standards Board ("FASB") Accounting Standards Codification ("ASC") is the exclusive reference of authoritative US generally accepted accounting principles ("US GAAP") recognized by the FASB to be applied by nongovernmental entities. Rules and interpretive releases of the SEC under authority of federal laws are also sources of authoritative US GAAP for SEC registrants. The Portfolio's financial statements are prepared in accordance with US GAAP, which may require the use of management estimates and assumptions. Actual results could differ from those estimates.
In March 2017, the FASB issued Accounting Standards Update ("ASU") 2017-08, Receivables—Nonrefundable Fees and Other Costs (Subtopic 310-20): Premium Amortization On Purchased Callable Debt Securities ("ASU 2017-08"). The update provides guidance related to the amortization period for certain purchased callable debt securities held at a premium. ASU 2017-08 is effective for annual periods, and interim periods within those annual periods, beginning after December 15, 2018. Management has assessed the impact of these changes, and the changes are incorporated within the financial statements.
In August 2018, the FASB issued ("ASU") 2018-13, Fair Value Measurement (Topic 820): Disclosure Framework—Changes to the Disclosure Requirements for Fair Value Measurement ("ASU 2018-13"). The update introduces new fair value disclosure requirements, eliminates some prior fair value disclosure requirements, and modifies certain existing fair value disclosure requirements. ASU 2018-13 is effective for fiscal years beginning after December 15, 2019, including interim periods within those fiscal years. Management has assessed the potential impact of these changes and the changes are incorporated within the financial statements.
The following is a summary of significant accounting policies:
Valuation of investments Under Rule 2a-7 under the 1940 Act, as amended ("Rule 2a-7"), the Portfolio has adopted a policy to operate
18
UBS Government Money Market Investments Fund
Notes to financial statements
as a "government money market fund". Under Rule 2a-7, a "government money market fund" invests 99.5% or more of its total assets in cash, government securities, and/or repurchase agreements that are collateralized fully (i.e., collateralized by cash and/or government securities). As a "government money market fund", the Portfolio values its investments at amortized cost unless the Portfolio's Board determines that this does not represent fair value. Periodic review and monitoring of the valuation of the securities held by the Portfolio is performed in an effort to ensure that amortized cost approximates market value.
US GAAP requires disclosure regarding the various inputs that are used in determining the value of each Portfolio's investments. These inputs are summarized into the three broad levels listed below:
Level 1—Unadjusted quoted prices in active markets for identical investments.
Level 2—Other significant observable inputs, including but not limited to, quoted prices for similar investments, interest rates, prepayment speeds and credit risks.
Level 3—Unobservable inputs inclusive of each Portfolio's own assumptions in determining the fair value of investments.
A fair value hierarchy table has been included near the end of each Portfolio's Portfolio of investments.
Constant net asset value per share—The Portfolio attempts to maintain a stable net asset value of $1.00 per share. There is no assurance, however, that the Portfolio will be able to maintain a stable net asset value of $1.00 per share. The Portfolio has adopted certain investment, portfolio valuation and dividend/distribution policies in an attempt to enable it to do so. The Portfolio has adopted a policy to operate as a "government money market fund" and as such the Portfolio is permitted to seek to maintain a stable price per share.
Liquidity fee and/or redemption gates—By operating as a "government money market fund," the Portfolio is exempt from
19
UBS Government Money Market Investments Fund
Notes to financial statements
requirements that permit the imposition of a liquidity fee and/or temporary redemption gates. While the Board may elect to subject the Portfolio to liquidity fee and gate requirements in the future, the Board has not elected to do so at this time.
Repurchase agreements—The Portfolio may purchase securities or other obligations from a bank or securities dealer (or its affiliate), subject to the seller's agreement to repurchase them at an agreed upon date (or upon demand) and price. The Portfolio maintain custody of the underlying obligations prior to their repurchase, either through their regular custodian or through a special "tri-party" custodian or sub-custodian that maintains a separate account for both the Portfolio and their counterparty. The underlying collateral is valued daily in an effort to ensure that the value, including accrued interest, is at least equal to the repurchase price.
Repurchase agreements carry certain risks not associated with direct investments in securities, including a possible decline in the market value of the underlying obligations. If their value becomes less than the repurchase price, plus any agreed-upon additional amount, the counterparty must provide additional collateral so that the collateral is at least equal to the repurchase price plus any agreed-upon additional amount. The difference between the total amount to be received upon repurchase of the obligations and the price that was paid by the Portfolio upon acquisition is accrued as interest and included in its net investment income. In the event of default of the obligation to repurchase, the Portfolio generally have the right to liquidate the collateral and apply the proceeds in satisfaction of the obligation. Repurchase agreements involving obligations other than US government securities (such as commercial paper, corporate bonds, equities and mortgage loans) may be subject to special risks and may not have the benefit of certain protections in the event of counterparty insolvency. Moreover, repurchase agreements secured by obligations that are not eligible for direct investment under Rule 2a-7 or a Portfolio's investment strategies and limitations, may require the Portfolio to promptly dispose of such collateral if the seller or guarantor becomes insolvent. If the seller (or seller's
20
UBS Government Money Market Investments Fund
Notes to financial statements
guarantor, if any) becomes insolvent, the Portfolio may suffer delays, costs and possible losses in connection with the disposition or retention of the collateral. Under certain circumstances, in the event of default or bankruptcy by the other party to the agreement, realization and/or retention of the collateral may be subject to legal proceedings. The Portfolio intends to enter into repurchase agreements only in transactions with counterparties believed by UBS AM and the applicable subadvisor to present minimal credit risks.
The Portfolio may participate in joint repurchase agreement transactions with other Portfolios managed, advised or subadvised by UBS AM. Under certain circumstances, the Portfolio may engage in a repurchase agreement transaction with a yield of zero in order to invest cash amounts remaining in its portfolio at the end of the day in order to avoid having the Portfolio potentially exposed to a fee for uninvested cash held in a business account at a bank.
Investment transactions and investment income—Investment transactions are recorded on the trade date. Realized gains and losses from investment transactions are calculated using the identified cost method. Interest income is recorded on an accrual basis. Discounts are accreted and premiums are amortized as adjustments to interest income and the identified cost of investments.
Dividends and distributions—Dividends and distributions to shareholders are recorded on the ex-dividend date. The amount of dividends from investment income and distributions from realized capital gains and/or return of capital are determined in accordance with US federal income tax regulations, which may differ from US GAAP. These "book/tax" differences are either considered temporary or permanent in nature. To the extent these differences are permanent in nature, such amounts are reclassified within the capital accounts based on their federal tax-basis treatment; temporary differences do not require reclassification.
Concentration of risk—The ability of the issuers of debt securities held by the Portfolio to meet their obligations may be affected by
21
UBS Government Money Market Investments Fund
Notes to financial statements
economic and political developments particular to a specific industry, country, state or region.
Many financial instruments, financings or other transactions to which a Fund may be a party use or may use a floating rate based on the London Interbank Offered Rate ("LIBOR"). LIBOR is widely used in financial markets. In July 2017, the United Kingdom's financial regulatory body announced that after 2021 it will cease its active encouragement of banks to provide the quotations needed to sustain LIBOR. That announcement suggests that LIBOR may cease to be published or utilized after that time. Various financial industry groups have begun planning for that transition, but the effect of the transition process and its ultimate success cannot yet be determined. The transition process may lead to increased volatility and illiquidity in markets for instruments the terms of which are based on LIBOR. It could also lead to a reduction in the value of some LIBOR-based investments and reduce the effectiveness of new hedges placed against existing LIBOR-based investments. Since the usefulness of LIBOR as a benchmark could deteriorate during the transition period, these effects could occur prior to the end of 2021. The willingness and ability of issuers to include enhanced provisions in new and existing contracts or instruments also remains uncertain. Any of these factors may adversely affect the Fund's performance or NAV.
Certain impacts to public health conditions particular to the coronavirus (COVID-19) outbreak that occurred may have a significant negative impact on the operations and profitability of the Portfolio's investments. The extent of the impact to the financial performance of the Portfolio will depend on future developments, including (i) the duration and spread of the outbreak, (ii) the restrictions and advisories, (iii) the effects on the financial markets, and (iv) the effects on the economy overall, all of which are highly uncertain and cannot be predicted.
22
UBS Government Money Market Investments Fund
Notes to financial statements
Investment management and administration fees and other transactions with affiliates
The Portfolio's Board has approved an investment management and administration contract ("Management Contract") with UBS AM. In accordance with the Management Contract, the Portfolio pays UBS AM an investment management and administration fee, which is accrued daily and paid monthly, at an annual rate of 0.35% from August 1, 2019 to November 26, 2019 and as of November 27, 2019 at 0.25% of the Portfolio's average daily net assets. At July 31, 2020, UBS AM is owed $10,377 by the Portfolio, representing investment management and administration fees net of fee waivers/expense reimbursements.
UBS AM has contractually undertaken to waive a portion of the Portfolio's investment management and administration fees and/or reimburse a portion of the Portfolio's other expenses, when necessary, to maintain the total ordinary annual operating expenses (excluding borrowing costs and interest expense, if any) through November 30, 2020 at a level not to exceed 0.60%. For the period ended July 31, 2020, UBS AM waived $330,288 in investment management and administration fees. The Portfolio will make a payment to UBS AM for any previously waived fees/reimbursed expenses during the following three fiscal years to the extent that operating expenses are otherwise below the expense cap.
At July 31, 2020, the Portfolio had remaining fee waivers/expense reimbursements subject to repayment to UBS AM and respective dates of expiration as follows:
Fee waivers/expense
reimbursements
subject to repayment | | Expires
July 31, 2021 | | Expires
July 31, 2022 | | Expires
July 31, 2023 | |
$ | 1,143,774 | | | $ | 409,180 | | | $ | 404,306 | | | $ | 330,288 | | |
No amount was repaid back to UBS AM in the past year.
UBS AM may voluntarily undertake to waive fees and/or reimburse expenses in the event that the Fund yields drop below a certain level.
23
UBS Government Money Market Investments Fund
Notes to financial statements
This undertaking is voluntary and not contractual and may be terminated at any time. At July 31, 2020, and for the period ended July 31, 2020, UBS AM voluntarily waived in the amount of $284,845, and which is not subject to future recoupment, the amount owed by UBS AM is $95,858.
Additional information regarding compensation to affiliate of a board member
Professor Meyer Feldberg serves as a senior advisor to Morgan Stanley, a financial services firm with which the Portfolio may conduct transactions, resulting in him being an interested trustee of the Portfolio. The Portfolio has been informed that Professor Feldberg's role at Morgan Stanley does not involve matters directly affecting any UBS funds. Portfolio transactions are executed through Morgan Stanley based on that firm's ability to provide best execution of the transactions.
During the period ended, July 31, 2020, the Portfolio purchased and sold certain securities (e.g., fixed income securities) in principal trades with Morgan Stanley, having an aggregate value of $3,684,549.
Morgan Stanley received compensation in connection with these trades, which may have been in the form of a "mark-up" or "mark-down" of the price of the securities, a fee from the issuer for maintaining a commercial paper program, or some other form of compensation. Although the precise amount of this compensation is not generally known by the Portfolio's investment manager, it is believed that under normal circumstances it represents a small portion of the total value of the transactions.
Transfer agency and related services fees
UBS Financial Services Inc. provides certain services to the Portfolio pursuant to a delegation of authority from BNY Mellon Investment Servicing (US) Inc. ("BNY Mellon"), the Portfolio's transfer agent, and is compensated for these services by BNY Mellon, not the Portfolio.
24
UBS Government Money Market Investments Fund
Notes to financial statements
UBS Financial Services Inc. has voluntarily agreed to waive a portion of the fee that it would otherwise have received from BNY Mellon with respect to UBS Government Money Market Investments Fund so that BNY Mellon would correspondingly reduce the fees it would have charged to that Portfolio. For the period ended July 31, 2020, the amount of the reduction in transfer agency and related services fees charged by BNY Mellon to the Portfolio was $62,190, which reflected an equal amount of compensation that was voluntarily waived by UBS Financial Services Inc. Voluntary fee waiver/expense reimbursement arrangements may end at any time.
For the period ended July 31, 2020, UBS Financial Services Inc. received from BNY Mellon, not the Portfolio, $368,215 of the total transfer agency and related services fees paid by the Portfolio to BNY Mellon.
Shares of beneficial interest
There is an unlimited amount of $0.001 par value shares of beneficial interest authorized. Transactions in shares of beneficial interest, at $1.00 per share, were as follows:
| | | Years ended July 31, | |
| | | 2020 | | 2019 | |
Shares sold | | | 616,957,497 | | | | 241,670,811 | | |
Shares repurchased | | | (487,035,778 | ) | | | (248,947,713 | ) | |
Dividends reinvested | | | 1,579,719 | | | | 3,084,709 | | |
Net increase (decrease) in shares outstanding | | | 131,501,438 | | | | (4,192,193 | ) | |
Federal tax status
The Portfolio intends to distribute substantially all of its income and to comply with the other requirements of the Internal Revenue Code applicable to regulated investment companies. Accordingly, no provision for federal income taxes is required. In addition, by distributing during each calendar year substantially all of its net investment income, net realized capital gains and certain other amounts, if any, the Portfolio intends not to be subject to a federal excise tax.
25
UBS Government Money Market Investments Fund
Notes to financial statements
The tax character of distributions paid to shareholders by the Portfolio during the fiscal years ended July 31, 2020 and July 31, 2019 was ordinary income in the amount of $1,609,056 and $3,456,399, respectively.
At July 31, 2020, the components of accumulated earnings on a tax basis were undistributed ordinary income of $818 and accumulated realized capital and other losses of $971, and other temporary differences of $(1,410).
There were no reclassifications arising from permanent "book/tax" differences for the fiscal year ended July 31, 2020.
Under the Regulated Investment Company Modernization Act of 2010 (The "Act"), net capital losses recognized by the portfolio after December 22, 2010, may be carried forward indefinitely, and retain their character as short-term and/or long-term losses. At July 31, 2020, the Portfolio had a short-term capital loss carryforward of $971.
ASC 740-10 "Income-Overall" sets forth a minimum threshold for financial statement recognition of the benefit of a tax position taken or expected to be taken. The Portfolio has analyzed and concluded as of July 31, 2020, that there are no significant uncertain tax positions taken or expected to be taken that would require recognition in the financial statements. The Portfolio recognizes interest and penalties, if any, related to uncertain tax positions as income tax expense in the Statement of Operations. During the period ended July 31, 2020, the Portfolio did not incur any interest or penalties.
Each of the tax years in the four year period ended July 31, 2020, remains subject to examination by the Internal Revenue Service and state taxing authorities.
26
UBS Government Money Market Investments Fund
Report of Ernst & Young LLP, independent
registered public accounting firm
To the Shareholders and the Board of
Trustees of UBS Government Money Market Investments Fund
Opinion on the Financial Statements
We have audited the accompanying statement of assets and liabilities of UBS Government Money Market Investments Fund (the "Fund") (one of the funds constituting PACE Select Advisors Trust), including the portfolio of investments, as of July 31, 2020 and the related statement of operations for the year then ended, the statements of changes in net assets for each of the two years in the period then ended, the financial highlights for each of the five years in the period then ended and the related notes (collectively referred to as the "financial statements"). In our opinion, the financial statements present fairly, in all material respects, the financial position of the Fund (one of the funds constituting PACE Select Advisors Trust) at July 31, 2020, the results of its operations for the year then ended, the changes in its net assets for each of the two years in the period then ended and its financial highlights for each of the five years in the period then ended, in conformity with U.S. generally accepted accounting principles.
Basis for Opinion
These financial statements are the responsibility of the Trust's management. Our responsibility is to express an opinion on the Fund's financial statements based on our audits. We are a public accounting firm registered with the Public Company Accounting Oversight Board (United States) ("PCAOB") and are required to be independent with respect to the Trust in accordance with the U.S. federal securities laws and the applicable rules and regulations of the Securities and Exchange Commission and the PCAOB.
We conducted our audits in accordance with the standards of the PCAOB. Those standards require that we plan and perform the audit to obtain reasonable assurance about whether the financial statements are free of material misstatement, whether due to error or fraud. The Trust is not required to have, nor were we engaged to perform, an audit of the Trust's internal control over financial reporting. As part of our audits we are required to obtain an understanding of internal control over
27
UBS Government Money Market Investments Fund
Report of Ernst & Young LLP, independent
registered public accounting firm
financial reporting but not for the purpose of expressing an opinion on the effectiveness of the Trust's internal control over financial reporting. Accordingly, we express no such opinion.
Our audits included performing procedures to assess the risks of material misstatement of the financial statements, whether due to error or fraud, and performing procedures that respond to those risks. Such procedures included examining, on a test basis, evidence regarding the amounts and disclosures in the financial statements. Our procedures included confirmation of securities owned as of July 31, 2020, by correspondence with the custodian and brokers or by other appropriate auditing procedures where replies from brokers were not received. Our audits also included evaluating the accounting principles used and significant estimates made by management, as well as evaluating the overall presentation of the financial statements. We believe that our audits provide a reasonable basis for our opinion.

We have served as the auditor of one or more UBS investment companies since 1978.
New York, New York
September 29, 2020
28
UBS Government Money Market Investments Fund
General information (unaudited)
Monthly and quarterly portfolio holdings disclosure
The Portfolio filed its complete schedule of portfolio holdings with the US Securities and Exchange Commission ("SEC") for the first and third quarters of each fiscal year through August 1, 2019 on Form N-Q. Effective August 1, 2019, Form N-Q is no longer required to be filed. The Portfolio's historical filings on Form N-Q are available on the SEC's Web site at http://www.sec.gov. Additionally, you may obtain copies of Forms N-Q from the Portfolio upon request by calling 1-800-647 1568.
In addition, the Portfolio discloses, on a monthly basis: (a) a complete schedule of its portfolio holdings; and (b) information regarding its weighted average maturity and weighted average life on UBS's Web site at the following internet address: www.ubs.com/usmoneymarketfunds. In addition, at this location, you will find a link to more detailed Portfolio information appearing in filings with the SEC on Form N-MFP. Investors also may find additional information about the Portfolio at the above referenced UBS Web site internet address.
Proxy voting policies, procedures and record
You may obtain a description of the Portfolio's (1) proxy voting policies, (2) proxy voting procedures and (3) information regarding how the Portfolio voted any proxies related to portfolio securities during the most recent 12-month period ended June 30 for which an SEC filing has been made, without charge, upon request by contacting the Portfolio directly at 1-800-647 1568, online on the Portfolio's Web site: www.ubs.com/ubsam-proxy, or on the EDGAR Database on SEC's Web site (http://www.sec.gov).
Other tax information
Pursuant to sections 871(k)(1)(C)(i) and 871(k)(2)(C)(i) of the Internal Revenue Code, the Portfolio designates $1,609,056 of ordinary income distributions paid as qualified interest income.
29
UBS Government Money Market Investments Fund (formerly, PACE Government Money Market Investments)
Board approval of investment managment and administration agreement (unaudited)
Background—At a meeting of the board of PACE Select Advisors Trust (the "Trust") on July 21-22, 2020, the members of the board, including the trustees who are not "interested persons," as defined in the Investment Company Act of 1940, as amended, of the Trust (the "Independent Trustees"), considered and approved the continuance of the investment management and administration agreement (the "Investment Management and Administration Agreement") between UBS Asset Management (Americas) Inc. ("UBS AM") and the Trust, on behalf of UBS Government Money Markets Investments Fund (formerly PACE Government Money Market Investments) (the "Portfolio"). In preparing for the meeting, the Independent Trustees had requested and received extensive information from UBS AM to assist them, including information about UBS AM, as well as the management, administrative and distribution arrangements for the Portfolio. The board reviewed and discussed with management the materials initially provided by UBS AM prior to the scheduled board meeting. The Independent Trustees also met in executive session to review the disclosure that had been made to them. At these sessions the Independent Trustees were joined by their independent legal counsel. The Independent Trustees also received a memorandum from their independent legal counsel discussing the duties of board members in considering the approval of management, administration and distribution agreements.
In its consideration of the approval of the Investment Management and Administration Agreement, the board considered the following factors:
Nature, extent and quality of the services under the Investment Management and Administration Agreement—The board received and considered information regarding the nature, extent and quality of management services provided to the Portfolio by UBS AM. The board also considered the nature, extent and quality of administrative, distribution and shareholder services performed by UBS AM and its affiliates for the Portfolio and the resources devoted to, and the record of compliance with, the Portfolio's compliance policies
30
UBS Government Money Market Investments Fund (formerly, PACE Government Money Market Investments)
Board approval of investment managment and administration agreement (unaudited)
and procedures. The board noted that it received information at regular meetings throughout the year regarding the services rendered by UBS AM concerning the management of the Portfolio's affairs and UBS AM's role in coordinating and overseeing providers of other services to the Portfolio. The board's evaluation of the services provided by UBS AM took into account the board's knowledge and familiarity gained as board members of funds in the UBS New York fund complex, including the scope and quality of UBS AM's investment management and other capabilities and the quality of its administrative and other services. The board observed that the scope of services provided by UBS AM had expanded over time as a result of regulatory and other developments, including maintaining and monitoring its own and the Portfolio's expanded compliance programs.
The board had available to it the qualifications, backgrounds and responsibilities of the senior personnel at UBS AM responsible for the Portfolio and had previously met with and received information regarding the persons primarily responsible for the day-to-day management of the Portfolio. The board recognized that several senior personnel at UBS AM report to the board regularly, and that at each regular meeting the board receives a detailed report from UBS AM on the Portfolio's performance. The board also considered, based on its knowledge of UBS AM and its affiliates, the financial resources available to UBS AM and its parent organization, UBS Group AG. In that regard, the board received extensive financial information regarding UBS AM and noted that it was a wholly owned, indirect subsidiary of one of the largest financial services firms in the world. It also was noted that UBS AM had approximately $206 billion in assets under management as of March 31, 2020 and was part of the UBS Asset Management Division, which had approximately $903 billion in assets under management worldwide as of March 31, 2020. The board also was cognizant of, and considered, the regulatory and litigation actions and investigations occurring in the past few years involving UBS Group AG, UBS AM and certain of their affiliates.
31
UBS Government Money Market Investments Fund (formerly, PACE Government Money Market Investments)
Board approval of investment managment and administration agreement (unaudited)
The board concluded that, overall, it was satisfied with the nature, extent and quality of services provided (and expected to be provided) to the Portfolio under the Investment Management and Administration Agreement.
Management fees and expense ratios—The board reviewed and considered the contractual management fee (the "Contractual Management Fee") payable by the Portfolio to UBS AM in light of the nature, extent and quality of the services provided by UBS AM pursuant to the Investment Management and Administration Agreement. The board also reviewed and considered the fee waiver and/or expense reimbursement arrangement for the Portfolio and considered the actual fee rate (after taking any waivers and reimbursements into account) (the "Actual Management Fee") payable by the Portfolio. The board considered that UBS AM had entered into a fee waiver and/or expense reimbursement agreement with the Portfolio under which UBS AM was contractually obligated to waive its management fees and/or reimburse the Portfolio so that the total ordinary operating expenses of the Portfolio through November 30, 2020 (excluding certain miscellaneous items) would not exceed a specified limit. The board also considered that the Portfolio had agreed to repay UBS AM for those waived fees and/or reimbursed expenses if the Portfolio can do so over the following three fiscal years without causing its expenses in any of those years to exceed the expense cap. Additionally, the board received and considered information comparing the Portfolio's Contractual Management Fee, Actual Management Fee and overall expenses with those of funds in a group of funds selected and provided by Broadridge, an independent provider of investment company data (the "Expense Group").
In connection with its consideration of the Portfolio's management fees, the board also received information from UBS AM with respect to fees paid by institutional or separate accounts; however, in management's view, such fee information was not very relevant to the Portfolio because, among other reasons, separately managed and institutional accounts with a "cash" mandate (a) were not subject to
32
UBS Government Money Market Investments Fund (formerly, PACE Government Money Market Investments)
Board approval of investment managment and administration agreement (unaudited)
all of the constraints of Rule 2a-7 under the 1940 Act to which the Portfolio is subject and (b) do not involve the management responsibilities attendant to the operation of a 1940 Act regulated fund, and, therefore, were not totally comparable. The board also received information on fees charged to other mutual funds managed by UBS AM.
The comparative Broadridge information showed that the Portfolio's Actual Management Fee was below the median, and its Contractual Management Fee and total expenses were at the median in the Portfolio's Expense Group for the comparison periods utilized in the Broadridge report. (Below median fees or expenses represent fees or expenses that are lower relative to the median, and above median fees or expenses represent fees or expenses that are higher relative to the median of the funds in the Expense Group.)
Portfolio performance—The board received and considered (a) annualized total return information of the Portfolio compared to other funds (the "Performance Universe") selected by Broadridge over the one-, three-, five-, ten-year and since inception periods ended April 30, 2020, and (b) annualized performance information for each year in the ten-year period ended April 30, 2020. Although the board received information for the ten-year and since inception periods, in its analysis, it generally placed greater emphasis on the one-, three- and five-year periods. The board was provided with a description of the methodology Broadridge used to determine the similarity of the Portfolio with the funds included in its Performance Universe. The board also noted that it had received information throughout the year at periodic intervals with respect to the Portfolio's performance.
The comparative Broadridge information showed that the Portfolio's performance was at or slightly above the Performance Universe median for the ten-year period and since inception, but slightly below the Performance Universe median for the one-, three- and five-year periods. (Below median performance represents performance that is worse relative to the median, and above median performance
33
UBS Government Money Market Investments Fund (formerly, PACE Government Money Market Investments)
Board approval of investment managment and administration agreement (unaudited)
represents performance that is better relative to the median.) Management noted that during the third quarter of 2019, the Portfolio began holding more liquid investments, reducing yield, as part of an expansion of the Portfolio's potential investor base.
Based on its review and management's explanations, the board concluded that the Portfolio's investment performance was acceptable and that the management fee as proposed by management continued to be appropriate under the circumstances and in light of the nature, extent and quality of the services provided to the Portfolio under the Investment Management and Administration Agreement.
Advisor profitability—The board received and considered a profitability analysis of UBS AM and its affiliates in providing services to the Portfolio and was provided information on UBS AM's expense allocation methodology. The board also received profitability information with respect to the UBS New York fund cluster as a whole. The board observed that the profitability and expense analyses are substantially similar to those used by UBS AM for many internal purposes,nd are subject to regular review with respect to how certain revenue and expenses should be allocated. UBS AM's profitability was considered not excessive in light of the nature, extent and quality of the services provided to the Portfolio.
Economies of scale—The board received and considered information from management regarding whether UBS AM realized economies of scale as the Portfolio's assets grew, whether the Portfolio has appropriately benefited from any economies of scale, and whether there is potential for realization of any further economies of scale for the Portfolio. The board considered whether economies of scale in the provision of services to the Portfolio were being passed along to the shareholders. The board noted that the Portfolio's Contractual Management Fee did not contain breakpoints. However, the board also noted that to the extent the Portfolio's assets increase over time, it will realize economies of scale as certain expenses, such as fees for
34
UBS Government Money Market Investments Fund (formerly, PACE Government Money Market Investments)
Board approval of investment managment and administration agreement (unaudited)
trustees, auditor and legal fees and printing and postage, become a smaller percentage of overall assets.
In light of UBS AM's profitability data, the Actual Management Fee, the Contractual Management Fee and the current assets of the Portfolio, the board believed that UBS AM's sharing of potential and current economies of scale with the Portfolio was acceptable.
Other benefits to UBS AM—The board considered other benefits received by UBS AM and its affiliates as a result of its relationship with the Portfolio, including the opportunity to offer additional products and services to Portfolio shareholders. In light of the costs of providing investment management, administrative and other services to the Portfolio and UBS AM's ongoing commitment to the Portfolio, the profits and other ancillary benefits that UBS AM and its affiliates received were considered reasonable.
In light of all of the foregoing, the board, including a majority of the Independent Trustees, approved the Investment Management and Administration Agreement for the Portfolio. No single factor reviewed by the board was identified by the board as the principal factor in determining whether to approve the Investment Management and Administration Agreement. The Independent Trustees were advised by separate independent legal counsel throughout the process. The board discussed the proposed continuance of the Investment Management and Administration Agreement in private sessions with its independent legal counsel at which no representatives of UBS AM were present.
35
UBS Government Money Market Investments Fund
Supplemental information (unaudited)
Board of Trustees & Officers
The Trust is governed by a Board of Trustees which oversees the Portfolios' operations. Each Trustee serves an indefinite term of office. Officers are appointed by the trustees and serve at the pleasure of the Board. The table below shows, for each trustee and officer, his or her name, address and age, the position held with the Trust, the length of time served as a trustee or officer of the Trust, the trustee's or officer's principal occupations during the last five years, the number of portfolios in the UBS fund complex overseen by the trustee or for which a person served as an officer, and other directorships held by the trustee.
The Trust's Statement of Additional Information contains additional information about the trustees and is available, without charge, upon request by calling 1-800-647 1568.
36
This page intentionally left blank.
37
UBS Government Money Market Investments Fund
Supplemental information (unaudited)
Interested Trustees:
Name, address,
and age | | Position(s)
held with
Trust | | Term of
office1 and
length of
time served | | Principal occupation(s) during past
5 years | |
Meyer Feldberg2; 78
Morgan Stanley
1585 Broadway
36th Floor
New York, NY 10036 | | Trustee | | Since 2001 (Trustee); Since 2017 (Chairman of the Board of Trustees) | | Professor Feldberg is Dean Emeritus and Professor of Leadership and Ethics at Columbia Business School, although on an extended leave of absence. He is also a senior advisor to Morgan Stanley (financial services) (since 2005). Professor Feldberg also served as president of New York City Global Partners (an organization located in part of the Office of the Mayor of the City of New York that promoted interaction with other cities around the world) (2007-2014). Prior to 2004, he was Dean and Professor of Management and Ethics of the Graduate School of Business at Columbia University (since 1989). From 1992 to 2016, Professor Feldberg was a director of Macy's, Inc. (operator of department stores). From 1997 to 2017, Professor Feldberg was a director of Revlon, Inc. (cosmetics). | |
38
UBS Government Money Market Investments Fund
Supplemental information (unaudited)
Name, address,
and age | | Number of portfolios in fund
complex overseen by Trustee | | Other directorships held by Trustee | |
Meyer Feldberg2; 78
Morgan Stanley
1585 Broadway
36th Floor
New York, NY 10036 | | Professor Feldberg is a director or trustee of 9 investment companies (consisting of 51 portfolios) for which UBS Asset Management (Americas) Inc. ("UBS AM") or one of its affiliates serves as investment advisor or manager. | | Professor Feldberg is also a director of the New York City Ballet. | |
39
UBS Government Money Market Investments Fund
Supplemental information (unaudited)
Independent Trustees:
Name, address,
and age | | Position(s)
held with
Trust | | Term of
office1 and
length of
time served | | Principal occupation(s) during past
5 years | |
Alan S. Bernikow; 79
207 Benedict Ave.
Staten Island, NY 10314 | | Trustee | | Since 2005 | | Mr. Bernikow is retired. Previously, he was deputy chief executive officer at Deloitte & Touche (international accounting and consulting firm). From 2003 to 2017, Mr. Bernikow was also a director of Destination XL Group, Inc. (menswear) (and served as a member of its nominating and corporate governance committee). | |
Richard R. Burt; 73
McLarty Associates
900 17th Street
Washington, D.C.
20006 | | Trustee | | Since 2001 | | Mr. Burt is a managing partner of McLarty Associates (a consulting firm) (since 2007). He was chairman of IEP Advisors (international investments and consulting firm) until 2009. | |
Bernard H. Garil;
80
6754 Casa Grande Way
Delray Beach, FL
33446 | | Trustee | | Since 2005 | | Mr. Garil is retired (since 2001). He was a managing director at PIMCO Advisory Services (from 1999 to 2001) where he served as president of closed-end funds and vice-president of the variable insurance product funds advised by OpCap Advisors (until 2001). | |
40
UBS Government Money Market Investments Fund
Supplemental information (unaudited)
Name, address,
and age | | Number of portfolios in fund
complex overseen by Trustee | | Other directorships held by Trustee | |
Alan S. Bernikow; 79
207 Benedict Ave.
Staten Island, NY 10314 | | Mr. Bernikow is a director or trustee of 5 investment companies (consisting of 47 portfolios) for which UBS AM serves as investment advisor or manager. | | Mr. Bernikow is also a director of Revlon, Inc. (cosmetics) (and serves as the chair of its audit committee and as the chair of the compensation committee), the lead director of Mack-Cali Realty Corporation (real estate investment trust) (and serves as the chair of its audit committee). | |
Richard R. Burt; 73
McLarty Associates
900 17th Street
Washington, D.C.
20006 | | Mr. Burt is a director or trustee of 5 investment companies (consisting of 47 portfolios) for which UBS AM serves as investment advisor or manager. | | Mr. Burt is also a director of The Central Europe, Russia and Turkey Fund, Inc., The European Equity Fund, Inc. and The New Germany Fund, Inc. (and serves as a member of each such fund's audit, nominating and governance committee). | |
Bernard H. Garil;
80
6754 Casa Grande Way
Delray Beach, FL
33446 | | Mr. Garil is a director or trustee of 5 investment companies (consisting of 47 portfolios) for which UBS AM serves as investment advisor or manager. | | Mr. Garil is also a director of The Leukemia and Lymphoma Society (voluntary health organization) and a trustee for the Brooklyn College Foundation, Inc. (charitable foundation). | |
41
UBS Government Money Market Investments Fund
Supplemental information (unaudited)
Independent Trustees (concluded):
Name, address,
and age | | Position(s)
held with
Trust | | Term of
office1 and
length of
time served | | Principal occupation(s) during past
5 years | |
Heather R. Higgins;
61
c/o Keith A. Weller
Fund Secretary
UBS Asset Management (Americas) Inc.
One North Wacker Drive
Chicago, IL
60606 | | Trustee | | Since 2005 | | Ms. Higgins is the president and director of The Randolph Foundation (charitable foundation) (since 1991). Ms. Higgins also serves (or has served) on the boards of several non-profit charitable groups, including the Independent Women's Forum (chairman) and the Philanthropy Roundtable (vice chairman). She also serves on the board of the Hoover Institution (from 2001 to 2007 and since 2009). | |
42
UBS Government Money Market Investments Fund
Supplemental information (unaudited)
Name, address,
and age | | Number of portfolios in fund
complex overseen by Trustee | | Other directorships held by Trustee | |
Heather R. Higgins;
61
c/o Keith A. Weller
Fund Secretary
UBS Asset Management (Americas) Inc.
One North Wacker Drive
Chicago, IL
60606 | | Ms. Higgins is a director or trustee of 5 investment companies (consisting of 47 portfolios) for which UBS AM serves as investment advisor or manager. | | None | |
43
UBS Government Money Market Investments Fund
Supplemental information (unaudited)
Officers:
Name, address,
and age | | Position(s)
held with
Trust | | Term of
office1 and
length of
time served | | Principal occupation(s) during past
5 years; number of portfolios in
fund complex for which person
serves as officer | |
Rose Ann Bubloski*;
52 | | Vice President and Assistant Treasurer | | Since 2011 | | Ms. Bubloski is a director (since 2012) (prior to which she was an associate director (from 2008 to 2012)) and a senior manager of product control and investment support of UBS AM—Americas region. Ms. Bubloski is vice president and assistant treasurer of 8 investment companies (consisting of 62 portfolios) for which UBS AM serves as investment advisor or manager. | |
Franklin P. Dickson*;
42 | | Vice President | | Since 2017 | | Mr. Dickson is an associate director (since 2015) and tax compliance manager (since 2017) (prior to which he was a product controller (from 2015 to 2017) of product control and investment support of UBS AM—Americas region. From 2013 through 2015, Mr. Dickson was fund administration and compliance manager for U.S. Bancorp Fund Services, LLC, and from 2008 through 2013, Mr. Dickson was vice president, client service manager at BNY Mellon Asset Servicing. Mr. Dickson is a vice president of 8 investment companies (consisting of 62 portfolios) for which UBS AM serves as investment advisor or manager. | |
44
UBS Government Money Market Investments Fund
Supplemental information (unaudited)
Officers (continued):
Name, address,
and age | | Position(s)
held with
Trust | | Term of
office1 and
length of
time served | | Principal occupation(s) during past
5 years; number of portfolios in
fund complex for which person
serves as officer | |
Mark F. Kemper**;
62 | | Vice President and Assistant Secretary | | Since 1999 and 2019, respectively | | Mr. Kemper is a managing director (since 2006) and senior legal counsel (since October 2019) (prior to which he was Interim head of Compliance and Operational Risk Control (from June 2019 through September 2019) and general counsel (from 2004 through May 2019) of UBS AM—Americas region. He has been secretary of UBS AM—Americas region (since 2004) and secretary of UBS Asset Management Trust Company (since 1993). Mr. Kemper is vice president and assistant secretary of 8 investment companies (consisting of 62 portfolios) for which UBS AM serves as investment advisor or manager. Mr. Kemper is employed by UBS Business Solutions US LLC (since 2017). | |
Joanne M. Kilkeary*;
52 | | Vice President, Treasurer and Principal Accounting Officer | | Since 1999 (Vice President); since 2017 (Treasurer and Principal Accounting Officer) | | Ms. Kilkeary is an executive director (since 2013) (prior to which she was a director) (from 2008 to 2013)) and head of regulatory, tax, audit and board governance for product control and investment support (since 2017) (prior to which she was a senior manager of registered fund product control of UBS AM—Americas region (from 2004 to 2017)). Ms. Kilkeary is a vice president and assistant treasurer of 8 investment companies (consisting of 62 portfolios) for which UBS AM serves as investment advisor or manager. | |
45
UBS Government Money Market Investments Fund
Supplemental information (unaudited)
Officers (continued):
Name, address,
and age | | Position(s)
held with
Trust | | Term of
office1 and
length of
time served | | Principal occupation(s) during past
5 years; number of portfolios in
fund complex for which person
serves as officer | |
Igor Lasun2;
41 | | President | | Since 2018 | | Mr. Lasun is an executive director and head of fund development and management for UBS AM—Americas region (since 2018) (prior to which he was a senior fixed income product specialist from 2007 to 2018, and had joined the firm in 2005). In this role, he oversees development and management for both wholesale and institutional businesses. Mr. Lasun serves as president of 7 investment companies (consisting of 61 portfolios) for which UBS AM serves as investment advisor or manager. | |
William Lawlor**;
33 | | Vice President and Assistant Secretary | | Since 2018 | | Mr. Lawlor is a director and associate general counsel with UBS Business Solutions US LLC (since 2017) and also with UBS AM—Americas region since 2013. Prior to joining UBS AM—Americas region, Mr. Lawlor attended Kent College of Law, where he graduated in 2013. Mr. Lawlor is a vice president and assistant secretary of 7 investment companies (consisting of 61 portfolios) for which UBS AM serves as investment advisor or manager. | |
Mabel Lung***;
62 | | Vice President | | Since 2016 | | Ms. Lung is a managing director and portfolio manager, Multi-Component Portfolios, of UBS AM—Americas region which she joined in 1995. Ms. Lung is a vice president of one investment company (consisting of 15 portfolios) for which UBS AM serves as investment advisor or manager. | |
46
UBS Government Money Market Investments Fund
Supplemental information (unaudited)
Officers (continued):
Name, address,
and age | | Position(s)
held with
Trust | | Term of
office1 and
length of
time served | | Principal occupation(s) during past
5 years; number of portfolios in
fund complex for which person
serves as officer | |
Frank S.
Pluchino***,
61 | | Chief Compliance Officer | | Since 2017 | | Mr. Pluchino is an executive director with UBS AM—Americas region and is also the chief compliance officer of UBS Hedge Fund Solutions LLC (since 2010). Mr. Pluchino serves as chief compliance officer of 12 investment companies (consisting of 66 portfolios) for which UBS AM or one of its affiliates serves as investment advisor or manager. | |
Robert Sabatino**;
47 | | Vice President | | Since 2001 | | Mr. Sabatino is a managing director (since 2010) (prior to which he was an executive director) (from 2007 to 2010)), global head of liquidity portfolio management (since 2015), head of US taxable money markets (from 2009 to 2015), and portfolio manager of UBS AM—Americas region in the short duration fixed income group (since 2001). Mr. Sabatino is a vice president of three investment companies (consisting of 45 portfolios) for which UBS AM serves as investment advisor or manager. | |
Eric Sanders**;
54 | | Vice President and Assistant Secretary | | Since 2005 | | Mr. Sanders is a director and associate general counsel with UBS Business Solutions US LLC (since 2017) and also with UBS AM—Americas region (since 2005). Mr. Sanders is a vice president and assistant secretary of 8 investment companies (consisting of 62 portfolios) for which UBS AM serves as investment advisor or manager. | |
47
UBS Government Money Market Investments Fund
Supplemental information (unaudited)
Officers (continued):
Name, address,
and age | | Position(s)
held with
Trust | | Term of
office1 and
length of
time served | | Principal occupation(s) during past
5 years; number of portfolios in
fund complex for which person
serves as officer | |
Philip Stacey**; 35 | | Vice President and Assistant Secretary | | Since 2018 | | Mr. Stacey is an executive director and associate general counsel with UBS Business Solutions US LLC (Since 2017) and also with UBS AM—Americas region since 2015. Prior to joining UBS AM—Americas region. Mr. Stacey was a legal associate with the Chicago-based investment manager HFR Asset Management, LLC from 2009 through 2015. Mr. Stacey is a vice president and assistant secretary of 7 investment companies (consisting of 61 portfolios) for which UBS AM serves as investment advisor or manager. | |
Gina M. Toth***;
56 | | Vice President | | Since 2016 | | Ms. Toth is an executive director and portfolio manager in the Multi-Manager Solutions team of UBS AM—Americas region (since 2013). Prior to joining UBS AM—Americas region, Ms. Toth was a senior portfolio manager at Alliance Bernstein (from 1993 to 2012). Ms. Toth is a vice president of one investment company (consisting of 15 portfolios) for which UBS AM serves as investment advisor or manager. | |
David Walczak**;
37 | | Vice President | | Since 2016 | | Mr. Walczak is an executive director (since 2016), head of US taxable money markets (since 2015) and portfolio manager of UBS AM—Americas region. Mr. Walczak is a vice president of three investment companies (consisting of 41 portfolios) for which UBS AM serves as investment advisor or manager. | |
48
UBS Government Money Market Investments Fund
Supplemental information (unaudited)
Officers (concluded):
Name, address,
and age | | Position(s)
held with
Trust | | Term of
office1 and
length of
time served | | Principal occupation(s) during past
5 years; number of portfolios in
fund complex for which person
serves as officer | |
Keith A. Weller**;
59 | | Vice President and Secretary | | Since 2000 and 2019, respectively | | Mr. Weller is an executive director and deputy general counsel (since 2019, prior to which he was senior associate general counsel) with UBS Business Solutions US LLC (since 2017) and also with UBS AM—Americas region (since 2005) and has been an attorney with affiliated entities since 1995. Mr. Weller is a vice president and secretary of 8 investment companies (consisting of 62 portfolios) for which UBS AM serves as investment advisor or manager. | |
1 Each trustee holds office for an indefinite term. Officers are appointed by the trustees and serve at the pleasure of the Board.
2 Professor Feldberg is deemed an "interested person" of the Trust as defined in the Investment Company Act of 1940, as amended, because he is a senior advisor to Morgan Stanley, a financial services firm with which the Trust may conduct transactions.
* This person's business address is 1285 Avenue of the Americas, New York, New York 10019-6028.
** This person's business address is One North Wacker Drive, Chicago, Illinois 60606.
*** This person's business address is 787 Seventh Avenue, New York, New York 10019.
49
Trustees
Meyer Feldberg
Chairman
Alan S. Bernikow
Richard R. Burt
Bernard H. Garil
Heather R. Higgins
Investment Manager and
Administrator
UBS Asset Management (Americas) Inc.
1285 Avenue of the Americas
New York, New York 10019-6028
Principal Underwriter
UBS Asset Management (US) Inc.
1285 Avenue of the Americas
New York, New York 10019-6028
This report is not to be used in connection with the offering of shares of the Portfolio unless accompanied or preceded by an effective prospectus.
© UBS 2020. All rights reserved.
UBS Asset Management (Americas), Inc.
PRESORTED
STANDARD
U.S. POSTAGE
PAID
COMPUTERSHARE

UBS Asset Management (Americas) Inc.
1285 Avenue of the Americas
New York, New York 10019-6028
| (b) | Copy of each notice transmitted to shareholders in reliance on Rule 30e-3 under the Investment Company Act of 1940, as amended (the "1940 Act"), that contains disclosures specified by paragraph (c)(3) of that rule: Not applicable to the registrant. |
Item 2. Code of Ethics.
The registrant has adopted a code of ethics that applies to its principal executive officer, principal financial officer, principal accounting officer or controller, or persons performing similar functions pursuant to Section 406 of the Sarbanes-Oxley Act of 2002. (The registrant has designated the code of ethics adopted pursuant to Sarbanes-Oxley as a “Code of Conduct” to lessen the risk of confusion with its separate code of ethics adopted pursuant to Rule 17j-1 under the 1940 Act.).
Item 3. Audit Committee Financial Expert.
The registrant’s Board has determined that the following person serving on the registrant’s Audit Committee is an “audit committee financial expert” as defined in item 3 of Form N-CSR: Alan S. Bernikow. Mr. Bernikow is independent as defined in item 3 of Form N-CSR.
Item 4. Principal Accountant Fees and Services.
For the fiscal years ended July 31, 2020 and July 31, 2019, the aggregate Ernst & Young LLP (E&Y) audit fees for professional services rendered to the registrant were approximately $1,013,104 and $1,013,104, respectively.
Fees included in the audit fees category are those associated with the annual audits of financial statements and services that are normally provided in connection with statutory and regulatory filings.
In each of the fiscal years ended July 31, 2020 and July 31, 2019, the aggregate audit-related fees billed by E&Y for services rendered to the registrant that are reasonably related to the performance of the audits of the financial statements, but not reported as audit fees, were approximately $42,826 and $42,826, respectively.
Fees included in the audit-related fees category are those associated with the reading and providing of comments on the 2020 and 2019 semiannual financial statements.
There were no audit-related fees required to be approved pursuant to paragraph (c)(7)(ii) of Rule 2-01 of Regulation S-X during the fiscal years indicated above.
In each of the fiscal years ended July 31, 2020 and July 31, 2019, the aggregate tax fees billed by E&Y for professional services rendered to the registrant were approximately $280,606 and $175,373, respectively.
Fees included in the tax fees category comprise all services performed by professional staff in the independent accountant’s tax division except those services related to the audits. This category comprises fees for review of tax compliance, tax return preparation and excise tax calculations.
There were no tax fees required to be approved pursuant to paragraph (c)(7)(ii) of Rule 2-01 of Regulation S-X during the fiscal years indicated above.
In each of the fiscal years ended July 31, 2020 and July 31, 2019, there were no fees billed by E&Y for products and services, other than the services reported in Item 4(a)-(c) above, rendered to the registrant.
Fees included in the all other fees category would consist of services related to internal control reviews, strategy and other consulting, financial information systems design and implementation, consulting on other information systems, and other tax services unrelated to the registrant.
There were no “all other fees” required to be approved pursuant to paragraph (c)(7)(ii) of Rule 2-01 of Regulation S-X during the fiscal years indicated above.
(e)(1) Audit Committee Pre-Approval Policies and Procedures:
The registrant’s Audit Committee (“audit committee”) has adopted an “Audit Committee Charter (Amended and Restated as of September 14, 2016)” (the “charter”). The charter contains the audit committee’s pre-approval policies and procedures. Reproduced below is an excerpt from the charter regarding pre-approval policies and procedures:
The [audit] Committee shall:
…
| 2. | Pre-approve (a) all audit and permissible non-audit services1 to be provided to the Fund and (b) all permissible non-audit services to be provided by the Fund’s independent auditors to UBS AM and any Covered Service Providers, if the engagement relates directly to the operations and financial reporting of the Fund. In carrying out this responsibility, the Committee shall seek periodically from UBS AM and from the independent auditors a list of such audit and permissible non-audit services that can be expected to be rendered to the Fund, UBS AM or any Covered Service Providers by the Fund’s independent auditors, and an estimate of the fees sought to be paid in connection with such services. The Committee has delegated its responsibility to pre-approve any such audit and permissible non-audit services not exceeding $100,000 (excluding reasonable out-of-pocket expenses) on an annual basis to the Chairperson. All such pre-approvals will be reported to the full Committee on a quarterly basis at the Committee’s next regularly scheduled meeting after the pre-approval. The Committee may not delegate to management its responsibility to pre-approve services to be performed by the independent auditor. Requests or applications to provide services that require specific pre-approval by the Committee or the Chairperson will be submitted by both the Fund's independent auditors and the Fund's Treasurer or other designated Fund officer and must include a joint statement as to whether, in their view, the request or application is consistent with SEC rules on auditor independence. From year to year, the Committee shall report to the Board whether this system of pre-approval has been effective and efficient or whether this Charter should be amended to allow for pre-approval pursuant to such policies and procedures as the Committee shall approve, including the delegation of some or all of the Committee’s pre-approval responsibilities to other persons (other than UBS AM or the Fund’s officers). |
1 The Committee will not approve non-audit services that the Committee believes may taint the independence of the auditors. Currently, permissible non-audit services include any professional services (including tax services) that are not prohibited services as described below, provided to the Fund by the independent auditors, other than those provided to the Fund in connection with an audit or a review of the financial statements of the Fund. Permissible non-audit services may not include: (i) bookkeeping or other services related to the accounting records or financial statements of the Fund; (ii) financial information systems design and implementation; (iii) appraisal or valuation services, fairness opinions or contribution-in-kind reports; (iv) actuarial services; (v) internal audit outsourcing services; (vi) management functions or human resources; (vii) broker or dealer, investment advisor or investment banking services; (viii) legal services and expert services unrelated to the audit; and (ix) any other service the Public Company Accounting Oversight Board determines, by regulation, is impermissible. Pre-approval by the Committee of any permissible non-audit services is not required so long as: (i) the aggregate amount of all such permissible non-audit services provided to the Fund, UBS AM and any service providers controlling, controlled by or under common control with UBS AM that provide ongoing services to the Fund (“Covered Service Providers”) constitutes not more than 5% of the total amount of revenues paid to the independent auditors (during the fiscal year in which the permissible non-audit services are provided) by (a) the Fund, (b) UBS AM and (c) any entity controlling, controlled by, or under common control with UBS AM that provides ongoing services to the Fund during the fiscal year in which the services are provided that would have to be approved by the Committee; (ii) the permissible non-audit services were not recognized by the Fund at the time of the engagement to be non-audit services; and (iii) such services are promptly brought to the attention of the Committee and approved by the Committee (or its delegate(s)) prior to the completion of the audit.
(e) (2) Services approved pursuant to paragraph (c)(7)(i)(C) of Rule 2-01 of Regulation S-X:
Audit-Related Fees:
There were no amounts that were approved by the audit committee pursuant to the de minimis exception for the fiscal years ended July 31, 2020 and July 31, 2019 on behalf of the registrant.
There were no amounts that were required to be approved by the audit committee pursuant to the de minimis exception for the fiscal years ended July 31, 2020 and July 31, 2019 on behalf of the registrant’s service providers that relate directly to the operations and financial reporting of the registrant.
Tax Fees:
There were no amounts that were approved by the audit committee pursuant to the de minimis exception for the fiscal years ended July 31, 2020 and July 31, 2019 on behalf of the registrant.
There were no amounts that were required to be approved by the audit committee pursuant to the de minimis exception for the fiscal years ended July 31, 2020 and July 31, 2019 on behalf of the registrant’s service providers that relate directly to the operations and financial reporting of the registrant.
All Other Fees:
There were no amounts that were approved by the audit committee pursuant to the de minimis exception for the fiscal years ended July 31, 2020 and July 31, 2019 on behalf of the registrant.
There were no amounts that were required to be approved by the audit committee pursuant to the de minimis exception for the fiscal years ended July 31, 2020 and July 31, 2019 on behalf of the registrant’s service providers that relate directly to the operations and financial reporting of the registrant.
| (f) | For the fiscal year ended July 31, 2020, if greater than 50%, specify the percentage of hours spent on the audit of the registrant’s financial statements for the most recent fiscal year that were attributed to work performed by persons who are not full-time, permanent employees of E&Y. According to E&Y, such amount was below 50%; therefore disclosure item not applicable to this filing. |
| (g) | For the fiscal years ended July 31, 2020 and July 31, 2019, the aggregate fees billed by E&Y of $642,172 and $415,439, respectively, for non-audit services rendered on behalf of the registrant (“covered”), its investment adviser (not including any sub-adviser whose role is primarily portfolio management and is subcontracted with or overseen by another investment adviser) and any entity controlling, controlled by, or under common control with the adviser (“non-covered”) that provides ongoing services (or provided during the relevant fiscal period) to the registrant for each of the last two fiscal years of the registrant is shown in the table below: |
| | | 2020 | | | 2019 | |
| Covered Services | | $ | 323,432 | | | $ | 218,199 | |
| Non-Covered Services | | $ | 318,740 | | | $ | 197,240 | |
| (h) | The registrant’s audit committee was not required to consider whether the provision of non-audit services that were rendered to the registrant’s investment adviser (not including any sub-adviser whose role is primarily portfolio management and is subcontracted with or overseen by another investment adviser), and any entity controlling, controlled by, or under common control with the investment adviser that provides ongoing services to the registrant that were not pre-approved pursuant to paragraph (c)(7)(ii) of Rule 2-01 of Regulation S-X is compatible with maintaining the principal accountant’s independence. |
Item 5. Audit Committee of Listed Registrants.
Not applicable to the registrant.
Item 6. Investments.
(a) Included as part of the report to shareholders filed under Item 1 of this form.
(b) Not applicable.
Item 7. Disclosure of Proxy Voting Policies and Procedures for Closed-End Management Investment Companies.
Not applicable to the registrant.
Item 8. Portfolio Managers of Closed-End Management Investment Companies.
Not applicable to the registrant.
Item 9. Purchases of Equity Securities by Closed-End Management Investment Company and Affiliated Purchasers.
Not applicable to the registrant.
Item 10. Submission of Matters to a Vote of Security Holders.
The registrant’s Board has established a Nominating and Corporate Governance Committee. The Nominating and Corporate Governance Committee will consider nominees recommended by shareholders if a vacancy occurs among those board members who are not “interested persons” as defined in Section 2(a)(19) of the Investment Company Act of 1940, as amended. In order to recommend a nominee, a shareholder should send a letter to the chairperson of the Nominating and Corporate Governance Committee, Richard R. Burt, care of the Secretary of the registrant at UBS Asset Management, UBS Building, One North Wacker Drive, Chicago, IL 60606, Attn: Keith A. Weller, Secretary, and indicate on the envelope “Nominating and Corporate Governance Committee.” The shareholder’s letter should state the nominee’s name and should include the nominee’s resume or curriculum vitae, and must be accompanied by a written consent of the individual to stand for election if nominated for the Board and to serve if elected by shareholders.
Item 11. Controls and Procedures.
| (a) | The registrant’s principal executive officer and principal financial officer have concluded that the registrant’s disclosure controls and procedures (as defined in Rule 30a-3(c) under the Investment Company Act of 1940, as amended) are effective based on their evaluation of these controls and procedures as of a date within 90 days of the filing date of this document. |
| (b) | The registrant’s principal executive officer and principal financial officer are aware of no changes in the registrant’s internal control over financial reporting that occurred during the period covered by this report that has materially affected, or is reasonably likely to materially affect, the registrant’s internal control over financial reporting. |
Item 12. Disclosure of Securities Lending Activities for Closed-End Management Investment Companies.
Not applicable to the registrant.
Item 13. Exhibits.
| (a) | (3) Written solicitation to purchase securities under Rule 23c-1 under the Investment Company Act of 1940 sent or given during the period covered by the report by or on behalf of the registrant to 10 or more persons – not applicable to the registrant. |
| (a) | (4) Change in the registrant's independent public accountant – Not applicable to the registrant. |
SIGNATURES
Pursuant to the requirements of the Securities Exchange Act of 1934 and the Investment Company Act of 1940, the registrant has duly caused this report to be signed on its behalf by the undersigned, thereunto duly authorized.
| PACE Select Advisors Trust | |
| | |
| By: | /s/ Igor Lasun | |
| | Igor Lasun | |
| | President | |
| | |
| Date: | October 9, 2020 | |
Pursuant to the requirements of the Securities Exchange Act of 1934 and the Investment Company Act of 1940, this report has been signed below by the following persons on behalf of the registrant and in the capacities and on the dates indicated.
| By: | /s/ Igor Lasun | |
| | Igor Lasun | |
| | President | |
| | |
| Date: | October 9, 2020 | |
| | |
| By: | /s/ Joanne M. Kilkeary | |
| | Joanne M. Kilkeary | |
| | Vice President, Treasurer and Principal Accounting Officer | |
| | |
| Date: | October 9, 2020 | |