UNITED STATES
SECURITIES AND EXCHANGE COMMISSION
Washington, D.C. 20549
FORM N-CSR
CERTIFIED SHAREHOLDER REPORT OF REGISTERED
MANAGEMENT INVESTMENT COMPANIES
Investment Company Act file number | 811-08764 |
|
PACE® Select Advisors Trust |
(Exact name of registrant as specified in charter) |
|
1285 Avenue of the Americas, New York, New York | | 10019-6028 |
(Address of principal executive offices) | | (Zip code) |
|
Mark F. Kemper, Esq. UBS Global Asset Management 1285 Avenue of the Americas New York, NY 10019-6028 |
(Name and address of agent for service) |
|
Copy to: |
Jack W. Murphy, Esq. Dechert LLP 1775 I Street, N.W. Washington, DC 20006-2401 |
|
Registrant’s telephone number, including area code: | 212-821 3000 | |
|
Date of fiscal year end: | July 31 | |
|
Date of reporting period: | July 31, 2011 | |
| | | | | | | | |
Item 1. Reports to Stockholders.

PACE Select
Annual Report
PACE® Select Advisors Trust
Annual Report
July 31, 2011
PACE® Select Advisors Trust
| Table of contents | |
|
| Introduction | | | 2 | | |
|
| Portfolio Advisor's and Sub-Advisors' commentaries and schedules of investments | |
|
| PACE® Money Market Investments | | | 5 | | |
|
| PACE® Government Securities Fixed Income Investments | | | 13 | | |
|
| PACE® Intermediate Fixed Income Investments | | | 25 | | |
|
| PACE® Strategic Fixed Income Investments | | | 40 | | |
|
| PACE® Municipal Fixed Income Investments | | | 60 | | |
|
| PACE® International Fixed Income Investments (formerly UBS PACE® Global Fixed Income Investments) | | | 72 | | |
|
| PACE® High Yield Investments | | | 84 | | |
|
| PACE® Large Co Value Equity Investments | | | 99 | | |
|
| PACE® Large Co Growth Equity Investments | | | 108 | | |
|
| PACE® Small/Medium Co Value Equity Investments | | | 120 | | |
|
| PACE® Small/Medium Co Growth Equity Investments | | | 130 | | |
|
| PACE® International Equity Investments | | | 141 | | |
|
| PACE® International Emerging Markets Equity Investments | | | 155 | | |
|
| PACE® Global Real Estate Securities Investments | | | 168 | | |
|
| PACE® Alternative Strategies Investments | | | 177 | | |
|
| Understanding your Portfolio's expenses | | | 228 | | |
|
| Statement of assets and liabilities | | | 234 | | |
|
| Statement of operations | | | 242 | | |
|
| Statement of changes in net assets | | | 246 | | |
|
| Financial highlights | | | 253 | | |
|
| Notes to financial statements | | | 306 | | |
|
| Report of independent registered public accounting firm | | | 347 | | |
|
| Tax information | | | 348 | | |
|
| General information | | | 349 | | |
|
| Board approvals of sub-advisory agreements | | | 350 | | |
|
| Trustees and officers | | | 366 | | |
|
PACE Select Advisors Trust offers multiple share classes representing interests in 15 separate Portfolios. (PACE Money Market Investments offers only one share class.) Different classes of shares and/or Portfolios are offered by separate prospectuses.
For more information on a portfolio or class of shares, contact your financial advisor. He or she can send you a current prospectus relating to a portfolio or class of shares. Investors should carefully read and consider a mutual fund's investment objectives, risks, charges, and expenses before investing. The prospectus contains this and other information about a mutual fund. For a current prospectus, contact UBS Global Asset Management (Americas) Inc. at 888-793 8637, or visit us on the Web at www.ubs.com/globalam-us.
Derivatives vary in complexity, involve risks which are different from, and may be greater than, the risks associated with investing in securities or other instruments. Please see the funds' prospectuses for more complete discussion of the risks associated with investing in derivatives.
1
PACE Select Advisors Trust
Introduction
September 16, 2011
Dear PACE Shareholder,
We are pleased to provide you with the annual report for the PACE portfolios (the "Portfolios"), comprising the PACE Select Advisors Trust. This report includes summaries of the performance of each Portfolio, as well as commentaries from the investment advisor and sub-advisors regarding the events that affected Portfolio performance during the 12 months ended July 31, 2011. Please note that the opinions of the sub-advisors do not necessarily represent those of UBS Global Asset Management (Americas) Inc.
Decelerating Growth in Developed Countries
The US and many developed countries abroad experienced decelerating economic growth during the reporting period. Oil and food prices moved higher during this time, which had a negative impact on consumer spending. In addition, supply disruptions following the devastating earthquake and tsunami in Japan in March led to moderating growth in the manufacturing sector. In the US, gross domestic product ("GDP") growth was 2.5% and 2.3% during the third and fourth quarters of 2010, followed by first and second quarter 2011 GDP growth of 0.4% and 1.0%, respectively.
In contrast to their developed country counterparts, growth in most emerging market economies, such as China and India, remained robust. Against a backdrop of higher inflation, several emerging market central banks raised their interest rates and took other actions in an effort to cool growth and stem rising prices. By the end of the period, commodity prices had declined from their peaks and inflationary pressures appeared to have eased.
Global equities produce strong returns
While the global equity markets gave back a portion of their earlier gains late in the reporting period, overall they generated strong results. Expectations for strengthening growth, corporate profits that were often better than expected and robust demand supported the US stock market during the first nine months of the period. However, risk appetite was later replaced with increased risk aversion as a result of the European sovereign debt crisis, fears that the US may default on its debt obligations and overall disappointing economic data. Despite weakening stock prices during the last three months of the period, the US stock market, as measured by the S&P 500 Index,1 returned 19.65% during the 12-months ended July 31, 2011.
International developed equities (as measured by the MSCI EAFE Index (net)2) proved resilient as well, gaining 17.17% during the reporting period. However, they experienced heightened volatility, at times, in light of fears that the European debt crisis may escalate. Emerging markets equities (as measured by the MSCI Emerging Markets Index3) also posted strong returns, gaining 17.79% over the period. Continued robust growth in developing countries and higher commodity prices supported emerging markets equities.
1 The S&P 500 Index is an unmanaged, weighted index composed of 500 widely held common stocks varying in composition, and is not available for direct investment. Investors should note that indices do not reflect the deduction of fees and expenses.
2 The MSCI EAFE Index (net) is an index of stocks from 22 countries designed to measure the investment returns of developed economies outside of North America. Dividends are reinvested after the deduction of withholding tax, using tax rates applicable to Luxembourg holding companies, as Luxembourg applies the highest rates. The Index is constructed and managed with a view to being fully investable from the perspective of international institutional investors. Investors should note that indices do not reflect the deduction of fees and expenses.
3 The MSCI Emerging Markets Index is a market capitalization-weighted index composed of companies representative of the market structure of 21 emerging market countries in Europe, Latin America, and the Pacific Basin. The Index is constructed and managed with a view to being fully investable from the perspective of international institutional investors. Investors should note that indices do not reflect the deduction of fees and expenses.
2
PACE Select Advisors Trust
Riskier fixed income securities outperform
There was also a meaningful shift in investor sentiment in the fixed income market during the reporting period. This, in turn, impacted the performance of the spread sectors (non-Treasuries). During much of the period, there were hopes for improving economic conditions, coupled with sharply rising oil and commodity prices. Despite hostilities in the Middle East and Northern Africa, the natural disaster in Japan and the European sovereign debt crisis, most spread sectors outperformed Treasuries and yields moved higher. Nonetheless, it was a different story during the last three months of the period. High oil prices hurt consumer spending, and economic data pointed to a soft patch in many developed countries. Against this backdrop, Treasury yields declined and nearly every spread sector lagged Treasuries. All told, during the 12 months ended July 31, 2011, the spread sectors typically outperformed Treasuries and the overall US bond market, as measured by the Barclays Capital US Aggregate Index,4 returned 4.44%.
Despite increased volatility and periodic flights to quality, riskier fixed income asset classes generated solid gains during the reporting period, as the BofA Merrill Lynch US High Yield Cash Pay Constrained Index5 returned 12.74% and the J.P. Morgan Emerging Markets Bond Index Global (EMBI Global)6 rose 9.41%.
Sincerely,

Mark E. Carver
President, PACE Select Advisors Trust
Managing Director, UBS Global Asset Management (Americas) Inc.
4 The Barclays Capital US Aggregate Index is an unmanaged broad based index designed to measure the US- dollar-denominated, investment-grade, fixed rate taxable bond market. The index includes bonds from the Treasury, government-related, corporate, mortgage-backed, asset-backed and commercial mortgage-backed sectors. US agency hybrid adjustable rate mortgage (ARM) securities were added to the Index on April 1, 2007. Investors should note that indices do not reflect the deduction of fees and expenses.
5 The BofA Merrill Lynch US High Yield Cash Pay Constrained Index is an unmanaged index of publicly placed non-convertible, coupon-bearing US-dollar-denominated below investment grade corporate debt with a term to maturity of at least one year. The index is market weighted, so that larger bond issuers have a greater effect on the index's return. However, the representation of any single bond issue is restricted to a maximum of 2% of the total index. Investors should note that indices do not reflect the deduction of fees and expenses.
6 The J.P. Morgan Emerging Markets Bond Index Global (EMBI Global) is an unmanaged index which is designed to track total returns for US-dollar-denominated debt instruments issued by emerging market sovereign and quasi-sovereign entities: Brady bonds, loans and Eurobonds. Investors should note that indices do not reflect the deduction of fees and expenses.
3
PACE Select Advisors Trust
This report is intended to assist investors in understanding how the Portfolios performed during the 12-month period ended July 31, 2011. The views expressed in the Advisor's and Sub-Advisors' Comments sections are as of the end of the reporting period, reflect performance results gross of fees and expenses, and are those of the investment advisor (with respect to PACE Money Market Investments only) and sub-advisors. Sub-advisors' comments on Portfolios that have more than one sub-advisor are reflective of their portion of the Portfolio only. The views and opinions in this report were current as of September 16, 2011. They are not guarantees of performance or investment results and should not be taken as investment advice. Investment decisions reflect a variety of factors, and the investment advisor and sub-advisors reserve the right to change their views about individual securities, sectors and markets at any time. As a result, the views expressed should not be relied upon as a forecast of a Portfolio's future investment intent.
4
PACE Select Advisors Trust
PACE Money Market Investments
Performance
For the 12 months ended July 31, 2011, the Portfolio returned 0.01%, before the deduction of the maximum PACE program fee. (The Portfolio declined 1.97%, after the deduction of the maximum PACE program fee, for the same 12-month period.) Please remember that the PACE program fee is assessed outside the Portfolio at the PACE program account level. The program fee does not impact the determination of the Portfolio's net asset value per share. For comparison purposes, the median return of the Lipper Money Market Funds category was 0.01%. (Returns over various time periods are shown in the "Performance at a glance" table on page 7. Please note that the returns shown do not reflect the deduction of taxes that a shareholder would pay on Portfolio distributions.) For a detailed commentary on the market environment in general during the reporting period, please refer to page 2.
Advisor's comments
The economic recovery continued during the reporting period, although growth moderated as the period progressed. Elevated unemployment, housing market weakness, higher oil prices and supply disruptions following the devastating earthquake in Japan caused economic growth to decelerate. Against this backdrop, the Federal Reserve Board (the "Fed") maintained the federal funds rate at a historically low range between 0% and 0.25% during the reporting period. (The federal funds rate, or "fed funds" rate, is the rate that banks charge one another for funds they borrow on an overnight basis.) As a result, the yields of the securities in which the Portfolio invests remained extremely low, which impacted the Portfolio's yield.
We tactically adjusted the Portfolio's weighted average maturity (WAM)—which is the average duration of the securities in the Portfolio—but generally kept it in a fairly narrow range. When the reporting period began, the Portfolio had a WAM of 46 days. As of July 31, 2011, the Fund's WAM was 47 days.
At the issuer level, we maintained a greater-than-usual level of diversification over the 12-month period by investing in smaller positions, with the goal of reducing risk and keeping the Portfolio highly liquid. As the economic recovery continued over the period, we slightly increased the size of our positions in single issuers, typically purchasing up to 3% in single nongovernment issuers by the end of the reporting period. (The Portfolio is generally able to hold up to 5% in any one issuer, subject to certain exceptions.)
In terms of securities, over the 12-month period we increased the Portfolio's exposure to repurchase agreements and, to lesser extents, its allocation to commercial paper and a US bank note. In contrast, we decreased the Portfolio's exposure to US government and agency obligations, CDs and short-term corporate obligations. (Repurchase agreements are transactions in which the seller of a security agrees to buy it back at a predetermined time and price, or upon demand.)
PACE Select Advisors Trust – PACE Money Market Investments
Investment Advisor:
UBS Global Asset Management (Americas) Inc.
Portfolio Manager:
Robert Sabatino
Objective:
Current income consistent with preservation of capital and liquidity
Investment process:
The Portfolio is a money market mutual fund and seeks to maintain a stable price of $1.00 per share, although it may be possible to lose money by investing in this Portfolio. The Portfolio invests in a diversified portfolio of high-quality money market instruments of governmental and private issuers. Security selection is based on the assessment of relative values and changes in market and economic conditions.
5
PACE Select Advisors Trust
PACE Money Market Investments
Advisor's comments – concluded
One final note, in response to revisions to the US Securities and Exchange Commission's ("SEC") rules governing money market funds, beginning on October 7, 2010, the Portfolio began disclosing, on a monthly basis: (a) a complete schedule of its portfolio holdings; and (b) information regarding its weighted average maturity and weighted average life. Also, beginning in February 2011, the Portfolio began including a link on UBS's Web site to more detailed Portfolio information appearing in filings with the SEC on Form N-MFP. This information is available on UBS's Web site at the following Internet address: www.ubs.com/usmoneymarketfundsholdings. This information will be updated monthly.
6
PACE Select Advisors Trust
PACE Money Market Investments
Performance at a glance (unaudited)
| Average annual total returns for periods ended 07/31/11 | | 1 year | | 5 years | | 10 years | |
| PACE Money Market Investments before deducting maximum PACE program fee1 | | | 0.01 | % | | | 1.80 | % | | | 1.82 | % | |
| PACE Money Market Investments after deducting maximum PACE program fee1 | | | (1.97 | )% | | | (0.22 | )% | | | (0.20 | )% | |
| Lipper Money Market Funds median | | | 0.01 | % | | | 1.79 | % | | | 1.74 | % | |
For PACE Money Market Investments, average annual total returns for periods ended June 30, 2011, after deduction of the maximum PACE program fee, were as follows: 1-year period, (1.97)%; 5-year period, (0.14)%; 10-year period, (0.16)%.
For PACE Money Market Investments, the 7-day current yield for the period ended July 31, 2011 was 0.01% (without maximum PACE program fee and after fee waivers and/or expense reimbursements; the yield was (0.96)% before fee waivers and/or expense reimbursements). With the maximum PACE program fee, the 7-day current yield was (1.99)% after fee waivers and/or expense reimbursements; the yield was (2.96)% before fee waivers and/or expense reimbursements. The Portfolio's yield quotation more closely reflects the current earnings of the Portfolio than the total return quotation. Yields will fluctuate and reflect fee waivers and/or expense reimbursements.
1 The maximum annual PACE program fee is 2% of the value of PACE assets. Prior to June 14, 2010, the maximum annual PACE program fee was 1.5% of the value of PACE assets; however, the current maximum annual PACE program fee of 2% is reflected in the performance returns throughout all periods in the average annual total returns shown above.
Past performance does not predict future performance and the performance information provided does not reflect the deduction of taxes that a shareholder would pay on Portfolio distributions. The return of an investment will fluctuate. Performance results assume reinvestment of all dividends and capital gain distributions at net asset value on the payable dates. Current performance may be higher or lower than the performance data quoted.
Lipper peer group data calculated by Lipper Inc.; used with permission. The Lipper median is the return of the fund that places in the middle of a Lipper peer group.
An investment in PACE Money Market Investments is not insured or guaranteed by the Federal Deposit Insurance Corporation or any other government agency. Although the Portfolio seeks to preserve the value of your investment at $1.00 per share, it is possible to lose money by investing in the Portfolio.
Not FDIC Insured. May lose value. No Bank guarantee.
7
PACE Select Advisors Trust
PACE Money Market Investments
Portfolio statistics (unaudited)
| Characteristics | | 07/31/11 | |
| Net assets (mm) | | $ | 365.8 | | |
| Number of holdings | | | 91 | | |
| Weighted average maturity | | | 47 days | | |
| Portfolio composition1 | | 07/31/11 | |
| Commercial paper | | | 41.2 | % | |
| Repurchase agreements | | | 21.3 | | |
| US government and agency obligations | | | 19.7 | | |
| Certificates of deposit | | | 12.4 | | |
| Short-term corporate obligations | | | 1.5 | | |
| Bank note | | | 0.8 | | |
| Other assets less liabilities | | | 3.1 | | |
| Total | | | 100.0 | % | |
| Top 10 holdings1 | | 07/31/11 | |
| Repurchase agreement with Deutsche Bank Securities, 0.180% due 08/01/11 | | | 15.8 | % | |
| Repurchase agreement with Barclays Bank PLC, 0.140% due 08/01/11 | | | 5.5 | | |
| US Treasury Notes, 0.750% due 05/31/12 | | | 2.5 | | |
| General Electric Co., 0.100% due 08/05/11 | | | 1.9 | | |
| Market Street Funding LLC, 0.150% due 08/01/11 | | | 1.6 | | |
| Atlantic Asset Securitization LLC, 0.160% due 08/05/11 | | | 1.6 | | |
| Bank of Nova Scotia, 0.180% due 10/03/11 | | | 1.4 | | |
| Amsterdam Funding Corp., 0.180% due 08/01/11 | | | 1.4 | | |
| Barclays US Funding Corp., 0.130% due 08/01/11 | | | 1.4 | | |
| Deutsche Bank Financial LLC, 0.100% due 08/01/11 | | | 1.4 | | |
| Total | | | 34.5 | % | |
1 Weightings represent percentages of the Portfolio's net assets as of July 31, 2011. The Portfolio is actively managed and its composition will vary over time.
8
PACE Select Advisors Trust
PACE Money Market Investments
Portfolio of investments—July 31, 2011
| | | Face
amount | | Value | |
US government and agency
obligations—19.71% | |
Federal Farm Credit Bank
0.230%, due 11/08/111 | | $ | 3,000,000 | | | $ | 2,998,102 | | |
Federal Home Loan Bank
0.165%, due 08/01/112 | | | 3,000,000 | | | | 3,000,000 | | |
| 0.280%, due 08/07/112 | | | 3,000,000 | | | | 3,000,000 | | |
| 0.040%, due 08/09/111 | | | 5,000,000 | | | | 4,999,956 | | |
| 0.300%, due 09/15/112 | | | 3,000,000 | | | | 3,000,000 | | |
| 0.270%, due 09/30/112 | | | 4,500,000 | | | | 4,500,000 | | |
| 0.280%, due 10/12/112 | | | 3,500,000 | | | | 3,500,000 | | |
| 0.270%, due 02/17/121 | | | 3,000,000 | | | | 2,995,500 | | |
Federal Home Loan Mortgage Corp.*
0.135%, due 08/06/112 | | | 3,000,000 | | | | 2,997,855 | | |
| 0.230%, due 08/23/111 | | | 5,000,000 | | | | 4,999,297 | | |
Federal National Mortgage
Association*
0.290%, due 08/08/111 | | | 2,000,000 | | | | 1,999,887 | | |
| 0.210%, due 09/01/111 | | | 4,000,000 | | | | 3,999,277 | | |
US Treasury Bills
0.155%, due 09/22/111 | | | 5,000,000 | | | | 4,998,881 | | |
| 0.040%, due 10/27/111 | | | 3,000,000 | | | | 2,999,709 | | |
| 0.250%, due 03/08/121 | | | 2,000,000 | | | | 1,996,944 | | |
US Treasury Notes
1.000%, due 12/31/11 | | | 2,000,000 | | | | 2,006,341 | | |
| 0.875%, due 02/29/12 | | | 3,000,000 | | | | 3,008,922 | | |
| 1.000%, due 04/30/12 | | | 3,000,000 | | | | 3,014,055 | | |
| 0.750%, due 05/31/12 | | | 9,000,000 | | | | 9,039,324 | | |
| 1.875%, due 06/15/12 | | | 3,000,000 | | | | 3,043,317 | | |
Total US government and agency
obligations
(cost—$72,097,367) | | | | | | | 72,097,367 | | |
| Bank note—0.82% | |
| Banking-US—0.82% | |
Bank of America N.A.
0.120%, due 08/24/11
(cost—$3,000,000) | | | 3,000,000 | | | | 3,000,000 | | |
| Certificates of deposit—12.37% | |
| Banking-non-US—12.37% | |
Abbey National Treasury Services PLC
0.700%, due 10/17/112 | | | 3,500,000 | | | | 3,500,000 | | |
| 0.450%, due 10/18/112 | | | 1,500,000 | | | | 1,500,000 | | |
Bank of Nova Scotia
0.190%, due 08/01/112 | | | 1,500,000 | | | | 1,500,000 | | |
| 0.190%, due 08/03/11 | | | 3,000,000 | | | | 3,000,000 | | |
| 0.180%, due 10/03/11 | | | 5,000,000 | | | | 5,000,000 | | |
BNP Paribas SA
0.399%, due 10/17/112 | | | 1,750,000 | | | | 1,750,000 | | |
Dnb NOR ASA
0.240%, due 12/28/11 | | | 2,000,000 | | | | 2,000,000 | | |
Lloyds TSB Bank PLC
0.500%, due 10/19/112 | | | 3,500,000 | | | | 3,500,000 | | |
Mitsubishi UFJ Trust & Banking Corp.
0.220%, due 08/16/11 | | | 3,000,000 | | | | 3,000,000 | | |
| | | Face
amount | | Value | |
| Certificates of deposit—(Concluded) | |
| Banking-non-US—(Concluded) | |
National Australia Bank Ltd.
0.269%, due 10/14/112 | | $ | 1,000,000 | | | $ | 1,000,000 | | |
| 0.270%, due 10/19/112 | | | 750,000 | | | | 749,966 | | |
Natixis
0.366%, due 10/13/112 | | | 1,000,000 | | | | 1,000,000 | | |
Nordea Bank Finland
0.400%, due 06/12/12 | | | 2,500,000 | | | | 2,500,000 | | |
Rabobank Nederland N.V.
0.267%, due 08/18/112 | | | 1,000,000 | | | | 1,000,000 | | |
Royal Bank of Canada
0.260%, due 08/01/112 | | | 1,500,000 | | | | 1,500,000 | | |
| 0.275%, due 08/01/112 | | | 1,500,000 | | | | 1,500,000 | | |
| 0.260%, due 01/11/12 | | | 3,000,000 | | | | 3,000,000 | | |
Royal Bank of Scotland PLC
0.553%, due 10/25/112 | | | 3,500,000 | | | | 3,500,000 | | |
Toronto-Dominion Bank
0.105%, due 08/08/11 | | | 3,000,000 | | | | 3,000,000 | | |
Westpac Banking Corp.
0.270%, due 08/01/112 | | | 1,750,000 | | | | 1,750,000 | | |
Total certificates of deposit
(cost—$45,249,966) | | | | | | | 45,249,966 | | |
| Commercial paper1—41.24% | |
| Asset backed-banking—1.91% | |
Atlantis One Funding
0.200%, due 08/01/11 | | | 4,000,000 | | | | 4,000,000 | | |
| 0.160%, due 09/13/11 | | | 3,000,000 | | | | 2,999,427 | | |
| | | | 6,999,427 | | |
| Asset backed-miscellaneous—15.05% | |
Amsterdam Funding Corp.
0.180%, due 08/01/11 | | | 5,000,000 | | | | 5,000,000 | | |
Atlantic Asset Securitization LLC
0.160%, due 08/05/11 | | | 6,000,000 | | | | 5,999,893 | | |
Barton Capital LLC
0.150%, due 08/02/11 | | | 3,000,000 | | | | 2,999,988 | | |
Gotham Funding Corp.
0.160%, due 08/05/11 | | | 2,000,000 | | | | 1,999,964 | | |
| 0.160%, due 08/08/11 | | | 3,000,000 | | | | 2,999,907 | | |
LMA Americas LLC
0.200%, due 08/22/11 | | | 3,000,000 | | | | 2,999,650 | | |
Market Street Funding LLC
0.150%, due 08/01/11 | | | 6,000,000 | | | | 6,000,000 | | |
Regency Markets No. 1 LLC
0.150%, due 08/15/11 | | | 5,000,000 | | | | 4,999,708 | | |
| 0.150%, due 08/16/11 | | | 3,000,000 | | | | 2,999,813 | | |
Salisbury Receivables Co. LLC
0.140%, due 08/25/11 | | | 5,000,000 | | | | 4,999,533 | | |
Thunderbay Funding
0.170%, due 09/13/11 | | | 5,000,000 | | | | 4,998,985 | | |
Windmill Funding Corp.
0.140%, due 08/04/11 | | | 3,000,000 | | | | 2,999,965 | | |
| 0.140%, due 08/09/11 | | | 3,000,000 | | | | 2,999,907 | | |
| 0.140%, due 08/10/11 | | | 3,050,000 | | | | 3,049,893 | | |
| | | | 55,047,206 | | |
9
PACE Select Advisors Trust
PACE Money Market Investments
Portfolio of investments—July 31, 2011
| | | Face
amount | | Value | |
| Commercial paper1—(Continued) | |
| Asset backed-securities—1.09% | |
Argento Variable Funding Co. LLC
0.180%, due 08/23/11 | | $ | 3,000,000 | | | $ | 2,999,670 | | |
Grampian Funding LLC
0.210%, due 09/15/11 | | | 1,000,000 | | | | 999,737 | | |
| | | | 3,999,407 | | |
| Banking-non-US—6.90% | |
Commonwealth Bank of Australia
0.265%, due 08/08/112,3 | | | 1,000,000 | | | | 999,981 | | |
| 0.180%, due 10/11/11 | | | 3,000,000 | | | | 2,998,935 | | |
Credit Suisse
0.190%, due 08/17/11 | | | 3,000,000 | | | | 2,999,747 | | |
| 0.190%, due 10/12/11 | | | 1,000,000 | | | | 999,620 | | |
Dnb NOR ASA
0.130%, due 08/05/11 | | | 5,000,000 | | | | 4,999,928 | | |
Kreditanstalt für Wiederaufbau
0.140%, due 09/08/11 | | | 3,000,000 | | | | 2,999,557 | | |
Sumitomo Mitsui Banking Corp.
0.180%, due 08/08/11 | | | 3,000,000 | | | | 2,999,895 | | |
Svenska Handelsbanken, Inc.
0.250%, due 12/14/11 | | | 5,000,000 | | | | 4,995,312 | | |
Westpac Securities NZ Ltd.
0.284%, due 09/01/112,3 | | | 1,250,000 | | | | 1,250,000 | | |
| | | | 25,242,975 | | |
| Banking-US—10.82% | |
Barclays US Funding Corp.
0.130%, due 08/01/11 | | | 5,000,000 | | | | 5,000,000 | | |
| 0.210%, due 08/17/11 | | | 5,000,000 | | | | 4,999,533 | | |
Deutsche Bank Financial LLC
0.100%, due 08/01/11 | | | 5,000,000 | | | | 5,000,000 | | |
| 0.200%, due 10/03/11 | | | 3,000,000 | | | | 2,998,950 | | |
ING (US) Funding LLC
0.240%, due 08/05/11 | | | 3,000,000 | | | | 2,999,920 | | |
| 0.160%, due 08/09/11 | | | 3,000,000 | | | | 2,999,893 | | |
| 0.360%, due 11/03/11 | | | 3,000,000 | | | | 2,997,180 | | |
JPMorgan Chase & Co.
0.150%, due 09/07/11 | | | 3,000,000 | | | | 2,999,538 | | |
Natixis US Finance Co. LLC
0.250%, due 09/12/11 | | | 3,000,000 | | | | 2,999,125 | | |
Nordea N.A., Inc.
0.230%, due 12/07/11 | | | 2,000,000 | | | | 1,998,364 | | |
Societe Generale N.A., Inc.
0.210%, due 08/01/11 | | | 1,575,000 | | | | 1,575,000 | | |
State Street Bank & Trust Co.
0.150%, due 10/13/11 | | | 3,000,000 | | | | 2,999,088 | | |
| | | | 39,566,591 | | |
| | | Face
amount | | Value | |
| Commercial paper1—(Concluded) | |
| Diversified manufacturing—1.91% | |
General Electric Co.
0.100%, due 08/05/11 | | $ | 7,000,000 | | | $ | 6,999,922 | | |
| Finance-captive automotive—1.37% | |
Toyota Motor Credit Corp.
0.160%, due 08/10/11 | | | 5,000,000 | | | | 4,999,800 | | |
| Insurance-life—2.19% | |
Axa Financial, Inc.
0.160%, due 08/11/11 | | | 3,000,000 | | | | 2,999,867 | | |
MetLife Short Term Funding LLC
0.140%, due 08/01/11 | | | 2,000,000 | | | | 2,000,000 | | |
| 0.150%, due 09/14/11 | | | 3,000,000 | | | | 2,999,450 | | |
| | | | 7,999,317 | | |
Total commercial paper
(cost—$150,854,645) | | | | | | | 150,854,645 | | |
| Short-term corporate obligations—1.50% | |
| Banking-non-US—1.09% | |
Svenska Handelsbanken, Inc.
0.292%, due 09/08/112,3 | | | 2,500,000 | | | | 2,500,000 | | |
Westpac Securities NZ Ltd.
0.355%, due 08/04/112,3 | | | 1,500,000 | | | | 1,500,000 | | |
| | | | 4,000,000 | | |
| Banking-US—0.41% | |
JPMorgan Chase Bank N.A.
0.275%, due 09/09/112 | | | 1,500,000 | | | | 1,500,000 | | |
Total short-term corporate
obligations
(cost—$5,500,000) | | | | | | | 5,500,000 | | |
| Repurchase agreements—21.34% | |
Repurchase agreement dated
07/29/11 with Barclays Bank
PLC, 0.140% due 08/01/11,
collateralized by $8,824,000
Federal Farm Credit Bank
obligations, 1.875% due 12/07/12
and $11,396,000 Federal National
Mortgage Association obligations,
zero coupon due 05/01/12;
(value—$20,400,564);
proceeds: $20,000,233 | | | 20,000,000 | | | | 20,000,000 | | |
Repurchase agreement dated
07/29/11 with Deutsche Bank
Securities, 0.180% due 08/01/11,
collateralized by $59,100,000
Federal Home Loan Bank
obligations, 0.320% due
12/09/11; (value—$59,162,318);
proceeds: $58,000,870 | | | 58,000,000 | | | | 58,000,000 | | |
10
PACE Select Advisors Trust
PACE Money Market Investments
Portfolio of investments—July 31, 2011
| | | Face
amount | | Value | |
| Repurchase agreements—(Concluded) | |
Repurchase agreement dated
07/29/11 with State Street Bank &
Trust Co., 0.010% due 08/01/11,
collateralized by $370 Federal
Home Loan Mortgage Corp.
obligations, 5.125% due 07/15/12
and $81,406 US Treasury Bills,
zero coupon due 08/04/11 to
07/26/12; (value—$81,632);
proceeds: $80,000 | | $ | 80,000 | | | $ | 80,000 | | |
Total repurchase agreements
(cost—$78,080,000) | | | | | | | 78,080,000 | | |
Total investments
(cost—$354,781,978,
which approximates cost
for federal income
tax purposes)—96.98% | | | | | | | 354,781,978 | | |
Other assets in excess
of liabilities—3.02% | | | | | | | 11,061,651 | | |
Net assets (applicable to 365,845,932
shares of beneficial interest
outstanding equivalent to $1.00
per share)—100.00% | | $ | 365,843,629 | | |
For a listing of defined portfolio acronyms and currency abbreviations that are used throughout the Portfolio of investments as well as the tables that follow, please refer to page 227.
* On September 7, 2008, the Federal Housing Finance Agency placed the Federal National Mortgage Association and the Federal Home Loan Mortgage Corporation into conservatorship, and the US Treasury guaranteed the debt issued by those organizations.
1 Rates shown are the discount rates at date of purchase.
2 Variable or floating rate security. The interest rate shown is the current rate as of July 31, 2011 and changes periodically. The maturity date reflects earlier of reset date or stated maturity date.
3 Security exempt from registration pursuant to Rule 144A under the Securities Act of 1933. These securities, which represent 1.71% of net assets as of July 31, 2011, are considered liquid and may be resold in transactions exempt from registration, normally to qualified institutional buyers.
Affiliated issuer activity
The table below details the Portfolio's transaction activity in an affiliated issuer during the year ended July 31, 2011.
The investment manager earns a management fee from UBS Private Money Market Fund LLC.
| Security description | | Value at
07/31/10 | | Purchases
during the
year ended
07/31/11 | | Sales
during the
year ended
07/31/11 | | Value at
07/31/11 | | Net income
earned from
affiliate for the
year ended
07/31/11 | |
| UBS Private Money Market Fund LLC | | $ | — | | | $ | 5,865,000 | | | $ | 5,865,000 | | | $ | — | | | $ | 24 | | |
11
PACE Select Advisors Trust
PACE Money Market Investments
Portfolio of investments—July 31, 2011
The following is a summary of the fair valuations according to the inputs used as of July 31, 2011 in valuing the Portfolio's investments:
| | | Unadjusted
quoted prices in
active markets for
identical investments
(Level 1) | | Other significant
observable inputs
(Level 2) | | Unobservable
inputs
(Level 3) | | Total | |
| US government and agency obligations | | $ | — | | | $ | 72,097,367 | | | $ | — | | | $ | 72,097,367 | | |
| Bank note | | | — | | | | 3,000,000 | | | | — | | | | 3,000,000 | | |
| Certificates of deposit | | | — | | | | 45,249,966 | | | | — | | | | 45,249,966 | | |
| Commercial paper | | | — | | | | 150,854,645 | | | | — | | | | 150,854,645 | | |
| Short-term corporate obligations | | | — | | | | 5,500,000 | | | | — | | | | 5,500,000 | | |
| Repurchase agreements | | | — | | | | 78,080,000 | | | | — | | | | 78,080,000 | | |
| Total | | $ | — | | | $ | 354,781,978 | | | $ | — | | | $ | 354,781,978 | | |
Issuer breakdown by country of origin (unaudited)
| | | Percentage of
total investments | |
| United States | | | 76.8 | % | |
| Canada | | | 5.2 | | |
| United Kingdom | | | 4.2 | | |
| Japan | | | 3.1 | | |
| Australia | | | 2.9 | | |
| Sweden | | | 2.1 | | |
| Norway | | | 2.0 | | |
| Switzerland | | | 1.1 | | |
| Germany | | | 0.8 | | |
| France | | | 0.8 | | |
| Finland | | | 0.7 | | |
| Netherlands | | | 0.3 | | |
| Total | | | 100.0 | % | |
Weighted average maturity—47 days
See accompanying notes to financial statements.
12
PACE Select Advisors Trust
PACE Government Securities Fixed Income Investments
Performance
For the 12 months ended July 31, 2011, the Portfolio's Class P shares returned 4.08%, before the deduction of the maximum PACE Select program fee. (Class P shares returned 2.02%, after the deduction of the maximum PACE Select program fee, for the same 12-month period.) In comparison, the Barclays Capital US Mortgage-Backed Securities Index (the "benchmark") returned 3.85%, and the Lipper US Mortgage Funds category posted a median return of 4.03%. (Returns for all share classes over various time periods are shown in the "Performance at a glance" table on page 16. Please note that the returns shown do not reflect the deduction of taxes that a shareholder would pay on Portfolio distributions or the redemption of Portfolio shares.) For a detailed commentary on the market environment in general during the reporting period, please refer to page 2.
Sub-Advisor's comments1
The Portfolio outperformed its benchmark during the reporting period, helped by an emphasis on attractively priced, high-quality assets. Tactical security selection among agency mortgage backed securities ("MBS") was positive for performance. This included an underweight to higher coupon securities in the first half of the period, as these were the most adversely impacted by refinancing concerns. Detractors from relative performance included a modest underweight to Ginnie Mae MBS in the second half of the period, as these securities outperformed conventional (Fannie Mae and Freddie Mac) MBS due to strong demand from banks and international investors.
Exposure to senior non-agency MBS benefited the Portfolio, as the sector remained resilient amid negative foreclosure headlines, and gained from limited supply in conjunction with strong investor demand for higher yielding assets. However, this benefit was mitigated by the sector's underperformance in the latter stages of the period, amid further signs of slowing economic growth. An allocation to commercial mortgage-backed securities ("CMBS") in the beginning of the reporting period also benefited the Portfolio, as spreads in this sector tightened given continued demand for higher yielding assets. (Spread measures the difference in yield between a fixed income security and a government bond of similar duration.)
1 All Sub-Advisors discuss performance on a gross of fees basis—meaning that no fees or expenses are reflected in their sleeves'/sleeve's performance. Alternately, Fund performance is shown net of fees, which does factor in fees and expenses associated with the Fund.
PACE Select Advisors Trust – PACE Government Securities Fixed Income Investments
Investment Sub-Advisor:
Pacific Investment Management Company LLC ("PIMCO")
Portfolio Manager:
W. Scott Simon
Objective:
Current income
Investment process:
The Portfolio invests primarily in government fixed income securities which include US bonds, including those backed by mortgages, and related repurchase agreements. Mortgage-backed securities include "to be announced" or "TBA" securities which usually are traded on a forward commitment basis with an approximate principal amount and no defined maturity date; issued or guaranteed by US government agencies and instrumentalities. The Portfolio also invests, to a lesser extent, in investment grade bonds of private issuers, including those backed by mortgages or other assets. The Portfolio may invest in bonds of varying maturities, but normally limits its duration to within two years (plus or minus) of the effective duration of the Portfolio's benchmark index. (Duration is a measure of a portfolio's sensitivity to interest rate changes.) The Portfolio may engage in short selling with respect to securities issued by the US Treasury and certain TBA securities coupon trades. PIMCO establishes duration targets based on its expectations for changes in interest rates, and then positions the Portfolio to take advantage of yield curve shifts. PIMCO decides to buy and sell specific bonds based on an analysis of their values relative to other similar securities.
13
PACE Select Advisors Trust
PACE Government Securities Fixed Income Investments
Sub-Advisor's comments – concluded
Duration positioning, including a shorter-than-benchmark duration in the latter half of the period as rates fell, was negative for relative performance. (Duration measures a portfolio's sensitivity to interest rate changes.)
A number of derivative instruments were used during the reporting period. Interest rate swaps were used to adjust interest rate and yield curve exposures, as well as to substitute for physical securities. Credit default swaps were used to manage credit exposure in lieu of the direct buying or selling of securities. Options were primarily used to manage interest rate and volatility exposures, but they were also used to generate income in expected interest rate scenarios. Mortgage derivatives were used to manage portfolio duration or enhance yield, while government futures were used to adjust interest rate exposures and replicate government bond positions. Overall, the use of these derivatives was beneficial during the reporting period.
Special considerations
The Portfolio may be appropriate for long-term investors seeking current income who are able to withstand short-term fluctuations in the fixed income markets in return for potentially higher returns over the long term. The yield and value of the Portfolio change every day and can be affected by changes in interest rates, general market conditions and other political, social and economic developments, as well as specific matters relating to the issuers in which the Portfolio invests. It is important to note that an investment in the Portfolio is only one component of a balanced investment plan.
14
PACE Select Advisors Trust
PACE Government Securities Fixed Income Investments
Illustration of an assumed investment of $10,000 in Class P shares of the Portfolio (unaudited)
The following graph depicts the performance of PACE Government Securities Fixed Income Investments Class P shares versus the Barclays Capital US Mortgage-Backed Securities Index over the 10 years ended July 31, 2011. The performance of the other classes will vary based upon the different class specific expenses and sales charges. The performance provided does not reflect the deduction of taxes that a shareholder would pay on Portfolio distributions or the redemption of Portfolio shares. Past performance is no guarantee of future results. Share price and returns will vary with market conditions; investors may realize a gain or loss upon redemption. It is important to note that PACE Government Securities Fixed Income Investments is a professionally managed portfolio while the Index is not available for investment and is unmanaged. The comparison is shown for illustration purposes only.

15
PACE Select Advisors Trust
PACE Government Securities Fixed Income Investments
Performance at a glance (unaudited)
| Average annual total returns for periods ended 07/31/11 | | 1 year | | 5 years | | 10 years | |
| Before deducting | | Class A1 | | | 3.74 | % | | | 6.53 | % | | | 5.14 | % | |
| maximum sales charge | | Class B2 | | | 3.03 | % | | | 5.73 | % | | | 4.65 | %6 | |
| or PACE Select | | Class C3 | | | 3.22 | % | | | 5.99 | % | | | 4.60 | % | |
| program fee | | Class Y4 | | | 4.00 | % | | | 6.81 | % | | | 5.44 | % | |
| | | Class P5 | | | 4.08 | % | | | 6.80 | % | | | 5.40 | % | |
| After deducting | | Class A1 | | | (0.96 | )% | | | 5.55 | % | | | 4.65 | % | |
| maximum sales charge | | Class B2 | | | (1.83 | )% | | | 5.40 | % | | | 4.65 | %6 | |
| or PACE Select | | Class C3 | | | 2.49 | % | | | 5.99 | % | | | 4.60 | % | |
| program fee | | Class P5 | | | 2.02 | % | | | 4.68 | % | | | 3.31 | % | |
| Barclays Capital US Mortgage-Backed Securities Index7 | | | | | 3.85 | % | | | 6.85 | % | | | 5.71 | % | |
| Lipper US Mortgage Funds median | | | | | 4.03 | % | | | 5.90 | % | | | 4.83 | % | |
Average annual total returns for periods ended June 30, 2011, after deduction of the maximum sales charge or PACE Select program fee, were as follows: Class A—1-year period, (0.69)%; 5-year period, 5.69%; 10-year period, 4.80%; Class B—1-year period, (1.67)%; 5-year period, 5.55%; 10-year period, 4.80%; Class C—1-year period, 2.74%; 5-year period, 6.12%; 10-year period, 4.74%; Class Y—1-year period, 4.24%; 5-year period, 6.95%; 10-year period, 5.59%; Class P—1-year period, 2.18%; 5-year period, 4.82%; 10-year period, 3.44%.
The annualized gross and net expense ratios, respectively, for each class of shares as in the November 28, 2010 prospectuses, were as follows: Class A—1.08% and 1.02%; Class B—1.91% and 1.77%; Class C—1.61% and 1.52%; Class Y—0.89% and 0.77%; and Class P—0.88% and 0.77%. Net expenses reflect fee waivers and/or expense reimbursements, if any, pursuant to an agreement that is in effect to cap the expenses. The Portfolio and UBS Global Asset Management (Americas) Inc. ("UBS Global AM") have entered into a written fee waiver/expense reimbursement agreement pursuant to which UBS Global AM is contractually obligated to (1) waive its management fees through November 28, 2011 to the extent necessary to reflect the lower sub-advisory fee paid by UBS Global AM to Pacific Investment Management Company LLC, the Portfolio's investment advisor; and (2) waive its management fees and/or reimburse expenses so that the Portfolio's ordinary total operating expenses of each class through November 28, 2011 (excluding dividend expense, borrowing costs, and interest expense relating to short sales, and interest, taxes, brokerage commissions and extraordinary expenses) would not exceed Class A—1.02%; Class B—1.77%; Class C—1.52%; Class Y—0.77%; and Class P—0.77%. The Portfolio has agreed to repay UBS Global AM for any waived fees/reimbursed expenses (pursuant to item (2)) to the extent that it can do so over the following three fiscal years without causing the Portfolio's expenses in any of those three years to exceed these expense caps. The fee waiver/expense reimbursement agreement may be terminated by the Portfolio's board at any time and also will terminate automatically upon the expiration or termination of the Portfolio's advisory contract with UBS Global AM. Upon termination of the agreement, however, UBS Global AM's three year recoupment rights will survive.
1 Maximum sales charge for Class A shares is 4.5%. Class A shares bear ongoing 12b-1 service fees.
2 Maximum contingent deferred sales charge for Class B shares is 5% imposed on redemptions and is reduced to 0% after a maximum of six years. Class B shares bear ongoing 12b-1 service and distribution fees.
3 Maximum contingent deferred sales charge for Class C shares is 0.75% imposed on redemptions and is reduced to 0% after one year. Class C shares bear ongoing 12b-1 service and distribution fees. Prior to September 30, 2003, Class C shares were subject to a maximum front-end sales charge of 1.00%; this front-end sales charge is not reflected in the average annual total returns presented for the Class C shares shown above.
4 The Portfolio offers Class Y shares to a limited group of eligible investors, including certain qualifying retirement plans. Class Y shares do not bear initial or contingent deferred sales charges or ongoing 12b-1 service and distribution fees.
5 Class P shares do not bear initial or contingent deferred sales charges or ongoing 12b-1 service and distribution fees, but are subject to a maximum annual PACE Select program fee of 2% of the value of Class P shares. Prior to June 14, 2010, the maximum annual PACE Select program fee was 1.5% of the value of Class P shares; however, the current maximum annual PACE Select program fee of 2% is reflected in the performance returns throughout all periods in the average annual total returns presented for the Class P shares shown above.
6 Assumes the conversion of Class B to Class A shares at the end of the sixth year.
7 The Barclays Capital US Mortgage-Backed Securities Index is an unmanaged index which primarily covers agency mortgage-backed pass-through securities issued by Ginnie Mae (formally known as Government National Mortgage Association or GNMA), Freddie Mac (formally known as Federal Home Loan Mortgage Corporation or FHLMC), and Fannie Mae (formally known as Federal National Mortgage Association or FNMA). Investors should note that indices do not reflect the deduction of fees and expenses.
If an investor sells or exchanges shares less than 90 days after purchase, a redemption fee of 1.00% of the amount sold or exchanged will be deducted at the time of the transaction, except as noted otherwise in the prospectuses.
Past performance does not predict future performance, and the performance information provided does not reflect the deduction of taxes that a shareholder would pay on Portfolio distributions or the redemption of Portfolio shares. The return and principal value of an investment will fluctuate, so that an investor's shares, when redeemed, may be worth more or less than their original cost. Performance results assume reinvestment of all dividends and capital gain distributions at net asset value on the ex-dividend dates. Current performance may be higher or lower than the performance data quoted. For month-end performance figures, please visit http://www.ubs.com.
Lipper peer group data calculated by Lipper Inc.; used with permission. The Lipper median is the return of the fund that places in the middle of a Lipper peer group.
16
PACE Select Advisors Trust
PACE Government Securities Fixed Income Investments
Portfolio statistics (unaudited)
| Characteristics | | 07/31/11 | |
| Weighted average duration | | | 3.0 yrs. | | |
| Weighted average maturity | | | 3.5 yrs. | | |
| Average coupon | | | 3.57 | % | |
| Average quality1 | | | AAA | | |
| Net assets (mm) | | $ | 607.6 | | |
| Number of holdings | | | 390 | | |
| Portfolio composition2 | | 07/31/11 | |
| Bonds | | | 152.1 | % | |
| Investments sold short | | | (43.6 | ) | |
| Cash equivalents and other assets less liabilities | | | (8.5 | ) | |
| Total | | | 100.0 | % | |
| Asset allocation2 | | 07/31/11 | |
| US government agency mortgage pass-through certificates | | | 134.5 | % | |
| Collateralized mortgage obligations | | | 13.8 | | |
| Asset-backed securities | | | 2.7 | | |
| Stripped mortgage-backed securities | | | 1.1 | | |
| Investments sold short | | | (43.6 | ) | |
| Cash equivalents and other assets less liabilities | | | (8.5 | ) | |
| Total | | | 100.0 | % | |
1 Credit quality ratings shown are based on the ratings assigned to portfolio holdings by Standard & Poor's Ratings Group, an independent rating agency.
2 Weightings represent percentages of the Portfolio's net assets as of July 31, 2011. The Portfolio is actively managed and its composition will vary over time.
17
PACE Select Advisors Trust
PACE Government Securities Fixed Income Investments
Portfolio of investments—July 31, 2011
| | | Face
amount | | Value | |
Government national mortgage association
certificates—30.99% | |
GNMA
3.500%, due 11/15/401 | | $ | 874,410 | | | $ | 869,105 | | |
| 3.500%, due 12/15/401 | | | 41,087,457 | | | | 40,838,187 | | |
| 3.500%, due 01/15/411 | | | 20,311,342 | | | | 20,188,118 | | |
| 3.500%, due 02/15/411 | | | 11,697,665 | | | | 11,626,698 | | |
| 4.500%, due 06/15/391 | | | 914,957 | | | | 979,134 | | |
| 4.500%, due 08/15/391 | | | 1,575,184 | | | | 1,685,056 | | |
| 4.500%, due 09/15/391 | | | 2,786,768 | | | | 2,981,586 | | |
| 4.500%, due 02/15/401 | | | 1,505,281 | | | | 1,606,985 | | |
| 4.500%, due 03/15/401 | | | 691,695 | | | | 738,429 | | |
| 4.500%, due 04/15/401 | | | 1,713,063 | | | | 1,828,805 | | |
| 4.500%, due 05/15/401 | | | 3,533,268 | | | | 3,771,991 | | |
| 5.500%, due 06/15/37 | | | 40,192 | | | | 44,515 | | |
| 5.500%, due 07/15/37 | | | 96,013 | | | | 106,341 | | |
| 5.500%, due 12/15/37 | | | 59,611 | | | | 66,023 | | |
| 5.500%, due 02/15/38 | | | 24,031 | | | | 26,619 | | |
| 5.500%, due 07/15/38 | | | 105,771 | | | | 117,116 | | |
| 5.500%, due 08/15/38 | | | 49,105 | | | | 54,372 | | |
| 5.500%, due 10/15/38 | | | 4,496,246 | | | | 4,979,088 | | |
| 5.500%, due 12/15/38 | | | 84,878 | | | | 93,991 | | |
| 5.500%, due 03/15/39 | | | 821,797 | | | | 909,941 | | |
| 5.500%, due 04/15/39 | | | 32,466 | | | | 35,949 | | |
| 5.500%, due 05/15/39 | | | 716,316 | | | | 793,164 | | |
| 5.500%, due 09/15/39 | | | 3,276,166 | | | | 3,627,730 | | |
| 5.500%, due 12/15/39 | | | 802,262 | | | | 888,311 | | |
| 5.500%, due 01/15/40 | | | 19,627 | | | | 21,732 | | |
| 5.500%, due 02/15/40 | | | 270,422 | | | | 299,427 | | |
| 5.500%, due 03/15/40 | | | 482,485 | | | | 534,235 | | |
| 5.500%, due 04/15/40 | | | 26,998 | | | | 30,003 | | |
| 5.500%, due 05/15/40 | | | 113,207 | | | | 125,350 | | |
| 5.500%, due 06/15/40 | | | 735,123 | | | | 813,971 | | |
| 6.000%, due 10/15/31 | | | 3,483 | | | | 3,913 | | |
| 6.000%, due 03/15/34 | | | 3,734 | | | | 4,190 | | |
| 6.000%, due 08/15/34 | | | 6,303 | | | | 7,073 | | |
| 6.000%, due 07/15/36 | | | 131,775 | | | | 148,499 | | |
| 6.500%, due 02/15/29 | | | 2,375 | | | | 2,725 | | |
| 6.500%, due 11/15/34 | | | 17,847 | | | | 20,204 | | |
| 6.500%, due 01/15/36 | | | 37,325 | | | | 42,253 | | |
| 6.500%, due 03/15/36 | | | 2,087 | | | | 2,359 | | |
| 6.500%, due 09/15/36 | | | 909,864 | | | | 1,028,233 | | |
| 6.500%, due 02/15/37 | | | 43,889 | | | | 49,533 | | |
| 6.500%, due 04/15/37 | | | 26,955 | | | | 30,421 | | |
| 6.500%, due 01/15/38 | | | 18,632 | | | | 21,045 | | |
| 6.500%, due 06/15/38 | | | 170,193 | | | | 192,570 | | |
| 6.500%, due 07/15/38 | | | 76,102 | | | | 85,769 | | |
| 6.500%, due 08/15/38 | | | 4,023 | | | | 4,534 | | |
| 6.500%, due 10/15/38 | | | 384,667 | | | | 433,530 | | |
| 6.500%, due 11/15/38 | | | 38,493 | | | | 43,383 | | |
| 6.500%, due 01/15/39 | | | 12,619 | | | | 14,240 | | |
| 7.500%, due 08/15/21 | | | 5,909 | | | | 6,892 | | |
| 7.500%, due 09/15/23 | | | 941 | | | | 1,099 | | |
| 8.000%, due 02/15/23 | | | 1,386 | | | | 1,634 | | |
| 8.250%, due 04/15/19 | | | 363,561 | | | | 413,073 | | |
| 10.500%, due 02/15/19 | | | 27,392 | | | | 27,699 | | |
| 10.500%, due 06/15/19 | | | 33,452 | | | | 38,468 | | |
| | | Face
amount | | Value | |
Government national mortgage association
certificates—(Continued) | |
| 10.500%, due 07/15/19 | | $ | 68,437 | | | $ | 75,606 | | |
| 10.500%, due 07/15/20 | | | 3,375 | | | | 3,457 | | |
| 10.500%, due 08/15/20 | | | 30,103 | | | | 33,342 | | |
| 10.500%, due 09/15/20 | | | 3,315 | | | | 3,820 | | |
| 11.500%, due 05/15/19 | | | 3,080 | | | | 3,590 | | |
GNMA II
3.500%, due 01/20/411 | | | 8,000,793 | | | | 7,952,254 | | |
| 4.500%, due 08/20/40 | | | 475,387 | | | | 506,541 | | |
| 9.000%, due 04/20/25 | | | 22,568 | | | | 27,168 | | |
| 9.000%, due 12/20/26 | | | 4,167 | | | | 5,019 | | |
| 9.000%, due 01/20/27 | | | 12,590 | | | | 15,177 | | |
| 9.000%, due 06/20/30 | | | 1,517 | | | | 1,611 | | |
| 9.000%, due 09/20/30 | | | 1,290 | | | | 1,376 | | |
| 9.000%, due 10/20/30 | | | 8,384 | | | | 10,201 | | |
| 9.000%, due 11/20/30 | | | 5,799 | | | | 7,056 | | |
GNMA II ARM
2.250%, due 02/20/28 | | | 3,940 | | | | 4,072 | | |
| 2.375%, due 01/20/23 | | | 104,348 | | | | 107,973 | | |
| 2.375%, due 03/20/23 | | | 52,182 | | | | 53,995 | | |
| 2.375%, due 01/20/24 | | | 131,663 | | | | 136,238 | | |
| 2.375%, due 01/20/25 | | | 12,485 | | | | 12,918 | | |
| 2.375%, due 02/20/25 | | | 35,875 | | | | 37,121 | | |
| 2.375%, due 03/20/26 | | | 26,935 | | | | 27,870 | | |
| 2.375%, due 01/20/27 | | | 170,939 | | | | 176,878 | | |
| 2.375%, due 02/20/27 | | | 18,037 | | | | 18,663 | | |
| 2.375%, due 01/20/28 | | | 19,268 | | | | 19,937 | | |
| 2.375%, due 02/20/28 | | | 11,279 | | | | 11,671 | | |
| 2.500%, due 11/20/21 | | | 29,786 | | | | 30,784 | | |
| 2.500%, due 03/20/25 | | | 44,227 | | | | 45,819 | | |
| 2.500%, due 10/20/30 | | | 29,962 | | | | 30,966 | | |
| 2.625%, due 07/20/17 | | | 7,377 | | | | 7,669 | | |
| 2.625%, due 09/20/21 | | | 150,940 | | | | 156,921 | | |
| 2.625%, due 08/20/25 | | | 34,527 | | | | 35,894 | | |
| 2.625%, due 09/20/25 | | | 41,554 | | | | 43,200 | | |
| 2.625%, due 08/20/26 | | | 48,411 | | | | 50,329 | | |
| 2.625%, due 09/20/26 | | | 7,183 | | | | 7,468 | | |
| 2.625%, due 07/20/27 | | | 18,013 | | | | 18,727 | | |
| 2.625%, due 08/20/27 | | | 46,322 | | | | 48,157 | | |
| 2.625%, due 07/20/30 | | | 223,095 | | | | 231,934 | | |
| 2.625%, due 08/20/30 | | | 175,310 | | | | 182,257 | | |
| 3.375%, due 04/20/18 | | | 12,561 | | | | 13,028 | | |
| 3.375%, due 06/20/22 | | | 135,002 | | | | 140,014 | | |
| 3.375%, due 04/20/24 | | | 151,369 | | | | 156,988 | | |
| 3.375%, due 05/20/25 | | | 108,305 | | | | 112,708 | | |
| 3.375%, due 06/20/25 | | | 26,018 | | | | 26,984 | | |
| 3.375%, due 04/20/26 | | | 242,619 | | | | 251,625 | | |
| 3.375%, due 06/20/26 | | | 104,680 | | | | 108,564 | | |
| 3.375%, due 04/20/27 | | | 61,346 | | | | 63,623 | | |
| 3.375%, due 04/20/30 | | | 42,383 | | | | 43,956 | | |
| 3.375%, due 05/20/30 | | | 855,057 | | | | 886,797 | | |
| 3.500%, due 03/20/25 | | | 22,615 | | | | 23,542 | | |
| 4.000%, due 01/20/18 | | | 138,227 | | | | 144,101 | | |
| 4.000%, due 05/20/18 | | | 6,392 | | | | 6,698 | | |
| 4.000%, due 06/20/19 | | | 15,439 | | | | 16,180 | | |
| 4.500%, due 06/20/19 | | | 24,213 | | | | 25,435 | | |
18
PACE Select Advisors Trust
PACE Government Securities Fixed Income Investments
Portfolio of investments—July 31, 2011
| | | Face
amount | | Value | |
Government national mortgage association
certificates—(Concluded) | | | |
GNMA TBA
4.000%, TBA | | $ | 45,925,000 | | | $ | 47,474,969 | | |
| 5.000%, TBA | | | 11,000,000 | | | | 11,984,843 | | |
| 6.000%, TBA | | | 11,000,000 | | | | 12,268,438 | | |
| 6.500%, TBA | | | 1,000,000 | | | | 1,126,250 | | |
Total government national mortgage
association certificates
(cost—$184,429,445) | | | | | | | 188,323,733 | | |
Federal home loan mortgage corporation
certificates*—24.55% | | | |
FHLMC
5.000%, due 10/01/29 | | | 1,851,276 | | | | 1,986,857 | | |
| 5.000%, due 06/01/34 | | | 87,854 | | | | 94,210 | | |
| 5.000%, due 11/01/40 | | | 683,679 | | | | 730,262 | | |
| 5.500%, due 02/01/33 | | | 739,682 | | | | 807,953 | | |
| 5.500%, due 12/01/33 | | | 365,264 | | | | 398,978 | | |
| 5.500%, due 12/01/34 | | | 381,901 | | | | 417,150 | | |
| 5.500%, due 06/01/35 | | | 3,778,544 | | | | 4,127,301 | | |
| 5.500%, due 06/01/36 | | | 3,924,551 | | | | 4,286,784 | | |
| 5.500%, due 03/01/37 | | | 699,221 | | | | 761,355 | | |
| 5.500%, due 04/01/37 | | | 825,321 | | | | 896,339 | | |
| 5.500%, due 10/01/37 | | | 66,975 | | | | 72,739 | | |
| 5.500%, due 11/01/37 | | | 1,898,526 | | | | 2,061,892 | | |
| 5.500%, due 12/01/38 | | | 29,623 | | | | 32,256 | | |
| 6.000%, due 11/01/37 | | | 16,528,242 | | | | 18,239,727 | | |
| 7.000%, due 08/01/25 | | | 1,008 | | | | 1,163 | | |
| 7.500%, due 10/01/17 | | | 1,599 | | | | 1,606 | | |
| 8.000%, due 03/01/13 | | | 10,621 | | | | 10,755 | | |
| 9.000%, due 04/01/25 | | | 37,101 | | | | 45,581 | | |
| 11.000%, due 09/01/15 | | | 695 | | | | 728 | | |
| 11.000%, due 10/01/15 | | | 271 | | | | 298 | | |
| 11.000%, due 12/01/15 | | | 4,005 | | | | 4,526 | | |
| 11.000%, due 04/01/19 | | | 4,427 | | | | 5,268 | | |
| 11.000%, due 06/01/19 | | | 391 | | | | 393 | | |
| 11.000%, due 08/01/20 | | | 32 | | | | 32 | | |
| 11.000%, due 09/01/20 | | | 1,280 | | | | 1,507 | | |
| 11.500%, due 01/01/16 | | | 2,262 | | | | 2,298 | | |
| 11.500%, due 01/01/18 | | | 7,652 | | | | 8,973 | | |
| 11.500%, due 05/01/19 | | | 2,628 | | | | 2,642 | | |
| 11.500%, due 06/01/19 | | | 18,399 | | | | 22,232 | | |
FHLMC ARM
2.387%, due 01/01/28 | | | 69,376 | | | | 72,487 | | |
| 2.400%, due 11/01/27 | | | 169,306 | | | | 178,008 | | |
| 2.483%, due 04/01/29 | | | 274,145 | | | | 288,030 | | |
| 2.498%, due 07/01/24 | | | 244,477 | | | | 246,129 | | |
| 2.531%, due 10/01/23 | | | 137,410 | | | | 144,222 | | |
| 2.583%, due 12/01/29 | | | 141,433 | | | | 149,116 | | |
| 2.587%, due 11/01/29 | | | 557,769 | | | | 587,601 | | |
| 2.597%, due 06/01/28 | | | 481,423 | | | | 506,946 | | |
| 2.597%, due 07/01/28 | | | 193,141 | | | | 203,167 | | |
| 2.670%, due 11/01/25 | | | 320,836 | | | | 338,936 | | |
| 2.685%, due 01/01/29 | | | 260,508 | | | | 274,801 | | |
| 2.754%, due 10/01/27 | | | 378,846 | | | | 400,416 | | |
| 2.764%, due 10/01/27 | | | 343,838 | | | | 362,791 | | |
| | | Face
amount | | Value | |
Federal home loan mortgage corporation
certificates*—(Concluded) | | | |
| 2.875%, due 01/01/30 | | $ | 36,632 | | | $ | 38,475 | | |
| 5.104%, due 10/01/29 | | | 14,672 | | | | 15,376 | | |
FHLMC TBA
4.000% | | | 22,700,000 | | | | 23,054,687 | | |
| 4.500% | | | 42,000,000 | | | | 43,785,000 | | |
| 5.000% | | | 21,500,000 | | | | 22,914,296 | | |
| 5.500% | | | 19,000,000 | | | | 20,573,437 | | |
Total federal home loan mortgage
corporation certificates
(cost—$147,193,416) | | | | | | | 149,155,726 | | |
Federal housing administration
certificates—0.18% | | | |
FHA GMAC
7.400%, due 02/01/21 | | | 382,416 | | | | 378,591 | | |
FHA Reilly
6.896%, due 07/01/20 | | | 700,224 | | | | 700,224 | | |
Total federal housing administration
certificates
(cost—$1,083,661) | | | | | | | 1,078,815 | | |
Federal national mortgage association
certificates*—78.68% | | | |
FNMA
3.500%, due 11/01/25 | | | 2,500,433 | | | | 2,573,940 | | |
| 3.500%, due 02/01/26 | | | 1,594,884 | | | | 1,642,268 | | |
| 3.500%, due 09/01/391 | | | 295,409 | | | | 289,210 | | |
| 3.500%, due 11/01/391 | | | 492,795 | | | | 482,406 | | |
| 3.500%, due 08/01/401 | | | 808,256 | | | | 792,626 | | |
| 3.500%, due 09/01/401 | | | 55,745 | | | | 54,570 | | |
| 3.500%, due 10/01/401 | | | 255,782 | | | | 250,390 | | |
| 3.500%, due 11/01/401 | | | 2,830,592 | | | | 2,770,915 | | |
| 3.500%, due 12/01/401 | | | 13,022,989 | | | | 12,748,431 | | |
| 3.500%, due 01/01/411 | | | 2,182,543 | | | | 2,136,530 | | |
| 3.500%, due 03/01/411 | | | 9,999,996 | | | | 9,789,170 | | |
| 4.000%, due 05/01/18 | | | 201,720 | | | | 210,930 | | |
| 4.000%, due 03/01/19 | | | 235,888 | | | | 250,821 | | |
| 4.000%, due 06/01/19 | | | 273,857 | | | | 291,194 | | |
| 4.000%, due 04/01/23 | | | 15,750 | | | | 16,582 | | |
| 4.000%, due 03/01/24 | | | 3,048,517 | | | | 3,203,393 | | |
| 4.000%, due 08/01/24 | | | 698,166 | | | | 733,635 | | |
| 4.000%, due 03/01/25 | | | 1,083,209 | | | | 1,137,055 | | |
| 4.000%, due 05/01/25 | | | 1,720,230 | | | | 1,805,742 | | |
| 4.000%, due 05/01/391 | | | 551,627 | | | | 562,579 | | |
| 4.000%, due 09/01/391 | | | 902,191 | | | | 919,681 | | |
| 4.000%, due 09/01/401 | | | 4,102,984 | | | | 4,172,910 | | |
| 4.000%, due 10/01/401 | | | 4,233,803 | | | | 4,305,958 | | |
| 4.000%, due 11/01/401 | | | 9,606,001 | | | | 9,769,710 | | |
| 4.000%, due 12/01/401 | | | 18,920,127 | | | | 19,242,572 | | |
| 4.000%, due 01/01/411 | | | 46,673,728 | | | | 47,469,158 | | |
| 4.000%, due 02/01/411 | | | 42,534,641 | | | | 43,255,431 | | |
| 4.000%, due 03/01/411 | | | 32,435,366 | | | | 32,979,300 | | |
| 4.000%, due 04/01/411 | | | 5,482,407 | | | | 5,574,127 | | |
| 4.000%, due 05/01/411 | | | 22,065,327 | | | | 22,434,479 | | |
| 4.500%, due 03/01/23 | | | 84,386 | | | | 90,287 | | |
19
PACE Select Advisors Trust
PACE Government Securities Fixed Income Investments
Portfolio of investments—July 31, 2011
| | | Face
amount | | Value | |
Federal national mortgage association
certificates*—(Continued) | |
| 4.500%, due 04/01/23 | | $ | 301,088 | | | $ | 320,999 | | |
| 4.500%, due 05/01/24 | | | 2,064,605 | | | | 2,199,813 | | |
| 4.500%, due 11/01/24 | | | 664,820 | | | | 708,138 | | |
| 4.500%, due 01/01/25 | | | 22,950 | | | | 24,445 | | |
| 4.500%, due 02/01/25 | | | 43,787 | | | | 46,612 | | |
| 4.500%, due 03/01/25 | | | 898,117 | | | | 956,073 | | |
| 4.500%, due 04/01/25 | | | 5,977,768 | | | | 6,363,538 | | |
| 4.500%, due 05/01/25 | | | 388,310 | | | | 413,368 | | |
| 4.500%, due 06/01/25 | | | 854,149 | | | | 909,268 | | |
| 4.500%, due 09/01/25 | | | 79,181 | | | | 84,340 | | |
| 4.500%, due 02/01/33 | | | 83,932 | | | | 88,389 | | |
| 4.500%, due 05/01/38 | | | 662,009 | | | | 692,613 | | |
| 4.500%, due 08/01/38 | | | 1,172,835 | | | | 1,227,052 | | |
| 4.500%, due 01/01/39 | | | 53,673 | | | | 56,154 | | |
| 4.500%, due 02/01/39 | | | 589,552 | | | | 616,806 | | |
| 4.500%, due 04/01/39 | | | 1,801,344 | | | | 1,884,616 | | |
| 4.500%, due 07/01/39 | | | 23,633 | | | | 24,777 | | |
| 4.500%, due 09/01/39 | | | 1,193,501 | | | | 1,248,464 | | |
| 4.500%, due 10/01/39 | | | 978,481 | | | | 1,023,255 | | |
| 4.500%, due 01/01/40 | | | 679,381 | | | | 710,469 | | |
| 4.500%, due 07/01/40 | | | 81,107 | | | | 84,882 | | |
| 4.500%, due 04/01/41 | | | 1,033,056 | | | | 1,079,999 | | |
| 4.500%, due 05/01/41 | | | 7,971,131 | | | | 8,332,146 | | |
| 5.000%, due 08/01/18 | | | 46,421 | | | | 49,872 | | |
| 5.000%, due 01/01/23 | | | 1,767,376 | | | | 1,899,578 | | |
| 5.000%, due 02/01/23 | | | 89,490 | | | | 96,142 | | |
| 5.000%, due 03/01/23 | | | 307,099 | | | | 330,103 | | |
| 5.000%, due 04/01/23 | | | 516,158 | | | | 554,524 | | |
| 5.000%, due 05/01/23 | | | 729,882 | | | | 789,837 | | |
| 5.000%, due 06/01/23 | | | 769,713 | | | | 826,925 | | |
| 5.000%, due 07/01/23 | | | 1,405,077 | | | | 1,509,517 | | |
| 5.000%, due 09/01/23 | | | 2,651,389 | | | | 2,883,829 | | |
| 5.000%, due 10/01/23 | | | 122,600 | | | | 131,713 | | |
| 5.000%, due 11/01/23 | | | 120,239 | | | | 129,176 | | |
| 5.000%, due 01/01/24 | | | 687,168 | | | | 738,245 | | |
| 5.000%, due 07/01/24 | | | 3,538,760 | | | | 3,840,147 | | |
| 5.000%, due 12/01/33 | | | 3,817,260 | | | | 4,099,422 | | |
| 5.500%, due 12/01/16 | | | 57,471 | | | | 62,351 | | |
| 5.500%, due 01/01/17 | | | 126,673 | | | | 137,428 | | |
| 5.500%, due 06/01/17 | | | 81,456 | | | | 87,900 | | |
| 5.500%, due 09/01/17 | | | 51,082 | | | | 55,452 | | |
| 5.500%, due 11/01/17 | | | 83,650 | | | | 90,805 | | |
| 5.500%, due 01/01/18 | | | 548,185 | | | | 596,103 | | |
| 5.500%, due 02/01/18 | | | 158,942 | | | | 172,537 | | |
| 5.500%, due 07/01/22 | | | 424,067 | | | | 459,719 | | |
| 5.500%, due 02/01/23 | | | 67,523 | | | | 73,200 | | |
| 5.500%, due 02/01/32 | | | 34,126 | | | | 37,271 | | |
| 5.500%, due 11/01/32 | | | 661,416 | | | | 722,361 | | |
| 5.500%, due 12/01/33 | | | 6,533 | | | | 7,135 | | |
| 5.500%, due 04/01/34 | | | 311,295 | | | | 340,303 | | |
| 5.500%, due 11/01/34 | | | 1,150,859 | | | | 1,256,543 | | |
| 5.500%, due 01/01/35 | | | 240,354 | | | | 262,501 | | |
| 5.500%, due 02/01/35 | | | 29,368 | | | | 32,065 | | |
| 5.500%, due 05/01/37 | | | 1,850,931 | | | | 2,021,481 | | |
| 5.500%, due 07/01/37 | | | 2,966,559 | | | | 3,221,365 | | |
| | | Face
amount | | Value | |
Federal national mortgage association
certificates*—(Continued) | |
| 5.500%, due 01/01/38 | | $ | 10,184,306 | | | $ | 11,059,065 | | |
| 5.500%, due 06/01/39 | | | 9,277,920 | | | | 10,132,815 | | |
| 6.000%, due 11/01/21 | | | 495,834 | | | | 540,072 | | |
| 6.000%, due 06/01/22 | | | 87,801 | | | | 95,470 | | |
| 6.000%, due 01/01/23 | | | 1,001,034 | | | | 1,095,350 | | |
| 6.000%, due 03/01/23 | | | 1,919,577 | | | | 2,090,839 | | |
| 6.000%, due 11/01/26 | | | 200,751 | | | | 221,217 | | |
| 6.000%, due 01/01/32 | | | 41,429 | | | | 46,132 | | |
| 6.000%, due 04/01/32 | | | 52,877 | | | | 58,879 | | |
| 6.000%, due 09/01/32 | | | 38,554 | | | | 42,930 | | |
| 6.000%, due 10/01/32 | | | 66,735 | | | | 74,310 | | |
| 6.000%, due 12/01/32 | | | 108,244 | | | | 120,530 | | |
| 6.000%, due 01/01/33 | | | 238,439 | | | | 265,504 | | |
| 6.000%, due 02/01/33 | | | 129,626 | | | | 144,178 | | |
| 6.000%, due 09/01/34 | | | 901,747 | | | | 1,001,939 | | |
| 6.000%, due 04/01/35 | | | 4,162 | | | | 4,608 | | |
| 6.000%, due 05/01/35 | | | 511,475 | | | | 566,453 | | |
| 6.000%, due 06/01/35 | | | 120,951 | | | | 133,924 | | |
| 6.000%, due 07/01/35 | | | 556,421 | | | | 616,704 | | |
| 6.000%, due 08/01/35 | | | 294,951 | | | | 326,588 | | |
| 6.000%, due 09/01/35 | | | 89,525 | | | | 99,178 | | |
| 6.000%, due 01/01/36 | | | 256,371 | | | | 284,350 | | |
| 6.000%, due 09/01/36 | | | 333,533 | | | | 369,933 | | |
| 6.000%, due 10/01/36 | | | 648,880 | | | | 717,262 | | |
| 6.000%, due 11/01/36 | | | 8,540 | | | | 9,436 | | |
| 6.000%, due 01/01/37 | | | 482,913 | | | | 533,735 | | |
| 6.000%, due 03/01/37 | | | 207,805 | | | | 230,149 | | |
| 6.000%, due 08/01/37 | | | 540,983 | | | | 596,642 | | |
| 6.000%, due 09/01/37 | | | 2,254,178 | | | | 2,486,099 | | |
| 6.000%, due 12/01/37 | | | 388,064 | | | | 427,990 | | |
| 6.000%, due 06/01/38 | | | 70,200 | | | | 77,291 | | |
| 6.000%, due 08/01/38 | | | 74,412 | | | | 81,929 | | |
| 6.000%, due 09/01/38 | | | 2,875,201 | | | | 3,165,625 | | |
| 6.000%, due 10/01/38 | | | 3,790,100 | | | | 4,182,591 | | |
| 6.000%, due 01/01/39 | | | 2,926,040 | | | | 3,226,623 | | |
| 6.000%, due 10/01/39 | | | 75,088 | | | | 82,814 | | |
| 6.500%, due 09/01/12 | | | 1,061 | | | | 1,090 | | |
| 6.500%, due 12/01/12 | | | 2,430 | | | | 2,609 | | |
| 6.500%, due 01/01/13 | | | 613 | | | | 631 | | |
| 6.500%, due 02/01/13 | | | 3,784 | | | | 3,887 | | |
| 6.500%, due 03/01/13 | | | 7,147 | | | | 7,343 | | |
| 6.500%, due 04/01/13 | | | 639 | | | | 657 | | |
| 6.500%, due 06/01/13 | | | 9,984 | | | | 10,420 | | |
| 6.500%, due 07/01/13 | | | 2,768 | | | | 2,883 | | |
| 6.500%, due 08/01/13 | | | 3,120 | | | | 3,260 | | |
| 6.500%, due 09/01/13 | | | 9,764 | | | | 10,201 | | |
| 6.500%, due 10/01/13 | | | 6,807 | | | | 7,105 | | |
| 6.500%, due 11/01/13 | | | 18,801 | | | | 19,643 | | |
| 6.500%, due 07/01/19 | | | 52,606 | | | | 58,448 | | |
| 6.500%, due 10/01/36 | | | 1,557,441 | | | | 1,745,481 | | |
| 7.500%, due 11/01/26 | | | 26,290 | | | | 30,447 | | |
| 8.000%, due 11/01/26 | | | 39,816 | | | | 46,368 | | |
| 9.000%, due 10/01/19 | | | 21,414 | | | | 21,603 | | |
| 9.000%, due 02/01/26 | | | 29,449 | | | | 34,916 | | |
| 10.500%, due 09/01/15 | | | 6,152 | | | | 6,912 | | |
20
PACE Select Advisors Trust
PACE Government Securities Fixed Income Investments
Portfolio of investments—July 31, 2011
| | | Face
amount | | Value | |
Federal national mortgage association
certificates*—(Concluded) | | | |
| 10.500%, due 08/01/20 | | $ | 1,032 | | | $ | 1,087 | | |
| 10.500%, due 04/01/22 | | | 459 | | | | 516 | | |
| 11.000%, due 10/01/15 | | | 1,248 | | | | 1,267 | | |
| 11.000%, due 02/01/16 | | | 1,075 | | | | 1,082 | | |
FNMA ARM
1.478%, due 03/01/44 | | | 622,457 | | | | 635,315 | | |
| 1.724%, due 10/01/26 | | | 740,922 | | | | 764,492 | | |
| 1.750%, due 09/01/15 | | | 39,686 | | | | 39,982 | | |
| 2.329%, due 02/01/26 | | | 50,553 | | | | 53,084 | | |
| 2.352%, due 09/01/26 | | | 34,055 | | | | 35,485 | | |
| 2.520%, due 02/01/30 | | | 45,026 | | | | 47,328 | | |
| 2.645%, due 07/01/30 | | | 26,044 | | | | 27,088 | | |
| 2.782%, due 12/01/27 | | | 43,896 | | | | 46,225 | | |
| 2.907%, due 05/01/30 | | | 118,219 | | | | 124,186 | | |
| 3.139%, due 03/01/25 | | | 225,785 | | | | 237,447 | | |
FNMA TBA
3.500% | | | 8,000,000 | | | | 8,223,750 | | |
| 4.000% | | | 15,000,000 | | | | 15,717,188 | | |
| 4.500% | | | 59,200,000 | | | | 61,966,813 | | |
| 5.000% | | | 7,400,000 | | | | 7,899,688 | | |
| 5.500% | | | 26,500,000 | | | | 28,708,673 | | |
| 6.000% | | | 5,500,000 | | | | 6,034,316 | | |
| 6.500% | | | 10,600,000 | | | | 11,754,406 | | |
Total federal national mortgage
association certificates
(cost—$468,353,367) | | | | | | | 478,110,242 | | |
Collateralized mortgage
obligations—13.81% | | | |
ARM Trust,
Series 2005-8, Class 3A21
5.240%, due 11/25/35 | | | 2,345,679 | | | | 1,709,679 | | |
Bear Stearns Asset Backed
Securities Trust,
Series 2003-AC5, Class A1
5.750%, due 10/25/332 | | | 2,491,001 | | | | 2,510,010 | | |
Series 2004-AC3, Class A2
5.500%, due 06/25/342 | | | 2,689,745 | | | | 2,657,813 | | |
Chevy Chase Funding LLC,
Series 2004-1, Class A1
0.467%, due 01/25/353,4 | | | 256,076 | | | | 189,699 | | |
Chevy Chase Mortgage
Funding Corp.,
Series 2007-2A, Class A1
0.317%, due 05/25/483,4 | | | 1,698,285 | | | | 740,568 | | |
Countrywide Alternative Loan Trust,
Series 2006-0A2, Class A1
0.396%, due 05/20/464 | | | 4,160,987 | | | | 2,219,783 | | |
FHLMC REMIC,*
Series 0023, Class KZ
6.500%, due 11/25/23 | | | 64,957 | | | | 74,270 | | |
Series 0159, Class H
4.500%, due 09/15/21 | | | 16,801 | | | | 17,574 | | |
Series 1003, Class H
0.938%, due 10/15/204 | | | 72,993 | | | | 73,003 | | |
| | | Face
amount | | Value | |
Collateralized mortgage
obligations—(Continued) | |
Series 1349, Class PS
7.500%, due 08/15/22 | | $ | 3,394 | | | $ | 3,903 | | |
Series 1502, Class PX
7.000%, due 04/15/23 | | | 481,765 | | | | 551,530 | | |
Series 1534, Class Z
5.000%, due 06/15/23 | | | 242,400 | | | | 242,353 | | |
Series 1573, Class PZ
7.000%, due 09/15/23 | | | 81,570 | | | | 93,270 | | |
Series 1658, Class GZ
7.000%, due 01/15/24 | | | 40,347 | | | | 46,259 | | |
Series 1694, Class Z
6.500%, due 03/15/24 | | | 345,118 | | | | 376,457 | | |
Series 1775, Class Z
8.500%, due 03/15/25 | | | 8,019 | | | | 9,405 | | |
Series 2411, Class FJ
0.537%, due 12/15/294 | | | 58,218 | | | | 57,857 | | |
Series 3312, Class FN
0.407%, due 07/15/364 | | | 2,923,650 | | | | 2,904,836 | | |
FNMA REMIC,*
Trust 1987-002, Class Z
11.000%, due 11/25/17 | | | 196,842 | | | | 224,902 | | |
Trust 1988-007, Class Z
9.250%, due 04/25/18 | | | 186,205 | | | | 208,391 | | |
Trust 1992-129, Class L
6.000%, due 07/25/22 | | | 11,173 | | | | 12,453 | | |
Trust 1992-158, Class ZZ
7.750%, due 08/25/22 | | | 31,201 | | | | 36,053 | | |
Trust 1993-037, Class PX
7.000%, due 03/25/23 | | | 429,848 | | | | 488,529 | | |
Trust 1993-240, Class Z
6.250%, due 12/25/13 | | | 1,062 | | | | 1,109 | | |
Trust 1993-250, Class Z
7.000%, due 12/25/23 | | | 14,440 | | | | 15,548 | | |
Trust 2004-72, Class F
0.687%, due 09/25/344 | | | 3,188,370 | | | | 3,181,949 | | |
Trust 2005-088, Class A
0.337%, due 10/25/354 | | | 2,840,075 | | | | 2,768,726 | | |
Trust 2007-4, Class DF
0.632%, due 02/25/374 | | | 3,088,177 | | | | 3,067,964 | | |
Trust G92-040, Class ZC
7.000%, due 07/25/22 | | | 46,173 | | | | 51,845 | | |
Trust G94-006, Class PJ
8.000%, due 05/17/24 | | | 57,506 | | | | 66,188 | | |
GNMA REMIC,
Trust 2000-009, Class FH
0.687%, due 02/16/304 | | | 46,909 | | | | 46,995 | | |
Trust 2010-H01, Class FA
1.006%, due 01/20/604,5 | | | 5,860,788 | | | | 5,902,340 | | |
Indymac Index Mortgage Loan Trust,
Series 2005-AR2, Class 2A1A
0.507%, due 02/25/354 | | | 1,120,453 | | | | 742,004 | | |
JPMorgan Alternative Loan Trust,
Series 2008-R4, Class 2A1
0.687%, due 06/27/373,4 | | | 4,051,833 | | | | 3,284,708 | | |
21
PACE Select Advisors Trust
PACE Government Securities Fixed Income Investments
Portfolio of investments—July 31, 2011
| | | Face
amount | | Value | |
Collateralized mortgage
obligations—(Concluded) | |
JPMorgan Chase Commercial
Mortgage Securities Corp.,
Series 2007-FL1A, Class A1
0.562%, due 07/15/193,4 | | $ | 8,012,521 | | | $ | 7,552,512 | | |
LB Commercial Conduit
Mortgage Trust,
Series 2007-C3, Class A4
5.941%, due 07/15/444 | | | 2,500,000 | | | | 2,735,851 | | |
MLCC Mortgage Investors, Inc.,
Series 2004-1, Class 2A2
2.166%, due 12/25/344 | | | 1,058,476 | | | | 1,017,201 | | |
Mortgage Equity Conversion
Asset Trust,
Series 2006-SFG3, Class A
0.690%, due 10/25/413,4,5 | | | 1,455,712 | | | | 1,387,089 | | |
Series 2007-FF1, Class A
0.690%, due 01/25/423,4 | | | 1,647,609 | | | | 1,556,991 | | |
Series 2007-FF3, Class A
0.740%, due 05/25/423,4,5 | | | 6,271,768 | | | | 5,974,243 | | |
NCUA Guaranteed Notes,
Series 2011-R4, Class 1A
0.581%, due 03/06/204 | | | 4,555,527 | | | | 4,555,527 | | |
RBSSP, Resecuritization Trust
Certificate,
Series 2009-6, Class 18A1
0.687%, due 12/26/363,4 | | | 3,307,506 | | | | 3,162,561 | | |
RiverView HECM Trust,
Series 2008-1, Class A1
0.937%, due 09/26/413,4,5 | | | 7,335,762 | | | | 7,095,630 | | |
Sequoia Mortgage Trust,
Series 5, Class A
0.537%, due 10/19/264 | | | 446,770 | | | | 392,438 | | |
Structured ARM Loan,
Series 2007-4, Class 1A2
0.407%, due 05/25/37 | | | 548,385 | | | | 316,692 | | |
Structured Asset Mortgage
Investments, Inc.,
Series 2006-AR3, Class 11A1
0.397%, due 04/25/364 | | | 1,779,822 | | | | 1,118,193 | | |
Series 2007-AR5, Class A2
0.737%, due 09/25/474 | | | 10,032,632 | | | | 3,571,507 | | |
Washington Mutual Mortgage
Pass-Through Certificates,
Series 2003-AR9, Class 1A6
2.712%, due 09/25/334 | | | 3,679,607 | | | | 3,462,874 | | |
Series 2003-AR9, Class 2A
2.777%, due 09/25/334 | | | 907,814 | | | | 876,870 | | |
Wells Fargo Mortgage Backed
Securities Trust,
Series 2007-14, Class 1A1
6.000%, due 10/25/37 | | | 4,607,373 | | | | 4,590,087 | | |
Total collateralized mortgage
obligations
(cost—$87,569,818) | | | | | | | 83,944,239 | | |
| | | Face
amount | | Value | |
| Asset-backed securities—2.73% | |
Countrywide Asset-Backed
Certificates,
Series 2005-13, Class 3AV3
0.437%, due 04/25/364 | | $ | 1,155,828 | | | $ | 1,014,333 | | |
Cumberland CLO Ltd.,
Series 2005-2A, Class A
0.517%, due 11/10/193,4,5 | | | 7,788,424 | | | | 7,530,425 | | |
EMC Mortgage Loan Trust,
Series 2003-A, Class A2
0.937%, due 08/25/403,4 | | | 301,000 | | | | 224,522 | | |
Green Tree Financial Corp.,
Series 1998-2, Class A5
6.240%, due 12/01/284 | | | 47,975 | | | | 50,229 | | |
Renaissance Home Equity Loan Trust,
Series 2003-2, Class A
0.627%, due 08/25/334 | | | 434,292 | | | | 394,348 | | |
SLM Student Loan Trust,
Series 2009-D, Class A
3.500%, due 08/17/433,4 | | | 4,723,519 | | | | 4,731,876 | | |
Series 2010-A, Class 2A
3.457%, due 05/16/443,4 | | | 1,943,901 | | | | 2,042,480 | | |
Specialty Underwriting & Residential
Financing,
Series 2003-BC1, Class A
0.867%, due 01/25/344 | | | 57,784 | | | | 45,528 | | |
Stone Tower CLO Ltd.,
Series 2007-6A, Class A1
0.480%, due 04/17/213,4 | | | 600,000 | | | | 557,331 | | |
Total asset-backed securities
(cost—$16,776,101) | | | | | | | 16,591,072 | | |
Stripped mortgage-backed
securities—1.14% | |
FHLMC Multifamily Structured
Pass Through Certificates,
Series K005, Class AX*
1.389%, due 11/25/194,6,7 | | | 24,799,764 | | | | 2,121,089 | | |
FHLMC REMIC,*
Series 0013, Class B
7.000%, due 06/25/236,7 | | | 172,804 | | | | 36,367 | | |
Series 2136, Class GD
7.000%, due 03/15/296,7 | | | 11,676 | | | | 2,208 | | |
Series 2178, Class PI
7.500%, due 08/15/296 | | | 69,267 | | | | 14,498 | | |
GNMA REMIC, Trust 2011-92,
Class IX
1.446%, due 11/16/444,5,6,7 | | | 37,500,000 | | | | 3,497,266 | | |
WF-RBS Commercial Mortgage Trust,
Series 2011-C4, Class XA
1.072%, due 06/15/444,5,6,7,8 | | | 29,000,000 | | | | 1,266,683 | | |
Total stripped mortgage-backed
securities
(cost—$6,807,205) | | | | | | | 6,938,111 | | |
22
PACE Select Advisors Trust
PACE Government Securities Fixed Income Investments
Portfolio of investments—July 31, 2011
| | | Face
amount | | Value | |
| Repurchase agreement—0.32% | |
Repurchase agreement dated
07/29/11 with State Street
Bank & Trust Co., 0.010%
due 08/01/11, collateralized
by $9,548 Federal Home Loan
Mortgage Corp. obligations,
5.125% due 07/15/12,
$1,372,274 US Treasury Bills,
zero coupon due 08/04/11
and $541,222 US Treasury
Notes, 2.375% to 2.625%
due 02/29/16 to 07/31/17;
(value—$1,957,401);
proceeds: $1,919,002
(cost—$1,919,000) | | $ | 1,919,000 | | | $ | 1,919,000 | | |
Total investments before
investments sold short
(cost—$914,132,013)—
152.40% | | | | | | | 926,060,938 | | |
| | | Face
amount | | Value | |
| Investments sold short—(43.61)% | |
FNMA TBA*
3.500%, TBA | | $ | (19,000,000 | ) | | $ | (18,519,062 | ) | |
| 4.000%, TBA | | | (168,000,000 | ) | | | (170,487,500 | ) | |
GNMA TBA
3.500%, TBA | | | (66,430,000 | ) | | | (65,911,016 | ) | |
| 4.500%, TBA | | | (2,000,000 | ) | | | (2,131,250 | ) | |
GNMA II TBA
3.500%, TBA | | | (8,000,000 | ) | | | (7,937,500 | ) | |
Total investments sold short
(proceeds—$261,813,240)—
(43.61)% | | | | | | | (264,986,328 | ) | |
Liabilities in excess of other
assets—(8.79)% | | | | | | | (53,425,022 | ) | |
| Net assets—100.00% | | | | | | $ | 607,649,588 | | |
Aggregate cost for federal income tax purposes before investments sold short was $914,567,790; and net unrealized appreciation consisted of:
| Gross unrealized appreciation | | $ | 17,910,229 | | |
| Gross unrealized depreciation | | | (6,417,081 | ) | |
| Net unrealized appreciation | | $ | 11,493,148 | | |
For a listing of defined portfolio acronyms and currency abbreviations that are used throughout the Portfolio of investments as well as the tables that follow, please refer to page 227.
* On September 7, 2008, the Federal Housing Finance Agency placed the Federal National Mortgage Association and the Federal Home Loan Mortgage Corporation into conservatorship, and the US Treasury guaranteed the debt issued by those organizations.
1 Entire amount designated as collateral for investments sold short.
2 Step bond that converts to the noted fixed rate at a designated future date.
3 Security exempt from registration pursuant to Rule 144A under the Securities Act of 1933. These securities, which represent 7.58% of net assets as of July 31, 2011, are considered liquid and may be resold in transactions exempt from registration, normally to qualified institutional buyers.
4 Variable or floating rate security. The interest rate shown is the current rate as of July 31, 2011 and changes periodically.
5 Security is being fair valued by a valuation committee under the direction of the board of trustees.
6 Interest only security. This security entitles the holder to receive interest payments from an underlying pool of mortgages. The risk associated with this security is related to the speed of the principal paydowns. High prepayments would result in a smaller amount of interest being received and cause the yield to decrease. Low prepayments would result in a greater amount of interest being received and cause the yield to increase.
7 Illiquid securities representing 1.15% of net assets as of July 31, 2011.
8 Security exempt from registration pursuant to Rule 144A under the Securities Act of 1933. This security, which represent 0.21% of net assets as of July 31, 2011, is considered illiquid and may be resold in transactions exempt from registration, normally to qualified institutional buyers.
23
PACE Select Advisors Trust
PACE Government Securities Fixed Income Investments
Portfolio of investments—July 31, 2011
Written options
Written option activity for the year ended July 31, 2011 was as follows:
| | | Number of
contracts | | Premiums
received | |
| Options outstanding at July 31, 2010 | | | 558 | | | $ | 180,178 | | |
| Options terminated in closing purchase transactions | | | (558 | ) | | | (180,178 | ) | |
| Options outstanding at July 31, 2011 | | | — | | | $ | — | | |
Swaptions
Swaptions activity for the year ended July 31, 2011 was as follows:
| | | Premiums
received | |
| Swaptions outstanding at July 31, 2010 | | $ | 911,875 | | |
| Swaptions terminated in closing purchase transactions | | | (911,875 | ) | |
| Swaptions outstanding at July 31, 2011 | | $ | — | | |
The following is a summary of the fair valuations according to the inputs used as of July 31, 2011 in valuing the Portfolio's investments:
| | | Unadjusted
quoted prices in
active markets for
identical investments
(Level 1) | | Other significant
observable inputs
(Level 2) | | Unobservable
inputs
(Level 3) | | Total | |
| Government national mortgage association certificates | | $ | — | | | $ | 188,323,733 | | | $ | — | | | $ | 188,323,733 | | |
| Federal home loan mortgage corporation certificates | | | — | | | | 149,155,726 | | | | — | | | | 149,155,726 | | |
| Federal housing administration certificates | | | — | | | | — | | | | 1,078,815 | | | | 1,078,815 | | |
| Federal national mortgage association certificates | | | — | | | | 478,110,242 | | | | — | | | | 478,110,242 | | |
| Collateralized mortgage obligations | | | — | | | | 63,584,937 | | | | 20,359,302 | | | | 83,944,239 | | |
| Asset-backed securities | | | — | | | | 16,591,072 | | | | — | | | | 16,591,072 | | |
| Stripped mortgage-backed securities | | | — | | | | 2,174,162 | | | | 4,763,949 | | | | 6,938,111 | | |
| Repurchase agreement | | | — | | | | 1,919,000 | | | | — | | | | 1,919,000 | | |
Federal national mortgage association and government
national mortgage association certificates sold short | | | — | | | | (264,986,328 | ) | | | — | | | | (264,986,328 | ) | |
| Total | | $ | — | | | $ | 634,872,544 | | | $ | 26,202,066 | | | $ | 661,074,610 | | |
The following is a rollforward of the Portfolio's investments that were valued using unobservable inputs (Level 3) for the year ended July 31, 2011:
| | | Federal housing
administration
certificates | | Collateralized
mortgage
obligations | | Stripped
mortgage-backed
securities | | Total | |
| Beginning balance | | $ | 1,257,578 | | | $ | 16,097,006 | | | $ | — | | | $ | 17,354,584 | | |
| Purchases | | | 1,136,643 | | | | 27,649,650 | | | | 4,641,894 | | | | 33,428,187 | | |
| Sales | | | (1,316,331 | ) | | | (21,498,900 | ) | | | — | | | | (22,815,231 | ) | |
| Accrued discounts/(premiums) | | | (1,381 | ) | | | 66,011 | | | | (4,046 | ) | | | 60,584 | | |
| Total realized gain/(loss) | | | — | | | | — | | | | — | | | | — | | |
Net change in unrealized
appreciation/depreciation | | | 2,306 | | | | (397,474 | ) | | | 126,101 | | | | (269,067 | ) | |
| Transfers in to Level 3 | | | — | | | | — | | | | — | | | | — | | |
| Transfers out of Level 31 | | | — | | | | (1,556,991 | ) | | | — | | | | (1,556,991 | ) | |
| Ending balance | | $ | 1,078,815 | | | $ | 20,359,302 | | | $ | 4,763,949 | | | $ | 26,202,066 | | |
The change in unrealized appreciation/depreciation relating to the Level 3 investments held at July 31, 2011 was $(206,927).
1 Transfers out of Level 3 represent the value at the end of the period. At July 31, 2011, a security was transferred from Level 3 to Level 2 as the valuation is based on observable inputs from an established pricing source.
See accompanying notes to financial statements.
24
PACE Select Advisors Trust
PACE Intermediate Fixed Income Investments
Performance
For the 12 months ended July 31, 2011, the Portfolio's Class P shares returned 3.58%, before the deduction of the maximum PACE Select program fee. (Class P shares returned 1.53%, after the deduction of the maximum PACE Select program fee, for the same 12-month period.) In comparison, the Barclays Capital US Intermediate Government/Credit Index (the "benchmark") returned 4.12%, and the Lipper Short-Intermediate Investment Grade Debt Funds category posted a median return of 3.73%. (Returns for all share classes over various time periods are shown in the "Performance at a glance" table on page 28. Please note that the returns shown do not reflect the deduction of taxes that a shareholder would pay on Portfolio distributions or the redemption of Portfolio shares.) For a detailed commentary on the market environment in general during the reporting period, please refer to page 2.
Sub-Advisor's comments1
The Portfolio lagged its benchmark during the reporting period, primarily due to duration and yield curve positioning. (Duration measures a portfolio's sensitivity to interest rate changes, while the yield curve plots the interest rates, at a set point in time, of bonds having equal credit quality, but differing maturity). Conversely, out-of-benchmark allocations to sectors such as commercial mortgage-backed securities ("CMBS"), non-agency residential mortgage-backed securities ("MBS") and Treasury inflation-protected securities ("TIPS") boosted relative performance.
Specifically, it was the Portfolio's yield curve-flattening bias in the fall of 2010 that detracted from relative performance as the yield curve steepened in anticipation of the Federal Reserve Board's (the "Fed") efforts to stimulate the economy via a second Treasury purchase program, or quantitative easing ("QE2"). (A "steepening yield curve" is one in which long term bond yields increase relative to those of short-term bonds.) Interest rates were volatile, as the 10-year Treasury yield rose as high as 3.74% and as low as 2.39% over the period. Thus, the Portfolio's duration positioning experienced some positive and some negative months of performance. In aggregate, duration positioning was a modest detractor, most recently due to a short duration bias in May and July 2011.
The Portfolio's allocations to CMBS and non-agency MBS were the largest contributors to performance during the reporting period. The performances of both sectors were highly correlated with investors' appetite for risk. From August 2010 until April 2011, CMBS and non-agency MBS benefited from an increased demand for yield in a low interest rate environment. However, both sectors underperformed during periods of increased risk aversion.
PACE Select Advisors Trust – PACE Intermediate Fixed Income Investments
Investment Sub-Advisor:
BlackRock Financial Management, Inc. ("BlackRock")
Portfolio Managers:
Matthew Marra and Brian Weinstein
Objective:
Current income, consistent with reasonable stability of principal
Investment process:
The Portfolio invests primarily in fixed income securities. BlackRock decides to buy specific bonds based on its credit analysis and review. BlackRock strives to add value by controlling the Portfolio's duration within a narrow band relative to the Barclays Capital US Intermediate Government/Credit Index. To accomplish this, BlackRock employs an analytical process that involves evaluating macroeconomic trends, technical market factors, yield-curve exposure and market volatility. Once BlackRock establishes the investment themes on duration, yield curve exposure, convexity, sector weighting, credit quality and liquidity, the Portfolio's investments are diversified by sector, subsector and security.
1 All Sub-Advisors discuss performance on a gross of fees basis—meaning that no fees or expenses are reflected in their sleeves'/sleeve's performance. Alternately, Fund performance is shown net of fees, which does factor in fees and expenses associated with the Fund.
25
PACE Select Advisors Trust
PACE Intermediate Fixed Income Investments
Sub-Advisor's comments – concluded
Inflation-linked strategies that we implemented in November 2010 contributed positively to performance. The Fed's second round of quantitative easing raised inflation expectations and caused the US dollar to depreciate. This, coupled with turmoil in the Middle East, sparked a sharp rise in commodity prices, leading to higher headline inflation across the globe. Against this backdrop, TIPS outperformed their nominal (non-TIPS) Treasury counterparts. Later in the reporting period, we eliminated a portion of the Portfolio's TIPS position to capture profits, as growth in the US began slowing and commodity prices declined, which served to reduce inflation expectations.
A number of derivative instruments were used during the reporting period. Futures were used to manage the overall duration and yield curve exposures of the Portfolio. Interest rate swaps were utilized to manage the Portfolio's overall duration and spread duration. Foreign exchange forward contracts were used to help us hedge foreign currency risk from buying bonds that are not denominated in US dollars. Furthermore, we used these forward contracts to opportunistically express our views on certain currencies. Credit default swaps were used to manage the credit risk of corporate bonds held in the Portfolio. Overall, the use of these derivatives contributed to performance during the reporting period.
Special considerations
The Portfolio may be appropriate for long-term investors seeking current income and a reasonable stability of principal. Investors should be able to withstand short-term fluctuations in the fixed income markets. The value of the Portfolio changes every day and can be affected by changes in interest rates, general market conditions and other political, social and economic developments, as well as specific matters relating to the companies in whose securities the Portfolio invests. It is important to note that an investment in the Portfolio is only one component of a balanced investment plan.
26
PACE Select Advisors Trust
PACE Intermediate Fixed Income Investments
Illustration of an assumed investment of $10,000 in Class P shares of the Portfolio (unaudited)
The following graph depicts the performance of PACE Intermediate Fixed Income Investments Class P shares versus the Barclays Capital US Intermediate Government/Credit Index over the 10 years ended July 31, 2011. The performance of the other classes will vary based upon the different class specific expenses and sales charges. The performance provided does not reflect the deduction of taxes that a shareholder would pay on Portfolio distributions or the redemption of Portfolio shares. Past performance is no guarantee of future results. Share price and returns will vary with market conditions; investors may realize a gain or loss upon redemption. It is important to note that PACE Intermediate Fixed Income Investments is a professionally managed portfolio while the Index is not available for investment and is unmanaged. The comparison is shown for illustration purposes only.

27
PACE Select Advisors Trust
PACE Intermediate Fixed Income Investments
Performance at a glance (unaudited)
| Average annual total returns for periods ended 07/31/11 | | 1 year | | 5 years | | 10 years | |
| Before deducting | | Class A1 | | | 3.24 | % | | | 5.11 | % | | | 3.47 | % | |
| maximum sales charge | | Class B2 | | | 2.46 | % | | | 4.31 | % | | | 3.00 | %6 | |
| or PACE Select | | Class C3 | | | 2.80 | % | | | 4.59 | % | | | 2.95 | % | |
| program fee | | Class Y4 | | | 3.49 | % | | | 5.37 | % | | | 3.73 | % | |
| | | Class P5 | | | 3.58 | % | | | 5.38 | % | | | 3.74 | % | |
| After deducting | | Class A1 | | | (1.44 | )% | | | 4.15 | % | | | 2.99 | % | |
| maximum sales charge | | Class B2 | | | (2.54 | )% | | | 3.97 | % | | | 3.00 | %6 | |
| or PACE Select | | Class C3 | | | 2.05 | % | | | 4.59 | % | | | 2.95 | % | |
| program fee | | Class P5 | | | 1.53 | % | | | 3.29 | % | | | 1.68 | % | |
| Barclays Capital US Intermediate Government/Credit Index7 | | | | | 4.12 | % | | | 6.15 | % | | | 5.28 | % | |
| Lipper Short-Intermediate Investment Grade Debt Funds median | | | | | 3.73 | % | | | 5.38 | % | | | 4.48 | % | |
Average annual total returns for periods ended June 30, 2011, after deduction of the maximum sales charge or PACE Select program fee, were as follows: Class A—1-year period, (1.50)%; 5-year period, 4.11%; 10-year period, 3.07%; Class B—1-year period, (2.65)%; 5-year period, 3.94%; 10-year period, 3.08%; Class C—1-year period, 1.85%; 5-year period, 4.55%; 10-year period, 3.02%; Class Y—1-year period, 3.39%; 5-year period, 5.36%; 10-year period, 3.81%; Class P—1-year period, 1.33%; 5-year period, 3.26%; 10-year period, 1.76%.
The annualized gross and net expense ratios, respectively, for each class of shares as in the November 28, 2010 prospectuses, were as follows: Class A—1.00% and 0.93%; Class B—1.82% and 1.68%; Class C—1.50% and 1.43%; Class Y—0.74% and 0.68%; and Class P—0.73% and 0.68%. Net expenses reflect fee waivers and/or expense reimbursements, if any, pursuant to an agreement that is in effect to cap the expenses. The Portfolio and UBS Global Asset Management (Americas) Inc. ("UBS Global AM") have entered into a written fee waiver/expense reimbursement agreement pursuant to which UBS Global AM is contractually obligated to waive its management fees and/or reimburse expenses so that the Portfolio's ordinary total operating expenses of each class through November 28, 2011 (excluding dividend expense, borrowing costs, and interest expense relating to short sales, and interest, taxes, brokerage commissions and extraordinary expenses) would not exceed Class A—0.93%; Class B—1.68%; Class C—1.43%; Class Y—0.68%; and Class P—0.68%. The Portfolio has agreed to repay UBS Global AM for any waived fees/reimbursed expenses to the extent that it can do so over the following three fiscal years without causing the Portfolio's expenses in any of those three years to exceed these expense caps. The fee waiver/expense reimbursement agreement may be terminated by the Portfolio's board at any time and also will terminate automatically upon the expiration or termination of the Portfolio's advisory contract with UBS Global AM. Upon termination of the agreement, however, UBS Global AM's three year recoupment rights will survive.
1 Maximum sales charge for Class A shares is 4.5%. Class A shares bear ongoing 12b-1 service fees.
2 Maximum contingent deferred sales charge for Class B shares is 5% imposed on redemptions and is reduced to 0% after a maximum of six years. Class B shares bear ongoing 12b-1 service and distribution fees.
3 Maximum contingent deferred sales charge for Class C shares is 0.75% imposed on redemptions and is reduced to 0% after one year. Class C shares bear ongoing 12b-1 service and distribution fees. Prior to September 30, 2003, Class C shares were subject to a maximum front-end sales charge of 1.00%; this front-end sales charge is not reflected in the average annual total returns presented for the Class C shares shown above.
4 The Portfolio offers Class Y shares to a limited group of eligible investors, including certain qualifying retirement plans. Class Y shares do not bear initial or contingent deferred sales charges or ongoing 12b-1 service and distribution fees.
5 Class P shares do not bear initial or contingent deferred sales charges or ongoing 12b-1 service and distribution fees, but are subject to a maximum annual PACE Select program fee of 2% of the value of Class P shares. Prior to June 14, 2010, the maximum annual PACE Select program fee was 1.5% of the value of Class P shares; however, the current maximum annual PACE Select program fee of 2% is reflected in the performance returns throughout all periods in the average annual total returns presented for the Class P shares shown above.
6 Assumes the conversion of Class B to Class A shares at the end of the sixth year.
7 The Barclays Capital US Intermediate Government/Credit Index is an unmanaged subset of the Barclays Capital US Government/Credit Index covering all investment grade issues with maturities from one up to (but not including) 10 years. The average-weighted maturity is typically between four and five years. Investors should note that indices do not reflect the deduction of fees and expenses.
If an investor sells or exchanges shares less than 90 days after purchase, a redemption fee of 1.00% of the amount sold or exchanged will be deducted at the time of the transaction, except as noted otherwise in the prospectuses.
Past performance does not predict future performance, and the performance information provided does not reflect the deduction of taxes that a shareholder would pay on Portfolio distributions or the redemption of Portfolio shares. The return and principal value of an investment will fluctuate, so that an investor's shares, when redeemed, may be worth more or less than their original cost. Performance results assume reinvestment of all dividends and capital gain distributions at net asset value on the ex-dividend dates. Current performance may be higher or lower than the performance data quoted. For month-end performance figures, please visit http://www.ubs.com.
Lipper peer group data calculated by Lipper Inc.; used with permission. The Lipper median is the return of the fund that places in the middle of a Lipper peer group.
28
PACE Select Advisors Trust
PACE Intermediate Fixed Income Investments
Portfolio statistics (unaudited)
| Characteristics | | 07/31/11 | |
| Weighted average duration | | | 3.5 yrs. | | |
| Weighted average maturity | | | 6.3 yrs. | | |
| Average coupon | | | 3.99 | % | |
| Net assets (mm) | | $ | 455.6 | | |
| Number of holdings | | | 253 | | |
| Portfolio composition1 | | 07/31/11 | |
| Bonds and notes | | | 107.1 | % | |
| Options, futures, swaps and forward foreign currency contracts | | | (0.4 | ) | |
| Cash equivalents and other assets less liabilities | | | (6.7 | ) | |
| Total | | | 100.0 | % | |
| Quality diversification1 | | 07/31/11 | |
| US government and agency securities | | | 40.7 | % | |
| AAA | | | 13.2 | | |
| AA | | | 6.3 | | |
| A | | | 14.9 | | |
| BBB and below/non-rated | | | 32.0 | | |
| Options, futures, swaps and forward foreign currency contracts | | | (0.4 | ) | |
| Cash equivalents and other assets less liabilities | | | (6.7 | ) | |
| Total | | | 100.0 | % | |
| Asset allocation1 | | 07/31/11 | |
| Corporate notes | | | 47.2 | % | |
| US government obligations | | | 29.8 | | |
| US government agency mortgage pass-through certificates | | | 10.5 | | |
| Collateralized mortgage obligations | | | 9.2 | | |
| Asset-backed securities | | | 9.1 | | |
| Non-US government obligations | | | 1.3 | | |
| Options, futures, swaps and forward foreign currency contracts | | | (0.4 | ) | |
| Cash equivalents and other assets less liabilities | | | (6.7 | ) | |
| Total | | | 100.0 | % | |
1 Weightings represent percentages of the Portfolio's net assets as of July 31, 2011. The Portfolio is actively managed and its composition will vary over time. Credit quality ratings shown are based on the ratings assigned to portfolio holdings by Standard & Poor's Ratings Group, an independent rating agency.
29
PACE Select Advisors Trust
PACE Intermediate Fixed Income Investments
Portfolio of investments—July 31, 2011
| | | Face
amount1 | | Value | |
| US government obligations—29.84% | |
US Treasury Bonds
4.375%, due 05/15/41 | | | 8,985,000 | | | $ | 9,352,846 | | |
| 4.750%, due 02/15/41 | | | 7,775,000 | | | | 8,612,025 | | |
| 6.250%, due 08/15/23 | | | 1,155,000 | | | | 1,511,426 | | |
| 7.250%, due 08/15/22 | | | 985,000 | | | | 1,381,770 | | |
| 8.125%, due 05/15/21 | | | 4,265,000 | | | | 6,246,225 | | |
US Treasury Inflation Index
Notes (TIPS)
2.000%, due 04/15/12 | | | 6,552,731 | | | | 6,671,499 | | |
US Treasury Notes
0.375%, due 07/31/13 | | | 11,925,000 | | | | 11,927,791 | | |
| 0.625%, due 07/15/14 | | | 13,170,000 | | | | 13,198,842 | | |
| 1.500%, due 06/30/162 | | | 17,956,000 | | | | 18,093,543 | | |
| 1.500%, due 07/31/16 | | | 29,610,000 | | | | 29,790,325 | | |
| 2.375%, due 05/31/18 | | | 21,020,000 | | | | 21,453,643 | | |
| 3.125%, due 05/15/21 | | | 6,515,000 | | | | 6,693,120 | | |
| 3.625%, due 02/15/20 | | | 920,000 | | | | 999,637 | | |
Total US government obligations
(cost—$133,746,919) | | | | | | | 135,932,692 | | |
Federal farm credit bank
certificate—1.38% | |
FFCB
2.625%, due 04/17/14
(cost—$5,992,529) | | | 6,000,000 | | | | 6,297,810 | | |
Federal home loan bank
certificate—0.51% | |
FHLB
5.625%, due 06/13/16
(cost—$2,168,980) | | | 2,085,000 | | | | 2,336,507 | | |
Federal home loan mortgage
corporation certificates*—2.96% | |
FHLMC
3.525%, due 09/30/19 | | | 10,490,000 | | | | 10,640,227 | | |
| 5.000%, due 11/13/14 | | | 2,500,000 | | | | 2,826,370 | | |
Total federal home loan mortgage
corporation certificates
(cost—$13,231,254) | | | | | | | 13,466,597 | | |
Federal national mortgage
association certificates*—5.62% | |
FNMA
1.625%, due 10/26/15 | | | 2,275,000 | | | | 2,302,318 | | |
| 2.375%, due 04/11/16 | | | 5,795,000 | | | | 6,009,125 | | |
| 3.383%, due 10/09/193 | | | 1,290,000 | | | | 932,468 | | |
| 3.607%, due 10/09/193 | | | 910,000 | | | | 657,787 | | |
| 4.625%, due 05/01/13 | | | 845,000 | | | | 902,042 | | |
FNMA TBA
4.000% | | | 11,700,000 | | | | 11,882,812 | | |
| 4.500% | | | 2,800,000 | | | | 2,922,500 | | |
Total federal national mortgage
association certificates
(cost—$25,028,645) | | | | | | | 25,609,052 | | |
| | | Face
amount1 | | Value | |
Collateralized mortgage
obligations—9.20% | |
Arkle Master Issuer PLC,
Series 2010-2A, Class 1A1
1.661%, due 05/17/604,5 | | | 2,015,000 | | | $ | 2,014,180 | | |
Banc of America Commercial
Mortgage, Inc.,
Series 2002-PB2, Class A4
6.186%, due 06/11/35 | | | 1,681,653 | | | | 1,697,082 | | |
Bear Stearns Alternative
Loan Trust-A Trust,
Series 2004-13, Class A1
0.927%, due 11/25/344 | | | 416,926 | | | | 375,425 | | |
Bear Stearns ARM Trust,
Series 2004-5, Class 2A
3.139%, due 07/25/34 | | | 899,109 | | | | 807,061 | | |
Bear Stearns Commercial
Mortgage Securities,
Series 2003-T12, Class A4
4.680%, due 08/13/394 | | | 2,400,000 | | | | 2,527,755 | | |
Countrywide Home Loans,
Series 2006-0A5, Class 2A1
0.387%, due 04/25/464 | | | 473,817 | | | | 268,533 | | |
CWCapital COBALT,
Series 2007-C3, Class A4
5.816%, due 05/15/464 | | | 840,000 | | | | 914,835 | | |
Extended Stay America Trust,
Series 2010-ESHA, Class A
2.951%, due 11/05/275 | | | 1,910,869 | | | | 1,892,127 | | |
Series 2010-ESHA, Class D
5.498%, due 11/05/275 | | | 1,210,000 | | | | 1,212,268 | | |
FNMA REMIC,*
Trust 2005-109, Class PV
6.000%, due 10/25/32 | | | 1,102,259 | | | | 1,220,577 | | |
Trust 2006-62, Class TA
5.500%, due 06/25/28 | | | 44,472 | | | | 44,622 | | |
GNMA REMIC,
Trust Series 2006-3, Class B
5.091%, due 01/16/374 | | | 1,560,000 | | | | 1,684,864 | | |
Greenwich Capital
Commercial Funding Corp.,
Series 2007-GG9, Class A4
5.444%, due 03/10/39 | | | 990,000 | | | | 1,063,137 | | |
Series 2007-GG11, Class A4
5.736%, due 12/10/49 | | | 1,451,000 | | | | 1,558,860 | | |
Holmes Master Issuer PLC,
Series 2010-1A, Class A2
1.649%, due 10/15/544,5 | | | 2,390,000 | | | | 2,393,462 | | |
JPMorgan Chase Commercial
Mortgage Securities,
Series 2003-ML1A, Class A2
4.767%, due 03/12/39 | | | 1,455,000 | | | | 1,510,641 | | |
Series 2004-CB8, Class A1A
4.158%, due 01/12/395 | | | 1,981,075 | | | | 2,047,586 | | |
Series 2004-CBX, Class A4
4.529%, due 01/12/37 | | | 2,090,000 | | | | 2,092,170 | | |
30
PACE Select Advisors Trust
PACE Intermediate Fixed Income Investments
Portfolio of investments—July 31, 2011
| | | Face
amount1 | | Value | |
Collateralized mortgage
obligations—(Concluded) | |
Series 2006-LDP8, Class AM
5.440%, due 05/15/45 | | | 1,315,000 | | | $ | 1,320,446 | | |
Series 2007-CB18, Class A3
5.447%, due 06/12/47 | | | 790,000 | | | | 824,756 | | |
JPMorgan Mortgage Trust,
Series 2006-S2, Class 2A2
5.875%, due 07/25/36 | | | 172,929 | | | | 167,289 | | |
Series 2007-S1, Class 1A2
5.500%, due 03/25/22 | | | 136,340 | | | | 133,176 | | |
Merrill Lynch/Countrywide
Commercial Mortgage Trust,
Series 2006-4, Class AM
5.204%, due 12/12/494 | | | 875,000 | | | | 834,085 | | |
Morgan Stanley Capital I,
Series 2005-HQ6, Class A4A
4.989%, due 08/13/42 | | | 2,075,000 | | | | 2,232,549 | | |
Series 2007-IQ14, Class A4
5.692%, due 04/15/494 | | | 2,000,000 | | | | 2,148,659 | | |
Permanent Master Issuer PLC,
Series 2006-1, Class 6A1
0.947%, due 04/15/204,6 | | GBP | 1,466,000 | | | | 2,356,640 | | |
Small Business Administration,
Series 2004-P10B, Class 1
4.754%, due 08/10/14 | | | 405,523 | | | | 431,668 | | |
Structured ARM Loan Trust,
Series 2004-6, Class 4A1
2.520%, due 06/25/34 | | | 2,057,188 | | | | 1,909,219 | | |
Series 2004-13, Class A2
0.487%, due 09/25/34 | | | 207,247 | | | | 150,783 | | |
Structured Asset Securities Corp.,
Series 2003-AL1, Class A
3.357%, due 04/25/315 | | | 538,174 | | | | 519,748 | | |
Thornburg Mortgage Securities Trust,
Series 2006-5, Class A1
0.307%, due 10/25/464 | | | 988,690 | | | | 985,745 | | |
TIAA Seasoned Commercial
Mortgage Trust,
Series 2007-C4, Class A1
5.575%, due 08/15/394 | | | 706,011 | | | | 706,413 | | |
Wachovia Bank Commercial
Mortgage Trust,
Series 2006-C28, Class A4
5.572%, due 10/15/48 | | | 1,385,000 | | | | 1,505,490 | | |
WaMu Mortgage Pass
Through Certificates,
Series 2007-0A4, Class 1A
1.033%, due 05/25/474 | | | 533,651 | | | | 359,691 | | |
Total collateralized mortgage obligations
(cost—$41,325,489) | | | | | | | 41,911,542 | | |
| Asset-backed securities—9.12% | |
AmeriCredit Automobile
Receivables Trust,
Series 2011-1, Class A2
0.840%, due 06/09/14 | | | 2,710,000 | | | | 2,711,009 | | |
| | | Face
amount1 | | Value | |
| Asset-backed securities—(Continued) | |
Citibank Omni Master Trust,
Series 2009, Class A14
2.937%, due 08/15/184,5 | | | 1,080,000 | | | $ | 1,136,572 | | |
Series 2009-A8, Class A8
2.307%, due 05/16/164,5 | | | 2,160,000 | | | | 2,186,044 | | |
Series 2009-A17, Class A17
4.900%, due 11/15/185 | | | 2,360,000 | | | | 2,580,772 | | |
Countrywide Asset-Backed
Certificates,
Series 2006-2, Class 2A2
0.377%, due 06/25/364 | | | 779,879 | | | | 655,830 | | |
Credit Acceptance
Auto Loan Trust,
Series 2010-1, Class A
2.060%, due 04/16/185 | | | 1,185,000 | | | | 1,188,522 | | |
Ford Credit Floorplan
Master Owner Trust,
Series 2009-2, Class A
1.757%, due 09/15/144 | | | 1,545,000 | | | | 1,564,509 | | |
Lehman XS Trust,
Series 2005-6, Class 1A1
0.447%, due 11/25/354 | | | 456,601 | | | | 213,330 | | |
Sallie Mae Student Loan Trust,
Series 2005-8, Class A4
1.003%, due 01/25/284 | | | 3,300,000 | | | | 3,208,008 | | |
Series 2008-5, Class A2
1.353%, due 10/25/164 | | | 3,160,580 | | | | 3,194,496 | | |
Series 2008-5, Class A3
1.553%, due 01/25/184 | | | 1,100,000 | | | | 1,124,381 | | |
Series 2008-5, Class A4
1.953%, due 07/25/234 | | | 2,950,000 | | | | 3,061,915 | | |
Series 2010-C, Class A1
1.857%, due 12/15/174,5 | | | 946,264 | | | | 952,507 | | |
Santander Consumer
Acquired Receivables Trust,
Series 2011-W0, Class A2
0.910%, due 11/15/135 | | | 3,107,297 | | | | 3,108,861 | | |
Series 2011-W0, Class C
3.190%, due 10/15/155 | | | 1,070,000 | | | | 1,071,829 | | |
Santander Drive Auto
Receivables Trust,
Series 2010-3, Class A2
0.930%, due 06/17/13 | | | 3,380,000 | | | | 3,382,558 | | |
Series 2010-B, Class A2
1.010%, due 07/15/135 | | | 2,872,960 | | | | 2,875,441 | | |
Series 2010-B, Class B
2.100%, due 09/15/145 | | | 2,490,000 | | | | 2,500,446 | | |
Series 2010-B, Class C
3.020%, due 10/17/165 | | | 1,150,000 | | | | 1,164,184 | | |
Series 2011-S1A, Class B
1.480%, due 05/15/175 | | | 1,290,325 | | | | 1,285,972 | | |
Series 2011-S1A, Class D
3.100%, due 05/15/175 | | | 949,713 | | | | 950,900 | | |
Series 2011-S2A, Class B
2.060%, due 06/15/175 | | | 908,209 | | | | 907,005 | | |
31
PACE Select Advisors Trust
PACE Intermediate Fixed Income Investments
Portfolio of investments—July 31, 2011
| | | Face
amount1 | | Value | |
| Asset-backed securities—(Concluded) | |
Structured Receivables Finance LLC,
Series 2010-B, Class A
3.730%, due 08/15/365 | | | 531,151 | | | $ | 525,840 | | |
Total asset-backed securities
(cost—$41,565,947) | | | | | | | 41,550,931 | | |
| Corporate notes—47.15% | |
| Airlines—0.29% | |
American Airlines, Inc.
10.500%, due 10/15/12 | | | 1,260,000 | | | | 1,323,000 | | |
| Automotive—0.74% | |
Asciano Finance Ltd.
5.000%, due 04/07/185 | | | 1,050,000 | | | | 1,096,485 | | |
Daimler Finance N.A. LLC MTN
5.750%, due 09/08/11 | | | 1,150,000 | | | | 1,155,853 | | |
Delphi Corp.
5.875%, due 05/15/195 | | | 1,134,000 | | | | 1,142,505 | | |
| | | | 3,394,843 | | |
| Banking-non-US—5.00% | |
Achmea Hypotheekbank N.V.
3.200%, due 11/03/145 | | | 1,605,000 | | | | 1,697,504 | | |
Bank of Nova Scotia
1.650%, due 10/29/155 | | | 3,805,000 | | | | 3,801,416 | | |
Canadian Imperial
Bank of Commerce
2.750%, due 01/27/165 | | | 3,190,000 | | | | 3,307,545 | | |
Credit Suisse AG
5.400%, due 01/14/20 | | | 900,000 | | | | 926,842 | | |
DEPFA Asset Covered Securities Bank
4.875%, due 10/28/155 | | | 1,300,000 | | | | 1,343,550 | | |
DnB NOR Boligkreditt
2.100%, due 10/14/155 | | | 1,700,000 | | | | 1,707,936 | | |
Eksportfinans A/S
5.500%, due 05/25/16 | | | 1,275,000 | | | | 1,481,350 | | |
Eksportfinans ASA
2.000%, due 09/15/15 | | | 3,090,000 | | | | 3,137,994 | | |
HSBC Bank Brazil SA
4.000%, due 05/11/165 | | | 2,275,000 | | | | 2,297,750 | | |
Royal Bank of Canada MTN
2.300%, due 07/20/167 | | | 1,325,000 | | | | 1,330,696 | | |
Toronto-Dominion Bank
2.200%, due 07/29/155,7 | | | 1,690,000 | | | | 1,730,175 | | |
| | | | 22,762,758 | | |
| Banking-US—3.31% | |
Bank of America Corp.
5.750%, due 12/01/17 | | | 2,775,000 | | | | 2,967,443 | | |
Series 1
3.750%, due 07/12/16 | | | 2,175,000 | | | | 2,183,933 | | |
Bank of America Corp. MTN
5.000%, due 05/13/21 | | | 825,000 | | | | 816,583 | | |
Capital One Financial Corp.
4.750%, due 07/15/21 | | | 1,125,000 | | | | 1,137,172 | | |
Discover Bank
8.700%, due 11/18/19 | | | 1,100,000 | | | | 1,361,290 | | |
| | | Face
amount1 | | Value | |
| Corporate notes—(Continued) | |
| Banking-US—(Concluded) | |
JPMorgan Chase Bank N.A.
6.000%, due 07/05/17 | | | 1,825,000 | | | $ | 2,058,959 | | |
| 6.000%, due 10/01/17 | | | 1,450,000 | | | | 1,633,173 | | |
State Street Capital Trust III
5.237%, due 09/12/114,8 | | | 1,725,000 | | | | 1,724,431 | | |
Wells Fargo & Co.
3.676%, due 06/15/169 | | | 1,161,000 | | | | 1,219,504 | | |
| | | | 15,102,488 | | |
| Beverages—0.78% | |
Anheuser-Busch InBev
Worldwide, Inc.
3.000%, due 10/15/12 | | | 3,365,000 | | | | 3,454,795 | | |
| 5.375%, due 01/15/20 | | | 75,000 | | | | 86,256 | | |
| | | | 3,541,051 | | |
| Chemicals—0.52% | |
CF Industries, Inc.
7.125%, due 05/01/20 | | | 1,060,000 | | | | 1,242,850 | | |
Nalco Co.
8.250%, due 05/15/17 | | | 615,000 | | | | 691,875 | | |
The Dow Chemical Co.
4.250%, due 11/15/20 | | | 442,000 | | | | 452,787 | | |
| | | | 2,387,512 | | |
| Consumer products—0.34% | |
Reynolds Group Issuer, Inc.
8.500%, due 10/15/165,9 | | | 1,505,000 | | | | 1,568,963 | | |
| Diversified financial services—1.19% | |
General Electric Capital Corp.
5.500%, due 01/08/20 | | | 1,220,000 | | | | 1,339,485 | | |
General Electric Capital Corp. MTN
0.366%, due 04/10/124 | | | 2,850,000 | | | | 2,854,093 | | |
| 4.375%, due 09/16/20 | | | 1,190,000 | | | | 1,208,933 | | |
| | | | 5,402,511 | | |
| Electric-integrated—3.26% | |
Carolina Power & Light Co.
5.300%, due 01/15/19 | | | 975,000 | | | | 1,109,540 | | |
Constellation Energy Group, Inc.
5.150%, due 12/01/20 | | | 846,000 | | | | 890,556 | | |
Duke Energy Corp.
3.950%, due 09/15/14 | | | 1,845,000 | | | | 1,976,279 | | |
EDP Finance BV
5.375%, due 11/02/125 | | | 5,300,000 | | | | 5,165,608 | | |
Florida Power Corp.
4.800%, due 03/01/13 | | | 340,000 | | | | 361,423 | | |
IPALCO Enterprises, Inc.
5.000%, due 05/01/185 | | | 1,600,000 | | | | 1,587,960 | | |
Jersey Central Power & Light Co.
5.625%, due 05/01/16 | | | 550,000 | | | | 626,739 | | |
Pacificorp
5.500%, due 01/15/19 | | | 1,400,000 | | | | 1,616,628 | | |
Progress Energy, Inc.
5.625%, due 01/15/16 | | | 1,325,000 | | | | 1,514,063 | | |
| | | | 14,848,796 | | |
32
PACE Select Advisors Trust
PACE Intermediate Fixed Income Investments
Portfolio of investments—July 31, 2011
| | | Face
amount1 | | Value | |
| Corporate notes—(Continued) | |
| Electronics—0.19% | |
Jabil Circuit, Inc.
5.625%, due 12/15/20 | | | 385,000 | | | $ | 379,225 | | |
| 7.750%, due 07/15/16 | | | 425,000 | | | | 476,000 | | |
| | | | 855,225 | | |
| Financial services—7.12% | |
Ally Financial, Inc.
4.500%, due 02/11/14 | | | 4,492,000 | | | | 4,469,540 | | |
Citigroup, Inc.
3.953%, due 06/15/16 | | | 1,625,000 | | | | 1,688,763 | | |
| 4.587%, due 12/15/15 | | | 5,150,000 | | | | 5,495,488 | | |
Credit Suisse AG Guernsey
5.860%, due 05/15/174,8 | | | 2,290,000 | | | | 2,129,700 | | |
Goldman Sachs Group, Inc.
3.625%, due 02/07/16 | | | 2,025,000 | | | | 2,049,995 | | |
| 5.250%, due 10/15/13 | | | 2,530,000 | | | | 2,705,243 | | |
HSBC Holdings PLC
5.100%, due 04/05/21 | | | 1,100,000 | | | | 1,155,368 | | |
JPMorgan Chase & Co.
3.150%, due 07/05/16 | | | 3,175,000 | | | | 3,208,480 | | |
Morgan Stanley
3.800%, due 04/29/16 | | | 925,000 | | | | 931,430 | | |
| 4.000%, due 07/24/15 | | | 520,000 | | | | 536,428 | | |
| 4.200%, due 11/20/14 | | | 2,180,000 | | | | 2,266,335 | | |
| 5.500%, due 07/28/21 | | | 550,000 | | | | 566,914 | | |
Morgan Stanley MTN
5.625%, due 09/23/19 | | | 795,000 | | | | 829,293 | | |
| 6.250%, due 08/28/17 | | | 740,000 | | | | 818,087 | | |
Nomura Holdings, Inc. MTN
4.125%, due 01/19/16 | | | 1,030,000 | | | | 1,059,882 | | |
SLM Corp.
5.679%, due 01/31/144 | | | 1,700,000 | | | | 1,659,999 | | |
SteelRiver Transmission Co. LLC
4.710%, due 06/30/175 | | | 849,565 | | | | 874,771 | | |
| | | | 32,445,716 | | |
| Food products—0.47% | |
Kraft Foods, Inc.
6.000%, due 02/11/13 | | | 575,000 | | | | 619,928 | | |
| 6.500%, due 08/11/17 | | | 1,275,000 | | | | 1,531,785 | | |
| | | | 2,151,713 | | |
| Gaming—0.60% | |
International Game Technology
7.500%, due 06/15/19 | | | 1,175,000 | | | | 1,371,263 | | |
MGM Resorts International
13.000%, due 11/15/13 | | | 1,129,000 | | | | 1,346,332 | | |
| | | | 2,717,595 | | |
| Health care equipment & supplies—0.15% | |
Boston Scientific Corp.
5.125%, due 01/12/17 | | | 623,000 | | | | 686,765 | | |
| Hotels, restaurants & leisure—0.18% | |
Wyndham Worldwide Corp.
6.000%, due 12/01/16 | | | 750,000 | | | | 814,244 | | |
| | | Face
amount1 | | Value | |
| Corporate notes—(Continued) | |
| Insurance—2.29% | |
Fairfax Financial Holdings Ltd.
5.800%, due 05/15/215 | | | 650,000 | | | $ | 642,627 | | |
Manulife Financial Corp.
3.400%, due 09/17/15 | | | 1,000,000 | | | | 1,047,107 | | |
Metropolitan Life Global Funding I
2.875%, due 09/17/125 | | | 2,050,000 | | | | 2,094,319 | | |
| 5.125%, due 04/10/135 | | | 1,850,000 | | | | 1,966,380 | | |
| 5.125%, due 06/10/145 | | | 245,000 | | | | 268,830 | | |
Pricoa Global Funding I
5.400%, due 10/18/125 | | | 2,175,000 | | | | 2,290,866 | | |
Prudential Financial, Inc. MTN
3.000%, due 05/12/16 | | | 350,000 | | | | 353,131 | | |
| 4.500%, due 11/15/20 | | | 375,000 | | | | 386,669 | | |
| 4.750%, due 09/17/15 | | | 360,000 | | | | 391,707 | | |
| 5.800%, due 06/15/12 | | | 975,000 | | | | 1,014,635 | | |
| | | | 10,456,271 | | |
| Media—2.62% | |
CCH II LLC/CCH II Capital Corp.
13.500%, due 11/30/16 | | | 1,840,000 | | | | 2,171,200 | | |
Clear Channel Worldwide
Holdings, Inc.
9.250%, due 12/15/17 | | | 625,000 | | | | 679,688 | | |
COX Communications, Inc.
7.125%, due 10/01/12 | | | 350,000 | | | | 374,242 | | |
DIRECTV Holdings/Financing
3.500%, due 03/01/16 | | | 2,300,000 | | | | 2,420,476 | | |
| 4.600%, due 02/15/21 | | | 47,000 | | | | 48,902 | | |
| 5.875%, due 10/01/19 | | | 615,000 | | | | 701,335 | | |
Discovery Communications LLC
3.700%, due 06/01/15 | | | 610,000 | | | | 651,086 | | |
Dish DBS Corp.
6.625%, due 10/01/14 | | | 1,050,000 | | | | 1,119,563 | | |
Interpublic Group of Cos., Inc.
6.250%, due 11/15/14 | | | 561,000 | | | | 624,113 | | |
| 10.000%, due 07/15/17 | | | 1,683,000 | | | | 1,990,147 | | |
News America, Inc.
4.500%, due 02/15/215 | | | 580,000 | | | | 579,857 | | |
| 8.500%, due 02/23/25 | | | 200,000 | | | | 254,726 | | |
| 9.500%, due 07/15/24 | | | 225,000 | | | | 308,266 | | |
| | | | 11,923,601 | | |
| Medical providers—1.75% | |
Coventry Health Care, Inc.
5.450%, due 06/15/21 | | | 825,000 | | | | 873,137 | | |
HCA, Inc.
6.500%, due 02/15/20 | | | 1,675,000 | | | | 1,700,125 | | |
| 9.250%, due 11/15/16 | | | 2,109,000 | | | | 2,250,040 | | |
Life Technologies Corp.
5.000%, due 01/15/21 | | | 1,243,000 | | | | 1,305,719 | | |
| 6.000%, due 03/01/20 | | | 213,000 | | | | 239,666 | | |
Tenet Healthcare Corp.
8.875%, due 07/01/19 | | | 614,000 | | | | 678,470 | | |
33
PACE Select Advisors Trust
PACE Intermediate Fixed Income Investments
Portfolio of investments—July 31, 2011
| | | Face
amount1 | | Value | |
| Corporate notes—(Continued) | |
| Medical providers—(Concluded) | |
WellPoint, Inc.
7.000%, due 02/15/19 | | | 750,000 | | | $ | 915,662 | | |
| | | | 7,962,819 | | |
| Metals & mining—1.06% | |
Alcoa, Inc.
5.400%, due 04/15/21 | | | 1,400,000 | | | | 1,455,299 | | |
Barrick Gold Corp.
4.400%, due 05/30/215 | | | 1,375,000 | | | | 1,427,984 | | |
Codelco, Inc.
3.750%, due 11/04/205 | | | 675,000 | | | | 672,202 | | |
Rio Tinto Finance USA Ltd.
3.500%, due 11/02/20 | | | 752,000 | | | | 750,616 | | |
Teck Resources Ltd.
6.250%, due 07/15/41 | | | 475,000 | | | | 509,629 | | |
| | | | 4,815,730 | | |
| Multi-line insurance—0.37% | |
American International Group, Inc.
5.450%, due 05/18/17 | | | 600,000 | | | | 636,012 | | |
Genworth Financial, Inc.
7.625%, due 09/24/21 | | | 110,000 | | | | 105,050 | | |
MetLife, Inc.
7.717%, due 02/15/19 | | | 750,000 | | | | 931,258 | | |
| | | | 1,672,320 | | |
| Oil & gas—4.36% | |
Anadarko Petroleum Corp.
5.750%, due 06/15/14 | | | 600,000 | | | | 666,447 | | |
| 5.950%, due 09/15/16 | | | 2,370,000 | | | | 2,732,290 | | |
| 6.375%, due 09/15/17 | | | 525,000 | | | | 618,891 | | |
| 6.450%, due 09/15/36 | | | 148,000 | | | | 161,313 | | |
| 7.625%, due 03/15/14 | | | 300,000 | | | | 345,295 | | |
BP Capital Markets PLC
3.125%, due 03/10/12 | | | 1,690,000 | | | | 1,715,173 | | |
| 3.200%, due 03/11/16 | | | 2,325,000 | | | | 2,437,932 | | |
Continental Resources, Inc.
8.250%, due 10/01/19 | | | 2,035,000 | | | | 2,238,500 | | |
Hilcorp Energy I LP/Hilcorp
Finance Co.
7.750%, due 11/01/155 | | | 653,000 | | | | 674,223 | | |
KeySpan Gas East Corp.
5.819%, due 04/01/415 | | | 1,100,000 | | | | 1,181,863 | | |
Linn Energy LLC
6.500%, due 05/15/195 | | | 1,132,000 | | | | 1,130,585 | | |
Marathon Petroleum Corp.
6.500%, due 03/01/415 | | | 304,000 | | | | 326,357 | | |
Nexen, Inc.
6.400%, due 05/15/37 | | | 359,000 | | | | 386,736 | | |
| 7.500%, due 07/30/39 | | | 600,000 | | | | 730,085 | | |
OGX Petroleo e Gas Participacoes SA
8.500%, due 06/01/185 | | | 1,092,000 | | | | 1,150,968 | | |
Pride International, Inc.
6.875%, due 08/15/20 | | | 975,000 | | | | 1,173,192 | | |
| | | Face
amount1 | | Value | |
| Corporate notes—(Continued) | |
| Oil & gas—(Concluded) | |
Southwestern Energy Co.
7.500%, due 02/01/18 | | | 1,894,000 | | | $ | 2,182,835 | | |
| | | | 19,852,685 | | |
| Oil refining—0.20% | |
Canadian Natural Resources Ltd.
6.500%, due 02/15/37 | | | 620,000 | | | | 731,522 | | |
Valero Energy Corp.
6.125%, due 02/01/20 | | | 175,000 | | | | 199,759 | | |
| | | | 931,281 | | |
| Oil services—0.88% | |
Petrobras International Finance Co.
3.875%, due 01/27/16 | | | 1,505,000 | | | | 1,560,620 | | |
| 5.750%, due 01/20/20 | | | 2,120,000 | | | | 2,324,624 | | |
| 5.875%, due 03/01/18 | | | 95,000 | | | | 105,773 | | |
| | | | 3,991,017 | | |
| Packaging & containers—0.20% | |
Ball Corp.
7.125%, due 09/01/16 | | | 816,000 | | | | 894,540 | | |
| Paper & forest products—0.73% | |
Domtar Corp.
7.125%, due 08/15/15 | | | 172,000 | | | | 191,780 | | |
Georgia-Pacific LLC
8.250%, due 05/01/165 | | | 925,000 | | | | 1,052,862 | | |
International Paper Co.
7.300%, due 11/15/39 | | | 460,000 | | | | 528,601 | | |
| 7.950%, due 06/15/18 | | | 1,250,000 | | | | 1,536,821 | | |
| | | | 3,310,064 | | |
| Pharmaceuticals—0.20% | |
Omnicare, Inc.
6.875%, due 12/15/15 | | | 884,000 | | | | 908,310 | | |
| Pipelines—1.54% | |
El Paso Pipeline Partners Operating
Co. LLC
4.100%, due 11/15/15 | | | 725,000 | | | | 767,641 | | |
| 6.500%, due 04/01/20 | | | 235,000 | | | | 270,151 | | |
Enterprise Products Operating LLC
3.200%, due 02/01/16 | | | 1,525,000 | | | | 1,575,499 | | |
| 5.200%, due 09/01/207 | | | 1,000,000 | | | | 1,093,511 | | |
Spectra Energy Partners LP
2.950%, due 06/15/16 | | | 2,275,000 | | | | 2,312,378 | | |
The Williams Cos., Inc.
8.750%, due 03/15/329 | | | 750,000 | | | | 984,853 | | |
| | | | 7,004,033 | | |
| Real estate investment trusts—0.96% | |
Developers Diversified Realty Corp.
7.875%, due 09/01/20 | | | 1,556,000 | | | | 1,841,305 | | |
ERP Operating LP
6.625%, due 03/15/12 | | | 780,000 | | | | 807,430 | | |
Rouse Co. LP
6.750%, due 05/01/135 | | | 1,087,000 | | | | 1,130,480 | | |
34
PACE Select Advisors Trust
PACE Intermediate Fixed Income Investments
Portfolio of investments—July 31, 2011
| | | Face
amount1 | | Value | |
| Corporate notes—(Continued) | |
| Real estate investment trusts—(Concluded) | |
UDR, Inc. MTN
4.250%, due 06/01/18 | | | 600,000 | | | $ | 609,385 | | |
| | | | 4,388,600 | | |
| Retail—0.96% | |
Dollar General Corp.
11.875%, due 07/15/1710 | | | 1,002,000 | | | | 1,137,270 | | |
Home Depot, Inc.
4.400%, due 04/01/21 | | | 1,021,000 | | | | 1,069,852 | | |
Macy's Retail Holdings, Inc.
5.750%, due 07/15/14 | | | 547,000 | | | | 604,642 | | |
| 5.875%, due 01/15/13 | | | 192,000 | | | | 203,991 | | |
| 7.450%, due 07/15/17 | | | 1,118,000 | | | | 1,347,458 | | |
| | | | 4,363,213 | | |
| Road & rail—0.19% | |
CSX Corp.
4.250%, due 06/01/21 | | | 832,000 | | | | 860,834 | | |
| Special purpose entity—1.11% | |
Capital One Multi-Asset, Series 4-3C
6.625%, due 06/17/144 | | GBP | 350,000 | | | | 602,943 | | |
Crown Castle Towers LLC
6.113%, due 01/15/205 | | | 1,805,000 | | | | 2,015,674 | | |
Novus USA Trust, Series 2010-1
1.511%, due 11/18/114,5 | | | 2,475,000 | | | | 2,460,598 | | |
| | | | 5,079,215 | | |
| Telecommunications—2.17% | |
Qwest Corp.
6.500%, due 06/01/17 | | | 435,000 | | | | 476,325 | | |
| 7.500%, due 10/01/14 | | | 194,000 | | | | 219,220 | | |
| 7.625%, due 06/15/15 | | | 115,000 | | | | 132,250 | | |
| 8.375%, due 05/01/16 | | | 350,000 | | | | 414,750 | | |
Rogers Communications, Inc.
6.250%, due 06/15/13 | | | 825,000 | | | | 902,887 | | |
SBA Tower Trust
4.254%, due 04/15/155,9 | | | 1,200,000 | | | | 1,271,073 | | |
Telefonica Emisiones SAU
5.855%, due 02/04/13 | | | 925,000 | | | | 969,037 | | |
| 6.421%, due 06/20/16 | | | 950,000 | | | | 1,042,709 | | |
Verizon Communications, Inc.
8.750%, due 11/01/18 | | | 1,555,000 | | | | 2,084,734 | | |
Verizon New Jersey, Inc.
5.875%, due 01/17/12 | | | 2,030,000 | | | | 2,077,790 | | |
Virgin Media Secured Finance PLC
5.500%, due 01/15/215 | | GBP | 190,000 | | | | 311,876 | | |
| | | | 9,902,651 | | |
| Telephone-integrated—0.41% | |
Qwest Communications
International, Inc.
7.125%, due 04/01/18 | | | 1,197,000 | | | | 1,280,790 | | |
| 8.000%, due 10/01/15 | | | 548,000 | | | | 595,950 | | |
| | | | 1,876,740 | | |
| | | Face
amount1 | | Value | |
| Corporate notes—(Concluded) | |
| Utilities—0.50% | |
Tennessee Valley Authority
5.250%, due 09/15/39 | | | 2,095,000 | | | $ | 2,296,568 | | |
| Wireless telecommunications—0.51% | |
Vodafone Group PLC
4.150%, due 06/10/14 | | | 2,150,000 | | | | 2,321,028 | | |
Total corporate notes
(cost—$207,556,420) | | | | | | | 214,814,700 | | |
Non-US government
obligations—1.30% | |
Israel Government AID Bond
5.500%, due 09/18/23 | | | 2,480,000 | | | | 2,952,209 | | |
Russian Foreign Bond
7.500%, due 03/31/306,9 | | | 1,894,350 | | | | 2,266,590 | | |
United Mexican States
5.125%, due 01/15/20 | | | 630,000 | | | | 694,575 | | |
Total non-US government obligations
(cost—$5,564,982) | | | | | | | 5,913,374 | | |
| Repurchase agreement—6.70% | |
Repurchase agreement dated
07/29/11 with State Street
Bank & Trust Co., 0.010%
due 08/01/11, collateralized
by $151,746 Federal Home
Loan Mortgage Corp. obligations,
5.125% due 07/15/12,
$21,810,503 US Treasury Bills,
zero coupon due 08/04/11 and
$8,602,013 US Treasury Notes,
2.375% to 2.625% due 02/29/16
to 07/31/17; (value—$31,110,328);
proceeds: $30,500,025
(cost—$30,500,000) | | | 30,500,000 | | | | 30,500,000 | | |
| | | Number of
contracts/
Notional
amount | | | |
| Options purchased—0.01% | |
| Call options purchased—0.00% | |
US Treasury Note 10 Year Futures,
strike @ $124.50,
expires 08/26/11 | | | 13 | | | | 8,125 | | |
| Put options purchased—0.01% | |
3 Month USD LIBOR11 Interest Rate
Swap, strike @ 2.550%, expires
08/19/11 (Counterparty: Credit
Suisse; receive floating rate);
underlying swap terminates
08/23/16 | | | 12,900,000 | | | | 26 | | |
US Treasury Note 5 Year Futures,
strike @ $116.00, expires 08/26/11 | | | 25 | | | | 391 | | |
US Treasury Note 5 Year Futures,
strike @ $117.00, expires 08/26/11 | | | 61 | | | | 1,906 | | |
35
PACE Select Advisors Trust
PACE Intermediate Fixed Income Investments
Portfolio of investments—July 31, 2011
| | | Number of
contracts | | Value | |
| Options purchased—(Concluded) | |
| Put options purchased—(Concluded) | |
US Treasury Note 10 Year Futures,
strike @ $117.50, expires 08/26/11 | | | 212 | | | $ | 9,938 | | |
US Treasury Note 10 Year Futures,
strike @ $118.50, expires 08/26/11 | | | 118 | | | | 7,375 | | |
US Treasury Note 10 Year Futures,
strike @ $124.50, expires 08/26/11 | | | 13 | | | | 23,562 | | |
| | | | 43,198 | | |
Total options
(cost—$255,570) | | | | | | | 51,323 | | |
| | | Number of
shares | | Value | |
Investment of cash collateral
from securities loaned—0.92% | |
| Money market fund—0.92% | |
UBS Private Money Market Fund LLC12
(cost—$4,196,400) | | | 4,196,400 | | | $ | 4,196,400 | | |
Total investments
(cost—$511,133,135)—
114.71% | | | | | | | 522,580,928 | | |
Liabilities in excess of
other assets—(14.71)% | | | | | | | (67,013,558 | ) | |
| Net assets—100.00% | | $ | 455,567,370 | | |
Aggregate cost for federal income tax purposes was $511,467,914; and net unrealized appreciation consisted of:
| Gross unrealized appreciation | | $ | 12,912,864 | | |
| Gross unrealized depreciation | | | (1,799,850 | ) | |
| Net unrealized appreciation | | $ | 11,113,014 | | |
For a listing of defined portfolio acronyms and currency abbreviations that are used throughout the Portfolio of investments as well as the tables that follow, please refer to page 227.
* On September 7, 2008, the Federal Housing Finance Agency placed the Federal National Mortgage Association and the Federal Home Loan Mortgage Corporation into conservatorship, and the US Treasury guaranteed the debt issued by those organizations.
1 In US Dollars unless otherwise indicated.
2 Partial amount delivered to broker as collateral for futures transactions.
3 Zero coupon bond. The rate shown represents the annualized yield at the date of purchase.
4 Variable or floating rate security. The interest rate shown is the current rate as of July 31, 2011 and changes periodically.
5 Security exempt from registration pursuant to Rule 144A under the Securities Act of 1933. These securities, which represent 18.11% of net assets as of July 31, 2011, are considered liquid and may be resold in transactions exempt from registration, normally to qualified institutional buyers.
6 Security exempt from registration pursuant to Regulation S under the Securities Act of 1933. Regulation S applies to securities offerings that are made outside of the United States and do not involve direct selling efforts in the United States. At July 31, 2011, the value of these securities amounted to 1.01% of net assets.
7 Security, or portion thereof, was on loan at July 31, 2011.
8 Perpetual bond security. The maturity date reflects the next call date.
9 Step bond that converts to the noted fixed rate at a designated future date.
10 Payment-in-kind security for which interest may be paid in cash or additional securities, at the discretion of the issuer.
11 3 Month LIBOR at July 31, 2011 was 0.256%
12 The table below details the Portfolio's transaction activity in an affiliated issuer during the year ended July 31, 2011. The investment manager earns a management fee from UBS Private Money Market Fund LLC.
| Security description | | Value at
07/31/10 | | Purchases
during the
year ended
07/31/11 | | Sales
during the
year ended
07/31/11 | | Value at
07/31/11 | | Net income
earned from
affiliate for the
year ended
07/31/11 | |
| UBS Private Money Market Fund LLC | | $ | 1,702,277 | | | $ | 808,542,911 | | | $ | 806,048,788 | | | $ | 4,196,400 | | | $ | 2,973 | | |
36
PACE Select Advisors Trust
PACE Intermediate Fixed Income Investments
Portfolio of investments—July 31, 2011
Futures contracts
Number of
contracts | | Currency | |
| | Expiration
date | | Cost | | Current
value | | Unrealized
appreciation
(depreciation) | |
| US Treasury futures buy contracts: | | | |
| | 692 | | | USD | | | | US Treasury Note 2 Year Futures | | September 2011 | | $ | 151,623,806 | | | $ | 152,185,938 | | | $ | 562,132 | | |
| Interest rate futures buy contracts: | | | |
| | 65 | | | AUD | | | | Australian Treasury Bond 10 Year Futures | | September 2011 | | | 7,563,994 | | | | 7,811,139 | | | | 247,145 | | |
| | | | | | | | | | | $ | 159,187,800 | | | $ | 159,997,077 | | | $ | 809,277 | | |
| | | | | | | | Proceeds | | | | | |
| US Treasury futures sell contracts: | | | |
| | 56 | | | USD | | | | Ultra Long-Term US Treasury Bond Futures | | September 2011 | | $ | 7,195,894 | | | $ | 7,388,500 | | | $ | (192,606 | ) | |
| | 75 | | | USD | | | | US Treasury Bond 30 Year Futures | | September 2011 | | | 9,286,381 | | | | 9,609,375 | | | | (322,994 | ) | |
| | 129 | | | USD | | | | US Treasury Note 5 Year Futures | | September 2011 | | | 15,262,089 | | | | 15,666,446 | | | | (404,357 | ) | |
| | 184 | | | USD | | | | US Treasury Note 10 Year Futures | | September 2011 | | | 22,754,739 | | | | 23,126,500 | | | | (371,761 | ) | |
| Interest rate futures sell contracts: | | | |
| | 43 | | | AUD | | | | Australian Treasury Bond 3 Year Futures | | September 2011 | | | 4,869,227 | | | | 4,934,922 | | | | (65,695 | ) | |
| | | | | | | | | | | $ | 59,368,330 | | | $ | 60,725,743 | | | $ | (1,357,413 | ) | |
| | | | | | | | | | | | | | | $ | (548,136 | ) | |
Forward foreign currency contracts
| Counterparty | | Contracts to
deliver | | In
exchange for | | Maturity
date | | Unrealized
appreciation
(depreciation) | |
| BNP Paribas SA | | CAD | 3,347,798 | | | JPY | 273,025,000 | | | 09/08/11 | | $ | 47,121 | | |
| Citibank N.A. | | EUR | 1,575,000 | | | USD | 2,273,300 | | | 08/15/11 | | | 10,818 | | |
| Citibank N.A. | | EUR | 1,590,000 | | | USD | 2,277,634 | | | 08/23/11 | | | (6,002 | ) | |
| Citibank N.A. | | JPY | 251,250,000 | | | USD | 3,136,320 | | | 09/07/11 | | | (128,836 | ) | |
| Citibank N.A. | | JPY | 273,025,000 | | | CAD | 3,326,924 | | | 09/08/11 | | | (68,952 | ) | |
| Citibank N.A. | | USD | 2,231,197 | | | EUR | 1,575,000 | | | 08/15/11 | | | 31,285 | | |
| Citibank N.A. | | USD | 4,456,388 | | | EUR | 3,180,000 | | | 08/23/11 | | | 110,883 | | |
| Citibank N.A. | | USD | 3,136,262 | | | JPY | 251,250,000 | | | 09/07/11 | | | 128,895 | | |
| Deutsche Bank AG London | | EUR | 1,590,000 | | | USD | 2,285,178 | | | 08/23/11 | | | 1,543 | | |
| Deutsche Bank AG London | | EUR | 1,630,000 | | | USD | 2,301,247 | | | 09/15/11 | | | (38,548 | ) | |
| Deutsche Bank AG London | | USD | 2,298,033 | | | EUR | 1,630,000 | | | 09/15/11 | | | 41,762 | | |
| Royal Bank of Scotland PLC | | GBP | 1,960,500 | | | USD | 3,132,618 | | | 10/07/11 | | | (83,196 | ) | |
| | | $ | 46,773 | | |
37
PACE Select Advisors Trust
PACE Intermediate Fixed Income Investments
Portfolio of investments—July 31, 2011
Interest rate swaps
| | | | | | | Rate type | | | | | | | |
| Counterparty | | Notional
amount
(000) | | Termination
dates | | Payments
made by
the Portfolio† | | Payments
received by
the Portfolio† | | Upfront
payments
received
(made) | | Value | | Unrealized
appreciation
(depreciation) | |
| Credit Suisse International | | USD | 7,200 | | | 04/19/41 | | | 4.264 | % | | | 0.256 | %13 | | $ | — | | | $ | (609,238 | ) | | $ | (609,238 | ) | |
| Credit Suisse International | | USD | 15,300 | | | 04/20/16 | | | 2.259 | | | | 0.256 | 13 | | | — | | | | (519,887 | ) | | | (519,887 | ) | |
| Goldman Sachs Bank USA | | USD | 26,200 | | | 04/28/13 | | | 0.815 | | | | 0.256 | 13 | | | — | | | | (121,862 | ) | | | (121,862 | ) | |
| Goldman Sachs Bank USA | | USD | 37,000 | | | 05/23/13 | | | 0.779 | | | | 0.256 | 13 | | | — | | | | (146,772 | ) | | | (146,772 | ) | |
| Goldman Sachs Bank USA | | USD | 5,100 | | | 04/28/16 | | | 2.249 | | | | 0.256 | 13 | | | — | | | | (169,798 | ) | | | (169,798 | ) | |
| Goldman Sachs Bank USA | | USD | 2,300 | | | 05/23/21 | | | 0.256 | 13 | | | 3.328 | | | | — | | | | 88,664 | | | | 88,664 | | |
| Goldman Sachs Bank USA | | USD | 1,700 | | | 05/24/41 | | | 4.090 | | | | 0.256 | 13 | | | — | | | | (89,560 | ) | | | (89,560 | ) | |
| | | | | | | | | | | $ | — | | | $ | (1,568,453 | ) | | $ | (1,568,453 | ) | |
13 Rate based on 3 Month LIBOR (USD on London Interbank Offered Rate).
† Payments made/received are based on the notional amount.
Credit default swaps on corporate issues—sell protection14
| | | | | | | Rate type | | | | | | | | | |
| Counterparty | | Notional
amount
(000) | | Termination
dates | | Payments
made by
the Portfolio | | Payments
received by
the Portfolio17 | | Upfront
payments
received | | Value | | Unrealized
appreciation | | Credit
spread15 | |
| Credit Suisse First Boston | | USD | 2,200 | | | 09/20/16 | | | — | 16 | | | 1.000 | % | | $ | 29,863 | | | $ | (19,937 | ) | | $ | 9,926 | | | | 1.19 | % | |
14 If the Portfolio is a seller of protection and a credit event occurs, as defined under the terms of the particular swap agreement, the Portfolio will either (i) pay to the buyer of protection an amount equal to the notional amount of the swap and take delivery of the referenced obligation or (ii) pay a net settlement amount in the form of cash or securities equal to the notional amount of the swap less the recovery value of the referenced obligation.
15 Credit spreads, where available, represented in absolute terms, utilized in determining the market value as of period end serve as an indicator of the current status of the payment/performance risk and represent the likelihood or risk of default for the credit derivative. The credit spread of a particular referenced entity reflects the cost of buying/selling protection and may include upfront payments required to be made to enter into the agreement. Wider credit spreads represent a deterioration of the referenced entity's credit soundness and a greater likelihood or risk of default or other credit event occurring as defined under the terms of the agreement. A credit spread identified as "Defaulted" indicates a credit event has occurred for the referenced entity.
16 Payment to the counterparty will be made upon the occurrence of bankruptcy and/or by a restructuring event with respect to the Pacific Gas & Electric Co. bond, 4.800%, due 03/01/14.
17 Payments received are based on the notional amount.
38
PACE Select Advisors Trust
PACE Intermediate Fixed Income Investments
Portfolio of investments—July 31, 2011
The following is a summary of the fair valuations according to the inputs used as of July 31, 2011 in valuing the Portfolio's investments:
| | | Unadjusted
quoted prices in
active markets for
identical investments
(Level 1) | | Other significant
observable inputs
(Level 2) | | Unobservable
inputs
(Level 3) | | Total | |
| US government obligations | | $ | — | | | $ | 135,932,692 | | | $ | — | | | $ | 135,932,692 | | |
| Federal farm credit bank certificate | | | — | | | | 6,297,810 | | | | — | | | | 6,297,810 | | |
| Federal home loan bank certificate | | | — | | | | 2,336,507 | | | | — | | | | 2,336,507 | | |
| Federal home loan mortgage corporation certificates | | | — | | | | 13,466,597 | | | | — | | | | 13,466,597 | | |
| Federal national mortgage association certificates | | | — | | | | 25,609,052 | | | | — | | | | 25,609,052 | | |
| Collateralized mortgage obligations | | | — | | | | 41,911,542 | | | | — | | | | 41,911,542 | | |
| Asset-backed securities | | | — | | | | 41,550,931 | | | | — | | | | 41,550,931 | | |
| Corporate notes | | | — | | | | 214,814,700 | | | | — | | | | 214,814,700 | | |
| Non-US government obligations | | | — | | | | 5,913,374 | | | | — | | | | 5,913,374 | | |
| Repurchase agreement | | | — | | | | 30,500,000 | | | | — | | | | 30,500,000 | | |
| Options purchased | | | 51,297 | | | | 26 | | | | — | | | | 51,323 | | |
| Investment of cash collateral from securities loaned | | | — | | | | 4,196,400 | | | | — | | | | 4,196,400 | | |
| Futures contracts, net | | | (548,136 | ) | | | — | | | | — | | | | (548,136 | ) | |
| Forward foreign currency contracts, net | | | — | | | | 46,773 | | | | — | | | | 46,773 | | |
| Swap agreements, net | | | — | | | | (1,588,390 | ) | | | — | | | | (1,588,390 | ) | |
| Total | | $ | (496,839 | ) | | $ | 520,988,014 | | | $ | — | | | $ | 520,491,175 | | |
Issuer breakdown by country or territory of origin (unaudited)
| | | Percentage of
total investments | |
| United States | | | 87.2 | % | |
| Canada | | | 2.9 | | |
| United Kingdom | | | 2.8 | | |
| Netherlands | | | 1.3 | | |
| Norway | | | 1.2 | | |
| Cayman Islands | | | 0.8 | | |
| Brazil | | | 0.7 | | |
| Switzerland | | | 0.6 | | |
| Israel | | | 0.6 | | |
| Russian Federation | | | 0.4 | | |
| Spain | | | 0.4 | | |
| Australia | | | 0.4 | | |
| Ireland | | | 0.3 | | |
| Japan | | | 0.2 | | |
| Mexico | | | 0.1 | | |
| Chile | | | 0.1 | | |
| Total | | | 100.0 | % | |
See accompanying notes to financial statements.
39
PACE Select Advisors Trust
PACE Strategic Fixed Income Investments
Performance
For the 12 months ended July 31, 2011, the Portfolio's Class P shares returned 6.88%, before the deduction of the maximum PACE Select program fee. (Class P shares returned 4.76%, after the deduction of the maximum PACE Select program fee, for the same 12-month period.) In comparison, the Barclays Capital US Government/Credit Index (the "benchmark") returned 4.52%, and the Lipper Intermediate Investment Grade Debt Funds category posted a median return of 5.13%. (Returns for all share classes over various time periods are shown in the "Performance at a glance" table on page 43. Please note that the returns shown do not reflect the deduction of taxes that a shareholder would pay on Portfolio distributions or the redemption of Portfolio shares.) For a detailed commentary on the market environment in general during the reporting period, please refer to page 2.
Sub-Advisor's comments1
The Portfolio outperformed its benchmark during the reporting period, helped by a focus on sectors that provided attractive risk-adjusted yields versus Treasuries. An emphasis on agency mortgage-backed securities ("MBS") was a contributor to performance, as this sector outperformed Treasuries during the reporting period. Within agency MBS, tactical coupon selection enhanced returns. Holdings of senior non-agency MBS were beneficial for the Portfolio, as the sector gained from limited supply in conjunction with strong investor demand for higher yielding assets.
An underweight to the corporate bond sector detracted from relative returns, as it outperformed like-duration Treasuries. This negative effect was partially offset by an allocation to high-yield corporate bonds, which outperformed investment-grade corporate bonds.
During the first half of the period, a longer-than-benchmark US duration had a negative impact on relative returns as US interest rates rose. A shorter-than-benchmark US duration during the second half of the period also detracted from relative returns, amid falling US interest rates. Duration exposure outside of the US, particularly in the UK, Australia and Canada, contributed to performance as interest rates fell in these markets over the period. (Duration measures a portfolio's sensitivity to interest rate changes.)
A number of derivative instruments were used during the reporting period. Interest rate swaps were used to adjust interest rate and yield curve exposures, as well as to substitute for physical securities. Credit default swaps were
PACE Select Advisors Trust – PACE Strategic Fixed Income Investments
Investment Sub-Advisor:
Pacific Investment Management Company LLC ("PIMCO")
Portfolio Manager:
Saumil H. Parikh
Objective:
Total return consisting of income and capital appreciation
Investment process:
The Portfolio invests primarily in investment grade fixed income securities of governmental and private issuers in the United States and foreign countries. Its duration (a measure of a portfolio's sensitivity to interest rate changes) is normally limited to within two years (plus or minus) of the effective duration of the Portfolio's benchmark index. PIMCO seeks to invest in the areas of the bond market it considers undervalued, based on such factors as quality, sector, coupon and maturity. PIMCO decides to buy or sell specific bonds based on an analysis of their values relative to other similar bonds. PIMCO monitors the prepayment experience of the Portfolio's mortgage-backed bonds, and will also buy and sell securities to adjust the average portfolio duration, credit quality, yield curve, sector and prepayment exposure, as appropriate.
1 All Sub-Advisors discuss performance on a gross of fees basis—meaning that no fees or expenses are reflected in their sleeves'/sleeve's performance. Alternately, Fund performance is shown net of fees, which does factor in fees and expenses associated with the Fund.
40
PACE Select Advisors Trust
PACE Strategic Fixed Income Investments
Sub-Advisor's comments – concluded
used to manage credit exposure in lieu of the direct buying or selling of securities. Options were primarily used to manage interest rate and volatility exposures, but they were also used to generate income in expected interest rate scenarios. Mortgage derivatives were used to manage portfolio duration or enhance yield. Government futures were used to adjust interest rate exposures and replicate government bond positions. Money market futures were used to manage exposures at the front end of the yield curve. Foreign exchange futures contracts were used to manage our currency exposures. Overall, the use of these derivatives was beneficial during the reporting period.
Special considerations
The Portfolio may be appropriate for long-term investors seeking total return consisting of income and capital appreciation and who are able to withstand short-term fluctuations in the fixed income markets in return for potentially higher returns over the long term. The value of the Portfolio changes every day and can be affected by changes in interest rates, general market conditions and other political, social and economic developments, as well as specific matters relating to the companies in whose securities the Portfolio invests. In addition, investments in foreign bonds involve special risks. It is important to note that an investment in the Portfolio is only one component of a balanced investment plan.
41
PACE Select Advisors Trust
PACE Strategic Fixed Income Investments
Illustration of an assumed investment of $10,000 in Class P shares of the Portfolio (unaudited)
The following graph depicts the performance of PACE Strategic Fixed Income Investments Class P shares versus the Barclays Capital US Government/Credit Index over the 10 years ended July 31, 2011. The performance of the other classes will vary based upon the different class specific expenses and sales charges. The performance provided does not reflect the deduction of taxes that a shareholder would pay on Portfolio distributions or the redemption of Portfolio shares. Past performance is no guarantee of future results. Share price and returns will vary with market conditions; investors may realize a gain or loss upon redemption. It is important to note that PACE Strategic Fixed Income Investments is a professionally managed portfolio while the Index is not available for investment and is unmanaged. The comparison is shown for illustration purposes only.
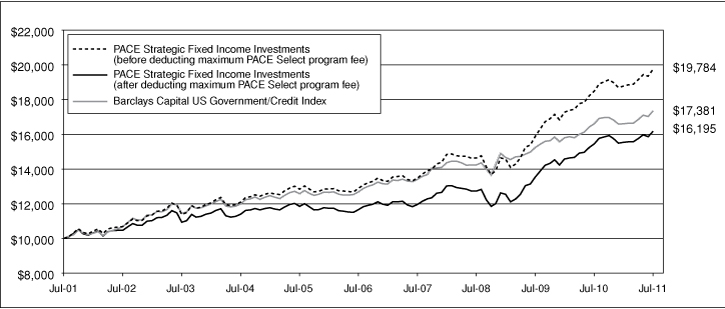
42
PACE Select Advisors Trust
PACE Strategic Fixed Income Investments
Performance at a glance (unaudited)
| Average annual total returns for periods ended 07/31/11 | | 1 year | | 5 years | | 10 years | |
| Before deducting | | Class A1 | | | 6.54 | % | | | 8.67 | % | | | 6.77 | % | |
| maximum sales charge | | Class B2 | | | 5.82 | % | | | 7.86 | % | | | 6.29 | %6 | |
| or PACE Select | | Class C3 | | | 6.10 | % | | | 8.15 | % | | | 6.26 | % | |
| program fee | | Class Y4 | | | 6.80 | % | | | 9.01 | % | | | 7.08 | % | |
| | | Class P5 | | | 6.88 | % | | | 8.95 | % | | | 7.06 | % | |
| After deducting | | Class A1 | | | 1.72 | % | | | 7.68 | % | | | 6.28 | % | |
| maximum sales charge | | Class B2 | | | 0.82 | % | | | 7.56 | % | | | 6.29 | %6 | |
| or PACE Select | | Class C3 | | | 5.35 | % | | | 8.15 | % | | | 6.26 | % | |
| program fee | | Class P5 | | | 4.76 | % | | | 6.79 | % | | | 4.94 | % | |
| Barclays Capital US Government/Credit Index7 | | | | | 4.52 | % | | | 6.48 | % | | | 5.68 | % | |
| Lipper Intermediate Investment Grade Debt Funds median | | | | | 5.13 | % | | | 6.36 | % | | | 5.30 | % | |
Average annual total returns for periods ended June 30, 2011, after deduction of the maximum sales charge or PACE Select program fee, were as follows: Class A—1-year period, 1.18%; 5-year period, 7.57%; 10-year period, 6.43%; Class B—1-year period, 0.27%; 5-year period, 7.45%; 10-year period, 6.43%; Class C—1-year period, 4.71%; 5-year period, 8.03%; 10-year period, 6.39%; Class Y—1-year period, 6.22%; 5-year period, 8.89%; 10-year period, 7.23%; Class P—1-year period, 4.11%; 5-year period, 6.66%; 10-year period, 5.07%.
The annualized gross and net expense ratios, respectively, for each class of shares as in the November 28, 2010 prospectuses, were as follows: Class A—1.09% and 1.06%; Class B—1.90% and 1.81%; Class C—1.56% and 1.56%; Class Y—0.85% and 0.81%; and Class P—0.87% and 0.81%. Net expenses reflect fee waivers and/or expense reimbursements, if any, pursuant to an agreement that is in effect to cap the expenses. The Portfolio and UBS Global Asset Management (Americas) Inc. ("UBS Global AM") have entered into a written fee waiver/expense reimbursement agreement pursuant to which UBS Global AM is contractually obligated to waive its management fees and/or reimburse expenses so that the Portfolio's ordinary total operating expenses of each class through November 28, 2011 (excluding dividend expense, borrowing costs, and interest expense relating to short sales, and interest, taxes, brokerage commissions and extraordinary expenses) would not exceed Class A—1.06%; Class B—1.81%; Class C—1.56%; Class Y—0.81%; and Class P—0.81%. The Portfolio has agreed to repay UBS Global AM for any waived fees/reimbursed expenses to the extent that it can do so over the following three fiscal years without causing the Portfolio's expenses in any of those three years to exceed these expense caps. The fee waiver/expense reimbursement agreement may be terminated by the Portfolio's board at any time and also will terminate automatically upon the expiration or termination of the Portfolio's advisory contract with UBS Global AM. Upon termination of the agreement, however, UBS Global AM's three year recoupment rights will survive.
1 Maximum sales charge for Class A shares is 4.5%. Class A shares bear ongoing 12b-1 service fees.
2 Maximum contingent deferred sales charge for Class B shares is 5% imposed on redemptions and is reduced to 0% after a maximum of six years. Class B shares bear ongoing 12b-1 service and distribution fees.
3 Maximum contingent deferred sales charge for Class C shares is 0.75% imposed on redemptions and is reduced to 0% after one year. Class C shares bear ongoing 12b-1 service and distribution fees. Prior to September 30, 2003, Class C shares were subject to a maximum front-end sales charge of 1.00%; this front-end sales charge is not reflected in the average annual total returns presented for the Class C shares shown above.
4 The Portfolio offers Class Y shares to a limited group of eligible investors, including certain qualifying retirement plans. Class Y shares do not bear initial or contingent deferred sales charges or ongoing 12b-1 service and distribution fees.
5 Class P shares do not bear initial or contingent deferred sales charges or ongoing 12b-1 service and distribution fees, but are subject to a maximum annual PACE Select program fee of 2% of the value of Class P shares. Prior to June 14, 2010, the maximum annual PACE Select program fee was 1.5% of the value of Class P shares; however, the current maximum annual PACE Select program fee of 2% is reflected in the performance returns throughout all periods in the average annual total returns presented for the Class P shares shown above.
6 Assumes the conversion of Class B to Class A shares at the end of the sixth year.
7 The Barclays Capital US Government/Credit Index is an unmanaged index which is composed of all investment-grade bonds that have at least one year to maturity. The Index's total return comprises price appreciation/depreciation and income as a percentage of the original investment. The Index is rebalanced monthly by market capitalization. Investors should note that indices do not reflect the deduction of fees and expenses.
If an investor sells or exchanges shares less than 90 days after purchase, a redemption fee of 1.00% of the amount sold or exchanged will be deducted at the time of the transaction, except as noted otherwise in the prospectuses.
Past performance does not predict future performance, and the performance information provided does not reflect the deduction of taxes that a shareholder would pay on Portfolio distributions or the redemption of Portfolio shares. The return and principal value of an investment will fluctuate, so that an investor's shares, when redeemed, may be worth more or less than their original cost. Performance results assume reinvestment of all dividends and capital gain distributions at net asset value on the ex-dividend dates. Current performance may be higher or lower than the performance data quoted. For month-end performance figures, please visit http://www.ubs.com.
Lipper peer group data calculated by Lipper Inc.; used with permission. The Lipper median is the return of the fund that places in the middle of a Lipper peer group.
43
PACE Select Advisors Trust
PACE Strategic Fixed Income Investments
Portfolio statistics (unaudited)
| Characteristics | | 07/31/11 | |
| Weighted average duration | | | 5.9 yrs. | | |
| Weighted average maturity | | | 7.7 yrs. | | |
| Average coupon | | | 4.07 | % | |
| Net assets (mm) | | $ | 818.7 | | |
| Number of holdings | | | 305 | | |
| Portfolio composition1 | | 07/31/11 | |
| Bonds, notes and loan assignments | | | 87.7 | % | |
| Preferred stock | | | 0.8 | | |
| Swaptions, futures, swaps and forward foreign currency contracts | | | 0.3 | | |
| Cash equivalents and other assets less liabilities | | | 11.2 | | |
| Total | | | 100.0 | % | |
| Quality diversification1 | | 07/31/11 | |
| US government and agency securities | | | 40.4 | % | |
| AAA | | | 5.6 | | |
| AA | | | 4.9 | | |
| A | | | 10.8 | | |
| BBB | | | 7.5 | | |
| BB | | | 6.8 | | |
| B | | | 1.6 | | |
| Below B/non-rated | | | 10.1 | | |
| Preferred stock | | | 0.8 | | |
| Swaptions, futures, swaps and forward foreign currency contracts | | | 0.3 | | |
| Cash equivalents and other assets less liabilities | | | 11.2 | | |
| Total | | | 100.0 | % | |
| Asset allocation1 | | 07/31/11 | |
| Collateralized mortgage obligations | | | 25.3 | % | |
| Corporate notes | | | 24.8 | | |
| US government obligations | | | 21.0 | | |
| Non-US government obligations | | | 6.2 | | |
| US government agency mortgage pass-through certificates | | | 2.9 | | |
| Municipal bonds and notes | | | 2.8 | | |
| Loan assignments | | | 2.4 | | |
| Asset-backed securities | | | 2.3 | | |
| Preferred stock | | | 0.8 | | |
| Swaptions, futures, swaps and forward foreign currency contracts | | | 0.3 | | |
| Cash equivalents and other assets less liabilities | | | 11.2 | | |
| Total | | | 100.0 | % | |
1 Weightings represent percentages of the Portfolio's net assets as of July 31, 2011. The Portfolio is actively managed and its composition will vary over time. Credit quality ratings shown are based on the ratings assigned to portfolio holdings by Standard & Poor's Ratings Group, an independent rating agency.
44
PACE Select Advisors Trust
PACE Strategic Fixed Income Investments
Portfolio of investments—July 31, 2011
| | | Face
amount1 | | Value | |
| US government obligations—21.02% | |
US Treasury Bonds
4.375%, due 05/15/41 | | | 5,900,000 | | | $ | 6,141,546 | | |
| 8.000%, due 11/15/212 | | | 25,500,000 | | | | 37,281,791 | | |
US Treasury Notes
1.500%, due 07/31/16 | | | 78,600,000 | | | | 79,078,674 | | |
| 3.125%, due 05/15/21 | | | 48,300,000 | | | | 49,620,522 | | |
Total US government obligations
(cost—$169,408,594) | | | | | 172,122,533 | | |
Government national mortgage association
certificates—0.02% | |
GNMA
8.000%, due 06/15/17 | | | 30,020 | | | | 33,535 | | |
| 8.000%, due 07/15/17 | | | 15,078 | | | | 17,195 | | |
| 8.000%, due 09/15/17 | | | 19,091 | | | | 21,236 | | |
| 8.000%, due 11/15/17 | | | 41,086 | | | | 46,271 | | |
GNMA II ARM
2.125%, due 11/20/23 | | | 6,843 | | | | 7,059 | | |
| 2.375%, due 01/20/26 | | | 15,638 | | | | 16,181 | | |
| 2.625%, due 07/20/25 | | | 8,731 | | | | 9,077 | | |
| 3.375%, due 05/20/26 | | | 26,219 | | | | 27,193 | | |
Total government national
mortgage association certificates
(cost—$160,017) | | | | | 177,747 | | |
Federal home loan mortgage corporation
certificates*—0.21% | |
FHLMC
7.645%, due 05/01/25 | | | 1,317,437 | | | | 1,515,053 | | |
FHLMC ARM
5.700%, due 03/01/36 | | | 172,550 | | | | 186,780 | | |
Total federal home loan mortgage
corporation certificates
(cost—$1,493,882) | | | | | 1,701,833 | | |
Federal housing administration
certificates—0.01% | |
FHA GMAC
7.430%, due 06/01/21 | | | 40,698 | | | | 40,698 | | |
FHA Reilly
7.430%, due 10/01/20 | | | 12,549 | | | | 12,549 | | |
Total federal housing
administration certificates
(cost—$56,683) | | | | | 53,247 | | |
Federal national mortgage association
certificates*—2.66% | |
FNMA
3.500%, due 12/01/25 | | | 1,897,784 | | | | 1,953,573 | | |
| 3.500%, due 11/01/40 | | | 321,497 | | | | 314,719 | | |
| 3.500%, due 12/01/40 | | | 658,640 | | | | 644,754 | | |
| 4.000%, due 02/01/41 | | | 992,627 | | | | 1,009,544 | | |
| 5.396%, due 11/01/34 | | | 11,400,511 | | | | 12,550,702 | | |
| 6.000%, due 10/01/36 | | | 51,954 | | | | 57,429 | | |
| 6.000%, due 12/01/37 | | | 421,827 | | | | 465,227 | | |
| | | Face
amount1 | | Value | |
Federal national mortgage association
certificates*—(Concluded) | |
FNMA ARM
1.678%, due 08/01/40 | | | 122,565 | | | $ | 124,171 | | |
| 2.507%, due 05/01/27 | | | 41,941 | | | | 44,321 | | |
| 2.522%, due 04/01/27 | | | 32,855 | | | | 34,565 | | |
| 2.907%, due 05/01/30 | | | 118,219 | | | | 124,186 | | |
| 5.158%, due 10/01/35 | | | 297,474 | | | | 315,993 | | |
| 5.215%, due 09/01/35 | | | 287,946 | | | | 307,462 | | |
| 5.332%, due 11/01/35 | | | 405,024 | | | | 436,336 | | |
| 5.375%, due 01/01/36 | | | 420,351 | | | | 452,558 | | |
| 5.513%, due 03/01/36 | | | 281,944 | | | | 304,525 | | |
| 5.552%, due 01/01/36 | | | 228,032 | | | | 244,213 | | |
| 5.603%, due 12/01/35 | | | 229,962 | | | | 248,673 | | |
| 5.620%, due 02/01/36 | | | 489,652 | | | | 529,049 | | |
| 5.633%, due 03/01/36 | | | 200,783 | | | | 215,018 | | |
| 5.638%, due 03/01/36 | | | 305,033 | | | | 329,500 | | |
| 5.728%, due 03/01/36 | | | 341,140 | | | | 368,737 | | |
| 5.816%, due 06/01/36 | | | 69,986 | | | | 75,950 | | |
FNMA ARM COFI
3.250%, due 11/01/26 | | | 93,610 | | | | 92,674 | | |
FNMA TBA
6.000% | | | 500,000 | | | | 548,574 | | |
Total federal national mortgage
association certificates
(cost—$20,462,036) | | | | | 21,792,453 | | |
Collateralized mortgage
obligations—25.31% | |
ARM Trust, Series 2005-5,
Class 2A1
2.886%, due 09/25/35 | | | 414,999 | | | | 295,064 | | |
Banc of America Funding Corp.,
Series 2005-D, Class A1
2.758%, due 05/25/353 | | | 3,396,092 | | | | 3,224,787 | | |
Series 2007-3, Class 2A1
5.500%, due 09/25/34 | | | 1,063,928 | | | | 1,053,919 | | |
Banc of America Large Loan,
Series 2010-HLTN, Class HLTN
1.937%, due 11/15/153,4 | | | 3,208,583 | | | | 2,977,704 | | |
Series 2010-UB5, Class A4A
5.671%, due 02/17/513,4 | | | 2,500,000 | | | | 2,745,196 | | |
Bank of America Mortgage
Securities, Inc.,
Series 2002-G, Class 1A3
3.460%, due 07/20/323 | | | 6,648 | | | | 6,201 | | |
Bear Stearns Alternative Loan
Trust-A Trust,
Series 2003-3, Class 1A
2.412%, due 10/25/333 | | | 40,047 | | | | 31,758 | | |
Series 2004-9, Class 2A1
3.037%, due 09/25/343 | | | 1,020,568 | | | | 742,347 | | |
Series 2005-7, Class 22A1
2.870%, due 09/25/353 | | | 1,562,299 | | | | 1,108,754 | | |
Series 2006-1, Class 21A2
2.736%, due 02/25/363 | | | 1,587,654 | | | | 653,058 | | |
45
PACE Select Advisors Trust
PACE Strategic Fixed Income Investments
Portfolio of investments—July 31, 2011
| | | Face
amount1 | | Value | |
Collateralized mortgage
obligations—(Continued) | |
Bear Stearns ARM Trust,
Series 2003-1, Class 5A1
5.535%, due 04/25/33 | | | 32,867 | | | $ | 31,568 | | |
Series 2003-1, Class 6A1
2.727%, due 04/25/33 | | | 95,628 | | | | 85,113 | | |
Series 2003-5, Class 2A1
2.610%, due 08/25/33 | | | 615,788 | | | | 587,543 | | |
Series 2004-3, Class 1A2
2.802%, due 07/25/34 | | | 479,375 | | | | 396,183 | | |
Series 2004-6, Class 2A1
3.013%, due 09/25/34 | | | 2,204,759 | | | | 1,848,615 | | |
Series 2004-7, Class 1A1
3.349%, due 10/25/34 | | | 597,630 | | | | 470,254 | | |
Series 2004-9, Class 22A1
3.574%, due 11/25/34 | | | 65,974 | | | | 61,651 | | |
Series 2005-2, Class A1
2.710%, due 03/25/35 | | | 2,052,696 | | | | 1,890,228 | | |
Series 2005-5, Class A2
2.400%, due 08/25/35 | | | 3,584,689 | | | | 3,208,817 | | |
Series 2005-9, Class A1
2.560%, due 10/25/35 | | | 1,618,363 | | | | 1,383,723 | | |
Series 2005-10, Class A1
2.810%, due 10/25/35 | | | 503,612 | | | | 497,886 | | |
Chase Mortgage Finance Corp.,
Series 2005-S3, Class A10
5.500%, due 11/25/35 | | | 3,227,000 | | | | 2,931,497 | | |
Series 2007-S6, Class 2A1
5.500%, due 12/25/22 | | | 2,744,554 | | | | 2,745,139 | | |
Citigroup Mortgage Loan Trust, Inc.,
Series 2005-4, Class A
5.326%, due 08/25/353 | | | 4,179,946 | | | | 4,014,533 | | |
Series 2005-6, Class A2
2.450%, due 08/25/353 | | | 239,720 | | | | 204,579 | | |
Series 2005-6, Class A3
2.100%, due 08/25/353 | | | 42,742 | | | | 39,328 | | |
Series 2005-11, Class A1A
2.660%, due 12/25/353 | | | 1,044,358 | | | | 916,499 | | |
Series 2006-AR1, Class 1A1
2.660%, due 10/25/353 | | | 5,398,169 | | | | 4,345,585 | | |
Countrywide Alternative Loan Trust,
Series 2003-J3, Class 2A1
6.250%, due 12/25/33 | | | 369,591 | | | | 387,354 | | |
Series 2005-62, Class 2A1
1.263%, due 12/25/353 | | | 684,938 | | | | 421,721 | | |
Series 2006-41CB, Class 1A9
6.000%, due 01/25/37 | | | 1,560,041 | | | | 997,012 | | |
Countrywide Home Loan Mortgage
Pass Through Trust,
Series 2003-R4, Class 2A
6.500%, due 01/25/343,4 | | | 1,363,412 | | | | 1,379,609 | | |
Series 2004-12, Class 11A1
2.803%, due 08/25/343 | | | 767,396 | | | | 560,622 | | |
Series 2004-12, Class 11A2
2.803%, due 08/25/343 | | | 493,326 | | | | 373,550 | | |
Series 2004-12, Class 12A1
2.779%, due 08/25/343 | | | 182,134 | | | | 143,611 | | |
| | | Face
amount1 | | Value | |
Collateralized mortgage
obligations—(Continued) | |
Series 2005-HYB9, Class 5A1
2.528%, due 02/20/363 | | | 463,893 | | | $ | 320,637 | | |
FHLMC REMIC,*
Series 1278, Class K
7.000%, due 05/15/22 | | | 97,542 | | | | 109,458 | | |
Series 1367, Class KA
6.500%, due 09/15/22 | | | 1,982 | | | | 2,235 | | |
Series 1502, Class PX
7.000%, due 04/15/23 | | | 535,937 | | | | 613,546 | | |
Series 1503, Class PZ
7.000%, due 05/15/23 | | | 187,787 | | | | 214,465 | | |
Series 1534, Class Z
5.000%, due 06/15/23 | | | 193,920 | | | | 193,883 | | |
Series 1548, Class Z
7.000%, due 07/15/23 | | | 140,372 | | | | 160,590 | | |
Series 1562, Class Z
7.000%, due 07/15/23 | | | 225,262 | | | | 257,584 | | |
Series 1694, Class Z
6.500%, due 03/15/24 | | | 105,149 | | | | 114,697 | | |
Series 2061, Class Z
6.500%, due 06/15/28 | | | 376,233 | | | | 399,689 | | |
Series 2400, Class FQ
0.687%, due 01/15/323 | | | 182,590 | | | | 182,670 | | |
Series 2579, Class DZ
5.000%, due 03/15/34 | | | 7,209,091 | | | | 7,858,354 | | |
Series 2764, Class LZ
4.500%, due 03/15/34 | | | 2,780,220 | | | | 2,795,371 | | |
Series 2764, Class ZG
5.500%, due 03/15/34 | | | 5,233,995 | | | | 5,829,964 | | |
Series 2835, Class JZ
5.000%, due 08/15/34 | | | 3,272,532 | | | | 3,586,324 | | |
Series 2921, Class PG
5.000%, due 01/15/35 | | | 6,200,000 | | | | 6,724,120 | | |
Series 2983, Class TZ
6.000%, due 05/15/35 | | | 6,219,522 | | | | 7,006,868 | | |
Series 3149, Class CZ
6.000%, due 05/15/36 | | | 8,661,573 | | | | 9,888,600 | | |
Series G23, Class KZ
6.500%, due 11/25/23 | | | 147,630 | | | | 168,795 | | |
Series T-054, Class 2A
6.500%, due 02/25/43 | | | 989,415 | | | | 1,113,711 | | |
Series T-058, Class 2A
6.500%, due 09/25/43 | | | 3,685,913 | | | | 4,241,411 | | |
Series T-075, Class A1
0.227%, due 12/25/363 | | | 2,152,711 | | | | 2,139,732 | | |
First Horizon Mortgage
Pass-Through Trust,
Series 2005-AR3, Class 2A1
2.754%, due 08/25/353 | | | 112,043 | | | | 92,305 | | |
FNMA REMIC,*
Series 1991-065, Class Z
6.500%, due 06/25/21 | | | 8,574 | | | | 9,465 | | |
Series 1992-040, Class ZC
7.000%, due 07/25/22 | | | 23,154 | | | | 25,998 | | |
Series 1992-129, Class L
6.000%, due 07/25/22 | | | 10,834 | | | | 12,076 | | |
46
PACE Select Advisors Trust
PACE Strategic Fixed Income Investments
Portfolio of investments—July 31, 2011
| | | Face
amount1 | | Value | |
Collateralized mortgage
obligations—(Continued) | |
Series 1993-037, Class PX
7.000%, due 03/25/23 | | | 29,803 | | | $ | 33,871 | | |
Series 1993-060, Class Z
7.000%, due 05/25/23 | | | 162,735 | | | | 185,735 | | |
Series 1993-065, Class ZZ
7.000%, due 06/25/13 | | | 74,193 | | | | 76,586 | | |
Series 1993-070, Class Z
6.900%, due 05/25/23 | | | 25,824 | | | | 29,426 | | |
Series 1993-096, Class PZ
7.000%, due 06/25/23 | | | 159,989 | | | | 182,765 | | |
Series 1993-160, Class ZB
6.500%, due 09/25/23 | | | 55,929 | | | | 57,702 | | |
Series 1993-163, Class ZB
7.000%, due 09/25/23 | | | 14,575 | | | | 15,730 | | |
Series 1994-023, Class PX
6.000%, due 08/25/23 | | | 249,698 | | | | 278,326 | | |
Series 1998-066, Class FG
0.487%, due 12/25/283 | | | 102,174 | | | | 101,795 | | |
Series 1998-M7, Class Z
6.390%, due 05/25/36 | | | 7,665 | | | | 7,660 | | |
Series 1999-W4, Class A9
6.250%, due 02/25/29 | | | 794,719 | | | | 904,888 | | |
Series 2000-034, Class F
0.637%, due 10/25/303 | | | 14,124 | | | | 14,070 | | |
Series 2002-080, Class A1
6.500%, due 11/25/42 | | | 1,846,633 | | | | 1,994,941 | | |
Series 2003-064, Class AH
6.000%, due 07/25/33 | | | 9,789,714 | | | | 10,986,444 | | |
Series 2003-106, Class US
8.794%, due 11/25/235,6 | | | 141,532 | | | | 140,964 | | |
Series 2003-W8, Class 2A
7.000%, due 10/25/42 | | | 131,078 | | | | 157,744 | | |
Series 2004-T1, Class 1A1
6.000%, due 01/25/44 | | | 2,233,307 | | | | 2,489,352 | | |
Series 2004-W8, Class 2A
6.500%, due 06/25/44 | | | 2,089,175 | | | | 2,397,982 | | |
Series 2005-024, Class ZE
5.000%, due 04/25/35 | | | 1,560,929 | | | | 1,688,144 | | |
Series 2005-116, Class TZ
5.500%, due 01/25/36 | | | 7,471,754 | | | | 8,324,891 | | |
Series 2005-120, Class ZU
5.500%, due 01/25/36 | | | 8,151,005 | | | | 9,096,843 | | |
Series 2006-065, Class GD
6.000%, due 07/25/26 | | | 2,800,000 | | | | 3,201,496 | | |
GNMA REMIC,
Trust Series 2000-009, Class FG
0.787%, due 02/16/303 | | | 129,458 | | | | 129,841 | | |
Trust Series 2002-031, Class FW
0.587%, due 06/16/313 | | | 132,474 | | | | 132,588 | | |
Trust Series 2003-98, Class Z
6.000%, due 11/20/33 | | | 15,822,594 | | | | 17,899,295 | | |
Trust Series 2005-26, Class ZA
5.500%, due 01/20/35 | | | 6,794,771 | | | | 7,570,519 | | |
GS Mortgage Securities Corp. II,
Series 2007-EOP, Class A1
1.142%, due 03/06/203,4 | | | 1,970,078 | | | | 1,951,285 | | |
| | | Face
amount1 | | Value | |
Collateralized mortgage
obligations—(Continued) | |
GS Residential Mortgage Loan Trust,
Series 2005-AR6, Class 2A1
2.780%, due 09/25/353 | | | 1,969,706 | | | | $1,848,900 | | |
Harborview Mortgage Loan Trust,
Series 2004-11, Class 3A1A
0.537%, due 01/19/353 | | | 132,188 | | | | 79,810 | | |
Series 2005-4, Class 3A1
2.770%, due 07/19/353 | | | 694,875 | | | | 513,245 | | |
Housing Security, Inc.,
Series 1992-8, Class B
3.194%, due 06/25/243 | | | 262,229 | | | | 253,734 | | |
Lehman Brothers Mortgage Trust,
Series 1991-2, Class A3
8.460%, due 01/20/173,7 | | | 285,194 | | | | 291,725 | | |
Residential Accredit Loans, Inc.,
Series 2006-Q03, Class A1
0.397%, due 04/25/463 | | | 1,985,073 | | | | 878,629 | | |
Residential Asset Securitization Trust,
Series 2006-A14C, Class 2A6
0.637%, due 12/25/363 | | | 1,745,506 | | | | 609,452 | | |
Residential Funding
Mortgage Security I,
Series 2004-S2, Class A1
5.250%, due 03/25/34 | | | 158,015 | | | | 158,632 | | |
Series 2004-S9, Class 1A23
5.500%, due 12/25/34 | | | 2,300,000 | | | | 2,143,145 | | |
Sequoia Mortgage Trust,
Series 2005-4, Class 2A1
2.780%, due 04/20/353 | | | 2,729,467 | | | | 2,514,625 | | |
Small Business Administration,
Series 1999-20K, Class 1
7.060%, due 11/01/19 | | | 296,591 | | | | 329,560 | | |
Series 2000-20K, Class 1
7.220%, due 11/01/20 | | | 474,346 | | | | 529,838 | | |
Series 2001-P10B, Class 1
6.344%, due 08/10/11 | | | 77,615 | | | | 77,758 | | |
Series 2002-20K, Class 1
5.080%, due 11/01/22 | | | 2,325,767 | | | | 2,511,596 | | |
Series 2003-20I, Class 1
5.130%, due 09/01/23 | | | 460,353 | | | | 497,914 | | |
Series 2003-20L, Class 1
4.890%, due 12/01/23 | | | 1,237,638 | | | | 1,344,363 | | |
Series 2004-P10A, Class 1
4.504%, due 02/10/14 | | | 1,298,772 | | | | 1,364,018 | | |
Series 2005-20H, Class 1
5.110%, due 08/01/25 | | | 1,638,543 | | | | 1,781,830 | | |
Series 2007-20D, Class 1
5.320%, due 04/01/27 | | | 4,725,529 | | | | 5,179,437 | | |
Structured ARM Loan Trust,
Series 2004-8, Class 3A
2.533%, due 07/25/34 | | | 1,361,711 | | | | 1,209,391 | | |
Structured Asset Mortgage
Investments, Inc.,
Series 2002-AR3, Class A1
0.847%, due 09/19/323 | | | 428,282 | | | | 364,222 | | |
47
PACE Select Advisors Trust
PACE Strategic Fixed Income Investments
Portfolio of investments—July 31, 2011
| | | Face
amount1 | | Value | |
Collateralized mortgage
obligations—(Concluded) | |
Series 2006-AR3, Class 11A1
0.397%, due 04/25/363 | | | 4,947,905 | | | $ | 3,108,576 | | |
Structured Asset Securities Corp.,
Series 2001-SB1, Class A2
3.375%, due 08/25/31 | | | 1,961,968 | | | | 1,932,908 | | |
WaMu Mortgage Pass Through
Certificates,
Series 2002-AR6, Class A
1.663%, due 06/25/423 | | | 59,036 | | | | 47,235 | | |
Series 2005-AR1, Class A1A
0.507%, due 01/25/453 | | | 157,875 | | | | 127,197 | | |
Series 2005-AR2, Class 2A1A
0.497%, due 01/25/453 | | | 185,621 | | | | 149,681 | | |
Series 2006-AR2, Class 2A1
5.675%, due 03/25/363 | | | 2,000,493 | | | | 1,767,178 | | |
Series 2006-AR7, Class 3A
2.860%, due 07/25/463 | | | 2,841,487 | | | | 2,059,782 | | |
Series 2006-AR9, Class 1A
1.263%, due 08/25/463 | | | 1,971,882 | | | | 1,307,032 | | |
Series 2006-AR9, Class 2A
2.860%, due 08/25/463 | | | 1,543,370 | | | | 1,157,518 | | |
Wells Fargo Mortgage Backed
Securities Trust,
Series 2003-M, Class A1
4.687%, due 12/25/333 | | | 837,827 | | | | 845,070 | | |
Series 2004-CC, Class A1
4.903%, due 01/25/353 | | | 353,872 | | | | 340,437 | | |
Series 2006-AR2, Class 2A1
2.747%, due 03/25/363 | | | 2,401,204 | | | | 2,097,603 | | |
Series 2006-AR8, Class 1A1
2.802%, due 04/25/363 | | | 1,028,789 | | | | 921,336 | | |
Total collateralized mortgage
obligations
(cost—$199,774,165) | | | | | 207,217,816 | | |
| Asset-backed securities—2.29% | |
Countrywide Asset-Backed
Certificates,
Series 2007-5, Class 2A1
0.287%, due 09/25/473 | | | 434,649 | | | | 426,924 | | |
Credit Suisse Mortgage Capital
Certificate 2010-UD1
5.946%, due 12/18/493,4 | | | 1,200,000 | | | | 1,353,898 | | |
CSAB Mortgage Backed Trust,
Series 2006-1, Class A6A
6.172%, due 06/25/368 | | | 730,111 | | | | 436,526 | | |
Delta Funding Home Equity Loan Trust,
Series 1999-003, Class A1A
1.027%, due 09/15/293 | | | 60,720 | | | | 47,321 | | |
EFS Volunteer LLC,
Series 2010-1, Class A1
1.103%, due 10/26/263,4 | | | 820,957 | | | | 816,241 | | |
Landmark V CDO Ltd.
Series 2005-1A, Class A1L
0.554%, due 06/01/173,4 | | | 2,760,119 | | | | 2,683,909 | | |
| | | Face
amount1 | | Value | |
| Asset-backed securities—(Concluded) | |
Mid-State Trust Series 4, Class A
8.330%, due 04/01/30 | | | 275,669 | | | $ | 284,404 | | |
SLC Student Loan Trust,
Series 2008-2, Class A2
0.697%, due 06/15/173 | | | 6,470,222 | | | | 6,465,966 | | |
SLM Student Loan Trust,
Series 2008-9, Class A
1.753%, due 04/25/233 | | | 6,032,407 | | | | 6,214,340 | | |
Total asset-backed securities
(cost—$18,741,000) | | | | | 18,729,529 | | |
| Corporate notes—24.78% | |
| Airlines—0.88% | |
American Airlines Pass Through
Trust 2009-1A
10.375%, due 07/02/19 | | | 2,815,851 | | | | 3,252,308 | | |
Continental Airlines Pass Through
Trust 2009-2, Series A
7.250%, due 11/10/19 | | | 190,383 | | | | 205,614 | | |
Northwest Airlines,
Series 2000-1, Class G
7.150%, due 10/01/198 | | | 3,770,384 | | | | 3,775,286 | | |
United Air Lines, 1991
Equipment Trust
10.360%, due 11/27/125 | | | 231,906 | | | | 1,136 | | |
| | | | 7,234,344 | | |
| Banking-non-US—4.39% | |
Banco Bradesco SA
2.361%, due 05/16/143,4 | | | 4,100,000 | | | | 4,147,716 | | |
Banco Mercantil del Norte SA
4.375%, due 07/19/154 | | | 1,800,000 | | | | 1,840,500 | | |
Banco Santander Brasil SA
2.347%, due 03/18/143,4 | | | 4,200,000 | | | | 4,187,358 | | |
| 4.250%, due 01/14/164 | | | 3,500,000 | | | | 3,543,505 | | |
Banco Votorantim SA
5.250%, due 02/11/164 | | | 3,800,000 | | | | 3,904,500 | | |
Depfa ACS Bank
3.250%, due 02/15/129 | | EUR | 5,500,000 | | | | 7,891,084 | | |
Export-Import Bank of Korea
5.125%, due 06/29/20 | | | 400,000 | | | | 415,652 | | |
| 5.875%, due 01/14/15 | | | 2,600,000 | | | | 2,867,020 | | |
ICICI Bank Ltd.
5.000%, due 01/15/169 | | | 2,500,000 | | | | 2,586,715 | | |
| 5.500%, due 03/25/154,10 | | | 3,000,000 | | | | 3,167,916 | | |
| 6.625%, due 10/03/124 | | | 1,000,000 | | | | 1,052,083 | | |
LBG Capital No.1 PLC
8.500%, due 12/17/213,4,11 | | | 400,000 | | | | 374,000 | | |
| | | | 35,978,049 | | |
| Banking-US—0.55% | |
Bank of America Corp.
5.750%, due 12/01/17 | | | 3,200,000 | | | | 3,421,917 | | |
CIT Group, Inc.
7.000%, due 05/01/1410 | | | 724,973 | | | | 730,411 | | |
JPMorgan Chase Bank N.A.
0.580%, due 06/13/163 | | | 400,000 | | | | 372,349 | | |
| | | | 4,524,677 | | |
48
PACE Select Advisors Trust
PACE Strategic Fixed Income Investments
Portfolio of investments—July 31, 2011
| | | Face
amount1 | | Value | |
| Corporate notes—(Continued) | |
| Beverages—0.53% | |
Pernod-Ricard SA
5.750%, due 04/07/214 | | | 4,000,000 | | | $ | 4,322,316 | | |
| Chemicals—0.91% | |
Lyondell Chemical Co.
11.000%, due 05/01/18 | | | 6,600,000 | | | | 7,474,500 | | |
| Diversified financials—3.42% | |
American Express Co.
6.800%, due 09/01/663 | | | 3,800,000 | | | | 3,914,000 | | |
Citigroup Capital XXI
8.300%, due 12/21/573 | | | 2,700,000 | | | | 2,774,250 | | |
Goldman Sachs Group, Inc.
0.653%, due 07/22/153 | | | 300,000 | | | | 286,267 | | |
| 0.697%, due 03/22/163 | | | 1,200,000 | | | | 1,130,060 | | |
| 0.746%, due 01/12/153 | | | 1,100,000 | | | | 1,062,078 | | |
| 3.700%, due 08/01/15 | | | 1,700,000 | | | | 1,750,427 | | |
| 5.150%, due 01/15/14 | | | 4,500,000 | | | | 4,847,990 | | |
| 5.950%, due 01/18/18 | | | 3,200,000 | | | | 3,490,595 | | |
Lehman Brothers Holdings,
Inc. MTN
5.625%, due 01/24/1312 | | | 4,500,000 | | | | 1,215,000 | | |
Merrill Lynch & Co. MTN
6.875%, due 04/25/18 | | | 6,700,000 | | | | 7,497,581 | | |
| | | | 27,968,248 | | |
| Diversified operations—0.49% | |
Sinochem Overseas Capital
Co. Ltd.
4.500%, due 11/12/204 | | | 1,900,000 | | | | 1,892,332 | | |
| 6.300%, due 11/12/404 | | | 2,000,000 | | | | 2,075,640 | | |
| | | | 3,967,972 | | |
| Electric utilities—0.24% | |
PSE&G Power LLC
5.000%, due 04/01/14 | | | 1,800,000 | | | | 1,939,225 | | |
| Electric-generation—0.85% | |
Korea Hydro & Nuclear
Power Co. Ltd.
6.250%, due 06/17/144 | | | 6,278,000 | | | | 6,870,518 | | |
| 6.250%, due 06/17/149 | | | 100,000 | | | | 109,438 | | |
| | | | 6,979,956 | | |
| Electric-integrated—1.03% | |
Centrais Eletricas Brasileiras SA
6.875%, due 07/30/194,10 | | | 200,000 | | | | 231,000 | | |
Puget Energy, Inc.
6.500%, due 12/15/20 | | | 7,600,000 | | | | 8,161,412 | | |
| | | | 8,392,412 | | |
| Finance-noncaptive diversified—0.76% | |
Ford Motor Credit Co. LLC
2.996%, due 01/13/123 | | | 233,000 | | | | 233,899 | | |
| 7.500%, due 08/01/12 | | | 200,000 | | | | 209,480 | | |
| 8.000%, due 06/01/14 | | | 1,100,000 | | | | 1,222,644 | | |
| 8.700%, due 10/01/14 | | | 4,000,000 | | | | 4,592,428 | | |
| | | | 6,258,451 | | |
| | | Face
amount1 | | Value | |
| Corporate notes—(Continued) | |
| Financial services—4.15% | |
Ally Financial, Inc.
3.466%, due 02/11/143 | | | 1,100,000 | | | $ | 1,081,402 | | |
| 3.647%, due 06/20/143 | | | 2,900,000 | | | | 2,836,931 | | |
| 6.000%, due 12/15/11 | | | 3,000,000 | | | | 3,056,250 | | |
| 6.625%, due 05/15/12 | | | 400,000 | | | | 409,000 | | |
Citigroup, Inc.
1.961%, due 05/15/183 | | | 900,000 | | | | 902,912 | | |
| 2.262%, due 08/13/133 | | | 1,000,000 | | | | 1,015,168 | | |
| 4.587%, due 12/15/15 | | | 400,000 | | | | 426,834 | | |
| 8.500%, due 05/22/19 | | | 6,400,000 | | | | 8,042,701 | | |
HSBC Finance Corp.
6.676%, due 01/15/214 | | | 1,400,000 | | | | 1,482,670 | | |
Morgan Stanley
1.853%, due 01/24/143 | | | 1,000,000 | | | | 998,906 | | |
| 7.300%, due 05/13/19 | | | 6,370,000 | | | | 7,324,665 | | |
Morgan Stanley MTN
6.000%, due 04/28/15 | | | 3,100,000 | | | | 3,408,013 | | |
SLM Corp. MTN
5.125%, due 08/27/12 | | | 1,400,000 | | | | 1,435,164 | | |
SLM Corp., Series A MTN
5.000%, due 10/01/13 | | | 700,000 | | | | 726,019 | | |
| 5.375%, due 01/15/13 | | | 800,000 | | | | 826,668 | | |
| | | | 33,973,303 | | |
| Health care—0.90% | |
HCA, Inc.
9.250%, due 11/15/16 | | | 3,800,000 | | | | 4,054,125 | | |
| 9.625%, due 11/15/1613 | | | 3,100,000 | | | | 3,317,000 | | |
| | | | 7,371,125 | | |
| Insurance—3.23% | |
American International Group, Inc.
8.175%, due 05/15/583 | | | 6,400,000 | | | | 6,976,000 | | |
| 8.250%, due 08/15/18 | | | 4,100,000 | | | | 4,859,709 | | |
| 8.625%, due 05/22/383,9 | | GBP | 1,600,000 | | | | 2,672,283 | | |
American International Group,
Inc. MTN
4.000%, due 09/20/11 | | EUR | 1,500,000 | | | | 2,157,060 | | |
Progressive Corp.
6.700%, due 06/15/373 | | | 2,800,000 | | | | 2,891,000 | | |
Prudential Financial, Inc. MTN
6.000%, due 12/01/17 | | | 6,000,000 | | | | 6,903,972 | | |
| | | | 26,460,024 | | |
| Media—0.19% | |
Historic TW, Inc.
9.125%, due 01/15/13 | | | 1,400,000 | | | | 1,550,724 | | |
| Media-cable—0.02% | |
DISH DBS Corp.
6.375%, due 10/01/11 | | | 200,000 | | | | 201,500 | | |
| Oil refining—0.04% | |
Valero Energy Corp.
6.625%, due 06/15/37 | | | 300,000 | | | | 325,407 | | |
49
PACE Select Advisors Trust
PACE Strategic Fixed Income Investments
Portfolio of investments—July 31, 2011
| | | Face
amount1 | | Value | |
| Corporate notes—(Concluded) | |
| Oil services—0.32% | |
BP Capital Markets PLC
3.625%, due 05/08/14 | | | 200,000 | | | $ | 211,740 | | |
BP Capital Markets PLC MTN
2.750%, due 02/27/12 | | | 200,000 | | | | 202,473 | | |
El Paso Corp.
7.000%, due 06/15/17 | | | 1,700,000 | | | | 1,968,756 | | |
TNK-BP Finance SA
7.875%, due 03/13/189 | | | 200,000 | | | | 231,000 | | |
| | | | 2,613,969 | | |
| Paper & forest products—0.07% | |
Celulosa Arauco y Constitucion SA
7.250%, due 07/29/19 | | | 500,000 | | | | 587,635 | | |
| Paper & packaging—0.39% | |
Georgia-Pacific LLC
9.500%, due 12/01/11 | | | 3,100,000 | | | | 3,172,208 | | |
| Retail—0.45% | |
Macy's Retail Holdings, Inc.
8.125%, due 07/15/158 | | | 3,100,000 | | | | 3,708,276 | | |
| Special purpose entity—0.25% | |
IPIC GMTN Ltd.
3.125%, due 11/15/154 | | | 2,000,000 | | | | 2,030,999 | | |
| Steel producers/products—0.17% | |
CSN Resources SA
6.500%, due 07/21/204 | | | 1,000,000 | | | | 1,075,000 | | |
GTL Trade Finance, Inc.
7.250%, due 10/20/174 | | | 300,000 | | | | 336,000 | | |
| | | | 1,411,000 | | |
| Tobacco—0.22% | |
Reynolds American, Inc.
7.250%, due 06/15/37 | | | 1,600,000 | | | | 1,777,859 | | |
| Wireless telecommunications—0.33% | |
America Movil SAB de CV
3.625%, due 03/30/15 | | | 2,500,000 | | | | 2,662,805 | | |
Total corporate notes
(cost—$193,359,372) | | | | | 202,886,984 | | |
| Loan assignments3—2.43% | |
| Airlines—0.36% | |
United Air Lines, Inc.
Tranche A Revolver
0.375%, due 09/30/11 | | | 3,000,000 | | | | 2,966,400 | | |
| Auto & truck—0.13% | |
Ford Motor Co., Term Loan B1
2.940%, due 08/15/11 | | | 1,082,741 | | | | 1,081,334 | | |
| Banking-US—0.31% | |
CIT Group, Inc. Term Loan 3
6.250%, due 08/15/11 | | | 2,500,000 | | | | 2,503,575 | | |
| Cable—0.36% | |
Charter Communications Operating,
LLC Extended Term Loan
3.500%, due 09/30/11 | | | 2,977,330 | | | | 2,959,972 | | |
| | | Face
amount1 | | Value | |
| Loan assignments3—(Concluded) | |
| Diversified financials—0.46% | |
First Data Corp. Term Loan B2
2.937%, due 08/24/11 | | | 876,768 | | | $ | 815,517 | | |
Springleaf Finance Corp.
Term Loan
5.500%, due 08/11/11 | | | 3,000,000 | | | | 2,925,000 | | |
| | | | 3,740,517 | | |
| Health care—0.74% | |
Biomet, Inc. Term Loan B
3.187%, due 08/25/11 | | | 902,305 | | | | 890,088 | | |
| 3.187%, due 08/31/11 | | | 136,761 | | | | 134,909 | | |
| 3.247%, due 09/26/11 | | | 2,721,860 | | | | 2,685,006 | | |
Fresenius Medical Care Holdings,
Inc. Tranche B Term Loan
1.621%, due 09/30/11 | | | 2,398,996 | | | | 2,383,762 | | |
| | | | 6,093,765 | | |
| Paper & packaging—0.07% | |
Georgia-Pacific Corp.
New Term Loan B
2.246%, due 08/31/11 | | | 11,013 | | | | 10,993 | | |
| 2.250%, due 08/10/11 | | | 533,428 | | | | 532,479 | | |
| | | | 543,472 | | |
Total loan assignments
(cost—$19,861,634) | | | | | 19,889,035 | | |
Non-US government
obligations—6.17% | |
Canadian Government Bond
3.250%, due 06/01/21 | | CAD | 3,000,000 | | | | 3,263,907 | | |
Emirate of Abu Dhabi
6.750%, due 04/08/194,10 | | | 2,300,000 | | | | 2,748,500 | | |
Federal Republic of Brazil
5.875%, due 01/15/19 | | | 3,400,000 | | | | 3,964,400 | | |
Government of Norway
6.500%, due 05/15/13 | | NOK | 25,687,000 | | | | 5,121,843 | | |
Mexican Bonos, Series M
10.000%, due 12/05/24 | | MXN | 12,500,000 | | | | 1,349,042 | | |
Notas do Tesouro Nacional,
Series F
10.000%, due 01/01/12 | | BRL | 1,356,000 | | | | 865,515 | | |
| 10.000%, due 01/01/13 | | BRL | 783,000 | | | | 487,897 | | |
| 10.000%, due 01/01/14 | | BRL | 787,000 | | | | 478,765 | | |
| 10.000%, due 01/01/17 | | BRL | 28,400,000 | | | | 16,372,070 | | |
State of Qatar
4.000%, due 01/20/154 | | | 4,300,000 | | | | 4,566,600 | | |
| 5.250%, due 01/20/204 | | | 2,100,000 | | | | 2,304,750 | | |
| 6.400%, due 01/20/404 | | | 200,000 | | | | 228,000 | | |
United Kingdom Treasury Bonds
4.000%, due 09/07/16 | | GBP | 4,800,000 | | | | 8,745,258 | | |
Total non-US government
obligations
(cost—$46,967,344) | | | | | 50,496,547 | | |
50
PACE Select Advisors Trust
PACE Strategic Fixed Income Investments
Portfolio of investments—July 31, 2011
| | | Face
amount1 | | Value | |
| Municipal bonds and notes—2.82% | |
| Education—1.29% | |
Clark County School District,
Limited Tax (Building), Series A
5.000%, due 06/15/19 | | | 300,000 | | | $ | 332,847 | | |
Los Angeles Unified School District
Refunding, Series A-1
(NATL-RE Insured)
4.500%, due 07/01/25 | | | 3,200,000 | | | | 3,218,912 | | |
| 4.500%, due 01/01/28 | | | 3,800,000 | | | | 3,688,166 | | |
New York City Transitional
Finance Authority Building
Aid Revenue Fiscal 2008,
Series S-1
5.000%, due 01/15/25 | | | 100,000 | | | | 104,938 | | |
University of Toledo General
Receipts Bonds (Build
America Bonds)
6.750%, due 06/01/22 | | | 2,000,000 | | | | 2,201,840 | | |
Will County Community
High School District No. 210
Lincoln-Way (Capital Appreciation)
(AGM Insured)
4.980%, due 01/01/2114 | | | 1,600,000 | | | | 1,012,112 | | |
| | | | 10,558,815 | | |
| General obligation—0.37% | |
California State Build America Bonds
7.500%, due 04/01/34 | | | 1,400,000 | | | | 1,712,158 | | |
Cook County Build America
Bonds (Recovery Zone
Economic Development)
6.360%, due 11/15/33 | | | 1,200,000 | | | | 1,302,324 | | |
| | | | 3,014,482 | | |
| Tobacco—0.20% | |
Buckeye Tobacco Settlement
Financing Authority
(Asset Backed Series Turbo),
Series A-2
5.875%, due 06/01/47 | | | 500,000 | | | | 368,335 | | |
Tobacco Settlement Funding
Corp., Louisiana, Series 2001-B
5.875%, due 05/15/39 | | | 1,075,000 | | | | 1,062,552 | | |
Tobacco Settlement Funding
Corp., Rhode Island,
Series A
6.250%, due 06/01/42 | | | 200,000 | | | | 187,812 | | |
| | | | 1,618,699 | | |
| Transportation—0.72% | |
Bay Area Toll Authority Toll
Bridge Revenue
(Build America Bonds)
6.263%, due 04/01/49 | | | 1,500,000 | | | | 1,741,020 | | |
| | | Face
amount1 | | Value | |
| Municipal bonds and notes—(Concluded) | |
| Transportation—(Concluded) | |
Harris County Metropolitan
Transportation Authority
(Build America Bonds), Series C
6.875%, due 11/01/38 | | | 3,100,000 | | | $ | 3,373,916 | | |
Port Authority of New York &
New Jersey Consolidated
(One Hundred Fifty-Eight)
5.859%, due 12/01/24 | | | 700,000 | | | | 816,067 | | |
| | | | 5,931,003 | | |
| Utilities—0.24% | |
Cincinnati Water System Revenue
(Build America Bonds), Series B
6.458%, due 12/01/34 | | | 100,000 | | | | 106,329 | | |
Metropolitan Water District
Southern California
(Build America Bonds)
5.906%, due 07/01/25 | | | 1,700,000 | | | | 1,846,404 | | |
| | | | 1,952,733 | | |
Total municipal bonds and notes
(cost—$20,984,995) | | | | | 23,075,732 | | |
| | | Number of
shares | | | |
| Preferred stock15—0.83% | |
| Commercial banks—0.83% | |
Wells Fargo & Co.
(cost—$3,810,820) | | | 6,400 | | | | 6,794,880 | | |
| | | Face
amount1 | | | |
| Certificate of deposit—0.46% | |
| Banking-non-US—0.46% | |
Banco Bradesco SA
1.955%, due 01/24/135,16
(cost—$3,800,000) | | | 3,800,000 | | | | 3,800,000 | | |
Short-term US government
obligation17—3.59% | |
US Treasury Bills
0.164%, due 09/01/11
(cost—$29,399,620) | | | 29,400,000 | | | | 29,399,620 | | |
| Repurchase agreements—15.82% | |
Repurchase agreement dated
07/29/11 with Citigroup Global
Markets, Inc., 0.170% due 08/01/11,
collateralized by $16,775,000 US
Treasury Notes, 0.750%
due 09/15/13; (value—$16,956,197);
proceeds: $16,600,235 | | | 16,600,000 | | | | 16,600,000 | | |
51
PACE Select Advisors Trust
PACE Strategic Fixed Income Investments
Portfolio of investments—July 31, 2011
| | | Face
amount1 | | Value | |
| Repurchase agreements—(Continued) | |
Repurchase agreement dated
07/29/11 with Citigroup
Global Markets, Inc., 0.200%
due 08/01/11, collateralized
by $6,705,000 Federal National
Mortgage Association obligations,
3.650% due 12/08/20;
(value—$6,757,189); proceeds:
$6,600,110 | | | 6,600,000 | | | $ | 6,600,000 | | |
Repurchase agreement dated
07/29/11 with Credit Suisse
Securities (USA) LLC, 0.170%
due 08/01/11, collateralized
by $3,548,000 US Treasury
Notes, 1.000% due 03/31/12;
(value—$3,577,802); proceeds:
$3,500,050 | | | 3,500,000 | | | | 3,500,000 | | |
Repurchase agreement dated
07/29/11 with Deutsche Bank
Securities, Inc., 0.170% due
08/01/11, collateralized by
$38,792,000 US Treasury
Inflation Index Bonds, 3.000%
due 07/15/12; (value—$50,848,750);
proceeds: $49,700,704 | | | 49,700,000 | | | | 49,700,000 | | |
Repurchase agreement dated
07/29/11 with Goldman
Sachs & Co., 0.220% due
08/01/11, collateralized by
$9,662,000 Federal National
Mortgage Association
obligations, 5.000% due 04/01/41;
(value—$10,342,701); proceeds:
$10,000,183 | | | 10,000,000 | | | | 10,000,000 | | |
Repurchase agreement dated
07/29/11 with JPMorgan
Securities LLC, 0.200%
due 08/01/11, collateralized
by $9,815,000 Federal Farm
Credit Bank obligations,
2.270% due 12/24/13;
(value—$10,244,534);
proceeds: $10,000,167 | | | 10,000,000 | | | | 10,000,000 | | |
| | | Face
amount1 | | Value | |
| Repurchase agreements—(Concluded) | |
Repurchase agreement dated
07/29/11 with Morgan
Stanley & Co., 0.170%
due 08/01/11, collateralized
by $27,556,500 US Treasury
Notes, 2.625% due 12/31/14;
(value—$29,419,185); proceeds:
$28,400,402 | | | 28,400,000 | | | $ | 28,400,000 | | |
Repurchase agreement dated
07/29/11 with State Street
Bank & Trust Co., 0.010%
due 08/01/11, collateralized
by $23,608 Federal Home
Loan Mortgage Corp.
obligations, 5.125% due
07/15/12, $3,393,142 US
Treasury Bills, zero coupon
due 08/04/11 and $1,338,248
US Treasury Notes, 2.375% to
2.625% due 02/29/16 to
07/31/17; (value—$4,839,951);
proceeds: $4,745,004 | | | 4,745,000 | | | | 4,745,000 | | |
Total repurchase agreements
(cost—$129,545,000) | | | | | 129,545,000 | | |
| | | Number of
shares | | | |
Investment of cash collateral from
securities loaned—0.54% | |
| Money market fund—0.54% | |
UBS Private Money Market Fund LLC18
(cost—$4,383,525) | | | 4,383,525 | | | | 4,383,525 | | |
Total investments
(cost—$862,208,687)—108.96% | | | | | 892,066,481 | | |
Liabilities in excess of
other assets—(8.96)% | | | | | (73,367,080 | ) | |
| Net assets—100.00% | | $ | 818,699,401 | | |
Aggregate cost for federal income tax purposes was $862,613,887; and net unrealized appreciation consisted of:
| Gross unrealized appreciation | | $ | 42,641,650 | | |
| Gross unrealized depreciation | | | (13,189,056 | ) | |
| Net unrealized appreciation | | $ | 29,452,594 | | |
For a listing of defined portfolio acronyms and currency abbreviations that are used throughout the Portfolio of investments as well as the tables that follow, please refer to page 227.
* On September 7, 2008, the Federal Housing Finance Agency placed the Federal National Mortgage Association and the Federal Home Loan Mortgage Corporation into conservatorship, and the US Treasury guaranteed the debt issued by those organizations.
52
PACE Select Advisors Trust
PACE Strategic Fixed Income Investments
Portfolio of investments—July 31, 2011
1 In US Dollars unless otherwise indicated.
2 Partial amount delivered to broker as collateral for futures transactions.
3 Variable or floating rate security. The interest rate shown is the current rate as of July 31, 2011 and changes periodically.
4 Security exempt from registration pursuant to Rule 144A under the Securities Act of 1933. These securities, which represent 8.10% of net assets as of July 31, 2011, are considered liquid and may be resold in transactions exempt from registration, normally to qualified institutional buyers.
5 Illiquid securities representing 0.47% of net assets as of July 31, 2011.
6 Inverse variable rate security. The interest rate shown is the current rate as of July 31, 2011, and changes periodically.
7 Security is being fair valued by a valuation committee under the direction of the board of trustees.
8 Step bond that converts to the noted fixed rate at a designated future date.
9 Security exempt from registration pursuant to Regulation S under the Securities Act of 1933. Regulation S applies to securities offerings that are made outside of the United States and do not involve direct selling efforts in the United States. At July 31, 2011, the value of these securities amounted to 1.65% of net assets.
10 Security, or portion thereof, was on loan at July 31, 2011.
11 Perpetual bond security. The maturity date reflects the next call date.
12 Bond interest in default.
13 Payment-in-kind security for which interest may be paid in cash or additional securities, at the discretion of the issuer.
14 Zero coupon bond. The interest rate represents annualized yield at date of purchase.
15 Non cumulative preferred stock. Convertible until 12/31/49.
16 Security exempt from registration pursuant to Rule 144A under the Securities Act of 1933. This security, which represents 0.46% of net assets as of July 31, 2011, is considered illiquid and restricted.
| Illiquid & restricted security | | Acquisition
date | | Acquisition
cost | | Acquisition cost
as a percentage
of net assets | | Value at
07/31/11 | | Value as a
percentage of
net assets | |
| Banco Bradesco SA | | 01/19/11 | | $ | 3,800,000 | | | | 0.46 | % | | $ | 3,800,000 | | | | 0.46 | % | |
17 Rate shown is the discount rate at date of purchase.
18 The table below details the Portfolios's transaction activity in an affiliated issuer during the year ended July 31, 2011. The investment manager earns a management fee from UBS Private Money Market Fund LLC.
| Security description | | Value at
07/31/10 | | Purchases
during the
year ended
07/31/11 | | Sales
during the
year ended
07/31/11 | | Value at
07/31/11 | | Net income
earned from
affiliate for the
year ended
07/31/11 | |
| UBS Private Money Market Fund LLC | | $ | 196,020 | | | $ | 490,644,508 | | | $ | 486,457,003 | | | $ | 4,383,525 | | | $ | 2,888 | | |
Written options
Written option activity for the year ended July 31, 2011 was as follows:
| | | Number of
contracts | | Premiums
received | |
| Options outstanding at July 31, 2010 | | $ | — | | | $ | — | | |
| Options written | | | 2,713 | | | | 1,215,312 | | |
| Options terminated in closing purchase transactions | | | (2,713 | ) | | | (1,215,312 | ) | |
| Options outstanding at July 31, 2011 | | $ | — | | | $ | — | | |
Swaptions5
Notional
amount
(000) | | Put options written | | Counterparty | | Pay/
receive
floating
date | | Expiration | | Premiums
received | | Current
value | | Unrealized
appreciation | |
| $ | 60,000 | | | USD 3 Month LIBOR19 Interest | | | | | | | | | | | | | | | | | | | | | |
| |
| | | Rate Swap, strike @ 2.250%; | | | | | | | | | | | | | | | | | | | | | |
| |
| | | underlying interest rate swap | | | | | | | | | | | | | | | | | | | | | |
| |
| | | terminating 09/26/14 | | Royal Bank of Scotland PLC | | Pay | | 09/24/12 | | $ | 318,000 | | | $ | (131,358 | ) | | $ | 186,642 | | |
19 3 Month LIBOR (USD on London Interbank Offered Rate) at July 31, 2011 was 0.256%.
53
PACE Select Advisors Trust
PACE Strategic Fixed Income Investments
Portfolio of investments—July 31, 2011
Swaption activity for the year ended July 31, 2011 was as follows:
| | | Premiums
received | |
| Swaptions outstanding at July 31, 2010 | | $ | 707,790 | | |
| Swaptions written | | | 608,600 | | |
| Swaptions terminated in closing purchase transactions | | | (998,390 | ) | |
| Swaptions outstanding at July 31, 2011 | | $ | 318,000 | | |
Futures contracts
Number of
contracts | | Currency | |
| | Expiration
date | | Cost | | Current
value | | Unrealized
appreciation | |
| Interest rate futures buy contracts: | | | |
| | 221 | | | GBP | | | | 3 Month GBP LIBOR20 Interest Rate Swap Futures | | March 2013 | | $ | 44,525,932 | | | $ | 44,761,461 | | | $ | 235,529 | | |
| | 113 | | | GBP | | | | 3 Month GBP LIBOR20 Interest Rate Swap Futures | | June 2013 | | | 22,822,300 | | | | 22,854,621 | | | | 32,321 | | |
| | 321 | | | USD | | | | 90 Day Euro Dollar Futures | | June 2013 | | | 78,966,549 | | | | 79,467,563 | | | | 501,014 | | |
| | 621 | | | USD | | | | 90 Day Euro Dollar Futures | | September 2013 | | | 152,534,342 | | | | 153,441,337 | | | | 906,995 | | |
| | 626 | | | USD | | | | 90 Day Euro Dollar Futures | | December 2013 | | | 153,856,220 | | | | 154,301,175 | | | | 444,955 | | |
| | 752 | | | USD | | | | 90 Day Euro Dollar Futures | | March 2014 | | | 184,307,274 | | | | 184,898,000 | | | | 590,726 | | |
| | 788 | | | USD | | | | 90 Day Euro Dollar Futures | | June 2014 | | | 192,427,969 | | | | 193,237,300 | | | | 809,331 | | |
| | 325 | | | USD | | | | 90 Day Euro Dollar Futures | | September 2014 | | | 79,284,452 | | | | 79,486,875 | | | | 202,423 | | |
| | 315 | | | USD | | | | 90 Day Euro Dollar Futures | | March 2016 | | | 75,396,038 | | | | 75,903,188 | | | | 507,150 | | |
| | | | | | | | | | | $ | 984,121,076 | | | $ | 988,351,520 | | | $ | 4,230,444 | | |
20 3 Months LIBOR (GBP on London Interbank Offered Rate) at July 31, 2011 was 0.833%
Forward foreign currency contracts
| Counterparty | | Contracts to
deliver | | In
exchange for | | Maturity
date | | Unrealized
appreciation
(depreciation) | |
| Bank of America N.A. | | AUD | 235,000 | | | USD | 256,150 | | | 08/31/11 | | $ | (1,113 | ) | |
| Barclays Bank PLC | | CAD | 5,565,000 | | | USD | 5,738,356 | | | 09/19/11 | | | (79,996 | ) | |
| Barclays Bank PLC | | GBP | 90,000 | | | USD | 146,972 | | | 08/03/11 | | | (758 | ) | |
| Barclays Bank PLC | | GBP | 7,107,000 | | | USD | 11,505,958 | | | 09/13/11 | | | (154,728 | ) | |
| Barclays Bank PLC | | JPY | 40,750,000 | | | USD | 523,988 | | | 08/04/11 | | | (5,350 | ) | |
| Barclays Bank PLC | | MXN | 10,093,041 | | | USD | 859,531 | | | 11/18/11 | | | 7,986 | | |
| Barclays Bank PLC | | USD | 391,060 | | | SGD | 500,000 | | | 09/09/11 | | | 24,221 | | |
| Barclays Capital | | BRL | 773,712 | | | USD | 480,000 | | | 08/02/11 | | | (18,895 | ) | |
| Barclays Capital | | BRL | 29,170,827 | | | USD | 18,127,534 | | | 09/02/11 | | | (532,242 | ) | |
| Barclays Capital | | MYR | 11,931,480 | | | USD | 3,930,000 | | | 08/11/11 | | | (87,329 | ) | |
| Barclays Capital | | USD | 18,243,169 | | | BRL | 29,170,827 | | | 08/02/11 | | | 566,405 | | |
| Barclays Capital | | USD | 1,900,000 | | | IDR | 17,474,300,000 | | | 10/31/11 | | | 131,856 | | |
| Barclays Capital | | USD | 11,064,896 | | | INR | 508,607,930 | | | 08/12/11 | | | 423,708 | | |
| Barclays Capital | | USD | 614,955 | | | MYR | 1,900,000 | | | 08/11/11 | | | 24,775 | | |
| Citibank N.A. | | AUD | 290,000 | | | USD | 319,481 | | | 08/03/11 | | | 887 | | |
| Citibank N.A. | | JPY | 1,232,757,000 | | | USD | 15,341,099 | | | 10/17/11 | | | (686,038 | ) | |
| Citibank N.A. | | NOK | 11,321,000 | | | USD | 2,091,059 | | | 08/08/11 | | | (10,781 | ) | |
| Citibank N.A. | | TWD | 2,548,048 | | | USD | 88,829 | | | 01/11/12 | | | 173 | | |
| Citibank N.A. | | USD | 1,183,035 | | | MYR | 3,650,000 | | | 08/11/11 | | | 45,920 | | |
54
PACE Select Advisors Trust
PACE Strategic Fixed Income Investments
Portfolio of investments—July 31, 2011
Forward foreign currency contracts—(Concluded)
| Counterparty | | Contracts to
deliver | | In
exchange for | | Maturity
date | | Unrealized
appreciation
(depreciation) | |
| Citibank N.A. | | USD | 1,602,746 | | | MYR | 4,779,390 | | | 11/10/11 | | $ | (4,357 | ) | |
| Citibank N.A. | | USD | 1,016,561 | | | SGD | 1,300,000 | | | 09/09/11 | | | 63,171 | | |
| Credit Suisse London Branch | | EUR | 9,279,000 | | | USD | 12,955,804 | | | 10/19/11 | | | (352,012 | ) | |
| Credit Suisse London Branch | | USD | 2,627,723 | | | CAD | 2,484,000 | | | 09/19/11 | | | (30,637 | ) | |
| Credit Suisse London Branch | | USD | 302,218 | | | NOK | 1,670,000 | | | 08/08/11 | | | 7,832 | | |
| Deutsche Bank AG London | | IDR | 34,760,850,000 | | | USD | 3,930,000 | | | 10/31/11 | | | (111,881 | ) | |
| Deutsche Bank AG London | | MXN | 5,672,796 | | | USD | 483,182 | | | 11/18/11 | | | 4,571 | | |
| Deutsche Bank AG London | | USD | 10,400,000 | | | CNY | 62,712,000 | | | 01/28/15 | | | (134,351 | ) | |
| Deutsche Bank AG London | | USD | 1,100,000 | | | CNY | 6,523,000 | | | 04/07/16 | | | (11,532 | ) | |
| Deutsche Bank AG London | | USD | 100,000 | | | IDR | 878,700,000 | | | 01/31/12 | | | 911 | | |
| Deutsche Bank AG London | | USD | 440,642 | | | INR | 20,600,000 | | | 08/12/11 | | | 24,678 | | |
| Deutsche Bank AG London | | USD | 10,708,787 | | | NOK | 56,476,000 | | | 08/08/11 | | | (223,534 | ) | |
| Deutsche Bank AG London | | USD | 470,459 | | | SGD | 600,000 | | | 09/09/11 | | | 27,879 | | |
| Deutsche Bank AG London | | USD | 3,800,000 | | | TWD | 108,186,000 | | | 01/11/12 | | | (35,823 | ) | |
| Goldman Sachs International | | TWD | 104,895,000 | | | USD | 3,700,000 | | | 01/11/12 | | | 50,329 | | |
| Goldman Sachs International | | USD | 390,000 | | | KRW | 426,036,000 | | | 08/12/11 | | | 13,803 | | |
| HSBC Bank USA | | BRL | 164,070 | | | USD | 100,000 | | | 08/02/11 | | | (5,794 | ) | |
| HSBC Bank USA | | BRL | 519,456 | | | USD | 320,000 | | | 09/02/11 | | | (12,282 | ) | |
| HSBC Bank USA | | NOK | 44,264,000 | | | USD | 8,205,242 | | | 08/08/11 | | | (12,748 | ) | |
| HSBC Bank USA | | USD | 149,138 | | | BRL | 245,585 | | | 09/02/11 | | | 7,956 | | |
| HSBC Bank USA | | USD | 360,158 | | | MYR | 1,108,385 | | | 08/11/11 | | | 13,036 | | |
| JPMorgan Chase Bank | | INR | 529,207,930 | | | USD | 11,815,664 | | | 08/12/11 | | | (138,260 | ) | |
| JPMorgan Chase Bank | | KRW | 483,075,000 | | | USD | 455,882 | | | 08/12/11 | | | (1,984 | ) | |
| JPMorgan Chase Bank | | USD | 5,860,000 | | | CNY | 34,779,100 | | | 04/07/16 | | | (56,543 | ) | |
| JPMorgan Chase Bank | | USD | 7,709,035 | | | INR | 358,315,930 | | | 07/12/12 | | | (2,676 | ) | |
| JPMorgan Chase Bank | | USD | 51,941 | | | KRW | 57,039,000 | | | 08/12/11 | | | 2,121 | | |
| JPMorgan Chase Bank | | USD | 453,421 | | | KRW | 483,075,000 | | | 11/14/11 | | | 1,576 | | |
| JPMorgan Chase Bank | | USD | 194,710 | | | MYR | 600,000 | | | 08/11/11 | | | 7,310 | | |
| JPMorgan Chase Bank | | USD | 1,152,202 | | | SGD | 1,471,059 | | | 09/09/11 | | | 69,605 | | |
| Morgan Stanley & Co., Inc. | | EUR | 9,280,000 | | | USD | 12,931,680 | | | 10/19/11 | | | (377,570 | ) | |
| Morgan Stanley & Co., Inc. | | MXN | 318,429 | | | USD | 27,145 | | | 11/18/11 | | | 280 | | |
| Morgan Stanley & Co., Inc. | | SGD | 5,176,474 | | | USD | 4,206,785 | | | 09/09/11 | | | (92,605 | ) | |
| Royal Bank of Scotland PLC | | BRL | 28,233,045 | | | USD | 17,516,469 | | | 08/02/11 | | | (688,415 | ) | |
| Royal Bank of Scotland PLC | | NOK | 29,964,000 | | | USD | 5,526,884 | | | 08/08/11 | | | (36,189 | ) | |
| Royal Bank of Scotland PLC | | USD | 1,867,239 | | | IDR | 17,514,700,000 | | | 10/31/11 | | | 169,315 | | |
| Royal Bank of Scotland PLC | | USD | 1,016,457 | | | SGD | 1,300,000 | | | 09/09/11 | | | 63,276 | | |
| | | $ | (2,152,843 | ) | |
55
PACE Select Advisors Trust
PACE Strategic Fixed Income Investments
Portfolio of investments—July 31, 2011
Interest rate swaps
| | | | | | | Rate type | | | | | | | |
| Counterparty | | Notional
amount
(000) | | Termination
date | | Payments
made by
the Portfolio† | | Payments
received by
the Portfolio† | | Upfront
payments
received
(made) | | Value | | Unrealized
appreciation
(depreciation) | |
| Barclays Bank PLC | | AUD | 5,000 | | | 12/15/20 | | | 5.015 | %21 | | | 6.000 | % | | $ | (10,670 | ) | | $ | 205,326 | | | $ | 194,656 | | |
| Barclays Bank PLC | | AUD | 10,700 | | | 12/15/20 | | | 5.01521 | | | | 6.000 | | | | 121,681 | | | | 439,397 | | | | 561,078 | | |
| Barclays Bank PLC | | BRL | 35,800 | | | 01/02/14 | | | 12.40022 | | | | 12.510 | | | | — | | | | (112,070 | ) | | | (112,070 | ) | |
| Citibank N.A. | | AUD | 8,700 | | | 12/15/21 | | | 5.01521 | | | | 5.750 | | | | 91,616 | | | | 142,465 | | | | 234,081 | | |
| | | | | | | | | | | $ | 202,627 | | | $ | 675,118 | | | $ | 877,745 | | |
21 Rate based on 6 Month LIBOR (AUD on Interbank Offered Rate).
22 Rate based on the Brazil CETIP (Central of Custody and Settlement of Private Bonds) Interbank Deposit Rate
† Payments made/received are based on the notional amount.
Inflation swaps
| | | | | | | Rate type | | | | | | | |
| Counterparty | | Notional
amount
(000) | | Termination
date | | Payments
made by
the Portfolio† | | Payments
received by
the Portfolio† | | Upfront
payments
received
(made) | | Value | | Unrealized
appreciation | |
| Barclays Bank PLC | | USD | 9,000 | | | 01/15/21 | | | 2.680 | % | | | —23 | | | | — | | | $ | 165,549 | | | $ | 165,549 | | |
23 Rate based on CPI Urban Consumers NSA.
† Payments made/received are based on the notional amount.
Credit default swaps on corporate issues—buy protection24
| | | | | | | Rate type | | | | | | | |
| Counterparty | | Notional
amount
(000) | | Termination
date | | Payments
made by
the Portfolio25 | | Payments
received by
the Portfolio | | Upfront
payments
made | | Value | | Unrealized
appreciation
(depreciation) | |
| Barclays Bank PLC | | USD | 3,100 | | | 09/20/15 | | | 7.150 | % | | | —26 | | | | — | | | $ | (781,455 | ) | | $ | (781,455 | ) | |
| Citibank N.A. | | USD | 300 | | | 12/20/13 | | | 3.400 | | | | —27 | | | | — | | | | (20,729 | ) | | | (20,729 | ) | |
| Credit Suisse First Boston | | USD | 1,400 | | | 03/20/13 | | | 1.450 | | | | —28 | | | | — | | | | (29,139 | ) | | | (29,139 | ) | |
| Deutsche Bank AG | | USD | 3,200 | | | 12/20/17 | | | 1.020 | | | | —29 | | | | — | | | | 160,712 | | | | 160,712 | | |
| | | | | | | | | | | | — | | | $ | (670,611 | ) | | $ | (670,611 | ) | |
24 If the Portfolio is a buyer of protection and a credit event occurs, as defined under the terms of the particular swap agreement, the Portfolio will either (i) receive from the seller of protection an amount equal to the notional amount of the swap and deliver the referenced obligation or (ii) received a net settlement amount in the form of cash or securities equal to the notional amount of the swap less the recovery value of the referenced obligation.
25 Payments made are based on the notional amount.
26 Payment from the counterparty will be received upon the occurrence of bankruptcy and/or by a restructuring event with respect to the Macy's Retail Holdings, Inc. bond, 8.375%, due 07/15/15.
27 Payment from the counterparty will be received upon the occurrence of bankruptcy and/or by a restructuring event with respect to the Valero Energy Corp. bond, 8.750%, due 06/15/30.
28 Payment from the counterparty will be received upon the occurrence of bankruptcy and/or by a restructuring event with respect to the Time Warner, Inc. bond, 9.125%, due 01/15/13
29 Payment from the counterparty will be received upon the occurrence of bankruptcy and/or by a restructuring event with respect to the Bank of America Corp. bond, 5.750%, due 12/01/17.
56
PACE Select Advisors Trust
PACE Strategic Fixed Income Investments
Portfolio of investments—July 31, 2011
Credit default swaps on corporate and soverign issues—sell protection30
| | | | | | | Rate type | | | | | | | | | |
| Counterparty | | Notional
amount
(000) | | Termination
date | | Payments
made by
the Portfolio | | Payments
received by
the Portfolio33 | | Upfront
payments
received
(made) | | Value | | Unrealized
appreciation
(depreciation) | | Credit
spread31 | |
| Bank of America N.A. | | USD | 3,500 | | | 06/20/16 | | | —32 | | | | 1.000 | % | | $ | 16,827 | | | $ | (86,353 | ) | | $ | (69,526 | ) | | | 1.54 | % | |
| Barclays Bank PLC | | EUR | 300 | | | 06/20/12 | | | —34 | | | | 1.000 | | | | 32,958 | | | | 3,251 | | | | 36,209 | | | | 0.16 | | |
| Barclays Bank PLC | | EUR | 500 | | | 06/20/15 | | | —34 | | | | 1.000 | | | | 75,251 | | | | 10,001 | | | | 85,252 | | | | 0.63 | | |
| Barclays Bank PLC | | USD | 3,900 | | | 03/20/13 | | | —35 | | | | 2.030 | | | | — | | | | 91,181 | | | | 91,181 | | | | 0.61 | | |
| Barclays Bank PLC | | USD | 5,500 | | | 06/20/16 | | | —36 | | | | 1.000 | | | | 15,937 | | | | (29,075 | ) | | | (13,138 | ) | | | 1.11 | | |
| Citibank N.A. | | USD | 1,800 | | | 03/20/14 | | | —37 | | | | 5.000 | | | | 88,920 | | | | 197,186 | | | | 286,106 | | | | 0.82 | | |
| Citibank N.A. | | USD | 200 | | | 06/20/15 | | | —34 | | | | 5.000 | | | | (3,642 | ) | | | 33,308 | | | | 29,666 | | | | 0.63 | | |
| Credit Suisse First Boston | | USD | 1,200 | | | 06/20/15 | | | —34 | | | | 5.000 | | | | (18,409 | ) | | | 199,849 | | | | 181,440 | | | | 0.63 | | |
| Deutsche Bank AG | | USD | 3,000 | | | 03/20/13 | | | —35 | | | | 2.073 | | | | — | | | | 72,269 | | | | 72,269 | | | | 0.61 | | |
| Deutsche Bank AG | | USD | 800 | | | 03/20/15 | | | —38 | | | | 1.000 | | | | (13,030 | ) | | | 16,691 | | | | 3,661 | | | | 0.42 | | |
| Deutsche Bank AG | | USD | 700 | | | 06/20/15 | | | —34 | | | | 5.000 | | | | (24,474 | ) | | | 116,578 | | | | 92,104 | | | | 0.63 | | |
| Deutsche Bank AG | | USD | 900 | | | 03/20/16 | | | —38 | | | | 1.000 | | | | (20,248 | ) | | | 19,334 | | | | (914 | ) | | | 0.53 | | |
| HSBC Bank USA | | USD | 7,800 | | | 09/20/11 | | | —39 | | | | 1.000 | | | | (12,142 | ) | | | 4,923 | | | | (7,219 | ) | | | 0.58 | | |
| | | | | | | | | | | $ | 137,948 | | | $ | 649,143 | | | $ | 787,091 | | | | | | |
30 If the Portfolio is a seller of protection and a credit event occurs, as defined under the terms of the particular swap agreement, the Portfolio will either (i) pay to the buyer of protection an amount equal to the notional amount of the swap and take delivery of the referenced obligation or (ii) pay a net settlement amount in the form of cash or securities equal to the notional amount of the swap less the recovery value of the referenced obligation.
31 Credit spreads, where available, represented in absolute terms, utilized in determining the market value as of period end serve as an indicator of the current status of the payment/performance risk and represent the likelihood or risk of default for the credit derivative or other credit event occurring. The credit spread of a particular referenced entity reflects the cost of buying/selling protection and may include upfront payments required to be made to enter into the agreement. Wider credit spreads represent a deterioration of the referenced entity's credit soundness and a greater likelihood or risk of default or other credit event occurring as defined under the terms of the agreement. A credit spread identified as "Defaulted" indicates a credit event has occurred for the referenced entity.
32 Payment to the counterparty will be made upon the occurrence of bankruptcy and/or by a restructuring event with respect to the General Electric Capital Corp. bond, 5.625%, due 09/15/17.
33 Payments received are based on the notional amount.
34 Payment to the counterparty will be made upon the occurrence of bankruptcy and/or by a restructuring event with respect to the BP Capital Markets America bond, 4.200%, due 06/15/18.
35 Payment to the counterparty will be made upon the occurrence of bankruptcy and/or by a restructuring event with respect to the MetLife, Inc. bond, 5.000%, due 06/15/15.
36 Payment to the counterparty will be made upon the occurrence of bankruptcy and/or by a restructuring event with respect to the Federal Republic of Brazil bond, 12.250%, due 03/06/30.
37 Payment to the counterparty will be made upon the occurrence of bankruptcy and/or by a restructuring event with respect to the El Paso Corp. bond, 6.875%, due 06/15/14.
38 Payment to the counterparty will be made upon the occurrence of bankruptcy and/or by a restructuring event with respect to the Australian Government bond, 6.500%, due 05/15/13.
39 Payment to the counterparty will be made upon the occurrence of bankruptcy and/or by a restructuring event with respect to the Export-Import Bank of Korea bond, 5.250%, due 02/10/14.
57
PACE Select Advisors Trust
PACE Strategic Fixed Income Investments
Portfolio of investments—July 31, 2011
The following is a summary of the fair valuations according to the inputs used as of July 31, 2011 in valuing the Portfolio's investments:
| | | Unadjusted
quoted prices in
active markets for
identical investments
(Level 1) | | Other significant
observable inputs
(Level 2) | | Unobservable
inputs
(Level 3) | | Total | |
| US government obligations | | $ | — | | | $ | 172,122,533 | | | $ | — | | | $ | 172,122,533 | | |
| Government national mortgage association certificates | | | — | | | | 177,747 | | | | — | | | | 177,747 | | |
| Federal home loan mortgage corporation certificates | | | — | | | | 186,780 | | | | 1,515,053 | | | | 1,701,833 | | |
| Federal housing administration certificates | | | — | | | | — | | | | 53,247 | | | | 53,247 | | |
| Federal national mortgage association certificates | | | — | | | | 21,699,779 | | | | 92,674 | | | | 21,792,453 | | |
| Collateralized mortgage obligations | | | — | | | | 206,926,091 | | | | 291,725 | | | | 207,217,816 | | |
| Asset-backed securities | | | — | | | | 18,729,529 | | | | — | | | | 18,729,529 | | |
| Corporate notes | | | — | | | | 202,886,984 | | | | — | | | | 202,886,984 | | |
| Loan assignments | | | — | | | | 19,889,035 | | | | — | | | | 19,889,035 | | |
| Non-US government obligations | | | — | | | | 50,496,547 | | | | — | | | | 50,496,547 | | |
| Municipal bonds and notes | | | — | | | | 23,075,732 | | | | — | | | | 23,075,732 | | |
| Preferred stock | | | 6,794,880 | | | | — | | | | — | | | | 6,794,880 | | |
| Certificate of deposit | | | — | | | | 3,800,000 | | | | — | | | | 3,800,000 | | |
| Short-term US government obligation | | | — | | | | 29,399,620 | | | | — | | | | 29,399,620 | | |
| Repurchase agreements | | | — | | | | 129,545,000 | | | | — | | | | 129,545,000 | | |
| Investment of cash collateral from securities loaned | | | — | | | | 4,383,525 | | | | — | | | | 4,383,525 | | |
| Swaptions, net | | | — | | | | (131,358 | ) | | | — | | | | (131,358 | ) | |
| Futures contracts, net | | | 4,230,444 | | | | — | | | | — | | | | 4,230,444 | | |
| Forward foreign currency contracts, net | | | — | | | | (2,152,843 | ) | | | — | | | | (2,152,843 | ) | |
| Swap agreements, net | | | — | | | | 819,199 | | | | — | | | | 819,199 | | |
| Total | | $ | 11,025,324 | | | $ | 881,853,900 | | | $ | 1,952,699 | | | $ | 894,831,923 | | |
The following is a rollforward of the Portfolio's investments that were valued using unobservable inputs (Level 3) for the year ended July 31, 2011:
| | | Federal home
loan mortgage
corporation
certificates | | Federal
housing
administration
certificates | | Federal
national
mortgage
association
certificates | | Collateralized
mortgage
obligations | | Total | |
| Beginning balance | | $ | 1,464,731 | | | $ | 57,642 | | | $ | 117,773 | | | $ | 356,174 | | | $ | 1,996,320 | | |
| Purchases | | | — | | | | 44,746 | | | | — | | | | — | | | | 44,746 | | |
| Sales | | | (49,904 | ) | | | (49,411 | ) | | | (25,353 | ) | | | (53,126 | ) | | | (177,794 | ) | |
| Accrued discounts/(premiums) | | | — | | | | (54 | ) | | | — | | | | — | | | | (54 | ) | |
| Total realized gain/(loss) | | | — | | | | — | | | | — | | | | — | | | | — | | |
Net change in unrealized
appreciation/depreciation | | | 100,226 | | | | 324 | | | | 254 | | | | (11,323 | ) | | | 89,481 | | |
| Transfers in to Level 3 | | | — | | | | — | | | | — | | | | — | | | | — | | |
| Transfers out of Level 3 | | | — | | | | — | | | | — | | | | — | | | | — | | |
| Ending balance | | $ | 1,515,053 | | | $ | 53,247 | | | $ | 92,674 | | | $ | 291,725 | | | $ | 1,952,699 | | |
The change in unrealized appreciation/depreciation relating to the Level 3 investments held at July 31, 2011 was $89,481.
58
PACE Select Advisors Trust
PACE Strategic Fixed Income Investments
Portfolio of investments—July 31, 2011
Issuer breakdown by country or territory of origin (unaudited)
| | | Percentage of
total investments | |
| United States | | | 87.1 | % | |
| Brazil | | | 4.7 | | |
| South Korea | | | 1.2 | | |
| United Kingdom | | | 1.1 | | |
| Ireland | | | 0.9 | | |
| Qatar | | | 0.8 | | |
| India | | | 0.8 | | |
| Mexico | | | 0.7 | | |
| Norway | | | 0.6 | | |
| France | | | 0.5 | | |
| British Virgin Islands | | | 0.5 | | |
| Canada | | | 0.4 | | |
| United Arab Emirates | | | 0.3 | | |
| Cayman Islands | | | 0.2 | | |
| Luxembourg | | | 0.1 | | |
| Chile | | | 0.1 | | |
| Total | | | 100.0 | % | |
See accompanying notes to financial statements.
59
PACE Select Advisors Trust
PACE Municipal Fixed Income Investments
Performance
For the 12 months ended July 31, 2011, the Portfolio's Class P shares returned 3.67%, before the deduction of the maximum PACE Select program fee. (Class P shares returned 1.62%, after the deduction of the maximum PACE Select program fee, for the same 12-month period.) In comparison, the Barclays Capital US Municipal 3-15 Year Blend Index (the "benchmark") returned 3.56%, and the Lipper Intermediate Municipal Debt Funds category posted a median return of 2.97%. (Returns for all share classes over various time periods are shown in the "Performance at a glance" table on page 63. Please note that the returns shown do not reflect the deduction of taxes that a shareholder could pay on Portfolio distributions or the redemption of Portfolio shares.) For a detailed commentary on the market environment in general during the reporting period, please refer to page 2.
Sub-Advisor's comments1
During the reporting period, the Portfolio outperformed its benchmark, largely due to favorable sector and security selection. Yield curve exposure was also beneficial, while the Portfolio maintained a relatively neutral duration posture. (Duration measures a portfolio's sensitivity to interest rate changes.) The municipal bond market rallied strongly during the latter half of the reporting period amidst a favorable backdrop of relatively light new issue supply, steady retail investor demand and improving municipal credit quality, particularly among states where tax revenues exhibited a consistent trend of positive growth. Adding pressure to the market were massive municipal mutual fund redemptions experienced from November 2010 to January 2011. However, demand for municipal securities reversed course and stabilized during the second half of the period.
Investor willingness to take on more risk in order to earn higher income in the low yield environment resulted in the strongest demand and returns to be achieved among intermediate maturity (primarily five to 15 years) and lower rated A and BBB municipal securities. Our overweight to A-rated revenue bonds, which provide attractive excess yield versus higher grade securities, was a positive contributor to relative performance. The Portfolio maintained a relatively neutral duration posture versus the benchmark and sought to capture excess yield provided by the steep yield curve. Yield curve positioning, with an overweight to five- to 10-year maturities enhanced the Portfolio's results. (The yield curve plots the interest rates, at a set point in time, of bonds having equal credit quality, but differing maturity dates.) A strategic emphasis on revenue sectors, such as hospital, airport, tobacco and industrial development was also a plus, as these attractively yielding bonds benefited from a strong investor appetite. Essential service revenue bonds, such as water/sewer and
PACE Select Advisors Trust – PACE Municipal Fixed Income Investments
Investment Sub-Advisor:
Standish Mellon Asset Management Company LLC ("Standish")
Portfolio Manager:
Christine L. Todd
Objective:
High current income exempt from federal income tax
Investment process:
In deciding which securities to buy for the Portfolio, Standish seeks to identify undervalued sectors or geographical regions of the municipal market, or undervalued individual securities. To do this, Standish uses credit research and valuation analysis, and monitors the relationship of the municipal yield curve to the Treasury yield curve. Standish may also make modest duration adjustments based on economic analyses and interest rate forecasts. Standish generally sells securities if it identifies more attractive investment opportunities within its investment criteria that may improve the Portfolio's return. Standish also may sell securities with weakening credit profiles or to adjust the average duration of the Portfolio.
1 All Sub-Advisors discuss performance on a gross of fees basis—meaning that no fees or expenses are reflected in their sleeves'/sleeve's performance. Alternately, Fund performance is shown net of fees, which does factor in fees and expenses associated with the Fund.
60
PACE Select Advisors Trust
PACE Municipal Fixed Income Investments
Sub-Advisor's comments – concluded
utility, considered to be among the highest and most stable credit quality, experienced less demand versus higher yielding alternatives. As a result, the Portfolio's overweight to these areas detracted from relative returns. The Portfolio benefited from being underweight to low yielding Treasury-backed pre-refunded bonds, which underperformed the benchmark as retail investors generally sought higher yielding alternatives.
The fundamental credit backdrop for state governments showed improvement, as evidenced by a Rockefeller Institute of Government report that indicated a 9.1% increase in tax revenues in the first quarter of 2011 compared to the first quarter of 2010. The spike in tax revenues represented the fifth consecutive quarter of positive year-over-year growth. The Portfolio maintained broad diversification across many geographic regions, and benefited greatly from an overweight exposure to high profile tax-backed credits such as those issued in Illinois and New Jersey. These bonds rallied strongly amidst positive headlines surrounding stabilizing fiscal outlooks, led by progress toward balancing budgets and pension and health care reform. Mitigating the impact was greater exposure toward Texas local school district bonds, as they lagged the benchmark during the reporting period.
Special considerations
The Portfolio may be appropriate for long-term investors seeking high current income exempt from federal income taxes. Investors should be able to withstand short-term fluctuations in the fixed income markets in return for potentially higher returns over the long term. The yield and value of the Portfolio change every day and can be affected by changes in interest rates, general market conditions and other political, social and economic developments, as well as specific matters relating to the issuers in which the Portfolio invests. It is important to note that an investment in the Portfolio is only one component of a balanced investment plan.
61
PACE Select Advisors Trust
PACE Municipal Fixed Income Investments
Illustration of an assumed investment of $10,000 in Class P shares of the Portfolio (unaudited)
The following graph depicts the performance of PACE Municipal Fixed Income Investments Class P shares versus the Barclays Capital US Municipal 3-15 Year Blend Index over the 10 years ended July 31, 2011. The performance of the other classes will vary based upon the different class specific expenses and sales charges. The performance provided does not reflect the deduction of taxes that a shareholder could pay on Portfolio distributions or the redemption of Portfolio shares. Past performance is no guarantee of future results. Share price and returns will vary with market conditions; investors may realize a gain or loss upon redemption. It is important to note that PACE Municipal Fixed Income Investments is a professionally managed portfolio while the Index is not available for investment and is unmanaged. The comparison is shown for illustration purposes only.
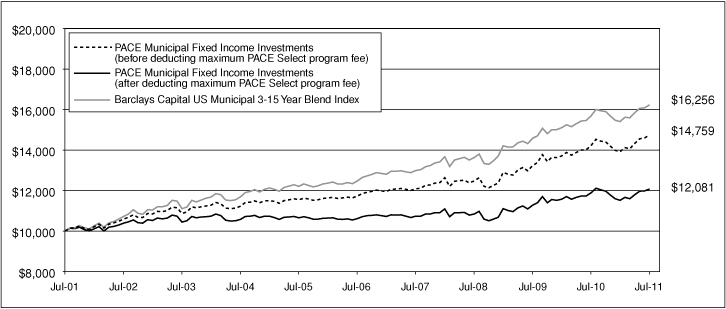
62
PACE Select Advisors Trust
PACE Municipal Fixed Income Investments
Performance at a glance (unaudited)
| Average annual total returns for periods ended 07/31/11 | | 1 year | | 5 years | | 10 years | |
| Before deducting | | Class A1 | | | 3.49 | % | | | 4.44 | % | | | 3.73 | % | |
| maximum sales charge | | Class B2 | | | 2.71 | % | | | 3.66 | % | | | 3.25 | %6 | |
| or PACE Select | | Class C3 | | | 2.97 | % | | | 3.92 | % | | | 3.20 | % | |
| program fee | | Class Y4 | | | 3.67 | % | | | 4.68 | % | | | 3.97 | % | |
| | | Class P5 | | | 3.67 | % | | | 4.70 | % | | | 3.97 | % | |
| After deducting | | Class A1 | | | (1.17 | )% | | | 3.48 | % | | | 3.25 | % | |
| maximum sales charge | | Class B2 | | | (2.29 | )% | | | 3.31 | % | | | 3.25 | %6 | |
| or PACE Select | | Class C3 | | | 2.22 | % | | | 3.92 | % | | | 3.20 | % | |
| program fee | | Class P5 | | | 1.62 | % | | | 2.63 | % | | | 1.91 | % | |
| Barclays Capital US Municipal 3-15 Year Blend Index7 | | | | | 3.56 | % | | | 5.43 | % | | | 4.98 | % | |
| Lipper Intermediate Municipal Debt Funds median | | | | | 2.97 | % | | | 4.33 | % | | | 4.07 | % | |
Average annual total returns for periods ended June 30, 2011, after deduction of the maximum sales charge or PACE Select program fee, were as follows: Class A—1-year period, (0.75)%; 5-year period, 3.44%; 10-year period, 3.25%; Class B—1-year period, (1.87)%; 5-year period, 3.24%; 10-year period, 3.26%; Class C—1-year period, 2.72%; 5-year period, 3.88%; 10-year period, 3.21%; Class Y—1-year period, 4.17%; 5-year period, 4.65%; 10-year period, 3.98%; Class P—1-year period, 2.10%; 5-year period, 2.59%; 10-year period, 1.92%.
The annualized gross and net expense ratios, respectively, for each class of shares as in the November 28, 2010 prospectuses, were as follows: Class A—0.95% and 0.93%; Class B—1.77% and 1.68%; Class C—1.46% and 1.43%; Class Y—0.74% and 0.68%; and Class P—0.74% and 0.68%. Net expenses reflect fee waivers and/or expense reimbursements, if any, pursuant to an agreement that is in effect to cap the expenses. The Portfolio and UBS Global Asset Management (Americas) Inc. ("UBS Global AM") have entered into a written fee waiver/expense reimbursement agreement pursuant to which UBS Global AM is contractually obligated to waive its management fees and/or reimburse expenses so that the Portfolio's ordinary total operating expenses of each class through November 28, 2011 (excluding dividend expense, borrowing costs, and interest expense relating to short sales, and interest, taxes, brokerage commissions and extraordinary expenses) would not exceed Class A—0.93%; Class B—1.68%; Class C—1.43%; Class Y—0.68%; and Class P—0.68%. The Portfolio has agreed to repay UBS Global AM for any waived fees/reimbursed expenses to the extent that it can do so over the following three fiscal years without causing the Portfolio's expenses in any of those three years to exceed these expense caps. The fee waiver/expense reimbursement agreement may be terminated by the Portfolio's board at any time and also will terminate automatically upon the expiration or termination of the Portfolio's advisory contract with UBS Global AM. Upon termination of the agreement, however, UBS Global AM's three year recoupment rights will survive.
1 Maximum sales charge for Class A shares is 4.5%. Class A shares bear ongoing 12b-1 service fees.
2 Maximum contingent deferred sales charge for Class B shares is 5% imposed on redemptions and is reduced to 0% after a maximum of six years. Class B shares bear ongoing 12b-1 service and distribution fees.
3 Maximum contingent deferred sales charge for Class C shares is 0.75% imposed on redemptions and is reduced to 0% after one year. Class C shares bear ongoing 12b-1 service and distribution fees. Prior to September 30, 2003, Class C shares were subject to a maximum front-end sales charge of 1.00%; this front-end sales charge is not reflected in the average annual total returns presented for the Class C shares shown above.
4 The Portfolio offers Class Y shares to a limited group of eligible investors, including certain qualifying retirement plans. Class Y shares do not bear initial or contingent deferred sales charges or ongoing 12b-1 service and distribution fees.
5 Class P shares do not bear initial or contingent deferred sales charges or ongoing 12b-1 service and distribution fees, but are subject to a maximum annual PACE Select program fee of 2% of the value of Class P shares. Prior to June 14, 2010, the maximum annual PACE Select program fee was 1.5% of the value of Class P shares; however, the current maximum annual PACE Select program fee of 2% is reflected in the performance returns throughout all periods in the average annual total returns presented for the Class P shares shown above.
6 Assumes the conversion of Class B to Class A shares at the end of the sixth year.
7 The Barclays Capital US Municipal 3-15 Year Blend Index is an unmanaged total return performance benchmark for the tax-exempt bond market. The Index includes municipal bonds with an effective maturity between 2 and 17 years that have at least one year to maturity and are investment grade. Investors should note that indices do not reflect the deduction of fees and expenses.
If an investor sells or exchanges shares less than 90 days after purchase, a redemption fee of 1.00% of the amount sold or exchanged will be deducted at the time of the transaction, except as noted otherwise in the prospectuses.
Past performance does not predict future performance, and the performance information provided does not reflect the deduction of taxes that a shareholder could pay on Portfolio distributions or the redemption of Portfolio shares. The return and principal value of an investment will fluctuate, so that an investor's shares, when redeemed, may be worth more or less than their original cost. Performance results assume reinvestment of all dividends and capital gain distributions at net asset value on the ex-dividend dates. Current performance may be higher or lower than the performance data quoted. For month-end performance figures, please visit http://www.ubs.com.
Lipper peer group data calculated by Lipper Inc.; used with permission. The Lipper median is the return of the fund that places in the middle of a Lipper peer group.
63
PACE Select Advisors Trust
PACE Municipal Fixed Income Investments
Portfolio statistics (unaudited)
| Characteristics | | 07/31/11 | |
| Weighted average duration | | | 4.9 yrs. | | |
| Weighted average maturity | | | 5.9 yrs. | | |
| Average coupon | | | 5.19 | % | |
| Net assets (mm) | | $ | 316.7 | | |
| Number of holdings | | | 165 | | |
| Portfolio composition1 | | 07/31/11 | |
| Municipal bonds and notes | | | 99.5 | % | |
| Tax-free money market fund | | | 0.0 | 2 | |
| Cash equivalents and other assets less liabilities | | | 0.5 | | |
| Total | | | 100.0 | % | |
| Top five sectors1 | | 07/31/11 | |
| Revenue | | | 48.7 | % | |
| Lease revenue/special revenue | | | 24.0 | | |
| General obligations | | | 18.7 | | |
| Pre-refunded | | | 3.1 | | |
| Other municipals | | | 2.4 | | |
| Total | | | 96.9 | % | |
| Top five states1 | | 07/31/11 | |
| California | | | 14.7 | % | |
| Florida | | | 11.0 | | |
| Illinois | | | 10.0 | | |
| Texas | | | 9.5 | | |
| Washington | | | 7.2 | | |
| Total | | | 52.4 | % | |
| Quality diversification1 | | 07/31/11 | |
| AAA and agency backed securities | | | 12.0 | % | |
| AA | | | 47.0 | | |
| A | | | 28.0 | | |
| BBB | | | 5.8 | | |
| Non-rated | | | 6.7 | | |
| Tax-free money market fund | | | 0.0 | 2 | |
| Cash equivalents and other assets less liabilities | | | 0.5 | | |
| Total | | | 100.0 | % | |
1 Weightings represent percentages of the Portfolio's net assets as of July 31, 2011. The Portfolio is actively managed and its composition will vary over time. Credit quality ratings shown are based on the ratings assigned to portfolio holdings by Standard & Poor's Ratings Group, an independent rating agency.
2 Weighting represents less than 0.05% of the Portfolio's net assets as of July 31, 2011.
64
PACE Select Advisors Trust
PACE Municipal Fixed Income Investments
Portfolio of investments—July 31, 2011
| | | Face
amount | | Value | |
| Municipal bonds and notes—99.47% | |
| Alabama—0.67% | |
Birmingham Waterworks Board
Water Revenue Series A
(Assured Guaranty Insured)
5.000%, due 01/01/24 | | $ | 2,005,000 | | | $ | 2,133,922 | | |
| Alaska—2.50% | |
Alaska Housing Finance Corp.
General Housing Series C
(NATL-RE Insured)
5.000%, due 12/01/13 | | | 1,110,000 | | | | 1,194,305 | | |
Alaska International Airports
Revenue Refunding Series A
(NATL-RE Insured)
5.500%, due 10/01/151 | | | 3,500,000 | | | | 3,748,955 | | |
North Slope Boro Series A
(NATL-RE Insured)
5.000%, due 06/30/16 | | | 2,000,000 | | | | 2,345,260 | | |
Northern Tobacco Securitization
Corp. Alaska Tobacco Settlement
Asset-Backed Bonds Series A
4.625%, due 06/01/23 | | | 685,000 | | | | 636,125 | | |
| | | | 7,924,645 | | |
| Arizona—1.80% | |
Arizona State Transportation Board
Excise Tax Revenue Maricopa
County Regional Area Road Fund
5.000%, due 07/01/15 | | | 2,000,000 | | | | 2,306,940 | | |
Pima County Sewer Revenue
System (AGM Insured)
5.000%, due 07/01/23 | | | 1,500,000 | | | | 1,633,905 | | |
San Manuel Entertainment
Series 04-C
4.500%, due 12/01/162 | | | 1,800,000 | | | | 1,771,812 | | |
| | | | 5,712,657 | | |
| California—14.72% | |
California Health Facilities
Financing Authority Revenue
Sutter Health Series B
5.250%, due 08/15/23 | | | 1,500,000 | | | | 1,626,045 | | |
California State
5.000%, due 03/01/17 | | | 2,000,000 | | | | 2,266,300 | | |
| 5.000%, due 08/01/19 | | | 3,000,000 | | | | 3,335,700 | | |
| 5.250%, due 10/01/20 | | | 1,000,000 | | | | 1,149,990 | | |
| 5.500%, due 04/01/21 | | | 3,000,000 | | | | 3,429,780 | | |
California State Department of
Water Resources Power Supply
Revenue Series L
5.000%, due 05/01/14 | | | 1,250,000 | | | | 1,395,225 | | |
| 5.000%, due 05/01/17 | | | 1,000,000 | | | | 1,179,820 | | |
California State Economic Recovery
Refunding Series A
5.000%, due 07/01/20 | | | 3,000,000 | | | | 3,462,510 | | |
California State Kindergarten
Series A4
0.210%, due 05/01/343 | | | 1,200,000 | | | | 1,200,000 | | |
| | | Face
amount | | Value | |
| Municipal bonds and notes—(Continued) | |
| California—(Concluded) | |
California State Refunding
5.000%, due 04/01/18 | | $ | 1,550,000 | | | $ | 1,800,992 | | |
California Statewide Communities
Development Authority Pollution
Control Revenue Refunding
Southern California Edison
Company Series A
(Mandatory Put 04/01/13 @ 100)
(XL Capital Insured)
4.100%, due 04/01/283 | | | 1,000,000 | | | | 1,048,450 | | |
California Statewide Communities
Development Authority Revenue
Kaiser Permanente Series A
5.000%, due 04/01/19 | | | 3,000,000 | | | | 3,428,220 | | |
California Statewide Communities
Development Authority Revenue
St. Joseph Series F (AGM Insured)
5.250%, due 07/01/18 | | | 1,500,000 | | | | 1,728,345 | | |
Irvine Improvement Bond Act 1915
Assessment District 05-21 Series A
0.220%, due 09/02/313 | | | 200,000 | | | | 200,000 | | |
Los Angeles Wastewater System
Revenue Refunding Series A
(NATL-RE-FGIC Insured)
6.000%, due 06/01/22 | | | 2,000,000 | | | | 2,499,180 | | |
San Diego Public Facilities Financing
Authority Sewer Revenue
Senior Series A
5.000%, due 05/15/25 | | | 2,500,000 | | | | 2,704,125 | | |
San Francisco City and County
Airports Community International
Airport Revenue San Francisco
International Airport
5.000%, due 05/01/171 | | | 3,715,000 | | | | 4,115,477 | | |
Southern California Public Power
Authority Power Project Revenue
Canyon Power Series A
5.000%, due 07/01/22 | | | 2,000,000 | | | | 2,226,400 | | |
Southern California Public Power
Authority Revenue Windy
Point/Windy Flats Project Series 1
5.000%, due 07/01/23 | | | 1,350,000 | | | | 1,506,195 | | |
Tobacco Securitization Authority
Northern California Tobacco
Settlement Revenue Asset-Backed
Bonds Series A-1
4.750%, due 06/01/23 | | | 825,000 | | | | 726,272 | | |
Tuolumne Wind Project Authority
Revenue Tuolumne Co.
Project Series A
5.250%, due 01/01/24 | | | 2,590,000 | | | | 2,801,240 | | |
University of California
Revenue Series Q
5.250%, due 05/15/23 | | | 2,500,000 | | | | 2,790,050 | | |
| | | | 46,620,316 | | |
65
PACE Select Advisors Trust
PACE Municipal Fixed Income Investments
Portfolio of investments—July 31, 2011
| | | Face
amount | | Value | |
| Municipal bonds and notes—(Continued) | |
| Colorado—1.38% | |
Colorado Health Facilities Authority
Revenue Boulder Community
Hospital Project Series A
4.000%, due 10/01/18 | | $ | 1,500,000 | | | $ | 1,561,455 | | |
Denver City & County Airport
Revenue Series A
5.500%, due 11/15/191 | | | 2,500,000 | | | | 2,807,175 | | |
| | | | 4,368,630 | | |
| District of Columbia—0.33% | |
Metropolitan Airport Authority
System Refunding Series A
(NATL-RE-FGIC Insured)
5.750%, due 10/01/141 | | | 1,000,000 | | | | 1,052,750 | | |
| Florida—11.03% | |
Citizens Property Insurance Corp.
Refunding Senior Secured High Risk
Account Series A (NATL-RE Insured)
5.000%, due 03/01/14 | | | 2,000,000 | | | | 2,112,680 | | |
Citizens Property Insurance Corp.
Senior Secured Coastal Series A-1
5.000%, due 06/01/19 | | | 2,000,000 | | | | 2,080,860 | | |
Citizens Property Insurance Corp.
Senior Secured High Account
Series A-1
5.500%, due 06/01/14 | | | 1,000,000 | | | | 1,075,130 | | |
| 5.500%, due 06/01/17 | | | 2,835,000 | | | | 3,113,737 | | |
Citizens Property Insurance Corp.
Senior Secured High Risk Series A-1
5.000%, due 06/01/15 | | | 1,600,000 | | | | 1,725,952 | | |
Florida Department of Children's &
Family Services Certificates of
Participation (Florida Civil
Commitment Center)
(NATL-RE Insured)
5.000%, due 04/01/14 | | | 1,065,000 | | | | 1,167,549 | | |
Florida Hurricane Catastrophe Fund
Finance Corp. Revenue Series A
5.000%, due 07/01/15 | | | 1,000,000 | | | | 1,111,410 | | |
| 5.000%, due 07/01/16 | | | 1,500,000 | | | | 1,677,060 | | |
Florida State Board of Education
Lottery Revenue Refunding
Series C
5.000%, due 07/01/16 | | | 1,000,000 | | | | 1,159,540 | | |
Series E
5.000%, due 07/01/19 | | | 1,000,000 | | | | 1,154,170 | | |
Florida State Municipal Power
Agency Revenue All Requirements
Power Series A
5.250%, due 10/01/20 | | | 1,555,000 | | | | 1,730,746 | | |
| 5.250%, due 10/01/21 | | | 2,000,000 | | | | 2,191,900 | | |
Lakeland Energy System Revenue
Refunding Series B (AGM Insured)
5.000%, due 10/01/17 | | | 2,000,000 | | | | 2,315,860 | �� | |
Miami-Dade County Water & Sewer
Revenue Refunding Series C
5.250%, due 10/01/18 | | | 2,000,000 | | | | 2,323,800 | | |
| | | Face
amount | | Value | |
| Municipal bonds and notes—(Continued) | |
| Florida—(Concluded) | |
Miami-Dade County Water & Sewer
Revenue Refunding Systems
Series B (AGM Insured)
5.250%, due 10/01/18 | | $ | 2,500,000 | | | $ | 2,940,150 | | |
Orlando & Orange County
Expressway Authority Expressway
Revenue Junior Lien
(NATL-RE-IBC/FGIC Insured)
8.250%, due 07/01/16 | | | 2,595,000 | | | | 3,289,111 | | |
Tampa Solid Waste System Revenue
Refunding (AGM Insured)
5.000%, due 10/01/151 | | | 1,000,000 | | | | 1,097,390 | | |
Tampa Utilities Tax & Special Revenue
Refunding Series B (AMBAC Insured)
5.750%, due 10/01/15 | | | 1,000,000 | | | | 1,166,960 | | |
Tampa-Hillsborough County
Expressway Authority Revenue
(Escrowed to Maturity)
(AMBAC Insured)
5.000%, due 07/01/14 | | | 640,000 | | | | 719,264 | | |
Tampa-Hillsborough County
Expressway Authority Revenue
Unrefunded Balance
(AMBAC Insured)
5.000%, due 07/01/14 | | | 695,000 | | | | 763,659 | | |
| | | | 34,916,928 | | |
| Georgia—1.13% | |
De Kalb County Water & Sewer
Revenue Refunding Series B
5.250%, due 10/01/24 | | | 2,000,000 | | | | 2,177,860 | | |
Gwinnett County Development
Authority Certificates of
Participation, Gwinnett County
Public Schools Project
(Pre-refunded with State and
Local Government Securities to
01/01/14 @ 100) (NATL-RE Insured)
5.250%, due 01/01/20 | | | 1,250,000 | | | | 1,390,525 | | |
| | | | 3,568,385 | | |
| Guam—0.32% | |
Guam Education Financing
Foundation Certificates of
Participation, Guam Public
Schools Project Series A
5.000%, due 10/01/12 | | | 1,000,000 | | | | 1,012,140 | | |
| Idaho—0.13% | |
Idaho Housing & Finance Association
Single-Family Mortgage
Series G-2, Class III
5.950%, due 07/01/191 | | | 350,000 | | | | 362,929 | | |
Subseries D-3
5.150%, due 07/01/131 | | | 45,000 | | | | 45,571 | | |
| | | | 408,500 | | |
66
PACE Select Advisors Trust
PACE Municipal Fixed Income Investments
Portfolio of investments—July 31, 2011
| | | Face
amount | | Value | |
| Municipal bonds and notes—(Continued) | |
| Illinois—9.97% | |
Chicago O'Hare International Airport
Revenue Refunding-General-Third
Lien-Series B (NATL-RE Insured)
5.250%, due 01/01/18 | | $ | 1,000,000 | | | $ | 1,130,520 | | |
Chicago (Pre-refunded with State
and Local Government Securities
to 01/01/14 @ 100) Series A
(AGM Insured)
5.000%, due 01/01/34 | | | 2,000,000 | | | | 2,212,820 | | |
Chicago Project Series C
(NATL-RE Insured)
5.000%, due 01/01/20 | | | 1,000,000 | | | | 1,030,290 | | |
Chicago Refunding Series A
(AGM Insured)
5.000%, due 01/01/17 | | | 2,500,000 | | | | 2,703,725 | | |
Cook County Forest Preservation
District (AMBAC Insured)
5.000%, due 11/15/19 | | | 5,180,000 | | | | 5,764,874 | | |
Illinois Development Finance
Authority Revenue DePaul
University Series C
5.500%, due 10/01/13 | | | 1,000,000 | | | | 1,082,690 | | |
Illinois Development Finance
Authority Revenue School District
Program School District No. U-46
(AGM Insured)
5.150%, due 01/01/19 | | | 2,000,000 | | | | 2,257,200 | | |
Illinois Health Facilities Authority
Revenue Evangelical Hospital
Series A (Escrowed to Maturity)
6.750%, due 04/15/17 | | | 660,000 | | | | 781,044 | | |
Illinois Municipal Electric Agency
Power Supply Refunding Series C
(NATL-RE-FGIC Insured)
5.000%, due 02/01/16 | | | 1,200,000 | | | | 1,349,244 | | |
Illinois State Refunding
5.000%, due 01/01/17 | | | 1,000,000 | | | | 1,108,350 | | |
| 5.000%, due 01/01/22 | | | 2,500,000 | | | | 2,599,175 | | |
| 5.000%, due 01/01/24 | | | 1,000,000 | | | | 1,015,070 | | |
Illinois Toll Highway Authority Toll
Highway Revenue Refunding
Senior Series A-1
5.000%, due 01/01/25 | | | 1,250,000 | | | | 1,301,375 | | |
Railsplitter Tobacco Settlement
Authority
5.500%, due 06/01/23 | | | 1,365,000 | | | | 1,414,208 | | |
Regional Transportation Authority
Series A (AGM Insured)
5.750%, due 06/01/18 | | | 3,000,000 | | | | 3,564,480 | | |
Springfield Electric Revenue
Senior Lien Electric
5.000%, due 03/01/16 | | | 2,000,000 | | | | 2,251,960 | | |
| | | | 31,567,025 | | |
| | | Face
amount | | Value | |
| Municipal bonds and notes—(Continued) | |
| Indiana—1.68% | |
Indiana State Finance Authority
Environmental Facilities Revenue
Refunding Industrial Power &
Light Co. Series C
4.900%, due 01/01/16 | | $ | 1,500,000 | | | $ | 1,652,445 | | |
Indiana University Revenues Student
Fees Series S
5.000%, due 08/01/19 | | | 1,185,000 | | | | 1,385,668 | | |
Indianapolis Thermal Energy System
Refunding (AGM Insured)
5.000%, due 10/01/16 | | | 2,000,000 | | | | 2,294,120 | | |
| | | | 5,332,233 | | |
| Iowa—1.09% | |
Iowa Finance Authority Revenue
Revolving Fund (Partially
Pre-refunded with US Treasury
obligations and State and Local
Government Securities to
08/01/12 @ 100)
5.250%, due 02/01/14 | | | 3,310,000 | | | | 3,462,426 | | |
| Kentucky—0.73% | |
Pikville Hospital Revenue
Refunding & Improvement
(Pikville Medical Center)
6.000%, due 03/01/22 | | | 2,055,000 | | | | 2,303,039 | | |
| Louisiana—1.74% | |
Jefferson Parish Home Mortgage
Authority Single-Family Mortgage
Revenue Series A (GNMA/FNMA and
FHA/VA/USDA Mortgages Insured)
5.125%, due 06/01/261 | | | 615,000 | | | | 635,394 | | |
Louisiana Public Facilities Authority
Revenue Hurricane Recovery
Project (AMBAC Insured)
5.000%, due 06/01/15 | | | 2,880,000 | | | | 3,179,923 | | |
New Orleans Aviation Board Revenue
New Orleans Aviation Series B2
Refunding (AGM Insured)
5.000%, due 01/01/121 | | | 1,655,000 | | | | 1,684,161 | | |
| | | | 5,499,478 | | |
| Maryland—0.71% | |
Maryland State & Local Facilities
Lien First Series
5.000%, due 08/01/15 | | | 2,000,000 | | | | 2,238,300 | | |
| Massachusetts—4.80% | |
Massachusetts Bay Transportation
Authority Massachusetts
Sales Tax Revenue
Series A
5.000%, due 07/01/22 | | | 2,000,000 | | | | 2,338,640 | | |
Series B
5.250%, due 07/01/21 | | | 6,000,000 | | | | 7,210,920 | | |
67
PACE Select Advisors Trust
PACE Municipal Fixed Income Investments
Portfolio of investments—July 31, 2011
| | | Face
amount | | Value | |
| Municipal bonds and notes—(Continued) | |
| Massachusetts—(Concluded) | |
Massachusetts Health & Educational
Facilities Authority Revenue
Massachusetts Institute of
Technology Series M
5.250%, due 07/01/29 | | $ | 1,000,000 | | | $ | 1,197,350 | | |
Massachusetts Health & Educational
Facilities Authority Revenue Partners
Healthcare Systems Series G-5
5.000%, due 07/01/19 | | | 1,000,000 | | | | 1,118,690 | | |
Massachusetts State Development
Finance Agency Solid Waste
Disposal Revenue Waste
Management Income Project
5.450%, due 06/01/141 | | | 2,000,000 | | | | 2,166,380 | | |
Massachusetts State Water
Resources Authority Refunding
General Series B
5.000%, due 08/01/15 | | | 1,000,000 | | | | 1,158,210 | | |
| | | | 15,190,190 | | |
| Michigan—3.78% | |
Detroit Sewer Disposal Revenue
Refunding Senior Lien Series C-1
6.500%, due 07/01/24 | | | 2,250,000 | | | | 2,510,482 | | |
Detroit Sewer Disposal Revenue
Second Lien Series D-2
(Mandatory Put 01/01/12 @ 100)
(NATL-RE Insured)
5.500%, due 07/01/323 | | | 2,000,000 | | | | 2,020,820 | | |
Detroit Sewer Disposal Revenue
Senior Lien Series A (AGM Insured)
5.250%, due 07/01/19 | | | 2,500,000 | | | | 2,749,500 | | |
Michigan State Housing
Development Authority Series A
4.550%, due 12/01/141 | | | 2,395,000 | | | | 2,503,877 | | |
Wayne County Airport Authority
Revenue Refunding Detroit
Metropolitan Airport
Series A
5.000%, due 12/01/161 | | | 1,500,000 | | | | 1,627,185 | | |
Series D
5.000%, due 12/01/17 | | | 510,000 | | | | 556,553 | | |
| | | | 11,968,417 | | |
| Minnesota—0.00% | |
Moorhead Residential Mortgage
(Escrowed to Maturity)
(FHA/VA Mortgages Insured)
7.100%, due 08/01/11 | | | 10,000 | | | | 10,003 | | |
| Missouri—2.35% | |
Missouri State Health & Educational
Facilities Authority Health Facilities
Revenue St. Lukes Health Systems
Series A (AGM Insured)
5.000%, due 11/15/16 | | | 2,000,000 | | | | 2,264,460 | | |
| 5.000%, due 11/15/17 | | | 2,500,000 | | | | 2,833,800 | | |
| | | Face
amount | | Value | |
| Municipal bonds and notes—(Continued) | |
| Missouri—(Concluded) | |
Missouri State Highways & Transit
Commission State Road Revenue
Second Lien
5.000%, due 05/01/16 | | $ | 2,000,000 | | | $ | 2,355,620 | | |
| | | | 7,453,880 | | |
| Nevada—0.55% | |
Las Vegas Valley Water District
Refunding & Improvement Series A
5.000%, due 02/01/17 | | | 1,500,000 | | | | 1,725,720 | | |
| New Jersey—2.26% | |
New Jersey Economic Development
Authority Revenue Refunding
School Facilities Construction
Series EE
5.250%, due 09/01/23 | | | 1,500,000 | | | | 1,622,835 | | |
New Jersey Economic Development
Authority Water Facilities Revenue
Refunding American Water Co.
Series C
5.100%, due 06/01/231 | | | 1,000,000 | | | | 1,055,240 | | |
New Jersey Transportation
Trust Fund Authority
Transportation System
Series B (AGC-ICC/FGIC Insured)
5.500%, due 12/15/20 | | | 1,500,000 | | | | 1,728,285 | | |
Series B (NATL-RE/FGIC Insured)
5.250%, due 12/15/18 | | | 2,500,000 | | | | 2,749,100 | | |
| | | | 7,155,460 | | |
| New York—6.86% | |
Metropolitan Transportation
Authority Revenue Transportation
Series G
5.000%, due 11/15/18 | | | 2,500,000 | | | | 2,857,675 | | |
New York City Health & Hospital
Corp. Revenue Health
System Series A
5.000%, due 02/15/22 | | | 3,500,000 | | | | 3,830,120 | | |
New York City
Series B
5.000%, due 08/01/17 | | | 1,750,000 | | | | 2,057,825 | | |
New York City Transitional Finance
Authority Revenue Refunding
Future Tax Secured Series A
5.500%, due 11/01/263 | | | 2,000,000 | | | | 2,024,740 | | |
New York State Dorm Authority
Lease Revenue Series B
(Mandatory Put 07/01/13 @ 100)
(XL Capital Insured)
5.250%, due 07/01/323 | | | 1,500,000 | | | | 1,627,965 | | |
New York State Dorm Authority
State Personal Income Tax Revenue
Education Series D
5.000%, due 03/15/15 | | | 2,500,000 | | | | 2,861,525 | | |
68
PACE Select Advisors Trust
PACE Municipal Fixed Income Investments
Portfolio of investments—July 31, 2011
| | | Face
amount | | Value | |
| Municipal bonds and notes—(Continued) | |
| New York—(Concluded) | |
Port Authority of New York &
New Jersey (NATL-RE-FGIC Insured)
5.000%, due 10/01/131 | | $ | 6,000,000 | | | $ | 6,464,460 | | |
| | | | 21,724,310 | | |
| Ohio—1.41% | |
Cincinnati Water System Revenue
Refunding Series A
5.000%, due 12/01/214 | | | 1,000,000 | | | | 1,182,180 | | |
Kent State University Revenue
General Receipts Series B (Assured
Guaranty Insured)
5.000%, due 05/01/21 | | | 3,000,000 | | | | 3,288,240 | | |
| | | | 4,470,420 | | |
| Oregon—0.36% | |
Oregon State Department of
Transportation Highway User Tax
Revenue Series A
5.250%, due 11/15/14 | | | 1,000,000 | | | | 1,147,490 | | |
| Pennsylvania—3.50% | |
Allegheny County Port Authority
Special Revenue Refunding
Transportation
5.000%, due 03/01/25 | | | 1,000,000 | | | | 1,056,910 | | |
Lancaster Sewer Authority
(Escrowed to Maturity)
6.000%, due 04/01/12 | | | 10,000 | | | | 10,325 | | |
Pennsylvania Intergovernmental
Cooperative Authority Special Tax
Revenue Refunding Philadelphia
Funding Program
5.000%, due 06/15/17 | | | 2,000,000 | | | | 2,352,720 | | |
Pennsylvania State Higher
Educational Facilities Authority
Revenue University of Pennsylvania
Series A
5.000%, due 09/01/17 | | | 1,150,000 | | | | 1,367,660 | | |
Pennsylvania Third Series
(AGM Insured)
5.000%, due 09/01/15 | | | 1,000,000 | | | | 1,123,080 | | |
Philadelphia School District
Refunding Series E
5.000%, due 09/01/18 | | | 1,000,000 | | | | 1,113,530 | | |
Philadelphia Water & Wastewater
Revenue Refunding Series A
5.000%, due 06/15/15 | | | 1,500,000 | | | | 1,697,100 | | |
University of Pittsburgh of the
Commonwealth System of Higher
Education Capital Project Series B
5.500%, due 09/15/21 | | | 2,000,000 | | | | 2,365,180 | | |
| | | | 11,086,505 | | |
| | | Face
amount | | Value | |
| Municipal bonds and notes—(Continued) | |
| Puerto Rico—4.23% | |
Puerto Rico Commonwealth
Government Development Bank
Senior Notes
Series B
5.000%, due 12/01/14 | | $ | 1,500,000 | | | $ | 1,618,965 | | |
Series C
5.250%, due 01/01/151 | | | 1,000,000 | | | | 1,057,270 | | |
Puerto Rico Commonwealth
Highway & Transportation
Authority Highway Revenue
Refunding Series CC
5.000%, due 07/01/13 | | | 1,070,000 | | | | 1,131,696 | | |
Puerto Rico Commonwealth
Highway & Transportation
Authority Transportation Revenue
(AGM Insured)
5.500%, due 07/01/25 | | | 2,000,000 | | | | 2,149,320 | | |
Puerto Rico Commonwealth
Refunding Series A (Mandatory
Put 07/01/12 @ 100)
5.000%, due 07/01/303 | | | 1,000,000 | | | | 1,025,680 | | |
Puerto Rico Public Buildings Authority
Revenue Guaranteed Refunding
Government Facilities Series J
(Mandatory Put 07/01/12 @ 100)
(Commonwealth GTD)
5.000%, due 07/01/283 | | | 1,450,000 | | | | 1,489,266 | | |
Puerto Rico Public Finance Corp.
Refunding Commonwealth
Appropriations Series A
(Mandatory Put 02/01/12 @ 100)
5.750%, due 08/01/273 | | | 500,000 | | | | 508,740 | | |
Puerto Rico Sales Tax Financing
Corp. Sales Tax Revenue First
Sub-Series A
5.500%, due 08/01/23 | | | 4,000,000 | | | | 4,397,480 | | |
| | | | 13,378,417 | | |
| South Carolina—0.73% | |
Richland County School
District No. 002 Series A
(SCSDE Insured)
5.000%, due 02/01/21 | | | 2,000,000 | | | | 2,312,400 | | |
| Tennessee—0.96% | |
Memphis Electric System Revenue
Refunding Sub
5.000%, due 12/01/15 | | | 2,625,000 | | | | 3,049,436 | | |
| Texas—9.47% | |
Austin Water & Wastewater
Systems Revenue Refunding
(NATL-RE Insured),
5.000%, due 11/15/17 | | | 2,000,000 | | | | 2,264,280 | | |
69
PACE Select Advisors Trust
PACE Municipal Fixed Income Investments
Portfolio of investments—July 31, 2011
| | | Face
amount | | Value | |
| Municipal bonds and notes—(Continued) | |
| Texas—(Continued) | |
Dallas-Fort Worth International
Airport Revenue Refunding &
Improvement Series A
(NATL-RE-FGIC Insured)
5.750%, due 11/01/131 | | $ | 2,000,000 | | | $ | 2,024,820 | | |
Dickinson Independent School
District Refunding Schoolhouse
(PSF-GTD)
5.000%, due 02/15/23 | | | 1,920,000 | | | | 2,097,965 | | |
Fort Worth Independent
School District (PSF-GTD)
5.000%, due 02/15/15 | | | 2,000,000 | | | | 2,287,520 | | |
Harris County Flood Control District
Refunding Contract Series A
5.250%, due 10/01/18 | | | 2,000,000 | | | | 2,425,240 | | |
Harris County Hospital District
Revenue Refunding Senior Lien
Series A (NATL-RE Insured)
5.000%, due 02/15/18 | | | 1,675,000 | | | | 1,849,870 | | |
Houston Utilities Systems Revenue
Refunding Combined First Lien
Series A (AGM Insured)
5.250%, due 11/15/17 | | | 2,500,000 | | | | 3,001,300 | | |
Lower Colorado River Authority
Refunding LCRA Transmission
Services (BHAC Insured)
5.000%, due 05/15/20 | | | 1,765,000 | | | | 1,963,474 | | |
North Texas Health Facilities
Development Corp. Hospital
Revenue United Regional Health
Care Systems (AGM Insured)
5.000%, due 09/01/21 | | | 1,450,000 | | | | 1,539,697 | | |
| 5.000%, due 09/01/22 | | | 1,400,000 | | | | 1,471,862 | | |
San Antonio Electric & Gas
Refunding Series A
5.000%, due 02/01/17 | | | 1,295,000 | | | | 1,525,109 | | |
Schertz-Cibolo-Universal City
Independent School District
School Building Series A
(PSF-GTD)
5.000%, due 02/01/14 | | | 1,500,000 | | | | 1,662,615 | | |
Texas Municipal Power Agency
Revenue (Escrowed to Maturity)
(NATL-RE Insured)
6.100%, due 09/01/135 | | | 25,000 | | | | 24,571 | | |
Texas Water Development Board
Revenue State Revolving Fund
Subseries A-1
5.000%, due 07/15/24 | | | 1,885,000 | | | | 2,099,211 | | |
Tyler Independent School District
School Building
5.000%, due 02/15/18 | | | 1,165,000 | | | | 1,383,018 | | |
| | | Face
amount | | Value | |
| Municipal bonds and notes—(Continued) | |
| Texas—(Concluded) | |
University of Texas University Revenues
Refunding Financing System
Series D (Pre-refunded with
State and Local Government
Securities to 02/15/17 @ 100)
5.000%, due 08/15/17 | | $ | 1,805,000 | | | $ | 2,141,777 | | |
Series D Unrefunded Balance
5.000%, due 08/15/17 | | | 195,000 | | | | 229,860 | | |
| | | | 29,992,189 | | |
| Utah—0.51% | |
Riverton Hospital Revenue
IHC Health Services, Inc.
5.000%, due 08/15/15 | | | 1,200,000 | | | | 1,373,868 | | |
Utah State Housing Finance Agency
Single-Family Mortgage Series G-3,
Class III
5.700%, due 07/01/151 | | | 240,000 | | | | 244,229 | | |
| | | | 1,618,097 | | |
| Virginia—0.56% | |
Virginia College Building Authority
Educational Facilities Revenue
21st Century College & Equipment
(Pre-refunded with State and Local
Government Securities to
02/01/14 @ 100) Series A
5.000%, due 02/01/21 | | | 1,600,000 | | | | 1,777,776 | | |
| Washington—7.21% | |
Energy Northwest Electric Revenue
Columbia Station Series A
5.000%, due 07/01/23 | | | 2,500,000 | | | | 2,717,025 | | |
Energy Northwest Electric Revenue
Refunding Columbia Station
Series A
5.000%, due 07/01/21 | | | 2,000,000 | | | | 2,206,280 | | |
Energy Northwest Electric Revenue
Refunding Project 1 Series A
5.000%, due 07/01/16 | | | 1,515,000 | | | | 1,780,625 | | |
Port of Seattle Refunding
5.500%, due 12/01/221 | | | 500,000 | | | | 566,485 | | |
Port of Seattle Revenue Refunding
Intermediate Lien Series C
5.000%, due 02/01/161 | | | 1,000,000 | | | | 1,107,610 | | |
Seattle Municipal Lighting & Power
Revenue Refunding & Improvement
Series A
5.000%, due 02/01/22 | | | 2,500,000 | | | | 2,900,550 | | |
Series B
5.000%, due 02/01/14 | | | 1,000,000 | | | | 1,108,670 | | |
Washington Health Care Facilities
Authority Overlake Hospital
Medical Center Series A
(Assured Guaranty Insured)
5.000%, due 07/01/16 | | | 1,000,000 | | | | 1,106,240 | | |
70
PACE Select Advisors Trust
PACE Municipal Fixed Income Investments
Portfolio of investments—July 31, 2011
| | | Face
amount | | Value | |
| Municipal bonds and notes—(Concluded) | |
| Washington—(Concluded) | |
Washington State Public Power
Supply Systems Nuclear
Project No. 1 Revenue Refunding
Series B
7.125%, due 07/01/16 | | $ | 3,000,000 | | | $ | 3,803,820 | | |
Washington State
Series 93-A (Escrowed to Maturity)
5.750%, due 10/01/12 | | | 5,000 | | | | 5,168 | | |
Series A-Various Purpose
5.000%, due 07/01/17 | | | 2,130,000 | | | | 2,532,975 | | |
| 5.000%, due 07/01/20 | | | 2,625,000 | | | | 3,011,846 | | |
| | | | 22,847,294 | | |
Total municipal bonds and notes
(cost—$298,780,581) | | | | | 315,029,378 | | |
| | | Number of
shares | | Value | |
| Tax-free money market fund—0.01% | |
State Street Global Advisors
Tax Free Money Market Fund
(cost—$14,408) | | | 14,408 | | | $ | 14,408 | | |
Total investments
(cost—$298,794,989)—99.48% | | | | | 315,043,786 | | |
Other assets in excess of
liabilities—0.52% | | | | | 1,653,117 | | |
| Net assets—100.00% | | $ | 316,696,903 | | |
Aggregate cost for federal income tax purposes was $298,794,989; and net unrealized appreciation consisted of:
| Gross unrealized appreciation | | $ | 17,104,803 | | |
| Gross unrealized depreciation | | | (856,006 | ) | |
| Net unrealized appreciation | | $ | 16,248,797 | | |
For a listing of defined portfolio acronyms and currency abbreviations that are used throughout the Portfolio of investments as well as the tables that follow, please refer to page 227.
1 Security subject to Alternative Minimum Tax.
2 Security exempt from registration pursuant to Rule 144A under the Securities Act of 1933. This security, which represents 0.56% of net assets as of July 31, 2011, is considered liquid and may be resold in transactions exempt from registration, normally to qualified institutional buyers.
3 Variable or floating rate security. The interest rate shown is the current rate as of July 31, 2011 and changes periodically.
4 Security purchased on a when-issued basis. When issued refers to a transaction made conditionally because a security, although authorized, has not yet been issued.
5 Zero coupon bond; interest rate represents annualized yield at date of purchase.
The following is a summary of the fair valuations according to the inputs used as of July 31, 2011 valuing the Portfolio's investments:
| | | Unadjusted
quoted prices in
active markets for
identical investments
(Level 1) | | Other significant
observable inputs
(Level 2) | | Unobservable
inputs
(Level 3) | | Total | |
| Municipal bonds and notes | | $ | — | | | $ | 315,029,378 | | | $ | — | | | $ | 315,029,378 | | |
| Tax-free money market fund | | | — | | | | 14,408 | | | | — | | | | 14,408 | | |
| Total | | $ | — | | | $ | 315,043,786 | | | $ | — | | | $ | 315,043,786 | | |
See accompanying notes to financial statements.
71
PACE Select Advisors Trust
PACE International Fixed Income Investments
Performance
For the 12 months ended July 31, 2011, the Portfolio's Class P shares returned 12.60%, before the deduction of the maximum PACE Select program fee. (Class P shares returned 10.37%, after the deduction of the maximum PACE Select program fee, for the same 12-month period.) In comparison, the Barclays Capital Global Aggregate ex US Index (the "benchmark") returned 12.42%, and the Lipper International Income Funds category posted a median return of 11.41%. (Returns for all share classes over various time periods are shown in the "Performance at a glance" table on page 75. Please note that the returns shown do not reflect the deduction of taxes that a shareholder would pay on Portfolio distributions or the redemption of Portfolio shares.) For a detailed commentary on the market environment in general during the reporting period, please refer to page 2.
Sub-Advisor's comments1
The Portfolio outperformed its benchmark during the reporting period. We had a preference for economies with improving economic fundamentals, such as Norway, Canada and Australia. We also had exposure to local interest rate markets in Korea and Mexico, as well as in Malaysia, during the first half of the period, given what we view to be their stronger economic growth prospects and more sound debt dynamics than other developed markets. During the reporting period, overweights in Canada, Korea, Mexico, Malaysia and Australia added to relative returns. An underweight to Japan was also beneficial. The intensification of the sovereign debt crisis in the Eurozone periphery resulted in a significant bond market selloff in the peripheral markets. Our decision to overweight the core Eurozone area economies versus the periphery added to returns. In contrast, underweights to the UK and US detracted from relative returns.
The ongoing recovery in the global economic environment resulted in our overweight to the Australian and Canadian dollars and an overweight to a basket of emerging markets currencies versus the US dollar. This positioning contributed to relative performance during the reporting period. An overweight to the Norwegian krone was also modestly beneficial. Conversely, an underweight to the Japanese yen detracted from relative results.
During the first half of the reporting period, the Portfolio's duration was largely in line with the benchmark. (Duration measures a portfolio's sensitivity to interest rate changes.) We then shifted to a shorter duration in February 2011, based on evidence of an ongoing global economic recovery and signs that the disinflationary forces
PACE Select Advisors Trust – PACE International Fixed Income Investments
Investment Sub-Advisor:
Rogge Global Partners plc ("Rogge Global Partners")
Portfolio Managers:
Olaf Rogge, John Graham, Richard Bell, Adrian James and Malie Conway
Objective:
High total return
Investment process:
Rogge Global Partners seeks to invest the Portfolio's assets in fixed income securities of financially healthy issuers, because it believes that these investments produce the highest bond and currency returns over time. In deciding which fixed income securities to buy for the Portfolio, Rogge Global Partners uses a top-down analysis to find value across countries and to forecast interest and currency-exchange rates over a one-year horizon in those countries. Rogge Global Partners also uses an optimization model to help determine country, currency and duration positions for the Portfolio. Rogge Global Partners generally sells securities that no longer meet these selection criteria or when it identifies more attractive investment opportunities, and may also sell securities to adjust the average duration of the Portfolio.
1 All Sub-Advisors discuss performance on a gross of fees basis—meaning that no fees or expenses are reflected in their sleeves'/sleeve's performance. Alternately, Fund performance is shown net of fees, which does factor in fees and expenses associated with the Fund.
72
PACE Select Advisors Trust
PACE International Fixed Income Investments
Sub-Advisor's comments – concluded
in a number of developed markets were abating. This shorter duration had a negative impact on performance as government bond yields fell. The Portfolio had a relatively neutral yield curve position, which had little impact on performance. (The yield curve plots the interest rates, at a set point in time, of bonds having equal credit quality, but differing maturity dates.)
We had an overweight exposure to investment grade bonds, with a preference for well funded, internationally diversified corporate issuers. As we expected, we saw greater differentiation of performance by geography and by industry sector. Companies with large exposure to peripheral Europe, for example, remained vulnerable, while others continued to benefit from secular growth in emerging markets. Our exposure to investment grade bonds in the financial and industrial sectors added to returns.
During the reporting period, futures were used to take positions in various government bond markets, to hedge interest rate exposure and to take yield curve positions. Foreign exchange futures contracts were used to manage the Portfolio's currency exposure. Overall, the use of futures was beneficial for performance.
Special considerations
The Portfolio may be appropriate for long-term investors seeking high total return and who are able to withstand short-term fluctuations in the fixed income markets in return for potentially higher returns over the long term. The yield and value of the Portfolio change every day and can be affected by changes in interest rates, general market conditions and other political, social and economic developments, as well as specific matters relating to the issuers in which the Portfolio invests. It is important to note that an investment in the Portfolio is only one component of a balanced investment plan. The value of the Portfolio's investments in foreign securities may fall due to adverse political, social and economic developments abroad and due to decreases in foreign currency values relative to the US dollar. These risks are greater for investments in emerging markets than in more developed countries.
73
PACE Select Advisors Trust
PACE International Fixed Income Investments
Illustration of an assumed investment of $10,000 in Class P shares of the Portfolio (unaudited)
The following graph depicts the performance of PACE International Fixed Income Investments Class P shares versus the Barclays Capital Global Aggregate ex US Index over the 10 years ended July 31, 2011. The performance of the other classes will vary based upon the different class specific expenses and sales charges. The performance provided does not reflect the deduction of taxes that a shareholder would pay on Portfolio distributions or the redemption of Portfolio shares. Past performance is no guarantee of future results. Share price and returns will vary with market conditions; investors may realize a gain or loss upon redemption. It is important to note that PACE International Fixed Income Investments is a professionally managed portfolio while the Index is not available for investment and is unmanaged. The comparison is shown for illustration purposes only.
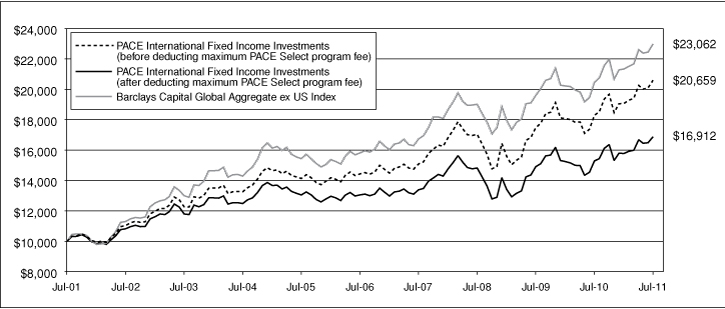
74
PACE Select Advisors Trust
PACE International Fixed Income Investments
Performance at a glance (unaudited)
| Average annual total returns for periods ended 07/31/11 | | 1 year | | 5 years | | 10 years | |
| Before deducting | | Class A1 | | | 12.36 | % | | | 7.14 | % | | | 7.26 | % | |
| maximum sales charge | | Class B2 | | | 11.54 | % | | | 6.34 | % | | | 6.79 | %6 | |
| or PACE Select | | Class C3 | | | 11.83 | % | | | 6.62 | % | | | 6.73 | % | |
| program fee | | Class Y4 | | | 12.54 | % | | | 7.46 | % | | | 7.58 | % | |
| | | Class P5 | | | 12.60 | % | | | 7.40 | % | | | 7.53 | % | |
| After deducting | | Class A1 | | | 7.30 | % | | | 6.16 | % | | | 6.77 | % | |
| maximum sales charge | | Class B2 | | | 6.54 | % | | | 6.03 | % | | | 6.79 | %6 | |
| or PACE Select | | Class C3 | | | 11.08 | % | | | 6.62 | % | | | 6.73 | % | |
| program fee | | Class P5 | | | 10.37 | % | | | 5.27 | % | | | 5.39 | % | |
| Barclays Capital Global Aggregate ex US Index7 | | | | | 12.42 | % | | | 7.78 | % | | | 8.72 | % | |
| Lipper International Income Funds median | | | | | 11.41 | % | | | 6.71 | % | | | 7.05 | % | |
Average annual total returns for periods ended June 30, 2011, after deduction of the maximum sales charge or PACE Select program fee, were as follows: Class A—1-year period, 10.26%; 5-year period, 5.75%; 10-year period, 6.73%; Class B—1-year period, 9.56%; 5-year period, 5.62%; 10-year period, 6.74%; Class C—1-year period, 14.12%; 5-year period, 6.21%; 10-year period, 6.70%; Class Y—1-year period, 15.61%; 5-year period, 7.07%; 10-year period, 7.54%; Class P—1-year period, 13.37%; 5-year period, 4.89%; 10-year period, 5.36%.
The annualized gross and net expense ratios, respectively, for each class of shares as in the November 28, 2010 prospectuses, were as follows: Class A—1.30% and 1.25%; Class B—2.09% and 2.00%; Class C—1.77% and 1.72%; Class Y—1.01% and 0.96%; and Class P—1.15% and 1.00%. Net expenses reflect fee waivers and/or expense reimbursements, if any, pursuant to an agreement that is in effect to cap the expenses. The Portfolio and UBS Global Asset Management (Americas) Inc. ("UBS Global AM") have entered into a written fee waiver/expense reimbursement agreement pursuant to which UBS Global AM is contractually obligated to (1) waive its management fees through November 28, 2011 to the extent necessary to reflect the lower sub-advisory fee paid by UBS Global AM to Rogge Global Partners plc, the Portfolio's investment advisor; and (2) waive its management fees and/or reimburse expenses so that the Portfolio's ordinary total operating expenses of each class through November 28, 2011 (excluding dividend expense, borrowing costs, and interest expense relating to short sales, and interest, taxes, brokerage commissions and extraordinary expenses) would not exceed Class A—1.25%; Class B—2.00%; Class C—1.75%; Class Y—1.00%; and Class P—1.00%. The Portfolio has agreed to repay UBS Global AM for any waived fees/reimbursed expenses (pursuant to item (2)) to the extent that it can do so over the following three fiscal years without causing the Portfolio's expenses in any of those three years to exceed these expense caps. The fee waiver/expense reimbursement agreement may be terminated by the Portfolio's board at any time and also will terminate automatically upon the expiration or termination of the Portfolio's advisory contract with UBS Global AM. Upon termination of the agreement, however, UBS Global AM's three year recoupment rights will survive.
1 Maximum sales charge for Class A shares is 4.5%. Class A shares bear ongoing 12b-1 service fees.
2 Maximum contingent deferred sales charge for Class B shares is 5% imposed on redemptions and is reduced to 0% after a maximum of six years. Class B shares bear ongoing 12b-1 service and distribution fees.
3 Maximum contingent deferred sales charge for Class C shares is 0.75% imposed on redemptions and is reduced to 0% after one year. Class C shares bear ongoing 12b-1 service and distribution fees. Prior to September 30, 2003, Class C shares were subject to a maximum front-end sales charge of 1.00%; this front-end sales charge is not reflected in the average annual total returns presented for the Class C shares shown above.
4 The Portfolio offers Class Y shares to a limited group of eligible investors, including certain qualifying retirement plans. Class Y shares do not bear initial or contingent deferred sales charges or ongoing 12b-1 service and distribution fees.
5 Class P shares do not bear initial or contingent deferred sales charges or ongoing 12b-1 service and distribution fees, but are subject to a maximum annual PACE Select program fee of 2% of the value of Class P shares. Prior to June 14, 2010, the maximum annual PACE Select program fee was 1.5% of the value of Class P shares; however, the current maximum annual PACE Select program fee of 2% is reflected in the performance returns throughout all periods in the average annual total returns presented for the Class P shares shown above.
6 Assumes the conversion of Class B to Class A shares at the end of the sixth year.
7 The Barclays Capital Global Aggregate ex US Index is an unmanaged index which provides a broad-based measure of the global investment-grade fixed income markets excluding the US market. The two major components of this Index are the Pan-European Aggregate and the Asian-Pacific Aggregate Indices. The Index also includes Eurodollar and Euro-Yen corporate bonds, Canadian government, agency and corporate securities. Investors should note that indices do not reflect the deduction of fees and expenses.
If an investor sells or exchanges shares less than 90 days after purchase, a redemption fee of 1.00% of the amount sold or exchanged will be deducted at the time of the transaction, except as noted otherwise in the prospectuses.
Past performance does not predict future performance, and the performance information provided does not reflect the deduction of taxes that a shareholder would pay on Portfolio distributions or the redemption of Portfolio shares. The return and principal value of an investment will fluctuate, so that an investor's shares, when redeemed, may be worth more or less than their original cost. Performance results assume reinvestment of all dividends and capital gain distributions at net asset value on the ex-dividend dates. Current performance may be higher or lower than the performance data quoted. For month-end performance figures, please visit http://www.ubs.com.
Lipper peer group data calculated by Lipper Inc.; used with permission. The Lipper median is the return of the fund that places in the middle of a Lipper peer group.
75
PACE Select Advisors Trust
PACE International Fixed Income Investments
Portfolio statistics (unaudited)
| Characteristics | | 07/31/11 | |
| Weighted average duration | | | 6.2 yrs. | | |
| Weighted average maturity | | | 8.8 yrs. | | |
| Average coupon | | | 4.32 | % | |
| Net assets (mm) | | $ | 577.7 | | |
| Number of holdings | | | 117 | | |
| Portfolio composition1 | | 07/31/11 | |
| Long-term global debt securities | | | 97.1 | % | |
| Futures and forward foreign currency contracts | | | 0.4 | | |
| Cash equivalents and other assets less liabilities | | | 2.5 | | |
| Total | | | 100.0 | % | |
| Quality diversification1 | | 07/31/11 | |
| AAA | | | 17.5 | % | |
| AA | | | 12.6 | | |
| A | | | 25.3 | | |
| BBB | | | 2.9 | | |
| BB | | | 1.3 | | |
| B | | | 0.2 | | |
| Non-rated | | | 37.3 | | |
| Futures and forward foreign currency contracts | | | 0.4 | | |
| Cash equivalents and other assets less liabilities | | | 2.5 | | |
| Total | | | 100.0 | % | |
| Top five countries of incorporation1 | | 07/31/11 | |
| Japan | | | 22.6 | % | |
| United Kingdom | | | 13.7 | | |
| United States | | | 11.0 | | |
| France | | | 7.6 | | |
| Canada | | | 7.5 | | |
| Total | | | 62.4 | % | |
1 Weightings represent percentages of the Portfolio's net assets as of July 31, 2011. The Portfolio is actively managed and its composition will vary over time. Credit quality ratings shown are based on the ratings assigned to portfolio holdings by Standard & Poor's Ratings Group, an independent rating agency.
76
PACE Select Advisors Trust
PACE International Fixed Income Investments
Portfolio of investments—July 31, 2011
| | | Face
amount1 | | Value | |
| Long-term global debt securities—97.11% | |
| Austria—0.18% | |
Sappi Papier Holding GmbH
6.625%, due 04/15/212,3 | | | 1,050,000 | | | $ | 1,034,250 | | |
| British Virgin Islands—0.54% | |
CNOOC Finance 2011 Ltd.
4.250%, due 01/26/212 | | | 3,100,000 | | | | 3,147,653 | | |
| Canada—7.46% | |
Canadian Government Bond
3.250%, due 06/01/21 | | | 12,050,000 | | | | 13,110,027 | | |
| 3.750%, due 06/01/19 | | | 10,040,000 | | | | 11,403,220 | | |
| 5.750%, due 06/01/33 | | | 4,460,000 | | | | 6,471,656 | | |
Cards II Trust
3.048%, due 05/15/13 | | | 3,100,000 | | | | 3,313,037 | | |
| 3.333%, due 05/15/16 | | | 2,300,000 | | | | 2,464,270 | | |
Toronto-Dominion Bank
5.375%, due 05/14/15 | | EUR | 4,000,000 | | | | 6,327,846 | | |
| | | | 43,090,056 | | |
| Cayman Islands—0.06% | |
UPCB Finance Ltd.
7.625%, due 01/15/204 | | EUR | 250,000 | | | | 362,817 | | |
| Denmark—0.71% | |
Kingdom of Denmark
4.000%, due 11/15/15 | | | 19,660,000 | | | | 4,126,274 | | |
| France—7.59% | |
BNP Paribas Home Loan
Covered Bonds SA
2.200%, due 11/02/152 | | USD | 3,900,000 | | | | 3,867,213 | | |
Caisse d'Amortissement de la
Dette Sociale
3.625%, due 04/25/15 | | | 10,325,000 | | | | 15,601,047 | | |
Electricite De France
5.375%, due 05/29/20 | | | 1,000,000 | | | | 1,617,903 | | |
GDF Suez
2.750%, due 10/18/17 | | | 1,800,000 | | | | 2,551,073 | | |
Pernod-Ricard SA
4.875%, due 03/18/16 | | | 950,000 | | | | 1,397,133 | | |
Republic of France
4.000%, due 04/25/55 | | | 1,250,000 | | | | 1,853,115 | | |
| 5.750%, due 10/25/32 | | | 2,520,000 | | | | 4,665,568 | | |
Sanofi
2.625%, due 03/29/16 | | USD | 4,100,000 | | | | 4,243,291 | | |
Societe Generale
4.000%, due 07/07/16 | | | 3,750,000 | | | | 5,649,213 | | |
| 5.250%, due 03/28/13 | | | 1,000,000 | | | | 1,492,757 | | |
| 6.125%, due 08/20/18 | | | 600,000 | | | | 922,822 | | |
| | | | 43,861,135 | | |
| Germany—5.43% | |
Bayerische Landesbank
4.000%, due 01/16/12 | | | 7,340,000 | | | | 10,657,013 | | |
Bundesrepublik Deutschland,
Series 08
4.750%, due 07/04/40 | | | 3,034,000 | | | | 5,516,578 | | |
Series 98
5.625%, due 01/04/28 | | | 3,600,000 | | | | 6,737,052 | | |
| | | Face
amount1 | | Value | |
| Long-term global debt securities—(Continued) | |
| Germany—(Concluded) | |
Deutsche Bank AG
3.625%, due 03/09/175 | | | 2,250,000 | | | $ | 3,164,102 | | |
Kabel BW Erste Beteiligungs
GmbH/Kabel Baden-Wurttemberg
GmbH & Co. KG
5.721%, due 03/15/184,5 | | | 750,000 | | | | 1,077,674 | | |
NRW Bank
3.875%, due 01/27/20 | | | 2,300,000 | | | | 3,467,907 | | |
Unitymedia Hessen GmbH & Co.
KG/Unitymedia NRW GmbH
8.125%, due 12/01/174 | | | 500,000 | | | | 748,984 | | |
| | | | 31,369,310 | | |
| Italy—3.55% | |
Buoni Poliennali Del Tesoro
4.500%, due 02/01/20 | | | 7,200,000 | | | | 9,611,132 | | |
| 4.750%, due 09/01/21 | | | 8,250,000 | | | | 10,886,150 | | |
| | | | 20,497,282 | | |
| Japan—22.63% | |
Bank of Tokyo-Mitsubishi UFJ Ltd.
3.850%, due 01/22/152 | | USD | 1,900,000 | | | | 2,024,612 | | |
Development Bank of Japan
1.750%, due 03/17/17 | | | 130,000,000 | | | | 1,796,545 | | |
| 2.300%, due 03/19/26 | | | 500,000,000 | | | | 7,101,150 | | |
Government of Japan
0.700%, due 09/20/14 | | | 2,733,000,000 | | | | 36,028,029 | | |
| 1.000%, due 12/20/12 | | | 1,640,000,000 | | | | 21,549,687 | | |
| 2.000%, due 03/20/16 | | | 1,976,000,000 | | | | 27,611,998 | | |
| 2.000%, due 12/20/24 | | | 685,000,000 | | | | 9,491,990 | | |
| 2.200%, due 09/20/26 | | | 159,700,000 | | | | 2,236,113 | | |
| 2.300%, due 06/20/35 | | | 1,177,000,000 | | | | 16,241,438 | | |
| 2.300%, due 12/20/36 | | | 480,000,000 | | | | 6,618,962 | | |
| | | | 130,700,524 | | |
| Luxembourg—1.50% | |
Gazprom Via Gaz Capital SA
4.560%, due 12/09/12 | | | 3,200,000 | | | | 4,706,238 | | |
| 8.125%, due 02/04/15 | | | 2,000,000 | | | | 3,258,888 | | |
Prologis International Funding SA
7.625%, due 10/23/146 | | | 450,000 | | | | 676,025 | | |
| | | | 8,641,151 | | |
| Malaysia—0.15% | |
Malaysia Government Bond,
Series 0902
4.378%, due 11/29/19 | | | 2,500,000 | | | | 874,326 | | |
| Mexico—5.09% | |
Mexican Bonos
6.500%, due 06/10/21 | | | 83,800,000 | | | | 7,020,835 | | |
| 8.000%, due 06/11/20 | | | 95,000,000 | | | | 8,857,909 | | |
| 8.500%, due 12/13/18 | | | 140,200,000 | | | | 13,506,073 | | |
| | | | 29,384,817 | | |
77
PACE Select Advisors Trust
PACE International Fixed Income Investments
Portfolio of investments—July 31, 2011
| | | Face
amount1 | | Value | |
| Long-term global debt securities—(Continued) | |
| Netherlands—3.18% | |
Bank Nederlandse Gemeenten
4.375%, due 01/19/15 | | GBP | 660,000 | | | $ | 1,174,915 | | |
BMW Finance N.V.
4.000%, due 09/17/14 | | | 600,000 | | | | 897,887 | | |
Government of the
Netherlands
5.500%, due 01/15/28 | | | 1,830,500 | | | | 3,327,233 | | |
ING Bank N.V.
1.652%, due 06/09/144,5 | | USD | 3,150,000 | | | | 3,148,236 | | |
| 6.125%, due 05/29/235 | | | 800,000 | | | | 1,184,637 | | |
Netherlands Government Bond
4.000%, due 01/15/37 | | | 2,750,000 | | | | 4,319,987 | | |
Schlumberger Finance BV
2.750%, due 12/01/15 | | | 1,400,000 | | | | 2,019,748 | | |
Urenco Finance N.V.
5.375%, due 05/22/15 | | | 1,500,000 | | | | 2,329,230 | | |
| | | | 18,401,873 | | |
| Norway—1.02% | |
DnB NOR Boligkreditt
3.375%, due 01/20/17 | | EUR | 4,000,000 | | | | 5,872,728 | | |
| Poland—0.25% | |
Poland Government Bond,
Series 1019
5.500%, due 10/25/19 | | | 4,050,000 | | | | 1,436,437 | | |
| Singapore—1.27% | |
DBS Bank Ltd.
2.375%, due 09/14/15 | | USD | 950,000 | | | | 951,957 | | |
| 5.000%, due 11/15/192,5 | | USD | 2,400,000 | | | | 2,564,043 | | |
Oversea-Chinese Banking
Corp., Ltd.
4.250%, due 11/18/195 | | USD | 2,300,000 | | | | 2,399,746 | | |
United Overseas Bank Ltd.
5.375%, due 09/03/192,5 | | USD | 1,300,000 | | | | 1,397,995 | | |
| | | | 7,313,741 | | |
| South Korea—3.86% | |
Korea Treasury Bond
5.750%, due 09/10/18 | | | 21,318,210,000 | | | | 22,275,336 | | |
| Spain—2.95% | |
Spain Government Bond
5.500%, due 04/30/21 | | | 12,450,000 | | | | 17,020,866 | | |
| Supranational—1.11% | |
European Investment Bank
6.000%, due 12/07/28 | | GBP | 3,200,000 | | | | 6,437,667 | | |
| Sweden—3.20% | |
Government of Sweden
4.250%, due 03/12/19 | | | 14,830,000 | | | | 2,648,699 | | |
Nordea Bank AB
4.000%, due 09/30/165 | | EUR | 1,900,000 | | | | 2,733,052 | | |
Nordea Hypotek AB
3.500%, due 01/18/17 | | EUR | 2,100,000 | | | | 3,095,940 | | |
| | | Face
amount1 | | Value | |
| Long-term global debt securities—(Continued) | |
| Sweden—(Concluded) | |
Skandinaviska Enskilda
Banken AB
4.500%, due 04/25/13 | | EUR | 3,880,000 | | | $ | 5,787,494 | | |
Vattenfall AB
6.250%, due 03/17/21 | | EUR | 2,450,000 | | | | 4,230,944 | | |
| | | | 18,496,129 | | |
| Switzerland—0.71% | |
Credit Suisse London
5.125%, due 09/18/17 | | EUR | 2,650,000 | | | | 4,101,062 | | |
| United Kingdom—13.72% | |
Abbey National Treasury
Services PLC
3.625%, due 10/14/16 | | EUR | 2,000,000 | | | | 2,873,333 | | |
| 5.750%, due 03/02/264 | | | 3,250,000 | | | | 5,689,246 | | |
Anglian Water Services
Finance PLC
6.250%, due 06/27/16 | | EUR | 900,000 | | | | 1,483,440 | | |
Aviva PLC
5.250%, due 10/02/235 | | EUR | 1,900,000 | | | | 2,736,934 | | |
Barclays Bank PLC
1.286%, due 01/13/145 | | USD | 2,600,000 | | | | 2,605,252 | | |
| 4.000%, due 10/07/19 | | EUR | 1,900,000 | | | | 2,803,123 | | |
| 4.500%, due 03/04/195 | | EUR | 1,450,000 | | | | 2,045,880 | | |
Diageo Finance PLC
6.625%, due 12/05/14 | | EUR | 1,900,000 | | | | 3,073,589 | | |
First Hydro Finance PLC
9.000%, due 07/31/21 | | | 700,000 | | | | 1,373,074 | | |
HSBC Bank PLC
1.050%, due 01/17/144,5 | | USD | 3,000,000 | | | | 3,006,990 | | |
HSBC Holdings PLC
6.250%, due 03/19/18 | | EUR | 4,000,000 | | | | 6,222,561 | | |
National Grid Gas PLC
5.125%, due 05/14/13 | | EUR | 1,700,000 | | | | 2,558,514 | | |
Nationwide Building Society
4.375%, due 02/28/22 | | EUR | 3,750,000 | | | | 5,448,771 | | |
Network Rail Infrastructure
Finance PLC
4.875%, due 11/27/15 | | | 705,000 | | | | 1,306,462 | | |
Royal Bank of Scotland
Group PLC
5.250%, due 05/15/13 | | EUR | 1,350,000 | | | | 1,992,761 | | |
Royal Bank of Scotland PLC
4.875%, due 08/25/142 | | USD | 3,000,000 | | | | 3,149,832 | | |
Scottish & Southern
Energy PLC
6.125%, due 07/29/13 | | EUR | 900,000 | | | | 1,382,168 | | |
Standard Chartered Bank
3.625%, due 02/03/175 | | EUR | 1,400,000 | | | | 2,001,647 | | |
Standard Chartered PLC
3.625%, due 12/15/15 | | EUR | 4,500,000 | | | | 6,580,192 | | |
United Kingdom
Treasury Bonds
4.250%, due 12/07/55 | | | 3,770,000 | | | | 6,525,532 | | |
78
PACE Select Advisors Trust
PACE International Fixed Income Investments
Portfolio of investments—July 31, 2011
| | | Face
amount1 | | Value | |
| Long-term global debt securities—(Continued) | |
| United Kingdom—(Concluded) | |
United Kingdom Treasury
Inflation Linked Bonds
1.250%, due 11/22/17 | | | 7,708,646 | | | $ | 14,371,694 | | |
| | | | 79,230,995 | | |
| United States—10.95% | |
ABB Treasury Center USA, Inc.
2.500%, due 06/15/162 | | | 2,350,000 | | | | 2,388,822 | | |
Ball Corp.
6.750%, due 09/15/20 | | | 1,050,000 | | | | 1,123,500 | | |
BMW US Capital LLC
5.000%, due 05/28/15 | | EUR | 600,000 | | | | 931,624 | | |
Boeing Capital Corp.
2.125%, due 08/15/16 | | | 1,650,000 | | | | 1,660,768 | | |
Celanese US Holdings LLC
6.625%, due 10/15/18 | | | 650,000 | | | | 702,000 | | |
Citigroup, Inc.
1.111%, due 02/15/135 | | | 3,000,000 | | | | 3,000,063 | | |
| 6.000%, due 08/15/17 | | | 1,800,000 | | | | 2,003,695 | | |
CONSOL Energy, Inc.
8.250%, due 04/01/20 | | | 1,050,000 | | | | 1,168,125 | | |
Daimler Finance N.A. LLC
0.856%, due 03/28/142,5 | | | 2,500,000 | | | | 2,500,867 | | |
Ford Motor Credit Co. LLC
5.750%, due 02/01/21 | | | 1,200,000 | | | | 1,225,714 | | |
Georgia-Pacific LLC
8.000%, due 01/15/24 | | | 500,000 | | | | 616,555 | | |
HSBC Bank USA N.A.
4.875%, due 08/24/20 | | | 1,400,000 | | | | 1,409,338 | | |
IBM Corp.
5.700%, due 09/14/17 | | | 4,200,000 | | | | 4,992,078 | | |
Johnson & Johnson
4.750%, due 11/06/19 | | EUR | 3,350,000 | | | | 5,333,333 | | |
JPMorgan Chase Bank N.A.
6.000%, due 10/01/17 | | | 4,850,000 | | | | 5,462,681 | | |
New York Life Global Funding
2.450%, due 07/14/162 | | | 2,800,000 | | | | 2,844,747 | | |
OBP Depositor LLC Trust,
Series 2010-OBP, Class A
4.646%, due 07/15/452 | | | 700,000 | | | | 742,976 | | |
Pfizer, Inc.
5.750%, due 06/03/21 | | EUR | 3,900,000 | | | | 6,558,617 | | |
Philip Morris International, Inc.
5.650%, due 05/16/18 | | | 1,200,000 | | | | 1,397,644 | | |
| 6.875%, due 03/17/14 | | | 1,800,000 | | | | 2,071,597 | | |
| | | Face
amount1 | | Value | |
| Long-term global debt securities—(Concluded) | |
| United States—(Concluded) | |
PNC Funding Corp.
5.125%, due 02/08/20 | | | 2,550,000 | | | $ | 2,781,588 | | |
Procter & Gamble Co.
4.500%, due 05/12/14 | | EUR | 3,700,000 | | | | 5,628,932 | | |
Roche Holdings, Inc.
6.500%, due 03/04/21 | | EUR | 2,900,000 | | | | 5,169,207 | | |
Teva Pharmaceutical
Finance III BV
0.747%, due 03/21/145 | | | 1,550,000 | | | | 1,560,653 | | |
| | | | 63,275,124 | | |
Total long-term global
debt securities
(cost—$516,153,677) | | | | | | | 560,951,553 | | |
| Repurchase agreement—0.83% | |
Repurchase agreement dated
07/29/11 with State Street
Bank & Trust Co., 0.010%
due 08/01/11, collateralized
by $23,931 Federal Home
Loan Mortgage Corp.
obligations, 5.125% due
07/15/12, $3,439,624 US
Treasury Bills, zero coupon due
08/04/11 and $1,356,580 US
Treasury Notes, 2.375% to 2.625%
due 02/29/16 to 07/31/17;
(value—$4,906,252);
proceeds: $4,810,004
(cost—$4,810,000) | | | 4,810,000 | | | | 4,810,000 | | |
| | | Number of
shares | | | |
Investment of cash collateral from
securities loaned—0.01% | |
| Money market fund—0.01% | |
UBS Private Money Market Fund LLC7
(cost—$65,600) | | | 65,600 | | | | 65,600 | | |
Total investments
(cost—$521,029,277)—
97.95% | | | | | | | 565,827,153 | | |
Other assets in excess
of liabilities—2.05% | | | | | | | 11,834,627 | | |
| Net assets—100.00% | | $ | 577,661,780 | | |
Aggregate cost for federal income tax purposes was $523,099,313; and net unrealized appreciation consisted of:
| Gross unrealized appreciation | | $ | 46,261,579 | | |
| Gross unrealized depreciation | | | (3,533,739 | ) | |
| Net unrealized appreciation | | $ | 42,727,840 | | |
For a listing of defined portfolio acronyms and currency abbreviations that are used throughout the Portfolio of investments as well as the tables that follow, please refer to page 227.
79
PACE Select Advisors Trust
PACE International Fixed Income Investments
Portfolio of investments—July 31, 2011
Note: The portfolio of investments is listed by the issuer's country of incorporation.
1 In local currency unless otherwise indicated.
2 Security exempt from registration pursuant to Rule 144A under the Securities Act of 1933. These securities, which represent 4.44% of net assets as of July 31, 2011, are considered liquid and may be resold in transactions exempt from registration, normally to qualified institutional buyers.
3 Security, or portion thereof, was on loan at July 31, 2011.
4 Security exempt from registration pursuant to Regulation S under the Securities Act of 1933. Regulation S applies to securities offerings that are made outside of the United States and do not involve direct selling efforts in the United States. At July 31, 2011, the value of these securities amounted to 2.43% of net assets.
5 Variable or floating rate security. The interest rate shown is the current rate as of July 31, 2011 and changes periodically.
6 Step bond that converts to the noted fixed rate at a designated future date.
7 The table below details the Portfolio's transaction activity in an affiliated issuer during the year ended July 31, 2011. The investment manager earns a management fee from UBS Private Money Market Fund LLC.
| Security description | | Value at
07/31/10 | | Purchases
during the
year ended
07/31/11 | | Sales
during the
year ended
07/31/11 | | Value at
07/31/11 | | Net income
earned from
affiliate for the
year ended
07/31/11 | |
| UBS Private Money Market Fund LLC | | $ | — | | | $ | 1,121,038 | | | $ | 1,055,438 | | | $ | 65,600 | | | $ | 19 | | |
Futures contracts
Number of
contracts | | Currency | |
| | Expiration
date | | Cost | | Current
value | | Unrealized
appreciation
(depreciation) | |
| US Treasury futures buy contracts: | | | |
| | 5 | | | USD | | | | US Treasury Bond 30 Year Futures | | September 2011 | | $ | 630,479 | | | $ | 640,625 | | | $ | 10,146 | | |
| Interest rate futures buy contracts: | | | |
| | 146 | | | AUD | | | | Australian Bond 10 Year Futures | | September 2011 | | | 17,086,504 | | | | 17,564,991 | | | | 478,487 | | |
| | 233 | | | CAD | | | | Canada Government Bond 10 Year Futures | | September 2011 | | | 30,235,873 | | | | 31,099,184 | | | | 863,311 | | |
| | 77 | | | EUR | | | | German Euro BOBL Futures | | September 2011 | | | 12,864,350 | | | | 13,218,141 | | | | 353,791 | | |
| | 160 | | | EUR | | | | German Euro Bund Futures | | September 2011 | | | 28,837,602 | | | | 29,959,857 | | | | 1,122,255 | | |
| | 86 | | | EUR | | | | German Euro Schatz Futures | | September 2011 | | | 13,266,702 | | | | 13,395,019 | | | | 128,317 | | |
| | | | | | | | | | | $ | 102,921,510 | | | $ | 105,877,817 | | | $ | 2,956,307 | | |
| | | | | | | | Proceeds | | | | | |
| US Treasury futures sell contracts: | | | |
| | 137 | | | USD | | | | US Treasury Note 2 Year Futures | | September 2011 | | $ | 29,980,163 | | | $ | 30,129,297 | | | $ | (149,134 | ) | |
| | 256 | | | USD | | | | US Treasury Note 5 Year Futures | | September 2011 | | | 30,363,736 | | | | 31,090,000 | | | | (726,264 | ) | |
| | 613 | | | USD | | | | US Treasury Note 10 Year Futures | | September 2011 | | | 74,598,013 | | | | 77,046,438 | | | | (2,448,425 | ) | |
| Interest rate futures sell contracts: | | | |
| | 24 | | | GBP | | | | United Kingdom Long Gilt 10 Year Futures | | September 2011 | | | 4,731,805 | | | | 4,932,549 | | | | (200,744 | ) | |
| | 2 | | | JPY | | | | Japan Government Bond 10 Year Futures | | September 2011 | | | 3,652,529 | | | | 3,680,072 | | | | (27,543 | ) | |
| | | | | | | | | | | $ | 143,326,246 | | | $ | 146,878,356 | | | $ | (3,552,110 | ) | |
| | | | | | | | | | | | | | | $ | (595,803 | ) | |
80
PACE Select Advisors Trust
PACE International Fixed Income Investments
Portfolio of investments—July 31, 2011
Forward foreign currency contracts
| Counterparty | | Contracts to
deliver | | In
exchange for | | Maturity
date | | Unrealized
appreciation
(depreciation) | |
| Barclays Bank PLC | | KRW | 1,238,591,000 | | | USD | 1,133,826 | | | 12/01/11 | | $ | (31,752 | ) | |
| Barclays Bank PLC | | PLN | 8,892,387 | | | USD | 3,232,079 | | | 08/10/11 | | | 38,833 | | |
| Barclays Bank PLC | | PLN | 8,949,201 | | | USD | 3,211,639 | | | 10/12/11 | | | 18,478 | | |
| Barclays Bank PLC | | USD | 50,792 | | | DKK | 259,709 | | | 08/10/11 | | | (711 | ) | |
| Barclays Bank PLC | | USD | 2,817,494 | | | KRW | 3,031,060,000 | | | 12/01/11 | | | 34,888 | | |
| Barclays Bank PLC | | USD | 3,211,639 | | | PLN | 8,892,387 | | | 08/10/11 | | | (18,393 | ) | |
| Citibank N.A. | | AUD | 10,010,667 | | | CAD | 10,236,607 | | | 10/12/11 | | | (203,863 | ) | |
| Citibank N.A. | | AUD | 31,079,155 | | | USD | 33,888,429 | | | 08/10/11 | | | (225,034 | ) | |
| Citibank N.A. | | CAD | 10,302,978 | | | AUD | 10,010,667 | | | 08/10/11 | | | 206,539 | | |
| Citibank N.A. | | CAD | 1,409,295 | | | USD | 1,454,000 | | | 08/10/11 | | | (20,748 | ) | |
| Citibank N.A. | | CAD | 10,389,872 | | | USD | 10,929,000 | | | 10/12/11 | | | 71,801 | | |
| Citibank N.A. | | EUR | 2,672,789 | | | GBP | 2,361,142 | | | 08/10/11 | | | 35,516 | | |
| Citibank N.A. | | GBP | 2,358,536 | | | EUR | 2,672,789 | | | 10/12/11 | | | (34,531 | ) | |
| Citibank N.A. | | GBP | 39,000 | | | USD | 62,735 | | | 08/10/11 | | | (1,275 | ) | |
| Citibank N.A. | | GBP | 13,000 | | | USD | 21,205 | | | 10/12/11 | | | (118 | ) | |
| Citibank N.A. | | JPY | 2,021,913,465 | | | USD | 25,873,504 | | | 08/10/11 | | | (393,047 | ) | |
| Citibank N.A. | | MXN | 110,814,438 | | | USD | 9,425,000 | | | 10/12/11 | | | 44,724 | | |
| Citibank N.A. | | NOK | 103,915,948 | | | USD | 19,354,805 | | | 08/10/11 | | | 64,226 | | |
| Citibank N.A. | | USD | 10,513,181 | | | AUD | 9,943,687 | | | 08/10/11 | | | 401,325 | | |
| Citibank N.A. | | USD | 33,467,544 | | | AUD | 30,935,189 | | | 10/12/11 | | | 218,674 | | |
| Citibank N.A. | | USD | 1,058,583 | | | CAD | 1,035,214 | | | 08/10/11 | | | 24,709 | | |
| Citibank N.A. | | USD | 4,723,064 | | | CNY | 30,400,000 | | | 12/01/11 | | | 4,778 | | |
| Citibank N.A. | | USD | 39,696,108 | | | EUR | 27,457,383 | | | 08/10/11 | | | (249,419 | ) | |
| Citibank N.A. | | USD | 746,180 | | | EUR | 516,347 | | | 10/12/11 | | | (5,505 | ) | |
| Citibank N.A. | | USD | 13,569,744 | | | JPY | 1,094,383,834 | | | 08/10/11 | | | 647,327 | | |
| Citibank N.A. | | USD | 25,839,648 | | | JPY | 2,018,321,997 | | | 10/12/11 | | | 399,405 | | |
| Citibank N.A. | | USD | 1,061,224 | | | MXN | 12,620,688 | | | 08/10/11 | | | 13,248 | | |
| Citibank N.A. | | USD | 19,211,675 | | | NOK | 103,915,948 | | | 08/10/11 | | | 78,905 | | |
| Citibank N.A. | | USD | 19,354,805 | | | NOK | 104,341,754 | | | 10/12/11 | | | (62,800 | ) | |
| Citibank N.A. | | USD | 976,742 | | | NZD | 1,207,643 | | | 08/10/11 | | | 84,088 | | |
| Credit Suisse London Branch | | CAD | 10,920,000 | | | AUD | 10,639,801 | | | 08/10/11 | | | 251,418 | | |
| Credit Suisse London Branch | | CHF | 6,659,682 | | | USD | 8,300,738 | | | 08/10/11 | | | (161,766 | ) | |
| Credit Suisse London Branch | | EUR | 2,983,807 | | | USD | 4,311,900 | | | 08/10/11 | | | 25,209 | | |
| Credit Suisse London Branch | | JPY | 106,627,547 | | | USD | 1,355,513 | | | 08/10/11 | | | (29,679 | ) | |
| Credit Suisse London Branch | | MXN | 10,355,490 | | | USD | 883,725 | | | 08/10/11 | | | 2,102 | | |
| Credit Suisse London Branch | | MXN | 104,335,060 | | | USD | 8,909,150 | | | 10/12/11 | | | 77,344 | | |
| Credit Suisse London Branch | | NZD | 1,207,643 | | | USD | 1,050,770 | | | 08/10/11 | | | (10,059 | ) | |
| Credit Suisse London Branch | | PLN | 12,027,334 | | | USD | 4,343,880 | | | 08/10/11 | | | 24,878 | | |
| Credit Suisse London Branch | | SGD | 1,909,131 | | | USD | 1,586,448 | | | 08/10/11 | | | 895 | | |
| Credit Suisse London Branch | | USD | 17,364,281 | | | CAD | 17,004,667 | | | 08/10/11 | | | 430,142 | | |
| Credit Suisse London Branch | | USD | 7,903,260 | | | CHF | 6,659,682 | | | 08/10/11 | | | 559,244 | | |
| Credit Suisse London Branch | | USD | 8,300,738 | | | CHF | 6,656,362 | | | 10/12/11 | | | 165,424 | | |
| Credit Suisse London Branch | | USD | 1,726,013 | | | EUR | 1,204,000 | | | 08/10/11 | | | 3,715 | | |
| Credit Suisse London Branch | | USD | 8,909,150 | | | MXN | 103,711,419 | | | 08/10/11 | | | (79,600 | ) | |
| Credit Suisse London Branch | | USD | 1,046,181 | | | NZD | 1,207,643 | | | 10/12/11 | | | 9,784 | | |
81
PACE Select Advisors Trust
PACE International Fixed Income Investments
Portfolio of investments—July 31, 2011
Forward foreign currency contracts—(Concluded)
| Counterparty | | Contracts to
deliver | | In
exchange for | | Maturity
date | | Unrealized
appreciation
(depreciation) | |
| Credit Suisse London Branch | | USD | 8,060,795 | | | PHP | 348,710,000 | | | 12/01/11 | | $ | 132,255 | | |
| Credit Suisse London Branch | | USD | 4,372,304 | | | PLN | 12,027,334 | | | 08/10/11 | | | (53,302 | ) | |
| Credit Suisse London Branch | | USD | 4,343,880 | | | PLN | 12,099,008 | | | 10/12/11 | | | (26,837 | ) | |
| Credit Suisse London Branch | | USD | 1,586,448 | | | SGD | 1,908,814 | | | 10/12/11 | | | (924 | ) | |
| Deutsche Bank AG London | | GBP | 2,367,119 | | | USD | 3,863,304 | | | 08/10/11 | | | (21,889 | ) | |
| Deutsche Bank AG London | | PEN | 2,760,000 | | | USD | 989,070 | | | 12/01/11 | | | (13,048 | ) | |
| Deutsche Bank AG London | | USD | 4,542,772 | | | CAD | 4,353,393 | | | 08/10/11 | | | 12,808 | | |
| Deutsche Bank AG London | | USD | 1,733,655 | | | CLP | 826,000,000 | | | 12/01/11 | | | 45,611 | | |
| Deutsche Bank AG London | | USD | 1,078,523 | | | CNY | 6,950,000 | | | 12/01/11 | | | 2,349 | | |
| Deutsche Bank AG London | | USD | 220,426 | | | EUR | 151,991 | | | 08/10/11 | | | (2,068 | ) | |
| Deutsche Bank AG London | | USD | 991,593 | | | PEN | 2,760,000 | | | 12/01/11 | | | 10,525 | | |
| Deutsche Bank AG London | | USD | 1,548,890 | | | SGD | 1,909,131 | | | 08/10/11 | | | 36,662 | | |
| JPMorgan Chase Bank | | EUR | 5,963,150 | | | USD | 8,479,750 | | | 08/10/11 | | | (87,218 | ) | |
| JPMorgan Chase Bank | | GBP | 35,136 | | | USD | 56,748 | | | 08/10/11 | | | (921 | ) | |
| JPMorgan Chase Bank | | MXN | 105,976,617 | | | USD | 8,861,069 | | | 08/10/11 | | | (161,331 | ) | |
| JPMorgan Chase Bank | | USD | 243,744 | | | CAD | 239,000 | | | 08/10/11 | | | 6,356 | | |
| JPMorgan Chase Bank | | USD | 2,532,629 | | | CNY | 16,300,000 | | | 12/01/11 | | | 2,365 | | |
| JPMorgan Chase Bank | | USD | 1,729,028 | | | EUR | 1,218,909 | | | 08/10/11 | | | 22,119 | | |
| JPMorgan Chase Bank | | USD | 91,173 | | | EUR | 64,000 | | | 10/12/11 | | | 632 | | |
| JPMorgan Chase Bank | | USD | 130,467 | | | GBP | 80,113 | | | 08/10/11 | | | 1,024 | | |
| JPMorgan Chase Bank | | USD | 12,518,661 | | | JPY | 1,004,901,675 | | | 08/10/11 | | | 535,954 | | |
| JPMorgan Chase Bank | | USD | 910,214 | | | MYR | 2,800,000 | | | 12/01/11 | | | 24,741 | | |
| JPMorgan Chase Bank | | USD | 3,598,385 | | | TWD | 102,500,000 | | | 12/01/11 | | | (36,766 | ) | |
| Morgan Stanley & Co. International PLC | | DKK | 16,024,490 | | | USD | 3,108,027 | | | 08/10/11 | | | 17,953 | | |
| Morgan Stanley & Co. International PLC | | EUR | 18,412,537 | | | USD | 26,592,491 | | | 08/10/11 | | | 140,093 | | |
| Morgan Stanley & Co. International PLC | | GBP | 2,000 | | | USD | 3,277 | | | 10/12/11 | | | (4 | ) | |
| Morgan Stanley & Co. International PLC | | JPY | 1,249,997 | | | USD | 15,490 | | | 08/10/11 | | | (748 | ) | |
| Morgan Stanley & Co. International PLC | | SEK | 21,869,176 | | | USD | 3,481,466 | | | 08/10/11 | | | 6,885 | | |
| Morgan Stanley & Co. International PLC | | USD | 143,385 | | | AUD | 134,001 | | | 08/10/11 | | | 3,698 | | |
| Morgan Stanley & Co. International PLC | | USD | 3,007,036 | | | DKK | 15,764,781 | | | 08/10/11 | | | 32,957 | | |
| Morgan Stanley & Co. International PLC | | USD | 301,731 | | | DKK | 1,556,690 | | | 10/12/11 | | | (1,990 | ) | |
| Morgan Stanley & Co. International PLC | | USD | 24,532,155 | | | EUR | 16,987,733 | | | 10/12/11 | | | (164,100 | ) | |
| Morgan Stanley & Co. International PLC | | USD | 377,758 | | | JPY | 30,505,500 | | | 08/10/11 | | | 18,537 | | |
| Morgan Stanley & Co. International PLC | | USD | 3,511,259 | | | SEK | 21,869,176 | | | 08/10/11 | | | (36,679 | ) | |
| Morgan Stanley & Co. International PLC | | USD | 3,481,466 | | | SEK | 21,946,465 | | | 10/12/11 | | | (6,474 | ) | |
| Royal Bank of Scotland PLC | | GBP | 4,000 | | | USD | 6,579 | | | 10/12/11 | | | 18 | | |
| Royal Bank of Scotland PLC | | USD | 371,347 | | | AUD | 351,000 | | | 08/10/11 | | | 13,922 | | |
| | | $ | 2,862,484 | | |
82
PACE Select Advisors Trust
PACE International Fixed Income Investments
Portfolio of investments—July 31, 2011
The following is a summary of the fair valuations according to the inputs used as of July 31, 2011 in valuing the Portfolio's investments:
| | | Unadjusted
quoted prices in
active markets for
identical investments
(Level 1) | | Other significant
observable inputs
(Level 2) | | Unobservable
inputs
(Level 3) | | Total | |
| Long-term global debt securities | | $ | — | | | $ | 560,951,553 | | | $ | — | | | $ | 560,951,553 | | |
| Repurchase agreement | | | — | | | | 4,810,000 | | | | — | | | | 4,810,000 | | |
| Investment of cash collateral from securities loaned | | | — | | | | 65,600 | | | | — | | | | 65,600 | | |
| Futures contracts, net | | | (595,803 | ) | | | — | | | | — | | | | (595,803 | ) | |
| Forward foreign currency contracts, net | | | — | | | | 2,862,484 | | | | — | | | | 2,862,484 | | |
| Total | | $ | (595,803 | ) | | $ | 568,689,637 | | | $ | — | | | $ | 568,093,834 | | |
Investments by type of issuer (unaudited)
| | | Percentage of total investments | |
| | | Long-term | | Short-term | |
| Government and other public issuers | | | 57.84 | % | | | — | | |
| Repurchase agreement | | | — | | | | 0.85 | % | |
| Banks and other financial institutions | | | 26.76 | | | | — | | |
| Industrial | | | 14.54 | | | | — | | |
| Investment of cash collateral from securities loaned | | | — | | | | 0.01 | | |
| | | | 99.14 | % | | | 0.86 | % | |
See accompanying notes to financial statements.
83
PACE Select Advisors Trust
PACE High Yield Investments
Performance
For the 12 months ended July 31, 2011, the Portfolio's Class P shares returned 10.30%, before the deduction of the maximum PACE Select program fee. (Class P shares returned 8.12%, after the deduction of the maximum PACE Select program fee, for the same 12-month period.) In comparison, the BofA Merrill Lynch Global High Yield Index (hedged in USD) (the "benchmark") returned 12.12%, and the Lipper High Current Yield Funds category posted a median return of 12.16%. (Returns for all share classes over various time periods are shown in the "Performance at a glance" table on page 87. Please note that the returns shown do not reflect the deduction of taxes that a shareholder would pay on Portfolio distributions or the redemption of Portfolio shares.) For a detailed commentary on the market environment in general during the reporting period, please refer to page 2.
Sub-Advisor's comments1
The Portfolio underperformed its benchmark during the reporting period. Our beta positioning helped relative performance in the first half of the reporting period, but detracted from results during the second half of the period. (Beta is a measure of volatility or risk relative to the market as a whole.)
We believe that the Portfolio has a beta slightly higher than the benchmark, and we have not changed this relative position since the third quarter of 2009. This stance was beneficial when the high yield market rallied during the first half of the period. However, our overweight exposure to autos and airlines were a drag on relative performance during the first quarter of 2011, as oil prices rose in response to unrest in the Middle East. In spite of this, Ford was our best performing issuer over the entire 12-month reporting period. General Motors, on the other hand, was the most significant laggard, and nearly offset the contribution from Ford.
The Portfolio's overweight in financials was a benefit during most of the fiscal year, but weighed heavily on relative results toward the end of the period due to concerns about European sovereign exposure and lower growth expectations. Non-European financials, such as Ally Financial and CIT Group, were among our top performers during the fiscal year, as they generally exceeded earnings expectations and recovered from the recession. Elsewhere, our exposure to housing and building materials companies were a drag on performance as the anticipated housing recovery did not take place. Among our poor-performing building materials companies were Texas Industries and US Concrete, the latter of which emerged from bankruptcy in the second half of 2010.
PACE Select Advisors Trust – PACE High Yield Investments
Investment Sub-Advisor:
MacKay Shields LLC ("MacKay Shields")
Portfolio Managers:
Dan Roberts, Taylor Wagenseil, Michael Kimble and Lou Cohen
Objective:
Total return
Investment process:
MacKay Shields attempts to deliver attractive risk-adjusted returns by avoiding most of the unusually large losses in the high yield market, even if it means giving up much of the large potential gains. MacKay Shields believes that there is a very small subset of bonds that delivers outsized gains in the market. Due to the limited upside inherent in most bonds, over time, outsized gains are expected to be smaller than unusually large losses. By attempting to limit the Portfolio's participation in the extremes of the market, MacKay Shields strives to add value over a market cycle with lower volatility. MacKay Shields seeks to do this through a rigorous process that attempts to screen out what it believes to be the riskiest issuers in the market.
1 All Sub-Advisors discuss performance on a gross of fees basis—meaning that no fees or expenses are reflected in their sleeves'/sleeve's performance. Alternately, Fund performance is shown net of fees, which does factor in fees and expenses associated with the Fund.
84
PACE Select Advisors Trust
PACE High Yield Investments
Sub-Advisor's comments – concluded
We are maintaining our current positioning relative to the benchmark because the economic recovery, in our view, is still on track, and we believe growth will continue at a slow pace. Our positive outlook is based on accommodative monetary policy and a recapitalized financial sector. In addition, the corporate health of issuers in the high yield market remains strong, with solid balance sheets, high cash levels, refinanced debt structures and record profits. Furthermore, high yield default rates, just under 2%, are well below their long term average of 4%. With high yield spreads currently in the 700 basis point (7%) range, we believe the market represents attractive value, and we continue to maintain a portfolio beta that is similar to, or slightly above, the benchmark. (Spread measures the difference in yield between a fixed income security and a government bond of similar duration.)
The Portfolio used currency forwards during the reporting period to hedge the currency exposure of the Portfolio into US dollars. Overall, the use of these derivatives during the period detracted from performance.
Special considerations
The Portfolio may be appropriate for long-term investors seeking total return and who are able to withstand short-term fluctuations in the fixed income markets in return for potentially higher returns over the long term. The Portfolio seeks to achieve its objective by investing primarily in a professionally managed, diversified portfolio of fixed income securities rated below investment grade or considered to be of comparable quality (commonly referred to as "junk bonds"). These securities are subject to higher risks than investment grade securities, including greater price volatility and a greater risk of loss of principal and nonpayment of interest. Issuers of such securities are typically in poor financial health, and their ability to pay interest and principal is uncertain. The prices of such securities may be more vulnerable to bad economic news, or even the expectation of bad news, than higher rated or investment grade bonds and other fixed income securities. The value of the Portfolio changes every day and can be affected by changes in interest rates, general market conditions and other political, social and economic developments, as well as specific matters relating to the issuers in which the Portfolio invests. In addition, investments in foreign bonds involve special risks. It is important to note that an investment in the Portfolio is only one component of a balanced investment plan.
85
PACE Select Advisors Trust
PACE High Yield Investments
Illustration of an assumed investment of $10,000 in Class P shares of the Portfolio (unaudited)
The following graph depicts the performance of PACE High Yield Investments Class P shares versus the BofA Merrill Lynch Global High Yield Index (hedged in USD) from April 30, 2006, which is the month-end after the inception date of the Class P shares, through July 31, 2011. The performance of the other classes will vary based upon the different class specific expenses and sales charges. The performance provided does not reflect the deduction of taxes that a shareholder would pay on Portfolio distributions or the redemption of Portfolio shares. Past performance is no guarantee of future results. Share price and returns will vary with market conditions; investors may realize a gain or loss upon redemption. It is important to note that PACE High Yield Investments is a professionally managed portfolio while the Index is not available for investment and is unmanaged. The comparison is shown for illustration purposes only.

86
PACE Select Advisors Trust
PACE High Yield Investments
Performance at a glance (unaudited)
| Average annual total returns for periods ended 07/31/11 | | 1 year | | 5 years | | Since
inception1 | |
| Before deducting | | Class A2 | | | 10.00 | % | | | 9.15 | % | | | 8.72 | % | |
| maximum sales charge | | Class C3 | | | 9.50 | % | | | N/A | | | | 22.98 | % | |
| or PACE Select | | Class Y4 | | | 10.24 | % | | | N/A | | | | 27.66 | % | |
| program fee | | Class P5 | | | 10.30 | % | | | 9.42 | % | | | 8.97 | % | |
After deducting
maximum sales charge | | Class A2 | | | 5.05 | % | | | 8.15 | % | | | 7.77 | % | |
| or PACE Select | | Class C3 | | | 8.75 | % | | | N/A | | | | 22.98 | % | |
| program fee | | Class P5 | | | 8.12 | % | | | 7.25 | % | | | 6.81 | % | |
| BofA Merrill Lynch Global High Yield Index (hedged in USD)6 | | | | | 12.12 | % | | | 9.33 | % | | | 9.03 | % | |
| Lipper High Current Yield Funds median | | | | | 12.16 | % | | | 7.38 | % | | | 7.05 | % | |
Average annual total returns for periods ended June 30, 2011, after deduction of the maximum sales charge or PACE Select program fee, were as follows: Class A—1-year period, 8.79%; 5-year period, 8.27%; since inception, 7.84%; Class C—1-year period, 12.60%; since inception, 23.73%; Class Y—1 year period, 14.11%; since inception, 28.54%; Class P—1-year period, 11.92%; 5-year period, 7.37%; since inception, 6.88%.
The annualized gross and net expense ratios, respectively, for each class of shares as in the November 28, 2010 prospectuses, were as follows: Class A—1.35% and 1.35%; Class B—2.06% and 2.06%; Class C—1.81% and 1.81%; Class Y—1.10% and 1.10%; and Class P—1.19% and 1.10%. Class B shares were not operational as of November 28, 2010. Therefore these amounts have been estimated. Net expenses reflect fee waivers and/or expense reimbursements, if any, pursuant to an agreement that is in effect to cap the expenses. The Portfolio and UBS Global Asset Management (Americas) Inc. ("UBS Global AM") have entered into a written fee waiver/expense reimbursement agreement pursuant to which UBS Global AM is contractually obligated to waive its management fees and/or reimburse expenses so that the Portfolio's ordinary total operating expenses through November 28, 2011 (excluding dividend expense, borrowing costs, and interest expense relating to short sales, and interest, taxes, brokerage commissions and extraordinary expenses) would not exceed Class A—1.35%; Class B—2.10%; Class C—1.85%; Class Y—1.10% and Class P—1.10%. The Portfolio has agreed to repay UBS Global AM for any waived fees/reimbursed expenses to the extent that it can do so over the following three fiscal years without causing the Portfolio's expenses in any of those three years to exceed these expense caps. The fee waiver/expense reimbursement agreement may be terminated by the Portfolio's board at any time and also will terminate automatically upon the expiration or termination of the Portfolio's advisory contract with UBS Global AM. Upon termination of the agreement, however, UBS Global AM's three year recoupment rights will survive.
1 Since inception returns are calculated as of commencement of issuance on April 10, 2006 for Class P shares, May 1, 2006 for Class A shares and January 21, 2009 for Class C shares. Class Y shares commenced issuance on April 3, 2006 and had fully redeemed by July 24, 2006 remaining inactive through December 25, 2008. The inception return of Class Y shares is calculated from December 26, 2008, which is the date the Class Y shares recommenced investment operations. Since inception returns for the Index and Lipper median are shown as of April 30, 2006, which is the month-end after the inception date of the oldest share class (Class P).
2 Maximum sales charge for Class A shares is 4.5%. Class A shares bear ongoing 12b-1 service fees.
3 Maximum contingent deferred sales charge for Class C shares is 0.75% imposed on redemptions and is reduced to 0% after one year. Class C shares bear ongoing 12b-1 service and distribution fees.
4 The Portfolio offers Class Y shares to a limited group of eligible investors, including certain qualifying retirement plans. Class Y shares do not bear initial or contingent deferred sales charges or ongoing 12b-1 service and distribution fees.
5 Class P shares do not bear initial or contingent deferred sales charges or ongoing 12b-1 service and distribution fees, but are subject to a maximum annual PACE Select program fee of 2% of the value of Class P shares. Prior to June 14, 2010, the maximum annual PACE Select program fee was 1.5% of the value of Class P shares; however, the current maximum annual PACE Select program fee of 2% is reflected in the performance returns throughout all periods in the average annual total returns presented for the Class P shares shown above.
6 The BofA Merrill Lynch Global High Yield Index (hedged in USD) is an unmanaged index which covers US dollar, Canadian dollar, sterling and euro-denominated fixed rate debt of corporate issuers domiciled in an investment grade rated country (i.e., BBB or higher foreign currency long-term debt rating). Individual bonds must be rated below investment grade (i.e., BB or lower based on a composite of Moody's and S&P) but not in default; and must have at least one year remaining term to maturity; a minimum face value outstanding of $100 million, C$50 million, 50 million pounds sterling or 50 million euros; and have available price quotations. New issues qualify for inclusion after they settle. Investors should note that indices do not reflect the deduction of fees and expenses.
If an investor sells or exchanges shares less than 90 days after purchase, a redemption fee of 1.00% of the amount sold or exchanged will be deducted at the time of the transaction, except as noted otherwise in the prospectuses.
Past performance does not predict future performance, and the performance information provided does not reflect the deduction of taxes that a shareholder would pay on Portfolio distributions or the redemption of Portfolio shares. The return and principal value of an investment will fluctuate, so that an investor's shares, when redeemed, may be worth more or less than their original cost. Performance results assume reinvestment of all dividends and capital gain distributions at net asset value on the ex-dividend dates. Current performance may be higher or lower than the performance data quoted. For month-end performance figures, please visit http://www.ubs.com.
Lipper peer group data calculated by Lipper Inc.; used with permission. The Lipper median is the return of the fund that places in the middle of a Lipper peer group.
87
PACE Select Advisors Trust
PACE High Yield Investments
Portfolio statistics (unaudited)
| Characteristics | | 07/31/11 | |
| Weighted average duration | | | 3.7 yrs. | | |
| Weighted average maturity | | | 4.5 yrs. | | |
| Average coupon | | | 7.05 | % | |
| Net assets (mm) | | $ | 277.9 | | |
| Number of holdings | | | 297 | | |
| Portfolio composition1 | | 07/31/11 | |
| Bonds and loan assignments | | | 94.7 | % | |
| Common stocks, preferred stock and warrants | | | 2.2 | | |
| Forward foreign currency contracts | | | (0.4 | ) | |
| Cash equivalents and other assets less liabilities | | | 3.5 | | |
| Total | | | 100.0 | % | |
| Quality diversification1 | | 07/31/11 | |
| BB & higher | | | 41.6 | % | |
| B | | | 36.1 | | |
| CCC & lower | | | 7.5 | | |
| Not rated | | | 11.7 | | |
| Forward foreign currency contracts | | | (0.4 | ) | |
| Cash equivalents and other assets less liabilities | | | 3.5 | | |
| Total | | | 100.0 | % | |
| Asset allocation1 | | 07/31/11 | |
| Corporate bonds | | | 88.0 | % | |
| Loan assignments | | | 3.6 | | |
| Asset-backed securities | | | 2.7 | | |
| Common stocks, preferred stock and warrants | | | 2.2 | | |
| Collateralized mortgage obligations | | | 0.4 | | |
| Forward foreign currency contracts | | | (0.4 | ) | |
| Cash equivalents and other assets less liabilities | | | 3.5 | | |
| Total | | | 100.0 | % | |
1 Weightings represent percentages of the Portfolio's net assets as of July 31, 2011. The Portfolio is actively managed and its composition will vary over time. Credit quality ratings shown are based on the ratings assigned to portfolio holdings by Standard & Poor's Ratings Group, an independent rating agency.
88
PACE Select Advisors Trust
PACE High Yield Investments
Portfolio of investments—July 31, 2011
| | | Face
amount1 | | Value | |
| Corporate bonds—88.00% | |
| Aerospace & defense—2.45% | |
Alliant Techsystems, Inc.
6.750%, due 04/01/16 | | | 55,000 | | | $ | 56,513 | | |
| 6.875%, due 09/15/20 | | | 2,150,000 | | | | 2,236,000 | | |
BE Aerospace, Inc.
6.875%, due 10/01/20 | | | 500,000 | | | | 537,500 | | |
| 8.500%, due 07/01/18 | | | 600,000 | | | | 662,250 | | |
Ducommun, Inc.
9.750%, due 07/15/182 | | | 1,115,000 | | | | 1,145,662 | | |
Hexcel Corp.
6.750%, due 02/01/15 | | | 453,000 | | | | 462,626 | | |
TransDigm, Inc.
7.750%, due 12/15/182 | | | 1,600,000 | | | | 1,704,000 | | |
| | | | 6,804,551 | | |
| Airlines—2.85% | |
American Airlines Pass
Through Trust 2001-01,
6.977%, due 05/23/21 | | | 356,673 | | | | 299,605 | | |
Class B
7.377%, due 05/23/19 | | | 254,956 | | | | 214,163 | | |
Continental Airlines Pass
Through Trust 2003-ERJ1,
Series RJ03
7.875%, due 07/02/18 | | | 875,214 | | | | 866,462 | | |
Continental Airlines Pass
Through Trust 2004-ERJ1,
Series RJ04
9.558%, due 09/01/19 | | | 789,498 | | | | 821,078 | | |
Continental Airlines Pass
Through Trust 2005-ERJ1,
Series ERJ1
9.798%, due 04/01/21 | | | 1,133,569 | | | | 1,173,244 | | |
Delta Air Lines, Inc.
12.250%, due 03/15/152,3,4 | | | 2,105,000 | | | | 2,344,444 | | |
Delta Air Lines Pass
Through Trust 2001-1,
Class B
7.711%, due 09/18/11 | | | 280,000 | | | | 281,736 | | |
Delta Air Lines Pass
Through Trust 2010-1,
Class B
6.375%, due 01/02/16 | | | 1,200,000 | | | | 1,140,000 | | |
United Air Lines Pass
Through Trust 2009-2A
9.750%, due 01/15/17 | | | 680,347 | | | | 772,194 | | |
| | | | 7,912,926 | | |
| Auto & truck—1.97% | |
Ford Holdings, Inc.
9.300%, due 03/01/30 | | | 1,145,000 | | | | 1,456,154 | | |
| 9.375%, due 03/01/20 | | | 285,000 | | | | 336,086 | | |
| | | Face
amount1 | | Value | |
| Corporate bonds—(Continued) | |
| Auto & truck—(Concluded) | |
Ford Motor Co.
6.625%, due 10/01/28 | | | 1,595,000 | | | $ | 1,629,029 | | |
General Motors Co.
8.375%, due 07/15/495,6* | | | 10,190,000 | | | | 216,538 | | |
Navistar International Corp.
8.250%, due 11/01/21 | | | 1,685,000 | | | | 1,832,437 | | |
| | | | 5,470,244 | | |
| Automotive parts—0.36% | |
Goodyear Tire & Rubber Co.
8.250%, due 08/15/204 | | | 420,000 | | | | 460,950 | | |
| 10.500%, due 05/15/16 | | | 475,000 | | | | 534,969 | | |
| | | | 995,919 | | |
| Banking-non-US—3.09% | |
Deutsche Postbank
Funding Trust IV
5.983%, due 06/29/177,8 | | EUR | 850,000 | | | | 995,412 | | |
EGG Banking PLC
7.500%, due 12/09/137,8 | | GBP | 1,560,000 | | | | 2,492,788 | | |
HBOS Capital Funding LP
6.461%, due 11/30/187,8 | | GBP | 1,400,000 | | | | 1,712,034 | | |
HT1 Funding GmbH
6.352%, due 06/30/177,8 | | EUR | 2,100,000 | | | | 2,249,538 | | |
IKB Deutsche Industriebank AG
4.500%, due 07/09/13 | | EUR | 1,000,000 | | | | 1,142,335 | | |
| | | | 8,592,107 | | |
| Banking-US—1.01% | |
Fifth Third Capital Trust IV
6.500%, due 04/15/378 | | | 1,600,000 | | | | 1,556,000 | | |
Wachovia Capital Trust III
5.570%, due 09/19/117,8 | | | 750,000 | | | | 699,375 | | |
Wells Fargo & Co., Series K
7.980%, due 06/15/187,8 | | | 525,000 | | | | 562,406 | | |
| | | | 2,817,781 | | |
| Beverages—0.45% | |
Constellation Brands, Inc.
7.250%, due 09/01/16 | | | 590,000 | | | | 650,475 | | |
| 7.250%, due 05/15/17 | | | 225,000 | | | | 246,375 | | |
| 8.375%, due 12/15/14 | | | 300,000 | | | | 344,250 | | |
| | | | 1,241,100 | | |
| Broadcast—0.73% | |
Clear Channel
Communications, Inc.
6.875%, due 06/15/18 | | | 730,000 | | | | 459,900 | | |
| 7.250%, due 10/15/27 | | | 445,000 | | | | 229,175 | | |
| 9.000%, due 03/01/212 | | | 775,000 | | | | 732,375 | | |
Clear Channel Worldwide
Holdings, Inc.
9.250%, due 12/15/17 | | | 550,000 | | | | 600,875 | | |
| | | | 2,022,325 | | |
89
PACE Select Advisors Trust
PACE High Yield Investments
Portfolio of investments—July 31, 2011
| | | Face
amount1 | | Value | |
| Corporate bonds—(Continued) | |
| Building & construction—2.91% | |
Beazer Homes USA, Inc.
8.125%, due 06/15/16 | | | 1,255,000 | | | $ | 1,073,025 | | |
D.R. Horton, Inc.
5.625%, due 01/15/16 | | | 195,000 | | | | 198,169 | | |
| 6.500%, due 04/15/16 | | | 255,000 | | | | 266,475 | | |
K. Hovnanian Enterprises, Inc.
6.500%, due 01/15/14 | | | 580,000 | | | | 475,600 | | |
| 10.625%, due 10/15/164 | | | 1,490,000 | | | | 1,381,975 | | |
Meritage Homes Corp.
6.250%, due 03/15/15 | | | 550,000 | | | | 546,563 | | |
PERI GmbH
5.625%, due 12/15/119 | | EUR | 335,000 | | | | 481,361 | | |
Pulte Group, Inc.
6.375%, due 05/15/33 | | | 567,000 | | | | 462,105 | | |
| 7.875%, due 06/15/32 | | | 870,000 | | | | 793,875 | | |
Shea Homes LP/Shea
Homes Funding Corp.
8.625%, due 05/15/192 | | | 1,045,000 | | | | 1,042,388 | | |
Standard Pacific Corp.
8.375%, due 05/15/18 | | | 1,365,000 | | | | 1,375,237 | | |
| | | | 8,096,773 | | |
| Building materials—0.43% | |
Interface, Inc.
7.625%, due 12/01/18 | | | 1,130,000 | | | | 1,203,450 | | |
| Building products—1.10% | |
Associated Materials LLC
9.125%, due 11/01/174 | | | 1,110,000 | | | | 1,121,100 | | |
USG Corp.
6.300%, due 11/15/16 | | | 1,235,000 | | | | 1,062,100 | | |
| 8.375%, due 10/15/182 | | | 210,000 | | | | 204,750 | | |
| 9.750%, due 01/15/183 | | | 690,000 | | | | 664,125 | | |
| | | | 3,052,075 | | |
| Building products-cement—0.92% | |
Hanson Ltd.
6.125%, due 08/15/16 | | | 600,000 | | | | 627,000 | | |
HeidelbergCement Finance BV
7.500%, due 04/03/20 | | EUR | 395,000 | | | | 593,116 | | |
Texas Industries, Inc.
9.250%, due 08/15/20 | | | 1,350,000 | | | | 1,328,063 | | |
| | | | 2,548,179 | | |
| Cable—1.77% | |
CCO Holdings LLC/CCO
Holdings Capital Corp.
7.000%, due 01/15/19 | | | 1,035,000 | | | | 1,076,400 | | |
Cequel Communications
Holdings I LLC/Cequel
Capital Corp.
8.625%, due 11/15/172 | | | 1,405,000 | | | | 1,494,569 | | |
Dish DBS Corp.
6.625%, due 10/01/14 | | | 800,000 | | | | 853,000 | | |
| 6.750%, due 06/01/212 | | | 675,000 | | | | 696,937 | | |
| 7.125%, due 02/01/16 | | | 750,000 | | | | 800,625 | | |
| | | | 4,921,531 | | |
| | | Face
amount1 | | Value | |
| Corporate bonds—(Continued) | |
| Car rental—1.64% | |
Avis Budget Car Rental
LLC/Avis Budget
Finance, Inc.
2.761%, due 05/15/144,8 | | | 200,000 | | | $ | 194,000 | | |
| 8.250%, due 01/15/19 | | | 1,425,000 | | | | 1,469,531 | | |
Europcar Groupe SA
4.920%, due 05/15/138,9 | | EUR | 300,000 | | | | 415,982 | | |
Hertz Corp.
6.750%, due 04/15/192 | | | 300,000 | | | | 300,000 | | |
| 7.375%, due 01/15/212 | | | 585,000 | | | | 598,163 | | |
| 8.875%, due 01/01/144 | | | 99,000 | | | | 101,599 | | |
Hertz Holdings Netherlands BV
8.500%, due 07/31/159 | | EUR | 1,000,000 | | | | 1,487,191 | | |
| | | | 4,566,466 | | |
| Chemicals—2.34% | |
Hexion US Finance
Corp./Hexion Nova Scotia
Finance ULC
8.875%, due 02/01/18 | | | 1,380,000 | | | | 1,462,800 | | |
Huntsman International LLC
6.875%, due 11/15/139 | | EUR | 600,000 | | | | 877,658 | | |
| 7.500%, due 01/01/15 | | EUR | 650,000 | | | | 945,659 | | |
Lyondell Chemical Co.
8.000%, due 11/01/172 | | | 1,210,000 | | | | 1,367,300 | | |
Nalco Co.
6.625%, due 01/15/192 | | | 880,000 | | | | 987,800 | | |
Rockwood Specialties
Group, Inc.
7.625%, due 11/15/14 | | EUR | 270,000 | | | | 388,933 | | |
Vertellus Specialties, Inc.
9.375%, due 10/01/152,4 | | | 470,000 | | | | 485,863 | | |
| | | | 6,516,013 | | |
| Coal—1.55% | |
Alpha Natural Resources, Inc.
6.000%, due 06/01/19 | | | 1,045,000 | | | | 1,077,656 | | |
| 6.250%, due 06/01/21 | | | 170,000 | | | | 175,950 | | |
Arch Coal, Inc.
7.000%, due 06/15/192 | | | 1,000,000 | | | | 1,047,500 | | |
Cloud Peak Energy Resources
LLC/Cloud Peak Energy
Finance Corp.
8.250%, due 12/15/17 | | | 1,270,000 | | | | 1,358,900 | | |
| 8.500%, due 12/15/19 | | | 605,000 | | | | 654,156 | | |
| | | | 4,314,162 | | |
| Commercial services—1.44% | |
Iron Mountain, Inc.
6.750%, due 10/15/18 | | EUR | 495,000 | | | | 689,927 | | |
| 8.375%, due 08/15/21 | | | 1,000,000 | | | | 1,070,000 | | |
United Rentals North
America, Inc.
9.250%, due 12/15/19 | | | 2,015,000 | | | | 2,254,281 | | |
| | | | 4,014,208 | | |
90
PACE Select Advisors Trust
PACE High Yield Investments
Portfolio of investments—July 31, 2011
| | | Face
amount1 | | Value | |
| Corporate bonds—(Continued) | |
| Computer software & services—0.22% | |
Sungard Data Systems, Inc.
10.250%, due 08/15/15 | | | 600,000 | | | $ | 622,500 | | |
| Consumer products—0.54% | |
Jarden Corp.
7.500%, due 01/15/20 | | | 670,000 | | | | 703,500 | | |
| 7.500%, due 01/15/20 | | EUR | 550,000 | | | | 794,246 | | |
| | | | 1,497,746 | | |
| Containers & packaging—1.72% | |
Ball Corp.
7.375%, due 09/01/19 | | | 310,000 | | | | 341,000 | | |
OI European Group BV
6.875%, due 03/31/179 | | EUR | 115,000 | | | | 165,656 | | |
Owens-Brockway Glass
Container, Inc.
7.375%, due 05/15/16 | | | 750,000 | | | | 819,375 | | |
Packaging Dynamics Corp.
8.750%, due 02/01/162 | | | 1,445,000 | | | | 1,488,350 | | |
Rexam PLC
6.750%, due 06/29/678 | | EUR | 1,406,000 | | | | 1,964,723 | | |
| | | | 4,779,104 | | |
| Diversified capital goods—0.45% | |
Mueller Water Products, Inc.
7.375%, due 06/01/17 | | | 445,000 | | | | 424,975 | | |
| 8.750%, due 09/01/20 | | | 755,000 | | | | 822,950 | | |
| | | | 1,247,925 | | |
| Diversified financial services—4.80% | |
Ally Financial, Inc.
4.500%, due 02/11/14 | | | 260,000 | | | | 258,700 | | |
| 6.750%, due 12/01/144 | | | 40,000 | | | | 41,841 | | |
| 6.750%, due 12/01/14 | | | 725,000 | | | | 761,250 | | |
| 7.500%, due 09/15/20 | | | 1,760,000 | | | | 1,848,000 | | |
| 8.300%, due 02/12/15 | | | 645,000 | | | | 706,275 | | |
Bank of America Corp.
8.000%, due 01/30/187,8 | | | 345,000 | | | | 355,319 | | |
Capital One Capital III
7.686%, due 08/15/36 | | | 2,000,000 | | | | 2,045,000 | | |
First Data Corp.
8.875%, due 08/15/202 | | | 1,715,000 | | | | 1,835,050 | | |
GE Capital Trust III
6.500%, due 09/15/678,9 | | GBP | 1,750,000 | | | | 2,843,814 | | |
Mizuho Capital Investment
USD 2 Ltd.
14.950%, due 06/30/142,7,8 | | | 1,000,000 | | | | 1,267,350 | | |
Pinafore LLC/Pinafore, Inc.
9.000%, due 10/01/182 | | | 1,250,000 | | | | 1,365,625 | | |
| | | | 13,328,224 | | |
| Diversified manufacturing—0.83% | |
Bombardier, Inc.
7.500%, due 03/15/182 | | | 270,000 | | | | 302,400 | | |
| 7.750%, due 03/15/202 | | | 1,770,000 | | | | 1,991,250 | | |
| | | | 2,293,650 | | |
| | | Face
amount1 | | Value | |
| Corporate bonds—(Continued) | |
| Diversified operations—0.78% | |
Icahn Enterprises LP
4.000%, due 08/15/138 | | | 900,000 | | | $ | 867,465 | | |
| 8.000%, due 01/15/18 | | | 1,250,000 | | | | 1,290,625 | | |
| | | | 2,158,090 | | |
| Electric utilities—1.71% | |
Edison Mission Energy
7.200%, due 05/15/19 | | | 150,000 | | | | 112,875 | | |
| 7.625%, due 05/15/27 | | | 65,000 | | | | 44,850 | | |
Energy Future Intermediate
Holding Co. LLC/EFIH
Finance, Inc.
10.000%, due 12/01/20 | | | 2,028,000 | | | | 2,139,832 | | |
NRG Energy, Inc.
7.625%, due 01/15/182 | | | 250,000 | | | | 254,375 | | |
| 8.250%, due 09/01/20 | | | 1,835,000 | | | | 1,890,050 | | |
| 8.500%, due 06/15/19 | | | 295,000 | | | | 306,800 | | |
| | | | 4,748,782 | | |
| Electric-generation—1.19% | |
Calpine Corp.
7.875%, due 07/31/202 | | | 1,415,000 | | | | 1,492,825 | | |
Intergen N.V.
8.500%, due 06/30/179 | | EUR | 205,000 | | | | 307,820 | | |
| 9.000%, due 06/30/172 | | | 400,000 | | | | 422,000 | | |
| 9.500%, due 06/30/179 | | GBP | 490,000 | | | | 862,623 | | |
Tenaska Alabama Partners LP
7.000%, due 06/30/212 | | | 212,281 | | | | 221,834 | | |
| | | | 3,307,102 | | |
| Electric-integrated—0.27% | |
Texas Competitive Electric
Holdings Co. LLC/TCEH
Finance, Inc.
11.500%, due 10/01/202,4 | | | 800,000 | | | | 740,000 | | |
| Electronics—0.95% | |
Freescale Semiconductor, Inc.
9.250%, due 04/15/182 | | | 1,180,000 | | | | 1,286,200 | | |
| 10.125%, due 03/15/182,4 | | | 569,000 | | | | 634,435 | | |
SGL Carbon SE
2.670%, due 05/16/158,9 | | EUR | 500,000 | | | | 707,673 | | |
| | | | 2,628,308 | | |
| Finance-captive automotive—1.06% | |
Ally Credit Canada Ltd.
6.000%, due 05/23/12 | | EUR | 300,000 | | | | 431,958 | | |
FCE Bank PLC
7.125%, due 01/15/13 | | EUR | 800,000 | | | | 1,186,879 | | |
Ford Motor Credit Co. LLC
8.000%, due 12/15/16 | | | 1,165,000 | | | | 1,334,309 | | |
| | | | 2,953,146 | | |
91
PACE Select Advisors Trust
PACE High Yield Investments
Portfolio of investments—July 31, 2011
| | | Face
amount1 | | Value | |
| Corporate bonds—(Continued) | |
| Finance-noncaptive consumer—1.57% | |
CIT Group, Inc.
7.000%, due 05/01/15 | | | 773 | | | $ | 775 | | |
| 7.000%, due 05/04/152 | | | 505,000 | | | | 506,263 | | |
| 7.000%, due 05/01/16 | | | 957 | | | | 959 | | |
| 7.000%, due 05/02/162 | | | 1,308,000 | | | | 1,311,270 | | |
| 7.000%, due 05/01/17 | | | 416 | | | | 417 | | |
| 7.000%, due 05/02/172 | | | 2,550,000 | | | | 2,556,375 | | |
| | | | 4,376,059 | | |
| Finance-other—1.88% | |
SLM Corp. MTN
8.000%, due 03/25/20 | | | 2,000,000 | | | | 2,191,306 | | |
| 8.450%, due 06/15/18 | | | 600,000 | | | | 670,836 | | |
Springleaf Finance Corp.
3.250%, due 01/16/13 | | EUR | 1,000,000 | | | | 1,353,119 | | |
| 6.900%, due 12/15/17 | | | 350,000 | | | | 327,687 | | |
Springleaf Finance Corp. MTN
6.500%, due 09/15/17 | | | 545,000 | | | | 495,950 | | |
Series H
5.375%, due 10/01/12 | | | 175,000 | | | | 173,688 | | |
| | | | 5,212,586 | | |
| Financial services—1.47% | |
HSBC Finance Capital Trust IX
5.911%, due 11/30/358 | | | 1,450,000 | | | | 1,341,250 | | |
Northern Rock Asset
Management PLC
9.375%, due 10/17/21 | | GBP | 2,000,000 | | | | 2,757,638 | | |
| | | | 4,098,888 | | |
| Food—0.17% | |
Smithfield Foods, Inc.
10.000%, due 07/15/14 | | | 410,000 | | | | 479,188 | | |
| Food-wholesale—0.08% | |
Barry Callebaut Services N.V.
6.000%, due 07/13/17 | | EUR | 140,000 | | | | 211,224 | | |
| Gaming—4.50% | |
Caesars Entertainment
Operating Co., Inc.
10.000%, due 12/15/18 | | | 2,709,000 | | | | 2,387,045 | | |
| 12.750%, due 04/15/18 | | | 370,000 | | | | 370,000 | | |
Isle of Capri Casinos, Inc.
7.000%, due 03/01/144 | | | 1,380,000 | | | | 1,380,000 | | |
| 7.750%, due 03/15/192,4 | | | 575,000 | | | | 586,500 | | |
MGM Resorts International
5.875%, due 02/27/144 | | | 55,000 | | | | 53,900 | | |
| 6.625%, due 07/15/154 | | | 1,735,000 | | | | 1,669,937 | | |
| 7.500%, due 06/01/16 | | | 1,485,000 | | | | 1,447,875 | | |
Mohegan Tribal
Gaming Authority
6.125%, due 02/15/134 | | | 1,475,000 | | | | 1,235,313 | | |
| 11.500%, due 11/01/172,4 | | | 285,000 | | | | 289,275 | | |
Pinnacle Entertainment, Inc.
7.500%, due 06/15/15 | | | 1,570,000 | | | | 1,617,100 | | |
| | | Face
amount1 | | Value | |
| Corporate bonds—(Continued) | |
| Gaming—(Concluded) | |
Wynn Las Vegas LLC/Wynn
Las Vegas Capital Corp.
7.750%, due 08/15/20 | | | 1,340,000 | | | $ | 1,480,700 | | |
| | | | 12,517,645 | | |
| Health care providers & services—1.35% | |
Fresenius Medical Care
US Finance, Inc.
6.875%, due 07/15/17 | | | 365,000 | | | | 390,550 | | |
HCA, Inc.
6.500%, due 02/15/16 | | | 3,165,000 | | | | 3,236,213 | | |
| 7.500%, due 02/15/22 | | | 55,000 | | | | 55,825 | | |
| 9.250%, due 11/15/16 | | | 55,000 | | | | 58,678 | | |
| | | | 3,741,266 | | |
| Hotels, restaurants & leisure—0.47% | |
Royal Caribbean Cruises Ltd.
5.625%, due 01/27/149 | | EUR | 925,000 | | | | 1,315,841 | | |
| Household durables—0.58% | |
Libbey Glass, Inc.
10.000%, due 02/15/15 | | | 1,493,000 | | | | 1,619,905 | | |
| Insurance—2.93% | |
American International
Group, Inc.
5.000%, due 04/26/23 | | GBP | 750,000 | | | | 1,104,551 | | |
Series A2
4.875%, due 03/15/678 | | EUR | 1,500,000 | | | | 1,691,949 | | |
Series A3
5.750%, due 03/15/678 | | GBP | 600,000 | | | | 802,670 | | |
Hartford Life, Inc.
7.650%, due 06/15/27 | | | 885,000 | | | | 965,637 | | |
Liberty Mutual Group, Inc.
7.800%, due 03/15/372,4 | | | 2,000,000 | | | | 2,020,000 | | |
Lincoln National Corp.
7.000%, due 05/17/668 | | | 1,555,000 | | | | 1,570,550 | | |
| | | | 8,155,357 | | |
| Machinery—1.13% | |
Boart Longyear
Management Pty Ltd.
7.000%, due 04/01/212 | | | 1,745,000 | | | | 1,792,988 | | |
Terex Corp.
8.000%, due 11/15/17 | | | 1,335,000 | | | | 1,360,031 | | |
| | | | 3,153,019 | | |
| Machinery-agriculture & construction—0.25% | |
CNH America LLC
7.250%, due 01/15/16 | | | 625,000 | | | | 687,500 | | |
| Manufacturing-diversified—1.57% | |
American Railcar Industries, Inc.
7.500%, due 03/01/14 | | | 1,520,000 | | | | 1,542,800 | | |
Amsted Industries, Inc.
8.125%, due 03/15/182 | | | 1,110,000 | | | | 1,168,275 | | |
Polypore International, Inc.
7.500%, due 11/15/17 | | | 760,000 | | | | 807,500 | | |
92
PACE Select Advisors Trust
PACE High Yield Investments
Portfolio of investments—July 31, 2011
| | | Face
amount1 | | Value | |
| Corporate bonds—(Continued) | |
| Manufacturing-diversified—(Concluded) | |
SPX Corp.
6.875%, due 09/01/172 | | | 390,000 | | | $ | 418,275 | | |
| 7.625%, due 12/15/14 | | | 385,000 | | | | 427,350 | | |
| | | | 4,364,200 | | |
| Media—0.69% | |
EN Germany Holdings BV
10.750%, due 11/15/159 | | EUR | 1,000,000 | | | | 1,420,375 | | |
Lamar Media Corp.
6.625%, due 08/15/15 | | | 285,000 | | | | 288,919 | | |
Series C
6.625%, due 08/15/15 | | | 105,000 | | | | 106,181 | | |
Lighthouse International Co. SA
8.000%, due 04/30/149 | | EUR | 275,000 | | | | 106,690 | | |
| | | | 1,922,165 | | |
| Medical products—0.14% | |
Bausch & Lomb, Inc.
9.875%, due 11/01/15 | | | 370,000 | | | | 391,275 | | |
| Metals—2.45% | |
Aleris International, Inc.
6.000%, due 06/01/205,10 | | | 13,347 | | | | 13,347 | | |
| 7.625%, due 02/15/182 | | | 1,415,000 | | | | 1,436,225 | | |
Century Aluminum Co.
8.000%, due 05/15/14 | | | 1,628,150 | | | | 1,693,276 | | |
Novelis, Inc.
8.375%, due 12/15/17 | | | 1,750,000 | | | | 1,905,312 | | |
Vedanta Resources PLC
8.250%, due 06/07/212 | | | 1,700,000 | | | | 1,757,460 | | |
| | | | 6,805,620 | | |
| Metals & mining—1.35% | |
Arch Western Finance LLC
6.750%, due 07/01/133 | | | 467,000 | | | | 469,919 | | |
FMG Resources
August 2006 Pty Ltd.
6.875%, due 02/01/182 | | | 525,000 | | | | 546,000 | | |
| 7.000%, due 11/01/152 | | | 630,000 | | | | 652,837 | | |
Foundation PA Coal Co.
7.250%, due 08/01/14 | | | 1,160,000 | | | | 1,186,100 | | |
Glencore Finance Europe SA
6.500%, due 02/27/19 | | GBP | 500,000 | | | | 891,538 | | |
| | | | 3,746,394 | | |
| Oil & gas—7.73% | |
AmeriGas Partners
LP/AmeriGas Finance Corp.
6.500%, due 05/20/21 | | | 1,420,000 | | | | 1,455,500 | | |
Berry Petroleum Co.
6.750%, due 11/01/20 | | | 1,120,000 | | | | 1,148,000 | | |
Chesapeake Energy Corp.
6.250%, due 01/15/17 | | EUR | 515,000 | | | | 754,885 | | |
| 6.625%, due 08/15/20 | | | 645,000 | | | | 696,600 | | |
| 6.875%, due 08/15/18 | | | 645,000 | | | | 696,600 | | |
Concho Resources, Inc.
6.500%, due 01/15/22 | | | 300,000 | | | | 313,500 | | |
| 7.000%, due 01/15/21 | | | 1,635,000 | | | | 1,761,712 | | |
| | | Face
amount1 | | Value | |
| Corporate bonds—(Continued) | |
| Oil & gas—(Concluded) | |
Denbury Resources, Inc.
9.750%, due 03/01/16 | | | 200,000 | | | $ | 223,500 | | |
El Paso Corp.
6.875%, due 06/15/14 | | | 1,030,000 | | | | 1,150,686 | | |
Energy Transfer Equity LP
7.500%, due 10/15/20 | | | 1,500,000 | | | | 1,605,000 | | |
Ferrellgas LP/Ferrellgas
Finance Corp.
6.500%, due 05/01/21 | | | 430,000 | | | | 414,950 | | |
Ferrellgas Partners LP/Ferrellgas
Partners Finance Corp.
8.625%, due 06/15/20 | | | 715,000 | | | | 752,538 | | |
Hilcorp Energy I LP/Hilcorp
Finance Co.
7.625%, due 04/15/212 | | | 400,000 | | | | 424,000 | | |
| 8.000%, due 02/15/202 | | | 355,000 | | | | 383,400 | | |
Inergy LP/Inergy Finance Corp.
6.875%, due 08/01/212 | | | 960,000 | | | | 964,800 | | |
Linn Energy LLC/Linn Energy
Finance Corp.
8.625%, due 04/15/20 | | | 1,790,000 | | | | 1,982,425 | | |
MarkWest Energy Partners
LP/MarkWest Energy
Finance Corp.
6.500%, due 08/15/21 | | | 925,000 | | | | 964,312 | | |
OGX Petroleo e Gas
Participacoes SA
8.500%, due 06/01/182 | | | 1,395,000 | | | | 1,470,330 | | |
Precision Drilling Corp.
6.500%, due 12/15/212 | | | 515,000 | | | | 525,300 | | |
| 6.625%, due 11/15/20 | | | 855,000 | | | | 884,925 | | |
Swift Energy Co.
7.125%, due 06/01/17 | | | 500,000 | | | | 515,000 | | |
| 8.875%, due 01/15/20 | | | 895,000 | | | | 975,550 | | |
Targa Resources Partners
LP/Targa Resources Partners
Finance Corp.
7.875%, due 10/15/182 | | | 730,000 | | | | 764,675 | | |
| 8.250%, due 07/01/16 | | | 630,000 | | | | 667,800 | | |
| | | | 21,495,988 | | |
| Oil refining—0.22% | |
Tesoro Corp.
6.250%, due 11/01/12 | | | 430,000 | | | | 451,500 | | |
| 6.500%, due 06/01/17 | | | 160,000 | | | | 164,000 | | |
| | | | 615,500 | | |
| Oil services—2.45% | |
Basic Energy Services, Inc.
7.125%, due 04/15/16 | | | 1,110,000 | | | | 1,129,425 | | |
| 7.750%, due 02/15/192 | | | 420,000 | | | | 430,500 | | |
Cie Generale de
Geophysique—Veritas
6.500%, due 06/01/212 | | | 1,350,000 | | | | 1,333,125 | | |
Geokinetics Holdings, Inc.
9.750%, due 12/15/14 | | | 915,000 | | | | 894,412 | | |
93
PACE Select Advisors Trust
PACE High Yield Investments
Portfolio of investments—July 31, 2011
| | | Face
amount1 | | Value | |
| Corporate bonds—(Continued) | |
| Oil services—(Concluded) | |
Helix Energy Solutions Group, Inc.
9.500%, due 01/15/162 | | | 1,245,000 | | | $ | 1,307,250 | | |
Hornbeck Offshore Services, Inc.,
8.000%, due 09/01/17 | | | 335,000 | | | | 342,538 | | |
Series B
6.125%, due 12/01/14 | | | 1,375,000 | | | | 1,375,000 | | |
| | | | 6,812,250 | | |
| Packaging—1.19% | |
Reynolds Group Issuer
8.500%, due 10/15/163,9 | | EUR | 1,100,000 | | | | 1,608,250 | | |
| 8.750%, due 05/15/182,3 | | | 1,765,000 | | | | 1,694,400 | | |
| | | | 3,302,650 | | |
| Paper & forest products—2.89% | |
Boise Cascade LLC
7.125%, due 10/15/14 | | | 1,980,000 | | | | 1,965,150 | | |
Boise Paper Holdings
LLC/Boise Co-Issuer Co.
8.000%, due 04/01/20 | | | 155,000 | | | | 163,137 | | |
Boise Paper Holdings
LLC/Boise Finance Co.
9.000%, due 11/01/17 | | | 1,290,000 | | | | 1,409,325 | | |
Domtar Corp.
9.500%, due 08/01/16 | | | 250,000 | | | | 304,375 | | |
| 10.750%, due 06/01/17 | | | 1,185,000 | | | | 1,528,650 | | |
Norske Skogindustrier ASA
7.000%, due 06/26/17 | | EUR | 505,000 | | | | 522,457 | | |
| 7.125%, due 10/15/332 | | | 1,850,000 | | | | 1,193,250 | | |
Stora Enso Oyj
7.250%, due 04/15/362 | | | 1,000,000 | | | | 935,000 | | |
| | | | 8,021,344 | | |
| Pharmaceuticals—0.31% | |
Mylan, Inc.
6.000%, due 11/15/182 | | | 850,000 | | | | 869,125 | | |
| Railroads—0.66% | |
RailAmerica, Inc.
9.250%, due 07/01/17 | | | 1,674,000 | | | | 1,841,400 | | |
| Real estate investment trusts—0.89% | |
Host Hotels & Resorts, Inc.
6.000%, due 11/01/20 | | | 1,315,000 | | | | 1,346,231 | | |
Prologis International Funding SA
7.625%, due 10/23/143 | | EUR | 750,000 | | | | 1,126,709 | | |
| | | | 2,472,940 | | |
| Steel—0.78% | |
APERAM
7.375%, due 04/01/162 | | | 1,000,000 | | | | 992,500 | | |
US Steel Corp.
7.000%, due 02/01/18 | | | 1,170,000 | | | | 1,175,850 | | |
| | | | 2,168,350 | | |
| Support-services—0.20% | |
TUI AG
5.125%, due 12/10/129 | | EUR | 380,000 | | | | 547,387 | | |
| | | Face
amount1 | | Value | |
| Corporate bonds—(Concluded) | |
| Telecom-integrated/services—1.14% | |
EH Holding Corp.
7.625%, due 06/15/212 | | | 368,000 | | | $ | 379,040 | | |
Intelsat Luxembourg SA
11.500%, due 02/04/1711 | | | 1,250,000 | | | | 1,343,750 | | |
Satmex Escrow SA de C.V.
9.500%, due 05/15/172 | | | 1,400,000 | | | | 1,435,000 | | |
| | | | 3,157,790 | | |
| Telecommunication services—0.91% | |
Alcatel-Lucent USA, Inc.
6.450%, due 03/15/29 | | | 1,020,000 | | | | 920,550 | | |
CommScope, Inc.
8.250%, due 01/15/192 | | | 1,560,000 | | | | 1,622,400 | | |
| | | | 2,542,950 | | |
| Telephone-integrated—0.82% | |
Frontier Communications Corp.
7.000%, due 11/01/25 | | | 965,000 | | | | 933,637 | | |
| 7.050%, due 10/01/46 | | | 265,000 | | | | 224,588 | | |
Virgin Media Finance PLC
9.500%, due 08/15/16 | | EUR | 700,000 | | | | 1,129,044 | | |
| | | | 2,287,269 | | |
| Transportation—0.94% | |
Stena AB
5.875%, due 02/01/199 | | EUR | 650,000 | | | | 747,187 | | |
| 6.125%, due 02/01/179 | | EUR | 1,500,000 | | | | 1,864,377 | | |
| | | | 2,611,564 | | |
| Transportation services—0.82% | |
Hapag-Lloyd AG
9.750%, due 10/15/172,4 | | | 1,130,000 | | | | 1,039,600 | | |
PHI, Inc.
8.625%, due 10/15/18 | | | 1,000,000 | | | | 1,025,000 | | |
Teekay Corp.
8.500%, due 01/15/20 | | | 195,000 | | | | 203,775 | | |
| | | | 2,268,375 | | |
| Wireless telecommunication services—1.93% | |
Crown Castle
International Corp.
7.125%, due 11/01/19 | | | 1,000,000 | | | | 1,066,250 | | |
| 9.000%, due 01/15/15 | | | 430,000 | | | | 470,850 | | |
MetroPCS Wireless, Inc.
6.625%, due 11/15/20 | | | 490,000 | | | | 491,225 | | |
| 7.875%, due 09/01/18 | | | 500,000 | | | | 531,875 | | |
Nextel Communications, Inc.
5.950%, due 03/15/14 | | | 1,500,000 | | | | 1,504,687 | | |
ViaSat, Inc.
8.875%, due 09/15/16 | | | 1,250,000 | | | | 1,312,500 | | |
| | | | 5,377,387 | | |
Total corporate bonds
(cost—$226,631,042) | | | | | 244,584,788 | | |
94
PACE Select Advisors Trust
PACE High Yield Investments
Portfolio of investments—July 31, 2011
| | | Face
amount1 | | Value | |
| Loan assignments8—3.58% | |
| Airlines—0.80% | |
US Airways Group, Inc.
Term Loan
2.687%, due 08/30/11 | | | 2,465,278 | | | $ | 2,227,600 | | |
| Broadcast—0.34% | |
Clear Channel
Communication, Inc.
Delay Draw Term Loan 2
3.837%, due 08/31/11 | | | 1,137,550 | | | | 939,048 | | |
| Computer software & services—0.65% | |
Sungard Data Systems, Inc.
Tranche B
3.842%, due 09/12/11 | | | 1,166,071 | | | | 1,154,993 | | |
| 3.845%, due 08/15/11 | | | 80,858 | | | | 80,090 | | |
| 3.848%, due 08/08/11 | | | 188,076 | | | | 186,289 | | |
| 3.893%, due 08/08/11 | | | 376,152 | | | | 372,579 | | |
| | | | 1,793,951 | | |
| Defense/aerospace—0.31% | |
Hawker Beechcraft
Acquisition Co. LLC LC
Facility Deposits
2.246%, due 09/29/11 | | | 60,863 | | | | 49,786 | | |
Hawker Beechcraft
Acquisition Co. LLC
Term Loan
2.187%, due 08/31/11 | | | 862,514 | | | | 582,731 | | |
| 2.246%, due 09/30/11 | | | 121,726 | | | | 222,378 | | |
| | | | 854,895 | | |
| Paper & packaging—0.30% | |
Georgia-Pacific Corp.
New Term Loan B
2.246%, due 08/31/11 | | | 17,099 | | | | 17,068 | | |
| 2.250%, due 08/10/11 | | | 828,176 | | | | 826,702 | | |
| | | | 843,770 | | |
| Support-services—0.36% | |
KAR Auction Services, Inc.
Term Loan B
5.000%, due 08/31/11 | | | 1,000,000 | | | | 1,004,170 | | |
| Telecom-integrated/services—0.54% | |
Intelsat Jackson Holdings SA
Tranche B Term Loan
5.250%, due 10/12/11 | | | 1,496,250 | | | | 1,497,746 | | |
| Wireless telecommunication services—0.28% | |
MetroPCS Wireless, Inc.
Extended Term Loan B
4.009%, due 08/01/11 | | | 509,820 | | | | 508,928 | | |
| 4.009%, due 08/31/11 | | | 267,146 | | | | 266,678 | | |
| | | | 775,606 | | |
Total loan assignments
(cost—$10,010,760) | | | | | 9,936,786 | | |
| | | Face
amount1 | | Value | |
| Asset-backed securities—2.75% | |
Citigroup Mortgage Loan
Trust, Inc., Series 2007-AHL2,
Class A3A
0.257%, due 05/25/378 | | | 797,630 | | | $ | 708,502 | | |
GSAA Home Equity Trust,
Series 2006-14, Class A1
0.237%, due 09/25/368 | | | 867,677 | | | | 378,851 | | |
Home Equity Loan Trust,
Series 2007-FRE1, Class 2AV1
0.317%, due 04/25/378 | | | 735,753 | | | | 519,295 | | |
HSI Asset Securitization Corp.
Trust, Series 2007-NC1,
Class A1
0.287%, due 04/25/378 | | | 1,206,197 | | | | 1,040,746 | | |
Merrill Lynch Mortgage
Investors Trust,
Series 2007-MLN1, Class A2A
0.297%, due 03/25/378 | | | 1,866,875 | | | | 956,977 | | |
Morgan Stanley Capital, Inc.,
Series 2006-HE6, Class A2B
0.287%, due 09/25/368 | | | 831,157 | | | | 727,054 | | |
Series 2006-HE8, Class A2B
0.287%, due 10/25/368 | | | 323,490 | | | | 211,776 | | |
Renaissance Home Equity Loan
Trust, Series 2007-2,
Class AF1
5.893%, due 06/25/373 | | | 1,481,749 | | | | 959,038 | | |
Soundview Home Equity
Loan Trust,
Series 2006-EQ2, Class A2
0.297%, due 01/25/378 | | | 1,707,567 | | | | 1,475,140 | | |
Series 2007-OPT1, Class 2A1
0.267%, due 06/25/378 | | | 782,720 | | | | 675,682 | | |
Total asset-backed securities
(cost—$9,724,291) | | | | | 7,653,061 | | |
| Collateralized mortgage obligations—0.42% | |
Banc of America Mortgage
Securities, Series 2005-J,
Class 1A1
3.072%, due 11/25/358 | | | 867,133 | | | | 671,578 | | |
Countrywide Alternative Loan
Trust, Series 2006-OC6,
Class 2A1
0.257%, due 07/25/368 | | | 20,328 | | | | 20,209 | | |
WaMu Mortgage Pass-Through
Certificates, Series 2006-AR14,
Class 1A1
5.368%, due 11/25/368 | | | 545,041 | | | | 471,495 | | |
Total collateralized
mortgage obligations
(cost—$1,291,319) | | | | | 1,163,282 | | |
95
PACE Select Advisors Trust
PACE High Yield Investments
Portfolio of investments—July 31, 2011
| | | Number of
shares | | Value | |
| Common stocks—1.17% | |
| Automobiles—0.52% | |
| General Motors Co.* | | | 52,394 | | | $ | 1,450,266 | | |
| Building products—0.02% | |
| Nortek, Inc.* | | | 1,375 | | | | 42,625 | | |
| Construction materials—0.18% | |
| US Concrete, Inc.5,* | | | 59,953 | | | | 505,404 | | |
| Diversified financial services—0.17% | |
| CIT Group, Inc.* | | | 11,794 | | | | 468,693 | | |
| Metals—0.28% | |
| Aleris International, Inc.5,10,* | | | 15,446 | | | | 772,300 | | |
Total common stocks
(cost—$3,669,714) | | | | | 3,239,288 | | |
| Preferred stock—0.44% | |
| Diversified financial services—0.44% | |
SG Preferred Capital II LLC2,12
(cost—$1,221,875) | | | 1,250 | | | | 1,230,078 | | |
| | | Number of
warrants | | | |
| Warrants*—0.57% | |
| Automobiles—0.56% | |
General Motors Co.,
strike price $10.00,
expires 07/10/16 | | | 47,630 | | | | 896,873 | | |
General Motors Co.,
strike price $18.33,
expires 07/10/19 | | | 47,630 | | | | 647,291 | | |
| | | | 1,544,164 | | |
| Cable—0.01% | |
Charter Communications, Inc.,
strike price $46.86,
expires 11/30/14 | | | 1,818 | | | | 25,016 | | |
Total warrants
(cost—$1,999,455) | | | | | 1,569,180 | | |
| | | Face
amount1 | | Value | |
| Repurchase agreement—1.52% | |
Repurchase agreement dated
07/29/11 with State Street
Bank & Trust Co., 0.010%
due 08/01/11, collateralized
by $21,026 Federal Home Loan
Mortgage Corp. obligations,
5.125% due 07/15/12,
$3,022,006 US Treasury Bills,
zero coupon due 08/04/11 and
$1,191,872 US Treasury Notes,
2.375% to 2.625%
due 02/29/16 to 07/31/17;
(value—$4,310,565);
proceeds: $4,226,004
(cost—$4,226,000) | | | 4,226,000 | | | $ | 4,226,000 | | |
| | | Number of
shares | | | |
| Investment of cash collateral from securities loaned—5.26% | |
| Money market fund—5.26% | |
UBS Private Money Market Fund LLC13
(cost—$14,627,018) | | | 14,627,018 | | | | 14,627,018 | | |
Total investments
(cost—$273,401,474)—103.71% | | | | | 288,229,481 | | |
Liabilities in excess of
other assets—(3.71)% | | | | | (10,305,876 | ) | |
| Net assets—100.00% | | $ | 277,923,605 | | |
Aggregate cost for federal income tax purposes was $273,403,538; and net unrealized appreciation consisted of:
| Gross unrealized appreciation | | $ | 20,801,652 | | |
| Gross unrealized depreciation | | | (5,975,709 | ) | |
| Net unrealized appreciation | | $ | 14,825,943 | | |
For a listing of defined portfolio acronyms and currency abbreviations that are used throughout the Portfolio of investments as well as the tables that follow, please refer to page 227.
* Non-income producing security.
1 In US Dollars unless otherwise indicated.
2 Security exempt from registration pursuant to Rule 144A under the Securities Act of 1933. These securities, which represent 22.12% of net assets as of July 31, 2011, are considered liquid and may be resold in transactions exempt from registration, normally to qualified institutional buyers.
3 Step bond that converts to the noted fixed rate at a designated future date.
4 Security, or portion thereof, was on loan at July 31, 2011.
5 Illiquid securities representing 0.54% of net assets as of July 31, 2011.
96
PACE Select Advisors Trust
PACE High Yield Investments
Portfolio of investments—July 31, 2011
6 Security exchanged on 04/21/11; position represents remaining escrow balance expected to be received upon finalization of debt restructuring.
7 Perpetual bond security. The maturity date reflects the next call date.
8 Variable or floating rate security. The interest rate shown is the current rate as of July 31, 2011, and changes periodically.
9 Security exempt from registration pursuant to Regulation S under the Securities Act of 1933. Regulation S applies to securities offerings that are made outside of the United States and do not involve direct selling efforts in the United States. At July 31, 2011, the value of these securities amounted to 5.67% of net assets.
10 Security is being fair valued by a valuation committee under the direction of the board of trustees.
11 Payment-in-kind security for which interest may be paid in cash or additional securities, at the discretion of the issuer.
12 Non cumulative preferred stock. Convertible until 12/31/49.
13 The table below details the Portfolio's transaction activity in an affiliated issuer during the year ended July 31, 2011. The investment manager earns a management fee from UBS Private Money Market Fund LLC.
| Security description | | Value at
07/31/10 | | Purchases
during the
year ended
07/31/11 | | Sales
during the
year ended
07/31/11 | | Value at
07/31/11 | | Net income
earned from
affiliate for the
year ended
07/31/11 | |
| UBS Private Money Market Fund LLC | | $ | 22,131,690 | | | $ | 98,175,537 | | | $ | 105,680,209 | | | $ | 14,627,018 | | | $ | 10,721 | | |
Forward foreign currency contracts
| Counterparty | | Contracts to
deliver | | In
exchange for | | Maturity
date | | Unrealized
depreciation | |
| JPMorgan Securities, Inc. | | EUR | 22,170,000 | | | USD | 31,070,546 | | | 08/26/11 | | $ | (769,032 | ) | |
| JPMorgan Securities, Inc. | | GBP | 8,540,000 | | | USD | 13,577,644 | | | 08/26/11 | | | (436,912 | ) | |
| | | $ | (1,205,944 | ) | |
The following is a summary of the fair valuations according to the inputs used as of July 31, 2011 in valuing the Portfolio's investments:
| | | Unadjusted
quoted prices in
active markets for
identical investments
(Level 1) | | Other significant
observable inputs
(Level 2) | | Unobservable
inputs
(Level 3) | | Total | |
| Corporate bonds | | $ | — | | | $ | 244,571,441 | | | $ | 13,347 | | | $ | 244,584,788 | | |
| Loan assignments | | | — | | | | 9,936,786 | | | | — | | | | 9,936,786 | | |
| Asset-backed securities | | | — | | | | 7,653,061 | | | | — | | | | 7,653,061 | | |
| Collateralized mortgage obligations | | | — | | | | 1,163,282 | | | | — | | | | 1,163,282 | | |
| Common stocks | | | 2,466,988 | | | | — | | | | 772,300 | | | | 3,239,288 | | |
| Preferred stock | | | — | | | | 1,230,078 | | | | — | | | | 1,230,078 | | |
| Warrants | | | 1,569,180 | | | | — | | | | — | | | | 1,569,180 | | |
| Repurchase agreement | | | — | | | | 4,226,000 | | | | — | | | | 4,226,000 | | |
| Investment of cash collateral from securities loaned | | | — | | | | 14,627,018 | | | | — | | | | 14,627,018 | | |
| Forward foreign currency contracts, net | | | — | | | | (1,205,944 | ) | | | — | | | | (1,205,944 | ) | |
| Total | | $ | 4,036,168 | | | $ | 282,201,722 | | | $ | 785,647 | | | $ | 287,023,537 | | |
97
PACE Select Advisors Trust
PACE High Yield Investments
Portfolio of investments—July 31, 2011
The following is a rollforward of the Portfolio's investments that were valued using unobservable inputs (Level 3) for the year ended July 31, 2011:
| | | Corporate
bond | | Asset-backed
security | | Common
stock | | Total | |
| Beginning balance | | $ | 14,375 | | | $ | 1,119,456 | | | $ | 540,610 | | | $ | 1,674,441 | | |
| Purchases | | | — | | | | — | | | | — | | | | — | | |
| Sales | | | — | | | | (1,195,200 | ) | | | — | | | | (1,195,200 | ) | |
| Accrued discounts/(premiums) | | | (84 | ) | | | 16,161 | | | | — | | | | 16,077 | | |
| Total realized gain/(loss) | | | — | | | | 38,997 | | | | — | | | | 38,997 | | |
| Net change in unrealized appreciation/depreciation | | | (944 | ) | | | 20,586 | | | | 231,690 | | | | 251,332 | | |
| Transfers in to Level 3 | | | — | | | | — | | | | — | | | | — | | |
| Transfers out of Level 3 | | | — | | | | — | | | | — | | | | — | | |
| Ending balance | | $ | 13,347 | | | $ | — | | | $ | 772,300 | | | $ | 785,647 | | |
The change in unrealized appreciation/depreciation relating to the Level 3 investments held at July 31, 2011 was $230,746.
Issuer breakdown by country or territory of origin (unaudited)
| | | Percentage of
total investments | |
| United States | | | 82.3 | % | |
| United Kingdom | | | 4.1 | | |
| Germany | | | 2.1 | | |
| Canada | | | 2.1 | | |
| Netherlands | | | 1.8 | | |
| Luxembourg | | | 1.5 | | |
| Australia | | | 1.0 | | |
| Sweden | | | 0.9 | | |
| France | | | 0.6 | | |
| Norway | | | 0.6 | | |
| Jersey | | | 0.6 | | |
| Brazil | | | 0.5 | | |
| Mexico | | | 0.5 | | |
| Liberia | | | 0.5 | | |
| Cayman Islands | | | 0.4 | | |
| Finland | | | 0.3 | | |
| Belgium | | | 0.1 | | |
| Marshall Islands | | | 0.1 | | |
| Total | | | 100.0 | % | |
See accompanying notes to financial statements.
98
PACE Select Advisors Trust
PACE Large Co Value Equity Investments
Performance
For the 12 months ended July 31, 2011, the Portfolio's Class P shares returned 17.07%, before the deduction of the maximum PACE Select program fee. (Class P shares returned 14.75%, after the deduction of the maximum PACE Select program fee, for the same 12-month period.) In comparison, the Russell 1000 Value Index (the "benchmark") returned 16.76%, and the Lipper Large-Cap Value Funds category posted a median return of 15.53%. (Returns for all share classes over various time periods are shown in the "Performance at a glance" table on page 103. Please note that the returns shown do not reflect the deduction of taxes that a shareholder would pay on Portfolio distributions or the redemption of Portfolio shares.) For a detailed commentary on the market environment in general during the reporting period, please refer to page 2.
Sub-Advisors' comments1
ICAP
Our portion of the Portfolio outperformed the benchmark during the reporting period. Overall, our portion of the Portfolio is built on a stock-by-stock basis and reflects the individual names that we believe have a combination of attractive valuations and catalysts likely to trigger appreciation over a 12- to 18-month timeframe.
In a period with a strongly rising market, our performance was primarily driven by several key factors. Stock selection in the consumer services sector added to performance, led by cable network operator Viacom, Inc., which benefited from improved ratings and rising affiliate fees. Stock selection in consumer durables added value as Johnson Controls, Inc., benefited from a recovery in auto sales. Underweighting the lagging financials sector also added to relative performance.
Stock selection in the retail sector detracted from performance, primarily due to office supply retailer Staples, Inc. It underperformed as sales and profit margins in its international business disappointed investors. Stock selection in basic industries hurt performance, in large part due to Newmont Mining Corp., which underperformed given higher costs and reduced profit expectations. Stock selection in consumer staples negatively impacted performance as beverage and snack maker PepsiCo, Inc. underperformed as increased
1 All Sub-Advisors discuss performance on a gross of fees basis—meaning that no fees or expenses are reflected in their sleeves'/sleeve's performance. Alternately, Fund performance is shown net of fees, which does factor in fees and expenses associated with the Fund.
PACE Select Advisors Trust – PACE Large Co Value Equity Investments
Investment Sub-Advisors:
Institutional Capital LLC ("ICAP"), Westwood Management Corp. ("Westwood") and Pzena Investment Management, LLC ("Pzena")
Portfolio Managers:
ICAP: Jerrold Senser and Thomas Wenzel;
Westwood: Susan M. Byrne;
Pzena: Antonio DeSpirito, III, Richard S. Pzena and John P. Goetz
Objective:
Capital appreciation and dividend income
Investment process:
ICAP uses its proprietary valuation model to identify large capitalization companies that it believes offer the best relative values and seeks to avoid companies that exhibit excessive deterioration in earnings trends. ICAP looks for companies where there is a catalyst for positive change with potential to produce stock appreciation of 15% or more relative to the market over a 12- to 18-month period.
ICAP also uses internally and externally generated research to evaluate the financial condition and business prospects of every company it considers. ICAP monitors each stock purchased and sells the stock when its target price is achieved, the catalyst becomes inoperative, or ICAP identifies another stock with greater opportunity for appreciation.
Westwood utilizes a value style of investing in which it chooses common stocks it believes are currently undervalued.
Other key metrics it considers are return on equity, debt/equity ratio and, in the case of
(continued on next page)
99
PACE Select Advisors Trust
PACE Large Co Value Equity Investments
Sub-Advisors' comments – continued
commodity prices hurt the company's profit margins. PepsiCo remains in our portion of the Portfolio, whereas we sold Staples and Newmont Mining.
Other specific stocks that added to performance included diversified pharmaceutical company Sanofi, ADR. Its shares moved higher as its results have improved due to ongoing restructuring at the company. Marathon Oil Corp. also added to performance as its plans for spinning off its refining business were viewed favorably by investors.
Cisco Systems, Inc. underperformed and detracted from performance as its sales and growth outlook disappointed investors. We sold the position during the fourth quarter of 2010. The Goldman Sachs Group, Inc. lagged as trading revenues and its outlook weakened over the period. The stock remains in our portion of the Portfolio, as we believe it has the ability to gain share and improve results over time.
Westwood
Our portion of the Portfolio outperformed the benchmark during the reporting period, aided by security selection in the financial services, energy, consumer staples and producer durables sectors. Additionally, relative performance was aided by underweights in financial services and consumer staples, coupled with overweights in energy and consumer discretionary. In contrast, our performance was hindered by security selection in the health care, utilities and consumer discretionary sectors.
Companies in the asset management and insurance industries were strong performers during the period. Our holdings in this area benefited relative performance, as did not owning many companies in the underperforming large money center banks. In energy, a strong rally in commodity prices propelled the sector higher. Our holdings, such as EQT Corp. and Anadarko Petroleum Corp., demonstrated good production growth and, when coupled with rising energy prices and a sector overweight, pulled our sector performance higher. Our consumer staples holdings benefited from international sales growth in Philip Morris International, Inc., whereas the producer durables sector benefited from periodic optimism regarding the health of the economy. Union Pacific Corp. and Caterpillar, Inc. both performed well as investors were hopeful that they would see improving sales as the global economy expanded. Caterpillar has since been sold from our portion of the Portfolio, as its shares appreciated to our price target and discounted much of the company's favorable outlook.
Security selection in the utilities sector was the largest detractor from performance. Electric utility holdings American Electric Power Co., Inc. and Sempra Energy lagged as inclement weather impacted their performance. Security selection in health care detracted from performance as holdings such as Teva Pharmaceutical Industries Ltd., ADR and Abbott Laboratories were impacted by company-specific issues. Lastly, stock selection in the consumer discretionary sector was negatively impacted by our holding in General Motors Co. Its shares declined as investors worried, at various times, about rising crude oil prices, gasoline prices and the potential for slowing sales as the economy slowed down.
Investment process (concluded)
common equities, positive earnings surprises without a corresponding increase in Wall Street estimates.
Westwood has disciplines in place that serve as sell signals, such as a security reaching a pre-determined price target or a change to a company's fundamentals that negatively impacts the original investment thesis.
Pzena follows a disciplined investment process to implement its value philosophy, focusing exclusively on companies that are underperforming their historically demonstrated earnings power. Pzena applies intensive fundamental research to these companies in an effort to determine whether the problems that caused the earnings shortfall are temporary or permanent. The research process incorporates perspectives on valuation, earnings, management strategy, and downside protection.
100
PACE Select Advisors Trust
PACE Large Co Value Equity Investments
Sub-Advisors' comments – concluded
Pzena
Our portion of the Portfolio modestly outperformed the benchmark during the reporting period. Our performance was led predominantly by economically sensitive sectors—energy, consumer discretionary and technology—with additional strong performance coming from our health care holdings. Top performing holdings included JC Penney Co., Inc. (retail), Exxon Mobil Corp. (integrated energy) and TE Connectivity Ltd. (technology). JC Penney rallied given stronger same-store sales data and the disclosure that an activist investor had taken a meaningful stake in the company, identifying it as "undervalued and an attractive investment." Exxon Mobil performed well due to solid earnings, higher oil prices and an aggressive program of buying back its own shares. TE Connectivity, a specialist in connectors and other electronic devices, benefited from tight cost controls and recovering top line growth. Health care holdings that were important contributors to performance included Aetna, Inc. (managed care), Forest Laboratories, Inc. (pharmaceuticals) and Zimmer Holdings, Inc. (medical devices).
The largest detractor from performance was Hewlett-Packard Co. Despite investor concerns surrounding the potential impact of cloud computing and tablets on Hewlett-Packard, we see a company with leading industry positions, diversified revenue sources, a strong balance sheet and one of the cheapest valuations in the benchmark. As a result, it was the largest holding in our portion of the Portfolio as of July 31, 2011. Other detractors during the reporting period included Bank of America Corp. and Morgan Stanley in the financial services sector.
We continue to view the current environment as being good for the value investor. Without a lot of stress at the company level, valuations are attractive in our view, and balance sheets and cash flows are strong. We believe our portion of the Portfolio is trading at an attractive valuation compared to both our history and the valuation of the benchmark on a price-to-normalized earnings basis. The opportunity set and our holdings continue to be dominated by high quality businesses. Our largest exposures are in the financial, technology, energy and consumer discretionary sectors.
Special considerations
The Portfolio may be appropriate for long-term investors seeking capital appreciation and dividend income and who are able to withstand short-term fluctuations in the equity markets in return for potentially higher returns over the long term. The value of the Portfolio changes every day and can be affected by changes in interest rates, general market conditions and other political, social and economic developments, as well as specific matters relating to the companies in whose securities the Portfolio invests. It is important to note that an investment in the Portfolio is only one component of a balanced investment plan.
101
PACE Select Advisors Trust
PACE Large Co Value Equity Investments
Illustration of an assumed investment of $10,000 in Class P shares of the Portfolio (unaudited)
The following graph depicts the performance of PACE Large Co Value Equity Investments Class P shares versus the Russell 1000 Value Index over the 10 years ended July 31, 2011. The performance of the other classes will vary based upon the different class specific expenses and sales charges. The performance provided does not reflect the deduction of taxes that a shareholder would pay on Portfolio distributions or the redemption of Portfolio shares. Past performance is no guarantee of future results. Share price and returns will vary with market conditions; investors may realize a gain or loss upon redemption. It is important to note that PACE Large Co Value Equity Investments is a professionally managed portfolio while the Index is not available for investment and is unmanaged. The comparison is shown for illustration purposes only.
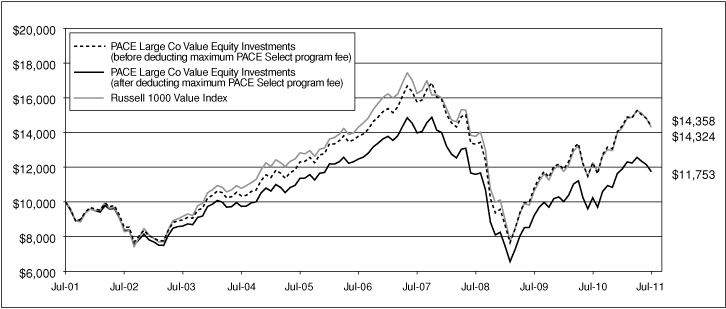
102
PACE Select Advisors Trust
PACE Large Co Value Equity Investments
Performance at a glance (unaudited)
| Average annual total returns for periods ended 07/31/11 | | 1 year | | 5 years | | 10 years | |
| Before deducting | | Class A1 | | | 16.79 | % | | | 0.53 | % | | | 3.42 | % | |
| maximum sales charge | | Class B2 | | | 15.78 | % | | | (0.32 | )% | | | 2.91 | %6 | |
| or PACE Select | | Class C3 | | | 15.81 | % | | | (0.26 | )% | | | 2.61 | % | |
| program fee | | Class Y4 | | | 17.00 | % | | | 0.85 | % | | | 3.76 | % | |
| | | Class P5 | | | 17.07 | % | | | 0.79 | % | | | 3.68 | % | |
| After deducting | | Class A1 | | | 10.36 | % | | | (0.60 | )% | | | 2.84 | % | |
| maximum sales charge | | Class B2 | | | 10.78 | % | | | (0.63 | )% | | | 2.91 | %6 | |
| or PACE Select | | Class C3 | | | 14.81 | % | | | (0.26 | )% | | | 2.61 | % | |
| program fee | | Class P5 | | | 14.75 | % | | | (1.21 | )% | | | 1.63 | % | |
| Russell 1000 Value Index7 | | | | | 16.76 | % | | | (0.01 | )% | | | 3.66 | % | |
| Lipper Large-Cap Value Funds median | | | | | 15.53 | % | | | 0.22 | % | | | 2.80 | % | |
Average annual total returns for periods ended June 30, 2011, after deduction of the maximum sales charge or PACE Select program fee, were as follows: Class A—1-year period, 21.84%; 5-year period, 0.36%; 10-year period, 3.17%; Class B—1-year period, 22.79%; 5-year period, 0.32%; 10-year period, 3.22%; Class C—1-year period, 26.73%; 5-year period, 0.69%; 10-year period, 2.93%; Class Y—1-year period, 29.08%; 5-year period, 1.83%; 10-year period, 4.09%; Class P—1-year period, 26.57%; 5-year period, (0.26)%; 10-year period, 1.95%.
The annualized gross and net expense ratios, respectively, for each class of shares as in the November 28, 2010 prospectuses, were as follows: Class A—1.20% and 1.20%; Class B—2.33% and 2.02%; Class C—2.02% and 2.02%; Class Y—0.89% and 0.89%; and Class P—0.95% and 0.95%. Net expenses reflect fee waivers and/or expense reimbursements, if any, pursuant to an agreement that is in effect to cap the expenses. The Portfolio and UBS Global Asset Management (Americas) Inc. ("UBS Global AM") have entered into a written fee waiver/expense reimbursement agreement pursuant to which UBS Global AM is contractually obligated to waive its management fees and/or reimburse expenses so that the Portfolio's ordinary total operating expenses of each class through November 28, 2011 (excluding dividend expense, borrowing costs, and interest expense relating to short sales, and interest, taxes, brokerage commissions and extraordinary expenses) would not exceed Class A—1.27%; Class B—2.02%; Class C—2.02%; Class Y—1.02%; and Class P—1.02%. The Portfolio has agreed to repay UBS Global AM for any waived fees/reimbursed expenses to the extent that it can do so over the following three fiscal years without causing the Portfolio's expenses in any of those three years to exceed these expense caps. The fee waiver/expense reimbursement agreement may be terminated by the Portfolio's board at any time and also will terminate automatically upon the expiration or termination of the Portfolio's advisory contract with UBS Global AM. Upon termination of the agreement, however, UBS Global AM's three year recoupment rights will survive.
1 Maximum sales charge for Class A shares is 5.5%. Class A shares bear ongoing 12b-1 service fees.
2 Maximum contingent deferred sales charge for Class B shares is 5% imposed on redemptions and is reduced to 0% after a maximum of six years. Class B shares bear ongoing 12b-1 service and distribution fees.
3 Maximum contingent deferred sales charge for Class C shares is 1% imposed on redemptions and is reduced to 0% after one year. Class C shares bear ongoing 12b-1 service and distribution fees. Prior to September 30, 2003, Class C shares were subject to a maximum front-end sales charge of 1.00%; this front-end sales charge is not reflected in the average annual total returns presented for the Class C shares shown above.
4 The Portfolio offers Class Y shares to a limited group of eligible investors, including certain qualifying retirement plans. Class Y shares do not bear initial or contingent deferred sales charges or ongoing 12b-1 service and distribution fees.
5 Class P shares do not bear initial or contingent deferred sales charges or ongoing 12b-1 service and distribution fees, but are subject to a maximum annual PACE Select program fee of 2% of the value of Class P shares. Prior to June 14, 2010, the maximum annual PACE Select program fee was 1.5% of the value of Class P shares; however, the current maximum annual PACE Select program fee of 2% is reflected in the performance returns throughout all periods in the average annual total returns presented for the Class P shares shown above.
6 Assumes the conversion of Class B to Class A shares at the end of the sixth year.
7 The Russell 1000 Value Index is designed to measure the performance of the large-cap value segment of the US equity universe. It includes those Russell 1000 companies with lower price-to-book ratios and lower expected growth values. The Russell 1000 Value Index is constructed to provide a comprehensive and unbiased barometer for the large-cap value segment. The Index is completely reconstituted annually to ensure new and growing equities are included and that the represented companies continue to reflect value characteristics. Investors should note that indices do not reflect the deduction of fees and expenses.
If an investor sells or exchanges shares less than 90 days after purchase, a redemption fee of 1.00% of the amount sold or exchanged will be deducted at the time of the transaction, except as noted otherwise in the prospectuses.
Past performance does not predict future performance, and the performance information provided does not reflect the deduction of taxes that a shareholder would pay on Portfolio distributions or the redemption of Portfolio shares. The return and principal value of an investment will fluctuate, so that an investor's shares, when redeemed, may be worth more or less than their original cost. Performance results assume reinvestment of all dividends and capital gain distributions at net asset value on the ex-dividend dates. Current performance may be higher or lower than the performance data quoted. For month-end performance figures, please visit http://www.ubs.com.
Lipper peer group data calculated by Lipper Inc.; used with permission. The Lipper median is the return of the fund that places in the middle of a Lipper peer group.
103
PACE Select Advisors Trust
PACE Large Co Value Equity Investments
Portfolio statistics (unaudited)
| Characteristics | | 07/31/11 | |
| Net assets (mm) | | $ | 1,199.8 | | |
| Number of holdings | | | 106 | | |
| Portfolio composition1 | | 07/31/11 | |
| Common stocks | | | 91.9 | % | |
| ADRs | | | 6.3 | | |
| Cash equivalents and other assets less liabilities | | | 1.8 | | |
| Total | | | 100.0 | % | |
| Top five sectors1 | | 07/31/11 | |
| Financials | | | 23.4 | % | |
| Health care | | | 15.2 | | |
| Information technology | | | 12.1 | | |
| Energy | | | 11.6 | | |
| Consumer discretionary | | | 10.1 | | |
| Total | | | 72.4 | % | |
| Top ten equity holdings1 | | 07/31/11 | |
| Microsoft Corp. | | | 3.4 | % | |
| JPMorgan Chase & Co. | | | 3.3 | | |
| Pfizer, Inc. | | | 3.2 | | |
| Johnson & Johnson | | | 2.8 | | |
| Exxon Mobil Corp. | | | 2.3 | | |
| MetLife, Inc. | | | 2.1 | | |
| Wells Fargo & Co. | | | 2.0 | | |
| The Goldman Sachs Group, Inc. | | | 2.0 | | |
| ACE Ltd. | | | 1.8 | | |
| PepsiCo, Inc. | | | 1.8 | | |
| Total | | | 24.7 | % | |
For a listing of defined portfolio acronyms that are used throughout the Portfolio statistics, please refer to page 227.
1 Weightings represent percentages of the Portfolio's net assets as of July 31, 2011. The Portfolio is actively managed and its composition will vary over time.
104
PACE Select Advisors Trust
PACE Large Co Value Equity Investments
Portfolio of investments—July 31, 2011
| | | Number of
shares | | Value | |
| Common stocks—98.20% | |
| Aerospace & defense—6.37% | |
| General Dynamics Corp. | | | 57,200 | | | $ | 3,897,608 | | |
| Honeywell International, Inc. | | | 396,400 | | | | 21,048,840 | | |
| Huntington Ingalls Industries, Inc.1,* | | | 41,279 | | | | 1,382,021 | | |
| ITT Corp. | | | 160,100 | | | | 8,539,734 | | |
| L-3 Communications Holdings, Inc. | | | 143,729 | | | | 11,371,838 | | |
| Northrop Grumman Corp. | | | 304,550 | | | | 18,428,321 | | |
| Raytheon Co. | | | 83,600 | | | | 3,739,428 | | |
| The Boeing Co. | | | 113,500 | | | | 7,998,345 | | |
| | | | 76,406,135 | | |
| Auto components—1.08% | |
| Johnson Controls, Inc. | | | 351,800 | | | | 12,999,010 | | |
| Automobiles—0.71% | |
| General Motors Co.* | | | 309,100 | | | | 8,555,888 | | |
| Beverages—4.18% | |
| Molson Coors Brewing Co., Class B | | | 262,050 | | | | 11,805,352 | | |
| PepsiCo, Inc. | | | 332,950 | | | | 21,322,118 | | |
| The Coca-Cola Co. | | | 250,100 | | | | 17,009,301 | | |
| | | | 50,136,771 | | |
| Building products—0.52% | |
| Masco Corp. | | | 587,075 | | | | 6,193,641 | | |
| Capital markets—5.25% | |
| Ameriprise Financial, Inc. | | | 70,500 | | | | 3,814,050 | | |
| BlackRock, Inc. | | | 46,050 | | | | 8,218,083 | | |
| Franklin Resources, Inc. | | | 76,600 | | | | 9,725,136 | | |
| Morgan Stanley | | | 217,750 | | | | 4,844,938 | | |
| State Street Corp. | | | 181,425 | | | | 7,523,695 | | |
| The Charles Schwab Corp. | | | 351,700 | | | | 5,250,881 | | |
| The Goldman Sachs Group, Inc. | | | 175,250 | | | | 23,653,492 | | |
| | | | 63,030,275 | | |
| Chemicals—3.49% | |
| E.I. du Pont de Nemours and Co. | | | 173,100 | | | | 8,900,802 | | |
| Monsanto Co. | | | 109,950 | | | | 8,079,126 | | |
| PPG Industries, Inc. | | | 96,975 | | | | 8,165,295 | | |
| The Dow Chemical Co. | | | 265,300 | | | | 9,251,011 | | |
| The Sherwin-Williams Co. | | | 96,350 | | | | 7,435,329 | | |
| | | | 41,831,563 | | |
| Commercial banks—3.80% | |
| BB&T Corp. | | | 340,850 | | | | 8,753,028 | | |
| CIT Group, Inc.* | | | 113,800 | | | | 4,522,412 | | |
| PNC Financial Services Group, Inc. | | | 145,325 | | | | 7,889,694 | | |
| Wells Fargo & Co. | | | 875,550 | | | | 24,462,867 | | |
| | | | 45,628,001 | | |
| Computers & peripherals—3.11% | |
| Dell, Inc.* | | | 1,128,325 | | | | 18,323,998 | | |
| Hewlett-Packard Co. | | | 541,600 | | | | 19,042,656 | | |
| | | | 37,366,654 | | |
| Diversified consumer services—0.69% | |
| Apollo Group, Inc., Class A* | | | 163,650 | | | | 8,318,330 | | |
| | | Number of
shares | | Value | |
| Common stocks—(Continued) | |
| Diversified financial services—5.32% | |
| Bank of America Corp. | | | 1,486,700 | | | $ | 14,435,857 | | |
| Citigroup, Inc. | | | 246,856 | | | | 9,464,459 | | |
| JPMorgan Chase & Co. | | | 985,793 | | | | 39,875,327 | | |
| | | | 63,775,643 | | |
| Diversified telecommunication services—1.07% | |
| AT&T, Inc. | | | 438,900 | | | | 12,842,214 | | |
| Electric utilities—2.34% | |
| American Electric Power Co., Inc. | | | 239,700 | | | | 8,835,342 | | |
| Edison International | | | 195,150 | | | | 7,429,361 | | |
| Entergy Corp. | | | 176,525 | | | | 11,791,870 | | |
| | | | 28,056,573 | | |
| Electronic equipment, instruments & components—1.64% | |
| Corning, Inc. | | | 218,200 | | | | 3,471,562 | | |
| TE Connectivity Ltd. | | | 471,350 | | | | 16,228,581 | | |
| | | | 19,700,143 | | |
| Food & staples retailing—1.88% | |
| CVS Caremark Corp. | | | 251,100 | | | | 9,127,485 | | |
| Sysco Corp. | | | 143,500 | | | | 4,389,665 | | |
| Wal-Mart Stores, Inc. | | | 172,500 | | | | 9,092,475 | | |
| | | | 22,609,625 | | |
| Food products—0.65% | |
| Archer Daniels Midland Co. | | | 256,050 | | | | 7,778,799 | | |
| Health care equipment & supplies—1.40% | |
| Covidien PLC | | | 321,700 | | | | 16,339,143 | | |
| Zimmer Holdings, Inc.* | | | 8,400 | | | | 504,168 | | |
| | | | 16,843,311 | | |
| Health care providers & services—0.80% | |
| Aetna, Inc. | | | 42,253 | | | | 1,753,077 | | |
| Laboratory Corp. of America Holdings* | | | 86,500 | | | | 7,850,740 | | |
| | | | 9,603,817 | | |
| Household durables—0.63% | |
| Fortune Brands, Inc. | | | 126,592 | | | | 7,622,104 | | |
| Insurance—9.05% | |
| ACE Ltd. | | | 325,128 | | | | 21,777,073 | | |
| Aflac, Inc. | | | 195,500 | | | | 9,004,730 | | |
| American International Group, Inc.* | | | 275,125 | | | | 7,896,088 | | |
| Axis Capital Holdings Ltd. | | | 330,900 | | | | 10,545,783 | | |
| Fidelity National Financial, Inc., Class A | | | 496,475 | | | | 8,092,542 | | |
| Hartford Financial Services Group, Inc. | | | 271,325 | | | | 6,354,432 | | |
| MetLife, Inc. | | | 610,950 | | | | 25,177,249 | | |
| The Allstate Corp. | | | 559,425 | | | | 15,507,261 | | |
| The Travelers Cos., Inc. | | | 75,600 | | | | 4,167,828 | | |
| | | | 108,522,986 | | |
| IT services—0.81% | |
| Computer Sciences Corp. | | | 148,325 | | | | 5,232,906 | | |
| International Business Machines Corp. | | | 24,550 | | | | 4,464,418 | | |
| | | | 9,697,324 | | |
105
PACE Select Advisors Trust
PACE Large Co Value Equity Investments
Portfolio of investments—July 31, 2011
| | | Number of
shares | | Value | |
| Common stocks—(Continued) | |
| Machinery—0.35% | |
| Deere & Co. | | | 53,300 | | | $ | 4,184,583 | | |
| Media—5.31% | |
| CBS Corp., Class B | | | 172,600 | | | | 4,724,062 | | |
| Comcast Corp., Class A | | | 370,700 | | | | 8,904,214 | | |
| Omnicom Group, Inc. | | | 226,083 | | | | 10,607,814 | | |
| The Walt Disney Co. | | | 230,500 | | | | 8,901,910 | | |
| Time Warner, Inc. | | | 531,400 | | | | 18,684,024 | | |
| Viacom, Inc., Class B | | | 245,950 | | | | 11,908,899 | | |
| | | | 63,730,923 | | |
| Multi-utilities—1.50% | |
| Dominion Resources, Inc. | | | 199,700 | | | | 9,675,465 | | |
| Sempra Energy | | | 164,100 | | | | 8,318,229 | | |
| | | | 17,993,694 | | |
| Multiline retail—0.55% | |
| J.C. Penney Co., Inc. (Holding Co.) | | | 215,450 | | | | 6,627,242 | | |
| Oil, gas & consumable fuels—11.61% | |
| Anadarko Petroleum Corp. | | | 122,900 | | | | 10,146,624 | | |
| Apache Corp. | | | 73,402 | | | | 9,081,295 | | |
| BP PLC, ADR | | | 328,286 | | | | 14,917,316 | | |
| Chevron Corp. | | | 85,100 | | | | 8,852,102 | | |
| EQT Corp. | | | 153,500 | | | | 9,744,180 | | |
| Exxon Mobil Corp. | | | 353,112 | | | | 28,174,807 | | |
| Marathon Oil Corp. | | | 287,950 | | | | 8,917,812 | | |
| Marathon Petroleum Corp. | | | 152,175 | | | | 6,663,743 | | |
| Newfield Exploration Co.* | | | 131,800 | | | | 8,885,956 | | |
| Occidental Petroleum Corp. | | | 173,447 | | | | 17,029,026 | | |
| Royal Dutch Shell PLC, A Shares, ADR | | | 158,236 | | | | 11,639,840 | | |
| Royal Dutch Shell PLC, B Shares, ADR | | | 71,075 | | | | 5,234,674 | | |
| | | | 139,287,375 | | |
| Personal products—0.49% | |
| Avon Products, Inc. | | | 222,730 | | | | 5,842,208 | | |
| Pharmaceuticals—12.98% | |
| Abbott Laboratories | | | 382,275 | | | | 19,618,353 | | |
| Bristol-Myers Squibb Co. | | | 173,800 | | | | 4,981,108 | | |
| Forest Laboratories, Inc.* | | | 273,700 | | | | 10,143,322 | | |
| Hospira, Inc.* | | | 71,350 | | | | 3,647,412 | | |
| Johnson & Johnson | | | 512,025 | | | | 33,174,100 | | |
| Merck & Co., Inc. | | | 596,175 | | | | 20,347,453 | | |
| Pfizer, Inc. | | | 1,968,152 | | | | 37,867,244 | | |
| Sanofi, ADR | | | 435,850 | | | | 16,889,187 | | |
| Teva Pharmaceutical Industries Ltd., ADR | | | 194,200 | | | | 9,057,488 | | |
| | | | 155,725,667 | | |
| Road & rail—0.79% | |
| Union Pacific Corp. | | | 92,000 | | | | 9,428,160 | | |
| Semiconductors & semiconductor equipment—2.12% | |
| Applied Materials, Inc. | | | 552,750 | | | | 6,809,880 | | |
| Intel Corp. | | | 393,200 | | | | 8,780,156 | | |
| Texas Instruments, Inc. | | | 330,100 | | | | 9,820,475 | | |
| | | | 25,410,511 | | |
| | | Number of
shares | | Value | |
| Common stocks—(Concluded) | |
| Software—4.37% | |
| CA, Inc. | | | 522,450 | | | $ | 11,650,635 | | |
| Microsoft Corp. | | | 1,489,752 | | | | 40,819,205 | | |
| | | | 52,469,840 | | |
| Specialty retail—1.08% | |
| Lowe's Cos., Inc. | | | 534,200 | | | | 11,528,036 | | |
| Staples, Inc. | | | 85,700 | | | | 1,376,342 | | |
| | | | 12,904,378 | | |
| Tobacco—0.79% | |
| Philip Morris International, Inc. | | | 132,400 | | | | 9,422,908 | | |
| Wireless telecommunication services—1.47% | |
| Vodafone Group PLC, ADR | | | 626,950 | | | | 17,617,295 | | |
Total common stocks
(cost—$1,078,618,679) | | | | | 1,178,163,591 | | |
| | | Face
amount | | | |
| Repurchase agreement—2.02% | |
Repurchase agreement dated
07/29/11 with State Street
Bank & Trust Co., 0.010%
due 08/01/11, collateralized by
$120,476 Federal Home Loan
Mortgage Corp. obligations,
5.125% due 07/15/12,
$17,316,109 US Treasury Bills,
zero coupon due 08/04/11 and
$6,829,434 US Treasury Notes,
2.375% to 2.625% due
02/29/16 to 07/31/17,
(value—$24,699,561);
proceeds: $24,215,020
(cost—$24,215,000) | | $ | 24,215,000 | | | | 24,215,000 | | |
| | | Number of
shares | | | |
| Investment of cash collateral from securities loaned—0.01% | |
| Money market fund—0.01% | |
UBS Private Money
Market Fund LLC2
(cost—$173,750) | | | 173,750 | | | | 173,750 | | |
Total investments
(cost—$1,103,007,429)—
100.23% | | | | | 1,202,552,341 | | |
Liabilities in excess of
other assets—(0.23)% | | | | | (2,792,132 | ) | |
| Net assets—100.00% | | $ | 1,199,760,209 | | |
106
PACE Select Advisors Trust
PACE Large Co Value Equity Investments
Portfolio of investments—July 31, 2011
Aggregate cost for federal income tax purposes was $1,144,616,827; and net unrealized appreciation consisted of:
| Gross unrealized appreciation | | $ | 103,990,808 | | |
| Gross unrealized depreciation | | | (46,055,294 | ) | |
| Net unrealized appreciation | | $ | 57,935,514 | | |
For a listing of defined portfolio acronyms and currency abbreviations that are used throughout the Portfolio of investments as well as the tables that follow, please refer to page 227.
* Non-income producing security.
1 Security, or portion thereof, was on loan at July 31, 2011.
2 The table below details the Portfolio's transaction activity in an affiliated issuer during the year ended July 31, 2011. The investment manager earns a management fee from UBS Private Money Market Fund LLC.
| Security description | | Value at
07/31/10 | | Purchases
during the
year ended
07/31/11 | | Sales
during the
year ended
07/31/11 | | Value at
07/31/11 | | Net income
earned from
affiliate for the
year ended
07/31/11 | |
| UBS Private Money Market Fund LLC | | $ | 9,903,388 | | | $ | 124,908,294 | | | $ | 134,637,932 | | | $ | 173,750 | | | $ | 804 | | |
The following is a summary of the fair valuations according to the inputs used as of July 31, 2011 in valuing the Portfolio's investments:
| | | Unadjusted
quoted prices in
active markets for
identical investments
(Level 1) | | Other significant
observable inputs
(Level 2) | | Unobservable
inputs
(Level 3) | | Total | |
| Common stocks | | $ | 1,178,163,591 | | | $ | — | | | $ | — | | | $ | 1,178,163,591 | | |
| Repurchase agreement | | | — | | | | 24,215,000 | | | | — | | | | 24,215,000 | | |
| Investment of cash collateral from securities loaned | | | — | | | | 173,750 | | | | — | | | | 173,750 | | |
| Total | | $ | 1,178,163,591 | | | $ | 24,388,750 | | | $ | — | | | $ | 1,202,552,341 | | |
Issuer breakdown by country or territory of origin (unaudited)
| | | Percentage of
total investments | |
| United States | | | 88.2 | % | |
| United Kingdom | | | 4.1 | | |
| Switzerland | | | 3.2 | | |
| France | | | 1.4 | | |
| Ireland | | | 1.4 | | |
| Bermuda | | | 0.9 | | |
| Israel | | | 0.8 | | |
| Total | | | 100.0 | % | |
See accompanying notes to financial statements.
107
PACE Select Advisors Trust
PACE Large Co Growth Equity Investments
Performance
For the 12 months ended July 31, 2011, the Portfolio's Class P shares returned 24.92%, before the deduction of the maximum PACE Select program fee. (Class P shares returned 22.45%, after the deduction of the maximum PACE Select program fee, for the same 12-month period.) In comparison, the Russell 1000 Growth Index (the "benchmark") returned 24.76%, and the Lipper Large-Cap Growth Funds category posted a median return of 23.38%. (Returns for all share classes over various time periods are shown in the "Performance at a glance" table on page 114. Please note that the returns shown do not reflect the deduction of taxes that a shareholder would pay on Portfolio distributions or the redemption of Portfolio shares.) For a detailed commentary on the market environment in general during the reporting period, please refer to page 2.
Sub-Advisors' comments1
Wellington Management
Our portion of the Portfolio outperformed the benchmark during the reporting period. Stock selection was the primary driver of our performance, whereas sector allocation, a residual of the bottom-up stock selection process, had a small negative impact on our performance.
Stock selection in the consumer staples and consumer discretionary sectors contributed the most to performance during the reporting period. The consumer staples sector benefited the most from one holding, Green Mountain Coffee Roasters, Inc. Its shares soared during the period after it announced several strategic partnerships for its single-cup brewing system, Keurig, which included Starbucks and Dunkin Donuts. Subsequent to the announcement, the company also beat market expectations, driving its share price higher. Within the consumer discretionary sector, our positions in online travel company Priceline.com, Inc. and consumer fashion accessory company Fossil contributed to relative performance. Priceline.com continued to benefit from growing Internet-based commerce and travel trends in Europe and across the globe. Fossil initiated a share repurchase program and continued to raise its outlook during the period.
Weak stock selection in the financials and health care sectors detracted from performance. Large detractors in financials
1 All Sub-Advisors discuss performance on a gross of fees basis—meaning that no fees or expenses are reflected in their sleeves'/sleeve's performance. Alternately, Fund performance is shown net of fees, which does factor in fees and expenses associated with the Fund.
PACE Select Advisors Trust – PACE Large Co Growth Equity Investments
Investment Sub-Advisors:
Wellington Management Company, LLP ("Wellington Management"), Marsico Capital Management, LLC ("Marsico"), Delaware Management Company ("Delaware"), Roxbury Capital Management, LLC ("Roxbury") and SSgA Funds Management, Inc. ("SSgA") until November 29, 2010.
Portfolio Managers:
Wellington: Andrew Shilling;
Marsico: Thomas Marsico, A. Douglas Rao and Coralie Witter
Delaware: Jeffrey Van Harte, Christopher Bonavico, Daniel Prislin and Christopher Ericksen
Roxbury: Brian L. Massey and Silas A. Myers
SSgA: J. Lee Montag and Brian Shannahan
Objective:
Capital appreciation
Investment process:
Wellington applies in-depth fundamental research in its effort to identify corporate change early, differentiate sustainable growth opportunities from short-lived events, identify superior business models, and develop strict valuation parameters for the companies it evaluates. Wellington's strategy is focused on investing in companies that appear well-positioned to benefit from long-lasting trends and that have structural advantages to maintaining their position.
Marsico uses an approach that combines top-down macro-economic analysis with bottom-up stock selection. It considers macro-economic factors such as interest rates, inflation, demographics, the regulatory environment and the global
(continued on next page)
108
PACE Select Advisors Trust
PACE Large Co Growth Equity Investments
Sub-Advisors' comments – continued
included Wells Fargo & Co. and Banco Santander Brazil SA, ADS. Wells Fargo declined as a result of issues in its mortgage business due to the struggling US housing market. Uncertainty surrounding the potential impact of regulatory changes to the financial industry also placed pressure on the company. We eliminated our position based on those concerns. Shares of Banco Santander fell as investors feared that a rising interest rate environment in Brazil may squeeze bank margins. We eliminated our position due to those concerns. Within health care, our positions in Edwards Life Sciences Corp. and Teva Pharmaceutical Industries Ltd., ADR detracted from results. Shares of Edwards Life Sciences came under pressure toward the end of the period when it issued third quarter 2011 guidance that was lower than analysts' expectations. Teva Pharmaceuticals saw its shares fall during the period as a result of missing expectations in the fourth quarter of 2010 and the first quarter of 2011. We eliminated our position in Teva Pharmaceuticals during the period due to the lackluster outlook for its existing products line-up and the potential threat of new competing products down the road.
From a sector perspective, an underweight to the strong performing energy sector, and an overweight to financials were drags on relative performance. This was partially offset by an overweight to consumer discretionary and an underweight to consumer staples.
Marsico
Our portion of the Portfolio performed largely in line with the benchmark during the reporting period. Stock selection and an overweight to the strong performing consumer discretionary sector contributed to our relative results during the reporting period. Positions in Internet travel services company Priceline.com, Inc., Internet retailer Amazon.com, Inc. and hotel and casino operator Wynn Resorts Ltd. were strong individual contributors. Select holdings and an underweight to the information technology sector also added to our returns in the period, as positions in Chinese Internet search company Baidu, Inc., ADR and Apple, Inc. were top individual contributors. Elsewhere, stock selection in the industrials sector, including Goodrich Corp., Precision Castparts Corp. and Union Pacific Corp. proved advantageous to our performance during the reporting period.
Stock selection in the financials sector hurt our performance. An overweight to the sector early in the period further detracted from results relative to the benchmark. During the
Investment process (continued)
competitive environment. It then seeks to identify companies with earnings growth potential that may not be recognized by the market at large. Marsico's stock selection process may focus on factors such as market expertise or dominance, franchise durability and pricing power, solid company fundamentals, as well as strong management and reasonable valuations.
Delaware invests primarily in common stocks of large capitalization growth-oriented companies that Delaware believes have long-term capital appreciation potential and are expected to grow faster than the US economy. Using a bottom-up approach, Delaware seeks to select securities of companies that it believes have attractive large end-market potential, dominant business models and strong free cash flow generation that are attractively priced compared to the intrinsic value of the securities. Delaware also considers a company's operational efficiencies, management's plans for capital allocation and the company's shareholder orientation.
Roxbury employs a bottom-up approach to stock selection, seeking high quality growth companies whose stocks are trading at discounts to fair value. Roxbury looks for companies with sustainable competitive advantages and opportunities to grow and reinvest capital at higher rates than their cost of capital. Roxbury also seeks to invest in companies with management teams with a proven ability to allocate capital in ways that maximize shareholder value. Roxbury's investment approach seeks to balance both the protection of capital as well as the appreciation potential of a stock.
SSgA (until November 29, 2010) uses several quantitative measures based on valuation, sentiment and quality to identify
(continued on next page)
109
PACE Select Advisors Trust
PACE Large Co Growth Equity Investments
Sub-Advisors' comments – continued
period, we reduced our exposure to the sector, trimming or selling outright various positions (including Citigroup and The Goldman Sachs Group, Inc.), but not before absorbing price declines in each of those holdings. Our reduced financials allocation represented a change in our outlook for a number of the largest financial services institutions. From our perspective, the regulatory environment for this group has become considerably more complex. Ultimately, we believe there could be a number of new or additional regulatory restrictions that may impact future profitability for some companies. A specific holding in the health care sector, Intuitive Surgical, emerged as the largest individual detractor in the period. It was subsequently sold to make room for ideas in which we have more conviction. From a sector perspective, having an underweight to energy, the strongest-performing sector in the benchmark, detracted from relative results.
As of July 31, 2011, our sector allocations emphasized information technology, consumer discretionary and industrials and we had no exposure to utilities and telecommunication services. As discussed, we significantly reduced our exposure to financials as we became more concerned about the regulatory overhang facing the industry.
Delaware
Our portion of the Portfolio outperformed the benchmark during the reporting period. Stock selection, particularly in the technology, consumer discretionary and health care sectors, drove our positive results.
In terms of individual holdings, top contributors to performance included Priceline.com, Inc., Polycom, Inc., QUALCOMM, Inc. and MasterCard, Inc. Priceline.com continued to exceed expectations and increase revenues, which we believe signifies that its core North American business is performing well. It also appears that Priceline.com's growing European hotel booking business was largely unaffected by sovereign debt crisis concerns during the period. Polycom more than doubled its second-quarter 2011 earnings due to improving sales and margins. A key focus for the company has been videoconferencing, which is experiencing strong demand in the developed and emerging market economies. Qualcomm's solid earnings momentum was driven by increased demand for smartphones and tablet devices. MasterCard's performance reversal during the reporting period appeared to result from the Federal Reserve Board's release of their final recommendations for debit card fee rates and network exclusivity rules. The final recommendations turned out to be more favorable than the original recommendations made in December 2010.
Individual holdings that detracted from performance included Staples, Inc. and EOG Resources, Inc. Staples released another modest earnings report during the second quarter of 2011, causing their stock price to weaken. This apparently increased investor concerns that the company's small- and medium-sized business customer base was struggling with an economy that had not fully recovered. We continue to hold the stock because we believe in the company's strategic plans to drive corporate profitability higher despite current economic conditions. EOG Resources' stock price likely suffered due to the company resetting its growth expectations for the large Eagle Ford
Investment process (concluded)
investment opportunities within a large cap growth universe and combines factors to produce an overall rank. Using comprehensive research, it seeks to determine the optimal weighting of these perspectives to arrive at strategies that vary by industry. SSgA ranks all companies within the investable universe from top to bottom based on their relative attractiveness. SSgA then constructs its portion of the Portfolio by selecting the highest-ranked stocks from the universe, and manages deviations from the benchmark to maximize the risk/reward trade-off. The aim is to have a resulting Portfolio with characteristics similar to the benchmark. SSgA generally sells stocks that no longer meet its selection criteria or that it believes otherwise may adversely affect performance relative to the benchmark.
110
PACE Select Advisors Trust
PACE Large Co Growth Equity Investments
Sub-Advisors' comments – continued
Shale project during the first half of the period, and because of oil price volatility during the second part of the period. Although the stock was affected by fluctuations in the price of oil and natural gas, we do not believe the company's long-term intrinsic business value is dependent solely on commodity prices. We continue to hold the position because we believe EOG Resources' management team has an unusual capital allocation discipline that increases the company's potential to perform and add value through a variety of commodity price and economic environments.
Roxbury
Our portion of the Portfolio underperformed the benchmark during the reporting period. Lower quality stocks with higher price-to-earnings ratios (P/Es) tended to outperform during the reporting period, whereas our style of investing emphasizes higher quality stocks with lower relative P/Es, which lagged the benchmark. The catalyst for the rally in higher P/E equities was increased risk appetite (the "risk-on" trade) that was given the "green light" from the Federal Reserve Board's quantitative easing policies. In general, there were no one or two stocks that were detrimental to our overall performance; rather it was broad-based and across almost every sector. We feel this is further evidence that our underperformance was likely a "style" issue, as opposed to poor execution of our investment process.
Equity selection and sector weightings in the information technology, financials and consumer discretionary sectors detracted the most from performance during the period. Cisco Systems and Hewlett-Packard Co. were the largest detractors in the information technology sector, and in our portion of the Portfolio. We sold Cisco due to persistent market share losses in its core switching and routing business units, which was a violation of our original investment thesis. Hewlett-Packard was recently sold from our portion of the Portfolio, and the proceeds were used to purchase shares of NetApp, Inc. Within the consumer discretionary sector, The Walt Disney Co. and News Corp. declined due to macro-economic concerns. Additionally, with respect to Disney, the spike in gas prices and weak economic data instilled fear that theme parks would experience declines. Moreover, the News of the World scandal in the UK caused a firestorm around News Corp.'s stock. We sold the stock from our portion of the Portfolio when it became apparent that we could no longer analyze the risk and potential downside outcomes from the News Corp. scandal.
Stock selection in the health care and industrials sectors were positive contributors to performance. Within health care, our holdings in Thermo Fisher Scientific, Inc., Johnson & Johnson and Baxter International, Inc. were rewarded. In the industrials sector, Stericycle and General Dynamics contributed positively to results. We sold Stericycle during the reporting period as we felt its stock price had reached its fair value. General Dynamics was eliminated from our portion of the Portfolio, given our concern over cuts to the national defense budget.
SSgA
During the period from August 1, 2010 through November 29, 2010, when we managed a portion of the Portfolio, we underperformed the benchmark. Our investment process incorporates model-driven quantitative measures such as valuation, quality and investor sentiment, which are designed to generate buy/hold/sell "signals." Overall, our signals were mixed over the reporting period. The dynamic change between risk-aversion and risk-seeking continued during this period. European sovereign debt worries triggered risk-aversion, and a stark upturn in US initial jobless claims in August put equity investors on the defensive. When new positive economic reports surfaced in September, macro fears waned and our model performance picked up again. Continuing their recent trend, cash flow and quality signals showed solid strength during most of the time period, with a temporary setback in August. Our growth signal, which had been weak all year, was the strongest signal through most of this
111
PACE Select Advisors Trust
PACE Large Co Growth Equity Investments
Sub-Advisors' comments – concluded
reporting period. As expected, due to the choppy market, our sentiment signal was the weakest, while earnings-based signals continue to struggle (as they did during most of 2010).
Overall, stock selection was weak and led to underperformance in nine out of 10 sectors within the benchmark. Our information technology and consumer discretionary holdings were the poorest-performing sectors on a relative basis. Within information technology, overweights to SanDisk Corp., a flash memory maker for consumer electronics products, and Intel Corp. were the largest detractors. Consumer discretionary stock selection was hurt by our underweight position in strong-performing Amazon.com, Inc. and an overweight to poor performer Whirlpool Corp., a home appliance maker. Partially offsetting these losses was strong stock selection in industrials, led by an overweight position in auto parts maker Timken Co., as its shares rallied sharply.
Special considerations
The Portfolio may be appropriate for long-term investors seeking capital appreciation who are able to withstand short-term fluctuations in the equity markets in return for potentially higher returns over the long term. The value of the Portfolio changes every day and can be affected by changes in interest rates, general market conditions and other political, social and economic developments, as well as specific matters relating to the companies in whose securities the Portfolio invests. Also, to the extent the Portfolio invests a large portion of its assets in a particular sector, the Portfolio may experience greater volatility and risk of loss due to unfavorable developments in that sector. It is important to note that an investment in the Portfolio is only one component of a balanced investment plan.
112
PACE Select Advisors Trust
PACE Large Co Growth Equity Investments
Illustration of an assumed investment of $10,000 in Class P shares of the Portfolio (unaudited)
The following graph depicts the performance of PACE Large Co Growth Equity Investments Class P shares versus the Russell 1000 Growth Index over the 10 years ended July 31, 2011. The performance of the other classes will vary based upon the different class specific expenses and sales charges. The performance provided does not reflect the deduction of taxes that a shareholder would pay on Portfolio distributions or the redemption of Portfolio shares. Past performance is no guarantee of future results. Share price and returns will vary with market conditions; investors may realize a gain or loss upon redemption. It is important to note that PACE Large Co Growth Equity Investments is a professionally managed portfolio while the Index is not available for investment and is unmanaged. The comparison is shown for illustration purposes only.

113
PACE Select Advisors Trust
PACE Large Co Growth Equity Investments
Performance at a glance (unaudited)
| Average annual total returns for periods ended 07/31/11 | | 1 year | | 5 years | | 10 years | |
| Before deducting | | Class A1 | | | 24.55 | % | | | 4.09 | % | | | 1.33 | % | |
| maximum sales charge | | Class B2 | | | 23.53 | % | | | 3.22 | % | | | 0.82 | %6 | |
| or PACE Select | | Class C3 | | | 23.47 | % | | | 3.23 | % | | | 0.50 | % | |
| program fee | | Class Y4 | | | 24.83 | % | | | 4.45 | % | | | 1.70 | % | |
| | | Class P5 | | | 24.92 | % | | | 4.38 | % | | | 1.61 | % | |
| After deducting | | Class A1 | | | 17.70 | % | | | 2.92 | % | | | 0.76 | % | |
| maximum sales charge | | Class B2 | | | 18.53 | % | | | 2.87 | % | | | 0.82 | %6 | |
| or PACE Select | | Class C3 | | | 22.47 | % | | | 3.23 | % | | | 0.50 | % | |
| program fee | | Class P5 | | | 22.45 | % | | | 2.31 | % | | | (0.40 | )% | |
| Russell 1000 Growth Index7 | | | | | 24.76 | % | | | 5.52 | % | | | 2.40 | % | |
| Lipper Large-Cap Growth Funds median | | | | | 23.38 | % | | | 4.36 | % | | | 2.07 | % | |
Average annual total returns for periods ended June 30, 2011, after deduction of the maximum sales charge or PACE Select program fee, were as follows: Class A—1-year period, 27.83%; 5-year period, 2.73%; 10-year period, 0.55%; Class B—1-year period, 29.11%; 5-year period, 2.70%; 10-year period, 0.60%; Class C—1-year period, 33.08%; 5-year period, 3.06%; 10-year period, 0.30%; Class Y—1-year period, 35.58%; 5-year period, 4.29%; 10-year period, 1.49%; Class P—1-year period, 32.95%; 5-year period, 2.14%; 10-year period, (0.60)%.
The annualized gross and net expense ratios, respectively, for each class of shares as in the November 28, 2010 prospectuses, were as follows: Class A—1.26% and 1.26%; Class B—2.37% and 2.05%; Class C—2.13% and 2.05%; Class Y—0.94% and 0.94%; and Class P—0.99% and 0.99%. Net expenses reflect fee waivers and/or expense reimbursements, if any, pursuant to an agreement that is in effect to cap the expenses. The Portfolio and UBS Global Asset Management (Americas) Inc. ("UBS Global AM") have entered into a written fee waiver/expense reimbursement agreement pursuant to which UBS Global AM is contractually obligated to waive its management fees and/or reimburse expenses so that the Portfolio's ordinary total operating expenses of each class through November 28, 2011 (excluding dividend expense, borrowing costs, and interest expense relating to short sales, and interest, taxes, brokerage commissions and extraordinary expenses) would not exceed Class A—1.30%; Class B—2.05%; Class C—2.05%; Class Y—1.05%; and Class P—1.05%. The Portfolio has agreed to repay UBS Global AM for any waived fees/reimbursed expenses to the extent that it can do so over the following three fiscal years without causing the Portfolio's expenses in any of those three years to exceed these expense caps. The fee waiver/expense reimbursement agreement may be terminated by the Portfolio's board at any time and also will terminate automatically upon the expiration or termination of the Portfolio's advisory contract with UBS Global AM. Upon termination of the agreement, however, UBS Global AM's three year recoupment rights will survive.
1 Maximum sales charge for Class A shares is 5.5%. Class A shares bear ongoing 12b-1 service fees.
2 Maximum contingent deferred sales charge for Class B shares is 5% imposed on redemptions and is reduced to 0% after a maximum of six years. Class B shares bear ongoing 12b-1 service and distribution fees.
3 Maximum contingent deferred sales charge for Class C shares is 1% imposed on redemptions and is reduced to 0% after one year. Class C shares bear ongoing 12b-1 service and distribution fees. Prior to September 30, 2003, Class C shares were subject to a maximum front-end sales charge of 1.00%; this front-end sales charge is not reflected in the average annual total returns presented for the Class C shares shown above.
4 The Portfolio offers Class Y shares to a limited group of eligible investors, including certain qualifying retirement plans. Class Y shares do not bear initial or contingent deferred sales charges or ongoing 12b-1 service and distribution fees.
5 Class P shares do not bear initial or contingent deferred sales charges or ongoing 12b-1 service and distribution fees, but are subject to a maximum annual PACE Select program fee of 2% of the value of Class P shares. Prior to June 14, 2010, the maximum annual PACE Select program fee was 1.5% of the value of Class P shares; however, the current maximum annual PACE Select program fee of 2% is reflected in the performance returns throughout all periods in the average annual total returns presented for the Class P shares shown above.
6 Assumes the conversion of Class B to Class A shares at the end of the sixth year.
7 The Russell 1000 Growth Index is designed to measure the performance of the large-cap growth segment of the US equity universe. It includes those Russell 1000 companies with higher price-to-book ratios and higher forecasted growth values. The Russell 1000 Growth Index is constructed to provide a comprehensive and unbiased barometer for the large-cap growth segment. The Index is completely reconstituted annually to ensure new and growing equities are included and that the represented companies continue to reflect growth characteristics. Investors should note that indices do not reflect the deduction of fees and expenses.
If an investor sells or exchanges shares less than 90 days after purchase, a redemption fee of 1.00% of the amount sold or exchanged will be deducted at the time of the transaction, except as noted otherwise in the prospectuses.
Past performance does not predict future performance, and the performance information provided does not reflect the deduction of taxes that a shareholder would pay on Portfolio distributions or the redemption of Portfolio shares. The return and principal value of an investment will fluctuate, so that an investor's shares, when redeemed, may be worth more or less than their original cost. Performance results assume reinvestment of all dividends and capital gain distributions at net asset value on the ex-dividend dates. Current performance may be higher or lower than the performance data quoted. For month-end performance figures, please visit http://www.ubs.com.
Lipper peer group data calculated by Lipper Inc.; used with permission. The Lipper median is the return of the fund that places in the middle of a Lipper peer group.
114
PACE Select Advisors Trust
PACE Large Co Growth Equity Investments
Portfolio statistics (unaudited)
| Characteristics | | 07/31/11 | |
| Net assets (mm) | | $ | 1,150.5 | | |
| Number of holdings | | | 121 | | |
| Portfolio composition1 | | 07/31/11 | |
| Common stocks | | | 93.7 | % | |
| ADRs | | | 4.1 | | |
| Cash equivalents and other assets less liabilities | | | 2.2 | | |
| Total | | | 100.0 | % | |
| Top five sectors1 | | 07/31/11 | |
| Information technology | | | 34.9 | % | |
| Consumer discretionary | | | 19.1 | | |
| Industrials | | | 12.0 | | |
| Energy | | | 8.1 | | |
| Health care | | | 8.0 | | |
| Total | | | 82.1 | % | |
| Top ten equity holdings1 | | 07/31/11 | |
| Apple, Inc. | | | 6.3 | % | |
| Oracle Corp. | | | 3.4 | | |
| QUALCOMM, Inc. | | | 3.0 | | |
| Priceline.com, Inc. | | | 2.8 | | |
| Visa, Inc. | | | 2.0 | | |
| Google, Inc. | | | 1.9 | | |
| EOG Resources, Inc. | | | 1.9 | | |
| Goodrich Corp. | | | 1.8 | | |
| Allergan, Inc. | | | 1.7 | | |
| Green Mountain Coffee Roasters, Inc. | | | 1.6 | | |
| Total | | | 26.4 | % | |
For a listing of defined portfolio acronyms that are used throughout the Portfolio statistics, please refer to page 227.
1 Weightings represent percentages of the Portfolio's net assets as of July 31, 2011. The Portfolio is actively managed and its composition will vary over time.
115
PACE Select Advisors Trust
PACE Large Co Growth Equity Investments
Portfolio of investments—July 31, 2011
| | | Number of
shares | | Value | |
| Common stocks—97.81% | |
| Aerospace & defense—3.42% | |
| Goodrich Corp. | | | 217,997 | | | $ | 20,740,235 | | |
| Honeywell International, Inc. | | | 200,197 | | | | 10,630,461 | | |
| Precision Castparts Corp. | | | 49,756 | | | | 8,029,623 | | |
| | | | 39,400,319 | | |
| Air freight & logistics—1.64% | |
| C.H. Robinson Worldwide, Inc. | | | 22,910 | | | | 1,656,622 | | |
Expeditors International of
Washington, Inc. | | | 140,900 | | | | 6,723,748 | | |
| FedEx Corp. | | | 121,125 | | | | 10,523,340 | | |
| | | | 18,903,710 | | |
| Auto components—0.64% | |
| Johnson Controls, Inc. | | | 200,360 | | | | 7,403,302 | | |
| Automobiles—0.52% | |
| Harley-Davidson, Inc. | | | 136,535 | | | | 5,924,254 | | |
| Beverages—1.00% | |
| PepsiCo, Inc. | | | 179,318 | | | | 11,483,525 | | |
| Biotechnology—0.52% | |
| Biogen Idec, Inc.* | | | 59,089 | | | | 6,019,396 | | |
| Capital markets—1.59% | |
| Ameriprise Financial, Inc. | | | 103,065 | | | | 5,575,817 | | |
| BlackRock, Inc. | | | 37,575 | | | | 6,705,634 | | |
| The Bank of New York Mellon Corp. | | | 241,600 | | | | 6,066,576 | | |
| | | | 18,348,027 | | |
| Chemicals—3.10% | |
| Monsanto Co. | | | 201,905 | | | | 14,835,980 | | |
| Syngenta AG, ADR | | | 116,000 | | | | 7,378,760 | | |
| The Dow Chemical Co. | | | 262,113 | | | | 9,139,880 | | |
| The Mosaic Co. | | | 61,135 | | | | 4,323,467 | | |
| | | | 35,678,087 | | |
| Commercial banks—0.12% | |
| PNC Financial Services Group, Inc. | | | 25,610 | | | | 1,390,367 | | |
| Communications equipment—4.55% | |
| Acme Packet, Inc.* | | | 56,380 | | | | 3,321,910 | | |
| F5 Networks, Inc.* | | | 35,985 | | | | 3,363,878 | | |
| Juniper Networks, Inc.* | | | 261,545 | | | | 6,117,537 | | |
| Polycom, Inc.* | | | 183,200 | | | | 4,951,896 | | |
| QUALCOMM, Inc. | | | 632,475 | | | | 34,646,980 | | |
| | | | 52,402,201 | | |
| Computers & peripherals—8.43% | |
| Apple, Inc.* | | | 184,556 | | | | 72,065,427 | | |
| EMC Corp.* | | | 415,995 | | | | 10,849,150 | | |
| NetApp, Inc.* | | | 297,153 | | | | 14,120,710 | | |
| | | | 97,035,287 | | |
| Consumer finance—0.85% | |
| American Express Co. | | | 195,560 | | | | 9,785,822 | | |
| Diversified consumer services—0.91% | |
| Apollo Group, Inc., Class A* | | | 206,400 | | | | 10,491,312 | | |
| | | Number of
shares | | Value | |
| Common stocks—(Continued) | |
| Diversified financial services—1.56% | |
| CME Group, Inc. | | | 27,500 | | | $ | 7,952,725 | | |
| IntercontinentalExchange, Inc.* | | | 81,300 | | | | 10,024,290 | | |
| | | | 17,977,015 | | |
| Electrical equipment—0.36% | |
| AMETEK, Inc. | | | 96,935 | | | | 4,119,738 | | |
| Electronic equipment, instruments & components—0.13% | |
| Dolby Laboratories, Inc., Class A* | | | 36,405 | | | | 1,542,116 | | |
| Energy equipment & services—2.67% | |
| Ensco PLC, ADR | | | 87,465 | | | | 4,657,511 | | |
| Halliburton Co. | | | 209,103 | | | | 11,444,207 | | |
| National-Oilwell Varco, Inc. | | | 78,065 | | | | 6,289,697 | | |
| Schlumberger Ltd. | | | 92,020 | | | | 8,315,848 | | |
| | | | 30,707,263 | | |
| Food & staples retailing—0.72% | |
| Walgreen Co. | | | 211,800 | | | | 8,268,672 | | |
| Food products—2.18% | |
| Green Mountain Coffee Roasters, Inc.* | | | 173,432 | | | | 18,028,256 | | |
| Mead Johnson Nutrition Co. | | | 98,069 | | | | 6,999,185 | | |
| | | | 25,027,441 | | |
| Health care equipment & supplies—0.99% | |
| Covidien PLC | | | 73,150 | | | | 3,715,289 | | |
| Edwards Lifesciences Corp.* | | | 56,690 | | | | 4,044,831 | | |
| Hologic, Inc.* | | | 194,960 | | | | 3,620,407 | | |
| | | | 11,380,527 | | |
| Health care providers & services—0.57% | |
| Medco Health Solutions, Inc.* | | | 103,600 | | | | 6,514,368 | | |
| Hotels, restaurants & leisure—3.77% | |
| Chipotle Mexican Grill, Inc.* | | | 9,036 | | | | 2,932,905 | | |
| Ctrip.com International Ltd., ADR* | | | 154,500 | | | | 7,122,450 | | |
| Las Vegas Sands Corp.* | | | 90,285 | | | | 4,259,646 | | |
| MGM Resorts International1,* | | | 335,260 | | | | 5,065,779 | | |
| Starbucks Corp. | | | 309,892 | | | | 12,423,570 | | |
| Wynn Resorts Ltd. | | | 75,381 | | | | 11,584,552 | | |
| | | | 43,388,902 | | |
| Household durables—0.09% | |
| Harman International Industries, Inc. | | | 25,254 | | | | 1,050,566 | | |
| Industrial conglomerates—0.57% | |
| Danaher Corp. | | | 132,382 | | | | 6,501,280 | | |
| Insurance—0.96% | |
| Berkshire Hathaway, Inc., Class B* | | | 148,315 | | | | 11,000,524 | | |
| Internet & catalog retail—4.13% | |
| Amazon.com, Inc.* | | | 58,135 | | | | 12,936,200 | | |
| Netflix, Inc.* | | | 9,160 | | | | 2,436,469 | | |
| Priceline.com, Inc.* | | | 59,828 | | | | 32,166,524 | | |
| | | | 47,539,193 | | |
| Internet software & services—5.35% | |
| Baidu, Inc., ADR* | | | 86,508 | | | | 13,587,812 | | |
| eBay, Inc.* | | | 435,630 | | | | 14,266,882 | | |
116
PACE Select Advisors Trust
PACE Large Co Growth Equity Investments
Portfolio of investments—July 31, 2011
| | | Number of
shares | | Value | |
| Common stocks—(Continued) | |
| Internet software & services—(Concluded) | |
| Google, Inc., Class A* | | | 36,925 | | | $ | 22,291,253 | | |
| VeriSign, Inc. | | | 364,210 | | | | 11,366,994 | | |
| | | | 61,512,941 | | |
| IT services—5.46% | |
| Accenture PLC, Class A | | | 164,897 | | | | 9,752,009 | | |
| Alliance Data Systems Corp.1,* | | | 63,480 | | | | 6,242,623 | | |
Cognizant Technology Solutions Corp.,
Class A* | | | 58,060 | | | | 4,056,652 | | |
| MasterCard, Inc., Class A | | | 43,000 | | | | 13,039,750 | | |
| Teradata Corp.* | | | 122,900 | | | | 6,754,584 | | |
| Visa, Inc., Class A | | | 268,074 | | | | 22,931,050 | | |
| | | | 62,776,668 | | |
| Life sciences tools & services—2.04% | |
| Agilent Technologies, Inc.* | | | 259,652 | | | | 10,946,928 | | |
| Thermo Fisher Scientific, Inc.* | | | 207,640 | | | | 12,477,088 | | |
| | | | 23,424,016 | | |
| Machinery—4.79% | |
| Caterpillar, Inc. | | | 46,845 | | | | 4,627,818 | | |
| Cummins, Inc. | | | 145,046 | | | | 15,212,424 | | |
| Eaton Corp. | | | 237,330 | | | | 11,379,974 | | |
| Illinois Tool Works, Inc. | | | 71,505 | | | | 3,560,949 | | |
| Joy Global, Inc. | | | 164,831 | | | | 15,480,928 | | |
| PACCAR, Inc. | | | 112,340 | | | | 4,809,275 | | |
| | | | 55,071,368 | | |
| Media—3.62% | |
British Sky Broadcasting
Group PLC, ADR | | | 55,551 | | | | 2,589,788 | | |
| News Corp., Class A | | | 402,550 | | | | 6,448,851 | | |
| Sirius XM Radio, Inc.1,* | | | 1,521,290 | | | | 3,209,922 | | |
| The Walt Disney Co. | | | 409,989 | | | | 15,833,775 | | |
| Time Warner, Inc. | | | 196,400 | | | | 6,905,424 | | |
| Viacom, Inc., Class B | | | 138,441 | | | | 6,703,313 | | |
| | | | 41,691,073 | | |
| Metals & mining—1.63% | |
| Freeport-McMoRan Copper & Gold, Inc. | | | 232,638 | | | | 12,320,509 | | |
| Rio Tinto PLC, ADR1 | | | 50,800 | | | | 3,605,784 | | |
| Walter Energy, Inc. | | | 22,920 | | | | 2,809,304 | | |
| | | | 18,735,597 | | |
| Multiline retail—0.61% | |
| Target Corp. | | | 137,341 | | | | 7,071,688 | | |
| Oil, gas & consumable fuels—5.42% | |
| Anadarko Petroleum Corp. | | | 128,717 | | | | 10,626,875 | | |
| CONSOL Energy, Inc. | | | 94,765 | | | | 5,079,404 | | |
| EOG Resources, Inc. | | | 213,903 | | | | 21,818,106 | | |
| Exxon Mobil Corp. | | | 153,260 | | | | 12,228,615 | | |
| Kinder Morgan Inc.1 | | | 124,482 | | | | 3,514,127 | | |
| Occidental Petroleum Corp. | | | 92,648 | | | | 9,096,181 | | |
| | | | 62,363,308 | | |
| | | Number of
shares | | Value | |
| Common stocks—(Concluded) | |
| Pharmaceuticals—3.92% | |
| Allergan, Inc. | | | 235,090 | | | $ | 19,115,168 | | |
| Johnson & Johnson | | | 190,861 | | | | 12,365,884 | | |
| Novo Nordisk A/S, ADR | | | 64,000 | | | | 7,809,280 | | |
| Perrigo Co. | | | 63,800 | | | | 5,761,778 | | |
| | | | 45,052,110 | | |
| Road & rail—1.18% | |
| J.B. Hunt Transport Services, Inc. | | | 51,620 | | | | 2,335,289 | | |
| Union Pacific Corp. | | | 109,138 | | | | 11,184,462 | | |
| | | | 13,519,751 | | |
| Semiconductors & semiconductor equipment—2.94% | |
| Altera Corp. | | | 346,115 | | | | 14,149,181 | | |
| Analog Devices, Inc. | | | 161,155 | | | | 5,543,732 | | |
| Broadcom Corp., Class A | | | 178,475 | | | | 6,616,068 | | |
| Skyworks Solutions, Inc.* | | | 136,590 | | | | 3,457,093 | | |
| Texas Instruments, Inc. | | | 137,340 | | | | 4,085,865 | | |
| | | | 33,851,939 | | |
| Software—8.06% | |
| Adobe Systems, Inc.* | | | 278,900 | | | | 7,731,108 | | |
| BMC Software, Inc.* | | | 118,235 | | | | 5,110,117 | | |
| Citrix Systems, Inc.* | | | 138,745 | | | | 9,995,190 | | |
| Intuit, Inc.* | | | 186,700 | | | | 8,718,890 | | |
| Microsoft Corp. | | | 494,385 | | | | 13,546,149 | | |
| Oracle Corp. | | | 1,295,419 | | | | 39,613,913 | | |
| Rovi Corp.* | | | 69,485 | | | | 3,680,620 | | |
| Salesforce.com, Inc.* | | | 14,440 | | | | 2,089,612 | | |
| VMware, Inc., Class A* | | | 22,205 | | | | 2,228,050 | | |
| | | | 92,713,649 | | |
| Specialty retail—2.28% | |
| Abercrombie & Fitch Co., Class A | | | 82,790 | | | | 6,053,605 | | |
| Lowe's Cos., Inc. | | | 683,694 | | | | 14,754,116 | | |
| Staples, Inc. | | | 336,100 | | | | 5,397,766 | | |
| | | | 26,205,487 | | |
| Textiles, apparel & luxury goods—2.48% | |
| Coach, Inc. | | | 100,070 | | | | 6,460,519 | | |
| Fossil, Inc.* | | | 44,970 | | | | 5,651,380 | | |
| Lululemon Athletica, Inc.1,* | | | 34,240 | | | | 2,072,890 | | |
| Nike, Inc., Class B | | | 84,700 | | | | 7,635,705 | | |
| Polo Ralph Lauren Corp. | | | 49,540 | | | | 6,691,368 | | |
| | | | 28,511,862 | | |
| Wireless telecommunication services—2.04% | |
| American Tower Corp., Class A* | | | 221,521 | | | | 11,636,498 | | |
| Crown Castle International Corp.* | | | 273,700 | | | | 11,878,580 | | |
| | | | 23,515,078 | | |
Total common stocks
(cost—$907,917,702) | | | | | | | 1,125,299,749 | | |
117
PACE Select Advisors Trust
PACE Large Co Growth Equity Investments
Portfolio of investments—July 31, 2011
| | | Face
amount | | Value | |
| Repurchase agreement—2.48% | |
Repurchase agreement dated
07/29/11 with State Street
Bank & Trust Co., 0.010%
due 08/01/11, collateralized
by $141,945 Federal Home
Loan Mortgage Corp.
obligations, 5.125%
due 07/15/12, $20,401,759
US Treasury Bills, zero coupon
due 08/04/11 and $8,046,407
US Treasury Notes, 2.375% to
2.625% due 02/29/16 to
07/31/17; (value—$29,100,907);
proceeds: $28,530,024
(cost—$28,530,000) | | $ | 28,530,000 | | | $ | 28,530,000 | | |
| | | Number of
shares | | Value | |
| Investment of cash collateral from securities loaned—1.55% | |
| Money market fund—1.55% | |
UBS Private Money Market Fund LLC2
(cost—$17,797,200) | | | 17,797,200 | | | $ | 17,797,200 | | |
Total investments
(cost—$954,244,902)—
101.84% | | | | | | | 1,171,626,949 | | |
Liabilities in excess of
other assets—(1.84)% | | | | | | | (21,123,714 | ) | |
| Net assets—100.00% | | $ | 1,150,503,235 | | |
Aggregate cost for federal income tax purposes was $968,137,840; and net unrealized appreciation consisted of:
| Gross unrealized appreciation | | $ | 218,487,963 | | |
| Gross unrealized depreciation | | | (14,998,854 | ) | |
| Net unrealized appreciation | | $ | 203,489,109 | | |
For a listing of defined portfolio acronyms and currency abbreviations that are used throughout the Portfolio of investments as well as the tables that follow, please refer to page 227.
* Non-income producing security.
1 Security, or portion thereof, was on loan at July 31, 2011.
2 The table below details the Portfolio's transaction activity in an affiliated issuer for the year ended July 31, 2011. The Investment manager earns a management fee from UBS Private Money Market Fund LLC.
| Security description | | Value at
07/31/10 | | Purchases
during the
year ended
07/31/11 | | Sales
during the
year ended
07/31/11 | | Value at
07/31/11 | | Net income
earned from
affiliate for the
year ended
07/31/11 | |
| UBS Private Money Market Fund LLC | | $ | 8,858,229 | | | $ | 291,359,338 | | | $ | 282,420,367 | | | $ | 17,797,200 | | | $ | 3,962 | | |
The following is a summary of the fair valuations according to the inputs used as of July 31, 2011 in valuing the Portfolio's investments:
| | | Unadjusted
quoted prices in
active markets for
identical investments
(Level 1) | | Other significant
observable inputs
(Level 2) | | Unobservable
inputs
(Level 3) | | Total | |
| Common stocks | | $ | 1,125,299,749 | | | $ | — | | | $ | — | | | $ | 1,125,299,749 | | |
| Repurchase agreement | | | — | | | | 28,530,000 | | | | — | | | | 28,530,000 | | |
| Investment of cash collateral from securities loaned | | | — | | | | 17,797,200 | | | | — | | | | 17,797,200 | | |
| Total | | $ | 1,125,299,749 | | | $ | 46,327,200 | | | $ | — | | | $ | 1,171,626,949 | | |
118
PACE Select Advisors Trust
PACE Large Co Growth Equity Investments
Portfolio of investments—July 31, 2011
Issuer breakdown by country or territory of origin (unaudited)
| | | Percentage of
total investments | |
| United States | | | 94.2 | % | |
| Cayman Islands | | | 1.8 | | |
| Ireland | | | 1.1 | | |
| United Kingdom | | | 0.9 | | |
| Curacao | | | 0.7 | | |
| Denmark | | | 0.7 | | |
| Switzerland | | | 0.6 | | |
| Total | | | 100.0 | % | |
See accompanying notes to financial statements.
119
PACE Select Advisors Trust
PACE Small/Medium Co Value Equity Investments
Performance
For the 12 months ended July 31, 2011, the Portfolio's Class P shares returned 19.66%, before the deduction of the maximum PACE Select program fee. (Class P shares returned 17.29%, after the deduction of the maximum PACE Select program fee, for the same 12-month period.) In comparison, the Russell 2500 Value Index (the "benchmark") returned 20.64% and the Lipper Small-Cap Core Funds category posted a median return of 23.99%. (Please note that despite the underperformance of one of the Fund's Sub-Advisors, the Fund as a whole outperformed the benchmark on a gross of fees basis. However, due to fees that are embedded in the Fund that are not embedded in the Index, the Fund underperformed the benchmark on a net of fees basis, as reported here. Returns for all share classes over various time periods are shown in the "Performance at a glance" table on page 124. Please note that the returns shown do not reflect the deduction of taxes that a shareholder would pay on Portfolio distributions or the redemption of Portfolio shares.) For a detailed commentary on the market environment in general during the reporting period, please refer to page 2.
Sub-Advisors' comments1
MetWest Capital
Our portion of the Portfolio significantly outperformed the benchmark during the reporting period. Stock selection was strongest in the information technology and consumer staples sectors. An underweight in financials also added value during the period, as that sector lagged the benchmark. It's important to note that all sector over- and underweights relative to the benchmark result from bottom-up stock selection rather than tactical allocation decisions.
Within the information technology sector, Entegris, Inc., a supplier of critical products used in the manufacture of semiconductors, was the top contributor to performance. Due to substantial investments in product development, the company has been able to regain some market share. Additionally, management has used its strong free cash flow generation to pay down debt, strengthening its balance sheet. Despite the selloff in the semiconductor equipment industry, investors finally appear to be recognizing that Entegris is executing well. In consumer staples, Ralcorp Holdings, Inc. added the most value. Shares of Ralcorp rallied as ConAgra
1 All Sub-Advisors discuss performance on a gross of fees basis—meaning that no fees or expenses are reflected in their sleeves'/sleeve's performance. Alternately, Fund performance is shown net of fees, which does factor in fees and expenses associated with the Fund.
PACE Select Advisors Trust – PACE Small/Medium Co Value Equity Investments
Investment Sub-Advisors:
Metropolitan West Capital Management, LLC ("MetWest Capital"), Buckhead Capital Management, LLC ("Buckhead") and Systematic Financial Management, L.P. ("Systematic")
Portfolio Managers:
MetWest Capital: Samir Sikka;
Buckhead: Matthew D. Reams and David S. Griffin;
Systematic: Ronald M. Mushock and D. Kevin McCreesh
Objective:
Capital appreciation
Investment process:
MetWest Capital utilizes a bottom-up, fundamental, research-driven style that it believes is well suited to the small cap market segment. MetWest Capital seeks to identify high-quality companies selling below intrinsic value with clear catalysts to realize full value within its investment time horizon and constructs a portfolio of its highest conviction ideas.
Buckhead utilizes a fundamental, bottom-up, research-driven investment style and a disciplined investment process that is designed to identify companies that it believes are attractively valued, have strong underlying fundamental characteristics and are likely to have one or more catalysts that are expected to drive their share prices higher. Buckhead seeks to build concentrated portfolios with the largest positions in those companies that it believes have the highest likelihood of outperforming the market and/or the Portfolio's benchmark.
(continued on next page)
120
PACE Select Advisors Trust
PACE Small/Medium Co Value Equity Investments
Sub-Advisors' comments – continued
Foods made a hostile bid to acquire the food products company. ConAgra is eager to acquire Ralcorp's private label business as well as its large portfolio of brands, which includes Anthony's pasta and Krusteaz pancake and waffle mixes. However, Ralcorp's management team has, in our view, wisely rejected ConAgra's acquisition overtures thus far, as they considered the price offered as being far too low.
Underweights in the strong performing energy and materials sectors detracted from our relative return. More specifically, our lack of exposure to oil, gas and consumable fuel within the energy sector and chemicals in the materials sector subtracted from performance. Given the commodity-driven, cyclical nature of these industries, it is difficult to find high-quality companies with sustainable competitive advantages; thus, we typically avoid investments in these areas. However, since both industries performed well during the fiscal year, our lack of exposure hindered relative performance.
The investment team remains committed to its long-term focus on high-quality investments. We will maintain our proactive and individual company focus in our efforts to add value for shareholders over a complete market cycle.
Buckhead
Our portion of the Portfolio underperformed the benchmark during the reporting period. Investments in financial service companies, particularly bank stocks, were the most significant detractors from performance during the period. Shares of First Horizon National Corp., for example, lagged because of renewed concerns surrounding the bank's exposure to the mortgage market. Wilmington Trust and United Community Banks (both eliminated from our portion of the Portfolio during the period) performed poorly as loan losses continued to mount. Elsewhere, difficult lending conditions caused high-quality Bank of Hawaii Corp. to underperform. Among consumer stocks, Central European Distribution Corp. and Cooper Tire & Rubber Co. were weak and underperformed as operating results disappointed investors and management reduced earnings guidance. Central European Distribution was sold in early 2011 due to poor operating results and a reduction in near term profitability.
There were, however, areas of strength in our portion of the Portfolio during the reporting period. Positive contributions came from holdings in a variety of sectors. Tidewater, Inc. (energy), Kennametal, Inc. and Dycom Industries, Inc. (producer durables), and Coinstar, Inc. (consumer discretionary), for example, all posted strong earnings and spoke with conviction about their businesses' long-term prospects. In terms of sector allocations, we maintain overweight positions in the consumer discretionary, producer durable and technology sectors, and underweights in the utility, health care and financial services sectors. While most of the over/underweights were fairly neutral to performance, our relative results were held back by the lack of exposure to health care stocks.
Notwithstanding the subdued results experienced by stock market investors in recent months, segments of the stock market still trade at extended levels (although many of the structural imbalances restricting economic expansion remain in place). Our research continues to indicate that prices of small company stocks relative to earnings, sales and book value are at levels similar to those measured prior to the financial crisis, and double those
Investment process (concluded)
Systematic employs a two-pronged investment approach that utilizes both quantitative screening and fundamental research. Systematic's investment philosophy is predicated on its belief that stock prices reflect the market's estimates of earnings, and as revisions to those estimates are made by the market, stock prices will follow suit.
Systematic conducts a quantitative screening of all companies within the small/mid capitalization universe, and then uses fundamental research analysis to gauge investor expectations by focusing on key revenue and margin assumptions underlying earnings estimates.
121
PACE Select Advisors Trust
PACE Small/Medium Co Value Equity Investments
Sub-Advisors' comments – concluded
measured at the market bottom. In this environment, caution is advised. We continue to favor companies with strong balance sheets, dominant market positions and business models designed to generate substantial free cash flows.
Systematic
Our portion of the Portfolio outperformed the benchmark during the reporting period. Our results for the period can be attributed to the effectiveness of two key factors in our investment philosophy; earnings estimate revision and our valuation framework. The earnings estimate revision factor performed in-line with its historical pattern, as those stocks with the most positive earnings estimate revisions outperformed those stocks with the least positive (or most negative) revisions. Our proprietary multi-factor valuation model was also effective during the period.
From a performance attribution standpoint, strong stock selection was the primary reason for our outperformance. Our stock picking in the materials, consumer discretionary and financials sectors provided the largest boost to relative results. The largest individual contributor was Atmel Co., which makes semiconductor controllers found in a variety of electronic devices and industrial products. Its stock price moved sharply higher during the period, largely due to the company's success with its touch-screen controllers.
On the flip side, our stock picking in the health care, industrials and consumer staples sectors detracted from results. One stock that performed poorly during the reporting period was Motorola Mobility Holdings. We believe the stock's sharp price decline was due to increasing skepticism among investors about the competitiveness of its new Xoom tablet product. The untimely release of the iPad2 by Apple, coupled with Xoom's surprisingly high price tag, led to poor results. Amid a series of negative estimate revisions for the company, we made the decision to sell our position in the stock, in accordance with our earnings-focused discipline.
Our sector allocation effect, in aggregate, was also additive to relative results. Our underweight to the financials sector was the largest contributor. This was partially offset by our underweight positioning to the utilities sector, which detracted from relative results.
Special considerations
The Portfolio may be appropriate for long-term investors seeking capital appreciation who are able to withstand short-term fluctuations in the equity markets in return for potentially higher returns over the long term. The value of the Portfolio changes every day and can be affected by changes in interest rates, general market conditions and other political, social and economic developments, as well as specific matters relating to the companies in whose securities the Portfolio invests. It is important to note that an investment in the Portfolio is only one component of a balanced investment plan. In addition, small- and mid-cap companies are typically subject to a greater degree of change in earnings and business prospects than are larger, more established companies. Therefore, they are considered to have a higher level of volatility and risk.
122
PACE Select Advisors Trust
PACE Small/Medium Co Value Equity Investments
Illustration of an assumed investment of $10,000 in Class P shares of the Portfolio (unaudited)
The following graph depicts the performance of PACE Small/Medium Co Value Equity Investments Class P shares versus the Russell 2500 Value Index over the 10 years ended July 31, 2011. The performance of the other classes will vary based upon the different class specific expenses and sales charges. The performance provided does not reflect the deduction of taxes that a shareholder would pay on Portfolio distributions or the redemption of Portfolio shares. Past performance is no guarantee of future results. Share price and returns will vary with market conditions; investors may realize a gain or loss upon redemption. It is important to note that PACE Small/Medium Co Value Equity Investments is a professionally managed portfolio while the Index is not available for investment and is unmanaged. The comparison is shown for illustration purposes only.

123
PACE Select Advisors Trust
PACE Small/Medium Co Value Equity Investments
Performance at a glance (unaudited)
| Average annual total returns for periods ended 07/31/11 | | 1 year | | 5 years | | 10 years | |
| Before deducting | | Class A1 | | | 19.40 | % | | | 3.51 | % | | | 5.75 | % | |
| maximum sales charge | | Class B2 | | | 18.70 | % | | | 2.74 | % | | | 5.24 | %6 | |
| or PACE Select | | Class C3 | | | 18.55 | % | | | 2.73 | % | | | 4.95 | % | |
| program fee | | Class Y4 | | | 19.74 | % | | | 3.86 | % | | | 6.09 | % | |
| | | Class P5 | | | 19.66 | % | | | 3.69 | % | | | 5.96 | % | |
| After deducting | | Class A1 | | | 12.84 | % | | | 2.35 | % | | | 5.15 | % | |
| maximum sales charge | | Class B2 | | | 13.70 | % | | | 2.39 | % | | | 5.24 | %6 | |
| or PACE Select | | Class C3 | | | 17.55 | % | | | 2.73 | % | | | 4.95 | % | |
| program fee | | Class P5 | | | 17.29 | % | | | 1.63 | % | | | 3.86 | % | |
| Russell 2500 Value Index7 | | | | | 20.64 | % | | | 3.05 | % | | | 8.02 | % | |
| Lipper Small-Cap Value Funds median8 | | | | | 19.91 | % | | | 3.17 | % | | | 7.94 | % | |
| Lipper Small-Cap Core Funds median8 | | | | | 23.99 | % | | | 4.08 | % | | | 6.94 | % | |
Average annual total returns for periods ended June 30, 2011, after deduction of the maximum sales charge or PACE Select program fee, were as follows: Class A—1-year period, 25.26%; 5-year period, 2.79%; 10-year period, 5.79%; Class B—1-year period, 26.47%; 5-year period, 2.74%; 10-year period, 5.87%; Class C—1-year period, 30.64%; 5-year period, 3.16%; 10-year period, 5.57%; Class Y—1-year period, 32.87%; 5-year period, 4.30%; 10-year period, 6.73%; Class P—1-year period, 30.15%; 5-year period, 2.07%; 10-year period, 4.49%.
The annualized gross and net expense ratios, respectively, for each class of shares as in the November 28, 2010 prospectuses, were as follows: Class A—1.35% and 1.35%; Class B—2.37% and 2.16%; Class C—2.11% and 2.11%; Class Y—0.97% and 0.97%; and Class P—1.25% and 1.16%. Net expenses reflect fee waivers and/or expense reimbursements, if any, pursuant to an agreement that is in effect to cap the expenses. The Portfolio and UBS Global Asset Management (Americas) Inc. ("UBS Global AM") have entered into a written fee waiver/expense reimbursement agreement pursuant to which UBS Global AM is contractually obligated to waive its management fees and/or reimburse expenses so that the Portfolio's ordinary total operating expenses of each class through November 28, 2011 (excluding dividend expense, borrowing costs, and interest expense relating to short sales, and interest, taxes, brokerage commissions and extraordinary expenses) would not exceed Class A—1.41%; Class B—2.16%; Class C—2.16%; Class Y—1.16%; and Class P—1.16%. The Portfolio has agreed to repay UBS Global AM for any waived fees/reimbursed expenses to the extent that it can do so over the following three fiscal years without causing the Portfolio's expenses in any of those three years to exceed these expense caps. The fee waiver/expense reimbursement agreement may be terminated by the Portfolio's board at any time and also will terminate automatically upon the expiration or termination of the Portfolio's advisory contract with UBS Global AM. Upon termination of the agreement, however, UBS Global AM's three year recoupment rights will survive.
1 Maximum sales charge for Class A shares is 5.5%. Class A shares bear ongoing 12b-1 service fees.
2 Maximum contingent deferred sales charge for Class B shares is 5% imposed on redemptions and is reduced to 0% after a maximum of six years. Class B shares bear ongoing 12b-1 service and distribution fees.
3 Maximum contingent deferred sales charge for Class C shares is 1% imposed on redemptions and is reduced to 0% after one year. Class C shares bear ongoing 12b-1 service and distribution fees. Prior to September 30, 2003, Class C shares were subject to a maximum front-end sales charge of 1.00%; this front-end sales charge is not reflected in the average annual total returns presented for the Class C shares shown above.
4 The Portfolio offers Class Y shares to a limited group of eligible investors, including certain qualifying retirement plans. Class Y shares do not bear initial or contingent deferred sales charges or ongoing 12b-1 service and distribution fees.
5 Class P shares do not bear initial or contingent deferred sales charges or ongoing 12b-1 service and distribution fees, but are subject to a maximum annual PACE Select program fee of 2% of the value of Class P shares. Prior to June 14, 2010, the maximum annual PACE Select program fee was 1.5% of the value of Class P shares; however, the current maximum annual PACE Select program fee of 2% is reflected in the performance returns throughout all periods in the average annual total returns presented for the Class P shares shown above.
6 Assumes the conversion of Class B to Class A shares at the end of the sixth year.
7 The Russell 2500 Value Index is designed to measure the performance of the small to mid-cap value segment of the US equity universe. It includes those Russell 2500 companies with lower price-to-book ratios and lower forecasted growth values. The Russell 2500 Value Index is constructed to provide a comprehensive and unbiased barometer of the small to mid-cap value market. The Index is completely reconstituted annually to ensure larger stocks do not distort the performance and characteristics of the true small to mid-cap opportunity set and that the represented companies continue to reflect value characteristics. Investors should note that indices do not reflect the deduction of fees and expenses.
8 On May 13, 2011, Lipper changed the peer group classification for PACE Small/Medium Co Value Equity Investments from the Lipper Small-Cap Core Funds category to the Lipper Small-Cap Value Funds category.
If an investor sells or exchanges shares less than 90 days after purchase, a redemption fee of 1.00% of the amount sold or exchanged will be deducted at the time of the transaction, except as noted otherwise in the prospectuses.
Past performance does not predict future performance, and the performance information provided does not reflect the deduction of taxes that a shareholder would pay on Portfolio distributions or the redemption of Portfolio shares. The return and principal value of an investment will fluctuate, so that an investor's shares, when redeemed, may be worth more or less than their original cost. Performance results assume reinvestment of all dividends and capital gain distributions at net asset value on the ex-dividend dates. Current performance may be higher or lower than the performance data quoted. For month-end performance figures, please visit http://www.ubs.com.
Lipper peer group data calculated by Lipper Inc.; used with permission. The Lipper median is the return of the fund that places in the middle of a Lipper peer group.
124
PACE Select Advisors Trust
PACE Small/Medium Co Value Equity Investments
Portfolio statistics (unaudited)
| Characteristics | | 07/31/11 | |
| Net assets (mm) | | $ | 425.3 | | |
| Number of holdings | | | 178 | | |
| Portfolio composition1 | | 07/31/11 | |
| Common stocks | | | 97.7 | % | |
| Cash equivalents and other assets less liabilities | | | 2.3 | | |
| Total | | | 100.0 | % | |
| Top five sectors1 | | 07/31/11 | |
| Financials | | | 22.0 | % | |
| Industrials | | | 19.5 | | |
| Consumer discretionary | | | 16.3 | | |
| Information technology | | | 12.8 | | |
| Health care | | | 6.8 | | |
| Total | | | 77.4 | % | |
| Top ten equity holdings1 | | 07/31/11 | |
| Raymond James Financial, Inc. | | | 1.6 | % | |
| Jabil Circuit, Inc. | | | 1.3 | | |
| American Greetings Corp. | | | 1.2 | | |
| Entegris, Inc. | | | 1.2 | | |
| Coinstar, Inc. | | | 1.2 | | |
| Con-way, Inc. | | | 1.1 | | |
| Tidewater, Inc. | | | 1.1 | | |
| Ralcorp Holdings, Inc. | | | 1.1 | | |
| Covance, Inc. | | | 1.1 | | |
| Avery Dennison Corp. | | | 1.0 | | |
| Total | | | 11.9 | % | |
1 Weightings represent percentages of the Portfolio's net assets as of July 31, 2011. The Portfolio is actively managed and its composition will vary over time.
125
PACE Select Advisors Trust
PACE Small/Medium Co Value Equity Investments
Portfolio of investments—July 31, 2011
| | | Number of
shares | | Value | |
| Common stocks—97.66% | |
| Aerospace & defense—0.46% | |
| Triumph Group, Inc. | | | 36,450 | | | $ | 1,962,468 | | |
| Air freight & logistics—0.74% | |
| Atlas Air Worldwide Holdings, Inc.* | | | 11,700 | | | | 612,963 | | |
| Forward Air Corp. | | | 81,500 | | | | 2,539,540 | | |
| | | | 3,152,503 | | |
| Auto components—1.15% | |
| Cooper Tire & Rubber Co. | | | 151,380 | | | | 2,552,267 | | |
| Lear Corp. | | | 47,850 | | | | 2,344,650 | | |
| | | | 4,896,917 | | |
| Automobiles—0.80% | |
| Harley-Davidson, Inc. | | | 35,825 | | | | 1,554,447 | | |
| Thor Industries, Inc. | | | 74,500 | | | | 1,842,385 | | |
| | | | 3,396,832 | | |
| Beverages—0.66% | |
| Constellation Brands, Inc., Class A* | | | 32,675 | | | | 666,243 | | |
| Dr. Pepper Snapple Group, Inc. | | | 56,370 | | | | 2,128,531 | | |
| | | | 2,794,774 | | |
| Building products—0.52% | |
| Owens Corning, Inc.* | | | 62,550 | | | | 2,225,529 | | |
| Capital markets—2.89% | |
| Invesco Ltd. | | | 34,500 | | | | 765,210 | | |
| Janus Capital Group, Inc. | | | 174,000 | | | | 1,468,560 | | |
| Knight Capital Group, Inc., Class A* | | | 149,005 | | | | 1,685,247 | | |
| Raymond James Financial, Inc. | | | 218,915 | | | | 6,952,740 | | |
| Stifel Financial Corp.* | | | 37,390 | | | | 1,419,324 | | |
| | | | 12,291,081 | | |
| Chemicals—0.75% | |
| Huntsman Corp. | | | 83,575 | | | | 1,596,282 | | |
| Innophos Holdings, Inc. | | | 17,500 | | | | 843,500 | | |
| PolyOne Corp. | | | 49,175 | | | | 762,213 | | |
| | | | 3,201,995 | | |
| Commercial banks—10.01% | |
| Associated Banc-Corp | | | 190,500 | | | | 2,600,325 | | |
| Bank of Hawaii Corp. | | | 78,825 | | | | 3,532,148 | | |
| Cathay General Bancorp | | | 215,000 | | | | 2,979,900 | | |
| CVB Financial Corp.1 | | | 321,000 | | | | 3,110,490 | | |
| East West Bancorp, Inc. | | | 74,355 | | | | 1,380,029 | | |
| Fifth Third Bancorp | | | 151,500 | | | | 1,916,475 | | |
| First Horizon National Corp. | | | 385,544 | | | | 3,466,041 | | |
| First Midwest Bancorp, Inc. | | | 317,220 | | | | 3,781,262 | | |
| Fulton Financial Corp. | | | 114,000 | | | | 1,157,100 | | |
| Glacier Bancorp, Inc. | | | 170,000 | | | | 2,233,800 | | |
| Huntington Bancshares, Inc. | | | 509,100 | | | | 3,077,509 | | |
| IBERIABANK Corp. | | | 39,950 | | | | 2,036,252 | | |
| KeyCorp | | | 389,300 | | | | 3,129,972 | | |
| Prosperity Bancshares, Inc. | | | 50,900 | | | | 2,113,877 | | |
| Wintrust Financial Corp. | | | 90,020 | | | | 3,076,884 | | |
| Zions Bancorporation | | | 136,500 | | | | 2,989,350 | | |
| | | | 42,581,414 | | |
| | | Number of
shares | | Value | |
| Common stocks—(Continued) | |
| Commercial services & supplies—4.07% | |
| Avery Dennison Corp. | | | 139,615 | | | $ | 4,404,853 | | |
| Copart, Inc.* | | | 34,000 | | | | 1,477,300 | | |
| KAR Auction Services, Inc.* | | | 117,500 | | | | 2,089,150 | | |
| Republic Services, Inc. | | | 92,055 | | | | 2,672,357 | | |
| Schawk, Inc. | | | 121,000 | | | | 1,910,590 | | |
| Sykes Enterprises, Inc.* | | | 89,800 | | | | 1,733,140 | | |
| United Stationers, Inc. | | | 94,350 | | | | 3,027,691 | | |
| | | | 17,315,081 | | |
| Communications equipment—1.03% | |
| Brocade Communications Systems, Inc.* | | | 383,000 | | | | 2,098,840 | | |
| Plantronics, Inc. | | | 66,000 | | | | 2,260,500 | | |
| | | | 4,359,340 | | |
| Computers & peripherals—1.70% | |
| Avid Technology, Inc.* | | | 164,800 | | | | 2,157,232 | | |
| Electronics for Imaging, Inc.* | | | 206,000 | | | | 3,545,260 | | |
| Western Digital Corp.* | | | 44,850 | | | | 1,545,531 | | |
| | | | 7,248,023 | | |
| Construction & engineering—1.97% | |
| Dycom Industries, Inc.* | | | 96,420 | | | | 1,642,997 | | |
| KBR, Inc. | | | 85,125 | | | | 3,034,706 | | |
| MasTec, Inc.* | | | 66,875 | | | | 1,396,350 | | |
| Pike Electric Corp.* | | | 263,000 | | | | 2,311,770 | | |
| | | | 8,385,823 | | |
| Construction materials—0.53% | |
| Texas Industries, Inc.1 | | | 58,500 | | | | 2,258,685 | | |
| Consumer finance—1.06% | |
| Discover Financial Services | | | 57,925 | | | | 1,483,459 | | |
| SLM Corp. | | | 194,925 | | | | 3,038,881 | | |
| | | | 4,522,340 | | |
| Containers & packaging—2.94% | |
| Ball Corp. | | | 64,210 | | | | 2,491,348 | | |
| Boise, Inc. | | | 129,100 | | | | 894,663 | | |
| Greif, Inc., Class A | | | 54,030 | | | | 3,298,531 | | |
| Owens-Illinois, Inc.* | | | 70,135 | | | | 1,625,028 | | |
| Rock-Tenn Co., Class A | | | 68,010 | | | | 4,179,895 | | |
| | | | 12,489,465 | | |
| Diversified consumer services—1.45% | |
| Coinstar, Inc.1,* | | | 101,970 | | | | 4,982,254 | | |
| Weight Watchers International, Inc. | | | 15,325 | | | | 1,182,937 | | |
| | | | 6,165,191 | | |
| Diversified telecommunication services—1.70% | |
| General Communication, Inc., Class A* | | | 141,500 | | | | 1,606,025 | | |
| Premiere Global Services, Inc.* | | | 218,065 | | | | 1,844,830 | | |
| tw telecom, Inc.* | | | 191,820 | | | | 3,788,445 | | |
| | | | 7,239,300 | | |
| Electric utilities—0.53% | |
| Westar Energy, Inc. | | | 87,000 | | | | 2,245,470 | | |
126
PACE Select Advisors Trust
PACE Small/Medium Co Value Equity Investments
Portfolio of investments—July 31, 2011
| | | Number of
shares | | Value | |
| Common stocks—(Continued) | |
Electronic equipment, instruments &
components—2.62% | |
| Jabil Circuit, Inc. | | | 309,675 | | | $ | 5,670,150 | | |
| Plexus Corp.* | | | 77,720 | | | | 2,293,517 | | |
| SYNNEX Corp.* | | | 112,460 | | | | 3,184,867 | | |
| | | | 11,148,534 | | |
| Energy equipment & services—3.01% | |
| Oceaneering International, Inc. | | | 55,000 | | | | 2,376,000 | | |
| Oil States International, Inc.* | | | 26,300 | | | | 2,122,410 | | |
| Superior Energy Services, Inc.* | | | 39,400 | | | | 1,634,706 | | |
| TETRA Technologies, Inc.* | | | 148,500 | | | | 1,911,195 | | |
| Tidewater, Inc.1 | | | 87,735 | | | | 4,767,520 | | |
| | | | 12,811,831 | | |
| Food products—3.25% | |
Brooklyn Cheesecake &
Desserts Co., Inc.2,* | | | 4,955 | | | | 1,239 | | |
| Flowers Foods, Inc. | | | 52,999 | | | | 1,161,738 | | |
| Hain Celestial Group, Inc.* | | | 49,875 | | | | 1,612,459 | | |
| J&J Snack Foods Corp. | | | 32,000 | | | | 1,654,080 | | |
| Ralcorp Holdings, Inc.* | | | 52,000 | | | | 4,498,000 | | |
| Smithfield Foods, Inc.* | | | 78,500 | | | | 1,728,570 | | |
| The Fresh Del Monte Produce, Inc. | | | 129,510 | | | | 3,174,290 | | |
| | | | 13,830,376 | | |
| Health care equipment & supplies—1.56% | |
| Sirona Dental Systems, Inc.* | | | 38,000 | | | | 1,922,040 | | |
| STERIS Corp. | | | 96,000 | | | | 3,359,040 | | |
| The Cooper Cos., Inc. | | | 17,825 | | | | 1,363,434 | | |
| | | | 6,644,514 | | |
| Health care providers & services—2.88% | |
| Amedisys, Inc.1,* | | | 102,500 | | | | 2,650,650 | | |
| AMN Healthcare Services, Inc.* | | | 279,500 | | | | 2,252,770 | | |
| Chemed Corp. | | | 29,500 | | | | 1,793,895 | | |
Health Management Associates, Inc.,
Class A* | | | 307,800 | | | | 2,924,100 | | |
| Health Net, Inc.* | | | 93,475 | | | | 2,628,517 | | |
| | | | 12,249,932 | | |
| Hotels, restaurants & leisure—2.53% | |
| Ameristar Casinos, Inc. | | | 60,725 | | | | 1,348,095 | | |
| Brinker International, Inc. | | | 58,800 | | | | 1,412,376 | | |
| CEC Entertainment, Inc. | | | 53,000 | | | | 2,051,100 | | |
| P.F. Chang's China Bistro, Inc. | | | 82,500 | | | | 2,716,725 | | |
| Papa John's International, Inc.* | | | 79,500 | | | | 2,481,195 | | |
| Wyndham Worldwide Corp. | | | 21,700 | | | | 750,603 | | |
| | | | 10,760,094 | | |
| Household durables—2.29% | |
| American Greetings Corp., Class A | | | 235,880 | | | | 5,229,459 | | |
| Ethan Allen Interiors, Inc.1 | | | 91,000 | | | | 1,674,400 | | |
| MDC Holdings, Inc. | | | 63,500 | | | | 1,435,735 | | |
| Newell Rubbermaid, Inc. | | | 90,515 | | | | 1,404,793 | | |
| | | | 9,744,387 | | |
| | | Number of
shares | | Value | |
| Common stocks—(Continued) | |
| Insurance—4.77% | |
| Arch Capital Group Ltd.* | | | 22,525 | | | $ | 761,345 | | |
| Brown & Brown, Inc. | | | 124,115 | | | | 2,706,948 | | |
| HCC Insurance Holdings, Inc. | | | 98,425 | | | | 2,965,545 | | |
| Horace Mann Educators Corp. | | | 141,000 | | | | 2,052,960 | | |
| Lincoln National Corp. | | | 114,900 | | | | 3,044,850 | | |
| Selective Insurance Group, Inc. | | | 177,500 | | | | 2,909,225 | | |
| StanCorp Financial Group, Inc. | | | 70,000 | | | | 2,328,200 | | |
| Unum Group | | | 52,125 | | | | 1,271,329 | | |
| XL Group PLC | | | 109,150 | | | | 2,239,758 | | |
| | | | 20,280,160 | | |
| Internet software & services—2.04% | |
| DealerTrack Holdings, Inc.* | | | 80,500 | | | | 1,866,795 | | |
| Digital River, Inc.* | | | 43,975 | | | | 1,121,363 | | |
| ValueClick, Inc.* | | | 188,025 | | | | 3,395,731 | | |
| WebMD Health Corp.* | | | 64,500 | | | | 2,273,625 | | |
| | | | 8,657,514 | | |
| IT services—0.03% | |
| TeleTech Holdings, Inc.* | | | 6,355 | | | | 125,765 | | |
| Life sciences tools & services—2.39% | |
| Bio-Rad Laboratories, Inc., Class A* | | | 22,200 | | | | 2,419,800 | | |
Charles River Laboratories
International, Inc.* | | | 82,500 | | | | 3,262,875 | | |
| Covance, Inc.* | | | 78,500 | | | | 4,494,125 | | |
| | | | 10,176,800 | | |
| Machinery—5.85% | |
| Briggs & Stratton Corp. | | | 130,125 | | | | 2,230,343 | | |
| Kennametal, Inc. | | | 97,300 | | | | 3,836,539 | | |
| Meritor, Inc.* | | | 162,815 | | | | 2,198,003 | | |
| Pentair, Inc. | | | 62,000 | | | | 2,282,220 | | |
| Timken Co. | | | 73,950 | | | | 3,229,396 | | |
| Trimas Corp.* | | | 135,460 | | | | 3,246,976 | | |
| Trinity Industries, Inc. | | | 135,700 | | | | 4,042,503 | | |
| Wabtec Corp. | | | 35,500 | | | | 2,290,460 | | |
| Watts Water Technologies, Inc., Class A | | | 45,000 | | | | 1,508,850 | | |
| | | | 24,865,290 | | |
| Media—1.39% | |
DreamWorks Animation SKG, Inc.,
Class A* | | | 110,000 | | | | 2,404,600 | | |
| John Wiley & Sons, Inc., Class A | | | 28,645 | | | | 1,433,969 | | |
| Valassis Communications, Inc.1,* | | | 77,750 | | | | 2,083,700 | | |
| | | | 5,922,269 | | |
| Metals & mining—0.87% | |
| Noranda Aluminum Holding Corp.* | | | 185,625 | | | | 2,576,475 | | |
| Walter Energy, Inc. | | | 9,325 | | | | 1,142,965 | | |
| | | | 3,719,440 | | |
| Multi-utilities—1.05% | |
| CMS Energy Corp. | | | 124,000 | | | | 2,373,360 | | |
| NiSource, Inc. | | | 102,925 | | | | 2,071,880 | | |
| | | | 4,445,240 | | |
127
PACE Select Advisors Trust
PACE Small/Medium Co Value Equity Investments
Portfolio of investments—July 31, 2011
| | | Number of
shares | | Value | |
| Common stocks—(Continued) | |
| Multiline retail—0.64% | |
| Macy's, Inc. | | | 94,425 | | | $ | 2,726,050 | | |
| Oil, gas & consumable fuels—2.37% | |
| Comstock Resources, Inc.* | | | 48,860 | | | | 1,558,634 | | |
| Denbury Resources, Inc.* | | | 120,425 | | | | 2,326,611 | | |
| Energen Corp. | | | 40,750 | | | | 2,396,507 | | |
| Rex Energy Corp.1,* | | | 122,900 | | | | 1,360,503 | | |
| Western Refining, Inc.1,* | | | 118,625 | | | | 2,423,509 | | |
| | | | 10,065,764 | | |
| Paper & forest products—0.94% | |
| Glatfelter | | | 140,000 | | | | 2,112,600 | | |
| MeadWestvaco Corp. | | | 60,525 | | | | 1,884,749 | | |
| | | | 3,997,349 | | |
| Personal products—0.20% | |
| Nu Skin Enterprises, Inc., Class A | | | 22,525 | | | | 845,589 | | |
| Professional services—2.43% | |
| Heidrick & Struggles International, Inc. | | | 70,000 | | | | 1,862,000 | | |
| Kelly Services, Inc., Class A* | | | 150,740 | | | | 2,359,081 | | |
| Resources Connection, Inc. | | | 291,500 | | | | 3,795,330 | | |
| School Specialty, Inc.* | | | 191,000 | | | | 2,295,820 | | |
| | | | 10,312,231 | | |
| Real estate investment trusts—2.56% | |
| BioMed Realty Trust, Inc. | | | 164,500 | | | | 3,227,490 | | |
| CBL & Associates Properties, Inc. | | | 126,400 | | | | 2,244,864 | | |
| DuPont Fabros Technology, Inc.1 | | | 45,675 | | | | 1,164,256 | | |
| Home Properties, Inc. | | | 47,700 | | | | 3,125,304 | | |
| Summit Hotel Properties, Inc. | | | 101,400 | | | | 1,143,792 | | |
| | | | 10,905,706 | | |
| Road & rail—3.27% | |
| Con-way, Inc. | | | 131,805 | | | | 4,826,699 | | |
| Hertz Global Holdings, Inc.* | | | 148,925 | | | | 2,095,375 | | |
| Landstar System, Inc. | | | 77,000 | | | | 3,453,450 | | |
| Ryder System, Inc. | | | 62,450 | | | | 3,517,184 | | |
| | | | 13,892,708 | | |
| Semiconductors & semiconductor equipment—4.21% | |
| Atmel Corp.* | | | 211,175 | | | | 2,555,218 | | |
| ATMI, Inc.* | | | 100,500 | | | | 1,874,325 | | |
| Brooks Automation, Inc.* | | | 115,500 | | | | 1,098,405 | | |
| Entegris, Inc.* | | | 581,500 | | | | 4,983,455 | | |
| NVIDIA Corp.* | | | 259,590 | | | | 3,590,130 | | |
| ON Semiconductor Corp.* | | | 437,260 | | | | 3,799,789 | | |
| | | | 17,901,322 | | |
| Software—1.16% | |
| Cadence Design Systems, Inc.* | | | 227,950 | | | | 2,354,723 | | |
| Progress Software Corp.* | | | 106,350 | | | | 2,563,035 | | |
| | | | 4,917,758 | | |
| Specialty retail—4.07% | |
| Aeropostale, Inc.* | | | 143,000 | | | | 2,409,550 | | |
| Chico's FAS, Inc. | | | 119,036 | | | | 1,796,253 | | |
| Foot Locker, Inc. | | | 49,775 | | | | 1,081,611 | | |
| Group 1 Automotive, Inc. | | | 32,000 | | | | 1,524,160 | | |
| | | Number of
shares | | Value | |
| Common stocks—(Concluded) | |
| Specialty retail—(Concluded) | |
| Jos. A. Bank Clothiers, Inc.* | | | 57,000 | | | $ | 2,924,670 | | |
| OfficeMax, Inc.* | | | 425,000 | | | | 3,009,000 | | |
| Pier 1 Imports, Inc.* | | | 118,600 | | | | 1,303,414 | | |
| Signet Jewelers Ltd.* | | | 60,300 | | | | 2,583,252 | | |
| Williams-Sonoma, Inc. | | | 17,700 | | | | 655,254 | | |
| | | | 17,287,164 | | |
| Textiles, apparel & luxury goods—2.03% | |
| Carter's, Inc.* | | | 76,500 | | | | 2,562,750 | | |
| PVH Corp. | | | 37,450 | | | | 2,679,547 | | |
| The Jones Group Inc. | | | 261,500 | | | | 3,383,810 | | |
| | | | 8,626,107 | | |
| Thrifts & mortgage finance—0.68% | |
| First Niagara Financial Group, Inc. | | | 237,025 | | | | 2,903,556 | | |
| Trading companies & distributors—0.24% | |
| Applied Industrial Technologies, Inc. | | | 31,950 | | | | 1,019,844 | | |
| Water utilities—0.91% | |
| American Water Works Co., Inc. | | | 137,600 | | | | 3,852,800 | | |
| Wireless telecommunication services—0.46% | |
| MetroPCS Communications, Inc.* | | | 119,650 | | | | 1,947,902 | | |
Total common stocks
(cost—$373,780,058) | | | | | | | 415,316,227 | | |
| | | Face
amount | | | |
| Repurchase agreement���3.72% | |
Repurchase agreement dated
07/29/11 with State Street
Bank & Trust Co., 0.010%
due 08/01/11, collateralized
by $78,659 Federal Home
Loan Mortgage Corp. obligations,
5.125% due 07/15/12, $11,305,706
US Treasury Bills, zero coupon due
08/04/11 and $4,458,944 US
Treasury Notes, 2.375% to 2.625%
due 02/29/16 to 07/31/17;
(value—$16,126,370);
proceeds: $15,810,013
(cost—$15,810,000) | | $ | 15,810,000 | | | | 15,810,000 | | |
| | | Number of
shares | | | |
| Investment of cash collateral from securities loaned—3.56% | |
| Money market fund—3.56% | |
UBS Private Money Market Fund LLC3
(cost—$15,163,573) | | | 15,163,573 | | | | 15,163,573 | | |
Total investments
(cost—$404,753,631)—
104.94% | | | | | | | 446,289,800 | | |
Liabilities in excess of
other assets—(4.94)% | | | | | | | (21,006,799 | ) | |
| Net assets—100.00% | | $ | 425,283,001 | | |
128
PACE Select Advisors Trust
PACE Small/Medium Co Value Equity Investments
Portfolio of investments—July 31, 2011
Aggregate cost for federal income tax purposes was $407,196,461; and net unrealized appreciation consisted of:
| Gross unrealized appreciation | | $ | 59,011,740 | | |
| Gross unrealized depreciation | | | (19,918,401 | ) | |
| Net unrealized appreciation | | $ | 39,093,339 | | |
For a listing of defined portfolio acronyms and currency abbreviations that are used throughout the Portfolio of investments as well as the tables that follow, please refer to page 227.
* Non-income producing security.
1 Security, or portion thereof, was on loan at July 31, 2011.
2 Illiquid security representing 0.00% of net assets as of July 31, 2011.
3 The table below details the Portolio's transaction activity in an affiliated issuer during the year ended July 31, 2011. The investment manager earns a management fee from UBS Private Money Market Fund LLC.
| Security description | | Value at
07/31/10 | | Purchases
during the
year ended
07/31/11 | | Sales
during the
year ended
07/31/11 | | Value at
07/31/11 | | Net income
earned from
affiliate for the
year ended
07/31/11 | |
| UBS Private Money Market Fund LLC | | $ | 11,194,599 | | | $ | 188,007,480 | | | $ | 184,038,506 | | | $ | 15,163,573 | | | $ | 7,632 | | |
The following is a summary of the fair valuations according to the inputs used as of July 31, 2011 in valuing the Portfolio's investments:
| | | Unadjusted
quoted prices in
active markets for
identical investments
(Level 1) | | Other significant
observable inputs
(Level 2) | | Unobservable
inputs
(Level 3) | | Total | |
| Common stocks | | $ | 415,314,988 | | | $ | 1,239 | | | $ | — | | | $ | 415,316,227 | | |
| Repurchase agreement | | | — | | | | 15,810,000 | | | | — | | | | 15,810,000 | | |
| Investment of cash collateral from securities loaned | | | — | | | | 15,163,573 | | | | — | | | | 15,163,573 | | |
| Total | | $ | 415,314,988 | | | $ | 30,974,812 | | | $ | — | | | $ | 446,289,800 | | |
Issuer breakdown by country or territory of origin (unaudited)
| | | Percentage of
total investments | |
| United States | | | 97.9 | % | |
| Bermuda | | | 0.9 | | |
| Cayman Islands | | | 0.7 | | |
| Ireland | | | 0.5 | | |
| Total | | | 100.0 | % | |
See accompanying notes to financial statements.
129
PACE Select Advisors Trust
PACE Small/Medium Co Growth Equity Investments
Performance
For the 12 months ended July 31, 2011, the Portfolio's Class P shares returned 35.82%, before the deduction of the maximum PACE Select program fee. (Class P shares returned 33.12%, after the deduction of the maximum PACE Select program fee, for the same 12-month period.) In comparison, the Russell 2500 Growth Index (the "benchmark") returned 30.39%, and the Lipper Small-Cap Growth Funds category posted a median return of 30.86%. (Returns for all share classes over various time periods are shown in the "Performance at a glance" table on page 134. Please note that the returns shown do not reflect the deduction of taxes that a shareholder would pay on Portfolio distributions or the redemption of Portfolio shares.) For a detailed commentary on the market environment in general during the reporting period, please refer to page 2.
Sub-Advisor's comments1
Copper Rock
Our portion of the Portfolio outperformed the benchmark during the reporting period. Despite some volatility that crept into the markets in the spring of 2011, stocks with good earnings reports and strong fundamentals were rewarded throughout the period. Solid stock selection contributed to our outperformance, with particularly strong results in a handful of positions in the consumer staples, health care and consumer discretionary sectors.
Leading contributors included Green Mountain Coffee Roasters, Inc. in the consumer staples sector, Lululemon Athletica, Inc. and Shutterfly, Inc. in the consumer discretionary sector and Zoll Medical Corp. in the health care sector. Solid fundamentals and earnings have been consistently rewarded as Green Mountain Coffee Roasters posted another strong 2010 holiday season with better than expected brewer and k-cup sales. It also announced a k-cup distribution agreement with Dunkin' Donuts and then a partnership agreement with Starbucks. These agreements are expected to be incremental to sales and solidify Green Mountain Coffee Roasters' position as the leader in the single cup serve market. Lululemon Athletica has continued to demonstrate strong sales momentum while also opening new stores at a robust pace and driving margin improvements substantially.
Weakness during the period stemmed primarily from stock selection in the information technology sector. This was partially offset by a positive contribution from the overweight position relative to the benchmark. As a result, performance in the sector for the period was essentially flat. While our portion of the portfolio benefited from owning positions in names like Skyworks Solutions, Inc., Acme Packet, Inc. and Riverbed Technology, Inc., our positions in DG Fast Channel and GSI Commerce detracted from performance. DG FastChannel pre-announced
PACE Select Advisors Trust – PACE Small/Medium Co Growth Equity Investments
Investment Sub-Advisors:
Copper Rock Capital Partners, LLC ("Copper Rock"), Riverbridge Partners, LLC ("Riverbridge"), and Palisade Capital Management, L.L.C. ("Palisade")
Portfolio Managers:
Copper Rock: Tucker Walsh;
Riverbridge: Mark Thompson;
Palisade: Sammy Oh
Objective:
Capital appreciation
Investment process:
Copper Rock employs a fundamental, bottom-up investment approach that focuses on identifying emerging companies that exhibit the potential for strong and sustainable revenue growth over each of the following two years. Copper Rock utilizes a "pure" growth investment style that emphasizes growth and momentum characteristics. Copper Rock attempts to manage risk by diversifying and understanding its holdings and employing a stringent sell discipline.
(continued on next page)
1 All Sub-Advisors discuss performance on a gross of fees basis—meaning that no fees or expenses are reflected in their sleeves'/sleeve's performance. Alternately, Fund performance is shown net of fees, which does factor in fees and expenses associated with the Fund.
130
PACE Select Advisors Trust
PACE Small/Medium Co Growth Equity Investments
Sub-Advisors' comments – continued
negative third quarter results at the end of August 2010, just three weeks after reporting very strong second quarter results. We were expecting similar strong results and this pre-announcement was very surprising. We exited the stock as our investment thesis was broken, but the stock's extreme underperformance had an outsized negative impact on our results during the fiscal year. GSI Commerce, an e-commerce and interactive marketing services provider, acquired RueLaLa, a private sale business, which is a bit different than the company's core business, but which had been growing very rapidly. The core e-commerce business continued to perform better than expected, although the RueLaLa business grew slightly below expectations, with higher associated expenses than we had anticipated. As a result, our earnings forecasts started to come down despite good performance from the e-commerce business line, and we made the decision to sell the stock. Subsequent to our sale, eBay purchased the e-commerce portion of GSI Commerce, but did not acquire the RueLaLa business line.
Riverbridge Partners
Our portion of the Portfolio modestly underperformed the benchmark during the reporting period. Stock selection in the consumer discretionary sector detracted from performance, primarily due to concerns over the for-profit education industry, which negatively impacted our holdings in Capella Education Co. and Grand Canyon Education, Inc. We have investments in this industry because we believe demand will continue for these services. These companies typically cater to demographic groups not well served by traditional colleges. Our investment team is mindful of the risks confronting this industry and exercises particular discernment as to which companies will best fit our portfolios and are best positioned within the group over the long term. Our underweight to the outperforming energy sector also detracted from our relative performance. Energy, benefiting from rising crude oil prices, was the best performing market sector over the past year.
Stock selection within the health care sector contributed to performance. We are focused on those health care companies that are delivering a product or service that compels the ultimate payer, whether that entity is a central system or the actual receiver of health care, to consume their products or services. One of our top performers over the reporting period was Cepheid, Inc., which enables its customers to deliver superior medical outcomes at a reduced cost versus what they would otherwise spend for care. The company also facilitates the rapid detection of a biological condition, to expedite diagnosis and for more targeted treatments of a condition. Our overweight to the outperforming information technology sector also enhanced our results.
We believe that our long-term excess performance relative to the benchmark is attributable to the consistent application of our investment process over time. Many investors, led by hedge funds, have truncated their investment horizons over the last several years. As a result, fewer investors have the fortitude to stick with their investments during times of market turbulence. Hedge funds will quickly reverse their positions based on fear of loss. Market trends, because of this short-term orientation, may be shorter in duration. We believe this phenomenon will provide us and other long-term oriented investors with an advantage.
Investment process (concluded)
Riverbridge believes that earnings power determines the value of a franchise. Riverbridge focuses on companies that are viewed as building their earnings power and building the intrinsic value of the company over long periods of time. Riverbridge looks to invest in high-quality growth companies that demonstrate the ability to sustain strong secular earnings growth, regardless of overall economic conditions.
Palisade seeks fundamentally strong and dynamic small- and mid-cap companies that are trading at a discount to their growth rates. Palisade's goal is to ascertain a dynamic of change before it manifests in consensus estimates. Palisade believes that the small- and mid-cap market is inherently less efficient than the large-cap market, and attempts to gain an information advantage through fundamental research.
131
PACE Select Advisors Trust
PACE Small/Medium Co Growth Equity Investments
Sub-Advisors' comments – concluded
Palisade
Our portion of the Portfolio outperformed the benchmark during the reporting period. Information technology was our best performing sector for the period, followed by the industrials, materials and energy sectors. Stock selection was particularly strong within information technology, especially among software stocks with strong earnings results. In addition, a number of our holdings were acquired at significant premiums. Netezza was acquired by IBM; ArcSight by Hewlett-Packard; Art Technology Group by Oracle Corp.; and Savvis Inc. by CenturyLink, Inc. Both Syniverse and CommScope were taken private by The Carlyle Group. Industrial company Baldor Electric was acquired by ABB. We do not own the acquiring companies as they were either purchased by larger-cap companies that are outside our investable universe, or taken over by larger equity firms.
The worst performing sector relative to the benchmark was consumer discretionary. We identified specialty retailers Talbots, OfficeMax and Coldwater Creek as potential turnaround candidates, but the turnarounds failed to materialize due to poor execution and a weak spending environment in women's apparel. We have exited all of these positions. Our portion of the Portfolio was hurt by its holdings in the financials sector. This was primarily due to weaker capital markets stocks such as Knight Capital Group, Inc. and MF Global Holdings Ltd., as transaction activity and trading volumes failed to improve. We continue to hold both stocks, as we believe business conditions will improve and both companies are valued attractively.
We feel that the market is likely to remain volatile as investors wrestle with numerous issues, including those surrounding the debt ceiling and global economic weakness. Although we are both cautious and aware of the economic and political factors, our portion of the Portfolio continues to be constructed from our bottom up research. We believe fear, dislocations in the market, the "risk off" trade, etc. can create opportunities if we maintain our discipline and a steady mindset. Acquisition activity within the benchmark has moderated in 2011, but we believe it will pick up again later in the year as corporate balance sheets remain flush with cash.
Special considerations
The Portfolio may be appropriate for long-term investors seeking capital appreciation who are able to withstand short-term fluctuations in the equity markets in return for potentially higher returns over the long term. The value of the Portfolio changes every day and can be affected by changes in interest rates, general market conditions and other political, social and economic developments, as well as specific matters relating to the companies in whose securities the Portfolio invests. It is important to note that an investment in the Portfolio is only one component of a balanced investment plan. In addition, small- and mid-cap companies are typically subject to a greater degree of change in earnings and business prospects than are larger, more established companies. Therefore, they are considered to have a higher level of volatility and risk. Also, to the extent the Portfolio invests a large portion of its assets in a particular sector, the Portfolio may experience greater volatility and risk of loss due to unfavorable developments in that sector.
132
PACE Select Advisors Trust
PACE Small/Medium Co Growth Equity Investments
Illustration of an assumed investment of $10,000 in Class P shares of the Portfolio (unaudited)
The following graph depicts the performance of PACE Small/Medium Co Growth Equity Investments Class P shares versus the Russell 2500 Growth Index over the 10 years ended July 31, 2011. The performance of the other classes will vary based upon the different class specific expenses and sales charges. The performance provided does not reflect the deduction of taxes that a shareholder would pay on Portfolio distributions or the redemption of Portfolio shares. Past performance is no guarantee of future results. Share price and returns will vary with market conditions; investors may realize a gain or loss upon redemption. It is important to note that PACE Small/Medium Co Growth Equity Investments is a professionally managed portfolio while the Index is not available for investment and is unmanaged. The comparison is shown for illustration purposes only.
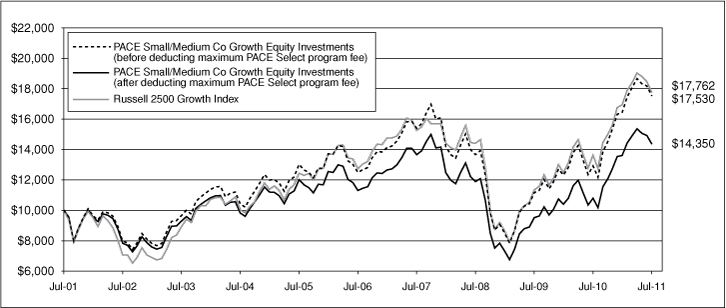
133
PACE Select Advisors Trust
PACE Small/Medium Co Growth Equity Investments
Performance at a glance (unaudited)
| Average annual total returns for periods ended 07/31/11 | | 1 year | | 5 years | | 10 years | |
| Before deducting | | Class A1 | | | 35.67 | % | | | 6.81 | % | | | 5.55 | % | |
| maximum sales charge | | Class B2 | | | 34.23 | % | | | 5.96 | % | | | 5.00 | %6 | |
| or PACE Select | | Class C3 | | | 34.50 | % | | | 6.00 | % | | | 4.72 | % | |
| program fee | | Class Y4 | | | 35.87 | % | | | 7.14 | % | | | 5.86 | % | |
| | | Class P5 | | | 35.82 | % | | | 7.02 | % | | | 5.77 | % | |
| After deducting | | Class A1 | | | 28.25 | % | | | 5.61 | % | | | 4.96 | % | |
| maximum sales charge | | Class B2 | | | 29.23 | % | | | 5.64 | % | | | 5.00 | %6 | |
| or PACE Select | | Class C3 | | | 33.50 | % | | | 6.00 | % | | | 4.72 | % | |
| program fee | | Class P5 | | | 33.12 | % | | | 4.90 | % | | | 3.68 | % | |
| Russell 2500 Growth Index7 | | | | | 30.39 | % | | | 6.89 | % | | | 5.91 | % | |
| Lipper Small-Cap Growth Funds median | | | | | 30.86 | % | | | 5.42 | % | | | 5.05 | % | |
Average annual total returns for periods ended June 30, 2011, after deduction of the maximum sales charge or PACE Select program fee, were as follows: Class A—1-year period, 39.13%; 5-year period, 5.49%; 10-year period, 4.51%; Class B—1-year period, 40.91%; 5-year period, 5.52%; 10-year period, 4.55%; Class C—1-year period, 44.98%; 5-year period, 5.88%; 10-year period, 4.27%; Class Y—1-year period, 47.49%; 5-year period, 7.02%; 10-year period, 5.41%; Class P—1-year period, 44.47%; 5-year period, 4.80%; 10-year period, 3.25%.
The annualized gross and net expense ratios, respectively, for each class of shares as in the November 28, 2010 prospectuses, were as follows: Class A—1.35% and 1.35%; Class B—2.73% and 2.13%; Class C—2.13% and 2.13%; Class Y—0.94% and 0.94%; and Class P—1.23% and 1.13%. Net expenses reflect fee waivers and/or expense reimbursements, if any, pursuant to an agreement that is in effect to cap the expenses. The Portfolio and UBS Global Asset Management (Americas) Inc. ("UBS Global AM") have entered into a written fee waiver/expense reimbursement agreement pursuant to which UBS Global AM is contractually obligated to waive its management fees and/or reimburse expenses so that the Portfolio's ordinary total operating expenses of each class through November 28, 2011 (excluding dividend expense, borrowing costs, and interest expense relating to short sales, and interest, taxes, brokerage commissions and extraordinary expenses) would not exceed Class A—1.38%; Class B—2.13%; Class C—2.13%; Class Y—1.13%; and Class P—1.13%. The Portfolio has agreed to repay UBS Global AM for any waived fees/reimbursed expenses to the extent that it can do so over the following three fiscal years without causing the Portfolio's expenses in any of those three years to exceed these expense caps. The fee waiver/expense reimbursement agreement may be terminated by the Portfolio's board at any time and also will terminate automatically upon the expiration or termination of the Portfolio's advisory contract with UBS Global AM. Upon termination of the agreement, however, UBS Global AM's three year recoupment rights will survive.
1 Maximum sales charge for Class A shares is 5.5%. Class A shares bear ongoing 12b-1 service fees.
2 Maximum contingent deferred sales charge for Class B shares is 5% imposed on redemptions and is reduced to 0% after a maximum of six years. Class B shares bear ongoing 12b-1 service and distribution fees.
3 Maximum contingent deferred sales charge for Class C shares is 1% imposed on redemptions and is reduced to 0% after one year. Class C shares bear ongoing 12b-1 service and distribution fees. Prior to September 30, 2003, Class C shares were subject to a maximum front-end sales charge of 1.00%; this front-end sales charge is not reflected in the average annual total returns presented for the Class C shares shown above.
4 The Portfolio offers Class Y shares to a limited group of eligible investors, including certain qualifying retirement plans. Class Y shares do not bear initial or contingent deferred sales charges or ongoing 12b-1 service and distribution fees.
5 Class P shares do not bear initial or contingent deferred sales charges or ongoing 12b-1 service and distribution fees, but are subject to a maximum annual PACE Select program fee of 2% of the value of Class P shares. Prior to June 14, 2010, the maximum annual PACE Select program fee was 1.5% of the value of Class P shares; however, the current maximum annual PACE Select program fee of 2% is reflected in the performance returns throughout all periods in the average annual total returns presented for the Class P shares shown above.
6 Assumes the conversion of Class B to Class A shares at the end of the sixth year.
7 The Russell 2500 Growth Index is designed to measure the performance of the small to mid-cap growth segment of the US equity universe. It includes those Russell 2500 companies with higher price-to-book ratios and higher forecasted growth values. The Russell 2500 Growth Index is constructed to provide a comprehensive and unbiased barometer of the small to mid-cap growth market. The Index is completely reconstituted annually to ensure larger stocks do not distort the performance and characteristics of the true small to mid-cap opportunity set and that the represented companies continue to reflect growth characteristics. Investors should note that indices do not reflect the deduction of fees and expenses.
If an investor sells or exchanges shares less than 90 days after purchase, a redemption fee of 1.00% of the amount sold or exchanged will be deducted at the time of the transaction, except as noted otherwise in the prospectuses.
Past performance does not predict future performance, and the performance information provided does not reflect the deduction of taxes that a shareholder would pay on Portfolio distributions or the redemption of Portfolio shares. The return and principal value of an investment will fluctuate, so that an investor's shares, when redeemed, may be worth more or less than their original cost. Performance results assume reinvestment of all dividends and capital gain distributions at net asset value on the ex-dividend dates. Current performance may be higher or lower than the performance data quoted. For month-end performance figures, please visit http://www.ubs.com.
Lipper peer group data calculated by Lipper Inc.; used with permission. The Lipper median is the return of the fund that places in the middle of a Lipper peer group.
134
PACE Select Advisors Trust
PACE Small/Medium Co Growth Equity Investments
Portfolio statistics (unaudited)
| Characteristics | | 07/31/11 | |
| Net assets (mm) | | $ | 468.6 | | |
| Number of holdings | | | 206 | | |
| Portfolio composition1 | | 07/31/11 | |
| Common stocks | | | 95.3 | % | |
| ADRs | | | 0.4 | | |
| Investment companies | | | 0.9 | | |
| Cash equivalents and other assets less liabilities | | | 3.4 | | |
| Total | | | 100.0 | % | |
| Top five sectors1 | | 07/31/11 | |
| Information technology | | | 22.5 | % | |
| Health care | | | 20.6 | | |
| Industrials | | | 18.8 | | |
| Consumer discretionary | | | 15.9 | | |
| Energy | | | 6.7 | | |
| Total | | | 84.5 | % | |
| Top ten equity holdings1 | | 07/31/11 | |
| Green Mountain Coffee Roasters, Inc. | | | 1.6 | % | |
| The Cooper Cos., Inc. | | | 1.5 | | |
| Zoll Medical Corp. | | | 1.5 | | |
| Affiliated Managers Group, Inc. | | | 1.3 | | |
| athenahealth, Inc. | | | 1.2 | | |
| AMETEK, Inc. | | | 1.2 | | |
| Acacia Research | | | 1.1 | | |
| Gentex Corp. | | | 1.1 | | |
| Cepheid, Inc. | | | 1.1 | | |
| SXC Health Solutions Corp. | | | 1.0 | | |
| Total | | | 12.6 | % | |
For a listing of defined portfolio acronyms that are used throughout the Portfolio statistics, please refer to page 227.
1 Weightings represent percentages of the Portfolio's net assets as of July 31, 2011. The Portfolio is actively managed and its composition will vary over time.
135
PACE Select Advisors Trust
PACE Small/Medium Co Growth Equity Investments
Portfolio of investments—July 31, 2011
| | | Number of
shares | | Value | |
| Common stocks—95.68% | |
| Aerospace & defense—1.59% | |
| BE Aerospace, Inc.* | | | 47,292 | | | $ | 1,882,222 | | |
| TransDigm Group, Inc.* | | | 37,007 | | | | 3,333,220 | | |
| Triumph Group, Inc. | | | 41,350 | | | | 2,226,284 | | |
| | | | 7,441,726 | | |
| Air freight & logistics—1.63% | |
| Atlas Air Worldwide Holdings, Inc.* | | | 54,116 | | | | 2,835,137 | | |
| Forward Air Corp. | | | 35,400 | | | | 1,103,064 | | |
| Hub Group, Inc., Class A* | | | 103,902 | | | | 3,686,443 | | |
| | | | 7,624,644 | | |
| Auto components—1.48% | |
| Gentex Corp. | | | 184,672 | | | | 5,233,605 | | |
| Tenneco, Inc.* | | | 42,116 | | | | 1,682,113 | | |
| | | | 6,915,718 | | |
| Biotechnology—3.31% | |
| Alexion Pharmaceuticals, Inc.* | | | 34,120 | | | | 1,938,016 | | |
| Ardea Biosciences, Inc.* | | | 83,410 | | | | 1,951,794 | | |
| Cepheid, Inc.* | | | 135,669 | | | | 5,122,861 | | |
| Dendreon Corp.* | | | 38,700 | | | | 1,428,030 | | |
| Human Genome Sciences, Inc.* | | | 71,260 | | | | 1,497,173 | | |
| Onyx Pharmaceuticals, Inc.* | | | 41,130 | | | | 1,356,467 | | |
| Pharmasset, Inc.* | | | 18,300 | | | | 2,221,254 | | |
| | | | 15,515,595 | | |
| Capital markets—3.14% | |
| Affiliated Managers Group, Inc.* | | | 60,252 | | | | 6,286,091 | | |
| Financial Engines, Inc.1,* | | | 36,767 | | | | 873,584 | | |
| Knight Capital Group, Inc., Class A* | | | 166,940 | | | | 1,888,092 | | |
| Lazard Ltd., Class A | | | 53,215 | | | | 1,788,024 | | |
| MF Global Holdings Ltd.* | | | 278,160 | | | | 2,050,039 | | |
| Stifel Financial Corp.* | | | 48,620 | | | | 1,845,615 | | |
| | | | 14,731,445 | | |
| Chemicals—2.23% | |
| Albemarle Corp. | | | 43,649 | | | | 2,906,151 | | |
| FMC Corp. | | | 30,630 | | | | 2,682,269 | | |
| Intrepid Potash, Inc.1,* | | | 50,050 | | | | 1,664,163 | | |
| Landec Corp.* | | | 91,546 | | | | 565,754 | | |
| Solutia, Inc.* | | | 122,960 | | | | 2,636,262 | | |
| | | | 10,454,599 | | |
| Commercial banks—0.51% | |
| Hancock Holding Co. | | | 72,870 | | | | 2,401,067 | | |
| Commercial services & supplies—2.66% | |
| Cenveo, Inc.* | | | 229,460 | | | | 1,328,574 | | |
| Clean Harbors, Inc.* | | | 40,560 | | | | 2,139,540 | | |
| EnerNOC, Inc.1,* | | | 36,214 | | | | 606,222 | | |
| Innerworkings, Inc.1,* | | | 140,700 | | | | 1,031,331 | | |
| Mobile Mini, Inc.* | | | 43,900 | | | | 926,729 | | |
| Ritchie Brothers Auctioneers, Inc.1 | | | 108,193 | | | | 2,963,406 | | |
| Rollins, Inc. | | | 180,900 | | | | 3,453,381 | | |
| | | | 12,449,183 | | |
| | | Number of
shares | | Value | |
| Common stocks—(Continued) | |
| Communications equipment—1.94% | |
| Acme Packet, Inc.* | | | 25,924 | | | $ | 1,527,442 | | |
| Digi International, Inc.* | | | 153,100 | | | | 2,187,799 | | |
| JDS Uniphase Corp.* | | | 87,660 | | | | 1,152,729 | | |
| Riverbed Technology, Inc.* | | | 148,027 | | | | 4,238,013 | | |
| | | | 9,105,983 | | |
| Computers & peripherals—0.45% | |
| Fusion-io, Inc.1,* | | | 39,806 | | | | 1,178,656 | | |
| Stratasys, Inc.1,* | | | 35,875 | | | | 914,812 | | |
| | | | 2,093,468 | | |
| Construction & engineering—0.36% | |
| Foster Wheeler AG* | | | 62,210 | | | | 1,685,891 | | |
| Consumer finance—0.42% | |
| First Cash Financial Services, Inc.* | | | 45,000 | | | | 1,947,150 | | |
| Distributors—0.53% | |
| LKQ Corp.* | | | 100,600 | | | | 2,471,742 | | |
| Diversified consumer services—1.01% | |
| Capella Education Co.* | | | 18,324 | | | | 783,351 | | |
| Coinstar, Inc.1,* | | | 50,550 | | | | 2,469,873 | | |
| Grand Canyon Education, Inc.* | | | 61,455 | | | | 945,792 | | |
| Universal Technical Institute, Inc.* | | | 29,900 | | | | 517,270 | | |
| | | | 4,716,286 | | |
| Diversified financial services—0.91% | |
| Portfolio Recovery Associates, Inc.* | | | 52,671 | | | | 4,262,664 | | |
| Electrical equipment—2.91% | |
| AMETEK, Inc. | | | 132,102 | | | | 5,614,335 | | |
| Polypore International, Inc.* | | | 28,896 | | | | 1,964,928 | | |
| Roper Industries, Inc. | | | 46,516 | | | | 3,797,101 | | |
| Woodward Governor Co. | | | 65,770 | | | | 2,269,065 | | |
| | | | 13,645,429 | | |
| Electronic equipment, instruments & components—1.63% | |
| Coherent, Inc.* | | | 39,000 | | | | 1,873,170 | | |
| Echelon Corp.* | | | 128,321 | | | | 1,063,781 | | |
| FARO Technologies, Inc.* | | | 34,200 | | | | 1,393,992 | | |
| Napco Security Systems, Inc.* | | | 56,250 | | | | 147,375 | | |
| National Instruments Corp. | | | 122,350 | | | | 3,161,524 | | |
| | | | 7,639,842 | | |
| Energy equipment & services—3.90% | |
| CARBO Ceramics, Inc. | | | 22,903 | | | | 3,574,471 | | |
| Core Laboratories N.V. | | | 9,414 | | | | 1,023,114 | | |
| ION Geophysical Corp.* | | | 257,930 | | | | 2,615,410 | | |
| Key Energy Services, Inc.* | | | 143,469 | | | | 2,796,211 | | |
| Lufkin Industries, Inc. | | | 37,492 | | | | 3,054,848 | | |
| OYO Geospace Corp.* | | | 26,771 | | | | 2,715,383 | | |
| Rowan Cos., Inc.* | | | 63,960 | | | | 2,505,313 | | |
| | | | 18,284,750 | | |
| Food & staples retailing—0.99% | |
| PriceSmart, Inc. | | | 18,502 | | | | 1,082,737 | | |
| The Fresh Market, Inc.1,* | | | 25,245 | | | | 896,955 | | |
136
PACE Select Advisors Trust
PACE Small/Medium Co Growth Equity Investments
Portfolio of investments—July 31, 2011
| | | Number of
shares | | Value | |
| Common stocks—(Continued) | |
| Food & staples retailing—(Concluded) | |
| United Natural Foods, Inc.* | | | 63,353 | | | $ | 2,644,988 | | |
| | | | 4,624,680 | | |
| Food products—2.14% | |
| Diamond Foods, Inc.1 | | | 34,950 | | | | 2,502,070 | | |
| Green Mountain Coffee Roasters, Inc.* | | | 72,261 | | | | 7,511,531 | | |
| | | | 10,013,601 | | |
| Health care equipment & supplies—6.92% | |
| Abaxis, Inc.* | | | 55,513 | | | | 1,316,768 | | |
| AngioDynamics, Inc.* | | | 109,400 | | | | 1,513,002 | | |
| DexCom, Inc.* | | | 214,118 | | | | 3,036,193 | | |
| IDEXX Laboratories, Inc.* | | | 18,813 | | | | 1,560,350 | | |
| Insulet Corp.* | | | 66,761 | | | | 1,312,521 | | |
| Masimo Corp. | | | 65,460 | | | | 1,818,479 | | |
| Neogen Corp.* | | | 53,540 | | | | 2,214,415 | | |
| ResMed, Inc.1,* | | | 48,950 | | | | 1,482,696 | | |
| Sirona Dental Systems, Inc.* | | | 37,269 | | | | 1,885,066 | | |
| The Cooper Cos., Inc. | | | 89,870 | | | | 6,874,156 | | |
| Thoratec Corp.* | | | 76,570 | | | | 2,579,643 | | |
| Zoll Medical Corp.* | | | 98,041 | | | | 6,829,536 | | |
| | | | 32,422,825 | | |
| Health care providers & services—6.22% | |
| Air Methods Corp.* | | | 30,072 | | | | 2,108,047 | | |
| AMERIGROUP Corp.* | | | 31,566 | | | | 1,736,130 | | |
| Bio-Reference Laboratories, Inc.1,* | | | 61,675 | | | | 1,229,800 | | |
| Catalyst Health Solutions, Inc.* | | | 42,463 | | | | 2,782,600 | | |
| Chemed Corp. | | | 51,000 | | | | 3,101,310 | | |
| ExamWorks Group, Inc.1,* | | | 88,917 | | | | 1,945,504 | | |
| HMS Holdings Corp.* | | | 34,892 | | | | 2,637,835 | | |
| IPC The Hospitalist Co.* | | | 102,041 | | | | 4,615,315 | | |
| Lincare Holdings, Inc. | | | 46,490 | | | | 1,189,679 | | |
| Magellan Health Services, Inc.* | | | 55,420 | | | | 2,887,382 | | |
| MEDNAX, Inc.* | | | 37,900 | | | | 2,583,264 | | |
| MWI Veterinary Supply, Inc.* | | | 25,963 | | | | 2,312,265 | | |
| | | | 29,129,131 | | |
| Health care technology—3.33% | |
| Allscripts Healthcare Solutions, Inc.* | | | 203,390 | | | | 3,691,529 | | |
| athenahealth, Inc.1,* | | | 96,495 | | | | 5,672,941 | | |
| Quality Systems, Inc.1 | | | 16,700 | | | | 1,525,712 | | |
| SXC Health Solutions Corp.* | | | 74,471 | | | | 4,701,354 | | |
| | | | 15,591,536 | | |
| Hotels, restaurants & leisure—3.40% | |
| Arcos Dorados Holdings, Inc., Class A | | | 115,100 | | | | 2,700,246 | | |
| Cheesecake Factory, Inc.* | | | 72,100 | | | | 2,078,643 | | |
| Chipotle Mexican Grill, Inc.* | | | 4,328 | | | | 1,404,782 | | |
| Dunkin' Brands Group, Inc.* | | | 2,303 | | | | 66,626 | | |
| Penn National Gaming, Inc.* | | | 60,440 | | | | 2,534,249 | | |
| Red Robin Gourmet Burgers, Inc.* | | | 54,400 | | | | 1,872,448 | | |
| Scientific Games Corp., Class A* | | | 209,300 | | | | 1,913,002 | | |
| Wyndham Worldwide Corp. | | | 97,910 | | | | 3,386,707 | | |
| | | | 15,956,703 | | |
| | | Number of
shares | | Value | |
| Common stocks—(Continued) | |
| Household durables—0.50% | |
| Tempur-Pedic International, Inc.* | | | 32,552 | | | $ | 2,344,070 | | |
| Internet & catalog retail—0.54% | |
| Shutterfly, Inc.* | | | 46,908 | | | | 2,551,795 | | |
| Internet software & services—2.81% | |
| Bankrate, Inc.1,* | | | 96,500 | | | | 1,764,985 | | |
| Constant Contact, Inc.1,* | | | 34,200 | | | | 647,406 | | |
| DealerTrack Holdings, Inc.* | | | 64,600 | | | | 1,498,074 | | |
| Dice Holdings, Inc.* | | | 93,740 | | | | 1,292,675 | | |
| Monster Worldwide, Inc.* | | | 157,780 | | | | 1,852,337 | | |
| OpenTable, Inc.1,* | | | 20,505 | | | | 1,452,984 | | |
| QuinStreet, Inc.* | | | 98,541 | | | | 1,230,777 | | |
| Rackspace Hosting, Inc.* | | | 34,540 | | | | 1,381,600 | | |
| SPS Commerce, Inc.* | | | 31,300 | | | | 574,981 | | |
| Vocus, Inc.* | | | 52,080 | | | | 1,487,926 | | |
| | | | 13,183,745 | | |
| IT services—2.51% | |
| Cass Information Systems, Inc. | | | 33,600 | | | | 1,261,344 | | |
| Echo Global Logistics, Inc.1,* | | | 78,166 | | | | 1,169,363 | | |
| Forrester Research, Inc. | | | 44,600 | | | | 1,409,360 | | |
| Gartner, Inc.* | | | 85,863 | | | | 3,169,203 | | |
| MAXIMUS, Inc. | | | 58,400 | | | | 2,255,992 | | |
| VeriFone Systems, Inc.* | | | 63,923 | | | | 2,516,649 | | |
| | | | 11,781,911 | | |
| Life sciences tools & services—0.84% | |
| Bruker Corp.* | | | 95,010 | | | | 1,636,072 | | |
| MEDTOX Scientific, Inc. | | | 29,900 | | | | 466,739 | | |
| Techne Corp. | | | 24,500 | | | | 1,856,855 | | |
| | | | 3,959,666 | | |
| Machinery—4.27% | |
| Astec Industries, Inc.* | | | 39,377 | | | | 1,477,425 | | |
| CLARCOR, Inc. | | | 41,515 | | | | 1,829,151 | | |
| Gardner Denver, Inc. | | | 35,345 | | | | 3,014,575 | | |
| Graco, Inc. | | | 42,286 | | | | 1,857,624 | | |
| Joy Global, Inc. | | | 19,473 | | | | 1,828,904 | | |
| Kennametal, Inc. | | | 45,860 | | | | 1,808,260 | | |
| Robbins & Myers, Inc. | | | 54,886 | | | | 2,647,701 | | |
| Wabash National Corp* | | | 157,700 | | | | 1,184,327 | | |
| WABCO Holdings, Inc.* | | | 68,962 | | | | 4,348,054 | | |
| | | | 19,996,021 | | |
| Media—0.49% | |
| Cinemark Holdings, Inc. | | | 118,570 | | | | 2,310,929 | | |
| Metals & mining—0.44% | |
| Schnitzer Steel Industries, Inc. | | | 40,460 | | | | 2,054,963 | | |
| Multiline retail—0.42% | |
| Big Lots, Inc.* | | | 56,500 | | | | 1,967,895 | | |
| Oil, gas & consumable fuels—2.77% | |
| Brigham Exploration Co.* | | | 138,548 | | | | 4,405,826 | | |
| Forest Oil Corp.* | | | 60,970 | | | | 1,585,220 | | |
| James River Coal Co.1,* | | | 107,100 | | | | 2,030,616 | | |
| Oasis Petroleum, Inc.* | | | 68,198 | | | | 2,014,569 | | |
137
PACE Select Advisors Trust
PACE Small/Medium Co Growth Equity Investments
Portfolio of investments—July 31, 2011
| | | Number of
shares | | Value | |
| Common stocks—(Continued) | |
| Oil, gas & consumable fuels—(Concluded) | |
| Plains Exploration & Production Co.* | | | 40,175 | | | $ | 1,567,227 | | |
| Rosetta Resources, Inc.* | | | 26,715 | | | | 1,383,036 | | |
| | | | 12,986,494 | | |
| Personal products—0.37% | |
| Herbalife Ltd. | | | 31,194 | | | | 1,738,130 | | |
| Professional services—2.71% | |
| 51job, Inc., ADR1,* | | | 28,198 | | | | 1,862,478 | | |
| Acacia Research* | | | 125,445 | | | | 5,384,099 | | |
| CoStar Group, Inc.* | | | 21,600 | | | | 1,269,216 | | |
| Equifax, Inc. | | | 56,130 | | | | 1,928,627 | | |
| Korn/Ferry International* | | | 48,800 | | | | 1,051,152 | | |
| Resources Connection, Inc. | | | 93,800 | | | | 1,221,276 | | |
| | | | 12,716,848 | | |
| Road & rail—0.87% | |
| Kansas City Southern* | | | 34,205 | | | | 2,030,067 | | |
| Knight Transportation, Inc. | | | 129,090 | | | | 2,031,876 | | |
| | | | 4,061,943 | | |
| Semiconductors & semiconductor equipment—4.64% | |
| Atmel Corp.* | | | 305,287 | | | | 3,693,973 | | |
| Cabot Microelectronics Corp.* | | | 42,761 | | | | 1,654,423 | | |
| Cavium, Inc.* | | | 40,002 | | | | 1,379,669 | | |
| Cypress Semiconductor Corp.* | | | 88,400 | | | | 1,819,272 | | |
| Entropic Communications, Inc.1,* | | | 154,565 | | | | 1,032,494 | | |
| Netlogic Microsystems, Inc.* | | | 27,718 | | | | 957,657 | | |
| Power Integrations, Inc.1 | | | 50,300 | | | | 1,785,147 | | |
| Semtech Corp.* | | | 111,700 | | | | 2,602,610 | | |
| Skyworks Solutions, Inc.* | | | 103,215 | | | | 2,612,372 | | |
| Ultratech, Inc.* | | | 78,975 | | | | 2,080,991 | | |
| Volterra Semiconductor Corp.* | | | 82,170 | | | | 2,117,521 | | |
| | | | 21,736,129 | | |
| Software—8.54% | |
| BroadSoft, Inc.* | | | 81,170 | | | | 2,370,976 | | |
| Concur Technologies, Inc.* | | | 20,400 | | | | 926,976 | | |
| Ebix, Inc.1,* | | | 77,077 | | | | 1,517,646 | | |
| Guidance Software, Inc.* | | | 72,300 | | | | 543,696 | | |
| Informatica Corp.* | | | 55,789 | | | | 2,852,492 | | |
| MICROS Systems, Inc.* | | | 40,582 | | | | 1,987,301 | | |
| NetSuite, Inc.1,* | | | 26,831 | | | | 1,052,043 | | |
| Nuance Communications, Inc.* | | | 77,040 | | | | 1,541,570 | | |
| Pegasystems, Inc.1 | | | 39,707 | | | | 1,602,575 | | |
| QLIK Technologies, Inc.* | | | 48,027 | | | | 1,455,698 | | |
| Rovi Corp.* | | | 68,191 | | | | 3,612,077 | | |
| Solera Holdings, Inc. | | | 21,792 | | | | 1,217,737 | | |
| Sourcefire, Inc.1,* | | | 81,200 | | | | 1,995,896 | | |
| SS&C Technologies Holdings, Inc.* | | | 100,220 | | | | 1,856,074 | | |
| SuccessFactors, Inc.* | | | 52,000 | | | | 1,404,000 | | |
| Synchronoss Technologies, Inc.* | | | 86,806 | | | | 2,539,075 | | |
| Taleo Corp., Class A* | | | 55,200 | | | | 1,827,120 | | |
| TIBCO Software, Inc.* | | | 169,988 | | | | 4,426,488 | | |
| Ultimate Software Group, Inc.* | | | 63,500 | | | | 3,453,130 | | |
| Verint Systems, Inc.* | | | 53,900 | | | | 1,833,678 | | |
| | | | 40,016,248 | | |
| | | Number of
shares | | Value | |
| Common stocks—(Concluded) | |
| Specialty retail—4.50% | |
| Abercrombie & Fitch Co., Class A | | | 51,428 | | | $ | 3,760,415 | | |
| Chico's FAS, Inc. | | | 120,240 | | | | 1,814,422 | | |
| Express, Inc. | | | 95,500 | | | | 2,143,020 | | |
| Foot Locker, Inc. | | | 79,600 | | | | 1,729,708 | | |
| GameStop Corp., Class A* | | | 86,030 | | | | 2,028,587 | | |
| Pier 1 Imports, Inc.* | | | 130,700 | | | | 1,436,393 | | |
| Tractor Supply Co. | | | 39,212 | | | | 2,584,855 | | |
| Ulta Salon, Cosmetics & Fragrance, Inc.* | | | 44,724 | | | | 2,818,954 | | |
| Vitamin Shoppe, Inc.* | | | 63,571 | | | | 2,769,153 | | |
| | | | 21,085,507 | | |
| Textiles, apparel & luxury goods—3.00% | |
| Crocs, Inc.* | | | 83,975 | | | | 2,630,937 | | |
| Fossil, Inc.* | | | 31,849 | | | | 4,002,464 | | |
| Lululemon Athletica, Inc.1,* | | | 35,269 | | | | 2,135,185 | | |
| Under Armour, Inc., Class A* | | | 47,729 | | | | 3,503,786 | | |
| Vera Bradley, Inc.* | | | 48,780 | | | | 1,769,250 | | |
| | | | 14,041,622 | | |
| Trading companies & distributors—1.85% | |
| Beacon Roofing Supply, Inc.* | | | 93,500 | | | | 1,999,030 | | |
| Kaman Corp. | | | 42,385 | | | | 1,509,754 | | |
| United Rentals, Inc.* | | | 78,310 | | | | 1,801,913 | | |
| WESCO International, Inc.* | | | 66,383 | | | | 3,364,954 | | |
| | | | 8,675,651 | | |
Total common stocks
(cost—$353,023,986) | | | | | | | 448,335,225 | | |
| Investment companies—0.91% | |
iShares Russell 2000 Growth
Index Fund1 | | | 14,553 | | | | 1,326,797 | | |
iShares Russell Midcap Growth
Index Fund1 | | | 49,264 | | | | 2,927,267 | | |
Total Investment companies
(cost—$4,407,717) | | | | | | | 4,254,064 | | |
| | | Face
amount | | | |
| Repurchase agreement—3.09% | |
Repurchase agreement dated
07/29/11 with State Street
Bank & Trust Co., 0.010%
due 08/01/11, collateralized
by $71,997 Federal Home
Loan Mortgage Corp.
obligations, 5.125% due
07/15/12, $10,348,190
US Treasury Bills, zero
coupon due 08/04/11 and
$4,081,302 US Treasury
Notes, 2.375% to 2.625%
due 02/29/16 to 07/31/17;
(value—$14,760,576);
proceeds: $14,471,012
(cost—$14,471,000) | | $ | 14,471,000 | | | | 14,471,000 | | |
138
PACE Select Advisors Trust
PACE Small/Medium Co Growth Equity Investments
Portfolio of investments—July 31, 2011
| | | Number of
shares | | Value | |
| Investment of cash collateral from securities loaned—8.65% | |
| Money market fund—8.65% | |
UBS Private Money Market Fund LLC2
(cost—$40,533,810) | | | 40,533,810 | | | $ | 40,533,810 | | |
Total investments
(cost—$412,436,513)—
108.33% | | | | | | | 507,594,099 | | |
Liabilities in excess of
other assets—(8.33)% | | | | | | | (39,024,670 | ) | |
| Net assets—100.00% | | $ | 468,569,429 | | |
Aggregate cost for federal income tax purposes was $415,263,472; and net unrealized appreciation consisted of:
| Gross unrealized appreciation | | $ | 107,747,117 | | |
| Gross unrealized depreciation | | | (15,416,490 | ) | |
| Net unrealized appreciation | | $ | 92,330,627 | | |
For a listing of defined portfolio acronyms and currency abbreviations that are used throughout the Portfolio of investments as well as the tables that follow, please refer to page 227.
* Non-income producing security.
1 Security, or portion thereof, was on loan at July 31, 2011.
2 The table below details the Portfolio's transaction activity in an affiliated issuer during the year ended July 31, 2011. The investment manager earns a management fee from UBS Private Money Market Fund LLC.
| Security description | | Value at
07/31/10 | | Purchases
during the
year ended
07/31/11 | | Sales
during the
year ended
07/31/11 | | Value at
07/31/11 | | Net income
earned from
affiliate for the
year ended
07/31/11 | |
| UBS Private Money Market Fund LLC | | $ | 49,573,183 | | | $ | 281,170,719 | | | $ | 290,210,092 | | | $ | 40,533,810 | | | $ | 25,086 | | |
The following is a summary of the fair valuations according to the inputs used as of July 31, 2011 in valuing the Portfolio's investments:
| | | Unadjusted
quoted prices in
active markets for
identical investments
(Level 1) | | Other significant
observable inputs
(Level 2) | | Unobservable
inputs
(Level 3) | | Total | |
| Common stocks | | $ | 448,335,225 | | | $ | — | | | $ | — | | | $ | 448,335,225 | | |
| Investment companies | | | 4,254,064 | | | | — | | | | — | | | | 4,254,064 | | |
| Repurchase agreement | | | — | | | | 14,471,000 | | | | — | | | | 14,471,000 | | |
| Investment of cash collateral from securities loaned | | | — | | | | 40,533,810 | | | | — | | | | 40,533,810 | | |
| Total | | $ | 452,589,289 | | | $ | 55,004,810 | | | $ | — | | | $ | 507,594,099 | | |
139
PACE Select Advisors Trust
PACE Small/Medium Co Growth Equity Investments
Portfolio of investments—July 31, 2011
Issuer breakdown by country or territory of origin (unaudited)
| | | Percentage of
total investments | |
| United States | | | 96.4 | % | |
| Canada | | | 1.5 | | |
| Cayman Islands | | | 0.7 | | |
| British Virgin Islands | | | 0.5 | | |
| Bermuda | | | 0.4 | | |
| Switzerland | | | 0.3 | | |
| Netherlands | | | 0.2 | | |
| Total | | | 100.0 | % | |
See accompanying notes to financial statements.
140
PACE Select Advisors Trust
PACE International Equity Investments
Performance
For the 12 months ended July 31, 2011, the Portfolio's Class P shares returned 16.79%, before the deduction of the maximum PACE Select program fee. (Class P shares returned 14.48%, after the deduction of the maximum PACE Select program fee, for the same 12-month period.) In comparison, the MSCI EAFE Index (net) (the "benchmark") returned 17.17%, and the Lipper International Large-Cap Core Funds category posted a median return of 16.77%. (Please note that while all of the Sub-Advisors outperformed the benchmark on a gross of fees basis, the Fund as a whole underperformed net of fees, as reported here, largely because fees and expenses that are embedded in the Fund are not embedded in the benchmark. Returns for all share classes over various time periods are shown in the "Performance at a glance" table on page 146. Please note that the returns shown do not reflect the deduction of taxes that a shareholder would pay on Portfolio distributions or the redemption of Portfolio shares.) For a detailed commentary on the market environment in general during the reporting period, please refer to page 2.
Sub-Advisors' comments1
Martin Currie
Our portion of the Portfolio outperformed the benchmark during the reporting period. On a regional level, our Asia ex-Japan holdings made the biggest positive contribution to returns, followed by our European positions. Conversely, our allocation to emerging markets equities, which aren't represented in the benchmark, was detrimental to returns over the period, as our emerging markets holdings underperformed due to concerns regarding inflation and central bank monetary tightening. Our Japanese holdings also detracted overall, although this was somewhat offset by our underweight position in what was a lagging region. On a sector level, our holdings in utilities, materials, energy, and especially consumer discretionary, did well. Consumer discretionary represents our largest sector overweight versus the benchmark, and we benefited from the robust performance of the sector, as well as from strong stock selection within it.
In terms of individual stocks, the best performer by far was Macao casino operator SJM Holdings Ltd., whose revenues continued to reflect the increasing disposable income of the
1 All Sub-Advisors discuss performance on a gross of fees basis—meaning that no fees or expenses are reflected in their sleeves'/sleeve's performance. Alternately, Fund performance is shown net of fees, which does factor in fees and expenses associated with the Fund.
PACE Select Advisors Trust –
PACE International Equity Investments
Investment Sub-Advisors:
Martin Currie Inc. ("Martin Currie"),
Mondrian Investment Partners Limited
("Mondrian") and J.P. Morgan Investment
Management Inc. ("J.P. Morgan")
Portfolio Managers:
Martin Currie: James Fairweather;
Mondrian: Elizabeth A. Desmond, Nigel G. May, Emma R. E. Lewis and Russell J. Mackie;
J.P. Morgan: International REI Segment—Beltran Lastra and Jaco Venter; EAFE Opportunities Segment—Jeroen Huysinga
Objective:
Capital appreciation
Investment process:
Martin Currie has a highly active "conviction" approach, seeking the best opportunities for growth across global stock markets. Martin Currie identifies change as the central dynamic behind stock price movement. This means recognizing change at the company level (management changes, product strategies, acquisitions, etc.) and at the macro level (legislative changes, economic prospects, sector dynamics, etc.). Martin Currie believes its investment process allows it to identify, evaluate and exploit change at an early stage. In managing its segment of the Portfolio's assets, Martin Currie uses a fully integrated international investment process. So rather than running distinct regional portfolios, it compares and ranks stock opportunities across the whole investment universe. To help identify and evaluate the best stock ideas, Martin Currie employs fundamental company and sector research, together with its own proprietary quantitative screening tool.
(continued on next page)
141
PACE Select Advisors Trust
PACE International Equity Investments
Sub-Advisors' comments – continued
Asian consumer. The next best performer was French oil services company Technip SA, as the rising price of oil increased projected spending by oil companies. As global car production continued to grow, UK-listed engineer GKN PLC performed particularly well. Our holding in Italian luxury goods company Bulgari was another standout, with LVMH buying the company at a premium of almost 60% in March 2011. Elsewhere, the continued strong operating performance of Brazilian telecommunication operator TIM Brasil was rewarded by earnings upgrades from analysts and impressive share price appreciation.
The main detractor from relative performance was Barclays PLC. In a weak period for European financials in general, it suffered from concerns about profits at its investment bank, Barclays Capital, and the possible impact of tighter regulatory capital requirements. Our holding in financial company Credit Suisse Group also hurt our results. Other prominent negative contributors included two consumer discretionary stocks: Sony Corp. and Panasonic. The fall in Sony's share price was linked to the theft of user information by computer hackers. Panasonic was badly affected by the Japanese earthquake. Our investment thesis was predicated on the company's restructuring of its TV business and synergies from the Sanyo Electric acquisition; neither of these outcomes looks likely in the next 18 months. Dutch electronics giant Philips has also been suffering from falling margins in the difficult TV market. Of these stocks, we have sold Panasonic and Philips, but we maintain our positions in Barclays, Credit Suisse and Sony.
JPMorgan (International REI)
Our portion of the Portfolio outperformed the benchmark during the reporting period. Regionally, Europe contributed to performance, while the Pacific Rim detracted from results. At the sector level, stock selection in basic industries and banks and finance added the most value, while transport services and consumer cyclical and energy hurt our performance.
At the stock level, Rhodia, the French specialty chemical company, was the largest contributor to performance, as it was acquired by Solvay, a Belgian chemical firm. After taking profits, we decided to sell Rhodia for Solvay. Solvay reported higher-than-expected earnings during the first quarter of 2011, and received the 'go-ahead' from French regulators for its planned takeover of Rhodia. Solvay also raised prices and boosted production of its most profitable polymers. Additionally, we view the merger favorably, especially since ex-
Investment process (continued)
Mondrian conducts research on a global basis in an effort to identify securities that have the potential for capital appreciation over a market cycle. The center of its research effort is a value-oriented dividend discount methodology toward individual securities and market analysis that attempts to identify value across country boundaries. This approach focuses on future anticipated dividends, and discounts the value of those dividends back to what they would be worth if they were being paid today. Comparisons of the values of different possible investments are then made. In an international portfolio, currency returns can be an integral component of an investment's total return. Mondrian uses a purchasing power parity approach to assess the value of individual currencies. Purchasing power parity attempts to identify the amount of goods and services that a dollar will buy in the United States, and compares that to the amount of a foreign currency required to buy the same amount of goods and services in another country.
J.P. Morgan manages two separate segments of the Portfolio's assets, utilizing distinct principal investment strategies and portfolio management for each. In managing one segment of the Portfolio's assets, the International Research Enhanced Index Strategy segment ("International REI" segment), J.P. Morgan uses a bottom-up, research driven strategy that seeks to generate risk characteristics that closely match those of the Portfolio's benchmark yet at the same time capitalize on the information advantage created by the firm's proprietary research capabilities to generate outperformance. The strategy is driven by valuation based fundamental analysis, focused on normalized earnings
(continued on next page)
142
PACE Select Advisors Trust
PACE International Equity Investments
Sub-Advisors' comments – continued
Rhodia executives, whom we have a positive view of, will occupy senior positions in the combined company.
On the downside, Shiseido, a Japanese consumer goods company, detracted from results. Its domestic sales have struggled and overseas business has not compensated to the extent that we originally anticipated. We decided to sell out of the position at the beginning of April 2011.
Our portion of the Portfolio used derivatives in the form of currency forwards and futures. Derivatives are only used for the efficient management of cash flow and to reduce currency deviations versus the benchmark, where practical, for the purposes of risk management. Derivatives are not used as a source of generating incremental performance (alpha). Exchange traded equity futures can be used to gain or reduce exposure to a market quickly and cheaply and, as such, are used by us for the efficient management of cash flows, subject to regulatory guidelines.
JPMorgan (EAFE Opportunities)
For the period from November 8, 2010, when we began managing a portion of the Portfolio, through July 31, 2011, we outperformed the benchmark. At the regional level, Japan and Canada contributed to performance, while our emerging markets equities and Pacific Rim exposures detracted from results. Sector-wise, stock selection in basic industries and utilities added value, while health care, banks and finance hurt performance.
At the stock level, First Quantum Minerals Ltd., a Canadian mining company, was the largest contributor for the period. The stock has performed well due to continued strength in commodity prices and ongoing progress in terms of the company's own projects. Despite losing its rights to its operations in the Congo, we feel that the company remains one of the most exciting mid-cap mining stocks, possessing a huge pipeline of near-term development prospects and a substantial net cash position. Additionally, First Quantum Minerals has four development projects underway and, despite plans to spend $3.6 billion over the next four years, it does not anticipate that it will need to resort to debt financing.
On the downside, Huabao International Holdings Ltd., a Chinese maker of flavorings and fragrances, detracted from results. Having risen sharply in 2010, the stock pulled back in early 2011. Part of that decline can be attributed to a general sluggishness in emerging markets stocks. The asset class lagged the developed markets in the first quarter of 2011, as policy makers throughout much of the emerging market world continue to tighten in a bid to preempt inflationary pressures. In addition, producers of flavors and fragrances faced a number of headwinds in the form of higher input prices and an expected slowdown in sales growth. Strong pricing power, however, provides Huabao with some degree of protection from these headwinds.
Our portion of the Portfolio used derivatives in the form of currency forwards and futures. Derivatives are only used for the efficient management of cash flow and to reduce currency deviations versus the benchmark, where
Investment process (concluded)
and earnings growth. The J.P. Morgan team seeks to maintain regional weights and sector/industry weights close to those of the benchmark. Stock selection is the focus, being the expected primary source of added value.
In managing the second segment of the Portfolio's assets, the Europe, Australasia, and Far East Opportunities Strategy segment ("EAFE Opportunities" segment), J.P. Morgan uses an active equity strategy, which represents a partnership between portfolio management and the firm's proprietary network of analysts. J.P. Morgan applies a uniform valuation methodology across regions and sectors, and analysts conduct thorough analysis with a particular emphasis on a company's normalized (or mid-cycle) earnings and their intermediate growth rate. J.P. Morgan typically focuses on the most attractive companies, within a sector, that possess a catalyst for share price appreciation in an effort to build a portfolio where stock selection is the primary source of added value.
143
PACE Select Advisors Trust
PACE International Equity Investments
Sub-Advisors' comments – concluded
practical, for the purposes of risk management. Derivatives are not used as a source of generating incremental performance (alpha). Exchange traded equity futures can be used to gain or reduce exposure to a market quickly and cheaply and, as such, are used by us for the efficient management of cash flows, subject to regulatory guidelines.
Mondrian
Our portion of the Portfolio performed largely in line with the benchmark during the reporting period. The overall impact of country allocation was neutral to performance over the fiscal year. In Europe, returns were supported by our overweight position in France. Having no exposure to Greece was also rewarded, as its market sold off sharply during the reporting period. These positive impacts were partially offset by an underweight to the strongly performing German market. In the Asia Pacific region, Japan was the worst performing equity market in the benchmark. Its weak performance in 2010 was compounded by the natural disaster that devastated north-east Japan in March 2011. Our underweight position in Japan was positive for returns, as was stock selection within the country. We also benefited strongly from our non-benchmark position in Taiwan, through Taiwan Semiconductor Manufacturing Co.
Overall, stock selection added to performance over the period. In Europe, stock selection in Spain and the UK was positive for returns, but this was more than offset by weak stock selection in Germany, France and Italy. Within the Asian region, stock selection was strong in Japan and Singapore. In terms of sector positioning, overweight positions in the health care, energy and telecommunications sectors, and an underweight in the financial sector were positive for returns. This was offset by the underweight positions in the more cyclical sectors, such as materials, consumer discretionary and industrials.
During the reporting period, non-US dollar currencies appreciated against the US dollar, adding to international equity returns for US dollar-based investors. In particular, the Swiss franc appreciated substantially against the US dollar. In Asia, currencies were similarly strong with the Australian and New Zealand dollars rising sharply against the US dollar. During February 2011, we initiated a partial hedge of our Australian dollar exposure. Additionally, in June 2011, we initiated a hedge of our Swiss franc exposure. This hedging is undertaken using three month forward currency contracts. We have chosen to hedge these currencies as our analysis shows that these are significantly overvalued and we wish to protect the value of the underlying investment in these markets.
Special considerations
The Portfolio may be appropriate for long-term investors seeking capital appreciation who are able to withstand short-term fluctuations in the equity markets in return for potentially higher returns over the long term. The value of the Portfolio changes every day and can be affected by changes in interest rates, general market conditions and other political, social and economic developments, as well as specific matters relating to the companies in whose securities the Portfolio invests. It is important to note that an investment in the Portfolio is only one component of a balanced investment plan. The value of the Portfolio's investments in foreign securities may fall due to adverse political, social, and economic developments abroad and due to decreases in foreign currency values relative to the US dollar. These risks are greater for investments in emerging market issuers than for issuers in more developed countries.
144
PACE Select Advisors Trust
PACE International Equity Investments
Illustration of an assumed investment of $10,000 in Class P shares of the Portfolio (unaudited)
The following graph depicts the performance of PACE International Equity Investments Class P shares versus the MSCI EAFE Index (net) over the 10 years ended July 31, 2011. The performance of the other classes will vary based upon the different class specific expenses and sales charges. The performance provided does not reflect the deduction of taxes that a shareholder would pay on Portfolio distributions or the redemption of Portfolio shares. Past performance is no guarantee of future results. Share price and returns will vary with market conditions; investors may realize a gain or loss upon redemption. It is important to note that PACE International Equity Investments is a professionally managed portfolio while the Index is not available for investment and is unmanaged. The comparison is shown for illustration purposes only.

145
PACE Select Advisors Trust
PACE International Equity Investments
Performance at a glance (unaudited)
| Average annual total returns for periods ended 07/31/11 | | 1 year | | 5 years | | 10 years | |
| Before deducting | | Class A1 | | | 16.37 | % | | | (0.68 | )% | | | 4.20 | % | |
| maximum sales charge | | Class B2 | | | 15.81 | % | | | (1.53 | )% | | | 3.59 | %6 | |
| or PACE Select | | Class C3 | | | 15.57 | % | | | (1.50 | )% | | | 3.35 | % | |
| program fee | | Class Y4 | | | 16.65 | % | | | (0.34 | )% | | | 4.59 | % | |
| | | Class P5 | | | 16.79 | % | | | (0.42 | )% | | | 4.48 | % | |
| After deducting | | Class A1 | | | 9.99 | % | | | (1.80 | )% | | | 3.62 | % | |
| maximum sales charge | | Class B2 | | | 10.81 | % | | | (1.84 | )% | | | 3.59 | %6 | |
| or PACE Select | | Class C3 | | | 14.57 | % | | | (1.50 | )% | | | 3.35 | % | |
| program fee | | Class P5 | | | 14.48 | % | | | (2.40 | )% | | | 2.41 | % | |
| MSCI EAFE Index (net)7 | | | | | 17.17 | % | | | 0.95 | % | | | 5.69 | % | |
| Lipper International Large-Cap Core Funds median | | | | | 16.77 | % | | | 0.82 | % | | | 4.94 | % | |
Average annual total returns for periods ended June 30, 2011, after deduction of the maximum sales charge or PACE Select program fee, were as follows: Class A—1-year period, 23.76%; 5-year period, (1.22)%; 10-year period, 3.48%; Class B—1-year period, 25.07%; 5-year period, (1.32)%; 10-year period, 3.45%; Class C—1-year period, 28.92%; 5-year period, (0.92)%; 10-year period, 3.20%; Class Y—1-year period, 31.30%; 5-year period, 0.25%; 10-year period, 4.44%; Class P—1-year period, 28.67%; 5-year period, (1.83)%; 10-year period, 2.27%.
The annualized gross and net expense ratios, respectively, for each class of shares as in the November 28, 2010 prospectuses, were as follows: Class A—1.43% and 1.43%; Class B—2.59% and 2.30%; Class C—2.26% and 2.26%; Class Y—1.10% and 1.10%; and Class P—1.18% and 1.18%. Net expenses reflect fee waivers and/or expense reimbursements, if any, pursuant to an agreement that is in effect to cap the expenses. The Portfolio and UBS Global Asset Management (Americas) Inc. ("UBS Global AM") have entered into a written fee waiver/expense reimbursement agreement pursuant to which UBS Global AM is contractually obligated to waive its management fees and/or reimburse expenses so that the Portfolio's ordinary total operating expenses of each class through November 28, 2011 (excluding dividend expense, borrowing costs, and interest expense relating to short sales, and interest, taxes, brokerage commissions and extraordinary expenses) would not exceed Class A—1.55%; Class B—2.30%; Class C—2.30%; Class Y—1.30%; and Class P—1.30%. The Portfolio has agreed to repay UBS Global AM for any waived fees/reimbursed expenses to the extent that it can do so over the following three fiscal years without causing the Portfolio's expenses in any of those three years to exceed these expense caps. The fee waiver/expense reimbursement agreement may be terminated by the Portfolio's board at any time and also will terminate automatically upon the expiration or termination of the Portfolio's advisory contract with UBS Global AM. Upon termination of the agreement, however, UBS Global AM's three year recoupment rights will survive.
1 Maximum sales charge for Class A shares is 5.5%. Class A shares bear ongoing 12b-1 service fees.
2 Maximum contingent deferred sales charge for Class B shares is 5% imposed on redemptions and is reduced to 0% after a maximum of six years. Class B shares bear ongoing 12b-1 service and distribution fees.
3 Maximum contingent deferred sales charge for Class C shares is 1% imposed on redemptions and is reduced to 0% after one year. Class C shares bear ongoing 12b-1 service and distribution fees. Prior to September 30, 2003, Class C shares were subject to a maximum front-end sales charge of 1.00%; this front-end sales charge is not reflected in the average annual total returns presented for the Class C shares shown above.
4 The Portfolio offers Class Y shares to a limited group of eligible investors, including certain qualifying retirement plans. Class Y shares do not bear initial or contingent deferred sales charges or ongoing 12b-1 service and distribution fees.
5 Class P shares do not bear initial or contingent deferred sales charges or ongoing 12b-1 service and distribution fees, but are subject to a maximum annual PACE Select program fee of 2% of the value of Class P shares. Prior to June 14, 2010, the maximum annual PACE Select program fee was 1.5% of the value of Class P shares; however, the current maximum annual PACE Select program fee of 2% is reflected in the performance returns throughout all periods in the average annual total returns presented for the Class P shares shown above.
6 Assumes the conversion of Class B to Class A shares at the end of the sixth year.
7 The MSCI EAFE Index (net) is an index of stocks from 22 countries designed to measure the investment returns of developed economies outside of North America. Dividends are reinvested after the deduction of withholding tax, using tax rates applicable to Luxembourg holding companies, as Luxembourg applies the highest rates. The Index is constructed and managed with a view to being fully investable from the perspective of international institutional investors. Investors should note that indices do not reflect the deduction of fees and expenses.
If an investor sells or exchanges shares less than 90 days after purchase, a redemption fee of 1.00% of the amount sold or exchanged will be deducted at the time of the transaction, except as noted otherwise in the prospectuses.
Past performance does not predict future performance, and the performance information provided does not reflect the deduction of taxes that a shareholder would pay on Portfolio distributions or the redemption of Portfolio shares. The return and principal value of an investment will fluctuate, so that an investor's shares, when redeemed, may be worth more or less than their original cost. Performance results assume reinvestment of all dividends and capital gain distributions at net asset value on the ex-dividend dates. Current performance may be higher or lower than the performance data quoted. For month-end performance figures, please visit http://www.ubs.com.
Lipper peer group data calculated by Lipper Inc.; used with permission. The Lipper median is the return of the fund that places in the middle of a Lipper peer group.
146
PACE Select Advisors Trust
PACE International Equity Investments
Portfolio statistics (unaudited)
| Characteristics | | 07/31/11 | |
| Net assets (mm) | | $ | 908.6 | | |
| Number of holdings | | | 293 | | |
| Portfolio composition1 | | 07/31/11 | |
| Common stocks, preferred stocks and rights | | | 94.8 | % | |
| ADRs and GDRs | | | 2.9 | | |
| Futures and forward foreign currency contracts | | | 0.1 | | |
| Cash equivalents and other assets less liabilities | | | 2.2 | | |
| Total | | | 100.0 | % | |
| Regional allocation (equity investments)1 | | 07/31/11 | |
| Europe and European territories | | | 64.8 | % | |
| Asia | | | 26.6 | | |
| Oceania | | | 4.6 | | |
| The Americas | | | 0.9 | | |
| Russia | | | 0.5 | | |
| Africa | | | 0.3 | | |
| Total | | | 97.7 | % | |
| Top five countries (equity investments)1 | | 07/31/11 | |
| United Kingdom | | | 21.7 | % | |
| Japan | | | 19.8 | | |
| France | | | 10.9 | | |
| Germany | | | 8.3 | | |
| Switzerland | | | 6.9 | | |
| Total | | | 67.6 | % | |
| Top five sectors1 | | 07/31/11 | |
| Financials | | | 19.4 | % | |
| Consumer discretionary | | | 12.2 | | |
| Health care | | | 11.0 | | |
| Consumer staples | | | 10.7 | | |
| Industrials | | | 10.4 | | |
| Total | | | 63.7 | % | |
| Top ten equity holdings1 | | 07/31/11 | |
| Sanofi SA | | | 2.3 | % | |
| Novartis AG | | | 2.2 | | |
| Royal Dutch Shell PLC, A Shares, Netherlands Exchange | | | 1.6 | | |
| GlaxoSmithKline PLC | | | 1.6 | | |
| Vodafone Group PLC | | | 1.6 | | |
| ING Groep N.V. | | | 1.4 | | |
| Compass Group PLC | | | 1.3 | | |
| BG Group PLC | | | 1.2 | | |
| BP PLC | | | 1.1 | | |
| Total SA | | | 1.1 | | |
| Total | | | 15.4 | % | |
For a listing of defined portfolio acronyms that are used throughout the Portfolio statistics, please refer to page 227.
1 Weightings represent percentages of the Portfolio's net assets as of July 31, 2011. The Portfolio is actively managed and its composition will vary over time.
147
PACE Select Advisors Trust
PACE International Equity Investments
Industry diversification—(unaudited)
As a percentage of net assets as of July 31, 2011
Common stocks
| Aerospace & defense | | | 0.68 | % | |
| Airlines | | | 0.06 | | |
| Auto components | | | 1.18 | | |
| Automobiles | | | 2.56 | | |
| Beverages | | | 1.92 | | |
| Biotechnology | | | 0.01 | | |
| Building products | | | 0.94 | | |
| Capital markets | | | 1.30 | | |
| Chemicals | | | 2.47 | | |
| Commercial banks | | | 9.31 | | |
| Commercial services & supplies | | | 0.20 | | |
| Communications equipment | | | 0.41 | | |
| Computers & peripherals | | | 0.85 | | |
| Construction & engineering | | | 0.52 | | |
| Construction materials | | | 0.16 | | |
| Containers & packaging | | | 0.49 | | |
| Distributors | | | 0.07 | | |
| Diversified consumer services | | | 0.08 | | |
| Diversified financial services | | | 1.94 | | |
| Diversified telecommunication services | | | 4.76 | | |
| Electric utilities | | | 1.42 | | |
| Electrical equipment | | | 2.48 | | |
| Electronic equipment, instruments & components | | | 0.76 | | |
| Energy equipment & services | | | 1.05 | | |
| Food & staples retailing | | | 3.50 | | |
| Food products | | | 2.22 | | |
| Gas utilities | | | 0.66 | | |
| Health care equipment & supplies | | | 0.26 | | |
| Health care providers & services | | | 0.39 | | |
| Hotels, restaurants & leisure | | | 2.59 | | |
| Household durables | | | 1.17 | | |
| Independent power producers & energy traders | | | 0.05 | | |
| Industrial conglomerates | | | 1.54 | | |
| Insurance | | | 5.01 | | |
| IT services | | | 0.13 | | |
| Machinery | | | 1.11 | | |
Common stocks—(concluded)
| Marine | | | 0.05 | % | |
| Media | | | 2.07 | | |
| Metals & mining | | | 3.50 | | |
| Multiline retail | | | 0.43 | | |
| Multi-utilities | | | 1.43 | | |
| Office electronics | | | 0.97 | | |
| Oil, gas & consumable fuels | | | 8.87 | | |
| Paper & forest products | | | 0.31 | | |
| Personal products | | | 1.27 | | |
| Pharmaceuticals | | | 10.38 | | |
| Professional services | | | 0.82 | | |
| Real estate investment trusts | | | 0.19 | | |
| Real estate management & development | | | 1.61 | | |
| Road & rail | | | 0.32 | | |
| Semiconductors & semiconductor equipment | | | 1.75 | | |
| Software | | | 0.61 | | |
| Specialty retail | | | 0.16 | | |
| Textiles, apparel & luxury goods | | | 1.49 | | |
| Tobacco | | | 1.15 | | |
| Trading companies & distributors | | | 1.28 | | |
| Transportation infrastructure | | | 0.45 | | |
| Wireless telecommunication services | | | 3.32 | | |
| Total common stocks | | | 96.68 | | |
Preferred stocks
| Automobiles | | | 0.44 | | |
| Household products | | | 0.58 | | |
| Total preferred stocks | | | 1.02 | | |
Rights
| Electric utilities | | | 0.02 | | |
| Repurchase agreement | | | 1.64 | | |
| Investment of cash collateral from securities loaned | | | 2.66 | | |
| Liabilities in excess of other assets | | | (2.02 | ) | |
| Net assets | | | 100.00 | % | |
148
PACE Select Advisors Trust
PACE International Equity Investments
Portfolio of investments—July 31, 2011
| | | Number of
shares | | Value | |
| Common stocks—96.68% | |
| Australia—4.58% | |
| AGL Energy Ltd. | | | 54,282 | | | $ | 845,615 | | |
| Amcor Ltd. | | | 579,437 | | | | 4,482,406 | | |
| AMP Ltd. | | | 822,705 | | | | 4,115,701 | | |
Australia & New Zealand Banking
Group Ltd. | | | 62,183 | | | | 1,420,537 | | |
| BHP Billiton Ltd. | | | 53,361 | | | | 2,440,976 | | |
| Commonwealth Bank of Australia | | | 15,510 | | | | 838,327 | | |
| Dexus Property Group | | | 590,026 | | | | 560,172 | | |
| Incitec Pivot Ltd. | | | 689,243 | | | | 2,992,021 | | |
| Macquarie Group Ltd. | | | 29,264 | | | | 884,972 | | |
| National Australia Bank Ltd. | | | 47,955 | | | | 1,262,129 | | |
| Newcrest Mining Ltd. | | | 82,096 | | | | 3,562,041 | | |
| QBE Insurance Group Ltd. | | | 333,516 | | | | 6,000,543 | | |
| Rio Tinto Ltd. | | | 16,260 | | | | 1,424,409 | | |
| Stockland | | | 198,877 | | | | 665,377 | | |
| Telstra Corp. Ltd. | | | 1,880,688 | | | | 6,173,957 | | |
| Treasury Wine Estates Ltd.1,* | | | 49,357 | | | | 186,151 | | |
| Wesfarmers Ltd. | | | 32,499 | | | | 1,045,397 | | |
| Westfield Group | | | 61,013 | | | | 532,898 | | |
| Westpac Banking Corp. | | | 68,263 | | | | 1,528,488 | | |
| Woodside Petroleum Ltd. | | | 15,695 | | | | 661,407 | | |
| Total Australia common stocks | | | | | 41,623,524 | | |
| Austria—0.15% | |
| Erste Group Bank AG | | | 20,777 | | | | 990,566 | | |
| Intercell AG* | | | 28,000 | | | | 112,758 | | |
| Palfinger AG | | | 8,438 | | | | 276,874 | | |
| Total Austria common stocks | | | | | 1,380,198 | | |
| Belgium—0.73% | |
| Ageas STRIP VVPR2,* | | | 151,262 | | | | 217 | | |
| Anheuser-Busch InBev N.V. | | | 7,817 | | | | 450,535 | | |
| KBC GROEP N.V. | | | 57,403 | | | | 2,017,197 | | |
| Nyrstar* | | | 54,019 | | | | 714,804 | | |
| Solvay SA | | | 22,911 | | | | 3,447,311 | | |
| Total Belgium common stocks | | | | | 6,630,064 | | |
| Bermuda—0.42% | |
| Huabao International Holdings Ltd. | | | 446,000 | | | | 376,643 | | |
| Jardine Matheson Holdings Ltd.1 | | | 60,000 | | | | 3,439,264 | | |
| Total Bermuda common stocks | | | | | 3,815,907 | | |
| Brazil—0.51% | |
| Tim Participacoes SA, ADR | | | 92,200 | | | | 4,613,688 | | |
| Canada—0.40% | |
| First Quantum Minerals Ltd. | | | 15,793 | | | | 2,189,482 | | |
| Kinross Gold Corp. | | | 90,338 | | | | 1,474,983 | | |
| Total Canada common stocks | | | | | 3,664,465 | | |
| Cayman Islands—0.50% | |
| China Resources Land Ltd. | | | 562,000 | | | | 1,106,868 | | |
| Hengan International Group Co. Ltd. | | | 118,500 | | | | 1,031,728 | | |
| Mindray Medical International Ltd., ADR1 | | | 88,100 | | | | 2,385,748 | | |
| Total Cayman Islands common stocks | | | | | 4,524,344 | | |
| | | Number of
shares | | Value | |
| Common stocks—(Continued) | |
| Denmark—0.36% | |
| Carlsberg A/S, Class B | | | 20,448 | | | $ | 2,010,661 | | |
| Danske Bank A/S* | | | 29,746 | | | | 575,863 | | |
| Novo-Nordisk A/S, Class B | | | 5,843 | | | | 715,471 | | |
| Total Denmark common stocks | | | | | 3,301,995 | | |
| Finland—0.54% | |
| Nokia Oyj | | | 62,388 | | | | 361,023 | | |
| Nokian Renkaat Oyj | | | 12,236 | | | | 573,230 | | |
| Outokumpu Oyj1 | | | 40,656 | | | | 432,708 | | |
| Sampo Oyj, A Shares | | | 31,406 | | | | 954,973 | | |
| Stora Enso Oyj, R Shares | | | 163,926 | | | | 1,406,021 | | |
| UPM-Kymmene Oyj | | | 77,419 | | | | 1,207,400 | | |
| Total Finland common stocks | | | | | 4,935,355 | | |
| France—10.92% | |
| Air Liquide SA | | | 23,050 | | | | 3,158,752 | | |
| Alcatel-Lucent1,* | | | 66,020 | | | | 265,963 | | |
| Alstom SA | | | 12,470 | | | | 654,275 | | |
| Atos Origin SA | | | 14,901 | | | | 818,647 | | |
| BNP Paribas | | | 131,787 | | | | 8,520,037 | | |
| Bouygues SA | | | 22,403 | | | | 844,212 | | |
| Carrefour SA | | | 146,474 | | | | 4,299,199 | | |
| Cie de Saint-Gobain | | | 64,747 | | | | 3,728,248 | | |
| France Telecom SA | | | 374,622 | | | | 7,736,837 | | |
| GDF Suez, STRIP VVPR2,* | | | 23,226 | | | | 33 | | |
| Imerys SA | | | 8,236 | | | | 564,127 | | |
| L'Oreal SA | | | 27,123 | | | | 3,253,454 | | |
| Lafarge SA1 | | | 12,803 | | | | 683,249 | | |
| Pernod Ricard SA | | | 23,685 | | | | 2,339,893 | | |
| PPR | | | 21,288 | | | | 3,921,775 | | |
| Safran SA | | | 79,951 | | | | 3,308,561 | | |
| Sanofi SA1 | | | 267,002 | | | | 20,726,881 | | |
| Schneider Electric SA | | | 61,399 | | | | 8,847,907 | | |
| Societe Generale SA | | | 50,788 | | | | 2,505,891 | | |
| Sodexo | | | 31,941 | | | | 2,435,772 | | |
| Suez Environnement Co. | | | 121,689 | | | | 2,250,586 | | |
| Technip SA | | | 40,449 | | | | 4,408,932 | | |
| Total SA | | | 186,687 | | | | 10,062,404 | | |
| Vinci SA | | | 67,390 | | | | 3,893,752 | | |
| Total France common stocks | | | | | 99,229,387 | | |
| Germany—7.25% | |
| Adidas AG | | | 85,744 | | | | 6,371,337 | | |
| Aixtron AG1 | | | 109,184 | | | | 2,949,238 | | |
| Allianz SE | | | 24,742 | | | | 3,235,333 | | |
| BASF SE | | | 20,989 | | | | 1,905,408 | | |
| Bayer AG | | | 73,871 | | | | 5,934,533 | | |
| Bayerische Motoren Werke (BMW) AG | | | 14,908 | | | | 1,494,764 | | |
| Brenntag AG | | | 7,130 | | | | 727,219 | | |
| Commerzbank AG* | | | 163,869 | | | | 622,479 | | |
| Continental AG* | | | 8,045 | | | | 803,121 | | |
| Daimler AG | | | 106,624 | | | | 7,757,455 | | |
| Deutsche Bank AG | | | 12,480 | | | | 687,886 | | |
| Deutsche Boerse AG* | | | 37,790 | | | | 2,789,882 | | |
| Deutsche Telekom AG | | | 465,122 | | | | 7,243,409 | | |
149
PACE Select Advisors Trust
PACE International Equity Investments
Portfolio of investments—July 31, 2011
| | | Number of
shares | | Value | |
| Common stocks—(Continued) | |
| Germany—(Concluded) | |
| E.ON AG | | | 57,588 | | | $ | 1,589,647 | | |
| Fresenius Medical Care AG & Co. KGaA | | | 45,800 | | | | 3,512,849 | | |
Hamburger Hafen und
Logistik AG (HHLA)1 | | | 13,299 | | | | 530,536 | | |
| HeidelbergCement AG | | | 3,408 | | | | 187,522 | | |
| Infineon Technologies AG | | | 147,676 | | | | 1,481,458 | | |
| Lanxess AG | | | 9,157 | | | | 738,464 | | |
| RWE AG | | | 125,381 | | | | 6,580,038 | | |
| SAP AG | | | 6,715 | | | | 420,892 | | |
| Siemens AG | | | 64,350 | | | | 8,260,036 | | |
| Total Germany common stocks | | | | | 65,823,506 | | |
| Guernsey—0.05% | |
| Resolution Ltd. | | | 101,431 | | | | 457,692 | | |
| Hong Kong—2.32% | |
| AIA Group Ltd.* | | | 1,161,200 | | | | 4,259,172 | | |
China Merchants Holdings
International Co. Ltd. | | | 908,000 | | | | 3,216,945 | | |
| China Overseas Land & Investment Ltd. | | | 708,000 | | | | 1,596,988 | | |
| Hang Lung Properties Ltd. | | | 430,000 | | | | 1,594,408 | | |
| Hang Seng Bank Ltd. | | | 30,300 | | | | 475,649 | | |
| Henderson Land Development Co. Ltd. | | | 527,500 | | | | 3,336,461 | | |
| Hutchison Whampoa Ltd. | | | 98,000 | | | | 1,139,938 | | |
| SJM Holdings Ltd. | | | 1,638,700 | | | | 4,143,665 | | |
| Sun Hung Kai Properties Ltd. | | | 84,000 | | | | 1,275,394 | | |
| Total Hong Kong common stocks | | | | | 21,038,620 | | |
| Indonesia—0.14% | |
| PT Perusahaan Gas Negara | | | 2,743,500 | | | | 1,280,260 | | |
| Ireland—0.07% | |
| Paddy Power PLC | | | 13,213 | | | | 644,216 | | |
| Isle of Man—0.08% | |
| Genting Singapore PLC* | | | 473,000 | | | | 744,089 | | |
| Israel—1.20% | |
Check Point Software
Technologies Ltd.* | | | 51,200 | | | | 2,951,680 | | |
Teva Pharmaceutical
Industries Ltd., ADR | | | 169,775 | | | | 7,918,306 | | |
| Total Israel common stocks | | | | | 10,869,986 | | |
| Italy—2.30% | |
| Enel SpA | | | 625,160 | | | | 3,589,163 | | |
| ENI SpA | | | 309,716 | | | | 6,715,080 | | |
| Intesa Sanpaolo SpA EURO 52 | | | 2,564,835 | | | | 5,921,392 | | |
| Snam Rete Gas SpA | | | 649,987 | | | | 3,752,684 | | |
| Telecom Italia SpA | | | 171,930 | | | | 215,811 | | |
| UniCredito Italiano SpA | | | 404,397 | | | | 718,436 | | |
| Total Italy common stocks | | | | | 20,912,566 | | |
| Japan—19.81% | |
| Ajinomoto Co., Inc. | | | 55,000 | | | | 680,932 | | |
| Amada Co. Ltd. | | | 111,000 | | | | 862,546 | | |
| Asahi Group Holdings Ltd. | | | 38,200 | | | | 808,817 | | |
| Astellas Pharma, Inc. | | | 228,600 | | | | 8,888,469 | | |
| Benesse Corp. | | | 17,200 | | | | 744,775 | | |
| | | Number of
shares | | Value | |
| Common stocks—(Continued) | |
| Japan—(Continued) | |
| Bridgestone Corp. | | | 227,600 | | | $ | 5,669,577 | | |
| Canon, Inc. | | | 180,900 | | | | 8,797,286 | | |
| Capcom Co. Ltd.1 | | | 38,000 | | | | 994,587 | | |
| Dai-ichi Life Insurance Co. Ltd. | | | 3,615 | | | | 5,114,306 | | |
| Daito Trust Construction Co. Ltd. | | | 7,900 | | | | 760,409 | | |
| Daiwa House Industry Co. Ltd. | | | 56,000 | | | | 753,825 | | |
| DIC Corp. | | | 192,000 | | | | 448,198 | | |
| East Japan Railway Co. | | | 45,400 | | | | 2,852,015 | | |
| Electric Power Development Co. Ltd.1 | | | 17,700 | | | | 466,613 | | |
| FUJIFILM Holdings Corp. | | | 106,500 | | | | 3,223,587 | | |
| Fujitsu Ltd. | | | 275,900 | | | | 1,625,326 | | |
| Hisamitsu Pharmaceutical Co., Inc. | | | 11,400 | | | | 497,684 | | |
| Hokuhoku Financial Group, Inc. | | | 182,000 | | | | 380,338 | | |
| Hoya Corp. | | | 46,100 | | | | 1,121,381 | | |
| Inpex Corp. | | | 580 | | | | 4,502,091 | | |
| Japan Tobacco, Inc. | | | 901 | | | | 4,101,959 | | |
| JFE Holdings, Inc. | | | 51,500 | | | | 1,402,918 | | |
| JS Group Corp. | | | 53,200 | | | | 1,333,295 | | |
| JX Holdings, Inc. | | | 488,100 | | | | 3,525,627 | | |
| Kao Corp. | | | 256,300 | | | | 7,253,753 | | |
| KDDI Corp. | | | 756 | | | | 5,624,964 | | |
| Kirin Holdings Co. Ltd. | | | 345,900 | | | | 5,090,194 | | |
| Komatsu Ltd. | | | 18,300 | | | | 570,971 | | |
| Minebea Co. Ltd. | | | 95,000 | | | | 484,142 | | |
| Mitsubishi Electric Corp. | | | 305,900 | | | | 3,612,085 | | |
| Mitsubishi Heavy Industries Ltd. | | | 406,000 | | | | 1,896,061 | | |
| Mitsubishi Logistics Corp. | | | 28,000 | | | | 322,743 | | |
Mitsubishi UFJ Financial Group,
Inc. (MUFG) | | | 986,100 | | | | 5,012,994 | | |
| Mitsui & Co. Ltd. | | | 425,600 | | | | 8,030,774 | | |
| Mitsui Fudosan Co. Ltd. | | | 193,700 | | | | 3,690,373 | | |
| Nintendo Co. Ltd. | | | 1,800 | | | | 287,008 | | |
| Nippon Express Co. Ltd. | | | 300 | | | | 1,324 | | |
| Nippon Sheet Glass Co. Ltd.1 | | | 1,087,300 | | | | 3,470,636 | | |
Nippon Telegraph & Telephone
Corp. (NTT) | | | 60,000 | | | | 2,964,349 | | |
| Nissan Motor Co. Ltd. | | | 350,700 | | | | 3,752,654 | | |
| Nitto Denko Corp. | | | 17,000 | | | | 819,873 | | |
| NTT DoCoMo, Inc. | | | 2,699 | | | | 4,957,091 | | |
| ORIX Corp.1 | | | 20,530 | | | | 2,220,669 | | |
| Otsuka Corp. | | | 5,700 | | | | 378,744 | | |
| Otsuka Holdings Co. Ltd. | | | 17,800 | | | | 491,469 | | |
| Sapporo Hokuyo Holdings, Inc. | | | 197,800 | | | | 854,767 | | |
| Seiko Epson Corp. | | | 44,000 | | | | 750,675 | | |
| Sekisui House Ltd.1 | | | 360,200 | | | | 3,445,050 | | |
| Seven & I Holdings Co. Ltd. | | | 303,700 | | | | 8,650,095 | | |
| Shin-Etsu Chemical Co. Ltd. | | | 23,600 | | | | 1,275,026 | | |
| Softbank Corp.1 | | | 23,500 | | | | 917,105 | | |
| Sony Corp. | | | 130,200 | | | | 3,287,356 | | |
| Sumitomo Corp. | | | 119,600 | | | | 1,693,720 | | |
| Sumitomo Heavy Industries Ltd. | | | 52,000 | | | | 366,490 | | |
| Sumitomo Metal Mining Co. Ltd. | | | 38,000 | | | | 673,643 | | |
| Sumitomo Mitsui Financial Group, Inc. | | | 100,032 | | | | 3,157,957 | | |
| Sumitomo Mitsui Trust Holdings, Inc. | | | 208,000 | | | | 766,117 | | |
| Sundrug Co. Ltd. | | | 17,900 | | | | 576,632 | | |
150
PACE Select Advisors Trust
PACE International Equity Investments
Portfolio of investments—July 31, 2011
| | | Number of
shares | | Value | |
| Common stocks—(Continued) | |
| Japan—(Concluded) | |
| Suzuki Motor Corp. | | | 182,000 | | | $ | 4,227,018 | | |
| Takashimaya Co. Ltd. | | | 700 | | | | 5,222 | | |
| Takeda Pharmaceutical Co. Ltd. | | | 177,900 | | | | 8,500,260 | | |
| The Bank of Yokohama Ltd. | | | 689,500 | | | | 3,383,155 | | |
| The Nishi-Nippon City Bank Ltd. | | | 177,000 | | | | 543,544 | | |
| Tokio Marine Holdings, Inc. | | | 200,700 | | | | 5,922,061 | | |
| Tokyo Gas Co. Ltd. | | | 193,000 | | | | 920,710 | | |
| Toshiba Corp. | | | 213,000 | | | | 1,110,226 | | |
| Toyota Motor Corp. | | | 146,607 | | | | 6,000,277 | | |
| Trend Micro, Inc. | | | 29,100 | | | | 912,974 | | |
| Ube Industries Ltd. | | | 286,000 | | | | 971,979 | | |
| Yamada Denki Co. Ltd. | | | 6,870 | | | | 548,096 | | |
| Total Japan common stocks | | | | | 179,949,587 | | |
| Jersey—1.67% | |
| Experian PLC | | | 475,036 | | | | 6,227,971 | | |
| Glencore International PLC* | | | 105,606 | | | | 818,991 | | |
| Petrofac Ltd. | | | 209,685 | | | | 4,789,212 | | |
| Shire Ltd. | | | 96,616 | | | | 3,345,990 | | |
| Total Jersey common stocks | | | | | 15,182,164 | | |
| Luxembourg—0.73% | |
| ArcelorMittal | | | 28,404 | | | | 882,865 | | |
| SES SA | | | 210,725 | | | | 5,696,091 | | |
| Total Luxembourg common stocks | | | | | 6,578,956 | | |
| Netherlands—4.79% | |
| ASML Holding N.V. | | | 30,853 | | | | 1,096,941 | | |
European Aeronautic Defense and
Space Co. N.V. | | | 60,515 | | | | 2,090,383 | | |
| Gemalto N.V.1 | | | 88,798 | | | | 4,221,204 | | |
| Heineken N.V. | | | 87,800 | | | | 5,188,934 | | |
| ING Groep N.V.* | | | 1,179,237 | | | | 12,615,604 | | |
| Koninklijke Ahold N.V. | | | 466,179 | | | | 6,201,691 | | |
| Koninklijke (Royal) KPN N.V.1 | | | 190,212 | | | | 2,715,133 | | |
| Reed Elsevier N.V. | | | 338,393 | | | | 4,500,992 | | |
| STMicroelectronics N.V. | | | 22,495 | | | | 176,533 | | |
| Unilever N.V. | | | 143,582 | | | | 4,668,753 | | |
| X5 Retail Group N.V., GDR3,* | | | 1,000 | | | | 41,274 | | |
| Total Netherlands common stocks | | | | | 43,517,442 | | |
| Norway—0.79% | |
| DnB NOR ASA | | | 420,619 | | | | 6,106,062 | | |
| Norske Skogindustrier ASA* | | | 157,762 | | | | 233,722 | | |
| Petroleum Geo-Services ASA* | | | 22,397 | | | | 361,903 | | |
| Telenor ASA | | | 27,172 | | | | 453,064 | | |
| Total Norway common stocks | | | | | 7,154,751 | | |
| Portugal—0.12% | |
| Jeronimo Martins, SGPS SA | | | 56,458 | | | | 1,102,089 | | |
| Russia—0.45% | |
| Gazprom OAO, ADR* | | | 277,410 | | | | 4,066,831 | | |
| Singapore—1.88% | |
| CapitaLand Ltd. | | | 212,000 | | | | 509,002 | | |
| Oversea-Chinese Banking Corp. Ltd. | | | 567,000 | | | | 4,672,955 | | |
| | | Number of
shares | | Value | |
| Common stocks—(Continued) | |
| Singapore—(Concluded) | |
| Singapore Airlines Ltd.1 | | | 48,740 | | | $ | 573,713 | | |
| Singapore Telecommunications Ltd.1 | | | 2,219,320 | | | | 6,170,160 | | |
| United Overseas Bank Ltd. | | | 305,420 | | | | 5,188,855 | | |
| Total Singapore common stocks | | | | | 17,114,685 | | |
| South Africa—0.31% | |
| Harmony Gold Mining Co. Ltd. | | | 210,288 | | | | 2,851,951 | | |
| South Korea—0.64% | |
| Samsung Electronics Co. Ltd. | | | 2,660 | | | | 2,125,982 | | |
| Samsung Electronics Co. Ltd., GDR3 | | | 9,327 | | | | 3,713,079 | | |
| Total South Korea common stocks | | | | | 5,839,061 | | |
| Spain—2.67% | |
| Banco Bilbao Vizcaya Argentaria SA | | | 244,313 | | | | 2,555,891 | | |
| Banco Santander SA1 | | | 408,613 | | | | 4,263,942 | | |
Distribuidora Internacional de
Alimentacion SA1,* | | | 146,474 | | | | 620,882 | | |
| Iberdrola SA | | | 948,575 | | | | 7,691,751 | | |
| Industria de Diseno Textil SA (Inditex) | | | 9,636 | | | | 870,140 | | |
| Telefonica SA | | | 369,016 | | | | 8,232,738 | | |
| Total Spain common stocks | | | | | 24,235,344 | | |
| Sweden—1.02% | |
| Atlas Copco AB, A Shares | | | 188,910 | | | | 4,442,818 | | |
| Nordea Bank AB | | | 102,214 | | | | 1,084,130 | | |
| Tele2 AB, B Shares | | | 27,396 | | | | 581,642 | | |
Telefonaktiebolaget LM Ericsson,
B Shares | | | 249,806 | | | | 3,125,381 | | |
| Total Sweden common stocks | | | | | 9,233,971 | | |
| Switzerland—6.94% | |
| ABB Ltd.* | | | 393,937 | | | | 9,419,129 | | |
Compagnie Financiere Richemont SA,
A Shares | | | 99,821 | | | | 6,419,336 | | |
| Credit Suisse Group* | | | 242,480 | | | | 8,729,940 | | |
| Georg Fischer AG* | | | 967 | | | | 511,858 | | |
| Kuehne & Nagel International AG | | | 3,469 | | | | 481,674 | | |
| Nestle SA | | | 42,862 | | | | 2,726,631 | | |
| Novartis AG | | | 322,142 | | | | 19,748,133 | | |
| Roche Holding AG | | | 11,503 | | | | 2,061,881 | | |
| SGS SA | | | 638 | | | | 1,236,469 | | |
| Syngenta AG* | | | 13,091 | | | | 4,175,013 | | |
| Zurich Financial Services AG* | | | 31,847 | | | | 7,557,985 | | |
| Total Switzerland common stocks | | | | | 63,068,049 | | |
| Taiwan—0.63% | |
HON HAI Precision Industry Co.
Ltd., GDR4 | | | 5,809 | | | | 32,909 | | |
HON HAI Precision Industry Co.
Ltd., GDR5 | | | 233,200 | | | | 1,317,438 | | |
Taiwan Semiconductor Manufacturing
Co. Ltd. | | | 707,000 | | | | 1,765,105 | | |
Taiwan Semiconductor Manufacturing
Co. Ltd., ADR | | | 212,090 | | | | 2,621,432 | | |
| Total Taiwan common stocks | | | | | 5,736,884 | | |
151
PACE Select Advisors Trust
PACE International Equity Investments
Portfolio of investments—July 31, 2011
| | | Number of
shares | | Value | |
| Common stocks—(Concluded) | |
| United Kingdom—21.71% | |
| Aegis Group PLC | | | 318,715 | | | $ | 804,277 | | |
| Afren PLC* | | | 197,723 | | | | 452,591 | | |
| Anglo American PLC | | | 105,401 | | | | 4,967,074 | | |
| AstraZeneca PLC | | | 23,950 | | | | 1,163,697 | | |
| Barclays PLC | | | 1,036,032 | | | | 3,774,959 | | |
| Barratt Developments PLC* | | | 294,229 | | | | 472,383 | | |
| BG Group PLC | | | 450,996 | | | | 10,608,280 | | |
| BHP Billiton PLC | | | 12,222 | | | | 459,198 | | |
| BP PLC | | | 1,351,294 | | | | 10,158,111 | | |
| British American Tobacco PLC | | | 137,918 | | | | 6,356,410 | | |
| BT Group PLC | | | 222,840 | | | | 730,309 | | |
| Burberry Group PLC | | | 30,711 | | | | 748,929 | | |
| Cairn Energy PLC* | | | 319,407 | | | | 1,925,851 | | |
| Centrica PLC | | | 654,556 | | | | 3,277,732 | | |
| Compass Group PLC | | | 1,241,768 | | | | 11,645,800 | | |
| Cookson Group PLC | | | 106,157 | | | | 1,113,052 | | |
| Domino's Pizza UK & IRL PLC | | | 78,736 | | | | 646,834 | | |
| GKN PLC | | | 992,441 | | | | 3,632,684 | | |
| GlaxoSmithKline PLC | | | 642,855 | | | | 14,344,888 | | |
| HSBC Holdings PLC6 | | | 34,266 | | | | 337,153 | | |
| HSBC Holdings PLC5 | | | 916,671 | | | | 8,952,950 | | |
| Inchcape PLC | | | 101,409 | | | | 644,356 | | |
| Intercontinental Hotels Group PLC | | | 167,735 | | | | 3,302,451 | | |
| ITV PLC* | | | 903,981 | | | | 1,031,191 | | |
| J Sainsbury PLC | | | 146,288 | | | | 726,958 | | |
| Johnson Matthey PLC | | | 64,089 | | | | 2,131,208 | | |
| Lloyds Banking Group PLC* | | | 4,312,579 | | | | 3,053,266 | | |
| Man Group PLC | | | 405,963 | | | | 1,472,756 | | |
| Meggitt PLC | | | 124,648 | | | | 790,371 | | |
| Pearson PLC | | | 351,415 | | | | 6,738,463 | | |
| Persimmon PLC | | | 455,130 | | | | 3,423,766 | | |
| Petropavlovsk PLC | | | 48,558 | | | | 631,623 | | |
| Premier Farnell PLC | | | 364,991 | | | | 1,159,995 | | |
| Prudential PLC | | | 698,914 | | | | 7,856,912 | | |
| Rio Tinto PLC | | | 88,694 | | | | 6,191,580 | | |
| Royal Dutch Shell PLC, A Shares5 | | | 74,988 | | | | 2,732,359 | | |
| Royal Dutch Shell PLC, A Shares7,* | | | 398,839 | | | | 14,671,142 | | |
| Royal Dutch Shell PLC, B Shares5 | | | 254,917 | | | | 9,309,324 | | |
| SABMiller PLC | | | 37,330 | | | | 1,393,139 | | |
| Serco Group PLC | | | 205,636 | | | | 1,815,367 | | |
| SIG PLC* | | | 287,098 | | | | 600,072 | | |
| Standard Chartered PLC | | | 120,978 | | | | 3,075,760 | | |
| Tate & Lyle PLC | | | 397,292 | | | | 3,955,841 | | |
| Tesco PLC | | | 1,366,028 | | | | 8,564,230 | | |
| The Weir Group PLC | | | 18,976 | | | | 656,472 | | |
| Travis Perkins PLC | | | 42,148 | | | | 606,969 | | |
| Tullow Oil PLC | | | 58,701 | | | | 1,176,215 | | |
| Unilever PLC | | | 255,284 | | | | 8,156,679 | | |
| Vodafone Group PLC | | | 4,998,530 | | | | 14,085,755 | | |
| Xstrata PLC | | | 34,098 | | | | 716,454 | | |
| Total United Kingdom common stocks | | | | | 197,243,836 | | |
Total common stocks
(cost—$828,780,437) | | | | | 878,365,463 | | |
| | | Number of
shares | | Value | |
| Preferred stocks—1.02% | |
| Germany—1.02% | |
| Henkel AG & Co. KGaA Vorzug | | | 78,785 | | | $ | 5,319,843 | | |
| Volkswagen AG | | | 19,914 | | | | 3,979,195 | | |
Total preferred stocks
(cost—$7,792,156) | | | | | 9,299,038 | | |
| | | Number of
rights | | | |
| Rights*—0.02% | |
| Spain—0.02% | |
Iberdrola SA, expires 08/02/11
(cost—$197,234) | | | 904,020 | | | | 194,848 | | |
| | | Face
amount | | | |
| Repurchase agreement—1.64% | |
Repurchase agreement dated
07/29/11 with State Street
Bank & Trust Co., 0.010%
due 08/01/11, collateralized
by $73,962 Federal Home Loan
Mortgage Corp. obligations,
5.125% due 07/15/12,
$10,630,653 US Treasury Bills,
zero coupon due 08/04/11 and
$4,192,706 US Treasury Notes,
2.375% to 2.625% due
02/29/16 to 07/31/17;
(value—$15,163,480);
proceeds: $14,866,012
(cost—$14,866,000) | | $ | 14,866,000 | | | | 14,866,000 | | |
| | | Number of
shares | | | |
| Investment of cash collateral from securities loaned—2.66% | |
| Money market fund—2.66% | |
UBS Private Money Market Fund LLC8
(cost—$24,172,469) | | | 24,172,469 | | | | 24,172,469 | | |
Total investments
(cost—$875,808,296)—
102.02% | | | | | 926,897,818 | | |
Liabilities in excess of
other assets—(2.02)% | | | | | (18,334,723 | ) | |
| Net assets—100.00% | | $ | 908,563,095 | | |
152
PACE Select Advisors Trust
PACE International Equity Investments
Portfolio of investments—July 31, 2011
Aggregate cost for federal income tax purposes was $885,710,169; and net unrealized appreciation consisted of:
| Gross unrealized appreciation | | $ | 87,970,349 | | |
| Gross unrealized depreciation | | | (46,782,700 | ) | |
| Net unrealized appreciation | | $ | 41,187,649 | | |
For a listing of defined portfolio acronyms and currency abbreviations that are used throughout the Portfolio of investments as well as the tables that follow, please refer to page 227.
* Non-income producing security.
1 Security, or portion thereof, was on loan at July 31, 2011.
2 Illiquid securities representing 0.00% of net assets as of July 31, 2011.
3 Security exempt from registration pursuant to Rule 144A under the Securities Act of 1933. These securities, which represent 0.41% of net assets as of July 31, 2011, are considered liquid and may be resold in transactions exempt from registration, normally to qualified institutional buyers.
4 Security is traded on the over-the-counter ("OTC") Market.
5 Security is traded on the London Exchange.
6 Security is traded on the Hong Kong Exchange.
7 Security is traded on the Netherlands Exchange.
8 The table below details the Portfolio's transaction activity in an affiliated issuer during the year ended July 31, 2011. The investment manager earns a management fee from UBS Private Money Market Fund LLC.
| Security description | | Value at
07/31/10 | | Purchases
during the
year ended
07/31/11 | | Sales
during the
year ended
07/31/11 | | Value at
07/31/11 | | Net income
earned from
affiliate for the
year ended
07/31/11 | |
| UBS Private Money Market Fund LLC | | $ | 37,141,889 | | | $ | 536,708,217 | | | $ | 549,677,637 | | | $ | 24,172,469 | | | $ | 18,648 | | |
Futures contracts
Number of
contracts | | Currency | |
| | Expiration
date | | Cost | | Current
value | | Unrealized
appreciation
(depreciation) | |
| Index futures buy contracts: | | | |
| | 9 | | | AUD | | | | ASX SPI 200 Index Futures | | September 2011 | | $ | 1,113,635 | | | $ | 1,081,781 | | | $ | (31,854 | ) | |
| | 132 | | | EUR | | | | DJ Euro Stoxx 50 Index Futures | | September 2011 | | | 5,196,612 | | | | 5,072,152 | | | | (124,460 | ) | |
| | 38 | | | GBP | | | | FTSE 100 Index Futures | | September 2011 | | | 3,600,313 | | | | 3,608,196 | | | | 7,883 | | |
| | 11 | | | JPY | | | | TOPIX Index Futures | | September 2011 | | | 1,157,696 | | | | 1,198,471 | | | | 40,775 | | |
| | | | | | | | | | | | | | | | | $ | 11,068,256 | | | $ | 10,960,600 | | | $ | (107,656 | ) | |
Forward foreign currency contracts
| Counterparty | | Contracts to
deliver | | In
exchange for | | Maturity
date | | Unrealized
appreciation
(depreciation) | |
| Barclays Bank PLC | | EUR | 649,507 | | | USD | 932,129 | | | 10/12/11 | | $ | 443 | | |
| Barclays Bank PLC | | GBP | 637,000 | | | USD | 1,018,126 | | | 10/12/11 | | | (26,693 | ) | |
| Barclays Bank PLC | | USD | 3,752,543 | | | SEK | 23,641,300 | | | 09/21/11 | | | (4,859 | ) | |
| BNP Paribas SA | | EUR | 322,167 | | | USD | 459,229 | | | 09/21/11 | | | (3,156 | ) | |
| BNP Paribas SA | | JPY | 68,671,984 | | | USD | 848,853 | | | 10/12/11 | | | (43,912 | ) | |
| BNP Paribas SA | | USD | 16,306,957 | | | AUD | 15,588,797 | | | 09/21/11 | | | 713,335 | | |
| BNP Paribas SA | | USD | 3,948,786 | | | CHF | 3,323,848 | | | 09/21/11 | | | 277,536 | | |
| BNP Paribas SA | | USD | 3,105,258 | | | HKD | 24,156,100 | | | 10/12/11 | | | (4,431 | ) | |
| Citibank N.A. | | AUD | 181,199 | | | USD | 192,315 | | | 10/12/11 | | | (4,998 | ) | |
| Citibank N.A. | | USD | 535,051 | | | EUR | 381,997 | | | 09/21/11 | | | 13,204 | | |
| Citibank N.A. | | USD | 857,231 | | | HKD | 6,669,125 | | | 09/21/11 | | | (1,262 | ) | |
| Credit Suisse London Branch | | EUR | 8,084,240 | | | USD | 11,674,774 | | | 09/21/11 | | | 71,996 | | |
153
PACE Select Advisors Trust
PACE International Equity Investments
Portfolio of investments—July 31, 2011
Forward foreign currency contracts—(concluded)
| Counterparty | | Contracts to
deliver | | In
exchange for | | Maturity
date | | Unrealized
appreciation
(depreciation) | |
| Credit Suisse London Branch | | USD | 1,092,414 | | | JPY | 88,719,319 | | | 09/21/11 | | $ | 60,726 | | |
| Credit Suisse London Branch | | USD | 818,201 | | | GBP | 510,897 | | | 09/21/11 | | | 19,970 | | |
| Credit Suisse London Branch | | USD | 2,617,681 | | | CHF | 2,203,747 | | | 10/12/11 | | | 185,244 | | |
| HSBC Bank PLC | | EUR | 1,060,895 | | | USD | 1,510,189 | | | 09/21/11 | | | (12,443 | ) | |
| HSBC Bank PLC | | GBP | 5,369,669 | | | USD | 8,736,859 | | | 09/21/11 | | | (72,555 | ) | |
| HSBC Bank PLC | | HKD | 19,195,342 | | | USD | 2,467,745 | | | 09/21/11 | | | 4,062 | | |
| HSBC Bank PLC | | USD | 690,368 | | | GBP | 423,223 | | | 09/21/11 | | | 3,966 | | |
| HSBC Bank PLC | | USD | 3,703,531 | | | JPY | 296,858,782 | | | 09/21/11 | | | 154,926 | | |
| HSBC Bank PLC | | USD | 2,388,088 | | | SGD | 2,939,671 | | | 09/21/11 | | | 53,559 | | |
| Merrill Lynch International Bank Ltd. | | EUR | 158,921 | | | USD | 226,782 | | | 10/12/11 | | | (1,182 | ) | |
| Royal Bank of Canada | | EUR | 130,000 | | | USD | 183,758 | | | 09/21/11 | | | (2,823 | ) | |
| Royal Bank of Canada | | GBP | 1,537,872 | | | USD | 2,454,202 | | | 10/12/11 | | | (68,243 | ) | |
| Royal Bank of Scotland PLC | | USD | 1,680,181 | | | SEK | 10,721,636 | | | 10/12/11 | | | 17,478 | | |
| State Street Bank & Trust Co. | | AUD | 11,953,500 | | | USD | 13,042,703 | | | 10/31/11 | | | 57,364 | | |
| State Street Bank & Trust Co. | | CHF | 3,818,500 | | | USD | 4,538,647 | | | 09/30/11 | | | (317,251 | ) | |
| Westpac Banking Corp. | | CAD | 2,995,610 | | | USD | 3,068,942 | | | 09/21/11 | | | (62,908 | ) | |
| Westpac Banking Corp. | | EUR | 458,300 | | | HKD | 5,048,605 | | | 09/21/11 | | | (9,790 | ) | |
| Westpac Banking Corp. | | JPY | 68,747,656 | | | EUR | 586,428 | | | 09/21/11 | | | (51,894 | ) | |
| Westpac Banking Corp. | | USD | 1,277,885 | | | EUR | 903,120 | | | 09/21/11 | | | 18,304 | | |
| | | $ | 963,713 | | |
The following is a summary of the fair valuations according to the inputs used as of July 31, 2011 in valuing the Portfolio's investments:
| | | Unadjusted
quoted prices in
active markets for
identical investments
(Level 1) | | Other significant
observable inputs
(Level 2) | | Unobservable
inputs
(Level 3) | | Total | |
| Common stocks | | $ | 47,301,436 | | | $ | 831,064,027 | | | $ | — | | | $ | 878,365,463 | | |
| Preferred stocks | | | — | | | | 9,299,038 | | | | — | | | | 9,299,038 | | |
| Rights | | | — | | | | 194,848 | | | | — | | | | 194,848 | | |
| Repurchase agreement | | | — | | | | 14,866,000 | | | | — | | | | 14,866,000 | | |
| Investment of cash collateral from securities loaned | | | — | | | | 24,172,469 | | | | — | | | | 24,172,469 | | |
| Futures contracts, net | | | — | | | | (107,656 | ) | | | — | | | | (107,656 | ) | |
| Forward foreign currency contracts, net | | | — | | | | 963,713 | | | | — | | | | 963,713 | | |
| Total | | $ | 47,301,436 | | | $ | 880,452,439 | | | $ | — | | | $ | 927,753,875 | | |
See accompanying notes to financial statements.
154
PACE Select Advisors Trust
PACE International Emerging Markets Equity Investments
Performance
For the 12 months ended July 31, 2011, the Portfolio's Class P shares returned 14.04%, before the deduction of the maximum PACE Select program fee. (Class P shares returned 11.78%, after the deduction of the maximum PACE Select program fee, for the same 12-month period.) In comparison, the MSCI Emerging Markets Index (the "benchmark") returned 17.79%, and the Lipper Emerging Markets Funds category posted a median return of 15.65%. (Returns for all share classes over various time periods are shown in the "Performance at a glance" table on page 160. Please note that the returns shown do not reflect the deduction of taxes that a shareholder would pay on Portfolio distributions or the redemption of Portfolio shares.) For a detailed commentary on the market environment in general during the reporting period, please refer to page 2.
Sub-Advisors' comments1
Mondrian
Our portion of the Portfolio underperformed the benchmark during the reporting period. Market and currency selection detracted from performance, primarily due to the impact of our underweight to Korea and an overweight to Turkey. These effects were partially offset by stock selection, particularly in Brazil and Taiwan. From a sector perspective, good positioning in the consumer staples and stock selection in the energy and information technology sectors benefited our portion of the Portfolio. However, this was partly offset by the impact of an underweight in materials.
In Asia, we benefited from our overweights to Thailand and Indonesia and an underweight to India. However, weak performance from our holdings in the Indian financial sector offset these gains. An underweight and poor stock selection in Korea weighed on relative returns, as the market was led higher by the cyclical automobile, chemicals and engineering sectors where we had limited exposure. These sectors recorded strong returns as tentative signs of recovery in the global economy drove demand higher. In addition, the devastating earthquake and tsunami in Japan led to disruption from competing manufacturers. Stock selection in Taiwan was strong as holdings in President Chainstore, Chunghwa Telecom Co. Ltd. and HTC Corp. performed well, leading to the complete sale of HTC during the period as the stock price approached our price objective.
In Latin America, we benefited from good stock selection in Brazil, where a zero weighting in Petrobras and strong
1 All Sub-Advisors discuss performance on a gross of fees basis—meaning that no fees or expenses are reflected in their sleeves'/sleeve's performance. Alternately, Fund performance is shown net of fees, which does factor in fees and expenses associated with the Fund.
PACE Select Advisors Trust – PACE
International Emerging Markets
Equity Investments
Investment Sub-Advisors:
Mondrian Investment Partners Limited ("Mondrian"),
Delaware Management Company ("Delaware") and
Pzena Investment Management, LLC ("Pzena")
William Blair & Company L.L.C.
("William Blair")
Gartmore Global Partners ("Gartmore"), until March 22, 2011
Portfolio Managers:
Mondrian: Robert Akester, Ginny Chong, and Gregory Halton
Delaware: Liu-Er Chen
Pzena: Allison Fisch, Caroline Cai and John P. Goetz
William Blair: Todd M. McClone and Jeffrey A. Urbina
Gartmore: Christopher Palmer
Objective:
Capital appreciation
Investment process:
Mondrian conducts research on a global basis in an effort to identify securities that have the potential for capital appreciation over a market cycle. The center of its research effort is a value-oriented dividend discount methodology toward individual securities and market analysis that attempts to identify value across country boundaries. This approach focuses on future anticipated dividends, and discounts the value of those dividends back to what they would be worth if they were being paid today. Comparisons of the values of
(continued on next page)
155
PACE Select Advisors Trust
PACE International Emerging Markets Equity Investments
Sub-Advisors' comments – continued
performance from holdings in the utility sector, port operator Santos Brasil Participacoes, SA, toll road operator Companhia de Concessoes Rodoviarias (CCR) and global brewer Companhia de Bebidas das Americas (AmBev) all added to relative returns.
In Europe, we were negatively impacted by an overweight to Turkey and underweight to Russia. This was offset by stock selection, as the energy companies LUKOIL, ADR and Tupras-Turkiye Petrol Rafinerileri A.S. and the Turkish auto manufacturer Tofas Turk Otomobil Fabrikasi A.S. all outperformed. In Africa, the strong performance of South African stocks Sasol Ltd. and Tiger Brands Ltd. was offset by weak performance of the Egyptian telecommunication stocks MobiNil and Orascom Telecom. We sold Orascom Telecom during the fiscal year to pursue other opportunities.
Delaware
For the period from November 4, 2010, when we began managing a portion of the Portfolio, through July 31, 2011, we underperformed the benchmark. Information technology was a key detractor from performance. Yahoo!, Inc. was notably weak due to negative sentiment surrounding its investment in Alibaba Group, a Chinese Internet company. An ownership dispute concerning one of Alibaba's subsidiaries, Alipay, raised questions about the value of this asset to Yahoo. We believe that Yahoo remains significantly undervalued and provides attractive exposure to the growing Chinese Internet market. MEMC Electronic Materials, Inc. also underperformed, as oversupply in the solar energy sector exerted downward pricing pressure throughout the supply chain. Our underweight in the consumer discretionary sector also detracted from relative results. In the materials sector, soft pricing trends and concerns about slowing global growth negatively impacted the performance of our holding in cement company, Cemex SAB de C.V., ADR, as well as pulp company, Fibria Cellulose. We continue to believe that these companies have high asset quality and trade at significant discounts.
Our sector overweight in consumer staples contributed positively to performance. In particular, shares of Lotte Chilsung Beverage Co. Ltd., a Korean beverage firm, rose due to strong performance in its core business and positive news regarding its non-core investments. This outperformance was somewhat offset by our investment in Hypermarcas SA, a Brazilian consumer products company, which declined after reporting disappointing results. Other sources of positive performance included telecommunications and financials. In telecommunications, Brazilian mobile operator Vivo performed well as the market took a favorable view on the company's merger with Telecomunicacoes de Sao Paulo SA, ADR. In
Investment process (continued)
different possible investments are then made. In an international portfolio, currency returns can be an integral component of an investment's total return. Mondrian uses a purchasing power parity approach to assess the value of individual currencies. Purchasing power parity attempts to identify the amount of goods and services that a dollar will buy in the United States, and compares that to the amount of a foreign currency required to buy the same amount of goods and services in another country.
Delaware selects growth-oriented and value-oriented investments on the basis of the investment's discount to its intrinsic value. When selecting growth-oriented securities, Delaware typically seeks high growth caused by long-term economic factors, which may include demographics, economic deregulation, and technological developments. When selecting value-oriented securities, Delaware typically seeks lower valuations caused by cyclical economic factors or temporary changes in business operations. Strong management and sustainable business franchise are key considerations in selecting both growth-oriented and value-oriented securities.
Pzena follows a disciplined investment process to implement its value philosophy. Pzena focuses exclusively on companies that are underperforming their historically demonstrated earnings power, and applies intensive fundamental research to these companies in an effort to determine whether the causes of the earnings shortfall are temporary or permanent. Pzena looks for companies where, in its opinion: (1) the current market price is low compared to the company's normalized earnings power; (2) current earnings are below historic norms; (3) the problems are temporary;
(continued on next page)
156
PACE Select Advisors Trust
PACE International Emerging Markets Equity Investments
Sub-Advisors' comments – continued
financials, an overall underweight position worked in our favor. Our investments in UEM Land Holdings Bhd, Sberbank and Hong Leong Bank Berhad also contributed positively to relative performance.
We remain disciplined in implementing our investment philosophy and process regardless of short-term market fluctuations. We continue to focus on companies that we believe have sustainable franchises that are trading at significant discounts to our conservative intrinsic value estimates. Currently, our largest sector overweights are in the more traditionally defensive consumer staples and telecommunications sectors. We also have a sector overweight in information technology. We remain underweight in financials, particularly in China, where asset quality remains a concern.
Pzena
For the period from November 4, 2010, when we began managing a portion of the Portfolio, through July 31, 2011, we underperformed the benchmark. Stock selection within the consumer staples and materials sectors were largely responsible for the underperformance. In terms of individual names, Usinas Siderurgicas de Minas Gerais (Usiminas), a Brazilian steel maker, and China Dongxiang Group Co. (a Chinese apparel design and marketing company) were the largest detractors. Usiminas detracted from results, as its margins have been negatively affected by a strong Brazilian currency, increased competition from imports and raw material inflation. We believe that Usiminas will work through these challenges and its share price seems to us to be discounting the company's problems fully. China Dongxiang's share price suffered after the company announced an extraordinary provision related to the reclaiming of unsold inventory. The company also stated that its first half expected results were too optimistic. While this news was unwelcome and clearly represents a near-term headwind for the company, we see it as part of the maturing process of the industry and of China Dongxiang. The company's balance sheet remains extremely strong in a net cash position, and the company is attractively valued in our view. Therefore, we continue to hold these names.
On the positive side, stock selection in utilities and energy were the largest relative contributors. The top contributor, despite the volatility of its share price, was Gazprom, ADR. At the beginning of the period, its share price saw significant appreciation, as energy prices rose and instability in the Middle East and North Africa spread.
While macro concerns continue to dominate both the headlines and investors' thinking, we are finding attractively valued companies with strong balance sheets to include in our portion of the Portfolio.
Investment process (concluded)
(4) management has a viable strategy to generate earnings recovery; and/or (5) there is meaningful downside protection in case the earnings recovery does not materialize.
William Blair invests in a portfolio of mid cap and large cap equity securities issued by companies in emerging markets worldwide, according to a quality growth philosophy. William Blair's primary focus is on identifying such companies whose growth characteristics (rate and durability) are underestimated by the market and supported by quality management and strong competitive positioning. After screening the universe of emerging country issuers for certain quality, growth and liquidity characteristics to create a prospective list of investible securities, William Blair undertakes detailed fundamental analysis of these companies, focusing attention on areas where short- to intermediate-term earnings trends and overall operating performance are improving or are strong. Key considerations are the sustainability of a company's competitive advantage relative to peers, its industry and market conditions, a sound financial structure and high reinvestment rates that combine to create favorable conditions for prospective growth.
Gartmore (until March 22, 2011) seeks to identify companies where it believes the market has underestimated the prospects for earnings potential. Gartmore employs a stringent analysis of strategic factors, industry dynamics and the assessment of individual company franchises. It focuses on bottom-up stock picking within a risk-controlled environment.
157
PACE Select Advisors Trust
PACE International Emerging Markets Equity Investments
Sub-Advisors' comments – concluded
William Blair
For the period from March 23, 2011, when we began managing a portion of the Portfolio, through July 31, 2011, we outperformed the benchmark. This was due to strong stock selection in consumer discretionary, industrials and materials sectors, along with a significant focus in consumer-related stocks. Our consumer discretionary stock selection was bolstered by strong results and overweights to auto-related companies, coupled with positive performance in specialty retail. Samsung Engineering Co. Ltd., a Korean engineering and construction firm, drove our industrials results as it benefited from strong order flow. United Tractors also performed well due to increased heavy equipment sales guidance. Finally, materials stock selection was additive, due to good results in Asia, with holdings such as Anhui Conch Cement Co., a Chinese cement company, boosting our returns. Stock selection was strong across regions, with particular value added in emerging Asia, as well as in Europe, the Middle East and Africa (EMEA).
Detracting from performance was poor stock selection in the energy, financials and information technology sectors. From a regional perspective, our relative performance was hindered by stock selection and an overweight exposure to Latin America. America Movil, a Mexico-based wireless and fixed telecommunications services company, struggled during the period as it posted weak results.
Gartmore Global Partners (Gartmore Global Partners was acquired by Henderson Global Investors in early April. For purposes of this commentary, the Sub-Adviser will be referenced as Gartmore.)
For the period from August 1, 2010 through March 22, 2011, when we managed a portion of the Portfolio, it outperformed the benchmark. Stock selection in Russia, Brazil and China significantly contributed to returns, as did our underweight stance in South Korea. Conversely, stock selection in Taiwan and Thailand detracted from performance. From a sector perspective, our holdings in materials and consumer staples added the most value, while an underweight in energy detracted from performance.
Individual stocks that made significant contributions to performance included Novatek, Hyundai Heavy, Melfas and Wynn Macau. The Russian natural gas producer Novatek performed strongly, helped by higher energy prices and encouraging earnings. Hyundai Heavy, the world's largest shipbuilder, added value, after Hapag-Lloyd AG increased a container ship order by roughly $754 million. Shares of touch-screen maker Melfas rose as it delivered exemplary annual results in 2010, with profits three times higher than those in 2009. Wynn Macau, the Hong Kong-listed casino unit of Wynn Resorts Ltd., performed well due to rapid profit growth in the third quarter of 2010 and improved prospects going forward.
Stocks that detracted from performance included Gazprom, ADR, Mphasis, Andhra Bank and Pruska Real Estate. Our underweight position in Russian energy giant Gazprom detracted from relative returns, although our holding in gas producer Novatek offset this to some degree. Our position in Mphasis, which provides outsourcing to Hewlett-Packard, detracted following the release of weak first quarter 2011 sales results. Our out-of-benchmark position in Andhra Bank detracted following a strong run in 2010 as investors took profits. Finally, rising interest rates and the possibility of further attempts by the Bank of Thailand to curb property lending negatively impacted homebuilder Pruska Real Estate and we sold the stock from our portion of the Portfolio.
Special considerations
The Portfolio may be appropriate for long-term investors seeking capital appreciation who are able to withstand short-term fluctuations in the equity markets in return for potentially higher returns over the long term. The value of the Portfolio changes every day and can be affected by changes in interest rates, general market conditions and other political, social and economic developments, as well as specific matters relating to the companies in whose securities the Portfolio invests. It is important to note that an investment in the Portfolio is only one component of a balanced investment plan. The value of the Portfolio's investments in foreign securities may fall due to adverse political, social, and economic developments abroad and due to decreases in foreign currency values relative to the US dollar. These risks are greater for investments in emerging market issuers than for issuers in more developed countries.
158
PACE Select Advisors Trust
PACE International Emerging Markets Equity Investments
Illustration of an assumed investment of $10,000 in Class P shares of the Portfolio (unaudited)
The following graph depicts the performance of PACE International Emerging Markets Equity Investments Class P shares versus the MSCI Emerging Markets Index over the 10 years ended July 31, 2011. The performance of the other classes will vary based upon the different class specific expenses and sales charges. The performance provided does not reflect the deduction of taxes that a shareholder would pay on Portfolio distributions or the redemption of Portfolio shares. Past performance is no guarantee of future results. Share price and returns will vary with market conditions; investors may realize a gain or loss upon redemption. It is important to note that PACE International Emerging Markets Equity Investments is a professionally managed portfolio while the Index is not available for investment and is unmanaged. The comparison is shown for illustration purposes only.

159
PACE Select Advisors Trust
PACE International Emerging Markets Equity Investments
Performance at a glance (unaudited)
| Average annual total returns for periods ended 07/31/11 | | 1 year | | 5 years | | 10 years | |
| Before deducting | | Class A1 | | | 14.01 | % | | | 8.75 | % | | | 13.36 | % | |
| maximum sales charge | | Class B2 | | | 13.07 | % | | | 7.85 | % | | | 12.78 | %6 | |
| or PACE Select | | Class C3 | | | 13.19 | % | | | 7.94 | % | | | 12.48 | % | |
| program fee | | Class Y4 | | | 14.22 | % | | | 9.13 | % | | | 13.76 | % | |
| | | Class P5 | | | 14.04 | % | | | 8.79 | % | | | 13.47 | % | |
| After deducting | | Class A1 | | | 7.73 | % | | | 7.52 | % | | | 12.72 | % | |
| maximum sales charge | | Class B2 | | | 8.07 | % | | | 7.63 | % | | | 12.78 | %6 | |
| or PACE Select | | Class C3 | | | 12.19 | % | | | 7.94 | % | | | 12.48 | % | |
| program fee | | Class P5 | | | 11.78 | % | | | 6.64 | % | | | 11.22 | % | |
| MSCI Emerging Markets Index7 | | | | | 17.79 | % | | | 11.34 | % | | | 17.26 | % | |
| Lipper Emerging Markets Funds median | | | | | 15.65 | % | | | 9.09 | % | | | 15.88 | % | |
Average annual total returns for periods ended June 30, 2011, after deduction of the maximum sales charge or PACE Select program fee, were as follows: Class A—1-year period, 20.62%; 5-year period, 8.13%; 10-year period, 11.83%; Class B—1-year period, 21.63%; 5-year period, 8.24%; 10-year period, 11.88%; Class C—1-year period, 25.67%; 5-year period, 8.56%; 10-year period, 11.59%; Class Y—1-year period, 27.92%; 5-year period, 9.74%; 10-year period, 12.86%; Class P—1-year period, 25.14%; 5-year period, 7.23%; 10-year period, 10.34%.
The annualized gross and net expense ratios, respectively, for each class of shares as in the November 28, 2010 prospectuses, were as follows: Class A—1.87% and 1.87%; Class B—2.72% and 2.72%; Class C—2.61% and 2.61%; Class Y—1.62% and 1.62%; and Class P—1.85% and 1.85%. Net expenses reflect fee waivers and/or expense reimbursements, if any, pursuant to an agreement that is in effect to cap the expenses. The Portfolio and UBS Global Asset Management (Americas) Inc. ("UBS Global AM") have entered into a written fee waiver/expense reimbursement agreement pursuant to which UBS Global AM is contractually obligated to waive its management fees and/or reimburse expenses so that the Portfolio's ordinary total operating expenses of each class through November 28, 2011 (excluding dividend expense, borrowing costs, and interest expense relating to short sales, and interest, taxes, brokerage commissions and extraordinary expenses) would not exceed Class A—2.15%; Class B—2.90%; Class C—2.90%; Class Y—1.90%; and Class P—1.90%. The Portfolio has agreed to repay UBS Global AM for any waived fees/reimbursed expenses to the extent that it can do so over the following three fiscal years without causing the Portfolio's expenses in any of those three years to exceed these expense caps. The fee waiver/expense reimbursement agreement may be terminated by the Portfolio's board at any time and also will terminate automatically upon the expiration or termination of the Portfolio's advisory contract with UBS Global AM. Upon termination of the agreement, however, UBS Global AM's three year recoupment rights will survive.
1 Maximum sales charge for Class A shares is 5.5%. Class A shares bear ongoing 12b-1 service fees.
2 Maximum contingent deferred sales charge for Class B shares is 5% imposed on redemptions and is reduced to 0% after a maximum of six years. Class B shares bear ongoing 12b-1 service and distribution fees.
3 Maximum contingent deferred sales charge for Class C shares is 1% imposed on redemptions and is reduced to 0% after one year. Class C shares bear ongoing 12b-1 service and distribution fees. Prior to September 30, 2003, Class C shares were subject to a maximum front-end sales charge of 1.00%; this front-end sales charge is not reflected in the average annual total returns presented for the Class C shares shown above.
4 The Portfolio offers Class Y shares to a limited group of eligible investors, including certain qualifying retirement plans. Class Y shares do not bear initial or contingent deferred sales charges or ongoing 12b-1 service and distribution fees.
5 Class P shares do not bear initial or contingent deferred sales charges or ongoing 12b-1 service and distribution fees, but are subject to a maximum annual PACE Select program fee of 2% of the value of Class P shares. Prior to June 14, 2010, the maximum annual PACE Select program fee was 1.5% of the value of Class P shares; however, the current maximum annual PACE Select program fee of 2% is reflected in the performance returns throughout all periods in the average annual total returns presented for the Class P shares shown above.
6 Assumes the conversion of Class B to Class A shares at the end of the sixth year.
7 The MSCI Emerging Markets Index is a market capitalization-weighted index composed of companies representative of the market structure of 21 emerging market countries in Europe, Latin America, and the Pacific Basin. The Index is constructed and managed with a view to being fully investable from the perspective of international institutional investors. Investors should note that indices do not reflect the deduction of fees and expenses.
If an investor sells or exchanges shares less than 90 days after purchase, a redemption fee of 1.00% of the amount sold or exchanged will be deducted at the time of the transaction, except as noted otherwise in the prospectuses.
Past performance does not predict future performance, and the performance information provided does not reflect the deduction of taxes that a shareholder would pay on Portfolio distributions or the redemption of Portfolio shares. The return and principal value of an investment will fluctuate, so that an investor's shares, when redeemed, may be worth more or less than their original cost. Performance results assume reinvestment of all dividends and capital gain distributions at net asset value on the ex-dividend dates. Current performance may be higher or lower than the performance data quoted. For month-end performance figures, please visit http://www.ubs.com.
Lipper peer group data calculated by Lipper Inc.; used with permission. The Lipper median is the return of the fund that places in the middle of a Lipper peer group.
160
PACE Select Advisors Trust
PACE International Emerging Markets Equity Investments
Portfolio statistics (unaudited)
| Characteristics | | 07/31/11 | |
| Net assets (mm) | | $ | 308.9 | | |
| Number of holdings | | | 254 | | |
| Portfolio composition1 | | 07/31/11 | |
| Common stocks, preferred stocks and warrants | | | 69.1 | % | |
| ADRs, ADSs, GDRs NVDRs and SDRs | | | 29.0 | | |
| Investment company | | | 1.2 | | |
| Cash equivalents and other assets less liabilities | | | 0.7 | | |
| Total | | | 100.0 | % | |
| Regional allocation (equity investments)1 | | 07/31/11 | |
| Asia | | | 48.5 | % | |
| The Americas | | | 25.8 | | |
| Europe and European territories | | | 11.1 | | |
| Africa | | | 7.1 | | |
| Russia | | | 5.6 | | |
| Total | | | 98.1 | % | |
| Top five countries (equity investments)1 | | 07/31/11 | |
| Brazil | | | 15.8 | % | |
| South Korea | | | 12.4 | | |
| South Africa | | | 7.1 | | |
| Taiwan | | | 7.0 | | |
| China | | | 6.7 | | |
| Total | | | 49.0 | % | |
| Top five sectors1 | | 07/31/11 | |
| Financials | | | 22.5 | % | |
| Information technology | | | 13.3 | | |
| Consumer staples | | | 12.2 | | |
| Energy | | | 11.3 | | |
| Consumer discretionary | | | 9.4 | | |
| Total | | | 68.7 | % | |
| Top ten equity holdings1 | | 07/31/11 | |
| Samsung Electronics Co. Ltd. | | | 2.0 | % | |
| Industrial & Commercial Bank of China Ltd. | | | 1.7 | | |
| Gazprom, ADR | | | 1.6 | | |
| PT Astra International Tbk | | | 1.4 | | |
| China Mobile Ltd. | | | 1.3 | | |
| Sasol Ltd. | | | 1.2 | | |
| China Construction Bank Corp. | | | 1.2 | | |
| KT&G Corp. | | | 1.2 | | |
| LUKOIL, ADR | | | 1.2 | | |
| Companhia de Bebidas das Americas (AmBev), ADR | | | 1.2 | | |
| Total | | | 14.0 | % | |
For a listing of defined portfolio acronyms that are used throughout the Portfolio statistics, please refer to page 227.
1 Weightings represent percentages of the Portfolio's net assets as of July 31, 2011. The Portfolio is actively managed and its composition will vary over time.
161
PACE Select Advisors Trust
PACE International Emerging Markets Equity Investments
Industry diversification—(unaudited)
As a percentage of net assets as of July 31, 2011
Common stocks
| Aerospace & defense | | | 0.24 | % | |
| Airlines | | | 0.12 | | |
| Auto components | | | 0.65 | | |
| Automobiles | | | 3.02 | | |
| Beverages | | | 1.29 | | |
| Building products | | | 0.24 | | |
| Chemicals | | | 1.47 | | |
| Commercial banks | | | 16.01 | | |
| Communications equipment | | | 0.87 | | |
| Computers & peripherals | | | 0.79 | | |
| Construction & engineering | | | 1.54 | | |
| Construction materials | | | 0.80 | | |
| Consumer finance | | | 0.38 | | |
| Diversified financial services | | | 1.25 | | |
| Diversified telecommunication services | | | 2.12 | | |
| Electric utilities | | | 1.66 | | |
| Electronic equipment, instruments & components | | | 1.79 | | |
| Food & staples retailing | | | 2.19 | | |
| Food products | | | 3.79 | | |
| Gas utilities | | | 1.28 | | |
| Health care providers & services | | | 0.14 | | |
| Hotels, restaurants & leisure | | | 0.84 | | |
| Household durables | | | 1.03 | | |
| Household products | | | 0.55 | | |
| Independent power producers & energy traders | | | 1.31 | | |
| Industrial conglomerates | | | 0.61 | | |
| Insurance | | | 1.57 | | |
| Internet & catalog retail | | | 0.11 | | |
| Internet software & services | | | 2.24 | | |
| IT services | | | 2.15 | | |
| Machinery | | | 1.49 | | |
| Marine | | | 0.57 | | |
| Media | | | 1.46 | | |
| Metals & mining | | | 4.47 | | |
| Multiline retail | | | 0.47 | | |
| Oil, gas & consumable fuels | | | 10.38 | | |
Common stocks—(Concluded)
| Paper & forest products | | | 0.31 | % | |
| Personal products | | | 1.87 | | |
| Real estate management & development | | | 1.33 | | |
| Road & rail | | | 0.15 | | |
| Semiconductors & semiconductor equipment | | | 4.85 | | |
| Specialty retail | | | 0.79 | | |
| Textiles, apparel & luxury goods | | | 0.79 | | |
| Tobacco | | | 1.19 | | |
| Transportation infrastructure | | | 2.14 | | |
| Water utilities | | | 0.56 | | |
| Wireless telecommunication services | | | 6.24 | | |
| Total common stocks | | | 91.11 | | |
Preferred stocks
| Automobiles | | | 0.20 | | |
| Beverages | | | 1.18 | | |
| Commercial banks | | | 1.38 | | |
| Food & staples retailing | | | 0.17 | | |
| Independent power producers & energy traders | | | 0.23 | | |
| Metals & mining | | | 1.54 | | |
| Oil, gas & consumable fuels | | | 0.88 | | |
| Semiconductors & semiconductor equipment | | | 0.29 | | |
| Total preferred stocks | | | 5.87 | | |
| Investment company | | | 1.22 | | |
Warrants
| Commercial banks | | | 0.38 | | |
| Industrial conglomerates | | | 0.31 | | |
| IT services | | | 0.30 | | |
| Real estate management & development | | | 0.16 | | |
| Total warrants | | | 1.15 | | |
| Repurchase agreement | | | 0.61 | | |
| Investment of cash collateral from securities loaned | | | 1.12 | | |
| Liabilities in excess of other assets | | | (1.08 | ) | |
| Net assets | | | 100.00 | % | |
162
PACE Select Advisors Trust
PACE International Emerging Markets Equity Investments
Portfolio of investments—July 31, 2011
| | | Number of
shares | | Value | |
| Common stocks—91.11% | |
| Bermuda—2.25% | |
| Bunge Ltd. | | | 18,600 | | | $ | 1,279,866 | | |
| China Gas Holdings Ltd. | | | 1,838,000 | | | | 689,812 | | |
| Credicorp Ltd. | | | 27,621 | | | | 2,698,572 | | |
| Huabao International Holdings Ltd. | | | 415,000 | | | | 350,464 | | |
| Pacific Basin Shipping Ltd. | | | 1,914,000 | | | | 1,053,601 | | |
| Texwinca Holdings Ltd. | | | 616,000 | | | | 867,193 | | |
| Total Bermuda common stocks | | | | | 6,939,508 | | |
| Brazil—10.40% | |
| AES Tiete SA | | | 4,400 | | | | 63,836 | | |
| All America Latina Logistica (ALL) | | | 65,700 | | | | 474,475 | | |
B2W Companhia Global do Varejo
(B2W Varejo) | | | 36,612 | | | | 341,603 | | |
| Banco Bradesco SA, ADR | | | 26,700 | | | | 513,441 | | |
| Banco do Brasil SA | | | 40,900 | | | | 693,337 | | |
| Banco Santander Brasil SA | | | 77,900 | | | | 731,859 | | |
| Banco Santander Brasil SA, ADS | | | 87,300 | | | | 810,144 | | |
| BR Malls Participacoes SA | | | 107,150 | | | | 1,247,786 | | |
| Braskem SA, ADR | | | 27,800 | | | | 674,706 | | |
| BRF—Brasil Foods SA, ADR | | | 39,500 | | | | 762,745 | | |
| Centrais Eletricas Brasileiras SA, ADR | | | 55,600 | | | | 670,536 | | |
| Cielo SA | | | 80,556 | | | | 2,238,749 | | |
Companhia de Concessoes
Rodoviarias (CCR) | | | 88,150 | | | | 2,653,850 | | |
Companhia de Saneamento de
Minas Gerais—Copasa MG | | | 67,100 | | | | 1,406,164 | | |
Companhia Siderurgica Nacional SA
(CSN), ADR | | | 80,200 | | | | 851,724 | | |
| CPFL Energia SA | | | 89,700 | | | | 1,275,355 | | |
| CPFL Energia SA, ADR1 | | | 26,721 | | | | 771,970 | | |
| Cyrela Brazil Realty SA | | | 45,600 | | | | 446,929 | | |
| Diagnosticos da America SA | | | 35,500 | | | | 440,645 | | |
| Embraer SA, ADR | | | 24,805 | | | | 732,244 | | |
| Fibria Celulose SA, ADR | | | 80,000 | | | | 956,800 | | |
| Gerdau SA | | | 64,300 | | | | 493,388 | | |
| Gerdau SA, ADR | | | 46,700 | | | | 425,904 | | |
| Gol Linhas Aereas Inteligentes SA, ADR | | | 46,300 | | | | 359,288 | | |
| Hypermarcas SA | | | 73,700 | | | | 566,466 | | |
| Magazine Luiza SA* | | | 13,800 | | | | 122,797 | | |
| Petroleo Brasileiro SA—Petrobras, ADR | | | 91,700 | | | | 3,115,049 | | |
| Redecard SA | | | 114,800 | | | | 1,976,439 | | |
| Santos Brasil Participacoes SA | | | 48,800 | | | | 846,452 | | |
| Telecomunicacoes de Sao Paulo SA, ADR | | | 31,310 | | | | 993,153 | | |
| Tractebel Energia SA | | | 58,650 | | | | 988,184 | | |
| Vale SA, ADR | | | 106,753 | | | | 3,463,067 | | |
| Total Brazil common stocks | | | | | 32,109,085 | | |
| British Virgin Islands—0.01% | |
| Arcos Dorados Holdings, Inc., Class A | | | 1,800 | | | | 42,228 | | |
| Canada—0.31% | |
| Methanex Corp. | | | 32,600 | | | | 965,597 | | |
| Cayman Islands—5.47% | |
| Baidu, Inc., ADR* | | | 17,199 | | | | 2,701,447 | | |
| Belle International Holdings Ltd. | | | 741,000 | | | | 1,627,033 | | |
Chaoda Modern Agriculture
Holdings Ltd. | | | 1,038,000 | | | | 416,661 | | |
| | | Number of
shares | | Value | |
| Common stocks—(Continued) | |
| Cayman Islands—(Concluded) | |
| China Dongxiang Group Co. | | | 4,168,000 | | | $ | 953,735 | | |
| China Mengniu Dairy Co. Ltd. | | | 139,000 | | | | 481,137 | | |
| Evergrande Real Estate Group Ltd. | | | 1,005,100 | | | | 758,851 | | |
| Hengan International Group Co. Ltd. | | | 117,000 | | | | 1,018,668 | | |
| Kingboard Laminates Holdings Ltd. | | | 1,039,000 | | | | 623,951 | | |
| MStar Semiconductor, Inc. | | | 34,127 | | | | 170,408 | | |
| Renren, Inc., ADR* | | | 2,100 | | | | 22,743 | | |
| SINA Corp.* | | | 10,000 | | | | 1,080,900 | | |
| Stella International Holdings Ltd. | | | 225,500 | | | | 615,938 | | |
| Tencent Holdings Ltd. | | | 55,700 | | | | 1,453,660 | | |
| Tingyi (Cayman Islands) Holding Corp. | | | 524,000 | | | | 1,627,558 | | |
| Want Want China Holdings Ltd. | | | 2,749,000 | | | | 2,453,185 | | |
| Xinao Gas Holdings Ltd. | | | 262,000 | | | | 882,391 | | |
| Total Cayman Islands common stocks | | | | | 16,888,266 | | |
| Chile—1.78% | |
| Banco Santander Chile, ADR1 | | | 16,401 | | | | 1,524,965 | | |
| Enersis SA, ADR | | | 91,300 | | | | 1,989,427 | | |
Inversiones Aguas Metropolitanas
SA (IAM), ADR2 | | | 10,100 | | | | 317,142 | | |
| S.A.C.I. Falabella | | | 91,879 | | | | 887,661 | | |
Sociedad Quimica y Minera de
Chile SA, ADR | | | 12,199 | | | | 784,640 | | |
| Total Chile common stocks | | | | | 5,503,835 | | |
| China—6.68% | |
| Bank of China Ltd., Class H | | | 1,266,000 | | | | 581,552 | | |
Bank of Communications Co. Ltd.,
Class H | | | 47,100 | | | | 40,991 | | |
| China Bluechemical Ltd., Class H | | | 1,070,000 | | | | 832,892 | | |
China Construction Bank Corp.,
Class H | | | 4,774,100 | | | | 3,837,124 | | |
China Petroleum and Chemical Corp.
(Sinopec), ADR | | | 2,900 | | | | 287,129 | | |
China Shenhua Energy Co. Ltd.,
Class H | | | 415,000 | | | | 2,076,815 | | |
China Shipping Development Co.
Ltd., Class H | | | 914,000 | | | | 713,634 | | |
| China Telecom Corp. Ltd., Class H | | | 1,206,000 | | | | 788,106 | | |
| China Vanke Co. Ltd., Class B | | | 164,969 | | | | 227,528 | | |
Dongfeng Motor Group Co. Ltd.,
Class H | | | 826,000 | | | | 1,639,420 | | |
Huadian Power International Co.,
Class H* | | | 2,667,000 | | | | 492,116 | | |
Industrial & Commercial Bank of
China Ltd., Class H | | | 6,690,376 | | | | 5,107,493 | | |
| Jiangsu Expressway Co. Ltd., Class H | | | 1,146,000 | | | | 1,101,446 | | |
| PetroChina Co. Ltd., ADR | | | 6,000 | | | | 853,380 | | |
Ping An Insurance (Group) Co. of
China Ltd., Class H | | | 119,000 | | | | 1,162,041 | | |
| Tsingtao Brewery Co. Ltd., Class H | | | 142,000 | | | | 904,101 | | |
| Total China common stocks | | | | | 20,645,768 | | |
| Colombia—0.16% | |
| Bancolombia SA, ADR | | | 7,600 | | | | 503,880 | | |
163
PACE Select Advisors Trust
PACE International Emerging Markets Equity Investments
Portfolio of investments—July 31, 2011
| | | Number of
shares | | Value | |
| Common stocks—(Continued) | |
| Egypt—0.05% | |
Egyptian Co. for Mobile Services
(MobiNil) | | | 9,517 | | | $ | 166,193 | | |
| Guernsey—0.13% | |
| Etalon Group Ltd., GDR2,* | | | 58,700 | | | | 403,269 | | |
| Hong Kong—4.48% | |
| Beijing Enterprises Holdings Ltd. | | | 201,000 | | | | 1,015,687 | | |
China Merchants Holdings
International Co. Ltd. | | | 308,000 | | | | 1,091,211 | | |
| China Mobile Ltd. | | | 414,000 | | | | 4,124,825 | | |
| China Mobile Ltd., ADR | | | 44,900 | | | | 2,237,367 | | |
China Power International
Development Ltd. | | | 2,685,000 | | | | 670,748 | | |
China Resources Power Holdings
Co. Ltd. | | | 938,000 | | | | 1,826,039 | | |
| China Unicom (Hong Kong) Ltd. | | | 274,000 | | | | 548,357 | | |
| CNOOC Ltd. | | | 646,000 | | | | 1,439,141 | | |
| CNOOC Ltd., ADR | | | 3,900 | | | | 867,009 | | |
| Total Hong Kong common stocks | | | | | 13,820,384 | | |
| Hungary—0.83% | |
Magyar Telekom
Telecommunications PLC | | | 320,425 | | | | 926,599 | | |
| OTP Bank PLC | | | 56,448 | | | | 1,643,144 | | |
| Total Hungary common stocks | | | | | 2,569,743 | | |
| India—4.82% | |
| Axis Bank Ltd. | | | 58,702 | | | | 1,771,732 | | |
| HCL Technologies Ltd. | | | 79,581 | | | | 874,132 | | |
| HDFC Bank Ltd., ADR | | | 72,755 | | | | 2,528,964 | | |
| ICICI Bank Ltd., ADR | | | 8,400 | | | | 391,188 | | |
| Infosys Technologies Ltd., ADR | | | 24,840 | | | | 1,545,545 | | |
| Larsen & Toubro Ltd., GDR | | | 43,875 | | | | 1,714,608 | | |
| Reliance Industries Ltd., GDR2 | | | 33,835 | | | | 1,278,625 | | |
| Rural Electrification Corp. Ltd. | | | 355,569 | | | | 1,686,868 | | |
| Tata Motors Ltd. | | | 81,514 | | | | 1,743,128 | | |
| Tata Motors Ltd., ADR | | | 62,598 | | | | 1,340,849 | | |
| Total India common stocks | | | | | 14,875,639 | | |
| Indonesia—3.70% | |
| PT Astra International Tbk | | | 530,000 | | | | 4,384,909 | | |
| PT Bank Rakyat Indonesia (Persero) Tbk | | | 2,024,000 | | | | 1,641,957 | | |
| PT Indofood Sukses Makmur Tbk | | | 1,360,500 | | | | 1,015,742 | | |
| PT Perusahaan Gas Negara | | | 5,105,000 | | | | 2,382,259 | | |
| PT Tambang Batubara Bukit Asam Tbk | | | 478,500 | | | | 1,196,997 | | |
| PT United Tractors Tbk | | | 254,393 | | | | 814,609 | | |
| Total Indonesia common stocks | | | | | 11,436,473 | | |
| Israel—0.30% | |
| Israel Chemicals Ltd. | | | 55,309 | | | | 925,432 | | |
| Kazakhstan—0.26% | |
KazMunaiGas Exploration
Production, GDR3 | | | 17,717 | | | | 327,765 | | |
KazMunaiGas Exploration
Production, GDR4 | | | 26,604 | | | | 487,170 | | |
| Total Kazakhstan common stocks | | | | | 814,935 | | |
| | | Number of
shares | | Value | |
| Common stocks—(Continued) | |
| Luxembourg—0.36% | |
| Oriflame Cosmetics SA, SDR | | | 24,325 | | | $ | 1,110,162 | | |
| Malaysia—1.74% | |
| CIMB Group Holdings Berhad | | | 528,100 | | | | 1,471,259 | | |
| Genting Malaysia Berhad | | | 552,400 | | | | 679,171 | | |
| Hong Leong Bank Berhad | | | 83,600 | | | | 375,332 | | |
| KLCC Property Holdings Bhd | | | 529,000 | | | | 599,727 | | |
| Malayan Banking Berhad | | | 104,804 | | | | 309,144 | | |
| Maxis Berhad | | | 582,600 | | | | 1,079,400 | | |
| UEM Land Holdings Bhd* | | | 988,600 | | | | 865,759 | | |
| Total Malaysia common stocks | | | | | 5,379,792 | | |
| Mexico—5.56% | |
America Movil SA de C.V., ADR,
Series L | | | 107,707 | | | | 2,778,841 | | |
| Cemex SAB de C.V., ADR* | | | 162,552 | | | | 1,144,366 | | |
| Compartamos SAB de C.V.1 | | | 649,200 | | | | 1,168,165 | | |
Corporacion GEO SAB de C.V.,
Series B* | | | 297,800 | | | | 596,498 | | |
| Empresas ICA SAB de C.V., ADR* | | | 54,000 | | | | 437,940 | | |
Fomento Economico Mexicano
SAB de C.V., ADR | | | 10,600 | | | | 767,122 | | |
Grupo Aeroportuario del Pacifico
SA de C.V., ADR | | | 22,800 | | | | 933,432 | | |
Grupo Financiero Banorte SAB de
C.V., Series O | | | 453,350 | | | | 1,985,311 | | |
| Grupo Mexico SAB de C.V., Series B | | | 625,000 | | | | 2,305,684 | | |
| Grupo Televisa SA, ADR | | | 71,300 | | | | 1,582,147 | | |
| Industrias CH SA, Series B* | | | 260,600 | | | | 923,633 | | |
Kimberly-Clark de Mexico SA de
C.V., Series A | | | 78,000 | | | | 485,120 | | |
Wal-Mart de Mexico SAB de C.V.,
Series V1 | | | 746,900 | | | | 2,062,402 | | |
| Total Mexico common stocks | | | | | 17,170,661 | | |
| Netherlands—0.25% | |
| X5 Retail Group N.V., GDR* | | | 18,386 | | | | 760,758 | | |
| Peru—0.19% | |
| Cia de Minas Buenaventura SA, ADR | | | 14,100 | | | | 577,254 | | |
| Philippines—0.50% | |
Philippine Long Distance Telephone
Co., ADR | | | 27,500 | | | | 1,556,500 | | |
| Poland—1.46% | |
| Bank Pekao SA | | | 6,378 | | | | 364,472 | | |
| Cyfrowy Polsat SA* | | | 178,564 | | | | 1,032,138 | | |
| Jastrzebska Spolka Weglowa SA* | | | 11,600 | | | | 569,077 | | |
| Polska Grupa Energetyczna SA | | | 49,635 | | | | 413,020 | | |
| Polski Koncern Naftowy Orlen SA* | | | 29,826 | | | | 497,900 | | |
Powszechna Kasa Oszczednosci Bank
Polski SA | | | 42,636 | | | | 629,047 | | |
| Powszechny Zaklad Ubezpieczen SA | | | 7,340 | | | | 997,474 | | |
| Total Poland common stocks | | | | | 4,503,128 | | |
| Qatar — 0.28% | |
| Industries Qatar QSC | | | 22,705 | | | | 856,346 | | |
164
PACE Select Advisors Trust
PACE International Emerging Markets Equity Investments
Portfolio of investments—July 31, 2011
| | | Number of
shares | | Value | |
| Common stocks—(Continued) | |
| Russia—5.58% | |
| Gazprom, ADR* | | | 341,597 | | | $ | 5,007,812 | | |
| LUKOIL, ADR | | | 54,864 | | | | 3,684,118 | | |
| Magnit OJSC, GDR2 | | | 35,490 | | | | 1,015,710 | | |
Mining and Metallurgical Co. Norilsk
Nickel, ADR3,* | | | 20,291 | | | | 542,581 | | |
Mining and Metallurgical Co. Norilsk
Nickel, ADR4,* | | | 26,950 | | | | 716,026 | | |
| Mobile TeleSystems, ADR | | | 10,700 | | | | 200,946 | | |
| Rosneft Oil Co., GDR | | | 221,325 | | | | 1,887,902 | | |
| Sberbank | | | 854,712 | | | | 3,123,557 | | |
| VTB Bank OJSC, GDR5 | | | 85,628 | | | | 514,624 | | |
| VTB Bank OJSC,GDR6 | | | 90,300 | | | | 537,540 | | |
| Total Russia common stocks | | | | | 17,230,816 | | |
| South Africa—7.05% | |
| ABSA Group Ltd. | | | 29,711 | | | | 583,075 | | |
| African Bank Investments Ltd. | | | 286,184 | | | | 1,437,450 | | |
| Anglo Platinum Ltd. | | | 9,652 | | | | 823,111 | | |
| ArcelorMittal South Africa Ltd. | | | 62,787 | | | | 643,956 | | |
| Aveng Ltd. | | | 85,150 | | | | 454,690 | | |
| Clicks Group Ltd. | | | 76,056 | | | | 452,673 | | |
| Impala Platinum Holdings Ltd. | | | 19,533 | | | | 497,907 | | |
| MTN Group Ltd. | | | 148,951 | | | | 3,217,078 | | |
| Murray & Roberts Holdings Ltd. | | | 118,754 | | | | 545,340 | | |
| Naspers Ltd., N Shares | | | 35,701 | | | | 1,901,745 | | |
| Pretoria Portland Cement Co. Ltd. | | | 146,581 | | | | 564,135 | | |
| Sasol Ltd. | | | 77,011 | | | | 3,850,077 | | |
| Sasol Ltd., ADR | | | 16,300 | | | | 817,445 | | |
| Shoprite Holdings Ltd. | | | 77,955 | | | | 1,212,913 | | |
| Standard Bank Group Ltd. | | | 80,520 | | | | 1,168,912 | | |
| Tiger Brands Ltd. | | | 45,355 | | | | 1,377,007 | | |
| Truworths International Ltd. | | | 76,450 | | | | 827,667 | | |
| Vodacom Group Ltd. | | | 110,713 | | | | 1,408,699 | | |
| Total South Africa common stocks | | | | | 21,783,880 | | |
| South Korea—11.86% | |
| Dongbu Insurance Co. Ltd. | | | 17,790 | | | | 881,423 | | |
| Grand Korea Leisure Co. Ltd. | | | 21,170 | | | | 468,289 | | |
| Hana Financial Group, Inc. | | | 30,360 | | | | 1,192,667 | | |
| Hyundai Mipo Dockyard Co. Ltd. | | | 4,396 | | | | 695,192 | | |
| Hyundai Mobis | | | 5,585 | | | | 2,009,880 | | |
| Hyundai Motor Co. | | | 10,421 | | | | 2,318,456 | | |
| Industrial Bank of Korea (IBK) | | | 66,950 | | | | 1,152,609 | | |
| Kangwon Land, Inc. | | | 49,110 | | | | 1,399,999 | | |
| KB Financial Group, Inc. | | | 35,478 | | | | 1,763,111 | | |
| KB Financial Group, Inc., ADR | | | 31,600 | | | | 1,567,676 | | |
| KCC Corp. | | | 2,241 | | | | 743,151 | | |
| KT Corp., ADR | | | 48,700 | | | | 962,312 | | |
| KT&G Corp. | | | 59,270 | | | | 3,687,444 | | |
| LG Display Co. Ltd., ADR | | | 35,000 | | | | 449,400 | | |
| LG Electronics, Inc. | | | 18,225 | | | | 1,387,592 | | |
| LG Household & Health Care Ltd. | | | 2,654 | | | | 1,200,448 | | |
| Lotte Chilsung Beverage Co. Ltd. | | | 1,682 | | | | 2,310,819 | | |
| Lotte Confectionery Co. Ltd. | | | 665 | | | | 1,135,658 | | |
| Samsung Electronics Co. Ltd. | | | 7,719 | | | | 6,169,345 | | |
| Samsung Engineering Co. Ltd. | | | 6,551 | | | | 1,613,406 | | |
| | | Number of
shares | | Value | |
| Common stocks—(Continued) | |
| South Korea—(Concluded) | |
| Samsung Life Insurance Co. Ltd. | | | 14,998 | | | $ | 1,418,751 | | |
| SK Telecom Co. Ltd. | | | 22 | | | | 3,060 | | |
| SK Telecom Co. Ltd., ADR | | | 132,275 | | | | 2,105,818 | | |
| Total South Korea common stocks | | | | | 36,636,506 | | |
| Taiwan—7.02% | |
Advanced Semiconductor
Engineering, Inc.* | | | 344,000 | | | | 371,411 | | |
Advanced Semiconductor
Engineering, Inc., ADR* | | | 92,575 | | | | 491,573 | | |
| Asustek Computer, Inc., GDR | | | 7,448 | | | | 299,624 | | |
| Cathay Financial Holding Co. Ltd. | | | 267,240 | | | | 400,328 | | |
| Chunghwa Telecom Co. Ltd. | | | 86,817 | | | | 301,066 | | |
| Chunghwa Telecom Co. Ltd., ADR | | | 58,534 | | | | 2,034,642 | | |
| Compal Electronics, Inc. | | | 546,000 | | | | 708,106 | | |
| Fubon Financial Holding Co. Ltd. | | | 447,000 | | | | 728,518 | | |
| HON HAI Precision Industry Co. Ltd. | | | 1,098,900 | | | | 3,136,045 | | |
HON HAI Precision Industry Co.
Ltd., GDR | | | 234,611 | | | | 1,329,073 | | |
| HTC Corp. | | | 90,300 | | | | 2,686,301 | | |
| Lite-On Technology Corp. | | | 388,222 | | | | 507,523 | | |
| MediaTek, Inc. | | | 125,652 | | | | 1,124,443 | | |
| President Chain Store Corp. | | | 71,680 | | | | 458,592 | | |
| Quanta Computer, Inc.* | | | 232,000 | | | | 571,169 | | |
Taiwan Semiconductor Manufacturing
Co. Ltd. | | | 1,392,156 | | | | 3,475,674 | | |
Taiwan Semiconductor Manufacturing
Co. Ltd., ADR | | | 153,300 | | | | 1,894,788 | | |
| United Microelectronics Corp. | | | 1,808,000 | | | | 811,899 | | |
| Wistron Corp.* | | | 208,000 | | | | 349,801 | | |
| Total Taiwan common stocks | | | | | 21,680,576 | | |
| Thailand—2.59% | |
| Bangkok Bank Public Co. Ltd. | | | 212,800 | | | | 1,254,258 | | |
| CP ALL Public Co. Ltd.7 | | | 764,400 | | | | 1,268,661 | | |
| Kasikornbank Public Co. Ltd., NVDR | | | 282,400 | | | | 1,327,704 | | |
| Kasikornbank Public Co. Ltd., PLC | | | 91,300 | | | | 432,336 | | |
| PTT Public Co. Ltd.7 | | | 251,700 | | | | 2,928,412 | | |
| Siam Cement Public Co. Ltd., NVDR | | | 60,700 | | | | 772,821 | | |
| Total Thailand common stocks | | | | | 7,984,192 | | |
| Turkey—2.66% | |
| Asya Katilim Bankasi A.S.* | | | 288,500 | | | | 408,677 | | |
| Ford Otomotiv Sanayi A.S. | | | 79,090 | | | | 622,093 | | |
| Tofas Turk Otomobil Fabrikasi A.S. | | | 84,551 | | | | 350,113 | | |
| Tupras-Turkiye Petrol Rafinerileri A.S. | | | 59,542 | | | | 1,448,641 | | |
Turkcell Iletisim Hizmetleri A.S.
(Turkcell), ADR* | | | 30,700 | | | | 392,960 | | |
| Turkiye Garanti Bankasi A.S. | | | 695,050 | | | | 3,065,376 | | |
| Turkiye Is Bankasi (Isbank), Class C | | | 214,962 | | | | 616,491 | | |
| Turkiye Sise ve Cam Fabrikalari A.S. | | | 338,626 | | | | 740,746 | | |
| Turkiye Vakiflar Bankasi T.A.O., Class D | | | 274,178 | | | | 575,281 | | |
| Total Turkey common stocks | | | | | 8,220,378 | | |
| United Kingdom—0.32% | |
| Anglo American PLC, ADR | | | 41,600 | | | | 983,424 | | |
165
PACE Select Advisors Trust
PACE International Emerging Markets Equity Investments
Portfolio of investments—July 31, 2011
| | | Number of
shares | | Value | |
| Common stocks—(Concluded) | |
| United States—2.06% | |
| Archer-Daniels-Midland Co. | | | 38,300 | | | $ | 1,163,554 | | |
| Avon Products, Inc. | | | 118,000 | | | | 3,095,140 | | |
| MEMC Electronic Materials, Inc.* | | | 61,700 | | | | 457,814 | | |
| Yahoo!, Inc.* | | | 126,600 | | | | 1,658,460 | | |
| Total United States common stocks | | | | | 6,374,968 | | |
Total common stocks
(cost—$266,819,795) | | | | | 281,419,576 | | |
| Preferred stocks—5.87% | |
| Brazil—5.38% | |
| AES Tiete SA | | | 44,700 | | | | 697,514 | | |
Companhia Brasileira de Distribuicao
Grupo Pao de Acucar, ADR | | | 12,000 | | | | 518,280 | | |
Companhia de Bebidas das Americas
(AmBev), ADR | | | 121,902 | | | | 3,659,498 | | |
| Confab Industrial SA | | | 197,372 | | | | 525,613 | | |
| Itau Unibanco Holding SA | | | 67,300 | | | | 1,364,356 | | |
| Itau Unibanco Holdings SA, ADR | | | 61,400 | | | | 1,250,718 | | |
| Itausa-Investimentos Itau SA | | | 244,235 | | | | 1,640,989 | | |
| Petroleo Brasileiro SA, ADR | | | 179,700 | | | | 2,722,991 | | |
Usinas Siderurgicas de Minas Gerais SA
(Usiminas), Class A | | | 181,100 | | | | 1,302,038 | | |
| Vale SA, ADR | | | 99,400 | | | | 2,934,288 | | |
| Total Brazil preferred stocks | | | | | 16,616,285 | | |
| South Korea—0.49% | |
| Hyundai Motor Co. | | | 8,373 | | | | 607,692 | | |
| Samsung Electronics Co. Ltd. | | | 1,688 | | | | 897,952 | | |
| Total South Korea preferred stocks | | | | | 1,505,644 | | |
Total preferred stocks
(cost—$16,678,051) | | | | | 18,121,929 | | |
| Investment company—1.22% | |
| United States—1.22% | |
WisdomTree India Earnings Fund
(cost—$3,809,259) | | | 160,694 | | | | 3,750,598 | | |
| | | Number of
warrants | | | |
| Warrants*—1.15% | |
| India—0.68% | |
Bank of Baroda (Citigroup Global
Markets Holdings),
expires 10/24/12 | | | 23,450 | | | | 463,888 | | |
Central Bank of India (Citigroup
Global Markets Holdings),
expires 10/24/127 | | | 91,745 | | | | 240,005 | | |
Corporation Bank (Citigroup
Global Markets Holdings),
expires 10/24/12 | | | 20,425 | | | | 231,252 | | |
| | | Number of
warrants | | Value | |
| Warrants*—(Concluded) | |
| India—(Concluded) | |
HCL Technologies Ltd. (Citigroup
Global Markets Holdings),
expires 10/24/12 | | | 83,775 | | | $ | 918,090 | | |
Indian Bank (Citigroup Global
Markets Holdings), expires 10/24/12 | | | 47,725 | | | | 241,918 | | |
| Total India warrants | | | | | 2,095,153 | | |
| Qatar—0.31% | |
Industries Qatar (Citigroup Global
Markets Holdings),
expires 03/25/18 | | | 25,250 | | | | 954,198 | | |
| United Arab Emirates—0.16% | |
Aldar Properties (Citigroup Global
Markets Holdings),
expires 07/18/13 | | | 1,504,000 | | | | 511,360 | | |
Total warrants
(cost—$3,773,222) | | | | | 3,560,711 | | |
| | | Face
amount | | | |
| Repurchase agreement—0.61% | |
Repurchase agreement dated
07/29/11 with State Street
Bank & Trust Co., 0.010%
due 08/01/11, collateralized
by $9,329 Federal Home Loan
Mortgage Corp. obligations,
5.125% due 07/15/12,
$1,340,810 US Treasury Bills,
zero coupon due 08/04/11 and
$528,812 US Treasury Notes,
2.375% to 2.625% due
02/29/16 to 07/31/17;
(value—$1,912,520);
proceeds: $1,875,002
(cost—$1,875,000) | | $ | 1,875,000 | | | | 1,875,000 | | |
| | | Number of
shares | | | |
| Investment of cash collateral from securities loaned—1.12% | |
| Money market fund—1.12% | |
UBS Private Money Market Fund LLC8
(cost—$3,466,958) | | | 3,466,958 | | | | 3,466,958 | | |
Total investments
(cost—$296,422,285)—
101.08% | | | | | 312,194,772 | | |
Liabilities in excess of
other assets—(1.08)% | | | | | (3,325,769 | ) | |
| Net assets—100.00% | | $ | 308,869,003 | | |
166
PACE Select Advisors Trust
PACE International Emerging Markets Equity Investments
Portfolio of investments—July 31, 2011
Aggregate cost for federal income tax purposes was $299,257,551; and net unrealized appreciation consisted of:
| Gross unrealized appreciation | | $ | 32,827,244 | | |
| Gross unrealized depreciation | | | (19,890,023 | ) | |
| Net unrealized appreciation | | $ | 12,937,221 | | |
For a listing of defined portfolio acronyms and currency abbreviations that are used throughout the Portfolio of investments as well as the tables that follow, please refer to page 227.
* Non-income producing security.
1 Security, or portion thereof, was on loan at July 31, 2011.
2 Security exempt from registration pursuant to Rule 144A under the Securities Act of 1933. These securities, which represent 0.98% of net assets as of July 31, 2011, are considered liquid and may be resold in transactions exempt from registration, normally to qualified institutional buyers.
3 Security is traded on the over-the-counter ("OTC") Market.
4 Security is traded on the Turquoise Exchange.
5 Security is traded on the Euroclear/Clearstream exchange.
6 Security is traded on the Crest exchange.
7 Security is being fair valued by a valuation committee under the direction of the board of trustees.
8 The table below details the Portfolio's transaction activity in an affiliated issuer for the year ended July 31, 2011. The investment manager earns a management fee from UBS Private Money Market Fund LLC.
| Security description | | Value at
07/31/10 | | Purchases
during the
year ended
07/31/11 | | Sales
during the
year ended
07/31/11 | | Value at
07/31/11 | | Net income
earned from
affiliate for the
year ended
07/31/11 | |
| UBS Private Money Market Fund LLC | | $ | 7,322,675 | | | $ | 77,801,886 | | | $ | 81,657,603 | | | $ | 3,466,958 | | | $ | 2,061 | | |
The following is a summary of the fair valuations according to the inputs used as of July 31, 2011 in valuing the Portfolio's investments:
| | | Unadjusted
quoted prices in
active markets for
identical investments
(Level 1) | | Other significant
observable inputs
(Level 2) | | Unobservable
inputs
(Level 3) | | Total | |
| Common stocks | | $ | 109,664,010 | | | $ | 171,755,566 | | | $ | — | | | $ | 281,419,576 | | |
| Preferred stocks | | | 16,616,285 | | | | 1,505,644 | | | | — | | | | 18,121,929 | | |
| Investment company | | | 3,750,598 | | | | — | | | | — | | | | 3,750,598 | | |
| Warrants | | | 3,560,711 | | | | — | | | | — | | | | 3,560,711 | | |
| Repurchase agreement | | | — | | | | 1,875,000 | | | | — | | | | 1,875,000 | | |
| Investment of cash collateral from securities loaned | | | — | | | | 3,466,958 | | | | — | | | | 3,466,958 | | |
| Total | | $ | 133,591,604 | | | $ | 178,603,168 | | | $ | — | | | $ | 312,194,772 | | |
See accompanying notes to financial statements.
167
PACE Select Advisors Trust
PACE Global Real Estate Securities Investments
Performance
For the 12 months ended July 31, 2011, the Portfolio's Class P shares returned 21.74%, before the deduction of the maximum PACE Select program fee. (The Class P shares returned 19.33%, after the deduction of the maximum PACE Select program fee, for the same 12-month period.) In comparison, the FTSE EPRA/NAREIT Developed Index (the "benchmark") returned 22.56%, while the Lipper Global Real Estate Funds category posted a median return of 20.87%. (Please note that while all of the Sub-Advisors outperformed the benchmark on a gross of fees basis, the Fund as a whole underperformed net of fees, as reported here, largely because fees and expenses that are embedded in the Fund are not embedded in the benchmark. Returns for all share classes over various time periods are shown in the "Performance at a glance" table on page 171. Please note that the returns shown do not reflect the deduction of taxes that a shareholder would pay on Portfolio distributions or the redemption of Portfolio shares.) For a detailed commentary on the market environment in general during the reporting period, please refer to page 2.
Sub-Advisors' comments1
CBRE Clarion (formerly, ING Clarion Real Estate Securities)
Our portion of the Portfolio outperformed the benchmark during the reporting period. Global real estate companies, as represented by the benchmark, were up a little more than 22% during the fiscal year, as all regions delivered strong performance. The best performing region was Europe, followed by the Americas. While property companies in the Asia-Pacific region continue to be challenged by the headwinds of governmental and central bank tightening measures, property companies in the region posted a solid double-digit return. The global economic backdrop continues to be somewhat bifurcated, with Western economies attempting to nurse a fragile recovery and Asian economies (ex-Japan) attempting to cool robust growth. In this environment, property fundamentals continue to exhibit evidence of sustained improvement, as recovering demand and limited supply of property generally combine to support the case for improved earnings prospects. Risks continue to include an economic recovery that occurs too slowly or, conversely, the potential that governmental and central bank policies unwittingly create inflationary pressures that prove difficult to contain. The ability for macro-economic policy to successfully support and sustain economic growth remains a critical backdrop to the continued recovery in property fundamentals.
Our relative performance benefited from positive stock selection in all regions, which more than offset the drag from our asset allocation decisions. Our portion of the Portfolio's modest cash position was also a drag on performance given the strong returns of real estate stocks during the period. The strongest contributions from a stock selection perspective came from our holdings in Hong Kong, the US and the UK. Conversely, our holdings in Japan, Singapore and France, overall, modestly lagged the benchmark during the period. From an asset allocation perspective, an underweight to the outperforming European region, along with an overweight to the
PACE Select Advisors Trust –
PACE Global Real Estate Securities Investments
Investment Sub-Advisors:
CBRE Clarion Securities, LLC ("CBRE Clarion") and Brookfield Investment Management Inc. ("Brookfield")
Portfolio Managers:
CBRE Clarion: T. Ritson Ferguson, Steven D. Burton & Joseph P. Smith
Brookfield: Jason Baine, Bernhard Krieg and Brett Ward
Objective:
Total Return
Investment process:
CBRE Clarion (formerly, ING Clarion Real Estate Securities) uses a multi-step investment process for constructing the investment portfolio. This process combines top-down region and sector allocation with bottom-up individual stock selection. First, CBRE Clarion selects property sectors and geographic regions in which to invest and determines the degree of representation of such sectors and regions, through a systematic evaluation of public and private real estate market trends and conditions. Second, CBRE Clarion uses a proprietary valuation process in an effort to identify investments with superior current income and growth potential relative to their peers.
(continued on next page)
1 All Sub-Advisors discuss performance on a gross of fees basis—meaning that no fees or expenses are reflected in their sleeves'/sleeve's performance. Alternately, Fund performance is shown net of fees, which does factor in fees and expenses associated with the Fund.
168
PACE Select Advisors Trust
PACE Global Real Estate Securities Investments
Sub-Advisors' comments – concluded
underperforming Asia-Pacific region, detracted from relative results.
We remain positive on regions and property types that are more responsive to improving economic conditions. We are maintaining the outlook we have held since the beginning of the year despite recent market setbacks, which we believe are likely temporary in nature. In particular, we are positioned toward geographies and property types that benefit sooner from economic improvement, including the apartment sector in the US and office markets in central business districts with a financial orientation, such as New York, London, Hong Kong, Singapore and Sydney. In the Asia-Pacific region, we remain positively disposed to the commercial property sectors of office, retail and industrial, and are cautious on residential, with the exception of the Tokyo market. We prefer companies with above-average dividend yields, and that have a bias toward quality, as measured by property type, management, balance sheet, geography and business strategy. We continue to believe that current yield via the dividend will be a critical and material component of total return for an investor in a global real estate securities strategy.
Brookfield
Our portion of the Portfolio performed largely in line with the benchmark during the reporting period. North America, particularly the US, was a strong positive contributor to performance during the period. Amid signs of a prolonged economic recovery, US real estate investment trusts (REITs) continued to provide solid returns. In an environment marked by periods of risk aversion and low interest rates, our US REITs offered a unique combination of relatively high current yield, improving underlying fundamentals and attractive prospects for growth. High conviction positions in health care operators, apartment REITs and regional malls were especially positive for our performance.
The UK and continental European equity markets once again faced significant headwinds due to ongoing concerns over sovereign debt risk in European Union member nations. Additionally, investors were troubled by rising levels of inflation in an environment of sluggish economic growth. Our portion of the Portfolio held an underweight position to the region based on medium-term concerns about the financial stability of several European economies and the outlook for the euro. However, this was offset by our stock selection in Europe. The largest detractor within Europe was stock selection in France. Despite generally positive macroeconomic fundamentals, our holdings in the country lagged those in the benchmark.
Australian stock selection was a significant drag on performance during the fiscal year. Australian retail performance was weak, most notably our holding in Westfield Group. Market sentiment grew increasingly negative regarding the Australian and US retail environments with regard to both consumers and retailers. However, the strong performance of our holdings in Hong Kong offset these losses. Overall, our performance within the Asia Pacific region moderately outperformed the benchmark during the period.
Investment process (concluded)
Brookfield invests in a diversified portfolio of global securities of companies primarily in the real estate industry, including real estate investment trusts, real estate operating companies, companies whose value is significantly affected by the value of such companies' real estate holdings, and related entities and structures. Brookfield utilizes a fundamental, bottom-up, value-based stock selection methodology.
Special considerations
The Portfolio may be appropriate for long-term investors seeking to diversify a portion of their assets into real-estate related investments. Investors should be willing to withstand short-term fluctuations in the equity and real estate markets in return for potentially higher returns over the long term. The value of the Portfolio changes every day and can be affected by changes in interest rates, general market conditions and other political, social and economic developments, as well as specific matters relating to the companies or issuers in whose securities the Portfolio invests. The value of the Portfolio's investments in foreign securities may fall due to adverse political, social, and economic developments abroad and due to decreases in foreign currency values relative to the US dollar. These risks are greater for investments in emerging market issuers than for issuers in more developed countries. There are certain risks associated with investing in real estate-related investments, including sensitivity to economic downturns, interest rates, declines in property values and variation in property management.
169
PACE Select Advisors Trust
PACE Global Real Estate Securities Investments
Illustration of an assumed investment of $10,000 in Class A shares of the Portfolio (unaudited)
The following graph depicts the performance of PACE Global Real Estate Securities Investments Class A shares versus the FTSE EPRA/NAREIT Developed Index from December 31, 2006, the month-end after the inception date of the Class A shares, through July 31, 2011. The performance of the other classes will vary based upon the different class specific expenses and sales charges. The performance provided does not reflect the deduction of taxes that a shareholder would pay on Portfolio distributions or the redemption of Portfolio shares. Past performance is no guarantee of future results. Share price and returns will vary with market conditions; investors may realize a gain or loss upon redemption. It is important to note that PACE Global Real Estate Securities Investments is a professionally managed portfolio while the Index is not available for investment and are unmanaged. The comparison is shown for illustration purposes only.

170
PACE Select Advisors Trust
PACE Global Real Estate Securities Investments
Performance at a glance (unaudited)
| Average annual total returns for periods ended 07/31/11 | | 1 year | | Since
inception1 | |
| Before deducting | | Class A2 | | | 21.49 | % | | | (5.87 | )% | |
| maximum sales charge | | Class C3 | | | 20.51 | % | | | (6.62 | )% | |
| or PACE Select | | Class Y4 | | | 21.89 | % | | | 20.94 | % | |
| program fee | | Class P5 | | | 21.74 | % | | | (6.70 | )% | |
After deducting
maximum sales charge | | Class A2 | | | 14.79 | % | | | (7.01 | )% | |
| or PACE Select | | Class C3 | | | 19.51 | % | | | (6.62 | )% | |
| program fee | | Class P5 | | | 19.33 | % | | | (8.55 | )% | |
| FTSE EPRA/NAREIT Developed Index6 | | | | | 22.56 | % | | | (3.11 | )% | |
| Lipper Global Real Estate Funds median | | | | | 20.87 | % | | | (3.68 | )% | |
Average annual total returns for periods ended June 30, 2011, after deduction of the maximum sales charge or PACE Select program fee, were as follows: Class A—1-year period, 25.37%; since inception, (7.24)%; Class C—1-year period, 30.82%; since inception, (6.80)%; Class Y—1-year period, 33.29%; since inception, 21.48%; Class P—1-year period, 30.51%; since inception, (8.78)%.
The annualized gross and net expense ratios, respectively, for each class of shares as in the November 28, 2010 prospectuses, were as follows: Class A—1.89% and 1.45%; Class C—2.69% and 2.20%; Class Y—1.51% and 1.20%; and Class P—1.91% and 1.20%. Net expenses reflect fee waivers and/or expense reimbursements, if any, pursuant to an agreement that is in effect to cap the expenses. The Portfolio and UBS Global Asset Management (Americas) Inc. ("UBS Global AM") have entered into a written fee waiver/expense reimbursement agreement pursuant to which UBS Global AM is contractually obligated to waive its management fees and/or reimburse expenses so that the Portfolio's ordinary total operating expenses of each class through November 28, 2011 (excluding dividend expense, borrowing costs, and interest expense relating to short sales, and interest, taxes, brokerage commissions and extraordinary expenses) would not exceed Class A—1.45%; Class C—2.20%; Class Y—1.20%; and Class P—1.20%. The Portfolio has agreed to repay UBS Global AM for any waived fees/reimbursed expenses to the extent that it can do so over the following three fiscal years without causing the Portfolio's expenses in any of those three years to exceed these expense caps. The fee waiver/expense reimbursement agreement may be terminated by the Portfolio's board at any time and also will terminate automatically upon the expiration or termination of the Portfolio's advisory contract with UBS Global AM. Upon termination of the agreement, however, UBS Global AM's three year recoupment rights will survive.
1 Since inception returns are calculated as of commencement of issuance on December 18, 2006 for Class A and C shares, and January 22, 2007 for Class P shares. Class Y shares commenced issuance on November 30, 2006 and had fully redeemed by February 15, 2007 remaining inactive through December 25, 2008. The inception return of Class Y shares is calculated from December 26, 2008, which is the date the Class Y shares recommenced investment operations. Since inception returns for the Index and Lipper median are shown as of December 31, 2006, which is the month-end after the inception date of the oldest share classes (Class A and Class C).
2 Maximum sales charge for Class A shares is 5.5%. Class A shares bear ongoing 12b-1 service fees.
3 Maximum contingent deferred sales charge for Class C shares is 1% imposed on redemptions and is reduced to 0% after one year. Class C shares bear ongoing 12b-1 service and distribution fees.
4 The Portfolio offers Class Y shares to a limited group of eligible investors, including certain qualifying retirement plans. Class Y shares do not bear initial or contingent deferred sales charges or ongoing 12b-1 service and distribution fees.
5 Class P shares do not bear initial or contingent deferred sales charges or ongoing 12b-1 service and distribution fees, but are subject to a maximum annual PACE Select program fee of 2% of the value of Class P shares. Prior to June 14, 2010, the maximum annual PACE Select program fee was 1.5% of the value of Class P shares; however, the current maximum annual PACE Select program fee of 2% is reflected in the performance returns throughout all periods in the average annual total returns presented for the Class P shares shown above.
6 The FTSE EPRA/NAREIT Developed Index is designed to track the performance of listed real estate companies and real estate investment trusts ("REITs") worldwide. By making the index constituents free-float adjusted, liquidity, size and revenue screened, the series is suitable for use as the basis for investment products, such as derivatives and exchange traded funds. Investors should note that indices do not reflect the deduction of fees and expenses.
If an investor sells or exchanges shares less than 90 days after purchase, a redemption fee of 1.00% of the amount sold or exchanged will be deducted at the time of the transaction, except as noted otherwise in the prospectuses.
Past performance does not predict future performance, and the performance information provided does not reflect the deduction of taxes that a shareholder would pay on Portfolio distributions or the redemption of Portfolio shares. The return and principal value of an investment will fluctuate, so that an investor's shares, when redeemed, may be worth more or less than their original cost. Performance results assume reinvestment of all dividends and capital gain distributions at net asset value on the ex-dividend dates. Current performance may be higher or lower than the performance data quoted. For month-end performance figures, please visit http://www.ubs.com.
Lipper peer group data calculated by Lipper Inc.; used with permission. The Lipper median is the return of the fund that places in the middle of a Lipper peer group.
171
PACE Select Advisors Trust
PACE Global Real Estate Securities Investments
Portfolio statistics (unaudited)
| Characteristics | | 07/31/11 | |
| Net assets (mm) | | $ | 106.0 | | |
| Number of holdings | | | 141 | | |
| Portfolio composition1 | | 07/31/11 | |
| Common stocks | | | 97.2 | % | |
| Cash equivalents and other assets less liabilities | | | 2.8 | | |
| Total | | | 100.0 | % | |
| Top five countries (equity investments)1 | | 07/31/11 | |
| United States | | | 42.5 | % | |
| Japan | | | 10.4 | | |
| Australia | | | 9.0 | | |
| Hong Kong | | | 8.5 | | |
| United Kingdom | | | 5.9 | | |
| Total | | | 76.3 | % | |
| Top ten equity holdings1 | | 07/31/11 | |
| Simon Property Group, Inc. | | | 4.5 | % | |
| Sun Hung Kai Properties Ltd. | | | 3.9 | | |
| Mitsubishi Estate Co. Ltd. | | | 3.1 | | |
| Unibail Rodamco | | | 2.8 | | |
| Mitsui Fudosan Co. Ltd. | | | 2.8 | | |
| Westfield Group | | | 2.8 | | |
| Public Storage, Inc. | | | 2.7 | | |
| ProLogis, Inc. | | | 2.7 | | |
| Boston Properties, Inc. | | | 2.6 | | |
| Hongkong Land Holdings Ltd. | | | 2.1 | | |
| Total | | | 30.0 | % | |
1 Weightings represent percentages of the Portfolio's net assets as of July 31, 2011. The Portfolio is actively managed and its composition will vary over time.
172
PACE Select Advisors Trust
PACE Global Real Estate Securities Investments
Industry diversification—(unaudited)
As a percentage of net assets as of July 31, 2011
Common stocks
| Apartments | | | 8.28 | % | |
| Building-residential/commercial | | | 0.70 | | |
| Diversified | | | 19.91 | | |
| Diversified operations | | | 1.89 | | |
| Health care | | | 3.39 | | |
| Hotels & motels | | | 2.27 | | |
| Manufactured homes | | | 0.47 | | |
| Office property | | | 9.21 | | |
| Real estate management/service | | | 5.66 | | |
| Real estate operations/development | | | 20.07 | | |
| Regional malls | | | 8.39 | | |
| Retirement/aged care | | | 0.87 | | |
| Shopping centers | | | 10.40 | | |
| Storage | | | 2.87 | | |
| Storage/warehousing | | | 0.19 | | |
| Warehouse/industrial | | | 2.65 | | |
| Total common stocks | | | 97.22 | | |
| Repurchase agreement | | | 2.72 | | |
| Investment of cash collateral from securities loaned | | | 5.29 | | |
| Liabilities in excess of other assets | | | (5.23 | ) | |
| Net assets | | | 100.00 | % | |
173
PACE Select Advisors Trust
PACE Global Real Estate Securities Investments
Portfolio of investments—July 31, 2011
| | | Number of
shares | | Value | |
| Common stocks—97.22% | |
| Australia—8.99% | |
| Charter Hall Group | | | 61,561 | | | $ | 141,349 | | |
| Dexus Property Group | | | 1,099,387 | | | | 1,043,760 | | |
| FKP Property Group | | | 353,852 | | | | 246,413 | | |
| Goodman Group | | | 1,326,013 | | | | 989,292 | | |
| GPT Group | | | 278,810 | | | | 920,914 | | |
| Investa Office Fund | | | 366,805 | | | | 257,737 | | |
| Mirvac Group | | | 252,521 | | | | 318,721 | | |
| Stockland | | | 405,064 | | | | 1,355,211 | | |
| Westfield Group | | | 334,772 | | | | 2,923,954 | | |
| Westfield Retail Trust | | | 496,097 | | | | 1,328,113 | | |
| Total Australia common stocks | | | | | 9,525,464 | | |
| Austria—0.17% | |
| Conwert Immobilien Invest SE1 | | | 11,038 | | | | 178,319 | | |
| Bermuda—3.00% | |
| Great Eagle Holdings Ltd. | | | 44,000 | | | | 145,332 | | |
| Hongkong Land Holdings Ltd. | | | 329,024 | | | | 2,210,099 | | |
| Kerry Properties Ltd. | | | 168,567 | | | | 819,630 | | |
| Total Bermuda common stocks | | | | | 3,175,061 | | |
| Brazil—0.32% | |
| BR Malls Participacoes SA | | | 17,000 | | | | 197,969 | | |
| Sonae Sierra Brasil SA | | | 8,800 | | | | 137,318 | | |
| Total Brazil common stocks | | | | | 335,287 | | |
| Canada—3.69% | |
| Boardwalk Real Estate Investment Trust | | | 8,570 | | | | 449,108 | | |
Brookfield Asset Management, Inc.,
Class A1 | | | 5,400 | | | | 170,262 | | |
| Brookfield Properties Corp. | | | 45,700 | | | | 866,015 | | |
| Calloway Real Estate Investment Trust | | | 29,900 | | | | 784,231 | | |
| Canadian Real Estate Investment Trust | | | 3,500 | | | | 122,241 | | |
| Cominar Real Estate Investment Trust2 | | | 2,500 | | | | 59,161 | | |
| Cominar Real Estate Investment Trust3,4,5 | | | 5,731 | | | | 135,620 | | |
| H&R Real Estate Investment Trust | | | 11,200 | | | | 257,537 | | |
| Primaris Retail Real Estate Investment Trust | | | 5,600 | | | | 121,091 | | |
| RioCan Real Estate Investment Trust3,4,5 | | | 2,200 | | | | 59,775 | | |
| RioCan Real Estate Investment Trust2 | | | 32,600 | | | | 885,756 | | |
| Total Canada common stocks | | | | | 3,910,797 | | |
| Cayman Islands—1.26% | |
| China Resources Land Ltd. | | | 285,789 | | | | 562,866 | | |
| Longfor Properties | | | 225,000 | | | | 347,954 | | |
| Shimao Property Holdings Ltd. | | | 173,000 | | | | 229,675 | | |
| Soho China Ltd. | | | 219,000 | | | | 199,247 | | |
| Total Cayman Islands common stocks | | | | | 1,339,742 | | |
| China—0.16% | |
Guangzhou R&F Properties Co. Ltd.,
Class H | | | 126,208 | | | | 163,704 | | |
| France—4.99% | |
| ICADE | | | 6,590 | | | | 757,240 | | |
| Klepierre | | | 13,299 | | | | 496,598 | | |
| Mercialys SA | | | 11,960 | | | | 497,501 | | |
| Nexity | | | 6,380 | | | | 286,659 | | |
| | | Number of
shares | | Value | |
| Common stocks—(Continued) | |
| France—(Concluded) | |
Societe Immobiliere de Location pour
l'Industrie et le Commerce (Silic)1 | | | 1,900 | | | $ | 245,975 | | |
| Unibail Rodamco | | | 13,512 | | | | 3,008,202 | | |
| Total France common stocks | | | | | 5,292,175 | | |
| Germany—0.36% | |
| GSW Immobilien AG* | | | 8,290 | | | | 290,371 | | |
| IVG Immobilien AG* | | | 12,700 | | | | 87,102 | | |
| Total Germany common stocks | | | | | 377,473 | | |
| Hong Kong—8.46% | |
| Cheung Kong (Holdings) Ltd. | | | 21,000 | | | | 320,089 | | |
| China Overseas Land & Investment Ltd. | | | 264,000 | | | | 595,487 | | |
| Franshion Properties China Ltd. | | | 781,723 | | | | 215,240 | | |
| Hang Lung Properties Ltd. | | | 73,000 | | | | 270,679 | | |
| Hysan Development Co. Ltd. | | | 42,000 | | | | 196,391 | | |
| Sino Land Co. Ltd. | | | 201,710 | | | | 341,257 | | |
| Sun Hung Kai Properties Ltd. | | | 269,376 | | | | 4,090,007 | | |
| The Link REIT | | | 267,300 | | | | 934,638 | | |
| Wharf (Holdings) Ltd. | | | 272,413 | | | | 1,999,302 | | |
| Total Hong Kong common stocks | | | | | 8,963,090 | | |
| Italy—0.09% | |
| Beni Stabili SpA | | | 109,879 | | | | 97,988 | | |
| Japan—10.36% | |
| Advance Residence Investment Corp. | | | 63 | | | | 132,681 | | |
| AEON Mall Co. Ltd. | | | 12,530 | | | | 323,025 | | |
| Frontier Real Estate Investment Corp.1 | | | 33 | | | | 299,648 | | |
| Japan Real Estate Investment Corp.1 | | | 55 | | | | 552,113 | | |
| Japan Retail Fund Investment Corp.1 | | | 284 | | | | 443,864 | | |
| Kenedix Realty Investment Corp.1 | | | 77 | | | | 287,394 | | |
| Mitsubishi Estate Co. Ltd. | | | 180,602 | | | | 3,242,904 | | |
| Mitsui Fudosan Co. Ltd. | | | 154,361 | | | | 2,940,887 | | |
| Nippon Accommodations Fund, Inc. | | | 27 | | | | 209,345 | | |
| Nippon Building Fund, Inc.1 | | | 37 | | | | 379,142 | | |
| Nomura Real Estate Holdings, Inc. | | | 9,000 | | | | 165,180 | | |
| Sumitomo Realty & Development Co. Ltd. | | | 61,876 | | | | 1,529,585 | | |
| United Urban Investment Corp. | | | 398 | | | | 478,151 | | |
| Total Japan common stocks | | | | | 10,983,919 | | |
| Jersey—0.12% | |
| Atrium European Real Estate Ltd. | | | 20,413 | | | | 130,734 | | |
| Luxembourg—0.14% | |
| GAGFAH SA1 | | | 21,476 | | | | 146,091 | | |
| Netherlands—0.92% | |
| Corio N.V. | | | 11,684 | | | | 710,779 | | |
| Eurocommercial Properties N.V. | | | 5,563 | | | | 265,615 | | |
| Total Netherlands common stocks | | | | | 976,394 | | |
| Norway—0.12% | |
| Norwegian Property ASA | | | 60,952 | | | | 128,378 | | |
| Poland—0.06% | |
| Globe Trade Centre SA* | | | 10,200 | | | | 60,351 | | |
174
PACE Select Advisors Trust
PACE Global Real Estate Securities Investments
Portfolio of investments—July 31, 2011
| | | Number of
shares | | Value | |
| Common stocks—(Continued) | |
| Singapore—4.53% | |
Ascendas Real Estate Investment Trust
(A-REIT) | | | 77,000 | | | $ | 130,398 | | |
| CapitaCommercial Trust1 | | | 497,000 | | | | 581,010 | | |
| Capitaland Ltd. | | | 632,966 | | | | 1,519,721 | | |
| CapitaMall Trust1 | | | 79,300 | | | | 123,973 | | |
| CapitaMalls Asia Ltd. | | | 313,410 | | | | 372,121 | | |
| City Developments Ltd. | | | 12,800 | | | | 111,814 | | |
| Global Logistic Properties Ltd.* | | | 576,175 | | | | 966,128 | | |
| Keppel Land Ltd.1 | | | 131,536 | | | | 416,835 | | |
| Suntec Real Estate Investment Trust1 | | | 458,063 | | | | 583,837 | | |
| Total Singapore common stocks | | | | | 4,805,837 | | |
| Sweden—0.45% | |
| Castellum AB | | | 13,133 | | | | 189,937 | | |
| Hufvudstaden AB, Class A | | | 25,875 | | | | 289,409 | | |
| Total Sweden common stocks | | | | | 479,346 | | |
| Switzerland—0.57% | |
| PSP Swiss Property AG* | | | 3,151 | | | | 318,860 | | |
| Swiss Prime Site AG* | | | 3,136 | | | | 287,306 | | |
| Total Switzerland common stocks | | | | | 606,166 | | |
| United Kingdom—5.94% | |
| Big Yellow Group PLC | | | 35,104 | | | | 164,589 | | |
| British Land Co. PLC | | | 112,044 | | | | 1,069,920 | | |
| Capital & Counties Properties PLC | | | 65,371 | | | | 200,281 | | |
| Derwent London PLC | | | 30,130 | | | | 882,458 | | |
| Grainger PLC | | | 33,102 | | | | 63,834 | | |
| Great Portland Estates PLC | | | 85,405 | | | | 580,249 | | |
| Hammerson PLC | | | 120,340 | | | | 919,088 | | |
| Land Securities Group PLC | | | 118,104 | | | | 1,645,917 | | |
| Safestore Holdings PLC | | | 102,441 | | | | 202,864 | | |
| Segro PLC | | | 22,444 | | | | 110,675 | | |
| Shaftesbury PLC | | | 23,217 | | | | 194,039 | | |
| Songbird Estates PLC* | | | 67,047 | | | | 165,687 | | |
| St. Modwen Properties PLC | | | 33,668 | | | | 95,248 | | |
| Total United Kingdom common stocks | | | | | 6,294,849 | | |
| United States—42.52% | |
| Alexandria Real Estate Equities, Inc. | | | 7,800 | | | | 639,600 | | |
Apartment Investment & Management Co.,
Class A | | | 24,000 | | | | 655,200 | | |
| AvalonBay Communities, Inc. | | | 14,983 | | | | 2,010,569 | | |
| Boston Properties, Inc. | | | 25,442 | | | | 2,731,453 | | |
| Brandywine Realty Trust | | | 57,783 | | | | 692,818 | | |
| BRE Properties, Inc. | | | 15,300 | | | | 802,944 | | |
| Brookdale Senior Living, Inc.* | | | 43,082 | | | | 921,524 | | |
| Camden Property Trust | | | 11,920 | | | | 799,474 | | |
| CBL & Associates Properties, Inc. | | | 30,800 | | | | 547,008 | | |
| Corporate Office Properties Trust | | | 16,500 | | | | 512,655 | | |
| Developers Diversified Realty Corp. | | | 43,200 | | | | 631,152 | | |
| Digital Realty Trust, Inc.1 | | | 13,647 | | | | 835,333 | | |
| Douglas Emmett, Inc. | | | 23,800 | | | | 476,000 | | |
| Equity Lifestyle Properties, Inc. | | | 7,600 | | | | 495,216 | | |
| Equity One, Inc.1 | | | 19,808 | | | | 384,275 | | |
| Equity Residential | | | 35,200 | | | | 2,176,064 | | |
| | | Number of
shares | | Value | |
| Common stocks—(Concluded) | |
| United States—(Concluded) | |
| Essex Property Trust, Inc. | | | 4,300 | | | $ | 603,548 | | |
| Federal Realty Investment Trust | | | 7,100 | | | | 620,114 | | |
| Forest City Enterprises, Inc., Class A* | | | 30,500 | | | | 549,305 | | |
| General Growth Properties, Inc. | | | 59,596 | | | | 1,001,809 | | |
| HCP, Inc. | | | 27,300 | | | | 1,002,729 | | |
| Health Care REIT, Inc. | | | 25,200 | | | | 1,330,056 | | |
| Highwoods Properties, Inc. | | | 25,900 | | | | 891,737 | | |
| Host Hotels & Resorts, Inc. | | | 69,083 | | | | 1,094,966 | | |
| Kimco Realty Corp. | | | 23,000 | | | | 437,690 | | |
| Lennar Corp., Class A | | | 20,900 | | | | 369,721 | | |
| Liberty Property Trust | | | 33,700 | | | | 1,144,452 | | |
| OMEGA Healthcare Investors, Inc. | | | 25,200 | | | | 494,928 | | |
| Pebblebrook Hotel Trust | | | 10,000 | | | | 197,700 | | |
| Pennsylvania Real Estate Investment Trust | | | 31,500 | | | | 459,900 | | |
| ProLogis, Inc. | | | 78,891 | | | | 2,810,886 | | |
| Public Storage, Inc. | | | 24,077 | | | | 2,880,332 | | |
| Regency Centers Corp. | | | 8,900 | | | | 399,788 | | |
| Simon Property Group, Inc. | | | 39,622 | | | | 4,774,847 | | |
| SL Green Realty Corp. | | | 11,600 | | | | 951,432 | | |
| Starwood Hotels & Resorts Worldwide, Inc. | | | 18,200 | | | | 1,000,272 | | |
| Tanger Factory Outlet Centers, Inc. | | | 11,700 | | | | 321,165 | | |
| Taubman Centers, Inc. | | | 8,700 | | | | 521,130 | | |
| The Macerich Co. | | | 23,926 | | | | 1,271,188 | | |
| Toll Brothers, Inc.* | | | 18,700 | | | | 373,252 | | |
| UDR, Inc. | | | 35,600 | | | | 936,636 | | |
| Ventas, Inc. | | | 14,036 | | | | 759,769 | | |
| Vornado Realty Trust | | | 20,491 | | | | 1,916,933 | | |
| Weingarten Realty Investors1 | | | 24,974 | | | | 642,331 | | |
| Total United States common stocks | | | | | 45,069,901 | | |
Total common stocks
(cost—$87,352,112) | | | | | 103,041,066 | | |
| | | Face
amount | | | |
| Repurchase agreement—2.72% | |
Repurchase agreement dated
07/29/11 with State Street
Bank & Trust Co., 0.010%
due 08/01/11, collateralized by
$14,339 Federal Home Loan
Mortgage Corp. obligations,
5.125% due 07/15/12,
$2,060,914 US Treasury Bills,
zero coupon due 08/04/11 and
$812,820 US Treasury Notes,
2.375% to 2.625%
due 02/29/16 to 07/31/17,
(value—$2,939,671);
proceeds: $2,882,002
(cost—$2,882,000) | | $ | 2,882,000 | | | | 2,882,000 | | |
175
PACE Select Advisors Trust
PACE Global Real Estate Securities Investments
Portfolio of investments—July 31, 2011
| | | Number of
shares | | Value | |
| Investment of cash collateral from securities loaned—5.29% | |
| Money market fund—5.29% | |
UBS Private Money Market Fund LLC6
(cost—$5,613,519) | | | 5,613,519 | | | $ | 5,613,519 | | |
Total investments
(cost—$95,847,631)—
105.23% | | | | | 111,536,585 | | |
Liabilities in excess of
other assets—(5.23)% | | | | | (5,548,074 | ) | |
| Net assets—100.00% | | $ | 105,988,511 | | |
Aggregate cost for federal income tax purposes was $101,600,280; and net unrealized appreciation consisted of:
| Gross unrealized appreciation | | $ | 11,169,434 | | |
| Gross unrealized depreciation | | | (1,233,129 | ) | |
| Net unrealized appreciation | | $ | 9,936,305 | | |
For a listing of defined portfolio acronyms and currency abbreviations that were used throughout the Portfolio of investments as well as the tables that follow, please refer to page 227.
* Non-income producing security.
1 Security, or portion thereof, was on loan at July 31, 2011.
2 Security is traded on the Toronto Stock Exchange.
3 Security is being fair valued by a valuation committee under the direction of the board of trustees.
4 Security is traded on the over-the-counter ("OTC") Market.
5 Security exempt from registration pursuant to Rule 144A under the Securities Act of 1933. These securities, which represent 0.18% of net assets as of July 31, 2011, are considered liquid and may be resold in transactions exempt from registration, normally to qualified institutional buyers.
6 The table below details the Portolio's transaction activity in an affiliated issuer during the year ended July 31, 2011. The investment manager earns a management fee from UBS Private Money Market Fund LLC.
| Security description | | Value at
07/31/10 | | Purchases
during the
year ended
07/31/11 | | Sales
during the
year ended
07/31/11 | | Value at
07/31/11 | | Net income
earned from
affiliate for the
year ended
07/31/11 | |
| UBS Private Money Market Fund LLC | | $ | 4,402,048 | | | $ | 59,205,335 | | | $ | 57,993,864 | | | $ | 5,613,519 | | | $ | 2,757 | | |
The following is a summary of the fair valuations according to the inputs used as of July 31, 2011 in valuing the Portfolio's investments:
| | | Unadjusted
quoted prices in
active markets for
identical investments
(Level 1) | | Other significant
observable inputs
(Level 2) | | Unobservable
inputs
(Level 3) | | Total | |
| Common stocks | | $ | 49,261,939 | | | $ | 53,779,127 | | | $ | — | | | $ | 103,041,066 | | |
| Repurchase agreement | | | — | | | | 2,882,000 | | | | — | | | | 2,882,000 | | |
| Investment of cash collateral from securities loaned | | | — | | | | 5,613,519 | | | | — | | | | 5,613,519 | | |
| Total | | $ | 49,261,939 | | | $ | 62,274,646 | | | $ | — | | | $ | 111,536,585 | | |
See accompanying notes to financial statements.
176
PACE Select Advisors Trust
PACE Alternative Strategies Investments
Performance
For the 12 months ended July 31, 2011, the Portfolio's Class P shares returned 2.94%, before the deduction of the maximum PACE Select program fee. (Class P shares returned 0.89%, after the deduction of the maximum PACE Select program fee, for the same 12-month period.) In comparison, the Citigroup Three-Month US Treasury Bill Index (the "benchmark") returned 0.13%, the MSCI World Free Index (net) returned 18.54%, the Barclays Capital Global Aggregate Index returned 9.09%, and the US Consumer Price Index (CPI) increased by 3.63%, while the Lipper Global Flexible Portfolio Funds category posted a median return of 14.22%. (Returns for all share classes over various time periods are also shown in the "Performance at a glance" table on page 184. Please note that the returns shown do not reflect the deduction of taxes that a shareholder would pay on Portfolio distributions or the redemption of Portfolio shares.) For a detailed commentary on the market environment in general during the reporting period, please refer to page 2.
Sub-Advisors' comments1
Analytic Investors
Our portion of the Portfolio consists of long-short equity positions.2 Our process is based on the premise that investor behavior changes—although slowly—and is fairly persistent from month to month. To support this premise, our model is driven by specific security characteristics within seven groups (such as valuation, quality and liquidity), to help us identify potential investment opportunities.
Our model worked quite well during the reporting period, as we were well-positioned in all factor categories. For example, our overweight to the quality category worked well as investors rewarded securities with above-average return on assets and attractive profit margins. Also, positive exposure to the revisions category, which includes factors such as earnings revision and analyst recommendations, the technical category, which includes the momentum factors, and the valuation category, with factors like earnings-to-price ratios, contributed positively to performance, as investors rewarded securities with strong earnings and above-average momentum. An underweight exposure to the risk category, which includes the debt-to-equity and analyst dispersion factors, contributed positively as well, as investors penalized these measures.
PACE Select Advisors Trust –
PACE Alternative Strategies Investments
Investment Sub-Advisors:
Analytic Investors, LLC ("Analytic Investors"); Wellington Management Company, LLP ("Wellington Management"); Goldman Sachs Asset Management, L.P. ("GSAM"), First Quadrant L.P. ("First Quadrant") and Standard Life Investments (Corporate Funds) Limited ("Standard Life Investments")
Portfolio Managers:
Analytic Investors: Dennis Bein, David Krider and Harindra de Silva
Wellington Management: Rick A. Wurster and Stephen A. Gorman
GSAM: Jonathan Beinner and Michael Swell
First Quadrant: Ken Ferguson and Dori Levanoni
Standard Life Investments: Guy Stern and David Millar
Objective:
Long-term capital appreciation
Investment process:
Analytic Investors primarily employs a long/short global equity strategy. This strategy is implemented by taking long and short positions of equity securities publicly traded in the United States and in foreign markets both by direct equity investment and through derivatives. Analytic Investors' strategy may also employ the use of derivatives, such as swaps, futures,
(continued on next page)
1 All Sub-Advisors discuss performance on a gross of fees basis—meaning that no fees or expenses are reflected in their sleeves'/sleeve's performance. Alternately, Fund performance is shown net of fees, which does factor in fees and expenses associated with the Fund.
2 When a long position is taken, a security is purchased with the expectation that it will rise in value. A short position is taken when we believe, based on our research, that securities are overpriced, and, therefore, we hope to make a profit when the security falls in value. When shorting an investment, we borrow the security, sell it, and then buy an equal number of shares later—hopefully at a lower price—to replace those we borrowed.
177
PACE Select Advisors Trust
PACE Alternative Strategies Investments
Sub-Advisors' comments – continued
The top equity performers were long positions in Biogen IDEC Inc., Lorillard, Inc. and Limited Brands, Inc., all of which performed well during the period. A short position in Nvidia Corp., and long positions in Oracle Corp. Japan and Pandora A/S, detracted from performance and were the worst-performing stocks in our portion of the Portfolio. We eliminated our position in Nvidia. Our stock selection added value over the period. Positions in the financial and consumer staples sectors performed well. Conversely, our positions in the materials and industrial sectors had a negative impact on performance.
Wellington Management
Top contributors to our absolute performance during the period included Green Mountain Coffee Roasters, Inc., the leading provider of single-cup brewers and portion packs for coffee and other beverages, and electronic cable and connectivity manufacturer Belden. Our portion of the Portfolio also benefited from its exposure to the US equity markets through the use of equity index futures on the S&P 500 and NASDAQ indexes.
Our thematic positioning within agricultural companies contributed to performance. Our exposures to fertilizer companies Intrepid Potash, Inc., CF Industries Holdings, Inc. and Monsanto Co. were the largest contributors to performance. Supply and demand factors, caused by limitations on net arable land growth and less fresh water, have required significant investment by farmers globally to improve productivity to meet strong emerging markets food demand growth, as well as continued growth in biofuels demand.
Our emerging markets equity exposure also contributed to positive absolute performance during the period, specifically our holdings in China, South Korea, Chile and the Philippines. The largest contributors to absolute performance among our emerging markets holdings included Baidu.com, the leading Internet search provider in China. Another strong performer was China-based news, information, entertainment and communications Internet portal company Sohu.com.
Our country relative value positions, which were intended to exploit spread inefficiencies in developed government bond markets, detracted from results. Specifically, our long US 10- and 30-year versus short Germany position was a drag on
Investment process (continued)
non-deliverable forwards ("NDFs"), and forward contracts.
Wellington Management pursues an "opportunistic equity plus alpha" strategy by opportunistically seeking non-core equity exposures that Wellington Management believes are attractively valued, have positive structural characteristics in the current market environment or are expected to benefit from anticipated economic cycles. In addition, Wellington Management may employ other investment approaches, for example, by allocating assets to fixed income securities or other non-equity investments that are expected to contribute positive returns over time. Wellington Management may buy and sell, directly or indirectly, listed or unlisted equity and fixed income securities issued by entities around the world, as well as derivative instruments.
GSAM seeks to employ a number of diverse strategies and seeks to allocate capital tactically to strategies it believes offer the best opportunities at a given point in time in a given market or sector. GSAM focuses mainly on the global fixed income and currency markets, across various investment grade and sub-investment grade sectors, and may also invest in derivative investments.
First Quadrant employs a "global macro strategy" which is implemented by combining several different complex investment techniques. It uses a "tactical risk allocation" approach across global markets which increases investment risk where it believes opportunities for risk-adjusted profit are high and attempts to lower market risks when it believes gains have been realized and future gains are unlikely. First Quadrant also assesses the
(continued on next page)
178
PACE Select Advisors Trust
PACE Alternative Strategies Investments
Sub-Advisors' comments – continued
results. Our thematic positioning in energy also detracted from results. Our positions in EOG Resources, Canada Natural Resources and Whiting Petroleum declined during the period as energy equities fell due to oil price weakness and the muted near-term earnings prospects for companies due to the slowdown of the economic recovery. Our short exposure to the Swiss franc was also a drag on performance.
Certain derivative instruments, including interest rate swaps, interest rate futures and bond futures were used to gain exposure to global bond markets, implement yield curve and duration strategies and to take advantage of inefficiencies within the global bond market. Equity index futures and equity index options were used to gain exposure to certain global equity markets and to hedge against anticipated declines. We also made use of currency forwards to gain exposure to certain currencies, hedge against anticipated changes and to take advantage of inefficiencies between various currencies. The derivatives used in our portion of the Portfolio during the period contributed to performance.
GSAM
Within our portion of the Portfolio, duration—a measure of a portfolio's sensitivity to interest rate changes—and yield curve positioning detracted from performance. (A yield curve is a line that plots interest rates, at a set point in time, of bonds having equal credit quality, but differing maturity dates.) During the fourth quarter of 2010, we had a long US duration bias, driven by a view that the Federal Reserve Board's ("Fed") second round of quantitative easing ("QE2") would push yields lower. However, this positioning detracted as Treasury yields moved higher in the wake of the Fed's introduction of QE2. In global duration, positive results from our short Japan duration position were offset by our long duration bias in Europe. Gains in February 2011 were more than offset by our short US duration position in early March. We removed some of our short US duration position in mid-March, as downside risk to global growth increased. During the second quarter of 2011, our short US position on the five-year portion of the yield curve was the main detractor. This positioning detracted as bond yields fell given heightened global growth concerns.
From a currency perspective, during the fourth quarter of 2010, our long exposure to the Mexican peso and short exposure to the euro proved positive. During the first part of 2011, our short euro position detracted from results as the currency appreciated, driven by central bank rate hike expectations. Our short Swiss franc was a negative as it was seen as a safe haven against a backdrop of heightened risk aversion in global markets. These losses were slightly offset by our short Japanese yen exposure, as the currency weakened amid a coordinated intervention effort by the G7 after the earthquake. Our long Canadian dollar exposure also proved positive.
Investment process (concluded)
combination of local market and economic factors as well as global equity, fixed income or currency market factors and attempts to capture inefficiencies in those markets. First Quadrant's strategy is primarily implemented through the use of derivatives and it seldom holds net long positions.
Standard Life Investments employs a "global multi-asset strategy" and seeks to achieve a total return by delivering a diversified global portfolio that makes use of multiple strategies across various asset classes. Standard Life Investments aims to exploit market cyclicality and a diverse array of inefficiencies across and within global markets to maximize risk adjusted absolute return. Standard Life Investments' portion of the Portfolio consists of listed equity, equity-related and debt securities, including exchange traded funds, and will routinely make use of derivatives or other instruments both for investment and hedging purposes. Standard Life Investments may take long and/or short positions, and its derivative investments may include, but are not restricted to, futures, options, swaps, and forward currency contracts.
179
PACE Select Advisors Trust
PACE Alternative Strategies Investments
Sub-Advisors' comments – continued
Overall, sector positioning contributed positively to returns. During the fourth quarter of 2010 and the first quarter of 2011, our exposure to non-agency mortgage-backed securities ("MBS") was the primary driver of results. The non-agency MBS market performed well due to strong supply/demand technicals. However, they gave back some of their gains later in the period due to broad risk reduction in the global markets, as well as seasonal weakness in US housing fundamentals. An overweight to corporate bonds contributed to relative performance for most of the fiscal year, as credit fundamentals remained strong and continued to improve. Late in the second quarter of 2011, however, some of these gains were reversed as investment grade corporate bond spreads widened, as a new wave of concerns surrounding peripheral Europe triggered increased volatility in the credit market. (Spread measures the difference in yield between a fixed income security and a government bond of similar duration.)
Finally, security selection contributed positively to performance. Excess returns were primarily driven by our security selection within the corporate bond sector. A down-in-quality bias proved beneficial, as lower quality investment grade bonds outperformed their higher quality counterparts. Our exposure to high yield bonds benefited performance as well. Within the collateralized sector, our selection of non-agency adjustable-rate mortgages ("ARMs") and collateralized mortgage obligations ("CMOs") within the residential MBS sector proved positive. Our selection of government securities within the government/agency sector also contributed to performance.
During the period we employed certain derivatives for the efficient management of our portion of the Portfolio. These included currency forwards, Treasury futures, credit default swaps and interest rate swaps and futures. Derivatives allow us to manage interest rate, credit and currency risks more effectively by allowing us both to hedge and to apply active investment views with greater versatility, and to afford greater risk management precision. The results of derivatives used during the period were within our expectations.
First Quadrant
Global asset class selection added modest value due to our preference toward global equities during the early part of 2011. The strengthening global economy favored equities during this period. However, as global market and economic conditions deteriorated in the summer months, this position was reduced. Our volatility management positioning also added value during the period.
Stock country selection benefited mildly from long positions in the US and Germany, as well as a short position in Australia. In contrast, our long positions in Spain and Italy detracted from results. Our currency risk strategy was steadily profitable as the factor that indicates whether a currency is expensive or inexpensive correctly anticipated equity market directions.
Bond country selection started the reporting period mixed, and ended the period in negative territory. Unfortunately, when the Federal Reserve Board ("Fed") announced implementation of its second round of quantitative easing ("QE2") in late 2010, our long US Treasury gave back its previous gains. The Canadian short position also detracted in the late part of 2010. July 2011 was also a difficult month for bond country selection. In particular, our long position in Japanese government bonds was a negative, as they performed poorly. A short position in the UK was also unprofitable, as UK gilts appreciated. Elsewhere, German bunds were buoyed by their relative appeal, as Portugal and Ireland joined Greece in being downgraded to below investment grade status by Moody's. A long position in German bunds made Germany our best performer in July.
Currency selection losses were dominated by our long British pound and short Australian dollar and Swiss franc positions. Additionally, one of our investment flow indicators and the relative valuation strategy (which measures the relative attractiveness of each market) experienced the greatest difficulty during the period. Investors shifted
180
PACE Select Advisors Trust
PACE Alternative Strategies Investments
Sub-Advisors' comments – continued
their focus to risk avoidance from risk-seeking. As that effect dissipates, we expect the strategy to see a return to profitability.
Certain derivative instruments, namely global equity and global government bond futures, were used to facilitate asset class and country selection asset exposures. Developed market forward currency contracts were used to implement currency selection investment exposures. Exchange-traded options on global indices were used to gain exposure to option pricing dynamics. The results of derivatives used during the period were within our expectations.
Standard Life Investments
From the date we started to manage a portion of the Portfolio on August 5, 2010 through July 31, 2011, the global markets have been volatile. Against this backdrop, our exposure to global equities made a significant contribution to returns for much of the period. However, when investors' confidence faltered, as was the case in the second quarter of 2011, the index futures that we held alongside our equity positions helped to reduce volatility. Our allocation to inflation-linked bonds was also positive as investors periodically sought to reduce their risk exposure. Many of our duration positions were negative over the period, although these positions proved particularly useful during periods of uncertainty (duration is measure of a portfolio's sensitivity to interest rate changes). Relative duration strategies, however, including one whereby we were long Japanese long-term government securities versus short European long-term government bonds, produced steadily positive returns.
Our portion of the Portfolio has a number of investments that have euro exposure. Our European corporate bonds were generally positive for results as investors sought the relative safety of well-financed companies in preference to government bonds. Exposure to financial sector credit versus broad market credit reflected our expectation that the cost of capital for banks relative to the amount they receive from their borrowers has to decline. This strategy was negative for our results during the period, but we feel our thesis will play out, as it is at the heart of any move to stabilize Europe. The euro, however, remains fundamentally overvalued in our opinion. This view has been reinforced by the continuing sovereign debt debacle in the Eurozone, which currently appears intractable. Despite this very volatile situation, our short exposure to the euro versus the US dollar detracted from performance over the reporting period. As a way of offsetting the impact of a weak US dollar, we have switched part of this strategy to being long Mexican government bonds. We feel this position allows us to take advantage of a significant yield opportunity and to gain exposure to Mexico's relatively stable fiscal position.
Our portion of the Portfolio has a cash benchmark and is mandated to seek absolute return opportunities based on our three-year outlook of markets globally. Our goal for our portion of the Portfolio is to beat cash returns by 5% on a three-year rolling basis, while maximizing risk adjusted absolute return. Cash returns remain anchored close to zero, and are not expected to increase markedly over the coming three years as we expect below-average growth in developed markets for some time to come. That said, we do not foresee this persisting indefinitely so we have built our portion of the Portfolio to seek returns to also beat the long-term expectations of cash returns.
In terms of derivatives, many of the individual investment strategies in our portion of the Portfolio should be considered in combination with other positions. This is particularly the case, for example, with relative value investments, but it is also the case when looking at equity hedges.
Our use of futures for equity hedging are to reduce market exposure and risk and secondly to re-balance market position to the equity markets that we favor. During the reporting period, equity markets rose globally by approximately 8% in USD terms. The hedging that we had alongside our equity positions detracted from
181
PACE Select Advisors Trust
PACE Alternative Strategies Investments
Sub-Advisors' comments – concluded
performance, although the equity positions, as would be expected, generated positive results. Because we were not 100% hedged, the net contribution from our equity positions was positive. For the second quarter of 2011, when equity markets fell sharply losing over 5% by mid June but ended the quarter marginally down, these equity hedges will have been generally positive, countering the portfolio's exposure to equity volatility. This has again been the position into the recent period of equity volatility.
While we have hedges in place for UK, European and Global Equity positions, we have a positive hedge for US Equities. This reflects our view that while we continue to seek alpha in these markets, we see relative value in US Equities compared to elsewhere in the world at present.
Special considerations
The Portfolio may be appropriate for investors seeking long term capital appreciation who are able to withstand short-term fluctuations in the equity markets and fixed income markets in return for potentially higher returns over the long-term. The Portfolio may employ investment strategies that involve greater risks than the strategies used by many other mutual funds, including increased use of short sales (which involve the risk of an unlimited increase in the market value of the security sold short, which could result in a theoretically unlimited loss), leverage and derivative transactions, and hedging strategies. The value of the Portfolio changes every day and can be affected by changes in interest rates, general market conditions and other political, social and economic developments, as well as specific matters relating to the issuers of securities in which the Portfolio invests. The value of the Portfolio's investments in foreign securities may fall due to adverse political, social and economic developments abroad and due to decreases in foreign currency values relative to the US dollar. It is important to note that an investment in the Portfolio is only one component of a balanced investment plan.
182
PACE Select Advisors Trust
PACE Alternative Strategies Investments
Illustration of an assumed investment of $10,000 in Class P shares of the Portfolio (unaudited)
The following graph depicts the performance of PACE Alternative Strategies Investments Class P shares versus the Citigroup Three-Month US Treasury Bill Index, the MSCI World Free Index (net), the Barclays Capital Global Aggregate Index and the US Consumer Price Index (CPI) from April 30, 2006, the month-end after the inception date of the Class P shares, through July 31, 2011. The performance of the other classes will vary based upon the different class specific expenses and sales charges. The performance provided does not reflect the deduction of taxes that a shareholder would pay on Portfolio distributions or the redemption of Portfolio shares. Past performance is no guarantee of future results. Share price and returns will vary with market conditions; investors may realize a gain or loss upon redemption. It is important to note that PACE Alternative Strategies Investments is a professionally managed portfolio while the Indices are not available for investment and are unmanaged. The comparison is shown for illustration purposes only.
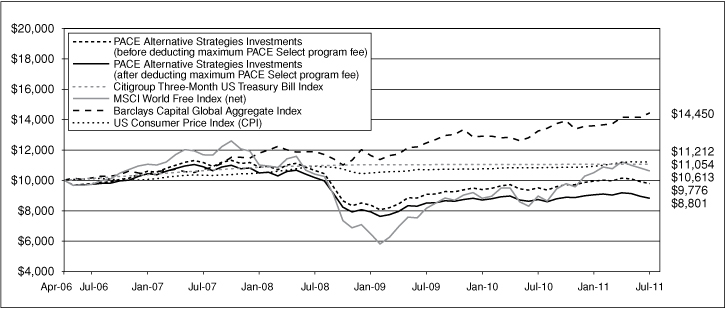
183
PACE Select Advisors Trust
PACE Alternative Strategies Investments
Performance at a glance (unaudited)
| Average annual total returns for periods ended 07/31/11 | | 1 year | | 5 years | | Since
inception1 | |
| Before deducting | | Class A2 | | | 2.69 | % | | | (0.22 | )% | | | (0.36 | )% | |
| maximum sales charge | | Class C3 | | | 1.93 | % | | | (0.96 | )% | | | (1.02 | )% | |
| or PACE Select | | Class Y4 | | | 2.84 | % | | | N/A | | | | (2.81 | )% | |
| program fee | | Class P5 | | | 2.94 | % | | | 0.02 | % | | | (0.11 | )% | |
After deducting
maximum sales charge | | Class A2 | | | (2.93 | )% | | | (1.35 | )% | | | (1.41 | )% | |
| or PACE Select | | Class C3 | | | 0.93 | % | | | (0.96 | )% | | | (1.02 | )% | |
| program fee | | Class P5 | | | 0.89 | % | | | (1.96 | )% | | | (2.09 | )% | |
| Citigroup Three-Month US Treasury Bill Index6,10 | | | | | 0.13 | % | | | 1.78 | % | | | 1.93 | % | |
| MSCI World Free Index (net)7,10 | | | | | 18.54 | % | | | 1.78 | % | | | 1.14 | % | |
| Barclays Capital Global Aggregate Index8 | | | | | 9.09 | % | | | 7.32 | % | | | 7.26 | % | |
| US Consumer Price Index (CPI)9 | | | | | 3.63 | % | | | 2.11 | % | | | 2.20 | % | |
| Lipper Global Flexible Portfolio Funds median | | | | | 14.22 | % | | | 4.56 | % | | | 3.39 | % | |
Average annual total returns for periods ended June 30, 2011, after deduction of the maximum sales charge or PACE Select program fee, were as follows: Class A—1-year period, (0.13)%; 5-year period, (1.00)%; since inception, (1.19)%; Class C—1-year period, 3.79%; 5-year period, (0.60)%; since inception, (0.79)%; Class Y—1-year period, 5.53%; since inception, (2.50)%; Class P—1-year period, 3.77%; 5-year period, (1.61)%; since inception, (1.85)%.
The annualized gross and net expense ratios, respectively, for each class of shares as in the November 28, 2010 prospectuses, were as follows: Class A—2.07% and 2.01%; Class B—3.21% and 2.78%; Class C—2.76% and 2.76%; Class Y—1.77% and 1.77%; and Class P—1.80% and 1.76%. Class B shares were not operational as of November 28, 2010; ratios for Class B are annualized and reflect the limited operating history during the fiscal year ended July 31, 2010. Net expenses reflect fee waivers and/or expense reimbursements, if any, pursuant to an agreement that is in effect to cap the expenses. The Portfolio and UBS Global Asset Management (Americas) Inc. ("UBS Global AM") have entered into a written fee waiver/expense reimbursement agreement pursuant to which UBS Global AM is contractually obligated to waive its management fees and/or reimburse expenses so that the Portfolio's ordinary total operating expenses of each class through November 28, 2011 (excluding dividend expense, borrowing costs, and interest expense relating to short sales, and interest, taxes, brokerage commissions and extraordinary expenses) would not exceed Class A—1.95%; Class B—2.70%; Class C—2.70%; Class Y—1.70%; and Class P—1.70%. The Portfolio has agreed to repay UBS Global AM for any waived fees/reimbursed expenses to the extent that it can do so over the following three fiscal years without causing the Portfolio's expenses in any of those three years to exceed these expense caps. The fee waiver/expense reimbursement agreement may be terminated by the Portfolio's board at any time and also will terminate automatically upon the expiration or termination of the Portfolio's advisory contract with UBS Global AM. Upon termination of the agreement, however, UBS Global AM's three year recoupment rights will survive.
1 Since inception returns are calculated as of commencement of issuance on April 10, 2006 for Class P and A shares, April 11, 2006 for Class C shares. Class Y shares commenced issuance on April 3, 2006, and had fully redeemed by July 27, 2006 remaining inactive through July 22, 2008. The inception return of Class Y shares is calculated from July 23, 2008, which is the date the Class Y shares recommenced investment operations. Class B shares commenced issuance on May 19, 2006, and had fully redeemed by April 8, 2010. Since inception returns for the Indices and Lipper median are shown as of April 30, 2006, which is the month-end after the inception date of the oldest share classes (Class P and Class A).
2 Maximum sales charge for Class A shares is 5.5%. Class A shares bear ongoing 12b-1 service fees.
3 Maximum contingent deferred sales charge for Class C shares is 1% imposed on redemptions and is reduced to 0% after one year. Class C shares bear ongoing 12b-1 service and distribution fees.
4 The Portfolio offers Class Y shares to a limited group of eligible investors, including certain qualifying retirement plans. Class Y shares do not bear initial or contingent deferred sales charges or ongoing 12b-1 service and distribution fees.
5 Class P shares do not bear initial or contingent deferred sales charges or ongoing 12b-1 service and distribution fees, but are subject to a maximum annual PACE Select program fee of 2% of the value of Class P shares. Prior to June 14, 2010, the maximum annual PACE Select program fee was 1.5% of the value of Class P shares; however, the current maximum annual PACE Select program fee of 2% is reflected in the performance returns throughout all periods in the average annual total returns presented for the Class P shares shown above.
6 The Citigroup Three-Month US Treasury Bill Index is an unmanaged index reflecting monthly return equivalents of yield averages that are not marked to the market and an average of the last three 3-month T-bill month-end rates. 3-month T-bills are the short-term debt obligations of the US government. Investors should note that indices do not reflect the deduction of fees and expenses.
7 The MSCI World Free Index (net) is a free float-adjusted market capitalization weighted index that is designed to measure the equity market performance of developed markets. As of May 2010, the index consisted of 24 developed market country indices. Dividends are reinvested after deduction of withholding tax, using tax rates applicable to Luxembourg holding companies, as Luxembourg applies the highest rates. Had US tax rates been applied, the performance of the index would be different. The index is constructed and managed with a view to being fully investable from the perspective of international institutional investors. Investors should note that indices do not reflect the deduction of fees and expenses.
8 The Barclays Capital Global Aggregate Index is an unmanaged broad-based, market capitalization weighted index which is designed to measure the broad global markets for US and non US corporate, government, governmental agency, supranational, mortgage-backed and asset-backed fixed income securities. Investors should note that indices do not reflect the deduction of fees and expenses.
9 The US Consumer Price Index (CPI) produces monthly data on changes in the prices paid by urban consumers for a representative basket of goods and services. The index is calculated by the Bureau of Labor Statistics. Investors should note that indices do not reflect the deduction of fees and expenses.
10 Effective November 28, 2010, the Portfolio's official benchmark had been changed from the MSCI World Free Index (net) to the Citigroup Three-Month US Treasury Bill Index in light of the investment strategies employed in pursuit of the Portfolio's investment objective.
If an investor sells or exchanges shares less than 90 days after purchase, a redemption fee of 1.00% of the amount sold or exchanged will be deducted at the time of the transaction, except as noted otherwise in the prospectuses.
Past performance does not predict future performance, and the performance information provided does not reflect the deduction of taxes that a shareholder would pay on Portfolio distributions or the redemption of Portfolio shares. The return and principal value of an investment will fluctuate, so that an investor's shares, when redeemed, may be worth more or less than their original cost. Performance results assume reinvestment of all dividends and capital gain distributions at net asset value on the ex-dividend dates. Current performance may be higher or lower than the performance data quoted. For month-end performance figures, please visit http://www.ubs.com.
Lipper peer group data calculated by Lipper Inc.; used with permission. The Lipper median is the return of the fund that places in the middle of a Lipper peer group.
184
PACE Select Advisors Trust
PACE Alternative Strategies Investments
Portfolio statistics (unaudited)
| Characteristics | | 07/31/11 | |
| Net assets (mm) | | $ | 548.4 | | |
| Number of holdings | | | 1,039 | | |
| Portfolio composition1 | | 07/31/11 | |
| Common and preferred stocks | | | 33.3 | % | |
| Bonds and notes | | | 30.6 | | |
| ADRs, GDRs and SDRs | | | 1.5 | | |
| Investment companies | | | 1.2 | | |
| Investments sold short | | | (5.0 | ) | |
| Options, swaptions, futures, swaps and forward foreign currency contracts | | | (1.5 | ) | |
| Cash equivalents and other assets less liabilities | | | 39.9 | | |
| Total | | | 100.0 | % | |
| Top five countries (long holdings)1 | | 07/31/11 | |
| United States | | | 37.9 | % | |
| Japan | | | 4.3 | | |
| United Kingdom | | | 2.9 | | |
| Canada | | | 2.5 | | |
| Mexico | | | 1.6 | | |
| Total | | | 49.2 | % | |
| Top five equity sectors (long holdings)1 | | 07/31/11 | |
| Consumer discretionary | | | 5.3 | % | |
| Energy | | | 5.0 | | |
| Financials | | | 4.8 | | |
| Information technology | | | 3.9 | | |
| Materials | | | 3.8 | | |
| Total | | | 22.8 | % | |
| Top five countries (short holdings)1 | | 07/31/11 | |
| Japan | | | (1.8 | )% | |
| United States | | | (1.4 | ) | |
| Canada | | | (0.3 | ) | |
| Sweden | | | (0.3 | ) | |
| Spain | | | (0.3 | ) | |
| Total | | | (4.1 | )% | |
| Top five equity sectors (short holdings)1 | | 07/31/11 | |
| Financials | | | (1.7 | )% | |
| Materials | | | (1.0 | ) | |
| Industrials | | | (0.4 | ) | |
| Energy | | | (0.4 | ) | |
| Consumer discretionary | | | (0.3 | ) | |
| Total | | | (3.8 | )% | |
1 Weightings represent percentages of the Portfolio's net assets as of July 31, 2011. The Portfolio is actively managed and its composition will vary over time.
For a listing of portfolio acronyms that are used throughout the Portfolio statistics, please refer to page 227.
185
PACE Select Advisors Trust
PACE Alternative Strategies Investments
Portfolio statistics (unaudited) (concluded)
| Top ten equity holdings (long holdings)1,2 | | 07/31/11 | |
| Eli Lilly & Co. | | | 0.5 | % | |
| Microsoft Corp. | | | 0.5 | | |
| Chevron Corp. | | | 0.5 | | |
| KDDI Corp. | | | 0.5 | | |
| Idemitsu Kosan Co. Ltd. | | | 0.5 | | |
| TonenGeneral Sekiyu KK | | | 0.4 | | |
| The Link REIT | | | 0.4 | | |
| Apple, Inc. | | | 0.4 | | |
| Lawson, Inc. | | | 0.4 | | |
| AmerisourceBergen Corp. | | | 0.4 | | |
| Total | | | 4.5 | % | |
| Top ten equity holdings (short holdings)1,2 | | 07/31/11 | |
| Daiwa Securities Group, Inc. | | | (0.3 | )% | |
| Nomura Holdings, Inc. | | | (0.3 | ) | |
| NGK Insulators Ltd. | | | (0.3 | ) | |
| The Dai-ichi Life Insurance Co. Ltd. | | | (0.3 | ) | |
| Hennes & Mauritz AB | | | (0.3 | ) | |
| Vulcan Materials Co. | | | (0.2 | ) | |
| Acciona SA | | | (0.2 | ) | |
| SBI Holdings, Inc. | | | (0.2 | ) | |
| Range Resources Corp. | | | (0.2 | ) | |
| NKSJ Holdings, Inc. | | | (0.2 | ) | |
| Total | | | (2.5 | )% | |
Top ten long-term fixed income holdings
(long holdings)1,2 | | 07/31/11 | |
| US Treasury Notes, 0.625%, 07/15/14 | | | 1.1 | % | |
US Treasury Inflation Index Notes (TIPS),
1.375%, 07/15/18 | | | 0.9 | | |
| FNMA, 3.500%, 03/01/41 | | | 0.9 | | |
| FNMA TBA, 3.500% | | | 0.7 | | |
| FNMA TBA, 4.000% | | | 0.7 | | |
US Treasury Inflation Index Bonds (TIPS),
3.875%, 04/15/29 | | | 0.7 | | |
US Treasury Inflation Index Notes (TIPS),
0.625%, 04/15/13 | | | 0.5 | | |
US Treasury Inflation Index Notes (TIPS),
3.000%, 07/15/12 | | | 0.5 | | |
FHLMC REMIC, Seres 2882, Class UL,
4.500%, 02/15/19 | | | 0.5 | | |
US Treasury Inflation Index Notes (TIPS),
0.500%, 04/15/15 | | | 0.4 | | |
| Total | | | 6.9 | % | |
1 Weightings represent percentages of the Portfolio's net assets as of July 31, 2011. The Portfolio is actively managed and its composition will vary over time.
2 Figures represent the breakdown of direct investments of PACE Alternative Strategies Investments. Figures would be different if a breakdown of the underlying investment companies was included.
186
PACE Select Advisors Trust
PACE Alternative Strategies Investments
Industry diversification—(unaudited)1
As a percentage of net assets as of July 31, 2011
Common stocks
| Aerospace & defense | | | 0.34 | % | |
| Air freight & logistics | | | 0.15 | | |
| Airlines | | | 0.38 | | |
| Auto components | | | 0.16 | | |
| Automobiles | | | 0.46 | | |
| Beverages | | | 0.29 | | |
| Biotechnology | | | 0.67 | | |
| Building products | | | 0.01 | | |
| Capital markets | | | 0.40 | | |
| Chemicals | | | 1.39 | | |
| Commercial banks | | | 1.84 | | |
| Commercial services & supplies | | | 0.20 | | |
| Communications equipment | | | 0.34 | | |
| Computers & peripherals | | | 0.46 | | |
| Construction & engineering | | | 0.11 | | |
| Construction materials | | | 0.05 | | |
| Containers & packaging | | | 0.19 | | |
| Distributors | | | 0.04 | | |
| Diversified consumer services | | | 0.13 | | |
| Diversified financial services | | | 0.48 | | |
| Diversified telecommunication services | | | 0.43 | | |
| Electric utilities | | | 0.10 | | |
| Electrical equipment | | | 0.41 | | |
| Electronic equipment, instruments & components | | | 0.11 | | |
| Energy equipment & services | | | 0.25 | | |
| Food & staples retailing | | | 1.10 | | |
| Food products | | | 0.86 | | |
| Gas utilities | | | 0.30 | | |
| Health care equipment & supplies | | | 0.20 | | |
| Health care providers & services | | | 0.84 | | |
| Hotels, restaurants & leisure | | | 0.91 | | |
| Household durables | | | 0.00 | 2 | |
| Independent power producers & energy traders | | | 0.36 | | |
| Industrial conglomerates | | | 0.60 | | |
| Insurance | | | 0.42 | | |
| Internet & catalog retail | | | 0.56 | | |
| Internet software & services | | | 0.55 | | |
| IT services | | | 0.31 | | |
| Leisure equipment & products | | | 0.25 | | |
| Life sciences tools & services | | | 0.15 | | |
| Machinery | | | 0.97 | | |
| Marine | | | 0.10 | | |
| Media | | | 0.87 | | |
| Metals & mining | | | 1.94 | | |
Common stocks—(Concluded)
| Multiline retail | | | 0.60 | % | |
| Oil, gas & consumable fuels | | | 4.74 | | |
| Paper & forest products | | | 0.19 | | |
| Personal products | | | 0.02 | | |
| Pharmaceuticals | | | 1.71 | | |
| Professional services | | | 0.09 | | |
| Real estate investment trusts | | | 1.04 | | |
| Real estate management & development | | | 0.57 | | |
| Road & rail | | | 0.14 | | |
| Semiconductors & semiconductor equipment | | | 1.06 | | |
| Software | | | 1.10 | | |
| Specialty retail | | | 1.02 | | |
| Textiles, apparel & luxury goods | | | 0.33 | | |
| Thrifts & mortgage finance | | | 0.10 | | |
| Tobacco | | | 0.13 | | |
| Trading companies & distributors | | | 0.18 | | |
| Transportation infrastructure | | | 0.03 | | |
| Wireless telecommunication services | | | 0.89 | | |
| Total common stocks | | | 34.62 | | |
Preferred stocks
| Chemicals | | | 0.01 | | |
| Household products | | | 0.14 | | |
| Total preferred stocks | | | 0.15 | | |
| Investment companies | | | 1.18 | | |
| US government obligations | | | 5.93 | | |
| Federal home loan mortgage corporation certificates | | | 0.31 | | |
| Federal national mortgage association certificates | | | 3.96 | | |
| Collateralized mortgage obligations | | | 3.32 | | |
| Asset-backed securities | | | 3.64 | | |
Corporate notes
| Aerospace & defense | | | 0.02 | | |
| Agriculture | | | 0.07 | | |
| Auto manufacturers | | | 0.21 | | |
| Auto parts & equipment | | | 0.05 | | |
| Banking non-US | | | 1.70 | | |
| Banking US | | | 0.39 | | |
| Beverages | | | 0.07 | | |
| Broadcast | | | 0.01 | | |
| Building materials | | | 0.17 | | |
| Cable | | | 0.04 | | |
187
PACE Select Advisors Trust
PACE Alternative Strategies Investments
Industry diversification—(unaudited) (concluded)
As a percentage of net assets as of July 31, 2011
Corporate notes—(Continued)
| Chemicals | | | 0.18 | % | |
| Commercial services | | | 0.24 | | |
| Consumer products-miscellaneous | | | 0.08 | | |
| Cosmetics/personal care | | | 0.02 | | |
| Distribution/wholesale | | | 0.00 | 2 | |
| Diversified banking institution | | | 0.74 | | |
| Diversified financial services | | | 0.98 | | |
| Diversified operations | | | 0.04 | | |
| Electrical composition & equipment | | | 0.03 | | |
| Electric-generation | | | 0.05 | | |
| Electric-integrated | | | 0.39 | | |
| Energy-alternate sources | | | 0.03 | | |
| Engineering & construction | | | 0.06 | | |
| Environmental control | | | 0.06 | | |
| Food-misc/diversified | | | 0.01 | | |
| Food-retail | | | 0.07 | | |
| Gas-distribution | | | 0.07 | | |
| Healthcare-products | | | 0.07 | | |
| Healthcare-services | | | 0.31 | | |
| Independent power producer | | | 0.02 | | |
| Insurance | | | 0.37 | | |
| Internet | | | 0.05 | | |
| Machine tools & related products | | | 0.01 | | |
| Machinery-construction & mining | | | 0.02 | | |
| Machinery-diversified | | | 0.05 | | |
| Mining | | | 0.08 | | |
| Money center banks | | | 0.50 | | |
| Mortgage banks | | | 0.26 | | |
| Multimedia | | | 0.01 | | |
| Office supplies & forms | | | 0.04 | | |
| Oil & gas | | | 0.33 | | |
| Packaging & containers | | | 0.09 | | |
| Paper & forest products | | | 0.05 | | |
| Pipelines | | | 0.13 | | |
| Publishing | | | 0.06 | | |
| Real estate | | | 0.11 | | |
| Retail-discount | | | 0.02 | | |
| Retail-drug store | | | 0.07 | | |
| Retail-major department store | | | 0.05 | | |
| Savings & loans | | | 0.03 | | |
| Semiconductors | | | 0.03 | | |
| Software | | | 0.03 | | |
| Steel-producers | | | 0.11 | | |
Corporate notes—(Concluded)
| Telecommunications | | | 1.05 | % | |
| Transportation | | | 0.02 | | |
| Water | | | 0.12 | | |
| Total corporate notes | | | 9.87 | | |
| Municipal bonds and notes | | | 0.93 | | |
| Non-US government obligations | | | 2.67 | | |
| Time deposits | | | 4.79 | | |
| Certificates of deposit | | | 1.46 | | |
| Short-term US government obligations | | | 16.69 | | |
| Repurchase agreement | | | 12.56 | | |
Options
| Call options purchased | | | 0.42 | | |
| Put options purchased | | | 0.78 | | |
| Total options | | | 1.20 | | |
Investments sold short
Common stocks
| Airlines | | | (0.04 | ) | |
| Biotechnology | | | (0.11 | ) | |
| Capital markets | | | (0.83 | ) | |
| Commercial banks | | | (0.17 | ) | |
| Construction & engineering | | | (0.07 | ) | |
| Construction materials | | | (0.24 | ) | |
| Diversified telecommunication services | | | (0.06 | ) | |
| Electric utilities | | | (0.23 | ) | |
| Electrical equipment | | | (0.03 | ) | |
| Energy equipment & services | | | (0.12 | ) | |
| Household durables | | | (0.02 | ) | |
| Insurance | | | (0.69 | ) | |
| Machinery | | | (0.28 | ) | |
| Metals & mining | | | (0.71 | ) | |
| Multi-utilities | | | (0.02 | ) | |
| Oil, gas & consumable fuels | | | (0.27 | ) | |
| Paper & forest products | | | (0.04 | ) | |
| Semiconductors & semiconductor equipment | | | (0.09 | ) | |
| Specialty retail | | | (0.27 | ) | |
| Total common stocks | | | (4.29 | ) | |
Federal national mortgage association certificates
sold short | | | (0.71 | ) | |
| Total investments sold short | | | (5.00 | ) | |
| Other assets in excess of liabilities | | | 1.72 | | |
| Net assets | | | 100.00 | % | |
1 Figures represent the industry breakdown of direct investments of PACE Alternative Strategies Investments. Figures would be different if a breakdown of the underlying investment companies' industry diversification was included.
2 Weighting represents less than 0.005% of the Portolio's net assets as of July 31, 2011.
188
PACE Select Advisors Trust
PACE Alternative Strategies Investments
Portfolio of investments—July 31, 2011
| | | Number of
shares | | Value | |
| Common stocks—34.62% | |
| Australia—0.96% | |
| Asciano Ltd. | | | 11,544 | | | $ | 21,133 | | |
| Brambles Ltd. | | | 87,172 | | | | 662,681 | | |
| Caltex Australia Ltd. | | | 96,180 | | | | 1,126,707 | | |
| CFS Retail Property Trust | | | 835,990 | | | | 1,587,475 | | |
| GrainCorp Ltd. | | | 5,658 | | | | 48,864 | | |
| Incitec Pivot Ltd. | | | 57,618 | | | | 250,121 | | |
| Lynas Corp. Ltd.* | | | 210,659 | | | | 495,691 | | |
| National Australia Bank Ltd. | | | 23,916 | | | | 629,446 | | |
| Rio Tinto Ltd. | | | 1,431 | | | | 125,359 | | |
| TABCORP Holdings Ltd. | | | 92,162 | | | | 325,643 | | |
| Total Australia common stocks | | | | | 5,273,120 | | |
| Bermuda—0.60% | |
| Arch Capital Group Ltd.* | | | 19,645 | | | | 664,001 | | |
| Asian Citrus Holdings Ltd. | | | 79,202 | | | | 68,972 | | |
| Bunge Ltd. | | | 9,527 | | | | 655,553 | | |
Cheung Kong Infrastructure
Holdings Ltd. | | | 40,000 | | | | 230,450 | | |
| China Green (Holdings) Ltd. | | | 50,851 | | | | 28,145 | | |
| China Yurun Food Group Ltd. | | | 24,350 | | | | 76,345 | | |
| Cosan Ltd., Class A | | | 8,382 | | | | 103,350 | | |
| Cosco Pacific Ltd. | | | 33,000 | | | | 53,441 | | |
| Digital China Holdings Ltd. | | | 11,000 | | | | 18,726 | | |
GOME Electrical Appliances
Holdings Ltd. | | | 927,000 | | | | 436,789 | | |
| Huabao International Holdings Ltd. | | | 28,000 | | | | 23,646 | | |
| Lazard Ltd., Class A | | | 6,608 | | | | 222,029 | | |
| Luk Fook Holdings International Ltd. | | | 4,000 | | | | 20,982 | | |
| Orient Overseas International Ltd. | | | 93,000 | | | | 530,742 | | |
| Shangri-La Asia Ltd. | | | 53,444 | | | | 138,018 | | |
| Trinity Ltd. | | | 16,000 | | | | 17,783 | | |
| Total Bermuda common stocks | | | | | 3,288,972 | | |
| Brazil—0.15% | |
Anhanguera Educacional
Participacoes SA | | | 17,600 | | | | 341,480 | | |
| Brasil Foods SA | | | 4,007 | | | | 76,220 | | |
| Cosan SA Industria e Comercio | | | 6,453 | | | | 99,030 | | |
| JBS SA* | | | 8,147 | | | | 24,375 | | |
| SLC Agricola SA | | | 8,222 | | | | 91,188 | | |
| Vale SA, ADR | | | 5,370 | | | | 174,203 | | |
| Total Brazil common stocks | | | | | 806,496 | | |
| Canada—2.50% | |
| Agrium, Inc. | | | 2,561 | | | | 224,109 | | |
Alimentation Couche Tard, Inc.,
Class B | | | 10,200 | | | | 321,869 | | |
| Barrick Gold Corp. | | | 12,180 | | | | 579,403 | | |
| Canadian National Railway Co. | | | 468 | | | | 35,091 | | |
| Canadian Natural Resources Ltd. | | | 10,600 | | | | 427,074 | | |
| Canadian Tire Corp. Ltd., Class A | | | 6,900 | | | | 421,893 | | |
| Cenovus Energy, Inc. | | | 19,149 | | | | 736,138 | | |
| CGI Group, Inc., Class A* | | | 6,000 | | | | 128,986 | | |
| Empire Co. Ltd. | | | 7,700 | | | | 467,101 | | |
| First Quantum Minerals Ltd. | | | 2,201 | | | | 305,138 | | |
| Genworth MI Canada, Inc. | | | 21,900 | | | | 542,314 | | |
| | | Number of
shares | | Value | |
| Common stocks—(Continued) | |
| Canada—(Concluded) | |
| George Weston Ltd. | | | 28,600 | | | $ | 1,984,594 | | |
| Goldcorp, Inc. | | | 17,241 | | | | 824,292 | | |
| IAMGOLD Corp. | | | 16,776 | | | | 335,520 | | |
| Ivanhoe Mines Ltd.* | | | 11,682 | | | | 306,419 | | |
| Kinross Gold Corp. | | | 36,728 | | | | 600,136 | | |
| Pacific Rubiales Energy Corp. | | | 27,010 | | | | 776,843 | | |
| Potash Corp. of Saskatchewan, Inc. | | | 13,390 | | | | 773,031 | | |
| Quadra FNX Mining Ltd.* | | | 24,947 | | | | 397,136 | | |
| Research In Motion Ltd. (RIM)* | | | 30,600 | | | | 766,401 | | |
| Sherritt International Corp. | | | 54,800 | | | | 342,411 | | |
| Sino-Forest Corp.* | | | 95,800 | | | | 731,948 | | |
| Teck Resources Ltd., Class B | | | 1,352 | | | | 66,988 | | |
| Tim Hortons, Inc. | | | 20,600 | | | | 988,550 | | |
| Yamana Gold, Inc. | | | 16,376 | | | | 212,561 | | |
| Yellow Media, Inc. | | | 190,400 | | | | 414,498 | | |
| Total Canada common stocks | | | | | 13,710,444 | | |
| Cayman Islands—0.63% | |
| 3SBio, Inc., ADR* | | | 1,200 | | | | 19,320 | | |
| Alibaba.com Ltd. | | | 56,786 | | | | 79,282 | | |
| ASM Pacific Technology Ltd. | | | 18,649 | | | | 204,290 | | |
| AutoNavi Holdings Ltd., ADR* | | | 2,200 | | | | 36,432 | | |
| Baidu, Inc., ADR* | | | 3,312 | | | | 520,216 | | |
| Belle International Holdings Ltd. | | | 138,000 | | | | 303,010 | | |
| China Kanghui Holdings, Inc., ADR* | | | 1,500 | | | | 32,685 | | |
| China Modern Dairy Holdings Ltd.* | | | 77,489 | | | | 23,686 | | |
China ZhengTong Auto Services
Holdings Ltd.* | | | 3,000 | | | | 3,958 | | |
| Ctrip.com International Ltd., ADR* | | | 2,220 | | | | 102,342 | | |
| Daphne International Holdings Ltd. | | | 40,000 | | | | 42,930 | | |
| ENN Energy Holdings Ltd. | | | 20,000 | | | | 67,358 | | |
Global Education & Technology
Group Ltd., ADR* | | | 3,500 | | | | 17,570 | | |
| Hengan International Group Co. Ltd. | | | 12,700 | | | | 110,573 | | |
| Hengdeli Holdings Ltd. | | | 32,000 | | | | 15,924 | | |
Home Inns & Hotels Management,
Inc., ADR* | | | 700 | | | | 26,978 | | |
Intime Department Store Group
Co. Ltd. | | | 44,000 | | | | 73,965 | | |
Kingdee International Software
Group Co. Ltd. | | | 332,000 | | | | 194,267 | | |
| Lifestyle International Holdings Ltd. | | | 9,500 | | | | 31,176 | | |
Lijun International Pharmaceutical
(Holding) Co. Ltd. | | | 149,000 | | | | 26,374 | | |
| Minth Group Ltd. | | | 31,000 | | | | 49,726 | | |
| NetEase.com, Inc., ADR* | | | 450 | | | | 22,734 | | |
| Parkson Retail Group Ltd. | | | 60,315 | | | | 85,008 | | |
| PCD Stores Group Ltd. | | | 94,000 | | | | 22,734 | | |
| Sands China Ltd.* | | | 132,800 | | | | 401,243 | | |
Simcere Pharmaceutical
Group, ADR* | | | 4,800 | | | | 52,608 | | |
Sun King Power Electronics
Group Ltd.* | | | 6,000 | | | | 853 | | |
| TAL Education Group, ADR* | | | 1,200 | | | | 15,300 | | |
| Tencent Holdings Ltd. | | | 10,986 | | | | 286,713 | | |
189
PACE Select Advisors Trust
PACE Alternative Strategies Investments
Portfolio of investments—July 31, 2011
| | | Number of
shares | | Value | |
| Common stocks—(Continued) | |
| Cayman Islands—(Concluded) | |
The United Laboratories
International Holdings Ltd. | | | 211,500 | | | $ | 218,261 | | |
| Towngas China Co. Ltd. | | | 34,000 | | | | 18,164 | | |
| Trauson Holdings Co. Ltd. | | | 38,000 | | | | 14,653 | | |
| Wynn Macau Ltd. | | | 92,800 | | | | 325,483 | | |
Total Cayman Islands
common stocks | | | | | 3,445,816 | | |
| Chile—0.21% | |
| Banco Santander Chile, ADR | | | 1,317 | | | | 122,454 | | |
| CAP SA | | | 2,777 | | | | 127,469 | | |
| Cencosud SA | | | 19,133 | | | | 126,257 | | |
| Empresa Nacional de Electricidad SA | | | 55,105 | | | | 98,766 | | |
| Empresas CMPC SA | | | 1,892 | | | | 90,936 | | |
| Empresas COPEC SA | | | 5,383 | | | | 95,600 | | |
| Enersis SA, ADR | | | 4,306 | | | | 93,828 | | |
| Lan Airlines SA, ADR | | | 4,355 | | | | 114,014 | | |
| S.A.C.I. Falabella | | | 13,314 | | | | 128,629 | | |
Sociedad Quimica y Minera de
Chile SA, ADR | | | 2,374 | | | | 152,696 | | |
| Total Chile common stocks | | | | | 1,150,649 | | |
| China—0.36% | |
| Angang Steel Co. Ltd., Class H | | | 42,500 | | | | 43,845 | | |
Anhui Conch Cement Co. Ltd.,
Class H | | | 45,850 | | | | 214,026 | | |
| Bank of China Ltd., Class H | | | 75,000 | | | | 34,452 | | |
| BYD Co. Ltd., Class H* | | | 14,202 | | | | 47,101 | | |
Changsha Zoomlion Heavy
Industry Science and Technology
Development Co. Ltd., Class H | | | 5,460 | | | | 10,801 | | |
China Construction Bank Corp.,
Class H | | | 359,110 | | | | 288,630 | | |
China Merchants Bank Co. Ltd.,
Class H | | | 24,055 | | | | 56,952 | | |
China National Building Material
Co. Ltd., Class H | | | 2,216 | | | | 4,435 | | |
China Pacific Insurance Group Co.
Ltd., Class H | | | 8,000 | | | | 30,273 | | |
China Shenhua Energy Co. Ltd.,
Class H | | | 43,000 | | | | 215,188 | | |
China Shipping Development Co.
Ltd., Class H | | | 6,000 | | | | 4,685 | | |
China Suntien Green Energy Corp.,
Class H | | | 7,000 | | | | 1,971 | | |
| China Telecom Corp. Ltd., Class H | | | 148,000 | | | | 96,716 | | |
Chongqing Machinery & Electric
Co. Ltd., Class H | | | 92,000 | | | | 26,972 | | |
Dongfeng Motor Group Co. Ltd.,
Class H | | | 16,000 | | | | 31,756 | | |
Huaneng Power International, Inc.,
Class H | | | 106,000 | | | | 52,005 | | |
Industrial & Commercial Bank of
China, Class H | | | 103,020 | | | | 78,646 | | |
Jiangsu Expressway Co. Ltd.,
Class H | | | 31,000 | | | | 29,795 | | |
| | | Number of
shares | | Value | |
| Common stocks—(Continued) | |
| China—(Concluded) | |
| PetroChina Co. Ltd., Class H | | | 56,000 | | | $ | 79,604 | | |
Ping An Insurance (Group) Co. of
China Ltd., Class H | | | 10,910 | | | | 106,537 | | |
| Qingling Motors Co. Ltd., Class H | | | 92,000 | | | | 31,377 | | |
Shandong Weigao Group Medical
Polymer Co. Ltd., Class H | | | 96,000 | | | | 131,438 | | |
Shenzhen Expressway Co. Ltd.,
Class H | | | 104,000 | | | | 54,760 | | |
Sinopec Shanghai Petrochemical
Co. Ltd., Class H | | | 152,000 | | | | 63,236 | | |
| Sinopharm Group Co., Class H | | | 5,600 | | | | 16,280 | | |
| Weichai Power Co. Ltd., Class H | | | 10,000 | | | | 54,624 | | |
| Wumart Stores, Inc., Class H | | | 2,406 | | | | 6,042 | | |
Zhuzhou CSR Times Electric Co.
Ltd., Class H | | | 8,000 | | | | 23,697 | | |
| Zijin Mining Group Co. Ltd. | | | 75,000 | | | | 40,610 | | |
| ZTE Corp., Class H | | | 38,668 | | | | 121,020 | | |
| Total China common stocks | | | | | 1,997,474 | | |
| Colombia—0.05% | |
| Almacenes Exito SA | | | 3,645 | | | | 48,793 | | |
| Bancolombia SA, ADR | | | 587 | | | | 38,918 | | |
| Cementos Argos SA | | | 5,949 | | | | 36,873 | | |
| Ecopetrol SA, ADR | | | 710 | | | | 29,997 | | |
| Grupo de Inversiones Suramericana | | | 3,104 | | | | 62,850 | | |
| Interconexion Electrica SA | | | 5,376 | | | | 37,010 | | |
| Inversiones Argos SA | | | 3,500 | | | | 35,867 | | |
| Total Colombia common stocks | | | | | 290,308 | | |
| Denmark—0.19% | |
| AP Moller - Maersk A/S, Class B | | | 1 | | | | 7,643 | | |
| Pandora A/S | | | 36,662 | | | | 1,039,998 | | |
| Total Denmark common stocks | | | | | 1,047,641 | | |
| France—0.56% | |
| Aeroports de Paris (ADP) | | | 342 | | | | 31,013 | | |
| Air Liquide SA | | | 3,664 | | | | 502,111 | | |
| Alcatel-Lucent, ADR* | | | 28,800 | | | | 116,640 | | |
| Christian Dior SA | | | 1,728 | | | | 275,311 | | |
| Compagnie de Saint-Gobain | | | 499 | | | | 28,733 | | |
| Peugeot SA | | | 8,170 | | | | 308,888 | | |
| Safran SA | | | 18,480 | | | | 764,746 | | |
| Societe Generale SA | | | 9,871 | | | | 487,037 | | |
| Vallourec SA | | | 4,919 | | | | 498,986 | | |
| Vinci SA | | | 545 | | | | 31,490 | | |
| Total France common stocks | | | | | 3,044,955 | | |
| Germany—0.85% | |
| Aixtron SE | | | 6,370 | | | | 172,064 | | |
| Asian Bamboo AG | | | 1,019 | | | | 33,308 | | |
Bayerische Motoren Werke
(BMW) AG | | | 6,435 | | | | 645,211 | | |
| Commerzbank AG* | | | 284,051 | | | | 1,079,007 | | |
| Deutsche Lufthansa AG | | | 14,122 | | | | 284,870 | | |
| Deutsche Post AG | | | 1,865 | | | | 32,964 | | |
| K+S AG | | | 3,729 | | | | 298,592 | | |
190
PACE Select Advisors Trust
PACE Alternative Strategies Investments
Portfolio of investments—July 31, 2011
| | | Number of
shares | | Value | |
| Common stocks—(Continued) | |
| Germany—(Concluded) | |
| Kabel Deutschland Holding AG* | | | 5,733 | | | $ | 323,281 | | |
| Linde AG | | | 4,025 | | | | 722,536 | | |
| Siemens AG | | | 5,599 | | | | 718,694 | | |
| Symrise AG | | | 12,494 | | | | 341,727 | | |
| Total Germany common stocks | | | | | 4,652,254 | | |
| Hong Kong—0.92% | |
| Beijing Enterprises Holdings Ltd. | | | 20,500 | | | | 103,590 | | |
| China Agri-Industries Holdings Ltd. | | | 198,143 | | | | 222,917 | | |
| China Mobile Ltd. | | | 18,500 | | | | 184,322 | | |
China Overseas Land &
Investment Ltd. | | | 31,422 | | | | 70,877 | | |
| China Resources Enterprise Ltd. | | | 16,000 | | | | 69,530 | | |
| China Unicom (Hong Kong) Ltd. | | | 33,000 | | | | 66,043 | | |
| CNOOC Ltd. | | | 80,000 | | | | 178,222 | | |
| Galaxy Entertainment Group Ltd.* | | | 11,000 | | | | 28,643 | | |
| Hang Lung Properties Ltd. | | | 25,671 | | | | 95,186 | | |
Hong Kong Exchanges &
Clearing Ltd. | | | 8,348 | | | | 171,961 | | |
| Hutchison Whampoa Ltd. | | | 2,317 | | | | 26,951 | | |
| Lenovo Group Ltd. | | | 62,000 | | | | 39,283 | | |
| PCCW Ltd. | | | 704,000 | | | | 307,387 | | |
| SJM Holdings Ltd. | | | 439,000 | | | | 1,110,068 | | |
| The Link REIT | | | 626,000 | | | | 2,188,864 | | |
| Wheelock & Co. Ltd. | | | 41,000 | | | | 176,695 | | |
| Total Hong Kong common stocks | | | | | 5,040,539 | | |
| India—0.05% | |
| Infosys Ltd., ADR | | | 2,000 | | | | 124,440 | | |
| Jain Irrigation Systems Ltd. | | | 3,329 | | | | 13,046 | | |
| JSW Steel Ltd. | | | 2,084 | | | | 36,435 | | |
| Sterlite Industries (India) Ltd. | | | 13,464 | | | | 48,528 | | |
| Tata Steel Ltd. | | | 3,680 | | | | 46,846 | | |
| Total India common stocks | | | | | 269,295 | | |
| Indonesia—0.08% | |
| PT Bumi Resources Tbk | | | 503,500 | | | | 180,097 | | |
| PT United Tractors Tbk | | | 74,121 | | | | 237,348 | | |
| Total Indonesia common stocks | | | | | 417,445 | | |
| Ireland—0.15% | |
| Warner Chilcott PLC, Class A1 | | | 39,200 | | | | 823,984 | | |
| Isle of Man—0.02% | |
| Genting Singapore PLC* | | | 83,000 | | | | 130,570 | | |
| Israel—0.02% | |
| Israel Chemicals Ltd. | | | 7,617 | | | | 127,448 | | |
| Italy—0.31% | |
| Eni SpA | | | 58,566 | | | | 1,269,793 | | |
| Fiat Industrial SpA* | | | 6,603 | | | | 87,192 | | |
| Prysmian SpA | | | 18,317 | | | | 338,193 | | |
| Total Italy common stocks | | | | | 1,695,178 | | |
| Japan—4.31% | |
| Alfresa Holdings Corp. | | | 5,500 | | | | 225,241 | | |
| Amada Co. Ltd. | | | 45,000 | | | | 349,681 | | |
| | | Number of
shares | | Value | |
| Common stocks—(Continued) | |
| Japan—(Concluded) | |
| Coca-Cola West Co. Ltd. | | | 6,600 | | | $ | 131,966 | | |
| Cosmo Oil Co. Ltd. | | | 106,000 | | | | 319,018 | | |
| Daito Trust Construction Co. Ltd. | | | 19,500 | | | | 1,876,959 | | |
| DeNA Co. Ltd. | | | 10,400 | | | | 518,878 | | |
| Denso Corp. | | | 10,800 | | | | 385,074 | | |
| Dowa Holdings Co. Ltd. | | | 59,000 | | | | 396,244 | | |
Electric Power Development
Co. Ltd. | | | 61,100 | | | | 1,610,739 | | |
| Hankyu Hanshin Holdings, Inc. | | | 5,761 | | | | 23,182 | | |
| Idemitsu Kosan Co. Ltd. | | | 22,100 | | | | 2,563,494 | | |
| Inpex Corp. | | | 55 | | | | 426,922 | | |
| Japan Retail Fund Investment Corp. | | | 148 | | | | 231,309 | | |
| Japan Tobacco, Inc. | | | 107 | | | | 487,136 | | |
| JX Holdings, Inc. | | | 107,000 | | | | 772,879 | | |
| KDDI Corp. | | | 345 | | | | 2,566,948 | | |
| Komatsu Ltd. | | | 1,217 | | | | 37,971 | | |
| Kubota Corp. | | | 38,000 | | | | 344,509 | | |
| Lawson, Inc. | | | 38,000 | | | | 2,055,162 | | |
| Medipal Holdings Corp. | | | 30,400 | | | | 287,284 | | |
| Miraca Holdings, Inc. | | | 7,000 | | | | 294,398 | | |
| Mitsubishi Corp. | | | 1,185 | | | | 31,807 | | |
| Mitsubishi Electric Corp. | | | 1,817 | | | | 21,455 | | |
| Nippon Yusen Kabushiki Kaisha | | | 4,920 | | | | 18,068 | | |
| Nomura Research Institute Ltd. | | | 16,800 | | | | 400,672 | | |
| Oracle Corp. Japan | | | 23,100 | | | | 775,522 | | |
| Osaka Gas Co. Ltd. | | | 400,000 | | | | 1,583,821 | | |
| Santen Pharmaceutical Co. Ltd. | | | 16,900 | | | | 680,130 | | |
| Softbank Corp. | | | 24,000 | | | | 936,617 | | |
| Sumitomo Metal Mining Co. Ltd. | | | 2,484 | | | | 44,035 | | |
Sumitomo Mitsui Financial
Group, Inc. | | | 18,900 | | | | 596,663 | | |
| TonenGeneral Sekiyu KK | | | 179,000 | | | | 2,249,131 | | |
| Toyota Tsusho Corp. | | | 1,586 | | | | 27,801 | | |
| Yamada Denki Co. Ltd. | | | 4,650 | | | | 370,982 | | |
| Total Japan common stocks | | | | | 23,641,698 | | |
| Jersey—0.14% | |
| Shire PLC | | | 22,484 | | | | 778,662 | | |
| Luxembourg—0.16% | |
| ArcelorMittal | | | 2,617 | | | | 81,343 | | |
| Evraz Group SA, GDR2,* | | | 1,461 | | | | 48,797 | | |
Millicom International Cellular
SA, SDR | | | 6,161 | | | | 737,330 | | |
| Total Luxembourg common stocks | | | | | 867,470 | | |
| Malaysia—0.04% | |
| UEM Land Holdings Bhd* | | | 262,200 | | | | 229,620 | | |
| Marshall Islands—0.03% | |
| Scorpio Tankers, Inc.* | | | 24,100 | | | | 178,099 | | |
| Mexico—0.01% | |
| Grupo Mexico SAB de CV, Series B | | | 18,564 | | | | 68,484 | | |
| Netherlands—0.14% | |
| ASML Holding N.V. | | | 11,051 | | | | 392,905 | | |
| Koninklijke Boskalis Westminster N.V. | | | 8,170 | | | | 343,151 | | |
191
PACE Select Advisors Trust
PACE Alternative Strategies Investments
Portfolio of investments—July 31, 2011
| | | Number of
shares | | Value | |
| Common stocks—(Continued) | |
| Netherlands—(Concluded) | |
| Koninklijke Philips Electronics N.V. | | | 994 | | | $ | 24,755 | | |
| Total Netherlands common stocks | | | | | 760,811 | | |
| Norway—0.10% | |
| DnB NOR ASA | | | 36,947 | | | | 536,354 | | |
| Papua New Guinea—0.09% | |
| Oil Search Ltd. | | | 66,981 | | | | 502,712 | | |
| Philippines—0.24% | |
| Aboitiz Power Corp. | | | 109,182 | | | | 84,120 | | |
| Alliance Global Group, Inc.* | | | 392,111 | | | | 107,816 | | |
| Ayala Corp. | | | 7,851 | | | | 60,720 | | |
| Ayala Land, Inc. | | | 322,569 | | | | 128,342 | | |
| Banco de Oro Unibank, Inc. | | | 72,258 | | | | 109,664 | | |
| Bank of the Philippine Islands | | | 42,161 | | | | 59,675 | | |
| Energy Development Corp. | | | 720,709 | | | | 116,007 | | |
| Globe Telecom, Inc. | | | 452 | | | | 10,278 | | |
| Jollibee Foods Corp. | | | 20,840 | | | | 43,042 | | |
| Manila Electric Co. | | | 12,890 | | | | 85,345 | | |
| Metropolitan Bank & Trust Co. | | | 86,564 | | | | 158,014 | | |
Philippine Long Distance
Telephone Co. | | | 1,820 | | | | 102,892 | | |
Philippine Long Distance Telephone
Co., ADR | | | 2,241 | | | | 126,841 | | |
| SM Investments Corp. | | | 6,045 | | | | 77,822 | | |
| SM Prime Holdings, Inc. | | | 217,487 | | | | 59,532 | | |
| Total Philippines common stocks | | | | | 1,330,110 | | |
| Poland—0.01% | |
| KGHM Polska Miedz SA | | | 756 | | | | 51,759 | | |
| Portugal—0.18% | |
| Galp Energia, SGPS SA, B Shares | | | 30,594 | | | | 689,193 | | |
| Jeronimo Martins, SGPS SA | | | 13,971 | | | | 272,721 | | |
| Total Portugal common stocks | | | | | 961,914 | | |
| Russia—0.81% | |
| Gazprom, ADR* | | | 114,970 | | | | 1,685,460 | | |
| LUKOIL, ADR | | | 11,900 | | | | 799,085 | | |
Mining and Metallurgical Co.
Norilsk Nickel, ADR3,* | | | 19,860 | | | | 530,635 | | |
Mining and Metallurgical Co.
Norilsk Nickel, ADR4,* | | | 736 | | | | 19,681 | | |
| Novolipetsk Steel (NLMK), GDR2 | | | 1,317 | | | | 49,387 | | |
| Rosneft Oil Co., GDR2 | | | 46,000 | | | | 392,380 | | |
| Sberbank of Russia, ADR* | | | 36,250 | | | | 541,937 | | |
| Uralkali, GDR2,3,* | | | 4,841 | | | | 238,279 | | |
| Uralkali, GDR2,4,* | | | 429 | | | | 21,133 | | |
| VTB Bank OJSC, GDR2 | | | 27,500 | | | | 165,275 | | |
| Total Russia common stocks | | | | | 4,443,252 | | |
| Singapore—0.94% | |
Ascendas Real Estate Investment
Trust (A-REIT) | | | 266,000 | | | | 450,467 | | |
| Avago Technologies Ltd.1 | | | 42,100 | | | | 1,415,823 | | |
| DBS Group Holdings Ltd. | | | 36,728 | | | | 472,556 | | |
| | | Number of
shares | | Value | |
| Common stocks—(Continued) | |
| Singapore—(Concluded) | |
| First Resources Ltd. | | | 58,310 | | | $ | 68,375 | | |
| Fraser and Neave Ltd. | | | 105,000 | | | | 522,046 | | |
| Jardine Cycle & Carriage Ltd. | | | 6,000 | | | | 240,488 | | |
| StarHub Ltd. | | | 55,000 | | | | 128,848 | | |
| UOL Group Ltd. | | | 109,000 | | | | 467,432 | | |
| Wilmar International Ltd. | | | 34,586 | | | | 168,777 | | |
Yangzijiang Shipbuilding
Holdings Ltd. | | | 998,000 | | | | 1,201,240 | | |
| Total Singapore common stocks | | | | | 5,136,052 | | |
| South Africa—0.10% | |
| AngloGold Ashanti Ltd., ADR | | | 13,266 | | | | 556,376 | | |
| South Korea—0.38% | |
| Hyundai Motor Co. | | | 1,870 | | | | 416,036 | | |
| Samsung C&T Corp. | | | 2,719 | | | | 216,123 | | |
| Samsung Electronics Co. Ltd. | | | 1,027 | | | | 820,821 | | |
| Samsung Heavy Industries Co. Ltd. | | | 14,920 | | | | 606,419 | | |
| Total South Korea common stocks | | | | | 2,059,399 | | |
| Spain—0.03% | |
ACS, Actividades de Contruccion y
Servicios SA | | | 681 | | | | 28,700 | | |
| Iberdrola SA | | | 14,012 | | | | 113,620 | | |
| Total Spain common stocks | | | | | 142,320 | | |
| Sweden—0.11% | |
| Sandvik AB | | | 1,600 | | | | 25,426 | | |
| Swedbank AB, A Shares | | | 33,569 | | | | 587,511 | | |
| Total Sweden common stocks | | | | | 612,937 | | |
| Switzerland—0.47% | |
| ABB Ltd.* | | | 1,463 | | | | 34,981 | | |
| Adecco SA* | | | 551 | | | | 33,028 | | |
| Barry Callebaut AG* | | | 377 | | | | 397,635 | | |
| Geberit AG* | | | 181 | | | | 42,656 | | |
| Lonza Group AG* | | | 5,676 | | | | 482,780 | | |
| Nestle SA | | | 1,517 | | | | 96,503 | | |
| Novartis AG | | | 8,465 | | | | 518,926 | | |
| Swiss Re Ltd.* | | | 9,554 | | | | 533,668 | | |
| Syngenta AG* | | | 418 | | | | 133,310 | | |
| Temenos Group AG* | | | 13,650 | | | | 326,783 | | |
| Total Switzerland common stocks | | | | | 2,600,270 | | |
| Taiwan—0.19% | |
| Delta Electronics, Inc. | | | 53,997 | | | | 190,981 | | |
| Delta Electronics, Inc., GDR2 | | | 13,706 | | | | 242,411 | | |
| HON HAI Precision Industry Co. Ltd. | | | 43,677 | | | | 124,646 | | |
| HTC Corp. | | | 8,556 | | | | 254,529 | | |
| MediaTek, Inc. | | | 4,989 | | | | 44,646 | | |
Synnex Technology
International Corp. | | | 9,290 | | | | 23,839 | | |
Taiwan Semiconductor
Manufacturing Co. Ltd. | | | 69,640 | | | | 173,864 | | |
| Total Taiwan common stocks | | | | | 1,054,916 | | |
192
PACE Select Advisors Trust
PACE Alternative Strategies Investments
Portfolio of investments—July 31, 2011
| | | Number of
shares | | Value | |
| Common stocks—(Continued) | |
| Turkey—0.16% | |
| Akbank T.A.S. | | | 18,652 | | | $ | 81,391 | | |
| Arcelik AS | | | 4,630 | | | | 21,172 | | |
| BIM Birlesik Magazalar AS | | | 727 | | | | 24,763 | | |
| Coca-Cola Icecek AS | | | 248 | | | | 3,565 | | |
| Enka Insaat ve Sanayi AS | | | 8,413 | | | | 23,048 | | |
Eregli Demir ve Celik Fabrikalari
TAS (Erdemir) | | | 22,302 | | | | 52,623 | | |
| Haci Omer Sabanci Holding AS | | | 16,628 | | | | 65,236 | | |
| Koc Holding AS | | | 15,533 | | | | 65,030 | | |
| Tupras-Turkiye Petrol Rafinerileri AS | | | 2,558 | | | | 62,235 | | |
Turk Hava Yollari Anonim
Ortakligi (THY)* | | | 28,131 | | | | 52,505 | | |
| Turk Telekomunikasyon AS | | | 12,801 | | | | 54,524 | | |
Turkcell Iletisim Hizmet AS
(Turkcell), ADR* | | | 6,040 | | | | 77,312 | | |
| Turkiye Garanti Bankasi AS | | | 38,789 | | | | 171,071 | | |
| Turkiye Halk Bankasi AS, Class C | | | 4,327 | | | | 30,410 | | |
| Turkiye Is Bankasi (Isbank) | | | 24,158 | | | | 69,283 | | |
| Yapi ve Kredi Bankasi AS* | | | 3,166 | | | | 7,569 | | |
| Total Turkey common stocks | | | | | 861,737 | | |
| United Kingdom—1.91% | |
| Aberdeen Asset Management PLC | | | 100,801 | | | | 363,052 | | |
| Anglo American PLC | | | 1,985 | | | | 93,544 | | |
| Antofagasta PLC | | | 2,660 | | | | 60,920 | | |
| ARM Holdings PLC, ADR | | | 9,300 | | | | 267,747 | | |
| AstraZeneca PLC | | | 38,197 | | | | 1,855,939 | | |
| BG Group PLC | | | 33,672 | | | | 792,029 | | |
| BHP Billiton PLC | | | 16,420 | | | | 616,922 | | |
| Chemring Group PLC | | | 24,260 | | | | 217,625 | | |
| Cookson Group PLC | | | 37,537 | | | | 393,574 | | |
| Croda International PLC | | | 18,474 | | | | 572,777 | | |
Eurasian Natural Resources
Corp. PLC | | | 3,828 | | | | 48,037 | | |
| GKN PLC | | | 98,303 | | | | 359,824 | | |
| Jazztel PLC* | | | 70,710 | | | | 438,052 | | |
| Kazakhmys PLC | | | 2,251 | | | | 49,273 | | |
| Michael Page International PLC | | | 56,855 | | | | 465,632 | | |
| Pearson PLC | | | 30,703 | | | | 588,737 | | |
| Rexam PLC | | | 174,254 | | | | 1,058,307 | | |
| Rio Tinto PLC | | | 2,298 | | | | 160,420 | | |
| Schroders PLC | | | 4,762 | | | | 126,656 | | |
| Telecity Group PLC* | | | 31,194 | | | | 281,852 | | |
| The Weir Group PLC | | | 18,391 | | | | 636,234 | | |
| Tullow Oil PLC | | | 24,305 | | | | 487,009 | | |
| Vedanta Resources PLC | | | 1,292 | | | | 37,200 | | |
| Xstrata PLC | | | 23,866 | | | | 501,463 | | |
Total United Kingdom
common stocks | | | | | 10,472,825 | | |
| United States—15.46% | |
| 3M Co. | | | 1,433 | | | | 124,872 | | |
| ACCO Brands Corp.* | | | 51,600 | | | | 442,212 | | |
| Acuity Brands, Inc. | | | 11,143 | | | | 542,553 | | |
| Advance Auto Parts, Inc.1 | | | 28,500 | | | | 1,566,645 | | |
| AGCO Corp.* | | | 1,256 | | | | 59,560 | | |
| | | Number of
shares | | Value | |
| Common stocks—(Continued) | |
| United States—(Continued) | |
| Alleghany Corp.* | | | 715 | | | $ | 235,528 | | |
| Altera Corp. | | | 19,364 | | | | 791,600 | | |
| Amazon.com, Inc.* | | | 3,700 | | | | 823,324 | | |
American International
Group, Inc.1,* | | | 16,700 | | | | 479,290 | | |
| AmerisourceBergen Corp.1 | | | 53,000 | | | | 2,030,430 | | |
| AMETEK, Inc. | | | 8,300 | | | | 352,750 | | |
| Anadarko Petroleum Corp. | | | 6,945 | | | | 573,379 | | |
| Annaly Capital Management, Inc.1 | | | 71,600 | | | | 1,201,448 | | |
| Apache Corp. | | | 2,900 | | | | 358,788 | | |
| Apple, Inc.* | | | 5,311 | | | | 2,073,839 | | |
| Arbitron, Inc. | | | 28,550 | | | | 1,116,876 | | |
| Archer-Daniels-Midland Co. | | | 5,100 | | | | 154,938 | | |
| AsiaInfo-Linkage, Inc.* | | | 700 | | | | 10,696 | | |
| AT&T, Inc. | | | 19,580 | | | | 572,911 | | |
| AutoZone, Inc.1,* | | | 4,900 | | | | 1,398,705 | | |
| Bank of America Corp. | | | 34,200 | | | | 332,082 | | |
| Belden, Inc. | | | 23,000 | | | | 847,550 | | |
| Berkshire Hathaway, Inc., Class B* | | | 3,700 | | | | 274,429 | | |
| Biogen Idec, Inc.1,* | | | 17,500 | | | | 1,782,725 | | |
| BMC Software, Inc.* | | | 2,900 | | | | 125,338 | | |
| C.H. Robinson Worldwide, Inc. | | | 4,300 | | | | 310,933 | | |
| Carlisle Cos., Inc. | | | 20,000 | | | | 864,600 | | |
| Caterpillar, Inc. | | | 1,606 | | | | 158,657 | | |
| Celgene Corp.* | | | 9,166 | | | | 543,544 | | |
| CenturyLink, Inc. | | | 13,225 | | | | 490,780 | | |
| Cephalon, Inc.1,* | | | 1,600 | | | | 127,904 | | |
| CF Industries Holdings, Inc. | | | 7,697 | | | | 1,195,498 | | |
| Chevron Corp.1 | | | 24,900 | | | | 2,590,098 | | |
| Chipotle Mexican Grill, Inc.1,* | | | 2,100 | | | | 681,618 | | |
| Citigroup, Inc.1 | | | 43,879 | | | | 1,682,321 | | |
| Citrix Systems, Inc.* | | | 4,900 | | | | 352,996 | | |
| Coach, Inc. | | | 3,200 | | | | 206,592 | | |
| Coca-Cola Enterprises, Inc.1 | | | 45,200 | | | | 1,270,572 | | |
| ConocoPhillips1 | | | 3,000 | | | | 215,970 | | |
| CONSOL Energy, Inc. | | | 8,500 | | | | 455,600 | | |
| CSX Corp. | | | 4,692 | | | | 115,282 | | |
| Cummins, Inc. | | | 3,000 | | | | 314,640 | | |
| Deere & Co. | | | 690 | | | | 54,172 | | |
| Deltic Timber Corp. | | | 3,899 | | | | 202,163 | | |
| Dendreon Corp.* | | | 13,187 | | | | 486,600 | | |
| Diebold, Inc. | | | 6,300 | | | | 190,512 | | |
| eBay, Inc.* | | | 7,400 | | | | 242,350 | | |
| Edwards Lifesciences Corp.1,* | | | 3,600 | | | | 256,860 | | |
| Eli Lilly & Co.1 | | | 72,700 | | | | 2,784,410 | | |
| EMC Corp.* | | | 8,000 | | | | 208,640 | | |
| Emerson Electric Co. | | | 1,904 | | | | 93,467 | | |
Endo Pharmaceuticals
Holdings, Inc.* | | | 7,100 | | | | 264,475 | | |
| EOG Resources, Inc. | | | 8,500 | | | | 867,000 | | |
| Exxon Mobil Corp.1 | | | 12,400 | | | | 989,396 | | |
| FedEx Corp. | | | 4,549 | | | | 395,217 | | |
| Fiserv, Inc.* | | | 14,400 | | | | 869,184 | | |
| Flowserve Corp. | | | 370 | | | | 36,771 | | |
| FMC Corp. | | | 3,300 | | | | 288,981 | | |
193
PACE Select Advisors Trust
PACE Alternative Strategies Investments
Portfolio of investments—July 31, 2011
| | | Number of
shares | | Value | |
| Common stocks—(Continued) | |
| United States—(Continued) | |
| Forest Laboratories, Inc.* | | | 3,500 | | | $ | 129,710 | | |
Freeport-McMoRan Copper &
Gold, Inc. | | | 5,438 | | | | 287,996 | | |
| GATX Corp. | | | 17,678 | | | | 697,044 | | |
| General Electric Co. | | | 5,774 | | | | 103,412 | | |
| General Mills, Inc. | | | 4,349 | | | | 162,435 | | |
| General Motors Co.1,* | | | 37,000 | | | | 1,024,160 | | |
| Gilead Sciences, Inc.1,* | | | 12,900 | | | | 546,444 | | |
| Goodrich Corp. | | | 2,400 | | | | 228,336 | | |
| Google, Inc., Class A* | | | 946 | | | | 571,091 | | |
Green Mountain Coffee
Roasters, Inc.* | | | 6,600 | | | | 686,070 | | |
| Halliburton Co. | | | 17,509 | | | | 958,268 | | |
| Hologic, Inc.* | | | 11,000 | | | | 204,270 | | |
| Honeywell International, Inc. | | | 2,474 | | | | 131,369 | | |
| Intrepid Potash, Inc.* | | | 1,193 | | | | 39,667 | | |
| Intuitive Surgical, Inc.* | | | 1,200 | | | | 480,660 | | |
| J.C. Penney Co., Inc.1 | | | 24,800 | | | | 762,848 | | |
| Joy Global, Inc. | | | 3,900 | | | | 366,288 | | |
| JPMorgan Chase & Co. | | | 6,100 | | | | 246,745 | | |
| KBR, Inc. | | | 4,874 | | | | 173,758 | | |
| KeyCorp1 | | | 212,400 | | | | 1,707,696 | | |
| L-3 Communications Holdings, Inc. | | | 688 | | | | 54,435 | | |
| Lear Corp. | | | 2,100 | | | | 102,900 | | |
| Liberty Global, Inc., Series C* | | | 21,800 | | | | 871,346 | | |
| Limited Brands, Inc.1 | | | 19,600 | | | | 742,056 | | |
| Lockheed Martin Corp. | | | 728 | | | | 55,131 | | |
| Lorillard, Inc.1 | | | 2,200 | | | | 233,684 | | |
| Lululemon Athletica, Inc.* | | | 3,400 | | | | 205,836 | | |
| Macy's, Inc.1 | | | 54,900 | | | | 1,584,963 | | |
| Mattel, Inc. | | | 51,200 | | | | 1,364,992 | | |
| Maxim Integrated Products, Inc. | | | 37,300 | | | | 856,408 | | |
Mead Johnson Nutrition Co.,
Class A | | | 7,673 | | | | 547,622 | | |
| Microsoft Corp.1 | | | 96,500 | | | | 2,644,100 | | |
| Molycorp, Inc.* | | | 12,147 | | | | 772,914 | | |
| Monsanto Co. | | | 15,003 | | | | 1,102,420 | | |
| Netflix, Inc.1,* | | | 6,400 | | | | 1,702,336 | | |
| Newmont Mining Corp. | | | 11,996 | | | | 667,098 | | |
| Nordstrom, Inc. | | | 4,100 | | | | 205,656 | | |
| Occidental Petroleum Corp. | | | 8,462 | | | | 830,799 | | |
| ON Semiconductor Corp.* | | | 52,243 | | | | 453,992 | | |
| OpenTable, Inc.* | | | 3,945 | | | | 279,543 | | |
| Pall Corp. | | | 4,000 | | | | 198,320 | | |
| Peabody Energy Corp. | | | 2,800 | | | | 160,916 | | |
| Penn National Gaming, Inc.* | | | 9,172 | | | | 384,582 | | |
| PepsiCo, Inc. | | | 3,098 | | | | 198,396 | | |
| Pfizer, Inc. | | | 39,589 | | | | 761,692 | | |
Pharmaceutical Product
Development, Inc.1 | | | 11,000 | | | | 317,130 | | |
| Plains Exploration & Production Co.* | | | 10,500 | | | | 409,605 | | |
| Precision Castparts Corp. | | | 379 | | | | 61,163 | | |
| Priceline.com, Inc.* | | | 1,000 | | | | 537,650 | | |
| QUALCOMM, Inc. | | | 11,277 | | | | 617,754 | | |
| Ralcorp Holdings, Inc.* | | | 7,300 | | | | 631,450 | | |
| | | Number of
shares | | Value | |
| Common stocks—(Concluded) | |
| United States—(Concluded) | |
| Range Resources Corp. | | | 5,700 | | | $ | 371,412 | | |
| Raytheon Co. | | | 1,914 | | | | 85,613 | | |
| RealD, Inc.* | | | 18,432 | | | | 285,327 | | |
| Safeway, Inc.1 | | | 31,400 | | | | 633,338 | | |
| Salesforce.com, Inc.* | | | 3,600 | | | | 520,956 | | |
| SEACOR Holdings, Inc. | | | 3,850 | | | | 386,386 | | |
| Sirius XM Radio, Inc.* | | | 207,900 | | | | 438,669 | | |
| Skyworks Solutions, Inc.* | | | 8,400 | | | | 212,604 | | |
| Smithfield Foods, Inc.* | | | 5,724 | | | | 126,042 | | |
| Sohu.com, Inc.* | | | 2,423 | | | | 218,312 | | |
| Sotheby's | | | 7,558 | | | | 320,081 | | |
| Southern Copper Corp. | | | 1,909 | | | | 65,211 | | |
| Southwest Airlines Co.1 | | | 163,700 | | | | 1,630,452 | | |
| Teavana Holdings, Inc.* | | | 200 | | | | 5,640 | | |
| Teradata Corp.* | | | 3,660 | | | | 201,154 | | |
| The Boeing Co. | | | 1,536 | | | | 108,242 | | |
| The Charles Schwab Corp. | | | 29,377 | | | | 438,599 | | |
| The Goldman Sachs Group, Inc. | | | 7,735 | | | | 1,043,993 | | |
| The Mosaic Co. | | | 4,665 | | | | 329,909 | | |
| Tiffany & Co. | | | 2,600 | | | | 206,934 | | |
| Time Warner, Inc. | | | 15,793 | | | | 555,282 | | |
| Tyson Foods, Inc., Class A | | | 6,976 | | | | 122,499 | | |
| Union Pacific Corp. | | | 5,835 | | | | 597,971 | | |
| United Parcel Service, Inc., Class B | | | 1,599 | | | | 110,683 | | |
| United Technologies Corp. | | | 1,722 | | | | 142,650 | | |
| UnitedHealth Group, Inc.1 | | | 35,400 | | | | 1,756,902 | | |
| Urban Outfitters, Inc.* | | | 16,071 | | | | 522,950 | | |
| US Bancorp | | | 10,400 | | | | 271,024 | | |
| Valero Energy Corp.1 | | | 36,500 | | | | 916,880 | | |
| Verizon Communications, Inc.1 | | | 9,300 | | | | 328,197 | | |
| Vertex Pharmaceuticals, Inc.* | | | 2,700 | | | | 140,022 | | |
| Virgin Media, Inc. | | | 18,486 | | | | 489,140 | | |
| VMware, Inc., Class A* | | | 5,700 | | | | 571,938 | | |
| Walter Energy, Inc. | | | 2,018 | | | | 247,346 | | |
| Watson Pharmaceuticals, Inc.1,* | | | 7,000 | | | | 469,910 | | |
| Websense, Inc.* | | | 7,300 | | | | 165,564 | | |
| Wells Fargo & Co. | | | 60,949 | | | | 1,702,915 | | |
| Weyerhaeuser Co. | | | 1,224 | | | | 24,468 | | |
| Whiting Petroleum Corp.* | | | 5,700 | | | | 334,020 | | |
| Wynn Resorts Ltd. | | | 1,900 | | | | 291,992 | | |
| Zep, Inc. | | | 12,200 | | | | 228,750 | | |
| Total United States common stocks | | | | | 84,765,404 | | |
Total common stocks
(cost—$182,753,055) | | | | | 189,825,769 | | |
| Preferred stocks—0.15% | |
| Brazil—0.01% | |
| Vale Fertilizantes SA | | | 4,143 | | | | 63,767 | | |
| Germany—0.14% | |
| Henkel AG & Co. KGaA | | | 11,487 | | | | 775,643 | | |
Total preferred stocks
(cost—$767,865) | | | | | 839,410 | | |
194
PACE Select Advisors Trust
PACE Alternative Strategies Investments
Portfolio of investments—July 31, 2011
| | | Number of
shares | | Value | |
| Investment companies—1.18% | |
| United States—1.18% | |
Consumer Discretionary Select
Sector SPDR Fund | | | 13,877 | | | $ | 549,807 | | |
Health Care Select Sector
SPDR Fund | | | 85,477 | | | | 2,919,039 | | |
iShares MSCI South Korea
Index Fund | | | 39,635 | | | | 2,603,227 | | |
| Market Vectors Gold Miners ETF | | | 6,699 | | | | 381,441 | | |
Total investment companies
(cost—$6,332,461) | | | | | 6,453,514 | | |
| | | Face
amount5 | | | |
| US government obligations—5.93% | |
US Treasury Inflation Index Bonds
(TIPS)
1.750%, due 01/15/28 | | | 1,682,281 | | | | 1,885,733 | | |
| 2.125%, due 02/15/40 | | | 1,484,326 | | | | 1,746,635 | | |
| 2.125%, due 02/15/41 | | | 515,885 | | | | 609,453 | | |
| 2.375%, due 01/15/25 | | | 1,450,294 | | | | 1,759,955 | | |
| 3.875%, due 04/15/29 | | | 2,638,714 | | | | 3,846,957 | | |
US Treasury Inflation Index Notes
(TIPS)
0.500%, due 04/15/15 | | | 1,928,681 | | | | 2,041,990 | | |
| 0.625%, due 04/15/13 | | | 2,878,548 | | | | 2,973,450 | | |
| 1.250%, due 07/15/20 | | | 1,346,878 | | | | 1,477,170 | | |
| 1.375%, due 07/15/18 | | | 4,444,428 | | | | 4,961,093 | | |
| 1.625%, due 01/15/15 | | | 673,252 | | | | 739,315 | | |
| 2.375%, due 01/15/17 | | | 1,501,050 | | | | 1,748,372 | | |
| 3.000%, due 07/15/12 | | | 2,638,776 | | | | 2,740,411 | | |
US Treasury Notes
0.625%, due 07/15/14 | | | 6,000,000 | | | | 6,013,140 | | |
Total US government obligations
(cost—$31,425,599) | | | | | 32,543,674 | | |
Federal home loan mortgage corporation
certificates**—0.31% | |
FHLMC
4.500%, due 05/01/23 | | | 17,216 | | | | 18,316 | | |
| 5.000%, due 11/01/16 | | | 7,070 | | | | 7,587 | | |
| 5.000%, due 01/01/17 | | | 13,989 | | | | 15,041 | | |
| 5.000%, due 02/01/17 | | | 33,800 | | | | 36,379 | | |
| 5.000%, due 03/01/17 | | | 25,523 | | | | 27,493 | | |
| 5.000%, due 04/01/17 | | | 59,059 | | | | 63,865 | | |
| 5.000%, due 09/01/17 | | | 168,315 | | | | 181,958 | | |
| 5.000%, due 10/01/17 | | | 371,757 | | | | 401,217 | | |
| 5.000%, due 11/01/17 | | | 290,139 | | | | 311,771 | | |
| 5.000%, due 12/01/17 | | | 80,033 | | | | 86,544 | | |
| 5.000%, due 01/01/18 | | | 35,731 | | | | 38,637 | | |
| 5.000%, due 02/01/18 | | | 119,826 | | | | 129,510 | | |
| 5.000%, due 03/01/18 | | | 61,775 | | | | 66,800 | | |
| 5.000%, due 04/01/18 | | | 49,949 | | | | 54,011 | | |
| 5.000%, due 05/01/18 | | | 19,404 | | | | 20,983 | | |
| 5.000%, due 06/01/18 | | | 20,068 | | | | 21,700 | | |
| 5.000%, due 07/01/18 | | | 50,752 | | | | 54,882 | | |
| 5.000%, due 08/01/18 | | | 18,577 | | | | 20,090 | | |
| | | Face
amount5 | | Value | |
Federal home loan mortgage corporation
certificates**—(Concluded) | |
| 5.000%, due 10/01/18 | | | 8,244 | | | $ | 8,915 | | |
| 5.000%, due 11/01/18 | | | 13,605 | | | | 14,712 | | |
| 5.500%, due 01/01/20 | | | 115,416 | | | | 125,558 | | |
Total federal home loan mortgage
corporation certificates
(cost—$1,672,064) | | | | | 1,705,969 | | |
Federal national mortgage association
certificates**—3.96% | |
FNMA
2.800%, due 03/01/18 | | | 298,123 | | | | 300,059 | | |
| 3.375%, due 11/01/20 | | | 298,464 | | | | 299,746 | | |
| 3.416%, due 10/01/20 | | | 199,003 | | | | 200,517 | | |
| 3.500%, due 03/01/41 | | | 4,964,470 | | | | 4,859,807 | | |
| 3.632%, due 12/01/20 | | | 99,517 | | | | 101,477 | | |
| 3.840%, due 05/01/18 | | | 210,000 | | | | 221,553 | | |
| 4.000%, due 12/01/40 | | | 66,403 | | | | 67,535 | | |
| 4.250%, due 01/01/21 | | | 297,972 | | | | 315,570 | | |
| 4.270%, due 01/01/21 | | | 298,011 | | | | 315,981 | | |
| 4.290%, due 02/01/21 | | | 198,917 | | | | 210,987 | | |
| 4.301%, due 01/01/21 | | | 298,762 | | | | 317,823 | | |
| 5.000%, due 09/01/17 | | | 22,676 | | | | 24,517 | | |
| 5.000%, due 10/01/17 | | | 200,714 | | | | 217,014 | | |
| 5.000%, due 12/01/17 | | | 1,061,837 | | | | 1,148,062 | | |
| 5.000%, due 01/01/18 | | | 513,908 | | | | 555,641 | | |
| 5.000%, due 02/01/18 | | | 544,745 | | | | 588,980 | | |
| 5.000%, due 03/01/18 | | | 338,209 | | | | 365,674 | | |
| 5.000%, due 04/01/18 | | | 511,535 | | | | 551,104 | | |
| 5.000%, due 05/01/18 | | | 41,392 | | | | 44,753 | | |
| 5.000%, due 06/01/18 | | | 40,667 | | | | 43,970 | | |
| 5.000%, due 01/01/20 | | | 12,277 | | | | 13,282 | | |
| 6.000%, due 03/01/32 | | | 147 | | | | 164 | | |
| 6.000%, due 05/01/33 | | | 5,218 | | | | 5,810 | | |
| 6.000%, due 12/01/33 | | | 2,992 | | | | 3,328 | | |
| 6.000%, due 08/01/35 | | | 503 | | | | 557 | | |
FNMA ARM
2.663%, due 11/01/34 | | | 781,719 | | | | 826,088 | | |
| 2.678%, due 04/01/37 | | | 1,838,988 | | | | 1,936,034 | | |
FNMA TBA
3.500% | | | 4,000,000 | | | | 4,111,875 | | |
| 4.000% | | | 4,000,000 | | | | 4,052,187 | | |
Total federal national mortgage
association certificates
(cost—$21,359,823) | | | | | 21,700,095 | | |
| Collateralized mortgage obligations—3.32% | |
American Home Mortgage Assets,
Series 2006-3, Class 1A1
1.233%, due 10/25/466 | | | 619,017 | | | | 385,114 | | |
Series 2006-3, Class 2A11
1.203%, due 10/25/466 | | | 668,910 | | | | 354,682 | | |
Series 2006-4, Class 1A11
0.377%, due 10/25/466 | | | 1,077,625 | | | | 559,744 | | |
Series 2007-1, Class A1
0.963%, due 02/25/476 | | | 652,244 | | | | 317,636 | | |
195
PACE Select Advisors Trust
PACE Alternative Strategies Investments
Portfolio of investments—July 31, 2011
| | | Face
amount5 | | Value | |
| Collateralized mortgage obligations—(Continued) | |
American Home Mortgage
Investment Trust,
Series 2004-3, Class 1A
0.557%, due 10/25/346 | | | 22,610 | | | $ | 20,433 | | |
Series 2005-4, Class 1A1
0.477%, due 11/25/456 | | | 803,995 | | | | 510,038 | | |
Arkle Master Issuer PLC,
Series 2010-2A, Class 1A1
1.661%, due 05/17/606,7 | | | 500,000 | | | | 499,797 | | |
Series 2011-1A, Class 2A
1.534%, due 05/17/606,7 | | | 500,000 | | | | 500,350 | | |
Banc of America Funding Corp.,
Series 2007-D, Class 1A5
0.466% , due 06/20/476 | | | 600,000 | | | | 307,496 | | |
Citimortgage Alternative Loan Trust,
Series 2006-A7, Class 1A12
6.000% , due 12/25/36 | | | 934,779 | | | | 674,019 | | |
Countrywide Alternative Loan Trust,
Series 2005-61, Class 1A1
0.447%, due 12/25/356 | | | 917,024 | | | | 664,167 | | |
Series 2006-23CB, Class 1A6
6.000%, due 08/25/36 | | | 255,945 | | | | 175,282 | | |
Series 2006-5T2, Class A3
6.000%, due 04/25/36 | | | 690,014 | | | | 517,561 | | |
Countrywide Home Loan
Mortgage Pass Through Trust.
Series 2007-14, Class A19
6.000% , due 09/25/37 | | | 566,117 | | | | 524,780 | | |
Credit Suisse Mortgage Capital
Certificates,
Series 2006-8, Class 4A1
6.500% , due 10/25/21 | | | 829,503 | | | | 639,192 | | |
Downey Savings & Loan
Association Mortgage Loan Trust,
Series 2004-AR2, Class A2A
0.577%, due 11/19/446 | | | 1,047,947 | | | | 719,513 | | |
Series 2006-AR2, Class 2A1A
0.387%, due 11/19/376 | | | 505,951 | | | | 326,725 | | |
FHLMC Multifamily Structured
Pass Through Certificates**,
Series K011, Class A2
4.084% , due 11/25/206 | | | 400,000 | | | | 416,700 | | |
FHLMC REMIC**,
Seres 2882, Class UL
4.500% , due 02/15/19 | | | 2,419,397 | | | | 2,525,335 | | |
FNMA REMIC**,
Series 2009-70, Class AL
5.000% , due 08/25/19 | | | 1,296,240 | | | | 1,402,953 | | |
Fosse Master Issuer PLC,
Series 2011-1A, Class A2
1.650% , due 10/18/546,7 | | | 500,000 | | | | 500,422 | | |
Greenpoint Mortgage Funding
Trust, Series 2007-AR3, Class A1
0.407% , due 06/25/376 | | | 512,822 | | | | 351,621 | | |
| | | Face
amount5 | | Value | |
| Collateralized mortgage obligations—(Concluded) | |
Harborview Mortgage Loan Trust,
Series 2005-9, Class 2A1A
0.526% , due 06/20/356 | | | 498,649 | | | $ | 397,570 | | |
Holmes Master Issuer PLC,
Series 2010-1A, Class A2
1.649% , due 10/15/546,7 | | | 100,000 | | | | 100,145 | | |
Lehman Mortgage Trust,
Series 2006-8, Class 2A1
0.607% , due 12/25/366 | | | 1,172,614 | | | | 546,621 | | |
NCUA Guaranteed Notes,
Series 2011-R4, Class 1A
0.581%, due 03/06/206 | | | 455,532 | | | | 455,532 | | |
Series 2011-R5, Class 1A
0.581%, due 04/06/206 | | | 460,401 | | | | 460,743 | | |
Series 2011-R6, Class 1A
0.581%, due 05/07/206 | | | 460,686 | | | | 460,686 | | |
Permanent Master Issuer PLC,
Series 2011-1A, Class 1A3
2.905% , due 07/15/426,7 | | EUR | 400,000 | | | | 572,929 | | |
Residential Accredit Loans, Inc.,
Series 2007-QH9, Class A1
6.475% , due 11/25/376 | | | 483,486 | | | | 233,346 | | |
Residential Asset Securitization
Trust, Series 2007-A2, Class 1A3
6.000% , due 04/25/37 | | | 741,943 | | | | 586,684 | | |
Sequoia Mortgage Trust,
Series 2004-10, Class A3A
0.765% , due 11/20/346 | | | 101,232 | | | | 88,655 | | |
WaMu Mortgage Pass Through
Certificates,
Series 2007-OA6, Class 1A
1.073% , due 07/25/476 | | | 760,000 | | | | 495,104 | | |
Wells Fargo Alternative Loan Trust,
Series 2007-PA2, Class 1A1
6.000% , due 06/25/37 | | | 1,111,015 | | | | 925,871 | | |
Total collateralized mortgage
obligations
(cost—$20,716,085) | | | | | 18,217,446 | | |
| Asset-backed securities—3.64% | |
Access Group, Inc.,
Series 2002-1, Class A2
0.427%, due 09/25/256 | | | 369,022 | | | | 368,112 | | |
Series 2003-1, Class A2
0.507%, due 12/27/166 | | | 426,118 | | | | 425,479 | | |
AH Mortgage Advance Trust,
Series SART-1, Class A1
2.630% , due 05/10/427 | | | 300,000 | | | | 300,750 | | |
Ally Master Owner Trust,
Series 2010-1, Class A
1.957% , due 01/15/156,7 | | | 800,000 | | | | 813,594 | | |
Bank of America Auto Trust,
Series 2009-2A, Class A3
2.130% , due 09/15/138,9 | | | 594,341 | | | | 597,499 | | |
BMW Floorplan Master Owner
Trust, Series 2009-1A, Class A
1.357% , due 09/15/146,7 | | | 500,000 | | | | 504,358 | | |
196
PACE Select Advisors Trust
PACE Alternative Strategies Investments
Portfolio of investments—July 31, 2011
| | | Face
amount5 | | Value | |
| Asset-backed securities—(Continued) | |
Brazos Higher Education
Authority, Inc.,
Series 2005-1, Class 1A2
0.327%, due 12/26/186 | | | 640,500 | | | $ | 634,972 | | |
Series 2005-2, Class A9
0.347%, due 12/26/176 | | | 766,603 | | | | 762,935 | | |
Series 2005-2, Class A10
0.367%, due 12/26/196 | | | 600,000 | | | | 585,571 | | |
Series 2005-3, Class A14
0.357%, due 09/25/236 | | | 348,107 | | | | 344,475 | | |
Series 2011-2, Class A2
1.097%, due 07/25/296 | | | 600,000 | | | | 594,683 | | |
Brazos Student Loan Finance Corp.,
Series 2010-1, Class A1
1.147% , due 06/25/356 | | | 833,245 | | | | 827,737 | | |
College Loan Corp. Trust,
Series 2004-1, Class A3
0.413%, due 04/25/216 | | | 817,249 | | | | 815,416 | | |
Series 2005-1, Class A2
0.353%, due 07/25/246 | | | 1,000,000 | | | | 994,757 | | |
Series 2005-2, Class A2
0.359%, due 10/15/216 | | | 180,534 | | | | 179,706 | | |
Collegiate Funding Services
Education Loan Trust,
Series 2003-A, Class A2
0.546% , due 09/28/206 | | | 68,205 | | | | 68,197 | | |
Education Funding Capital Trust,
Series 2003-3, Class A3
0.517%, due 03/16/206 | | | 424,100 | | | | 423,944 | | |
Series 2004-1, Class A2
0.407%, due 12/15/226 | | | 438,342 | | | | 435,079 | | |
Educational Funding of the
South, Inc.,
Series 2011-1, Class A2
0.903% , due 04/25/356 | | | 700,000 | | | | 660,010 | | |
Ford Credit Floorplan Master
Owner Trust,
Series 2009-2, Class A
1.757%, due 09/15/146 | | | 500,000 | | | | 506,313 | | |
Series 2010-1, Class A
1.857%, due 12/15/146,7 | | | 1,400,000 | | | | 1,423,094 | | |
GCO Education Loan Funding Trust,
Series 2005-1, Class A3L
0.337% , due 11/25/206 | | | 661,277 | | | | 659,249 | | |
GMAC Mortgage Corp. Loan Trust,
Series 2007-HE3, Class 1A1
7.000%, due 09/25/37 | | | 43,103 | | | | 32,230 | | |
Series 2007-HE3, Class 2A1
7.000%, due 09/25/37 | | | 83,177 | | | | 60,648 | | |
Household Home Equity Loan Trust,
Series 2007-3, Class APT
1.386% , due 11/20/366 | | | 254,201 | | | | 224,600 | | |
Nelnet Student Loan Corp.,
Series 2004-2A, Class A3
0.357% , due 11/25/156 | | | 52,515 | | | | 52,505 | | |
| | | Face
amount5 | | Value | |
| Asset-backed securities—(Concluded) | |
Northstar Education Finance, Inc.,
Series 2004-1, Class A3
0.423%, due 04/28/176 | | | 122,500 | | | $ | 122,366 | | |
Series 2004-2, Class A1
0.373%, due 04/28/166 | | | 577,576 | | | | 560,411 | | |
Penarth Master Issuer,
Series 2011-1A, Class A1
0.837% , due 05/18/156,7 | | | 600,000 | | | | 599,149 | | |
SLM Student Loan Trust,
Series 2004-9, Class A4
0.383%, due 04/25/176 | | | 132,127 | | | | 132,050 | | |
Series 2007-1, Class A3
0.283%, due 07/25/186 | | | 1,298,113 | | | | 1,293,184 | | |
Series 2007-2, Class A2
0.253%, due 07/25/176 | | | 356,540 | | | | 353,440 | | |
Series 2011-2, Class A2
1.387%, due 10/25/346 | | | 100,000 | | | | 100,077 | | |
Student Loan Consolidation Center,
Series 2011-1, Class A
1.407% , due 10/25/276,7 | | | 289,693 | | | | 290,612 | | |
Suntrust Student Loan Trust,
Series 2006-1A, Class A2
0.353% , due 07/28/206,7 | | | 432,730 | | | | 430,975 | | |
US Education Loan Trust LLC,
Series 2006-1, Class A2
0.384% , due 03/01/256,7 | | | 397,096 | | | | 395,566 | | |
Wachovia Student Loan Trust,
Series 2005-1, Class A4
0.363% , due 07/27/206 | | | 993,809 | | | | 987,449 | | |
World Financial Network Credit
Card Master Trust,
Series 2006-A, Class A
0.337%, due 02/15/176,7 | | | 1,000,000 | | | | 989,261 | | |
Series 2009-B, Class A
3.790%, due 05/15/16 | | | 400,000 | | | | 409,159 | | |
Total asset-backed securities
(cost—$19,997,561) | | | | | 19,959,612 | | |
| Corporate notes—9.87% | |
| Australia—0.14% | |
Australia & New Zealand Banking
Group Ltd.
3.750%, due 03/10/17 | | EUR | 80,000 | | | | 116,277 | | |
| 5.125%, due 09/10/19 | | EUR | 60,000 | | | | 88,740 | | |
FMG Resources August 2006
Pty Ltd.
6.875%, due 02/01/187 | | | 325,000 | | | | 338,000 | | |
National Australia Bank Ltd.
3.750%, due 01/06/17 | | EUR | 119,000 | | | | 173,341 | | |
Santos Finance Ltd.
8.250%, due 09/22/706 | | EUR | 50,000 | | | | 72,474 | | |
| Total Australia corporate notes | | | | | 788,832 | | |
| Austria—0.02% | |
PE Paper Escrow GmbH
12.000%, due 08/01/147 | | | 100,000 | | | | 113,500 | | |
197
PACE Select Advisors Trust
PACE Alternative Strategies Investments
Portfolio of investments—July 31, 2011
| | | Face
amount5 | | Value | |
| Corporate notes—(Continued) | |
| Belgium—0.06% | |
Anheuser-Busch InBev SA
6.570%, due 02/27/14 | | EUR | 150,000 | | | $ | 237,047 | | |
Fortis Bank SA/N.V.
4.625%, due 10/27/142,6,10 | | EUR | 50,000 | | | | 62,182 | | |
| Total Belgium corporate notes | | | | | 299,229 | | |
| Bermuda—0.02% | |
Digicel Ltd.
8.250%, due 09/01/177 | | | 125,000 | | | | 129,713 | | |
| Canada—0.03% | |
TransCanada PipeLines Ltd.
6.350%, due 05/15/676 | | | 175,000 | | | | 179,253 | | |
| Cayman Islands—0.21% | |
Hutchison Whampoa Finance 09 Ltd.
4.750%, due 11/14/16 | | EUR | 50,000 | | | | 75,610 | | |
MUFG Capital Finance 1 Ltd.
6.346%, due 07/25/166,10 | | | 300,000 | | | | 314,061 | | |
MUFG Capital Finance 4 Ltd.
5.271%, due 01/25/176,10 | | EUR | 60,000 | | | | 82,550 | | |
Resona Preferred Global Securities
Cayman Ltd.
7.191%, due 07/30/156,7,10 | | | 425,000 | | | | 436,605 | | |
Thames Water Utilities Ltd.
3.250%, due 11/09/16 | | EUR | 50,000 | | | | 72,076 | | |
UPCB Finance III Ltd.
6.625%, due 07/01/207 | | | 150,000 | | | | 150,375 | | |
| Total Cayman Islands corporate notes | | | | | 1,131,277 | | |
| Czech Republic—0.03% | |
CEZ AS
4.500%, due 06/29/20 | | EUR | 100,000 | | | | 145,617 | | |
| Denmark—0.13% | |
AP Moller - Maersk A/S
4.375%, due 11/24/17 | | EUR | 60,000 | | | | 88,748 | | |
Carlsberg Breweries A/S
6.000%, due 05/28/14 | | EUR | 50,000 | | | | 77,894 | | |
Danske Bank A/S
4.100%, due 03/16/186 | | EUR | 60,000 | | | | 80,196 | | |
| 4.750%, due 06/04/14 | | EUR | 100,000 | | | | 149,758 | | |
Dong Energy A/S
4.875%, due 05/07/14 | | EUR | 80,000 | | | | 121,800 | | |
| 7.750%, due 06/01/30106 | | EUR | 25,000 | | | | 38,350 | | |
TDC A/S
4.375%, due 02/23/182 | | EUR | 100,000 | | | | 149,164 | | |
| Total Denmark corporate notes | | | | | 705,910 | | |
| France—0.90% | |
Alstom SA
4.000%, due 09/23/14 | | EUR | 100,000 | | | | 148,785 | | |
Areva SA
3.875%, due 09/23/16 | | EUR | 100,000 | | | | 144,453 | | |
ASF
7.375%, due 03/20/19 | | EUR | 50,000 | | | | 88,648 | | |
| | | Face
amount5 | | Value | |
| Corporate notes—(Continued) | |
| France—(Concluded) | |
AXA SA
4.500%, due 01/23/15 | | EUR | 50,000 | | | $ | 75,612 | | |
| 5.250%, due 04/16/406 | | EUR | 100,000 | | | | 133,129 | | |
BNP Paribas SA
3.500%, due 03/07/16 | | EUR | 100,000 | | | | 144,869 | | |
Bouygues SA
3.641%, due 10/29/19 | | EUR | 100,000 | | | | 142,727 | | |
Carrefour SA
3.875%, due 04/25/21 | | EUR | 50,000 | | | | 69,536 | | |
Casino Guichard-Perrachon SA
4.379%, due 02/08/17 | | EUR | 200,000 | | | | 293,675 | | |
Cie de Financement Foncier
1.625%, due 07/23/127 | | | 100,000 | | | | 100,724 | | |
| 2.125%, due 04/22/137 | | | 500,000 | | | | 507,402 | | |
CNP Assurances
6.875%, due 09/30/416 | | EUR | 100,000 | | | | 141,385 | | |
Credit Agricole SA
3.900%, due 04/19/21 | | EUR | 100,000 | | | | 127,125 | | |
Electricite de France
6.250%, due 01/25/21 | | EUR | 100,000 | | | | 172,702 | | |
France Telecom SA
3.375%, due 09/16/22 | | EUR | 50,000 | | | | 67,639 | | |
| 4.125%, due 01/23/19 | | EUR | 100,000 | | | | 149,104 | | |
| 8.125%, due 01/28/33 | | EUR | 50,000 | | | | 98,979 | | |
GDF Suez
3.500%, due 10/18/22 | | EUR | 100,000 | | | | 140,394 | | |
Lafarge SA
5.375%, due 11/29/1811 | | EUR | 65,000 | | | | 95,346 | | |
| 8.875%, due 05/27/1411 | | EUR | 60,000 | | | | 96,710 | | |
Lagardere SCA
4.875%, due 10/06/14 | | EUR | 50,000 | | | | 74,192 | | |
PPR
3.750%, due 04/08/15 | | EUR | 170,000 | | | | 251,261 | | |
RCI Banque SA
2.875%, due 07/23/12 | | EUR | 140,000 | | | | 201,377 | | |
| 3.250%, due 01/17/142 | | EUR | 30,000 | | | | 43,217 | | |
| 4.000%, due 01/25/16 | | EUR | 50,000 | | | | 71,590 | | |
Schneider Electric SA
3.750%, due 07/12/18 | | EUR | 100,000 | | | | 146,370 | | |
Societe Fonciere Lyonnaise SA
4.625%, due 05/25/16 | | EUR | 100,000 | | | | 145,508 | | |
Societe Generale SA
3.750%, due 08/21/14 | | EUR | 150,000 | | | | 220,279 | | |
| 4.750%, due 03/02/21 | | EUR | 100,000 | | | | 146,409 | | |
| 9.375%, due 09/04/196,10 | | EUR | 50,000 | | | | 74,720 | | |
Suez Environnement Co.
4.125%, due 06/24/22 | | EUR | 50,000 | | | | 74,515 | | |
| 4.820%, due 09/12/156,10 | | EUR | 50,000 | | | | 70,408 | | |
Unibail-Rodamco SE
3.375%, due 03/11/15 | | EUR | 90,000 | | | | 131,736 | | |
Veolia Environnement
5.250%, due 04/24/14 | | EUR | 160,000 | | | | 246,163 | | |
Vivendi SA
4.250%, due 12/01/16 | | EUR | 50,000 | | | | 74,266 | | |
| Total France corporate notes | | | | | 4,910,955 | | |
198
PACE Select Advisors Trust
PACE Alternative Strategies Investments
Portfolio of investments—July 31, 2011
| | | Face
amount5 | | Value | |
| Corporate notes—(Continued) | |
| Germany—0.16% | |
Commerzbank AG
7.750%, due 03/16/21 | | EUR | 100,000 | | | $ | 143,468 | | |
Metro AG
4.250%, due 02/22/17 | | EUR | 100,000 | | | | 148,785 | | |
Muenchener
Rueckversicherungs AG
5.767%, due 06/12/176,10 | | EUR | 100,000 | | | | 133,273 | | |
RWE AG
4.625%, due 09/28/156,10 | | EUR | 75,000 | | | | 103,457 | | |
Thyssenkrupp AG
8.000%, due 06/18/14 | | EUR | 120,000 | | | | 194,528 | | |
Volkswagen Leasing GmbH
2.750%, due 07/13/15 | | EUR | 100,000 | | | | 143,312 | | |
| Total Germany corporate notes | | | | | 866,823 | | |
| Ireland—0.28% | |
Ardagh Glass Finance PLC
9.250%, due 07/01/162 | | EUR | 50,000 | | | | 76,874 | | |
Banesto Financial Product PLC
4.000%, due 05/08/12 | | EUR | 60,000 | | | | 86,605 | | |
Bord Gais Eireann
6.250%, due 06/16/1411 | | EUR | 50,000 | | | | 68,832 | | |
GE Capital European Funding
2.875%, due 09/17/15 | | EUR | 40,000 | | | | 57,400 | | |
| 3.750%, due 04/04/16 | | EUR | 100,000 | | | | 146,572 | | |
| 5.250%, due 01/31/13 | | EUR | 200,000 | | | | 299,272 | | |
| 6.000%, due 01/15/19 | | EUR | 150,000 | | | | 242,188 | | |
LeasePlan Finance N.V.
3.750%, due 03/18/13 | | EUR | 60,000 | | | | 86,947 | | |
Smurfit Kappa Acquisitions
7.250%, due 11/15/172 | | EUR | 60,000 | | | | 87,076 | | |
The Governor & Co. of the
Bank of Ireland
2.750%, due 03/02/128,9 | | | 180,000 | | | | 169,198 | | |
| 4.625%, due 04/08/13 | | EUR | 20,000 | | | | 25,002 | | |
Vimpel Communications
7.748%, due 02/02/217 | | | 200,000 | | | | 206,286 | | |
| Total Ireland corporate notes | | | | | 1,552,252 | | |
| Italy—0.37% | |
Assicurazioni Generali SpA MTN
5.125%, due 09/16/24 | | EUR | 50,000 | | | | 69,885 | | |
Atlantia SpA
5.625%, due 05/06/16 | | EUR | 110,000 | | | | 169,419 | | |
Banco Popolare SC
4.000%, due 04/06/13 | | EUR | 100,000 | | | | 140,795 | | |
| 6.000%, due 11/05/20 | | EUR | 70,000 | | | | 87,918 | | |
Enel SpA
5.250%, due 01/14/15 | | EUR | 230,000 | | | | 349,407 | | |
ENI SpA
3.500%, due 01/29/18 | | EUR | 50,000 | | | | 69,744 | | |
Intesa Sanpaolo SpA
3.375%, due 01/19/15 | | EUR | 150,000 | | | | 207,084 | | |
| 5.750%, due 05/28/186 | | EUR | 150,000 | | | | 214,916 | | |
| 8.375%, due 10/14/196,10 | | EUR | 50,000 | | | | 67,175 | | |
| | | Face
amount5 | | Value | |
| Corporate notes—(Continued) | |
| Italy—(Concluded) | |
Telecom Italia SpA
6.750%, due 03/21/13 | | EUR | 80,000 | | | $ | 121,834 | | |
| 8.250%, due 03/21/16 | | EUR | 60,000 | | | | 97,106 | | |
UniCredit SpA
4.250%, due 07/31/18 | | EUR | 100,000 | | | | 137,903 | | |
| 5.250%, due 04/30/232 | | EUR | 100,000 | | | | 144,055 | | |
| 6.125%, due 04/19/21 | | EUR | 130,000 | | | | 172,841 | | |
| Total Italy corporate notes | | | | | 2,050,082 | | |
| Jersey—0.10% | |
ASIF III Jersey Ltd.
4.750%, due 09/11/13 | | EUR | 50,000 | | | | 73,403 | | |
BAA Funding Ltd.
3.975%, due 02/15/122 | | EUR | 90,000 | | | | 130,337 | | |
| 4.125%, due 10/12/16 | | EUR | 50,000 | | | | 73,072 | | |
HSBC Capital Funding LP
5.130%, due 03/29/166,10 | | EUR | 60,000 | | | | 80,826 | | |
QBE Capital Funding III Ltd
7.250%, due 05/24/416,7 | | | 200,000 | | | | 203,829 | | |
| Total Jersey corporate notes | | | | | 561,467 | | |
| Luxembourg—0.38% | |
ArcelorMittal
8.250%, due 06/03/13 | | EUR | 50,000 | | | | 78,654 | | |
| 9.375%, due 06/03/16 | | EUR | 50,000 | | | | 87,671 | | |
Fiat Finance & Trade Ltd. SA
9.000%, due 07/30/12 | | EUR | 60,000 | | | | 89,447 | | |
Fiat Industrial Finance Europe SA
6.250%, due 03/09/18 | | EUR | 100,000 | | | | 139,379 | | |
Finmeccanica Finance
5.750%, due 12/12/18 | | EUR | 60,000 | | | | 91,032 | | |
FMC Finance VII SA
5.250%, due 02/15/212 | | EUR | 60,000 | | | | 83,628 | | |
Gazprom (Gaz Capital SA)
8.125%, due 02/04/15 | | EUR | 50,000 | | | | 81,472 | | |
| 9.250%, due 04/23/192 | | | 250,000 | | | | 320,625 | | |
Intelsat Jackson Holdings SA
7.250%, due 04/01/197 | | | 400,000 | | | | 405,000 | | |
Wind Acquisition Finance SA
7.250%, due 02/15/187 | | | 400,000 | | | | 399,000 | | |
| 7.375%, due 02/15/182 | | EUR | 100,000 | | | | 142,612 | | |
Zinc Capital SA
8.875%, due 05/15/182 | | EUR | 100,000 | | | | 142,253 | | |
| Total Luxembourg corporate notes | | | | | 2,060,773 | | |
| Mexico—0.24% | |
America Movil SAB de C.V.
3.750%, due 06/28/17 | | EUR | 100,000 | | | | 145,730 | | |
Bank of New York Mellon SA
Institucion de Banca Multiple
9.625%, due 05/02/217 | | | 200,000 | | | | 206,220 | | |
BBVA Bancomer SA Texas
7.250%, due 04/22/207 | | | 325,000 | | | | 344,656 | | |
199
PACE Select Advisors Trust
PACE Alternative Strategies Investments
Portfolio of investments—July 31, 2011
| | | Face
amount5 | | Value | |
| Corporate notes—(Continued) | |
| Mexico—(Concluded) | |
Cemex SAB de C.V.
5.246%, due 09/30/156,7 | | | 540,000 | | | $ | 496,800 | | |
| 9.000%, due 01/11/188,9 | | | 100,000 | | | | 94,000 | | |
| Total Mexico corporate notes | | | | | 1,287,406 | | |
| Netherlands—0.81% | |
ABN Amro Bank N.V.
4.250%, due 04/11/16 | | EUR | 100,000 | | | | 146,270 | | |
| 6.375%, due 04/27/21 | | EUR | 100,000 | | | | 146,424 | | |
Allianz Finance II BV
4.750%, due 07/22/19 | | EUR | 50,000 | | | | 76,522 | | |
| 5.750%, due 07/08/416 | | EUR | 100,000 | | | | 138,369 | | |
| 6.125%, due 05/31/226 | | EUR | 100,000 | | | | 144,030 | | |
BMW Finance N.V.
3.625%, due 01/29/18 | | EUR | 100,000 | | | | 145,929 | | |
| 4.000%, due 09/17/14 | | EUR | 100,000 | | | | 149,648 | | |
Conti-Gummi Finance BV
7.500%, due 09/15/172 | | EUR | 50,000 | | | | 74,672 | | |
Daimler International Finance BV
7.875%, due 01/16/14 | | EUR | 170,000 | | | | 274,883 | | |
Deutsche Telekom International
Finance BV
6.000%, due 01/20/17 | | EUR | 100,000 | | | | 162,472 | | |
E.ON International Finance BV
5.250%, due 09/08/15 | | EUR | 40,000 | | | | 62,988 | | |
EDP Finance BV
5.500%, due 02/18/14 | | EUR | 80,000 | | | | 107,024 | | |
ELM BV (Swiss Reinsurance Co.)
5.252%, due 05/25/166,10 | | EUR | 50,000 | | | | 62,864 | | |
Elsevier Finance (ELM BV)
6.500%, due 04/02/13 | | EUR | 50,000 | | | | 76,540 | | |
Eureko BV
7.375%, due 06/16/14 | | EUR | 50,000 | | | | 79,515 | | |
HeidelbergCement Finance BV
8.000%, due 01/31/17 | | EUR | 90,000 | | | | 139,990 | | |
ING Bank N.V.
2.500%, due 01/14/167 | | | 600,000 | | | | 596,140 | | |
| 3.375%, due 03/03/15 | | EUR | 120,000 | | | | 174,021 | | |
| 4.625%, due 03/15/196 | | EUR | 60,000 | | | | 86,687 | | |
KBC IFIMA N.V.
3.875%, due 03/31/15 | | EUR | 90,000 | | | | 126,578 | | |
| 4.375%, due 10/26/15 | | EUR | 100,000 | | | | 141,794 | | |
Koninklijke KPN N.V.
4.750%, due 01/17/17 | | EUR | 120,000 | | | | 183,481 | | |
LeasePlan Corp. N.V.
3.875%, due 09/16/15 | | EUR | 50,000 | | | | 71,754 | | |
Linde Finance BV
7.375%, due 07/14/666 | | EUR | 60,000 | | | | 95,266 | | |
Metro Finance BV
9.375%, due 11/28/13 | | EUR | 50,000 | | | | 82,913 | | |
OI European Group BV
6.750%, due 09/15/202 | | EUR | 100,000 | | | | 142,253 | | |
Portugal Telecom International
Finance BV
3.750%, due 03/26/12 | | EUR | 100,000 | | | | 141,392 | | |
| | | Face
amount5 | | Value | |
| Corporate notes—(Continued) | |
| Netherlands—(Concluded) | |
Rabobank Nederland
8.375%, due 07/26/166,10 | | | 110,000 | | | $ | 117,975 | | |
RWE Finance BV
4.625%, due 07/23/14 | | EUR | 100,000 | | | | 152,510 | | |
Schlumberger Finance BV
2.750%, due 12/01/15 | | EUR | 50,000 | | | | 72,134 | | |
SNS Bank N.V.
3.625%, due 07/18/13 | | EUR | 10,000 | | | | 14,320 | | |
Telefonica Europe BV
5.875%, due 02/14/33 | | EUR | 50,000 | | | | 71,443 | | |
Ziggo Bond Co.
8.000%, due 05/15/182 | | EUR | 60,000 | | | | 88,154 | | |
Ziggo Finance BV
6.125%, due 11/15/172 | | EUR | 50,000 | | | | 70,408 | | |
| Total Netherlands corporate notes | | | | | 4,417,363 | | |
| New Zealand—0.06% | |
Westpac Securities NZ Ltd.
3.875%, due 03/20/17 | | EUR | 220,000 | | | | 319,121 | | |
| Norway—0.59% | |
DnB NOR Bank ASA
4.375%, due 02/24/212 | | EUR | 110,000 | | | | 160,446 | | |
DnB NOR Boligkreditt
2.100%, due 10/14/157 | | | 1,200,000 | | | | 1,205,602 | | |
| 2.900%, due 03/29/167 | | | 800,000 | | | | 824,774 | | |
Nordea Eiendomskreditt AS
1.875%, due 04/07/147 | | | 200,000 | | | | 203,036 | | |
Sparebank 1 Boligkreditt AS
2.625%, due 05/27/167 | | | 800,000 | | | | 812,216 | | |
| Total Norway corporate notes | | | | | 3,206,074 | | |
| Spain—0.28% | |
Banco Bilbao Vizcaya Argentaria SA
4.250%, due 03/30/15 | | EUR | 100,000 | | | | 141,934 | | |
BBVA Senior Finance SA
3.250%, due 04/23/15 | | EUR | 100,000 | | | | 136,359 | | |
Gas Natural Capital
4.125%, due 01/26/18 | | EUR | 100,000 | | | | 135,064 | | |
Iberdrola Finanzas SAU
3.875%, due 02/10/14 | | EUR | 100,000 | | | | 145,260 | | |
| 4.625%, due 04/07/17 | | EUR | 100,000 | | | | 146,653 | | |
| 4.875%, due 03/04/14 | | EUR | 100,000 | | | | 148,523 | | |
Santander International Debt SA
3.500%, due 08/12/14 | | EUR | 100,000 | | | | 140,775 | | |
Santander Issuances
5.435%, due 10/24/176 | | EUR | 150,000 | | | | 202,729 | | |
Telefonica Emisiones SAU
3.661%, due 09/18/17 | | EUR | 50,000 | | | | 67,901 | | |
| 4.375%, due 02/02/16 | | EUR | 100,000 | | | | 143,963 | | |
| 5.580%, due 06/12/13 | | EUR | 100,000 | | | | 149,426 | | |
| Total Spain corporate notes | | | | | 1,558,587 | | |
| Sweden—0.31% | |
Akzo Nobel Sweden Finance AB
7.750%, due 01/31/1411 | | EUR | 100,000 | | | | 161,158 | | |
200
PACE Select Advisors Trust
PACE Alternative Strategies Investments
Portfolio of investments—July 31, 2011
| | | Face
amount5 | | Value | |
| Corporate notes—(Continued) | |
| Sweden—(Concluded) | |
Nordea Bank AB
3.750%, due 02/24/17 | | EUR | 90,000 | | | $ | 131,539 | | |
| 6.250%, due 09/10/186 | | EUR | 100,000 | | | | 150,817 | | |
Sandvik AB
6.875%, due 02/25/14 | | EUR | 50,000 | | | | 79,066 | | |
Skandinaviska Enskilda Banken AB
2.500%, due 09/01/15 | | EUR | 100,000 | | | | 140,651 | | |
| 9.250%, due 03/13/156,10 | | EUR | 100,000 | | | | 152,234 | | |
Stadshypotek AB
1.450%, due 09/30/137 | | | 400,000 | | | | 403,113 | | |
Svenska Handelsbanken AB
4.875%, due 03/25/14 | | EUR | 90,000 | | | | 137,353 | | |
Swedbank Hypotek AB
0.696%, due 03/28/146,7 | | | 200,000 | | | | 200,325 | | |
TeliaSonera AB
3.875%, due 10/01/25 | | EUR | 50,000 | | | | 66,346 | | |
Volvo Treasury AB
9.875%, due 02/27/14 | | EUR | 60,000 | | | | 101,054 | | |
| Total Sweden corporate notes | | | | | 1,723,656 | | |
| Switzerland—0.02% | |
Credit Suisse London
4.750%, due 08/05/19 | | EUR | 80,000 | | | | 120,583 | | |
| United Arab Emirates—0.03% | |
Dolphin Energy Ltd.
5.888%, due 06/15/197 | | | 150,212 | | | | 163,731 | | |
| United Kingdom—1.03% | |
Anglian Water Services
Financing PLC
4.625%, due 10/07/13 | | EUR | 80,000 | | | | 120,205 | | |
Anglo American Capital PLC
4.375%, due 12/02/16 | | EUR | 60,000 | | | | 88,999 | | |
Aviva PLC
5.250%, due 10/02/236 | | EUR | 60,000 | | | | 86,430 | | |
| 5.700%, due 09/29/156,10 | | EUR | 40,000 | | | | 51,154 | | |
Bank of Scotland PLC
5.000%, due 11/21/117 | | | 800,000 | | | | 809,194 | | |
| 5.250%, due 02/21/177 | | | 200,000 | | | | 215,963 | | |
Barclays Bank PLC
5.250%, due 05/27/14 | | EUR | 150,000 | | | | 227,980 | | |
| 6.000%, due 01/23/18 | | EUR | 60,000 | | | | 86,279 | | |
Brambles Finance PLC
4.625%, due 04/20/18 | | EUR | 100,000 | | | | 149,982 | | |
British Telecommunications PLC
6.125%, due 07/11/14 | | EUR | 50,000 | | | | 78,797 | | |
Experian Finance PLC
4.750%, due 02/04/20 | | EUR | 50,000 | | | | 75,692 | | |
FCE Bank PLC
4.750%, due 01/19/15 | | EUR | 100,000 | | | | 141,175 | | |
Hammerson PLC
4.875%, due 06/19/15 | | EUR | 110,000 | | | | 164,502 | | |
HSBC Bank PLC
3.125%, due 11/15/17 | | EUR | 150,000 | | | | 212,152 | | |
| 3.750%, due 11/30/16 | | EUR | 100,000 | | | | 147,690 | | |
| | | Face
amount5 | | Value | |
| Corporate notes—(Continued) | |
| United Kingdom—(Concluded) | |
HSBC Holdings PLC
6.000%, due 06/10/19 | | EUR | 65,000 | | | $ | 100,269 | | |
Imperial Tobacco Finance PLC
4.500%, due 07/05/18 | | EUR | 100,000 | | | | 146,222 | | |
| 7.250%, due 09/15/14 | | EUR | 150,000 | | | | 242,409 | | |
LBG Capital No. 2 PLC, Series 22
15.000%, due 12/21/19 | | EUR | 50,000 | | | | 95,195 | | |
Legal & General Group PLC
4.000%, due 06/08/256 | | EUR | 50,000 | | | | 64,898 | | |
Lloyds TSB Bank PLC
4.500%, due 09/15/142 | | EUR | 100,000 | | | | 146,607 | | |
| 6.250%, due 04/15/14 | | EUR | 160,000 | | | | 244,515 | | |
| 6.500%, due 03/24/20 | | EUR | 90,000 | | | | 120,406 | | |
Mondi Finance Ltd.
5.750%, due 04/03/17 | | EUR | 60,000 | | | | 87,201 | | |
National Grid PLC
6.500%, due 04/22/14 | | EUR | 100,000 | | | | 158,126 | | |
Nationwide Building Society
3.750%, due 01/20/15 | | EUR | 50,000 | | | | 71,671 | | |
| 6.750%, due 07/22/20 | | EUR | 60,000 | | | | 83,663 | | |
Rexam PLC
4.375%, due 03/15/13 | | EUR | 110,000 | | | | 161,893 | | |
Royal Bank of Scotland PLC
4.875%, due 01/20/17 | | EUR | 170,000 | | | | 244,420 | | |
| 6.000%, due 05/10/13 | | EUR | 90,000 | | | | 133,053 | | |
SABMiller PLC
4.500%, due 01/20/15 | | EUR | 50,000 | | | | 75,523 | | |
Scottish & Southern Energy PLC
5.025%, due 10/01/156,10 | | EUR | 50,000 | | | | 70,947 | | |
| 6.125%, due 07/29/13 | | EUR | 80,000 | | | | 122,859 | | |
Standard Chartered PLC
5.750%, due 04/30/14 | | EUR | 100,000 | | | | 154,925 | | |
United Utilities Water PLC
4.250%, due 01/24/20 | | EUR | 50,000 | | | | 74,457 | | |
Virgin Media Finance PLC
9.500%, due 08/15/16 | | | 250,000 | | | | 281,250 | | |
Vodafone Group PLC
4.750%, due 06/14/16 | | EUR | 80,000 | | | | 124,662 | | |
Total United Kingdom
corporate notes | | | | | 5,661,365 | | |
| United States—3.65% | |
ACCO Brands Corp.
10.625%, due 03/15/15 | | | 175,000 | | | | 195,344 | | |
AES Corp.
7.375%, due 07/01/218,9 | | | 100,000 | | | | 103,500 | | |
Ally Financial, Inc.
6.875%, due 09/15/11 | | | 750,000 | | | | 754,277 | | |
ANZ Capital Trust II
5.360%, due 12/15/137,10 | | | 400,000 | | | | 406,000 | | |
Ashtead Capital, Inc.
9.000%, due 08/15/167 | | | 250,000 | | | | 260,000 | | |
Bank of America Corp.
4.750%, due 04/03/17 | | EUR | 100,000 | | | | 144,341 | | |
| 5.125%, due 09/26/14 | | EUR | 100,000 | | | | 150,286 | | |
201
PACE Select Advisors Trust
PACE Alternative Strategies Investments
Portfolio of investments—July 31, 2011
| | | Face
amount5 | | Value | |
| Corporate notes—(Continued) | |
| United States—(Continued) | |
BNP Paribas Capital Trust III
6.625%, due 10/23/116,10 | | EUR | 100,000 | | | $ | 141,175 | | |
Capital One Capital III
7.686%, due 08/15/36 | | | 401,000 | | | | 410,022 | | |
Case New Holland, Inc.
7.750%, due 09/01/13 | | | 125,000 | | | | 136,719 | | |
Casella Waste Systems, Inc.
11.000%, due 07/15/14 | | | 150,000 | | | | 166,500 | | |
Charter Communications Operating
LLC/Charter Communications
Operating Capital
10.875%, due 09/15/147,11 | | | 100,000 | | | | 110,250 | | |
CHS/Community Health Systems
8.875%, due 07/15/15 | | | 250,000 | | | | 258,437 | | |
Chubb Corp.
6.375%, due 03/29/676 | | | 400,000 | | | | 413,000 | | |
Cimarex Energy Co.
7.125%, due 05/01/17 | | | 50,000 | | | | 52,625 | | |
Citigroup Capital XXI
8.300%, due 12/21/576 | | | 335,000 | | | | 344,212 | | |
Citigroup, Inc.
4.000%, due 11/26/15 | | EUR | 100,000 | | | | 144,533 | | |
| 4.750%, due 05/31/176 | | EUR | 90,000 | | | | 120,352 | | |
| 7.375%, due 06/16/14 | | EUR | 230,000 | | | | 365,746 | | |
CommScope, Inc.
8.250%, due 01/15/197 | | | 150,000 | | | | 156,000 | | |
CVS Caremark Corp.
6.302%, due 06/01/376 | | | 395,000 | | | | 385,125 | | |
DJO Finance LLC/DJO
Finance Corp.
10.875%, due 11/15/14 | | | 275,000 | | | | 294,594 | | |
Enterprise Products Operating LLC
8.375%, due 08/01/666 | | | 200,000 | | | | 217,500 | | |
Equinix, Inc.
7.000%, due 07/15/21 | | | 250,000 | | | | 260,000 | | |
Fidelity National Information
Services, Inc.
7.875%, due 07/15/20 | | | 150,000 | | | | 160,125 | | |
Ford Motor Co.
7.450%, due 07/16/31 | | | 425,000 | | | | 484,423 | | |
Freescale Semiconductor, Inc.
8.050%, due 02/01/207 | | | 150,000 | | | | 151,125 | | |
Frontier Communications Corp.
8.250%, due 04/15/17 | | | 625,000 | | | | 685,937 | | |
GE Capital Trust II
5.500%, due 09/15/672,6 | | EUR | 50,000 | | | | 66,457 | | |
| | | Number of
units | | | |
GMAC Capital Trust I
8.125%, due 02/15/4012 | | | 11,560 | | | | 296,167 | | |
| | | Face
amount5 | | | |
Goodyear Tire & Rubber Co.
10.500%, due 05/15/16 | | | 162,000 | | | | 182,453 | | |
| | | Face
amount5 | | Value | |
| Corporate notes—(Continued) | |
| United States—(Continued) | |
HCA, Inc.
7.500%, due 02/15/22 | | | 350,000 | | | $ | 355,250 | | |
| 7.875%, due 02/15/20 | | | 125,000 | | | | 135,313 | | |
| 9.250%, due 11/15/16 | | | 425,000 | | | | 453,422 | | |
HSBC Bank USA N.A.
6.000%, due 08/15/406 | | BRL | 490,000 | | | | 663,152 | | |
HSBC Finance Corp.
3.750%, due 11/04/15 | | EUR | 100,000 | | | | 146,823 | | |
Huntsman International LLC
5.500%, due 06/30/16 | | | 400,000 | | | | 396,000 | | |
HVB Funding Trust VIII
7.055%, due 03/28/126,10 | | EUR | 55,000 | | | | 76,263 | | |
IPALCO Enterprises, Inc.
5.000%, due 05/01/187 | | | 100,000 | | | | 99,248 | | |
JP Morgan Chase & Co.
6.125%, due 04/01/14 | | EUR | 200,000 | | | | 311,569 | | |
JP Morgan Chase Bank N.A.
4.625%, due 05/31/176 | | EUR | 150,000 | | | | 213,309 | | |
Kraft Foods, Inc.
6.250%, due 03/20/15 | | EUR | 50,000 | | | | 79,733 | | |
Lyondell Chemical Co.
11.000%, due 05/01/18 | | | 300,000 | | | | 339,750 | | |
MarkWest Energy Partners
LP/MarkWest Energy Finance Corp.
8.750%, due 04/15/18 | | | 50,000 | | | | 54,750 | | |
Merrill Lynch & Co., Inc.
4.625%, due 09/14/18 | | EUR | 50,000 | | | | 67,913 | | |
| 4.875%, due 05/30/14 | | EUR | 100,000 | | | | 149,448 | | |
MetLife Global Funding I
4.625%, due 05/16/17 | | EUR | 50,000 | | | | 75,606 | | |
Morgan Stanley
4.000%, due 11/17/15 | | EUR | 255,000 | | | | 364,780 | | |
| 4.500%, due 02/23/16 | | EUR | 100,000 | | | | 144,270 | | |
National City Preferred Capital
Trust I
12.000%, due 12/10/126,10 | | | 325,000 | | | | 354,981 | | |
Newfield Exploration Co.
7.125%, due 05/15/18 | | | 100,000 | | | | 107,000 | | |
Nielsen Finance LLC/Nielsen
Finance Co.
11.500%, due 05/01/16 | | | 216,000 | | | | 251,100 | | |
NRG Energy, Inc.
7.375%, due 01/15/17 | | | 100,000 | | | | 104,875 | | |
Pemex Project Funding Master Trust
6.375%, due 08/05/162 | | EUR | 80,000 | | | | 126,332 | | |
Plains Exploration & Production Co.
7.625%, due 06/01/18 | | | 250,000 | | | | 268,750 | | |
Plastipak Holdings, Inc.
8.500%, due 12/15/157 | | | 75,000 | | | | 78,094 | | |
ProLogis LP
1.875%, due 11/15/37 | | | 175,000 | | | | 173,469 | | |
Puget Sound Energy, Inc., Series A
6.974%, due 06/01/676 | | | 150,000 | | | | 154,482 | | |
Qwest Communications
International, Inc.
8.000%, due 10/01/15 | | | 225,000 | | | | 244,688 | | |
202
PACE Select Advisors Trust
PACE Alternative Strategies Investments
Portfolio of investments—July 31, 2011
| | | Face
amount5 | | Value | |
| Corporate notes—(Continued) | |
| United States—(Continued) | |
Range Resources Corp.
7.250%, due 05/01/18 | | | 50,000 | | | $ | 53,375 | | |
Regency Energy Partners
LP/Regency Energy Finance Corp.
9.375%, due 06/01/16 | | | 250,000 | | | | 279,687 | | |
Regions Bank
7.500%, due 05/15/18 | | | 250,000 | | | | 261,509 | | |
Regions Financial Corp.
5.750%, due 06/15/15 | | | 125,000 | | | | 124,219 | | |
Rensselaer Polytechnic Institute
5.600%, due 09/01/20 | | | 375,000 | | | | 406,612 | | |
Reynolds Group Issuance/Reynold
6.875%, due 02/15/217 | | | 250,000 | | | | 240,000 | | |
| 8.250%, due 02/15/217 | | | 100,000 | | | | 92,250 | | |
| 8.500%, due 10/15/162,11 | | EUR | 60,000 | | | | 87,723 | | |
Roche Holdings, Inc.
6.500%, due 03/04/21 | | EUR | 130,000 | | | | 231,723 | | |
Rock-Tenn Co.
5.625%, due 03/15/13 | | | 25,000 | | | | 25,906 | | |
RSC Equipment Rental, Inc./RSC
Holdings III LLC
8.250%, due 02/01/21 | | | 125,000 | | | | 129,063 | | |
| 10.000%, due 07/15/177 | | | 175,000 | | | | 197,313 | | |
SandRidge Energy, Inc.
7.500%, due 03/15/217 | | | 400,000 | | | | 420,000 | | |
SGS International, Inc.
12.000%, due 12/15/13 | | | 25,000 | | | | 25,656 | | |
SLM Corp.
3.125%, due 09/17/12 | | EUR | 50,000 | | | | 70,984 | | |
| 6.250%, due 01/25/16 | | | 175,000 | | | | 183,120 | | |
Springleaf Finance Corp. MTN
4.875%, due 07/15/12 | | | 125,000 | | | | 124,531 | | |
Sprint Capital Corp.
6.900%, due 05/01/19 | | | 400,000 | | | | 409,000 | | |
| 8.375%, due 03/15/12 | | | 125,000 | | | | 129,688 | | |
Steel Dynamics, Inc.
7.750%, due 04/15/16 | | | 250,000 | | | | 264,375 | | |
Swiss Re Treasury (US)
7.000%, due 05/19/14 | | EUR | 50,000 | | | | 79,793 | | |
Tenet Healthcare Corp.
9.000%, due 05/01/15 | | | 250,000 | | | | 266,250 | | |
Terex Corp.
10.875%, due 06/01/16 | | | 75,000 | | | | 86,063 | | |
The Procter & Gamble Co.
4.875%, due 05/11/27 | | EUR | 75,000 | | | | 114,894 | | |
Wachovia Corp.
4.375%, due 08/01/16 | | EUR | 300,000 | | | | 449,649 | | |
| 4.375%, due 11/27/18 | | EUR | 50,000 | | | | 71,927 | | |
Wal-Mart Stores, Inc.
4.875%, due 09/21/29 | | EUR | 60,000 | | | | 92,551 | | |
Windstream Corp.
7.750%, due 10/01/21 | | | 400,000 | | | | 424,000 | | |
XM Satellite Radio, Inc.
13.000%, due 08/01/137 | | | 50,000 | | | | 58,625 | | |
| | | Face
amount5 | | Value | |
| Corporate notes—(Concluded) | |
| United States—(Concluded) | |
ZFS Finance USA Trust IV
5.875%, due 05/09/326,8,9 | | | 500,000 | | | $ | 504,315 | | |
Zurich Finance (USA), Inc.
5.750%, due 10/02/236 | | EUR | 80,000 | | | | 116,018 | | |
Total United States
corporate notes | | | | | 20,028,414 | | |
| Venezuela—0.02% | |
Petroleos de Venezuela SA
5.250%, due 04/12/17 | | | 60,000 | | | | 38,700 | | |
| 8.500%, due 11/02/172 | | | 100,000 | | | | 76,000 | | |
| Total Venezuela corporate notes | | | | | 114,700 | | |
Total corporate notes
(cost—$51,595,889) | | | | | 54,096,683 | | |
| Municipal bonds and notes—0.93% | |
| United States—0.93% | |
Brazos Higher Education Authority,
Series I-A-2
0.407% , due 06/27/226 | | | 670,419 | | | | 669,997 | | |
California (Build America Bonds)
7.500%, due 04/01/34 | | | 325,000 | | | | 397,465 | | |
| 7.550%, due 04/01/39 | | | 675,000 | | | | 837,817 | | |
| 7.625%, due 03/01/40 | | | 375,000 | | | | 466,252 | | |
Illinois (Build America Bonds)
7.350% , due 07/01/35 | | | 225,000 | | | | 253,076 | | |
Illinois Taxable Pension
5.100% , due 06/01/33 | | | 1,000,000 | | | | 908,340 | | |
Pennsylvania Higher Education
Assistance Agency Student Loan
Revenue, Series 2, Class A-1
0.853% , due 04/25/196 | | | 386,027 | | | | 386,281 | | |
South Carolina Student Loan Corp.
Education Loan Revenue,
Series A-1
0.354% , due 12/03/186 | | | 1,200,000 | | | | 1,181,040 | | |
Total municipal bonds and notes
(cost—$4,793,009) | | | | | 5,100,268 | | |
| Non-US government obligations—2.67% | |
| Argentina—0.10% | |
Argentina Government Bond
0.010%, due 12/15/3513 | | EUR | 2,680,000 | | | | 575,708 | | |
| Australia—0.17% | |
Australia Index Linked
Government Bond
4.000%, due 08/20/20 | | AUD | 500,000 | | | | 949,888 | | |
| Colombia—0.05% | |
Colombia Government
International Bond
4.375%, due 07/12/21 | | | 260,000 | | | | 267,540 | | |
203
PACE Select Advisors Trust
PACE Alternative Strategies Investments
Portfolio of investments—July 31, 2011
| | | Face
amount5 | | Value | |
| Non-US government obligations—(Concluded) | |
| Germany—0.23% | |
Bundesrepublik Deutschland
6.250%, due 01/04/24 | | EUR | 120,000 | | | $ | 233,223 | | |
Series 07
4.250%, due 07/04/17 | | EUR | 25,000 | | | | 40,476 | | |
Series 98
4.750%, due 07/04/28 | | EUR | 100,000 | | | | 171,724 | | |
Deutsche Bundesrepublik
Inflation Linked Bond
1.750%, due 04/15/20 | | EUR | 505,632 | | | | 807,261 | | |
| Total Germany | | | | | 1,252,684 | | |
| Malaysia—0.41% | |
Bank Negara Malaysia Monetary
Notes
2.796%, due 09/27/1114 | | MYR | 1,325,000 | | | | 444,372 | | |
| 2.798%, due 09/22/1114 | | MYR | 1,325,000 | | | | 444,504 | | |
Malaysia Government Bond
3.434%, due 08/15/14 | | MYR | 3,950,000 | | | | 1,339,114 | | |
| Total Malaysia | | | | | 2,227,990 | | |
| Mexico—1.33% | |
Mexican Bonos
6.500%, due 06/10/21 | | MXN | 21,400,000 | | | | 1,792,910 | | |
| 7.500%, due 06/03/27 | | MXN | 21,522,700 | | | | 1,878,338 | | |
| 8.500%, due 05/31/29 | | MXN | 19,300,000 | | | | 1,821,124 | | |
| 10.000%, due 12/05/24 | | MXN | 16,700,000 | | | | 1,802,320 | | |
| Total Mexico | | | | | 7,294,692 | | |
| Qatar—0.09% | |
State of Qatar
5.250%, due 01/20/207 | | | 470,000 | | | | 515,825 | | |
| South Africa—0.22% | |
South Africa Government Bond
6.750%, due 03/31/21 | | ZAR | 2,285,000 | | | | 307,938 | | |
| 10.500%, due 12/21/26 | | ZAR | 5,050,000 | | | | 884,585 | | |
| Total South Africa | | | | | 1,192,523 | | |
| Venezuela—0.07% | |
Venezuela Government International
Bond
7.750%, due 10/13/192 | | | 130,000 | | | | 93,600 | | |
| 8.250%, due 10/13/242 | | | 270,000 | | | | 182,250 | | |
| 9.000%, due 05/07/232 | | | 110,000 | | | | 79,200 | | |
| 9.250%, due 05/07/282 | | | 40,000 | | | | 28,200 | | |
| Total Venezuela | | | | | 383,250 | | |
Total non-US government
obligations
(cost—$14,175,039) | | | | | 14,660,100 | | |
| Time deposits—4.79% | |
BNP Paribas
0.120% , due 08/01/11 | | | 3,781,203 | | | | 3,781,203 | | |
ING Bank N.V.
0.050% , due 08/01/11 | | | 4,291,244 | | | | 4,291,244 | | |
JPMorgan Chase
0.050% , due 08/01/11 | | | 4,215,140 | | | | 4,215,140 | | |
| | | Face
amount5 | | Value | |
| Time deposits—(Concluded) | |
Rabobank Nederland N.V.
0.040% , due 08/01/11 | | | 9,993,004 | | | $ | 9,993,004 | | |
Societe Generale, Cayman Islands
0.140% , due 08/01/11 | | | 3,979,801 | | | | 3,979,801 | | |
Total time deposits
(cost—$26,260,392) | | | | | 26,260,392 | | |
| Certificates of deposit—1.46% | |
| Banking-non-US—1.46% | |
Dexia Bank Belgium SA
0.460% , due 08/23/11 | | | 4,000,000 | | | | 4,000,000 | | |
UniCredit SpA London
0.390% , due 09/12/11 | | | 4,000,000 | | | | 4,000,000 | | |
Total certificates of deposit
(cost—$8,000,000) | | | | | 8,000,000 | | |
| Short-term US government obligations15—16.69% | |
US Treasury Bills
0.020%, due 08/18/11 | | | 31,150,000 | | | | 31,147,259 | | |
| 0.039%, due 09/08/111 | | | 52,353,000 | | | | 52,348,183 | | |
| 0.022%, due 09/22/111 | | | 8,000,000 | | | | 7,999,136 | | |
Total short-term US government
obligations
(cost—$91,497,496) | | | | | 91,494,578 | | |
| Repurchase agreement—12.56% | |
Repurchase agreement dated
07/29/11 with State Street
Bank & Trust Co., 0.010%
due 08/01/11, collateralized
by $342,762 Federal Home Loan
Mortgage Corp. obligations,
5.125% due 07/15/12,
$49,265,277 US Treasury Bills,
zero coupon due 08/04/11 and
$19,430,113 US Treasury Notes,
2.375% to 2.625% due
02/29/16 to 07/31/17;
(value—$70,271,602);
proceeds: $68,893,057
(cost—$68,893,000) | | | 68,893,000 | | | | 68,893,000 | | |
| | | Number of
contracts/
Notional
amount | | | |
| Options purchased—1.20% | |
| Call options purchased—0.42% | |
Euro Stoxx 50 Index,
strike @ 2,750, expires 09/16/11 | | | 168 | | | | 133,735 | | |
GBP Call/EUR Put, strike @ EUR 1.33,
expires 11/07/11 | | GBP | 7,800,000 | | | | 5,859 | | |
GBP Call/ZAR Put, strike @ ZAR 13.7,
expires 10/19/11 | | GBP | 3,700,000 | | | | 3,882 | | |
S&P 500 Index, Strike @ 1,360,
expires 08/20/11 | | | 38 | | | | 12,540 | | |
204
PACE Select Advisors Trust
PACE Alternative Strategies Investments
Portfolio of investments—July 31, 2011
| | | Number of
contracts/
Notional
amount | | Value | |
| Options purchased—(Continued) | |
| Call options purchased—(Continued) | |
S&P 500 Index, Strike @ 1,600,
expires 09/17/11 | | | 189 | | | $ | 945 | | |
USD Call/JPY Put, strike @ JPY 86,
expires 12/10/15 | | | 1,000,000 | | | | 51,978 | | |
USD Call/JPY Put, strike @ JPY 88,
expires 05/16/14 | | | 1,250,000 | | | | 44,989 | | |
USD Call/JPY Put, strike @ JPY 94,
expires 08/15/13 | | | 11,700,000 | | | | 191,697 | | |
3 month EURIBOR16 Interest Rate
Swap, strike @ 2.600%,
expires 09/12/13 (counterparty:
Royal Bank of Scotland PLC;
receive floating rate); underlying
swap terminates 11/12/18 | | EUR | 2,500,000 | | | | 44,464 | | |
3 month EURIBOR16 Interest Rate
Swap, strike @ 2.600%,
expires 11/01/13 (counterparty:
Royal Bank of Scotland PLC;
receive floating rate); underlying
swap terminates 05/11/18 | | EUR | 19,150,000 | | | | 341,526 | | |
3 month USD LIBOR17 Interest Rate
Swap, strike @ 2.320%,
expires 01/06/12 (counterparty:
Deutsche Bank AG.; receive
floating rate); underlying swap
terminates 01/10/17 | | | 28,200,000 | | | | 167,952 | | |
3 month USD LIBOR17 Interest Rate
Swap, strike @ 2.605%,
expires 02/21/12 (counterparty:
Citibank N.A.; receive floating
rate); underlying swap
terminates 02/23/17 | | | 5,600,000 | | | | 30,668 | | |
3 month USD LIBOR17 Interest Rate
Swap, strike @ 2.703%,
expires 07/06/12 (counterparty:
Deutsche Bank AG.; receive
floating rate); underlying
swap terminates 07/10/17 | | | 26,300,000 | | | | 307,269 | | |
3 month USD LIBOR17 Interest Rate
Swap, strike @ 3.510%,
expires 06/27/12 (counterparty:
Bank of America N.A.; receive
floating rate); underlying
swap terminates 06/29/22 | | | 12,000,000 | | | | 357,205 | | |
3 month USD LIBOR17 Interest Rate
Swap, strike @ 3.510%,
expires 06/27/12 (counterparty:
Citibank N.A.; receive floating
rate); underlying swap
terminates 06/29/22 | | | 11,100,000 | | | | 330,415 | | |
| | | Number of
contracts/
Notional
amount | | Value | |
| Options purchased—(Continued) | |
| Call options purchased—(Concluded) | |
3 month USD LIBOR17 Interest Rate
Swap, strike @ 3.560%,
expires 06/15/12 (counterparty:
Citibank N.A.; receive floating
rate); underlying swap
terminates 06/19/22 | | | 2,200,000 | | | $ | 59,541 | | |
3 month USD LIBOR17 Interest Rate
Swap, strike @ 3.570%,
expires 07/11/12 (counterparty:
Bank of America N.A.; receive
floating rate); underlying swap
terminates 07/13/22 | | | 5,800,000 | | | | 169,509 | | |
3 month USD LIBOR17 Interest Rate
Swap, strike @ 3.595%,
expires 02/24/12 (counterparty:
Citibank N.A.; receive floating
rate); underlying swap
terminates 02/28/22 | | | 3,900,000 | | | | 57,897 | | |
| Total call options purchased | | | | | 2,312,071 | | |
| Put options purchased—0.78% | |
GBP Put/EUR Call, strike @ EUR 1.19,
expires 11/07/11 | | GBP | 7,800,000 | | | | 600,640 | | |
S&P 500 Index, strike @ 1,150,
expires 09/17/11 | | | 189 | | | | 192,780 | | |
S&P 500 Index, strike @ 1,150,
expires 10/22/11 | | | 95 | | | | 142,699 | | |
3 month USD LIBOR17 Interest Rate
Swap, strike @ 2.320%,
expires 01/06/12 (counterparty:
Deutsche Bank AG.; pay
floating rate); underlying swap
terminates 01/10/17 | | | 28,200,000 | | | | 687,662 | | |
3 month USD LIBOR17 Interest Rate
Swap, strike @ 2.605%,
expires 02/21/12 (counterparty:
Citibank N.A.; pay floating rate);
underlying swap
terminates 02/23/17 | | | 5,600,000 | | | | 188,044 | | |
3 month USD LIBOR17 Interest Rate
Swap, strike @ 2.703%,
expires 07/06/12 (counterparty:
Deutsche Bank AG.; pay
floating rate); underlying swap
terminates 07/10/17 | | | 26,300,000 | | | | 835,322 | | |
3 month USD LIBOR17 Interest Rate
Swap, strike @ 3.510%,
expires 06/27/12 (counterparty:
Bank of America N.A.; pay
floating rate); underlying swap
terminates 06/29/22 | | | 12,000,000 | | | | 548,359 | | |
205
PACE Select Advisors Trust
PACE Alternative Strategies Investments
Portfolio of investments—July 31, 2011
| | | Number of
contracts/
Notional
amount | | Value | |
| Options purchased—(Concluded) | |
| Put options purchased—(Concluded) | |
3 month USD LIBOR17 Interest Rate
Swap, strike @ 3.510%,
expires 06/27/12 (counterparty:
Citibank N.A.; pay floating
rate); underlying swap
terminates 06/29/22 | | | 11,100,000 | | | $ | 507,232 | | |
3 month USD LIBOR17 Interest Rate
Swap, strike @ 3.560%,
expires 06/15/12 (counterparty:
Citibank N.A.; pay floating
rate); underlying swap
terminates 06/19/22 | | | 2,200,000 | | | | 106,084 | | |
3 month USD LIBOR17 Interest Rate
Swap, strike @ 3.570%,
expires 07/11/12 (counterparty:
Bank of America N.A.; pay
floating rate); underlying swap
terminates 07/13/22 | | | 5,800,000 | | | | 282,314 | | |
3 month USD LIBOR17 Interest Rate
Swap, strike @ 3.595%,
expires 02/24/12 (counterparty:
Citibank N.A.; pay floating
rate); underlying swap
terminates 02/28/22 | | | 3,900,000 | | | | 199,720 | | |
| Total put options purchased | | | | | 4,290,856 | | |
Total options purchased
(cost—$7,465,638) | | | | | 6,602,927 | | |
Total investments before investments
sold short
(cost—$557,704,976)—103.28% | | | | | 566,353,437 | | |
| | | Number of
shares | | | |
| Investments sold short—(5.00)% | |
| Common stocks—(4.29)% | |
| Belgium—(0.14)% | |
| Ageas | | | (375,107 | ) | | | (769,906 | ) | |
| Canada—(0.30)% | |
| Ivanhoe Mines Ltd. | | | (35,995 | ) | | | (942,587 | ) | |
| Manulife Financial Corp. | | | (26,800 | ) | | | (425,793 | ) | |
| Progress Energy Resources Corp. | | | (17,200 | ) | | | (249,508 | ) | |
| Total Canada common stocks | | | | | (1,617,888 | ) | |
| Finland—(0.13)% | |
| Outokumpu Oyj | | | (67,942 | ) | | | (723,117 | ) | |
| France—(0.22)% | |
| Alstom SA | | | (2,643 | ) | | | (138,673 | ) | |
Compagnie Generale de
Geophysique-Veritas | | | (19,782 | ) | | | (663,087 | ) | |
| | | Number of
shares | | Value | |
| Investments sold short—(Continued) | |
| Common stocks—(Concluded) | |
| France—(Concluded) | |
| Iliad SA | | | (2,465 | ) | | $ | (315,831 | ) | |
| Veolia Environnement SA | | | (4,377 | ) | | | (98,825 | ) | |
| Total France common stocks | | | | | (1,216,416 | ) | |
| Germany—(0.06)% | |
| Salzgitter AG | | | (4,781 | ) | | | (349,458 | ) | |
| Italy—(0.07)% | |
| Banco Popolare Society Cooperativa | | | (184,521 | ) | | | (353,792 | ) | |
| Japan—(1.84)% | |
| Daiwa Securities Group, Inc. | | | (387,000 | ) | | | (1,687,023 | ) | |
| NGK Insulators Ltd. | | | (85,000 | ) | | | (1,555,928 | ) | |
| Nippon Paper Group, Inc. | | | (8,900 | ) | | | (198,758 | ) | |
| NKSJ Holdings, Inc. | | | (166,000 | ) | | | (1,101,335 | ) | |
| Nomura Holdings, Inc. | | | (337,500 | ) | | | (1,646,108 | ) | |
| SBI Holdings, Inc. | | | (12,573 | ) | | | (1,233,532 | ) | |
| Senshu Ikeda Holdings, Inc. | | | (371,900 | ) | | | (574,235 | ) | |
| The Dai-ichi Life Insurance Co. Ltd. | | | (1,056 | ) | | | (1,493,972 | ) | |
| Tokyo Steel Manufacturing Co. Ltd. | | | (57,100 | ) | | | (585,951 | ) | |
| Total Japan common stocks | | | | | (10,076,842 | ) | |
| Jersey—(0.15)% | |
| Glencore International PLC | | | (104,551 | ) | | | (810,809 | ) | |
| Norway—(0.08)% | |
| Norsk Hydro ASA | | | (63,875 | ) | | | (453,006 | ) | |
| Spain—(0.27)% | |
| Acciona SA | | | (12,446 | ) | | | (1,284,601 | ) | |
International Consolidated Airlines
Group SA | | | (50,744 | ) | | | (196,798 | ) | |
| Total Spain common stocks | | | | | (1,481,399 | ) | |
| Sweden—(0.27)% | |
| Hennes & Mauritz AB, B Shares | | | (43,736 | ) | | | (1,490,797 | ) | |
| Switzerland—(0.07)% | |
| Foster Wheeler AG | | | (14,200 | ) | | | (384,820 | ) | |
| United States—(0.69)% | |
| Cree, Inc. | | | (15,000 | ) | | | (492,900 | ) | |
| Human Genome Sciences, Inc. | | | (27,800 | ) | | | (584,078 | ) | �� |
| Range Resources Corp. | | | (18,900 | ) | | | (1,231,524 | ) | |
| Toll Brothers, Inc. | | | (6,600 | ) | | | (131,736 | ) | |
| Vulcan Materials Co. | | | (38,800 | ) | | | (1,330,452 | ) | |
| Total United States common stocks | | | | | (3,770,690 | ) | |
Total common stocks
(proceeds—$25,695,483) | | | | | (23,498,940 | ) | |
206
PACE Select Advisors Trust
PACE Alternative Strategies Investments
Portfolio of investments—July 31, 2011
| | | Face
amount | | Value | |
| Investments sold short—(Concluded) | |
Federal national mortgage association
certificate**—(0.71)% | |
| United States—(0.71)% | |
FNMA TBA
3.500%
(proceeds—$3,842,500) | | $ | (4,000,000 | ) | | $ | (3,911,250 | ) | |
Total investments sold short
(proceeds—$29,537,983)—
(5.00)% | | | | | (27,410,190 | ) | |
Other assets in excess
of liabilities—1.72% | | | | | 9,411,053 | | |
| Net assets—100.00% | | | | $ | 548,354,300 | | |
Aggregate cost for federal income tax purposes before investments sold short was $560,742,278; and net unrealized appreciation consisted of:
| Gross unrealized appreciation | | $ | 20,492,986 | | |
| Gross unrealized depreciation | | | (14,881,827 | ) | |
| Net unrealized appreciation | | $ | 5,611,159 | | |
For a listing of defined portfolio acronyms and currency abbreviations that are used throughout the Portfolio of investments as well as the tables that follow, please refer to page 227.
* Non-income producing security.
** On September 7, 2008, the Federal Housing Finance Agency placed the Federal National Mortgage Association and the Federal Home Loan Mortgage Corporation into conservatorship, and the US Treasury guaranteed the debt issued by those organizations.
1 Security, or portion thereof, pledged as collateral for investments sold short, written options or futures.
2 Security exempt from registration pursuant to Regulation S under the Securities Act of 1933. Regulation S applies to securities offerings that are made outside of the United States and do not involve direct selling efforts in the United States. At July 31, 2011, the value of these securities amounted to 0.72% of net assets.
3 Security is traded on the London Exchange.
4 Security is traded on the over-the-counter ("OTC") market.
5 In US Dollars unless otherwise indicated.
6 Variable or floating rate security. The interest rate shown is the current rate as of July 31, 2011 and changes periodically.
7 Security exempt from registration pursuant to Rule 144A under the Securities Act of 1933. These securities, which represent 3.68% of net assets as of July 31, 2011, are considered liquid and may be resold in transactions exempt from registration, normally to qualified institutional buyers.
8 Illiquid securities representing 0.27% of net assets as of July 31, 2011.
9 Security exempt from registration pursuant to Rule 144A under the Securities Act of 1933. These securities, which represent 0.27% of net assets as of July 31, 2011, are considered illiquid and may be resold in transactions exempt from registration, normally to qualified institutional buyers.
10 Perpetual bond security. The maturity date reflects the next call date.
11 Step bond that converts to the noted fixed rate at a designated future date.
12 Represents a preferred security which trades as a bond. Coupon is variable and may periodically change. Security pays income on a quarterly basis.
13 GDP-linked bond.
14 Zero coupon bond. The interest rate represents annualized yield at date of purchase.
15 Rates shown are the discount rates at date of purchase.
16 3 Month EURIBOR at July 31, 2011 was 1.557%.
17 3 Month USD LIBOR at July 31, 2011 was 0.256%
207
PACE Select Advisors Trust
PACE Alternative Strategies Investments
Portfolio of investments—July 31, 2011
Written options
Number of
contracts | | Call options written | | Expiration
date | | Premiums
received | | Current
value | | Unrealized
appreciation
(depreciation) | |
| | 94 | | | S&P 500 Index, strike @ 1,350 | | 09/17/11 | | $ | 157,163 | | | $ | (110,920 | ) | | $ | 46,243 | | |
| | 92 | | | S&P 500 Index, strike @ 1,375 | | 09/17/11 | | | 91,807 | | | | (51,152 | ) | | | 40,655 | | |
| | | | | | | | | $ | 248,970 | | | $ | (162,072 | ) | | $ | 86,898 | | |
| | | Put options written | | | | | | | | | |
| | 168 | | | Euro Stoxx 50 Index, strike @ 2,600 | | 09/16/11 | | | 163,363 | | | | (160,048 | ) | | | 3,315 | | |
| | 95 | | | S&P 500 Index, strike @ 1,225 | | 10/22/11 | | | 265,801 | | | | (265,801 | ) | | | — | | |
| | 123 | | | S&P 500 Index, strike @ 1,250 | | 09/17/11 | | | 202,223 | | | | (319,800 | ) | | | (117,577 | ) | |
| | | | | | | | | $ | 631,387 | | | $ | (745,649 | ) | | $ | (114,262 | ) | |
| | | | | | | | | $ | 880,357 | | | $ | (907,721 | ) | | $ | (27,364 | ) | |
Written option activity for the year ended July 31, 2011 was as follows:
| | | Number of
contracts | | Premiums
received | |
| Options outstanding at July 31, 2010 | | | 224 | | | $ | 269,063 | | |
| Options written | | | 6,527 | | | | 10,739,926 | | |
| Options terminated in closing purchase transactions | | | (5,871 | ) | | | (10,069,960 | ) | |
| Options expired prior to exercise | | | (308 | ) | | | (58,672 | ) | |
| Options outstanding at July 31, 2011 | | | 572 | | | $ | 880,357 | | |
Swaptions and foreign exchange written options
Notional
amount
(000) | | Call options written | | Counterparty | | Pay/
receive
floating
rate | | Expiration
date | | Premiums
received | | Current
value | | Unrealized
appreciation
(depreciation) | |
| EUR | 1,000
| | | 3 Month EURIBOR16 Interest
Rate Swap, strike @ 2.70%;
terminating 11/12/23 | | Royal Bank of Scotland PLC | | Pay | | 09/12/13 | | $ | 14,536 | | | $ | (22,494 | ) | | $ | (7,958 | ) | |
| EUR | 3,000 | | | 6 Month EURIBOR18 Interest
Rate Swap, strike @ 3.240%;
terminating 08/17/21 | | Citibank N.A. | | Pay | | 08/15/11 | | | 43,122 | | | | (17,932 | ) | | | 25,190 | | |
| EUR | 3,000 | | | 6 Month EURIBOR18 Interest
Rate Swap, strike @ 3.330%;
terminating 08/24/21 | | Citibank N.A. | | Pay | | 08/22/11 | | | 39,218 | | | | (13,286 | ) | | | 25,932 | | |
| GBP | 7,800 | | | GBP Call/EUR Put,
strike @ EUR 1.333 | | BNP Paribas | | n/a | | 11/07/11 | | | 90,594 | | | | (5,859 | ) | | | 84,735 | | |
| GBP | 3,700 | | | GBP Call/ZAR Put,
strike @ ZAR 13.7 | | Royal Bank of Scotland PLC | | n/a | | 10/19/11 | | | 91,477 | | | | (3,882 | ) | | | 87,595 | | |
| USD | 13,700 | | | 3 Month USD LIBOR17 Interest
Rate Swap, strike @ 2.120%;
terminating 01/30/17 | | Deutsche Bank AG | | Pay | | 01/26/12 | | | 176,730 | | | | (138,588 | ) | | | 38,142 | | |
| USD | 10,100 | | | 3 Month USD LIBOR17 Interest
Rate Swap, strike @ 2.178%;
terminating 01/25/17 | | JPMorgan Chase Bank N.A. | | Pay | | 01/23/12 | | | 135,340 | | | | (89,720 | ) | | | 45,620 | | |
| USD | 4,900 | | | 3 Month USD LIBOR17 Interest
Rate Swap, strike @ 4.725%;
terminating 07/22/26 | | Bank of America N.A. | | Pay | | 07/20/16 | | | 352,310 | | | | (344,383 | ) | | | 7,927 | | |
| USD | 5,600 | | | 3 Month USD LIBOR17 Interest
Rate Swap, strike @ 4.745%;
terminating 07/22/26 | | Deutsche Bank AG | | Pay | | 07/20/16 | | | 400,960 | | | | (389,916 | ) | | | 11,044 | | |
| | | | | | | | | | | | | $ | 1,344,287 | | | $ | (1,026,060 | ) | | $ | 318,227 | | |
208
PACE Select Advisors Trust
PACE Alternative Strategies Investments
Portfolio of investments—July 31, 2011
Swaptions and foreign exchange written options—(concluded)
Notional
amount
(000) | | Put options written | | Counterparty | | Pay/
receive
floating
rate | | Expiration
date | | Premiums
received | | Current
value | | Unrealized
appreciation
(depreciation) | |
| EUR | 10,200 | | | 3 Month EURIBOR16 Interest
Rate Swap, strike @ 2.70%;
terminating 05/11/23 | | Royal Bank of Scotland PLC | | Receive | | 11/01/13 | | $ | 389,298 | | | $ | (225,948 | ) | | $ | 163,350 | | |
| EUR | 3,000 | | | 6 Month EURIBOR18 Interest
Rate Swap, strike @ 3.240%;
terminating 08/17/21 | | Citibank N.A. | | Receive | | 08/15/11 | | | 43,122 | | | | (54,551 | ) | | | (11,429 | ) | |
| EUR | 3,000 | | | 6 Month EURIIBOR18 Interest
Rate Swap, strike @ 3.330%;
terminating 08/24/21 | | Citibank N.A. | | Receive | | 08/22/11 | | | 39,218 | | | | (80,802 | ) | | | (41,584 | ) | |
| GBP | 7,800 | | | GBP Put/EUR Call,
strike @ EUR 1.19 | | BNP Paribas | | n/a | | 11/07/11 | | | 470,464 | | | | (600,640 | ) | | | (130,176 | ) | |
| USD | 13,700 | | | 3 Month USD LIBOR17 Interest
Rate Swap, strike @ 2.120%;
terminating 01/30/17 | | Deutsche Bank AG | | Receive | | 01/26/12 | | | 176,730 | | | | (234,698 | ) | | | (57,968 | ) | |
| USD | 10,100 | | | 3 Month USD LIBOR17 Interest
Rate Swap, strike @ 2.178%;
terminating 01/25/17 | | JPMorgan Chase Bank N.A. | | Receive | | 01/23/12 | | | 135,340 | | | | (193,001 | ) | | | (57,661 | ) | |
| USD | 4,900 | | | 3 Month USD LIBOR17 Interest
Rate Swap, strike @ 4.725%;
terminating 07/22/26 | | Bank of America N.A. | | Receive | | 07/20/16 | | | 352,310 | | | | (370,641 | ) | | | (18,331 | ) | |
| USD | 5,600 | | | 3 Month USD LIBOR17 Interest
Rate Swap, strike @ 4.745%;
terminating 07/22/26 | | Deutsche Bank AG | | Receive | | 07/20/16 | | | 400,960 | | | | (428,155 | ) | | | (27,195 | ) | |
| USD | 1,000 | | | USD Put/JPY Call,
strike @ JPY 68 | | Royal Bank of Scotland PLC | | n/a | | 12/10/15 | | | 84,275 | | | | (93,904 | ) | | | (9,629 | ) | |
| USD | 1,250 | | | USD Put/JPY Call,
strike @ JPY 71 | | Barclays Bank PLC | | n/a | | 05/16/14 | | | 67,475 | | | | (88,772 | ) | | | (21,297 | ) | |
| USD | 11,700 | | | USD Put/JPY Call,
strike @ JPY 75 | | Royal Bank of Scotland PLC | | n/a | | 08/15/13 | | | 592,605 | | | | (864,074 | ) | | | (271,469 | ) | |
| | | | | | | | | | | | | $ | 2,751,797 | | | $ | (3,235,186 | ) | | $ | (483,389 | ) | |
| | | | | | | | | | | | | $ | 4,096,084 | | | $ | (4,261,246 | ) | | $ | (165,162 | ) | |
18 6 Month EURIBOR at July 31, 2011 was 1.801%.
Swaption and foreign exchange written option activity for the year ended July 31, 2011 was as follows:
| | | Premiums
received | |
| Swaption and foreign exchange options outstanding at July 31, 2010 | | $ | — | | |
| Swaption and foreign exchange options written | | | 5,824,950 | | |
| Swaption and foreign exchange options terminated in closing purchase transactions | | | (1,590,648 | ) | |
| Swaption and foreign exchange options expired prior to exercise | | | (138,218 | ) | |
| Swaption and foreign exchange options outstanding at July 31, 2011 | | $ | 4,096,084 | | |
Futures contracts
Number of
contracts | | Currency | |
| | Expiration
date | | Cost | | Current
value | | Unrealized
appreciation
(depreciation) | |
| US Treasury futures buy contracts: | | | |
| | 145 | | | USD | | | | Ultra Long-Term US Treasury Bond Futures | | September 2011 | | $ | 18,569,599 | | | $ | 19,130,938 | | | $ | 561,339 | | |
| | 67 | | | USD | | | | US Treasury Note 2 Year Futures | | September 2011 | | | 14,720,496 | | | | 14,734,766 | | | | 14,270 | | |
| | 10 | | | USD | | | | US Treasury Note 5 Year Futures | | September 2011 | | | 1,204,439 | | | | 1,214,453 | | | | 10,014 | | |
| | 662 | | | USD | | | | US Treasury Note 10 Year Futures | | September 2011 | | | 81,258,889 | | | | 83,205,125 | | | | 1,946,236 | | |
209
PACE Select Advisors Trust
PACE Alternative Strategies Investments
Portfolio of investments—July 31, 2011
Futures contracts—(continued)
Number of
contracts | | Currency | | | | Expiration
date | | Cost | | Current
value | | Unrealized
appreciation
(depreciation) | |
| Index futures buy contracts: | | | |
| | 7 | | | AUD | | | | ASX SPI 200 Index Futures | | September 2011 | | $ | 853,850 | | | $ | 841,385 | | | $ | (12,465 | ) | |
| | 8 | | | CAD | | | | S&P TSE 60 Index Futures | | September 2011 | | | 1,243,532 | | | | 1,227,815 | | | | (15,717 | ) | |
| | 52 | | | CHF | | | | Swiss Market Index Futures | | September 2011 | | | 4,257,838 | | | | 3,826,440 | | | | (431,398 | ) | |
| | 13 | | | EUR | | | | AEX Index Futures | | August 2011 | | | 1,237,628 | | | | 1,223,980 | | | | (13,648 | ) | |
| | 50 | | | EUR | | | | CAC 40 Index Futures | | August 2011 | | | 2,714,769 | | | | 2,639,411 | | | | (75,358 | ) | |
| | 6 | | | EUR | | | | DAX Index Futures | | September 2011 | | | 1,550,677 | | | | 1,547,865 | | | | (2,812 | ) | |
| | 129 | | | EUR | | | | DJ Euro Stoxx 50 Index Futures | | September 2011 | | | 5,137,027 | | | | 4,956,876 | | | | (180,151 | ) | |
| | 33 | | | EUR | | | | FTSE MIB Index Futures | | September 2011 | | | 4,684,335 | | | | 4,369,846 | | | | (314,489 | ) | |
| | 10 | | | EUR | | | | IBEX 35 Index Futures | | August 2011 | | | 1,377,404 | | | | 1,379,448 | | | | 2,044 | | |
| | 90 | | | GBP | | | | FTSE 100 Index Futures | | September 2011 | | | 8,663,092 | | | | 8,545,730 | | | | (117,362 | ) | |
| | 1 | | | GBP | | | | FTSE 250 Index Futures | | September 2011 | | | 193,043 | | | | 188,871 | | | | (4,172 | ) | |
| | 18 | | | HKD | | | | Hang Seng Index Futures | | August 2011 | | | 2,578,380 | | | | 2,577,779 | | | | (601 | ) | |
| | 8 | | | JPY | | | | NIKKEI 225 Index Futures | | September 2011 | | | 484,877 | | | | 508,874 | | | | 23,997 | | |
| | 49 | | | JPY | | | | TOPIX Index Futures | | September 2011 | | | 5,146,525 | | | | 5,338,644 | | | | 192,119 | | |
| | 73 | | | KRW | | | | KOSPI 200 Index Futures | | September 2011 | | | 9,639,146 | | | | 9,629,588 | | | | (9,558 | ) | |
| | 2 | | | SEK | | | | OMX 30 Index Futures | | August 2011 | | | 34,463 | | | | 33,951 | | | | (512 | ) | |
| | 23 | | | USD | | | | MSCI Taiwan Index Futures | | August 2011 | | | 692,151 | | | | 689,080 | | | | (3,071 | ) | |
| | 19 | | | USD | | | | NIKKEI 225 Index Futures | | September 2011 | | | 892,568 | | | | 933,850 | | | | 41,282 | | |
| | 7 | | | USD | | | | Russell 2000 Mini Index Futures | | September 2011 | | | 543,216 | | | | 556,850 | | | | 13,634 | | |
| | 274 | | | USD | | | | S&P 500 E-Mini Index Futures | | September 2011 | | | 17,838,422 | | | | 17,651,080 | | | | (187,342 | ) | |
| Interest rate futures buy contracts: | | | |
| | 1 | | | AUD | | | | Australian Treasury Bond 3 Year Futures | | September 2011 | | | 114,330 | | | | 114,766 | | | | 436 | | |
| | 358 | | | EUR | | | | German Euro Bund Futures | | September 2011 | | | 64,563,200 | | | | 67,063,201 | | | | 2,500,001 | | |
| | 50 | | | GBP | | | | United Kingdom Long Gilt 10 Year Futures | | September 2011 | | | 10,112,999 | | | | 10,266,760 | | | | 153,761 | | |
| | 2 | | | JPY | | | | Japan Government Bond 10 Year Futures | | September 2011 | | | 3,661,899 | | | | 3,674,828 | | | | 12,929 | | |
| | 233 | | | JPY | | | | Japan Government Bond 10 Year Mini Futures | | September 2011 | | | 42,503,063 | | | | 42,802,695 | | | | 299,632 | | |
| | 115 | | | USD | | | | 90 Day Euro Dollar Futures | | September 2011 | | | 28,640,834 | | | | 28,642,188 | | | | 1,354 | | |
| | 1 | | | USD | | | | 90 Day Euro Dollar Futures | | December 2011 | | | 248,940 | | | | 248,763 | | | | (177 | ) | |
| | 1 | | | USD | | | | 90 Day Euro Dollar Futures | | March 2012 | | | 248,802 | | | | 248,663 | | | | (139 | ) | |
| | 1 | | | USD | | | | 90 Day Euro Dollar Futures | | June 2012 | | | 248,577 | | | | 248,575 | | | | (2 | ) | |
| | 2 | | | USD | | | | 90 Day Euro Dollar Futures | | September 2012 | | | 496,504 | | | | 496,850 | | | | 346 | | |
| | 3 | | | USD | | | | 90 Day Euro Dollar Futures | | December 2012 | | | 743,470 | | | | 744,563 | | | | 1,093 | | |
| | 2 | | | USD | | | | 90 Day Euro Dollar Futures | | March 2013 | | | 494,855 | | | | 495,850 | | | | 995 | | |
| | 2 | | | USD | | | | 90 Day Euro Dollar Futures | | June 2013 | | | 493,841 | | | | 495,125 | | | | 1,284 | | |
| | 2 | | | USD | | | | 90 Day Euro Dollar Futures | | September 2013 | | | 492,743 | | | | 494,175 | | | | 1,432 | | |
| | 2 | | | USD | | | | 90 Day Euro Dollar Futures | | December 2013 | | | 491,443 | | | | 492,975 | | | | 1,532 | | |
| | 1 | | | USD | | | | 90 Day Euro Dollar Futures | | March 2014 | | | 245,002 | | | | 245,875 | | | | 873 | | |
| | 1 | | | USD | | | | 90 Day Euro Dollar Futures | | June 2014 | | | 244,365 | | | | 245,225 | | | | 860 | | |
| | 1 | | | USD | | | | 90 Day Euro Dollar Futures | | September 2014 | | | 243,841 | | | | 244,575 | | | | 734 | | |
| | 1 | | | USD | | | | 90 Day Euro Dollar Futures | | December 2014 | | | 243,191 | | | | 243,913 | | | | 722 | | |
| | 1 | | | USD | | | | 90 Day Euro Dollar Futures | | March 2015 | | | 242,603 | | | | 243,288 | | | | 685 | | |
| | 1 | | | USD | | | | 90 Day Euro Dollar Futures | | June 2015 | | | 241,991 | | | | 242,663 | | | | 672 | | |
| | | | | | | | | | | $ | 340,532,859 | | | $ | 344,948,161 | | | $ | 4,415,302 | | |
210
PACE Select Advisors Trust
PACE Alternative Strategies Investments
Portfolio of investments—July 31, 2011
Futures contracts—(concluded)
Number of
contracts | | Currency | | | | Expiration
date | | Proceeds | | Current
value | | Unrealized
appreciation
(depreciation) | |
| US Treasury futures sell contracts: | | | |
| | 46 | | | USD | | | | Ultra Long US Treasury Bond Futures | | September 2011 | | $ | 5,934,750 | | | $ | 6,069,125 | | | $ | (134,375 | ) | |
| | 65 | | | USD | | | | US Treasury Bond 30 Year Futures | | September 2011 | | | 8,178,099 | | | | 8,328,125 | | | | (150,026 | ) | |
| | 184 | | | USD | | | | US Treasury Note 2 Year Futures | | September 2011 | | | 40,271,468 | | | | 40,465,626 | | | | (194,158 | ) | |
| | 151 | | | USD | | | | US Treasury Note 10 Year Futures | | September 2011 | | | 18,370,183 | | | | 18,978,813 | | | | (608,630 | ) | |
| Index futures sell contracts: | | | |
| | 48 | | | AUD | | | | ASX SPI 200 Index Futures | | September 2011 | | | 5,964,717 | | | | 5,769,497 | | | | 195,220 | | |
| | 8 | | | CAD | | | | S&P TSE 60 Index Futures | | September 2011 | | | 1,267,605 | | | | 1,227,815 | | | | 39,790 | | |
| | 3 | | | EUR | | | | AEX Index Futures | | August 2011 | | | 288,685 | | | | 282,457 | | | | 6,228 | | |
| | 17 | | | EUR | | | | DAX Index Futures | | September 2011 | | | 4,395,475 | | | | 4,385,618 | | | | 9,857 | | |
| | 235 | | | EUR | | | | DJ Euro Stoxx 50 Index Futures | | September 2011 | | | 9,101,848 | | | | 9,029,967 | | | | 71,881 | | |
| | 597 | | | EUR | | | | DJ Euro Stoxx Banks Futures | | September 2011 | | | 6,784,176 | | | | 6,138,198 | | | | 645,978 | | |
| | 4 | | | EUR | | | | FTSE MIB Index Futures | | September 2011 | | | 552,402 | | | | 529,678 | | | | 22,724 | | |
| | 4 | | | EUR | | | | IBEX 35 Index Futures | | August 2011 | | | 572,929 | | | | 551,779 | | | | 21,150 | | |
| | 13 | | | HKD | | | | Hang Seng Index Futures | | August 2011 | | | 1,855,007 | | | | 1,861,730 | | | | (6,723 | ) | |
| | 5 | | | JPY | | | | NIKKEI 225 Index Futures | | September 2011 | | | 643,156 | | | | 636,741 | | | | 6,415 | | |
| | 34 | | | JPY | | | | TOPIX Index Futures | | September 2011 | | | 3,576,870 | | | | 3,704,366 | | | | (127,496 | ) | |
| | 16 | | | SEK | | | | OMX 30 Index Futures | | August 2011 | | | 278,526 | | | | 271,607 | | | | 6,919 | | |
| | 28 | | | SGD | | | | MSCI Singapore Index Futures SGX | | August 2011 | | | 1,679,669 | | | | 1,696,631 | | | | (16,962 | ) | |
| | 161 | | | USD | | | | Russell 2000 Mini Index Futures | | September 2011 | | | 12,569,089 | | | | 12,807,550 | | | | (238,461 | ) | |
| Interest rate futures sell contracts: | | | |
| | 548 | | | AUD | | | | Australian Treasury Bond 10 Year Futures | | September 2011 | | | 63,959,701 | | | | 65,853,911 | | | | (1,894,210 | ) | |
| | 402 | | | CAD | | | | Canadian Government Bond 10 Year Futures | | September 2011 | | | 52,465,980 | | | | 53,726,395 | | | | (1,260,415 | ) | |
| | 24 | | | EUR | | | | German Euro BOBL Futures | | September 2011 | | | 4,107,970 | | | | 4,121,663 | | | | (13,693 | ) | |
| | 23 | | | EUR | | | | German Euro Buxl Futures | | September 2011 | | | 3,600,189 | | | | 3,669,323 | | | | (69,134 | ) | |
| | 3 | | | EUR | | | | German Euro Schatz Futures | | September 2011 | | | 466,002 | | | | 467,463 | | | | (1,461 | ) | |
| | 1 | | | GBP | | | | 3 Month Sterling Interest Rate Futures | | September 2011 | | | 203,400 | | | | 203,402 | | | | (2 | ) | |
| | 284 | | | GBP | | | | United Kingdom Long Gilt 10 Year Futures | | September 2011 | | | 56,001,257 | | | | 58,315,198 | | | | (2,313,941 | ) | |
| | 5 | | | JPY | | | | Japan Government Bond 10 Year Futures | | September 2011 | | | 9,183,806 | | | | 9,187,069 | | | | (3,263 | ) | |
| | 18 | | | USD | | | | 90 Day Euro Dollar Futures | | September 2011 | | | 4,482,569 | | | | 4,483,125 | | | | (556 | ) | |
| | 18 | | | USD | | | | 90 Day Euro Dollar Futures | | December 2011 | | | 4,477,270 | | | | 4,477,725 | | | | (455 | ) | |
| | 1,446 | | | USD | | | | 90 Day Euro Dollar Futures | | September 2012 | | | 358,627,483 | | | | 359,222,550 | | | | (595,067 | ) | |
| | 109 | | | USD | | | | 90 Day Euro Dollar Futures | | March 2013 | | | 26,652,980 | | | | 27,023,825 | | | | (370,845 | ) | |
| | | | | | | | | | | $ | 706,513,261 | | | $ | 713,486,972 | | | $ | (6,973,711 | ) | |
| | | | | | | | | | | | | | | $ | (2,558,409 | ) | |
Forward foreign currency contracts
| Counterparty | | Contracts to
deliver | | In
exchange for | | Maturity
date | | Unrealized
appreciation
(depreciation) | |
| Bank of America N.A. | | AUD | 140,000 | | | USD | 146,853 | | | 09/21/11 | | $ | (6,003 | ) | |
| Bank of America N.A. | | CHF | 785,000 | | | USD | 958,544 | | | 09/21/11 | | | (39,595 | ) | |
| Bank of America N.A. EU | | | 980,000 | | | USD | 1,408,929 | | | 09/21/11 | | | 2,399 | | |
| Bank of America N.A. | | JPY | 152,600,000 | | | USD | 1,909,661 | | | 09/21/11 | | | (73,776 | ) | |
| Bank of America N.A. | | NOK | 17,382,000 | | | USD | 3,197,260 | | | 09/21/11 | | | (21,013 | ) | |
211
PACE Select Advisors Trust
PACE Alternative Strategies Investments
Portfolio of investments—July 31, 2011
Forward foreign currency contracts—(continued)
| Counterparty | | Contracts to
deliver | | In
exchange for | | Maturity
date | | Unrealized
appreciation
(depreciation) | |
| Bank of America N.A. | | NZD | 2,145,000 | | | USD | 1,764,977 | | | 09/21/11 | | $ | (113,662 | ) | |
| Bank of America N.A. | | SEK | 12,060,000 | | | USD | 1,905,976 | | | 09/21/11 | | | (5,808 | ) | |
| Bank of America N.A. | | SGD | 1,565,000 | | | USD | 1,272,658 | | | 09/15/11 | | | (27,191 | ) | |
| Bank of America N.A. | | SGD | 9,760,000 | | | USD | 7,957,585 | | | 09/21/11 | | | (148,923 | ) | |
| Bank of America N.A. | | TWD | 29,514,000 | | | USD | 1,029,259 | | | 09/23/11 | | | 5,323 | | |
| Bank of America N.A. | | USD | 1,734,982 | | | AUD | 1,645,000 | | | 09/21/11 | | | 61,076 | | |
| Bank of America N.A. | | USD | 795,039 | | | CHF | 665,000 | | | 09/21/11 | | | 50,518 | | |
| Bank of America N.A. | | USD | 619,871 | | | EUR | 435,000 | | | 09/15/11 | | | 4,553 | | |
| Bank of America N.A. | | USD | 950,860 | | | EUR | 665,000 | | | 09/21/11 | | | 3,570 | | |
| Bank of America N.A. | | USD | 1,591,465 | | | GBP | 995,000 | | | 09/21/11 | | | 40,920 | | |
| Bank of America N.A. | | USD | 481,352 | | | GBP | 294,000 | | | 10/19/11 | | | 837 | | |
| Bank of America N.A. | | USD | 2,066,381 | | | JPY | 167,200,000 | | | 09/21/11 | | | 106,821 | | |
| Bank of America N.A. | | USD | 458,303 | | | NOK | 2,509,000 | | | 09/21/11 | | | 6,238 | | |
| Bank of America N.A. | | USD | 805,799 | | | NZD | 970,000 | | | 09/21/11 | | | 43,749 | | |
| Bank of America N.A. | | USD | 154,241 | | | SGD | 190,000 | | | 09/15/11 | | | 3,568 | | |
| Bank of America N.A. | | USD | 8,602,001 | | | SGD | 10,570,000 | | | 09/21/11 | | | 177,280 | | |
| Bank of America N.A. | | USD | 1,037,034 | | | TWD | 29,514,000 | | | 09/23/11 | | | (13,098 | ) | |
| Barclays Bank PLC | | AUD | 39,439 | | | USD | 41,835 | | | 08/12/11 | | | (1,443 | ) | |
| Barclays Bank PLC | | AUD | 1,495,000 | | | USD | 1,580,058 | | | 09/15/11 | | | (53,469 | ) | |
| Barclays Bank PLC | | AUD | 890,000 | | | USD | 946,382 | | | 09/21/11 | | | (25,346 | ) | |
| Barclays Bank PLC | | CHF | 230,000 | | | USD | 265,712 | | | 08/09/11 | | | (26,546 | ) | |
| Barclays Bank PLC | | CHF | 135,000 | | | USD | 162,036 | | | 09/21/11 | | | (9,619 | ) | |
| Barclays Bank PLC | | CZK | 36,837,000 | | | PLN | 6,000,000 | | | 08/17/11 | | | (36,251 | ) | |
| Barclays Bank PLC | | CZK | 36,446,982 | | | PLN | 6,000,000 | | | 10/18/11 | | | (25,520 | ) | |
| Barclays Bank PLC | | EUR | 697,936 | | | USD | 1,028,982 | | | 08/09/11 | | | 26,270 | | |
| Barclays Bank PLC | | EUR | 3,847,611 | | | USD | 5,524,212 | | | 08/12/11 | | | (3,226 | ) | |
| Barclays Bank PLC | | EUR | 2,162,427 | | | USD | 3,108,960 | | | 08/16/11 | | | 2,708 | | |
| Barclays Bank PLC | | EUR | 118,795 | | | USD | 171,722 | | | 09/09/11 | | | 1,170 | | |
| Barclays Bank PLC | | EUR | 545,000 | | | USD | 793,575 | | | 09/15/11 | | | 11,251 | | |
| Barclays Bank PLC | | EUR | 4,120,795 | | | USD | 5,890,624 | | | 09/21/11 | | | (23,682 | ) | |
| Barclays Bank PLC | | EUR | 450,000 | | | USD | 651,755 | | | 10/07/11 | | | 6,167 | | |
| Barclays Bank PLC | | EUR | 608,000 | | | USD | 860,890 | | | 10/19/11 | | | (11,095 | ) | |
| Barclays Bank PLC | | GBP | 2,532,519 | | | USD | 4,185,742 | | | 08/10/11 | | | 29,076 | | |
| Barclays Bank PLC | | GBP | 201,830 | | | USD | 332,340 | | | 09/08/11 | | | 1,173 | | |
| Barclays Bank PLC | | GBP | 495,000 | | | USD | 797,794 | | | 09/15/11 | | | (14,350 | ) | |
| Barclays Bank PLC | | GBP | 1,470,000 | | | USD | 2,372,055 | | | 09/21/11 | | | (39,609 | ) | |
| Barclays Bank PLC | | GBP | 139,921 | | | USD | 225,171 | | | 10/07/11 | | | (4,343 | ) | |
| Barclays Bank PLC | | GBP | 2,310,000 | | | USD | 3,745,924 | | | 10/19/11 | | | (42,705 | ) | |
| Barclays Bank PLC | | JPY | 77,700,000 | | | USD | 966,830 | | | 09/15/11 | | | (43,019 | ) | |
| Barclays Bank PLC | | JPY | 342,347,507 | | | USD | 4,272,502 | | | 09/21/11 | | | (177,201 | ) | |
| Barclays Bank PLC | | JPY | 50,000,000 | | | USD | 620,010 | | | 10/07/11 | | | (29,980 | ) | |
| Barclays Bank PLC | | NOK | 70,000 | | | USD | 13,006 | | | 09/21/11 | | | 45 | | |
| Barclays Bank PLC | | SEK | 4,300,000 | | | USD | 685,765 | | | 08/12/11 | | | 2,652 | | |
| Barclays Bank PLC | | SGD | 450,000 | | | USD | 364,882 | | | 08/12/11 | | | (8,850 | ) | |
212
PACE Select Advisors Trust
PACE Alternative Strategies Investments
Portfolio of investments—July 31, 2011
Forward foreign currency contracts—(continued)
| Counterparty | | Contracts to
deliver | | In
exchange for | | Maturity
date | | Unrealized
appreciation
(depreciation) | |
| Barclays Bank PLC | | SGD | 376,000 | | | USD | 308,632 | | | 10/19/11 | | $ | (3,694 | ) | |
| Barclays Bank PLC | | USD | 316,952 | | | CAD | 305,000 | | | 09/21/11 | | | 1,919 | | |
| Barclays Bank PLC | | USD | 336,748 | | | CAD | 320,000 | | | 10/07/11 | | | (2,314 | ) | |
| Barclays Bank PLC | | USD | 2,079,950 | | | CHF | 1,735,000 | | | 09/21/11 | | | 126,129 | | |
| Barclays Bank PLC | | USD | 76,398 | | | EUR | 53,839 | | | 09/09/11 | | | 897 | | |
| Barclays Bank PLC | | USD | 481,246 | | | EUR | 330,000 | | | 09/21/11 | | | (7,618 | ) | |
| Barclays Bank PLC | | USD | 955,715 | | | GBP | 585,000 | | | 09/15/11 | | | 4,093 | | |
| Barclays Bank PLC | | USD | 4,304,498 | | | GBP | 2,675,000 | | | 09/21/11 | | | 84,075 | | |
| Barclays Bank PLC | | USD | 2,286,049 | | | GBP | 1,421,000 | | | 10/19/11 | | | 44,532 | | |
| Barclays Bank PLC | | USD | 297,986 | | | JPY | 23,594,831 | | | 08/26/11 | | | 8,599 | | |
| Barclays Bank PLC | | USD | 654,496 | | | JPY | 52,200,000 | | | 09/15/11 | | | 23,935 | | |
| Barclays Bank PLC | | USD | 8,576,948 | | | JPY | 691,600,000 | | | 09/21/11 | | | 412,207 | | |
| Barclays Bank PLC | | USD | 2,344,105 | | | KRW | 2,494,831,000 | | | 10/19/11 | | | 9,375 | | |
| Barclays Bank PLC | | USD | 1,119,100 | | | SGD | 1,375,000 | | | 09/15/11 | | | 22,940 | | |
| Barclays Bank PLC | | USD | 957,908 | | | SGD | 1,170,000 | | | 09/21/11 | | | 13,876 | | |
| Barclays Bank PLC | | USD | 3,684,703 | | | SGD | 4,489,000 | | | 10/19/11 | | | 44,103 | | |
| BNP Paribas SA | | AUD | 4,357,835 | | | USD | 4,631,095 | | | 08/12/11 | | | (150,997 | ) | |
| BNP Paribas SA | | AUD | 1,505,000 | | | USD | 1,574,034 | | | 09/21/11 | | | (69,168 | ) | |
| BNP Paribas SA | | CAD | 550,000 | | | USD | 575,552 | | | 08/09/11 | | | (4 | ) | |
| BNP Paribas SA | | CAD | 2,300,000 | | | USD | 2,377,492 | | | 08/12/11 | | | (29,223 | ) | |
| BNP Paribas SA | | CAD | 1,245,000 | | | USD | 1,269,479 | | | 09/21/11 | | | (32,143 | ) | |
| BNP Paribas SA | | CHF | 1,600,000 | | | USD | 1,825,607 | | | 08/12/11 | | | (207,588 | ) | |
| BNP Paribas SA | | DKK | 1,200,000 | | | USD | 231,193 | | | 08/12/11 | | | (198 | ) | |
| BNP Paribas SA | | EUR | 543,929 | | | USD | 778,195 | | | 08/12/11 | | | (3,208 | ) | |
| BNP Paribas SA | | EUR | 153,399 | | | USD | 220,537 | | | 08/18/11 | | | 194 | | |
| BNP Paribas SA | | EUR | 19,332,927 | | | USD | 27,914,309 | | | 09/09/11 | | | 158,423 | | |
| BNP Paribas SA | | EUR | 2,685,000 | | | USD | 3,828,797 | | | 09/21/11 | | | (24,807 | ) | |
| BNP Paribas SA | | EUR | 3,841,847 | | | USD | 5,421,742 | | | 10/21/11 | | | (87,894 | ) | |
| BNP Paribas SA | | EUR | 700,000 | | | USD | 1,003,771 | | | 10/26/11 | | | 25 | | |
| BNP Paribas SA | | GBP | 95,000 | | | USD | 152,918 | | | 09/21/11 | | | (2,938 | ) | |
| BNP Paribas SA | | HKD | 3,900,000 | | | USD | 502,018 | | | 08/12/11 | | | 1,587 | | |
| BNP Paribas SA | | JPY | 320,000,000 | | | USD | 3,965,259 | | | 08/12/11 | | | (191,952 | ) | |
| BNP Paribas SA | | JPY | 89,800,000 | | | USD | 1,122,359 | | | 09/21/11 | | | (44,828 | ) | |
| BNP Paribas SA | | JPY | 277,005,000 | | | USD | 3,501,681 | | | 10/19/11 | | | (99,744 | ) | |
| BNP Paribas SA | | NOK | 1,000,000 | | | USD | 181,571 | | | 08/12/11 | | | (4,043 | ) | |
| BNP Paribas SA | | NOK | 13,670,000 | | | USD | 2,530,029 | | | 09/15/11 | | | (1,968 | ) | |
| BNP Paribas SA | | NOK | 23,262,000 | | | USD | 4,237,855 | | | 09/21/11 | | | (69,098 | ) | |
| BNP Paribas SA | | SEK | 48,393,000 | | | USD | 7,536,936 | | | 09/21/11 | | | (134,455 | ) | |
| BNP Paribas SA | | USD | 1,870,470 | | | AUD | 1,744,130 | | | 08/12/11 | | | 43,460 | | |
| BNP Paribas SA | | USD | 1,747,616 | | | CAD | 1,705,000 | | | 09/21/11 | | | 34,928 | | |
| BNP Paribas SA | | USD | 1,436,211 | | | CHF | 1,200,000 | | | 09/21/11 | | | 89,607 | | |
| BNP Paribas SA | | USD | 495,562 | | | EUR | 350,000 | | | 08/12/11 | | | 7,244 | | |
| BNP Paribas SA | | USD | 1,628,636 | | | EUR | 1,133,154 | | | 09/09/11 | | | (1,790 | ) | |
| BNP Paribas SA | | USD | 2,544,658 | | | EUR | 1,770,000 | | | 09/21/11 | | | (4,293 | ) | |
213
PACE Select Advisors Trust
PACE Alternative Strategies Investments
Portfolio of investments—July 31, 2011
Forward foreign currency contracts—(continued)
| Counterparty | | Contracts to
deliver | | In
exchange for | | Maturity
date | | Unrealized
appreciation
(depreciation) | |
| BNP Paribas SA | | USD | 472,743 | | | GBP | 295,000 | | | 09/21/11 | | $ | 11,231 | | |
| BNP Paribas SA | | USD | 1,359,930 | | | JPY | 107,579,000 | | | 10/19/11 | | | 38,737 | | |
| BNP Paribas SA | | USD | 952,269 | | | NOK | 5,300,000 | | | 09/15/11 | | | 29,412 | | |
| BNP Paribas SA | | USD | 8,424,239 | | | NOK | 45,843,000 | | | 09/21/11 | | | 63,580 | | |
| BNP Paribas SA | | USD | 475,726 | | | SEK | 2,950,000 | | | 09/15/11 | | | (7,930 | ) | |
| BNP Paribas SA | | USD | 11,078,097 | | | SEK | 70,229,144 | | | 09/21/11 | | | 54,820 | | |
| Brown Brothers Harriman & Co. | | CHF | 260,000 | | | USD | 307,721 | | | 09/21/11 | | | (22,872 | ) | |
| Brown Brothers Harriman & Co. | | GBP | 585,000 | | | USD | 957,353 | | | 09/21/11 | | | (2,391 | ) | |
| Brown Brothers Harriman & Co. | | USD | 5,858 | | | CHF | 5,000 | | | 09/21/11 | | | 500 | | |
| Brown Brothers Harriman & Co. | | USD | 155,581 | | | EUR | 110,000 | | | 09/15/11 | | | 2,320 | | |
| Brown Brothers Harriman & Co. | | USD | 1,590,722 | | | GBP | 980,000 | | | 09/21/11 | | | 17,055 | | |
| Citibank N.A. | | AUD | 2,996,000 | | | JPY | 251,406,344 | | | 09/21/11 | | | (3,434 | ) | |
| Citibank N.A. | | AUD | 2,024,000 | | | USD | 2,128,886 | | | 09/21/11 | | | (80,974 | ) | |
| Citibank N.A. | | CAD | 1,685,000 | | | USD | 1,750,106 | | | 09/21/11 | | | (11,528 | ) | |
| Citibank N.A. | | CHF | 1,310,000 | | | USD | 1,613,202 | | | 09/21/11 | | | (52,483 | ) | |
| Citibank N.A. | | EUR | 980,000 | | | NZD | 1,739,882 | | | 09/21/11 | | | 117,298 | | |
| Citibank N.A. | | EUR | 3,489,000 | | | USD | 5,013,231 | | | 09/21/11 | | | 5,699 | | |
| Citibank N.A. | | GBP | 90,000 | | | USD | 145,183 | | | 09/15/11 | | | (2,480 | ) | |
| Citibank N.A. | | GBP | 2,809,000 | | | USD | 4,532,519 | | | 09/21/11 | | | (75,892 | ) | |
| Citibank N.A. | | JPY | 319,700,000 | | | USD | 3,986,466 | | | 09/21/11 | | | (168,873 | ) | |
| Citibank N.A. | | MXN | 9,075,000 | | | USD | 771,933 | | | 10/19/11 | | | 4,229 | | |
| Citibank N.A. | | NOK | 7,841,025 | | | EUR | 1,013,000 | | | 09/21/11 | | | 2,129 | | |
| Citibank N.A. | | NOK | 18,432,000 | | | USD | 3,357,208 | | | 09/21/11 | | | (55,472 | ) | |
| Citibank N.A. | | NZD | 5,675,000 | | | USD | 4,591,807 | | | 09/21/11 | | | (378,485 | ) | |
| Citibank N.A. | | SEK | 20,109,786 | | | USD | 3,143,087 | | | 09/21/11 | | | (44,772 | ) | |
| Citibank N.A. | | USD | 3,200,516 | | | AUD | 3,034,671 | | | 09/21/11 | | | 112,825 | | |
| Citibank N.A. | | USD | 2,732,690 | | | CAD | 2,675,000 | | | 09/15/11 | | | 64,337 | | |
| Citibank N.A. | | USD | 1,432,603 | | | CAD | 1,405,000 | | | 09/21/11 | | | 36,296 | | |
| Citibank N.A. | | USD | 325,888 | | | CHF | 275,000 | | | 09/21/11 | | | 23,778 | | |
| Citibank N.A. | | USD | 4,934,250 | | | EUR | 3,429,000 | | | 09/21/11 | | | (12,832 | ) | |
| Citibank N.A. | | USD | 3,568,984 | | | MXN | 41,967,000 | | | 10/19/11 | | | (18,762 | ) | |
| Citibank N.A. | | USD | 4,842,903 | | | NOK | 26,563,805 | | | 09/21/11 | | | 75,379 | | |
| Citibank N.A. | | USD | 2,129,348 | | | NOK | 11,814,000 | | | 10/19/11 | | | 53,951 | | |
| Citibank N.A. | | USD | 1,415,628 | | | NZD | 1,742,000 | | | 09/21/11 | | | 110,055 | | |
| Citibank N.A. | | USD | 4,982,520 | | | SEK | 32,023,217 | | | 09/21/11 | | | 93,889 | | |
| Credit Suisse London Branch | | CAD | 930,000 | | | USD | 952,898 | | | 09/21/11 | | | (19,398 | ) | |
| Credit Suisse London Branch | | CHF | 592,287 | | | GBP | 444,000 | | | 09/21/11 | | | (24,681 | ) | |
| Credit Suisse London Branch | | CHF | 130,000 | | | USD | 155,401 | | | 09/15/11 | | | (9,882 | ) | |
| Credit Suisse London Branch | | CHF | 945,000 | | | USD | 1,131,343 | | | 09/21/11 | | | (70,239 | ) | |
| Credit Suisse London Branch | | EUR | 2,440,000 | | | USD | 3,513,616 | | | 09/21/11 | | | 11,644 | | |
| Credit Suisse London Branch | | GBP | 1,780,000 | | | USD | 2,863,072 | | | 09/21/11 | | | (57,175 | ) | |
| Credit Suisse London Branch | | JPY | 153,300,000 | | | USD | 1,912,988 | | | 09/21/11 | | | (79,547 | ) | |
| Credit Suisse London Branch | | NOK | 18,100,000 | | | USD | 3,323,424 | | | 09/21/11 | | | (27,786 | ) | |
214
PACE Select Advisors Trust
PACE Alternative Strategies Investments
Portfolio of investments—July 31, 2011
Forward foreign currency contracts—(continued)
| Counterparty | | Contracts to
deliver | | In
exchange for | | Maturity
date | | Unrealized
appreciation
(depreciation) | |
| Credit Suisse London Branch | | NZD | 1,535,000 | | | USD | 1,274,552 | | | 09/21/11 | | $ | (69,835 | ) | |
| Credit Suisse London Branch | | TRY | 1,544,000 | | | USD | 920,253 | | | 10/19/11 | | | 19,486 | | |
| Credit Suisse London Branch | | USD | 5,736,587 | | | CHF | 4,775,000 | | | 09/21/11 | | | 334,897 | | |
| Credit Suisse London Branch | | USD | 3,034,014 | | | EUR | 2,125,000 | | | 09/21/11 | | | 15,859 | | |
| Credit Suisse London Branch | | USD | 953,354 | | | JPY | 77,100,000 | | | 09/21/11 | | | 48,763 | | |
| Credit Suisse London Branch | | USD | 636,984 | | | NZD | 770,000 | | | 09/21/11 | | | 37,399 | | |
| Credit Suisse London Branch | | USD | 1,117,813 | | | SEK | 7,200,000 | | | 09/21/11 | | | 23,551 | | |
| Credit Suisse London Branch | | USD | 323,042 | | | TRY | 542,000 | | | 10/19/11 | | | (6,840 | ) | |
| Deutsche Bank AG London | | AUD | 805,338 | | | EUR | 591,000 | | | 09/21/11 | | | (31,067 | ) | |
| Deutsche Bank AG London | | AUD | 1,370,000 | | | USD | 1,414,855 | | | 09/21/11 | | | (80,950 | ) | |
| Deutsche Bank AG London | | AUD | 160,000 | | | USD | 174,041 | | | 10/19/11 | | | (34 | ) | |
| Deutsche Bank AG London | | CAD | 5,000 | | | USD | 5,119 | | | 09/15/11 | | | (109 | ) | |
| Deutsche Bank AG London | | CHF | 5,480,000 | | | USD | 6,695,470 | | | 09/21/11 | | | (272,432 | ) | |
| Deutsche Bank AG London | | CNY | 4,250,000 | | | USD | 660,194 | | | 03/30/12 | | | (3,396 | ) | |
| Deutsche Bank AG London | | EUR | 1,445,000 | | | CAD | 1,942,846 | | | 09/21/11 | | | (42,707 | ) | |
| Deutsche Bank AG London | | EUR | 219,999 | | | USD | 315,897 | | | 09/01/11 | | | (15 | ) | |
| Deutsche Bank AG London | | EUR | 110,000 | | | USD | 157,892 | | | 09/21/11 | | | 16 | | |
| Deutsche Bank AG London | | EUR | 1,044,000 | | | USD | 1,470,370 | | | 10/19/11 | | | (26,921 | ) | |
| Deutsche Bank AG London | | GBP | 1,096,519 | | | USD | 1,752,530 | | | 08/05/11 | | | (47,298 | ) | |
| Deutsche Bank AG London | | GBP | 2,070,000 | | | USD | 3,334,481 | | | 09/21/11 | | | (61,536 | ) | |
| Deutsche Bank AG London | | JPY | 25,900,000 | | | USD | 318,816 | | | 09/21/11 | | | (17,822 | ) | |
| Deutsche Bank AG London | | NOK | 7,710,000 | | | USD | 1,420,915 | | | 09/21/11 | | | (6,590 | ) | |
| Deutsche Bank AG London | | NZD | 2,485,000 | | | USD | 2,060,636 | | | 09/21/11 | | | (115,782 | ) | |
| Deutsche Bank AG London | | SEK | 2,950,000 | | | USD | 474,811 | | | 09/15/11 | | | 7,015 | | |
| Deutsche Bank AG London | | SEK | 35,120,000 | | | USD | 5,539,567 | | | 09/21/11 | | | (27,752 | ) | |
| Deutsche Bank AG London | | SGD | 5,875,000 | | | USD | 4,792,702 | | | 09/21/11 | | | (86,983 | ) | |
| Deutsche Bank AG London | | USD | 2,212,519 | | | AUD | 2,105,000 | | | 09/21/11 | | | 85,780 | | |
| Deutsche Bank AG London | | USD | 480,001 | | | CHF | 385,000 | | | 09/21/11 | | | 9,532 | | |
| Deutsche Bank AG London | | USD | 1,438,846 | | | CNY | 9,223,000 | | | 03/30/12 | | | 1,224 | | |
| Deutsche Bank AG London | | USD | 5,100,293 | | | EUR | 3,565,000 | | | 09/21/11 | | | 16,317 | | |
| Deutsche Bank AG London | | USD | 388,718 | | | EUR | 276,000 | | | 10/19/11 | | | 7,117 | | |
| Deutsche Bank AG London | | USD | 1,270,909 | | | GBP | 790,000 | | | 09/21/11 | | | 25,155 | | |
| Deutsche Bank AG London | | USD | 2,227,677 | | | JPY | 177,000,000 | | | 09/21/11 | | | 72,902 | | |
| Deutsche Bank AG London | | USD | 1,891,012 | | | NOK | 10,461,000 | | | 09/21/11 | | | 45,839 | | |
| Deutsche Bank AG London | | USD | 4,924,931 | | | NZD | 5,995,000 | | | 09/21/11 | | | 325,624 | | |
| Deutsche Bank AG London | | USD | 3,815,137 | | | SEK | 24,129,000 | | | 09/21/11 | | | 9,858 | | |
| Deutsche Bank AG London | | USD | 1,117,504 | | | SGD | 1,350,000 | | | 09/21/11 | | | 3,785 | | |
| Goldman Sachs International | | AUD | 450,000 | | | USD | 472,694 | | | 09/21/11 | | | (18,629 | ) | |
| Goldman Sachs International | | CAD | 2,730,000 | | | USD | 2,861,927 | | | 09/21/11 | | | 7,766 | | |
| Goldman Sachs International | | CHF | 385,000 | | | USD | 479,249 | | | 09/21/11 | | | (10,284 | ) | |
| Goldman Sachs International | | CHF | 2,166,000 | | | USD | 2,654,184 | | | 10/19/11 | | | (100,999 | ) | |
| Goldman Sachs International | | GBP | 895,000 | | | USD | 1,436,600 | | | 09/21/11 | | | (31,726 | ) | |
| Goldman Sachs International | | JPY | 385,600,000 | | | USD | 4,758,902 | | | 09/21/11 | | | (252,980 | ) | |
| Goldman Sachs International | | JPY | 122,672,000 | | | USD | 1,566,412 | | | 10/19/11 | | | (28,483 | ) | |
215
PACE Select Advisors Trust
PACE Alternative Strategies Investments
Portfolio of investments—July 31, 2011
Forward foreign currency contracts—(continued)
| Counterparty | | Contracts to
deliver | | In
exchange for | | Maturity
date | | Unrealized
appreciation
(depreciation) | |
| Goldman Sachs International | | NOK | 6,048,000 | | | USD | 1,105,586 | | | 09/21/11 | | $ | (14,199 | ) | |
| Goldman Sachs International | | SEK | 14,657,000 | | | USD | 2,256,655 | | | 09/21/11 | | | (66,813 | ) | |
| Goldman Sachs International | | USD | 152,656 | | | AUD | 145,000 | | | 09/21/11 | | | 5,659 | | |
| Goldman Sachs International | | USD | 1,823,404 | | | CAD | 1,746,000 | | | 10/19/11 | | | 823 | | |
| Goldman Sachs International | | USD | 1,111,756 | | | GBP | 690,000 | | | 09/21/11 | | | 20,250 | | |
| Goldman Sachs International | | USD | 1,287,641 | | | JPY | 103,300,000 | | | 09/21/11 | | | 55,013 | | |
| Goldman Sachs International | | USD | 931,293 | | | NOK | 5,140,000 | | | 09/21/11 | | | 20,377 | | |
| Goldman Sachs International | | USD | 1,665,801 | | | NOK | 9,302,000 | | | 10/19/11 | | | 53,266 | | |
| Goldman Sachs International | | USD | 785,125 | | | NZD | 965,000 | | | 09/21/11 | | | 60,043 | | |
| Goldman Sachs International | | USD | 2,339,212 | | | SEK | 15,134,000 | | | 09/21/11 | | | 59,871 | | |
| HSBC Bank PLC | | AUD | 2,680,000 | | | USD | 2,797,840 | | | 09/21/11 | | | (128,261 | ) | |
| HSBC Bank PLC | | CHF | 1,205,417 | | | EUR | 1,005,000 | | | 09/21/11 | | | (90,296 | ) | |
| HSBC Bank PLC | | CHF | 594,683 | | | GBP | 443,000 | | | 09/21/11 | | | (29,368 | ) | |
| HSBC Bank PLC | | EUR | 1,476,000 | | | CHF | 1,801,064 | | | 09/21/11 | | | 171,675 | | |
| HSBC Bank PLC | | EUR | 4,029,000 | | | SEK | 37,043,537 | | | 09/21/11 | | | 89,685 | | |
| HSBC Bank PLC | | EUR | 1,020,000 | | | USD | 1,443,814 | | | 09/21/11 | | | (20,125 | ) | |
| HSBC Bank PLC | | NOK | 7,842,401 | | | EUR | 1,013,000 | | | 09/21/11 | | | 1,874 | | |
| HSBC Bank PLC | | NOK | 12,797,600 | | | USD | 2,285,000 | | | 09/21/11 | | | (84,472 | ) | |
| HSBC Bank PLC | | NZD | 1,757,000 | | | USD | 1,425,821 | | | 09/21/11 | | | (112,998 | ) | |
| HSBC Bank PLC | | SEK | 30,168,100 | | | USD | 4,652,433 | | | 09/21/11 | | | (129,898 | ) | |
| HSBC Bank PLC | | USD | 2,565,000 | | | CHF | 2,080,745 | | | 09/21/11 | | | 80,699 | | |
| HSBC Bank PLC | | USD | 4,419,801 | | | EUR | 3,098,708 | | | 09/21/11 | | | 27,571 | | |
| HSBC Bank PLC | | USD | 5,251,000 | | | NOK | 28,464,495 | | | 09/21/11 | | | 19,193 | | |
| HSBC Bank PLC | | USD | 1,478,000 | | | SEK | 9,287,542 | | | 09/21/11 | | | (5,713 | ) | |
| HSBC Bank USA | | AUD | 1,350,000 | | | USD | 1,413,933 | | | 09/21/11 | | | (60,035 | ) | |
| HSBC Bank USA | | CHF | 5,525,000 | | | USD | 6,538,249 | | | 09/21/11 | | | (486,872 | ) | |
| HSBC Bank USA | | GBP | 1,590,000 | | | USD | 2,554,510 | | | 09/21/11 | | | (54,025 | ) | |
| HSBC Bank USA | | JPY | 241,000,000 | | | USD | 3,028,837 | | | 09/21/11 | | | (103,590 | ) | |
| HSBC Bank USA | | MXN | 27,461,000 | | | USD | 2,326,524 | | | 10/19/11 | | | 3,446 | | |
| HSBC Bank USA | | NZD | 2,550,000 | | | USD | 2,059,915 | | | 09/21/11 | | | (173,432 | ) | |
| HSBC Bank USA | | SEK | 4,140,000 | | | USD | 635,274 | | | 09/21/11 | | | (21,010 | ) | |
| HSBC Bank USA | | USD | 473,237 | | | CAD | 465,000 | | | 09/21/11 | | | 12,912 | | |
| HSBC Bank USA | | USD | 2,718,685 | | | CHF | 2,285,000 | | | 09/21/11 | | | 186,727 | | |
| HSBC Bank USA | | USD | 1,120,792 | | | GBP | 695,000 | | | 09/21/11 | | | 19,417 | | |
| HSBC Bank USA | | USD | 316,157 | | | NZD | 390,000 | | | 09/21/11 | | | 25,413 | | |
| HSBC Bank USA | | USD | 54,204 | | | PLN | 156,000 | | | 10/19/11 | | | 1,421 | | |
| HSBC Bank USA | | USD | 958,100 | | | SGD | 1,180,000 | | | 09/21/11 | | | 21,990 | | |
| HSBC Bank USA | | USD | 447,381 | | | ZAR | 3,128,000 | | | 10/19/11 | | | 15,357 | | |
| JPMorgan Chase Bank | | AUD | 290,000 | | | USD | 304,790 | | | 09/15/11 | | | (12,081 | ) | |
| JPMorgan Chase Bank | | AUD | 1,520,000 | | | USD | 1,590,529 | | | 09/21/11 | | | (69,050 | ) | |
| JPMorgan Chase Bank | | BRL | 882,000 | | | USD | 551,595 | | | 10/18/11 | | | (7,075 | ) | |
| JPMorgan Chase Bank | | CAD | 155,000 | | | USD | 157,124 | | | 09/15/11 | | | (4,946 | ) | |
| JPMorgan Chase Bank | | CHF | 3,747,358 | | | USD | 4,475,003 | | | 09/21/11 | | | (289,818 | ) | |
| JPMorgan Chase Bank | | CNY | 21,782,000 | | | USD | 3,343,405 | | | 09/14/11 | | | (38,972 | ) | |
216
PACE Select Advisors Trust
PACE Alternative Strategies Investments
Portfolio of investments—July 31, 2011
Forward foreign currency contracts—(continued)
| Counterparty | | Contracts to
deliver | | In
exchange for | | Maturity
date | | Unrealized
appreciation
(depreciation) | |
| JPMorgan Chase Bank | | CNY | 10,503,000 | | | USD | 1,610,841 | | | 03/30/12 | | $ | (29,087 | ) | |
| JPMorgan Chase Bank | | EUR | 1,717,811 | | | USD | 2,467,472 | | | 09/01/11 | | | 747 | | |
| JPMorgan Chase Bank | | EUR | 1,000,000 | | | USD | 1,421,010 | | | 09/21/11 | | | (14,224 | ) | |
| JPMorgan Chase Bank | | JPY | 68,490,560 | | | USD | 864,780 | | | 08/26/11 | | | (25,168 | ) | |
| JPMorgan Chase Bank | | JPY | 13,658,000 | | | USD | 173,298 | | | 10/19/11 | | | (4,273 | ) | |
| JPMorgan Chase Bank | | MXN | 1,302,261 | | | USD | 111,247 | | | 09/30/11 | | | 894 | | |
| JPMorgan Chase Bank | | NOK | 21,019,000 | | | USD | 3,831,868 | | | 09/21/11 | | | (59,794 | ) | |
| JPMorgan Chase Bank | | NOK | 1,839,000 | | | USD | 326,067 | | | 10/19/11 | | | (13,792 | ) | |
| JPMorgan Chase Bank | | NZD | 10,000 | | | USD | 8,132 | | | 09/21/11 | | | (626 | ) | |
| JPMorgan Chase Bank | | SEK | 13,110,000 | | | USD | 2,060,807 | | | 09/21/11 | | | (17,427 | ) | |
| JPMorgan Chase Bank | | SGD | 5,890,000 | | | USD | 4,779,627 | | | 09/21/11 | | | (112,517 | ) | |
| JPMorgan Chase Bank | | USD | 1,743,522 | | | AUD | 1,650,000 | | | 09/21/11 | | | 57,995 | | |
| JPMorgan Chase Bank | | USD | 338,848 | | | AUD | 319,000 | | | 10/19/11 | | | 8,213 | | |
| JPMorgan Chase Bank | | USD | 161,240 | | | BRL | 260,000 | | | 10/19/11 | | | 3,395 | | |
| JPMorgan Chase Bank | | USD | 723,000 | | | CAD | 684,009 | | | 09/21/11 | | | (7,883 | ) | |
| JPMorgan Chase Bank | | USD | 2,878,659 | | | CHF | 2,329,806 | | | 09/21/11 | | | 83,724 | | |
| JPMorgan Chase Bank | | USD | 4,736,511 | | | CNY | 31,317,000 | | | 09/14/11 | | | 126,491 | | |
| JPMorgan Chase Bank | | USD | 2,195,912 | | | CNY | 14,504,000 | | | 03/30/12 | | | 68,727 | | |
| JPMorgan Chase Bank | | USD | 2,336,584 | | | CNY | 14,856,000 | | | 12/07/12 | | | 10,070 | | |
| JPMorgan Chase Bank | | USD | 693,623 | | | EUR | 482,888 | | | 09/01/11 | | | (210 | ) | |
| JPMorgan Chase Bank | | USD | 953,459 | | | EUR | 670,000 | | | 09/21/11 | | | 8,148 | | |
| JPMorgan Chase Bank | | USD | 1,557,042 | | | GBP | 974,370 | | | 08/05/11 | | | 42,289 | | |
| JPMorgan Chase Bank | | USD | 625,067 | | | GBP | 390,000 | | | 09/21/11 | | | 14,763 | | |
| JPMorgan Chase Bank | | USD | 3,664,071 | | | JPY | 293,580,000 | | | 09/08/11 | | | 151,233 | | |
| JPMorgan Chase Bank | | USD | 650,189 | | | KRW | 706,625,000 | | | 09/09/11 | | | 18,227 | | |
| JPMorgan Chase Bank | | USD | 1,197,590 | | | NOK | 6,620,000 | | | 09/15/11 | | | 28,586 | | |
| JPMorgan Chase Bank | | USD | 6,236,317 | | | NOK | 33,768,169 | | | 09/21/11 | | | 15,851 | | |
| JPMorgan Chase Bank | | USD | 635,701 | | | NZD | 785,000 | | | 09/15/11 | | | 52,131 | | |
| JPMorgan Chase Bank | | USD | 627,050 | | | NZD | 785,000 | | | 09/21/11 | | | 60,470 | | |
| JPMorgan Chase Bank | | USD | 217,331 | | | NZD | 256,000 | | | 10/19/11 | | | 6,391 | | |
| JPMorgan Chase Bank | | USD | 1,129,155 | | | SEK | 7,290,000 | | | 09/21/11 | | | 26,476 | | |
| JPMorgan Chase Bank | | USD | 2,467,384 | | | SEK | 16,151,000 | | | 10/19/11 | | | 88,968 | | |
| JPMorgan Chase Bank | | USD | 4,469,978 | | | SGD | 5,480,000 | | | 09/21/11 | | | 81,627 | | |
| JPMorgan Chase Bank | | ZAR | 7,888,905 | | | USD | 1,155,756 | | | 09/02/11 | | | (19,360 | ) | |
| Morgan Stanley & Co., Inc. | | EUR | 450,000 | | | USD | 635,135 | | | 09/21/11 | | | (10,721 | ) | |
| Morgan Stanley & Co., Inc. | | GBP | 485,000 | | | USD | 791,884 | | | 09/21/11 | | | (3,801 | ) | |
| Morgan Stanley & Co., Inc. | | NZD | 920,000 | | | USD | 798,514 | | | 09/21/11 | | | (7,242 | ) | |
| Morgan Stanley & Co., Inc. | | SGD | 380,000 | | | USD | 315,790 | | | 09/21/11 | | | 168 | | |
| Morgan Stanley & Co., Inc. | | USD | 791,522 | | | CAD | 760,000 | | | 09/21/11 | | | 3,042 | | |
| Morgan Stanley & Co., Inc. | | USD | 1,276,765 | | | JPY | 102,900,000 | | | 09/21/11 | | | 60,690 | | |
| Morgan Stanley & Co., Inc. | | USD | 2,215,068 | | | NOK | 12,075,000 | | | 09/21/11 | | | 20,615 | | |
| Morgan Stanley & Co., Inc. | | USD | 795,683 | | | NZD | 985,000 | | | 09/21/11 | | | 67,002 | | |
| Morgan Stanley Capital Services, Inc. | | AUD | 41,805,539 | | | USD | 43,875,079 | | | 09/21/11 | | | (1,769,400 | ) | |
| Morgan Stanley Capital Services, Inc. | | CAD | 9,796,536 | | | USD | 10,003,827 | | | 09/21/11 | | | (238,256 | ) | |
| Morgan Stanley Capital Services, Inc. | | CHF | 43,486,084 | | | USD | 51,917,903 | | | 09/21/11 | | | (3,375,310 | ) | |
217
PACE Select Advisors Trust
PACE Alternative Strategies Investments
Portfolio of investments—July 31, 2011
Forward foreign currency contracts—(continued)
| Counterparty | | Contracts to
deliver | | In
exchange for | | Maturity
date | | Unrealized
appreciation
(depreciation) | |
| Morgan Stanley Capital Services, Inc. | | EUR | 10,203,705 | | | USD | 14,674,734 | | | 09/21/11 | | $ | 30,028 | | |
| Morgan Stanley Capital Services, Inc. | | GBP | 12,841,594 | | | USD | 20,602,637 | | | 09/21/11 | | | (465,128 | ) | |
| Morgan Stanley Capital Services, Inc. | | JPY | 1,275,761,956 | | | USD | 15,928,015 | | | 09/21/11 | | | (653,855 | ) | |
| Morgan Stanley Capital Services, Inc. | | NZD | 13,543,598 | | | USD | 11,057,149 | | | 09/21/11 | | | (804,636 | ) | |
| Morgan Stanley Capital Services, Inc. | | SEK | 127,639,017 | | | USD | 19,834,675 | | | 09/21/11 | | | (399,014 | ) | |
| Morgan Stanley Capital Services, Inc. | | USD | 8,919,187 | | | AUD | 8,313,540 | | | 09/21/11 | | | 157,772 | | |
| Morgan Stanley Capital Services, Inc. | | USD | 6,661,079 | | | CAD | 6,380,152 | | | 09/21/11 | | | 9,243 | | |
| Morgan Stanley Capital Services, Inc. | | USD | 17,101,685 | | | CHF | 14,108,909 | | | 09/21/11 | | | 838,006 | | |
| Morgan Stanley Capital Services, Inc. | | USD | 29,659,815 | | | EUR | 20,769,723 | | | 09/21/11 | | | 149,602 | | |
| Morgan Stanley Capital Services, Inc. | | USD | 47,898,161 | | | GBP | 29,400,161 | | | 09/21/11 | | | 335,389 | | |
| Morgan Stanley Capital Services, Inc. | | USD | 7,186,720 | | | JPY | 578,411,376 | | | 09/21/11 | | | 331,252 | | |
| Morgan Stanley Capital Services, Inc. | | USD | 25,286,493 | | | NZD | 30,834,195 | | | 09/21/11 | | | 1,718,783 | | |
| Morgan Stanley Capital Services, Inc. | | USD | 28,675,468 | | | SEK | 180,825,105 | | | 09/21/11 | | | (10,574 | ) | |
| Royal Bank of Canada | | AUD | 1,345,000 | | | USD | 1,411,876 | | | 09/21/11 | | | (56,633 | ) | |
| Royal Bank of Canada | | BRL | 3,693,000 | | | USD | 2,328,970 | | | 10/19/11 | | | (9,482 | ) | |
| Royal Bank of Canada | | CAD | 1,502,000 | | | JPY | 124,264,967 | | | 09/21/11 | | | 44,838 | | |
| Royal Bank of Canada | | CAD | 780,000 | | | USD | 793,015 | | | 09/15/11 | | | (22,567 | ) | |
| Royal Bank of Canada | | CAD | 8,746,022 | | | USD | 8,939,319 | | | 09/21/11 | | | (204,473 | ) | |
| Royal Bank of Canada | | CAD | 441,000 | | | USD | 459,069 | | | 10/19/11 | | | (1,689 | ) | |
| Royal Bank of Canada | | EUR | 2,422,000 | | | USD | 3,439,796 | | | 09/21/11 | | | (36,342 | ) | |
| Royal Bank of Canada | | GBP | 885,000 | | | USD | 1,439,917 | | | 09/21/11 | | | (12,004 | ) | |
| Royal Bank of Canada | | JPY | 57,552,501 | | | CAD | 703,000 | | | 09/21/11 | | | (13,073 | ) | |
| Royal Bank of Canada | | JPY | 101,600,000 | | | USD | 1,267,249 | | | 09/21/11 | | | (53,310 | ) | |
| Royal Bank of Canada | | MXN | 45,733,000 | | | USD | 3,873,368 | | | 10/19/11 | | | 4,560 | | |
| Royal Bank of Canada | | NOK | 1,717,000 | | | USD | 316,889 | | | 09/21/11 | | | (1,013 | ) | |
| Royal Bank of Canada | | SEK | 4,596,327 | | | USD | 710,000 | | | 09/21/11 | | | (18,622 | ) | |
| Royal Bank of Canada | | USD | 5,850,237 | | | AUD | 5,482,000 | | | 09/21/11 | | | 135,167 | | |
| Royal Bank of Canada | | USD | 2,149,855 | | | BRL | 3,433,000 | | | 10/19/11 | | | 23,962 | | |
| Royal Bank of Canada | | USD | 957,649 | | | CAD | 940,000 | | | 09/15/11 | | | 25,231 | | |
| Royal Bank of Canada | | USD | 12,783,388 | | | CAD | 12,372,871 | | | 09/21/11 | | | 152,203 | | |
| Royal Bank of Canada | | USD | 3,286,100 | | | CAD | 3,154,000 | | | 10/19/11 | | | 9,209 | | |
| Royal Bank of Canada | | USD | 3,200,390 | | | CHF | 2,680,000 | | | 09/21/11 | | | 207,271 | | |
| Royal Bank of Canada | | USD | 1,429,917 | | | EUR | 1,019,000 | | | 09/21/11 | | | 32,587 | | |
| Royal Bank of Canada | | USD | 3,191,878 | | | GBP | 1,950,000 | | | 09/21/11 | | | 7,269 | | |
| Royal Bank of Canada | | USD | 318,066 | | | JPY | 25,500,000 | | | 09/15/11 | | | 13,352 | | |
| Royal Bank of Canada | | USD | 3,349,623 | | | JPY | 262,800,000 | | | 09/21/11 | | | 66,151 | | |
| Royal Bank of Canada | | USD | 3,093,083 | | | MXN | 36,473,000 | | | 10/19/11 | | | (7,630 | ) | |
| Royal Bank of Canada | | USD | 312,489 | | | NOK | 1,750,000 | | | 09/15/11 | | | 11,651 | | |
| Royal Bank of Canada | | USD | 4,057 | | | NZD | 5,000 | | | 09/21/11 | | | 322 | | |
| Royal Bank of Canada | | USD | 4,058 | | | SGD | 5,000 | | | 09/21/11 | | | 95 | | |
| Royal Bank of Scotland PLC | | AUD | 2,532,000 | | | USD | 2,690,192 | | | 09/21/11 | | | (74,318 | ) | |
| Royal Bank of Scotland PLC | | AUD | 6,893,000 | | | USD | 7,265,980 | | | 10/19/11 | | | (233,373 | ) | |
| Royal Bank of Scotland PLC | | CHF | 987,494 | | | EUR | 828,000 | | | 09/21/11 | | | (67,240 | ) | |
| Royal Bank of Scotland PLC | | CHF | 1,681,904 | | | USD | 1,996,989 | | | 09/21/11 | | | (141,578 | ) | |
218
PACE Select Advisors Trust
PACE Alternative Strategies Investments
Portfolio of investments—July 31, 2011
Forward foreign currency contracts—(continued)
| Counterparty | | Contracts to
deliver | | In
exchange for | | Maturity
date | | Unrealized
appreciation
(depreciation) | |
| Royal Bank of Scotland PLC | | CZK | 36,807,000 | | | PLN | 6,000,000 | | | 08/12/11 | | $ | (33,413 | ) | |
| Royal Bank of Scotland PLC | | EUR | 504,000 | | | CAD | 685,927 | | | 09/21/11 | | | (6,235 | ) | |
| Royal Bank of Scotland PLC | | EUR | 1,007,000 | | | JPY | 112,161,674 | | | 09/21/11 | | | 12,554 | | |
| Royal Bank of Scotland PLC | | EUR | 987,000 | | | SEK | 9,133,895 | | | 09/21/11 | | | 31,354 | | |
| Royal Bank of Scotland PLC | | EUR | 11,310 | | | USD | 15,741 | | | 08/12/11 | | | (506 | ) | |
| Royal Bank of Scotland PLC | | EUR | 2,162,661 | | | USD | 3,057,492 | | | 08/17/11 | | | (49,029 | ) | |
| Royal Bank of Scotland PLC | | EUR | 4,585,754 | | | USD | 6,545,585 | | | 08/18/11 | | | (41,408 | ) | |
| Royal Bank of Scotland PLC | | EUR | 99,731 | | | USD | 143,344 | | | 09/09/11 | | | 162 | | |
| Royal Bank of Scotland PLC | | EUR | 3,215,000 | | | USD | 4,592,319 | | | 09/21/11 | | | (21,959 | ) | |
| Royal Bank of Scotland PLC | | GBP | 1,314,000 | | | JPY | 169,801,781 | | | 09/21/11 | | | 51,287 | | |
| Royal Bank of Scotland PLC | | GBP | 1,757,000 | | | NOK | 15,620,767 | | | 09/21/11 | | | 9,668 | | |
| Royal Bank of Scotland PLC | | GBP | 1,783,000 | | | USD | 2,862,131 | | | 09/21/11 | | | (63,037 | ) | |
| Royal Bank of Scotland PLC | | GBP | 832,000 | | | USD | 1,366,260 | | | 10/19/11 | | | 1,698 | | |
| Royal Bank of Scotland PLC | | JPY | 115,372,522 | | | CAD | 1,372,000 | | | 09/21/11 | | | (65,170 | ) | |
| Royal Bank of Scotland PLC | | JPY | 319,510,886 | | | USD | 4,089,253 | | | 09/21/11 | | | (63,629 | ) | |
| Royal Bank of Scotland PLC | | MXN | 9,183,000 | | | USD | 781,791 | | | 10/19/11 | | | 4,951 | | |
| Royal Bank of Scotland PLC | | NOK | 20,000 | | | USD | 3,663 | | | 09/21/11 | | | (40 | ) | |
| Royal Bank of Scotland PLC | | SEK | 18,170,688 | | | EUR | 1,989,928 | | | 09/21/11 | | | (24,455 | ) | |
| Royal Bank of Scotland PLC | | SEK | 14,941,145 | | | USD | 2,270,617 | | | 09/21/11 | | | (97,895 | ) | |
| Royal Bank of Scotland PLC | | USD | 1,420,537 | | | AUD | 1,344,000 | | | 09/21/11 | | | 46,881 | | |
| Royal Bank of Scotland PLC | | USD | 1,720,308 | | | AUD | 1,632,000 | | | 10/19/11 | | | 55,254 | | |
| Royal Bank of Scotland PLC | | USD | 1,662,874 | | | CAD | 1,589,431 | | | 09/21/11 | | | (1,156 | ) | |
| Royal Bank of Scotland PLC | | USD | 910,211 | | | CAD | 872,000 | | | 10/19/11 | | | 858 | | |
| Royal Bank of Scotland PLC | | USD | 154,437 | | | CHF | 130,000 | | | 09/15/11 | | | 10,846 | | |
| Royal Bank of Scotland PLC | | USD | 956,976 | | | EUR | 670,000 | | | 09/21/11 | | | 4,631 | | |
| Royal Bank of Scotland PLC | | USD | 5,462,225 | | | GBP | 3,373,592 | | | 09/21/11 | | | 72,450 | | |
| Royal Bank of Scotland PLC | | USD | 5,303,013 | | | JPY | 419,861,640 | | | 09/21/11 | | | 154,190 | | |
| Royal Bank of Scotland PLC | | USD | 1,773,563 | | | NZD | 2,104,000 | | | 09/21/11 | | | 69,168 | | |
| Royal Bank of Scotland PLC | | USD | 294,660 | | | PLN | 832,000 | | | 10/19/11 | | | 2,006 | | |
| Royal Bank of Scotland PLC | | USD | 1,765,546 | | | SEK | 10,950,000 | | | 09/21/11 | | | (29,722 | ) | |
| Standard Chartered Bank | | JPY | 51,100,000 | | | USD | 642,686 | | | 09/21/11 | | | (21,492 | ) | |
| Standard Chartered Bank | | USD | 159,522 | | | JPY | 12,600,000 | | | 09/21/11 | | | 4,248 | | |
| Standard Chartered Bank | | USD | 315,600 | | | NZD | 375,000 | | | 09/21/11 | | | 12,833 | | |
| Standard Chartered Bank | | USD | 317,415 | | | SGD | 390,000 | | | 09/21/11 | | | 6,513 | | |
| State Street Bank & Trust Co. | | CHF | 2,455,258 | | | EUR | 2,014,158 | | | 09/21/11 | | | (231,110 | ) | |
| State Street Bank & Trust Co. | | CHF | 1,065,000 | | | USD | 1,271,293 | | | 09/21/11 | | | (82,871 | ) | |
| State Street Bank & Trust Co. | | EUR | 220,000 | | | USD | 320,379 | | | 09/21/11 | | | 4,628 | | |
| State Street Bank & Trust Co. | | GBP | 585,000 | | | USD | 960,313 | | | 09/21/11 | | | 569 | | |
| State Street Bank & Trust Co. | | NZD | 390,000 | | | USD | 314,761 | | | 09/21/11 | | | (26,809 | ) | |
| State Street Bank & Trust Co. | | SEK | 6,930,000 | | | USD | 1,104,639 | | | 09/21/11 | | | 6,077 | | |
| State Street Bank & Trust Co. | | USD | 800,937 | | | CHF | 670,000 | | | 09/21/11 | | | 50,978 | | |
| State Street Bank & Trust Co. | | USD | 5,180,166 | | | EUR | 3,587,000 | | | 09/16/11 | | | (31,316 | ) | |
| State Street Bank & Trust Co. | | USD | 480,522 | | | EUR | 340,000 | | | 09/21/11 | | | 7,458 | | |
| State Street Bank & Trust Co. | | USD | 3,506,252 | | | GBP | 2,165,000 | | | 09/21/11 | | | 45,621 | | |
219
PACE Select Advisors Trust
PACE Alternative Strategies Investments
Portfolio of investments—July 31, 2011
Forward foreign currency contracts—(concluded)
| Counterparty | | Contracts to
deliver | | In
exchange for | | Maturity
date | | Unrealized
appreciation
(depreciation) | |
| State Street Bank & Trust Co. | | USD | 953,477 | | | SEK | 5,890,000 | | | 09/21/11 | | $ | (19,778 | ) | |
| Westpac Banking Corp. | | AUD | 8,125,000 | | | USD | 8,649,968 | | | 09/21/11 | | | (221,138 | ) | |
| Westpac Banking Corp. | | CAD | 615,000 | | | USD | 637,185 | | | 09/21/11 | | | (5,785 | ) | |
| Westpac Banking Corp. | | GBP | 200,000 | | | USD | 320,148 | | | 09/21/11 | | | (7,970 | ) | |
| Westpac Banking Corp. | | JPY | 115,514,609 | | | AUD | 1,373,000 | | | 09/21/11 | | | (2,335 | ) | |
| Westpac Banking Corp. | | JPY | 25,800,000 | | | USD | 320,321 | | | 09/21/11 | | | (15,017 | ) | |
| Westpac Banking Corp. | | NZD | 785,000 | | | USD | 637,059 | | | 09/15/11 | | | (50,773 | ) | |
| Westpac Banking Corp. | | NZD | 6,301,341 | | | USD | 5,136,063 | | | 09/21/11 | | | (382,792 | ) | |
| Westpac Banking Corp. | | NZD | 2,679,000 | | | USD | 2,239,698 | | | 10/19/11 | | | (101,518 | ) | |
| Westpac Banking Corp. | | SGD | 575,000 | | | USD | 477,614 | | | 09/21/11 | | | 28 | | |
| Westpac Banking Corp. | | USD | 1,891,056 | | | AUD | 1,785,000 | | | 09/15/11 | | | 59,343 | | |
| Westpac Banking Corp. | | USD | 9,058,094 | | | AUD | 8,540,000 | | | 09/21/11 | | | 266,121 | | |
| Westpac Banking Corp. | | USD | 1,756,457 | | | CAD | 1,720,000 | | | 09/21/11 | | | 41,769 | | |
| Westpac Banking Corp. | | USD | 478,724 | | | CHF | 390,000 | | | 09/21/11 | | | 17,167 | | |
| Westpac Banking Corp. | | USD | 1,117,253 | | | EUR | 780,000 | | | 09/21/11 | | | 2,229 | | |
| Westpac Banking Corp. | | USD | 4,355,628 | | | GBP | 2,656,000 | | | 09/16/11 | | | 2,014 | | |
| Westpac Banking Corp. | | USD | 2,068,095 | | | JPY | 164,100,000 | | | 09/21/11 | | | 64,815 | | |
| Westpac Banking Corp. | | USD | 8,847,915 | | | NZD | 10,711,000 | | | 09/21/11 | | | 533,018 | | |
| Westpac Banking Corp. | | USD | 881,165 | | | NZD | 1,054,000 | | | 10/19/11 | | | 39,940 | | |
| Westpac Banking Corp. | | USD | 1,434,241 | | | SGD | 1,760,000 | | | 09/21/11 | | | 27,588 | | |
| | | $ | (5,634,364 | ) | |
Interest rate swaps
| | | | | | | Rate type | | | | | | | |
| Counterparty | | Notional
amount
(000) | | Termination
date | | Payments
made by
the Portfolio† | | Payments
received by
the Portfolio† | | Upfront
payments
received
(made) | | Value | | Unrealized
appreciation
(depreciation) | |
| Bank of America N.A. | | USD | 9,000 | | | 07/15/14 | | | 1.665 | % | | | 0.256 | %19 | | $ | — | | | $ | (27,339 | ) | | $ | (27,339 | ) | |
| Bank of America N.A. | | USD | 8,300 | | | 07/25/14 | | | 1.761 | | | | 0.256 | 19 | | | — | | | | (30,974 | ) | | | (30,974 | ) | |
| Bank of America N.A. | | USD | 10,000 | | | 11/23/14 | | | 2.116 | | | | 0.256 | 19 | | | — | | | | (162,162 | ) | | | (162,162 | ) | |
| Bank of America N.A. | | USD | 4,000 | | | 12/31/15 | | | 1.750 | | | | 0.256 | 19 | | | 17,192 | | | | (49,714 | ) | | | (32,522 | ) | |
| Bank of America N.A. | | USD | 6,800 | | | 12/31/15 | | | 1.750 | | | | 0.256 | 19 | | | 38,741 | | | | (84,514 | ) | | | (45,773 | ) | |
| Bank of America N.A. | | USD | 5,600 | | | 07/15/16 | | | 0.256 | 19 | | | 3.112 | | | | — | | | | 32,100 | | | | 32,100 | | |
| Bank of America N.A. | | USD | 5,200 | | | 07/25/16 | | | 0.256 | 19 | | | 3.193 | | | | — | | | | 35,283 | | | | 35,283 | | |
| Bank of America N.A. | | USD | 4,600 | | | 05/15/18 | | | 2.600 | | | | 0.256 | 19 | | | 39,135 | | | | (89,199 | ) | | | (50,064 | ) | |
| Bank of America N.A. | | USD | 8,900 | | | 11/23/19 | | | 0.256 | 19 | | | 3.587 | | | | — | | | | 303,510 | | | | 303,510 | | |
| Bank of America N.A. | | USD | 5,900 | | | 07/01/24 | | | 0.256 | 19 | | | 4.479 | | | | — | | | | 148,219 | | | | 148,219 | | |
| Bank of America N.A. | | USD | 3,200 | | | 11/23/27 | | | 4.206 | | | | 0.256 | 19 | | | — | | | | (126,755 | ) | | | (126,755 | ) | |
| Bank of America N.A. | | USD | 3,300 | | | 07/01/44 | | | 4.595 | | | | 0.256 | 19 | | | — | | | | (135,597 | ) | | | (135,597 | ) | |
| Barclays Bank PLC | | EUR | 2,400 | | | 05/06/13 | | | 2.462 | | | | 1.801 | 20 | | | — | | | | (36,316 | ) | | | (36,316 | ) | |
| Barclays Bank PLC | | EUR | 900 | | | 05/06/21 | | | 1.801 | 20 | | | 3.616 | | | | — | | | | 55,266 | | | | 55,266 | | |
| Barclays Bank PLC | | EUR | 200 | | | 05/06/41 | | | 3.838 | | | | 1.801 | 20 | | | — | | | | (22,082 | ) | | | (22,082 | ) | |
| Barclays Bank PLC | | NOK | 19,900 | | | 07/07/21 | | | 3.270 | 21 | | | 4.420 | | | | — | | | | 83,632 | | | | 83,632 | | |
| Barclays Bank PLC | | SEK | 175,000 | | | 02/23/13 | | | 2.580 | 22 | | | 3.050 | | | | — | | | | 116,480 | | | | 116,480 | | |
| Barclays Bank PLC | | SEK | 46,000 | | | 06/30/13 | | | 2.580 | 22 | | | 2.850 | | | | — | | | | 10,875 | | | | 10,875 | | |
220
PACE Select Advisors Trust
PACE Alternative Strategies Investments
Portfolio of investments—July 31, 2011
Interest rate swaps—(continued)
| | | | | | | Rate type | | | | | | | |
| Counterparty | | Notional
amount
(000) | | Termination
date | | Payments
made by
the Portfolio† | | Payments
received by
the Portfolio† | | Upfront
payments
received
(made) | | Value | | Unrealized
appreciation
(depreciation) | |
| BNP Paribas | | CAD | 1600 | | | 12/21/16 | | | 3.000 | % | | | 1.180 | %23 | | $ | 27,926 | | | $ | (51,074 | ) | | $ | (23,148 | ) | |
| Citibank NA | | CAD | 6650 | | | 12/21/16 | | | 3.000 | | | | 1.180 | 23 | | | 108,827 | | | | (212,276 | ) | | | (103,449 | ) | |
| Citibank NA | | EUR | 200 | | | 12/21/41 | | | 1.801 | 20 | | | 3.750 | | | | (5,225 | ) | | | 15,675 | | | | 10,450 | | |
| Credit Suisse International | | AUD | 2,600 | | | 12/21/13 | | | 4.913 | 24 | | | 5.250 | | | | (19,032 | ) | | | 26,070 | | | | 7,038 | | |
| Credit Suisse International | | AUD | 2,950 | | | 12/21/13 | | | 4.913 | 24 | | | 5.250 | | | | (6,573 | ) | | | 29,579 | | | | 23,006 | | |
| Credit Suisse International | | AUD | 5,550 | | | 12/21/13 | | | 4.913 | 24 | | | 5.250 | | | | (14,953 | ) | | | 55,649 | | | | 40,696 | | |
| Credit Suisse International | | CAD | 6,450 | | | 07/14/16 | | | 2.356 | | | | 1.180 | 23 | | | — | | | | (55,882 | ) | | | (55,882 | ) | |
| Credit Suisse International | | CAD | 650 | | | 07/15/16 | | | 2.374 | | | | 1.180 | 23 | | | — | | | | (6,179 | ) | | | (6,179 | ) | |
| Credit Suisse International | | CHF | 1,850 | | | 10/26/20 | | | 1.860 | | | | 0.242 | 25 | | | — | | | | (6,885 | ) | | | (6,885 | ) | |
| Credit Suisse International | | CHF | 2,820 | | | 02/04/21 | | | 0.242 | 25 | | | 2.275 | | | | — | | | | 133,880 | | | | 133,880 | | |
| Credit Suisse International | | EUR | 31,800 | | | 03/18/14 | | | 3.120 | | | | 1.801 | 20 | | | — | | | | (409,656 | ) | | | (409,656 | ) | |
| Credit Suisse International | | EUR | 48,800 | | | 04/18/14 | | | 3.370 | | | | 1.801 | 20 | | | — | | | | (768,650 | ) | | | (768,650 | ) | |
| Credit Suisse International | | EUR | 21,900 | | | 03/18/16 | | | 1.801 | 20 | | | 3.445 | | | | — | | | | 650,176 | | | | 650,176 | | |
| Credit Suisse International | | EUR | 34,100 | | | 04/18/16 | | | 1.801 | 20 | | | 3.690 | | | | — | | | | 1,288,865 | | | | 1,288,865 | | |
| Credit Suisse International | | EUR | 5,650 | | | 07/18/16 | | | 1.801 | 20 | | | 2.577 | | | | — | | | | 43,286 | | | | 43,286 | | |
| Credit Suisse International | | EUR | 550 | | | 07/19/16 | | | 1.801 | 20 | | | 2.531 | | | | — | | | | 2,515 | | | | 2,515 | | |
| Credit Suisse International | | EUR | 9,525 | | | 12/21/16 | | | 1.801 | 20 | | | 3.250 | | | | (191,060 | ) | | | 410,491 | | | | 219,431 | | |
| Credit Suisse International | | EUR | 5,000 | | | 03/18/20 | | | 3.805 | | | | 1.801 | 20 | | | — | | | | (221,823 | ) | | | (221,823 | ) | |
| Credit Suisse International | | EUR | 7,900 | | | 04/18/20 | | | 4.050 | | | | 1.801 | 20 | | | — | | | | (499,011 | ) | | | (499,011 | ) | |
| Credit Suisse International | | GBP | 280 | | | 02/15/16 | | | 1.115 | 26 | | | 3.210 | | | | — | | | | 24,717 | | | | 24,717 | | |
| Credit Suisse International | | GBP | 550 | | | 02/16/16 | | | 1.115 | 26 | | | 3.201 | | | | — | | | | 48,199 | | | | 48,199 | | |
| Credit Suisse International | | GBP | 620 | | | 02/18/16 | | | 1.115 | 26 | | | 3.124 | | | | — | | | | 50,866 | | | | 50,866 | | |
| Credit Suisse International | | NZD | 3,550 | | | 12/21/13 | | | 3.750 | | | | 2.815 | 27 | | | — | | | | 14,959 | | | | 14,959 | | |
| Credit Suisse International | | NZD | 4,000 | | | 12/21/13 | | | 3.750 | | | | 2.815 | 27 | | | (7,205 | ) | | | 16,855 | | | | 9,650 | | |
| Credit Suisse International | | NZD | 7,850 | | | 12/21/13 | | | 3.750 | | | | 2.815 | 27 | | | (10,235 | ) | | | 33,077 | | | | 22,842 | | |
| Credit Suisse International | | USD | 11,500 | | | 12/21/16 | | | 0.256 | 19 | | | 2.500 | | | | (79,012 | ) | | | 332,364 | | | | 253,352 | | |
| Deutsche Bank AG | | EUR | 21,100 | | | 07/15/14 | | | 2.516 | | | | 1.801 | 20 | | | — | | | | (45,089 | ) | | | (45,089 | ) | |
| Deutsche Bank AG | | EUR | 14,450 | | | 07/15/16 | | | 1.801 | 20 | | | 2.982 | | | | — | | | | 74,531 | | | | 74,531 | | |
| Deutsche Bank AG | | EUR | 1,300 | | | 12/21/16 | | | 1.801 | 20 | | | 3.250 | | | | (31,622 | ) | | | 56,025 | | | | 24,403 | | |
| Deutsche Bank AG | | EUR | 3,325 | | | 07/15/20 | | | 3.453 | | | | 1.801 | 20 | | | — | | | | (16,758 | ) | | | (16,758 | ) | |
| Deutsche Bank AG | | GBP | 10 | | | 12/17/11 | | | 5.250 | | | | 1.115 | 26 | | | 963 | | | | (265 | ) | | | 698 | | |
| Deutsche Bank AG | | GBP | 950 | | | 02/11/16 | | | 1.115 | 26 | | | 3.188 | | | | — | | | | 82,367 | | | | 82,367 | | |
| Deutsche Bank AG | | NZD | 2,050 | | | 02/15/16 | | | 4.690 | | | | 2.815 | 27 | | | — | | | | (22,625 | ) | | | (22,625 | ) | |
| Deutsche Bank AG | | NZD | 1,660 | | | 02/18/16 | | | 4.700 | | | | 2.815 | 27 | | | — | | | | (18,841 | ) | | | (18,841 | ) | |
| Deutsche Bank AG | | NZD | 1,380 | | | 02/22/16 | | | 4.683 | | | | 2.815 | 27 | | | — | | | | (14,748 | ) | | | (14,748 | ) | |
| Deutsche Bank AG | | USD | 51,600 | | | 06/30/13 | | | 0.256 | 19 | | | 0.750 | | | | 25,488 | | | | 124,666 | | | | 150,154 | | |
| Deutsche Bank AG | | USD | 61,100 | | | 06/30/13 | | | 0.256 | 19 | | | 0.750 | | | | (65,500 | ) | | | 147,618 | | | | 82,118 | | |
| Deutsche Bank AG | | USD | 8,400 | | | 07/25/14 | | | 1.716 | | | | 0.256 | 19 | | | — | | | | (27,631 | ) | | | (27,631 | ) | |
| Deutsche Bank AG | | USD | 9,000 | | | 07/29/14 | | | 1.625 | | | | 0.256 | 19 | | | — | | | | (20,717 | ) | | | (20,717 | ) | |
| Deutsche Bank AG | | USD | 5,200 | | | 07/25/16 | | | 0.256 | 19 | | | 3.160 | | | | — | | | | 32,092 | | | | 32,092 | | |
| Deutsche Bank AG | | USD | 5,600 | | | 07/29/16 | | | 0.256 | 19 | | | 3.090 | | | | — | | | | 26,102 | | | | 26,102 | | |
| Deutsche Bank AG | | USD | 1,700 | | | 12/21/16 | | | 2.500 | | | | 0.256 | 19 | | | 25,096 | | | | (49,132 | ) | | | (24,036 | ) | |
| Deutsche Bank AG | | USD | 1,700 | | | 12/21/16 | | | 0.256 | 19 | | | 2.500 | | | | (33,580 | ) | | | 49,132 | | | | 15,552 | | |
| Deutsche Bank AG | | USD | 1,400 | | | 12/21/18 | | | 3.250 | | | | 0.256 | 19 | | | 42,659 | | | | (66,492 | ) | | | (23,833 | ) | |
| Deutsche Bank AG | | USD | 1,400 | | | 12/21/18 | | | 0.256 | 19 | | | 3.250 | | | | (50,992 | ) | | | 66,282 | | | | 15,290 | | |
| Deutsche Bank AG | | USD | 2,600 | | | 12/21/21 | | | 0.256 | 19 | | | 3.500 | | | | (52,136 | ) | | | 92,237 | | | | 40,101 | | |
| JPMorgan Chase Bank | | CAD | 5,260 | | | 11/04/15 | | | 2.104 | | | | 1.180 | 23 | | | — | | | | (13,841 | ) | | | (13,841 | ) | |
| JPMorgan Chase Bank | | EUR | 4,630 | | | 11/08/15 | | | 1.801 | 20 | | | 2.060 | | | | — | | | | (70,880 | ) | | | (70,880 | ) | |
| JPMorgan Chase Bank | | USD | 3,800 | | | 06/30/13 | | | 0.750 | | | | 0.256 | 19 | | | 4,292 | | | | (9,181 | ) | | | (4,889 | ) | |
| JPMorgan Chase Bank | | USD | 18,000 | | | 06/30/13 | | | 0.750 | | | | 0.256 | 19 | | | 12,710 | | | | (43,488 | ) | | | (30,778 | ) | |
221
PACE Select Advisors Trust
PACE Alternative Strategies Investments
Portfolio of investments—July 31, 2011
Interest rate swaps—(concluded)
| | | | | | | Rate type | | | | | | | |
| Counterparty | | Notional
amount
(000) | | Termination
date | | Payments
made by
the Portfolio† | | Payments
received by
the Portfolio† | | Upfront
payments
received
(made) | | Value | | Unrealized
appreciation
(depreciation) | |
| JPMorgan Chase Bank | | USD | 123,100 | | | 06/30/13 | | | 0.750 | % | | | 0.256 | %19 | | $ | 74,637 | | | $ | (297,411 | ) | | $ | (222,774 | ) | |
| JPMorgan Chase Bank | | USD | 2,300 | | | 12/21/16 | | | 2.500 | | | | 0.256 | 19 | | | 50,915 | | | | (66,473 | ) | | | (15,558 | ) | |
| JPMorgan Chase Bank | | USD | 1,000 | | | 12/21/18 | | | 3.250 | | | | 0.256 | 19 | | | 38,177 | | | | (47,494 | ) | | | (9,317 | ) | |
| JPMorgan Chase Bank | | USD | 2,600 | | | 12/21/21 | | | 3.500 | | | | 0.256 | 19 | | | 55,100 | | | | (92,237 | ) | | | (37,137 | ) | |
Morgan Stanley & Co.
International PLC | | EUR | 5,200 | | | 12/21/21 | | | 1.801 | 20 | | | 3.750 | | | | (314,600 | ) | | | 333,573 | | | | 18,973 | | |
Morgan Stanley & Co.
International PLC | | GBP | 9,550 | | | 12/21/16 | | | 3.000 | | | | 1.115 | 26 | | | 81,232 | | | | (518,522 | ) | | | (437,290 | ) | |
Morgan Stanley Capital
Services Inc. | | CHF | 1,770 | | | 07/26/21 | | | 2.010 | | | | 0.242 | 25 | | | — | | | | 0 | | | | 0 | | |
Morgan Stanley Capital
Services Inc. | | SEK | 23,565 | | | 12/06/20 | | | 3.443 | | | | 2.580 | 22 | | | — | | | | (86,715 | ) | | | (86,715 | ) | |
| Royal Bank of Scotland PLC | | AUD | 36,000 | | | 08/13/14 | | | 4.913 | 24 | | | 5.100 | | | | — | | | | 261,200 | | | | 261,200 | | |
| Royal Bank of Scotland PLC | | AUD | 3,000 | | | 12/10/14 | | | 4.913 | 24 | | | 5.710 | | | | — | | | | 53,156 | | | | 53,156 | | |
| Royal Bank of Scotland PLC | | SEK | 81,000 | | | 02/14/13 | | | 2.580 | 22 | | | 3.050 | | | | — | | | | 52,705 | | | | 52,705 | | |
| | | | | | | | | | | $ | (238,635 | ) | | $ | 889,646 | | | $ | 651,011 | | |
19 Rate based on 3 Month LIBOR (USD on Interbank Offered Rate).
20 Rate based on 6 Month EURIBOR.
21 Rate based on 6 Month LIBOR (NOK on Interbank Offered Rate).
22 Rate based on 3 Month LIBOR (SEK on Interbank Offered Rate).
23 Rate based on 3 Month LIBOR (CAD on Interbank Offered Rate).
24 Rate based on 3 Month LIBOR (AUD on Interbank Offered Rate).
25 Rate based on 6 Month LIBOR (CHF on Interbank Offered Rate).
26 Rate based on 6 Month LIBOR (GBP on Interbank Offered Rate).
27 Rate based on 3 Month LIBOR (NZD on Interbank Offered Rate).
† Payments made/received are based on the notional amount.
Credit default swaps on credit indices—buy protection28
| | | | | | | Rate type | | | | | | | |
| Counterparty | | Notional
amount
(000) | | Termination
date | | Payments
made by
the Portfolio29 | | Payments
received by
the Portfolio | | Upfront
payments
received
(made) | | Value | | Unrealized
appreciation
(depreciation) | |
| Bank of America NA | | USD | 2,600 | | | 06/20/14 | | | 1.000 | % | | | — | 30 | | $ | 27,934 | | | $ | (28,719 | ) | | $ | (785 | ) | |
| Barclays Bank PLC | | EUR | 5,600 | | | 06/20/16 | | | 1.000 | | | | — | 31 | | | (9,320 | ) | | | 59,472 | | | | 50,152 | | |
| BNP Paribas | | EUR | 13,500 | | | 06/20/16 | | | 1.000 | | | | — | 31 | | | (36,133 | ) | | | 143,370 | | | | 107,237 | | |
| Deutsche Bank AG | | USD | 2,100 | | | 06/20/14 | | | 1.000 | | | | — | 30 | | | 23,693 | | | | (23,196 | ) | | | 497 | | |
| JP Morgan Chase Bank | | USD | 2,800 | | | 06/20/14 | | | 1.000 | | | | — | 30 | | | 33,473 | | | | (30,928 | ) | | | 2,545 | | |
| | | | | | | | | | | $ | 39,647 | | | $ | 119,999 | | | $ | 159,646 | | |
28 If the Portfolio is a buyer of protection and a credit event occurs, as defined under the terms of the particular swap agreement, the Portfolio will either (i) receive from the seller of protection an amount equal to the notional value of the swap and deliver the referenced obligation or underlying securities comprising the referenced index or (ii) receive a net settlement amount in the form of cash or securities equal to the notional amount of the swap less the recovery value of the referenced obligation or underlying securities comprising the referenced index.
29 Payments made are based on the notional amount.
30 Payment from the counterparty will be received upon the occurrence of a failure to pay, obligation acceleration, repudiation or restructuring of the referenced obligation specified in the CDX North America Investment Grade Index.
222
PACE Select Advisors Trust
PACE Alternative Strategies Investments
Portfolio of investments—July 31, 2011
31 Payment from the counterparty will be received upon the occurrence of a failure to pay, obligation acceleration, repudiation or restructuring of the referenced obligation specified in the iTraxx Europe Main Index.
Credit default swaps on sovereign issues—buy protection32
| | | | | | | Rate type | | | | | | | |
| Counterparty | | Notional
amount
(000) | | Termination
date | | Payments
made by
the Portfolio29 | | Payments
received by
the Portfolio | | Upfront
payments
made | | Value | | Unrealized
appreciation
(depreciation) | |
| Bank of America NA | | USD | 2,500 | | | 06/20/21 | | | 0.250 | % | | | — | 33 | | $ | (127,181 | ) | | $ | 232,657 | | | $ | 105,476 | | |
| Citibank NA | | USD | 2,100 | | | 09/20/16 | | | 1.000 | | | | — | 34 | | | (183,415 | ) | | | 244,440 | | | | 61,025 | | |
| Citibank NA | | USD | 180 | | | 12/20/20 | | | 0.250 | | | | — | 33 | | | (9,011 | ) | | | 15,898 | | | | 6,887 | | |
| Credit Suisse International | | USD | 405 | | | 12/20/15 | | | 1.000 | | | | — | 35 | | | (53,448 | ) | | | 112,601 | | | | 59,153 | | |
| Credit Suisse International | | USD | 950 | | | 06/20/16 | | | 1.000 | | | | — | 35 | | | (169,481 | ) | | | 268,404 | | | | 98,923 | | |
| Deutsche Bank AG | | USD | 1,050 | | | 09/20/16 | | | 1.000 | | | | — | 34 | | | (102,323 | ) | | | 122,220 | | | | 19,897 | | |
| Deutsche Bank AG | | USD | 1,200 | | | 09/20/16 | | | 1.000 | | | | — | 34 | | | (126,457 | ) | | | 139,680 | | | | 13,223 | | |
| Deutsche Bank AG | | USD | 2,060 | | | 12/20/20 | | | 0.250 | | | | — | 33 | | | (120,479 | ) | | | 181,942 | | | | 61,463 | | |
| | | | | | | | | | | $ | (891,795 | ) | | $ | 1,317,842 | | | $ | 426,047 | | |
32 If the Portfolio is a buyer of protection and a credit event occurs, as defined under the terms of the particular swap agreement, the Portfolio will either (i) receive from the seller of protection an amount equal to the notional amount of the swap and take delivery of the referenced obligation or (ii) receive a net settlement amount in the form of cash or securities equal to the notional amount of the swap less the recovery value of the referenced obligation.
33 Payment from the counterparty will be received upon the occurrence of bankruptcy and/or by a restructuring event with respect to the French Government bond, 4.250%, due 04/25/19.
34 Payment from the counterparty will be received upon the occurrence of bankruptcy and/or by a restructuring event with respect to the Spain Government bond, 5.500%, due 07/30/17.
35 Payment from the counterparty will be received upon the occurrence of bankruptcy and/or by a restructuring event with respect to the Portuguese Republic bond, 5.450%, due 09/23/13.
Credit default swaps on credit indices—sell protection36
| | | | | | | Rate type | | | | | | | | | |
| | | Notional
amount
(000) | | Termination
date | | Payments
made by
the Portfolio | | Payments
received by
the Portfolio39 | | Upfront
payments
received
(made) | | Value | | Unrealized
appreciation
(depreciation) | | Credit
spread37 | |
| Bank of America NA | | USD | 2,600 | | | 6/20/16 | | | —38 | | | | 1.000 | % | | $ | (3,652 | ) | | $ | 5,498 | | | $ | 1,846 | | | | 0.96 | % | |
| Bank of America NA | | USD | 5,000 | | | 6/20/16 | | | —40 | | | | 5.000 | | | | (145,486 | ) | | | 16,190 | | | | (129,296 | ) | | | 4.92 | | |
| Barclays Bank PLC | | EUR | 5,600 | | | 6/20/16 | | | —41 | | | | 1.000 | | | | 549,898 | | | | (726,821 | ) | | | (176,923 | ) | | | 3.11 | | |
| BNP Paribus | | EUR | 13,500 | | | 6/20/16 | | | —41 | | | | 1.000 | | | | 1,473,779 | | | | (1,752,159 | ) | | | (278,380 | ) | | | 3.11 | | |
| Deutsche Bank AG | | USD | 2,100 | | | 6/20/16 | | | —38 | | | | 1.000 | | | | (6,229 | ) | | | 4,440 | | | | (1,789 | ) | | | 0.96 | | |
| Deutsche Bank AG | | USD | 10,500 | | | 6/20/16 | | | —40 | | | | 5.000 | | | | (280,000 | ) | | | 33,999 | | | | (246,001 | ) | | | 4.92 | | |
| Deutsche Bank AG | | USD | 2,500 | | | 6/20/21 | | | —42 | | | | 1.000 | | | | 76,330 | | | | (131,275 | ) | | | (54,945 | ) | | | 1.88 | | |
| Deutsche Bank AG | | USD | 2,500 | | | 6/20/21 | | | —42 | | | | 1.000 | | | | 73,549 | | | | (131,275 | ) | | | (57,726 | ) | | | 1.88 | | |
| Deutsche Bank AG | | USD | 2,500 | | | 6/20/21 | | | —42 | | | | 1.000 | | | | 76,692 | | | | (131,275 | ) | | | (54,583 | ) | | | 1.88 | | |
JPMorgan
Chase Bank NA | | USD | 2,800 | | | 6/20/16 | | | —38 | | | | 1.000 | | | | (9,962 | ) | | | 5,921 | | | | (4,041 | ) | | | 0.96 | | |
Royal Bank of
Scotland PLC | | USD | 15,100 | | | 6/20/16 | | | —40 | | | | 5.000 | | | | (386,937 | ) | | | 48,894 | | | | (338,043 | ) | | | 4.92 | | |
| | | | | | | | | | | $ | 1,417,982 | | | $ | (2,757,863 | ) | | $ | (1,339,881 | ) | | | | | |
36 If the Portfolio is a seller of protection and a credit event occurs, as defined under the terms of the particular swap agreement, the Portfolio will either (i) pay to the buyer of protection an amount equal to the notional amount of the swap and take delivery of the referenced obligation or underlying securities comprising the referenced index or (ii) pay a net settlement amount in the form of cash or securities equal to the notional amount of the swap less the recovery value of the referenced obligation or underlying securities comprising the referenced index.
223
PACE Select Advisors Trust
PACE Alternative Strategies Investments
Portfolio of investments—July 31, 2011
37 Credit spreads, where available, represented in absolute terms, utilized in determining the market value as of period end serve as an indicator of the current status of the payment/performance risk and represent the likelihood or risk of default for the credit derivative. The credit spread of a particular referenced entity reflects the cost of buying/selling protection and may include upfront payments required to be made to enter into the agreement. Wider credit spreads represent a deterioration of the referenced entity's credit soundness and a greater likelihood or risk of default or other credit event occurring as defined under the terms of the agreement. A credit spread identified as "Defaulted" indicates a credit event has occurred for the referenced entity.
38 Payment to the counterparty will be made upon the occurrence of a failure to pay, obligation acceleration, repudiation or restructuring of the referenced obligation specified in the CDX North America Investment Grade Index.
39 Payments received are based on the notional amount.
40 Payment to the counterparty will be made upon the occurrence of a failure to pay, obligation acceleration, repudiation or restructuring of the referenced obligation specified in the CDX North America High Yield Index.
41 Payment to the counterparty will be made upon the occurrence of a failure to pay, obligation acceleration, repudiation or restructuring of the referenced obligation specified in the iTraxx Europe Subordinated Financials Index.
42 Payment to the counterparty will be made upon the occurrence of a failure to pay, obligation acceleration, repudiation or restructuring of the referenced obligation specified in the MCDX North America Index.
Credit default swaps on sovereign issues—sell protection43
| | | | | | | Rate type | | | | | | | | | |
| Counterparty | | Notional
amount
(000) | | Termination
date | | Payments
made by
the Portfolio | | Payments
received by
the Portfolio39 | | Upfront
payments
received | | Value | | Unrealized
(depreciation) | | Credit
spread37 | |
Credit Suisse
International | | USD | 2,400 | | | 06/20/21 | | | —44 | | | | 0.250 | % | | $ | 65,519 | | | $ | (127,075 | ) | | $ | (61,556 | ) | | | 0.87 | % | |
| JPMorgan Chase Bank | | USD | 250 | | | 03/20/16 | | | —45 | | | | 1.000 | | | | 44,853 | | | | (70,073 | ) | | | (25,220 | ) | | | 10.13 | | |
| JPMorgan Chase Bank | | USD | 1,200 | | | 09/20/16 | | | —46 | | | | 1.000 | | | | 95,174 | | | | (116,972 | ) | | | (21,798 | ) | | | 3.19 | | |
Morgan Stanley & Co.
International PLC | | USD | 1,890 | | | 03/20/21 | | | —44 | | | | 0.250 | | | | 70,494 | | | | (97,248 | ) | | | (26,754 | ) | | | 0.87 | | |
| | | | | | | | | | | $ | 276,040 | | | $ | (411,368 | ) | | $ | (135,328 | ) | | | | | |
43 If the Portfolio is a seller of protection and a credit event occurs, as defined under the terms of the particular swap agreement, the Portfolio will either (i) pay to the buyer of protection an amount equal to the notional amount of the swap and take delivery of the referenced obligation or (ii) pay a net settlement amount in the form of cash or securities equal to the notional amount of the swap less the recovery value of the referenced obligation.
44 Payment to the counterparty will be made upon the occurrence of bankruptcy and/or by a restructuring event with respect to the Bundesrepublik Deutschland bond, 6.000%, due 06/20/16.
45 Payment to the counterparty will be made upon the occurrence of bankruptcy and/or by a restructuring event with respect to the Portuguese Republic bond, 4.250%, due 04/25/19.
46 Payment to the counterparty will be made upon the occurrence of bankruptcy and/or by a restructuring event with respect to the Republic of Italy Bond, 6.875%, due 09/27/23.
Variance swaps47
| Counterparty | | Notional
amount
(000) | | Termination
date | | Pay/
receive
variance | | Reference
entity | | Volatility
strike
price | | Upfront
payments
received
(made) | | Value | | Unrealized
appreciation
(depreciation) | |
Barclays
Bank PLC | | EUR | 5 | | | 12/21/12 | | Receive | | DJ Euro Stoxx 50 Index | | | 32.90 | % | | $ | — | | | $ | (50,144 | ) | | $ | (50,144 | ) | |
Barclays
Bank PLC | | GBP | 2 | | | 12/16/11 | | Pay | | FTSE 100 Index | | | 27.90 | | | | — | | | | 29,421 | | | | 29,421 | | |
Barclays
Bank PLC | | GBP | 13 | | | 12/21/12 | | Pay | | FTSE 100 Index | | | 24.60 | | | | — | | | | 11,333 | | | | 11,333 | | |
Barclays
Bank PLC | | HKD | 10 | | | 12/29/11 | | Receive | | China Enterprises Index (Hang Seng) | | | 33.75 | | | | — | | | | (11,524 | ) | | | (11,524 | ) | |
Barclays
Bank PLC | | HKD | 146 | | | 12/28/12 | | Receive | | China Enterprises Index (Hang Seng) | | | 31.50 | | | | — | | | | (23,444 | ) | | | (23,444 | ) | |
224
PACE Select Advisors Trust
PACE Alternative Strategies Investments
Portfolio of investments—July 31, 2011
Variance swaps47—(concluded)
| Counterparty | | Notional
amount
(000) | | Termination
date | | Pay/
receive
variance | | Reference
entity | | Volatility
strike
price | | Upfront
payments
received
(made) | | Value | | Unrealized
appreciation
(depreciation) | |
Barclays
Bank PLC | | USD | 13 | | | 12/21/12 | | Pay | | S&P 500 Index | | | 30.95 | % | | $ | — | | | $ | 105,213 | | | $ | 105,213 | | |
| BNP Paribas | | EUR | 88 | | | 12/16/11 | | Receive | | DJ Euro Stoxx 50 Index | | | 27.30 | | | | — | | | | (485,165 | ) | | | (485,165 | ) | |
| BNP Paribas | | EUR | 14 | | | 12/21/12 | | Receive | | DAX Index | | | 27.25 | | | | — | | | | (83,897 | ) | | | (83,897 | ) | |
| BNP Paribas | | EUR | 6 | | | 12/21/12 | | Receive | | DAX Index | | | 25.85 | | | | — | | | | (5,863 | ) | | | (5,863 | ) | |
| BNP Paribas | | EUR | 90 | | | 12/21/12 | | Receive | | DJ Euro Stoxx 50 Index | | | 35.25 | | | | — | | | | (1,168,658 | ) | | | (1,168,658 | ) | |
| BNP Paribas | | GBP | 3 | | | 12/16/11 | | Pay | | FTSE 100 Index | | | 29.20 | | | | — | | | | 48,994 | | | | 48,994 | | |
| BNP Paribas | | GBP | 5 | | | 12/16/11 | | Pay | | FTSE 100 Index | | | 25.80 | | | | — | | | | 53,515 | | | | 53,515 | | |
| BNP Paribas | | GBP | 5 | | | 12/16/11 | | Pay | | FTSE 100 Index | | | 25.25 | | | | — | | | | 55,760 | | | | 55,760 | | |
| BNP Paribas | | GBP | 6 | | | 12/16/11 | | Pay | | FTSE 100 Index | | | 24.80 | | | | — | | | | 58,396 | | | | 58,396 | | |
| BNP Paribas | | GBP | 15 | | | 12/16/11 | | Receive | | FTSE 100 Index | | | 30.00 | | | | — | | | | (256,335 | ) | | | (256,335 | ) | |
| BNP Paribas | | GBP | 38 | | | 12/16/11 | | Pay | | FTSE 100 Index | | | 30.25 | | | | — | | | | 659,103 | | | | 659,103 | | |
| BNP Paribas | | GBP | 1 | | | 12/21/12 | | Pay | | FTSE 100 Index | | | 25.40 | | | | — | | | | 5,324 | | | | 5,324 | | |
| BNP Paribas | | GBP | 2 | | | 12/21/12 | | Pay | | FTSE 100 Index | | | 25.40 | | | | — | | | | 10,700 | | | | 10,700 | | |
| BNP Paribas | | GBP | 2 | | | 12/21/12 | | Pay | | FTSE 100 Index | | | 25.65 | | | | — | | | | 11,327 | | | | 11,327 | | |
| BNP Paribas | | HKD | 30 | | | 12/29/11 | | Receive | | China Enterprises Index (Hang Seng) | | | 34.95 | | | | — | | | | (38,647 | ) | | | (38,647 | ) | |
| BNP Paribas | | HKD | 34 | | | 12/29/11 | | Receive | | China Enterprises Index (Hang Seng) | | | 35.80 | | | | — | | | | (45,858 | ) | | | (45,858 | ) | |
| BNP Paribas | | HKD | 50 | | | 12/29/11 | | Receive | | China Enterprises Index (Hang Seng) | | | 35.25 | | | | — | | | | (64,506 | ) | | | (64,506 | ) | |
| BNP Paribas | | HKD | 51 | | | 12/29/11 | | Receive | | China Enterprises Index (Hang Seng) | | | 34.80 | | | | — | | | | (63,961 | ) | | | (63,961 | ) | |
| BNP Paribas | | HKD | 165 | | | 12/29/11 | | Pay | | China Enterprises Index (Hang Seng) | | | 35.75 | | | | — | | | | 227,649 | | | | 227,649 | | |
| BNP Paribas | | HKD | 400 | | | 12/29/11 | | Receive | | China Enterprises Index (Hang Seng) | | | 35.40 | | | | — | | | | (541,336 | ) | | | (541,336 | ) | |
| BNP Paribas | | HKD | 10 | | | 12/28/12 | | Receive | | China Enterprises Index (Hang Seng) | | | 35.10 | | | | — | | | | (8,279 | ) | | | (8,279 | ) | |
| BNP Paribas | | HKD | 15 | | | 12/28/12 | | Receive | | China Enterprises Index (Hang Seng) | | | 34.50 | | | | — | | | | (11,259 | ) | | | (11,259 | ) | |
| BNP Paribas | | HKD | 17 | | | 12/28/12 | | Receive | | China Enterprises Index (Hang Seng) | | | 35.10 | | | | — | | | | (14,110 | ) | | | (14,110 | ) | |
| BNP Paribas | | HKD | 18 | | | 12/28/12 | | Receive | | China Enterprises Index (Hang Seng) | | | 35.35 | | | | — | | | | (15,332 | ) | | | (15,332 | ) | |
| BNP Paribas | | JPY | 4,800 | | | 12/14/12 | | Receive | | Nikkei 225 Index | | | 28.70 | | | | — | | | | (178,215 | ) | | | (178,215 | ) | |
| BNP Paribas | | JPY | 20,000 | | | 12/14/12 | | Receive | | Nikkei 225 Index | | | 32.20 | | | | — | | | | (1,620,886 | ) | | | (1,620,886 | ) | |
| BNP Paribas | | USD | 72 | | | 12/21/12 | | Pay | | S&P 500 Index | | | 27.40 | | | | — | | | | 362,287 | | | | 362,287 | | |
| BNP Paribas | | USD | 233 | | | 12/21/12 | | Pay | | S&P 500 Index | | | 32.40 | | | | — | | | | 2,169,292 | | | | 2,169,292 | | |
| | | | | | | | | | | | | $ | — | | | $ | (879,105 | ) | | $ | (879,105 | ) | |
47 At the maturity date, a net cash flow is exchanged, where the payoff amount is equivalent to the difference between the realized price variance of the reference entity and the strike price multiplied by the notional amount. As a receiver of the realized price variance, the Portfolio would receive the payoff amount when the realized price variance of the reference entity is greater than the strike price and would owe the payoff amount when the variance is less than the strike price. As a payer of the realized price variance, the Portfolio would owe the payoff amount when the realized price variance of the reference entity is greater than the strike price and would receive the payoff amount when the variance is less than the strike price.
225
PACE Select Advisors Trust
PACE Alternative Strategies Investments
Portfolio of investments—July 31, 2011
The following is a summary of the fair valuations according to the inputs used as of July 31, 2011 in valuing the Portfolio's investments:
| | | Unadjusted
quoted prices in
active markets for
identical investments
(Level 1) | | Other significant
observable inputs
(Level 2) | | Unobservable
inputs
(Level 3) | | Total | |
| Common stocks | | $ | 111,330,986 | | | $ | 78,494,783 | | | $ | — | | | $ | 189,825,769 | | |
| Preferred stocks | | | 63,767 | | | | 775,643 | | | | — | | | | 839,410 | | |
| Investment companies | | | 6,453,514 | | | | — | | | | — | | | | 6,453,514 | | |
| US government obligations | | | — | | | | 32,543,674 | | | | — | | | | 32,543,674 | | |
| Federal home loan mortgage corporation certificates | | | — | | | | 1,705,969 | | | | — | | | | 1,705,969 | | |
| Federal national mortgage association certificates | | | — | | | | 21,700,095 | | | | — | | | | 21,700,095 | | |
| Collateralized mortgage obligations | | | — | | | | 18,217,446 | | | | — | | | | 18,217,446 | | |
| Asset-backed securities | | | — | | | | 19,959,612 | | | | — | | | | 19,959,612 | | |
| Corporate notes | | | 296,167 | | | | 53,800,516 | | | | — | | | | 54,096,683 | | |
| Municipal bonds and notes | | | — | | | | 5,100,268 | | | | — | | | | 5,100,268 | | |
| Non-US government obligations | | | — | | | | 14,660,100 | | | | — | | | | 14,660,100 | | |
| Time deposits | | | — | | | | 26,260,392 | | | | — | | | | 26,260,392 | | |
| Certificates of deposit | | | — | | | | 8,000,000 | | | | — | | | | 8,000,000 | | |
| Short-term US government obligations | | | — | | | | 91,494,578 | | | | — | | | | 91,494,578 | | |
| Repurchase agreement | | | — | | | | 68,893,000 | | | | — | | | | 68,893,000 | | |
| Options purchased | | | 482,699 | | | | 6,120,228 | | | | — | | | | 6,602,927 | | |
| Common stocks sold short | | | (5,773,398 | ) | | | (17,725,542 | ) | | | — | | | | (23,498,940 | ) | |
| Federal national mortgage association certificates sold short | | | — | | | | (3,911,250 | ) | | | — | | | | (3,911,250 | ) | |
| Written options | | | (907,721 | ) | | | — | | | | — | | | | (907,721 | ) | |
| Swaptions and foreign exchange written options | | | — | | | | (4,261,246 | ) | | | — | | | | (4,261,246 | ) | |
| Futures, net | | | (2,449,234 | ) | | | (109,175 | ) | | | — | | | | (2,558,409 | ) | |
| Forward foreign currency contracts, net | | | — | | | | (5,634,364 | ) | | | — | | | | (5,634,364 | ) | |
| Swap agreements, net | | | — | | | | (1,720,849 | ) | | | — | | | | (1,720,849 | ) | |
| Total | | $ | 109,496,780 | | | $ | 414,363,878 | | | $ | — | | | $ | 523,860,658 | | |
226
PACE Select Advisors Trust
Portfolio acronyms:
ADR American Depositary Receipt
ADS American Depositary Shares
AGC Associated General Contractors
AGM Assured Guaranty Municipal Corporation
AMBAC American Municipal Bond Assurance Corporation
ARM Adjustable Rate Mortgage — The interest rate shown is the current rate as of July 31, 2011.
BHAC Berkshire Hathaway Assurance Corporation
CDO Collaterlized Debt Obligation
CLO Collateralized Loan Obligation
COFI Cost of Funds Index
ETF Exchange Traded Fund
EURIBOR Euro Interbank Offered Rate
FFCB Federal Farm Credit Bank
FGIC Financial Guaranty Insurance Company
FHA Federal Housing Administration
FHLB Federal Home Loan Bank
FHLMC Federal Home Loan Mortgage Corporation
FNMA Federal National Mortgage Association
GDR Global Depositary Receipt
GE General Electric
GMAC General Motors Acceptance Corporation
GNMA Government National Mortgage Association
GS Goldman Sachs
GTD Guaranteed
IBC Insured Bond Certificate
ICC International Code Council
LIBOR London Interbank Offered Rate
MLCC Merrill Lynch Credit Corporation
MSCI Morgan Stanley Capital International
MTN Medium Term Note
NATL-RE National Reinsurance
NVDR Non Voting Depositary Receipt
OJSC Open Joint Stock Company
PSF Permanent School Fund
REIT Real Estate Investment Trust
REMIC Real Estate Mortgage Investment Conduit
SCSDE South Carolina School District Enhancement
SDR Special Drawing Rights
SPDR Standard & Poor's Depository Receipts
STRIP Separate Trading of Registered Interest and Principal of Securities
TBA (To Be Announced) Security is purchased on a forward commitment basis with an approximate principal amount (generally +/- 1.0%) and no definite maturity date. The actual principal amount and maturity date will be determined upon settlement when the specific mortgage pools are assigned.
TIAA Teachers Insurance and Annuity Association
TIPS Treasury inflation protected securities ("TIPS") are debt securities issued by the US Treasury whose principal and/or interest payments are adjusted for inflation, unlike debt securities that make fixed principal and interest payments. The interest rate paid by the TIPS is fixed, while the principal value rises or falls based on changes in a published Consumer Price Index ("CPI"). Thus, if inflation occurs, the principal and interest payments on TIPS are adjusted accordingly to protect investors from inflationary loss. During a deflationary period, the principal and interest payments decrease, although the TIPS principal amounts will not drop below their face amounts at maturity. In exchange for the inflation protection, the TIPS generally pay lower interest rates than typical US Treasury securities. Only if inflation occurs will TIPS offer a higher real yield than a conventional Treasury bond of the same maturity.
USDA United States Department of Agriculture
VA Veterans Administration
VVPR Verminderde Voorheffing Precompte Reduit (Belgium dividend coupon)
Currency type abbreviations:
AUD Australian Dollar
BRL Brazilian Real
CAD Canadian Dollar
CHF Swiss Franc
CLP Chilean Peso
CNY Chinese Yuan Renminbi
CZK Czech Koruna
DKK Danish Krone
EUR Euro
GBP Great Britain Pound
HKD Hong Kong Dollar
IDR Indonesian Rupiah
INR Indian Rupee
JPY Japanese Yen
KRW South Korean Won
MXN Mexican Peso
MYR Malaysian Ringgit
NOK Norwegian Krone
NZD New Zealand Dollar
PEN Peruvian Nuevo Sol
PHP Philippine Peso
PLN Polish Zloty
SEK Swedish Krona
SGD Singapore Dollar
TRY Turkish Lira
TWD New Taiwan Dollar
USD United States Dollar
ZAR South African Rand
See accompanying notes to financial statements.
227
PACE Select Advisors Trust
Understanding your Portfolio's expenses (unaudited)
As a shareholder of a Portfolio, you incur two types of costs: (1) transactional costs (as applicable), including sales charges (loads), or ongoing program fees; and (2) ongoing Portfolio costs, including management fees; service and/or distribution (12b-1) fees (if applicable); and other Portfolio expenses. These examples are intended to help you understand your ongoing costs (in dollars) of investing in each Portfolio and to compare these costs with the ongoing costs of investing in other mutual funds.
The examples below are based on an investment of $1,000 invested at the beginning of the period and held for the entire period, February 1, 2011 to July 31, 2011.
Actual expenses
The first line for each class of shares in the table below for each Portfolio provides information about its actual account values and actual expenses. You may use the information in this line, together with the amount you invested, to estimate the expenses that you paid over a period. Simply divide your account value by $1,000 (for example, an $8,600 account value divided by $1,000 = 8.6), then multiply the result by the number in the first line for each class of shares for each respective Portfolio under the heading entitled "Expenses paid during period" to estimate the expenses you paid on your account during the period.
Hypothetical example for comparison purposes
The second line for each class of shares in the table below for each Portfolio provides information about hypothetical account values and hypothetical expenses based on that Portfolio's actual expense ratios for each class of shares and an assumed rate of return of 5% per year before expenses, which is not that Portfolio's actual return for each class of shares. The hypothetical account values and expenses may not be used to estimate the actual ending account balance or expenses you paid for the period. You may use this information to compare the ongoing costs of investing in a Portfolio and other funds. To do so, compare this 5% hypothetical example with the 5% hypothetical examples that appear in the shareholder reports of other funds.
Please note that the expenses shown in the table are meant to highlight your ongoing Portfolio costs only and do not reflect any transactional costs (as applicable), such as sales charges (loads), or program fees. Therefore, the second line in the table for each class of shares for each Portfolio is useful in comparing ongoing Portfolio costs only, and will not help you determine the relative total costs of owning different funds. In addition, if these transactional costs or program fees were included, your costs would have been higher.
228
PACE Select Advisors Trust
| |
| | Beginning
account value
February 1, 2011 | | Ending
account value
July 31, 2011 | | Expenses paid
during period1
02/01/11 to 07/31/11 | | Expense
ratio during
the period | |
| PACE Money Market Investments | | | |
| | Class P | | | Actual | | $ | 1,000.00 | | | $ | 1,000.00 | | | $ | 1.09 | | | | 0.22 | % | |
| | | | | Hypothetical
(5% annual return before expenses) | | | 1,000.00 | | | | 1,023.70 | | | | 1.10 | | | | 0.22 | | |
| PACE Government Securities Fixed Income Investments | | | |
| | Class A | | | Actual | | | 1,000.00 | | | | 1,031.40 | | | | 5.14 | | | | 1.02 | | |
| | | | | Hypothetical
(5% annual return before expenses) | | | 1,000.00 | | | | 1,019.74 | | | | 5.11 | | | | 1.02 | | |
| | Class B | | | Actual | | | 1,000.00 | | | | 1,027.50 | | | | 8.90 | | | | 1.77 | | |
| | | | | Hypothetical
(5% annual return before expenses) | | | 1,000.00 | | | | 1,016.02 | | | | 8.85 | | | | 1.77 | | |
| | Class C | | | Actual | | | 1,000.00 | | | | 1,028.00 | | | | 7.64 | | | | 1.52 | | |
| | | | | Hypothetical
(5% annual return before expenses) | | | 1,000.00 | | | | 1,017.26 | | | | 7.60 | | | | 1.52 | | |
| | Class Y | | | Actual | | | 1,000.00 | | | | 1,031.90 | | | | 3.88 | | | | 0.77 | | |
| | | | | Hypothetical
(5% annual return before expenses) | | | 1,000.00 | | | | 1,020.98 | | | | 3.86 | | | | 0.77 | | |
| | Class P | | | Actual | | | 1,000.00 | | | | 1,032.60 | | | | 3.88 | | | | 0.77 | | |
| | | | | Hypothetical
(5% annual return before expenses) | | | 1,000.00 | | | | 1,020.98 | | | | 3.86 | | | | 0.77 | | |
| PACE Intermediate Fixed Income Investments | | | |
| | Class A | | | Actual | | | 1,000.00 | | | | 1,028.30 | | | | 4.68 | | | | 0.93 | | |
| | | | | Hypothetical
(5% annual return before expenses) | | | 1,000.00 | | | | 1,020.18 | | | | 4.66 | | | | 0.93 | | |
| | Class B | | | Actual | | | 1,000.00 | | | | 1,024.40 | | | | 8.43 | | | | 1.68 | | |
| | | | | Hypothetical
(5% annual return before expenses) | | | 1,000.00 | | | | 1,016.46 | | | | 8.40 | | | | 1.68 | | |
| | Class C | | | Actual | | | 1,000.00 | | | | 1,026.50 | | | | 7.19 | | | | 1.43 | | |
| | | | | Hypothetical
(5% annual return before expenses) | | | 1,000.00 | | | | 1,017.70 | | | | 7.15 | | | | 1.43 | | |
| | Class Y | | | Actual | | | 1,000.00 | | | | 1,029.50 | | | | 3.42 | | | | 0.68 | | |
| | | | | Hypothetical
(5% annual return before expenses) | | | 1,000.00 | | | | 1,021.42 | | | | 3.41 | | | | 0.68 | | |
| | Class P | | | Actual | | | 1,000.00 | | | | 1,030.40 | | | | 3.42 | | | | 0.68 | | |
| | | | | Hypothetical
(5% annual return before expenses) | | | 1,000.00 | | | | 1,021.42 | | | | 3.41 | | | | 0.68 | | |
229
PACE Select Advisors Trust
| |
| | Beginning
account value
February 1, 2011 | | Ending
account value
July 31, 2011 | | Expenses paid
during period1
02/01/11 to 07/31/11 | | Expense
ratio during
the period | |
| PACE Strategic Fixed Income Investments | | | |
| | Class A | | | Actual | | $ | 1,000.00 | | | $ | 1,050.00 | | | $ | 5.39 | | | | 1.06 | % | |
| | | | | Hypothetical
(5% annual return before expenses) | | | 1,000.00 | | | | 1,019.54 | | | | 5.31 | | | | 1.06 | | |
| | Class B | | | Actual | | | 1,000.00 | | | | 1,046.80 | | | | 9.19 | | | | 1.81 | | |
| | | | | Hypothetical
(5% annual return before expenses) | | | 1,000.00 | | | | 1,015.82 | | | | 9.05 | | | | 1.81 | | |
| | Class C | | | Actual | | | 1,000.00 | | | | 1,048.20 | | | | 7.87 | | | | 1.55 | | |
| | | | | Hypothetical
(5% annual return before expenses) | | | 1,000.00 | | | | 1,017.11 | | | | 7.75 | | | | 1.55 | | |
| | Class Y | | | Actual | | | 1,000.00 | | | | 1,052.00 | | | | 4.12 | | | | 0.81 | | |
| | | | | Hypothetical
(5% annual return before expenses) | | | 1,000.00 | | | | 1,020.78 | | | | 4.06 | | | | 0.81 | | |
| | Class P | | | Actual | | | 1,000.00 | | | | 1,052.00 | | | | 4.12 | | | | 0.81 | | |
| | | | | Hypothetical
(5% annual return before expenses) | | | 1,000.00 | | | | 1,020.78 | | | | 4.06 | | | | 0.81 | | |
| PACE Municipal Fixed Income Investments | | | |
| | Class A | | | Actual | | | 1,000.00 | | | | 1,058.30 | | | | 4.75 | | | | 0.93 | | |
| | | | | Hypothetical
(5% annual return before expenses) | | | 1,000.00 | | | | 1,020.18 | | | | 4.66 | | | | 0.93 | | |
| | Class B | | | Actual | | | 1,000.00 | | | | 1,054.30 | | | | 8.56 | | | | 1.68 | | |
| | | | | Hypothetical
(5% annual return before expenses) | | | 1,000.00 | | | | 1,016.46 | | | | 8.40 | | | | 1.68 | | |
| | Class C | | | Actual | | | 1,000.00 | | | | 1,055.70 | | | | 7.29 | | | | 1.43 | | |
| | | | | Hypothetical
(5% annual return before expenses) | | | 1,000.00 | | | | 1,017.70 | | | | 7.15 | | | | 1.43 | | |
| | Class Y | | | Actual | | | 1,000.00 | | | | 1,058.80 | | | | 3.47 | | | | 0.68 | | |
| | | | | Hypothetical
(5% annual return before expenses) | | | 1,000.00 | | | | 1,021.42 | | | | 3.41 | | | | 0.68 | | |
| | Class P | | | Actual | | | 1,000.00 | | | | 1,059.60 | | | | 3.47 | | | | 0.68 | | |
| | | | | Hypothetical
(5% annual return before expenses) | | | 1,000.00 | | | | 1,021.42 | | | | 3.41 | | | | 0.68 | | |
| PACE International Fixed Income Investments | | | |
| | Class A | | | Actual | | | 1,000.00 | | | | 1,079.10 | | | | 6.19 | | | | 1.20 | | |
| | | | | Hypothetical
(5% annual return before expenses) | | | 1,000.00 | | | | 1,018.84 | | | | 6.01 | | | | 1.20 | | |
| | Class B | | | Actual | | | 1,000.00 | | | | 1,074.70 | | | | 10.29 | | | | 2.00 | | |
| | | | | Hypothetical
(5% annual return before expenses) | | | 1,000.00 | | | | 1,014.88 | | | | 9.99 | | | | 2.00 | | |
| | Class C | | | Actual | | | 1,000.00 | | | | 1,075.60 | | | | 8.65 | | | | 1.68 | | |
| | | | | Hypothetical
(5% annual return before expenses) | | | 1,000.00 | | | | 1,016.46 | | | | 8.40 | | | | 1.68 | | |
| | Class Y | | | Actual | | | 1,000.00 | | | | 1,079.50 | | | | 5.16 | | | | 1.00 | | |
| | | | | Hypothetical
(5% annual return before expenses) | | | 1,000.00 | | | | 1,019.84 | | | | 5.01 | | | | 1.00 | | |
| | Class P | | | Actual | | | 1,000.00 | | | | 1,080.20 | | | | 5.16 | | | | 1.00 | | |
| | | | | Hypothetical
(5% annual return before expenses) | | | 1,000.00 | | | | 1,019.84 | | | | 5.01 | | | | 1.00 | | |
230
PACE Select Advisors Trust
| |
| | Beginning
account value
February 1, 2011 | | Ending
account value
July 31, 2011 | | Expenses paid
during period1
02/01/11 to 07/31/11 | | Expense
ratio during
the period | |
| PACE High Yield Investments | | | |
| | Class A | | | Actual | | $ | 1,000.00 | | | $ | 1,012.90 | | | $ | 6.59 | | | | 1.32 | % | |
| | | | | Hypothetical
(5% annual return before expenses) | | | 1,000.00 | | | | 1,018.25 | | | | 6.61 | | | | 1.32 | | |
| | Class C | | | Actual | | | 1,000.00 | | | | 1,010.60 | | | | 8.87 | | | | 1.78 | | |
| | | | | Hypothetical
(5% annual return before expenses) | | | 1,000.00 | | | | 1,015.97 | | | | 8.90 | | | | 1.78 | | |
| | Class Y | | | Actual | | | 1,000.00 | | | | 1,014.00 | | | | 5.19 | | | | 1.04 | | |
| | | | | Hypothetical
(5% annual return before expenses) | | | 1,000.00 | | | | 1,019.64 | | | | 5.21 | | | | 1.04 | | |
| | Class P | | | Actual | | | 1,000.00 | | | | 1,013.90 | | | | 5.49 | | | | 1.10 | | |
| | | | | Hypothetical
(5% annual return before expenses) | | | 1,000.00 | | | | 1,019.34 | | | | 5.51 | | | | 1.10 | | |
| PACE Large Co Value Equity Investments | | | |
| | Class A | | | Actual | | | 1,000.00 | | | | 995.30 | | | | 5.74 | | | | 1.16 | | |
| | | | | Hypothetical
(5% annual return before expenses) | | | 1,000.00 | | | | 1,019.04 | | | | 5.81 | | | | 1.16 | | |
| | Class B | | | Actual | | | 1,000.00 | | | | 991.90 | | | | 9.98 | | | | 2.02 | | |
| | | | | Hypothetical
(5% annual return before expenses) | | | 1,000.00 | | | | 1,014.78 | | | | 10.09 | | | | 2.02 | | |
| | Class C | | | Actual | | | 1,000.00 | | | | 991.90 | | | | 9.58 | | | | 1.94 | | |
| | | | | Hypothetical
(5% annual return before expenses) | | | 1,000.00 | | | | 1,015.17 | | | | 9.69 | | | | 1.94 | | |
| | Class Y | | | Actual | | | 1,000.00 | | | | 996.50 | | | | 4.50 | | | | 0.91 | | |
| | | | | Hypothetical
(5% annual return before expenses) | | | 1,000.00 | | | | 1,020.28 | | | | 4.56 | | | | 0.91 | | |
| | Class P | | | Actual | | | 1,000.00 | | | | 997.10 | | | | 4.56 | | | | 0.92 | | |
| | | | | Hypothetical
(5% annual return before expenses) | | | 1,000.00 | | | | 1,020.23 | | | | 4.61 | | | | 0.92 | | |
| PACE Large Co Growth Equity Investments | | | |
| | Class A | | | Actual | | | 1,000.00 | | | | 1,026.50 | | | | 6.18 | | | | 1.23 | | |
| | | | | Hypothetical
(5% annual return before expenses) | | | 1,000.00 | | | | 1,018.70 | | | | 6.16 | | | | 1.23 | | |
| | Class B | | | Actual | | | 1,000.00 | | | | 1,022.20 | | | | 10.28 | | | | 2.05 | | |
| | | | | Hypothetical
(5% annual return before expenses) | | | 1,000.00 | | | | 1,014.63 | | | | 10.24 | | | | 2.05 | | |
| | Class C | | | Actual | | | 1,000.00 | | | | 1,022.10 | | | | 10.28 | | | | 2.05 | | |
| | | | | Hypothetical
(5% annual return before expenses) | | | 1,000.00 | | | | 1,014.63 | | | | 10.24 | | | | 2.05 | | |
| | Class Y | | | Actual | | | 1,000.00 | | | | 1,027.50 | | | | 4.88 | | | | 0.97 | | |
| | | | | Hypothetical
(5% annual return before expenses) | | | 1,000.00 | | | | 1,019.98 | | | | 4.86 | | | | 0.97 | | |
| | Class P | | | Actual | | | 1,000.00 | | | | 1,027.60 | | | | 4.88 | | | | 0.97 | | |
| | | | | Hypothetical
(5% annual return before expenses) | | | 1,000.00 | | | | 1,019.98 | | | | 4.86 | | | | 0.97 | | |
231
PACE Select Advisors Trust
| |
| | Beginning
account value
February 1, 2011 | | Ending
account value
July 31, 2011 | | Expenses paid
during period1
02/01/11 to 07/31/11 | | Expense
ratio during
the period | |
| PACE Small/Medium Co Value Equity Investments | | | |
| | Class A | | | Actual | | $ | 1,000.00 | | | $ | 996.50 | | | $ | 6.34 | | | | 1.28 | % | |
| | | | | Hypothetical
(5% annual return before expenses) | | | 1,000.00 | | | | 1,018.45 | | | | 6.41 | | | | 1.28 | | |
| | Class B | | | Actual | | | 1,000.00 | | | | 996.10 | | | | 10.69 | | | | 2.16 | | |
| | | | | Hypothetical
(5% annual return before expenses) | | | 1,000.00 | | | | 1,014.08 | | | | 10.79 | | | | 2.16 | | |
| | Class C | | | Actual | | | 1,000.00 | | | | 993.00 | | | | 9.98 | | | | 2.02 | | |
| | | | | Hypothetical
(5% annual return before expenses) | | | 1,000.00 | | | | 1,014.78 | | | | 10.09 | | | | 2.02 | | |
| | Class Y | | | Actual | | | 1,000.00 | | | | 997.70 | | | | 5.30 | | | | 1.07 | | |
| | | | | Hypothetical
(5% annual return before expenses) | | | 1,000.00 | | | | 1,019.49 | | | | 5.36 | | | | 1.07 | | |
| | Class P | | | Actual | | | 1,000.00 | | | | 997.10 | | | | 5.74 | | | | 1.16 | | |
| | | | | Hypothetical
(5% annual return before expenses) | | | 1,000.00 | | | | 1,019.04 | | | | 5.81 | | | | 1.16 | | |
| PACE Small/Medium Co Growth Equity Investments | | | |
| | Class A | | | Actual | | | 1,000.00 | | | | 1,065.90 | | | | 6.51 | | | | 1.27 | | |
| | | | | Hypothetical
(5% annual return before expenses) | | | 1,000.00 | | | | 1,018.50 | | | | 6.36 | | | | 1.27 | | |
| | Class B | | | Actual | | | 1,000.00 | | | | 1,061.10 | | | | 10.89 | | | | 2.13 | | |
| | | | | Hypothetical
(5% annual return before expenses) | | | 1,000.00 | | | | 1,014.23 | | | | 10.64 | | | | 2.13 | | |
| | Class C | | | Actual | | | 1,000.00 | | | | 1,061.40 | | | | 10.53 | | | | 2.06 | | |
| | | | | Hypothetical
(5% annual return before expenses) | | | 1,000.00 | | | | 1,014.58 | | | | 10.29 | | | | 2.06 | | |
| | Class Y | | | Actual | | | 1,000.00 | | | | 1,066.50 | | | | 5.69 | | | | 1.11 | | |
| | | | | Hypothetical
(5% annual return before expenses) | | | 1,000.00 | | | | 1,019.29 | | | | 5.56 | | | | 1.11 | | |
| | Class P | | | Actual | | | 1,000.00 | | | | 1,065.90 | | | | 5.79 | | | | 1.13 | | |
| | | | | Hypothetical
(5% annual return before expenses) | | | 1,000.00 | | | | 1,019.19 | | | | 5.66 | | | | 1.13 | | |
| PACE International Equity Investments | | | |
| | Class A | | | Actual | | | 1,000.00 | | | | 1,019.00 | | | | 7.01 | | | | 1.40 | | |
| | | | | Hypothetical
(5% annual return before expenses) | | | 1,000.00 | | | | 1,017.85 | | | | 7.00 | | | | 1.40 | | |
| | Class B | | | Actual | | | 1,000.00 | | | | 1,020.30 | | | | 11.67 | | | | 2.33 | | |
| | | | | Hypothetical
(5% annual return before expenses) | | | 1,000.00 | | | | 1,013.24 | | | | 11.63 | | | | 2.33 | | |
| | Class C | | | Actual | | | 1,000.00 | | | | 1,015.50 | | | | 11.04 | | | | 2.21 | | |
| | | | | Hypothetical
(5% annual return before expenses) | | | 1,000.00 | | | | 1,013.84 | | | | 11.03 | | | | 2.21 | | |
| | Class Y | | | Actual | | | 1,000.00 | | | | 1,020.60 | | | | 5.71 | | | | 1.14 | | |
| | | | | Hypothetical
(5% annual return before expenses) | | | 1,000.00 | | | | 1,019.14 | | | | 5.71 | | | | 1.14 | | |
| | Class P | | | Actual | | | 1,000.00 | | | | 1,020.60 | | | | 5.76 | | | | 1.15 | | |
| | | | | Hypothetical
(5% annual return before expenses) | | | 1,000.00 | | | | 1,019.09 | | | | 5.76 | | | | 1.15 | | |
232
PACE Select Advisors Trust
| |
| | Beginning
account value
February 1, 2011 | | Ending
account value
July 31, 2011 | | Expenses paid
during period1
02/01/11 to 07/31/11 | | Expense
ratio during
the period | |
| PACE International Emerging Markets Equity Investments | | | |
| | Class A | | | Actual | | $ | 1,000.00 | | | $ | 1,011.70 | | | $ | 9.28 | | | | 1.86 | % | |
| | | | | Hypothetical
(5% annual return before expenses) | | | 1,000.00 | | | | 1,015.57 | | | | 9.30 | | | | 1.86 | | |
| | Class B | | | Actual | | | 1,000.00 | | | | 1,008.50 | | | | 12.65 | | | | 2.54 | | |
| | | | | Hypothetical
(5% annual return before expenses) | | | 1,000.00 | | | | 1,012.20 | | | | 12.67 | | | | 2.54 | | |
| | Class C | | | Actual | | | 1,000.00 | | | | 1,008.60 | | | | 12.90 | | | | 2.59 | | |
| | | | | Hypothetical
(5% annual return before expenses) | | | 1,000.00 | | | | 1,011.95 | | | | 12.92 | | | | 2.59 | | |
| | Class Y | | | Actual | | | 1,000.00 | | | | 1,013.70 | | | | 8.04 | | | | 1.61 | | |
| | | | | Hypothetical
(5% annual return before expenses) | | | 1,000.00 | | | | 1,016.81 | | | | 8.05 | | | | 1.61 | | |
| | Class P | | | Actual | | | 1,000.00 | | | | 1,012.30 | | | | 8.98 | | | | 1.80 | | |
| | | | | Hypothetical
(5% annual return before expenses) | | | 1,000.00 | | | | 1,015.87 | | | | 9.00 | | | | 1.80 | | |
| PACE Global Real Estate Securities Investments | | | |
| | Class A | | | Actual | | | 1,000.00 | | | | 1,052.40 | | | | 7.38 | | | | 1.45 | | |
| | | | | Hypothetical
(5% annual return before expenses) | | | 1,000.00 | | | | 1,017.60 | | | | 7.25 | | | | 1.45 | | |
| | Class C | | | Actual | | | 1,000.00 | | | | 1,049.00 | | | | 11.18 | | | | 2.20 | | |
| | | | | Hypothetical
(5% annual return before expenses) | | | 1,000.00 | | | | 1,013.88 | | | | 10.99 | | | | 2.20 | | |
| | Class Y | | | Actual | | | 1,000.00 | | | | 1,054.00 | | | | 6.11 | | | | 1.20 | | |
| | | | | Hypothetical
(5% annual return before expenses) | | | 1,000.00 | | | | 1,018.84 | | | | 6.01 | | | | 1.20 | | |
| | Class P | | | Actual | | | 1,000.00 | | | | 1,052.40 | | | | 6.11 | | | | 1.20 | | |
| | | | | Hypothetical
(5% annual return before expenses) | | | 1,000.00 | | | | 1,018.84 | | | | 6.01 | | | | 1.20 | | |
| PACE Alternative Strategies Investments | | | |
| | Class A | | | Actual | | | 1,000.00 | | | | 984.20 | | | | 10.23 | | | | 2.08 | | |
| | | | | Hypothetical
(5% annual return before expenses) | | | 1,000.00 | | | | 1,014.48 | | | | 10.39 | | | | 2.08 | | |
| | Class C | | | Actual | | | 1,000.00 | | | | 979.60 | | | | 13.94 | | | | 2.84 | | |
| | | | | Hypothetical
(5% annual return before expenses) | | | 1,000.00 | | | | 1,010.71 | | | | 14.16 | | | | 2.84 | | |
| | Class Y | | | Actual | | | 1,000.00 | | | | 985.30 | | | | 9.01 | | | | 1.83 | | |
| | | | | Hypothetical
(5% annual return before expenses) | | | 1,000.00 | | | | 1,015.72 | | | | 9.15 | | | | 1.83 | | |
| | Class P | | | Actual | | | 1,000.00 | | | | 984.20 | | | | 9.00 | | | | 1.83 | | |
| | | | | Hypothetical
(5% annual return before expenses) | | | 1,000.00 | | | | 1,015.72 | | | | 9.15 | | | | 1.83 | | |
1 Expenses are equal to the Portfolios' annualized net expense ratios, multiplied by the average account value over the period, multiplied by 181 divided by 365 (to reflect the one-half year period).
233
PACE Select Advisors Trust
Statement of assets and liabilities
July 31, 2011
| | | PACE
Money Market
Investments | | PACE
Government
Securities
Fixed Income
Investments | | PACE
Intermediate
Fixed Income
Investments | | PACE
Strategic
Fixed Income
Investments | |
| Assets: | |
Investments in unaffiliated securities, at value (cost—$276,701,978; $912,213,013;
$476,436,735; $728,280,162; $298,794,989; $516,153,677 and $254,548,456, respectively)1 | | $ | 276,701,978 | | | $ | 924,141,938 | | | $ | 487,884,528 | | | $ | 758,137,956 | | |
Investment in an affiliated security, at value (cost—$0; $0; $4,196,400; $4,383,525; $0; $65,600
and $14,627,018, respectively) | | | — | | | | — | | | | 4,196,400 | | | | 4,383,525 | | |
Repurchase agreements, at value (cost—$78,080,000; $1,919,000; $30,500,000;
$129,545,000; $0; $4,810,000 and $4,226,000, respectively) | | | 78,080,000 | | | | 1,919,000 | | | | 30,500,000 | | | | 129,545,000 | | |
Total investments in securities, at value (cost—$354,781,978; $914,132,013; $511,133,135;
$862,208,687; $298,794,989; $521,029,277 and $273,401,474, respectively) | | $ | 354,781,978 | | | $ | 926,060,938 | | | $ | 522,580,928 | | | $ | 892,066,481 | | |
| Cash | | | 715 | | | | 57,790 | | | | — | | | | 42 | | |
Foreign currency, at value (cost—$0; $0; $65,009; $284,230; $0; $18,125 and $1,258,788,
respectively) | | | — | | | | — | | | | 75,078 | | | | 288,607 | | |
| Receivable from affiliate | | | 112,635 | | | | — | | | | — | | | | — | | |
| Receivable for investments sold | | | — | | | | 464,049,865 | | | | 34,198,619 | | | | 13,211,424 | | |
| Receivable for shares of beneficial interest sold | | | 12,460,761 | | | | 577,324 | | | | 628,976 | | | | 3,757,518 | | |
| Receivable for dividends and interest | | | 59,292 | | | | 1,971,645 | | | | 3,701,108 | | | | 5,310,466 | | |
| Swap agreements, at value3 | | | — | | | | — | | | | 88,664 | | | | 1,878,020 | | |
| Due from broker | | | — | | | | — | | | | 37,435 | | | | 192,047 | | |
| Unrealized appreciation on forward foreign currency contracts | | | — | | | | — | | | | 372,307 | | | | 1,753,580 | | |
| Receivable for variation margin | | | — | | | | — | | | | — | | | | 1,865,603 | | |
| Receivable for foreign tax reclaims | | | — | | | | — | | | | 9,927 | | | | 1,298 | | |
| Other assets | | | 20,712 | | | | 28,870 | | | | 29,344 | | | | 767,290 | | |
| Total assets | | | 367,436,093 | | | | 1,392,746,432 | | | | 561,722,386 | | | | 921,092,376 | | |
| Liabilities: | |
| Payable for shares of beneficial interest repurchased | | | 1,154,661 | | | | 1,584,234 | | | | 503,991 | | | | 1,062,024 | | |
| Payable to custodian | | | 4,066 | | | | 21,581 | | | | 19,118 | | | | 35,800 | | |
| Dividends payable to shareholders | | | 1,260 | | | | — | | | | — | | | | — | | |
| Payable for investments purchased | | | — | | | | 516,470,185 | | | | 98,305,871 | | | | 90,378,762 | | |
| Investments sold short, at value (proceeds—$0; $261,813,240; $0; $0; $0; $0 and $0, respectively) | | | — | | | | 264,986,328 | | | | — | �� | | | — | | |
| Due to broker | | | — | | | | 1,400,000 | | | | 337,260 | | | | 617,422 | | |
| Payable to affiliate | | | — | | | | 304,228 | | | | 179,397 | | | | 416,833 | | |
| Payable for cash collateral from securities loaned | | | — | | | | — | | | | 4,196,400 | | | | 4,383,525 | | |
| Swap agreements, at value3 | | | — | | | | — | | | | 1,677,054 | | | | 1,058,821 | | |
| Payable for variation margin | | | — | | | | — | | | | 412,195 | | | | — | | |
| Unrealized depreciation on forward foreign currency contracts | | | — | | | | — | | | | 325,534 | | | | 3,906,423 | | |
| Payable for foreign withholding taxes | | | — | | | | — | | | | 4,556 | | | | 3,105 | | |
Options and swaptions written, at value (premiums received $0; $0; $0; $318,000; $0; $0 and $0,
respectively) | | | — | | | | — | | | | — | | | | 131,358 | | |
| Accrued expenses and other liabilities | | | 432,477 | | | | 330,288 | | | | 193,640 | | | | 398,902 | | |
| Total liabilities | | | 1,592,464 | | | | 785,096,844 | | | | 106,155,016 | | | | 102,392,975 | | |
1 Includes $0; $0; $4,122,835; $4,287,883; $0; $64,324; and $14,290,915, respectively, of investments in securities on loan, at value plus accrued interest and dividends, if any.
2 Includes restricted cash of $5,037,905 delivered to broker as initial margin for futures contracts for PACE International Fixed Income Investments.
3 Net upfront payments received by PACE Intermediate Fixed Income Investments and PACE Strategic Fixed Income Investments were, $29,863 and $340,575, respectively.
234
| | | PACE
Municipal
Fixed Income
Investments | | PACE
International
Fixed Income
Investments | | PACE
High Yield
Investments | |
| Assets: | |
Investments in unaffiliated securities, at value (cost—$276,701,978; $912,213,013;
$476,436,735; $728,280,162; $298,794,989; $516,153,677 and $254,548,456, respectively)1 | | $ | 315,043,786 | | | $ | 560,951,553 | | | $ | 269,376,463 | | |
Investment in an affiliated security, at value (cost—$0; $0; $4,196,400; $4,383,525; $0; $65,600
and $14,627,018, respectively) | | | — | | | | 65,600 | | | | 14,627,018 | | |
Repurchase agreements, at value (cost—$78,080,000; $1,919,000; $30,500,000;
$129,545,000; $0; $4,810,000 and $4,226,000, respectively) | | | — | | | | 4,810,000 | | | | 4,226,000 | | |
Total investments in securities, at value (cost—$354,781,978; $914,132,013; $511,133,135;
$862,208,687; $298,794,989; $521,029,277 and $273,401,474, respectively) | | $ | 315,043,786 | | | $ | 565,827,153 | | | $ | 288,229,481 | | |
| Cash | | | — | | | | 5,038,9262 | | | | — | | |
Foreign currency, at value (cost—$0; $0; $65,009; $284,230; $0; $18,125 and $1,258,788,
respectively) | | | — | | | | 18,515 | | | | 1,280,480 | | |
| Receivable from affiliate | | | — | | | | — | | | | — | | |
| Receivable for investments sold | | | — | | | | — | | | | — | | |
| Receivable for shares of beneficial interest sold | | | 171,329 | | | | 494,056 | | | | 453,468 | | |
| Receivable for dividends and interest | | | 3,499,557 | | | | 7,148,941 | | | | 5,207,349 | | |
| Swap agreements, at value3 | | | — | | | | — | | | | — | | |
| Due from broker | | | — | | | | — | | | | — | | |
| Unrealized appreciation on forward foreign currency contracts | | | — | | | | 5,005,083 | | | | — | | |
| Receivable for variation margin | | | — | | | | — | | | | — | | |
| Receivable for foreign tax reclaims | | | — | | | | 110,488 | | | | 4,302 | | |
| Other assets | | | 23,126 | | | | 26,998 | | | | 24,486 | | |
| Total assets | | | 318,737,798 | | | | 583,670,160 | | | | 295,199,566 | | |
| Liabilities: | |
| Payable for shares of beneficial interest repurchased | | | 562,433 | | | | 791,587 | | | | 983,223 | | |
| Payable to custodian | | | 12,410 | | | | 42,370 | | | | 18,656 | | |
| Dividends payable to shareholders | | | — | | | | — | | | | — | | |
| Payable for investments purchased | | | 1,182,940 | | | | 1,655,590 | | | | 55,056 | | |
| Investments sold short, at value (proceeds—$0; $261,813,240; $0; $0; $0; $0 and $0, respectively) | | | — | | | | — | | | | — | | |
| Due to broker | | | — | | | | — | | | | — | | |
| Payable to affiliate | | | 159,000 | | | | 342,832 | | | | 170,990 | | |
| Payable for cash collateral from securities loaned | | | — | | | | 65,600 | | | | 14,627,018 | | |
| Swap agreements, at value3 | | | — | | | | — | | | | — | | |
| Payable for variation margin | | | — | | | | 591,884 | | | | — | | |
| Unrealized depreciation on forward foreign currency contracts | | | — | | | | 2,142,599 | | | | 1,205,944 | | |
| Payable for foreign withholding taxes | | | — | | | | — | | | | 2,866 | | |
Options and swaptions written, at value (premiums received $0; $0; $0; $318,000; $0; $0 and $0,
respectively) | | | — | | | | — | | | | — | | |
| Accrued expenses and other liabilities | | | 124,112 | | | | 375,918 | | | | 212,208 | | |
| Total liabilities | | | 2,040,895 | | | | 6,008,380 | | | | 17,275,961 | | |
See accompanying notes to financial statements.
235
PACE Select Advisors Trust
Statement of assets and liabilities (continued)
July 31, 2011
| | | PACE
Money Market
Investments | | PACE
Government
Securities
Fixed Income
Investments | | PACE
Intermediate
Fixed Income
Investments | | PACE
Strategic
Fixed Income
Investments | |
| Net assets: | |
| Beneficial interest shares of $0.001 par value (unlimited amount authorized) | | $ | 365,845,642 | | | $ | 598,872,232 | | | $ | 458,672,837 | | | $ | 779,141,192 | | |
| Accumulated undistributed (distributions in excess of) net investment income | | | — | | | | 93,823 | | | | 237,492 | | | | 988,102 | | |
| Accumulated net realized gain (loss) | | | (2,013 | ) | | | (72,304 | ) | | | (12,741,073 | ) | | | 5,275,257 | | |
| Net unrealized appreciation | | | — | | | | 8,755,837 | | | | 9,398,114 | | | | 33,294,850 | | |
| Net assets | | $ | 365,843,629 | | | $ | 607,649,588 | | | $ | 455,567,370 | | | $ | 818,699,401 | | |
| Class A | |
| Net assets | | $ | — | | | $ | 80,726,776 | | | $ | 39,022,093 | | | $ | 56,151,226 | | |
| Shares outstanding | | | — | | | | 6,065,684 | | | | 3,211,356 | | | | 3,858,021 | | |
| Net asset value per share | | $ | — | | | $ | 13.31 | | | $ | 12.15 | | | $ | 14.55 | | |
| Maximum offering price per share | | $ | — | | | $ | 13.94 | | | $ | 12.72 | | | $ | 15.24 | | |
| Class B | |
| Net assets | | $ | — | | | $ | 98,001 | | | $ | 72,210 | | | $ | 229,639 | | |
| Shares outstanding | | | — | | | | 7,359 | | | | 5,932 | | | | 15,783 | | |
| Net asset value and offering price per share | | $ | — | | | $ | 13.32 | | | $ | 12.17 | | | $ | 14.55 | | |
| Class C | |
| Net assets | | $ | — | | | $ | 22,063,619 | | | $ | 3,473,627 | | | $ | 12,855,927 | | |
| Shares outstanding | | | — | | | | 1,656,194 | | | | 285,506 | | | | 883,242 | | |
| Net asset value and offering price per share | | $ | — | | | $ | 13.32 | | | $ | 12.17 | | | $ | 14.56 | | |
| Class Y | |
| Net assets | | $ | — | | | $ | 50,829,815 | | | $ | 1,276,728 | | | $ | 2,809,723 | | |
| Shares outstanding | | | — | | | | 3,818,596 | | | | 105,059 | | | | 193,237 | | |
| Net asset value, offering price and redemption value per share2 | | $ | — | | | $ | 13.31 | | | $ | 12.15 | | | $ | 14.54 | | |
| Class P | |
| Net assets | | $ | 365,843,629 | | | $ | 453,931,377 | | | $ | 411,722,712 | | | $ | 746,652,886 | | |
| Shares outstanding | | | 365,845,932 | | | | 34,090,921 | | | | 33,872,673 | | | | 51,321,873 | | |
| Net asset value, offering price and redemption value per share2 | | $ | 1.00 | | | $ | 13.32 | | | $ | 12.16 | | | $ | 14.55 | | |
1 Net assets divided by shares outstanding does not equal net asset value due to rounding.
2 Assumes shares were held a sufficient period or are otherwise not subject to a redemption fee.
236
| | | PACE
Municipal
Fixed Income
Investments | | PACE
International
Fixed Income
Investments | | PACE
High Yield
Investments | |
| Net assets: | |
| Beneficial interest shares of $0.001 par value (unlimited amount authorized) | | $ | 302,752,991 | | | $ | 533,195,742 | | | $ | 262,700,248 | | |
| Accumulated undistributed (distributions in excess of) net investment income | | | — | | | | 8,793,860 | | | | (2,793 | ) | |
| Accumulated net realized gain (loss) | | | (2,304,885 | ) | | | (11,514,149 | ) | | | 1,566,374 | | |
| Net unrealized appreciation | | | 16,248,797 | | | | 47,186,327 | | | | 13,659,776 | | |
| Net assets | | $ | 316,696,903 | | | $ | 577,661,780 | | | $ | 277,923,605 | | |
| Class A | |
| Net assets | | $ | 73,527,720 | | | $ | 98,635,523 | | | $ | 25,550,476 | | |
| Shares outstanding | | | 5,658,135 | | | | 7,877,944 | | | | 2,459,126 | | |
| Net asset value per share | | $ | 13.00 | | | $ | 12.52 | | | $ | 10.39 | | |
| Maximum offering price per share | | $ | 13.61 | | | $ | 13.11 | | | $ | 10.88 | | |
| Class B | |
| Net assets | | $ | 46,502 | | | $ | 150,691 | | | $ | — | | |
| Shares outstanding | | | 3,576 | | | | 11,998 | | | | — | | |
| Net asset value and offering price per share | | $ | 13.011 | | | $ | 12.56 | | | $ | — | | |
| Class C | |
| Net assets | | $ | 13,942,810 | | | $ | 8,034,443 | | | $ | 3,791,405 | | |
| Shares outstanding | | | 1,072,841 | | | | 641,527 | | | | 365,206 | | |
| Net asset value and offering price per share | | $ | 13.00 | | | $ | 12.52 | | | $ | 10.38 | | |
| Class Y | |
| Net assets | | $ | 117,834 | | | $ | 5,215,965 | | | $ | 384,720 | | |
| Shares outstanding | | | 9,062 | | | | 417,537 | | | | 36,924 | | |
| Net asset value, offering price and redemption value per share2 | | $ | 13.00 | | | $ | 12.49 | | | $ | 10.42 | | |
| Class P | |
| Net assets | | $ | 229,062,037 | | | $ | 465,625,158 | | | $ | 248,197,004 | | |
| Shares outstanding | | | 17,621,799 | | | | 37,184,348 | | | | 23,846,315 | | |
| Net asset value, offering price and redemption value per share2 | | $ | 13.00 | | | $ | 12.52 | | | $ | 10.41 | | |
See accompanying notes to financial statements.
237
PACE Select Advisors Trust
Statement of assets and liabilities (continued)
July 31, 2011
| | | PACE
Large Co
Value Equity
Investments | | PACE
Large Co
Growth Equity
Investments | | PACE
Small/Medium Co
Value Equity
Investments | | PACE
Small/Medium Co
Growth Equity
Investments | |
| Assets: | |
Investments in unaffiliated securities, at value (cost—$1,078,618,679; $907,917,702;
$373,780,058; $357,431,703; $836,769,827; $291,080,327; $87,352,112 and
$488,811,976, respectively)1 | | $ | 1,178,163,591 | | | $ | 1,125,299,749 | | | $ | 415,316,227 | | | $ | 452,589,289 | | |
Investment in an affiliated security, at value (cost—$173,750; $17,797,200; $15,163,573;
$40,533,810; $24,172,469; $3,466,958; $5,613,519 and $0, respectively) | | | 173,750 | | | | 17,797,200 | | | | 15,163,573 | | | | 40,533,810 | | |
Repurchase agreement, at value (cost—$24,215,000; $28,530,000; $15,810,000;
$14,471,000; $14,866,000; $1,875,000; $2,882,000 and $68,893,000, respectively) | | | 24,215,000 | | | | 28,530,000 | | | | 15,810,000 | | | | 14,471,000 | | |
Total investments in securities, at value (cost—$1,103,007,429; $954,244,902; $404,753,631;
$412,436,513; $875,808,296; $296,422,285; $95,847,631 and $557,704,976, respectively) | | $ | 1,202,552,341 | | | $ | 1,171,626,949 | | | $ | 446,289,800 | | | $ | 507,594,099 | | |
| Cash | | | 1,130 | | | | 1,043 | | | | 837 | | | | — | | |
Foreign currency, at value (cost—$0; $0; $0; $0; $1,299,921; $920,360; $37,550 and $3,343,589,
respectively) | | | — | | | | — | | | | — | | | | — | | |
| Receivable for investments sold | | | 1,489,190 | | | | 14,973,294 | | | | 1,386,444 | | | | 8,546,894 | | |
| Receivable for shares of beneficial interest sold | | | 1,137,357 | | | | 1,026,414 | | | | 435,369 | | | | 396,975 | | |
| Receivable for dividends and interest | | | 1,930,161 | | | | 482,956 | | | | 92,959 | | | | 51,386 | | |
| Swap agreements, at value3 | | | — | | | | — | | | | — | | | | — | | |
| Due from broker | | | — | | | | — | | | | — | | | | — | | |
| Unrealized appreciation on forward foreign currency contracts | | | — | | | | — | | | | — | | | �� | — | | |
| Receivable for variation margin | | | — | | | | — | | | | — | | | | — | | |
| Receivable for foreign tax reclaims | | | 54,293 | | | | 3,455 | | | | 722 | | | | — | | |
| Other assets | | | 38,166 | | | | 37,283 | | | | 25,711 | | | | 25,778 | | |
| Total assets | | | 1,207,202,638 | | | | 1,188,151,394 | | | | 448,231,842 | | | | 516,615,132 | | |
| Liabilities: | |
| Payable for investments purchased | | | 4,042,584 | | | | 16,620,834 | | | | 6,355,642 | | | | 5,314,774 | | |
| Payable for shares of beneficial interest repurchased | | | 1,929,361 | | | | 1,984,756 | | | | 727,895 | | | | 895,443 | | |
| Payable to affiliate | | | 827,923 | | | | 802,490 | | | | 318,480 | | | | 345,961 | | |
| Payable for cash collateral from securities loaned | | | 173,750 | | | | 17,797,200 | | | | 15,163,573 | | | | 40,533,810 | | |
| Payable to custodian | | | 39,891 | | | | 38,158 | | | | 13,784 | | | | 587,201 | | |
| Payable for foreign withholding taxes | | | — | | | | — | | | | — | | | | 353 | | |
| Unrealized depreciation on forward foreign currency contracts | | | — | | | | — | | | | — | | | | — | | |
| Payable for variation margin | | | — | | | | — | | | | — | | | | — | | |
| Due to broker | | | — | | | | — | | | | — | | | | — | | |
| Swap agreements, at value3 | | | — | | | | — | | | | — | | | | — | | |
| Investments sold short, at value (proceeds—$0; $0; $0; $0; $0; $0; $0 and $29,537,983, respectively) | | | — | | | | — | | | | — | | | | — | | |
Options and swaptions written, at value (premiums received $0; $0; $0; $0; $0; $0; $0 and $4,976,441,
respectively) | | | — | | | | — | | | | — | | | | — | | |
| Payable for dividend and interest on investments sold short | | | — | | | | — | | | | — | | | | — | | |
| Accrued expenses and other liabilities | | | 428,920 | | | | 404,721 | | | | 369,467 | | | | 368,161 | | |
| Total liabilities | | | 7,442,429 | | | | 37,648,159 | | | | 22,948,841 | | | | 48,045,703 | | |
1 Includes $167,400; $17,186,868; $14,631,022; $39,113,909; $22,960,155; $3,348,995; $5,405,314; and $0, respectively, of investments in securities on loan, at value plus accrued interest and dividends, if any.
2 Includes restricted cash of $669,000 and $27,247,353 delivered to broker as initial margin for investments sold short, futures contracts and/or swaps for PACE International Equity Investments and PACE Alternative Strategies Investments, respectively.
3 Net upfront payments received by PACE Alternative Strategies Investments were $603,239.
238
| | | PACE
International
Equity
Investments | | PACE
International
Emerging
Markets Equity
Investments | | PACE
Global
Real Estate
Securities
Investments | | PACE
Alternative
Strategies
Investments | |
| Assets: | |
Investments in unaffiliated securities, at value (cost—$1,078,618,679; $907,917,702;
$373,780,058; $357,431,703; $836,769,827; $291,080,327; $87,352,112 and
$488,811,976, respectively)1 | | $ | 887,859,349 | | | $ | 306,852,814 | | | $ | 103,041,066 | | | $ | 497,460,437 | | |
Investment in an affiliated security, at value (cost—$173,750; $17,797,200; $15,163,573;
$40,533,810; $24,172,469; $3,466,958; $5,613,519 and $0, respectively) | | | 24,172,469 | | | | 3,466,958 | | | | 5,613,519 | | | | — | | |
Repurchase agreement, at value (cost—$24,215,000; $28,530,000; $15,810,000;
$14,471,000; $14,866,000; $1,875,000; $2,882,000 and $68,893,000, respectively) | | | 14,866,000 | | | | 1,875,000 | | | | 2,882,000 | | | | 68,893,000 | | |
Total investments in securities, at value (cost—$1,103,007,429; $954,244,902; $404,753,631;
$412,436,513; $875,808,296; $296,422,285; $95,847,631 and $557,704,976, respectively) | | $ | 926,897,818 | | | $ | 312,194,772 | | | $ | 111,536,585 | | | $ | 566,353,437 | | |
| Cash | | | 671,2192 | | | | — | | | | 172 | | | | 27,247,3532 | | |
Foreign currency, at value (cost—$0; $0; $0; $0; $1,299,921; $920,360; $37,550 and $3,343,589,
respectively) | | | 1,324,210 | | | | 923,589 | | | | 37,610 | | | | 3,420,361 | | |
| Receivable for investments sold | | | 9,457,641 | | | | 111,345 | | | | 554,947 | | | | 31,388,146 | | |
| Receivable for shares of beneficial interest sold | | | 671,379 | | | | 244,398 | | | | 181,467 | | | | 851,699 | | |
| Receivable for dividends and interest | | | 1,603,052 | | | | 965,359 | | | | 238,643 | | | | 1,733,870 | | |
| Swap agreements, at value3 | | | — | | | | — | | | | — | | | | 10,858,214 | | |
| Due from broker | | | — | | | | — | | | | — | | | | 1,095,828 | | |
| Unrealized appreciation on forward foreign currency contracts | | | 1,652,114 | | | | — | | | | — | | | | 11,831,034 | | |
| Receivable for variation margin | | | — | | | | — | | | | — | | | | 366,961 | | |
| Receivable for foreign tax reclaims | | | 295,857 | | | | 12,201 | | | | 16,900 | | | | 36,986 | | |
| Other assets | | | 34,305 | | | | 23,310 | | | | 10,749 | | | | 32,676 | | |
| Total assets | | | 942,607,595 | | | | 314,474,974 | | | | 112,577,073 | | | | 655,216,565 | | |
| Liabilities: | |
| Payable for investments purchased | | | 6,301,834 | | | | 507,193 | | | | 490,394 | | | | 34,651,783 | | |
| Payable for shares of beneficial interest repurchased | | | 1,540,901 | | | | 550,532 | | | | 179,625 | | | | 3,505,529 | | |
| Payable to affiliate | | | 692,308 | | | | 286,700 | | | | 32,251 | | | | 651,258 | | |
| Payable for cash collateral from securities loaned | | | 24,172,469 | | | | 3,466,958 | | | | 5,613,519 | | | | — | | |
| Payable to custodian | | | 71,235 | | | | 90,807 | | | | 6,649 | | | | 425,241 | | |
| Payable for foreign withholding taxes | | | 73,388 | | | | 382,596 | | | | 63,376 | | | | 52,846 | | |
| Unrealized depreciation on forward foreign currency contracts | | | 688,401 | | | | — | | | | — | | | | 17,465,398 | | |
| Payable for variation margin | | | 74,967 | | | | — | | | | — | | | | 641,413 | | |
| Due to broker | | | 22,827 | | | | — | | | | — | | | | 4,050,400 | | |
| Swap agreements, at value3 | | | — | | | | — | | | | — | | | | 12,579,063 | | |
| Investments sold short, at value (proceeds—$0; $0; $0; $0; $0; $0; $0 and $29,537,983, respectively) | | | — | | | | — | | | | — | | | | 27,410,190 | | |
Options and swaptions written, at value (premiums received $0; $0; $0; $0; $0; $0; $0 and $4,976,441,
respectively) | | | — | | | | — | | | | — | | | | 5,168,967 | | |
| Payable for dividend and interest on investments sold short | | | — | | | | — | | | | — | | | | 2,655 | | |
| Accrued expenses and other liabilities | | | 406,170 | | | | 321,185 | | | | 202,748 | | | | 257,522 | | |
| Total liabilities | | | 34,044,500 | | | | 5,605,971 | | | | 6,588,562 | | | | 106,862,265 | | |
See accompanying notes to financial statements.
239
PACE Select Advisors Trust
Statement of assets and liabilities (concluded)
July 31, 2011
| | | PACE
Large Co
Value Equity
Investments | | PACE
Large Co
Growth Equity
Investments | | PACE
Small/Medium Co
Value Equity
Investments | | PACE
Small/Medium Co
Growth Equity
Investments | |
| Net assets: | |
| Beneficial interest shares of $0.001 par value (unlimited amount authorized) | | $ | 1,371,543,701 | | | $ | 1,089,825,262 | | | $ | 424,550,030 | | | $ | 405,502,780 | | |
| Accumulated undistributed (distributions in excess of) net investment income | | | 7,999,067 | | | | 2,434,116 | | | | 125,408 | | | | — | | |
| Accumulated net realized loss | | | (279,327,471 | ) | | | (159,138,190 | ) | | | (40,928,606 | ) | | | (32,090,937 | ) | |
| Net unrealized appreciation | | | 99,544,912 | | | | 217,382,047 | | | | 41,536,169 | | | | 95,157,586 | | |
| Net assets | | $ | 1,199,760,209 | | | $ | 1,150,503,235 | | | $ | 425,283,001 | | | $ | 468,569,429 | | |
| Class A | |
| Net assets | | $ | 147,471,298 | | | $ | 64,314,599 | | | $ | 32,166,478 | | | $ | 40,991,958 | | |
| Shares outstanding | | | 8,623,080 | | | | 3,454,067 | | | | 1,886,190 | | | | 2,461,167 | | |
| Net asset value per share | | $ | 17.10 | | | $ | 18.62 | | | $ | 17.05 | | | $ | 16.66 | | |
| Maximum offering price per share | | $ | 18.10 | | | $ | 19.70 | | | $ | 18.04 | | | $ | 17.63 | | |
| Class B | |
| Net assets | | $ | 85,994 | | | $ | 69,313 | | | $ | 2,307 | | | $ | 12,037 | | |
| Shares outstanding | | | 5,010 | | | | 4,064 | | | | 150 | | | | 806 | | |
| Net asset value and offering price per share | | $ | 17.16 | | | $ | 17.06 | | | $ | 15.431 | | | $ | 14.941 | | |
| Class C | |
| Net assets | | $ | 14,806,745 | | | $ | 4,208,956 | | | $ | 5,109,019 | | | $ | 4,157,934 | | |
| Shares outstanding | | | 867,549 | | | | 246,104 | | | | 329,064 | | | | 276,358 | | |
| Net asset value and offering price per share | | $ | 17.07 | | | $ | 17.10 | | | $ | 15.53 | | | $ | 15.05 | | |
| Class Y | |
| Net assets | | $ | 16,983,985 | | | $ | 13,858,353 | | | $ | 371,353 | | | $ | 97,647 | | |
| Shares outstanding | | | 990,039 | | | | 727,357 | | | | 21,214 | | | | 5,642 | | |
| Net asset value, offering price and redemption value per share2 | | $ | 17.15 | | | $ | 19.05 | | | $ | 17.51 | | | $ | 17.31 | | |
| Class P | |
| Net assets | | $ | 1,020,412,187 | | | $ | 1,068,052,014 | | | $ | 387,633,844 | | | $ | 423,309,853 | | |
| Shares outstanding | | | 59,673,297 | | | | 56,295,148 | | | | 22,306,159 | | | | 24,690,440 | | |
| Net asset value, offering price and redemption value per share2 | | $ | 17.10 | | | $ | 18.97 | | | $ | 17.38 | | | $ | 17.14 | | |
1 Net assets divided by shares outstanding does not equal net asset value due to rounding.
2 Assumes shares were held a sufficient period or are otherwise not subject to a redemption fee.
240
| | | PACE
International
Equity
Investments | | PACE
International
Emerging
Markets Equity
Investments | | PACE
Global
Real Estate
Securities
Investments | | PACE
Alternative
Strategies
Investments | |
| Net assets: | |
| Beneficial interest shares of $0.001 par value (unlimited amount authorized) | | $ | 1,107,776,517 | | | $ | 291,374,942 | | | $ | 135,605,289 | | | $ | 661,491,195 | | |
| Accumulated undistributed (distributions in excess of) net investment income | | | 15,656,869 | | | | 2,060,455 | | | | (1,847,200 | ) | | | (8,331,082 | ) | |
| Accumulated net realized loss | | | (266,876,554 | ) | | | (94,529 | ) | | | (43,462,852 | ) | | | (106,167,268 | ) | |
| Net unrealized appreciation | | | 52,006,263 | | | | 15,528,135 | | | | 15,693,274 | | | | 1,361,455 | | |
| Net assets | | $ | 908,563,095 | | | $ | 308,869,003 | | | $ | 105,988,511 | | | $ | 548,354,300 | | |
| Class A | |
| Net assets | | $ | 66,904,052 | | | $ | 22,648,452 | | | $ | 4,566,246 | | | $ | 63,766,689 | | |
| Shares outstanding | | | 4,987,477 | | | | 1,641,162 | | | | 758,409 | | | | 6,838,726 | | |
| Net asset value per share | | $ | 13.41 | | | $ | 13.80 | | | $ | 6.02 | | | $ | 9.32 | | |
| Maximum offering price per share | | $ | 14.19 | | | $ | 14.60 | | | $ | 6.37 | | | $ | 9.86 | | |
| Class B | |
| Net assets | | $ | 849 | | | $ | 48,651 | | | $ | — | | | $ | — | | |
| Shares outstanding | | | 63 | | | | 3,748 | | | | — | | | | — | | |
| Net asset value and offering price per share | | $ | 13.471 | | | $ | 12.98 | | | $ | — | | | $ | — | | |
| Class C | |
| Net assets | | $ | 3,601,201 | | | $ | 3,372,764 | | | $ | 219,755 | | | $ | 6,478,862 | | |
| Shares outstanding | | | 274,140 | | | | 262,048 | | | | 36,692 | | | | 709,881 | | |
| Net asset value and offering price per share | | $ | 13.14 | | | $ | 12.87 | | | $ | 5.99 | | | $ | 9.13 | | |
| Class Y | |
| Net assets | | $ | 21,046,045 | | | $ | 17,807,804 | | | $ | 194,543 | | | $ | 1,564,823 | | |
| Shares outstanding | | | 1,569,166 | | | | 1,266,755 | | | | 32,176 | | | | 166,772 | | |
| Net asset value, offering price and redemption value per share2 | | $ | 13.41 | | | $ | 14.06 | | | $ | 6.05 | | | $ | 9.38 | | |
| Class P | |
| Net assets | | $ | 817,010,948 | | | $ | 264,991,332 | | | $ | 101,007,967 | | | $ | 476,543,926 | | |
| Shares outstanding | | | 61,025,022 | | | | 18,929,133 | | | | 16,747,836 | | | | 50,932,013 | | |
| Net asset value, offering price and redemption value per share2 | | $ | 13.39 | | | $ | 14.00 | | | $ | 6.03 | | | $ | 9.36 | | |
See accompanying notes to financial statements.
241
PACE Select Advisors Trust
Statement of operations
For the year ended July 31, 2011
| | | PACE
Money Market
Investments | | PACE
Government
Securities
Fixed Income
Investments | | PACE
Intermediate
Fixed Income
Investments | | PACE
Strategic
Fixed Income
Investments | |
| Investment income: | |
Interest (net of foreign withholding taxes of $0; $0; $4,556; $2,736; $0; $3,808 and
$157, respectively) | | $ | 947,570 | | | $ | 19,817,497 | | | $ | 14,393,732 | | | $ | 33,760,547 | | |
| Dividends | | | — | | | | — | | | | — | | | | 480,000 | | |
Securities lending income (includes $24; $0; $2,973; $2,888; $0; $19 and $10,721,
respectively earned from an affiliated entity) | | | 381 | | | | — | | | | 10,765 | | | | 4,800 | | |
| | | | 947,951 | | | | 19,817,497 | | | | 14,404,497 | | | | 34,245,347 | | |
| Expenses: | |
| Investment management and administration fees | | | 1,267,950 | | | | 3,830,186 | | | | 2,443,633 | | | | 4,682,450 | | |
| Service fees–Class A | | | — | | | | 214,475 | | | | 102,607 | | | | 122,830 | | |
| Service and distribution fees–Class B | | | — | | | | 1,331 | | | | 1,218 | | | | 2,642 | | |
| Service and distribution fees–Class C | | | — | | | | 175,604 | | | | 31,093 | | | | 95,622 | | |
| Transfer agency and related services fees | | | 1,533,469 | | | | 834,713 | | | | 400,489 | | | | 1,010,983 | | |
| Reports and notices to shareholders | | | 114,198 | | | | 54,348 | | | | 30,122 | | | | 68,134 | | |
| Professional fees | | | 111,301 | | | | 171,738 | | | | 169,987 | | | | 167,260 | | |
| Custody and accounting fees | | | 48,853 | | | | 264,054 | | | | 179,333 | | | | 401,755 | | |
| State registration fees | | | 39,789 | | | | 73,613 | | | | 71,611 | | | | 80,122 | | |
| Trustees' fees | | | 19,157 | | | | 21,743 | | | | 20,241 | | | | 23,129 | | |
| Insurance expense | | | 9,984 | | | | 14,849 | | | | 11,060 | | | | 17,658 | | |
| Interest expense | | | — | | | | 100 | | | | 974 | | | | — | | |
| Other expenses | | | 25,163 | | | | 48,288 | | | | 34,285 | | | | 38,179 | | |
| | | | 3,169,864 | | | | 5,705,042 | | | | 3,496,653 | | | | 6,710,764 | | |
| Fee waivers and/or expense reimbursements by investment manager and administrator | | | (2,258,176 | ) | | | (519,197 | ) | | | (207,420 | ) | | | (241,526 | ) | |
| Recoupment of fees waived or expenses previously reimbursed | | | — | | | | — | | | | — | | | | 2,711 | | |
| Net expenses | | | 911,688 | | | | 5,185,845 | | | | 3,289,233 | | | | 6,471,949 | | |
| Net investment income | | | 36,263 | | | | 14,631,652 | | | | 11,115,264 | | | | 27,773,398 | | |
| Net realized and unrealized gains (losses) from investment activities: | |
| Net realized gains (losses) from: | |
| Investments | | | (659 | ) | | | 5,078,049 | | | | 6,341,985 | | | | 11,043,527 | | |
| Futures | | | — | | | | 315,895 | | | | 803,461 | | | | 6,515,426 | | |
| Options and swaptions written | | | — | | | | 1,092,053 | | | | — | | | | (828,009 | ) | |
| Investments sold short | | | — | | | | (204,277 | ) | | | — | | | | — | | |
| Swaps | | | — | | | | (1,533,033 | ) | | | (324,289 | ) | | | 558,907 | | |
| Forward foreign currency contracts | | | — | | | | — | | | | 215,208 | | | | (6,934,292 | ) | |
| Foreign currency transactions | | | — | | | | — | | | | 44,678 | | | | 1,132,184 | | |
| Net realized gain (loss) | | | (659 | ) | | | 4,748,687 | | | | 7,081,043 | | | | 11,487,743 | | |
| Net change in unrealized appreciation/depreciation of: | |
| Investments | | | — | | | | 7,706,972 | | | | (735,669 | ) | | | 8,447,004 | | |
| Futures | | | — | | | | (261,891 | ) | | | 19,883 | | | | 3,322,876 | | |
| Options and swaptions written | | | — | | | | (130,362 | ) | | | — | | | | 1,261,319 | | |
| Investments sold short | | | — | | | | (2,907,155 | ) | | | 13,481 | | | | — | | |
| Swaps | | | — | | | | (36,836 | ) | | | (1,558,527 | ) | | | (400,602 | ) | |
| Forward foreign currency contracts | | | — | | | | — | | | | (323,921 | ) | | | 105,006 | | |
| Other assets and liabilities denominated in foreign currency | | | — | | | | — | | | | 10,181 | | | | (50,978 | ) | |
| Net change in unrealized appreciation/depreciation | | | — | | | | 4,370,728 | | | | (2,574,572 | ) | | | 12,684,625 | | |
| Net realized and unrealized gains (losses) from investment activities | | | (659 | ) | | | 9,119,415 | | | | 4,506,471 | | | | 24,172,368 | | |
| Net increase in net assets resulting from operations | | $ | 35,604 | | | $ | 23,751,067 | | | $ | 15,621,735 | | | $ | 51,945,766 | | |
242
| | | PACE
Municipal
Fixed Income
Investments | | PACE
International
Fixed Income
Investments | | PACE
High Yield
Investments | |
| Investment income: | |
Interest (net of foreign withholding taxes of $0; $0; $4,556; $2,736; $0; $3,808 and
$157, respectively) | | $ | 12,496,928 | | | $ | 18,393,985 | | | $ | 20,996,707 | | |
| Dividends | | | — | | | | — | | | | 536,379 | | |
Securities lending income (includes $24; $0; $2,973; $2,888; $0; $19 and $10,721,
respectively earned from an affiliated entity) | | | — | | | | 112 | | | | 153,164 | | |
| | | | 12,496,928 | | | | 18,394,097 | | | | 21,686,250 | | |
| Expenses: | |
| Investment management and administration fees | | | 1,729,825 | | | | 4,068,300 | | | | 2,051,096 | | |
| Service fees–Class A | | | 195,770 | | | | 246,360 | | | | 52,690 | | |
| Service and distribution fees–Class B | | | 552 | | | | 1,518 | | | | — | | |
| Service and distribution fees–Class C | | | 110,653 | | | | 57,306 | | | | 25,923 | | |
| Transfer agency and related services fees | | | 181,605 | | | | 1,004,864 | | | | 466,917 | | |
| Reports and notices to shareholders | | | 19,663 | | | | 73,576 | | | | 39,061 | | |
| Professional fees | | | 137,330 | | | | 169,936 | | | | 154,205 | | |
| Custody and accounting fees | | | 110,115 | | | | 481,977 | | | | 109,722 | | |
| State registration fees | | | 65,143 | | | | 71,028 | | | | 57,653 | | |
| Trustees' fees | | | 18,854 | | | | 20,934 | | | | 18,214 | | |
| Insurance expense | | | 7,678 | | | | 12,893 | | | | 5,263 | | |
| Interest expense | | | 69 | | | | — | | | | — | | |
| Other expenses | | | 26,284 | | | | 27,738 | | | | 24,677 | | |
| | | | 2,603,541 | | | | 6,236,430 | | | | 3,005,421 | | |
| Fee waivers and/or expense reimbursements by investment manager and administrator | | | (113,934 | ) | | | (540,638 | ) | | | (118,506 | ) | |
| Recoupment of fees waived or expenses previously reimbursed | | | — | | | | 18,289 | | | | 5,357 | | |
| Net expenses | | | 2,489,607 | | | | 5,714,081 | | | | 2,892,272 | | |
| Net investment income | | | 10,007,321 | | | | 12,680,016 | | | | 18,793,978 | | |
| Net realized and unrealized gains (losses) from investment activities: | |
| Net realized gains (losses) from: | |
| Investments | | | 1,212,664 | | | | 7,114,195 | | | | 5,934,741 | | |
| Futures | | | — | | | | (5,221,921 | ) | | | — | | |
| Options and swaptions written | | | — | | | | — | | | | — | | |
| Investments sold short | | | — | | | | — | | | | — | | |
| Swaps | | | — | | | | — | | | | — | | |
| Forward foreign currency contracts | | | — | | | | 13,581,572 | | | | (3,740,949 | ) | |
| Foreign currency transactions | | | — | | | | 17,640,431 | | | | (143,724 | ) | |
| Net realized gain (loss) | | | 1,212,664 | | | | 33,114,277 | | | | 2,050,068 | | |
| Net change in unrealized appreciation/depreciation of: | |
| Investments | | | (303,823 | ) | | | 19,670,031 | | | | 3,090,358 | | |
| Futures | | | — | | | | 1,254,317 | | | | — | | |
| Options and swaptions written | | | — | | | | — | | | | — | | |
| Investments sold short | | | — | | | | — | | | | — | | |
| Swaps | | | — | | | | — | | | | — | | |
| Forward foreign currency contracts | | | — | | | | (1,924,130 | ) | | | (238,831 | ) | |
| Other assets and liabilities denominated in foreign currency | | | — | | | | 107,920 | | | | 17,585 | | |
| Net change in unrealized appreciation/depreciation | | | (303,823 | ) | | | 19,108,138 | | | | 2,869,112 | | |
| Net realized and unrealized gains (losses) from investment activities | | | 908,841 | | | | 52,222,415 | | | | 4,919,180 | | |
| Net increase in net assets resulting from operations | | $ | 10,916,162 | | | $ | 64,902,431 | | | $ | 23,713,158 | | |
See accompanying notes to financial statements.
243
PACE Select Advisors Trust
Statement of operations (concluded)
For the year ended July 31, 2011
| | | PACE
Large Co
Value Equity
Investments | | PACE
Large Co
Growth Equity
Investments | | PACE
Small/Medium Co
Value Equity
Investments | | PACE
Small/Medium Co
Growth Equity
Investments | |
| Investment income: | |
| Interest (net of foreign withholding taxes of $0; $0; $0; $0; $4; $53; $0 and $11,067, respectively) | | $ | 2,369 | | | $ | 3,411 | | | $ | 1,378 | | | $ | 1,058 | | |
Dividends (net of foreign withholding taxes of $171,329; $36,457; $1,083; $5,953;
$2,732,155; $853,637; $132,782 and $308,183, respectively) | | | 25,029,009 | | | | 13,292,856 | | | | 4,660,679 | | | | 1,707,471 | | |
Securities lending income (includes $804; $3,962; $7,632; $25,086; $18,648; $2,061;
$2,757 and $0, respectively, earned from an affiliated entity) | | | 97,753 | | | | 33,608 | | | | 75,434 | | | | 356,850 | | |
| | | | 25,129,131 | | | | 13,329,875 | | | | 4,737,491 | | | | 2,065,379 | | |
| Expenses: | |
| Investment management and administration fees | | | 8,912,754 | | | | 8,702,260 | | | | 3,406,070 | | | | 3,599,144 | | |
| Service fees–Class A | | | 382,020 | | | | 160,046 | | | | 79,942 | | | | 98,181 | | |
| Service and distribution fees–Class B | | | 1,246 | | | | 843 | | | | 183 | | | | 152 | | |
| Service and distribution fees–Class C | | | 158,610 | | | | 43,529 | | | | 54,416 | | | | 39,008 | | |
| Transfer agency and related services fees | | | 1,231,369 | | | | 1,139,030 | | | | 1,041,776 | | | | 1,045,170 | | |
| Custody and accounting fees | | | 468,062 | | | | 436,293 | | | | 167,297 | | | | 176,767 | | |
| Professional fees | | | 149,834 | | | | 194,713 | | | | 142,234 | | | | 142,434 | | |
| Reports and notices to shareholders | | | 94,753 | | | | 125,005 | | | | 69,157 | | | | 70,563 | | |
| State registration fees | | | 79,697 | | | | 78,617 | | | | 66,415 | | | | 66,651 | | |
| Insurance expense | | | 26,985 | | | | 24,956 | | | | 9,393 | | | | 9,771 | | |
| Trustees' fees | | | 26,844 | | | | 26,082 | | | | 19,805 | | | | 20,039 | | |
| Interest expense | | | — | | | | 182 | | | | — | | | | 46 | | |
| Dividend expense, interest expense and other borrowing costs for investments sold short | | | — | | | | — | | | | — | | | | — | | |
| Other expenses | | | 38,510 | | | | 50,485 | | | | 29,304 | | | | 28,360 | | |
| | | | 11,570,684 | | | | 10,982,041 | | | | 5,085,992 | | | | 5,296,286 | | |
| Fee waivers and/or expense reimbursements by investment manager and administrator | | | (404 | ) | | | (89,315 | ) | | | (56,610 | ) | | | (116,207 | ) | |
| Recoupment of fees waived or expenses previously reimbursed | | | 2,092 | | | | — | | | | — | | | | 1,606 | | |
| Net expenses | | | 11,572,372 | | | | 10,892,726 | | | | 5,029,382 | | | | 5,181,685 | | |
| Net investment income (loss) | | | 13,556,759 | | | | 2,437,149 | | | | (291,891 | ) | | | (3,116,306 | ) | |
| Net realized and unrealized gains (losses) from investment activities: | |
| Net realized gains (losses) from: | |
| Investments (net of foreign tax expense of $0; $0; $0; $0; $0; $734,675; $0 and $0, respectively) | | | 108,714,009 | | | | 105,162,554 | | | | 54,858,592 | | | | 63,060,360 | | |
| Futures | | | — | | | | — | | | | — | | | | — | | |
| Options and swaptions written | | | — | | | | — | | | | — | | | | — | | |
| Investments sold short | | | — | | | | — | | | | — | | | | — | | |
| Swaps | | | — | | | | — | | | | — | | | | — | | |
| Forward foreign currency contracts | | | — | | | | — | | | | — | | | | — | | |
| Foreign currency transactions | | | — | | | | — | | | | — | | | | — | | |
| Net realized gain | | | 108,714,009 | | | | 105,162,554 | | | | 54,858,592 | | | | 63,060,360 | | |
| Net change in unrealized appreciation/depreciation of: | |
| Investments | | | 57,535,762 | | | | 128,680,588 | | | | 18,234,910 | | | | 70,447,583 | | |
| Futures | | | — | | | | — | | | | — | | | | — | | |
| Options and swaptions written | | | — | | | | — | | | | — | | | | — | | |
| Investments sold short | | | — | | | | — | | | | — | | | | — | | |
| Swaps | | | — | | | | — | | | | — | | | | — | | |
| Forward foreign currency contracts | | | — | | | | — | | | | — | | | | — | | |
| Other assets and liabilities denominated in foreign currency | | | — | | | | — | | | | — | | | | — | | |
| Net change in unrealized appreciation/depreciation | | | 57,535,762 | | | | 128,680,588 | | | | 18,234,910 | | | | 70,447,583 | | |
| Net realized and unrealized gain from investment activities | | | 166,249,771 | | | | 233,843,142 | | | | 73,093,502 | | | | 133,507,943 | | |
| Net increase in net assets resulting from operations | | $ | 179,806,530 | | | $ | 236,280,291 | | | $ | 72,801,611 | | | $ | 130,391,637 | | |
244
| | | PACE
International
Equity
Investments | | PACE
International
Emerging
Markets Equity
Investments | | PACE
Global
Real Estate
Securities
Investments | | PACE
Alternative
Strategies
Investments | |
| Investment income: | |
| Interest (net of foreign withholding taxes of $0; $0; $0; $0; $4; $53; $0 and $11,067, respectively) | | $ | 6,514 | | | $ | 564 | | | $ | 77 | | | $ | 6,134,683 | | |
Dividends (net of foreign withholding taxes of $171,329; $36,457; $1,083; $5,953;
$2,732,155; $853,637; $132,782 and $308,183, respectively) | | | 28,493,850 | | | | 8,356,184 | | | | 2,761,120 | | | | 4,356,295 | | |
Securities lending income (includes $804; $3,962; $7,632; $25,086; $18,648; $2,061;
$2,757 and $0, respectively, earned from an affiliated entity) | | | 930,288 | | | | 17,797 | | | | 36,245 | | | | — | | |
| | | | 29,430,652 | | | | 8,374,545 | | | | 2,797,442 | | | | 10,490,978 | | |
| Expenses: | |
| Investment management and administration fees | | | 7,808,820 | | | | 3,367,727 | | | | 754,017 | | | | 7,232,850 | | |
| Service fees–Class A | | | 172,403 | | | | 56,377 | | | | 11,051 | | | | 159,990 | | |
| Service and distribution fees–Class B | | | 69 | | | | 540 | | | | — | | | | — | | |
| Service and distribution fees–Class C | | | 37,892 | | | | 37,530 | | | | 1,991 | | | | 71,056 | | |
| Transfer agency and related services fees | | | 1,106,093 | | | | 946,683 | | | | 417,370 | | | | 493,866 | | |
| Custody and accounting fees | | | 821,946 | | | | 658,238 | | | | 70,689 | | | | 528,076 | | |
| Professional fees | | | 180,021 | | | | 167,295 | | | | 161,406 | | | | 363,466 | | |
| Reports and notices to shareholders | | | 113,423 | | | | 116,801 | | | | 33,127 | | | | 65,095 | | |
| State registration fees | | | 77,076 | | | | 64,214 | | | | 50,858 | | | | 69,657 | | |
| Insurance expense | | | 20,307 | | | | 7,095 | | | | 1,877 | | | | 11,562 | | |
| Trustees' fees | | | 23,831 | | | | 18,671 | | | | 16,671 | | | | 20,670 | | |
| Interest expense | | | 1,159 | | | | 3,255 | | | | — | | | | 10,199 | | |
| Dividend expense, interest expense and other borrowing costs for investments sold short | | | — | | | | — | | | | — | | | | 526,474 | | |
| Other expenses | | | 50,942 | | | | 54,617 | | | | 36,326 | | | | 48,383 | | |
| | | | 10,413,982 | | | | 5,499,043 | | | | 1,555,383 | | | | 9,601,344 | | |
| Fee waivers and/or expense reimbursements by investment manager and administrator | | | (19,744 | ) | | | (13,416 | ) | | | (411,315 | ) | | | (42,140 | ) | |
| Recoupment of fees waived or expenses previously reimbursed | | | — | | | | — | | | | — | | | | 477 | | |
| Net expenses | | | 10,394,238 | | | | 5,485,627 | | | | 1,144,068 | | | | 9,559,681 | | |
| Net investment income (loss) | | | 19,036,414 | | | | 2,888,918 | | | | 1,653,374 | | | | 931,297 | | |
| Net realized and unrealized gains (losses) from investment activities: | |
| Net realized gains (losses) from: | |
| Investments (net of foreign tax expense of $0; $0; $0; $0; $0; $734,675; $0 and $0, respectively) | | | 33,819,226 | | | | 62,348,164 | | | | 8,763,514 | | | | 29,071,047 | | |
| Futures | | | 317,834 | | | | — | | | | — | | | | (2,261,629 | ) | |
| Options and swaptions written | | | — | | | | — | | | | — | | | | 1,525,717 | | |
| Investments sold short | | | — | | | | — | | | | — | | | | (5,858,995 | ) | |
| Swaps | | | — | | | | — | | | | — | | | | 363,828 | | |
| Forward foreign currency contracts | | | 2,546,075 | | | | 1,860 | | | | — | | | | (11,726,240 | ) | |
| Foreign currency transactions | | | 453,714 | | | | (442,785 | ) | | | (35,683 | ) | | | 807,760 | | |
| Net realized gain | | | 37,136,849 | | | | 61,907,239 | | | | 8,727,831 | | | | 11,921,488 | | |
| Net change in unrealized appreciation/depreciation of: | |
| Investments | | | 73,507,800 | | | | (26,976,318 | ) | | | 7,182,408 | | | | 6,669,293 | | |
| Futures | | | (163,901 | ) | | | — | | | | — | | | | (1,746,873 | ) | |
| Options and swaptions written | | | — | | | | — | | | | — | | | | (140,189 | ) | |
| Investments sold short | | | — | | | | — | | | | — | | | | 2,404,320 | | |
| Swaps | | | — | | | | — | | | | — | | | | (1,052,488 | ) | |
| Forward foreign currency contracts | | | 857,964 | | | | — | | | | — | | | | (5,896,640 | ) | |
| Other assets and liabilities denominated in foreign currency | | | (10,449 | ) | | | 353,614 | | | | 468 | | | | 87,743 | | |
| Net change in unrealized appreciation/depreciation | | | 74,191,414 | | | | (26,622,704 | ) | | | 7,182,876 | | | | 325,166 | | |
| Net realized and unrealized gain from investment activities | | | 111,328,263 | | | | 35,284,535 | | | | 15,910,707 | | | | 12,246,654 | | |
| Net increase in net assets resulting from operations | | $ | 130,364,677 | | | $ | 38,173,453 | | | $ | 17,564,081 | | | $ | 13,177,951 | | |
See accompanying notes to financial statements.
245
PACE Select Advisors Trust
Statement of changes in net assets
| | | PACE
Money Market
Investments | | PACE
Government Securities
Fixed Income Investments | | PACE
Intermediate Fixed Income
Investments | |
| | | Years ended July 31, | | Years ended July 31, | | Years ended July 31, | |
| | | 2011 | | 2010 | | 2011 | | 2010 | | 2011 | | 2010 | |
| From operations: | |
| Net investment income | | $ | 36,263 | | | $ | 43,561 | | | $ | 14,631,652 | | | $ | 19,750,643 | | | $ | 11,115,264 | | | $ | 13,710,690 | | |
| Net realized gains (losses) | | | (659 | ) | | | (94 | ) | | | 4,748,687 | | | | 26,064,435 | | | | 7,081,043 | | | | 4,979,981 | | |
| Net change in unrealized appreciation/depreciation | | | — | | | | — | | | | 4,370,728 | | | | 12,933,532 | | | | (2,574,572 | ) | | | 13,117,623 | | |
| Net increase in net assets resulting from operations | | | 35,604 | | | | 43,467 | | | | 23,751,067 | | | | 58,748,610 | | | | 15,621,735 | | | | 31,808,294 | | |
| Dividends and distributions to shareholders from: | |
| Net investment income–Class A | | | — | | | | — | | | | (2,406,844 | ) | | | (3,092,475 | ) | | | (863,862 | ) | | | (1,454,509 | ) | |
| Net investment income–Class B | | | — | | | | — | | | | (2,676 | ) | | | (3,663 | ) | | | (1,681 | ) | | | (4,138 | ) | |
| Net investment income–Class C | | | — | | | | — | | | | (542,028 | ) | | | (700,042 | ) | | | (65,946 | ) | | | (134,304 | ) | |
| Net investment income–Class Y | | | — | | | | — | | | | (1,552,096 | ) | | | (1,558,291 | ) | | | (38,926 | ) | | | (78,814 | ) | |
| Net investment income–Class P | | | (36,263 | ) | | | (43,561 | ) | | | (14,214,219 | ) | | | (16,487,839 | ) | | | (9,834,848 | ) | | | (13,904,993 | ) | |
| Net realized gains–Class A | | | — | | | | — | | | | (3,234,533 | ) | | | (3,082,896 | ) | | | — | | | | — | | |
| Net realized gains–Class B | | | — | | | | — | | | | (4,578 | ) | | | (4,285 | ) | | | — | | | | — | | |
| Net realized gains–Class C | | | — | | | | — | | | | (886,763 | ) | | | (821,564 | ) | | | — | | | | — | | |
| Net realized gains–Class Y | | | — | | | | — | | | | (1,877,527 | ) | | | (1,438,485 | ) | | | — | | | | — | | |
| Net realized gains–Class P | | | (1,389 | ) | | | (10,489 | ) | | | (17,268,828 | ) | | | (15,257,195 | ) | | | — | | | | — | | |
| | | | (37,652 | ) | | | (54,050 | ) | | | (41,990,092 | ) | | | (42,446,735 | ) | | | (10,805,263 | ) | | | (15,576,758 | ) | |
| From beneficial interest transactions: | |
| Net proceeds from shares sold | | | 359,119,509 | | | | 409,092,964 | | | | 123,731,378 | | | | 162,167,465 | | | | 102,696,255 | | | | 146,111,607 | | |
| Cost of shares repurchased | | | (379,510,934 | ) | | | (552,857,220 | ) | | | (180,478,574 | ) | | | (150,566,609 | ) | | | (132,429,235 | ) | | | (112,192,313 | ) | |
| Proceeds from dividends reinvested | | | 19,904 | | | | 33,528 | | | | 38,969,566 | | | | 39,428,168 | | | | 9,945,673 | | | | 14,435,941 | | |
| Net increase (decrease) in net assets from beneficial interest transactions | | | (20,371,521 | ) | | | (143,730,728 | ) | | | (17,777,630 | ) | | | 51,029,024 | | | | (19,787,307 | ) | | | 48,355,235 | | |
| Redemption fees | | | — | | | | — | | | | 41,268 | | | | 35,049 | | | | 32,209 | | | | 33,544 | | |
| Net increase (decrease) in net assets | | | (20,373,569 | ) | | | (143,741,311 | ) | | | (35,975,387 | ) | | | 67,365,948 | | | | (14,938,626 | ) | | | 64,620,315 | | |
| Net assets: | |
| Beginning of year | | | 386,217,198 | | | | 529,958,509 | | | | 643,624,975 | | | | 576,259,027 | | | | 470,505,996 | | | | 405,885,681 | | |
| End of year | | $ | 365,843,629 | | | $ | 386,217,198 | | | $ | 607,649,588 | | | $ | 643,624,975 | | | $ | 455,567,370 | | | $ | 470,505,996 | | |
| Accumulated undistributed (distributions in excess of) net investment income | | $ | — | | | $ | — | | | $ | 93,823 | | | $ | 53,465 | | | $ | 237,492 | | | $ | (269,948 | ) | |
246
| | | PACE
Strategic Fixed Income
Investments | | PACE
Municipal Fixed Income
Investments | |
| | | Years ended July 31, | | Years ended July 31, | |
| | | 2011 | | 2010 | | 2011 | | 2010 | |
| From operations: | |
| Net investment income | | $ | 27,773,398 | | | $ | 25,265,746 | | | $ | 10,007,321 | | | $ | 10,057,677 | | |
| Net realized gains (losses) | | | 11,487,743 | | | | 28,675,034 | | | | 1,212,664 | | | | (337,288 | ) | |
| Net change in unrealized appreciation/depreciation | | | 12,684,625 | | | | 51,979,570 | | | | (303,823 | ) | | | 12,365,344 | | |
| Net increase in net assets resulting from operations | | | 51,945,766 | | | | 105,920,350 | | | | 10,916,162 | | | | 22,085,733 | | |
| Dividends and distributions to shareholders from: | |
| Net investment income–Class A | | | (1,752,790 | ) | | | (1,573,552 | ) | | | (2,318,045 | ) | | | (2,642,625 | ) | |
| Net investment income–Class B | | | (7,423 | ) | | | (11,180 | ) | | | (1,218 | ) | | | (1,834 | ) | |
| Net investment income–Class C | | | (391,745 | ) | | | (372,694 | ) | | | (362,564 | ) | | | (401,842 | ) | |
| Net investment income–Class Y | | | (107,818 | ) | | | (159,112 | ) | | | (3,901 | ) | | | (4,175 | ) | |
| Net investment income–Class P | | | (26,840,251 | ) | | | (28,715,448 | ) | | | (7,322,824 | ) | | | (7,008,463 | ) | |
| Net realized gains–Class A | | | (1,289,755 | ) | | | (41,715 | ) | | | — | | | | — | | |
| Net realized gains–Class B | | | (7,592 | ) | | | (395 | ) | | | — | | | | — | | |
| Net realized gains–Class C | | | (360,580 | ) | | | (11,433 | ) | | | — | | | | — | | |
| Net realized gains–Class Y | | | (75,877 | ) | | | (4,631 | ) | | | — | | | | — | | |
| Net realized gains–Class P | | | (19,163,723 | ) | | | (741,454 | ) | | | — | | | | — | | |
| | | | (49,997,554 | ) | | | (31,631,614 | ) | | | (10,008,552 | ) | | | (10,058,939 | ) | |
| From beneficial interest transactions: | |
| Net proceeds from shares sold | | | 189,350,728 | | | | 193,295,918 | | | | 56,391,695 | | | | 84,935,927 | | |
| Cost of shares repurchased | | | (172,483,419 | ) | | | (175,530,436 | ) | | | (77,508,355 | ) | | | (68,680,922 | ) | |
| Proceeds from dividends reinvested | | | 47,506,095 | | | | 30,395,726 | | | | 8,408,948 | | | | 8,481,872 | | |
| Net increase (decrease) in net assets from beneficial interest transactions | | | 64,373,404 | | | | 48,161,208 | | | | (12,707,712 | ) | | | 24,736,877 | | |
| Redemption fees | | | 45,160 | | | | 38,697 | | | | 15,262 | | | | 14,907 | | |
| Net increase (decrease) in net assets | | | 66,366,776 | | | | 122,488,641 | | | | (11,784,840 | ) | | | 36,778,578 | | |
| Net assets: | |
| Beginning of year | | | 752,332,625 | | | | 629,843,984 | | | | 328,481,743 | | | | 291,703,165 | | |
| End of year | | $ | 818,699,401 | | | $ | 752,332,625 | | | $ | 316,696,903 | | | $ | 328,481,743 | | |
| Accumulated undistributed (distributions in excess of) net investment income | | $ | 988,102 | | | $ | 6,329,490 | | | $ | — | | | $ | — | | |
See accompanying notes to financial statements.
247
PACE Select Advisors Trust
Statement of changes in net assets (continued)
| | | PACE
International Fixed Income
Investments | | PACE
High Yield
Investments | | PACE
Large Co Value Equity
Investments | |
| | | Years ended July 31, | | Years ended July 31, | | Years ended July 31, | |
| | | 2011 | | 2010 | | 2011 | | 2010 | | 2011 | | 2010 | |
| From operations: | |
| Net investment income (loss) | | $ | 12,680,016 | | | $ | 12,637,486 | | | $ | 18,793,978 | | | $ | 16,963,583 | | | $ | 13,556,759 | | | $ | 11,115,134 | | |
| Net realized gains | | | 33,114,277 | | | | 12,551,643 | | | | 2,050,068 | | | | 9,726,065 | | | | 108,714,009 | | | | 64,628,748 | | |
| Net change in unrealized appreciation/depreciation | | | 19,108,138 | | | | (3,389,286 | ) | | | 2,869,112 | | | | 13,323,709 | | | | 57,535,762 | | | | 59,307,694 | | |
| Net increase in net assets resulting from operations | | | 64,902,431 | | | | 21,799,843 | | | | 23,713,158 | | | | 40,013,357 | | | | 179,806,530 | | | | 135,051,576 | | |
| Dividends and distributions to shareholders from: | |
| Net investment income–Class A | | | (2,504,717 | ) | | | (6,049,909 | ) | | | (1,428,831 | ) | | | (765,754 | ) | | | (1,238,328 | ) | | | (1,427,479 | ) | |
| Net investment income–Class B | | | (2,658 | ) | | | (9,958 | ) | | | — | | | | — | | | | — | | | | — | | |
| Net investment income–Class C | | | (158,235 | ) | | | (393,818 | ) | | | (221,860 | ) | | | (152,806 | ) | | | — | | | | (31,970 | ) | |
| Net investment income–Class Y | | | (150,612 | ) | | | (454,829 | ) | | | (4,034 | ) | | | (605 | ) | | | (185,964 | ) | | | (316,414 | ) | |
| Net investment income–Class P | | | (11,903,830 | ) | | | (23,807,959 | ) | | | (16,282,071 | ) | | | (14,154,934 | ) | | | (10,356,972 | ) | | | (10,516,247 | ) | |
| Net realized gains–Class A | | | — | | | | — | | | | (130,986 | ) | | | (78,625 | ) | | | — | | | | — | | |
| Net realized gains–Class C | | | — | | | | — | | | | (18,866 | ) | | | (16,928 | ) | | | — | | | | — | | |
| Net realized gains–Class Y | | | — | | | | — | | | | (1,874 | ) | | | (51 | ) | | | — | | | | — | | |
| Net realized gains–Class P | | | — | | | | — | | | | (1,227,557 | ) | | | (1,255,813 | ) | | | — | | | | — | | |
| Return of capital–Class A | | | — | | | | (192,113 | ) | | | — | | | | — | | | | — | | | | — | | |
| Return of capital–Class B | | | — | | | | (248 | ) | | | — | | | | — | | | | — | | | | — | | |
| Return of capital–Class C | | | — | | | | (11,357 | ) | | | — | | | | — | | | | — | | | | — | | |
| Return of capital–Class Y | | | — | | | | (13,488 | ) | | | — | | | | — | | | | — | | | | — | | |
| Return of capital–Class P | | | — | | | | (833,372 | ) | | | — | | | | — | | | | — | | | | — | | |
| | | | (14,720,052 | ) | | | (31,767,051 | ) | | | (19,316,079 | ) | | | (16,425,516 | ) | | | (11,781,264 | ) | | | (12,292,110 | ) | |
| From beneficial interest transactions: | |
| Net proceeds from shares sold | | | 101,651,223 | | | | 113,913,467 | | | | 89,099,205 | | | | 78,982,899 | | | | 183,390,929 | | | | 189,228,067 | | |
| Cost of shares repurchased | | | (103,612,336 | ) | | | (101,037,675 | ) | | | (59,328,894 | ) | | | (48,839,004 | ) | | | (238,882,033 | ) | | | (254,574,170 | ) | |
| Proceeds from dividends reinvested | | | 13,558,753 | | | | 29,414,162 | | | | 18,090,389 | | | | 15,514,240 | | | | 11,209,828 | | | | 11,815,305 | | |
| Net increase (decrease) in net assets from beneficial interest transactions | | | 11,597,640 | | | | 42,289,954 | | | | 47,860,700 | | | | 45,658,135 | | | | (44,281,276 | ) | | | (53,530,798 | ) | |
| Redemption fees | | | 17,861 | | | | 18,579 | | | | 14,993 | | | | 11,666 | | | | 23,830 | | | | 34,372 | | |
| Net increase in net assets | | | 61,797,880 | | | | 32,341,325 | | | | 52,272,772 | | | | 69,257,642 | | | | 123,767,820 | | | | 69,263,040 | | |
| Net assets: | |
| Beginning of year | | | 515,863,900 | | | | 483,522,575 | | | | 225,650,833 | | | | 156,393,191 | | | | 1,075,992,389 | | | | 1,006,729,349 | | |
| End of year | | $ | 577,661,780 | | | $ | 515,863,900 | | | $ | 277,923,605 | | | $ | 225,650,833 | | | $ | 1,199,760,209 | | | $ | 1,075,992,389 | | |
| Accumulated undistributed (distributions in excess of) net investment income | | $ | 8,793,860 | | | $ | (14,446,493 | ) | | $ | (2,793 | ) | | $ | (863,267 | ) | | $ | 7,999,067 | | | $ | 6,223,572 | | |
248
| | | PACE
Large Co Growth Equity
Investments | | PACE
Small/Medium Co Value
Equity Investments | |
| | | Years ended July 31, | | Years ended July 31, | |
| | | 2011 | | 2010 | | 2011 | | 2010 | |
| From operations: | |
| Net investment income (loss) | | $ | 2,437,149 | | | $ | 1,659,535 | | | $ | (291,891 | ) | | $ | 435,026 | | |
| Net realized gains | | | 105,162,554 | | | | 57,779,334 | | | | 54,858,592 | | | | 51,988,477 | | |
| Net change in unrealized appreciation/depreciation | | | 128,680,588 | | | | 52,043,717 | | | | 18,234,910 | | | | 13,559,055 | | |
| Net increase in net assets resulting from operations | | | 236,280,291 | | | | 111,482,586 | | | | 72,801,611 | | | | 65,982,558 | | |
| Dividends and distributions to shareholders from: | |
| Net investment income–Class A | | | — | | | | (116,030 | ) | | | — | | | | (16,813 | ) | |
| Net investment income–Class B | | | — | | | | — | | | | — | | | | — | | |
| Net investment income–Class C | | | — | | | | — | | | | — | | | | — | | |
| Net investment income–Class Y | | | (26,597 | ) | | | (100,359 | ) | | | (174 | ) | | | (13,258 | ) | |
| Net investment income–Class P | | | (1,631,101 | ) | | | (4,102,688 | ) | | | (147,159 | ) | | | (818,895 | ) | |
| Net realized gains–Class A | | | — | | | | — | | | | — | | | | — | | |
| Net realized gains–Class C | | | — | | | | — | | | | — | | | | — | | |
| Net realized gains–Class Y | | | — | | | | — | | | | — | | | | — | | |
| Net realized gains–Class P | | | — | | | | — | | | | — | | | | — | | |
| Return of capital–Class A | | | — | | | | — | | | | — | | | | — | | |
| Return of capital–Class B | | | — | | | | — | | | | — | | | | — | | |
| Return of capital–Class C | | | — | | | | — | | | | — | | | | — | | |
| Return of capital–Class Y | | | — | | | | — | | | | — | | | | — | | |
| Return of capital–Class P | | | — | | | | — | | | | — | | | | — | | |
| | | | (1,657,698 | ) | | | (4,319,077 | ) | | | (147,333 | ) | | | (848,966 | ) | |
| From beneficial interest transactions: | |
| Net proceeds from shares sold | | | 180,861,704 | | | | 186,545,357 | | | | 68,096,464 | | | | 64,946,583 | | |
| Cost of shares repurchased | | | (235,118,577 | ) | | | (228,881,459 | ) | | | (94,588,078 | ) | | | (95,629,678 | ) | |
| Proceeds from dividends reinvested | | | 1,587,210 | | | | 4,184,445 | | | | 141,912 | | | | 826,718 | | |
| Net increase (decrease) in net assets from beneficial interest transactions | | | (52,669,663 | ) | | | (38,151,657 | ) | | | (26,349,702 | ) | | | (29,856,377 | ) | |
| Redemption fees | | | 22,934 | | | | 31,168 | | | | 12,379 | | | | 13,369 | | |
| Net increase in net assets | | | 181,975,864 | | | | 69,043,020 | | | | 46,316,955 | | | | 35,290,584 | | |
| Net assets: | |
| Beginning of year | | | 968,527,371 | | | | 899,484,351 | | | | 378,966,046 | | | | 343,675,462 | | |
| End of year | | $ | 1,150,503,235 | | | $ | 968,527,371 | | | $ | 425,283,001 | | | $ | 378,966,046 | | |
| Accumulated undistributed (distributions in excess of) net investment income | | $ | 2,434,116 | | | $ | 1,654,665 | | | $ | 125,408 | | | $ | 178,159 | | |
See accompanying notes to financial statements.
249
PACE Select Advisors Trust
Statement of changes in net assets (concluded)
| | | PACE
Small/Medium Co Growth Equity
Investments | | PACE
International Equity
Investments | | PACE
International Emerging Markets
Equity Investments | |
| | | Years ended July 31, | | Years ended July 31, | | Years ended July 31, | |
| | | 2011 | | 2010 | | 2011 | | 2010 | | 2011 | | 2010 | |
| From operations: | |
| Net investment income (loss) | | $ | (3,116,306 | ) | | $ | (2,005,318 | ) | | $ | 19,036,414 | | | $ | 14,556,203 | | | $ | 2,888,918 | | | $ | 2,150,750 | | |
| Net realized gains | | | 63,060,360 | | | | 57,725,409 | | | | 37,136,849 | | | | 16,552,276 | | | | 61,907,239 | | | | 159,232 | | |
| Net change in unrealized appreciation/depreciation | | | 70,447,583 | | | | (1,119,645 | ) | | | 74,191,414 | | | | (13,858,933 | ) | | | (26,622,704 | ) | | | 40,318,395 | | |
| Net increase in net assets resulting from operations | | | 130,391,637 | | | | 54,600,446 | | | | 130,364,677 | | | | 17,249,546 | | | | 38,173,453 | | | | 42,628,377 | | |
| Dividends to shareholders from: | |
| Net investment income–Class A | | | — | | | | — | | | | (1,165,174 | ) | | | (1,498,115 | ) | | | (163,519 | ) | | | (253,419 | ) | |
| Net investment income–Class B | | | — | | | | — | | | | — | | | | (401 | ) | | | — | | | | — | | |
| Net investment income–Class C | | | — | | | | — | | | | (33,337 | ) | | | (54,114 | ) | | | — | | | | (38,834 | ) | |
| Net investment income–Class Y | | | — | | | | — | | | | (433,443 | ) | | | (812,371 | ) | | | (177,379 | ) | | | (551,002 | ) | |
| Net investment income–Class P | | | — | | | | — | | | | (14,656,797 | ) | | | (16,405,498 | ) | | | (1,739,478 | ) | | | (3,017,588 | ) | |
| | | | — | | | | — | | | | (16,288,751 | ) | | | (18,770,499 | ) | | | (2,080,376 | ) | | | (3,860,843 | ) | |
| From beneficial interest transactions: | |
| Net proceeds from shares sold | | | 67,727,931 | | | | 65,977,633 | | | | 160,262,924 | | | | 169,969,986 | | | | 66,897,606 | | | | 53,575,620 | | |
| Cost of shares repurchased | | | (103,860,922 | ) | | | (93,868,360 | ) | | | (173,419,299 | ) | | | (187,811,537 | ) | | | (73,418,751 | ) | | | (84,031,041 | ) | |
| Proceeds from dividends reinvested | | | — | | | | — | | | | 15,566,057 | | | | 18,146,234 | | | | 2,000,818 | | | | 3,764,075 | | |
| Net increase (decrease) in net assets from beneficial interest transactions | | | (36,132,991 | ) | | | (27,890,727 | ) | | | 2,409,682 | | | | 304,683 | | | | (4,520,327 | ) | | | (26,691,346 | ) | |
| Redemption fees | | | 12,119 | | | | 14,263 | | | | 20,237 | | | | 29,308 | | | | 11,530 | | | | 16,208 | | |
| Net increase (decrease) in net assets | | | 94,270,765 | | | | 26,723,982 | | | | 116,505,845 | | | | (1,186,962 | ) | | | 31,584,280 | | | | 12,092,396 | | |
| Net assets: | |
| Beginning of year | | | 374,298,664 | | | | 347,574,682 | | | | 792,057,250 | | | | 793,244,212 | | | | 277,284,723 | | | | 265,192,327 | | |
| End of year | | $ | 468,569,429 | | | $ | 374,298,664 | | | $ | 908,563,095 | | | $ | 792,057,250 | | | $ | 308,869,003 | | | $ | 277,284,723 | | |
| Accumulated undistributed (distributions in excess of) net investment income | | $ | — | | | $ | — | | | $ | 15,656,869 | | | $ | 9,642,793 | | | $ | 2,060,455 | | | $ | 1,933,910 | | |
250
| | | PACE
Global Real Estate Securities
Investments | | PACE
Alternative Strategies
Investments | |
| | | Years ended July 31, | | Years ended July 31, | |
| | | 2011 | | 2010 | | 2011 | | 2010 | |
| From operations: | |
| Net investment income (loss) | | $ | 1,653,374 | | | $ | 1,658,115 | | | $ | 931,297 | | | $ | 1,069,754 | | |
| Net realized gains | | | 8,727,831 | | | | 8,195,357 | | | | 11,921,488 | | | | 15,343,826 | | |
| Net change in unrealized appreciation/depreciation | | | 7,182,876 | | | | 1,809,258 | | | | 325,166 | | | | 4,137,729 | | |
| Net increase in net assets resulting from operations | | | 17,564,081 | | | | 11,662,730 | | | | 13,177,951 | | | | 20,551,309 | | |
| Dividends to shareholders from: | |
| Net investment income–Class A | | | (281,969 | ) | | | (294,268 | ) | | | (583,054 | ) | | | (183,571 | ) | |
| Net investment income–Class B | | | — | | | | — | | | | — | | | | — | | |
| Net investment income–Class C | | | (11,375 | ) | | | (12,411 | ) | | | (18,811 | ) | | | — | | |
| Net investment income–Class Y | | | (10,901 | ) | | | (4,423 | ) | | | (14,369 | ) | | | (28,303 | ) | |
| Net investment income–Class P | | | (5,732,414 | ) | | | (5,852,048 | ) | | | (5,018,074 | ) | | | (2,293,558 | ) | |
| | | | (6,036,659 | ) | | | (6,163,150 | ) | | | (5,634,308 | ) | | | (2,505,432 | ) | |
| From beneficial interest transactions: | |
| Net proceeds from shares sold | | | 31,045,874 | | | | 26,534,560 | | | | 194,272,098 | | | | 147,143,220 | | |
| Cost of shares repurchased | | | (20,503,596 | ) | | | (16,205,411 | ) | | | (124,042,441 | ) | | | (144,625,395 | ) | |
| Proceeds from dividends reinvested | | | 5,791,306 | | | | 5,976,100 | | | | 5,436,765 | | | | 2,436,809 | | |
| Net increase (decrease) in net assets from beneficial interest transactions | | | 16,333,584 | | | | 16,305,249 | | | | 75,666,422 | | | | 4,954,634 | | |
| Redemption fees | | | 4,843 | | | | 5,061 | | | | 31,814 | | | | 29,553 | | |
| Net increase (decrease) in net assets | | | 27,865,849 | | | | 21,809,890 | | | | 83,241,879 | | | | 23,030,064 | | |
| Net assets: | |
| Beginning of year | | | 78,122,662 | | | | 56,312,772 | | | | 465,112,421 | | | | 442,082,357 | | |
| End of year | | $ | 105,988,511 | | | $ | 78,122,662 | | | $ | 548,354,300 | | | $ | 465,112,421 | | |
| Accumulated undistributed (distributions in excess of) net investment income | | $ | (1,847,200 | ) | | $ | 424,617 | | | $ | (8,331,082 | ) | | $ | 4,954,050 | | |
See accompanying notes to financial statements.
251
This page intentionally left blank.
252
PACE Select Advisors Trust
Financial highlights
PACE Money Market Investments
Selected data for a share of beneficial interest outstanding throughout each year is presented below:
| | | Class P | |
| | | Years ended July 31, | |
| | | 2011 | | 2010 | | 2009 | | 2008 | | 2007 | |
| Net asset value, beginning of year | | $ | 1.00 | | | $ | 1.00 | | | $ | 1.00 | | | $ | 1.00 | | | $ | 1.00 | | |
| Net investment income | | | 0.0001 | | | | 0.0001 | | | | 0.008 | | | | 0.033 | | | | 0.048 | | |
| Dividends from net investment income | | | (0.000 | )1 | | | (0.000 | )1 | | | (0.008 | ) | | | (0.033 | ) | | | (0.048 | ) | |
| Distributions from net realized gains | | | (0.000 | )1 | | | (0.000 | )1 | | | (0.000 | )1 | | | — | | | | — | | |
| Total dividends and distributions | | | (0.000 | )1 | | | (0.000 | )1 | | | (0.008 | ) | | | (0.033 | ) | | | (0.048 | ) | |
| Net asset value, end of year | | $ | 1.00 | | | $ | 1.00 | | | $ | 1.00 | | | $ | 1.00 | | | $ | 1.00 | | |
| Total investment return2 | | | 0.01 | % | | | 0.01 | % | | | 0.81 | % | | | 3.40 | % | | | 4.86 | % | |
| Ratios to average net assets: | |
| Expenses before fee waivers and/or expense reimbursements by manager | | | 0.88 | % | | | 0.90 | % | | | 0.89 | % | | | 0.93 | % | | | 0.92 | % | |
| Expenses after fee waivers and/or expense reimbursements by manager | | | 0.25 | % | | | 0.27 | % | | | 0.59 | % | | | 0.60 | % | | | 0.60 | % | |
| Net investment income | | | 0.01 | % | | | 0.01 | % | | | 0.78 | % | | | 3.27 | % | | | 4.75 | % | |
| Supplemental data: | |
| Net assets, end of year (000's) | | $ | 365,844 | | | $ | 386,217 | | | $ | 529,959 | | | $ | 523,243 | | | $ | 408,562 | | |
1 Amount represents less than $0.0005 per share.
2 Total investment return is calculated assuming a $10,000 investment on the first day of each year reported, reinvestment of all dividends and other distributions, if any, at net asset value on the payable dates, and a sale at net asset value on the last day of each year reported. The figures do not include program fees; results would be lower if these fees were included. Returns do not reflect the deduction of taxes that a shareholder would pay on Portfolio distributions.
See accompanying notes to financial statements.
253
PACE Select Advisors Trust
Financial highlights
PACE Government Securities Fixed Income Investments
Selected data for a share of beneficial interest outstanding throughout each year is presented below:
| | | Class A | |
| | | Years ended July 31, | |
| | | 2011 | | 2010 | | 2009 | | 2008 | | 2007 | |
| Net asset value, beginning of year | | $ | 13.71 | | | $ | 13.36 | | | $ | 12.87 | | | $ | 12.72 | | | $ | 12.71 | | |
| Net investment income1 | | | 0.29 | | | | 0.41 | | | | 0.57 | | | | 0.56 | | | | 0.57 | | |
| Net realized and unrealized gains | | | 0.20 | | | | 0.86 | | | | 0.56 | | | | 0.15 | | | | 0.002 | | |
| Net increase from operations | | | 0.49 | | | | 1.27 | | | | 1.13 | | | | 0.71 | | | | 0.57 | | |
| Dividends from net investment income | | | (0.38 | ) | | | (0.46 | ) | | | (0.64 | ) | | | (0.56 | ) | | | (0.56 | ) | |
| Distributions from net realized gains | | | (0.51 | ) | | | (0.46 | ) | | | — | | | | — | | | | — | | |
| Total dividends and distributions | | | (0.89 | ) | | | (0.92 | ) | | | (0.64 | ) | | | (0.56 | ) | | | (0.56 | ) | |
| Net asset value, end of year | | $ | 13.31 | | | $ | 13.71 | | | $ | 13.36 | | | $ | 12.87 | | | $ | 12.72 | | |
| Total investment return3 | | | 3.74 | % | | | 9.92 | % | | | 9.09 | % | | | 5.53 | % | | | 4.52 | % | |
| Ratios to average net assets: | |
| Expenses before fee waivers and/or expense reimbursements by manager | | | 1.06 | %4 | | | 1.08 | %4 | | | 1.07 | %4 | | | 1.12 | % | | | 1.13 | % | |
| Expenses after fee waivers and/or expense reimbursements by manager | | | 1.02 | %4 | | | 1.02 | %4 | | | 1.02 | %4 | | | 1.07 | % | | | 1.12 | % | |
| Net investment income | | | 2.16 | % | | | 3.06 | % | | | 4.41 | % | | | 4.30 | % | | | 4.40 | % | |
| Supplemental data: | |
| Net assets, end of year (000's) | | $ | 80,727 | | | $ | 92,416 | | | $ | 90,386 | | | $ | 91,614 | | | $ | 99,378 | | |
| Portfolio turnover | | | 1,105 | % | | | 1,065 | % | | | 877 | % | | | 588 | % | | | 495 | % | |
| | | Class C | |
| | | Years ended July 31, | |
| | | 2011 | | 2010 | | 2009 | | 2008 | | 2007 | |
| Net asset value, beginning of year | | $ | 13.72 | | | $ | 13.37 | | | $ | 12.88 | | | $ | 12.73 | | | $ | 12.72 | | |
| Net investment income1 | | | 0.22 | | | | 0.35 | | | | 0.51 | | | | 0.50 | | | | 0.50 | | |
| Net realized and unrealized gains | | | 0.20 | | | | 0.85 | | | | 0.55 | | | | 0.14 | | | | 0.01 | | |
| Net increase from operations | | | 0.42 | | | | 1.20 | | | | 1.06 | | | | 0.64 | | | | 0.51 | | |
| Dividends from net investment income | | | (0.31 | ) | | | (0.39 | ) | | | (0.57 | ) | | | (0.49 | ) | | | (0.50 | ) | |
| Distributions from net realized gains | | | (0.51 | ) | | | (0.46 | ) | | | — | | | | — | | | | — | | |
| Total dividends and distributions | | | (0.82 | ) | | | (0.85 | ) | | | (0.57 | ) | | | (0.49 | ) | | | (0.50 | ) | |
| Net asset value, end of year | | $ | 13.32 | | | $ | 13.72 | | | $ | 13.37 | | | $ | 12.88 | | | $ | 12.73 | | |
| Total investment return3 | | | 3.22 | % | | | 9.37 | % | | | 8.45 | % | | | 5.06 | % | | | 4.00 | % | |
| Ratios to average net assets: | |
| Expenses before fee waivers and/or expense reimbursements by manager | | | 1.58 | %4 | | | 1.61 | %4 | | | 1.63 | %4 | | | 1.68 | % | | | 1.70 | % | |
| Expenses after fee waivers and/or expense reimbursements by manager | | | 1.52 | %4 | | | 1.52 | %4 | | | 1.52 | %4 | | | 1.57 | % | | | 1.62 | % | |
| Net investment income | | | 1.66 | % | | | 2.56 | % | | | 3.90 | % | | | 3.80 | % | | | 3.90 | % | |
| Supplemental data: | |
| Net assets, end of year (000's) | | $ | 22,064 | | | $ | 24,394 | | | $ | 24,477 | | | $ | 24,536 | | | $ | 26,449 | | |
| Portfolio turnover | | | 1,105 | % | | | 1,065 | % | | | 877 | % | | | 588 | % | | | 495 | % | |
1 Calculated using the average shares method.
2 Amount represents less than $0.005 per share.
3 Total investment return is calculated assuming a $10,000 investment on the first day of each year reported, reinvestment of all dividends and other distributions, if any, at net asset value on the ex-dividend dates, and a sale at net asset value on the last day of each year reported. The figures do not include any applicable sales charges or redemption fees; results would be lower if they were included. Returns do not reflect the deduction of taxes that a shareholder would pay on Portfolio distributions or the redemption of Portfolio shares.
4 Includes interest expense representing less than 0.005%.
254
| | | Class B | |
| | | Years ended July 31, | |
| | | 2011 | | 2010 | | 2009 | | 2008 | | 2007 | |
| Net asset value, beginning of year | | $ | 13.71 | | | $ | 13.36 | | | $ | 12.87 | | | $ | 12.73 | | | $ | 12.72 | | |
| Net investment income1 | | | 0.19 | | | | 0.30 | | | | 0.46 | | | | 0.45 | | | | 0.46 | | |
| Net realized and unrealized gains | | | 0.21 | | | | 0.87 | | | | 0.56 | | | | 0.15 | | | | 0.01 | | |
| Net increase from operations | | | 0.40 | | | | 1.17 | | | | 1.02 | | | | 0.60 | | | | 0.47 | | |
| Dividends from net investment income | | | (0.28 | ) | | | (0.36 | ) | | | (0.53 | ) | | | (0.46 | ) | | | (0.46 | ) | |
| Distributions from net realized gains | | | (0.51 | ) | | | (0.46 | ) | | | — | | | | — | | | | — | | |
| Total dividends and distributions | | | (0.79 | ) | | | (0.82 | ) | | | (0.53 | ) | | | (0.46 | ) | | | (0.46 | ) | |
| Net asset value, end of year | | $ | 13.32 | | | $ | 13.71 | | | $ | 13.36 | | | $ | 12.87 | | | $ | 12.73 | | |
| Total investment return3 | | | 3.03 | % | | | 9.12 | % | | | 8.16 | % | | | 4.72 | % | | | 3.73 | % | |
| Ratios to average net assets: | |
| Expenses before fee waivers and/or expense reimbursements by manager | | | 1.83 | %4 | | | 1.91 | %4 | | | 1.86 | %4 | | | 1.89 | % | | | 1.88 | % | |
| Expenses after fee waivers and/or expense reimbursements by manager | | | 1.77 | %4 | | | 1.77 | %4 | | | 1.77 | %4 | | | 1.82 | % | | | 1.87 | % | |
| Net investment income | | | 1.39 | % | | | 2.29 | % | | | 3.70 | % | | | 3.55 | % | | | 3.64 | % | |
| Supplemental data: | |
| Net assets, end of year (000's) | | $ | 98 | | | $ | 157 | | | $ | 173 | | | $ | 769 | | | $ | 1,617 | | |
| Portfolio turnover | | | 1,105 | % | | | 1,065 | % | | | 877 | % | | | 588 | % | | | 495 | % | |
| | | Class Y | |
| | | Years ended July 31, | |
| | | 2011 | | 2010 | | 2009 | | 2008 | | 2007 | |
| Net asset value, beginning of year | | $ | 13.71 | | | $ | 13.36 | | | $ | 12.87 | | | $ | 12.73 | | | $ | 12.72 | | |
| Net investment income1 | | | 0.32 | | | | 0.44 | | | | 0.61 | | | | 0.59 | | | | 0.61 | | |
| Net realized and unrealized gains | | | 0.20 | | | | 0.86 | | | | 0.55 | | | | 0.15 | | | | 0.002 | | |
| Net increase from operations | | | 0.52 | | | | 1.30 | | | | 1.16 | | | | 0.74 | | | | 0.61 | | |
| Dividends from net investment income | | | (0.41 | ) | | | (0.49 | ) | | | (0.67 | ) | | | (0.60 | ) | | | (0.60 | ) | |
| Distributions from net realized gains | | | (0.51 | ) | | | (0.46 | ) | | | — | | | | — | | | | — | | |
| Total dividends and distributions | | | (0.92 | ) | | | (0.95 | ) | | | (0.67 | ) | | | (0.60 | ) | | | (0.60 | ) | |
| Net asset value, end of year | | $ | 13.31 | | | $ | 13.71 | | | $ | 13.36 | | | $ | 12.87 | | | $ | 12.73 | | |
| Total investment return3 | | | 4.00 | % | | | 10.20 | % | | | 9.29 | % | | | 5.86 | % | | | 4.87 | % | |
| Ratios to average net assets: | |
| Expenses before fee waivers and/or expense reimbursements by manager | | | 0.88 | %4 | | | 0.89 | %4 | | | 0.92 | %4 | | | 0.90 | % | | | 0.79 | % | |
| Expenses after fee waivers and/or expense reimbursements by manager | | | 0.77 | %4 | | | 0.77 | %4 | | | 0.77 | %4 | | | 0.82 | % | | | 0.79 | % | |
| Net investment income | | | 2.42 | % | | | 3.29 | % | | | 4.65 | % | | | 4.56 | % | | | 4.74 | % | |
| Supplemental data: | |
| Net assets, end of year (000's) | | $ | 50,830 | | | $ | 49,486 | | | $ | 39,199 | | | $ | 25,669 | | | $ | 13,658 | | |
| Portfolio turnover | | | 1,105 | % | | | 1,065 | % | | | 877 | % | | | 588 | % | | | 495 | % | |
See accompanying notes to financial statements.
255
PACE Select Advisors Trust
Financial highlights
PACE Government Securities Fixed Income Investments
(concluded)
Selected data for a share of beneficial interest outstanding throughout each year is presented below:
| | | Class P | |
| | | Years ended July 31, | |
| | | 2011 | | 2010 | | 2009 | | 2008 | | 2007 | |
| Net asset value, beginning of year | | $ | 13.71 | | | $ | 13.36 | | | $ | 12.87 | | | $ | 12.72 | | | $ | 12.72 | | |
| Net investment income1 | | | 0.32 | | | | 0.44 | | | | 0.61 | | | | 0.59 | | | | 0.60 | | |
| Net realized and unrealized gains (losses) | | | 0.21 | | | | 0.86 | | | | 0.55 | | | | 0.15 | | | | (0.01 | ) | |
| Net increase from operations | | | 0.53 | | | | 1.30 | | | | 1.16 | | | | 0.74 | | | | 0.59 | | |
| Dividends from net investment income | | | (0.41 | ) | | | (0.49 | ) | | | (0.67 | ) | | | (0.59 | ) | | | (0.59 | ) | |
| Distributions from net realized gains | | | (0.51 | ) | | | (0.46 | ) | | | — | | | | — | | | | — | | |
| Total dividends and distributions | | | (0.92 | ) | | | (0.95 | ) | | | (0.67 | ) | | | (0.59 | ) | | | (0.59 | ) | |
| Net asset value, end of year | | $ | 13.32 | | | $ | 13.71 | | | $ | 13.36 | | | $ | 12.87 | | | $ | 12.72 | | |
| Total investment return2 | | | 4.08 | % | | | 10.20 | % | | | 9.27 | % | | | 5.87 | % | | | 4.71 | % | |
| Ratios to average net assets: | |
| Expenses before fee waivers and/or expense reimbursements by manager | | | 0.86 | %3 | | | 0.88 | %3 | | | 0.86 | %3 | | | 0.90 | % | | | 0.91 | % | |
| Expenses after fee waivers and/or expense reimbursements by manager | | | 0.77 | %3 | | | 0.77 | %3 | | | 0.77 | %3 | | | 0.82 | % | | | 0.87 | % | |
| Net investment income | | | 2.41 | % | | | 3.30 | % | | | 4.66 | % | | | 4.55 | % | | | 4.66 | % | |
| Supplemental data: | |
| Net assets, end of year (000's) | | $ | 453,931 | | | $ | 477,172 | | | $ | 422,024 | | | $ | 542,337 | | | $ | 469,556 | | |
| Portfolio turnover | | | 1,105 | % | | | 1,065 | % | | | 877 | % | | | 588 | % | | | 495 | % | |
1 Calculated using the average shares method.
2 Total investment return is calculated assuming a $10,000 investment on the first day of each year reported, reinvestment of all
dividends and other distributions, if any, at net asset value on the ex-dividend dates, and a sale at net asset value on the last day of each year reported. The figures do not include any applicable program or redemption fees; results would be lower if they were included. Returns do not reflect the deduction of taxes that a shareholder would pay on Portfolio distributions or the redemption of Portfolio shares.
3 Includes interest expense representing less than 0.005%.
See accompanying notes to financial statements.
256
This page intentionally left blank.
257
PACE Select Advisors Trust
Financial highlights
PACE Intermediate Fixed Income Investments
Selected data for a share of beneficial interest outstanding throughout each year is presented below:
| | | Class A | |
| | | Years ended July 31, | |
| | | 2011 | | 2010 | | 2009 | | 2008 | | 2007 | |
| Net asset value, beginning of year | | $ | 12.02 | | | $ | 11.58 | | | $ | 11.51 | | | $ | 11.39 | | | $ | 11.27 | | |
| Net investment income1 | | | 0.26 | | | | 0.34 | | | | 0.44 | | | | 0.48 | | | | 0.43 | | |
| Net realized and unrealized gains | | | 0.12 | | | | 0.49 | | | | 0.08 | | | | 0.12 | | | | 0.12 | | |
| Net increase from operations | | | 0.38 | | | | 0.83 | | | | 0.52 | | | | 0.60 | | | | 0.55 | | |
| Dividends from net investment income | | | (0.25 | ) | | | (0.39 | ) | | | (0.45 | ) | | | (0.48 | ) | | | (0.43 | ) | |
| Net asset value, end of year | | $ | 12.15 | | | $ | 12.02 | | | $ | 11.58 | | | $ | 11.51 | | | $ | 11.39 | | |
| Total investment return2 | | | 3.24 | % | | | 7.24 | % | | | 4.88 | % | | | 5.26 | % | | | 4.96 | % | |
| Ratios to average net assets: | |
| Expenses before fee waivers and/or expense reimbursements by manager | | | 0.99 | %3 | | | 1.00 | %3 | | | 1.02 | % | | | 1.05 | % | | | 1.08 | % | |
| Expenses after fee waivers and/or expense reimbursements by manager | | | 0.93 | %3 | | | 0.93 | %3 | | | 0.93 | % | | | 0.93 | % | | | 1.05 | % | |
| Net investment income | | | 2.18 | % | | | 2.93 | % | | | 3.97 | % | | | 4.10 | % | | | 3.81 | % | |
| Supplemental data: | |
| Net assets, end of year (000's) | | $ | 39,022 | | | $ | 42,905 | | | $ | 45,165 | | | $ | 46,257 | | | $ | 51,800 | | |
| Portfolio turnover | | | 664 | % | | | 974 | % | | | 512 | % | | | 387 | % | | | 255 | % | |
| | | Class C | |
| | | Years ended July 31, | |
| | | 2011 | | 2010 | | 2009 | | 2008 | | 2007 | |
| Net asset value, beginning of year | | $ | 12.03 | | | $ | 11.59 | | | $ | 11.52 | | | $ | 11.40 | | | $ | 11.28 | | |
| Net investment income1 | | | 0.20 | | | | 0.29 | | | | 0.38 | | | | 0.42 | | | | 0.38 | | |
| Net realized and unrealized gains | | | 0.13 | | | | 0.48 | | | | 0.09 | | | | 0.12 | | | | 0.11 | | |
| Net increase from operations | | | 0.33 | | | | 0.77 | | | | 0.47 | | | | 0.54 | | | | 0.49 | | |
| Dividends from net investment income | | | (0.19 | ) | | | (0.33 | ) | | | (0.40 | ) | | | (0.42 | ) | | | (0.37 | ) | |
| Net asset value, end of year | | $ | 12.17 | | | $ | 12.03 | | | $ | 11.59 | | | $ | 11.52 | | | $ | 11.40 | | |
| Total investment return2 | | | 2.80 | % | | | 6.70 | % | | | 4.36 | % | | | 4.72 | % | | | 4.43 | % | |
| Ratios to average net assets: | |
| Expenses before fee waivers and/or expense reimbursements by and recoupments to manager | | | 1.49 | %3 | | | 1.50 | %3 | | | 1.53 | % | | | 1.57 | % | | | 1.57 | % | |
| Expenses after fee waivers and/or expense reimbursements by and recoupments to manager | | | 1.43 | %3 | | | 1.43 | %3 | | | 1.43 | % | | | 1.43 | % | | | 1.55 | % | |
| Net investment income | | | 1.67 | % | | | 2.43 | % | | | 3.43 | % | | | 3.60 | % | | | 3.31 | % | |
| Supplemental data: | |
| Net assets, end of year (000's) | | $ | 3,474 | | | $ | 4,646 | | | $ | 5,185 | | | $ | 3,992 | | | $ | 4,116 | | |
| Portfolio turnover | | | 664 | % | | | 974 | % | | | 512 | % | | | 387 | % | | | 255 | % | |
1 Calculated using the average shares method.
2 Total investment return is calculated assuming a $10,000 investment on the first day of each year reported, reinvestment of all dividends and other distributions, if any, at net asset value on the ex-dividend dates, and a sale at net asset value on the last day of each year reported. The figures do not include any applicable sales charges or redemption fees; results would be lower if they were included. Returns do not reflect the deduction of taxes that a shareholder would pay on Portfolio distributions or the redemption of Portfolio shares.
3 Includes interest expense representing less than 0.005%.
4 During the year ended July 31, 2009, UBS Global Asset Management (Americas) Inc. waived fees and/or reimbursed a portion of ordinary operating expenses. The ratios after and before fee waivers and/or expense reimbursements are the same since the fee waiver/reimbursement represents less than 0.01%.
5 The investment manager recouped expenses previously reimbursed by the investment manager on behalf of the Portfolio, not to exceed the expense cap.
258
| | | Class B | |
| | | Years ended July 31, | |
| | | 2011 | | 2010 | | 2009 | | 2008 | | 2007 | |
| Net asset value, beginning of year | | $ | 12.04 | | | $ | 11.60 | | | $ | 11.53 | | | $ | 11.41 | | | $ | 11.29 | | |
| Net investment income1 | | | 0.17 | | | | 0.25 | | | | 0.36 | | | | 0.38 | | | | 0.34 | | |
| Net realized and unrealized gains | | | 0.12 | | | | 0.50 | | | | 0.08 | | | | 0.13 | | | | 0.13 | | |
| Net increase from operations | | | 0.29 | | | | 0.75 | | | | 0.44 | | | | 0.51 | | | | 0.47 | | |
| Dividends from net investment income | | | (0.16 | ) | | | (0.31 | ) | | | (0.37 | ) | | | (0.39 | ) | | | (0.35 | ) | |
| Net asset value, end of year | | $ | 12.17 | | | $ | 12.04 | | | $ | 11.60 | | | $ | 11.53 | | | $ | 11.41 | | |
| Total investment return2 | | | 2.46 | % | | | 6.43 | % | | | 4.08 | % | | | 4.45 | % | | | 4.18 | % | |
| Ratios to average net assets: | |
| Expenses before fee waivers and/or expense reimbursements by manager | | | 1.81 | %3 | | | 1.82 | %3 | | | 1.82 | % | | | 1.91 | % | | | 1.84 | % | |
| Expenses after fee waivers and/or expense reimbursements by manager | | | 1.68 | %3 | | | 1.68 | %3 | | | 1.68 | % | | | 1.68 | % | | | 1.80 | % | |
| Net investment income | | | 1.42 | % | | | 2.18 | % | | | 3.23 | % | | | 3.35 | % | | | 3.04 | % | |
| Supplemental data: | |
| Net assets, end of year (000's) | | $ | 72 | | | $ | 157 | | | $ | 155 | | | $ | 166 | | | $ | 324 | | |
| Portfolio turnover | | | 664 | % | | | 974 | % | | | 512 | % | | | 387 | % | | | 255 | % | |
| | | Class Y | |
| | | Years ended July 31, | |
| | | 2011 | | 2010 | | 2009 | | 2008 | | 2007 | |
| Net asset value, beginning of year | | $ | 12.02 | | | $ | 11.59 | | | $ | 11.51 | | | $ | 11.39 | | | $ | 11.28 | | |
| Net investment income1 | | | 0.29 | | | | 0.38 | | | | 0.47 | | | | 0.51 | | | | 0.47 | | |
| Net realized and unrealized gains | | | 0.12 | | | | 0.48 | | | | 0.09 | | | | 0.11 | | | | 0.10 | | |
| Net increase from operations | | | 0.41 | | | | 0.86 | | | | 0.56 | | | | 0.62 | | | | 0.57 | | |
| Dividends from net investment income | | | (0.28 | ) | | | (0.43 | ) | | | (0.48 | ) | | | (0.50 | ) | | | (0.46 | ) | |
| Net asset value, end of year | | $ | 12.15 | | | $ | 12.02 | | | $ | 11.59 | | | $ | 11.51 | | | $ | 11.39 | | |
| Total investment return2 | | | 3.49 | % | | | 7.53 | % | | | 5.15 | % | | | 5.52 | % | | | 5.17 | % | |
| Ratios to average net assets: | |
| Expenses before fee waivers and/or expense reimbursements by and recoupments to manager | | | 0.83 | %3 | | | 0.74 | %3 | | | 0.68 | % | | | 0.76 | % | | | 0.80 | % | |
| Expenses after fee waivers and/or expense reimbursements by and recoupments to manager | | | 0.68 | %3 | | | 0.68 | %3 | | | 0.68 | %4 | | | 0.68 | % | | | 0.80 | %5 | |
| Net investment income | | | 2.42 | % | | | 3.19 | % | | | 4.17 | % | | | 4.34 | % | | | 4.07 | % | |
| Supplemental data: | |
| Net assets, end of year (000's) | | $ | 1,277 | | | $ | 1,997 | | | $ | 2,313 | | | $ | 1,359 | | | $ | 1,249 | | |
| Portfolio turnover | | | 664 | % | | | 974 | % | | | 512 | % | | | 387 | % | | | 255 | % | |
See accompanying notes to financial statements.
259
PACE Select Advisors Trust
Financial highlights
PACE Intermediate Fixed Income Investments (concluded)
Selected data for a share of beneficial interest outstanding throughout each year is presented below:
| | | Class P | |
| | | Years ended July 31, | |
| | | 2011 | | 2010 | | 2009 | | 2008 | | 2007 | |
| Net asset value, beginning of year | | $ | 12.02 | | | $ | 11.59 | | | $ | 11.51 | | | $ | 11.39 | | | $ | 11.28 | | |
| Net investment income1 | | | 0.29 | | | | 0.37 | | | | 0.47 | | | | 0.51 | | | | 0.46 | | |
| Net realized and unrealized gains | | | 0.13 | | | | 0.48 | | | | 0.09 | | | | 0.11 | | | | 0.11 | | |
| Net increase from operations | | | 0.42 | | | | 0.85 | | | | 0.56 | | | | 0.62 | | | | 0.57 | | |
| Dividends from net investment income | | | (0.28 | ) | | | (0.42 | ) | | | (0.48 | ) | | | (0.50 | ) | | | (0.46 | ) | |
| Net asset value, end of year | | $ | 12.16 | | | $ | 12.02 | | | $ | 11.59 | | | $ | 11.51 | | | $ | 11.39 | | |
| Total investment return2 | | | 3.58 | % | | | 7.51 | % | | | 5.14 | % | | | 5.52 | % | | | 5.17 | % | |
| Ratios to average net assets: | |
| Expenses before fee waivers and/or expense reimbursements by and recoupments to manager | | | 0.72 | %3 | | | 0.73 | %3 | | | 0.74 | % | | | 0.77 | % | | | 0.80 | % | |
| Expenses after fee waivers and/or expense reimbursements by and recoupments to manager | | | 0.68 | %3 | | | 0.68 | %3 | | | 0.68 | % | | | 0.68 | % | | | 0.80 | %4 | |
| Net investment income | | | 2.43 | % | | | 3.16 | % | | | 4.22 | % | | | 4.35 | % | | | 4.07 | % | |
| Supplemental data: | |
| Net assets, end of year (000's) | | $ | 411,723 | | | $ | 420,801 | | | $ | 353,068 | | | $ | 404,407 | | | $ | 381,254 | | |
| Portfolio turnover | | | 664 | % | | | 974 | % | | | 512 | % | | | 387 | % | | | 255 | % | |
1 Calculated using the average shares method.
2 Total investment return is calculated assuming a $10,000 investment on the first day of each year reported, reinvestment of all dividends and other distributions, if any, at net asset value on the ex-dividend dates, and a sale at net asset value on the last day of each year reported. The figures do not include any applicable program or redemption fees; results would be lower if they were included. Returns do not reflect the deduction of taxes that a shareholder would pay on Portfolio distributions or the redemption of Portfolio shares.
3 Includes interest expense representing less than 0.005%.
4 The investment manager recouped expenses previously reimbursed by the investment manager on behalf of the Portfolio, not to exceed the expense cap.
See accompanying notes to financial statements.
260
This page intentionally left blank.
261
PACE Select Advisors Trust
Financial highlights
PACE Strategic Fixed Income Investments
Selected data for a share of beneficial interest outstanding throughout each year is presented below:
| | | Class A | |
| | | Years ended July 31, | |
| | | 2011 | | 2010 | | 2009 | | 2008 | | 2007 | |
| Net asset value, beginning of year | | $ | 14.56 | | | $ | 13.09 | | | $ | 13.75 | | | $ | 13.25 | | | $ | 13.26 | | |
| Net investment income1 | | | 0.48 | | | | 0.47 | | | | 0.60 | | | | 0.61 | | | | 0.56 | | |
| Net realized and unrealized gains | | | 0.43 | | | | 1.60 | | | | 0.39 | | | | 0.51 | | | | 0.002 | | |
| Net increase from operations | | | 0.91 | | | | 2.07 | | | | 0.99 | | | | 1.12 | | | | 0.56 | | |
| Dividends from net investment income | | | (0.51 | ) | | | (0.58 | ) | | | (0.73 | ) | | | (0.62 | ) | | | (0.55 | ) | |
| Distributions from net realized gains | | | (0.41 | ) | | | (0.02 | ) | | | (0.92 | ) | | | — | | | | — | | |
| Return of capital | | | — | | | | — | | | | — | | | | — | | | | (0.02 | ) | |
| Total dividends, distributions and return of capital | | | (0.92 | ) | | | (0.60 | ) | | | (1.65 | ) | | | (0.62 | ) | | | (0.57 | ) | |
| Net asset value, end of year | | $ | 14.55 | | | $ | 14.56 | | | $ | 13.09 | | | $ | 13.75 | | | $ | 13.25 | | |
| Total investment return3 | | | 6.54 | % | | | 16.09 | % | | | 8.31 | % | | | 8.42 | % | | | 4.32 | % | |
| Ratios to average net assets: | |
Expenses before fee waivers and/or expense reimbursements by and recoupments to manager,
including interest expense | | | 1.09 | % | | | 1.09 | % | | | 1.10 | % | | | 1.13 | % | | | 1.15 | % | |
Expenses after fee waivers and/or expense reimbursements by and recoupments to manager,
including interest expense | | | 1.06 | % | | | 1.06 | % | | | 1.07 | % | | | 1.06 | % | | | 1.15 | %4 | |
Expenses after fee waivers and/or expense reimbursements by and recoupments to manager,
excluding interest expense | | | 1.06 | % | | | 1.06 | % | | | 1.06 | % | | | 1.06 | % | | | 1.15 | %4 | |
| Net investment income | | | 3.38 | % | | | 3.36 | % | | | 4.75 | % | | | 4.40 | % | | | 4.17 | % | |
| Supplemental data: | |
| Net assets, end of year (000's) | | $ | 56,151 | | | $ | 45,499 | | | $ | 33,293 | | | $ | 27,180 | | | $ | 21,711 | | |
| Portfolio turnover | | | 444 | % | | | 239 | % | | | 178 | % | | | 236 | % | | | 188 | % | |
| | | Class C | |
| | | Years ended July 31, | |
| | | 2011 | | 2010 | | 2009 | | 2008 | | 2007 | |
| Net asset value, beginning of year | | $ | 14.56 | | | $ | 13.09 | | | $ | 13.75 | | | $ | 13.26 | | | $ | 13.26 | | |
| Net investment income1 | | | 0.42 | | | | 0.40 | | | | 0.54 | | | | 0.54 | | | | 0.50 | | |
| Net realized and unrealized gains (losses) | | | 0.43 | | | | 1.60 | | | | 0.39 | | | | 0.50 | | | | 0.002 | | |
| Net increase from operations | | | 0.85 | | | | 2.00 | | | | 0.93 | | | | 1.04 | | | | 0.50 | | |
| Dividends from net investment income | | | (0.44 | ) | | | (0.51 | ) | | | (0.67 | ) | | | (0.55 | ) | | | (0.48 | ) | |
| Distributions from net realized gains | | | (0.41 | ) | | | (0.02 | ) | | | (0.92 | ) | | | — | | | | — | | |
| Return of capital | | | — | | | | — | | | | — | | | | — | | | | (0.02 | ) | |
| Total dividends, distributions and return of capital | | | (0.85 | ) | | | (0.53 | ) | | | (1.59 | ) | | | (0.55 | ) | | | (0.50 | ) | |
| Net asset value, end of year | | $ | 14.56 | | | $ | 14.56 | | | $ | 13.09 | | | $ | 13.75 | | | $ | 13.26 | | |
| Total investment return3 | | | 6.10 | % | | | 15.52 | % | | | 7.78 | % | | | 7.79 | % | | | 3.87 | % | |
| Ratios to average net assets: | |
Expenses before fee waivers and/or expense reimbursements by and recoupments to manager,
including interest expense | | | 1.53 | % | | | 1.56 | % | | | 1.58 | % | | | 1.61 | % | | | 1.63 | % | |
Expenses after fee waivers and/or expense reimbursements by and recoupments to manager,
including interest expense | | | 1.55 | %4 | | | 1.56 | % | | | 1.57 | % | | | 1.56 | % | | | 1.63 | % | |
Expenses after fee waivers and/or expense reimbursements by and recoupments to manager,
excluding interest expense | | | 1.55 | %4 | | | 1.56 | % | | | 1.56 | % | | | 1.56 | % | | | 1.63 | % | |
| Net investment income | | | 2.88 | % | | | 2.86 | % | | | 4.24 | % | | | 3.90 | % | | | 3.69 | % | |
| Supplemental data: | |
| Net assets, end of year (000's) | | $ | 12,856 | | | $ | 12,289 | | | $ | 8,797 | | | $ | 5,592 | | | $ | 5,531 | | |
| Portfolio turnover | | | 444 | % | | | 239 | % | | | 178 | % | | | 236 | % | | | 188 | % | |
1 Calculated using the average shares method.
2 Amount represents less than $0.005 per share.
3 Total investment return is calculated assuming a $10,000 investment on the first day of each year reported, reinvestment of all dividends and other distributions, if any, at net asset value on the ex-dividend dates, and a sale at net asset value on the last day of each year reported. The figures do not include any applicable sales charges or redemption fees; results would be lower if they were included. Returns do not reflect the deduction of taxes that a shareholder would pay on Portfolio distributions or the redemption of Portfolio shares.
4 The investment manager recouped expenses previously reimbursed by the investment manager on behalf of the Portfolio, not to exceed the expense cap.
5 During the year ended July 31, 2007, UBS Global Asset Management (Americas) Inc. waived fees and/or reimbursed a portion of ordinary operating expenses. The ratios net and before fee waivers and/or expense reimbursements are the same since the fee waiver/reimbursement represents less than 0.01%.
262
| | | Class B | |
| | | Years ended July 31, | |
| | | 2011 | | 2010 | | 2009 | | 2008 | | 2007 | |
| Net asset value, beginning of year | | $ | 14.55 | | | $ | 13.08 | | | $ | 13.75 | | | $ | 13.25 | | | $ | 13.26 | | |
| Net investment income1 | | | 0.38 | | | | 0.36 | | | | 0.49 | | | | 0.48 | | | | 0.44 | | |
| Net realized and unrealized gains | | | 0.44 | | | | 1.60 | | | | 0.40 | | | | 0.53 | | | | 0.01 | | |
| Net increase from operations | | | 0.82 | | | | 1.96 | | | | 0.89 | | | | 1.01 | | | | 0.45 | | |
| Dividends from net investment income | | | (0.41 | ) | | | (0.47 | ) | | | (0.64 | ) | | | (0.51 | ) | | | (0.44 | ) | |
| Distributions from net realized gains | | | (0.41 | ) | | | (0.02 | ) | | | (0.92 | ) | | | — | | | | — | | |
| Return of capital | | | — | | | | — | | | | — | | | | — | | | | (0.02 | ) | |
| Total dividends, distributions and return of capital | | | (0.82 | ) | | | (0.49 | ) | | | (1.56 | ) | | | (0.51 | ) | | | (0.46 | ) | |
| Net asset value, end of year | | $ | 14.55 | | | $ | 14.55 | | | $ | 13.08 | | | $ | 13.75 | | | $ | 13.25 | | |
| Total investment return3 | | | 5.82 | % | | | 15.23 | % | | | 7.45 | % | | | 7.58 | % | | | 3.55 | % | |
| Ratios to average net assets: | |
Expenses before fee waivers and/or expense reimbursements by and recoupments to manager,
including interest expense | | | 1.85 | % | | | 1.90 | % | | | 1.93 | % | | | 2.03 | % | | | 1.93 | %5 | |
Expenses after fee waivers and/or expense reimbursements by and recoupments to manager,
including interest expense | | | 1.81 | % | | | 1.81 | % | | | 1.82 | % | | | 1.81 | % | | | 1.93 | %5 | |
Expenses after fee waivers and/or expense reimbursements by and recoupments to manager,
excluding interest expense | | | 1.81 | % | | | 1.81 | % | | | 1.81 | % | | | 1.81 | % | | | 1.93 | %5 | |
| Net investment income | | | 2.63 | % | | | 2.63 | % | | | 4.02 | % | | | 3.59 | % | | | 3.36 | % | |
| Supplemental data: | |
| Net assets, end of year (000's) | | $ | 230 | | | $ | 300 | | | $ | 333 | | | $ | 142 | | | $ | 456 | | |
| Portfolio turnover | | | 444 | % | | | 239 | % | | | 178 | % | | | 236 | % | | | 188 | % | |
| | | Class Y | |
| | | Years ended July 31, | |
| | | 2011 | | 2010 | | 2009 | | 2008 | | 2007 | |
| Net asset value, beginning of year | | $ | 14.54 | | | $ | 13.08 | | | $ | 13.74 | | | $ | 13.25 | | | $ | 13.26 | | |
| Net investment income1 | | | 0.52 | | | | 0.51 | | | | 0.64 | | | | 0.66 | | | | 0.61 | | |
| Net realized and unrealized gains (losses) | | | 0.44 | | | | 1.59 | | | | 0.39 | | | | 0.49 | | | | (0.01 | ) | |
| Net increase from operations | | | 0.96 | | | | 2.10 | | | | 1.03 | | | | 1.15 | | | | 0.60 | | |
| Dividends from net investment income | | | (0.55 | ) | | | (0.62 | ) | | | (0.77 | ) | | | (0.66 | ) | | | (0.59 | ) | |
| Distributions from net realized gains | | | (0.41 | ) | | | (0.02 | ) | | | (0.92 | ) | | | — | | | | — | | |
| Return of capital | | | — | | | | — | | | | — | | | | — | | | | (0.02 | ) | |
| Total dividends, distributions and return of capital | | | (0.96 | ) | | | (0.64 | ) | | | (1.69 | ) | | | (0.66 | ) | | | (0.61 | ) | |
| Net asset value, end of year | | $ | 14.54 | | | $ | 14.54 | | | $ | 13.08 | | | $ | 13.74 | | | $ | 13.25 | | |
| Total investment return3 | | | 6.80 | % | | | 16.47 | % | | | 8.68 | % | | | 8.67 | % | | | 4.76 | % | |
| Ratios to average net assets: | |
Expenses before fee waivers and/or expense reimbursements by and recoupments to manager,
including interest expense | | | 0.96 | % | | | 0.85 | % | | | 0.73 | % | | | 0.78 | % | | | 0.79 | % | |
Expenses after fee waivers and/or expense reimbursements by and recoupments to manager,
including interest expense | | | 0.81 | % | | | 0.81 | % | | | 0.73 | % | | | 0.78 | % | | | 0.79 | % | |
Expenses after fee waivers and/or expense reimbursements by and recoupments to manager,
excluding interest expense | | | 0.81 | % | | | 0.81 | % | | | 0.72 | % | | | 0.78 | % | | | 0.79 | % | |
| Net investment income | | | 3.62 | % | | | 3.63 | % | | | 5.09 | % | | | 4.71 | % | | | 4.55 | % | |
| Supplemental data: | |
| Net assets, end of year (000's) | | $ | 2,810 | | | $ | 3,058 | | | $ | 3,186 | | | $ | 3,045 | | | $ | 1,208 | | |
| Portfolio turnover | | | 444 | % | | | 239 | % | | | 178 | % | | | 236 | % | | | 188 | % | |
See accompanying notes to financial statements.
263
PACE Select Advisors Trust
Financial highlights
PACE Strategic Fixed Income Investments (concluded)
Selected data for a share of beneficial interest outstanding throughout each year is presented below:
| | | Class P | |
| | | Years ended July 31, | |
| | | 2011 | | 2010 | | 2009 | | 2008 | | 2007 | |
| Net asset value, beginning of year | | $ | 14.55 | | | $ | 13.08 | | | $ | 13.74 | | | $ | 13.25 | | | $ | 13.26 | | |
| Net investment income1 | | | 0.52 | | | | 0.50 | | | | 0.64 | | | | 0.64 | | | | 0.59 | | |
| Net realized and unrealized gains | | | 0.44 | | | | 1.60 | | | | 0.38 | | | | 0.50 | | | | 0.002 | | |
| Net increase from operations | | | 0.96 | | | | 2.10 | | | | 1.02 | | | | 1.14 | | | | 0.59 | | |
| Dividends from net investment income | | | (0.55 | ) | | | (0.61 | ) | | | (0.76 | ) | | | (0.65 | ) | | | (0.58 | ) | |
| Distributions from net realized gains | | | (0.41 | ) | | | (0.02 | ) | | | (0.92 | ) | | | — | | | | — | | |
| Return of capital | | | — | | | | — | | | | — | | | | — | | | | (0.02 | ) | |
| Total dividends, distributions and return of capital | | | (0.96 | ) | | | (0.63 | ) | | | (1.68 | ) | | | (0.65 | ) | | | (0.60 | ) | |
| Net asset value, end of year | | $ | 14.55 | | | $ | 14.55 | | | $ | 13.08 | | | $ | 13.74 | | | $ | 13.25 | | |
| Total investment return3 | | | 6.88 | % | | | 16.39 | % | | | 8.58 | % | | | 8.62 | % | | | 4.63 | % | |
| Ratios to average net assets: | |
Expenses before fee waivers and/or expense reimbursements by and recoupments to manager,
including interest expense | | | 0.84 | % | | | 0.87 | % | | | 0.87 | % | | | 0.89 | % | | | 0.93 | % | |
Expenses after fee waivers and/or expense reimbursements by and recoupments to manager,
including interest expense | | | 0.81 | % | | | 0.81 | % | | | 0.82 | % | | | 0.81 | % | | | 0.93 | %4 | |
Expenses after fee waivers and/or expense reimbursements by and recoupments to manager,
excluding interest expense | | | 0.81 | % | | | 0.81 | % | | | 0.81 | % | | | 0.81 | % | | | 0.93 | %4 | |
| Net investment income | | | 3.63 | % | | | 3.62 | % | | | 5.00 | % | | | 4.65 | % | | | 4.40 | % | |
| Supplemental data: | |
| Net assets, end of year (000's) | | $ | 746,653 | | | $ | 691,186 | | | $ | 584,235 | | | $ | 785,267 | | | $ | 679,623 | | |
| Portfolio turnover | | | 444 | % | | | 239 | % | | | 178 | % | | | 236 | % | | | 188 | % | |
1 Calculated using the average shares method.
2 Amount represents less than $0.005 per share.
3 Total investment return is calculated assuming a $10,000 investment on the first day of each year reported, reinvestment of all dividends and other distributions, if any, at net asset value on the ex-dividend dates, and a sale at net asset value on the last day of each year reported. The figures do not include any applicable program or redemption fees; results would be lower if they were included. Returns do not reflect the deduction of taxes that a shareholder would pay on Portfolio distributions or the redemption of Portfolio shares.
4 The investment manager recouped expenses previously reimbursed by the investment manager on behalf of the Portfolio, not to exceed the expense cap.
See accompanying notes to financial statements.
264
This page intentionally left blank.
265
PACE Select Advisors Trust
Financial highlights
PACE Municipal Fixed Income Investments
Selected data for a share of beneficial interest outstanding throughout each year is presented below:
| | | Class A | |
| | | Years ended July 31, | |
| | | 2011 | | 2010 | | 2009 | | 2008 | | 2007 | |
| Net asset value, beginning of year | | $ | 12.94 | | | $ | 12.45 | | | $ | 12.15 | | | $ | 12.22 | | | $ | 12.27 | | |
| Net investment income1 | | | 0.38 | | | | 0.39 | | | | 0.41 | | | | 0.41 | | | | 0.40 | | |
| Net realized and unrealized gains (losses) | | | 0.06 | | | | 0.49 | | | | 0.30 | | | | (0.07 | ) | | | (0.05 | ) | |
| Net increase from operations | | | 0.44 | | | | 0.88 | | | | 0.71 | | | | 0.34 | | | | 0.35 | | |
| Dividends from net investment income | | | (0.38 | ) | | | (0.39 | ) | | | (0.41 | ) | | | (0.41 | ) | | | (0.40 | ) | |
| Net asset value, end of year | | $ | 13.00 | | | $ | 12.94 | | | $ | 12.45 | | | $ | 12.15 | | | $ | 12.22 | | |
| Total investment return2 | | | 3.49 | % | | | 7.18 | % | | | 5.97 | % | | | 2.81 | % | | | 2.84 | % | |
| Ratios to average net assets: | |
| Expenses before fee waivers and/or expense reimbursements by manager | | | 0.94 | % | | | 0.95 | % | | | 0.96 | % | | | 1.01 | % | | | 1.02 | % | |
| Expenses after fee waivers and/or expense reimbursements by manager | | | 0.93 | % | | | 0.93 | % | | | 0.93 | % | | | 0.93 | % | | | 1.01 | % | |
| Net investment income | | | 2.96 | % | | | 3.08 | % | | | 3.35 | % | | | 3.34 | % | | | 3.21 | % | |
| Supplemental data: | |
| Net assets, end of year (000's) | | $ | 73,528 | | | $ | 83,501 | | | $ | 88,167 | | | $ | 87,036 | | | $ | 90,219 | | |
| Portfolio turnover | | | 34 | % | | | 10 | % | | | 25 | % | | | 16 | % | | | 48 | % | |
| | | Class C | |
| | | Years ended July 31, | |
| | | 2011 | | 2010 | | 2009 | | 2008 | | 2007 | |
| Net asset value, beginning of year | | $ | 12.94 | | | $ | 12.45 | | | $ | 12.16 | | | $ | 12.22 | | | $ | 12.27 | | |
| Net investment income1 | | | 0.32 | | | | 0.33 | | | | 0.35 | | | | 0.35 | | | | 0.33 | | |
| Net realized and unrealized gains (losses) | | | 0.06 | | | | 0.49 | | | | 0.29 | | | | (0.06 | ) | | | (0.05 | ) | |
| Net increase from operations | | | 0.38 | | | | 0.82 | | | | 0.64 | | | | 0.29 | | | | 0.28 | | |
| Dividends from net investment income | | | (0.32 | ) | | | (0.33 | ) | | | (0.35 | ) | | | (0.35 | ) | | | (0.33 | ) | |
| Net asset value, end of year | | $ | 13.00 | | | $ | 12.94 | | | $ | 12.45 | | | $ | 12.16 | | | $ | 12.22 | | |
| Total investment return2 | | | 2.97 | % | | | 6.65 | % | | | 5.36 | % | | | 2.38 | % | | | 2.32 | % | |
| Ratios to average net assets: | |
| Expenses before fee waivers and/or expense reimbursements by manager | | | 1.45 | % | | | 1.46 | % | | | 1.47 | % | | | 1.52 | % | | | 1.53 | % | |
| Expenses after fee waivers and/or expense reimbursements by manager | | | 1.43 | % | | | 1.43 | % | | | 1.43 | % | | | 1.43 | % | | | 1.51 | % | |
| Net investment income | | | 2.46 | % | | | 2.58 | % | | | 2.85 | % | | | 2.84 | % | | | 2.71 | % | |
| Supplemental data: | |
| Net assets, end of year (000's) | | $ | 13,943 | | | $ | 15,767 | | | $ | 15,474 | | | $ | 13,905 | | | $ | 14,777 | | |
| Portfolio turnover | | | 34 | % | | | 10 | % | | | 25 | % | | | 16 | % | | | 48 | % | |
1 Calculated using the average shares method.
2 Total investment return is calculated assuming a $10,000 investment on the first day of each year reported, reinvestment of all dividends and other distributions, if any, at net asset value on the ex-dividend dates, and a sale at net asset value on the last day of each year reported. The figures do not include any applicable sales charges or redemption fees; results would be lower if they were included. Returns do not reflect the deduction of taxes that a shareholder could pay on Portfolio distributions or the redemption of Portfolio shares.
266
| | | Class B | |
| | | Years ended July 31, | |
| | | 2011 | | 2010 | | 2009 | | 2008 | | 2007 | |
| Net asset value, beginning of year | | $ | 12.95 | | | $ | 12.46 | | | $ | 12.16 | | | $ | 12.23 | | | $ | 12.27 | | |
| Net investment income1 | | | 0.28 | | | | 0.29 | | | | 0.31 | | | | 0.31 | | | | 0.30 | | |
| Net realized and unrealized gains (losses) | | | 0.06 | | | | 0.50 | | | | 0.31 | | | | (0.06 | ) | | | (0.04 | ) | |
| Net increase from operations | | | 0.34 | | | | 0.79 | | | | 0.62 | | | | 0.25 | | | | 0.26 | | |
| Dividends from net investment income | | | (0.28 | ) | | | (0.30 | ) | | | (0.32 | ) | | | (0.32 | ) | | | (0.30 | ) | |
| Net asset value, end of year | | $ | 13.01 | | | $ | 12.95 | | | $ | 12.46 | | | $ | 12.16 | | | $ | 12.23 | | |
| Total investment return2 | | | 2.71 | % | | | 6.37 | % | | | 5.17 | % | | | 2.05 | % | | | 2.10 | % | |
| Ratios to average net assets: | |
| Expenses before fee waivers and/or expense reimbursements by manager | | | 1.75 | % | | | 1.77 | % | | | 1.74 | % | | | 1.89 | % | | | 1.78 | % | |
| Expenses after fee waivers and/or expense reimbursements by manager | | | 1.68 | % | | | 1.68 | % | | | 1.68 | % | | | 1.68 | % | | | 1.76 | % | |
| Net investment income | | | 2.21 | % | | | 2.33 | % | | | 2.63 | % | | | 2.57 | % | | | 2.44 | % | |
| Supplemental data: | |
| Net assets, end of year (000's) | | $ | 47 | | | $ | 62 | | | $ | 103 | | | $ | 196 | | | $ | 259 | | |
| Portfolio turnover | | | 34 | % | | | 10 | % | | | 25 | % | | | 16 | % | | | 48 | % | |
| | | Class Y | |
| | | Years ended July 31, | |
| | | 2011 | | 2010 | | 2009 | | 2008 | | 2007 | |
| Net asset value, beginning of year | | $ | 12.95 | | | $ | 12.45 | | | $ | 12.16 | | | $ | 12.23 | | | $ | 12.28 | | |
| Net investment income1 | | | 0.41 | | | | 0.42 | | | | 0.44 | | | | 0.44 | | | | 0.43 | | |
| Net realized and unrealized gains (losses) | | | 0.05 | | | | 0.50 | | | | 0.29 | | | | (0.07 | ) | | | (0.05 | ) | |
| Net increase from operations | | | 0.46 | | | | 0.92 | | | | 0.73 | | | | 0.37 | | | | 0.38 | | |
| Dividends from net investment income | | | (0.41 | ) | | | (0.42 | ) | | | (0.44 | ) | | | (0.44 | ) | | | (0.43 | ) | |
| Net asset value, end of year | | $ | 13.00 | | | $ | 12.95 | | | $ | 12.45 | | | $ | 12.16 | | | $ | 12.23 | | |
| Total investment return2 | | | 3.67 | % | | | 7.45 | % | | | 6.23 | % | | | 3.05 | % | | | 3.09 | % | |
| Ratios to average net assets: | |
| Expenses before fee waivers and/or expense reimbursements by manager | | | 0.74 | % | | | 0.74 | % | | | 0.76 | % | | | 0.96 | % | | | 0.83 | % | |
| Expenses after fee waivers and/or expense reimbursements by manager | | | 0.68 | % | | | 0.68 | % | | | 0.68 | % | | | 0.68 | % | | | 0.76 | % | |
| Net investment income | | | 3.21 | % | | | 3.33 | % | | | 3.60 | % | | | 3.59 | % | | | 3.46 | % | |
| Supplemental data: | |
| Net assets, end of year (000's) | | $ | 118 | | | $ | 123 | | | $ | 145 | | | $ | 136 | | | $ | 137 | | |
| Portfolio turnover | | | 34 | % | | | 10 | % | | | 25 | % | | | 16 | % | | | 48 | % | |
See accompanying notes to financial statements.
267
PACE Select Advisors Trust
Financial highlights
PACE Municipal Fixed Income Investments (concluded)
Selected data for a share of beneficial interest outstanding throughout each year is presented below:
| | | Class P | |
| | | Years ended July 31, | |
| | | 2011 | | 2010 | | 2009 | | 2008 | | 2007 | |
| Net asset value, beginning of year | | $ | 12.95 | | | $ | 12.45 | | | $ | 12.16 | | | $ | 12.22 | | | $ | 12.27 | | |
| Net investment income1 | | | 0.41 | | | | 0.42 | | | | 0.44 | | | | 0.44 | | | | 0.43 | | |
| Net realized and unrealized gains (losses) | | | 0.05 | | | | 0.50 | | | | 0.29 | | | | (0.06 | ) | | | (0.05 | ) | |
| Net increase from operations | | | 0.46 | | | | 0.92 | | | | 0.73 | | | | 0.38 | | | | 0.38 | | |
| Dividends from net investment income | | | (0.41 | ) | | | (0.42 | ) | | | (0.44 | ) | | | (0.44 | ) | | | (0.43 | ) | |
| Net asset value, end of year | | $ | 13.00 | | | $ | 12.95 | | | $ | 12.45 | | | $ | 12.16 | | | $ | 12.22 | | |
| Total investment return2 | | | 3.67 | % | | | 7.54 | % | | | 6.14 | % | | | 3.14 | % | | | 3.10 | % | |
| Ratios to average net assets: | |
| Expenses before fee waivers and/or expense reimbursements by manager | | | 0.72 | % | | | 0.74 | % | | | 0.74 | % | | | 0.79 | % | | | 0.81 | % | |
| Expenses after fee waivers and/or expense reimbursements by manager | | | 0.68 | % | | | 0.68 | % | | | 0.68 | % | | | 0.68 | % | | | 0.76 | % | |
| Net investment income | | | 3.21 | % | | | 3.33 | % | | | 3.61 | % | | | 3.59 | % | | | 3.47 | % | |
| Supplemental data: | |
| Net assets, end of year (000's) | | $ | 229,062 | | | $ | 229,028 | | | $ | 187,814 | | | $ | 242,033 | | | $ | 194,370 | | |
| Portfolio turnover | | | 34 | % | | | 10 | % | | | 25 | % | | | 16 | % | | | 48 | % | |
1 Calculated using the average shares method.
2 Total investment return is calculated assuming a $10,000 investment on the first day of each year reported, reinvestment of all dividends and other distributions, if any, at net asset value on the ex-dividend dates, and a sale at net asset value on the last day of each year reported. The figures do not include any applicable program or redemption fees; results would be lower if they were included. Returns do not reflect the deduction of taxes that a shareholder could pay on Portfolio distributions or the redemption of Portfolio shares.
See accompanying notes to financial statements.
268
This page intentionally left blank.
269
PACE Select Advisors Trust
Financial highlights
PACE International Fixed Income Investments
Selected data for a share of beneficial interest outstanding throughout each year is presented below:
| | | Class A | |
| | | Years ended July 31, | |
| | | 2011 | | 2010 | | 2009 | | 20081 | | 2007 | |
| Net asset value, beginning of year | | $ | 11.43 | | | $ | 11.64 | | | $ | 11.84 | | | $ | 11.38 | | | $ | 11.20 | | |
| Net investment income2 | | | 0.26 | | | | 0.27 | | | | 0.30 | | | | 0.25 | | | | 0.25 | | |
| Net realized and unrealized gains (losses) | | | 1.13 | | | | 0.24 | | | | (0.06 | ) | | | 1.14 | | | | 0.23 | | |
| Net increase from operations | | | 1.39 | | | | 0.51 | | | | 0.24 | | | | 1.39 | | | | 0.48 | | |
| Dividends from net investment income | | | (0.30 | ) | | | (0.70 | ) | | | (0.44 | ) | | | (0.93 | ) | | | (0.30 | ) | |
| Return of capital | | | — | | | | (0.02 | ) | | | — | | | | — | | | | — | | |
| Total dividends and return of capital | | | (0.30 | ) | | | (0.72 | ) | | | (0.44 | ) | | | (0.93 | ) | | | (0.30 | ) | |
| Net asset value, end of year | | $ | 12.52 | | | $ | 11.43 | | | $ | 11.64 | | | $ | 11.84 | | | $ | 11.38 | | |
| Total investment return3 | | | 12.36 | % | | | 4.32 | % | | | 2.35 | % | | | 12.76 | % | | | 4.36 | % | |
| Ratios to average net assets: | |
| Expenses before fee waivers and/or expense reimbursements by and recoupments to manager | | | 1.26 | % | | | 1.30 | % | | | 1.32 | % | | | 1.35 | % | | | 1.37 | % | |
| Expenses after fee waivers and/or expense reimbursements by and recoupments to manager | | | 1.22 | %4 | | | 1.25 | %4 | | | 1.25 | % | | | 1.25 | % | | | 1.37 | % | |
| Net investment income | | | 2.16 | % | | | 2.30 | % | | | 2.83 | % | | | 2.07 | % | | | 2.23 | % | |
| Supplemental data: | |
| Net assets, end of year (000's) | | $ | 98,636 | | | $ | 98,039 | | | $ | 103,708 | | | $ | 118,784 | | | $ | 111,910 | | |
| Portfolio turnover | | | 66 | % | | | 67 | % | | | 37 | % | | | 65 | % | | | 111 | % | |
| | | Class C | |
| | | Years ended July 31, | |
| | | 2011 | | 2010 | | 2009 | | 20081 | | 2007 | |
| Net asset value, beginning of year | | $ | 11.43 | | | $ | 11.64 | | | $ | 11.85 | | | $ | 11.38 | | | $ | 11.20 | | |
| Net investment income2 | | | 0.20 | | | | 0.21 | | | | 0.25 | | | | 0.19 | | | | 0.20 | | |
| Net realized and unrealized gains (losses) | | | 1.14 | | | | 0.24 | | | | (0.08 | ) | | | 1.15 | | | | 0.23 | | |
| Net increase from operations | | | 1.34 | | | | 0.45 | | | | 0.17 | | | | 1.34 | | | | 0.43 | | |
| Dividends from net investment income | | | (0.25 | ) | | | (0.64 | ) | | | (0.38 | ) | | | (0.87 | ) | | | (0.25 | ) | |
| Return of capital | | | — | | | | (0.02 | ) | | | — | | | | — | | | | — | | |
| Total dividends and return of capital | | | (0.25 | ) | | | (0.66 | ) | | | (0.38 | ) | | | (0.87 | ) | | | (0.25 | ) | |
| Net asset value, end of year | | $ | 12.52 | | | $ | 11.43 | | | $ | 11.64 | | | $ | 11.85 | | | $ | 11.38 | | |
| Total investment return3 | | | 11.83 | % | | | 3.81 | % | | | 1.85 | % | | | 12.20 | % | | | 3.86 | % | |
| Ratios to average net assets: | |
| Expenses before fee waivers and/or expense reimbursements by and recoupments to manager | | | 1.74 | % | | | 1.77 | % | | | 1.80 | % | | | 1.84 | % | | | 1.85 | % | |
| Expenses after fee waivers and/or expense reimbursements by and recoupments to manager | | | 1.69 | % | | | 1.72 | %4 | | | 1.75 | %4 | | | 1.75 | % | | | 1.85 | % | |
| Net investment income | | | 1.69 | % | | | 1.83 | % | | | 2.32 | % | | | 1.57 | % | | | 1.74 | % | |
| Supplemental data: | |
| Net assets, end of year (000's) | | $ | 8,034 | | | $ | 7,154 | | | $ | 7,234 | | | $ | 7,161 | | | $ | 6,347 | | |
| Portfolio turnover | | | 66 | % | | | 67 | % | | | 37 | % | | | 65 | % | | | 111 | % | |
1 Effective August 23, 2007, Rogge Global Partners plc ("Rogge") assumed the role of sole manager of the Portfolio. Prior to August 23, 2007, the investment advisory function for this Portfolio was performed by Rogge and Fischer Francis Trees & Watts, Inc., who were each responsible for a portion of the Portfolio.
2 Calculated using the average shares method.
3 Total investment return is calculated assuming a $10,000 investment on the first day of each year reported, reinvestment of all dividends and other distributions, if any, at net asset value on the ex-dividend dates, and a sale at net asset value on the last day of each year reported. The figures do not include any applicable sales charges or redemption fees; results would be lower if they were included. Returns do not reflect the deduction of taxes that a shareholder would pay on Portfolio distributions or the redemption of Portfolio shares.
4 The investment manager recouped expenses previously reimbursed by the investment manager on behalf of the Portfolio, not to exceed the expense cap.
270
| | | Class B | |
| | | Years ended July 31, | |
| | | 2011 | | 2010 | | 2009 | | 20081 | | 2007 | |
| Net asset value, beginning of year | | $ | 11.46 | | | $ | 11.68 | | | $ | 11.87 | | | $ | 11.40 | | | $ | 11.22 | | |
| Net investment income2 | | | 0.16 | | | | 0.18 | | | | 0.22 | | | | 0.15 | | | | 0.16 | | |
| Net realized and unrealized gains (losses) | | | 1.15 | | | | 0.23 | | | | (0.06 | ) | | | 1.16 | | | | 0.24 | | |
| Net increase from operations | | | 1.31 | | | | 0.41 | | | | 0.16 | | | | 1.31 | | | | 0.40 | | |
| Dividends from net investment income | | | (0.21 | ) | | | (0.61 | ) | | | (0.35 | ) | | | (0.84 | ) | | | (0.22 | ) | |
| Return of capital | | | — | | | | (0.02 | ) | | | — | | | | — | | | | — | | |
| Total dividends and return of capital | | | (0.21 | ) | | | (0.63 | ) | | | (0.35 | ) | | | (0.84 | ) | | | (0.22 | ) | |
| Net asset value, end of year | | $ | 12.56 | | | $ | 11.46 | | | $ | 11.68 | | | $ | 11.87 | | | $ | 11.40 | | |
| Total investment return3 | | | 11.54 | % | | | 3.51 | % | | | 1.64 | % | | | 11.89 | % | | | 3.57 | % | |
| Ratios to average net assets: | |
| Expenses before fee waivers and/or expense reimbursements by and recoupments to manager | | | 2.06 | % | | | 2.09 | % | | | 2.10 | % | | | 2.15 | % | | | 2.13 | % | |
| Expenses after fee waivers and/or expense reimbursements by and recoupments to manager | | | 2.00 | % | | | 2.00 | % | | | 2.00 | % | | | 2.00 | % | | | 2.13 | % | |
| Net investment income | | | 1.38 | % | | | 1.55 | % | | | 2.11 | % | | | 1.31 | % | | | 1.47 | % | |
| Supplemental data: | |
| Net assets, end of year (000's) | | $ | 151 | | | $ | 166 | | | $ | 191 | | | $ | 505 | | | $ | 723 | | |
| Portfolio turnover | | | 66 | % | | | 67 | % | | | 37 | % | | | 65 | % | | | 111 | % | |
| | | Class Y | |
| | | Years ended July 31, | |
| | | 2011 | | 2010 | | 2009 | | 20081 | | 2007 | |
| Net asset value, beginning of year | | $ | 11.40 | | | $ | 11.63 | | | $ | 11.83 | | | $ | 11.36 | | | $ | 11.19 | | |
| Net investment income2 | | | 0.28 | | | | 0.30 | | | | 0.34 | | | | 0.29 | | | | 0.29 | | |
| Net realized and unrealized gains (losses) | | | 1.14 | | | | 0.23 | | | | (0.07 | ) | | | 1.15 | | | | 0.22 | | |
| Net increase from operations | | | 1.42 | | | | 0.53 | | | | 0.27 | | | | 1.44 | | | | 0.51 | | |
| Dividends from net investment income | | | (0.33 | ) | | | (0.74 | ) | | | (0.47 | ) | | | (0.97 | ) | | | (0.34 | ) | |
| Return of capital | | | — | | | | (0.02 | ) | | | — | | | | — | | | | — | | |
| Total dividends and return of capital | | | (0.33 | ) | | | (0.76 | ) | | | (0.47 | ) | | | (0.97 | ) | | | (0.34 | ) | |
| Net asset value, end of year | | $ | 12.49 | | | $ | 11.40 | | | $ | 11.63 | | | $ | 11.83 | | | $ | 11.36 | | |
| Total investment return3 | | | 12.54 | % | | | 4.68 | % | | | 2.71 | % | | | 13.16 | % | | | 4.67 | % | |
| Ratios to average net assets: | |
| Expenses before fee waivers and/or expense reimbursements by and recoupments to manager | | | 1.11 | % | | | 1.01 | % | | | 0.94 | % | | | 0.99 | % | | | 1.03 | % | |
| Expenses after fee waivers and/or expense reimbursements by and recoupments to manager | | | 1.00 | % | | | 0.96 | % | | | 0.89 | % | | | 0.93 | % | | | 1.03 | %4 | |
| Net investment income | | | 2.38 | % | | | 2.57 | % | | | 3.19 | % | | | 2.40 | % | | | 2.58 | % | |
| Supplemental data: | |
| Net assets, end of year (000's) | | $ | 5,216 | | | $ | 5,825 | | | $ | 7,773 | | | $ | 10,253 | | | $ | 7,113 | | |
| Portfolio turnover | | | 66 | % | | | 67 | % | | | 37 | % | | | 65 | % | | | 111 | % | |
See accompanying notes to financial statements.
271
PACE Select Advisors Trust
Financial highlights
PACE International Fixed Income Investments (concluded)
Selected data for a share of beneficial interest outstanding throughout each year is presented below:
| | | Class P | |
| | | Years ended July 31, | |
| | | 2011 | | 2010 | | 2009 | | 20081 | | 2007 | |
| Net asset value, beginning of year | | $ | 11.43 | | | $ | 11.64 | | | $ | 11.84 | | | $ | 11.38 | | | $ | 11.20 | | |
| Net investment income2 | | | 0.28 | | | | 0.30 | | | | 0.33 | | | | 0.28 | | | | 0.28 | | |
| Net realized and unrealized gains (losses) | | | 1.14 | | | | 0.23 | | | | (0.07 | ) | | | 1.14 | | | | 0.23 | | |
| Net increase from operations | | | 1.42 | | | | 0.53 | | | | 0.26 | | | | 1.42 | | | | 0.51 | | |
| Dividends from net investment income | | | (0.33 | ) | | | (0.72 | ) | | | (0.46 | ) | | | (0.96 | ) | | | (0.33 | ) | |
| Return of capital | | | — | | | | (0.02 | ) | | | — | | | | — | | | | — | | |
| Total dividends and return of capital | | | (0.33 | ) | | | (0.74 | ) | | | (0.46 | ) | | | (0.96 | ) | | | (0.33 | ) | |
| Net asset value, end of year | | $ | 12.52 | | | $ | 11.43 | | | $ | 11.64 | | | $ | 11.84 | | | $ | 11.38 | | |
| Total investment return3 | | | 12.60 | % | | | 4.65 | % | | | 2.60 | % | | | 12.95 | % | | | 4.62 | % | |
| Ratios to average net assets: | |
| Expenses before fee waivers and/or expense reimbursements by manager | | | 1.11 | % | | | 1.15 | % | | | 1.17 | % | | | 1.18 | % | | | 1.22 | % | |
| Expenses after fee waivers and/or expense reimbursements by manager | | | 1.00 | % | | | 1.00 | % | | | 1.00 | % | | | 1.00 | % | | | 1.13 | % | |
| Net investment income | | | 2.38 | % | | | 2.56 | % | | | 3.09 | % | | | 2.32 | % | | | 2.49 | % | |
| Supplemental data: | |
| Net assets, end of year (000's) | | $ | 465,625 | | | $ | 404,680 | | | $ | 364,616 | | | $ | 534,097 | | | $ | 440,787 | | |
| Portfolio turnover | | | 66 | % | | | 67 | % | | | 37 | % | | | 65 | % | | | 111 | % | |
1 Effective August 23, 2007, Rogge Global Partners plc ("Rogge") assumed the role of sole manager of the Portfolio. Prior to August 23, 2007, the investment advisory function for this Portfolio was performed by Rogge and Fischer Francis Trees & Watts, Inc., who were each responsible for a portion of the Portfolio.
2 Calculated using the average shares method.
3 Total investment return is calculated assuming a $10,000 investment on the first day of each year reported, reinvestment of all dividends and other distributions, if any, at net asset value on the ex-dividend dates, and a sale at net asset value on the last day of each year reported. The figures do not include any applicable program or redemption fees; results would be lower if they were included. Returns do not reflect the deduction of taxes that a shareholder would pay on Portfolio distributions or the redemption of Portfolio shares.
See accompanying notes to financial statements.
272
This page intentionally left blank.
273
PACE Select Advisors Trust
Financial highlights
PACE High Yield Investments
Selected data for a share of beneficial interest outstanding throughout each period is presented below:
| | | Class A | | Class C | |
| | | Years ended July 31, | | Years ended July 31, | | Period ended
July 31, | |
| | | 2011 | | 2010 | | 2009 | | 2008 | | 2007 | | 2011 | | 2010 | | 20091 | |
| Net asset value, beginning of period | | $ | 10.17 | | | $ | 8.94 | | | $ | 9.04 | | | $ | 9.60 | | | $ | 9.81 | | | $ | 10.16 | | | $ | 8.93 | | | $ | 7.49 | | |
| Net investment income2 | | | 0.75 | | | | 0.82 | | | | 0.66 | | | | 0.60 | | | | 0.60 | | | | 0.71 | | | | 0.77 | | | | 0.29 | | |
| Net realized and unrealized gains (losses) | | | 0.25 | | | | 1.21 | | | | 0.02 | | | | (0.54 | ) | | | (0.23 | ) | | | 0.24 | | | | 1.21 | | | | 1.54 | | |
| Net increase from operations | | | 1.00 | | | | 2.03 | | | | 0.68 | | | | 0.06 | | | | 0.37 | | | | 0.95 | | | | 1.98 | | | | 1.83 | | |
| Dividends from net investment income | | | (0.73 | ) | | | (0.74 | ) | | | (0.78 | ) | | | (0.59 | ) | | | (0.58 | ) | | | (0.68 | ) | | | (0.69 | ) | | | (0.39 | ) | |
| Distributions from net realized gains | | | (0.05 | ) | | | (0.06 | ) | | | — | | | | (0.01 | ) | | | — | | | | (0.05 | ) | | | (0.06 | ) | | | — | | |
| Return of capital | | | — | | | | — | | | | — | | | | (0.02 | ) | | | — | | | | — | | | | — | | | | — | | |
| Total dividends, distributions and return of capital | | | (0.78 | ) | | | (0.80 | ) | | | (0.78 | ) | | | (0.62 | ) | | | (0.58 | ) | | | (0.73 | ) | | | (0.75 | ) | | | (0.39 | ) | |
| Net asset value, end of period | | $ | 10.39 | | | $ | 10.17 | | | $ | 8.94 | | | $ | 9.04 | | | $ | 9.60 | | | $ | 10.38 | | | $ | 10.16 | | | $ | 8.93 | | |
| Total investment return3 | | | 10.00 | % | | | 23.35 | % | | | 9.49 | % | | | 0.58 | % | | | 3.66 | % | | | 9.50 | % | | | 22.81 | % | | | 25.40 | % | |
| Ratios to average net assets: | |
| Expenses before fee waivers and/or expense reimbursements by and recoupments to manager | | | 1.31 | % | | | 1.35 | % | | | 1.46 | % | | | 1.59 | % | | | 1.96 | % | | | 1.77 | % | | | 1.81 | % | | | 1.92 | %5 | |
| Expenses after fee waivers and/or expense reimbursements by and recoupments to manager | | | 1.33 | %4 | | | 1.35 | %4 | | | 1.35 | % | | | 1.35 | % | | | 1.35 | % | | | 1.77 | % | | | 1.81 | %4 | | | 1.85 | %5 | |
| Net investment income | | | 7.11 | % | | | 8.36 | % | | | 8.46 | % | | | 6.43 | % | | | 5.96 | % | | | 6.69 | % | | | 7.91 | % | | | 6.96 | %5 | |
| Supplemental data: | |
| Net assets, end of period (000's) | | $ | 25,550 | | | $ | 13,158 | | | $ | 7,538 | | | $ | 2,181 | | | $ | 741 | | | $ | 3,791 | | | $ | 2,834 | | | $ | 1,819 | | |
| Portfolio turnover | | | 36 | % | | | 30 | % | | | 49 | % | | | 25 | % | | | 26 | % | | | 36 | % | | | 30 | % | | | 49 | % | |
| | | Class Y | | Class P | |
| | | Years ended July 31, | | Period ended
July 31, | | Years ended July 31, | |
| | | 2011 | | 2010 | | 20096 | | 2011 | | 2010 | | 2009 | | 2008 | | 2007 | |
| Net asset value, beginning of period | | $ | 10.20 | | | $ | 8.95 | | | $ | 6.83 | | | $ | 10.18 | | | $ | 8.95 | | | $ | 9.04 | | | $ | 9.61 | | | $ | 9.81 | | |
| Net investment income2 | | | 0.74 | | | | 0.85 | | | | 0.42 | | | | 0.77 | | | | 0.85 | | | | 0.69 | | | | 0.63 | | | | 0.62 | | |
| Net realized and unrealized gains (losses) | | | 0.28 | | | | 1.22 | | | | 2.11 | | | | 0.26 | | | | 1.20 | | | | 0.02 | | | | (0.56 | ) | | | (0.22 | ) | |
| Net increase from operations | | | 1.02 | | | | 2.07 | | | | 2.53 | | | | 1.03 | | | | 2.05 | | | | 0.71 | | | | 0.07 | | | | 0.40 | | |
| Dividends from net investment income | | | (0.75 | ) | | | (0.76 | ) | | | (0.41 | ) | | | (0.75 | ) | | | (0.76 | ) | | | (0.80 | ) | | | (0.61 | ) | | | (0.60 | ) | |
| Distributions from net realized gains | | | (0.05 | ) | | | (0.06 | ) | | | — | | | | (0.05 | ) | | | (0.06 | ) | | | — | | | | (0.01 | ) | | | — | | |
| Return of capital | | | — | | | | — | | | | — | | | | — | | | | — | | | | — | | | | (0.02 | ) | | | — | | |
| Total dividends, distributions and return of capital | | | (0.80 | ) | | | (0.82 | ) | | | (0.41 | ) | | | (0.80 | ) | | | (0.82 | ) | | | (0.80 | ) | | | (0.64 | ) | | | (0.60 | ) | |
| Net asset value, end of period | | $ | 10.42 | | | $ | 10.20 | | | $ | 8.95 | | | $ | 10.41 | | | $ | 10.18 | | | $ | 8.95 | | | $ | 9.04 | | | $ | 9.61 | | |
| Total investment return3 | | | 10.24 | % | | | 23.82 | % | | | 38.23 | % | | | 10.30 | % | | | 23.60 | % | | | 9.87 | % | | | 0.71 | % | | | 3.96 | % | |
| Ratios to average net assets: | |
| Expenses before fee waivers and/or expense reimbursements by and recoupments to manager | | | 1.03 | % | | | 1.10 | % | | | 1.37 | %5 | | | 1.15 | % | | | 1.19 | % | | | 1.34 | % | | | 1.31 | % | | | 1.72 | % | |
| Expenses after fee waivers and/or expense reimbursements by and recoupments to manager | | | 1.05 | %4 | | | 1.10 | % | | | 1.10 | %5 | | | 1.10 | % | | | 1.10 | % | | | 1.10 | % | | | 1.10 | % | | | 1.10 | % | |
| Net investment income | | | 7.86 | % | | | 8.61 | % | | | 9.13 | %5 | | | 7.36 | % | | | 8.60 | % | | | 8.80 | % | | | 6.68 | % | | | 6.24 | % | |
| Supplemental data: | |
| Net assets, end of period (000's) | | $ | 385 | | | $ | 9 | | | $ | 7 | | | $ | 248,197 | | | $ | 209,650 | | | $ | 147,029 | | | $ | 142,985 | | | $ | 87,171 | | |
| Portfolio turnover | | | 36 | % | | | 30 | % | | | 49 | % | | | 36 | % | | | 30 | % | | | 49 | % | | | 25 | % | | | 26 | % | |
1 For the period January 21, 2009 (commencement of issuance) through July 31, 2009.
2 Calculated using the average shares method.
3 Total investment return is calculated assuming a $10,000 investment on the first day of each period reported, reinvestment of all dividends and other distributions, if any, at net asset value on the ex-dividend dates, and a sale at net asset value on the last day of each period reported. The figures do not include any applicable sales charges, redemption fees or program fees; results would be lower if they were included. Total investment return for periods of less than one year has not been annualized. Returns do not reflect the deduction of taxes that a shareholder would pay on Portfolio distributions or the redemption of Portfolio shares.
4 The investment manager recouped expenses previously reimbursed by the investment manager on behalf of the Portfolio, not to exceed the expense cap.
5 Annualized.
6 For the period December 26, 2008 (recommencement of issuance) through July 31, 2009.
274
See accompanying notes to financial statements.
275
PACE Select Advisors Trust
Financial highlights
PACE Large Co Value Equity Investments
Selected data for a share of beneficial interest outstanding throughout each year is presented below:
| | | Class A | |
| | | Years ended July 31, | |
| | | 2011 | | 2010 | | 2009 | | 20081 | | 2007 | |
| Net asset value, beginning of year | | $ | 14.76 | | | $ | 13.16 | | | $ | 16.67 | | | $ | 22.41 | | | $ | 22.35 | | |
| Net investment income (loss)2 | | | 0.16 | | | | 0.12 | | | | 0.19 | | | | 0.25 | | | | 0.23 | | |
| Net realized and unrealized gains (losses) | | | 2.31 | | | | 1.62 | | | | (3.44 | ) | | | (3.34 | ) | | | 2.80 | | |
| Net increase (decrease) from operations | | | 2.47 | | | | 1.74 | | | | (3.25 | ) | | | (3.09 | ) | | | 3.03 | | |
| Dividends from net investment income | | | (0.13 | ) | | | (0.14 | ) | | | (0.26 | ) | | | (0.11 | ) | | | (0.23 | ) | |
| Distributions from net realized gains | | | — | | | | — | | | | — | | | | (2.54 | ) | | | (2.74 | ) | |
| Total dividends and distributions | | | (0.13 | ) | | | (0.14 | ) | | | (0.26 | ) | | | (2.65 | ) | | | (2.97 | ) | |
| Net asset value, end of year | | $ | 17.10 | | | $ | 14.76 | | | $ | 13.16 | | | $ | 16.67 | | | $ | 22.41 | | |
| Total investment return4 | | | 16.79 | % | | | 13.20 | % | | | (19.27 | )% | | | (15.56 | )% | | | 13.94 | % | |
| Ratios to average net assets: | |
| Expenses before fee waivers and/or expense reimbursements by manager | | | 1.17 | % | | | 1.20 | % | | | 1.24 | % | | | 1.22 | % | | | 1.21 | % | |
| Expenses after fee waivers and/or expense reimbursements by manager | | | 1.17 | % | | | 1.20 | % | | | 1.24 | % | | | 1.09 | % | | | 1.08 | % | |
| Net investment income (loss) | | | 0.94 | % | | | 0.81 | % | | | 1.52 | % | | | 1.26 | % | | | 0.99 | % | |
| Supplemental data: | |
| Net assets, end of year (000's) | | $ | 147,471 | | | $ | 143,284 | | | $ | 146,510 | | | $ | 217,986 | | | $ | 291,942 | | |
| Portfolio turnover | | | 49 | % | | | 61 | % | | | 87 | % | | | 161 | % | | | 105 | % | |
| | | Class C | |
| | | Years ended July 31, | |
| | | 2011 | | 2010 | | 2009 | | 20081 | | 2007 | |
| Net asset value, beginning of year | | $ | 14.73 | | | $ | 13.15 | | | $ | 16.59 | | | $ | 22.36 | | | $ | 22.29 | | |
| Net investment income (loss)2 | | | 0.02 | | | | (0.00 | )3 | | | 0.09 | | | | 0.09 | | | | 0.05 | | |
| Net realized and unrealized gains (losses) | | | 2.32 | | | | 1.61 | | | | (3.41 | ) | | | (3.32 | ) | | | 2.80 | | |
| Net increase (decrease) from operations | | | 2.34 | | | | 1.61 | | | | (3.32 | ) | | | (3.23 | ) | | | 2.85 | | |
| Dividends from net investment income | | | — | | | | (0.03 | ) | | | (0.12 | ) | | | — | | | | (0.04 | ) | |
| Distributions from net realized gains | | | — | | | | — | | | | — | | | | (2.54 | ) | | | (2.74 | ) | |
| Total dividends and distributions | | | — | | | | (0.03 | ) | | | (0.12 | ) | | | (2.54 | ) | | | (2.78 | ) | |
| Net asset value, end of year | | $ | 17.07 | | | $ | 14.73 | | | $ | 13.15 | | | $ | 16.59 | | | $ | 22.36 | | |
| Total investment return4 | | | 15.81 | % | | | 12.31 | % | | | (19.89 | )% | | | (16.24 | )% | | | 13.11 | % | |
| Ratios to average net assets: | |
Expenses before fee waivers and/or expense reimbursements by
and recoupments to manager | | | 1.96 | % | | | 2.02 | % | | | 2.05 | % | | | 2.01 | % | | | 2.00 | % | |
Expenses after fee waivers and/or expense reimbursements by
and recoupments to manager | | | 1.98 | %5 | | | 2.02 | %5 | | | 2.02 | % | | | 1.88 | % | | | 1.86 | % | |
| Net investment income (loss) | | | 0.13 | % | | | (0.01 | )% | | | 0.74 | % | | | 0.47 | % | | | 0.21 | % | |
| Supplemental data: | |
| Net assets, end of year (000's) | | $ | 14,807 | | | $ | 15,272 | | | $ | 16,560 | | | $ | 24,765 | | | $ | 35,110 | | |
| Portfolio turnover | | | 49 | % | | | 61 | % | | | 87 | % | | | 161 | % | | | 105 | % | |
1 A portion of the investment advisory function for this Portfolio was transferred from SSgA Funds Management, Inc. to Pzena Investment Management, LLC on May 27, 2008. Institutional Capital LLC and Westwood Management Corp. continue to provide a portion of the investment advisory function.
2 Calculated using the average shares method.
3 Amount represents less than $0.005 per share.
4 Total investment return is calculated assuming a $10,000 investment on the first day of each year reported, reinvestment of all dividends and other distributions, if any, at net asset value on the ex-dividend dates, and a sale at net asset value on the last day of each year reported. The figures do not include any applicable sales charges or redemption fees; results would be lower if they were included. Returns do not reflect the deduction of taxes that a shareholder would pay on Portfolio distributions or the redemption of Portfolio shares.
5 The investment manager recouped expenses previously reimbursed by the investment manager on behalf of the Portfolio, not to exceed the expense cap.
276
| | | Class B | |
| | | Years ended July 31, | |
| | | 2011 | | 2010 | | 2009 | | 20081 | | 2007 | |
| Net asset value, beginning of year | | $ | 14.82 | | | $ | 13.20 | | | $ | 16.62 | | | $ | 22.43 | | | $ | 22.34 | | |
| Net investment income (loss)2 | | | 0.01 | | | | (0.00 | )3 | | | 0.09 | | | | 0.06 | | | | 0.04 | | |
| Net realized and unrealized gains (losses) | | | 2.33 | | | | 1.62 | | | | (3.41 | ) | | | (3.33 | ) | | | 2.79 | | |
| Net increase (decrease) from operations | | | 2.34 | | | | 1.62 | | | | (3.32 | ) | | | (3.27 | ) | | | 2.83 | | |
| Dividends from net investment income | | | — | | | | — | | | | (0.10 | ) | | | — | | | | — | | |
| Distributions from net realized gains | | | — | | | | — | | | | — | | | | (2.54 | ) | | | (2.74 | ) | |
| Total dividends and distributions | | | — | | | | — | | | | (0.10 | ) | | | (2.54 | ) | | | (2.74 | ) | |
| Net asset value, end of year | | $ | 17.16 | | | $ | 14.82 | | | $ | 13.20 | | | $ | 16.62 | | | $ | 22.43 | | |
| Total investment return4 | | | 15.78 | % | | | 12.35 | % | | | (19.92 | )% | | | (16.38 | )% | | | 13.00 | % | |
| Ratios to average net assets: | |
| Expenses before fee waivers and/or expense reimbursements by manager | | | 2.34 | % | | | 2.33 | % | | | 2.30 | % | | | 2.16 | % | | | 2.11 | % | |
| Expenses after fee waivers and/or expense reimbursements by manager | | | 2.02 | % | | | 2.02 | % | | | 2.02 | % | | | 2.02 | % | | | 1.98 | % | |
| Net investment income (loss) | | | 0.07 | % | | | (0.02 | )% | | | 0.76 | % | | | 0.29 | % | | | 0.18 | % | |
| Supplemental data: | |
| Net assets, end of year (000's) | | $ | 86 | | | $ | 165 | | | $ | 405 | | | $ | 765 | | | $ | 1,872 | | |
| Portfolio turnover | | | 49 | % | | | 61 | % | | | 87 | % | | | 161 | % | | | 105 | % | |
| | | Class Y | |
| | | Years ended July 31, | |
| | | 2011 | | 2010 | | 2009 | | 20081 | | 2007 | |
| Net asset value, beginning of year | | $ | 14.81 | | | $ | 13.21 | | | $ | 16.75 | | | $ | 22.51 | | | $ | 22.45 | | |
| Net investment income (loss)2 | | | 0.20 | | | | 0.16 | | | | 0.23 | | | | 0.32 | | | | 0.30 | | |
| Net realized and unrealized gains (losses) | | | 2.31 | | | | 1.63 | | | | (3.45 | ) | | | (3.35 | ) | | | 2.82 | | |
| Net increase (decrease) from operations | | | 2.51 | | | | 1.79 | | | | (3.22 | ) | | | (3.03 | ) | | | 3.12 | | |
| Dividends from net investment income | | | (0.17 | ) | | | (0.19 | ) | | | (0.32 | ) | | | (0.19 | ) | | | (0.32 | ) | |
| Distributions from net realized gains | | | — | | | | — | | | | — | | | | (2.54 | ) | | | (2.74 | ) | |
| Total dividends and distributions | | | (0.17 | ) | | | (0.19 | ) | | | (0.32 | ) | | | (2.73 | ) | | | (3.06 | ) | |
| Net asset value, end of year | | $ | 17.15 | | | $ | 14.81 | | | $ | 13.21 | | | $ | 16.75 | | | $ | 22.51 | | |
| Total investment return4 | | | 17.00 | % | | | 13.55 | % | | | (18.93 | )% | | | (15.30 | )% | | | 14.36 | % | |
| Ratios to average net assets: | |
Expenses before fee waivers and/or expense reimbursements by
and recoupments to manager | | | 0.94 | % | | | 0.89 | % | | | 0.86 | % | | | 0.89 | % | | | 0.88 | % | |
Expenses after fee waivers and/or expense reimbursements by
and recoupments to manager | | | 0.94 | % | | | 0.89 | % | | | 0.86 | % | | | 0.76 | % | | | 0.74 | % | |
| Net investment income (loss) | | | 1.17 | % | | | 1.11 | % | | | 1.90 | % | | | 1.59 | % | | | 1.32 | % | |
| Supplemental data: | |
| Net assets, end of year (000's) | | $ | 16,984 | | | $ | 17,345 | | | $ | 23,834 | | | $ | 33,809 | | | $ | 45,177 | | |
| Portfolio turnover | | | 49 | % | | | 61 | % | | | 87 | % | | | 161 | % | | | 105 | % | |
See accompanying notes to financial statements.
277
PACE Select Advisors Trust
Financial highlights
PACE Large Co Value Equity Investments (concluded)
Selected data for a share of beneficial interest outstanding throughout each year is presented below:
| | | Class P | |
| | | Years ended July 31, | |
| | | 2011 | | 2010 | | 2009 | | 20081 | | 2007 | |
| Net asset value, beginning of year | | $ | 14.76 | | | $ | 13.16 | | | $ | 16.69 | | | $ | 22.44 | | | $ | 22.38 | | |
| Net investment income2 | | | 0.20 | | | | 0.16 | | | | 0.22 | | | | 0.30 | | | | 0.28 | | |
| Net realized and unrealized gains (losses) | | | 2.31 | | | | 1.61 | | | | (3.44 | ) | | | (3.34 | ) | | | 2.82 | | |
| Net increase (decrease) from operations | | | 2.51 | | | | 1.77 | | | | (3.22 | ) | | | (3.04 | ) | | | 3.10 | | |
| Dividends from net investment income | | | (0.17 | ) | | | (0.17 | ) | | | (0.31 | ) | | | (0.17 | ) | | | (0.30 | ) | |
| Distributions from net realized gains | | | — | | | | — | | | | — | | | | (2.54 | ) | | | (2.74 | ) | |
| Total dividends and distributions | | | (0.17 | ) | | | (0.17 | ) | | | (0.31 | ) | | | (2.71 | ) | | | (3.04 | ) | |
| Net asset value, end of year | | $ | 17.10 | | | $ | 14.76 | | | $ | 13.16 | | | $ | 16.69 | | | $ | 22.44 | | |
| Total investment return3 | | | 17.07 | % | | | 13.48 | % | | | (19.01 | )% | | | (15.39 | )% | | | 14.26 | % | |
| Ratios to average net assets: | |
| Expenses before fee waivers and/or expense reimbursements by manager | | | 0.93 | % | | | 0.95 | % | | | 0.99 | % | | | 0.98 | % | | | 0.96 | % | |
| Expenses after fee waivers and/or expense reimbursements by manager | | | 0.93 | % | | | 0.95 | % | | | 0.99 | % | | | 0.85 | % | | | 0.83 | % | |
| Net investment income | | | 1.18 | % | | | 1.05 | % | | | 1.76 | % | | | 1.51 | % | | | 1.23 | % | |
| Supplemental data: | |
| Net assets, end of year (000's) | | $ | 1,020,412 | | | $ | 899,926 | | | $ | 819,420 | | | $ | 1,159,915 | | | $ | 1,306,425 | | |
| Portfolio turnover | | | 49 | % | | | 61 | % | | | 87 | % | | | 161 | % | | | 105 | % | |
1 A portion of the investment advisory function for this Portfolio was transferred from SSgA Funds Management, Inc. to Pzena Investment Management, LLC on May 27, 2008. Institutional Capital LLC and Westwood Management Corp. continue to provide a portion of the investment advisory function.
2 Calculated using the average shares method.
3 Total investment return is calculated assuming a $10,000 investment on the first day of each year reported, reinvestment of all dividends and other distributions, if any, at net asset value on the ex-dividend dates, and a sale at net asset value on the last day of each year reported. The figures do not include any applicable program or redemption fees; results would be lower if they were included. Returns do not reflect the deduction of taxes that a shareholder would pay on Portfolio distributions or the redemption of Portfolio shares.
See accompanying notes to financial statements.
278
This page intentionally left blank.
279
PACE Select Advisors Trust
Financial highlights
PACE Large Co Growth Equity Investments
Selected data for a share of beneficial interest outstanding throughout each year is presented below:
| | | Class A | |
| | | Years ended July 31, | |
| | | 20111 | | 20102 | | 2009 | | 20083 | | 20074 | |
| Net asset value, beginning of year | | $ | 14.95 | | | $ | 13.36 | | | $ | 16.67 | | | $ | 18.18 | | | $ | 15.75 | | |
| Net investment income (loss)5 | | | (0.00 | )6 | | | (0.01 | ) | | | 0.03 | | | | 0.006 | | | | (0.02 | ) | |
| Net realized and unrealized gains (losses) | | | 3.67 | | | | 1.63 | | | | (3.27 | ) | | | (1.03 | ) | | | 2.45 | | |
| Net increase (decrease) from operations | | | 3.67 | | | | 1.62 | | | | (3.24 | ) | | | (1.03 | ) | | | 2.43 | | |
| Dividends from net investment income | | | — | | | | (0.03 | ) | | | — | | | | — | | | | — | | |
| Distributions from net realized gains | | | — | | | | — | | | | (0.07 | ) | | | (0.48 | ) | | | — | | |
| Total dividends and distributions | | | — | | | | (0.03 | ) | | | (0.07 | ) | | | (0.48 | ) | | | — | | |
| Net asset value, end of year | | $ | 18.62 | | | $ | 14.95 | | | $ | 13.36 | | | $ | 16.67 | | | $ | 18.18 | | |
| Total investment return7 | | | 24.55 | % | | | 12.12 | % | | | (19.39 | )% | | | (5.94 | )% | | | 15.43 | % | |
| Ratios to average net assets: | |
| Expenses before fee waivers and/or expense reimbursements by manager | | | 1.23 | % | | | 1.26 | % | | | 1.30 | % | | | 1.25 | % | | | 1.25 | % | |
| Expenses after fee waivers and/or expense reimbursements by manager | | | 1.22 | % | | | 1.23 | % | | | 1.26 | % | | | 1.20 | % | | | 1.20 | % | |
| Net investment income (loss) | | | (0.02 | )% | | | (0.08 | )% | | | 0.21 | % | | | 0.00 | %8 | | | (0.10 | )% | |
| Supplemental data: | |
| Net assets, end of year (000's) | | $ | 64,315 | | | $ | 55,978 | | | $ | 56,038 | | | $ | 77,628 | | | $ | 80,334 | | |
| Portfolio turnover | | | 84 | % | | | 91 | % | | | 100 | % | | | 120 | % | | | 95 | % | |
| | | Class C | |
| | | Years ended July 31, | |
| | | 20111 | | 20102 | | 2009 | | 20083 | | 20074 | |
| Net asset value, beginning of year | | $ | 13.84 | | | $ | 12.45 | | | $ | 15.66 | | | $ | 17.26 | | | $ | 15.08 | | |
| Net investment income (loss)5 | | | (0.14 | ) | | | (0.12 | ) | | | (0.07 | ) | | | (0.14 | ) | | | (0.16 | ) | |
| Net realized and unrealized gains (losses) | | | 3.40 | | | | 1.51 | | | | (3.07 | ) | | | (0.98 | ) | | | 2.34 | | |
| Net increase (decrease) from operations | | | 3.26 | | | | 1.39 | | | | (3.14 | ) | | | (1.12 | ) | | | 2.18 | | |
| Dividends from net investment income | | | — | | | | — | | | | — | | | | — | | | | — | | |
| Distributions from net realized gains | | | — | | | | — | | | | (0.07 | ) | | | (0.48 | ) | | | — | | |
| Total dividends and distributions | | | — | | | | — | | | | (0.07 | ) | | | (0.48 | ) | | | — | | |
| Net asset value, end of year | | $ | 17.10 | | | $ | 13.84 | | | $ | 12.45 | | | $ | 15.66 | | | $ | 17.26 | | |
| Total investment return7 | | | 23.47 | % | | | 11.24 | % | | | (20.00 | )% | | | (6.80 | )% | | | 14.46 | % | |
| Ratios to average net assets: | |
| Expenses before fee waivers and/or expense reimbursements by and recoupments to manager | | | 2.07 | % | | | 2.13 | % | | | 2.20 | % | | | 2.09 | % | | | 2.09 | % | |
| Expenses after fee waivers and/or expense reimbursements by and recoupments to manager | | | 2.05 | % | | | 2.05 | % | | | 2.05 | % | | | 2.04 | %9 | | | 2.05 | %9 | |
| Net investment income (loss) | | | (0.84 | )% | | | (0.90 | )% | | | (0.57 | )% | | | (0.84 | )% | | | (0.95 | )% | |
| Supplemental data: | |
| Net assets, end of year (000's) | | $ | 4,209 | | | $ | 3,956 | | | $ | 4,170 | | | $ | 6,120 | | | $ | 7,488 | | |
| Portfolio turnover | | | 84 | % | | | 91 | % | | | 100 | % | | | 120 | % | | | 95 | % | |
1 A portion of the investment advisory function for this Portfolio was transferred from SSgA Funds Management, Inc. to Roxbury Capital Management, LLC and Delaware Management Company at the close of business on November 29, 2010. Marsico Capital Management, LLC and Wellington Management Company, LLP also continue to provide a portion of the investment advisory function.
2 A portion of the investment advisory function for this Portfolio was transferred to Roxbury Capital Management, LLC on May 25, 2010.
3 A portion of the investment advisory function for this Portfolio was transferred to Delaware Management Company on December 5, 2007.
4 A portion of the investment advisory function for this Portfolio was transferred from GE Asset Management, Inc. to Wellington Management Company, LLP on June 1, 2007.
5 Calculated using the average shares method.
6 Amount represents less than $0.005 per share.
280
| | | Class B | |
| | | Years ended July 31, | |
| | | 20111 | | 20102 | | 2009 | | 20083 | | 20074 | |
| Net asset value, beginning of year | | $ | 13.80 | | | $ | 12.41 | | | $ | 15.62 | | | $ | 17.22 | | | $ | 15.05 | | |
| Net investment income (loss)5 | | | (0.13 | ) | | | (0.11 | ) | | | (0.07 | ) | | | (0.14 | ) | | | (0.15 | ) | |
| Net realized and unrealized gains (losses) | | | 3.39 | | | | 1.50 | | | | (3.07 | ) | | | (0.98 | ) | | | 2.32 | | |
| Net increase (decrease) from operations | | | 3.26 | | | | 1.39 | | | | (3.14 | ) | | | (1.12 | ) | | | 2.17 | | |
| Dividends from net investment income | | | — | | | | — | | | | — | | | | — | | | | — | | |
| Distributions from net realized gains | | | — | | | | — | | | | (0.07 | ) | | | (0.48 | ) | | | — | | |
| Total dividends and distributions | | | — | | | | — | | | | (0.07 | ) | | | (0.48 | ) | | | — | | |
| Net asset value, end of year | | $ | 17.06 | | | $ | 13.80 | | | $ | 12.41 | | | $ | 15.62 | | | $ | 17.22 | | |
| Total investment return7 | | | 23.53 | % | | | 11.28 | % | | | (20.05 | )% | | | (6.81 | )% | | | 14.42 | % | |
| Ratios to average net assets: | |
| Expenses before fee waivers and/or expense reimbursements by manager | | | 2.34 | % | | | 2.37 | % | | | 2.32 | % | | | 2.24 | % | | | 2.24 | % | |
| Expenses after fee waivers and/or expense reimbursements by manager | | | 2.05 | % | | | 2.05 | % | | | 2.05 | % | | | 2.05 | % | | | 2.05 | % | |
| Net investment income (loss) | | | (0.83 | )% | | | (0.87 | )% | | | (0.58 | )% | | | (0.85 | )% | | | (0.90 | )% | |
| Supplemental data: | |
| Net assets, end of year (000's) | | $ | 69 | | | $ | 86 | | | $ | 199 | | | $ | 371 | | | $ | 643 | | |
| Portfolio turnover | | | 84 | % | | | 91 | % | | | 100 | % | | | 120 | % | | | 95 | % | |
| | | Class Y | |
| | | Years ended July 31, | |
| | | 20111 | | 20102 | | 2009 | | 20083 | | 20074 | |
| Net asset value, beginning of year | | $ | 15.29 | | | $ | 13.67 | | | $ | 17.03 | | | $ | 18.54 | | | $ | 16.05 | | |
| Net investment income (loss)5 | | | 0.04 | | | | 0.04 | | | | 0.08 | | | | 0.07 | | | | 0.05 | | |
| Net realized and unrealized gains (losses) | | | 3.75 | | | | 1.67 | | | | (3.34 | ) | | | (1.05 | ) | | | 2.49 | | |
| Net increase (decrease) from operations | | | 3.79 | | | | 1.71 | | | | (3.26 | ) | | | (0.98 | ) | | | 2.54 | | |
| Dividends from net investment income | | | (0.03 | ) | | | (0.09 | ) | | | (0.03 | ) | | | (0.05 | ) | | | (0.05 | ) | |
| Distributions from net realized gains | | | — | | | | — | | | | (0.07 | ) | | | (0.48 | ) | | | — | | |
| Total dividends and distributions | | | (0.03 | ) | | | (0.09 | ) | | | (0.10 | ) | | | (0.53 | ) | | | (0.05 | ) | |
| Net asset value, end of year | | $ | 19.05 | | | $ | 15.29 | | | $ | 13.67 | | | $ | 17.03 | | | $ | 18.54 | | |
| Total investment return7 | | | 24.83 | % | | | 12.49 | % | | | (19.04 | )% | | | (5.64 | )% | | | 15.90 | % | |
| Ratios to average net assets: | |
| Expenses before fee waivers and/or expense reimbursements by and recoupments to manager | | | 0.99 | % | | | 0.94 | % | | | 0.88 | % | | | 0.87 | % | | | 0.86 | % | |
| Expenses after fee waivers and/or expense reimbursements by and recoupments to manager | | | 0.98 | % | | | 0.91 | % | | | 0.84 | % | | | 0.82 | % | | | 0.82 | % | |
| Net investment income (loss) | | | 0.22 | % | | | 0.25 | % | | | 0.63 | % | | | 0.38 | % | | | 0.27 | % | |
| Supplemental data: | |
| Net assets, end of year (000's) | | $ | 13,858 | | | $ | 12,619 | | | $ | 16,885 | | | $ | 23,263 | | | $ | 26,125 | | |
| Portfolio turnover | | | 84 | % | | | 91 | % | | | 100 | % | | | 120 | % | | | 95 | % | |
7 Total investment return is calculated assuming a $10,000 investment on the first day of each year reported, reinvestment of all dividends and other distributions, if any, at net asset value on the ex-dividend dates, and a sale at net asset value on the last day of each year reported. The figures do not include any applicable sales charges or redemption fees; results would be lower if they were included. Returns do not reflect the deduction of taxes that a shareholder would pay on Portfolio distributions or the redemption of Portfolio shares.
8 Amount represents less than 0.005%.
9 The investment manager recouped expenses previously reimbursed by the investment manager on behalf of the Portfolio, not to exceed the expense cap.
See accompanying notes to financial statements.
281
PACE Select Advisors Trust
Financial highlights
PACE Large Co Growth Equity Investments (concluded)
Selected data for a share of beneficial interest outstanding throughout each year is presented below:
| | | Class P | |
| | | Years ended July 31, | |
| | | 20111 | | 20102 | | 2009 | | 20083 | | 20074 | |
| Net asset value, beginning of year | | $ | 15.21 | | | $ | 13.59 | | | $ | 16.94 | | | $ | 18.45 | | | $ | 15.97 | | |
| Net investment income5 | | | 0.04 | | | | 0.03 | | | | 0.06 | | | | 0.05 | | | | 0.03 | | |
| Net realized and unrealized gains (losses) | | | 3.75 | | | | 1.66 | | | | (3.32 | ) | | | (1.04 | ) | | | 2.49 | | |
| Net increase (decrease) from operations | | | 3.79 | | | | 1.69 | | | | (3.26 | ) | | | (0.99 | ) | | | 2.52 | | |
| Dividends from net investment income | | | (0.03 | ) | | | (0.07 | ) | | | (0.02 | ) | | | (0.04 | ) | | | (0.04 | ) | |
| Distributions from net realized gains | | | — | | | | — | | | | (0.07 | ) | | | (0.48 | ) | | | — | | |
| Total dividends and distributions | | | (0.03 | ) | | | (0.07 | ) | | | (0.09 | ) | | | (0.52 | ) | | | (0.04 | ) | |
| Net asset value, end of year | | $ | 18.97 | | | $ | 15.21 | | | $ | 13.59 | | | $ | 16.94 | | | $ | 18.45 | | |
| Total investment return6 | | | 24.92 | % | | | 12.42 | % | | | (19.19 | )% | | | (5.68 | )% | | | 15.76 | % | |
| Ratios to average net assets: | |
| Expenses before fee waivers and/or expense reimbursements by manager | | | 0.97 | % | | | 0.99 | % | | | 1.01 | % | | | 0.96 | % | | | 0.95 | % | |
| Expenses after fee waivers and/or expense reimbursements by manager | | | 0.96 | % | | | 0.96 | % | | | 0.97 | % | | | 0.91 | % | | | 0.91 | % | |
| Net investment income | | | 0.24 | % | | | 0.19 | % | | | 0.50 | % | | | 0.29 | % | | | 0.17 | % | |
| Supplemental data: | |
| Net assets, end of year (000's) | | $ | 1,068,052 | | | $ | 895,889 | | | $ | 822,192 | | | $ | 1,230,206 | | | $ | 1,231,468 | | |
| Portfolio turnover | | | 84 | % | | | 91 | % | | | 100 | % | | | 120 | % | | | 95 | % | |
1 A portion of the investment advisory function for this Portfolio was transferred from SSgA Funds Management, Inc. to Roxbury Capital Management, LLC and Delaware Management Company at the close of business on November 29, 2010. Marsico Capital Management, LLC and Wellington Management Company, LLP also continue to provide a portion of the investment advisory function.
2 A portion of the investment advisory function for this Portfolio was transferred to Roxbury Capital Management, LLC on May 25, 2010.
3 A portion of the investment advisory function for this Portfolio was transferred to Delaware Management Company on December 5, 2007.
4 A portion of the investment advisory function for this Portfolio was transferred from GE Asset Management, Inc. to Wellington Management Company, LLP on June 1, 2007.
5 Calculated using the average shares method.
6 Total investment return is calculated assuming a $10,000 investment on the first day of each year reported, reinvestment of all dividends and other distributions, if any, at net asset value on the ex-dividend dates, and a sale at net asset value on the last day of each year reported. The figures do not include any applicable program or redemption fees; results would be lower if they were included. Returns do not reflect the deduction of taxes that a shareholder would pay on Portfolio distributions or the redemption of Portfolio shares.
See accompanying notes to financial statements.
282
This page intentionally left blank.
283
PACE Select Advisors Trust
Financial highlights
PACE Small/Medium Co Value Equity Investments
Selected data for a share of beneficial interest outstanding throughout each year is presented below:
| | | Class A | |
| | | Years ended July 31, | |
| | | 2011 | | 2010 | | 20091 | | 2008 | | 2007 | |
| Net asset value, beginning of year | | $ | 14.28 | | | $ | 11.99 | | | $ | 14.27 | | | $ | 19.29 | | | $ | 17.07 | | |
| Net investment income (loss)2 | | | (0.03 | ) | | | (0.01 | ) | | | 0.05 | | | | 0.06 | | | | 0.01 | | |
| Net realized and unrealized gains (losses) | | | 2.80 | | | | 2.31 | | | | (2.25 | ) | | | (3.01 | ) | | | 2.97 | | |
| Net increase (decrease) from operations | | | 2.77 | | | | 2.30 | | | | (2.20 | ) | | | (2.95 | ) | | | 2.98 | | |
| Dividends from net investment income | | | — | | | | (0.01 | ) | | | (0.08 | ) | | | (0.00 | )3 | | | — | | |
| Distributions from net realized gains | | | — | | | | — | | | | (0.00 | )3 | | | (2.07 | ) | | | (0.76 | ) | |
| Total dividends and distributions | | | — | | | | (0.01 | ) | | | (0.08 | ) | | | (2.07 | ) | | | (0.76 | ) | |
| Net asset value, end of year | | $ | 17.05 | | | $ | 14.28 | | | $ | 11.99 | | | $ | 14.27 | | | $ | 19.29 | | |
| Total investment return4 | | | 19.40 | % | | | 19.17 | % | | | (15.29 | )% | | | (16.25 | )% | | | 17.70 | % | |
| Ratios to average net assets: | |
| Expenses before fee waivers and/or expense reimbursements by manager | | | 1.29 | % | | | 1.35 | % | | | 1.39 | % | | | 1.29 | % | | | 1.27 | % | |
| Expenses after fee waivers and/or expense reimbursements by manager | | | 1.29 | % | | | 1.35 | % | | | 1.38 | % | | | 1.29 | % | | | 1.27 | % | |
| Net investment income (loss) | | | (0.18 | )% | | | (0.05 | )% | | | 0.44 | % | | | 0.34 | % | | | 0.05 | % | |
| Supplemental data: | |
| Net assets, end of year (000's) | | $ | 32,166 | | | $ | 27,920 | | | $ | 24,661 | | | $ | 37,185 | | | $ | 47,845 | | |
| Portfolio turnover | | | 70 | % | | | 81 | % | | | 111 | % | | | 43 | % | | | 59 | % | |
| | | Class C | |
| | | Years ended July 31, | |
| | | 2011 | | 2010 | | 20091 | | 2008 | | 2007 | |
| Net asset value, beginning of year | | $ | 13.10 | | | $ | 11.07 | | | $ | 13.18 | | | $ | 18.12 | | | $ | 16.19 | | |
| Net investment income (loss)2 | | | (0.14 | ) | | | (0.10 | ) | | | (0.03 | ) | | | (0.06 | ) | | | (0.13 | ) | |
| Net realized and unrealized gains (losses) | | | 2.57 | | | | 2.13 | | | | (2.08 | ) | | | (2.81 | ) | | | 2.82 | | |
| Net increase (decrease) from operations | | | 2.43 | | | | 2.03 | | | | (2.11 | ) | | | (2.87 | ) | | | 2.69 | | |
| Dividends from net investment income | | | — | | | | — | | | | — | | | | — | | | | — | | |
| Distributions from net realized gains | | | — | | | | — | | | | (0.00 | )3 | | | (2.07 | ) | | | (0.76 | ) | |
| Total dividends and distributions | | | — | | | | — | | | | (0.00 | )3 | | | (2.07 | ) | | | (0.76 | ) | |
| Net asset value, end of year | | $ | 15.53 | | | $ | 13.10 | | | $ | 11.07 | | | $ | 13.18 | | | $ | 18.12 | | |
| Total investment return4 | | | 18.55 | % | | | 18.34 | % | | | (15.98 | )% | | | (16.93 | )% | | | 16.85 | % | |
| Ratios to average net assets: | |
| Expenses before fee waivers and/or expense reimbursements by manager | | | 2.05 | % | | | 2.11 | % | | | 2.15 | % | | | 2.06 | % | | | 2.04 | % | |
| Expenses after fee waivers and/or expense reimbursements by manager | | | 2.05 | % | | | 2.11 | % | | | 2.14 | % | | | 2.06 | % | | | 2.04 | % | |
| Net investment income (loss) | | | (0.93 | )% | | | (0.80 | )% | | | (0.32 | )% | | | (0.42 | )% | | | (0.71 | )% | |
| Supplemental data: | |
| Net assets, end of year (000's) | | $ | 5,109 | | | $ | 5,178 | | | $ | 5,603 | | | $ | 8,400 | | | $ | 11,964 | | |
| Portfolio turnover | | | 70 | % | | | 81 | % | | | 111 | % | | | 43 | % | | | 59 | % | |
1 A portion of the investment advisory function for this Portfolio was transferred to Buckhead Capital Management, LLC and Systematic Financial Management, L.P. on May 28, 2009. Ariel Investments, LLC and Opus Capital Group, LLC ceased serving as investment advisors for the Portfolio effective May 29, 2009. Metropolitan West Capital Management, LLC continues to provide a portion of the investment advisory function.
2 Calculated using the average shares method.
3 Amount represents less than $0.005 per share.
4 Total investment return is calculated assuming a $10,000 investment on the first day of each year reported, reinvestment of all dividends and other distributions, if any, at net asset value on the ex-dividend dates, and a sale at net asset value on the last day of each year reported. The figures do not include any applicable sales charges or redemption fees; results would be lower if they were included. Returns do not reflect the deduction of taxes that a shareholder would pay on Portfolio distributions or the redemption of Portfolio shares.
284
| | | Class B | |
| | | Years ended July 31, | |
| | | 2011 | | 2010 | | 20091 | | 2008 | | 2007 | |
| Net asset value, beginning of year | | $ | 13.03 | | | $ | 11.02 | | | $ | 13.12 | | | $ | 18.06 | | | $ | 16.15 | | |
| Net investment income (loss)2 | | | (0.11 | ) | | | (0.10 | ) | | | (0.02 | ) | | | (0.08 | ) | | | (0.14 | ) | |
| Net realized and unrealized gains (losses) | | | 2.51 | | | | 2.11 | | | | (2.08 | ) | | | (2.79 | ) | | | 2.81 | | |
| Net increase (decrease) from operations | | | 2.40 | | | | 2.01 | | | | (2.10 | ) | | | (2.87 | ) | | | 2.67 | | |
| Dividends from net investment income | | | — | | | | — | | | | — | | | | — | | | | — | | |
| Distributions from net realized gains | | | — | | | | — | | | | (0.00 | )3 | | | (2.07 | ) | | | (0.76 | ) | |
| Total dividends and distributions | | | — | | | | — | | | | (0.00 | )3 | | | (2.07 | ) | | | (0.76 | ) | |
| Net asset value, end of year | | $ | 15.43 | | | $ | 13.03 | | | $ | 11.02 | | | $ | 13.12 | | | $ | 18.06 | | |
| Total investment return4 | | | 18.70 | % | | | 18.31 | % | | | (15.90 | )% | | | (16.99 | )% | | | 16.77 | % | |
| Ratios to average net assets: | |
| Expenses before fee waivers and/or expense reimbursements by manager | | | 2.29 | % | | | 2.37 | % | | | 2.47 | % | | | 2.20 | % | | | 2.13 | % | |
| Expenses after fee waivers and/or expense reimbursements by manager | | | 2.16 | % | | | 2.16 | % | | | 2.16 | % | | | 2.16 | % | | | 2.13 | % | |
| Net investment income (loss) | | | (0.92 | )% | | | (0.81 | )% | | | (0.25 | )% | | | (0.53 | )% | | | (0.80 | )% | |
| Supplemental data: | |
| Net assets, end of year (000's) | | $ | 2 | | | $ | 57 | | | $ | 97 | | | $ | 333 | | | $ | 1,006 | | |
| Portfolio turnover | | | 70 | % | | | 81 | % | | | 111 | % | | | 43 | % | | | 59 | % | |
| | | Class Y | |
| | | Years ended July 31, | |
| | | 2011 | | 2010 | | 20091 | | 2008 | | 2007 | |
| Net asset value, beginning of year | | $ | 14.63 | | | $ | 12.29 | | | $ | 14.64 | | | $ | 19.73 | | | $ | 17.39 | | |
| Net investment income (loss)2 | | | 0.01 | | | | 0.07 | | | | 0.09 | | | | 0.11 | | | | 0.07 | | |
| Net realized and unrealized gains (losses) | | | 2.88 | | | | 2.32 | | | | (2.31 | ) | | | (3.07 | ) | | | 3.03 | | |
| Net increase (decrease) from operations | | | 2.89 | | | | 2.39 | | | | (2.22 | ) | | | (2.96 | ) | | | 3.10 | | |
| Dividends from net investment income | | | (0.01 | ) | | | (0.05 | ) | | | (0.13 | ) | | | (0.06 | ) | | | — | | |
| Distributions from net realized gains | | | — | | | | — | | | | (0.00 | )3 | | | (2.07 | ) | | | (0.76 | ) | |
| Total dividends and distributions | | | (0.01 | ) | | | (0.05 | ) | | | (0.13 | ) | | | (2.13 | ) | | | (0.76 | ) | |
| Net asset value, end of year | | $ | 17.51 | | | $ | 14.63 | | | $ | 12.29 | | | $ | 14.64 | | | $ | 19.73 | | |
| Total investment return4 | | | 19.74 | % | | | 19.50 | % | | | (14.92 | )% | | | (15.95 | )% | | | 18.07 | % | |
| Ratios to average net assets: | |
| Expenses before fee waivers and/or expense reimbursements by manager | | | 1.08 | % | | | 0.97 | % | | | 0.98 | % | | | 0.95 | % | | | 0.94 | % | |
| Expenses after fee waivers and/or expense reimbursements by manager | | | 1.08 | % | | | 0.97 | % | | | 0.97 | % | | | 0.95 | % | | | 0.94 | % | |
| Net investment income (loss) | | | 0.03 | % | | | 0.47 | % | | | 0.85 | % | | | 0.68 | % | | | 0.37 | % | |
| Supplemental data: | |
| Net assets, end of year (000's) | | $ | 371 | | | $ | 318 | | | $ | 3,255 | | | $ | 4,443 | | | $ | 5,980 | | |
| Portfolio turnover | | | 70 | % | | | 81 | % | | | 111 | % | | | 43 | % | | | 59 | % | |
See accompanying notes to financial statements.
285
PACE Select Advisors Trust
Financial highlights
PACE Small/Medium Co Value Equity Investments (concluded)
Selected data for a share of beneficial interest outstanding throughout each year is presented below:
| | | Class P | |
| | | Years ended July 31, | |
| | | 2011 | | 2010 | | 20091 | | 2008 | | 2007 | |
| Net asset value, beginning of year | | $ | 14.53 | | | $ | 12.20 | | | $ | 14.53 | | | $ | 19.60 | | | $ | 17.31 | | |
| Net investment income (loss)2 | | | (0.01 | ) | | | 0.02 | | | | 0.07 | | | | 0.08 | | | | 0.03 | | |
| Net realized and unrealized gains (losses) | | | 2.87 | | | | 2.34 | | | | (2.30 | ) | | | (3.05 | ) | | | 3.02 | | |
| Net increase (decrease) from operations | | | 2.86 | | | | 2.36 | | | | (2.23 | ) | | | (2.97 | ) | | | 3.05 | | |
| Dividends from net investment income | | | (0.01 | ) | | | (0.03 | ) | | | (0.10 | ) | | | (0.03 | ) | | | — | | |
| Distributions from net realized gains | | | — | | | | — | | | | (0.00 | )3 | | | (2.07 | ) | | | (0.76 | ) | |
| Total dividends and distributions | | | (0.01 | ) | | | (0.03 | ) | | | (0.10 | ) | | | (2.10 | ) | | | (0.76 | ) | |
| Net asset value, end of year | | $ | 17.38 | | | $ | 14.53 | | | $ | 12.20 | | | $ | 14.53 | | | $ | 19.60 | | |
| Total investment return4 | | | 19.66 | % | | | 19.38 | % | | | (15.14 | )% | | | (16.13 | )% | | | 17.86 | % | |
| Ratios to average net assets: | |
Expenses before fee waivers and/or expense reimbursements by
and recoupments to manager | | | 1.17 | % | | | 1.25 | % | | | 1.32 | % | | | 1.18 | % | | | 1.16 | % | |
Expenses after fee waivers and/or expense reimbursements by
and recoupments to manager | | | 1.16 | % | | | 1.16 | % | | | 1.16 | % | | | 1.16 | % | | | 1.16 | %5 | |
| Net investment income (loss) | | | (0.05 | )% | | | 0.14 | % | | | 0.66 | % | | | 0.48 | % | | | 0.16 | % | |
| Supplemental data: | |
| Net assets, end of year (000's) | | $ | 387,634 | | | $ | 345,494 | | | $ | 310,059 | | | $ | 428,819 | | | $ | 483,873 | | |
| Portfolio turnover | | | 70 | % | | | 81 | % | | | 111 | % | | | 43 | % | | | 59 | % | |
1 A portion of the investment advisory function for this Portfolio was transferred to Buckhead Capital Management, LLC and Systematic Financial Management, L.P. on May 28, 2009. Ariel Investments, LLC and Opus Capital Group, LLC ceased serving as investment advisors for the Portfolio effective May 29, 2009. Metropolitan West Capital Management, LLC continues to provide a portion of the investment advisory function.
2 Calculated using the average shares method.
3 Amount represents less than $0.005 per share.
4 Total investment return is calculated assuming a $10,000 investment on the first day of each year reported, reinvestment of all dividends and other distributions, if any, at net asset value on the ex-dividend dates, and a sale at net asset value on the last day of each year reported. The figures do not include any applicable program or redemption fees; results would be lower if they were included. Returns do not reflect the deduction of taxes that a shareholder would pay on Portfolio distributions or the redemption of Portfolio shares.
5 The investment manager recouped expenses previously reimbursed by the investment manager on behalf of the Portfolio, not to exceed the expense cap.
See accompanying notes to financial statements.
286
This page intentionally left blank.
287
PACE Select Advisors Trust
Financial highlights
PACE Small/Medium Co Growth Equity Investments
Selected data for a share of beneficial interest outstanding throughout each year is presented below:
| | | Class A | |
| | | Years ended July 31, | |
| | | 2011 | | 2010 | | 20091 | | 2008 | | 20072 | |
| Net asset value, beginning of year | | $ | 12.28 | | | $ | 10.63 | | | $ | 13.06 | | | $ | 17.30 | | | $ | 14.45 | | |
| Net investment loss3 | | | (0.13 | ) | | | (0.09 | ) | | | (0.05 | ) | | | (0.11 | ) | | | (0.12 | ) | |
| Net realized and unrealized gains (losses) | | | 4.51 | | | | 1.74 | | | | (2.38 | ) | | | (1.53 | ) | | | 3.40 | | |
| Net increase (decrease) from operations | | | 4.38 | | | | 1.65 | | | | (2.43 | ) | | | (1.64 | ) | | | 3.28 | | |
| Distributions from net realized gains | | | — | | | | — | | | | — | | | | (2.60 | ) | | | (0.43 | ) | |
| Net asset value, end of year | | $ | 16.66 | | | $ | 12.28 | | | $ | 10.63 | | | $ | 13.06 | | | $ | 17.30 | | |
| Total investment return4 | | | 35.67 | % | | | 15.52 | % | | | (18.61 | )% | | | (11.39 | )% | | | 23.00 | % | |
| Ratios to average net assets: | |
| Expenses before fee waivers and/or expense reimbursements by and recoupments to manager | | | 1.28 | % | | | 1.35 | % | | | 1.40 | % | | | 1.31 | % | | | 1.30 | % | |
| Expenses after fee waivers and/or expense reimbursements by and recoupments to manager | | | 1.28 | % | | | 1.35 | %5 | | | 1.38 | % | | | 1.31 | % | | | 1.30 | % | |
| Net investment loss | | | (0.83 | )% | | | (0.71 | )% | | | (0.56 | )% | | | (0.70 | )% | | | (0.77 | )% | |
| Supplemental data: | |
| Net assets, end of year (000's) | | $ | 40,992 | | | $ | 32,053 | | | $ | 29,429 | | | $ | 41,494 | | | $ | 49,562 | | |
| Portfolio turnover | | | 103 | % | | | 133 | % | | | 154 | % | | | 128 | % | | | 109 | % | |
| | | Class C | |
| | | Years ended July 31, | |
| | | 2011 | | 2010 | | 20091 | | 2008 | | 20072 | |
| Net asset value, beginning of year | | $ | 11.19 | | | $ | 9.76 | | | $ | 12.07 | | | $ | 16.30 | | | $ | 13.74 | | |
| Net investment loss3 | | | (0.23 | ) | | | (0.16 | ) | | | (0.11 | ) | | | (0.21 | ) | | | (0.24 | ) | |
| Net realized and unrealized gains (losses) | | | 4.09 | | | | 1.59 | | | | (2.20 | ) | | | (1.42 | ) | | | 3.23 | | |
| Net increase (decrease) from operations | | | 3.86 | | | | 1.43 | | | | (2.31 | ) | | | (1.63 | ) | | | 2.99 | | |
| Distributions from net realized gains | | | — | | | | — | | | | — | | | | (2.60 | ) | | | (0.43 | ) | |
| Net asset value, end of year | | $ | 15.05 | | | $ | 11.19 | | | $ | 9.76 | | | $ | 12.07 | | | $ | 16.30 | | |
| Total investment return4 | | | 34.50 | % | | | 14.65 | % | | | (19.21 | )% | | | (12.08 | )% | | | 22.14 | % | |
| Ratios to average net assets: | |
| Expenses before fee waivers and/or expense reimbursements by and recoupments to manager | | | 2.05 | % | | | 2.13 | % | | | 2.19 | % | | | 2.08 | % | | | 2.08 | % | |
| Expenses after fee waivers and/or expense reimbursements by and recoupments to manager | | | 2.09 | %5 | | | 2.13 | %5 | | | 2.13 | % | | | 2.08 | % | | | 2.08 | % | |
| Net investment loss | | | (1.63 | )% | | | (1.49 | )% | | | (1.30 | )% | | | (1.47 | )% | | | (1.55 | )% | |
| Supplemental data: | |
| Net assets, end of year (000's) | | $ | 4,158 | | | $ | 3,217 | | | $ | 3,285 | | | $ | 4,991 | | | $ | 6,712 | | |
| Portfolio turnover | | | 103 | % | | | 133 | % | | | 154 | % | | | 128 | % | | | 109 | % | |
1 A portion of the investment advisory function for this Portfolio was transferred from AG Asset Management LLC to Palisade Capital Management, LLC on February 2, 2009. Copper Rock Capital Partners, LLC and Riverbridge Partners, LLC continue to provide a portion of the investment advisory function.
2 A portion of the investment advisory function for this Portfolio was transferred from Delaware Management Co., Inc. to Copper Rock Capital Partners, LLC on March 1, 2007. ForstmannLeff Associates, LLC changed its name to AG Asset Management LLC on May 1, 2007.
3 Calculated using the average shares method.
4 Total investment return is calculated assuming a $10,000 investment on the first day of each year reported, reinvestment of all dividends and other distributions, if any, at net asset value on the ex-dividend dates, and a sale at net asset value on the last day of each year reported. The figures do not include any applicable sales charges or redemption fees; results would be lower if they were included. Returns do not reflect the deduction of taxes that a shareholder would pay on Portfolio distributions or the redemption of Portfolio shares.
5 The investment manager recouped expenses previously reimbursed by the investment manager on behalf of the Portfolio, not to exceed the expense cap.
288
| | | Class B | |
| | | Years ended July 31, | |
| | | 2011 | | 2010 | | 20091 | | 2008 | | 20072 | |
| Net asset value, beginning of year | | $ | 11.11 | | | $ | 9.69 | | | $ | 11.99 | | | $ | 16.22 | | | $ | 13.68 | | |
| Net investment loss3 | | | (0.22 | ) | | | (0.15 | ) | | | (0.11 | ) | | | (0.22 | ) | | | (0.23 | ) | |
| Net realized and unrealized gains (losses) | | | 4.05 | | | | 1.57 | | | | (2.19 | ) | | | (1.41 | ) | | | 3.20 | | |
| Net increase (decrease) from operations | | | 3.83 | | | | 1.42 | | | | (2.30 | ) | | | (1.63 | ) | | | 2.97 | | |
| Distributions from net realized gains | | | — | | | | — | | | | — | | | | (2.60 | ) | | | (0.43 | ) | |
| Net asset value, end of year | | $ | 14.94 | | | $ | 11.11 | | | $ | 9.69 | | | $ | 11.99 | | | $ | 16.22 | | |
| Total investment return4 | | | 34.23 | % | | | 14.86 | % | | | (19.18 | )% | | | (12.16 | )% | | | 22.02 | % | |
| Ratios to average net assets: | |
| Expenses before fee waivers and/or expense reimbursements by and recoupments to manager | | | 2.74 | % | | | 2.73 | % | | | 2.61 | % | | | 2.43 | % | | | 2.30 | % | |
| Expenses after fee waivers and/or expense reimbursements by and recoupments to manager | | | 2.13 | % | | | 2.13 | % | | | 2.13 | % | | | 2.13 | % | | | 2.13 | % | |
| Net investment loss | | | (1.65 | )% | | | (1.39 | )% | | | (1.29 | )% | | | (1.52 | )% | | | (1.58 | )% | |
| Supplemental data: | |
| Net assets, end of year (000's) | | $ | 12 | | | $ | 16 | | | $ | 68 | | | $ | 123 | | | $ | 310 | | |
| Portfolio turnover | | | 103 | % | | | 133 | % | | | 154 | % | | | 128 | % | | | 109 | % | |
| | | Class Y | |
| | | Years ended July 31, | |
| | | 2011 | | 2010 | | 20091 | | 2008 | | 20072 | |
| Net asset value, beginning of year | | $ | 12.74 | | | $ | 11.02 | | | $ | 13.47 | | | $ | 17.71 | | | $ | 14.72 | | |
| Net investment loss3 | | | (0.10 | ) | | | (0.02 | ) | | | (0.01 | ) | | | (0.05 | ) | | | (0.07 | ) | |
| Net realized and unrealized gains (losses) | | | 4.67 | | | | 1.74 | | | | (2.44 | ) | | | (1.59 | ) | | | 3.49 | | |
| Net increase (decrease) from operations | | | 4.57 | | | | 1.72 | | | | (2.45 | ) | | | (1.64 | ) | | | 3.42 | | |
| Distributions from net realized gains | | | — | | | | — | | | | — | | | | (2.60 | ) | | | (0.43 | ) | |
| Net asset value, end of year | | $ | 17.31 | | | $ | 12.74 | | | $ | 11.02 | | | $ | 13.47 | | | $ | 17.71 | | |
| Total investment return4 | | | 35.87 | % | | | 15.71 | % | | | (18.26 | )% | | | (11.09 | )% | | | 23.54 | % | |
| Ratios to average net assets: | |
| Expenses before fee waivers and/or expense reimbursements by and recoupments to manager | | | 1.08 | % | | | 0.94 | % | | | 0.96 | % | | | 0.94 | % | | | 0.93 | % | |
| Expenses after fee waivers and/or expense reimbursements by and recoupments to manager | | | 1.08 | % | | | 0.94 | % | | | 0.96 | % | | | 0.94 | % | | | 0.93 | % | |
| Net investment loss | | | (0.61 | )% | | | (0.14 | )% | | | (0.15 | )% | | | (0.33 | )% | | | (0.41 | )% | |
| Supplemental data: | |
| Net assets, end of year (000's) | | $ | 98 | | | $ | 62 | | | $ | 4,369 | | | $ | 5,671 | | | $ | 6,022 | | |
| Portfolio turnover | | | 103 | % | | | 133 | % | | | 154 | % | | | 128 | % | | | 109 | % | |
See accompanying notes to financial statements.
289
PACE Select Advisors Trust
Financial highlights
PACE Small/Medium Co Growth Equity Investments (concluded)
Selected data for a share of beneficial interest outstanding throughout each year is presented below:
| | | Class P | |
| | | Years ended July 31, | |
| | | 2011 | | 2010 | | 20091 | | 2008 | | 20072 | |
| Net asset value, beginning of year | | $ | 12.62 | | | $ | 10.90 | | | $ | 13.36 | | | $ | 17.61 | | | $ | 14.67 | | |
| Net investment loss3 | | | (0.11 | ) | | | (0.06 | ) | | | (0.03 | ) | | | (0.08 | ) | | | (0.10 | ) | |
| Net realized and unrealized gains (losses) | | | 4.63 | | | | 1.78 | | | | (2.43 | ) | | | (1.57 | ) | | | 3.47 | | |
| Net increase (decrease) from operations | | | 4.52 | | | | 1.72 | | | | (2.46 | ) | | | (1.65 | ) | | | 3.37 | | |
| Distributions from net realized gains | | | — | | | | — | | | | — | | | | (2.60 | ) | | | (0.43 | ) | |
| Net asset value, end of year | | $ | 17.14 | | | $ | 12.62 | | | $ | 10.90 | | | $ | 13.36 | | | $ | 17.61 | | |
| Total investment return4 | | | 35.82 | % | | | 15.78 | % | | | (18.41 | )% | | | (11.22 | )% | | | 23.28 | % | |
| Ratios to average net assets: | |
| Expenses before fee waivers and/or expense reimbursements by manager | | | 1.16 | % | | | 1.23 | % | | | 1.31 | % | | | 1.17 | % | | | 1.16 | % | |
| Expenses after fee waivers and/or expense reimbursements by manager | | | 1.13 | % | | | 1.13 | % | | | 1.13 | % | | | 1.13 | % | | | 1.13 | % | |
| Net investment loss | | | (0.67 | )% | | | (0.50 | )% | | | (0.31 | )% | | | (0.52 | )% | | | (0.60 | )% | |
| Supplemental data: | |
| Net assets, end of year (000's) | | $ | 423,310 | | | $ | 338,951 | | | $ | 310,425 | | | $ | 456,354 | | | $ | 500,929 | | |
| Portfolio turnover | | | 103 | % | | | 133 | % | | | 154 | % | | | 128 | % | | | 109 | % | |
1 A portion of the investment advisory function for this Portfolio was transferred from AG Asset Management LLC to Palisade Capital Management, LLC on February 2, 2009. Copper Rock Capital Partners, LLC and Riverbridge Partners, LLC continue to provide a portion of the investment advisory function.
2 A portion of the investment advisory function for this Portfolio was transferred from Delaware Management Co., Inc. to Copper Rock Capital Partners, LLC on March 1, 2007. ForstmannLeff Associates, LLC changed its name to AG Asset Management LLC on May 1, 2007.
3 Calculated using the average shares method.
4 Total investment return is calculated assuming a $10,000 investment on the first day of each year reported, reinvestment of all dividends and other distributions, if any, at net asset value on the ex-dividend dates, and a sale at net asset value on the last day of each year reported. The figures do not include any applicable program or redemption fees; results would be lower if they were included. Returns do not reflect the deduction of taxes that a shareholder would pay on Portfolio distributions or the redemption of Portfolio shares.
See accompanying notes to financial statements.
290
This page intentionally left blank.
291
PACE Select Advisors Trust
Financial highlights
PACE International Equity Investments
Selected data for a share of beneficial interest outstanding throughout each year is presented below:
| | | Class A | |
| | | Years ended July 31, | |
| | | 20111 | | 2010 | | 2009 | | 2008 | | 2007 | |
| Net asset value, beginning of year | | $ | 11.72 | | | $ | 11.72 | | | $ | 16.17 | | | $ | 21.27 | | | $ | 19.03 | | |
| Net investment income2 | | | 0.25 | | | | 0.19 | | | | 0.27 | | | | 0.41 | | | | 0.29 | | |
| Net realized and unrealized gains (losses) | | | 1.66 | | | | 0.06 | | | | (4.22 | ) | | | (2.99 | ) | | | 4.09 | | |
| Net increase (decrease) from operations | | | 1.91 | | | | 0.25 | | | | (3.95 | ) | | | (2.58 | ) | | | 4.38 | | |
| Dividends from net investment income | | | (0.22 | ) | | | (0.25 | ) | | | (0.50 | ) | | | (0.28 | ) | | | (0.35 | ) | |
| Distributions from net realized gains | | | — | | | | — | | | | — | | | | (2.24 | ) | | | (1.79 | ) | |
| Total dividends and distributions | | | (0.22 | ) | | | (0.25 | ) | | | (0.50 | ) | | | (2.52 | ) | | | (2.14 | ) | |
| Net asset value, end of year | | $ | 13.41 | | | $ | 11.72 | | | $ | 11.72 | | | $ | 16.17 | | | $ | 21.27 | | |
| Total investment return3 | | | 16.37 | % | | | 2.05 | % | | | (24.02 | )% | | | (13.73 | )% | | | 24.14 | % | |
| Ratios to average net assets: | |
| Expenses before fee waivers and/or expense reimbursements by manager | | | 1.40 | % | | | 1.43 | % | | | 1.46 | % | | | 1.37 | % | | | 1.38 | % | |
| Expenses after fee waivers and/or expense reimbursements by manager | | | 1.40 | %4 | | | 1.43 | % | | | 1.46 | % | | | 1.37 | % | | | 1.38 | % | |
| Net investment income | | | 1.91 | % | | | 1.54 | % | | | 2.47 | % | | | 2.16 | % | | | 1.42 | % | |
| Supplemental data: | |
| Net assets, end of year (000's) | | $ | 66,904 | | | $ | 66,355 | | | $ | 71,466 | | | $ | 106,380 | | | $ | 130,966 | | |
| Portfolio turnover | | | 66 | % | | | 60 | % | | | 60 | % | | | 54 | % | | | 61 | % | |
| | | Class C | |
| | | Years ended July 31, | |
| | | 20111 | | 2010 | | 2009 | | 2008 | | 2007 | |
| Net asset value, beginning of year | | $ | 11.47 | | | $ | 11.49 | | | $ | 15.79 | | | $ | 20.81 | | | $ | 18.65 | | |
| Net investment income2 | | | 0.14 | | | | 0.08 | | | | 0.17 | | | | 0.25 | | | | 0.12 | | |
| Net realized and unrealized gains (losses) | | | 1.64 | | | | 0.05 | | | | (4.11 | ) | | | (2.92 | ) | | | 4.01 | | |
| Net increase (decrease) from operations | | | 1.78 | | | | 0.13 | | | | (3.94 | ) | | | (2.67 | ) | | | 4.13 | | |
| Dividends from net investment income | | | (0.11 | ) | | | (0.15 | ) | | | (0.36 | ) | | | (0.11 | ) | | | (0.18 | ) | |
| Distributions from net realized gains | | | — | | | | — | | | | — | | | | (2.24 | ) | | | (1.79 | ) | |
| Total dividends and distributions | | | (0.11 | ) | | | (0.15 | ) | | | (0.36 | ) | | | (2.35 | ) | | | (1.97 | ) | |
| Net asset value, end of year | | $ | 13.14 | | | $ | 11.47 | | | $ | 11.49 | | | $ | 15.79 | | | $ | 20.81 | | |
| Total investment return3 | | | 15.57 | % | | | 1.10 | % | | | (24.67 | )% | | | (14.42 | )% | | | 23.13 | % | |
| Ratios to average net assets: | |
| Expenses before fee waivers and/or expense reimbursements by manager | | | 2.23 | % | | | 2.26 | % | | | 2.31 | % | | | 2.18 | % | | | 2.18 | % | |
| Expenses after fee waivers and/or expense reimbursements by manager | | | 2.23 | %4 | | | 2.26 | % | | | 2.31 | % | | | 2.18 | % | | | 2.18 | % | |
| Net investment income | | | 1.08 | % | | | 0.69 | % | | | 1.62 | % | | | 1.33 | % | | | 0.60 | % | |
| Supplemental data: | |
| Net assets, end of year (000's) | | $ | 3,601 | | | $ | 3,769 | | | $ | 4,342 | | | $ | 6,949 | | | $ | 8,856 | | |
| Portfolio turnover | | | 66 | % | | | 60 | % | | | 60 | % | | | 54 | % | | | 61 | % | |
1 A portion of the investment advisory function for this Portfolio was transferred to J.P. Morgan Investment Management Inc. (EAFE Opportunities Segment) on November 8, 2010. Martin Currie Inc., Mondrian Investment Partners Limited and J.P. Morgan Investment Management Inc. (REI Segment) continue to provide a portion of the investment advisory function.
2 Calculated using the average shares method.
3 Total investment return is calculated assuming a $10,000 investment on the first day of each year reported, reinvestment of all dividends and other distributions, if any, at net asset value on the ex-dividend dates, and a sale at net asset value on the last day of each year reported. The figures do not include any applicable sales charges or redemption fees; results would be lower if they were included. Returns do not reflect the deduction of taxes that a shareholder would pay on Portfolio distributions or the redemption of Portfolio shares.
4 During the year ended July 31, 2011, UBS Global Asset Management (Americas) Inc. waived fees and/or reimbursed a portion of ordinary operating expenses. The ratios after and before fee waivers and/or expense reimbursements are the same since the fee waiver/reimbursement represents less than 0.01%.
292
| | | Class B | |
| | | Years ended July 31, | |
| | | 20111 | | 2010 | | 2009 | | 2008 | | 2007 | |
| Net asset value, beginning of year | | $ | 11.68 | | | $ | 11.65 | | | $ | 15.79 | | | $ | 20.80 | | | $ | 18.60 | | |
| Net investment income2 | | | 0.07 | | | | 0.05 | | | | 0.14 | | | | 0.17 | | | | 0.07 | | |
| Net realized and unrealized gains (losses) | | | 1.72 | | | | 0.08 | | | | (4.09 | ) | | | (2.88 | ) | | | 4.04 | | |
| Net increase (decrease) from operations | | | 1.79 | | | | 0.13 | | | | (3.95 | ) | | | (2.71 | ) | | | 4.11 | | |
| Dividends from net investment income | | | — | | | | (0.10 | ) | | | (0.19 | ) | | | (0.06 | ) | | | (0.12 | ) | |
| Distributions from net realized gains | | | — | | | | — | | | | — | | | | (2.24 | ) | | | (1.79 | ) | |
| Total dividends and distributions | | | — | | | | (0.10 | ) | | | (0.19 | ) | | | (2.30 | ) | | | (1.91 | ) | |
| Net asset value, end of year | | $ | 13.47 | | | $ | 11.68 | | | $ | 11.65 | | | $ | 15.79 | | | $ | 20.80 | | |
| Total investment return3 | | | 15.81 | % | | | 1.14 | % | | | (24.80 | )% | | | (14.57 | )% | | | 23.03 | % | |
| Ratios to average net assets: | |
| Expenses before fee waivers and/or expense reimbursements by manager | | | 3.50 | % | | | 2.59 | % | | | 2.63 | % | | | 2.31 | % | | | 2.27 | % | |
| Expenses after fee waivers and/or expense reimbursements by manager | | | 2.36 | % | | | 2.40 | % | | | 2.40 | % | | | 2.31 | % | | | 2.27 | % | |
| Net investment income | | | 0.62 | % | | | 0.43 | % | | | 1.36 | % | | | 0.89 | % | | | 0.37 | % | |
| Supplemental data: | |
| Net assets, end of year (000's) | | $ | 1 | | | $ | 20 | | | $ | 66 | | | $ | 186 | | | $ | 489 | | |
| Portfolio turnover | | | 66 | % | | | 60 | % | | | 60 | % | | | 54 | % | | | 61 | % | |
| | | Class Y | |
| | | Years ended July 31, | |
| | | 20111 | | 2010 | | 2009 | | 2008 | | 2007 | |
| Net asset value, beginning of year | | $ | 11.71 | | | $ | 11.72 | | | $ | 16.20 | | | $ | 21.30 | | | $ | 19.06 | | |
| Net investment income2 | | | 0.28 | | | | 0.22 | | | | 0.31 | | | | 0.48 | | | | 0.36 | | |
| Net realized and unrealized gains (losses) | | | 1.67 | | | | 0.07 | | | | (4.23 | ) | | | (2.98 | ) | | | 4.10 | | |
| Net increase (decrease) from operations | | | 1.95 | | | | 0.29 | | | | (3.92 | ) | | | (2.50 | ) | | | 4.46 | | |
| Dividends from net investment income | | | (0.25 | ) | | | (0.30 | ) | | | (0.56 | ) | | | (0.36 | ) | | | (0.43 | ) | |
| Distributions from net realized gains | | | — | | | | — | | | | — | | | | (2.24 | ) | | | (1.79 | ) | |
| Total dividends and distributions | | | (0.25 | ) | | | (0.30 | ) | | | (0.56 | ) | | | (2.60 | ) | | | (2.22 | ) | |
| Net asset value, end of year | | $ | 13.41 | | | $ | 11.71 | | | $ | 11.72 | | | $ | 16.20 | | | $ | 21.30 | | |
| Total investment return3 | | | 16.65 | % | | | 2.43 | % | | | (23.73 | )% | | | (13.38 | )% | | | 24.55 | % | |
| Ratios to average net assets: | |
| Expenses before fee waivers and/or expense reimbursements by manager | | | 1.16 | % | | | 1.10 | % | | | 1.06 | % | | | 1.02 | % | | | 1.02 | % | |
| Expenses after fee waivers and/or expense reimbursements by manager | | | 1.16 | %4 | | | 1.10 | % | | | 1.06 | % | | | 1.02 | % | | | 1.02 | % | |
| Net investment income | | | 2.14 | % | | | 1.77 | % | | | 2.89 | % | | | 2.51 | % | | | 1.78 | % | |
| Supplemental data: | |
| Net assets, end of year (000's) | | $ | 21,046 | | | $ | 23,368 | | | $ | 33,012 | | | $ | 50,655 | | | $ | 65,377 | | |
| Portfolio turnover | | | 66 | % | | | 60 | % | | | 60 | % | | | 54 | % | | | 61 | % | |
See accompanying notes to financial statements.
293
PACE Select Advisors Trust
Financial highlights
PACE International Equity Investments (concluded)
Selected data for a share of beneficial interest outstanding throughout each year is presented below:
| | | Class P | |
| | | Years ended July 31, | |
| | | 20111 | | 2010 | | 2009 | | 2008 | | 2007 | |
| Net asset value, beginning of year | | $ | 11.69 | | | $ | 11.70 | | | $ | 16.16 | | | $ | 21.27 | | | $ | 19.03 | | |
| Net investment income2 | | | 0.29 | | | | 0.22 | | | | 0.29 | | | | 0.46 | | | | 0.35 | | |
| Net realized and unrealized gains (losses) | | | 1.66 | | | | 0.05 | | | | (4.21 | ) | | | (2.99 | ) | | | 4.09 | | |
| Net increase (decrease) from operations | | | 1.95 | | | | 0.27 | | | | (3.92 | ) | | | (2.53 | ) | | | 4.44 | | |
| Dividends from net investment income | | | (0.25 | ) | | | (0.28 | ) | | | (0.54 | ) | | | (0.34 | ) | | | (0.41 | ) | |
| Distributions from net realized gains | | | — | | | | — | | | | — | | | | (2.24 | ) | | | (1.79 | ) | |
| Total dividends and distributions | | | (0.25 | ) | | | (0.28 | ) | | | (0.54 | ) | | | (2.58 | ) | | | (2.20 | ) | |
| Net asset value, end of year | | $ | 13.39 | | | $ | 11.69 | | | $ | 11.70 | | | $ | 16.16 | | | $ | 21.27 | | |
| Total investment return3 | | | 16.79 | % | | | 2.21 | % | | | (23.81 | )% | | | (13.53 | )% | | | 24.48 | % | |
| Ratios to average net assets: | |
| Expenses before fee waivers and/or expense reimbursements by manager | | | 1.16 | % | | | 1.18 | % | | | 1.22 | % | | | 1.12 | % | | | 1.12 | % | |
| Expenses after fee waivers and/or expense reimbursements by manager | | | 1.16 | %4 | | | 1.18 | % | | | 1.22 | % | | | 1.12 | % | | | 1.12 | % | |
| Net investment income | | | 2.20 | % | | | 1.80 | % | | | 2.72 | % | | | 2.44 | % | | | 1.70 | % | |
| Supplemental data: | |
| Net assets, end of year (000's) | | $ | 817,011 | | | $ | 698,546 | | | $ | 684,359 | | | $ | 1,048,105 | | | $ | 1,173,137 | | |
| Portfolio turnover | | | 66 | % | | | 60 | % | | | 60 | % | | | 54 | % | | | 61 | % | |
1 A portion of the investment advisory function for this Portfolio was transferred to J.P. Morgan Investment Management Inc. (EAFE Opportunities Segment) on November 8, 2010. Martin Currie Inc., Mondrian Investment Partners Limited and J.P. Morgan Investment Management Inc. (REI Segment) continue to provide a portion of the investment advisory function.
2 Calculated using the average shares method.
3 Total investment return is calculated assuming a $10,000 investment on the first day of each year reported, reinvestment of all dividends and other distributions, if any, at net asset value on the ex-dividend dates, and a sale at net asset value on the last day of each year reported. The figures do not include any applicable program or redemption fees; results would be lower if they were included. Returns do not reflect the deduction of taxes that a shareholder would pay on Portfolio distributions or the redemption of Portfolio shares.
4 During the year ended July 31, 2011, UBS Global Asset Management (Americas) Inc. waived fees and/or reimbursed a portion of ordinary operating expenses. The ratios after and before fee waivers and/or expense reimbursements are the same since the fee waiver/reimbursement represents less than 0.01%.
See accompanying notes to financial statements.
294
This page intentionally left blank.
295
PACE Select Advisors Trust
Financial highlights
PACE International Emerging Markets Equity Investments
Selected data for a share of beneficial interest outstanding throughout each year is presented below:
| | | Class A | |
| | | Years ended July 31, | |
| | | 20111 | | 2010 | | 2009 | | 2008 | | 2007 | |
| Net asset value, beginning of year | | $ | 12.19 | | | $ | 10.58 | | | $ | 19.46 | | | $ | 23.61 | | | $ | 18.30 | | |
| Net investment income (loss)2 | | | 0.12 | | | | 0.09 | | | | 0.20 | | | | 0.25 | | | | 0.21 | | |
| Net realized and unrealized gains (losses) | | | 1.59 | | | | 1.68 | | | | (5.71 | ) | | | (0.49 | ) | | | 8.02 | | |
| Net increase (decrease) from operations | | | 1.71 | | | | 1.77 | | | | (5.51 | ) | | | (0.24 | ) | | | 8.23 | | |
| Dividends from net investment income | | | (0.10 | ) | | | (0.16 | ) | | | (0.13 | ) | | | (0.27 | ) | | | (0.22 | ) | |
| Distributions from net realized gains | | | — | | | | — | | | | (3.24 | ) | | | (3.64 | ) | | | (2.70 | ) | |
| Total dividends and distributions | | | (0.10 | ) | | | (0.16 | ) | | | (3.37 | ) | | | (3.91 | ) | | | (2.92 | ) | |
| Net asset value, end of year | | $ | 13.80 | | | $ | 12.19 | | | $ | 10.58 | | | $ | 19.46 | | | $ | 23.61 | | |
| Total investment return3 | | | 14.01 | % | | | 16.81 | % | | | (21.37 | )% | | | (2.61 | )% | | | 49.16 | % | |
| Ratios to average net assets: | |
| Expenses before fee waivers and/or expense reimbursements by manager | | | 1.84 | % | | | 1.87 | % | | | 1.93 | % | | | 1.86 | % | | | 1.89 | % | |
| Expenses after fee waivers and/or expense reimbursements by manager | | | 1.84 | %4 | | | 1.87 | % | | | 1.93 | % | | | 1.86 | % | | | 1.89 | % | |
| Net investment income | | | 0.87 | % | | | 0.75 | % | | | 2.06 | % | | | 1.14 | % | | | 1.05 | % | |
| Supplemental data: | |
| Net assets, end of year (000's) | | $ | 22,648 | | | $ | 19,111 | | | $ | 17,784 | | | $ | 29,938 | | | $ | 31,216 | | |
| Portfolio turnover | | | 111 | % | | | 60 | % | | | 77 | % | | | 53 | % | | | 54 | % | |
| | | Class C | |
| | | Years ended July 31, | |
| | | 20111 | | 2010 | | 2009 | | 2008 | | 2007 | |
| Net asset value, beginning of year | | $ | 11.38 | | | $ | 9.90 | | | $ | 18.48 | | | $ | 22.61 | | | $ | 17.62 | | |
| Net investment income (loss)2 | | | 0.01 | | | | (0.00 | )5 | | | 0.13 | | | | 0.08 | | | | 0.06 | | |
| Net realized and unrealized gains (losses) | | | 1.48 | | | | 1.58 | | | | (5.47 | ) | | | (0.46 | ) | | | 7.69 | | |
| Net increase (decrease) from operations | | | 1.49 | | | | 1.58 | | | | (5.34 | ) | | | (0.38 | ) | | | 7.75 | | |
| Dividends from net investment income | | | — | | | | (0.10 | ) | | | — | | | | (0.11 | ) | | | (0.06 | ) | |
| Distributions from net realized gains | | | — | | | | — | | | | (3.24 | ) | | | (3.64 | ) | | | (2.70 | ) | |
| Total dividends and distributions | | | — | | | | (0.10 | ) | | | (3.24 | ) | | | (3.75 | ) | | | (2.76 | ) | |
| Net asset value, end of year | | $ | 12.87 | | | $ | 11.38 | | | $ | 9.90 | | | $ | 18.48 | | | $ | 22.61 | | |
| Total investment return3 | | | 13.19 | % | | | 15.96 | % | | | (21.97 | )% | | | (3.34 | )% | | | 48.03 | % | |
| Ratios to average net assets: | |
| Expenses before fee waivers and/or expense reimbursements by manager | | | 2.58 | % | | | 2.61 | % | | | 2.67 | % | | | 2.60 | % | | | 2.64 | % | |
| Expenses after fee waivers and/or expense reimbursements by manager | | | 2.58 | %4 | | | 2.61 | % | | | 2.67 | % | | | 2.60 | % | | | 2.64 | % | |
| Net investment income (loss) | | | 0.11 | % | | | (0.01 | )% | | | 1.35 | % | | | 0.39 | % | | | 0.30 | % | |
| Supplemental data: | |
| Net assets, end of year (000's) | | $ | 3,373 | | | $ | 3,682 | | | $ | 3,525 | | | $ | 6,536 | | | $ | 7,461 | | |
| Portfolio turnover | | | 111 | % | | | 60 | % | | | 77 | % | | | 53 | % | | | 54 | % | |
1 Portions of the investment advisory function for this Portfolio were transferred to Delaware Management Company and Pzena Investment Management, LLC, respectively, on November 4, 2010 and to William Blair & Company LLC on March 23, 2011. Mondrian Investment Partners Limited continues to provide a portion of the investment advisory function. Gartmore Global Partners provided a portion of the investment advisory function during this period and then was subsequently terminated as a sub-advisor to the Portfolio at the close of business on March 22, 2011.
2 Calculated using the average shares method.
3 Total investment return is calculated assuming a $10,000 investment on the first day of each year reported, reinvestment of all dividends and other distributions, if any, at net asset value on the ex-dividend dates, and a sale at net asset value on the last day of each year reported. The figures do not include any applicable sales charges or redemption fees; results would be lower if they were included. Returns do not reflect the deduction of taxes that a shareholder would pay on Portfolio distributions or the redemption of Portfolio shares.
4 During the year ended July 31, 2011, UBS Global Asset Management (Americas) Inc. waived fees and/or reimbursed a portion of ordinary operating expenses. The ratios after and before fee waivers and/or expense reimbursements are the same since the fee waiver/reimbursement represents less than 0.01%.
5 Amount represents less than $0.005 per share.
296
| | | Class B | |
| | | Years ended July 31, | |
| | | 20111 | | 2010 | | 2009 | | 2008 | | 2007 | |
| Net asset value, beginning of year | | $ | 11.48 | | | $ | 9.91 | | | $ | 18.50 | | | $ | 22.61 | | | $ | 17.60 | | |
| Net investment income (loss)2 | | | 0.01 | | | | (0.03 | ) | | | 0.11 | | | | 0.06 | | | | 0.04 | | |
| Net realized and unrealized gains (losses) | | | 1.49 | | | | 1.60 | | | | (5.46 | ) | | | (0.46 | ) | | | 7.69 | | |
| Net increase (decrease) from operations | | | 1.50 | | | | 1.57 | | | | (5.35 | ) | | | (0.40 | ) | | | 7.73 | | |
| Dividends from net investment income | | | — | | | | — | | | | — | | | | (0.07 | ) | | | (0.02 | ) | |
| Distributions from net realized gains | | | — | | | | — | | | | (3.24 | ) | | | (3.64 | ) | | | (2.70 | ) | |
| Total dividends and distributions | | | — | | | | — | | | | (3.24 | ) | | | (3.71 | ) | | | (2.72 | ) | |
| Net asset value, end of year | | $ | 12.98 | | | $ | 11.48 | | | $ | 9.91 | | | $ | 18.50 | | | $ | 22.61 | | |
| Total investment return3 | | | 13.07 | % | | | 15.84 | % | | | (22.05 | )% | | | (3.41 | )% | | | 47.95 | % | |
| Ratios to average net assets: | |
| Expenses before fee waivers and/or expense reimbursements by manager | | | 2.64 | % | | | 2.72 | % | | | 2.72 | % | | | 2.68 | % | | | 2.69 | % | |
| Expenses after fee waivers and/or expense reimbursements by manager | | | 2.64 | %4 | | | 2.72 | % | | | 2.72 | % | | | 2.68 | % | | | 2.69 | % | |
| Net investment income | | | 0.09 | % | | | (0.31 | )% | | | 1.14 | % | | | 0.28 | % | | | 0.20 | % | |
| Supplemental data: | |
| Net assets, end of year (000's) | | $ | 49 | | | $ | 60 | | | $ | 135 | | | $ | 319 | | | $ | 535 | | |
| Portfolio turnover | | | 111 | % | | | 60 | % | | | 77 | % | | | 53 | % | | | 54 | % | |
| | | Class Y | |
| | | Years ended July 31, | |
| | | 20111 | | 2010 | | 2009 | | 2008 | | 2007 | |
| Net asset value, beginning of year | | $ | 12.41 | | | $ | 10.78 | | | $ | 19.79 | | | $ | 23.95 | | | $ | 18.53 | | |
| Net investment income (loss)2 | | | 0.15 | | | | 0.10 | | | | 0.28 | | | | 0.34 | | | | 0.30 | | |
| Net realized and unrealized gains (losses) | | | 1.61 | | | | 1.74 | | | | (5.83 | ) | | | (0.51 | ) | | | 8.12 | | |
| Net increase (decrease) from operations | | | 1.76 | | | | 1.84 | | | | (5.55 | ) | | | (0.17 | ) | | | 8.42 | | |
| Dividends from net investment income | | | (0.11 | ) | | | (0.21 | ) | | | (0.22 | ) | | | (0.35 | ) | | | (0.30 | ) | |
| Distributions from net realized gains | | | — | | | | — | | | | (3.24 | ) | | | (3.64 | ) | | | (2.70 | ) | |
| Total dividends and distributions | | | (0.11 | ) | | | (0.21 | ) | | | (3.46 | ) | | | (3.99 | ) | | | (3.00 | ) | |
| Net asset value, end of year | | $ | 14.06 | | | $ | 12.41 | | | $ | 10.78 | | | $ | 19.79 | | | $ | 23.95 | | |
| Total investment return3 | | | 14.22 | % | | | 17.15 | % | | | (21.00 | )% | | | (2.22 | )% | | | 49.74 | % | |
| Ratios to average net assets: | |
| Expenses before fee waivers and/or expense reimbursements by manager | | | 1.61 | % | | | 1.62 | % | | | 1.47 | % | | | 1.50 | % | | | 1.52 | % | |
| Expenses after fee waivers and/or expense reimbursements by manager | | | 1.61 | %4 | | | 1.62 | % | | | 1.47 | % | | | 1.50 | % | | | 1.52 | % | |
| Net investment income (loss) | | | 1.08 | % | | | 0.88 | % | | | 2.87 | % | | | 1.49 | % | | | 1.44 | % | |
| Supplemental data: | |
| Net assets, end of year (000's) | | $ | 17,808 | | | $ | 21,524 | | | $ | 33,069 | | | $ | 31,579 | | | $ | 29,576 | | |
| Portfolio turnover | | | 111 | % | | | 60 | % | | | 77 | % | | | 53 | % | | | 54 | % | |
See accompanying notes to financial statements.
297
PACE Select Advisors Trust
Financial highlights
PACE International Emerging Markets Equity Investments (concluded)
Selected data for a share of beneficial interest outstanding throughout each year is presented below:
| | | Class P | |
| | | Years ended July 31, | |
| | | 20111 | | 2010 | | 2009 | | 2008 | | 2007 | |
| Net asset value, beginning of year | | $ | 12.36 | | | $ | 10.72 | | | $ | 19.68 | | | $ | 23.84 | | | $ | 18.44 | | |
| Net investment income2 | | | 0.13 | | | | 0.09 | | | | 0.20 | | | | 0.28 | | | | 0.23 | | |
| Net realized and unrealized gains (losses) | | | 1.60 | | | | 1.71 | | | | (5.77 | ) | | | (0.51 | ) | | | 8.09 | | |
| Net increase (decrease) from operations | | | 1.73 | | | | 1.80 | | | | (5.57 | ) | | | (0.23 | ) | | | 8.32 | | |
| Dividends from net investment income | | | (0.09 | ) | | | (0.16 | ) | | | (0.15 | ) | | | (0.29 | ) | | | (0.22 | ) | |
| Distributions from net realized gains | | | — | | | | — | | | | (3.24 | ) | | | (3.64 | ) | | | (2.70 | ) | |
| Total dividends and distributions | | | (0.09 | ) | | | (0.16 | ) | | | (3.39 | ) | | | (3.93 | ) | | | (2.92 | ) | |
| Net asset value, end of year | | $ | 14.00 | | | $ | 12.36 | | | $ | 10.72 | | | $ | 19.68 | | | $ | 23.84 | | |
| Total investment return3 | | | 14.04 | % | | | 16.85 | % | | | (21.42 | )% | | | (2.52 | )% | | | 49.31 | % | |
| Ratios to average net assets: | |
| Expenses before fee waivers and/or expense reimbursements by manager | | | 1.79 | % | | | 1.85 | % | | | 1.97 | % | | | 1.78 | % | | | 1.82 | % | |
| Expenses after fee waivers and/or expense reimbursements by manager | | | 1.79 | %4 | | | 1.85 | % | | | 1.97 | % | | | 1.78 | % | | | 1.82 | % | |
| Net investment income | | | 0.95 | % | | | 0.78 | % | | | 2.03 | % | | | 1.22 | % | | | 1.13 | % | |
| Supplemental data: | |
| Net assets, end of year (000's) | | $ | 264,991 | | | $ | 232,908 | | | $ | 210,680 | | | $ | 337,958 | | | $ | 374,910 | | |
| Portfolio turnover | | | 111 | % | | | 60 | % | | | 77 | % | | | 53 | % | | | 54 | % | |
1 Portions of the investment advisory function for this Portfolio were transferred to Delaware Management Company and Pzena Investment Management, LLC, respectively, on November 4, 2010 and to William Blair & Company LLC on March 23, 2011. Mondrian Investment Partners Limited continues to provide a portion of the investment advisory function. Gartmore Global Partners provided a portion of the investment advisory function during this period and then was subsequently terminated as a sub-advisor to the Portfolio at the close of business on March 22, 2011.
2 Calculated using the average shares method.
3 Total investment return is calculated assuming a $10,000 investment on the first day of each year reported, reinvestment of all dividends and other distributions, if any, at net asset value on the ex-dividend dates, and a sale at net asset value on the last day of each year reported. The figures do not include any applicable program or redemption fees; results would be lower if they were included. Returns do not reflect the deduction of taxes that a shareholder would pay on Portfolio distributions or the redemption of Portfolio shares.
4 During the year ended July 31, 2011, UBS Global Asset Management (Americas) Inc. waived fees and/or reimbursed a portion of ordinary operating expenses. The ratios after and before fee waivers and/or expense reimbursements are the same since the fee waiver/reimbursement represents less than 0.01%.
See accompanying notes to financial statements.
298
This page intentionally left blank.
299
PACE Select Advisors Trust
Financial highlights
PACE Global Real Estate Securities Investments
Selected data for a share of beneficial interest outstanding throughout each period is presented below:
| | | Class A | |
| | | Years ended July 31, | | Period ended
July 31, | |
| | | 2011 | | 20101 | | 2009 | | 2008 | | 20072 | |
| Net asset value, beginning of period | | $ | 5.31 | | | $ | 4.86 | | | $ | 7.73 | | | $ | 9.54 | | | $ | 9.84 | | |
| Net investment income3 | | | 0.09 | | | | 0.11 | | | | 0.16 | | | | 0.19 | | | | 0.09 | | |
| Net realized and unrealized gains (losses) | | | 1.01 | | | | 0.83 | | | | (2.97 | ) | | | (1.70 | ) | | | (0.35 | ) | |
| Net increase (decrease) from operations | | | 1.10 | | | | 0.94 | | | | (2.81 | ) | | | (1.51 | ) | | | (0.26 | ) | |
| Dividends from net investment income | | | (0.39 | ) | | | (0.49 | ) | | | (0.06 | ) | | | (0.27 | ) | | | (0.04 | ) | |
| Distributions from net realized gains | | | — | | | | — | | | | — | | | | (0.03 | ) | | | — | | |
| Total dividends and distributions | | | (0.39 | ) | | | (0.49 | ) | | | (0.06 | ) | | | (0.30 | ) | | | (0.04 | ) | |
| Net asset value, end of period | | $ | 6.02 | | | $ | 5.31 | | | $ | 4.86 | | | $ | 7.73 | | | $ | 9.54 | | |
| Total investment return4 | | | 21.49 | % | | | 19.70 | % | | | (36.25 | )% | | | (16.22 | )% | | | (2.63 | )% | |
| Ratios to average net assets: | |
| Expenses before fee waivers and/or expense reimbursements by manager | | | 1.68 | % | | | 1.89 | % | | | 2.06 | % | | | 1.74 | % | | | 3.06 | %5 | |
| Expenses after fee waivers and/or expense reimbursements by manager | | | 1.45 | % | | | 1.45 | % | | | 1.45 | % | | | 1.45 | % | | | 1.45 | %5 | |
| Net investment income | | | 1.54 | % | | | 2.13 | % | | | 3.32 | % | | | 2.10 | % | | | 1.47 | %5 | |
| Supplemental data: | |
| Net assets, end of period (000's) | | $ | 4,566 | | | $ | 3,975 | | | $ | 3,238 | | | $ | 6,647 | | | $ | 4,199 | | |
| Portfolio turnover | | | 51 | % | | | 117 | % | | | 127 | % | | | 68 | % | | | 38 | % | |
| | | Class Y | |
| | | Years ended July 31, | | Period ended
July 31, | | Period ended
February 15, | |
| | | 2011 | | 20101 | | 20096 | | 20077 | |
| Net asset value, beginning of period | | $ | 5.33 | | | $ | 4.87 | | | $ | 4.35 | | | $ | 10.00 | | |
| Net investment income3 | | | 0.10 | | | | 0.12 | | | | 0.09 | | | | 0.06 | | |
| Net realized and unrealized gains | | | 1.02 | | | | 0.84 | | | | 0.43 | | | | 0.97 | | |
| Net increase from operations | | | 1.12 | | | | 0.96 | | | | 0.52 | | | | 1.03 | | |
| Dividends from net investment income | | | (0.40 | ) | | | (0.50 | ) | | | — | | | | (0.04 | ) | |
| Distributions from net realized gains | | | — | | | | — | | | | — | | | | — | | |
| Total dividends and distributions | | | (0.40 | ) | | | (0.50 | ) | | | — | | | | (0.04 | ) | |
| Net asset value, end of period | | $ | 6.05 | | | $ | 5.33 | | | $ | 4.87 | | | $ | 10.99 | | |
| Total investment return4 | | | 21.89 | % | | | 20.15 | % | | | 11.95 | % | | | 10.39 | % | |
| Ratios to average net assets: | |
| Expenses before fee waivers and/or expense reimbursements by manager | | | 1.34 | % | | | 1.51 | % | | | 1.87 | % | | | 1.92 | %5 | |
| Expenses after fee waivers and/or expense reimbursements by manager | | | 1.20 | % | | | 1.20 | % | | | 1.20 | % | | | 1.20 | %5 | |
| Net investment income | | | 1.74 | % | | | 2.34 | % | | | 3.84 | % | | | 3.07 | %5 | |
| Supplemental data: | |
| Net assets, end of period (000's) | | $ | 195 | | | $ | 111 | | | $ | 13 | | | $ | — | | |
| Portfolio turnover | | | 51 | % | | | 117 | % | | | 127 | % | | | 38 | % | |
1 Investment advisory functions for this Portfolio were transferred from Goldman Sachs Asset Management, L.P. to Brookfield Investment Management Inc. and CBRE Clarion Securities, LLC (formerly ING Clarion Real Estate Securities, LLC) on November 17, 2009.
2 For the period December 18, 2006 (commencement of issuance) through July 31, 2007.
3 Calculated using the average shares method.
4 Total investment return is calculated assuming a $10,000 investment on the first day of each period reported, reinvestment of all dividends and other distributions, if any, at net asset value on the ex-dividend dates, and a sale at net asset value on the last day of each period reported. The figures do not include any applicable sales charges, redemption fees or program fees; results would be lower if they were included. Total investment return for periods of less than one year has not been annualized. Returns do not reflect the deduction of taxes that a shareholder would pay on Portfolio distributions or the redemption of Portfolio shares.
5 Annualized.
6 For the period December 26, 2008 (recommencement of issuance) through July 31, 2009.
7 For the period November 30, 2006 (commencement of issuance) through February 15, 2007. There were no shares outstanding from February 16, 2007 through December 25, 2008.
8 For the period January 22, 2007 (commencement of issuance) through July 31, 2007.
300
| | | Class C | |
| | | Years ended July 31, | | Period ended
July 31, | |
| | | 2011 | | 20101 | | 2009 | | 2008 | | 20072 | |
| Net asset value, beginning of period | | $ | 5.29 | | | $ | 4.85 | | | $ | 7.69 | | | $ | 9.49 | | | $ | 9.84 | | |
| Net investment income3 | | | 0.05 | | | | 0.07 | | | | 0.12 | | | | 0.12 | | | | 0.05 | | |
| Net realized and unrealized gains (losses) | | | 1.00 | | | | 0.82 | | | | (2.95 | ) | | | (1.69 | ) | | | (0.36 | ) | |
| Net increase (decrease) from operations | | | 1.05 | | | | 0.89 | | | | (2.83 | ) | | | (1.57 | ) | | | (0.31 | ) | |
| Dividends from net investment income | | | (0.35 | ) | | | (0.45 | ) | | | (0.01 | ) | | | (0.20 | ) | | | (0.04 | ) | |
| Distributions from net realized gains | | | — | | | | — | | | | — | | | | (0.03 | ) | | | — | | |
| Total dividends and distributions | | | (0.35 | ) | | | (0.45 | ) | | | (0.01 | ) | | | (0.23 | ) | | | (0.04 | ) | |
| Net asset value, end of period | | $ | 5.99 | | | $ | 5.29 | | | $ | 4.85 | | | $ | 7.69 | | | $ | 9.49 | | |
| Total investment return4 | | | 20.51 | % | | | 18.74 | % | | | (36.73 | )% | | | (16.84 | )% | | | (3.16 | )% | |
| Ratios to average net assets: | |
| Expenses before fee waivers and/or expense reimbursements by manager | | | 2.45 | % | | | 2.69 | % | | | 2.96 | % | | | 2.68 | % | | | 3.78 | %5 | |
| Expenses after fee waivers and/or expense reimbursements by manager | | | 2.20 | % | | | 2.20 | % | | | 2.20 | % | | | 2.20 | % | | | 2.20 | %5 | |
| Net investment income | | | 0.79 | % | | | 1.37 | % | | | 2.67 | % | | | 1.29 | % | | | 0.84 | %5 | |
| Supplemental data: | |
| Net assets, end of period (000's) | | $ | 220 | | | $ | 171 | | | $ | 136 | | | $ | 213 | | | $ | 343 | | |
| Portfolio turnover | | | 51 | % | | | 117 | % | | | 127 | % | | | 68 | % | | | 38 | % | |
| | | Class P | |
| | | Years ended July 31, | | Period ended
July 31, | |
| | | 2011 | | 20101 | | 2009 | | 2008 | | 20078 | |
| Net asset value, beginning of period | | $ | 5.32 | | | $ | 4.86 | | | $ | 7.75 | | | $ | 9.56 | | | $ | 10.26 | | |
| Net investment income3 | | | 0.10 | | | | 0.12 | | | | 0.17 | | | | 0.21 | | | | 0.09 | | |
| Net realized and unrealized gains | | | 1.01 | | | | 0.83 | | | | (2.97 | ) | | | (1.71 | ) | | | (0.79 | ) | |
| Net increase from operations | | | 1.11 | | | | 0.95 | | | | (2.80 | ) | | | (1.50 | ) | | | (0.70 | ) | |
| Dividends from net investment income | | | (0.40 | ) | | | (0.49 | ) | | | (0.09 | ) | | | (0.28 | ) | | | — | | |
| Distributions from net realized gains | | | — | | | | — | | | | — | | | | (0.03 | ) | | | — | | |
| Total dividends and distributions | | | (0.40 | ) | | | (0.49 | ) | | | (0.09 | ) | | | (0.31 | ) | | | — | | |
| Net asset value, end of period | | $ | 6.03 | | | $ | 5.32 | | | $ | 4.86 | | | $ | 7.75 | | | $ | 9.56 | | |
| Total investment return4 | | | 21.74 | % | | | 20.10 | % | | | (36.09 | )% | | | (16.06 | )% | | | (6.82 | )% | |
| Ratios to average net assets: | |
| Expenses before fee waivers and/or expense reimbursements by manager | | | 1.65 | % | | | 1.91 | % | | | 2.17 | % | | | 1.71 | % | | | 3.02 | %5 | |
| Expenses after fee waivers and/or expense reimbursements by manager | | | 1.20 | % | | | 1.20 | % | | | 1.20 | % | | | 1.20 | % | | | 1.20 | %5 | |
| Net investment income | | | 1.77 | % | | | 2.36 | % | | | 3.67 | % | | | 2.38 | % | | | 1.75 | %5 | |
| Supplemental data: | |
| Net assets, end of period (000's) | | $ | 101,008 | | | $ | 73,866 | | | $ | 52,925 | | | $ | 70,125 | | | $ | 44,772 | | |
| Portfolio turnover | | | 51 | % | | | 117 | % | | | 127 | % | | | 68 | % | | | 38 | % | |
See accompanying notes to financial statements.
301
PACE Select Advisors Trust
Financial highlights
PACE Alternative Strategies Investments
Selected data for a share of beneficial interest outstanding throughout each period is presented below:
| | | Class A | | Class B | |
| | | Years ended July 31, | | Period ended
April 7, | | Years ended July 31, | |
| | | 20111 | | 2010 | | 20092 | | 20083 | | 2007 | | 20104 | | 20092 | | 20083 | | 2007 | |
| Net asset value, beginning of period | | $ | 9.16 | | | $ | 8.79 | | | $ | 10.46 | | | $ | 11.27 | | | $ | 9.93 | | | $ | 8.64 | | | $ | 10.36 | | | $ | 11.19 | | | $ | 9.91 | | |
| Net investment income (loss)5 | | | (0.00 | )6 | | | 0.006 | | | | 0.06 | | | | 0.09 | | | | 0.13 | | | | (0.03 | ) | | | (0.01 | ) | | | 0.01 | | | | 0.02 | | |
| Net realized and unrealized gains (losses) | | | 0.25 | | | | 0.40 | | | | (1.63 | ) | | | (0.65 | ) | | | 1.26 | | | | 0.56 | | | | (1.62 | ) | | | (0.64 | ) | | | 1.29 | | |
| Net increase (decrease) from operations | | | 0.25 | | | | 0.40 | | | | (1.57 | ) | | | (0.56 | ) | | | 1.39 | | | | 0.53 | | | | (1.63 | ) | | | (0.63 | ) | | | 1.31 | | |
| Dividends from net investment income | | | (0.09 | ) | | | (0.03 | ) | | | (0.03 | ) | | | (0.07 | ) | | | (0.05 | ) | | | — | | | | (0.02 | ) | | | (0.02 | ) | | | (0.03 | ) | |
| Distributions from net realized gains | | | — | | | | — | | | | (0.07 | ) | | | (0.18 | ) | | | — | | | | — | | | | (0.07 | ) | | | (0.18 | ) | | | — | | |
| Total dividends and distributions | | | (0.09 | ) | | | (0.03 | ) | | | (0.10 | ) | | | (0.25 | ) | | | (0.05 | ) | | | — | | | | (0.09 | ) | | | (0.20 | ) | | | (0.03 | ) | |
| Net asset value, end of period | | $ | 9.32 | | | $ | 9.16 | | | $ | 8.79 | | | $ | 10.46 | | | $ | 11.27 | | | $ | 9.17 | | | $ | 8.64 | | | $ | 10.36 | | | $ | 11.19 | | |
| Total investment return7 | | | 2.69 | % | | | 4.41 | % | | | (14.95 | )% | | | (4.94 | )% | | | 14.09 | % | | | 6.01 | % | | | (15.54 | )% | | | (5.68 | )% | | | 13.26 | % | |
| Ratios to average net assets: | |
Expenses before fee waivers and/or expense reimbursements by and
recoupments to manager including dividend expense, interest expense and
other borrowing costs for investments sold short | | | 2.08 | % | | | 2.06 | % | | | 2.23 | % | | | 2.42 | % | | | 2.69 | % | | | 3.20 | %8 | | | 3.13 | % | | | 4.51 | % | | | 3.68 | % | |
Expenses after fee waivers and/or expense reimbursements by and
recoupments to manager including dividend expense, interest expense and
other borrowing costs for investments sold short | | | 2.05 | % | | | 2.00 | % | | | 2.20 | % | | | 2.42 | %9 | | | 2.52 | % | | | 2.77 | %8 | | | 3.00 | % | | | 3.16 | % | | | 3.23 | % | |
Expenses after fee waivers and/or expense reimbursements by and
recoupments to manager, excluding dividend expense, interest expense and
other borrowing costs for investments sold short | | | 1.95 | % | | | 1.95 | % | | | 1.95 | % | | | 1.94 | %9 | | | 1.88 | % | | | 2.70 | %8 | | | 2.70 | % | | | 2.70 | % | | | 2.63 | % | |
| Net investment income (loss) | | | (0.02 | )% | | | 0.04 | % | | | 0.69 | % | | | 0.79 | % | | | 1.21 | % | | | (0.49 | )%8 | | | (0.08 | )% | | | 0.08 | % | | | 0.31 | % | |
| Supplemental data: | |
| Net assets, end of period (000's) | | $ | 63,767 | | | $ | 56,772 | | | $ | 65,429 | | | $ | 150,598 | | | $ | 64,409 | | | $ | — | | | $ | 29 | | | $ | 23 | | | $ | 18 | | |
| Portfolio turnover | | | 295 | % | | | 244 | % | | | 423 | % | | | 389 | % | | | 178 | % | | | 244 | % | | | 423 | % | | | 389 | % | | | 178 | % | |
1 A portion of the investment advisory function for this Portfolio was transferred to Standard Life Investments (Corporate Funds) Limited on August 5, 2010. Analytic Investors, LLC, First Quadrant L.P., Goldman Sachs Asset Management, L.P. and Wellington Management Company, LLP continue to provide a portion of the investment advisory function.
2 A portion of the investment advisory function for this Portfolio was transferred to First Quadrant L.P. on April 8, 2009.
3 A portion of the investment advisory function for this Portfolio was transferred to Goldman Sachs Asset Management, L.P. on September 10, 2007.
4 For the period August 1, 2009 through April 7, 2010. There were no shares outstanding from April 8, 2010 through July 31, 2010.
5 Calculated using the average shares method.
6 Amount represents less than $0.005 per share.
7 Total investment return is calculated assuming a $10,000 investment on the first day of each period reported, reinvestment of all dividends and other distributions, if any, at net asset value on the ex-dividend dates, and a sale at net asset value on the last day of each period reported. The figures do not include any applicable sales charges or redemption fees; results would be lower if they were included. Total investment return for periods of less than one year has not been annualized. Returns do not reflect the deduction of taxes that a shareholder would pay on Portfolio distributions or the redemption of Portfolio shares.
8 Annualized.
9 The investment manager recouped expenses previously reimbursed by the investment manager on behalf of the Portfolio, not to exceed the expense cap.
10 The ratios after and before fee waivers and/or expense reimbursements by and recoupments to manager are the same since the recoupments to manager represent less than 0.01%.
302
| | | Class C | |
| | | Years ended July 31, | |
| | | 20111 | | 2010 | | 20092 | | 20083 | | 2007 | |
| Net asset value, beginning of period | | $ | 8.97 | | | $ | 8.64 | | | $ | 10.34 | | | $ | 11.20 | | | $ | 9.91 | | |
| Net investment income (loss)5 | | | (0.07 | ) | | | (0.06 | ) | | | (0.01 | ) | | | 0.01 | | | | 0.05 | | |
| Net realized and unrealized gains (losses) | | | 0.25 | | | | 0.39 | | | | (1.62 | ) | | | (0.64 | ) | | | 1.26 | | |
| Net increase (decrease) from operations | | | 0.18 | | | | 0.33 | | | | (1.63 | ) | | | (0.63 | ) | | | 1.31 | | |
| Dividends from net investment income | | | (0.02 | ) | | | — | | | | — | | | | (0.05 | ) | | | (0.02 | ) | |
| Distributions from net realized gains | | | — | | | | — | | | | (0.07 | ) | | | (0.18 | ) | | | — | | |
| Total dividends and distributions | | | (0.02 | ) | | | — | | | | (0.07 | ) | | | (0.23 | ) | | | (0.02 | ) | |
| Net asset value, end of period | | $ | 9.13 | | | $ | 8.97 | | | $ | 8.64 | | | $ | 10.34 | | | $ | 11.20 | | |
| Total investment return7 | | | 1.93 | % | | | 3.70 | % | | | (15.61 | )% | | | (5.67 | )% | | | 13.23 | % | |
| Ratios to average net assets: | |
Expenses before fee waivers and/or expense reimbursements by and
recoupments to manager including dividend expense, interest expense and
other borrowing costs for investments sold short | | | 2.78 | % | | | 2.75 | % | | | 2.96 | % | | | 3.16 | %10 | | | 3.45 | % | |
Expenses after fee waivers and/or expense reimbursements by and
recoupments to manager including dividend expense, interest expense and
other borrowing costs for investments sold short | | | 2.78 | %9 | | | 2.75 | % | | | 2.96 | % | | | 3.16 | %9,10 | | | 3.28 | % | |
Expenses after fee waivers and/or expense reimbursements by and
recoupments to manager, excluding dividend expense, interest expense and
other borrowing costs for investments sold short | | | 2.68 | %9 | | | 2.70 | % | | | 2.70 | % | | | 2.67 | %9 | | | 2.65 | % | |
| Net investment income (loss) | | | (0.77 | )% | | | (0.72 | )% | | | (0.08 | )% | | | 0.08 | % | | | 0.56 | % | |
| Supplemental data: | |
| Net assets, end of period (000's) | | $ | 6,479 | | | $ | 6,887 | | | $ | 6,565 | | | $ | 7,921 | | | $ | 3,843 | | |
| Portfolio turnover | | | 295 | % | | | 244 | % | | | 423 | % | | | 389 | % | | | 178 | % | |
See accompanying notes to financial statements.
303
PACE Select Advisors Trust
Financial highlights
PACE Alternative Strategies Investments (concluded)
Selected data for a share of beneficial interest outstanding throughout each period is presented below:
| | | Class Y | |
| | | Years ended July 31, | | Period ended
July 31, | |
| | | 20111 | | 2010 | | 20092 | | 20083,4 | |
| Net asset value, beginning of period | | $ | 9.19 | | | $ | 8.80 | | | $ | 10.51 | | | $ | 10.52 | | |
| Net investment income5 | | | 0.02 | | | | 0.03 | | | | 0.08 | | | | (0.00 | )6 | |
| Net realized and unrealized gains (losses) | | | 0.25 | | | | 0.40 | | | | (1.66 | ) | | | (0.01 | ) | |
| Net increase (decrease) from operations | | | 0.27 | | | | 0.43 | | | | (1.58 | ) | | | (0.01 | ) | |
| Dividends from net investment income | | | (0.08 | ) | | | (0.04 | ) | | | (0.06 | ) | | | — | | |
| Distributions from net realized gains | | | — | | | | — | | | | (0.07 | ) | | | — | | |
| Total dividends and distributions | | | (0.08 | ) | | | (0.04 | ) | | | (0.13 | ) | | | — | | |
| Net asset value, end of period | | $ | 9.38 | | | $ | 9.19 | | | $ | 8.80 | | | $ | 10.51 | | |
| Total investment return7 | | | 2.84 | % | | | 4.83 | % | | | (14.81 | )% | | | (0.10 | )% | |
| Ratios to average net assets: | |
Expenses before fee waivers and/or expense reimbursements by and
recoupments to manager including dividend expense, interest expense and
other borrowing costs for investments sold short | | | 1.85 | % | | | 1.76 | % | | | 1.98 | % | | | 2.69 | %9 | |
Expenses after fee waivers and/or expense reimbursements by and
recoupments to manager including dividend expense, interest expense and
other borrowing costs for investments sold short | | | 1.80 | % | | | 1.76 | %8 | | | 1.95 | % | | | 2.52 | %9 | |
Expenses after fee waivers and/or expense reimbursements by and
recoupments to manager, excluding dividend expense, interest expense and
other borrowing costs for investments sold short | | | 1.70 | % | | | 1.70 | %8 | | | 1.70 | % | | | 1.70 | %9 | |
| Net investment income (loss) | | | 0.21 | % | | | 0.37 | % | | | 0.95 | % | | | (1.77 | )%9 | |
| Supplemental data: | |
| Net assets, end of period (000's) | | $ | 1,565 | | | $ | 1,977 | | | $ | 13,707 | | | $ | 57,552 | | |
| Portfolio turnover | | | 295 | % | | | 244 | % | | | 423 | % | | | 389 | % | |
1 A portion of the investment advisory function for this Portfolio was transferred to Standard Life Investments (Corporate Funds) Limited on August 5, 2010. Analytic Investors, LLC, First Quadrant L.P., Goldman Sachs Asset Management, L.P. and Wellington Management Company, LLP continue to provide a portion of the investment advisory function.
2 A portion of the investment advisory function for this Portfolio was transferred to First Quadrant L.P. on April 8, 2009.
3 A portion of the investment advisory function for this Portfolio was transferred to Goldman Sachs Asset Management, L.P. on September 10, 2007.
4 For the period July 23, 2008 (recommencement of issuance) through July 31, 2008.
5 Calculated using the average shares method.
6 Amount represents less than $0.005 per share.
7 Total investment return is calculated assuming a $10,000 investment on the first day of each period reported, reinvestment of all dividends and other distributions, if any, at net asset value on the ex-dividend dates, and a sale at net asset value on the last day of each period reported. The figures do not include any applicable sales charges or redemption fees or program fees; results would be lower if they were included. Total investment return for periods of less than one year has not been annualized. Returns do not reflect the deduction of taxes that a shareholder would pay on Portfolio distributions or the redemption of Portfolio shares.
8 The investment manager recouped expenses previously reimbursed by the investment manager on behalf of the Portfolio, not to exceed the expense cap.
9 Annualized.
304
| | | Class P | |
| | | Years ended July 31, | |
| | | 20111 | | 2010 | | 20092 | | 20083 | | 2007 | |
| Net asset value, beginning of period | | $ | 9.19 | | | $ | 8.82 | | | $ | 10.51 | | | $ | 11.30 | | | $ | 9.94 | | |
| Net investment income5 | | | 0.02 | | | | 0.03 | | | | 0.08 | | | | 0.12 | | | | 0.16 | | |
| Net realized and unrealized gains (losses) | | | 0.26 | | | | 0.40 | | | | (1.65 | ) | | | (0.65 | ) | | | 1.26 | | |
| Net increase (decrease) from operations | | | 0.28 | | | | 0.43 | | | | (1.57 | ) | | | (0.53 | ) | | | 1.42 | | |
| Dividends from net investment income | | | (0.11 | ) | | | (0.06 | ) | | | (0.05 | ) | | | (0.08 | ) | | | (0.06 | ) | |
| Distributions from net realized gains | | | — | | | | — | | | | (0.07 | ) | | | (0.18 | ) | | | — | | |
| Total dividends and distributions | | | (0.11 | ) | | | (0.06 | ) | | | (0.12 | ) | | | (0.26 | ) | | | (0.06 | ) | |
| Net asset value, end of period | | $ | 9.36 | | | $ | 9.19 | | | $ | 8.82 | | | $ | 10.51 | | | $ | 11.30 | | |
| Total investment return7 | | | 2.94 | % | | | 4.71 | % | | | (14.73 | )% | | | (4.76 | )% | | | 14.38 | % | |
| Ratios to average net assets: | |
Expenses before fee waivers and/or expense reimbursements by and
recoupments to manager including dividend expense, interest expense and
other borrowing costs for investments sold short | | | 1.81 | % | | | 1.79 | % | | | 1.96 | % | | | 2.13 | % | | | 2.43 | % | |
Expenses after fee waivers and/or expense reimbursements by and
recoupments to manager including dividend expense, interest expense and
other borrowing costs for investments sold short | | | 1.80 | % | | | 1.75 | % | | | 1.95 | % | | | 2.13 | %8 | | | 2.28 | % | |
Expenses after fee waivers and/or expense reimbursements by and
recoupments to manager, excluding dividend expense, interest expense and
other borrowing costs for investments sold short | | | 1.70 | % | | | 1.70 | % | | | 1.70 | % | | | 1.68 | %8 | | | 1.64 | % | |
| Net investment income (loss) | | | 0.22 | % | | | 0.28 | % | | | 0.93 | % | | | 1.10 | % | | | 1.44 | % | |
| Supplemental data: | |
| Net assets, end of period (000's) | | $ | 476,544 | | | $ | 399,477 | | | $ | 356,352 | | | $ | 555,361 | | | $ | 384,649 | | |
| Portfolio turnover | | | 295 | % | | | 244 | % | | | 423 | % | | | 389 | % | | | 178 | % | |
See accompanying notes to financial statements.
305
PACE Select Advisors Trust
Notes to financial statements
Organization and significant accounting policies
PACE Select Advisors Trust (the "Trust") is registered with the US Securities and Exchange Commission ("SEC") under the Investment Company Act of 1940, as amended, as an open-end management investment company currently composed of fifteen separate investment portfolios and was organized as a Delaware statutory trust under the laws of the State of Delaware by Certificate of Trust dated September 9, 1994, as amended June 9, 1995 and thereafter. The trustees of the Trust have authority to issue an unlimited number of shares of beneficial interest, par value $0.001 per share.
The Trust has fifteen Portfolios available for investment, each having its own investment objectives and policies: PACE Money Market Investments, PACE Government Securities Fixed Income Investments, PACE Intermediate Fixed Income Investments, PACE Strategic Fixed Income Investments, PACE Municipal Fixed Income Investments, PACE International Fixed Income Investments, PACE High Yield Investments, PACE Large Co Value Equity Investments, PACE Large Co Growth Equity Investments, PACE Small/Medium Co Value Equity Investments, PACE Small/Medium Co Growth Equity Investments, PACE International Equity Investments, PACE International Emerging Markets Equity Investments, PACE Global Real Estate Securities Investments and PACE Alternative Strategies Investments (collectively, the "Portfolios").
Effective November 22, 2010, the names of the Trust and each of the Portfolios have been changed as indicated below:
| Former name | | Current name | |
| UBS PACE® Select Advisors Trust | | PACE® Select Advisors Trust | |
|
| UBS PACE® Money Market Investments | | PACE® Money Market Investments | |
|
| UBS PACE® Government Securities Fixed Income Investments | | PACE® Government Securities Fixed Income Investments | |
|
| UBS PACE® Intermediate Fixed Income Investments | | PACE® Intermediate Fixed Income Investments | |
|
| UBS PACE® Strategic Fixed Income Investments | | PACE® Strategic Fixed Income Investments | |
|
| UBS PACE® Municipal Fixed Income Investments | | PACE® Municipal Fixed Income Investments | |
|
| UBS PACE® Global Fixed Income Investments | | PACE® International Fixed Income Investments | |
|
| UBS PACE® High Yield Investments | | PACE® High Yield Investments | |
|
| UBS PACE® Large Co Value Equity Investments | | PACE® Large Co Value Equity Investments | |
|
| UBS PACE® Large Co Growth Equity Investments | | PACE® Large Co Growth Equity Investments | |
|
| UBS PACE® Small/Medium Co Value Equity Investments | | PACE® Small/Medium Co Value Equity Investments | |
|
| UBS PACE® Small/Medium Co Growth Equity Investments | | PACE® Small/Medium Co Growth Equity Investments | |
|
| UBS PACE® International Equity Investments | | PACE® International Equity Investments | |
|
| UBS PACE® International Emerging Markets Equity Investments | | PACE® International Emerging Markets Equity Investments | |
|
| UBS PACE® Global Real Estate Securities Investments | | PACE® Global Real Estate Securities Investments | |
|
| UBS PACE® Alternative Strategies Investments | | PACE® Alternative Strategies Investments | |
|
Each of the Portfolios is classified as a diversified investment company with the exception of PACE Intermediate Fixed Income Investments, PACE International Fixed Income Investments, PACE Global Real Estate Securities Investments and PACE Alternative Strategies Investments. With the exception of PACE Money Market Investments (which currently offers Class P shares only) and PACE Global Real Estate Securities Investments (which currently offers Class A, Class C, Class Y and Class P shares), each Portfolio currently offers Class A, Class B, Class C, Class Y and Class P shares. Each class represents interests in the same assets of the applicable Portfolio and the classes are identical except for differences in their sales charge structures, ongoing service and distribution charges and certain transfer agency and related services expenses. In addition, Class B shares and all corresponding reinvested dividend shares automatically convert to Class A shares within a certain number of years after issuance which varies depending upon the amount invested. All classes of shares have equal voting privileges except that each class has exclusive voting rights with respect to its service and/or distribution plan, if any. Class Y and Class P
306
PACE Select Advisors Trust
Notes to financial statements
shares have no service or distribution plan. The Portfolios' Class P shares currently are available for purchase only to participants in the PACESM Select Advisors Program, except that PACE Money Market Investments shares are also available to participants in the PACESM Multi Advisor Program.
As of October 1, 2007, new or additional investments into Class B shares, including investments through an automatic investment plan, are not permitted. Existing shareholders of Class B shares may: (i) continue as Class B shareholders; (ii) continue to reinvest dividends and distributions into Class B shares; and (iii) exchange their Class B shares for Class B shares of other series of the UBS Family of Funds, as permitted by existing exchange privileges. For Class B shares outstanding on October 1, 2007 and Class B shares acquired upon reinvestment of dividends and distributions or through exchanges, all Class B share attributes, including the associated Rule 12b-1 service plan and distribution fees, contingent deferred sales charges and conversion features will continue.
The Trust accounts separately for the assets, liabilities and operations of each Portfolio. Expenses directly attributable to each Portfolio are charged to that Portfolio's operations; expenses which are applicable to all Portfolios are allocated among them on a pro rata basis.
In the normal course of business, the Portfolios may enter into contracts that contain a variety of representations or that provide indemnification for certain liabilities. The Portfolios' maximum exposure under these arrangements is unknown, as this would involve future claims that may be made against the Portfolios that have not yet occurred. However, the Portfolios have not had prior claims or losses pursuant to these contracts and expect the risk of loss to be remote.
PACE Money Market Investments attempts to maintain a stable net asset value of $1.00 per share; the Portfolio has adopted certain investment, portfolio valuation and dividend/distribution policies in an attempt to enable it to do so. As with any money market portfolio, there is no assurance, however, that the Portfolio will be able to maintain a stable net asset value of $1.00 per share.
The Financial Accounting Standards Board ("FASB") Accounting Standards Codification ("ASC") is the exclusive reference of authoritative US generally accepted accounting principles ("GAAP") recognized by the FASB to be applied by nongovernmental entities. Rules and interpretive releases of the SEC under authority of federal laws are also sources of authoritative GAAP for SEC registrants. The Portfolios' financial statements are prepared in accordance with GAAP, which may require the use of management estimates and assumptions. Actual results could differ from those estimates. The following is a summary of significant accounting policies:
Valuation of investments—Each Portfolio (except PACE Money Market Investments) calculates its net asset value based on the current value for its portfolio securities. The Portfolios normally obtain values for their securities from independent pricing sources. Independent pricing sources may use last reported sale prices, official market closing prices, current market quotations or valuations from computerized "matrix" systems that derive values based on comparable securities. Securities traded in the over-the-counter ("OTC") market and listed on The NASDAQ Stock Market, Inc. ("NASDAQ") normally are valued at the NASDAQ Official Closing Price. Other OTC securities are valued at the last bid price available prior to valuation. Securities which are listed on US and foreign stock exchanges normally are valued at the market close, last sale price on the day the securities are valued or, lacking any sales on such day, at the last available bid price. Securities listed on foreign stock exchanges (and certain related derivatives) may be fair valued based on significant events that occur between the close of the foreign markets and 4:00 pm EST. PACE International Equity Investments, PACE International Emerging Markets Equity Investments, PACE Global Real Estate Securities Investments and PACE Alternative Strategies Investments may use a systematic fair valuation model provided by an independent third party to value securities principally traded in foreign markets (and certain related derivatives) in order to adjust for possible stale pricing that may occur between the close of the foreign exchanges and the time for valuation. If a security is valued at a "fair value", that value is likely to be
307
PACE Select Advisors Trust
Notes to financial statements
different from the last quoted market price for the security. The use of the fair valuation model may result in securities being transferred between Level 1 and Level 2 of the fair value hierarchy at reporting period ends. In cases where securities are traded on more than one exchange, the securities are valued on the exchange designated as the primary market by UBS Global Asset Management (Americas) Inc. ("UBS Global AM"). If a market value is not available from an independent pricing source for a particular security, that security is valued at fair value as determined in good faith by or under the direction of the Trust's Board of Trustees (the "Board"). Various factors may be reviewed in order to make a good faith determination of a security's fair value. These factors include, but are not limited to, the type and cost of the security; contractual or legal restrictions on resale of the security; relevant financial or business developments of the issuer; actively traded similar or related securities; conversion or exchange rights on the security; related corporate actions; and changes in overall market conditions. If events occur that materially affect the value of securities (particularly non-US securities) between the close of trading in those securities and the close of regular trading on the New York Stock Exchange ("NYSE"), the securities are fair valued. The amortized cost method of valuation, which approximates market value, generally is used to value short-term debt instruments with sixty days or less remaining to maturity, unless the Board determines that this does not represent fair value. Investments of the PACE Money Market Investments Portfolio are valued using the amortized cost method of valuation. All investments quoted in foreign currencies will be valued daily in US dollars on the basis of the foreign currency exchange rates prevailing at the time such valuation is determined by the Portfolios' custodian. Investments in open-end investment companies are valued at the daily closing net asset value of the respective investment company. Pursuant to the Portfolios' use of the practical expediant within ASC Topic 820, investments in non-registered investment companies are also valued at the daily net asset value. Futures contracts are generally valued at the settlement price established each day on the exchange on which they are traded. Forward foreign currency contracts are valued daily using forward exchange rates quoted by independent pricing services. Swaps are marked to market daily based upon values from third party vendors or quotations from market makers to the extent available and the change in value, if any, is recorded on the Statement of assets and liabilities. In the event that market quotations are not readily available or deemed unreliable, swaps are valued at fair value as determined in good faith by or under the direction of the Board.
GAAP requires disclosure surrounding the various inputs that are used in determining the value of the Portfolio's investments. These inputs are summarized into the three broad levels listed below:
Level 1—Unadjusted quoted prices in active markets for identical investments.
Level 2—Other significant observable inputs, including but not limited to, quoted prices for similar investments, interest rates, prepayment speeds and credit risks.
Level 3—Unobservable inputs inclusive of the Portfolio's own assumptions in determining the fair value of investments.
In accordance with the requirements of GAAP, a fair value hierarchy has been included near the end of each Portfolio's Portfolio of investments.
In January 2010, FASB issued Accounting Standards Update No. 2010-06 "Improving Disclosures about Fair Value Measurements" ("ASU 2010-06"). ASU No. 2010-06 will require reporting entities to make new disclosures about amounts and reasons for significant transfers in and out of Level 1 and Level 2 fair value measurements as well as inputs and valuation techniques used to measure fair value for both recurring and nonrecurring fair value measurements that fall in either Level 2 or Level 3, and information on purchases, sales, issuances and settlements on a gross basis in the reconciliation of activity in Level 3 fair value measurements. The new and revised disclosures have been implemented for annual and interim periods beginning after December 15, 2009 except for the disclosures surrounding purchases, sales, issuances and settlements on a gross basis in the reconciliation of Level 3 fair value measurements, which have been implemented for annual and interim periods beginning after December 15, 2010.
308
PACE Select Advisors Trust
Notes to financial statements
In April 2011, the FASB issued Accounting Standards Update No. 2011-03 ("ASU 2011-03") which relates to the accounting for repurchase agreements and similar agreements, including mortgage dollar rolls, that both entitle and obligate a transferor to repurchase or redeem financial assets before their maturity. ASU 2011-03 modifies the criteria for determining effective control of transferred assets and as a result certain agreements may now be accounted for as secured borrowings. ASU 2011-03 is effective prospectively for new transfers and existing transactions that are modified in the first interim or annual period beginning on or after December 15, 2011. Management is currently evaluating the implications of this change and its impact on the financial statements.
In May 2011, FASB Issued ASU No. 2011-04 "Amendments to Achieve Common Fair Value Measurement and Disclosure Requirements in US GAAP and International Financial Reporting Standards ("IFRS")" ("ASU 2011-04"). ASU 2011-04 includes common requirements for measurement of and disclosure about fair value between US GAAP and IFRS. ASU 2011-04 will require reporting entities to disclose the following information for fair value measurements categorized within Level 3 of the fair value hierarchy: quantitative information about the unobservable inputs used in the fair value measurement, the valuation processes used by the reporting entity and a narrative description of the sensitivity of the fair value measurement to changes in unobservable inputs and the interrelationships between those unobservable inputs. In addition, ASU 2011-04 will require reporting entities to make disclosure about amounts and reason for all transfers in and out of Level 1 and Level 2 fair value measurements. The new and revised disclosures are effective for interim and annual reporting periods beginning after December 15, 2011. At this time, management is evaluating the implications of ASU 2011-04 and its impact on the financial statements.
The provisions of ASC Topic 815 "Derivatives and Hedging" ("ASC Topic 815") require qualitative disclosures about objectives and strategies for using derivatives, quantitative disclosures about fair value amounts of gains and losses on derivative instruments and disclosures about credit-risk related contingent features in derivative agreements. Since investment companies value their derivatives at fair value and recognize changes in fair value through the Statement of operations, they do not qualify for hedge accounting under ASC Topic 815. Accordingly, even though a Portfolio's investments in derivatives may represent economic hedges, they are considered to be non-hedge transactions for purposes of disclosure under ASC Topic 815. ASC Topic 815 requires (1) objectives for using derivative instruments be disclosed in terms of underlying risk and accounting designation, (2) the fair values of derivative instruments and their gains and losses be disclosed in a tabular format, and (3) information be disclosed about credit-risk contingent features of derivatives contracts. Certain derivative contracts entered into by the Portfolios may contain credit risk related contingent features that could be triggered subject to certain circumstances. If triggered, the derivative counterparty could request additional cash margin and/or terminate the derivative contract. Details of this disclosure can be found below as well as in the Portfolio of investments. The volume of derivatives that is presented in the Portfolio of investments of each Portfolio is consistent with the derivative activity during the year ended July 31, 2011 except for PACE Government Securities Fixed Income Investments, for which the derivatives volume during the year was greater than at year end. The Portfolios may be sellers of protection through credit default swap agreements which are by nature credit-risk contingent (the terms of these agreements can be found within the Portfolio of investments, with further discussion in the Notes to financial statements); however, the Portfolios are not aware of any additional credit-risk contingent features on other derivative contracts held by the Portfolios.
At July 31, 2011, the Portfolios had the following derivatives categorized by underlying risk:
| Asset derivatives1 | |
| | | | Interest rate
risk | | Foreign exchange
risk | | Credit
risk | | Equity
risk | |
Total | |
| PACE Intermediate Fixed Income Investments | |
| | | Futures contracts | | $ | 809,277 | | | | — | | | | — | | | | — | | | $ | 809,277 | | |
| | | Options purchased | | | 51,323 | | | | — | | | | — | | | | — | | | | 51,323 | | |
| | | Forward foreign
currency contracts | | | — | | | $ | 372,307 | | | | — | | | | — | | | | 372,307 | | |
| | | Swap agreements | | | 88,664 | | | | — | | | | — | | | | — | | | | 88,664 | | |
| | | Total value | | $ | 949,264 | | | $ | 372,307 | | | | — | | | | — | | | $ | 1,321,571 | | |
309
PACE Select Advisors Trust
Notes to financial statements
| Asset derivatives1 | |
| | | | Interest rate
risk | | Foreign exchange
risk | | Credit
risk | | Equity
risk | | Total | |
| PACE Strategic Fixed Income Investments | |
| | | Futures contracts | | $ | 4,230,444 | | | | — | | | | — | | | | — | | | $ | 4,230,444 | | |
| | | Forward foreign
currency contracts | | | — | | | $ | 1,753,580 | | | | — | | | | — | | | | 1,753,580 | | |
| | | Swap agreements | | | 952,737 | | | | — | | | $ | 925,283 | | | | — | | | | 1,878,020 | | |
| | | Total value | | $ | 5,183,181 | | | $ | 1,753,580 | | | $ | 925,283 | | | | — | | | $ | 7,862,044 | | |
| PACE International Fixed Income Investments | |
| | | Futures contracts | | $ | 2,956,307 | | | | — | | | | — | | | | — | | | $ | 2,956,307 | | |
| | | Forward foreign
currency contracts | | | — | | | $ | 5,005,083 | | | | — | | | | — | | | | 5,005,083 | | |
| | | Total value | | $ | 2,956,307 | | | $ | 5,005,083 | | | | — | | | | — | | | $ | 7,961,390 | | |
| PACE International Equity Investments | |
| | | Futures contracts | | | — | | | | — | | | | — | | | $ | 48,658 | | | $ | 48,658 | | |
| | | Forward foreign
currency contracts | | | — | | | $ | 1,652,114 | | | | — | | | | — | | | | 1,652,114 | | |
| | | Total value | | | — | | | $ | 1,652,114 | | | | — | | | $ | 48,658 | | | $ | 1,700,772 | | |
| PACE Alternative Strategies Investments | |
| | | Futures contracts | | $ | 5,511,200 | | | | — | | | | — | | | $ | 1,299,238 | | | $ | 6,810,438 | | |
| | | Options purchased | | | 5,221,183 | | | $ | 899,045 | | | | — | | | | 482,699 | | | | 6,602,927 | | |
| | | Forward foreign
currency contracts | | | — | | | | 11,831,034 | | | | — | | | | — | | | | 11,831,034 | | |
| | | Swap agreements | | | 5,414,274 | | | | — | | | $ | 1,635,626 | | | | 3,808,314 | | | | 10,858,214 | | |
| | | Total value | | $ | 16,146,657 | | | $ | 12,730,079 | | | $ | 1,635,626 | | | $ | 5,590,251 | | | $ | 36,102,613 | | |
1 In the Statement of assets and liabilities, options purchased are shown within Investments in securities of unaffiliated issuers, at value, swap agreements are shown at value while forward foreign currency contracts are shown using unrealized appreciation. Futures contracts are reported in the table above using the cumulative appreciation as detailed in the futures contract table at the end of the Portfolio of investments, but only the variation margin to be received, if any, is reported within the Statement of assets and liabilities.
| Liability derivatives2 | |
| | | | Interest rate
risk | | Foreign exchange
risk | | Credit
risk | | Equity
risk | | Total | |
| PACE Intermediate Fixed Income Investments | |
| | | Futures contracts | | $ | (1,357,413 | ) | | | — | | | | — | | | | — | | | $ | (1,357,413 | ) | |
| | | Forward foreign
currency contracts | | | — | | | $ | (325,534 | ) | | | — | | | | — | | | | (325,534 | ) | |
| | | Swap agreements | | | (1,657,117 | ) | | | — | | | $ | (19,937 | ) | | | — | | | | (1,677,054 | ) | |
| | | Total value | | $ | (3,014,530 | ) | | $ | (325,534 | ) | | $ | (19,937 | ) | | | — | | | $ | (3,360,001 | ) | |
| PACE Strategic Fixed Income Investments | |
| | | Written options
and swaptions | | $ | (131,358 | ) | | | — | | | | — | | | | — | | | $ | (131,358 | ) | |
| | | Forward foreign
currency contracts | | | — | | | $ | (3,906,423 | ) | | | — | | | | — | | | | (3,906,423 | ) | |
| | | Swap agreements | | | (112,070 | ) | | | — | | | $ | (946,751 | ) | | | — | | | | (1,058,821 | ) | |
| | | Total value | | $ | (243,428 | ) | | $ | (3,906,423 | ) | | $ | (946,751 | ) | | | — | | | $ | (5,096,602 | ) | |
| PACE International Fixed Income Investments | |
| | | Futures contracts | | $ | (3,552,110 | ) | | | — | | | | — | | | | — | | | $ | (3,552,110 | ) | |
| | | Forward foreign
currency contracts | | | — | | | $ | (2,142,599 | ) | | | — | | | | — | | | | (2,142,599 | ) | |
| | | Total value | | $ | (3,552,110 | ) | | $ | (2,142,599 | ) | | | — | | | | — | | | $ | (5,694,709 | ) | |
| PACE High Yield Investments | |
| | | Forward foreign
currency contracts | | | — | | | $ | (1,205,944 | ) | | | — | | | | — | | | $ | (1,205,944 | ) | |
| | | Total value | | | — | | | $ | (1,205,944 | ) | | | — | | | | — | | | $ | (1,205,944 | ) | |
| PACE International Equity Investments | |
| | | Futures contracts | | | — | | | | — | | | | — | | | | (156,314 | ) | | $ | (156,314 | ) | |
| | | Forward foreign
currency contracts | | | — | | | $ | (688,401 | ) | | | — | | | | — | | | | (688,401 | ) | |
| | | Total value | | | — | | | $ | (688,401 | ) | | | — | | | | (156,314 | ) | | $ | (844,715 | ) | |
310
PACE Select Advisors Trust
Notes to financial statements
| Liability derivatives2 | |
| | | | Interest rate
risk | | Foreign exchange
risk | | Credit
risk | | Equity
risk | | Total | |
| PACE Alternative Strategies Investments | |
| | | Futures contracts | | $ | (7,610,549 | ) | | | — | | | | — | | | $ | (1,758,298 | ) | | $ | (9,368,847 | ) | |
| | | Written options
and swaptions | | | (2,604,115 | ) | | $ | (1,657,131 | ) | | | — | | | | (907,721 | ) | | | (5,168,967 | ) | |
| | | Forward foreign
currency contracts | | | — | | | | (17,465,398 | ) | | | — | | | | — | | | | (17,465,398 | ) | |
| | | Swap agreements | | | (4,524,628 | ) | | | — | | | $ | (3,367,016 | ) | | | (4,687,419 | ) | | | (12,579,063 | ) | |
| | | Total value | | $ | (14,739,292 | ) | | $ | (19,122,529 | ) | | $ | (3,367,016 | ) | | $ | (7,353,438 | ) | | $ | (44,582,275 | ) | |
2 In the Statement of assets and liabilities, swap agreements, written options and swaptions are shown at value while forward foreign currency contracts are shown using unrealized depreciation. Futures contracts are reported in the table above using the cumulative depreciation as detailed in the futures contract table at the end of the Portfolio of investments, but only the variation margin to be paid, if any, is reported within the Statement of assets and liabilities.
Transactions in derivative instruments during the year ended July 31, 2011, were as follows:
| | | | Interest rate
risk | | Foreign exchange
risk | | Credit
risk | | Equity
risk | | Total | |
| PACE Government Securities Fixed Income Investments | |
| | | Net realized gain (loss)3 | | | | | | | | | | | |
| | | Futures contracts | | $ | 315,895 | | | | — | | | | — | | | | — | | | $ | 315,895 | | |
| | | Written options and swaptions | | | 1,092,053 | | | | — | | | | — | | | | — | | | | 1,092,053 | | |
| | | Swap agreements | | | (1,404,955 | ) | | | — | | | $ | (128,078 | ) | | | — | | | | (1,533,033 | ) | |
| | | Total net realized gain (loss) | | $ | 2,993 | | | | — | | | $ | (128,078 | ) | | | — | | | $ | (125,085 | ) | |
| | | Net change in unrealized
appreciation/depreciation4 | | | | | | | | | | | |
| | | Futures contracts | | $ | (261,891 | ) | | | — | | | | — | | | | — | | | $ | (261,891 | ) | |
| | | Written options and swaptions | | | (130,362 | ) | | | — | | | | — | | | | — | | | | (130,362 | ) | |
| | | Swap agreements | | | — | | | | — | | | $ | (36,836 | ) | | | — | | | | (36,836 | ) | |
| | | Total net change in unrealized
appreciation/depreciation | | $ | (392,253 | ) | | | — | | | $ | (36,836 | ) | | | — | | | $ | (429,089 | ) | |
| PACE Intermediate Fixed Income Investments | |
| | | Net realized gain (loss)3 | | | | | | | | | | | |
| | | Futures contracts | | $ | 803,461 | | | | — | | | | — | | | | — | | | $ | 803,461 | | |
| | | Options purchased5 | | | (24,277 | ) | | | — | | | | — | | | | — | | | | (24,277 | ) | |
| | | Forward foreign
currency contracts | | | — | | | $ | 215,208 | | | | — | | | | — | | | | 215,208 | | |
| | | Swap agreements | | | (325,022 | ) | | | — | | | $ | 733 | | | | — | | | | (324,289 | ) | |
| | | Total net realized gain (loss) | | $ | 454,162 | | | $ | 215,208 | | | $ | 733 | | | | — | | | $ | 670,103 | | |
| | | Net change in unrealized
appreciation/depreciation4 | | | | | | | | | | | |
| | | Futures contracts | | $ | 19,883 | | | | — | | | | — | | | | — | | | $ | 19,883 | | |
| | | Options purchased5 | | | (204,247 | ) | | | — | | | | — | | | | — | | | | (204,247 | ) | |
| | | Forward foreign
currency contracts | | | — | | | $ | (323,921 | ) | | | — | | | | — | | | | (323,921 | ) | |
| | | Swap agreements | | | (1,568,453 | ) | | | — | | | $ | 9,926 | | | | — | | | | (1,558,527 | ) | |
| | | Total net change in unrealized
appreciation/depreciation | | $ | (1,752,817 | ) | | $ | (323,921 | ) | | $ | 9,926 | | | | — | | | $ | (2,066,812 | ) | |
311
PACE Select Advisors Trust
Notes to financial statements
| | | | Interest rate
risk | | Foreign exchange
risk | | Credit
risk | | Equity
risk | | Total | |
| PACE Strategic Fixed Income Investments | |
| | | Net realized gain (loss)3 | | | | | | | | | | | |
| | | Futures contracts | | $ | 6,515,426 | | | | — | | | | — | | | | — | | | $ | 6,515,426 | | |
| | | Written options and swaptions | | | (828,009 | ) | | | — | | | | — | | | | — | | | | (828,009 | ) | |
| | | Forward foreign
currency contracts | | | — | | | $ | (6,934,292 | ) | | | — | | | | — | | | | (6,934,292 | ) | |
| | | Swap agreements | | | 327,722 | | | | — | | | $ | 231,185 | | | | — | | | | 558,907 | | |
| | | Total net realized gain (loss) | | $ | 6,015,139 | | | $ | (6,934,292 | ) | | $ | 231,185 | | | | — | | | $ | (687,968 | ) | |
| | | Net change in unrealized
appreciation/depreciation4 | | | | | | | | | | | |
| | | Futures contracts | | $ | 3,322,876 | | | | — | | | | — | | | | — | | | $ | 3,322,876 | | |
| | | Written options and swaptions | | | 1,261,319 | | | | — | | | | — | | | | — | | | | 1,261,319 | | |
| | | Forward foreign
currency contracts | | | — | | | $ | 105,006 | | | | — | | | | — | | | | 105,006 | | |
| | | Swap agreements | | | (731,685 | ) | | | — | | | $ | 331,083 | | | | — | | | | (400,602 | ) | |
| | | Total net change in unrealized
appreciation/depreciation | | $ | 3,852,510 | | | $ | 105,006 | | | $ | 331,083 | | | | — | | | $ | 4,288,599 | | |
| PACE International Fixed Income Investments | |
| | | Net realized gain (loss)3 | | | | | | | | | | | |
| | | Futures contracts | | $ | (5,221,921 | ) | | | — | | | | — | | | | — | | | $ | (5,221,921 | ) | |
| | | Forward foreign
currency contracts | | | — | | | $ | 13,581,572 | | | | — | | | | — | | | | 13,581,572 | | |
| | | Total net realized gain (loss) | | $ | (5,221,921 | ) | | $ | 13,581,572 | | | | — | | | | — | | | $ | 8,359,651 | | |
| | | Net change in unrealized
appreciation/depreciation4 | | | | | | | | | | | |
| | | Futures contracts | | $ | 1,254,317 | | | | — | | | | — | | | | — | | | $ | 1,254,317 | | |
| | | Forward foreign
currency contracts | | | | | | $ | (1,924,130 | ) | | | — | | | | — | | | | (1,924,130 | ) | |
| | | Total net change in unrealized
appreciation/depreciation | | $ | 1,254,317 | | | $ | (1,924,130 | ) | | | — | | | | — | | | $ | (669,813 | ) | |
| PACE High Yield Investments | |
| | | Net realized gain (loss)3 | | | | | | | | | | | |
| | | Forward foreign
currency contracts | | | — | | | $ | (3,740,949 | ) | | | — | | | | — | | | $ | (3,740,949 | ) | |
| | | Total net realized gain (loss) | | | — | | | $ | (3,740,949 | ) | | | — | | | | — | | | $ | (3,740,949 | ) | |
| | | Net change in unrealized
appreciation/depreciation4 | | | | | | | | | | | |
| | | Forward foreign
currency contracts | | | — | | | $ | (238,831 | ) | | | — | | | | — | | | $ | (238,831 | ) | |
| | | Total net change in unrealized
appreciation/depreciation | | | — | | | $ | (238,831 | ) | | | — | | | | — | | | $ | (238,831 | ) | |
| PACE International Equity Investments | |
| | | Net realized gain (loss)3 | | | | | | | | | | | |
| | | Futures contracts | | | — | | | | — | | | | — | | | $ | 317,834 | | | $ | 317,834 | | |
| | | Forward foreign
currency contracts | | | — | | | $ | 2,546,075 | | | | — | | | | — | | | | 2,546,075 | | |
| | | Total net realized gain (loss) | | | — | | | $ | 2,546,075 | | | | — | | | $ | 317,834 | | | $ | 2,863,909 | | |
| | | Net change in unrealized
appreciation/depreciation4 | | | | | | | | | | | |
| | | Futures contracts | | | — | | | | — | | | | — | | | $ | (163,901 | ) | | $ | (163,901 | ) | |
| | | Forward foreign
currency contracts | | | — | | | $ | 857,964 | | | | — | | | | — | | | | 857,964 | | |
| | | Total net change in unrealized
appreciation/depreciation | | | — | | | $ | 857,964 | | | | — | | | $ | (163,901 | ) | | $ | 694,063 | | |
312
PACE Select Advisors Trust
Notes to financial statements
| | | | Interest rate
risk | | Foreign exchange
risk | | Credit
risk | | Equity
risk | | Total | |
| PACE Alternative Strategies Investments | |
| | | Net realized gain (loss)3 | | | | | | | | | | | |
| | | Futures contracts | | $ | (3,805,891 | ) | | | — | | | | — | | | $ | 1,544,262 | | | $ | (2,261,629 | ) | |
| | | Options purchased5 | | | 23,930 | | | | (8,888 | ) | | | — | | | | (1,176,244 | ) | | | (1,161,202 | ) | |
| | | Written options and swaptions | | | (248,775 | ) | | | — | | | | — | | | | 1,774,492 | | | | 1,525,717 | | |
| | | Forward foreign
currency contracts | | | — | | | | (11,726,240 | ) | | | — | | | | — | | | | (11,726,240 | ) | |
| | | Swap agreements | | | (1,252,774 | ) | | | — | | | $ | 2,079,198 | | | | (462,596 | ) | | | 363,828 | | |
| | | Total net realized gain (loss) | | $ | (5,283,510 | ) | | $ | (11,735,128 | ) | | $ | 2,079,198 | | | $ | 1,679,914 | | | $ | (13,259,526 | ) | |
| | | Net change in unrealized
appreciation/depreciation4 | | | | | | | | | | | |
| | | Futures contracts | | $ | (1,303,747 | ) | | | — | | | | — | | | $ | (443,126 | ) | | $ | (1,746,873 | ) | |
| | | Options purchased5 | | | 50,212 | | | $ | (976,819 | ) | | | — | | | | 79,317 | | | | (847,290 | ) | |
| | | Written options and swaptions | | | 95,079 | | | | (260,241 | ) | | | | | 24,973 | | | | (140,189 | ) | |
| | | Forward foreign
currency contracts | | | — | | | | (5,896,640 | ) | | | — | | | | — | | | | (5,896,640 | ) | |
| | | Swap agreements | | | 759,524 | | | | — | | | $ | (932,907 | ) | | | (879,105 | ) | | | (1,052,488 | ) | |
| | | Total net change in unrealized
appreciation/depreciation | | $ | (398,932 | ) | | $ | (7,133,700 | ) | | $ | (932,907 | ) | | $ | (1,217,941 | ) | | $ | (9,683,480 | ) | |
3 The net realized gains (losses) from futures, written options and swaptions, swap agreements and forward foreign currency contracts are shown in the Statement of operations.
4 The net change in unrealized appreciation/depreciation on futures, written options and swaptions, swap agreements and forward foreign currency contracts are shown in the Statement of operations.
5 Realized and unrealized gain (loss) is included in net realized gain (loss) from investments and net change in unrealized appreciation/ depreciation of investments in the Statement of operations.
Repurchase agreements—The Portfolios may purchase securities or other obligations from a bank or securities dealer (or its affiliate), subject to the seller's agreement to repurchase them at an agreed upon date (or upon demand) and price. The Portfolios maintain custody of the underlying obligations prior to their repurchase, either through its regular custodian or through a special "tri-party" custodian or sub-custodian that maintains a separate account for both the Portfolios and their counterparty. The underlying collateral is valued daily to ensure that the value, including accrued interest, is at least equal to the repurchase price. In the event of default of the obligation to repurchase, the Portfolios generally have the right to liquidate the collateral and apply the proceeds in satisfaction of the obligation. Repurchase agreements involving obligations other than US government securities (such as commercial paper, corporate bonds, equities and mortgage loans) may be subject to special risks and may not have the benefit of certain protections in the event of counterparty insolvency. If the seller (or seller's guarantor, if any) becomes insolvent, the Portfolios may suffer delays, costs and possible losses in connection with the disposition or retention of the collateral. Under certain circumstances, in the event of default or bankruptcy by the other party to the agreement, realization and/or retention of the collateral may be subject to legal proceedings. Each Portfolio (with the exception of PACE Municipal Fixed Income Investments) may participate in joint repurchase agreement transactions with other funds managed, advised or sub-advised by UBS Global AM.
Under certain circumstances, the Portfolios may engage in a repurchase agreement transaction with a yield of zero in order to invest cash amounts remaining in its portfolio at the end of the day in order to avoid having the Portfolios assessed a fee for uninvested cash held in a business account at a bank.
Restricted securities—The Portfolios may invest in securities that are subject to legal or contractual restrictions on resale. These securities generally may be resold in transactions exempt from registration or to the public if the securities are registered. Disposal of these securities may involve time-consuming negotiations and expense, and prompt sale at an acceptable price may be difficult. Information regarding restricted securities, if any, is included at the end of each Portfolio's Portfolio of investments.
313
PACE Select Advisors Trust
Notes to financial statements
Investment transactions, investment income and expenses—Investment transactions are recorded on the trade date. Realized gains and losses from investment transactions and foreign exchange transactions are calculated using the identified cost method. Dividend income is recorded net of withholding taxes on the ex-dividend date ("ex-date") (except in the case of certain dividends from foreign securities which are recorded as soon after the ex-date as the respective Portfolio, using reasonable diligence, becomes aware of such dividends). Interest income is recorded on an accrual basis. Discounts are accreted and premiums are amortized as adjustments to interest income and the identified cost of investments.
Income, expenses (excluding class-specific expenses) and realized/unrealized gains/losses are allocated proportionately to each class of shares based upon the relative net asset value of outstanding shares (or the value of dividend-eligible shares, as appropriate) of each class at the beginning of the day (after adjusting for current capital share activity of the respective classes). Class-specific expenses are charged directly to the applicable class of shares.
Foreign currency translation—The books and records of the Portfolios are maintained in US dollars. Foreign currency amounts are translated into US dollars as follows: (1) the foreign currency market value of investment securities and other assets and liabilities stated in foreign currencies are translated into US dollars based on the current exchange rates each business day; and (2) purchases, sales, income and expenses are translated at the rate of exchange prevailing on the respective dates of such transactions. The resulting exchange gains and losses are included on the Statement of operations.
The Portfolios do not generally isolate the effects of fluctuations in foreign exchange rates from the effects of fluctuations in the market prices of securities. However, the Portfolios do isolate the effect of fluctuations in foreign exchange rates when determining the realized gain or loss upon the sale or maturity of foreign currency-denominated debt obligations pursuant to US federal income tax regulations; such amount is categorized as realized foreign currency transaction gain or loss for both financial reporting and income tax purposes. Net realized foreign currency transaction gain (loss) is treated as ordinary income (loss) for income tax reporting purposes.
Forward foreign currency contracts—Certain Portfolios may enter into forward foreign currency contracts ("forward contracts") as part of its investment strategy, in connection with planned purchases or sales of securities or to hedge the US dollar value of portfolio securities denominated in a particular currency. The Portfolios may also engage in cross-hedging by using forward contracts in one currency to hedge fluctuations in the value of securities denominated in a different currency if the applicable investment sub-advisor anticipates that there is a correlation between the two currencies. Forward contracts may also be used to shift a Portfolio's exposure to foreign currency fluctuations from one country to another.
The Portfolios have no specific limitation on the percentage of assets which may be committed to such contracts; however, the value of all forward contracts will not exceed the value of a Portfolio's total assets. The Portfolios may enter into forward contracts or maintain a net exposure to forward contracts only if (1) the consummation of the contracts would not obligate the Portfolios to deliver an amount of foreign currency in excess of the value of the positions being hedged by such contracts or (2) the Portfolios maintain cash or liquid securities in a segregated account in an amount determined pursuant to the Portfolios' segregation policies as disclosed in the Trust's Statement of Additional Information.
Risks may arise upon entering into forward contracts from the potential inability of counterparties to meet the terms of their contracts and from unanticipated movements in the value of foreign currencies relative to the US dollar or each other.
314
PACE Select Advisors Trust
Notes to financial statements
Fluctuations in the value of open forward contracts are recorded for book purposes as unrealized gains or losses on forward foreign currency contracts by the Portfolios. Realized gains and losses on forward foreign currency contracts include net gains or losses recognized by the Portfolios on contracts which have matured. Net realized foreign currency gain (loss) from forward foreign currency contracts is treated as ordinary income (loss) for income tax reporting purposes by all Portfolios except PACE International Fixed Income Investments and PACE High Yield Investments. These two Portfolios treat net realized gain (loss) from forward foreign currency contracts as capital gain (loss) for income tax reporting.
Securities traded on to-be-announced basis—The Portfolios may from time to time purchase securities on a to-be-announced ("TBA") basis. In a TBA transaction, the Portfolio commits to purchasing or selling securities for which all specific information is not yet known at the time of the trade, particularly the face amount and maturity date of the underlying security transactions. Securities purchased on a TBA basis are not settled until they are delivered to the Portfolio, normally 15 to 45 days later. Beginning on the date the Portfolio enters into a TBA transaction, cash, US government securities or other liquid securities are segregated in an amount equal in value to the purchase price of the TBA security. These transactions are subject to market fluctuations, and their current value is determined in the same manner as for other securities.
Option writing—Certain Portfolios may write (sell) put and call options on securities or derivative instruments in order to gain exposure to or protect against changes in the markets. When a Portfolio writes a call or a put option, an amount equal to the premium received by the Portfolio is included on the Portfolio's Statement of assets and liabilities as an asset and as an equivalent liability. The amount of the liability is subsequently marked-to-market to reflect the current market value of the option written. If an option which the Portfolio has written either expires on its stipulated expiration date or the Portfolio enters into a closing purchase transaction, the Portfolio realizes a gain (or loss if the cost of a closing purchase transaction exceeds the premium received when the option was written) without regard to any unrealized gain or loss on the underlying security or derivative instrument, and the liability related to such option is extinguished. If a call option which the Portfolio has written is exercised, the Portfolio recognizes a realized gain or loss (long-term or short-term, depending on the holding period of the underlying security) from the sale of the underlying security or derivative instrument and the proceeds from the sale are increased by the premium originally received. If a put option which the Portfolio has written is exercised, the amount of the premium originally received reduces the cost of the security or derivative instrument which the Portfolio purchases upon exercise of the option.
In writing an option, the Portfolios bear the market risk of an unfavorable change in the price of the derivative instrument, security or currency underlying the written option. Exercise of an option written by a Portfolio could result in the Portfolio selling or buying a derivative instrument, security or currency at a price different from current market value.
In the ordinary course of business, the Portfolios may enter into contracts or agreements that contain indemnifications or warranties. Future events could occur that lead to the execution of these provisions against the Portfolios. Based on its history and experience, the Portfolios feel that the likelihood of such an event is remote.
In the normal course of trading activities, the Portfolios trade and hold certain fair valued derivative contracts that constitute guarantees. Such contracts include written put options, where the Portfolios would be obligated to purchase securities at specified prices (i.e. the options are exercised by the counterparties). The maximum payout for these contracts is limited to the number of put option contracts written and the related strike prices, respectively. At July 31, 2011, PACE Strategic Fixed Income Investments and PACE Alternative Strategies Investments had maximum payout amounts of approximately $318,000 and $3,383,184, respectively, relating to written put option contracts, which expire between one month and five years. Maximum payout amounts could be offset by the subsequent sale, if any, of assets obtained via the execution of a payout event.
315
PACE Select Advisors Trust
Notes to financial statements
The fair value of written put option contracts as of July 31, 2011 is $131,358 and $3,980,835 for PACE Strategic Fixed Income Investments and PACE Alternative Strategies Investments, respectively, and is included as a liability in Options and swaptions written, at fair value on the Statement of assets and liabilities.
Purchased options—Certain Portfolios may also purchase put and call options. Purchasing call options tends to increase exposure to the underlying instrument. Purchasing put options tends to decrease exposure to the underlying instrument. The Portfolio pays a premium which is included on the Statement of assets and liabilities as an investment and subsequently marked to market to reflect the current value of the option. Premiums paid for purchasing options which expire are treated as realized losses. The risk associated with purchasing put and call options is limited to the premium paid. Premiums paid for purchasing options which are exercised or closed are added to the amounts paid or offset against the proceeds on the underlying future, security or currency transaction to determine the realized gain or loss.
Futures contracts—Certain Portfolios may purchase or sell futures contracts to increase or reduce their exposure to an asset class without purchasing or selling the underlying securities. They may do this to enhance or realize gains, as a hedge and/or to manage the average duration of the Portfolio. Using futures contracts involves various market risks, including interest rate and equity risk as well as the risks that there may be an illiquid market or that a change in the value of the contract may not correlate with changes in the value of the underlying securities.
Upon entering into a futures contract, a Portfolio is required to deliver to a broker an amount of cash and/or liquid securities equal to a certain percentage of the contract amount. This amount is known as the "initial margin". Subsequent payments, known as "variation margin", generally are made or received by the Portfolio each day depending on the fluctuations in the value of the underlying futures contracts, except that in the case of certain futures contracts payments may be made or received at settlement. Such variation margin is recorded for financial statement purposes on a daily basis as an unrealized gain or loss on futures until the financial futures contract is closed, at which time the net gain or loss is reclassified to realized gain or loss on futures.
Loan assignments—Certain Portfolios may invest in secured or unsecured fixed or floating rate loans ("Loans") arranged through private negotiations between a borrowing corporation, government or other entity and one or more financial institutions ("Lenders") which may be in the form of participations ("Participations") in Loans or assignments ("Assignments") of all or a portion of Loans from third parties. A Portfolio may invest in multiple series or tranches of a Loan, which may have varying terms and carry different associated risks. Participations typically result in a Portfolio having a contractual relationship only with the Lender, not with the borrower. A Portfolio has the right to receive payments of principal, interest and any fees to which it is entitled only from the Lender selling the Participation and only upon receipt by the Lender of the payments from the borrower. In connection with purchasing Participations, a Portfolio generally has no direct right to enforce compliance by the borrower with the terms of the loan agreement relating to the Loan, or any rights of set-off against the borrower, and a Portfolio may not directly benefit from any collateral supporting the Loan in which it has purchased the Participation. As a result, a Portfolio assumes the credit risk of both the borrower and the Lender that is selling the Participation. In the event of the insolvency of the selling Lender, the Portfolio may be treated as a general creditor of that Lender and may not benefit from any set-off between the Lender and the borrower. A Portfolio will acquire Participations only if its sub-advisor determines that the selling Lender is creditworthy. When a Portfolio purchases Assignments from Lenders, it acquires direct rights against the borrower on the Loan. In an Assignment, the Portfolio is entitled to receive payments directly from the borrower and, therefore, does not depend on the selling bank to pass these payments onto the Portfolio. However, because Assignments are arranged through private negotiations between potential assignees and assignors, the rights and obligations acquired by a Portfolio as the purchaser of an Assignment may differ from, and be more limited than, those held by the assigning Lender.
316
PACE Select Advisors Trust
Notes to financial statements
Short sales "Against the Box"—Each Portfolio (other than PACE Money Market Investments and PACE Municipal Fixed Income Investments) may engage in short sales of securities it owns or has the right to acquire at no added cost through conversion or exchange of other securities it owns (short sales "against the box"). To make delivery to the purchaser in a short sale, the executing broker borrows the securities being sold short on behalf of a Portfolio, and that Portfolio is obligated to replace the securities borrowed at a date in the future. When a Portfolio sells short, it establishes a margin account with the broker effecting the short sale and deposits collateral with the broker. In addition, the Portfolio maintains, in a segregated account with its custodian, the securities that could be used to cover the short sale. Each Portfolio may incur transaction costs, including dividend and interest expense, in connection with opening, maintaining and closing short sales "against the box".
A Portfolio might make a short sale "against the box" to hedge against market risks when its sub-advisor believes that the price of a security may decline, thereby causing a decline in the value of a security owned by the Portfolio or a security convertible into or exchangeable for a security owned by the Portfolio. In such case, any loss in the Portfolio's long position after the short sale should be reduced by a corresponding gain in the short position. Conversely, any gain in the long position after the short sale should be reduced by a corresponding loss in the short position. The extent to which gains or losses in the long position are reduced will depend upon the amount of the securities sold short relative to the amount of the securities a Portfolio owns, either directly or indirectly, and in the case where the Portfolio owns convertible securities, changes in the investment values or conversion premiums of such securities.
Short sales—PACE Government Securities Fixed Income Investments (with respect to securities issued by the US Treasury and TBA securities coupon trades), PACE Global Real Estate Securities Investments and PACE Alternative Strategies Investments may engage in short sale transactions in which the Portfolio sells a security it does not own (or does not have the right to acquire at no added cost). The Portfolio must borrow the security to make delivery to the buyer. In a short sale where a Portfolio is not holding a position in the same security (or convertible into the same security), the Portfolio will maintain an account containing cash or liquid assets at such a level that the amount deposited in the account plus that amount deposited with the broker as collateral will, at minimum, equal the current value of the investment sold short. The initial amount of a short sale is recorded as a liability which is marked to market daily. Fluctuations in the value of this liability are recorded as unrealized gains or losses on the Statement of operations. A Portfolio incurs transaction costs, including interest expenses, in connection with opening, maintaining and closing short sales. Because PACE Alternative Strategies Investments is multi-managed and has the ability to engage in short sales, one investment advisor may take a short position and another advisor may take a long position in the same security. A Portfolio will be required to pay the buyer for any dividends or other corporate actions and interest payable on securities while those securities are in a short position. These dividends and interest are booked as an expense or liability to the Portfolio. A Portfolio will incur a loss as a result of the short sale if the price of the security increases between the date of the short sale and the date on which the Portfolio replaces the borrowed security, and a Portfolio will realize a gain if the security declines in price between those same dates. Because a Portfolio's loss on a short sale arises from increases in the value of the investment sold short, such loss, like the potential increase in price of the security sold short, is theoretically unlimited. In addition, a Portfolio's investments held long could decline in value at the same time the value of the investment sold short increases, thereby increasing the Portfolio's potential for loss. PACE Government Securities Fixed Income Investments and PACE Global Real Estate Securities Investments did not engage in uncovered short sales during the year ended July 31, 2011.
Treasury roll transactions—Certain Portfolios may enter into treasury roll transactions. A treasury roll transaction involves the sale of a Treasury security, with an agreement to repurchase the same security at an agreed upon price and date. Treasury rolls may constitute a financing transaction and the difference between the sale and repurchase price represents interest expense at an agreed upon rate. Whether such a transaction produces a positive impact on performance depends upon whether the income and gains on the securities purchased with
317
PACE Select Advisors Trust
Notes to financial statements
the proceeds received from the sale of the security exceeds the interest expense incurred by the Portfolio. Treasury rolls are not considered purchases and sales and any gains or losses incurred on the treasury rolls will be deferred until the Treasury securities are disposed.
Treasury roll transactions involve the risk that the market value of the securities that the Portfolio is required to purchase may decline below the agreed upon purchase price of those securities. If investment performance of securities purchased with proceeds from these transactions does not exceed the income, capital appreciation and gain or loss that would have been realized on the securities sold as part of the treasury roll, the use of this technique will adversely impact the investment performance of the Portfolio. During the year ended July 31, 2011, the only Portfolio that utilizied treasury roll transactions was PACE Intermediate Fixed Income Investments.
Reverse repurchase agreements—Certain Portfolios may enter into reverse repurchase agreements with qualified third party banks, securities dealers or their affiliates. Interest on the value of reverse repurchase agreements issued and outstanding is based upon competitive market rates at the time of issuance. At the time a Portfolio enters into reverse repurchase agreements, the Portfolio establishes and maintains a segregated account with the Portfolio's custodian containing liquid securities having a value not less than the repurchase price, including accrued interest, of the reverse repurchase agreement. For the year ended July 31, 2011, PACE Government Securities Fixed Income Investments had an average daily reverse repurchase agreement of $1,257,143 for 7 days with a related weighted average annualized interest rate of 0.245%, which resulted in $60 of interest expense and PACE Intermediate Fixed Income Investments had an average daily reverse repurchase agreement of $5,412,500 for 1 day with a related weighted average annualized interest rate of 0.23%, which resulted in $35 of interest expense. There were no reverse repurchase agreements outstanding on July 31, 2011.
Interest rate swap agreements—Certain Portfolios may enter into interest rate swap agreements. This type of swap is an agreement that obligates two parties to exchange a series of cash flows at specified intervals based upon or calculated by reference to a specified interest rate(s) for a specified amount. The payment flows are usually netted against each other, with the difference being paid by one party to the other. Upfront payments made and/or received by the Portfolio are recorded as an adjustment to cost.
Risks may arise as a result of the failure of the counterparty to the swap contract to comply with the terms of the contract. The loss incurred by the failure of a counterparty is generally limited to the net interest payment to be received by the Portfolio. Therefore, the Portfolio considers the creditworthiness of the counterparty to a swap contract in evaluating potential credit risk.
The Portfolio accrues for interim payments on swap contracts on a daily basis, with the net amount recorded within swap agreements at value on the Statement of assets and liabilities. Once interim payments are settled in cash, the net amount is recorded as realized gain/loss on swaps, in addition to realized gain/loss recorded upon the termination of swap contracts on the Statement of operations. Fluctuations in the value of swap contracts are recorded for financial statement purposes as unrealized appreciation or depreciation of swaps within the Statement of operations.
Inflation swaps—Inflation swap agreements are used to hedge inflation risk by transferring inflation risk from one party to another through an exchange of cash flows. In an inflation swap, one party pays a fixed rate on a notional principal amount while the other party pays a floating rate linked to an inflation index on that same notional amount. The party paying the floating rate pays the inflation adjusted rate multiplied by the notional principal amount. If the average inflation rate over the term of the swap is the same as the fixed rate of the swap, the two legs will have the same value and the swap will break even.
318
PACE Select Advisors Trust
Notes to financial statements
Credit default swap agreements—Credit default swap agreements involve commitments to make or receive payments in the event of a default of a security or a credit event. As a buyer, the Portfolio would make periodic payments to the counterparty, and the Portfolio would receive payments only upon the occurrence of a credit event. If no credit event occurs, the Portfolio will lose its periodic stream of payments over the term of the contract. However, if a credit event does occur, the Portfolio typically would receive full notional value for a reference obligation that may have little or no value. As a seller, the Portfolio would receive periodic payments from the counterparty, and the Portfolio would make payments only upon the occurrence of a credit event. If no default or credit event occurs, the Portfolio will gain the periodic stream of payments it received over the term of the contract and the counterparty will lose its periodic stream of payments over the term of the contract. However, if a default or credit event occurs, the Portfolio typically pays full notional value for a reference obligation that may have little or no value. Credit default swaps may involve greater risks than if the Portfolio had invested in the reference obligation directly and are subject to general market risk, liquidity risk and credit risk. Upfront payments made and/or received by the Portfolio are recorded as an adjustment to cost.
Credit default swap agreements on credit indices involve one party making a stream of payments to another party in exchange for the right to receive a specified return in the event of a write-down, principal shortfall, interest shortfall or default of all or part of the referenced entities comprising the credit index. A credit index is a list of a basket of credit instruments or exposures designed to be representative of some part of the credit market as a whole. These indices are made up of referenced credits that are judged by a poll of dealers to be the most liquid entities in the credit default swap market based on the sector of the index. Components of the indices may include, but are not limited to, investment grade securities, high yield securities, asset backed securities, emerging markets, and/or various credit ratings within each sector. Credit indices are traded using credit default swaps with standardized terms including a fixed spread and standard maturity dates. An index credit default swap references all the names in the index, and if there is a default, the credit event is settled based on that name's weight in the index. The composition of the indices changes periodically, usually every six months, and for most indices, each name has an equal weight in the index. A Portfolio may use credit default swaps on credit indices to hedge a portfolio of credit default swaps or bonds with a credit default swap on indices which is less expensive than it would be to buy many credit default swaps to achieve a similar effect. Credit default swaps on indices are benchmarks for protecting investors owning bonds against default, and traders use them to speculate on changes in credit quality.
Credit default swap agreements on corporate issues or sovereign issues of an emerging country involve one party making a stream of payments to another party in exchange for the right to receive a specified return in the event of a default or other credit event. If a credit event occurs and cash settlement is not elected, a variety of other deliverable obligations may be delivered in lieu of the specific referenced obligation. The ability to deliver other obligations may result in a cheapest-to-deliver option (the buyer of protection's right to choose the deliverable obligation with the lowest value following a credit event). The Portfolio may use credit default swaps on corporate issues or sovereign issues of an emerging country to provide a measure of protection against defaults of the issuers (i.e., to reduce risk where the Portfolio owns or has exposure to the referenced obligation) or to take an active long or short position with respect to the likelihood of a particular issuer's default.
The maximum potential amount of future payments (undiscounted) that a Portfolio as a seller of protection could be required to make under a credit default swap agreement would be an amount equal to the notional amount of the agreement which may exceed the amount of unrealized appreciation or depreciation reflected on the Statement of assets and liabilities. Notional amounts of all credit default swap agreements outstanding as of July 31, 2011 for which a Portfolio is the seller of protection are disclosed under the sections "Credit default swaps on credit indices—sell protection" and "Credit default swaps on corporate and sovereign issues—sell protection" in the Portfolios of investments. These potential amounts would be partially offset by any recovery values of the respective referenced obligations, upfront payments received upon entering into the agreement, or
319
PACE Select Advisors Trust
Notes to financial statements
net amounts received from the settlement of buy protection credit default swap agreements entered into, if any, by a Portfolio for the same referenced entity or entities.
The use of swaps involves investment techniques and risks different from those associated with ordinary portfolio security transactions. If a Portfolio's sub-adviser is incorrect in its forecast of market values, interest rates and other applicable factors, the investment performance of the Portfolios will be less favorable than it would have been if this investment technique was never used. Swaps do not involve the delivery of securities and are subject to counterparty risk. If the other party to a swap defaults and fails to consummate the transaction, a Portfolio's risk of loss will consist of the net amount of interest or other payments that the Portfolio is contractually entitled to receive. Therefore, the Portfolio would consider the creditworthiness of the counterparty to a swap agreement in evaluating potential credit risk.
Total return swaps—Total return swap contracts involve commitments to pay interest in exchange for a market-linked return both based on notional amounts. To the extent the total return of the security or index underlying the transactions exceeds or falls short of the offsetting interest rate obligation, the Portfolio will receive a payment from or make a payment to the counterparty. At July 31, 2011, there were no Portfolios that were invested in total return swap contracts.
Variance swaps—Variance swap agreements involve two parties agreeing to exchange cash flows based on the measured variance (or square of volatility) of a specified underlying asset. One party agrees to exchange a "fixed rate" or strike price payment for the "floating rate" or realized price variance on the underlying asset with respect to the notional amount. At inception, the strike price is generally chosen such that the fair value of the swap is zero. At the maturity date, a net cash flow is exchanged, where the payoff amount is equivalent to the difference between the realized price variance of the underlying asset and the strike price multiplied by the notional amount. As a receiver of the realized price variance, the Portfolio would receive the payoff amount when the realized price variance of the underlying asset is greater than the strike price and would owe the payoff amount when the variance is less than the strike. As a payer of the realized price variance the Portfolio would owe the payoff amount when the realized price variance of the underlying asset is greater than the strike price and would receive the payoff amount when the variance is less than the strike.
Dividends and distributions—Dividends and distributions to shareholders are recorded on the ex-dividend date. The amounts of dividends and distributions are determined in accordance with federal income tax regulations, which may differ from GAAP. These "book/tax" differences are either considered temporary or permanent in nature. To the extent these differences are permanent in nature, such amounts are reclassified within the capital accounts based on their federal tax-basis treatment; temporary differences do not require reclassification.
Concentration of risk
Investing in securities of foreign issuers and currency transactions may involve certain considerations and risks not typically associated with investments in the United States. These risks include revaluation of currencies, adverse fluctuations in foreign currency values and possible adverse political, social and economic developments, including those particular to a specific industry, country or region, which could cause the securities and their markets to be less liquid and prices more volatile than those of comparable US companies and US government securities. These risks are greater with respect to securities of issuers located in emerging market countries in which PACE International Fixed Income Investments, PACE High Yield Investments, PACE International Equity Investments, PACE International Emerging Markets Equity Investments, PACE Global Real Estate Securities Investments and PACE Alternative Strategies Investments are authorized to invest.
Small capitalization ("small cap") companies may be more vulnerable than larger capitalization companies to adverse business or economic developments. Small cap companies may also have limited product lines, markets or
320
PACE Select Advisors Trust
Notes to financial statements
financial resources, and may be dependent on a relatively small management group. Securities of such companies may be less liquid and more volatile than securities of larger capitalization companies or the market averages in general and therefore may involve greater risk than investing in larger capitalization companies. In addition, small cap companies may not be well-known to the investing public, may not have institutional ownership and may have only cyclical, static or moderate growth prospects. These risks are greater with respect to the securities in which PACE Small/Medium Co Value Equity Investments and PACE Small/Medium Co Growth Equity Investments tend to invest.
The ability of the issuers of debt securities held by the Portfolios to meet their obligations may be affected by economic and political developments particular to a specific industry, country, state or region.
Investment management and administration fees and other transactions with affiliates
The Trust has entered into an investment management and administration contract ("Management Contract") with UBS Global AM. In accordance with the Management Contract, each Portfolio paid UBS Global AM investment management and administration fees, which were accrued daily and paid monthly, in accordance with the following schedule as of July 31, 2011:
| Portfolio | | Annual rate as a percentage of
each Portfolio's average daily net assets | |
| PACE Money Market Investments | | 0.350% | |
|
| PACE Government Securities Fixed Income Investments | | 0.650% up to $250 million
0.600% above $250 million up to $500 million
0.575% above $500 million up to $750 million
0.550% above $750 million up to $1 billion
0.525% above $1 billion | |
|
| PACE Intermediate Fixed Income Investments | | 0.550% up to $250 million
0.500% above $250 million up to $500 million
0.475% above $500 million up to $750 million
0.450% above $750 million up to $1 billion
0.425% above $1 billion | |
|
| PACE Strategic Fixed Income Investments | | 0.650% up to $250 million
0.600% above $250 million up to $500 million
0.575% above $500 million up to $750 million
0.550% above $750 million up to $1 billion
0.525% above $1 billion | |
|
| PACE Municipal Fixed Income Investments | | 0.550% up to $250 million
0.500% above $250 million up to $500 million
0.475% above $500 million up to $750 million
0.450% above $750 million up to $1 billion
0.425% above $1 billion | |
|
| PACE International Fixed Income Investments | | 0.750% up to $500 million
0.725% above $500 million up to $1 billion
0.700% above $1 billion | |
|
| PACE High Yield Investments | | 0.800% up to $500 million
0.750% above $500 million up to $1 billion
0.725% above $1 billion up to $1.5 billion
0.700% above $1.5 billion up to $2 billion
0.675% above $2 billion | |
|
| PACE Large Co Value Equity Investments | | 0.800% up to $250 million
0.770% above $250 million up to $500 million
0.730% above $500 million up to $1 billion
0.700% above $1 billion | |
|
321
PACE Select Advisors Trust
Notes to financial statements
| Portfolio | | Annual rate as a percentage of
each Portfolio's average daily net assets | |
| PACE Large Co Growth Equity Investments | | 0.800% up to $500 million
0.775% above $500 million up to $1 billion
0.750% above $1 billion up to $1.5 billion
0.725% above $1.5 billion up to $2 billion
0.700% above $2 billion | |
|
| PACE Small/Medium Co Value Equity Investments | | 0.800% up to $500 million
0.775% above $500 million | |
|
| PACE Small/Medium Co Growth Equity Investments | | 0.800% up to $500 million
0.775% above $500 million | |
|
| PACE International Equity Investments | | 0.900% up to $500 million
0.875% above $500 million up to $1 billion
0.850% above $1 billion up to $1.5 billion
0.825% above $1.5 billion up to $2 billion
0.800% above $2 billion | |
|
| PACE International Emerging Markets Equity Investments | | 1.100% up to $500 million
1.075% above $500 million up to $1 billion
1.050% above $1 billion up to $1.5 billion
1.025% above $1.5 billion up to $2 billion
1.000% above $2 billion | |
|
| PACE Global Real Estate Securities Investments | | 0.800% up to $500 million
0.750% above $500 million up to $1 billion
0.725% above $1 billion up to $1.5 billion
0.700% above $1.5 billion up to $2 billion
0.675% above $2 billion | |
|
PACE Alternative Strategies Investments1
| | 1.400% up to $500 million
1.350% above $500 million up to $1 billion
1.300% above $1 billion up to $1.5 billion
1.275% above $1.5 billion up to $2 billion
1.250% above $2 billion | |
|
1 At a meeting held on September 14, 2011, the Board of Trustees for PACE Alternative Strategies Investments approved a fee waiver pursuant to which, effective October 1, 2011, UBS Global AM is voluntarily obligated to waive 0.05% of its management fee through November 30, 2012.
Under separate Sub-Advisory Agreements, with the exception of PACE Money Market Investments, UBS Global AM (not the Portfolios) pays each investment sub-advisor a fee from the investment management and administration fees which UBS Global AM receives, which is accrued daily and paid monthly, in accordance with the following schedule:
| Portfolio | | Investment sub-advisor | | Annual rate
as a percentage of
each sub-advisor's
portion of the Portfolio's
average daily net assets | |
| PACE Government Securities Fixed Income Investments | | Pacific Investment Management Company LLC
| | 0.200%
| |
|
PACE Intermediate Fixed Income Investments
| | BlackRock Financial Management, Inc.
| | 0.200% up to $120 million
0.100% above $120 million | |
|
| PACE Strategic Fixed Income Investments | | Pacific Investment Management Company LLC | | 0.250% | |
|
PACE Municipal Fixed Income Investments
| | Standish Mellon Asset Management Company LLC
| | 0.200% up to $60 million
0.150% above $60 million | |
|
322
PACE Select Advisors Trust
Notes to financial statements
| Portfolio | | Investment sub-advisor | | Annual rate
as a percentage of
each sub-advisor's
portion of the Portfolio's
average daily net assets | |
PACE International Fixed Income Investments
| | Rogge Global Partners plc
| | 0.250% up to $150 million
0.180% above $150 million
up to $500 million
0.150% above $500 million | |
|
| PACE High Yield Investments | | MacKay Shields LLC | | 0.350% | |
|
PACE Large Co Value Equity Investments
| | Institutional Capital LLC
Pzena Investment Management, LLC1
Westwood Management Corp. | | 0.300%
0.700% up to $25 million
0.500% above $25 million
up to $100 million
0.400% above $100 million
up to $300 million
0.350% above $300 million
0.300% | |
|
PACE Large Co Growth Equity Investments2
| | Delaware Management Company
Marsico Capital Management, LLC
Roxbury Capital Management, LLC
Wellington Management Company, LLP | | 0.400%
0.300%
0.250% up to $250 million
0.200% above $250 million
0.300% | |
|
PACE Small/Medium Co Value Equity
Investments
| | Buckhead Capital Management, LLC
Metropolitan West Capital Management, LLC
Systematic Financial Management, L.P. | | 0.400% up to $100 million
0.350% above $100 million
0.400%
0.400% | |
|
| PACE Small/Medium Co Growth Equity Investments | | Copper Rock Capital Partners, LLC
Palisade Capital Management, LLC
Riverbridge Partners, LLC | | 0.450% up to $100 million
0.400% above $100 million
0.450% up to $100 million
0.400% above $100 million
0.400% | |
|
| PACE International Equity Investments | | J.P. Morgan Investment Management Inc.—
International REI segment
J.P. Morgan Investment Management Inc.—EAFE
Opportunities segment3
Martin Currie Inc.
Mondrian Investment Partners Ltd.
| | 0.200%
0.350% up to $150 million
0.300% above $150 million
0.350% up to $150 million
0.300% above $150 million
up to $250 million
0.250% above $250 million
up to $350 million
0.200% above $350 million
0.350% up to $150 million
0.300% above $150 million | |
|
1 If the assets under Pzena's management are less than $10 million, Pzena receives 1.00% of the Portfolio's average daily net assets that it manages with a minimum annual fee of $35,000 and a maximum annual fee of $70,000.
2 SSgA Funds Management, Inc. was terminated as a sub-advisor to the Portfolio, effective November 29, 2010.
3 J.P. Morgan Investment Management Inc. assumed investment advisory responsibility with respect to a new mandate managing a separate portion of the Portfolio effective November 8, 2010.
323
PACE Select Advisors Trust
Notes to financial statements
| Portfolio | | Investment sub-advisor | | Annual rate
as a percentage of
each sub-advisor's
portion of the Portfolio's
average daily net assets | |
PACE International Emerging Markets
Equity Investments | | Delaware Management Company4
Mondrian Investment Partners Ltd.
Pzena Investment Management, LLC4
William Blair & Company L.L.C.5 | | 0.600% up to $10 million
0.500% above $10 million
0.650% up to $150 million
0.550% above $150 million
up to $250 million
0.500% above $250 million
0.810% up to $10 million
0.650% above $10 million
up to $50 million
0.590% above $50 million
up to $100 million
0.520% above $100 million
up to $300 million
0.490% above $300 million
0.600% up to $100 million
0.550% above $100 million | |
|
| PACE Global Real Estate Securities Investments | | Brookfield Investment Management Inc.
CBRE Clarion Securities, LLC6 | | 0.420% up to $50 million
0.400% above $50 million
0.400% | |
|
| PACE Alternative Strategies Investments | | Analytic Investors, LLC
First Quadrant L.P.
Goldman Sachs Asset Management, L.P.
Standard Life Investments (Corporate Funds) Limited7
Wellington Management Company, LLP | | 0.450% up to $200 million
0.400% above $200 million
up to $400 million
0.300% above $400 million
0.90%
0.680% up to $300 million
0.640% above $300 million
up to $500 million
0.600% above $500 million
0.700%
0.750% up to $200 million
0.725% above $200 million | |
|
4 Delaware Management Company and Pzena Investment Management, LLC became sub-advisors effective November 4, 2010.
5 Effective March 23, 2011, William Blair & Company L.L.C. commenced as a sub-adviser for a portion of PACE International Emerging Markets Equity Investments. As of the close of business, March 22, 2011, Gartmore Global Partners terminated as a sub-adviser to PACE International Emerging Markets Equity Investments.
6 Formerly known as ING Clarion Real Estate Securities, LLC.
7 Standard Life Investments (Corporate Funds) Limited became a sub-advisor effective August 5, 2010.
324
PACE Select Advisors Trust
Notes to financial statements
At July 31, 2011, certain Portfolios owe or are (owed by) UBS Global AM for investment management and administration fees, net of fee waivers/expense reimbursements and/or recoupments as follows:
| Portfolio | | Amounts due
to (owed by)
UBS Global AM | |
| PACE Money Market Investments | | $ | (112,635 | ) | |
| PACE Government Securities Fixed Income Investments | | | 272,791 | | |
| PACE Intermediate Fixed Income Investments | | | 168,733 | | |
| PACE Strategic Fixed Income Investments | | | 397,071 | | |
| PACE Municipal Fixed Income Investments | | | 134,294 | | |
| PACE International Fixed Income Investments | | | 316,977 | | |
| PACE High Yield Investments | | | 163,017 | | |
| PACE Large Co Value Equity Investments | | | 782,591 | | |
| PACE Large Co Growth Equity Investments | | | 784,674 | | |
| PACE Small/Medium Co Value Equity Investments | | | 306,672 | | |
| PACE Small/Medium Co Growth Equity Investments | | | 333,116 | | |
| PACE International Equity Investments | | | 674,787 | | |
| PACE International Emerging Markets Equity Investments | | | 278,903 | | |
| PACE Global Real Estate Securities Investments | | | 31,072 | | |
| PACE Alternative Strategies Investments | | | 631,211 | | |
UBS Global AM has entered into a written fee waiver agreement with each of PACE Government Securities Fixed Income Investments, PACE International Fixed Income Investments, and PACE Large Co Growth Equity Investments under which UBS Global AM is contractually obligated to waive its management fees to the extent necessary to reflect the lower subadvisory fees paid by UBS Global AM to each of these Portfolio's sub-advisors: Pacific Investment Management Company LLC, Rogge Global Partners plc and SSgA Funds Management, Inc., respectively. Effective at the close of business November 29, 2010, SSgA Funds Management, Inc. no longer serves as a sub-advisor for PACE Large Co Growth Equity Investments. As a result, this fee waiver was discontinued effective November 30, 2010. For the year ended July 31, 2011, UBS Global AM was contractually obligated to waive $155,661, $288,903 and $88,539 in investment management and administration fees for PACE Government Securities Fixed Income Investments, PACE International Fixed Income Investments and PACE Large Co Growth Equity Investments, respectively.
Additionally, with respect to PACE Money Market Investments, UBS Global AM may voluntarily waive fees and/or reimburse expenses from time to time in the event that the Portfolio's yield falls below a certain level. Once started, there is no guarantee that UBS Global AM would continue to voluntarily waive an additional portion of its fees and/or reimburse expenses. For the year ended July 31, 2011, UBS Global AM voluntarily waived and/or reimbursed expenses of $1,261,944 for PACE Money Market Investments for that purpose.
UBS Global AM is contractually obligated to waive all or a portion of its investment management and administration fees and/or to reimburse the Portfolios for certain operating expenses in order to maintain the total annual ordinary operating expenses of each class (with certain exclusions such as dividend expense, borrowing costs and interest expense, if any) through November 30, 2011 at a level not to exceed amounts in the table below.
Each Portfolio will repay UBS Global AM for any such waived fees/reimbursed expenses during a three-year period following July 31, 2011, to the extent that ordinary operating expenses (with certain exclusions such as dividend expense, borrowing costs and interest expense) are otherwise below the applicable expense cap in effect at the time the fees or expenses were waived/reimbursed. For the year ended July 31, 2011, UBS Global AM had the following voluntary fee waivers/expense reimbursements, and recoupments. The fee waivers/expense
325
PACE Select Advisors Trust
Notes to financial statements
reimbursements, portions of which are subject to repayment by the Portfolios through July 31, 2014, and recoupments for the year ended July 31, 2011, were as follows:
| Portfolio | | Class A
expense
cap | | Class B
expense
cap | | Class C
expense
cap | | Class Y
expense
cap | | Class P
expense
cap | | Fee waivers/
expense
reimbursements | | Recoupments | |
| PACE Money Market Investments | | | N/A | | | | N/A | | | | N/A | | | | N/A | | | | 0.60 | % | | $ | 996,232 | | | $ | — | | |
PACE Government Securities Fixed
Income Investments | | | 1.02 | % | | | 1.77 | % | | | 1.52 | % | | | 0.77 | % | | | 0.77 | | | | 363,536 | | | | — | | |
| PACE Intermediate Fixed Income Investments | | | 0.93 | | | | 1.68 | | | | 1.43 | | | | 0.68 | | | | 0.68 | | | | 207,420 | | | | — | | |
| PACE Strategic Fixed Income Investments | | | 1.06 | | | | 1.81 | | | | 1.56 | | | | 0.81 | | | | 0.81 | | | | 241,526 | | | | 2,711 | | |
| PACE Municipal Fixed Income Investments | | | 0.93 | | | | 1.68 | | | | 1.43 | | | | 0.68 | | | | 0.68 | | | | 113,934 | | | | — | | |
| PACE International Fixed Income Investments | | | 1.25 | | | | 2.00 | | | | 1.75 | | | | 1.00 | | | | 1.00 | | | | 251,735 | | | | 18,289 | | |
| PACE High Yield Investments | | | 1.35 | | | | 2.10 | 1 | | | 1.85 | | | | 1.10 | | | | 1.10 | | | | 118,506 | | | | 5,357 | | |
| PACE Large Co Value Equity Investments | | | 1.27 | | | | 2.02 | | | | 2.02 | | | | 1.02 | | | | 1.02 | | | | 404 | | | | 2,092 | | |
| PACE Large Co Growth Equity Investments | | | 1.30 | | | | 2.05 | | | | 2.05 | | | | 1.05 | | | | 1.05 | | | | 776 | | | | — | | |
| PACE Small/Medium Co Value Equity Investments | | | 1.41 | | | | 2.16 | | | | 2.16 | | | | 1.16 | | | | 1.16 | | | | 56,610 | | | | — | | |
PACE Small/Medium Co Growth Equity
Investments | | | 1.38 | | | | 2.13 | | | | 2.13 | | | | 1.13 | | | | 1.13 | | | | 116,207 | | | | 1,606 | | |
| PACE International Equity Investments2 | | | 1.55 | | | | 2.30 | | | | 2.30 | | | | 1.30 | | | | 1.30 | | | | 79 | | | | — | | |
PACE International Emerging Markets
Equity Investments2 | | | 2.15 | | | | 2.90 | | | | 2.90 | | | | 1.90 | | | | 1.90 | | | | — | | | | — | | |
| PACE Global Real Estate Securities Investments | | | 1.45 | | | | N/A | 3 | | | 2.20 | | | | 1.20 | | | | 1.20 | | | | 411,315 | | | | — | | |
| PACE Alternative Strategies Investments | | | 1.95 | | | | 2.70 | | | | 2.70 | | | | 1.70 | | | | 1.70 | | | | 42,140 | | | | 477 | | |
1 Share class has not commenced operations.
2 Expense caps in the table above became effective November 28, 2010. Prior to November 28, 2010, expense caps were as follows:
| Portfolio | | Class A
expense
cap | | Class B
expense
cap | | Class C
expense
cap | | Class Y
expense
cap | | Class P
expense
cap | |
| PACE International Equity Investments | | | 1.65 | % | | | 2.40 | % | | | 2.40 | % | | | 1.40 | % | | | 1.40 | % | |
| PACE International Emerging Markets Equity Investments | | | 2.25 | | | | 3.00 | | | | 3.00 | | | | 2.00 | | | | 2.00 | | |
3 PACE Global Real Estate Securities Investments does not offer Class B shares.
At July 31, 2011, the following Portfolios had remaining fee waivers/expense reimbursements subject to repayment to UBS Global AM and respective dates of expiration as follows:
| Portfolio | | Fee waivers/
expense
reimbursements
subject to
repayment | | Expires
July 31,
2012 | | Expires
July 31,
2013 | | Expires
July 31,
2014 | |
| PACE Money Market Investments | | $ | 3,988,289 | | | $ | 1,729,334 | | | $ | 1,262,723 | | | $ | 996,232 | | |
| PACE Government Securities Fixed Income Investments—Class A | | | 70,328 | | | | 26,444 | | | | 31,628 | | | | 12,256 | | |
| PACE Government Securities Fixed Income Investments—Class B | | | 494 | | | | 280 | | | | 163 | | | | 51 | | |
| PACE Government Securities Fixed Income Investments—Class C | | | 43,633 | | | | 20,528 | | | | 16,083 | | | | 7,022 | | |
| PACE Government Securities Fixed Income Investments—Class Y | | | 128,036 | | | | 42,938 | | | | 40,800 | | | | 44,298 | | |
| PACE Government Securities Fixed Income Investments—Class P | | | 996,627 | | | | 316,871 | | | | 379,847 | | | | 299,909 | | |
| PACE Intermediate Fixed Income Investments—Class A | | | 97,143 | | | | 40,388 | | | | 32,279 | | | | 24,476 | | |
| PACE Intermediate Fixed Income Investments—Class B | | | 646 | | | | 259 | | | | 228 | | | | 159 | | |
| PACE Intermediate Fixed Income Investments—Class C | | | 10,164 | | | | 4,223 | | | | 3,445 | | | | 2,496 | | |
326
PACE Select Advisors Trust
Notes to financial statements
| Portfolio | | Fee waivers/
expense
reimbursements
subject to
repayment | | Expires
July 31,
2012 | | Expires
July 31,
2013 | | Expires
July 31,
2014 | |
| PACE Intermediate Fixed Income Investments—Class Y | | $ | 3,837 | | | $ | 25 | | | $ | 1,293 | | | $ | 2,519 | | |
| PACE Intermediate Fixed Income Investments—Class P | | | 584,929 | | | | 209,484 | | | | 197,675 | | | | 177,770 | | |
| PACE Strategic Fixed Income Investments—Class A | | | 35,263 | | | | 8,462 | | | | 10,025 | | | | 16,776 | | |
| PACE Strategic Fixed Income Investments—Class B | | | 649 | | | | 278 | | | | 278 | | | | 93 | | |
| PACE Strategic Fixed Income Investments—Class Y | | | 5,864 | | | | — | | | | 1,522 | | | | 4,342 | | |
| PACE Strategic Fixed Income Investments—Class P | | | 999,195 | | | | 360,438 | | | | 418,442 | | | | 220,315 | | |
| PACE Municipal Fixed Income Investments—Class A | | | 51,369 | | | | 23,896 | | | | 17,116 | | | | 10,357 | | |
| PACE Municipal Fixed Income Investments—Class B | | | 198 | | | | 84 | | | | 74 | | | | 40 | | |
| PACE Municipal Fixed Income Investments—Class C | | | 12,434 | | | | 5,657 | | | | 4,247 | | | | 2,530 | | |
| PACE Municipal Fixed Income Investments—Class Y | | | 247 | | | | 106 | | | | 72 | | | | 69 | | |
| PACE Municipal Fixed Income Investments—Class P | | | 346,182 | | | | 129,158 | | | | 116,086 | | | | 100,938 | | |
| PACE International Fixed Income Investments—Class B | | | 205 | | | | 125 | | | | 68 | | | | 12 | | |
| PACE International Fixed Income Investments—Class Y | | | 3,207 | | | | — | | | | — | | | | 3,207 | | |
| PACE International Fixed Income Investments—Class P | | | 1,106,739 | | | | 469,248 | | | | 388,975 | | | | 248,516 | | |
| PACE High Yield Investments—Class A | | | 1,044 | | | | 1,044 | | | | — | | | | — | | |
| PACE High Yield Investments—Class P | | | 589,363 | | | | 296,377 | | | | 174,480 | | | | 118,506 | | |
| PACE Large Co Value Equity Investments—Class B | | | 2,613 | | | | 1,350 | | | | 859 | | | | 404 | | |
| PACE Large Co Growth Equity Investments—Class B | | | 1,093 | | | | 487 | | | | 368 | | | | 238 | | |
| PACE Large Co Growth Equity Investments—Class C | | | 7,241 | | | | 4,566 | | | | 2,137 | | | | 538 | | |
| PACE Small/Medium Co Value Equity Investments—Class B | | | 689 | | | | 490 | | | | 175 | | | | 24 | | |
| PACE Small/Medium Co Value Equity Investments—Class P | | | 821,220 | | | | 464,511 | | | | 300,123 | | | | 56,586 | | |
| PACE Small/Medium Co Growth Equity Investments—Class B | | | 717 | | | | 364 | | | | 261 | | | | 92 | | |
| PACE Small/Medium Co Growth Equity Investments—Class P | | | 1,002,386 | | | | 547,958 | | | | 338,313 | | | | 116,115 | | |
| PACE International Equity Investments—Class B | | | 356 | | | | 191 | | | | 86 | | | | 79 | | |
| PACE Global Real Estate Securities Investments—Class A | | | 46,327 | | | | 20,367 | | | | 15,857 | | | | 10,103 | | |
| PACE Global Real Estate Securities Investments—Class C | | | 2,269 | | | | 1,009 | | | | 768 | | | | 492 | | |
| PACE Global Real Estate Securities Investments—Class Y | | | 423 | | | | 39 | | | | 150 | | | | 234 | | |
| PACE Global Real Estate Securities Investments—Class P | | | 1,317,681 | | | | 444,161 | | | | 473,034 | | | | 400,486 | | |
| PACE Alternative Strategies Investments—Class A | | | 80,488 | | | | 28,060 | | | | 36,429 | | | | 15,999 | | |
| PACE Alternative Strategies Investments—Class B | | | 92 | | | | 54 | | | | 38 | | | | — | | |
| PACE Alternative Strategies Investments—Class Y | | | 6,979 | | | | 6,086 | | | | — | | | | 893 | | |
| PACE Alternative Strategies Investments—Class P | | | 199,629 | | | | 39,257 | | | | 135,124 | | | | 25,248 | | |
PACE Strategic Fixed Income Investments Class C, PACE International Fixed Income Investments Class A and Class C, PACE High Yield Investments Class C and Class Y, PACE Large Co Value Equity Investments Class A, Class C, Class Y and Class P, PACE Large Co Growth Equity Investments Class A, Class Y and Class P, PACE Small/Medium Co Value Equity Investments Class A, Class C and Class Y, PACE Small/Medium Co Growth Equity Investments Class A, Class C and Class Y, PACE International Equity Investments Class A, Class C, Class Y and Class P, PACE International Emerging Markets Equity Investments Class A, Class B, Class C, Class Y and Class P and PACE Alternative Strategies Investments Class C have no remaining fee waivers/expense reimbursements subject to repayment.
327
PACE Select Advisors Trust
Notes to financial statements
During the year ended July 31, 2011, the Portfolios listed below paid broker commissions to affiliates of the investment manager as follows:
| Affiliated broker | | PACE
Large Co
Value
Equity
Investments | | PACE
Large Co
Growth
Equity
Investments | | PACE
International
Equity
Investments | | International
Emerging
Markets
Equity
Investments | | PACE
PACE
Global
Real Estate
Securities
Investments | | PACE
Alternative
Strategies
Investments | |
| UBS AG | | $ | — | | | $ | — | | | $ | 3,323 | | | $ | 15,182 | | | $ | 60 | | | $ | 9,437 | | |
| UBS Securities Asia Ltd. | | | — | | | | — | | | | — | | | | 2,462 | | | | 539 | | | | 108 | | |
| UBS Securites Australia Ltd. | | | — | | | | — | | | | — | | | | — | | | | — | | | | 5 | | |
| UBS Securities Canada Inc. | | | — | | | | — | | | | — | | | | 143 | | | | 27 | | | | 94 | | |
| UBS Securities LLC | | | 2,484 | | | | 2,247 | | | | — | | | | 3,096 | | | | 437 | | | | 905 | | |
Additional information regarding compensation to affiliate of a board member
Professor Meyer Feldberg serves as a senior advisor to Morgan Stanley, a financial services firm with which the Portfolios may conduct transactions, resulting in him being an interested trustee of the Portfolio. The Portfolios have been informed that Professor Feldberg's role at Morgan Stanley does not involve matters directly affecting any UBS funds. Portfolio transactions are executed through Morgan Stanley based on that firm's ability to provide best execution of the transactions. For the year ended July 31, 2011, the following Portfolios paid brokerage commissions to Morgan Stanley in the amounts as follows:
| PACE Large Co Value Equity Investments | | $ | 48,137 | | |
| PACE Large Co Growth Equity Investments | | | 71,780 | | |
| PACE Small/Medium Co Value Equity Investments | | | 7,470 | | |
| PACE Small/Medium Co Growth Equity Investments | | | 14,949 | | |
| PACE International Equity Investments | | | 26,693 | | |
| PACE International Emerging Markets Equity Investments | | | 66,554 | | |
| PACE Global Real Estate Securities Investments | | | 1,871 | | |
| PACE Alternative Strategies Investments | | | 156,792 | | |
During the year ended July 31, 2011, the following Portfolios purchased and sold certain securities (e.g., fixed income securities) in principal trades with Morgan Stanley having aggregate values as follows:
| PACE Money Market Investments | | $ | 198,963,243 | | |
| PACE Government Securities Fixed Income Investments | | | 6,069,828,721 | | |
| PACE Intermediate Fixed Income Investments | | | 693,179,180 | | |
| PACE Strategic Fixed Income Investments | | | 2,795,570,830 | | |
| PACE Municipal Fixed Income Investments | | | 12,969,694 | | |
| PACE International Fixed Income Investments | | | 87,386,386 | �� | |
| PACE High Yield Investments | | | 7,110,469 | | |
| PACE Large Co Growth Equity Investments | | | 17,177,812 | | |
| PACE Small/Medium Co Growth Equity Investments | | | 3,046,863 | | |
| PACE International Equity Investments | | | 4,467,484 | | |
| PACE International Emerging Markets Equity Investments | | | 346,556 | | |
| PACE Global Real Estate Securities Investments | | | 172,535 | | |
| PACE Alternative Strategies Investments | | | 640,657,971 | | |
328
PACE Select Advisors Trust
Notes to financial statements
Morgan Stanley received compensation in connection with these trades, which may have been in the form of a "mark-up" or "mark-down" of the price of the securities, a fee from the issuer for maintaining a commercial paper program, or some other form of compensation. Although the precise amount of this compensation is not generally known by the investment manager, it is believed that under normal circumstances it represents a small portion of the total value of the transactions.
Service and distribution plans
UBS Global Asset Management (US) Inc. ("UBS Global AM (US)") is the principal underwriter of each Portfolio's shares. Under separate plans of service and/or distribution pertaining to Class A, Class B and Class C shares, the Portfolios (with the exception of PACE Money Market Investments, which only offers Class P shares, and PACE Global Real Estate Securities Investments, which does not offer Class B shares) pay UBS Global AM (US) monthly service fees at the annual rate of 0.25% of the average daily net assets of Class A, Class B and Class C shares and monthly distribution fees (1) at the annual rate of 0.75% of the average daily net assets of Class B and Class C shares for PACE Large Co Value Equity Investments, PACE Large Co Growth Equity Investments, PACE Small/Medium Co Value Equity Investments, PACE Small/Medium Co Growth Equity Investments, PACE International Equity Investments, PACE International Emerging Markets Equity Investments, PACE Global Real Estate Securities Investments and PACE Alternative Strategies Investments and (2) at the annual rate of 0.75% and 0.50% of the average daily net assets of Class B and Class C shares, respectively, for PACE Government Securities Fixed Income Investments, PACE Intermediate Fixed Income Investments, PACE Strategic Fixed Income Investments, PACE Municipal Fixed Income Investments, PACE International Fixed Income Investments and PACE High Yield Investments Portfolios.
UBS Global AM (US) also receives the proceeds of the initial sales charges paid upon the purchase of Class A shares and the contingent deferred sales charges paid by shareholders upon certain redemptions of Class A, Class B and Class C shares.
At July 31, 2011, certain Portfolios owed UBS Global AM (US) service and distribution fees, and for the year ended July 31, 2011, certain Portfolios were informed by UBS Global AM (US) that it had earned sales charges as follows:
| Portfolio | | Service and distribution
fees owed | | Sales charges earned | |
| PACE Government Securities Fixed Income Investments—Class A | | $ | 17,264 | | | $ | 4,226 | | |
| PACE Government Securities Fixed Income Investments—Class B | | | 99 | | | | 3 | | |
| PACE Government Securities Fixed Income Investments—Class C | | | 14,074 | | | | 671 | | |
| PACE Intermediate Fixed Income Investments—Class A | | | 8,326 | | | | 6,276 | | |
| PACE Intermediate Fixed Income Investments—Class B | | | 61 | | | | — | | |
| PACE Intermediate Fixed Income Investments—Class C | | | 2,277 | | | | 18 | | |
| PACE Strategic Fixed Income Investments—Class A | | | 11,432 | | | | 19,167 | | |
| PACE Strategic Fixed Income Investments—Class B | | | 193 | | | | 204 | | |
| PACE Strategic Fixed Income Investments—Class C | | | 8,137 | | | | 911 | | |
| PACE Municipal Fixed Income Investments—Class A | | | 15,798 | | | | 9,625 | | |
| PACE Municipal Fixed Income Investments—Class B | | | 40 | | | | — | | |
| PACE Municipal Fixed Income Investments—Class C | | | 8,868 | | | | 44 | | |
| PACE International Fixed Income Investments—Class A | | | 20,690 | | | | 5,276 | | |
| PACE International Fixed Income Investments—Class B | | | 126 | | | | — | | |
| PACE International Fixed Income Investments—Class C | | | 5,039 | | | | 75 | | |
| PACE High Yield Investments—Class A | | | 5,572 | | | | 92,153 | | |
| PACE High Yield Investments—Class C | | | 2,401 | | | | 666 | | |
| PACE Large Co Value Equity Investments—Class A | | | 32,285 | | | | 9,036 | | |
| PACE Large Co Value Equity Investments—Class B | | | 75 | | | | 56 | | |
329
PACE Select Advisors Trust
Notes to financial statements
| Portfolio | | Service and distribution
fees owed | | Sales charges earned | |
| PACE Large Co Value Equity Investments—Class C | | $ | 12,972 | | | $ | 102 | | |
| PACE Large Co Growth Equity Investments—Class A | | | 14,070 | | | | 4,075 | | |
| PACE Large Co Growth Equity Investments—Class B | | | 60 | | | | 184 | | |
| PACE Large Co Growth Equity Investments—Class C | | | 3,686 | | | | 36 | | |
| PACE Small/Medium Co Value Equity Investments—Class A | | | 7,194 | | | | 4,092 | | |
| PACE Small/Medium Co Value Equity Investments—Class B | | | 2 | | | | — | | |
| PACE Small/Medium Co Value Equity Investments—Class C | | | 4,612 | | | | 1 | | |
| PACE Small/Medium Co Growth Equity Investments—Class A | | | 9,143 | | | | 5,177 | | |
| PACE Small/Medium Co Growth Equity Investments—Class B | | | 11 | | | | 2 | | |
| PACE Small/Medium Co Growth Equity Investments—Class C | | | 3,691 | | | | 31 | | |
| PACE International Equity Investments—Class A | | | 14,424 | | | | 7,713 | | |
| PACE International Equity Investments—Class B | | | 1 | | | | 84 | | |
| PACE International Equity Investments—Class C | | | 3,096 | | | | 11 | | |
| PACE International Emerging Markets Equity Investments—Class A | | | 4,854 | | | | 5,955 | | |
| PACE International Emerging Markets Equity Investments—Class B | | | 42 | | | | 71 | | |
| PACE International Emerging Markets Equity Investments—Class C | | | 2,901 | | | | 515 | | |
| PACE Global Real Estate Securities Investments—Class A | | | 991 | | | | 1,879 | | |
| PACE Global Real Estate Securities Investments—Class C | | | 188 | | | | — | | |
| PACE Alternative Strategies Investments—Class A | | | 14,227 | | | | 15,752 | | |
| PACE Alternative Strategies Investments—Class C | | | 5,820 | | | | 577 | | |
Transfer agency and related services fees
UBS Financial Services Inc. provides certain services to the Portfolios pursuant to a delegation of authority from BNY Mellon Investment Servicing (US) Inc. ("BNY Mellon"), the Portfolios' transfer agent, and was compensated for these services by BNY Mellon, not the Portfolios.
For the year ended July 31, 2011, UBS Financial Services Inc. received from BNY Mellon, not the Portfolios, total delegated services fees as follows:
| Portfolio | | Delegated
services
fees earned | |
| PACE Money Market Investments | | $ | 768,376 | | |
| PACE Government Securities Fixed Income Investments | | | 419,290 | | |
| PACE Intermediate Fixed Income Investments | | | 223,212 | | |
| PACE Strategic Fixed Income Investments | | | 554,557 | | |
| PACE Municipal Fixed Income Investments | | | 97,959 | | |
| PACE International Fixed Income Investments | | | 561,656 | | |
| PACE High Yield Investments | | | 268,160 | | |
| PACE Large Co Value Equity Investments | | | 689,915 | | |
| PACE Large Co Growth Equity Investments | | | 646,582 | | |
| PACE Small/Medium Co Value Equity Investments | | | 603,871 | | |
| PACE Small/Medium Co Growth Equity Investments | | | 605,721 | | |
| PACE International Equity Investments | | | 619,134 | | |
| PACE International Emerging Markets Equity Investments | | | 530,504 | | |
| PACE Global Real Estate Securities Investments | | | 246,277 | | |
| PACE Alternative Strategies Investments | | | 285,648 | | |
330
PACE Select Advisors Trust
Notes to financial statements
For the year ended July 31, 2011, each Portfolio accrued transfer agency and related services fees payable to BNY Mellon on each class as follows:
| Porfolio | | Class A | | Class B | | Class C | | Class Y | | Class P | |
| PACE Money Market Investments | | $ | — | | | $ | — | | | $ | — | | | $ | — | | | $ | 1,533,469 | | |
| PACE Government Securities Fixed Income Investments | | | 77,271 | | | | 153 | | | | 24,746 | | | | 82,342 | | | | 650,201 | | |
| PACE Intermediate Fixed Income Investments | | | 41,676 | | | | 213 | | | | 4,271 | | | | 3,243 | | | | 351,086 | | |
| PACE Strategic Fixed Income Investments | | | 65,965 | | | | 358 | | | | 9,260 | | | | 7,195 | | | | 928,205 | | |
| PACE Municipal Fixed Income Investments | | | 27,105 | | | | 53 | | | | 5,678 | | | | 95 | | | | 148,674 | | |
| PACE International Fixed Income Investments | | | 101,604 | | | | 237 | | | | 6,452 | | | | 11,261 | | | | 885,310 | | |
| PACE High Yield Investments | | | 20,299 | | | | — | | | | 1,964 | | | | 29 | | | | 444,625 | | |
| PACE Large Co Value Equity Investments | | | 146,158 | | | | 647 | | | | 22,232 | | | | 20,308 | | | | 1,042,024 | | |
| PACE Large Co Growth Equity Investments | | | 72,702 | | | | 398 | | | | 8,814 | | | | 16,946 | | | | 1,040,170 | | |
| PACE Small/Medium Co Value Equity Investments | | | 39,870 | | | | 67 | | | | 6,904 | | | | 594 | | | | 994,341 | | |
| PACE Small/Medium Co Growth Equity Investments | | | 46,738 | | | | 127 | | | | 5,311 | | | | 144 | | | | 992,850 | | |
| PACE International Equity Investments | | | 83,375 | | | | 104 | | | | 7,393 | | | | 28,731 | | | | 986,490 | | |
| PACE International Emerging Markets Equity Investments | | | 31,343 | | | | 101 | | | | 4,926 | | | | 33,792 | | | | 876,521 | | |
| PACE Global Real Estate Securities Investments | | | 10,388 | | | | — | | | | 505 | | | | 245 | | | | 406,232 | | |
| PACE Alternative Strategies Investments | | | 72,026 | | | | — | | | | 4,682 | | | | 2,438 | | | | 414,720 | | |
Securities lending
Each Portfolio may lend securities up to 331/3% of its total assets to qualified broker-dealers or institutional investors. The loans are secured at all times by cash, US government securities or irrevocable letters of credit in an amount at least equal to the market value of the securities loaned, plus accrued interest and dividends, determined on a daily basis and adjusted accordingly. The Portfolio will regain ownership of loaned securities to exercise certain beneficial rights; however, each Portfolio may bear the risk of delay in recovery of, or even loss of rights in, the securities loaned should the borrower fail financially. Each Portfolio receives compensation for lending its securities from interest or dividends earned on the cash, US government securities or irrevocable letters of credit held as collateral, net of fee rebates paid to the borrower plus reasonable administrative and custody fees. State Street Bank and Trust Company serves as the Portfolios' lending agent.
Bank line of credit
Each Portfolio, other than PACE Money Market Investments, participates with other funds managed, advised or sub-advised by UBS Global AM in a $100 million committed credit facility with State Street Bank and Trust Company ("Committed Credit Facility"), to be utilized for temporary financing until the settlement of sales or purchases of portfolio securities, the repurchase or redemption of shares of each Portfolio at the request of shareholders and other temporary or emergency purposes. Under the Committed Credit Facility arrangement, each Portfolio has agreed to pay commitment fees, pro rata, based on the relative asset size of the funds in the Committed Credit Facility. Each Portfolio borrows at prevailing rates in effect at the time of borrowings. For the year ended July 31, 2011, the following Portfolios had borrowings as follows:
| Portfolio | | Average daily
amount of
borrowings
outstanding | | Days
outstanding | | Interest
expense | | Weighted average
annualized
interest rate | |
| PACE Government Securities Fixed Income Investments | | $ | 1,185,528 | | | | 1 | | | $ | 40 | | | | 1.215 | % | |
| PACE Municipal Fixed Income Investments | | | 1,032,194 | | | | 2 | | | | 69 | | | | 1.203 | | |
| PACE Large Co Growth Equity Investments | | | 1,066,458 | | | | 5 | | | | 182 | | | | 1.229 | | |
| PACE Small/Medium Co Growth Equity Investments | | | 1,358,379 | | | | 1 | | | | 46 | | | | 1.219 | | |
| PACE International Equity Investments | | | 906,589 | | | | 37 | | | | 1,159 | | | | 1.244 | | |
| PACE International Emerging Markets Equity Investments | | | 1,206,185 | | | | 80 | | | | 3,255 | | | | 1.214 | | |
| PACE Alternative Strategies Investments | | | 7,798,139 | | | | 4 | | | | 1,073 | | | | 1.238 | | |
331
PACE Select Advisors Trust
Notes to financial statements
Prior to February 17, 2011, PACE Large Co Growth Equity Investments participated with other funds advised by UBS Global AM in a $75 million committed credit facility with JP Morgan Chase Bank ("JPMorgan Chase Bank Facility"), to be utilized for temporary financing until the settlement of sales or purchases of portfolio securities, the repurchase or redemption of shares of the Portfolio at the request of shareholders and other temporary or emergency purposes. Under the JPMorgan Chase Bank Facility arrangement, the Portfolio had agreed to pay commitment fees, pro rata, based on the relative asset size of the funds in the JPMorgan Chase Bank Facility. The Portfolio was permitted to borrow at prevailing rates in effect at the time of borrowings. For the period ended February 16, 2011, the Portfolio did not borrow under the JPMorgan Chase Bank Facility.
Purchases and sales of securities
For the year ended July 31, 2011, aggregate purchases and sales of portfolio securities, excluding short-term securities and US Government and agency securities, were as follows:
| Portfolio | | Purchases | | Sales | |
| PACE Government Securities Fixed Income Investments | | $ | 31,164,152 | | | $ | 116,432,771 | | |
| PACE Intermediate Fixed Income Investments | | | 235,554,830 | | | | 165,789,498 | | |
| PACE Strategic Fixed Income Investments | | | 253,941,976 | | | | 242,790,331 | | |
| PACE Municipal Fixed Income Investments | | | 108,069,705 | | | | 115,076,920 | | |
| PACE International Fixed Income Investments | | | 352,238,888 | | | | 331,125,829 | | |
| PACE High Yield Investments | | | 127,143,548 | | | | 88,942,493 | | |
| PACE Large Co Value Equity Investments | | | 572,665,922 | | | | 622,836,963 | | |
| PACE Large Co Growth Equity Investments | | | 903,217,857 | | | | 957,552,323 | | |
| PACE Small/Medium Co Value Equity Investments | | | 287,058,214 | | | | 316,477,073 | | |
| PACE Small/Medium Co Growth Equity Investments | | | 453,228,350 | | | | 491,936,143 | | |
| PACE International Equity Investments | | | 563,690,949 | | | | 563,365,146 | | |
| PACE International Emerging Markets Equity Investments | | | 331,782,185 | | | | 335,504,329 | | |
| PACE Global Real Estate Securities Investments | | | 57,328,267 | | | | 46,656,750 | | |
| PACE Alternative Strategies Investments | | | 633,786,474 | | | | 604,262,567 | | |
For the year ended July 31, 2011, aggregate purchases and sales of US Government and agency securities, excluding short-term securities, were as follows:
| Portfolio | | Purchases | | Sales | |
| PACE Government Securities Fixed Income Investments | | $ | 9,491,134,631 | | | $ | 9,323,718,885 | | |
| PACE Intermediate Fixed Income Investments | | | 2,938,751,091 | | | | 2,993,097,336 | | |
| PACE Strategic Fixed Income Investments | | | 3,348,159,520 | | | | 3,444,072,419 | | |
| PACE International Fixed Income Investments | | | 14,296,546 | | | | 14,294,971 | | |
| PACE Alternative Strategies Investments | | | 482,529,450 | | | | 453,982,218 | | |
Commission recapture program
The following Portfolios participate in a brokerage commission recapture program: PACE Large Co Value Equity Investments, PACE Large Co Growth Equity Investments, PACE Small/Medium Co Value Equity Investments, PACE Small/Medium Co Growth Equity Investments, PACE International Equity Investments, PACE International Emerging Markets Equity Investments, PACE Global Real Estate Securities Investments and PACE Alternative Strategies Investments. These Portfolios have established commission recapture arrangements with certain participating brokers or dealers. If a Portfolio's investment sub-advisor chooses to execute a transaction through a participating broker subject to best price and execution, the broker will rebate a portion of the commission back to the Portfolio. Any collateral benefit received through participation in the commission recapture program is directed exclusively to the Portfolio. For the year ended July 31, 2011, the following Portfolios recorded recaptured
332
PACE Select Advisors Trust
Notes to financial statements
commissions which are reflected on the Statement of operations within the net realized gains (losses) on investment activities:
| Portfolio | | Amount | |
| PACE Large Co Value Equity Investments | | $ | 150,906 | | |
| PACE Large Co Growth Equity Investments | | | 62,853 | | |
| PACE Small/Medium Co Value Equity Investments | | | 146,576 | | |
| PACE Small/Medium Co Growth Equity Investments | | | 273,769 | | |
| PACE International Equity Investments | | | 1,964 | | |
| PACE International Emerging Markets Equity Investments | | | 7,088 | | |
| PACE Global Real Estate Securities Investments | | | 23,672 | | |
| PACE Alternative Strategies Investments | | | 1,605 | | |
Shares of beneficial interest
There is an unlimited amount of $0.001 par value shares of beneficial interest authorized. Transactions in shares of beneficial interest for each of the Portfolios, except PACE Money Market Investments, about which similar information is provided on the Statement of changes in net assets, were as follows:
PACE Government Securities Fixed Income Investments
For the year ended July 31, 2011:
| | | Class A | | Class B | | Class C | |
| | Shares | | Amount | | Shares | | Amount | | Shares | | Amount | |
| Shares sold | | | 322,017 | | | $ | 4,311,205 | | | | — | | | $ | — | | | | 29,388 | | | $ | 398,630 | | |
| Shares repurchased | | | (1,323,351 | ) | | | (17,690,694 | ) | | | (3,066 | ) | | | (41,129 | ) | | | (239,374 | ) | | | (3,185,094 | ) | |
| Shares converted from Class B to Class A | | | 1,523 | | | | 20,445 | | | | (1,523 | ) | | | (20,445 | ) | | | — | | | | — | | |
| Dividends reinvested | | | 322,295 | | | | 4,240,233 | | | | 532 | | | | 6,996 | | | | 87,921 | | | | 1,156,389 | | |
| Net decrease | | | (677,516 | ) | | $ | (9,118,811 | ) | | | (4,057 | ) | | $ | (54,578 | ) | | | (122,065 | ) | | $ | (1,630,075 | ) | |
| | | Class Y | | Class P | | | |
| | Shares | | Amount | | Shares | | Amount | | | | | |
| Shares sold | | | 1,549,324 | | | $ | 20,826,642 | | | | 7,352,916 | | | $ | 98,174,456 | | | | | | |
| Shares repurchased | | | (1,600,592 | ) | | | (21,457,841 | ) | | | (10,351,370 | ) | | | (138,083,371 | ) | | | | | |
| Dividends reinvested | | | 259,880 | | | | 3,420,694 | | | | 2,289,948 | | | | 30,145,254 | | | | | | |
| Net increase (decrease) | | | 208,612 | | | $ | 2,789,495 | | | | (708,506 | ) | | $ | (9,763,661 | ) | | | | | |
For the year ended July 31, 2010:
| | | Class A | | Class B | | Class C | |
| | Shares | | Amount | | Shares | | Amount | | Shares | | Amount | |
| Shares sold | | | 728,713 | | | $ | 9,852,320 | | | | 5,617 | | | $ | 76,341 | | | | 138,831 | | | $ | 1,877,632 | | |
| Shares repurchased | | | (1,098,779 | ) | | | (14,815,822 | ) | | | (4,153 | ) | | | (56,643 | ) | | | (284,012 | ) | | | (3,824,901 | ) | |
| Shares converted from Class B to Class A | | | 3,556 | | | | 48,107 | | | | (3,554 | ) | | | (48,107 | ) | | | — | | | | — | | |
| Dividends reinvested | | | 342,102 | | | | 4,543,316 | | | | 550 | | | | 7,290 | | | | 92,411 | | | | 1,227,180 | | |
| Net decrease | | | (24,408 | ) | | $ | (372,079 | ) | | | (1,540 | ) | | $ | (21,119 | ) | | | (52,770 | ) | | $ | (720,089 | ) | |
| | | Class Y | | Class P | | | |
| | Shares | | Amount | | Shares | | Amount | | | | | |
| Shares sold | | | 1,769,546 | | | $ | 23,862,711 | | | | 9,379,343 | | | $ | 126,498,461 | | | | | | |
| Shares repurchased | | | (1,318,594 | ) | | | (17,728,119 | ) | | | (8,472,594 | ) | | | (114,141,124 | ) | | | | | |
| Dividends reinvested | | | 224,552 | | | | 2,983,809 | | | | 2,307,855 | | | | 30,666,573 | | | | | | |
| Net increase | | | 675,504 | | | $ | 9,118,401 | | | | 3,214,604 | | | $ | 43,023,910 | | | | | | |
333
PACE Select Advisors Trust
Notes to financial statements
PACE Intermediate Fixed Income Investments
For the year ended July 31, 2011:
| | | Class A | | Class B | | Class C | |
| | Shares | | Amount | | Shares | | Amount | | Shares | | Amount | |
| Shares sold | | | 188,507 | | | $ | 2,275,985 | | | | 584 | | | $ | 7,102 | | | | 12,230 | | | $ | 148,784 | | |
| Shares repurchased | | | (605,032 | ) | | | (7,266,358 | ) | | | (3,035 | ) | | | (36,265 | ) | | | (117,218 | ) | | | (1,411,529 | ) | |
| Shares converted from Class B to Class A | | | 4,722 | | | | 57,226 | | | | (4,714 | ) | | | (57,226 | ) | | | — | | | | — | | |
| Dividends reinvested | | | 52,304 | | | | 628,474 | | | | 93 | | | | 1,115 | | | | 4,236 | | | | 50,980 | | |
| Net decrease | | | (359,499 | ) | | $ | (4,304,673 | ) | | | (7,072 | ) | | $ | (85,274 | ) | | | (100,752 | ) | | $ | (1,211,765 | ) | |
| | | Class Y | | Class P | | | |
| | Shares | | Amount | | Shares | | Amount | | | | | |
| Shares sold | | | 9,306 | | | $ | 112,398 | | | | 8,314,566 | | | $ | 100,094,760 | | | | | | |
| Shares repurchased | | | (73,699 | ) | | | (887,064 | ) | | | (10,219,923 | ) | | | (122,770,793 | ) | | | | | |
| Dividends reinvested | | | 3,237 | | | | 38,926 | | | | 767,677 | | | | 9,226,178 | | | | | | |
| Net decrease | | | (61,156 | ) | | $ | (735,740 | ) | | | (1,137,680 | ) | | $ | (13,449,855 | ) | | | | | |
For the year ended July 31, 2010:
| | | Class A | | Class B | | Class C | |
| | Shares | | Amount | | Shares | | Amount | | Shares | | Amount | |
| Shares sold | | | 281,329 | | | $ | 3,310,190 | | | | 4,034 | | | $ | 47,518 | | | | 84,600 | | | $ | 995,456 | | |
| Shares repurchased | | | (703,084 | ) | | | (8,259,636 | ) | | | (1,917 | ) | | | (22,533 | ) | | | (154,565 | ) | | | (1,820,536 | ) | |
| Shares converted from Class B to Class A | | | 2,664 | | | | 31,143 | | | | (2,659 | ) | | | (31,143 | ) | | | — | | | | — | | |
| Dividends reinvested | | | 90,459 | | | | 1,061,686 | | | | 223 | | | | 2,622 | | | | 9,019 | | | | 105,968 | | |
| Net decrease | | | (328,632 | ) | | $ | (3,856,617 | ) | | | (319 | ) | | $ | (3,536 | ) | | | (60,946 | ) | | $ | (719,112 | ) | |
| | | Class Y | | Class P | | | |
| | Shares | | Amount | | Shares | | Amount | | | | | |
| Shares sold | | | 47,283 | | | $ | 554,932 | | | | 12,008,075 | | | $ | 141,203,511 | | | | | | |
| Shares repurchased | | | (87,440 | ) | | | (1,024,060 | ) | | | (8,594,102 | ) | | | (101,065,548 | ) | | | | | |
| Dividends reinvested | | | 6,714 | | | | 78,814 | | | | 1,122,720 | | | | 13,186,851 | | | | | | |
| Net increase (decrease) | | | (33,443 | ) | | $ | (390,314 | ) | | | 4,536,693 | | | $ | 53,324,814 | | | | | | |
PACE Strategic Fixed Income Investments
For the year ended July 31, 2011:
| | | Class A | | Class B | | Class C | |
| | Shares | | Amount | | Shares | | Amount | | Shares | | Amount | |
| Shares sold | | | 1,570,957 | | | $ | 22,619,992 | | | | 257 | | | $ | 3,858 | | | | 193,006 | | | $ | 2,811,676 | | |
| Shares repurchased | | | (1,029,608 | ) | | | (14,912,964 | ) | | | (1,523 | ) | | | (22,298 | ) | | | (197,671 | ) | | | (2,847,584 | ) | |
| Shares converted from Class B to Class A | | | 4,421 | | | | 63,557 | | | | (4,422 | ) | | | (63,557 | ) | | | — | | | | — | | |
| Dividends reinvested | | | 186,281 | | | | 2,649,058 | | | | 863 | | | | 12,261 | | | | 43,729 | | | | 621,104 | | |
| Net increase (decrease) | | | 732,051 | | | $ | 10,419,643 | | | | (4,825 | ) | | $ | (69,736 | ) | | | 39,064 | | | $ | 585,196 | | |
| | | Class Y | | Class P | | | |
| | Shares | | Amount | | Shares | | Amount | | | | | |
| Shares sold | | | 28,690 | | | $ | 410,410 | | | | 11,362,544 | | | $ | 163,441,235 | | | | | | |
| Shares repurchased | | | (58,505 | ) | | | (842,906 | ) | | | (10,649,315 | ) | | | (153,794,110 | ) | | | | | |
| Dividends reinvested | | | 12,714 | | | | 180,892 | | | | 3,097,600 | | | | 44,042,780 | | | | | | |
| Net increase (decrease) | | | (17,101 | ) | | $ | (251,604 | ) | | | 3,810,829 | | | $ | 53,689,905 | | | | | | |
334
PACE Select Advisors Trust
Notes to financial statements
For the year ended July 31, 2010:
| | | Class A | | Class B | | Class C | |
| | Shares | | Amount | | Shares | | Amount | | Shares | | Amount | |
| Shares sold | | | 1,269,639 | | | $ | 17,649,022 | | | | 879 | | | $ | 11,691 | | | | 272,509 | | | $ | 3,806,220 | | |
| Shares repurchased | | | (792,786 | ) | | | (10,971,115 | ) | | | (2,823 | ) | | | (39,093 | ) | | | (124,012 | ) | | | (1,711,165 | ) | |
| Shares converted from Class B to Class A | | | 3,582 | | | | 49,561 | | | | (3,584 | ) | | | (49,561 | ) | | | — | | | | — | | |
| Dividends reinvested | | | 101,324 | | | | 1,400,996 | | | | 687 | | | | 9,459 | | | | 23,560 | | | | 325,832 | | |
| Net increase (decrease) | | | 581,759 | | | $ | 8,128,464 | | | | (4,841 | ) | | $ | (67,504 | ) | | | 172,057 | | | $ | 2,420,887 | | |
| | | Class Y | | Class P | | | |
| | Shares | | Amount | | Shares | | Amount | | | | | |
| Shares sold | | | 99,028 | | | $ | 1,354,135 | | | | 12,390,311 | | | $ | 170,474,850 | | | | | | |
| Shares repurchased | | | (144,124 | ) | | | (2,001,353 | ) | | | (11,612,066 | ) | | | (160,807,710 | ) | | | | | |
| Dividends reinvested | | | 11,880 | | | | 163,743 | | | | 2,063,819 | | | | 28,495,696 | | | | | | |
| Net increase (decrease) | | | (33,216 | ) | | $ | (483,475 | ) | | | 2,842,064 | | | $ | 38,162,836 | | | | | | |
PACE Municipal Fixed Income Investments
For the year ended July 31, 2011:
| | | Class A | | Class B | | Class C | |
| | Shares | | Amount | | Shares | | Amount | | Shares | | Amount | |
| Shares sold | | | 253,434 | | | $ | 3,257,914 | | | | — | | | $ | — | | | | 83,281 | | | $ | 1,045,044 | | |
| Shares repurchased | | | (1,174,212 | ) | | | (14,955,246 | ) | | | — | | | | — | | | | (247,223 | ) | | | (3,135,562 | ) | |
| Shares converted from Class B to Class A | | | 1,257 | | | | 16,264 | | | | (1,256 | ) | | | (16,264 | ) | | | — | | | | — | | |
| Dividends reinvested | | | 125,625 | | | | 1,607,082 | | | | 79 | | | | 1,011 | | | | 18,560 | | | | 237,581 | | |
| Net decrease | | | (793,896 | ) | | $ | (10,073,986 | ) | | | (1,177 | ) | | $ | (15,253 | ) | | | (145,382 | ) | | $ | (1,852,937 | ) | |
| | | Class Y | | Class P | | | |
| | Shares | | Amount | | Shares | | Amount | | | | | |
| Shares sold | | | — | | | $ | — | | | | 4,069,360 | | | $ | 52,072,473 | | | | | | |
| Shares repurchased | | | (571 | ) | | | (7,279 | ) | | | (4,652,243 | ) | | | (59,394,004 | ) | | | | | |
| Dividends reinvested | | | 99 | | | | 1,271 | | | | 513,064 | | | | 6,562,003 | | | | | | |
| Net decrease | | | (472 | ) | | $ | (6,008 | ) | | | (69,819 | ) | | $ | (759,528 | ) | | | | | |
For the year ended July 31, 2010:
| | | Class A | | Class B | | Class C | |
| | Shares | | Amount | | Shares | | Amount | | Shares | | Amount | |
| Shares sold | | | 729,755 | | | $ | 9,296,918 | | | | — | | | $ | — | | | | 127,864 | | | $ | 1,627,841 | | |
| Shares repurchased | | | (1,509,793 | ) | | | (19,186,226 | ) | | | — | | | | — | | | | (176,048 | ) | | | (2,234,934 | ) | |
| Shares converted from Class B to Class A | | | 3,647 | | | | 46,031 | | | | (3,644 | ) | | | (46,031 | ) | | | — | | | | — | | |
| Dividends reinvested | | | 145,060 | | | | 1,842,634 | | | | 127 | | | | 1,600 | | | | 23,373 | | | | 296,962 | | |
| Net decrease | | | (631,331 | ) | | $ | (8,000,643 | ) | | | (3,517 | ) | | $ | (44,431 | ) | | | (24,811 | ) | | $ | (310,131 | ) | |
| | | Class Y | | Class P | | | |
| | Shares | | Amount | | Shares | | Amount | | | | | |
| Shares sold | | | — | | | $ | — | | | | 5,824,530 | | | $ | 74,011,168 | | | | | | |
| Shares repurchased | | | (2,240 | ) | | | (28,205 | ) | | | (3,716,258 | ) | | | (47,231,557 | ) | | | | | |
| Dividends reinvested | | | 116 | | | | 1,473 | | | | 498,842 | | | | 6,339,203 | | | | | | |
| Net increase (decrease) | | | (2,124 | ) | | $ | (26,732 | ) | | | 2,607,114 | | | $ | 33,118,814 | | | | | | |
335
PACE Select Advisors Trust
Notes to financial statements
PACE International Fixed Income Investments
For the year ended July 31, 2011:
| | | Class A | | Class B | | Class C | |
| | Shares | | Amount | | Shares | | Amount | | Shares | | Amount | |
| Shares sold | | | 365,771 | | | $ | 4,327,620 | | | | 1 | | | $ | 12 | | | | 76,850 | | | $ | 917,453 | | |
| Shares repurchased | | | (1,235,268 | ) | | | (14,724,825 | ) | | | — | | | | — | | | | (70,170 | ) | | | (841,818 | ) | |
| Shares converted from Class B to Class A | | | 2,620 | | | | 30,425 | | | | (2,611 | ) | | | (30,425 | ) | | | — | | | | — | | |
| Dividends reinvested | | | 164,935 | | | | 1,961,670 | | | | 124 | | | | 1,484 | | | | 8,805 | | | | 104,777 | | |
| Net increase (decrease) | | | (701,942 | ) | | $ | (8,405,110 | ) | | | (2,486 | ) | | $ | (28,929 | ) | | | 15,485 | | | $ | 180,412 | | |
| | | Class Y | | Class P | | | |
| | Shares | | Amount | | Shares | | Amount | | | | | |
| Shares sold | | | 5,649 | | | $ | 67,459 | | | | 8,097,069 | | | $ | 96,308,254 | | | | | | |
| Shares repurchased | | | (111,419 | ) | | | (1,326,843 | ) | | | (7,282,606 | ) | | | (86,688,425 | ) | | | | | |
| Dividends reinvested | | | 12,387 | | | | 146,924 | | | | 953,184 | | | | 11,343,898 | | | | | | |
| Net increase (decrease) | | | (93,383 | ) | | $ | (1,112,460 | ) | | | 1,767,647 | | | $ | 20,963,727 | | | | | | |
For the year ended July 31, 2010:
| | | Class A | | Class B | | Class C | |
| | Shares | | Amount | | Shares | | Amount | | Shares | | Amount | |
| Shares sold | | | 426,369 | | | $ | 4,923,082 | | | | 1,847 | | | $ | 22,267 | | | | 93,275 | | | $ | 1,081,590 | | |
| Shares repurchased | | | (1,175,359 | ) | | | (13,584,368 | ) | | | (2,404 | ) | | | (26,147 | ) | | | (114,266 | ) | | | (1,329,048 | ) | |
| Shares converted from Class B to Class A | | | 1,872 | | | | 21,921 | | | | (1,868 | ) | | | (21,921 | ) | | | — | | | | — | | |
| Dividends reinvested | | | 421,149 | | | | 4,859,108 | | | | 522 | | | | 6,037 | | | | 25,817 | | | | 297,937 | | |
| Net increase (decrease) | | | (325,969 | ) | | $ | (3,780,257 | ) | | | (1,903 | ) | | $ | (19,764 | ) | | | 4,826 | | | $ | 50,479 | | |
| | | Class Y | | Class P | | | |
| | Shares | | Amount | | Shares | | Amount | | | | | |
| Shares sold | | | 44,952 | | | $ | 533,137 | | | | 9,245,770 | | | $ | 107,353,391 | | | | | | |
| Shares repurchased | | | (242,403 | ) | | | (2,810,513 | ) | | | (7,210,772 | ) | | | (83,287,599 | ) | | | | | |
| Dividends reinvested | | | 39,822 | | | | 459,531 | | | | 2,064,683 | | | | 23,791,549 | | | | | | |
| Net increase (decrease) | | | (157,629 | ) | | $ | (1,817,845 | ) | | | 4,099,681 | | | $ | 47,857,341 | | | | | | |
PACE High Yield Investments
For the year ended July 31, 2011:
| | | Class A | | Class C | | | |
| | Shares | | Amount | | Shares | | Amount | | | | | |
| Shares sold | | | 1,507,757 | | | $ | 15,845,072 | | | | 132,012 | | | $ | 1,385,347 | | | | | | | | | | |
| Shares repurchased | | | (465,657 | ) | | | (4,890,434 | ) | | | (60,679 | ) | | | (636,565 | ) | | | | | |
| Dividends reinvested | | | 123,200 | | | | 1,290,852 | | | | 14,872 | | | | 155,475 | | | | | | |
| Net increase | | | 1,165,300 | | | $ | 12,245,490 | | | | 86,205 | | | $ | 904,257 | | | | | | |
| | | Class Y | | Class P | | | |
| | Shares | | Amount | | Shares | | Amount | | | | | |
| Shares sold | | | 35,520 | | | $ | 374,613 | | | | 6,780,923 | | | $ | 71,494,173 | | | | | | |
| Shares repurchased | | | — | | | | — | | | | (5,111,960 | ) | | | (53,801,895 | ) | | | | | |
| Dividends reinvested | | | 565 | | | | 5,908 | | | | 1,587,383 | | | | 16,638,154 | | | | | | |
| Net increase | | | 36,085 | | | $ | 380,521 | | | | 3,256,346 | | | $ | 34,330,432 | | | | | | |
336
PACE Select Advisors Trust
Notes to financial statements
For the year ended July 31, 2010:
| | | Class A | | Class C | | | |
| | Shares | | Amount | | Shares | | Amount | | | | | |
| Shares sold | | | 691,126 | | | $ | 6,773,730 | | | | 105,595 | | | $ | 1,064,331 | | | | | | | | | | |
| Shares repurchased | | | (306,128 | ) | | | (2,956,039 | ) | | | (41,670 | ) | | | (409,248 | ) | | | | | |
| Dividends reinvested | | | 65,476 | | | | 644,671 | | | | 11,285 | | | | 110,746 | | | | | | |
| Net increase | | | 450,474 | | | $ | 4,462,362 | | | | 75,210 | | | $ | 765,829 | | | | | | |
| | | Class Y | | Class P | | | |
| | Shares | | Amount | | Shares | | Amount | | | | | |
| Shares sold | | | — | | | $ | — | | | | 7,284,556 | | | $ | 71,144,838 | | | | | | |
| Shares repurchased | | | — | | | | — | | | | (4,630,407 | ) | | | (45,473,717 | ) | | | | | |
| Dividends reinvested | | | 67 | | | | 656 | | | | 1,500,995 | | | | 14,758,167 | | | | | | |
| Net increase | | | 67 | | | $ | 656 | | | | 4,155,144 | | | $ | 40,429,288 | | | | | | |
PACE Large Co Value Equity Investments
For the year ended July 31, 2011:
| | | Class A | | Class B | | Class C | |
| | Shares | | Amount | | Shares | | Amount | | Shares | | Amount | |
| Shares sold | | | 380,458 | | | $ | 6,280,843 | | | | — | | | $ | — | | | | 4,292 | | | $ | 69,685 | | |
| Shares repurchased | | | (1,535,140 | ) | | | (25,587,664 | ) | | | (1,541 | ) | | | (24,132 | ) | | | (173,217 | ) | | | (2,887,719 | ) | |
| Shares converted from Class B to Class A | | | 4,634 | | | | 78,259 | | | | (4,607 | ) | | | (78,259 | ) | | | — | | | | — | | |
| Dividends reinvested | | | 67,781 | | | | 1,123,133 | | | | — | | | | — | | | | — | | | | — | | |
| Net decrease | | | (1,082,267 | ) | | $ | (18,105,429 | ) | | | (6,148 | ) | | $ | (102,391 | ) | | | (168,925 | ) | | $ | (2,818,034 | ) | |
| | | Class Y | | Class P | | | |
| | Shares | | Amount | | Shares | | Amount | | | | | |
| Shares sold | | | 13,189 | | | $ | 224,663 | | | | 10,531,750 | | | $ | 176,737,479 | | | | | | |
| Shares repurchased | | | (205,734 | ) | | | (3,442,569 | ) | | | (12,420,127 | ) | | | (206,861,690 | ) | | | | | |
| Dividends reinvested | | | 11,196 | | | | 185,748 | | | | 598,607 | | | | 9,900,947 | | | | | | |
| Net decrease | | | (181,349 | ) | | $ | (3,032,158 | ) | | | (1,289,770 | ) | | $ | (20,223,264 | ) | | | | | |
For the year ended July 31, 2010:
| | | Class A | | Class B | | Class C | |
| | Shares | | Amount | | Shares | | Amount | | Shares | | Amount | |
| Shares sold | | | 478,776 | | | $ | 7,064,437 | | | | 322 | | | $ | 4,280 | | | | 27,826 | | | $ | 400,742 | | |
| Shares repurchased | | | (2,009,868 | ) | | | (29,646,475 | ) | | | (5,540 | ) | | | (81,835 | ) | | | (253,109 | ) | | | (3,721,875 | ) | |
| Shares converted from Class B to Class A | | | 14,394 | | | | 207,494 | | | | (14,332 | ) | | | (207,494 | ) | | | — | | | | — | | |
| Dividends reinvested | | | 89,586 | | | | 1,296,304 | | | | — | | | | — | | | | 2,021 | | | | 29,340 | | |
| Net decrease | | | (1,427,112 | ) | | $ | (21,078,240 | ) | | | (19,550 | ) | | $ | (285,049 | ) | | | (223,262 | ) | | $ | (3,291,793 | ) | |
| | | Class Y | | Class P | | | |
| | Shares | | Amount | | Shares | | Amount | | | | | |
| Shares sold | | | 46,448 | | | $ | 677,794 | | | | 12,305,196 | | | $ | 181,080,814 | | | | | | |
| Shares repurchased | | | (701,510 | ) | | | (10,350,068 | ) | | | (14,320,429 | ) | | | (210,773,917 | ) | | | | | |
| Dividends reinvested | | | 21,785 | | | | 315,880 | | | | 704,054 | | | | 10,173,781 | | | | | | |
| Net decrease | | | (633,277 | ) | | $ | (9,356,394 | ) | | | (1,311,179 | ) | | $ | (19,519,322 | ) | | | | | |
337
PACE Select Advisors Trust
Notes to financial statements
PACE Large Co Growth Equity Investments
For the year ended July 31, 2011:
| | | Class A | | Class B | | Class C | |
| | Shares | | Amount | | Shares | | Amount | | Shares | | Amount | |
| Shares sold | | | 368,063 | | | $ | 6,293,081 | | | | — | | | $ | — | | | | 16,815 | | | $ | 267,832 | | |
| Shares repurchased | | | (660,165 | ) | | | (11,692,399 | ) | | | (789 | ) | | | (13,566 | ) | | | (56,460 | ) | | | (912,011 | ) | |
| Shares converted from Class B to Class A | | | 1,290 | | | | 22,760 | | | | (1,402 | ) | | | (22,760 | ) | | | — | | | | — | | |
| Net decrease | | | (290,812 | ) | | $ | (5,376,558 | ) | | | (2,191 | ) | | $ | (36,326 | ) | | | (39,645 | ) | | $ | (644,179 | ) | |
| | | Class Y | | Class P | | | |
| | Shares | | Amount | | Shares | | Amount | | | | | |
| Shares sold | | | 12,823 | | | $ | 235,091 | | | | 9,668,622 | | | $ | 174,042,940 | | | | | | |
| Shares repurchased | | | (112,418 | ) | | | (2,031,452 | ) | | | (12,344,173 | ) | | | (220,446,389 | ) | | | | | |
| Dividends reinvested | | | 1,476 | | | | 26,597 | | | | 86,991 | | | | 1,560,613 | | | | | | |
| Net decrease | | | (98,119 | ) | | $ | (1,769,764 | ) | | | (2,588,560 | ) | | $ | (44,842,836 | ) | | | | | |
For the year ended July 31, 2010:
| | | Class A | | Class B | | Class C | |
| | Shares | | Amount | | Shares | | Amount | | Shares | | Amount | |
| Shares sold | | | 360,614 | | | $ | 5,374,502 | | | | — | | | $ | — | | | | 11,242 | | | $ | 150,284 | | |
| Shares repurchased | | | (821,528 | ) | | | (12,255,768 | ) | | | (6,348 | ) | | | (83,644 | ) | | | (60,499 | ) | | | (835,844 | ) | |
| Shares converted from Class B to Class A | | | 3,150 | | | | 46,396 | | | | (3,398 | ) | | | (46,396 | ) | | | — | | | | — | | |
| Dividends reinvested | | | 7,175 | | | | 107,262 | | | | — | | | | — | | | | — | | | | — | | |
| Net decrease | | | (450,589 | ) | | $ | (6,727,608 | ) | | | (9,746 | ) | | $ | (130,040 | ) | | | (49,257 | ) | | $ | (685,560 | ) | |
| | | Class Y | | Class P | | | |
| | Shares | | Amount | | Shares | | Amount | | | | | |
| Shares sold | | | 41,512 | | | $ | 629,541 | | | | 11,896,506 | | | $ | 180,391,030 | | | | | | |
| Shares repurchased | | | (458,112 | ) | | | (6,994,734 | ) | | | (13,763,085 | ) | | | (208,711,469 | ) | | | | | |
| Dividends reinvested | | | 6,572 | | | | 100,359 | | | | 261,629 | | �� | | 3,976,824 | | | | | | |
| Net decrease | | | (410,028 | ) | | $ | (6,264,834 | ) | | | (1,604,950 | ) | | $ | (24,343,615 | ) | | | | | |
PACE Small/Medium Co Value Equity Investments
For the year ended July 31, 2011:
| | | Class A | | Class B | | Class C | |
| | Shares | | Amount | | Shares | | Amount | | Shares | | Amount | |
| Shares sold | | | 260,606 | | | $ | 4,305,822 | | | | — | | | $ | — | | | | 2,263 | | | $ | 35,547 | | |
| Shares repurchased | | | (333,884 | ) | | | (5,514,100 | ) | | | — | | | | — | | | | (68,593 | ) | | | (1,033,795 | ) | |
| Shares converted from Class B to Class A | | | 3,814 | | | | 59,064 | | | | (4,188 | ) | | | (59,064 | ) | | | — | | | | — | | |
| Net decrease | | | (69,464 | ) | | $ | (1,149,214 | ) | | | (4,188 | ) | | $ | (59,064 | ) | | | (66,330 | ) | | $ | (998,248 | ) | |
| | | Class Y | | Class P | | | |
| | Shares | | Amount | | Shares | | Amount | | | | | |
| Shares sold | | | 1,762 | | | $ | 29,583 | | | | 3,744,485 | | | $ | 63,666,448 | | | | | | |
| Shares repurchased | | | (2,277 | ) | | | (36,808 | ) | | | (5,218,114 | ) | | | (87,944,311 | ) | | | | | |
| Dividends reinvested | | | 9 | | | | 159 | | | | 8,363 | | | | 141,753 | | | | | | |
| Net decrease | | | (506 | ) | | $ | (7,066 | ) | | | (1,465,266 | ) | | $ | (24,136,110 | ) | | | | | |
338
PACE Select Advisors Trust
Notes to financial statements
For the year ended July 31, 2010:
| | | Class A | | Class B | | Class C | |
| | Shares | | Amount | | Shares | | Amount | | Shares | | Amount | |
| Shares sold | | | 297,532 | | | $ | 4,074,207 | | | | 56 | | | $ | 830 | | | | 9,934 | | | $ | 128,678 | | |
| Shares repurchased | | | (404,304 | ) | | | (5,637,104 | ) | | | (234 | ) | | | (2,966 | ) | | | (120,560 | ) | | | (1,511,606 | ) | |
| Shares converted from Class B to Class A | | | 3,902 | | | | 55,684 | | | | (4,260 | ) | | | (55,684 | ) | | | — | | | | — | | |
| Dividends reinvested | | | 1,166 | | | | 15,652 | | | | — | | | | — | | | | — | | | | — | | |
| Net decrease | | | (101,704 | ) | | $ | (1,491,561 | ) | | | (4,438 | ) | | $ | (57,820 | ) | | | (110,626 | ) | | $ | (1,382,928 | ) | |
| | | Class Y | | Class P | | | |
| | Shares | | Amount | | Shares | | Amount | | | | | |
| Shares sold | | | 25,574 | | | $ | 342,820 | | | | 4,314,115 | | | $ | 60,400,048 | | | | | | |
| Shares repurchased | | | (269,745 | ) | | | (3,763,238 | ) | | | (6,013,602 | ) | | | (84,714,764 | ) | | | | | |
| Dividends reinvested | | | 959 | | | | 13,160 | | | | 58,453 | | | | 797,906 | | | | | | |
| Net decrease | | | (243,212 | ) | | $ | (3,407,258 | ) | | | (1,641,034 | ) | | $ | (23,516,810 | ) | | | | | |
PACE Small/Medium Co Growth Equity Investments
For the year ended July 31, 2011:
| | | Class A | | Class B | | Class C | |
| | Shares | | Amount | | Shares | | Amount | | Shares | | Amount | |
| Shares sold | | | 314,027 | | | $ | 4,764,920 | | | | — | | | $ | — | | | | 24,821 | | | $ | 350,495 | | |
| Shares repurchased | | | (462,972 | ) | | | (7,121,652 | ) | | | (7 | ) | | | (126 | ) | | | (36,073 | ) | | | (487,364 | ) | |
| Shares converted from Class B to Class A | | | 543 | | | | 8,424 | | | | (603 | ) | | | (8,424 | ) | | | — | | | | — | | |
| Net decrease | | | (148,402 | ) | | $ | (2,348,308 | ) | | | (610 | ) | | $ | (8,550 | ) | | | (11,252 | ) | | $ | (136,869 | ) | |
| | | Class Y | | Class P | | | |
| | Shares | | Amount | | Shares | | Amount | | | | | |
| Shares sold | | | 2,139 | | | $ | 32,122 | | | | 3,937,214 | | | $ | 62,571,970 | | | | | | |
| Shares repurchased | | | (1,399 | ) | | | (23,934 | ) | | | (6,096,566 | ) | | | (96,219,422 | ) | | | | | |
| Net increase (decrease) | | | 740 | | | $ | 8,188 | | | | (2,159,352 | ) | | $ | (33,647,452 | ) | | | | | |
For the year ended July 31, 2010:
| | | Class A | | Class B | | Class C | |
| | Shares | | Amount | | Shares | | Amount | | Shares | | Amount | |
| Shares sold | | | 372,728 | | | $ | 4,448,415 | | | | — | | | $ | — | | | | 5,911 | | | $ | 63,859 | | |
| Shares repurchased | | | (532,918 | ) | | | (6,433,244 | ) | | | (3,198 | ) | | | (34,983 | ) | | | (54,864 | ) | | | (602,918 | ) | |
| Shares converted from Class B to Class A | | | 2,174 | | | | 27,928 | | | | (2,395 | ) | | | (27,928 | ) | | | — | | | | — | | |
| Net decrease | | | (158,016 | ) | | $ | (1,956,901 | ) | | | (5,593 | ) | | $ | (62,911 | ) | | | (48,953 | ) | | $ | (539,059 | ) | |
| | | Class Y | | Class P | | | |
| | Shares | | Amount | | Shares | | Amount | | | | | |
| Shares sold | | | 23,604 | | | $ | 280,777 | | | | 4,970,247 | | | $ | 61,184,582 | | | | | | |
| Shares repurchased | | | (415,257 | ) | | | (5,102,238 | ) | | | (6,588,473 | ) | | | (81,694,977 | ) | | | | | |
| Net decrease | | | (391,653 | ) | | $ | (4,821,461 | ) | | | (1,618,226 | ) | | $ | (20,510,395 | ) | | | | | |
339
PACE Select Advisors Trust
Notes to financial statements
PACE International Equity Investments
For the year ended July 31, 2011:
| | | Class A | | Class B | | Class C | |
| | Shares | | Amount | | Shares | | Amount | | Shares | | Amount | |
| Shares sold | | | 364,568 | | | $ | 4,725,654 | | | | — | | | $ | — | | | | 4,235 | | | $ | 55,191 | | |
| Shares repurchased | | | (1,124,903 | ) | | | (14,576,281 | ) | | | (876 | ) | | | (10,940 | ) | | | (61,106 | ) | | | (774,473 | ) | |
| Shares converted from Class B to Class A | | | 739 | | | | 9,579 | | | | (736 | ) | | | (9,579 | ) | | | — | | | | — | | |
| Dividends reinvested | | | 83,851 | | | | 1,064,071 | | | | — | | | | — | | | | 2,571 | | | | 32,114 | | |
| Net decrease | | | (675,745 | ) | | $ | (8,776,977 | ) | | | (1,612 | ) | | $ | (20,519 | ) | | | (54,300 | ) | | $ | (687,168 | ) | |
| | | Class Y | | Class P | | | |
| | Shares | | Amount | | Shares | | Amount | | | | | |
| Shares sold | | | 27,582 | | | $ | 364,308 | | | | 11,927,604 | | | $ | 155,108,192 | | | | | | |
| Shares repurchased | | | (487,348 | ) | | | (6,360,275 | ) | | | (11,743,974 | ) | | | (151,687,751 | ) | | | | | |
| Dividends reinvested | | | 34,096 | | | | 431,995 | | | | 1,109,714 | | | | 14,037,877 | | | | | | |
| Net increase (decrease) | | | (425,670 | ) | | $ | (5,563,972 | ) | | | 1,293,344 | | | $ | 17,458,318 | | | | | | |
For the year ended July 31, 2010:
| | | Class A | | Class B | | Class C | |
| | Shares | | Amount | | Shares | | Amount | | Shares | | Amount | |
| Shares sold | | | 503,111 | | | $ | 6,154,751 | | | | — | | | $ | — | | | | 1,004 | | | $ | 14,453 | | |
| Shares repurchased | | | (1,050,216 | ) | | | (12,862,565 | ) | | | (2,628 | ) | | | (31,642 | ) | | | (54,910 | ) | | | (661,529 | ) | |
| Shares converted from Class B to Class A | | | 1,355 | | | | 16,554 | | | | (1,358 | ) | | | (16,554 | ) | | | — | | | | — | | |
| Dividends reinvested | | | 111,135 | | | | 1,369,177 | | | | 26 | | | | 324 | | | | 4,283 | | | | 51,910 | | |
| Net decrease | | | (434,615 | ) | | $ | (5,322,083 | ) | | | (3,960 | ) | | $ | (47,872 | ) | | | (49,623 | ) | | $ | (595,166 | ) | |
| | | Class Y | | Class P | | | |
| | Shares | | Amount | | Shares | | Amount | | | | | |
| Shares sold | | | 123,787 | | | $ | 1,550,206 | | | | 13,345,211 | | | $ | 162,250,576 | | | | | | |
| Shares repurchased | | | (1,010,798 | ) | | | (12,327,501 | ) | | | (13,418,026 | ) | | | (161,928,300 | ) | | | | | |
| Dividends reinvested | | | 65,958 | | | | 810,623 | | | | 1,296,971 | | | | 15,914,200 | | | | | | |
| Net increase (decrease) | | | (821,053 | ) | | $ | (9,966,672 | ) | | | 1,224,156 | | | $ | 16,236,476 | | | | | | |
PACE International Emerging Markets Equity Investments
For the year ended July 31, 2011:
| | | Class A | | Class B | | Class C | |
| | Shares | | Amount | | Shares | | Amount | | Shares | | Amount | |
| Shares sold | | | 432,002 | | | $ | 5,829,038 | | | | — | | | $ | — | | | | 13,242 | | | $ | 169,950 | | |
| Shares repurchased | | | (370,304 | ) | | | (5,052,285 | ) | | | (392 | ) | | | (5,136 | ) | | | (74,900 | ) | | | (957,439 | ) | |
| Shares converted from Class B to Class A | | | 1,021 | | | | 13,911 | | | | (1,087 | ) | | | (13,911 | ) | | | — | | | | — | | |
| Dividends reinvested | | | 10,985 | | | | 149,945 | | | | — | | | | — | | | | — | | | | — | | |
| Net increase (decrease) | | | 73,704 | | | $ | 940,609 | | | | (1,479 | ) | | $ | (19,047 | ) | | | (61,658 | ) | | $ | (787,489 | ) | |
| | | Class Y | | Class P | | | |
| | Shares | | Amount | | Shares | | Amount | | | | | |
| Shares sold | | | 112,481 | | | $ | 1,534,065 | | | | 4,268,386 | | | $ | 59,350,642 | | | | | | |
| Shares repurchased | | | (593,537 | ) | | | (8,188,910 | ) | | | (4,306,615 | ) | | | (59,201,070 | ) | | | | | |
| Dividends reinvested | | | 12,721 | | | | 176,698 | | | | 120,966 | | | | 1,674,175 | | | | | | |
| Net increase (decrease) | | | (468,335 | ) | | $ | (6,478,147 | ) | | | 82,737 | | | $ | 1,823,747 | | | | | | |
340
PACE Select Advisors Trust
Notes to financial statements
For the year ended July 31, 2010:
| | | Class A | | Class B | | Class C | |
| | Shares | | Amount | | Shares | | Amount | | Shares | | Amount | |
| Shares sold | | | 293,755 | | | $ | 3,411,311 | | | | 2,997 | | | $ | 32,222 | | | | 59,539 | | | $ | 620,009 | | |
| Shares repurchased | | | (435,195 | ) | | | (5,038,895 | ) | | | (2,946 | ) | | | (33,469 | ) | | | (95,114 | ) | | | (1,013,907 | ) | |
| Shares converted from Class B to Class A | | | 7,921 | | | | 89,017 | | | | (8,423 | ) | | | (89,017 | ) | | | — | | | | — | | |
| Dividends reinvested | | | 20,292 | | | | 234,169 | | | | — | | | | — | | | | 3,397 | | | | 36,756 | | |
| Net decrease | | | (113,227 | ) | | $ | (1,304,398 | ) | | | (8,372 | ) | | $ | (90,264 | ) | | | (32,178 | ) | | $ | (357,142 | ) | |
| | | Class Y | | Class P | | | |
| | Shares | | Amount | | Shares | | Amount | | | | | |
| Shares sold | | | 366,046 | | | $ | 4,338,509 | | | | 3,830,899 | | | $ | 45,173,569 | | | | | | |
| Shares repurchased | | | (1,745,193 | ) | | | (20,603,579 | ) | | | (4,891,148 | ) | | | (57,341,191 | ) | | | | | |
| Dividends reinvested | | | 46,841 | | | | 549,454 | | | | 251,595 | | | | 2,943,696 | | | | | | |
| Net decrease | | | (1,332,306 | ) | | $ | (15,715,616 | ) | | | (808,654 | ) | | $ | (9,223,926 | ) | | | | | |
PACE Global Real Estate Securities Investments
For the year ended July 31, 2011:
| | | Class A | | Class C | | | |
| | Shares | | Amount | | Shares | | Amount | | | | | |
| Shares sold | | | 181,474 | | | $ | 1,051,599 | | | | 4,228 | | | $ | 24,012 | | | | | | | | | | |
| Shares repurchased | | | (218,850 | ) | | | (1,275,191 | ) | | | (1,845 | ) | | | (11,092 | ) | | | | | |
| Dividends reinvested | | | 47,248 | | | | 256,556 | | | | 2,033 | | | | 11,040 | | | | | | |
| Net increase | | | 9,872 | | | $ | 32,964 | | | | 4,416 | | | $ | 23,960 | | | | | | |
| | | Class Y | | Class P | | | |
| | Shares | | Amount | | Shares | | Amount | | | | | |
| Shares sold | | | 12,459 | | | $ | 72,352 | | | | 5,149,263 | | | $ | 29,897,911 | | | | | | |
| Shares repurchased | | | (3,100 | ) | | | (18,283 | ) | | �� | (3,305,551 | ) | | | (19,199,030 | ) | | | | | |
| Dividends reinvested | | | 2,000 | | | | 10,900 | | | | 1,015,251 | | | | 5,512,810 | | | | | | |
| Net increase | | | 11,359 | | | $ | 64,969 | | | | 2,858,963 | | | $ | 16,211,691 | | | | | | |
For the year ended July 31, 2010:
| | | Class A | | Class C | | | |
| | Shares | | Amount | | Shares | | Amount | | | | | |
| Shares sold | | | 283,967 | | | $ | 1,491,573 | | | | 2,860 | | | $ | 14,196 | | | | | | | | | | |
| Shares repurchased | | | (254,559 | ) | | | (1,343,395 | ) | | | (1,174 | ) | | | (6,091 | ) | | | | | |
| Dividends reinvested | | | 52,970 | | | | 269,088 | | | | 2,443 | | | | 12,410 | | | | | | |
| Net increase | | | 82,378 | | | $ | 417,266 | | | | 4,129 | | | $ | 20,515 | | | | | | |
| | | Class Y | | Class P | | | |
| | Shares | | Amount | | Shares | | Amount | | | | | |
| Shares sold | | | 17,273 | | | $ | 93,233 | | | | 4,722,449 | | | $ | 24,935,558 | | | | | | |
| Shares repurchased | | | — | | | | — | | | | (2,835,106 | ) | | | (14,855,925 | ) | | | | | |
| Dividends reinvested | | | 869 | | | | 4,423 | | | | 1,120,076 | | | | 5,690,179 | | | | | | |
| Net increase | | | 18,142 | | | $ | 97,656 | | | | 3,007,419 | | | $ | 15,769,812 | | | | | | |
341
PACE Select Advisors Trust
Notes to financial statements
PACE Alternative Strategies Investments
For the year ended July 31, 2011:
| | | Class A | | Class C | | | |
| | Shares | | Amount | | Shares | | Amount | | | | | |
| Shares sold | | | 3,255,936 | | | $ | 30,672,672 | | | | 209,720 | | | $ | 1,928,515 | | | | | | | | | | |
| Shares repurchased | | | (2,675,217 | ) | | | (25,135,225 | ) | | | (269,638 | ) | | | (2,495,833 | ) | | | | | |
| Dividends reinvested | | | 58,309 | | | | 546,937 | | | | 1,959 | | | | 18,066 | | | | | | |
| Net increase (decrease) | | | 639,028 | | | $ | 6,084,384 | | | | (57,959 | ) | | $ | (549,252 | ) | | | | | |
| | | Class Y | | Class P | | | |
| | Shares | | Amount | | Shares | | Amount | | | | | |
| Shares sold | | | 28,635 | | | $ | 269,901 | | | | 17,084,492 | | | $ | 161,401,010 | | | | | | |
| Shares repurchased | | | (78,454 | ) | | | (734,955 | ) | | | (10,148,149 | ) | | | (95,676,428 | ) | | | | | |
| Dividends reinvested | | | 1,404 | | | | 13,223 | | | | 516,866 | | | | 4,858,539 | | | | | | |
| Net increase (decrease) | | | (48,415 | ) | | $ | (451,831 | ) | | | 7,453,209 | | | $ | 70,583,121 | | | | | | |
For the year ended July 31, 2010:
| | | Class A | | Class B | | Class C | |
| | Shares | | Amount | | Shares | | Amount | | Shares | | Amount | |
| Shares sold | | | 2,529,691 | | | $ | 23,129,053 | | | | — | | | $ | — | | | | 228,421 | | | $ | 2,039,743 | | |
| Shares repurchased | | | (3,794,681 | ) | | | (34,566,460 | ) | | | (3,392 | ) | | | (30,354 | ) | | | (220,007 | ) | | | (1,967,859 | ) | |
| Dividends reinvested | | | 18,849 | | | | 170,776 | | | | — | | | | — | | | | — | | | | — | | |
| Net increase (decrease) | | | (1,246,141 | ) | | $ | (11,266,631 | ) | | | (3,392 | ) | | $ | (30,354 | ) | | | 8,414 | | | $ | 71,884 | | |
| | | Class Y | | Class P | | | |
| | Shares | | Amount | | Shares | | Amount | | | | | |
| Shares sold | | | 313,777 | | | $ | 2,854,661 | | | | 13,022,405 | | | $ | 119,119,763 | | | | | | |
| Shares repurchased | | | (1,658,490 | ) | | | (15,104,028 | ) | | | (10,188,891 | ) | | | (92,956,694 | ) | | | | | |
| Dividends reinvested | | | 3,063 | | | | 27,810 | | | | 246,494 | | | | 2,238,223 | | | | | | |
| Net increase (decrease) | | | (1,341,650 | ) | | $ | (12,221,557 | ) | | | 3,080,008 | | | $ | 28,401,292 | | | | | | |
Redemption fees
Each class of each series of the Trust, with the exception of PACE Money Market Investments, will impose a 1% redemption fee on shares sold or exchanged within 90 days of their purchase date, subject to limited exemptions as noted in the prospectuses. This amount is paid to the applicable Portfolio. The redemption fees earned by the Portfolios are disclosed in the Statement of changes in net assets. For the year ended July 31, 2011, redemption fees represent less than $0.005 per share.
Federal tax status
Each of the Portfolios intends to distribute substantially all of its income and to comply with the other requirements of the Internal Revenue Code applicable to regulated investment companies. Accordingly, no provision for federal income taxes is required. In addition, by distributing during each calendar year substantially all of its net investment income, net realized capital gains and certain other amounts, if any, each Portfolio intends not to be subject to a federal excise tax.
342
PACE Select Advisors Trust
Notes to financial statements
The tax character of distributions paid during the fiscal years ended July 31, 2011 and July 31, 2010 were as follows:
| | | 2011 | | 2010 | |
| Portfolio | | Tax-exempt
income | | Ordinary
Income | | Long
term
realized
capital
gains | | Return of
capital | | Tax-exempt
income | | Ordinary
Income | | Long
term
realized
capital
gains | | Return of
capital | |
| PACE Money Market Investments | | $ | — | | | $ | 37,652 | | | $ | — | | | $ | — | | | $ | — | | | $ | 54,050 | | | $ | — | | | $ | — | | |
PACE Government Securities Fixed
Income Investments | | | — | | | | 41,351,427 | | | | 638,665 | | | | — | | | | — | | | | 36,810,388 | | | | 5,636,347 | | | | — | | |
PACE Intermediate Fixed Income
Investments | | | — | | | | 10,805,263 | | | | — | | | | — | | | | — | | | | 15,576,758 | | | | — | | | | — | | |
PACE Strategic Fixed Income
Investments | | | | | 47,433,092 | | | | 2,564,462 | | | | — | | | | — | | | | 30,831,986 | | | | 799,628 | | | | — | | |
PACE Municipal Fixed Income
Investments | | | 10,001,108 | | | | 7,444 | | | | — | | | | — | | | | 10,048,679 | | | | 10,260 | | | | — | | | | — | | |
PACE International Fixed Income
Investments | | | — | | | | 14,720,052 | | | | — | | | | — | | | | — | | | | 30,716,473 | | | | — | | | | 1,050,578 | | |
| PACE High Yield Investments | | | — | | | | 17,938,536 | | | | 1,377,543 | | | | — | | | | — | | | | 15,132,172 | | | | 1,293,344 | | | | |
PACE Large Co Value Equity
Investments | | | — | | | | 11,781,264 | | | | — | | | | — | | | | — | | | | 12,292,110 | | | | — | | | | — | | |
PACE Large Co Growth Equity
Investments | | | — | | | | 1,657,698 | | | | — | | | | — | | | | — | | | | 4,319,077 | | | | — | | | | — | | |
PACE Small/Medium Co Value
Equity Investments | | | — | | | | 147,333 | | | | — | | | | — | | | | — | | | | 848,966 | | | | — | | | | — | | |
PACE International Equity
Investments | | | — | | | | 16,288,751 | | | | — | | | | — | | | | — | | | | 18,770,499 | | | | — | | | | — | | |
PACE International Emerging
Markets Equity Investments | | | — | | | | 2,080,376 | | | | — | | | | — | | | | — | | | | 3,860,843 | | | | — | | | | — | | |
PACE Global Real Estate Securities
Investments | | | — | | | | 6,036,659 | | | | — | | | | — | | | | — | | | | 6,163,150 | | | | — | | | | — | | |
| PACE Alternative Strategies Investments | | | — | | | | 5,634,308 | | | | — | | | | — | | | | — | | | | 2,505,432 | | | | — | | | | — | | |
At July 31, 2011, the components of accumulated earnings (deficit) on a tax basis were as follows:
| Portfolio | | Undistributed
ordinary
income | | Undistributed
long-term
capital gains | | Accumulated
realized
capital and
other losses | | Unrealized
appreciation
(depreciation) | | Total | |
| PACE Money Market Investments | | $ | — | | | | — | | | | (753 | ) | | | — | | | $ | (753 | ) | |
| PACE Government Securities Fixed Income Investments | | | 2,284,476 | | | | 850,769 | | | | (2,677,946 | ) | | | 8,320,057 | | | | 8,777,356 | | |
| PACE Intermediate Fixed Income Investments | | | 415,703 | | | | — | | | | (13,395,229 | ) | | | 9,874,059 | | | | (3,105,467 | ) | |
| PACE Strategic Fixed Income Investments | | | 5,001,427 | | | | 5,612,430 | | | | (2,411,734 | ) | | | 31,356,086 | | | | 39,558,209 | | |
| PACE Municipal Fixed Income Investments | | | — | | | | — | | | | (2,304,884 | ) | | | 16,248,796 | | | | 13,943,912 | | |
| PACE International Fixed Income Investments | | | 16,878,505 | | | | — | | | | (18,427,768 | ) | | | 46,015,301 | | | | 44,466,038 | | |
| PACE High Yield Investments | | | — | | | | 362,496 | | | | (2,793 | ) | | | 14,863,654 | | | | 15,223,357 | | |
| PACE Large Co Value Equity Investments | | | 7,999,067 | | | | — | | | | (237,718,073 | ) | | | 57,935,514 | | | | (171,783,492 | ) | |
| PACE Large Co Growth Equity Investments | | | 2,434,116 | | | | — | | | | (145,245,252 | ) | | | 203,489,109 | | | | 60,677,973 | | |
| PACE Small/Medium Co Value Equity Investments | | | — | | | | — | | | | (38,360,368 | ) | | | 39,093,339 | | | | 732,971 | | |
343
PACE Select Advisors Trust
Notes to financial statements
| Portfolio | | Undistributed
ordinary
income | | Undistributed
long-term
capital gains | | Accumulated
realized
capital and
other losses | | Unrealized
appreciation
(depreciation) | | Total | |
| PACE Small/Medium Co Growth Equity Investments | | $ | — | | | $ | — | | | $ | (29,263,978 | ) | | $ | 92,330,627 | | | $ | 63,066,649 | | |
| PACE International Equity Investments | | | 16,895,667 | | | | — | | | | (257,272,050 | ) | | | 41,162,961 | | | | (199,213,422 | ) | |
| PACE International Emerging Markets Equity Investments | | | 2,533,088 | | | | 2,730,463 | | | | (462,361 | ) | | | 12,692,871 | | | | 17,494,061 | | |
| PACE Global Real Estate Securities Investments | | | 2,565,339 | | | | — | | | | (42,122,741 | ) | | | 9,940,624 | | | | (29,616,778 | ) | |
| PACE Alternative Strategies Investments | | | — | | | | | | (119,890,147 | ) | | | 6,753,252 | | | | (113,136,895 | ) | |
At July 31, 2011, the following Portfolios had net capital loss carryforwards available as reductions, to the extent provided in the regulations, of future net realized gains. These losses expire as follows:
| | | Expiration dates | | | |
| Portfolio | | July 31,
2012 | | July 31,
2013 | | July 31,
2014 | | July 31,
2015 | | July 31,
2016 | | July 31,
2017 | | July 31,
2018 | | July 31,
2019 | | Total | |
PACE Money Market
Investments | | $ | — | | | $ | — | | | $ | — | | | $ | — | | | $ | — | | | $ | — | | | $ | 94 | | | $ | 23 | | | $ | 117 | | |
PACE Intermediate
Fixed Income
Investments | | | 2,348,512 | | | | — | | | | 3,023,333 | | | | 1,958,404 | | | | — | | | | — | | | | 3,551,093 | | | | — | | | | 10,881,342 | | |
PACE Municipal Fixed
Income Investments | | | — | | | | — | | | | — | | | | — | | | | 794,627 | | | | — | | | | 1,510,257 | | | | — | | | | 2,304,884 | | |
PACE International
Fixed Income
Investments | | | — | | | | — | | | | — | | | | 1,422,528 | | | | 2,354,563 | | | | 765,140 | | | | 7,784,695 | | | | — | | | | 12,326,926 | | |
PACE Large Co
Value Equity
Investments | | | — | | | | — | | | | — | | | | — | | | | — | | | | 31,704,391 | | | | 206,013,682 | | | | — | | | | 237,718,073 | | |
PACE Large Co
Growth Equity
Investments | | | — | | | | — | | | | — | | | | — | | | | — | | | | — | | | | 145,245,252 | | | | — | | | | 145,245,252 | | |
PACE Small/Medium
Co Value Equity
Investments | | | — | | | | — | | | | — | | | | — | | | | — | | | | — | | | | 38,360,368 | | | | — | | | | 38,360,368 | | |
PACE Small/Medium
Co Growth
Equity Investments | | | — | | | | — | | | | — | | | | — | | | | — | | | | 5,318,367 | | | | 23,945,611 | | | | — | | | | 29,263,978 | | |
PACE International
Equity Investments | | | — | | | | — | | | | — | | | | — | | | | — | | | | 42,420,347 | | | | 214,851,703 | | | | — | | | | 257,272,050 | | |
PACE Global Real
Estate Securities
Investments | | | — | | | | — | | | | — | | | | — | | | | — | | | | 15,250,731 | | | | 26,828,947 | | | | — | | | | 42,079,678 | | |
PACE Alternative
Strategies
Investments | | | — | | | | — | | | | — | | | | — | | | | — | | | | 16,499,361 | | | | 88,910,660 | | | | | | | | 105,410,021 | | |
344
PACE Select Advisors Trust
Notes to financial statements
During the fiscal year, the following Portfolios utilized capital loss carryforwards to offset current year realized gains:
| Portfolio | | Capital loss
carryforwards
utilized | |
| PACE Intermediate Fixed Income Investments | | $ | 7,005,972 | | |
| PACE Municipal Fixed Income Investments | | | 1,132,447 | | |
| PACE International Fixed Income Investments | | | 4,917,847 | | |
| PACE Large Co Value Equity Investments | | | 107,166,808 | | |
| PACE Large Co Growth Equity Investments | | | 93,822,789 | | |
| PACE Small/Medium Co Value Equity Investments | | | 55,202,231 | | |
| PACE Small/Medium Co Growth Equity Investments | | | 61,234,181 | | |
| PACE International Equity Investments | | | 32,739,806 | | |
| PACE International Emerging Markets Equity Investments | | | 52,507,478 | | |
| PACE Global Real Estate Securities Investments | | | 1,265,997 | | |
| PACE Alternative Strategies Investments | | | 19,372,329 | | |
In accordance with US Treasury regulations, the following Portfolios have elected to defer realized capital losses and foreign currency losses arising after October 31, 2010. Such losses are treated for tax purposes as arising on August 1, 2011:
| Portfolio | | Capital
losses | | Foreign
currency
losses | |
| PACE Money Market Investments | | $ | (636 | ) | | | — | | |
| PACE Government Securities Fixed Income Investments | | | (2,677,946 | ) | | | — | | |
| PACE Intermediate Fixed Income Investments | | | (2,132,886 | ) | | | (121,512 | ) | |
| PACE International Fixed Income Investments | | | (86,234 | ) | | | — | | |
| PACE High Yield Investments | | | — | | | | (2,793 | ) | |
| PACE Global Real Estate Securities Investments | | | — | | | | (43,063 | ) | |
| PACE Alternative Strategies Investments | | | (441,785 | ) | | | (13,802,983 | ) | |
At July 31, 2011, the effect of permanent "book/tax" reclassifications resulted in increases and decreases to components of the Portfolios' net assets as follows:
| Portfolio | | Accumulated
net investment
income/( loss) | | Accumulated
net realized
gain/(loss) | | Beneficial
interest | |
| PACE Money Market Investments | | $ | — | | | $ | 129 | | | $ | (129 | ) | |
| PACE Government Securities Fixed Income Investments | | | 4,126,569 | | | | (4,126,569 | ) | | | — | | |
| PACE Intermediate Fixed Income Investments | | | 197,439 | | | | (197,439 | ) | | | — | | |
| PACE Strategic Fixed Income Investments | | | (4,014,759 | ) | | | 4,014,759 | | | | — | | |
| PACE Municipal Fixed Income Investments | | | 1,231 | | | | — | | | | (1,231 | ) | |
| PACE International Fixed Income Investments | | | 25,280,389 | | | | (25,280,389 | ) | | | — | | |
| PACE High Yield Investments | | | 3,292 | | | | (3,292 | ) | | | — | | |
| PACE Small/Medium Co Value Equity Investments | | | 386,473 | | | | 23,406 | | | | (409,879 | ) | |
| PACE Small/Medium Co Growth Equity Investments | | | 3,116,306 | | | | — | | | | (3,116,306 | ) | |
| PACE International Equity Investments | | | 3,266,413 | | | | (3,266,413 | ) | | | — | | |
| PACE International Emerging Markets Equity Investments | | | (681,997 | ) | | | 681,997 | | | | — | | |
| PACE Global Real Estate Securities Investments | | | 2,111,468 | | | | (2,111,468 | ) | | | — | | |
| PACE Alternative Strategies Investments | | | (8,582,121 | ) | | | 13,199,792 | | | | (4,617,671 | ) | |
345
PACE Select Advisors Trust
Notes to financial statements
These differences are primarily due to tax treatment of foreign currency and futures transactions, net operating losses, paydown gains and losses, distributions in excess of net investment income, disposition of PFIC investments, swap adjustments, REIT adjustments, tax character of distributions and adjustments for certain debt obligations.
As of and during the year ended July 31, 2011, the Portfolios did not have any liabilities for any uncertain tax positions. The Portfolios recognize interest and penalties, if any, related to uncertain tax positions as income tax expense in the Statements of operations. During the year ended July 31, 2011, the Portfolios did not incur any interest or penalties.
Each of the tax years in the four year period ended July 31, 2011, remains subject to examination by the Internal Revenue Service and state taxing authorities.
346
PACE Select Advisors Trust
Report of Ernst & Young LLP, independent registered public accounting firm
The Board of Trustees and Shareholders of
PACE Select Advisors Trust
We have audited the accompanying statements of assets and liabilities, including the portfolios of investments, of PACE Select Advisors Trust (formerly UBS PACE Select Advisors Trust) (comprising, respectively, PACE Money Market Investments, PACE Government Securities Fixed Income Investments, PACE Intermediate Fixed Income Investments, PACE Strategic Fixed Income Investments, PACE Municipal Fixed Income Investments, PACE International Fixed Income Investments (formerly UBS PACE Global Fixed Income Investments), PACE High Yield Investments, PACE Large Co Value Equity Investments, PACE Large Co Growth Equity Investments, PACE Small/Medium Co Value Equity Investments, PACE Small/Medium Co Growth Equity Investments, PACE International Equity Investments, PACE International Emerging Markets Equity Investments, PACE Global Real Estate Securities Investments and PACE Alternative Strategies Investments, collectively the "Trust") as of July 31, 2011, and the related statements of operations for the year then ended, the statements of changes in net assets for each of the two years in the period then ended, and the financial highlights for each of the periods indicated therein. These financial statements and financial highlights are the responsibility of the Trust's management. Our responsibility is to express an opinion on these financial statements and financial highlights based on our audits.
We conducted our audits in accordance with the standards of the Public Company Accounting Oversight Board (United States). Those standards require that we plan and perform the audit to obtain reasonable assurance about whether the financial statements and financial highlights are free of material misstatement. We were not engaged to perform an audit of the Trust's internal control over financial reporting. Our audits included consideration of internal control over financial reporting as a basis for designing audit procedures that are appropriate in the circumstances, but not for the purpose of expressing an opinion on the effectiveness of the Trust's internal control over financial reporting. Accordingly, we express no such opinion. An audit also includes examining, on a test basis, evidence supporting the amounts and disclosures in the financial statements and financial highlights, assessing the accounting principles used and significant estimates made by management, and evaluating the overall financial statement presentation. Our procedures included confirmation of securities owned as of July 31, 2011, by correspondence with the custodian and others, or by other appropriate auditing procedures where replies from others were not received. We believe that our audits provide a reasonable basis for our opinion.
In our opinion, the financial statements and financial highlights referred to above present fairly, in all material respects, the financial position of each of the respective series constituting PACE Select Advisors Trust at July 31, 2011, the results of their operations for the year then ended, the changes in their net assets for each of the two years in the period then ended, and the financial highlights for each of the indicated periods, in conformity with US generally accepted accounting principles.

New York, New York
September 29, 2011
347
PACE Select Advisors Trust
Tax information (unaudited)
We are required by subchapter M of the Internal Revenue Code of 1986, as amended, to advise you within 60 days of each Portfolio's fiscal year end (July 31, 2011) as to the federal tax status of distributions received by shareholders during such fiscal year. Accordingly, the percentage of dividends paid that qualify for the dividends received deduction for corporate shareholders and the amount of foreign tax credit to be passed through to shareholders are as follows:
| Portfolio | | Dividend
Received
Deduction | | Foreign
Tax
Credit | |
| PACE Large Co Value Equity Investments | | | 100 | % | | | — | | |
| PACE Large Co Growth Equity Investments | | | 100 | % | | | — | | |
| PACE Small/Medium Co Value Equity Investments | | | 98.28 | % | | | — | | |
| PACE International Equity Investments | | | — | | | $ | 1,188,804 | | |
| PACE International Emerging Markets Equity Investments | | | — | | | | 1,556,443 | | |
| PACE Global Real Estate Securities Investments | | | 0.04 | % | | | — | | |
| PACE Alternative Strategies Investments | | | 10.86 | % | | | — | | |
Also, for the fiscal year ended July 31, 2011, the foreign source income for information reporting purposes for PACE International Equity Investments and PACE International Emerging Markets Equity Investments is $31,191,629 and $9,076,120, respectively.
For the period ended July 31, 2011, certain dividends paid by the Portfolios below may be subject to a maximum tax rate of 15%, as provided for by the Jobs and Growth Tax Relief Reconciliation Act of 2003. Of the distributions paid during the period, the amounts below represent the maximum amount that may be considered qualified dividend income.
| Portfolio | | Maximum amount
considered qualified
dividend income | |
| PACE Large Co Value Equity Investments | | $ | 11,781,264 | | |
| PACE Large Co Growth Equity Investments | | | 1,657,698 | | |
| PACE Small/Medium Co Value Equity Investments | | | 147,333 | | |
| PACE International Equity Investments | | | 16,288,751 | | |
| PACE International Emerging Markets Equity Investments | | | 2,080,376 | | |
| PACE Global Real Estate Securities Investments | | | 6,036,659 | | |
| PACE Alternative Strategies Investments | | | 5,634,308 | | |
Dividends received by tax-exempt recipients (e.g., IRAs and Keoghs) need not be reported as taxable income. Some retirement trusts (e.g., corporate, Keogh and 403(b)(7) plans) may need this information for their annual information reporting.
Shareholders should not use the above information to prepare their tax returns. Since each Portfolio's fiscal year is not the calendar year, another notification will be sent with respect to calendar year 2011. Such notification, which will reflect the amount to be used by calendar year taxpayers on their federal income tax returns, will be made in conjunction with Form 1099 DIV and will be mailed in February 2012. Shareholders are advised to consult their own tax advisers with respect to the tax consequences of their investment in each of the Portfolios.
348
PACE Select Advisors Trust
General information (unaudited)
Monthly and quarterly portfolio holdings disclosure
Each Portfolio will file its complete schedule of portfolio holdings with the Securities and Exchange Commission ("SEC") for the first and third quarters of each fiscal year on Form N-Q. The Portfolios' Forms N-Q are available on the SEC's Web site at http://www.sec.gov. The Portfolios' Forms N-Q may be reviewed and copied at the SEC's Public Reference Room in Washington, D.C. Information on the operation of the SEC's Public Reference Room may be obtained by calling 1-800-SEC 0330. Additionally, you may obtain copies of Forms N-Q from the Portfolios upon request by calling 1-800-647 1568.
In addition, PACE Money Market Investments discloses, on a monthly basis: (a) a complete schedule of its portfolio holdings; and (b) information regarding its weighted average maturity and weighted average life on UBS's Web site at the following internet address: www.ubs.com/usmoneymarketfundsholdings. In addition, at this location, you will find a link to more detailed Fund information appearing in filings with the SEC on Form N-MFP.
Proxy voting policies, procedures and record
You may obtain a description of each Portfolio's (1) proxy voting policies, (2) proxy voting procedures and (3) information regarding how a Portfolio voted any proxies related to portfolio securities during the most recent 12-month period ended June 30 for which an SEC filing has been made, without charge, upon request by contacting a Portfolio directly at 1-800-647 1568, online on a Portfolio's Web site: www.ubs.com/ubsglobalam-proxy, or on the EDGAR Database on the SEC's Web site (http://www.sec.gov).
Other tax information
Pursuant to Section 871(k)(2)(C) of the Internal Revenue Code, PACE Money Market Investments designates 100% of its "qualified short-term gains" (as defined in Section 871(k)(2)(D)) related to the distribution made in December 2010 as short-term capital gain dividends.
349
PACE Select Advisors Trust
Board approvals of investment management and administration agreement and subadvisory agreements (unaudited)
February 2011 Board Meeting
William Blair & Company L.L.C.
Background—At a meeting of the board of PACE Select Advisors Trust (the "Trust") on February 15-16, 2011, the members of the board, including the trustees who are not "interested persons" of the Trust (the "Independent Trustees") as defined in the Investment Company Act of 1940, as amended, considered and approved the proposed sub-advisory agreement between UBS Global Asset Management (Americas) Inc. ("UBS Global AM") and William Blair & Company L.L.C. ("William Blair") (the "Sub-Advisory Agreement") with respect to PACE International Emerging Markets Equity Investments (the "Portfolio"). In considering the approval of the Sub-Advisory Agreement, the board was able to draw on its knowledge of the Trust, its portfolios and UBS Global AM. The board recognized its familiarity with UBS Global AM and the investment management and sub-advisory agreements for this and other portfolios of the Trust, including the extensive materials the board had previously reviewed in connection with the annual reconsideration of the contracts for the portfolios, and noted that it had previously received a memorandum from its independent legal counsel discussing, among other things, the duties of the board members in considering approval of management and sub-advisory agreements. The board also received a memorandum from UBS Global AM discussing UBS Global AM's reasons for recommending William Blair as a sub-advisor to the Portfolio.
In its consideration of the approval of the Sub-Advisory Agreement, the board considered the following factors:
Nature, extent and quality of the services under the Sub-Advisory Agreement—The board's evaluation of the services to be provided by William Blair to the Portfolio took into account the board's knowledge and familiarity gained as board members of funds in the UBS New York fund complex, including the Trust and its portfolios. The board considered management's reasons for recommending William Blair as an additional sub-advisor to the Portfolio, including its belief that William Blair's strategy focuses on securities of companies that are attractive complements to the companies that may be the primary investments covered by the strategies of the incumbent sub-advisors (excluding the sub-advisor proposed to be terminated at the same meeting). The board also received materials from William Blair detailing its investment philosophy and met with representatives of William Blair, who discussed with the board their investment philosophies and process and the backgrounds and qualifications of the portfolio management team. The board concluded that, overall, it was satisfied with the nature, extent and quality of services expected to be provided to the Portfolio under the proposed Sub-Advisory Agreement.
Sub-Advisory fee—The board reviewed and considered the proposed contractual sub-advisory fee to be payable by UBS Global AM to William Blair in light of the nature, extent and quality of the sub-advisory services anticipated to be provided by William Blair. The board noted that the proposed contractual sub-advisory fee was generally in line with the sub-advisory fees paid to the Portfolio's current sub-advisors. The board determined that the proposed sub-advisory fee was reasonable in light of the nature, extent and quality of the services proposed to be provided to the Portfolio under the Sub-Advisory Agreement.
Fund performance—The board received and considered composite performance information provided by William Blair. The board also noted that, as William Blair would be a new sub-advisor to the Portfolio, the current performance of the Portfolio was not a significant factor in the consideration of the approval of the Sub-Advisory Agreement.
Advisor profitability—Profitability of UBS Global AM or its affiliates in providing services to the Portfolio was not a significant factor considered by the board, as the sub-advisory fee would be paid by UBS Global AM out of the management fee paid to it by the Portfolio, and not by the Portfolio.
350
PACE Select Advisors Trust
Board approvals of investment management and administration agreement and subadvisory agreements (unaudited)
Economies of scale—The board noted that, as the sub-advisory fee for the Portfolio would be paid by UBS Global AM, not by the Portfolio, consideration of economies of scale with respect specifically to the sub-advisory fee was not relevant.
Other benefits to William Blair—The board was informed by management that William Blair's relationship with the Portfolio would be limited to its provision of sub-advisory services to the Portfolio and that therefore management believed that William Blair would not receive tangible ancillary benefits as a result of its relationship with the Portfolio, with the exception of possible benefits from soft dollars (e.g., research credits related to transaction commissions) for the Portfolio (which would also potentially benefit the Portfolio). The board recognized that William Blair could receive intangible benefits from its association with the Portfolio, such as increased name recognition or publicity from being selected as a sub-advisor to the Portfolio after an extensive review process. Similarly, the Portfolio could benefit from having a sub-advisor with an established or well-regarded reputation.
In light of all of the foregoing, the board approved the Sub-Advisory Agreement for the Portfolio.
No single factor reviewed by the board was identified by the board as the principal factor in determining whether to approve the Sub-Advisory Agreement. The Independent Trustees were advised by separate independent legal counsel throughout the process.
351
PACE Select Advisors Trust
Board approvals of investment management and administration agreement and subadvisory agreements (unaudited)
May 2011 Board Meeting
CBRE Clarion Securities, LLC
Background—At a meeting of the board of PACE Select Advisors Trust (the "Trust") on May 17-18, 2011, the members of the board, including the trustees who are not "interested persons" of the Trust as defined in the Investment Company Act of 1940, as amended, considered the reappointment of CBRE Clarion Securities, LLC ("Clarion") (formerly, ING Clarion Real Estate Securities, LLC ("ING CRES")) as a sub-advisor and approved the sub-advisory agreement between UBS Global Asset Management (Americas) Inc. ("UBS Global AM") and Clarion (the "Sub-Advisory Agreement") with respect to PACE Global Real Estate Securities Investments (the "Portfolio"). It was explained to the board that, upon the consummation of the anticipated acquisition of Clarion by CB Richard Ellis Group, Inc., a large real estate services company, the current sub-advisory agreement with ING CRES would automatically be terminated. In considering the approval of the Sub-Advisory Agreement, the board was able to draw on its knowledge of the Trust, its portfolios and UBS Global AM. The board recognized its familiarity with UBS Global AM and the investment management and sub-advisory agreements for this and other portfolios of the Trust, including the extensive materials the Board had previously reviewed in connection with the annual reconsideration of the contracts for the portfolios, and noted that it had previously received a memorandum from its independent legal counsel discussing, among other things, the duties of the board members in considering approval of management and sub-advisory agreements. The board also received a memorandum from UBS Global AM discussing UBS Global AM's reasons for recommending Clarion as a sub-advisor to the Portfolio.
In its consideration of the approval of the Sub-Advisory Agreement, the board considered the following factors:
Nature, extent and quality of the services under the Sub-Advisory Agreement—The board's evaluation of the services to be provided by Clarion to the Portfolio took into account the board's knowledge and familiarity gained as board members of funds in the UBS New York fund complex, including the Trust and its portfolios. The board considered management's reasons for recommending the reappointment of Clarion as a sub-advisor to the Portfolio, including that it currently manages a portion of the Portfolio's assets and was expected to continue to manage those assets in a materially similar manner. UBS Global AM expressed that Clarion did not expect any changes to relevant personnel as a result of the acquisition. The board also received materials from Clarion detailing the sub-advisor's investment philosophy and met with representatives of Clarion, who discussed with the board their investment philosophies and process, as well as the implications of the acquisition. The board concluded that, overall, it was satisfied with the nature, extent and quality of services expected to be provided to the Portfolio under the proposed Sub-Advisory Agreement.
Sub-Advisory fee—The board reviewed and considered the proposed contractual sub-advisory fee to be payable by UBS Global AM to Clarion in light of the nature, extent and quality of the sub-advisory services anticipated to be provided by Clarion. The board noted that Clarion has agreed to the same fee schedule as that currently in place, and that the proposed contractual sub-advisory fee was generally in line with the sub-advisory fee paid to the Portfolio's other current sub-advisor. The board determined that the proposed sub-advisory fee was reasonable in light of the nature, extent and quality of the services proposed to be provided to the Portfolio under the Sub-Advisory Agreement.
Fund performance—The board received and considered performance information provided by Clarion. The board also noted that UBS Global AM expects that the investment team will continue to perform at its current level after the transaction. The board concluded that, overall, it was satisfied with the performance of the Portfolio.
352
PACE Select Advisors Trust
Board approvals of investment management and administration agreement and subadvisory agreements (unaudited)
Advisor profitability—Profitability of UBS Global AM or its affiliates in providing services to the Portfolio was not a significant factor considered by the board, as the sub-advisory fee would be paid by UBS Global AM out of the management fee paid to it by the Portfolio, and not by the Portfolio.
Economies of scale—The board noted that, as the sub-advisory fee for the Portfolio would be paid by UBS Global AM, not by the Portfolio, consideration of economies of scale with respect specifically to the sub-advisory fee was not relevant.
Other benefits to Clarion—The board was informed by management that Clarion's relationship with the Portfolio would be limited to its provision of sub-advisory services to the Portfolio and that therefore management believed that Clarion would not receive tangible ancillary benefits as a result of its relationship with the Portfolio, with the exception of possible benefits from soft dollars (e.g., research credits related to transaction commissions) for the Portfolio (which would also potentially benefit the Portfolio). The board recognized that Clarion could receive intangible benefits from its association with the Portfolio, such as increased name recognition or publicity from being selected as a sub-advisor to the Portfolio after an extensive review process. Similarly, the Portfolio could benefit from having a sub-advisor with an established or well-regarded reputation.
In light of all of the foregoing, the board approved the Sub-Advisory Agreement for the Portfolio.
No single factor reviewed by the board was identified by the board as the principal factor in determining whether to approve the Sub-Advisory Agreement. The Independent Trustees were advised by separate independent legal counsel throughout the process.
353
PACE Select Advisors Trust
Board approvals of investment management and administration agreement and subadvisory agreements (unaudited)
July 6, 2011 Board Meeting
Mondrian Investment Partners Limited
Background—At a special meeting of the board of PACE Select Advisors Trust (the "Trust") held by telephone conference call on July 6, 2011, the members of the board, including the trustees who are not "interested persons" of the Trust (the "Independent Trustees") as defined in the Investment Company Act of 1940, as amended, considered and approved interim sub-advisory agreements between UBS Global Asset Management (Americas) Inc. ("UBS Global AM") and Mondrian Investment Partners Limited ("Mondrian") (each an "Interim Sub-Advisory Agreement") with respect to each of PACE International Equity Investments and PACE International Emerging Markets Equity Investments (each a "Portfolio" and together the "Portfolios"). For each Portfolio, it was necessary for the board to consider an Interim Sub-Advisory Agreement with Mondrian, a sub-advisor to the Portfolio, as a result of an anticipated change of control of Mondrian, that was expected to be consummated prior to the next in-person board meeting; the upcoming change of control would amount to an "assignment" of each current sub-advisory agreement and result in the termination of the sub-advisory agreement in accordance with its terms. The board was advised that the change of control of Mondrian was not expected to result in any personnel or strategy change that is likely to affect the Portfolios. The terms of each Interim Sub-Advisory agreement were substantially the same as the terms of each current sub-advisory agreement with Mondrian, except that: (i) the duration of the Interim Sub-Advisory Agreement was no more than 150 days from the date on which the current sub-advisory agreement terminated; (ii) the board (and shareholders) would be permitted to terminate the Interim Sub-Advisory Agreement on no more than 10 days' written notice to Mondrian; and (iii) Mondrian was not entitled to receive compensation from UBS Global AM under the Interim Sub-Advisory agreement for as long as it was in effect.The benefits of Mondrian's fee waiver would flow through UBS Global AM to each portfolio (UBS Global AM, in turn, agreed to pass through to each Portfolio, the benefits of the Mondrian fee waivers.) It was noted to the board that the superseding Sub-Advisory agreements between UBS Global AM and Mondrian would be considered later in the month in connection with the annual reconsideration of contracts. In considering the approval of each Interim Sub-Advisory Agreement, the board was able to draw on its knowledge of the Trust, its portfolios and UBS Global AM. The board recognized its familiarity with UBS Global AM, the portfolio management team and management record of Mondrian, and the investment management and sub-advisory agreements for this and other portfolios of the Trust, including the extensive materials the board had reviewed in connection with the prior annual reconsideration of the contracts for the portfolios, and noted that it had received a memorandum from its independent legal counsel discussing, among other things, the duties of the board members in considering approval of management and sub-advisory agreements. The board also received a memorandum discussing UBS Global AM's reasons for recommending Mondrian as a sub-advisor to the Portfolios.
In its consideration of the approval of each Sub-Advisory Agreement, the board considered the following factors:
Nature, extent and quality of the services under the Interim Sub-Advisory Agreement—The board's evaluation of the services to be provided by Mondrian to each Portfolio took into account the board's knowledge and familiarity gained as board members of funds in the UBS New York fund complex, including the Trust and its portfolios. The board received and considered information regarding the nature, extent and quality of services provided to the Portfolio by Mondrian during the past year. The board concluded that, overall, it was satisfied with the nature, extent and quality of services expected to be provided to each Portfolio under the proposed Interim Sub-Advisory Agreements.
Sub-Advisory fee—The board reviewed and considered the proposed contractual sub-advisory fee to be payable by UBS Global AM to Mondrian in light of the nature, extent and quality of the sub-advisory services anticipated to be provided by Mondrian. The board noted that the proposed contractual sub-advisory fee was generally in line
354
PACE Select Advisors Trust
Board approvals of investment management and administration agreement and subadvisory agreements (unaudited)
with the sub-advisory fees paid to the Portfolio's other current sub-advisors. It was also noted that Mondrian had agreed to waive the entirety of its sub-advisory fees under the Interim Sub-Advisory Agreements until superseding sub-advisory agreements could be considered at an in-person board meeting to be held later in the month. The board determined that the proposed sub-advisory fee was reasonable in light of the nature, extent and quality of the services proposed to be provided to each Portfolio under its Interim Sub-Advisory Agreement.
Fund performance—The board considered Mondrian's historical performance as a sub-advisor. The board concluded that, overall, it was satisfied with Mondrian's performance. The Board also recognized that it would be reconsidering each Portfolio's relationship with Mondrian at another meeting late in the month at which additional detailed performance information would be reviewed.
Advisor profitability—Profitability of UBS Global AM or its affiliates in providing services to the Portfolio was not a significant factor considered by the board, as the sub-advisory fee was being waived, which waiver was being passed through to the benefit of each Portfolio.
Economies of scale—The board noted that, as the sub-advisory fee was being waived, consideration of economies of scale was not relevant.
Other benefits to Mondrian—The board was informed by management that Mondrian's relationship with each Portfolio would be limited to its provision of sub-advisory services to the Portfolio and that therefore management believed that Mondrian would not receive tangible ancillary benefits as a result of its relationship with the Portfolio, with the exception of possible benefits from soft dollars (e.g., research credits related to transaction commissions) for the Portfolio (which would also potentially benefit the Portfolio). The board recognized that Mondrian could receive intangible benefits from its association with the Portfolio, such as increased name recognition or publicity from being selected as a sub-advisor to the Portfolio after an extensive review process. Similarly, the Portfolio could benefit from having a sub-advisor with an established or well-regarded reputation.
In light of all of the foregoing, the board approved the Interim Sub-Advisory Agreement for each Portfolio.
No single factor reviewed by the board was identified by the board as the principal factor in determining whether to approve the Interim Sub-Advisory Agreement for each Portfolio. The Independent Trustees were advised by separate independent legal counsel throughout the process.
355
PACE Select Advisors Trust
Board approvals of investment management and administration agreement and subadvisory agreements (unaudited)
July 19-20, 2011 Board Meeting
All Portfolios
Background—At a meeting of the board of PACE Select Advisors Trust (the "Trust") on July 19-20, 2011, the members of the board, including the trustees who are not "interested persons" of the Trust ("Independent Trustees"), as defined in the Investment Company Act of 1940, as amended, considered and approved the continuance of the investment management and administration agreement (the "Investment Management and Administration Agreement") between UBS Global Asset Management (Americas) Inc. ("UBS Global AM") and the Trust, on behalf of each series of the Trust (each a "Portfolio" and together the "Portfolios") and, for those Portfolios with sub-advisors, the sub-advisory agreements for the Portfolios, except that with respect to Mondrian Investment Partners Limited ("Mondrian"), new sub-advisory agreements were approved; the new Mondrian agreements were substantially the same as the sub-advisory agreements that had been in place for most of the prior year and which had been replaced by Interim Sub-Advisory Agreements earlier in July to address the automatic termination of prior sub-advisory agreements because of a change in control of the sub-advisor. (Throughout this discussion, each sub-advisor to a Portfolio is referred to as a "Sub-Advisor" and each sub-advisory agreement is referred to as a "Sub-Advisory Agreement.") In preparing for the meeting, the board members had requested and received extensive information from UBS Global AM to assist them, including information about the Portfolios' Sub-Advisors, as well as the management, sub-advisory, administrative and distribution arrangements for the Portfolios. The Independent Trustees discussed the materials initially provided by management prior to the scheduled board meeting. The Independent Trustees also met in executive session after management's presentation was completed to review the disclosure that had been made to them at the meeting. At all of these sessions the Independent Trustees were joined by their independent legal counsel. The Independent Trustees also received a memorandum from their independent legal counsel discussing the duties of board members in considering approval of management, sub-advisory, administration and distribution agreements.
In its consideration of the approval of the Investment Management and Administration Agreement and the Sub-Advisory Agreements, the board considered the following factors:
Nature, extent and quality of the services under the Investment Management and Administration Agreement and the Sub-Advisory Agreements—The board received and considered information regarding the nature, extent and quality of management services provided to the Portfolios by UBS Global AM and, for those Portfolios with sub-advisor(s), sub-advisory services provided by the particular Sub-Advisor during the past year. The board also considered the nature, extent and quality of administrative, distribution, and shareholder services performed by UBS Global AM and its affiliates for the Portfolios and the resources devoted to, and the record of compliance with, each Portfolio's compliance policies and procedures. The board noted that it received information at regular meetings throughout the year regarding the services rendered by UBS Global AM concerning the management of each Portfolio's affairs and UBS Global AM's role in coordinating providers of other services to the Portfolios. The board noted the complexity of this process for the Portfolios, given their broad range of investment strategies. The board noted that UBS Global AM provided extensive oversight of the Sub-Advisors for the Portfolios and reported to the board at each regular meeting on the Sub-Advisors' performance and made recommendations with respect to Sub-Advisor changes from time to time based on the performance of the Sub-Advisors and other relevant factors. The board's evaluation of the services provided by UBS Global AM and the Sub-Advisors took into account the board's knowledge and familiarity gained as board members of funds in the UBS New York fund complex, including the scope and quality of UBS Global AM's investment management and other capabilities and the quality of its administrative and other services. The board observed that the scope of services provided by UBS Global AM had expanded over time as a result of regulatory and other developments, including maintaining and monitoring its own and the Portfolios' expanded compliance programs. It also was noted that the Investment Management and Administration Agreement under consideration had been approved by shareholders at a special meeting of shareholders held in 2008.
356
PACE Select Advisors Trust
Board approvals of investment management and administration agreement and subadvisory agreements (unaudited)
The board had available to it the qualifications, backgrounds and responsibilities of the senior personnel at UBS Global AM responsible for the Portfolios and had previously received information regarding the person, persons or portfolio management team primarily responsible for the day-to-day portfolio management of each Portfolio and recognized that the Portfolios' senior personnel at UBS Global AM report to the board regularly and that at each regular meeting the board receives a detailed report on each Portfolio's performance and receives more extensive information periodically from each Sub-Advisor. The board also considered, based on its knowledge of UBS Global AM and its affiliates, the financial resources available to UBS Global AM and its parent organization, UBS AG. In that regard, the board received extensive financial information regarding UBS Global AM and noted that it was a wholly owned, indirect subsidiary of one of the largest financial services firms in the world. It was also noted that UBS Global AM had approximately $152 billion in assets under management as of March 31, 2011 and was part of the UBS Global Asset Management Division, which had approximately $621 billion in assets under management worldwide as of March 31, 2011. The board was also cognizant of, and considered, the regulatory and litigation actions and investigations occurring in the past few years involving UBS AG, UBS Global AM and certain of their affiliates.
The board concluded that, overall, it was satisfied with the nature, extent and quality of services provided (and expected to be provided) to the Portfolios under the Investment Management and Administration Agreement as well as under the Sub-Advisory Agreements.
Management and sub-advisory fees and expense ratios—For each Portfolio, the board reviewed and considered the contractual management fee (the "Contractual Management Fee") payable by the Portfolio to UBS Global AM in light of the nature, extent and quality of the advisory and administrative services provided by UBS Global AM. The board also reviewed and considered the fee waiver and/or expense reimbursement arrangements for the Portfolio (if any) and considered the actual fee rate (after taking any waivers and reimbursements into account) (the "Actual Management Fee"). The board considered whether UBS Global AM had entered into one or more fee waiver and/or expense reimbursement agreements with a Portfolio under which UBS Global AM was contractually obligated to waive its management fees and/or reimburse the Portfolio so that the total ordinary operating expenses of certain or all classes of a given Portfolio through November 28, 2011 (excluding dividend expense, borrowing costs, and interest expense relating to short sales, and interest, taxes, brokerage commissions and extraordinary expenses) would not exceed specified limits for each class (or, with respect to certain Portfolios, an agreement to waive a portion of its management fee). The board also considered that each Portfolio with such a fee waiver/reimbursement agreement had agreed to repay UBS Global AM for those waived fees and/or reimbursed expenses if the Portfolio can do so over the following three fiscal years without causing its expenses in any of those years to exceed the expense caps. Additionally, the board received and considered information comparing each Portfolio's Contractual Management Fee, Actual Management Fee and overall expenses with those of funds in a group of funds selected and provided by Lipper, Inc. ("Lipper"), an independent provider of investment company data (the "Expense Group"), and, when appropriate, the board also received additional comparative data provided by Lipper on a supplemental expense group of sub-advised peers (which may include certain of the sub-advised peers contained within the primary Expense Group) (the "Supplemental Expense Group"). The board also noted that it had received supplemental information relating to net and gross fund yields and certain expense information for UBS money market funds, including PACE Money Market Investments, as compared to peers in the respective Expense Group. A discussion of the board's considerations with respect to each Portfolio's fees is set forth below.
In connection with its consideration of each Portfolio's management fees, the board also received information on UBS Global AM's standard institutional account fees for accounts of a similar investment type to each of the Portfolios. The board noted management's explanation that comparisons with such accounts may be of limited relevance given the different structures and regulatory requirements of mutual funds versus such accounts and the differences in the levels of services required by mutual funds and such accounts. The board also received information on fees charged to other mutual funds managed by UBS Global AM. The board did not receive
357
PACE Select Advisors Trust
Board approvals of investment management and administration agreement and subadvisory agreements (unaudited)
comparative information from Lipper with respect to the sub-advisory fees for those Portfolios with sub-advisors in connection with its consideration of sub-advisory fees. The board observed that it had received certain information regarding fees, profitability, compensation from other similar funds, and economies of scale from certain Sub-Advisors as part of the summary of each Sub-Advisor's responses to requests for due diligence materials in connection with the board's annual reconsideration of the Sub-Advisory Agreements; however, the board also observed that the compensation paid to a Sub-Advisor is paid by UBS Global AM, not by the particular Portfolio and, accordingly, that the retention of a Sub-Advisor generally does not increase the fees otherwise incurred by a Portfolio's shareholders (unless a management fee waiver level was affected by a sub-advisory fee change or a reallocation of assets).
Portfolio performance—For each Portfolio, the board received and considered (a) annualized total return information of the Portfolio compared to other funds (the "Performance Universe") selected by Lipper over the one-, three-, five-, ten-year (or shorter for newer Portfolios) and since inception periods ended April 30, 2011, and (b) annualized performance information for each year in the ten-year (or shorter) period ended April 30, 2011. The board was provided with a description of the methodology Lipper used to determine the similarity of a Portfolio with the funds included in its Performance Universe. The board also received updated supplemental data showing each Portfolio's performance through June 30, 2011. The board also considered UBS Global AM's statement that while management believed that the Lipper peer groups were useful in evaluating Portfolio expenses relative to peers, they were less useful in evaluating performance, as in many cases they were broad-based and consisted of funds that did not necessarily have similar investment parameters to the applicable Portfolio. The board also noted that it had received information throughout the year at periodic intervals with respect to each Portfolio's performance, in most cases with respect to certain benchmark indices, including with respect to each Sub-Advisor's performance. Further discussion of the board's considerations with respect to each Portfolio's performance is set forth below.
Advisor profitability—The board received and considered a profitability analysis of UBS Global AM and its affiliates in providing services to each Portfolio. The board also received profitability information with respect to the UBS New York fund complex as a whole. UBS Global AM's profitability was considered not excessive in light of the nature, extent and quality of the services provided to the Portfolios. To the extent provided by a Sub-Advisor, the board also reviewed information with respect to the Sub-Advisor's profitability in providing services to a Portfolio. The board did not consider such Sub-Advisor profitability information highly relevant as the sub-advisory fees are paid by UBS Global AM, not by the relevant Portfolio.
Economies of scale—The board received and considered information from management regarding whether UBS Global AM realized economies of scale as the Portfolios' assets grew, whether the Portfolios have appropriately benefited from any economies of scale, and whether there is potential for realization of any further economies of scale for the Portfolios. The board considered whether economies of scale in the provision of services to the Portfolios were being passed along to the shareholders. The board noted that each Portfolio's Contractual Management Fee contained breakpoints, with the exception of PACE Money Markets Investments. The board also noted that as of March 31, 2011, with the exception of PACE Small/Medium Co Growth Equity Investments, PACE Small/Medium Co Value Equity Investments, PACE International Emerging Markets Equity Investments, PACE Global Real Estate Securities Investments and PACE High Yield Investments, for those Portfolios having breakpoints, each Portfolio's asset level exceeded at least its first breakpoint. Accordingly, the board determined that actual economies of scale existed for those Portfolios whose assets had reached the first breakpoint level and potential economies of scale existed for those Portfolios whose assets had not yet reached their first breakpoint level. The board also noted that to the extent a Portfolio's assets have increased over time, it has realized other economies of scale as certain expenses, such as fees for Trustees, auditor and legal fees and printing and postage, become a smaller percentage of overall assets. The board also took note of the relationship between any breakpoints in a sub-advisory fee and the breakpoints in fees paid by the Portfolios to UBS Global AM.
358
PACE Select Advisors Trust
Board approvals of investment management and administration agreement and subadvisory agreements (unaudited)
Generally, in light of UBS Global AM's profitability data, the Actual Management Fee, the Contractual Management Fee and the breakpoints currently in place for the Portfolios, the board believed that UBS Global AM's sharing of potential and current economies of scale with the Portfolios was acceptable.
Other benefits to UBS Global AM and the Sub-Advisors—The board was informed by management that the Sub-Advisors' relationships with the sub-advised Portfolios were limited to their provision of sub-advisory services to these Portfolios, and that therefore, management believed that the Sub-Advisors and their affiliates did not receive tangible ancillary benefits as a result of the Sub-Advisors' relationships with the sub-advised Portfolios, with the exception of possible benefits from soft dollars (e.g., research credits related to transaction commissions) for the equity Portfolios (which would also potentially benefit such Portfolios) and possible limited benefits to certain affiliates of a Sub-Advisor, such as broker-dealers (e.g., an affiliate's execution of portfolio transactions subject to detailed restrictions in SEC rules and board oversight procedures). The board recognized that certain Sub-Advisors could receive intangible benefits from their association with the Trust, such as increased name recognition or publicity from being selected as Sub-Advisors to the Trust after an extensive review process. Similarly, a Portfolio could benefit from having a Sub-Advisor with an established or well-regarded reputation. In light of the costs of providing investment management, administrative and other services to the Portfolios and UBS Global AM's ongoing commitment to the Portfolios, the profits and other ancillary benefits that UBS Global AM and its affiliates received were considered reasonable.
In the discussions that follow, reference is made to "quintile" placement in Lipper expense group and performance universe categories. With respect to expenses, the first quintile represents that 20% of the funds in the Expense Group with the lowest fees or expenses, as applicable, and the fifth quintile represents that 20% of the funds in the Expense Group with the highest fees or expenses, as applicable. With respect to performance, the first quintile represents that 20% of the funds in the Performance Universe with the best relative performance, and the fifth quintile represents that 20% of the funds in the Performance Universe with the worst relative performance. Lipper quintile placement information is calculated on a share class basis. References to quintile placement appearing below relate to Class A shares, and the board had information relevant to other share classes (e.g., Class P shares) during its considerations.
PACE Large Co Growth Equity Investments
In approving the Investment Management and Administration Agreement and the Sub-Advisory Agreements with each of Delaware Management Company, Wellington Management Company, LLP, Marsico Capital Management, LLC and Roxbury Capital Management LLC, the board, including the Independent Trustees, also considered the following factors:
Portfolio performance—The comparative Lipper information showed that the Portfolio's performance was in the second quintile for the one- and three-year periods, in the third quintile for the five-year period and in the fourth quintile for the ten-year period and since inception. Management noted the Portfolio's strong performance relative to its Performance Universe over the recent period.
Management and sub-advisory fees and expense ratios—The comparative Lipper information showed that the Portfolio's Contractual Management Fee and Actual Management Fee were in the fourth quintile and its total expenses were in the second quintile in the Portfolio's Expense Group for the comparison periods utilized in the Lipper report. Management noted that in addition to total expenses being below the median, only three other funds in the Supplemental Expense Group, consisting of eleven sub-advised funds, had lower total expenses for the period.
359
PACE Select Advisors Trust
Board approvals of investment management and administration agreement and subadvisory agreements (unaudited)
PACE Large Co Value Equity Investments
In approving the Investment Management and Administration Agreement and the Sub-Advisory Agreements with each of Pzena Investment Management, LLC, Westwood Management Corp. and Institutional Capital LLC, the board, including the Independent Trustees, also considered the following factors:
Portfolio performance—The comparative Lipper information showed that the Portfolio's performance was in the third quintile for the one-year period and in the second quintile for the three-, five- and ten-year periods and since inception. Management noted the Portfolio's consistent relative performance within its Large Cap Value classification.
Management and sub-advisory fees and expense ratios—The comparative Lipper information showed that the Portfolio's Contractual Management Fee and total expenses were in the third quintile and its Actual Management Fee was in the fourth quintile. Management noted that the Portfolio's total expenses were less than one basis point above the peer group median. It was also noted that the Portfolio's total expenses were below the median of the Supplemental Expense Group Management also discussed tactical adjustments to sub-advisor weightings in response to changes in market conditions and its perception of the ability of a Sub-Advisor to effectively implement its strategy in such conditions.
PACE Small/Medium Co Growth Equity Investments
In approving the Investment Management and Administration Agreement and the Sub-Advisory Agreements with each of Copper Rock Capital Partners, LLC, Palisade Capital Management, L.L.C. and Riverbridge Partners, LLC, the board, including the Independent Trustees, also considered the following factors:
Portfolio performance—The comparative Lipper information showed that the Portfolio's performance was in the third quintile for the one-, three- and ten-year periods, in the second quintile for the five-year period and in the fourth quintile since inception.
Management and sub-advisory fees and expense ratios—The comparative Lipper information showed that the Portfolio's Contractual Management Fee and Actual Management Fee were in the third quintile and its total expenses were in the first quintile.
PACE Small/Medium Co Value Equity Investments
In approving the Investment Management and Administration Agreement and the Sub-Advisory Agreements with each of Buckhead Capital Management, LLC, Metropolitan West Capital Management, LLC and Systematic Financial Management, L.P., the board, including the Independent Trustees, also considered the following factors:
Portfolio performance—The comparative Lipper information showed that the Portfolio's performance was in the fifth quintile for the one-year period, in the third quintile for the three- and five-year periods and since inception and in the fourth quintile for the ten-year period. Management noted that the Portfolio had strong absolute performance for the one-year period, although it underperformed relative to the median.
Management and sub-advisory fees and expense ratios—The comparative Lipper information showed that the Portfolio's Contractual Management Fee was in the second quintile, its Actual Management Fee was in the third quintile and its total expenses were in the first quintile in the Portfolio's Expense Group for the comparison periods utilized in the Lipper report.
360
PACE Select Advisors Trust
Board approvals of investment management and administration agreement and subadvisory agreements (unaudited)
PACE International Equity Investments
In approving the Investment Management and Administration Agreement and the Sub-Advisory Agreements with each of Martin Currie Inc., Mondrian Investment Partners Limited and J.P. Morgan Investment Management Inc., the board, including the Independent Trustees, also considered the following factors:
Portfolio performance—The comparative Lipper information showed that the Portfolio's performance was in the fifth quintile for the one-year period and in the fourth quintile for the three-, five- and ten-year periods and since inception. Management noted that, although the Portfolio underperformed on a relative basis compared to its peer group, it had strong absolute performance for the one-year period, and explained why it expects performance to improve.
Management and sub-advisory fees and expense ratios—The comparative Lipper information showed that the Portfolio's Contractual Management Fee was in the fourth quintile, its Actual Management Fee was in the fifth quintile and its total expenses were in the third quintile in the Portfolio's Expense Group for the comparison periods utilized in the Lipper report. Management noted that, compared to the Supplemental Expense Group, consisting of sub-advised funds, the Portfolio's Contractual Management Fee and Actual Management Fee were in line with the median, while its total expenses were below the median.
PACE International Emerging Markets Equity Investments
In approving the Investment Management and Administration Agreement and the Sub-Advisory Agreements with each of Mondrian Investment Partners Limited, Pzena Investment Management, LLC, Delaware Management Company and William Blair & Company L.L.C., the board, including the Independent Trustees, also considered the following factors:
Portfolio performance—The comparative Lipper information showed that the Portfolio's performance was in the third quintile for the one- and five-year periods, in the fourth quintile for the three-year period and in the fifth quintile for the ten-year period and since inception. Management noted that, although the Portfolio ranked in the third quintile for the one-year period, it had strong absolute performance.
Management and sub-advisory fees and expense ratios—The comparative Lipper information showed that the Portfolio's Contractual Management Fee and Actual Management Fee were in the third quintile and its total expenses were in the fourth quintile in the Portfolio's Expense Group for the comparison periods utilized in the Lipper report. Management noted that the Portfolio's Contractual Management Fee and Actual Management Fee were in line with the median, and that its total expenses were above the median partly due to slightly higher custodian fees and other non-management expenses versus the median. It was noted that custodian fees in emerging markets countries can vary significantly; therefore, the custodian fees at the Portfolio level are largely a function of actual countries invested in by the Portfolio relative to peers during the measurement period.
PACE Alternative Strategies Investments
In approving the Investment Management and Administration Agreement and the Sub-Advisory Agreements with each of Analytic Investors, LLC, Goldman Sachs Asset Management, L.P., First Quadrant L.P., Wellington Management Company, LLP and Standard Life Investments (Corporate Funds) Limited, the board, including the Independent Trustees, also considered the following factors:
Portfolio performance—The comparative Lipper information showed that the Portfolio's performance was in the fifth quintile for the one-, three- and five-year periods and since inception. Management noted the Portfolio's considerably lower volatility profile compared to its stated peer group. Management discussed with the board its
361
PACE Select Advisors Trust
Board approvals of investment management and administration agreement and subadvisory agreements (unaudited)
belief that the Lipper peer group classification does not accurately reflect the complex strategies employed by the Portfolio and that while newly developed Lipper classifications might provide improved points of comparison, currently they include only a small sampling of other funds. Management instead provided the board with information comparing the Portfolio to Morningstar's new Multialternatives category, which it feels is a more appropriate classification, although not ideal. Referring to the supplemental data, management noted that the Portfolio's one-year performance ended June 30, 2011 is most representative of how the Portfolio is expected to perform and that the Portfolio's performance—especially its relatively mild volatility—is meeting management's expectations given the global markets.
Management and sub-advisory fees and expense ratios—The comparative Lipper information showed that the Portfolio's Contractual Management Fee, Actual Management Fee and total expenses were in the fifth quintile in the Portfolio's Expense Group for the comparison periods utilized in the Lipper report. Reiterating its belief that the Lipper peer group classification does not provide a meaningful comparison, management stated that it continues to believe that the current fee arrangements for the Portfolio are reasonable.
In light of the complex strategies employed by the Portfolio and the evolving nature of the alternative investments space, the board determined that the management fee and the sub-advisory fees were reasonable in light of the nature, extent and quality of the services provided to the Portfolio. Nonetheless, the board determined that it would continue to monitor the Portfolio's expenses over the next year and requested that additional information be provided at the next quarterly board meeting.
PACE Global Real Estate Securities Investments
In approving the Investment Management and Administration Agreement and the Sub-Advisory Agreement with each of CBRE Clarion Securities, LLC and Brookfield Investment Management Inc., the board, including the Independent Trustees, also considered the following factors:
Portfolio performance—The comparative Lipper information showed that the Portfolio's performance was in the third quintile for the one-year period and in the fifth quintile for the three-year period and since inception.
Management and sub-advisory fees and expense ratios—The comparative Lipper information showed that the Portfolio's Contractual Management Fee and total expenses were in the third quintile, while its Actual Management Fee was in the first quintile in the Portfolio's Expense Group for the comparison periods utilized in the Lipper report.
PACE Government Securities Fixed Income Investments
In approving the Investment Management and Administration Agreement and the Sub-Advisory Agreement with Pacific Investment Management Company LLC, the board, including the Independent Trustees, also considered the following factors:
Portfolio performance—The comparative Lipper information showed that the Portfolio's performance was in the third quintile for the one-year period and in the second quintile for the three-, five- and ten-year periods and since inception. Management noted that, despite the slightly higher fees, the Portfolio continues to perform well versus its peers.
Management and sub-advisory fees and expense ratios—The comparative Lipper information showed that the Portfolio's Contractual Management Fee and total expenses were in the fifth quintile and its Actual Management Fee was in the fourth quintile in the Portfolio's Expense Group for the comparison periods utilized in the Lipper report. Recognizing that the sub-advised universe of two funds, including the Portfolio, might not allow
362
PACE Select Advisors Trust
Board approvals of investment management and administration agreement and subadvisory agreements (unaudited)
for a very meaningful comparison, management noted that the Portfolio's Actual Management Fee and total expenses are in line with the other sub-advised fund in the peer group. In light of the Portfolio's strong performance versus its peers, the board determined that the management fee and the sub-advisory fees were satisfactory. Nonetheless, the board determined that it would continue to monitor the Portfolio's expenses over the next year.
PACE High Yield Investments
In approving the Investment Management and Administration Agreement and the Sub-Advisory Agreement with MacKay Shields LLC, the board, including the Independent Trustees, also considered the following factors:
Portfolio performance—The comparative Lipper information showed that the Portfolio was in the fifth quintile for the one-year period and in the first quintile for the three-year period and since inception. Management noted that the performance for the one-year period can be attributed to unprofitable positions in the energy sector and the automotive sector.
Management and sub-advisory fees and expense ratios—The comparative Lipper information showed that the Portfolio's Contractual Management Fee was in the fourth quintile and its Actual Management Fee and total expenses were in the fifth quintile in the Portfolio's Expense Group for the comparison periods utilized in the Lipper report. Management emphasized the exceptional nature and quality of the services provided by MacKay Shields LLC, noting its view that longer-term performance has been outstanding in this asset class. Although the board determined that the management fee and the sub-advisory fees were satisfactory, it noted that it would continue to monitor the Portfolio's expenses over the next year.
PACE Intermediate Fixed Income Investments
In approving the Investment Management and Administration Agreement and the Sub-Advisory Agreement with BlackRock Financial Management, Inc., the board, including the Independent Trustees, also considered the following factors:
Portfolio performance—The comparative Lipper information showed that the Portfolio's performance was in the third quintile for the one- and five-year periods, in the fourth quintile for the three-year period and in the fifth quintile for the ten-year period and since inception.
Management and sub-advisory fees and expense ratios—The comparative Lipper information showed that the Portfolio's Contractual Management Fee was in the third quintile and its Actual Management Fee and total expenses were in the fourth quintile in the Portfolio's Expense Group for the comparison periods utilized in the Lipper report. Management noted that the Portfolio's Contractual Management Fee and Actual Management Fee were at or within 0.01% of the median.
PACE Municipal Fixed Income Investments
In approving the Investment Management and Administration Agreement and the Sub-Advisory Agreement with Standish Mellon Asset Management Company LLC, the board, including the Independent Trustees, also considered the following factors:
Portfolio performance—The comparative Lipper information showed that the Portfolio's performance was in the second quintile for the one- and three-year periods, in the third quintile for the five-year period and in the fourth quintile for the ten-year period and since inception. Management noted the Portfolio's consistent very competitive relative performance for the most recent periods.
363
PACE Select Advisors Trust
Board approvals of investment management and administration agreement and subadvisory agreements (unaudited)
Management and sub-advisory fees and expense ratios—The comparative Lipper information showed that the Portfolio's Contractual Management Fee was in the third quintile and its Actual Management Fee and total expenses were in the fourth quintile in the Portfolio's Expense Group for the comparison periods utilized in the Lipper report. Management noted that the Portfolio's Contractual Management Fee was slightly below the median, and that the small size of the Supplemental Expense Group, consisting of sub-advised funds, does not allow for a very meaningful comparison; however, the Portfolio's Actual Management Fee and total expenses were closer to the peer group median in the Supplemental Expense Group.
PACE Strategic Fixed Income Investments
In approving the Investment Management and Administration Agreement and the Sub-Advisory Agreement with Pacific Investment Management Company LLC, the board, including the Independent Trustees, also considered the following factors:
Portfolio performance—The comparative Lipper information showed that the Portfolio's performance was in the first quintile for the one-, three-, five- and ten-year periods and since inception. Management noted that the Portfolio continues to perform extremely well, ranking in the first quintile for all time periods in the Lipper Intermediate Investment-Grade Debt classification. For the one-year period ended April 30, 2011, the Portfolio ranked in the top 19 percent, for the three-year period it ranked in the top six percent and for the five-year period it ranked in the top five percent.
Management and sub-advisory fees and expense ratios—The comparative Lipper information showed that the Portfolio's Contractual Management Fee and Actual Management Fee were in the fourth quintile and its total expenses were in the fifth quintile. Management noted that the strategies and investments used by the Portfolio were more complex than those used by many other funds in the Expense Group, adding that performance is in the first quintile for all periods.
PACE International Fixed Income Investments
(formerly, UBS PACE Global Fixed Income Investments)
In approving the Investment Management and Administration Agreement and the Sub-Advisory Agreement with Rogge Global Partners plc, the board, including the Independent Trustees, also considered the following factors:
Portfolio performance—The comparative Lipper information showed that the Portfolio's performance was in the second quintile for the one-year period, in the fourth quintile for the three-year period and in the third quintile for the five- and ten-year periods and since inception.
Management and sub-advisory fees and expense ratios—The comparative Lipper information showed that the Portfolio's Contractual Management Fee was in the third quintile and its Actual Management Fee and total expenses were in the fourth quintile in the Portfolio's Expense Group for the comparison periods utilized in the Lipper report. Management noted that although the Supplemental Expense Group, consisting of sub-advised funds, is relatively small, the Portfolio's Contractual Management Fee, Actual Management Fee and total expenses were generally in line with the median.
364
PACE Select Advisors Trust
Board approvals of investment management and administration agreement and subadvisory agreements (unaudited)
PACE Money Market Investments
In approving the Investment Management and Administration Agreement, the board, including the Independent Trustees, also considered the following factors:
Portfolio performance—The comparative Lipper information showed that the Portfolio's performance was in the second quintile for the one- and ten-year periods and since inception and in the third quintile for the three- and five-year periods.
Management fees and expense ratios—The comparative Lipper information showed that the Portfolio's Contractual Management Fee was in the second quintile, its Actual Management Fee was in the first quintile and its total expenses were in the third quintile in the Portfolio's Expense Group for the comparison periods utilized in the Lipper report.
Conclusion
Based on its review and, in certain instances, management's explanations upon further questioning, the board concluded that each Portfolio's investment performance was satisfactory or acceptable and that each management fee and sub-advisory fee was reasonable in light of the nature, extent and quality of the services provided to the Portfolio under the applicable Investment Management and Administration Agreement and Sub-Advisory Agreement or Sub-Advisory Agreements, respectively.
In light of all of the foregoing, the board approved the Investment Management and Administration Agreement for each Portfolio and, for those Portfolios with Sub-Advisors, the Sub-Advisory Agreement(s) (noting that with respect to Mondrian, such approvals related to proposed new Sub-Advisory Agreements that would be replacing similar interim sub-advisory agreements). No single factor reviewed by the board was identified by the board as the principal factor in determining whether to approve the Investment Management and Administration Agreement or, for the sub-advised Portfolios, the Sub-Advisory Agreement(s). The Independent Trustees were advised by separate independent legal counsel throughout the process. The board discussed the proposed continuance of the Investment Management and Administration Agreement and the continuance/approval of new Sub-Advisory Agreements in private sessions with their independent legal counsel at which no representatives of UBS Global AM or the Sub-Advisors were present.
365
PACE Select Advisors Trust
Supplemental information (unaudited)
Board of Trustees & Officers
The Trust is governed by a Board of Trustees which oversees the Portfolios' operations. Each Trustee serves an indefinite term of office. Officers are appointed by the trustees and serve at the pleasure of the Board. The table below shows, for each trustee and officer, his or her name, address and age, the position held with the Trust, the length of time served as a trustee or officer of the Trust, the trustee's or officer's principal occupations during the last five years, the number of portfolios in the UBS fund complex overseen by the trustee or for which a person served as an officer, and other directorships held by the trustee.
The Trust's Statement of Additional Information contains additional information about the trustees and is available, without charge, upon request by calling 1-800-647 1568.
Interested Trustees:
Name,
address,
and age | | Position(s)
held with
Trust | | Term of office1
and length of
time served | | Principal
occupation(s)
during past
5 years | | Number of
portfolios in fund
complex overseen
by trustee | | Other
directorships
held by
trustee | |
Meyer Feldberg2; 69
Morgan Stanley
1585 Broadway
36th Floor
New York, NY
10036 | | Trustee | | Since 2001 | | Professor Feldberg is Dean Emeritus and Professor of Leadership and Ethics at Columbia Business School, although on an extended leave of absence. He is also a senior advisor to Morgan Stanley (financial services) (since March 2005). Professor Feldberg also serves as president of New York City Global Partners (an organization located in part of the Office of the Mayor of the City of New York that promotes interaction with other cities around the world) (since May 2007). Prior to July 2004, he was Dean and Professor of Management and Ethics of the Graduate School of Business at Columbia University (since 1989). | | Professor Feldberg is a director or trustee of 27 investment companies (consisting of 59 portfolios) for which UBS Global AM or one of its affiliates serves as investment advisor or manager. | | Professor Feldberg is also a director of Primedia Inc. (publishing), Macy's, Inc. (operator of department stores), Revlon, Inc. (cosmetics), SAPPI, Ltd. (producer of paper) and the New York City Ballet. | |
|
366
PACE Select Advisors Trust
Supplemental information (unaudited)
Interested Trustees (concluded):
Name,
address,
and age | | Position(s)
held with
Trust | | Term of office1
and length of
time served | | Principal
occupation(s)
during past
5 years | | Number of
portfolios in fund
complex overseen
by trustee | | Other
directorships
held by
trustee | |
| Barry M. Mandinach*3; 55 | | Trustee | | Since July 2010 | | Mr. Mandinach is a managing director of UBS Global Asset Management (US) Inc. and UBS Global AM (collectively, "UBS Global AM—Americas region"). He has been with UBS Global AM—Americas region or its predecessors since 2001. He is the Head of Institutional & Wholesale Business (US) (since 2009) as well as Chief Marketing Officer (US) (since 2006). | | Mr. Mandinach is a director or trustee of 13 investment companies (consisting of 45 portfolios) for which UBS Global AM or one of its affiliates serves as investment advisor or manager. | | None | |
|
Independent Trustees:
Richard Q. Armstrong; 75
c/o Keith Weller
Assistant Fund Secretary
UBS Global Asset Management (Americas) Inc.
1285 Avenue of the Americas,
New York, NY 10019 | | Trustee and Chairman of the Board of Trustees | | Since 2001 (Trustee) Since 2004 (Chairman of the Board of Trustees) | | Mr. Armstrong is chairman and principal of R.Q.A. Enterprises (management consulting firm) (since April 1991 and principal occupation since March 1995). Mr. Armstrong was president or chairman of a number of packaged goods companies (responsible for such brands as Canada Dry, Dr. Pepper, Adirondack Beverages and Moët Hennessy) (from 1982 until 1995). | | Mr. Armstrong is a director or trustee of 13 investment companies (consisting of 45 portfolios) for which UBS Global AM or one of its affiliates serves as investment advisor or manager. | | None | |
|
367
PACE Select Advisors Trust
Supplemental information (unaudited)
Independent Trustees (continued):
Name,
address,
and age | | Position(s)
held with
Trust | | Term of office1
and length of
time served | | Principal
occupation(s)
during past
5 years | | Number of
portfolios in fund
complex overseen
by trustee | | Other
directorships
held by
trustee | |
Alan S. Bernikow;
70
207 Benedict Ave.
Staten Island, NY
10314 | | Trustee | | Since 2005 | | Mr. Bernikow is retired. He was a consultant on non-management matters for the firm of Deloitte & Touche (international accounting and consulting firm) (from June 2003 until 2007). Previously, he was deputy chief executive officer at Deloitte & Touche. | | Mr. Bernikow is a director or trustee of 13 investment companies (consisting of 45 portfolios) for which UBS Global AM or one of its affiliates serves as investment advisor or manager. | | Mr. Bernikow is also a director of Revlon, Inc. (cosmetics) (and serves as the chair of its audit committee and as the chair of its compensation committee), a director of Mack-Cali Realty Corporation (real estate investment trust) (and serves as the chair of its audit committee); and a director of the Casual Male Retail Group, Inc. (menswear) (and serves as a member of its audit committee and as a member of its nominating and corporate governance committee). He is also a director of Premier American Bank, N.A. | |
|
Richard R. Burt; 64
McLarty Associates
900 17th Street,
8th Floor
Washington, D.C.
20006 | | Trustee | | Since 2001 | | Mr. Burt is a managing director to McLarty Associates (a consulting firm) with which he has been employed since April 2007. He was chairman of IEP Advisors (international investments and consulting firm) until February 2009. Prior to April 2007, he was chairman of Diligence Inc. (information and risk management firm). | | Mr. Burt is a director or trustee of 13 investment companies (consisting of 45 portfolios) for which UBS Global AM or one of its affiliates serves as investment advisor or manager. | | Mr. Burt is also a director of Central Europe & Russia Fund, Inc., European Equity Fund, Inc. and The New Germany Fund, Inc. | |
|
368
PACE Select Advisors Trust
Supplemental information (unaudited)
Independent Trustees (concluded):
Name,
address,
and age | | Position(s)
held with
Trust | | Term of office1
and length of
time served | | Principal
occupation(s)
during past
5 years | | Number of
portfolios in fund
complex overseen
by trustee | | Other
directorships
held by
trustee | |
Bernard H. Garil; 71
6754 Casa Grande Way
Delray Beach, FL
33446 | | Trustee | | Since 2005 | | Mr. Garil is retired (since 2001). He was a managing director at PIMCO Advisory Services (from 1999 to 2001) where he served as president of closed-end funds and vice-president of the variable insurance product funds advised by OpCap Advisors (until 2001). | | Mr. Garil is a director or trustee of 13 investment companies (consisting of 45 portfolios) for which UBS Global AM or one of its affiliates serves as investment advisor or manager. | | Mr. Garil is also a director of OFI Trust Company (commercial trust company), the Leukemia and Lymphoma Society (voluntary health agency) and a trustee for the Brooklyn College Foundation, Inc. (charitable foundation). | |
|
Heather R. Higgins; 52
255 E. 49th St.,
Suite 23D
New York, NY
10017 | | Trustee | | Since 2005 | | Ms. Higgins is the president and director of The Randolph Foundation (charitable foundation) (since 1991). Ms. Higgins also serves (or had served) on the boards of several non-profit charitable groups, including the Independent Women's Forum (chairman) (until term-limited), and the Philanthropy Roundtable (vice chairman). She also serves on the board of the Hoover Institution (from 2001 to 2007 and since January 2009). | | Ms. Higgins is a director or trustee of 13 investment companies (consisting of 45 portfolios) for which UBS Global AM or one of its affiliates serves as investment advisor or manager. | | None | |
|
369
PACE Select Advisors Trust
Supplemental information (unaudited)
Officers:
Name,
address,
and age | | Position(s)
held with
Trust | | Term of office1
and length of
time served | | Principal occupation(s) during past 5 years;
number of portfolios in fund complex
for which person serves as officer | |
| Joseph Allessie*; 46 | | Vice President and Assistant Secretary | | Since 2005 | | Mr. Allessie is an executive director (since 2007) (prior to which he was a director) and deputy general counsel (since 2005) UBS Global AM—Americas region. Mr. Allessie is a vice president and assistant secretary of 17 investment companies (consisting of 100 portfolios) for which UBS Global AM—Americas region or one of its affiliates serves as investment advisor, sub-advisor or manager. | |
|
| Rose Ann Bubloski*; 43 | | Vice President and Assistant Treasurer | | Since May 2011 | | Ms. Bubloski is an associate director (2003-2007 and 2008 to present) and senior manager of the US mutual fund treasury administration department of UBS Global AM—Americas region. From 2004 through 2007 she was a vice president and assistant treasurer of certain UBS funds. From 2007 to 2008 she was vice president at Cohen & Steers Capital Management, Inc. (investment manager). She is vice president and assistant treasurer of 17 investment companies (consisting of 100 portfolios) for which UBS Global AM serves as investment advisor or manager. | |
|
| Mark E. Carver*; 47 | | President | | Since May 2010 | | Mr. Carver is a managing director and Head of Product Development and Management-Americas for UBS Global AM—Americas region (since 2008). In this role, he oversees product development and management for both wholesale and institutional businesses. He is a member of the Americas Management Committee (since 2008) and the Regional Operating Committee (since 2008). Prior to 2008, Mr. Carver held a number of product-related or sales responsibilities with respect to funds, advisory programs and separately managed accounts. Mr. Carver joined a predecessor of an affiliated firm in 1985 and has been with UBS Global AM—Americas region (or its affiliates) since 1996. Mr. Carver is president of 17 investment companies (consisting of 100 portfolios) for which UBS Global AM or one of its affiliates serves as investment advisor or manager. | |
|
| Thomas Disbrow*; 45 | | Vice President and Treasurer | | Since 2000
(Vice President)
Since 2004
(Treasurer) | | Mr. Disbrow is a managing director (since March 2011) (prior to which he was an executive director) (since 2007) (prior to which he was a director) (since 2000) and head of North America Fund Treasury (since March 2011) of UBS Global AM—Americas region. Mr. Disbrow is a vice president and treasurer and/or principal accounting officer of 17 investment companies (consisting of 100 portfolios) for which UBS Global AM—Americas region or one of its affiliates serves as investment advisor or manager. | |
|
| Michael J. Flook*; 46 | | Vice President and Assistant Treasurer | | Since 2006 | | Mr. Flook is a director (since March 2010) (prior to which he was an associate director) (since 2006) and a senior manager of the US mutual fund treasury administration department of UBS Global AM—Americas region. Mr. Flook is a vice president and assistant treasurer of 17 investment companies (consisting of 100 portfolios) for which UBS Global AM—Americas region or one of its affiliates serves as investment advisor or manager. | |
|
370
PACE Select Advisors Trust
Supplemental information (unaudited)
Officers (continued):
Name,
address,
and age | | Position(s)
held with
Trust | | Term of office1
and length of
time served | | Principal occupation(s) during past 5 years;
number of portfolios in fund complex
for which person serves as officer | |
| Mark F. Kemper**; 53 | | Vice President and Secretary | | Since 2004 | | Mr. Kemper is a managing director (since 2006) and head of the legal department of UBS Global AM—Americas region (since 2004). He has been secretary of UBS Global AM—Americas region since 2004, assistant secretary of UBS Global Asset Management Trust Company since 1993 and secretary of UBS AM Holdings (USA) Inc. (since 2001). Mr. Kemper is vice president and secretary of 17 investment companies (consisting of 100 portfolios) for which UBS Global AM—Americas region or one of its affiliates serves as investment advisor or manager. | |
|
| Joanne M. Kilkeary*; 43 | | Vice President and Assistant Treasurer | | Since 1999 | | Ms. Kilkeary is a director (since 2008) (prior to which she was an associate director) (since 2000) and a senior manager (since 2004) of the US mutual fund treasury administration department of UBS Global AM—Americas region. Ms. Kilkeary is a vice president and assistant treasurer of 17 investment companies (consisting of 100 portfolios) for which UBS Global AM—Americas region or one of its affiliates serves as investment advisor or manager. | |
|
| Tammie Lee*; 40 | | Vice President and Assistant Secretary | | Since 2005 | | Ms. Lee is an executive director (since 2010) (prior to which she was a director) and associate general counsel of UBS Global AM—Americas region (since 2005). Ms. Lee is a vice president and assistant secretary of 17 investment companies (consisting of 100 portfolios) for which UBS Global AM—Americas region or one of its affiliates serves as investment advisor or manager. | |
|
| Joseph McGill*; 49 | | Vice President and Chief Compliance Officer | | Since 2004 | | Mr. McGill is a managing director (since 2006) and chief compliance officer (since 2003) at UBS Global AM—Americas region. Mr. McGill is a vice president and chief compliance officer of 17 investment companies (consisting of 100 portfolios) for which UBS Global AM—Americas region or one of its affiliates serves as investment advisor or manager. | |
|
| Nancy D. Osborn*; 45 | | Vice President and Assistant Treasurer | | Since 2007 | | Mrs. Osborn is a director (since 2010) (prior to which she was an associate director) and a senior manager of the US mutual fund treasury administration department of UBS Global AM—Americas region (since 2006). Mrs. Osborn is a vice president and assistant treasurer of 17 investment companies (consisting of 100 portfolios) for which UBS Global AM—Americas region or one of its affiliates serves as investment advisor or manager. | |
|
| Robert Sabatino**; 38 | | Vice President | | Since 2001 | | Mr. Sabatino is a managing director (since 2010) (prior to which he was an executive director) (since 2007), head of US taxable money markets (since 2009), and portfolio manager of UBS Global AM—Americas region in the short duration fixed income group (since 2001). Mr. Sabatino is a vice president of six investment companies (consisting of 37 portfolios) for which UBS Global AM—Americas region or one of its affiliates serves as investment advisor or manager. | |
|
371
PACE Select Advisors Trust
Supplemental information (unaudited)
Officers (concluded):
Name,
address,
and age | | Position(s)
held with
Trust | | Term of office1
and length of
time served | | Principal occupation(s) during past 5 years;
number of portfolios in fund complex
for which person serves as officer | |
| Eric Sanders*; 45 | | Vice President and Assistant Secretary | | Since 2005 | | Mr. Sanders is a director and associate general counsel of UBS Global AM—Americas region (since 2005). Mr. Sanders is a vice president and assistant secretary of 17 investment companies (consisting of 100 portfolios) for which UBS Global AM—Americas region or one of its affiliates serves as investment advisor or manager. | |
|
| Andrew Shoup*; 55 | | Vice President and Chief Operating Officer | | Since 2006 | | Mr. Shoup is a managing director and global head of the treasury administration department of UBS Global AM—Americas region (since July 2006). Mr. Shoup is also a director of UBS (IRL) Fund p.l.c. (since 2008). Prior to joining UBS Global AM—Americas region, he was chief administrative officer for the Legg Mason Partner Funds (formerly Smith Barney, Salomon Brothers, and CitiFunds mutual funds) from November 2003 to July 2006. Mr. Shoup is a vice president and chief operating officer of 17 investment companies (consisting of 100 portfolios) for which UBS Global AM—Americas region or one of its affiliates serves as investment advisor or manager. | |
|
| Keith A. Weller*; 50 | | Vice President and Assistant Secretary | | Since 2000 | | Mr. Weller is an executive director and senior associate general counsel of UBS Global AM—Americas region (since 2005) and has been an attorney with affiliated entities since 1995. Mr. Weller is a vice president and assistant secretary of 17 investment companies (consisting of 100 portfolios) for which UBS Global AM—Americas region or one of its affiliates serves as investment advisor or manager. | |
|
1 Each trustee holds office for an indefinite term. Officers are appointed by the trustees and serve at the pleasure of the Board.
2 Professor Feldberg is deemed an "interested person" of the Trust as defined in the Investment Company Act of 1940, as amended, because he is a senior advisor to Morgan Stanley, a financial services firm with which the Trust may conduct transactions.
3 Mr. Mandinach is deemed an "interested person" of the Trust as defined in the Investment Company Act of 1940, as amended, because of his employment by UBS Global AM—Americas region.
* This person's business address is 1285 Avenue of the Americas, New York, New York 10019-6028.
** This person's business address is One North Wacker Drive, Chicago, Illinois 60606.
372
PRESORTED
STANDARD
U.S. POSTAGE
PAID
COMPUTERSHARE

UBS Global Asset Management (Americas) Inc.
1285 Avenue of the Americas
New York, NY 10019-6028
S003

Money Market Funds
PACE® Money Market Investments
Annual Report
July 31, 2011
PACE Money Market Investments
September 16, 2011
Dear Shareholder,
Performance
For the 12 months ended July 31, 2011, the Portfolio returned 0.01%, before the deduction of the maximum PACE program fee. (The Portfolio declined 1.97%, after the deduction of the maximum PACE program fee, for the same 12-month period.) Please remember that the PACE program fee is assessed outside the Portfolio at the PACE program account level. The program fee does not impact the determination of the Portfolio's net asset value per share. For comparison purposes, the median return of the Lipper Money Market Funds category was 0.01%. (Returns over various time periods are shown in the "Performance at a glance" table on page 4. Please note that the returns shown do not reflect the deduction of taxes that a shareholder would pay on Portfolio distributions.)
Advisor's Comments
The economic recovery continued during the reporting period, although growth moderated as the period progressed. Elevated unemployment, housing market weakness, higher oil prices and supply disruptions following the devastating earthquake in Japan caused economic growth to decelerate. Against this backdrop, the Federal Reserve Board (the "Fed") maintained the federal funds rate at a historically low range between 0% and 0.25% during the reporting period. (The federal funds rate, or "fed
PACE Money
Market Investments
Investment Advisor:
UBS Global Asset Management (Americas) Inc.
Portfolio Manager:
Robert Sabatino
Objective:
Current income consistent with preservation of capital and liquidity
Investment process:
The Portfolio is a money market mutual fund and seeks to maintain a stable price of $1.00 per share, although it may be possible to lose money by investing in this Portfolio. The Portfolio invests in a diversified portfolio of high-quality money market instruments of governmental and private issuers. Security selection is based on the assessment of relative values and changes in market and economic conditions.
1
PACE Money Market Investments
funds" rate, is the rate that banks charge one another for funds they borrow on an overnight basis.) As a result, the yields of the securities in which the Portfolio invests remained extremely low, which impacted the Portfolio's yield.
We tactically adjusted the Portfolio's weighted average maturity (WAM)—which is the average duration of the securities in the Portfolio—but generally kept it in a fairly narrow range. When the reporting period began, the Portfolio had a WAM of 46 days. As of July 31, 2011, the Fund's WAM was 47 days.
At the issuer level, we maintained a greater-than-usual level of diversification over the 12-month period by investing in smaller positions, with the goal of reducing risk and keeping the Portfolio highly liquid. As the economic recovery continued over the period, we slightly increased the size of our positions in single issuers, typically purchasing up to 3% in single nongovernment issuers by the end of the reporting period. (The Portfolio is generally able to hold up to 5% in any one issuer, subject to certain exceptions.)
In terms of securities, over the 12-month period we increased the Portfolio's exposure to repurchase agreements and, to lesser extents, its allocation to commercial paper and a US bank note. In contrast, we decreased the Portfolio's exposure to US government and agency obligations, CDs and short-term corporate obligations. (Repurchase agreements are transactions in which the seller of a security agrees to buy it back at a predetermined time and price or upon demand.)
One final note, in response to revisions to the US Securities and Exchange Commission's ("SEC") rules governing money market funds, beginning on October 7, 2010, the Portfolio began disclosing, on a monthly basis: (a) a complete schedule of its portfolio holdings; and (b) information regarding its weighted average maturity and weighted average life. Also, beginning in February 2011, the Portfolio began including a link on UBS's Web site to more detailed Portfolio information appearing in filings with the SEC on Form N-MFP. This information is
2
PACE Money Market Investments
available on UBS's Web site at the following Internet address: www.ubs.com/usmoneymarketfundsholdings. This information will be updated monthly.
As always, we thank you for your continued support and welcome any comments or questions you may have.
Sincerely,
 | |  | |
|
Mark E. Carver
President,
PACE Select Advisors Trust
Managing Director,
UBS Global Asset Management
(Americas) Inc. | | Robert Sabatino
Portfolio Manager,
PACE Money Market
Investments
Managing Director,
UBS Global Asset Management
(Americas) Inc. | |
|
This letter is intended to assist shareholders in understanding how the Portfolio performed during the year ended July 31, 2011. The views and opinions in this letter were current as of September 16, 2011. They are not guarantees of performance or investment results and should not be taken as investment advice.
Investment decisions reflect a variety of factors, and we reserve the right to change our views about individual securities, sectors and markets at any time. As a result, the views expressed should not be relied upon as a forecast of the Portfolio's future investment intent. We encourage you to consult your financial advisor regarding your personal investment program. Investors should carefully read and consider a mutual fund's investment objectives, risks, charges, and expenses before investing. The prospectus contains this and other information about a mutual fund. For a current prospectus, contact UBS Global Asset Management at 888-793 8637, or visit us on the Web at www.ubs.com/globalam-us.
3
PACE Money Market Investments
Performance at a glance (unaudited)
Average annual total returns
for periods ended 07/31/11 | | 1 year | | 5 years | | 10 years | |
PACE Money Market Investments
before deducting maximum PACE program fee1 | | | 0.01 | % | | | 1.80 | % | | | 1.82 | % | |
PACE Money Market Investments
after deducting maximum PACE program fee1 | | | (1.97 | )% | | | (0.22 | )% | | | (0.20 | )% | |
| Lipper Money Market Funds median | | | 0.01 | % | | | 1.79 | % | | | 1.74 | % | |
For PACE Money Market Investments, average annual total returns for periods ended June 30, 2011, after deduction of the maximum PACE program fee, were as follows: 1-year period, (1.97)%; 5-year period, (0.14)%; 10-year period, (0.16)%.
For PACE Money Market Investments, the 7-day current yield for the period ended July 31, 2011 was 0.01% (without maximum PACE program fee and after fee waivers and/or expense reimbursements; the yield was (0.96)% before fee waivers and/or expense reimbursements). With the maximum PACE program fee, the 7-day current yield was (1.99)% after fee waivers and/or expense reimbursements; the yield was (2.96)% before fee waivers and/or expense reimbursements. The Portfolio's yield quotation more closely reflects the current earnings of the Portfolio than the total return quotation. Yields will fluctuate and reflect fee waivers and/or expense reimbursements.
1 The maximum annual PACE program fee is 2% of the value of PACE assets. Prior to June 14, 2010, the maximum annual PACE program fee was 1.5% of the value of PACE assets; however, the current maximum annual PACE program fee of 2% is reflected in the performance returns throughout all periods in the average annual total returns shown above.
Past performance does not predict future performance and the performance information provided does not reflect the deduction of taxes that a shareholder would pay on Portfolio distributions. The return of an investment will fluctuate. Performance results assume reinvestment of all dividends and capital gain distributions at net asset value on the payable dates. Current performance may be higher or lower than the performance data quoted.
Lipper peer group data calculated by Lipper Inc.; used with permission. The Lipper median is the return of the fund that places in the middle of a Lipper peer group.
An investment in PACE Money Market Investments is not insured or guaranteed by the Federal Deposit Insurance Corporation or any other government agency. Although the Portfolio seeks to preserve the value of your investment at $1.00 per share, it is possible to lose money by investing in the Portfolio.
Not FDIC Insured. May lose value. No Bank guarantee.
4
PACE Money Market Investments
Understanding your Portfolio's expenses (unaudited)
As a shareholder of the Portfolio, you incur two types of costs: (1) ongoing program fees; and (2) ongoing Portfolio costs, including management fees and other Portfolio expenses. This example is intended to help you understand your ongoing costs (in dollars) of investing in the Portfolio and to compare these costs with the ongoing costs of investing in other mutual funds.
The example below is based on an investment of $1,000 invested at the beginning of the period and held for the entire period, February 1, 2011 to July 31, 2011.
Actual expenses
The first line in the table below provides information about actual account values and actual expenses. You may use the information in this line, together with the amount you invested, to estimate the expenses that you paid over a period. Simply divide your account value by $1,000 (for example, an $8,600 account value divided by $1,000 = 8.6), then multiply the result by the number in the first line under the heading entitled "Expenses paid during period" to estimate the expenses you paid on your account during this period.
Hypothetical example for comparison purposes
The second line in the table below provides information about hypothetical account values and hypothetical expenses based on the Portfolio's actual expense ratio and an assumed rate of return of 5% per year before expenses, which is not the Portfolio's actual return. The hypothetical account values and expenses may not be used to estimate the actual ending account balance or expenses you paid for the period. You may use this information to compare the ongoing costs of investing in the Portfolio and other funds. To do so, compare this 5% hypothetical example with the 5% hypothetical examples that appear in the shareholder reports of other funds.
5
PACE Money Market Investments
Understanding your Portfolio's expenses (unaudited) (concluded)
Please note that the expenses shown in the table are meant to highlight your ongoing Portfolio costs only and do not reflect any program fees. Therefore, the second line in the table is useful in comparing ongoing Portfolio costs only, and will not help you determine the relative total costs of owning different funds. In addition, if program fees were included, your costs would have been higher.
| | Beginning
account value
February 1,
2011 | | Ending
account value
July 31,
2011 | | Expenses paid
during period1
02/01/11 to
07/31/11 | | Expense
ratio
during the
period | |
| Actual | | $ | 1,000.00 | | | $ | 1,000.00 | | | $ | 1.09 | | | | 0.22 | % | |
Hypothetical (5% annual
return before expenses) | | | 1,000.00 | | | | 1,023.70 | | | | 1.10 | | | | 0.22 | | |
1 Expenses are equal to the Portfolio's annualized net expense ratio, multiplied by the average account value over the period, multiplied by 181 divided by 365 (to reflect the one-half year period).
6
PACE Money Market Investments
Portfolio statistics (unaudited)
| Characteristics | | 07/31/11 | |
| Net assets (mm) | | $ | 365.8 | | |
| Number of holdings | | | 91 | | |
| Weighted average maturity | | | 47 days | | |
| Portfolio composition1 | | 07/31/11 | |
| Commercial paper | | | 41.2 | % | |
| Repurchase agreements | | | 21.3 | | |
| US government and agency obligations | | | 19.7 | | |
| Certificates of deposit | | | 12.4 | | |
| Short-term corporate obligations | | | 1.5 | | |
| Bank note | | | 0.8 | | |
| Other assets less liabilities | | | 3.1 | | |
| Total | | | 100.0 | % | |
| Top 10 holdings1 | | 07/31/11 | |
Repurchase agreement with Deutsche Bank Securities, 0.180%
due 08/01/11 | | | 15.8 | % | |
| Repurchase agreement with Barclays Bank PLC, 0.140% due 08/01/11 | | | 5.5 | | |
| US Treasury Notes, 0.750% due 05/31/12 | | | 2.5 | | |
| General Electric Co., 0.100% due 08/05/11 | | | 1.9 | | |
| Market Street Funding LLC, 0.150% due 08/01/11 | | | 1.6 | | |
| Atlantic Asset Securitization LLC, 0.160% due 08/05/11 | | | 1.6 | | |
| Bank of Nova Scotia, 0.180% due 10/03/11 | | | 1.4 | | |
| Amsterdam Funding Corp., 0.180% due 08/01/11 | | | 1.4 | | |
| Barclays US Funding Corp., 0.130% due 08/01/11 | | | 1.4 | | |
| Deutsche Bank Financial LLC, 0.100% due 08/01/11 | | | 1.4 | | |
| Total | | | 34.5 | % | |
1 Weightings represent percentages of the Portfolio's net assets as of July 31, 2011. The Portfolio is actively managed and its composition will vary over time.
7
PACE Money Market Investments
Statement of net assets—July 31, 2011
| Security description | | Face
amount | | Value | |
| US government and agency obligations—19.71% | |
| Federal Farm Credit Bank | |
| 0.230%, due 11/08/111 | | $ | 3,000,000 | | | $ | 2,998,102 | | |
| Federal Home Loan Bank | |
| 0.165%, due 08/01/112 | | | 3,000,000 | | | | 3,000,000 | | |
| 0.280%, due 08/07/112 | | | 3,000,000 | | | | 3,000,000 | | |
| 0.040%, due 08/09/111 | | | 5,000,000 | | | | 4,999,956 | | |
| 0.300%, due 09/15/112 | | | 3,000,000 | | | | 3,000,000 | | |
| 0.270%, due 09/30/112 | | | 4,500,000 | | | | 4,500,000 | | |
| 0.280%, due 10/12/112 | | | 3,500,000 | | | | 3,500,000 | | |
| 0.270%, due 02/17/121 | | | 3,000,000 | | | | 2,995,500 | | |
| Federal Home Loan Mortgage Corp.* | |
| 0.135%, due 08/06/112 | | | 3,000,000 | | | | 2,997,855 | | |
| 0.230%, due 08/23/111 | | | 5,000,000 | | | | 4,999,297 | | |
| Federal National Mortgage Association* | |
| 0.290%, due 08/08/111 | | | 2,000,000 | | | | 1,999,887 | | |
| 0.210%, due 09/01/111 | | | 4,000,000 | | | | 3,999,277 | | |
| US Treasury Bills | |
| 0.155%, due 09/22/111 | | | 5,000,000 | | | | 4,998,881 | | |
| 0.040%, due 10/27/111 | | | 3,000,000 | | | | 2,999,709 | | |
| 0.250%, due 03/08/121 | | | 2,000,000 | | | | 1,996,944 | | |
| US Treasury Notes | |
| 1.000%, due 12/31/11 | | | 2,000,000 | | | | 2,006,341 | | |
| 0.875%, due 02/29/12 | | | 3,000,000 | | | | 3,008,922 | | |
| 1.000%, due 04/30/12 | | | 3,000,000 | | | | 3,014,055 | | |
| 0.750%, due 05/31/12 | | | 9,000,000 | | | | 9,039,324 | | |
| 1.875%, due 06/15/12 | | | 3,000,000 | | | | 3,043,317 | | |
| Total US government and agency obligations (cost—$72,097,367) | | | | | 72,097,367 | | |
| Bank note—0.82% | |
| Banking-US—0.82% | |
| Bank of America N.A. | |
| 0.120%, due 08/24/11 (cost—$3,000,000) | | | 3,000,000 | | | | 3,000,000 | | |
8
PACE Money Market Investments
Statement of net assets—July 31, 2011
| Security description | | Face
amount | | Value | |
| Certificates of deposit—12.37% | |
| Banking-non-US—12.37% | |
| Abbey National Treasury Services PLC | |
| 0.700%, due 10/17/112 | | $ | 3,500,000 | | | $ | 3,500,000 | | |
| 0.450%, due 10/18/112 | | | 1,500,000 | | | | 1,500,000 | | |
| Bank of Nova Scotia | |
| 0.190%, due 08/01/112 | | | 1,500,000 | | | | 1,500,000 | | |
| 0.190%, due 08/03/11 | | | 3,000,000 | | | | 3,000,000 | | |
| 0.180%, due 10/03/11 | | | 5,000,000 | | | | 5,000,000 | | |
| BNP Paribas SA | |
| 0.399%, due 10/17/112 | | | 1,750,000 | | | | 1,750,000 | | |
| Dnb NOR ASA | |
| 0.240%, due 12/28/11 | | | 2,000,000 | | | | 2,000,000 | | |
| Lloyds TSB Bank PLC | |
| 0.500%, due 10/19/112 | | | 3,500,000 | | | | 3,500,000 | | |
| Mitsubishi UFJ Trust & Banking Corp. | |
| 0.220%, due 08/16/11 | | | 3,000,000 | | | | 3,000,000 | | |
| National Australia Bank Ltd. | |
| 0.269%, due 10/14/112 | | | 1,000,000 | | | | 1,000,000 | | |
| 0.270%, due 10/19/112 | | | 750,000 | | | | 749,966 | | |
| Natixis | |
| 0.366%, due 10/13/112 | | | 1,000,000 | | | | 1,000,000 | | |
| Nordea Bank Finland | |
| 0.400%, due 06/12/12 | | | 2,500,000 | | | | 2,500,000 | | |
| Rabobank Nederland N.V. | |
| 0.267%, due 08/18/112 | | | 1,000,000 | | | | 1,000,000 | | |
| Royal Bank of Canada | |
| 0.260%, due 08/01/112 | | | 1,500,000 | | | | 1,500,000 | | |
| 0.275%, due 08/01/112 | | | 1,500,000 | | | | 1,500,000 | | |
| 0.260%, due 01/11/12 | | | 3,000,000 | | | | 3,000,000 | | |
| Royal Bank of Scotland PLC | |
| 0.553%, due 10/25/112 | | | 3,500,000 | | | | 3,500,000 | | |
| Toronto-Dominion Bank | |
| 0.105%, due 08/08/11 | | | 3,000,000 | | | | 3,000,000 | | |
9
PACE Money Market Investments
Statement of net assets—July 31, 2011
| Security description | | Face
amount | | Value | |
| Certificates of deposit—(concluded) | |
| Banking-non-US—(concluded) | |
| Westpac Banking Corp. | |
| 0.270%, due 08/01/112 | | $ | 1,750,000 | | | $ | 1,750,000 | | |
| Total certificates of deposit (cost—$45,249,966) | | | | | 45,249,966 | | |
| Commercial paper1—41.24% | |
| Asset backed-banking—1.91% | |
| Atlantis One Funding | |
| 0.200%, due 08/01/11 | | | 4,000,000 | | | | 4,000,000 | | |
| 0.160%, due 09/13/11 | | | 3,000,000 | | | | 2,999,427 | | |
| | | | | | 6,999,427 | | |
| Asset backed-miscellaneous—15.05% | |
| Amsterdam Funding Corp. | |
| 0.180%, due 08/01/11 | | | 5,000,000 | | | | 5,000,000 | | |
| Atlantic Asset Securitization LLC | |
| 0.160%, due 08/05/11 | | | 6,000,000 | | | | 5,999,893 | | |
| Barton Capital LLC | |
| 0.150%, due 08/02/11 | | | 3,000,000 | | | | 2,999,988 | | |
| Gotham Funding Corp. | |
| 0.160%, due 08/05/11 | | | 2,000,000 | | | | 1,999,964 | | |
| 0.160%, due 08/08/11 | | | 3,000,000 | | | | 2,999,907 | | |
| LMA Americas LLC | |
| 0.200%, due 08/22/11 | | | 3,000,000 | | | | 2,999,650 | | |
| Market Street Funding LLC | |
| 0.150%, due 08/01/11 | | | 6,000,000 | | | | 6,000,000 | | |
| Regency Markets No. 1 LLC | |
| 0.150%, due 08/15/11 | | | 5,000,000 | | | | 4,999,708 | | |
| 0.150%, due 08/16/11 | | | 3,000,000 | | | | 2,999,813 | | |
| Salisbury Receivables Co. LLC | |
| 0.140%, due 08/25/11 | | | 5,000,000 | | | | 4,999,533 | | |
| Thunderbay Funding | |
| 0.170%, due 09/13/11 | | | 5,000,000 | | | | 4,998,985 | | |
10
PACE Money Market Investments
Statement of net assets—July 31, 2011
| Security description | | Face
amount | | Value | |
| Commercial paper1—(continued) | |
| Asset backed-miscellaneous—(concluded) | |
| Windmill Funding Corp. | |
| 0.140%, due 08/04/11 | | $ | 3,000,000 | | | $ | 2,999,965 | | |
| 0.140%, due 08/09/11 | | | 3,000,000 | | | | 2,999,907 | | |
| 0.140%, due 08/10/11 | | | 3,050,000 | | | | 3,049,893 | | |
| | | | | | 55,047,206 | | |
| Asset backed-securities—1.09% | |
| Argento Variable Funding Co. LLC | |
| 0.180%, due 08/23/11 | | | 3,000,000 | | | | 2,999,670 | | |
| Grampian Funding LLC | |
| 0.210%, due 09/15/11 | | | 1,000,000 | | | | 999,737 | | |
| | | | | | 3,999,407 | | |
| Banking-non-US—6.90% | |
| Commonwealth Bank of Australia | |
| 0.265%, due 08/08/112,3 | | | 1,000,000 | | | | 999,981 | | |
| 0.180%, due 10/11/11 | | | 3,000,000 | | | | 2,998,935 | | |
| Credit Suisse | |
| 0.190%, due 08/17/11 | | | 3,000,000 | | | | 2,999,747 | | |
| 0.190%, due 10/12/11 | | | 1,000,000 | | | | 999,620 | | |
| Dnb NOR ASA | |
| 0.130%, due 08/05/11 | | | 5,000,000 | | | | 4,999,928 | | |
| Kreditanstalt für Wiederaufbau | |
| 0.140%, due 09/08/11 | | | 3,000,000 | | | | 2,999,557 | | |
| Sumitomo Mitsui Banking Corp. | |
| 0.180%, due 08/08/11 | | | 3,000,000 | | | | 2,999,895 | | |
| Svenska Handelsbanken, Inc. | |
| 0.250%, due 12/14/11 | | | 5,000,000 | | | | 4,995,312 | | |
| Westpac Securities NZ Ltd. | |
| 0.284%, due 09/01/112,3 | | | 1,250,000 | | | | 1,250,000 | | |
| | | | | | 25,242,975 | | |
| Banking-US—10.82% | |
| Barclays US Funding Corp. | |
| 0.130%, due 08/01/11 | | | 5,000,000 | | | | 5,000,000 | | |
| 0.210%, due 08/17/11 | | | 5,000,000 | | | | 4,999,533 | | |
11
PACE Money Market Investments
Statement of net assets—July 31, 2011
| Security description | | Face
amount | | Value | |
| Commercial paper1—(concluded) | |
| Banking-US—(concluded) | |
| Deutsche Bank Financial LLC | |
| 0.100%, due 08/01/11 | | $ | 5,000,000 | | | $ | 5,000,000 | | |
| 0.200%, due 10/03/11 | | | 3,000,000 | | | | 2,998,950 | | |
| ING (US) Funding LLC | |
| 0.240%, due 08/05/11 | | | 3,000,000 | | | | 2,999,920 | | |
| 0.160%, due 08/09/11 | | | 3,000,000 | | | | 2,999,893 | | |
| 0.360%, due 11/03/11 | | | 3,000,000 | | | | 2,997,180 | | |
| JPMorgan Chase & Co. | |
| 0.150%, due 09/07/11 | | | 3,000,000 | | | | 2,999,538 | | |
| Natixis US Finance Co. LLC | |
| 0.250%, due 09/12/11 | | | 3,000,000 | | | | 2,999,125 | | |
| Nordea N.A., Inc. | |
| 0.230%, due 12/07/11 | | | 2,000,000 | | | | 1,998,364 | | |
| Societe Generale N.A., Inc. | |
| 0.210%, due 08/01/11 | | | 1,575,000 | | | | 1,575,000 | | |
| State Street Bank & Trust Co. | |
| 0.150%, due 10/13/11 | | | 3,000,000 | | | | 2,999,088 | | |
| | | | | | 39,566,591 | | |
| Diversified manufacturing—1.91% | |
| General Electric Co. | |
| 0.100%, due 08/05/11 | | | 7,000,000 | | | | 6,999,922 | | |
| Finance-captive automotive—1.37% | |
| Toyota Motor Credit Corp. | |
| 0.160%, due 08/10/11 | | | 5,000,000 | | | | 4,999,800 | | |
| Insurance-life—2.19% | |
| Axa Financial, Inc. | |
| 0.160%, due 08/11/11 | | | 3,000,000 | | | | 2,999,867 | | |
| MetLife Short Term Funding LLC | |
| 0.140%, due 08/01/11 | | | 2,000,000 | | | | 2,000,000 | | |
| 0.150%, due 09/14/11 | | | 3,000,000 | | | | 2,999,450 | | |
| | | | | | 7,999,317 | | |
| Total commercial paper (cost—$150,854,645) | | | | | 150,854,645 | | |
12
PACE Money Market Investments
Statement of net assets—July 31, 2011
| Security description | | Face
amount | | Value | |
| Short-term corporate obligations—1.50% | |
| Banking-non-US—1.09% | |
| Svenska Handelsbanken, Inc. | |
| 0.292%, due 09/08/112,3 | | $ | 2,500,000 | | | $ | 2,500,000 | | |
| Westpac Securities NZ Ltd. | |
| 0.355%, due 08/04/112,3 | | | 1,500,000 | | | | 1,500,000 | | |
| | | | | | 4,000,000 | | |
| Banking-US—0.41% | |
| JPMorgan Chase Bank N.A. | |
| 0.275%, due 09/09/112 | | | 1,500,000 | | | | 1,500,000 | | |
| Total short-term corporate obligations (cost—$5,500,000) | | | | | 5,500,000 | | |
| Repurchase agreements—21.34% | |
Repurchase agreement dated 07/29/11 with
Barclays Bank PLC, 0.140% due 08/01/11,
collateralized by $8,824,000 Federal Farm
Credit Bank obligations, 1.875% due 12/07/12
and $11,396,000 Federal National Mortgage
Association obligations, zero coupon due 05/01/12;
(value—$20,400,564); proceeds: $20,000,233 | | | 20,000,000 | | | | 20,000,000 | | |
Repurchase agreement dated 07/29/11 with
Deutsche Bank Securities, 0.180% due 08/01/11,
collateralized by $59,100,000 Federal Home Loan
Bank obligations, 0.320% due 12/09/11;
(value—$59,162,318); proceeds: $58,000,870 | | | 58,000,000 | | | | 58,000,000 | | |
Repurchase agreement dated 07/29/11 with
State Street Bank & Trust Co., 0.010% due
08/01/11, collateralized by $370 Federal Home
Loan Mortgage Corp. obligations, 5.125%
due 07/15/12 and $81,406 US Treasury Bills,
zero coupon due 08/04/11 to 07/26/12;
(value—$81,632); proceeds: $80,000 | | | 80,000 | | | | 80,000 | | |
| Total repurchase agreements (cost—$78,080,000) | | | | | 78,080,000 | | |
Total investments (cost—$354,781,978
which approximates cost for federal income
tax purposes)—96.98% | | | | | 354,781,978 | | |
| Other assets in excess of liabilities—3.02% | | | | | 11,061,651 | | |
Net assets (applicable to 365,845,932
shares of beneficial interest outstanding
equivalent to $1.00 per share)—100.00% | | | | $ | 365,843,629 | | |
13
PACE Money Market Investments
Statement of net assets—July 31, 2011
* On September 7, 2008, the Federal Housing Finance Agency placed the Federal National Mortgage Association and the Federal Home Loan Mortgage Corporation into conservatorship, and the US Treasury guaranteed the debt issued by those organizations.
1 Rates shown are the discount rates at date of purchase.
2 Variable or floating rate security. The interest rate shown is the current rate as of July 31, 2011 and changes periodically. The maturity date reflects earlier of reset date or stated maturity date.
3 Security exempt from registration pursuant to Rule 144A under the Securities Act of 1933. These securities, which represent 1.71% of net assets as of July 31, 2011, are considered liquid and may be resold in transactions exempt from registration, normally to qualified institutional buyers.
Affiliated issuer activity
The table below details the Portfolio's transaction activity in an affiliated issuer during the year ended July 31, 2011. The investment manager earns a management fee from UBS Private Money Market Fund LLC.
Security
description | | Value at
07/31/10 | | Purchases
during the
year ended
07/31/11 | | Sales
during the
year ended
07/31/11 | | Value at
07/31/11 | | Net income
earned from
affiliate for
the year
ended
07/31/11 | |
UBS Private Money
Market Fund LLC | | $ | — | | | $ | 5,865,000 | | | $ | 5,865,000 | | | $ | — | | | $ | 24 | | |
14
PACE Money Market Investments
Statement of net assets—July 31, 2011
The following is a summary of the fair valuations according to the inputs used as of July 31, 2011 in valuing the Portfolio's investments:
| | | Unadjusted
quoted prices
in active
markets for
identical
investments
(Level 1) | | Other
significant
observable
inputs
(Level 2) | | Unobservable
inputs
(Level 3) | | Total | |
US government and
agency obligations | | $ | — | | | $ | 72,097,367 | | | $ | — | | | $ | 72,097,367 | | |
| Bank note | | | | | 3,000,000 | | | | | | 3,000,000 | | |
| Certificates of deposit | | | | | 45,249,966 | | | | | | 45,249,966 | | |
| Commercial paper | | | | | 150,854,645 | | | | | | 150,854,645 | | |
Short-term corporate
obligations | | | | | 5,500,000 | | | | | | 5,500,000 | | |
| Repurchase agreements | | | | | 78,080,000 | | | | | | 78,080,000 | | |
| Total | | $ | — | | | $ | 354,781,978 | | | $ | — | | | $ | 354,781,978 | | |
Issuer breakdown by country of origin (unaudited)
| | | Percentage of
total investments | |
| United States | | | 76.8 | % | |
| Canada | | | 5.2 | | |
| United Kingdom | | | 4.2 | | |
| Japan | | | 3.1 | | |
| Australia | | | 2.9 | | |
| Sweden | | | 2.1 | | |
| Norway | | | 2.0 | | |
| Switzerland | | | 1.1 | | |
| Germany | | | 0.8 | | |
| France | | | 0.8 | | |
| Finland | | | 0.7 | | |
| Netherlands | | | 0.3 | | |
| Total | | | 100.0 | % | |
Weighted average maturity—47 days
See accompanying notes to financial statements
15
PACE Money Market Investments
Statement of operations
| | | For the
year ended
July 31, 2011 | |
| Investment income: | |
| Interest | | $ | 947,570 | | |
Securities lending income (includes $24 earned from an
affiliated entity) | | | 381 | | |
| | | | 947,951 | | |
| Expenses: | |
| Transfer agency and related services fees | | | 1,533,469 | | |
| Investment management and administration fees | | | 1,267,950 | | |
| Reports and notices to shareholders | | | 114,198 | | |
| Professional fees | | | 111,301 | | |
| Custody and accounting fees | | | 48,853 | | |
| State registration fees | | | 39,789 | | |
| Trustees' fees | | | 19,157 | | |
| Insurance expense | | | 9,984 | | |
| Other expenses | | | 25,163 | | |
| | | | 3,169,864 | | |
Fee waivers and/or expense reimbursements by investment
manager and administrator | | | (2,258,176 | ) | |
| Net expenses | | | 911,688 | | |
| Net investment income | | | 36,263 | | |
| Net realized loss | | | (659 | ) | |
| Net increase in net assets resulting from operations | | $ | 35,604 | | |
See accompanying notes to financial statements
16
PACE Money Market Investments
Statement of changes in net assets
| | | For the years ended July 31, | |
| | | 2011 | | 2010 | |
| From operations: | |
| Net investment income | | $ | 36,263 | | | $ | 43,561 | | |
| Net realized losses | | | (659 | ) | | | (94 | ) | |
| Net increase in net assets resulting from operations | | | 35,604 | | | | 43,467 | | |
| Dividends and distributions to shareholders from: | |
| Net investment income | | | (36,263 | ) | | | (43,561 | ) | |
| Net realized gains | | | (1,389 | ) | | | (10,489 | ) | |
| Total dividends and distributions to shareholders | | | (37,652 | ) | | | (54,050 | ) | |
| From beneficial interest transactions: | |
Net decrease in net assets from beneficial
interest transactions | | | (20,371,521 | ) | | | (143,730,728 | ) | |
| Net decrease in net assets | | | (20,373,569 | ) | | | (143,741,311 | ) | |
| Net assets: | |
| Beginning of year | | | 386,217,198 | | | | 529,958,509 | | |
| End of year | | $ | 365,843,629 | | | $ | 386,217,198 | | |
| Accumulated undistributed net investment income | | $ | — | | | $ | — | | |
See accompanying notes to financial statements
17
PACE Money Market Investments
Financial highlights
Selected data for a share of beneficial interest outstanding throughout each year is presented below:
| | | Years ended July 31, | |
| | | 2011 | | 2010 | | 2009 | | 2008 | | 2007 | |
Net asset value,
beginning of year | | $ | 1.00 | | | $ | 1.00 | | | $ | 1.00 | | | $ | 1.00 | | | $ | 1.00 | | |
| Net investment income | | | 0.000 | 1 | | | 0.000 | 1 | | | 0.008 | | | | 0.033 | | | | 0.048 | | |
Dividends from net
investment income | | | (0.000 | )1 | | | (0.000 | )1 | | | (0.008 | ) | | | (0.033 | ) | | | (0.048 | ) | |
Distributions from net
realized gains | | | (0.000 | )1 | | | (0.000 | )1 | | | (0.000 | )1 | | | — | | | | — | | |
Total dividends and
distributions | | | (0.000 | )1 | | | (0.000 | )1 | | | (0.008 | ) | | | (0.033 | ) | | | (0.048 | ) | |
Net asset value,
end of year | | $ | 1.00 | | | $ | 1.00 | | | $ | 1.00 | | | $ | 1.00 | | | $ | 1.00 | | |
Total investment
return2 | | | 0.01 | % | | | 0.01 | % | | | 0.81 | % | | | 3.40 | % | | | 4.86 | % | |
Ratios to average
net assets: | |
Expenses before fee
waivers and/or expense
reimbursements by
manager | | | 0.88 | % | | | 0.90 | % | | | 0.89 | % | | | 0.93 | % | | | 0.92 | % | |
Expenses after fee
waivers and/or expense
reimbursements by
manager | | | 0.25 | % | | | 0.27 | % | | | 0.59 | % | | | 0.60 | % | | | 0.60 | % | |
| Net investment income | | | 0.01 | % | | | 0.01 | % | | | 0.78 | % | | | 3.27 | % | | | 4.75 | % | |
| Supplemental data: | |
Net assets, end of
year (000's) | | $ | 365,844 | | | $ | 386,217 | | | $ | 529,959 | | | $ | 523,243 | | | $ | 408,562 | | |
1 Amount represents less than $0.0005 per share.
2 Total investment return is calculated assuming a $10,000 investment on the first day of each year reported, reinvestment of all dividends and other distributions, if any, at net asset value on the payable dates, and a sale at net asset value on the last day of each year reported. The figures do not include program fees; results would be lower if these fees were included. Returns do not reflect the deduction of taxes that a shareholder would pay on Portfolio distributions.
See accompanying notes to financial statements
18
PACE Money Market Investments
Notes to financial statements
Organization and significant accounting policies—PACE Money Market Investments (the "Portfolio") is a diversified portfolio of PACE Select Advisors Trust (the "Trust"), which was organized as a Delaware statutory trust under the laws of the State of Delaware by Certificate of Trust dated September 9, 1994, as amended June 9, 1995 and thereafter, and is registered with the US Securities and Exchange Commission ("SEC") under the Investment Company Act of 1940, as amended, as an open-end management investment company. The trustees of the Trust have authority to issue an unlimited number of shares of beneficial interest, par value $0.001 per share.
Effective November 22, 2010, the names of the Trust and the Portfolio have been changed as indicated below:
| Former name | | Current name | |
| UBS PACE® Select Advisors Trust | | PACE® Select Advisors Trust | |
|
| UBS PACE® Money Market Investments | | PACE® Money Market Investments | |
|
The Trust has fifteen Portfolios available for investment, each having its own investment objectives and policies. Shares of the Portfolio currently are available only to participants in the PACESM Select Advisors Program and the PACESM Multi Advisor Program.
The Trust accounts separately for the assets, liabilities and operations of each Portfolio. Expenses directly attributable to each Portfolio are charged to that Portfolio's operations; expenses which are applicable to all Portfolios are allocated among them on a pro rata basis.
In the normal course of business, the Portfolio may enter into contracts that contain a variety of representations or that provide indemnification for certain liabilities. The Portfolio's maximum exposure under these arrangements is unknown, as this would involve future claims that may be made against the Portfolio that have not yet occurred. However, the Portfolio has not had prior claims or losses pursuant to these contracts and expects the risk of loss to be remote.
19
PACE Money Market Investments
Notes to financial statements
The Portfolio attempts to maintain a stable net asset value of $1.00 per share; the Portfolio has adopted certain investment, portfolio valuation and dividend/distribution policies in an attempt to enable it to do so. As with any money market portfolio, there is no assurance, however, that the Portfolio will be able to maintain a stable net asset value of $1.00 per share.
The Financial Accounting Standards Board ("FASB") Accounting Standards Codification ("ASC") is the exclusive reference of authoritative US generally accepted accounting principles ("GAAP") recognized by the FASB to be applied by nongovernmental entities. Rules and interpretive releases of the SEC under authority of federal laws are also sources of authoritative GAAP for SEC registrants. The Portfolio's financial statements are prepared in accordance with GAAP, which may require the use of management estimates and assumptions. Actual results could differ from those estimates. The following is a summary of significant accounting policies:
Valuation of investments—Investments are valued at amortized cost. Periodic review and monitoring of the valuation of the securities held by the Portfolio is performed in an effort to ensure that amortized cost approximates market value.
GAAP requires disclosure surrounding the various inputs that are used in determining the value of the Portfolio's investments. These inputs are summarized into the three broad levels listed below:
Level 1—Unadjusted quoted prices in active markets for identical investments.
Level 2—Other significant observable inputs, including but not limited to, quoted prices for similar investments, interest rates, prepayment speeds and credit risks.
Level 3—Unobservable inputs inclusive of the Portfolio's own assumptions in determining the fair value of investments.
In accordance with the requirements of GAAP, a fair value hierarchy has been included near the end of the Portfolio's Statement of net assets.
20
PACE Money Market Investments
Notes to financial statements
In January 2010, FASB issued Accounting Standards Update No. 2010-06 "Improving Disclosures about Fair Value Measurements" ("ASU 2010-06"). ASU 2010-06 will require reporting entities to make new disclosures about amounts and reasons for significant transfers in and out of Level 1 and Level 2 fair value measurements as well as inputs and valuation techniques used to measure fair value for both recurring and nonrecurring fair value measurements that fall in either Level 2 or Level 3, and information on purchases, sales, issuances and settlements on a gross basis in the reconciliation of activity in Level 3 fair value measurements. The new and revised disclosures have been implemented for annual and interim periods beginning after December 15, 2009 except for the disclosures surrounding purchases, sales, issuances and settlements on a gross basis in the reconciliation of Level 3 fair value measurements, which have been implemented for annual and interim periods beginning after December 15, 2010.
In May 2011, FASB Issued ASU No. 2011-04 "Amendments to Achieve Common Fair Value Measurement and Disclosure Requirements in US GAAP and International Financial Reporting Standards ("IFRS")" ("ASU 2011-04"). ASU 2011-04 includes common requirements for measurement of and disclosure about fair value between US GAAP and IFRS. ASU 2011-04 will require reporting entities to disclose the following information for fair value measurements categorized within Level 3 of the fair value hierarchy: quantitative information about the unobservable inputs used in the fair value measurement, the valuation processes used by the reporting entity and a narrative description of the sensitivity of the fair value measurement to changes in unobservable inputs and the interrelationships between those unobservable inputs. In addition, ASU 2011-04 will require reporting entities to make disclosure about amounts and reasons for all transfers in and out of Level 1 and Level 2 fair value measurements. The new and revised disclosures are effective for interim and annual reporting periods beginning after December 15, 2011. At this time, management is evaluating the implications of ASU 2011-04 and its impact on the financial statements.
Repurchase agreements—The Portfolio may purchase securities or other obligations from a bank or securities dealer (or its affiliate),
21
PACE Money Market Investments
Notes to financial statements
subject to the seller's agreement to repurchase them at an agreed upon date (or upon demand) and price. The Portfolio maintains custody of the underlying obligations prior to their repurchase, either through its regular custodian or through a special "tri-party" custodian or sub-custodian that maintains a separate account for both the Portfolio and its counterparty. The underlying collateral is valued daily to ensure that the value, including accrued interest, is at least equal to the repurchase price. In the event of default of the obligation to repurchase, the Portfolio generally has the right to liquidate the collateral and apply the proceeds in satisfaction of the obligation. Repurchase agreements involving obligations other than US government securities (such as commercial paper, corporate bonds, equities and mortgage loans) may be subject to special risks and may not have the benefit of certain protections in the event of counterparty insolvency. If the seller (or seller's guarantor, if any) becomes insolvent, the Portfolio may suffer delays, costs and possible losses in connection with the disposition or retention of the collateral. Under certain circumstances, in the event of default or bankruptcy by the other party to the agreement, realization and/or retention of the collateral may be subject to legal proceedings. The Portfolio may participate in joint repurchase agreement transactions with other funds managed, advised or sub-advised by UBS Global Asset Management (Americas) Inc. ("UBS Global AM").
Under certain circumstances, the Portfolio may engage in a repurchase agreement transaction with a yield of zero in order to invest cash amounts remaining in its portfolio at the end of the day in order to avoid having the Portfolio assessed a fee for uninvested cash held in a business account at a bank.
Investment transactions and investment income—Investment transactions are recorded on the trade date. Realized gains and losses from investment transactions are calculated using the identified cost method. Interest income is recorded on an accrual basis. Discounts are accreted and premiums are amortized as adjustments to interest income and the identified cost of investments.
22
PACE Money Market Investments
Notes to financial statements
Dividends and distributions—Dividends and distributions to shareholders are recorded on the ex-dividend date. The amount of dividends and distributions is determined in accordance with federal income tax regulations, which may differ from GAAP. These "book/tax" differences are either considered temporary or permanent in nature. To the extent these differences are permanent in nature, such amounts are reclassified within the capital accounts based on their federal tax-basis treatment; temporary differences do not require reclassification.
Concentration of risk—The ability of the issuers of debt securities held by the Portfolio to meet their obligations may be affected by economic and political developments, including those particular to a specific industry, country, state or region.
Investment management and administration fees and other transactions with affiliates—The Portfolio's Board of Trustees has approved an investment management and administration contract ("Management Contract") with UBS Global AM. In accordance with the Management Contract, the Portfolio pays UBS Global AM an investment management and administration fee, which is accrued daily and paid monthly, at an annual rate of 0.35% of the Portfolio's average daily net assets. At July 31, 2011, the Portfolio is owed $112,635 from UBS Global AM, representing investment management and administration fees net of fee waivers/expense reimbursements.
UBS Global AM has contractually undertaken to waive a portion of the Portfolio's investment management and administration fees and/or reimburse a portion of the Portfolio's other expenses, when necessary, to maintain the total ordinary annual operating expenses (excluding dividend expense, borrowing costs and interest expense, if any) through November 28, 2011 at a level not to exceed 0.60%. The Portfolio will make a payment to UBS Global AM for any previously waived fees/reimbursed expenses during the following three fiscal years to the extent that operating expenses are otherwise below the expense cap.
23
PACE Money Market Investments
Notes to financial statements
At July 31, 2011, the Portfolio had fee waivers/expense reimbursements subject to repayment and respective dates of expiration as follows:
Fee waivers/expense
reimbursements
subject to repayment | | Expires
July 31,
2012 | | Expires
July 31,
2013 | | Expires
July 31,
2014 | |
| $ | 3,988,289 | | | $ | 1,729,334 | | | $ | 1,262,723 | | | $ | 996,232 | | |
Additionally, UBS Global AM may voluntarily waive fees and/or reimburse expenses from time to time in the event that the Portfolio's yield falls below a certain level. Once started, there is no guarantee that UBS Global AM would continue to voluntarily waive an additional portion of its fees and/or reimburse expenses. For the year ended July 31, 2011, UBS Global AM voluntarily waived and/or reimbursed expenses of $1,261,944 for that purpose.
For the year ended July 31, 2011, UBS Global AM waived fees/reimbursed expenses, in total, of $2,258,176.
Additional information regarding compensation to affiliate of a board member
Professor Meyer Feldberg serves as a senior advisor to Morgan Stanley, a financial services firm with which the Portfolio may conduct transactions, resulting in him being an interested trustee of the Portfolio. The Portfolio has been informed that Professor Feldberg's role at Morgan Stanley does not involve matters directly affecting any UBS funds. Portfolio transactions are executed through Morgan Stanley based on that firm's ability to provide best execution of the transactions. During the year ended July 31, 2011, the Portfolio purchased and sold certain securities (e.g., fixed income securities) in principal trades with Morgan Stanley, having an aggregate value of $198,963,243. Morgan Stanley received compensation in connection with these trades, which may have been in the form of a "mark-up" or "mark-down" of the price of the securities, a fee from the issuer for maintaining a commercial paper program, or some other form of compensation. Although the precise amount of this compensation is not generally
24
PACE Money Market Investments
Notes to financial statements
known by the Portfolio's investment manager, it is believed that under normal circumstances it represents a small portion of the total value of the transactions.
Transfer agency related services
UBS Financial Services Inc. provides certain services to the Portfolio pursuant to a delegation of authority from BNY Mellon Investment Servicing (US) Inc. ("BNY Mellon"), the Portfolio's transfer agent, and is compensated for these services by BNY Mellon, not the Portfolio .
For the year ended July 31, 2011, UBS Financial Services, Inc. received from BNY Mellon, not the Portfolio, $768,376 of the total transfer agency and related services fees paid by the Portfolio to BNY Mellon.
Securities lending
The Portfolio may lend securities up to 331/3% of its total assets to qualified broker-dealers or institutional investors. The loans are secured at all times by cash, US government securities or irrevocable letters of credit in an amount at least equal to the market value of the securities loaned, plus accrued interest and dividends, determined on a daily basis and adjusted accordingly. The Portfolio will regain ownership of loaned securities to exercise certain beneficial rights; however, the Portfolio may bear the risk of delay in recovery of, or even loss of rights in, the securities loaned should the borrower fail financially. The Portfolio receives compensation for lending its securities from interest or dividends earned on the cash, US government securities or irrevocable letters of credit held as collateral, net of fee rebates paid to the borrower plus reasonable administrative and custody fees. State Street Bank and Trust Company serves as the Portfolio's lending agent. At July 31, 2011, the Portfolio did not have any securities on loan.
25
PACE Money Market Investments
Notes to financial statements
Other liabilities and components of net assets
At July 31, 2011, the Portfolio had the following liabilities outstanding:
| Payable for shares of beneficial interest repurchased | | $ | 1,154,661 | | |
| Dividends payable to shareholders | | | 1,260 | | |
| Other accrued expenses* | | | 436,543 | | |
* Excludes investment management and administration fees.
At July 31, 2011, the components of net assets were as follows:
| Accumulated paid in capital | | $ | 365,845,642 | | |
| Accumulated net realized loss | | | (2,013 | ) | |
| Net assets | | $ | 365,843,629 | | |
Shares of beneficial interest
There is an unlimited amount of $0.001 par value shares of beneficial interest authorized. Transactions in shares of beneficial interest, at $1.00 per share, were as follows:
| | | For the years ended July 31, | |
| | | 2011 | | 2010 | |
| Shares sold | | | 359,119,509 | | | | 409,092,964 | | |
| Shares repurchased | | | (379,510,934 | ) | | | (552,857,220 | ) | |
| Dividends reinvested | | | 19,904 | | | | 33,528 | | |
| Net decrease in shares outstanding | | | (20,371,521 | ) | | | (143,730,728 | ) | |
Federal tax status
The Portfolio intends to distribute substantially all of its income and to comply with the other requirements of the Internal Revenue Code applicable to regulated investment companies. Accordingly, no provision for federal income taxes is required. In addition, by distributing during each calendar year substantially all of its net investment income, net realized capital gains and certain other amounts, if any, the Portfolio intends not to be subject to a federal excise tax.
26
PACE Money Market Investments
Notes to financial statements
The tax character of distributions paid to shareholders by the Portfolio during the fiscal years ended July 31, 2011 and July 31, 2010 was ordinary income.
At July 31, 2011 the components of accumulated deficit on a tax basis was accumulated capital and other losses of $(753).
As of and during the year ended July 31, 2011, the Portfolio did not have any liabilities for any uncertain tax positions. The Portfolio recognizes interest and penalties, if any, related to uncertain tax positions as income tax expense in the Statement of operations. During the year ended July 31, 2011, the Portfolio did not incur any interest or penalties.
Each of the tax years in the four year period ended July 31, 2011, remains subject to examination by the Internal Revenue Service and state taxing authorities.
27
PACE Money Market Investments
Report of Ernst & Young LLP, independent registered public accounting firm
The Board of Trustees and Shareholders of
PACE Select Advisors Trust
We have audited the accompanying statement of net assets of PACE Money Market Investments (one of the series comprising PACE Select Advisors Trust) (the "Portfolio") as of July 31, 2011, and the related statement of operations for the year then ended, the statement of changes in net assets for each of the two years in the period then ended, and the financial highlights for each of the five years in the period then ended. These financial statements and financial highlights are the responsibility of the Portfolio's management. Our responsibility is to express an opinion on these financial statements and financial highlights based on our audits.
We conducted our audits in accordance with the standards of the Public Company Accounting Oversight Board (United States). Those standards require that we plan and perform the audit to obtain reasonable assurance about whether the financial statements and financial highlights are free of material misstatement. We were not engaged to perform an audit of the Portfolio's internal control over financial reporting. Our audits included consideration of internal control over financial reporting as a basis for designing audit procedures that are appropriate in the circumstances, but not for the purpose of expressing an opinion on the effectiveness of the Portfolio's internal control over financial reporting. Accordingly, we express no such opinion. An audit also includes examining, on a test basis, evidence supporting the amounts and disclosures in the financial statements and financial highlights, assessing the accounting principles used and significant estimates made by management, and evaluating the overall financial statement presentation. Our procedures included confirmation of securities owned as of July 31, 2011, by correspondence with the custodian and others, or by other appropriate auditing procedures where replies from others were not received. We believe that our audits provide a reasonable basis for our opinion.
In our opinion, the financial statements and financial highlights referred to above present fairly, in all material respects, the financial position of
28
PACE Money Market Investments
Report of Ernst & Young LLP, independent registered public accounting firm (concluded)
PACE Money Market Investments at July 31, 2011, the results of its operations for the year then ended, the changes in its net assets for each of the two years in the period then ended, and the financial highlights for each of the five years in the period then ended, in conformity with US generally accepted accounting principles.

New York, New York
September 29, 2011
29
PACE Money Market Investments
General information (Unaudited)
Monthly and quarterly portfolio holdings disclosure
The Portfolio will file its complete schedule of portfolio holdings with the Securities and Exchange Commission ("SEC") for the first and third quarters of each fiscal year on Form N-Q. The Portfolio's Forms N-Q are available on the SEC's Web site at http://www.sec.gov. The Portfolio's Forms N-Q may be reviewed and copied at the SEC's Public Reference Room in Washington, D.C. Information on the operation of the SEC's Public Reference Room may be obtained by calling 1-800-SEC 0330. Additionally, you may obtain copies of Forms N-Q from the Portfolio upon request by calling 1-800-647 1568.
In addition, the Portfolio discloses, on a monthly basis: (a) a complete schedule of its portfolio holdings; and (b) information regarding its weighted average maturity and weighted average life on UBS's Web site at the following internet address: www.ubs.com/ usmoneymarketfundsholdings. In addition, at this location, you will find a link to more detailed Portfolio information appearing in filings with the SEC on Form N-MFP.
Proxy voting policies, procedures and record
You may obtain a description of the Portfolio's (1) proxy voting policies, (2) proxy voting procedures and (3) information regarding how the Portfolio voted any proxies related to portfolio securities during the most recent 12-month period ended June 30 for which an SEC filing has been made, without charge, upon request by contacting the Portfolio directly at 1-800-647 1568, online on the Portfolio's Web site: www.ubs.com/ubsglobalam-proxy, or on the EDGAR Database on the SEC's Web site (http://www.sec.gov).
Other tax information
Pursuant to Section 871(k)(2)(C) of the Internal Revenue Code, PACE Money Market Investments designates 100% of its "qualified short-term gains" (as defined in Section 871(k)(2)(D)) related to the distribution made in December 2010 as short-term capital gain dividends.
30
PACE Money Market Investments
Board approval of investment management and administration agreement (unaudited)
Background—At a meeting of the board of PACE Select Advisors Trust (the "Trust") on July 19-20, 2011, the members of the board, including the trustees who are not "interested persons" of the Trust ("Independent Trustees"), as defined in the Investment Company Act of 1940, as amended (the "1940 Act"), considered and approved the continuance of the investment management and administration agreement (the "Investment Management and Administration Agreement") between UBS Global Asset Management (Americas) Inc. ("UBS Global AM") and the Trust, on behalf of PACE Money Market Investments (the "Portfolio"). In preparing for the meeting, the board members had requested and received extensive information from UBS Global AM to assist them, including performance and expense information for other investment companies with similar investment objectives as the Portfolio. The Independent Trustees discussed the materials initially provided by management prior to the scheduled board meeting. The Independent Trustees also met in executive session to review the disclosure that had been made to them at the meeting. At all of these sessions the Independent Trustees were joined by their independent legal counsel. The Independent Trustees also received a memorandum from their independent legal counsel discussing the duties of board members in considering approval of management, administration and distribution agreements.
In its consideration of the approval of the Investment Management and Administration Agreement, the board considered the following factors:
Nature, extent and quality of the services under the Investment Management and Administration Agreement—The board received and considered information regarding the nature, extent and quality of management services provided to the Portfolio by UBS Global AM. The board also considered the nature, extent and quality of administrative, distribution, and shareholder services performed by UBS Global AM and its affiliates for the Portfolio and the resources devoted to, and the record of compliance with, the Portfolio's compliance policies and procedures. The board noted that it received information at regular meetings throughout the year regarding the
31
PACE Money Market Investments
Board approval of investment management and administration agreement (unaudited)
services rendered by UBS Global AM concerning the management of the Portfolio's affairs and UBS Global AM's role in coordinating providers of other services to the Portfolio. The board's evaluation of the services provided by UBS Global AM took into account the board's knowledge and familiarity gained as board members of funds in the UBS New York fund complex, including the scope and quality of UBS Global AM's investment management and other capabilities and the quality of its administrative and other services. The board observed that the scope of services provided by UBS Global AM had expanded over time as a result of regulatory and other developments, including maintaining and monitoring its own and the Portfolio's expanded compliance programs. It also was noted that the Investment Management and Administration Agreement under consideration had been approved by shareholders at a special meeting of shareholders held in 2008.
The board had available to it the qualifications, backgrounds and responsibilities of the senior personnel at UBS Global AM responsible for the Portfolio and had previously received information regarding the person primarily responsible for the day-to-day portfolio management of the Portfolio and recognized that the Portfolio's senior personnel at UBS Global AM report to the board regularly and that at each regular meeting the board receives a detailed report on the Portfolio's performance. The board also considered, based on its knowledge of UBS Global AM and its affiliates, the financial resources available to UBS Global AM and its parent organization, UBS AG. In that regard, the board received extensive financial information regarding UBS Global AM and noted that it was a wholly owned, indirect subsidiary of one of the largest financial services firms in the world. It was also noted that UBS Global AM had approximately $152 billion in assets under management as of March 31, 2011 and was part of the UBS Global Asset Management Division, which had approximately $621 billion in assets under management worldwide as of March 31, 2011. The board was also cognizant of, and considered, the regulatory and litigation actions and investigations occurring in the past few years involving UBS AG, UBS Global AM and certain of their affiliates.
32
PACE Money Market Investments
Board approval of investment management and administration agreement (unaudited)
The board concluded that, overall, it was satisfied with the nature, extent and quality of services provided (and expected to be provided) to the Portfolio under the Investment Management and Administration Agreement.
Management fees and expense ratios—The board reviewed and considered the contractual management fee (the "Contractual Management Fee") payable by the Portfolio to UBS Global AM in light of the nature, extent and quality of the management and administrative services provided by UBS Global AM. The board also reviewed and considered the fee waiver and/or expense reimbursement arrangements for the Portfolio and considered the actual fee rate (after taking any waivers and reimbursements into account) (the "Actual Management Fee"). The board considered that UBS Global AM had entered into an agreement with the Portfolio under which UBS Global AM was contractually obligated to waive its management fees and/or reimburse the Portfolio so that the total ordinary operating expenses of the Portfolio through November 28, 2011 (excluding dividend expense, borrowing costs, interest, taxes and extraordinary expenses) would not exceed a specified limit. The board also considered that the Portfolio had agreed to repay UBS Global AM for those waived fees and/or reimbursed expenses if the Portfolio can do so over the following three fiscal years without causing its expenses in any of those years to exceed the expense cap. Additionally, the board received and considered information comparing the Portfolio's Contractual Management Fee, Actual Management Fee and overall expenses with those of funds in a group of funds selected and provided by Lipper, Inc. ("Lipper"), an independent provider of investment company data (the "Expense Group"). The board also noted that it had received supplemental information relating to net and gross fund yields and certain expense information for UBS money market funds, including the Portfolio, as compared to peers in the respective Expense Group.
In connection with its consideration of the Portfolio's management fees, the board also received information from UBS Global AM with
33
PACE Money Market Investments
Board approval of investment management and administration agreement (unaudited)
respect to fees paid by institutional or separate accounts; however, in management's view, such fee information was not very relevant to the Portfolio because, among other reasons, separately managed and institutional accounts with a "cash" mandate (a) were not subject to all of the constraints of Rule 2a-7 under the 1940 Act to which the Portfolio is subject and (b) do not involve the management responsibilities attendant to the operation of a 1940 Act regulated fund, and, therefore, were not totally comparable. The board also received information on fees charged to other mutual funds managed by UBS Global AM.
The comparative Lipper information showed that the Portfolio's Contractual Management Fee was in the second quintile, its Actual Management Fee was in the first quintile and its total expenses were in the third quintile in the Portfolio's Expense Group for the comparison periods utilized in the Lipper report. (The first quintile represents that 20% of the funds in the Expense Group with the lowest fees or expenses, as applicable, and the fifth quintile represents that 20% of the funds in the Expense Group with the highest fees or expenses, as applicable.)
In light of the foregoing, the board determined that the proposed contractual management fee payable by the Portfolio to UBS Global AM was reasonable in light of the nature, extent and quality of services expected to be provided to the Portfolio under the Investment Management and Administration Agreement.
Portfolio performance—The board received and considered (a) annualized total return information of the Portfolio compared to other funds (the "Performance Universe") selected by Lipper over the one-, three-, five-, ten-year and since inception periods ended April 30, 2011 and (b) annualized performance information for each year in the ten-year period ended April 30, 2011. The board was provided with a description of the methodology Lipper used to determine the similarity of the Portfolio with the funds included in its Performance Universe. The board also noted that it had received information throughout the year at periodic intervals with respect to the Portfolio's
34
PACE Money Market Investments
Board approval of investment management and administration agreement (unaudited)
performance. The comparative Lipper information showed that the Portfolio's performance was in the second quintile for the one- and ten-year periods and since inception and in the third quintile for the three- and five-year periods. (The first quintile represents that 20% of the funds in the Performance Universe with the best relative performance, and the fifth quintile represents that 20% of the funds in the Performance Universe with the worst relative performance.)
Advisor profitability—The board received and considered a profitability analysis of UBS Global AM and its affiliates in providing services to the Portfolio. The board also received profitability information with respect to the UBS New York fund complex as a whole. UBS Global AM's profitability was considered not excessive in light of the nature, extent and quality of the services provided to the Portfolio.
Economies of scale—The board received and considered information from management regarding whether UBS Global AM realized economies of scale as the Portfolio's assets grew, whether the Portfolio has appropriately benefited from any economies of scale, and whether there is potential for realization of any further economies of scale for the Portfolio. The board considered whether economies of scale in the provision of services to the Portfolio were being passed along to the shareholders. The board noted that the Portfolio's Contractual Management Fee did not contain breakpoints. The board also noted that to the extent the Portfolio's assets increase over time, it will realize economies of scale as certain expenses, such as fees for trustees, auditor and legal fees and printing and postage, become a smaller percentage of overall assets.
Generally, in light of UBS Global AM's profitability data, the Actual Management Fee and the Contractual Management Fee, the board believed that UBS Global AM's sharing of potential and current economies of scale with the Portfolio was acceptable.
Other benefits to UBS Global AM—The board considered other benefits received by UBS Global AM and its affiliates as a result of its relationship with the Portfolio, including the opportunity to offer
35
PACE Money Market Investments
Board approval of investment management and administration agreement (unaudited)
additional products and services to Portfolio shareholders. In light of the costs of providing investment management, administrative and other services to the Portfolio and UBS Global AM's ongoing commitment to the Portfolio, the profits and other ancillary benefits that UBS Global AM and its affiliates received were considered reasonable.
In light of all of the foregoing, the board approved the Investment Management and Administration Agreement for the Portfolio. No single factor reviewed by the board was identified by the board as the principal factor in determining whether to approve the Investment Management and Administration Agreement. The Independent Trustees were advised by separate independent legal counsel throughout the process. The board discussed the proposed continuance of the Investment Management and Administration Agreement in private sessions with their independent legal counsel at which no representatives of UBS Global AM were present.
36
This page intentionally left blank.
37
PACE Money Market Investments
Supplemental information (unaudited)
Board of Trustees & Officers
The Trust is governed by a Board of Trustees which oversees the Portfolios' operations. Each Trustee serves an indefinite term of office. Officers are appointed by the trustees and serve at the pleasure of the Board. The table below shows, for each trustee and officer, his or her name, address and age, the position held with the Trust, the length of time served as a trustee or officer of the Trust, the trustee's or officer's principal occupations during the last five years, the number of portfolios in the UBS fund complex overseen by the trustee or for which a person served as an officer, and other directorships held by the trustee.
The Trust's Statement of Additional Information contains additional information about the trustees and is available, without charge, upon request by calling 1-800-647 1568.
Interested Trustees
| Name, address, and age | | Position(s)
held with
Trust | | Term of office1
and length of time served | |
Principal occupation(s)
during past 5 years | | Number of
portfolios in fund complex
overseen by trustee | | Other directorships
held by trustee | |
Meyer Feldberg2; 69
Morgan Stanley
1585 Broadway
36th Floor
New York, NY 10036 | | Trustee | | Since 2001 | | Professor Feldberg is Dean Emeritus and Professor of Leadership and Ethics at Columbia Business School, although on an extended leave of absence. He is also a senior advisor to Morgan Stanley (financial services) (since March 2005). Professor Feldberg also serves as president of New York City Global Partners (an organization located in part of the Office of the Mayor of the City of New York that promotes interaction with other cities around the world) (since May 2007). Prior to July 2004, he was Dean and Professor of Management of the Graduate School of Business at Columbia University (since 1989). | | Professor Feldberg is a director or trustee of 27 investment companies (consisting of 59 portfolios) for which UBS Global AM or one of its affiliates serves as investment advisor, sub-advisor or manager. | | Professor Feldberg is also a director of Primedia Inc. (publishing), Macy's, Inc. (operator of department stores), Revlon, Inc. (cosmetics), SAPPI, Ltd. (producer of paper) and the New York City Ballet. | |
|
38
PACE Money Market Investments
Supplemental information (unaudited)
39
PACE Money Market Investments
Supplemental information (unaudited)
Interested Trustees (concluded)
| Name, address, and age | | Position(s)
held with
Trust | | Term of office1
and length of time served | |
Principal occupation(s)
during past 5 years | | Number of
portfolios in fund complex
overseen by trustee | | Other directorships
held by trustee | |
| Barry M. Mandinach*3; 55 | | Trustee | | Since July 2010 | | Mr. Mandinach is a managing director of UBS Global Asset Management (US) Inc. and UBS Global AM (collectively, "UBS Global AM—Americas region"). He has been with UBS Global AM—Americas region or its predecessors since 2001. He is the Head of Institutional & Wholesale Business (US) (since 2009) as well as Chief Marketing Officer (US) (since 2006). | | Mr. Mandinach is a director or trustee of 13 investment companies (consisting of 45 portfolios) for which UBS Global AM or one of its affiliates serves as investment advisor or manager. | | None | |
|
Independent Trustees
| Name, address, and age | | Position(s)
held with
Trust | | Term of office1
and length of time served | |
Principal occupation(s)
during past 5 years | | Number of
portfolios in fund complex
overseen by trustee | | Other directorships
held by trustee | |
Richard Q. Armstrong; 76
c/o Keith Weller Assistant Fund Secretary UBS Global Asset Management (Americas) Inc. 1285 Avenue of the Americas New York, NY, 10019 | | Trustee and Chairman of the Board of Trustees | | Since 2001 (Trustee) Since 2004 (Chairman of the Board of Trustees) | | Mr. Armstrong is chairman and principal of R.Q.A. Enterprises (management consulting firm) (since April 1991 and principal occupation since March 1995). Mr. Armstrong was president or chairman of a number of packaged goods companies (responsible for such brands as Canada Dry, Dr. Pepper, Adirondack Beverages and Moët Hennessy) (from 1982 until 1995). | | Mr. Armstrong is a director or trustee of 13 investment companies (consisting of 45 portfolios) for which UBS Global AM or one of its affiliates serves as investment advisor or manager. | | None | |
|
40
PACE Money Market Investments
Supplemental information (unaudited)
41
PACE Money Market Investments
Supplemental information (unaudited)
Independent Trustees (continued)
| Name, address, and age | | Position(s)
held with
Trust | | Term of office1
and length of time served | |
Principal occupation(s)
during past 5 years | | Number of
portfolios in fund complex
overseen by trustee | | Other directorships
held by trustee | |
Alan S. Bernikow; 70
207 Benedict Ave.
Staten Island, NY 10314 | | Trustee | | Since 2005 | | Mr. Bernikow is retired. He was a consultant on non-management matters for the firm of Deloitte & Touche (international accounting and consulting firm) (from June 2003 until 2007). Previously, he was deputy chief executive officer at Deloitte & Touche. | | Mr. Bernikow is a director or trustee of 13 investment companies (consisting of 45 portfolios) for which UBS Global AM or one of its affiliates serves as investment advisor or manager. | | Mr. Bernikow is also a director of Revlon, Inc. (cosmetics) (and serves as the chair of its audit committee and as the chair of its compensation committee), a director of Mack-Cali Realty Corporation (real estate investment trust) (and serves as the chair of its audit committee); and a director of the Casual Male Retail Group, Inc. (menswear) (and serves as a member of its audit committee and as a member of its nominating and corporate governance committee). He is also a director of Premier American Bank, N.A. | |
|
Richard R. Burt; 64
McLarty Associates
900 17th Street, 8th Floor
Washington, D.C. 20006 | | Trustee | | Since 2001 | | Mr. Burt is a managing director to McLarty Associates (a consulting firm) with which he has been employed since April 2007. He was chairman of IEP Advisors (international investments and consulting firm) until February 2009. Prior to April 2007, he was chairman of Diligence Inc. (information and risk management firm). | | Mr. Burt is a director or trustee of 13 investment companies (consisting of 45 portfolios) for which UBS Global AM or one of its affiliates serves as investment advisor or manager. | | Mr. Burt is also a director of Central Europe & Russia Fund, Inc., European Equity Fund, Inc. and The New Germany Fund, Inc. | |
|
42
PACE Money Market Investments
Supplemental information (unaudited)
43
PACE Money Market Investments
Supplemental information (unaudited)
Independent Trustees (concluded)
| Name, address, and age | | Position(s)
held with
Trust | | Term of office1
and length of time served | |
Principal occupation(s)
during past 5 years | | Number of
portfolios in fund complex
overseen by trustee | | Other directorships
held by trustee | |
Bernard H. Garil; 71
6754 Casa Grande Way
Delray Beach, FL 33446 | | Trustee | | Since 2005 | | Mr. Garil is retired (since 2001). He was a managing director at PIMCO Advisory Services (from 1999 to 2001) where he served as president of closed-end funds and vice-president of the variable insurance product funds advised by OpCap Advisors (until 2001). | | Mr. Garil is a director or trustee of 13 investment companies (consisting of 45 portfolios) for which UBS Global AM or one of its affiliates serves as investment advisor or manager. | | Mr. Garil is also a director of OFI Trust Company (commercial trust company), the Leukemia and Lymphoma Society (voluntary health organization), and a trustee for the Brooklyn College Foundation, Inc. (charitable foundation). | |
|
Heather R. Higgins; 52
255 E. 49th St., Suite 23D
New York, NY 10017 | | Trustee | | Since 2005 | | Ms. Higgins is the president and director of The Randolph Foundation (charitable foundation) (since 1991). Ms. Higgins also serves (or had served) on the boards of several non-profit charitable groups, including the Independent Women's Forum (chairman until term-limited), and the Philanthropy Roundtable (vice chairman). She also serves on the board of the Hoover Institution (from 2001 to 2007 and since January 2009). | | Ms. Higgins is a director or trustee of 13 investment companies (consisting of 45 portfolios) for which UBS Global AM or one of its affiliates serves as investment advisor or manager. | | None | |
|
44
PACE Money Market Investments
Supplemental information (unaudited)
45
PACE Money Market Investments
Supplemental information (unaudited)
Officers
Name, address,
and age | | Position(s)
held
with Trust | | Term of
office1 and
length of
time served | | Principal occupation(s)
during past 5 years;
number of portfolios in
fund complex for which person
serves as officer | |
Joseph Allessie*;
46 | | Vice President and Assistant Secretary | | Since 2005 | | Mr. Allessie is an executive director (since 2007) (prior to which he was a director) and deputy general counsel (since 2005) UBS Global AM—Americas region. Mr. Allessie is a vice president and assistant secretary of 17 investment companies (consisting of 100 portfolios) for which UBS Global AM—Americas region or one of its affiliates serves as investment advisor or manager. | |
|
| Rose Ann Bubloski*, 43 | | Vice President and Assistant Treasurer | | Since May 2011 | | Ms. Bubloski is an associate director (2003-2007 and 2008 to present) and senior manager of the US mutual fund treasury administration department of UBS Global AM—Americas region. From 2004 through 2007 she was a vice president and assistant treasurer of certain UBS funds. From 2007 to 2008 she was vice president at Cohen & Steers Capital Management, Inc. (investment manager). She is vice president and assistant treasurer of 17 investment companies (consisting of 100 portfolios) for which UBS Global AM serves as investment advisor or manager. | |
|
46
PACE Money Market Investments
Supplemental information (unaudited)
Officers (continued)
Name, address,
and age | | Position(s)
held
with Trust | | Term of
office1 and
length of
time served | | Principal occupation(s)
during past 5 years;
number of portfolios in
fund complex for which person
serves as officer | |
Mark E. Carver*;
47 | | President | | Since May 2010 | | Mr. Carver is a managing director and Head of Product Development and Management—Americas for UBS Global AM—Americas region (since 2008). In this role, he oversees product development and management for both wholesale and institutional businesses. He is a member of the Americas Management Committee (since 2008) and the Regional Operating Committee (since 2008). Prior to 2008, Mr. Carver held a number of product-related or sales responsibilities with respect to funds, advisory programs and separately managed accounts. Mr. Carver joined a predecessor of an affiliated firm in 1985 and has been with UBS Global AM—Americas region (or its affiliates) since 1996. Mr. Carver is president of 17 investment companies (consisting of 100 portfolios) for which UBS Global AM or one of its affiliates serves as investment advisor or manager. | |
|
47
PACE Money Market Investments
Supplemental information (unaudited)
Officers (continued)
Name, address,
and age | | Position(s)
held
with Trust | | Term of
office1 and
length of
time served | | Principal occupation(s)
during past 5 years;
number of portfolios in
fund complex for which person
serves as officer | |
Thomas Disbrow*;
45 | | Vice President and Treasurer | | Since 2000 (Vice President) Since 2004 (Treasurer) | | Mr. Disbrow is a managing director (since March 2011) prior to which he was an executive director (since 2007) and head of UBS Global AM—Americas region. Mr. Disbrow is a vice president and treasurer and/or principal accounting officer of 17 investment companies (consisting of 100 portfolios) for which UBS Global AM—Americas region or one of its affiliates serves as investment advisor or manager. | |
|
Michael J. Flook*;
46 | | Vice President and Assistant Treasurer | | Since 2006 | | Mr. Flook is a director (since 2010) (prior to which he was an associate director) (since 2006) and a senior manager of the US mutual fund treasury administration department of UBS Global AM—Americas region. Mr. Flook is a vice president and assistant treasurer of 17 investment companies (consisting of 100 portfolios) for which UBS Global AM—Americas region or one of its affiliates serves as investment advisor or manager. | |
|
48
PACE Money Market Investments
Supplemental information (unaudited)
Officers (continued)
Name, address,
and age | | Position(s)
held
with Trust | | Term of
office1 and
length of
time served | | Principal occupation(s)
during past 5 years;
number of portfolios in
fund complex for which person
serves as officer | |
Mark F. Kemper**;
53 | | Vice President and Secretary | | Since 2004 | | Mr. Kemper is a managing director (since 2006) and head of the legal department of UBS Global AM—Americas region (since 2004). He has been secretary of UBS Global AM—Americas region since 2004 and of UBS Global Asset Management Trust Company since 1993 and secretary of UBS AM Holdings (USA) Inc. (since 2001). Mr. Kemper is vice president and secretary of 17 investment companies (consisting of 100 portfolios) for which UBS Global AM—Americas region or one of its affiliates serves as investment advisor or manager. | |
|
Joanne M. Kilkeary*;
43 | | Vice President and Assistant Treasurer | | Since 1999 | | Ms. Kilkeary is a director (since 2008) (prior to which she was an associate director) (since 2000) and a senior manager (since 2004) of the US mutual fund treasury administration department of UBS Global AM—Americas region. Ms. Kilkeary is a vice president and assistant treasurer of 17 investment companies (consisting of 100 portfolios) for which UBS Global AM—Americas region or one of its affiliates serves as investment advisor or manager. | |
|
49
PACE Money Market Investments
Supplemental information (unaudited)
Officers (continued)
Name, address,
and age | | Position(s)
held
with Trust | | Term of
office1 and
length of
time served | | Principal occupation(s)
during past 5 years;
number of portfolios in
fund complex for which person
serves as officer | |
Tammie Lee*;
40 | | Vice President and Assistant Secretary | | Since 2005 | | Ms. Lee is an executive director (since 2010) (prior to which she was a director) and associate general counsel of UBS Global AM—Americas region (since 2005). Ms. Lee is a vice president and assistant secretary of 17 investment companies (consisting of 100 portfolios) for which UBS Global AM—Americas region or one of its affiliates serves as investment advisor or manager. | |
|
Joseph McGill*;
49 | | Vice President and Chief Compliance Officer | | Since 2004 | | Mr. McGill is a managing director (since 2006) and chief compliance officer (since 2003) at UBS Global AM—Americas region. Mr. McGill is a vice president and chief compliance officer of 17 investment companies (consisting of 100 portfolios) for which UBS Global AM—Americas region or one of its affiliates serves as investment advisor or manager. | |
|
50
PACE Money Market Investments
Supplemental information (unaudited)
Officers (continued)
Name, address,
and age | | Position(s)
held
with Trust | | Term of
office1 and
length of
time served | | Principal occupation(s)
during past 5 years;
number of portfolios in
fund complex for which person
serves as officer | |
Nancy D. Osborn*;
45 | | Vice President and Assistant Treasurer | | Since 2007 | | Mrs. Osborn is a director (since 2010)(prior to which she was an associate director) and a senior manager of the US mutual fund treasury administration department of UBS Global AM—Americas region (since 2006). Mrs. Osborn is a vice president and assistant treasurer of 17 investment companies (consisting of 100 portfolios) for which UBS Global AM—Americas region or one of its affiliates serves as investment advisor or manager. | |
|
Robert Sabatino**;
38 | | Vice President | | Since 2001 | | Mr. Sabatino is a managing director (since 2010)(prior to which he was an executive director)(since 2007), head of US taxable money markets (since 2009), and portfolio manager of UBS Global AM—Americas region in the short duration fixed income group (since 2001). Mr. Sabatino is a vice president of six investment companies (consisting of 37 portfolios) for which UBS Global AM—Americas region or one of its affiliates serves as investment advisor or manager. | |
|
51
PACE Money Market Investments
Supplemental information (unaudited)
Officers (continued)
Name, address,
and age | | Position(s)
held
with Trust | | Term of
office1 and
length of
time served | | Principal occupation(s)
during past 5 years;
number of portfolios in
fund complex for which person
serves as officer | |
Eric Sanders*;
45 | | Vice President and Assistant Secretary | | Since 2005 | | Mr. Sanders is a director and associate general counsel of UBS Global AM—Americas region (since 2005). Mr. Sanders is a vice president and assistant secretary of 17 investment companies (consisting of 100 portfolios) for which UBS Global AM—Americas region or one of its affiliates serves as investment advisor or manager. | |
|
Andrew Shoup*;
55 | | Vice President and Chief Operating Officer | | Since 2006 | | Mr. Shoup is a managing director and global head of the treasury administration department of UBS Global AM—Americas region (since July 2006). Mr. Shoup is also a director of UBS (IRL) Fund p.l.c. (since 2008). Prior to joining UBS Global AM—Americas region, he was chief administrative officer for the Legg Mason Partner Funds (formerly Smith Barney, Salomon Brothers, and CitiFunds mutual funds) from November 2003 to July 2006. Mr. Shoup is a vice president and chief operating officer of 17 investment companies (consisting of 100 portfolios) for which UBS Global AM—Americas region or one of its affiliates serves as investment advisor or manager. | |
|
52
PACE Money Market Investments
Supplemental information (unaudited)
Officers (concluded)
Name, address,
and age | | Position(s)
held
with Trust | | Term of
office1 and
length of
time served | | Principal occupation(s)
during past 5 years;
number of portfolios in
fund complex for which person
serves as officer | |
Keith A. Weller*;
50 | | Vice President and Assistant Secretary | | Since 2000 | | Mr. Weller is an executive director and senior associate general counsel of UBS Global AM—Americas region (since 2005) and has been an attorney with affiliated entities since 1995. Mr. Weller is a vice president and assistant secretary of 17 investment companies (consisting of 100 portfolios) for which UBS Global AM—Americas region or one of its affiliates serves as investment advisor or manager. | |
|
1 Each trustee holds office for an indefinite term. Officers are appointed by the trustees and serve at the pleasure of the Board.
2 Professor Feldberg is deemed an "interested person" of the Trust as defined in the Investment Company Act of 1940, as amended, because he is a senior advisor to Morgan Stanley, a financial services firm with which the Trust may conduct transactions.
3 Mr. Mandinach is deemed an "interested person" of the Trust as defined in the Investment Company Act of 1940, as amended, because of his employment by UBS Global AM—Americas region.
* This person's business address is 1285 Avenue of the Americas, New York, New York 10019-6028.
** This person's business address is One North Wacker Drive, Chicago, Illinois 60606.
53
This page intentionally left blank.
54
This page intentionally left blank.
55
This page intentionally left blank.
56
Trustees
Richard Q. Armstrong
Chairman
Alan S. Bernikow
Richard R. Burt | | Meyer Feldberg
Bernard H. Garil
Heather R. Higgins
Barry M. Mandinach | |
|
Principal Officers
Mark E. Carver
President | | Thomas Disbrow
Vice President and Treasurer | |
|
Mark F. Kemper
Vice President and Secretary | | Robert Sabatino
Vice President | |
|
Investment Manager and
Administrator
UBS Global Asset Management (Americas) Inc.
1285 Avenue of the Americas
New York, New York 10019-6028
Principal Underwriter
UBS Global Asset Management (US) Inc.
1285 Avenue of the Americas
New York, New York 10019-6028
This report is not to be used in connection with the offering of shares of the Portfolio unless accompanied or preceded by an effective prospectus.
© 2011 UBS Global Asset Management (Americas) Inc. All rights reserved.
PRESORTED
STANDARD
U.S. POSTAGE
PAID
COMPUTERSHARE

UBS Global Asset Management (Americas) Inc.
1285 Avenue of the Americas
New York, New York 10019-6028
S097
Item 2. Code of Ethics.
The registrant has adopted a code of ethics that applies to its principal executive officer, principal financial officer, principal accounting officer or controller, or persons performing similar functions pursuant to Section 406 of the Sarbanes-Oxley Act of 2002. (The registrant has designated the code of ethics adopted pursuant to Sarbanes-Oxley as a “Code of Conduct” to lessen the risk of confusion with its separate code of ethics adopted pursuant to Rule 17j-1 under the Investment Company Act of 1940, as amended.)
Item 3. Audit Committee Financial Expert.
The registrant’s Board has determined that the following person serving on the registrant’s Audit Committee is an “audit committee financial expert” as defined in item 3 of Form N-CSR: Alan S. Bernikow. Mr. Bernikow is independent as defined in item 3 of Form N-CSR.
Item 4. Principal Accountant Fees and Services.
(a) Audit Fees:
For the fiscal years ended July 31, 2011 and July 31, 2010, the aggregate Ernst & Young LLP (E&Y) audit fees for professional services rendered to the registrant were approximately $894,350 and $854,350, respectively.
Fees included in the audit fees category are those associated with the annual audits of financial statements and services that are normally provided in connection with statutory and regulatory filings.
(b) Audit-Related Fees:
In each of the fiscal years ended July 31, 2011 and July 31, 2010, the aggregate audit-related fees billed by E&Y for services rendered to the registrant that are reasonably related to the performance of the audits of the financial statements, but not reported as audit fees, were approximately $42,000 and $40,900, respectively.
Fees included in the audit-related fees category are those associated with (1) the reading and providing of comments on the 2011 and 2010 semiannual financial statements and (2) review of the consolidated 2010, 2009 and 2008 reports on the profitability of the UBS Funds to UBS Global Asset Management (Americas) Inc. and its affiliates to assist the board members in their annual advisory/administration contract and service/distribution plan reviews.
There were no audit-related fees required to be approved pursuant to paragraph (c)(7)(ii) of Rule 2-01 of Regulation S-X during the fiscal years indicated above.
(c) Tax Fees:
In each of the fiscal years ended July 31, 2011 and July 31, 2010, the aggregate tax fees billed by E&Y for professional services rendered to the registrant were approximately $280,050 and $293,440, respectively.
Fees included in the tax fees category comprise all services performed by professional staff in the independent accountant’s tax division except those services related to the audits. This category comprises fees for review of tax compliance, tax return preparation and excise tax calculations.
There were no tax fees required to be approved pursuant to paragraph (c)(7)(ii) of Rule 2-01 of Regulation S-X during the fiscal years indicated above.
(d) All Other Fees:
In each of the fiscal years ended July 31, 2011 and July 31, 2010, there were no fees billed by E&Y for products and services, other than the services reported in Item 4(a)-(c) above, rendered to the registrant.
Fees included in the all other fees category would consist of services related to internal control reviews, strategy and other consulting, financial information systems design and implementation, consulting on other information systems, and other tax services unrelated to the registrant.
There were no “all other fees” required to be approved pursuant to paragraph (c)(7)(ii) of Rule 2-01 of Regulation S-X during the fiscal years indicated above.
(e) (1) Audit Committee Pre-Approval Policies and Procedures:
The registrant’s Audit Committee (“audit committee”) has adopted an “Audit Committee Charter (Amended and Restated as of May 12, 2004 — with revisions through July 2008)” (the “charter”). The charter contains the audit committee’s pre-approval policies and procedures. Reproduced below is an excerpt from the charter regarding pre-approval policies and procedures:
The [audit] Committee shall:
…
2. Pre-approve (a) all audit and permissible non-audit services(1) to be provided to the Fund and (b) all permissible non-audit services to be provided by the Fund’s independent auditors to UBS Global [Asset Management (Americas) Inc. (“UBS Global AM”)] and any Covered Service Providers, if the engagement relates directly to the operations and financial reporting of the Fund. In carrying out this responsibility, the Committee shall seek periodically from UBS Global [AM] and from the independent auditors a list of such audit and permissible non-audit services that can be expected to be rendered to the Fund, UBS Global [AM] or any Covered Service Providers by the Fund’s independent auditors, and an estimate of the fees sought to be paid in connection with such services. The Committee may delegate its responsibility to pre-approve any such audit and permissible non-audit
services to a sub-committee consisting of the Chairperson of the Committee and two other members of the Committee as the Chairperson, from time to time, may determine and appoint, and such sub-committee shall report to the Committee, at its next regularly scheduled meeting after the sub-committee’s meeting, its decision(s). From year to year, the Committee shall report to the Board whether this system of pre-approval has been effective and efficient or whether this Charter should be amended to allow for pre-approval pursuant to such policies and procedures as the Committee shall approve, including the delegation of some or all of the Committee’s pre-approval responsibilities to other persons (other than UBS Global [AM] or the Fund’s officers).
(1) The Committee will not approve non-audit services that the Committee believes may taint the independence of the auditors. Currently, permissible non-audit services include any professional services (including tax services) that are not prohibited services as described below, provided to the Fund by the independent auditors, other than those provided to the Fund in connection with an audit or a review of the financial statements of the Fund. Permissible non-audit services may not include: (i) bookkeeping or other services related to the accounting records or financial statements of the Fund; (ii) financial information systems design and implementation; (iii) appraisal or valuation services, fairness opinions or contribution-in-kind reports; (iv) actuarial services; (v) internal audit outsourcing services; (vi) management functions or human resources; (vii) broker or dealer, investment adviser or investment banking services; (viii) legal services and expert services unrelated to the audit; and (ix) any other service the Public Company Accounting Oversight Board determines, by regulation, is impermissible.
Pre-approval by the Committee of any permissible non-audit services is not required so long as: (i) the aggregate amount of all such permissible non-audit services provided to the Fund, UBS Global [AM] and any service providers controlling, controlled by or under common control with UBS Global [AM] that provide ongoing services to the Fund (“Covered Service Providers”) constitutes not more than 5% of the total amount of revenues paid to the independent auditors (during the fiscal year in which the permissible non-audit services are provided) by (a) the Fund, (b) its investment adviser and (c) any entity controlling, controlled by, or under common control with the investment adviser that provides ongoing services to the Fund during the fiscal year in which the services are provided that would have to be approved by the Committee; (ii) the permissible non-audit services were not recognized by the Fund at the time of the engagement to be non-audit services; and (iii) such services are promptly brought to the attention of the Committee and approved by the Committee (or its delegate(s)) prior to the completion of the audit.
(e) (2) Services approved pursuant to paragraph (c)(7)(i)(C) of Rule 2-01 of Regulation S-X:
Audit-Related Fees:
There were no amounts that were approved by the audit committee pursuant to the de minimis exception for the fiscal years ended July 31, 2011 and July 31, 2010 on behalf of the registrant.
There were no amounts that were required to be approved by the audit committee pursuant to the de minimis exception for the fiscal years ended July 31, 2011 and July 31, 2010 on behalf of the registrant’s service providers that relate directly to the operations and financial reporting of the registrant.
Tax Fees:
There were no amounts that were approved by the audit committee pursuant to the de minimis exception for the fiscal years ended July 31, 2011 and July 31, 2010 on behalf of the registrant.
There were no amounts that were required to be approved by the audit committee pursuant to the de minimis exception for the fiscal years ended July 31, 2011 and July 31, 2010 on behalf of the registrant’s service providers that relate directly to the operations and financial reporting of the registrant.
All Other Fees:
There were no amounts that were approved by the audit committee pursuant to the de minimis exception for the fiscal years ended July 31, 2011 and July 31, 2010 on behalf of the registrant.
There were no amounts that were required to be approved by the audit committee pursuant to the de minimis exception for the fiscal years ended July 31, 2011 and July 31, 2010 on behalf of the registrant’s service providers that relate directly to the operations and financial reporting of the registrant.
(f) According to E&Y, for the fiscal year ended July 31, 2011, the percentage of hours spent on the audit of the registrant’s financial statements for the most recent fiscal year that were attributed to work performed by persons who are not full-time, permanent employees of E&Y was 0%.
(g) For the fiscal years ended July 31, 2011 and July 31, 2010, the aggregate fees billed by E&Y of $386,425 and $564,340, respectively, for non-audit services rendered on behalf of the registrant (“covered”), its investment adviser (not including any sub-adviser whose role is primarily portfolio management and is subcontracted with or overseen by another investment adviser) and any entity controlling, controlled by, or under common control with the adviser (“non-covered”) that provides ongoing services to the registrant for each of the last two fiscal years of the registrant is shown in the table below:
| | 2011 | | 2010 | |
Covered Services | | $ | 322,050 | | $ | 334,340 | |
Non-Covered Services | | 64,375 | | 230,000 | |
| | | | | | | |
(h) The registrant’s audit committee was not required to consider whether the provision of non-audit services that were rendered to the registrant’s investment adviser (not including any sub-adviser whose role is primarily portfolio management and is subcontracted with or overseen by another investment adviser), and any entity controlling, controlled by, or under common control with the investment adviser that provides ongoing services to the registrant that were not pre-approved pursuant to paragraph (c)(7)(ii) of Rule 2-01 of Regulation S-X is compatible with maintaining the principal accountant’s independence.
Item 5. Audit Committee of Listed Registrants.
Not applicable to the registrant.
Item 6. Investments.
(a) Included as part of the report to shareholders filed under Item 1 of this form.
(b) Not applicable.
Item 7. Disclosure of Proxy Voting Policies and Procedures for Closed-End Management Investment Companies.
Not applicable to the registrant.
Item 8. Portfolio Managers of Closed-End Management Investment Companies.
Not applicable to the registrant.
Item 9. Purchases of Equity Securities by Closed-End Management Investment Company and Affiliated Purchasers.
Not applicable to the registrant.
Item 10. Submission of Matters to a Vote of Security Holders.
The registrant’s Board has established a Nominating and Corporate Governance Committee. The Nominating and Corporate Governance Committee will consider nominees recommended by shareholders if a vacancy occurs among those board members who are not “interested persons” as defined in Section 2(a)(19) of the Investment Company Act of 1940, as amended. In order to recommend a nominee, a shareholder should send a letter to the chairperson of the Nominating and Corporate Governance Committee, Richard R. Burt, care of the Secretary of the registrant at UBS Global Asset Management, UBS Building, One North Wacker Drive, Chicago, IL 60606, Attn: Mark Kemper, Secretary, and indicate on the envelope “Nominating and Corporate Governance Committee.” The shareholder’s letter should state the nominee’s name and should include the nominee’s resume or curriculum vitae, and must be accompanied by a written consent of the individual to stand for election if nominated for the Board and to serve if elected by shareholders.
Item 11. Controls and Procedures.
(a) The registrant’s principal executive officer and principal financial officer have concluded that the registrant’s disclosure controls and procedures (as defined in Rule 30a-3(c) under the Investment Company Act of 1940, as amended) are effective based on their evaluation of these controls and procedures as of a date within 90 days of the filing date of this document.
(b) The registrant’s principal executive officer and principal financial officer are aware of no changes in the registrant’s internal control over financial reporting that occurred during the second fiscal quarter of the period covered by this report that has materially affected, or is reasonably likely to materially affect, the registrant’s internal control over financial reporting.
Item 12. Exhibits.
(a) (1) Code of Ethics as required pursuant to Section 406 of the Sarbanes-Oxley Act of 2002 (and designated by registrant as a “Code of Conduct”) is filed herewith as Exhibit EX-99.CODE ETH.
(a) (2) Certifications of principal executive officer and principal financial officer pursuant to Section 302 of the Sarbanes-Oxley Act of 2002 are attached hereto as Exhibit EX-99.CERT.
(a) (3) Written solicitation to purchase securities under Rule 23c-1 under the Investment Company Act of 1940 sent or given during the period covered by the report by or on behalf of the registrant to 10 or more persons — not applicable to the registrant.
(b) Certifications of principal executive officer and principal financial officer pursuant to Section 906 of the Sarbanes-Oxley Act of 2002 are attached hereto as Exhibit EX-99.906CERT.
SIGNATURES
Pursuant to the requirements of the Securities Exchange Act of 1934 and the Investment Company Act of 1940, the registrant has duly caused this report to be signed on its behalf by the undersigned, thereunto duly authorized.
PACE Select Advisors Trust
By: | /s/ Mark E. Carver | |
| Mark E. Carver |
| President |
| |
Date: | October 10, 2011 |
Pursuant to the requirements of the Securities Exchange Act of 1934 and the Investment Company Act of 1940, this report has been signed below by the following persons on behalf of the registrant and in the capacities and on the dates indicated.
By: | /s/ Mark E. Carver | |
| Mark E. Carver |
| President |
| |
Date: | October 10, 2011 |
| |
By: | /s/ Thomas Disbrow | |
| Thomas Disbrow |
| Vice President and Treasurer |
| |
Date: | October 10, 2011 |