UNITED STATES
SECURITIES AND EXCHANGE COMMISSION
Washington, D.C. 20549
FORM N-CSR
CERTIFIED SHAREHOLDER REPORT OF REGISTERED
MANAGEMENT INVESTMENT COMPANIES
Investment Company Act file number | 811-08764 |
|
UBS PACE Select Advisors Trust |
(Exact name of registrant as specified in charter) |
|
51 West 52nd Street, New York, New York | | 10019-6114 |
(Address of principal executive offices) | | (Zip code) |
|
Mark F. Kemper, Esq. UBS Global Asset Management 51 West 52nd Street New York, NY 10019-6114 |
(Name and address of agent for service) |
|
Copy to: |
Jack W. Murphy, Esq. Dechert LLP 1775 I Street, N.W. Washington, DC 20006-2401 |
|
Registrant’s telephone number, including area code: | 212-882 5000 | |
|
Date of fiscal year end: | July 31 | |
|
Date of reporting period: | July 31, 2009 | |
| | | | | | | | |
Item 1. Reports to Stockholders.
UBS PACE Select Advisors Trust
Annual Report
July 31, 2009
Table of contents
| Introduction | | | 2 | | |
|
| Portfolio Advisor's and Sub-Advisors' commentaries and schedules of investments | |
|
| UBS PACE Money Market Investments | | | 5 | | |
|
| UBS PACE Government Securities Fixed Income Investments | | | 14 | | |
|
| UBS PACE Intermediate Fixed Income Investments | | | 28 | | |
|
| UBS PACE Strategic Fixed Income Investments | | | 41 | | |
|
| UBS PACE Municipal Fixed Income Investments | | | 61 | | |
|
| UBS PACE Global Fixed Income Investments | | | 74 | | |
|
| UBS PACE High Yield Investments | | | 86 | | |
|
| UBS PACE Large Co Value Equity Investments | | | 100 | | |
|
| UBS PACE Large Co Growth Equity Investments | | | 110 | | |
|
| UBS PACE Small/Medium Co Value Equity Investments | | | 122 | | |
|
| UBS PACE Small/Medium Co Growth Equity Investments | | | 134 | | |
|
| UBS PACE International Equity Investments | | | 146 | | |
|
| UBS PACE International Emerging Markets Equity Investments | | | 159 | | |
|
| UBS PACE Global Real Estate Securities Investments | | | 171 | | |
|
| UBS PACE Alternative Strategies Investments | | | 180 | | |
|
| Understanding your Portfolio's expenses | | | 210 | | |
|
| Statement of assets and liabilities | | | 216 | | |
|
| Statement of operations | | | 224 | | |
|
| Statement of changes in net assets | | | 228 | | |
|
| Financial highlights | | | 235 | | |
|
| Notes to financial statements | | | 288 | | |
|
| Report of independent registered public accounting firm | | | 331 | | |
|
| General information | | | 333 | | |
|
| Board approval of certain investment advisory agreements | | | 334 | | |
|
| Trustees and officers | | | 350 | | |
|
UBS PACE Select Advisors Trust offers multiple share classes representing interests in 15 separate Portfolios. (UBS PACE Money Market Investments offers only one share class.) Different classes of shares and/or Portfolios are offered by separate prospectuses.
For more information on a Portfolio or class of shares, contact your financial advisor. He or she can send you a current prospectus relating to a Portfolio or class of shares. Investors should carefully read and consider a mutual fund's investment objectives, risks, charges, and expenses before investing. The prospectus contains this and other information about a mutual fund. For a current prospectus, contact UBS Global Asset Management at 888-793 8637, or visit us on the Web at www.ubs.com/globalam-us.
1
UBS PACE Select Advisors Trust
Introduction
September 21, 2009
Dear UBS PACESM Shareholder,
We are pleased to provide you with the annual report for the UBS PACE Portfolios, comprising the UBS PACE Select Advisors Trust. This report includes summaries of the performance of each Portfolio and commentaries from the investment advisor and sub-advisors regarding the events that affected Portfolio performance during the 12 months ended July 31, 2009. Please note that the opinions of the sub-advisors do not necessarily represent those of UBS Global Asset Management (Americas) Inc.
Market review
The 12-month reporting period was marked by some of the most challenging economic and market conditions in a generation. The bursting of the housing bubble, a severe credit crunch, lower business and consumer spending and surging unemployment caused the US economy to weaken significantly, with US gross domestic product ("GDP") declining in each quarter of the reporting period.
Following the conclusion of the reporting period, however, signs of recovery were seen to be emerging. The Federal Reserve Board issued a statement on August 12, 2009 acknowledging that the economy had stabilized. In that statement, it wrote that it expects the US economy to remain weak for a time, noting that "economic activity is leveling out," and adding that "conditions in financial markets have improved further in recent weeks".
Economic growth outside the US was also poor during the reporting period. According to forecasts by the Organization for Economic Cooperation and Development ("OECD"), world economic growth is expected to contract 2.2% in 2009. From a regional perspective, Eurozone GDP declined 4.8% during the first quarter, while Japan's economy shrank 14.2% over the same period. However, as 2009 progressed, there were indications that the recession in the global economy was nearing a bottom. Accordingly, the OECD forecasts a rebound in world economic growth, projecting a 2.3% expansion in 2010.
Despite a strong finish, global equities perform poorly
In the equity markets, the reporting period was a study in contrasts. After a small gain in August 2008, stock prices declined during five of the next six months through February 2009. This was due to a number of factors, including the rapidly weakening global economy, turmoil in the financial markets, frozen credit conditions, a lack of liquidity and plunging corporate profits. However, after reaching a 12-year low on March 9, 2009, stock prices in the US rallied sharply given expectations that the worst of the global recession may be over. From its March low through July 31, 2009, the S&P 500 Index1 gained more than 45%. However, this was not enough to overcome the market's earlier weakness, and, all told, the S&P 500 Index declined 19.96% during the 12 months ended July 31, 2009.
The international equity markets delivered similar results. During the first seven months of the reporting period, both the equities of international developed markets (as measured by MSCI EAFE Index (net)2) and
1 The S&P 500 Index is an unmanaged, weighted index composed of 500 widely held common stocks varying in composition, and is not available for direct investment. Investors should note that indices do not reflect the deduction of fees, expenses or taxes.
2 The MSCI EAFE Index (net) is an index of stocks from 21 countries designed to measure the investment returns of developed economies outside of North America. Dividends are reinvested after the deduction of withholding tax, using tax rates applicable to Luxembourg holding companies, as Luxembourg applies the highest rates. Investors should note that indices do not reflect the deduction of fees and expenses.
2
UBS PACE Select Advisors Trust
emerging markets (as measured by the MSCI Emerging Markets Index3) were extremely weak. The impressive rally that began in mid-March was not enough to make up for the severity of the earlier decline, however, and international developed equity markets fell 22.60%, while emerging markets equities declined 16.57% during the reporting period as a whole.
Bonds significantly outperform stocks
The extreme shift in market sentiment was also evident in the fixed income markets. During much of the first half of the reporting period, heightened risk caused US investors to flock to the relative safety of short-term Treasury securities, causing their yields to fall and their prices to rise. In contrast, the spread sectors (that is, non-Treasury sectors) performed poorly. However, as the reporting period progressed, risk aversion abated and investors shunned Treasuries in favor of what they viewed as attractively valued and higher-yielding spread sectors.
During the 12 months ended July 31, 2009, the overall US bond market, as measured by the Barclays Capital US Aggregate Index,4 returned 7.85%. Turning to the riskier fixed income asset classes, high yield bonds and emerging markets debt generated extremely strong performance during the second half of the reporting period. This more than offset their earlier weakness, as the Merrill Lynch US High Yield Cash Pay Constrained Index5 returned 4.17% and the J.P. Morgan Emerging Markets Bond Index Global (EMBI Global)6 gained 4.24% during the 12-month reporting period.
3 The MSCI Emerging Markets Index is a market capitalization-weighted index composed of companies representative of the market structure of 22 emerging market countries in Europe, Latin America and the Pacific Basin. The MSCI Emerging Markets Index excludes closed markets and those shares in otherwise free markets that are not purchasable by foreigners. Investors should note that indices do not reflect the deduction of fees, expenses or taxes.
4 The Barclays Capital US Aggregate Index (formerly known as the Lehman Brothers US Aggregate Index) is an unmanaged index of the USD-denominated, investment-grade, fixed-rate, taxable bond market of SEC-registered securities. The Index includes bonds from the treasury, government-related, corporate, mortgage-backed, asset-backed and commercial mortgage-backed sectors. US agency hybrid adjustable rate mortgage (ARM) securities were added to the Index on April 1, 2007. Investors should note that indices do not reflect the deduction of fees, expenses or taxes.
5 The Merrill Lynch US High Yield Cash Pay Constrained Index is an index of publicly placed non-convertible, coupon-bearing US domestic debt with a term to maturity of at least one year. The Index is market weighted, so that larger bond issuers have a greater effect on the Index's return. However, the representation of any single bond issue is restricted to a maximum of 2% of the total index. Investors should note that indices do not reflect the deduction of fees, expenses or taxes.
6 The J.P. Morgan Emerging Markets Bond Index Global (EMBI Global) is an unmanaged index which tracks total returns for US-dollar-denominated debt instruments issued by emerging market sovereign and quasi-sovereign entities: Brady bonds, loans and Eurobonds. Investors should note that indices do not reflect the deduction of fees, expenses or taxes.
3
UBS PACE Select Advisors Trust
Looking for signs of a sustained recovery
As the reporting period demonstrated, the financial markets can experience periods of extreme volatility and unnerve even the most experienced investor. However, there are increasing signs that the severe global recession may be bottoming. In addition, the financial markets have largely stabilized following the extreme turmoil in 2008. Despite this, there could be periods of heightened volatility going forward as incoming economic data from around the globe is scrutinized. As always, it is important to work closely with a professional financial advisor. He or she can proactively monitor your investment portfolio and help you remain focused on your long-term financial goals. We appreciate your continued support.
Sincerely,

Kai R. Sotorp
President, UBS PACE Select Advisors Trust
Head—Americas, UBS Global Asset Management (Americas) Inc.
This report is intended to assist investors in understanding how the Portfolios performed during the 12-month period ended July 31, 2009. The views expressed in the Advisor and Sub-Advisors' Comments sections are as of the end of the reporting period, reflect performance results gross of fees and expenses, and are those of the investment advisor and/or sub-advisors. Sub-advisors' comments on Portfolios that have more than one sub-advisor are reflective of their portion of the Portfolio only. The views and opinions in this report were current as of September 21, 2009. They are not guarantees of performance or investment results and should not be taken as investment advice. Investment decisions reflect a variety of factors, and the investment advisor and sub-advisors reserve the right to change their views about individual securities, sectors and the markets at any time. As a result, the views expressed should not be relied upo n as a forecast of a Portfolio's future investment intent.
4
UBS PACE Select Advisors Trust
UBS PACE Money Market Investments
Performance
For the 12 months ended July 31, 2009, the Portfolio returned 0.81% (before the deduction of the maximum UBS PACE Select program fee; after the deduction of the maximum UBS PACE Select program fee, the Portfolio declined 0.70%). In comparison, the 90-Day US T-Bill Index (the "benchmark") returned 0.65%, and the Lipper Money Market Funds category posted a median return of 0.77%. (Returns over various time periods are shown in the "Performance at a glance" table on page 8. Please note that the returns shown do not reflect the deduction of taxes that a shareholder would pay on Portfolio distributions.) For a detailed commentary on the market environment in general during the reporting period, please refer to page two.
Advisor's Comments
Given the issues impacting the credit markets, we sought to maintain a high degree of liquidity in the Portfolio in order to minimize pricing volatility and to meet redemption requests. We did so by investing a significant portion of the Portfolio's new subscriptions in shorter-dated money market securities maturing within one to three months.
At the security level, we maintained a greater than usual level of diversification over the reporting period by investing in smaller positions. While the Portfolio is generally able to hold up to 5.00% in any one security (subject to certain exceptions), we typically purchased no more than 1.00% to 2.00% in any one nongovernment issuer, as part of our efforts to reduce risk and keep the Portfolio highly diversified.
In terms of the securities that we emphasized, at the beginning of the reporting period, the Portfolio held a significant exposure to commercial paper and US government and agency obligations. As the period continued, we increased the Portfolio's exposure to asset-backed commercial paper. This move followed measures taken by the Federal Reserve Board to improve the liquidity of asset-backed commercial paper in response to the turmoil in the credit markets. In addition, we increased the Portfolio's exposure to US government and agency obligations, while decreasing exposure to certificates of deposit and repurchase agreements over the period. (Repurchase agreements are transactions in which the seller of a security agrees to buy it back at a predetermined time and price or upon demand.)
UBS PACE Select Advisors Trust – UBS PACE Money Market Investments
Investment Advisor:
UBS Global Asset Management (Americas) Inc.
Portfolio Manager:
Robert Sabatino
Objective:
Current income consistent with preservation of capital and liquidity
Investment process:
The Portfolio is a money market mutual fund and seeks to maintain a stable price of $1.00 per share, although it may be possible to lose money by investing in this Portfolio. The Portfolio invests in a diversified portfolio of high-quality money market instruments of governmental and private issuers. Security selection is based on the assessment of relative values and changes in market and economic conditions.
5
UBS PACE Select Advisors Trust
UBS PACE Money Market Investments
A Note about the Temporary Guarantee Program for Money Market Funds
Following unprecedented turmoil in the credit markets, the US government announced the Temporary Guarantee Program for Money Market Funds (the "Program"). The Portfolio participated in the Program from the Program's inception in the fall of 2008 until it expired on September 18, 2009. Under the Program, the US Treasury guaranteed the share price of any publicly offered eligible money market mutual fund that applied and was accepted into it. Shareholders in money market funds enrolled in the Program were covered for the amounts they held as of the close of business on September 19, 2008 until September 18, 2009. The Portfolio did not encounter circumstances triggering a need to invoke the guarantee provided by the Program.
The Portfolio has maintained its net asset value ("NAV") of $1.00 per share* throughout the recent unprecedented turmoil and has continued to meet its stated goal, which is to provide current income consistent with preservation of capital and liquidity. We were pleased to have the Portfolio participate in the Program to provide an added level of protection for covered shareholders, until it expired. We want to reassure shareholders of the following:
• The Portfolio holds very high-quality assets. While we consider rating agencies' credit ratings, we rely first and foremost on our own proprietary research, conducted by dedicated teams of credit analysts. This approach benefited the Portfolio in the volatile environment that prevailed during the reporting period.
• UBS Global Asset Management (Americas) Inc. and its predecessor firms have been managing money market funds for more than 30 years; this is a key line of business for the firm, and we have dedicated significant resources to the management of the assets entrusted to us.
When the Program was introduced, it had an initial termination date of December 18, 2008. The Portfolio paid a fee of 0.01% of the value of the Portfolio's outstanding shares (valued at $1.00 per share for this purpose) as of September 19, 2008. This ensured Program coverage for the period from September 19, 2008 through December 18, 2008. The Program was extended twice—first through April 30, 2009, and then, finally, through September 18, 2009. The Portfolio paid additional fees calculated on the same basis, but at the rate of 0.015% for each of the two extension election periods, to continue to participate through September 18, 2009. This cost was absorbed by the Portfolio as a fund expense.
The Portfolio's yield did decline during the coverage period as a result of the Program participation fees through September 18, 2009.
* An investment in the Portfolio is not insured or guaranteed by the Federal Deposit Insurance Corporation (FDIC) or any other government agency. Although the Portfolio seeks to preserve the value of your investment at $1.00 per share, it is possible to lose money by investing in the Portfolio.
6
UBS PACE Select Advisors Trust
UBS PACE Money Market Investments
Comparison of change in value of a $10,000 investment in the Portfolio and the 90-Day US T-Bill Index (unaudited)

The graph depicts the performance of UBS PACE Money Market Investments versus the 90-Day US T-Bill Index over the 10 years ended July 31, 2009. Past performance does not predict future performance and the performance provided does not reflect the deduction of taxes that a shareholder would pay on Portfolio distributions. It is important to note that UBS PACE Money Market Investments is a professionally managed portfolio while the Index is not available for investment and is unmanaged. The comparison is shown for illustrative purposes only.
7
UBS PACE Select Advisors Trust
UBS PACE Money Market Investments
Performance at a glance (unaudited)
| Average annual total returns for periods ended 07/31/09 | | 1 year | | 5 years | | 10 years | |
UBS PACE Money Market Investments before deducting
maximum UBS PACE Select program fee1 | | | 0.81 | % | | | 2.94 | % | | | 2.92 | % | |
UBS PACE Money Market Investments after deducting
maximum UBS PACE Select program fee1 | | | (0.70 | )% | | | 1.41 | % | | | 1.38 | % | |
| 90-Day US T-Bill Index2 | | | 0.65 | % | | | 3.00 | % | | | 3.04 | % | |
| Lipper Money Market Funds median | | | 0.77 | % | | | 2.81 | % | | | 2.77 | % | |
For UBS PACE Money Market Investments, average annual total returns for periods ended June 30, 2009, after deduction of the maximum UBS PACE Select program fee, were as follows: 1-year period, (0.53)%; 5-year period, 1.42%; 10-year period, 1.42%.
For UBS PACE Money Market Investments, the 7-day current yield for the period ended July 31, 2009 was 0.01% (without maximum UBS PACE Select program fee and after fee waivers and/or expense reimbursements; the yield was (0.05)% before fee waivers and/or expense reimbursements). With the maximum UBS PACE Select program fee, the 7-day current yield was (1.49)% after fee waivers and/or expense reimbursements; the yield was (1.55)% before fee waivers and/or expense reimbursements. The Portfolio's yield quotation more closely reflects the current earnings of the Portfolio than the total return quotation. Yields will fluctuate and reflect fee waivers.
1 The maximum annual UBS PACE Select program fee is 1.5% of the value of UBS PACE assets.
2 90-Day US T-Bills are promissory notes issued by the US Treasury and sold through competitive bidding, with a short-term maturity date, in this case, of three months. This Index is derived from secondary market interest rates as published by the Federal Reserve Bank. Investors should note that indices do not reflect the deduction of fees, expenses or taxes.
Past performance does not predict future performance and the performance information provided does not reflect the deduction of taxes that a shareholder would pay on Portfolio distributions. The return of an investment will fluctuate. Performance results assume reinvestment of all dividends and capital gain distributions at net asset value on the payable dates. Current performance may be higher or lower than the performance data quoted.
Lipper peer group data calculated by Lipper Inc.; used with permission. The Lipper median is the return of the fund that places in the middle of a Lipper peer group.
An investment in UBS PACE Money Market Investments is not insured or guaranteed by the Federal Deposit Insurance Corporation or any other government agency. Although the Portfolio seeks to preserve the value of your investment at $1.00 per share, it is possible to lose money by investing in the Portfolio.
Not FDIC Insured. May lose value. No Bank guarantee.
8
UBS PACE Select Advisors Trust
UBS PACE Money Market Investments
Portfolio statistics (unaudited)
| Characteristics | | 07/31/09 | |
| Net assets (mm) | | $ | 530.0 | | |
| Number of holdings | | | 92 | | |
| Weighted average maturity | | | 45 days | | |
| Portfolio composition1 | | 07/31/09 | |
| Commercial paper | | | 39.7 | % | |
| US government and agency obligations | | | 31.5 | | |
| Repurchase agreements | | | 14.1 | | |
| Certificates of deposit | | | 10.0 | | |
| Short-term corporate obligations | | | 3.2 | | |
| Bank notes | | | 2.5 | | |
| Money market fund | | | 1.9 | | |
| Other assets less liabilities | | | (2.9 | ) | |
| Total | | | 100.0 | % | |
| Top 10 holdings1 | | 07/31/09 | |
| Repurchase agreement with Deutsche Bank Securities, 0.190% due 08/03/09 | | | 9.2 | % | |
| Repurchase agreement with Barclays Bank PLC, 0.180% due 08/03/09 | | | 4.7 | | |
| Federal National Mortgage Association, 0.300% due 08/24/09 | | | 2.8 | | |
| US Treasury Bills, 0.285% due 10/29/09 | | | 2.3 | | |
| Federal Home Loan Bank, 0.650% due 09/10/09 | | | 1.9 | | |
| Federal Home Loan Mortgage Corp., 0.620% due 08/03/09 | | | 1.9 | | |
| Thames Asset Global Securitization No.1, 0.280% due 08/07/09 | | | 1.9 | | |
| Federal Home Loan Mortgage Corp., 0.215% due 08/28/09 | | | 1.9 | | |
| Federal Home Loan Bank, 0.210% due 08/17/09 | | | 1.9 | | |
| Dexia Delaware LLC, 0.290% due 08/13/09 | | | 1.9 | | |
| Total | | | 30.4 | % | |
1 Weightings represent percentages of the Portfolio's net assets as of July 31, 2009. The Portfolio is actively managed and its composition will vary over time.
9
UBS PACE Select Advisors Trust
UBS PACE Money Market Investments
Portfolio of investments—July 31, 2009
| Security description | | Face
amount | | Value | |
US government and agency
obligations—31.50% | |
Federal Home Loan Bank
0.476%, due 08/13/091 | | $ | 5,000,000 | | | $ | 5,000,000 | | |
| 0.210%, due 08/17/092 | | | 10,000,000 | | | | 9,999,067 | | |
| 0.210%, due 08/21/092 | | | 10,000,000 | | | | 9,998,833 | | |
| 0.650%, due 09/10/091 | | | 10,000,000 | | | | 10,004,552 | | |
| 0.220%, due 09/28/092 | | | 5,000,000 | | | | 4,998,228 | | |
| 0.320%, due 12/21/092 | | | 3,000,000 | | | | 2,996,213 | | |
| 0.520%, due 06/01/10 | | | 3,000,000 | | | | 2,999,083 | | |
Federal Home Loan
Mortgage Corp.*
0.620%, due 08/03/091 | | | 10,000,000 | | | | 10,000,000 | | |
| 0.570%, due 08/17/092 | | | 5,000,000 | | | | 4,998,733 | | |
| 0.215%, due 08/28/091 | | | 10,000,000 | | | | 9,999,425 | | |
| 4.125%, due 11/30/09 | | | 7,000,000 | | | | 7,042,350 | | |
| 0.350%, due 02/16/102 | | | 5,000,000 | | | | 4,990,326 | | |
| 0.520%, due 07/16/102 | | | 5,000,000 | | | | 4,974,794 | | |
Federal National Mortgage
Association*
0.410%, due 08/03/091 | | | 7,000,000 | | | | 7,000,000 | | |
| 0.300%, due 08/24/092 | | | 15,000,000 | | | | 14,997,125 | | |
| 0.400%, due 10/13/091 | | | 5,000,000 | | | | 5,000,000 | | |
| 0.250%, due 10/26/092 | | | 5,000,000 | | | | 4,997,014 | | |
| 0.250%, due 11/16/092 | | | 10,000,000 | | | | 9,992,570 | | |
| 0.530%, due 12/21/092 | | | 5,000,000 | | | | 4,989,547 | | |
US Treasury Bills
0.180%, due 09/24/092 | | | 10,000,000 | | | | 9,997,300 | | |
| 0.285%, due 10/29/092,3 | | | 12,000,000 | | | | 11,991,545 | | |
| 0.235%, due 11/19/092 | | | 10,000,000 | | | | 9,992,820 | | |
Total US government and
agency obligations
(cost—$166,959,525) | | | | | | | 166,959,525 | | |
| Bank notes—2.54% | |
| Banking-US—2.54% | |
Bank of America N.A.
1.207%, due 08/06/091 | | | 5,000,000 | | | | 5,000,000 | | |
HSBC Bank USA, Inc.
3.875%, due 09/15/09 | | | 2,470,000 | | | | 2,471,632 | | |
Wells Fargo Bank N.A.
0.389%, due 08/19/091 | | | 4,000,000 | | | | 4,000,000 | | |
Westpac Banking Corp.
0.593%, due 08/14/091 | | | 2,000,000 | | | | 2,000,000 | | |
Total bank notes
(cost—$13,471,632) | | | | | | | 13,471,632 | | |
| Certificates of deposit—10.03% | |
| Banking-non-US—9.09% | |
Bank of Nova Scotia
0.430%, due 11/17/09 | | | 1,600,000 | | | | 1,597,936 | | |
| 1.100%, due 05/11/10 | | | 1,600,000 | | | | 1,600,000 | | |
BNP Paribas
0.500%, due 11/25/09 | | | 3,000,000 | | | | 3,000,000 | | |
Calyon N.A., Inc./New York
0.330%, due 11/02/09 | | | 5,000,000 | | | | 5,000,000 | | |
| 0.530%, due 12/18/09 | | | 2,000,000 | | | | 2,000,000 | | |
| Security description | | Face
amount | | Value | |
| Certificates of deposit—(concluded) | |
| Banking-non-US—(concluded) | |
Canadian Imperial Bank of
Commerce/Canada
0.250%, due 09/03/09 | | $ | 4,250,000 | | | $ | 4,250,000 | | |
Lloyds TSB Bank PLC
0.460%, due 10/19/09 | | | 5,700,000 | | | | 5,700,000 | | |
Natixis
0.650%, due 10/09/09 | | | 6,000,000 | | | | 6,000,000 | | |
Rabobank Nederland NV
0.520%, due 12/07/09 | | | 1,000,000 | | | | 1,000,000 | | |
Royal Bank of Canada
0.280%, due 08/24/09 | | | 5,000,000 | | | | 5,000,000 | | |
Societe Generale
0.500%, due 02/01/10 | | | 2,000,000 | | | | 2,000,000 | | |
Svenska Handelsbanken
0.350%, due 08/24/09 | | | 5,000,000 | | | | 5,000,000 | | |
Toronto-Dominion Bank
1.150%, due 08/20/09 | | | 5,000,000 | | | | 5,000,390 | | |
| 0.520%, due 01/25/10 | | | 1,000,000 | | | | 1,000,343 | | |
| | | | 48,148,669 | | |
| Banking-US—0.94% | |
Bank of America N.A.
0.400%, due 09/10/09 | | | 5,000,000 | | | | 5,000,000 | | |
Total certificates of deposit
(cost—$53,148,669) | | | | | | | 53,148,669 | | |
| Commercial paper2—39.68% | |
| Asset backed-banking—0.94% | |
Atlantis One Funding
0.400%, due 09/09/09 | | | 5,000,000 | | | | 4,997,833 | | |
| Asset backed-miscellaneous—18.65% | |
Amsterdam Funding Corp.
0.320%, due 08/10/09 | | | 5,000,000 | | | | 4,999,600 | | |
| 0.360%, due 09/18/09 | | | 5,000,000 | | | | 4,997,600 | | |
Barton Capital LLC
0.250%, due 08/07/09 | | | 2,876,000 | | | | 2,875,880 | | |
Chariot Funding LLC
0.250%, due 08/13/09 | | | 1,438,000 | | | | 1,437,880 | | |
| 0.230%, due 08/25/09 | | | 5,000,000 | | | | 4,999,234 | | |
Enterprise Funding Co. LLC
0.310%, due 10/05/09 | | | 5,000,000 | | | | 4,997,202 | | |
Kitty Hawk Funding Corp.
0.380%, due 09/18/09 | | | 7,541,000 | | | | 7,537,179 | | |
Market Street Funding LLC
0.350%, due 08/17/09 | | | 5,000,000 | | | | 4,999,222 | | |
Ranger Funding Co. LLC
0.400%, due 08/18/09 | | | 8,000,000 | | | | 7,998,489 | | |
| 0.300%, due 10/13/09 | | | 5,000,000 | | | | 4,996,958 | | |
Regency Markets No. 1 LLC
0.280%, due 08/20/09 | | | 5,000,000 | | | | 4,999,261 | | |
Sheffield Receivables Corp.
0.250%, due 08/25/09 | | | 5,000,000 | | | | 4,999,167 | | |
10
UBS PACE Select Advisors Trust
UBS PACE Money Market Investments
Portfolio of investments—July 31, 2009
| Security description | | Face
amount | | Value | |
| Commercial paper2—(continued) | |
| Asset backed-miscellaneous—(concluded) | |
Thames Asset Global
Securitization No. 1
0.280%, due 08/07/09 | | $ | 10,000,000 | | | $ | 9,999,533 | | |
Variable Funding Capital Corp.
0.280%, due 09/09/09 | | | 4,000,000 | | | | 3,998,787 | | |
| 0.350%, due 09/28/09 | | | 10,000,000 | | | | 9,994,361 | | |
Windmill Funding Corp.
0.260%, due 08/10/09 | | | 5,000,000 | | | | 4,999,675 | | |
Yorktown Capital LLC
0.350%, due 10/09/09 | | | 5,000,000 | | | | 4,996,646 | | |
| 0.300%, due 10/13/09 | | | 5,000,000 | | | | 4,996,958 | | |
| | | | 98,823,632 | | |
| Asset backed-securities—1.89% | |
Clipper Receivables Co. LLC
0.170%, due 08/03/09 | | | 5,000,000 | | | | 4,999,953 | | |
| 0.300%, due 08/03/09 | | | 5,000,000 | | | | 4,999,917 | | |
| | | | 9,999,870 | | |
| Banking-non-US—1.51% | |
Dnb NOR ASA
1.000%, due 08/04/09 | | | 3,000,000 | | | | 2,999,750 | | |
Svenska Handelsbanken
0.540%, due 08/05/09 | | | 5,000,000 | | | | 4,999,700 | | |
| | | | 7,999,450 | | |
| Banking-US—13.39% | |
ANZ (Delaware), Inc.
0.500%, due 08/10/09 | | | 5,000,000 | | | | 4,999,375 | | |
Calyon N.A., Inc.
0.400%, due 09/01/09 | | | 5,000,000 | | | | 4,998,278 | | |
| 0.540%, due 01/19/10 | | | 2,000,000 | | | | 1,994,870 | | |
Danske Corp.
0.270%, due 08/03/09 | | | 3,000,000 | | | | 2,999,955 | | |
| 0.310%, due 08/17/09 | | | 5,000,000 | | | | 4,999,311 | | |
| 0.350%, due 10/09/09 | | | 5,000,000 | | | | 4,996,646 | | |
Deutsche Bank Financial LLC
0.300%, due 10/27/09 | | | 2,000,000 | | | | 1,998,550 | | |
Dexia Delaware LLC
0.290%, due 08/13/09 | | | 10,000,000 | | | | 9,999,034 | | |
ING (US) Funding LLC
0.250%, due 08/11/09 | | | 4,000,000 | | | | 3,999,722 | | |
| 0.400%, due 08/17/09 | | | 5,000,000 | | | | 4,999,111 | | |
| 0.400%, due 09/02/09 | | | 5,000,000 | | | | 4,998,222 | | |
Morgan (J.P.) Chase Funding, Inc.
0.310%, due 09/03/09 | | | 10,000,000 | | | | 9,997,158 | | |
Natexis Banques Populaires US
Finance Co. LLC
0.260%, due 08/31/09 | | | 5,000,000 | | | | 4,998,917 | | |
Societe Generale N.A., Inc.
0.600%, due 08/06/09 | | | 5,000,000 | | | | 4,999,583 | | |
| | | | 70,978,732 | | |
| Security description | | Face
amount | | Value | |
| Commercial paper2—(concluded) | |
| Brokerage—0.94% | |
RBS Holdings USA, Inc.
0.160%, due 08/03/09 | | $ | 5,000,000 | | | $ | 4,999,956 | | |
| Finance-captive automotive—0.57% | |
Toyota Motor Credit Corp.
0.280%, due 08/12/09 | | | 3,000,000 | | | | 2,999,743 | | |
| Food/beverage—0.28% | |
Nestle Capital Corp.
0.650%, due 02/16/10 | | | 1,500,000 | | | | 1,494,610 | | |
| Pharmaceuticals—1.51% | |
Pfizer, Inc.
0.230%, due 08/20/09 | | | 5,000,000 | | | | 4,999,393 | | |
| 0.320%, due 11/03/09 | | | 3,000,000 | | | | 2,997,493 | | |
| | | | 7,996,886 | | |
Total commercial paper
(cost—$210,290,712) | | | | | | | 210,290,712 | | |
| Short-term corporate obligations—3.17% | |
| Banking-non-US—1.32% | |
Lloyds TSB Group PLC
1.286%, due 08/07/091,4 | | | 5,000,000 | | | | 5,000,000 | | |
Nordea Bank AB
0.717%, due 09/24/091,4 | | | 2,000,000 | | | | 2,000,000 | | |
| | | | 7,000,000 | | |
| Banking-US—1.47% | |
HSBC Bank USA, Inc.
0.925%, due 10/14/091 | | | 4,000,000 | | | | 4,000,000 | | |
Wells Fargo & Co.
0.782%, due 09/23/091 | | | 3,800,000 | | | | 3,802,304 | | |
| | | | 7,802,304 | | |
| Finance-noncaptive consumer—0.38% | |
General Electric Capital Corp.
0.580%, due 10/20/091 | | | 2,000,000 | | | | 1,999,363 | | |
Total short-term
corporate obligations
(cost—$16,801,667) | | | | | | | 16,801,667 | | |
| Repurchase agreements—14.13% | |
Repurchase agreement dated
07/31/09 with Barclays Bank PLC,
0.180% due 08/03/09,
collateralized by $25,534,000
Federal Home Loan Bank
obligations, zero coupon
due 01/08/10;
(value—$25,500,806);
proceeds: $25,000,375 | | | 25,000,000 | | | | 25,000,000 | | |
11
UBS PACE Select Advisors Trust
UBS PACE Money Market Investments
Portfolio of investments—July 31, 2009
| Security description | | Face
amount | | Value | |
| Repurchase agreements—(concluded) | |
Repurchase agreement dated
07/31/09 with Deutsche Bank
Securities, 0.190% due
08/03/09, collateralized by
$40,000,000 Federal Home Loan
Bank obligations, 3.000%
due 06/11/10, $6,631,000
Federal National Mortgage
Association obligations,
6.125% due 08/17/26 and
$6,603,000 Resolution Funding
Principal Strips, zero coupon
due 04/15/30;
(value—$49,980,300);
proceeds: $49,000,776 | | $ | 49,000,000 | | | $ | 49,000,000 | | |
Repurchase agreement dated
07/31/09 with State Street
Bank & Trust Co., 0.010%
due 08/03/09, collateralized
by $882,425 US Treasury Bills,
zero coupon due 08/27/09 to
09/10/09; (value—$882,336);
proceeds: $865,001 | | | 865,000 | | | | 865,000 | | |
Total repurchase agreements
(cost—$74,865,000) | | | | | 74,865,000 | | |
| Security description | | Number of
shares | | Value | |
| Investment of cash collateral from securities loaned—1.87% | |
| Money market fund—1.87% | |
UBS Private Money Market
Fund LLC5
(cost—$9,894,000) | | | 9,894,000 | | | $ | 9,894,000 | | |
Total investments
(cost—$545,431,205 which
approximates cost for federal
income tax purposes)—
102.92% | | | | | 545,431,205 | | |
Liabilities in excess of other
assets—(2.92)% | | | | | (15,472,696 | ) | |
Net assets (applicable to
529,948,181 shares of
beneficial interest outstanding
equivalent to $1.00 per share)—
100.00% | | $ | 529,958,509 | | |
* On September 7, 2008, the Federal Housing Finance Agency placed the Federal National Mortgage Association and the Federal Home Loan Mortgage Corporation into conservatorship, and the US Treasury guaranteed the debt issued by those organizations.
1 Variable rate security. The maturity dates reflect earlier of reset dates or stated maturity dates. The interest rates shown are the current rates as of July 31, 2009, and reset periodically.
2 Rates shown are the discount rates at date of purchase.
3 Security, or portion thereof, was on loan at July 31, 2009.
4 Security exempt from registration under Rule 144A of the Securities Act of 1933. These securities, which represent 1.32% of net assets as of July 31, 2009, are considered liquid and may be resold in transactions exempt from registration, normally to qualified institutional buyers.
5 The table below details the Portfolio's transaction activity in an affiliated issuer during the year ended July 31, 2009.
| Security description | | Value at
07/31/08 | | Purchases
during the
year ended
07/31/09 | | Sales
during the
year ended
07/31/09 | | Value at
07/31/09 | | Net income
earned from
affiliate for the
year ended
07/31/09 | |
| UBS Private Money Market Fund LLC | | $ | 0 | | | $ | 151,079,000 | | | $ | 141,185,000 | | | $ | 9,894,000 | | | $ | 5,504 | | |
12
UBS PACE Select Advisors Trust
UBS PACE Money Market Investments
Portfolio of investments—July 31, 2009
The following is a summary of the fair valuations according to the inputs used as of July 31, 2009 in valuing the Portfolio's investments:
| Measurements at 07/31/09 | |
| | | Quoted prices in
active markets for
identical investments
(Level 1) | | Significant other
observable inputs
(Level 2) | | Unobservable
inputs
(Level 3) | | Total | |
| US government and agency obligations | | $ | — | | | $ | 166,959,525 | | | $ | — | | | $ | 166,959,525 | | |
| Bank notes | | | — | | | | 13,471,632 | | | | — | | | | 13,471,632 | | |
| Certificates of deposit | | | — | | | | 53,148,669 | | | | — | | | | 53,148,669 | | |
| Commercial paper | | | — | | | | 210,290,712 | | | | — | | | | 210,290,712 | | |
| Short-term corporate obligations | | | — | | | | 16,801,667 | | | | — | | | | 16,801,667 | | |
| Repurchase agreements | | | — | | | | 74,865,000 | | | | — | | | | 74,865,000 | | |
Investment of cash collateral from
securities loaned | | | — | | | | 9,894,000 | | | | — | | | | 9,894,000 | | |
| Total | | $ | — | | | $ | 545,431,205 | | | $ | — | | | $ | 545,431,205 | | |
Issuer breakdown by country of origin (unaudited)
| | | Percentage of
total investments | |
| United States | | | 86.7 | % | |
| Canada | | | 3.4 | | |
| France | | | 3.3 | | |
| United Kingdom | | | 2.9 | | |
| Sweden | | | 2.2 | | |
| Norway | | | 0.5 | | |
| Japan | | | 0.5 | | |
| Switzerland | | | 0.3 | | |
| Netherlands | | | 0.2 | | |
| Total | | | 100.0 | % | |
Weighted average maturity—45 days
See accompanying notes to financial statements.
13
UBS PACE Select Advisors Trust
UBS PACE Government Securities Fixed Income Investments
Performance
For the 12 months ended July 31, 2009, the Portfolio's Class P shares returned 9.27% (before the deduction of the maximum UBS PACE Select program fee; after the deduction of the maximum UBS PACE Select program fee, the Portfolio returned 7.65%). In comparison, the Barclays Capital US Mortgage-Backed Securities Index (formerly known as the Lehman Brothers Mortgage-Backed Securities Index) (the "benchmark") returned 10.43%, and the Lipper US Mortgage Funds category posted a median return of 7.58%. (Returns for all share classes over various time periods are shown in the "Performance at a glance" table on page 17. Please note that the returns shown do not reflect the deduction of taxes that a shareholder would pay on Portfolio distributions or the redemption of Portfolio shares.) For a detailed commentary on the market environment in general during the reporting period, please refer to page two.
Sub-Advisor's comments
The Portfolio underperformed its benchmark during the reporting period in a difficult market environment. During the first half of the reporting period, a shorter-than-benchmark duration hurt relative performance, as did a longer-than-benchmark duration in the second half of the reporting period, as 10-year Treasury yields rose to an eight-month high. (Duration measures a portfolio's sensitivity to interest rate changes. A longer duration means that changes in market interest rates are likely to have a larger effect on the value of assets in the Portfolio.)
Positioning the Portfolio to benefit from a steepening yield curve helped performance, on both an absolute and a relative basis. (The yield curve plots the interest rates, at a set point in time, of bonds having equal credit quality, but differing maturity dates. A "steepening yield curve" is one in which long-term bond yields increase relative to those of short-term bonds.) Our focus on securities with shorter maturities added to returns as investors flocked to these securities, following concerns that increases in the money supply could lead to inflation over the longer term.
An overweight to agency-guaranteed, AAA-rated mortgage-backed securities ("MBS") helped
UBS PACE Select Advisors Trust – UBS PACE Government Securities Fixed Income Investments
Investment Sub-Advisor:
Pacific Investment Management Company LLC ("PIMCO")
Portfolio Manager:
W. Scott Simon
Objective:
Current income
Investment process:
The Portfolio invests primarily in government fixed income securities which include US bonds, including those backed by mortgages, and related repurchase agreements. Mortgage-backed securities include "to be announced" or "TBA" securities which usually are traded on a forward commitment basis with an approximate principal amount and no defined maturity date issued or guaranteed by US government agencies and instrumentalities. The Portfolio also invests, to a lesser extent, in investment grade bonds of private issuers, including those backed by mortgages or other assets. The Portfolio may invest in bonds of varying maturities, but normally limits its duration to within two years (plus or minus) of the effective duration of the Portfolio's benchmark index. (Duration is a measure of a portfolio's sensitivity to interest rate changes.) PIMCO establishes duration targets based on its expectations for changes in interest rates, and th en positions the Portfolio to take advantage of yield curve shifts. PIMCO decides to buy and sell specific bonds based on an analysis of their values relative to other similar securities.
14
UBS PACE Select Advisors Trust
UBS PACE Government Securities Fixed Income Investments
Sub-Advisor's comments – concluded
performance during the reporting period.1 During this time, MBS outperformed Treasuries, and posted their eighth consecutive month of relative outperformance in July. The Federal Reserve introduced its MBS Purchase Program to provide support to mortgage and housing markets and to foster improved conditions in financial markets. The program has compressed MBS spreads—that is, the difference between the yields paid on these securities versus those paid on Treasuries—to narrower levels.
The Portfolio's exposure to nonagency mortgages detracted from relative performance during the second half of 2008, as a flight to quality amidst financial volatility drove prices down. While the prices of adjustable-rate mortgage-backed securities recovered somewhat in December, the sector detracted from the Portfolio's performance overall. In addition, the Portfolio's exposure to commercial MBS detracted from returns during the second half of 2008, as credit spreads widened during that time.
1 AAA is the highest rating assigned by Standard & Poor's Ratings Group to a debt obligation and indicates an extremely strong capacity to pay principal and interest.
Special considerations
The Portfolio may be appropriate for long-term investors seeking current income who are able to withstand short-term fluctuations in the fixed income markets in return for potentially higher returns over the long term. The yield and value of the Portfolio change every day and can be affected by changes in interest rates, general market conditions and other political, social and economic developments, as well as specific matters relating to the issuers in which the Portfolio invests. It is important to note that an investment in the Portfolio is only one component of a balanced investment plan.
15
UBS PACE Select Advisors Trust
UBS PACE Government Securities Fixed Income Investments
Comparison of change in value of a $10,000 investment in the Class P shares of the Portfolio and the Barclays Capital US Mortgage-Backed Securities Index (unaudited)
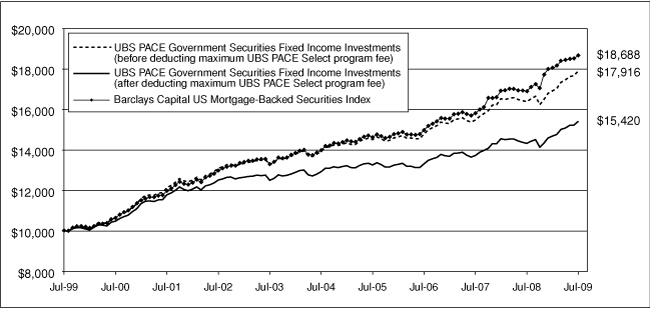
The graph depicts the performance of UBS PACE Government Securities Fixed Income Investments Class P shares versus the Barclays Capital US Mortgage-Backed Securities Index (formerly known as the Lehman Brothers Mortgage-Backed Securities Index) over the 10 years ended July 31, 2009. The performance of the other classes will vary from the performance of the class shown based on the difference in sales charges and fees paid by shareholders investing in different share classes. Past performance does not predict future performance and the performance provided does not reflect the deduction of taxes that a shareholder would pay on Portfolio distributions or the redemption of Portfolio shares. It is important to note that UBS PACE Government Securities Fixed Income Investments is a professiona lly managed portfolio while the Index is not available for investment and is unmanaged. The comparison is shown for illustrative purposes only.
16
UBS PACE Select Advisors Trust
UBS PACE Government Securities Fixed Income Investments
Performance at a glance (unaudited)
| Average annual total returns for periods ended 07/31/09 | | 1 year | | 5 years | | 10 years | | Since
inception1 | |
| Before deducting | | Class A2 | | | 9.09 | % | | | 4.92 | % | | N/A | | | 5.00 | % | |
| maximum sales charge | | Class B3 | | | 8.16 | % | | | 4.11 | % | | N/A | | | 4.69 | % | |
| or UBS PACE Select | | Class C4 | | | 8.45 | % | | | 4.37 | % | | N/A | | | 4.82 | % | |
| program fee | | Class Y5 | | | 9.29 | % | | | 5.22 | % | | N/A | | | 5.32 | % | |
| | | Class P6 | | | 9.27 | % | | | 5.15 | % | | | 6.00 | % | | | 6.03 | % | |
| After deducting | | Class A2 | | | 4.15 | % | | | 3.96 | % | | N/A | | | 4.43 | % | |
| maximum sales charge | | Class B3 | | | 3.16 | % | | | 3.77 | % | | N/A | | | 4.69 | % | |
| or UBS PACE Select | | Class C4 | | | 7.70 | % | | | 4.37 | % | | N/A | | | 4.82 | % | |
| program fee | | Class P6 | | | 7.65 | % | | | 3.58 | % | | | 4.43 | % | | | 4.45 | % | |
| Barclays Capital US Mortgage-Backed Securities Index7 | | | 10.43 | % | | | 5.97 | % | | | 6.45 | % | | | 6.49 | % | |
| Lipper US Mortgage Funds median8 | | | 7.58 | % | | | 3.98 | % | | | 4.90 | % | | | 4.91 | % | |
| Lipper Intermediate US Government Funds median8 | | | 6.88 | % | | | 4.43 | % | | | 5.41 | % | | | 5.41 | % | |
Average annual total returns for periods ended June 30, 2009, after deduction of the maximum sales charge or UBS PACE Select program fee, were as follows: Class A—1-year period, 2.44%; 5-year period, 3.88%; since inception, 4.32%; Class B—1-year period, 1.44%; 5-year period, 3.70%; since inception, 4.58%; Class C—1-year period, 5.97%; 5-year period, 4.32%; since inception, 4.72%; Class Y—1-year period, 7.46%; 5-year period, 5.16%; since inception, 5.21%; Class P—1-year period, 5.93%; 5-year period, 3.53%; 10-year period, 4.22%; since inception, 4.39%.
The annualized gross and net expense ratios, respectively, for each class of shares as in the November 28, 2008 prospectuses, were as follows: Class A—1.07% and 1.02%; Class B—1.84% and 1.77%; Class C—1.63% and 1.52%; Class Y—0.85% and 0.77%; and Class P—0.85% and 0.77%. Net expenses reflect fee waivers and/or expense reimbursements, if any, pursuant to an agreement that is in effect to cap the expenses. The Portfolio and UBS Global AM have entered into a written fee waiver agreement pursuant to which UBS Global AM is contractually obligated to waive its management fees through November 30, 2009 to the extent necessary to reflect the lower sub-advisory fee paid by UBS Global AM to PIMCO. The Portfolio and UBS Global AM have also entered into an additional written fee waiver/expense reimbursement agreement pursuant to which UBS Global AM is contractually obligated to waive its management fees and/or reimb urse the Portfolio so that the Portfolio's ordinary total operating expenses of each class through November 30, 2009 (excluding dividend expense, borrowing costs and interest expense, if any) would not exceed Class A—1.02%; Class B—1.77%; Class C—1.52%; Class Y—0.77% and Class P—0.77%. The Portfolio has agreed to repay UBS Global AM for any waived fees/reimbursed expenses under the preceding sentence to the extent that it can do so over the following three fiscal years without causing the Portfolio's expenses in any of those three years to exceed the expense caps described above.
1 Since inception returns are calculated as of commencement of issuance or reissuance on August 24, 1995 for Class P shares, January 31, 2001 for Class A shares, December 18, 2000 for Class B shares, December 4, 2000 for Class C shares and February 2, 2001 for Class Y shares. Since inception returns for the Index and Lipper median are shown as of August 31, 1995, which is the month-end after the inception date of the oldest share class (Class P).
2 Maximum sales charge for Class A shares is 4.5%. Class A shares bear ongoing 12b-1 service fees.
3 Maximum contingent deferred sales charge for Class B shares is 5% imposed on redemptions and is reduced to 0% after a maximum of six years. Class B shares bear ongoing 12b-1 service and distribution fees.
4 Maximum contingent deferred sales charge for Class C shares is 0.75% imposed on redemptions and is reduced to 0% after one year. Class C shares bear ongoing 12b-1 service and distribution fees.
5 The Portfolio offers Class Y shares to a limited group of eligible investors, including certain qualifying retirement plans. Class Y shares do not bear initial or contingent deferred sales charges or ongoing 12b-1 service and distribution fees.
6 Class P shares do not bear initial or contingent deferred sales charges or ongoing 12b-1 service and distribution fees, but are subject to a maximum annual UBS PACE Select program fee of 1.5% of the value of Class P shares.
7 The Barclays Capital US Mortgage-Backed Securities Index (formerly known as the Lehman Brothers Mortgage-Backed Securities Index) covers fixed rate securitized issues backed by the mortgage pools of the Government National Mortgage Association, the Federal Home Loan Mortgage Corporation and the Federal National Mortgage Association. Graduated Payment Mortgages and Graduated Equity Mortgages are excluded. The average-weighted life is approximately eight years. Investors should note that indices do not reflect the deduction of fees, expenses or taxes.
8 On February 9, 2009, Lipper changed the peer group classification for UBS PACE Government Securities Fixed Income Investments from Lipper Intermediate US Government Funds category to the Lipper US Mortgage Funds category.
If an investor sells or exchanges shares less than 90 days after purchase, a redemption fee of 1.00% of the amount sold or exchanged will be deducted at the time of the transaction, except as noted otherwise in the prospectuses.
Past performance does not predict future performance, and the performance information provided does not reflect the deduction of taxes that a shareholder would pay on Portfolio distributions or the redemption of Portfolio shares. The return and principal value of an investment will fluctuate, so that an investor's shares, when redeemed, may be worth more or less than their original cost. Performance results assume reinvestment of all dividends and capital gain distributions at net asset value on the ex-dividend dates. Current performance may be higher or lower than the performance data quoted. For month-end performance figures, please visit http://www.ubs.com.
Lipper peer group data calculated by Lipper Inc.; used with permission. The Lipper median is the return of the fund that places in the middle of a Lipper peer group.
17
UBS PACE Select Advisors Trust
UBS PACE Government Securities Fixed Income Investments
Portfolio statistics (unaudited)
| Characteristics | | 07/31/09 | |
| Weighted average duration | | | 2.5 | yrs. | |
| Weighted average maturity | | | 2.9 | yrs. | |
| Average coupon | | | 4.42 | % | |
| Average quality1 | | | AAA | | |
| Net assets (mm) | | $ | 576.3 | | |
| Number of holdings | | | 450 | | |
| Portfolio composition2 | | 07/31/09 | |
| Bonds | | | 130.4 | % | |
| Options, futures and swaps | | | (0.2 | ) | |
| Investments sold short | | | (20.1 | ) | |
| Cash equivalents and other assets less liabilities | | | (10.1 | ) | |
| Total | | | 100.0 | % | |
| Asset allocation2 | | 07/31/09 | |
| US government agency mortgage pass-through certificates | | | 110.6 | % | |
| Collateralized mortgage obligations | | | 14.2 | | |
| Asset-backed securities | | | 5.2 | | |
| Corporate notes | | | 0.3 | | |
| Stripped mortgage-backed securities | | | 0.1 | | |
| Options, futures and swaps | | | (0.2 | ) | |
| Investments sold short | | | (20.1 | ) | |
| Cash equivalents and other assets less liabilities | | | (10.1 | ) | |
| Total | | | 100.0 | % | |
1 Credit quality ratings shown are based on the ratings assigned to portfolio holdings by Standard & Poor's Ratings Group, an independent rating agency.
2 Weightings represent percentages of the Portfolio's net assets as of July 31, 2009. The Portfolio is actively managed and its composition will vary over time.
18
UBS PACE Select Advisors Trust
UBS PACE Government Securities Fixed Income Investments
Portfolio of investments—July 31, 2009
| Security description | | Face
amount | | Value | |
| Government national mortgage association certificates—13.73% | |
GNMA
4.500%, due 05/15/39 | | $ | 6,999,303 | | | $ | 7,063,581 | | |
| 6.000%, due 10/15/31 | | | 5,737 | | | | 6,085 | | |
| 6.000%, due 03/15/34 | | | 6,910 | | | | 7,300 | | |
| 6.000%, due 08/15/34 | | | 10,687 | | | | 11,289 | | |
| 6.000%, due 02/15/36 | | | 14,720 | | | | 15,487 | | |
| 6.000%, due 04/15/36 | | | 12,735 | | | | 13,398 | | |
| 6.000%, due 07/15/36 | | | 200,488 | | | | 210,934 | | |
| 6.000%, due 07/15/37 | | | 3,943,491 | | | | 4,146,488 | | |
| 6.000%, due 11/15/37 | | | 1,301,803 | | | | 1,368,816 | | |
| 6.000%, due 03/15/38 | | | 481,963 | | | | 506,697 | | |
| 6.000%, due 05/15/38 | | | 3,974,354 | | | | 4,178,431 | | |
| 6.000%, due 07/15/38 | | | 354,047 | | | | 372,322 | | |
| 6.000%, due 08/15/38 | | | 2,100,505 | | | | 2,208,304 | | |
| 6.000%, due 09/15/38 | | | 2,732,174 | | | | 2,872,391 | | |
| 6.000%, due 10/15/38 | | | 1,620,259 | | | | 1,703,411 | | |
| 6.000%, due 11/15/38 | | | 434,725 | | | | 457,035 | | |
| 6.000%, due 02/15/39 | | | 470,402 | | | | 494,544 | | |
| 6.500%, due 01/15/36 | | | 48,210 | | | | 51,398 | | |
| 6.500%, due 09/15/36 | | | 1,335,481 | | | | 1,423,809 | | |
| 6.500%, due 02/15/37 | | | 70,057 | | | | 74,657 | | |
| 6.500%, due 01/15/38 | | | 53,327 | | | | 56,804 | | |
| 6.500%, due 06/15/38 | | | 183,005 | | | | 194,938 | | |
| 6.500%, due 07/15/38 | | | 829,233 | | | | 883,523 | | |
| 6.500%, due 11/15/38 | | | 49,753 | | | | 52,997 | | |
| 7.500%, due 08/15/21 | | | 7,013 | | | | 7,788 | | |
| 7.500%, due 09/15/23 | | | 1,030 | | | | 1,147 | | |
| 8.000%, due 02/15/23 | | | 1,879 | | | | 2,120 | | |
| 8.250%, due 04/15/19 | | | 491,723 | | | | 544,133 | | |
| 10.500%, due 02/15/19 | | | 31,637 | | | | 35,501 | | |
| 10.500%, due 06/15/19 | | | 38,389 | | | | 43,078 | | |
| 10.500%, due 07/15/19 | | | 78,574 | | | | 88,171 | | |
| 10.500%, due 07/15/20 | | | 3,903 | | | | 4,302 | | |
| 10.500%, due 08/15/20 | | | 37,626 | | | | 42,211 | | |
| 10.500%, due 09/15/20 | | | 3,699 | | | | 4,150 | | |
| 11.500%, due 05/15/19 | | | 3,546 | | | | 4,032 | | |
GNMA II
9.000%, due 04/20/25 | | | 28,923 | | | | 33,159 | | |
| 9.000%, due 12/20/26 | | | 8,043 | | | | 9,208 | | |
| 9.000%, due 01/20/27 | | | 13,248 | | | | 15,151 | | |
| 9.000%, due 06/20/30 | | | 1,681 | | | | 1,935 | | |
| 9.000%, due 09/20/30 | | | 1,332 | | | | 1,533 | | |
| 9.000%, due 10/20/30 | | | 8,736 | | | | 10,055 | | |
| 9.000%, due 11/20/30 | | | 29,772 | | | | 34,267 | | |
GNMA II ARM
4.125%, due 11/20/21 | | | 35,957 | | | | 36,728 | | |
| 4.125%, due 11/20/22 | | | 71,900 | | | | 72,883 | | |
| 4.125%, due 12/20/24 | | | 1,248 | | | | 1,267 | | |
| 4.125%, due 10/20/25 | | | 37,457 | | | | 37,956 | | |
| 4.125%, due 12/20/25 | | | 8,075 | | | | 8,179 | | |
| 4.125%, due 10/20/26 | | | 25,207 | | | | 25,598 | | |
| 4.125%, due 12/20/26 | | | 34,134 | | | | 34,653 | | |
| Security description | | Face
amount | | Value | |
| Government national mortgage association certificates—(concluded) | |
| 4.125%, due 11/20/27 | | $ | 102,657 | | | $ | 103,887 | | |
| 4.125%, due 12/20/27 | | | 11,938 | | | | 12,122 | | |
| 4.125%, due 10/20/29 | | | 17,917 | | | | 18,193 | | |
| 4.125%, due 10/20/30 | | | 40,905 | | | | 41,877 | | |
| 4.250%, due 02/20/28 | | | 5,153 | | | | 5,226 | | |
| 4.375%, due 01/20/23 | | | 140,257 | | | | 142,609 | | |
| 4.375%, due 03/20/23 | | | 68,992 | | | | 70,219 | | |
| 4.375%, due 01/20/24 | | | 181,686 | | | | 184,879 | | |
| 4.375%, due 01/20/25 | | | 16,656 | | | | 16,982 | | |
| 4.375%, due 02/20/25 | | | 41,389 | | | | 42,122 | | |
| 4.375%, due 03/20/25 | | | 61,662 | | | | 63,163 | | |
| 4.375%, due 03/20/26 | | | 31,536 | | | | 32,077 | | |
| 4.375%, due 01/20/27 | | | 213,266 | | | | 216,603 | | |
| 4.375%, due 02/20/27 | | | 22,717 | | | | 23,155 | | |
| 4.375%, due 01/20/28 | | | 24,581 | | | | 25,005 | | |
| 4.375%, due 02/20/28 | | | 13,636 | | | | 13,870 | | |
| 4.500%, due 01/20/18 | | | 204,907 | | | | 209,616 | | |
| 4.500%, due 03/20/25 | | | 29,872 | | | | 30,817 | | |
| 4.625%, due 07/20/17 | | | 13,764 | | | | 14,079 | | |
| 4.625%, due 09/20/21 | | | 196,458 | | | | 201,011 | | |
| 4.625%, due 08/20/25 | | | 45,395 | | | | 46,466 | | |
| 4.625%, due 09/20/25 | | | 54,927 | | | | 56,214 | | |
| 4.625%, due 08/20/26 | | | 57,531 | | | | 58,902 | | |
| 4.625%, due 09/20/26 | | | 8,936 | | | | 9,167 | | |
| 4.625%, due 07/20/27 | | | 22,560 | | | | 23,094 | | |
| 4.625%, due 08/20/27 | | | 53,789 | | | | 55,183 | | |
| 4.625%, due 07/20/30 | | | 300,146 | | | | 308,269 | | |
| 4.625%, due 08/20/30 | | | 222,633 | | | | 228,558 | | |
| 5.375%, due 04/20/18 | | | 17,874 | | | | 18,463 | | |
| 5.375%, due 05/20/21 | | | 8,199 | | | | 8,509 | | |
| 5.375%, due 06/20/22 | | | 180,883 | | | | 186,102 | | |
| 5.375%, due 04/20/24 | | | 209,444 | | | | 215,561 | | |
| 5.375%, due 05/20/25 | | | 143,261 | | | | 147,756 | | |
| 5.375%, due 06/20/25 | | | 37,548 | | | | 39,105 | | |
| 5.375%, due 04/20/26 | | | 296,136 | | | | 304,437 | | |
| 5.375%, due 06/20/26 | | | 138,766 | | | | 142,718 | | |
| 5.375%, due 04/20/27 | | | 79,722 | | | | 82,019 | | |
| 5.375%, due 04/20/30 | | | 57,896 | | | | 59,637 | | |
| 5.375%, due 05/20/30 | | | 1,181,857 | | | | 1,218,215 | | |
| 5.500%, due 05/20/18 | | | 7,985 | | | | 8,233 | | |
| 5.500%, due 06/20/19 | | | 52,356 | | | | 54,481 | | |
| 5.500%, due 06/20/30 | | | 25,564 | | | | 26,421 | | |
GNMA TBA
4.000%, TBA | | | 15,000,000 | | | | 14,692,968 | | |
| 4.500%, TBA | | | 1,000,000 | | | | 1,007,188 | | |
| 5.000%, TBA | | | 20,000,000 | | | | 20,531,240 | | |
| 5.500%, TBA | | | 7,700,000 | | | | 7,981,527 | | |
| 6.000%, TBA | | | 600,000 | | | | 629,813 | | |
Total government national
mortgage association
certificates
(cost—$77,375,525) | | | | | | | 79 | ,081,602 | |
19
UBS PACE Select Advisors Trust
UBS PACE Government Securities Fixed Income Investments
Portfolio of investments—July 31, 2009
| Security description | | Face
amount | | Value | |
| Federal home loan mortgage corporation certificates*—33.64% | |
FHLMC
4.000%, due 06/01/391 | | $ | 7,999,999 | | | $ | 7,838,871 | | |
| 4.000%, due 07/01/391 | | | 8,000,000 | | | | 7,838,872 | | |
| 5.000%, due 11/01/36 | | | 11,957,208 | | | | 12,272,591 | | |
| 5.500%, due 02/01/33 | | | 2,282,960 | | | | 2,376,809 | | |
| 5.500%, due 12/01/33 | | | 623,778 | | | | 649,421 | | |
| 5.500%, due 12/01/34 | | | 697,877 | | | | 726,130 | | |
| 5.500%, due 06/01/36 | | | 6,928,214 | | | | 7,204,365 | | |
| 5.500%, due 12/01/36 | | | 2,798,852 | | | | 2,903,414 | | |
| 5.500%, due 03/01/37 | | | 1,461,585 | | | | 1,515,503 | | |
| 5.500%, due 07/01/37 | | | 2,134,726 | | | | 2,213,477 | | |
| 5.500%, due 12/01/37 | | | 3,384,289 | | | | 3,509,135 | | |
| 5.500%, due 02/01/38 | | | 12,104,158 | | | | 12,550,683 | | |
| 5.500%, due 08/01/38 | | | 4,515,379 | | | | 4,681,698 | | |
| 5.500%, due 12/01/38 | | | 2,613,845 | | | | 2,710,123 | | |
| 6.000%, due 07/01/37 | | | 562,564 | | | | 590,174 | | |
| 6.000%, due 07/01/38 | | | 357,359 | | | | 374,877 | | |
| 6.000%, due 09/01/38 | | | 8,016,389 | | | | 8,409,363 | | |
| 6.000%, due 10/01/38 | | | 9,465,609 | | | | 9,929,626 | | |
| 6.000%, due 12/01/38 | | | 8,300,388 | | | | 8,707,285 | | |
| 6.000%, due 02/01/39 | | | 3,137,138 | | | | 3,290,925 | | |
| 6.000%, due 03/01/39 | | | 4,860,159 | | | | 5,098,411 | | |
| 7.000%, due 08/01/25 | | | 1,693 | | | | 1,869 | | |
| 7.500%, due 10/01/17 | | | 3,365 | | | | 3,759 | | |
| 8.000%, due 03/01/13 | | | 57,719 | | | | 64,490 | | |
| 9.000%, due 02/01/10 | | | 112 | | | | 117 | | |
| 9.000%, due 04/01/25 | | | 39,659 | | | | 40,305 | | |
| 9.750%, due 11/01/16 | | | 11,203 | | | | 11,395 | | |
| 10.500%, due 11/01/20 | | | 3,256 | | | | 3,281 | | |
| 11.000%, due 05/01/11 | | | 2,940 | | | | 3,121 | | |
| 11.000%, due 03/01/13 | | | 516 | | | | 546 | | |
| 11.000%, due 07/01/15 | | | 135 | | | | 137 | | |
| 11.000%, due 09/01/15 | | | 1,899 | | | | 2,150 | | |
| 11.000%, due 10/01/15 | | | 512 | | | | 556 | | |
| 11.000%, due 12/01/15 | | | 7,838 | | | | 8,700 | | |
| 11.000%, due 04/01/19 | | | 5,098 | | | | 5,905 | | |
| 11.000%, due 06/01/19 | | | 451 | | | | 522 | | |
| 11.000%, due 08/01/20 | | | 55 | | | | 64 | | |
| 11.000%, due 09/01/20 | | | 2,315 | | | | 2,660 | | |
| 11.500%, due 05/01/10 | | | 1,715 | | | | 1,774 | | |
| 11.500%, due 11/01/10 | | | 4,028 | | | | 4,229 | | |
| 11.500%, due 09/01/14 | | | 533 | | | | 554 | | |
| 11.500%, due 01/01/16 | | | 2,959 | | | | 3,424 | | |
| 11.500%, due 01/01/18 | | | 9,890 | | | | 11,445 | | |
| 11.500%, due 05/01/19 | | | 5,012 | | | | 5,441 | | |
| 11.500%, due 06/01/19 | | | 20,971 | | | | 24,658 | | |
FHLMC ARM
3.575%, due 07/01/28 | | | 272,172 | | | | 274,206 | | |
| 3.988%, due 11/01/29 | | | 721,247 | | | | 734,746 | | |
| 4.044%, due 11/01/27 | | | 193,496 | | | | 195,298 | | |
| 4.055%, due 04/01/29 | | | 369,955 | | | | 377,969 | | |
| 4.060%, due 06/01/28 | | | 590,845 | | | | 603,316 | | |
| 4.082%, due 11/01/25 | | | 438,820 | | | | 444,311 | | |
| 4.102%, due 12/01/29 | | | 166,923 | | | | 169,086 | | |
| Security description | | Face
amount | | Value | |
| Federal home loan mortgage corporation certificates*—(concluded) | |
| 4.114%, due 01/01/29 | | $ | 321,235 | | | $ | 325,405 | | |
| 4.240%, due 07/01/24 | | | 376,637 | | | | 381,984 | | |
| 4.319%, due 10/01/23 | | | 197,174 | | | | 201,003 | | |
| 4.345%, due 01/01/28 | | | 106,582 | | | | 108,302 | | |
| 4.361%, due 10/01/27 | | | 453,508 | | | | 464,601 | | |
| 4.767%, due 10/01/27 | | | 489,080 | | | | 499,592 | | |
| 5.091%, due 10/01/29 | | | 19,763 | | | | 20,050 | | |
| 5.375%, due 01/01/30 | | | 39,220 | | | | 39,674 | | |
FHLMC TBA
5.000%, TBA | | | 29,900,000 | | | | 30,572,750 | | |
| 5.500%, TBA | | | 47,000,000 | | | | 48,674,375 | | |
| 6.000%, TBA | | | 4,000,000 | | | | 4,191,248 | | |
Total federal home loan mortgage
corporation certificates
(cost—$191,403,060) | | | | | | | 193,870,771 | | |
Federal housing administration
certificates—0.25% | |
FHA GMAC
7.400%, due 02/01/21 | | | 538,014 | | | | 527,254 | | |
| 7.480%, due 04/01/19 | | | 14,808 | | | | 14,808 | | |
FHA Reilly
6.896%, due 07/01/20 | | | 910,384 | | | | 892,176 | | |
Total federal housing
administration certificates
(cost—$1,466,549) | | | | | | | 1,434,238 | | |
| Federal national mortgage association certificates*—62.93% | |
FNMA
4.000%, due 05/01/241 | | | 2,982,327 | | | | 3,014,353 | | |
| 4.000%, due 06/01/241 | | | 12,904,372 | | | | 13,042,948 | | |
| 4.000%, due 07/01/241 | | | 4,039,958 | | | | 4,083,341 | | |
| 4.500%, due 11/01/20 | | | 758,920 | | | | 787,229 | | |
| 4.500%, due 04/01/21 | | | 13,055 | | | | 13,423 | | |
| 4.500%, due 12/01/21 | | | 24,407 | | | | 25,096 | | |
| 4.500%, due 07/01/22 | | | 287,298 | | | | 295,350 | | |
| 4.500%, due 11/01/22 | | | 87,611 | | | | 90,878 | | |
| 4.500%, due 01/01/23 | | | 139,596 | | | | 143,508 | | |
| 4.500%, due 02/01/23 | | | 50,184 | | | | 51,591 | | |
| 4.500%, due 03/01/23 | | | 2,444,979 | | | | 2,510,841 | | |
| 4.500%, due 04/01/23 | | | 802,297 | | | | 824,783 | | |
| 4.500%, due 05/01/23 | | | 1,409,520 | | | | 1,449,023 | | |
| 4.500%, due 07/01/23 | | | 334,934 | | | | 344,321 | | |
| 4.500%, due 08/01/23 | | | 22,334 | | | | 22,960 | | |
| 4.500%, due 11/01/23 | | | 198,524 | | | | 204,088 | | |
| 4.500%, due 01/01/24 | | | 325,338 | | | | 334,424 | | |
| 4.500%, due 02/01/24 | | | 639,146 | | | | 657,001 | | |
| 4.500%, due 03/01/24 | | | 3,758,444 | | | | 3,863,402 | | |
| 4.500%, due 05/01/24 | | | 1,103,806 | | | | 1,134,632 | | |
| 4.500%, due 06/01/24 | | | 83,903 | | | | 86,246 | | |
| 4.500%, due 07/01/391 | | | 6,999,997 | | | | 7,046,946 | | |
| 5.000%, due 04/01/211 | | | 819,114 | | | | 855,043 | | |
20
UBS PACE Select Advisors Trust
UBS PACE Government Securities Fixed Income Investments
Portfolio of investments—July 31, 2009
| Security description | | Face
amount | | Value | |
| Federal national mortgage association certificates*—(continued) | |
| 5.000%, due 05/01/211 | | $ | 1,814,088 | | | $ | 1,893,660 | | |
| 5.000%, due 11/01/211 | | | 718,488 | | | | 750,003 | | |
| 5.000%, due 12/01/211 | | | 214,028 | | | | 223,416 | | |
| 5.000%, due 01/01/221 | | | 114,335 | | | | 119,211 | | |
| 5.000%, due 02/01/221 | | | 726,171 | | | | 755,527 | | |
| 5.000%, due 03/01/221 | | | 27,760 | | | | 28,883 | | |
| 5.000%, due 05/01/221 | | | 1,115,998 | | | | 1,161,295 | | |
| 5.000%, due 06/01/221 | | | 19,841 | | | | 20,643 | | |
| 5.000%, due 07/01/221 | | | 395,838 | | | | 411,840 | | |
| 5.000%, due 11/01/221 | | | 144,438 | | | | 150,277 | | |
| 5.000%, due 12/01/221 | | | 121,687 | | | | 126,606 | | |
| 5.000%, due 01/01/231 | | | 1,556,196 | | | | 1,618,943 | | |
| 5.000%, due 01/01/23 | | | 27,561 | | | | 28,676 | | |
| 5.000%, due 02/01/231 | | | 1,632,892 | | | | 1,698,046 | | |
| 5.000%, due 03/01/231 | | | 549,565 | | | | 571,577 | | |
| 5.000%, due 06/01/231 | | | 863,455 | | | | 897,908 | | |
| 5.000%, due 09/01/231 | | | 1,800,583 | | | | 1,873,373 | | |
| 5.000%, due 02/01/241 | | | 3,382,641 | | | | 3,519,388 | | |
| 5.000%, due 12/01/331 | | | 6,592,983 | | | | 6,786,865 | | |
| 5.000%, due 06/01/351 | | | 78,896,359 | | | | 81,038,967 | | |
| 5.000%, due 05/01/371 | | | 1,000,000 | | | | 1,024,501 | | |
| 5.000%, due 03/01/381 | | | 16,631,551 | | | | 17,038,105 | | |
| 5.000%, due 04/01/381 | | | 1,224,641 | | | | 1,254,578 | | |
| 5.000%, due 07/01/381 | | | 1,896,260 | | | | 1,942,614 | | |
| 5.000%, due 11/01/381 | | | 747,000 | | | | 765,261 | | |
| 5.500%, due 05/01/141 | | | 2,763 | | | | 2,918 | | |
| 5.500%, due 06/01/171 | | | 120,903 | | | | 123,820 | | |
| 5.500%, due 01/01/181 | | | 9,943 | | | | 10,519 | | |
| 5.500%, due 11/01/181 | | | 362,200 | | | | 383,184 | | |
| 5.500%, due 07/01/191 | | | 71,479 | | | | 75,397 | | |
| 5.500%, due 06/01/201 | | | 73,746 | | | | 77,604 | | |
| 5.500%, due 07/01/201 | | | 55,376 | | | | 58,273 | | |
| 5.500%, due 10/01/201 | | | 63,765 | | | | 67,100 | | |
| 5.500%, due 12/01/201 | | | 521,874 | | | | 549,174 | | |
| 5.500%, due 01/01/211 | | | 127,378 | | | | 133,719 | | |
| 5.500%, due 02/01/211 | | | 270,271 | | | | 283,648 | | |
| 5.500%, due 03/01/211 | | | 941,663 | | | | 988,273 | | |
| 5.500%, due 04/01/211 | | | 574,394 | | | | 602,826 | | |
| 5.500%, due 05/01/211 | | | 235,013 | | | | 246,644 | | |
| 5.500%, due 06/01/211 | | | 1,332,332 | | | | 1,398,279 | | |
| 5.500%, due 07/01/211 | | | 616,298 | | | | 646,851 | | |
| 5.500%, due 08/01/211 | | | 78,276 | | | | 82,151 | | |
| 5.500%, due 03/01/221 | | | 51,938 | | | | 54,468 | | |
| 5.500%, due 05/01/221 | | | 821,463 | | | | 861,482 | | |
| 5.500%, due 06/01/221 | | | 32,142 | | | | 33,708 | | |
| 5.500%, due 09/01/221 | | | 797,311 | | | | 836,153 | | |
| 5.500%, due 10/01/221 | | | 54,871 | | | | 57,544 | | |
| 5.500%, due 12/01/221 | | | 63,976 | | | | 67,093 | | |
| 5.500%, due 04/01/231 | | | 22,836 | | | | 23,949 | | |
| 5.500%, due 05/01/231 | | | 399,434 | | | | 418,871 | | |
| 5.500%, due 06/01/231 | | | 324,730 | | | | 340,531 | | |
| 5.500%, due 08/01/231 | | | 789,313 | | | | 827,766 | | |
| 5.500%, due 09/01/231 | | | 7,000,001 | | | | 7,340,626 | | |
| 5.500%, due 10/01/231 | | | 39,248 | | | | 41,158 | | |
| Security description | | Face
amount | | Value | |
| Federal national mortgage association certificates*—(continued) | |
| 5.500%, due 02/01/32 | | $ | 80,648 | | | $ | 84,140 | | |
| 5.500%, due 11/01/32 | | | 1,259,588 | | | | 1,311,762 | | |
| 5.500%, due 01/01/33 | | | 701,634 | | | | 730,696 | | |
| 5.500%, due 02/01/33 | | | 381,890 | | | | 397,470 | | |
| 5.500%, due 06/01/33 | | | 130,068 | | | | 135,374 | | |
| 5.500%, due 09/01/33 | | | 431,738 | | | | 449,351 | | |
| 5.500%, due 10/01/33 | | | 715,223 | | | | 744,401 | | |
| 5.500%, due 11/01/33 | | | 177,476 | | | | 184,717 | | |
| 5.500%, due 12/01/33 | | | 2,476,484 | | | | 2,578,619 | | |
| 5.500%, due 01/01/34 | | | 255,487 | | | | 265,910 | | |
| 5.500%, due 04/01/34 | | | 625,971 | | | | 651,117 | | |
| 5.500%, due 07/01/34 | | | 425,625 | | | | 442,989 | | |
| 5.500%, due 11/01/34 | | | 2,001,852 | | | | 2,082,269 | | |
| 5.500%, due 01/01/35 | | | 349,686 | | | | 363,515 | | |
| 5.500%, due 02/01/37 | | | 354,155 | | | | 367,386 | | |
| 5.500%, due 03/01/37 | | | 377,958 | | | | 392,078 | | |
| 5.500%, due 04/01/37 | | | 858,796 | | | | 890,880 | | |
| 5.500%, due 05/01/37 | | | 1,593,808 | | | | 1,653,350 | | |
| 5.500%, due 06/01/37 | | | 399,310 | | | | 414,228 | | |
| 5.500%, due 07/01/37 | | | 1,462,030 | | | | 1,516,649 | | |
| 5.500%, due 08/01/37 | | | 6,249,515 | | | | 6,500,567 | | |
| 5.500%, due 10/01/37 | | | 851,638 | | | | 883,455 | | |
| 5.500%, due 11/01/37 | | | 434,770 | | | | 451,013 | | |
| 5.500%, due 12/01/37 | | | 3,884,487 | | | | 4,029,607 | | |
| 5.500%, due 01/01/38 | | | 3,378,769 | | | | 3,504,996 | | |
| 5.500%, due 02/01/38 | | | 3,693,473 | | | | 3,830,860 | | |
| 5.500%, due 03/01/38 | | | 5,065,596 | | | | 5,253,764 | | |
| 5.500%, due 04/01/38 | | | 2,843,688 | | | | 2,949,321 | | |
| 5.500%, due 05/01/38 | | | 983,684 | | | | 1,020,224 | | |
| 5.500%, due 06/01/38 | | | 2,152,060 | | | | 2,232,819 | | |
| 5.500%, due 07/01/38 | | | 473,542 | | | | 491,133 | | |
| 5.500%, due 08/01/38 | | | 81,424 | | | | 84,449 | | |
| 5.500%, due 09/01/38 | | | 2,813,569 | | | | 2,918,083 | | |
| 5.500%, due 11/01/38 | | | 300,000 | | | | 311,144 | | |
| 6.000%, due 01/01/23 | | | 1,117,870 | | | | 1,186,589 | | |
| 6.000%, due 11/01/26 | | | 413,631 | | | | 437,784 | | |
| 6.000%, due 01/01/32 | | | 93,879 | | | | 99,381 | | |
| 6.000%, due 04/01/32 | | | 119,983 | | | | 126,902 | | |
| 6.000%, due 09/01/32 | | | 87,809 | | | | 92,873 | | |
| 6.000%, due 10/01/32 | | | 107,843 | | | | 114,062 | | |
| 6.000%, due 12/01/32 | | | 183,903 | | | | 194,509 | | |
| 6.000%, due 01/01/33 | | | 304,448 | | | | 322,006 | | |
| 6.000%, due 02/01/33 | | | 230,103 | | | | 243,122 | | |
| 6.000%, due 06/01/33 | | | 262,480 | | | | 277,330 | | |
| 6.000%, due 07/01/33 | | | 169,070 | | | | 178,636 | | |
| 6.000%, due 10/01/33 | | | 169,021 | | | | 178,584 | | |
| 6.000%, due 11/01/33 | | | 521,624 | | | | 551,137 | | |
| 6.000%, due 02/01/34 | | | 1,745,622 | | | | 1,844,385 | | |
| 6.000%, due 05/01/34 | | | 121,093 | | | | 127,736 | | |
| 6.000%, due 09/01/34 | | | 330,448 | | | | 348,576 | | |
| 6.000%, due 11/01/34 | | | 165,125 | | | | 174,184 | | |
| 6.000%, due 01/01/35 | | | 784,461 | | | | 826,965 | | |
| 6.000%, due 02/01/35 | | | 681,305 | | | | 717,663 | | |
| 6.000%, due 04/01/35 | | | 8,488 | | | | 8,932 | | |
21
UBS PACE Select Advisors Trust
UBS PACE Government Securities Fixed Income Investments
Portfolio of investments—July 31, 2009
| Security description | | Face
amount | | Value | |
| Federal national mortgage association certificates*—(continued) | |
| 6.000%, due 05/01/35 | | $ | 763,649 | | | $ | 803,774 | | |
| 6.000%, due 06/01/35 | | | 198,234 | | | | 208,613 | | |
| 6.000%, due 07/01/35 | | | 1,586,318 | | | | 1,669,376 | | |
| 6.000%, due 08/01/35 | | | 479,518 | | | | 504,625 | | |
| 6.000%, due 09/01/35 | | | 474,965 | | | | 499,834 | | |
| 6.000%, due 01/01/36 | | | 404,865 | | | | 426,063 | | |
| 6.000%, due 06/01/36 | | | 83,616 | | | | 87,864 | | |
| 6.000%, due 07/01/36 | | | 417,722 | | | | 438,941 | | |
| 6.000%, due 09/01/36 | | | 676,936 | | | | 711,322 | | |
| 6.000%, due 11/01/36 | | | 419,855 | | | | 441,183 | | |
| 6.000%, due 12/01/36 | | | 1,358,128 | | | | 1,427,116 | | |
| 6.000%, due 01/01/37 | | | 386,298 | | | | 405,920 | | |
| 6.000%, due 04/01/37 | | | 520,266 | | | | 546,206 | | |
| 6.000%, due 05/01/37 | | | 938,564 | | | | 985,360 | | |
| 6.000%, due 06/01/37 | | | 680,296 | | | | 714,215 | | |
| 6.000%, due 07/01/37 | | | 294,376 | | | | 309,329 | | |
| 6.000%, due 08/01/37 | | | 767,053 | | | | 805,297 | | |
| 6.000%, due 09/01/37 | | | 192,964 | | | | 202,584 | | |
| 6.000%, due 11/01/37 | | | 845,543 | | | | 887,700 | | |
| 6.000%, due 01/01/38 | | | 31,426 | | | | 32,993 | | |
| 6.000%, due 03/01/38 | | | 506,251 | | | | 531,226 | | |
| 6.000%, due 08/01/38 | | | 232,946 | | | | 244,439 | | |
| 6.000%, due 09/01/38 | | | 10,325,373 | | | | 10,837,560 | | |
| 6.000%, due 10/01/38 | | | 124,887 | | | | 131,048 | | |
| 6.000%, due 11/01/38 | | | 4,000,001 | | | | 4,197,337 | | |
| 6.500%, due 09/01/12 | | | 3,943 | | | | 4,199 | | |
| 6.500%, due 12/01/12 | | | 11,284 | | | | 12,017 | | |
| 6.500%, due 01/01/13 | | | 2,902 | | | | 3,096 | | |
| 6.500%, due 02/01/13 | | | 15,591 | | | | 16,604 | | |
| 6.500%, due 03/01/13 | | | 19,221 | | | | 20,470 | | |
| 6.500%, due 04/01/13 | | | 1,952 | | | | 2,079 | | |
| 6.500%, due 06/01/13 | | | 35,590 | | | | 37,970 | | |
| 6.500%, due 07/01/13 | | | 7,886 | | | | 8,412 | | |
| 6.500%, due 08/01/13 | | | 8,070 | | | | 8,609 | | |
| 6.500%, due 09/01/13 | | | 37,609 | | | | 40,122 | | |
| 6.500%, due 10/01/13 | | | 18,216 | | | | 19,435 | | |
| 6.500%, due 11/01/13 | | | 36,230 | | | | 38,652 | | |
| 6.500%, due 07/01/19 | | | 105,183 | | | | 113,935 | | |
| 6.500%, due 09/01/36 | | | 6,323,704 | | | | 6,774,777 | | |
| 6.500%, due 10/01/36 | | | 2,640,939 | | | | 2,829,318 | | |
| 6.500%, due 11/01/36 | | | 137,770 | | | | 147,597 | | |
| 6.500%, due 05/01/37 | | | 43,256 | | | | 46,321 | | |
| 6.500%, due 08/01/37 | | | 4,012,799 | | | | 4,297,154 | | |
| 6.500%, due 11/01/37 | | | 5,393,981 | | | | 5,776,209 | | |
| 7.500%, due 10/01/26 | | | 3,481 | | | | 3,866 | | |
| 7.500%, due 11/01/26 | | | 28,609 | | | | 31,742 | | |
| 8.000%, due 11/01/26 | | | 45,048 | | | | 49,785 | | |
| 8.500%, due 09/01/25 | | | 90,000 | | | | 100,208 | | |
| 9.000%, due 10/01/19 | | | 25,205 | | | | 27,606 | | |
| 9.000%, due 02/01/26 | | | 34,081 | | | | 37,471 | | |
| 9.250%, due 04/01/10 | | | 1,964 | | | | 1,997 | | |
| 9.250%, due 05/01/14 | | | 376 | | | | 379 | | |
| 9.500%, due 12/01/09 | | | 561 | | | | 569 | | |
| 10.000%, due 08/01/19 | | | 23,194 | | | | 25,636 | | |
| Security description | | Face
amount | | Value | |
| Federal national mortgage association certificates*—(concluded) | |
| 10.500%, due 02/01/12 | | $ | 494 | | | $ | 535 | | |
| 10.500%, due 07/01/13 | | | 984 | | | | 1,039 | | |
| 10.500%, due 09/01/15 | | | 10,474 | | | | 11,654 | | |
| 10.500%, due 08/01/20 | | | 1,511 | | | | 1,678 | | |
| 10.500%, due 04/01/22 | | | 2,234 | | | | 2,472 | | |
| 11.000%, due 07/01/13 | | | 1,727 | | | | 1,760 | | |
| 11.000%, due 10/01/15 | | | 3,997 | | | | 4,457 | | |
| 11.000%, due 11/01/15 | | | 9,245 | | | | 9,424 | | |
| 11.000%, due 02/01/16 | | | 1,759 | | | | 1,793 | | |
FNMA ARM
2.539%, due 03/01/44 | | | 1,019,593 | | | | 1,015,316 | | |
| 2.750%, due 10/01/26 | | | 892,765 | | | | 899,072 | | |
| 3.255%, due 02/01/29 | | | 8,399 | | | | 8,490 | | |
| 3.816%, due 02/01/26 | | | 77,044 | | | | 78,137 | | |
| 4.369%, due 02/01/30 | | | 78,607 | | | | 80,539 | | |
| 4.580%, due 09/01/15 | | | 134,834 | | | | 135,959 | | |
| 4.645%, due 07/01/30 | | | 27,857 | | | | 28,111 | | |
| 4.773%, due 12/01/27 | | | 54,117 | | | | 54,677 | | |
| 4.902%, due 05/01/30 | | | 128,784 | | | | 130,743 | | |
| 5.095%, due 09/01/26 | | | 73,334 | | | | 75,027 | | |
| 5.136%, due 03/01/25 | | | 383,247 | | | | 394,572 | | |
| 6.365%, due 11/01/23 | | | 6,703 | | | | 6,833 | | |
FNMA TBA
4.000%, TBA | | | 12,000,000 | | | | 11,765,626 | | |
| 4.500%, TBA | | | 6,000,000 | | | | 6,159,372 | | |
| 5.000%, TBA | | | 2,600,000 | | | | 2,660,125 | | |
| 5.500%, TBA | | | 23,000,000 | | | | 23,826,574 | | |
| 6.000%, TBA | | | 11,000,000 | | | | 11,578,123 | | |
| 6.500%, TBA | | | 12,900,000 | | | | 13,794,938 | | |
Total federal national mortgage
association certificates
(cost—$354,126,054) | | | | | | | 362,638,217 | | |
| Collateralized mortgage obligations—14.19% | |
Adjustable Rate Mortgage Trust,
Series 2005-8, Class 3A21
5.382%, due 11/25/35 | | | 2,900,945 | | | | 2,143,140 | | |
Banc of America Commercial
Mortgage, Inc.,
Series 2006-5, Class A4
5.414%, due 09/10/47 | | | 1,700,000 | | | | 1,436,111 | | |
Bear Stearns Asset Backed
Securities Trust,
Series 2003-AC5, Class A1
5.250%, due 10/25/332 | | | 3,515,987 | | | | 3,051,287 | | |
Series 2004-AC3, Class A2
5.500%, due 06/25/342 | | | 3,459,369 | | | | 2,876,108 | | |
Bear Stearns Commercial
Mortgage Securities Inc.,
Series 2005-PW10, Class A4
5.405%, due 12/11/40 | | | 8,000,000 | | | | 7,916,815 | | |
Series 2006-PW13, Class A4
5.540%, due 09/11/41 | | | 5,600,000 | | | | 5,211,827 | | |
22
UBS PACE Select Advisors Trust
UBS PACE Government Securities Fixed Income Investments
Portfolio of investments—July 31, 2009
| Security description | | Face
amount | | Value | |
| Collateralized mortgage obligations—(continued) | |
Chevy Chase Funding LLC,
Series 2004-1, Class A1
0.565%, due 01/25/353,4 | | $ | 298,851 | | | $ | 207,250 | | |
Chevy Chase Mortgage
Funding Corp.,
Series 2007-2A, Class A1
0.415%, due 05/25/483,4 | | | 2,300,704 | | | | 836,725 | | |
Countrywide Alternative
Loan Trust,
Series 2006-0A2, Class A1
0.499%, due 05/20/463 | | | 4,690,576 | | | | 2,291,625 | | |
Credit Suisse Mortgage Capital
Certificates,
Series 2006-C4, Class A3
5.467%, due 09/15/39 | | | 7,000,000 | | | | 5,358,175 | | |
Federal Agricultural Mortgage
Corp. ARM,
Series 2002, Class AA1
7.863%, due 04/25/11 | | | 612,946 | | | | 668,632 | | |
FHLMC REMIC,*
Series 0023, Class KZ
6.500%, due 11/25/23 | | | 93,164 | | | | 100,766 | | |
Series 0159, Class H
4.500%, due 09/15/21 | | | 22,842 | | | | 22,855 | | |
Series 1003, Class H
1.063%, due 10/15/203 | | | 103,163 | | | | 102,765 | | |
Series 1349, Class PS
7.500%, due 08/15/22 | | | 4,927 | | | | 5,323 | | |
Series 1502, Class PX
7.000%, due 04/15/23 | | | 718,145 | | | | 756,582 | | |
Series 1534, Class Z
5.000%, due 06/15/23 | | | 351,356 | | | | 355,654 | | |
Series 1573, Class PZ
7.000%, due 09/15/23 | | | 120,962 | | | | 130,639 | | |
Series 1658, Class GZ
7.000%, due 01/15/24 | | | 61,033 | | | | 65,491 | | |
Series 1694, Class Z
6.500%, due 03/15/24 | | | 486,511 | | | | 523,023 | | |
Series 1775, Class Z
8.500%, due 03/15/25 | | | 12,238 | | | | 13,337 | | |
Series 2411, Class FJ
0.638%, due 12/15/293 | | | 89,177 | | | | 87,607 | | |
FNMA REMIC,*
Trust 1987-002, Class Z
11.000%, due 11/25/17 | | | 314,295 | | | | 350,635 | | |
Trust 1988-007, Class Z
9.250%, due 04/25/18 | | | 279,453 | | | | 307,792 | | |
Trust 1992-074, Class Z
8.000%, due 05/25/22 | | | 1,138 | | | | 1,239 | | |
Trust 1992-129, Class L
6.000%, due 07/25/22 | | | 17,657 | | | | 18,372 | | |
Trust 1992-158, Class ZZ
7.750%, due 08/25/22 | | | 48,002 | | | | 52,247 | | |
| Security description | | Face
amount | | Value | |
| Collateralized mortgage obligations—(continued) | |
Trust 1993-037, Class PX
7.000%, due 03/25/23 | | $ | 685,366 | | | $ | 748,234 | | |
Trust 1993-240, Class Z
6.250%, due 12/25/13 | | | 2,696 | | | | 2,855 | | |
Trust 1993-250, Class Z
7.000%, due 12/25/23 | | | 24,780 | | | | 26,490 | | |
Trust 2007-114, Class A6
0.485%, due 10/27/373 | | | 5,000,000 | | | | 4,550,000 | | |
Trust G92-040, Class ZC
7.000%, due 07/25/22 | | | 66,134 | | | | 72,150 | | |
Trust G94-006, Class PJ
8.000%, due 05/17/24 | | | 83,584 | | | | 91,838 | | |
GNMA REMIC,
Trust 2000-009, Class FH
0.788%, due 02/16/303 | | | 66,728 | | | | 66,657 | | |
Greenwich Capital Acceptance, Inc.,
Resecuritization Trust Certificate,
Series 2009-6, Class 18A1
0.785%, due 12/26/363,4 | | | 4,768,415 | | | | 4,124,679 | | |
Indymac Index Mortgage
Loan Trust,
Series 2005-AR2, Class 2A1A
0.605%, due 02/25/353 | | | 1,459,737 | | | | 733,944 | | |
JPMorgan Alternative Loan Trust,
Series 2008-R4, Class 2A1
0.785%, due 06/27/373,4 | | | 5,308,935 | | | | 3,794,477 | | |
JPMorgan Chase Commercial
Mortgage Securities Corp.,
Series 2006-LDP9, Class A3
5.336%, due 05/15/47 | | | 900,000 | | | | 731,031 | | |
Series 2007-FL1A, Class A1
0.663%, due 07/15/193,4 | | | 9,610,369 | | | | 6,908,455 | | |
Series 2007-LD12, Class A4
5.882%, due 07/15/17 | | | 3,500,000 | | | | 2,762,712 | | |
Merrill Lynch/Countrywide
Commercial Mortgage Trust,
Series 2007-5, Class A4
5.378%, due 08/12/48 | | | 2,500,000 | | | | 1,722,375 | | |
MLCC Mortgage Investors, Inc.,
Series 2004-1, Class 2A2
4.346%, due 12/25/343 | | | 1,675,399 | | | | 1,530,824 | | |
Sequoia Mortgage Trust,
Series 5, Class A
0.639%, due 10/19/263 | | | 640,295 | | | | 503,180 | | |
Small Business Administration,
Series 2000-10, Class B1
7.449%, due 08/01/10 | | | 113,507 | | | | 117,103 | | |
Structured ARM Loan,
Series 2007-4, Class 1A2
0.505%, due 05/25/37 | | | 3,633,641 | | | | 1,685,169 | | |
Structured Asset Mortgage
Investments Inc.,
Series 2006-AR3, Class 11A1
0.495%, due 04/25/363 | | | 2,269,012 | | | | 1,225,923 | | |
23
UBS PACE Select Advisors Trust
UBS PACE Government Securities Fixed Income Investments
Portfolio of investments—July 31, 2009
| Security description | | Face
amount | | Value | |
| Collateralized mortgage obligations—(concluded) | |
Series 2007-AR5, Class A2
0.835%, due 09/25/473 | | $ | 11,825,536 | | | $ | 2,780,697 | | |
Washington Mutual Mortgage
Pass-Through Certificates,
Series 2003-AR9, Class 1A6
4.526%, due 09/25/333 | | | 5,000,000 | | | | 4,266,740 | | |
Series 2003-AR9, Class 2A
4.457%, due 09/25/333 | | | 1,237,984 | | | | 1,156,628 | | |
Washington Mutual,
Series 2003-R1, Class A1
0.825%, due 12/25/273 | | | 1,578,954 | | | | 1,168,889 | | |
Wells Fargo Mortgage Backed
Securities Trust,
Series 2007-14, Class 1A1
6.000%, due 10/25/37 | | | 7,671,389 | | | | 6,121,529 | | |
Total collateralized mortgage
obligations
(cost—$98,642,182) | | | | | | | 81,784,601 | | |
| Asset-backed securities—5.22% | |
American Express Credit
Account Master Trust,
Series 2008-3, Class A
1.238%, due 08/15/123 | | | 5,000,000 | | | | 5,008,567 | | |
Bank of America Credit
Card Trust,
Series 2008-A5, Class A5
1.488%, due 12/16/133 | | | 2,730,000 | | | | 2,710,863 | | |
Citibank Omni Master Trust,
Series 2007-A9A, Class A9
1.386%, due 12/23/133,4 | | | 5,400,000 | | | | 5,393,010 | | |
Conseco Finance
Securitizations Corp.,
Series 2000-5, Class M1
8.400%, due 02/01/325 | | | 27,967 | | | | 125 | | |
Countrywide Asset-Backed
Certificates,
Series 2005-13, Class 3AV3
0.535%, due 04/25/363 | | | 1,688,393 | | | | 1,180,534 | | |
EMC Mortgage Loan Trust,
Series 2003-A, Class A2
1.035%, due 08/25/403,4 | | | 408,010 | | | | 218,634 | | |
Ford Credit Auto Owner Trust,
Series 2008-C, Class A2B
1.188%, due 01/15/113 | | | 3,640,493 | | | | 3,643,284 | | |
Green Tree Financial Corp.,
Series 1998-2, Class A5
6.240%, due 11/01/16 | | | 65,364 | | | | 57,183 | | |
Renaissance Home Equity
Loan Trust,
Series 2003-2, Class A
0.725%, due 08/25/333 | | | 511,063 | | | | 298,488 | | |
| Security description | | Face
amount | | Value | |
| Asset-backed securities—(concluded) | |
SLM Student Loan Trust,
Series 2008-9, Class A
2.004%, due 04/25/233 | | $ | 7,460,648 | | | $ | 7,566,551 | | |
Soundview Home Equity
Loan Trust,
Series 2007-OPT1, Class 2A1
0.365%, due 06/25/373 | | | 4,769,618 | | | | 3,544,928 | | |
Specialty Underwriting &
Residential Financing,
Series 2003-BC1, Class A
0.965%, due 01/25/343 | | | 57,784 | | | | 18,667 | | |
Wells Fargo Home Equity Trust,
Series 2005-2, Class AII2
0.525%, due 10/25/353 | | | 471,147 | | | | 454,297 | | |
Total asset-backed securities
(cost—$32,091,465) | | | | | | | 30,095,131 | | |
| Stripped mortgage-backed securities—0.06% | |
FHLMC REMIC,*
Series 0013, Class B
7.000%, due 06/25/235,6 | | | 250,470 | | | | 40,179 | | |
Series 2136, Class GD
7.000%, due 03/15/295,6 | | | 18,192 | | | | 2,877 | | |
Series 2178, Class PI
7.500%, due 08/15/295,6 | | | 101,597 | | | | 16,248 | | |
Hilton Hotel Pool Trust,
Series 2000-HLTA, Class X
0.589%, due 10/03/154,5,7 | | | 36,945,667 | | | | 292,384 | | |
Total stripped mortgage-backed
securities
(cost—$339,479) | | | | | | | 351,688 | | |
| Corporate notes—0.34% | |
| Multi-line insurance—0.34% | |
American International Group
5.050%, due 10/01/15 | | | 1,500,000 | | | | 772,638 | | |
| 8.250%, due 08/15/18 | | | 2,000,000 | | | | 1,182,096 | | |
Total corporate notes
(cost—$2,333,559) | | | | | | | 1,954,734 | | |
| Repurchase agreement—0.66% | |
Repurchase agreement dated
07/31/09 with State Street
Bank & Trust Co.,
0.010% due 08/03/09,
collateralized by $3,897,971
US Treasury Bills, zero coupon
due 08/27/09 to 09/10/09;
(value—$3,897,581);
proceeds: $3,821,003
(cost—$3,821,000) | | | 3,821,000 | | | | 3,821,000 | | |
Total investments before
investments sold short
(cost—$761,598,873)—
131.02% | | | | | | | 755,031,982 | | |
24
UBS PACE Select Advisors Trust
UBS PACE Government Securities Fixed Income Investments
Portfolio of investments—July 31, 2009
| Security description | | Face
amount | | Value | |
| Investments sold short—(20.10)% | |
FHLMC TBA*
4.000%, TBA | | $ | (16,000,000 | ) | | $ | (15,685,000 | ) | |
FNMA TBA*
4.000%, TBA | | | (6,000,000 | ) | | | (6,056,250 | ) | |
| 4.500%, TBA | | | (6,600,000 | ) | | | (6,639,191 | ) | |
| 5.000%, TBA | | | (84,900,000 | ) | | | (86,909,251 | ) | |
| 5.500%, TBA | | | (500,000 | ) | | | (523,750 | ) | |
Total investments sold short
(proceeds—$115,045,547)—
(20.10)% | | | | | | | (115,813,442 | ) | |
Liabilities in excess
of other assets—(10.92)% | | | | | | | (62,959,513 | ) | |
| Net assets—100.00% | | $ | 576,259,027 | | |
Aggregate cost for federal income tax purposes before investments sold short was $762,346,211; and net unrealized depreciation consisted of:
| Gross unrealized appreciation | | $ | 13,579,539 | | |
| Gross unrealized depreciation | | | (20,893,768 | ) | |
| Net unrealized depreciation | | $ | (7,314,229 | ) | |
* On September 7, 2008, the Federal Housing Finance Agency placed the Federal National Mortgage Association and the Federal Home Loan Mortgage Corporation into conservatorship, and the US Treasury guaranteed the debt issued by those organizations.
1 Security, or portion thereof, pledged as collateral for investments sold short and written options.
2 Step-up bond that converts to the noted fixed rate at a designated future date.
3 Floating rate security. The interest rate shown is the current rate as of July 31, 2009.
4 Security exempt from registration under Rule 144A of the Securities Act of 1933. These securities, which represent 3.78% of net assets as of July 31, 2009, are considered liquid and may be resold in transactions exempt from registration, normally to qualified institutional buyers.
5 Interest Only Security. This security entitles the holder to receive interest payments from an underlying pool of mortgages. The risk associated with this security is related to the speed of the principal paydowns. High prepayments would result in a smaller amount of interest being received and cause the yield to decrease. Low prepayments would result in a greater amount of interest being received and cause the yield to increase.
6 Illiquid security. These securities represent 0.01% of net assets as of July 31, 2009.
7 Variable rate security. The interest rate shown is the current rate as of July 31, 2009.
ARM Adjustable Rate Mortgage—The interest rate shown is the current rate as of July 31, 2009.
FHA Federal Housing Administration
FHLMC Federal Home Loan Mortgage Corporation
FNMA Federal National Mortgage Association
GMAC General Motors Acceptance Corporation
GNMA Government National Mortgage Association
MLCC Merrill Lynch Credit Corporation
REMIC Real Estate Mortgage Investment Conduit
TBA (To Be Announced) Security is purchased on a forward commitment basis with an approximate principal amount (generally +/-1.0%) and no definite maturity date. The actual principal amount and maturity date will be determined upon settlement when the specific mortgage pools are assigned.
25
UBS PACE Select Advisors Trust
UBS PACE Government Securities Fixed Income Investments
Portfolio of investments—July 31, 2009
Affiliated issuer activity
The table below details the Portfolio's activity in an affiliated issuer for the year ended July 31, 2009.
| Security description | | Value at
07/31/08 | | Purchases
during the
year ended
07/31/09 | | Sales
during the
year ended
07/31/09 | | Value at
07/31/09 | | Net income
earned from
affiliate for the
year ended
07/31/09 | |
| UBS Private Money Market Fund LLC | | $ | 0 | | | $ | 2,055,463 | | | $ | 2,055,463 | | | $ | 0 | | | $ | 206 | | |
Written options
Number of
contracts | | Put options written | | Expiration
date | | Premiums
received | | Current
value | | Unrealized
appreciation | |
| 115 | | 90 Day Euro Dollar Futures, strike @ $98.50 | | 09/14/09 | | $ | 25,587 | | | $ | 2,156 | | | $ | 23,431 | | |
Written option activity for the year ended July 31, 2009 was as follows:
| | | Number of
contracts
(000) | | Premiums
received | |
| Options outstanding at July 31, 2008 | | | 0 | | | $ | 0 | | |
| Options written | | | 14,400 | | | | 114,609 | | |
| Options terminated in closing purchase transactions | | | (14,400 | ) | | | (89,022 | ) | |
| Options outstanding at July 31, 2009 | | | 0 | 8 | | $ | 25,587 | | |
8 Amount represents less than 500 contracts.
Credit default swaps on credit indices—buy protection9
| | | | | Rate type | | | |
| Counterparty | | Notional
amount (000) | | Termination
dates | | Payments
made by
the Portfolio | | Payments
received by
the Portfolio | | Upfront
payments
made | | Value | | Unrealized
depreciation | |
| Deutsche Bank AG | | USD | 3,850 | | | 03/15/49 | | | 0.700 | %10 | | | 0.000 | %11 | | $ | (1,120,440 | ) | | $ | 471,625 | | | $ | (648,815 | ) | |
| Deutsche Bank AG | | USD | 3,850 | | | 02/17/51 | | | 0.350 | 10 | | | 0.000 | 11 | | | (1,350,938 | ) | | | 781,935 | | | | (569,003 | ) | |
Morgan Stanley
Capital Services Inc. | | USD | 7,000 | | | 12/13/49 | | | 0.800 | 10 | | | 0.000 | 11 | | | (1,321,250 | ) | | | 1,302,000 | | | | (19,250 | ) | |
| | | $ | (3,792,628 | ) | | $ | 2,555,560 | | | $ | (1,237,068 | ) | |
9 If the Portfolio is a buyer of protection and a credit event occurs, as defined under the terms of that particular swap agreement, the Portfolio will either (i) receive from the seller of protection an amount equal to the notional value of the swap and take delivery of the referenced obligation or underlying securities comprising the referenced index or (ii) receive a net settlement amount in the form of cash or securities equal to the notional amount of the swap less the recovery value of the referenced obligation or underlying securities comprising the referenced index.
10 Payments are based on the notional amount.
11 Payment from the counterparty will be received upon the occurrence of bankruptcy and/or by a restructuring event with respect to the CMBX.NA.AAA Index.
USD United States Dollar
26
UBS PACE Select Advisors Trust
UBS PACE Government Securities Fixed Income Investments
Portfolio of investments—July 31, 2009
The following is a summary of the fair valuations according to the inputs used as of July 31, 2009 in valuing the Portfolio's investments:
| Measurements at 07/31/09 | |
| | | Quoted prices in
active markets for
identical investments
(Level 1) | | Significant other
observable inputs
(Level 2) | | Unobservable
inputs
(Level 3) | | Total | |
Government national mortgage
association certificates | | $ | — | | | $ | 79,081,602 | | | $ | — | | | $ | 79,081,602 | | |
Federal home loan mortgage
corporation certificates | | | — | | | | 193,870,771 | | | | | | | | 193,870,771 | | |
Federal housing administration
certificates | | | — | | | | — | | | | 1,434,238 | | | | 1,434,238 | | |
Federal national mortgage
association certificates | | | — | | | | 362,638,217 | | | | — | | | | 362,638,217 | | |
| Collateralized mortgage obligations | | | — | | | | 77,234,601 | | | | 4,550,000 | | | | 81,784,601 | | |
| Asset-backed securities | | | — | | | | 30,095,131 | | | | — | | | | 30,095,131 | | |
| Stripped mortgage-backed securities | | | — | | | | 351,688 | | | | — | | | | 351,688 | | |
| Corporate notes | | | — | | | | 1,954,734 | | | | — | | | | 1,954,734 | | |
| Repurchase agreement | | | — | | | | 3,821,000 | | | | — | | | | 3,821,000 | | |
Federal home loan mortgage corporation
and federal national mortgage association
certificates sold short | | | — | | | | (115,813,442 | ) | | | — | | | | (115,813,442 | ) | |
| Other financial instruments, net12 | | | 23,431 | | | | (1,237,068 | ) | | | — | | | | (1,213,637 | ) | |
| Total | | $ | 23,431 | | | $ | 631,997,234 | | | $ | 5,984,238 | | | $ | 638,004,903 | | |
12 Other financial instruments include written options and open swap contracts.
The following is a rollforward of the Portfolio's investments that were valued using unobservable inputs (Level 3) for the period:
| Measurements at 07/31/09 | |
| | | Federal housing
administration
certificates | | Collateralized
mortgage
obligations | | Total | |
| Beginning balance | | $ | 1,665,023 | | | $ | — | | | $ | 1,665,023 | | |
| Net purchases/(sales) | | | (202,095 | ) | | | — | | | | (202,095 | ) | |
| Accrued discounts/(premiums) | | | (1,473 | ) | | | 205,639 | | | | 204,166 | | |
| Total realized gain/(loss) | | | — | | | | — | | | | — | | |
| Total unrealized appreciation/(depreciation) | | | (27,217 | ) | | | (290,039 | ) | | | (317,256 | ) | |
| Net transfers in/(out) of Level 3 | | | — | | | | 4,634,400 | | | | 4,634,400 | | |
| Ending balance | | $ | 1,434,238 | | | $ | 4,550,000 | | | $ | 5,984,238 | | |
The change in unrealized appreciation/(depreciation) relating to the Level 3 investments held at July 31, 2009 was $(317,256).
See accompanying notes to financial statements.
27
UBS PACE Select Advisors Trust
UBS PACE Intermediate Fixed Income Investments
Performance
For the 12 months ended July 31, 2009, the Portfolio's Class P shares returned 5.14% (before the deduction of the maximum UBS PACE Select program fee; after the deduction of the maximum UBS PACE Select program fee, the Portfolio returned 3.58%). In comparison, the Barclays Capital US Intermediate Government/Credit Index (formerly known as the Lehman Brothers Intermediate Government/Credit Index) (the "benchmark") returned 6.52%, and the Lipper Short-Intermediate Investment Grade Debt Funds category posted a median return of 5.75%.(Returns for all share classes over various time periods are shown in the "Performance at a glance" table on page 31. Please note that the returns shown do not reflect the deduction of taxes that a shareholder would pay on Portfolio distributions or the redemption of Portfolio shares.) For a detailed commentary on the market environment in general during the reporting period, please refer to page two.
Sub-Advisor's comments
The Portfolio underperformed its benchmark during the reporting period. Allocations to commercial mortgage-backed securities ("CMBS"), as well as nonagency mortgages were the largest detractors from performance during the period. Negative security selection within the corporate sector, particularly in the Portfolio's overweight to financials, also hurt performance.
The CMBS sector struggled during difficult times in the market. Against this backdrop, investors sold CMBS in late 2008, driving down prices. However, the sector recovered dramatically in 2009, significantly outperforming Treasuries. We believe that this was in response to the announcement of the Treasury's Public-Private Investment Program, which aims to facilitate the purchase of $40 billion of "toxic" mortgage assets from bank balance sheets, and the Federal Reserve's Term Asset-Backed Securities Loan Facility (TALF). The TALF is intended to make credit available to consumers and businesses on more favorable terms by facilitating the issuance of asset-backed securities ("ABS") and improving the market conditions for ABS more generally. We expect the TALF to stabilize the supply and demand imbalance within the sector. Nonagency mortgages also struggled in the initial part of the reporting period, underperforming as a result of a weak economy.
Elsewhere, the Portfolio's exposure to asset-backed securities was a modest detractor from performance during the reporting period. The Portfolio maintained a high-quality bias, avoiding the underperforming lower-quality issues.
UBS PACE Select Advisors Trust – UBS PACE Intermediate Fixed Income Investments
Investment Sub-Advisor:
BlackRock Financial Management, Inc. ("BlackRock")
Portfolio Managers:
Curtis Arledge and Matthew Marra
Objective:
Current income, consistent with reasonable stability of principal
Investment process:
The Portfolio invests primarily in fixed income securities. BlackRock decides to buy specific bonds based on its credit analysis and review. BlackRock strives to add value by controlling the Portfolio's duration within a narrow band relative to the Barclays Capital US Intermediate Government/Credit Index. To accomplish this, BlackRock employs an analytical process that involves evaluating macroeconomic trends, technical market factors, yield-curve exposure and market volatility. Once BlackRock establishes the investment themes on duration, yield curve exposure, convexity, sector weighting, credit quality and liquidity, the Portfolio's investments are diversified by sector, subsector and security.
28
UBS PACE Select Advisors Trust
UBS PACE Intermediate Fixed Income Investments
Sub-Advisor's comments – concluded
The Portfolio's allocation to agency mortgages also contributed to performance. In an effort to keep mortgage rates low, the federal government supported the agency sector with its mortgage purchase program, announcing its intent to purchase over $1 trillion in agency mortgages. In addition, an underweight to corporate securities benefited relative performance during periods when spreads—the difference between the yields paid on these securities versus those paid on US Treasuries—became wider.
We adjusted the Portfolio's duration throughout the period, both increasing and decreasing it versus the benchmark, which benefited performance. (Duration measures a portfolio's sensitivity to interest rate changes. A longer duration means that changes in market interest rates are likely to have a larger effect on the value of assets in the Portfolio.) In addition, positioning the Portfolio to benefit from a steepening yield curve significantly contributed to performance as two-year to 10-year spreads steepened during the period. (The yield curve plots the interest rates, at a set point in time, of bonds having equal credit quality, but differing maturity dates. A "steepening yield curve" is one in which long-term bond yields increase relative to those of short-term bonds.)
Special considerations
The Portfolio may be appropriate for long-term investors seeking current income and a reasonable stability of principal. Investors should be able to withstand short-term fluctuations in the fixed income markets. The value of the Portfolio changes every day and can be affected by changes in interest rates, general market conditions and other political, social and economic developments, as well as specific matters relating to the companies in whose securities the Portfolio invests. It is important to note that an investment in the Portfolio is only one component of a balanced investment plan.
29
UBS PACE Select Advisors Trust
UBS PACE Intermediate Fixed Income Investments
Comparison of change in value of a $10,000 investment in the Class P shares of the Portfolio and the Barclays Capital US Intermediate Government/Credit Index (unaudited)
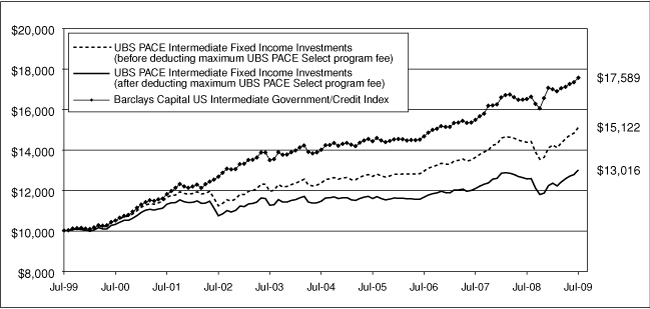
The graph depicts the performance of UBS PACE Intermediate Fixed Income Investments Class P shares versus the Barclays Capital US Intermediate Government/Credit Index (formerly known as the Lehman Brothers Intermediate Government/Credit Index) over the 10 years ended July 31, 2009. The performance of the other classes will vary from the performance of the class shown based on the difference in sales charges and fees paid by shareholders investing in different share classes. Past performance does not predict future performance and the performance provided does not reflect the deduction of taxes that a shareholder would pay on Portfolio distributions or the redemption of Portfolio shares. It is important to note that UBS PACE Intermediate Fixed Income Investments is a professionally manage d portfolio while the Index is not available for investment and is unmanaged. The comparison is shown for illustrative purposes only.
30
UBS PACE Select Advisors Trust
UBS PACE Intermediate Fixed Income Investments
Performance at a glance (unaudited)
| Average annual total returns for periods ended 07/31/09 | | 1 year | | 5 years | | 10 years | | Since
inception1 | |
| Before deducting | | Class A2 | | | 4.88 | % | | | 3.87 | % | | N/A | | | 3.36 | % | |
| maximum sales charge | | Class B3 | | | 4.08 | % | | | 3.08 | % | | N/A | | | 3.02 | % | |
| or UBS PACE Select | | Class C4 | | | 4.36 | % | | | 3.32 | % | | N/A | | | 3.14 | % | |
| program fee | | Class Y5 | | | 5.15 | % | | | 4.12 | % | | N/A | | | 3.63 | % | |
| | | Class P6 | | | 5.14 | % | | | 4.12 | % | | | 4.22 | % | | | 4.53 | % | |
| After deducting | | Class A2 | | | 0.18 | % | | | 2.92 | % | | N/A | | | 2.80 | % | |
| maximum sales charge | | Class B3 | | | (0.92 | )% | | | 2.72 | % | | N/A | | | 3.02 | % | |
| or UBS PACE Select | | Class C4 | | | 3.61 | % | | | 3.32 | % | | N/A | | | 3.14 | % | |
| program fee | | Class P6 | | | 3.58 | % | | | 2.57 | % | | | 2.67 | % | | | 2.97 | % | |
| Barclays Capital US Intermediate Government/Credit Index7 | | | 6.52 | % | | | 4.68 | % | | | 5.81 | % | | | 5.89 | % | |
| Lipper Short-Intermediate Investment Grade Debt Funds median | | | 5.75 | % | | | 3.67 | % | | | 4.85 | % | | | 5.07 | % | |
Average annual total returns for periods ended June 30, 2009, after deduction of the maximum sales charge or UBS PACE Select program fee, were as follows: Class A—1-year period, (2.14)%; 5-year period, 2.69%; since inception, 2.60%; Class B—1-year period, (3.19)%; 5-year period, 2.49%; since inception, 2.82%; Class C—1-year period, 1.25%; 5-year period, 3.09%; since inception, 2.95%; Class Y—1-year period, 2.76%; 5-year period, 3.89%; since inception, 3.43%; Class P—1-year period, 1.23%; 5-year period, 2.34%; 10-year period, 2.47%; since inception, 2.86%.
The annualized gross and net expense ratios, respectively, for each class of shares as in the November 28, 2008 prospectuses, were as follows: Class A—1.00% and 0.93%; Class B—1.86% and 1.68%; Class C—1.52% and 1.43%; Class Y—0.71% and 0.68%; and Class P—0.72% and 0.68%. Net expenses reflect fee waivers and/or expense reimbursements, if any, pursuant to an agreement that is in effect to cap the expenses. The Portfolio and UBS Global AM have entered into a written fee waiver/expense reimbursement agreement pursuant to which UBS Global AM is contractually obligated to waive its management fees and/or reimburse the Portfolio so that the ordinary total operating expenses of each class through November 30, 2009 (excluding dividend expense, borrowing costs and interest expense, if any) would not exceed Class A—0.93%; Class B—1.68%; Class C—1.43%; Class Y—0.68% and Class P—0.68%. The Po rtfolio has agreed to repay UBS Global AM for any waived fees/reimbursed expenses to the extent that it can do so over the following three fiscal years without causing the Portfolio's expenses in any of those three years to exceed the expense caps described above.
1 Since inception returns are calculated as of commencement of issuance or reissuance on August 24, 1995 for Class P shares, January 31, 2001 for Class A shares, December 14, 2000 for Class B shares, December 1, 2000 for Class C shares and February 2, 2001 for Class Y shares. Since inception returns for the Index and Lipper median are shown as of August 31, 1995, which is the month-end after the inception date of the oldest share class (Class P).
2 Maximum sales charge for Class A shares is 4.5%. Class A shares bear ongoing 12b-1 service fees.
3 Maximum contingent deferred sales charge for Class B shares is 5% imposed on redemptions and is reduced to 0% after a maximum of six years. Class B shares bear ongoing 12b-1 service and distribution fees.
4 Maximum contingent deferred sales charge for Class C shares is 0.75% imposed on redemptions and is reduced to 0% after one year. Class C shares bear ongoing 12b-1 service and distribution fees.
5 The Portfolio offers Class Y shares to a limited group of eligible investors, including certain qualifying retirement plans. Class Y shares do not bear initial or contingent deferred sales charges or ongoing 12b-1 service and distribution fees.
6 Class P shares do not bear initial or contingent deferred sales charges or ongoing 12b-1 service and distribution fees, but are subject to a maximum annual UBS PACE Select program fee of 1.5% of the value of Class P shares.
7 The Barclays Capital US Intermediate Government/Credit Index (formerly known as the Lehman Brothers Intermediate Government/Credit Index) is a subset of the Barclays Capital US Government/Credit Index (formerly known as the Lehman Brothers Government/Credit Index) covering all investment grade issues with maturities from one up to (but not including) 10 years. The average weighted maturity is typically between four and five years. Investors should note that indices do not reflect the deduction of fees, expenses or taxes.
If an investor sells or exchanges shares less than 90 days after purchase, a redemption fee of 1.00% of the amount sold or exchanged will be deducted at the time of the transaction, except as noted otherwise in the prospectuses.
Past performance does not predict future performance, and the performance information provided does not reflect the deduction of taxes that a shareholder would pay on Portfolio distributions or the redemption of Portfolio shares. The return and principal value of an investment will fluctuate, so that an investor's shares, when redeemed, may be worth more or less than their original cost. Performance results assume reinvestment of all dividends and capital gain distributions at net asset value on the ex-dividend dates. Current performance may be higher or lower than the performance data quoted. For month-end performance figures, please visit http://www.ubs.com.
Lipper peer group data calculated by Lipper Inc.; used with permission. The Lipper median is the return of the fund that places in the middle of a Lipper peer group.
31
UBS PACE Select Advisors Trust
UBS PACE Intermediate Fixed Income Investments
Portfolio statistics (unaudited)
| Characteristics | | 07/31/09 | |
| Weighted average duration | | | 3.8 | yrs. | |
| Weighted average maturity | | | 5.5 | yrs. | |
| Average coupon | | | 4.46 | % | |
| Net assets (mm) | | $ | 405.9 | | |
| Number of holdings | | | 231 | | |
| Portfolio composition1 | | 07/31/09 | �� |
| Bonds and notes | | | 106.0 | % | |
| Futures and forward foreign currency contracts | | | 0.0 | 2 | |
| Investments sold short | | | (9.7 | ) | |
| Cash equivalents and other assets less liabilities | | | 3.7 | | |
| Total | | | 100.0 | % | |
| Quality diversification1 | | 07/31/09 | |
| US government and agency securities | | | 48.9 | % | |
| AAA | | | 23.3 | | |
| AA | | | 6.1 | | |
| A | | | 16.0 | | |
| BBB and below/non-rated | | | 11.7 | | |
| Futures and forward foreign currency contracts | | | 0.0 | 2 | |
| Investments sold short | | | (9.7 | ) | |
| Cash equivalents and other assets less liabilities | | | 3.7 | | |
| Total | | | 100.0 | % | |
| Asset allocation1 | | 07/31/09 | |
| Corporate notes | | | 36.0 | % | |
| US government agency mortgage pass-through certificates | | | 23.0 | | |
| Collateralized mortgage obligations | | | 21.3 | | |
| US government obligations | | | 20.0 | | |
| Asset-backed securities | | | 4.8 | | |
| Non-US government obligations | | | 0.9 | | |
| Futures and forward foreign currency contracts | | | 0.0 | 2 | |
| Investments sold short | | | (9.7 | ) | |
| Cash equivalents and other assets less liabilities | | | 3.7 | | |
| Total | | | 100.0 | % | |
1 Weightings represent percentages of the Portfolio's net assets as of July 31, 2009. The Portfolio is actively managed and its composition will vary over time. Credit quality ratings shown are based on the ratings assigned to portfolio holdings by Standard & Poor's Ratings Group, an independent rating agency.
2 Weightings represent less than 0.05% of the Portfolio's net assets as of July 31, 2009.
32
UBS PACE Select Advisors Trust
UBS PACE Intermediate Fixed Income Investments
Portfolio of investments—July 31, 2009
| Security description | | Face
amount1 | | Value | |
| US government obligations—20.04% | |
US Treasury Bonds
6.250%, due 08/15/232 | | $ | 4,525,000 | | | $ | 5,531,813 | | |
| 7.250%, due 08/15/22 | | | 1,600,000 | | | | 2,110,750 | | |
| 8.000%, due 11/15/21 | | | 8,950,000 | | | | 12,390,156 | | |
US Treasury Notes
1.500%, due 07/15/12 | | | 7,250,000 | | | | 7,229,627 | | |
| 2.625%, due 06/30/14 | | | 2,555,000 | | | | 2,567,775 | | |
| 2.625%, due 07/31/14 | | | 12,885,000 | | | | 12,940,366 | | |
| 3.125%, due 05/15/19 | | | 39,815,000 | | | | 38,583,124 | | |
Total US government obligations
(cost—$81,306,432) | | | | | | | 81,353,611 | | |
| Federal farm credit bank certificate—1.46% | |
FFCB
2.625%, due 04/17/14
(cost—$5,987,350) | | | 6,000,000 | | | | 5,914,332 | | |
| Federal home loan bank certificates—2.66% | |
FHLB
5.530%, due 11/03/143 | | | 3,740,000 | | | | 3,824,516 | | |
| 5.625%, due 06/13/16 | | | 2,085,000 | | | | 2,005,887 | | |
| 5.625%, due 06/11/21 | | | 4,485,000 | | | | 4,973,336 | | |
Total federal home loan bank
certificates
(cost—$10,352,712) | | | | | | | 10,803,739 | | |
| Federal home loan mortgage corporation certificates*—4.98% | |
FHLMC
1.750%, due 06/15/122 | | | 1,500,000 | | | | 1,496,855 | | |
| 3.000%, due 07/28/14 | | | 10,960,000 | | | | 11,062,564 | | |
| 5.000%, due 03/01/21 | | | 114,151 | | | | 118,980 | | |
| 5.000%, due 04/01/214 | | | 1,933,106 | | | | 2,015,152 | | |
| 5.000%, due 05/01/21 | | | 122,269 | | | | 127,441 | | |
| 5.000%, due 02/01/224 | | | 1,206,805 | | | | 1,257,854 | | |
| 5.000%, due 04/01/224 | | | 1,188,809 | | | | 1,239,097 | | |
| 5.000%, due 10/01/224 | | | 1,351,743 | | | | 1,405,544 | | |
| 5.000%, due 11/01/224 | | | 1,427,056 | | | | 1,483,855 | | |
Total federal home loan mortgage
corporation certificates
(cost—$19,942,896) | | | | | | | 20,207,342 | | |
| Federal national mortgage association certificates*—13.87% | |
FNMA
2.500%, due 05/15/14 | | | 1,330,000 | | | | 1,312,992 | | |
| 2.750%, due 02/05/14 | | | 3,650,000 | | | | 3,662,673 | | |
| 4.500%, due 04/01/39 | | | 29,717 | | | | 29,929 | | |
| 4.500%, due 06/01/394 | | | 433,633 | | | | 436,736 | | |
| 4.500%, due 07/01/394 | | | 6,434,122 | | | | 6,480,173 | | |
| 4.500%, due 08/01/394 | | | 2,255,000 | | | | 2,271,140 | | |
| 4.625%, due 05/01/13 | | | 845,000 | | | | 881,701 | | |
| 5.000%, due 01/01/234 | | | 2,643,803 | | | | 2,750,682 | | |
| 5.000%, due 02/01/244 | | | 6,290,726 | | | | 6,532,526 | | |
| Security description | | Face
amount1 | | Value | |
| Federal national mortgage association certificates*—(concluded) | |
| 5.250%, due 08/01/122 | | $ | 1,460,000 | | | $ | 1,545,330 | | |
| 5.250%, due 09/15/16 | | | 3,260,000 | | | | 3,617,009 | | |
| 6.000%, due 02/01/374 | | | 1,310,440 | | | | 1,375,777 | | |
| 6.000%, due 08/01/374 | | | 1,356,774 | | | | 1,424,421 | | |
| 6.000%, due 11/01/374 | | | 3,818,060 | | | | 4,008,424 | | |
| 6.000%, due 02/01/384 | | | 6,251,869 | | | | 6,560,297 | | |
| 6.000%, due 03/01/384 | | | 1,075,807 | | | | 1,128,881 | | |
FNMA TBA
5.000%, TBA | | | 11,900,000 | | | | 12,175,187 | | |
| 5.500%, TBA | | | 100,000 | | | | 103,594 | | |
Total federal national mortgage
association certificates
(cost—$55,931,462) | | | | | | | 56,297,472 | | |
| Collateralized mortgage obligations—21.29% | |
Banc of America Commercial
Mortgage, Inc.,
Series 2001-1, Class A2
6.503%, due 04/15/36 | | | 1,550,167 | | | | 1,605,822 | | |
Series 2000-1, Class A2A
7.333%, due 11/15/31 | | | 897,365 | | | | 898,237 | | |
Series 2002-PB2, Class A4
6.186%, due 06/11/35 | | | 2,145,000 | | | | 2,256,104 | | |
Bear Stearns Alternative Loan
Trust-A Trust,
Series 2004-13, Class A1
1.025%, due 11/25/345 | | | 591,717 | | | | 367,071 | | |
Bear Stearns ARM Trust,
Series 2004-5, Class 2A
4.641%, due 07/25/34 | | | 1,480,476 | | | | 1,195,629 | | |
Bear Stearns Commercial
Mortgage Securities,
Series 2003-T12, Class A4
4.680%, due 08/13/39 | | | 2,400,000 | | | | 2,347,336 | | |
Chase Commercial Mortgage
Securities Corp.,
Series 1999-2, Class A2
7.198%, due 01/15/32 | | | 1,217,995 | | | | 1,224,880 | | |
Commercial Mortgage
Pass-Through Certificates,
Series 2004-LB3A, Class A3
5.090%, due 07/10/37 | | | 1,280,000 | | | | 1,237,182 | | |
Series 2005-C6, Class A2
4.999%, due 06/10/44 | | | 3,305,000 | | | | 3,316,910 | | |
Countrywide Home Loans,
Series 2006-0A5, Class 2A1
0.485%, due 04/25/465 | | | 530,132 | | | | 249,017 | | |
CWCapital COBALT,
Series 2007-C3, Class A4
5.820%, due 06/15/175 | | | 840,000 | | | | 637,321 | | |
FHLMC REMIC,*
Trust 2626, Class NA
5.000%, due 06/15/23 | | | 1,407,650 | | | | 1,439,064 | | |
33
UBS PACE Select Advisors Trust
UBS PACE Intermediate Fixed Income Investments
Portfolio of investments—July 31, 2009
| Security description | | Face
amount1 | | Value | |
| Collateralized mortgage obligations—(continued) | |
Trust 2964, Class NA
5.500%, due 02/15/26 | | $ | 619,152 | | | $ | 630,615 | | |
Trust 3154, Class PJ
5.500%, due 03/15/27 | | | 1,368,552 | | | | 1,398,958 | | |
Trust 3159, Class TA
5.500%, due 11/15/26 | | | 1,126,839 | | | | 1,152,863 | | |
Trust 3162, Class OA
6.000%, due 10/15/26 | | | 1,365,137 | | | | 1,405,206 | | |
Trust 3184, Class LA
6.000%, due 03/15/28 | | | 1,306,308 | | | | 1,340,942 | | |
Trust 3303, Class PA
5.500%, due 01/15/22 | | | 2,816,948 | | | | 2,871,518 | | |
First Horizon Alternative
Mortgage Securities,
Series 2006-FA2, Class 1A5
6.000%, due 05/25/36 | | | 1,888,959 | | | | 1,334,642 | | |
First Union National Bank
Commercial Mortgage Trust,
Series 2001-C2, Class A2
6.663%, due 01/12/43 | | | 3,047,719 | | | | 3,166,900 | | |
Series 2001-C3, Class A3
6.423%, due 08/15/33 | | | 2,787,780 | | | | 2,901,583 | | |
FNMA REMIC,*
Trust 2004-25, Class PA
5.500%, due 10/25/30 | | | 1,039,226 | | | | 1,067,072 | | |
Trust 2004-36, Class BS
5.500%, due 11/25/30 | | | 774,501 | | | | 796,931 | | |
Trust 2005-47, Class PA
5.500%, due 09/25/24 | | | 383,993 | | | | 386,479 | | |
Trust 2005-88, Class PA
5.000%, due 09/25/24 | | | 1,171,558 | | | | 1,185,871 | | |
Trust 2005-97, Class HM
5.000%, due 01/25/26 | | | 1,940,037 | | | | 1,983,302 | | |
Trust 2005-109, Class PV
6.000%, due 10/25/32 | | | 1,626,080 | | | | 1,733,623 | | |
Trust 2005-118, Class MC
6.000%, due 01/25/32 | | | 1,987,367 | | | | 2,047,940 | | |
Trust 2005-118, Class WA
6.000%, due 10/25/33 | | | 2,042,113 | | | | 2,104,934 | | |
Trust 2006-26, Class QA
5.500%, due 06/25/26 | | | 1,016,674 | | | | 1,044,817 | | |
Trust 2006-62, Class TA
5.500%, due 06/25/28 | | | 413,217 | | | | 427,177 | | |
GMAC Commercial
Mortgage Securities, Inc.,
Series 2000-C3, Class A2
6.957%, due 09/15/35 | | | 2,759,777 | | | | 2,862,334 | | |
Series 2001-C1, Class A2
6.465%, due 04/15/34 | | | 2,375,043 | | | | 2,463,960 | | |
Series 2004-C3, Class A3
4.207%, due 12/10/41 | | | 3,152,584 | | | | 3,151,818 | | |
Goldman Sachs Mortgage
Securities Corp. II,
Series 2005-GG4, Class A4A
4.751%, due 07/10/39 | | | 700,000 | | | | 667,248 | | |
| Security description | | Face
amount1 | | Value | |
| Collateralized mortgage obligations—(continued) | |
Greenwich Capital Commercial
Funding Corp.,
Series 2007-GG11, Class A4
5.736%, due 12/10/49 | | $ | 1,451,000 | | | $ | 1,256,985 | | |
JPMorgan Chase Commercial
Mortgage Securities,
Series 2004-CB8, Class A1A
4.158%, due 01/12/396 | | | 2,347,818 | | | | 2,189,207 | | |
Series 2004-CBX, Class A4
4.529%, due 01/12/37 | | | 2,090,000 | | | | 2,036,808 | | |
Series 2005-LDP4, Class A2
4.790%, due 10/15/42 | | | 3,114,494 | | | | 3,118,404 | | |
Series 2006-LDP8, Class A4,
5.399%, due 05/15/45 | | | 385,000 | | | | 322,703 | | |
JPMorgan Mortgage Trust,
Series 2006-S2, Class 2A2
5.875%, due 07/25/36 | | | 309,043 | | | | 265,922 | | |
Series 2007-S1, Class 1A2
5.500%, due 03/25/22 | | | 253,444 | | | | 214,794 | | |
Morgan Stanley Capital I,
Series 2005-HQ6, Class A2A
4.882%, due 08/13/42 | | | 2,600,000 | | | | 2,585,932 | | |
Series 2005-HQ6, Class A4A
4.989%, due 08/13/42 | | | 2,980,000 | | | | 2,861,087 | | |
Series 2007-IQ14, Class A4
5.692%, due 04/15/49 | | | 2,000,000 | | | | 1,505,724 | | |
Small Business Administration,
Series 2004-P10B, Class 1
4.754%, due 08/10/14 | | | 775,082 | | | | 801,327 | | |
Structured ARM Loan Trust,
Series 2004-13, Class A2
0.585%, due 09/25/34 | | | 232,272 | | | | 166,464 | | |
Structured Asset Securities Corp.,
Series 2003-AL1, Class A
3.357%, due 04/25/316 | | | 704,703 | | | | 610,378 | | |
Series 2004-6, Class 4A1 ARM
4.844%, due 06/25/34 | | | 2,905,144 | | | | 2,622,313 | | |
TIAA Seasoned Commercial
Mortgage Trust,
Series 2007-C4, Class A1
5.667%, due 08/15/395 | | | 2,874,430 | | | | 2,926,791 | | |
Wachovia Bank Commercial
Mortgage Trust,
Series 2005-C17, Class A2
4.782%, due 03/15/42 | | | 3,154,343 | | | | 3,167,400 | | |
Series 2005-C21, Class A3
5.209%, due 10/15/445 | | | 1,215,000 | | | | 1,213,864 | | |
Series 2006-C28, Class A4
5.572%, due 10/15/48 | | | 1,385,000 | | | | 1,162,495 | | |
WaMu Mortgage Pass
Through Certificates,
Series 2007-0A4, Class 1A
1.980%, due 05/25/475 | | | 629,541 | | | | 280,177 | | |
Series 2007-0A5, Class 1A
1.960%, due 06/25/475 | | | 554,057 | | | | 240,220 | | |
34
UBS PACE Select Advisors Trust
UBS PACE Intermediate Fixed Income Investments
Portfolio of investments—July 31, 2009
| Security description | | Face
amount1 | | Value | |
| Collateralized mortgage obligations—(concluded) | |
Washington Mutual Asset
Securities Corp.,
Series 2005-C1A, Class A2
5.150%, due 05/25/366 | | $ | 1,115,493 | | | $ | 1,119,410 | | |
Wells Fargo Mortgage Backed
Securities Trust,
Series 2006-AR4, Class 2A4
5.776%, due 04/25/365 | | | 1,200,000 | | | | 852,107 | | |
Total collateralized mortgage
obligations (cost—$89,231,652) | | | | | | | 86,421,818 | | |
| Asset-backed securities—4.80% | |
American Express Issuance Trust,
Series 2008-2, Class A
4.020%, due 01/18/11 | | | 3,425,000 | | | | 3,472,526 | | |
Citigroup Mortgage Loan Trust, Inc.,
Series 2007-AMC3, Class A2A
0.395%, due 03/25/375 | | | 487,185 | | | | 343,270 | | |
Countrywide Asset-Backed
Certificates,
Series 2006-2, Class 2A2
0.475%, due 06/25/365,7 | | | 1,123,258 | | | | 811,914 | | |
Ford Credit Auto Owner Trust,
Series 2006-B, Class A3
5.260%, due 10/15/10 | | | 278,921 | | | | 279,796 | | |
Lehman XS Trust,
Series 2005-6, Class 1A1
0.545%, due 11/25/355 | | | 607,900 | | | | 311,696 | | |
Nissan Auto Receivables
Owner Trust,
Series 2006-C, Class A4
5.450%, due 06/15/12 | | | 2,961,550 | | | | 3,032,976 | | |
Sallie Mae Student Loan Trust,
Series 2005-8, Class A4
1.254%, due 01/25/285 | | | 3,300,000 | | | | 2,781,283 | | |
Series 2008-5, Class A2
1.604%, due 10/25/165 | | | 4,330,000 | | | | 4,363,791 | | |
Series 2008-5, Class A3
1.804%, due 01/25/185 | | | 1,100,000 | | | | 1,103,149 | | |
Series 2008-5, Class A4
2.204%, due 07/25/235 | | | 2,950,000 | | | | 2,976,362 | | |
Total asset-backed securities
(cost—$20,294,624) | | | | | | | 19,476,763 | | |
| Corporate notes—35.99% | |
| Airlines—0.11% | |
Continental Airlines, Inc.
6.545%, due 02/02/19 | | | 463,238 | | | | 426,179 | | |
| Automotive—0.54% | |
DaimlerChrysler N.A. Holding
4.875%, due 06/15/10 | | | 800,000 | | | | 808,177 | | |
| 5.750%, due 09/08/11 | | | 1,150,000 | | | | 1,185,739 | | |
| 6.500%, due 11/15/13 | | | 200,000 | | | | 211,564 | | |
| | | | 2,205,480 | | |
| Security description | | Face
amount1 | | Value | |
| Corporate notes—(continued) | |
| Banking-non-US—3.02% | |
Barclays Bank PLC
7.434%, due 12/15/176,8,9 | | $ | 850,000 | | | $ | 646,000 | | |
Deutsche Bank AG London
5.375%, due 10/12/12 | | | 2,450,000 | | | | 2,626,366 | | |
Eksportfinans A/S
5.500%, due 05/25/16 | | | 1,275,000 | | | | 1,336,149 | | |
Kreditanstalt fuer Wiederaufbau
3.500%, due 03/10/14 | | | 3,725,000 | | | | 3,830,886 | | |
Landwirtschaftliche Rentenbank
4.125%, due 07/15/13 | | | 145,000 | | | | 151,910 | | |
Landwirtschaftliche
Rentenbank MTN
4.000%, due 02/02/15 | | | 290,000 | | | | 297,172 | | |
| 4.375%, due 01/15/13 | | | 320,000 | | | | 337,750 | | |
| 5.250%, due 07/02/12 | | | 500,000 | | | | 539,818 | | |
Royal Bank of Scotland PLC
2.625%, due 05/11/126 | | | 380,000 | | | | 383,815 | | |
Societe Financement de
l'Economie Francaise
3.375%, due 05/05/146 | | | 2,100,000 | | | | 2,124,423 | | |
| | | | 12,274,289 | | |
| Banking-US—3.73% | |
Bank of America Corp.
5.750%, due 12/01/17 | | | 2,775,000 | | | | 2,664,264 | | |
Citibank N.A.
1.375%, due 08/10/11 | | | 6,400,000 | | | | 6,394,944 | | |
DEPFA Asset Covered
Securities Bank
4.875%, due 10/28/156 | | | 1,300,000 | | | | 1,046,562 | | |
JPMorgan Chase Bank N.A.
6.000%, due 07/05/17 | | | 1,825,000 | | | | 1,883,159 | | |
| 6.000%, due 10/01/17 | | | 1,450,000 | | | | 1,506,659 | | |
State Street Capital Trust
8.250%, due 03/15/118,9 | | | 1,725,000 | | | | 1,613,047 | | |
| | | | 15,108,635 | | |
| Beverages—0.54% | |
Bottling Group LLC
6.950%, due 03/15/14 | | | 650,000 | | | | 754,908 | | |
Coca-Cola Enterprises, Inc.
3.750%, due 03/01/12 | | | 1,365,000 | | | | 1,419,040 | | |
| | | | 2,173,948 | | |
| Consumer products—0.10% | |
Xstrata Finance Canada
5.800%, due 11/15/166 | | | 415,000 | | | | 397,369 | | |
| Diversified financial services—2.99% | |
EnCana Holdings Financial Corp.
5.800%, due 05/01/14 | | | 450,000 | | | | 489,703 | | |
General Electric Capital Corp.
2.125%, due 12/21/122 | | | 1,420,000 | | | | 1,418,717 | | |
| 5.000%, due 11/15/11 | | | 4,555,000 | | | | 4,763,063 | | |
| 6.375%, due 11/15/675 | | | 1,125,000 | | | | 798,327 | | |
35
UBS PACE Select Advisors Trust
UBS PACE Intermediate Fixed Income Investments
Portfolio of investments—July 31, 2009
| Security description | | Face
amount1 | | Value | |
| Corporate notes—(continued) | |
| Diversified financial services—(concluded) | |
General Electric Capital Corp. MTN
5.000%, due 12/01/10 | | $ | 2,160,000 | | | $ | 2,236,479 | | |
LeasePlan Corp. N.V.
3.000%, due 05/07/126 | | | 2,400,000 | | | | 2,420,470 | | |
| | | | 12,126,759 | | |
| Diversified manufacturing—0.25% | |
Honeywell International, Inc.
3.875%, due 02/15/14 | | | 990,000 | | | | 1,015,066 | | |
| Electric utilities—0.24% | |
Scottish Power Ltd.
4.910%, due 03/15/10 | | | 950,000 | | | | 969,154 | | |
| Electric-integrated—2.01% | |
EDP Finance BV
5.375%, due 11/02/126 | | | 5,300,000 | | | | 5,618,768 | | |
Pacificorp
5.500%, due 01/15/19 | | | 1,400,000 | | | | 1,512,195 | | |
Progress Energy Carolina
5.300%, due 01/15/19 | | | 975,000 | | | | 1,038,234 | | |
| | | | 8,169,197 | | |
| Energy—0.42% | |
Florida Power Corp.
4.800%, due 03/01/13 | | | 340,000 | | | | 356,355 | | |
XTO Energy, Inc.
6.250%, due 08/01/17 | | | 1,250,000 | | | | 1,360,445 | | |
| | | | 1,716,800 | | |
| Financial services—4.98% | |
BP Capital Markets PLC
3.125%, due 03/10/12 | | | 1,690,000 | | | | 1,737,344 | | |
Citigroup, Inc.
2.125%, due 04/30/12 | | | 3,865,000 | | | | 3,882,957 | | |
Credit Suisse Guernsey
5.860%, due 05/15/178,9 | | | 2,290,000 | | | | 1,534,300 | | |
Dexia Credit Local
2.375%, due 09/23/116 | | | 1,385,000 | | | | 1,387,872 | | |
Goldman Sachs Group, Inc.
5.250%, due 10/15/13 | | | 2,530,000 | | | | 2,648,409 | | |
JPMorgan Chase & Co.
7.900%, due 04/30/188,9 | | | 1,415,000 | | | | 1,344,972 | | |
JPMorgan Chase Capital XXV
6.800%, due 10/01/37 | | | 600,000 | | | | 548,491 | | |
Lehman Brothers Holdings,
Inc. MTN
6.750%, due 12/28/1710 | | | 1,375,000 | | | | 137 | | |
Morgan Stanley
0.788%, due 01/09/125 | | | 4,595,000 | | | | 4,393,812 | | |
| 6.750%, due 04/15/11 | | | 250,000 | | | | 264,434 | | |
Morgan Stanley MTN
5.550%, due 04/27/17 | | | 305,000 | | | | 305,184 | | |
| 6.250%, due 08/28/17 | | | 740,000 | | | | 769,550 | | |
SLM Corp.
1.383%, due 01/31/145 | | | 1,700,000 | | | | 1,051,637 | | |
| Security description | | Face
amount1 | | Value | |
| Corporate notes—(continued) | |
| Financial services—(concluded) | |
State Street Corp.
7.650%, due 06/15/10 | | $ | 345,000 | | | $ | 357,937 | | |
| | | | 20,227,036 | | |
| Food products—0.87% | |
Kraft Foods, Inc.
6.000%, due 02/11/13 | | | 575,000 | | | | 622,417 | | |
| 6.500%, due 08/11/17 | | | 2,625,000 | | | | 2,917,194 | | |
| | | | 3,539,611 | | |
| Insurance—1.57% | |
Chubb Corp.
6.375%, due 03/29/675 | | | 425,000 | | | | 344,250 | | |
Metropolitan Life Global Funding I
5.125%, due 04/10/136 | | | 1,850,000 | | | | 1,886,181 | | |
Pricoa Global Funding I
5.400%, due 10/18/126 | | | 2,175,000 | | | | 2,212,712 | | |
Progressive Corp.
6.700%, due 06/15/375 | | | 735,000 | | | | 556,363 | | |
Prudential Financial, Inc. MTN
5.800%, due 06/15/12 | | | 975,000 | | | | 977,917 | | |
Travelers Cos., Inc.
6.250%, due 03/15/375 | | | 450,000 | | | | 382,782 | | |
| | | | 6,360,205 | | |
| Media—1.36% | |
Comcast Corp.
5.450%, due 11/15/10 | | | 1,525,000 | | | | 1,587,864 | | |
| 5.900%, due 03/15/16 | | | 550,000 | | | | 588,681 | | |
News America Holdings
8.500%, due 02/23/25 | | | 200,000 | | | | 228,039 | | |
| 9.500%, due 07/15/24 | | | 225,000 | | | | 265,319 | | |
Rogers Communications
6.250%, due 06/15/13 | | | 825,000 | �� | | | 887,422 | | |
Time Warner Cable, Inc.
5.850%, due 05/01/17 | | | 810,000 | | | | 850,961 | | |
Time Warner, Inc.
6.875%, due 05/01/12 | | | 685,000 | | | | 747,680 | | |
| 7.570%, due 02/01/24 | | | 350,000 | | | | 360,955 | | |
| | | | 5,516,921 | | |
| Medical providers—0.80% | |
Roche Holdings, Inc.
2.661%, due 02/25/115,6 | | | 395,000 | | | | 400,871 | | |
| 5.000%, due 03/01/146 | | | 1,750,000 | | | | 1,861,496 | | |
WellPoint, Inc.
5.000%, due 01/15/11 | | | 950,000 | | | | 973,556 | | |
| | | | 3,235,923 | | |
| Multi-line insurance—0.21% | |
MetLife, Inc.
7.717%, due 02/15/19 | | | 750,000 | | | | 848,225 | | |
36
UBS PACE Select Advisors Trust
UBS PACE Intermediate Fixed Income Investments
Portfolio of investments—July 31, 2009
| Security description | | Face
amount1 | | Value | |
| Corporate notes—(continued) | |
| Oil & gas—0.89% | |
ConocoPhillips Co.
4.600%, due 01/15/15 | | $ | 2,025,000 | | | $ | 2,144,360 | | |
| 8.750%, due 05/25/10 | | | 1,250,000 | | | | 1,333,221 | | |
EnCana Corp.
4.600%, due 08/15/09 | | | 150,000 | | | | 150,134 | | |
| | | | 3,627,715 | | |
| Oil refining—0.10% | |
Canadian Natural Resources
5.700%, due 05/15/17 | | | 380,000 | | | | 399,408 | | |
| Oil services—0.69% | |
Halliburton Co.
5.500%, due 10/15/10 | | | 850,000 | | | | 887,952 | | |
Shell International Finance BV
4.000%, due 03/21/14 | | | 1,825,000 | | | | 1,917,850 | | |
| | | | 2,805,802 | | |
| Pharmaceuticals—1.78% | |
Abbott Laboratories
5.600%, due 05/15/11 | | | 535,000 | | | | 571,596 | | |
Eli Lilly & Co.
3.550%, due 03/06/12 | | | 810,000 | | | | 841,123 | | |
GlaxoSmithKline Capital, Inc.
4.850%, due 05/15/13 | | | 1,075,000 | | | | 1,140,779 | | |
Merck & Co., Inc.
4.000%, due 06/30/15 | | | 1,325,000 | | | | 1,382,301 | | |
Pfizer, Inc.
5.350%, due 03/15/15 | | | 2,645,000 | | | | 2,927,378 | | |
Schering-Plough Corp.
5.550%, due 12/01/135 | | | 340,000 | | | | 369,008 | | |
| | | | 7,232,185 | | |
| Real estate investment trusts—0.27% | |
AvalonBay Communities, Inc. MTN
6.125%, due 11/01/12 | | | 280,000 | | | | 285,730 | | |
ERP Operating LP
6.625%, due 03/15/12 | | | 780,000 | | | | 805,331 | | |
| | | | 1,091,061 | | |
| Retail—0.50% | |
CVS Caremark Corp.
0.968%, due 06/01/105 | | | 2,025,000 | | | | 2,018,340 | | |
| Software—0.50% | |
Oracle Corp.
4.950%, due 04/15/132 | | | 250,000 | | | | 267,770 | | |
Oracle Corp./Ozark Holdings
5.000%, due 01/15/11 | | | 1,700,000 | | | | 1,778,753 | | |
| | | | 2,046,523 | | |
| Special purpose entity—0.63% | |
AEP Texas Central Transition,
Series A-4
5.170%, due 01/01/20 | | | 425,000 | | | | 438,130 | | |
| Security description | | Face
amount1 | | Value | |
| Corporate notes—(continued) | |
| Special purpose entity—(concluded) | |
BAE Systems Holdings, Inc.
5.200%, due 08/15/156 | | $ | 330,000 | | | $ | 339,771 | | |
Goldman Sachs Capital II
5.793%, due 06/01/128,9 | | | 450,000 | | | | 315,000 | | |
UnitedHealth Group
5.250%, due 03/15/11 | | | 1,425,000 | | | | 1,473,647 | | |
| | | | 2,566,548 | | |
| Telecommunications—4.12% | |
AT&T Broadband Corp.
8.375%, due 03/15/13 | | | 1,585,000 | | | | 1,821,133 | | |
Cox Communications, Inc.
7.125%, due 10/01/12 | | | 350,000 | | | | 388,876 | | |
| 7.750%, due 11/01/10 | | | 110,000 | | | | 115,763 | | |
| 8.375%, due 03/01/396 | | | 850,000 | | | | 1,062,117 | | |
SBC Communications, Inc.
5.875%, due 02/01/12 | | | 95,000 | | | | 102,218 | | |
TCI Communications, Inc.
7.875%, due 08/01/13 | | | 100,000 | | | | 114,120 | | |
| 8.750%, due 08/01/15 | | | 50,000 | | | | 59,914 | | |
Telecom Italia Capital
5.250%, due 11/15/13 | | | 1,665,000 | | | | 1,718,933 | | |
| 5.250%, due 10/01/15 | | | 205,000 | | | | 208,748 | | |
| 6.200%, due 07/18/11 | | | 1,750,000 | | | | 1,854,421 | | |
Telefonica Emisiones SAU
5.855%, due 02/04/13 | | | 925,000 | | | | 998,048 | | |
| 5.984%, due 06/20/11 | | | 1,500,000 | | | | 1,607,127 | | |
| 6.421%, due 06/20/16 | | | 950,000 | | | | 1,065,712 | | |
Telefonica Europe BV
7.750%, due 09/15/10 | | | 235,000 | | | | 249,152 | | |
Verizon Communications
6.350%, due 04/01/192 | | | 775,000 | | | | 873,216 | | |
| 8.750%, due 11/01/18 | | | 1,800,000 | | | | 2,301,885 | | |
Verizon New Jersey, Inc.
5.875%, due 01/17/12 | | | 2,030,000 | | | | 2,152,117 | | |
| | | | 16,693,500 | | |
| Tobacco—0.33% | |
Philip Morris International, Inc.
5.650%, due 05/16/18 | | | 1,250,000 | | | | 1,329,905 | | |
| Utilities—0.67% | |
Dominion Resources, Inc.
5.125%, due 12/15/09 | | | 650,000 | | | | 657,181 | | |
Nisource Finance Corp.
1.231%, due 11/23/095 | | | 950,000 | | | | 944,003 | | |
| 7.875%, due 11/15/10 | | | 1,075,000 | | | | 1,124,455 | | |
| | | | 2,725,639 | | |
| Wireless telecommunications—1.77% | |
Cellco Partnership/Verizon
Wireless Capital LLC
3.750%, due 05/20/116 | | | 3,930,000 | | | | 4,048,324 | | |
37
UBS PACE Select Advisors Trust
UBS PACE Intermediate Fixed Income Investments
Portfolio of investments—July 31, 2009
| Security description | | Face
amount1 | | Value | |
| Corporate notes—(concluded) | |
| Wireless telecommunications—(concluded) | |
Vodafone Group PLC
4.150%, due 06/10/14 | | $ | 2,150,000 | | | $ | 2,191,626 | | |
| 7.750%, due 02/15/10 | | | 920,000 | | | | 948,722 | | |
| | | | 7,188,672 | | |
Total corporate notes
(cost—$144,701,461) | | | | | | | 146,036,095 | | |
| Non-US government obligations—0.86% | |
Bundesrepublik Deutschland
4.000%, due 01/04/37 | | EUR | 1,050,000 | | | | 1,485,250 | | |
| 4.250%, due 07/04/39 | | EUR | 550,000 | | | | 818,187 | | |
Japan Finance Corp.
2.000%, due 06/24/11 | | | 1,120,000 | | | | 1,120,984 | | |
Province of Ontario
4.100%, due 06/16/14 | | | 75,000 | | | | 78,054 | | |
Total non-US government
obligations
(cost—$3,381,624) | | | | | | | 3,502,475 | | |
| Short-term US government obligation—4.04% | |
US Treasury Bills
0.150%, due 08/20/0911
(cost—$16,413,684) | | | 16,415,000 | | | | 16,413,684 | | |
| Repurchase agreement—0.07% | |
Repurchase agreement dated
07/31/09 with State Street
Bank & Trust Co.,
0.010% due 08/03/09,
collateralized by $308,084
US Treasury Bills, zero coupon
due 08/27/09 to 09/10/09;
(value—$308,053);
proceeds: $302,000
(cost—$302,000) | | | 302,000 | | | | 302,000 | | |
| Security description | | Number of
shares | | Value | |
| Investment of cash collateral from securities loaned—1.95% | |
| Money market fund—1.95% | |
UBS Private Money Market
Fund LLC12
(cost—$7,903,377) | | | 7,903,377 | | | $ | 7,903,377 | | |
Total investments before
investments sold short
(cost—$455,749,274)—
112.01% | | | | | | | 454,632,708 | | |
| | | Face
amount1 | | | |
| Investments sold short—(9.65)% | |
FHLMC TBA*
5.000%, TBA | | $ | (6,800,000 | ) | | | (7,055,000 | ) | |
FNMA TBA*
4.500%, TBA | | | (9,110,000 | ) | | | (9,164,095 | ) | |
| 5.000%, TBA | | | (8,200,000 | ) | | | (8,515,192 | ) | |
| 6.000%, TBA | | | (13,800,000 | ) | | | (14,464,125 | ) | |
Total investments sold short
(proceeds—$39,058,572)—
(9.66)% | | | | | | | (39,198,412 | ) | |
Liabilities in excess of other
assets—(2.35)% | | | | | | | (9,548,615 | ) | |
| Net assets—100.00% | | $ | 405,885,681 | | |
Aggregate cost for federal income tax purposes before investments sold short was $457,820,017; and net unrealized depreciation consisted of:
| Gross unrealized appreciation | | $ | 6,419,195 | | |
| Gross unrealized depreciation | | | (9,606,504 | ) | |
| Net unrealized depreciation | | $ | (3,187,309 | ) | |
* On September 7, 2008, the Federal Housing Finance Agency placed the Federal National Mortgage Association and the Federal Home Loan Mortgage Corporation into conservatorship, and the US Treasury guaranteed the debt issued by those organizations.
1 In US Dollars unless otherwise indicated.
2 Security, or portion thereof, was on loan at July 31, 2009.
3 Partial amount delivered to broker as collateral for futures transactions.
4 Entire amount pledged as collateral for investments sold short.
5 Floating rate security. The interest rate shown is the current rate as of July 31, 2009.
38
UBS PACE Select Advisors Trust
UBS PACE Intermediate Fixed Income Investments
Portfolio of investments—July 31, 2009
6 Security exempt from registration under Rule 144A of the Securities Act of 1933. These securities, which represent 7.33% of net assets as of July 31, 2009, are considered liquid and may be resold in transactions exempt from registration, normally to qualified institutional buyers.
7 Step-up bond that converts to the noted fixed rate at a designated future date.
8 Variable rate security. The interest rate shown is the current rate as of July 31, 2009, and resets at the next call date.
9 Perpetual bond security. The maturity date reflects the next call date.
10 Bond interest in default.
11 Rate shown is the discount rate at date of purchase.
12 The table below details the Portfolio's transaction activity in an affiliated issuer during the year ended July 31, 2009.
| Security description | | Value at
07/31/08 | | Purchases
during the
year ended
07/31/09 | | Sales
during the
year ended
07/31/09 | | Value at
07/31/09 | | Net income
earned from
affiliate for the
year ended
07/31/09 | |
| UBS Private Money Market Fund LLC | | $ | 1,287,062 | | | $ | 249,022,161 | | | $ | 242,405,846 | | | $ | 7,903,377 | | | $ | 41,681 | | |
ARM Adjustable Rate Mortgage—The interest rate shown is the current rate as of July 31, 2009.
EUR Euro
FFCB Federal Farm Credit Bank
FHLB Federal Home Loan Bank
FHLMC Federal Home Loan Mortgage Corporation
FNMA Federal National Mortgage Association
GMAC General Motors Acceptance Corporation
MTN Medium Term Note
REMIC Real Estate Mortgage Investment Conduit
TBA (To Be Announced) Security is purchased on a forward commitment basis with an approximate principal amount (generally +/- 1.0%) and no definite maturity date. The actual principal amount and maturity date will be determined upon settlement when the specific mortgage pools are assigned.
TIAA Teachers Insurance and Annuity Association
Futures contracts
Number of
contracts | | Currency | | Buy contracts | | Expiration
dates | | Cost | | Current
value | | Unrealized
appreciation
(depreciation) | |
| 300 | | USD | | US Treasury Note 5 Year Futures | | September 2009 | | $ | 34,375,030 | | | $ | 34,614,844 | | | $ | 239,814 | | |
| | | | | Sale contracts | | | | Proceeds | | | | | |
| 85 | | USD | | US Treasury Note 2 Year Futures | | September 2009 | | $ | 18,400,367 | | | $ | 18,409,141 | | | $ | (8,774 | ) | |
| 32 | | USD | | US Treasury Note 10 Year Futures | | September 2009 | | | 3,739,342 | | | | 3,753,000 | | | | (13,658 | ) | |
| | | | | | | | | | 22,139,709 | | | | 22,162,141 | | | | (22,432 | ) | |
| | | | | | | | | | | | | | | | | $ | 217,382 | | |
Forward foreign currency contracts
| | | Contracts to
deliver | | In
exchange for | | Mautrity
dates | | Unrealized
appreciation
(depreciation) | |
| Euro | | | 2,350,500 | | | USD | 3,274,247 | | | 09/16/09 | | $ | (76,146 | ) | |
| Japanese Yen | | | 381,168,500 | | | USD | 3,988,599 | | | 08/26/09 | | | (40,410 | ) | |
| United States Dollar | | | 4,020,175 | | | JPY | 381,168,500 | | | 08/26/09 | | | 8,834 | | |
| | | $ | (107,722 | ) | |
Currency type abbreviations:
JPY Japanese Yen
USD United States Dollar
39
UBS PACE Select Advisors Trust
UBS PACE Intermediate Fixed Income Investments
Portfolio of investments—July 31, 2009
The following is a summary of the fair valuations according to the inputs used as of July 31, 2009 in valuing the Portfolio's investments:
| Measurements at 07/31/09 | |
| | | Quoted prices in
active markets for
identical investments
(Level 1) | | Significant other
observable inputs
(Level 2) | | Unobservable
inputs
(Level 3) | | Total | |
| US government obligations | | $ | — | | | $ | 81,353,611 | | | $ | — | | | $ | 81,353,611 | | |
| Federal farm credit bank certificate | | | — | | | | 5,914,332 | | | | — | | | | 5,914,332 | | |
| Federal home loan bank certificates | | | — | | | | 10,803,739 | | | | — | | | | 10,803,739 | | |
Federal home loan mortgage
corporation certificates | | | — | | | | 20,207,342 | | | | — | | | | 20,207,342 | | |
Federal national mortgage association
certificates | | | — | | | | 56,297,472 | | | | — | | | | 56,297,472 | | |
| Collateralized mortgage obligations | | | — | | | | 86,421,818 | | | | — | | | | 86,421,818 | | |
| Asset-backed securities | | | — | | | | 19,476,763 | | | | — | | | | 19,476,763 | | |
| Corporate notes | | | — | | | | 146,036,095 | | | | — | | | | 146,036,095 | | |
| Non-US government obligations | | | — | | | | 3,502,475 | | | | — | | | | 3,502,475 | | |
| Short-term US government obligation | | | — | | | | 16,413,684 | | | | — | | | | 16,413,684 | | |
| Repurchase agreement | | | — | | | | 302,000 | | | | — | | | | 302,000 | | |
Investment of cash collateral from
securities loaned | | | — | | | | 7,903,377 | | | | — | | | | 7,903,377 | | |
Federal home loan mortgage corporation
and federal national mortgage association
certificates sold short | | | — | | | | (39,198,412 | ) | | | — | | | | (39,198,412 | ) | |
| Other financial instruments, net13 | | | 217,382 | | | | (107,722 | ) | | | — | | | | 109,660 | | |
| Total | | $ | 217,382 | | | $ | 415,326,574 | | | $ | — | | | $ | 415,543,956 | | |
13 Other financial instruments include open futures contracts and forward foreign currency contracts.
Issuer breakdown by country of origin (unaudited)
| | | Percentage of
total investments | |
| United States | | | 90.2 | % | |
| Netherlands | | | 2.2 | | |
| Germany | | | 2.2 | | |
| United Kingdom | | | 1.5 | | |
| Luxembourg | | | 0.8 | | |
| Spain | | | 0.8 | | |
| France | | | 0.8 | | |
| Canada | | | 0.5 | | |
| Switzerland | | | 0.3 | | |
| Norway | | | 0.3 | | |
| Japan | | | 0.2 | | |
| Ireland | | | 0.2 | | |
| | | | 100.0 | % | |
See accompanying notes to financial statements.
40
UBS PACE Select Advisors Trust
UBS PACE Strategic Fixed Income Investments
Performance
For the 12 months ended July 31, 2009, the Portfolio's Class P shares returned 8.58% (before the deduction of the maximum UBS PACE Select program fee; after the deduction of the maximum UBS PACE Select program fee, the Portfolio returned 6.96%). In comparison, the Barclays Capital US Government/Credit Index (formerly known as the Lehman Brothers Government/Credit Index) (the "benchmark") returned 7.14%, and the Lipper Intermediate Investment Grade Debt Funds category posted a median return of 6.92%. (Returns for all share classes over various time periods are shown in the "Performance at a glance" table on page 44. Please note that the returns shown do not reflect the deduction of taxes that a shareholder would pay on Portfolio distributions or the redemption of Portfolio shares.) For a detailed commentary on the market environment in general during the reporting period, please refer to page two.
Sub-Advisor's comments
The Portfolio outperformed its benchmark during the reporting period, largely due to duration and sector positioning.
A duration position greater than that of the benchmark's toward the end of 2008 was positive for results as interest rates declined. (Duration measures a portfolio's sensitivity to interest rate changes. A longer duration means that changes in market interest rates are likely to have a larger effect on the value of assets in the portfolio.) However, the Portfolio's longer duration in the first half of 2009 had a negative impact on performance as the shorter end of the yield curve outperformed, with 10-year Treasury yields rising to an eight-month high. (The yield curve plots the interest rates, at a set point in time, of bonds having equal credit quality, but differing maturity dates.) The financial markets continued to price securities consistent with expectations of a cyclical economic recovery, rather than sustained deflation. The demand for Treasuries also waned as the prospect of an oversupply of Treasury securities outweig hed the likelihood of the extension of the Federal Reserve Board's Treasury Purchase Program, which was created to help improve conditions in private credit markets.
The Portfolio's exposure to the United Kingdom was positive for performance as rates fell during the end of 2008. However, rates in the United Kingdom rose during the first half of 2009, which tempered gains from these holdings.
UBS PACE Select Advisors Trust – UBS PACE Strategic Fixed Income Investments
Investment Sub-Advisor:
Pacific Investment Management Company LLC ("PIMCO")
Portfolio Manager:
Saumil H. Parikh
Objective:
Total return consisting of income and capital appreciation
Investment process:
The Portfolio invests primarily in investment grade fixed income securities of governmental and private issuers in the United States and foreign countries. Its duration (a measure of a portfolio's sensitivity to interest rate changes) is normally limited to within two years (plus or minus) of the effective duration of the Portfolio's benchmark index. PIMCO seeks to invest in the areas of the bond market it considers undervalued, based on such factors as quality, sector, coupon and maturity. PIMCO decides to buy or sell specific bonds based on an analysis of their values relative to other similar bonds. PIMCO monitors the prepayment experience of the Portfolio's mortgage-backed bonds, and will also buy and sell securities to adjust the average portfolio duration, credit quality, yield curve, sector and prepayment exposure, as appropriate.
41
UBS PACE Select Advisors Trust
UBS PACE Strategic Fixed Income Investments
Sub-Advisor's comments – concluded
From a yield curve perspective, a steepening bias was positive for the Portfolio's performance, on both an absolute basis and relative to the Portfolio's benchmark. A focus on securities with shorter maturities added to returns as investors flocked to these securities, following concerns that increases in the money supply could lead to inflation over the longer term. (A "steepening yield curve" is one in which long-term bond yields increase relative to those of short-term bonds.)
A substantial overweight to high-quality agency mortgage pass-through securities added to relative returns over the reporting period as these bonds outperformed Treasuries. Overall, mortgage-backed securities ("MBS") posted their eighth consecutive month of outperformance relative to Treasuries in July 2009, and the success of the Federal Reserve's MBS Purchase Program—designed to provide support to the mortgage and housing markets, and to foster improved conditions in financial markets—has narrowed mortgage spreads.
An underweight to investment-grade corporate issues was positive for performance as corporate spreads—the difference between the yields paid on these securities versus those paid on US Treasuries—widened over the period. However, exposure to high-quality financial issues detracted from the Portfolio's performance as the financial services sector was hurt by write-downs, decreased profitability and funding issues over the 12-month reporting period.
Despite a rebound in the second quarter of 2009, the financial sector underperformed Treasuries for the reporting period as a whole. A modest allocation to high yield corporate bonds and emerging markets debt hurt returns as the global flight to quality continued through the second half of 2008. While emerging markets were relatively unscathed during the financial crisis, prospects of a global recession weighed on the asset class. The high yield corporate sector underperformed Treasuries of the same duration by 1.62%, and the emerging markets sector underperformed US Treasuries by 3.6% over the 12-month reporting period, as measured by the Barclays Capital U.S. Corporate High Yield Index and the Barclays Capital Global Emerging Markets Index, respectively.1
1 Formerly known as the Lehman Brothers U.S. Corporate High Yield Index and the Lehman Brothers Global Emerging Markets Index, respectively.
Special considerations
The Portfolio may be appropriate for long-term investors seeking total return consisting of income and capital appreciation and who are able to withstand short-term fluctuations in the fixed income markets in return for potentially higher returns over the long term. The value of the Portfolio changes every day and can be affected by changes in interest rates, general market conditions and other political, social and economic developments, as well as specific matters relating to the companies in whose securities the Portfolio invests. In addition, investments in foreign bonds involve special risks. It is important to note that an investment in the Portfolio is only one component of a balanced investment plan.
42
UBS PACE Select Advisors Trust
UBS PACE Strategic Fixed Income Investments
Comparison of change in value of a $10,000 investment in the Class P shares of the Portfolio and the Barclays Capital US Government/Credit Index (unaudited)
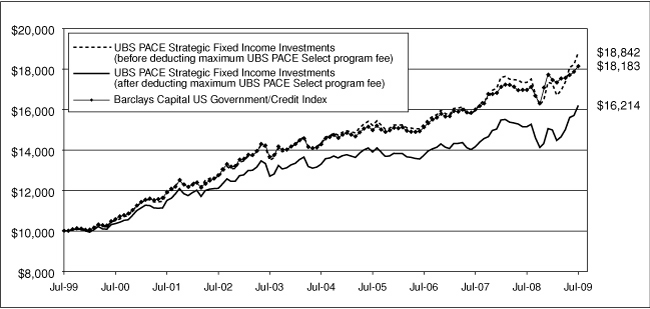
The graph depicts the performance of UBS PACE Strategic Fixed Income Investments Class P shares versus the Barclays Captial US Government/Credit Index (formerly known as the Lehman Brothers Government/Credit Index) over the 10 years ended July 31, 2009. The performance of the other classes will vary from the performance of the class shown based on the difference in sales charges and fees paid by shareholders investing in different share classes. Past performance does not predict future performance and the performance provided does not reflect the deduction of taxes that a shareholder would pay on Portfolio distributions or the redemption of Portfolio shares. It is important to note that UBS PACE Strategic Fixed Income Investments is a professionally managed portfolio while the Index is not available for investment and is unmanaged. The comparison is shown for illustrative purposes only.
43
UBS PACE Select Advisors Trust
UBS PACE Strategic Fixed Income Investments
Performance at a glance (unaudited)
| Average annual total returns for periods ended 07/31/09 | | 1 year | | 5 years | | 10 years | | Since
inception1 | |
| Before deducting | | Class A2 | | | 8.31 | % | | | 5.35 | % | | N/A | | | 6.08 | % | |
| maximum sales charge | | Class B3 | | | 7.45 | % | | | 4.55 | % | | N/A | | | 5.37 | % | |
| or UBS PACE Select | | Class C4 | | | 7.78 | % | | | 4.84 | % | | N/A | | | 5.63 | % | |
| program fee | | Class Y5 | | | 8.68 | % | | | 5.71 | % | | N/A | | | 6.13 | % | |
| | | Class P6 | | | 8.58 | % | | | 5.61 | % | | | 6.54 | % | | | 6.71 | % | |
| After deducting | | Class A2 | | | 3.42 | % | | | 4.39 | % | | N/A | | | 5.52 | % | |
| maximum sales charge | | Class B3 | | | 2.70 | % | | | 4.23 | % | | N/A | | | 5.37 | % | |
| or UBS PACE Select | | Class C4 | | | 7.07 | % | | | 4.84 | % | | N/A | | | 5.63 | % | |
| program fee | | Class P6 | | | 6.96 | % | | | 4.04 | % | | | 4.95 | % | | | 5.12 | % | |
| Barclays Capital US Government/Credit Index7 | | | 7.14 | % | | | 4.95 | % | | | 6.16 | % | | | 6.22 | % | |
| Lipper Intermediate Investment Grade Debt Funds median | | | 6.92 | % | | | 4.09 | % | | | 5.29 | % | | | 5.41 | % | |
Average annual total returns for periods ended June 30, 2009, after deduction of the maximum sales charge or UBS PACE Select program fee, were as follows: Class A—1-year period, 0.24%; 5-year period, 3.93%; since inception, 5.17%; Class B—1-year period, (0.39)%; 5-year period, 3.81%; since inception, 5.02%; Class C—1-year period, 3.69%; 5-year period, 4.39%; since inception, 5.29%; Class Y—1-year period, 5.33%; 5-year period, 5.28%; since inception, 5.79%; Class P—1-year period, 3.67%; 5-year period, 3.62%; 10-year period, 4.56%; since inception, 4.91%.
The annualized gross and net expense ratios, respectively, for each class of shares as in the November 28, 2008 prospectuses, were as follows: Class A—1.08% and 1.06%; Class B—1.98% and 1.81%; Class C—1.56% and 1.56%; Class Y—0.73% and 0.73%; and Class P—0.84% and 0.81%. Net expenses reflect fee waivers and/or expense reimbursements, if any, pursuant to an agreement that is in effect to cap the expenses. The Portfolio and UBS Global AM have entered into a written fee waiver/expense reimbursement agreement pursuant to which UBS Global AM is contractually obligated to waive its management fees and/or reimburse the Portfolio so that the ordinary total operating expenses of each class through November 30, 2009 (excluding dividend expense, borrowing costs and interest expense, if any) would not exceed Class A—1.06%; Class B—1.81%; Class C—1.56%; Class Y—0.81% and Class P—0.81%. The Po rtfolio has agreed to repay UBS Global AM for any waived fees/reimbursed expenses to the extent that it can do so over the following three fiscal years without causing the Portfolio's expenses in any of those three years to exceed the expense caps described above.
1 Since inception returns are calculated as of commencement of issuance or reissuance on August 24, 1995 for Class P shares, December 11, 2000 for Class A shares, January 30, 2001 for Class B shares, December 1, 2000 for Class C shares and February 2, 2001 for Class Y shares. Since inception returns for the Index and Lipper median are shown as of August 31, 1995, which is the month-end after the inception date of the oldest share class (Class P).
2 Maximum sales charge for Class A shares is 4.5%. Class A shares bear ongoing 12b-1 service fees.
3 Maximum contingent deferred sales charge for Class B shares is 5% imposed on redemptions and is reduced to 0% after a maximum of six years. Class B shares bear ongoing 12b-1 service and distribution fees.
4 Maximum contingent deferred sales charge for Class C shares is 0.75% imposed on redemptions and is reduced to 0% after one year. Class C shares bear ongoing 12b-1 service and distribution fees.
5 The Portfolio offers Class Y shares to a limited group of eligible investors, including certain qualifying retirement plans. Class Y shares do not bear initial or contingent deferred sales charges or ongoing 12b-1 service and distribution fees.
6 Class P shares do not bear initial or contingent deferred sales charges or ongoing 12b-1 service and distribution fees, but are subject to a maximum annual UBS PACE Select program fee of 1.5% of the value of Class P shares.
7 The Barclays Capital US Government/Credit Index (formerly known as the Lehman Brothers Government/Credit Index) is composed of all investment-grade bonds that have at least one year to maturity. The Index's total return comprises price appreciation/depreciation and income as a percentage of the original investment. The Index is rebalanced monthly by market capitalization. Investors should note that indices do not reflect the deduction of fees, expenses or taxes.
If an investor sells or exchanges shares less than 90 days after purchase, a redemption fee of 1.00% of the amount sold or exchanged will be deducted at the time of the transaction, except as noted otherwise in the prospectuses.
Past performance does not predict future performance, and the performance information provided does not reflect the deduction of taxes that a shareholder would pay on Portfolio distributions or the redemption of Portfolio shares. The return and principal value of an investment will fluctuate, so that an investor's shares, when redeemed, may be worth more or less than their original cost. Performance results assume reinvestment of all dividends and capital gain distributions at net asset value on the ex-dividend dates. Current performance may be higher or lower than the performance data quoted. For month-end performance figures, please visit http://www.ubs.com.
Lipper peer group data calculated by Lipper Inc.; used with permission. The Lipper median is the return of the fund that places in the middle of a Lipper peer group.
44
UBS PACE Select Advisors Trust
UBS PACE Strategic Fixed Income Investments
Portfolio statistics (unaudited)
| Characteristics | | 07/31/09 | |
| Weighted average duration | | | 6.1 | yrs. | |
| Weighted average maturity | | | 7.8 | yrs. | |
| Average coupon | | | 4.47 | % | |
| Net assets (mm) | | $ | 629.8 | | |
| Number of holdings | | | 281 | | |
| Portfolio composition1 | | 07/31/09 | |
| Bonds, notes and loan assignments | | | 88.7 | % | |
| Preferred stock | | | 0.9 | | |
| Options, futures, swaps and forward foreign currency contracts | | | 0.1 | | |
| Investments sold short | | | (3.1 | ) | |
| Cash equivalents and other assets less liabilities | | | 13.4 | | |
| Total | | | 100.0 | % | |
| Quality diversification1 | | 07/31/09 | |
| US government and agency securities | | | 30.9 | % | |
| AAA | | | 25.3 | | |
| AA | | | 5.7 | | |
| A | | | 11.5 | | |
| BBB | | | 6.8 | | |
| BB | | | 0.8 | | |
| B | | | 0.3 | | |
| Below B/non-rated | | | 7.4 | | |
| Preferred stock | | | 0.9 | | |
| Options, futures, swaps and forward foreign currency contracts | | | 0.1 | | |
| Investments sold short | | | (3.1 | ) | |
| Cash equivalents and other assets less liabilities | | | 13.4 | | |
| Total | �� | | 100.0 | % | |
| Asset allocation1 | | 07/31/09 | |
| Collateralized mortgage obligations | | | 34.7 | % | |
| Corporate notes | | | 33.6 | | |
| US government agency mortgage pass-through certificates | | | 7.3 | | |
| Municipal bonds and notes | | | 4.1 | | |
| Asset-backed securities | | | 4.0 | | |
| US government obligations | | | 2.6 | | |
| Loan assignments | | | 2.4 | | |
| Preferred stock | | | 0.9 | | |
| Options, futures, swaps and forward foreign currency contracts | | | 0.1 | | |
| Investments sold short | | | (3.1 | ) | |
| Cash equivalents and other assets less liabilities | | | 13.4 | | |
| Total | | | 100.0 | % | |
1 Weightings represent percentages of the Portfolio's net assets as of July 31, 2009. The Portfolio is actively managed and its composition will vary over time. Credit quality ratings shown are based on the ratings assigned to portfolio holdings by Standard & Poor's Ratings Group, an independent rating agency.
45
UBS PACE Select Advisors Trust
UBS PACE Strategic Fixed Income Investments
Portfolio of investments—July 31, 2009
| Security description | | Face
amount1 | | Value | |
| US government obligations—2.55% | |
US Treasury Notes
0.875%, due 04/30/112,3 | | $ | 1,958,000 | | | $ | 1,954,339 | | |
| 0.875%, due 05/31/113 | | | 22,000 | | | | 21,943 | | |
| 3.125%, due 05/15/192 | | | 14,000,000 | | | | 13,566,840 | | |
| 4.000%, due 08/15/18 | | | 500,000 | | | | 520,195 | | |
Total US government obligations
(cost—$15,846,675) | | | | | | | 16,063,317 | | |
| Government national mortgage association certificates—0.05% | |
GNMA
8.000%, due 06/15/17 | | | 53,181 | | | | 58,106 | | |
| 8.000%, due 07/15/17 | | | 42,249 | | | | 46,642 | | |
| 8.000%, due 09/15/17 | | | 31,586 | | | | 34,118 | | |
| 8.000%, due 11/15/17 | | | 68,874 | | | | 75,388 | | |
GNMA II ARM
4.125%, due 11/20/23 | | | 9,235 | | | | 9,351 | | |
| 4.375%, due 01/20/26 | | | 20,071 | | | | 20,408 | | |
| 4.625%, due 07/20/25 | | | 11,219 | | | | 11,481 | | |
| 5.375%, due 05/20/26 | | | 34,760 | | | | 35,764 | | |
Total government national
mortgage association
certificates
(cost—$284,205) | | | | | | | 291,258 | | |
| Federal home loan mortgage corporation certificates*—0.41% | |
FHLMC
0.703%, due 03/09/112,4 | | | 333,000 | | | | 334,245 | | |
| 0.937%, due 08/05/114 | | | 6,000 | | | | 6,003 | | |
| 5.500%, due 12/01/38 | | | 283,962 | | | | 294,422 | | |
| 7.645%, due 05/01/25 | | | 1,413,331 | | | | 1,512,265 | | |
FHLMC ARM
5.700%, due 03/01/36 | | | 439,902 | | | | 460,072 | | |
Total federal home loan mortgage
corporation certificates
(cost—$2,495,986) | | | | | | | 2,607,007 | | |
Federal housing administration
certificates—0.02% | |
FHA GMAC
7.430%, due 06/01/21 | | | 89,294 | | | | 89,294 | | |
FHA Reilly
7.430%, due 10/01/20 | | | 15,004 | | | | 15,004 | | |
Total federal housing
administration certificates
(cost—$112,009) | | | | | | | 104,298 | | |
| Federal national mortgage association certificates*—6.80% | |
FNMA
5.396%, due 11/01/34 | | | 11,909,206 | | | | 12,062,955 | | |
| 5.500%, due 03/01/375 | | | 1,348,918 | | | | 1,399,312 | | |
| 5.500%, due 08/01/375 | | | 5,440,066 | | | | 5,643,300 | | |
| 5.500%, due 12/01/375 | | | 5,323,020 | | | | 5,521,882 | | |
| Security description | | Face
amount1 | | Value | |
| Federal national mortgage association certificates*—(concluded) | |
| 5.500%, due 02/01/385 | | $ | 367,155 | | | $ | 380,871 | | |
| 6.000%, due 05/01/385 | | | 1,914,201 | | | | 2,008,635 | | |
| 6.000%, due 08/01/385 | | | 3,583,664 | | | | 3,760,460 | | |
| 6.970%, due 12/01/09 | | | 3,495,827 | | | | 3,524,393 | | |
FNMA ARM
2.739%, due 08/01/40 | | | 260,503 | | | | 259,611 | | |
| 3.926%, due 05/01/27 | | | 59,385 | | | | 59,725 | | |
| 4.109%, due 04/01/27 | | | 41,108 | | | | 41,342 | | |
| 4.902%, due 05/01/30 | | | 128,784 | | | | 130,743 | | |
| 5.171%, due 10/01/35 | | | 581,869 | | | | 603,349 | | |
| 5.221%, due 09/01/35 | | | 456,402 | | | | 477,530 | | |
| 5.370%, due 11/01/35 | | | 624,710 | | | | 653,821 | | |
| 5.399%, due 01/01/36 | | | 650,554 | | | | 693,975 | | |
| 5.531%, due 03/01/36 | | | 439,747 | | | | 459,828 | | |
| 5.564%, due 01/01/36 | | | 433,784 | | | | 451,393 | | |
| 5.585%, due 02/01/36 | | | 858,968 | | | | 899,035 | | |
| 5.607%, due 12/01/35 | | | 540,443 | | | | 566,158 | | |
| 5.639%, due 03/01/36 | | | 536,329 | | | | 563,474 | | |
| 5.714%, due 03/01/36 | | | 645,881 | | | | 674,992 | | |
| 5.745%, due 03/01/36 | | | 734,445 | | | | 768,475 | | |
| 5.929%, due 06/01/36 | | | 309,009 | | | | 326,347 | | |
FNMA ARM COFI
4.683%, due 11/01/26 | | | 152,733 | | | | 149,678 | | |
FNMA TBA
5.500%, TBA | | | 600,000 | | | | 621,563 | | |
| 6.000%, TBA | | | 100,000 | | | | 104,813 | | |
Total federal national mortgage
association certificates
(cost—$42,477,042) | | | | | | | 42,807,660 | | |
| Collateralized mortgage obligations—34.73% | |
ARM Trust, Series 2005-5,
Class 2A1
5.148%, due 09/25/35 | | | 573,110 | | | | 436,166 | | |
Banc of America Funding Corp.,
Series 2005-D, Class A1
3.678%, due 05/25/354 | | | 5,011,318 | | | | 4,531,716 | | |
Bank of America Mortgage
Securities, Inc.,
Series 2002-G, Class 1A3
4.765%, due 07/20/324 | | | 9,561 | | | | 8,558 | | |
Bear Stearns Alternative Loan
Trust-A Trust,
Series 2005-7, Class 22A1
5.491%, due 09/25/364 | | | 1,911,225 | | | | 1,218,489 | | |
Series 2006-1, Class 21A2
5.724%, due 02/25/364 | | | 1,950,115 | | | | 1,081,809 | | |
Bear Stearns ARM Trust,
Series 2003-5, Class 2A1
4.537%, due 08/25/33 | | | 1,167,325 | | | | 1,064,859 | | |
Series 2004-9, Class 22A1
4.807%, due 11/25/34 | | | 98,667 | | | | 86,338 | | |
Series 2005-5, Class A2
4.550%, due 08/25/35 | | | 5,397,023 | | | | 4,755,622 | | |
46
UBS PACE Select Advisors Trust
UBS PACE Strategic Fixed Income Investments
Portfolio of investments—July 31, 2009
| Security description | | Face
amount1 | | Value | |
| Collateralized mortgage obligations— (continued) | |
Series 2005-9, Class A1
4.625%, due 10/25/35 | | $ | 2,245,814 | | | $ | 1,911,109 | | |
Bear Stearns Commerical
Mortgage Securities,
Series 2006-BBA7, Class A1
0.398%, due 03/15/194,6 | | | 3,933,408 | | | | 3,349,913 | | |
Bear Stearns,
Series 2003-1, Class 5A1
5.428%, due 04/25/334 | | | 67,360 | | | | 63,587 | | |
Series 2003-1, Class 6A1
5.011%, due 04/25/334 | | | 154,080 | | | | 143,246 | | |
Series 2003-3, Class 1A
4.209%, due 10/25/334 | | | 75,907 | | | | 68,819 | | |
Series 2004-3, Class 1A2
4.174%, due 07/25/344 | | | 663,077 | | | | 605,754 | | |
Series 2004-6, Class 2A1
4.607%, due 09/25/344 | | | 3,055,677 | | | | 2,381,616 | | |
Series 2004-7, Class 1A1
5.486%, due 10/25/344 | | | 861,947 | | | | 624,026 | | |
Series 2004-9, Class 2A1
5.075%, due 09/25/344 | | | 1,293,528 | | | | 906,272 | | |
Citicorp Mortgage Securities, Inc.,
Series 2002-12, Class 2A1
5.250%, due 12/25/32 | | | 132,337 | | | | 132,006 | | |
Citigroup Mortgage Loan Trust, Inc.,
Series 2005-6, Class A2
4.248%, due 08/25/354 | | | 360,345 | | | | 299,629 | | |
Series 2005-6, Class A3
4.098%, due 08/25/354 | | | 72,080 | | | | 59,566 | | |
Series 2005-11, Class A1A
2.990%, due 12/25/354 | | | 1,337,534 | | | | 1,090,093 | | |
Series 2006-AR1, Class 1A1
4.900%, due 10/25/354 | | | 3,421,535 | | | | 2,680,263 | | |
Countrywide Alternative Loan Trust,
Series 2003-J3, Class 2A1
6.250%, due 12/25/33 | | | 563,909 | | | | 499,920 | | |
Series 2006-41CB, Class 1A9
6.000%, due 01/25/37 | | | 1,877,622 | | | | 1,122,759 | | |
Countrywide Home Loans,
Series 2003-R4, Class 2A
6.500%, due 01/25/346 | | | 1,664,254 | | | | 1,213,865 | | |
Series 2004-12, Class 11A2
4.016%, due 08/25/344 | | | 668,492 | | | | 441,011 | | |
FHLMC REMIC,*
Series 1278, Class K
7.000%, due 05/15/22 | | | 153,861 | | | | 166,169 | | |
Series 1367, Class KA
6.500%, due 09/15/22 | | | 2,988 | | | | 3,227 | | |
Series 1502, Class PXZ
7.000%, due 04/15/23 | | | 798,896 | | | | 841,655 | | |
Series 1503, Class PZ
7.000%, due 05/15/23 | | | 275,149 | | | | 288,633 | | |
Series 1534, Class Z
5.000%, due 06/15/23 | | | 281,085 | | | | 284,523 | | |
| Security description | | Face
amount1 | | Value | |
| Collateralized mortgage obligations— (continued) | |
Series 1548, Class Z
7.000%, due 07/15/23 | | $ | 225,341 | | | $ | 239,211 | | |
Series 1562, Class Z
7.000%, due 07/15/23 | | | 338,415 | | | | 365,488 | | |
Series 1694, Class Z
6.500%, due 03/15/24 | | | 148,228 | | | | 159,353 | | |
Series 2061, Class Z
6.500%, due 06/15/28 | | | 653,762 | | | | 693,527 | | |
Series 2400, Class FQ
0.788%, due 01/15/324 | | | 281,187 | | | | 277,548 | | |
Series 2579, Class DZ
5.000%, due 03/15/34 | | | 6,524,410 | | | | 6,447,234 | | |
Series 2764, Class LZ
4.500%, due 03/15/34 | | | 2,541,357 | | | | 2,391,204 | | |
Series 2764, Class ZG
5.500%, due 03/15/34 | | | 4,689,970 | | | | 4,723,743 | | |
Series 2835, Class JZ
5.000%, due 08/15/34 | | | 3,578,494 | | | | 3,630,427 | | |
Series 2921, Class PG
5.000%, due 01/15/35 | | | 6,200,000 | | | | 6,339,218 | | |
Series 2983, Class TZ
6.000%, due 05/15/35 | | | 5,517,871 | | | | 5,816,019 | | |
Series 3149, Class CZ
6.000%, due 05/15/36 | | | 7,684,423 | | | | 8,073,552 | | |
Series G23, Class KZ
6.500%, due 11/25/23 | | | 211,736 | | | | 229,015 | | |
Series T-054, Class 2A
6.500%, due 02/25/43 | | | 1,184,957 | | | | 1,243,464 | | |
Series T-058, Class 2A
6.500%, due 09/25/43 | | | 4,677,212 | | | | 5,048,612 | | |
Series T-075, Class A1
0.325%, due 12/25/364 | | | 3,157,394 | | | | 2,959,070 | | |
First Horizon Mortgage
Pass-Through Trust,
Series 2005-AR3, Class 2A1
5.366%, due 08/25/354 | | | 145,056 | | | | 118,389 | | |
FNMA REMIC,*
Series 1998-066, Class FG
0.585%, due 12/25/284 | | | 132,559 | | | | 130,208 | | |
Series 2000-034, Class F
0.735%, due 10/25/304 | | | 23,745 | | | | 23,426 | | |
Series 2002-080, Class A1
6.500%, due 11/25/42 | | | 2,240,569 | | | | 2,421,999 | | |
Series 2003-064, Class AH
6.000%, due 07/25/33 | | | 10,074,432 | | | | 10,631,883 | | |
Series 2003-106, Class US
8.648%, due 11/25/237,8 | | | 333,000 | | | | 299,770 | | |
Series 2003-W8, Class 2A
7.000%, due 10/25/42 | | | 156,152 | | | | 170,693 | | |
Series 2004-T1, Class 1A1
6.000%, due 01/25/44 | | | 2,741,137 | | | | 2,906,462 | | |
Series 2004-W8, Class 2A
6.500%, due 06/25/44 | | | 3,138,415 | | | | 3,392,549 | | |
47
UBS PACE Select Advisors Trust
UBS PACE Strategic Fixed Income Investments
Portfolio of investments—July 31, 2009
| Security description | | Face
amount1 | | Value | |
| Collateralized mortgage obligations—(continued) | |
Series 2005-024, Class ZE
5.000%, due 04/25/35 | | $ | 1,412,680 | | | $ | 1,398,175 | | |
Series 2005-116, Class TZ
5.500%, due 01/25/36 | | | 6,695,135 | | | | 6,718,805 | | |
Series 2005-120, Class ZU
5.500%, due 01/25/36 | | | 7,303,784 | | | | 7,328,955 | | |
Series 2006-065, Class GD
6.000%, due 07/25/26 | | | 2,800,000 | | | | 2,979,386 | | |
Trust, Series 1991-065, Class Z
6.500%, due 06/25/21 | | | 13,752 | | | | 14,713 | | |
Trust, Series 1992-040, Class ZC
7.000%, due 07/25/22 | | | 33,163 | | | | 36,180 | | |
Trust, Series 1992-129, Class L
6.000%, due 07/25/22 | | | 17,122 | | | | 17,815 | | |
Trust, Series 1993-037, Class PX
7.000%, due 03/25/23 | | | 47,519 | | | | 51,877 | | |
Trust, Series 1993-060, Class Z
7.000%, due 05/25/23 | | | 261,726 | | | | 284,917 | | |
Trust, Series 1993-065, Class ZZ
7.000%, due 06/25/13 | | | 227,381 | | | | 241,122 | | |
Trust, Series 1993-070, Class Z
6.900%, due 05/25/23 | | | 42,393 | | | | 46,090 | | |
Trust, Series 1993-096, Class PZ
7.000%, due 06/25/23 | | | 250,671 | | | | 272,967 | | |
Trust, Series 1993-160, Class ZB
6.500%, due 09/25/23 | | | 68,188 | | | | 70,149 | | |
Trust, Series 1993-163, Class ZB
7.000%, due 09/25/23 | | | 22,143 | | | | 23,472 | | |
Trust, Series 1994-023, Class PX
6.000%, due 08/25/23 | | | 515,793 | | | | 541,824 | | |
Trust, Series 1998-M7, Class Z
6.390%, due 05/25/36 | | | 621,303 | | | | 648,841 | | |
Trust, Series 1999-W4, Class A9
6.250%, due 02/25/29 | | | 1,087,772 | | | | 1,168,675 | | |
GNMA REMIC,
Trust, Series 2000-009, Class FG
0.888%, due 02/16/304 | | | 177,339 | | | | 177,268 | | |
Trust, Series 2002-031, Class FW
0.688%, due 06/16/314 | | | 180,482 | | | | 178,857 | | |
Trust, Series 2003-98, Class Z
6.000%, due 11/20/33 | | | 14,037,579 | | | | 14,726,452 | | |
Trust, Series 2005-26, Class ZA
5.500%, due 01/20/35 | | | 6,088,518 | | | | 6,058,336 | | |
GS Mortgage Securities Corp. II,
Series 2007-EOP, Class A1
0.394%, due 03/06/204,6 | | | 2,070,898 | | | | 1,782,653 | | |
GS Residential Mortgage Loan Trust,
Series 2005-AR6, Class 2A1
4.409%, due 09/25/354 | | | 2,790,197 | | | | 2,526,713 | | |
Harborview Mortgage Loan Trust,
Series 2005-4, Class 3A1
5.143%, due 07/19/354 | | | 867,185 | | | | 541,036 | | |
| Security description | | Face
amount1 | | Value | |
| Collateralized mortgage obligations—(continued) | |
Housing Security, Inc.,
Series 1992-8, Class B
4.376%, due 06/25/244 | | $ | 326,337 | | | $ | 314,579 | | |
JPMorgan Chase Commercial
Mortgage Securities Corp.,
Series 2006-LDP9, Class A3
5.336%, due 05/15/47 | | | 5,200,000 | | | | 4,223,735 | | |
Series 2007-CB19, Class A4
5.937%, due 02/12/494 | | | 3,200,000 | | | | 2,556,235 | | |
Lehman Brothers Mortgage Trust,
Series 1991-2, Class A3
8.936%, due 01/20/174 | | | 433,935 | | | | 436,104 | | |
Merrill Lynch/Countrywide
Commercial Mortgage Trust,
Series 2006-4, Class A3
5.172%, due 12/12/494 | | | 7,900,000 | | | | 6,223,423 | | |
Series 2007-8, Class A3
6.156%, due 08/12/494 | | | 11,500,000 | | | | 8,600,695 | | |
Morgan Stanley Capital I,
Series 2006-HQ9, Class A4
5.731%, due 07/12/44 | | | 1,900,000 | | | | 1,779,879 | | |
Series 2006-IQ12, Class A4
5.332%, due 12/15/43 | | | 3,100,000 | | | | 2,455,157 | | |
Residential Asset Securitization Trust,
Series 2006-A14C, Class 2A6
0.735%, due 12/25/364 | | | 2,183,948 | | | | 963,684 | | |
Residential Funding
Mortgage Security I,
Series 2004-S2, Class A1
5.250%, due 03/25/34 | | | 970,109 | | | | 967,303 | | |
Series 2004-S9, Class 1A23
5.500%, due 12/25/34 | | | 2,300,000 | | | | 1,687,996 | | |
Small Business Administration,
Series 1999-20K, Class 1
7.060%, due 11/01/19 | | | 535,432 | | | | 578,188 | | |
Series 2000-20K, Class 1
7.220%, due 11/01/20 | | | 729,291 | | | | 793,333 | | |
Series 2001-P10B, Class 1
6.344%, due 08/10/11 | | | 441,509 | | | | 462,154 | | |
Series 2002-20K, Class 1
5.080%, due 11/01/22 | | | 3,129,708 | | | | 3,280,599 | | |
Series 2003-20I, Class 1
5.130%, due 09/01/23 | | | 581,354 | | | | 610,024 | | |
Series 2003-20L, Class 1
4.890%, due 12/01/23 | | | 1,644,783 | | | | 1,713,123 | | |
Series 2004-P10A, Class 1
4.504%, due 02/10/14 | | | 3,409,341 | | | | 3,485,966 | | |
Series 2005-20H, Class 1
5.110%, due 08/01/25 | | | 2,106,292 | | | | 2,201,481 | | |
Series 2007-20D, Class 1
5.320%, due 04/01/27 | | | 6,087,891 | | | | 6,469,886 | | |
Structured ARM Loan Trust,
Series 2004-8, Class 3A
3.687%, due 07/25/34 | | | 1,560,954 | | | | 1,394,866 | | |
48
UBS PACE Select Advisors Trust
UBS PACE Strategic Fixed Income Investments
Portfolio of investments—July 31, 2009
| Security description | | Face
amount1 | | Value | |
| Collateralized mortgage obligations—(concluded) | |
Structured Asset Mortgage
Investments, Inc.,
Series 2002-AR3, Class A1
0.949%, due 09/19/324 | | $ | 507,108 | | | $ | 370,428 | | |
Series 2006-AR3, Class 11A1
0.495%, due 04/25/364 | | | 2,359,772 | | | | 1,274,960 | | |
Structured Asset Securities Corp.,
Series 2001-SB1, Class A2
3.375%, due 08/25/31 | | | 2,763,121 | | | | 2,204,791 | | |
Wachovia Bank Commercial
Mortgage Trust,
Series 2006-C28, Class A4
5.572%, due 10/15/48 | | | 7,100,000 | | | | 5,959,359 | | |
Washington Mutual
Mortgage Securities Corp.,
Series 2002-AR6, Class A
2.610%, due 06/25/424 | | | 86,107 | | | | 65,650 | | |
Series 2005-AR1, Class A1A
0.605%, due 01/25/454 | | | 198,849 | | | | 101,110 | | |
Series 2005-AR2, Class 2A1A
0.595%, due 01/25/454 | | | 245,913 | | | | 128,306 | | |
Series 2006-AR7, Class 3A
3.332%, due 07/25/464 | | | 3,375,659 | | | | 1,672,230 | | |
Series 2006-AR9, Class 1A
2.210%, due 08/25/464 | | | 2,447,484 | | | | 1,093,834 | | |
Series 2006-AR9, Class 2A
3.332%, due 08/25/464 | | | 1,837,205 | | | | 873,460 | | |
Wells Fargo Mortgage
Backed Securities Trust,
Series 2003-M, Class A1
4.695%, due 12/25/334 | | | 1,756,120 | | | | 1,638,674 | | |
Series 2004-CC, Class A1
4.941%, due 01/25/354 | | | 640,866 | | | | 582,811 | | |
Series 2006-AR2, Class 2A1
4.950%, due 03/25/36 | | | 3,349,209 | | | | 2,658,476 | | |
Total collateralized mortgage
obligations
(cost—$234,414,901) | | | | | | | 218,751,059 | | |
| Asset-backed securities—4.00% | |
Chase Issuance Trust,
Series 2008-A13, Class A13
2.129%, due 09/15/154 | | | 2,200,000 | | | | 2,206,901 | | |
Countrywide Asset-Backed
Certificates,
Series 2007-5, Class 2A1
0.385%, due 03/25/374 | | | 1,294,124 | | | | 1,155,121 | | |
CSAB Mortgage Backed Trust,
Series 2006-1, Class A6A
6.172%, due 06/25/369 | | | 795,099 | | | | 423,445 | | |
| Security description | | Face
amount1 | | Value | |
| Asset-backed securities—(concluded) | |
Delta Funding Home Equity
Loan Trust,
Series 1999-003, Class A1A
1.108%, due 09/15/294 | | $ | 60,720 | | | $ | 21,717 | | |
Ford Credit Auto Owner Trust,
Series 2008-C, Class A2B
1.188%, due 01/15/114 | | | 208,028 | | | | 208,188 | | |
Series 2008-C, Class A3
1.708%, due 06/15/124 | | | 4,300,000 | | | | 4,316,569 | | |
Franklin Auto Trust,
Series 2008-A, Class A2
1.289%, due 10/20/114 | | | 368,059 | | | | 368,575 | | |
Merrill Lynch Mortgage
Investors, Inc.,
Series 2006-AHL1, Class A2A
0.335%, due 05/25/374 | | | 269,923 | | | | 265,792 | | |
Mid-State Trust Series 4, Class A
8.330%, due 04/01/30 | | | 403,277 | | | | 362,287 | | |
SLC Student Loan Trust,
Series 2008-2, Class A2
1.079%, due 06/15/174 | | | 8,300,000 | | | | 8,204,088 | | |
SLM Student Loan Trust,
Series 2008-9, Class A
2.004%, due 04/25/234 | | | 7,542,846 | | | | 7,649,916 | | |
Total asset-backed securities
(cost—$25,620,379) | | | | | | | 25,182,599 | | |
| Corporate notes—33.61% | |
| Airlines—0.53% | |
Northwest Airlines,
Series 2000-1, Class G
7.150%, due 04/01/214 | | | 4,092,840 | | | | 3,340,780 | | |
United Air Lines
1991 Equipment Trust
10.360%, due 11/27/127,10 | | | 231,906 | | | | 557 | | |
| | | | 3,341,337 | | |
| Banking-non-US—8.47% | |
Bank of Scotland Group PLC
0.689%, due 12/08/104,6 | | | 200,000 | | | | 191,086 | | |
Barclays Bank PLC
7.434%, due 12/15/176,11,12 | | | 1,000,000 | | | | 760,000 | | |
BNP Paribas
5.186%, due 06/29/156,11,12 | | | 3,100,000 | | | | 2,099,807 | | |
Credit Agricole
0.714%, due 05/28/104,6 | | | 6,800,000 | | | | 6,765,320 | | |
| 6.637%, due 05/31/176,11,12 | | | 900,000 | | | | 567,000 | | |
Export-Import Bank of Korea
5.875%, due 01/14/15 | | | 1,000,000 | | | | 1,007,500 | | |
ING Bank N.V.
3.900%, due 03/19/146 | | | 2,000,000 | | | | 2,042,380 | | |
Lloyds Banking Group PLC
6.657%, due 05/21/376,11,12 | | | 2,400,000 | | | | 984,000 | | |
National Australia Bank
1.048%, due 07/08/144,6 | | | 21,700,000 | | | | 21,702,617 | | |
49
UBS PACE Select Advisors Trust
UBS PACE Strategic Fixed Income Investments
Portfolio of investments—July 31, 2009
| Security description | | Face
amount1 | | Value | |
| Corporate notes—(continued) | |
| Banking-non-US—(concluded) | |
Resona Bank Ltd.
5.850%, due 04/15/166,11,12 | | $ | 2,900,000 | | | $ | 2,320,000 | | |
Royal Bank of Scotland
Group PLC
7.640%, due 09/29/1711,12 | | | 5,500,000 | | | | 2,530,000 | | |
Santander Perpetual
6.671%, due 10/24/176,11,12 | | | 6,700,000 | | | | 5,595,317 | | |
Societe Financement
de l'Economie Francaise
3.375%, due 05/05/146 | | | 6,700,000 | | | | 6,777,921 | | |
| | | | 53,342,948 | | |
| Banking-US—3.17% | |
Bank of America Corp.
5.750%, due 12/01/17 | | | 3,200,000 | | | | 3,072,304 | | |
Bank of America N.A.
5.300%, due 03/15/17 | | | 3,500,000 | | | | 3,187,551 | | |
| 6.100%, due 06/15/17 | | | 4,400,000 | | | | 4,186,838 | | |
Credit Suisse New York MTN
5.000%, due 05/15/13 | | | 2,700,000 | | | | 2,829,020 | | |
JPMorgan Chase Bank N.A.
0.959%, due 06/13/162,4 | | | 400,000 | | | | 326,672 | | |
Wachovia Corp.
5.250%, due 08/01/14 | | | 900,000 | | | | 906,221 | | |
Wachovia Corp. MTN
5.500%, due 05/01/13 | | | 5,200,000 | | | | 5,449,428 | | |
| | | | 19,958,034 | | |
| Computers—0.66% | |
Hewlett-Packard Co.
2.250%, due 05/27/11 | | | 4,100,000 | | | | 4,160,155 | | |
| Diversified financials—11.19% | |
American Express Co.
6.150%, due 08/28/17 | | | 5,400,000 | | | | 5,317,801 | | |
General Electric Capital Corp.
5.500%, due 09/15/674,6 | | EUR | 5,000,000 | | | | 4,382,724 | | |
| 5.875%, due 01/14/38 | | | 5,400,000 | | | | 4,678,176 | | |
General Electric Capital
Corp. MTN
0.779%, due 09/15/144 | | | 2,300,000 | | | | 1,989,700 | | |
| 1.124%, due 05/08/134 | | | 1,300,000 | | | | 1,177,435 | | |
| 1.156%, due 05/11/164 | | | 500,000 | | | | 407,890 | | |
| 1.616%, due 05/22/134 | | | 600,000 | | | | 558,995 | | |
Goldman Sachs Group, Inc.
1.059%, due 03/22/164 | | | 1,000,000 | | | | 888,507 | | |
| 5.625%, due 01/15/17 | | | 1,800,000 | | | | 1,802,423 | | |
| 6.250%, due 09/01/17 | | | 14,400,000 | | | | 15,421,493 | | |
LeasePlan Corp. N.V. MTN
3.250%, due 05/22/14 | | | 4,300,000 | | | | 6,165,499 | | |
Lehman Brothers Holdings,
Inc. MTN
5.625%, due 01/24/1310 | | | 4,500,000 | | | | 787,500 | | |
| Security description | | Face
amount1 | | Value | |
| Corporate notes—(continued) | |
| Diversified financials—(concluded) | |
Macquarie Bank Ltd.
2.600%, due 01/20/126 | | $ | 900,000 | | | $ | 908,608 | | |
| 4.100%, due 12/17/136 | | | 6,700,000 | | | | 6,934,768 | | |
| 4.100%, due 12/17/137 | | | 10,400,000 | | | | 10,798,610 | | |
Merrill Lynch & Co. MTN
6.875%, due 04/25/18 | | | 8,200,000 | | | | 8,265,592 | | |
| | | | 70,485,721 | | |
| Education—0.88% | |
Stanford University
4.250%, due 05/01/16 | | | 3,500,000 | | | | 3,514,070 | | |
| 4.750%, due 05/01/19 | | | 2,000,000 | | | | 2,042,120 | | |
| | | | 5,556,190 | | |
| Electric utilities—0.30% | |
PSE&G Power LLC
5.000%, due 04/01/142 | | | 1,800,000 | | | | 1,867,230 | | |
| Electric-integrated—0.03% | |
Centrais Eletricas Brasileiras SA
6.875%, due 07/30/196 | | | 200,000 | | | | 205,162 | | |
| Financial services—2.03% | |
Citigroup, Inc.
0.631%, due 12/28/094 | | | 600,000 | | | | 596,527 | | |
| 0.944%, due 05/18/114 | | | 700,000 | | | | 656,280 | | |
| 2.583%, due 05/15/184 | | | 900,000 | | | | 694,282 | | |
General Motors Acceptance
Corp. LLC
7.250%, due 03/02/112 | | | 1,300,000 | | | | 1,209,758 | | |
Morgan Stanley MTN
1.570%, due 11/29/134 | | EUR | 5,900,000 | | | | 7,482,658 | | |
SLM Corp.
0.829%, due 03/15/114 | | | 2,600,000 | | | | 2,158,811 | | |
| | | | 12,798,316 | | |
| Insurance—2.45% | |
American International Group
8.175%, due 05/15/384 | | | 6,400,000 | | | | 1,584,000 | | |
| 8.250%, due 08/15/18 | | | 5,700,000 | | | | 3,368,973 | | |
| 8.625%, due 05/22/384,7 | | GBP | 1,600,000 | | | | 628,089 | | |
American International Group,
Inc. MTN
4.000%, due 09/20/11 | | | 1,500,000 | | | | 1,416,227 | | |
Metropolitan Life Global
Funding I
0.894%, due 05/17/104,6 | | | 500,000 | | | | 496,162 | | |
Progressive Corp.
6.700%, due 06/15/374 | | | 2,800,000 | | | | 2,119,480 | | |
Prudential Financial, Inc. MTN
6.000%, due 12/01/17 | | | 6,000,000 | | | | 5,847,534 | | |
| | | | 15,460,465 | | |
50
UBS PACE Select Advisors Trust
UBS PACE Strategic Fixed Income Investments
Portfolio of investments—July 31, 2009
| Security description | | Face
amount1 | | Value | |
| Corporate notes—(concluded) | |
| Media—0.76% | |
Historic TW, Inc.
9.125%, due 01/15/13 | | $ | 1,400,000 | | | $ | 1,620,920 | | |
Time Warner, Inc.
5.500%, due 11/15/11 | | | 3,000,000 | | | | 3,178,830 | | |
| | | | 4,799,750 | | |
| Oil refining—0.04% | |
Valero Energy Corp.
6.625%, due 06/15/37 | | | 300,000 | | | | 266,607 | | |
| Oil services—1.92% | |
Cameron International Corp.
6.375%, due 07/15/18 | | | 8,400,000 | | | | 8,442,177 | | |
El Paso Corp.
7.000%, due 06/15/17 | | | 1,700,000 | | | | 1,633,358 | | |
Gaz Capital (Gazprom)
7.288%, due 08/16/376 | | | 2,600,000 | | | | 2,034,500 | | |
| | | | 12,110,035 | | |
| Paper & forest products—0.08% | |
Celulosa Arauco y Constitucion SA
7.250%, due 07/29/196 | | | 500,000 | | | | 517,901 | | |
| Retail—0.72% | |
Kroger Co.
6.400%, due 08/15/17 | | | 1,200,000 | | | | 1,309,947 | | |
Macy's Retail Holdings, Inc.
8.875%, due 07/15/152,9 | | | 3,100,000 | | | | 3,210,447 | | |
| | �� | | 4,520,394 | | |
| Telecommunication services—0.14% | |
Verizon North, Inc.
5.634%, due 01/01/217,13 | | | 1,000,000 | | | | 857,120 | | |
| Tobacco—0.24% | |
Reynolds American, Inc.
7.250%, due 06/15/37 | | | 1,600,000 | | | | 1,488,402 | | |
Total corporate notes
(cost—$229,964,652) | | | | | | | 211,735,767 | | |
| Loan assignments4—2.36% | |
| Diversified financials—1.07% | |
Chrysler Financial Term Loan
4.290%, due 08/03/12 | | | 6,267,212 | | | | 5,902,961 | | |
First Data Corp. B2 Loan
3.035%, due 09/24/14 | | | 984,962 | | | | 834,342 | | |
| | | | 6,737,303 | | |
| Electric utilities—0.48% | |
NRG Energy Bank Debt
1.785%, due 02/01/13 | | | 559,622 | | | | 533,460 | | |
NRG Energy, Inc. Term Loan
0.498%, due 06/23/10 | | | 1,208,715 | | | | 1,152,207 | | |
NRG Energy, Inc. Term Loan B
2.098%, due 02/01/13 | | | 1,414,551 | | | | 1,348,421 | | |
| | | | 3,034,088 | | |
| Security description | | Face
amount1 | | Value | |
| Loan assignments4—(concluded) | |
| Health care—0.29% | |
Community Health Systems, Inc.
Term Loan
2.535%, due 07/30/16 | | $ | 65,526 | | | $ | 61,485 | | |
| 2.924%, due 07/25/14 | | | 853,666 | | | | 801,020 | | |
Community Health Systems, Inc.
Term Loan B
2.535%, due 07/25/14 | | | 46,909 | | | | 44,016 | | |
HCA, Inc. Loan
2.848%, due 11/16/13 | | | 1,016,953 | | | | 954,023 | | |
| | | | 1,860,544 | | |
| Media—0.30% | |
Cablevision Term Loan B
2.038%, due 03/30/13 | | | 1,966,302 | | | | 1,918,384 | | |
| | | | 1,918,384 | | |
| Raw materials/paper—0.22% | |
Georgia Pacific Corp. Term Loan C
3.550%, due 12/31/20 | | | 117,170 | | | | 114,769 | | |
| 3.589%, due 12/31/20 | | | 77,425 | | | | 75,838 | | |
| 3.900%, due 12/31/20 | | | 292,386 | | | | 286,392 | | |
Koch Forest Products, Inc.
2.300%, due 12/20/12 | | | 86,203 | | | | 83,247 | | |
| 2.339%, due 12/20/12 | | | 63,805 | | | | 61,617 | | |
| 2.650%, due 12/20/12 | | | 734,232 | | | | 709,055 | | |
| | | | 1,330,918 | | |
Total loan assignments
(cost—$14,939,909) | | | | | | | 14,881,237 | | |
| Municipal bonds and notes—4.11% | |
| Education—1.80% | |
California Educational Facilities
Authority Revenue
(Clairmont McKenna College)
5.000%, due 01/01/38 | | | 200,000 | | | | 189,546 | | |
Clark County School District,
Limited Tax (Building), Series A
5.000%, due 06/15/19 | | | 300,000 | | | | 314,196 | | |
Keller Independent School District
School Building (PSF-GTD)
4.750%, due 08/15/30 | | | 1,300,000 | | | | 1,312,090 | | |
Los Angeles Unified School
District Refunding,
Series A-1 (NATL-RE Insured)
4.500%, due 07/01/25 | | | 3,200,000 | | | | 3,001,152 | | |
| 4.500%, due 01/01/28 | | | 3,800,000 | | | | 3,438,506 | | |
New York City Transitional
Finance Authority Building Aid
Revenue Fiscal 2008,
Series S-1
5.000%, due 01/15/25 | | | 100,000 | | | | 101,303 | | |
51
UBS PACE Select Advisors Trust
UBS PACE Strategic Fixed Income Investments
Portfolio of investments—July 31, 2009
| Security description | | Face
amount1 | | Value | |
| Municipal bonds and notes—(continued) | |
| Education—(concluded) | |
University of Toledo General
Receipts Bonds
(Build America Bonds)
6.750%, due 06/01/22 | | $ | 2,000,000 | | | $ | 2,081,360 | | |
Will County Community High
School District No. 210
Lincoln-Way (Capital
Appreciation) (FSA Insured)
4.980%, due 01/01/2114 | | | 1,600,000 | | | | 903,392 | | |
| | | | 11,341,545 | | |
| General obligation—0.60% | |
California State
6.000%, due 04/01/38 | | | 1,100,000 | | | | 1,136,520 | | |
California State Build
America Bonds
7.500%, due 04/01/34 | | | 1,400,000 | | | | 1,444,646 | | |
Cook County Build America
Bonds (Recovery Zone
Economic Development)
6.360%, due 11/15/33 | | | 1,200,000 | | | | 1,228,356 | | |
| | | | 3,809,522 | | |
| Tobacco—0.78% | |
Buckeye Tobacco Settlement
Financing Authority
(Asset Backed Series Turbo),
Series A-2
5.875%, due 06/01/47 | | | 500,000 | | | | 286,445 | | |
Tobacco Settlement Funding
Corp., Louisiana,
Series 2001-B
5.875%, due 05/15/39 | | | 1,075,000 | | | | 850,863 | | |
Tobacco Settlement Funding
Corp., Rhode Island,
Series A
6.250%, due 06/01/42 | | | 200,000 | | | | 146,014 | | |
Tobacco Settlement Revenue
Management Authority,
South Carolina Tobacco
Settlement Revenue,
Series B (Escrowed to Maturity)
6.375%, due 05/15/30 | | | 3,030,000 | | | | 3,599,549 | | |
| | | | 4,882,871 | | |
| Transportation—0.62% | |
Harris County Metropolitan
Transportation Authority
(Build America Bonds),
Series C
6.875%, due 11/01/38 | | | 3,100,000 | | | | 3,192,535 | | |
| Security description | | Face
amount1 | | Value | |
| Municipal bonds and notes—(concluded) | |
| Transportation—(concluded) | |
Port Authority of New York &
New Jersey Consolidated
(One Hundred Fifty-Eight)
5.859%, due 12/01/24 | | $ | 700,000 | | | $ | 723,177 | | |
| | | | 3,915,712 | | |
| Utilities—0.31% | |
Cincinnati Water System Revenue
(Build America Bonds),
Series B
6.458%, due 12/01/34 | | | 100,000 | | | | 101,326 | | |
Metropolitan Water District
Southern California
(Build America Bonds)
5.906%, due 07/01/25 | | | 1,700,000 | | | | 1,729,988 | | |
New York City Municipal Water
Finance Authority Water &
Sewer Revenue,
Series DD
5.000%, due 06/15/37 | | | 100,000 | | | | 99,250 | | |
| | | | 1,930,564 | | |
Total municipal bonds and notes
(cost—$25,369,822) | | | | | | | 25,880,214 | | |
| | | Number of
shares | | | |
| Preferred stock15—0.85% | |
| Commercial banks—0.85% | |
Wells Fargo & Co.
(cost—$3,810,820) | | | 6,400 | | | | 5,375,680 | | |
| | | Face
amount1 | | | |
Short-term US government
obligations16—0.21% | |
US Treasury Bills
0.147%, due 08/20/09 | | $ | 1,320,000 | | | | 1,319,897 | | |
| 0.197%, due 09/03/093 | | | 11,000 | | | | 10,998 | | |
Total short-term
US government obligations
(cost—$1,330,895) | | | | | | | 1,330,895 | | |
| Repurchase agreement—7.90% | |
Repurchase agreement dated
07/31/09 with State Street
Bank & Trust Co.,
0.010% due 08/03/09,
collateralized by $50,736,866
US Treasury Bills, zero coupon
due 08/27/09 to 09/10/09;
(value—$50,731,792);
proceeds: $49,735,041
(cost—$49,735,000) | | | 49,735,000 | | | | 49,735,000 | | |
52
UBS PACE Select Advisors Trust
UBS PACE Strategic Fixed Income Investments
Portfolio of investments—July 31, 2009
| Security description | | Number of
shares | | Value | |
| Investment of cash collateral from securities loaned—2.66% | |
| Money market fund—2.66% | |
UBS Private Money Market
Fund LLC17
(cost—$16,758,475) | | | 16,758,475 | | | $ | 16,758,475 | | |
Total investments before
investments sold short
(cost—$663,160,770)—
100.26% | | | | | 631,504,466 | | |
| Security description | | Face
amount1 | | Value | |
| Investments sold short—(3.05)% | |
FNMA TBA*
5.500%, TBA | | $ | (13,000,000 | ) | | $ | (13,467,194 | ) | |
| 6.000%, TBA | | | (5,500,000 | ) | | | (5,764,688 | ) | |
Total investments sold short
(proceeds—$19,126,250)—
(3.06)% | | | | | (19,231,882 | ) | |
Other assets in excess
of liabilities—2.79% | | | | | 17,571,400 | | |
| Net assets—100.00% | | $ | 629,843,984 | | |
Aggregate cost for federal income tax purposes before investments sold short was $663,181,177; and net unrealized depreciation consisted of:
| Gross unrealized appreciation | | $ | 16,706,697 | | |
| Gross unrealized depreciation | | | (48,383,408 | ) | |
| Net unrealized depreciation | | $ | (31,676,711 | ) | |
* On September 7, 2008, the Federal Housing Finance Agency placed the Federal National Mortgage Association and the Federal Home Loan Mortgage Corporation into conservatorship, and the US Treasury guaranteed the debt issued by those organizations.
1 In US Dollars unless otherwise indicated.
2 Security, or portion thereof, was on loan at July 31, 2009.
3 Partial amount delivered to broker as collateral for futures transactions.
4 Floating rate security. The interest rate shown is the current rate as of July 31, 2009.
5 Entire amount pledged as collateral for investments sold short.
6 Security exempt from registration under Rule 144A of the Securities Act of 1933. These securities, which represent 11.37% of net assets as of July 31, 2009, are considered liquid and may be resold in transactions exempt from registration, normally to qualified institutional buyers.
7 Illiquid securities representing 2.17% of net assets as of July 31, 2009.
8 Inverse variable rate security. The interest rate shown is the current rate as of July 31, 2009.
9 Step-up bond that converts to the noted fixed rate at a designated future date.
10 Bond interest in default.
11 Variable rate security. The interest rate shown is the current rate as of July 31, 2009 and resets at the next call date.
12 Perpetual bond security. The maturity date reflects the next call date.
13 Security exempt from registration under Rule 144A of the Securities Act of 1933. This security, which represents 0.14% of net assets as of July 31, 2009, is considered illiquid and restricted (see table below for more information).
| Illiquid and restricted security | | Acquisition
date | | Acquisition
cost | | Acquisition cost
as a percentage
of net assets | | Value at
07/31/09 | | Value as a
percentage
of net assets | |
| Verizon North, Inc. 5.634%, 01/01/21 | | | 04/25/03 | | | $ | 1,000,000 | | | | 0.16 | % | | $ | 857,120 | | | | 0.14 | % | |
14 Zero coupon bond; interest rate represents annualized yield at date of purchase.
15 Non cumulative preferred stock. Convertible until 12/31/49.
16 Rates shown are the discount rates at date of purchase.
17 The table below details the Portfolios's transaction activity in an affiliated issuer for the year ended July 31, 2009.
| Security description | | Value at
07/31/08 | | Purchases
during the
year ended
07/31/09 | | Sales
during the
year ended
07/31/09 | | Value at
07/31/09 | | Net income
earned from
affiliate for the
year ended
07/31/09 | |
| UBS Private Money Market Fund LLC | | $ | 4,558,411 | | | $ | 253,843,887 | | | $ | 241,643,823 | | | $ | 16,758,475 | | | $ | 58,930 | | |
ARM Adjustable Rate Mortgage—The interest rate shown is the current rate as of July 31, 2009.
53
UBS PACE Select Advisors Trust
UBS PACE Strategic Fixed Income Investments
Portfolio of investments—July 31, 2009
COFI Cost of Funds Index
EUR Euro
FHA Federal Housing Administration
FHLMC Federal Home Loan Mortgage Corporation
FNMA Federal National Mortgage Association
FSA Financial Security Assurance
GBP Great Britain Pound
GMAC General Motors Acceptance Corporation
GNMA Government National Mortgage Association
GS Goldman Sachs
GTD Guaranteed
MTN Medium Term Note
NATL-RE National Reinsurance
PSF Permanent School Fund
REMIC Real Estate Mortgage Investment Conduit
TBA (To Be Announced) Security is purchased on a forward commitment basis with an approximate principal amount (generally +/- 1.0%) and no definite maturity date. The actual principal amount and maturity date will be determined upon settlement when the specific mortgage pools are assigned.
Written options7
Number of
contracts
(000) | | Put options written | | Counterparty | | Pay/
receive
floating
rate | | Expiration
dates | | Premiums
received | | Current
value | | Unrealized
appreciation | |
| 020 | | GBP 90 Day Sterling Futures,
strike @ GBP 92.00 | |
N/A | |
N/A | |
12/16/09 | | $ | 16,474 | | | $ | 0 | | | $ | 16,474 | | |
41,400
| | USD 3 Month LIBOR19 Interest Rate Swap,
strike @ 1.750% | | Credit Suisse
International | |
Pay | |
08/21/09 | | | 97,290 | | | | 35,604 | | | | 61,686 | | |
36,500
| | USD 3 Month LIBOR19 Interest Rate Swap,
strike @ 4.250% | | Barclays
Bank PLC | |
Pay | |
08/21/09 | | | 405,150 | | | | 15,330 | | | | 389,820 | | |
| | | $ | 518,914 | | | $ | 50,934 | | | $ | 467,980 | | |
19 3 Month LIBOR (USD on London Interbank Offered Rate) at July 31, 2009 was 0.479%.
20 Amount represents less than 500 contracts.
LIBOR London Interbank Offered Rate
N/A Not applicable.
Currency type abbreviations:
GBP Great Britain Pound
USD United States Dollar
Written option activity for the year ended July 31, 2009 was as follows:
| | | Number of
contracts
(000) | | Premiums
received | |
| Options outstanding at July 31, 2008 | | | 90,601 | | | $ | 3,418,017 | | |
| Options written | | | 151,901 | | | | 1,278,336 | | |
| Options terminated in closing purchase transactions | | | (137,601 | ) | | | (3,341,953 | ) | |
| Options expired prior to exercise | | | (27,001 | ) | | | (835,486 | ) | |
| Options outstanding at July 31, 2009 | | | 77,900 | | | $ | 518,914 | | |
54
UBS PACE Select Advisors Trust
UBS PACE Strategic Fixed Income Investments
Portfolio of investments—July 31, 2009
Futures contracts
Number of
contracts | | Currency | | Buy contracts | | Expiration
dates | | Cost | | Current
value | | Unrealized
appreciation
(depreciation) | |
| 266 | | USD | | 90 Day Euro Dollar Futures | | December 2010 | | $ | 65,096,463 | | | $ | 65,050,300 | | | $ | (46,163 | ) | |
| 79 | | USD | | 90 Day Euro Dollar Futures | | September 2010 | | | 19,415,237 | | | | 19,400,425 | | | | (14,812 | ) | |
| 273 | | USD | | 90 Day Euro Dollar Futures | | March 2011 | | | 66,769,325 | | | | 66,530,100 | | | | (239,225 | ) | |
| | | | | | | | | $ | 151,281,026 | | | $ | 150,980,825 | | | $ | (300,200 | ) | |
Currency type abbreviation:
USD United States Dollar
Forward foreign currency contracts
| | | Contracts to
deliver | | In
exchange for | | Maturity
dates | | Unrealized
appreciation
(depreciation) | |
| Australian Dollar | | | 7,300,000 | | | USD | 5,988,920 | | | 08/28/09 | | $ | (106,401 | ) | |
| Brazilian Real | | | 25,312,364 | | | USD | 11,412,247 | | | 08/04/09 | | | (2,154,610 | ) | |
| Brazilian Real | | | 11,590,650 | | | USD | 5,800,000 | | | 08/04/09 | | | (412,328 | ) | |
| Brazilian Real | | | 3,516,970 | | | USD | 1,765,547 | | | 08/04/09 | | | (119,470 | ) | |
| Canadian Dollar | | | 12,900,000 | | | USD | 11,772,580 | | | 08/04/09 | | | (202,356 | ) | |
| Chinese Yuan Renminbi | | | 41,659,040 | | | USD | 6,134,449 | | | 03/29/10 | | | 8,278 | | |
| Euro | | | 13,922,000 | | | USD | 19,797,321 | | | 09/04/09 | | | (47,089 | ) | |
| Great Britain Pound | | | 189,000 | | | USD | 311,844 | | | 08/06/09 | | | (3,869 | ) | |
| Great Britain Pound | | | 1,810,000 | | | USD | 2,980,595 | | | 08/06/09 | | | (42,906 | ) | |
| Japanese Yen | | | 1,180,000,000 | | | USD | 12,408,383 | | | 08/04/09 | | | (61,894 | ) | |
| Japanese Yen | | | 10,000,000 | | | USD | 106,352 | | | 09/02/09 | | | 644 | | |
| Japanese Yen | | | 1,180,000,000 | | | USD | 12,317,328 | | | 09/09/09 | | | (157,104 | ) | |
| Mexican Peso | | | 70,039,900 | | | USD | 4,897,039 | | | 11/27/09 | | | (322,491 | ) | |
| Mexican Peso | | | 4,418,790 | | | USD | 314,000 | | | 11/27/09 | | | (15,298 | ) | |
| Philippine Peso | | | 3,000,000 | | | USD | 62,073 | | | 12/24/10 | | | (323 | ) | |
| Singapore Dollar | | | 9,304 | | | USD | 6,455 | | | 11/18/09 | | | (7 | ) | |
| Singapore Dollar | | | 367,716 | | | USD | 257,847 | | | 12/24/10 | | | 2,492 | | |
| Taiwan Dollar | | | 926,750 | | | USD | 27,500 | | | 08/10/09 | | | (761 | ) | |
| Taiwan Dollar | | | 869,310 | | | USD | 26,000 | | | 08/10/09 | | | (509 | ) | |
| Taiwan Dollar | | | 429,823 | | | USD | 12,777 | | | 08/10/09 | | | (330 | ) | |
| Taiwan Dollar | | | 330,407 | | | USD | 9,854 | | | 08/10/09 | | | (221 | ) | |
| Taiwan Dollar | | | 751,669 | | | USD | 23,026 | | | 11/16/09 | | | (87 | ) | |
| Taiwan Dollar | | | 1,796,379 | | | USD | 54,790 | | | 11/16/09 | | | (446 | ) | |
| United States Dollar | | | 110,043 | | | AUD | 136,000 | | | 08/25/09 | | | 3,538 | | |
| United States Dollar | | | 2,464,507 | | | AUD | 3,122,000 | | | 06/07/10 | | | 81,812 | | |
| United States Dollar | | | 3,597,339 | | | AUD | 4,550,000 | | | 06/07/10 | | | 113,663 | | |
| United States Dollar | | | 360,000 | | | BRL | 701,280 | | | 08/04/09 | | | 15,870 | | |
| United States Dollar | | | 7,297,000 | | | BRL | 14,462,654 | | | 08/04/09 | | | 454,657 | | |
55
UBS PACE Select Advisors Trust
UBS PACE Strategic Fixed Income Investments
Portfolio of investments—July 31, 2009
Forward foreign currency contracts—(concluded)
| | | Contracts to
deliver | | In
exchange for | | Maturity
dates | | Unrealized
appreciation
(depreciation) | |
| United States Dollar | | | 10,868,570 | | | BRL | 21,777,350 | | | 08/04/09 | | $ | 803,599 | | |
| United States Dollar | | | 1,720,000 | | | BRL | 3,478,700 | | | 08/04/09 | | | 144,505 | | |
| United States Dollar | | | 1,744,529 | | | BRL | 3,516,970 | | | 10/02/09 | | | 119,608 | | |
| United States Dollar | | | 11,216,399 | | | CAD | 12,547,000 | | | 08/04/09 | | | 430,851 | | |
| United States Dollar | | | 6,200,000 | | | CNY | 41,659,040 | | | 03/29/10 | | | (73,830 | ) | |
| United States Dollar | | | 188,662 | | | GBP | 116,000 | | | 08/06/09 | | | 5,109 | | |
| United States Dollar | | | 2,804,065 | | | GBP | 1,700,000 | | | 08/06/09 | | | 35,687 | | |
| United States Dollar | | | 12,313,472 | | | JPY | 1,180,000,000 | | | 08/04/09 | | | 156,806 | | |
| United States Dollar | | | 6,254 | | | KRW | 7,910,000 | | | 11/18/09 | | | 184 | | |
| United States Dollar | | | 6,197,718 | | | KRW | 7,902,090,000 | | | 11/18/09 | | | 233,719 | | |
| United States Dollar | | | 2,527,140 | | | MXN | 34,128,641 | | | 11/27/09 | | | 16,203 | | |
| United States Dollar | | | 730,000 | | | MXN | 10,017,918 | | | 11/27/09 | | | 16,558 | | |
| United States Dollar | | | 668,848 | | | MXN | 9,039,474 | | | 11/27/09 | | | 4,794 | | |
| United States Dollar | | | 281,967 | | | MXN | 3,803,102 | | | 11/27/09 | | | 1,449 | | |
| United States Dollar | | | 1,130,972 | | | MXN | 15,271,125 | | | 11/27/09 | | | 7,067 | | |
| United States Dollar | | | 67,024 | | | PHP | 3,000,000 | | | 12/24/10 | | | (4,628 | ) | |
| United States Dollar | | | 266,499 | | | SGD | 367,716 | | | 12/24/10 | | | (11,144 | ) | |
| United States Dollar | | | 22,861 | | | TWD | 751,669 | | | 08/10/09 | | | 61 | | |
| United States Dollar | | | 54,650 | | | TWD | 1,804,621 | | | 08/10/09 | | | 381 | | |
| | | $ | (1,080,567 | ) | |
Currency type abbreviations:
AUD Australian Dollar
BRL Brazilian Real
CAD Canadian Dollar
CNY Chinese Yuan Renminbi
GBP Great Britain Pound
JPY Japanese Yen
KRW South Korean Won
MXN Mexican Peso
PHP Philippine Peso
SGD Singapore Dollar
TWD Taiwan Dollar
USD United States Dollar
56
UBS PACE Select Advisors Trust
UBS PACE Strategic Fixed Income Investments
Portfolio of investments—July 31, 2009
Interest rate swaps
| | | | | | | Rate type | | | | | | | |
| Counterparty | | Notional
amount
(000) | | Termination
dates | | Payments
made by the
Portfolio | | Payments
received by
the Portfolio | | Upfront
payments
received (made) | | Value | | Unrealized
appreciation
(depreciation) | |
Barclays
Bank PLC | | GBP | 400 | | | 03/18/14 | | | 1.099 | %21 | | | 5.000 | % | | $ | 1,539 | | | $ | 41,327 | | | $ | 42,866 | | |
Barclays
Bank PLC | | GBP | 22,900 | | | 09/16/14 | | | 1.099 | 21 | | | 3.500 | | | | 188,931 | | | | (397,161 | ) | | | (208,230 | )7 | |
Barclays
Bank PLC | | USD | 7,800 | | | 12/16/16 | | | 0.479 | 19 | | | 4.000 | | | | (117,780 | ) | | | 193,476 | | | | 75,696 | 7 | |
| Citibank N.A. | | USD | 24,700 | | | 12/16/14 | | | 0.479 | 19 | | | 4.000 | | | | (661,960 | ) | | | 917,422 | | | | 255,462 | | |
Deutsche
Bank AG | | USD | 7,600 | | | 12/16/16 | | | 0.479 | 19 | | | 4.000 | | | | (117,420 | ) | | | 188,515 | | | | 71,095 | 7 | |
Morgan
Stanley
Capital
Services, Inc. | | USD | 17,200 | | | 12/16/16 | | | 0.479 | 19 | | | 4.000 | | | | (497,131 | ) | | | 426,639 | | | | (70,492 | ) | |
Royal Bank of
Scotland PLC | | GBP | 10,100 | | | 09/16/14 | | | 1.099 | 21 | | | 3.500 | | | | 90,391 | | | | (175,167 | ) | | | (84,776 | )7 | |
Royal Bank of
Scotland PLC | | USD | 101,700 | | | 12/16/14 | | | 0.479 | 19 | | | 4.000 | | | | (1,325,110 | ) | | | 3,777,400 | | | | 2,452,290 | | |
Royal Bank of
Scotland PLC | | USD | 25,800 | | | 12/16/16 | | | 0.479 | 19 | | | 4.000 | | | | (761,100 | ) | | | 639,958 | | | | (121,142 | )7 | |
Royal Bank of
Scotland PLC | | USD | 1,300 | | | 12/16/19 | | | 0.479 | 19 | | | 4.000 | | | | (7,280 | ) | | | 9,120 | | | | 1,840 | | |
| | | | | | | | | | | | | | | | | $ | (3,206,920 | ) | | $ | 5,621,529 | | | $ | 2,414,609 | | |
21 Rate based on 6 Month LIBOR (GBP on Interbank Offered Rate).
GBP Great Britain Pound
USD United States Dollar
Credit default swaps on corporate issues—buy protection22
| | | | | | | Rate type | | | | | | | |
| Counterparty | | Notional
amount
(000) | | Termination
dates | | Payments
made by
the Portfolio | | Payments
received by
the Portfolio | | Upfront
payments
made | | Value | | Unrealized
appreciation
(depreciation) | |
Barclays
Bank PLC | | USD | 3,100 | | | 09/20/15 | | | 7.150 | %23 | | | 0.000 | %24 | | $ | — | | | $ | (709,444 | ) | | $ | (709,444 | ) | |
| Citibank N.A. | | USD | 5,000 | | | 12/20/11 | | | 2.470 | 23 | | | 0.000 | 25 | | | — | | | | (182,046 | ) | | | (182,046 | ) | |
| Citibank N.A. | | USD | 300 | | | 12/20/13 | | | 3.400 | 23 | | | 0.000 | 26 | | | — | | | | (13,367 | ) | | | (13,367 | ) | |
Credit Suisse
First Boston | | USD | 1,400 | | | 03/20/13 | | | 1.450 | 23 | | | 0.000 | 27 | | | — | | | | (53,619 | ) | | | (53,619 | ) | |
Deutsche
Bank AG | | USD | 1,200 | | | 09/20/17 | | | 0.775 | 23 | | | 0.000 | 28 | | | — | | | | (10,776 | ) | | | (10,776 | ) | |
Deutsche
Bank AG | | USD | 3,200 | | | 12/20/17 | | | 1.020 | 23 | | | 0.000 | 29 | | | — | | | | 56,395 | | | | 56,395 | | |
Deutsche
Bank AG | | USD | 1,000 | | | 06/20/18 | | | 1.370 | 23 | | | 0.000 | 30 | | | (45,996 | ) | | | (4,784 | ) | | | (50,780 | ) | |
Deutsche
Bank AG | | USD | 8,400 | | | 09/20/18 | | | 0.820 | 23 | | | 0.000 | 31 | | | — | | | | 360,316 | | | | 360,316 | | |
| | | | | | | | | | | | | | | | | $ | (45,996 | ) | | $ | (557,325 | ) | | $ | (603,321 | ) | |
57
UBS PACE Select Advisors Trust
UBS PACE Strategic Fixed Income Investments
Portfolio of investments—July 31, 2009
22 If the Portfolio is a buyer of protection and a credit event occurs, as defined under the terms of the particular swap agreement, the Portfolio will either (i) receive from the seller of protection an amount equal to the notional amount of the swap and take delivery of the referenced obligation or underlying securities comprising the referenced obligation or (ii) receive a net settlement amount in the form of cash or securities equal to the notional amount of the swap less the recovery value of the referenced obligation.
23 Payments are made based on the notional amount.
24 Payment from the counterparty will be received upon the occurrence of bankruptcy and/or by a restructuring event with respect to the Macy's Retail Holdings, Inc bond, 8.875%, due 07/15/15.
25 Payment from the counterparty will be received upon the occurrence of bankruptcy and/or by a restructuring event with respect to the Wachovia Corp. bond, 5.300%, due 10/15/11.
26 Payment from the counterparty will be received upon the occurrence of bankruptcy and/or by a restructuring event with respect to the Valero Energy Corp.. bond, 8.750%, due 06/15/30.
27 Payment from the counterparty will be received upon the occurrence of bankruptcy and/or by a restructuring event with respect to the Historic TW, Inc. bond, 9.125%, due 01/15/13.
28 Payment from the counterparty will be received upon the occurrence of bankruptcy and/or by a restructuring event with respect to the Kroger Co. bond, 6.400%, due 05/15/17.
29 Payment from the counterparty will be received upon the occurrence of bankruptcy and/or by a restructuring event with respect to the Bank of America Corp. bond, 5.750%, due 12/01/17.
30 Payment from the counterparty will be received upon the occurrence of bankruptcy and/or by a restructuring event with respect to the Merrill Lynch & Co. bond, 6.875%, due 04/25/18.
31 Payment from the counterparty will be received upon the occurrence of bankruptcy and/or by a restructuring event with respect to the Cameron International Corp. bond, 6.375%, due 07/15/18.
USD United States Dollar
Credit default swaps on corporate issues—sell protection32
| | | | | | | Rate type | | | | | | | | | |
| Counterparty | | Notional
amount
(000) | | Termination
dates | | Payments
made by
the Portfolio | | Payments
received by
the Portfolio | | Upfront
payments
received | | Value | | Unrealized
appreciation
(depreciation) | | Credit spread33 | |
Barclays
Bank PLC | | USD | 3,900 | | | 03/20/13 | | | 0.000 | %34 | | | 2.029 | %35 | | $ | — | | | $ | (158,343 | ) | | $ | (158,343 | ) | | | 3.29 | % | |
| BNP Paribas | | USD | 1,000 | | | 12/20/12 | | | 0.000 | 36 | | | 2.870 | 35 | | | — | | | | (210,281 | ) | | | (210,281 | ) | | | 11.60 | | |
| Citibank N.A. | | USD | 1,800 | | | 03/20/14 | | | 0.000 | 37 | | | 5.000 | 35 | | | 88,920 | | | | (38,998 | ) | | | 49,922 | | | | 5.59 | | |
Deutsche
Bank AG | | USD | 300 | | | 09/20/11 | | | 0.000 | 38 | | | 1.500 | 35 | | | — | | | | (6,854 | ) | | | (6,854 | ) | | | 2.62 | | |
Deutsche
Bank AG | | USD | 1,000 | | | 12/20/12 | | | 0.000 | 36 | | | 2.900 | 35 | | | — | | | | (209,557 | ) | | | (209,557 | ) | | | 11.60 | | |
Deutsche
Bank AG | | USD | 3,000 | | | 03/20/13 | | | 0.000 | 34 | | | 2.073 | 35 | | | — | | | | (117,621 | ) | | | (117,621 | ) | | | 3.29 | | |
Deutsche
Bank AG | | USD | 1,800 | | | 09/20/13 | | | 0.000 | 39 | | | 1.000 | 35 | | | 45,267 | | | | 7,075 | | | | 52,342 | 7 | | | 0.90 | | |
Royal Bank of
Scotland PLC | | USD | 800 | | | 03/20/10 | | | 0.000 | 40 | | | 8.250 | 35 | | | — | | | | 39,317 | | | | 39,317 | | | | 0.68 | | |
| | | | | | | | | | | | | | | | | $ | 134,187 | | | $ | (695,262 | ) | | $ | (561,075 | ) | | | | | |
32 If the Portfolio is a seller of protection and a credit event occurs, as defined under the terms of the particular swap agreement, the Portfolio will either (i) pay to the buyer of protection an amount equal to the notional amount of the swap and take delivery of the referenced obligation or (ii) pay a net settlement amount in the form of cash or securities equal to the notional amount of the swap less the recovery value of the referenced obligation.
33 Credit spreads, where applicable, represented in absolute terms, utilized in determining the market value as of period end serve as an indicator of the current status of the payment/performance risk and represent the likelihood or risk of default for the credit derivative. The credit spread of a particular referenced entity reflects the cost of buying/selling protection and may include upfront payments required to be made to enter into the agreement. Wider credit spreads represent a deterioration of the referenced entity's credit soundness and a greater likelihood or risk of default or other credit event occurring as defined under the terms of the agreement. A credit spread identified as "Defaulted" indicates a credit event has occurred for the referenced entity.
58
UBS PACE Select Advisors Trust
UBS PACE Strategic Fixed Income Investments
Portfolio of investments—July 31, 2009
34 Payment to the counterparty will be made upon the occurrence of bankruptcy and/or by a restructuring event with respect to the MetLife, Inc. bond, 5.000%, due 06/15/15.
35 Payments received are based on the notional amount.
36 Payment to the counterparty will be made upon the occurrence of bankruptcy and/or by a restructuring event with respect to the SLM Corp. bond, 5.125%, due 08/27/12.
37 Payment to the counterparty will be made upon the occurrence of bankruptcy and/or by a restructuring event with respect to the El Paso Corp. bond, 6.875%, due 06/15/14.
38 Payment to the counterparty will be made upon the occurrence of bankruptcy and/or by a restructuring event with respect to the General Electric Capital Corp. bond, 6.000%, due 06/15/12.
39 Payment to the counterparty will be made upon the occurrence of bankruptcy and/or by a restructuring event with respect to the Wells Fargo & Co. bond, 0.702%, due 10/28/15.
40 Payment to the counterparty will be made upon the occurrence of bankruptcy and/or by a restructuring event with respect to the JPMorgan Chase & Co. bond, 4.750%, due 03/01/15.
USD United States Dollar
The following is a summary of the fair valuations according to the inputs used as of July 31, 2009 in valuing the Portfolio's investments:
| Measurements at 07/31/09 | |
| | | Quoted prices in
active markets for
identical investments
(Level 1) | | Significant other
observable inputs
(Level 2) | | Unobservable
inputs
(Level 3) | | Total | |
| US government obligations | | $ | — | | | $ | 16,063,317 | | | $ | — | | | $ | 16,063,317 | | |
Government national mortgage
association certificates | | | — | | | | 291,258 | | | | — | | | | 291,258 | | |
Federal home loan mortgage corporation
certificates | | | — | | | | 1,094,742 | | | | 1,512,265 | | | | 2,607,007 | | |
| Federal housing administration certificates | | | — | | | | — | | | | 104,298 | | | | 104,298 | | |
Federal national mortgage association
certificates | | | — | | | | 42,657,982 | | | | 149,678 | | | | 42,807,660 | | |
| Collateralized mortgage obligations | | | | | | | 215,355,885 | | | | 3,395,174 | | | | 218,751,059 | | |
| Asset-backed securities | | | — | | | | 25,182,599 | | | | — | | | | 25,182,599 | | |
| Corporate notes | | | | | | | 211,735,767 | | | | | | | | 211,735,767 | | |
| Loan assignments | | | — | | | | 14,881,237 | | | | — | | | | 14,881,237 | | |
| Municipal bonds and notes | | | — | | | | 25,880,214 | | | | — | | | | 25,880,214 | | |
| Preferred stock | | | — | | | | 5,375,680 | | | | — | | | | 5,375,680 | | |
| Short-term US government obligations | | | — | | | | 1,330,895 | | | | — | | | | 1,330,895 | | |
| Repurchase agreement | | | — | | | | 49,735,000 | | | | — | | | | 49,735,000 | | |
Investment of cash collateral from
securities loaned | | | — | | | | 16,758,475 | | | | — | | | | 16,758,475 | | |
Federal national mortgage association
certificates sold short | | | — | | | | (19,231,882 | ) | | | — | | | | (19,231,882 | ) | |
| Other financial instruments, net41 | | | (283,726 | ) | | | 621,152 | | | | — | | | | 337,426 | | |
| Total | | $ | (283,726 | ) | | $ | 607,732,321 | | | $ | 5,161,415 | | | $ | 612,610,010 | | |
41 Other financial instruments include written options, open futures contracts, forward foreign currency contracts and open swap contracts.
59
UBS PACE Select Advisors Trust
UBS PACE Strategic Fixed Income Investments
Portfolio of investments—July 31, 2009
The following is a rollforward of the Portfolio's investments that were valued using unobservable inputs (Level 3) for the period:
| Measurements at 07/31/09 | |
| | | Federal home
loan mortgage
corporation
certificates | | Federal
housing
administration
certificates | | Federal national
mortgage
association
certificates | | Collateralized
mortgage
obligations | | Total | |
| Beginning balance | | $ | 1,555,360 | | | $ | 125,403 | | | $ | 179,964 | | | $ | 560,051 | | | $ | 2,420,778 | | |
| Net purchases/(sales) | | | (42,493 | ) | | | (21,105 | ) | | | (27,231 | ) | | | (1,286,205 | ) | | | (1,377,034 | ) | |
| Accrued discounts/(premiums) | | | — | | | | (1,705 | ) | | | — | | | | — | | | | (1,705 | ) | |
| Total realized gain/(loss) | | | — | | | | — | | | | — | | | | — | | | | — | | |
Total unrealized appreciation/
(depreciation) | | | (602 | ) | | | 1,705 | | | | (3,055 | ) | | | (64,045 | ) | | | (65,997 | ) | |
| Net transfers in/(out) of Level 3 | | | — | | | | — | | | | — | | | | 4,185,373 | | | | 4,185,373 | | |
| Ending balance | | $ | 1,512,265 | | | $ | 104,298 | | | $ | 149,678 | | | $ | 3,395,174 | | | $ | 5,161,415 | | |
The change in unrealized appreciation/(depreciation) relating to the Level 3 investments held at July 31, 2009 was $(65,997).
Issuer breakdown by country of origin (unaudited)
| | | Percentage of
total investments | |
| United States | | | 86.7 | % | |
| Australia | | | 6.4 | | |
| France | | | 2.6 | | |
| Netherlands | | | 1.3 | | |
| Spain | | | 0.9 | | |
| United Kingdom | | | 0.7 | | |
| Switzerland | | | 0.4 | | |
| Japan | | | 0.4 | | |
| Luxembourg | | | 0.3 | | |
| South Korea | | | 0.2 | | |
| Chile | | | 0.1 | | |
| Total | | | 100.0 | % | |
See accompanying notes to financial statements.
60
UBS PACE Select Advisors Trust
UBS PACE Municipal Fixed Income Investments
Performance
For the 12 months ended July 31, 2009, the Portfolio's Class P shares returned 6.14% (before the deduction of the maximum UBS PACE Select program fee; after the deduction of the maximum UBS PACE Select program fee, the Portfolio returned 4.56%). In comparison, the Barclays Capital US Municipal 3-15 Year Blend Index (formerly known as the Lehman Brothers US Municipal 3-15 Year Blend Index) (the "benchmark") returned 7.07%, and the Lipper Intermediate Municipal Debt Funds category posted a median return of 4.56%. (Returns for all share classes over various time periods are shown in the "Performance at a glance" table on page 64. Please note that the returns shown do not reflect the deduction of taxes that a shareholder could pay on Portfolio distributions or the redemption of Portfolio shares.) For a detailed commentary on the market environment in general during the reporting period, please refer to page two.
Sub-Advisor's comments
While the Portfolio delivered strong absolute performance, it lagged its benchmark during the reporting period. Following the severe flight to quality that culminated in late 2008, the Portfolio was hurt by an underweight to US Treasury-backed pre-refunded bonds. These securities outperformed all other municipal sectors as investors flocked to the highest grade assets.
Investors' risk aversion began to reverse course at the start of 2009, with demand for higher-yielding assets accelerating. The Portfolio was well-positioned to benefit from this shift in demand, driven by an overweight to revenue bonds, including those backed by essential service water and sewer projects, as well as utilities, hospitals and colleges. The strong performance from revenue bonds during the first half of 2009 helped mitigate the negative impact experienced during the most challenging liquidity conditions in the fourth quarter of 2008. Within the revenue bond sector, the Portfolio was aided by favorable security selection, particularly within the hospital, education and housing sectors.
During the reporting period, we reduced the Portfolio's exposure to bonds backed by corporate entities, such as industrial development and prepaid natural gas contracts. Despite this, exposure to these securities hurt the Portfolio's relative returns. However, the Portfolio benefited greatly from improving market conditions during 2009, when prices improved as the taxable credit markets rallied. Tobacco securitization bonds remained a key overweight in the Portfolio, and benefited greatly from the broad municipal market rally experienced during the first half of 2009.
UBS PACE Select Advisors Trust – UBS PACE Municipal Fixed Income Investments
Investment Sub-Advisor:
Standish Mellon Asset Management Company LLC ("Standish Mellon")
Portfolio Manager:
Christine L. Todd
Objective:
High current income exempt from federal income tax
Investment process:
In deciding which securities to buy for the Portfolio, Standish Mellon seeks to identify undervalued sectors or geographical regions of the municipal market, or undervalued individual securities. To do this, Standish Mellon uses credit research and valuation analysis, and monitors the relationship of the municipal yield curve to the Treasury yield curve. Standish Mellon may also make modest duration adjustments based on economic analyses and interest rate forecasts. Standish Mellon generally sells securities if it identifies more attractive investment opportunities within its investment criteria that may improve the Portfolio's return. Standish Mellon also may sell securities with weakening credit profiles or to adjust the average duration of the Portfolio.
61
UBS PACE Select Advisors Trust
UBS PACE Municipal Fixed Income Investments
Sub-Advisor's comments – concluded
Weak economic conditions continued to pressure state and local government budgets, straining tax revenues during the reporting period. The Portfolio maintained a strategic underweight to general obligation bonds and benefited from less exposure to geographic areas prone to extended periods of economic weakness. In particular, a decision to underweight both California and New York City general obligation bonds helped performance relative to the benchmark as those credits suffered amidst heavy supply and weak economic conditions. While lower-quality bonds in the A- and BBB-rated categories performed well during the latter half of the reporting period, an overweight position detracted from the Portfolio's relative returns overall.1 Bonds backed by the Commonwealth of Puerto Rico remained a key portfolio overweight. These bonds benefited relative returns as investor demand for lower-rated bonds increased during 2009.
Overall, we maintained the Portfolio's duration closely to that of the benchmark's. However, a modestly short duration position was detrimental as the market rallied during the reporting period. (Duration measures a portfolio's sensitivity to interest rate changes.) The Portfolio was positioned to benefit from a steepening yield curve, which added to performance as the spread between two-year and 10-year municipals increased substantially. (The yield curve plots the interest rates, at a set point in time, of bonds having equal credit quality, but differing maturity dates. A "steepening yield curve" is one in which long-term bond yields increase relative to those of short-term bonds.) The yield curve steepened due to the monetary policy of the Federal Reserve Board, which helped to keep short-term interest rates low. Municipal bonds with call features allowing the issuer to opportunistically redeem bonds at a set price were poor performers overall during the reporting period, and the Portfolio's underweight to these issues benefited returns relative to the benchmark.
1 According to ratings assigned by Standard & Poor's Ratings Group, bonds rated A have a strong capacity to pay principal and interest, although they are somewhat more susceptible to the adverse effects of changes in circumstances and economic conditions, while debt rated BB has less near-term vulnerability to default than other speculative grade debt. However, it faces major ongoing uncertainties or exposure to adverse business, financial or economic conditions which could lend to inadequate capacity to meet timely interest and principal payments.
Special considerations
The Portfolio may be appropriate for long-term investors seeking high current income exempt from federal income taxes. Investors should be able to withstand short-term fluctuations in the fixed income markets in return for potentially higher returns over the long term. The yield and value of the Portfolio change every day and can be affected by changes in interest rates, general market conditions and other political, social and economic developments, as well as specific matters relating to the issuers in which the Portfolio invests. It is important to note that an investment in the Portfolio is only one component of a balanced investment plan.
62
UBS PACE Select Advisors Trust
UBS PACE Municipal Fixed Income Investments
Comparison of change in value of a $10,000 investment in the Class P shares of the Portfolio and the Barclays Capital US Municipal 3-15 Year Blend Index (unaudited)
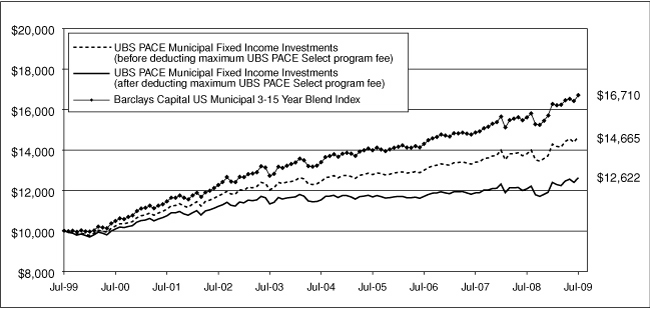
The graph depicts the performance of UBS PACE Municipal Fixed Income Investments Class P shares versus the Barclays Captial US Municipal 3-15 Year Blend Index (formerly known as the Lehman Brothers US Municipal 3-15 Year Blend Index) over the 10 years ended July 31, 2009. The performance of the other classes will vary from the performance of the class shown based on the difference in sales charges and fees paid by shareholders investing in different share classes. Past performance does not predict future performance and the performance provided does not reflect the deduction of taxes that a shareholder could pay on Portfolio distributions or the redemption of Portfolio shares. It is important to note that UBS PACE Municipal Fixed Income Investments is a professionally managed portfolio while the Index is not available for investment and is unmanaged. The comparison is shown for illustrative purposes only.
63
UBS PACE Select Advisors Trust
UBS PACE Municipal Fixed Income Investments
Performance at a glance (unaudited)
| Average annual total returns for periods ended 07/31/09 | | 1 year | | 5 years | | 10 years | | Since
inception1 | |
| Before deducting | | Class A2 | | | 5.97 | % | | | 3.12 | % | | N/A | | | 3.47 | % | |
| maximum sales charge | | Class B3 | | | 5.17 | % | | | 2.35 | % | | N/A | | | 2.92 | % | |
| or UBS PACE Select | | Class C4 | | | 5.36 | % | | | 2.60 | % | | N/A | | | 3.21 | % | |
| program fee | | Class Y5 | | | 6.23 | % | | | 3.38 | % | | N/A | | | 3.73 | % | |
| | | Class P6 | | | 6.14 | % | | | 3.36 | % | | | 3.90 | % | | | 4.36 | % | |
| After deducting | | Class A2 | | | 1.22 | % | | | 2.18 | % | | N/A | | | 2.91 | % | |
| maximum sales charge | | Class B3 | | | 0.17 | % | | | 1.98 | % | | N/A | | | 2.92 | % | |
| or UBS PACE Select | | Class C4 | | | 4.61 | % | | | 2.60 | % | | N/A | | | 3.21 | % | |
| program fee | | Class P6 | | | 4.56 | % | | | 1.82 | % | | | 2.36 | % | | | 2.81 | % | |
| Barclays Capital US Municipal 3-15 Year Blend Index7 | | | 7.07 | % | | | 4.55 | % | | | 5.27 | % | | | 5.40 | % | |
| Lipper Intermediate Municipal Debt Funds median | | | 4.56 | % | | | 3.28 | % | | | 4.19 | % | | | 4.43 | % | |
Average annual total returns for periods ended June 30, 2009, after deduction of the maximum sales charge or UBS PACE Select program fee, were as follows: Class A—1-year period, (0.08)%; 5-year period, 1.95%; since inception, 2.71%; Class B—1-year period, (1.17)%; 5-year period, 1.76%; since inception, 2.72%; Class C—1-year period, 3.35%; 5-year period, 2.38%; since inception, 3.02%; Class Y—1-year period, 4.88%; 5-year period, 3.14%; since inception, 3.53%; Class P—1-year period, 3.32%; 5-year period, 1.60%; 10-year period, 2.19%; since inception, 2.69%.
The annualized gross and net expense ratios, respectively, for each class of shares as in the November 28, 2008 prospectuses, were as follows: Class A—0.96% and 0.93%; Class B—1.84% and 1.68%; Class C—1.47% and 1.43%; Class Y—0.91% and 0.68%; and Class P—0.74% and 0.68%. Net expenses reflect fee waivers and/or expense reimbursements, if any, pursuant to an agreement that is in effect to cap the expenses. The Portfolio and UBS Global AM have entered into a written fee waiver/expense reimbursement agreement pursuant to which UBS Global AM is contractually obligated to waive its management fees and/or reimburse the Portfolio so that the ordinary total operating expenses of each class through November 30, 2009 (excluding dividend expense, borrowing costs and interest expense, if any) would not exceed Class A—0.93%; Class B—1.68%; Class C—1.43%; Class Y—0.68% and Class P—0.68%. The Po rtfolio has agreed to repay UBS Global AM for any waived fees/reimbursed expenses to the extent that it can do so over the following three fiscal years without causing the Portfolio's expenses in any of those three years to exceed the expense caps described above.
1 Since inception returns are calculated as of commencement of issuance on August 24, 1995 for Class P shares, January 23, 2001 for Class A shares, February 23, 2001 for Class B shares, December 4, 2000 for Class C shares and February 23, 2001 for Class Y shares. Since inception returns for the Index and Lipper median are shown as of August 31, 1995, which is the month-end after the inception date of the oldest share class (Class P).
2 Maximum sales charge for Class A shares is 4.5%. Class A shares bear ongoing 12b-1 service fees.
3 Maximum contingent deferred sales charge for Class B shares is 5% imposed on redemptions and is reduced to 0% after a maximum of six years. Class B shares bear ongoing 12b-1 service and distribution fees.
4 Maximum contingent deferred sales charge for Class C shares is 0.75% imposed on redemptions and is reduced to 0% after one year. Class C shares bear ongoing 12b-1 service and distribution fees.
5 The Portfolio offers Class Y shares to a limited group of eligible investors, including certain qualifying retirement plans. Class Y shares do not bear initial or contingent deferred sales charges or ongoing 12b-1 service and distribution fees.
6 Class P shares do not bear initial or contingent deferred sales charges or ongoing 12b-1 service and distribution fees, but are subject to a maximum annual UBS PACE Select program fee of 1.5% of the value of Class P shares.
7 The Barclays Capital US Municipal 3-15 Year Blend Index (formerly known as the Lehman Brothers US Municipal 3-15 Year Blend Index) is a total return performance benchmark for the tax-exempt bond market. The Index includes municipal bonds with an effective maturity between 2 and 17 years that have at least one year to maturity and are investment grade. Investors should note that indices do not reflect the deduction of fees, expenses or taxes.
If an investor sells or exchanges shares less than 90 days after purchase, a redemption fee of 1.00% of the amount sold or exchanged will be deducted at the time of the transaction, except as noted otherwise in the prospectuses.
Past performance does not predict future performance, and the performance information provided does not reflect the deduction of taxes that a shareholder could pay on Portfolio distributions or the redemption of Portfolio shares. The return and principal value of an investment will fluctuate, so that an investor's shares, when redeemed, may be worth more or less than their original cost. Performance results assume reinvestment of all dividends and capital gain distributions at net asset value on the ex-dividend dates. Current performance may be higher or lower than the performance data quoted. For month-end performance figures, please visit http://www.ubs.com.
Lipper peer group data calculated by Lipper Inc.; used with permission. The Lipper median is the return of the fund that places in the middle of a Lipper peer group.
64
UBS PACE Select Advisors Trust
UBS PACE Municipal Fixed Income Investments
Portfolio statistics (unaudited)
| Characteristics | | 07/31/09 | |
| Weighted average duration | | | 5.3 | yrs. | |
| Weighted average maturity | | | 6.7 | yrs. | |
| Average coupon | | | 5.26 | % | |
| Net assets (mm) | | $ | 291.7 | | |
| Number of holdings | | | 150 | | |
| Portfolio composition1 | | 07/31/09 | |
| Municipal bonds and notes | | | 98.7 | % | |
| Tax-free money market fund | | | 0.6 | | |
| Other assets less liabilities | | | 0.7 | | |
| Total | | | 100.0 | % | |
| Top five sectors1 | | 07/31/09 | |
| Revenue | | | 34.2 | % | |
| General obligations | | | 24.1 | | |
| Lease revenue/special revenue | | | 19.6 | | |
| Insured | | | 12.8 | | |
| Housing | | | 3.1 | | |
| Total | | | 93.8 | % | |
| Top five states or territories1 | | 07/31/09 | |
| Texas | | | 16.5 | % | |
| California | | | 8.6 | | |
| Puerto Rico | | | 7.3 | | |
| Florida | | | 7.2 | | |
| Washington | | | 6.9 | | |
| Total | | | 46.5 | % | |
| Quality diversification1 | | 07/31/09 | |
| AAA and agency backed securities | | | 34.2 | % | |
| AA | | | 25.2 | | |
| A | | | 21.5 | | |
| BBB | | | 10.5 | | |
| Non-rated | | | 7.3 | | |
| Tax-free money market fund | | | 0.6 | | |
| Other assets less liabilities | | | 0.7 | | |
| Total | | | 100.0 | % | |
1 Weightings represent percentages of the Portfolio's net assets as of July 31, 2009. The Portfolio is actively managed and its composition will vary over time. Credit quality ratings shown are based on the ratings assigned to portfolio holdings by Standard & Poor's Ratings Group, an independent rating agency.
65
UBS PACE Select Advisors Trust
UBS PACE Municipal Fixed Income Investments
Portfolio of investments—July 31, 2009
| Security description | | Face
amount | | Value | |
| Municipal bonds and notes—98.72% | |
| Alabama—0.72% | |
Birmingham Waterworks Board
Water Revenue Series A
(Assured Guaranty Insured)
5.000%, due 01/01/24 | | $ | 2,005,000 | | | $ | 2,095,285 | | |
| Alaska—3.03% | |
Alaska Housing Finance Corp.
General Housing Series C
(NATL-RE Insured)
5.000%, due 12/01/13 | | | 1,110,000 | | | | 1,238,482 | | |
Alaska Housing Finance Corp.
Mortgage Series A-2
5.650%, due 12/01/101 | | | 970,000 | | | | 971,746 | | |
Alaska International Airports
Revenue Refunding Series A
(NATL-RE Insured)
5.500%, due 10/01/151 | | | 3,500,000 | | | | 3,632,055 | | |
North Slope Boro Series A
(NATL-RE Insured)
5.000%, due 06/30/16 | | | 2,000,000 | | | | 2,273,540 | | |
Northern Tobacco Securitization
Corp. Alaska Tobacco Settlement
Asset-Backed Bonds Series A
4.625%, due 06/01/23 | | | 790,000 | | | | 714,200 | | |
| | | | 8,830,023 | | |
| Arizona—1.27% | |
Arizona State Transportation Board
Excise Tax Revenue Maricopa
County Regional Area Road Fund
5.000%, due 07/01/15 | | | 2,000,000 | | | | 2,274,540 | | |
San Manuel Entertainment
Series 04-C
4.500%, due 12/01/162 | | | 1,800,000 | | | | 1,441,566 | | |
| | | | 3,716,106 | | |
| Arkansas—0.00% | |
Springdale Residential Housing
Mortgage Series A
(FNMA Collateralized)
7.650%, due 09/01/11 | | | 1,375 | | | | 1,408 | | |
| California—8.64% | |
California State
5.000%, due 03/01/17 | | | 2,000,000 | | | | 2,146,880 | | |
| 5.000%, due 08/01/19 | | | 3,000,000 | | | | 3,143,610 | | |
| 5.500%, due 04/01/21 | | | 3,000,000 | | | | 3,226,290 | | |
California Statewide Communities
Development Authority Pollution
Control Revenue Refunding
Southern California Edison
Company Series A
(Mandatory Put 04/01/13 @ 100)
(XL Capital Insured)
4.100%, due 04/01/28 | | | 1,000,000 | | | | 1,007,750 | | |
| Security description | | Face
amount | | Value | |
| Municipal bonds and notes—(continued) | |
| California—(concluded) | |
California Statewide Communities
Development Authority Revenue
Kaiser Permanente Series A
5.000%, due 04/01/19 | | $ | 3,000,000 | | | $ | 3,117,540 | | |
California Statewide Communities
Development Authority Revenue
St. Joseph Series F (FSA Insured)
5.250%, due 07/01/18 | | | 1,500,000 | | | | 1,635,885 | | |
Golden State Tobacco Securitization
Corp. Tobacco Settlement Revenue
Asset-Backed Senior Series A-1
4.500%, due 06/01/27 | | | 5,915,000 | | | | 4,945,354 | | |
Sacramento Utility District Electric
Revenue, White Rock Project
(Escrowed to Maturity)
6.750%, due 03/01/10 | | | 100,000 | | | | 102,983 | | |
| 6.800%, due 05/01/10 | | | 50,000 | | | | 52,305 | | |
San Diego Public Facilities Financing
Authority Sewer Revenue Senior
Series A
5.000%, due 05/15/25 | | | 2,500,000 | | | | 2,564,050 | | |
Tobacco Securitization Authority
Northern California Tobacco
Settlement Revenue Asset-Backed
Bonds Series A-1
4.750%, due 06/01/23 | | | 825,000 | | | | 648,731 | | |
Tuolumne Wind Project Authority
Revenue Tuolumne Co. Project
Series A
5.250%, due 01/01/24 | | | 2,590,000 | | | | 2,610,927 | | |
| | | | 25,202,305 | | |
| Delaware—0.60% | |
Delaware State Series 2009B
5.000%, due 01/01/17 | | | 1,500,000 | | | | 1,755,720 | | |
| District of Columbia—0.37% | |
Metropolitan Airport Authority
System Refunding Series A
(NATL-RE-FGIC Insured)
5.750%, due 10/01/141 | | | 1,000,000 | | | | 1,070,090 | | |
| Florida—7.19% | |
Citizens Property Insurance Corp.
Refunding Senior Secured High
Risk Account Series A
(NATL-RE Insured)
5.000%, due 03/01/14 | | | 2,000,000 | | | | 2,012,440 | | |
Citizens Property Insurance Corp.
Senior Secured High Account
Series A-1
5.500%, due 06/01/14 | | | 1,000,000 | | | | 1,027,330 | | |
66
UBS PACE Select Advisors Trust
UBS PACE Municipal Fixed Income Investments
Portfolio of investments—July 31, 2009
| Security description | | Face
amount | | Value | |
| Municipal bonds and notes—(continued) | |
| Florida—(concluded) | |
Florida Department of Children's &
Family Services Certificates of
Participation (Florida Civil
Commitment Center)
(NATL-RE Insured)
5.000%, due 04/01/14 | | $ | 1,065,000 | | | $ | 1,178,092 | | |
Florida State Municipal Power
Agency Revenue All Requirements
Power Series A
5.250%, due 10/01/20 | | | 1,555,000 | | | | 1,642,718 | | |
| 5.250%, due 10/01/21 | | | 2,000,000 | | | | 2,082,080 | | |
Gainesville Utilities Systems Revenue
Series B
6.500%, due 10/01/12 | | | 1,795,000 | | | | 2,063,981 | | |
Miami-Dade County Water & Sewer
Revenue Refunding Series C
5.250%, due 10/01/18 | | | 2,000,000 | | | | 2,151,520 | | |
Miami-Dade County Water & Sewer
Revenue Refunding Systems
Series B (FSA Insured)
5.250%, due 10/01/18 | | | 2,500,000 | | | | 2,783,975 | | |
Orlando & Orange County
Expressway Authority Expressway
Revenue Junior Lien
(NATL-RE-IBC/FGIC Insured)
8.250%, due 07/01/16 | | | 2,595,000 | | | | 3,239,520 | | |
Tampa Utilities Tax & Special
Revenue Refunding Series B
(AMBAC Insured)
5.750%, due 10/01/15 | | | 1,000,000 | | | | 1,148,270 | | |
Tampa-Hillsborough County
Expressway Authority Revenue
(AMBAC Insured)
5.000%, due 07/01/14 | | | 1,535,000 | | | | 1,629,587 | | |
| | | | 20,959,513 | | |
| Georgia—1.88% | |
De Kalb County Water & Sewer
Revenue Refunding Series B
5.250%, due 10/01/24 | | | 2,000,000 | | | | 2,304,340 | | |
Fulton De Kalb Hospital Authority
Hospital Revenue Refunding
Certificates (FSA Insured)
5.250%, due 01/01/15 | | | 2,000,000 | | | | 2,237,480 | | |
Main Street Natural Gas, Inc.
Gas Project Revenue Series B
5.000%, due 03/15/15 | | | 1,000,000 | | | | 947,230 | | |
| | | | 5,489,050 | | |
| Security description | | Face
amount | | Value | |
| Municipal bonds and notes—(continued) | |
| Guam—0.34% | |
Guam Education Financing
Foundation Certificates of
Participation, Guam Public
Schools Project Series A
5.000%, due 10/01/12 | | $ | 1,000,000 | | | $ | 990,710 | | |
| Hawaii—0.36% | |
Hawaii State Harbor Systems
Revenue Series A (FSA Insured)
5.000%, due 01/01/131 | | | 1,000,000 | | | | 1,050,840 | | |
| Idaho—0.19% | |
Idaho Housing & Finance Association
Single-Family Mortgage
Series G-2, Class III
5.950%, due 07/01/191 | | | 425,000 | | | | 441,707 | | |
Subseries D-3
5.150%, due 07/01/131 | | | 110,000 | | | | 111,960 | | |
| | | | 553,667 | | |
| Illinois—6.51% | |
Belleville St. Clair County
(Escrowed to Maturity)
(MGIC Insured)
7.250%, due 11/01/09 | | | 75,000 | | | | 76,288 | | |
Cook County Forest Preservation
District (AMBAC Insured)
5.000%, due 11/15/19 | | | 5,180,000 | | | | 5,582,745 | | |
Illinois Development Finance
Authority Revenue DePaul
University Series C
5.500%, due 10/01/13 | | | 1,000,000 | | | | 1,089,410 | | |
Illinois Development Finance
Authority Revenue School District
Program School District No. U-46
(FSA Insured)
5.150%, due 01/01/19 | | | 2,000,000 | | | | 2,257,600 | | |
Illinois Educational Facilities
Authority Revenue Evangelical
Hospital Series A
(Escrowed to Maturity)
6.750%, due 04/15/17 | | | 660,000 | | | | 797,141 | | |
Illinois Health Facilities Authority
Revenue University of Chicago
Hospital & Health
(NATL-RE Insured)
5.000%, due 08/15/12 | | | 2,000,000 | | | | 2,117,120 | | |
Illinois Municipal Electric Agency
Power Supply Refunding Series C
(NATL-RE-FGIC Insured)
5.000%, due 02/01/16 | | | 1,200,000 | | | | 1,300,932 | | |
Regional Transportation Authority
Series A (FSA Insured)
5.750%, due 06/01/18 | | | 3,000,000 | | | | 3,548,970 | | |
67
UBS PACE Select Advisors Trust
UBS PACE Municipal Fixed Income Investments
Portfolio of investments—July 31, 2009
| Security description | | Face
amount | | Value | |
| Municipal bonds and notes—(continued) | |
| Illinois—(concluded) | |
Springfield Electric Revenue Senior
Lien Electric
5.000%, due 03/01/16 | | $ | 2,000,000 | | | $ | 2,224,680 | | |
| | | | 18,994,886 | | |
| Indiana—0.97% | |
Indiana State Finance Authority
Environmental Facilities Revenue
Refunding Industrial Power &
Light Co. Series C
4.900%, due 01/01/16 | | | 1,500,000 | | | | 1,508,805 | | |
Indiana University Revenues Student
Fees Series S
5.000%, due 08/01/19 | | | 1,185,000 | | | | 1,318,514 | | |
| | | | 2,827,319 | | |
| Iowa—1.24% | |
Iowa Finance Authority Revenue
Revolving Fund
5.250%, due 02/01/14 | | | 3,310,000 | | | | 3,621,935 | | |
| Kentucky—0.54% | |
Louisville & Jefferson County
Regional Airport Authority Airport
Systems Revenue Series A
(FSA Insured)
5.750%, due 07/01/131 | | | 1,505,000 | | | | 1,575,299 | | |
| Louisiana—1.95% | |
Jefferson Parish Home Mortgage
Authority Single-Family Mortgage
Revenue Series A (GNMA/FNMA
and FHA/VA/USDA Mortgages
Insured)
5.125%, due 06/01/261 | | | 950,000 | | | | 952,765 | | |
Louisiana Public Facilities Authority
Revenue Hurricane Recovery
Project (AMBAC Insured)
5.000%, due 06/01/15 | | | 2,880,000 | | | | 3,026,851 | | |
New Orleans Aviation Board
Revenue New Orleans Aviation
Series B2 Refunding (FSA Insured)
5.000%, due 01/01/121 | | | 1,655,000 | | | | 1,717,062 | | |
| | | | 5,696,678 | | |
| Maryland—0.78% | |
Maryland State & Local Facilities
Lien First Series
5.000%, due 08/01/15 | | | 2,000,000 | | | | 2,284,960 | | |
| Security description | | Face
amount | | Value | |
| Municipal bonds and notes—(continued) | |
| Massachusetts—5.28% | |
Massachusetts Bay Transportation
Authority Massachusetts Sales
Tax Revenue
Series A
5.000%, due 07/01/22 | | $ | 2,000,000 | | | $ | 2,267,200 | | |
Series B
5.250%, due 07/01/21 | | | 6,000,000 | | | | 6,990,300 | | |
Massachusetts Health & Educational
Facilities Authority Revenue
Massachusetts Institute of
Technology Series M
5.250%, due 07/01/29 | | | 1,000,000 | | | | 1,145,110 | | |
Massachusetts Health & Educational
Facilities Authority Revenue
Partners Healthcare Systems
Series G-5
5.000%, due 07/01/19 | | | 1,000,000 | | | | 1,048,570 | | |
Massachusetts State Development
Finance Agency Solid Waste
Disposal Revenue Waste
Management Income Project
5.450%, due 06/01/141 | | | 2,000,000 | | | | 1,951,800 | | |
Massachusetts State Housing
Finance Agency Series D
3.900%, due 12/01/171 | | | 2,000,000 | | | | 1,998,180 | | |
| | | | 15,401,160 | | |
| Michigan—3.26% | |
Detroit Sewer Disposal Revenue
Refunding Senior Lien Series C-1
6.500%, due 07/01/24 | | | 2,250,000 | | | | 2,461,500 | | |
Detroit Sewer Disposal Revenue
Second Lien Series D-2
(Mandatory Put 01/01/12 @ 100)
(NATL-RE Insured)
5.500%, due 07/01/323 | | | 2,000,000 | | | | 2,037,900 | | |
Detroit Sewer Disposal Revenue
Senior Lien Series A (FSA Insured)
5.250%, due 07/01/19 | | | 2,500,000 | | | | 2,583,850 | | |
Michigan State Housing
Development Authority Series A
4.550%, due 12/01/141 | | | 2,395,000 | | | | 2,436,841 | | |
| | | | 9,520,091 | | |
| Minnesota—0.01% | |
Moorhead Residential Mortgage
(Escrowed to Maturity)
(FHA/VA Insured)
7.100%, due 08/01/11 | | | 20,000 | | | | 21,390 | | |
68
UBS PACE Select Advisors Trust
UBS PACE Municipal Fixed Income Investments
Portfolio of investments—July 31, 2009
| Security description | | Face
amount | | Value | |
| Municipal bonds and notes—(continued) | |
| Missouri—3.57% | |
Missouri State Health & Educational
Facilities Authority Health Facilities
Revenue St. Lukes Health Systems
Series A (FSA Insured)
5.000%, due 11/15/16 | | $ | 2,000,000 | | | $ | 2,166,000 | | |
| 5.000%, due 11/15/17 | | | 2,500,000 | | | | 2,686,625 | | |
Missouri State Highways & Transit
Commission State Road Revenue
Second Lien
5.000%, due 05/01/16 | | | 2,000,000 | | | | 2,316,780 | | |
Springfield Public Building Corp.
Leasehold Revenue Springfield
Branson Airport Series B
(AMBAC Insured)
5.000%, due 07/01/131 | | | 2,075,000 | | | | 2,159,079 | | |
St. Louis Airport Revenue Lambert
International Airport Series A
(FSA Insured)
5.000%, due 07/01/13 | | | 1,000,000 | | | | 1,082,020 | | |
| | | | 10,410,504 | | |
| Nevada—0.56% | |
Las Vegas Valley Water District
Refunding & Improvement Series A
5.000%, due 02/01/17 | | | 1,500,000 | | | | 1,622,610 | | |
| New Jersey—0.69% | |
New Jersey Transportation Trust
Fund Authority Transportation
System Series B
(AGC-ICC/FGIC Insured)
5.500%, due 12/15/20 | | | 1,500,000 | | | | 1,695,690 | | |
Tobacco Settlement Financing Corp.
Series 1-A
4.500%, due 06/01/23 | | | 380,000 | | | | 324,759 | | |
| | | | 2,020,449 | | |
| New York—5.91% | |
New York City Industrial
Development Agency Special
Facility Revenue Terminal One
Group Association Project
5.000%, due 01/01/111 | | | 4,000,000 | | | | 4,051,120 | | |
New York City Transitional Finance
Authority Revenue Refunding
Future Tax Secured Series A
5.500%, due 11/01/263 | | | 2,000,000 | | | | 2,138,380 | | |
New York State Dorm Authority
Lease Revenue Series B
(Mandatory Put 07/01/13 @ 100)
(XL Capital Insured)
5.250%, due 07/01/323 | | | 1,500,000 | | | | 1,614,030 | | |
| Security description | | Face
amount | | Value | |
| Municipal bonds and notes—(continued) | |
| New York—(concluded) | |
New York State Dorm Authority
State Personal Income Tax Revenue
Education Series D
5.000%, due 03/15/15 | | $ | 2,500,000 | | | $ | 2,838,475 | | |
New York State Urban Development
Corp. Correctional & Youth
Facilities Service (Pre-refunded
with US Government Securities
to 01/01/11 @ 100) Series A
5.500%, due 01/01/17 | | | 70,000 | | | | 74,821 | | |
Port Authority of New York &
New Jersey (NATL-RE-FGIC Insured)
5.000%, due 10/01/131 | | | 6,000,000 | | | | 6,526,620 | | |
| | | | 17,243,446 | | |
| North Carolina—0.39% | |
Iredell County Certificates of
Participation Iredell County School
Project (FSA Insured)
5.250%, due 06/01/15 | | | 1,000,000 | | | | 1,144,170 | | |
| Ohio—2.25% | |
Buckeye Tobacco Settlement
Financing Authority Asset-Backed
Securities Turbo Series A-2
5.125%, due 06/01/24 | | | 2,685,000 | | | | 2,203,177 | | |
Cleveland Waterworks Revenue
Refunding First Mortgage Series G
(NATL-RE Insured)
5.500%, due 01/01/13 | | | 2,265,000 | | | | 2,341,738 | | |
Franklin County Revenue Refunding
Trinity Health Credit Series A
5.000%, due 06/01/11 | | | 1,680,000 | | | | 1,747,368 | | |
Ohio Housing Finance Agency
Mortgage Revenue Residential
Series B-2 (GNMA Collateralized)
5.350%, due 09/01/181 | | | 275,000 | | | | 281,388 | | |
| | | | 6,573,671 | | |
| Oklahoma—0.39% | |
Oklahoma Department of
Transportation Revenue Grant
Anticipation Notes Series A
5.000%, due 09/01/13 | | | 1,000,000 | | | | 1,125,420 | | |
| Pennsylvania—3.08% | |
Allegheny County Sanitation
Authority Sewer Revenue
(Pre-refunded with US Government
Securities and a Repurchase
Agreement to 12/01/10 @ 101)
(NATL-RE Insured)
5.750%, due 12/01/15 | | | 800,000 | | | | 854,640 | | |
69
UBS PACE Select Advisors Trust
UBS PACE Municipal Fixed Income Investments
Portfolio of investments—July 31, 2009
| Security description | | Face
amount | | Value | |
| Municipal bonds and notes—(continued) | |
| Pennsylvania—(concluded) | |
Lancaster Sewer Authority
(Escrowed to Maturity)
6.000%, due 04/01/12 | | $ | 30,000 | | | $ | 32,070 | | |
Pennsylvania Intergovernmental
Cooperative Authority Special Tax
Revenue Refunding Philadelphia
Funding Program
5.000%, due 06/15/17 | | | 2,000,000 | | | | 2,237,780 | | |
Pennsylvania State Higher
Educational Facilties Authority
Revenue University of
Pennsylvania Series A
5.000%, due 09/01/17 | | | 1,150,000 | | | | 1,331,585 | | |
Pennsylvania Third Series
(FSA Insured)
5.000%, due 09/01/15 | | | 2,000,000 | | | | 2,270,980 | | |
University of Pittsburgh of the
Commonwealth System of Higher
Education Capital Project Series B
5.500%, due 09/15/21 | | | 2,000,000 | | | | 2,256,480 | | |
| | | | 8,983,535 | | |
| Puerto Rico—7.29% | |
Puerto Rico Commonwealth
Government Development Bank
Senior Notes
Series B
5.000%, due 12/01/14 | | | 1,500,000 | | | | 1,506,660 | | |
Series C
5.250%, due 01/01/151 | | | 1,000,000 | | | | 1,014,060 | | |
Puerto Rico Commonwealth
Highway & Transportation
Authority Highway Revenue
Refunding Series CC
5.000%, due 07/01/13 | | | 1,070,000 | | | | 1,093,016 | | |
Puerto Rico Commonwealth
Highway & Transportation
Authority Transportation Revenue
(Assured Guaranty FSA)
5.500%, due 07/01/25 | | | 2,000,000 | | | | 2,081,960 | | |
Puerto Rico Commonwealth
Refunding Public Improvement
Series A
5.000%, due 07/01/13 | | | 1,000,000 | | | | 1,021,510 | | |
Puerto Rico Commonwealth
Refunding Series A
(Mandatory Put 07/01/12 @ 100)
5.000%, due 07/01/303 | | | 1,000,000 | | | | 1,003,990 | | |
| Security description | | Face
amount | | Value | |
| Municipal bonds and notes—(continued) | |
| Puerto Rico—(concluded) | |
Puerto Rico Public Buildings
Authority Revenue Guaranteed
Refunding Government Facilities
Series J (Mandatory Put
07/01/12 @ 100)
(Commonwealth GTD)
5.000%, due 07/01/283 | | $ | 3,000,000 | | | $ | 3,011,970 | | |
Series M (Commonwealth GTD)
5.750%, due 07/01/16 | | | 2,000,000 | | | | 2,027,760 | | |
Puerto Rico Public Finance Corp.
Refunding Commonwealth
Appropriations Series A
(Mandatory Put 02/01/12 @ 100)
(Government Development Bank
for Puerto Rico Insured)
5.750%, due 08/01/273 | | | 4,250,000 | | | | 4,315,067 | | |
Puerto Rico Sales Tax Financing
Corp. Sales Tax Revenue
First Sub-Series A
5.500%, due 08/01/23 | | | 4,000,000 | | | | 4,171,880 | | |
| | | | 21,247,873 | | |
| South Carolina—0.84% | |
Richland County School
District No. 002 Series A
(SCSDE Insured)
5.000%, due 02/01/21 | | | 2,000,000 | | | | 2,248,440 | | |
South Carolina Housing Finance &
Development Authority Mortgage
Revenue Series A-2 (FSA Insured)
4.700%, due 07/01/201 | | | 215,000 | | | | 212,085 | | |
| | | | 2,460,525 | | |
| South Dakota—0.86% | |
South Dakota Health & Educational
Facilities Authority Revenue
Refunding Prairie Lakes Health
Care (ACA/CBI Insured)
5.450%, due 04/01/13 | | | 2,485,000 | | | | 2,502,370 | | |
| Tennessee—3.04% | |
Clarksville Natural Gas Acquisition
Corp. Gas Revenue
5.000%, due 12/15/14 | | | 2,000,000 | | | | 1,907,300 | | |
Metropolitan Government
Nashville & Davidson County
Water Sewer Revenue Cab
Converter Refunding
(NATL-RE-FGIC/TCRs)
7.700%, due 01/01/12 | | | 6,450,000 | | | | 6,955,422 | | |
| | | | 8,862,722 | | |
70
UBS PACE Select Advisors Trust
UBS PACE Municipal Fixed Income Investments
Portfolio of investments—July 31, 2009
| Security description | | Face
amount | | Value | |
| Municipal bonds and notes—(continued) | |
| Texas—16.53% | |
Aldine Independent School District
School Building (PSF-GTD)
5.000%, due 02/15/19 | | $ | 1,435,000 | | | $ | 1,620,603 | | |
Cypress-Fairbanks Independent
School District Refunding
(PSF-GTD)
5.000%, due 02/15/22 | | | 2,000,000 | | | | 2,156,140 | | |
Cypress-Fairbanks Independent
School District Schoolhouse
(PSF-GTD)
5.000%, due 02/15/18 | | | 2,500,000 | | | | 2,839,600 | | |
Dallas-Fort Worth International
Airport Revenue Refunding &
Improvement Series A
(NATL-RE-FGIC Insured)
5.750%, due 11/01/131 | | | 2,000,000 | | | | 2,107,080 | | |
Dickinson Independent School
District Refunding Schoolhouse
(PSF-GTD)
5.000%, due 02/15/23 | | | 1,920,000 | | | | 2,028,768 | | |
Fort Worth Independent
School District (PSF-GTD)
5.000%, due 02/15/15 | | | 2,000,000 | | | | 2,295,560 | | |
Harris County Flood Control District
Refunding Contract Series A
5.250%, due 10/01/18 | | | 2,000,000 | | | | 2,345,980 | | |
Harris County Hospital District
Revenue Refunding Senior Lien
Series A (NATL-RE Insured)
5.000%, due 02/15/18 | | | 1,675,000 | | | | 1,746,506 | | |
Houston Texas Airport Systems
Revenue (Escrowed to Maturity)
7.600%, due 07/01/10 | | | 45,000 | | | | 47,468 | | |
Houston Utilities Systems Revenue
Refunding Combined First Lien
Series A (FSA Insured)
5.250%, due 11/15/17 | | | 2,500,000 | | | | 2,867,475 | | |
Katy Independent School District
School Building Series A (PSF-GTD)
5.000%, due 02/15/14 | | | 2,000,000 | | | | 2,218,100 | | |
Keller Independent School District
Refunding (PSF-GTD)
5.000%, due 08/15/16 | | | 1,500,000 | | | | 1,706,535 | | |
Klein Independent School District
Refunding Schoolhouse Series A
(PSF-GTD)
5.000%, due 08/01/19 | | | 1,530,000 | | | | 1,744,139 | | |
Lower Colorado River Authority
Refunding LCRA Transmission
Services (BHAC Insured)
5.000%, due 05/15/20 | | | 1,765,000 | | | | 1,917,778 | | |
| Security description | | Face
amount | | Value | |
| Municipal bonds and notes—(continued) | |
| Texas—(concluded) | |
North East Independent School
District School Building Series A
(PSF-GTD)
5.000%, due 08/01/21 | | $ | 2,000,000 | | | $ | 2,204,100 | | |
North Texas Health Facilities
Development Corp. Hospital
Revenue United Regional Health
Care Systems (FSA Insured)
5.000%, due 09/01/21 | | | 1,450,000 | | | | 1,485,481 | | |
| 5.000%, due 09/01/22 | | | 1,400,000 | | | | 1,424,808 | | |
Pasadena Independent School
District Refunding (PSF-GTD)
5.000%, due 02/15/19 | | | 2,000,000 | | | | 2,274,780 | | |
Round Rock Independent
School District (PSF-GTD)
5.000%, due 08/01/16 | | | 2,750,000 | | | | 3,184,775 | | |
San Antonio Electric & Gas
Refunding Series A
5.000%, due 02/01/17 | | | 1,295,000 | | | | 1,468,724 | | |
Schertz-Cibolo-Universal City
Independent School District
School Building Series A
(PSF-GTD)
5.000%, due 02/01/14 | | | 1,500,000 | | | | 1,705,200 | | |
Texas Municipal Power Agency
Revenue (Escrowed to Maturity)
(NATL-RE Insured)
6.100%, due 09/01/134 | | | 25,000 | | | | 23,049 | | |
Texas Water Development Board
Revenue State Revolving Fund
Subseries A-1
5.000%, due 07/15/245 | | | 1,885,000 | | | | 2,042,661 | | |
Tyler Independent School District
School Building
5.000%, due 02/15/18 | | | 2,165,000 | | | | 2,449,806 | | |
University of Texas Revenue
Refunding Financing Systems
Series D
5.000%, due 08/15/17 | | | 2,000,000 | | | | 2,296,120 | | |
| | | | 48,201,236 | | |
| Utah—0.18% | |
Utah State Housing Finance Agency
Single-Family Mortgage Series G-3,
Class III
5.700%, due 07/01/151 | | | 515,000 | | | | 531,835 | | |
| Virginia—0.71% | |
Fairfax County Economic
Development Authority Resource
Recovery Revenue Refunding
Series A (AMBAC Insured)
6.100%, due 02/01/111 | | | 2,000,000 | | | | 2,076,860 | | |
71
UBS PACE Select Advisors Trust
UBS PACE Municipal Fixed Income Investments
Portfolio of investments—July 31, 2009
| Security description | | Face
amount | | Value | |
| Municipal bonds and notes—(continued) | |
| Washington — 6.94% | |
Energy Northwest Electric Revenue
Columbia Station Series A
5.000%, due 07/01/23 | | $ | 2,500,000 | | | $ | 2,622,725 | | |
Energy Northwest Electric Revenue
Refunding Columbia Station
Series A
5.000%, due 07/01/21 | | | 2,000,000 | | | | 2,124,080 | | |
Energy Northwest Electric Revenue
Refunding Project 1 Series A
5.000%, due 07/01/16 | | | 1,515,000 | | | | 1,711,026 | | |
Energy Northwest Electric Revenue
Refunding Project 3 Series A
5.500%, due 07/01/13 | | | 1,000,000 | | | | 1,139,710 | | |
King County School District No. 414
Lake Washington
(School Board Guaranty)
5.000%, due 12/01/18 | | | 1,000,000 | | | | 1,132,980 | | |
Washington Health Care Facilities
Authority Overlake Hospital
Medical Center Series A
(Assured Guaranty Insured)
5.000%, due 07/01/16 | | | 1,000,000 | | | | 1,043,620 | | |
Washington State Public Power
Supply Systems Nuclear
Project No. 1 Revenue Refunding
Series B
7.125%, due 07/01/16 | | | 3,000,000 | | | | 3,795,540 | | |
Washington State
Series 93-A (Escrowed to Maturity)
5.750%, due 10/01/12 | | | 15,000 | | | | 16,063 | | |
Series A-Various Purpose
5.000%, due 07/01/17 | | | 2,130,000 | | | | 2,449,202 | | |
| 5.000%, due 07/01/20 | | | 2,625,000 | | | | 2,932,807 | | |
Washington State Unrefunded
Balance Series 93-A (FSA Insured)
5.750%, due 10/01/12 | | | 1,215,000 | | | | 1,286,928 | | |
| | | | 20,254,681 | | |
| Security description | | Face
amount | | Value | |
| Municipal bonds and notes—(concluded) | |
| Wyoming—0.36% | |
Sweetwater County Improvement
Projects Joint Powers Board Lease
Revenue Bonds (NATL-RE Insured)
5.000%, due 06/15/13 | | $ | 1,000,000 | | | $ | 1,050,720 | | |
Total municipal bonds and notes
(cost—$283,783,786) | | | | | 287,971,062 | | |
| | | Number of
shares | | | |
| Tax-free money market fund—0.63% | |
State Street Global Advisors
Tax Free Money Market Fund
(cost—$1,848,801) | | | 1,848,801 | | | | 1,848,801 | | |
Total investments
(cost—$285,632,587)—
99.35% | | | | | 289,819,863 | | |
Other assets in excess
of liabilities—0.65% | | | | | 1,883,302 | | |
| Net assets—100.00% | | $ | 291,703,165 | | |
Aggregate cost for federal income tax purposes was $285,633,119; and net unrealized appreciation consisted of:
| Gross unrealized appreciation | | $ | 7,697,901 | | |
| Gross unrealized depreciation | | | (3,511,157 | ) | |
| Net unrealized appreciation | | $ | 4,186,744 | | |
72
UBS PACE Select Advisors Trust
UBS PACE Municipal Fixed Income Investments
Portfolio of investments—July 31, 2009
1 Security subject to Alternative Minimum Tax.
2 Security exempt from registration under Rule 144A of the Securities Act of 1933. This security, which represents 0.49% of net assets as of July 31, 2009, is considered liquid and may be resold in transactions exempt from registration, normally to qualified institutional buyers.
3 Floating rate security. The interest rate shown is the current rate as of July 31, 2009.
4 Zero coupon bond; interest rate represents annualized yield at date of purchase.
5 Security purchased on a when-issued basis. When issued refers to a transaction made conditionally because a security, although authorized, has not yet been issued.
ACA American Capital Access
AGC Associated General Contractors
AMBAC American Municipal Bond Assurance Corporation
BHAC Berkshire Hathaway Assurance Corporation
CBI Certificates of Bond Insurance
FGIC Financial Guaranty Insurance Company
FHA Federal Housing Administration
FNMA Federal National Mortgage Association
FSA Financial Security Assurance
GNMA Government National Mortgage Association
GTD Guaranteed
IBC Insured Bond Certificate
ICC International Code Council
MGIC Mortgage Guaranty Insurance Corporation
NATL-RE National Reinsurance
PSF Permanent School Fund
SCSDE South Carolina School District Enhancement
TCRs Transferable Custodial Receipts
USDA United States Department of Agriculture
VA Veterans Administration
The following is a summary of the fair valuations according to the inputs used as of July 31, 2009 in valuing the Portfolio's investments:
| Measurements at 07/31/09 | |
| | | Quoted prices in
active markets for
identical investments
(Level 1) | | Significant other
observable inputs
(Level 2) | | Unobservable
inputs
(Level 3) | | Total | |
| Municipal bonds and notes | | $ | — | | | $ | 287,971,062 | | | $ | — | | | $ | 287,971,062 | | |
| Tax-free money market fund | | | — | | | | 1,848,801 | | | | — | | | | 1,848,801 | | |
| Total | | $ | — | | | $ | 289,819,863 | | | $ | — | | | $ | 289,819,863 | | |
See accompanying notes to financial statements.
73
UBS PACE Select Advisors Trust
UBS PACE Global Fixed Income Investments
Performance
For the 12 months ended July 31, 2009, the Portfolio's Class P shares returned 2.60% (before the deduction of the maximum UBS PACE Select program fee; after the deduction of the maximum UBS PACE Select program fee, the Portfolio returned 1.07%). In comparison, the Barclays Capital Global Aggregate ex-US Index (formerly known as the Lehman Brothers Global Aggregate ex-US Index) (the "benchmark") returned 3.04%, the Citigroup World Government Bond Index (WGBI)SM returned 5.63%, and the Lipper International Income Funds category posted a median return of 3.33%. (Returns for all share classes over various time periods are shown in the "Performance at a glance" table on page 77. Please note that the returns shown do not reflect the deduction of taxes that a shareholder would pay on Portfolio distributions or the redemption of Portfolio shares.) For a detailed commentary on the market environment in general during the repo rting period, please refer to page two.
Sub-Advisor's comments
The Portfolio slightly lagged its benchmark during the reporting period, due to country allocations and currency positioning.
In terms of country allocations, an overweight position to Australia produced mixed results. While it added value in the latter part of 2008, the overweight has underperformed during the first seven months of 2009. Having an overweight to Sweden was beneficial in the latter part of 2008, as it was among the best-performing developed markets. Elsewhere, underweights to the US and the United Kingdom, as well as an overweight exposure to the core European bond markets detracted from relative performance in the later months of 2008. However, they have added value thus far in 2009.
From a currency perspective, an overweight to the Australian dollar versus the Canadian dollar detracted from relative performance in the third quarter of 2008, but it has added back some value in 2009. An overweight to the Norwegian krone, which often moves in tandem with oil prices, also hurt relative performance in late 2008, as oil prices fell. However, this position has added value in 2009.
Within currency, the primary source of added value was an underweight position in the British pound. In late 2008, the British pound fell to an all-time low against the euro, and our portion of the Portfolio's significant underweight to this area—which we have subsequently reduced—proved to be beneficial. An underweight
UBS PACE Select Advisors Trust – UBS PACE Global Fixed Income Investments
Investment Sub-Advisor:
Rogge Global Partners plc ("Rogge Global Partners")
Portfolio Managers:
Olaf Rogge, John Graham, Richard Bell, Adrian James, Malie Conway and Richard Gray
Objective:
High total return
Investment process:
Rogge Global Partners seeks to invest the Portfolio assets in fixed income securities of financially healthy issuers, because it believes that these investments produce the highest bond and currency returns over time. In deciding which fixed income securities to buy for the Portfolio, Rogge Global Partners uses a top-down analysis to find value across countries and to forecast interest and currency-exchange rates over a one-year horizon in those countries. Rogge Global Partners also uses an optimization model to help determine country, currency and duration positions for the Portfolio. Rogge Global Partners generally sells securities that no longer meet these selection criteria or when it identifies more attractive investment opportunities, and may also sell securities to adjust the average duration of the Portfolio assets it manages.
74
UBS PACE Select Advisors Trust
UBS PACE Global Fixed Income Investments
Sub-Advisor's comments – concluded
to the Japanese yen detracted from relative performance in late 2008, although with an improvement in the risk environment, this position has added value in 2009 as investors became less risk-averse.
The Portfolio's overall duration position was neutral compared to that of the benchmark for most of the reporting period. (Duration measures a portfolio's sensitivity to interest rate changes.) However, a longer-than-benchmark duration at the end of the reporting period added to returns.
An overweight to investment grade credit added to performance on a relative basis during the 12-month reporting period as a whole. While exposure to the financial sector detracted from the Portfolio's results during the second half of 2008 and the first quarter of 2009, the Portfolio's results have significantly recovered since then, as the financial sector rallied. An underweight to sterling-denominated bonds, which underperformed euro and US dollar-denominated bonds—to which we were overweight—added value relative to the benchmark, particularly in 2009.
An underweight exposure to more deeply subordinated financial debt detracted from performance during the second quarter of 2009. (Subordinated debt is debt which ranks after other debts should a company fall into receivership or be closed. Such debt is referred to as subordinate, because the debt providers—that is, the lenders—have subordinate status in relationship to the normal debt.) Finally, we added positions in US inflation-linked bonds in the first quarter of 2009. (In these bonds, the principal is indexed to inflation, and they are designed to cut out the inflation risk of an investment.) This also added value to the Portfolio as fears of inflation increased.
Special considerations
The Portfolio may be appropriate for long-term investors seeking high total return and who are able to withstand short-term fluctuations in the fixed income markets in return for potentially higher returns over the long term. The yield and value of the Portfolio change every day and can be affected by changes in interest rates, general market conditions and other political, social and economic developments, as well as specific matters relating to the issuers in which the Portfolio invests. It is important to note that an investment in the Portfolio is only one component of a balanced investment plan. The value of the Portfolio's investments in foreign securities may fall due to adverse political, social and economic developments abroad and due to decreases in foreign currency values relative to the US dollar. These risks are greater for investments in emerging markets than in more developed countries.
75
UBS PACE Select Advisors Trust
UBS PACE Global Fixed Income Investments
Comparison of change in value of a $10,000 investment in the Class P shares of the Portfolio, the Barclays Capital Global Aggregate ex US Index, and the Citigroup World Government Bond Index (WGBI)SM (unaudited)
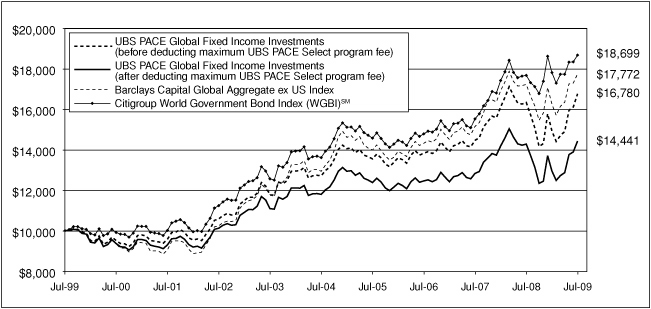
The graph depicts the performance of UBS PACE Global Fixed Income Investments Class P shares versus the Barclays Capital Global Aggregate ex US Index (formerly known as the Lehman Brothers Global Aggregate ex US Index), and the Citigroup World Government Bond Index (WGBI)SM over the 10 years ended July 31, 2009. The performance of the other classes will vary from the performance of the class shown based on the difference in sales charges and fees paid by shareholders investing in different share classes. Past performance does not predict future performance and the performance provided does not reflect the deduction of taxes that a shareholder would pay on Portfolio distributions or the redemption of Portfolio shares. It is important to note that UBS PACE Global Fixed Income Investments is a professionally managed portfolio while the Indicies are not available for investment and are unmanaged. The comparison is shown f or illustrative purposes only.
76
UBS PACE Select Advisors Trust
UBS PACE Global Fixed Income Investments
Performance at a glance (unaudited)
| Average annual total returns for periods ended 07/31/09 | | 1 year | | 5 years | | 10 years | | Since
inception1 | |
| Before deducting | | Class A2 | | | 2.35 | % | | | 5.46 | % | | N/A | | | 6.61 | % | |
| maximum sales charge | | Class B3 | | | 1.64 | % | | | 4.67 | % | | N/A | | | 5.65 | % | |
| or UBS PACE Select | | Class C4 | | | 1.85 | % | | | 4.94 | % | | N/A | | | 6.15 | % | |
| program fee | | Class Y5 | | | 2.71 | % | | | 5.81 | % | | N/A | | | 6.64 | % | |
| | | Class P6 | | | 2.60 | % | | | 5.70 | % | | | 5.31 | % | | | 5.36 | % | |
| After deducting | | Class A2 | | | (2.27 | )% | | | 4.50 | % | | N/A | | | 6.05 | % | |
| maximum sales charge | | Class B3 | | | (3.28 | )% | | | 4.34 | % | | N/A | | | 5.65 | % | |
| or UBS PACE Select | | Class C4 | | | 1.12 | % | | | 4.94 | % | | N/A | | | 6.15 | % | |
| program fee | | Class P6 | | | 1.07 | % | | | 4.13 | % | | | 3.74 | % | | | 3.79 | % | |
| Barclays Capital Global Aggregate ex US Index7 | | | 3.04 | % | | | 6.54 | % | | | 5.92 | % | | | 5.60 | % | |
| Citigroup World Government Bond Index (WGBI)SM 8 | | | 5.63 | % | | | 6.54 | % | | | 6.46 | % | | | 5.97 | % | |
| Lipper International Income Funds median9 | | | 3.33 | % | | | 5.29 | % | | | 5.62 | % | | | 5.66 | % | |
| Lipper Global Income Funds median9 | | | 3.38 | % | | | 5.29 | % | | | 5.41 | % | | | 5.63 | % | |
Average annual total returns for periods ended June 30, 2009, after deduction of the maximum sales charge or UBS PACE Select program fee, were as follows: Class A—1-year period, (5.53)%; 5-year period, 3.63%; since inception, 5.63%; Class B—1-year period, (6.57)%; 5-year period, 3.48%; since inception, 5.22%; Class C—1-year period, (2.24)%; 5-year period, 4.08%; since inception, 5.73%; Class Y—1-year period, (0.79)%; 5-year period, 4.94%; since inception, 6.22%; Class P—1-year period, (2.37)%; 5-year period, 3.27%; 10-year period, 3.49%; since inception, 3.53%.
The annualized gross and net expense ratios, respectively, for each class of shares as in the November 28, 2008 prospectuses, were as follows: Class A—1.30% and 1.24%; Class B—2.10% and 2.00%; Class C—1.79% and 1.73%; Class Y—0.94% and 0.88%; and Class P—1.13% and 1.00%. Net expenses reflect fee waivers and/or expense reimbursements, if any, pursuant to an agreement that is in effect to cap the expenses. The Portfolio and UBS Global AM have entered into a written fee waiver agreement pursuant to which UBS Global AM is contractually obligated to waive its management fees through November 30, 2009 to the extent necessary to reflect the lower sub-advisory fee paid by UBS Global AM to Rogge Global Partners. The Portfolio and UBS Global AM have also entered into an additional written fee waiver/expense reimbursement agreement pursuant to which UBS Global AM is contractually obligated to waive its management f ees and/or reimburse the Portfolio so that the ordinary total operating expenses of each class through November 30, 2009 (excluding dividend expense, borrowing costs and interest expense, if any) would not exceed Class A—1.25%; Class B—2.00%; Class C—1.75%; Class Y—1.00% and Class P—1.00%. The Portfolio has agreed to repay UBS Global AM for any waived fees/reimbursed expenses under the preceding sentence to the extent that it can do so over the following three fiscal years without causing the Portfolio's expenses in any of those three years to exceed the expense caps described above.
1 Since inception returns are calculated as of commencement of issuance on August 24, 1995 for Class P shares, December 11, 2000 for Class A shares, February 5, 2001 for Class B shares, December 1, 2000 for Class C shares and January 16, 2001 for Class Y shares. Since inception returns for the Indices and Lipper median are shown as of August 31, 1995, which is the month-end after the inception date of the oldest share class (Class P). Effective December 1, 2005, the Portfolio's benchmark was changed to the Barclays Capital Global Aggregate ex US Index (formerly known as the Lehman Brothers Global Aggregate ex US Index). The other index that is shown is for supplemental purposes only.
2 Maximum sales charge for Class A shares is 4.5%. Class A shares bear ongoing 12b-1 service fees.
3 Maximum contingent deferred sales charge for Class B shares is 5% imposed on redemptions and is reduced to 0% after a maximum of six years. Class B shares bear ongoing 12b-1 service and distribution fees.
4 Maximum contingent deferred sales charge for Class C shares is 0.75% imposed on redemptions and is reduced to 0% after one year. Class C shares bear ongoing 12b-1 service and distribution fees.
5 The Portfolio offers Class Y shares to a limited group of eligible investors, including certain qualifying retirement plans. Class Y shares do not bear initial or contingent deferred sales charges or ongoing 12b-1 service and distribution fees.
6 Class P shares do not bear initial or contingent deferred sales charges or ongoing 12b-1 service and distribution fees, but are subject to a maximum annual UBS PACE Select program fee of 1.5% of the value of Class P shares.
7 The Barclays Capital Global Aggregate ex US Index (formerly known as the Lehman Brothers Global Aggregate ex US Index) provides a broad-based measure of the global investment-grade fixed income markets excluding the US market. The two major components of this Index are the Pan-European Aggregate and the Asian-Pacific Aggregate Indices. The Index also includes Eurodollar and Euro-Yen corporate bonds, Canadian government, agency and corporate securities. Investors should note that indices do not reflect the deduction of fees, expenses or taxes.
8 The Citigroup World Government Bond Index (WGBI)SM is a market capitalization-weighted index composed of straight (i.e., not floating rate or index-linked) government bonds with a one-year minimum maturity. The average maturity is seven years. The Index tracks the government bond markets of 23 developed countries. Investors should note that indices do not reflect the deduction of fees, expenses or taxes.
9 On September 18, 2009, Lipper changed the peer group classification for UBS PACE Global Fixed Income Investments from Lipper Global Income Funds category to the Lipper International Income Funds category.
If an investor sells or exchanges shares less than 90 days after purchase, a redemption fee of 1.00% of the amount sold or exchanged will be deducted at the time of the transaction, except as noted otherwise in the prospectuses.
Past performance does not predict future performance, and the performance information provided does not reflect the deduction of taxes that a shareholder would pay on Portfolio distributions or the redemption of Portfolio shares. The return and principal value of an investment will fluctuate, so that an investor's shares, when redeemed, may be worth more or less than their original cost. Performance results assume reinvestment of all dividends and capital gain distributions at net asset value on the ex-dividend dates. Current performance may be higher or lower than the performance data quoted. For month-end performance figures, please visit http://www.ubs.com.
Lipper peer group data calculated by Lipper Inc.; used with permission. The Lipper median is the return of the fund that places in the middle of a Lipper peer group.
77
UBS PACE Select Advisors Trust
UBS PACE Global Fixed Income Investments
Portfolio statistics (unaudited)
| Characteristics | | 07/31/09 | |
| Weighted average duration | | | 6.11 | yrs. | |
| Weighted average maturity | | | 7.98 | yrs. | |
| Average coupon | | | 4.02 | % | |
| Net assets (mm) | | $ | 483.5 | | |
| Number of holdings | | | 125 | | |
| Portfolio composition1 | | 07/31/09 | |
| Long-term global debt securities | | | 92.4 | % | |
| Futures and forward foreign currency contracts | | | 1.1 | | |
| Cash equivalents and other assets less liabilities | | | 6.5 | | |
| Total | | | 100.0 | % | |
| Quality diversification1 | | 07/31/09 | |
| US government and agency securities | | | 1.9 | % | |
| AAA | | | 33.4 | | |
| AA | | | 22.7 | | |
| A | | | 23.2 | | |
| BBB | | | 5.4 | | |
| BB | | | 0.4 | | |
| Non-rated | | | 5.4 | | |
| Futures and forward foreign currency contracts | | | 1.1 | | |
| Cash equivalents and other assets less liabilities | | | 6.5 | | |
| Total | | | 100.0 | % | |
| Top five countries of origin1 | | 07/31/09 | |
| United States | | | 17.7 | % | |
| Japan | | | 17.7 | | |
| Germany | | | 15.4 | | |
| France | | | 9.6 | | |
| United Kingdom | | | 9.1 | | |
| Total | | | 69.5 | % | |
1 Weightings represent percentages of the Portfolio's net assets as of July 31, 2009. The Portfolio is actively managed and its composition will vary over time. Credit quality ratings shown are based on the ratings assigned to portfolio holdings by Standard & Poor's Ratings Group, an independent rating agency.
78
UBS PACE Select Advisors Trust
UBS PACE Global Fixed Income Investments
Portfolio of investments—July 31, 2009
| Security description | | Face
amount1 | | Value | |
| Long-term global debt securities—92.44% | |
| Australia—0.40% | |
Australia & New Zealand
Banking Group Ltd.
4.450%, due 02/05/152 | | EUR | 450,000 | | | $ | 627,961 | | |
BHP Billiton Finance
4.125%, due 05/05/11 | | EUR | 900,000 | | | | 1,319,802 | | |
| | | | 1,947,763 | | |
| Brazil—0.50% | |
Federal Republic of Brazil
8.000%, due 01/15/18 | | USD | 991,666 | | | | 1,123,062 | | |
| 11.000%, due 08/17/40 | | USD | 1,000,000 | | | | 1,309,000 | | |
| | | | 2,432,062 | | |
| Canada—1.27% | |
Toronto-Dominion Bank
5.375%, due 05/14/15 | | EUR | 4,000,000 | | | | 6,158,662 | | |
| Cayman Islands—0.13% | |
Pacific Life Funding LLC
5.125%, due 01/20/15 | | GBP | 400,000 | | | | 602,849 | | |
| Denmark—8.71% | |
Kingdom of Denmark
4.000%, due 11/15/15 | | | 11,760,000 | | | | 2,361,634 | | |
| 4.000%, due 11/15/17 | | | 176,000,000 | | | | 35,088,802 | | |
| 5.000%, due 11/15/13 | | | 14,180,000 | | | | 2,973,859 | | |
Nykredit A/S
4.000%, due 01/01/12 | | | 8,613,000 | | | | 1,688,639 | | |
| | | | 42,112,934 | | |
| France—9.16% | |
BNP Paribas
3.125%, due 12/06/152 | | | 750,000 | | | | 1,052,771 | | |
Caisse d'Amortissement
de la Dette Sociale
3.625%, due 04/25/15 | | | 4,500,000 | | | | 6,595,314 | | |
Credit Agricole (London)
5.971%, due 01/02/18 | | | 3,000,000 | | | | 4,601,456 | | |
Dexia Municipal Agency
4.500%, due 04/27/15 | | | 7,500,000 | | | | 11,150,901 | | |
Electricite De France
5.375%, due 05/29/20 | | | 1,000,000 | | | | 1,502,123 | | |
France Telecom
8.125%, due 01/28/33 | | | 350,000 | | | | 683,182 | | |
Republic of France
4.000%, due 04/25/55 | | | 1,250,000 | | | | 1,743,943 | | |
| 5.750%, due 10/25/32 | | | 2,520,000 | | | | 4,438,834 | | |
Societe Financement
de I' Economic Francaise
3.500%, due 11/24/11 | | | 3,000,000 | | | | 4,428,864 | | |
Societe Generale
4.875%, due 12/18/142 | | | 2,100,000 | | | | 2,957,899 | | |
| 5.250%, due 03/28/13 | | | 2,750,000 | | | | 4,199,509 | | |
| 6.125%, due 08/20/18 | | | 600,000 | | | | 932,401 | | |
| | | | 44,287,197 | | |
| Security description | | Face
amount1 | | Value | |
| Long-term global debt securities—(continued) | |
| Germany—15.35% | |
Bayerische Landesbank
4.000%, due 01/16/12 | | | 7,340,000 | | | $ | 10,935,508 | | |
| 5.750%, due 10/23/17 | | | 1,550,000 | | | | 2,108,549 | | |
Bundesrepublik Deutschland,
Series 03
4.500%, due 01/04/13 | | | 12,200,000 | | | | 18,783,222 | | |
Series 07
4.000%, due 01/04/18 | | | 50,000 | | | | 75,676 | | |
DEFPA Deutsche
Pfandbriefbank AG
4.000%, due 03/15/13 | | | 6,605,000 | | | | 9,601,537 | | |
Deutsche Bank AG
3.625%, due 03/09/172 | | | 4,900,000 | | | | 6,378,590 | | |
| 4.500%, due 03/07/11 | | | 1,700,000 | | | | 2,507,553 | | |
Deutsche Genossenschafts-
Hypothekenbank
4.000%, due 10/31/16 | | | 4,050,000 | | | | 5,955,230 | | |
Kreditanstalt Fuer Wiederaufbau
5.250%, due 07/04/12 | | | 4,100,000 | | | | 6,341,531 | | |
L-Bank Fuer Baden-
Wuerttemberg Foerderbank
4.125%, due 07/15/11 | | USD | 2,300,000 | | | | 2,384,635 | | |
NRW Bank
3.875%, due 01/27/20 | | | 2,300,000 | | | | 3,259,804 | | |
SEB AG
4.250%, due 05/07/13 | | | 3,900,000 | | | | 5,870,175 | | |
| | | | 74,202,010 | | |
| Ireland—0.75% | |
Bank of Ireland Mortgage Bank
3.500%, due 09/22/09 | | | 2,550,000 | | | | 3,638,711 | | |
| Japan—17.68% | |
Bank of Tokyo-
Mitsubishi UFJ
3.500%, due 12/16/152 | | EUR | 2,300,000 | | | | 3,240,040 | | |
Development Bank of Japan
1.750%, due 03/17/17 | | | 130,000,000 | | | | 1,415,211 | | |
| 2.300%, due 03/19/26 | | | 500,000,000 | | | | 5,298,631 | | |
Government of Japan
1.700%, due 12/20/16 | | | 1,755,000,000 | | | | 19,420,992 | | |
| 1.700%, due 03/20/17 | | | 1,444,600,000 | | | | 15,945,621 | | |
| 2.000%, due 03/20/16 | | | 2,906,000,000 | | | | 32,808,702 | | |
| 2.200%, due 09/20/26 | | | 159,700,000 | | | | 1,732,849 | | |
| 2.300%, due 12/20/36 | | | 380,000,000 | | | | 3,992,464 | | |
Japan Finance Corp.
Municipal Enterprises
1.900%, due 06/22/18 | | | 40,000,000 | | | | 440,119 | | |
Sumitomo Mitsui Banking
4.375%, due 10/15/153,4 | | EUR | 1,050,000 | | | | 1,167,320 | | |
| | | | 85,461,949 | | |
79
UBS PACE Select Advisors Trust
UBS PACE Global Fixed Income Investments
Portfolio of investments—July 31, 2009
| Security description | | Face
amount1 | | Value | |
| Long-term global debt securities—(continued) | |
| Luxembourg—3.07% | |
European Investment Bank
1.400%, due 06/20/17 | | JPY | 42,000,000 | | | $ | 439,587 | | |
| 4.625%, due 03/21/12 | | USD | 3,500,000 | | | | 3,750,915 | | |
| 6.000%, due 12/07/28 | | GBP | 3,200,000 | | | | 6,158,130 | | |
Gaz Capital SA
8.125%, due 02/04/15 | | | 2,000,000 | | | | 2,986,002 | | |
John Deere Bank SA
6.000%, due 06/23/11 | | | 1,000,000 | | | | 1,510,056 | | |
| | | | 14,844,690 | | |
| Mexico—0.43% | |
United Mexican States
5.500%, due 02/17/20 | | EUR | 300,000 | | | | 403,003 | | |
| 5.625%, due 01/15/17 | | USD | 500,000 | | | | 510,000 | | |
| 7.500%, due 03/08/10 | | EUR | 800,000 | | | | 1,175,872 | | |
| | | | 2,088,875 | | |
| Netherlands—5.49% | |
Bank Nederlandse Gemeenten
3.750%, due 12/16/13 | | | 200,000 | | | | 294,743 | | |
| 4.375%, due 01/19/15 | | GBP | 660,000 | | | | 1,126,780 | | |
Deutsche Telekom
International Finance
8.125%, due 05/29/12 | | | 1,805,000 | | | | 2,906,716 | | |
EDP Finance BV
5.375%, due 11/02/125 | | USD | 3,600,000 | | | | 3,816,522 | | |
ELM BV (Swiss
Reinsurance Co.)
5.252%, due 05/29/163,4 | | | 700,000 | | | | 642,994 | | |
ENBW International Finance BV
4.875%, due 01/16/25 | | | 1,580,000 | | | | 2,262,366 | | |
Generali Finance BV
6.214%, due 06/16/163,4 | | GBP | 550,000 | | | | 678,036 | | |
Government of
the Netherlands
5.500%, due 01/15/28 | | | 1,830,500 | | | | 3,067,153 | | |
ING Bank NV
6.125%, due 05/29/232 | | | 800,000 | | | | 1,064,756 | | |
Rabobank Nederland
5.000%, due 01/25/12 | | | 6,700,000 | | | | 7,220,476 | | |
RWE Finance BV
5.125%, due 07/23/18 | | | 900,000 | | | | 1,363,278 | | |
Urenco Finance NV
5.375%, due 05/22/15 | | | 1,500,000 | | | | 2,118,600 | | |
| | | | 26,562,420 | | |
| Peru—0.43% | |
Republic of Peru
6.550%, due 03/14/37 | | USD | 550,000 | | | | 539,000 | | |
| 7.350%, due 07/21/25 | | USD | 400,000 | | | | 431,000 | | |
| 8.750%, due 11/21/33 | | USD | 900,000 | | | | 1,100,250 | | |
| | | | 2,070,250 | | |
| Security description | | Face
amount1 | | Value | |
| Long-term global debt securities—(continued) | |
| Philippines—0.45% | |
Republic of Philippines
8.375%, due 02/15/11 | | USD | 2,000,000 | | | $ | 2,160,000 | | |
| Russia—1.03% | |
Gaz Capital (Gazprom)
4.560%, due 12/09/12 | | EUR | 3,200,000 | | | | 4,372,818 | | |
| 8.625%, due 04/28/34 | | USD | 100,000 | | | | 103,750 | | |
Russian Ministry of Finance
3.000%, due 05/14/11 | | USD | 500,000 | | | | 482,500 | | |
| | | | 4,959,068 | | |
| Singapore—0.52% | |
DBS Bank Ltd.
5.000%, due 11/15/192,5 | | USD | 1,250,000 | | | | 1,225,011 | | |
United Overseas Bank Ltd.
5.375%, due 09/03/192,5 | | USD | 1,300,000 | | | | 1,264,318 | | |
| | | | 2,489,329 | | |
| Spain—2.08% | |
Santander International Debt SA
5.625%, due 02/14/12 | | | 3,000,000 | | | | 4,547,841 | | |
Santander Issuances
4.500%, due 09/30/192 | | | 1,600,000 | | | | 2,193,349 | | |
Telefonica Emisiones SAU
6.221%, due 07/03/17 | | USD | 3,000,000 | | | | 3,329,583 | | |
| | | | 10,070,773 | | |
| Sweden—1.75% | |
Nordea Bank AB
4.000%, due 09/30/162 | | EUR | 1,900,000 | | | | 2,629,302 | | |
Skandinaviska Enskilda
4.500%, due 04/25/13 | | EUR | 3,880,000 | | | | 5,806,714 | | |
| | | | 8,436,016 | | |
| Switzerland—0.93% | |
Credit Suisse London
5.125%, due 09/18/17 | | EUR | 3,000,000 | | | | 4,516,708 | | |
| United Kingdom—9.09% | |
Anglian Water Services Finance
6.250%, due 06/27/16 | | EUR | 900,000 | | | | 1,397,423 | | |
Aviva PLC
5.250%, due 10/02/232 | | EUR | 1,500,000 | | | | 1,795,877 | | |
Barclays Bank PLC
4.250%, due 10/24/11 | | EUR | 360,000 | | | | 539,919 | | |
| 4.500%, due 03/04/192 | | EUR | 2,200,000 | | | | 2,884,674 | | |
| 6.000%, due 01/23/18 | | EUR | 3,000,000 | | | | 4,489,813 | | |
Diageo Finance PLC
6.625%, due 12/05/14 | | EUR | 3,100,000 | | | | 4,970,634 | | |
HSBC Holdings PLC
3.625%, due 06/29/202 | | EUR | 1,050,000 | | | | 1,359,629 | | |
| 6.250%, due 03/19/18 | | EUR | 4,000,000 | | | | 6,172,573 | | |
Lloyds TSB Bank PLC
5.625%, due 03/05/182 | | EUR | 1,800,000 | | | | 2,446,652 | | |
National Grid Gas PLC
5.125%, due 05/14/13 | | EUR | 1,700,000 | | | | 2,544,232 | | |
80
UBS PACE Select Advisors Trust
UBS PACE Global Fixed Income Investments
Portfolio of investments—July 31, 2009
| Security description | | Face
amount1 | | Value | |
| Long-term global debt securities—(continued) | |
| United Kingdom—(concluded) | |
Network Rail
Infrastructure Finance
4.875%, due 11/27/15 | | | 705,000 | | | $ | 1,247,483 | | |
Royal Bank of Scotland
Group PLC
5.250%, due 05/15/13 | | EUR | 2,300,000 | | | | 3,469,458 | | |
| 6.934%, due 04/09/18 | | EUR | 1,550,000 | | | | 2,149,766 | | |
Scottish & Southern Energy
6.125%, due 07/29/13 | | EUR | 900,000 | | | | 1,392,215 | | |
Standard Chartered Bank
3.625%, due 02/03/172 | | EUR | 1,400,000 | | | | 1,827,165 | | |
United Kingdom Treasury Bonds
4.000%, due 09/07/16 | | | 100,000 | | | | 173,548 | | |
| 4.250%, due 12/07/55 | | | 2,920,000 | | | | 4,693,581 | | |
| 4.750%, due 09/07/15 | | | 230,000 | | | | 419,693 | | |
| | | | 43,974,335 | | |
| United States—13.22% | |
Bank of America Corp.
4.000%, due 03/28/182 | | EUR | 2,600,000 | | | | 3,098,831 | | |
| 5.650%, due 05/01/18 | | | 500,000 | | | | 476,906 | | |
| 5.750%, due 12/01/17 | | | 5,000,000 | | | | 4,800,475 | | |
Bank of New York Mellon
4.500%, due 04/01/13 | | | 1,820,000 | | | | 1,896,922 | | |
| 5.125%, due 08/27/13 | | | 500,000 | | | | 535,286 | | |
Citigroup, Inc.
2.400%, due 10/31/25 | | JPY | 46,100,000 | | | | 322,590 | | |
| 6.000%, due 08/15/17 | | | 700,000 | | | | 640,745 | | |
| 6.125%, due 05/15/18 | | | 1,000,000 | | | | 915,608 | | |
IBM Corp.
5.700%, due 09/14/17 | | | 3,000,000 | | | | 3,282,666 | | |
Inter-American
Development Bank
5.125%, due 09/13/16 | | | 7,000,000 | | | | 7,589,169 | | |
JPMorgan Chase & Co.
3.125%, due 12/01/11 | | | 4,500,000 | | | | 4,656,703 | | |
| 6.000%, due 01/15/18 | | | 1,500,000 | | | | 1,588,475 | | |
JPMorgan Chase Bank N.A.
4.625%, due 05/29/172 | | EUR | 1,000,000 | | | | 1,411,309 | | |
| 6.000%, due 10/01/17 | | | 4,850,000 | | | | 5,039,514 | | |
Pfizer, Inc.
5.350%, due 03/15/15 | | | 1,200,000 | | | | 1,328,111 | | |
| 5.750%, due 06/03/21 | | EUR | 700,000 | | | | 1,109,134 | | |
Philip Morris
International, Inc.
5.650%, due 05/16/18 | | | 1,200,000 | | | | 1,276,709 | | |
| 6.875%, due 03/17/14 | | | 1,800,000 | | | | 2,047,768 | | |
Procter & Gamble Co.
4.875%, due 05/11/27 | | EUR | 1,610,000 | | | | 2,254,918 | | |
SunTrust Bank
3.000%, due 11/16/11 | | | 5,600,000 | | | | 5,775,918 | | |
| Security description | | Face
amount1 | | Value | |
| Long-term global debt securities—(concluded) | |
| United States—(concluded) | |
US Treasury Inflation Index
Notes (TIPS)
1.375%, due 07/15/186 | | | 9,420,485 | | | $ | 9,170,258 | | |
Vodafone Group PLC
5.625%, due 02/27/17 | | | 980,000 | | | | 1,040,231 | | |
Wells Fargo & Co.
4.375%, due 01/31/13 | | | 2,900,000 | | | | 2,968,637 | | |
Wells Fargo Bank N.A.
5.750%, due 05/16/16 | | | 700,000 | | | | 703,702 | | |
| | | | 63,930,585 | | |
Total long-term global
debt securities
(cost—$420,908,977) | | | | | | | 446,947,186 | | |
| Commercial paper7—0.41% | |
| France—0.41% | |
Caisse Des Depots
et Consignations
0.866%, due 08/17/09
(cost—$1,999,230) | | USD | 2,000,000 | | | | 1,999,230 | | |
| Repurchase agreement—3.74% | |
Repurchase agreement dated
07/31/09 with State Street
Bank & Trust Co., 0.010%
due 08/03/09, collateralized
by $18,460,527 US Treasury
Bills, zero coupon due
08/27/09 to 09/10/09;
(value—$18,458,681);
proceeds: $18,096,015
(cost—$18,096,000) | | | 18,096,000 | | | | 18,096,000 | | |
| | | Number of
shares | | | |
| Investment of cash collateral from securities loaned—0.77% | |
| Money market fund—0.77% | |
UBS Private Money Market
Fund LLC8
(cost—$3,705,975) | | | 3,705,975 | | | | 3,705,975 | | |
Total investments
(cost—$444,710,182)—
97.36% | | | | | 470,748,391 | | |
Other assets in excess
of liabilities—2.64% | | | | | 12,774,184 | | |
| Net assets—100.00% | | $ | 483,522,575 | | |
Aggregate cost for federal income tax purposes was $446,381,902; and net unrealized appreciation consisted of:
| Gross unrealized appreciation | | $ | 33,498,512 | | |
| Gross unrealized depreciation | | | (9,132,023 | ) | |
| Net unrealized appreciation | | $ | 24,366,489 | | |
81
UBS PACE Select Advisors Trust
UBS PACE Global Fixed Income Investments
Portfolio of investments—July 31, 2009
Note: The portfolio of investments is listed by the issuer's country of origin.
1 In local currency unless otherwise indicated.
2 Floating rate security. The interest rate shown is the current rate as of July 31, 2009.
3 Variable rate security. The interest rate shown is the current rate as of July 31, 2009, and resets periodically.
4 Perpetual bond security. The maturity date reflects the next call date.
5 Security exempt from registration under Rule 144A of the Securities Act of 1933. These securities, which represent 1.30% of net assets as of July 31, 2009, are considered liquid and may be resold in transactions exempt from registration, normally to qualified institutional buyers.
6 Security, or portion thereof, was on loan at July 31, 2009.
7 Rate shown is the discount rate at date of purchase.
8 The table below details the Portfolio's transaction activity in an affiliated issuer during the year ended July 31, 2009.
| Security description | | Value at
07/31/08 | | Purchases
during the
year ended
07/31/09 | | Sales
during the
year ended
07/31/09 | | Value at
07/31/09 | | Net income
earned from
affiliate for the
year ended
07/31/09 | |
| UBS Private Money Market Fund LLC | | $ | 0 | | | $ | 15,543,458 | | | $ | 11,837,483 | | | $ | 3,705,975 | | | $ | 3,562 | | |
EUR Euro
GBP Great Britain Pound
JPY Japanese Yen
TIPS Treasury inflation protected securities ("TIPS") are debt securities issued by the US Treasury whose principal and/or interest payments are adjusted for inflation, unlike debt securities that make fixed principal and interest payments. The interest rate paid by the TIPS is fixed, while the principal value rises or falls based on changes in a published Consumer Price Index ("CPI"). Thus, if inflation occurs, the principal and interest payments on TIPS are adjusted accordingly to protect investors from inflationary loss. During a deflationary period, the principal and interest payments decrease, although the TIPS principal amounts will not drop below their face amounts at maturity. In exchange for the inflation protection, the TIPS generally pay lower interest rates than typical US Treasury securities. Only if inflation occurs will TIPS offer a higher real yield than a conventional Treasury bond of the same maturit y.
USD United States Dollar
Futures contracts
Number of
contracts | | Currency | | Buy contracts | | Expiration
dates | | Cost | | Current
value | | Unrealized
appreciation
(depreciation) | |
| | 270 | | | AUD | | Australia Bond 10 Year Futures | | September 2009 | | $ | 23,290,762 | | | $ | 23,263,955 | | | $ | (26,807 | ) | |
| | 79 | | | CAD | | Canada Government Bond
10 Year Futures | | September 2009 | | | 8,991,713 | | | | 8,819,677 | | | | (172,036 | ) | |
| | 576 | | | EUR | | Euro Bund 10 Year Futures | | September 2009 | | | 97,764,837 | | | | 100,198,550 | | | | 2,433,713 | | |
| | 11 | | | JPY | | Japan Government Bond
10 Year Futures | | September 2009 | | | 15,758,837 | | | | 16,035,039 | | | | 276,202 | | |
| | | | | | | | | | | | 145,806,149 | | | | 148,317,221 | | | | 2,511,072 | | |
| | | | | Sale contracts | | | | Proceeds | | | | | |
| | 20 | | | EUR | | Euro BOBL 5 Year Futures | | September 2009 | | $ | 3,265,956 | | | $ | 3,311,204 | | | $ | (45,248 | ) | |
| | 72 | | | GBP | | United Kingdom Long Gilt
10 Year Futures | | September 2009 | | | 14,151,117 | | | | 14,111,817 | | | | 39,300 | | |
| | 126 | | | USD | | US Treasury Bond 20 Year Futures | | September 2009 | | | 14,769,298 | | | | 14,994,000 | | | | (224,702 | ) | |
| | 223 | | | USD | | US Treasury Note 5 Year Futures | | September 2009 | | | 25,764,743 | | | | 25,730,368 | | | | 34,375 | | |
| | 533 | | | USD | | US Treasury Note 10 Year Futures | | September 2009 | | | 62,463,743 | | | | 62,510,906 | | | | (47,163 | ) | |
| | | | | | | | | | | | 120,414,857 | | | | 120,658,295 | | | | (243,438 | ) | |
| | | | | | | | | | | | | | | | | | | $ | 2,267,634 | | |
82
UBS PACE Select Advisors Trust
UBS PACE Global Fixed Income Investments
Portfolio of investments—July 31, 2009
Currency type abbreviations:
AUD Australian Dollar
CAD Canadian Dollar
EUR Euro
GBP Great Britain Pound
JPY Japanese Yen
USD United States Dollar
Forward foreign currency contracts
| | | Contracts to
deliver | | In
exchange for | | Maturity
dates | | Unrealized
appreciation
(depreciation) | |
| Australian Dollar | | | 9,990,000 | | | CAD | 9,118,909 | | | 09/16/09 | | $ | 136,527 | | |
| Australian Dollar | | | 33,911,149 | | | EUR | 18,979,767 | | | 09/16/09 | | | (1,221,893 | ) | |
| Australian Dollar | | | 168,000 | | | USD | 128,288 | | | 09/16/09 | | | (11,792 | ) | |
| Australian Dollar | | | 200,000 | | | USD | 159,446 | | | 09/16/09 | | | (7,317 | ) | |
| Australian Dollar | | | 1,300,000 | | | USD | 1,016,507 | | | 09/16/09 | | | (67,450 | ) | |
| Australian Dollar | | | 161,000 | | | USD | 129,747 | | | 09/16/09 | | | (4,497 | ) | |
| Canadian Dollar | | | 9,253,154 | | | AUD | 10,665,231 | | | 09/16/09 | | | 301,851 | | |
| Canadian Dollar | | | 3,794,387 | | | GBP | 2,134,917 | | | 09/16/09 | | | 43,096 | | |
| Canadian Dollar | | | 6,382,141 | | | NOK | 37,004,932 | | | 09/16/09 | | | 105,053 | | |
| Canadian Dollar | | | 70,000 | | | USD | 62,978 | | | 09/16/09 | | | (2,013 | ) | |
| Canadian Dollar | | | 119,000 | | | USD | 105,077 | | | 09/16/09 | | | (5,407 | ) | |
| Canadian Dollar | | | 526,000 | | | USD | 467,499 | | | 09/16/09 | | | (20,859 | ) | |
| Danish Krone | | | 61,492,797 | | | GBP | 7,190,542 | | | 09/16/09 | | | 251,188 | | |
| Danish Krone | | | 8,869,558 | | | SEK | 12,816,511 | | | 09/16/09 | | | 80,383 | | |
| Danish Krone | | | 175,664,172 | | | USD | 33,440,733 | | | 09/16/09 | | | (151,167 | ) | |
| Euro | | | 4,844,044 | | | CAD | 7,508,268 | | | 09/16/09 | | | 66,267 | | |
| Euro | | | 6,743,535 | | | CHF | 10,182,738 | | | 09/16/09 | | | (79,824 | ) | |
| Euro | | | 6,263,802 | | | DKK | 46,712,302 | | | 09/16/09 | | | 4,303 | | |
| Euro | | | 46,718,596 | | | JPY | 6,297,666,729 | | | 09/16/09 | | | (11,663 | ) | |
| Euro | | | 2,880,000 | | | JPY | 385,689,600 | | | 09/16/09 | | | (27,513 | ) | |
| Euro | | | 2,342,695 | | | NOK | 20,959,624 | | | 09/16/09 | | | 76,392 | | |
| Euro | | | 7,210,000 | | | SEK | 76,015,828 | | | 09/16/09 | | | 259,416 | | |
| Euro | | | 18,068,000 | | | USD | 25,381,284 | | | 09/16/09 | | | (372,761 | ) | |
| Euro | | | 2,597,000 | | | USD | 3,593,677 | | | 09/16/09 | | | (108,075 | ) | |
| Euro | | | 11,383,849 | | | USD | 16,000,000 | | | 09/16/09 | | | (226,487 | ) | |
| Euro | | | 2,185,000 | | | USD | 3,060,893 | | | 09/16/09 | | | (53,597 | ) | |
| Great Britain Pound | | | 11,930,636 | | | AUD | 24,480,473 | | | 09/16/09 | | | 484,456 | | |
| Great Britain Pound | | | 16,203,652 | | | EUR | 18,855,179 | | | 09/16/09 | | | (188,799 | ) | |
| Great Britain Pound | | | 602,324 | | | JPY | 92,998,801 | | | 09/16/09 | | | (22,848 | ) | |
| Great Britain Pound | | | 5,075,676 | | | USD | 8,330,000 | | | 09/16/09 | | | (147,878 | ) | |
| Indian Rupee | | | 165,400,000 | | | USD | 3,421,597 | | | 08/06/09 | | | (27,296 | ) | |
| Japanese Yen | | | 985,845,066 | | | AUD | 13,005,872 | | | 09/16/09 | | | 421,820 | | |
| Japanese Yen | | | 200,832,300 | | | USD | 2,094,204 | | | 09/16/09 | | | (29,055 | ) | |
| Japanese Yen | | | 1,724,316,430 | | | USD | 18,240,944 | | | 09/16/09 | | | 10,956 | | |
| Mexican Peso | | | 44,700,000 | | | USD | 3,365,964 | | | 08/06/09 | | | (17,204 | ) | |
| Norwegian Krone | | | 6,466,958 | | | GBP | 630,787 | | | 09/16/09 | | | (279 | ) | |
| Norwegian Krone | | | 34,481,889 | | | SEK | 41,695,500 | | | 09/16/09 | | | 160,096 | | |
83
UBS PACE Select Advisors Trust
UBS PACE Global Fixed Income Investments
Portfolio of investments—July 31, 2009
Forward foreign currency contracts—(concluded)
| | | Contracts to
deliver | | In
exchange for | | Maturity
dates | | Unrealized
appreciation
(depreciation) | |
| Singapore Dollar | | | 1,270,000 | | | USD | 883,171 | | | 11/17/09 | | $ | 1,052 | | |
| South Korean Won | | | 3,570,000,000 | | | USD | 2,857,486 | | | 08/06/09 | | | (49,161 | ) | |
| Swedish Krona | | | 105,840,574 | | | EUR | 9,746,807 | | | 09/16/09 | | | (777,456 | ) | |
| Swiss Franc | | | 10,093,048 | | | EUR | 6,680,000 | | | 09/16/09 | | | 73,223 | | |
| United States Dollar | | | 3,379,452 | | | AUD | 4,274,000 | | | 09/16/09 | | | 184,266 | | |
| United States Dollar | | | 13,185,727 | | | AUD | 16,158,979 | | | 09/16/09 | | | 287,845 | | |
| United States Dollar | | | 346,340 | | | BRL | 750,000 | | | 11/17/09 | | | 47,842 | | |
| United States Dollar | | | 3,109,655 | | | BRL | 6,590,000 | | | 11/17/09 | | | 353,896 | | |
| United States Dollar | | | 4,492,434 | | | CAD | 4,873,180 | | | 09/16/09 | | | 32,001 | | |
| United States Dollar | | | 4,498,705 | | | CNY | 30,400,000 | | | 11/17/09 | | | (43,305 | ) | |
| United States Dollar | | | 2,406,792 | | | CNY | 16,300,000 | | | 11/17/09 | | | (17,877 | ) | |
| United States Dollar | | | 77,251 | | | DKK | 417,000 | | | 09/16/09 | | | 2,491 | | |
| United States Dollar | | | 96,404,502 | | | EUR | 68,531,169 | | | 09/16/09 | | | 1,279,517 | | |
| United States Dollar | | | 4,824,036 | | | EUR | 3,402,000 | | | 09/16/09 | | | 25,159 | | |
| United States Dollar | | | 14,170,000 | | | EUR | 9,955,549 | | | 09/16/09 | | | 20,595 | | |
| United States Dollar | | | 29,549,985 | | | EUR | 21,007,000 | | | 09/16/09 | | | 393,298 | | |
| United States Dollar | | | 299,101 | | | EUR | 215,000 | | | 09/16/09 | | | 7,359 | | |
| United States Dollar | | | 29,970,733 | | | GBP | 18,259,250 | | | 09/16/09 | | | 527,608 | | |
| United States Dollar | | | 2,257,677 | | | GBP | 1,382,000 | | | 09/16/09 | | | 50,672 | | |
| United States Dollar | | | 3,313,778 | | | INR | 165,400,000 | | | 08/06/09 | | | 135,115 | | |
| United States Dollar | | | 3,365,893 | | | INR | 165,400,000 | | | 06/10/10 | | | 14,513 | | |
| United States Dollar | | | 2,328,207 | | | JPY | 223,147,000 | | | 09/16/09 | | | 30,970 | | |
| United States Dollar | | | 2,778,975 | | | KRW | 3,570,000,000 | | | 08/06/09 | | | 127,672 | | |
| United States Dollar | | | 407,166 | | | KRW | 500,000,000 | | | 11/17/09 | | | (223 | ) | |
| United States Dollar | | | 6,865,478 | | | KRW | 8,472,000,000 | | | 11/17/09 | | | 29,770 | | |
| United States Dollar | | | 2,881,472 | | | KRW | 3,570,000,000 | | | 06/10/10 | | | 25,221 | | |
| United States Dollar | | | 3,256,845 | | | MXN | 44,700,000 | | | 08/06/09 | | | 126,324 | | |
| United States Dollar | | | 3,228,836 | | | MXN | 44,700,000 | | | 06/10/10 | | | 12,933 | | |
| United States Dollar | | | 1,420,455 | | | MYR | 5,000,000 | | | 11/17/09 | | | (6,239 | ) | |
| United States Dollar | | | 13,907,355 | | | NOK | 86,730,387 | | | 09/16/09 | | | 226,552 | | |
| United States Dollar | | | 3,404,812 | | | RUB | 112,900,000 | | | 11/17/09 | | | 85,973 | | |
| United States Dollar | | | 674,920 | | | SEK | 5,181,128 | | | 09/16/09 | | | 43,233 | | |
| United States Dollar | | | 2,182,567 | | | SGD | 3,180,000 | | | 11/17/09 | | | 26,205 | | |
| | | $ | 2,873,174 | | |
84
UBS PACE Select Advisors Trust
UBS PACE Global Fixed Income Investments
Portfolio of investments—July 31, 2009
Currency type abbreviations:
AUD Australian Dollar
BRL Brazilian Real
CAD Canadian Dollar
CHF Swiss Franc
CNY Chinese Yuan Renminbi
DKK Danish Krone
EUR Euro
GBP Great Britain Pound
INR Indian Rupee
JPY Japanese Yen
KRW South Korean Won
MXN Mexican Peso
MYR Malaysian Ringgit
NOK Norwegian Krone
RUB Russian Ruble
SEK Swedish Krona
SGD Singapore Dollar
USD United States Dollar
The following is a summary of the fair valuations according to the inputs used as of July 31, 2009 in valuing the Portfolio's investments:
| Measurements at 07/31/09 | |
| | | Quoted prices in
active markets for
identical investments
(Level 1) | | Significant other
observable inputs
(Level 2) | | Unobservable
inputs
(Level 3) | | Total | |
| Long-term global debt securities | | $ | — | | | $ | 446,947,186 | | | $ | — | | | $ | 446,947,186 | | |
| Commercial paper | | | — | | | | 1,999,230 | | | | — | | | | 1,999,230 | | |
| Repurchase agreement | | | — | | | | 18,096,000 | | | | — | | | | 18,096,000 | | |
Investment of cash collateral from
securities loaned | | | — | | | | 3,705,975 | | | | — | | | | 3,705,975 | | |
| Other financial instruments, net9 | | | 2,267,634 | | | | 2,873,174 | | | | — | | | | 5,140,808 | | |
| Total | | $ | 2,267,634 | | | $ | 473,621,565 | | | $ | — | | | $ | 475,889,199 | | |
9 Other financial instruments include open futures contracts and forward foreign currency contracts.
Investments by type of issuer (unaudited)
| | | Percentage of total investments | |
| | | Long-term | | Short-term | |
| Government and other public issuers | | | 42.02 | % | | | — | | |
| Repurchase agreement | | | — | | | | 3.84 | % | |
| Banks and other financial institutions | | | 44.23 | | | | 0.43 | | |
| Industrial | | | 8.69 | | | | — | | |
| Investment of cash collateral from securities loaned | | | — | | | | 0.79 | | |
| | | | 94.94 | % | | | 5.06 | % | |
See accompanying notes to financial statements.
85
UBS PACE Select Advisors Trust
UBS PACE High Yield Investments
Performance
For the 12 months ended July 31, 2009, the Portfolio's Class P shares returned 9.87% (before the deduction of the maximum UBS PACE Select program fee; after the deduction of the maximum UBS PACE Select program fee, the Portfolio returned 8.24%). In comparison, the Merrill Lynch Global High Yield Index (hedged in USD) (the "benchmark") returned 5.32%, and the Lipper High Current Yield Funds category posted a median return of 0.24%. (Returns for all share classes over various time periods are shown in the "Performance at a glance" table on page 89. Please note that the returns shown do not reflect the deduction of taxes that a shareholder would pay on Portfolio distributions or the redemption of Portfolio shares.) For a detailed commentary on the market environment in general during the reporting period, please refer to page two.
Sub-Advisor's comments
The Portfolio outperformed its benchmark during the reporting period. This was primarily due to our extremely defensive posture before last fall's selloff and the fact that we moved the Portfolio to a less defensive position in time to participate in most of the second quarter 2009 market rally.
Toward the end of 2008, we became more confident that global central banks' efforts to avert a financial system collapse were working. In our opinion, high yield prices were depressed to levels that seemed to anticipate a worst-case scenario, which we did not believe was likely to happen. In response, we began to increase the Portfolio's exposure to securities that offered more risk—and potentially more reward—late in October.
This strategy proved effective, particularly during April and May 2009, as the high yield market quickly gained almost 20% during those two months. In the beginning of 2009, the Portfolio had concentrations in the energy sector, including exploration and production, as well as the specialty chemicals and gas distribution sub-sectors, all of which performed very well during the downturn. As we repositioned the Portfolio, we subsequently lowered its allocation to the chemicals and gas distribution sectors and increased its allocation to the metals, mining and airline sectors.
UBS PACE Select Advisors Trust – UBS PACE High Yield Investments
Investment Sub-Advisor:
MacKay Shields LLC ("MacKay Shields")
Portfolio Managers:
Dan Roberts, Taylor Wagenseil, Michael Kimble and Louis Cohen
Objective:
Total return
Investment process:
MacKay Shields attempts to deliver attractive risk-adjusted returns by avoiding most of the unusually large losses in the high yield market, even if it means giving up much of the large gains. MacKay Shields believes that there is a very small subset of bonds that delivers outsized gains in the market. Due to the limited upside inherent in most bonds, over time, outsized gains are expected to be smaller than unusually large losses. By attempting to limit the Portfolio's participation in the extremes of the market, MacKay Shields strives to add value over a market cycle with lower volatility. MacKay Shields does this through a rigorous process that attempts to screen out what it believes to be the riskiest issuers in the market.
86
UBS PACE Select Advisors Trust
UBS PACE High Yield Investments
Sub-Advisor's comments – concluded
In addition, we significantly increased the Portfolio's weightings to the financial sector, as bank downgrades in the first quarter of 2009 introduced many bank securities to the high yield market.
Special considerations
The Portfolio may be appropriate for long-term investors seeking total return and who are able to withstand short-term fluctuations in the fixed income markets in return for potentially higher returns over the long term. The Portfolio seeks to achieve its objective by investing primarily in a professionally managed, diversified portfolio of fixed income securities rated below investment grade or considered to be of comparable quality (commonly referred to as "junk bonds"). These securities are subject to higher risks than investment grade securities, including greater price volatility and a greater risk of loss of principal and nonpayment of interest. Issuers of such securities are typically in poor financial health, and their ability to pay interest and principal is uncertain. The prices of such securities may be more vulnerable to bad economic news, or even the expectation of bad news, than higher rated or investment grade bon ds and other fixed income securities. The value of the Portfolio changes every day and can be affected by changes in interest rates, general market conditions and other political, social and economic developments, as well as specific matters relating to the issuers in which the Portfolio invests. In addition, investments in foreign bonds involve special risks. It is important to note that an investment in the Portfolio is only one component of a balanced investment plan.
87
UBS PACE Select Advisors Trust
UBS PACE High Yield Investments
Comparison of change in value of a $10,000 investment in the Class P shares of the Portfolio and the Merrill Lynch Global High Yield Index (hedged in USD) (unaudited)
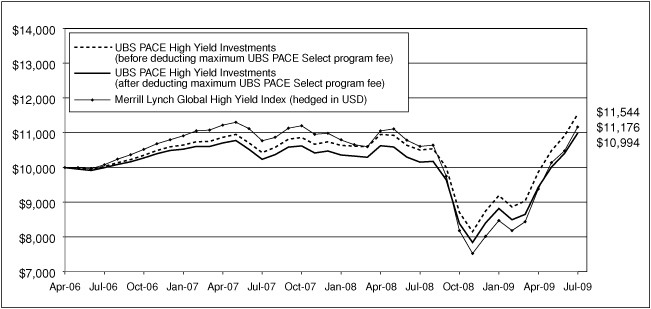
The graph depicts the performance of UBS PACE High Yield Investments Class P shares versus the Merrill Lynch Global High Yield Index (hedged in USD) from April 30, 2006, which is the month-end after the inception date of the Class P shares, through July 31, 2009. The performance of the other classes will vary from the performance of the class shown based on the difference in sales charges and fees paid by shareholders investing in different share classes. Past performance does not predict future performance and the performance provided does not reflect the deduction of taxes that a shareholder would pay on Portfolio distributions or the redemption of Portfolio shares. It is important to note that UBS PACE High Yield Investments is a professionally managed portfolio while the Index is not available for investment and is unmanaged. The comparison is shown for illustrative purposes only.
88
UBS PACE Select Advisors Trust
UBS PACE High Yield Investments
Performance at a glance (unaudited)
| Average annual total returns for periods ended 07/31/09 | | 1 year | | Since
inception1 | |
| Before deducting Class A2 | | | 9.49 | % | | | 4.20 | % | |
| maximum sales charge Class C3 | | | N/A | | | | 25.40 | % | |
| or UBS PACE Select Class Y4 | | | N/A | | | | 38.23 | % | |
| program fee Class P5 | | | 9.87 | % | | | 4.51 | % | |
After deducting
maximum sales charge Class A2 | | | 4.52 | % | | | 2.73 | % | |
| or UBS PACE Select Class C3 | | | N/A | | | | 24.65 | % | |
| program fee Class P5 | | | 8.24 | % | | | 2.95 | % | |
| Merrill Lynch Global High Yield Index (hedged in USD)6 | | | 5.32 | % | | | 3.48 | % | |
| Lipper High Current Yield Funds median | | | 0.24 | % | | | 1.67 | % | |
Average annual total returns for periods ended June 30, 2009, after deduction of the maximum sales charge or UBS PACE Select program fee, were as follows: Class A—1-year period, (2.13)%; since inception, 1.06%; Class C—since inception, 18.04%; Class Y—since inception, 30.89%; Class P—1-year period, 1.05%; since inception, 1.30%. Please note the since inception returns for Class C shares and Class Y shares have not been annualized.
The annualized gross and net expense ratios, respectively, for each class of shares as in the November 28, 2008 prospectuses, were as follows: Class A—1.58% and 1.35%; Class B—2.33% and 2.10%; Class C—2.08% and 1.85%; Class Y—2.32% and 1.10%; and Class P—1.30% and 1.10%. Class B and Class C shares were not operational as of November 28, 2008. Therefore these amounts have been estimated. Net expenses reflect fee waivers and/or expense reimbursements, if any, pursuant to an agreement that is in effect to cap the expenses. The Portfolio and UBS Global AM have entered into a written fee waiver/expense reimbursement agreement pursuant to which UBS Global AM is contractually obligated to waive its management fees and/or reimburse the Portfolio so that the ordinary total operating expenses of each class through November 30, 2009 (excluding dividend expense, borrowing costs and interest expense, if any) would no t exceed Class A—1.35%; Class B—2.10%; Class C—1.85%; Class Y—1.10% and Class P—1.10%. The Portfolio has agreed to repay UBS Global AM for any waived fees/reimbursed expenses to the extent that it can do so over the following three fiscal years without causing the Portfolio's expenses in any of those three years to exceed the expense caps described above.
1 Since inception returns are calculated as of commencement of issuance on April 10, 2006 for Class P shares, May 1, 2006 for Class A shares and January 21, 2009 for Class C shares. Class Y shares commenced issuance on April 3, 2006 and had fully redeemed by July 24, 2006 remaining inactive through December 25, 2008. The inception return of Class Y shares is calculated from December 26, 2008, which is the date the Class Y shares recommenced investment operations. Please note the since inception returns for Class C shares and Class Y shares have not been annualized. Since inception returns for the Index and Lipper median are shown as of April 30, 2006, which is the month-end after the inception date of the oldest share class (Class P).
2 Maximum sales charge for Class A shares is 4.5%. Class A shares bear ongoing 12b-1 service fees.
3 Maximum contingent deferred sales charge for Class C shares is 0.75% imposed on redemptions and is reduced to 0% after one year. Class C shares bear ongoing 12b-1 service and distribution fees.
4 The Portfolio offers Class Y shares to a limited group of eligible investors, including certain qualifying retirement plans. Class Y shares do not bear initial or contingent deferred sales charges or ongoing 12b-1 service and distribution fees.
5 Class P shares do not bear initial or contingent deferred sales charges or ongoing 12b-1 service and distribution fees, but are subject to a maximum annual UBS PACE Select program fee of 1.5% of the value of Class P shares.
6 The Merrill Lynch Global High Yield Index (hedged in USD) covers US dollar, Canadian dollar, sterling and euro-denominated fixed rate debt of corporate issuers domiciled in an investment grade rated country (i.e., BBB or higher foreign currency long-term debt rating). Individual bonds must be rated below investment grade (i.e., BB or lower based on a composite of Moody's and S&P) but not in default and must have at least one year remaining term to maturity; a minimum face value outstanding of $100 million, C$50 million, 50 million pounds sterling or 50 million euros; and have available price quotations. New issues qualify for inclusion after they settle. Investors should note that indices do not reflect the deduction of fees, expenses or taxes.
If an investor sells or exchanges shares less than 90 days after purchase, a redemption fee of 1.00% of the amount sold or exchanged will be deducted at the time of the transaction, except as noted otherwise in the prospectuses.
Past performance does not predict future performance, and the performance information provided does not reflect the deduction of taxes that a shareholder would pay on Portfolio distributions or the redemption of Portfolio shares. The return and principal value of an investment will fluctuate, so that an investor's shares, when redeemed, may be worth more or less than their original cost. Performance results assume reinvestment of all dividends and capital gain distributions at net asset value on the ex-dividend dates. Total returns for the period of less than one year have not been annualized. Current performance may be higher or lower than the performance data quoted. For month-end performance figures, please visit http://www.ubs.com.
Lipper peer group data calculated by Lipper Inc.; used with permission. The Lipper median is the return of the fund that places in the middle of a Lipper peer group.
89
UBS PACE Select Advisors Trust
UBS PACE High Yield Investments
Portfolio statistics (unaudited)
| Characteristics | | 07/31/09 | |
| Weighted average duration | | | 4.3 | yrs. | |
| Weighted average maturity | | | 7.4 | yrs. | |
| Average coupon | | | 7.32 | % | |
| Net assets (mm) | | $ | 156.4 | | |
| Number of holdings | | | 244 | | |
| Portfolio composition1 | | 07/31/09 | |
| Bonds and loan assignments | | | 98.0 | % | |
| Common stock | | | 0.3 | | |
| Forward foreign currency contracts | | | (0.2 | ) | |
| Collateralized mortgage obligation | | | 0.9 | | |
| Cash equivalents and other assets less liabilities | | | 1.0 | | |
| Total | | | 100.0 | % | |
| Quality diversification1 | | 07/31/09 | |
| BB & higher | | | 30.1 | % | |
| B | | | 27.3 | | |
| CCC & lower | | | 18.0 | | |
| Not rated | | | 23.8 | | |
| Forward foreign currency contracts | | | (0.2 | ) | |
| Cash equivalents and other assets less liabilities | | | 1.0 | | |
| Total | | | 100.0 | % | |
| Asset allocation1 | | 07/31/09 | |
| Corporate bonds | | | 90.2 | % | |
| Loan assignments | | | 7.4 | | |
| Collateralized mortgage obligation | | | 0.9 | | |
| Asset-backed security | | | 0.4 | | |
| Forward foreign currency contracts | | | (0.2 | ) | |
| Common stock | | | 0.3 | | |
| Cash equivalents and other assets less liabilities | | | 1.0 | | |
| Total | | | 100.0 | % | |
1 Weightings represent percentages of the Portfolio's net assets as of July 31, 2009. The Portfolio is actively managed and its composition will vary over time. Credit quality ratings shown are based on the ratings assigned to portfolio holdings by Standard & Poor's Ratings Group, an independent rating agency.
90
UBS PACE Select Advisors Trust
UBS PACE High Yield Investments
Portfolio of investments—July 31, 2009
| Security description | | Face
amount1 | | Value | |
| Corporate bonds—90.20% | |
| Aerospace & defense—1.13% | |
Alliant Techsystems, Inc.
6.750%, due 04/01/16 | | $ | 55,000 | | | $ | 52,250 | | |
BE Aerospace, Inc.
8.500%, due 07/01/18 | | | 600,000 | | | | 597,000 | | |
Hexcel Corp.
6.750%, due 02/01/15 | | | 1,190,000 | | | | 1,121,575 | | |
| | | | 1,770,825 | | |
| Airlines—2.06% | |
American Airlines Pass Through
Trust 2001-01
6.977%, due 05/23/21 | | | 418,989 | | | | 247,204 | | |
American Airlines, Inc.,
Series 2001-1, Class B
7.377%, due 05/23/19 | | | 420,418 | | | | 210,209 | | |
British Airways
7.250%, due 08/23/16 | | GBP | 510,000 | | | | 695,745 | | |
Continental Airlines, Inc.
7.033%, due 06/15/11 | | | 150,969 | | | | 119,265 | | |
Series ERJ1
9.798%, due 04/01/21 | | | 1,275,332 | | | | 803,459 | | |
Series RJ03
7.875%, due 07/02/18 | | | 552,389 | | | | 343,862 | | |
Series RJ04
9.558%, due 03/01/21 | | | 912,425 | | | | 570,266 | | |
Delta Air Lines, Inc.
7.711%, due 09/18/112 | | | 280,000 | | | | 235,200 | | |
| | | | 3,225,210 | | |
| Auto & truck—4.37% | |
Ford Holdings, Inc.
9.300%, due 03/01/302 | | | 815,000 | | | | 586,800 | | |
Ford Motor Co.
6.625%, due 10/01/28 | | | 4,345,000 | | | | 2,998,050 | | |
| 7.125%, due 11/15/25 | | | 570,000 | | | | 381,900 | | |
| 7.450%, due 07/16/312 | | | 970,000 | | | | 727,500 | | |
General Motors
8.375%, due 07/05/333 | | EUR | 2,000,000 | | | | 320,692 | | |
| 8.375%, due 07/15/332,3 | | | 11,910,000 | | | | 1,816,275 | | |
| | | | 6,831,217 | | |
| Automotive parts—0.40% | |
Goodyear Tire & Rubber Co.
10.500%, due 05/15/16 | | | 590,000 | | | | 632,775 | | |
| Banking-non-US—0.67% | |
HT1 Funding GmbH
5.351%, due 06/30/174,5 | | EUR | 850,000 | | | | 580,444 | | |
IKB Deutsche Industriebank AG
4.500%, due 07/09/13 | | EUR | 450,000 | | | | 461,797 | | |
| | | | 1,042,241 | | |
| Banking-US—0.29% | |
Wells Fargo & Co., Series K
7.980%, due 03/15/184,5 | | | 525,000 | | | | 454,125 | | |
| Security description | | Face
amount1 | | Value | |
| Corporate bonds—(continued) | |
| Beverages—1.34% | |
Constellation Brands, Inc.
7.250%, due 09/01/16 | | $ | 590,000 | | | $ | 578,200 | | |
| 7.250%, due 05/15/17 | | | 225,000 | | | | 219,937 | | |
| 8.375%, due 12/15/14 | | | 470,000 | | | | 486,450 | | |
Constellation Brands,
Inc., Series B
8.125%, due 01/15/122 | | | 800,000 | | | | 808,000 | | |
| | | | 2,092,587 | | |
| Broadcast—0.22% | |
Clear Channel Communications
5.500%, due 09/15/142 | | | 310,000 | | | | 70,525 | | |
| 5.750%, due 01/15/13 | | | 90,000 | | | | 22,500 | | |
| 6.875%, due 06/15/18 | | | 730,000 | | | | 153,300 | | |
| 7.250%, due 10/15/27 | | | 445,000 | | | | 93,450 | | |
| | | | 339,775 | | |
| Building & construction—1.89% | |
D.R. Horton, Inc.
5.625%, due 01/15/16 | | | 195,000 | | | | 167,700 | | |
| 6.500%, due 04/15/16 | | | 255,000 | | | | 229,500 | | |
K. Hovnanian Enterprises
6.500%, due 01/15/14 | | | 770,000 | | | | 411,950 | | |
| 7.750%, due 05/15/132 | | | 80,000 | | | | 38,800 | | |
| 11.500%, due 05/01/13 | | | 785,000 | | | | 724,162 | | |
PERI GmbH
5.625%, due 12/15/11 | | EUR | 335,000 | | | | 467,926 | | |
Taylor Wimpey PLC
10.925%, due 05/24/194 | | GBP | 338,533 | | | | 458,056 | | |
| 11.175%, due 07/03/124 | | GBP | 286,141 | | | | 387,167 | | |
William Lyon Homes, Inc.
10.750%, due 04/01/132 | | | 200,000 | | | | 74,000 | | |
| | | | 2,959,261 | | |
| Building materials—0.34% | |
Interface, Inc.
11.375%, due 11/01/136 | | | 510,000 | | | | 536,775 | | |
| Building products—1.97% | |
Mueller Water Products
7.375%, due 06/01/17 | | | 755,000 | | | | 553,038 | | |
Nortek, Inc.
10.000%, due 12/01/13 | | | 1,375,000 | | | | 1,213,437 | | |
US Concrete, Inc.
8.375%, due 04/01/14 | | | 1,050,000 | | | | 674,625 | | |
USG Corp.
9.500%, due 01/15/187 | | | 690,000 | | | | 634,800 | | |
| | | | 3,075,900 | | |
| Building products-cement—0.49% | |
Texas Industries, Inc.
7.250%, due 07/15/136 | | | 60,000 | | | | 55,200 | | |
| 7.250%, due 07/15/132 | | | 777,000 | | | | 714,840 | | |
| | | | 770,040 | | |
91
UBS PACE Select Advisors Trust
UBS PACE High Yield Investments
Portfolio of investments—July 31, 2009
| Security description | | Face
amount1 | | Value | |
| Corporate bonds—(continued) | |
| Cable—0.80% | |
CCH I Holdings LLC
9.920%, due 04/01/143 | | $ | 710,000 | | | $ | 7,100 | | |
Central Euro Media Enterprises
8.250%, due 05/15/12 | | EUR | 100,000 | | | | 132,553 | | |
DIRECTV Holdings Finance
6.375%, due 06/15/15 | | | 310,000 | | | | 296,825 | | |
| 8.375%, due 03/15/13 | | | 40,000 | | | | 40,850 | | |
Dish DBS Corp.
6.625%, due 10/01/14 | | | 800,000 | | | | 768,000 | | |
| | | | 1,245,328 | | |
| Car rental—1.15% | |
Avis Budget Car Rental .
7.625%, due 05/15/142 | | | 605,000 | | | | 465,850 | | |
Europcar Groupe SA
4.781%, due 05/15/137 | | EUR | 300,000 | | | | 303,589 | | |
Hertz Corp.
8.875%, due 01/01/14 | | | 1,065,000 | | | | 1,025,062 | | |
| | | | 1,794,501 | | |
| Chemicals—4.69% | |
Hexion US Finance Corp./
Nova Scotia
9.750%, due 11/15/14 | | | 630,000 | | | | 422,100 | | |
Huntsman International LLC
6.875%, due 11/15/13 | | EUR | 200,000 | | | | 226,623 | | |
| 7.500%, due 01/01/15 | | EUR | 650,000 | | | | 694,833 | | |
Huntsman LLC
11.500%, due 07/15/12 | | | 1,810,000 | | | | 1,862,037 | | |
Innophos, Inc.
8.875%, due 08/15/14 | | | 960,000 | | | | 912,000 | | |
Invista
9.250%, due 05/01/126 | | | 675,000 | | | | 648,000 | | |
Koppers Holdings, Inc.
9.875%, due 11/15/148 | | | 390,000 | | | | 360,750 | | |
Koppers, Inc.
9.875%, due 10/15/13 | | | 915,000 | | | | 915,000 | | |
Nalco Co.
7.750%, due 11/15/11 | | | 304,000 | | | | 305,520 | | |
| 9.000%, due 11/15/13 | | EUR | 430,000 | | | | 622,072 | | |
Rockwood Specialties Group
7.625%, due 11/15/14 | | EUR | 270,000 | | | | 371,362 | | |
| | | | 7,340,297 | | |
| Commercial services—2.80% | |
Ashtead Holdings PLC
8.625%, due 08/01/156 | | | 490,000 | | | | 421,400 | | |
Corrections Corp. of America
6.250%, due 03/15/13 | | | 430,000 | | | | 421,400 | | |
| 6.750%, due 01/31/14 | | | 685,000 | | | | 673,013 | | |
Iron Mountain, Inc.
6.750%, due 10/15/18 | | EUR | 495,000 | | | | 649,081 | | |
| 7.750%, due 01/15/15 | | | 390,000 | | | | 384,150 | | |
| Security description | | Face
amount1 | | Value | |
| Corporate bonds—(continued) | |
| Commercial services—(concluded) | |
United Rentals North
America, Inc.
6.500%, due 02/15/122 | | $ | 845,000 | | | $ | 815,425 | | |
| 7.000%, due 02/15/14 | | | 155,000 | | | | 127,875 | | |
| 7.750%, due 11/15/132 | | | 1,010,000 | | | | 888,800 | | |
| | | | 4,381,144 | | |
| Computer software & services—0.39% | |
Sungard Data Systems, Inc.
10.250%, due 08/15/152 | | | 600,000 | | | | 615,000 | | |
| Containers & packaging—1.95% | |
Ball Corp.
6.875%, due 12/15/12 | | | 40,000 | | | | 40,200 | | |
Crown Euro Holdings SA
6.250%, due 09/01/11 | | EUR | 440,000 | | | | 614,589 | | |
IFCO Systems NV
10.000%, due 06/30/16 | | EUR | 500,000 | | | | 748,282 | | |
Impress Holdings BV
4.121%, due 10/15/097 | | EUR | 700,000 | | | | 912,904 | | |
Owens-Brockway Glass
Container, Inc.
6.750%, due 12/01/14 | | EUR | 435,000 | | | | 582,805 | | |
OI European Group BV
6.875%, due 03/31/17 | | EUR | 115,000 | | | | 150,797 | | |
| | | | 3,049,577 | | |
| Diversified financial services—1.40% | |
Bank of America Corp.
8.000%, due 01/30/182,4,5 | | | 345,000 | | | | 295,075 | | |
GMAC, Inc.
8.000%, due 11/01/312 | | | 2,495,000 | | | | 1,898,164 | | |
| | | | 2,193,239 | | |
| Diversified operations—0.45% | |
Stena AB
5.875%, due 02/01/19 | | EUR | 650,000 | | | | 699,466 | | |
| Electric utilities—3.87% | |
Edison Mission Energy
7.500%, due 06/15/13 | | | 1,385,000 | | | | 1,263,812 | | |
Energy Future Holdings
11.250%, due 11/01/179 | | | 1,691,100 | | | | 1,251,414 | | |
Series Q
6.500%, due 11/15/24 | | | 485,000 | | | | 271,217 | | |
Series R
6.550%, due 11/15/34 | | | 2,210,000 | | | | 1,175,508 | | |
NRG Energy, Inc.
7.250%, due 02/01/14 | | | 1,830,000 | | | | 1,797,975 | | |
| 8.500%, due 06/15/19 | | | 295,000 | | | | 290,206 | | |
| | | | 6,050,132 | | |
| Electric-generation—0.54% | |
Intergen NV
8.500%, due 06/30/17 | | EUR | 205,000 | | | | 286,343 | | |
| 9.500%, due 06/30/17 | | GBP | 340,000 | | | | 550,914 | | |
| | | | 837,257 | | |
92
UBS PACE Select Advisors Trust
UBS PACE High Yield Investments
Portfolio of investments—July 31, 2009
| Security description | | Face
amount1 | | Value | |
| Corporate bonds—(continued) | |
| Electronics—0.38% | |
SGL Carbon SE
2.531%, due 05/15/157 | | EUR | 500,000 | | | $ | 593,281 | | |
UCAR Finance, Inc.
10.250%, due 02/15/12 | | | 6,000 | | | | 5,850 | | |
| | | | 599,131 | | |
| Finance-captive automotive—2.64% | |
FCE Bank PLC
7.125%, due 01/15/13 | | EUR | 800,000 | | | | 997,710 | | |
Ford Motor Credit Co.
7.000%, due 10/01/13 | | | 755,000 | | | | 675,127 | | |
Ford Motor Credit Co. LLC
8.000%, due 12/15/16 | | | 2,332,000 | | | | 2,090,223 | | |
GMAC Canada Ltd.
6.000%, due 05/23/12 | | EUR | 300,000 | | | | 359,175 | | |
| | | | 4,122,235 | | |
| Finance-noncaptive consumer—0.93% | |
CIT Group, Inc.
5.400%, due 02/13/122 | | | 475,000 | | | | 260,554 | | |
| 5.500%, due 12/20/16 | | GBP | 500,000 | | | | 375,851 | | |
| 5.600%, due 04/27/112 | | | 455,000 | | | | 256,303 | | |
| 5.800%, due 07/28/112 | | | 1,005,000 | | | | 566,279 | | |
| | | | 1,458,987 | | |
| Finance-other—4.08% | |
American General Finance Corp.,
Series H
4.000%, due 03/15/11 | | | 910,000 | | | | 639,084 | | |
| 5.375%, due 10/01/12 | | | 175,000 | | | | 112,326 | | |
Series J
5.200%, due 12/15/11 | | | 865,000 | | | | 580,473 | | |
American Real Estate
Partners Finance
7.125%, due 02/15/132 | | | 1,460,000 | | | | 1,354,150 | | |
American Real Estate Partners LP
4.000%, due 08/15/136,7 | | | 230,000 | | | | 167,900 | | |
FMG Finance Pty Ltd.
9.750%, due 09/01/13 | | EUR | 725,000 | | | | 971,342 | | |
| 10.000%, due 09/01/136 | | | 650,000 | | | | 665,437 | | |
| 10.625%, due 09/01/166 | | | 685,000 | | | | 707,262 | | |
KAR Holdings, Inc.
10.000%, due 05/01/15 | | | 1,340,000 | | | | 1,179,200 | | |
| | | | 6,377,174 | | |
| Financial services—0.71% | |
Bear Stearns Cos., Inc.
11.000%, due 02/02/174,10,11 | | | 320,000 | | | | 310,400 | | |
HSBC Finance Capital Trust IX
5.911%, due 11/30/354 | | | 1,450,000 | | | | 797,500 | | |
| | | | 1,107,900 | | |
| Security description | | Face
amount1 | | Value | |
| Corporate bonds—(continued) | |
| Food—1.43% | |
Land O'Lakes Capital Trust I
7.450%, due 03/15/286 | | $ | 785,000 | | | $ | 628,000 | | |
Smithfield Foods, Inc.
7.000%, due 08/01/11 | | | 1,695,000 | | | | 1,610,250 | | |
| | | | 2,238,250 | | |
| Gaming—5.64% | |
Harrah's Operating Co., Inc.
10.000%, due 12/15/186 | | | 250,000 | | | | 175,000 | | |
| 10.000%, due 12/15/182,6 | | | 329,000 | | | | 230,300 | | |
| 10.750%, due 02/01/16 | | | 1,435,000 | | | | 921,987 | | |
Isle of Capri Casinos
7.000%, due 03/01/142 | | | 765,000 | | | | 673,200 | | |
Mandalay Resort Group
6.375%, due 12/15/11 | | | 790,000 | | | | 608,300 | | |
MGM Mirage, Inc.
5.875%, due 02/27/142 | | | 395,000 | | | | 284,400 | | |
| 6.625%, due 07/15/152 | | | 790,000 | | | | 572,750 | | |
| 7.500%, due 06/01/162 | | | 1,195,000 | | | | 872,350 | | |
Mohegan Tribal Gaming
6.125%, due 02/15/132 | | | 1,475,000 | | | | 1,209,500 | | |
| 8.000%, due 04/01/122 | | | 240,000 | | | | 196,800 | | |
Pinnacle Entertainment, Inc.
7.500%, due 06/15/152 | | | 1,060,000 | | | | 940,750 | | |
River Rock Entertainment
9.750%, due 11/01/11 | | | 830,000 | | | | 632,875 | | |
Station Casinos
6.000%, due 04/01/122,3 | | | 575,000 | | | | 172,500 | | |
Wynn Las Vegas LLC Corp.
6.625%, due 12/01/142 | | | 1,440,000 | | | | 1,335,600 | | |
| | | | 8,826,312 | | |
| Health care providers & services—1.83% | |
HCA, Inc.
6.500%, due 02/15/162 | | | 3,165,000 | | | | 2,808,937 | | |
| 9.250%, due 11/15/16 | | | 55,000 | | | | 57,338 | | |
| | | | 2,866,275 | | |
| Hotels, restaurants & leisure—0.61% | |
Royal Caribbean Cruises Ltd.
5.625%, due 01/27/14 | | EUR | 575,000 | | | | 635,149 | | |
TUI AG
5.125%, due 12/10/12 | | EUR | 380,000 | | | | 324,968 | | |
| | | | 960,117 | | |
| Insurance—0.59% | |
Liberty Mutual Group
7.800%, due 03/15/376 | | | 1,375,000 | | | | 921,250 | | |
| Machinery—1.00% | |
AGCO Corp.
6.875%, due 04/15/14 | | EUR | 300,000 | | | | 395,521 | | |
Terex Corp.
7.375%, due 01/15/142 | | | 1,220,000 | | | | 1,162,050 | | |
| | | | 1,557,571 | | |
93
UBS PACE Select Advisors Trust
UBS PACE High Yield Investments
Portfolio of investments—July 31, 2009
| Security description | | Face
amount1 | | Value | |
| Corporate bonds—(continued) | |
| Machinery-agriculture & construction—0.37% | |
Case Corp.
7.250%, due 01/15/16 | | $ | 625,000 | | | $ | 579,688 | | |
| Manufacturing-diversified—2.77% | |
American Railcar Industries, Inc.
7.500%, due 03/01/14 | | | 1,135,000 | | | | 1,038,525 | | |
Bombardier, Inc.
7.250%, due 11/15/16 | | EUR | 750,000 | | | | 962,077 | | |
RBS Global & Rexnord Corp.
9.500%, due 08/01/14 | | | 1,590,000 | | | | 1,383,300 | | |
SPX Corp.
7.625%, due 12/15/14 | | | 955,000 | | | | 950,225 | | |
| | | | 4,334,127 | | |
| Media—1.06% | |
Lamar Media Corp.
6.625%, due 08/15/152 | | | 285,000 | | | | 250,800 | | |
| 7.250%, due 01/01/132 | | | 1,135,000 | | | | 1,095,275 | | |
Series C,
6.625%, due 08/15/15 | | | 105,000 | | | | 90,300 | | |
Lighthouse International Co. SA
8.000%, due 04/30/14 | | EUR | 275,000 | | | | 215,577 | | |
| | | | 1,651,952 | | |
| Medical products—0.78% | |
Bausch & Lomb, Inc.
9.875%, due 11/01/152 | | | 1,215,000 | | | | 1,211,963 | | |
| Metals—2.54% | |
Century Aluminum Co.
7.500%, due 08/15/14 | | | 2,315,000 | | | | 1,684,162 | | |
Novelis, Inc.
7.250%, due 02/15/15 | | | 2,670,000 | | | | 2,176,050 | | |
RathGibson, Inc.
11.250%, due 02/15/142,3 | | | 335,000 | | | | 118,925 | | |
| | | | 3,979,137 | | |
| Metals & mining—3.33% | |
Arch Western Finance
6.750%, due 07/01/13 | | | 1,835,000 | | | | 1,779,950 | | |
Foundation PA Coal Co.
7.250%, due 08/01/14 | | | 1,160,000 | | | | 1,160,000 | | |
Freeport-McMoRan
Copper & Gold, Inc.
8.250%, due 04/01/15 | | | 140,000 | | | | 148,050 | | |
| 8.375%, due 04/01/17 | | | 535,000 | | | | 567,100 | | |
Massey Energy Co.
6.875%, due 12/15/13 | | | 1,065,000 | | | | 1,027,725 | | |
Teck Resources Ltd.
10.250%, due 05/15/166 | | | 155,000 | | | | 175,537 | | |
| 10.750%, due 05/15/196 | | | 305,000 | | | | 354,944 | | |
| | | | 5,213,306 | | |
| Security description | | Face
amount1 | | Value | |
| Corporate bonds—(continued) | |
| Oil & gas—11.72% | |
Chesapeake Energy Corp.
6.250%, due 01/15/17 | | EUR | 515,000 | | | $ | 660,626 | | |
| 6.375%, due 06/15/152 | | | 2,240,000 | | | | 2,088,800 | | |
| 7.500%, due 09/15/13 | | | 595,000 | | | | 592,025 | | |
| 7.500%, due 06/15/14 | | | 515,000 | | | | 508,562 | | |
Compton Petroleum
Finance Corp.
7.625%, due 12/01/13 | | $ | 1,150,000 | | | | 750,375 | | |
Delta Petroleum Corp.
7.000%, due 04/01/15 | | | 1,490,000 | | | | 812,050 | | |
Denbury Resources, Inc.
7.500%, due 12/15/15 | | | 1,040,000 | | | | 1,029,600 | | |
El Paso Corp.
6.875%, due 06/15/14 | | | 2,055,000 | | | | 2,031,144 | | |
Forest Oil Corp.
8.000%, due 12/15/11 | | | 140,000 | | | | 142,800 | | |
Hilcorp Energy Co.
9.000%, due 06/01/166 | | | 510,000 | | | | 469,200 | | |
Inergy LP
6.875%, due 12/15/14 | | | 1,475,000 | | | | 1,393,875 | | |
Linn Energy LLC
9.875%, due 07/01/18 | | | 990,000 | | | | 930,600 | | |
Markwest Energy Partners
8.500%, due 07/15/16 | | | 975,000 | | | | 901,875 | | |
Pacific Energy Partners
6.250%, due 09/15/15 | | | 65,000 | | | | 68,166 | | |
Range Resources Corp.
7.375%, due 07/15/13 | | | 1,350,000 | | | | 1,343,250 | | |
Regency Energy Partners
8.375%, due 12/15/13 | | | 1,198,000 | | | | 1,203,990 | | |
Swift Energy Co.
7.625%, due 07/15/11 | | | 775,000 | | | | 759,500 | | |
Targa Resources, Inc.
8.500%, due 11/01/13 | | | 820,000 | | | | 729,800 | | |
Targa Resources Partners
8.250%, due 07/01/16 | | | 445,000 | | | | 394,938 | | |
Tenaska Alabama Partners
7.000%, due 06/30/216 | | | 237,876 | | | | 205,287 | | |
Williams Partners LP
7.500%, due 06/15/112 | | | 1,270,000 | | | | 1,308,100 | | |
| | | | 18,324,563 | | |
| Oil refining—1.91% | |
Frontier Oil Corp.
6.625%, due 10/01/11 | | | 145,000 | | | | 145,725 | | |
Petroplus Finance Ltd.
6.750%, due 05/01/146 | | | 1,050,000 | | | | 934,500 | | |
Tesoro Corp.
6.250%, due 11/01/12 | | | 1,835,000 | | | | 1,770,775 | | |
| 6.500%, due 06/01/172 | | | 160,000 | | | | 140,000 | | |
| | | | 2,991,000 | | |
94
UBS PACE Select Advisors Trust
UBS PACE High Yield Investments
Portfolio of investments—July 31, 2009
| Security description | | Face
amount1 | | Value | |
| Corporate bonds—(continued) | |
| Oil services—2.69% | |
Basic Energy Services
7.125%, due 04/15/16 | | $ | 1,115,000 | | | $ | 791,650 | | |
CIE Generale de Geophysique
7.500%, due 05/15/15 | | | 1,270,000 | | | | 1,219,200 | | |
Helix Energy Solutions
9.500%, due 01/15/166 | | | 1,005,000 | | | | 924,600 | | |
Hornbeck Offshore Services,
Series B
6.125%, due 12/01/14 | | | 1,375,000 | | | | 1,278,750 | | |
| | | | 4,214,200 | | |
| Paper & forest products—1.00% | |
Boise Cascade LLC
7.125%, due 10/15/14 | | | 1,105,000 | | | | 712,725 | | |
Domtar Corp.
10.750%, due 06/01/17 | | | 375,000 | | | | 380,625 | | |
Norske Skogindustrier ASA
7.000%, due 06/26/17 | | EUR | 550,000 | | | | 468,389 | | |
| | | | 1,561,739 | | |
| Publishing—0.09% | |
R.H. Donnelley, Inc.
11.750%, due 05/15/153,6 | | | 257,000 | | | | 133,640 | | |
| Railroads—0.64% | |
RailAmerica, Inc.
9.250%, due 07/01/176 | | | 965,000 | | | | 993,950 | | |
| Retail—0.67% | |
Neiman Marcus Group, Inc.
9.000%, due 10/15/152,9 | | | 1,408,375 | | | | 1,042,198 | | |
| Special purpose entity—1.02% | |
Argon Capital PLC
8.162%, due 10/05/124,5 | | GBP | 750,000 | | | | 463,613 | | |
Barry Callebaut Services NV
6.000%, due 07/13/17 | | EUR | 340,000 | | | | 450,680 | | |
Glencore Finance Europe
6.500%, due 02/27/19 | | GBP | 500,000 | | | | 683,197 | | |
| | | | 1,597,490 | | |
| Steel—1.63% | |
California Steel Industries
6.125%, due 03/15/14 | | | 1,280,000 | | | | 1,139,200 | | |
US Steel Corp.
5.650%, due 06/01/13 | | | 300,000 | | | | 284,826 | | |
| 7.000%, due 02/01/18 | | | 1,170,000 | | | | 1,118,928 | | |
| | | | 2,542,954 | | |
| Telecommunication services—2.15% | |
Nordic Telephone Co. Holdings
6.872%, due 05/01/167 | | EUR | 535,000 | | | | 728,221 | | |
| 8.875%, due 05/01/166 | | | 705,000 | | | | 715,575 | | |
Softbank Corp.
7.750%, due 10/15/13 | | EUR | 1,450,000 | | | | 1,922,016 | | |
| | | | 3,365,812 | | |
| Security description | | Face
amount1 | | Value | |
| Corporate bonds—(concluded) | |
| Telephone-integrated—1.34% | |
Frontier Communications Corp.
7.000%, due 11/01/25 | | $ | 540,000 | | | $ | 402,300 | | |
| 7.050%, due 10/01/46 | | | 905,000 | | | | 628,975 | | |
Virgin Media Finance PLC
9.500%, due 08/15/16 | | EUR | 700,000 | | | | 960,295 | | |
| 9.750%, due 04/15/14 | | GBP | 50,000 | | | | 83,105 | | |
Windstream Holdings Midwest
6.750%, due 04/01/28 | | | 40,000 | | | | 27,658 | | |
| | | | 2,102,333 | | |
| Transportation services—1.15% | |
Bristow Group, Inc.
6.125%, due 06/15/13 | | | 1,147,000 | | | | 1,072,445 | | |
PHI, Inc.
7.125%, due 04/15/13 | | | 805,000 | | | | 730,537 | | |
| | | | 1,802,982 | | |
| Wireless telecommunication services—0.29% | |
Crown Castle International Corp.
9.000%, due 01/15/15 | | | 430,000 | | | | 454,188 | | |
Total corporate bonds
(cost—$142,526,034) | | | | | | | 141,069,096 | | |
| Loan assignments7—7.36% | |
| Biotechnology—0.13% | |
Invitrogen Term Loan
5.250%, due 06/11/15 | | | 198,125 | | | | 199,447 | | |
| Cable—0.57% | |
Charter Communications
Operating LLC Term Loan B
6.250%, due 04/27/11 | | | 731,349 | | | | 669,279 | | |
| 6.250%, due 04/27/11 | | | 238,114 | | | | 217,905 | | |
| | | | 887,184 | | |
| Chemicals—0.65% | |
Lyondell Bassell Term Loan
13.000%, due 06/12/14 | | | 222,932 | | | | 230,581 | | |
Lyondell Bassell Term Loan B2
3.786%, due 05/22/15 | | | 905,378 | | | | 390,851 | | |
| 5.814%, due 12/22/14 | | | 334,017 | | | | 281,229 | | |
| 5.990%, due 12/20/14 | | | 111,415 | | | | 115,237 | | |
| | | | 1,017,898 | | |
| Commercial services—0.75% | |
Aramark Term Loan
2.473%, due 01/26/14 | | | 263,666 | | | | 249,906 | | |
| 2.473%, due 01/30/14 | | | 450,223 | | | | 426,726 | | |
Aramark Term Loan B
2.025%, due 01/17/14 | | | 28,603 | | | | 27,110 | | |
| 2.025%, due 01/26/14 | | | 45,353 | | | | 42,986 | | |
| 2.473%, due 01/26/14 | | | 450,224 | | | | 426,727 | | |
| | | | 1,173,455 | | |
| Computer software & services—1.15% | |
Sungard Term Loan B
2.724%, due 02/28/14 | | | 1,093,630 | | | | 1,048,244 | | |
95
UBS PACE Select Advisors Trust
UBS PACE High Yield Investments
Portfolio of investments—July 31, 2009
| Security description | | Face
amount1 | | Value | |
| Loan assignments7—(concluded) | |
| Computer software & services—(concluded) | |
| 3.921%, due 02/28/14 | | $ | 782,319 | | | $ | 749,853 | | |
| | | | 1,798,097 | | |
| Defense/aerospace—0.48% | |
Hawker Beechcraft Acquisition
Co. Term Loan
2.598%, due 03/26/14 | | | 60,863 | | | | 41,920 | | |
Hawker Beechcraft Term Loan
2.285%, due 03/26/14 | | | 342,045 | | | | 235,583 | | |
| 2.285%, due 03/26/14 | | | 689,180 | | | | 474,673 | | |
| | | | 752,176 | | |
| Energy equipment & services—0.62% | |
Precision Drilling Term Loan
9.250%, due 09/30/14 | | | 975,000 | | | | 975,000 | | |
| Machinery—0.46% | |
Charter Per Loan
6.250%, due 04/30/14 | | | 119,482 | | | | 109,342 | | |
Manitowoc Term Loan B
7.500%, due 04/14/14 | | | 680,000 | | | | 611,578 | | |
| | | | 720,920 | | |
| Metals—0.55% | |
Aleris International Term Loan
4.250%, due 02/12/10 | | | 356,095 | | | | 213,657 | | |
| 4.250%, due 12/19/13 | | | 518,945 | | | | 171,252 | | |
| 4.250%, due 02/12/15 | | | 255,431 | | | | 16,176 | | |
| 13.000%, due 02/12/10 | | | 140,604 | | | | 136,854 | | |
| 13.000%, due 12/19/13 | | | 46,868 | | | | 45,617 | | |
Aleris Term Loan
13.000%, due 02/12/10 | | | 281,208 | | | | 273,709 | | |
| | | | 857,265 | | |
| Paper & packaging—0.85% | |
Georgia Pacific Corp. Term Loan
2.339%, due 12/23/13 | | | 40,179 | | | | 38,801 | | |
| 2.650%, due 12/23/13 | | | 350,749 | | | | 338,722 | | |
Georgia Pacific First Lien B Term
Loan B
2.464%, due 02/15/14 | | | 58,880 | | | | 56,861 | | |
Georgia Pacific Term Loan A
2.650%, due 12/23/10 | | | 923,020 | | | | 891,370 | | |
| | | | 1,325,754 | | |
| Printing & publishing—0.62% | |
Quebecor World Color
Term Loan
9.000%, due 07/21/12 | | | 1,000,000 | | | | 970,000 | | |
| Wireless telecommunication services—0.53% | |
MetroPCS Term Loan
2.688%, due 11/15/13 | | | 309,478 | | | | 295,800 | | |
| 3.438%, due 11/15/13 | | | 556,616 | | | | 532,013 | | |
| | | | 827,813 | | |
Total loan assignments
(cost—$12,172,502) | | | | | | | 11,505,009 | | |
| Security description | | Face
amount1 | | Value | |
| Collateralized mortgage obligation—0.94% | |
| Financial services—0.94% | |
Countrywide Alternative Loan
Trust, Series 2006-OC6,
Class 2A1
0.355%, due 07/25/367
(cost—$1,495,237) | | $ | 1,728,597 | | | $ | 1,473,508 | | |
| Asset-backed security—0.41% | |
| Commercial services—0.41% | |
Rutland Rated Investments,
Series DRYD-1A, Class A1AL
0.959%, due 06/20/137,10,11
(cost—$1,053,654) | | | 1,440,000 | | | | 636,437 | | |
| | | Number of
shares | | | |
| Common stock—0.27% | |
| Diversified financial services—0.27% | |
Citigroup, Inc.2
(cost—$222,447) | | | 131,538 | | | | 416,977 | | |
| | | Face
amount1 | | | |
| Repurchase agreement—1.44% | |
Repurchase agreement dated
07/31/09 with State Street
Bank & Trust Co., 0.010%
due 08/03/09, collateralized
by $2,307,566 US Treasury
Bills, zero coupon due
08/27/09 to 09/10/09;
(value—$2,307,335);
proceeds: $2,262,002
(cost—$2,262,000) | | $ | 2,262,000 | | | | 2,262,000 | | |
| | | Number of
shares | | | |
| Investment of cash collateral from securities loaned—13.92% | |
| Money market fund—13.92% | |
UBS Private Money Market
Fund LLC12
(cost—$21,770,202) | | | 21,770,202 | | | | 21,770,202 | | |
Total investments
(cost—$181,502,076)—
114.54% | | | | | | | 179,133,229 | | |
Liabilities in excess of other
assets—(14.54)% | | | | | | | (22,740,038 | ) | |
| Net assets—100.00% | | | | | | $ | 156,393,191 | | |
96
UBS PACE Select Advisors Trust
UBS PACE High Yield Investments
Portfolio of investments—July 31, 2009
Aggregate cost for federal income tax purposes was $182,123,138; and net unrealized depreciation consisted of:
| Gross unrealized appreciation | | $ | 10,061,000 | | |
| Gross unrealized depreciation | | | (13,050,909 | ) | |
| Net unrealized depreciation | | $ | (2,989,909 | ) | |
1 In US Dollars unless otherwise indicated.
2 Security, or portion thereof, was on loan at July 31, 2009.
3 Bond interest in default.
4 Variable rate security. The interest rate shown is the current rate as of July 31, 2009, and resets periodically.
5 Perpetual bond security. The maturity date reflects the next call date.
6 Security exempt from registration under Rule 144A of the Securities Act of 1933. These securities, which represent 6.43% of net assets as of July 31, 2009, are considered liquid and may be resold in transactions exempt from registration, normally to qualified institutional buyers.
7 Floating rate security. The interest rate shown is the current rate as of July 31, 2009.
8 Denotes a step-up bond that converts to the noted fixed rate at a designated future date.
9 Payment-in-kind security for which part of the income earned may be paid as additional principal.
10 Illiquid securities representing 0.61% of net assets as of July 31, 2009.
11 Security exempt from registration under Rule 144A of the Securities Act of 1933. These securities, which represent 0.61% of net assets as of July 31, 2009, are considered illiquid and restricted (see table below for more information).
| Illiquid and restricted securities | | Acquisition
dates | | Acquisition
cost | | Acquisition cost
as a percentage
of net assets | | Value at
07/31/09 | | Value as a
percentage
of net assets | |
Bear Stearns Cos., Inc.
11.000%, 02/02/17 | | 02/01/07 | | $ | 318,400 | | | | 0.20 | % | | $ | 310,400 | | | | 0.20 | % | |
Rutland Rated Investments,
Series DRYD-1A, Class A1AL
0.959%, 06/20/13 | | 03/19/08 | | | 951,094 | | | | 0.61 | | | | 636,437 | | | | 0.41 | | |
| | | | | $ | 1,269,494 | | | | 0.81 | % | | $ | 946,837 | | | | 0.61 | % | |
12 The table below details the Portfolio's transaction activity in an affiliated issuer during the year ended July 31, 2009.
| Security description | | Value at
07/31/08 | | Purchases
during the
year ended
07/31/09 | | Sales
during the
year ended
07/31/09 | | Value at
07/31/09 | | Net income
earned from
affiliate for the
year ended
07/31/09 | |
| UBS Private Money Market Fund LLC | | $ | 296,274 | | | $ | 86,323,152 | | | $ | 64,849,224 | | | $ | 21,770,202 | | | $ | 75,752 | | |
EUR Euro
GBP Great Britain Pound
GMAC General Motors Acceptance Corporation
Forward foreign currency contract
| | | Contracts to
deliver | | In
exchange for | | Maturity
date | | Unrealized
depreciation | |
| Euro | | | 13,000,000 | | | USD | 18,292,040 | | | | 08/06/09 | | | $ | (236,935 | ) | |
Currency type abbreviation:
USD United States Dollar
97
UBS PACE Select Advisors Trust
UBS PACE High Yield Investments
Portfolio of investments—July 31, 2009
The following is a summary of the fair valuations according to the inputs used as of July 31, 2009 in valuing the Portfolio's investments:
| Measurements at 07/31/09 | |
| | | Quoted prices in
active markets for
identical investments
(Level 1) | | Significant other
observable inputs
(Level 2) | | Unobservable
inputs
(Level 3) | | Total | |
| Corporate bonds | | $ | — | | | $ | 141,069,096 | | | $ | — | | | $ | 141,069,096 | | |
| Loan assignments | | | — | | | | 11,505,009 | | | | — | | | | 11,505,009 | | |
| Collateralized mortgage obligation | | | — | | | | 1,473,508 | | | | — | | | | 1,473,508 | | |
| Asset-backed security | | | — | | | | — | | | | 636,437 | | | | 636,437 | | |
| Common stock | | | 416,977 | | | | — | | | | — | | | | 416,977 | | |
| Repurchase agreement | | | — | | | | 2,262,000 | | | | — | | | | 2,262,000 | | |
Investment of cash collateral from
securities loaned | | | — | | | | 21,770,202 | | | | — | | | | 21,770,202 | | |
| Other financial instruments, net13 | | | — | | | | (236,935 | ) | | | — | | | | (236,935 | ) | |
| Total | | $ | 416,977 | | | $ | 177,842,880 | | | $ | 636,437 | | | $ | 178,896,294 | | |
13 Other financial instruments include forward foreign currency contracts.
The following is a rollforward of the Portfolio's investment that was valued using unobservable inputs (Level 3) for the period:
| Measurements at 07/31/09 | |
| | | Asset-backed
security | |
| Beginning balance | | $ | — | | |
| Net purchases/(sales) | | | — | | |
| Accrued discounts/(premiums) | | | 72,317 | | |
| Total realized gain/(loss) | | | — | | |
| Total unrealized appreciation/(depreciation) | | | (133,830 | ) | |
| Net transfers in/(out) of Level 3 | | | 697,950 | | |
| Ending balance | | $ | 636,437 | | |
The change in unrealized appreciation/(depreciation) relating to the Level 3 investment held at July 31, 2009 was $(133,830).
98
UBS PACE Select Advisors Trust
UBS PACE High Yield Investments
Portfolio of investments—July 31, 2009
Issuer breakdown by country or territory of origin (unaudited)
| | | Percentage of
total investments | |
| United States | | | 84.6 | % | |
| Canada | | | 2.7 | | |
| United Kingdom | | | 2.2 | | |
| Netherlands | | | 1.5 | | |
| Germany | | | 1.4 | | |
| Australia | | | 1.3 | | |
| France | | | 1.2 | | |
| Japan | | | 1.1 | | |
| Denmark | | | 0.8 | | |
| Bermuda | | | 0.6 | | |
| Luxembourg | | | 0.5 | | |
| Sweden | | | 0.4 | | |
| Cayman Islands | | | 0.4 | | |
| Liberia | | | 0.4 | | |
| Norway | | | 0.3 | | |
| Ireland | | | 0.3 | | |
| Belgium | | | 0.3 | | |
| Total | | | 100.0 | % | |
See accompanying notes to financial statements.
99
UBS PACE Select Advisors Trust
UBS PACE Large Co Value Equity Investments
Performance
For the 12 months ended July 31, 2009, the Portfolio's Class P shares declined 19.01% (before the deduction of the maximum UBS PACE Select program fee; after the deduction of the maximum UBS PACE Select program fee, the Portfolio declined 20.22%). In comparison, the Russell 1000 Value Index (the "benchmark") declined 22.94%, and the Lipper Large-Cap Value Funds category posted a median decline of 20.75%. (Returns for all share classes over various time periods are shown in the "Performance at a glance" table on page 105. Please note that the returns shown do not reflect the deduction of taxes that a shareholder would pay on Portfolio distributions or the redemption of Portfolio shares.) For a detailed commentary on the market environment in general during the reporting period, please refer to page two.
Sub-Advisors' comments
ICAP
Our portion of the Portfolio outperformed the benchmark during the reporting period, with stock selection and sector allocations benefiting performance for the reporting period overall.
Stock selection in the health care sector was the biggest driver of our portion of the Portfolio's relative performance. Our strategy is focused on diversified health care companies with little exposure to generic competition, which helped us to select a number of the best performers in the sector.
Our portion of the Portfolio had an overweight to the technology sector during the period, which was the second-largest contributor to outperformance. Within technology, we were able to find companies that had strong balance sheets and solid cash flow. This included QUALCOMM, Inc., which had a strong balance sheet with no debt and $13 billion in cash, and we sold the position from our portion of the Portfolio, taking gains during the reporting period. Intel Corp. also had a strong balance sheet and a significant amount of cash, and we held the stock as we believed that the company's margins would recover as a result of facility restructuring.
Other top contributors for the reporting period included Wyeth, Schering-Plough Corp., Total SA and Occidental Petroleum Corp. Total SA has consistently generated some of the best growth in the industry, and we believe
UBS PACE Select Advisors Trust – UBS PACE Large Co Value Equity Investments
Investment Sub-Advisors:
Institutional Capital LLC ("ICAP"), Westwood Management Corp. ("Westwood") and Pzena Investment Management, LLC ("Pzena")
Portfolio Managers:
ICAP: Jerrold Senser and Thomas Wenzel;
Westwood: Susan M. Byrne;
Pzena: Richard S. Pzena, John P. Goetz and Antonio DeSpirito, III
Objective:
Capital appreciation and dividend income
Investment process:
ICAP uses its proprietary valuation model to identify large capitalization companies that it believes offer the best relative values because they sell below the price-to-earnings ratio warranted by their prospects. ICAP looks for companies where there is a catalyst for positive change with potential to produce stock appreciation of 15% or more relative to the market over a 12- to 18-month period.
ICAP also uses internally generated research to evaluate the financial condition and business prospects of every company it considers. ICAP monitors each stock purchased and sells the stock when its target price is achieved, the catalyst becomes inoperative, or ICAP identifies another stock with greater opportunity for appreciation.
Westwood utilizes a value style of investing in which it chooses common stocks it believes are currently undervalued.
Other key metrics it considers are return on equity, debt/equity ratio and, in the case of
(continued on next page)
100
UBS PACE Select Advisors Trust
UBS PACE Large Co Value Equity Investments
Sub-Advisors' comments – continued
that its successful and timely start of projects will benefit the company. We felt that Occidental Petroleum Corp., with a track record of generating best-in-class capital returns, deserved to trade at a premium to its peers.
The largest detractors from performance included stocks in the communications and basic industries sectors. Our portion of the Portfolio's weighting in consumer services also detracted from relative performance. The largest individual detractors from performance during the reporting period included Capital One Financial Corp. as well as Johnson & Johnson, News Corp., Bank of America Corp. and Vodafone Group plc, the last four of which were sold from our portion of the Portfolio during the period. Bank of America Corp. was added as we thought it would benefit from recent acquisitions, which would, in turn, enhance long-term earnings growth. However, higher-than-expected credit costs led to capital impairment, and we eliminated the position. In the case of News Corp., we believed that improvement in cable networks ratings and affiliate fee growth were likely to provide earnings growth, but the company's exposure to old media o verwhelmed the growth divisions, and we sold News Corp. from our portion of the Portfolio.
Westwood
Our portion of the Portfolio underperformed the benchmark during the reporting period. A high degree of risk aversion during the first half of the reporting period benefited performance as we held high-quality securities with strong fundamentals. However, our portion of the Portfolio's performance relative to the benchmark was hindered in the second half of the reporting period as an increase in risk appetite led to strong performance for low-quality, higher-risk securities, which hurt performance overall.
During the reporting period as a whole, our portion of the Portfolio's performance relative to the benchmark was hindered by security selection in the energy, consumer discretionary, financial services and materials and processing sectors. Within energy, our portion of the Portfolio's holdings were impacted as crude oil fell from over $140 per barrel. In addition, underweights to Exxon Mobil Corp. and Chevron Corp. hindered results.
Our portion of the Portfolio's exposure to the consumer discretionary sector was heavily impacted by the low-quality, higher-risk rally during the second half of the reporting period, when lower-quality stocks posted their largest gains. More defensive holdings, such as Wal-Mart Stores, Inc., also underperformed given the market's preference for aggressive stocks during this time. Within financial services, security selection helped performance during the first half of the reporting period. During this time, investor risk aversion led to the outperformance of high-quality banks and other financial service companies outside the banking industry.
Later in the reporting period, however, securities such as State Street Corp. and Bank of America Corp.—both of which were sold from our portion of the Portfolio during the period—and PNC Financial Services Group, Inc.
Investment process (concluded)
common equities, positive earnings surprises without a corresponding increase in Wall Street estimates.
Westwood has disciplines in place that serve as sell signals, such as a security reaching a pre-determined price target or a change to a company's fundamentals that negatively impacts the original investment thesis.
Pzena follows a disciplined investment process to implement its value philosophy, focusing exclusively on companies that are underperforming their historically demonstrated earnings power. Pzena applies intensive fundamental research to these companies in an effort to determine whether the problems that caused the earnings shortfall are temporary or permanent. The research process incorporates perspectives on valuation, earnings, management strategy, and downside protection.
101
UBS PACE Select Advisors Trust
UBS PACE Large Co Value Equity Investments
Sub-Advisors' comments – continued
hindered performance as they either posted higher-than-expected credit losses or investors began to fear an increase in losses. Since March of 2009, large banks have outperformed on the heels of the government's stress test results and an increase in investor risk appetites. Our portion of the Portfolio's holdings in the materials and processing sector were impacted by poor performance from economically sensitive Freeport-McMoRan Copper & Gold, Inc. during the first half of the reporting period, before we eliminated the position.
On the upside, stock selection in the technology, producer durables and consumer staples sectors were strong performers. Within technology, a focus on large, stable, cash-generating securities aided results, as IBM Corp., EMC Corp., Oracle Corp. and Cisco Systems, Inc. all posted strong relative earnings results over the past 12 months. Holdings in the producer durables sector outperformed those in the benchmark, following strong performance by selected securities such as Union Pacific Corp. In addition, an underweight to poor performing General Electric Co., which we sold during the reporting period, benefited performance relative to the benchmark. Elsewhere, exposure to the consumer staples and utilities sectors was positive for performance following investors' flight to safety during the first half of the reporting period.
Pzena
Our portion of the Portfolio outperformed the benchmark during the reporting period, primarily due to stock selection.
The largest contributor to results was in the financial sector, as title insurance company Fidelity National Financial, Inc. performed well, acquiring the third-largest title insurer out of bankruptcy at what we believed to be a very good valuation. This acquisition has propelled the company to become the largest US title insurance company. The Federal Reserve Board's announcement in late 2008 that it would be purchasing mortgage-backed securities also benefited the stock. With Fidelity National Financial, Inc.'s revenue tied directly to mortgage activity, its shares moved higher, given investor optimism that increased refinancing will translate into margin expansion.
The largest detractor from performance was financial firm Citigroup, Inc. Its shares suffered from a combination of both industry and company-related news. The bank, in concert with many global financial names, was negatively impacted by massive asset write-downs.
Despite the recent strong rally, we believe that our portion of the Portfolio continues to be attractively valued. In areas such as health care, consumer discretionary and financials, we sold and trimmed positions among some of the strongest performers. The proceeds were then used to either purchase stocks that we believed were being overlooked, or to add to existing holdings that were lagging, but that we believed still had equally good business prospects compared to their faster-moving counterparts. These opportunities come from a diverse set of economic sectors, and we believe that they are all attractive franchises with healthy balance sheets.
102
UBS PACE Select Advisors Trust
UBS PACE Large Co Value Equity Investments
Sub-Advisors' comments – concluded
While valuations no longer reflect concerns over the risk of another "Great Depression," we believe that they continue to discount extremely depressed fundamentals. We believe that the road to recovery is winding and that stock prices will likely remain volatile, and that our portion of the Portfolio could be well-positioned to benefit when global economic conditions normalize.
Special considerations
The Portfolio may be appropriate for long-term investors seeking capital appreciation who are able to withstand short-term fluctuations in the equity markets in return for potentially higher returns over the long term. The value of the Portfolio changes every day and can be affected by changes in interest rates, general market conditions and other political, social and economic developments, as well as specific matters relating to the companies in whose securities the Portfolio invests. It is important to note that an investment in the Portfolio is only one component of a balanced investment plan.
103
UBS PACE Select Advisors Trust
UBS PACE Large Co Value Equity Investments
Comparison of change in value of a $10,000 investment in the Class P shares of the Portfolio and the Russell 1000 Value Index (unaudited)
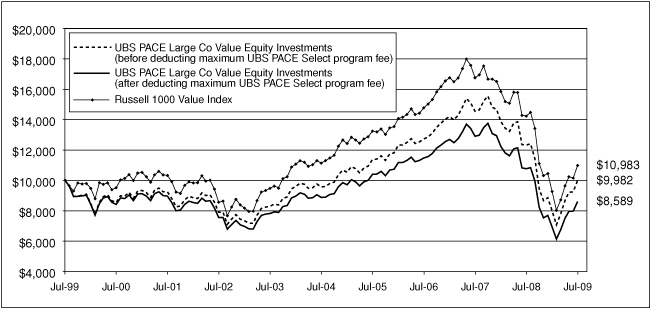
The graph depicts the performance of UBS PACE Large Co Value Equity Investments Class P shares versus the Russell 1000 Value Index over the 10 years ended July 31, 2009. The performance of the other classes will vary from the performance of the class shown based on the difference in sales charges and fees paid by shareholders investing in different share classes. Past performance does not predict future performance and the performance provided does not reflect the deduction of taxes that a shareholder would pay on Portfolio distributions or the redemption of Portfolio shares. It is important to note that UBS PACE Large Co Value Equity Investments is a professionally managed portfolio while the Index is not available for investment and is unmanaged. The comparison is shown for illustrative purposes only.
104
UBS PACE Select Advisors Trust
UBS PACE Large Co Value Equity Investments
Performance at a glance (unaudited)
| Average annual total returns for periods ended 07/31/09 | | 1 year | | 5 years | | 10 years | | Since
inception1 | |
| Before deducting | | Class A2 | | | (19.27 | )% | | | 0.62 | % | | N/A | | | 1.18 | % | |
| maximum sales charge | | Class B3 | | | (19.92 | )% | | | (0.25 | )% | | N/A | | | 0.62 | % | |
| or UBS PACE Select | | Class C4 | | | (19.89 | )% | | | (0.16 | )% | | N/A | | | 0.41 | % | |
| program fee | | Class Y5 | | | (18.93 | )% | | | 0.98 | % | | N/A | | | 1.27 | % | |
| | | Class P6 | | | (19.01 | )% | | | 0.87 | % | | | (0.02 | )% | | | 5.74 | % | |
| After deducting | | Class A2 | | | (23.71 | )% | | | (0.51 | )% | | N/A | | | 0.52 | % | |
| maximum sales charge | | Class B3 | | | (23.89 | )% | | | (0.56 | )% | | N/A | | | 0.62 | % | |
| or UBS PACE Select | | Class C4 | | | (20.68 | )% | | | (0.16 | )% | | N/A | | | 0.41 | % | |
| program fee | | Class P6 | | | (20.22 | )% | | | (0.63 | )% | | | (1.51 | )% | | | 4.16 | % | |
| Russell 1000 Value Index7 | | | (22.94 | )% | | | (0.29 | )% | | | 0.94 | % | | | 6.89 | % | |
| Lipper Large-Cap Value Funds median | | | (20.75 | )% | | | (0.50 | )% | | | 0.42 | % | | | 5.62 | % | |
Average annual total returns for periods ended June 30, 2009, after deduction of the maximum sales charge or UBS PACE Select program fee, were as follows: Class A—1-year period, (29.67)%; 5-year period, (2.43)%; since inception, (0.38)%; Class B—1-year period, (29.82)%; 5-year period, (2.47)%; since inception, (0.27)%; Class C—1-year period, (26.95)%; 5-year period, (2.10)%; since inception, (0.48)%; Class Y—1-year period, (25.27)%; 5-year period, (0.97)%; since inception, 0.35%; Class P—1-year period, (26.53)%; 5-year period, (2.56)%; 10-year period, (2.70)%; since inception, 3.61%.
The annualized gross and net expense ratios, respectively, for each class of shares as in the November 28, 2008 prospectuses, were as follows: Class A—1.15% and 1.15%; Class B—2.09% and 2.02%; Class C—1.94% and 1.94%; Class Y—0.82% and 0.82%; and Class P—0.91% and 0.91%. Net expenses reflect fee waivers and/or expense reimbursements, if any, pursuant to an agreement that is in effect to cap the expenses. The Portfolio and UBS Global AM have entered into a written fee waiver/expense reimbursement agreement pursuant to which UBS Global AM is contractually obligated to waive its management fees and/or reimburse the Portfolio so that the ordinary total operating expenses of each class through November 30, 2009 (excluding dividend expense, borrowing costs and interest expense, if any) would not exceed Class A—1.27%; Class B—2.02%; Class C—2.02%; Class Y—1.02% and Class P—1.02%. The Po rtfolio has agreed to repay UBS Global AM for any waived fees/reimbursed expenses to the extent that it can do so over the following three fiscal years without causing the Portfolio's expenses in any of those three years to exceed the expense caps described above.
1 Since inception returns are calculated as of commencement of issuance on August 24, 1995 for Class P shares, November 27, 2000 for Class A, B, and C shares and January 19, 2001 for Class Y shares. Since inception returns for the Index and Lipper median are shown as of August 31, 1995, which is the month-end after the inception date of the oldest share class (Class P).
2 Maximum sales charge for Class A shares is 5.5%. Class A shares bear ongoing 12b-1 service fees.
3 Maximum contingent deferred sales charge for Class B shares is 5% imposed on redemptions and is reduced to 0% after a maximum of six years. Class B shares bear ongoing 12b-1 service and distribution fees.
4 Maximum contingent deferred sales charge for Class C shares is 1% imposed on redemptions and is reduced to 0% after one year. Class C shares bear ongoing 12b-1 service and distribution fees.
5 The Portfolio offers Class Y shares to a limited group of eligible investors, including certain qualifying retirement plans. Class Y shares do not bear initial or contingent deferred sales charges or ongoing 12b-1 service and distribution fees.
6 Class P shares do not bear initial or contingent deferred sales charges or ongoing 12b-1 service and distribution fees, but are subject to a maximum annual UBS PACE Select program fee of 1.5% of the value of Class P shares.
7 The Russell 1000 Value Index measures the performance of a large universe of stocks with lower price-to-book ratios and lower forecasted growth rates. Investors should note that indices do not reflect the deduction of fees, expenses or taxes.
If an investor sells or exchanges shares less than 90 days after purchase, a redemption fee of 1.00% of the amount sold or exchanged will be deducted at the time of the transaction, except as noted otherwise in the prospectuses.
Past performance does not predict future performance, and the performance information provided does not reflect the deduction of taxes that a shareholder would pay on Portfolio distributions or the redemption of Portfolio shares. The return and principal value of an investment will fluctuate, so that an investor's shares, when redeemed, may be worth more or less than their original cost. Performance results assume reinvestment of all dividends and capital gain distributions at net asset value on the ex-dividend dates. Current performance may be higher or lower than the performance data quoted. For month-end performance figures, please visit http://www.ubs.com.
Lipper peer group data calculated by Lipper Inc.; used with permission. The Lipper median is the return of the fund that places in the middle of a Lipper peer group.
105
UBS PACE Select Advisors Trust
UBS PACE Large Co Value Equity Investments
Portfolio statistics (unaudited)
| Characteristics | | 07/31/09 | |
| Net assets (mm) | | $ | 1,006.7 | | |
| Number of holdings | | | 108 | | |
| Portfolio composition1 | | 07/31/09 | |
| Common stocks | | | 95.6 | % | |
| ADRs | | | 2.8 | | |
| Cash equivalents and other assets less liabilities | | | 1.6 | | |
| Total | | | 100.0 | % | |
| Top five sectors1 | | 07/31/09 | |
| Financials | | | 19.6 | % | |
| Information technology | | | 15.5 | | |
| Health care | | | 13.0 | | |
| Energy | | | 12.1 | | |
| Industrials | | | 12.1 | | |
| Total | | | 72.3 | % | |
| Top ten equity holdings1 | | 07/31/09 | |
| JPMorgan Chase & Co. | | | 3.3 | % | |
| Wyeth | | | 2.5 | | |
| CVS Corp. | | | 2.1 | | |
| Cisco Systems, Inc. | | | 1.9 | | |
| Wells Fargo & Co. | | | 1.8 | | |
| Schering-Plough Corp. | | | 1.8 | | |
| ACE Ltd. | | | 1.8 | | |
| Occidental Petroleum Corp. | | | 1.7 | | |
| Apache Corp. | | | 1.7 | | |
| Covidien PLC | | | 1.6 | | |
| Total | | | 20.2 | % | |
1 Weightings represent percentages of the Portfolio's net assets as of July 31, 2009. The Portfolio is actively managed and its composition will vary over time.
ADR American Depositary Receipt
106
UBS PACE Select Advisors Trust
UBS PACE Large Co Value Equity Investments
Portfolio of investments—July 31, 2009
| Security description | | Number of
shares | | Value | |
| Common stocks—98.37% | |
| Aerospace & defense—7.67% | |
| Boeing Co.1 | | | 296,100 | | | $ | 12,705,651 | | |
| Honeywell International, Inc.1 | | | 377,000 | | | | 13,081,900 | | |
| ITT Industries, Inc. | | | 157,600 | | | | 7,785,440 | | |
L-3 Communications
Holdings, Inc. | | | 109,279 | | | | 8,250,565 | | |
| Lockheed Martin Corp. | | | 131,800 | | | | 9,853,368 | | |
| Northrop Grumman Corp. | | | 307,200 | | | | 13,694,976 | | |
| Raytheon Co.1 | | | 83,600 | | | | 3,925,020 | | |
| United Technologies Corp. | | | 144,398 | | | | 7,865,359 | | |
| | | | 77,162,279 | | |
| Auto components—2.13% | |
| Johnson Controls, Inc.1 | | | 325,150 | | | | 8,414,882 | | |
Magna International,
Inc., Class A | | | 256,075 | | | | 13,049,582 | | |
| | | | 21,464,464 | | |
| Beverages—2.05% | |
| Coca-Cola Co. | | | 191,100 | | | | 9,524,424 | | |
| PepsiCo, Inc. | | | 195,750 | | | | 11,108,812 | | |
| | | | 20,633,236 | | |
| Capital markets—2.78% | |
| Bank of New York Mellon Corp. | | | 392,850 | | | | 10,740,519 | | |
| BlackRock, Inc.1 | | | 32,500 | | | | 6,192,550 | | |
| Morgan Stanley | | | 275,125 | | | | 7,841,062 | | |
| State Street Corp. | | | 64,700 | | | | 3,254,410 | | |
| | | | 28,028,541 | | |
| Chemicals—0.40% | |
| Praxair, Inc. | | | 51,700 | | | | 4,041,906 | | |
| Commercial banks—3.76% | |
| BB&T Corp.1 | | | 186,200 | | | | 4,260,256 | | |
| Comerica, Inc.1 | | | 306,300 | | | | 7,302,192 | | |
PNC Financial Services
Group, Inc. | | | 215,725 | | | | 7,908,478 | | |
| Wells Fargo & Co.1 | | | 753,050 | | | | 18,419,603 | | |
| | | | 37,890,529 | | |
| Communications equipment—4.29% | |
| Alcatel-Lucent, ADR1,* | | | 4,141,200 | | | | 11,429,712 | | |
| Cisco Systems, Inc.* | | | 872,550 | | | | 19,204,826 | | |
| Motorola, Inc. | | | 1,186,390 | | | | 8,494,552 | | |
| Research In Motion Ltd.* | | | 52,800 | | | | 4,012,800 | | |
| | | | 43,141,890 | | |
| Computers & peripherals—3.29% | |
| Dell, Inc.* | | | 586,950 | | | | 7,853,391 | | |
| EMC Corp.* | | | 257,700 | | | | 3,880,962 | | |
| Hewlett-Packard Co. | | | 308,200 | | | | 13,345,060 | | |
International Business
Machines Corp. | | | 67,950 | | | | 8,013,343 | | |
| | | | 33,092,756 | | |
| Security description | | Number of
shares | | Value | |
| Common stocks—(continued) | |
| Consumer finance—1.42% | |
| Capital One Financial Corp.1 | | | 466,275 | | | $ | 14,314,643 | | |
| Diversified financial services—4.95% | |
| Bank of America Corp. | | | 630,900 | | | | 9,331,011 | | |
| Citigroup, Inc. | | | 2,441,739 | | | | 7,740,313 | | |
| JPMorgan Chase & Co. | | | 848,393 | | | | 32,790,389 | | |
| | | | 49,861,713 | | |
| Diversified telecommunication services—1.21% | |
| AT&T, Inc. | | | 310,000 | | | | 8,131,300 | | |
| Verizon Communications, Inc. | | | 126,901 | | | | 4,069,715 | | |
| | | | 12,201,015 | | |
| Electric utilities—1.12% | |
| Exelon Corp.1 | | | 145,900 | | | | 7,420,474 | | |
| FPL Group, Inc.1 | | | 68,500 | | | | 3,881,895 | | |
| | | | 11,302,369 | | |
| Electronic equipment, instruments & components—0.91% | |
| Tyco Electronics Ltd. | | | 426,850 | | | | 9,164,470 | | |
| Energy equipment & services—1.92% | |
| Baker Hughes, Inc. | | | 322,850 | | | | 13,075,425 | | |
| BJ Services Co.1 | | | 442,625 | | | | 6,276,423 | | |
| | | | 19,351,848 | | |
| Food & staples retailing—2.85% | |
| CVS Corp. | | | 628,400 | | | | 21,038,832 | | |
| Sysco Corp. | | | 163,700 | | | | 3,889,512 | | |
| Wal-Mart Stores, Inc. | | | 75,600 | | | | 3,770,928 | | |
| | | | 28,699,272 | | |
| Food products—1.46% | |
| Kraft Foods, Inc., Class A | | | 248,025 | | | | 7,029,029 | | |
| Sara Lee Corp. | | | 722,850 | | | | 7,691,124 | | |
| | | | 14,720,153 | | |
| Health care equipment & supplies—3.09% | |
| Becton, Dickinson and Co. | | | 113,600 | | | | 7,401,040 | | |
| Covidien PLC | | | 438,300 | | | | 16,572,123 | | |
| Zimmer Holdings, Inc.* | | | 152,400 | | | | 7,101,840 | | |
| | | | 31,075,003 | | |
| Health care providers & services—2.91% | |
| Aetna, Inc. | | | 174,350 | | | | 4,702,220 | | |
| AmerisourceBergen Corp. | | | 303,150 | | | | 5,978,118 | | |
| Cardinal Health, Inc. | | | 333,475 | | | | 11,104,717 | | |
| WellPoint, Inc.* | | | 142,950 | | | | 7,524,888 | | |
| | | | 29,309,943 | | |
| Hotels, restaurants & leisure—0.76% | |
| McDonald's Corp. | | | 139,000 | | | | 7,653,340 | | |
| Household durables—0.87% | |
| Whirlpool Corp.1 | | | 153,000 | | | | 8,734,770 | | |
| Household products—0.40% | |
| Colgate-Palmolive Co. | | | 54,900 | | | | 3,976,956 | | |
107
UBS PACE Select Advisors Trust
UBS PACE Large Co Value Equity Investments
Portfolio of investments—July 31, 2009
| Security description | | Number of
shares | | Value | |
| Common stocks—(continued) | |
| Insurance—6.63% | |
| ACE Ltd. | | | 361,200 | | | $ | 17,720,472 | | |
| Allstate Corp. | | | 485,800 | | | | 13,072,878 | | |
| Aon Corp. | | | 37,750 | | | | 1,489,238 | | |
Fidelity National Financial,
Inc., Class A | | | 251,875 | | | | 3,614,406 | | |
Hartford Financial Services
Group, Inc. | | | 271,325 | | | | 4,474,149 | | |
| MetLife, Inc. | | | 221,150 | | | | 7,508,042 | | |
| The Travelers Cos., Inc. | | | 178,300 | | | | 7,679,381 | | |
| Torchmark Corp.1 | | | 287,350 | | | | 11,223,891 | | |
| | | | 66,782,457 | | |
| IT services—0.78% | |
| MasterCard, Inc., Class A1 | | | 40,500 | | | | 7,858,215 | | |
| Leisure equipment & products—0.46% | |
| Mattel, Inc. | | | 261,675 | | | | 4,600,247 | | |
| Machinery—2.26% | |
| Caterpillar, Inc.1 | | | 228,800 | | | | 10,080,928 | | |
| Cummins, Inc.1 | | | 148,000 | | | | 6,365,480 | | |
| Deere & Co.1 | | | 144,200 | | | | 6,307,308 | | |
| | | | 22,753,716 | | |
| Media—2.91% | |
| Omnicom Group, Inc.1 | | | 328,100 | | | | 11,155,400 | | |
| The DIRECTV Group, Inc.1,* | | | 299,900 | | | | 7,767,410 | | |
| Viacom, Inc., Class B* | | | 447,900 | | | | 10,373,364 | | |
| | | | 29,296,174 | | |
| Metals & mining—0.91% | |
| Newmont Mining Corp. | | | 221,400 | | | | 9,154,890 | | |
| Multi-utilities—2.48% | |
| Dominion Resources, Inc.1 | | | 114,600 | | | | 3,873,480 | | |
| PG&E Corp.1 | | | 178,200 | | | | 7,193,934 | | |
| Sempra Energy | | | 194,725 | | | | 10,209,432 | | |
| Wisconsin Energy Corp. | | | 85,700 | | | | 3,682,529 | | |
| | | | 24,959,375 | | |
| Multiline retail—1.44% | |
J.C. Penney Co., Inc.
(Holding Co.) | | | 480,200 | | | | 14,478,030 | | |
| Oil, gas & consumable fuels—10.20% | |
| Anadarko Petroleum Corp. | | | 160,300 | | | | 7,726,460 | | |
| Apache Corp. | | | 199,102 | | | | 16,714,613 | | |
| BP PLC, ADR1 | | | 200,850 | | | | 10,050,534 | | |
| Chevron Corp. | | | 136,800 | | | | 9,503,496 | | |
| ConocoPhillips | | | 176,400 | | | | 7,710,444 | | |
| Devon Energy Corp. | | | 68,100 | | | | 3,955,929 | | |
| Exxon Mobil Corp. | | | 129,862 | | | | 9,140,986 | | |
| Marathon Oil Corp. | | | 360,350 | | | | 11,621,287 | | |
| Occidental Petroleum Corp. | | | 246,597 | | | | 17,592,230 | | |
| Total SA, ADR | | | 124,050 | | | | 6,903,383 | | |
| Valero Energy Corp. | | | 98,325 | | | | 1,769,850 | | |
| | | | 102,689,212 | | |
| Security description | | Number of
shares | | Value | |
| Common stocks—(concluded) | |
| Personal products—1.02% | |
| Avon Products, Inc. | | | 318,450 | | | $ | 10,311,411 | | |
| Pharmaceuticals—7.02% | |
| Johnson & Johnson | | | 239,700 | | | | 14,595,333 | | |
| Pfizer, Inc.1 | | | 825,250 | | | | 13,146,232 | | |
| Schering-Plough Corp. | | | 680,300 | | | | 18,034,753 | | |
| Wyeth | | | 535,700 | | | | 24,936,835 | | |
| | | | 70,713,153 | | |
| Road & rail—2.17% | |
| CSX Corp. | | | 361,150 | | | | 14,489,338 | | |
| Union Pacific Corp. | | | 128,400 | | | | 7,385,568 | | |
| | | | 21,874,906 | | |
| Semiconductors & semiconductor equipment—3.13% | |
| Intel Corp. | | | 819,500 | | | | 15,775,375 | | |
| Lam Research Corp.1,* | | | 85,650 | | | | 2,574,639 | | |
| Texas Instruments, Inc. | | | 546,500 | | | | 13,143,325 | | |
| | | | 31,493,339 | | |
| Software—3.15% | |
| CA, Inc. | | | 550,325 | | | | 11,633,871 | | |
| Microsoft Corp. | | | 687,077 | | | | 16,160,051 | | |
| Oracle Corp. | | | 174,800 | | | | 3,868,324 | | |
| | | | 31,662,246 | | |
| Specialty retail—1.98% | |
| Home Depot, Inc. | | | 176,125 | | | | 4,568,682 | | |
| Lowe's Cos., Inc. | | | 510,350 | | | | 11,462,461 | | |
| The Gap, Inc. | | | 238,900 | | | | 3,898,848 | | |
| | | | 19,929,991 | | |
| Textiles, apparel & luxury goods—0.80% | |
| Nike, Inc., Class B1 | | | 141,500 | | | | 8,014,560 | | |
| Tobacco—0.79% | |
| Philip Morris International, Inc. | | | 169,600 | | | | 7,903,360 | | |
Total common stocks
(cost—$1,007,594,922) | | | | | | | 990,296,378 | | |
| | | Face
amount | | | |
| Repurchase agreement—1.79% | |
Repurchase agreement dated
07/31/09 with State Street
Bank & Trust Co.,
0.010% due 08/03/09,
collateralized by $18,450,326
US Treasury Bills, zero coupon
due 08/27/09 to 09/10/09;
(value—$18,448,481);
proceeds: $18,086,015
(cost—$18,086,000) | | $ | 18,086,000 | | | | 18,086,000 | | |
108
UBS PACE Select Advisors Trust
UBS PACE Large Co Value Equity Investments
Portfolio of investments—July 31, 2009
| Security description | | Number of
shares | | Value | |
| Investment of cash collateral from securities loaned—14.70% | |
| Money market fund—14.70% | |
UBS Private Money Market
Fund LLC2
(cost—$147,996,105) | | | 147,996,105 | | | $ | 147,996,105 | | |
Total investments
(cost—$1,173,677,027)—
114.86% | | | | | 1,156,378,483 | | |
Liabilities in excess of other
assets—(14.86)% | | | | | (149,649,134 | ) | |
| Net assets—100.00% | | $ | 1,006,729,349 | | |
Aggregate cost for federal income tax purposes was $1,237,768,638; and net unrealized depreciation consisted of:
| Gross unrealized appreciation | | $ | 24,304,735 | | |
| Gross unrealized depreciation | | | (105,694,890 | ) | |
| Net unrealized depreciation | | $ | (81,390,155 | ) | |
* Non-income producing security.
1 Security, or portion thereof, was on loan at July 31, 2009.
2 The table below details the Portolio's transaction activity in an affiliated issuer during the year ended July 31, 2009.
| Security description | | Value at
07/31/08 | | Purchases
during the
year ended
07/31/09 | | Sales
during the
year ended
07/31/09 | | Value at
07/31/09 | | Net income
earned from
affiliate for the
year ended
07/31/09 | |
| UBS Private Money Market Fund LLC | | $ | 53,422,826 | | | $ | 1,155,488,752 | | | $ | 1,060,915,473 | | | $ | 147,996,105 | | | $ | 919,223 | | |
ADR American Depositary Receipt
The following is a summary of the fair valuations according to the inputs used as of July 31, 2009 in valuing the Portfolio's investments:
| | | Measurements at 07/31/09 | |
| | | Quoted prices in
active markets for
identical investments
(Level 1) | | Significant other
observable inputs
(Level 2) | | Unobservable
inputs
(Level 3) | | Total | |
| Common stocks | | $ | 990,296,378 | | | $ | — | | | $ | — | | | $ | 990,296,378 | | |
| Repurchase agreement | | | — | | | | 18,086,000 | | | | — | | | | 18,086,000 | | |
Investment of cash collateral
from securities loaned | | | — | | | | 147,996,105 | | | | — | | | | 147,996,105 | | |
| Total | | $ | 990,296,378 | | | $ | 166,082,105 | | | $ | — | | | $ | 1,156,378,483 | | |
Issuer breakdown by country of origin (unaudited)
| | | Percentage of
total investments | |
| United States | | | 92.3 | % | |
| Switzerland | | | 2.3 | | |
| France | | | 1.6 | | |
| Canada | | | 1.5 | | |
| Ireland | | | 1.4 | | |
| United Kingdom | | | 0.9 | | |
| Total | | | 100.0 | % | |
See accompanying notes to financial statements.
109
UBS PACE Select Advisors Trust
UBS PACE Large Co Growth Equity Investments
Performance
For the 12 months ended July 31, 2009, the Portfolio's Class P shares declined 19.19% (before the deduction of the maximum UBS PACE Select program fee; after the deduction of the maximum UBS PACE Select program fee, the Portfolio declined 20.39%). In comparison, the Russell 1000 Growth Index (the "benchmark") declined 17.57%, and the Lipper Large-Cap Growth Funds category posted a median decline of 19.78%. (Returns for all share classes over various time periods are shown in the "Performance at a glance" table on page 115. Please note that the returns shown do not reflect the deduction of taxes that a shareholder would pay on Portfolio distributions or the redemption of Portfolio shares.) For a detailed commentary on the market environment in general during the reporting period, please refer to page two.
Sub-Advisors' comments
Wellington
Our portion of the Portfolio outperformed the benchmark during the reporting period, due largely to strong stock selection.
The health care sector was the largest contributor to relative performance during the period, as an underweight to the sector and strong stock selection benefited relative performance in this area. Significant positive contributors to relative performance included Abbott Laboratories, which was sold from our portion of the Portfolio, and Teva Pharmaceutical Industries Ltd. Strong stock selection within the consumer discretionary sector was also a contributor to our portion of the Portfolio's relative performance. Positions in TJX Companies, Inc., Coach, Inc., Nike, Inc. and Apollo Group, Inc. contributed the most to relative results within the sector.
The materials sector was the largest detractor from relative results. The underperformance in the sector was primarily the result of weak stock selection. In particular, owning Freeport-McMoRan Copper & Gold, Inc., Vale do Rio Doce and Agrium, Inc.—all of which were sold from our portion of the Portfolio during the reporting period—hurt relative results. An underweight to the consumer staples sector and an overweight to the energy and financials sectors also detracted from relative results within our portion of the Portfolio.
UBS PACE Select Advisors Trust – UBS PACE Large Co Growth Equity Investments
Investment Sub-Advisors:
Wellington Management Company, LLP ("Wellington"), Marsico Capital Management, LLC ("Marsico"), SSgA Funds Management, Inc. ("SSgA") and Delaware Management Company ("Delaware")
Portfolio Managers:
Wellington: Andrew Shilling;
Marsico: Thomas Marsico;
SSgA: Nick de Peyster and Brian Shannahan;
Delaware: Jeffrey Van Harte, Christopher Bonavico, Daniel Prislin and Christopher Ericksen
Objective:
Capital appreciation
Investment process:
Wellington applies in-depth fundamental research in its effort to identify corporate change early, differentiate sustainable growth opportunities from short-lived events, identify superior business models, and develop strict valuation parameters for the companies it evaluates. Wellington's strategy is focused on investing in companies that appear well-positioned to benefit from long-lasting trends and that have structural advantages to maintaining their position.
Marsico uses an approach that combines top-down macro-economic analysis with bottom-up stock selection. It considers macro-economic factors such as interest rates, inflation, demographics, the regulatory environment and the global competitive environment. It then seeks to identify companies with earnings growth potential that may not be recognizable by the market at large. Marsico's stock
(continued on next page)
110
UBS PACE Select Advisors Trust
UBS PACE Large Co Growth Equity Investments
Sub-Advisors' comments – continued
The top contributors to the Portfolio's absolute performance during the period were NetApp Inc., Texas Instruments, Inc. and Schlumberger Ltd. The largest detractors from absolute returns were Transocean Ltd., Covidien PLC, and Electronic Arts, Inc., the last of which we eliminated during the reporting period.
At the end of the reporting period, our portion of the Portfolio was positioned with overweights to the information technology, energy, industrials, consumer discretionary and financials sectors. In contrast, it was underweight to the materials, consumer staples, health care, telecommunication services and utilities sectors.
Marsico
Our portion of the Portfolio underperformed the benchmark during the reporting period. There were several contributing factors to our underperformance, including sector allocation and stock selection.
Stock selection in the consumer discretionary sector hampered our portion of the Portfolio's results. Holdings in the consumer services industry, including Las Vegas Sands Corp. and retailer Target Corp., which were both subsequently sold from our portion of the Portfolio, detracted from performance, as did Wynn Resorts Ltd. An overweight in banks, the weakest-performing industry group in the benchmark, also hurt results. Stock selection in the industrials sector was another source of underperformance as positions in aerospace/defense companies General Dynamics Corp. and Lockheed Martin Corp. lagged the benchmark, as did railroad operators Union Pacific Corp. and Norfolk Southern Corp. Finally, relative performance was negatively impacted by an underweight to and stock selection in the information technology sector.
On the upside, with the benchmark declining almost 18% during the reporting period, our portion of the Portfolio's average holding of cash and short-term investments—which was approximately 8% of net assets—helped preserve capital to some degree. Elsewhere, stock selection in the diversified financials industry significantly outpaced that of the benchmark. A position in Goldman Sachs Group, Inc. was among the top individual contributors in the reporting period.
Investment process (concluded)
selection process may focus on factors such as market expertise or dominance, franchise durability and pricing power, solid company fundamentals, as well as strong management and reasonable valuations.
SSgA uses several quantitative measures based on valuation, sentiment and quality to identify investment opportunities within a large cap growth universe and combines factors to produce an overall rank. Using comprehensive research, it seeks to determine the optimal weighting of these perspectives to arrive at strategies that vary by industry. SSgA ranks all companies within the investable universe from top to bottom based on their relative attractiveness. SSgA then constructs its portion of the Portfolio by selecting the highest-ranked stocks from the universe, and manages deviations from the benchmark to maximize the risk/reward trade-off. The aim is to have a resulting Portfolio with characteristics similar to the benchmark. SSgA generally sells stocks that no longer meet its selection criteria or that it believes otherwise may adversely affect per formance relative to the benchmark.
Delaware invests primarily in common stocks of large capitalization growth-oriented companies that Delaware believes have long-term capital appreciation potential and are expected to grow faster than the US economy. Using a bottom-up approach, Delaware seeks to select securities of companies that it believes have attractive end market potential, dominant business models and strong free cash flow generation that are attractively priced compared to the intrinsic value of the securities. Delaware also considers a company's operational efficiencies, management's plans for capital allocation and the company's shareholder orientation.
111
UBS PACE Select Advisors Trust
UBS PACE Large Co Growth Equity Investments
Sub-Advisors' comments – continued
On an individual stock basis, positions in biotechnology company Genentech Inc., which was sold from our portion of the Portfolio during the period, and Google Inc. benefited performance. Information technology company International Business Machines Corp., computer chipmaker QUALCOMM, Inc. and Apple Inc. also benefited our portion of the Portfolio's performance. Additionally, Dow Chemical Co., Australia-based resources company BHP Billiton PLC and pharmaceutical company Schering-Plough Corp., which was subsequently sold from the Portfolio, helped performance.
As of July 31, 2009, our portion of the Portfolio's sector allocations emphasized information technology, financials, consumer discretionary and industrials. In addition, our portion of the Portfolio had no exposure to the utilities and telecommunications services sectors.
SSgA
Our portion of the Portfolio underperformed its benchmark during the reporting period, primarily due to stock selection.
During the 12-month reporting period, the industrials, materials and financials sectors were among the biggest detractors from performance within our portion of the Portfolio. Within the industrials sector, positions in heavy equipment leaser United Rentals Inc., construction and engineering firm Foster Wheeler Ltd. and mining equipment maker Joy Global Inc. all performed poorly, detracting from returns, and all were sold from our portion of the Portfolio during the reporting period. In addition, makers of key materials used in construction, including Reliance Steel and Aluminum as well as Freeport-McMorRan Copper & Gold, Inc. underperformed, limiting returns within our portion of the Portfolio and were sold from the Portfolio during the reporting period as a result.
Additionally, stocks tied to agriculture slumped as investors feared shrinking demand and contracting prices. As a result, an overweight position in fertilizer producer Mosaic Co. fell significantly during the 12-month reporting period, and we eliminated the position. However, our portion of the Portfolio did benefit from stock selection in the technology and consumer discretionary sectors. Within technology, overweight positions in software company Oracle Corp. and developer of wireless technology InterDigital Inc., which was subsequently sold from our portion of the Portfolio, bolstered performance. Overweights to AutoZone Inc., retailer Gap Inc. and gaming company WMS Industries Inc., prior to being sold from our portion of the Portfolio, drove outperformance within the consumer discretionary sector.
Delaware
Our portion of the Portfolio outperformed the benchmark during the reporting period, primarily due to stock selection.
During the 12-month period, stock selection, particularly in the health care sector, drove positive relative performance. In addition, a significant underweight in the energy sector—which was the worst-performing sector in the benchmark—and a slight overweight in health care were beneficial for relative performance.
In terms of individual holdings, top contributors to performance included Intuitive Surgical, Inc. and IntercontinentalExchange, Inc. Intuitive Surgical, Inc., creator of robotic tools to assist in surgeries, was purchased after a significant selloff that occurred because of investors' concerns over a slower hospital capital investment cycle. The stock then appreciated significantly as the cycle did not meet worst-case expectations. Another significant contributor, IntercontinentalExchange Inc., benefited from an increase in
112
UBS PACE Select Advisors Trust
UBS PACE Large Co Growth Equity Investments
Sub-Advisors' comments – concluded
investor risk appetite in the market, which fueled trading activity in the futures and derivatives markets. The company is also playing an important role in the evolution of credit default swaps trading and other complicated over-the-counter derivative instruments. Consequently, IntercontinentalExchange, Inc.'s early lead as an important gatekeeper in this new business helped drive positive investor sentiment for the stock.
The largest detractors from performance in our portion of the Portfolio were Seagate Technology and Research In Motion Ltd. Seagate Technology's weakness was a function of a difficult consumer and enterprise spending environment, combined with management mistakes in maneuvering the notebook hard drive product cycle. We ultimately sold the position as we believed that the company had weakened to the point where its viability was threatened. Research In Motion, Ltd.'s stock suffered in the weak economy, which affected sales of Blackberry devices and services. Management decreased expectations for future profitability as a more competitive market in smartphones is forcing it to increase component and feature development costs to effectively compete at current prices. As a result, we sold this holding during the reporting period.
Special considerations
The Portfolio may be appropriate for long-term investors seeking capital appreciation who are able to withstand short-term fluctuations in the equity markets in return for potentially higher returns over the long term. The value of the Portfolio changes every day and can be affected by changes in interest rates, general market conditions and other political, social and economic developments, as well as specific matters relating to the companies in whose securities the Portfolio invests. Also, to the extent the Portfolio invests a large portion of its assets in technology companies, the Portfolio may experience greater volatility and risk of loss due to unfavorable developments in the technology sector. It is important to note that an investment in the Portfolio is only one component of a balanced investment plan.
113
UBS PACE Select Advisors Trust
UBS PACE Large Co Growth Equity Investments
Comparison of change in value of a $10,000 investment in the Class P shares of the Portfolio and the Russell 1000 Growth Index (unaudited)
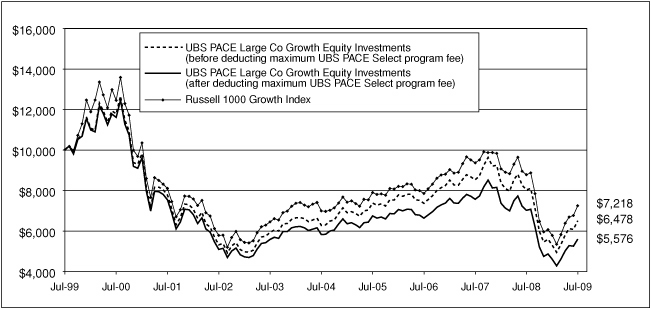
The graph depicts the performance of UBS PACE Large Co Growth Equity Investments Class P shares versus the Russell 1000 Growth Index over the 10 years ended July 31, 2009. The performance of the other classes will vary from the performance of the class shown based on the difference in sales charges and fees paid by shareholders investing in different share classes. Past performance does not predict future performance and the performance provided does not reflect the deduction of taxes that a shareholder would pay on Portfolio distributions or the redemption of Portfolio shares. It is important to note that UBS PACE Large Co Growth Equity Investments is a professionally managed portfolio while the Index is not available for investment and is unmanaged. The comparison is shown for illustrative purposes only.
114
UBS PACE Select Advisors Trust
UBS PACE Large Co Growth Equity Investments
Performance at a glance (unaudited)
| Average annual total returns for periods ended 07/31/09 | | 1 year | | 5 years | | 10 years | | Since
inception1 | |
| Before deducting | | Class A2 | | | (19.39 | )% | | | 0.42 | % | | N/A | | | (5.05 | )% | |
| maximum sales charge | | Class B3 | | | (20.05 | )% | | | (0.45 | )% | | N/A | | | (5.59 | )% | |
| or UBS PACE Select | | Class C4 | | | (20.00 | )% | | | (0.42 | )% | | N/A | | | (5.80 | )% | |
| program fee | | Class Y5 | | | (19.04 | )% | | | 0.81 | % | | N/A | | | (3.95 | )% | |
| | | Class P6 | | | (19.19 | )% | | | 0.70 | % | | | (4.25 | )% | | | 3.34 | % | |
| After deducting | | Class A2 | | | (23.82 | )% | | | (0.72 | )% | | N/A | | | (5.67 | )% | |
| maximum sales charge | | Class B3 | | | (24.03 | )% | | | (0.84 | )% | | N/A | | | (5.59 | )% | |
| or UBS PACE Select | | Class C4 | | | (20.80 | )% | | | (0.42 | )% | | N/A | | | (5.80 | )% | |
| program fee | | Class P6 | | | (20.39 | )% | | | (0.80 | )% | | | (5.67 | )% | | | 1.80 | % | |
| Russell 1000 Growth Index7 | | | (17.57 | )% | | | 0.70 | % | | | (3.21 | )% | | | 4.65 | % | |
| Lipper Large-Cap Growth Funds median | | | (19.78 | )% | | | 0.36 | % | | | (2.21 | )% | | | 4.12 | % | |
Average annual total returns for periods ended June 30, 2009, after deduction of the maximum sales charge or UBS PACE Select program fee, were as follows: Class A—1-year period, (30.72)%; 5-year period, (3.12)%; since inception, (6.47)%; Class B—1-year period, (30.87)%; 5-year period, (3.23)%; since inception, (6.39)%; Class C—1-year period, (27.97)%; 5-year period, (2.83)%; since inception, (6.59)%; Class Y—1-year period, (26.42)%; 5-year period, (1.64)%; since inception, (4.78)%; Class P—1-year period, (27.57)%; 5-year period, (3.19)%; 10-year period, (6.70)%; since inception, 1.32%.
The annualized gross and net expense ratios, respectively, for each class of shares as in the November 28, 2008 prospectuses, were as follows: Class A—1.25% and 1.21%; Class B—2.24% and 2.05%; Class C—2.09% and 2.05%; Class Y—0.87% and 0.83%; and Class P—0.96% and 0.92%. Net expenses reflect fee waivers and/or expense reimbursements, if any, pursuant to an agreement that is in effect to cap the expenses. The Portfolio and UBS Global AM have entered into a written fee waiver agreement pursuant to which UBS Global AM is contractually obligated to waive its management fees through November 30, 2009 to the extent necessary to reflect the lower sub-advisory fee paid by UBS Global AM to SSgA. The Portfolio and UBS Global AM have also entered into an additional written fee waiver/expense reimbursement agreement pursuant to which UBS Global AM is contractually obligated to waive its management fees and/or reimbu rse the Portfolio so that the ordinary total operating expenses of each class through November 30, 2009 (excluding dividend expense, borrowing costs and interest expense, if any) would not exceed Class A—1.30%; Class B—2.05%; Class C—2.05%; Class Y—1.05% and Class P—1.05%. The Portfolio has agreed to repay UBS Global AM for any waived fees/reimbursed expenses to the extent that it can do so over the following three fiscal years without causing the Portfolio's expenses in any of those three years to exceed the expense caps described above.
1 Since inception returns are calculated as of commencement of issuance on August 24, 1995 for Class P shares, November 27, 2000 for Class A, B, and C shares and February 15, 2001 for Class Y shares. Since inception returns for the Index and Lipper median are shown as of August 31, 1995, which is the month-end after the inception date of the oldest share class (Class P).
2 Maximum sales charge for Class A shares is 5.5%. Class A shares bear ongoing 12b-1 service fees.
3 Maximum contingent deferred sales charge for Class B shares is 5% imposed on redemptions and is reduced to 0% after a maximum of six years. Class B shares bear ongoing 12b-1 service and distribution fees.
4 Maximum contingent deferred sales charge for Class C shares is 1% imposed on redemptions and is reduced to 0% after one year. Class C shares bear ongoing 12b-1 service and distribution fees.
5 The Portfolio offers Class Y shares to a limited group of eligible investors, including certain qualifying retirement plans. Class Y shares do not bear initial or contingent deferred sales charges or ongoing 12b-1 service and distribution fees.
6 Class P shares do not bear initial or contingent deferred sales charges or ongoing 12b-1 service and distribution fees, but are subject to a maximum annual UBS PACE Select program fee of 1.5% of the value of Class P shares.
7 The Russell 1000 Growth Index measures the performance of a large universe of stocks with higher price-to-book ratios and higher forecasted growth rates. Investors should note that indices do not reflect the deduction of fees, expenses or taxes.
If an investor sells or exchanges shares less than 90 days after purchase, a redemption fee of 1.00% of the amount sold or exchanged will be deducted at the time of the transaction, except as noted otherwise in the prospectuses.
Past performance does not predict future performance, and the performance information provided does not reflect the deduction of taxes that a shareholder would pay on Portfolio distributions or the redemption of Portfolio shares. The return and principal value of an investment will fluctuate, so that an investor's shares, when redeemed, may be worth more or less than their original cost. Performance results assume reinvestment of all dividends and capital gain distributions at net asset value on the ex-dividend dates. Current performance may be higher or lower than the performance data quoted. For month-end performance figures, please visit http://www.ubs.com.
Lipper peer group data calculated by Lipper Inc.; used with permission. The Lipper median is the return of the fund that places in the middle of a Lipper peer group.
115
UBS PACE Select Advisors Trust
UBS PACE Large Co Growth Equity Investments
Portfolio statistics (unaudited)
| Characteristics | | 07/31/09 | |
| Net assets (mm) | | $ | 899.5 | | |
| Number of holdings | | | 222 | | |
| Portfolio composition1 | | 07/31/09 | |
| Common stocks | | | 93.4 | % | |
| ADRs | | | 4.4 | | |
| Cash equivalents and other assets less liabilities | | | 2.2 | | |
| Total | | | 100.0 | % | |
| Top five sectors1 | | 07/31/09 | |
| Information technology | | | 35.4 | % | |
| Consumer discretionary | | | 13.6 | | |
| Financials | | | 11.5 | | |
| Industrials | | | 10.0 | | |
| Health care | | | 10.0 | | |
| Total | | | 80.5 | % | |
| Top ten equity holdings1 | | 07/31/09 | |
| Apple, Inc. | | | 3.9 | % | |
| Google, Inc. | | | 3.0 | | |
| QUALCOMM, Inc. | | | 2.8 | | |
| Visa, Inc. | | | 2.3 | | |
| International Business Machines Corp. | | | 2.2 | | |
| Oracle Corp. | | | 2.0 | | |
| Cisco Systems, Inc. | | | 1.9 | | |
| MasterCard, Inc. | | | 1.8 | | |
| Goldman Sachs Group, Inc. | | | 1.6 | | |
| Hewlett-Packard Co. | | | 1.6 | | |
| Total | | | 23.1 | % | |
1 Weightings represent percentages of the Portfolio's net assets as of July 31, 2009. The Portfolio is actively managed and its composition will vary over time.
ADR American Depositary Receipt
116
UBS PACE Select Advisors Trust
UBS PACE Large Co Growth Equity Investments
Portfolio of investments—July 31, 2009
| Security description | | Number of
shares | | Value | |
| Common stocks—97.81% | |
| Aerospace & defense—3.81% | |
| General Dynamics Corp. | | | 206,924 | | | $ | 11,461,520 | | |
| Honeywell International, Inc. | | | 52,840 | | | | 1,833,548 | | |
| Lockheed Martin Corp. | | | 95,890 | | | | 7,168,736 | | |
| Northrop Grumman Corp. | | | 37,800 | | | | 1,685,124 | | |
| Precision Castparts Corp. | | | 72,350 | | | | 5,774,254 | | |
| Raytheon Co.1 | | | 85,500 | | | | 4,014,225 | | |
| United Technologies Corp. | | | 43,000 | | | | 2,342,210 | | |
| | | | 34,279,617 | | |
| Air freight & logistics—1.82% | |
| C.H. Robinson Worldwide, Inc.1 | | | 14,100 | | | | 768,873 | | |
Expeditors International of
Washington, Inc.1 | | | 185,000 | | | | 6,277,050 | | |
| FedEx Corp. | | | 52,280 | | | | 3,546,675 | | |
United Parcel Service, Inc.,
Class B | | | 107,400 | | | | 5,770,602 | | |
| | | | 16,363,200 | | |
| Auto components—0.39% | |
| Johnson Controls, Inc.1 | | | 129,280 | | | | 3,345,766 | | |
| TRW Automotive Holdings Corp.* | | | 9,700 | | | | 163,251 | | |
| | | | 3,509,017 | | |
| Beverages—0.54% | |
| Coca-Cola Co. | | | 29,478 | | | | 1,469,183 | | |
| Coca-Cola Enterprises, Inc. | | | 109,000 | | | | 2,048,110 | | |
| PepsiCo, Inc. | | | 24,193 | | | | 1,372,953 | | |
| | | | 4,890,246 | | |
| Biotechnology—1.56% | |
| Acorda Therapeutics, Inc.1,* | | | 12,500 | | | | 315,750 | | |
| Amgen, Inc.* | | | 11,700 | | | | 729,027 | | |
| Gilead Sciences, Inc.* | | | 248,879 | | | | 12,177,650 | | |
| United Therapeutics Corp.* | | | 8,400 | | | | 778,008 | | |
| | | | 14,000,435 | | |
| Capital markets—3.00% | |
| Bank of New York Mellon Corp.1 | | | 275,200 | | | | 7,523,968 | | |
| BlackRock, Inc.1 | | | 3,300 | | | | 628,782 | | |
| Franklin Resources, Inc. | | | 8,900 | | | | 789,252 | | |
| Goldman Sachs Group, Inc. | | | 90,385 | | | | 14,759,871 | | |
| Morgan Stanley | | | 67,712 | | | | 1,929,792 | | |
| Northern Trust Corp. | | | 1,200 | | | | 71,772 | | |
| T. Rowe Price Group, Inc.1 | | | 9,300 | | | | 434,403 | | |
| TD Ameritrade Holding Corp.* | | | 46,100 | | | | 854,694 | | |
| | | | 26,992,534 | | |
| Chemicals—2.45% | |
| Dow Chemical Co. | | | 244,105 | | | | 5,167,703 | | |
| Monsanto Co. | | | 41,983 | | | | 3,526,572 | | |
Potash Corp. of
Saskatchewan, Inc.1 | | | 39,764 | | | | 3,698,450 | | |
| Praxair, Inc. | | | 70,000 | | | | 5,472,600 | | |
| Syngenta AG, ADR | | | 91,100 | | | | 4,183,312 | | |
| | | | 22,048,637 | | |
| Security description | | Number of
shares | | Value | |
| Common stocks—(continued) | |
| Commercial banks—2.70% | |
Itau Unibanco Banco
Multiplo SA | | | 140,790 | | | $ | 2,518,733 | | |
PNC Financial Services
Group, Inc. | | | 9,800 | | | | 359,268 | | |
| SunTrust Banks, Inc. | | | 152,650 | | | | 2,976,675 | | |
| US Bancorp1 | | | 310,058 | | | | 6,328,284 | | |
| Wells Fargo & Co.1 | | | 493,384 | | | | 12,068,173 | | |
| | | | 24,251,133 | | |
| Commercial services & supplies—0.01% | |
| Deluxe Corp. | | | 6,900 | | | | 107,985 | | |
| Communications equipment—5.92% | |
| Arris Group, Inc.1,* | | | 32,100 | | | | 390,978 | | |
| Cisco Systems, Inc.* | | | 760,394 | | | | 16,736,272 | | |
| Harris Corp. | | | 46,600 | | | | 1,459,046 | | |
| Juniper Networks, Inc.1,* | | | 210,990 | | | | 5,513,169 | | |
| Motorola, Inc. | | | 54,200 | | | | 388,072 | | |
| QUALCOMM, Inc. | | | 547,136 | | | | 25,283,154 | | |
| Research In Motion Ltd.* | | | 45,740 | | | | 3,476,240 | | |
| | | | 53,246,931 | | |
| Computers & peripherals—9.50% | |
| Apple, Inc.* | | | 214,200 | | | | 34,998,138 | | |
| EMC Corp.* | | | 77,200 | | | | 1,162,632 | | |
| Hewlett-Packard Co. | | | 334,788 | | | | 14,496,320 | | |
International Business
Machines Corp. | | | 165,602 | | | | 19,529,444 | | |
| NetApp, Inc.* | | | 314,320 | | | | 7,059,627 | | |
| QLogic Corp.* | | | 36,200 | | | | 472,410 | | |
| Teradata Corp.* | | | 240,000 | | | | 5,896,800 | | |
| Western Digital Corp.* | | | 61,900 | | | | 1,872,475 | | |
| | | | 85,487,846 | | |
| Construction & engineering—0.26% | |
| Fluor Corp. | | | 44,000 | | | | 2,323,200 | | |
| Consumer finance—0.25% | |
| American Express Co.1 | | | 80,475 | | | | 2,279,857 | | |
| Containers & packaging—0.39% | |
| Owens-Illinois, Inc.* | | | 43,100 | | | | 1,462,814 | | |
| Pactiv Corp.* | | | 48,300 | | | | 1,216,194 | | |
| Rock-Tenn Co., Class A1 | | | 9,300 | | | | 418,128 | | |
| Sealed Air Corp. | | | 20,900 | | | | 384,351 | | |
| | | | 3,481,487 | | |
| Diversified consumer services—1.96% | |
| Apollo Group, Inc., Class A1,* | | | 158,091 | | | | 10,914,603 | | |
| ITT Educational Services, Inc.1,* | | | 26,030 | | | | 2,534,020 | | |
Weight Watchers
International, Inc.1 | | | 150,000 | | | | 4,182,000 | | |
| | | | 17,630,623 | | |
117
UBS PACE Select Advisors Trust
UBS PACE Large Co Growth Equity Investments
Portfolio of investments—July 31, 2009
| Security description | | Number of
shares | | Value | |
| Common stocks—(continued) | |
| Diversified financial services—4.55% | |
| Bank of America Corp. | | | 771,216 | | | $ | 11,406,285 | | |
| CME Group, Inc. | | | 21,900 | | | | 6,106,377 | | |
| IntercontinentalExchange, Inc.* | | | 82,500 | | | | 7,759,950 | | |
| JPMorgan Chase & Co. | | | 302,525 | | | | 11,692,591 | | |
| Moody's Corp.1 | | | 166,780 | | | | 3,959,357 | | |
| | | | 40,924,560 | | |
| Diversified telecommunication services—0.01% | |
Qwest Communications
International, Inc.1 | | | 25,700 | | | | 99,202 | | |
| Electrical equipment—0.51% | |
| ABB Ltd., ADR | | | 160,780 | | | | 2,939,058 | | |
| Emerson Electric Co. | | | 37,050 | | | | 1,347,879 | | |
| Thomas & Betts Corp.* | | | 11,800 | | | | 314,352 | | |
| | | | 4,601,289 | | |
| Electronic equipment, instruments & components—0.20% | |
| Avnet, Inc.* | | | 45,600 | | | | 1,112,640 | | |
| Ingram Micro, Inc., Class A* | | | 19,900 | | | | 334,718 | | |
| Tech Data Corp.* | | | 10,100 | | | | 352,793 | | |
| | | | 1,800,151 | | |
| Energy equipment & services—3.26% | |
| Cameron International Corp.1,* | | | 51,400 | | | | 1,605,222 | | |
| Halliburton Co. | | | 172,640 | | | | 3,813,618 | | |
| National-Oilwell Varco, Inc.* | | | 104,980 | | | | 3,772,981 | | |
| Schlumberger Ltd. | | | 133,970 | | | | 7,167,395 | | |
| Transocean Ltd.* | | | 163,086 | | | | 12,996,323 | | |
| | | | 29,355,539 | | |
| Food & staples retailing—2.47% | |
| CVS Caremark Corp. | | | 207,281 | | | | 6,939,768 | | |
| Safeway, Inc. | | | 6,700 | | | | 126,831 | | |
| Wal-Mart Stores, Inc. | | | 170,429 | | | | 8,500,998 | | |
| Walgreen Co. | | | 213,300 | | | | 6,622,965 | | |
| | | | 22,190,562 | | |
| Food products—0.34% | |
| Archer-Daniels-Midland Co. | | | 21,400 | | | | 644,568 | | |
| Dean Foods Co.* | | | 71,100 | | | | 1,506,609 | | |
| Del Monte Foods Co. | | | 81,200 | | | | 784,392 | | |
| Lancaster Colony Corp.1 | | | 2,900 | | | | 132,066 | | |
| | | | 3,067,635 | | |
| Health care equipment & supplies—1.63% | |
American Medical Systems
Holdings, Inc.1,* | | | 51,800 | | | | 792,022 | | |
| Covidien PLC | | | 87,950 | | | | 3,325,389 | | |
| Hospira, Inc.* | | | 46,100 | | | | 1,771,623 | | |
| Intuitive Surgical, Inc.1,* | | | 9,000 | | | | 2,045,880 | | |
| Medtronic, Inc. | | | 46,400 | | | | 1,643,488 | | |
| St. Jude Medical, Inc.* | | | 134,690 | | | | 5,079,160 | | |
| | | | 14,657,562 | | |
| Security description | | Number of
shares | | Value | |
| Common stocks—(continued) | |
| Health care providers & services—2.45% | |
| CIGNA Corp. | | | 27,800 | | | $ | 789,520 | | |
Laboratory Corp. of
America Holdings1,* | | | 3,800 | | | | 255,322 | | |
| Medco Health Solutions, Inc.* | | | 146,300 | | | | 7,733,418 | | |
| Omnicare, Inc.1 | | | 27,600 | | | | 658,812 | | |
| Quest Diagnostics, Inc.1 | | | 5,600 | | | | 305,872 | | |
| UnitedHealth Group, Inc. | | | 352,850 | | | | 9,900,971 | | |
| WellPoint, Inc.* | | | 45,000 | | | | 2,368,800 | | |
| | | | 22,012,715 | | |
| Hotels, restaurants & leisure—2.38% | |
| Brinker International, Inc.1 | | | 13,400 | | | | 222,976 | | |
| International Game Technology1 | | | 146,910 | | | | 2,901,473 | | |
Marriott International,
Inc., Class A | | | 1 | | | | 19 | | |
| McDonald's Corp. | | | 216,084 | | | | 11,897,585 | | |
| Starbucks Corp.* | | | 113,200 | | | | 2,003,640 | | |
| Wynn Resorts Ltd.1,* | | | 85,771 | | | | 4,388,902 | | |
| | | | 21,414,595 | | |
| Household durables—0.16% | |
| Newell Rubbermaid, Inc.1 | | | 73,000 | | | | 939,510 | | |
| Tempur-Pedic International, Inc. | | | 35,000 | | | | 519,050 | | |
| | | | 1,458,560 | | |
| Household products—0.98% | |
| Kimberly-Clark Corp. | | | 11,000 | | | | 642,950 | | |
| Procter & Gamble Co. | | | 146,500 | | | | 8,132,215 | | |
| | | | 8,775,165 | | |
| Independent power producers & energy traders—0.16% | |
| AES Corp.* | | | 86,500 | | | | 1,106,335 | | |
| Constellation Energy Group, Inc. | | | 12,700 | | | | 364,490 | | |
| | | | 1,470,825 | | |
| Industrial conglomerates—0.40% | |
| Siemens AG, ADR1 | | | 44,990 | | | | 3,575,805 | | |
| Insurance—0.99% | |
| AFLAC, Inc. | | | 9,200 | | | | 348,312 | | |
Hartford Financial Services
Group, Inc.1 | | | 195,900 | | | | 3,230,391 | | |
| Marsh & McLennan Cos., Inc. | | | 208,240 | | | | 4,252,261 | | |
| Principal Financial Group, Inc. | | | 11,100 | | | | 263,070 | | |
| Prudential Financial, Inc. | | | 17,300 | | | | 765,871 | | |
| | | | 8,859,905 | | |
| Internet & catalog retail—0.15% | |
| Amazon.com, Inc.1,* | | | 3,670 | | | | 314,739 | | |
| Priceline.com, Inc.1,* | | | 8,000 | | | | 1,036,960 | | |
| | | | 1,351,699 | | |
| Internet software & services—4.15% | |
| Google, Inc., Class A* | | | 61,479 | | | | 27,238,271 | | |
| VeriSign, Inc.1,* | | | 492,710 | | | | 10,070,992 | | |
| | | | 37,309,263 | | |
118
UBS PACE Select Advisors Trust
UBS PACE Large Co Growth Equity Investments
Portfolio of investments—July 31, 2009
| Security description | | Number of
shares | | Value | |
| Common stocks—(continued) | |
| IT services—6.31% | |
| Accenture Ltd., Class A | | | 219,970 | | | $ | 7,714,348 | | |
| Alliance Data Systems Corp.1,* | | | 31,200 | | | | 1,591,200 | | |
Broadridge Financial
Solutions, Inc. | | | 16,400 | | | | 283,228 | | |
| Computer Sciences Corp.1,* | | | 47,200 | | | | 2,273,624 | | |
Fidelity National Information
Services, Inc.1 | | | 24,400 | | | | 571,448 | | |
| Fiserv, Inc.* | | | 37,400 | | | | 1,773,134 | | |
| Global Payments, Inc. | | | 8,400 | | | | 355,320 | | |
| Lender Processing Services, Inc. | | | 6,800 | | | | 232,424 | | |
| MasterCard, Inc., Class A1 | | | 82,209 | | | | 15,951,012 | | |
| Visa, Inc., Class A1 | | | 318,410 | | | | 20,843,119 | | |
| Western Union Co. | | | 278,990 | | | | 4,876,745 | | |
| Wright Express Corp.* | | | 9,800 | | | | 277,144 | | |
| | | | 56,742,746 | | |
| Life sciences tools & services—0.39% | |
| Life Technologies Corp.* | | | 43,800 | | | | 1,994,214 | | |
| Millipore Corp.* | | | 22,300 | | | | 1,552,080 | | |
| | | | 3,546,294 | | |
| Machinery—1.74% | |
| Caterpillar, Inc. | | | 46,210 | | | | 2,036,013 | | |
| Cummins, Inc. | | | 62,960 | | | | 2,707,910 | | |
| Deere & Co.1 | | | 33,470 | | | | 1,463,978 | | |
| Eaton Corp.1 | | | 26,130 | | | | 1,356,670 | | |
| Illinois Tool Works, Inc. | | | 103,290 | | | | 4,188,409 | | |
| PACCAR, Inc.1 | | | 112,690 | | | | 3,904,708 | | |
| | | | 15,657,688 | | |
| Media—0.78% | |
| McGraw-Hill Cos., Inc.1 | | | 23,600 | | | | 739,860 | | |
| Omnicom Group, Inc.1 | | | 29,300 | | | | 996,200 | | |
| The DIRECTV Group, Inc.1,* | | | 77,380 | | | | 2,004,142 | | |
| Viacom, Inc., Class B* | | | 142,000 | | | | 3,288,720 | | |
| | | | 7,028,922 | | |
| Metals & mining—1.25% | |
| BHP Billiton Ltd., ADR1 | | | 58,820 | | | | 3,703,307 | | |
| BHP Billiton PLC, ADR | | | 85,200 | | | | 4,507,080 | | |
| Cliffs Natural Resources, Inc.1 | | | 6,200 | | | | 169,818 | | |
| Newmont Mining Corp. | | | 70,180 | | | | 2,901,943 | | |
| | | | 11,282,148 | | |
| Multi-utilities—0.02% | |
| Sempra Energy | | | 3,600 | | | | 188,748 | | |
| Multiline retail—1.04% | |
| Dollar Tree, Inc.1,* | | | 31,300 | | | | 1,443,556 | | |
| Kohl's Corp.* | | | 36,400 | | | | 1,767,220 | | |
| Macy's, Inc. | | | 32,000 | | | | 445,120 | | |
| Sears Holdings Corp.1,* | | | 6,500 | | | | 431,210 | | |
| Target Corp. | | | 121,670 | | | | 5,307,245 | | |
| | | | 9,394,351 | | |
| Security description | | Number of
shares | | Value | |
| Common stocks—(continued) | |
| Oil, gas & consumable fuels—3.91% | |
| CONSOL Energy, Inc. | | | 55,740 | | | $ | 1,980,442 | | |
| EOG Resources, Inc. | | | 94,700 | | | | 7,010,641 | | |
| Exxon Mobil Corp. | | | 59,053 | | | | 4,156,741 | | |
| Hess Corp. | | | 79,090 | | | | 4,365,768 | | |
| Murphy Oil Corp.1 | | | 32,500 | | | | 1,891,500 | | |
| Occidental Petroleum Corp. | | | 73,874 | | | | 5,270,171 | | |
| Peabody Energy Corp.1 | | | 30,900 | | | | 1,023,099 | | |
| Petroleo Brasileiro SA, ADR | | | 214,781 | | | | 8,857,569 | | |
| Southern Union Co.1 | | | 30,300 | | | | 587,214 | | |
| | | | 35,143,145 | | |
| Personal products—0.10% | |
| Nu Skin Enterprises, Inc., Class A | | | 48,200 | | | | 868,082 | | |
| Pharmaceuticals—3.94% | |
| Abbott Laboratories | | | 102,816 | | | | 4,625,692 | | |
| Allergan, Inc. | | | 176,600 | | | | 9,435,738 | | |
| Eli Lilly & Co. | | | 35,100 | | | | 1,224,639 | | |
Endo Pharmaceuticals
Holdings, Inc.* | | | 6,200 | | | | 130,262 | | |
| Forest Laboratories, Inc.* | | | 8,400 | | | | 216,972 | | |
| Johnson & Johnson | | | 74,967 | | | | 4,564,741 | | |
| Novo Nordisk A/S, ADR | | | 98,700 | | | | 5,763,093 | | |
| Pfizer, Inc.1 | | | 167,443 | | | | 2,667,367 | | |
| Sepracor, Inc.* | | | 13,600 | | | | 235,960 | | |
Teva Pharmaceutical Industries
Ltd., ADR | | | 117,960 | | | | 6,291,986 | | |
| Watson Pharmaceuticals, Inc.* | | | 2,900 | | | | 100,717 | | |
| Wyeth | | | 4,200 | | | | 195,510 | | |
| | | | 35,452,677 | | |
| Professional services—0.07% | |
| Manpower, Inc.1 | | | 13,800 | | | | 661,710 | | |
| Road & rail—1.39% | |
| Avis Budget Group, Inc.* | | | 43,600 | | | | 372,780 | | |
J.B. Hunt Transport
Services, Inc.1 | | | 6,500 | | | | 181,675 | | |
| Norfolk Southern Corp. | | | 75,831 | | | | 3,279,691 | | |
| Union Pacific Corp. | | | 151,098 | | | | 8,691,157 | | |
| | | | 12,525,303 | | |
| Semiconductors & semiconductor equipment—2.74% | |
| Altera Corp. | | | 219,890 | | | | 4,109,744 | | |
| Analog Devices, Inc. | | | 177,810 | | | | 4,866,660 | | |
| Broadcom Corp., Class A* | | | 63,400 | | | | 1,789,782 | | |
| Intel Corp. | | | 241,727 | | | | 4,653,245 | | |
| Linear Technology Corp.1 | | | 7,600 | | | | 204,212 | | |
| Tessera Technologies, Inc.* | | | 22,300 | | | | 626,407 | | |
| Texas Instruments, Inc.1 | | | 270,960 | | | | 6,516,588 | | |
| Xilinx, Inc. | | | 84,440 | | | | 1,831,503 | | |
| | | | 24,598,141 | | |
119
UBS PACE Select Advisors Trust
UBS PACE Large Co Growth Equity Investments
Portfolio of investments—July 31, 2009
| Security description | | Number of
shares | | Value | |
| Common stocks—(continued) | |
| Software—6.61% | |
| Adobe Systems, Inc.* | | | 171,000 | | | $ | 5,543,820 | | |
| BMC Software, Inc.* | | | 101,370 | | | | 3,449,621 | | |
| Intuit, Inc.* | | | 275,000 | | | | 8,167,500 | | |
| McAfee, Inc.1,* | | | 97,244 | | | | 4,335,138 | | |
| Microsoft Corp. | | | 589,765 | | | | 13,871,273 | | |
| Oracle Corp. | | | 804,762 | | | | 17,809,383 | | |
| Symantec Corp.* | | | 417,800 | | | | 6,237,754 | | |
| | | | 59,414,489 | | |
| Specialty retail—5.02% | |
| Advance Auto Parts, Inc.1 | | | 46,500 | | | | 2,149,695 | | |
| Aeropostale, Inc.1,* | | | 9,900 | | | | 360,360 | | |
| AutoNation, Inc.1,* | | | 39,300 | | | | 812,724 | | |
| AutoZone, Inc.1,* | | | 13,453 | | | | 2,065,977 | | |
| Bed Bath & Beyond, Inc.* | | | 600 | | | | 20,850 | | |
| Best Buy Co., Inc.1 | | | 140,190 | | | | 5,238,900 | | |
| Limited Brands, Inc. | | | 72,500 | | | | 938,150 | | |
| Lowe's Cos., Inc. | | | 422,136 | | | | 9,481,174 | | |
| RadioShack Corp. | | | 17,800 | | | | 276,078 | | |
| Ross Stores, Inc.1 | | | 43,400 | | | | 1,913,506 | | |
| Staples, Inc.1 | | | 588,430 | | | | 12,368,799 | | |
| The Gap, Inc. | | | 116,631 | | | | 1,903,418 | | |
| The Sherwin-Williams Co.1 | | | 28,700 | | | | 1,657,425 | | |
| TJX Cos., Inc. | | | 153,060 | | | | 5,545,364 | | |
| Tractor Supply Co.1,* | | | 8,700 | | | | 417,339 | | |
| | | | 45,149,759 | | |
| Textiles, apparel & luxury goods—1.76% | |
| Carter's, Inc.* | | | 19,600 | | | | 555,464 | | |
| Coach, Inc.1 | | | 216,500 | | | | 6,406,235 | | |
| Nike, Inc., Class B1 | | | 156,350 | | | | 8,855,664 | | |
| | | | 15,817,363 | | |
| Tobacco—0.47% | |
| Philip Morris International, Inc. | | | 91,413 | | | | 4,259,846 | | |
| Security description | | Number of
shares | | Value | |
| Common stocks—(concluded) | |
| Trading companies & distributors—0.02% | |
| WESCO International, Inc.* | | | 6,400 | | | $ | 158,016 | | |
| Wireless telecommunication services—0.90% | |
| Crown Castle International Corp.* | | | 280,800 | | | | 8,070,192 | | |
Total common stocks
(cost—$843,119,658) | | | | | | | 879,777,400 | | |
| | | Face
amount | | | |
| Repurchase agreement—1.40% | |
Repurchase agreement dated
07/31/09 with State Street
Bank & Trust Co.,
0.010% due 08/03/09,
collateralized by $12,855,856
US Treasury Bills, zero coupon
due 08/27/09 to 09/10/09,
(value—$12,854,570);
proceeds: $12,602,011
(cost—$12,602,000) | | $ | 12,602,000 | | | | 12,602,000 | | |
| | | Number of
shares | | | |
| Investment of cash collateral from securities loaned—16.70% | |
| Money market fund—16.70% | |
UBS Private Money Market
Fund LLC2
(cost—$150,213,457) | | | 150,213,457 | | | | 150,213,457 | | |
Total investments
(cost—$1,005,935,115)—
115.91% | | | | | | | 1,042,592,857 | | |
Liabilities in excess of other
assets—(15.91)% | | | | | | | (143,108,506 | ) | |
| Net assets—100.00% | | $ | 899,484,351 | | |
Aggregate cost for federal income tax purposes was $1,048,883,416; and net unrealized depreciation consisted of:
| Gross unrealized appreciation | | $ | 39,172,447 | | |
| Gross unrealized depreciation | | | (45,463,006 | ) | |
| Net unrealized depreciation | | $ | (6,290,559 | ) | |
* Non-income producing security.
1 Security, or portion thereof, was on loan at July 31, 2009.
2 The table below details the Portfolio's transaction activity in an affiliated issuer for the year ended July 31, 2009.
| Security description | | Value at
07/31/08 | | Purchases
during the
year ended
07/31/09 | | Sales
during the
year ended
07/31/09 | | Value at
07/31/09 | | Net income
earned from
affiliate for the
year ended
07/31/09 | |
| UBS Private Money Market Fund LLC | | $ | 11,316,943 | | | $ | 1,108,593,957 | | | $ | 969,697,443 | | | $ | 150,213,457 | | | $ | 492,795 | | |
ADR American Depositary Receipt
120
UBS PACE Select Advisors Trust
UBS PACE Large Co Growth Equity Investments
Portfolio of investments—July 31, 2009
The following is a summary of the fair valuations according to the inputs used as of July 31, 2009 in valuing the Portfolio's investments:
| | | Quoted prices in
active markets for
identical investments
(Level 1) | | Significant other
observable inputs
(Level 2) | | Unobservable
inputs
(Level 3) | | Total | |
| Common stocks | | $ | 879,777,400 | | | $ | — | | | $ | — | | | $ | 879,777,400 | | |
| Repurchase agreement | | | — | | | | 12,602,000 | | | | — | | | | 12,602,000 | | |
Investment of cash collateral
from securities loaned | | | — | | | | 150,213,457 | | | | — | | | | 150,213,457 | | |
| Total | | $ | 879,777,400 | | | $ | 162,815,457 | | | $ | — | | | $ | 1,042,592,857 | | |
Issuer breakdown by country or territory of origin (unaudited)
| | | Percentage of
total investments | |
| United States | | | 92.3 | % | |
| Switzerland | | | 1.9 | | |
| Brazil | | | 1.1 | | |
| Bermuda | | | 0.7 | | |
| Canada | | | 0.7 | | |
| Netherlands Antilles | | | 0.7 | | |
| Israel | | | 0.6 | | |
| Denmark | | | 0.6 | | |
| United Kingdom | | | 0.4 | | |
| Australia | | | 0.4 | | |
| Germany | | | 0.3 | | |
| Ireland | | | 0.3 | | |
| Total | | | 100.0 | % | |
See accompanying notes to financial statements.
121
UBS PACE Select Advisors Trust
UBS PACE Small/Medium Co Value Equity Investments
Performance
For the 12 months ended July 31, 2009, the Portfolio's Class P shares declined 15.14% (before the deduction of the maximum UBS PACE Select program fee; after the deduction of the maximum UBS PACE Select program fee, the Portfolio declined 16.40%). In comparison, the Russell 2500 Value Index (the "benchmark") declined 20.12% and the Lipper Small-Cap Value Funds category posted a median decline of 18.30%. (Returns for all share classes over various time periods are shown in the "Performance at a glance" table on page 127. Please note that the returns shown do not reflect the deduction of taxes that a shareholder would pay on Portfolio distributions or the redemption of Portfolio shares.) For a detailed commentary on the market environment in general during the reporting period, please refer to page two.
Sub-Advisors' comments
Ariel
During the period from August 1, 2008 through May 29, 2009, our portion of the Portfolio slightly underperformed the benchmark, primarily due to stock selection.
While our portion of the Portfolio's overweight to the consumer discretionary sector was beneficial, overall stock selection within the sector hurt performance. In the downtrodden media area, some holdings fell quite sharply, including Gannett Co. Inc., Interpublic Group of Companies. Inc. and McClatchy Co., which was subsequently sold from our portion of the Portfolio.
The prices of other media stocks, namely CBS Corp. and Meredith Corporation, actually increased during the reporting period. In addition, some consumer holdings outside the media area rose, including International Game Technology and Nordstrom, Inc. Within the financial services sector, we should note that while our portion of the Portfolio had a weighting to the sector very close to that of the benchmark, most of our holdings were not banks at the center of the credit crisis, a key reason for outperformance in that area.
On the upside, two primary factors boosted our portion of the Portfolio's relative returns during the reporting period. These included a contrarian decision to overweight the consumer discretionary sector and strong stock selection in the volatile financial services area.
UBS PACE Select Advisors Trust – UBS PACE Small/Medium Co Value Equity Investments
Investment Sub-Advisors:
Ariel Investments, LLC ("Ariel") until May 29, 2009, Opus Capital Group, LLC ("Opus") until May 29, 2009, Metropolitan West Capital Management, LLC ("MetWest Capital"), Buckhead Capital Management, LLC ("Buckhead"), commencing May 28, 2009, and Systematic Financial Management, L.P. ("Systematic"), commencing May 28, 2009
Portfolio Managers:
Ariel: John W. Rogers, Jr.;
Opus: Len Haussler, Kevin P. Whelan and Jonathon M. Detter;
MetWest Capital: Samir Sikka;
Buckhead: Matthew D. Reams and David S. Griffin;
Systematic: Ronald M. Mushock and D. Kevin McCreesh
Objective:
Capital appreciation
Investment process:
Ariel seeks to invest in stocks of quality companies in industries where it believes it has expertise. Ariel buys stocks when it determines that these businesses appear to be selling at excellent values. It believes that quality companies share several attributes that should result in capital appreciation over time, such as solid financials, high entry barriers, competitive advantages and quality management teams.
Opus uses quantitative and qualitative analysis to construct a value-oriented portfolio of stocks that are believed to be fundamentally undervalued, financially strong, and exhibit strong earnings growth and positive earnings momentum.
(continued on next page)
122
UBS PACE Select Advisors Trust
UBS PACE Small/Medium Co Value Equity Investments
Sub-Advisors' comments – continued
Opus
During the period from August 1, 2008 through May 29, 2009, our portion of the Portfolio outperformed the benchmark, primarily as a result of strong stock selection.
In all sectors, we focused on companies with very little or no debt, strong cash flow generation, and higher returns on equity. The success of this strategy during times of market weakness outweighed underperformance relative to the benchmark during the low-quality rally that began on March 9, 2009.
From a sector perspective, we focused on avoiding regional banks and maintained an overweight in the health care sector. After being propped up by government bailouts in 2008, regional banks significantly underperformed the small-cap market in the first half of 2009. This underweight significantly aided our portion of the Portfolio's relative performance. We believe that rising unemployment and higher loan default rates will keep a lid on the recovery of banks.
The health care sector, however, has remained under the cloud of political uncertainty since the Obama administration took office. We took this opportunity to add to the health care weighting, as we found high-quality operators with what we considered to be good growth potential which were trading at historically low valuations. While this emphasis did not help performance during the 12-month reporting period, we believe that the long-term outlook for these health care stocks is strong.
MetWest Capital
Our portion of the Portfolio outperformed the benchmark during the reporting period. Our in-depth company research and analysis resulted in stock selection being the primary source of outperformance. Sector weighting was also beneficial, albeit to a lesser extent. All sector over- and underweights relative to the benchmark are the result of bottom-up stock selection, rather than tactical allocation decisions.
Security selection was strongest in the health care, consumer discretionary and energy sectors. Within health care, Emergency Medical Services Corp. (EMS) added the most value. EMS's well-managed operations, stable business and large market share contributed to the stock's appreciation. In the consumer discretionary sector, Borders Group Inc. was the primary contributor. The stock advanced in early 2009 as investors finally
MetWest Capital utilizes a bottom-up, fundamental, research-driven style that it believes is well suited to the small cap market segment. MetWest Capital seeks to identify high-quality companies selling below intrinsic value with clear catalysts to realize full value within its investment time horizon and constructs a portfolio of its highest conviction ideas.
Buckhead utilizes a fundamental, bottom-up, research-driven investment style and a disciplined investment process that is designed to identify companies that it believes are attractively valued, have strong underlying fundamental characteristics and are likely to have one or more catalysts that are expected to drive their share prices higher. Buckhead seeks to build concentrated portfolios with the largest positions in those companies that it believes have the highest likelihood of outperforming the market and/or the portfolio's benchmark.
Systematic employs a two-pronged investment approach that utilizes both quantitative screening and fundamental research. Systematic's investment philosophy is predicated on its belief that stock prices reflect the market's estimates of earnings, and as revisions to those estimates are made by the market, stock prices will follow suit.
Systematic conducts a quantitative screening of all companies within the small/mid capitalization universe, and then uses fundamental research analysis to gauge investor expectations by focusing on key revenue and margin assumptions underlying earnings estimates.
123
UBS PACE Select Advisors Trust
UBS PACE Small/Medium Co Value Equity Investments
Sub-Advisors' comments – continued
acknowledged its strong cash flow generated in the fourth quarter of 2008. Oceaneering International Inc. was the top contributor in the energy sector, as the oil service provider's stock rebounded after having been widely sold amidst tremendous oil price volatility. We also added value relative to the benchmark in the information technology sector through both stock selection and an overweight to the sector, while we benefited in the troubled financials sector relative to the benchmark due to stock selection and an underweight position.
During the reporting period, the most significant detractor from relative performance was stock selection in and an underweight to the traditionally defensive utilities sector, which held up well during this difficult period for the stock market. Our position in El Paso Electric Co. declined in response to news affecting short-term results during the reporting period, subtracting value. However, we believe that above-average customer growth and continued share repurchases should cause the stock to appreciate toward our estimate of intrinsic value in the coming years. Security selection in materials was also weak during this period.
Overall, the positives outweighed negatives during the reporting period, resulting in outperformance relative to the benchmark. Over the long term, we believe our focus on exceptional companies in good businesses will continue to offer some protection on the downside in declining markets and continue to add value for shareholders.
Buckhead
During the period from May 28, 2009 through July 31, 2009, when we managed a portion of the Portfolio, it outperformed the benchmark, primarily due to stock selection.
Our bottom-up approach identified what we considered to be exceptional stocks in the health care, industrial/producer durable and consumer staples sectors. In the health care sector, both Amedisys, Inc. and Integra Lifesciences Holdings were big percentage gainers. As opposition to President Obama's health care plan took hold, stocks in this market segment rallied after sustaining heavy losses earlier in the year.
In the industrial/producer durable sector, positions in Republic Services, Inc., Con-Way, Inc. and Ball Corp. turned in above-average results. Republic Services, Inc. posted strong quarterly results, and Con-Way, Inc. continued to gain market share in a difficult trucking market, while its major competitor stumbled. Finally, Ball Corp. announced an acquisition that would quickly add to the company's growing profitability. Wall Street greeted all of this news enthusiastically.
An investment in the consumer staples sector—namely, Fresh Del Monte Produce, Inc.—also outperformed the benchmark and added value to our portion of the Portfolio. Fresh Del Monte Produce, Inc. is a global sourcer, distributor, and marketer of fresh produce. The stock's price had become depressed as an oversupply of melons and a weak demand weighed on volumes of higher-priced products, such as pineapples. The company is an industry leader with a solid balance sheet, and we believe that it is capable of outlasting near-term pricing pressures. We expect that the commodity cycle will soon begin to reverse itself, and profitability will normalize to historic levels.
Our portion of the Portfolio had a neutral sector weighting relative to the bechmark. One exception, however, was an underweight to utilities. Although this positioning detracted from performance during the period, we remain skeptical of the belief that long-term gains can be realized in an industry that, while highly regulated by the government, may soon be forced to operate in a whole new environment.
124
UBS PACE Select Advisors Trust
UBS PACE Small/Medium Co Value Equity Investments
Sub-Advisors' comments – concluded
Systematic
During the period from May 28, 2009 through July 31, 2009, when we managed a portion of the Portfolio, it outperformed the benchmark, primarily due to stock selection.
During this period, the equity markets were buoyed by further signs of stabilization in the broader economy, and our portion of the Portfolio benefited accordingly. Given the improving economic environment, we have positioned our portion of the Portfolio in an effort to benefit from a sustained market rally, and it is focused on quality businesses with attractive fundamentals. Relative outperformance was due to stock selection, especially in the materials and financials sectors, where our portion of the Portfolio outperformed the benchmark by 1.53% and 2.01%, respectively. The information technology sector contributed favorable relative results as well.
While performance in the industrials and consumer discretionary sectors faced mild headwinds, a few lower-quality, contrarian constituents of the benchmark did well during the market rally. However, sector allocation within our portion of the Portfolio did not meaningfully add or detract value during the reporting period.
Stock selection was helped moderately by the quantitative fundamental metrics we use in our investment process. Most notably, we examined stocks' earnings in an attempt to uncover those stocks likely to outperform. This strategy was successful for our portion of the Portfolio, as companies with the best earnings revisions—that is, a change in earnings estimates for companies—outperformed those with the worst earnings revisions by 2.16% during the reporting period, relative to the Russell 2500 Value Index.
The two largest contributors in the period during which we managed a portion of the Portfolio were Thompson Creek Metals Co. Inc. and Walter Energy, Inc., while the two largest detractors were diversified energy business Delek US Holdings, Inc. and communications and energy infrastructure service provider MasTec, Inc.
Special considerations
The Portfolio may be appropriate for long-term investors seeking capital appreciation who are able to withstand short-term fluctuations in the equity markets in return for potentially higher returns over the long term. The value of the Portfolio changes every day and can be affected by changes in interest rates, general market conditions and other political, social and economic developments, as well as specific matters relating to the companies in whose securities the Portfolio invests. It is important to note that an investment in the Portfolio is only one component of a balanced investment plan. In addition, small- and mid-cap companies are typically subject to a greater degree of change in earnings and business prospects than are larger, more established companies. Therefore, they are considered to have a higher level of volatility and risk.
125
UBS PACE Select Advisors Trust
UBS PACE Small/Medium Co Value Equity Investments
Comparison of change in value of a $10,000 investment in the Class P shares of the Portfolio and the Russell 2500 Value Index (unaudited)

The graph depicts the performance of UBS PACE Small/Medium Co Value Equity Investments Class P shares versus the Russell 2500 Value Index over the 10 years ended July 31, 2009. The performance of the other classes will vary from the performance of the class shown based on the difference in sales charges and fees paid by shareholders investing in different share classes. Past performance does not predict future performance and the performance provided does not reflect the deduction of taxes that a shareholder would pay on Portfolio distributions or the redemption of Portfolio shares. It is important to note that UBS PACE Small/Medium Co Value Equity Investments is a professionally managed portfolio while the Index is not available for investment and is unmanaged. The comparison is shown for illustrative purposes only.
126
UBS PACE Select Advisors Trust
UBS PACE Small/Medium Co Value Equity Investments
Performance at a glance (unaudited)
| Average annual total returns for periods ended 07/31/09 | | 1 year | | 5 years | | 10 years | | Since
inception1 | |
| Before deducting | | Class A2 | | | (15.29 | )% | | | (0.41 | )% | | N/A | | | 4.80 | % | |
| maximum sales charge | | Class B3 | | | (15.90 | )% | | | (1.22 | )% | | N/A | | | 4.28 | % | |
| or UBS PACE Select | | Class C4 | | | (15.98 | )% | | | (1.18 | )% | | N/A | | | 4.01 | % | |
| program fee | | Class Y5 | | | (14.92 | )% | | | (0.04 | )% | | N/A | | | 5.37 | % | |
| | | Class P6 | | | (15.14 | )% | | | (0.25 | )% | | | 3.73 | % | | | 6.35 | % | |
| After deducting | | Class A2 | | | (19.94 | )% | | | (1.53 | )% | | N/A | | | 4.12 | % | |
| maximum sales charge | | Class B3 | | | (20.11 | )% | | | (1.46 | )% | | N/A | | | 4.28 | % | |
| or UBS PACE Select | | Class C4 | | | (16.82 | )% | | | (1.18 | )% | | N/A | | | 4.01 | % | |
| program fee | | Class P6 | | | (16.40 | )% | | | (1.74 | )% | | | 2.18 | % | | | 4.76 | % | |
| Russell 2500 Value Index7 | | | (20.12 | )% | | | 1.20 | % | | | 6.20 | % | | | 8.75 | % | |
| Lipper Small-Cap Value Funds median | | | (18.30 | )% | | | 1.09 | % | | | 6.46 | % | | | 7.71 | % | |
Average annual total returns for periods ended June 30, 2009, after deduction of the maximum sales charge or UBS PACE Select program fee, were as follows: Class A—1-year period, (25.62)%; 5-year period, (4.52)%; since inception, 2.94%; Class B—1-year period, (25.75)%; 5-year period, (4.46)%; since inception, 3.10%; Class C—1-year period, (22.67)%; 5-year period, (4.18)%; since inception, 2.84%; Class Y—1-year period, (20.94)%; 5-year period, (3.08)%; since inception, 4.17%; Class P—1-year period, (22.29)%; 5-year period, (4.72)%; 10-year period, 1.04%; since inception, 4.03%.
The annualized gross and net expense ratios, respectively, for each class of shares as in the November 28, 2008 prospectuses, were as follows: Class A—1.29% and 1.29%; Class B—2.20% and 2.16%; Class C—2.06% and 2.06%; Class Y—0.95% and 0.95%; and Class P—1.18% and 1.16%. Net expenses reflect fee waivers and/or expense reimbursements, if any, pursuant to an agreement that is in effect to cap the expenses. The Portfolio and UBS Global AM have entered into a written fee waiver/expense reimbursement agreement pursuant to which UBS Global AM is contractually obligated to waive its management fees and/or reimburse the Portfolio so that the Portfolio's ordinary total operating expenses through November 30, 2009 (excluding dividend expense, borrowing costs and interest expense, if any) would not exceed Class A—1.41%; Class B—2.16%; Class C—2.16%; Class Y—1.16% and Class P—1.16%. The Port folio has agreed to repay UBS Global AM for any waived fees/reimbursed expenses to the extent that it can do so over the following three fiscal years without causing the Portfolio's expenses in any of those three years to exceed the expense caps described above.
1 Since inception returns are calculated as of commencement of issuance on August 24, 1995 for Class P shares, November 27, 2000 for Class A and C shares, November 28, 2000 for Class B shares, and December 20, 2000 for Class Y shares. Since inception returns for the Index and Lipper median are shown as of August 31, 1995, which is the month-end after the inception date of the oldest share class (Class P).
2 Maximum sales charge for Class A shares is 5.5%. Class A shares bear ongoing 12b-1 service fees.
3 Maximum contingent deferred sales charge for Class B shares is 5% imposed on redemptions and is reduced to 0% after a maximum of six years. Class B shares bear ongoing 12b-1 service and distribution fees.
4 Maximum contingent deferred sales charge for Class C shares is 1% imposed on redemptions and is reduced to 0% after one year. Class C shares bear ongoing 12b-1 service and distribution fees.
5 The Portfolio offers Class Y shares to a limited group of eligible investors, including certain qualifying retirement plans. Class Y shares do not bear initial or contingent deferred sales charges or ongoing 12b-1 service and distribution fees.
6 Class P shares do not bear initial or contingent deferred sales charges or ongoing 12b-1 service and distribution fees, but are subject to a maximum annual UBS PACE Select program fee of 1.5% of the value of Class P shares.
7 The Russell 2500 Value Index measures the performance of those Russell 2500 companies with lower price-to-book ratios and lower forecasted growth rates. Investors should note that indices do not reflect the deduction of fees, expenses or taxes.
If an investor sells or exchanges shares less than 90 days after purchase, a redemption fee of 1.00% of the amount sold or exchanged will be deducted at the time of the transaction, except as noted otherwise in the prospectuses.
Past performance does not predict future performance, and the performance information provided does not reflect the deduction of taxes that a shareholder would pay on Portfolio distributions or the redemption of Portfolio shares. The return and principal value of an investment will fluctuate, so that an investor's shares, when redeemed, may be worth more or less than their original cost. Performance results assume reinvestment of all dividends and capital gain distributions at net asset value on the ex-dividend dates. Current performance may be higher or lower than the performance data quoted. For month-end performance figures, please visit http://www.ubs.com.
Lipper peer group data calculated by Lipper Inc.; used with permission. The Lipper median is the return of the fund that places in the middle of a Lipper peer group.
127
UBS PACE Select Advisors Trust
UBS PACE Small/Medium Co Value Equity Investments
Portfolio statistics (unaudited)
| Characteristics | | 07/31/09 | |
| Net assets (mm) | | $ | 343.7 | | |
| Number of holdings | | | 173 | | |
| Portfolio composition1 | | 07/31/09 | |
| Common and preferred stocks | | | 96.4 | % | |
| Cash equivalents and other assets less liabilities | | | 3.6 | | |
| Total | | | 100.0 | % | |
| Top five sectors1 | | 07/31/09 | |
| Financials | | | 23.3 | % | |
| Information technology | | | 16.8 | | |
| Industrials | | | 16.4 | | |
| Consumer discretionary | | | 14.0 | | |
| Health care | | | 6.7 | | |
| Total | | | 77.2 | % | |
| Top ten equity holdings1 | | 07/31/09 | |
| Entegris, Inc. | | | 1.7 | % | |
| Raymond James Financial, Inc. | | | 1.4 | | |
| VeriFone Holdings, Inc. | | | 1.3 | | |
| Tidewater, Inc. | | | 1.3 | | |
| Coinstar, Inc. | | | 1.2 | | |
| Republic Services, Inc. | | | 1.2 | | |
| Amedisys, Inc. | | | 1.2 | | |
| RPM International, Inc. | | | 1.2 | | |
| Ball Corp. | | | 1.2 | | |
| Solera Holdings, Inc. | | | 1.2 | | |
| Total | | | 12.9 | % | |
1 Weightings represent percentages of the Portfolio's net assets as of July 31, 2009. The Portfolio is actively managed and its composition will vary over time.
128
UBS PACE Select Advisors Trust
UBS PACE Small/Medium Co Value Equity Investments
Portfolio of investments—July 31, 2009
| Security description | | Number of
shares | | Value | |
| Common stocks—95.91% | |
| Aerospace & defense—0.50% | |
| Hexcel Corp.1,* | | | 170,000 | | | $ | 1,735,700 | | |
| Air freight & logistics—0.71% | |
| Forward Air Corp.1 | | | 105,000 | | | | 2,428,650 | | |
| Auto components—0.26% | |
| Cooper Tire & Rubber Co.1 | | | 60,000 | | | | 885,600 | | |
| Automobiles—0.52% | |
| Thor Industries, Inc.1 | | | 75,000 | | | | 1,793,250 | | |
| Beverages—0.59% | |
| Dr. Pepper Snapple Group, Inc.* | | | 81,900 | | | | 2,015,559 | | |
| Capital markets—2.92% | |
| Invesco Ltd. | | | 131,900 | | | | 2,605,025 | | |
| Raymond James Financial, Inc.1 | | | 230,550 | | | | 4,730,886 | | |
| Stifel Financial Corp.1,* | | | 54,000 | | | | 2,696,220 | | |
| | | | 10,032,131 | | |
| Chemicals—1.85% | |
| Celanese Corp., Series A | | | 46,200 | | | | 1,187,340 | | |
International Flavors &
Fragrances, Inc. | | | 28,275 | | | | 996,977 | | |
| RPM International, Inc. | | | 261,200 | | | | 4,168,752 | | |
| | | | 6,353,069 | | |
| Commercial banks—7.27% | |
| Bank of Hawaii Corp.1 | | | 50,125 | | | | 1,923,296 | | |
| Cathay General Bancorp1 | | | 281,000 | | | | 2,562,720 | | |
| CVB Financial Corp.1 | | | 310,400 | | | | 2,340,416 | | |
| East West Bancorp, Inc.1 | | | 19,100 | | | | 168,844 | | |
| First Horizon National Corp.1,* | | | 171,768 | | | | 2,202,066 | | |
| International Bancshares Corp.1 | | | 167,000 | | | | 2,201,060 | | |
| Prosperity Bancshares, Inc.1 | | | 85,100 | | | | 2,851,701 | | |
| Synovus Financial Corp.1 | | | 884,300 | | | | 3,103,893 | | |
| Texas Capital Bancshares, Inc.1,* | | | 137,400 | | | | 2,282,214 | | |
| United Community Banks, Inc.1,* | | | 129,285 | | | | 870,088 | | |
| Wilmington Trust Corp.1 | | | 139,900 | | | | 1,607,451 | | |
| Zions Bancorporation1 | | | 211,500 | | | | 2,872,170 | | |
| | | | 24,985,919 | | |
| Commercial services & supplies—3.84% | |
| ATC Technology Corp.* | | | 85,000 | | | | 1,778,200 | | |
| Copart, Inc.1,* | | | 76,000 | | | | 2,683,560 | | |
| Republic Services, Inc.1 | | | 158,325 | | | | 4,211,445 | | |
| Schawk, Inc.1 | | | 189,000 | | | | 1,368,360 | | |
| United Stationers, Inc. * | | | 68,000 | | | | 3,156,560 | | |
| | | | 13,198,125 | | |
| Communications equipment—0.63% | |
| Plantronics, Inc. | | | 64,600 | | | | 1,529,082 | | |
| Tellabs, Inc.* | | | 108,700 | | | | 630,460 | | |
| | | | 2,159,542 | | |
| Security description | | Number of
shares | | Value | |
| Common stocks—(continued) | |
| Computers & peripherals—2.01% | |
| Avid Technology, Inc.1,* | | | 219,100 | | | $ | 2,683,975 | | |
| Electronics for Imaging, Inc.1,* | | | 262,000 | | | | 2,986,800 | | |
| Western Digital Corp.* | | | 41,300 | | | | 1,249,325 | | |
| | | | 6,920,100 | | |
| Construction & engineering—2.09% | |
| Dycom Industries, Inc.* | | | 212,800 | | | | 2,708,944 | | |
| Fluor Corp. | | | 24,200 | | | | 1,277,760 | | |
| MasTec, Inc.1,* | | | 85,000 | | | | 879,750 | | |
| Pike Electric Corp.1,* | | | 220,000 | | | | 2,316,600 | | |
| | | | 7,183,054 | | |
| Containers & packaging—2.16% | |
| Ball Corp. | | | 84,500 | | | | 4,086,420 | | |
| Crown Holdings, Inc.1,* | | | 59,500 | | | | 1,493,450 | | |
| Temple-Inland, Inc.1 | | | 117,600 | | | | 1,841,616 | | |
| | | | 7,421,486 | | |
| Diversified consumer services—1.24% | |
| Coinstar, Inc.1,* | | | 128,275 | | | | 4,262,578 | | |
| Diversified telecommunication services—0.80% | |
General Communication,
Inc., Class A1,* | | | 255,500 | | | | 1,750,175 | | |
| Premiere Global Services, Inc.* | | | 105,555 | | | | 1,012,272 | | |
| | | | 2,762,447 | | |
| Electrical equipment—2.16% | |
| AMETEK, Inc.1 | | | 73,000 | | | | 2,362,280 | | |
| Brady Corp., Class A | | | 32,700 | | | | 961,707 | | |
| Cooper Industries Ltd., Class A1 | | | 56,800 | | | | 1,871,560 | | |
| General Cable Corp.1,* | | | 57,900 | | | | 2,244,783 | | |
| | | | 7,440,330 | | |
| Electric utilities—1.42% | |
| El Paso Electric Co.* | | | 100,000 | | | | 1,511,000 | | |
| Northeast Utilities | | | 53,500 | | | | 1,231,035 | | |
| NV Energy, Inc.1 | | | 106,700 | | | | 1,227,050 | | |
| Unitil Corp. | | | 44,100 | | | | 910,224 | | |
| | | | 4,879,309 | | |
| Electronic equipment, instruments & components—2.60% | |
| Ingram Micro, Inc., Class A* | | | 196,400 | | | | 3,303,448 | | |
| Jabil Circuit, Inc.1 | | | 205,000 | | | | 1,877,800 | | |
| OSI Systems, Inc.1,* | | | 36,900 | | | | 730,989 | | |
| Plexus Corp. * | | | 51,000 | | | | 1,310,190 | | |
| Tyco Electronics Ltd. | | | 79,500 | | | | 1,706,865 | | |
| | | | 8,929,292 | | |
| Energy equipment & services—2.92% | |
| Noble Corp. | | | 72,000 | | | | 2,437,920 | | |
| Oceaneering International, Inc.* | | | 36,000 | | | | 1,833,120 | | |
| TETRA Technologies, Inc.1,* | | | 188,500 | | | | 1,453,335 | | |
| Tidewater, Inc. | | | 95,700 | | | | 4,306,500 | | |
| | | | 10,030,875 | | |
129
UBS PACE Select Advisors Trust
UBS PACE Small/Medium Co Value Equity Investments
Portfolio of investments—July 31, 2009
| Security description | | Number of
shares | | Value | |
| Common stocks—(continued) | |
| Food products—3.26% | |
American Italian Pasta Co.,
Class A1,* | | | 28,900 | | | $ | 909,194 | | |
Brooklyn Cheesecake &
Desserts Co., Inc.2,* | | | 34,680 | | | | 5,202 | | |
| Dean Foods Co.* | | | 55,300 | | | | 1,171,807 | | |
| Flowers Foods, Inc.1 | | | 97,500 | | | | 2,303,925 | | |
| Fresh Del Monte Produce, Inc.* | | | 121,900 | | | | 2,609,879 | | |
| J&J Snack Foods Corp. | | | 39,500 | | | | 1,711,930 | | |
| Ralcorp Holdings, Inc.* | | | 39,000 | | | | 2,476,890 | | |
| | | | 11,188,827 | | |
| Health care equipment & supplies—1.16% | |
| Cooper Cos., Inc.1 | | | 48,500 | | | | 1,330,840 | | |
| ICU Medical, Inc.1,* | | | 38,500 | | | | 1,498,805 | | |
| Integra LifeSciences Holdings1,* | | | 36,870 | | | | 1,167,304 | | |
| | | | 3,996,949 | | |
| Health care providers & services—3.44% | |
| Amedisys, Inc.1,* | | | 93,590 | | | | 4,184,409 | | |
| AMN Healthcare Services, Inc.1,* | | | 251,000 | | | | 1,827,280 | | |
| Chemed Corp. | | | 48,000 | | | | 2,116,800 | | |
Emergency Medical Services
Corp., Class A1,* | | | 31,000 | | | | 1,213,340 | | |
Health Management Associates,
Inc., Class A* | | | 241,900 | | | | 1,458,657 | | |
| Sun Healthcare Group, Inc.1,* | | | 104,800 | | | | 1,019,704 | | |
| | | | 11,820,190 | | |
| Hotels, restaurants & leisure—1.99% | |
| Burger King Holdings, Inc.1 | | | 139,000 | | | | 2,365,780 | | |
Cracker Barrel Old Country
Store, Inc.1 | | | 29,275 | | | | 844,877 | | |
| Darden Restaurants, Inc.1 | | | 27,000 | | | | 874,530 | | |
| Papa John's International, Inc.1,* | | | 64,000 | | | | 1,626,240 | | |
| Wyndham Worldwide Corp. | | | 79,900 | | | | 1,114,605 | | |
| | | | 6,826,032 | | |
| Household durables—1.54% | |
| Fortune Brands, Inc. | | | 26,200 | | | | 1,036,734 | | |
| Jarden Corp.1,* | | | 54,200 | | | | 1,336,030 | | |
| Snap-on, Inc.1 | | | 81,555 | | | | 2,905,805 | | |
| | | | 5,278,569 | | |
| Independent power producers & energy traders—0.64% | |
| AES Corp.* | | | 115,700 | | | | 1,479,803 | | |
| NRG Energy, Inc.1,* | | | 27,000 | | | | 734,670 | | |
| | | | 2,214,473 | | |
| Insurance—6.74% | |
| Alleghany Corp.* | | | 6,840 | | | | 1,850,220 | | |
| Arch Capital Group Ltd.* | | | 38,500 | | | | 2,394,315 | | |
| Arthur J. Gallagher & Co.1 | | | 59,300 | | | | 1,357,970 | | |
| Assurant, Inc. | | | 65,100 | | | | 1,661,352 | | |
| Brown & Brown, Inc.1 | | | 155,675 | | | | 2,985,847 | | |
| Security description | | Number of
shares | | Value | |
| Common stocks—(continued) | |
| Insurance—(concluded) | |
Hartford Financial Services
Group, Inc.1 | | | 134,000 | | | $ | 2,209,660 | | |
| HCC Insurance Holdings, Inc. | | | 80,000 | | | | 2,008,000 | | |
| Horace Mann Educators Corp. | | | 178,000 | | | | 2,020,300 | | |
Reinsurance Group of
America, Inc.1 | | | 35,300 | | | | 1,464,950 | | |
| Selective Insurance Group, Inc. | | | 113,000 | | | | 1,688,220 | | |
| Unum Group1 | | | 131,200 | | | | 2,462,624 | | |
| Zenith National Insurance Corp.1 | | | 44,860 | | | | 1,070,808 | | |
| | | | 23,174,266 | | |
| Internet software & services—0.99% | |
| DealerTrack Holdings, Inc.1,* | | | 172,500 | | | | 3,420,675 | | |
| IT services—3.59% | |
| Amdocs Ltd.* | | | 131,475 | | | | 3,144,882 | | |
Broadridge Financial
Solutions, Inc. | | | 152,200 | | | | 2,628,494 | | |
| Perot Systems Corp., Class A* | | | 64,600 | | | | 1,032,308 | | |
| Unisys Corp.1,* | | | 670,000 | | | | 1,199,300 | | |
| VeriFone Holdings, Inc.1,* | | | 480,800 | | | | 4,332,008 | | |
| | | | 12,336,992 | | |
| Leisure equipment & products—0.69% | |
| RC2 Corp.* | | | 155,000 | | | | 2,366,850 | | |
| Life sciences tools & services—2.05% | |
Bio-Rad Laboratories, Inc.,
Class A* | | | 23,500 | | | | 1,819,840 | | |
| Covance, Inc.1,* | | | 60,000 | | | | 3,309,000 | | |
| Life Technologies Corp.* | | | 42,100 | | | | 1,916,813 | | |
| | | | 7,045,653 | | |
| Machinery—3.26% | |
| Briggs & Stratton Corp.1 | | | 130,900 | | | | 2,247,553 | | |
| Chart Industries, Inc.* | | | 19,400 | | | | 373,644 | | |
| Harsco Corp. | | | 79,460 | | | | 2,185,944 | | |
| Kennametal, Inc. | | | 131,500 | | | | 2,803,580 | | |
| SPX Corp. | | | 19,800 | | | | 1,045,836 | | |
| Wabtec Corp. | | | 56,000 | | | | 1,884,400 | | |
Watts Water Technologies,
Inc., Class A1 | | | 25,290 | | | | 666,139 | | |
| | | | 11,207,096 | | |
| Marine—0.49% | |
| Kirby Corp.* | | | 45,600 | | | | 1,687,656 | | |
| Media—2.24% | |
John Wiley & Sons,
Inc., Class A1 | | | 57,625 | | | | 1,837,661 | | |
| Marvel Entertainment, Inc.1,* | | | 37,550 | | | | 1,485,478 | | |
| McGraw-Hill Cos., Inc.1 | | | 31,400 | | | | 984,390 | | |
| Scholastic Corp. | | | 87,140 | | | | 1,965,007 | | |
Shaw Communications,
Inc., Class B | | | 81,100 | | | | 1,421,683 | | |
| | | | 7,694,219 | | |
130
UBS PACE Select Advisors Trust
UBS PACE Small/Medium Co Value Equity Investments
Portfolio of investments—July 31, 2009
| Security description | | Number of
shares | | Value | |
| Common stocks—(continued) | |
| Metals & mining—1.33% | |
Thompson Creek Metals
Co., Inc.1,* | | | 227,300 | | | $ | 3,307,215 | | |
| Walter Energy, Inc. | | | 25,400 | | | | 1,253,744 | | |
| | | | 4,560,959 | | |
| Multi-utilities—0.62% | |
| CMS Energy Corp.1 | | | 164,800 | | | | 2,132,512 | | |
| Multiline retail—0.78% | |
| Fred's, Inc., Class A1 | | | 140,400 | | | | 1,892,592 | | |
| J.C. Penney Co., Inc. | | | 26,500 | | | | 798,975 | | |
| | | | 2,691,567 | | |
| Oil, gas & consumable fuels—2.40% | |
| Bill Barrett Corp.1,* | | | 35,100 | | | | 1,108,809 | | |
| Comstock Resources, Inc.* | | | 76,000 | | | | 2,926,000 | | |
| Delek US Holdings, Inc.1 | | | 82,300 | | | | 701,196 | | |
| El Paso Corp.1 | | | 114,000 | | | | 1,146,840 | | |
| Quicksilver Resources, Inc.1,* | | | 100,000 | | | | 1,146,000 | | |
| Whiting Petroleum Corp.* | | | 26,900 | | | | 1,236,324 | | |
| | | | 8,265,169 | | |
| Paper & forest products—0.81% | |
| Glatfelter | | | 178,000 | | | | 1,842,300 | | |
| Neenah Paper, Inc. | | | 97,900 | | | | 959,420 | | |
| | | | 2,801,720 | | |
| Professional services—1.78% | |
| MPS Group, Inc.* | | | 199,000 | | | | 1,721,350 | | |
| Resources Connection, Inc.* | | | 108,500 | | | | 1,638,350 | | |
| School Specialty, Inc.* | | | 123,000 | | | | 2,751,510 | | |
| | | | 6,111,210 | | |
| Real estate investment trusts (REITs)—3.54% | |
Annaly Capital
Management, Inc. | | | 165,175 | | | | 2,783,199 | | |
| Boston Properties, Inc.1 | | | 20,300 | | | | 1,073,870 | | |
| DiamondRock Hospitality Co.1 | | | 150,000 | | | | 1,014,000 | | |
| Digital Realty Trust, Inc.1 | | | 56,500 | | | | 2,291,075 | | |
| Health Care REIT, Inc.1 | | | 56,000 | | | | 2,243,360 | | |
| MFA Financial, Inc. | | | 300,525 | | | | 2,223,885 | | |
| National Retail Properties, Inc.1 | | | 27,300 | | | | 538,083 | | |
| | | | 12,167,472 | | |
| Road & rail—1.28% | |
| Con-way, Inc. | | | 50,605 | | | | 2,305,058 | | |
| Landstar System, Inc.1 | | | 57,000 | | | | 2,090,760 | | |
| | | | 4,395,818 | | |
| Semiconductors & semiconductor equipment—4.92% | |
| Entegris, Inc.* | | | 1,535,000 | | | | 5,725,550 | | |
Marvell Technology
Group Ltd.1,* | | | 54,900 | | | | 732,366 | | |
| Security description | | Number of
shares | | Value | |
| Common stocks—(concluded) | |
| Semiconductors & semiconductor equipment—(concluded) | |
| NVIDIA Corp.* | | | 89,050 | | | $ | 1,151,417 | | |
| ON Semiconductor Corp.* | | | 516,675 | | | | 3,771,727 | | |
| Semtech Corp.* | | | 133,800 | | | | 2,461,920 | | |
| Skyworks Solutions, Inc.* | | | 46,200 | | | | 558,096 | | |
Varian Semiconductor Equipment
Associates, Inc.1,* | | | 78,500 | | | | 2,515,140 | | |
| | | | 16,916,216 | | |
| Software—2.07% | |
| Informatica Corp.* | | | 114,500 | | | | 2,105,655 | | |
| Solera Holdings, Inc.* | | | 150,500 | | | | 4,052,965 | | |
TeleCommunication Systems,
Inc., Class A* | | | 114,000 | | | | 943,920 | | |
| | | | 7,102,540 | | |
| Specialty retail—3.61% | |
| AutoNation, Inc.1,* | | | 28,300 | | | | 585,244 | | |
| Borders Group, Inc.1,* | | | 580,050 | | | | 2,302,798 | | |
| Foot Locker, Inc.1 | | | 106,000 | | | | 1,174,480 | | |
| Group 1 Automotive, Inc.1 | | | 95,000 | | | | 2,798,700 | | |
| Gymboree Corp.* | | | 46,000 | | | | 1,829,880 | | |
| The Sherwin-Williams Co.1 | | | 64,200 | | | | 3,707,550 | | |
| | | | 12,398,652 | | |
| Textiles, apparel & luxury goods—1.09% | |
| The Warnaco Group, Inc.* | | | 65,700 | | | | 2,386,881 | | |
| Volcom, Inc.1,* | | | 113,000 | | | | 1,370,690 | | |
| | | | 3,757,571 | | |
| Thrifts & mortgage finance—2.34% | |
First Niagara Financial
Group, Inc. | | | 215,000 | | | | 2,827,250 | | |
| Hudson City Bancorp, Inc.1 | | | 192,700 | | | | 2,709,362 | | |
New York Community
Bancorp, Inc.1 | | | 227,925 | | | | 2,493,499 | | |
| | | | 8,030,111 | | |
| Trading companies & distributors—0.28% | |
| Huttig Building Products, Inc.2,* | | | 162,000 | | | | 140,940 | | |
| Textainer Group Holdings Ltd. | | | 68,000 | | | | 817,360 | | |
| | | | 958,300 | | |
| Wireless telecommunication services—0.49% | |
| NTELOS Holdings Corp. | | | 108,000 | | | | 1,672,920 | | |
Total common stocks
(cost—$319,418,531) | | | | | | | 329,638,200 | | |
| Preferred stock—0.50% | |
| Commercial banks—0.50% | |
East West Bancorp,
Inc., Series A2,3
(cost—$2,188,000) | | | 2,188 | | | | 1,710,535 | | |
131
UBS PACE Select Advisors Trust
UBS PACE Small/Medium Co Value Equity Investments
Portfolio of investments—July 31, 2009
| Security description | | Face
amount | | Value | |
| Repurchase agreement—2.48% | |
Repurchase agreement dated
07/31/09 with State Street
Bank & Trust Co.,
0.010% due 08/03/09
collateralized by $8,691,628
US Treasury Bills, zero coupon
due 08/27/09 to 09/10/09;
(value—$8,690,758);
proceeds: $8,520,007
(cost—$8,520,000) | | $ | 8,520,000 | | | $ | 8,520,000 | | |
| Security description | | Number of
shares | | Value | |
| Investment of cash collateral from securities loaned—25.23% | |
| Money market fund—25.23% | |
UBS Private Money Market
Fund LLC4
(cost—$86,696,079) | | | 86,696,079 | | | $ | 86,696,079 | | |
Total investments
(cost—$416,822,610)—
124.12% | | | | | 426,564,814 | | |
Liabilities in excess of other
assets—(24.12)% | | | | | (82,889,352 | ) | |
| Net assets—100.00% | | $ | 343,675,462 | | |
Aggregate cost for federal income tax purposes was $419,279,557; and net unrealized appreciation consisted of:
| Gross unrealized appreciation | | $ | 34,871,092 | | |
| Gross unrealized depreciation | | | (27,585,835 | ) | |
| Net unrealized appreciation | | $ | 7,285,257 | | |
* Non-income producing security.
1 Security, or portion thereof, was on loan at July 31, 2009.
2 Illiquid securities representing 0.54% of net assets as of July 31, 2009.
3 Non cumulative preferred stock. Convertible until 12/31/49.
4 The table below details the Portolio's transaction activity in an affiliated issuer during the year ended July 31, 2009.
| Security description | | Value at
07/31/08 | | Purchases
during the
year ended
07/31/09 | | Sales
during the
year ended
07/31/09 | | Value at
07/31/09 | | Net income
earned from
affiliate for the
year ended
07/31/09 | |
| UBS Private Money Market Fund LLC | | $ | 75,003,218 | | | $ | 416,153,524 | | | $ | 404,460,663 | | | $ | 86,696,079 | | | $ | 478,638 | | |
The following is a summary of the fair valuations according to the inputs used as of July 31, 2009 in valuing the Portfolio's investments:
| Measurements at 07/31/09 | |
| | | Quoted prices in
active markets for
identical investments
(Level 1) | | Significant other
observable inputs
(Level 2) | | Unobservable
inputs
(Level 3) | | Total | |
| Common stocks | | $ | 329,492,058 | | | $ | 146,142 | | | $ | — | | | $ | 329,638,200 | | |
| Preferred stock | | | — | | | | — | | | | 1,710,535 | | | | 1,710,535 | | |
| Repurchase agreement | | | — | | | | 8,520,000 | | | | — | | | | 8,520,000 | | |
Investment of cash collateral
from securities loaned | | | — | | | | 86,696,079 | | | | — | | | | 86,696,079 | | |
| Total | | $ | 329,492,058 | | | $ | 95,362,221 | | | $ | 1,710,535 | | | $ | 426,564,814 | | |
132
UBS PACE Select Advisors Trust
UBS PACE Small/Medium Co Value Equity Investments
Portfolio of investments—July 31, 2009
The following is a rollforward of the Portfolio's investment that was valued using unobservable inputs (Level 3) for the period:
| Measurements at 07/31/09 | |
| | | Preferred
stock | |
| Beginning balance | | $ | — | | |
| Net purchases/(sales) | | | — | | |
| Accrued discounts/(premiums) | | | — | | |
| Total realized gain/(loss) | | | — | | |
| Total unrealized appreciation/(depreciation) | | | 69,535 | | |
| Net transfers in/(out) of Level 3 | | | 1,641,000 | | |
| Ending balance | | $ | 1,710,535 | | |
The change in unrealized appreciation/(depreciation) relating to the Level 3 investment held at July 31, 2009 was $69,535.
Issuer breakdown by country or territory of origin (unaudited)
| | | Percentage of
total investments | |
| United States | | | 94.6 | % | |
| Bermuda | | | 2.0 | | |
| Canada | | | 1.1 | | |
| China | | | 1.0 | | |
| Guernsey | | | 0.7 | | |
| Cayman Islands | | | 0.6 | | |
| Total | | | 100.0 | % | |
See accompanying notes to financial statements.
133
UBS PACE Select Advisors Trust
UBS PACE Small/Medium Co Growth Equity Investments
Performance
For the 12 months ended July 31, 2009, the Portfolio's Class P shares declined 18.41% (before the deduction of the maximum UBS PACE Select program fee; after the deduction of the maximum UBS PACE Select program fee, the Portfolio declined 19.63%). In comparison, the Russell 2500 Growth Index (the "benchmark") declined 21.36%, and the Lipper Mid-Cap Growth Funds category posted a median decline of 23.89%. (Returns for all share classes over various time periods are shown in the "Performance at a glance" table on page 139. Please note that the returns shown do not reflect the deduction of taxes that a shareholder would pay on Portfolio distributions or the redemption of Portfolio shares.) For a detailed commentary on the market environment in general during the reporting period, please refer to page two.
Sub-Advisors' comments
Copper Rock
Our portion of the Portfolio slightly underperformed the benchmark during the reporting period.
Stock selection in the information technology, industrials, energy, materials and financial sectors contributed to performance during this time. However, stock selection within the health care and consumer discretionary sectors detracted from results, despite pockets of outperformance in some segments of the consumer discretionary sector.
Within the technology sector, holdings in semiconductors and networking equipment companies, including PMC-Sierra, Inc., CommScope, Inc., and Akamai Technologies, Inc., benefited performance and were sold from our portion of the Portfolio. Despite the energy sector's downward slide in the summer of 2008, stock selection in energy services holdings contributed to our portion of the Portfolio's performance during the fourth quarter of 2008, and well into the first half of 2009. Our portion of the Portfolio held an underweight in the sector during the third quarter of 2008 as the fundamentals for natural gas and coal worsened and oil prices quickly plummeted. However, we found new opportunities in oil and oil services stocks toward the end of 2008, which enhanced results.
* Note: During the reporting period, Palisade acquired AG Asset Management's Small/Smid Growth Equity investment team, which was responsible for the day-to-day management of the portion of the Portfolio allocated to AG Asset Management. Following the acquisition, Palisade assumed investment advisory responsibility with respect to this portion of the Portfolio. The key members of the Small/Smid Growth Equity investment team continue to sub-advise the portion of the Portfolio allocated to Palisade in their new positions with Palisade.
UBS PACE Select Advisors Trust – UBS PACE Small/Medium Co Growth
Equity Investments
Investment Sub-Advisors:
Copper Rock Capital Partners, LLC ("Copper Rock"), Riverbridge Partners, LLC ("Riverbridge"), and AG Asset Management LLC ("AG Asset Management") until February 1, 2009 and Palisade Capital Management, LLC ("Palisade") commencing February 2, 2009*
Portfolio Managers:
Copper Rock: Tucker Walsh;
Riverbridge: Mark Thompson;
Palisade: Sammy Oh
Objective:
Capital appreciation
Investment process:
Copper Rock employs a fundamental, bottom-up investment approach that focuses on identifying emerging companies that exhibit the potential for strong and sustainable revenue growth over each of the following two years. Copper Rock utilizes a "pure" growth investment style that emphasizes growth and momentum characteristics. Copper Rock attempts to manage risk by diversifying and understanding its holdings and employing a stringent sell discipline.
134
UBS PACE Select Advisors Trust
UBS PACE Small/Medium Co Growth Equity Investments
Sub-Advisors' comments – continued
Strong stock selection, combined with overweight positions in industrials and transportation, contributed to our portion of the Portfolio's returns over the reporting period. Examples of strong performers included Regal-Beloit Corp., General Cable Corp. and J.B. Hunt Transport Services, Inc., which were sold from our portion of the Portfolio following gains during the reporting period, as well as Con-Way, Inc. Throughout the period, our portion of the Portfolio was underweight in the financials sector in light of the weakened outlook for that sector due to the recession. That said, a holding in investment banking firm Greenhill, Inc. proved beneficial. The company has added extensively to its team in order to support the demand for merger and acquisition (M&A) activity, which we expect will pick up as the economy rebounds.
Two sectors impacted directly by the recession and lower consumer spending have been health care and consumer discretionary. Health care has become an even more challenging sector to navigate following the administration change in Washington, D.C., as there is uncertainty over issues such as reimbursement rates, and a potential move toward universal health care. Collectively, these issues have impacted stock valuations in the health care sector.
For example, Wright Medical Group Inc., a medical device company that designs reconstructive joint devices and artificial limbs, was impacted by a slowdown in the orthopedics market. The company revised expected revenues downward based on unforeseen macroeconomic pressures, and we sold the stock from our portion of the Portfolio. In light of the uncertainty hovering over the health care sector, we remain underweight in health care relative to the benchmark. Within the consumer discretionary sector, a holding in Las Vegas Sands Corp. negatively impacted performance as the company's stock price was down following a greater-than-anticipated slowdown in tourism and gambling/casino revenues in light of the recession, and was eliminated from our portion of the Portfolio.
Riverbridge
Our portion of the Portfolio outperformed the benchmark during the reporting period due to sector allocation and stock selection.
During the 12-month period, our portion of the Portfolio benefited from an underweight exposure to the energy sector. Stock selection within the industrial sector also aided performance, while stock selection in the information technology sector detracted from performance. In addition, we believe that the excess
Investment process (concluded)
Riverbridge believes that earnings power determines the value of a franchise. Riverbridge focuses on companies that are viewed as building their earnings power and building the intrinsic value of the company over long periods of time. Riverbridge looks to invest in high-quality growth companies that demonstrate the ability to sustain strong secular earnings growth, regardless of overall economic conditions.
Palisade seeks fundamentally strong and dynamic small- and mid-cap companies that are trading at a discount to their growth rates. Palisade's goal is to ascertain a dynamic of change before it manifests in consensus estimates. Palisade believes that it can be successful because it views the small- and mid-cap market to be inherently less efficient than the large-cap market.
135
UBS PACE Select Advisors Trust
UBS PACE Small/Medium Co Growth Equity Investments
Sub-Advisors' comments – continued
performance relative to the benchmark generated by our portion of the Portfolio is attributable to the consistent application of our investment process. We emphasize companies that have the ability to internally finance their growth, limiting the impact of the struggling credit markets.
Stocks benefiting our portion of the Portfolio included Allscripts Healthcare Solutions, Inc., which gained traction with new software, as well as United Natural Foods, Inc., which outperformed analysts' expectations during the 12-month reporting period. Shares of the Cheesecake Factory Inc., which held up well despite lower consumer spending, also benefited performance.
Detractors from our portion of the Portfolio's performance included Napco Security Systems, Inc., as a declining level of housing starts lowered spending on home alarm systems. In addition, Smith International, Inc., a provider of oil field services, saw its price fall along with energy prices, while print procurement company Innerworkings, Inc. also declined due to lowered demand for some of its products.
Going forward, we plan to continue to invest in those companies generating strong free cash flows. Pricing power is increasingly becoming an important criterion when selecting companies, and we seek those with the greatest ability to set their own prices for their goods and services. A continuing hallmark of our investment process will be the search for companies with the ability to internally finance their growth and not be reliant on debt to generate earnings growth.
Palisade
Our portion of the Portfolio outperformed the benchmark during the reporting period due to sector allocation and stock selection.
Strong relative performance in the technology, energy and financial sectors more than offset weakness in the industrial and health care sectors. In addition, our portion of the Portfolio benefited from both an overweight position to and strong stock selection within the technology sector. We believed that technology stocks were positioned to outperform the overall market given their growth dynamics, strong balance sheets and attractive valuations. Top performers within the sector included McAfee, Inc., Riverbed Technology, Inc. and Data Domain, Inc.—all of which were sold from our portion of the Portfolio during the period—as well as Brocade Communications Systems, Inc.
Although financial services securities were under significant duress during this reporting period, those in our portion of the Portfolio were up 0.78% versus those of the benchmark, which were down 21.2%. While we had maintained an underweight to financials for much of 2008, several fourth quarter 2008 purchases, including Affiliated Managers Group, Inc., Lazard Ltd. and Fidelity National Financial, Inc., the last of which we sold during the period, appreciated significantly.
Industrials was the weakest sector for our portion of the Portfolio during the reporting period, due to both an overweight to the sector and poor stock selection within it. Fears of a global economic slowdown pushed these stocks to historically low valuations, hurting performance. In particular, transportation holdings Kansas City
136
UBS PACE Select Advisors Trust
UBS PACE Small/Medium Co Growth Equity Investments
Sub-Advisors' comments – concluded
Southern, as well as Con-Way, Inc. and Trinity Industries Inc., the last two of which were sold from our portion of the Portfolio during the period, fared poorly. Our portion of the Portfolio remains overweight in industrials as we continue to believe that they will help lead us out of the recession. Elsewhere, our portion of the Portfolio's health care positions lagged, primarily due to an underweight to biotechnology stocks.
We continue to position our portion of the Portfolio in companies that we believe have the wherewithal to survive this difficult economic environment and the ability to grow faster than their peers as we emerge from this downturn.
Special considerations
The Portfolio may be appropriate for long-term investors seeking capital appreciation who are able to withstand short-term fluctuations in the equity markets in return for potentially higher returns over the long term. The value of the Portfolio changes every day and can be affected by changes in interest rates, general market conditions and other political, social and economic developments, as well as specific matters relating to the companies in whose securities the Portfolio invests. It is important to note that an investment in the Portfolio is only one component of a balanced investment plan. In addition, small- and mid-cap companies are typically subject to a greater degree of change in earnings and business prospects than are larger, more established companies. Therefore, they are considered to have a higher level of volatility and risk. Also, to the extent the Portfolio invests a large portion of its assets in technology companies, the Portfolio may experience greater volatility and risk of loss due to unfavorable developments in the technology sector.
137
UBS PACE Select Advisors Trust
UBS PACE Small/Medium Co Growth Equity Investments
Comparison of change in value of a $10,000 investment in the Class P shares of the Portfolio and the Russell 2500 Growth Index (unaudited)
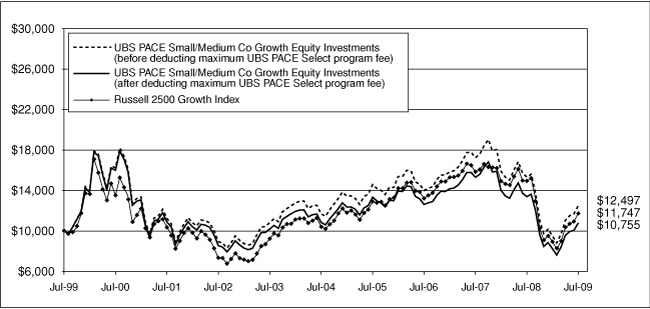
The graph depicts the performance of UBS PACE Small/Medium Co Growth Equity Investments Class P shares versus the Russell 2500 Growth Index over the 10 years ended July 31, 2009. The performance of the other classes will vary from the performance of the class shown based on the difference in sales charges and fees paid by shareholders investing in different share classes. Past performance does not predict future performance and the performance provided does not reflect the deduction of taxes that a shareholder would pay on Portfolio distributions or the redemption of Portfolio shares. It is important to note that UBS PACE Small/Medium Co Growth Equity Investments is a professionally managed portfolio while the Index is not available for investment and is unmanaged. The comparison is shown for illustrative purposes only.
138
UBS PACE Select Advisors Trust
UBS PACE Small/Medium Co Growth Equity Investments
Performance at a glance (unaudited)
| Average annual total returns for periods ended 07/31/09 | | 1 year | | 5 years | | 10 years | | Since
inception1 | |
| Before deducting | | Class A2 | | | (18.61 | )% | | | 1.20 | % | | N/A | | | (1.60 | )% | |
| maximum sales charge | | Class B3 | | | (19.18 | )% | | | 0.34 | % | | N/A | | | (2.17 | )% | |
| or UBS PACE Select | | Class C4 | | | (19.21 | )% | | | 0.42 | % | | N/A | | | (2.35 | )% | |
| program fee | | Class Y5 | | | (18.26 | )% | | | 1.58 | % | | N/A | | | 0.34 | % | |
| | | Class P6 | | | (18.41 | )% | | | 1.39 | % | | | 2.25 | % | | | 6.17 | % | |
| After deducting | | Class A2 | | | (23.08 | )% | | | 0.06 | % | | N/A | | | (2.24 | )% | |
| maximum sales charge | | Class B3 | | | (23.22 | )% | | | 0.05 | % | | N/A | | | (2.17 | )% | |
| or UBS PACE Select | | Class C4 | | | (20.01 | )% | | | 0.42 | % | | N/A | | | (2.35 | )% | |
| program fee | | Class P6 | | | (19.63 | )% | | | (0.12 | )% | | | 0.73 | % | | | 4.58 | % | |
| Russell 2500 Growth Index7 | | | (21.36 | )% | | | 2.50 | % | | | 1.62 | % | | | 4.65 | % | |
| Lipper Mid-Cap Growth Funds median | | | (23.89 | )% | | | 2.06 | % | | | 1.80 | % | | | 5.54 | % | |
Average annual total returns for periods ended June 30, 2009, after deduction of the maximum sales charge or UBS PACE Select program fee, were as follows: Class A—1-year period, (29.94)%; 5-year period, (2.73)%; since inception, (3.05)%; Class B—1-year period, (30.10)%; 5-year period, (2.74)%; since inception, (2.98)%; Class C—1-year period, (27.15)%; 5-year period, (2.40)%; since inception, (3.15)%; Class Y—1-year period, (25.51)%; 5-year period, (1.23)%; since inception, (0.47)%; Class P—1-year period, (26.82)%; 5-year period, (2.90)%; 10-year period, 0.23%; since inception, 4.10%.
The annualized gross and net expense ratios, respectively, for each class of shares as in the November 28, 2008 prospectuses, were as follows: Class A—1.31% and 1.31%; Class B—2.43% and 2.13%; Class C—2.08% and 2.08%; Class Y—0.94% and 0.94%; and Class P—1.17% and 1.13%. Net expenses reflect fee waivers and/or expense reimbursements, if any, pursuant to an agreement that is in effect to cap the expenses. The Portfolio and UBS Global AM have entered into a written fee waiver/expense reimbursement agreement pursuant to which UBS Global AM is contractually obligated to waive its management fees and/or reimburse the Portfolio so that the ordinary total operating expenses of each class through November 30, 2009 (excluding dividend expense, borrowing costs and interest expense, if any) would not exceed Class A—1.38%; Class B—2.13%; Class C—2.13%; Class Y—1.13% and Class P—1.13%. The Po rtfolio has agreed to repay UBS Global AM for any waived fees/reimbursed expenses to the extent that it can do so over the following three fiscal years without causing the Portfolio's expenses in any of those three years to exceed the expense caps described above.
1 Since inception returns are calculated as of commencement of issuance on August 24, 1995 for Class P shares, November 27, 2000 for Class A, B, and C shares and February 12, 2001 for Class Y shares. Since inception returns for the Index and Lipper median are shown as of August 31, 1995, which is the month-end after the inception date of the oldest share class (Class P).
2 Maximum sales charge for Class A shares is 5.5%. Class A shares bear ongoing 12b-1 service fees.
3 Maximum contingent deferred sales charge for Class B shares is 5% imposed on redemptions and is reduced to 0% after a maximum of six years. Class B shares bear ongoing 12b-1 service and distribution fees.
4 Maximum contingent deferred sales charge for Class C shares is 1% imposed on redemptions and is reduced to 0% after one year. Class C shares bear ongoing 12b-1 service and distribution fees.
5 The Portfolio offers Class Y shares to a limited group of eligible investors, including certain qualifying retirement plans. Class Y shares do not bear initial or contingent deferred sales charges or ongoing 12b-1 service and distribution fees.
6 Class P shares do not bear initial or contingent deferred sales charges or ongoing 12b-1 service and distribution fees, but are subject to a maximum annual UBS PACE Select program fee of 1.5% of the value of Class P shares.
7 The Russell 2500 Growth Index measures the performance of those Russell 2500 companies with higher price-to-book ratios and higher forecasted growth rates. Investors should note that indices do not reflect the deduction of fees, expenses or taxes.
If an investor sells or exchanges shares less than 90 days after purchase, a redemption fee of 1.00% of the amount sold or exchanged will be deducted at the time of the transaction, except as noted otherwise in the prospectuses.
Past performance does not predict future performance, and the performance information provided does not reflect the deduction of taxes that a shareholder would pay on Portfolio distributions or the redemption of Portfolio shares. The return and principal value of an investment will fluctuate, so that an investor's shares, when redeemed, may be worth more or less than their original cost. Performance results assume reinvestment of all dividends and capital gain distributions at net asset value on the ex-dividend dates. Current performance may be higher or lower than the performance data quoted. For month-end performance figures, please visit http://www.ubs.com.
Lipper peer group data calculated by Lipper Inc.; used with permission. The Lipper median is the return of the fund that places in the middle of a Lipper peer group.
139
UBS PACE Select Advisors Trust
UBS PACE Small/Medium Co Growth Equity Investments
Portfolio statistics (unaudited)
| Characteristics | | 07/31/09 | |
| Net assets (mm) | | $ | 347.6 | | |
| Number of holdings | | | 214 | | |
| Portfolio composition1 | | 07/31/09 | |
| Common stocks | | | 97.4 | % | |
| ADRs | | | 0.6 | | |
| Cash equivalents and other assets less liabilities | | | 2.0 | | |
| Total | | | 100.0 | % | |
| Top five sectors1 | | 07/31/09 | |
| Information technology | | | 26.0 | % | |
| Industrials | | | 19.4 | | |
| Health care | | | 18.5 | | |
| Consumer discretionary | | | 14.2 | | |
| Financials | | | 7.9 | | |
| Total | | | 86.0 | % | |
| Top ten equity holdings1 | | 07/31/09 | |
| Polycom, Inc. | | | 1.5 | % | |
| Scientific Games Corp. | | | 1.3 | | |
| Affiliated Managers Group, Inc. | | | 1.2 | | |
| Nuance Communications, Inc. | | | 1.2 | | |
| Green Mountain Coffee Roasters, Inc. | | | 1.2 | | |
| Informatica Corp. | | | 1.0 | | |
| Atmel Corp. | | | 1.0 | | |
| Lubrizol Corp. | | | 1.0 | | |
| Priceline.com, Inc. | | | 0.9 | | |
| MSCI, Inc. | | | 0.9 | | |
| Total | | | 11.2 | % | |
1 Weightings represent percentages of the Portfolio's net assets as of July 31, 2009. The Portfolio is actively managed and its composition will vary over time.
ADR American Depositary Receipt
140
UBS PACE Select Advisors Trust
UBS PACE Small/Medium Co Growth Equity Investments
Portfolio of investments—July 31, 2009
| Security description | | Number of
shares | | Value | |
| Common stocks—98.05% | |
| Aerospace & defense—1.48% | |
| DigitalGlobe, Inc.* | | | 54,300 | | | $ | 988,260 | | |
| Orbital Sciences Corp.* | | | 110,300 | | | | 1,493,462 | | |
| TransDigm Group, Inc.1,* | | | 69,525 | | | | 2,662,112 | | |
| | | | 5,143,834 | | |
| Air freight & logistics—1.16% | |
Atlas Air Worldwide
Holdings, Inc.* | | | 57,288 | | | | 1,429,909 | | |
| Dynamex, Inc.* | | | 38,000 | | | | 591,660 | | |
| Forward Air Corp.1 | | | 40,000 | | | | 925,200 | | |
| Hub Group, Inc., Class A* | | | 49,892 | | | | 1,072,179 | | |
| | | | 4,018,948 | | |
| Auto components—0.63% | |
| Gentex Corp. | | | 145,500 | | | | 2,178,135 | | |
| Biotechnology—3.75% | |
| Acorda Therapeutics, Inc.1,* | | | 47,990 | | | | 1,212,227 | | |
| Alexion Pharmaceuticals, Inc.1,* | | | 51,700 | | | | 2,277,385 | | |
| Cephalon, Inc.1,* | | | 16,258 | | | | 953,532 | | |
| Cepheid, Inc.1,* | | | 239,820 | | | | 2,534,897 | | |
| Dendreon Corp.1,* | | | 70,260 | | | | 1,700,995 | | |
| Human Genome Sciences, Inc.* | | | 48,200 | | | | 689,260 | | |
| Medivation, Inc.* | | | 51,959 | | | | 1,285,985 | | |
| United Therapeutics Corp.1,* | | | 11,100 | | | | 1,028,082 | | |
| Vertex Pharmaceuticals, Inc.1,* | | | 37,598 | | | | 1,353,904 | | |
| | | | 13,036,267 | | |
| Capital markets—4.19% | |
Affiliated Managers
Group, Inc.1,* | | | 65,280 | | | | 4,309,786 | | |
| Greenhill & Co., Inc.1 | | | 20,710 | | | | 1,559,877 | | |
Investment Technology
Group, Inc.* | | | 67,345 | | | | 1,505,161 | | |
| Lazard Ltd., Class A1 | | | 43,685 | | | | 1,615,908 | | |
| MF Global Ltd.1,* | | | 368,002 | | | | 2,347,853 | | |
| Raymond James Financial, Inc.1 | | | 62,020 | | | | 1,272,650 | | |
| SEI Investments Co. | | | 102,881 | | | | 1,944,451 | | |
| | | | 14,555,686 | | |
| Chemicals—2.55% | |
| Celanese Corp., Series A | | | 74,100 | | | | 1,904,370 | | |
| Intrepid Potash, Inc.1,* | | | 84,240 | | | | 2,127,903 | | |
| Landec Corp.* | | | 112,000 | | | | 707,840 | | |
| Lubrizol Corp. | | | 57,938 | | | | 3,356,348 | | |
| Zoltek Companies, Inc.1,* | | | 77,500 | | | | 768,800 | | |
| | | | 8,865,261 | | |
| Commercial banks—1.43% | |
| IBERIABANK Corp. | | | 41,220 | | | | 1,930,745 | | |
Pinnacle Financial
Partners, Inc.1,* | | | 95,400 | | | | 1,488,240 | | |
| Signature Bank1,* | | | 52,193 | | | | 1,538,649 | | |
| | | | 4,957,634 | | |
| Security description | | Number of
shares | | Value | |
| Common stocks—(continued) | |
| Commercial services & supplies—3.09% | |
| Cenveo, Inc.1,* | | | 248,450 | | | $ | 1,200,014 | | |
| Covanta Holding Corp.1,* | | | 8,134 | | | | 137,383 | | |
| EnergySolutions, Inc. | | | 189,525 | | | | 1,631,810 | | |
| G & K Services, Inc., Class A1 | | | 39,000 | | | | 886,080 | | |
| Innerworkings, Inc.1,* | | | 100,000 | | | | 517,000 | | |
| Mobile Mini, Inc.1,* | | | 49,000 | | | | 792,820 | | |
Ritchie Brothers
Auctioneers, Inc.1 | | | 44,614 | | | | 1,070,736 | | |
| Rollins, Inc.1 | | | 136,000 | | | | 2,492,880 | | |
| Waste Connections, Inc.* | | | 71,369 | | | | 2,013,319 | | |
| | | | 10,742,042 | | |
| Communications equipment—5.02% | |
| Aruba Networks, Inc.* | | | 13,500 | | | | 119,998 | | |
| Blue Coat Systems, Inc.1,* | | | 94,100 | | | | 1,758,729 | | |
Brocade Communications
Systems, Inc.* | | | 348,290 | | | | 2,737,559 | | |
| CommScope, Inc.1,* | | | 73,100 | | | | 1,871,360 | | |
| Digi International, Inc.* | | | 171,500 | | | | 1,751,015 | | |
| F5 Networks, Inc.* | | | 71,791 | | | | 2,664,882 | | |
| Polycom, Inc.1,* | | | 216,565 | | | | 5,143,419 | | |
| Tellabs, Inc.* | | | 241,300 | | | | 1,399,540 | | |
| | | | 17,446,502 | | |
| Computers & peripherals—0.56% | |
| STEC, Inc.1,* | | | 22,278 | | | | 759,457 | | |
| Stratasys, Inc.1,* | | | 75,500 | | | | 1,191,390 | | |
| | | | 1,950,847 | | |
| Construction & engineering—0.84% | |
| Foster Wheeler AG* | | | 64,800 | | | | 1,496,880 | | |
| MasTec, Inc.1,* | | | 137,900 | | | | 1,427,265 | | |
| | | | 2,924,145 | | |
| Containers & packaging—1.02% | |
| Greif, Inc.1 | | | 30,282 | | | | 1,554,375 | | |
| Silgan Holdings, Inc. | | | 39,350 | | | | 1,977,731 | | |
| | | | 3,532,106 | | |
| Distributors—0.59% | |
| LKQ Corp.1,* | | | 114,000 | | | | 2,045,160 | | |
| Diversified consumer services—1.71% | |
| Bridgepoint Education, Inc.1,* | | | 99,100 | | | | 1,799,656 | | |
| Capella Education Co.1,* | | | 16,376 | | | | 1,053,959 | | |
| DeVry, Inc.1 | | | 51,221 | | | | 2,547,733 | | |
Universal Technical
Institute, Inc.1,* | | | 34,200 | | | | 542,754 | | |
| | | | 5,944,102 | | |
| Diversified financial services—1.89% | |
| IntercontinentalExchange, Inc.* | | | 10,354 | | | | 973,897 | | |
| MSCI, Inc., Class A1,* | | | 109,153 | | | | 3,050,827 | | |
Portfolio Recovery
Associates, Inc.1,* | | | 55,000 | | | | 2,538,250 | | |
| | | | 6,562,974 | | |
141
UBS PACE Select Advisors Trust
UBS PACE Small/Medium Co Growth Equity Investments
Portfolio of investments—July 31, 2009
| Security description | | Number of
shares | | Value | |
| Common stocks—(continued) | |
| Electrical equipment—2.38% | |
| AMETEK, Inc.1 | | | 35,900 | | | $ | 1,161,724 | | |
| General Cable Corp.1,* | | | 35,200 | | | | 1,364,704 | | |
| GrafTech International Ltd.* | | | 199,405 | | | | 2,737,831 | | |
| Roper Industries, Inc.1 | | | 27,559 | | | | 1,317,871 | | |
| SunPower Corp. Class B* | | | 61,400 | | | | 1,676,220 | | |
| | | | 8,258,350 | | |
| Electronic equipment, instruments & components—1.85% | |
Dolby Laboratories, Inc.,
Class A* | | | 61,567 | | | | 2,563,034 | | |
| Echelon Corp.1,* | | | 86,000 | | | | 729,280 | | |
| FARO Technologies, Inc.1,* | | | 38,500 | | | | 681,450 | | |
| Napco Security Systems, Inc.* | | | 103,200 | | | | 134,160 | | |
| National Instruments Corp.1 | | | 92,000 | | | | 2,320,240 | | |
| | | | 6,428,164 | | |
| Energy equipment & services—0.76% | |
| Atwood Oceanics, Inc.1,* | | | 30,652 | | | | 884,004 | | |
| Smith International, Inc.1 | | | 18,134 | | | | 455,707 | | |
| Superior Energy Services, Inc.1,* | | | 79,325 | | | | 1,316,002 | | |
| | | | 2,655,713 | | |
| Food & staples retailing—0.74% | |
| United Natural Foods, Inc.* | | | 95,000 | | | | 2,567,850 | | |
| Food products—1.43% | |
Green Mountain Coffee
Roasters, Inc.1,* | | | 58,695 | | | | 4,134,476 | | |
| Hain Celestial Group, Inc.1,* | | | 50,500 | | | | 838,805 | | |
| | | | 4,973,281 | | |
| Health care equipment & supplies—5.19% | |
| Abaxis, Inc.1,* | | | 46,000 | | | | 1,231,420 | | |
| AngioDynamics, Inc.* | | | 122,000 | | | | 1,522,560 | | |
| Beckman Coulter, Inc. | | | 18,890 | | | | 1,189,881 | | |
| Conceptus, Inc.1,* | | | 56,345 | | | | 946,033 | | |
| Edwards Lifesciences Corp.* | | | 15,432 | | | | 1,009,407 | | |
| Haemonetics Corp.* | | | 27,655 | | | | 1,631,922 | | |
Inverness Medical
Innovations, Inc.1,* | | | 83,703 | | | | 2,816,606 | | |
| Neogen Corp.1,* | | | 73,000 | | | | 2,127,220 | | |
| NuVasive, Inc.1,* | | | 19,275 | | | | 797,792 | | |
| ResMed, Inc.1,* | | | 49,500 | | | | 2,029,500 | | |
| STERIS Corp. | | | 49,500 | | | | 1,389,960 | | |
West Pharmaceutical
Services, Inc.1 | | | 36,690 | | | | 1,339,185 | | |
| | | | 18,031,486 | | |
| Health care providers & services—6.55% | |
| Amedisys, Inc.1,* | | | 30,300 | | | | 1,354,713 | | |
| Bio-Reference Laboratories, Inc.* | | | 31,323 | | | | 1,004,215 | | |
| Centene Corp.* | | | 50,563 | | | | 976,372 | | |
| Chemed Corp. | | | 57,000 | | | | 2,513,700 | | |
Community Health
Systems, Inc.1,* | | | 80,200 | | | | 2,271,264 | | |
| Security description | | Number of
shares | | Value | |
| Common stocks—(continued) | |
| Health care providers & services—(concluded) | |
Health Management
Associates, Inc., Class A* | | | 238,300 | | | $ | 1,436,949 | | |
| Health Net, Inc.* | | | 75,500 | | | | 1,021,515 | | |
| IPC The Hospitalist Co.* | | | 40,000 | | | | 1,114,000 | | |
| Lincare Holdings, Inc.1,* | | | 52,100 | | | | 1,363,978 | | |
| MEDNAX, Inc.* | | | 43,000 | | | | 1,993,050 | | |
| Omnicare, Inc.1 | | | 89,885 | | | | 2,145,555 | | |
| PSS World Medical, Inc.1,* | | | 75,700 | | | | 1,529,897 | | |
| Psychiatric Solutions, Inc.1,* | | | 95,000 | | | | 2,566,900 | | |
Universal Health Services,
Inc., Class B | | | 26,500 | | | | 1,473,665 | | |
| | | | 22,765,773 | | |
| Health care technology—0.53% | |
Allscripts Healthcare
Solutions, Inc.1 | | | 108,000 | | | | 1,860,840 | | |
| Hotels, restaurants & leisure—5.04% | |
| Burger King Holdings, Inc.1 | | | 81,634 | | | | 1,389,411 | | |
| Cheesecake Factory, Inc.1,* | | | 82,000 | | | | 1,588,340 | | |
Chipotle Mexican Grill,
Inc., Class B* | | | 16,374 | | | | 1,338,575 | | |
| Choice Hotels International, Inc.1 | | | 58,385 | | | | 1,626,022 | | |
Orient-Express Hotels Ltd.,
Class A1 | | | 149,800 | | | | 1,325,730 | | |
| Panera Bread Co., Class A1,* | | | 19,048 | | | | 1,046,878 | | |
| Penn National Gaming, Inc.* | | | 64,468 | | | | 2,044,280 | | |
Scientific Games Corp.,
Class A1,* | | | 256,749 | | | | 4,626,617 | | |
| Wyndham Worldwide Corp. | | | 180,958 | | | | 2,524,364 | | |
| | | | 17,510,217 | | |
| Insurance—0.37% | |
| Brown & Brown, Inc.1 | | | 67,400 | | | | 1,292,732 | | |
| Internet & catalog retail—0.92% | |
| Priceline.com, Inc.1,* | | | 24,658 | | | | 3,196,170 | | |
| Internet software & services—1.95% | |
| Art Technology Group, Inc.* | | | 202,100 | | | | 765,959 | | |
| DealerTrack Holdings, Inc.1,* | | | 73,000 | | | | 1,447,590 | | |
| Equinix, Inc.1,* | | | 26,613 | | | | 2,175,080 | | |
| MercadoLibre, Inc.1,* | | | 27,543 | | | | 793,789 | | |
| VistaPrint Ltd.1,* | | | 38,378 | | | | 1,583,093 | | |
| | | | 6,765,511 | | |
| IT services—2.34% | |
| Alliance Data Systems Corp.1,* | | | 22,644 | | | | 1,154,844 | | |
| Cass Information Systems, Inc.1 | | | 37,500 | | | | 1,299,000 | | |
Cognizant Technology Solutions
Corp., Class A* | | | 74,243 | | | | 2,196,850 | | |
| Forrester Research, Inc.* | | | 50,500 | | | | 1,139,785 | | |
| MAXIMUS, Inc. | | | 33,000 | | | | 1,406,460 | | |
| SAIC, Inc.* | | | 52,153 | | | | 943,448 | | |
| | | | 8,140,387 | | |
142
UBS PACE Select Advisors Trust
UBS PACE Small/Medium Co Growth Equity Investments
Portfolio of investments—July 31, 2009
| Security description | | Number of
shares | | Value | |
| Common stocks—(continued) | |
| Life sciences tools & services—2.18% | |
| Covance, Inc.* | | | 16,151 | | | $ | 890,728 | | |
| ICON PLC, ADR* | | | 47,700 | | | | 1,120,950 | | |
| Illumina, Inc.1,* | | | 29,042 | | | | 1,049,578 | | |
| MEDTOX Scientific, Inc.* | | | 34,500 | | | | 310,500 | | |
Mettler-Toledo
International, Inc.* | | | 16,600 | | | | 1,395,396 | | |
| Millipore Corp.* | | | 14,894 | | | | 1,036,622 | | |
| Techne Corp. | | | 28,000 | | | | 1,786,960 | | |
| | | | 7,590,734 | | |
| Machinery—3.13% | |
| Bucyrus International, Inc. | | | 46,612 | | | | 1,374,122 | | |
| IDEX Corp. | | | 51,315 | | | | 1,399,873 | | |
| Kaydon Corp.1 | | | 40,305 | | | | 1,316,764 | | |
| Kennametal, Inc. | | | 132,791 | | | | 2,831,104 | | |
| Terex Corp.1,* | | | 174,185 | | | | 2,644,128 | | |
| Wabtec Corp. | | | 39,575 | | | | 1,331,699 | | |
| | | | 10,897,690 | | |
| Marine—0.32% | |
| Genco Shipping & Trading Ltd.1 | | | 46,462 | | | | 1,110,906 | | |
| Metals & mining—0.33% | |
| Steel Dynamics, Inc. | | | 70,300 | | | | 1,150,108 | | |
| Oil, gas & consumable fuels—3.57% | |
| Arena Resources, Inc.1,* | | | 18,139 | | | | 591,876 | | |
| Cabot Oil & Gas Corp. | | | 26,533 | | | | 932,104 | | |
| Comstock Resources, Inc.* | | | 55,000 | | | | 2,117,500 | | |
| Concho Resources, Inc.1,* | | | 55,432 | | | | 1,701,762 | | |
| Denbury Resources, Inc.* | | | 67,053 | | | | 1,113,080 | | |
| Foundation Coal Holdings, Inc.1 | | | 49,200 | | | | 1,767,756 | | |
Plains Exploration &
Production Co.* | | | 95,185 | | | | 2,727,050 | | |
| Whiting Petroleum Corp.* | | | 31,674 | | | | 1,455,737 | | |
| | | | 12,406,865 | | |
| Personal products—0.42% | |
| Chattem, Inc.1,* | | | 15,100 | | | | 946,317 | | |
| USANA Health Sciences, Inc.1,* | | | 15,000 | | | | 500,250 | | |
| | | | 1,446,567 | | |
| Pharmaceuticals—0.32% | |
| Sepracor, Inc.* | | | 63,500 | | | | 1,101,725 | | |
| Professional services—3.87% | |
| CoStar Group, Inc.1,* | | | 24,500 | | | | 899,885 | | |
| Dun & Bradstreet Corp. | | | 21,052 | | | | 1,515,533 | | |
| FTI Consulting, Inc.1,* | | | 38,100 | | | | 2,073,783 | | |
| Huron Consulting Group, Inc.1,* | | | 36,737 | | | | 1,629,286 | | |
| Manpower, Inc.1 | | | 30,000 | | | | 1,438,500 | | |
| Monster Worldwide, Inc.1,* | | | 187,576 | | | | 2,444,115 | | |
| Resources Connection, Inc.* | | | 104,500 | | | | 1,577,950 | | |
| Robert Half International, Inc.1 | | | 76,154 | | | | 1,887,858 | | |
| | | | 13,466,910 | | |
| Security description | | Number of
shares | | Value | |
| Common stocks—(continued) | |
| Road & rail—2.14% | |
| Con-way, Inc. | | | 23,768 | | | $ | 1,082,632 | | |
| Kansas City Southern1,* | | | 136,485 | | | | 2,772,010 | | |
| Landstar System, Inc.1 | | | 62,833 | | | | 2,304,715 | | |
| Old Dominion Freight Line, Inc.1,* | | | 36,100 | | | | 1,286,243 | | |
| | | | 7,445,600 | | |
| Semiconductors & semiconductor equipment—6.40% | |
| ARM Holdings PLC, ADR1 | | | 165,400 | | | | 1,056,906 | | |
| Atheros Communications1,* | | | 47,080 | | | | 1,177,000 | | |
| Atmel Corp.* | | | 810,830 | | | | 3,381,161 | | |
| Cabot Microelectronics Corp.* | | | 34,000 | | | | 1,153,280 | | |
| Cymer, Inc.* | | | 44,880 | | | | 1,535,345 | | |
| Cypress Semiconductor Corp.1,* | | | 234,533 | | | | 2,490,740 | | |
| FormFactor, Inc.* | | | 49,311 | | | | 1,136,619 | | |
| ON Semiconductor Corp.* | | | 269,715 | | | | 1,968,919 | | |
| Power Integrations, Inc.1 | | | 57,000 | | | | 1,669,530 | | |
| Rudolph Technologies, Inc.* | | | 45,500 | | | | 371,735 | | |
| Semtech Corp.* | | | 126,500 | | | | 2,327,600 | | |
| Silicon Laboratories, Inc.1,* | | | 35,264 | | | | 1,510,357 | | |
Varian Semiconductor Equipment
Associates, Inc.1,* | | | 45,575 | | | | 1,460,223 | | |
| Xilinx, Inc.1 | | | 46,911 | | | | 1,017,500 | | |
| | | | 22,256,915 | | |
| Software—7.91% | |
| ANSYS, Inc.1,* | | | 24,000 | | | | 750,240 | | |
| ArcSight, Inc.* | | | 80,270 | | | | 1,522,722 | | |
| Blackboard, Inc.1,* | | | 70,323 | | | | 2,388,872 | | |
| Citrix Systems, Inc.* | | | 37,150 | | | | 1,322,540 | | |
| Concur Technologies, Inc.1,* | | | 23,000 | | | | 793,270 | | |
| Guidance Software, Inc.* | | | 80,000 | | | | 319,200 | | |
| Informatica Corp.1,* | | | 192,317 | | | | 3,536,710 | | |
| Manhattan Associates, Inc.1,* | | | 51,000 | | | | 943,500 | | |
| NetSuite, Inc.* | | | 74,900 | | | | 910,784 | | |
| Nuance Communications, Inc.1,* | | | 318,357 | | | | 4,202,313 | | |
| Rosetta Stone, Inc.* | | | 30,600 | | | | 939,114 | | |
| Sybase, Inc.1,* | | | 61,494 | | | | 2,201,485 | | |
Take-Two Interactive
Software, Inc.1 | | | 132,900 | | | | 1,265,208 | | |
| THQ, Inc.* | | | 404,837 | | | | 2,716,456 | | |
| TiVo, Inc.* | | | 110,828 | | | | 1,135,987 | | |
| Ultimate Software Group, Inc.1,* | | | 71,000 | | | | 1,817,600 | | |
| Verint Systems, Inc.* | | | 61,578 | | | | 736,473 | | |
| | | | 27,502,474 | | |
| Specialty retail—4.37% | |
| Aeropostale, Inc.1,* | | | 47,091 | | | | 1,714,112 | | |
| American Eagle Outfitters, Inc. | | | 70,928 | | | | 1,020,654 | | |
| AnnTaylor Stores Corp.* | | | 123,100 | | | | 1,485,817 | | |
| Chico's FAS, Inc.1,* | | | 155,800 | | | | 1,787,026 | | |
| Guess?, Inc.1 | | | 98,449 | | | | 2,861,913 | | |
| Gymboree Corp.* | | | 28,223 | | | | 1,122,711 | | |
| Hibbett Sports, Inc.1,* | | | 113,291 | | | | 2,085,687 | | |
143
UBS PACE Select Advisors Trust
UBS PACE Small/Medium Co Growth Equity Investments
Portfolio of investments—July 31, 2009
| Security description | | Number of
shares | | Value | |
| Common stocks—(concluded) | |
| Specialty retail—(concluded) | |
| Ross Stores, Inc.1 | | | 34,600 | | | $ | 1,525,514 | | |
| Urban Outfitters, Inc.* | | | 65,920 | | | | 1,584,717 | | |
| | | | 15,188,151 | | |
| Textiles, apparel & luxury goods—0.98% | |
| Deckers Outdoor Corp.1,* | | | 25,800 | | | | 1,744,338 | | |
| Phillips-Van Heusen Corp. | | | 46,650 | | | | 1,650,477 | | |
| | | | 3,394,815 | | |
| Trading companies & distributors—0.51% | |
| Beacon Roofing Supply, Inc.1,* | | | 106,000 | | | | 1,777,620 | | |
| Transportation infrastructure—0.47% | |
Aegean Marine Petroleum
Network, Inc.1 | | | 95,700 | | | | 1,626,900 | | |
| Wireless telecommunication services—1.17% | |
Leap Wireless
International, Inc.1,* | | | 82,175 | | | | 1,968,091 | | |
SBA Communications Corp.,
Class A1,* | | | 81,108 | | | | 2,116,108 | | |
| | | | 4,084,199 | | |
Total common stocks
(cost—$314,968,648) | | | | | | | 340,798,296 | | |
| Security description | | Face
amount | | Value | |
| Repurchase agreement—2.61% | |
Repurchase agreement dated
07/31/09 with State Street
Bank & Trust Co.,
0.010% due 08/03/09,
collateralized by $9,239,445
US Treasury Bills, zero coupon
due 08/27/09 to 09/10/09;
(value—$9,238,521);
proceeds: $9,057,008
(cost—$9,057,000) | | $ | 9,057,000 | | | $ | 9,057,000 | | |
| | | Number of
shares | | | |
| Investment of cash collateral from securities loaned—28.36% | |
| Money market fund—28.36% | |
UBS Private Money Market
Fund LLC2
(cost—$98,587,174) | | | 98,587,174 | | | | 98,587,174 | | |
Total investments
(cost—$422,612,822)—
129.02% | | | | | 448,442,470 | | |
Liabilities in excess of other
assets—(29.02)% | | | | | (100,867,788 | ) | |
| Net assets—100.00% | | $ | 347,574,682 | | |
Aggregate cost for federal income tax purposes was $432,121,600; and net unrealized appreciation consisted of:
| Gross unrealized appreciation | | $ | 39,911,800 | | |
| Gross unrealized depreciation | | | (23,590,930 | ) | |
| Net unrealized appreciation | | $ | 16,320,870 | | |
* Non-income producing security.
1 Security, or portion thereof, was on loan at July 31, 2009.
2 The table below details the Portolio's transaction activity in an affiliated issuer during the year ended July 31, 2009.
| Security description | | Value at
07/31/08 | | Purchases
during the
year ended
07/31/09 | | Sales
during the
year ended
07/31/09 | | Value at
07/31/09 | | Net income
earned from
affiliate for the
year ended
07/31/09 | |
| UBS Private Money Market Fund LLC | | $ | 57,474,628 | | | $ | 278,560,995 | | | $ | 237,448,449 | | | $ | 98,587,174 | | | $ | 761,914 | | |
ADR American Depositary Receipt
144
UBS PACE Select Advisors Trust
UBS PACE Small/Medium Co Growth Equity Investments
Portfolio of investments—July 31, 2009
The following is a summary of the fair valuations according to the inputs used as of July 31, 2009 in valuing the Portfolio's investments:
| | | Quoted prices in
active markets for
identical investments
(Level 1) | | Significant other
observable inputs
(Level 2) | | Unobservable
inputs
(Level 3) | | Total | |
| Common stocks | | $ | 340,798,296 | | | $ | — | | | $ | — | | | $ | 340,798,296 | | |
| Repurchase agreement | | | — | | | | 9,057,000 | | | | — | | | | 9,057,000 | | |
Investment of cash collateral
from securities loaned | | | — | | | | 98,587,174 | | | | — | | | | 98,587,174 | | |
| Total | | $ | 340,798,296 | | | $ | 107,644,174 | | | $ | — | | | $ | 448,442,470 | | |
Issuer breakdown by country or territory of origin (unaudited)
| | | Percentage of
total investments | |
| United States | | | 96.9 | % | |
| Bermuda | | | 1.5 | | |
| Marshall Islands | | | 0.6 | | |
| Switzerland | | | 0.3 | | |
| Ireland | | | 0.3 | | |
| Canada | | | 0.2 | | |
| United Kingdom | | | 0.2 | | |
| Total | | | 100.0 | % | |
See accompanying notes to financial statements.
145
UBS PACE Select Advisors Trust
UBS PACE International Equity Investments
Performance
For the 12 months ended July 31, 2009, the Portfolio's Class P shares declined 23.81% (before the deduction of the maximum UBS PACE Select program fee; after the deduction of the maximum UBS PACE Select program fee, the Portfolio declined 24.95%). In comparison, the MSCI EAFE Index (net) (the "benchmark") declined 22.60%, and the Lipper International Large-Cap Core category posted a median decline of 22.82%. (Returns for all share classes over various time periods are shown in the "Performance at a glance" table on page 150. Please note that the returns shown do not reflect the deduction of taxes that a shareholder would pay on Portfolio distributions or the redemption of Portfolio shares.) For a detailed commentary on the market environment in general during the reporting period, please refer to page two.
Sub-Advisors' comments
Martin Currie
Despite a marked improvement in performance during the second half of the reporting period, our portion of the Portfolio lagged the benchmark during the reporting period as a whole.
During the first half of the reporting period, investors gravitated to safer sectors, such as pharmaceuticals, utilities and food and beverage producers. Then, as the market rallied in the second half of the period, these sectors staged a spectacular recovery, with metals and mining stocks rallying strongly.
Our portion of the Portfolio's exposure to the financial sector detracted from results during the 12-month period. Major negatives included positions in National Bank of Greece, as well as Société Générale and DnB NOR ASA, which was sold from the Portfolio during the period along with Lloyds Banking Group PLC, which was driven to partial government ownership. This drag on performance was partially tempered by the positive contributions of banking giants HSBC Holdings PLC and Bank of China, Ltd.
The other negatives for performance were a selection of cyclical stocks which struggled against the prevailing economic headwinds, and were sold from our portion of the Portfolio. These included Boart Longyear Group, maker of drilling tools, fertilizer producer K+S, Tecnicas
UBS PACE Select Advisors Trust – UBS PACE International Equity Investments
Investment Sub-Advisors:
Martin Currie Inc. ("Martin Currie"), Mondrian Investment Partners Limited ("Mondrian") and J.P. Morgan Investment Management Inc. ("J.P. Morgan")
Portfolio Managers:
Martin Currie: James Fairweather; Mondrian: Nigel G. May, Hugh A. Serjeant and Emma R. E. Lewis;
J.P. Morgan: Beltran Lastra and Jaco Venter
Objective:
Capital appreciation
Investment process:
Martin Currie has a highly active "conviction" approach, seeking the best opportunities for growth across global stock markets. Martin Currie identifies change as the central dynamic behind stock price movement. This means recognizing change at the company level (management changes, product strategies, acquisitions, etc.) and at the macro level (legislative changes, economic prospects, sector dynamics, etc.). Determining the impact of these changes may lead to outperformance. Martin Currie believes its investment process allows it to identify, evaluate and exploit change at an early stage. In managing its segment of the Portfolio's assets, Martin Currie uses a fully integrated international investment process. So rather than running distinct regional portfolios, it compares and ranks stock opportunities across the whole investment universe. To help id entify and evaluate the best stock ideas, Martin Currie employs fundamental company and sector research, together with its own proprietary quantitative screening tool.
(continued on next page)
146
UBS PACE Select Advisors Trust
UBS PACE International Equity Investments
Sub-Advisors' comments – continued
Reunidas, an industrial engineering contractor, and provider of drilling services Seadrill Ltd. In addition, electronics maker Siemens AG had a negative impact on performance during the reporting period.
We remained focused on high-quality stocks where we are seeing what we consider positive change and good growth prospects. Our portion of the Portfolio is well-stocked with market leaders, including Petroleo Brasileiro SA - Petrobras, Banco Santander Central Hispano SA, Toyota Motor Corp., Samsung Electronics Co. Ltd., ArcelorMittal and Credit Suisse Group. We believe that these holdings will ultimately be rewarded as investors recognize their greater competitiveness and readiness for the next economic cycle, and value them accordingly.
Mondrian
Our portion of the Portfolio outperformed the benchmark during the reporting period, with country and currency selection contributing positively to performance. In particular, weighting in the Pacific region was positive for performance, as were overweight positions in the outperforming markets of Australia and Singapore. An out-of-index position in Taiwan was also beneficial as our stock selection was rewarded. Elsewhere, underweight positions in the underperforming British pound and Japanese yen were rewarded.
Overall, stock selection detracted from performance. While stock selection was strong in Germany and Japan, it hurt performance in Belgium, the Netherlands and the United Kingdom. A handful of financial stocks in our portion of the Portfolio were especially weak. For example, UniCredito Italiano SpA in Italy was down 36.5%, ING Groep NV in the Netherlands fell 59.4% and Société Générale declined 32.6% during the reporting period.
However, stocks in other areas performed well. These included Nitto Denko Corp., a maker of films and adhesives in Japan, which rose 8.1% during the reporting period. Its strong balance sheet, with a significant net cash position, insulated it somewhat from the economic slowdown. Telefonica SA in Spain rose 4.1%, and Jardine Matheson Holdings Ltd., the diversified, Asia-based conglomerate, was up a modest 1.5% for the period.
Investment process (concluded)
Mondrian conducts research on a global basis in an effort to identify securities that have the potential for capital appreciation over a market cycle. The center of its research effort is a value-oriented dividend discount methodology toward individual securities and market analysis that attempts to identify value across country boundaries. This approach focuses on future anticipated dividends, and discounts the value of those dividends back to what they would be worth if they were being paid today. Comparisons of the values of different possible investments are then made. In an international portfolio, currency returns can be an integral component of an investment's total return. Mondrian uses a purchasing power parity approach to assess the value of individual currencies. Purchasing power parity attempts to identify the amount of goods and services that a dollar will buy in the United States, and compares that to the amount of a foreign currency required to buy the same amount of goods and services in another country.
J.P. Morgan manages its segment of the Portfolio's assets using a bottom-up, research-driven strategy that seeks to generate risk characteristics that closely match those of the benchmark, yet at the same time capitalize on the information advantage created by the firm's proprietary research capabilities to generate outperformance. The strategy is driven by valuation-based fundamental analysis, focused on normalized earnings and earnings growth. It seeks to maintain regional weights and sector/industry weights close to those of the benchmark. Stock selection is the focus, being the expected primary source of added value.
147
UBS PACE Select Advisors Trust
UBS PACE International Equity Investments
Sub-Advisors' comments – concluded
From a sector perspective, underweight positions in the weak materials and financials sectors were helpful, and an overweight position in the telecommunications sector was positive relative to the benchmark. In contrast, stock selection within the financials, health care and consumer discretionary sectors detracted from performance. Stock selection was beneficial, however, in the information technology, utilities and materials sectors.
J.P. Morgan
Our portion of the Portfolio underperformed the benchmark during the reporting period. While our valuation-oriented approach suffered during the first half of the reporting period, absolute and relative returns have improved dramatically in 2009, as the fear and panic that gripped the market abated and market participants have begun to refocus on fundamentals and valuation.
Our portion of the Portfolio's sector and regional exposure is substantially similar to the benchmark, and we seek to add value through security selection. During the reporting period, stock selection within the industrial cyclical and consumer nondurable sectors detracted most substantially, while the insurance and basic industries sectors made the greatest positive contribution to results. Regionally, stock selection in Japan and Continental Europe detracted from performance, while the UK enhanced our results.
BNP Paribas, a French bank, was the largest detractor for the period as profits declined 42% in the fourth quarter of 2008, as the company wrote off €589 million to reflect the effects of the credit slump. The stock has rebounded sharply in recent months, in line with other financial stocks. This turnaround occurred as fears of a financial meltdown receded, giving way to the anticipation of an eventual economic recovery. BNP Paribas avoided most of the problems associated with the US subprime mortgage crisis and, while it has not been completely immune to the effects of the global recession, it has remained profitable and is in better shape than many of its rivals. Additionally, the company reported higher-than-expected earnings for the first quarter of 2009 and finalized its takeov er of Fortis Bank.
On the upside, Royal Dutch Shell PLC, the Anglo/Dutch oil and gas company, has been a large contributor to performance. Despite the plunge in oil prices last year, shares of large oil companies generally did well in the second half of 2008. In the face of the credit crisis, large oil companies, with their cash-laden balance sheets, represented "safe havens" and a source of secure dividends for many investors. However, now that the cycle is reversing, investors' risk appetite has returned, demand for safe haven names has declined and the sharp falloff in oil prices from last year's levels is being reflected in current earnings. In response, Royal Dutch Shell PLC continues to pursue an aggressive restructuring program. It has already eliminated 20% of senior management positions, and we believe that substantial further cuts are likely.
Special considerations
The Portfolio may be appropriate for long-term investors seeking capital appreciation who are able to withstand short-term fluctuations in the equity markets in return for potentially higher returns over the long term. The value of the Portfolio changes every day and can be affected by changes in interest rates, general market conditions and other political, social and economic developments, as well as specific matters relating to the companies in whose securities the Portfolio invests. It is important to note that an investment in the Portfolio is only one component of a balanced investment plan. The value of the Portfolio's investments in foreign securities may fall due to adverse political, social, and economic developments abroad and due to decreases in foreign currency values relative to the US dollar. These risks are greater for investments in emerging market issuers than for issuers in more developed countries.
148
UBS PACE Select Advisors Trust
UBS PACE International Equity Investments
Comparison of change in value of a $10,000 investment in the Class P shares of the Portfolio and the MSCI EAFE Index (net) (unaudited)
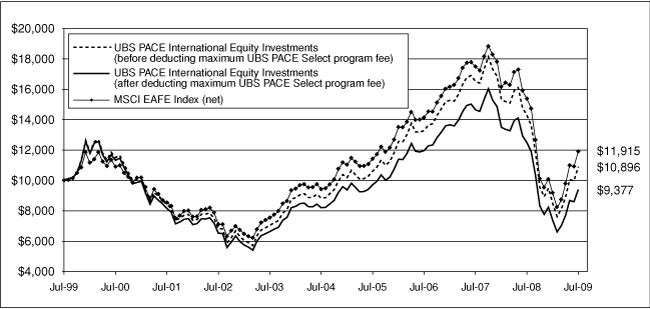
The graph depicts the performance of UBS PACE International Equity Investments Class P shares versus the MSCI EAFE Index (net) over the 10 years ended July 31, 2009. The performance of the other classes will vary from the performance of the class shown based on the difference in sales charges and fees paid by shareholders investing in different share classes. Past performance does not predict future performance and the performance provided does not reflect the deduction of taxes that a shareholder would pay on Portfolio distributions or the redemption of Portfolio shares. It is important to note that UBS PACE International Equity Investments is a professionally managed portfolio while the Index is not available for investment and is unmanaged. The comparison is shown for illustrative purposes only.
149
UBS PACE Select Advisors Trust
UBS PACE International Equity Investments
Performance at a glance (unaudited)
| SinceAverage annual total returns for periods ended 07/31/09 | | 1 year | | 5 years | | 10 years | | inception1 | |
| Before deducting | | Class A2 | | | (24.02 | )% | | | 3.99 | % | | N/A | | | 0.55 | % | |
| maximum sales charge | | Class B3 | | | (24.80 | )% | | | 2.98 | % | | N/A | | | (0.11 | )% | |
| or UBS PACE Select | | Class C4 | | | (24.67 | )% | | | 3.13 | % | | N/A | | | (0.26 | )% | |
| program fee | | Class Y5 | | | (23.73 | )% | | | 4.40 | % | | N/A | | | 1.15 | % | |
| | | Class P6 | | | (23.81 | )% | | | 4.29 | % | | | 0.86 | % | | | 3.88 | % | |
| After deducting | | Class A2 | | | (28.20 | )% | | | 2.82 | % | | N/A | | | (0.11 | )% | |
| maximum sales charge | | Class B3 | | | (28.49 | )% | | | 2.65 | % | | N/A | | | (0.11 | )% | |
| or UBS PACE Select | | Class C4 | | | (25.40 | )% | | | 3.13 | % | | N/A | | | (0.26 | )% | |
| program fee | | Class P6 | | | (24.95 | )% | | | 2.73 | % | | | (0.64 | )% | | | 2.34 | % | |
| MSCI EAFE Index (net)7 | | | (22.60 | )% | | | 4.80 | % | | | 1.77 | % | | | 4.11 | % | |
| Lipper International Large-Cap Core median8 | | | (22.82 | )% | | | 4.40 | % | | | 1.46 | % | | | 4.27 | % | |
| Lipper International Large-Cap Growth Funds median8 | | | (23.73 | )% | | | 5.07 | % | | | 1.80 | % | | | 5.08 | % | |
Average annual total returns for periods ended June 30, 2009, after deduction of the maximum sales charge or UBS PACE Select program fee, were as follows: Class A—1-year period, (36.45)%; 5-year period, 0.49%; since inception, (1.13)%; Class B—1-year period, (36.80)%; 5-year period, 0.29%; since inception, (1.13)%; Class C—1-year period, (33.99)%; 5-year period, 0.78%; since inception, (1.28)%; Class Y—1-year period, (32.47)%; 5-year period, 2.03%; since inception, 0.11%; Class P—1-year period, (33.62)%; 5-year period, 0.38%; 10-year period, (1.33)%; since inception, 1.70%.
The annualized gross and net expense ratios, respectively, for each class of shares as in the November 28, 2008 prospectuses, were as follows: Class A—1.37% and 1.37%; Class B—2.31% and 2.31%; Class C—2.18% and 2.18%; Class Y—1.02% and 1.02%; and Class P—1.12% and 1.12%. Net expenses reflect fee waivers and/or expense reimbursements, if any, pursuant to an agreement that is in effect to cap the expenses.
1 Since inception returns are calculated as of commencement of issuance on August 24, 1995 for Class P shares, November 27, 2000 for Class A, B, and C shares and January 17, 2001 for Class Y shares. Since inception returns for the Index and Lipper median are shown as of August 31, 1995, which is the month-end after the inception date of the oldest share class (Class P).
2 Maximum sales charge for Class A shares is 5.5%. Class A shares bear ongoing 12b-1 service fees.
3 Maximum contingent deferred sales charge for Class B shares is 5% imposed on redemptions and is reduced to 0% after a maximum of six years. Class B shares bear ongoing 12b-1 service and distribution fees.
4 Maximum contingent deferred sales charge for Class C shares is 1% imposed on redemptions and is reduced to 0% after one year. Class C shares bear ongoing 12b-1 service and distribution fees.
5 The Portfolio offers Class Y shares to a limited group of eligible investors, including certain qualifying retirement plans. Class Y shares do not bear initial or contingent deferred sales charges or ongoing 12b-1 service and distribution fees.
6 Class P shares do not bear initial or contingent deferred sales charges or ongoing 12b-1 service and distribution fees, but are subject to a maximum annual UBS PACE Select program fee of 1.5% of the value of Class P shares.
7 The MSCI EAFE Index (net) is an index of stocks from 21 countries designed to measure the investment returns of developed economies outside of North America. Dividends are reinvested after the deduction of withholding tax, using tax rates applicable to Luxembourg holding companies, as Luxembourg applies the highest rates. Investors should note that indices do not reflect the deduction of fees and expenses.
8 On September 15, 2009, Lipper changed the peer group classification for UBS PACE International Equity Investments from Lipper International Large-Cap Growth Funds category to the Lipper International Large-Cap Core category.
If an investor sells or exchanges shares less than 90 days after purchase, a redemption fee of 1.00% of the amount sold or exchanged will be deducted at the time of the transaction, except as noted otherwise in the prospectuses.
Past performance does not predict future performance, and the performance information provided does not reflect the deduction of taxes that a shareholder would pay on Portfolio distributions or the redemption of Portfolio shares. The return and principal value of an investment will fluctuate, so that an investor's shares, when redeemed, may be worth more or less than their original cost. Performance results assume reinvestment of all dividends and capital gain distributions at net asset value on the ex-dividend dates. Current performance may be higher or lower than the performance data quoted. For month-end performance figures, please visit http://www.ubs.com.
Lipper peer group data calculated by Lipper Inc.; used with permission. The Lipper median is the return of the fund that places in the middle of a Lipper peer group.
150
UBS PACE Select Advisors Trust
UBS PACE International Equity Investments
Portfolio statistics (unaudited)
| Characteristics | | 07/31/09 | |
| Net assets (mm) | | $ | 793.2 | | |
| Number of holdings | | | 244 | | |
| Portfolio composition1 | | 07/31/09 | |
| Common stocks, preferred stocks and rights | | | 95.8 | % | |
| ADRs and GDRs | | | 3.1 | | |
| Futures and forward foreign currency contracts | | | 0.0 | 2 | |
| Cash equivalents and other assets less liabilities | | | 1.1 | | |
| Total | | | 100.0 | % | |
| Regional allocation (equity investments)1 | | 07/31/09 | |
| Europe and European territories | | | 63.0 | % | |
| Asia | | | 29.2 | | |
| Oceania | | | 6.0 | | |
| The Americas | | | 0.4 | | |
| Africa | | | 0.3 | | |
| Total | | | 98.9 | % | |
| Top five countries (equity investments)1 | | 07/31/09 | |
| Japan | | | 21.6 | % | |
| United Kingdom | | | 17.9 | | |
| France | | | 10.0 | | |
| Switzerland | | | 8.0 | | |
| Spain | | | 6.7 | | |
| Total | | | 64.2 | % | |
| Top five sectors1 | | 07/31/09 | |
| Financials | | | 23.8 | % | |
| Consumer staples | | | 11.2 | | |
| Health care | | | 10.1 | | |
| Energy | | | 9.6 | | |
| Industrials | | | 9.0 | | |
| Total | | | 63.7 | % | |
| Top ten equity holdings1 | | 07/31/09 | |
| BP PLC | | | 3.1 | % | |
| Banco Santander Central Hispano SA | | | 2.6 | | |
| GlaxoSmithKline PLC | | | 2.5 | | |
| Toyota Motor Corp. | | | 2.1 | | |
| Nestle SA | | | 1.9 | | |
| Telefonica SA | | | 1.7 | | |
| HSBC Holdings PLC | | | 1.7 | | |
| Total SA | | | 1.6 | | |
| Societe Generale | | | 1.6 | | |
| Novartis AG | | | 1.6 | | |
| Total | | | 20.4 | % | |
1 Weightings represent percentages of the Portfolio's net assets as of July 31, 2009. The Portfolio is actively managed and its composition will vary over time.
2 Weighting represents less than 0.05% of the Portfolio's net assets as of July 31, 2009.
ADR American Depositary Receipt
GDR Global Depositary Receipt
151
UBS PACE Select Advisors Trust
UBS PACE International Equity Investments
Industry diversification—(unaudited)
As a percentage of net assets as of July 31, 2009
Common stocks
| Aerospace & defense | | | 0.05 | % | |
| Air freight & logistics | | | 0.07 | | |
| Airlines | | | 0.19 | | |
| Auto components | | | 1.01 | | |
| Automobiles | | | 2.25 | | |
| Beverages | | | 1.19 | | |
| Biotechnology | | | 0.05 | | |
| Building products | | | 1.11 | | |
| Capital markets | | | 2.13 | | |
| Chemicals | | | 1.85 | | |
| Commercial banks | | | 13.91 | | |
| Commercial services & supplies | | | 0.56 | | |
| Communications equipment | | | 0.09 | | |
| Computers & peripherals | | | 0.72 | | |
| Construction & engineering | | | 0.26 | | |
| Construction materials | | | 0.20 | | |
| Consumer finance | | | 0.04 | | |
| Containers & packaging | | | 0.38 | | |
| Diversified consumer services | | | 0.07 | | |
| Diversified financial services | | | 0.78 | | |
| Diversified telecommunication services | | | 7.31 | | |
| Electric utilities | | | 3.86 | | |
| Electrical equipment | | | 2.13 | | |
| Electronic equipment, instruments & components | | | 0.18 | | |
| Energy equipment & services | | | 0.11 | | |
| Food & staples retailing | | | 4.08 | | |
| Food products | | | 4.34 | | |
| Gas utilities | | | 0.42 | | |
| Health care equipment & supplies | | | 0.12 | | |
| Health care providers & services | | | 0.07 | | |
| Hotels, restaurants & leisure | | | 1.27 | | |
| Household durables | | | 1.93 | | |
| Household products | | | 1.11 | | |
| Independent power producers & energy traders | | | 0.69 | | |
| Industrial conglomerates | | | 1.79 | | |
| Insurance | | | 4.47 | | |
| Internet software & services | | | 0.55 | | |
| IT services | | | 0.28 | | |
| Leisure equipment & products | | | 0.69 | | |
| Machinery | | | 1.02 | | |
| Marine | | | 0.11 | | |
| Media | | | 0.61 | | |
| Metals & mining | | | 3.01 | | |
| Multi-utilities | | | 1.28 | | |
| Office electronics | | | 1.54 | | |
| Oil, gas & consumable fuels | | | 9.48 | | |
| Common stocks—(concluded) | |
| Paper & forest products | | | 0.35 | % | |
| Personal products | | | 0.04 | | |
| Pharmaceuticals | | | 9.83 | | |
| Real estate management & development | | | 2.50 | | |
| Road & rail | | | 0.91 | | |
| Semiconductors & semiconductor equipment | | | 1.43 | | |
| Software | | | 0.67 | | |
| Specialty retail | | | 1.12 | | |
| Tobacco | | | 0.46 | | |
| Trading companies & distributors | | | 0.80 | | |
| Transportation infrastructure | | | 0.03 | | |
| Water utilities | | | 0.03 | | |
| Wireless telecommunication services | | | 1.25 | | |
| Total common stocks | | | 98.78 | | |
| Preferred stocks | |
| Automobiles | | | 0.05 | | |
| Multi-utilities | | | 0.10 | | |
| Total preferred stocks | | | 0.15 | | |
| Rights | | | 0.00 | | |
| Repurchase agreement | | | 0.68 | | |
| Investment of cash collateral from securities loaned | | | 14.25 | | |
| Liabilities in excess of other assets | | | (13.86 | ) | |
| Net assets | | | 100.0 | % | |
152
UBS PACE Select Advisors Trust
UBS PACE International Equity Investments
Portfolio of investments—July 31, 2009
| Security description | | Number of
shares | | Value | |
| Common stocks—98.78% | |
| Australia—5.74% | |
| Amcor Ltd. | | | 695,665 | | | $ | 2,880,005 | | |
Australia & New Zealand
Banking Group Ltd. | | | 46,138 | | | | 715,026 | | |
| BHP Billiton Ltd. | | | 91,467 | | | | 2,895,465 | | |
Commonwealth Bank of
Australia | | | 19,924 | | | | 713,195 | | |
| Foster's Group Ltd. | | | 1,789,448 | | | | 8,066,698 | | |
| Macquarie Group Ltd. | | | 13,176 | | | | 485,089 | | |
| National Australia Bank Ltd. | | | 361,187 | | | | 7,349,574 | | |
| Qantas Airways Ltd. | | | 454,085 | | | | 881,075 | | |
| Rio Tinto Ltd.1 | | | 21,139 | | | | 1,067,848 | | |
| Santos Ltd. | | | 40,305 | | | | 489,456 | | |
| Telstra Corp. Ltd. | | | 3,755,815 | | | | 11,088,348 | | |
| Wesfarmers Ltd.1 | | | 291,619 | | | | 6,304,698 | | |
| Westpac Banking Corp. | | | 55,704 | | | | 1,010,494 | | |
| Woodside Petroleum Ltd. | | | 14,488 | | | | 553,749 | | |
| Woolworths Ltd. | | | 43,294 | | | | 986,693 | | |
| Total Australia common stocks | | | 45,487,413 | | |
| Austria—0.21% | |
| Andritz AG | | | 8,513 | | | | 373,107 | | |
| Intercell AG1,* | | | 10,468 | | | | 383,893 | | |
| Vienna Insurance Group | | | 14,019 | | | | 647,393 | | |
| Voestalpine AG | | | 10,606 | | | | 294,323 | | |
| Total Austria common stocks | | | 1,698,716 | | |
| Belgium—0.27% | |
| Anheuser-Busch InBev N.V. | | | 13,332 | | | | 530,443 | | |
| Fortis* | | | 407,261 | | | | 1,584,680 | | |
| Fortis STRIP VVPR* | | | 151,262 | | | | 216 | | |
| Total Belgium common stocks | | | 2,115,339 | | |
| Bermuda—0.53% | |
| Esprit Holdings Ltd. | | | 74,869 | | | | 538,087 | | |
| Jardine Matheson Holdings Ltd. | | | 128,000 | | | | 3,686,400 | | |
| Total Bermuda common stocks | | | 4,224,487 | | |
| Brazil—0.38% | |
Petroleo Brasileiro SA-Petrobas,
ADR | | | 89,900 | | | | 3,029,630 | | |
| Cayman Islands—0.55% | |
| NetEase.com, Inc., ADR1,* | | | 99,700 | | | | 4,392,782 | | |
| China—1.18% | |
| Bank of China Ltd., Class H | | | 11,461,000 | | | | 5,708,280 | | |
China Life Insurance Co.,
Class H* | | | 822,000 | | | | 3,648,596 | | |
| Total China common stocks | | | 9,356,876 | | |
| Czech Republic—0.64% | |
| CEZ | | | 94,048 | | | | 5,065,690 | | |
| Denmark—0.22% | |
| Carlsberg A/S, Class B | | | 12,076 | | | | 837,857 | | |
| Security description | | Number of
shares | | Value | |
| Common stocks—(continued) | |
| Denmark—(concluded) | |
| Novo-Nordisk A/S, Class B | | | 14,935 | | | $ | 879,000 | | |
| Total Denmark common stocks | | | 1,716,857 | | |
| Finland—0.66% | |
| KCI Konecranes Oyj1 | | | 29,147 | | | | 794,721 | | |
| Nokia Oyj | | | 51,467 | | | | 685,144 | | |
| TietoEnator Oyj | | | 17,853 | | | | 305,859 | | |
| UPM-Kymmene Oyj | | | 267,641 | | | | 2,803,794 | | |
| YIT Oyj1 | | | 49,611 | | | | 651,244 | | |
| Total Finland common stocks | | | 5,240,762 | | |
| France—9.95% | |
| Alstom | | | 64,163 | | | | 4,405,218 | | |
| Arkema | | | 5,914 | | | | 169,596 | | |
| Atos Origin SA* | | | 28,818 | | | | 1,313,761 | | |
| AXA SA | | | 28,089 | | | | 593,723 | | |
| BNP Paribas SA | | | 8,165 | | | | 595,262 | | |
| Carrefour SA | | | 221,245 | | | | 10,385,735 | | |
| Casino Guichard-Perrachon SA1 | | | 65,614 | | | | 4,521,672 | | |
| Cie de Saint-Gobain1 | | | 164,445 | | | | 6,668,206 | | |
Compagnie Generale des
Etablissements Michelin1 | | | 14,646 | | | | 1,057,524 | | |
| France Telecom | | | 496,286 | | | | 12,385,806 | | |
| GDF Suez, STRIP VVPR* | | | 23,226 | | | | 33 | | |
| Ipsos | | | 5,658 | | | | 147,698 | | |
| Lafarge SA1 | | | 21,536 | | | | 1,555,635 | | |
| Renault SA* | | | 8,174 | | | | 348,580 | | |
| Rhodia SA1,* | | | 45,688 | | | | 498,096 | | |
| Sanofi-Aventis | | | 124,857 | | | | 8,178,977 | | |
| Societe Generale | | | 197,288 | | | | 12,667,810 | | |
| Technip SA | | | 9,798 | | | | 592,399 | | |
| Total SA1 | | | 230,776 | | | | 12,798,467 | | |
| Total France common stocks | | | 78,884,198 | | |
| Germany—6.64% | |
| Allianz SE | | | 76,072 | | | | 7,503,036 | | |
| Bayer AG | | | 23,310 | | | | 1,430,614 | | |
| Bilfinger Berger AG | | | 11,937 | | | | 626,108 | | |
| Daimler AG | | | 14,650 | | | | 677,994 | | |
| Deutsche Boerse AG | | | 13,440 | | | | 1,065,075 | | |
| Deutsche Telekom AG | | | 559,136 | | | | 7,164,456 | | |
| E.ON AG | | | 289,171 | | | | 10,946,843 | | |
| Fielmann AG | | | 5,681 | | | | 374,735 | | |
| MAN AG | | | 8,147 | | | | 563,178 | | |
Muenchener Rueckversicherungs-
Gesellschaft AG (MunichRe) | | | 608 | | | | 91,936 | | |
| RWE AG | | | 119,797 | | | | 10,116,735 | | |
| Siemens AG | | | 111,391 | | | | 8,890,869 | | |
| Tognum AG | | | 233,124 | | | | 3,249,615 | | |
| Total Germany common stocks | | | 52,701,194 | | |
| Greece—0.85% | |
| National Bank of Greece SA* | | | 229,705 | | | | 6,705,119 | | |
153
UBS PACE Select Advisors Trust
UBS PACE International Equity Investments
Portfolio of investments—July 31, 2009
| Security description | | Number of
shares | | Value | |
| Common stocks—(continued) | |
| Hong Kong—2.15% | |
| Hang Lung Properties Ltd. | | | 137,000 | | | $ | 506,455 | | |
| Hong Kong Electric Holdings | | | 686,500 | | | | 3,773,511 | | |
| Hutchison Whampoa Ltd. | | | 124,000 | | | | 924,794 | | |
New World Development
Co. Ltd. | | | 318,000 | | | | 757,451 | | |
| Sun Hung Kai Properties Ltd. | | | 382,000 | | | | 5,791,575 | | |
| Wharf Holdings Ltd. | | | 1,131,875 | | | | 5,330,732 | | |
| Total Hong Kong common stocks | | | 17,084,518 | | |
| Ireland—0.02% | |
| Smurfit Kappa Group PLC | | | 25,020 | | | | 145,497 | | |
| Israel—0.55% | |
Teva Pharmaceutical Industries
Ltd., ADR1 | | | 81,200 | | | | 4,331,208 | | |
| Italy—2.61% | |
| Atlantia SpA | | | 9,506 | | | | 209,737 | | |
| Eni SpA | | | 326,527 | | | | 7,599,961 | | |
| Intesa Sanpaolo | | | 208,432 | | | | 588,215 | | |
| Intesa Sanpaolo SpA EURO 52* | | | 1,792,464 | | | | 6,674,409 | | |
| Snam Rete Gas SpA | | | 363,845 | | | | 1,593,362 | | |
| UniCredito Italiano SpA | | | 1,375,075 | | | | 4,027,581 | | |
| Total Italy common stocks | | | 20,693,265 | | |
| Japan—21.64% | |
| Aisin Seiki Co. Ltd. | | | 176,700 | | | | 4,547,049 | | |
| Asahi Glass Co. Ltd. | | | 91,000 | | | | 790,510 | | |
| Astellas Pharma, Inc. | | | 189,800 | | | | 7,240,983 | | |
| Benesse Corp. | | | 13,300 | | | | 576,275 | | |
| Bridgestone Corp.1 | | | 60,100 | | | | 1,044,168 | | |
| Canon, Inc. | | | 326,500 | | | | 12,180,132 | | |
| Chugai Pharmaceutical Co. Ltd.1 | | | 20,600 | | | | 377,712 | | |
| Daikin Industries Ltd. | | | 38,095 | | | | 1,384,907 | | |
| DIC Corp. | | | 192,000 | | | | 269,865 | | |
| East Japan Railway Co. | | | 78,100 | | | | 4,481,723 | | |
| Elpida Memory, Inc.1,* | | | 33,000 | | | | 376,645 | | |
| Fast Retailing Co. Ltd. | | | 3,200 | | | | 415,620 | | |
| Hitachi Capital Corp. | | | 25,600 | | | | 349,810 | | |
| INPEX Corp. | | | 581 | | | | 4,445,379 | | |
| Itochu Corp. | | | 678,000 | | | | 5,072,909 | | |
| Japan Tobacco, Inc.1 | | | 453 | | | | 1,311,725 | | |
| JFE Holdings, Inc. | | | 44,400 | | | | 1,787,730 | | |
| Kao Corp. | | | 377,000 | | | | 8,545,997 | | |
| Kawasaki Kisen Kaisha Ltd.1 | | | 148,000 | | | | 558,373 | | |
| KDDI Corp. | | | 1,326 | | | | 7,034,631 | | |
| Kinden Corp. | | | 31,000 | | | | 260,777 | | |
| Kubota Corp.1 | | | 42,000 | | | | 378,166 | | |
| Maruha Nichiro Holdings, Inc. | | | 133,000 | | | | 199,588 | | |
| Minebea Co. Ltd. | | | 171,000 | | | | 695,746 | | |
| Mitsubishi Electric Corp. | | | 280,000 | | | | 2,053,580 | | |
Mitsubishi Tokyo Financial
Group, Inc.1 | | | 310,000 | | | | 1,854,267 | | |
| Mitsui & Co. Ltd. | | | 13,700 | | | | 171,856 | | |
| Mitsui Fudosan Co. Ltd.1 | | | 289,000 | | | | 5,314,240 | | |
| Security description | | Number of
shares | | Value | |
| Common stocks—(continued) | |
| Japan—(concluded) | |
| NIDEC Corp. | | | 7,900 | | | $ | 571,889 | | |
| Nikon Corp. | | | 271,000 | | | | 5,447,207 | | |
| Nippon Oil Corp. | | | 82,000 | | | | 435,022 | | |
Nippon Telegraph & Telephone
Corp. (NTT) | | | 32,200 | | | | 1,330,536 | | |
| Nippon Yusen Kabushiki Kaisha | | | 65,000 | | | | 278,203 | | |
| Nissan Motor Co. Ltd. | | | 28,400 | | | | 206,791 | | |
| Nitori Co. Ltd. | | | 9,300 | | | | 666,357 | | |
| Nitto Denko Corp. | | | 131,000 | | | | 4,222,457 | | |
| Nomura Research Institute Ltd.1 | | | 18,700 | | | | 463,424 | | |
| Olympus Corp.1 | | | 16,500 | | | | 474,293 | | |
| Panasonic Corp. | | | 444,700 | | | | 7,049,406 | | |
| Sekisui House Ltd.1 | | | 794,000 | | | | 7,484,787 | | |
| Seven & I Holdings Co. Ltd.1 | | | 285,100 | | | | 6,688,740 | | |
| Shin-Etsu Chemical Co. Ltd. | | | 117,900 | | | | 6,354,452 | | |
| Shiseido Co. Ltd.1 | | | 21,000 | | | | 342,658 | | |
| Softbank Corp.1 | | | 35,900 | | | | 764,476 | | |
| Sony Financial Holdings, Inc. | | | 135 | | | | 416,164 | | |
| Sumitomo Corp.1 | | | 84,000 | | | | 831,789 | | |
Sumitomo Mitsui Financial
Group, Inc.1 | | | 177,149 | | | | 7,582,071 | | |
Sumitomo Realty & Development
Co. Ltd.1 | | | 25,000 | | | | 515,192 | | |
| Sumitomo Rubber Industries Ltd. | | | 55,300 | | | | 480,387 | | |
| Suzuken Co. Ltd.1 | | | 10,600 | | | | 319,820 | | |
| Takeda Pharmaceutical Co. | | | 246,300 | | | | 9,969,131 | | |
| TDK Corp. | | | 16,300 | | | | 857,849 | | |
| The Bank of Yokohama Ltd. | | | 878,000 | | | | 4,759,989 | | |
| Tohoku Electric Power Co., Inc. | | | 7,500 | | | | 156,222 | | |
| Tokio Marine Holdings, Inc. | | | 221,800 | | | | 6,445,971 | | |
| Tokyo Electric Power Co., Inc. | | | 30,900 | | | | 791,889 | | |
| Tokyo Gas Co. Ltd. | | | 282,000 | | | | 1,034,124 | | |
| Tokyu Land Corp.1 | | | 104,000 | | | | 419,847 | | |
| Toyota Motor Corp. | | | 395,007 | | | | 16,656,042 | | |
| Ube Industries Ltd. | | | 420,000 | | | | 1,216,169 | | |
| West Japan Railway Co.1 | | | 853 | | | | 2,722,388 | | |
| Total Japan common stocks | | | 171,676,105 | | |
| Jersey—0.16% | |
| Shire Ltd. | | | 55,226 | | | | 819,200 | | |
| United Business Media Ltd. | | | 63,201 | | | | 447,898 | | |
| Total Jersey common stocks | | | 1,267,098 | | |
| Luxembourg—1.00% | |
| ArcelorMittal1 | | | 221,286 | | | | 7,963,819 | | |
| Netherlands—3.36% | |
| Akzo Nobel N.V. | | | 24,804 | | | | 1,360,919 | | |
| ASML Holding N.V. | | | 12,872 | | | | 337,025 | | |
| Gemalto N.V.1,* | | | 153,366 | | | | 5,727,123 | | |
| ING Groep N.V. | | | 274,102 | | | | 3,515,315 | | |
| Koninklijke Ahold N.V. | | | 71,997 | | | | 818,783 | | |
| Koninklijke DSM N.V. | | | 12,110 | | | | 432,890 | | |
| Koninklijke (Royal) KPN N.V.1 | | | 74,722 | | | | 1,123,055 | | |
| Mediq N.V. | | | 15,191 | | | | 201,101 | | |
154
UBS PACE Select Advisors Trust
UBS PACE International Equity Investments
Portfolio of investments—July 31, 2009
| Security description | | Number of
shares | | Value | |
| Common stocks—(continued) | |
| Netherlands—(concluded) | |
| Reed Elsevier N.V. | | | 404,051 | | | $ | 4,235,122 | | |
| TNT N.V.1 | | | 23,404 | | | | 555,906 | | |
| Unilever N.V.1 | | | 306,083 | | | | 8,363,102 | | |
| Total Netherlands common stocks | | | 26,670,341 | | |
| New Zealand—0.29% | |
Telecom Corp. of
New Zealand Ltd. | | | 1,265,864 | | | | 2,330,173 | | |
| Norway—0.61% | |
| Sevan Marine ASA1,* | | | 217,644 | | | | 284,063 | | |
| Storebrand ASA* | | | 839,115 | | | | 4,551,889 | | |
| Total Norway common stocks | | | 4,835,952 | | |
| Singapore—2.09% | |
| Capitaland Ltd.1 | | | 93,000 | | | | 246,854 | | |
| City Developments Ltd.1 | | | 135,000 | | | | 951,186 | | |
| Oversea-Chinese Banking Corp.1 | | | 789,642 | | | | 4,290,728 | | |
| Singapore Airlines Ltd.1 | | | 62,740 | | | | 588,535 | | |
Singapore
Telecommunications Ltd. | | | 2,449,120 | | | | 5,956,238 | | |
| United Overseas Bank Ltd. | | | 371,000 | | | | 4,557,746 | | |
| Total Singapore common stocks | | | 16,591,287 | | |
| South Africa—0.36% | |
| Sasol Ltd. | | | 79,986 | | | | 2,865,478 | | |
| South Korea—0.65% | |
Samsung Electronics Co.
Ltd., GDR2 | | | 17,485 | | | | 5,175,560 | | |
| Spain—6.67% | |
Banco Bilbao Vizcaya
Argentaria SA1 | | | 121,714 | | | | 1,998,477 | | |
Banco Santander Central
Hispano SA1 | | | 1,441,704 | | | | 20,877,375 | | |
| Enagas | | | 35,827 | | | | 708,516 | | |
| Iberdrola Renovables SA1 | | | 1,083,425 | | | | 5,003,224 | | |
| Iberdrola SA | | | 1,147,724 | | | | 9,847,819 | | |
| Laboratorios Almirall SA | | | 57,442 | | | | 724,567 | | |
| Telefonica SA | | | 551,646 | | | | 13,724,180 | | |
| Total Spain common stocks | | | 52,884,158 | | |
| Sweden—1.91% | |
| Atlas Copco AB, A Shares1 | | | 444,400 | | | | 5,296,341 | | |
| Electrolux AB, Series B* | | | 42,979 | | | | 804,069 | | |
| Elekta AB, B Shares1 | | | 30,806 | | | | 484,546 | | |
Hennes & Mauritz AB (H&M),
Class B1 | | | 109,850 | | | | 6,530,717 | | |
| Intrum Justitia AB1 | | | 31,872 | | | | 329,055 | | |
| Nordea Bank AB1 | | | 126,545 | | | | 1,227,571 | | |
| Swedish Match AB1 | | | 25,387 | | | | 484,626 | | |
| Total Sweden common stocks | | | 15,156,925 | | |
| Switzerland—7.97% | |
| ABB Ltd.* | | | 392,401 | | | | 7,167,611 | | |
| Baloise Holding AG | | | 5,632 | | | | 449,021 | | |
| Security description | | Number of
shares | | Value | |
| Common stocks—(continued) | |
| Switzerland—(concluded) | |
| Credit Suisse Group | | | 198,568 | | | $ | 9,383,506 | | |
| Nestle SA | | | 357,464 | | | | 14,711,334 | | |
| Novartis AG | | | 271,994 | | | | 12,456,264 | | |
| Roche Holding Genussehein AG | | | 72,752 | | | | 11,471,213 | | |
| Zurich Financial Services AG | | | 38,558 | | | | 7,577,018 | | |
| Total Switzerland common stocks | | | 63,215,967 | | |
| Taiwan—0.98% | |
Chunghwa Telecom Co.
Ltd., ADR1 | | | 163,790 | | | | 2,859,774 | | |
Taiwan Semiconductor
Manufacturing Co. Ltd., ADR | | | 466,690 | | | | 4,886,248 | | |
| Total Taiwan common stocks | | | 7,746,022 | | |
| United Kingdom—17.94% | |
| Admiral Group PLC | | | 22,551 | | | | 360,317 | | |
| Afren PLC* | | | 248,733 | | | | 229,562 | | |
| Anglo American PLC | | | 23,487 | | | | 757,214 | | |
| ARM Holdings PLC | | | 284,724 | | | | 600,467 | | |
| Autonomy Corp. PLC* | | | 269,284 | | | | 5,285,450 | | |
| Aviva PLC | | | 383,521 | | | | 2,247,089 | | |
| Babcock International Group PLC | | | 518,742 | | | | 4,079,203 | | |
| Barclays PLC | | | 153,905 | | | | 777,185 | | |
| Beazley PLC | | | 238,788 | | | | 407,858 | | |
| BG Group PLC | | | 406,844 | | | | 6,789,330 | | |
| BP PLC | | | 2,980,212 | | | | 24,752,087 | | |
| British American Tobacco PLC | | | 59,314 | | | | 1,840,927 | | |
| Carillion PLC | | | 120,233 | | | | 522,694 | | |
| Cobham PLC | | | 143,911 | | | | 430,549 | | |
| Compass Group PLC | | | 1,524,877 | | | | 8,214,820 | | |
| Cookson Group PLC | | | 137,912 | | | | 717,043 | | |
| Domino's Pizza UK & IRL PLC | | | 191,437 | | | | 765,887 | | |
| Filtrona PLC | | | 71,495 | | | | 154,362 | | |
| GKN PLC | | | 529,418 | | | | 908,686 | | |
| GlaxoSmithKline PLC | | | 1,047,975 | | | | 20,114,280 | | |
| HSBC Holdings PLC3 | | | 85,066 | | | | 846,813 | | |
| HSBC Holdings PLC4 | | | 1,309,770 | | | | 13,253,238 | | |
| ICAP PLC | | | 90,833 | | | | 688,863 | | |
InterContinental Hotels
Group PLC | | | 60,492 | | | | 686,122 | | |
| International Power PLC | | | 110,420 | | | | 470,811 | | |
| J Sainsbury PLC | | | 182,584 | | | | 968,367 | | |
| Lloyds TSB Group PLC | | | 189,714 | | | | 269,372 | | |
| Logica PLC | | | 104,184 | | | | 176,210 | | |
| Man Group PLC | | | 1,374,292 | | | | 6,353,312 | | |
| Pennon Group PLC | | | 33,682 | | | | 256,846 | | |
| Peter Hambro Mining PLC1 | | | 21,614 | | | | 235,947 | | |
| Prudential PLC | | | 73,376 | | | | 549,424 | | |
| Reckitt Benckiser Group PLC | | | 5,841 | | | | 280,614 | | |
| Rio Tinto PLC | | | 202,707 | | | | 8,428,052 | | |
Royal Dutch Shell PLC,
A Shares1,4 | | | 55,639 | | | | 1,461,051 | | |
Royal Dutch Shell PLC,
A Shares1,5 | | | 351,113 | | | | 9,228,134 | | |
155
UBS PACE Select Advisors Trust
UBS PACE International Equity Investments
Portfolio of investments—July 31, 2009
| Security description | | Number of
shares | | Value | |
| Common stocks—(concluded) | |
| United Kingdom—(concluded) | |
Royal Dutch Shell PLC,
B Shares4 | | | 20,349 | | | $ | 528,236 | | |
| SIG PLC | | | 126,823 | | | | 257,929 | | |
| Standard Chartered PLC | | | 54,307 | | | | 1,289,091 | | |
| Tesco PLC | | | 140,591 | | | | 863,075 | | |
| Tui Travel PLC | | | 99,855 | | | | 378,642 | | |
| Unilever PLC | | | 421,496 | | | | 11,124,592 | | |
| Vodafone Group PLC | | | 1,034,009 | | | | 2,119,349 | | |
| WH Smith PLC | | | 51,947 | | | | 369,227 | | |
William Morrison
Supermarkets PLC | | | 180,459 | | | | 812,402 | | |
| Xstrata PLC | | | 34,098 | | | | 460,343 | | |
Total United Kingdom
common stocks | | | 142,311,072 | | |
Total common stocks
(cost—$791,776,259) | | | 783,563,508 | | |
| Preferred stocks—0.15% | |
| Germany—0.15% | |
| Porsche Automobil Holding SE | | | 1,538 | | | | 100,267 | | |
| RWE AG | | | 11,379 | | | | 807,356 | | |
| Volkswagen AG | | | 3,273 | | | | 256,529 | | |
Total preferred stocks
(cost—$1,544,223) | | | 1,164,152 | | |
| | | Number of
rights | | | |
| Rights*—0.00% | |
| Belgium—0.00% | |
Fortis, expires 07/04/146
(cost—$0) | | | 407,261 | | | | 0 | | |
| Security description | | Face
Amount | | Value | |
| Repurchase agreement—0.68% | |
Repurchase agreement dated
07/31/09 with State Street
Bank & Trust Co., 0.010%
due 08/03/09, collateralized
by $5,514,899 US Treasury
Bills, zero coupon due
08/27/09 to 09/10/09;
(value—$5,514,347);
proceeds: $5,406,005
(cost—$5,406,000) | | $ | 5,406,000 | | | $ | 5,406,000 | | |
| | | Number of
shares | | | |
| Investment of cash collateral from securities loaned—14.25% | |
| Money market fund—14.25% | |
UBS Private Money Market
Fund LLC7
(cost—$113,067,670) | | | 113,067,670 | | | | 113,067,670 | | |
Total investments
(cost—$911,794,152)—
113.86% | | | | | 903,201,330 | | |
Liabilities in excess of other
assets—(13.86)% | | | (109,957,118 | ) | |
| Net assets—100.00% | | $ | 793,244,212 | | |
Aggregate cost for federal income tax purposes was $937,288,696; and net unrealized depreciation consisted of:
| Gross unrealized appreciation | | $ | 52,204,284 | | |
| Gross unrealized depreciation | | | (86,291,650 | ) | |
| Net unrealized depreciation | | $ | (34,087,366 | ) | |
* Non-income producing security.
1 Security, or portion thereof, was on loan at July 31, 2009.
2 Security exempt from registration under Rule 144A of the Securities Act of 1933. This security, which represents 0.65% of net assets as of July 31, 2009, is considered liquid and may be resold in transactions exempt from registration, normally to qualified institutional buyers.
3 Security is traded on the Hong Kong Exchange.
4 Security is traded on the London Exchange.
5 Security is traded on the Netherlands Exchange.
6 Illiquid security representing 0.00% of net assets as of July 31, 2009.
156
UBS PACE Select Advisors Trust
UBS PACE International Equity Investments
Portfolio of investments—July 31, 2009
7 The table below details the Portfolio's transaction activity in an affiliated issuer during the year ended July 31, 2009.
| Security description | | Value at
07/31/08 | | Purchases
during the
year ended
07/31/09 | | Sales
during the
year ended
07/31/09 | | Value at
07/31/09 | | Net income
earned from
affiliate for the
year ended
07/31/09 | |
| UBS Private Money Market Fund LLC | | $ | 10,293,589 | | | $ | 580,393,504 | | | $ | 477,619,423 | | | $ | 113,067,670 | | | $ | 816,220 | | |
ADR American Depositary Receipt
GDR Global Depositary Receipt
STRIP Separate Trading of Registered Interest and Principal of Securities
VVPR Verminderde Voorheffing Precompte Reduit (Belgium dividend coupon)
Futures contracts
Number of
contracts | | Currency | | Buy contracts | | Expiration
dates | | Cost | | Current
value | | Unrealized
appreciation | |
| | 32 | | | EUR | | Dow Jones Euro STOXX 50 Index Futures | | September 2009 | | $ | 1,135,247 | | | $ | 1,195,900 | | | $ | 60,653 | | |
| | 4 | | | GBP | | FTSE 100 Index Futures | | September 2009 | | | 300,118 | | | | 303,453 | | | | 3,335 | | |
| | 3 | | | JPY | | TOPIX Index Futures | | September 2009 | | | 290,404 | | | | 301,119 | | | | 10,715 | | |
| | | | | | | | | | | $ | 1,725,769 | | | $ | 1,800,472 | | | $ | 74,703 | | |
Forward foreign currency contracts
| | | Contracts to
deliver | | In
exchange for | | Maturity
dates | | Unrealized
appreciation
(depreciation) | |
| Euro | | | 816,889 | | | USD | 1,152,671 | | | 10/13/09 | | $ | (11,707 | ) | |
| Great Britain Pound | | | 2,159,669 | | | USD | 3,474,761 | | | 10/13/09 | | | (132,342 | ) | |
| United States Dollar | | | 1,143,135 | | | AUD | 1,466,949 | | | 10/13/09 | | | 77,480 | | |
| United States Dollar | | | 1,135,177 | | | EUR | 816,889 | | | 10/13/09 | | | 29,201 | | |
| United States Dollar | | | 1,328,528 | | | GBP | 806,024 | | | 10/13/09 | | | 17,701 | | |
| United States Dollar | | | 1,148,799 | | | GBP | 695,000 | | | 10/13/09 | | | 11,998 | | |
| United States Dollar | | | 1,545,416 | | | SEK | 12,243,503 | | | 10/13/09 | | | 151,864 | | |
| | | $ | 144,195 | | |
Currency type abbreviations:
AUD Australian Dollar
EUR Euro
GBP Great Britain Pound
JPY Japanese Yen
SEK Swedish Krona
USD United States Dollar
157
UBS PACE Select Advisors Trust
UBS PACE International Equity Investments
Portfolio of investments—July 31, 2009
The following is a summary of the fair valuations according to the inputs used as of July 31, 2009 in valuing the Portfolio's investments:
| Measurements at 07/31/09 | |
| | | Quoted prices in
active markets for
identical investments
(Level 1)9 | | Significant other
observable inputs
(Level 2)8 | | Unobservable
inputs
(Level 3)9 | | Total | |
| Common stocks | | $ | 783,563,508 | | | $ | — | | | $ | — | | | $ | 783,563,508 | | |
| Preferred stocks | | | 1,164,152 | | | | — | | | | — | | | | 1,164,152 | | |
| Rights | | | — | | | | — | | | | 0 | | | | 0 | | |
| Repurchase agreement | | | — | | | | 5,406,000 | | | | — | | | | 5,406,000 | | |
Investment of cash collateral from
securities loaned | | | — | | | | 113,067,670 | | | | — | | | | 113,067,670 | | |
| Other financial instruments, net10 | | | 74,703 | | | | 144,195 | | | | | | | | 218,898 | | |
| Total | | $ | 784,802,363 | | | $ | 118,617,865 | | | $ | 0 | | | $ | 903,420,228 | | |
8 The Portfolio may hold securities which are periodically fair valued in accordance with the Portfolio's fair valuation policy. This may result in movements between Level 1 and Level 2 throughout the fiscal year.
9 Security categorized as Level 3 has a value of $0.
10 Other financial instruments include open futures contracts and forward foreign currency contracts.
The following is a rollforward of the Portfolio's investment that was valued using unobservable inputs (Level 3) for the period:
| Measurements at 07/31/09 | |
| | | Rights | |
| Beginning balance | | $ | — | | |
| Net purchases/(sales) | | | 0 | | |
| Accrued discounts/(premiums) | | | — | | |
| Total realized gain/(loss) | | | 0 | | |
| Total unrealized appreciation/(depreciation) | | | 0 | | |
| Net transfers in/(out) of Level 3 | | | — | | |
| Ending balance | | $ | 0 | | |
See accompanying notes to financial statements.
158
UBS PACE Select Advisors Trust
UBS PACE International Emerging Markets Equity Investments
Performance
For the 12 months ended July 31, 2009, the Portfolio's Class P shares declined 21.42% (before the deduction of the maximum UBS PACE Select program fee; after the deduction of the maximum UBS PACE Select program fee, the Portfolio declined 22.59%). In comparison, the MSCI Emerging Markets Index (the "benchmark") declined 16.57%, and the Lipper Emerging Markets Funds category posted a median decline of 19.89%. (Returns for all share classes over various time periods are shown in the "Performance at a glance" table on page 163. Please note that the returns shown do not reflect the deduction of taxes that a shareholder would pay on Portfolio distributions or the redemption of Portfolio shares.) For a detailed commentary on the market environment in general during the reporting period, please refer to page two.
Sub-Advisors' comments
Gartmore
Our portion of the Portfolio underperformed the benchmark during the reporting period, negatively impacted by sector allocation and stock selection.
During the latter stages of 2008, our portion of the Portfolio delivered disappointing performance, as a weakening global economic outlook caused commodity prices to fall. This, in turn, negatively impacted overweight positions in basic materials and energy companies, as well as overweight positions in Brazil and Russia. Two Russian stocks in particular hurt returns in our portion of the Portfolio: the automaker Sollers and fertilizer producer Uralkali GDR. More successful were our overweight positions in a number of companies with more resilient earnings, among them Telecom Egypt and China Resources Power Holdings Co. Ltd.
As the outlook for corporate earnings became difficult to predict, in the fourth quarter of 2008 we moved to a more defensive position. For example, we reduced our portion of the Portfolio's exposure to Brazil and Russia while increasing exposure to Chile, one of Latin America's most stable economies, and India, which was relatively insulated from the credit crisis. We also scaled back exposure to Taiwan, a country heavily dependent on global demand for consumer electronics.
UBS PACE Select Advisors Trust – UBS PACE International Emerging Markets Equity Investments
Investment Sub-Advisors:
Gartmore Global Partners ("Gartmore") and Mondrian Investment Partners Limited ("Mondrian")
Portfolio Managers:
Gartmore: Christopher Palmer;
Mondrian: Robert Akester, Ginny Chong, and Gregory Halton
Objective:
Capital appreciation
Investment process:
Gartmore seeks to identify companies where it believes the market has underestimated the prospects for earnings potential. Gartmore employs a stringent analysis of strategic factors, industry dynamics and the assessment of individual company franchises. It focuses on bottom-up stock picking within a risk-controlled environment.
Mondrian conducts research on a global basis in an effort to identify securities that have the potential for capital appreciation over a market cycle. The center of its research effort is a value-oriented dividend discount methodology toward individual securities and market analysis that identifies value across country boundaries. This approach focuses on future anticipated dividends, and discounts the value of those dividends back to what they would be worth if they were being paid today. Comparisons of the values of different possible investments are then made. In an international portfolio, currency returns can be an integral component of an investment's total return. Mondrian uses a
(continued on next page)
159
UBS PACE Select Advisors Trust
UBS PACE International Emerging Markets Equity Investments
Sub-Advisors' comments – continued
During the early stages of 2009, the outlook improved markedly and, amid signs of an economic rebound in China, equity and commodity markets staged very strong recoveries. In this environment, our stance proved too defensive. For example, underweight positions in Taiwan and Russia detracted from relative returns. However, our portion of the Portfolio benefited from being underweight to the health care and consumer staples sectors. At the stock level, notable successes included positions in the Brazilian house builder Cyrela Brazil Realty SA, and the traded unit of Kazakhstan's state energy company, KazMunaiGas Exploration.
In the final few months of the reporting period, we reduced the average weighted market capitalization of the stocks we held, and increased the level of risk in our portion of the Portfolio. In addition, we favored stocks that we considered to be value offerings, and increased our focus on factors such as earnings, income and sales when choosing stocks. Such changes translated into larger positions in the basic materials and energy sectors and larger weightings in Brazil and China. Conversely, our positions in Central and Eastern Europe were reduced.
At the end of the reporting period, our portion of the Portfolio held overweight positions in basic materials and consumer discretionary stocks, which we expect will benefit from improving rates of domestic and international economic growth. Conversely, we are underweight in financials as well as more defensive sectors, such as consumer staples, telecommunications and health care.
Mondrian
Our portion of the Portfolio outperformed the benchmark during the reporting period, primarily due to stock selection and market positioning.
Within our portion of the Portfolio, we maintained a defensive strategy during the first half of the reporting period, while capturing most of the market's gains in the second half of the period. Strong results were achieved in all regions, with the gains achieved from stock selection and market positioning being partially offset by the depreciation of many emerging market currencies against the US dollar. At the sector level, the greatest contribution came from the energy sector, to which our portion of the Portfolio was overweight as energy prices bottomed out in 2008. Stock selection within the defensive telecommunications and utilities sectors also benefited performance. However, this contribution was somewhat offset by the impact of underweight exposures to the consumer staples and health care sectors.
In Asia, an overweight position in China during the second half of 2008 benefited performance relative to the benchmark. However, this gain was partially offset by the impact of an underweight position in the strongly performing Indian market. Overweight exposure to and good stock selection within Taiwan helped relative performance, as holdings in technology companies Lite-On Technology Corp., MediaTek, Inc. and Taiwan Semiconductor Manufacturing Co. Ltd. produced solid gains during the reporting period. Our portion of the Portfolio also benefited from our holding in the Malaysian utility and gaming company Tanjong PLC. However, this positive impact was somewhat offset by the underperformance of key holdings in the telecommunications sector, principally Bharti Airtel Ltd. in India and China Mobile (Hong Kong) Ltd.
Investment process (concluded)
purchasing power parity approach to assess the value of individual currencies. Purchasing power parity attempts to identify the amount of goods and services that a dollar will buy in the United States, and compares that to the amount of a foreign currency required to buy the same amount of goods and services in another country.
160
UBS PACE Select Advisors Trust
UBS PACE International Emerging Markets Equity Investments
Sub-Advisors' comments – concluded
Stock selection in Mexico dominated our portion of the Portfolio's returns from Latin America, with telecommunications company America Movil, paper products manufacturer Kimberly-Clark de Mexico and airport operator Groupo Aeropuerto del Pacifico all significantly outperforming the benchmark. We were also rewarded for overweighting Colombia and underweighting Brazil, although these benefits were largely offset by currency depreciation and stock selection elsewhere.
In Europe, an overweight exposure to and stock selection within Turkey boosted our portion of the Portfolio's results, as holdings in Turkcell and Akbank T.A.S. outperformed the benchmark, despite a headwind from the weak lira. While Russian holdings LUKOIL and Mobile TeleSystems outperformed the local market, overweighting the market as a whole negatively impacted our returns. Elsewhere, our portion of the Portfolio gained from the strong performance of Egyptian mobile operator MobiNil, as it became the target of a takeover bid, and from underweighting the Israeli market, which performed weakly during this time.
Special considerations
The Portfolio may be appropriate for long-term investors seeking capital appreciation who are able to withstand short-term fluctuations in the equity markets in return for potentially higher returns over the long term. The value of the Portfolio changes every day and can be affected by changes in interest rates, general market conditions and other political, social and economic developments, as well as specific matters relating to the companies in whose securities the Portfolio invests. It is important to note that an investment in the Portfolio is only one component of a balanced investment plan. The value of the Portfolio's investments in foreign securities may fall due to adverse political, social, and economic developments abroad and due to decreases in foreign currency values relative to the US dollar. These risks are greater for investments in emerging market issuers than for issuers in more developed countries.
161
UBS PACE Select Advisors Trust
UBS PACE International Emerging Markets Equity Investments
Comparison of change in value of a $10,000 investment in the Class P shares of the Portfolio and the MSCI Emerging Markets Index (unaudited)
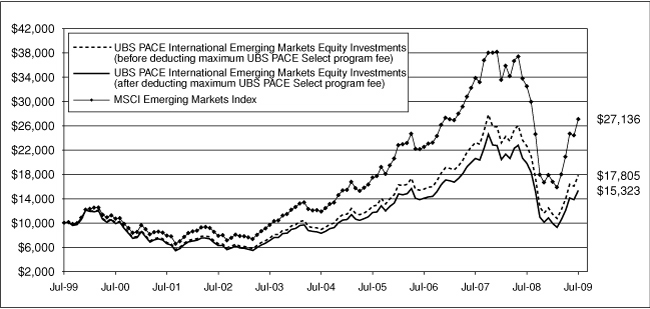
The graph depicts the performance of UBS PACE International Emerging Markets Equity Investments Class P shares versus the MSCI Emerging Markets Index over the 10 years ended July 31, 2009. (The composition of the MSCI EMF Index, like many indices, may change from time to time. For example, at one point Malaysia was excluded from the Index, but as of July 31, 2001, was included.) The performance of the other classes will vary from the performance of the class shown based on the difference in sales charges and fees paid by shareholders investing in different share classes. Past performance does not predict future performance and the performance provided does not reflect the deduction of taxes that a shareholder would pay on Portfolio distributions or the redemption of Portfolio shares. It is important to note that UBS PACE International Emerging Markets Equity Investments is a professionally managed portfolio while the Index is no t available for investment and is unmanaged. The comparison is shown for illustrative purposes only.
162
UBS PACE Select Advisors Trust
UBS PACE International Emerging Markets Equity Investments
Performance at a glance (unaudited)
| Average annual total returns for periods ended 07/31/09 | | 1 year | | 5 years | | 10 years | | Since
inception1 | |
| Before deducting | | Class A2 | | | (21.37 | )% | | | 14.85 | % | | N/A | | | 9.25 | % | |
| maximum sales charge | | Class B3 | | | (22.05 | )% | | | 13.85 | % | | N/A | | | 9.55 | % | |
| or UBS PACE Select | | Class C4 | | | (21.97 | )% | | | 13.97 | % | | N/A | | | 9.29 | % | |
| program fee | | Class Y5 | | | (21.00 | )% | | | 15.33 | % | | N/A | | | 9.61 | % | |
| | | Class P6 | | | (21.42 | )% | | | 14.89 | % | | | 5.94 | % | | | 4.38 | % | |
| After deducting | | Class A2 | | | (25.68 | )% | | | 13.57 | % | | N/A | | | 8.54 | % | |
| maximum sales charge | | Class B3 | | | (24.73 | )% | | | 13.62 | % | | N/A | | | 9.55 | % | |
| or UBS PACE Select | | Class C4 | | | (22.51 | )% | | | 13.97 | % | | N/A | | | 9.29 | % | |
| program fee | | Class P6 | | | (22.59 | )% | | | 13.18 | % | | | 4.36 | % | | | 2.83 | % | |
| MSCI Emerging Markets Index7 | | | (16.57 | )% | | | 18.00 | % | | | 10.50 | % | | | 6.92 | % | |
| Lipper Emerging Markets Funds median | | | (19.89 | )% | | | 15.57 | % | | | 9.87 | % | | | 6.55 | % | |
Average annual total returns for periods ended June 30, 2009, after deduction of the maximum sales charge or UBS PACE Select program fee, were as follows: Class A—1-year period, (35.90)%; 5-year period, 10.59%; since inception, 7.29%; Class B—1-year period, (35.13)%; 5-year period, 10.65%; since inception, 8.30%; Class C—1-year period, (33.11)%; 5-year period, 10.99%; since inception, 8.06%; Class Y—1-year period, (31.81)%; 5-year period, 12.32%; since inception, 8.34%; Class P—1-year period, (33.17)%; 5-year period, 10.23%; 10-year period, 2.96%; since inception, 2.08%.
The annualized gross and net expense ratios, respectively, for each class of shares as in the November 28, 2008 prospectuses, were as follows: Class A—1.76% and 1.76%; Class B—2.58% and 2.58%; Class C—2.50% and 2.50%; Class Y—1.40% and 1.40%; and Class P—1.68% and 1.68%. Net expenses reflect fee waivers and/or expense reimbursements, if any, pursuant to an agreement that is in effect to cap the expenses.
1 Since inception returns are calculated as of commencement of issuance on August 24, 1995 for Class P shares, December 11, 2000 for Class A shares, December 22, 2000 for Class B shares, December 1, 2000 for Class C shares and February 9, 2001 for Class Y shares. Since inception returns for the Index and Lipper median are shown as of August 31, 1995, which is the month-end after the inception date of the oldest share class (Class P).
2 Maximum sales charge for Class A shares is 5.5%. Class A shares bear ongoing 12b-1 service fees.
3 Maximum contingent deferred sales charge for Class B shares is 5% imposed on redemptions and is reduced to 0% after a maximum of six years. Class B shares bear ongoing 12b-1 service and distribution fees.
4 Maximum contingent deferred sales charge for Class C shares is 1% imposed on redemptions and is reduced to 0% after one year. Class C shares bear ongoing 12b-1 service and distribution fees.
5 The Portfolio offers Class Y shares to a limited group of eligible investors, including certain qualifying retirement plans. Class Y shares do not bear initial or contingent deferred sales charges or ongoing 12b-1 service and distribution fees.
6 Class P shares do not bear initial or contingent deferred sales charges or ongoing 12b-1 service and distribution fees, but are subject to a maximum annual UBS PACE Select program fee of 1.5% of the value of Class P shares.
7 The MSCI Emerging Markets Index is a market capitalization-weighted index composed of companies representative of the market structure of 22 emerging market countries in Europe, Latin America, and the Pacific Basin. The MSCI Emerging Markets Index excludes closed markets and those shares in otherwise free markets that are not purchasable by foreigners. Investors should note that indices do not reflect the deduction of fees, expenses or taxes.
If an investor sells or exchanges shares less than 90 days after purchase, a redemption fee of 1.00% of the amount sold or exchanged will be deducted at the time of the transaction, except as noted otherwise in the prospectuses.
Past performance does not predict future performance, and the performance information provided does not reflect the deduction of taxes that a shareholder would pay on Portfolio distributions or the redemption of Portfolio shares. The return and principal value of an investment will fluctuate, so that an investor's shares, when redeemed, may be worth more or less than their original cost. Performance results assume reinvestment of all dividends and capital gain distributions at net asset value on the ex-dividend dates. Current performance may be higher or lower than the performance data quoted. For month-end performance figures, please visit http://www.ubs.com.
Lipper peer group data calculated by Lipper Inc.; used with permission. The Lipper median is the return of the fund that places in the middle of a Lipper peer group.
163
UBS PACE Select Advisors Trust
UBS PACE International Emerging Markets Equity Investments
Portfolio statistics (unaudited)
| Characteristics | | 07/31/09 | |
| Net assets (mm) | | $ | 265.2 | | |
| Number of holdings | | | 163 | | |
| Portfolio composition1 | | 07/31/09 | |
| Common stocks, preferred stocks and rights | | | 77.7 | % | |
| ADRs, GDRs and NVDRs | | | 20.7 | | |
| Corporate bond | | | 0.0 | 2 | |
| Cash equivalents and other assets less liabilities | | | 1.6 | | |
| Total | | | 100.0 | % | |
| Regional allocation (equity investments)1 | | 07/31/09 | |
| Asia | | | 54.3 | % | |
| The Americas | | | 19.7 | | |
| Europe and European territories | | | 9.5 | | |
| Africa | | | 8.2 | | |
| Russia | | | 6.7 | | |
| Total | | | 98.4 | % | |
| Top five countries (equity investments)1 | | 07/31/09 | |
| Taiwan | | | 10.0 | % | |
| China | | | 9.8 | | |
| Brazil | | | 12.4 | | |
| South Korea | | | 11.0 | | |
| Russia | | | 6.7 | | |
| Total | | | 49.9 | % | |
| Top five sectors1 | | 07/31/09 | |
| Financials | | | 23.2 | % | |
| Energy | | | 15.3 | | |
| Telecommunication services | | | 14.7 | | |
| Information technology | | | 13.4 | | |
| Materials | | | 9.5 | | |
| Total | | | 76.1 | % | |
| Top ten equity holdings1 | | 07/31/09 | |
| China Construction Bank Corp. | | | 2.8 | % | |
| Taiwan Semiconductor Manufacturing Co. Ltd. | | | 2.0 | | |
| China Mobile (Hong Kong) Ltd. | | | 1.9 | | |
| Petroleo Brasileiro SA - Petrobras | | | 1.9 | | |
| Samsung Electronics Co. Ltd. | | | 1.8 | | |
| America Movil SA de C.V., ADR | | | 1.8 | | |
| Turkcell Iletisim Hizmetleri A.S. (Turkcell) | | | 1.6 | | |
| Industrial & Commercial Bank of China Ltd. | | | 1.5 | | |
| China Shipping Development Co. Ltd. | | | 1.5 | | |
| Sasol Ltd. | | | 1.4 | | |
| Total | | | 18.2 | % | |
1 Weightings represent percentages of the Portfolio's net assets as of July 31, 2009. The Portfolio is actively managed and its composition will vary over time.
2 Weighting represents less than 0.05% of the Portfolio's net assets as of July 31, 2009.
ADR American Depositary Receipt
GDR Global Depositary Receipt
NVDR Non Voting Depositary Receipt
164
UBS PACE Select Advisors Trust
UBS PACE International Emerging Markets Equity Investments
Industry diversification—(unaudited)
As a percentage of net assets as of July 31, 2009
Common stocks
| Automobiles | | | 1.88 | % | |
| Beverages | | | 0.26 | | |
| Capital markets | | | 0.40 | | |
| Chemicals | | | 1.34 | | |
| Commercial banks | | | 16.60 | | |
| Computers & peripherals | | | 2.26 | | |
| Construction & engineering | | | 0.64 | | |
| Construction materials | | | 1.06 | | |
| Consumer finance | | | 0.39 | | |
| Diversified financial services | | | 1.78 | | |
| Diversified telecommunication services | | | 3.09 | | |
| Electric utilities | | | 3.00 | | |
| Electronic equipment, instruments & components | | | 1.82 | | |
| Food & staples retailing | | | 1.99 | | |
| Food products | | | 1.09 | | |
| Household durables | | | 1.11 | | |
| Household products | | | 0.35 | | |
| Independent power producers & energy traders | | | 1.82 | | |
| Industrial conglomerates | | | 0.48 | | |
| Insurance | | | 0.51 | | |
| Internet software & services | | | 0.88 | | |
| IT services | | | 2.31 | | |
| Machinery | | | 0.80 | | |
| Marine | | | 1.87 | | |
| Media | | | 0.64 | | |
| Metals & mining | | | 5.86 | | |
| Oil, gas & consumable fuels | | | 15.03 | | |
| Real estate management & development | | | 2.46 | | |
| Semiconductors & semiconductor equipment | | | 4.70 | | |
| Software | | | 0.31 | | |
| Textiles, apparel & luxury goods | | | 0.52 | | |
| Tobacco | | | 1.29 | | |
| Transportation infrastructure | | | 3.41 | | |
| Water utilities | | | 0.20 | | |
| Wireless telecommunication services | | | 11.65 | | |
| Total common stocks | | | 93.80 | | |
| Preferred stocks | |
| Automobiles | | | 0.78 | % | |
| Beverages | | | 0.00 | | |
| Commercial banks | | | 0.98 | | |
| Independent power producers & energy traders | | | 0.21 | | |
| Metals & mining | | | 1.22 | | |
| Oil, gas & consumable fuels | | | 0.23 | | |
| Semiconductors & semiconductor equipment | | | 1.13 | | |
| Total preferred stocks | | | 4.55 | | |
| Rights | | | 0.03 | | |
| Corporate bond | |
| Metals & mining | | | 0.00 | | |
| Repurchase agreement | | | 0.50 | | |
| Investment of cash collateral from securities loaned | | | 6.94 | | |
| Liabilities in excess of other assets | | | (5.82 | ) | |
| Net assets | | | 100.0 | % | |
165
UBS PACE Select Advisors Trust
UBS PACE International Emerging Markets Equity Investments
Portfolio of investments—July 31, 2009
| Security description | | Number of
shares | | Value | |
| Common stocks—93.80% | |
| Bermuda—2.26% | |
| China Yurun Food Group Ltd. | | | 744,000 | | | $ | 1,176,952 | | |
| Cosco Pacific Ltd. | | | 1,546,000 | | | | 2,146,433 | | |
| Credicorp Ltd. | | | 10,200 | | | | 680,340 | | |
| Pacific Basin Shipping Ltd. | | | 1,445,000 | | | | 1,092,599 | | |
| SRE Group Ltd.* | | | 6,548,000 | | | | 887,143 | | |
| Total Bermuda common stocks | | | | | | | 5,983,467 | | |
| Brazil—9.75% | |
| AES Tiete SA | | | 41,600 | | | | 397,995 | | |
| BM&F BOVESPA SA | | | 224,400 | | | | 1,450,497 | | |
Cia Brasileira de Meios de
Pagamento* | | | 139,340 | | | | 1,336,828 | | |
Companhia Brasileira de
Distribuicao Grupo Pao de
Acucar, ADR1 | | | 28,883 | | | | 1,351,724 | | |
Companhia de Concessoes
Rodoviarias (CCR) | | | 162,820 | | | | 2,661,670 | | |
Companhia Siderurgica
Nacional SA (CSN), ADR1 | | | 20,841 | | | | 533,530 | | |
| CPFL Energia SA | | | 70,200 | | | | 1,241,269 | | |
| CPFL Energia SA, ADR1 | | | 14,700 | | | | 773,073 | | |
| Cyrela Brazil Realty SA | | | 177,000 | | | | 1,826,209 | | |
Itau Unibanco Banco Multiplo
SA, ADR | | | 114,877 | | | | 2,055,149 | | |
| MPX Mineracao e Energia SA | | | 58,000 | | | | 506,402 | | |
| Petroleo Brasileiro SA-Petrobras1 | | | 124,675 | | | | 5,141,597 | | |
| Redecard SA | | | 185,200 | | | | 2,754,549 | | |
| Santos Brasil Participacoes SA | | | 44,900 | | | | 298,411 | | |
Tele Norte Leste Participacoes
SA Tetemar, ADR1 | | | 79,761 | | | | 1,227,522 | | |
| Vale SA, ADR1 | | | 133,700 | | | | 2,299,640 | | |
| Total Brazil common stocks | | | | | | | 25,856,065 | | |
| Cayman Islands—2.41% | |
| China Zhongwang Holdings Ltd.* | | | 677,200 | | | | 908,753 | | |
Foxconn International
Holdings Ltd.* | | | 999,000 | | | | 698,651 | | |
| Kingboard Chemical Holdings Ltd. | | | 491,000 | | | | 1,564,854 | | |
| Li Ning Co. Ltd. | | | 418,000 | | | | 1,391,527 | | |
| NetEase.com, Inc. ADR1,* | | | 25,320 | | | | 1,115,599 | | |
| Want Want China Holdings Ltd. | | | 1,200,000 | | | | 716,899 | | |
Total Cayman Islands
common stocks | | | | | | | 6,396,283 | | |
| Chile—0.62% | |
| Banco Santander Chile SA, ADR | | | 22,700 | | | | 1,114,797 | | |
Inversiones Aguas Metropolitanas
SA (IAM), ADR2 | | | 23,900 | | | | 529,885 | | |
| Total Chile common stocks | | | | | | | 1,644,682 | | |
| China—9.76% | |
| Angang Steel Co. Ltd., Class H | | | 400,000 | | | | 907,349 | | |
Anhui Conch Cement Co. Ltd.,
Class H | | | 800 | | | | 5,827 | | |
| Security description | | Number of
shares | | Value | |
| Common stocks—(continued) | |
| China—(concluded) | |
Bank of Communications Co.
Ltd., Class H | | | 1,033,000 | | | $ | 1,272,914 | | |
China Bluechemical Ltd.,
Class H | | | 1,366,000 | | | | 757,905 | | |
| China Coal Energy Co., Class H | | | 925,000 | | | | 1,296,185 | | |
| China Construction Bank Corp. | | | 9,292,000 | | | | 7,493,500 | | |
China Merchants Bank Co. Ltd.,
Class H | | | 666,500 | | | | 1,568,630 | | |
China Railway Group Ltd.,
Class H* | | | 1,068,000 | | | | 961,883 | | |
China Shenhua Energy Co. Ltd.,
Class H | | | 606,000 | | | | 2,490,448 | | |
China Shipping Development
Co. Ltd., Class H | | | 2,536,000 | | | | 3,861,240 | | |
Industrial & Commercial Bank of
China Ltd., Class H | | | 5,437,930 | | | | 3,915,284 | | |
| PetroChina Co. Ltd., Class H | | | 1,135,200 | | | | 1,351,978 | | |
| Total China common stocks | | | | | | | 25,883,143 | | |
| Colombia—0.71% | |
| Bancolombia SA1 | | | 59,000 | | | | 1,894,490 | | |
| Czech Republic—2.68% | |
| CEZ | | | 65,229 | | | | 3,513,418 | | |
| Komercni Banka A.S. | | | 12,473 | | | | 2,153,893 | | |
| Telefonica O2 Czech Republic A.S. | | | 52,957 | | | | 1,446,876 | | |
Total Czech Republic common
stocks | | | | | | | 7,114,187 | | |
| Egypt—2.04% | |
| Commercial International Bank | | | 37,617 | | | | 328,844 | | |
Egyptian Co. for Mobile Services
(MobiNil) | | | 24,400 | | | | 941,124 | | |
Orascom Telecom Holding S.A.E.,
GDR* | | | 84,497 | | | | 2,923,596 | | |
| Telecom Egypt, GDR | | | 81,386 | | | | 1,204,513 | | |
| Total Egypt common stocks | | | | | | | 5,398,077 | | |
| Hong Kong—6.13% | |
China Merchants Holdings
International Co. Ltd. | | | 754,000 | | | | 2,490,616 | | |
| China Mobile (Hong Kong) Ltd. | | | 490,400 | | | | 5,163,404 | | |
China Power International
Development Ltd.* | | | 3,984,000 | | | | 1,429,090 | | |
China Resources Power
Holdings Co. Ltd. | | | 632,200 | | | | 1,635,552 | | |
| CNOOC Ltd. | | | 1,943,100 | | | | 2,617,527 | | |
| Denway Motors Ltd. | | | 3,068,600 | | | | 1,524,391 | | |
| Sino-Ocean Land Holdings Ltd. | | | 1,322,734 | | | | 1,408,063 | | |
| Total Hong Kong common stocks | | | | | | | 16,268,643 | | |
| Hungary—0.53% | |
| OTP Bank Nyrt.1,* | | | 66,100 | | | | 1,415,042 | | |
166
UBS PACE Select Advisors Trust
UBS PACE International Emerging Markets Equity Investments
Portfolio of investments—July 31, 2009
| Security description | | Number of
shares | | Value | |
| Common stocks—(continued) | |
| India—5.27% | |
| Axis Bank Ltd. | | | 13,480 | | | $ | 257,216 | | |
| Bank of India | | | 285,925 | | | | 1,955,858 | | |
| Bharti Airtel Ltd. | | | 364,630 | | | | 3,125,400 | | |
| DLF Ltd. | | | 138,600 | | | | 1,146,377 | | |
| Financial Technologies (India) Ltd. | | | 27,468 | | | | 816,307 | | |
| Grasim Industries Ltd. | | | 19,300 | | | | 1,103,622 | | |
| HCL Technologies Ltd. | | | 115,519 | | | | 578,197 | | |
| Indiabulls Real Estate Ltd. | | | 118,500 | | | | 607,946 | | |
| JSW Steel Ltd. | | | 28,206 | | | | 410,031 | | |
| Mphasis Ltd. | | | 146,525 | | | | 1,452,569 | | |
| Reliance Industries Ltd.* | | | 27,733 | | | | 1,141,709 | | |
| Tata Power Co. Ltd. | | | 49,920 | | | | 1,381,831 | | |
| Total India common stocks | | | | | | | 13,977,063 | | |
| Indonesia—0.87% | |
| PT Bank Central Asia Tbk | | | 2,641,000 | | | | 1,004,511 | | |
| PT Bumi Resources Tbk | | | 4,600,000 | | | | 1,297,733 | | |
| Total Indonesia common stocks | | | | | | | 2,302,244 | | |
| Israel—0.95% | |
Bezeq Israeli Telecommunication
Corp. Ltd. | | | 980,862 | | | | 1,953,929 | | |
| Israel Chemicals Ltd. | | | 48,497 | | | | 552,416 | | |
| Total Israel common stocks | | | | | | | 2,506,345 | | |
| Kazakhstan—1.40% | |
KazMunaiGas Exploration
Production, GDR | | | 172,309 | | | | 3,713,259 | | |
| Luxembourg—0.32% | |
| Evraz Group SA, GDR | | | 38,084 | | | | 837,848 | | |
| Malaysia—0.40% | |
| Axiata Group Berhad* | | | 1,279,000 | | | | 1,067,498 | | |
| Mexico—5.99% | |
America Movil SA de C.V., ADR,
Series L | | | 111,144 | | | | 4,780,303 | | |
| Banco Compartamos SA de C.V. | | | 313,100 | | | | 1,035,844 | | |
Grupo Aeroportuario del Pacifico
SA de C.V., ADR1 | | | 51,500 | | | | 1,437,365 | | |
Grupo Mexico SAB de C.V.,
Series B | | | 1,056,724 | | | | 1,504,006 | | |
Grupo Modelo SA de C.V.,
Series C* | | | 175,300 | | | | 685,593 | | |
| Grupo Televisa SA, ADR | | | 94,400 | | | | 1,707,696 | | |
| Industrias CH SA, Series B* | | | 280,300 | | | | 986,748 | | |
Kimberly-Clark de Mexico
SA de C.V., Series A | | | 220,500 | | | | 918,124 | | |
Urbi, Desarrollos Urbanos,
SA de C.V.* | | | 650,185 | | | | 1,124,251 | | |
Wal-Mart de Mexico SA de C.V.,
Series V1 | | | 503,279 | | | | 1,715,317 | | |
| Total Mexico common stocks | | | | | | | 15,895,247 | | |
| Security description | | Number of
shares | | Value | |
| Common stocks—(continued) | |
| Morocco—0.27% | |
Compagnie Generale
Immobiliere | | | 2,934 | | | $ | 707,104 | | |
| Philippines—1.19% | |
| Megaworld Corp. | | | 29,813,900 | | | | 855,723 | | |
Philippine Long Distance
Telephone Co., ADR | | | 43,900 | | | | 2,312,213 | | |
| Total Philippines common stocks | | | | | | | 3,167,936 | | |
| Poland—0.94% | |
| Bank Pekao SA* | | | 41,615 | | | | 2,082,860 | | |
| KGHM Polska Miedz SA | | | 13,809 | | | | 410,608 | | |
| Total Poland common stocks | | | | | | | 2,493,468 | | |
| Russia—6.72% | |
| Gazprom, ADR3 | | | 119,506 | | | | 2,467,799 | | |
| Gazprom, ADR4 | | | 147,550 | | | | 3,046,908 | | |
| LUKOIL, ADR | | | 70,212 | | | | 3,510,600 | | |
Mining & Metallurgical Co.
Norilsk Nickel, ADR | | | 112,300 | | | | 1,124,123 | | |
| Mobile TeleSystems, ADR | | | 85,400 | | | | 3,585,946 | | |
| Rosneft Oil Co., GDR | | | 260,477 | | | | 1,591,515 | | |
| RusHydro* | | | 87 | | | | 3 | | |
| RusHydro, ADR* | | | 292,349 | | | | 1,040,762 | | |
| Sollers JSC5,6 | | | 63,752 | | | | 512,301 | | |
| Uralkali, GDR | | | 51,583 | | | | 949,127 | | |
| Total Russia common stocks | | | | | | | 17,829,084 | | |
| South Africa—5.92% | |
| African Bank Investments Ltd. | | | 846,519 | | | | 3,269,352 | | |
| Harmony Gold Mining Co. Ltd.* | | | 68,942 | | | | 623,676 | | |
| Impala Platinum Holdings Ltd. | | | 54,281 | | | | 1,314,985 | | |
| Kumba Iron Ore Ltd. | | | 34,415 | | | | 918,029 | | |
| MTN Group Ltd. | | | 82,742 | | | | 1,364,816 | | |
Pretoria Portland Cement
Co. Ltd. | | | 271,281 | | | | 1,015,206 | | |
| Sasol Ltd. | | | 104,254 | | | | 3,734,873 | | |
| Shoprite Holdings Ltd. | | | 166,700 | | | | 1,224,472 | | |
| Standard Bank Group Ltd. | | | 159,553 | | | | 1,919,982 | | |
| Telkom South Africa Ltd. | | | 61,115 | | | | 304,394 | | |
Total South Africa
common stocks | | | | | | | 15,689,785 | | |
| South Korea—9.09% | |
| Daelim Industrial Co. Ltd. | | | 13,437 | | | | 743,947 | | |
| Hyundai Motor Co. | | | 31,807 | | | | 2,281,547 | | |
| KB Financial Group, Inc.* | | | 53,310 | | | | 2,304,805 | | |
| KB Financial Group, Inc., ADR1,* | | | 36,761 | | | | 1,577,414 | | |
| KT&G Corp. | | | 58,831 | | | | 3,415,283 | | |
| LG Corp. | | | 23,821 | | | | 1,283,952 | | |
| NHN Corp.* | | | 8,442 | | | | 1,226,915 | | |
| OCI Co. Ltd. | | | 2,553 | | | | 440,674 | | |
| POSCO | | | 5,015 | | | | 2,049,772 | | |
| Samsung Electronics Co. Ltd. | | | 8,292 | | | | 4,887,973 | | |
167
UBS PACE Select Advisors Trust
UBS PACE International Emerging Markets Equity Investments
Portfolio of investments—July 31, 2009
| Security description | | Number of
shares | | Value | |
| Common stocks—(continued) | |
| South Korea—(concluded) | |
Samsung Fire & Marine
Insurance Co. Ltd. | | | 8,116 | | | $ | 1,361,257 | | |
Samsung Heavy Industries
Co. Ltd. | | | 56,240 | | | | 1,485,905 | | |
| Samsung Securities Co. Ltd. | | | 16,900 | | | | 1,056,766 | | |
Total South Korea
common stocks | | | | | | | 24,116,210 | | |
| Taiwan—10.02% | |
| Asustek Computer, Inc. | | | 1,394,397 | | | | 2,210,090 | | |
| China Steel Corp. | | | 723,842 | | | | 699,396 | | |
Chinatrust Financial
Holding Co. Ltd. | | | 4,260,256 | | | | 2,694,474 | | |
Chunghwa Telecom
Co. Ltd., ADR1 | | | 117,325 | | | | 2,048,486 | | |
Far EasTone Telecommunications
Co. Ltd. | | | 1,274,530 | | | | 1,499,539 | | |
HON HAI Precision Industry
Co. Ltd. (Foxconn) | | | 573,070 | | | | 1,973,815 | | |
| HTC Corp. | | | 87,000 | | | | 1,186,677 | | |
| Lite-On Technology Corp. | | | 2,281,705 | | | | 2,597,589 | | |
| MediaTek, Inc. | | | 154,286 | | | | 2,217,320 | | |
Nan Ya Printed Circuit
Board Corp. | | | 180,000 | | | | 581,566 | | |
| President Chain Store Corp. | | | 380,000 | | | | 993,782 | | |
| Shin Zu Shing Co., Ltd. | | | 119,270 | | | | 639,829 | | |
Taiwan Semiconductor
Manufacturing Co. Ltd. | | | 2,990,184 | | | | 5,368,259 | | |
| TSRC Corp. | | | 727,000 | | | | 856,454 | | |
| Uni-President Enterprises Corp. | | | 969,000 | | | | 1,005,683 | | |
| Total Taiwan common stocks | | | | | | | 26,572,959 | | |
| Thailand—3.12% | |
| Banpu Public Co. Ltd., NVDR | | | 142,891 | | | | 1,574,614 | | |
Kasikornbank Public
Co. Ltd., PLC | | | 615,300 | | | | 1,446,488 | | |
| Preuksa Real Estate PLC | | | 3,204,000 | | | | 903,861 | | |
PTT Exploration and Production
Public Co. Ltd. NVDR | | | 304,400 | | | | 1,234,417 | | |
| PTT Public Co. Ltd.6 | | | 343,700 | | | | 2,423,979 | | |
Siam Cement Public
Co. Ltd., NVDR | | | 126,100 | | | | 681,822 | | |
| Total Thailand common stocks | | | | | | | 8,265,181 | | |
| Turkey—4.11% | |
| Akbank T.A.S. | | | 604,691 | | | | 3,412,037 | | |
Tofas Turk Otomobil
Fabrikasi A.S. | | | 321,085 | | | | 672,315 | | |
Tupras-Turkiye Petrol
Rafinerileri A.S. | | | 93,970 | | | | 1,213,794 | | |
Turkcell Iletisim Hizmetleri
A.S. (Turkcell) | | | 647,908 | | | | 4,118,386 | | |
| Turkiye Garanti Bankasi A.S.* | | | 417,818 | | | | 1,477,041 | | |
| Total Turkey common stocks | | | | | | | 10,893,573 | | |
| Security description | | Number of
shares | | Value | |
| Common stocks—(concluded) | |
| United Kingdom—0.33% | |
| Tanjong PLC | | | 199,800 | | | $ | 862,160 | | |
Total common stocks
(cost—$245,759,165) | | | | | | | 248,751,043 | | |
| Preferred stocks—4.55% | |
| Brazil—2.64% | |
| AES Tiete SA | | | 50,500 | | | | 544,044 | | |
Companhia de Bebida das
Americas (AmBev) | | | 72 | | | | 5,102 | | |
Companhia Vale do Rio Doce
(CVRD), Class A | | | 186,854 | | | | 3,244,845 | | |
| Itausa-Investimentos Itau SA | | | 508,056 | | | | 2,605,974 | | |
Petroleo Brasileiro SA-
Petrobras, ADR | | | 18,132 | | | | 611,048 | | |
| Total Brazil preferred stocks | | | | | | | 7,011,013 | | |
| South Korea—1.91% | |
| Hyundai Motor Co. | | | 70,660 | | | | 2,068,252 | | |
| Samsung Electronics Co. Ltd. | | | 7,912 | | | | 2,992,285 | | |
| Total South Korea preferred stocks | | | | | | | 5,060,537 | | |
Total preferred stocks
(cost—$13,057,331) | | | | | | | 12,071,550 | | |
| | | Number of
rights | | | |
| Rights*—0.03% | |
| South Korea—0.03% | |
KB Financial Group, Inc.
expires 08/21/097 | | | 2,855 | | | | 38,542 | | |
KB Financial Group, Inc.
expires 08/27/098 | | | 4,141 | | | | 53,440 | | |
Total rights
(cost—$24,131) | | | | | | | 91,982 | | |
| | | Face
amount | | | |
| Corporate bond5,6,9,10—0.00% | |
| Brazil—0.00% | |
Companhia Vale do Rio Doce
1.000%, due 09/29/49
(cost—$0) | | $ | 10,050 | | | | 0 | | |
| Repurchase agreement—0.50% | |
Repurchase agreement dated
07/31/09 with State Street
Bank & Trust Co.,
0.010% due 08/03/09,
collateralized by $1,352,711
US Treasury Bills, zero coupon
due 08/27/09 to 09/10/09,
(value—$1,352,576);
proceeds: $1,326,001
(cost—$1,326,000) | | | 1,326,000 | | | | 1,326,000 | | |
168
UBS PACE Select Advisors Trust
UBS PACE International Emerging Markets Equity Investments
Portfolio of investments—July 31, 2009
| Security description | | Number of
shares | | Value | |
| Investment of cash collateral from securities loaned—6.94% | |
| Money market fund—6.94% | |
UBS Private Money market
Fund LLC11
(cost—$18,398,485) | | | 18,398,485 | | | $ | 18,398,485 | | |
Total investments
(cost—$278,565,112)—
105.82% | | | | | 280,639,060 | | |
Liabilities in excess
of other assets—(5.82)% | | | | | (15,446,733 | ) | |
| Net assets—100.00% | | $ | 265,192,327 | | |
Aggregate cost for federal income tax purposes was $290,209,722; and net unrealized depreciation consisted of:
| Gross unrealized appreciation | | $ | 15,368,921 | | |
| Gross unrealized depreciation | | | (24,939,583 | ) | |
| Net unrealized depreciation | | $ | (9,570,662 | ) | |
* Non-income producing security.
1 Security, or portion thereof, was on loan at July 31, 2009.
2 Security exempt from registration under Rule 144A of the Securities Act of 1933. This security, which represents 0.20% of net assets as of July 31, 2009, is considered liquid and may be resold in transactions exempt from registration, normally to qualified institutional buyers.
3 Security is traded on the London Exchange.
4 Security is traded on the OTC Market.
5 Illiquid securities representing 0.19% of net assets as of July 31, 2009.
6 Security is being fair valued by a valuation committee under the direction of the board of trustees.
7 Security is traded on the New York Stock Exchange.
8 Security is traded on the Korea Stock Exchange.
9 Variable rate security. The interest rate shown is the current rate as of July 31, 2009, and resets periodically.
10 Perpetual bond security. The maturity date represents the final maturity.
11 The table below details the Portfolio's transaction activity in an affiliated issuer during the year ended July 31, 2009.
| Security description | | Value at
07/31/08 | | Purchases
during the
year ended
07/31/09 | | Sales
during the
year ended
07/31/09 | | Value at
07/31/09 | | Net income
earned from
affiliate for the
year ended
07/31/09 | |
| UBS Private Money Market Fund LLC | | $ | 6,385,235 | | | $ | 220,485,620 | | | $ | 208,472,370 | | | $ | 18,398,485 | | | $ | 67,945 | | |
ADR American Depositary Receipt
GDR Global Depositary Receipt
JSC Joint Stock Company
NVDR Non Voting Depositary Receipt
OTC Over The Counter
169
UBS PACE Select Advisors Trust
UBS PACE International Emerging Markets Equity Investments
Portfolio of investments—July 31, 2009
The following is a summary of the fair valuations according to the inputs used as of July 31, 2009 in valuing the Portfolio's investments:
| Measurements at 07/31/09 | |
| | | Quoted prices in
active markets for
identical investments
(Level 1)12 | | Significant other
observable inputs
(Level 2)12 | | Unobservable
inputs
(Level 3)13 | | Total | |
| Common stocks | | $ | 246,804,996 | | | $ | 1,946,047 | | | $ | — | | | $ | 248,751,043 | | |
| Preferred stocks | | | 12,071,550 | | | | — | | | | — | | | | 12,071,550 | | |
| Rights | | | 91,982 | | | | — | | | | — | | | | 91,982 | | |
| Corporate bond | | | — | | | | — | | | | 0 | | | | 0 | | |
| Repurchase agreement | | | — | | | | 1,326,000 | | | | — | | | | 1,326,000 | | |
Investment of cash collateral from
securities loaned | | | — | | | | 18,398,485 | | | | — | | | | 18,398,485 | | |
| Total | | $ | 258,968,528 | | | $ | 21,670,532 | | | $ | 0 | | | $ | 280,639,060 | | |
12 The Portfolio may hold securities which are periodically fair valued in accordance with the Portfolio's fair valuation policy. This may result in movements between Level 1 and Level 2 throughout the fiscal year.
13 Security categorized as Level 3 has a value of $0.
The following is a rollforward of the Portfolio's investment that was valued using unobservable inputs (Level 3) for the period:
| Measurements at 07/31/09 | |
| | | Corporate
bond | |
| Beginning balance | | $ | 0 | | |
| Net purchases/(sales) | | | — | | |
| Accrued discounts/(premiums) | | | — | | |
| Total realized gain/(loss) | | | — | | |
| Total unrealized appreciation/(depreciation) | | | — | | |
| Net transfers in/(out) of Level 3 | | | — | | |
| Ending balance | | $ | 0 | | |
See accompanying notes to financial statements.
170
UBS PACE Select Advisors Trust
UBS PACE Global Real Estate Securities Investments
Performance
For the 12 months ended July 31, 2009, the Portfolio's Class P shares declined 36.09% (before the deduction of the maximum UBS PACE Select program fee; after the deduction of the maximum UBS PACE Select program fee, the Portfolio declined 37.04%). In comparison, the FTSE EPRA/NAREIT Developed Index (formerly known as the FTSE EPRA/NAREIT Global Real Estate Index) (the "benchmark") declined 30.01%, while the FTSE NAREIT Equity REIT Index (the "Index") declined 39.46% and the Lipper Global Real Estate Funds category (which is inclusive of US and international funds) posted a median decline of 27.41%. (Returns for all share classes over various time periods are shown in the "Performance at a glance" table on page 174. Please note that the returns shown do not reflect the deduction of taxes that a shareholder would pay on Portfolio distributions or the redemption of Portfolio shares.) For a detailed commentary on the market environm ent in general during the reporting period, please refer to page two.
Sub-Advisor's comments
The Portfolio underperformed its benchmark during the reporting period, primarily due to stock selection.
For the first seven months of the reporting period, through February 28, 2009, the global real estate securities market, as represented by the Portfolio's benchmark, declined 56.3%. The selloff was also apparent in the global equity markets, as the MSCI World Free Index (net) fell 44.4% over the same time period. As cash flows declined due to the weakening economy and the strained credit environment persisted, property values faced downward pressure.
However, beginning in March 2009, the global real estate market made a remarkable comeback. From March 1, 2009, through July 31, 2009, the Portfolio's benchmark returned 60.1%. During the same time period, it outperformed the MSCI World Free Index (net) by 19.25%. During this time, fear of a systemic collapse in the banking sector subsided, the pace of deterioration in the economy slowed and the capital markets showed signs of modest improvement. Additionally, real estate securities underwent successful equity offerings, which removed the prospect of looming liquidity issues for many companies.
During the reporting period as a whole, China and Hong Kong were the strongest performers within the benchmark, returning 39.7% and 7.8%, respectively. On the country level, an underweight position to China detracted from the Portfolio's relative performance. Australia performed poorly within the benchmark, declining 45.7%, and the Portfolio's relative underweight to the country benefited relative results.
Europe delivered mixed results, with Continental Europe outperforming with a decline of 30.1% within the benchmark, while the United Kingdom was the worst-performing market within the benchmark, as it fell 47.3%.
UBS PACE Select Advisors Trust – UBS PACE Global Real Estate Securities Investments
Investment Sub-Advisor:
Goldman Sachs Asset Management, L.P. ("GSAM")
Portfolio Managers:
David Kruth and James Otness
Objective:
Total return
Investment process:
The Portfolio invests primarily in real estate investment trusts (REITs) and other real estate related securities. Under normal market conditions, the Portfolio will maintain exposure to real estate related securities of issues in the US and at least three non-US countries.
GSAM employs a bottom-up investment process focusing on fundamental research seeking to identify undervalued, well-managed businesses with strong growth potential that offer an attractive level of income and capital appreciation.
171
UBS PACE Select Advisors Trust
UBS PACE Global Real Estate Securities Investments
Sub-Advisor's comments – concluded
Within the Portfolio, however, stock selection contributed positively in the United Kingdom, where the Portfolio was underweight Liberty International PLC, which was later sold from the Portfolio during the reporting period. Stock selection also contributed positively in Continental Europe, where the Portfolio did not hold Immofinanz. Elsewhere, the US declined 40.5% within the benchmark, and the Portfolio's underweight to the US was positive for performance.
During the reporting period, stock selection detracted from performance in the US, where the Portfolio was overweight ProLogis. Other detractors from performance included an underweight to Nippon Building Fund, Inc. in Japan, an overweight to Tishman Speyer Office Fund in Australia, a position which we eliminated during the reporting period, and an underweight to Link REIT in Hong Kong and CapitaLand Ltd. in Singapore.
Special considerations
The Portfolio may be appropriate for long-term investors seeking to diversify a portion of their assets into real-estate related investments. Investors should be willing to withstand short-term fluctuations in the equity and real estate markets in return for potentially higher returns over the long term. The value of the Portfolio changes every day and can be affected by changes in interest rates, general market conditions and other political, social and economic developments, as well as specific matters relating to the companies or issuers in whose securities the Portfolio invests. The value of the Portfolio's investments in foreign securities may fall due to adverse political, social, and economic developments abroad and due to decreases in foreign currency values relative to the US dollar. These risks are greater for investments in emerging market issuers than for issuers in more developed countries. There are certain risks a ssociated with investing in real estate-related investments, including sensitivity to economic downturns, interest rates, declines in property values and variation in property management.
172
UBS PACE Select Advisors Trust
UBS PACE Global Real Estate Securities Investments
Comparison of change in value of a $10,000 investment in the Class A shares of the Portfolio, the FTSE EPRA/NAREIT Developed Index (formerly known as the FTSE EPRA/NAREIT Global Real Estate Index) and the FTSE NAREIT Equity REIT Index (unaudited)

The graph depicts the performance of UBS PACE Global Real Estate Securities Investments Class A shares versus the FTSE EPRA/NAREIT Developed Index (formerly known as the FTSE EPRA/NAREIT Global Real Estate Index) and the FTSE NAREIT Equity REIT Index from December 31, 2006, the month-end after the inception date of the Class A shares, through July 31, 2009. The performance of the other classes will vary from the performance of the class shown based on the difference in sales charges and fees paid by shareholders investing in different share classes. Past performance does not predict future performance and the performance provided does not reflect the deduction of taxes that a shareholder would pay on Portfolio distributions or the redemption of Portfolio shares. It is important to note that UBS PACE Global Real Estate Securities Investments is a professionally managed portfolio while the Indices are not available for investment and are unmanaged. The comparison is shown for illustrative purposes only.
173
UBS PACE Select Advisors Trust
UBS PACE Global Real Estate Securities Investments
Performance at a glance (unaudited)
| Average annual total returns for periods ended 07/31/09 | | | | 1 year | | Since
inception1 | |
| Before deducting | | Class A2 | | | (36.25 | )% | | | (22.11 | )% | |
| maximum sales charge | | Class C3 | | | (36.73 | )% | | | (22.72 | )% | |
| or UBS PACE Select | | Class Y4 | | | N/A | | | | 11.95 | % | |
| program fee | | Class P5 | | | (36.09 | )% | | | (24.05 | )% | |
After deducting
maximum sales charge | | Class A2 | | | (39.76 | )% | | | (23.77 | )% | |
| or UBS PACE Select | | Class C3 | | | (37.36 | )% | | | (22.72 | )% | |
| program fee | | Class P5 | | | (37.04 | )% | | | (25.18 | )% | |
| FTSE EPRA/NAREIT Developed Index6,7 | | | | | (30.01 | )% | | | (19.74 | )% | |
| FTSE NAREIT Equity REIT Index8 | | | | | (39.46 | )% | | | (22.99 | )% | |
| Lipper Global Real Estate Funds median | | | | | (27.41 | )% | | | (19.64 | )% | |
Average annual total returns for periods ended June 30, 2009, after deduction of the maximum sales charge or UBS PACE Select program fee, were as follows: Class A—1-year period, (45.41)%; since inception, (27.24)%; Class C—1-year period, (43.27)%; since inception, (26.21)%; Class Y—since inception, 1.61%; Class P—1-year period, (42.96)%; since inception, (28.73)%. Please note the since inception return for the Class Y shares has not been annualized.
The annualized gross and net expense ratios, respectively, for each class of shares as in the November 28, 2008 prospectuses, were as follows: Class A—1.74% and 1.45%; Class C—2.68% and 2.20%; Class Y—1.92% and 1.20%; and Class P—1.71% and 1.20%. Net expenses reflect fee waivers and/or expense reimbursements, if any, pursuant to an agreement that is in effect to cap the expenses. The Portfolio and UBS Global AM have entered into a written fee waiver/expense reimbursement agreement pursuant to which UBS Global AM is contractually obligated to waive its management fees and/or reimburse the Portfolio so that the ordinary total operating expenses of each class through November 30, 2009 (excluding dividend expense, borrowing costs and interest expense, if any) would not exceed Class A—1.45%; Class C—2.20%; Class Y—1.20% and Class P—1.20%. The Portfolio has agreed to repay UBS Global AM for any waived fees/reimbursed expenses to the extent that it can do so over the following three fiscal years without causing the Portfolio's expenses in any of those three years to exceed the expense caps described above.
1 Since inception returns are calculated as of commencement of issuance on December 18, 2006 for Class A and C shares, and January 22, 2007 for Class P shares. Class Y shares commenced issuance on November 30, 2006 and had fully redeemed by February 15, 2007 remaining inactive through December 25, 2008. The inception return of Class Y shares is calculated from December 26, 2008, which is the date the Class Y shares recommenced investment operations. Please note the since inception return for the Class Y shares has not been annualized. Since inception returns for the Indices and Lipper median are shown as of December 31, 2006, which is the month-end after the inception date of the oldest share classes (Class A & Class C).
2 Maximum sales charge for Class A shares is 5.5%. Class A shares bear ongoing 12b-1 service fees.
3 Maximum contingent deferred sales charge for Class C shares is 1% imposed on redemptions and is reduced to 0% after one year. Class C shares bear ongoing 12b-1 service and distribution fees.
4 The Portfolio offers Class Y shares to a limited group of eligible investors, including certain qualifying retirement plans. Class Y shares do not bear initial or contingent deferred sales charges or ongoing 12b-1 service and distribution fees.
5 Class P shares do not bear initial or contingent deferred sales charges or ongoing 12b-1 service and distribution fees, but are subject to a maximum annual UBS PACE Select program fee of 1.5% of the value of Class P shares.
6 The FTSE EPRA/NAREIT Developed Index (formerly known as the FTSE EPRA/NAREIT Global Real Estate Index) is designed to track the performance of listed real estate companies and REITS worldwide. By making the index constituents free-float adjusted, liquidity, size and revenue screened, the series is suitable for use as the basis for investment products, such as derivatives and Exchange Traded Funds (ETFs). Investors should note that indices do not reflect the deduction of fees, expenses or taxes.
7 Effective November 28, 2008, the Portfolio's benchmark was changed to the FTSE EPRA/NAREIT Developed Index (formerly known as the FTSE EPRA/NAREIT Global Real Estate Index) to more closely reflect its current strategy.
8 The FTSE NAREIT Equity REIT Index is an unmanaged market weighted index of publicly traded US equity real estate investment trusts ("REITs"). Equity REITs include those firms that own, manage and lease investment grade commercial real estate. A company is classified as an Equity REIT if 75% or more of its gross invested book assets is invested in real property. Investors should note that indices do not reflect the deduction of fees, expenses or taxes.
If an investor sells or exchanges shares less than 90 days after purchase, a redemption fee of 1.00% of the amount sold or exchanged will be deducted at the time of the transaction, except as noted otherwise in the prospectuses.
Past performance does not predict future performance, and the performance information provided does not reflect the deduction of taxes that a shareholder would pay on Portfolio distributions or the redemption of Portfolio shares. The return and principal value of an investment will fluctuate, so that an investor's shares, when redeemed, may be worth more or less than their original cost. Performance results assume reinvestment of all dividends and capital gain distributions at net asset value on the ex-dividend dates. Total returns for the period of less than one year have not been annualized. Current performance may be higher or lower than the performance data quoted. For month-end performance figures, please visit http://www.ubs.com.
Lipper peer group data calculated by Lipper Inc.; used with permission. The Lipper median is the return of the fund that places in the middle of a Lipper peer group.
174
UBS PACE Select Advisors Trust
UBS PACE Global Real Estate Securities Investments
Portfolio statistics (unaudited)
| Characteristics | | 07/31/09 | |
| Net assets (mm) | | $ | 56.3 | | |
| Number of holdings | | | 94 | | |
| Portfolio composition1 | | 07/31/09 | |
| Common stocks | | | 96.9 | % | |
| Cash equivalents and other assets less liabilities | | | 3.1 | | |
| Total | | | 100.0 | % | |
| Top five countries (equity investments)1 | | 07/31/09 | |
| United States | | | 36.2 | % | |
| Hong Kong | | | 13.2 | | |
| Japan | | | 12.3 | | |
| Australia | | | 8.3 | | |
| France | | | 6.3 | | |
| Total | | | 76.3 | % | |
| Top ten equity holdings1 | | 07/31/09 | |
| Sun Hung Kai Properties Ltd. | | | 5.8 | % | |
| Unibail Rodamco | | | 4.7 | | |
| Mitsui Fudosan Co. Ltd. | | | 4.7 | | |
| Simon Property Group, Inc. | | | 3.8 | | |
| Mitsubishi Estate Co. Ltd. | | | 2.7 | | |
| Sumitomo Realty & Development Co. Ltd. | | | 2.5 | | |
| Boston Properties, Inc. | | | 2.4 | | |
| Vornado Realty Trust | | | 2.3 | | |
| Public Storage, Inc. | | | 2.2 | | |
| Capitaland Ltd. | | | 2.2 | | |
| Total | | | 33.3 | % | |
1 Weightings represent percentages of the Portfolio's net assets as of July 31, 2009. The Portfolio is actively managed and its composition will vary over time.
175
UBS PACE Select Advisors Trust
UBS PACE Global Real Estate Securities Investments
Industry diversification—(unaudited)
As a percentage of net assets as of July 31, 2009
Common stocks
| Diversified | | | 32.83 | % | |
| Health care | | | 5.50 | | |
| Hotels | | | 3.44 | | |
| Industrial | | | 4.80 | | |
| Office | | | 22.29 | | |
| Other | | | 2.83 | | |
| Residential | | | 8.18 | | |
| Retail | | | 17.03 | | |
| Total common stocks | | | 96.90 | | |
| Repurchase agreement | | | 2.80 | | |
| Investment of cash collateral from securities loaned | | | 26.74 | | |
| Liabilities in excess of other assets | | | (26.44 | ) | |
| Net assets | | | 100.0 | % | |
176
UBS PACE Select Advisors Trust
UBS PACE Global Real Estate Securities Investments
Portfolio of investments—July 31, 2009
| Security description | | Number of
shares | | Value | |
| Common stocks—96.90% | |
| Australia—8.27% | |
| CFS Retail Property Trust1 | | | 676,510 | | | $ | 970,345 | | |
Commonwealth Property
Office Fund | | | 937,938 | | | | 662,855 | | |
| Dexus Property Group | | | 1,300,792 | | | | 794,180 | | |
| ING Office Fund | | | 1,085,705 | | | | 440,394 | | |
| Macquarie Office Trust | | | 3,168,972 | | | | 622,837 | | |
| Stockland | | | 51,250 | | | | 135,018 | | |
| Westfield Group | | | 108,854 | | | | 1,031,484 | | |
| Total Australia common stocks | | | | | | | 4,657,113 | | |
| Bermuda—2.95% | |
| Hongkong Land Holdings Ltd. | | | 87,000 | | | | 338,430 | | |
Hopson Development
Holdings Ltd. | | | 358,000 | | | | 574,644 | | |
| Kerry Properties Ltd. | | | 145,000 | | | | 750,253 | | |
| Total Bermuda common stocks | | | | | | | 1,663,327 | | |
| Brazil—0.18% | |
| BR Malls Participacoes SA* | | | 9,561 | | | | 99,415 | | |
| Canada—2.36% | |
Allied Properties Real Estate
Investment Trust | | | 9,500 | | | | 137,043 | | |
Boardwalk Real Estate
Investment Trust | | | 8,900 | | | | 273,052 | | |
Cominar Real Estate
Investment Trust2 | | | 3,500 | | | | 55,428 | | |
Cominar Real Estate
Investment Trust3 | | | 11,462 | | | | 179,817 | | |
| First Capital Realty, Inc. | | | 16,200 | | | | 258,659 | | |
InnVest Real Estate
Investment Trust | | | 104,300 | | | | 359,204 | | |
RioCan Real Estate
Investment Trust4,5 | | | 4,400 | | | | 63,391 | | |
| Total Canada common stocks | | | | | | | 1,326,594 | | |
| Cayman Islands—2.31% | |
| China Resources Land Ltd. | | | 368,000 | | | | 892,691 | | |
| Shimao Property Holdings Ltd. | | | 203,500 | | | | 409,623 | | |
Total Cayman Islands
common stocks | | | | | | | 1,302,314 | | |
| France—6.26% | |
| Klepierre | | | 20,504 | | | | 586,240 | | |
| Mercialys | | | 8,571 | | | | 287,082 | | |
| Unibail Rodamco | | | 15,174 | | | | 2,651,530 | | |
| Total France common stocks | | | | | | | 3,524,852 | | |
| Hong Kong—13.16% | |
China Overseas Land &
Investment Ltd. | | | 376,000 | | | | 925,682 | | |
| Hang Lung Properties Ltd. | | | 161,000 | | | | 595,177 | | |
Henderson Land Development
Co. Ltd. | | | 160,000 | | | | 1,060,122 | | |
| Hysan Development Co. | | | 148,321 | | | | 402,856 | | |
| Security description | | Number of
shares | | Value | |
| Common stocks—(continued) | |
| Hong Kong—(concluded) | |
| Link REIT | | | 243,500 | | | $ | 552,977 | | |
| Sun Hung Kai Properties Ltd. | | | 215,000 | | | | 3,259,656 | | |
| Wharf (Holdings) Ltd. | | | 131,000 | | | | 616,964 | | |
| Total Hong Kong common stocks | | | | | | | 7,413,434 | | |
| Japan—12.30% | |
Frontier Real Estate
Investment Corp. | | | 19 | | | | 122,684 | | |
| Japan Logistics Fund, Inc. | | | 21 | | | | 142,035 | | |
Japan Real Estate
Investment Corp. | | | 33 | | | | 276,206 | | |
| Mitsubishi Estate Co. Ltd. | | | 92,000 | | | | 1,533,252 | | |
| Mitsui Fudosan Co. Ltd.1 | | | 144,000 | | | | 2,647,926 | | |
| Nippon Building Fund, Inc. | | | 46 | | | | 413,210 | | |
Sumitomo Real Estate
Sales Co., Ltd.1 | | | 3,030 | | | | 135,129 | | |
Sumitomo Realty &
Development Co. Ltd.1 | | | 67,000 | | | | 1,380,714 | | |
| TOKYU REIT, Inc. | | | 50 | | | | 277,939 | | |
| Total Japan common stocks | | | | | | | 6,929,095 | | |
| Netherlands—0.99% | |
| Vastned Offices/Industrial N.V. | | | 36,620 | | | | 556,654 | | |
| Singapore—3.63% | |
| Allgreen Properties Ltd. | | | 164,000 | | | | 136,748 | | |
Ascendas Real Estate Investment
Trust (A-REIT)1 | | | 219,066 | | | | 258,772 | | |
| Capitaland Ltd.1 | | | 458,000 | | | | 1,215,690 | | |
| CapitaMall Trust | | | 395,700 | | | | 434,427 | | |
| Total Singapore common stocks | | | | | | | 2,045,637 | | |
| Sweden—2.08% | |
| Castellum AB | | | 49,602 | | | | 366,035 | | |
| Hufvudstaden AB, Class A | | | 102,845 | | | | 674,136 | | |
| Wihlborgs Fastigheter AB | | | 8,404 | | | | 129,857 | | |
| Total Sweden common stocks | | | | | | | 1,170,028 | | |
| United Kingdom—6.20% | |
| Berkeley Group Holdings PLC* | | | 10,141 | | | | 139,925 | | |
| British Land Co. PLC | | | 40,724 | | | | 295,919 | | |
| Derwent London PLC1 | | | 34,175 | | | | 550,896 | | |
| Great Portland Estates PLC | | | 163,405 | | | | 634,632 | | |
| Hammerson PLC | | | 104,255 | | | | 600,392 | | |
| Helical Bar PLC | | | 21,570 | | | | 122,507 | | |
| Land Securities Group PLC | | | 111,109 | | | | 991,115 | | |
| Segro PLC | | | 33,343 | | | | 153,588 | | |
Total United Kingdom
common stocks | | | | | | | 3,488,974 | | |
| United States—36.21% | |
| Acadia Realty Trust1 | | | 16,070 | | | | 220,159 | | |
Alexandria Real Estate
Equities, Inc.1 | | | 8,929 | | | | 340,284 | | |
| AMB Property Corp.1 | | | 13,474 | | | | 266,920 | | |
177
UBS PACE Select Advisors Trust
UBS PACE Global Real Estate Securities Investments
Portfolio of investments—July 31, 2009
| Security description | | Number of
shares | | Value | |
| Common stocks—(concluded) | |
| United States—(concluded) | |
American Campus
Communities, Inc.1 | | | 14,787 | | | $ | 339,066 | | |
| AvalonBay Communities, Inc.1 | | | 8,443 | | | | 491,383 | | |
| Boston Properties, Inc.1 | | | 25,044 | | | | 1,324,828 | | |
| Brandywine Realty Trust | | | 18,884 | | | | 154,471 | | |
| Camden Property Trust1 | | | 17,577 | | | | 518,697 | | |
| Corporate Office Properties Trust1 | | | 7,134 | | | | 241,914 | | |
| Corrections Corp. of America* | | | 30,992 | | | | 534,922 | | |
Cypress Sharpridge
Investments, Inc.* | | | 10,542 | | | | 139,682 | | |
| Digital Realty Trust, Inc.1 | | | 14,525 | | | | 588,989 | | |
| Douglas Emmett, Inc.1 | | | 57,183 | | | | 580,979 | | |
| Duke Realty Corp.1 | | | 39,233 | | | | 372,321 | | |
| Entertainment Properties Trust1 | | | 23,295 | | | | 636,186 | | |
| Equity Lifestyle Properties, Inc.1 | | | 9,943 | | | | 414,325 | | |
| Equity Residential1 | | | 25,087 | | | | 602,088 | | |
| Essex Property Trust, Inc.1 | | | 7,367 | | | | 478,929 | | |
| Federal Realty Investment Trust1 | | | 9,225 | | | | 526,286 | | |
| HCP, Inc.1 | | | 32,037 | | | | 825,273 | | |
| Health Care REIT, Inc.1 | | | 21,394 | | | | 857,044 | | |
| Hospitality Properties Trust | | | 31,982 | | | | 504,996 | | |
| Host Hotels & Resorts, Inc. | | | 77,355 | | | | 702,383 | | |
| Jones Lang LaSalle, Inc.1 | | | 3,920 | | | | 148,803 | | |
| Kimco Realty Corp.1 | | | 45,652 | | | | 449,216 | | |
| MFA Financial, Inc. | | | 18,067 | | | | 133,696 | | |
Nationwide Health
Properties, Inc.1 | | | 13,684 | | | | 397,110 | | |
| ProLogis1 | | | 73,779 | | | | 648,517 | | |
| Public Storage, Inc.1 | | | 16,957 | | | | 1,230,570 | | |
| Regency Centers Corp.1 | | | 7,135 | | | | 228,891 | | |
| Simon Property Group, Inc.1 | | | 38,217 | | | | 2,129,451 | | |
| SL Green Realty Corp.1 | | | 5,731 | | | | 147,745 | | |
Starwood Hotels & Resorts
Worldwide, Inc.1 | | | 15,768 | | | | 372,282 | | |
Tanger Factory Outlet
Centers, Inc.1 | | | 6,437 | | | | 228,771 | | |
| Taubman Centers, Inc.1 | | | 12,277 | | | | 326,691 | | |
| Ventas, Inc.1 | | | 28,853 | | | | 1,018,511 | | |
| Vornado Realty Trust1 | | | 24,867 | | | | 1,268,714 | | |
Total United States
common stocks | | | | | | | 20,391,093 | | |
Total common stocks
(cost—$47,873,936) | | | | | | | 54,568,530 | | |
| Security description | | Face
amount | | Value | |
| Repurchase agreement—2.80% | |
Repurchase agreement dated
07/31/09 with State Street
Bank & Trust Co. 0.010%,
due 08/03/09, collateralized
by $1,604,687 US Treasury
Bills, zero coupon due
08/27/09 to 09/10/09;
(value—$1,604,526);
proceeds: $1,573,001
(cost—$1,573,000) | | $ | 1,573,000 | | | $ | 1,573,000 | | |
| | | Number of
shares | | | |
| Investment of cash collateral from securities loaned—26.74% | |
| Money market fund—26.74% | |
UBS Private Money Market
Fund LLC,6
(cost—$15,057,573) | | | 15,057,573 | | | | 15,057,573 | | |
Total investments
(cost—$64,504,509)—
126.44% | | | | | 71,199,103 | | |
Liabilities in excess of other
assets—(26.44)% | | | | | (14,886,331 | ) | |
| Net assets—100.00% | | $ | 56,312,772 | | |
Aggregate cost for federal income tax purposes was $78,730,431; and net unrealized depreciation consisted of:
| Gross unrealized appreciation | | $ | 8,154,115 | | |
| Gross unrealized depreciation | | | (15,685,443 | ) | |
| Net unrealized depreciation | | $ | (7,531,328 | ) | |
178
UBS PACE Select Advisors Trust
UBS PACE Global Real Estate Securities Investments
Portfolio of investments—July 31, 2009
* Non-income producing security.
1 Security, or portion thereof, was on loan at July 31, 2009.
2 Security is traded on the Toronto Stock Exchange.
3 Security is traded on the OTC Market.
4 Security is being fair valued by a valuation committee under the direction of the board of trustees.
5 Security exempt from registration under Rule 144A of the Securities Act of 1933. This security, which represents 0.11% of net assets as of July 31, 2009, is considered liquid and may be resold in transactions exempt from registration, normally to qualified institutional buyers.
6 The table below details the Portfolio's transaction activity in an affiliated issuer for the year ended July 31, 2009.
| Security description | | Value at
07/31/08 | | Purchases
during the
year ended
07/31/09 | | Sales
during the
year ended
07/31/09 | | Value at
07/31/09 | | Net income
earned from
affiliate for the
year ended
07/31/09 | |
| UBS Private Money Market Fund LLC | | $ | 1,692,918 | | | $ | 85,801,777 | | | $ | 72,437,122 | | | $ | 15,057,573 | | | $ | 37,922 | | |
OTC Over the Counter
REIT Real Estate Investment Trust
The following is a summary of the fair valuations according to the inputs used as of July 31, 2009 in valuing the Portfolio's investments:
| Measurements at 07/31/09 | |
| | | Quoted prices in
active markets for
identical investments
(Level 1)7 | | Significant other
observable inputs
(Level 2)7 | | Unobservable
inputs
(Level 3) | | Total | |
| Common stocks | | $ | 54,325,322 | | | $ | 243,208 | | | $ | — | | | $ | 54,568,530 | | |
| Repurchase agreement | | | — | | | | 1,573,000 | | | | — | | | | 1,573,000 | | |
Investment of cash collateral from
securities loaned | | | — | | | | 15,057,573 | | | | — | | | | 15,057,573 | | |
| Total | | $ | 54,325,322 | | | $ | 16,873,781 | | | $ | — | | | $ | 71,199,103 | | |
7 The Portfolio may hold securities which are periodically fair valued in accordance with the Portfolio's fair valuation policy. This may result in movements between Level 1 and Level 2 throughout the fiscal year.
See accompanying notes to financial statements.
179
UBS PACE Select Advisors Trust
UBS PACE Alternative Strategies Investments
Performance
For the 12 months ended July 31, 2009, the Portfolio's Class P shares declined 14.73% (before the deduction of the maximum UBS PACE Select program fee; after the deduction of the maximum UBS PACE Select program fee, the Portfolio declined 16.00%). In comparison, the MSCI World Free Index (net) declined 21.61%, the Barclays Capital Global Aggregate Index (formerly known as the Lehman Brothers Global Aggregate Index) returned 4.89%, the US Consumer Price Index (CPI) declined 2.10%, while the Lipper Global Flexible Portfolio Funds category posted a median decline of 10.44%. (Returns for all share classes over various time periods are also shown in the "Performance at a glance" table on page 185. Please note that the returns shown do not reflect the deduction of taxes that a shareholder would pay on Portfolio distributions or the redemption of Portfolio shares.) For a detailed commentary on the market environment in general during t he reporting period, please refer to page two.
Sub-Advisors' comments
Analytic Investors
At the beginning of the reporting period, we used a multi-strategy approach, comprised of long-short equities, long-short global index futures, long-short currencies and call options.1 As the reporting period continued, we used long-short equities and call options. Over the final three months of the reporting period, we only used long-short equities. The equity positions, index futures and currencies detracted from our portion of the Portfolio's overall performance, while the call options added value over the reporting period.
During the 12-month reporting period, our emphasis on companies with above-average earnings quality, measured through cash flow and earnings to price ratios, contributed positively to performance. Short positions in companies where there was little consensus among analysts about expected earnings—as well as those that, in our opinion, had unattractive debt-to-equity ratios—contributed positively to our portion of the Portfolio's performance. This was a result of the fact that risk-averse investors avoided buying shares in companies for which analysts did not have a great deal of consensus about expected earnings. Investors also avoided
UBS PACE Select Advisors Trust – UBS PACE Alternative Strategies Investments
Investment Sub-Advisors:
Analytic Investors, LLC ("Analytic Investors"); Wellington Management Company, LLP ("Wellington Management"); Goldman Sachs Asset Management, L.P. ("GSAM") and First Quadrant L.P. ("First Quadrant"), commencing April 8, 2009
Portfolio Managers:
Analytic Investors: Dennis Bein;
Wellington Management: Scott M. Elliott and Evan S. Grace, CFA;
GSAM: Jonathan Beinner, Thomas Kenny, James Clark and Michael Swell;
First Quadrant: Ken Ferguson, Dori Levanoni and Chuck Fannin
Objective:
Long-term capital appreciation
Investment process:
Analytic Investors primarily employs a long/short global equity strategy. This strategy is implemented by taking long and short positions of equity securities publicly traded in the United States and in foreign markets both by direct equity investment and through derivatives. Analytic Investors' strategy may also employ the use of derivatives, such as swaps, futures, non-deliverable forwards ("NDFs"), and forward contracts.
(continued on next page)
1 When a long position is taken, a security is purchased with the expectation that it will rise in value. A short position is taken when we believe, based on our research, that securities are overpriced, in hopes of making a profit when the security falls in value. When shorting an investment, we borrow the security, sell it, and then buy an equal number of shares later—hopefully at a lower price—to replace those we borrowed. A call option is a short-term contract in which the purchaser of the option, in return for a premium, has the right to buy the security underlying the option at a specified price at any time during the term of the option, or at specified times, or at the expiration of the option depending on the type of option involved.
180
UBS PACE Select Advisors Trust
UBS PACE Alternative Strategies Investments
Sub-Advisors' comments – continued
companies that were leveraged—that is, companies that had above-average levels of debt relative to equity in their capital structure.
Stock selection subtracted value over the period within our portion of the Portfolio. Positions in the energy, financials and consumer discretionary sectors performed well; however, positions in the industrial, health care and material sectors had a negative impact on performance. The top equity performers were long positions in Ford Motor Co. and Yum Brands Inc., as well as a short position in Liberty Global Inc. Long positions in Henkel AG & Co., Wm. Morrison Supermarkets PLC, and Procter & Gamble Co. detracted from relative performance within our portion of the Portfolio.
Options positions, which were held in our portion of the Portfolio through the beginning of April 2009, added 2.51% to performance in the declining equity market. Using our forecasts of market volatility, we were able to opportunistically identify and sell those call options which we believed to be overvalued. In particular, calls written on the KBW Regional Bank, as well as the Germany Blue Chip and the OMX Stockholm 30 indices added value. In addition, calls written on natural gas and oil and gas sector indices helped performance. However, calls written on the gold and silver sectors, as well as the ISE SINdex Index and the S&P 500 Index subtracted value over the 12-month period.
Our global asset allocation overlay, which was applied to the Portfolio in August and a portion of September 2008, subtracted from overall performance, with both the equity and the currency components posting losses as rising risk aversion and weakening economic activity hurt returns.
From a currency perspective, negative returns in this area were mostly due to the fact that the US dollar gained strength during the reporting period, reversing its relative weakness. Our portion of the Portfolio did not benefit from the strengthening of the US dollar. It also was not positioned to benefit from the weakening of the Australian dollar against the Canadian dollar.
Investment process (concluded)
Wellington Management pursues an "opportunistic equity plus Alpha" strategy by opportunistically seeking non-core equity exposures that Wellington Management believes are attractively valued, have positive structural characteristics in the current market environment or are expected to benefit from anticipated economic cycles. In addition, Wellington Management may employ other investment approaches, for example, by allocating assets to fixed income securities or other non-equity investments that are expected to beat their respective benchmarks over time. Wellington Management may buy and sell, directly or indirectly, listed or unlisted equity and fixed income securities issued by entities around the world, as well as derivative instruments.
GSAM seeks to employ a number of diverse strategies and seeks to allocate capital tactically to strategies it believes offer the best opportunities at a given point in time in a given market or sector. GSAM focuses mainly on the global fixed income and currency markets, across variable investment grade and sub-investment grade sectors. GSAM invests mainly in currencies, fixed income securities, and derivative investments.
First Quadrant employs a global macro strategy that seeks to add value through a disciplined, active quantitative investment process. It uses independent alpha categories (comprised of more than 20 strategies believed by First Quadrant to be uncorrelated) that span a wide variety of asset classes. The global macro strategy tactically allocates risk between these different alpha categories and attempts to take advantage of inefficiencies when there are potential opportunities for gains. Currently, First Quadrant looks at the following alpha categories: (i) global asset class selection; (ii) stock country selection; (iii) bond country selection; (iv) currency selection; and (v) volatility management. However, the number and nature of alpha categories may change over time.
181
UBS PACE Select Advisors Trust
UBS PACE Alternative Strategies Investments
Sub-Advisors' comments – continued
Wellington Management
Metals and energy-related holdings detracted from our portion of the Portfolio's absolute results during the reporting period, as commodity and energy prices declined amid slowing global economic growth. In particular, positions in Teck Resources Ltd., as well as in Alumina Limited and Eurasian Natural Resources Corp., both of which we sold during the period, performed poorly and were the largest detractors from Portfolio performance. Other significant detractors from absolute results included media audience rating services provider Arbitron Inc., as well as cable and connectivity product manufacturer Belden CTD, Inc.
Our portion of the Portfolio's holdings in Chinese equities had a positive impact on absolute returns during the 12-month period. These stocks performed well following indications that massive government stimulus spending had started to spur growth. Our consumer staples holdings, including the largest producer of baby diapers in China, Hengan International Group Co. Ltd. and holdings in the materials sector, including Angang Steel Co. Ltd., and Huabao International Holdings, Ltd., were the primary drivers of returns in these areas. At the same time, select financials, including Beijing-based China Life Insurance Co. Ltd. and property developer China Overseas Land & Investment Ltd., aided results.
Later in the reporting period, positions in outperforming Goldman Sachs Group, Inc. and Bank of America Corp. also significantly contributed to our portion of the Portfolio's absolute returns. These companies benefited from consolidation in the financial industry and having solid balance sheets relative to their peers.
GSAM
Within our portion of the Portfolio, duration and yield curve positioning were the largest positive contributors to performance. (Duration measures a portfolio's sensitivity to interest rate changes, while the yield curve plots the interest rates, at a set point in time, of bonds having equal credit quality, but differing maturity dates.) In late 2008, a long position in the two-year and 30-year portions of the European bond yield curve performed well as interest rates rallied significantly across the globe amid an extreme flight to quality. More recently, our portion of the Portfolio maintained a duration position that was shorter than that of the benchmark. This was also beneficial, as interest rates have risen in 2009 due to stimulus-related issuance and long-term inflationary concerns.
The decision to increase our portion of the Portfolio's exposure to corporate bonds during the reporting period enhanced performance. During this time, the Federal Reserve's Open Market Committee agreed to purchase $300 billion in longer-term Treasury securities over six months. Many interest rates are benchmarked to Treasuries, and the massive purchase was expected to drive these rates down and make borrowing cheaper. Corporate bond prices rallied significantly in response. Strong inflows into corporate bond mutual funds also helped spreads—that is, the difference between the yields paid on these securities versus those paid on Treasuries—to decrease. This, in turn, breathed life into the new issuance market, allowing many companies to refinance their liabilities.
We increased our portion of the Portfolio's exposure to credit-sensitive mortgages during the reporting period. However, exposure to nonagency mortgages significantly detracted from performance due to the extreme market stress of 2008. During that period, these securities suffered from deteriorating fundamentals, such as continued declines in home prices, rising delinquencies and default rates. In our view, this created an opportunity, as we believed securities in this sector were attractively priced, even under extremely conservative default and recovery assumptions. Therefore, we increased the allocation to nonagency mortgages, which proved to be beneficial in recent months as the supply and demand outlook improved.
182
UBS PACE Select Advisors Trust
UBS PACE Alternative Strategies Investments
Sub-Advisors' comments – concluded
Elsewhere, our portion of the Portfolio's long positions in agency mortgage-backed securities and asset-backed securities detracted from performance. These sectors underperformed during the final months of 2008 as all spread sectors—that is, all non-Treasury investment grade sectors, including federal agency securities, corporate bonds, asset-backed securities, mortgage-backed securities and commercial mortgage-backed securities—underperformed their Treasury counterparts. However, these sectors have since performed well as investors' risk appetite has returned.
First Quadrant
We managed a portion of the Portfolio from April 8, 2009 through July 31, 2009. During that time, from an asset allocation perspective, our portion of the Portfolio benefited as global stocks rose and bonds slumped, particularly in April and May of 2009. In terms of country allocation within equities, over the entire period, our positions in Japan and Australia benefited performance. However, losses from positions in the United Kingdom and Spain offset those gains, and country allocation was negative for performance within our portion of the Portfolio.
In terms of country allocation within fixed income, our portion of the Portfolio ended the period on a positive note, with strong performance in July 2009. Profitable investments included positions in German, Canadian and Japanese bonds, while positions in the US and Australia detracted from performance.
Currency positioning within our portion of the Portfolio delivered mixed results, with detracting positions in the US dollar and the British pound offsetting gains from positions in the New Zealand and Australian dollars as well as the Swiss franc.
From a volatility management perspective, our portion of the Portfolio struggled, especially during May 2009. During that time, asset prices trended strongly upward, and positions that were taken with the expectation that market volatility would remain high suffered when the overall levels of expected volatility dropped, which hurt performance.
Special considerations
The Portfolio may be appropriate for investors seeking long term capital appreciation who are able to withstand short-term fluctuations in the equity markets and fixed income markets in return for potentially higher returns over the long-term. The Portfolio may employ investment strategies that involve greater risks than the strategies used by many other mutual funds, including increased use of short sales (which involve the risk of an unlimited increase in the market value of the security sold short, which could result in a theoretically unlimited loss), leverage and derivative transactions, and hedging strategies. The value of the Portfolio changes every day and can be affected by changes in interest rates, general market conditions and other political, social and economic developments, as well as specific matters relating to the issuers of securities in which the Portfolio invests. The value of the Portfolio's investments in foreign securities may fall due to adverse political, social and economic developments abroad and due to decreases in foreign currency values relative to the US dollar. It is important to note that an investment in the Portfolio is only one component of a balanced investment plan.
183
UBS PACE Select Advisors Trust
UBS PACE Alternative Strategies Investments
Comparison of change in value of a $10,000 investment in the Class P shares of the Portfolio, the MSCI World Free Index (net), the Barclays Capital Global Aggregate Index and the US Consumer Price Index (CPI) (unaudited)
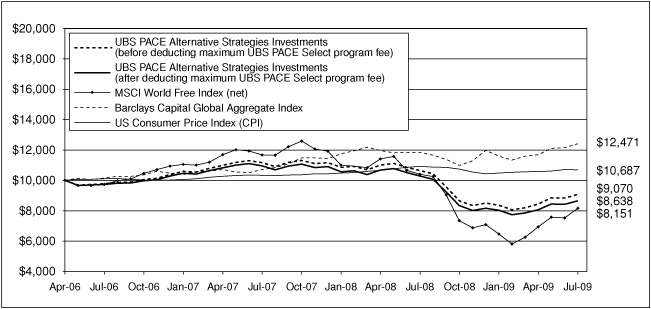
The graph depicts the performance of UBS PACE Alternative Strategies Investments Class P shares versus the MSCI World Free Index (net), the Barclays Capital Global Aggregate Index and the US Consumer Price Index (CPI) from April 30, 2006, the month-end after the inception date of the Class P shares, through July 31, 2009. The performance of the other classes will vary from the performance of the class shown based on the difference in sales charges and fees paid by shareholders investing in different share classes. Past performance does not predict future performance and the performance provided does not reflect the deduction of taxes that a shareholder would pay on Portfolio distributions or the redemption of Portfolio shares. It is important to note that UBS PACE Alternative Strategies Investments is a professionally managed portfolio while the Indices are not available for investment and are unmanaged. The comparison is shown for illustrative purposes only.
184
UBS PACE Select Advisors Trust
UBS PACE Alternative Strategies Investments
Performance at a glance (unaudited)
| Average annual total returns for periods ended 07/31/09 | | | | 1 year | | Since
inception1 | |
| Before deducting | | Class A2 | | | (14.95 | )% | | | (2.65 | )% | |
| maximum sales charge | | Class B3 | | | (15.54 | )% | | | (2.95 | )% | |
| or UBS PACE Select | | Class C4 | | | (15.61 | )% | | | (3.27 | )% | |
| program fee | | Class Y5 | | | (14.81 | )% | | | (14.56 | )% | |
| | | Class P6 | | | (14.73 | )% | | | (2.41 | )% | |
| After deducting | | Class A2 | | | (19.63 | )% | | | (4.30 | )% | |
| maximum sales charge | | Class B3 | | | (19.71 | )% | | | (3.54 | )% | |
| or UBS PACE Select | | Class C4 | | | (16.44 | )% | | | (3.27 | )% | |
| program fee | | Class P6 | | | (16.00 | )% | | | (3.87 | )% | |
| MSCI World Free Index (net)7 | | | | | (21.61 | )% | | | (6.10 | )% | |
| Barclays Capital Global Aggregate Index8 | | | | | 4.89 | % | | | 7.03 | % | |
| US Consumer Price Index (CPI)9 | | | | | (2.10 | )% | | | 2.07 | % | |
| Lipper Global Flexible Portfolio Funds median | | | | | (10.44 | )% | | | (1.98 | )% | |
Average annual total returns for periods ended June 30, 2009, after deduction of the maximum sales charge or UBS PACE Select program fee, were as follows: Class A—1-year period, (23.44)%; since inception, (5.26)%; Class B—1-year period, (23.56)%; since inception, (4.50)%: Class C—1-year period, (20.45)%; since inception, (4.20)%; Class Y—since inception, (17.31)%; Class P—1-year period, (20.05)%; since inception, (4.78)%. Please note that the since inception return for the Class Y shares has not been annualized.
The annualized gross and net expense ratios, respectively, for each class of shares as in the November 28, 2008 prospectuses, were as follows: Class A—2.42% and 2.41%; Class B—4.51% and 3.16%; Class C—3.16% and 3.16%; Class Y—2.69% and 2.16%; and Class P—2.13% and 2.13%. Net expenses reflect fee waivers and/or expense reimbursements, if any, pursuant to an agreement that is in effect to cap the expenses. The Portfolio and UBS Global AM have entered into a written fee waiver/expense reimbursement agreement pursuant to which UBS Global AM is contractually obligated to waive its management fees and/or reimburse the Portfolio so that the ordinary total operating expenses of each class through November 30, 2009 (excluding dividend expense, borrowing costs and interest expense, if any) would not exceed Class A—1.95%; Class B—2.70%; Class C—2.70%; Class Y—1.70% and Class P—1.70%. The Po rtfolio has agreed to repay UBS Global AM for any waived fees/reimbursed expenses to the extent that it can do so over the following three fiscal years without causing the Portfolio's expenses in any of those three years to exceed the expense caps described above.
1 Since inception returns are calculated as of commencement of issuance on April 10, 2006 for Class P and A shares, May 19, 2006 for Class B shares, April 11, 2006 for Class C shares. Class Y shares commenced issuance on April 3, 2006, and had fully redeemed by July 26, 2006 remaining inactive through July 22, 2008. The inception return of Class Y shares is calculated from July 23, 2008, which is the date the Class Y shares recommenced investment operations. Since inception returns for the Indices and Lipper median are shown as of April 30, 2006, which is the month-end after the inception date of the oldest share classes (Class P and Class A).
2 Maximum sales charge for Class A shares is 5.5%. Class A shares bear ongoing 12b-1 service fees.
3 Maximum contingent deferred sales charge for Class B shares is 5% imposed on redemptions and is reduced to 0% after a maximum of six years. Class B shares bear ongoing 12b-1 service and distribution fees.
4 Maximum contingent deferred sales charge for Class C shares is 1% imposed on redemptions and is reduced to 0% after one year. Class C shares bear ongoing 12b-1 service and distribution fees.
5 The Portfolio offers Class Y shares to a limited group of eligible investors, including certain qualifying retirement plans. Class Y shares do not bear initial or contingent deferred sales charges or ongoing 12b-1 service and distribution fees.
6 Class P shares do not bear initial or contingent deferred sales charges or ongoing 12b-1 service and distribution fees, but are subject to a maximum annual UBS PACE Select program fee of 1.5% of the value of Class P shares.
7 The MSCI World Free Index (net) is a free float-adjusted market capitalization weighted index that is designed to measure the equity market performance of developed markets. As of June 2007, the Index consisted of 23 developed market country indices. Dividends are reinvested after deduction of withholding tax, using tax rates applicable to Luxembourg holding companies, as Luxembourg applies the highest rates. The Index excludes closed markets and those shares in otherwise free markets that are not purchasable by foreigners. Investors should note that indices do not reflect the deduction of fees and expenses.
8 The Barclays Capital Global Aggregate Index (formerly known as the Lehman Brothers Global Aggregate Index) is a broad-based, market capitalization-weighted index which measures the broad global markets for US and non-US corporate, government, governmental agency, supranational, mortgage-backed and asset-backed fixed income securities. Investors should note that indices do not reflect the deduction of fees, expenses or taxes.
9 The US Consumer Price Index (CPI) produces monthly data on changes in the prices paid by urban consumers for a representative basket of goods and services. The Index is calculated by the Bureau of Labor Statistics. Investors should note that indices do not reflect the deduction of fees, expenses or taxes.
If an investor sells or exchanges shares less than 90 days after purchase, a redemption fee of 1.00% of the amount sold or exchanged will be deducted at the time of the transaction, except as noted otherwise in the prospectuses.
Past performance does not predict future performance, and the performance information provided does not reflect the deduction of taxes that a shareholder would pay on Portfolio distributions or the redemption of Portfolio shares. The return and principal value of an investment will fluctuate, so that an investor's shares, when redeemed, may be worth more or less than their original cost. Performance results assume reinvestment of all dividends and capital gain distributions at net asset value on the ex-dividend dates. Total returns for the period of less than one year have not been annualized. Current performance may be higher or lower than the performance data quoted. For month-end performance figures, please visit http://www.ubs.com.
Lipper peer group data calculated by Lipper Inc.; used with permission. The Lipper median is the return of the fund that places in the middle of a Lipper peer group.
185
UBS PACE Select Advisors Trust
UBS PACE Alternative Strategies Investments
Portfolio statistics (unaudited)
| Characteristics | | 07/31/09 | |
| Net assets (mm) | | $ | 442.1 | | |
| Number of holdings | | | 710 | | |
| Portfolio composition1 | | 07/31/09 | |
| Common and preferred stocks | | | 33.4 | % | |
| Bonds and notes | | | 29.5 | | |
| ADRs and GDRs | | | 1.9 | | |
| Investment companies | | | 0.8 | | |
| Unit trusts | | | 0.2 | | |
| Investments sold short | | | (4.8 | ) | |
| Options, futures, swaps and forward foreign currency contracts | | | (1.1 | ) | |
| Cash equivalents and other assets less liabilities | | | 40.1 | | |
| Total | | | 100.0 | % | |
| Top five countries (long holdings)1 | | 07/31/09 | |
| United States | | | 40.9 | % | |
| Canada | | | 3.2 | | |
| China | | | 2.8 | | |
| Japan | | | 2.7 | | |
| Australia | | | 2.2 | | |
| Total | | | 51.8 | % | |
| Top five equity sectors (long holdings)1 | | 07/31/09 | |
| Information technology | | | 5.8 | % | |
| Financials | | | 5.6 | | |
| Materials | | | 5.5 | | |
| Industrials | | | 4.3 | | |
| Consumer discretionary | | | 3.8 | | |
| Total | | | 25.0 | % | |
| Top five countries (short holdings)1 | | 07/31/09 | |
| United States | | | (2.2 | )% | |
| Japan | | | (1.0 | ) | |
| Canada | | | (0.5 | ) | |
| Netherlands | | | (0.3 | ) | |
| Germany | | | (0.3 | ) | |
| Total | | | (4.3 | )% | |
| Top five equity sectors (short holdings)1 | | 07/31/09 | |
| Industrials | | | (1.0 | )% | |
| Health care | | | (0.9 | ) | |
| Information technology | | | (0.6 | ) | |
| Consumer discretionary | | | (0.5 | ) | |
| Financials | | | (0.5 | ) | |
| Total | | | (3.5 | )% | |
1 Weightings represent percentages of the Portfolio's net assets as of July 31, 2009. The Portfolio is actively managed and its composition will vary over time.
ADR American Depositary Receipt
GDR Global Depositary Receipt
186
UBS PACE Select Advisors Trust
UBS PACE Alternative Strategies Investments
Portfolio statistics (unaudited) (concluded)
| Top ten equity holdings (long holdings)1 | | 07/31/09 | |
| Apple, Inc. | | | 0.6 | % | |
| Ford Motor Co. | | | 0.6 | | |
| Goldcorp., Inc. | | | 0.5 | | |
| Fluor Corp. | | | 0.4 | | |
| Google, Inc. | | | 0.4 | | |
| China Moblie Ltd., ADR | | | 0.4 | | |
| Seagate Technology | | | 0.4 | | |
| Freeport-McMoRan Copper & Gold, Inc. | | | 0.4 | | |
| General Dynamics, Inc. | | | 0.4 | | |
| Amazon.com, Inc. | | | 0.3 | | |
| Total | | | 4.4 | % | |
| Top ten equity holdings (short holdings)1 | | 07/31/09 | |
| ASML Holding N.V. | | | (0.3 | )% | |
| Celgene Corp. | | | (0.2 | ) | |
| SBA Communications Corp. | | | (0.2 | ) | |
| Vertex Pharmaceuticals, Inc. | | | (0.2 | ) | |
| George Weston Ltd. | | | (0.2 | ) | |
| Plains Exploration & Production Co. | | | (0.2 | ) | |
| Caterpillar, Inc. | | | (0.2 | ) | |
| Bayerische Motoren Werke (BMW) AG | | | (0.1 | ) | |
| Hokuriku Electric Power Co. | | | (0.1 | ) | |
| Gerdau Ameristeel Corp. | | | (0.1 | ) | |
| Total | | | (1.8 | )% | |
Top ten long-term fixed income holdings
(long holdings)1 | | 07/31/09 | |
| FNMA, 5.000%, due 06/01/23 | | | 1.3 | % | |
US Treaury Inflation Index Notes (TIPS),
0.875%, due 04/15/10 | | | 1.2 | | |
| FFCB, 4.500%, due 05/21/15 | | | 1.1 | | |
Societe Financement de l'Economie Francaise,
1.500%, due 10/29/10 | | | 1.0 | | |
| FNMA, 5.000%, due 12/01/18 | | | 0.9 | | |
| FNMA, 2.000%, due 04/01/11 | | | 0.9 | | |
| FNMA, 4.241%, due 04/01/37 | | | 0.7 | | |
| US Treasury Principal Strip, 6.500%, due 11/15/26 | | | 0.7 | | |
| FNMA, 5.000%, due 12/01/19 | | | 0.7 | | |
| Suncorp-Metway Ltd., 1.759%, due 04/15/11 | | | 0.6 | | |
| Total | | | 9.1 | % | |
1 Weightings represent percentages of the Portfolio's net assets as of July 31, 2009. The Portfolio is actively managed and its composition will vary over time.
187
UBS PACE Select Advisors Trust
UBS PACE Alternative Strategies Investments
Industry diversification—(unaudited)
As a percentage of net assets as of July 31, 2009
Common stocks
| Aerospace & defense | | | 0.65 | % | |
| Air freight & logistics | | | 0.25 | | |
| Airlines | | | 0.06 | | |
| Auto components | | | 0.05 | | |
| Automobiles | | | 0.58 | | |
| Beverages | | | 0.01 | | |
| Biotechnology | | | 0.51 | | |
| Capital markets | | | 0.75 | | |
| Chemicals | | | 0.94 | | |
| Commercial banks | | | 2.18 | | |
| Commercial services & supplies | | | 0.26 | | |
| Communications equipment | | | 0.53 | | |
| Computers & peripherals | | | 1.63 | | |
| Construction & engineering | | | 0.84 | | |
| Construction materials | | | 0.10 | | |
| Containers & packaging | | | 0.07 | | |
| Distributors | | | 0.05 | | |
| Diversified consumer services | | | 0.02 | | |
| Diversified financial services | | | 0.81 | | |
| Diversified telecommunication services | | | 0.68 | | |
| Electric utilities | | | 0.94 | | |
| Electrical equipment | | | 0.67 | | |
| Electronic equipment, instruments & components | | | 0.27 | | |
| Energy equipment & services | | | 0.45 | | |
| Food & staples retailing | | | 0.87 | | |
| Food products | | | 1.01 | | |
| Gas utilities | | | 0.06 | | |
| Health care equipment & supplies | | | 0.83 | | |
| Health care providers & services | | | 0.04 | | |
| Hotels, restaurants & leisure | | | 0.77 | | |
| Household durables | | | 0.16 | | |
| Independent power producers & energy traders | | | 0.18 | | |
| Industrial conglomerates | | | 0.56 | | |
| Insurance | | | 1.03 | | |
| Internet & catalog retail | | | 0.57 | | |
| Internet software & services | | | 1.28 | | |
| IT services | | | 0.45 | | |
| Leisure equipment & products | | | 0.16 | | |
| Life sciences tools & services | | | 0.11 | | |
| Machinery | | | 0.45 | | |
| Media | | | 0.92 | | |
| Metals & mining | | | 4.29 | | |
| Multiline retail | | | 0.05 | | |
| Multi-utilities | | | 0.09 | | |
| Office electronics | | | 0.02 | | |
| Oil, gas & consumable fuels | | | 2.24 | | |
| Common stocks—(concluded) | |
| Paper & forest products | | | 0.06 | % | |
| Personal products | | | 0.40 | | |
| Pharmaceuticals | | | 1.01 | | |
| Professional services | | | 0.28 | | |
| Real estate investment trusts (REITs) | | | 0.25 | | |
| Real estate management & development | | | 0.53 | | |
| Road & rail | | | 0.11 | | |
| Semiconductors & semiconductor equipment | | | 0.81 | | |
| Software | | | 0.77 | | |
| Specialty retail | | | 0.36 | | |
| Textiles, apparel & luxury goods | | | 0.09 | | |
| Tobacco | | | 0.15 | | |
| Trading companies & distributors | | | 0.10 | | |
| Transportation infrastructure | | | 0.01 | | |
| Water utilities | | | 0.05 | | |
| Wireless telecommunication services | | | 0.88 | | |
| Total common stocks | | | 35.30 | | |
| Preferred stock | |
| Telecommunication services | | | 0.01 | | |
| Investment companies | | | 0.84 | | |
| Unit trusts | | | 0.20 | | |
| US government obligations | | | 3.46 | | |
| Federal farm credit bank certificates | | | 1.12 | | |
| Federal home loan mortgage corporation certificates | | | 0.41 | | |
| Federal national mortgage association certificates | | | 7.47 | | |
| Collateralized mortgage obligations | | | 6.61 | | |
| Asset-backed securities | | | 1.27 | | |
| Corporate notes | |
| Appliances | | | 0.04 | | |
| Banking-non US | | | 1.72 | | |
| Banking-US | | | 0.50 | | |
| Cable | | | 0.46 | | |
| Chemicals | | | 0.09 | | |
| Containers | | | 0.07 | | |
| Defense/aerospace | | | 0.06 | | |
| Diversified financials | | | 0.15 | | |
| Electric-integrated | | | 0.50 | | |
| Electronics | | | 0.09 | | |
| Finance-leasing company | | | 0.16 | | |
188
UBS PACE Select Advisors Trust
UBS PACE Alternative Strategies Investments
Industry diversification—(unaudited)
As a percentage of net assets as of July 31, 2009
| Corporate notes—(concluded) | |
| Financial services | | | 1.01 | % | |
| Food processors/beverage/bottling | | | 0.14 | | |
| Gaming | | | 0.04 | | |
| Industrial products & services | | | 0.02 | | |
| Insurance | | | 0.13 | | |
| Media | | | 0.11 | | |
| Medical products | | | 0.06 | | |
| Metals | | | 0.03 | | |
| Multi-line insurance | | | 0.02 | | |
| Oil & gas | | | 0.75 | | |
| Pipelines | | | 0.30 | | |
| Publishing | | | 0.08 | | |
| Real estate | | | 0.15 | | |
| Reinsurance | | | 0.02 | | |
| Retail-restaurants | | | 0.05 | | |
| Special purpose banks | | | 1.02 | | |
| Special purpose entity | | | 0.14 | | |
| Steel | | | 0.13 | | |
| Telecommunication services | | | 0.06 | | |
| Telephone-integrated | | | 0.39 | | |
| Tobacco | | | 0.18 | | |
| Wireless telecommunication services | | | 0.12 | | |
| Total corporate notes | | | 8.79 | | |
| Municipal bonds and notes | | | 0.09 | | |
| Non-US government obligations | | | 0.31 | | |
| Time deposit | | | 2.18 | | |
| Short-term US government obligations | | | 17.34 | | |
| Repurchase agreement | | | 13.11 | | |
| Options | |
| Call options purchased | | | 0.05 | | |
| Put options purchased | | | 0.00 | * | |
| Total options | | | 0.05 | | |
| Total investments before securities sold short | | | 98.56 | | |
| Investments sold short | |
| Common stocks | |
| Automobiles | | | (0.21 | ) | |
| Beverages | | | (0.08 | ) | |
| Biotechnology | | | (0.58 | ) | |
* Amount represents less than 0.005% of net assets.
| Investments sold short—(concluded) | |
| Common stocks—(concluded) | |
| Building products | | | (0.02 | )% | |
| Capital markets | | | (0.01 | ) | |
| Chemicals | | | (0.06 | ) | |
| Commercial services & supplies | | | (0.17 | ) | |
| Computers & peripherals | | | (0.02 | ) | |
| Construction & engineering | | | (0.04 | ) | |
| Electric utilities | | | (0.19 | ) | |
| Electrical equipment | | | (0.07 | ) | |
| Electronic equipment, instruments & components | | | (0.05 | ) | |
| Food & staples retailing | | | (0.26 | ) | |
| Food products | | | (0.02 | ) | |
| Health care equipment & supplies | | | (0.14 | ) | |
| Household durables | | | (0.10 | ) | |
| Independent power producers & energy traders | | | (0.09 | ) | |
| Industrial conglomerates | | | (0.01 | ) | |
| Insurance | | | (0.27 | ) | |
| Internet software & services | | | (0.14 | ) | |
| Life sciences tools & services | | | (0.16 | ) | |
| Machinery | | | (0.34 | ) | |
| Marine | | | (0.06 | ) | |
| Media | | | (0.17 | ) | |
| Metals & mining | | | (0.18 | ) | |
| Oil, gas & consumable fuels | | | (0.24 | ) | |
| Pharmaceuticals | | | (0.01 | ) | |
| Professional services | | | (0.13 | ) | |
| Real estate investment trusts (REITs) | | | (0.19 | ) | |
| Road & rail | | | (0.10 | ) | |
| Semiconductors & semiconductor equipment | | | (0.27 | ) | |
| Software | | | (0.10 | ) | |
| Trading companies & distributors | | | (0.03 | ) | |
| Wireless telecommunication services | | | (0.24 | ) | |
| Total common stocks | | | (4.75 | ) | |
| Unit trust | | | (0.02 | ) | |
| Total investments sold short | | | (4.77 | ) | |
| Other assets in excess of liabilities | | | 6.21 | | |
| Net assets | | | 100.00 | % | |
189
UBS PACE Select Advisors Trust
UBS PACE Alternative Strategies Investments
Portfolio of investments—July 31, 2009
| Security description | | Number of
shares | | Value | |
| Common stocks—35.30% | |
| Antigua and Barbuda—0.01% | |
| Sinovac Biotech Ltd.* | | | 8,700 | | | $ | 40,716 | | |
| Australia—1.33% | |
| ABB Grain Ltd. | | | 11,302 | | | | 84,221 | | |
| Bendigo and Adelaide Bank Ltd. | | | 20,708 | | | | 142,017 | | |
| BHP Billiton Ltd. | | | 39,740 | | | | 1,258,003 | | |
| BHP Billiton Ltd., ADR | | | 20,800 | | | | 1,309,568 | | |
| CSL Ltd. | | | 13,022 | | | | 332,718 | | |
Energy Resources of
Australia Ltd. | | | 29,723 | | | | 628,928 | | |
| Fortescue Metals Group Ltd.* | | | 151,202 | | | | 533,652 | | |
| Incitec Pivot Ltd. | | | 52,966 | | | | 122,263 | | |
| Orica Ltd. | | | 30,532 | | | | 573,526 | | |
| Paladin Resources Ltd.* | | | 99,345 | | | | 378,878 | | |
| Rio Tinto Ltd. | | | 4,080 | | | | 206,103 | | |
| Wesfarmers Ltd. | | | 15,225 | | | | 329,032 | | |
| Total Australia common stocks | | | | | | | 5,898,909 | | |
| Austria—0.17% | |
Oesterreichische
Elektrizitaetswirtschafts-AG
(Verbund), Class A | | | 12,234 | | | | 596,175 | | |
| OMV AG | | | 4,144 | | | | 164,494 | | |
| Total Austria common stocks | | | | | | | 760,669 | | |
| Belgium—0.05% | |
| Fortis* | | | 53,805 | | | | 209,359 | | |
| Bermuda—0.25% | |
| Bunge Ltd. | | | 4,024 | | | | 281,559 | | |
| China Yurun Food Group Ltd. | | | 20,089 | | | | 31,779 | | |
Huabao International
Holdings Ltd. | | | 263,000 | | | | 277,591 | | |
| Shangri-La Asia Ltd. | | | 223,603 | | | | 354,877 | | |
| Sinofert Holdings Ltd. | | | 294,000 | | | | 160,846 | | |
| Total Bermuda common stocks | | | | | | | 1,106,652 | | |
| Brazil—0.75% | |
| All America Latina Logistica (ALL) | | | 7,200 | | | | 45,459 | | |
| BM&F BOVESPA SA | | | 6,787 | | | | 43,870 | | |
| Brasil Foods SA | | | 7,157 | | | | 158,810 | | |
Companhia Brasileira de
Distribuicao Grupo Pao de
Acucar, ADR | | | 792 | | | | 37,066 | | |
Companhia de Saneamento de
Minas Gerais-Copasa MG | | | 15,900 | | | | 215,182 | | |
Companhia Energetica de Minas
Gerais-CEMIG, ADR | | | 10,400 | | | | 148,512 | | |
| Cosan SA Industria e Comercio* | | | 10,000 | | | | 91,170 | | |
| Cyrela Brazil Realty SA | | | 4,512 | | | | 46,553 | | |
| Gerdau SA, ADR | | | 85,500 | | | | 997,785 | | |
Itau Unibanco Banco
Multiplo SA, ADR | | | 60,897 | | | | 1,089,447 | | |
Marfrig Frigorificos e Comercio de
Alimentos SA* | | | 4,803 | | | | 40,700 | | |
| Security description | | Number of
shares | | Value | |
| Common stocks—(continued) | |
| Brazil—(concluded) | |
| Petroleo Brasileiro SA, ADR | | | 2,702 | | | $ | 111,431 | | |
| SLC Agricola SA | | | 16,273 | | | | 155,687 | | |
| Tam SA, ADR* | | | 2,728 | | | | 33,527 | | |
| Vale SA, ADR | | | 4,069 | | | | 80,281 | | |
| Weg SA | | | 2,400 | | | | 19,424 | | |
| Total Brazil common stocks | | | | | | | 3,314,904 | | |
| Canada—2.51% | |
| Agnico-Eagle Mines Ltd. | | | 24,600 | | | | 1,440,330 | | |
| Agrium, Inc1 | | | 1,706 | | | | 78,800 | | |
| Agrium, Inc.2 | | | 1,400 | | | | 64,343 | | |
| Barrick Gold Corp. | | | 31,470 | | | | 1,098,400 | | |
Brookfield Asset
Management, Inc. | | | 3,600 | | | | 75,744 | | |
| Cameco Corp. | | | 2,000 | | | | 55,300 | | |
Canadian Imperial Bank of
Commerce | | | 2,000 | | | | 123,110 | | |
| Canadian Natural Resources Ltd. | | | 14,900 | | | | 895,729 | | |
| Enerplus Resources Fund | | | 1,500 | | | | 32,708 | | |
| Goldcorp, Inc. | | | 61,500 | | | | 2,324,887 | | |
| Kinross Gold Corp. | | | 50,100 | | | | 983,964 | | |
| Manitoba Telecom Services, Inc. | | | 4,200 | | | | 134,899 | | |
Potash Corp. of
Saskatchewan, Inc. | | | 3,000 | | | | 279,489 | | |
| Precision Drilling Trust | | | 16,800 | | | | 95,287 | | |
| Research In Motion Ltd. (RIM)* | | | 9,800 | | | | 744,336 | | |
| Shoppers Drug Mart Corp. | | | 10,700 | | | | 447,071 | | |
| Suncor Energy, Inc. | | | 14,900 | | | | 483,952 | | |
| Teck Cominco Ltd., Class B* | | | 1,380 | | | | 36,318 | | |
| Telus Corp. | | | 34,900 | | | | 1,007,556 | | |
| TransAlta Corp. | | | 16,200 | | | | 322,722 | | |
| Ultra Petroleum Corp.* | | | 1,842 | | | | 81,269 | | |
| Uranium One, Inc.* | | | 108,160 | | | | 289,163 | | |
| Total Canada common stocks | | | | | | | 11,095,377 | | |
| Cayman Islands—1.32% | |
| Alibaba.com Ltd.* | | | 180,500 | | | | 414,565 | | |
| Baidu, Inc., ADR* | | | 1,400 | | | | 487,396 | | |
Chaoda Modern Agriculture
(Holdings) Ltd. | | | 88,960 | | | | 60,722 | | |
| China Dongxiang Group Co. | | | 8,000 | | | | 6,080 | | |
China High Speed Transmission
Equipment Group Co. Ltd. | | | 15,538 | | | | 38,935 | | |
| China Mengniu Dairy Co. Ltd.* | | | 10,000 | | | | 23,948 | | |
Ctrip.com International
Ltd., ADR* | | | 7,060 | | | | 361,825 | | |
Daphne International
Holdings Ltd. | | | 68,000 | | | | 46,152 | | |
| Golden Meditech Co. Ltd.* | | | 381,332 | | | | 71,838 | | |
Hengan International
Group Co. Ltd. | | | 124,000 | | | | 721,595 | | |
Lee & Man Paper
Manufacturing Ltd. | | | 56,837 | | | | 89,325 | | |
| NetEase.com, Inc., ADR* | | | 850 | | | | 37,451 | | |
190
UBS PACE Select Advisors Trust
UBS PACE Alternative Strategies Investments
Portfolio of investments—July 31, 2009
| Security description | | Number of
shares | | Value | |
| Common stocks—(continued) | |
| Cayman Islands—(concluded) | |
| Seagate Technology3 | | | 136,200 | | | $ | 1,639,848 | | |
| Tencent Holdings Ltd. | | | 66,600 | | | | 899,739 | | |
Tingyi (Cayman Islands)
Holding Corp. | | | 250,000 | | | | 463,223 | | |
| Want Want China Holdings Ltd. | | | 597,000 | | | | 356,657 | | |
Yingli Green Energy Holding Co.
Ltd., ADR* | | | 9,000 | | | | 119,430 | | |
Total Cayman Islands
common stocks | | | | | | | 5,838,729 | | |
| China—2.76% | |
| Air China Ltd., Class H* | | | 322,000 | | | | 208,572 | | |
| Angang Steel Co. Ltd., Class H | | | 182,000 | | | | 412,844 | | |
Anhui Conch Cement Co. Ltd.,
Class H | | | 58,000 | | | | 422,462 | | |
| Bank of China Ltd., Class H | | | 2,886,000 | | | | 1,437,405 | | |
China Communications
Construction Co. Ltd., Class H | | | 168,000 | | | | 218,073 | | |
China Construction Bank Corp.,
Class H | | | 1,436,119 | | | | 1,158,153 | | |
China Life Insurance Co.,
Class H | | | 256,023 | | | | 1,136,404 | | |
China Life Insurance Co.
Ltd. ADR | | | 11,100 | | | | 738,816 | | |
China Merchants Bank Co. Ltd.,
Class H | | | 528,000 | | | | 1,242,666 | | |
China Oilfield Services Ltd.,
Class H | | | 86,000 | | | | 93,878 | | |
China Railway Construction Corp.
Ltd., Class H | | | 11,287 | | | | 18,117 | | |
China Railway Group Ltd.,
Class H* | | | 1,059,000 | | | | 953,777 | | |
China Shenhua Energy Co. Ltd.,
Class H | | | 129,468 | | | | 532,068 | | |
China South Locomotive and
Rolling Stock Corp. Ltd.,
Series H | | | 797,000 | | | | 497,736 | | |
China Telecom Corp. Ltd.,
Class H | | | 596,000 | | | | 312,225 | | |
Datang International Power
Generation Co. Ltd., Class H | | | 302,000 | | | | 198,345 | | |
Industrial & Commercial Bank of
China, Class H | | | 1,305,460 | | | | 939,925 | | |
| PetroChina Co. Ltd., ADR | | | 312 | | | | 36,738 | | |
| PetroChina Co. Ltd., Class H | | | 354,000 | | | | 421,600 | | |
Shandong Weigao Group Medical
Polymer Co. Ltd., Class H | | | 116,000 | | | | 303,843 | | |
Shanghai Electric Group Co. Ltd.,
Class H | | | 414,000 | | | | 217,415 | | |
| Weichai Power Co. Ltd., Class H | | | 33,842 | | | | 153,926 | | |
| Zijin Mining Group Co. Ltd. | | | 52,000 | | | | 48,712 | | |
| ZTE Corp., Class H | | | 113,600 | | | | 497,638 | | |
| Total China common stocks | | | | | | | 12,201,338 | | |
| Security description | | Number of
shares | | Value | |
| Common stocks—(continued) | |
| Denmark—0.16% | |
| Novo Nordisk A/S, Class B | | | 6,584 | | | $ | 387,502 | | |
| Vestas Wind Systems A/S* | | | 4,360 | | | | 307,095 | | |
| Total Denmark common stocks | | | | | | | 694,597 | | |
| Egypt—0.03% | |
Egyptian Financial Group-Hermes
Holding | | | 10,296 | | | | 46,933 | | |
Orascom Construction
Industries (OCI) | | | 1,738 | | | | 66,723 | | |
Orascom Telecom Holding
SAE, GDR* | | | 739 | | | | 25,569 | | |
| Total Egypt common stocks | | | | | | | 139,225 | | |
| Finland—0.08% | |
| Fortum Oyj | | | 9,127 | | | | 211,392 | | |
| Orion Oyj, Class B | | | 7,346 | | | | 128,784 | | |
| Total Finland common stocks | | | | | | | 340,176 | | |
| France—0.52% | |
| Alstom SA | | | 6,827 | | | | 468,719 | | |
| Danone SA | | | 874 | | | | 46,895 | | |
| GDF Suez | | | 2,856 | | | | 109,114 | | |
| Gecina SA | | | 2,848 | | | | 234,462 | | |
| L'Oreal SA | | | 12,131 | | | | 1,051,424 | | |
| PagesJaunes Groupe | | | 33,474 | | | | 361,168 | | |
| Suez Environnement SA | | | 2,015 | | | | 38,398 | | |
| Total SA | | | 13 | | | | 721 | | |
| Total France common stocks | | | | | | | 2,310,901 | | |
| Germany—0.48% | |
| Deutsche Bank AG | | | 909 | | | | 58,807 | | |
| Deutsche Post AG | | | 25,496 | | | | 403,549 | | |
| E.ON AG | | | 34,741 | | | | 1,315,153 | | |
| K+S AG | | | 2,191 | | | | 122,977 | | |
| Q-Cells SE* | | | 1,808 | | | | 32,547 | | |
| Siemens AG | | | 1,126 | | | | 89,874 | | |
| SMA Solar Technology AG | | | 1,149 | | | | 91,890 | | |
| Total Germany common stocks | | | | | | | 2,114,797 | | |
| Hong Kong—1.83% | |
| Beijing Enterprises Holdings Ltd. | | | 189,000 | | | | 953,529 | | |
| China Mobile Ltd. | | | 102,500 | | | | 1,079,219 | | |
| China Mobile Ltd. ADR | | | 33,739 | | | | 1,770,285 | | |
China Overseas Land &
Investment Ltd. | | | 592,792 | | | | 1,459,406 | | |
| China Resources Enterprise Ltd. | | | 90,000 | | | | 226,683 | | |
China Resources Power Holdings
Co. Ltd. | | | 68,000 | | | | 175,922 | | |
| CNOOC Ltd. | | | 611,000 | | | | 823,071 | | |
| CNOOC Ltd., ADR | | | 298 | | | | 39,732 | | |
Galaxy Entertainment
Group Ltd.* | | | 82,000 | | | | 24,970 | | |
Henderson Land Development
Co. Ltd. | | | 43,000 | | | | 284,908 | | |
191
UBS PACE Select Advisors Trust
UBS PACE Alternative Strategies Investments
Portfolio of investments—July 31, 2009
| Security description | | Number of
shares | | Value | |
| Common stocks—(continued) | |
| Hong Kong—(concluded) | |
Hong Kong Exchanges &
Clearing Ltd. | | | 32,000 | | | $ | 602,422 | | |
| MTR Corp. | | | 124,000 | | | | 449,597 | | |
| Sino-Ocean Land Holdings Ltd. | | | 174,833 | | | | 186,111 | | |
| Total Hong Kong common stocks | | | | | | | 8,075,855 | | |
| India—0.08% | |
| Bharti Airtel Ltd. | | | 3,842 | | | | 32,931 | | |
| Educomp Solutions Ltd.* | | | 779 | | | | 66,349 | | |
| Glenmark Pharmaceuticals Ltd.* | | | 5,062 | | | | 26,392 | | |
| ICICI Bank Ltd., ADR | | | 507 | | | | 15,895 | | |
Infrastructure Development
Finance Co. Ltd. | | | 8,155 | | | | 22,960 | | |
| Lanco Infratech Ltd.* | | | 6,588 | | | | 56,139 | | |
| Mahindra & Mahindra Ltd. | | | 1,665 | | | | 29,557 | | |
| Nicholas Piramal India Ltd. | | | 5,351 | | | | 34,740 | | |
| Reliance Industries Ltd.* | | | 961 | | | | 39,562 | | |
| Sterlite Industries (India) Ltd. | | | 3,090 | | | | 41,565 | | |
| Total India common stocks | | | | | | | 366,090 | | |
| Indonesia—0.01% | |
| PT Bank Mandiri | | | 54,925 | | | | 23,104 | | |
| Ireland—0.20% | |
| Covidien PLC3 | | | 23,600 | | | | 892,316 | | |
| Israel—0.04% | |
Bezeq Israeli Telecommunication
Corp. Ltd. | | | 17,441 | | | | 34,743 | | |
| Israel Chemicals Ltd. | | | 4,821 | | | | 54,915 | | |
Teva Pharmaceutical Industries
Ltd., ADR | | | 1,861 | | | | 99,266 | | |
| Total Israel common stocks | | | | | | | 188,924 | | |
| Italy—0.05% | |
| ACEA SpA | | | 12,314 | | | | 140,058 | | |
| Banca Carige SpA | | | 22,956 | | | | 65,406 | | |
| ENI SpA | | | 22 | | | | 512 | | |
| Total Italy common stocks | | | | | | | 205,976 | | |
| Japan—2.68% | |
| AEON Mall Co. Ltd. | | | 5,700 | | | | 120,475 | | |
| Astellas Pharma, Inc. | | | 16,700 | | | | 637,115 | | |
| Daito Trust Construction Co. Ltd. | | | 4,000 | | | | 196,988 | | |
| DeNA Co. Ltd. | | | 82 | | | | 250,701 | | |
| FamilyMart Co. Ltd. | | | 29,800 | | | | 969,976 | | |
| Fast Retailing Co. Ltd. | | | 2,500 | | | | 324,703 | | |
Hisamitsu Pharmaceutical
Co., Inc. | | | 4,300 | | | | 148,597 | | |
| INPEX Corp. | | | 27 | | | | 206,584 | | |
| Japan Steel Works Ltd. | | | 28,000 | | | | 366,922 | | |
| Japan Tobacco, Inc. | | | 227 | | | | 657,310 | | |
| Lawson, Inc. | | | 9,200 | | | | 382,098 | | |
| MEIJI Holdings Co. Ltd.* | | | 12,400 | | | | 500,586 | | |
Mitsubishi UFJ Financial Group,
Inc. (MUFG) | | | 33,500 | | | | 200,380 | | |
| Security description | | Number of
shares | | Value | |
| Common stocks—(continued) | |
| Japan—(concluded) | |
| Nintendo Co. Ltd. | | | 3,400 | | | $ | 919,482 | | |
| Nippon Mining Holdings, Inc. | | | 109,000 | | | | 518,362 | | |
| Rakuten, Inc. | | | 1,245 | | | | 799,958 | | |
| SOFTBANK Corp. | | | 36,000 | | | | 766,605 | | |
| Sompo Japan Insurance, Inc. | | | 77,000 | | | | 511,028 | | |
| Sony Financial Holdings, Inc. | | | 27 | | | | 83,233 | | |
| Suruga Bank Ltd. | | | 47,000 | | | | 499,678 | | |
| T&D Holdings, Inc. | | | 1,350 | | | | 39,662 | | |
| Takeda Pharmaceutical Co. Ltd. | | | 26,600 | | | | 1,076,650 | | |
| The 77 Bank Ltd. | | | 37,000 | | | | 218,970 | | |
| The Iyo Bank Ltd. | | | 9,000 | | | | 94,161 | | |
| Tokio Marine Holdings, Inc. | | | 3,500 | | | | 101,717 | | |
Tokyo Steel Manufacturing
Co. Ltd. | | | 14,300 | | | | 158,679 | | |
| Toyo Suisan Kaisha Ltd. | | | 2,000 | | | | 49,987 | | |
| Yahoo Japan Corp. | | | 2,065 | | | | 677,604 | | |
| Yamaguchi Financial Group, Inc. | | | 26,000 | | | | 355,826 | | |
| Total Japan common stocks | | | | | | | 11,834,037 | | |
| Jersey—0.08% | |
| Randgold Resources Ltd., ADR | | | 5,800 | | | | 360,296 | | |
| Luxembourg—0.35% | |
| ArcelorMittal | | | 38,030 | | | | 1,370,118 | | |
| Tenaris SA | | | 11,290 | | | | 171,215 | | |
Total Luxembourg
common stocks | | | | | | | 1,541,333 | | |
| Malaysia—0.01% | |
| Genting Berhad | | | 16,032 | | | | 29,584 | | |
| Mauritius—0.03% | |
| Golden Agri-Resources Ltd. | | | 484,167 | | | | 142,981 | | |
| Mexico—0.03% | |
America Movil SA de C.V., ADR,
Series L | | | 2,626 | | | | 112,944 | | |
| Cemex SAB de C.V.* | | | 19,252 | | | | 18,117 | | |
| Total Mexico common stocks | | | | | | | 131,061 | | |
| Netherlands—0.14% | |
| Aegon N.V. | | | 30,185 | | | | 221,911 | | |
| Unilever N.V. | | | 14,663 | | | | 400,637 | | |
Total Netherlands
common stocks | | | | | | | 622,548 | | |
| New Zealand—0.02% | |
| Auckland International Airport Ltd. | | | 57,053 | | | | 64,222 | | |
| Norway—0.18% | |
| Aker Solutions ASA | | | 53,200 | | | | 456,537 | | |
| Marine Harvest* | | | 67,599 | | | | 42,460 | | |
| Renewable Energy Corp. AS* | | | 14,200 | | | | 112,753 | | |
| Telenor ASA* | | | 12,000 | | | | 110,692 | | |
| Yara International ASA | | | 2,704 | | | | 83,818 | | |
| Total Norway common stocks | | | | | | | 806,260 | | |
192
UBS PACE Select Advisors Trust
UBS PACE Alternative Strategies Investments
Portfolio of investments—July 31, 2009
| Security description | | Number of
shares | | Value | |
| Common stocks—(continued) | |
| Papua New Guinea—0.01% | |
| New Britain Palm Oil Ltd. | | | 4,055 | | | $ | 23,708 | | |
| Peru—0.01% | |
Compania de Minas Buenaventura
SA, ADR | | | 2,200 | | | | 57,310 | | |
| Philippines—0.01% | |
Philippine Long Distance
Telephone Co., ADR | | | 600 | | | | 31,602 | | |
| Portugal—0.23% | |
Banco Comercial Portugues
SA (BCP) | | | 965,020 | | | | 1,032,957 | | |
| Russia—0.06% | |
| Gazprom, ADR | | | 3,358 | | | | 69,343 | | |
| Mechel, ADR | | | 3,419 | | | | 36,515 | | |
Mining & Metallurgical Co. Norilsk
Nickel, ADR | | | 7,836 | | | | 78,438 | | |
| Rosneft Oil Co., GDR | | | 13,288 | | | | 81,190 | | |
| Total Russia common stocks | | | | | | | 265,486 | | |
| Singapore—0.66% | |
| SembCorp Industries Ltd. | | | 83,000 | | | | 185,130 | | |
| SembCorp Marine Ltd. | | | 49,000 | | | | 106,229 | | |
| Singapore Exchange Ltd. | | | 194,000 | | | | 1,175,472 | | |
Singapore
Telecommunications Ltd. | | | 552,000 | | | | 1,342,459 | | |
| Wilmar International Ltd. | | | 26,391 | | | | 109,844 | | |
| Total Singapore common stocks | | | | | | | 2,919,134 | | |
| South Africa—0.12% | |
| Adcock Ingram Holdings Ltd. | | | 4,844 | | | | 28,714 | | |
| Anglo Platinum Ltd. | | | 732 | | | | 52,306 | | |
| Aspen Pharmacare Holdings Ltd.* | | | 7,913 | | | | 60,673 | | |
| Barloworld Ltd. | | | 8,241 | | | | 48,320 | | |
| Gold Fields Ltd. | | | 1,739 | | | | 20,718 | | |
| Impala Platinum Holdings Ltd. | | | 2,181 | | | | 52,836 | | |
| MTN Group Ltd. | | | 1,213 | | | | 20,008 | | |
| Naspers Ltd., N Shares | | | 700 | | | | 20,883 | | |
| Sasol Ltd. | | | 4,695 | | | | 168,197 | | |
| Truworths International Ltd. | | | 12,819 | | | | 66,061 | | |
| Total South Africa common stocks | | | | | | | 538,716 | | |
| South Korea—0.05% | |
| LG Display Co. Ltd. | | | 1,102 | | | | 31,808 | | |
| LG Electronics, Inc. | | | 508 | | | | 53,563 | | |
| Samsung Electronics Co. Ltd. | | | 84 | | | | 49,516 | | |
| Samsung Securities Co. Ltd. | | | 589 | | | | 36,831 | | |
| Shinsegae Co. Ltd. | | | 60 | | | | 25,940 | | |
Total South Korea
common stocks | | | | | | | 197,658 | | |
| Spain—0.80% | |
| Banco Santander SA | | | 38,101 | | | | 551,742 | | |
| Enagas | | | 998 | | | | 19,736 | | |
| Security description | | Number of
shares | | Value | |
| Common stocks—(continued) | |
| Spain—(concluded) | |
Gamesa Corp. Tecnologica
SA (Gamesa) | | | 14,811 | | | $ | 320,451 | | |
| Grifols SA | | | 40,906 | | | | 744,825 | | |
| Iberdrola SA | | | 80,714 | | | | 692,551 | | |
| Repsol YPF SA | | | 36,933 | | | | 857,515 | | |
| Zardoya Otis SA | | | 15,581 | | | | 353,989 | | |
| Total Spain common stocks | | | | | | | 3,540,809 | | |
| Sweden—0.21% | |
| SSAB Svenskt Staal AB, Series B | | | 74,997 | | | | 896,409 | | |
| Tele2 AB, B Shares | | | 2,301 | | | | 30,963 | | |
| Volvo AB, A Shares | | | 2,543 | | | | 18,061 | | |
| Total Sweden common stocks | | | | | | | 945,433 | | |
| Switzerland—0.45% | |
| Credit Suisse Group AG | | | 4,500 | | | | 212,652 | | |
| Nestle SA | | | 11,412 | | | | 469,658 | | |
| Noble Corp. | | | 8,500 | | | | 287,810 | | |
| Swiss Life Holding AG* | | | 2,706 | | | | 271,195 | | |
| Syngenta AG | | | 748 | | | | 172,607 | | |
| Tyco International Ltd.3 | | | 19,300 | | | | 583,246 | | |
| Total Switzerland common stocks | | | | | | | 1,997,168 | | |
| Taiwan—0.09% | |
Advanced Semiconductor
Engineering, Inc. | | | 34,336 | | | | 24,751 | | |
Cathay Financial Holding
Co. Ltd.* | | | 17,365 | | | | 26,676 | | |
Chinatrust Financial Holding
Co. Ltd. | | | 43,120 | | | | 27,272 | | |
Chunghwa Telecom Co.
Ltd., ADR | | | 1,466 | | | | 25,588 | | |
HON HAI Precision Industry Co.
Ltd. (Foxconn) | | | 27,141 | | | | 93,481 | | |
| HTC Corp. | | | 3,000 | | | | 40,920 | | |
| MediaTek, Inc. | | | 2,669 | | | | 38,358 | | |
| Taiwan Mobile Co. Ltd. | | | 25,436 | | | | 38,920 | | |
Taiwan Semiconductor
Manufacturing Co. Ltd., ADR | | | 7,810 | | | | 81,776 | | |
| Total Taiwan common stocks | | | | | | | 397,742 | | |
| Thailand—0.01% | |
| Bangkok Bank Public Co. Ltd. | | | 14,270 | | | | 47,175 | | |
| United Kingdom—1.30% | |
| Anglo American PLC | | | 45,381 | | | | 1,463,069 | | |
| BAE Systems PLC | | | 43,869 | | | | 224,973 | | |
| Berkeley Group Holdings PLC* | | | 29,641 | | | | 408,984 | | |
| BG Group PLC | | | 51 | | | | 851 | | |
| BHP Billiton PLC | | | 7,410 | | | | 193,469 | | |
| BP PLC | | | 109 | | | | 905 | | |
| Man Group PLC | | | 77,686 | | | | 359,140 | | |
| National Grid PLC | | | 9,035 | | | | 84,292 | | |
| Reed Elsevier PLC | | | 175,520 | | | | 1,240,958 | | |
| Rio Tinto PLC | | | 11,370 | | | | 472,736 | | |
193
UBS PACE Select Advisors Trust
UBS PACE Alternative Strategies Investments
Portfolio of investments—July 31, 2009
| Security description | | Number of
shares | | Value | |
| Common stocks—(continued) | |
| United Kingdom—(concluded) | |
| Royal Dutch Shell PLC | | | 26 | | | $ | 675 | | |
| Royal Dutch Shell PLC, A Shares | | | 28,130 | | | | 738,679 | | |
| Scottish & Southern Energy PLC | | | 8,779 | | | | 162,340 | | |
| Xstrata PLC | | | 28,390 | | | | 383,282 | | |
Total United Kingdom
common stocks | | | | | | | 5,734,353 | | |
| United States—15.14% | |
| Acco Brands Corp.* | | | 45,600 | | | | 199,272 | | |
| Acuity Brands, Inc. | | | 5,600 | | | | 165,256 | | |
| Advance Auto Parts, Inc.3 | | | 12,200 | | | | 564,006 | | |
| Aflac, Inc.3 | | | 11,700 | | | | 442,962 | | |
| Alleghany Corp.* | | | 576 | | | | 155,808 | | |
| Allegheny Energy, Inc. | | | 7,000 | | | | 176,470 | | |
| Allstate Corp. | | | 3,900 | | | | 104,949 | | |
| Amazon.com, Inc.* | | | 17,300 | | | | 1,483,648 | | |
| Ameriprise Financial, Inc. | | | 6,900 | | | | 191,820 | | |
| Apple, Inc.3,* | | | 16,900 | | | | 2,761,291 | | |
| Applied Materials, Inc. | | | 8,000 | | | | 110,400 | | |
| Arbitron, Inc. | | | 29,400 | | | | 478,632 | | |
| Archer-Daniels-Midland Co. | | | 7,300 | | | | 219,876 | | |
| Bank of America Corp. | | | 36,000 | | | | 532,440 | | |
| Belden CDT, Inc. | | | 26,300 | | | | 461,302 | | |
Berkshire Hathaway, Inc.,
Class B* | | | 110 | | | | 349,855 | | |
| Biogen Idec, Inc.3,* | | | 1,900 | | | | 90,345 | | |
| BlackRock, Inc.3 | | | 3,000 | | | | 571,620 | | |
| BorgWarner, Inc. | | | 3,203 | | | | 106,308 | | |
| C.H. Robinson Worldwide, Inc.3 | | | 3,300 | | | | 179,949 | | |
| CA, Inc. | | | 8,100 | | | | 171,234 | | |
| Cabot Oil & Gas Corp. | | | 1,900 | | | | 66,747 | | |
| Cardinal Health, Inc. | | | 5,600 | | | | 186,480 | | |
| Carlisle Cos., Inc. | | | 20,200 | | | | 632,866 | | |
| CF Industries Holdings, Inc. | | | 1,400 | | | | 110,516 | | |
| CONSOL Energy, Inc. | | | 31,700 | | | | 1,126,301 | | |
| Corn Products International, Inc. | | | 1,700 | | | | 47,600 | | |
| Corning, Inc. | | | 29,800 | | | | 506,600 | | |
| Costco Wholesale Corp.3 | | | 11,000 | | | | 544,500 | | |
| Covanta Holding Corp.* | | | 8,438 | | | | 142,518 | | |
| Cree, Inc.* | | | 1,999 | | | | 64,088 | | |
| Cummins, Inc. | | | 2,172 | | | | 93,418 | | |
| CVS Caremark Corp.3 | | | 18,900 | | | | 632,772 | | |
| Deere & Co. | | | 3,100 | | | | 135,594 | | |
| Dell, Inc.* | | | 33,100 | | | | 442,878 | | |
| Deltic Timber Corp. | | | 3,699 | | | | 166,344 | | |
| Diamond Offshore Drilling, Inc.3 | | | 6,600 | | | | 593,142 | | |
| Diebold, Inc. | | | 7,100 | | | | 196,812 | | |
| DISH Network Corp., Class A* | | | 49,400 | | | | 837,330 | | |
Dolby Laboratories, Inc.,
Class A3,* | | | 6,200 | | | | 258,106 | | |
| Dow Chemical Co. | | | 3,800 | | | | 80,446 | | |
| Dun & Bradstreet Corp.3 | | | 17,100 | | | | 1,231,029 | | |
| eBay, Inc.* | | | 24,200 | | | | 514,250 | | |
| El Paso Corp. | | | 58,500 | | | | 588,510 | | |
| Security description | | Number of
shares | | Value | |
| Common stocks—(continued) | |
| United States—(continued) | |
| EMC Corp.* | | | 95,000 | | | $ | 1,430,700 | | |
| Energy Conversion Devices, Inc.* | | | 4,100 | | | | 58,384 | | |
| Entergy Corp. | | | 1,106 | | | | 88,845 | | |
| EOG Resources, Inc. | | | 800 | | | | 59,224 | | |
| EQT Corp. | | | 3,800 | | | | 145,844 | | |
| ESCO Technologies, Inc.* | | | 3,800 | | | | 156,142 | | |
| Exelon Corp. | | | 4,500 | | | | 228,870 | | |
Expeditors International of
Washington, Inc. | | | 15,700 | | | | 532,701 | | |
| Exterran Holdings, Inc.* | | | 1,600 | | | | 27,824 | | |
Fidelity National Financial, Inc.,
Class A | | | 3,700 | | | | 53,095 | | |
| First Solar, Inc.* | | | 1,416 | | | | 218,616 | | |
| Fiserv, Inc.* | | | 11,100 | | | | 526,251 | | |
| FLIR Systems, Inc.3,* | | | 8,700 | | | | 186,963 | | |
| Flowserve Corp.3 | | | 1,300 | | | | 105,001 | | |
| Fluor Corp.3 | | | 36,800 | | | | 1,943,040 | | |
| FMC Corp.3 | | | 7,300 | | | | 355,072 | | |
| Ford Motor Co.3,* | | | 315,700 | | | | 2,525,600 | | |
| Forest Laboratories, Inc.3,* | | | 40,700 | | | | 1,051,281 | | |
| FPL Group, Inc. | | | 3,414 | | | | 193,471 | | |
| Franklin Resources, Inc.3 | | | 2,700 | | | | 239,436 | | |
Freeport-McMoRan Copper &
Gold, Inc. | | | 26,180 | | | | 1,578,654 | | |
| GameStop Corp., Class A* | | | 13,700 | | | | 299,893 | | |
| GATX Corp. | | | 18,378 | | | | 463,493 | | |
| General Dynamics Corp.3 | | | 28,200 | | | | 1,561,998 | | |
| Gilead Sciences, Inc.3,* | | | 6,000 | | | | 293,580 | | |
| Goldman Sachs Group, Inc. | | | 3,300 | | | | 538,890 | | |
| Google, Inc., Class A* | | | 4,200 | | | | 1,860,810 | | |
| Hansen Natural Corp.3,* | | | 1,500 | | | | 46,515 | | |
| Hewlett-Packard Co.3 | | | 16,500 | | | | 714,450 | | |
| International Game Technology | | | 29,300 | | | | 578,675 | | |
| Intuitive Surgical, Inc.3,* | | | 1,200 | | | | 272,784 | | |
| ITC Holdings Corp. | | | 3,000 | | | | 143,100 | | |
| Itron, Inc.* | | | 2,400 | | | | 125,208 | | |
Jacobs Engineering
Group, Inc.3,* | | | 8,200 | | | | 336,036 | | |
| Johnson & Johnson3 | | | 9,000 | | | | 548,010 | | |
| Kroger Co. | | | 5,032 | | | | 107,584 | | |
| Lance, Inc. | | | 6,200 | | | | 157,108 | | |
| Liberty Global, Inc., Series C* | | | 20,200 | | | | 420,968 | | |
| Lincoln National Corp. | | | 5,100 | | | | 108,069 | | |
| Mattel, Inc. | | | 39,100 | | | | 687,378 | | |
| Maxim Integrated Products, Inc.3 | | | 78,100 | | | | 1,383,932 | | |
| McAfee, Inc.* | | | 5,300 | | | | 236,274 | | |
| Merck & Co., Inc. | | | 5,300 | | | | 159,053 | | |
| Monsanto Co. | | | 4,595 | | | | 385,980 | | |
| Moody's Corp.3 | | | 18,900 | | | | 448,686 | | |
| National-Oilwell Varco, Inc.* | | | 2,600 | | | | 93,444 | | |
| Newell Rubbermaid, Inc.3 | | | 16,400 | | | | 211,068 | | |
| Newmont Mining Corp. | | | 24,350 | | | | 1,006,872 | | |
| Northeast Utilities | | | 8,000 | | | | 184,080 | | |
| NVIDIA Corp.* | | | 99,500 | | | | 1,286,535 | | |
194
UBS PACE Select Advisors Trust
UBS PACE Alternative Strategies Investments
Portfolio of investments—July 31, 2009
| Security description | | Number of
shares | | Value | |
| Common stocks—(continued) | |
| United States—(continued) | |
| O'Reilly Automotive, Inc.* | | | 3,300 | | | $ | 134,178 | | |
| ON Semiconductor Corp.* | | | 21,982 | | | | 160,469 | | |
| Oracle Corp. | | | 65,400 | | | | 1,447,302 | | |
| Ormat Technologies, Inc. | | | 1,911 | | | | 75,656 | | |
| Owens-Illinois, Inc.3,* | | | 9,800 | | | | 332,612 | | |
| Peabody Energy Corp.3 | | | 9,000 | | | | 297,990 | | |
| Penske Automotive Group, Inc. | | | 8,981 | | | | 185,727 | | |
| PG&E Corp. | | | 900 | | | | 36,333 | | |
Pharmaceutical Product
Development, Inc. (PPD)3 | | | 23,200 | | | | 481,864 | | |
| Pitney Bowes, Inc.3 | | | 39,900 | | | | 823,935 | | |
| Polo Ralph Lauren Corp.3 | | | 4,100 | | | | 258,505 | | |
| Precision Castparts Corp.3 | | | 500 | | | | 39,905 | | |
| Prudential Financial, Inc. | | | 2,400 | | | | 106,248 | | |
| Public Storage3 | | | 12,000 | | | | 870,840 | | |
| QUALCOMM, Inc. | | | 23,700 | | | | 1,095,177 | | |
| Quanta Services, Inc.* | | | 5,254 | | | | 122,471 | | |
| Questar Corp. | | | 3,000 | | | | 99,210 | | |
| Ralcorp Holdings, Inc.* | | | 6,513 | | | | 413,641 | | |
| Raytheon Co.3 | | | 22,500 | | | | 1,056,375 | | |
| Ross Stores, Inc. | | | 400 | | | | 17,636 | | |
| Safeway, Inc. | | | 16,000 | | | | 302,880 | | |
| SEACOR Holdings, Inc.* | | | 2,100 | | | | 166,908 | | |
| Sears Holdings Corp.3,* | | | 3,500 | | | | 232,190 | | |
| SEI Investments Co. | | | 2,200 | | | | 41,580 | | |
Simcere Pharmaceutical
Group, ADR* | | | 9,800 | | | | 92,904 | | |
| Sohu.com, Inc.* | | | 800 | | | | 48,936 | | |
| St. Mary Land & Exploration Co. | | | 3,800 | | | | 90,706 | | |
| Starbucks Corp.* | | | 47,900 | | | | 847,830 | | |
| Stryker Corp.3 | | | 28,500 | | | | 1,108,080 | | |
| SunPower Corp., Class A* | | | 7,100 | | | | 228,620 | | |
| SunPower Corp., Class B* | | | 3,732 | | | | 101,884 | | |
| T. Rowe Price Group, Inc.3 | | | 21,800 | | | | 1,018,278 | | |
| Texas Instruments, Inc. | | | 15,100 | | | | 363,155 | | |
| The J.M. Smucker Co. | | | 1,382 | | | | 69,141 | | |
| The Mosaic Co. | | | 19,956 | | | | 1,040,705 | | |
The NASDAQ OMX
Group, Inc.3,* | | | 26,800 | | | | 566,284 | | |
| Time Warner Cable, Inc. | | | 4,700 | | | | 155,382 | | |
| Time Warner, Inc.3 | | | 20,000 | | | | 533,200 | | |
| Torchmark Corp.3 | | | 2,700 | | | | 105,462 | | |
| Total System Services, Inc.3 | | | 17,900 | | | | 262,772 | | |
TRW Automotive
Holdings Corp.* | | | 6,600 | | | | 111,078 | | |
| Tyson Foods, Inc., Class A3 | | | 9,139 | | | | 104,459 | | |
| UniFirst Corp. | | | 1,900 | | | | 73,948 | | |
| Varian Medical Systems, Inc.3,* | | | 9,300 | | | | 328,011 | | |
| Vertex Pharmaceuticals, Inc.* | | | 21,000 | | | | 756,210 | | |
| VMware, Inc., Class A* | | | 15,800 | | | | 509,234 | | |
| Websense, Inc.* | | | 8,400 | | | | 124,320 | | |
| Wells Fargo & Co. | | | 15,200 | | | | 371,792 | | |
| Western Union Co.3 | | | 69,100 | | | | 1,207,868 | | |
| Xerox Corp. | | | 9,300 | | | | 76,167 | | |
| Security description | | Number of
shares | | Value | |
| Common stocks—(concluded) | |
| United States—(concluded) | |
| Yahoo!, Inc.* | | | 49,300 | | | $ | 705,976 | | |
| Yum! Brands, Inc. | | | 34,200 | | | | 1,212,732 | | |
| Zep, Inc. | | | 11,700 | | | | 188,136 | | |
| Zimmer Holdings, Inc.3,* | | | 14,900 | | | | 694,340 | | |
Total United States
common stocks | | | | | | | 66,979,019 | | |
Total common stocks
(cost—$139,526,483) | | | | | | | 156,059,206 | | |
| Preferred stock—0.01% | |
| Brazil—0.01% | |
Vivo Participacoes SA
(cost—$22,420) | | | 1,181 | | | | 26,902 | | |
| Investment companies—0.84% | |
| United States—0.84% | |
| Energy Select Sector SPDR Fund | | | 47,300 | | | | 2,389,123 | | |
| SPDR Metals & Mining ETF | | | 33,200 | | | | 1,316,048 | | |
Total investment companies
(cost—$3,384,274) | | | | | | | 3,705,171 | | |
| Unit trusts—0.20% | |
| Canada—0.20% | |
| Canadian Oil Sands Trust | | | 22,500 | | | | 566,442 | | |
| Penn West Energy Trust | | | 23,000 | | | | 299,977 | | |
Total unit trusts
(cost—$607,171) | | | | | | | 866,419 | | |
| | | Face
amount4 | | | |
| US government obligations—3.46% | |
| US Treasury Bonds | |
| 6.375%, due 08/15/27 | | $ | 2,000,000 | | | | 2,528,124 | | |
| 6.625%, due 02/15/27 | | | 1,200,000 | | | | 1,550,250 | | |
| US Treasury Inflation Index Bonds (TIPS) | |
| 2.000%, due 01/15/26 | | | 861,904 | | | | 836,047 | | |
| US Treasury Inflation Index Notes (TIPS) | |
| 0.875%, due 04/15/10 | | | 5,305,125 | | | | 5,316,733 | | |
| 1.625%, due 01/15/15 | | | 559,940 | | | | 557,840 | | |
| 2.500%, due 07/15/16 | | | 211,770 | | | | 222,292 | | |
| 4.250%, due 01/15/10 | | | 1,270,980 | | | | 1,294,017 | | |
| US Treasury Principal STRIPS | |
| due 11/15/265 | | | 6,500,000 | | | | 3,000,010 | | |
Total US government obligations
(cost—$15,433,110) | | | | | | | 15,305,313 | | |
| Federal farm credit bank certificates—1.12% | |
| FFCB | |
4.500%, due 05/21/15
(cost—$4,751,416) | | | 4,700,000 | | | | 4,941,726 | | |
195
UBS PACE Select Advisors Trust
UBS PACE Alternative Strategies Investments
Portfolio of investments—July 31, 2009
| Security description | | Face
amount4 | | Value | |
Federal home loan mortgage
corporation certificates**—0.41% | |
| FHLMC | |
| 4.500%, due 05/01/23 | | $ | 33,940 | | | $ | 34,860 | | |
| 5.000%, due 09/01/38 | | | 674,065 | | | | 690,122 | | |
| 5.500%, due 06/01/38 | | | 886,618 | | | | 919,276 | | |
| 6.000%, due 11/01/36 | | | 22,479 | | | | 23,599 | | |
| 6.000%, due 11/01/37 | | | 107,514 | | | | 112,790 | | |
| 6.000%, due 04/01/38 | | | 24,101 | | | | 25,284 | | |
| 6.000%, due 02/01/39 | | | 25,564 | | | | 26,817 | | |
Total federal home loan mortgage
corporation certificates
(cost—$1,778,212) | | | | | | | 1,832,748 | | |
Federal national mortgage
association certificates**—7.47% | |
| FNMA | |
| 1.750%, due 04/15/11 | | | 2,000,000 | | | | 2,009,016 | | |
| 1.875%, due 04/08/11 | | | 2,500,000 | | | | 2,513,390 | | |
| 2.000%, due 04/01/11 | | | 3,800,000 | | | | 3,828,409 | | |
| 2.125%, due 04/15/11 | | | 2,000,000 | | | | 2,018,572 | | |
| 4.120%, due 05/06/13 | | | 2,000,000 | | | | 2,016,642 | | |
| 4.241%, due 04/01/376 | | | 3,037,260 | | | | 3,142,530 | | |
| 4.500%, due 10/01/18 | | | 405,166 | | | | 423,065 | | |
| 4.500%, due 11/01/18 | | | 93,522 | | | | 97,653 | | |
| 4.500%, due 12/01/18 | | | 152,601 | | | | 159,343 | | |
| 4.500%, due 05/01/19 | | | 588,507 | | | | 613,216 | | |
| 4.500%, due 06/01/19 | | | 285,914 | | | | 297,920 | | |
| 4.500%, due 08/01/19 | | | 202,251 | | | | 210,744 | | |
| 4.500%, due 06/01/23 | | | 655,382 | | | | 673,750 | | |
| 5.000%, due 12/01/18 | | | 3,677,318 | | | | 3,866,772 | | |
| 5.000%, due 12/01/19 | | | 2,755,379 | | | | 2,897,336 | | |
| 5.000%, due 06/01/23 | | | 5,617,736 | | | | 5,899,261 | | |
| 5.000%, due 07/01/34 | | | 733,372 | | | | 753,288 | | |
| 5.500%, due 02/01/38 | | | 774,191 | | | | 802,950 | | |
| 6.000%, due 03/01/32 | | | 158 | | | | 167 | | |
| 6.000%, due 05/01/33 | | | 15,318 | | | | 16,202 | | |
| 6.000%, due 12/01/33 | | | 7,080 | | | | 7,480 | | |
| 6.000%, due 04/01/35 | | | 11,728 | | | | 12,343 | | |
| 6.000%, due 07/01/35 | | | 63,829 | | | | 67,171 | | |
| 6.000%, due 08/01/35 | | | 779 | | | | 820 | | |
| 6.000%, due 11/01/35 | | | 140,312 | | | | 147,658 | | |
| 6.000%, due 01/01/36 | | | 184,985 | | | | 194,671 | | |
| 6.000%, due 02/01/36 | | | 16,238 | | | | 17,063 | | |
| 6.000%, due 09/01/36 | | | 20,236 | | | | 21,264 | | |
| 6.000%, due 10/01/36 | | | 19,470 | | | | 20,459 | | |
| 6.000%, due 08/01/37 | | | 77,103 | | | | 80,947 | | |
| 6.000%, due 09/01/37 | | | 90,283 | | | | 94,784 | | |
| 6.000%, due 10/01/37 | | | 20,386 | | | | 21,403 | | |
| 6.000%, due 11/01/37 | | | 39,166 | | | | 41,119 | | |
| 6.000%, due 01/01/38 | | | 21,448 | | | | 22,517 | | |
| 6.000%, due 02/01/38 | | | 28,014 | | | | 29,411 | | |
| 6.000%, due 01/01/39 | | | 24,500 | | | | 25,722 | | |
Total federal national mortgage
association certificates
(cost—$32,370,849) | | | | | | | 33,045,058 | | |
| Security description | | Face
amount4 | | Value | |
| Collateralized mortgage obligations—6.61% | |
American Home Mortgage Assets,
Series 2006-3, Class 1A1
2.180%, due 10/25/466 | | $ | 779,778 | | | $ | 368,896 | | |
Series 2006-3, Class 2A11
2.150%, due 10/25/466 | | | 796,175 | | | | 371,102 | | |
Series 2006-4, Class 1A11
0.475%, due 10/25/466 | | | 1,389,861 | | | | 647,180 | | |
Series 2007-1, Class A1
1.910%, due 02/25/476 | | | 807,923 | | | | 325,605 | | |
American Home Mortgage
Investment Trust,
Series 2004-3, Class 1A
0.655%, due 10/25/346 | | | 55,531 | | | | 40,853 | | |
Series 2005-4, Class 1A1
0.575%, due 11/25/456 | | | 1,077,865 | | | | 546,750 | | |
Banc of America Funding Corp.,
Series 2007-D, Class 1A5
0.569%, due 06/20/476 | | | 600,000 | | | | 102,455 | | |
BCAP LLC Trust, Series 2006-RR1,
Class CF
0.925%, due 11/25/366 | | | 207,270 | | | | 170,286 | | |
Bear Stearns Alternative Trust-A
Trust, Series 2005-8, Class 11A1
0.555%, due 10/25/356 | | | 965,672 | | | | 490,798 | | |
Citimortgage Alternative Loan
Trust, Series 2006-A7, Class 1A12
6.000%, due 12/25/36 | | | 1,319,093 | | | | 956,297 | | |
Countrywide Alternative Loan Trust,
Series 2005-46C8, Class A8
5.500%, due 10/25/35 | | | 824,495 | | | | 667,622 | | |
Series 2005-61, Class 1A1
0.545%, due 12/25/356 | | | 1,256,086 | | | | 650,961 | | |
Series 2006-23CB, Class 1A6
6.000%, due 08/25/36 | | | 364,830 | | | | 229,941 | | |
Series 2006-5T2, Class A3
6.000%, due 04/25/36 | | | 1,115,667 | | | | 715,231 | | |
Series 2007-0A11, Class A1A
2.590%, due 11/25/476 | | | 945,906 | | | | 338,298 | | |
Series 2007-6, Class A4
5.750%, due 04/25/47 | | | 1,200,000 | | | | 512,814 | | |
Countrywide Home Loan,
Series 2007-14, Class A19
6.000%, due 09/25/37 | | | 830,937 | | | | 579,968 | | |
Credit Suisse Mortgage Capital
Certificates, Series 2006-8,
Class 4A1
6.500%, due 10/25/21 | | | 1,367,887 | | | | 837,831 | | |
DSLA Mortgage Loan Trust,
Series 2004-AR2, Class A2A
0.679%, due 11/19/446 | | | 1,263,842 | | | | 612,118 | | |
Series 2006-AR2, Class 2A1A
0.489%, due 11/19/376 | | | 626,463 | | | | 293,886 | | |
196
UBS PACE Select Advisors Trust
UBS PACE Alternative Strategies Investments
Portfolio of investments—July 31, 2009
| Security description | | Face
amount4 | | Value | |
| Collateralized mortgage obligations—(continued) | |
First Horizon Alternative Mortgage
Securities, Series 2005-AA9,
Class AA9
5.618%, due 11/25/366 | | $ | 1,226,042 | | | $ | 752,842 | | |
FNMA REMIC, Series 2008-56,
Class FD**
1.225%, due 07/25/486 | | | 1,789,535 | | | | 1,784,154 | | |
Greenpoint Mortgage Funding
Trust, Series 2007-AR3, Class A1
0.505%, due 06/25/376 | | | 656,798 | | | | 307,936 | | |
Harborview Mortgage Loan Trust,
Series 2005-10, Class 2A1A
0.599%, due 11/19/356 | | | 2,849,263 | | | | 1,588,194 | | |
Series 2005-11, Class 2A1A
0.599%, due 08/19/456 | | | 310,983 | | | | 166,231 | | |
Series 2005-16, Class 3A1A
0.539%, due 01/19/366 | | | 754,083 | | | | 373,740 | | |
Series 2005-3, Class 2A1A
0.529%, due 06/19/356 | | | 1,556,717 | | | | 801,634 | | |
Series 2005-9, Class 2A1A
0.629%, due 06/20/356 | | | 649,030 | | | | 351,957 | | |
Series 2006-1, Class 2A1A
0.529%, due 03/19/376 | | | 1,409,752 | | | | 689,299 | | |
Series 2006-12, Class 2A2A
0.479%, due 01/19/386 | | | 708,705 | | | | 346,249 | | |
Series 2006-14, Class 2A1A
0.439%, due 01/25/476 | | | 2,701,227 | | | | 1,257,335 | | |
Indymac Index Mortgage Loan
Trust, Series 2006-AR4, Class A1A
0.495%, due 05/25/466 | | | 2,332,776 | | | | 1,125,026 | | |
Lehman Mortgage Trust,
Series 2006-8, Class 2A1
0.705%, due 12/25/366 | | | 1,542,705 | | | | 626,061 | | |
Luminent Mortgage Trust,
Series 2006-2, Class A1A
0.485%, due 02/25/466 | | | 2,438,369 | | | | 1,182,414 | | |
Series 2006-5, Class A1A
0.475%, due 07/25/366 | | | 906,141 | | | | 426,451 | | |
Morgan Stanley Capital I,
Series 2005-HQ7, Class A4
5.378%, due 11/14/426 | | | 500,000 | | | | 478,875 | | |
Morgan Stanley Mortgage Loan
Trust, Series 2007-15AR, Class 2A1
6.195%, due 11/25/376 | | | 862,008 | | | | 551,592 | | |
MortgageIT Trust, Series 2005-AR1,
Class 1A1
0.535%, due 11/25/356 | | | 826,951 | | | | 405,796 | | |
Residential Accredit Loans, Inc.,
Series 2005-Q05, Class A1
2.210%, due 01/25/466 | | | 2,550,204 | | | | 1,349,972 | | |
Series 2007-QH9, Class A1
6.536%, due 11/25/376 | | | 935,695 | | | | 426,396 | | |
Series 2007-QS1, Class 2A2
0.645%, due 01/25/376 | | | 2,194,228 | | | | 1,075,648 | | |
| Security description | | Face
amount4 | | Value | |
| Collateralized mortgage obligations—(concluded) | |
Residential Asset Securitization
Trust, Series 2007-A2, Class 1A3
6.000%, due 04/25/37 | | $ | 1,262,390 | | | $ | 649,116 | | |
Sequoia Mortgage Trust,
Series 2004-10, Class A3A
1.971%, due 11/20/346 | | | 116,874 | | | | 82,359 | | |
Structured Adjustable Rate
Mortgage Loan Trust,
Series 2005-21, Class 7A1
6.006%, due 11/25/35 | | | 2,209,791 | | | | 1,487,019 | | |
WaMu Mortgage Pass Through
Certificates, Series 2007-OA6,
Class 1A
2.020%, due 07/25/476 | | | 884,366 | | | | 433,084 | | |
Wells Fargo Alternative Loan Trust,
Series 2007-PA2, Class 1A1
6.000%, due 06/25/37 | | | 1,464,563 | | | | 1,051,510 | | |
Total collateralized mortgage
obligations
(cost—$42,844,206) | | | | | | | 29,229,782 | | |
| Asset-backed securities—1.27% | |
Bank of America Auto Trust,
Series 2009-1A, Class A2
1.700%, due 12/15/117,8 | | | 1,800,000 | | | | 1,802,917 | | |
Chase Issuance Trust,
Series 2009-A5, Class A5
1.088%, due 06/15/126 | | | 2,500,000 | | | | 2,497,831 | | |
CIT Mortgage Loan Trust,
Series 2007-1, Class 2A1
1.285%, due 10/01/376,7,8 | | | 275,707 | | | | 209,537 | | |
Series 2007-1, Class 2A2
1.535%, due 10/01/376,7,8 | | | 130,000 | | | | 44,200 | | |
Series 2007-1, Class 2A3
1.735%, due 10/01/376,7,8 | | | 230,000 | | | | 69,000 | | |
GMAC Mortgage Corp. Loan Trust,
Series 2007-HE3, Class 1A1
7.000%, due 09/25/37 | | | 63,657 | | | | 29,600 | | |
Series 2007-HE3, Class 2A1
7.000%, due 09/25/37 | | | 105,607 | | | | 36,195 | | |
Household Home Equity Loan Trust,
Series 2007-3, Class APT
1.489%, due 11/20/366 | | | 364,213 | | | | 275,568 | | |
USAA Auto Owner Trust,
Series 2007-2, Class A3
4.900%, due 02/15/12 | | | 619,762 | | | | 630,532 | | |
Total asset-backed securities
(cost—$6,088,789) | | | | | | | 5,595,380 | | |
| Corporate notes—8.79% | |
| Australia—0.90% | |
QBE Insurance Group Ltd.
9.750%, due 03/14/147,8 | | | 105,000 | | | | 114,009 | | |
197
UBS PACE Select Advisors Trust
UBS PACE Alternative Strategies Investments
Portfolio of investments—July 31, 2009
| Security description | | Face
amount4 | | Value | |
| Corporate notes—(continued) | |
| Australia—(concluded) | |
Suncorp-Metway Ltd.
0.989%, due 12/17/106,9 | | $ | 1,000,000 | | | $ | 1,000,160 | | |
| 1.759%, due 04/15/116,9 | | | 2,500,000 | | | | 2,533,727 | | |
Westfield Capital/Westfield
Financial
4.375%, due 11/15/109 | | | 325,000 | | | | 322,411 | | |
| Total Australia corporate notes | | | | | | | 3,970,307 | | |
| Bermuda—0.09% | |
Endurance Specialty Holdings
7.000%, due 07/15/34 | | | 125,000 | | | | 90,258 | | |
Qtel International Finance
6.500%, due 06/10/149 | | | 170,000 | | | | 179,057 | | |
White Mountains Re Group
6.375%, due 03/20/179 | | | 150,000 | | | | 114,776 | | |
| Total Bermuda corporate notes | | | | | | | 384,091 | | |
| Canada—0.44% | |
Canadian Natural Resources
5.150%, due 02/01/13 | | | 250,000 | | | | 258,378 | | |
| 5.700%, due 05/15/17 | | | 40,000 | | | | 42,043 | | |
Nexen, Inc.
6.400%, due 05/15/37 | | | 225,000 | | | | 211,988 | | |
Rogers Communications, Inc.
6.800%, due 08/15/18 | | | 450,000 | | | | 515,268 | | |
Thomson Reuters Corp.
6.500%, due 07/15/18 | | | 450,000 | | | | 496,787 | | |
TransCanada Pipelines
7.625%, due 01/15/39 | | | 175,000 | | | | 222,257 | | |
Transocean, Inc.
6.800%, due 03/15/38 | | | 200,000 | | | | 228,734 | | |
| Total Canada corporate notes | | | | | | | 1,975,455 | | |
| Cayman Islands—0.05% | |
Resona Preferred Global Securities
7.191%, due 07/30/159,10,11 | | | 275,000 | | | | 200,750 | | |
| Denmark—0.04% | |
Nordic Telephone Co. Holdings
8.250%, due 05/01/16 | | EUR | 125,000 | | | | 181,726 | | |
| France—1.36% | |
Dexia Credit Local
2.375%, due 09/23/119 | | | 1,500,000 | | | | 1,503,111 | | |
Societe Financement de l'Economie
Francaise
1.500%, due 10/29/109 | | | 4,500,000 | | | | 4,500,863 | | |
| Total France corporate notes | | | | | | | 6,003,974 | | |
| Germany—0.35% | |
NRW Bank MTN
5.375%, due 07/19/10 | | | 1,500,000 | | | | 1,551,952 | | |
| Ireland—0.02% | |
VIP Fin (Vimpelcom)
9.125%, due 04/30/18 | | | 100,000 | | | | 90,500 | | |
| Security description | | Face
amount4 | | Value | |
| Corporate notes—(continued) | |
| Luxembourg—0.37% | |
ArcelorMittal
6.125%, due 06/01/18 | | $ | 575,000 | | | $ | 555,363 | | |
Hellas Telecom V
4.496%, due 10/15/126 | | EUR | 250,000 | | | | 251,209 | | |
Telecom Italia Capital
6.000%, due 09/30/34 | | | 200,000 | | | | 187,252 | | |
| 6.200%, due 07/18/11 | | | 325,000 | | | | 344,392 | | |
| 7.721%, due 06/04/38 | | | 275,000 | | | | 309,908 | | |
Total Luxembourg
corporate notes | | | | | | | 1,648,124 | | |
| Mexico—0.13% | |
Petroleos Mexicanos
8.000%, due 05/03/199 | | | 510,000 | | | | 575,025 | | |
| Netherlands—0.23% | |
Impress Holdings BV
4.121%, due 09/15/136 | | | 250,000 | | | | 326,037 | | |
LeasePlan Corp. N.V.
3.000%, due 05/07/129 | | | 700,000 | | | | 705,971 | | |
Total Netherlands
corporate notes | | | | | | | 1,032,008 | | |
| New Zealand—0.14% | |
ANZ National (International) Ltd.
3.250%, due 04/02/127,8 | | | 600,000 | | | | 614,826 | | |
| United Arab Emirates—0.04% | |
Dolphin Energy Ltd.
5.888%, due 06/15/197,8 | | | 170,000 | | | | 169,745 | | |
| United Kingdom—0.12% | |
HSBC Holdings PLC
6.500%, due 09/15/37 | | | 250,000 | | | | 235,575 | | |
Royal Bank of Scotland Group PLC
9.118%, due 03/31/1010 | | | 200,000 | | | | 184,000 | | |
Swiss Re Capital I LP
6.854%, due 05/25/169,10,11 | | | 175,000 | | | | 105,000 | | |
Total United Kingdom
corporate notes | | | | | | | 524,575 | | |
| United States—4.51% | |
Allied Waste Industries, Inc.
4.250%, due 04/15/34 | | | 85,000 | | | | 84,363 | | |
Altria Group, Inc.
9.700%, due 11/10/18 | | | 275,000 | | | | 334,403 | | |
Anheuser-Busch InBev
Worldwide, Inc.
7.750%, due 01/15/199 | | | 550,000 | | | | 642,398 | | |
ANZ Capital Trust II
5.360%, due 12/15/139,10,11 | | | 200,000 | | | | 174,632 | | |
Bank of America Corp.
5.750%, due 12/01/17 | | | 200,000 | | | | 192,019 | | |
Bear Stearns Co., Inc.
6.400%, due 10/02/17 | | | 25,000 | | | | 26,732 | | |
| 7.250%, due 02/01/18 | | | 950,000 | | | | 1,064,976 | | |
198
UBS PACE Select Advisors Trust
UBS PACE Alternative Strategies Investments
Portfolio of investments—July 31, 2009
| Security description | | Face
amount4 | | Value | |
| Corporate notes—(continued) | |
| United States—(continued) | |
Boardwalk Pipelines LP
5.875%, due 11/15/16 | | $ | 225,000 | | | $ | 214,757 | | |
Boston Scientific Corp.
6.250%, due 11/15/35 | | | 125,000 | | | | 109,375 | | |
Chubb Corp.
6.500%, due 05/15/38 | | | 150,000 | | | | 164,369 | | |
Citigroup Funding, Inc.
2.125%, due 07/12/12 | | | 600,000 | | | | 602,270 | | |
CNA Financial Corp.
7.250%, due 11/15/23 | | | 100,000 | | | | 73,053 | | |
Comcast Corp.
5.500%, due 03/15/11 | | | 225,000 | | | | 236,578 | | |
| 6.450%, due 03/15/37 | | | 200,000 | | | | 214,086 | | |
Comcast Holdings Corp.
10.625%, due 07/15/12 | | | 250,000 | | | | 301,929 | | |
Commonwealth Edison Co.
5.800%, due 03/15/18 | | | 350,000 | | | | 376,962 | | |
| 5.900%, due 03/15/36 | | | 150,000 | | | | 156,859 | | |
COX Communications, Inc.
4.625%, due 01/15/10 | | | 400,000 | | | | 403,944 | | |
| 6.250%, due 06/01/189 | | | 375,000 | | | | 397,102 | | |
CSC Holdings, Inc., Series B
7.625%, due 04/01/11 | | | 250,000 | | | | 253,125 | | |
Darden Restaurants, Inc.
5.625%, due 10/15/12 | | | 225,000 | | | | 232,825 | | |
Dow Chemical Co.
7.600%, due 05/15/14 | | | 375,000 | | | | 407,482 | | |
EchoStar DBS Corp.
7.125%, due 02/01/16 | | | 250,000 | | | | 242,500 | | |
Energy Transfer Partners
5.950%, due 02/01/15 | | | 300,000 | | | | 317,706 | | |
| 6.700%, due 07/01/18 | | | 350,000 | | | | 374,155 | | |
Enterprise Products Operating LLC
6.300%, due 09/15/17 | | | 175,000 | | | | 188,195 | | |
| 6.500%, due 01/31/19 | | | 225,000 | | | | 247,567 | | |
| 8.375%, due 08/01/666 | | | 200,000 | | | | 174,000 | | |
Enterprise Products Operating LLC,
Series B
5.000%, due 03/01/15 | | | 175,000 | | | | 173,564 | | |
FirstEnergy Corp.
7.375%, due 11/15/31 | | | 100,000 | | | | 109,984 | | |
Fiserv, Inc.
6.125%, due 11/20/12 | | | 250,000 | | | | 266,724 | | |
Freeport-McMoRan Copper &
Gold, Inc.
4.995%, due 04/01/156 | | | 125,000 | | | | 120,233 | | |
GMAC, Inc.
6.875%, due 09/15/11 | | | 750,000 | | | | 682,900 | | |
HCA, Inc.
9.625%, due 11/15/1612 | | | 131,000 | | | | 136,567 | | |
International Game Technology
7.500%, due 06/15/19 | | | 175,000 | | | | 186,263 | | |
| Security description | | Face
amount4 | | Value | |
| Corporate notes—(continued) | |
| United States—(continued) | |
International Lease Finance
Corp. MTN
4.950%, due 02/01/11 | | $ | 175,000 | | | $ | 135,624 | | |
JPMorgan Chase Bank NA
6.000%, due 10/01/17 | | | 250,000 | | | | 259,769 | | |
L-3 Communications Corp.
7.625%, due 06/15/12 | | | 375,000 | | | | 379,219 | | |
Merrill Lynch & Co., Inc.
5.450%, due 02/05/13 | | | 450,000 | | | | 454,345 | | |
| 6.400%, due 08/28/17 | | | 100,000 | | | | 98,210 | | |
MetLife Capital Trust X
9.250%, due 04/08/336,9 | | | 300,000 | | | | 288,375 | | |
MidAmerican Energy Holdings Co.
5.750%, due 04/01/18 | | | 300,000 | | | | 319,949 | | |
| 6.125%, due 04/01/36 | | | 225,000 | | | | 239,031 | | |
Morgan Stanley MTN
5.950%, due 12/28/17 | | | 225,000 | | | | 231,678 | | |
| 6.250%, due 08/28/17 | | | 200,000 | | | | 207,986 | | |
| 6.625%, due 04/01/18 | | | 100,000 | | | | 106,428 | | |
Nevada Power Co.
6.500%, due 05/15/18 | | | 375,000 | | | | 403,469 | | |
Nisource Finance Corp.
10.750%, due 03/15/16 | | | 150,000 | | | | 174,713 | | |
ONEOK Partners, LP
6.150%, due 10/01/16 | | | 75,000 | | | | 80,591 | | |
| 6.850%, due 10/15/37 | | | 50,000 | | | | 52,792 | | |
Philip Morris International, Inc.
5.650%, due 05/16/18 | | | 425,000 | | | | 452,168 | | |
PNC Bank NA
6.875%, due 04/01/18 | | | 250,000 | | | | 269,826 | | |
Progress Energy, Inc.
7.050%, due 03/15/19 | | | 300,000 | | | | 343,965 | | |
Puget Sound Energy, Inc., Series A
6.974%, due 06/01/676 | | | 150,000 | | | | 109,638 | | |
Qwest Capital Funding, Inc.
7.900%, due 08/15/10 | | | 375,000 | | | | 377,812 | | |
Reed Elsevier Capital, Inc.
8.625%, due 01/15/19 | | | 300,000 | | | | 362,166 | | |
Simon Property Group LP
6.125%, due 05/30/18 | | | 725,000 | | | | 685,507 | | |
SLM Corp. MTN
0.664%, due 07/26/106 | | | 100,000 | | | | 88,188 | | |
| 5.125%, due 08/27/12 | | | 425,000 | | | | 319,443 | | |
| 8.450%, due 06/15/18 | | | 25,000 | | | | 20,000 | | |
Tennessee Gas Pipeline
8.375%, due 06/15/32 | | | 350,000 | | | | 412,618 | | |
TEPPCO Partners LP
6.650%, due 04/15/18 | | | 425,000 | | | | 452,333 | | |
Verizon Wireless Capital
8.500%, due 11/15/189 | | | 250,000 | | | | 317,476 | | |
Wachovia Corp. MTN
5.500%, due 05/01/13 | | | 975,000 | | | | 1,021,768 | | |
Wells Fargo & Co.
5.625%, due 12/11/17 | | | 100,000 | | | | 101,501 | | |
199
UBS PACE Select Advisors Trust
UBS PACE Alternative Strategies Investments
Portfolio of investments—July 31, 2009
| Security description | | Face
amount4 | | Value | |
| Corporate notes—(concluded) | |
| United States—(concluded) | |
Wells Fargo Capital XIII
7.700%, due 03/26/1310,11 | | $ | 425,000 | | | $ | 369,750 | | |
Whirlpool Corp.
8.000%, due 05/01/12 | | | 75,000 | | | | 79,020 | | |
| 8.600%, due 05/01/14 | | | 100,000 | | | | 107,342 | | |
Williams Cos., Inc.
6.375%, due 10/01/109 | | | 250,000 | | | | 254,977 | | |
ZFS Finance USA Trust I
6.150%, due 12/15/109,11 | | | 550,000 | | | | 489,500 | | |
Total United States
corporate notes | | | | | | | 19,951,774 | | |
Total corporate notes
(cost—$37,817,349) | | | | | | | 38,874,832 | | |
| Municipal bonds and notes—0.09% | |
| United States—0.09% | |
California (Build America Bonds)
7.500%, due 04/01/34 | | | 200,000 | | | | 206,378 | | |
| 7.550%, due 04/01/39 | | | 200,000 | | | | 206,748 | | |
Total municipal bonds and notes
(cost—$379,139) | | | | | | | 413,126 | | |
| Non-US government obligations—0.31% | |
| Argentina—0.11% | |
Republic of Argentina
7.000%, due 10/03/15 | | | 930,000 | | | | 513,825 | | |
| Japan—0.14% | |
Japan Finance Corp.
2.000%, due 06/24/11 | | | 600,000 | | | | 605,549 | | |
| Peru—0.06% | |
Republic of Peru
7.125%, due 03/30/19 | | | 250,000 | | | | 270,000 | | |
Total non-US government
obligations
(cost—$1,226,223) | | | | | | | 1,389,374 | | |
| Time deposit—2.18% | |
Rabobank Nederland N.V.
0.120%, due 08/03/09
(cost—$9,639,955) | | | 9,639,955 | | | | 9,639,955 | | |
| Short-term US government obligations13—17.34% | |
| US Treasury Bills | |
| 0.145%, due 08/13/09 | | | 5,000,000 | | | | 4,999,758 | | |
| 0.155%, due 08/13/09 | | | 20,000,000 | | | | 19,998,967 | | |
| 0.175%, due 10/29/093 | | | 8,675,000 | | | | 8,671,247 | | |
| 0.235%, due 11/12/09 | | | 8,000,000 | | | | 7,994,621 | | |
| 0.260%, due 11/12/09 | | | 35,000,000 | | | | 34,973,964 | | |
Total short-term US government
obligations
(cost—$76,638,557) | | | | | | | 76,638,557 | | |
| Security description | | Face
amount4 | | Value | |
| Repurchase agreement—13.11% | |
Repurchase agreement dated
07/31/09 with State Street
Bank & Trust Co., 0.010%
due 08/03/09, collateralized
by $59,111,228 US Treasury
Bills, zero coupon due
08/27/09 to 09/10/09;
(value—$59,105,317);
proceeds: $57,944,048
(cost—$57,944,000) | | $ | 57,944,000 | | | $ | 57,944,000 | | |
| | | Number of
contracts | | | |
| Options*—0.05% | |
| Call options purchased—0.05% | |
DJ Euro Stoxx 50 Index,
strike @ EUR 650,
expires 08/21/09 | | | 80 | | | | 64,081 | | |
Russell 2000 Index,
strike @ $560,
expires 08/22/09 | | | 9 | | | | 9,855 | | |
S&P 500 Index, strike @ $975,
expires 08/22/09 | | | 49 | | | | 133,281 | | |
| Total call options purchased | | | | | | | 207,217 | | |
| Put options purchased—0.00%*** | |
DJ Euro Stoxx 50 Index,
strike @ EUR 900,
expires 09/18/09 | | | 213 | | | | 10,018 | | |
Russell 2000 Index,
strike @ $380,
expires 09/19/09 | | | 12 | | | | 300 | | |
S&P 500 Index, strike @ $700,
expires 09/19/09 | | | 84 | | | | 6,720 | | |
| Total put options purchased | | | | | | | 17,038 | | |
| Total options (cost—$204,825) | | | | | | | 224,255 | | |
Total investments before
investments sold short
(cost—$430,656,978)—98.56% | | | | | | | 435,731,804 | | |
| | | Number of
shares | | | |
| Investments sold short—(4.77)% | |
| Common stocks—(4.75)% | |
| Belgium—(0.08)% | |
| Anheuser-Busch InBev N.V | | | (8,865 | ) | | | (352,714 | ) | |
| Bermuda—(0.05)% | |
| PartnerRe Ltd. | | | (2,900 | ) | | | (198,911 | ) | |
| Canada—(0.46)% | |
| Biovail Corp. | | | (4,100 | ) | | | (54,616 | ) | |
| George Weston Ltd. | | | (17,100 | ) | | | (931,948 | ) | |
| Gerdau Ameristeel Corp. | | | (80,100 | ) | | | (555,439 | ) | |
| Ivanhoe Mines Ltd. | | | (30,800 | ) | | | (248,744 | ) | |
200
UBS PACE Select Advisors Trust
UBS PACE Alternative Strategies Investments
Portfolio of investments—July 31, 2009
| Security description | | Number of
shares | | Value | |
| Investments sold short—(continued) | |
| Common stocks—(continued) | |
| Canada—(concluded) | |
| Loblaw Cos. Ltd. | | | (4,200 | ) | | $ | (133,340 | ) | |
| Open Text Corp. | | | (3,500 | ) | | | (132,657 | ) | |
| Total Canada common stocks | | | | | | | (2,056,744 | ) | |
| Finland—(0.02)% | |
| Kesko Oyj, B Shares | | | (3,587 | ) | | | (94,582 | ) | |
| France—(0.05)% | |
| Eutelsat Communications | | | (8,550 | ) | | | (238,913 | ) | |
| Germany—(0.25)% | |
Bayerische Motoren Werke
(BMW) AG | | | (13,440 | ) | | | (621,230 | ) | |
| United Internet AG | | | (38,062 | ) | | | (485,535 | ) | |
| Total Germany common stocks | | | | | | | (1,106,765 | ) | |
| Japan—(0.98)% | |
| Amada Co. Ltd. | | | (43,000 | ) | | | (273,564 | ) | |
| Chugoku Electric Power Co., Inc. | | | (7,200 | ) | | | (150,810 | ) | |
| Citizen Holdings Co. Ltd. | | | (33,800 | ) | | | (183,601 | ) | |
| Dai Nippon Printing Co. Ltd. | | | (8,000 | ) | | | (117,178 | ) | |
| East Japan Railway Co. | | | (7,400 | ) | | | (424,645 | ) | |
| Furukawa Electric Co. Ltd. | | | (58,000 | ) | | | (280,116 | ) | |
| Haseko Corp. | | | (451,000 | ) | | | (428,956 | ) | |
| Hino Motors Ltd. | | | (6,000 | ) | | | (20,037 | ) | |
| Hokuriku Electric Power Co. | | | (24,600 | ) | | | (562,843 | ) | |
| Kawasaki Kisen Kaisha Ltd. | | | (23,000 | ) | | | (86,774 | ) | |
Mitsubishi Gas Chemical
Co., Inc. | | | (18,000 | ) | | | (110,901 | ) | |
| Murata Manufacturing Co. Ltd. | | | (1,100 | ) | | | (53,939 | ) | |
| Nippon Sheet Glass Co. Ltd. | | | (32,000 | ) | | | (95,704 | ) | |
| Nippon Yusen | | | (44,000 | ) | | | (188,322 | ) | |
| NSK Ltd. | | | (24,000 | ) | | | (130,114 | ) | |
| NTN Corp. | | | (74,000 | ) | | | (299,519 | ) | |
| Obayashi Corp. | | | (40,000 | ) | | | (178,811 | ) | |
| Seiko Epson Corp. | | | (6,700 | ) | | | (103,093 | ) | |
| THK Co. Ltd. | | | (7,600 | ) | | | (124,813 | ) | |
| Tohoku Electric Power Co., Inc. | | | (5,000 | ) | | | (104,148 | ) | |
| Toyota Tsusho Corp. | | | (6,900 | ) | | | (106,025 | ) | |
| Ushio, Inc. | | | (1,000 | ) | | | (18,864 | ) | |
| Yamaha Motor Co. Ltd. | | | (24,300 | ) | | | (302,514 | ) | |
| Total Japan common stocks | | | | | | | (4,345,291 | ) | |
| Netherlands—(0.27)% | |
| ASML Holding N.V. | | | (45,718 | ) | | | (1,197,023 | ) | |
| Switzerland—(0.11)% | |
| Adecco SA | | | (3,288 | ) | | | (158,454 | ) | |
| Givaudan SA | | | (253 | ) | | | (169,156 | ) | |
| Nobel Biocare Holding AG | | | (5,858 | ) | | | (139,125 | ) | |
| Total Switzerland common stocks | | | | | | | (466,735 | ) | |
| Security description | | Number of
shares | | Value | |
| Investments sold short—(concluded) | |
| Common stocks—(concluded) | |
| United Kingdom—(0.24)% | |
| F&C Asset Management PLC | | | (47,236 | ) | | $ | (57,996 | ) | |
| Friends Provident Group PLC | | | (472,360 | ) | | | (553,521 | ) | |
| Prudential PLC | | | (57,188 | ) | | | (428,212 | ) | |
Total United Kingdom
common stocks | | | | | | | (1,039,729 | ) | |
| United States—(2.24)% | |
| Amylin Pharmaceuticals, Inc. | | | (33,800 | ) | | | (497,198 | ) | |
| Annaly Capital Management, Inc. | | | (21,600 | ) | | | (363,960 | ) | |
| Cadence Design Systems, Inc. | | | (75,400 | ) | | | (444,860 | ) | |
| Caterpillar, Inc. | | | (15,200 | ) | | | (669,712 | ) | |
| Celgene Corp. | | | (19,200 | ) | | | (1,093,633 | ) | |
Charles River Laboratories
International, Inc. | | | (15,600 | ) | | | (515,892 | ) | |
| Constellation Energy Group, Inc. | | | (14,200 | ) | | | (407,540 | ) | |
| Edwards Lifesciences Corp. | | | (7,500 | ) | | | (490,575 | ) | |
| FTI Consulting, Inc. | | | (7,700 | ) | | | (419,111 | ) | |
| Iron Mountain, Inc. | | | (5,500 | ) | | | (160,655 | ) | |
Liberty Media Corp.—
Entertainment, Series A | | | (17,800 | ) | | | (497,866 | ) | |
| Life Technologies Corp. | | | (3,800 | ) | | | (173,014 | ) | |
| Petrohawk Energy Corp. | | | (9,900 | ) | | | (240,372 | ) | |
Plains Exploration &
Production Co. | | | (27,800 | ) | | | (796,470 | ) | |
| Ralcorp Holdings, Inc. | | | (1,600 | ) | | | (101,616 | ) | |
| Republic Services, Inc. | | | (9,600 | ) | | | (255,360 | ) | |
SBA Communications Corp.,
Class A | | | (41,200 | ) | | | (1,074,908 | ) | |
| Stericycle, Inc. | | | (4,300 | ) | | | (220,160 | ) | |
| Textron, Inc. | | | (3,700 | ) | | | (49,728 | ) | |
| UDR, Inc. | | | (45,900 | ) | | | (479,655 | ) | |
| Vertex Pharmaceuticals, Inc. | | | (27,000 | ) | | | (972,270 | ) | |
Total United States
common stocks | | | | | | | (9,924,555 | ) | |
Total common stocks
(proceeds—$17,854,116) | | | | | | $ | (21,021,962 | ) | |
| Unit Trust—(0.02)% | |
| Canada—(0.02)% | |
Yellow Pages Income Fund
(proceeds—$93,750) | | | (21,700 | ) | | | (100,719 | ) | |
Total investments sold short
(proceeds—$17,947,866)—
(4.77)% | | | | | | | (21,122,681 | ) | |
Other assets in excess of
liabilities—6.21% | | | | | | | 27,473,234 | | |
| Net assets—100.00% | | $ | 442,082,357 | | |
Aggregate cost for federal income tax purposes before investments sold short was $437,208,110 and net unrealized depreciation consisted of:
| Gross unrealized appreciation | | $ | 24,413,808 | | |
| Gross unrealized depreciation | | | (25,890,114 | ) | |
| Net unrealized depreciation | | $ | (1,476,306 | ) | |
201
UBS PACE Select Advisors Trust
UBS PACE Alternative Strategies Investments
Portfolio of investments—July 31, 2009
* Non-income producing security.
** On September 7, 2008, the Federal Housing Finance Agency placed the Federal National Mortgage Association and the Federal Home Loan Mortgage Corporation into conservatorship, and the US Treasury guaranteed the debt issued by those organizations.
*** Amount represents less than 0.005%.
1 Security is traded on the New York Stock Exchange.
2 Security is traded on the Toronto Stock Exchange.
3 Security, or portion thereof, pledged as collateral for investments sold short, written options and futures.
4 In US Dollars unless otherwise indicated.
5 Security issued with zero coupon. Income is recognized through the accretion of discount.
6 Floating rate security. The interest rate shown is the current rate as of July 31, 2009.
7 Illiquid securities representing 1.70% of net assets as of July 31, 2009.
8 Security exempt from registration under Rule 144A of the Securities Act of 1933. These securities, which represent 0.68% of net assets as of July 31, 2009, are considered illiquid and restricted (see table below for more information).
| Illiquid and restricted securities | | Acquisition
dates | | Acquisition
cost | | Acquisition cost
as a percentage
of net assets | | Value at
07/31/09 | | Value as a
percentage
of net assets | |
ANZ National (International) Ltd.,
3.250%, 04/02/12 | | 07/30/09 | | $ | 614,760 | | | | 0.14 | % | | $ | 614,826 | | | | 0.14 | % | |
Bank of America Auto Trust,
Series 2009-IA, Class A2, 1.700%,
12/15/11 | | 07/07/09 | | | 1,799,843 | | | | 0.41 | | | | 1,802,917 | | | | 0.41 | | |
CIT Mortgage Loan Trust, Series 2007-1,
Class 2A1, 1.285%, 10/01/37 | | 10/05/07 | | | 275,707 | | | | 0.06 | | | | 209,537 | | | | 0.05 | | |
CIT Mortgage Loan Trust, Series 2007-1,
Class 2A2, 1.535%, 10/01/37 | | 10/05/07 | | | 130,000 | | | | 0.03 | | | | 44,200 | | | | 0.01 | | |
CIT Mortgage Loan Trust, Series 2007-1,
Class 2A3, 1.735%, 10/01/37 | | 10/05/07 | | | 230,000 | | | | 0.05 | | | | 69,000 | | | | 0.01 | | |
| Dolphin Energy Ltd., 5.888%, 06/15/19 | | 07/23/09 | | | 170,000 | | | | 0.04 | | | | 169,745 | | | | 0.04 | | |
| QBE Insurance Group Ltd., 9.750%, 03/14/14 | | 12/30/08 | | | 92,264 | | | | 0.02 | | | | 114,009 | | | | 0.02 | | |
| | | | | $ | 3,312,574 | | | | 0.75 | % | | $ | 3,024,234 | | | | 0.68 | % | |
9 Security exempt from registration under Rule 144A of the Securities Act of 1933. These securities, which represent 3.24% of net assets as of July 31, 2009, are considered liquid and may be resold in transactions exempt from registration, normally to qualified institutional buyers.
10 Perpetual bond security. The maturity date reflects the next call date.
11 Variable rate security. The interest rate shown is the current rate as of July 31, 2009, and resets at the next call date.
12 Payment-in-kind security for which part of the income earned may be paid as additional principal.
13 Rates shown are the discount rates at date of purchase.
ADR American Depositary Receipt
EUR Euro
FFCB Federal Farm Credit Bank
FHLMC Federal Home Loan Mortgage Corporation
FNMA Federal National Mortgage Association
GDR Global Depositary Receipt
GMAC General Motors Acceptance Corporation
MTN Medium Term Note
REMIC Real Estate Mortgage Investment Conduit
SPDR Standard & Poor's Depository Receipts
STRIPS Separate Trading of Registered Interest and Principal of Securities
TIPS Treasury inflation protected securities ("TIPS") are debt securities issued by the US Treasury whose principal and/or interest payments are adjusted for inflation, unlike debt securities that make fixed principal and interest payments. The interest rate paid by the TIPS is fixed, while the principal value rises or falls based on changes in a published Consumer Price Index ("CPI"). Thus, if inflation occurs, the principal and interest payments on TIPS are adjusted accordingly to protect investors from inflationary loss. During a deflationary period, the principal and interest payments decrease, although the TIPS principal amounts will not drop below their face amounts at maturity. In exchange for the inflation protection, the TIPS generally pay lower interest rates than typical US Treasury securities. Only if inflation occurs will TIPS offer a higher real yield than a conventional Treasury bond of the same maturit y.
202
UBS PACE Select Advisors Trust
UBS PACE Alternative Strategies Investments
Portfolio of investments—July 31, 2009
Written options
Number of
contracts | | Call options written | | Expiration
dates | | Premiums
received | | Current
value | | Unrealized
appreciation
(depreciation) | |
| | 80 | | | DJ Euro Stoxx 50 Index, strike @ EUR 2,550 | | 08/21/09 | | $ | 39,857 | | | $ | 135,917 | | | $ | (96,060 | ) | |
| | 9 | | | Russell 2000 Index Option, strike @ $540 | | 08/22/09 | | | 6,418 | | | | 21,600 | | | | (15,182 | ) | |
| | 49 | | | S&P 500 Index, strike @ $950 | | 08/22/09 | | | 79,763 | | | | 209,818 | | | | (130,055 | ) | |
| | | | | | | | | $ | 126,038 | | | $ | 367,335 | | | $ | (241,297 | ) | |
| | | Put options written | | | | | | | | | |
| | 213 | | | DJ Euro Stoxx 50 Index, strike @ EUR 2,000 | | 08/21/09 | | $ | 52,085 | | | $ | 2,732 | | | $ | 49,353 | | |
| | 12 | | | Russell 2000 Index, strike @ $410 | | 08/22/09 | | | 6,091 | | | | 120 | | | | 5,971 | | |
| | 84 | | | S&P 500 Index, strike @ $750 | | 08/22/09 | | | 47,158 | | | | 2,520 | | | | 44,638 | | |
| | | | | | | | | | 105,334 | | | | 5,372 | | | | 99,962 | | |
| | | | | | | | | $ | 231,372 | | | $ | 372,707 | | | $ | (141,335 | ) | |
Currency type abbreviation:
EUR Euro
Written option activity for the year ended July 31, 2009 was as follows:
| | | Number of
contracts | | Premiums
received | |
| Options outstanding at July 31, 2008 | | | 6,140 | | | $ | 3,206,903 | | |
| Options written | | | 16,540,543 | | | | 47,990,023 | | |
| Options terminated in closing purchase transactions | | | (16,521,166 | ) | | | (29,535,592 | ) | |
| Options expired prior to exercise | | | (25,070 | ) | | | (21,429,962 | ) | |
| Options outstanding at July 31, 2009 | | | 447 | | | $ | 231,372 | | |
Futures contracts
Number of
contracts | | Currency | | Buy contracts | | Expiration
dates | | Cost | | Current
value | | Unrealized
appreciation
(depreciation) | |
| | 220 | | | AUD | | Australian Bond 10 Year Futures | | September 2009 | | $ | 18,845,798 | | | $ | 18,886,523 | | | $ | 40,725 | | |
| | 3 | | | EUR | | DAX Index Futures | | September 2009 | | | 523,372 | | | | 568,022 | | | | 44,650 | | |
| | 12 | | | EUR | | FTSE MIB Index Futures | | September 2009 | | | 1,658,450 | | | | 1,752,764 | | | | 94,314 | | |
| | 98 | | | EUR | | German Euro Bobl Futures | | September 2009 | | | 15,891,357 | | | | 16,137,822 | | | | 246,465 | | |
| | 149 | | | EUR | | German Euro Bund Futures | | September 2009 | | | 25,197,103 | | | | 25,780,308 | | | | 583,205 | | |
| | 145 | | | GBP | | 90 Day Sterling Futures | | December 2010 | | | 29,320,010 | | | | 29,355,699 | | | | 35,689 | | |
| | 58 | | | GBP | | FTSE 100 Index Futures | | September 2009 | | | 4,157,004 | | | | 4,400,066 | | | | 243,062 | | |
| | 20
| | | GBP
| | United Kingdom Long Gilt 10 Year
Futures | |
September 2009 | | | 3,884,049 | | | | 3,893,294 | | | | 9,245 | | |
| | 15 | | | HKD | | Hang Seng Index Futures | | August 2009 | | | 1,965,059 | | | | 1,970,600 | | | | 5,541 | | |
| | 37 | | | USD | | 90 Day Euro Dollar Futures | | August 2009 | | | 9,194,330 | | | | 9,206,988 | | | | 12,658 | | |
| | 22 | | | USD | | 90 Day Euro Dollar Futures | | September 2009 | | | 5,465,933 | | | | 5,472,775 | | | | 6,842 | | |
| | 58 | | | USD | | MSCI EAFE E Mini Index Futures | | September 2009 | | | 4,086,796 | | | | 4,143,810 | | | | 57,014 | | |
| | 6 | | | USD | | S&P 500 Index Futures | | September 2009 | | | 1,411,064 | | | | 1,476,600 | | | | 65,536 | | |
| | 17 | | | USD | | US Treasury Bond 30 Year Futures | | September 2009 | | | 1,980,482 | | | | 2,023,000 | | | | 42,518 | | |
| | 368 | | | USD | | US Treasury Note 10 Year Futures | | September 2009 | | | 43,341,034 | | | | 43,159,500 | | | | (181,534 | ) | |
| | | | | | | | | | | $ | 166,921,841 | | | $ | 168,227,771 | | | $ | 1,305,930 | | |
203
UBS PACE Select Advisors Trust
UBS PACE Alternative Strategies Investments
Portfolio of investments—July 31, 2009
Futures contracts—(concluded)
Number of
contracts | | Currency | | Sale contracts | | Expiration
dates | | Proceeds | | Current
value | | Unrealized
appreciation
(depreciation) | |
| | 39 | | | AUD | | ASX SPI 200 Index Futures | | September 2009 | | $ | 3,234,554 | | | $ | 3,410,052 | | | $ | (175,498 | ) | |
| | 112 | | | AUD | | Australian Bond 3 Year Futures | | September 2009 | | | 9,693,196 | | | | 9,620,994 | | | | 72,202 | | |
| | 221
| | | CAD
| | Canada Government Bond 10 Year
Futures | |
September 2009 | | | 24,792,614 | | | | 24,622,560 | | | | 170,054 | | |
| | 32 | | | EUR | | AEX Index Futures | | August 2009 | | | 2,268,369 | | | | 2,562,385 | | | | (294,016 | ) | |
| | 22 | | | EUR | | CAC 40 Index Futures | | August 2009 | | | 957,317 | | | | 1,067,495 | | | | (110,178 | ) | |
| | 16 | | | EUR | | German Euro Bobl Futures | | September 2009 | | | 2,637,738 | | | | 2,648,963 | | | | (11,225 | ) | |
| | 16 | | | EUR | | German Euro Bund Futures | | September 2009 | | | 2,755,035 | | | | 2,768,355 | | | | (13,320 | ) | |
| | 10 | | | EUR | | IBEX 35 Index Futures | | August 2009 | | | 1,360,151 | | | | 1,535,211 | | | | (175,060 | ) | |
| | 145 | | | GBP | | 90 Day Sterling Futures | | December 2009 | | | 29,917,916 | | | | 29,948,682 | | | | (30,766 | ) | |
| | 76
| | | GBP
| | United Kingdom Long Gilt 10 Year
Futures | |
September 2009 | | | 14,833,045 | | | | 14,815,842 | | | | 17,203 | | |
| | 178
| | | JPY
| | Japan Government Bond 10 Year
Mini Futures | |
September 2009 | | | 25,620,216 | | | | 25,815,092 | | | | (194,876 | ) | |
| | 1 | | | JPY | | TOPIX Index Futures | | September 2009 | | | 96,616 | | | | 100,373 | | | | (3,757 | ) | |
| | 10 | | | USD | | 90 Day Euro Dollar Futures | | December 2009 | | | 2,465,133 | | | | 2,482,250 | | | | (17,117 | ) | |
| | 10 | | | USD | | 90 Day Euro Dollar Futures | | March 2010 | | | 2,463,557 | | | | 2,475,375 | | | | (11,818 | ) | |
| | 259 | | | USD | | S&P 500 E Mini Index Futures | | September 2009 | | | 11,898,877 | | | | 12,747,980 | | | | (849,103 | ) | |
| | 312 | | | USD | | US Treasury Bond 30 Year Futures | | September 2009 | | | 36,860,260 | | | | 37,128,000 | | | | (267,740 | ) | |
| | 51 | | | USD | | US Treasury Note 2 Year Futures | | September 2009 | | | 11,070,403 | | | | 11,045,484 | | | | 24,919 | | |
| | 301 | | | USD | | US Treasury Note 5 Year Futures | | September 2009 | | | 34,430,518 | | | | 34,730,227 | | | | (299,709 | ) | |
| | 33 | | | USD | | US Treasury Note 10 Year Futures | | September 2009 | | | 3,878,787 | | | | 3,870,281 | | | | 8,506 | | |
| | | | | | | | | | | $ | 221,234,302 | | | $ | 223,395,601 | | | $ | (2,161,299 | ) | |
| | | | | | | | | | | | | | | | | | | $ | (855,369 | ) | |
Currency type abbreviations:
AUD Australian Dollar
CAD Canadian Dollar
EUR Euro
GBP Great Britain Pound
HKD Hong Kong Dollar
JPY Japanese Yen
USD United States Dollar
Forward foreign currency contracts
| | | Contracts to
deliver | | In
exchange for | | Maturity
dates | | Unrealized
appreciation
(depreciation) | |
| Australian Dollar | | | 2,799,000 | | | CHF | 2,386,427 | | | 09/16/09 | | $ | (99,835 | ) | |
| Australian Dollar | | | 5,347,519 | | | EUR | 3,050,000 | | | 09/16/09 | | | (111,376 | ) | |
| Australian Dollar | | | 4,206,000 | | | JPY | 322,762,627 | | | 09/16/09 | | | (94,676 | ) | |
| Australian Dollar | | | 6,258,840 | | | USD | 5,063,838 | | | 09/16/09 | | | (154,866 | ) | |
| Australian Dollar | | | 4,211,500 | | | USD | 3,320,174 | | | 09/16/09 | | | (191,431 | ) | |
| Canadian Dollar | | | 1,596,200 | | | CHF | 1,515,065 | | | 09/16/09 | | | (63,669 | ) | |
| Canadian Dollar | | | 2,307,705 | | | EUR | 1,485,000 | | | 09/16/09 | | | (25,844 | ) | |
| Canadian Dollar | | | 4,722,600 | | | USD | 4,219,600 | | | 09/16/09 | | | (165,031 | ) | |
204
UBS PACE Select Advisors Trust
UBS PACE Alternative Strategies Investments
Portfolio of investments—July 31, 2009
Forward foreign currency contracts—(continued)
| | | Contracts to
deliver | | In
exchange for | | Maturity
dates | | Unrealized
appreciation
(depreciation) | |
| Canadian Dollar | | | 7,747,900 | | | USD | 7,003,710 | | | 09/16/09 | | $ | (189,719 | ) | |
| Chinese Yuan Renminbi | | | 10,650,000 | | | USD | 1,552,026 | | | 09/02/09 | | | (6,963 | ) | |
| Chinese Yuan Renminbi | | | 34,660,000 | | | USD | 4,915,681 | | | 09/02/09 | | | (157,985 | ) | |
| Chinese Yuan Renminbi | | | 12,640,000 | | | USD | 1,814,207 | | | 09/02/09 | | | (36,086 | ) | |
| Euro | | | 1,296,000 | | | CAD | 2,095,567 | | | 09/16/09 | | | 98,287 | | |
| Euro | | | 686,000 | | | JPY | 92,380,190 | | | 09/16/09 | | | (1,150 | ) | |
| Euro | | | 1,054,000 | | | USD | 1,343,218 | | | 09/02/09 | | | (159,147 | ) | |
| Euro | | | 1,512,000 | | | USD | 2,152,332 | | | 09/02/09 | | | (2,862 | ) | |
| Euro | | | 1,126,000 | | | USD | 1,628,196 | | | 09/02/09 | | | 23,204 | | |
| Euro | | | 1,119,243 | | | USD | 1,580,433 | | | 09/04/09 | | | (14,936 | ) | |
| Euro | | | 4,014,000 | | | USD | 5,561,824 | | | 09/16/09 | | | (159,713 | ) | |
| Euro | | | 10,513,176 | | | USD | 14,758,946 | | | 09/16/09 | | | (226,488 | ) | |
| Great Britain Pound | | | 903,176 | | | EUR | 1,061,000 | | | 09/16/09 | | | 3,773 | | |
| Great Britain Pound | | | 584,000 | | | JPY | 92,334,488 | | | 09/16/09 | | | 735 | | |
| Great Britain Pound | | | 692,000 | | | NZD | 1,761,832 | | | 09/16/09 | | | 7,613 | | |
| Great Britain Pound | | | 728,647 | | | USD | 1,208,992 | | | 08/07/09 | | | (8,167 | ) | |
| Great Britain Pound | | | 2,895,326 | | | USD | 4,704,859 | | | 09/16/09 | | | (131,189 | ) | |
| Great Britain Pound | | | 8,301,800 | | | USD | 13,444,200 | | | 09/16/09 | | | (422,258 | ) | |
| Japanese Yen | | | 84,530,611 | | | AUD | 1,103,000 | | | 09/16/09 | | | 26,013 | | |
| Japanese Yen | | | 274,273,359 | | | CHF | 3,009,000 | | | 09/16/09 | | | (82,880 | ) | |
| Japanese Yen | | | 354,423,307 | | | EUR | 2,613,000 | | | 09/16/09 | | | (22,511 | ) | |
| Japanese Yen | | | 272,579,984 | | | GBP | 1,736,000 | | | 09/16/09 | | | 17,836 | | |
| Japanese Yen | | | 1,104,593,488 | | | USD | 11,384,719 | | | 09/16/09 | | | (293,374 | ) | |
| Japanese Yen | | | 127,400,000 | | | USD | 1,311,593 | | | 09/16/09 | | | (35,318 | ) | |
| New Zealand Dollar | | | 2,931,350 | | | EUR | 1,326,000 | | | 09/16/09 | | | (45,695 | ) | |
| New Zealand Dollar | | | 1,156,000 | | | USD | 739,840 | | | 09/16/09 | | | (23,545 | ) | |
| New Zealand Dollar | | | 3,680,100 | | | USD | 2,334,249 | | | 09/16/09 | | | (95,970 | ) | |
| Norwegian Krone | | | 14,084,000 | | | SEK | 17,308,178 | | | 09/16/09 | | | 103,897 | | |
| Swedish Krona | | | 13,769,520 | | | USD | 1,772,362 | | | 09/16/09 | | | (136,224 | ) | |
| Swedish Krona | | | 57,959,500 | | | USD | 7,452,207 | | | 09/16/09 | | | (581,530 | ) | |
| Swiss Franc | | | 1,972,599 | | | GBP | 1,118,000 | | | 09/16/09 | | | 20,778 | | |
| Swiss Franc | | | 8,330,916 | | | USD | 7,692,328 | | | 09/16/09 | | | (106,504 | ) | |
| Swiss Franc | | | 18,775,220 | | | USD | 17,480,180 | | | 09/16/09 | | | (95,893 | ) | |
| Swiss Franc | | | 2,103,000 | | | USD | 1,948,034 | | | 10/23/09 | | | (21,399 | ) | |
| United States Dollar | | | 11,558,153 | | | AUD | 14,333,911 | | | 09/16/09 | | | 393,652 | | |
| United States Dollar | | | 11,984,236 | | | AUD | 15,104,400 | | | 09/16/09 | | | 610,015 | | |
| United States Dollar | | | 933,063 | | | AUD | 1,173,000 | | | 10/23/09 | | | 42,174 | | |
| United States Dollar | | | 936,375 | | | BRL | 1,847,000 | | | 10/23/09 | | | 38,851 | | |
| United States Dollar | | | 4,596,000 | | | CAD | 5,152,895 | | | 09/16/09 | | | 188,133 | | |
| United States Dollar | | | 4,071,719 | | | CAD | 4,500,700 | | | 09/16/09 | | | 106,892 | | |
| United States Dollar | | | 1,862,000 | | | CHF | 1,993,178 | | | 09/16/09 | | | 3,876 | | |
| United States Dollar | | | 2,657,339 | | | CHF | 2,892,900 | | | 09/16/09 | | | 50,796 | | |
| United States Dollar | | | 3,071,980 | | | CNY | 20,997,000 | | | 09/02/09 | | | 1,642 | | |
| United States Dollar | | | 3,753,862 | | | CNY | 25,613,000 | | | 09/02/09 | | | (4,530 | ) | |
205
UBS PACE Select Advisors Trust
UBS PACE Alternative Strategies Investments
Portfolio of investments—July 31, 2009
Forward foreign currency contracts—(concluded)
| | | Contracts to
deliver | | In
exchange for | | Maturity
dates | | Unrealized
appreciation
(depreciation) | |
| United States Dollar | | | 1,703,214 | | | CNY | 11,340,000 | | | 09/02/09 | | $ | (43,221 | ) | |
| United States Dollar | | | 790,316 | | | EUR | 610,000 | | | 09/02/09 | | | 79,174 | | |
| United States Dollar | | | 2,301,753 | | | EUR | 1,802,000 | | | 09/02/09 | | | 266,805 | | |
| United States Dollar | | | 1,861,120 | | | EUR | 1,280,000 | | | 09/02/09 | | | (36,617 | ) | |
| United States Dollar | | | 496,652 | | | EUR | 351,723 | | | 09/04/09 | | | 4,694 | | |
| United States Dollar | | | 3,499,439 | | | EUR | 2,460,000 | | | 09/16/09 | | | 7,034 | | |
| United States Dollar | | | 2,462,856 | | | EUR | 1,750,100 | | | 09/16/09 | | | 31,728 | | |
| United States Dollar | | | 1,042,928 | | | GBP | 630,095 | | | 08/07/09 | | | 9,608 | | |
| United States Dollar | | | 9,243,455 | | | GBP | 5,695,502 | | | 09/16/09 | | | 269,716 | | |
| United States Dollar | | | 9,833,474 | | | GBP | 5,990,300 | | | 09/16/09 | | | 172,096 | | |
| United States Dollar | | | 453,779 | | | INR | 22,242,000 | | | 10/23/09 | | | 7,338 | | |
| United States Dollar | | | 7,572,000 | | | JPY | 725,184,145 | | | 09/16/09 | | | 94,863 | | |
| United States Dollar | | | 7,330,458 | | | JPY | 699,600,000 | | | 09/16/09 | | | 65,922 | | |
| United States Dollar | | | 900,750 | | | KRW | 1,132,693,000 | | | 10/23/09 | | | 21,121 | | |
| United States Dollar | | | 851,840 | | | MXN | 11,611,000 | | | 10/23/09 | | | 17,700 | | |
| United States Dollar | | | 5,776,700 | | | NOK | 36,757,491 | | | 09/16/09 | | | 213,437 | | |
| United States Dollar | | | 895,265 | | | NOK | 5,657,000 | | | 10/23/09 | | | 25,722 | | |
| United States Dollar | | | 4,009,336 | | | NZD | 6,274,995 | | | 09/16/09 | | | 134,469 | | |
| United States Dollar | | | 10,037,151 | | | NZD | 15,966,700 | | | 09/16/09 | | | 506,742 | | |
| United States Dollar | | | 265,225 | | | PHP | 12,821,000 | | | 10/08/09 | | | (341 | ) | |
| United States Dollar | | | 944,229 | | | PLN | 2,868,000 | | | 10/23/09 | | | 36,656 | | |
| United States Dollar | | | 3,261,000 | | | SEK | 24,415,646 | | | 09/16/09 | | | 123,240 | | |
| United States Dollar | | | 4,978,787 | | | SEK | 38,367,000 | | | 09/16/09 | | | 339,245 | | |
| | | $ | 116,534 | | |
Currency type abbreviations:
AUD Australian Dollar
BRL Brazilian Real
CAD Canadian Dollar
CHF Swiss Franc
CNY Chinese Yuan Renminbi
EUR Euro
GBP Great Britain Pound
INR Indian Rupee
JPY Japanese Yen
KRW South Korean Won
MXN Mexican Peso
NOK Norwegian Krone
NZD New Zealand Dollar
PHP Philippine Peso
PLN Polish Zloty
SEK Swedish Krona
USD United States Dollar
206
UBS PACE Select Advisors Trust
UBS PACE Alternative Strategies Investments
Portfolio of investments—July 31, 2009
Interest rate swaps7
| | | | | Rate type | | | |
| Counterparty | | Notional
amount (000) | | Termination
dates | | Payments
made by
the Portfolio | | Payments
received by
the Portfolio | | Upfront
payments
received
(made) | | Value | | Unrealized
appreciation
(depreciation) | |
| Deutsche Bank AG | | GBP | 10 | | | 12/17/11 | | | 5.250 | % | | | 1.099 | %14 | | $ | 963 | | | $ | (1,055 | ) | | $ | (92 | ) | |
| Deutsche Bank AG | | JPY | 1,898,000 | | | 12/16/14 | | | 1.000 | | | | 0.638 | 15 | | | 124,992 | | | | (3,838 | ) | | | 121,154 | | |
| Deutsche Bank AG | | KRW | 660,000 | | | 01/28/11 | | | 2.410 | 16 | | | 2.820 | | | | 0 | | | | (4,033 | ) | | | (4,033 | ) | |
| Deutsche Bank AG | | KRW | 200,000 | | | 06/12/11 | | | 2.410 | 16 | | | 3.869 | | | | 0 | | | | 1,054 | | | | 1,054 | | |
| Deutsche Bank AG | | KRW | 1,420,000 | | | 06/26/11 | | | 2.410 | 16 | | | 3.692 | | | | 0 | | | | 2,965 | | | | 2,965 | | |
| Deutsche Bank AG | | KRW | 613,856 | | | 07/06/11 | | | 2.410 | 16 | | | 3.620 | | | | 0 | | | | 308 | | | | 308 | | |
| Deutsche Bank AG | | KRW | 1,025,603 | | | 07/07/11 | | | 2.410 | 16 | | | 3.626 | | | | 0 | | | | 573 | | | | 573 | | |
| Deutsche Bank AG | | USD | 3,200 | | | 12/16/14 | | | 3.000 | | | | 0.479 | 17 | | | (6,193 | ) | | | 29,923 | | | | 23,730 | | |
| Deutsche Bank AG | | USD | 7,300 | | | 12/16/19 | | | 3.500 | | | | 0.479 | 17 | | | (454,874 | ) | | | 254,893 | | | | (199,981 | ) | |
| Deutsche Bank AG | | USD | 600 | | | 12/16/39 | | | 4.000 | | | | 0.479 | 17 | | | 54,362 | | | | 25,883 | | | | 80,245 | | |
| JPMorgan Chase Bank | | GBP | 9,170 | | | 12/16/14 | | | 1.099 | 14 | | | 3.500 | | | | 202,038 | | | | (299,258 | ) | | | (97,220 | ) | |
| JPMorgan Chase Bank | | KRW | 641,000 | | | 01/28/11 | | | 2.410 | 16 | | | 2.830 | | | | 0 | | | | (3,841 | ) | | | (3,841 | ) | |
| JPMorgan Chase Bank | | KRW | 500,000 | | | 06/15/11 | | | 2.410 | 16 | | | 3.900 | | | | 0 | | | | 2,700 | | | | 2,700 | | |
| JPMorgan Chase Bank | | KRW | 1,500,000 | | | 06/22/11 | | | 2.410 | 16 | | | 3.719 | | | | 0 | | | | 4,138 | | | | 4,138 | | |
| JPMorgan Chase Bank | | KRW | 487,792 | | | 07/08/11 | | | 2.410 | 16 | | | 3.660 | | | | 0 | | | | 502 | | | | 502 | | |
Morgan Stanley Capital
Services, Inc. | | EUR | 5,723 | | | 12/16/14 | | | 1.131 | 18 | | | 3.000 | | | | 27,357 | | | | 10,793 | | | | 38,150 | | |
Morgan Stanley Capital
Services, Inc. | | EUR | 11,500 | | | 12/16/14 | | | 3.000 | | | | 1.131 | 18 | | | (146,323 | ) | | | (21,687 | ) | | | (168,010 | ) | |
| | | $ | (197,678 | ) | | $ | 20 | | | $ | (197,658 | ) | |
14 Rate based on 6 Month LIBOR (GBP on Interbank Offered Rate).
15 Rate based on 6 Month LIBOR (JPY on Interbank Offered Rate).
16 Rate based on 3 Month Korean Won CD.
17 Rate based on 3 Month LIBOR (London Interbank Offered Rate).
18 Rate based on 6 Month LIBOR (EUR on Interbank Offered Rate).
EUR Euro
GBP Great Britain Pound
JPY Japanese Yen
KRW South Korean Won
USD United States Dollar
Credit default swaps on credit indicies—buy protection7,19
| | | | | Rate type | | | |
| Counterparty | | Notional
amount (000) | | Termination
date | | Payment
made by
the Portfolio | | Payment
received by
the Portfolio | | Upfront
payment
made | | Value | | Unrealized
depreciation | |
| Deutsche Bank AG | | USD | 27,000 | | | | 12/20/13 | | | | 1.500 | %20 | | | 0.000 | %21 | | $ | (831,776 | ) | | $ | (22,920 | ) | | $ | (854,696 | ) | |
19 If the Portfolio is a buyer of protection and a credit event occurs, as defined under the terms of the particular swap agreement, the Portfolio will either (i) receive from the seller of protection an amount equal to the notional amount of the swap and take delivery of the referenced obligation or underlying securities comprising the referenced obligation or (ii) receive a net settlement amount in the form of cash or securities equal to the notional amount of the swap less the recovery value of the referenced obligation or underlying securities comprising the referenced index.
20 Payments are made based on the notional amount.
21 Payment from the counterparty will be received upon the occurrence of bankruptcy and/or by a restructuring event with respect to the CDX North America Investment Grade Index.
USD United States Dollar
207
UBS PACE Select Advisors Trust
UBS PACE Alternative Strategies Investments
Portfolio of investments—July 31, 2009
Credit default swaps on credit indicies—sell protection7,22
| | | | | Rate type | | | |
| Counterparty | | Notional
amount
(000) | | Termination
dates | | Payments
made by
the Portfolio | | Payments
received by
the Portfolio | | Upfront
payments
received | | Value | | Unrealized
depreciation | | Credit
spread23 | |
| Citibank N.A. | | USD | 1,500 | | | 08/25/37 | | | 0.000 | %24 | | | 0.090 | %25 | | $ | 761,276 | | | $ | (1,013,250 | ) | | $ | (251,974 | ) | | | 8.08 | % | |
| Citibank N.A. | | USD | 1,500 | | | 08/25/37 | | | 0.000 | 24 | | | 0.090 | 25 | | | 772,526 | | | | (1,013,250 | ) | | | (240,724 | ) | | | 8.08 | | |
| Citibank N.A. | | USD | 3,000 | | | 08/25/37 | | | 0.000 | 24 | | | 0.090 | 25 | | | 1,545,053 | | | | (2,026,500 | ) | | | (481,447 | ) | | | 8.08 | | |
| Citibank N.A. | | USD | 4,500 | | | 08/25/37 | | | 0.000 | 24 | | | 0.090 | 25 | | | 2,295,079 | | | | (3,039,750 | ) | | | (744,671 | ) | | | 8.08 | | |
| Deutsche Bank AG | | USD | 2,000 | | | 08/25/37 | | | 0.000 | 24 | | | 0.090 | 25 | | | 464,875 | | | | (1,351,000 | ) | | | (886,125 | ) | | | 8.08 | | |
| Deutsche Bank AG | | USD | 1,500 | | | 08/25/37 | | | 0.000 | 24 | | | 0.090 | 25 | | | 776,276 | | | | (1,013,250 | ) | | | (236,974 | ) | | | 8.08 | | |
| Deutsche Bank AG | | USD | 1,500 | | | 08/25/37 | | | 0.000 | 24 | | | 0.090 | 25 | | | 772,526 | | | | (1,013,250 | ) | | | (240,724 | ) | | | 8.08 | | |
| | | $ | 7,387,611 | | | $ | (10,470,250 | ) | | $ | (3,082,639 | ) | | | | | |
22 If the Portfolio is a seller of protection and a credit event occurs, as defined under the terms of the particular swap agreement, the Portfolio will either (i) pay to the buyer of protection an amount equal to the notional amount of the swap and take delivery of the referenced obligation or (ii) pay a net settlement amount in the form of cash or securities equal to the notional amount of the swap less the recovery value of the referenced obligation.
23 Credit spreads, where applicable, represented in absolute terms, utilized in determining the market value as of period end serve as an indicator of the current status of the payment/performance risk and represent the likelihood or risk of default for the credit derivative. The credit spread of a particular referenced entity reflects the cost of buying/selling protection and may include upfront payments required to be made to enter into the agreement. Wider credit spreads represent a deterioration of the referenced entity's credit soundness and a greater likelihood or risk of default or other credit event occurring as defined under the terms of the agreement. A credit spread identified as "Defaulted" indicates a credit event has occurred for the referenced entity.
24 Payment to the counterparty will be made upon the occurrence of bankruptcy and/or by a restructuring event with respect to the bonds on the Asset Backed Securities Index.
25 Payments received are based on the notional amount.
USD United States Dollar
208
UBS PACE Select Advisors Trust
UBS PACE Alternative Strategies Investments
Portfolio of investments—July 31, 2009
The following is a summary of the fair valuations according to the inputs used as of July 31, 2009 in valuing the Portfolio's investments:
| Measurements at 07/31/09 | |
| | | Quoted prices in
active markets for
identical investments
(Level 1)26 | | Significant other
observable inputs
(Level 2)26 | | Unobservable
inputs
(Level 3) | | Total | |
| Common stocks | | $ | 156,059,206 | | | $ | — | | | $ | — | | | $ | 156,059,206 | | |
| Preferred stocks | | | 26,902 | | | | — | | | | — | | | | 26,902 | | |
| Investment companies | | | 3,705,171 | | | | — | | | | — | | | | 3,705,171 | | |
| Unit trusts | | | 866,419 | | | | — | | | | — | | | | 866,419 | | |
| US government obligations | | | — | | | | 15,305,313 | | | | — | | | | 15,305,313 | | |
| Federal farm credit bank certificates | | | — | | | | 4,941,726 | | | | — | | | | 4,941,726 | | |
Federal home loan mortgage
corporation certificates | | | — | | | | 1,832,748 | | | | — | | | | 1,832,748 | | |
Federal national mortgage
association certificates | | | — | | | | 33,045,058 | | | | — | | | | 33,045,058 | | |
| Collateralized mortgage obligations | | | — | | | | 29,229,782 | | | | — | | | | 29,229,782 | | |
| Asset-backed securities | | | — | | | | 5,272,643 | | | | 322,737 | | | | 5,595,380 | | |
| Corporate notes | | | — | | | | 38,874,832 | | | | — | | | | 38,874,832 | | |
| Municipal bonds and notes | | | — | | | | 413,126 | | | | — | | | | 413,126 | | |
| Non-US government obligations | | | — | | | | 1,389,374 | | | | — | | | | 1,389,374 | | |
| Time deposit | | | — | | | | 9,639,955 | | | | — | | | | 9,639,955 | | |
| Short-term US government obligations | | | — | | | | 76,638,557 | | | | — | | | | 76,638,557 | | |
| Repurchase agreement | | | — | | | | 57,944,000 | | | | — | | | | 57,944,000 | | |
| Options purchased | | | 224,255 | | | | — | | | | — | | | | 224,255 | | |
| Common stocks sold short | | | (21,122,681 | ) | | | — | | | | — | | | | (21,122,681 | ) | |
| Other financial instruments, net27 | | | (996,704 | ) | | | (4,018,459 | ) | | | — | | | | (5,015,163 | ) | |
| Total | | $ | 138,762,568 | | | $ | 270,508,655 | | | $ | 322,737 | | | $ | 409,593,960 | | |
26 The Portfolio may hold securities which are periodically fair valued in accordance with the Portfolio's fair valuation policy. This may result in movements between Level 1 and Level 2 throughout the fiscal year.
27 Other financial instruments include written options, open futures contracts, forward foreign currency contracts and open swap contracts.
The following is a rollforward of the Portfolio's investments that were valued using unobservable inputs (Level 3) for the period:
| Measurements at 07/31/09 | |
| | | Asset-backed
securities | |
| Beginning balance | | $ | 521,265 | | |
| Net purchases/(sales) | | | (145,193 | ) | |
| Accrued discounts/(premiums) | | | — | | |
| Total realized gain/(loss) | | | — | | |
| Total unrealized appreciation/(depreciation) | | | (53,335 | ) | |
| Net transfers in/(out) of Level 3 | | | — | | |
| Ending balance | | $ | 322,737 | | |
The change in unrealized appreciation/(depreciation) relating to the Level 3 investments held at July 31, 2009 was $(53,335).
See accompanying notes to financial statements.
209
UBS PACE Select Advisors Trust
Understanding your Portfolio's expenses (unaudited)
As a shareholder of a Portfolio, you incur two types of costs: (1) transactional costs (as applicable), including sales charges (loads), or ongoing program fees; and (2) ongoing Portfolio costs, including management fees; service and/or distribution (12b-1) fees (if applicable); and other Portfolio expenses. These examples are intended to help you understand your ongoing costs (in dollars) of investing in each Portfolio and to compare these costs with the ongoing costs of investing in other mutual funds.
The examples below are based on an investment of $1,000 invested at the beginning of the period and held for the entire period, February 1, 2009 to July 31, 2009.
Actual expenses
The first line for each class of shares in the table below for each Portfolio provides information about its actual account values and actual expenses. You may use the information in this line, together with the amount you invested, to estimate the expenses that you paid over a period. Simply divide your account value by $1,000 (for example, an $8,600 account value divided by $1,000 = 8.6), then multiply the result by the number in the first line for each class of shares for each respective Portfolio under the heading entitled "Expenses paid during period" to estimate the expenses you paid on your account during the period.
Hypothetical example for comparison purposes
The second line for each class of shares in the table below for each Portfolio provides information about hypothetical account values and hypothetical expenses based on that Portfolio's actual expense ratios for each class of shares and an assumed rate of return of 5% per year before expenses, which is not that Portfolio's actual return for each class of shares. The hypothetical account values and expenses may not be used to estimate the actual ending account balance or expenses you paid for the period. You may use this information to compare the ongoing costs of investing in a Portfolio and other funds. To do so, compare this 5% hypothetical example with the 5% hypothetical examples that appear in the shareholder reports of other funds.
Please note that the expenses shown in the table are meant to highlight your ongoing Portfolio costs only and do not reflect any transactional costs (as applicable), such as sales charges (loads), or program fees. Therefore, the second line in the table for each class of shares for each Portfolio is useful in comparing ongoing Portfolio costs only, and will not help you determine the relative total costs of owning different funds. In addition, if these transactional costs or program fees were included, your costs would have been higher.
210
UBS PACE Select Advisors Trust
| |
| | Beginning
account value
February 1, 2009 | | Ending
account value
July 31, 2009 | | Expenses paid
during period1
02/01/09 to 07/31/09 | | Expense
ratio
during the period | |
| UBS PACE Money Market Investments | |
| Class P | | Actual | | $ | 1,000.00 | | | $ | 1,000.60 | | | $ | 2.73 | | | | 0.55 | % | |
| | Hypothetical
(5% annual return before expenses) | | |
1,000.00 | | | |
1,022.07 | | | |
2.76 | | | |
0.55 | | |
| UBS PACE Government Securities Fixed Income Investments | |
| Class A | | Actual | | | 1,000.00 | | | | 1,056.60 | | | | 5.20 | | | | 1.02 | | |
| | Hypothetical
(5% annual return before expenses) | | |
1,000.00 | | | |
1,019.74 | | | |
5.11 | | | |
1.02 | | |
| Class B | | Actual | | | 1,000.00 | | | | 1,052.60 | | | | 9.01 | | | | 1.77 | | |
| | Hypothetical
(5% annual return before expenses) | | |
1,000.00 | | | |
1,016.02 | | | |
8.85 | | | |
1.77 | | |
| Class C | | Actual | | | 1,000.00 | | | | 1,054.00 | | | | 7.74 | | | | 1.52 | | |
| | Hypothetical
(5% annual return before expenses) | | |
1,000.00 | | | |
1,017.26 | | | |
7.60 | | | |
1.52 | | |
| Class Y | | Actual | | | 1,000.00 | | | | 1,057.90 | | | | 3.93 | | | | 0.77 | | |
| | Hypothetical
(5% annual return before expenses) | | |
1,000.00 | | | |
1,020.98 | | | |
3.86 | | | |
0.77 | | |
| Class P | | Actual | | | 1,000.00 | | | | 1,057.90 | | | | 3.93 | | | | 0.77 | | |
| | Hypothetical
(5% annual return before expenses) | | |
1,000.00 | | | |
1,020.98 | | | |
3.86 | | | |
0.77 | | |
| UBS PACE Intermediate Fixed Income Investments | |
| Class A | | Actual | | | 1,000.00 | | | | 1,059.50 | | | | 4.75 | | | | 0.93 | | |
| | Hypothetical
(5% annual return before expenses) | | |
1,000.00 | | | |
1,020.18 | | | |
4.66 | | | |
0.93 | | |
| Class B | | Actual | | | 1,000.00 | | | | 1,055.40 | | | | 8.56 | | | | 1.68 | | |
| | Hypothetical
(5% annual return before expenses) | | |
1,000.00 | | | |
1,016.46 | | | |
8.40 | | | |
1.68 | | |
| Class C | | Actual | | | 1,000.00 | | | | 1,056.90 | | | | 7.29 | | | | 1.43 | | |
| | Hypothetical
(5% annual return before expenses) | | |
1,000.00 | | | |
1,017.70 | | | |
7.15 | | | |
1.43 | | |
| Class Y | | Actual | | | 1,000.00 | | | | 1,060.80 | | | | 3.47 | | | | 0.68 | | |
| | Hypothetical
(5% annual return before expenses) | | |
1,000.00 | | | |
1,021.42 | | | |
3.41 | | | |
0.68 | | |
| Class P | | Actual | | | 1,000.00 | | | | 1,060.80 | | | | 3.47 | | | | 0.68 | | |
| | Hypothetical
(5% annual return before expenses) | | |
1,000.00 | | | |
1,021.42 | | | |
3.41 | | | |
0.68 | | |
211
UBS PACE Select Advisors Trust
| |
| | Beginning
account value
February 1, 2009 | | Ending
account value
July 31, 2009 | | Expenses paid
during period1
02/01/09 to 07/31/09 | | Expense
ratio
during the period | |
| UBS PACE Strategic Fixed Income Investments | |
| Class A | | Actual | | $ | 1,000.00 | | | $ | 1,088.30 | | | $ | 5.49 | | | | 1.06 | % | |
| | Hypothetical
(5% annual return before expenses) | | |
1,000.00 | | | |
1,019.54 | | | |
5.31 | | | |
1.06 | | |
| Class B | | Actual | | | 1,000.00 | | | | 1,084.40 | | | | 9.35 | | | | 1.81 | | |
| | Hypothetical
(5% annual return before expenses) | | |
1,000.00 | | | |
1,015.82 | | | |
9.05 | | | |
1.81 | | |
| Class C | | Actual | | | 1,000.00 | | | | 1,085.70 | | | | 8.07 | | | | 1.56 | | |
| | Hypothetical
(5% annual return before expenses) | | |
1,000.00 | | | |
1,017.06 | | | |
7.80 | | | |
1.56 | | |
| Class Y | | Actual | | | 1,000.00 | | | | 1,090.10 | | | | 3.89 | | | | 0.75 | | |
| | Hypothetical
(5% annual return before expenses) | | |
1,000.00 | | | |
1,021.08 | | | |
3.76 | | | |
0.75 | | |
| Class P | | Actual | | | 1,000.00 | | | | 1,089.70 | | | | 4.20 | | | | 0.81 | | |
| | Hypothetical
(5% annual return before expenses) | | |
1,000.00 | | | |
1,020.78 | | | |
4.06 | | | |
0.81 | | |
| UBS PACE Municipal Fixed Income Investments | |
| Class A | | Actual | | | 1,000.00 | | | | 1,024.60 | | | | 4.67 | | | | 0.93 | | |
| | Hypothetical
(5% annual return before expenses) | | |
1,000.00 | | | |
1,020.18 | | | |
4.66 | | | |
0.93 | | |
| Class B | | Actual | | | 1,000.00 | | | | 1,021.70 | | | | 8.42 | | | | 1.68 | | |
| | Hypothetical
(5% annual return before expenses) | | |
1,000.00 | | | |
1,016.46 | | | |
8.40 | | | |
1.68 | | |
| Class C | | Actual | | | 1,000.00 | | | | 1,022.10 | | | | 7.17 | | | | 1.43 | | |
| | Hypothetical
(5% annual return before expenses) | | |
1,000.00 | | | |
1,017.70 | | | |
7.15 | | | |
1.43 | | |
| Class Y | | Actual | | | 1,000.00 | | | | 1,026.70 | | | | 3.42 | | | | 0.68 | | |
| | Hypothetical
(5% annual return before expenses) | | |
1,000.00 | | | |
1,021.42 | | | |
3.41 | | | |
0.68 | | |
| Class P | | Actual | | | 1,000.00 | | | | 1,025.90 | | | | 3.42 | | | | 0.68 | | |
| | Hypothetical
(5% annual return before expenses) | | |
1,000.00 | | | |
1,021.42 | | | |
3.41 | | | |
0.68 | | |
| UBS PACE Global Fixed Income Investments | |
| Class A | | Actual | | | 1,000.00 | | | | 1,122.50 | | | | 6.58 | | | | 1.25 | | |
| | Hypothetical
(5% annual return before expenses) | | |
1,000.00 | | | |
1,018.60 | | | |
6.26 | | | |
1.25 | | |
| Class B | | Actual | | | 1,000.00 | | | | 1,118.00 | | | | 10.50 | | | | 2.00 | | |
| | Hypothetical
(5% annual return before expenses) | | |
1,000.00 | | | |
1,014.88 | | | |
9.99 | | | |
2.00 | | |
| Class C | | Actual | | | 1,000.00 | | | | 1,119.80 | | | | 9.20 | | | | 1.75 | | |
| | Hypothetical
(5% annual return before expenses) | | |
1,000.00 | | | |
1,016.12 | | | |
8.75 | | | |
1.75 | | |
| Class Y | | Actual | | | 1,000.00 | | | | 1,124.50 | | | | 4.79 | | | | 0.91 | | |
| | Hypothetical
(5% annual return before expenses) | | |
1,000.00 | | | |
1,020.28 | | | |
4.56 | | | |
0.91 | | |
| Class P | | Actual | | | 1,000.00 | | | | 1,122.90 | | | | 5.26 | | | | 1.00 | | |
| | Hypothetical
(5% annual return before expenses) | | |
1,000.00 | | | |
1,019.84 | | | |
5.01 | | | |
1.00 | | |
212
UBS PACE Select Advisors Trust
| |
| | Beginning
account value
February 1, 2009 | | Ending
account value
July 31, 2009 | | Expenses paid
during period1
02/01/09 to 07/31/09 | | Expense
ratio
during the period | |
| UBS PACE High Yield Investments | |
| Class A | | Actual | | $ | 1,000.00 | | | $ | 1,252.90 | | | $ | 7.54 | | | | 1.35 | % | |
| | Hypothetical
(5% annual return before expenses) | | |
1,000.00 | | | |
1,018.10 | | | |
6.76 | | | |
1.35 | | |
| Class C | | Actual | | | 1,000.00 | | | | 1,250.80 | | | | 10.32 | | | | 1.85 | | |
| | Hypothetical
(5% annual return before expenses) | | |
1,000.00 | | | |
1,015.62 | | | |
9.25 | | | |
1.85 | | |
| Class Y | | Actual | | | 1,000.00 | | | | 1,253.70 | | | | 6.15 | | | | 1.10 | | |
| | Hypothetical
(5% annual return before expenses) | | |
1,000.00 | | | |
1,019.34 | | | |
5.51 | | | |
1.10 | | |
| Class P | | Actual | | | 1,000.00 | | | | 1,255.70 | | | | 6.15 | | | | 1.10 | | |
| | Hypothetical
(5% annual return before expenses) | | |
1,000.00 | | | |
1,019.34 | | | |
5.51 | | | |
1.10 | | |
| UBS PACE Large Co Value Equity Investments | |
| Class A | | Actual | | | 1,000.00 | | | | 1,248.60 | | | | 7.14 | | | | 1.28 | | |
| | Hypothetical
(5% annual return before expenses) | | |
1,000.00 | | | |
1,018.45 | | | |
6.41 | | | |
1.28 | | |
| Class B | | Actual | | | 1,000.00 | | | | 1,244.10 | | | | 11.24 | | | | 2.02 | | |
| | Hypothetical
(5% annual return before expenses) | | |
1,000.00 | | | |
1,014.78 | | | |
10.09 | | | |
2.02 | | |
| Class C | | Actual | | | 1,000.00 | | | | 1,245.30 | | | | 11.25 | | | | 2.02 | | |
| | Hypothetical
(5% annual return before expenses) | | |
1,000.00 | | | |
1,014.78 | | | |
10.09 | | | |
2.02 | | |
| Class Y | | Actual | | | 1,000.00 | | | | 1,252.10 | | | | 4.91 | | | | 0.88 | | |
| | Hypothetical
(5% annual return before expenses) | | |
1,000.00 | | | |
1,020.43 | | | |
4.41 | | | |
0.88 | | |
| Class P | | Actual | | | 1,000.00 | | | | 1,251.00 | | | | 5.69 | | | | 1.02 | | |
| | Hypothetical
(5% annual return before expenses) | | |
1,000.00 | | | |
1,019.74 | | | |
5.11 | | | |
1.02 | | |
| UBS PACE Large Co Growth Equity Investments | |
| Class A | | Actual | | | 1,000.00 | | | | 1,229.10 | | | | 7.13 | | | | 1.29 | | |
| | Hypothetical
(5% annual return before expenses) | | |
1,000.00 | | | |
1,018.40 | | | |
6.46 | | | |
1.29 | | |
| Class B | | Actual | | | 1,000.00 | | | | 1,223.90 | | | | 11.30 | | | | 2.05 | | |
| | Hypothetical
(5% annual return before expenses) | | |
1,000.00 | | | |
1,014.63 | | | |
10.24 | | | |
2.05 | | |
| Class C | | Actual | | | 1,000.00 | | | | 1,224.20 | | | | 11.31 | | | | 2.05 | | |
| | Hypothetical
(5% annual return before expenses) | | |
1,000.00 | | | |
1,014.63 | | | |
10.24 | | | |
2.05 | | |
| Class Y | | Actual | | | 1,000.00 | | | | 1,231.50 | | | | 4.76 | | | | 0.86 | | |
| | Hypothetical
(5% annual return before expenses) | | |
1,000.00 | | | |
1,020.53 | | | |
4.31 | | | |
0.86 | | |
| Class P | | Actual | | | 1,000.00 | | | | 1,229.90 | | | | 5.47 | | | | 0.99 | | |
| | Hypothetical
(5% annual return before expenses) | | |
1,000.00 | | | |
1,019.89 | | | |
4.96 | | | |
0.99 | | |
213
UBS PACE Select Advisors Trust
| |
| | Beginning
account value
February 1, 2009 | | Ending
account value
July 31, 2009 | | Expenses paid
during period1
02/01/09 to 07/31/09 | | Expense
ratio
during the period | |
| UBS PACE Small/Medium Co Value Equity Investments | |
| Class A | | Actual | | $ | 1,000.00 | | | $ | 1,335.20 | | | $ | 8.28 | | | | 1.43 | % | |
| | Hypothetical
(5% annual return before expenses) | | |
1,000.00 | | | |
1,017.70 | | | |
7.15 | | | |
1.43 | | |
| Class B | | Actual | | | 1,000.00 | | | | 1,330.50 | | | | 12.48 | | | | 2.16 | | |
| | Hypothetical
(5% annual return before expenses) | | |
1,000.00 | | | |
1,014.08 | | | |
10.79 | | | |
2.16 | | |
| Class C | | Actual | | | 1,000.00 | | | | 1,328.90 | | | | 12.65 | | | | 2.19 | | |
| | Hypothetical
(5% annual return before expenses) | | |
1,000.00 | | | |
1,013.93 | | | |
10.94 | | | |
2.19 | | |
| Class Y | | Actual | | | 1,000.00 | | | | 1,337.30 | | | | 5.85 | | | | 1.01 | | |
| | Hypothetical
(5% annual return before expenses) | | |
1,000.00 | | | |
1,019.79 | | | |
5.06 | | | |
1.01 | | |
| Class P | | Actual | | | 1,000.00 | | | | 1,336.30 | | | | 6.72 | | | | 1.16 | | |
| | Hypothetical
(5% annual return before expenses) | | |
1,000.00 | | | |
1,019.04 | | | |
5.81 | | | |
1.16 | | |
| UBS PACE Small/Medium Co Growth Equity Investments | |
| Class A | | Actual | | | 1,000.00 | | | | 1,312.30 | | | | 7.97 | | | | 1.39 | | |
| | Hypothetical
(5% annual return before expenses) | | |
1,000.00 | | | |
1,017.90 | | | |
6.95 | | | |
1.39 | | |
| Class B | | Actual | | | 1,000.00 | | | | 1,307.70 | | | | 12.19 | | | | 2.13 | | |
| | Hypothetical
(5% annual return before expenses) | | |
1,000.00 | | | |
1,014.23 | | | |
10.64 | | | |
2.13 | | |
| Class C | | Actual | | | 1,000.00 | | | | 1,308.30 | | | | 12.19 | | | | 2.13 | | |
| | Hypothetical
(5% annual return before expenses) | | |
1,000.00 | | | |
1,014.23 | | | |
10.64 | | | |
2.13 | | |
| Class Y | | Actual | | | 1,000.00 | | | | 1,315.40 | | | | 5.63 | | | | 0.98 | | |
| | Hypothetical
(5% annual return before expenses) | | |
1,000.00 | | | |
1,019.93 | | | |
4.91 | | | |
0.98 | | |
| Class P | | Actual | | | 1,000.00 | | | | 1,314.80 | | | | 6.49 | | | | 1.13 | | |
| | Hypothetical
(5% annual return before expenses) | | |
1,000.00 | | | |
1,019.19 | | | |
5.66 | | | |
1.13 | | |
| UBS PACE International Equity Investments | |
| Class A | | Actual | | | 1,000.00 | | | | 1,285.10 | | | | 8.39 | | | | 1.48 | | |
| | Hypothetical
(5% annual return before expenses) | | |
1,000.00 | | | |
1,017.46 | | | |
7.40 | | | |
1.48 | | |
| Class B | | Actual | | | 1,000.00 | | | | 1,279.90 | | | | 13.57 | | | | 2.40 | | |
| | Hypothetical
(5% annual return before expenses) | | |
1,000.00 | | | |
1,012.89 | | | |
11.98 | | | |
2.40 | | |
| Class C | | Actual | | | 1,000.00 | | | | 1,279.50 | | | | 13.17 | | | | 2.33 | | |
| | Hypothetical
(5% annual return before expenses) | | |
1,000.00 | | | |
1,013.24 | | | |
11.63 | | | |
2.33 | | |
| Class Y | | Actual | | | 1,000.00 | | | | 1,287.90 | | | | 6.01 | | | | 1.06 | | |
| | Hypothetical
(5% annual return before expenses) | | |
1,000.00 | | | |
1,019.54 | | | |
5.31 | | | |
1.06 | | |
| Class P | | Actual | | | 1,000.00 | | | | 1,287.10 | | | | 6.92 | | | | 1.22 | | |
| | Hypothetical
(5% annual return before expenses) | | |
1,000.00 | | | |
1,018.74 | | | |
6.11 | | | |
1.22 | | |
214
UBS PACE Select Advisors Trust
| |
| | Beginning
account value
February 1, 2009 | | Ending
account value
July 31, 2009 | | Expenses paid
during period1
02/01/09 to 07/31/09 | | Expense
ratio
during the period | |
| UBS PACE International Emerging Markets Equity Investments | |
| Class A | | Actual | | $ | 1,000.00 | | | $ | 1,565.10 | | | $ | 12.40 | | | | 1.95 | % | |
| | Hypothetical
(5% annual return before expenses) | | |
1,000.00 | | | |
1,015.12 | | | |
9.74 | | | |
1.95 | | |
| Class B | | Actual | | | 1,000.00 | | | | 1,560.60 | | | | 17.14 | | | | 2.70 | | |
| | Hypothetical
(5% annual return before expenses) | | |
1,000.00 | | | |
1,011.41 | | | |
13.47 | | | |
2.70 | | |
| Class C | | Actual | | | 1,000.00 | | | | 1,559.10 | | | | 17.07 | | | | 2.69 | | |
| | Hypothetical
(5% annual return before expenses) | | |
1,000.00 | | | |
1,011.46 | | | |
13.42 | | | |
2.69 | | |
| Class Y | | Actual | | | 1,000.00 | | | | 1,569.10 | | | | 9.43 | | | | 1.48 | | |
| | Hypothetical
(5% annual return before expenses) | | |
1,000.00 | | | |
1,017.46 | | | |
7.40 | | | |
1.48 | | |
| Class P | | Actual | | | 1,000.00 | | | | 1,565.00 | | | | 12.53 | | | | 1.97 | | |
| | Hypothetical
(5% annual return before expenses) | | |
1,000.00 | | | |
1,015.03 | | | |
9.84 | | | |
1.97 | | |
| UBS PACE Global Real Estate Securities Investments | |
| Class A | | Actual | | | 1,000.00 | | | | 1,252.60 | | | | 8.10 | | | | 1.45 | | |
| | Hypothetical
(5% annual return before expenses) | | |
1,000.00 | | | |
1,017.60 | | | |
7.25 | | | |
1.45 | | |
| Class C | | Actual | | | 1,000.00 | | | | 1,250.00 | | | | 12.27 | | | | 2.20 | | |
| | Hypothetical
(5% annual return before expenses) | | |
1,000.00 | | | |
1,013.88 | | | |
10.99 | | | |
2.20 | | |
| Class Y | | Actual | | | 1,000.00 | | | | 1,255.20 | | | | 6.71 | | | | 1.20 | | |
| | Hypothetical
(5% annual return before expenses) | | |
1,000.00 | | | |
1,018.84 | | | |
6.01 | | | |
1.20 | | |
| Class P | | Actual | | | 1,000.00 | | | | 1,252.60 | | | | 6.70 | | | | 1.20 | | |
| | Hypothetical
(5% annual return before expenses) | | |
1,000.00 | | | |
1,018.84 | | | |
6.01 | | | |
1.20 | | |
| UBS PACE Alternative Strategies Investments | |
| Class A | | Actual | | | 1,000.00 | | | | 1,086.40 | | | | 11.48 | | | | 2.22 | | |
| | Hypothetical
(5% annual return before expenses) | | |
1,000.00 | | | |
1,013.79 | | | |
11.08 | | | |
2.22 | | |
| Class B | | Actual | | | 1,000.00 | | | | 1,082.60 | | | | 15.28 | | | | 2.96 | | |
| �� | Hypothetical
(5% annual return before expenses) | | |
1,000.00 | | | |
1,010.12 | | | |
14.75 | | | |
2.96 | | |
| Class C | | Actual | | | 1,000.00 | | | | 1,081.30 | | | | 15.38 | | | | 2.98 | | |
| | Hypothetical
(5% annual return before expenses) | | |
1,000.00 | | | |
1,010.02 | | | |
14.85 | | | |
2.98 | | |
| Class Y | | Actual | | | 1,000.00 | | | | 1,086.30 | | | | 10.50 | | | | 2.03 | | |
| | Hypothetical
(5% annual return before expenses) | | |
1,000.00 | | | |
1,014.73 | | | |
10.14 | | | |
2.03 | | |
| Class P | | Actual | | | 1,000.00 | | | | 1,086.10 | | | | 10.29 | | | | 1.99 | | |
| | Hypothetical
(5% annual return before expenses) | | |
1,000.00 | | | |
1,014.93 | | | |
9.94 | | | |
1.99 | | |
1 Expenses are equal to the Portfolios' annualized net expense ratios, multiplied by the average account value over the period, multiplied by 181 divided by 365 (to reflect the one-half year period).
215
UBS PACE Select Advisors Trust
Statement of assets and liabilities
July 31, 2009
| | | UBS PACE
Money Market
Investments | | UBS PACE
Government
Securities
Fixed Income
Investments | | UBS PACE
Intermediate
Fixed Income
Investments | | UBS PACE
Strategic
Fixed Income
Investments | |
| Assets: | |
Investments in unaffiliated securities, at value (cost – $460,672,205;
$757,777,873; $447,543,897; $596,667,295; $285,632,587;
$422,908,207; $157,469,874, respectively)1 | | $ | 460,672,205 | | | $ | 751,210,982 | | | $ | 446,427,331 | | | $ | 565,010,991 | | |
Investment in an affiliated security, at value (cost – $9,894,000;
$0; $7,903,377; $16,758,475; $0; $3,705,975; $21,770,202,
respectively) | | | 9,894,000 | | | | — | | | | 7,903,377 | | | | 16,758,475 | | |
Repurchase agreements, at value (cost – $74,865,000; $3,821,000;
$302,000; $49,735,000; $0; $18,096,000; $2,262,000, respectively) | | | 74,865,000 | | | | 3,821,000 | | | | 302,000 | | | | 49,735,000 | | |
Total investments in securities, at value (cost – $545,431,205;
$761,598,873; $455,749,274; $663,160,770; $285,632,587;
$444,710,182; $181,502,076, respectively) | | $ | 545,431,205 | | | $ | 755,031,982 | | | $ | 454,632,708 | | | $ | 631,504,466 | | |
| Cash | | | 650 | | | | 826 | | | | 4,195,490 | | | | 10,465 | | |
Foreign currency, at value (cost – $0; $0; $131; $1,073,620; $0;
$745,362; $270,803, respectively) | | | — | | | | — | | | | 155 | | | | 1,095,401 | | |
| Receivable from affiliates | | | 17,719 | | | | — | | | | — | | | | — | | |
| Receivable for investments sold | | | — | | | | 382,833,936 | | | | 52,145,895 | | | | 40,785,667 | | |
| Receivable for shares of beneficial interest sold | | | 1,139,276 | | | | 1,089,932 | | | | 949,076 | | | | 1,281,028 | | |
| Receivable for interest | | | 200,010 | | | | 2,424,957 | | | | 3,440,307 | | | | 4,730,649 | | |
| Swap contracts, at value3 | | | — | | | | 2,555,560 | | | | — | | | | 6,656,960 | | |
| Due from broker | | | — | | | | 90,700 | | | | — | | | | 44,320 | | |
| Unrealized appreciation on forward foreign currency contracts | | | — | | | | — | | | | 8,834 | | | | 2,657,535 | | |
| Receivable for variation margin | | | — | | | | — | | | | 137,031 | | | | 241,549 | | |
| Receivable for foreign tax reclaims | | | — | | | | — | | | | 7,523 | | | | 34,460 | | |
| Other assets | | | 71,049 | | | | 40,023 | | | | 37,321 | | | | 517,751 | | |
| Total assets | | | 546,859,909 | | | | 1,144,067,916 | | | | 515,554,340 | | | | 689,560,251 | | |
| Liabilities: | |
| Payable for cash collateral from securities loaned | | | 9,894,000 | | | | — | | | | 7,903,377 | | | | 16,758,475 | | |
| Payable for shares of beneficial interest repurchased | | | 4,487,995 | | | | 981,403 | | | | 679,925 | | | | 1,179,396 | | |
| Payable for investments purchased | | | 1,999,847 | | | | 448,311,484 | | | | 61,431,611 | | | | 15,164,094 | | |
| Dividends payable to shareholders | | | 2,574 | | | | — | | | | — | | | | — | | |
Investments sold short, at value (proceeds - $0; $115,045,547;
$39,058,572; $19,126,250; $0; $0; $0, respectively) | | | — | | | | 115,813,442 | | | | 39,198,412 | | | | 19,231,882 | | |
| Due to broker | | | — | | | | 2,140,423 | | | | — | | | | 630,579 | | |
| Payable to affiliates | | | — | | | | 266,404 | | | | 156,912 | | | | 296,744 | | |
Options written, at value (premiums received - $0; $25,587; $0;
$518,914; $0; $0; $0, respectively) | | | — | | | | 2,156 | | | | — | | | | 50,934 | | |
| Unrealized depreciation of forward foreign currency contracts | | | — | | | | — | | | | 116,556 | | | | 3,738,102 | | |
| Payable for foreign withholding taxes | | | — | | | | — | | | | 3,685 | | | | — | | |
| Swap contracts, at value3 | | | — | | | | — | | | | — | | | | 2,288,018 | | |
| Accrued expenses and other liabilities | | | 516,984 | | | | 293,577 | | | | 178,181 | | | | 378,043 | | |
| Total liabilities | | | 16,901,400 | | | | 567,808,889 | | | | 109,668,659 | | | | 59,716,267 | | |
1 Includes $9,695,781; $0; $7,795,459; $15,612,407; $0; $3,675,829; $21,757,940, respectively of investments in securities on loan, at value.
2 Includes restricted cash of $7,794,676 delivered to broker as initial margin for futures contracts for UBS PACE Global Fixed Income Investments.
3 Includes net upfront payments made by UBS PACE Government Securities Fixed Income Investments of $3,792,628 and net upfront payments made by UBS PACE Strategic Fixed Income Investments of $3,118,729.
See accompanying notes to financial statements
216
| | | UBS PACE
Municipal
Fixed Income
Investments | | UBS PACE
Global
Fixed Income
Investments | | UBS PACE
High Yield
Investments | |
| Assets: | |
Investments in unaffiliated securities, at value (cost – $460,672,205;
$757,777,873; $447,543,897; $596,667,295; $285,632,587;
$422,908,207; $157,469,874, respectively)1 | | $ | 289,819,863 | | | $ | 448,946,416 | | | $ | 155,101,027 | | |
Investment in an affiliated security, at value (cost – $9,894,000;
$0; $7,903,377; $16,758,475; $0; $3,705,975; $21,770,202,
respectively) | | | — | | | | 3,705,975 | | | | 21,770,202 | | |
Repurchase agreements, at value (cost – $74,865,000; $3,821,000;
$302,000; $49,735,000; $0; $18,096,000; $2,262,000, respectively) | | | — | | | | 18,096,000 | | | �� | 2,262,000 | | |
Total investments in securities, at value (cost – $545,431,205;
$761,598,873; $455,749,274; $663,160,770; $285,632,587;
$444,710,182; $181,502,076, respectively) | | $ | 289,819,863 | | | $ | 470,748,391 | | | $ | 179,133,229 | | |
| Cash | | | — | | | | 7,795,028 | 2 | | | 943 | | |
Foreign currency, at value (cost – $0; $0; $131; $1,073,620; $0;
$745,362; $270,803, respectively) | | | — | | | | 754,482 | | | | 273,984 | | |
| Receivable from affiliates | | | — | | | | — | | | | — | | |
| Receivable for investments sold | | | 979,263 | | | | — | | | | — | | |
| Receivable for shares of beneficial interest sold | | | 384,506 | | | | 739,525 | | | | 449,169 | | |
| Receivable for interest | | | 3,364,203 | | | | 7,372,931 | | | | 3,286,385 | | |
| Swap contracts, at value3 | | | — | | | | — | | | | — | | |
| Due from broker | | | — | | | | — | | | | — | | |
| Unrealized appreciation on forward foreign currency contracts | | | — | | | | 6,573,109 | | | | — | | |
| Receivable for variation margin | | | — | | | | 2,267,634 | | | | — | | |
| Receivable for foreign tax reclaims | | | — | | | | 103,655 | | | | 3,281 | | |
| Other assets | | | 39,602 | | | | 36,784 | | | | 27,944 | | |
| Total assets | | | 294,587,437 | | | | 496,391,539 | | | | 183,174,935 | | |
| Liabilities: | |
| Payable for cash collateral from securities loaned | | | — | | | | 3,705,975 | | | | 21,770,202 | | |
| Payable for shares of beneficial interest repurchased | | | 574,219 | | | | 768,931 | | | | 273,218 | | |
| Payable for investments purchased | | | 2,028,298 | | | | — | | | | 4,270,427 | | |
| Dividends payable to shareholders | | | — | | | | — | | | | — | | |
Investments sold short, at value (proceeds - $0; $115,045,547;
$39,058,572; $19,126,250; $0; $0; $0, respectively) | | | — | | | | — | | | | — | | |
| Due to broker | | | — | | | | 3,977,587 | | | | — | | |
| Payable to affiliates | | | 154,031 | | | | 317,288 | | | | 74,573 | | |
Options written, at value (premiums received - $0; $25,587; $0;
$518,914; $0; $0; $0, respectively) | | | — | | | | — | | | | — | | |
| Unrealized depreciation of forward foreign currency contracts | | | — | | | | 3,699,935 | | | | 236,935 | | |
| Payable for foreign withholding taxes | | | — | | | | 27,265 | | | | 2,708 | | |
| Swap contracts, at value3 | | | — | | | | — | | | | — | | |
| Accrued expenses and other liabilities | | | 127,724 | | | | 371,983 | | | | 153,681 | | |
| Total liabilities | | | 2,884,272 | | | | 12,868,964 | | | | 26,781,744 | | |
217
UBS PACE Select Advisors Trust
Statement of assets and liabilities (continued)
July 31, 2009
| | | UBS PACE
Money Market
Investments | | UBS PACE
Government
Securities
Fixed Income
Investments | | UBS PACE
Intermediate
Fixed Income
Investments | | UBS PACE
Strategic
Fixed Income
Investments | |
| Net assets: | |
Beneficial interest shares of $0.001 par value (unlimited
amount authorized) | | $ | 529,948,020 | | | $ | 565,544,521 | | | $ | 430,039,156 | | | $ | 666,522,723 | | |
Accumulated undistributed (distributions in excess of)
net investment income | | | — | | | | 1,237,067 | | | | 1,710,474 | | | | 5,309,230 | | |
Accumulated net realized gains (losses) from investments, futures,
options written, short sales, swaps, forward foreign currency contracts
and foreign currency transactions | | | 10,489 | | | | 18,025,862 | | | | (24,719,012 | ) | | | (10,618,624 | ) | |
Net unrealized appreciation (depreciation) of investments, other
assets and liabilities denominated in foreign currency, futures, options
written, short sales, swaps and forward foreign currency contracts | | | — | | | | (8,548,423 | ) | | | (1,144,937 | ) | | | (31,369,345 | ) | |
| Net assets | | $ | 529,958,509 | | | $ | 576,259,027 | | | $ | 405,885,681 | | | $ | 629,843,984 | | |
| Class A | |
| Net assets | | $ | — | | | $ | 90,385,837 | | | $ | 45,164,690 | | | $ | 33,293,067 | | |
| Shares outstanding | | | — | | | | 6,767,608 | | | | 3,899,487 | | | | 2,544,211 | | |
| Net asset value per share | | $ | — | | | $ | 13.36 | | | $ | 11.58 | | | $ | 13.09 | | |
| Maximum offering price per share | | $ | — | | | $ | 13.99 | | | $ | 12.13 | | | $ | 13.71 | | |
| Class B | |
| Net assets | | $ | — | | | $ | 173,132 | | | $ | 154,588 | | | $ | 332,885 | | |
| Shares outstanding | | | — | | | | 12,956 | | | | 13,323 | | | | 25,449 | | |
| Net asset value and offering price per share | | $ | — | | | $ | 13.36 | | | $ | 11.60 | | | $ | 13.08 | | |
| Class C | |
| Net assets | | $ | — | | | $ | 24,476,585 | | | $ | 5,185,281 | | | $ | 8,797,149 | | |
| Shares outstanding | | | — | | | | 1,831,029 | | | | 447,204 | | | | 672,121 | | |
| Net asset value and offering price per share | | $ | — | | | $ | 13.37 | | | $ | 11.59 | | | $ | 13.09 | | |
| Class Y | |
| Net assets | | $ | — | | | $ | 39,199,299 | | | $ | 2,313,357 | | | $ | 3,185,978 | | |
| Shares outstanding | | | — | | | | 2,934,480 | | | | 199,658 | | | | 243,554 | | |
| Net asset value, offering price and redemption value per share1 | | $ | — | | | $ | 13.36 | | | $ | 11.59 | | | $ | 13.08 | | |
| Class P | |
| Net assets | | $ | 529,958,509 | | | $ | 422,024,174 | | | $ | 353,067,765 | | | $ | 584,234,905 | | |
| Shares outstanding | | | 529,948,181 | | | | 31,584,823 | | | | 30,473,660 | | | | 44,668,980 | | |
| Net asset value, offering price and redemption value per share1 | | $ | 1.00 | | | $ | 13.36 | | | $ | 11.59 | | | $ | 13.08 | | |
1 Assumes shares were held a sufficient period or are otherwise not subject to a redemption fee.
See accompanying notes to financial statements
218
| | | UBS PACE
Municipal
Fixed Income
Investments | | UBS PACE
Global
Fixed Income
Investments | | UBS PACE
High Yield
Investments | |
| Net assets: | |
Beneficial interest shares of $0.001 par value (unlimited
amount authorized) | | $ | 290,696,150 | | | $ | 480,322,286 | | | $ | 169,154,754 | | |
Accumulated undistributed (distributions in excess of)
net investment income | | | — | | | | (6,709,415 | ) | | | (1,125,494 | ) | |
Accumulated net realized gains (losses) from investments, futures,
options written, short sales, swaps, forward foreign currency contracts
and foreign currency transactions | | | (3,180,261 | ) | | | (21,557,771 | ) | | | (9,103,024 | ) | |
Net unrealized appreciation (depreciation) of investments, other
assets and liabilities denominated in foreign currency, futures, options
written, short sales, swaps and forward foreign currency contracts | | | 4,187,276 | | | | 31,467,475 | | | | (2,533,045 | ) | |
| Net assets | | $ | 291,703,165 | | | $ | 483,522,575 | | | $ | 156,393,191 | | |
| Class A | |
| Net assets | | $ | 88,167,334 | | | $ | 103,707,674 | | | $ | 7,538,042 | | |
| Shares outstanding | | | 7,083,362 | | | | 8,905,855 | | | | 843,352 | | |
| Net asset value per share | | $ | 12.45 | | | $ | 11.64 | | | $ | 8.94 | | |
| Maximum offering price per share | | $ | 13.04 | | | $ | 12.19 | | | $ | 9.36 | | |
| Class B | |
| Net assets | | $ | 103,022 | | | $ | 191,343 | | | $ | — | | |
| Shares outstanding | | | 8,270 | | | | 16,387 | | | | — | | |
| Net asset value and offering price per share | | $ | 12.46 | | | $ | 11.68 | | | $ | — | | |
| Class C | |
| Net assets | | $ | 15,473,601 | | | $ | 7,234,041 | | | $ | 1,819,499 | | |
| Shares outstanding | | | 1,243,034 | | | | 621,216 | | | | 203,791 | | |
| Net asset value and offering price per share | | $ | 12.45 | | | $ | 11.64 | | | $ | 8.93 | | |
| Class Y | |
| Net assets | | $ | 145,198 | | | $ | 7,773,194 | | | $ | 6,913 | | |
| Shares outstanding | | | 11,658 | | | | 668,549 | | | | 772 | | |
| Net asset value, offering price and redemption value per share1 | | $ | 12.45 | | | $ | 11.63 | | | $ | 8.95 | | |
| Class P | |
| Net assets | | $ | 187,814,010 | | | $ | 364,616,323 | | | $ | 147,028,737 | | |
| Shares outstanding | | | 15,084,504 | | | | 31,317,020 | | | | 16,434,825 | | |
| Net asset value, offering price and redemption value per share1 | | $ | 12.45 | | | $ | 11.64 | | | $ | 8.95 | | |
219
UBS PACE Select Advisors Trust
Statement of assets and liabilities (continued)
July 31, 2009
| | | UBS PACE
Large Co
Value Equity
Investments | | UBS PACE
Large Co
Growth Equity
Investments | | UBS PACE
Small/Medium Co
Value Equity
Investments | | UBS PACE
Small/Medium Co
Growth Equity
Investments | |
| Assets: | |
Investments in unaffiliated securities, at value (cost – $1,007,594,922;
$843,119,658; $321,606,531; $314,968,648; $793,320,482;
$258,840,627; $47,873,936; $372,712,978, respectively)1 | | $ | 990,296,378 | | | $ | 879,777,400 | | | $ | 331,348,735 | | | $ | 340,798,296 | | |
Investment in an affiliated security, at value (cost – $147,996,105;
$150,213,457; $86,696,079; $98,587,174; $113,067,670;
$18,398,485; $15,057,573; $0, respectively) | | | 147,996,105 | | | | 150,213,457 | | | | 86,696,079 | | | | 98,587,174 | | |
Repurchase agreements, at value (cost – $18,086,000; $12,602,000;
$8,520,000; $9,057,000; $5,406,000; $1,326,000; $1,573,000;
$57,944,000, respectively) | | | 18,086,000 | | | | 12,602,000 | | | | 8,520,000 | | | | 9,057,000 | | |
Total investments in securities, at value (cost – $1,173,677,027;
$1,005,935,115; $416,822,610; $422,612,822; $911,794,152;
$278,565,112; $64,504,509; $430,656,978, respectively) | | $ | 1,156,378,483 | | | $ | 1,042,592,857 | | | $ | 426,564,814 | | | $ | 448,442,470 | | |
| Cash | | | 1,278 | | | | 644,293 | | | | 688 | | | | 512 | | |
Foreign currency, at value (cost – $0; $0; $0; $0; $698,671;
$1,812,424; $106,031; $99,577, respectively) | | | — | | | | — | | | | — | | | | — | | |
| Receivable from affiliates | | | — | | | | — | | | | — | | | | — | | |
| Receivable for investments sold | | | 5,554,296 | | | | 14,262,859 | | | | 8,154,185 | | | | 13,537,381 | | |
| Receivable for shares of beneficial interest sold | | | 1,517,179 | | | | 1,569,563 | | | | 551,515 | | | | 576,116 | | |
| Receivable for dividends and interest | | | 1,037,007 | | | | 762,580 | | | | 211,565 | | | | 37,132 | | |
| Swap contracts, at value3 | | | — | | | | — | | | | — | | | | — | | |
| Due from broker | | | — | | | | — | | | | — | | | | — | | |
| Unrealized appreciation on forward foreign currency contracts | | | — | | | | — | | | | — | | | | — | | |
| Receivable for variation margin | | | — | | | | — | | | | — | | | | — | | |
| Receivable for foreign tax reclaims | | | — | | | | 108 | | | | — | | | | — | | |
| Other assets | | | 46,173 | | | | 45,262 | | | | 32,712 | | | | 32,959 | | |
| Total assets | | | 1,164,534,416 | | | | 1,059,877,522 | | | | 435,515,479 | | | | 462,626,570 | | |
| Liabilities: | |
| Payable for cash collateral from securities loaned | | | 147,996,105 | | | | 150,213,457 | | | | 86,696,079 | | | | 98,587,174 | | |
| Payable for investments purchased | | | 6,999,539 | | | | 7,824,243 | | | | 4,049,174 | | | | 15,399,858 | | |
| Payable for shares of beneficial interest repurchased | | | 1,717,432 | | | | 1,399,968 | | | | 567,537 | | | | 527,913 | | |
| Payable to affiliates | | | 685,364 | | | | 570,821 | | | | 209,256 | | | | 222,964 | | |
| Payable for foreign withholding taxes | | | — | | | | 12,308 | | | | — | | | | — | | |
| Unrealized depreciation of forward foreign currency contracts | | | — | | | | — | | | | — | | | | — | | |
| Payable for bank loan | | | — | | | | — | | | | — | | | | — | | |
Investments sold short, at value (proceeds - $0; $0; $0; $0; $0;
$0; $0; $17,947,866, respectively) | | | — | | | | — | | | | — | | | | — | | |
| Swap contracts, at value3 | | | — | | | | — | | | | — | | | | — | | |
Options written, at value (premiums received - $0; $0; $0; $0;
$0; $0; $0; $231,372, respectively) | | | — | | | | — | | | | — | | | | — | | |
| Due to broker | | | — | | | | — | | | | — | | | | — | | |
| Accrued expenses and other liabilities | | | 406,627 | | | | 372,374 | | | | 317,971 | | | | 313,979 | | |
| Total liabilities | | | 157,805,067 | | | | 160,393,171 | | | | 91,840,017 | | | | 115,051,888 | | |
1 Includes $144,327,280; $146,480,661; $82,966,906; $93,595,990; $109,214,107; $18,150,079; $14,631,632, $0, respectively, of investments in securities on loan, at value.
2 Includes restricted cash of $169,000 and $28,332,468 delivered to broker as initial margin for investments sold short, futures contracts and/or swaps for UBS PACE International Equity Investments and UBS PACE Alternative Strategies Investments, respectively.
3 Includes net upfront payments received by UBS PACE Alternative Strategies Investments of $6,358,157.
See accompanying notes to financial statements
220
| | | UBS PACE
International
Equity
Investments | | UBS PACE
International
Emerging
Markets Equity
Investments | | UBS PACE
Global
Real Estate
Securities
Investments | | UBS PACE
Alternative
Strategies
Investments | |
| Assets: | |
Investments in unaffiliated securities, at value (cost – $1,007,594,922;
$843,119,658; $321,606,531; $314,968,648; $793,320,482;
$258,840,627; $47,873,936; $372,712,978, respectively)1 | | $ | 784,727,660 | | | $ | 260,914,575 | | | $ | 54,568,530 | | | $ | 377,787,804 | | |
Investment in an affiliated security, at value (cost – $147,996,105;
$150,213,457; $86,696,079; $98,587,174; $113,067,670;
$18,398,485; $15,057,573; $0, respectively) | | | 113,067,670 | | | | 18,398,485 | | | | 15,057,573 | | | | — | | |
Repurchase agreements, at value (cost – $18,086,000; $12,602,000;
$8,520,000; $9,057,000; $5,406,000; $1,326,000; $1,573,000;
$57,944,000, respectively) | | | 5,406,000 | | | | 1,326,000 | | | | 1,573,000 | | | | 57,944,000 | | |
Total investments in securities, at value (cost – $1,173,677,027;
$1,005,935,115; $416,822,610; $422,612,822; $911,794,152;
$278,565,112; $64,504,509; $430,656,978, respectively) | | $ | 903,201,330 | | | $ | 280,639,060 | | | $ | 71,199,103 | | | $ | 435,731,804 | | |
| Cash | | | 170,785 | 2 | | | 494 | | | | 184 | | | | 28,380,932 | 2 | |
Foreign currency, at value (cost – $0; $0; $0; $0; $698,671;
$1,812,424; $106,031; $99,577, respectively) | | | 706,415 | | | | 1,815,487 | | | | 110,199 | | | | 100,127 | | |
| Receivable from affiliates | | | — | | | | — | | | | 9,585 | | | | — | | |
| Receivable for investments sold | | | 2,420,666 | | | | 4,499,161 | | | | 123,404 | | | | 16,466,074 | | |
| Receivable for shares of beneficial interest sold | | | 1,245,137 | | | | 472,809 | | | | 184,894 | | | | 908,270 | | |
| Receivable for dividends and interest | | | 1,901,126 | | | | 1,692,582 | | | | 199,769 | | | | 1,028,547 | | |
| Swap contracts, at value3 | | | — | | | | — | | | | — | | | | 333,732 | | |
| Due from broker | | | — | | | | — | | | | — | | | | 17,713 | | |
| Unrealized appreciation on forward foreign currency contracts | | | 288,244 | | | | — | | | | — | | | | 4,165,477 | | |
| Receivable for variation margin | | | 29,679 | | | | — | | | | — | | | | 318,661 | | |
| Receivable for foreign tax reclaims | | | 610,791 | | | | 20,397 | | | | 11,536 | | | | 178,284 | | |
| Other assets | | | 47,171 | | | | 38,807 | | | | 16,359 | | | | 44,170 | | |
| Total assets | | | 910,621,344 | | | | 289,178,797 | | | | 71,855,033 | | | | 487,673,791 | | |
| Liabilities: | |
| Payable for cash collateral from securities loaned | | | 113,067,670 | | | | 18,398,485 | | | | 15,057,573 | | | | — | | |
| Payable for investments purchased | | | 1,879,223 | | | | 2,462,938 | | | | 139,414 | | | | 7,060,224 | | |
| Payable for shares of beneficial interest repurchased | | | 1,075,485 | | | | 405,547 | | | | 132,882 | | | | 1,245,714 | | |
| Payable to affiliates | | | 583,658 | | | | 240,105 | | | | 747 | | | | 556,843 | | |
| Payable for foreign withholding taxes | | | 173,060 | | | | 470,428 | | | | 65,000 | | | | 8,578 | | |
| Unrealized depreciation of forward foreign currency contracts | | | 144,049 | | | | — | | | | — | | | | 4,048,943 | | |
| Payable for bank loan | | | — | | | | 1,659,464 | | | | — | | | | — | | |
Investments sold short, at value (proceeds - $0; $0; $0; $0; $0;
$0; $0; $17,947,866, respectively) | | | — | | | | — | | | | — | | | | 21,122,681 | | |
| Swap contracts, at value3 | | | — | | | | — | | | | — | | | | 10,826,882 | | |
Options written, at value (premiums received - $0; $0; $0; $0;
$0; $0; $0; $231,372, respectively) | | | — | | | | — | | | | — | | | | 372,707 | | |
| Due to broker | | | — | | | | — | | | | — | | | | 65,326 | | |
| Accrued expenses and other liabilities | | | 453,987 | | | | 349,503 | | | | 146,645 | | | | 283,536 | | |
| Total liabilities | | | 117,377,132 | | | | 23,986,470 | | | | 15,542,261 | | | | 45,591,434 | | |
221
UBS PACE Select Advisors Trust
Statement of assets and liabilities (concluded)
July 31, 2009
| | | UBS PACE
Large Co
Value Equity
Investments | | UBS PACE
Large Co
Growth Equity
Investments | | UBS PACE
Small/Medium Co
Value Equity
Investments | | UBS PACE
Small/Medium Co
Growth Equity
Investments | |
| Net assets: | |
Beneficial interest shares of $0.001 par value (unlimited
amount authorized) | | $ | 1,469,303,944 | | | $ | 1,180,592,480 | | | $ | 481,143,931 | | | $ | 474,621,740 | | |
| Accumulated undistributed net investment income | | | 7,394,177 | | | | 4,314,260 | | | | 662,945 | | | | — | | |
Accumulated net realized loss from investments,
futures, options written, short sales, swaps, forward foreign
currency contracts and foreign currency transactions | | | (452,670,228 | ) | | | (322,080,131 | ) | | | (147,873,618 | ) | | | (152,876,706 | ) | |
Net unrealized appreciation (depreciation) of investments, other
assets and liabilities denominated in foreign currency, futures,
options written, short sales, swaps and forward foreign
currency contracts | | | (17,298,544 | ) | | | 36,657,742 | | | | 9,742,204 | | | | 25,829,648 | | |
| Net assets | | $ | 1,006,729,349 | | | $ | 899,484,351 | | | $ | 343,675,462 | | | $ | 347,574,682 | | |
| Class A | |
| Net assets | | $ | 146,510,169 | | | $ | 56,038,262 | | | $ | 24,661,307 | | | $ | 29,428,678 | | |
| Shares outstanding | | | 11,132,459 | | | | 4,195,468 | | | | 2,057,358 | | | | 2,767,585 | | |
| Net asset value per share | | $ | 13.16 | | | $ | 13.36 | | | $ | 11.99 | | | $ | 10.63 | | |
| Maximum offering price per share | | $ | 13.93 | | | $ | 14.14 | | | $ | 12.69 | | | $ | 11.25 | | |
| Class B | |
| Net assets | | $ | 405,399 | | | $ | 198,628 | | | $ | 96,728 | | | $ | 67,925 | | |
| Shares outstanding | | | 30,708 | | | | 16,001 | | | | 8,776 | | | | 7,009 | | |
| Net asset value and offering price per share | | $ | 13.20 | | | $ | 12.41 | | | $ | 11.02 | | | $ | 9.69 | | |
| Class C | |
| Net assets | | $ | 16,559,792 | | | $ | 4,169,801 | | | $ | 5,602,837 | | | $ | 3,284,523 | | |
| Shares outstanding | | | 1,259,736 | | | | 335,006 | | | | 506,020 | | | | 336,563 | | |
| Net asset value and offering price per share | | $ | 13.15 | | | $ | 12.45 | | | $ | 11.07 | | | $ | 9.76 | | |
| Class Y | |
| Net assets | | $ | 23,834,181 | | | $ | 16,885,370 | | | $ | 3,255,153 | | | $ | 4,368,671 | | |
| Shares outstanding | | | 1,804,665 | | | | 1,235,504 | | | | 264,932 | | | | 396,555 | | |
| Net asset value, offering price and redemption value per share1 | | $ | 13.21 | | | $ | 13.67 | | | $ | 12.29 | | | $ | 11.02 | | |
| Class P | |
| Net assets | | $ | 819,419,808 | | | $ | 822,192,290 | | | $ | 310,059,437 | | | $ | 310,424,885 | | |
| Shares outstanding | | | 62,274,246 | | | | 60,488,658 | | | | 25,412,459 | | | | 28,468,018 | | |
| Net asset value, offering price and redemption value per share1 | | $ | 13.16 | | | $ | 13.59 | | | $ | 12.20 | | | $ | 10.90 | | |
1 Assumes shares were held a sufficient period or are otherwise not subject to a redemption fee.
See accompanying notes to financial statements
222
| | | UBS PACE
International
Equity
Investments | | UBS PACE
International
Emerging
Markets Equity
Investments | | UBS PACE
Global
Real Estate
Securities
Investments | | UBS PACE
Alternative
Strategies
Investments | |
| Net assets: | |
Beneficial interest shares of $0.001 par value (unlimited
amount authorized) | | $ | 1,105,012,607 | | | $ | 322,558,877 | | | $ | 102,956,552 | | | $ | 579,914,583 | | |
| Accumulated undistributed net investment income | | | 13,620,567 | | | | 3,826,880 | | | | 1,070,627 | | | | 3,750,219 | | |
Accumulated net realized loss from investments,
futures, options written, short sales, swaps, forward foreign
currency contracts and foreign currency transactions | | | (317,062,744 | ) | | | (63,025,874 | ) | | | (54,415,547 | ) | | | (138,481,005 | ) | |
Net unrealized appreciation (depreciation) of investments, other
assets and liabilities denominated in foreign currency, futures,
options written, short sales, swaps and forward foreign
currency contracts | | | (8,326,218 | ) | | | 1,832,444 | | | | 6,701,140 | | | | (3,101,440 | ) | |
| Net assets | | $ | 793,244,212 | | | $ | 265,192,327 | | | $ | 56,312,772 | | | $ | 442,082,357 | | |
| Class A | |
| Net assets | | $ | 71,465,909 | | | $ | 17,783,669 | | | $ | 3,238,321 | | | $ | 65,428,905 | | |
| Shares outstanding | | | 6,097,837 | | | | 1,680,685 | | | | 666,159 | | | | 7,445,839 | | |
| Net asset value per share | | $ | 11.72 | | | $ | 10.58 | | | $ | 4.86 | | | $ | 8.79 | | |
| Maximum offering price per share | | $ | 12.40 | | | $ | 11.20 | | | $ | 5.14 | | | $ | 9.30 | | |
| Class B | |
| Net assets | | $ | 65,670 | | | $ | 134,725 | | | $ | — | | | $ | 29,298 | | |
| Shares outstanding | | | 5,635 | | | | 13,599 | | | | — | | | | 3,392 | | |
| Net asset value and offering price per share | | $ | 11.65 | | | $ | 9.91 | | | $ | — | | | $ | 8.64 | | |
| Class C | |
| Net assets | | $ | 4,342,090 | | | $ | 3,524,939 | | | $ | 136,387 | | | $ | 6,564,992 | | |
| Shares outstanding | | | 378,063 | | | | 355,884 | | | | 28,147 | | | | 759,426 | | |
| Net asset value and offering price per share | | $ | 11.49 | | | $ | 9.90 | | | $ | 4.85 | | | $ | 8.64 | | |
| Class Y | |
| Net assets | | $ | 33,011,754 | | | $ | 33,069,480 | | | $ | 13,016 | | | $ | 13,707,421 | | |
| Shares outstanding | | | 2,815,889 | | | | 3,067,396 | | | | 2,675 | | | | 1,556,837 | | |
| Net asset value, offering price and redemption value per share1 | | $ | 11.72 | | | $ | 10.78 | | | $ | 4.87 | | | $ | 8.80 | | |
| Class P | |
| Net assets | | $ | 684,358,789 | | | $ | 210,679,514 | | | $ | 52,925,048 | | | $ | 356,351,741 | | |
| Shares outstanding | | | 58,507,522 | | | | 19,655,050 | | | | 10,881,454 | | | | 40,398,796 | | |
| Net asset value, offering price and redemption value per share1 | | $ | 11.70 | | | $ | 10.72 | | | $ | 4.86 | | | $ | 8.82 | | |
223
UBS PACE Select Advisors Trust
Statement of operations
For the year ended July 31, 2009
| | | UBS PACE
Money Market
Investments | | UBS PACE
Government
Securities
Fixed Income
Investments | | UBS PACE
Intermediate
Fixed Income
Investments | | UBS PACE
Strategic
Fixed Income
Investments | |
| Investment income: | |
Interest (net of foreign withholding taxes of: $0; $1,083; $25,648; $12,352;
$0; $8,530; $2,708, respectively) | | $ | 8,987,395 | | | $ | 33,885,628 | | | $ | 19,823,587 | | | $ | 38,938,453 | | |
Securities lending income (includes $5,504; $206; $41,681; $58,930; $0;
$3,562; $75,752, respectively, earned from an affiliated entity) | | | 5,504 | | | | 206 | | | | 46,196 | | | | 66,602 | | |
| Dividends | | | — | | | | — | | | | 33,516 | | | | 276,250 | | |
| | | | 8,992,899 | | | | 33,885,834 | | | | 19,903,299 | | | | 39,281,305 | | |
| Expenses: | |
| Investment management and administration fees | | | 2,298,428 | | | | 3,837,279 | | | | 2,155,865 | | | | 4,132,309 | | |
| Service fees–Class A | | | — | | | | 228,947 | | | | 110,627 | | | | 71,676 | | |
| Service and distribution fees–Class B | | | — | | | | 4,131 | | | | 1,845 | | | | 2,398 | | |
| Service and distribution fees–Class C | | | — | | | | 183,079 | | | | 32,707 | | | | 49,618 | | |
| Transfer agency and related services fees | | | 2,735,628 | | | | 877,582 | | | | 390,923 | | | | 1,043,003 | | |
| Reports and notices to shareholders | | | 349,482 | | | | 92,135 | | | | 42,672 | | | | 88,364 | | |
| US Treasury Temporary Guarantee Program Participation fees | | | 197,324 | | | | — | | | | — | | | | — | | |
| Professional fees | | | 101,796 | | | | 187,525 | | | | 156,505 | | | | 166,682 | | |
| Custody and accounting fees | | | 91,158 | | | | 252,879 | | | | 160,446 | | | | 283,491 | | |
| State registration fees | | | 48,364 | | | | 61,727 | | | | 61,452 | | | | 62,431 | | |
| Trustees' fees | | | 18,245 | | | | 17,775 | | | | 16,135 | | | | 17,972 | | |
| Insurance expense | | | 15,524 | | | | 17,315 | | | | 11,625 | | | | 20,109 | | |
| Interest expense | | | — | | | | 1,705 | | | | — | | | | 36,146 | | |
| Other expenses | | | 10,870 | | | | 22,646 | | | | 20,732 | | | | 22,116 | | |
| | | | 5,866,819 | | | | 5,784,725 | | | | 3,161,534 | | | | 5,996,315 | | |
Less: Fee waivers and/or expense reimbursements by investment
manager and administrator | | | (1,987,435 | ) | | | (563,029 | ) | | | (254,379 | ) | | | (369,976 | ) | |
| Net expenses | | | 3,879,384 | | | | 5,221,696 | | | | 2,907,155 | | | | 5,626,339 | | |
| Net investment income | | | 5,113,515 | | | | 28,664,138 | | | | 16,996,144 | | | | 33,654,966 | | |
| Net realized and unrealized gains (losses) from investment activities: | |
| Net realized gains (losses) from: | |
| Investments | | | 43,603 | | | | 33,272,964 | | | | (14,695,110 | ) | | | (5,626,682 | ) | |
| Futures | | | — | | | | 4,997,687 | | | | 7,129,567 | | | | 40,390,360 | | |
| Options written | | | — | | | | 89,032 | | | | — | | | | (945,536 | ) | |
| Short sales | | | — | | | | (706,028 | ) | | | (296,413 | ) | | | (3,503,789 | ) | |
| Swaps | | | — | | | | (13,814,653 | ) | | | — | | | | (21,065,915 | ) | |
| Forward foreign currency contracts and foreign currency transactions | | | — | | | | — | | | | 543,179 | | | | (1,280,842 | ) | |
| Net change in unrealized appreciation/depreciation of: | |
| Investments | | | — | | | | 2,708,649 | | | | 7,792,830 | | | | 4,007,924 | | |
| Futures | | | — | | | | (516,000 | ) | | | 168,258 | | | | (3,305,805 | ) | |
| Options written | | | — | | | | 23,431 | | | | — | | | | (383,960 | ) | |
| Short sales | | | — | | | | (603,407 | ) | | | (152,281 | ) | | | (400,505 | ) | |
| Swaps | | | — | | | | (1,153,921 | ) | | | — | | | | 2,133,077 | | |
Other assets and liabilities denominated in foreign currency and
forward foreign currency contracts | | | — | | | | — | | | | (128,237 | ) | | | (170,695 | ) | |
| Net realized and unrealized gains (losses) from investment activities | | | 43,603 | | | | 24,297,754 | | | | 361,793 | | | | 9,847,632 | | |
| Net increase (decrease) in net assets resulting from operations | | $ | 5,157,118 | | | $ | 52,961,892 | | | $ | 17,357,937 | | | $ | 43,502,598 | | |
See accompanying notes to financial statements
224
| | | UBS PACE
Municipal
Fixed Income
Investments | | UBS PACE
Global
Fixed Income
Investments | | UBS PACE
High Yield
Investments | |
| Investment income: | |
Interest (net of foreign withholding taxes of: $0; $1,083; $25,648; $12,352;
$0; $8,530; $2,708, respectively) | | $ | 13,157,534 | | | $ | 21,069,200 | | | $ | 12,530,489 | | |
Securities lending income (includes $5,504; $206; $41,681; $58,930; $0;
$3,562; $75,752, respectively, earned from an affiliated entity) | | | — | | | | 3,588 | | | | 77,726 | | |
| Dividends | | | — | | | | — | | | | 7,993 | | |
| | | | 13,157,534 | | | | 21,072,788 | | | | 12,616,208 | | |
| Expenses: | |
| Investment management and administration fees | | | 1,659,569 | | | | 3,864,008 | | | | 1,020,138 | | |
| Service fees–Class A | | | 213,824 | | | | 253,576 | | | | 9,192 | | |
| Service and distribution fees–Class B | | | 1,500 | | | | 2,633 | | | | — | | |
| Service and distribution fees–Class C | | | 110,456 | | | | 50,763 | | | | 3,131 | �� | |
| Transfer agency and related services fees | | | 205,669 | | | | 1,126,385 | | | | 348,477 | | |
| Reports and notices to shareholders | | | 30,120 | | | | 124,818 | | | | 36,804 | | |
| US Treasury Temporary Guarantee Program Participation fees | | | — | | | | — | | | | — | | |
| Professional fees | | | 124,396 | | | | 150,454 | | | | 145,964 | | |
| Custody and accounting fees | | | 120,317 | | | | 508,268 | | | | 62,108 | | |
| State registration fees | | | 62,053 | | | | 63,215 | | | | 54,683 | | |
| Trustees' fees | | | 15,207 | | | | 16,930 | | | | 14,017 | | |
| Insurance expense | | | 8,868 | | | | 15,491 | | | | 3,047 | | |
| Interest expense | | | — | | | | 2,564 | | | | 427 | | |
| Other expenses | | | 19,716 | | | | 22,594 | | | | 18,194 | | |
| | | | 2,571,695 | | | | 6,201,699 | | | | 1,716,182 | | |
Less: Fee waivers and/or expense reimbursements by investment
manager and administrator | | | (158,901 | ) | | | (744,658 | ) | | | (300,796 | ) | |
| Net expenses | | | 2,412,794 | | | | 5,457,041 | | | | 1,415,386 | | |
| Net investment income | | | 10,744,740 | | | | 15,615,747 | | | | 11,200,822 | | |
| Net realized and unrealized gains (losses) from investment activities: | |
| Net realized gains (losses) from: | |
| Investments | | | (1,123,099 | ) | | | 6,213,048 | | | | (5,849,633 | ) | |
| Futures | | | — | | | | (1,281,317 | ) | | | — | | |
| Options written | | | — | | | | — | | | | — | | |
| Short sales | | | — | | | | — | | | | — | | |
| Swaps | | | — | | | | — | | | | — | �� | |
| Forward foreign currency contracts and foreign currency transactions | | | — | | | | (31,297,039 | ) | | | 842,004 | | |
| Net change in unrealized appreciation/depreciation of: | |
| Investments | | | 7,206,351 | | | | (4,409,443 | ) | | | 6,482,884 | | |
| Futures | | | — | | | | 1,255,329 | | | | — | | |
| Options written | | | — | | | | — | | | | — | | |
| Short sales | | | — | | | | — | | | | — | | |
| Swaps | | | — | | | | — | | | | — | | |
Other assets and liabilities denominated in foreign currency and
forward foreign currency contracts | | | — | | | | 8,217,362 | | | | (262,270 | ) | |
| Net realized and unrealized gains (losses) from investment activities | | | 6,083,252 | | | | (21,302,060 | ) | | | 1,212,985 | | |
| Net increase (decrease) in net assets resulting from operations | | $ | 16,827,992 | | | $ | (5,686,313 | ) | | $ | 12,413,807 | | |
225
UBS PACE Select Advisors Trust
Statement of operations (concluded)
For the year ended July 31, 2009
| | | UBS PACE
Large Co
Value Equity
Investments | | UBS PACE
Large Co
Growth Equity
Investments | | UBS PACE
Small/Medium Co
Value Equity
Investments | | UBS PACE
Small/Medium Co
Growth Equity
Investments | |
| Investment income: | |
Interest (net of foreign withholding taxes of $0; $0; $0; $0; 1,232; $25; $0;
$5,166, respectively) | | $ | 42,019 | | | $ | 91,637 | | | $ | 26,525 | | | $ | 50,754 | | |
Dividends (net of foreign witholding taxes of $92,529; $159,898; $2,520;
$1,245; $2,756,839; $994,158; $160,785; $397,121, respectively) | | | 26,151,195 | | | | 12,703,013 | | | | 5,426,367 | | | | 1,896,574 | | |
Securities lending income (includes $919,223; $492,795; $478,638;
$761,914; $816,220; $67,945; $37,922; $0, respectively,
earned from an affiliated entity) | | | 1,161,581 | | | | 604,059 | | | | 565,684 | | | | 842,722 | | |
| | | | 27,354,795 | | | | 13,398,709 | | | | 6,018,576 | | | | 2,790,050 | | |
| Expenses: | |
| Investment management and administration fees | | | 7,530,470 | | | | 7,168,481 | | | | 2,649,914 | | | | 2,717,394 | | |
| Service fees–Class A | | | 371,084 | | | | 136,584 | | | | 62,391 | | | | 69,877 | | |
| Service and distribution fees–Class B | | | 4,889 | | | | 2,137 | | | | 1,628 | | | | 756 | | |
| Service and distribution fees–Class C | | | 168,593 | | | | 42,104 | | | | 56,597 | | | | 33,032 | | |
| Transfer agency and related services fees | | | 1,402,327 | | | | 1,258,061 | | | | 1,170,522 | | | | 1,173,954 | | |
| Custody and accounting fees | | | 397,303 | | | | 363,298 | | | | 132,369 | | | | 135,739 | | |
| Reports and notices to shareholders | | | 212,241 | | | | 135,986 | | | | 112,198 | | | | 116,071 | | |
| Professional fees | | | 157,282 | | | | 136,232 | | | | 132,796 | | | | 136,468 | | |
| State registration fees | | | 70,013 | | | | 67,982 | | | | 57,537 | | | | 57,309 | | |
| Insurance expense | | | 39,508 | | | | 35,080 | | | | 12,228 | | | | 13,215 | | |
| Trustees' fees | | | 20,696 | | | | 20,162 | | | | 15,630 | | | | 15,720 | | |
| Interest expense | | | — | | | | 1,017 | | | | 1,419 | | | | 4,217 | | |
| Dividend and interest expense for securities sold short | | | — | | | | — | | | | — | | | | — | | |
| Other expenses | | | 28,243 | | | | 35,233 | | | | 21,429 | | | | 21,297 | | |
| | | | 10,402,649 | | | | 9,402,357 | | | | 4,426,658 | | | | 4,495,049 | | |
Less: Fee waivers and/or expense reimbursements by investment
manager and administrator | | | (6,824 | ) | | | (352,267 | ) | | | (475,632 | ) | | | (555,588 | ) | |
| Net expenses | | | 10,395,825 | | | | 9,050,090 | | | | 3,951,026 | | | | 3,939,461 | | |
| Net investment income (loss) | | | 16,958,970 | | | | 4,348,619 | | | | 2,067,550 | | | | (1,149,411 | ) | |
| Net realized and unrealized gains (losses) from investment activities: | |
| Net realized gains (losses) from: | |
Investments (net of foreign tax expense of $0; $0; $0; $0; $0; $53,817;
$0; $0, respectively) | | | (420,460,079 | ) | | | (308,021,719 | ) | | | (126,673,018 | ) | | | (117,266,224 | ) | |
| Commissions recaptured | | | 422,304 | | | | 51,121 | | | | 146,516 | | | | 294,692 | | |
| Futures | | | — | | | | — | | | | — | | | | — | | |
| Options written | | | — | | | | — | | | | — | | | | — | | |
| Short sales | | | — | | | | — | | | | — | | | | — | | |
| Swaps | | | — | | | | — | | | | — | | | | — | | |
| Forward foreign currency contracts and foreign currency transactions | | | — | | | | (720 | ) | | | 300 | | | | — | | |
| Net change in unrealized appreciation/depreciation of: | |
| Investments | | | 122,875,680 | | | | 32,566,206 | | | | 47,722,997 | | | | 17,977,754 | | |
| Futures | | | — | | | | — | | | | — | | | | — | | |
| Options written | | | — | | | | — | | | | — | | | | — | | |
| Short sales | | | — | | | | — | | | | — | | | | — | | |
| Swaps | | | — | | | | — | | | | — | | | | — | | |
Other assets and liabilities denominated in foreign currency and
forward foreign currency contracts | | | — | | | | — | | | | — | | | | — | | |
| Net realized and unrealized losses from investment activities | | | (297,162,095 | ) | | | (275,405,112 | ) | | | (78,803,205 | ) | | | (98,993,778 | ) | |
| Net decrease in net assets resulting from operations | | $ | (280,203,125 | ) | | $ | (271,056,493 | ) | | $ | (76,735,655 | ) | | $ | (100,143,189 | ) | |
See accompanying notes to financial statements
226
| | | UBS PACE
International
Equity
Investments | | UBS PACE
International
Emerging
Markets Equity
Investments | | UBS PACE
Global
Real Estate
Securities
Investments | | UBS PACE
Alternative
Strategies
Investments | |
| Investment income: | |
Interest (net of foreign withholding taxes of $0; $0; $0; $0; 1,232; $25; $0;
$5,166, respectively) | | $ | 26,528 | | | $ | 6,273 | | | $ | 7,004 | | | $ | 10,150,717 | | |
Dividends (net of foreign witholding taxes of $92,529; $159,898; $2,520;
$1,245; $2,756,839; $994,158; $160,785; $397,121, respectively) | | | 29,230,608 | | | | 9,204,122 | | | | 2,342,022 | | | | 5,000,199 | | |
Securities lending income (includes $919,223; $492,795; $478,638;
$761,914; $816,220; $67,945; $37,922; $0, respectively,
earned from an affiliated entity) | | | 889,437 | | | | 103,370 | | | | 45,875 | | | | — | | |
| | | | 30,146,573 | | | | 9,313,765 | | | | 2,394,901 | | | | 15,150,916 | | |
| Expenses: | |
| Investment management and administration fees | | | 6,821,226 | | | | 2,541,874 | | | | 393,810 | | | | 7,333,286 | | |
| Service fees–Class A | | | 169,927 | | | | 40,854 | | | | 8,389 | | | | 226,165 | | |
| Service and distribution fees–Class B | | | 837 | | | | 1,525 | | | | — | | | | 401 | | |
| Service and distribution fees–Class C | | | 42,643 | | | | 31,572 | | | | 1,336 | | | | 66,194 | | |
| Transfer agency and related services fees | | | 1,227,062 | | | | 1,035,419 | | | | 350,523 | | | | 576,486 | | |
| Custody and accounting fees | | | 759,408 | | | | 467,541 | | | | 30,355 | | | | 527,562 | | |
| Reports and notices to shareholders | | | 123,545 | | | | 87,467 | | | | 36,414 | | | | 112,664 | | |
| Professional fees | | | 152,162 | | | | 138,062 | | | | 153,616 | | | | 290,810 | | |
| State registration fees | | | 65,919 | | | | 57,705 | | | | 49,824 | | | | 79,857 | | |
| Insurance expense | | | 33,181 | | | | 10,378 | | | | 1,686 | | | | 14,814 | | |
| Trustees' fees | | | 18,962 | | | | 14,808 | | | | 13,414 | | | | 23,012 | | |
| Interest expense | | | 18,060 | | | | 8,042 | | | | — | | | | 2,577 | | |
| Dividend and interest expense for securities sold short | | | — | | | | — | | | | — | | | | 1,320,832 | | |
| Other expenses | | | 34,215 | | | | 32,525 | | | | 27,096 | | | | 36,487 | | |
| | | | 9,467,147 | | | | 4,467,772 | | | | 1,066,463 | | | | 10,611,147 | | |
Less: Fee waivers and/or expense reimbursements by investment
manager and administrator | | | (191 | ) | | | — | | | | (465,576 | ) | | | (75,285 | ) | |
| Net expenses | | | 9,466,956 | | | | 4,467,772 | | | | 600,887 | | | | 10,535,862 | | |
| Net investment income (loss) | | | 20,679,617 | | | | 4,845,993 | | | | 1,794,014 | | | | 4,615,054 | | |
| Net realized and unrealized gains (losses) from investment activities: | |
| Net realized gains (losses) from: | |
Investments (net of foreign tax expense of $0; $0; $0; $0; $0; $53,817;
$0; $0, respectively) | | | (304,248,891 | ) | | | (62,301,825 | ) | | | (44,684,628 | ) | | | (151,054,594 | ) | |
| Commissions recaptured | | | 7,576 | | | | — | | | | — | | | | 1,343 | | |
| Futures | | | (27,743 | ) | | | — | | | | — | | | | (12,647,910 | ) | |
| Options written | | | — | | | | — | | | | — | | | | 4,803,213 | | |
| Short sales | | | — | | | | — | | | | — | | | | 19,462,453 | | |
| Swaps | | | — | | | | — | | | | — | | | | 2,439,946 | | |
| Forward foreign currency contracts and foreign currency transactions | | | 4,325,869 | | | | (963,079 | ) | | | (198,973 | ) | | | (14,446,727 | ) | |
| Net change in unrealized appreciation/depreciation of: | |
| Investments | | | (19,329,653 | ) | | | (37,248,268 | ) | | | 17,617,935 | | | | 34,400,925 | | |
| Futures | | | 162,196 | | | | — | | | | — | | | | 3,009,037 | | |
| Options written | | | — | | | | — | | | | — | | | | (505,288 | ) | |
| Short sales | | | — | | | | — | | | | — | | | | (12,060,782 | ) | |
| Swaps | | | — | | | | — | | | | — | | | | (3,354,077 | ) | |
Other assets and liabilities denominated in foreign currency and
forward foreign currency contracts | | | 123,513 | | | | 64,732 | | | | 11,926 | | | | (1,635,101 | ) | |
| Net realized and unrealized losses from investment activities | | | (318,987,133 | ) | | | (100,448,440 | ) | | | (27,253,740 | ) | | | (131,587,562 | ) | |
| Net decrease in net assets resulting from operations | | $ | (298,307,516 | ) | | $ | (95,602,447 | ) | | $ | (25,459,726 | ) | | $ | (126,972,508 | ) | |
227
UBS PACE Select Advisors Trust
Statement of changes in net assets
| | | UBS PACE
Money Market
Investments | | UBS PACE
Government Securities
Fixed Income Investments | | UBS PACE
Intermediate Fixed Income
Investments | |
| | | For the years ended July 31, | | For the years ended July 31, | | For the years ended July 31, | |
| | | 2009 | | 2008 | | 2009 | | 2008 | | 2009 | | 2008 | |
| From operations: | |
| Net investment income | | $ | 5,113,515 | | | $ | 16,388,771 | | | $ | 28,664,138 | | | $ | 30,047,193 | | | $ | 16,996,144 | | | $ | 20,192,901 | | |
Net realized gains (losses) from:
Investments, futures, options written, short sales and swaps | | | 43,603 | | | | 42,669 | | | | 23,839,002 | | | | 5,450,671 | | | | (7,861,956 | ) | | | 10,732,001 | | |
Forward foreign currency contracts and foreign
currency transactions | | | — | | | | — | | | | — | | | | — | | | | 543,179 | | | | 414,205 | | |
Net change in unrealized appreciation/depreciation of:
Investments, futures, options written, short sales and swaps | | | — | | | | — | | | | 458,752 | | | | 564,109 | | | | 7,808,807 | | | | (6,859,657 | ) | |
Other assets and liabilities denominated in foreign
currency and forward foreign currency contracts | | | — | | | | — | | | | — | | | | — | | | | (128,237 | ) | | | (98,422 | ) | |
Net increase in net assets resulting
from operations | | | 5,157,118 | | | | 16,431,440 | | | | 52,961,892 | | | | 36,061,973 | | | | 17,357,937 | | | | 24,381,028 | | |
| Dividends and distributions to shareholders from: | |
| Net investment income–Class A | | | — | | | | — | | | | (4,459,286 | ) | | | (4,119,301 | ) | | | (1,795,305 | ) | | | (2,033,603 | ) | |
| Net investment income–Class B | | | — | | | | — | | | | (17,093 | ) | | | (40,817 | ) | | | (6,035 | ) | | | (8,534 | ) | |
| Net investment income–Class C | | | — | | | | — | | | | (1,065,359 | ) | | | (980,550 | ) | | | (154,820 | ) | | | (142,870 | ) | |
| Net investment income–Class Y | | | — | | | | — | | | | (1,813,866 | ) | | | (832,563 | ) | | | (80,494 | ) | | | (58,840 | ) | |
| Net investment income–Class P | | | (5,113,515 | ) | | | (16,388,771 | ) | | | (24,117,548 | ) | | | (23,950,574 | ) | | | (15,303,630 | ) | | | (17,812,371 | ) | |
| Net realized gains from investment activities–Class A | | | — | | | | — | | | | — | | | | — | | | | — | | | | — | | |
| Net realized gains from investment activities–Class B | | | — | | | | — | | | | — | | | | — | | | | — | | | | — | | |
| Net realized gains from investment activities–Class C | | | — | | | | — | | | | — | | | | — | | | | — | | | | — | | |
| Net realized gains from investment activities–Class Y | | | — | | | | — | | | | — | | | | — | | | | — | | | | — | | |
| Net realized gains from investment activities–Class P | | | (75,184 | ) | | | — | | | | — | | | | — | | | | — | | | | — | | |
| | | | (5,188,699 | ) | | | (16,388,771 | ) | | | (31,473,152 | ) | | | (29,923,805 | ) | | | (17,340,284 | ) | | | (20,056,218 | ) | |
| From beneficial interest transactions: | |
| Net proceeds from shares sold | | | 993,352,180 | | | | 687,863,695 | | | | 180,737,884 | | | | 188,101,229 | | | | 156,868,298 | | | | 122,559,372 | | |
| Cost of shares repurchased | | | (992,040,001 | ) | | | (589,650,962 | ) | | | (340,376,987 | ) | | | (148,148,685 | ) | | | (223,675,213 | ) | | | (128,651,203 | ) | |
| Proceeds from dividends reinvested | | | 5,435,215 | | | | 16,424,952 | | | | 29,363,558 | | | | 28,132,846 | | | | 16,380,092 | | | | 19,171,605 | | |
Net increase (decrease) in net assets from beneficial
interest transactions | | | 6,747,394 | | | | 114,637,685 | | | | (130,275,545 | ) | | | 68,085,390 | | | | (50,426,823 | ) | | | 13,079,774 | | |
| Redemption fees | | | — | | | | — | | | | 120,261 | | | | 42,726 | | | | 113,274 | | | | 33,393 | | |
| Net increase (decrease) in net assets | | | 6,715,813 | | | | 114,680,354 | | | | (108,666,544 | ) | | | 74,266,284 | | | | (50,295,896 | ) | | | 17,437,977 | | |
| Net assets: | |
| Beginning of year | | | 523,242,696 | | | | 408,562,342 | | | | 684,925,571 | | | | 610,659,287 | | | | 456,181,577 | | | | 438,743,600 | | |
| End of year | | $ | 529,958,509 | | | $ | 523,242,696 | | | $ | 576,259,027 | | | $ | 684,925,571 | | | $ | 405,885,681 | | | $ | 456,181,577 | | |
Accumulated undistributed (distributions in excess of)
net investment income | | $ | — | | | $ | — | | | $ | 1,237,067 | | | $ | 1,125,269 | | | $ | 1,710,474 | | | $ | (82,298 | ) | |
See accompanying notes to financial statements
228
| | | UBS PACE
Strategic Fixed Income
Investments | | UBS PACE
Municipal Fixed Income
Investments | |
| | | For the years ended July 31, | | For the years ended July 31, | |
| | | 2009 | | 2008 | | 2009 | | 2008 | |
| From operations: | |
| Net investment income | | $ | 33,654,966 | | | $ | 37,185,606 | | | $ | 10,744,740 | | | $ | 11,603,659 | | |
Net realized gains (losses) from:
Investments, futures, options written, short sales and swaps | | | 9,248,438 | | | | 52,792,029 | | | | (1,123,099 | ) | | | (67,099 | ) | |
Forward foreign currency contracts and foreign
currency transactions | | | (1,280,842 | ) | | | (1,286,693 | ) | | | — | | | | — | | |
Net change in unrealized appreciation/depreciation of:
Investments, futures, options written, short sales and swaps | | | 2,050,731 | | | | (24,821,644 | ) | | | 7,206,351 | | | | (2,260,754 | ) | |
Other assets and liabilities denominated in foreign
currency and forward foreign currency contracts | | | (170,695 | ) | | | (379,967 | ) | | | — | | | | — | | |
Net increase in net assets resulting
from operations | | | 43,502,598 | | | | 63,489,331 | | | | 16,827,992 | | | | 9,275,806 | | |
| Dividends and distributions to shareholders from: | |
| Net investment income–Class A | | | (1,614,614 | ) | | | (1,088,696 | ) | | | (2,879,884 | ) | | | (2,998,965 | ) | |
| Net investment income–Class B | | | (11,303 | ) | | | (9,402 | ) | | | (3,929 | ) | | | (5,340 | ) | |
| Net investment income–Class C | | | (334,904 | ) | | | (221,755 | ) | | | (421,556 | ) | | | (410,457 | ) | |
| Net investment income–Class Y | | | (174,389 | ) | | | (110,514 | ) | | | (5,020 | ) | | | (4,940 | ) | |
| Net investment income–Class P | | | (37,539,805 | ) | | | (36,319,300 | ) | | | (7,435,480 | ) | | | (8,184,710 | ) | |
| Net realized gains from investment activities–Class A | | | (1,866,391 | ) | | | — | | | | — | | | | — | | |
| Net realized gains from investment activities–Class B | | | (13,019 | ) | | | — | | | | — | | | | — | | |
| Net realized gains from investment activities–Class C | | | (398,362 | ) | | | — | | | | — | | | | — | | |
| Net realized gains from investment activities–Class Y | | | (189,340 | ) | | | — | | | | — | | | | — | | |
| Net realized gains from investment activities–Class P | | | (43,989,249 | ) | | | — | | | | — | | | | — | | |
| | | | (86,131,376 | ) | | | (37,749,667 | ) | | | (10,745,869 | ) | | | (11,604,412 | ) | |
| From beneficial interest transactions: | |
| Net proceeds from shares sold | | | 152,450,169 | | | | 235,154,671 | | | | 90,502,777 | | | | 107,388,328 | | |
| Cost of shares repurchased | | | (385,082,637 | ) | | | (185,254,613 | ) | | | (157,640,422 | ) | | | (71,944,136 | ) | |
| Proceeds from dividends reinvested | | | 83,799,182 | | | | 37,006,861 | | | | 9,402,735 | | | | 10,405,239 | | |
Net increase (decrease) in net assets from beneficial
interest transactions | | | (148,833,286 | ) | | | 86,906,919 | | | | (57,734,910 | ) | | | 45,849,431 | | |
| Redemption fees | | | 80,018 | | | | 49,522 | | | | 48,672 | | | | 23,517 | | |
| Net increase (decrease) in net assets | | | (191,382,046 | ) | | | 112,696,105 | | | | (51,604,115 | ) | | | 43,544,342 | | |
| Net assets: | |
| Beginning of year | | | 821,226,030 | | | | 708,529,925 | | | | 343,307,280 | | | | 299,762,938 | | |
| End of year | | $ | 629,843,984 | | | $ | 821,226,030 | | | $ | 291,703,165 | | | $ | 343,307,280 | | |
Accumulated undistributed (distributions in excess of)
net investment income | | $ | 5,309,230 | | | $ | 2,271,040 | | | $ | — | | | $ | — | | |
229
UBS PACE Select Advisors Trust
Statement of changes in net assets (continued)
| | | UBS PACE
Global Fixed Income
Investments | | UBS PACE
High Yield
Investments | | UBS PACE
Large Co Value Equity
Investments | |
| | | For the years ended July 31, | | For the years ended July 31, | | For the years ended July 31, | |
| | | 2009 | | 2008 | | 2009 | | 2008 | | 2009 | | 2008 | |
| From operations: | |
| Net investment income | | $ | 15,615,747 | | | $ | 14,739,705 | | | $ | 11,200,822 | | | $ | 8,067,148 | | | $ | 16,958,970 | | | $ | 23,945,537 | | |
Net realized gains (losses) from:
Investments and futures | | | 4,931,731 | | | | (8,602,616 | ) | | | (5,849,633 | ) | | | (3,216,156 | ) | | | (420,037,775 | ) | | | (5,359,277 | ) | |
Forward foreign currency contracts and foreign
currency transactions | | | (31,297,039 | ) | | | 54,950,690 | | | | 842,004 | | | | (635,133 | ) | | | — | | | | — | | |
Net change in unrealized appreciation/depreciation of:
Investments and futures | | | (3,154,114 | ) | | | 19,986,726 | | | | 6,482,884 | | | | (4,833,431 | ) | | | 122,875,680 | | | | (286,373,179 | ) | |
Other assets and liabilities denominated in foreign
currency and forward foreign currency contracts | | | 8,217,362 | | | | (5,398,653 | ) | | | (262,270 | ) | | | 74,885 | | | | — | | | | — | | |
Net increase (decrease) in net assets resulting
from operations | | | (5,686,313 | ) | | | 75,675,852 | | | | 12,413,807 | | | | (542,687 | ) | | | (280,203,125 | ) | | | (267,786,919 | ) | |
| Dividends and distributions to shareholders from: | |
| Net investment income–Class A | | | (4,095,955 | ) | | | (9,011,090 | ) | | | (341,107 | ) | | | (78,546 | ) | | | (3,178,460 | ) | | | (1,415,372 | ) | |
| Net investment income–Class B | | | (9,089 | ) | | | (43,567 | ) | | | — | | | | — | | | | (4,380 | ) | | | — | | |
| Net investment income–Class C | | | (240,524 | ) | | | (493,198 | ) | | | (33,225 | ) | | | — | | | | (172,642 | ) | | | — | | |
| Net investment income–Class Y | | | (350,713 | ) | | | (667,585 | ) | | | (309 | ) | | | — | | | | (628,808 | ) | | | (365,430 | ) | |
| Net investment income–Class P | | | (17,151,555 | ) | | | (40,596,801 | ) | | | (12,387,174 | ) | | | (7,678,098 | ) | | | (20,083,416 | ) | | | (10,592,086 | ) | |
| Net realized gains from investment activities–Class A | | | — | | | | — | | | | — | | | | (885 | ) | | | — | | | | (31,780,291 | ) | |
| Net realized gains from investment activities–Class B | | | — | | | | — | | | | — | | | | — | | | | — | | | | (167,260 | ) | |
| Net realized gains from investment activities–Class C | | | — | | | | — | | | | — | | | | — | | | | — | | | | (3,771,932 | ) | |
| Net realized gains from investment activities–Class Y | | | — | | | | — | | | | — | | | | — | | | | — | | | | (4,834,393 | ) | |
| Net realized gains from investment activities–Class P | | | — | | | | — | | | | — | | | | (115,248 | ) | | | — | | | | (154,419,861 | ) | |
| Return of capital–Class A | | | — | | | | — | | | | — | | | | (3,499 | ) | | | — | | | | — | | |
| Return of capital–Class P | | | — | | | | — | | | | — | | | | (296,649 | ) | | | — | | | | — | | |
| | | | (21,847,836 | ) | | | (50,812,241 | ) | | | (12,761,815 | ) | | | (8,172,925 | ) | | | (24,067,706 | ) | | | (207,346,625 | ) | |
| From beneficial interest transactions: | |
| Net proceeds from shares sold | | | 76,168,397 | | | | 162,404,589 | | | | 64,069,371 | | | | 83,071,564 | | | | 241,241,795 | | | | 356,271,471 | | |
| Cost of shares repurchased | | | (256,422,347 | ) | | | (131,458,816 | ) | | | (64,890,905 | ) | | | (25,196,294 | ) | | | (390,942,993 | ) | | | (325,980,857 | ) | |
| Proceeds from dividends reinvested | | | 20,468,390 | | | | 48,069,713 | | | | 12,364,524 | | | | 8,081,173 | | | | 23,321,670 | | | | 201,490,481 | | |
Net increase (decrease) in net assets from beneficial
interest transactions | | | (159,785,560 | ) | | | 79,015,486 | | | | 11,542,990 | | | | 65,956,443 | | | | (126,379,528 | ) | | | 231,781,095 | | |
| Redemption fees | | | 42,336 | | | | 40,812 | | | | 31,454 | | | | 14,143 | | | | 140,448 | | | | 64,874 | | |
| Net increase (decrease) in net assets | | | (187,277,373 | ) | | | 103,919,909 | | | | 11,226,436 | | | | 57,254,974 | | | | (430,509,911 | ) | | | (243,287,575 | ) | |
| Net assets: | |
| Beginning of year | | | 670,799,948 | | | | 566,880,039 | | | | 145,166,755 | | | | 87,911,781 | | | | 1,437,239,260 | | | | 1,680,526,835 | | |
| End of year | | $ | 483,522,575 | | | $ | 670,799,948 | | | $ | 156,393,191 | | | $ | 145,166,755 | | | $ | 1,006,729,349 | | | $ | 1,437,239,260 | | |
Accumulated undistributed (distributions in excess of)
net investment income | | $ | (6,709,415 | ) | | $ | 13,367,564 | | | $ | (1,125,494 | ) | | $ | (435,085 | ) | | $ | 7,394,177 | | | $ | 14,502,913 | | |
See accompanying notes to financial statements
230
| | | UBS PACE
Large Co Growth Equity
Investments | | UBS PACE
Small/Medium Co Value
Equity Investments | |
| | | For the years ended July 31, | | For the years ended July 31, | |
| | | 2009 | | 2008 | | 2009 | | 2008 | |
| From operations: | |
| Net investment income | | $ | 4,348,619 | | | $ | 3,804,474 | | | $ | 2,067,550 | | | $ | 2,328,140 | | |
Net realized gains (losses) from:
Investments and futures | | | (307,970,598 | ) | | | 15,635,038 | | | | (126,526,502 | ) | | | (6,014,549 | ) | |
Forward foreign currency contracts and foreign
currency transactions | | | (720 | ) | | | 710 | | | | 300 | | | | — | | |
Net change in unrealized appreciation/depreciation of:
Investments and futures | | | 32,566,206 | | | | (105,987,544 | ) | | | 47,722,997 | | | | (89,021,683 | ) | |
Other assets and liabilities denominated in foreign
currency and forward foreign currency contracts | | | — | | | | — | | | | — | | | | — | | |
Net increase (decrease) in net assets resulting
from operations | | | (271,056,493 | ) | | | (86,547,322 | ) | | | (76,735,655 | ) | | | (92,708,092 | ) | |
| Dividends and distributions to shareholders from: | |
| Net investment income–Class A | | | — | | | | — | | | | (180,976 | ) | | | (11,759 | ) | |
| Net investment income–Class B | | | — | | | | — | | | | — | | | | — | | |
| Net investment income–Class C | | | — | | | | — | | | | — | | | | — | | |
| Net investment income–Class Y | | | (44,473 | ) | | | (69,854 | ) | | | (41,898 | ) | | | (17,009 | ) | |
| Net investment income–Class P | | | (1,242,075 | ) | | | (2,467,674 | ) | | | (2,895,233 | ) | | | (702,792 | ) | |
| Net realized gains from investment activities–Class A | | | (294,201 | ) | | | (2,106,176 | ) | | | (6,943 | ) | | | (4,977,880 | ) | |
| Net realized gains from investment activities–Class B | | | (1,255 | ) | | | (12,830 | ) | | | (57 | ) | | | (98,245 | ) | |
| Net realized gains from investment activities–Class C | | | (24,776 | ) | | | (196,275 | ) | | | (1,751 | ) | | | (1,303,538 | ) | |
| Net realized gains from investment activities–Class Y | | | (89,212 | ) | | | (679,047 | ) | | | (938 | ) | | | (544,442 | ) | |
| Net realized gains from investment activities–Class P | | | (4,536,274 | ) | | | (33,937,523 | ) | | | (83,038 | ) | | | (53,593,047 | ) | |
| Return of capital–Class A | | | — | | | | — | | | | — | | | | — | | |
| Return of capital–Class P | | | — | | | | — | | | | — | | | | — | | |
| | | | (6,232,266 | ) | | | (39,469,379 | ) | | | (3,210,834 | ) | | | (61,248,712 | ) | |
| From beneficial interest transactions: | |
| Net proceeds from shares sold | | | 217,727,567 | | | | 368,287,523 | | | | 83,578,030 | | | | 131,971,549 | | |
| Cost of shares repurchased | | | (384,750,899 | ) | | | (289,528,903 | ) | | | (142,331,683 | ) | | | (109,717,136 | ) | |
| Proceeds from dividends reinvested | | | 6,083,258 | | | | 38,722,166 | | | | 3,140,822 | | | | 60,186,089 | | |
Net increase (decrease) in net assets from beneficial
interest transactions | | | (160,940,074 | ) | | | 117,480,786 | | | | (55,612,831 | ) | | | 82,440,502 | | |
| Redemption fees | | | 126,320 | | | | 64,871 | | | | 54,836 | | | | 28,189 | | |
| Net increase (decrease) in net assets | | | (438,102,513 | ) | | | (8,471,044 | ) | | | (135,504,484 | ) | | | (71,488,113 | ) | |
| Net assets: | |
| Beginning of year | | | 1,337,586,864 | | | | 1,346,057,908 | | | | 479,179,946 | | | | 550,668,059 | | |
| End of year | | $ | 899,484,351 | | | $ | 1,337,586,864 | | | $ | 343,675,462 | | | $ | 479,179,946 | | |
Accumulated undistributed (distributions in excess of)
net investment income | | $ | 4,314,260 | | | $ | 1,365,350 | | | $ | 662,945 | | | $ | 1,790,046 | | |
231
UBS PACE Select Advisors Trust
Statement of changes in net assets (concluded)
| | | UBS PACE
Small/Medium Co Growth
Equity Investments | | UBS PACE
International
Equity Investments | | UBS PACE
International Emerging
Markets Equity Investments | |
| | | For the years ended July 31, | | For the years ended July 31, | | For the years ended July 31, | |
| | | 2009 | | 2008 | | 2009 | | 2008 | | 2009 | | 2008 | |
| From operations: | |
| Net investment income (loss) | | $ | (1,149,411 | ) | | $ | (3,035,935 | ) | | $ | 20,679,617 | | | $ | 33,042,219 | | | $ | 4,845,993 | | | $ | 5,632,361 | | |
Net realized gains (losses) from:
Investments, futures, options written, short sales and swaps | | | (116,971,532 | ) | | | (21,662,074 | ) | | | (304,269,058 | ) | | | 32,871,481 | | | | (62,301,825 | ) | | | 73,028,013 | | |
Forward foreign currency contracts and foreign
currency transactions | | | — | | | | — | | | | 4,325,869 | | | | 1,601,404 | | | | (963,079 | ) | | | 74,349 | | |
Net change in unrealized appreciation/depreciation of:
Investments, futures, options written, short sales, and swaps | | | 17,977,754 | | | | (41,842,187 | ) | | | (19,167,457 | ) | | | (260,973,271 | ) | | | (37,248,268 | ) | | | (88,839,298 | ) | |
Other assets and liabilities denominated in foreign currency
and forward foreign currency contracts | | | — | | | | — | | | | 123,513 | | | | (419,156 | ) | | | 64,732 | | | | 112,725 | | |
Net decrease in net assets resulting
from operations | | | (100,143,189 | ) | | | (66,540,196 | ) | | | (298,307,516 | ) | | | (193,877,323 | ) | | | (95,602,447 | ) | | | (9,991,850 | ) | |
| Dividends and distributions to shareholders from: | |
| Net investment income–Class A | | | — | | | | — | | | | (3,074,397 | ) | | | (1,698,807 | ) | | | (167,345 | ) | | | (355,396 | ) | |
| Net investment income–Class B | | | — | | | | — | | | | (1,520 | ) | | | (1,378 | ) | | | — | | | | (1,385 | ) | |
| Net investment income–Class C | | | — | | | | — | | | | (139,987 | ) | | | (44,547 | ) | | | — | | | | (37,870 | ) | |
| Net investment income–Class Y | | | — | | | | — | | | | (1,620,207 | ) | | | (1,063,788 | ) | | | (285,985 | ) | | | (491,601 | ) | |
| Net investment income–Class P | | | — | | | | — | | | | (32,754,998 | ) | | | (19,300,639 | ) | | | (2,344,776 | ) | | | (4,491,022 | ) | |
| Net realized gains from investment activities–Class A | | | — | | | | (7,153,725 | ) | | | — | | | | (13,559,594 | ) | | | (4,223,244 | ) | | | (4,756,491 | ) | |
| Net realized gains from investment activities–Class B | | | — | | | | (38,611 | ) | | | — | | | | (48,077 | ) | | | (44,804 | ) | | | (77,205 | ) | |
| Net realized gains from investment activities–Class C | | | — | | | | (1,017,570 | ) | | | — | | | | (932,772 | ) | | | (852,014 | ) | | | (1,209,655 | ) | |
| Net realized gains from investment activities–Class Y | | | — | | | | (998,131 | ) | | | — | | | | (6,706,296 | ) | | | (4,254,851 | ) | | | (5,043,668 | ) | |
| Net realized gains from investment activities–Class P | | | — | | | | (76,426,562 | ) | | | — | | | | (128,203,620 | ) | | | (50,552,316 | ) | | | (56,782,137 | ) | |
| | | | — | | | | (85,634,599 | ) | | | (37,591,109 | ) | | | (171,559,518 | ) | | | (62,725,335 | ) | | | (73,246,430 | ) | |
| From beneficial interest transactions: | |
| Net proceeds from shares sold | | | 81,226,131 | | | | 129,795,967 | | | | 202,345,602 | | | | 318,182,760 | | | | 68,138,687 | | | | 97,285,770 | | |
| Cost of shares repurchased | | | (142,190,090 | ) | | | (116,659,181 | ) | | | (322,151,375 | ) | | | (287,047,955 | ) | | | (112,478,538 | ) | | | (123,610,703 | ) | |
| Proceeds from dividends reinvested | | | — | | | | 84,110,955 | | | | 36,549,444 | | | | 167,691,909 | | | | 61,489,737 | | | | 72,159,958 | | |
Net increase (decrease) in net assets from beneficial
interest transactions | | | (60,963,959 | ) | | | 97,247,741 | | | | (83,256,329 | ) | | | 198,826,714 | | | | 17,149,886 | | | | 45,835,025 | | |
| Redemption fees | | | 50,018 | | | | 25,799 | | | | 123,290 | | | | 61,090 | | | | 40,596 | | | | 33,560 | | |
Contributions to capital from investment
manager/sub-advisors | | | — | | | | — | | | | — | | | | — | | | | — | | | | 1,813 | | |
| Net increase (decrease) in net assets | | | (161,057,130 | ) | | | (54,901,255 | ) | | | (419,031,664 | ) | | | (166,549,037 | ) | | | (141,137,300 | ) | | | (37,367,882 | ) | |
| Net assets: | |
| Beginning of year | | | 508,631,812 | | | | 563,533,067 | | | | 1,212,275,876 | | | | 1,378,824,913 | | | | 406,329,627 | | | | 443,697,509 | | |
| End of year | | $ | 347,574,682 | | | $ | 508,631,812 | | | $ | 793,244,212 | | | $ | 1,212,275,876 | | | $ | 265,192,327 | | | $ | 406,329,627 | | |
| Accumulated undistributed net investment income | | $ | — | | | $ | — | | | $ | 13,620,567 | | | $ | 26,006,105 | | | $ | 3,826,880 | | | $ | 2,797,118 | | |
See accompanying notes to financial statements
232
| | | UBS PACE
Global Real Estate
Securities Investments | | UBS PACE
Alternative
Strategies Investments | |
| | | For the years ended July 31, | | For the years ended July 31, | |
| | | 2009 | | 2008 | | 2009 | | 2008 | |
| From operations: | |
| Net investment income (loss) | | $ | 1,794,014 | | | $ | 1,649,656 | | | $ | 4,615,054 | | | $ | 6,238,281 | | |
Net realized gains (losses) from:
Investments, futures, options written, short sales and swaps | | | (44,684,628 | ) | | | (9,280,848 | ) | | | (136,995,549 | ) | | | 6,841,807 | | |
Forward foreign currency contracts and foreign
currency transactions | | | (198,973 | ) | | | 27,404 | | | | (14,446,727 | ) | | | (5,490,621 | ) | |
Net change in unrealized appreciation/depreciation of:
Investments, futures, options written, short sales, and swaps | | | 17,617,935 | | | | (6,393,023 | ) | | | 21,489,815 | | | | (41,059,684 | ) | |
Other assets and liabilities denominated in foreign currency
and forward foreign currency contracts | | | 11,926 | | | | (2,185 | ) | | | (1,635,101 | ) | | | 2,446,942 | | |
Net decrease in net assets resulting
from operations | | | (25,459,726 | ) | | | (13,998,996 | ) | | | (126,972,508 | ) | | | (31,023,275 | ) | |
| Dividends and distributions to shareholders from: | |
| Net investment income–Class A | | | (41,094 | ) | | | (193,919 | ) | | | (277,728 | ) | | | (518,325 | ) | |
| Net investment income–Class B | | | — | | | | — | | | | (159 | ) | | | (42 | ) | |
| Net investment income–Class C | | | (416 | ) | | | (7,557 | ) | | | — | | | | (22,588 | ) | |
| Net investment income–Class Y | | | — | | | | — | | | | (232,481 | ) | | | — | | |
| Net investment income–Class P | | | (812,682 | ) | | | (1,805,244 | ) | | | (2,404,742 | ) | | | (3,317,376 | ) | |
| Net realized gains from investment activities–Class A | | | — | | | | (21,919 | ) | | | (763,753 | ) | | | (1,412,016 | ) | |
| Net realized gains from investment activities–Class B | | | — | | | | — | | | | (502 | ) | | | (432 | ) | |
| Net realized gains from investment activities–Class C | | | — | | | | (1,147 | ) | | | (59,017 | ) | | | (83,108 | ) | |
| Net realized gains from investment activities–Class Y | | | — | | | | — | | | | (267,241 | ) | | | — | | |
| Net realized gains from investment activities–Class P | | | — | | | | (194,759 | ) | | | (3,358,184 | ) | | | (7,895,868 | ) | |
| | | | (854,192 | ) | | | (2,224,545 | ) | | | (7,363,807 | ) | | | (13,249,755 | ) | |
| From beneficial interest transactions: | |
| Net proceeds from shares sold | | | 30,395,528 | | | | 61,193,248 | | | | 126,582,421 | | | | 482,244,241 | | |
| Cost of shares repurchased | | | (25,608,398 | ) | | | (19,527,568 | ) | | | (328,929,754 | ) | | | (132,651,645 | ) | |
| Proceeds from dividends reinvested | | | 833,559 | | | | 2,211,384 | | | | 7,232,610 | | | | 13,118,387 | | |
Net increase (decrease) in net assets from beneficial
interest transactions | | | 5,620,689 | | | | 43,877,064 | | | | (195,114,723 | ) | | | 362,710,983 | | |
| Redemption fees | | | 21,004 | | | | 17,378 | | | | 77,746 | | | | 82,047 | | |
Contributions to capital from investment
manager/sub-advisors | | | — | | | | — | | | | — | | | | 16,460 | | |
| Net increase (decrease) in net assets | | | (20,672,225 | ) | | | 27,670,901 | | | | (329,373,292 | ) | | | 318,536,460 | | |
| Net assets: | |
| Beginning of year | | | 76,984,997 | | | | 49,314,096 | | | | 771,455,649 | | | | 452,919,189 | | |
| End of year | | $ | 56,312,772 | | | $ | 76,984,997 | | | $ | 442,082,357 | | | $ | 771,455,649 | | |
| Accumulated undistributed net investment income | | $ | 1,070,627 | | | $ | 111,647 | | | $ | 3,750,219 | | | $ | 2,149,382 | | |
233
(This page has been left blank intentionally)
234
UBS PACE Select Advisors Trust
Financial highlights
UBS PACE Money Market Investments
Selected data for a share of beneficial interest outstanding throughout each year is presented below:
| | | Class P | |
| | | For the years ended July 31, | |
| | | 2009 | | 2008 | | 2007 | | 2006 | | 2005 | |
| Net asset value, beginning of year | | $ | 1.00 | | | $ | 1.00 | | | $ | 1.00 | | | $ | 1.00 | | | $ | 1.00 | | |
| Net investment income | | | 0.008 | | | | 0.033 | | | | 0.048 | | | | 0.038 | | | | 0.018 | | |
| Dividends from net investment income | | | (0.008 | ) | | | (0.033 | ) | | | (0.048 | ) | | | (0.038 | ) | | | (0.018 | ) | |
| Distributions from net realized gains from investment activities | | | (0.000 | )(1) | | | — | | | | — | | | | — | | | | — | | |
| Total dividends and distributions | | | (0.008 | ) | | | (0.033 | ) | | | (0.048 | ) | | | (0.038 | ) | | | (0.018 | ) | |
| Net asset value, end of year | | $ | 1.00 | | | $ | 1.00 | | | $ | 1.00 | | | $ | 1.00 | | | $ | 1.00 | | |
| Total investment return(2) | | | 0.81 | % | | | 3.40 | % | | | 4.86 | % | | | 3.89 | % | | | 1.80 | % | |
| Ratios/supplemental data: | |
| Net assets, end of year (000's) | | $ | 529,959 | | | $ | 523,243 | | | $ | 408,562 | | | $ | 342,573 | | | $ | 227,528 | | |
Expenses to average net assets, net of fee waivers and/or
expense reimbursements by manager | | | 0.59 | % | | | 0.60 | % | | | 0.60 | % | | | 0.60 | % | | | 0.60 | % | |
Expenses to average net assets, before fee waivers and/or
expense reimbursements by manager | | | 0.89 | % | | | 0.93 | % | | | 0.92 | % | | | 0.99 | % | | | 0.97 | % | |
| Net investment income to average net assets | | | 0.78 | % | | | 3.27 | % | | | 4.75 | % | | | 3.89 | % | | | 1.85 | % | |
(1) Amount of distribution paid represents less than $0.0005 per share.
(2) Total investment return is calculated assuming a $10,000 investment on the first day of each year reported, reinvestment of all dividends and other distributions, if any, at net asset value on the payable dates, and a sale at net asset value on the last day of each year reported. The figures do not include program fees; results would be lower if these fees were included. Returns do not reflect the deduction of taxes that a shareholder would pay on Portfolio distributions.
See accompanying notes to financial statements
235
UBS PACE Select Advisors Trust
Financial highlights
UBS PACE Government Securities Fixed Income Investments
Selected data for a share of beneficial interest outstanding throughout each year is presented below:
| | | Class A | |
| | | For the years ended July 31, | |
| | | 2009 | | 2008 | | 2007 | | 2006 | | 2005 | |
| Net asset value, beginning of year | | $ | 12.87 | | | $ | 12.72 | | | $ | 12.71 | | | $ | 13.20 | | | $ | 13.05 | | |
| Net investment income | | | 0.57 | (1) | | | 0.56 | (1) | | | 0.57 | (1) | | | 0.51 | | | | 0.34 | | |
| Net realized and unrealized gains (losses) from investment activities | | | 0.56 | | | | 0.15 | | | | 0.00 | (2) | | | (0.31 | ) | | | 0.17 | | |
| Net increase from operations | | | 1.13 | | | | 0.71 | | | | 0.57 | | | | 0.20 | | | | 0.51 | | |
| Dividends from net investment income | | | (0.64 | ) | | | (0.56 | ) | | | (0.56 | ) | | | (0.53 | ) | | | (0.36 | ) | |
| Distributions from net realized gains from investment activities | | | — | | | | — | | | | — | | | | (0.16 | ) | | | — | | |
| Total dividends and distributions | | | (0.64 | ) | | | (0.56 | ) | | | (0.56 | ) | | | (0.69 | ) | | | (0.36 | ) | |
| Net asset value, end of year | | $ | 13.36 | | | $ | 12.87 | | | $ | 12.72 | | | $ | 12.71 | | | $ | 13.20 | | |
| Total investment return(3) | | | 9.09 | % | | | 5.53 | % | | | 4.52 | % | | | 1.61 | % | | | 3.97 | % | |
| Ratios/supplemental data: | |
| Net assets, end of year (000's) | | $ | 90,386 | | | $ | 91,614 | | | $ | 99,378 | | | $ | 114,663 | | | $ | 140,734 | | |
Expenses to average net assets, net of fee waivers and/or
expense reimbursements by manager | | | 1.02 | % | | | 1.07 | % | | | 1.12 | % | | | 1.11 | % | | | 1.08 | % | |
Expenses to average net assets, before fee waivers and/or
expense reimbursements by manager | | | 1.07 | % | | | 1.12 | % | | | 1.13 | % | | | 1.17 | % | | | 1.17 | % | |
| Net investment income to average net assets | | | 4.41 | % | | | 4.30 | % | | | 4.40 | % | | | 3.97 | % | | | 2.54 | % | |
| Portfolio turnover | | | 877 | % | | | 588 | % | | | 495 | % | | | 575 | % | | | 665 | % | |
| | | Class C | |
| | | For the years ended July 31, | |
| | | 2009 | | 2008 | | 2007 | | 2006 | | 2005 | |
| Net asset value, beginning of year | | $ | 12.88 | | | $ | 12.73 | | | $ | 12.72 | | | $ | 13.21 | | | $ | 13.06 | | |
| Net investment income | | | 0.51 | (1) | | | 0.50 | (1) | | | 0.50 | (1) | | | 0.45 | | | | 0.27 | | |
| Net realized and unrealized gains (losses) from investment activities | | | 0.55 | | | | 0.14 | | | | 0.01 | | | | (0.32 | ) | | | 0.17 | | |
| Net increase from operations | | | 1.06 | | | | 0.64 | | | | 0.51 | | | | 0.13 | | | | 0.44 | | |
| Dividends from net investment income | | | (0.57 | ) | | | (0.49 | ) | | | (0.50 | ) | | | (0.46 | ) | | | (0.29 | ) | |
| Distributions from net realized gains from investment activities | | | — | | | | — | | | | — | | | | (0.16 | ) | | | — | | |
| Total dividends and distributions | | | (0.57 | ) | | | (0.49 | ) | | | (0.50 | ) | | | (0.62 | ) | | | (0.29 | ) | |
| Net asset value, end of year | | $ | 13.37 | | | $ | 12.88 | | | $ | 12.73 | | | $ | 12.72 | | | $ | 13.21 | | |
| Total investment return(3) | | | 8.45 | % | | | 5.06 | % | | | 4.00 | % | | | 1.09 | % | | | 3.40 | % | |
| Ratios/supplemental data: | |
| Net assets, end of year (000's) | | $ | 24,477 | | | $ | 24,536 | | | $ | 26,449 | | | $ | 30,338 | | | $ | 36,372 | | |
Expenses to average net assets, net of fee waivers and/or
expense reimbursements by manager | | | 1.52 | % | | | 1.57 | % | | | 1.62 | % | | | 1.62 | % | | | 1.62 | % | |
Expenses to average net assets, before fee waivers and/or
expense reimbursements by manager | | | 1.63 | % | | | 1.68 | % | | | 1.70 | % | | | 1.75 | % | | | 1.74 | % | |
| Net investment income to average net assets | | | 3.90 | % | | | 3.80 | % | | | 3.90 | % | | | 3.45 | % | | | 2.00 | % | |
| Portfolio turnover | | | 877 | % | | | 588 | % | | | 495 | % | | | 575 | % | | | 665 | % | |
(1) Calculated using the average shares method.
(2) Amount represents less than $0.005 per share.
(3) Total investment return is calculated assuming a $10,000 investment on the first day of each year reported, reinvestment of all dividends and other distributions, if any, at net asset value on the ex-dividend dates, and a sale at net asset value on the last day of each year reported. The figures do not include any applicable sales charges or redemption fees; results would be lower if they were included. Returns do not reflect the deduction of taxes that a shareholder would pay on Portfolio distributions or the redemption of Portfolio shares.
236
| | | Class B | |
| | | For the years ended July 31, | |
| | | 2009 | | 2008 | | 2007 | | 2006 | | 2005 | |
| Net asset value, beginning of year | | $ | 12.87 | | | $ | 12.73 | | | $ | 12.72 | | | $ | 13.20 | | | $ | 13.05 | | |
| Net investment income | | | 0.46 | (1) | | | 0.45 | (1) | | | 0.46 | (1) | | | 0.40 | | | | 0.22 | | |
| Net realized and unrealized gains (losses) from investment activities | | | 0.56 | | | | 0.15 | | | | 0.01 | | | | (0.29 | ) | | | 0.19 | | |
| Net increase from operations | | | 1.02 | | | | 0.60 | | | | 0.47 | | | | 0.11 | | | | 0.41 | | |
| Dividends from net investment income | | | (0.53 | ) | | | (0.46 | ) | | | (0.46 | ) | | | (0.43 | ) | | | (0.26 | ) | |
| Distributions from net realized gains from investment activities | | | — | | | | — | | | | — | | | | (0.16 | ) | | | — | | |
| Total dividends and distributions | | | (0.53 | ) | | | (0.46 | ) | | | (0.46 | ) | | | (0.59 | ) | | | (0.26 | ) | |
| Net asset value, end of year | | $ | 13.36 | | | $ | 12.87 | | | $ | 12.73 | | | $ | 12.72 | | | $ | 13.20 | | |
| Total investment return(3) | | | 8.16 | % | | | 4.72 | % | | | 3.73 | % | | | 0.92 | % | | | 3.17 | % | |
| Ratios/supplemental data: | |
| Net assets, end of year (000's) | | $ | 173 | | | $ | 769 | | | $ | 1,617 | | | $ | 2,776 | | | $ | 4,273 | | |
Expenses to average net assets, net of fee waivers and/or
expense reimbursements by manager | | | 1.77 | % | | | 1.82 | % | | | 1.87 | % | | | 1.86 | % | | | 1.84 | % | |
Expenses to average net assets, before fee waivers and/or
expense reimbursements by manager | | | 1.86 | % | | | 1.89 | % | | | 1.88 | % | | | 1.93 | % | | | 1.93 | % | |
| Net investment income to average net assets | | | 3.70 | % | | | 3.55 | % | | | 3.64 | % | | | 3.20 | % | | | 1.69 | % | |
| Portfolio turnover | | | 877 | % | | | 588 | % | | | 495 | % | | | 575 | % | | | 665 | % | |
| | | Class Y | |
| | | For the years ended July 31, | |
| | | 2009 | | 2008 | | 2007 | | 2006 | | 2005 | |
| Net asset value, beginning of year | | $ | 12.87 | | | $ | 12.73 | | | $ | 12.72 | | | $ | 13.20 | | | $ | 13.05 | | |
| Net investment income | | | 0.61 | (1) | | | 0.59 | (1) | | | 0.61 | (1) | | | 0.55 | | | | 0.38 | | |
| Net realized and unrealized gains (losses) from investment activities | | | 0.55 | | | | 0.15 | | | | 0.00 | (2) | | | (0.30 | ) | | | 0.17 | | |
| Net increase from operations | | | 1.16 | | | | 0.74 | | | | 0.61 | | | | 0.25 | | | | 0.55 | | |
| Dividends from net investment income | | | (0.67 | ) | | | (0.60 | ) | | | (0.60 | ) | | | (0.57 | ) | | | (0.40 | ) | |
| Distributions from net realized gains from investment activities | | | — | | | | — | | | | — | | | | (0.16 | ) | | | — | | |
| Total dividends and distributions | | | (0.67 | ) | | | (0.60 | ) | | | (0.60 | ) | | | (0.73 | ) | | | (0.40 | ) | |
| Net asset value, end of year | | $ | 13.36 | | | $ | 12.87 | | | $ | 12.73 | | | $ | 12.72 | | | $ | 13.20 | | |
| Total investment return(3) | | | 9.29 | % | | | 5.86 | % | | | 4.87 | % | | | 1.97 | % | | | 4.24 | % | |
| Ratios/supplemental data: | |
| Net assets, end of year (000's) | | $ | 39,199 | | | $ | 25,669 | | | $ | 13,658 | | | $ | 8,460 | | | $ | 10,069 | | |
Expenses to average net assets, net of fee waivers and/or
expense reimbursements by manager | | | 0.77 | % | | | 0.82 | % | | | 0.79 | % | | | 0.81 | % | | | 0.76 | % | |
Expenses to average net assets, before fee waivers and/or
expense reimbursements by manager | | | 0.92 | % | | | 0.90 | % | | | 0.79 | % | | | 0.84 | % | | | 0.85 | % | |
| Net investment income to average net assets | | | 4.65 | % | | | 4.56 | % | | | 4.74 | % | | | 4.27 | % | | | 2.88 | % | |
| Portfolio turnover | | | 877 | % | | | 588 | % | | | 495 | % | | | 575 | % | | | 665 | % | |
See accompanying notes to financial statements
237
UBS PACE Select Advisors Trust
Financial highlights
UBS PACE Government Securities Fixed Income Investments
(concluded)
Selected data for a share of beneficial interest outstanding throughout each year is presented below:
| | | Class P | |
| | | For the years ended July 31, | |
| | | 2009 | | 2008 | | 2007 | | 2006 | | 2005 | |
| Net asset value, beginning of year | | $ | 12.87 | | | $ | 12.72 | | | $ | 12.72 | | | $ | 13.20 | | | $ | 13.06 | | |
| Net investment income | | | 0.61 | (1) | | | 0.59 | (1) | | | 0.60 | (1) | | | 0.54 | | | | 0.37 | | |
| Net realized and unrealized gains (losses) from investment activities | | | 0.55 | | | | 0.15 | | | | (0.01 | ) | | | (0.30 | ) | | | 0.16 | | |
| Net increase from operations | | | 1.16 | | | | 0.74 | | | | 0.59 | | | | 0.24 | | | | 0.53 | | |
| Dividends from net investment income | | | (0.67 | ) | | | (0.59 | ) | | | (0.59 | ) | | | (0.56 | ) | | | (0.39 | ) | |
| Distributions from net realized gains from investment activities | | | — | | | | — | | | | — | | | | (0.16 | ) | | | — | | |
| Total dividends and distributions | | | (0.67 | ) | | | (0.59 | ) | | | (0.59 | ) | | | (0.72 | ) | | | (0.39 | ) | |
| Net asset value, end of year | | $ | 13.36 | | | $ | 12.87 | | | $ | 12.72 | | | $ | 12.72 | | | $ | 13.20 | | |
| Total investment return(2) | | | 9.27 | % | | | 5.87 | % | | | 4.71 | % | | | 1.94 | % | | | 4.11 | % | |
| Ratios/supplemental data: | |
| Net assets, end of year (000's) | | $ | 422,024 | | | $ | 542,337 | | | $ | 469,556 | | | $ | 384,472 | | | $ | 318,339 | | |
Expenses to average net assets, net of fee waivers and/or
expense reimbursements by manager | | | 0.77 | % | | | 0.82 | % | | | 0.87 | % | | | 0.87 | % | | | 0.87 | % | |
Expenses to average net assets, before fee waivers and/or
expense reimbursements by manager | | | 0.86 | % | | | 0.90 | % | | | 0.91 | % | | | 0.96 | % | | | 0.96 | % | |
| Net investment income to average net assets | | | 4.66 | % | | | 4.55 | % | | | 4.66 | % | | | 4.22 | % | | | 2.82 | % | |
| Portfolio turnover | | | 877 | % | | | 588 | % | | | 495 | % | | | 575 | % | | | 665 | % | |
(1) Calculated using the average shares method.
(2) Total investment return is calculated assuming a $10,000 investment on the first day of each year reported, reinvestment of all dividends and other distributions, if any, at net asset value on the ex-dividend dates, and a sale at net asset value on the last day of each year reported. The figures do not include any applicable program or redemption fees; results would be lower if they were included. Returns do not reflect the deduction of taxes that a shareholder would pay on Portfolio distributions or the redemption of Portfolio shares.
See accompanying notes to financial statements
238
(This page has been left blank intentionally)
239
UBS PACE Select Advisors Trust
Financial highlights
UBS PACE Intermediate Fixed Income Investments
Selected data for a share of beneficial interest outstanding throughout each year is presented below:
| | | Class A | |
| | | For the years ended July 31, | |
| | | 2009 | | 2008 | | 2007 | | 2006 | | 2005 | |
| Net asset value, beginning of year | | $ | 11.51 | | | $ | 11.39 | | | $ | 11.27 | | | $ | 11.44 | | | $ | 11.51 | | |
| Net investment income(1) | | | 0.44 | | | | 0.48 | | | | 0.43 | | | | 0.38 | | | | 0.34 | | |
| Net realized and unrealized gains (losses) from investment activities | | | 0.08 | | | | 0.12 | | | | 0.12 | | | | (0.17 | ) | | | (0.07 | ) | |
| Net increase from operations | | | 0.52 | | | | 0.60 | | | | 0.55 | | | | 0.21 | | | | 0.27 | | |
| Dividends from net investment income | | | (0.45 | ) | | | (0.48 | ) | | | (0.43 | ) | | | (0.38 | ) | | | (0.34 | ) | |
| Net asset value, end of year | | $ | 11.58 | | | $ | 11.51 | | | $ | 11.39 | | | $ | 11.27 | | | $ | 11.44 | | |
| Total investment return(2) | | | 4.88 | % | | | 5.26 | % | | | 4.96 | % | | | 1.90 | % | | | 2.38 | % | |
| Ratios/supplemental data: | |
| Net assets, end of year (000's) | | $ | 45,165 | | | $ | 46,257 | | | $ | 51,800 | | | $ | 59,884 | | | $ | 75,331 | | |
Expenses to average net assets, net of fee waivers and/or
expense reimbursements by manager | | | 0.93 | % | | | 0.93 | % | | | 1.05 | % | | | 1.06 | % | | | 1.07 | % | |
Expenses to average net assets, before fee waivers and/or
expense reimbursements by manager | | | 1.02 | % | | | 1.05 | % | | | 1.08 | % | | | 1.10 | % | | | 1.09 | % | |
| Net investment income to average net assets | | | 3.97 | % | | | 4.10 | % | | | 3.81 | % | | | 3.36 | % | | | 2.93 | % | |
| Portfolio turnover | | | 512 | % | | | 387 | % | | | 255 | % | | | 349 | % | | | 221 | % | |
| | | Class C | |
| | | For the years ended July 31, | |
| | | 2009 | | 2008 | | 2007 | | 2006 | | 2005 | |
| Net asset value, beginning of year | | $ | 11.52 | | | $ | 11.40 | | | $ | 11.28 | | | $ | 11.46 | | | $ | 11.53 | | |
| Net investment income(1) | | | 0.38 | | | | 0.42 | | | | 0.38 | | | | 0.32 | | | | 0.28 | | |
| Net realized and unrealized gains (losses) from investment activities | | | 0.09 | | | | 0.12 | | | | 0.11 | | | | (0.17 | ) | | | (0.06 | ) | |
| Net increase from operations | | | 0.47 | | | | 0.54 | | | | 0.49 | | | | 0.15 | | | | 0.22 | | |
| Dividends from net investment income | | | (0.40 | ) | | | (0.42 | ) | | | (0.37 | ) | | | (0.33 | ) | | | (0.29 | ) | |
| Net asset value, end of year | | $ | 11.59 | | | $ | 11.52 | | | $ | 11.40 | | | $ | 11.28 | | | $ | 11.46 | | |
| Total investment return(2) | | | 4.36 | % | | | 4.72 | % | | | 4.43 | % | | | 1.30 | % | | | 1.87 | % | |
| Ratios/supplemental data: | |
| Net assets, end of year (000's) | | $ | 5,185 | | | $ | 3,992 | | | $ | 4,116 | | | $ | 5,301 | | | $ | 7,684 | | |
Expenses to average net assets, net of fee waivers and/or
expense reimbursements by and recoupments to manager | | | 1.43 | % | | | 1.43 | % | | | 1.55 | % | | | 1.55 | % | | | 1.56 | % | |
Expenses to average net assets, before fee waivers and/or
expense reimbursements by manager | | | 1.53 | % | | | 1.57 | % | | | 1.57 | % | | | 1.59 | % | | | 1.59 | % | |
| Net investment income to average net assets | | | 3.43 | % | | | 3.60 | % | | | 3.31 | % | | | 2.86 | % | | | 2.44 | % | |
| Portfolio turnover | | | 512 | % | | | 387 | % | | | 255 | % | | | 349 | % | | | 221 | % | |
(1) Calculated using the average shares method.
(2) Total investment return is calculated assuming a $10,000 investment on the first day of each year reported, reinvestment of all dividends and other distributions, if any, at net asset value on the ex-dividend dates, and a sale at net asset value on the last day of each year reported. The figures do not include any applicable sales charges or redemption fees; results would be lower if they were included. Returns do not reflect the deduction of taxes that a shareholder would pay on Portfolio distributions or the redemption of Portfolio shares.
(3) During the year ended July 31, 2009, UBS Global Asset Management (Americas) Inc. reimbursed a portion of its ordinary operating expenses. The ratios net and before fee waivers and/or expense reimbursements are the same since the reimbursement represents less than 0.01%.
(4) The investment manager recouped expenses previously reimbursed by the investment manager on behalf of the Portfolio, not to exceed the expense cap.
240
| | | Class B | |
| | | For the years ended July 31, | |
| | | 2009 | | 2008 | | 2007 | | 2006 | | 2005 | |
| Net asset value, beginning of year | | $ | 11.53 | | | $ | 11.41 | | | $ | 11.29 | | | $ | 11.46 | | | $ | 11.53 | | |
| Net investment income(1) | | | 0.36 | | | | 0.38 | | | | 0.34 | | | | 0.28 | | | | 0.24 | | |
| Net realized and unrealized gains (losses) from investment activities | | | 0.08 | | | | 0.13 | | | | 0.13 | | | | (0.15 | ) | | | (0.06 | ) | |
| Net increase from operations | | | 0.44 | | | | 0.51 | | | | 0.47 | | | | 0.13 | | | | 0.18 | | |
| Dividends from net investment income | | | (0.37 | ) | | | (0.39 | ) | | | (0.35 | ) | | | (0.30 | ) | | | (0.25 | ) | |
| Net asset value, end of year | | $ | 11.60 | | | $ | 11.53 | | | $ | 11.41 | | | $ | 11.29 | | | $ | 11.46 | | |
| Total investment return(2) | | | 4.08 | % | | | 4.45 | % | | | 4.18 | % | | | 1.13 | % | | | 1.60 | % | |
| Ratios/supplemental data: | |
| Net assets, end of year (000's) | | $ | 155 | | | $ | 166 | | | $ | 324 | | | $ | 637 | | | $ | 1,458 | | |
Expenses to average net assets, net of fee waivers and/or
expense reimbursements by manager | | | 1.68 | % | | | 1.68 | % | | | 1.80 | % | | | 1.80 | % | | | 1.81 | % | |
Expenses to average net assets, before fee waivers and/or
expense reimbursements by manager | | | 1.82 | % | | | 1.91 | % | | | 1.84 | % | | | 1.89 | % | | | 1.87 | % | |
| Net investment income to average net assets | | | 3.23 | % | | | 3.35 | % | | | 3.04 | % | | | 2.56 | % | | | 2.15 | % | |
| Portfolio turnover | | | 512 | % | | | 387 | % | | | 255 | % | | | 349 | % | | | 221 | % | |
| | | Class Y | |
| | | For the years ended July 31, | |
| | | 2009 | | 2008 | | 2007 | | 2006 | | 2005 | |
| Net asset value, beginning of year | | $ | 11.51 | | | $ | 11.39 | | | $ | 11.28 | | | $ | 11.45 | | | $ | 11.52 | | |
| Net investment income(1) | | | 0.47 | | | | 0.51 | | | | 0.47 | | | | 0.41 | | | | 0.37 | | |
| Net realized and unrealized gains (losses) from investment activities | | | 0.09 | | | | 0.11 | | | | 0.10 | | | | (0.17 | ) | | | (0.07 | ) | |
| Net increase from operations | | | 0.56 | | | | 0.62 | | | | 0.57 | | | | 0.24 | | | | 0.30 | | |
| Dividends from net investment income | | | (0.48 | ) | | | (0.50 | ) | | | (0.46 | ) | | | (0.41 | ) | | | (0.37 | ) | |
| Net asset value, end of year | | $ | 11.59 | | | $ | 11.51 | | | $ | 11.39 | | | $ | 11.28 | | | $ | 11.45 | | |
| Total investment return(2) | | | 5.15 | % | | | 5.52 | % | | | 5.17 | % | | | 2.17 | % | | | 2.66 | % | |
| Ratios/supplemental data: | |
| Net assets, end of year (000's) | | $ | 2,313 | | | $ | 1,359 | | | $ | 1,249 | | | $ | 1,074 | | | $ | 1,108 | | |
Expenses to average net assets, net of fee waivers and/or
expense reimbursements by and recoupments to manager | | | 0.68 | %(3) | | | 0.68 | % | | | 0.80 | %(4) | | | 0.80 | % | | | 0.81 | % | |
Expenses to average net assets, before fee waivers and/or
expense reimbursements by manager | | | 0.68 | %(3) | | | 0.76 | % | | | 0.80 | % | | | 0.83 | % | | | 0.86 | % | |
| Net investment income to average net assets | | | 4.17 | % | | | 4.34 | % | | | 4.07 | % | | | 3.63 | % | | | 3.20 | % | |
| Portfolio turnover | | | 512 | % | | | 387 | % | | | 255 | % | | | 349 | % | | | 221 | % | |
See accompanying notes to financial statements
241
UBS PACE Select Advisors Trust
Financial highlights
UBS PACE Intermediate Fixed Income Investments
(concluded)
Selected data for a share of beneficial interest outstanding throughout each year is presented below:
| | | Class P | |
| | | For the years ended July 31, | |
| | | 2009 | | 2008 | | 2007 | | 2006 | | 2005 | |
| Net asset value, beginning of year | | $ | 11.51 | | | $ | 11.39 | | | $ | 11.28 | | | $ | 11.45 | | | $ | 11.52 | | |
| Net investment income(1) | | | 0.47 | | | | 0.51 | | | | 0.46 | | | | 0.41 | | | | 0.37 | | |
| Net realized and unrealized gains (losses) from investment activities | | | 0.09 | | | | 0.11 | | | | 0.11 | | | | (0.17 | ) | | | (0.07 | ) | |
| Net increase from operations | | | 0.56 | | | | 0.62 | | | | 0.57 | | | | 0.24 | | | | 0.30 | | |
| Dividends from net investment income | | | (0.48 | ) | | | (0.50 | ) | | | (0.46 | ) | | | (0.41 | ) | | | (0.37 | ) | |
| Net asset value, end of year | | $ | 11.59 | | | $ | 11.51 | | | $ | 11.39 | | | $ | 11.28 | | | $ | 11.45 | | |
| Total investment return(2) | | | 5.14 | % | | | 5.52 | % | | | 5.17 | % | | | 2.17 | % | | | 2.66 | % | |
| Ratios/supplemental data: | |
| Net assets, end of year (000's) | | $ | 353,068 | | | $ | 404,407 | | | $ | 381,254 | | | $ | 346,298 | | | $ | 313,031 | | |
Expenses to average net assets, net of fee waivers and/or
expense reimbursements by and recoupments to manager | | | 0.68 | % | | | 0.68 | % | | | 0.80 | %(3) | | | 0.80 | % | | | 0.80 | % | |
Expenses to average net assets, before fee waivers and/or
expense reimbursements by manager | | | 0.74 | % | | | 0.77 | % | | | 0.80 | % | | | 0.81 | % | | | 0.82 | % | |
| Net investment income to average net assets | | | 4.22 | % | | | 4.35 | % | | | 4.07 | % | | | 3.64 | % | | | 3.22 | % | |
| Portfolio turnover | | | 512 | % | | | 387 | % | | | 255 | % | | | 349 | % | | | 221 | % | |
(1) Calculated using the average shares method.
(2) Total investment return is calculated assuming a $10,000 investment on the first day of each year reported, reinvestment of all dividends and other distributions, if any, at net asset value on the ex-dividend dates, and a sale at net asset value on the last day of each year reported. The figures do not include any applicable program or redemption fees; results would be lower if they were included. Returns do not reflect the deduction of taxes that a shareholder would pay on Portfolio distributions or the redemption of Portfolio shares.
(3) The investment manager recouped expenses previously reimbursed by the investment manager on behalf of the Portfolio, not to exceed the expense cap.
See accompanying notes to financial statements
242
(This page has been left blank intentionally)
243
UBS PACE Select Advisors Trust
Financial highlights
UBS PACE Strategic Fixed Income Investments
Selected data for a share of beneficial interest outstanding throughout each year is presented below:
| | | Class A | |
| | | For the years ended July 31, | |
| | | 2009 | | 2008 | | 2007 | | 2006 | | 2005 | |
| Net asset value, beginning of year | | $ | 13.75 | | | $ | 13.25 | | | $ | 13.26 | | | $ | 13.89 | | | $ | 13.88 | | |
| Net investment income(1) | | | 0.60 | | | | 0.61 | | | | 0.56 | | | | 0.60 | | | | 0.45 | | |
| Net realized and unrealized gains (losses) from investment activities | | | 0.39 | | | | 0.51 | | | | 0.00 | (2) | | | (0.59 | ) | | | 0.35 | | |
| Net increase (decrease) from operations | | | 0.99 | | | | 1.12 | | | | 0.56 | | | | 0.01 | | | | 0.80 | | |
| Dividends from net investment income | | | (0.73 | ) | | | (0.62 | ) | | | (0.55 | ) | | | (0.62 | ) | | | (0.46 | ) | |
| Distributions from net realized gains from investment activities | | | (0.92 | ) | | | — | | | | — | | | | — | | | | (0.33 | ) | |
| Returns of capital | | | — | | | | — | | | | (0.02 | ) | | | (0.02 | ) | | | — | | |
| Total dividends, distributions and returns of capital | | | (1.65 | ) | | | (0.62 | ) | | | (0.57 | ) | | | (0.64 | ) | | | (0.79 | ) | |
| Net asset value, end of year | | $ | 13.09 | | | $ | 13.75 | | | $ | 13.25 | | | $ | 13.26 | | | $ | 13.89 | | |
| Total investment return(3) | | | 8.31 | % | | | 8.42 | % | | | 4.32 | % | | | 0.06 | % | | | 5.88 | % | |
| Ratios/supplemental data: | |
| Net assets, end of year (000's) | | $ | 33,293 | | | $ | 27,180 | | | $ | 21,711 | | | $ | 20,735 | | | $ | 23,269 | | |
Expenses to average net assets, net of fee waivers and/or
expense reimbursements by and recoupments to manager | | | 1.07 | % | | | 1.06 | % | | | 1.15 | %(4) | | | 1.20 | %(4) | | | 1.23 | %(4) | |
Expenses to average net assets, before fee waivers and/or
expense reimbursements by manager | | | 1.10 | % | | | 1.13 | % | | | 1.15 | % | | | 1.20 | % | | | 1.23 | % | |
| Net investment income to average net assets | | | 4.75 | % | | | 4.40 | % | | | 4.17 | % | | | 4.46 | % | | | 3.20 | % | |
| Portfolio turnover | | | 178 | % | | | 236 | % | | | 188 | % | | | 196 | % | | | 147 | % | |
| | | Class C | |
| | | For the years ended July 31, | |
| | | 2009 | | 2008 | | 2007 | | 2006 | | 2005 | |
| Net asset value, beginning of year | | $ | 13.75 | | | $ | 13.26 | | | $ | 13.26 | | | $ | 13.89 | | | $ | 13.88 | | |
| Net investment income(1) | | | 0.54 | | | | 0.54 | | | | 0.50 | | | | 0.54 | | | | 0.38 | | |
| Net realized and unrealized gains (losses) from investment activities | | | 0.39 | | | | 0.50 | | | | 0.00 | (2) | | | (0.60 | ) | | | 0.35 | | |
| Net increase (decrease) from operations | | | 0.93 | | | | 1.04 | | | | 0.50 | | | | (0.06 | ) | | | 0.73 | | |
| Dividends from net investment income | | | (0.67 | ) | | | (0.55 | ) | | | (0.48 | ) | | | (0.55 | ) | | | (0.39 | ) | |
| Distributions from net realized gains from investment activities | | | (0.92 | ) | | | — | | | | — | | | | — | | | | (0.33 | ) | |
| Returns of capital | | | — | | | | — | | | | (0.02 | ) | | | (0.02 | ) | | | — | | |
| Total dividends, distributions and returns of capital | | | (1.59 | ) | | | (0.55 | ) | | | (0.50 | ) | | | (0.57 | ) | | | (0.72 | ) | |
| Net asset value, end of year | | $ | 13.09 | | | $ | 13.75 | | | $ | 13.26 | | | $ | 13.26 | | | $ | 13.89 | | |
| Total investment return(3) | | | 7.78 | % | | | 7.79 | % | | | 3.87 | % | | | (0.43 | )% | | | 5.38 | % | |
| Ratios/supplemental data: | |
| Net assets, end of year (000's) | | $ | 8,797 | | | $ | 5,592 | | | $ | 5,531 | | | $ | 6,280 | | | $ | 8,082 | | |
Expenses to average net assets, net of fee waivers and/or
expense reimbursements by and recoupments to manager | | | 1.57 | % | | | 1.56 | % | | | 1.63 | % | | | 1.68 | %(4) | | | 1.70 | %(4) | |
Expenses to average net assets, before fee waivers and/or
expense reimbursements by manager | | | 1.58 | % | | | 1.61 | % | | | 1.63 | % | | | 1.68 | % | | | 1.70 | % | |
| Net investment income to average net assets | | | 4.24 | % | | | 3.90 | % | | | 3.69 | % | | | 3.97 | % | | | 2.73 | % | |
| Portfolio turnover | | | 178 | % | | | 236 | % | | | 188 | % | | | 196 | % | | | 147 | % | |
(1) Calculated using the average shares method.
(2) Amount represents less than $0.005 per share.
(3) Total investment return is calculated assuming a $10,000 investment on the first day of each year reported, reinvestment of all dividends and other distributions, if any, at net asset value on the ex-dividend dates, and a sale at net asset value on the last day of each year reported. The figures do not include any applicable sales charges or redemption fees; results would be lower if they were included. Returns do not reflect the deduction of taxes that a shareholder would pay on Portfolio distributions or the redemption of Portfolio shares.
(4) The investment manager recouped expenses previously reimbursed by the investment manager on behalf of the Portfolio, not to exceed the expense cap.
(5) For the year ended July 31, 2007, UBS Global Asset Management (Americas) Inc. reimbursed a portion of its ordinary operating expenses. The ratios net and before fee waivers and/or expense reimbursements are the same since the fee waivers/reimbursement represents less than 0.01%.
244
| | | Class B | |
| | | For the years ended July 31, | |
| | | 2009 | | 2008 | | 2007 | | 2006 | | 2005 | |
| Net asset value, beginning of year | | $ | 13.75 | | | $ | 13.25 | | | $ | 13.26 | | | $ | 13.88 | | | $ | 13.88 | | |
| Net investment income(1) | | | 0.49 | | | | 0.48 | | | | 0.44 | | | | 0.48 | | | | 0.33 | | |
| Net realized and unrealized gains (losses) from investment activities | | | 0.40 | | | | 0.53 | | | | 0.01 | | | | (0.56 | ) | | | 0.36 | | |
| Net increase (decrease) from operations | | | 0.89 | | | | 1.01 | | | | 0.45 | | | | (0.08 | ) | | | 0.69 | | |
| Dividends from net investment income | | | (0.64 | ) | | | (0.51 | ) | | | (0.44 | ) | | | (0.52 | ) | | | (0.36 | ) | |
| Distributions from net realized gains from investment activities | | | (0.92 | ) | | | — | | | | — | | | | — | | | | (0.33 | ) | |
| Returns of capital | | | — | | | | — | | | | (0.02 | ) | | | (0.02 | ) | | | — | | |
| Total dividends, distributions and returns of capital | | | (1.56 | ) | | | (0.51 | ) | | | (0.46 | ) | | | (0.54 | ) | | | (0.69 | ) | |
| Net asset value, end of year | | $ | 13.08 | | | $ | 13.75 | | | $ | 13.25 | | | $ | 13.26 | | | $ | 13.88 | | |
| Total investment return(3) | | | 7.45 | % | | | 7.58 | % | | | 3.55 | % | | | (0.68 | )% | | | 5.06 | % | |
| Ratios/supplemental data: | |
| Net assets, end of year (000's) | | $ | 333 | | | $ | 142 | | | $ | 456 | | | $ | 1,098 | | | $ | 2,175 | | |
Expenses to average net assets, net of fee waivers and/or
expense reimbursements by and recoupments to manager | | | 1.82 | % | | | 1.81 | % | | | 1.93 | %(5) | | | 1.93 | % | | | 1.94 | % | |
Expenses to average net assets, before fee waivers and/or
expense reimbursements by manager | | | 1.93 | % | | | 2.03 | % | | | 1.93 | %(5) | | | 1.98 | % | | | 1.96 | % | |
| Net investment income to average net assets | | | 4.02 | % | | | 3.59 | % | | | 3.36 | % | | | 3.64 | % | | | 2.45 | % | |
| Portfolio turnover | | | 178 | % | | | 236 | % | | | 188 | % | | | 196 | % | | | 147 | % | |
| | | Class Y | |
| | | For the years ended July 31, | |
| | | 2009 | | 2008 | | 2007 | | 2006 | | 2005 | |
| Net asset value, beginning of year | | $ | 13.74 | | | $ | 13.25 | | | $ | 13.26 | | | $ | 13.88 | | | $ | 13.87 | | |
| Net investment income(1) | | | 0.64 | | | | 0.66 | | | | 0.61 | | | | 0.65 | | | | 0.51 | | |
| Net realized and unrealized gains (losses) from investment activities | | | 0.39 | | | | 0.49 | | | | (0.01 | ) | | | (0.59 | ) | | | 0.34 | | |
| Net increase (decrease) from operations | | | 1.03 | | | | 1.15 | | | | 0.60 | | | | 0.06 | | | | 0.85 | | |
| Dividends from net investment income | | | (0.77 | ) | | | (0.66 | ) | | | (0.59 | ) | | | (0.66 | ) | | | (0.51 | ) | |
| Distributions from net realized gains from investment activities | | | (0.92 | ) | | | — | | | | — | | | | — | | | | (0.33 | ) | |
| Returns of capital | | | — | | | | — | | | | (0.02 | ) | | | (0.02 | ) | | | — | | |
| Total dividends, distributions and returns of capital | | | (1.69 | ) | | | (0.66 | ) | | | (0.61 | ) | | | (0.68 | ) | | | (0.84 | ) | |
| Net asset value, end of year | | $ | 13.08 | | | $ | 13.74 | | | $ | 13.25 | | | $ | 13.26 | | | $ | 13.88 | | |
| Total investment return(3) | | | 8.68 | % | | | 8.67 | % | | | 4.76 | % | | | 0.41 | % | | | 6.25 | % | |
| Ratios/supplemental data: | |
| Net assets, end of year (000's) | | $ | 3,186 | | | $ | 3,045 | | | $ | 1,208 | | | $ | 716 | | | $ | 959 | | |
Expenses to average net assets, net of fee waivers and/or
expense reimbursements by and recoupments to manager | | | 0.73 | % | | | 0.78 | % | | | 0.79 | % | | | 0.85 | % | | | 0.89 | %(4) | |
Expenses to average net assets, before fee waivers and/or
expense reimbursements by manager | | | 0.73 | % | | | 0.78 | % | | | 0.79 | % | | | 0.85 | % | | | 0.89 | % | |
| Net investment income to average net assets | | | 5.09 | % | | | 4.71 | % | | | 4.55 | % | | | 4.79 | % | | | 3.58 | % | |
| Portfolio turnover | | | 178 | % | | | 236 | % | | | 188 | % | | | 196 | % | | | 147 | % | |
See accompanying notes to financial statements
245
UBS PACE Select Advisors Trust
Financial highlights
UBS PACE Strategic Fixed Income Investments
(concluded)
Selected data for a share of beneficial interest outstanding throughout each year is presented below:
| | | Class P | |
| | | For the years ended July 31, | |
| | | 2009 | | 2008 | | 2007 | | 2006 | | 2005 | |
| Net asset value, beginning of year | | $ | 13.74 | | | $ | 13.25 | | | $ | 13.26 | | | $ | 13.88 | | | $ | 13.88 | | |
| Net investment income(1) | | | 0.64 | | | | 0.64 | | | | 0.59 | | | | 0.64 | | | | 0.49 | | |
| Net realized and unrealized gains (losses) from investment activities | | | 0.38 | | | | 0.50 | | | | 0.00 | (2) | | | (0.59 | ) | | | 0.34 | | |
| Net increase from operations | | | 1.02 | | | | 1.14 | | | | 0.59 | | | | 0.05 | | | | 0.83 | | |
| Dividends from net investment income | | | (0.76 | ) | | | (0.65 | ) | | | (0.58 | ) | | | (0.65 | ) | | | (0.50 | ) | |
| Distributions from net realized gains from investment activities | | | (0.92 | ) | | | — | | | | — | | | | — | | | | (0.33 | ) | |
| Returns of capital | | | — | | | | — | | | | (0.02 | ) | | | (0.02 | ) | | | — | | |
| Total dividends, distributions and returns of capital | | | (1.68 | ) | | | (0.65 | ) | | | (0.60 | ) | | | (0.67 | ) | | | (0.83 | ) | |
| Net asset value, end of year | | $ | 13.08 | | | $ | 13.74 | | | $ | 13.25 | | | $ | 13.26 | | | $ | 13.88 | | |
| Total investment return(3) | | | 8.58 | % | | | 8.62 | % | | | 4.63 | % | | | 0.34 | % | | | 6.13 | % | |
| Ratios/supplemental data: | |
| Net assets, end of year (000's) | | $ | 584,235 | | | $ | 785,267 | | | $ | 679,623 | | | $ | 539,286 | | | $ | 429,250 | | |
Expenses to average net assets, net of fee waivers and/or
expense reimbursements by and recoupments to manager | | | 0.82 | % | | | 0.81 | % | | | 0.93 | %(4) | | | 0.93 | % | | | 0.93 | % | |
Expenses to average net assets, before fee waivers and/or
expense reimbursements by manager | | | 0.87 | % | | | 0.89 | % | | | 0.93 | % | | | 0.98 | % | | | 0.98 | % | |
| Net investment income to average net assets | | | 5.00 | % | | | 4.65 | % | | | 4.40 | % | | | 4.77 | % | | | 3.51 | % | |
| Portfolio turnover | | | 178 | % | | | 236 | % | | | 188 | % | | | 196 | % | | | 147 | % | |
(1) Calculated using the average shares method.
(2) Amount represents less than $0.005 per share.
(3) Total investment return is calculated assuming a $10,000 investment on the first day of each year reported, reinvestment of all dividends and other distributions, if any, at net asset value on the ex-dividend dates, and a sale at net asset value on the last day of each year reported. The figures do not include any applicable program or redemption fees; results would be lower if they were included. Returns do not reflect the deduction of taxes that a shareholder would pay on Portfolio distributions or the redemption of Portfolio shares.
(4) The investment manager recouped expenses previously reimbursed by the investment manager on behalf of the Portfolio, not to exceed the expense cap.
See accompanying notes to financial statements
246
(This page has been left blank intentionally)
247
UBS PACE Select Advisors Trust
Financial highlights
UBS PACE Municipal Fixed Income Investments
Selected data for a share of beneficial interest outstanding throughout each year is presented below:
| | | Class A | |
| | | For the years ended July 31, | |
| | | 2009 | | 2008 | | 2007 | | 2006 | | 2005 | |
| Net asset value, beginning of year | | $ | 12.15 | | | $ | 12.22 | | | $ | 12.27 | | | $ | 12.49 | | | $ | 12.56 | | |
| Net investment income(1) | | | 0.41 | | | | 0.41 | | | | 0.40 | | | | 0.39 | | | | 0.40 | | |
| Net realized and unrealized gains (losses) from investment activities | | | 0.30 | | | | (0.07 | ) | | | (0.05 | ) | | | (0.22 | ) | | | (0.07 | ) | |
| Net increase from operations | | | 0.71 | | | | 0.34 | | | | 0.35 | | | | 0.17 | | | | 0.33 | | |
| Dividends from net investment income | | | (0.41 | ) | | | (0.41 | ) | | | (0.40 | ) | | | (0.39 | ) | | | (0.40 | ) | |
| Net asset value, end of year | | $ | 12.45 | | | $ | 12.15 | | | $ | 12.22 | | | $ | 12.27 | | | $ | 12.49 | | |
| Total investment return(2) | | | 5.97 | % | | | 2.81 | % | | | 2.84 | % | | | 1.42 | % | | | 2.61 | % | |
| Ratios/supplemental data: | |
| Net assets, end of year (000's) | | $ | 88,167 | | | $ | 87,036 | | | $ | 90,219 | | | $ | 99,169 | | | $ | 115,286 | | |
Expenses to average net assets, net of fee waivers and/or
expense reimbursements by manager | | | 0.93 | % | | | 0.93 | % | | | 1.01 | % | | | 0.99 | % | | | 0.96 | % | |
Expenses to average net assets, before fee waivers and/or
expense reimbursements by manager | | | 0.96 | % | | | 1.01 | % | | | 1.02 | % | | | 1.04 | % | | | 1.03 | % | |
| Net investment income to average net assets | | | 3.35 | % | | | 3.34 | % | | | 3.21 | % | | | 3.19 | % | | | 3.12 | % | |
| Portfolio turnover | | | 25 | % | | | 16 | % | | | 48 | % | | | 27 | % | | | 35 | % | |
| | | Class C | |
| | | For the years ended July 31, | |
| | | 2009 | | 2008 | | 2007 | | 2006 | | 2005 | |
| Net asset value, beginning of year | | $ | 12.16 | | | $ | 12.22 | | | $ | 12.27 | | | $ | 12.49 | | | $ | 12.56 | | |
| Net investment income(1) | | | 0.35 | | | | 0.35 | | | | 0.33 | | | | 0.33 | | | | 0.33 | | |
| Net realized and unrealized gains (losses) from investment activities | | | 0.29 | | | | (0.06 | ) | | | (0.05 | ) | | | (0.22 | ) | | | (0.07 | ) | |
| Net increase from operations | | | 0.64 | | | | 0.29 | | | | 0.28 | | | | 0.11 | | | | 0.26 | | |
| Dividends from net investment income | | | (0.35 | ) | | | (0.35 | ) | | | (0.33 | ) | | | (0.33 | ) | | | (0.33 | ) | |
| Net asset value, end of year | | $ | 12.45 | | | $ | 12.16 | | | $ | 12.22 | | | $ | 12.27 | | | $ | 12.49 | | |
| Total investment return(2) | | | 5.36 | % | | | 2.38 | % | | | 2.32 | % | | | 0.91 | % | | | 2.07 | % | |
| Ratios/supplemental data: | |
| Net assets, end of year (000's) | | $ | 15,474 | | | $ | 13,905 | | | $ | 14,777 | | | $ | 17,315 | | | $ | 21,291 | | |
Expenses to average net assets, net of fee waivers and/or
expense reimbursements by manager | | | 1.43 | % | | | 1.43 | % | | | 1.51 | % | | | 1.50 | % | | | 1.48 | % | |
Expenses to average net assets, before fee waivers and/or
expense reimbursements by manager | | | 1.47 | % | | | 1.52 | % | | | 1.53 | % | | | 1.55 | % | | | 1.55 | % | |
| Net investment income to average net assets | | | 2.85 | % | | | 2.84 | % | | | 2.71 | % | | | 2.68 | % | | | 2.61 | % | |
| Portfolio turnover | | | 25 | % | | | 16 | % | | | 48 | % | | | 27 | % | | | 35 | % | |
(1) Calculated using the average shares method.
(2) Total investment return is calculated assuming a $10,000 investment on the first day of each year reported, reinvestment of all dividends and other distributions, if any, at net asset value on the ex-dividend dates, and a sale at net asset value on the last day of each year reported. The figures do not include any applicable sales charges or redemption fees; results would be lower if they were included. Returns do not reflect the deduction of taxes that a shareholder could pay on Portfolio distributions or the redemption of Portfolio shares.
248
| | | Class B | |
| | | For the years ended July 31, | |
| | | 2009 | | 2008 | | 2007 | | 2006 | | 2005 | |
| Net asset value, beginning of year | | $ | 12.16 | | | $ | 12.23 | | | $ | 12.27 | | | $ | 12.49 | | | $ | 12.56 | | |
| Net investment income(1) | | | 0.31 | | | | 0.31 | | | | 0.30 | | | | 0.29 | | | | 0.30 | | |
| Net realized and unrealized gains (losses) from investment activities | | | 0.31 | | | | (0.06 | ) | | | (0.04 | ) | | | (0.21 | ) | | | (0.07 | ) | |
| Net increase from operations | | | 0.62 | | | | 0.25 | | | | 0.26 | | | | 0.08 | | | | 0.23 | | |
| Dividends from net investment income | | | (0.32 | ) | | | (0.32 | ) | | | (0.30 | ) | | | (0.30 | ) | | | (0.30 | ) | |
| Net asset value, end of year | | $ | 12.46 | | | $ | 12.16 | | | $ | 12.23 | | | $ | 12.27 | | | $ | 12.49 | | |
| Total investment return(2) | | | 5.17 | % | | | 2.05 | % | | | 2.10 | % | | | 0.65 | % | | | 1.82 | % | |
| Ratios/supplemental data: | |
| Net assets, end of year (000's) | | $ | 103 | | | $ | 196 | | | $ | 259 | | | $ | 985 | | | $ | 2,665 | | |
Expenses to average net assets, net of fee waivers and/or
expense reimbursements by manager | | | 1.68 | % | | | 1.68 | % | | | 1.76 | % | | | 1.74 | % | | | 1.71 | % | |
Expenses to average net assets, before fee waivers and/or
expense reimbursements by manager | | | 1.74 | % | | | 1.89 | % | | | 1.78 | % | | | 1.80 | % | | | 1.79 | % | |
| Net investment income to average net assets | | | 2.63 | % | | | 2.57 | % | | | 2.44 | % | | | 2.43 | % | | | 2.37 | % | |
| Portfolio turnover | | | 25 | % | | | 16 | % | | | 48 | % | | | 27 | % | | | 35 | % | |
| | | Class Y | |
| | | For the years ended July 31, | |
| | | 2009 | | 2008 | | 2007 | | 2006 | | 2005 | |
| Net asset value, beginning of year | | $ | 12.16 | | | $ | 12.23 | | | $ | 12.28 | | | $ | 12.49 | | | $ | 12.56 | | |
| Net investment income(1) | | | 0.44 | | | | 0.44 | | | | 0.43 | | | | 0.43 | | | | 0.42 | | |
| Net realized and unrealized gains (losses) from investment activities | | | 0.29 | | | | (0.07 | ) | | | (0.05 | ) | | | (0.22 | ) | | | (0.07 | ) | |
| Net increase from operations | | | 0.73 | | | | 0.37 | | | | 0.38 | | | | 0.21 | | | | 0.35 | | |
| Dividends from net investment income | | | (0.44 | ) | | | (0.44 | ) | | | (0.43 | ) | | | (0.42 | ) | | | (0.42 | ) | |
| Net asset value, end of year | | $ | 12.45 | | | $ | 12.16 | | | $ | 12.23 | | | $ | 12.28 | | | $ | 12.49 | | |
| Total investment return(2) | | | 6.23 | % | | | 3.05 | % | | | 3.09 | % | | | 1.75 | % | | | 2.83 | % | |
| Ratios/supplemental data: | |
| Net assets, end of year (000's) | | $ | 145 | | | $ | 136 | | | $ | 137 | | | $ | 176 | | | $ | 186 | | |
Expenses to average net assets, net of fee waivers and/or
expense reimbursements by manager | | | 0.68 | % | | | 0.68 | % | | | 0.76 | % | | | 0.75 | % | | | 0.74 | % | |
Expenses to average net assets, before fee waivers and/or
expense reimbursements by manager | | | 0.76 | % | | | 0.96 | % | | | 0.83 | % | | | 0.84 | % | | | 0.85 | % | |
| Net investment income to average net assets | | | 3.60 | % | | | 3.59 | % | | | 3.46 | % | | | 3.44 | % | | | 3.35 | % | |
| Portfolio turnover | | | 25 | % | | | 16 | % | | | 48 | % | | | 27 | % | | | 35 | % | |
See accompanying notes to financial statements
249
UBS PACE Select Advisors Trust
Financial highlights
UBS PACE Municipal Fixed Income Investments
(concluded)
Selected data for a share of beneficial interest outstanding throughout each year is presented below:
| | | Class P | |
| | | For the years ended July 31, | |
| | | 2009 | | 2008 | | 2007 | | 2006 | | 2005 | |
| Net asset value, beginning of year | | $ | 12.16 | | | $ | 12.22 | | | $ | 12.27 | | | $ | 12.49 | | | $ | 12.56 | | |
| Net investment income(1) | | | 0.44 | | | | 0.44 | | | | 0.43 | | | | 0.42 | | | | 0.42 | | |
| Net realized and unrealized gains (losses) from investment activities | | | 0.29 | | | | (0.06 | ) | | | (0.05 | ) | | | (0.22 | ) | | | (0.07 | ) | |
| Net increase from operations | | | 0.73 | | | | 0.38 | | | | 0.38 | | | | 0.20 | | | | 0.35 | | |
| Dividends from net investment income | | | (0.44 | ) | | | (0.44 | ) | | | (0.43 | ) | | | (0.42 | ) | | | (0.42 | ) | |
| Net asset value, end of year | | $ | 12.45 | | | $ | 12.16 | | | $ | 12.22 | | | $ | 12.27 | | | $ | 12.49 | | |
| Total investment return(2) | | | 6.14 | % | | | 3.14 | % | | | 3.10 | % | | | 1.66 | % | | | 2.81 | % | |
| Ratios/supplemental data: | |
| Net assets, end of year (000's) | | $ | 187,814 | | | $ | 242,033 | | | $ | 194,370 | | | $ | 140,320 | | | $ | 111,908 | | |
Expenses to average net assets, net of fee waivers and/or
expense reimbursements by manager | | | 0.68 | % | | | 0.68 | % | | | 0.76 | % | | | 0.76 | % | | | 0.76 | % | |
Expenses to average net assets, before fee waivers and/or
expense reimbursements by manager | | | 0.74 | % | | | 0.79 | % | | | 0.81 | % | | | 0.84 | % | | | 0.82 | % | |
| Net investment income to average net assets | | | 3.61 | % | | | 3.59 | % | | | 3.47 | % | | | 3.43 | % | | | 3.33 | % | |
| Portfolio turnover | | | 25 | % | | | 16 | % | | | 48 | % | | | 27 | % | | | 35 | % | |
(1) Calculated using the average shares method.
(2) Total investment return is calculated assuming a $10,000 investment on the first day of each year reported, reinvestment of all dividends and other distributions, if any, at net asset value on the ex-dividend dates, and a sale at net asset value on the last day of each year reported. The figures do not include any applicable program or redemption fees; results would be lower if they were included. Returns do not reflect the deduction of taxes that a shareholder could pay on Portfolio distributions or the redemption of Portfolio shares.
See accompanying notes to financial statements
250
(This page has been left blank intentionally)
251
UBS PACE Select Advisors Trust
Financial highlights
UBS PACE Global Fixed Income Investments
Selected data for a share of beneficial interest outstanding throughout each year is presented below:
| | | Class A | |
| | | For the years ended July 31, | |
| | | 2009 | | 2008(1) | | 2007 | | 2006 | | 2005 | |
| Net asset value, beginning of year | | $ | 11.84 | | | $ | 11.38 | | | $ | 11.20 | | | $ | 11.76 | | | $ | 11.74 | | |
| Net investment income(2) | | | 0.30 | | | | 0.25 | | | | 0.25 | | | | 0.25 | | | | 0.24 | | |
| Net realized and unrealized gains (losses) from investment activities | | | (0.06 | ) | | | 1.14 | | | | 0.23 | | | | (0.06 | ) | | | 0.52 | | |
| Net increase from operations | | | 0.24 | | | | 1.39 | | | | 0.48 | | | | 0.19 | | | | 0.76 | | |
| Dividends from net investment income | | | (0.44 | ) | | | (0.93 | ) | | | (0.30 | ) | | | (0.57 | ) | | | (0.72 | ) | |
| Distributions from net realized gains from investment activities | | | — | | | | — | | | | — | | | | (0.18 | ) | | | (0.02 | ) | |
| Total dividends and distributions | | | (0.44 | ) | | | (0.93 | ) | | | (0.30 | ) | | | (0.75 | ) | | | (0.74 | ) | |
| Net asset value, end of year | | $ | 11.64 | | | $ | 11.84 | | | $ | 11.38 | | | $ | 11.20 | | | $ | 11.76 | | |
| Total investment return(3) | | | 2.35 | % | | | 12.76 | % | | | 4.36 | % | | | 1.86 | % | | | 6.33 | % | |
| Ratios/supplemental data: | |
| Net assets, end of year (000's) | | $ | 103,708 | | | $ | 118,784 | | | $ | 111,910 | | | $ | 124,045 | | | $ | 144,325 | | |
Expenses to average net assets, net of fee waivers and/or
expense reimbursements by manager | | | 1.25 | % | | | 1.25 | % | | | 1.37 | % | | | 1.37 | % | | | 1.37 | %(5) | |
Expenses to average net assets, before fee waivers and/or
expense reimbursements by manager | | | 1.32 | % | | | 1.35 | % | | | 1.37 | % | | | 1.40 | % | | | 1.41 | %(5) | |
| Net investment income to average net assets | | | 2.83 | % | | | 2.07 | % | | | 2.23 | % | | | 2.25 | % | | | 1.98 | % | |
| Portfolio turnover | | | 37 | % | | | 65 | % | | | 111 | % | | | 175 | % | | | 260 | % | |
| | | Class C | |
| | | For the years ended July 31, | |
| | | 2009 | | 2008(1) | | 2007 | | 2006 | | 2005 | |
| Net asset value, beginning of year | | $ | 11.85 | | | $ | 11.38 | | | $ | 11.20 | | | $ | 11.76 | | | $ | 11.74 | | |
| Net investment income(2) | | | 0.25 | | | | 0.19 | | | | 0.20 | | | | 0.20 | | | | 0.18 | | |
| Net realized and unrealized gains (losses) from investment activities | | | (0.08 | ) | | | 1.15 | | | | 0.23 | | | | (0.06 | ) | | | 0.53 | | |
| Net increase from operations | | | 0.17 | | | | 1.34 | | | | 0.43 | | | | 0.14 | | | | 0.71 | | |
| Dividends from net investment income | | | (0.38 | ) | | | (0.87 | ) | | | (0.25 | ) | | | (0.52 | ) | | | (0.67 | ) | |
| Distributions from net realized gains from investment activities | | | — | | | | — | | | | — | | | | (0.18 | ) | | | (0.02 | ) | |
| Total dividends and distributions | | | (0.38 | ) | | | (0.87 | ) | | | (0.25 | ) | | | (0.70 | ) | | | (0.69 | ) | |
| Net asset value, end of year | | $ | 11.64 | | | $ | 11.85 | | | $ | 11.38 | | | $ | 11.20 | | | $ | 11.76 | | |
| Total investment return(3) | | | 1.85 | % | | | 12.20 | % | | | 3.86 | % | | | 1.35 | % | | | 5.82 | % | |
| Ratios/supplemental data: | |
| Net assets, end of year (000's) | | $ | 7,234 | | | $ | 7,161 | | | $ | 6,347 | | | $ | 7,499 | | | $ | 8,736 | | |
Expenses to average net assets, net of fee waivers and/or
expense reimbursements by and recoupments to manager | | | 1.75 | %(4) | | | 1.75 | % | | | 1.85 | % | | | 1.87 | % | | | 1.86 | %(5) | |
Expenses to average net assets, before fee waivers and/or
expense reimbursements by manager | | | 1.80 | % | | | 1.84 | % | | | 1.85 | % | | | 1.89 | % | | | 1.92 | %(5) | |
| Net investment income to average net assets | | | 2.32 | % | | | 1.57 | % | | | 1.74 | % | | | 1.75 | % | | | 1.50 | % | |
| Portfolio turnover | | | 37 | % | | | 65 | % | | | 111 | % | | | 175 | % | | | 260 | % | |
(1) Effective August 23, 2007, Rogge Global Partners plc ("Rogge") assumed the role of sole manager of the Portfolio. Prior to August 23, 2007, the investment advisory function for this Portfolio was performed by Rogge and Fischer Francis Trees & Watts, Inc., who were each responsible for a portion of the Portfolio.
(2) Calculated using the average shares method.
(3) Total investment return is calculated assuming a $10,000 investment on the first day of each year reported, reinvestment of all dividends and other distributions, if any, at net asset value on the ex-dividend dates, and a sale at net asset value on the last day of each year reported. The figures do not include any applicable sales charges or redemption fees; results would be lower if they were included. Returns do not reflect the deduction of taxes that a shareholder would pay on Portfolio distributions or the redemption of Portfolio shares.
(4) The investment manager recouped expenses previously reimbursed by the investment manager on behalf of the Portfolio, not to exceed the expense cap.
(5) Includes 0.01% of interest expense related to reverse repurchase agreement activity during the year ended July 31, 2005.
252
| | | Class B | |
| | | For the years ended July 31, | |
| | | 2009 | | 2008(1) | | 2007 | | 2006 | | 2005 | |
| Net asset value, beginning of year | | $ | 11.87 | | | $ | 11.40 | | | $ | 11.22 | | | $ | 11.78 | | | $ | 11.76 | | |
| Net investment income(2) | | | 0.22 | | | | 0.15 | | | | 0.16 | | | | 0.17 | | | | 0.15 | | |
| Net realized and unrealized gains (losses) from investment activities | | | (0.06 | ) | | | 1.16 | | | | 0.24 | | | | (0.06 | ) | | | 0.52 | | |
| Net increase from operations | | | 0.16 | | | | 1.31 | | | | 0.40 | | | | 0.11 | | | | 0.67 | | |
| Dividends from net investment income | | | (0.35 | ) | | | (0.84 | ) | | | (0.22 | ) | | | (0.49 | ) | | | (0.63 | ) | |
| Distributions from net realized gains from investment activities | | | — | | | | — | | | | — | | | | (0.18 | ) | | | (0.02 | ) | |
| Total dividends and distributions | | | (0.35 | ) | | | (0.84 | ) | | | (0.22 | ) | | | (0.67 | ) | | | (0.65 | ) | |
| Net asset value, end of year | | $ | 11.68 | | | $ | 11.87 | | | $ | 11.40 | | | $ | 11.22 | | | $ | 11.78 | | |
| Total investment return(3) | | | 1.64 | % | | | 11.89 | % | | | 3.57 | % | | | 1.08 | % | | | 5.52 | % | |
| Ratios/supplemental data: | |
| Net assets, end of year (000's) | | $ | 191 | | | $ | 505 | | | $ | 723 | | | $ | 878 | | | $ | 1,450 | | |
Expenses to average net assets, net of fee waivers and/or
expense reimbursements by manager | | | 2.00 | % | | | 2.00 | % | | | 2.13 | % | | | 2.12 | % | | | 2.12 | %(5) | |
Expenses to average net assets, before fee waivers and/or
expense reimbursements by manager | | | 2.10 | % | | | 2.15 | % | | | 2.13 | % | | | 2.16 | % | | | 2.17 | %(5) | |
| Net investment income to average net assets | | | 2.11 | % | | | 1.31 | % | | | 1.47 | % | | | 1.50 | % | | | 1.22 | % | |
| Portfolio turnover | | | 37 | % | | | 65 | % | | | 111 | % | | | 175 | % | | | 260 | % | |
| | | Class Y | |
| | | For the years ended July 31, | |
| | | 2009 | | 2008(1) | | 2007 | | 2006 | | 2005 | |
| Net asset value, beginning of year | | $ | 11.83 | | | $ | 11.36 | | | $ | 11.19 | | | $ | 11.75 | | | $ | 11.73 | | |
| Net investment income(2) | | | 0.34 | | | | 0.29 | | | | 0.29 | | | | 0.29 | | | | 0.28 | | |
| Net realized and unrealized gains (losses) from investment activities | | | (0.07 | ) | | | 1.15 | | | | 0.22 | | | | (0.06 | ) | | | 0.52 | | |
| Net increase from operations | | | 0.27 | | | | 1.44 | | | | 0.51 | | | | 0.23 | | | | 0.80 | | |
| Dividends from net investment income | | | (0.47 | ) | | | (0.97 | ) | | | (0.34 | ) | | | (0.61 | ) | | | (0.76 | ) | |
| Distributions from net realized gains from investment activities | | | — | | | | — | | | | — | | | | (0.18 | ) | | | (0.02 | ) | |
| Total dividends and distributions | | | (0.47 | ) | | | (0.97 | ) | | | (0.34 | ) | | | (0.79 | ) | | | (0.78 | ) | |
| Net asset value, end of year | | $ | 11.63 | | | $ | 11.83 | | | $ | 11.36 | | | $ | 11.19 | | | $ | 11.75 | | |
| Total investment return(3) | | | 2.71 | % | | | 13.16 | % | | | 4.67 | % | | | 2.21 | % | | | 6.67 | % | |
| Ratios/supplemental data: | |
| Net assets, end of year (000's) | | $ | 7,773 | | | $ | 10,253 | | | $ | 7,113 | | | $ | 7,077 | | | $ | 9,285 | | |
Expenses to average net assets, net of fee waivers and/or
expense reimbursements by and recoupments to manager | | | 0.89 | % | | | 0.93 | % | | | 1.03 | %(4) | | | 1.05 | %(4) | | | 1.06 | %(4)(5) | |
Expenses to average net assets, before fee waivers and/or
expense reimbursements by manager | | | 0.94 | % | | | 0.99 | % | | | 1.03 | % | | | 1.05 | % | | | 1.06 | %(5) | |
| Net investment income to average net assets | | | 3.19 | % | | | 2.40 | % | | | 2.58 | % | | | 2.57 | % | | | 2.30 | % | |
| Portfolio turnover | | | 37 | % | | | 65 | % | | | 111 | % | | | 175 | % | | | 260 | % | |
See accompanying notes to financial statements
253
UBS PACE Select Advisors Trust
Financial highlights
UBS PACE Global Fixed Income Investments
(concluded)
Selected data for a share of beneficial interest outstanding throughout each year is presented below:
| | | Class P | |
| | | For the years ended July 31, | |
| | | 2009 | | 2008(1) | | 2007 | | 2006 | | 2005 | |
| Net asset value, beginning of year | | $ | 11.84 | | | $ | 11.38 | | | $ | 11.20 | | | $ | 11.76 | | | $ | 11.74 | | |
| Net investment income(2) | | | 0.33 | | | | 0.28 | | | | 0.28 | | | | 0.28 | | | | 0.27 | | |
| Net realized and unrealized gains (losses) from investment activities | | | (0.07 | ) | | | 1.14 | | | | 0.23 | | | | (0.06 | ) | | | 0.52 | | |
| Net increase from operations | | | 0.26 | | | | 1.42 | | | | 0.51 | | | | 0.22 | | | | 0.79 | | |
| Dividends from net investment income | | | (0.46 | ) | | | (0.96 | ) | | | (0.33 | ) | | | (0.60 | ) | | | (0.75 | ) | |
| Distributions from net realized gains from investment activities | | | — | | | | — | | | | — | | | | (0.18 | ) | | | (0.02 | ) | |
| Total dividends and distributions | | | (0.46 | ) | | | (0.96 | ) | | | (0.33 | ) | | | (0.78 | ) | | | (0.77 | ) | |
| Net asset value, end of year | | $ | 11.64 | | | $ | 11.84 | | | $ | 11.38 | | | $ | 11.20 | | | $ | 11.76 | | |
| Total investment return(3) | | | 2.60 | % | | | 12.95 | % | | | 4.62 | % | | | 2.11 | % | | | 6.58 | % | |
| Ratios/supplemental data: | |
| Net assets, end of year (000's) | | $ | 364,616 | | | $ | 534,097 | | | $ | 440,787 | | | $ | 349,676 | | | $ | 274,572 | | |
Expenses to average net assets, net of fee waivers and/or
expense reimbursements by and recoupments to manager | | | 1.00 | %(4) | | | 1.00 | % | | | 1.13 | % | | | 1.13 | % | | | 1.14 | %(5) | |
Expenses to average net assets, before fee waivers and/or
expense reimbursements by manager | | | 1.17 | % | | | 1.18 | % | | | 1.22 | % | | | 1.27 | % | | | 1.29 | %(5) | |
| Net investment income to average net assets | | | 3.09 | % | | | 2.32 | % | | | 2.49 | % | | | 2.49 | % | | | 2.25 | % | |
| Portfolio turnover | | | 37 | % | | | 65 | % | | | 111 | % | | | 175 | % | | | 260 | % | |
(1) Effective August 23, 2007, Rogge Global Partners plc ("Rogge") assumed the role of sole manager of the Portfolio. Prior to August 23, 2007, the investment advisory function for this Portfolio was performed by Rogge and Fischer Francis Trees & Watts, Inc., who were each responsible for a portion of the Portfolio.
(2) Calculated using the average shares method.
(3) Total investment return is calculated assuming a $10,000 investment on the first day of each year reported, reinvestment of all dividends and other distributions, if any, at net asset value on the ex-dividend dates, and a sale at net asset value on the last day of each year reported. The figures do not include any applicable program or redemption fees; results would be lower if they were included. Returns do not reflect the deduction of taxes that a shareholder would pay on Portfolio distributions or the redemption of Portfolio shares.
(4) The investment manager recouped expenses previously reimbursed by the investment manager on behalf of the Portfolio, not to exceed the expense cap.
(5) Includes 0.01% of interest expense related to reverse repurchase agreement activity during the year ended July 31, 2005.
See accompanying notes to financial statements
254
(This page has been left blank intentionally)
255
UBS PACE Select Advisors Trust
Financial highlights
UBS PACE High Yield Investments
Selected data for a share of beneficial interest outstanding throughout each period is presented below:
| | | Class A | | Class C | |
| | | For the years ended July 31, | | For the
period ended
July 31, | | For the
period ended
July 31, | |
| | | 2009 | | 2008 | | 2007 | | 2006(1) | | 2009(2) | |
| Net asset value, beginning of period | | $ | 9.04 | | | $ | 9.60 | | | $ | 9.81 | | | $ | 9.95 | | | $ | 7.49 | | |
| Net investment income(6) | | | 0.66 | | | | 0.60 | | | | 0.60 | | | | 0.11 | | | | 0.29 | | |
| Net realized and unrealized gains (losses) from investment activities | | | 0.02 | | | | (0.54 | ) | | | (0.23 | ) | | | (0.10 | ) | | | 1.54 | | |
| Net increase (decrease) from operations | | | 0.68 | | | | 0.06 | | | | 0.37 | | | | 0.01 | | | | 1.83 | | |
| Dividends from net investment income | | | (0.78 | ) | | | (0.59 | ) | | | (0.58 | ) | | | (0.15 | ) | | | (0.39 | ) | |
| Distributions from net realized gains from investment activities | | | — | | | | (0.01 | ) | | | — | | | | — | | | | — | | |
| Return of capital | | | — | | | | (0.02 | ) | | | — | | | | — | | | | — | | |
| Total dividends, distributions and return of capital | | | (0.78 | ) | | | (0.62 | ) | | | (0.58 | ) | | | (0.15 | ) | | | (0.39 | ) | |
| Net asset value, end of period | | $ | 8.94 | | | $ | 9.04 | | | $ | 9.60 | | | $ | 9.81 | | | $ | 8.93 | | |
| Total investment return(7) | | | 9.49 | % | | | 0.58 | % | | | 3.66 | % | | | 0.15 | % | | | 25.40 | % | |
| Ratios/supplemental data: | |
| Net assets, end of period (000's) | | $ | 7,538 | | | $ | 2,181 | | | $ | 741 | | | $ | 345 | | | $ | 1,819 | | |
Expenses to average net assets, net of fee waivers and/or
expense reimbursements by manager | | | 1.35 | % | | | 1.35 | % | | | 1.35 | % | | | 1.35 | %(8) | | | 1.85 | %(8) | |
Expenses to average net assets, before fee waivers and/or
expense reimbursements by manager | | | 1.46 | % | | | 1.59 | % | | | 1.96 | % | | | 7.56 | %(8) | | | 1.92 | %(8) | |
| Net investment income to average net assets | | | 8.46 | % | | | 6.43 | % | | | 5.96 | % | | | 6.04 | %(8) | | | 6.96 | %(8) | |
| Portfolio turnover | | | 49 | % | | | 25 | % | | | 26 | % | | | 39 | % | | | 49 | % | |
(1) For the period May 1, 2006 (commencement of issuance) through July 31, 2006.
(2) For the period January 21, 2009 (commencement of issuance) through July 31, 2009.
(3) For the period December 26, 2008 (recommencement of issuance) through July 31, 2009.
(4) For the period April 3, 2006 (commencement of issuance) through July 24, 2006. There were no shares outstanding from July 25, 2006 through December 25, 2008.
(5) For the period April 10, 2006 (commencement of issuance) through July 31, 2006.
(6) Calculated using the average shares method.
(7) Total investment return is calculated assuming a $10,000 investment on the first day of each period reported, reinvestment of all dividends and other distributions, if any, at net asset value on the ex-dividend dates, and a sale at net asset value on the last day of each period reported. The figures do not include any applicable sales charges, redemption fees or program fees; results would be lower if they were included. Total investment return for periods of less than one year has not been annualized. Returns do not reflect the deduction of taxes that a shareholder would pay on Portfolio distributions or the redemption of Portfolio shares.
(8) Annualized.
256
| | | Class Y | | Class P | |
| | | For the
period ended
July 31, | | For the
period ended
July 24, | | For the years ended July 31, | | For the
period ended
July 31, | |
| | | 2009(3) | | 2006(4) | | 2009 | | 2008 | | 2007 | | 2006(5) | |
| Net asset value, beginning of period | | $ | 6.83 | | | $ | 10.00 | | | $ | 9.04 | | | $ | 9.61 | | | $ | 9.81 | | | $ | 9.95 | | |
| Net investment income(6) | | | 0.42 | | | | 0.17 | | | | 0.69 | | | | 0.63 | | | | 0.62 | | | | 0.14 | | |
| Net realized and unrealized gains (losses) from investment activities | | | 2.11 | | | | (0.22 | ) | | | 0.02 | | | | (0.56 | ) | | | (0.22 | ) | | | (0.09 | ) | |
| Net increase (decrease) from operations | | | 2.53 | | | | (0.05 | ) | | | 0.71 | | | | 0.07 | | | | 0.40 | | | | 0.05 | | |
| Dividends from net investment income | | | (0.41 | ) | | | (0.14 | ) | | | (0.80 | ) | | | (0.61 | ) | | | (0.60 | ) | | | (0.19 | ) | |
| Distributions from net realized gains from investment activities | | | — | | | | — | | | | — | | | | (0.01 | ) | | | — | | | | — | | |
| Return of capital | | | — | | | | — | | | | — | | | | (0.02 | ) | | | — | | | | — | | |
| Total dividends, distributions and return of capital | | | (0.41 | ) | | | (0.14 | ) | | | (0.80 | ) | | | (0.64 | ) | | | (0.60 | ) | | | (0.19 | ) | |
| Net asset value, end of period | | $ | 8.95 | | | $ | 9.81 | | | $ | 8.95 | | | $ | 9.04 | | | $ | 9.61 | | | $ | 9.81 | | |
| Total investment return(7) | | | 38.23 | % | | | (0.45 | )% | | | 9.87 | % | | | 0.71 | % | | | 3.96 | % | | | 0.56 | % | |
| Ratios/supplemental data: | |
| Net assets, end of period (000's) | | $ | 7 | | | $ | — | | | $ | 147,029 | | | $ | 142,985 | | | $ | 87,171 | | | $ | 11,103 | | |
Expenses to average net assets, net of fee waivers and/or
expense reimbursements by manager | | | 1.10 | %(8) | | | 1.10 | %(8) | | | 1.10 | % | | | 1.10 | % | | | 1.10 | % | | | 1.10 | %(8) | |
Expenses to average net assets, before fee waivers and/or
expense reimbursements by manager | | | 1.37 | %(8) | | | 2.32 | %(8) | | | 1.34 | % | | | 1.31 | % | | | 1.72 | % | | | 8.16 | %(8) | |
| Net investment income to average net assets | | | 9.13 | %(8) | | | 5.94 | %(8) | | | 8.80 | % | | | 6.68 | % | | | 6.24 | % | | | 6.34 | %(8) | |
| Portfolio turnover | | | 49 | % | | | 39 | % | | | 49 | % | | | 25 | % | | | 26 | % | | | 39 | % | |
See accompanying notes to financial statements
257
UBS PACE Select Advisors Trust
Financial highlights
UBS PACE Large Co Value Equity Investments
Selected data for a share of beneficial interest outstanding throughout each year is presented below:
| | | Class A | |
| | | For the years ended July 31, | |
| | | 2009 | | 2008(1) | | 2007 | | 2006 | | 2005 | |
| Net asset value, beginning of year | | $ | 16.67 | | | $ | 22.41 | | | $ | 22.35 | | | $ | 20.64 | | | $ | 17.56 | | |
| Net investment income(2) | | | 0.19 | | | | 0.25 | | | | 0.23 | | | | 0.22 | | | | 0.22 | | |
| Net realized and unrealized gains (losses) from investment activities | | | (3.44 | ) | | | (3.34 | ) | | | 2.80 | | | | 2.16 | | | | 3.06 | | |
| Net increase (decrease) from operations | | | (3.25 | ) | | | (3.09 | ) | | | 3.03 | | | | 2.38 | | | | 3.28 | | |
| Dividends from net investment income | | | (0.26 | ) | | | (0.11 | ) | | | (0.23 | ) | | | (0.20 | ) | | | (0.20 | ) | |
| Distributions from net realized gains from investment activities | | | — | | | | (2.54 | ) | | | (2.74 | ) | | | (0.47 | ) | | | — | | |
| Total dividends and distributions | | | (0.26 | ) | | | (2.65 | ) | | | (2.97 | ) | | | (0.67 | ) | | | (0.20 | ) | |
| Net asset value, end of year | | $ | 13.16 | | | $ | 16.67 | | | $ | 22.41 | | | $ | 22.35 | | | $ | 20.64 | | |
| Total investment return(3) | | | (19.27 | )% | | | (15.56 | )% | | | 13.94 | % | | | 11.77 | % | | | 18.78 | % | |
| Ratios/supplemental data: | |
| Net assets, end of year (000's) | | $ | 146,510 | | | $ | 217,986 | | | $ | 291,942 | | | $ | 292,632 | | | $ | 306,916 | | |
Expenses to average net assets, net of fee waivers and/or
expense reimbursements by and recoupments to manager | | | 1.24 | % | | | 1.09 | % | | | 1.08 | % | | | 1.14 | %(4) | | | 1.15 | %(4) | |
Expenses to average net assets, before fee waivers and/or
expense reimbursements by manager | | | 1.24 | % | | | 1.22 | % | | | 1.21 | % | | | 1.27 | % | | | 1.27 | % | |
| Net investment income to average net assets | | | 1.52 | % | | | 1.26 | % | | | 0.99 | % | | | 1.03 | % | | | 1.16 | % | |
| Portfolio turnover | | | 87 | % | | | 161 | % | | | 105 | % | | | 95 | % | | | 74 | % | |
| | | Class C | |
| | | For the years ended July 31, | |
| | | 2009 | | 2008(1) | | 2007 | | 2006 | | 2005 | |
| Net asset value, beginning of year | | $ | 16.59 | | | $ | 22.36 | | | $ | 22.29 | | | $ | 20.58 | | | $ | 17.50 | | |
| Net investment income(2) | | | 0.09 | | | | 0.09 | | | | 0.05 | | | | 0.05 | | | | 0.07 | | |
| Net realized and unrealized gains (losses) from investment activities | | | (3.41 | ) | | | (3.32 | ) | | | 2.80 | | | | 2.15 | | | | 3.05 | | |
| Net increase (decrease) from operations | | | (3.32 | ) | | | (3.23 | ) | | | 2.85 | | | | 2.20 | | | | 3.12 | | |
| Dividends from net investment income | | | (0.12 | ) | | | — | | | | (0.04 | ) | | | (0.02 | ) | | | (0.04 | ) | |
| Distributions from net realized gains from investment activities | | | — | | | | (2.54 | ) | | | (2.74 | ) | | | (0.47 | ) | | | — | | |
| Total dividends and distributions | | | (0.12 | ) | | | (2.54 | ) | | | (2.78 | ) | | | (0.49 | ) | | | (0.04 | ) | |
| Net asset value, end of year | | $ | 13.15 | | | $ | 16.59 | | | $ | 22.36 | | | $ | 22.29 | | | $ | 20.58 | | |
| Total investment return(3) | | | (19.89 | )% | | | (16.24 | )% | | | 13.11 | % | | | 10.86 | % | | | 17.87 | % | |
| Ratios/supplemental data: | |
| Net assets, end of year (000's) | | $ | 16,560 | | | $ | 24,765 | | | $ | 35,110 | | | $ | 36,374 | | | $ | 40,113 | | |
Expenses to average net assets, net of fee waivers and/or
expense reimbursements by and recoupments to manager | | | 2.02 | % | | | 1.88 | % | | | 1.86 | % | | | 1.93 | %(4) | | | 1.94 | %(4) | |
Expenses to average net assets, before fee waivers and/or
expense reimbursements by manager | | | 2.05 | % | | | 2.01 | % | | | 2.00 | % | | | 2.06 | % | | | 2.06 | % | |
| Net investment income to average net assets | | | 0.74 | % | | | 0.47 | % | | | 0.21 | % | | | 0.24 | % | | | 0.38 | % | |
| Portfolio turnover | | | 87 | % | | | 161 | % | | | 105 | % | | | 95 | % | | | 74 | % | |
(1) A portion of the investment advisory function for this Portfolio was transferred from SSgA Funds Management, Inc. to Pzena Investment Management, LLC on May 27, 2008. Institutional Capital LLC and Westwood Management Corp. continue to provide a portion of the investment advisory function.
(2) Calculated using the average shares method.
(3) Total investment return is calculated assuming a $10,000 investment on the first day of each year reported, reinvestment of all dividends and other distributions, if any, at net asset value on the ex-dividend dates, and a sale at net asset value on the last day of each year reported. The figures do not include any applicable sales charges or redemption fees; results would be lower if they were included. Returns do not reflect the deduction of taxes that a shareholder would pay on Portfolio distributions or the redemption of Portfolio shares.
(4) The investment manager recouped expenses previously reimbursed by the investment manager on behalf of the Portfolio, not to exceed the expense cap.
258
| | | Class B | |
| | | For the years ended July 31, | |
| | | 2009 | | 2008(1) | | 2007 | | 2006 | | 2005 | |
| Net asset value, beginning of year | | $ | 16.62 | | | $ | 22.43 | | | $ | 22.34 | | | $ | 20.62 | | | $ | 17.50 | | |
| Net investment income(2) | | | 0.09 | | | | 0.06 | | | | 0.04 | | | | 0.03 | | | | 0.07 | | |
| Net realized and unrealized gains (losses) from investment activities | | | (3.41 | ) | | | (3.33 | ) | | | 2.79 | | | | 2.16 | | | | 3.05 | | |
| Net increase (decrease) from operations | | | (3.32 | ) | | | (3.27 | ) | | | 2.83 | | | | 2.19 | | | | 3.12 | | |
| Dividends from net investment income | | | (0.10 | ) | | | — | | | | — | | | | — | | | | — | | |
| Distributions from net realized gains from investment activities | | | — | | | | (2.54 | ) | | | (2.74 | ) | | | (0.47 | ) | | | — | | |
| Total dividends and distributions | | | (0.10 | ) | | | (2.54 | ) | | | (2.74 | ) | | | (0.47 | ) | | | — | | |
| Net asset value, end of year | | $ | 13.20 | | | $ | 16.62 | | | $ | 22.43 | | | $ | 22.34 | | | $ | 20.62 | | |
| Total investment return(3) | | | (19.92 | )% | | | (16.38 | )% | | | 13.00 | % | | | 10.77 | % | | | 17.83 | % | |
| Ratios/supplemental data: | |
| Net assets, end of year (000's) | | $ | 405 | | | $ | 765 | | | $ | 1,872 | | | $ | 5,289 | | | $ | 8,554 | | |
Expenses to average net assets, net of fee waivers and/or
expense reimbursements by and recoupments to manager | | | 2.02 | % | | | 2.02 | % | | | 1.98 | % | | | 2.00 | % | | | 2.02 | %(4) | |
Expenses to average net assets, before fee waivers and/or
expense reimbursements by manager | | | 2.30 | % | | | 2.16 | % | | | 2.11 | % | | | 2.13 | % | | | 2.13 | % | |
| Net investment income to average net assets | | | 0.76 | % | | | 0.29 | % | | | 0.18 | % | | | 0.16 | % | | | 0.36 | % | |
| Portfolio turnover | | | 87 | % | | | 161 | % | | | 105 | % | | | 95 | % | | | 74 | % | |
| | | Class Y | |
| | | For the years ended July 31, | |
| | | 2009 | | 2008(1) | | 2007 | | 2006 | | 2005 | |
| Net asset value, beginning of year | | $ | 16.75 | | | $ | 22.51 | | | $ | 22.45 | | | $ | 20.70 | | | $ | 17.60 | | |
| Net investment income(2) | | | 0.23 | | | | 0.32 | | | | 0.30 | | | | 0.30 | | | | 0.28 | | |
| Net realized and unrealized gains (losses) from investment activities | | | (3.45 | ) | | | (3.35 | ) | | | 2.82 | | | | 2.17 | | | | 3.07 | | |
| Net increase (decrease) from operations | | | (3.22 | ) | | | (3.03 | ) | | | 3.12 | | | | 2.47 | | | | 3.35 | | |
| Dividends from net investment income | | | (0.32 | ) | | | (0.19 | ) | | | (0.32 | ) | | | (0.25 | ) | | | (0.25 | ) | |
| Distributions from net realized gains from investment activities | | | — | | | | (2.54 | ) | | | (2.74 | ) | | | (0.47 | ) | | | — | | |
| Total dividends and distributions | | | (0.32 | ) | | | (2.73 | ) | | | (3.06 | ) | | | (0.72 | ) | | | (0.25 | ) | |
| Net asset value, end of year | | $ | 13.21 | | | $ | 16.75 | | | $ | 22.51 | | | $ | 22.45 | | | $ | 20.70 | | |
| Total investment return(3) | | | (18.93 | )% | | | (15.30 | )% | | | 14.36 | % | | | 12.20 | % | | | 19.17 | % | |
| Ratios/supplemental data: | |
| Net assets, end of year (000's) | | $ | 23,834 | | | $ | 33,809 | | | $ | 45,177 | | | $ | 43,234 | | | $ | 42,046 | | |
Expenses to average net assets, net of fee waivers and/or
expense reimbursements by and recoupments to manager | | | 0.86 | % | | | 0.76 | % | | | 0.74 | % | | | 0.77 | % | | | 0.83 | %(4) | |
Expenses to average net assets, before fee waivers and/or
expense reimbursements by manager | | | 0.86 | % | | | 0.89 | % | | | 0.88 | % | | | 0.90 | % | | | 0.95 | % | |
| Net investment income to average net assets | | | 1.90 | % | | | 1.59 | % | | | 1.32 | % | | | 1.40 | % | | | 1.48 | % | |
| Portfolio turnover | | | 87 | % | | | 161 | % | | | 105 | % | | | 95 | % | | | 74 | % | |
See accompanying notes to financial statements
259
UBS PACE Select Advisors Trust
Financial highlights
UBS PACE Large Co Value Equity Investments
(concluded)
Selected data for a share of beneficial interest outstanding throughout each year is presented below:
| | | Class P | |
| | | For the years ended July 31, | |
| | | 2009 | | 2008(1) | | 2007 | | 2006 | | 2005 | |
| Net asset value, beginning of year | | $ | 16.69 | | | $ | 22.44 | | | $ | 22.38 | | | $ | 20.66 | | | $ | 17.58 | | |
| Net investment income(2) | | | 0.22 | | | | 0.30 | | | | 0.28 | | | | 0.28 | | | | 0.26 | | |
| Net realized and unrealized gains (losses) from investment activities | | | (3.44 | ) | | | (3.34 | ) | | | 2.82 | | | | 2.16 | | | | 3.07 | | |
| Net increase (decrease) from operations | | | (3.22 | ) | | | (3.04 | ) | | | 3.10 | | | | 2.44 | | | | 3.33 | | |
| Dividends from net investment income | | | (0.31 | ) | | | (0.17 | ) | | | (0.30 | ) | | | (0.25 | ) | | | (0.25 | ) | |
| Distributions from net realized gains from investment activities | | | — | | | | (2.54 | ) | | | (2.74 | ) | | | (0.47 | ) | | | — | | |
| Total dividends and distributions | | | (0.31 | ) | | | (2.71 | ) | | | (3.04 | ) | | | (0.72 | ) | | | (0.25 | ) | |
| Net asset value, end of year | | $ | 13.16 | | | $ | 16.69 | | | $ | 22.44 | | | $ | 22.38 | | | $ | 20.66 | | |
| Total investment return(3) | | | (19.01 | )% | | | (15.39 | )% | | | 14.26 | % | | | 12.07 | % | | | 19.03 | % | |
| Ratios/supplemental data: | |
| Net assets, end of year (000's) | | $ | 819,420 | | | $ | 1,159,915 | | | $ | 1,306,425 | | | $ | 1,078,221 | | | $ | 837,901 | | |
Expenses to average net assets, net of fee waivers and/or
expense reimbursements by and recoupments to manager | | | 0.99 | % | | | 0.85 | % | | | 0.83 | % | | | 0.86 | % | | | 0.91 | %(4) | |
Expenses to average net assets, before fee waivers and/or
expense reimbursements by manager | | | 0.99 | % | | | 0.98 | % | | | 0.96 | % | | | 0.99 | % | | | 1.03 | % | |
| Net investment income to average net assets | | | 1.76 | % | | | 1.51 | % | | | 1.23 | % | | | 1.30 | % | | | 1.38 | % | |
| Portfolio turnover | | | 87 | % | | | 161 | % | | | 105 | % | | | 95 | % | | | 74 | % | |
(1) A portion of the investment advisory function for this Portfolio was transferred from SSgA Funds Management, Inc. to Pzena Investment Management, LLC on May 27, 2008. Institutional Capital LLC and Westwood Management Corp. continue to provide a portion of the investment advisory function.
(2) Calculated using the average shares method.
(3) Total investment return is calculated assuming a $10,000 investment on the first day of each year reported, reinvestment of all dividends and other distributions, if any, at net asset value on the ex-dividend dates, and a sale at net asset value on the last day of each year reported. The figures do not include any applicable program or redemption fees; results would be lower if they were included. Returns do not reflect the deduction of taxes that a shareholder would pay on Portfolio distributions or the redemption of Portfolio shares.
(4) The investment manager recouped expenses previously reimbursed by the investment manager on behalf of the Portfolio, not to exceed the expense cap.
See accompanying notes to financial statements
260
(This page has been left blank intentionally)
261
UBS PACE Select Advisors Trust
Financial highlights
UBS PACE Large Co Growth Equity Investments
Selected data for a share of beneficial interest outstanding throughout each year is presented below:
| | | Class A | |
| | | For the years ended July 31, | |
| | | 2009 | | 2008(1) | | 2007(2) | | 2006 | | 2005 | |
| Net asset value, beginning of year | | $ | 16.67 | | | $ | 18.18 | | | $ | 15.75 | | | $ | 15.83 | | | $ | 13.50 | | |
| Net investment income (loss)(3) | | | 0.03 | | | | 0.00 | (4) | | | (0.02 | ) | | | (0.03 | ) | | | (0.02 | ) | |
| Net realized and unrealized gains (losses) from investment activities | | | (3.27 | ) | | | (1.03 | ) | | | 2.45 | | | | (0.05 | ) | | | 2.35 | | |
| Net increase (decrease) from operations | | | (3.24 | ) | | | (1.03 | ) | | | 2.43 | | | | (0.08 | ) | | | 2.33 | | |
| Distributions from net realized gains from investment activities | | | (0.07 | ) | | | (0.48 | ) | | | — | | | | — | | | | — | | |
| Net asset value, end of year | | $ | 13.36 | | | $ | 16.67 | | | $ | 18.18 | | | $ | 15.75 | | | $ | 15.83 | | |
| Total investment return(5) | | | (19.39 | )% | | | (5.94 | )% | | | 15.43 | % | | | (0.51 | )% | | | 17.26 | % | |
| Ratios/supplemental data: | |
| Net assets, end of year (000's) | | $ | 56,038 | | | $ | 77,628 | | | $ | 80,334 | | | $ | 82,201 | | | $ | 95,264 | | |
Expenses to average net assets, net of fee waivers and/or
expense reimbursements by and recoupments to manager | | | 1.26 | % | | | 1.20 | % | | | 1.20 | % | | | 1.23 | % | | | 1.28 | %(6) | |
Expenses to average net assets, before fee waivers and/or
expense reimbursements by manager | | | 1.30 | % | | | 1.25 | % | | | 1.25 | % | | | 1.28 | % | | | 1.32 | % | |
| Net investment income (loss) to average net assets | | | 0.21 | % | | | 0.00 | %(7) | | | (0.10 | )% | | | (0.18 | )% | | | (0.11 | )% | |
| Portfolio turnover | | | 100 | % | | | 120 | % | | | 95 | % | | | 64 | % | | | 79 | % | |
| | | Class C | |
| | | For the years ended July 31, | |
| | | 2009 | | 2008(1) | | 2007(2) | | 2006 | | 2005 | |
| Net asset value, beginning of year | | $ | 15.66 | | | $ | 17.26 | | | $ | 15.08 | | | $ | 15.27 | | | $ | 13.14 | | |
| Net investment income (loss)(3) | | | (0.07 | ) | | | (0.14 | ) | | | (0.16 | ) | | | (0.16 | ) | | | (0.13 | ) | |
| Net realized and unrealized gains (losses) from investment activities | | | (3.07 | ) | | | (0.98 | ) | | | 2.34 | | | | (0.03 | ) | | | 2.26 | | |
| Net increase (decrease) from operations | | | (3.14 | ) | | | (1.12 | ) | | | 2.18 | | | | (0.19 | ) | | | 2.13 | | |
| Dividends from net investment income | | | — | | | | — | | | | — | | | | — | | | | — | | |
| Distributions from net realized gains from investment activities | | | (0.07 | ) | | | (0.48 | ) | | | — | | | | — | | | | — | | |
| Total dividends and distributions | | | (0.07 | ) | | | (0.48 | ) | | | — | | | | — | | | | — | | |
| Net asset value, end of year | | $ | 12.45 | | | $ | 15.66 | | | $ | 17.26 | | | $ | 15.08 | | | $ | 15.27 | | |
| Total investment return(5) | | | (20.00 | )% | | | (6.80 | )% | | | 14.46 | % | | | (1.24 | )% | | | 16.21 | % | |
| Ratios/supplemental data: | |
| Net assets, end of year (000's) | | $ | 4,170 | | | $ | 6,120 | | | $ | 7,488 | | | $ | 7,586 | | | $ | 9,944 | | |
Expenses to average net assets, net of fee waivers and/or
expense reimbursements by and recoupments to manager | | | 2.05 | % | | | 2.04 | %(6) | | | 2.05 | %(6) | | | 2.07 | %(6) | | | 2.11 | %(6) | |
Expenses to average net assets, before fee waivers and/or
expense reimbursements by manager | | | 2.20 | % | | | 2.09 | % | | | 2.09 | % | | | 2.12 | % | | | 2.15 | % | |
| Net investment income (loss) to average net assets | | | (0.57 | )% | | | (0.84 | )% | | | (0.95 | )% | | | (1.03 | )% | | | (0.94 | )% | |
| Portfolio turnover | | | 100 | % | | | 120 | % | | | 95 | % | | | 64 | % | | | 79 | % | |
(1) A portion of the investment advisory function for this Portfolio was transferred to Delaware Management Company on December 5, 2007. Marsico Capital Management, LLC, SSgA Funds Management, Inc. and Wellington Management Company, LLP continue to provide a portion of the investment advisory function.
(2) A portion of the investment advisory function for this Portfolio was transferred from GE Asset Management, Inc. to Wellington Management Company, LLP on June 1, 2007. Marsico Capital Management, LLC and SSgA Funds Management, Inc. continued to provide a portion of the investment advisory function.
(3) Calculated using the average shares method.
(4) Amount represents less than $0.005 per share.
(5) Total investment return is calculated assuming a $10,000 investment on the first day of each year reported, reinvestment of all dividends and other distributions, if any, at net asset value on the ex-dividend dates, and a sale at net asset value on the last day of each year reported. The figures do not include any applicable sales charges or redemption fees; results would be lower if they were included. Returns do not reflect the deduction of taxes that a shareholder would pay on Portfolio distributions or the redemption of Portfolio shares.
(6) The investment manager recouped expenses previously reimbursed by the investment manager on behalf of the Portfolio, not to exceed the expense cap.
(7) Amount represents less than 0.005%.
262
| | | Class B | |
| | | For the years ended July 31, | |
| | | 2009 | | 2008(1) | | 2007(2) | | 2006 | | 2005 | |
| Net asset value, beginning of year | | $ | 15.62 | | | $ | 17.22 | | | $ | 15.05 | | | $ | 15.25 | | | $ | 13.12 | | |
| Net investment income (loss)(3) | | | (0.07 | ) | | | (0.14 | ) | | | (0.15 | ) | | | (0.16 | ) | | | (0.13 | ) | |
| Net realized and unrealized gains (losses) from investment activities | | | (3.07 | ) | | | (0.98 | ) | | | 2.32 | | | | (0.04 | ) | | | 2.26 | | |
| Net increase (decrease) from operations | | | (3.14 | ) | | | (1.12 | ) | | | 2.17 | | | | (0.20 | ) | | | 2.13 | | |
| Distributions from net realized gains from investment activities | | | (0.07 | ) | | | (0.48 | ) | | | — | | | | — | | | | — | | |
| Net asset value, end of year | | $ | 12.41 | | | $ | 15.62 | | | $ | 17.22 | | | $ | 15.05 | | | $ | 15.25 | | |
| Total investment return(5) | | | (20.05 | )% | | | (6.81 | )% | | | 14.42 | % | | | (1.31 | )% | | | 16.24 | % | |
| Ratios/supplemental data: | |
| Net assets, end of year (000's) | | $ | 199 | | | $ | 371 | | | $ | 643 | | | $ | 1,450 | | | $ | 3,185 | | |
Expenses to average net assets, net of fee waivers and/or
expense reimbursements by and recoupments to manager | | | 2.05 | % | | | 2.05 | % | | | 2.05 | % | | | 2.10 | % | | | 2.16 | % | |
Expenses to average net assets, before fee waivers and/or
expense reimbursements by manager | | | 2.32 | % | | | 2.24 | % | | | 2.24 | % | | | 2.27 | % | | | 2.27 | % | |
| Net investment income (loss) to average net assets | | | (0.58 | )% | | | (0.85 | )% | | | (0.90 | )% | | | (1.09 | )% | | | (0.98 | )% | |
| Portfolio turnover | | | 100 | % | | | 120 | % | | | 95 | % | | | 64 | % | | | 79 | % | |
| | | Class Y | |
| | | For the years ended July 31, | |
| | | 2009 | | 2008(1) | | 2007(2) | | 2006 | | 2005 | |
| Net asset value, beginning of year | | $ | 17.03 | | | $ | 18.54 | | | $ | 16.05 | | | $ | 16.09 | | | $ | 13.67 | | |
| Net investment income (loss)(3) | | | 0.08 | | | | 0.07 | | | | 0.05 | | | | 0.03 | | | | 0.04 | | |
| Net realized and unrealized gains (losses) from investment activities | | | (3.34 | ) | | | (1.05 | ) | | | 2.49 | | | | (0.04 | ) | | | 2.38 | | |
| Net increase (decrease) from operations | | | (3.26 | ) | | | (0.98 | ) | | | 2.54 | | | | (0.01 | ) | | | 2.42 | | |
| Dividends from net investment income | | | (0.03 | ) | | | (0.05 | ) | | | (0.05 | ) | | | (0.03 | ) | | | — | | |
| Distributions from net realized gains from investment activities | | | (0.07 | ) | | | (0.48 | ) | | | — | | | | — | | | | — | | |
| Total dividends and distributions | | | (0.10 | ) | | | (0.53 | ) | | | (0.05 | ) | | | (0.03 | ) | | | — | | |
| Net asset value, end of year | | $ | 13.67 | | | $ | 17.03 | | | $ | 18.54 | | | $ | 16.05 | | | $ | 16.09 | | |
| Total investment return(5) | | | (19.04 | )% | | | (5.64 | )% | | | 15.90 | % | | | (0.10 | )% | | | 17.70 | % | |
| Ratios/supplemental data: | |
| Net assets, end of year (000's) | | $ | 16,885 | | | $ | 23,263 | | | $ | 26,125 | | | $ | 22,668 | | | $ | 25,014 | | |
Expenses to average net assets, net of fee waivers and/or
expense reimbursements by and recoupments to manager | | | 0.84 | % | | | 0.82 | % | | | 0.82 | % | | | 0.85 | %(6) | | | 0.85 | % | |
Expenses to average net assets, before fee waivers and/or
expense reimbursements by manager | | | 0.88 | % | | | 0.87 | % | | | 0.86 | % | | | 0.89 | % | | | 0.90 | % | |
| Net investment income (loss) to average net assets | | | 0.63 | % | | | 0.38 | % | | | 0.27 | % | | | 0.20 | % | | | 0.30 | % | |
| Portfolio turnover | | | 100 | % | | | 120 | % | | | 95 | % | | | 64 | % | | | 79 | % | |
See accompanying notes to financial statements
263
UBS PACE Select Advisors Trust
Financial highlights
UBS PACE Large Co Growth Equity Investments
(concluded)
Selected data for a share of beneficial interest outstanding throughout each year is presented below:
| | | Class P | |
| | | For the years ended July 31, | |
| | | 2009 | | 2008(1) | | 2007(2) | | 2006 | | 2005 | |
| Net asset value, beginning of year | | $ | 16.94 | | | $ | 18.45 | | | $ | 15.97 | | | $ | 16.02 | | | $ | 13.62 | | |
| Net investment income(3) | | | 0.06 | | | | 0.05 | | | | 0.03 | | | | 0.02 | | | | 0.03 | | |
| Net realized and unrealized gains (losses) from investment activities | | | (3.32 | ) | | | (1.04 | ) | | | 2.49 | | | | (0.05 | ) | | | 2.37 | | |
| Net increase (decrease) from operations | | | (3.26 | ) | | | (0.99 | ) | | | 2.52 | | | | (0.03 | ) | | | 2.40 | | |
| Dividends from net investment income | | | (0.02 | ) | | | (0.04 | ) | | | (0.04 | ) | | | (0.02 | ) | | | — | | |
| Distributions from net realized gains from investment activities | | | (0.07 | ) | | | (0.48 | ) | | | — | | | | — | | | | — | | |
| Total dividends and distributions | | | (0.09 | ) | | | (0.52 | ) | | | (0.04 | ) | | | (0.02 | ) | | | — | | |
| Net asset value, end of year | | $ | 13.59 | | | $ | 16.94 | | | $ | 18.45 | | | $ | 15.97 | | | $ | 16.02 | | |
| Total investment return(4) | | | (19.19 | )% | | | (5.68 | )% | | | 15.76 | % | | | (0.20 | )% | | | 17.62 | % | |
| Ratios/supplemental data: | |
| Net assets, end of year (000's) | | $ | 822,192 | | | $ | 1,230,206 | | | $ | 1,231,468 | | | $ | 945,358 | | | $ | 780,687 | | |
Expenses to average net assets, net of fee waivers and/or
expense reimbursements by and recoupments to manager | | | 0.97 | % | | | 0.91 | % | | | 0.91 | % | | | 0.95 | %(5) | | | 0.97 | %(5) | |
Expenses to average net assets, before fee waivers and/or
expense reimbursements by manager | | | 1.01 | % | | | 0.96 | % | | | 0.95 | % | | | 1.00 | % | | | 1.01 | % | |
| Net investment income to average net assets | | | 0.50 | % | | | 0.29 | % | | | 0.17 | % | | | 0.12 | % | | | 0.18 | % | |
| Portfolio turnover | | | 100 | % | | | 120 | % | | | 95 | % | | | 64 | % | | | 79 | % | |
(1) A portion of the investment advisory function for this Portfolio was transferred to Delaware Management Company on December 5, 2007. Marsico Capital Management, LLC, SSgA Funds Management, Inc. and Wellington Management Company, LLP continue to provide a portion of the investment advisory function.
(2) A portion of the investment advisory function for this Portfolio was transferred from GE Asset Management, Inc. to Wellington Management Company, LLP on June 1, 2007. Marsico Capital Management, LLC and SSgA Funds Management, Inc. continued to provide a portion of the investment advisory function.
(3) Calculated using the average shares method.
(4) Total investment return is calculated assuming a $10,000 investment on the first day of each year reported, reinvestment of all dividends and other distributions, if any, at net asset value on the ex-dividend dates, and a sale at net asset value on the last day of each year reported. The figures do not include any applicable program or redemption fees; results would be lower if they were included. Returns do not reflect the deduction of taxes that a shareholder would pay on Portfolio distributions or the redemption of Portfolio shares.
(5) The investment manager recouped expenses previously reimbursed by the investment manager on behalf of the Portfolio, not to exceed the expense cap.
See accompanying notes to financial statements
264
(This page has been left blank intentionally)
265
UBS PACE Select Advisors Trust
Financial highlights
UBS PACE Small/Medium Co Value Equity Investments
Selected data for a share of beneficial interest outstanding throughout each year is presented below:
| | | Class A | |
| | | For the years ended July 31, | |
| | | 2009(1) | | 2008(2) | | 2007 | | 2006(2) | | 2005 | |
| Net asset value, beginning of year | | $ | 14.27 | | | $ | 19.29 | | | $ | 17.07 | | | $ | 21.80 | | | $ | 19.63 | | |
| Net investment income (loss)(3) | | | 0.05 | | | | 0.06 | | | | 0.01 | | | | (0.03 | ) | | | (0.05 | ) | |
| Net realized and unrealized gains (losses) from investment activities | | | (2.25 | ) | | | (3.01 | ) | | | 2.97 | | | | (0.82 | ) | | | 4.27 | | |
| Net increase (decrease) from operations | | | (2.20 | ) | | | (2.95 | ) | | | 2.98 | | | | (0.85 | ) | | | 4.22 | | |
| Dividends from net investment income | | | (0.08 | ) | | | (0.00 | )(4) | | | — | | | | — | | | | — | | |
| Distributions from net realized gains from investment activities | | | (0.00 | )(4) | | | (2.07 | ) | | | (0.76 | ) | | | (3.88 | ) | | | (2.05 | ) | |
| Total dividends and distributions | | | (0.08 | ) | | | (2.07 | ) | | | (0.76 | ) | | | (3.88 | ) | | | (2.05 | ) | |
| Net asset value, end of year | | $ | 11.99 | | | $ | 14.27 | | | $ | 19.29 | | | $ | 17.07 | | | $ | 21.80 | | |
| Total investment return(5) | | | (15.29 | )% | | | (16.25 | )% | | | 17.70 | % | | | (4.10 | )% | | | 22.35 | % | |
| Ratios/supplemental data: | |
| Net assets, end of year (000's) | | $ | 24,661 | | | $ | 37,185 | | | $ | 47,845 | | | $ | 45,583 | | | $ | 55,299 | | |
Expenses to average net assets, net of fee waivers and/or
expense reimbursements by and recoupments to manager | | | 1.38 | % | | | 1.29 | % | | | 1.27 | % | | | 1.30 | % | | | 1.33 | %(6) | |
Expenses to average net assets, before fee waivers and/or
expense reimbursements by manager | | | 1.39 | % | | | 1.29 | % | | | 1.27 | % | | | 1.30 | % | | | 1.33 | % | |
| Net investment income (loss) to average net assets | | | 0.44 | % | | | 0.34 | % | | | 0.05 | % | | | (0.16 | )% | | | (0.27 | )% | |
| Portfolio turnover | | | 111 | % | | | 43 | % | | | 59 | % | | | 81 | % | | | 55 | % | |
| | | Class C | |
| | | For the years ended July 31, | |
| | | 2009(1) | | 2008(2) | | 2007 | | 2006(2) | | 2005 | |
| Net asset value, beginning of year | | $ | 13.18 | | | $ | 18.12 | | | $ | 16.19 | | | $ | 21.03 | | | $ | 19.13 | | |
| Net investment income (loss)(3) | | | (0.03 | ) | | | (0.06 | ) | | | (0.13 | ) | | | (0.17 | ) | | | (0.20 | ) | |
| Net realized and unrealized gains (losses) from investment activities | | | (2.08 | ) | | | (2.81 | ) | | | 2.82 | | | | (0.79 | ) | | | 4.15 | | |
| Net increase (decrease) from operations | | | (2.11 | ) | | | (2.87 | ) | | | 2.69 | | | | (0.96 | ) | | | 3.95 | | |
| Dividends from net investment income | | | — | | | | — | | | | — | | | | — | | | | — | | |
| Distributions from net realized gains from investment activities | | | (0.00 | )(4) | | | (2.07 | ) | | | (0.76 | ) | | | (3.88 | ) | | | (2.05 | ) | |
| Total dividends and distributions | | | (0.00 | )(4) | | | (2.07 | ) | | | (0.76 | ) | | | (3.88 | ) | | | (2.05 | ) | |
| Net asset value, end of year | | $ | 11.07 | | | $ | 13.18 | | | $ | 18.12 | | | $ | 16.19 | | | $ | 21.03 | | |
| Total investment return(5) | | | (15.98 | )% | | | (16.93 | )% | | | 16.85 | % | | | (4.86 | )% | | | 21.48 | % | |
| Ratios/supplemental data: | |
| Net assets, end of year (000's) | | $ | 5,603 | | | $ | 8,400 | | | $ | 11,964 | | | $ | 11,552 | | | $ | 14,515 | | |
Expenses to average net assets, net of fee waivers and/or
expense reimbursements by and recoupments to manager | | | 2.15 | % | | | 2.06 | % | | | 2.04 | % | | | 2.08 | % | | | 2.08 | %(6) | |
Expenses to average net assets, before fee waivers and/or
expense reimbursements by manager | | | 2.14 | % | | | 2.06 | % | | | 2.04 | % | | | 2.08 | % | | | 2.08 | % | |
| Net investment income (loss) to average net assets | | | (0.32 | )% | | | (0.42 | )% | | | (0.71 | )% | | | (0.93 | )% | | | (1.03 | )% | |
| Portfolio turnover | | | 111 | % | | | 43 | % | | | 59 | % | | | 81 | % | | | 55 | % | |
(1) A portion of the investment advisory function for this Portfolio was transferred to Buckhead Capital Management, LLC and Systematic Financial Management, L.P. on May 28, 2009. Ariel Investments, LLC and Opus Capital Group, LLC ceased serving as investment advisors for the Portfolio effective May 29, 2009. Metropolitan West Capital Management, LLC continues to provide a portion of the investment advisory function.
(2) A portion of the investment advisory function for this Portfolio was transferred from ICM Asset Management, Inc. to Metropolitan West Capital Management, LLC and Opus Capital Group, LLC on October 1, 2005. Ariel Investments, LLC continued to provide a portion of the investment advisory function. Ariel Capital Management, LLC changed its name to Ariel Investments, LLC on April 30, 2008.
(3) Calculated using the average shares method.
(4) Amount of dividend or distribution paid represents less than $0.005 per share.
(5) Total investment return is calculated assuming a $10,000 investment on the first day of each year reported, reinvestment of all dividends and other distributions, if any, at net asset value on the ex-dividend dates, and a sale at net asset value on the last day of each year reported. The figures do not include any applicable sales charges or redemption fees; results would be lower if they were included. Returns do not reflect the deduction of taxes that a shareholder would pay on Portfolio distributions or the redemption of Portfolio shares.
(6) The investment manager recouped expenses previously reimbursed by the investment manager on behalf of the Portfolio, not to exceed the expense cap.
266
| | | Class B | |
| | | For the years ended July 31, | |
| | | 2009(1) | | 2008(2) | | 2007 | | 2006(2) | | 2005 | |
| Net asset value, beginning of year | | $ | 13.12 | | | $ | 18.06 | | | $ | 16.15 | | | $ | 21.00 | | | $ | 19.12 | | |
| Net investment income (loss)(3) | | | (0.02 | ) | | | (0.08 | ) | | | (0.14 | ) | | | (0.18 | ) | | | (0.21 | ) | |
| Net realized and unrealized gains (losses) from investment activities | | | (2.08 | ) | | | (2.79 | ) | | | 2.81 | | | | (0.79 | ) | | | 4.14 | | |
| Net increase (decrease) from operations | | | (2.10 | ) | | | (2.87 | ) | | | 2.67 | | | | (0.97 | ) | | | 3.93 | | |
| Dividends from net investment income | | | — | | | | — | | | | — | | | | — | | | | — | | |
| Distributions from net realized gains from investment activities | | | (0.00 | )(4) | | | (2.07 | ) | | | (0.76 | ) | | | (3.88 | ) | | | (2.05 | ) | |
| Total dividends and distributions | | | (0.00 | )(4) | | | (2.07 | ) | | | (0.76 | ) | | | (3.88 | ) | | | (2.05 | ) | |
| Net asset value, end of year | | $ | 11.02 | | | $ | 13.12 | | | $ | 18.06 | | | $ | 16.15 | | | $ | 21.00 | | |
| Total investment return(5) | | | (15.90 | )% | | | (16.99 | )% | | | 16.77 | % | | | (4.93 | )% | | | 21.38 | % | |
| Ratios/supplemental data: | |
| Net assets, end of year (000's) | | $ | 97 | | | $ | 333 | | | $ | 1,006 | | | $ | 1,859 | | | $ | 4,373 | | |
Expenses to average net assets, net of fee waivers and/or
expense reimbursements by and recoupments to manager | | | 2.16 | % | | | 2.16 | % | | | 2.13 | % | | | 2.14 | %(6) | | | 2.14 | %(6) | |
Expenses to average net assets, before fee waivers and/or
expense reimbursements by manager | | | 2.47 | % | | | 2.20 | % | | | 2.13 | % | | | 2.14 | % | | | 2.14 | % | |
| Net investment income (loss) to average net assets | | | (0.25 | )% | | | (0.53 | )% | | | (0.80 | )% | | | (0.97 | )% | | | (1.09 | )% | |
| Portfolio turnover | | | 111 | % | | | 43 | % | | | 59 | % | | | 81 | % | | | 55 | % | |
| | | Class Y | |
| | | For the years ended July 31, | |
| | | 2009(1) | | 2008(2) | | 2007 | | 2006(2) | | 2005 | |
| Net asset value, beginning of year | | $ | 14.64 | | | $ | 19.73 | | | $ | 17.39 | | | $ | 22.07 | | | $ | 19.78 | | |
| Net investment income (loss)(3) | | | 0.09 | | | | 0.11 | | | | 0.07 | | | | 0.03 | | | | 0.02 | | |
| Net realized and unrealized gains (losses) from investment activities | | | (2.31 | ) | | | (3.07 | ) | | | 3.03 | | | | (0.83 | ) | | | 4.32 | | |
| Net increase (decrease) from operations | | | (2.22 | ) | | | (2.96 | ) | | | 3.10 | | | | (0.80 | ) | | | 4.34 | | |
| Dividends from net investment income | | | (0.13 | ) | | | (0.06 | ) | | | — | | | | — | | | | — | | |
| Distributions from net realized gains from investment activities | | | (0.00 | )(4) | | | (2.07 | ) | | | (0.76 | ) | | | (3.88 | ) | | | (2.05 | ) | |
| Total dividends and distributions | | | (0.13 | ) | | | (2.13 | ) | | | (0.76 | ) | | | (3.88 | ) | | | (2.05 | ) | |
| Net asset value, end of year | | $ | 12.29 | | | $ | 14.64 | | | $ | 19.73 | | | $ | 17.39 | | | $ | 22.07 | | |
| Total investment return(5) | | | (14.92 | )% | | | (15.95 | )% | | | 18.07 | % | | | (3.78 | )% | | | 22.82 | % | |
| Ratios/supplemental data: | |
| Net assets, end of year (000's) | | $ | 3,255 | | | $ | 4,443 | | | $ | 5,980 | | | $ | 4,311 | | | $ | 4,994 | | |
Expenses to average net assets, net of fee waivers and/or
expense reimbursements by and recoupments to manager | | | 0.97 | % | | | 0.95 | % | | | 0.94 | % | | | 0.97 | % | | | 0.98 | %(6) | |
Expenses to average net assets, before fee waivers and/or
expense reimbursements by manager | | | 0.98 | % | | | 0.95 | % | | | 0.94 | % | | | 0.97 | % | | | 0.98 | % | |
| Net investment income (loss) to average net assets | | | 0.85 | % | | | 0.68 | % | | | 0.37 | % | | | 0.17 | % | | | 0.08 | % | |
| Portfolio turnover | | | 111 | % | | | 43 | % | | | 59 | % | | | 81 | % | | | 55 | % | |
See accompanying notes to financial statements
267
UBS PACE Select Advisors Trust
Financial highlights
UBS PACE Small/Medium Co Value Equity Investments
(concluded)
Selected data for a share of beneficial interest outstanding throughout each year is presented below:
| | | Class P | |
| | | For the years ended July 31, | |
| | | 2009(1) | | 2008(2) | | 2007 | | 2006(2) | | 2005 | |
| Net asset value, beginning of year | | $ | 14.53 | | | $ | 19.60 | | | $ | 17.31 | | | $ | 22.02 | | | $ | 19.78 | | |
| Net investment income (loss)(3) | | | 0.07 | | | | 0.08 | | | | 0.03 | | | | (0.00 | )(4) | | | (0.02 | ) | |
| Net realized and unrealized gains (losses) from investment activities | | | (2.30 | ) | | | (3.05 | ) | | | 3.02 | | | | (0.83 | ) | | | 4.31 | | |
| Net increase (decrease) from operations | | | (2.23 | ) | | | (2.97 | ) | | | 3.05 | | | | (0.83 | ) | | | 4.29 | | |
| Dividends from net investment income | | | (0.10 | ) | | | (0.03 | ) | | | — | | | | — | | | | — | | |
| Distributions from net realized gains from investment activities | | | (0.00 | )(5) | | | (2.07 | ) | | | (0.76 | ) | | | (3.88 | ) | | | (2.05 | ) | |
| Total dividends and distributions | | | (0.10 | ) | | | (2.10 | ) | | | (0.76 | ) | | | (3.88 | ) | | | (2.05 | ) | |
| Net asset value, end of year | | $ | 12.20 | | | $ | 14.53 | | | $ | 19.60 | | | $ | 17.31 | | | $ | 22.02 | | |
| Total investment return(6) | | | (15.14 | )% | | | (16.13 | )% | | | 17.86 | % | | | (3.95 | )% | | | 22.55 | % | |
| Ratios/supplemental data: | |
| Net assets, end of year (000's) | | $ | 310,059 | | | $ | 428,819 | | | $ | 483,873 | | | $ | 387,514 | | | $ | 366,083 | | |
Expenses to average net assets, net of fee waivers and/or
expense reimbursements by and recoupments to manager | | | 1.16 | % | | | 1.16 | % | | | 1.16 | %(7) | | | 1.16 | % | | | 1.16 | % | |
Expenses to average net assets, before fee waivers and/or
expense reimbursements by manager | | | 1.32 | % | | | 1.18 | % | | | 1.16 | % | | | 1.18 | % | | | 1.17 | % | |
| Net investment income (loss) to average net assets | | | 0.66 | % | | | 0.48 | % | | | 0.16 | % | | | (0.03 | )% | | | (0.10 | )% | |
| Portfolio turnover | | | 111 | % | | | 43 | % | | | 59 | % | | | 81 | % | | | 55 | % | |
(1) A portion of the investment advisory function for this Portfolio was transferred to Buckhead Capital Management, LLC and Systematic Financial Management, L.P. on May 28, 2009. Ariel Investments, LLC and Opus Capital Group, LLC ceased serving as investment advisors for the Portfolio effective May 29, 2009. Metropolitan West Capital Management, LLC continues to provide a portion of the investment advisory function.
(2) A portion of the investment advisory function for this Portfolio was transferred from ICM Asset Management, Inc. to Metropolitan West Capital Management, LLC and Opus Capital Group, LLC on October 1, 2005. Ariel Investments, LLC continued to provide a portion of the investment advisory function. Ariel Capital Management, LLC changed its name to Ariel Investments, LLC on April 30, 2008.
(3) Calculated using the average shares method.
(4) Amount of loss represents less than $0.005 per share.
(5) Amount of distribution paid represents less than $0.005 per share.
(6) Total investment return is calculated assuming a $10,000 investment on the first day of each year reported, reinvestment of all dividends and other distributions, if any, at net asset value on the ex-dividend dates, and a sale at net asset value on the last day of each year reported. The figures do not include any applicable program or redemption fees; results would be lower if they were included. Returns do not reflect the deduction of taxes that a shareholder would pay on Portfolio distributions or the redemption of Portfolio shares.
(7) The investment manager recouped expenses previously reimbursed by the investment manager on behalf of the Portfolio, not to exceed the expense cap.
See accompanying notes to financial statements
268
(This page has been left blank intentionally)
269
UBS PACE Select Advisors Trust
Financial highlights
UBS PACE Small/Medium Co Growth Equity Investments
Selected data for a share of beneficial interest outstanding throughout each year is presented below:
| | | Class A | |
| | | For the years ended July 31, | |
| | | 2009(1) | | 2008 | | 2007(2) | | 2006(3) | | 2005 | |
| Net asset value, beginning of year | | $ | 13.06 | | | $ | 17.30 | | | $ | 14.45 | | | $ | 17.52 | | | $ | 14.08 | | |
| Net investment loss(4) | | | (0.05 | ) | | | (0.11 | ) | | | (0.12 | ) | | | (0.12 | ) | | | (0.14 | ) | |
| Net realized and unrealized gains (losses) from investment activities | | | (2.38 | ) | | | (1.53 | ) | | | 3.40 | | | | (0.58 | ) | | | 3.64 | | |
| Net increase (decrease) from operations | | | (2.43 | ) | | | (1.64 | ) | | | 3.28 | | | | (0.70 | ) | | | 3.50 | | |
| Distributions from net realized gains from investment activities | | | — | | | | (2.60 | ) | | | (0.43 | ) | | | (2.37 | ) | | | (0.06 | ) | |
| Net asset value, end of year | | $ | 10.63 | | | $ | 13.06 | | | $ | 17.30 | | | $ | 14.45 | | | $ | 17.52 | | |
| Total investment return(5) | | | (18.61 | )% | | | (11.39 | )% | | | 23.00 | % | | | (4.22 | )% | | | 24.91 | % | |
| Ratios/supplemental data: | |
| Net assets, end of year (000's) | | $ | 29,429 | | | $ | 41,494 | | | $ | 49,562 | | | $ | 48,824 | | | $ | 60,328 | | |
Expenses to average net assets, net of fee waivers and/or
expense reimbursements by and recoupments to manager | | | 1.38 | % | | | 1.31 | % | | | 1.30 | % | | | 1.32 | % | | | 1.33 | %(6) | |
Expenses to average net assets, before fee waivers and/or
expense reimbursements by manager | | | 1.40 | % | | | 1.31 | % | | | 1.30 | % | | | 1.32 | % | | | 1.33 | % | |
| Net investment loss to average net assets | | | (0.56 | )% | | | (0.70 | )% | | | (0.77 | )% | | | (0.78 | )% | | | (0.92 | )% | |
| Portfolio turnover | | | 154 | % | | | 128 | % | | | 109 | % | | | 134 | % | | | 60 | % | |
| | | Class C | |
| | | For the years ended July 31, | |
| | | 2009(1) | | 2008 | | 2007(2) | | 2006(3) | | 2005 | |
| Net asset value, beginning of year | | $ | 12.07 | | | $ | 16.30 | | | $ | 13.74 | | | $ | 16.90 | | | $ | 13.70 | | |
| Net investment loss(4) | | | (0.11 | ) | | | (0.21 | ) | | | (0.24 | ) | | | (0.24 | ) | | | (0.26 | ) | |
| Net realized and unrealized gains (losses) from investment activities | | | (2.20 | ) | | | (1.42 | ) | | | 3.23 | | | | (0.55 | ) | | | 3.52 | | |
| Net increase (decrease) from operations | | | (2.31 | ) | | | (1.63 | ) | | | 2.99 | | | | (0.79 | ) | | | 3.26 | | |
| Distributions from net realized gains from investment activities | | | — | | | | (2.60 | ) | | | (0.43 | ) | | | (2.37 | ) | | | (0.06 | ) | |
| Net asset value, end of year | | $ | 9.76 | | | $ | 12.07 | | | $ | 16.30 | | | $ | 13.74 | | | $ | 16.90 | | |
| Total investment return(5) | | | (19.21 | )% | | | (12.08 | )% | | | 22.14 | % | | | (4.98 | )% | | | 23.84 | % | |
| Ratios/supplemental data: | |
| Net assets, end of year (000's) | | $ | 3,285 | | | $ | 4,991 | | | $ | 6,712 | | | $ | 6,709 | | | $ | 8,337 | | |
Expenses to average net assets, net of fee waivers and/or
expense reimbursements by and recoupments to manager | | | 2.13 | % | | | 2.08 | % | | | 2.08 | % | | | 2.11 | % | | | 2.15 | %(6) | |
Expenses to average net assets, before fee waivers and/or
expense reimbursements by manager | | | 2.19 | % | | | 2.08 | % | | | 2.08 | % | | | 2.11 | % | | | 2.15 | % | |
| Net investment loss to average net assets | | | (1.30 | )% | | | (1.47 | )% | | | (1.55 | )% | | | (1.56 | )% | | | (1.74 | )% | |
| Portfolio turnover | | | 154 | % | | | 128 | % | | | 109 | % | | | 134 | % | | | 60 | % | |
(1) A portion of the investment advisory function for this Portfolio was transferred from AG Asset Management LLC to Palisade Capital Management, LLC on February 2, 2009. Copper Rock Partners, LLC and Riverbridge Partners, LLC continue to provide a portion of the investment advisory function.
(2) A portion of the investment advisory function for this Portfolio was transferred from Delaware Management Co., Inc. to Copper Rock Capital Partners, LLC on March 1, 2007. ForstmannLeff Associates, LLC changed its name to AG Asset Management LLC on May 1, 2007. AG Asset Management LLC and Riverbridge Partners, LLC continued to provide a portion of the investment advisory function.
(3) A portion of the investment advisory function for this Portfolio was transferred from Delaware Management Co., Inc. to ForstmannLeff Associates, LLC and Riverbridge Partners, LLC on October 1, 2005.
(4) Calculated using the average shares method.
(5) Total investment return is calculated assuming a $10,000 investment on the first day of each year reported, reinvestment of all dividends and other distributions, if any, at net asset value on the ex-dividend dates, and a sale at net asset value on the last day of each year reported. The figures do not include any applicable sales charges or redemption fees; results would be lower if they were included. Returns do not reflect the deduction of taxes that a shareholder would pay on Portfolio distributions or the redemption of Portfolio shares.
(6) The investment manager recouped expenses previously reimbursed by the investment manager on behalf of the Portfolio, not to exceed the expense cap.
270
| | | Class B | |
| | | For the years ended July 31, | |
| | | 2009(1) | | 2008 | | 2007(2) | | 2006(3) | | 2005 | |
| Net asset value, beginning of year | | $ | 11.99 | | | $ | 16.22 | | | $ | 13.68 | | | $ | 16.86 | | | $ | 13.68 | | |
| Net investment loss(4) | | | (0.11 | ) | | | (0.22 | ) | | | (0.23 | ) | | | (0.24 | ) | | | (0.28 | ) | |
| Net realized and unrealized gains (losses) from investment activities | | | (2.19 | ) | | | (1.41 | ) | | | 3.20 | | | | (0.57 | ) | | | 3.52 | | |
| Net increase (decrease) from operations | | | (2.30 | ) | | | (1.63 | ) | | | 2.97 | | | | (0.81 | ) | | | 3.24 | | |
| Distributions from net realized gains from investment activities | | | — | | | | (2.60 | ) | | | (0.43 | ) | | | (2.37 | ) | | | (0.06 | ) | |
| Net asset value, end of year | | $ | 9.69 | | | $ | 11.99 | | | $ | 16.22 | | | $ | 13.68 | | | $ | 16.86 | | |
| Total investment return(5) | | | (19.18 | )% | | | (12.16 | )% | | | 22.02 | % | | | (5.13 | )% | | | 23.73 | % | |
| Ratios/supplemental data: | |
| Net assets, end of year (000's) | | $ | 68 | | | $ | 123 | | | $ | 310 | | | $ | 696 | | | $ | 1,915 | | |
Expenses to average net assets, net of fee waivers and/or
expense reimbursements by and recoupments to manager | | | 2.13 | % | | | 2.13 | % | | | 2.13 | % | | | 2.19 | % | | | 2.27 | % | |
Expenses to average net assets, before fee waivers and/or
expense reimbursements by manager | | | 2.61 | % | | | 2.43 | % | | | 2.30 | % | | | 2.27 | % | | | 2.28 | % | |
| Net investment loss to average net assets | | | (1.29 | )% | | | (1.52 | )% | | | (1.58 | )% | | | (1.62 | )% | | | (1.85 | )% | |
| Portfolio turnover | | | 154 | % | | | 128 | % | | | 109 | % | | | 134 | % | | | 60 | % | |
| | | Class Y | |
| | | For the years ended July 31, | |
| | | 2009(1) | | 2008 | | 2007(2) | | 2006(3) | | 2005 | |
| Net asset value, beginning of year | | $ | 13.47 | | | $ | 17.71 | | | $ | 14.72 | | | $ | 17.74 | | | $ | 14.21 | | |
| Net investment loss(4) | | | (0.01 | ) | | | (0.05 | ) | | | (0.07 | ) | | | (0.07 | ) | | | (0.09 | ) | |
| Net realized and unrealized gains (losses) from investment activities | | | (2.44 | ) | | | (1.59 | ) | | | 3.49 | | | | (0.58 | ) | | | 3.68 | | |
| Net increase (decrease) from operations | | | (2.45 | ) | | | (1.64 | ) | | | 3.42 | | | | (0.65 | ) | | | 3.59 | | |
| Distributions from net realized gains from investment activities | | | — | | | | (2.60 | ) | | | (0.43 | ) | | | (2.37 | ) | | | (0.06 | ) | |
| Net asset value, end of year | | $ | 11.02 | | | $ | 13.47 | | | $ | 17.71 | | | $ | 14.72 | | | $ | 17.74 | | |
| Total investment return(5) | | | (18.26 | )% | | | (11.09 | )% | | | 23.54 | % | | | (3.86 | )% | | | 25.32 | % | |
| Ratios/supplemental data: | |
| Net assets, end of year (000's) | | $ | 4,369 | | | $ | 5,671 | | | $ | 6,022 | | | $ | 4,279 | | | $ | 4,057 | | |
Expenses to average net assets, net of fee waivers and/or
expense reimbursements by and recoupments to manager | | | 0.96 | % | | | 0.94 | % | | | 0.93 | % | | | 0.95 | % | | | 0.96 | % | |
Expenses to average net assets, before fee waivers and/or
expense reimbursements by manager | | | 0.96 | % | | | 0.94 | % | | | 0.93 | % | | | 0.95 | % | | | 0.96 | % | |
| Net investment loss to average net assets | | | (0.15 | )% | | | (0.33 | )% | | | (0.41 | )% | | | (0.41 | )% | | | (0.55 | )% | |
| Portfolio turnover | | | 154 | % | | | 128 | % | | | 109 | % | | | 134 | % | | | 60 | % | |
See accompanying notes to financial statements
271
UBS PACE Select Advisors Trust
Financial highlights
UBS PACE Small/Medium Co Growth Equity Investments
(concluded)
Selected data for a share of beneficial interest outstanding throughout each year is presented below:
| | | Class P | |
| | | For the years ended July 31, | |
| | | 2009(1) | | 2008 | | 2007(2) | | 2006(3) | | 2005 | |
| Net asset value, beginning of year | | $ | 13.36 | | | $ | 17.61 | | | $ | 14.67 | | | $ | 17.72 | | | $ | 14.22 | | |
| Net investment loss(4) | | | (0.03 | ) | | | (0.08 | ) | | | (0.10 | ) | | | (0.10 | ) | | | (0.11 | ) | |
| Net realized and unrealized gains (losses) from investment activities | | | (2.43 | ) | | | (1.57 | ) | | | 3.47 | | | | (0.58 | ) | | | 3.67 | | |
| Net increase (decrease) from operations | | | (2.46 | ) | | | (1.65 | ) | | | 3.37 | | | | (0.68 | ) | | | 3.56 | | |
| Distributions from net realized gains from investment activities | | | — | | | | (2.60 | ) | | | (0.43 | ) | | | (2.37 | ) | | | (0.06 | ) | |
| Net asset value, end of year | | $ | 10.90 | | | $ | 13.36 | | | $ | 17.61 | | | $ | 14.67 | | | $ | 17.72 | | |
| Total investment return(5) | | | (18.41 | )% | | | (11.22 | )% | | | 23.28 | % | | | (4.05 | )% | | | 25.08 | % | |
| Ratios/supplemental data: | |
| Net assets, end of year (000's) | | $ | 310,425 | | | $ | 456,354 | | | $ | 500,929 | | | $ | 380,197 | | | $ | 356,839 | | |
Expenses to average net assets, net of fee waivers and/or
expense reimbursements by manager | | | 1.13 | % | | | 1.13 | % | | | 1.13 | % | | | 1.13 | % | | | 1.13 | % | |
Expenses to average net assets, before fee waivers and/or
expense reimbursements by manager | | | 1.31 | % | | | 1.17 | % | | | 1.16 | % | | | 1.18 | % | | | 1.18 | % | |
| Net investment loss to average net assets | | | (0.31 | )% | | | (0.52 | )% | | | (0.60 | )% | | | (0.59 | )% | | | (0.72 | )% | |
| Portfolio turnover | | | 154 | % | | | 128 | % | | | 109 | % | | | 134 | % | | | 60 | % | |
(1) A portion of the investment advisory function for this Portfolio was transferred from AG Asset Management LLC to Palisade Capital Management, LLC on February 2, 2009. Copper Rock Partners, LLC and Riverbridge Partners, LLC continue to provide a portion of the investment advisory function.
(2) A portion of the investment advisory function for this Portfolio was transferred from Delaware Management Co., Inc. to Copper Rock Capital Partners, LLC on March 1, 2007. ForstmannLeff Associates, LLC changed its name to AG Asset Management LLC on May 1, 2007. AG Asset Management LLC and Riverbridge Partners, LLC continued to provide a portion of the investment advisory function.
(3) A portion of the investment advisory function for this Portfolio was transferred from Delaware Management Co., Inc. to ForstmannLeff Associates, LLC and Riverbridge Partners, LLC on October 1, 2005.
(4) Calculated using the average shares method.
(5) Total investment return is calculated assuming a $10,000 investment on the first day of each year reported, reinvestment of all dividends and other distributions, if any, at net asset value on the ex-dividend dates, and a sale at net asset value on the last day of each year reported. The figures do not include any applicable program or redemption fees; results would be lower if they were included. Returns do not reflect the deduction of taxes that a shareholder would pay on Portfolio distributions or the redemption of Portfolio shares.
See accompanying notes to financial statements
272
(This page has been left blank intentionally)
273
UBS PACE Select Advisors Trust
Financial highlights
UBS PACE International Equity Investments
Selected data for a share of beneficial interest outstanding throughout each year is presented below:
| | | Class A | |
| | | For the years ended July 31, | |
| | | 2009 | | 2008 | | 2007 | | 2006 | | 2005(1) | |
| Net asset value, beginning of year | | $ | 16.17 | | | $ | 21.27 | | | $ | 19.03 | | | $ | 15.46 | | | $ | 12.96 | | |
| Net investment income(2) | | | 0.27 | | | | 0.41 | | | | 0.29 | | | | 0.30 | | | | 0.21 | | |
| Net realized and unrealized gains (losses) from investment activities | | | (4.22 | ) | | | (2.99 | ) | | | 4.09 | | | | 3.50 | | | | 2.35 | | |
| Net increase (decrease) from operations | | | (3.95 | ) | | | (2.58 | ) | | | 4.38 | | | | 3.80 | | | | 2.56 | | |
| Dividends from net investment income | | | (0.50 | ) | | | (0.28 | ) | | | (0.35 | ) | | | (0.23 | ) | | | (0.06 | ) | |
| Distributions from net realized gains from investment activities | | | — | | | | (2.24 | ) | | | (1.79 | ) | | | — | | | | — | | |
| Total dividends and distributions | | | (0.50 | ) | | | (2.52 | ) | | | (2.14 | ) | | | (0.23 | ) | | | (0.06 | ) | |
| Net asset value, end of year | | $ | 11.72 | | | $ | 16.17 | | | $ | 21.27 | | | $ | 19.03 | | | $ | 15.46 | | |
| Total investment return(3) | | | (24.02 | )% | | | (13.73 | )% | | | 24.14 | % | | | 24.77 | % | | | 19.78 | % | |
| Ratios/supplemental data: | |
| Net assets, end of year (000's) | | $ | 71,466 | | | $ | 106,380 | | | $ | 130,966 | | | $ | 111,153 | | | $ | 97,046 | | |
Expenses to average net assets, net of fee waivers and/or
expense reimbursements by and recoupments to manager | | | 1.46 | % | | | 1.37 | % | | | 1.38 | % | | | 1.47 | %(4) | | | 1.55 | %(4) | |
Expenses to average net assets, before fee waivers and/or
expense reimbursements by manager | | | 1.46 | % | | | 1.37 | % | | | 1.38 | % | | | 1.47 | % | | | 1.55 | % | |
| Net investment income to average net assets | | | 2.47 | % | | | 2.16 | % | | | 1.42 | % | | | 1.73 | % | | | 1.45 | % | |
| Portfolio turnover | | | 60 | % | | | 54 | % | | | 61 | % | | | 52 | % | | | 39 | % | |
| | | Class C | |
| | | For the years ended July 31, | |
| | | 2009 | | 2008 | | 2007 | | 2006 | | 2005(1) | |
| Net asset value, beginning of year | | $ | 15.79 | | | $ | 20.81 | | | $ | 18.65 | | | $ | 15.16 | | | $ | 12.76 | | |
| Net investment income(2) | | | 0.17 | | | | 0.25 | | | | 0.12 | | | | 0.14 | | | | 0.09 | | |
| Net realized and unrealized gains (losses) from investment activities | | | (4.11 | ) | | | (2.92 | ) | | | 4.01 | | | | 3.44 | | | | 2.31 | | |
| Net increase (decrease) from operations | | | (3.94 | ) | | | (2.67 | ) | | | 4.13 | | | | 3.58 | | | | 2.40 | | |
| Dividends from net investment income | | | (0.36 | ) | | | (0.11 | ) | | | (0.18 | ) | | | (0.09 | ) | | | — | | |
| Distributions from net realized gains from investment activities | | | — | | | | (2.24 | ) | | | (1.79 | ) | | | — | | | | — | | |
| Total dividends and distributions | | | (0.36 | ) | | | (2.35 | ) | | | (1.97 | ) | | | (0.09 | ) | | | — | | |
| Net asset value, end of year | | $ | 11.49 | | | $ | 15.79 | | | $ | 20.81 | | | $ | 18.65 | | | $ | 15.16 | | |
| Total investment return(3) | | | (24.67 | )% | | | (14.42 | )% | | | 23.13 | % | | | 23.68 | % | | | 18.81 | % | |
| Ratios/supplemental data: | |
| Net assets, end of year (000's) | | $ | 4,342 | | | $ | 6,949 | | | $ | 8,856 | | | $ | 8,168 | | | $ | 8,099 | | |
Expenses to average net assets, net of fee waivers and/or
expense reimbursements by and recoupments to manager | | | 2.31 | % | | | 2.18 | % | | | 2.18 | % | | | 2.32 | %(4) | | | 2.35 | %(4) | |
Expenses to average net assets, before fee waivers and/or
expense reimbursements by manager | | | 2.31 | % | | | 2.18 | % | | | 2.18 | % | | | 2.32 | % | | | 2.35 | % | |
| Net investment income to average net assets | | | 1.62 | % | | | 1.33 | % | | | 0.60 | % | | | 0.84 | % | | | 0.64 | % | |
| Portfolio turnover | | | 60 | % | | | 54 | % | | | 61 | % | | | 52 | % | | | 39 | % | |
(1) Delaware International Advisors Ltd. changed its name to Mondrian Investment Partners Ltd. on September 24, 2004.
(2) Calculated using the average shares method.
(3) Total investment return is calculated assuming a $10,000 investment on the first day of each year reported, reinvestment of all dividends and other distributions, if any, at net asset value on the ex-dividend dates, and a sale at net asset value on the last day of each year reported. The figures do not include any applicable sales charges or redemption fees; results would be lower if they were included. Returns do not reflect the deduction of taxes that a shareholder would pay on Portfolio distributions or the redemption of Portfolio shares.
(4) The investment manager recouped expenses previously reimbursed by the investment manager on behalf of the Portfolio, not to exceed the expense cap.
274
| | | Class B | |
| | | For the years ended July 31, | |
| | | 2009 | | 2008 | | 2007 | | 2006 | | 2005(1) | |
| Net asset value, beginning of year | | $ | 15.79 | | | $ | 20.80 | | | $ | 18.60 | | | $ | 15.07 | | | $ | 12.71 | | |
| Net investment income(2) | | | 0.14 | | | | 0.17 | | | | 0.07 | | | | 0.12 | | | | 0.05 | | |
| Net realized and unrealized gains (losses) from investment activities | | | (4.09 | ) | | | (2.88 | ) | | | 4.04 | | | | 3.43 | | | | 2.31 | | |
| Net increase (decrease) from operations | | | (3.95 | ) | | | (2.71 | ) | | | 4.11 | | | | 3.55 | | | | 2.36 | | |
| Dividends from net investment income | | | (0.19 | ) | | | (0.06 | ) | | | (0.12 | ) | | | (0.02 | ) | | | — | | |
| Distributions from net realized gains from investment activities | | | — | | | | (2.24 | ) | | | (1.79 | ) | | | — | | | | — | | |
| Total dividends and distributions | | | (0.19 | ) | | | (2.30 | ) | | | (1.91 | ) | | | (0.02 | ) | | | — | | |
| Net asset value, end of year | | $ | 11.65 | | | $ | 15.79 | | | $ | 20.80 | | | $ | 18.60 | | | $ | 15.07 | | |
| Total investment return(3) | | | (24.80 | )% | | | (14.57 | )% | | | 23.03 | % | | | 23.60 | % | | | 18.57 | % | |
| Ratios/supplemental data: | |
| Net assets, end of year (000's) | | $ | 66 | | | $ | 186 | | | $ | 489 | | | $ | 740 | | | $ | 831 | | |
Expenses to average net assets, net of fee waivers and/or
expense reimbursements by and recoupments to manager | | | 2.40 | % | | | 2.31 | % | | | 2.27 | % | | | 2.45 | %(4) | | | 2.55 | %(4) | |
Expenses to average net assets, before fee waivers and/or
expense reimbursements by manager | | | 2.63 | % | | | 2.31 | % | | | 2.27 | % | | | 2.45 | % | | | 2.55 | % | |
| Net investment income to average net assets | | | 1.36 | % | | | 0.89 | % | | | 0.37 | % | | | 0.73 | % | | | 0.39 | % | |
| Portfolio turnover | | | 60 | % | | | 54 | % | | | 61 | % | | | 52 | % | | | 39 | % | |
| | | Class Y | |
| | | For the years ended July 31, | |
| | | 2009 | | 2008 | | 2007 | | 2006 | | 2005(1) | |
| Net asset value, beginning of year | | $ | 16.20 | | | $ | 21.30 | | | $ | 19.06 | | | $ | 15.49 | | | $ | 12.98 | | |
| Net investment income(2) | | | 0.31 | | | | 0.48 | | | | 0.36 | | | | 0.38 | | | | 0.28 | | |
| Net realized and unrealized gains (losses) from investment activities | | | (4.23 | ) | | | (2.98 | ) | | | 4.10 | | | | 3.49 | | | | 2.36 | | |
| Net increase (decrease) from operations | | | (3.92 | ) | | | (2.50 | ) | | | 4.46 | | | | 3.87 | | | | 2.64 | | |
| Dividends from net investment income | | | (0.56 | ) | | | (0.36 | ) | | | (0.43 | ) | | | (0.30 | ) | | | (0.13 | ) | |
| Distributions from net realized gains from investment activities | | | — | | | | (2.24 | ) | | | (1.79 | ) | | | — | | | | — | | |
| Total dividends and distributions | | | (0.56 | ) | | | (2.60 | ) | | | (2.22 | ) | | | (0.30 | ) | | | (0.13 | ) | |
| Net asset value, end of year | | $ | 11.72 | | | $ | 16.20 | | | $ | 21.30 | | | $ | 19.06 | | | $ | 15.49 | | |
| Total investment return(3) | | | (23.73 | )% | | | (13.38 | )% | | | 24.55 | % | | | 25.25 | % | | | 20.35 | % | |
| Ratios/supplemental data: | |
| Net assets, end of year (000's) | | $ | 33,012 | | | $ | 50,655 | | | $ | 65,377 | | | $ | 53,388 | | | $ | 45,107 | | |
Expenses to average net assets, net of fee waivers and/or
expense reimbursements by and recoupments to manager | | | 1.06 | % | | | 1.02 | % | | | 1.02 | % | | | 1.06 | % | | | 1.11 | % | |
Expenses to average net assets, before fee waivers and/or
expense reimbursements by manager | | | 1.06 | % | | | 1.02 | % | | | 1.02 | % | | | 1.06 | % | | | 1.11 | % | |
| Net investment income to average net assets | | | 2.89 | % | | | 2.51 | % | | | 1.78 | % | | | 2.14 | % | | | 1.93 | % | |
| Portfolio turnover | | | 60 | % | | | 54 | % | | | 61 | % | | | 52 | % | | | 39 | % | |
See accompanying notes to financial statements
275
UBS PACE Select Advisors Trust
Financial highlights
UBS PACE International Equity Investments
(concluded)
Selected data for a share of beneficial interest outstanding throughout each year is presented below:
| | | Class P | |
| | | For the years ended July 31, | |
| | | 2009 | | 2008 | | 2007 | | 2006 | | 2005(1) | |
| Net asset value, beginning of year | | $ | 16.16 | | | $ | 21.27 | | | $ | 19.03 | | | $ | 15.46 | | | $ | 12.96 | | |
| Net investment income(2) | | | 0.29 | | | | 0.46 | | | | 0.35 | | | | 0.37 | | | | 0.27 | | |
| Net realized and unrealized gains (losses) from investment activities | | | (4.21 | ) | | | (2.99 | ) | | | 4.09 | | | | 3.48 | | | | 2.34 | | |
| Net increase (decrease) from operations | | | (3.92 | ) | | | (2.53 | ) | | | 4.44 | | | | 3.85 | | | | 2.61 | | |
| Dividends from net investment income | | | (0.54 | ) | | | (0.34 | ) | | | (0.41 | ) | | | (0.28 | ) | | | (0.11 | ) | |
| Distributions from net realized gains from investment activities | | | — | | | | (2.24 | ) | | | (1.79 | ) | | | — | | | | — | | |
| Total dividends and distributions | | | (0.54 | ) | | | (2.58 | ) | | | (2.20 | ) | | | (0.28 | ) | | | (0.11 | ) | |
| Net asset value, end of year | | $ | 11.70 | | | $ | 16.16 | | | $ | 21.27 | | | $ | 19.03 | | | $ | 15.46 | | |
| Total investment return(3) | | | (23.81 | )% | | | (13.53 | )% | | | 24.48 | % | | | 25.17 | % | | | 20.16 | % | |
| Ratios/supplemental data: | |
| Net assets, end of year (000's) | | $ | 684,359 | | | $ | 1,048,105 | | | $ | 1,173,137 | | | $ | 900,603 | | | $ | 625,091 | | |
Expenses to average net assets, net of fee waivers and/or
expense reimbursements by and recoupments to manager | | | 1.22 | % | | | 1.12 | % | | | 1.12 | % | | | 1.17 | % | | | 1.24 | %(4) | |
Expenses to average net assets, before fee waivers and/or
expense reimbursements by manager | | | 1.22 | % | | | 1.12 | % | | | 1.12 | % | | | 1.17 | % | | | 1.24 | % | |
| Net investment income to average net assets | | | 2.72 | % | | | 2.44 | % | | | 1.70 | % | | | 2.09 | % | | | 1.83 | % | |
| Portfolio turnover | | | 60 | % | | | 54 | % | | | 61 | % | | | 52 | % | | | 39 | % | |
(1) Delaware International Advisors Ltd. changed its name to Mondrian Investment Partners Ltd. on September 24, 2004.
(2) Calculated using the average shares method.
(3) Total investment return is calculated assuming a $10,000 investment on the first day of each year reported, reinvestment of all dividends and other distributions, if any, at net asset value on the ex-dividend dates, and a sale at net asset value on the last day of each year reported. The figures do not include any applicable program or redemption fees; results would be lower if they were included. Returns do not reflect the deduction of taxes that a shareholder would pay on Portfolio distributions or the redemption of Portfolio shares.
(4) The investment manager recouped expenses previously reimbursed by the investment manager on behalf of the Portfolio, not to exceed the expense cap.
See accompanying notes to financial statements
276
(This page has been left blank intentionally)
277
UBS PACE Select Advisors Trust
Financial highlights
UBS PACE International Emerging Markets Equity Investments
Selected data for a share of beneficial interest outstanding throughout each year is presented below:
| | | Class A | |
| | | For the years ended July 31, | |
| | | 2009 | | 2008 | | 2007 | | 2006 | | 2005(1) | |
| Net asset value, beginning of year | | $ | 19.46 | | | $ | 23.61 | | | $ | 18.30 | | | $ | 15.13 | | | $ | 10.55 | | |
| Net investment income(2) | | | 0.20 | | | | 0.25 | | | | 0.21 | | | | 0.21 | | | | 0.15 | | |
| Net realized and unrealized gains (losses) from investment activities | | | (5.71 | ) | | | (0.49 | ) | | | 8.02 | | | | 3.10 | | | | 4.43 | | |
| Net increase (decrease) from operations | | | (5.51 | ) | | | (0.24 | ) | | | 8.23 | | | | 3.31 | | | | 4.58 | | |
| Dividends from net investment income | | | (0.13 | ) | | | (0.27 | ) | | | (0.22 | ) | | | (0.14 | ) | | | (0.00 | )(3) | |
| Distributions from net realized gains from investment activities | | | (3.24 | ) | | | (3.64 | ) | | | (2.70 | ) | | | — | | | | — | | |
| Total dividends and distributions | | | (3.37 | ) | | | (3.91 | ) | | | (2.92 | ) | | | (0.14 | ) | | | (0.00 | )(3) | |
| Net asset value, end of year | | $ | 10.58 | | | $ | 19.46 | | | $ | 23.61 | | | $ | 18.30 | | | $ | 15.13 | | |
| Total investment return(4) | | | (21.37 | )% | | | (2.61 | )% | | | 49.16 | % | | | 21.97 | % | | | 43.42 | % | |
| Ratios/supplemental data: | |
| Net assets, end of year (000's) | | $ | 17,784 | | | $ | 29,938 | | | $ | 31,216 | | | $ | 21,651 | | | $ | 16,691 | | |
Expenses to average net assets, net of fee waivers and/or
expense reimbursements by and recoupments to manager | | | 1.93 | % | | | 1.86 | % | | | 1.89 | % | | | 1.97 | %(5) | | | 2.09 | %(5) | |
Expenses to average net assets, before fee waivers and/or
expense reimbursements by manager | | | 1.93 | % | | | 1.86 | % | | | 1.89 | % | | | 1.97 | % | | | 2.09 | % | |
| Net investment income to average net assets | | | 2.06 | % | | | 1.14 | % | | | 1.05 | % | | | 1.20 | % | | | 1.13 | % | |
| Portfolio turnover | | | 77 | % | | | 53 | % | | | 54 | % | | | 84 | % | | | 119 | % | |
| | | Class C | |
| | | For the years ended July 31, | |
| | | 2009 | | 2008 | | 2007 | | 2006 | | 2005(1) | |
| Net asset value, beginning of year | | $ | 18.48 | | | $ | 22.61 | | | $ | 17.62 | | | $ | 14.58 | | | $ | 10.25 | | |
| Net investment income(2) | | | 0.13 | | | | 0.08 | | | | 0.06 | | | | 0.07 | | | | 0.04 | | |
| Net realized and unrealized gains (losses) from investment activities | | | (5.47 | ) | | | (0.46 | ) | | | 7.69 | | | | 3.00 | | | | 4.29 | | |
| Net increase (decrease) from operations | | | (5.34 | ) | | | (0.38 | ) | | | 7.75 | | | | 3.07 | | | | 4.33 | | |
| Dividends from net investment income | | | — | | | | (0.11 | ) | | | (0.06 | ) | | | (0.03 | ) | | | — | | |
| Distributions from net realized gains from investment activities | | | (3.24 | ) | | | (3.64 | ) | | | (2.70 | ) | | | — | | | | — | | |
| Total dividends and distributions | | | (3.24 | ) | | | (3.75 | ) | | | (2.76 | ) | | | (0.03 | ) | | | — | | |
| Net asset value, end of year | | $ | 9.90 | | | $ | 18.48 | | | $ | 22.61 | | | $ | 17.62 | | | $ | 14.58 | | |
| Total investment return(4) | | | (21.97 | )% | | | (3.34 | )% | | | 48.03 | % | | | 21.06 | % | | | 42.24 | % | |
| Ratios/supplemental data: | |
| Net assets, end of year (000's) | | $ | 3,525 | | | $ | 6,536 | | | $ | 7,461 | | | $ | 5,484 | | | $ | 4,625 | | |
Expenses to average net assets, net of fee waivers and/or
expense reimbursements by and recoupments to manager | | | 2.67 | % | | | 2.60 | % | | | 2.64 | % | | | 2.78 | %(5) | | | 2.86 | %(5) | |
Expenses to average net assets, before fee waivers and/or
expense reimbursements by manager | | | 2.67 | % | | | 2.60 | % | | | 2.64 | % | | | 2.78 | % | | | 2.86 | % | |
| Net investment income to average net assets | | | 1.35 | % | | | 0.39 | % | | | 0.30 | % | | | 0.40 | % | | | 0.35 | % | |
| Portfolio turnover | | | 77 | % | | | 53 | % | | | 54 | % | | | 84 | % | | | 119 | % | |
(1) Investment advisory functions for this Portfolio were transferred from Baring International Investment Limited to Mondrian Investment Partners Ltd. on September 28, 2004. Gartmore Global Partners continues to provide a portion of the investment advisory function.
(2) Calculated using the average shares method.
(3) Amount of dividend paid represents less than $0.005 per share.
(4) Total investment return is calculated assuming a $10,000 investment on the first day of each year reported, reinvestment of all dividends and other distributions, if any, at net asset value on the ex-dividend dates, and a sale at net asset value on the last day of each year reported. The figures do not include any applicable sales charges or redemption fees; results would be lower if they were included. Returns do not reflect the deduction of taxes that a shareholder would pay on Portfolio distributions or the redemption of Portfolio shares.
(5) The investment manager recouped expenses previously reimbursed by the investment manager on behalf of the Portfolio, not to exceed the expense cap.
278
| | | Class B | |
| | | For the years ended July 31, | |
| | | 2009 | | 2008 | | 2007 | | 2006 | | 2005(1) | |
| Net asset value, beginning of year | | $ | 18.50 | | | $ | 22.61 | | | $ | 17.60 | | | $ | 14.55 | | | $ | 10.25 | | |
| Net investment income(2) | | | 0.11 | | | | 0.06 | | | | 0.04 | | | | 0.05 | | | | 0.01 | | |
| Net realized and unrealized gains (losses) from investment activities | | | (5.46 | ) | | | (0.46 | ) | | | 7.69 | | | | 3.00 | | | | 4.29 | | |
| Net increase (decrease) from operations | | | (5.35 | ) | | | (0.40 | ) | | | 7.73 | | | | 3.05 | | | | 4.30 | | |
| Dividends from net investment income | | | — | | | | (0.07 | ) | | | (0.02 | ) | | | — | | | | — | | |
| Distributions from net realized gains from investment activities | | | (3.24 | ) | | | (3.64 | ) | | | (2.70 | ) | | | — | | | | — | | |
| Total dividends and distributions | | | (3.24 | ) | | | (3.71 | ) | | | (2.72 | ) | | | — | | | | — | | |
| Net asset value, end of year | | $ | 9.91 | | | $ | 18.50 | | | $ | 22.61 | | | $ | 17.60 | | | $ | 14.55 | | |
| Total investment return(4) | | | (22.05 | )% | | | (3.41 | )% | | | 47.95 | % | | | 20.96 | % | | | 41.95 | % | |
| Ratios/supplemental data: | |
| Net assets, end of year (000's) | | $ | 135 | | | $ | 319 | | | $ | 535 | | | $ | 522 | | | $ | 690 | | |
Expenses to average net assets, net of fee waivers and/or
expense reimbursements by and recoupments to manager | | | 2.72 | % | | | 2.68 | % | | | 2.69 | % | | | 2.86 | %(5) | | | 3.02 | %(5) | |
Expenses to average net assets, before fee waivers and/or
expense reimbursements by manager | | | 2.72 | % | | | 2.68 | % | | | 2.69 | % | | | 2.86 | % | | | 3.02 | % | |
| Net investment income to average net assets | | | 1.14 | % | | | 0.28 | % | | | 0.20 | % | | | 0.29 | % | | | 0.11 | % | |
| Portfolio turnover | | | 77 | % | | | 53 | % | | | 54 | % | | | 84 | % | | | 119 | % | |
| | | Class Y | |
| | | For the years ended July 31, | |
| | | 2009 | | 2008 | | 2007 | | 2006 | | 2005(1) | |
| Net asset value, beginning of year | | $ | 19.79 | | | $ | 23.95 | | | $ | 18.53 | | | $ | 15.30 | | | $ | 10.66 | | |
| Net investment income(2) | | | 0.28 | | | | 0.34 | | | | 0.30 | | | | 0.30 | | | | 0.23 | | |
| Net realized and unrealized gains (losses) from investment activities | | | (5.83 | ) | | | (0.51 | ) | | | 8.12 | | | | 3.13 | | | | 4.45 | | |
| Net increase (decrease) from operations | | | (5.55 | ) | | | (0.17 | ) | | | 8.42 | | | | 3.43 | | | | 4.68 | | |
| Dividends from net investment income | | | (0.22 | ) | | | (0.35 | ) | | | (0.30 | ) | | | (0.20 | ) | | | (0.04 | ) | |
| Distributions from net realized gains from investment activities | | | (3.24 | ) | | | (3.64 | ) | | | (2.70 | ) | | | — | | | | — | | |
| Total dividends and distributions | | | (3.46 | ) | | | (3.99 | ) | | | (3.00 | ) | | | (0.20 | ) | | | (0.04 | ) | |
| Net asset value, end of year | | $ | 10.78 | | | $ | 19.79 | | | $ | 23.95 | | | $ | 18.53 | | | $ | 15.30 | | |
| Total investment return(4) | | | (21.00 | )% | | | (2.22 | )% | | | 49.74 | % | | | 22.52 | % | | | 43.97 | % | |
| Ratios/supplemental data: | |
| Net assets, end of year (000's) | | $ | 33,069 | | | $ | 31,579 | | | $ | 29,576 | | | $ | 20,201 | | | $ | 14,518 | | |
Expenses to average net assets, net of fee waivers and/or
expense reimbursements by and recoupments to manager | | | 1.47 | % | | | 1.50 | % | | | 1.52 | % | | | 1.56 | % | | | 1.67 | % | |
Expenses to average net assets, before fee waivers and/or
expense reimbursements by manager | | | 1.47 | % | | | 1.50 | % | | | 1.52 | % | | | 1.56 | % | | | 1.67 | % | |
| Net investment income to average net assets | | | 2.87 | % | | | 1.49 | % | | | 1.44 | % | | | 1.64 | % | | | 1.72 | % | |
| Portfolio turnover | | | 77 | % | | | 53 | % | | | 54 | % | | | 84 | % | | | 119 | % | |
See accompanying notes to financial statements
279
UBS PACE Select Advisors Trust
Financial highlights
UBS PACE International Emerging Markets Equity Investments (concluded)
Selected data for a share of beneficial interest outstanding throughout each year is presented below:
| | | Class P | |
| | | For the years ended July 31, | |
| | | 2009 | | 2008 | | 2007 | | 2006 | | 2005(1) | |
| Net asset value, beginning of year | | $ | 19.68 | | | $ | 23.84 | | | $ | 18.44 | | | $ | 15.25 | | | $ | 10.64 | | |
| Net investment income(2) | | | 0.20 | | | | 0.28 | | | | 0.23 | | | | 0.21 | | | | 0.17 | | |
| Net realized and unrealized gains (losses) from investment activities | | | (5.77 | ) | | | (0.51 | ) | | | 8.09 | | | | 3.13 | | | | 4.45 | | |
| Net increase (decrease) from operations | | | (5.57 | ) | | | (0.23 | ) | | | 8.32 | | | | 3.34 | | | | 4.62 | | |
| Dividends from net investment income | | | (0.15 | ) | | | (0.29 | ) | | | (0.22 | ) | | | (0.15 | ) | | | (0.01 | ) | |
| Distributions from net realized gains from investment activities | | | (3.24 | ) | | | (3.64 | ) | | | (2.70 | ) | | | — | | | | — | | |
| Total dividends and distributions | | | (3.39 | ) | | | (3.93 | ) | | | (2.92 | ) | | | (0.15 | ) | | | (0.01 | ) | |
| Net asset value, end of year | | $ | 10.72 | | | $ | 19.68 | | | $ | 23.84 | | | $ | 18.44 | | | $ | 15.25 | | |
| Total investment return(3) | | | (21.42 | )% | | | (2.52 | )% | | | 49.31 | % | | | 21.98 | % | | | 43.46 | % | |
| Ratios/supplemental data: | |
| Net assets, end of year (000's) | | $ | 210,680 | | | $ | 337,958 | | | $ | 374,910 | | | $ | 259,321 | | | $ | 199,403 | | |
Expenses to average net assets, net of fee waivers and/or
expense reimbursements by and recoupments to manager | | | 1.97 | % | | | 1.78 | % | | | 1.82 | % | | | 1.98 | %(4) | | | 2.00 | % | |
Expenses to average net assets, before fee waivers and/or
expense reimbursements by manager | | | 1.97 | % | | | 1.78 | % | | | 1.82 | % | | | 1.98 | % | | | 2.05 | % | |
| Net investment income to average net assets | | | 2.03 | % | | | 1.22 | % | | | 1.13 | % | | | 1.20 | % | | | 1.28 | % | |
| Portfolio turnover | | | 77 | % | | | 53 | % | | | 54 | % | | | 84 | % | | | 119 | % | |
(1) Investment advisory functions for this Portfolio were transferred from Baring International Investment Limited to Mondrian Investment Partners Ltd. on September 28, 2004. Gartmore Global Partners continues to provide a portion of the investment advisory function.
(2) Calculated using the average shares method.
(3) Total investment return is calculated assuming a $10,000 investment on the first day of each year reported, reinvestment of all dividends and other distributions, if any, at net asset value on the ex-dividend dates, and a sale at net asset value on the last day of each year reported. The figures do not include any applicable program or redemption fees; results would be lower if they were included. Returns do not reflect the deduction of taxes that a shareholder would pay on Portfolio distributions or the redemption of Portfolio shares.
(4) The investment manager recouped expenses previously reimbursed by the investment manager on behalf of the Portfolio, not to exceed the expense cap.
See accompanying notes to financial statements
280
(This page has been left blank intentionally)
281
UBS PACE Select Advisors Trust
Financial highlights
UBS PACE Global Real Estate Securities Investments
Selected data for a share of beneficial interest outstanding throughout each period is presented below:
| | | Class A | | Class C | |
| | | For the years ended
July 31, | | For the
period ended
July 31, | | For the years ended
July 31, | | For the
period ended
July 31, | |
| | | 2009 | | 2008 | | 2007(1) | | 2009 | | 2008 | | 2007(1) | |
| Net asset value, beginning of period | | $ | 7.73 | | | $ | 9.54 | | | $ | 9.84 | | | $ | 7.69 | | | $ | 9.49 | | | $ | 9.84 | | |
| Net investment income(5) | | | 0.16 | | | | 0.19 | | | | 0.09 | | | | 0.12 | | | | 0.12 | | | | 0.05 | | |
Net realized and unrealized gains (losses) from
investment activities | | | (2.97 | ) | | | (1.70 | ) | | | (0.35 | ) | | | (2.95 | ) | | | (1.69 | ) | | | (0.36 | ) | |
| Net increase (decrease) from operations | | | (2.81 | ) | | | (1.51 | ) | | | (0.26 | ) | | | (2.83 | ) | | | (1.57 | ) | | | (0.31 | ) | |
| Dividends from net investment income | | | (0.06 | ) | | | (0.27 | ) | | | (0.04 | ) | | | (0.01 | ) | | | (0.20 | ) | | | (0.04 | ) | |
Distributions from net realized gains from
investment activities | | | — | | | | (0.03 | ) | | | — | | | | — | | | | (0.03 | ) | | | — | | |
| Total dividends and distributions | | | (0.06 | ) | | | (0.30 | ) | | | (0.04 | ) | | | (0.01 | ) | | | (0.23 | ) | | | (0.04 | ) | |
| Net asset value, end of period | | $ | 4.86 | | | $ | 7.73 | | | $ | 9.54 | | | $ | 4.85 | | | $ | 7.69 | | | $ | 9.49 | | |
| Total investment return(6) | | | (36.25 | )% | | | (16.22 | )% | | | (2.63 | )% | | | (36.73 | )% | | | (16.84 | )% | | | (3.16 | )% | |
| Ratios/supplemental data: | |
| Net assets, end of period (000's) | | $ | 3,238 | | | $ | 6,647 | | | $ | 4,199 | | | $ | 136 | | | $ | 213 | | | $ | 343 | | |
Expenses to average net assets, net of
fee waivers and/or expense
reimbursements by manager | | | 1.45 | % | | | 1.45 | % | | | 1.45 | %(7) | | | 2.20 | % | | | 2.20 | % | | | 2.20 | %(7) | |
Expenses to average net assets, before
fee waivers and/or expense reimbursements
by manager | | | 2.06 | % | | | 1.74 | % | | | 3.06 | %(7) | | | 2.96 | % | | | 2.68 | % | | | 3.78 | %(7) | |
| Net investment income to average net assets | | | 3.32 | % | | | 2.10 | % | | | 1.47 | %(7) | | | 2.67 | % | | | 1.29 | % | | | 0.84 | %(7) | |
| Portfolio turnover | | | 127 | % | | | 68 | % | | | 38 | % | | | 127 | % | | | 68 | % | | | 38 | % | |
(1) For the period December 18, 2006 (commencement of issuance) through July 31, 2007.
(2) For the period December 26, 2008 (recommencement of issuance) through July 31, 2009.
(3) For the period November 30, 2006 (commencement of issuance) through February 15, 2007. There were no shares outstanding from February 16, 2007 through December 25, 2008.
(4) For the period January 22, 2007 (commencement of issuance) through July 31, 2007.
(5) Calculated using the average shares method.
(6) Total investment return is calculated assuming a $10,000 investment on the first day of each period reported, reinvestment of all dividends and other distributions, if any, at net asset value on the ex-dividend dates, and a sale at net asset value on the last day of each period reported. The figures do not include any applicable sales charges, redemption fees or program fees; results would be lower if they were included. Total investment return for periods of less than one year has not been annualized. Returns do not reflect the deduction of taxes that a shareholder would pay on Portfolio distributions or the redemption of Portfolio shares.
(7) Annualized.
282
| | | Class Y | | Class P | |
| | | For the
period ended
July 31, | | For the
period ended
February 15, | | For the years ended
July 31, | | For the
period ended
July 31, | |
| | | 2009(2) | | 2007(3) | | 2009 | | 2008 | | 2007(4) | |
| Net asset value, beginning of period | | $ | 4.35 | | | $ | 10.00 | | | $ | 7.75 | | | $ | 9.56 | | | $ | 10.26 | | |
| Net investment income(5) | | | 0.09 | | | | 0.06 | | | | 0.17 | | | | 0.21 | | | | 0.09 | | |
Net realized and unrealized gains (losses) from
investment activities | | | 0.43 | | | | 0.97 | | | | (2.97 | ) | | | (1.71 | ) | | | (0.79 | ) | |
| Net increase (decrease) from operations | | | 0.52 | | | | 1.03 | | | | (2.80 | ) | | | (1.50 | ) | | | (0.70 | ) | |
| Dividends from net investment income | | | — | | | | (0.04 | ) | | | (0.09 | ) | | | (0.28 | ) | | | — | | |
Distributions from net realized gains from
investment activities | | | — | | | | — | | | | — | | | | (0.03 | ) | | | — | | |
| Total dividends and distributions | | | — | | | | (0.04 | ) | | | (0.09 | ) | | | (0.31 | ) | | | — | | |
| Net asset value, end of period | | $ | 4.87 | | | $ | 10.99 | | | $ | 4.86 | | | $ | 7.75 | | | $ | 9.56 | | |
| Total investment return(6) | | | 11.95 | % | | | 10.39 | % | | | (36.09 | )% | | | (16.06 | )% | | | (6.82 | )% | |
| Ratios/supplemental data: | |
| Net assets, end of period (000's) | | $ | 13 | | | $ | — | | | $ | 52,925 | | | $ | 70,125 | | | $ | 44,772 | | |
Expenses to average net assets, net of
fee waivers and/or expense
reimbursements by manager | | | 1.20 | %(7) | | | 1.20 | %(7) | | | 1.20 | % | | | 1.20 | % | | | 1.20 | %(7) | |
Expenses to average net assets, before
fee waivers and/or expense reimbursements
by manager | | | 1.87 | %(7) | | | 1.92 | %(7) | | | 2.17 | % | | | 1.71 | % | | | 3.02 | %(7) | |
| Net investment income to average net assets | | | 3.84 | %(7) | | | 3.07 | %(7) | | | 3.67 | % | | | 2.38 | % | | | 1.75 | %(7) | |
| Portfolio turnover | | | 127 | % | | | 38 | % | | | 127 | % | | | 68 | % | | | 38 | % | |
See accompanying notes to financial statements
283
UBS PACE Select Advisors Trust
Financial highlights
UBS PACE Alternative Strategies Investments
Selected data for a share of beneficial interest outstanding throughout each period is presented below:
| | | Class A | | Class B | |
| | | For the years ended July 31, | | For the period
ended July 31, | | For the years ended July 31, | | For the period
ended July 31, | |
| | | 2009(1) | | 2008(2) | | 2007 | | 2006(3) | | 2009(1) | | 2008(2) | | 2007 | | 2006(4) | |
| Net asset value, beginning of period | | $ | 10.46 | | | $ | 11.27 | | | $ | 9.93 | | | $ | 10.01 | | | $ | 10.36 | | | $ | 11.19 | | | $ | 9.91 | | | $ | 9.84 | | |
| Net investment income (loss)(6) | | | 0.06 | | | | 0.09 | | | | 0.13 | | | | 0.03 | | | | (0.01 | ) | | | 0.01 | | | | 0.02 | | | | 0.01 | | |
| Net realized and unrealized gains (losses) from investment activities | | | (1.63 | ) | | | (0.65 | ) | | | 1.26 | | | | (0.11 | ) | | | (1.62 | ) | | | (0.64 | ) | | | 1.29 | | | | 0.06 | | |
| Net increase (decrease) from operations | | | (1.57 | ) | | | (0.56 | ) | | | 1.39 | | | | (0.08 | ) | | | (1.63 | ) | | | (0.63 | ) | | | 1.31 | | | | 0.07 | | |
| Dividends from net investment income | | | (0.03 | ) | | | (0.07 | ) | | | (0.05 | ) | | | — | | | | (0.02 | ) | | | (0.02 | ) | | | (0.03 | ) | | | — | | |
| Distributions from net realized gains from investment activities | | | (0.07 | ) | | | (0.18 | ) | | | — | | | | — | | | | (0.07 | ) | | | (0.18 | ) | | | — | | | | — | | |
| Total dividends and distributions | | | (0.10 | ) | | | (0.25 | ) | | | (0.05 | ) | | | — | | | | (0.09 | ) | | | (0.20 | ) | | | (0.03 | ) | | | — | | |
| Net asset value, end of period | | $ | 8.79 | | | $ | 10.46 | | | $ | 11.27 | | | $ | 9.93 | | | $ | 8.64 | | | $ | 10.36 | | | $ | 11.19 | | | $ | 9.91 | | |
| Total investment return(7) | | | (14.95 | )% | | | (4.94 | )% | | | 14.09 | % | | | (0.80 | )% | | | (15.54 | )% | | | (5.68 | )% | | | 13.26 | % | | | 0.71 | % | |
| Ratios/supplemental data: | |
| Net assets, end of period (000's) | | $ | 65,429 | | | $ | 150,598 | | | $ | 64,409 | | | $ | 10,393 | | | $ | 29 | | | $ | 23 | | | $ | 18 | | | $ | 3 | | |
Expenses to average net assets, net of fee waivers and/or expense
reimbursements by and recoupments to manager including dividend
and interest expense for securities sold short | | | 2.20 | % | | | 2.42 | %(8) | | | 2.52 | % | | | 2.14 | %(9) | | | 3.00 | % | | | 3.16 | % | | | 3.23 | % | | | 2.83 | %(9) | |
Expenses to average net assets, before fee waivers and/or expense
reimbursements by manager including dividend and interest expense
for securities sold short | | | 2.23 | % | | | 2.42 | % | | | 2.69 | % | | | 4.24 | %(9) | | | 3.13 | % | | | 4.51 | % | | | 3.68 | % | | | 5.09 | %(9) | |
Expenses to average net assets, net of fee waivers and/or expense
reimbursements by and recoupments to manager excluding dividend
and interest expense for securities sold short | | | 1.95 | % | | | 1.94 | %(8) | | | 1.88 | % | | | 1.66 | %(9) | | | 2.70 | % | | | 2.70 | % | | | 2.63 | % | | | 2.38 | %(9) | |
| Net investment income (loss) to average net assets | | | 0.69 | % | | | 0.79 | % | | | 1.21 | % | | | 1.30 | %(9) | | | (0.08 | )% | | | 0.08 | % | | | 0.31 | % | | | 0.41 | %(9) | |
| Portfolio turnover | | | 423 | % | | | 389 | % | | | 178 | % | | | 54 | % | | | 423 | % | | | 389 | % | | | 178 | % | | | 54 | % | |
(1) A portion of the investment advisory function for this Portfolio was transferred to First Quadrant L.P. on April 8, 2009. Analytic Investors, LLC, Goldman Sachs Asset Management, L.P. and Wellington Management Company, LLP continue to provide a portion of the investment advisory function.
(2) A portion of the investment advisory function for this Porftolio was transferred to Goldman Sachs Asset Managment, L.P. on September 10, 2007. Analytic Investors LLC and Wellington Management Company, LLP continue to provide a portion of the investment advisory function.
(3) For the period April 10, 2006 (commencement of issuance) through July 31, 2006.
(4) For the period May 19, 2006 (commencement of issuance) through July 31, 2006.
(5) For the period April 11, 2006 (commencement of issuance) through July 31, 2006.
(6) Calculated using the average shares method.
(7) Total investment return is calculated assuming a $10,000 investment on the first day of each period reported, reinvestment of all dividends and other distributions, if any, at net asset value on the ex-dividend dates, and a sale at net asset value on the last day of each period reported. The figures do not include any applicable sales charges or redemption fees; results would be lower if they were included. Total investment return for periods of less than one year has not been annualized. Returns do not reflect the deduction of taxes that a shareholder would pay on Portfolio distributions or the redemption of Portfolio shares.
(8) The investment manager recouped expenses previously reimbursed by the investment manager on behalf of the Portfolio, not to exceed the expense cap.
(9) Annualized.
284
| | | Class C | |
| | | For the years ended July 31, | | For the period
ended July 31, | |
| | | 2009(1) | | 2008(2) | | 2007 | | 2006(5) | |
| Net asset value, beginning of period | | $ | 10.34 | | | $ | 11.20 | | | $ | 9.91 | | | $ | 9.97 | | |
| Net investment income (loss)(6) | | | (0.01 | ) | | | 0.01 | | | | 0.05 | | | | 0.02 | | |
| Net realized and unrealized gains (losses) from investment activities | | | (1.62 | ) | | | (0.64 | ) | | | 1.26 | | | | (0.08 | ) | |
| Net increase (decrease) from operations | | | (1.63 | ) | | | (0.63 | ) | | | 1.31 | | | | (0.06 | ) | |
| Dividends from net investment income | | | — | | | | (0.05 | ) | | | (0.02 | ) | | | — | | |
| Distributions from net realized gains from investment activities | | | (0.07 | ) | | | (0.18 | ) | | | — | | | | — | | |
| Total dividends and distributions | | | (0.07 | ) | | | (0.23 | ) | | | (0.02 | ) | | | — | | |
| Net asset value, end of period | | $ | 8.64 | | | $ | 10.34 | | | $ | 11.20 | | | $ | 9.91 | | |
| Total investment return(7) | | | (15.61 | )% | | | (5.67 | )% | | | 13.23 | % | | | (0.60 | )% | |
| Ratios/supplemental data: | |
| Net assets, end of period (000's) | | $ | 6,565 | | | $ | 7,921 | | | $ | 3,843 | | | $ | 302 | | |
Expenses to average net assets, net of fee waivers and/or expense
reimbursements by and recoupments to manager including dividend
and interest expense for securities sold short | | | 2.96 | % | | | 3.16 | %(8) | | | 3.28 | % | | | 2.84 | %(9) | |
Expenses to average net assets, before fee waivers and/or expense
reimbursements by manager including dividend and interest expense
for securities sold short | | | 2.96 | % | | | 3.16 | % | | | 3.45 | % | | | 4.35 | %(9) | |
Expenses to average net assets, net of fee waivers and/or expense
reimbursements by and recoupments to manager excluding dividend
and interest expense for securities sold short | | | 2.70 | % | | | 2.67 | %(8) | | | 2.65 | % | | | 2.40 | %(9) | |
| Net investment income (loss) to average net assets | | | (0.08 | )% | | | 0.08 | % | | | 0.56 | % | | | 0.66 | %(9) | |
| Portfolio turnover | | | 423 | % | | | 389 | % | | | 178 | % | | | 54 | % | |
See accompanying notes to financial statements
285
UBS PACE Select Advisors Trust
Financial highlights
UBS PACE Alternative Strategies Investments
(concluded)
Selected data for a share of beneficial interest outstanding throughout each period is presented below:
| | | Class Y | |
| | | For the year
ended July 31, | | For the periods ended July 31, | |
| | | 2009(1) | | 2008(2),(3) | | 2006(4) | |
| Net asset value, beginning of period | | $ | 10.51 | | | $ | 10.52 | | | $ | 10.00 | | |
| Net investment income (loss)(6) | | | 0.08 | | | | (0.00 | )(7) | | | 0.06 | | |
| Net realized and unrealized gains (losses) from investment activities | | | (1.66 | ) | | | (0.01 | ) | | | (0.20 | ) | |
| Net increase (decrease) from operations | | | (1.58 | ) | | | (0.01 | ) | | | (0.14 | ) | |
| Dividends from net investment income | | | (0.06 | ) | | | — | | | | — | | |
| Distributions from net realized gains from investment activities | | | (0.07 | ) | | | — | | | | — | | |
| Total dividends and distributions | | | (0.13 | ) | | | — | | | | — | | |
| Net asset value, end of period | | $ | 8.80 | | | $ | 10.51 | | | $ | 9.86 | | |
| Total investment return(8) | | | (14.81 | )% | | | (0.10 | )% | | | (1.40 | )% | |
| Ratios/supplemental data: | |
| Net assets, end of period (000's) | | $ | 13,707 | | | $ | 57,552 | | | $ | — | | |
Expenses to average net assets, net of fee waivers and/or expense
reimbursements by and recoupments to manager including dividend
and interest expense for securities sold short | | | 1.95 | % | | | 2.52 | %(9) | | | 1.76 | %(9) | |
Expenses to average net assets, before fee waivers and/or expense
reimbursements by manager including dividend and interest expense
for securities sold short | | | 1.98 | % | | | 2.69 | %(9) | | | 2.34 | %(9) | |
Expenses to average net assets, net of fee waivers and/or expense
reimbursements by and recoupments to manager excluding dividend
and interest expense for securities sold short | | | 1.70 | % | | | 1.70 | %(9) | | | 1.41 | %(9) | |
| Net investment income (loss) to average net assets | | | 0.95 | % | | | (1.77 | )%(9) | | | 1.94 | %(9) | |
| Portfolio turnover | | | 423 | % | | | 389 | % | | | 54 | % | |
(1) A portion of the investment advisory function for this Portfolio was transferred to First Quadrant L.P. on April 8, 2009. Analytic Investors, LLC, Goldman Sachs Asset Management, L.P. and Wellington Management Company, LLP continue to provide a portion of the investment advisory function.
(2) A portion of the investment advisory function for this Porftolio was transferred to Goldman Sachs Asset Managment, L.P. on September 10, 2007. Analytic Investors, LLC and Wellington Management Company, LLP continue to provide a portion of the investment advisory function.
(3) For the period July 23, 2008 (recommencement of issuance) through July 31, 2008.
(4) For the period April 3, 2006 (commencement of issuance) through July 26, 2006. There were no shares outstanding from July 27, 2006 through July 22, 2008.
(5) For the period April 10, 2006 (commencement of issuance) through July 31, 2006.
(6) Calculated using the average shares method.
(7) Amount of loss represents less than $0.005 per share.
(8) Total investment return is calculated assuming a $10,000 investment on the first day of each period reported, reinvestment of all dividends and other distributions, if any, at net asset value on the ex-dividend dates, and a sale at net asset value on the last day of each period reported. The figures do not include any applicable sales charges, redemption fees or program fees; results would be lower if they were included. Total investment return for periods of less than one year has not been annualized. Returns do not reflect the deduction of taxes that a shareholder would pay on Portfolio distributions or the redemption of Portfolio shares.
(9) Annualized.
(10) The investment manager recouped expenses previously reimbursed by the investment manager on behalf of the Portfolio, not to exceed the expense cap.
286
| | | Class P | |
| | | For the years ended July 31, | | For the period
ended July 31, | |
| | | 2009(1) | | 2008(2) | | 2007 | | 2006(5) | |
| Net asset value, beginning of period | | $ | 10.51 | | | $ | 11.30 | | | $ | 9.94 | | | $ | 10.01 | | |
| Net investment income (loss)(6) | | | 0.08 | | | | 0.12 | | | | 0.16 | | | | 0.03 | | |
| Net realized and unrealized gains (losses) from investment activities | | | (1.65 | ) | | | (0.65 | ) | | | 1.26 | | | | (0.10 | ) | |
| Net increase (decrease) from operations | | | (1.57 | ) | | | (0.53 | ) | | | 1.42 | | | | (0.07 | ) | |
| Dividends from net investment income | | | (0.05 | ) | | | (0.08 | ) | | | (0.06 | ) | | | — | | |
| Distributions from net realized gains from investment activities | | | (0.07 | ) | | | (0.18 | ) | | | — | | | | — | | |
| Total dividends and distributions | | | (0.12 | ) | | | (0.26 | ) | | | (0.06 | ) | | | — | | |
| Net asset value, end of period | | $ | 8.82 | | | $ | 10.51 | | | $ | 11.30 | | | $ | 9.94 | | |
| Total investment return(8) | | | (14.73 | )% | | | (4.76 | )% | | | 14.38 | % | | | (0.70 | )% | |
| Ratios/supplemental data: | |
| Net assets, end of period (000's) | | $ | 356,352 | | | $ | 555,361 | | | $ | 384,649 | | | $ | 46,920 | | |
Expenses to average net assets, net of fee waivers and/or expense
reimbursements by and recoupments to manager including dividend
and interest expense for securities sold short | | | 1.95 | % | | | 2.13 | %(10) | | | 2.28 | % | | | 1.90 | %(9) | |
Expenses to average net assets, before fee waivers and/or expense
reimbursements by manager including dividend and interest expense
for securities sold short | | | 1.96 | % | | | 2.13 | % | | | 2.43 | % | | | 4.12 | %(9) | |
Expenses to average net assets, net of fee waivers and/or expense
reimbursements by and recoupments to manager excluding dividend
and interest expense for securities sold short | | | 1.70 | % | | | 1.68 | %(10) | | | 1.64 | % | | | 1.41 | %(9) | |
| Net investment income (loss) to average net assets | | | 0.93 | % | | | 1.10 | % | | | 1.44 | % | | | 1.47 | %(9) | |
| Portfolio turnover | | | 423 | % | | | 389 | % | | | 178 | % | | | 54 | % | |
See accompanying notes to financial statements
287
UBS PACE Select Advisors Trust
Notes to financial statements
Organization and significant accounting policies
UBS PACESM Select Advisors Trust (the "Trust") is registered with the Securities and Exchange Commission under the Investment Company Act of 1940, as amended, as an open-end management investment company currently composed of fifteen separate investment portfolios and was organized as a Delaware statutory trust under the laws of the State of Delaware by Certificate of Trust dated September 9, 1994, as amended June 9, 1995 and thereafter. The trustees of the Trust have authority to issue an unlimited number of shares of beneficial interest, par value $0.001 per share.
The Trust has fifteen Portfolios available for investment, each having its own investment objectives and policies: UBS PACE Money Market Investments, UBS PACE Government Securities Fixed Income Investments, UBS PACE Intermediate Fixed Income Investments, UBS PACE Strategic Fixed Income Investments, UBS PACE Municipal Fixed Income Investments, UBS PACE Global Fixed Income Investments, UBS PACE High Yield Investments, UBS PACE Large Co Value Equity Investments, UBS PACE Large Co Growth Equity Investments, UBS PACE Small/Medium Co Value Equity Investments, UBS PACE Small/Medium Co Growth Equity Investments, UBS PACE International Equity Investments, UBS PACE International Emerging Markets Equity Investments, UBS PACE Global Real Estate Securities Investments and UBS PACE Alternative Strategies Investments (collectively, the "Portfolios").
Each of the Portfolios is classified as a diversified investment company with the exception of UBS PACE Intermediate Fixed Income Investments, UBS PACE Global Fixed Income Investments, UBS PACE Global Real Estate Securities Investments and UBS PACE Alternative Strategies Investments. With the exception of UBS PACE Money Market Investments (which currently offers Class P shares only) and UBS PACE Global Real Estate Securities Investments (which currently offers Class A, Class C, Class Y and Class P shares), each Portfolio currently offers Class A, Class B, Class C, Class Y and Class P shares. Each class represents interests in the same assets of the applicable Portfolio and the classes are identical except for differences in their sales charge structures, ongoing service and distribution charges and certain transfer agency and related services expenses. In addition, Class B shares and all corresponding reinvested dividend shares automatically convert to Class A shares within a certain number of years after issuance which varies depending upon the amount invested. All classes of shares have equal voting privileges except that each class has exclusive voting rights with respect to its service and/or distribution plan, if any. Class Y and Class P shares have no service or distribution plan. The Portfolios' Class P shares currently are available for purchase only to participants in the UBS PACESM Select Advisors Program, except that UBS PACE Money Market Investments shares are also available to participants in the UBS PACESM Multi Advisor Program.
As of October 1, 2007, new or additional investments into Class B shares, including investments through an automatic investment plan, are not permitted. Existing shareholders of Class B shares may: (i) continue as Class B shareholders; (ii) continue to reinvest dividends and distributions into Class B shares; and (iii) exchange their Class B shares for Class B shares of other series of the UBS Family of Funds, as permitted by existing exchange privileges. For Class B shares outstanding on October 1, 2007 and Class B shares acquired upon reinvestment of dividends and distributions or through exchanges, all Class B share attributes, including the associated Rule 12b-1 service plan and distribution fees, contingent deferred sales charges and conversion features will continue.
The Trust accounts separately for the assets, liabilities and operations of each Portfolio. Expenses directly attributable to each Portfolio are charged to that Portfolio's operations; expenses which are applicable to all Portfolios are allocated among them on a pro rata basis.
288
UBS PACE Select Advisors Trust
Notes to financial statements
In the normal course of business, the Portfolios may enter into contracts that contain a variety of representations or that provide indemnification for certain liabilities. The Portfolios' maximum exposure under these arrangements is unknown, as this would involve future claims that may be made against the Portfolios that have not yet occurred. However, the Portfolios have not had prior claims or losses pursuant to these contracts and expect the risk of loss to be remote.
The preparation of financial statements in accordance with US generally accepted accounting principles requires the Trust's management to make estimates and assumptions that affect the reported amounts and disclosures in the financial statements. Actual results could differ from those estimates. The following is a summary of significant accounting policies:
Valuation of investments—Each Portfolio (except UBS PACE Money Market Investments) calculates its net asset value based on the current value for its portfolio securities. The Portfolios normally obtain values for their securities from independent pricing sources. Independent pricing sources may use last reported sale prices, current market quotations or valuations from computerized "matrix" systems that derive values based on comparable securities. Securities traded in the over-the-counter ("OTC") market and listed on The Nasdaq Stock Market, Inc. ("Nasdaq") normally are valued at the NASDAQ Official Closing Price. Other OTC securities are valued at the last bid price available prior to valuation. Securities which are listed on US and foreign stock exchanges normally are valued at the last sale price on the day the securities are valued or, lacki ng any sales on such day, at the last available bid price. Securities listed on foreign stock exchanges (and certain related derivatives) may be fair valued based on significant events that occur between the close of the foreign markets and 4:00 pm EST. UBS PACE International Equity Investments, UBS PACE International Emerging Markets Equity Investments, UBS PACE Global Real Estate Securities Investments and UBS PACE Alternative Strategies Investments may use a systematic fair valuation model provided by an independent third party to value securities principally traded in foreign markets (and certain related derivatives) in order to adjust for possible stale pricing that may occur between the close of the foreign exchanges and the time for valuation. If a security is valued at a "fair value", that value is likely to be different from the last quoted market price for the security. In cases where securities are traded on more than one exchange, the securities are valued on the exchange designated as the primar y market by UBS Global Asset Management (Americas) Inc. ("UBS Global AM"). If a market value is not available from an independent pricing source for a particular security, that security is valued at fair value as determined in good faith by or under the direction of the Trust's Board of Trustees (the "Board"). Various factors may be reviewed in order to make a good faith determination of a security's fair value. These factors include, but are not limited to, the type and cost of the security; contractual or legal restrictions on resale of the security; relevant financial or business developments of the issuer; actively traded similar or related securities; conversion or exchange rights on the security; related corporate actions; and changes in overall market conditions. If events occur that materially affect the value of securities (particularly non-US securities) between the close of trading in those securities and the close of regular trading on the New York Stock Exchange ("NYSE"), the securities are fair valued. The amortized cost method of valuation, which approximates market value, generally is used to value short-term debt instruments with sixty days or less remaining to maturity, unless the Board determines that this does not represent fair value. Investments of the UBS PACE Money Market Investments Portfolio are valued using the amortized cost method of valuation. All investments quoted in foreign currencies will be valued daily in US dollars on the basis of the foreign currency exchange rates prevailing at the time such valuation is determined by the Portfolios' custodian. Investments in open-end investment companies are valued at the daily closing net asset value of the respective investment company. Futures contracts are generally valued at the settlement price established each day on the exchange on which they are traded. Forward foreign currency contracts are valued daily using forward exchange rates quoted by independent pricing services. Swaps are marked to market daily based upon values from th ird party vendors or quotations from market
289
UBS PACE Select Advisors Trust
Notes to financial statements
makers to the extent available and the change in value, if any, is recorded on the Statement of assets and liabilities. In the event that market quotations are not readily available or deemed unreliable, swaps are valued at fair value as determined in good faith by or under the direction of the Board.
On August 1, 2008, the Portfolios adopted the Financial Accounting Standards Board ("FASB") Statement of Financial Accounting Standards No. 157, "Fair Value Measurements" ("FAS 157"). FAS 157 requires disclosure surrounding the various inputs that are used in determining the value of the Portfolio's investments. These inputs are summarized into the three broad levels listed below:
Level 1—Quoted prices in active markets for identical investments.
Level 2—Other significant observable inputs, including but not limited to, quoted prices for similar investments, interest rates, prepayment speeds and credit risks.
Level 3—Unobservable inputs inclusive of the Portfolio's own assumptions in determining the fair value of investments.
In accordance with the requirements of FAS 157, a fair value hierarchy has been included near the end of each Portfolios' Portfolio of investments.
In September 2008, the FASB issued FASB Staff Position No. FAS 133-1 and FIN 45-4, "Disclosures about Credit Derivatives and Certain Guarantees: An Amendment of FASB Statement No. 133 and FASB Interpretation No. 45" (the "FSP"). The FSP amends FASB Statement No. 133 ("FAS 133"), "Accounting for Derivative Instruments and Hedging Activities", and also amends FASB Interpretation No. 45 ("FIN 45"), "Guarantor's Ac counting and Disclosure Requirements for Guarantees, Including Indirect Guarantees of Indebtedness of Others". The amendments to FAS 133 include required disclosure for (i) the nature and terms of the credit derivative, reasons for entering into the credit derivative, the events or circumstances that would require the seller to perform under the credit derivative, and the current status of the payment/performance risk of the credit derivative, (ii) the maximum potential amount of future payments (undiscounted) the seller could be required to make under the credit derivative, (iii) the fair value of the credit derivative, and (iv) the nature of any recourse provisions and assets held either as collateral or by third parties. The amendments to FIN 45 require additional disclosures about the current status of the payment/performance risk of a guarantee. All changes to accounting policies have been made in accordance with the FSP and inc orporated for the current period.
In March 2008, the FASB issued Statement of Financial Accounting Standards No. 161, "Disclosures about Derivative Instruments and Hedging Activities" ("FAS 161"), which changes the disclosure requirements for derivative instruments and hedging activities. Since investment companies value their derivatives at fair value and recognize changes in fair value through the statement of operations, they do not qualify for FAS 133 hedge accounting. Accordingly, even though a fund's investments in derivatives may represent economic hedges, they are considered to be non-hedge transactions for purposes of FAS 161 disclosure. FAS 161 requires that (1) objectives for using derivative instruments be disclosed in terms of underlying risk and accounting designation, (2) the fair values of derivati ve instruments and their gains and losses be disclosed in a tabular format, and (3) information be disclosed about credit-risk contingent features of derivatives contracts. FAS 161 is effective for financial statements for fiscal years and interim periods beginning after November 15, 2008. Details of this disclosure can be found below as well as in the Portfolio of investments.
290
UBS PACE Select Advisors Trust
Notes to financial statements
At July 31, 2009, the Portfolios had the following derivatives (not designated as hedging instruments under SFAS No. 133):
| | | Asset derivatives1 | |
| | | | Interest rate
risk | | Foreign exchange
risk | | Credit
risk | | Equity
risk | | Total | |
UBS PACE Government
Securities Fixed Income
Investments | | Swap contracts
Total value
| | —
—
| | —
—
| | $2,555,560
$2,555,560
| | —
—
| | $2,555,560
$2,555,560
| |
UBS PACE Intermediate
Fixed Income
Investments
| | Futures contracts
Forward foreign
currency contracts
Total value | | $239,814
—
$239,814 | | —
$8,834
$8,834 | | —
—
— | | —
—
— | | $239,814
8,834
$248,648 | |
UBS PACE Strategic
Fixed Income
Investments
| | Option contracts
Forward foreign
currency contracts
Swap contracts
Total value | | —
—
$6,193,857
$6,193,857 | | $16,474
2,657,535
—
$2,674,009 | | —
—
$463,103
$463,103 | | —
—
—
— | | $16,474
2,657,535
6,656,960
$9,330,969 | |
UBS PACE Global Fixed
Income Investments
| | Futures contracts
Forward foreign
currency contracts
Total value | | $2,783,590
—
$2,783,590 | | —
$6,573,109
$6,573,109 | | —
—
— | | —
—
— | | $2,783,590
6,573,109
$9,356,699 | |
UBS PACE International
Equity Investments
| | Futures contracts
Forward foreign
currency contracts
Total value | | —
—
— | | —
$288,244
$288,244 | | —
—
— | | $74,703
—
$74,703 | | $74,703
288,244
$362,947 | |
UBS PACE Alternative
Strategies Investments
| | Futures contracts
Forward foreign
currency contracts
Swap contracts
Total value | | $1,234,542
—
333,732
$1,568,274 | | $35,689
$4,165,477
—
$4,201,166 | | —
—
—
— | | $510,117
—
—
$510,117 | | $1,780,348
4,165,477
333,732
$6,279,557 | |
1 Statement of assets and liabilities location: Swap contracts, at value, Receivable for variation margin and Unrealized appreciation on forward foreign currency contracts. Cumulative appreciation (depreciation) of futures contracts as reported in the Portfolio of investments. Only current day's variation margin, if any, is reported within the Statement of assets and liabilities.
| | | Liability derivatives1 | |
| | | | Interest rate
risk | | Foreign exchange
risk | | Credit
risk | | Equity
risk | | Total | |
UBS PACE Government
Securities Fixed Income
Investments | | Written options
Total value
| | $2,156
$2,156
| | —
—
| | —
—
| | —
—
| | $2,156
$2,156
| |
UBS PACE Intermediate
Fixed Income
Investments | | Futures contracts
Forward foreign
currency contracts
Total value | | $22,432
—
$22,432 | | —
$116,556
$116,556 | | —
—
— | | —
—
— | | $22,432
116,556
$138,988 | |
UBS PACE Strategic
Fixed Income
Investments
| | Futures contracts
Written options
Forward foreign
currency contracts
Swap contracts
Total value | | $300,200
50,934
—
572,328
$923,462 | | —
—
$3,738,102
—
$3,738,102 | | —
—
—
$1,715,690
$1,715,690 | | —
—
—
—
— | | $300,200
50,934
3,738,102
2,288,018
$6,377,254 | |
291
UBS PACE Select Advisors Trust
Notes to financial statements
| | | Liability derivatives1 | |
| | | | Interest rate
risk | | Foreign exchange
risk | | Credit
risk | | Equity
risk | | Total | |
UBS PACE Global Fixed
Income Investments
| | Futures contracts
Forward foreign
currency contracts
Total value | | $515,956
$515,956 | | —
$3,699,935
$3,699,935 | | —
—
— | | —
—
— | | $515,956
3,699,935
$4,215,891 | |
UBS PACE High Yield
Investments | | Forward foreign
currency contracts
Total value | | —
— | | $236,935
$236,935 | | —
— | | —
— | | $236,935
$236,935 | |
UBS PACE International
Equity Investments
| | Futures contracts
Forward foreign
currency contracts
Total value | | —
—
— | | —
$144,049
$144,049 | | —
—
— | | —
—
— | | —
$144,049
$144,049 | |
UBS PACE Alternative
Strategies Investments
| | Futures contracts
Written options
Forward foreign
currency contracts
Swap contracts
Total value | | $997,339
—
—
333,712
$1,331,051 | | $30,766
—
4,048,943
—
$4,079,709 | | —
—
—
$10,493,170
$10,493,170 | | $1,607,612
372,707
—
—
$1,980,319 | | $2,635,717
372,707
4,048,943
10,826,882
$17,884,249 | |
1 Statement of assets and liabilities location: Options written, at value, Swap contracts, at value, Payable for variation margin and Unrealized depreciation on forward foreign currency contracts. Cumulative appreciation (depreciation) of futures contracts as reported in the Portfolio of investments. Only current day's variation margin, if any, is reported within the Statement of assets and liabilities.
Transactions in derivative instruments during the year ended July, 31, 2009, were as follows:
| | | | Interest rate
risk | | Foreign exchange
risk | | Credit
risk | | Equity
risk | | Total | |
| UBS PACE Government Securities Fixed Income Investments | |
| | Realized gain (loss)1 | | | | | | | | | | | | | | | | | | | | | |
| | Futures contracts | | $ | 4,997,687 | | | | — | | | | — | | | | — | | | $ | 4,997,687 | | |
| | Written options | | | 89,032 | | | | — | | | | — | | | | — | | | | 89,032 | | |
| | Swap contracts | | | (14,387,967 | ) | | | — | | | $ | 573,314 | | | | — | | | | (13,814,653 | ) | |
| | Total realized gain (loss) | | $ | (9,301,248 | ) | | | — | | | $ | 573,314 | | | | — | | | $ | (8,727,934 | ) | |
| | Change in appreciation
(depreciation)2 | | | | | | | | | | | | | | | | | | | | | |
| | Futures contracts | | $ | (516,000 | ) | | | — | | | | — | | | | — | | | $ | (516,000 | ) | |
| | Written options | | | 23,431 | | | | — | | | | — | | | | — | | | | 23,431 | | |
| | Swap contracts | | | 83,147 | | | | — | | | $ | (1,237,068 | ) | | | — | | | | (1,153,921 | ) | |
| | Total change in appreciation
(depreciation) | | $ | (409,422 | ) | | | — | | | $ | (1,237,068 | ) | | | — | | | $ | (1,646,490 | ) | |
| UBS PACE Intermediate Fixed Income Investments | |
| | Realized gain (loss)1 | | | | | | | | | | | | | | | | | | | | | |
| | Futures contracts | | $ | 7,129,567 | | | | — | | | | — | | | | — | | | $ | 7,129,567 | | |
| | Forward foreign
currency contracts | | | — | | | $ | (741,235 | ) | | | — | | | | — | | | | (741,235 | ) | |
| | Total realized gain (loss) | | $ | 7,129,567 | | | $ | (741,235 | ) | | | — | | | | — | | | $ | 6,388,332 | | |
| | Change in appreciation
(depreciation)2 | | | | | | | | | | | | | | | | | | | | | |
| | Futures contracts | | $ | 168,258 | | | | — | | | | — | | | | — | | | $ | 168,258 | | |
| | Forward foreign
currency contracts | | | — | | | $ | (129,636 | ) | | | — | | | | — | | | | (129,636 | ) | |
| | Total change in appreciation
(depreciation) | | $ | 168,258 | | | $ | (129,636 | ) | | | — | | | | — | | | $ | 38,622 | | |
292
UBS PACE Select Advisors Trust
Notes to financial statements
| | | | Interest rate
risk | | Foreign exchange
risk | | Credit
risk | | Equity
risk | | Total | |
| UBS PACE Strategic Fixed Income Investments | |
| | Realized gain (loss)1 | | | | | | | | | | | | | | | | | | | | | |
| | Futures contracts | | $ | 40,390,360 | | | | — | | | | — | | | | — | | | $ | 40,390,360 | | |
| | Written options | | | (945,536 | ) | | | — | | | | — | | | | — | | | | (945,536 | ) | |
| | Forward foreign
currency contracts | | | — | | | $ | 2,348,353 | | | | — | | | | — | | | | 2,348,353 | | |
| | Swap contracts | | | (15,723,231 | ) | | | — | | | $ | (5,342,684 | ) | | | — | | | | (21,065,915 | ) | |
| | Total realized gain/(loss) | | $ | 23,721,593 | | | $ | 2,348,353 | | | $ | (5,342,684 | ) | | | — | | | $ | 20,727,262 | | |
| | Change in appreciation
(depreciation)2 | | | | | | | | | | | | | | | | | | | | | |
| | Futures contracts | | $ | (3,305,805 | ) | | | — | | | | — | | | | — | | | $ | (3,305,805 | ) | |
| | Written options | | | (383,960 | ) | | | — | | | | — | | | | — | | | | (383,960 | ) | |
| | Forward foreign
currency contracts | | | — | | | | $5,931 | | | | — | | | | — | | | | 5,931 | | |
| | Swap contracts | | | 2,591,422 | | | | — | | | $ | (458,345 | ) | | | | | | | 2,133,077 | | |
| | Total change in appreciation
(depreciation) | | $ | (1,098,343 | ) | | $ | 5,931 | | | $ | (458,345 | ) | | | — | | | $ | (1,550,757 | ) | |
| UBS PACE Global Fixed Income Investments | |
| | Realized gain (loss)1 | | | | | | | | | | | | | | | | | | | | | |
| | Futures contracts | | $ | (1,281,317 | ) | | | — | | | | — | | | | — | | | $ | (1,281,317 | ) | |
| | Forward foreign
currency contracts | | | — | | | $ | (13,279,256 | ) | | | — | | | | — | | | | (13,279,256 | ) | |
| | Total realized loss | | $ | (1,281,317 | ) | | $ | (13,279,256 | ) | | | — | | | | — | | | $ | (14,560,573 | ) | |
| | Change in appreciation
(depreciation)2 | | | | | | | | | | | | | | | | | | | | | |
| | Futures contracts | | $ | 1,255,329 | | | | — | | | | — | | | | — | | | $ | 1,255,329 | | |
| | Forward foreign
currency contracts | | | — | | | $ | 8,026,371 | | | | — | | | | — | | | | 8,026,371 | | |
| | Total change in appreciation
(depreciation) | | $ | 1,255,329 | | | $ | 8,026,371 | | | | — | | | | — | | | $ | 9,281,700 | | |
| UBS PACE High Yield Investments | |
| | Realized gain (loss)1 | | | | | | | | | | | | | | | | | | | | | |
| | Forward foreign
currency contracts | | | — | | | $ | 1,119,238 | | | | — | | | | — | | | $ | 1,119,238 | | |
| | Total realized gain | | | — | | | $ | 1,119,238 | | | | — | | | | — | | | $ | 1,119,238 | | |
| | Change in appreciation
(depreciation)2 | | | | | | | | | | | | | | | | | | | | | |
| | Forward foreign
currency contracts | | | — | | | $ | (335,718 | ) | | | — | | | | — | | | $ | (335,718 | ) | |
| | Total change in appreciation
(depreciation) | | | — | | | $ | (335,718 | ) | | | — | | | | — | | | $ | (335,718 | ) | |
| UBS PACE International Equity Investments | |
| | Realized gain (loss)1 | | | | | | | | | | | | | | | | | | | | | |
| | Futures contracts | | | — | | | | — | | | | — | | | $ | (27,743 | ) | | $ | (27,743 | ) | |
| | Forward foreign
currency contracts | | | — | | | $ | 4,832,906 | | | | — | | | | — | | | | 4,832,906 | | |
| | Total realized gain/(loss) | | | — | | | $ | 4,832,906 | | | | — | | | $ | (27,743 | ) | | $ | 4,805,163 | | |
| | Change in appreciation
(depreciation)2 | | | | | | | | | | | | | | | | | | | | | |
| | Futures contracts | | | — | | | | — | | | | — | | | $ | 162,196 | | | $ | 162,196 | | |
| | Forward foreign
currency contracts | | | — | | | $ | 85,196 | | | | — | | | | — | | | | 85,196 | | |
| | Total change in appreciation
(depreciation) | | | — | | | $ | 85,196 | | | | — | | | $ | 162,196 | | | $ | 247,392 | | |
293
UBS PACE Select Advisors Trust
Notes to financial statements
| | | | Interest rate
risk | | Foreign exchange
risk | | Credit
risk | | Equity
risk | | Total | |
| UBS PACE Alternative Strategies Investments | |
| | Realized gain (loss)1 | | | | | | | | | | | | | | | | | | | | | |
| | Futures contracts | | $ | 1,563,277 | | | | — | | | | — | | | | $(12,752,924) | | | $ | (11,189,647 | ) | |
| | Written options | | | — | | | $ | (148,340 | ) | | | — | | | | 4,951,553 | | | | 4,803,213 | | |
| | Forward foreign
currency contracts | | | — | | | | (13,855,943 | ) | | | — | | | | — | | | | (13,855,943 | ) | |
| | Swap contracts | | | 388,823 | | | | — | | | $ | 2,051,123 | | | | — | | | | 2,439,946 | | |
| | Total realized gain (loss) | | $ | 1,952,100 | | | $ | (14,004,283 | ) | | $ | 2,051,123 | | | $ | (7,801,371 | ) | | $ | (17,802,431 | ) | |
| | Change in appreciation
(depreciation)2 | | | | | | | | | | | | | | | | | | | | | |
| | Futures contracts | | $ | 620,496 | | | $ | 4,923 | | | | — | | | $ | 2,383,618 | | | $ | 3,009,037 | | |
| | Written options | | | — | | | | — | | | | — | | | | (505,288 | ) | | | (505,288 | ) | |
| | Forward foreign
currency contracts | | | — | | | | (1,624,992 | ) | | | — | | | | — | | | | (1,624,992 | ) | |
| | Swap contracts | | | 144,500 | | | | — | | | $ | (3,498,577 | ) | | | — | | | | (3,354,077 | ) | |
| | Total change in appreciation
(depreciation) | | $ | 764,996 | | | $ | (1,620,069 | ) | | $ | (3,498,577 | ) | | $ | 1,878,330 | | | $ | (2,475,320 | ) | |
1 Statement of operations location: Net realized gain (loss) on futures contracts, options written, swap contracts and forward foreign currency contracts.
2 Statement of operations location: Net change in unrealized appreciation (depreciation) on futures contracts, options written, swap contracts and forward foreign currency contracts.
Repurchase agreements—The Portfolios may purchase securities or other obligations from a bank or securities dealer (or its affiliate), subject to the seller's agreement to repurchase them at an agreed upon date (or upon demand) and price. The Portfolios maintain custody of the underlying obligations prior to their repurchase, either through its regular custodian or through a special "tri-party" custodian or sub-custodian that maintains a separate account for both the Portfolios and their counterparty. The underlying collateral is valued daily to ensure that the value, including accrued interest, is at least equal to the repurchase price. In the event of default of the obligation to repurchase, the Portfolios generally have the right to liquidate the collateral and apply the proceeds in satisfaction of the obligation. Repurchase agreements involvi ng obligations other than US government securities (such as commercial paper, corporate bonds and mortgage loans) may be subject to special risks and may not have the benefit of certain protections in the event of counterparty insolvency. If the seller (or seller's guarantor, if any) becomes insolvent, the Portfolios may suffer delays, costs and possible losses in connection with the disposition or retention of the collateral. Under certain circumstances, in the event of default or bankruptcy by the other party to the agreement, realization and/or retention of the collateral may be subject to legal proceedings. Each Portfolio (with the exception of UBS PACE Municipal Fixed Income Investments) may participate in joint repurchase agreement transactions with other funds managed, advised or sub-advised by UBS Global AM.
Restricted securities—The Portfolios may invest in securities that are subject to legal or contractual restrictions on resale. Frequently, these securities generally may be resold in transactions exempt from registration or to the public if the securities are registered. Disposal of these securities may involve time-consuming negotiations and expense, and prompt sale at an acceptable price may be difficult. Information regarding restricted securities, if any, is included at the end of each Portfolio's Portfolio of investments.
Investment transactions, investment income and expenses—Investment transactions are recorded on the trade date. Realized gains and losses from investment transactions and foreign exchange transactions are calculated using the identified cost method. Dividend income is recorded net of withholding taxes on the ex-dividend date ("ex-date") (except in the case of certain dividends from foreign securities which are recorded
294
UBS PACE Select Advisors Trust
Notes to financial statements
as soon after the ex-date as the respective Portfolio, using reasonable diligence, becomes aware of such dividends). Interest income is recorded on an accrual basis. Discounts are accreted and premiums are amortized as adjustments to interest income and the identified cost of investments.
Income, expenses (excluding class-specific expenses) and realized/unrealized gains/losses are allocated proportionately to each class of shares based upon the relative net asset value of outstanding shares (or the value of dividend-eligible shares, as appropriate) of each class at the beginning of the day (after adjusting for current capital share activity of the respective classes). Class-specific expenses are charged directly to the applicable class of shares.
Foreign currency translation—The books and records of the Portfolios are maintained in US dollars. Foreign currency amounts are translated into US dollars as follows: (1) the foreign currency market value of investment securities and other assets and liabilities stated in foreign currencies are translated into US dollars based on the current exchange rates each business day; and (2) purchases, sales, income and expenses are translated at the rate of exchange prevailing on the respective dates of such transactions. The resulting exchange gains and losses are included on the Statement of operations.
The Portfolios do not generally isolate the effects of fluctuations in foreign exchange rates from the effects of fluctuations in the market prices of securities. However, the Portfolios do isolate the effect of fluctuations in foreign exchange rates when determining the realized gain or loss upon the sale or maturity of foreign currency-denominated debt obligations pursuant to US federal income tax regulations; such amount is categorized as realized foreign currency transaction gain or loss for both financial reporting and income tax purposes. Net realized foreign currency transaction gain (loss) is treated as ordinary income (loss) for income tax reporting purposes.
Forward foreign currency contracts—Certain Portfolios may enter into forward foreign currency contracts ("forward contracts") as part of its investment strategy, in connection with planned purchases or sales of securities or to hedge the US dollar value of portfolio securities denominated in a particular currency. The Portfolios may also engage in cross-hedging by using forward contracts in one currency to hedge fluctuations in the value of securities denominated in a different currency if the applicable investment sub-advisor anticipates that there is a correlation between the two currencies. Forward contracts may also be used to shift a Portfolio's exposure to foreign currency fluctuations from one country to another.
The Portfolios have no specific limitation on the percentage of assets which may be committed to such contracts; however, the value of all forward contracts will not exceed the value of a Portfolio's total assets. The Portfolios may enter into forward contracts or maintain a net exposure to forward contracts only if (1) the consummation of the contracts would not obligate the Portfolios to deliver an amount of foreign currency in excess of the value of the positions being hedged by such contracts or (2) the Portfolios maintain cash or liquid securities in a segregated account in an amount determined pursuant to the Portfolios' segregation policies as disclosed in the Trust's Statement of Additional Information.
Risks may arise upon entering into forward contracts from the potential inability of counterparties to meet the terms of their contracts and from unanticipated movements in the value of foreign currencies relative to the US dollar or each other.
Fluctuations in the value of open forward contracts are recorded for book purposes as unrealized gains or losses on forward foreign currency contracts by the Portfolios. Realized gains and losses on forward foreign currency contracts include net gains or losses recognized by the Portfolios on contracts which have matured.
295
UBS PACE Select Advisors Trust
Notes to financial statements
Securities traded on to-be-announced basis—The Portfolios may from time to time purchase securities on a to-be-announced ("TBA") basis. In a TBA transaction, the Portfolio commits to purchasing or selling securities for which all specific information is not yet known at the time of the trade, particularly the face amount and maturity date of the underlying security transactions. Securities purchased on a TBA basis are not settled until they are delivered to the Portfolio, normally 15 to 45 days later. Beginning on the date the Portfolio enters into a TBA transaction, cash, US government securities or other liquid securities are segregated in an amount equal in value to the purchase price of the TBA security. These transactions are subject to market fluctuations, and their current value is determined in the same manner as for other securities.
At July 31, 2009, UBS PACE Government Securities Fixed Income Investments, UBS PACE Intermediate Fixed Income Investments and UBS PACE Strategic Fixed Income Investments held TBA securities with a total cost of $196,635,422, $12,229,141, and $725,789, respectively.
Option writing—Certain Portfolios may write (sell) put and call options on securities or derivative instruments in order to gain exposure to or protect against changes in the markets. When a Portfolio writes a call or a put option, an amount equal to the premium received by the Portfolio is included on the Portfolio's Statement of assets and liabilities as an asset and as an equivalent liability. The amount of the liability is subsequently marked-to-market to reflect the current market value of the option written. If an option which the Portfolio has written either expires on its stipulated expiration date or the Portfolio enters into a closing purchase transaction, the Portfolio realizes a gain (or loss if the cost of a closing purchase transaction exceeds the premium received when the option was written) without regard to any unrealized gain or loss on the underlying security or derivative instrument, and the liability related to such option is extinguished. If a call option which the Portfolio has written is exercised, the Portfolio recognizes a realized gain or loss (long-term or short-term, depending on the holding period of the underlying security) from the sale of the underlying security or derivative instrument and the proceeds from the sale are increased by the premium originally received. If a put option which the Portfolio has written is exercised, the amount of the premium originally received reduces the cost of the security or derivative instrument which the Portfolio purchases upon exercise of the option.
In writing an option, the Portfolios bear the market risk of an unfavorable change in the price of the derivative instrument, security or currency underlying the written option. Exercise of an option written by a Portfolio could result in the Portfolio selling or buying a derivative instrument, security or currency at a price different from current market value.
Purchased options—Certain Portfolios may also purchase put and call options. Purchasing call options tends to increase exposure to the underlying instrument. Purchasing put options tends to decrease exposure to the underlying instrument. The Portfolio pays a premium which is included on the Statement of assets and liabilities as an investment and subsequently marked to market to reflect the current value of the option. Premiums paid for purchasing options which expire are treated as realized losses. The risk associated with purchasing put and call options is limited to the premium paid. Premiums paid for purchasing options which are exercised or closed are added to the amounts paid or offset against the proceeds on the underlying future, security or currency transaction to determine the realized gain or loss.
Futures contracts—Certain Portfolios may use financial futures contracts as part of its investment strategy, for hedging purposes to adjust exposure to US and foreign markets in connection with a reallocation of the Portfolios' assets or to manage the average duration of a Portfolio. In addition, a Portfolio may purchase or sell futures contracts or purchase options thereon to increase or reduce its exposure to an asset class without purchasing or selling the underlying securities, either as a hedge or to enhance return or realize gains. Using financial futures contracts involves various market risks. However, imperfect correlations between futures
296
UBS PACE Select Advisors Trust
Notes to financial statements
contracts and the related securities or markets, or market disruptions, do not normally permit full control of these risks at all times. The maximum amount at risk from the purchase of a futures contract is the contract value or the loss of the benefit of the transaction should the counterparty default.
Upon entering into a financial futures contract, a Portfolio is required to deliver to a broker an amount of cash and/or government securities equal to a certain percentage of the contract amount. This amount is known as the "initial margin". Subsequent payments, known as "variation margin", generally are made or received by the Portfolio each day depending on the fluctuations in the value of the underlying financial futures contracts, except that in the case of certain futures contracts payments may be made or received at settlement. Such variation margin is recorded for financial statement purposes on a daily basis as an unrealized gain or loss on futures until the financial futures contract is closed, at which time the net gain or loss is reclassified to realized gain or loss on futures.
Short sales "Against the Box"—Each Portfolio (other than UBS PACE Money Market Investments and UBS PACE Municipal Fixed Income Investments) may engage in short sales of securities it owns or has the right to acquire at no added cost through conversion or exchange of other securities it owns (short sales "against the box"). To make delivery to the purchaser in a short sale, the executing broker borrows the securities being sold short on behalf of a Portfolio, and that Portfolio is obligated to replace the securities borrowed at a date in the future. When a Portfolio sells short, it establishes a margin account with the broker effecting the short sale and deposits collateral with the broker. In addition, the Portfolio maintains, in a segregated account with its custodian, the securities that could be used to cover the short sale. Each Portfolio may incur transaction costs, including dividend and interest expense, in connection with opening, maintaining and closing short sales "against the box".
A Portfolio might make a short sale "against the box" to hedge against market risks when its investment manager or sub-advisor believes that the price of a security may decline, thereby causing a decline in the value of a security owned by the Portfolio or a security convertible into or exchangeable for a security owned by the Portfolio. In such case, any loss in the Portfolio's long position after the short sale should be reduced by a corresponding gain in the short position. Conversely, any gain in the long position after the short sale should be reduced by a corresponding loss in the short position. The extent to which gains or losses in the long position are reduced will depend upon the amount of the securities sold short relative to the amount of the securities a Portfolio owns, either directly or indirectly, and in the case where the Portfolio owns convertible securities, changes in the investment values or conversion prem iums of such securities.
Short sales—UBS PACE Government Securities Fixed Income Investments (with respect to securities issued by the US Treasury and TBA securities coupon trades), UBS PACE Alternative Strategies Investments and UBS PACE Global Real Estate Securities Investments can enter into short sales whereby they sell a security they generally do not own, in anticipation of a decline in the security's price. The initial amount of a short sale is recorded as a liability which is marked to market daily. Fluctuations in the value of this liability are recorded as unrealized gains or losses on the Statement of operations. The Portfolio will realize a gain or loss upon closing of the short sale (returning the security to the counterparty by way of purchase or delivery of a long position owned). The Portfolio is liable to the buyer for any dividends and interest payable on securities while those securities are in a short position. These dividends and interest are booked as an expense of the Portfolio. UBS PACE Alternative Strategies Investments maintains one or more accounts containing cash and/or liquid assets at such a level that the amount deposited in the account plus that amount deposited with the broker as collateral will, at minimum, equal the current value of the stock sold short. UBS PACE Global Real Estate Securities Investments did not engage in short sales during the year ended July 31, 2009.
Reverse repurchase agreements—Certain Portfolios may enter into reverse repurchase agreements with qualified third party banks, securities dealers or their affiliates. Interest on the value of reverse repurchase
297
UBS PACE Select Advisors Trust
Notes to financial statements
agreements issued and outstanding is based upon competitive market rates at the time of issuance. At the time a Portfolio enters into reverse repurchase agreements, the Portfolio establishes and maintains a segregated account with the Portfolio's custodian containing liquid securities having a value not less than the repurchase price, including accrued interest, of the reverse repurchase agreement. The Portfolios did not enter into any reverse repurchase agreements during the year ended July 31, 2009.
Interest rate swap agreements—Certain Portfolios may enter into interest rate swap agreements. This type of swap is an agreement that obligates two parties to exchange a series of cash flows at specified intervals based upon or calculated by reference to a specified interest rate(s) for a specified amount. The payment flows are usually netted against each other, with the difference being paid by one party to the other. Upfront payments made and/or received by the Portfolio are recorded as an adjustment to cost.
Risks may arise as a result of the failure of the counterparty to the swap contract to comply with the terms of the contract. The loss incurred by the failure of a counterparty is generally limited to the net interest payment to be received by the Portfolio. Therefore, the Portfolio considers the creditworthiness of the counterparty to a swap contract in evaluating potential credit risk.
The Portfolio accrues for interim payments on swap contracts on a daily basis, with the net amount recorded within unrealized appreciation/depreciation of swap contracts on the Statement of assets and liabilities. Once interim payments are settled in cash, the net amount is recorded as realized gain/loss on swaps, in addition to realized gain/loss recorded upon the termination of swap contracts on the Statement of operations. Fluctuations in the value of swap contracts are recorded for financial statement purposes as unrealized appreciation or depreciation of swaps.
Credit default swap agreements—Credit default swap agreements involve commitments to make or receive payments in the event of a default of a security or a credit event. As a buyer, the Portfolio would make periodic payments to the counterparty, and the Portfolio would receive payments only upon the occurrence of a credit event. If no credit event occurs, the Portfolio will lose its periodic stream of payments over the term of the contract. However, if a credit event does occur, the Portfolio typically would receive full notional value for a reference obligation that may have little or no value. As a seller, the Portfolio would receive periodic payments from the counterparty, and the Portfolio would make payments only upon the occurrence of a credit event. If no default or credit event occurs, the Portfolio will gain the periodic stream of payment s it received over the term of the contract and the counterparty will lose its periodic stream of payments over the term of the contract. However, if a default or credit event occurs, the Portfolio typically pays full notional value for a reference obligation that may have little or no value. Credit default swaps may involve greater risks than if the Portfolio had invested in the reference obligation directly and are subject to general market risk, liquidity risk and credit risk.
Credit default swap agreements on credit indices involve one party making a stream of payments to another party in exchange for the right to receive a specified return in the event of a write-down, principal shortfall, interest shortfall or default of all or part of the referenced entities comprising the credit index. A credit index is a list of a basket of credit instruments or exposures designed to be representative of some part of the credit market as a whole. These indices are made up of referenced credits that are judged by a poll of dealers to be the most liquid entities in the credit default swap market based on the sector of the index. Components of the indices may include, but are not limited to, investment grade securities, high yield securities, asset backed securities, emerging markets, and/or various credit ratings within each sector. Credit indices are traded using credit default swaps with standardized terms inclu ding a fixed spread and standard maturity dates. An index credit default swap references all the names in the index, and if there is a default, the credit event is settled based on that name's weight in the index. The composition of the indices changes
298
UBS PACE Select Advisors Trust
Notes to financial statements
periodically, usually every six months, and for most indices, each name has an equal weight in the index. A Portfolio may use credit default swaps on credit indices to hedge a portfolio of credit default swaps or bonds with a credit default swap on indices which is less expensive than it would be to buy many credit default swaps to achieve a similar effect. Credit default swaps on indices are benchmarks for protecting investors owning bonds against default, and traders use them to speculate on changes in credit quality.
Credit default swap agreements on corporate issues or sovereign issues of an emerging country involve one party making a stream of payments to another party in exchange for the right to receive a specified return in the event of a default or other credit event. If a credit event occurs and cash settlement is not elected, a variety of other deliverable obligations may be delivered in lieu of the specific referenced obligation. The ability to deliver other obligations may result in a cheapest-to-deliver option (the buyer of protection's right to choose the deliverable obligation with the lowest value following a credit event). The Portfolio may use credit default swaps on corporate issues or sovereign issues of an emerging country to provide a measure of protection against defaults of the issuers (i.e., to reduce risk where the Portfolio owns or has exposure to the referenced obligation) or to take an active long or short position with respect to the likelihood of a particular issuer's default.
The maximum potential amount of future payments (undiscounted) that a Portfolio as a seller of protection could be required to make under a credit default swap agreement would be an amount equal to the notional amount of the agreement which may exceed the amount of unrealized appreciation or depreciation reflected on the Statement of assets and liabilities. Notional amounts of all credit default swap agreements outstanding as of July 31, 2009 for which a Portfolio is the seller of protection are disclosed under the sections "Credit default swaps on credit indices—sell protection" and "Credit default swaps on corporate issues—sell protection" in the Portfolios of investments. These potential amounts would be partially offset by any recovery values of the respective referenced obligations, upfront payments received upon entering into the agreement, or net amounts received from the settlement of buy protection credit defa ult swap agreements entered into, if any, by a Portfolio for the same referenced entity or entities.
The use of swaps involves investment techniques and risks different from those associated with ordinary portfolio security transactions. If a Portfolio's sub-adviser is incorrect in its forecast of market values, interest rates and other applicable factors, the investment performance of the Portfolios will be less favorable than it would have been if this investment technique was never used. Swaps do not involve the delivery of securities and are subject to counterparty risk. If the other party to a swap defaults and fails to consummate the transaction, a Portfolio's risk of loss will consist of the net amount of interest or other payments that the Portfolio is contractually entitled to receive. Therefore, the Portfolio would consider the creditworthiness of the counterparty to a swap agreement in evaluating potential credit risk.
Total return swaps—Total return swap contracts involve commitments to pay interest in exchange for a market-linked return both based on notional amounts. To the extent the total return of the security or index underlying the transactions exceeds or falls short of the offsetting interest rate obligation, the Portfolio will receive a payment from or make a payment to the counterparty. At July 31, 2009, there were no Portfolios that were invested in total return swap contracts.
Dividends and distributions—Dividends and distributions to shareholders are recorded on the ex-dividend date. The amounts of dividends and distributions are determined in accordance with federal income tax regulations, which may differ from US generally accepted accounting principles. These "book/tax" differences are either considered temporary or permanent in nature. To the extent these differences are permanent in nature, such amounts are reclassified within the capital accounts based on their federal tax-basis treatment; temporary differences do not require reclassification.
299
UBS PACE Select Advisors Trust
Notes to financial statements
Concentration of risk
Investing in securities of foreign issuers and currency transactions may involve certain considerations and risks not typically associated with investments in the United States. These risks include revaluation of currencies, adverse fluctuations in foreign currency values and possible adverse political, social and economic developments, including those particular to a specific industry, country or region, which could cause the securities and their markets to be less liquid and prices more volatile than those of comparable US companies and US government securities. These risks are greater with respect to securities of issuers located in emerging market countries in which UBS PACE Global Fixed Income Investments, UBS PACE High Yield Investments, UBS PACE International Equity Investments, UBS PACE International Emerging Markets Equity Investments, UBS PACE Global Real Estate Securities Investments and UBS PACE Alternative Strategie s Investments are authorized to invest.
Small capitalization ("small cap") companies may be more vulnerable than larger capitalization companies to adverse business or economic developments. Small cap companies may also have limited product lines, markets or financial resources, and may be dependent on a relatively small management group. Securities of such companies may be less liquid and more volatile than securities of larger capitalization companies or the market averages in general and therefore may involve greater risk than investing in larger capitalization companies. In addition, small cap companies may not be well-known to the investing public, may not have institutional ownership and may have only cyclical, static or moderate growth prospects. These risks are greater with respect to the securities in which UBS PACE Small/Medium Co Value Equity Investments and UBS PACE Small/Medium Co Growth Equity Investments tend to invest.
The ability of the issuers of debt securities held by the Portfolios to meet their obligations may be affected by economic and political developments particular to a specific industry, country, state or region.
Investment Management and Administration Fees and Other Transactions with Affiliates
The Trust has entered into an investment management and administration contract ("Management Contract") with UBS Global AM. In accordance with the Management Contract, each Portfolio paid UBS Global AM investment management and administration fees, which were accrued daily and paid monthly, in accordance with the following schedule as of July 31, 2009:
| Portfolio | | Annual rate
as a percentage of
each Portfolio's
average daily net assets | |
| UBS PACE Money Market Investments | | | 0.350 | % | |
|
| UBS PACE Government Securities Fixed Income Investments | | 0.650% up to $250 million
0.600% above $250 million
up to $500 million
0.575% above $500 million
up to $750 million
0.550% above $750 million
up to $1 billion
0.525% above $1 billion | |
|
| UBS PACE Intermediate Fixed Income Investments | | 0.550% up to $250 million
0.500% above $250 million
up to $500 million
0.475% above $500 million
up to $750 million
0.450% above $750 million
up to $1 billion
0.425% above $1 billion | |
|
300
UBS PACE Select Advisors Trust
Notes to financial statements
| Portfolio | | Annual rate
as a percentage of
each Portfolio's
average daily net assets | |
| UBS PACE Strategic Fixed Income Investments | | 0.650% up to $250 million
0.600% above $250 million
up to $500 million
0.575% above $500 million
up to $750 million
0.550% above $750 million
up to $1 billion
0.525% above $1 billion | |
|
| UBS PACE Municipal Fixed Income Investments | | 0.550% up to $250 million
0.500% above $250 million
up to $500 million
0.475% above $500 million
up to $750 million
0.450% above $750 million
up to $1 billion
0.425% above $1 billion | |
|
| UBS PACE Global Fixed Income Investments | | 0.750% up to $500 million
0.725% above $500 million
up to $1 billion
0.700% above $1 billion | |
|
| UBS PACE High Yield Investments | | 0.800% up to $500 million
0.750% above $500 million
up to $1 billion
0.725% above $1 billion
up to $1.5 billion
0.700% above $1.5 billion
up to $2 billion
0.675% above $2 billion | |
|
| UBS PACE Large Co Value Equity Investments | | 0.800% up to $250 million
0.770% above $250 million
up to $500 million
0.730% above $500 million
up to $1 billion
0.700% above $1 billion | |
|
| UBS PACE Large Co Growth Equity Investments | | 0.800% up to $500 million
0.775% above $500 million
up to $1 billion
0.750% above $1 billion
up to $1.5 billion
0.725% above $1.5 billion
up to $2 billion
0.700% above $2 billion | |
|
| UBS PACE Small/Medium Co Value Equity Investments | | 0.800% up to $500 million
0.775% above $500 million | |
|
| UBS PACE Small/Medium Co Growth Equity Investments | | 0.800% up to $500 million
0.775% above $500 million | |
|
301
UBS PACE Select Advisors Trust
Notes to financial statements
| Portfolio | | Annual rate
as a percentage of
each Portfolio's
average daily net assets | |
| UBS PACE International Equity Investments | | 0.900% up to $500 million
0.875% above $500 million
up to $1 billion
0.850% above $1 billion
up to $1.5 billion
0.825% above $1.5 billion
up to $2 billion
0.800% above $2 billion | |
|
| UBS PACE International Emerging Markets Equity Investments | | 1.100% up to $500 million
1.075% above $500 million
up to $1 billion
1.050% above $1 billion
up to $1.5 billion
1.025% above $1.5 billion
up to $2 billion
1.000% above $2 billion | |
|
| UBS PACE Global Real Estate Securities Investments | | 0.800% up to $500 million
0.750% above $500 million
up to $1 billion
0.725% above $1 billion
up to $1.5 billion
0.700% above $1.5 billion
up to $2 billion
0.675% above $2 billion | |
|
| UBS PACE Alternative Strategies Investments | | 1.400% up to $500 million
1.350% above $500 million
up to $1 billion
1.300% above $1 billion
up to $1.5 billion
1.275% above $1.5 billion
up to $2 billion
1.250% above $2 billion | |
|
Under separate Sub-Advisory Agreements, with the exception of UBS PACE Money Market Investments, UBS Global AM (not the Portfolios) pays each investment sub-advisor a fee from the investment management and administration fees which UBS Global AM receives, which is accrued daily and paid monthly, in accordance with the following schedule:
| Portfolio | | Investment sub-advisor | | Annual rate
as a percentage of
each sub-advisor's
portion of the Portfolio's
average daily net assets | |
UBS PACE Government Securities Fixed Income
Investments | | Pacific Investment Management Company LLC
| | 0.200%
| |
|
UBS PACE Intermediate Fixed Income
Investments | | BlackRock Financial Management, Inc. | | 0.200% up to $120 million
0.100% above $120 million | |
|
| UBS PACE Strategic Fixed Income Investments | | Pacific Investment Management Company LLC | | 0.250% | |
|
| UBS PACE Municipal Fixed Income Investments | | Standish Mellon Asset Management Company LLC | | 0.200% up to $60 million
0.150% above $60 million | |
|
302
UBS PACE Select Advisors Trust
Notes to financial statements
| Portfolio | | Investment sub-advisor | | Annual rate
as a percentage of
each sub-advisor's
portion of the Portfolio's
average daily net assets | |
| UBS PACE Global Fixed Income Investments | | Rogge Global Partners plc | | 0.250% up to $150 million
0.180% above $150 million up to $500 million
0.150% above $500 million | |
|
| UBS PACE High Yield Investments | | MacKay Shields LLC | | 0.350% | |
|
| UBS PACE Large Co Value Equity Investments | | Institutional Capital LLC
Pzena Investment Management, LLC1
Westwood Management Corp. | | 0.300%
0.700% up to $25 million
0.500% above $25 million
up to $100 million
0.400% above $100 million
up to $300 million
0.350% above $300 million
0.300% | |
|
| UBS PACE Large Co Growth Equity Investments | | Delaware Management Company
Marsico Capital Management, LLC
SSgA Funds Management, Inc.
Wellington Management Company, LLP | | 0.400%
0.300%
0.150%
0.300% | |
|
| UBS PACE Small/Medium Co Value Equity Investments | | Buckhead Capital Management, LLC2
Metropolitan West Capital Management, LLC
Systematic Financial Mangement, L.P.2 | | 0.400% up to $100 million
0.350% above $100 million
0.400%
0.400% | |
|
| UBS PACE Small/Medium Co Growth Equity Investments | | Copper Rock Capital Partners, LLC
Palisade Capital Management, LLC3
Riverbridge Partners, LLC | | 0.450% up to $100 million
0.400% above $100 million
0.450% up to $100 million
0.400% above $100 million
0.400% | |
|
| UBS PACE International Equity Investments | | J.P. Morgan Investment Management Inc.
Martin Currie Inc.
Mondrian Investment Partners Ltd. | | 0.200%
0.350% up to $150 million
0.300% above $150 million
up to $250 million
0.250% above $250 million
up to $350 million
0.200% above $350 million
0.350% up to $150 million
0.300% above $150 million | |
|
UBS PACE International Emerging Markets
Equity Investments | | Mondrian Investment Partners Ltd.
Gartmore Global Partners | | 0.650% up to $150 million
0.550% above $150 million
up to $250 million
0.500% above $250 million
0.500% | |
|
| UBS PACE Global Real Estate Securities Investments | | Goldman Sachs Asset Management, L.P. | | 0.420% up to $50 million
0.400% above $50 million | |
|
1 If the assets under Pzena's management are less than $10 million, Pzena receives 1.00% of the Portfolio's average daily net assets that it manages with a minimum annual fee of $35,000 and a maximum annual fee of $70,000.
2 Buckhead Capital Management, LLC and Systematic Financial Management, L.P. became sub-advisors effective May 28, 2009. Ariel Investments, LLC and Opus Capital Group, LLC ceased serving as sub-advisors for the Portfolio effective May 29, 2009.
3 Palisade Capital Management, LLC replaced AG Asset Management LLC effective February 2, 2009.
303
UBS PACE Select Advisors Trust
Notes to financial statements
| Portfolio | | Investment sub-advisor | | Annual rate
as a percentage of
each sub-advisor's
portion of the Portfolio's
average daily net assets | |
| UBS PACE Alternative Strategies Investments | | Analytic Investors, LLC
First Quadrant L.P.4
Goldman Sachs Asset Management, L.P.
Wellington Management Company, LLP | | 0.450% up to $200 million
0.400% above $200 million
up to $400 million
0.300% above $400 million
0.750%
0.680% up to $300 million
0.640% above $300 million
up to $500 million
0.600% above $500 million
0.750% up to $200 million
0.725% above $200 million | |
|
4 First Quadrant L.P. became a sub-advisor effective April 8, 2009.
At July 31, 2009, certain Portfolios owe or are (owed by) UBS Global AM for investment management and administration fees, net of fee waivers/expense reimbursements and/or recoupments as follows:
| Portfolio | | Amounts due
to (owed by)
UBS Global AM | |
| UBS PACE Money Market Investments | | $ | (17,719 | ) | |
| UBS PACE Government Securities Fixed Income Investments | | | 231,410 | | |
| UBS PACE Intermediate Fixed Income Investments | | | 144,008 | | |
| UBS PACE Strategic Fixed Income Investments | | | 284,044 | | |
| UBS PACE Municipal Fixed Income Investments | | | 125,291 | | |
| UBS PACE Global Fixed Income Investments | | | 290,906 | | |
| UBS PACE High Yield Investments | | | 71,994 | | |
| UBS PACE Large Co Value Equity Investments | | | 642,372 | | |
| UBS PACE Large Co Growth Equity Investments | | | 555,998 | | |
| UBS PACE Small/Medium Co Value Equity Investments | | | 199,864 | | |
| UBS PACE Small/Medium Co Growth Equity Investments | | | 214,398 | | |
| UBS PACE International Equity Investments | | | 566,033 | | |
| UBS PACE International Emerging Markets Equity Investments | | | 233,792 | | |
| UBS PACE Global Real Estate Securities Investments | | | (9,585 | ) | |
| UBS PACE Alternative Strategies Investments | | | 537,507 | | |
UBS Global AM has entered into a written fee waiver agreement with each of UBS PACE Government Securities Fixed Income Investments, UBS PACE Global Fixed Income Investments and UBS PACE Large Co Growth Equity Investments under which UBS Global AM is contractually obligated to waive its management fees to the extent necessary to reflect the lower subadvisory fees paid by UBS Global AM to each of these Portfolio's sub-advisors: Pacific Investment Management Company LLC, Rogge Global Partners plc and SSgA Funds Management, Inc., respectively. For the year ended July 31, 2009, UBS Global AM was contractually obligated to waive $155,968, $260,659 and $347,214 in investment management and administration fees for UBS PACE Government Securities Fixed Income Investments, UBS PACE Global Fixed Income Investments and UBS PACE Large Co Growth Equity Investments, respectively.
304
UBS PACE Select Advisors Trust
Notes to financial statements
Additionally, with respect to UBS PACE Money Market Investments, UBS Global AM may voluntarily waive fees and/or reimburse expenses from time to time in the event that the Portfolio's yield falls below a certain level. Once started, there is no guarantee that UBS Global AM would continue to voluntarily waive an additional portion of its fees and/or reimburse expenses. For the year ended July 31, 2009, UBS Global AM voluntarily waived and/or reimbursed expenses of $258,101 for UBS PACE Money Market Investments for that purpose.
UBS Global AM is contractually obligated to waive all or a portion of its investment management and administration fees and/or to reimburse the Portfolios for certain operating expenses in order to maintain the total annual ordinary operating expenses of each class for the year ending November 30, 2009 (with certain exclusions such as dividend expense, borrowing costs and interest expense, if any) at a level not to exceed the following:
| Portfolio | | Expense
cap | |
| UBS PACE Money Market Investments | | | 0.60 | % | |
| UBS PACE Government Securities Fixed Income Investments—Class A | | | 1.02 | | |
| UBS PACE Government Securities Fixed Income Investments—Class B | | | 1.77 | | |
| UBS PACE Government Securities Fixed Income Investments—Class C | | | 1.52 | | |
| UBS PACE Government Securities Fixed Income Investments—Class Y | | | 0.77 | | |
| UBS PACE Government Securities Fixed Income Investments—Class P | | | 0.77 | | |
| UBS PACE Intermediate Fixed Income Investments—Class A | | | 0.93 | | |
| UBS PACE Intermediate Fixed Income Investments—Class B | | | 1.68 | | |
| UBS PACE Intermediate Fixed Income Investments—Class C | | | 1.43 | | |
| UBS PACE Intermediate Fixed Income Investments—Class Y | | | 0.68 | | |
| UBS PACE Intermediate Fixed Income Investments—Class P | | | 0.68 | | |
| UBS PACE Strategic Fixed Income Investments—Class A | | | 1.06 | | |
| UBS PACE Strategic Fixed Income Investments—Class B | | | 1.81 | | |
| UBS PACE Strategic Fixed Income Investments—Class C | | | 1.56 | | |
| UBS PACE Strategic Fixed Income Investments—Class Y | | | 0.81 | | |
| UBS PACE Strategic Fixed Income Investments—Class P | | | 0.81 | | |
| UBS PACE Municipal Fixed Income Investments—Class A | | | 0.93 | | |
| UBS PACE Municipal Fixed Income Investments—Class B | | | 1.68 | | |
| UBS PACE Municipal Fixed Income Investments—Class C | | | 1.43 | | |
| UBS PACE Municipal Fixed Income Investments—Class Y | | | 0.68 | | |
| UBS PACE Municipal Fixed Income Investments—Class P | | | 0.68 | | |
| UBS PACE Global Fixed Income Investments—Class A | | | 1.25 | | |
| UBS PACE Global Fixed Income Investments—Class B | | | 2.00 | | |
| UBS PACE Global Fixed Income Investments—Class C | | | 1.75 | | |
| UBS PACE Global Fixed Income Investments—Class Y | | | 1.00 | | |
| UBS PACE Global Fixed Income Investments—Class P | | | 1.00 | | |
| UBS PACE High Yield Investments—Class A | | | 1.35 | | |
| UBS PACE High Yield Investments—Class B1 | | | 2.10 | | |
| UBS PACE High Yield Investments—Class C2 | | | 1.85 | | |
| UBS PACE High Yield Investments—Class Y3 | | | 1.10 | | |
| UBS PACE High Yield Investments—Class P | | | 1.10 | | |
305
UBS PACE Select Advisors Trust
Notes to financial statements
| Portfolio | | Expense
cap | |
| UBS PACE Large Co Value Equity Investments—Class A | | | 1.27 | % | |
| UBS PACE Large Co Value Equity Investments—Class B | | | 2.02 | | |
| UBS PACE Large Co Value Equity Investments—Class C | | | 2.02 | | |
| UBS PACE Large Co Value Equity Investments—Class Y | | | 1.02 | | |
| UBS PACE Large Co Value Equity Investments—Class P | | | 1.02 | | |
| UBS PACE Large Co Growth Equity Investments—Class A | | | 1.30 | | |
| UBS PACE Large Co Growth Equity Investments—Class B | | | 2.05 | | |
| UBS PACE Large Co Growth Equity Investments—Class C | | | 2.05 | | |
| UBS PACE Large Co Growth Equity Investments—Class Y | | | 1.05 | | |
| UBS PACE Large Co Growth Equity Investments—Class P | | | 1.05 | | |
| UBS PACE Small/Medium Co Value Equity Investments—Class A | | | 1.41 | | |
| UBS PACE Small/Medium Co Value Equity Investments—Class B | | | 2.16 | | |
| UBS PACE Small/Medium Co Value Equity Investments—Class C | | | 2.16 | | |
| UBS PACE Small/Medium Co Value Equity Investments—Class Y | | | 1.16 | | |
| UBS PACE Small/Medium Co Value Equity Investments—Class P | | | 1.16 | | |
| UBS PACE Small/Medium Co Growth Equity Investments—Class A | | | 1.38 | | |
| UBS PACE Small/Medium Co Growth Equity Investments—Class B | | | 2.13 | | |
| UBS PACE Small/Medium Co Growth Equity Investments—Class C | | | 2.13 | | |
| UBS PACE Small/Medium Co Growth Equity Investments—Class Y | | | 1.13 | | |
| UBS PACE Small/Medium Co Growth Equity Investments—Class P | | | 1.13 | | |
| UBS PACE International Equity Investments—Class A | | | 1.65 | | |
| UBS PACE International Equity Investments—Class B | | | 2.40 | | |
| UBS PACE International Equity Investments—Class C | | | 2.40 | | |
| UBS PACE International Equity Investments—Class Y | | | 1.40 | | |
| UBS PACE International Equity Investments—Class P | | | 1.40 | | |
| UBS PACE International Emerging Markets Equity Investments—Class A | | | 2.25 | | |
| UBS PACE International Emerging Markets Equity Investments—Class B | | | 3.00 | | |
| UBS PACE International Emerging Markets Equity Investments—Class C | | | 3.00 | | |
| UBS PACE International Emerging Markets Equity Investments—Class Y | | | 2.00 | | |
| UBS PACE International Emerging Markets Equity Investments—Class P | | | 2.00 | | |
| UBS PACE Global Real Estate Securities Investments—Class A | | | 1.45 | | |
| UBS PACE Global Real Estate Securities Investments—Class C | | | 2.20 | | |
| UBS PACE Global Real Estate Securities Investments—Class Y3 | | | 1.20 | | |
| UBS PACE Global Real Estate Securities Investments—Class P | | | 1.20 | | |
| UBS PACE Alternative Strategies Investments—Class A | | | 1.95 | | |
| UBS PACE Alternative Strategies Investments—Class B | | | 2.70 | | |
| UBS PACE Alternative Strategies Investments—Class C | | | 2.70 | | |
| UBS PACE Alternative Strategies Investments—Class Y | | | 1.70 | | |
| UBS PACE Alternative Strategies Investments—Class P | | | 1.70 | | |
1 Share class has not commenced operations.
2 The share class' effective date is January 21, 2009 (commencement of issuance).
3 Share class commenced and redeemed in a prior fiscal year. Share class recommenced operations on December 26, 2008.
Each Portfolio will repay UBS Global AM for any such waived fees/reimbursed expenses during a three-year period following July 31, 2009, to the extent that ordinary operating expenses (with certain exclusions such as dividend expense, borrowing costs and interest expense) are otherwise below the expense caps.
306
UBS PACE Select Advisors Trust
Notes to financial statements
For the year ended July 31, 2009, UBS Global AM had the following voluntary fee waiver/expense reimbursements, and recoupments. The recoupments are included in the investment management and administration fees on the Statement of operations. The fee waivers/expense reimbursements, portions of which are subject to repayment by the Portfolios through December 1, 2012, and recoupments for the year ended July 31, 2009, were as follows:
| Portfolio | | Fee waivers/expense
reimbursements | | Recoupments | |
| UBS PACE Money Market Investments | | $ | 1,729,334 | | | | — | | |
| UBS PACE Government Securities Fixed Income Investments | | | 407,061 | | | | — | | |
| UBS PACE Intermediate Fixed Income Investments | | | 254,379 | | | | — | | |
| UBS PACE Strategic Fixed Income Investments | | | 369,976 | | | | — | | |
| UBS PACE Municipal Fixed Income Investments | | | 158,901 | | | | — | | |
| UBS PACE Global Fixed Income Investments | | | 483,999 | | | $ | 482 | | |
| UBS PACE High Yield Investments | | | 300,796 | | | | — | | |
| UBS PACE Large Co Value Equity Investments | | | 6,824 | | | | — | | |
| UBS PACE Large Co Growth Equity Investments | | | 5,053 | | | | — | | |
| UBS PACE Small/Medium Co Value Equity Investments | | | 465,001 | | | | — | | |
| UBS PACE Small/Medium Co Growth Equity Investments | | | 555,588 | | | | — | | |
| UBS PACE International Equity Investments | | | 191 | | | | — | | |
| UBS PACE International Emerging Markets Equity Investments | | | — | | | | — | | |
| UBS PACE Global Real Estate Securities Investments | | | 465,576 | | | | — | | |
| UBS PACE Alternative Strategies Investments | | | 75,285 | | | | — | | |
At July 31, 2009, the following Portfolios had remaining fee waivers/expense reimbursements subject to repayment to UBS Global AM and respective dates of expiration as follows:
| Portfolio | | Fee waivers/
expense
reimbursements
subject to
repayment | | Expires
July 31,
2010 | | Expires
July 31,
2011 | | Expires
July 31,
2012 | |
| UBS PACE Money Market Investments | | $ | 4,355,534 | | | $ | 1,199,238 | | | $ | 1,426,962 | | | $ | 1,729,334 | | |
| UBS PACE Government Securities Fixed Income Investments—Class A | | | 38,532 | | | | 6,440 | | | | 5,648 | | | | 26,444 | | |
| UBS PACE Government Securities Fixed Income Investments—Class B | | | 772 | | | | 158 | | | | 334 | | | | 280 | | |
| UBS PACE Government Securities Fixed Income Investments—Class C | | | 60,846 | | | | 22,421 | | | | 17,897 | | | | 20,528 | | |
| UBS PACE Government Securities Fixed Income Investments—Class Y | | | 49,870 | | | | — | | | | 6,932 | | | | 42,938 | | |
| UBS PACE Government Securities Fixed Income Investments—Class P | | | 683,399 | | | | 173,439 | | | | 193,089 | | | | 316,871 | | |
| UBS PACE Intermediate Fixed Income Investments—Class A | | | 107,077 | | | | 15,881 | | | | 50,808 | | | | 40,388 | | |
| UBS PACE Intermediate Fixed Income Investments—Class B | | | 1,010 | | | | 201 | | | | 550 | | | | 259 | | |
| UBS PACE Intermediate Fixed Income Investments—Class C | | | 10,096 | | | | 832 | | | | 5,041 | | | | 4,223 | | |
| UBS PACE Intermediate Fixed Income Investments—Class Y | | | 842 | | | | — | | | | 817 | | | | 25 | | |
| UBS PACE Intermediate Fixed Income Investments—Class P | | | 514,051 | | | | — | | | | 304,567 | | | | 209,484 | | |
| UBS PACE Strategic Fixed Income Investments—Class A | | | 20,072 | | | | — | | | | 11,610 | | | | 8,462 | | |
| UBS PACE Strategic Fixed Income Investments—Class B | | | 834 | | | | 19 | | | | 537 | | | | 278 | | |
| UBS PACE Strategic Fixed Income Investments—Class C | | | 2,589 | | | | — | | | | 1,791 | | | | 798 | | |
| UBS PACE Strategic Fixed Income Investments—Class P | | | 851,394 | | | | — | | | | 490,956 | | | | 360,438 | | |
307
UBS PACE Select Advisors Trust
Notes to financial statements
| Portfolio | | Fee waivers/
expense
reimbursements
subject to
repayment | | Expires
July 31,
2010 | | Expires
July 31,
2011 | | Expires
July 31,
2012 | |
| UBS PACE Municipal Fixed Income Investments—Class A | | $ | 90,678 | | | $ | 12,636 | | | $ | 54,146 | | | $ | 23,896 | | |
| UBS PACE Municipal Fixed Income Investments—Class B | | | 605 | | | | 134 | | | | 387 | | | | 84 | | |
| UBS PACE Municipal Fixed Income Investments—Class C | | | 19,742 | | | | 3,609 | | | | 10,476 | | | | 5,657 | | |
| UBS PACE Municipal Fixed Income Investments—Class Y | | | 561 | | | | 99 | | | | 356 | | | | 106 | | |
| UBS PACE Municipal Fixed Income Investments—Class P | | | 430,263 | | | | 86,390 | | | | 214,715 | | | | 129,158 | | |
| UBS PACE Global Fixed Income Investments—Class A | | | 34,214 | | | | — | | | | 19,588 | | | | 14,626 | | |
| UBS PACE Global Fixed Income Investments—Class B | | | 558 | | | | — | | | | 433 | | | | 125 | | |
| UBS PACE Global Fixed Income Investments—Class C | | | 522 | | | | — | | | | 522 | | | | — | | |
| UBS PACE Global Fixed Income Investments—Class P | | | 1,292,840 | | | $ | 337,692 | | | | 485,900 | | | | 469,248 | | |
| UBS PACE High Yield Investments—Class A | | | 10,438 | | | | 3,786 | | | | 2,554 | | | | 4,098 | | |
| UBS PACE High Yield Investments—Class C | | | 311 | | | | — | | | | — | | | | 311 | | |
| UBS PACE High Yield Investments—Class Y | | | 10 | | | | — | | | | — | | | | 10 | | |
| UBS PACE High Yield Investments—Class P | | | 795,341 | | | | 296,414 | | | | 202,550 | | | | 296,377 | | |
| UBS PACE Large Co Value Equity Investments—Class B | | | 1,391 | | | | — | | | | 41 | | | | 1,350 | | |
| UBS PACE Large Co Value Equity Investments—Class C | | | 5,474 | | | | — | | | | — | | | | 5,474 | | |
| UBS PACE Large Co Growth Equity Investments—Class B | | | 2,515 | | | | 1,430 | | | | 598 | | | | 487 | | |
| UBS PACE Large Co Growth Equity Investments—Class C | | | 4,566 | | | | — | | | | — | | | | 4,566 | | |
| UBS PACE Small/Medium Co Value Equity Investments—Class B | | | 623 | | | | — | | | | 133 | | | | 490 | | |
| UBS PACE Small/Medium Co Value Equity Investments—Class P | | | 464,511 | | | | — | | | | — | | | | 464,511 | | |
| UBS PACE Small/Medium Co Growth Equity Investments—Class A | | | 5,290 | | | | — | | | | — | | | | 5,290 | | |
| UBS PACE Small/Medium Co Growth Equity Investments—Class B | | | 1,797 | | | | 848 | | | | 585 | | | | 364 | | |
| UBS PACE Small/Medium Co Growth Equity Investments—Class C | | | 1,976 | | | | — | | | | — | | | | 1,976 | | |
| UBS PACE Small/Medium Co Growth Equity Investments—Class P | | | 737,469 | | | | 111,841 | | | | 77,670 | | | | 547,958 | | |
| UBS PACE International Equity Investments—Class B | | | 191 | | | | — | | | | — | | | | 191 | | |
| UBS PACE Global Real Estate Securities Investments—Class A | | | 55,037 | | | | 19,517 | | | | 15,153 | | | | 20,367 | | |
| UBS PACE Global Real Estate Securities Investments—Class C | | | 4,773 | | | | 2,563 | | | | 1,201 | | | | 1,009 | | |
| UBS PACE Global Real Estate Securities Investments—Class Y | | | 13,370 | | | | 13,331 | | | | — | | | | 39 | | |
| UBS PACE Global Real Estate Securities Investments—Class P | | | 973,153 | | | | 250,408 | | | | 278,584 | | | | 444,161 | | |
| UBS PACE Alternative Strategies Investments—Class A | | | 56,058 | | | | 27,998 | | | | — | | | | 28,060 | | |
| UBS PACE Alternative Strategies Investments—Class B | | | 447 | | | | 64 | | | | 329 | | | | 54 | | |
| UBS PACE Alternative Strategies Investments—Class C | | | 1,515 | | | | 1,110 | | | | — | | | | 405 | | |
| UBS PACE Alternative Strategies Investments—Class Y | | | 7,509 | | | | — | | | | — | | | | 7,509 | | |
| UBS PACE Alternative Strategies Investments—Class P | | | 191,619 | | | | 152,362 | | | | — | | | | 39,257 | | |
UBS PACE Strategic Fixed Income Investments Class Y, UBS PACE Global Fixed Income Investments Class Y, UBS PACE Large Co Value Equity Investments Class A, Class Y and Class P, UBS PACE Large Co Growth Equity Investments Class A, Class Y and Class P, UBS PACE Small/Medium Co Value Equity Investments Class A, Class C and Class Y, UBS PACE Small/Medium Co Growth Equity Investments Class Y, UBS PACE International Equity Investments Class A, Class C, Class Y and Class P and UBS PACE International Emerging Markets Equity Investments Class A, Class B, Class C, Class Y and Class P have no remaining fee waivers/expense reimbursements subject to repayment.
308
UBS PACE Select Advisors Trust
Notes to financial statements
During the year ended July 31, 2009, the Portfolios listed below paid broker commissions to affiliates of the investment manager as follows:
| Affiliated broker | | UBS PACE
Large Co Value
Equity
Investments | | UBS PACE
Large Co Growth
Equity
Investments | | UBS PACE
Small/Medium
Co Value
Equity
Investments | | UBS PACE
International
Emerging Markets
Equity
Investments | | UBS PACE
Alternative
Strategies
Investments | |
| UBS AG | | | — | | | | — | | | | — | | | $ | 38,585 | | | $ | 1,133 | | |
| UBS Securities Asia Ltd. | | | — | | | | — | | | | — | | | | — | | | | 548 | | |
| UBS Securities LLC | | $ | 3,230 | | | $ | 28,633 | | | $ | 410 | | | | 7,594 | | | | 17,604 | | |
Additional information regarding compensation to affiliate of a board member
Professor Meyer Feldberg serves as a senior advisor to Morgan Stanley, resulting in him being an interested trustee of the Portfolios. The Portfolios have been informed that Professor Feldberg's role at Morgan Stanley does not involve matters directly affecting any UBS funds. Portfolio transactions are executed through Morgan Stanley based on that firm's ability to provide best execution of the transactions. For the year ended July 31, 2009, the following Portfolios paid brokerage commissions to Morgan Stanley in the amounts as follows:
| UBS PACE Large Co Value Equity Investments | | $ | 64,101 | | |
| UBS PACE Large Co Growth Equity Investments | | | 82,816 | | |
| UBS PACE Small/Medium Co Value Equity Investments | | | 6,175 | | |
| UBS PACE Small/Medium Co Growth Equity Investments | | | 24,322 | | |
| UBS PACE International Equity Investments | | | 74,079 | | |
| UBS PACE International Emerging Markets Equity Investments | | | 47,741 | | |
| UBS PACE Global Real Estate Securities Investments | | | 8,533 | | |
| UBS PACE Alternative Strategies Investments | | | 367,740 | | |
During the year ended July 31, 2009, the following Portfolios purchased and sold certain securities (e.g., fixed income securities) in principal trades with Morgan Stanley having aggregate values as follows:
| UBS PACE Money Market Investments | | $ | 184,331,956 | | |
| UBS PACE Government Securities Fixed Income Investments | | | 1,350,323,851 | | |
| UBS PACE Intermediate Fixed Income Investments | | | 122,534,795 | | |
| UBS PACE Strategic Fixed Income Investments | | | 79,246,806 | | |
| UBS PACE Municipal Fixed Income Investments | | | 4,451,810 | | |
| UBS PACE Global Fixed Income Investments | | | 26,459,408 | | |
| UBS PACE High Yield Investments | | | 8,358,410 | | |
| UBS PACE Large Co Growth Equity Investments | | | 5,038,793 | | |
| UBS PACE International Emerging Markets Equity Investments | | | 202,950 | | |
| UBS PACE Global Real Estate Securities Investments | | | 374,655 | | |
| UBS PACE Alternative Strategies Investments | | | 200,491,279 | | |
Morgan Stanley received compensation in connection with these trades, which may have been in the form of a "mark-up" or "mark-down" of the price of the securities, a fee from the issuer for maintaining a commercial paper program, or some other form of compensation. Although the precise amount of this compensation is not generally known by the investment manager, it is believed that under normal circumstances it represents a small portion of the total value of the transactions.
309
UBS PACE Select Advisors Trust
Notes to financial statements
Service and distribution plans
UBS Global Asset Management (US) Inc. ("UBS Global AM (US)") is the principal underwriter of each Portfolio's shares. Under separate plans of service and/or distribution pertaining to Class A, Class B and Class C shares, the Portfolios (with the exception of UBS PACE Money Market Investments, which only offers Class P shares, and UBS PACE Global Real Estate Securities Investments, which does not offer Class B shares) pay UBS Global AM (US) monthly service fees at the annual rate of 0.25% of the average daily net assets of Class A, Class B and Class C shares and monthly distribution fees (1) at the annual rate of 0.75% of the average daily net assets of Class B and Class C shares for UBS PACE Large Co Value Equity Investments, UBS PACE Large Co Growth Equity Investments, UBS PACE Small/Medium Co Value Equity Investments, UBS PACE Small/Medium Co Growth Equity Investments, UBS PACE International Equity Investments, UBS PACE Intern ational Emerging Markets Equity Investments, UBS PACE Global Real Estate Securities Investments and UBS PACE Alternative Strategies Investments Portfolios and (2) at the annual rate of 0.75% and 0.50% of the average daily net assets of Class B and Class C shares, respectively, for UBS PACE Government Securities Fixed Income Investments, UBS PACE Intermediate Fixed Income Investments, UBS PACE Strategic Fixed Income Investments, UBS PACE Municipal Fixed Income Investments, UBS PACE Global Fixed Income Investments and UBS PACE High Yield Investments Portfolios.
UBS Global AM (US) also receives the proceeds of the initial sales charges paid upon the purchase of Class A shares and the contingent deferred sales charges paid by shareholders upon certain redemptions of Class A, Class B and Class C shares.
At July 31, 2009, certain Portfolios owed UBS Global AM (US) service and distribution fees, and for the year ended July 31, 2009, certain Portfolios were informed by UBS Global AM (US) that it had earned sales charges as follows:
| Portfolio | | Service and distribution
fees owed | | Sales charges earned
by distributor | |
| UBS PACE Government Securities Fixed Income Investments—Class A | | $ | 19,285 | | | $ | 14,830 | | |
| UBS PACE Government Securities Fixed Income Investments—Class B | | | 146 | | | | 745 | | |
| UBS PACE Government Securities Fixed Income Investments—Class C | | | 15,563 | | | | 371 | | |
| UBS PACE Intermediate Fixed Income Investments—Class A | | | 9,557 | | | | 9,833 | | |
| UBS PACE Intermediate Fixed Income Investments—Class B | | | 153 | | | | 741 | | |
| UBS PACE Intermediate Fixed Income Investments—Class C | | | 3,194 | | | | 175 | | |
| UBS PACE Strategic Fixed Income Investments—Class A | | | 6,972 | | | | 36,287 | | |
| UBS PACE Strategic Fixed Income Investments—Class B | | | 283 | | | | 274 | | |
| UBS PACE Strategic Fixed Income Investments—Class C | | | 5,445 | | | | 843 | | |
| UBS PACE Municipal Fixed Income Investments—Class A | | | 18,824 | | | | 16,922 | | |
| UBS PACE Municipal Fixed Income Investments—Class B | | | 87 | | | | 558 | | |
| UBS PACE Municipal Fixed Income Investments—Class C | | | 9,829 | | | | 280 | | |
| UBS PACE Global Fixed Income Investments—Class A | | | 21,712 | | | | 9,355 | | |
| UBS PACE Global Fixed Income Investments—Class B | | | 167 | | | | 1,065 | | |
| UBS PACE Global Fixed Income Investments—Class C | | | 4,503 | | | | 920 | | |
| UBS PACE High Yield Investments—Class A | | | 1,440 | | | | 11,165 | | |
| UBS PACE High Yield Investments—Class C | | | 1,139 | | | | — | | |
| UBS PACE Large Co Value Equity Investments—Class A | | | 29,412 | | | | 8,498 | | |
| UBS PACE Large Co Value Equity Investments—Class B | | | 327 | | | | 647 | | |
| UBS PACE Large Co Value Equity Investments—Class C | | | 13,253 | | | | 106 | | |
| UBS PACE Large Co Growth Equity Investments—Class A | | | 11,309 | | | | 4,986 | | |
310
UBS PACE Select Advisors Trust
Notes to financial statements
| Portfolio | | Service and distribution
fees owed | | Sales charges earned
by distributor | |
| UBS PACE Large Co Growth Equity Investments—Class B | | $ | 160 | | | $ | 596 | | |
| UBS PACE Large Co Growth Equity Investments—Class C | | | 3,354 | | | | 191 | | |
| UBS PACE Small/Medium Co Value Equity Investments—Class A | | | 4,891 | | | | 1,393 | | |
| UBS PACE Small/Medium Co Value Equity Investments—Class B | | | 76 | | | | 99 | | |
| UBS PACE Small/Medium Co Value Equity Investments—Class C | | | 4,425 | | | | — | | |
| UBS PACE Small/Medium Co Growth Equity Investments—Class A | | | 5,874 | | | | 2,015 | | |
| UBS PACE Small/Medium Co Growth Equity Investments —Class B | | | 54 | | | | 187 | | |
| UBS PACE Small/Medium Co Growth Equity Investments—Class C | | | 2,638 | | | | 6 | | |
| UBS PACE International Equity Investments—Class A | | | 14,137 | | | | 4,180 | | |
| UBS PACE International Equity Investments—Class B | | | 52 | | | | 148 | | |
| UBS PACE International Equity Investments—Class C | | | 3,436 | | | | — | | |
| UBS PACE International Emerging Markets Equity Investments—Class A | | | 3,524 | | | | 9,032 | | |
| UBS PACE International Emerging Markets Equity Investments—Class B | | | 106 | | | | 97 | | |
| UBS PACE International Emerging Markets Equity Investments—Class C | | | 2,683 | | | | 95 | | |
| UBS PACE Global Real Estate Securities Investments—Class A | | | 633 | | | | 410 | | |
| UBS PACE Global Real Estate Securities Investments—Class C | | | 114 | | | | 10 | | |
| UBS PACE Alternative Strategies Investments—Class A | | | 13,829 | | | | 7,269 | | |
| UBS PACE Alternative Strategies Investments—Class B | | | 24 | | | | — | | |
| UBS PACE Alternative Strategies Investments—Class C | | | 5,483 | | | | 3,746 | | |
Redemption fees
The Portfolios, except for UBS PACE Money Market Investments, charge a 1.00% redemption fee if you sell or exchange any class of shares less than 90 days after purchase, subject to certain exemptions as noted in the prospectuses.
For the year ended July 31, 2009, the following Portfolios received redemption fees as follows:
| Portfolio | | Redemption
fees received | |
| UBS PACE Government Securities Fixed Income Investments | | $ | 120,261 | | |
| UBS PACE Intermediate Fixed Income Investments | | | 113,274 | | |
| UBS PACE Strategic Fixed Income Investments | | | 80,018 | | |
| UBS PACE Municipal Fixed Income Investments | | | 48,672 | | |
| UBS PACE Global Fixed Income Investments | | | 42,336 | | |
| UBS PACE High Yield Investments | | | 31,454 | | |
| UBS PACE Large Co Value Equity Investments | | | 140,448 | | |
| UBS PACE Large Co Growth Equity Investments | | | 126,320 | | |
| UBS PACE Small/Medium Co Value Equity Investments | | | 54,836 | | |
| UBS PACE Small/Medium Co Growth Equity Investments | | | 50,018 | | |
| UBS PACE International Equity Investments | | | 123,290 | | |
| UBS PACE International Emerging Markets Equity Investments | | | 40,596 | | |
| UBS PACE Global Real Estate Securities Investments | | | 21,004 | | |
| UBS PACE Alternative Strategies Investments | | | 77,746 | | |
311
UBS PACE Select Advisors Trust
Notes to financial statements
Transfer agency and related services fees
UBS Financial Services Inc. provides certain services pursuant to a delegation of authority from PNC Global Investment Servicing (U.S.) Inc. ("PNC"), the Portfolios' transfer agent, and was compensated for these services by PNC, not the Portfolios.
For the year ended July 31, 2009, UBS Financial Services Inc. received from PNC, not the Portfolios, total delegated services fees as follows:
| Portfolio | | Delegated
services
fees earned | |
| UBS PACE Money Market Investments | | $ | 1,367,378 | | |
| UBS PACE Government Securities Fixed Income Investments | | | 455,472 | | |
| UBS PACE Intermediate Fixed Income Investments | | | 221,632 | | |
| UBS PACE Strategic Fixed Income Investments | | | 601,296 | | |
| UBS PACE Municipal Fixed Income Investments | | | 112,200 | | |
| UBS PACE Global Fixed Income Investments | | | 642,126 | | |
| UBS PACE High Yield Investments | | | 203,470 | | |
| UBS PACE Large Co Value Equity Investments | | | 802,142 | | |
| UBS PACE Large Co Growth Equity Investments | | | 734,922 | | |
| UBS PACE Small/Medium Co Value Equity Investments | | | 690,011 | | |
| UBS PACE Small/Medium Co Growth Equity Investments | | | 691,423 | | |
| UBS PACE International Equity Investments | | | 712,253 | | |
| UBS PACE International Emerging Markets Equity Investments | | | 610,297 | | |
| UBS PACE Global Real Estate Securities Investments | | | 206,428 | | |
| UBS PACE Alternative Strategies Investments | | | 310,943 | | |
For the year ended July 31, 2009, each Portfolio accrued transfer agency and related services fees payable to PNC on each class as follows:
| Portfolio | | Transfer agency
and related
services fees | |
| UBS PACE Money Market Investments | | $ | 2,735,628 | | |
| UBS PACE Government Securities Fixed Income Investments—Class A | | | 94,307 | | |
| UBS PACE Government Securities Fixed Income Investments—Class B | | | 623 | | |
| UBS PACE Government Securities Fixed Income Investments—Class C | | | 38,597 | | |
| UBS PACE Government Securities Fixed Income Investments—Class Y | | | 68,137 | | |
| UBS PACE Government Securities Fixed Income Investments—Class P | | | 675,918 | | |
| UBS PACE Intermediate Fixed Income Investments—Class A | | | 54,995 | | |
| UBS PACE Intermediate Fixed Income Investments—Class B | | | 320 | | |
| UBS PACE Intermediate Fixed Income Investments—Class C | | | 5,586 | | |
| UBS PACE Intermediate Fixed Income Investments—Class Y | | | 596 | | |
| UBS PACE Intermediate Fixed Income Investments—Class P | | | 329,426 | | |
| UBS PACE Strategic Fixed Income Investments—Class A | | | 35,810 | | |
| UBS PACE Strategic Fixed Income Investments—Class B | | | 494 | | |
| UBS PACE Strategic Fixed Income Investments—Class C | | | 6,959 | | |
| UBS PACE Strategic Fixed Income Investments—Class Y | | | 217 | | |
| UBS PACE Strategic Fixed Income Investments—Class P | | | 999,523 | | |
312
UBS PACE Select Advisors Trust
Notes to financial statements
| Portfolio | | Transfer agency
and related
services fees | |
| UBS PACE Municipal Fixed Income Investments—Class A | | $ | 36,163 | | |
| UBS PACE Municipal Fixed Income Investments—Class B | | | 109 | | |
| UBS PACE Municipal Fixed Income Investments—Class C | | | 7,654 | | |
| UBS PACE Municipal Fixed Income Investments—Class Y | | | 124 | | |
| UBS PACE Municipal Fixed Income Investments—Class P | | | 161,619 | | |
| UBS PACE Global Fixed Income Investments—Class A | | | 140,966 | | |
| UBS PACE Global Fixed Income Investments—Class B | | | 471 | | |
| UBS PACE Global Fixed Income Investments—Class C | | | 7,874 | | |
| UBS PACE Global Fixed Income Investments—Class Y | | | 1,008 | | |
| UBS PACE Global Fixed Income Investments—Class P | | | 976,066 | | |
| UBS PACE High Yield Investments—Class A | | | 5,183 | | |
| UBS PACE High Yield Investments—Class C | | | 414 | | |
| UBS PACE High Yield Investments—Class Y | | | 11 | | |
| UBS PACE High Yield Investments—Class P | | | 342,869 | | |
| UBS PACE Large Co Value Equity Investments—Class A | | | 213,585 | | |
| UBS PACE Large Co Value Equity Investments—Class B | | | 2,183 | | |
| UBS PACE Large Co Value Equity Investments—Class C | | | 34,069 | | |
| UBS PACE Large Co Value Equity Investments—Class Y | | | 2,101 | | |
| UBS PACE Large Co Value Equity Investments—Class P | | | 1,150,389 | | |
| UBS PACE Large Co Growth Equity Investments—Class A | | | 96,106 | | |
| UBS PACE Large Co Growth Equity Investments—Class B | | | 944 | | |
| UBS PACE Large Co Growth Equity Investments—Class C | | | 13,487 | | |
| UBS PACE Large Co Growth Equity Investments—Class Y | | | 685 | | |
| UBS PACE Large Co Growth Equity Investments—Class P | | | 1,146,839 | | |
| UBS PACE Small/Medium Co Value Equity Investments—Class A | | | 47,762 | | |
| UBS PACE Small/Medium Co Value Equity Investments—Class B | | | 858 | | |
| UBS PACE Small/Medium Co Value Equity Investments—Class C | | | 11,639 | | |
| UBS PACE Small/Medium Co Value Equity Investments—Class Y | | | 967 | | |
| UBS PACE Small/Medium Co Value Equity Investments—Class P | | | 1,109,296 | | |
| UBS PACE Small/Medium Co Growth Equity Investments—Class A | | | 56,705 | | |
| UBS PACE Small/Medium Co Growth Equity Investments—Class B | | | 503 | | |
| UBS PACE Small/Medium Co Growth Equity Investments—Class C | | | 8,057 | | |
| UBS PACE Small/Medium Co Growth Equity Investments—Class Y | | | 444 | | |
| UBS PACE Small/Medium Co Growth Equity Investments—Class P | | | 1,108,245 | | |
| UBS PACE International Equity Investments—Class A | | | 112,276 | | |
| UBS PACE International Equity Investments—Class B | | | 490 | | |
| UBS PACE International Equity Investments—Class C | | | 11,323 | | |
| UBS PACE International Equity Investments—Class Y | | | 2,349 | | |
| UBS PACE International Equity Investments—Class P | | | 1,100,624 | | |
| UBS PACE International Emerging Markets Equity Investments—Class A | | | 37,134 | | |
| UBS PACE International Emerging Markets Equity Investments—Class B | | | 406 | | |
| UBS PACE International Emerging Markets Equity Investments—Class C | | | 7,004 | | |
| UBS PACE International Emerging Markets Equity Investments—Class Y | | | 2,905 | | |
| UBS PACE International Emerging Markets Equity Investments—Class P | | | 987,970 | | |
| UBS PACE Global Real Estate Securities Investments—Class A | | | 13,265 | | |
| UBS PACE Global Real Estate Securities Investments—Class C | | | 700 | | |
313
UBS PACE Select Advisors Trust
Notes to financial statements
| Portfolio | | Transfer agency
and related
services fees | |
| UBS PACE Global Real Estate Securities Investments—Class Y | | $ | 17 | | |
| UBS PACE Global Real Estate Securities Investments—Class P | | | 336,541 | | |
| UBS PACE Alternative Strategies Investments—Class A | | | 120,973 | | |
| UBS PACE Alternative Strategies Investments—Class B | | | 85 | | |
| UBS PACE Alternative Strategies Investments—Class C | | | 5,957 | | |
| UBS PACE Alternative Strategies Investments—Class Y | | | 41,463 | | |
| UBS PACE Alternative Strategies Investments—Class P | | | 408,008 | | |
Securities lending
Each Portfolio may lend securities up to 331/3% of its total assets to qualified broker-dealers or institutional investors. The loans are secured at all times by cash, US government securities or irrevocable letters of credit in an amount at least equal to the market value of the securities loaned, plus accrued interest and dividends, determined on a daily basis and adjusted accordingly. The Portfolio will regain ownership of loaned securities to exercise certain beneficial rights; however, each Portfolio may bear the risk of delay in recovery of, or even loss of rights in, the securities loaned should the borrower fail fina ncially. Each Portfolio receives compensation for lending its securities from interest or dividends earned on the cash, US government securities or irrevocable letters of credit held as collateral, net of fee rebates paid to the borrower plus reasonable administrative and custody fees. Until November 12, 2008, UBS Financial Services Inc., an indirect wholly owned subsidiary of UBS AG, and other affiliated broker-dealers had been approved as borrowers under the Portfolios' securities lending program. As of November 12, 2008, State Street Bank and Trust Company is the Portfolios' lending agent. Prior to November 12, 2008, UBS Securities LLC was the Portfolios' lending agent.
For the period August 1, 2008 through November 12, 2008, UBS Securities LLC earned compensation from certain Portfolios as the Portfolios' lending agent as follows:
| Portfolio | | Compensation | |
| UBS PACE Intermediate Fixed Income Investments | | $ | 1,051 | | |
| UBS PACE Strategic Fixed Income Investments | | | 1,120 | | |
| UBS PACE Global Fixed Income Investments | | | 257 | | |
| UBS PACE High Yield Investments | | | 306 | | |
| UBS PACE Large Co Value Equity Investments | | | 24,812 | | |
| UBS PACE Large Co Growth Equity Investments | | | 7,346 | | |
| UBS PACE Small/Medium Co Value Equity Investments | | | 23,607 | | |
| UBS PACE Small/Medium Co Growth Equity Investments | | | 46,602 | | |
| UBS PACE International Equity Investments | | | 7,408 | | |
| UBS PACE International Emerging Markets Equity Investments | | | 4,555 | | |
| UBS PACE Global Real Estate Securities Investments | | | 297 | | |
Bank line of credit
Each Portfolio, other than UBS PACE Money Market Investments and UBS PACE Large Co Growth Equity Investments, participates with other funds managed, advised or sub-advised by UBS Global AM in a $100 million committed credit facility with State Street Bank and Trust Company ("Committed Credit Facility"), to be utilized for temporary financing until the settlement of sales or purchases of portfolio securities, the repurchase or redemption of shares of each Portfolio at the request of shareholders and other temporary or emergency purposes. Under the Committed Credit Facility arrangement, each Portfolio has agreed to pay commitment fees, pro rata, based on the relative asset size of the funds in the Committed Credit Facility.
314
UBS PACE Select Advisors Trust
Notes to financial statements
Interest is charged to each Portfolio at the overnight federal funds rate in effect at the time of borrowings, plus 0.50%. For the year ended July 31, 2009, the following Portfolios had borrowings as follows:
| Portfolio | | Average daily
amount of
borrowing
outstanding | | Days
outstanding | | Weighted average
annualized
interest rate | | Interest
expense | |
| UBS PACE Government Securities Fixed Income Investments | | $ | 2,455,591 | | | | 15 | | | | 1.666 | % | | $ | 1,705 | | |
| UBS PACE Global Fixed Income Investments | | | 2,188,120 | | | | 13 | | | | 3.245 | | | | 2,564 | | |
| UBS PACE High Yield Investments | | | 1,919,993 | | | | 2 | | | | 4.003 | | | | 427 | | |
| UBS PACE Small/Medium Co Value Equity Investments | | | 1,091,235 | | | | 55 | | | | 0.851 | | | | 1,419 | | |
| UBS PACE Small/Medium Co Growth Equity Investments | | | 2,328,259 | | | | 67 | | | | 0.973 | | | | 4,217 | | |
| UBS PACE International Equity Investments | | | 3,120,252 | | | | 154 | | | | 1.353 | | | | 18,060 | | |
| UBS PACE International Emerging Markets Equity Investments | | | 1,832,699 | | | | 94 | | | | 1.681 | | | | 8,042 | | |
| UBS PACE Alternative Strategies Investments | | | 3,006,814 | | | | 47 | | | | 0.656 | | | | 2,577 | | |
UBS PACE Large Co Growth Equity Investments participates with other funds advised by UBS Global AM, in a $75 million committed credit facility with JP Morgan Chase Bank ("JPMorgan Chase Bank Facility"), to be utilized for temporary financing until the settlement of sales or purchases of portfolio securities, the repurchase or redemption of shares of the Portfolio at the request of shareholders and other temporary or emergency purposes. Under the JPMorgan Chase Bank Facility arrangement, the Portfolio has agreed to pay commitment fees, pro rata, based on the relative asset size of the funds in the JPMorgan Chase Bank Facility. Interest is charged to the Portfolio at the overnight federal funds rate in effect at the time of borrowings, plus 0.50%. For the year ended July 31, 2009, the Portfolio had an average daily amount of borrowing of $3,532,529 for 13 days at a weighted average annualized interest rate of 0.797%, resulting in $1,017 of interest expense.
Purchases and sales of securities
For the year ended July 31, 2009, aggregate purchases and sales of portfolio securities, excluding short-term securities and US Government and agency securities, were as follows:
| Portfolio | | Purchases | | Sales | |
| UBS PACE Government Securities Fixed Income Investments | | $ | 77,569,915 | | | $ | 31,461,267 | | |
| UBS PACE Intermediate Fixed Income Investments | | | 94,260,830 | | | | 174,020,807 | | |
| UBS PACE Strategic Fixed Income Investments | | | 376,395,754 | | | | 459,641,793 | | |
| UBS PACE Municipal Fixed Income Investments | | | 70,354,718 | | | | 124,851,002 | | |
| UBS PACE Global Fixed Income Investments | | | 147,581,643 | | | | 313,624,944 | | |
| UBS PACE High Yield Investments | | | 79,455,176 | | | | 60,931,252 | | |
| UBS PACE Large Co Value Equity Investments | | | 872,486,395 | | | | 995,604,374 | | |
| UBS PACE Large Co Growth Equity Investments | | | 902,401,443 | | | | 1,040,804,369 | | |
| UBS PACE Small/Medium Co Value Equity Investments | | | 370,698,153 | | | | 430,154,811 | | |
| UBS PACE Small/Medium Co Growth Equity Investments | | | 522,709,531 | | | | 563,930,563 | | |
| UBS PACE International Equity Investments | | | 467,552,280 | | | | 570,133,371 | | |
| UBS PACE International Emerging Markets Equity Investments | | | 183,329,629 | | | | 221,878,015 | | |
| UBS PACE Global Real Estate Securities Investments | | | 70,338,438 | | | | 62,392,959 | | |
| UBS PACE Alternative Strategies Investments | | | 881,676,404 | | | | 893,108,672 | | |
315
UBS PACE Select Advisors Trust
Notes to financial statements
For the year ended July 31, 2009, aggregate purchases and sales of US Government and agency securities, excluding short-term securities, were as follows:
| Portfolio | | Purchases | | Sales | |
| UBS PACE Government Securities Fixed Income Investments | | $ | 8,783,810,715 | | | $ | 9,034,432,597 | | |
| UBS PACE Intermediate Fixed Income Investments | | | 2,267,924,326 | | | | 2,249,084,680 | | |
| UBS PACE Strategic Fixed Income Investments | | | 856,599,213 | | | | 1,003,317,253 | | |
| UBS PACE Municipal Fixed Income Investments | | | 4,227,584 | | | | 4,289,657 | | |
| UBS PACE Global Fixed Income Investments | | | 34,063,596 | | | | 37,636,341 | | |
| UBS PACE Large Co Value Equity Investments | | | 0 | | | | 1,103,547 | | |
| UBS PACE Alternative Strategies Investments | | | 1,142,038,726 | | | | 1,126,504,575 | | |
Commission recapture program
The Board has approved a brokerage commission recapture program for the following Portfolios: UBS PACE Large Co Value Equity Investments, UBS PACE Large Co Growth Equity Investments, UBS PACE Small/Medium Co Value Equity Investments, UBS PACE Small/Medium Co Growth Equity Investments, UBS PACE International Equity Investments, UBS PACE International Emerging Markets Equity Investments, UBS PACE Global Real Estate Securities Investments and UBS PACE Alternative Strategies Investments. These Portfolios have established commission recapture arrangements with certain participating brokers or dealers. If a Portfolio's investment sub-advisor chooses to execute a transaction through a participating broker, the broker will rebate a portion of the commission back to the Portfolio. Any collateral benefit received through participation in the commission recapture program is directed exclusively to the Portfolio. The recaptured commissions are reflected on the Statement of operations within the net realized gains (losses) from investment activities.
Federal tax status
Each of the Portfolios intends to distribute substantially all of its income and to comply with the other requirements of the Internal Revenue Code applicable to regulated investment companies. Accordingly, no provision for federal income taxes is required. In addition, by distributing during each calendar year substantially all of its net investment income, net realized capital gains and certain other amounts, if any, each Portfolio intends not to be subject to a federal excise tax.
The tax character of distributions paid during the fiscal years ended July 31, 2009 and July 31, 2008 were as follows:
| | | 2009 | | 2008 | |
| Portfolio | | Tax-
exempt
income | | Ordinary
income | | Long term
realized
capital gains | | Tax-
exempt
income | | Ordinary
income | | Long term
realized
capital gains | | Return of
capital | |
UBS PACE Money Market
Investments | | | — | | | $ | 5,188,699 | | | | — | | | | — | | | $ | 16,388,771 | | | | — | | | | — | | |
UBS PACE Government Securities
Fixed Income Investments | | | — | | | | 31,473,152 | | | | — | | | | — | | | | 29,923,805 | | | | — | | | | — | | |
UBS PACE Intermediate Fixed
Income Investments | | | — | | | | 17,340,284 | | | | — | | | | — | | | | 20,056,218 | | | | — | | | | — | | |
UBS PACE Strategic Fixed
Income Investments | | | — | | | | 72,003,648 | | | $ | 14,127,728 | | | | — | | | | 37,749,667 | | | | — | | | | — | | |
UBS PACE Municipal Fixed
Income Investments | | $ | 10,716,766 | | | | 29,103 | | | | — | | | $ | 11,582,137 | | | | 22,275 | | | | — | | | | — | | |
316
UBS PACE Select Advisors Trust
Notes to financial statements
| | | 2009 | | 2008 | |
| Portfolio | | Tax-
exempt
income | | Ordinary
income | | Long term
realized
capital gains | | Tax-
exempt
income | | Ordinary
income | | Long term
realized
capital gains | | Return of
capital | |
UBS PACE Global Fixed Income
Investments | | | — | | | $ | 21,847,836 | | | | — | | | | — | | | $ | 50,812,241 | | | | — | | | | — | | |
| UBS PACE High Yield Investments | | | — | | | | 12,761,815 | | | | — | | | | — | | | | 7,872,436 | | | $ | 341 | | | $ | 300,148 | | |
UBS PACE Large Co Value Equity
Investments | | | — | | | | 24,067,706 | | | | — | | | | — | | | | 87,332,323 | | | | 120,014,302 | | | | — | | |
UBS PACE Large Co Growth
Equity Investments | | | — | | | | 1,291,989 | | | $ | 4,940,277 | | | | — | | | | 2,537,528 | | | | 36,931,851 | | | | — | | |
UBS PACE Small/Medium Co
Value Equity Investments | | | — | | | | 3,121,118 | | | | 89,716 | | | | — | | | | 17,793,767 | | | | 43,454,945 | | | | — | | |
UBS PACE Small/Medium Co
Growth Equity Investments | | | — | | | | — | | | | — | | | | — | | | | 27,551,313 | | | | 58,083,286 | | | | — | | |
UBS PACE International Equity
Investments | | | — | | | | 37,591,109 | | | | — | | | | — | | | | 64,931,494 | | | | 106,628,024 | | | | — | | |
UBS PACE International Emerging
Markets Equity Investments | | | — | | | | 5,178,821 | | | | 57,546,514 | | | | — | | | | 26,061,029 | | | | 47,185,401 | | | | — | | |
UBS PACE Global Real Estate
Securities Investments | | | — | | | | 854,192 | | | | — | | | | — | | | | 2,154,323 | | | | 70,222 | | | | — | | |
UBS PACE Alternative Strategies
Investments | | | — | | | | 2,920,045 | | | | 4,443,762 | | | | — | | | | 13,249,755 | | | | — | | | | — | | |
At July 31, 2009, the components of accumulated earnings (deficit) on a tax basis were as follows:
| Portfolio | | Undistributed
ordinary
income | | Undistributed
long-term
capital gains | | Accumulated
realized
capital and
other losses | | Unrealized
appreciation
(depreciation) | | Total | |
| UBS PACE Money Market Investments | | $ | 13,063 | | | | — | | | | — | | | | — | | | $ | 13,063 | | |
UBS PACE Government Securities Fixed
Income Investments | | | 13,140,670 | | | $ | 5,632,533 | | | | — | | | $ | (8,058,697 | ) | | | 10,714,506 | | |
| UBS PACE Intermediate Fixed Income Investments | | | 1,678,898 | | | | — | | | $ | (22,507,033 | ) | | | (3,325,340 | ) | | | (24,153,475 | ) | |
| UBS PACE Strategic Fixed Income Investments | | | 4,609,753 | | | | 4,043,926 | | | | (16,533,964 | ) | | | (28,798,453 | ) | | | (36,678,739 | ) | |
| UBS PACE Municipal Fixed Income Investments | | | — | | | | — | | | | (3,179,729 | ) | | | 4,186,744 | | | | 1,007,015 | | |
| UBS PACE Global Fixed Income Investments | | | — | | | | — | | | | (23,704,111 | ) | | | 26,904,400 | | | | 3,200,289 | | |
| UBS PACE High Yield Investments | | | — | | | | — | | | | (9,844,390 | ) | | | (2,917,173 | ) | | | (12,761,563 | ) | |
| UBS PACE Large Co Value Equity Investments | | | 7,394,177 | | | | — | | | | (388,578,617 | ) | | | (81,390,155 | ) | | | (462,574,595 | ) | |
| UBS PACE Large Co Growth Equity Investments | | | 4,314,260 | | | | — | | | | (279,131,830 | ) | | | (6,290,559 | ) | | | (281,108,129 | ) | |
UBS PACE Small/Medium Co Value
Equity Investments | | | 658,051 | | | | — | | | | (145,411,777 | ) | | | 7,285,257 | | | | (137,468,469 | ) | |
UBS PACE Small/Medium Co Growth
Equity Investments | | | — | | | | — | | | | (143,367,928 | ) | | | 16,320,870 | | | | (127,047,058 | ) | |
| UBS PACE International Equity Investments | | | 13,786,350 | | | | — | | | | (291,589,787 | ) | | | (33,964,958 | ) | | | (311,768,395 | ) | |
UBS PACE International Emerging Markets
Equity Investments | | | 3,858,081 | | | | — | | | | (51,412,455 | ) | | | (9,812,176 | ) | | | (57,366,550 | ) | |
| UBS PACE Global Real Estate Securities Investments | | | 3,518,470 | | | | — | | | | (42,637,468 | ) | | | (7,524,782 | ) | | | (46,643,780 | ) | |
| UBS PACE Alternative Strategies Investments | | | — | | | | — | | | | (133,462,421 | ) | | | (4,369,805 | ) | | | (137,832,226 | ) | |
317
UBS PACE Select Advisors Trust
Notes to financial statements
At July 31, 2009, the following Portfolios had net capital loss carryforwards available as reductions, to the extent provided in the regulations, of future net realized gains. These losses expire as follows:
| | | Expiration Dates | | | |
| Portfolio | | July 31,
2011 | | July 31,
2012 | | July 31,
2013 | | July 31,
2014 | | July 31,
2015 | | July 31,
2016 | | July 31,
2017 | | Total | |
UBS PACE Intermediate
Fixed Income Investments | | $ | 1,504,703 | | | $ | 7,849,781 | | | $ | — | | | $ | 3,023,333 | | | $ | 1,958,404 | | | $ | — | | | $ | — | | | $ | 14,336,221 | | |
UBS PACE Municipal
Fixed Income Investments | | | — | | | | — | | | | — | | | | — | | | | 875,309 | | | | 1,051,765 | | | | — | | | | 1,927,074 | | |
UBS PACE Global Fixed
Income Investments | | | — | | | | — | | | | — | | | | — | | | | 6,340,375 | | | | 2,354,563 | | | | 765,140 | | | | 9,460,078 | | |
UBS PACE High Yield
Investments | | | — | | | | — | | | | — | | | | — | | | | — | | | | 187,540 | | | | 4,621,857 | | | | 4,809,397 | | |
UBS PACE Large Co Value
Equity Investments | | | — | | | | — | | | | — | | | | — | | | | — | | | | — | | | | 138,871,199 | | | | 138,871,199 | | |
UBS PACE Large Co Growth
Equity Investments | | | — | | | | — | | | | — | | | | — | | | | — | | | | — | | | | 58,515,117 | | | | 58,515,117 | | |
UBS PACE Small/Medium Co
Value Equity Investments | | | — | | | | — | | | | — | | | | — | | | | — | | | | — | | | | 36,465,774 | | | | 36,465,774 | | |
UBS PACE Small/Medium Co
Growth Equity Investments | | | — | | | | — | | | | — | | | | — | | | | — | | | | — | | | | 66,552,548 | | | | 66,552,548 | | |
UBS PACE International
Equity Investments | | | — | | | | — | | | | — | | | | — | | | | — | | | | — | | | | 75,160,153 | | | | 75,160,153 | | |
UBS PACE International
Emerging Markets
Equity Investments | | | — | | | | — | | | | — | | | | — | | | | — | | | | — | | | | 14,417,167 | | | | 14,417,167 | | |
UBS PACE Global Real Estate
Securities Investments | | | — | | | | — | | | | — | | | | — | | | | — | | | | 20,265 | | | | 16,496,463 | | | | 16,516,728 | | |
UBS PACE Alternative
Strategies Investments | | | — | | | | — | | | | — | | | | — | | | | — | | | | — | | | | 38,285,609 | | | | 38,285,609 | | |
During the fiscal year, the following Portfolios utilized capital loss carryforwards to offset current year realized gains:
| Portfolio | | Capital loss
carryforwards
utilized | |
| UBS PACE Government Securities Fixed Income Investments | | $ | 1,054,103 | | |
| UBS PACE Intermediate Fixed Income Investments | | | 676,539 | | |
| UBS PACE Municipal Fixed Income Investments | | | 126,300 | | |
318
UBS PACE Select Advisors Trust
Notes to financial statements
In accordance with US Treasury regulations, the following Portfolios have elected to defer realized capital losses, foreign currency losses and passive foreign investment company losses ("PFIC") arising after October 31, 2008. Such losses are treated for tax purposes as arising on August 1, 2009:
| Portfolio | | Capital
losses | | Foreign
currency
losses | |
| UBS PACE Intermediate Fixed Income Investments | | $ | 8,094,666 | | | | — | | |
| UBS PACE Strategic Fixed Income Investments | | | 16,533,964 | | | | — | | |
| UBS PACE Municipal Fixed Income Investments | | | 1,252,655 | | | | — | | |
| UBS PACE Global Fixed Income Investments | | | 12,170,919 | | | $ | 1,083,293 | | |
| UBS PACE High Yield Investments | | | 3,672,564 | | | | 1,362,429 | | |
| UBS PACE Large Co Value Equity Investments | | | 249,707,418 | | | | — | | |
| UBS PACE Large Co Growth Equity Investments | | | 220,616,713 | | | | — | | |
| UBS PACE Small/Medium Co Value Equity Investments | | | 108,946,003 | | | | — | | |
| UBS PACE Small/Medium Co Growth Equity Investments | | | 76,815,380 | | | | — | | |
| UBS PACE International Equity Investments | | | 216,429,634 | | | | — | | |
| UBS PACE International Emerging Markets Equity Investments | | | 36,995,288 | | | | — | | |
| UBS PACE Global Real Estate Securities Investments | | | 26,120,740 | | | | — | | |
| UBS PACE Alternative Strategies Investments | | | 95,176,812 | | | | — | | |
At July 31, 2009, the effect of permanent "book/tax" reclassifications resulted in increases and decreases to components of the Portfolios' net assets as follows:
| Portfolio | | Accumulated
net investment
income/(loss) | | Accumulated
net realized
gain/(loss) | | Beneficial
interest | |
| UBS PACE Government Securities Fixed Income Investments | | $ | 2,920,812 | | | $ | (2,920,812 | ) | | | — | | |
| UBS PACE Intermediate Fixed Income Investments | | | 2,136,912 | | | | (2,136,912 | ) | | | — | | |
| UBS PACE Strategic Fixed Income Investments | | | 9,058,239 | | | | (9,058,239 | ) | | | — | | |
| UBS PACE Municipal Fixed Income Investments | | | 1,129 | | | | — | | | $ | (1,129 | ) | |
| UBS PACE Global Fixed Income Investments | | | (13,844,890 | ) | | | 13,844,890 | | | | — | | |
| UBS PACE High Yield Investments | | | 870,584 | | | | (870,584 | ) | | | — | | |
| UBS PACE Large Co Growth Equity Investments | | | (113,161 | ) | | | 113,161 | | | | — | | |
| UBS PACE Small/Medium Co Value Equity Investments | | | (76,544 | ) | | | 76,544 | | | | — | | |
| UBS PACE Small/Medium Co Growth Equity Investments | | | 1,149,411 | | | | — | | | | (1,149,411 | ) | |
| UBS PACE International Equity Investments | | | 4,525,954 | | | | (4,525,954 | ) | | | — | | |
| UBS PACE International Emerging Markets Equity Investments | | | (1,018,125 | ) | | | 1,018,125 | | | | — | | |
| UBS PACE Global Real Estate Securities Investments | | | 19,158 | | | | (19,158 | ) | | | — | | |
| UBS PACE Alternative Strategies Investments | | | (99,107 | ) | | | 15,368,699 | | | | (15,269,592 | ) | |
319
UBS PACE Select Advisors Trust
Notes to financial statements
These differences are primarily due to tax treatment of foreign currency and futures transactions, net operating losses, paydown gains and losses, distributions in excess of net investment income, disposition of PFIC investments, swap adjustments, REIT adjustments, expiration of capital loss carryforwards, tax character of distributions and adjustments for certain debt obligations.
As of and during the year ended July 31, 2009, the Portfolios did not have any liabilities for any unrecognized tax positions. The Portfolios recognize interest and penalties, if any, related to unrecognized tax positions as income tax expense in the Statement of operations. During the year ended July 31, 2009, the Portfolios did not incur any interest or penalties.
Each of the tax years in the four year period ended July 31, 2009, remains subject to examination by the Internal Revenue Service and state taxing authorities.
Capital contributions from investment manager and sub-advisors
On July 8, 2008, UBS PACE Alternative Strategies Investments recorded a capital contribution from Analytic Investors, Inc., in the amount of $16,460 which was paid in connection with losses incurred due to the disposition of a restricted security.
On May 8, 2008, UBS PACE International Emerging Markets Equity Investments recorded a capital contribution from Mondrian Investment Partners Ltd., in the amount of $1,813 which was paid in connection with losses incurred due to the disposition of a restricted security.
Shares of beneficial interest
There is an unlimited amount of $0.001 par value shares of beneficial interest authorized. Transactions in shares of beneficial interest for each of the Portfolios, except UBS PACE Money Market Investments, about which similar information is provided on the Statement of changes in net assets, were as follows:
UBS PACE Government Securities Fixed Income Investments
For the year ended July 31, 2009:
| | | Class A | | Class B | | Class C | |
| | | Shares | | Amount | | Shares | | Amount | | Shares | | Amount | |
| Shares sold | | | 794,704 | | | $ | 10,324,132 | | | | 4,608 | | | $ | 59,505 | | | | 187,121 | | | $ | 2,422,895 | | |
| Shares repurchased | | | (1,435,064 | ) | | | (18,693,940 | ) | | | (11,081 | ) | | | (143,809 | ) | | | (327,195 | ) | | | (4,265,308 | ) | |
| Shares converted from Class B to Class A | | | 41,278 | | | | 534,675 | | | | (41,259 | ) | | | (534,675 | ) | | | — | | | | — | | |
| Dividends reinvested | | | 245,499 | | | | 3,183,096 | | | | 952 | | | | 12,265 | | | | 65,462 | | | | 849,557 | | |
| Net decrease | | | (353,583 | ) | | $ | (4,652,037 | ) | | | (46,780 | ) | | $ | (606,714 | ) | | | (74,612 | ) | | $ | (992,856 | ) | |
| | | Class Y | | Class P | | | |
| | | Shares | | Amount | | Shares | | Amount | | | | | |
| Shares sold | | | 2,359,212 | | | $ | 30,552,270 | | | | 10,532,417 | | | $ | 137,379,082 | | | | | | | | | | |
| Shares repurchased | | | (1,558,509 | ) | | | (20,269,280 | ) | | | (22,899,522 | ) | | | (297,004,650 | ) | | | | | | | | | |
| Dividends reinvested | | | 139,038 | | | | 1,805,219 | | | | 1,814,928 | | | | 23,513,421 | | | | | | | | | | |
| Net increase (decrease) | | | 939,741 | | | $ | 12,088,209 | | | | (10,552,177 | ) | | $ | (136,112,147 | ) | | | | | | | | | |
320
UBS PACE Select Advisors Trust
Notes to financial statements
UBS PACE Government Securities Fixed Income Investments (concluded)
For the year ended July 31, 2008:
| | | Class A | | Class B | | Class C | |
| | | Shares | | Amount | | Shares | | Amount | | Shares | | Amount | |
| Shares sold | | | 267,376 | | | $ | 3,493,088 | | | | 13,964 | | | $ | 181,622 | | | | 50,268 | | | $ | 652,745 | | |
| Shares repurchased | | | (1,237,929 | ) | | | (16,096,363 | ) | | | (26,575 | ) | | | (344,974 | ) | | | (283,336 | ) | | | (3,708,104 | ) | |
| Shares converted from Class B to Class A | | | 57,116 | | | | 743,322 | | | | (57,090 | ) | | | (743,322 | ) | | | — | | | | — | | |
| Dividends reinvested | | | 221,591 | | | | 2,881,420 | | | | 2,368 | | | | 30,792 | | | | 60,592 | | | | 788,521 | | |
| Net decrease | | | (691,846 | ) | | $ | (8,978,533 | ) | | | (67,333 | ) | | $ | (875,882 | ) | | | (172,476 | ) | | $ | (2,266,838 | ) | |
| | | Class Y | | Class P | | | |
| | | Shares | | Amount | | Shares | | Amount | | | | | |
| Shares sold | | | 1,553,338 | | | $ | 20,205,410 | | | | 12,538,956 | | | $ | 163,568,364 | | | | | | | | | | |
| Shares repurchased | | | (695,280 | ) | | | (9,076,847 | ) | | | (9,119,327 | ) | | | (118,922,397 | ) | | | | | | | | | |
| Dividends reinvested | | | 63,455 | | | | 825,403 | | | | 1,814,366 | | | | 23,606,710 | | | | | | | | | | |
| Net increase | | | 921,513 | | | $ | 11,953,966 | | | | 5,233,995 | | | $ | 68,252,677 | | | | | | | | | | |
UBS PACE Intermediate Fixed Income Investments
For the year ended July 31, 2009:
| | | Class A | | Class B | | Class C | |
| | | Shares | | Amount | | Shares | | Amount | | Shares | | Amount | |
| Shares sold | | | 508,717 | | | $ | 5,673,742 | | | | 5,548 | | | $ | 59,615 | | | | 162,600 | | | $ | 1,812,116 | | |
| Shares repurchased | | | (751,373 | ) | | | (8,370,574 | ) | | | (4,201 | ) | | | (48,125 | ) | | | (72,890 | ) | | | (816,207 | ) | |
| Shares converted from Class B to Class A | | | 2,715 | | | | 30,358 | | | | (2,711 | ) | | | (30,358 | ) | | | — | | | | — | | |
| Dividends reinvested | | | 119,581 | | | | 1,330,289 | | | | 290 | | | | 3,228 | | | | 10,949 | | | | 122,167 | | |
| Net increase (decrease) | | | (120,360 | ) | | $ | (1,336,185 | ) | | | (1,074 | ) | | $ | (15,640 | ) | | | 100,659 | | | $ | 1,118,076 | | |
| | | Class Y | | Class P | | | |
| | | Shares | | Amount | | Shares | | Amount | | | | | |
| Shares sold | | | 137,417 | | | $ | 1,531,926 | | | | 13,274,784 | | | $ | 147,790,899 | | | | | | | | | | |
| Shares repurchased | | | (63,002 | ) | | | (702,761 | ) | | | (19,267,717 | ) | | | (213,737,546 | ) | | | | | | | | | |
| Dividends reinvested | | | 7,218 | | | | 80,452 | | | | 1,334,036 | | | | 14,843,956 | | | | | | | | | | |
| Net increase (decrease) | | | 81,633 | | | $ | 909,617 | | | | (4,658,897 | ) | | $ | (51,102,691 | ) | | | | | | | | | |
For the year ended July 31, 2008:
| | | Class A | | Class B | | Class C | |
| | | Shares | | Amount | | Shares | | Amount | | Shares | | Amount | |
| Shares sold | | | 399,133 | | | $ | 4,688,328 | | | | 2,703 | | | $ | 31,929 | | | | 58,259 | | | $ | 687,004 | | |
| Shares repurchased | | | (1,073,707 | ) | | | (12,584,466 | ) | | | (509 | ) | | | (6,097 | ) | | | (81,885 | ) | | | (951,800 | ) | |
| Shares converted from Class B to Class A | | | 16,630 | | | | 195,566 | | | | (16,612 | ) | | | (195,566 | ) | | | — | | | | — | | |
| Dividends reinvested | | | 128,127 | | | | 1,493,747 | | | | 424 | | | | 4,958 | | | | 8,969 | | | | 104,684 | | |
| Net decrease | | | (529,817 | ) | | $ | (6,206,825 | ) | | | (13,994 | ) | | $ | (164,776 | ) | | | (14,657 | ) | | $ | (160,112 | ) | |
| | | Class Y | | Class P | | | |
| | | Shares | | Amount | | Shares | | Amount | | | | | |
| Shares sold | | | 81,654 | | | $ | 960,221 | | | | 9,926,037 | | | $ | 116,191,890 | | | | | | | | | | |
| Shares repurchased | | | (78,315 | ) | | | (915,183 | ) | | | (9,770,537 | ) | | | (114,193,657 | ) | | | | | | | | | |
| Dividends reinvested | | | 5,008 | | | | 58,434 | | | | 1,501,065 | | | | 17,509,782 | | | | | | | | | | |
| Net increase | | | 8,347 | | | $ | 103,472 | | | | 1,656,565 | | | $ | 19,508,015 | | | | | | | | | | |
321
UBS PACE Select Advisors Trust
Notes to financial statements
UBS PACE Strategic Fixed Income Investments
For the year ended July 31, 2009:
| | | Class A | | Class B | | Class C | |
| | | Shares | | Amount | | Shares | | Amount | | Shares | | Amount | |
| Shares sold | | | 1,158,554 | | | $ | 14,732,706 | | | | 20,511 | | | $ | 257,482 | | | | 360,847 | | | $ | 4,531,256 | | |
| Shares repurchased | | | (834,812 | ) | | | (10,596,812 | ) | | | (3,024 | ) | | | (38,773 | ) | | | (145,805 | ) | | | (1,860,777 | ) | |
| Shares converted from Class B to Class A | | | 4,220 | | | | 54,950 | | | | (4,221 | ) | | | (54,950 | ) | | | — | | | | — | | |
| Dividends reinvested | | | 239,230 | | | | 2,973,992 | | | | 1,826 | | | | 22,594 | | | | 50,492 | | | | 627,167 | | |
| Net increase | | | 567,192 | | | $ | 7,164,836 | | | | 15,092 | | | $ | 186,353 | | | | 265,534 | | | $ | 3,297,646 | | |
| | | Class Y | | Class P | | | |
| | | Shares | | Amount | | Shares | | Amount | | | | | |
| Shares sold | | | 124,187 | | | $ | 1,548,317 | | | | 10,383,796 | | | $ | 131,380,408 | | | | | | | | | | |
| Shares repurchased | | | (131,417 | ) | | | (1,641,523 | ) | | | (29,277,183 | ) | | | (370,944,752 | ) | | | | | | | | | |
| Dividends reinvested | | | 29,260 | | | | 363,729 | | | | 6,416,564 | | | | 79,811,700 | | | | | | | | | | |
| Net increase (decrease) | | | 22,030 | | | $ | 270,523 | | | | (12,476,823 | ) | | $ | (159,752,644 | ) | | | | | | | | | |
For the year ended July 31, 2008:
| | | Class A | | Class B | | Class C | |
| | | Shares | | Amount | | Shares | | Amount | | Shares | | Amount | |
| Shares sold | | | 736,365 | | | $ | 10,299,729 | | | | 5,070 | | | $ | 71,091 | | | | 47,039 | | | $ | 658,442 | | |
| Shares repurchased | | | (484,834 | ) | | | (6,702,458 | ) | | | (8,260 | ) | | | (113,441 | ) | | | (71,066 | ) | | | (981,567 | ) | |
| Shares converted from Class B to Class A | | | 21,425 | | | | 297,023 | | | | (21,429 | ) | | | (297,023 | ) | | | — | | | | — | | |
| Dividends reinvested | | | 66,098 | | | | 915,062 | | | | 586 | | | | 8,073 | | | | 13,444 | | | | 186,085 | | |
| Net increase (decrease) | | | 339,054 | | | $ | 4,809,356 | | | | (24,033 | ) | | $ | (331,300 | ) | | | (10,583 | ) | | $ | (137,040 | ) | |
| | | Class Y | | Class P | | | |
| | | Shares | | Amount | | Shares | | Amount | | | | | |
| Shares sold | | | 149,834 | | | $ | 2,095,884 | | | | 16,017,839 | | | $ | 222,029,525 | | | | | | | | | | |
| Shares repurchased | | | (27,477 | ) | | | (381,575 | ) | | | (12,753,702 | ) | | | (177,075,572 | ) | | | | | | | | | |
| Dividends reinvested | | | 7,966 | | | | 110,514 | | | | 2,586,757 | | | | 35,787,127 | | | | | | | | | | |
| Net increase | | | 130,323 | | | $ | 1,824,823 | | | | 5,850,894 | | | $ | 80,741,080 | | | | | | | | | | |
UBS PACE Municipal Fixed Income Investments
For the year ended July 31, 2009:
| | | Class A | | Class B | | Class C | |
| | | Shares | | Amount | | Shares | | Amount | | Shares | | Amount | |
| Shares sold | | | 955,999 | | | $ | 11,591,980 | | | | 1,282 | | | $ | 15,656 | | | | 179,584 | | | $ | 2,143,204 | | |
| Shares repurchased | | | (1,208,678 | ) | | | (14,615,846 | ) | | | (4,854 | ) | | | (58,641 | ) | | | (106,948 | ) | | | (1,307,803 | ) | |
| Shares converted from Class B to Class A | | | 4,476 | | | | 54,425 | | | | (4,476 | ) | | | (54,425 | ) | | | — | | | | — | | |
| Dividends reinvested | | | 170,919 | | | | 2,076,191 | | | | 169 | | | | 2,063 | | | | 26,485 | | | | 321,829 | | |
| Net increase (decrease) | | | (77,284 | ) | | $ | (893,250 | ) | | | (7,879 | ) | | $ | (95,347 | ) | | | 99,121 | | | $ | 1,157,230 | | |
| | | Class Y | | Class P | | | |
| | | Shares | | Amount | | Shares | | Amount | | | | | |
| Shares sold | | | 1,017 | | | $ | 12,001 | | | | 6,342,348 | | | $ | 76,739,936 | | | | | | | | | | |
| Shares repurchased | | | (712 | ) | | | (8,858 | ) | | | (11,741,873 | ) | | | (141,649,274 | ) | | | | | | | | | |
| Dividends reinvested | | | 172 | | | | 2,094 | | | | 576,921 | | | | 7,000,558 | | | | | | | | | | |
| Net increase (decrease) | | | 477 | | | $ | 5,237 | | | | (4,822,604 | ) | | $ | (57,908,780 | ) | | | | | | | | | |
322
UBS PACE Select Advisors Trust
Notes to financial statements
UBS PACE Municipal Fixed Income Investments (concluded)
For the year ended July 31, 2008:
| | | Class A | | Class B | | Class C | |
| | | Shares | | Amount | | Shares | | Amount | | Shares | | Amount | |
| Shares sold | | | 1,161,100 | | | $ | 14,282,356 | | | | 4,874 | | | $ | 60,248 | | | | 21,111 | | | $ | 259,803 | | |
| Shares repurchased | | | (1,565,195 | ) | | | (19,238,457 | ) | | | (1,114 | ) | | | (13,773 | ) | | | (112,220 | ) | | | (1,384,101 | ) | |
| Shares converted from Class B to Class A | | | 8,975 | | | | 110,554 | | | | (8,976 | ) | | | (110,554 | ) | | | — | | | | — | | |
| Dividends reinvested | | | 172,667 | | | | 2,121,314 | | | | 174 | | | | 2,141 | | | | 25,857 | | | | 317,758 | | |
| Net decrease | | | (222,453 | ) | | $ | (2,724,233 | ) | | | (5,042 | ) | | $ | (61,938 | ) | | | (65,252 | ) | | $ | (806,540 | ) | |
| | | Class Y | | Class P | | | |
| | | Shares | | Amount | | Shares | | Amount | | | | | |
| Shares sold | | | — | | | | — | | | | 7,525,054 | | | $ | 92,785,921 | | | | | | | | | | |
| Shares repurchased | | | (211 | ) | | $ | (2,589 | ) | | | (4,170,651 | ) | | | (51,305,216 | ) | | | | | | | | | |
| Dividends reinvested | | | 147 | | | | 1,814 | | | | 647,986 | | | | 7,962,212 | | | | | | | | | | |
| Net increase (decrease) | | | (64 | ) | | $ | (775 | ) | | | 4,002,389 | | | $ | 49,442,917 | | | | | | | | | | |
UBS PACE Global Fixed Income Investments
For the year ended July 31, 2009:
| | | Class A | | Class B | | Class C | |
| | | Shares | | Amount | | Shares | | Amount | | Shares | | Amount | |
| Shares sold | | | 466,380 | | | $ | 5,094,875 | | | | 3,570 | | | $ | 40,001 | | | | 91,793 | | | $ | 1,013,832 | | |
| Shares repurchased | | | (1,901,242 | ) | | | (20,414,425 | ) | | | (14,161 | ) | | | (156,962 | ) | | | (92,348 | ) | | | (981,653 | ) | |
| Shares converted from Class B to Class A | | | 15,903 | | | | 172,589 | | | | (15,881 | ) | | | (172,589 | ) | | | — | | | | — | | |
| Dividends reinvested | | | 296,581 | | | | 3,208,918 | | | | 322 | | | | 3,505 | | | | 17,268 | | | | 186,956 | | |
| Net increase (decrease) | | | (1,122,378 | ) | | $ | (11,938,043 | ) | | | (26,150 | ) | | $ | (286,045 | ) | | | 16,713 | | | $ | 219,135 | | |
| | | Class Y | | Class P | | | |
| | | Shares | | Amount | | Shares | | Amount | | | | | |
| Shares sold | | | 82,623 | | | $ | 880,745 | | | | 6,404,190 | | | $ | 69,138,944 | | | | | | | | | | |
| Shares repurchased | | | (312,929 | ) | | | (3,317,046 | ) | | | (21,733,322 | ) | | | (231,552,261 | ) | | | | | | | | | |
| Dividends reinvested | | | 31,926 | | | | 344,796 | | | | 1,546,584 | | | | 16,724,215 | | | | | | | | | | |
| Net decrease | | | (198,380 | ) | | $ | (2,091,505 | ) | | | (13,782,548 | ) | | $ | (145,689,102 | ) | | | | | | | | | |
For the year ended July 31, 2008:
| | | Class A | | Class B | | Class C | |
| | | Shares | | Amount | | Shares | | Amount | | Shares | | Amount | |
| Shares sold | | | 896,730 | | | $ | 10,881,929 | | | | 14,833 | | | $ | 175,823 | | | | 73,431 | | | $ | 884,034 | | |
| Shares repurchased | | | (1,330,821 | ) | | | (15,823,221 | ) | | | (18,642 | ) | | | (218,532 | ) | | | (62,309 | ) | | | (742,896 | ) | |
| Shares converted from Class B to Class A | | | 18,914 | | | | 223,427 | | | | (18,879 | ) | | | (223,427 | ) | | | — | | | | — | | |
| Dividends reinvested | | | 607,558 | | | | 6,962,895 | | | | 1,856 | | | | 21,267 | | | | 35,606 | | | | 407,024 | | |
| Net increase (decrease) | | | 192,381 | | | $ | 2,245,030 | | | | (20,832 | ) | | $ | (244,869 | ) | | | 46,728 | | | $ | 548,162 | | |
| | | Class Y | | Class P | | | |
| | | Shares | | Amount | | Shares | | Amount | | | | | |
| Shares sold | | | 299,660 | | | $ | 3,612,554 | | | | 12,333,305 | | | $ | 146,850,249 | | | | | | | | | | |
| Shares repurchased | | | (115,861 | ) | | | (1,375,239 | ) | | | (9,468,802 | ) | | | (113,298,928 | ) | | | | | | | | | |
| Dividends reinvested | | | 57,027 | | | | 654,523 | | | | 3,488,465 | | | | 40,024,004 | | | | | | | | | | |
| Net increase | | | 240,826 | | | $ | 2,891,838 | | | | 6,352,968 | | | $ | 73,575,325 | | | | | | | | | | |
323
UBS PACE Select Advisors Trust
Notes to financial statements
UBS PACE High Yield Investments
For the year ended July 31, 2009:
| | | Class A | | Class C1 | | | |
| | | Shares | | Amount | | Shares | | Amount | | | | | |
| Shares sold | | | 774,901 | | | $ | 5,974,010 | | | | 213,076 | | | $ | 1,681,927 | | | | | | |
| Shares repurchased | | | (210,539 | ) | | | (1,623,355 | ) | | | (12,105 | ) | | | (95,429 | ) | | | | | |
| Dividends reinvested | | | 37,621 | | | | 286,334 | | | | 2,820 | | | | 22,709 | | | | | | |
| Net increase | | | 601,983 | | | $ | 4,636,989 | | | | 203,791 | | | $ | 1,609,207 | | | | | | |
| | | Class Y2 | | Class P | | | |
| | | Shares | | Amount | | Shares | | Amount | | | | | |
| Shares sold | | | 732 | | | $ | 5,000 | | | | 7,202,359 | | | $ | 56,408,434 | | | | | | |
| Shares repurchased | | | — | | | | — | | | | (8,176,699 | ) | | | (63,172,121 | ) | | | | | |
| Dividends reinvested | | | 40 | | | | 309 | | | | 1,598,523 | | | | 12,055,172 | | | | | | |
| Net increase | | | 772 | | | $ | 5,309 | | | | 624,183 | | | $ | 5,291,485 | | | | | | |
For the year ended July 31, 2008:
| | | Class A | | Class P | | | |
| | | Shares | | Amount | | Shares | | Amount | | | | | |
| Shares sold | | | 203,952 | | | $ | 1,926,149 | | | | 8,505,508 | | | $ | 81,145,415 | | | | | | |
| Shares repurchased | | | (48,122 | ) | | | (451,590 | ) | | | (2,610,410 | ) | | | (24,744,704 | ) | | | | | |
| Dividends reinvested | | | 8,363 | | | | 78,924 | | | | 844,374 | | | | 8,002,249 | | | | | | |
| Net increase | | | 164,193 | | | $ | 1,553,483 | | | | 6,739,472 | | | $ | 64,402,960 | | | | | | |
UBS PACE Large Co Value Equity Investments
For the year ended July 31, 2009:
| | | Class A | | Class B | | Class C | |
| | | Shares | | Amount | | Shares | | Amount | | Shares | | Amount | |
| Shares sold | | | 660,284 | | | $ | 7,930,768 | | | | 8,254 | | | $ | 93,264 | | | | 33,877 | | | $ | 393,827 | | |
| Shares repurchased | | | (2,870,387 | ) | | | (34,570,268 | ) | | | (10,569 | ) | | | (125,003 | ) | | | (281,109 | ) | | | (3,414,489 | ) | |
| Shares converted from Class B to Class A | | | 13,348 | | | | 153,186 | | | | (13,301 | ) | | | (153,186 | ) | | | — | | | | — | | |
| Dividends reinvested | | | 252,025 | | | | 2,923,492 | | | | 288 | | | | 3,364 | | | | 13,830 | | | | 160,984 | | |
| Net decrease | | | (1,944,730 | ) | | $ | (23,562,822 | ) | | | (15,328 | ) | | $ | (181,561 | ) | | | (233,402 | ) | | $ | (2,859,678 | ) | |
| | | Class Y | | Class P | | | |
| | | Shares | | Amount | | Shares | | Amount | | | | | |
| Shares sold | | | 210,794 | | | $ | 2,271,355 | | | | 20,080,494 | | | $ | 230,552,581 | | | | | | | | | | |
| Shares repurchased | | | (478,980 | ) | | | (5,700,488 | ) | | | (29,018,138 | ) | | | (347,132,745 | ) | | | | | | | | | |
| Dividends reinvested | | | 54,081 | | | | 627,879 | | | | 1,694,551 | | | | 19,605,951 | | | | | | | | | | |
| Net decrease | | | (214,105 | ) | | $ | (2,801,254 | ) | | | (7,243,093 | ) | | $ | (96,974,213 | ) | | | | | | | | | |
1 For the period January 21, 2009 (commencement of issuance) through July 31, 2009.
2 For the period December 26, 2008 (recommencement of issuance) through July 31, 2009.
324
UBS PACE Select Advisors Trust
Notes to financial statements
UBS PACE Large Co Value Equity Investments (concluded)
For the year ended July 31, 2008:
| | | Class A | | Class B | | Class C | |
| | | Shares | | Amount | | Shares | | Amount | | Shares | | Amount | |
| Shares sold | | | 644,603 | | | $ | 12,370,102 | | | | 163 | | | $ | 3,623 | | | | 12,514 | | | $ | 252,274 | | |
| Shares repurchased | | | (2,169,908 | ) | | | (42,489,031 | ) | | | (13,493 | ) | | | (277,505 | ) | | | (266,816 | ) | | | (5,304,656 | ) | |
| Shares converted from Class B to Class A | | | 31,163 | | | | 631,532 | | | | (31,166 | ) | | | (631,532 | ) | | | — | | | | — | | |
| Dividends reinvested | | | 1,542,382 | | | | 30,446,607 | | | | 7,050 | | | | 139,512 | | | | 177,155 | | | | 3,495,274 | | |
| Net increase (decrease) | | | 48,240 | | | $ | 959,210 | | | | (37,446 | ) | | $ | (765,902 | ) | | | (77,147 | ) | | $ | (1,557,108 | ) | |
| | | Class Y | | Class P | | | |
| | | Shares | | Amount | | Shares | | Amount | | | | | |
| Shares sold | | | 145,483 | | | $ | 2,758,563 | | | | 17,006,422 | | | $ | 340,886,909 | | | | | | | | | | |
| Shares repurchased | | | (394,378 | ) | | | (7,782,137 | ) | | | (13,942,311 | ) | | | (270,127,528 | ) | | | | | | | | | |
| Dividends reinvested | | | 260,610 | | | | 5,157,464 | | | | 8,223,599 | | | | 162,251,624 | | | | | | | | | | |
| Net increase | | | 11,715 | | | $ | 133,890 | | | | 11,287,710 | | | $ | 233,011,005 | | | | | | | | | | |
UBS PACE Large Co Growth Equity Investments
For the year ended July 31, 2009:
| | | Class A | | Class B | | Class C | |
| | | Shares | | Amount | | Shares | | Amount | | Shares | | Amount | |
| Shares sold | | | 644,241 | | | $ | 7,861,600 | | | | 6,266 | | | $ | 67,411 | | | | 23,348 | | | $ | 253,122 | | |
| Shares repurchased | | | (1,136,486 | ) | | | (13,708,024 | ) | | | (6,538 | ) | | | (70,404 | ) | | | (81,212 | ) | | | (919,964 | ) | |
| Shares converted from Class B to Class A | | | 7,080 | | | | 90,720 | | | | (7,571 | ) | | | (90,720 | ) | | | — | | | | — | | |
| Dividends reinvested | | | 24,059 | | | | 276,436 | | | | 97 | | | | 1,047 | | | | 2,162 | | | | 23,264 | | |
| Net decrease | | | (461,106 | ) | | $ | (5,479,268 | ) | | | (7,746 | ) | | $ | (92,666 | ) | | | (55,702 | ) | | $ | (643,578 | ) | |
| | | Class Y | | Class P | | | |
| | | Shares | | Amount | | Shares | | Amount | | | | | |
| Shares sold | | | 163,249 | | | $ | 1,893,714 | | | | 17,204,825 | | | $ | 207,651,720 | | | | | | | | | | |
| Shares repurchased | | | (305,109 | ) | | | (3,752,192 | ) | | | (29,819,584 | ) | | | (366,300,315 | ) | | | | | | | | | |
| Dividends reinvested | | | 11,397 | | | | 133,685 | | | | 484,047 | | | | 5,648,826 | | | | | | | | | | |
| Net decrease | | | (130,463 | ) | | $ | (1,724,793 | ) | | | (12,130,712 | ) | | $ | (152,999,769 | ) | | | | | | | | | |
For the year ended July 31, 2008:
| | | Class A | | Class B | | Class C | |
| | | Shares | | Amount | | Shares | | Amount | | Shares | | Amount | |
| Shares sold | | | 873,239 | | | $ | 15,611,199 | | | | 2,676 | | | $ | 44,465 | | | | 16,235 | | | $ | 278,745 | | |
| Shares repurchased | | | (749,290 | ) | | | (13,458,199 | ) | | | (6,932 | ) | | | (119,269 | ) | | | (69,936 | ) | | | (1,208,829 | ) | |
| Shares converted from Class B to Class A | | | 9,461 | | | | 176,752 | | | | (9,959 | ) | | | (176,752 | ) | | | — | | | | — | | |
| Dividends reinvested | | | 105,408 | | | | 1,982,738 | | | | 625 | | | | 11,064 | | | | 10,461 | | | | 185,883 | | |
| Net increase (decrease) | | | 238,818 | | | $ | 4,312,490 | | | | (13,590 | ) | | $ | (240,492 | ) | | | (43,240 | ) | | $ | (744,201 | ) | |
| | | Class Y | | Class P | | | |
| | | Shares | | Amount | | Shares | | Amount | | | | | |
| Shares sold | | | 193,699 | | | $ | 3,586,259 | | | | 18,867,946 | | | $ | 348,766,855 | | | | | | | | | | |
| Shares repurchased | | | (275,574 | ) | | | (5,086,115 | ) | | | (14,860,424 | ) | | | (269,656,491 | ) | | | | | | | | | |
| Dividends reinvested | | | 39,066 | | | | 748,901 | | | | 1,875,974 | | | | 35,793,580 | | | | | | | | | | |
| Net increase (decrease) | | | (42,809 | ) | | $ | (750,955 | ) | | | 5,883,496 | | | $ | 114,903,944 | | | | | | | | | | |
325
UBS PACE Select Advisors Trust
Notes to financial statements
UBS PACE Small/Medium Co Value Equity Investments
For the year ended July 31, 2009:
| | | Class A | | Class B | | Class C | |
| | | Shares | | Amount | | Shares | | Amount | | Shares | | Amount | |
| Shares sold | | | 246,372 | | | $ | 2,616,610 | | | | 675 | | | $ | 9,455 | | | | 21,582 | | | $ | 222,857 | | |
| Shares repurchased | | | (824,188 | ) | | | (8,527,066 | ) | | | (4,666 | ) | | | (40,399 | ) | | | (152,975 | ) | | | (1,441,002 | ) | |
| Shares converted from Class B to Class A | | | 11,752 | | | | 129,112 | | | | (12,604 | ) | | | (129,112 | ) | | | — | | | | — | | |
| Dividends reinvested | | | 18,011 | | | | 178,128 | | | | 6 | | | | 55 | | | | 185 | | | | 1,701 | | |
| Net decrease | | | (548,053 | ) | | $ | (5,603,216 | ) | | | (16,589 | ) | | $ | (160,001 | ) | | | (131,208 | ) | | $ | (1,216,444 | ) | |
| | | Class Y | | Class P | | | |
| | | Shares | | Amount | | Shares | | Amount | | | | | |
| Shares sold | | | 124,253 | | | $ | 1,318,210 | | | | 7,961,183 | | | $ | 79,410,898 | | | | | | | | | | |
| Shares repurchased | | | (166,989 | ) | | | (1,665,642 | ) | | | (12,358,189 | ) | | | (130,657,574 | ) | | | | | | | | | |
| Dividends reinvested | | | 4,215 | | | | 42,610 | | | | 290,387 | | | | 2,918,328 | | | | | | | | | | |
| Net decrease | | | (38,521 | ) | | $ | (304,822 | ) | | | (4,106,619 | ) | | $ | (48,328,348 | ) | | | | | | | | | |
For the year ended July 31, 2008:
| | | Class A | | Class B | | Class C | |
| | | Shares | | Amount | | Shares | | Amount | | Shares | | Amount | |
| Shares sold | | | 333,867 | | | $ | 5,152,566 | | | | 367 | | | $ | 6,716 | | | | 7,589 | | | $ | 120,928 | | |
| Shares repurchased | | | (531,278 | ) | | | (8,363,222 | ) | | | (14,388 | ) | | | (216,313 | ) | | | (117,631 | ) | | | (1,739,022 | ) | |
| Shares converted from Class B to Class A | | | 21,226 | | | | 342,689 | | | | (22,826 | ) | | | (342,689 | ) | | | — | | | | — | | |
| Dividends reinvested | | | 301,804 | | | | 4,750,403 | | | | 6,508 | | | | 94,621 | | | | 86,848 | | | | 1,267,979 | | |
| Net increase (decrease) | | | 125,619 | | | $ | 1,882,436 | | | | (30,339 | ) | | $ | (457,665 | ) | | | (23,194 | ) | | $ | (350,115 | ) | |
| | | Class Y | | Class P | | | |
| | | Shares | | Amount | | Shares | | Amount | | | | | |
| Shares sold | | | 65,797 | | | $ | 1,057,319 | | | | 7,540,297 | | | $ | 125,634,020 | | | | | | | | | | |
| Shares repurchased | | | (99,939 | ) | | | (1,753,388 | ) | | | (6,056,150 | ) | | | (97,645,191 | ) | | | | | | | | | |
| Dividends reinvested | | | 34,568 | | | | 556,895 | | | | 3,344,771 | | | | 53,516,191 | | | | | | | | | | |
| Net increase (decrease) | | | 426 | | | $ | (139,174 | ) | | | 4,828,918 | | | $ | 81,505,020 | | | | | | | | | | |
UBS PACE Small/Medium Co Growth Equity Investments
For the year ended July 31, 2009:
| | | Class A | | Class B | | Class C | |
| | | Shares | | Amount | | Shares | | Amount | | Shares | | Amount | |
| Shares sold | | | 275,725 | | | $ | 2,618,914 | | | | 2,493 | | | $ | 18,607 | | | | 18,606 | | | $ | 183,786 | | |
| Shares repurchased | | | (688,549 | ) | | | (6,322,902 | ) | | | (2,560 | ) | | | (20,138 | ) | | | (95,360 | ) | | | (830,687 | ) | |
| Shares converted from Class B to Class A | | | 2,918 | | | | 25,851 | | | | (3,160 | ) | | | (25,851 | ) | | | — | | | | — | | |
| Net decrease | | | (409,906 | ) | | $ | (3,678,137 | ) | | | (3,227 | ) | | $ | (27,382 | ) | | | (76,754 | ) | | $ | (646,901 | ) | |
| | | Class Y | | Class P | | | |
| | | Shares | | Amount | | Shares | | Amount | | | | | |
| Shares sold | | | 136,334 | | | $ | 1,266,993 | | | | 8,477,168 | | | $ | 77,137,831 | | | | | | | | | | |
| Shares repurchased | | | (160,723 | ) | | | (1,523,761 | ) | | | (14,173,325 | ) | | | (133,492,602 | ) | | | | | | | | | |
| Net decrease | | | (24,389 | ) | | $ | (256,768 | ) | | | (5,696,157 | ) | | $ | (56,354,771 | ) | | | | | | | | | |
326
UBS PACE Select Advisors Trust
Notes to financial statements
UBS PACE Small/Medium Co Growth Equity Investments (concluded)
For the year ended July 31, 2008:
| | | Class A | | Class B | | Class C | |
| | | Shares | | Amount | | Shares | | Amount | | Shares | | Amount | |
| Shares sold | | | 380,059 | | | $ | 5,447,262 | | | | 327 | | | $ | 5,331 | | | | 7,534 | | | $ | 117,654 | | |
| Shares repurchased | | | (528,194 | ) | | | (7,918,571 | ) | | | (3,335 | ) | | | (50,451 | ) | | | (76,220 | ) | | | (1,072,709 | ) | |
| Shares converted from Class B to Class A | | | 7,920 | | | | 117,327 | | | | (8,518 | ) | | | (117,327 | ) | | | — | | | | — | | |
| Dividends reinvested | | | 452,998 | | | | 6,767,795 | | | | 2,665 | | | | 36,746 | | | | 70,362 | | | | 976,626 | | |
| Net increase (decrease) | | | 312,783 | | | $ | 4,413,813 | | | | (8,861 | ) | | $ | (125,701 | ) | | | 1,676 | | | $ | 21,571 | | |
| | | Class Y | | Class P | | | |
| | | Shares | | Amount | | Shares | | Amount | | | | | |
| Shares sold | | | 157,897 | | | $ | 2,543,445 | | | | 7,795,327 | | | $ | 121,682,275 | | | | | | | | | | |
| Shares repurchased | | | (141,977 | ) | | | (2,124,837 | ) | | | (7,013,876 | ) | | | (105,492,613 | ) | | | | | | | | | |
| Dividends reinvested | | | 64,940 | | | | 998,131 | | | | 4,936,544 | | | | 75,331,657 | | | | | | | | | | |
| Net increase | | | 80,860 | | | $ | 1,416,739 | | | | 5,717,995 | | | $ | 91,521,319 | | | | | | | | | | |
UBS PACE International Equity Investments
For the year ended July 31, 2009:
| | | Class A | | Class B | | Class C | |
| | | Shares | | Amount | | Shares | | Amount | | Shares | | Amount | |
| Shares sold | | | 571,939 | | | $ | 6,201,114 | | | | — | | | | — | | | | 8,873 | | | $ | 89,598 | | |
| Shares repurchased | | | (1,330,999 | ) | | | (13,944,210 | ) | | | (2,348 | ) | | $ | (30,919 | ) | | | (84,168 | ) | | | (889,223 | ) | |
| Shares converted from Class B to Class A | | | 3,892 | | | | 40,865 | | | | (3,932 | ) | | | (40,865 | ) | | | — | | | | — | | |
| Dividends reinvested | | | 275,755 | | | | 2,845,791 | | | | 133 | | | | 1,371 | | | | 13,339 | | | | 135,660 | | |
| Net decrease | | | (479,413 | ) | | $ | (4,856,440 | ) | | | (6,147 | ) | | $ | (70,413 | ) | | | (61,956 | ) | | $ | (663,965 | ) | |
| | | Class Y | | Class P | | | |
| | | Shares | | Amount | | Shares | | Amount | | | | | |
| Shares sold | | | 340,446 | | | $ | 3,224,877 | | | | 19,170,198 | | | $ | 192,830,013 | | | | | | | | | | |
| Shares repurchased | | | (808,911 | ) | | | (8,469,346 | ) | | | (28,623,459 | ) | | | (298,817,677 | ) | | | | | | | | | |
| Dividends reinvested | | | 157,137 | | | | 1,616,941 | | | | 3,107,946 | | | | 31,949,681 | | | | | | | | | | |
| Net decrease | | | (311,328 | ) | | $ | (3,627,528 | ) | | | (6,345,315 | ) | | $ | (74,037,983 | ) | | | | | | | | | |
For the year ended July 31, 2008:
| | | Class A | | Class B | | Class C | |
| | | Shares | | Amount | | Shares | | Amount | | Shares | | Amount | |
| Shares sold | | | 638,256 | | | $ | 11,810,528 | | | | 632 | | | $ | 12,600 | | | | 20,781 | | | $ | 433,118 | | |
| Shares repurchased | | | (981,066 | ) | | | (17,987,580 | ) | | | (4,434 | ) | | | (78,737 | ) | | | (57,882 | ) | | | (1,091,880 | ) | |
| Shares converted from Class B to Class A | | | 10,311 | | | | 189,592 | | | | (10,514 | ) | | | (189,592 | ) | | | — | | | | — | | |
| Dividends reinvested | | | 752,680 | | | | 14,082,644 | | | | 2,592 | | | | 47,641 | | | | 51,557 | | | | 946,583 | | |
| Net increase (decrease) | | | 420,181 | | | $ | 8,095,184 | | | | (11,724 | ) | | $ | (208,088 | ) | | | 14,456 | | | $ | 287,821 | | |
| | | Class Y | | Class P | | | |
| | | Shares | | Amount | | Shares | | Amount | | | | | |
| Shares sold | | | 277,148 | | | $ | 5,076,460 | | | | 15,737,511 | | | $ | 300,850,054 | | | | | | | | | | |
| Shares repurchased | | | (633,552 | ) | | | (11,668,351 | ) | | | (13,814,250 | ) | | | (256,221,407 | ) | | | | | | | | | |
| Dividends reinvested | | | 414,916 | | | | 7,754,775 | | | | 7,763,144 | | | | 144,860,266 | | | | | | | | | | |
| Net increase | | | 58,512 | | | $ | 1,162,884 | | | | 9,686,405 | | | $ | 189,488,913 | | | | | | | | | | |
327
UBS PACE Select Advisors Trust
Notes to financial statements
UBS PACE International Emerging Markets Equity Investments
For the year ended July 31, 2009:
| | | Class A | | Class B | | Class C | |
| | | Shares | | Amount | | Shares | | Amount | | Shares | | Amount | |
| Shares sold | | | 308,284 | | | $ | 2,828,696 | | | | 628 | | | $ | 5,635 | | | | 29,331 | | | $ | 263,728 | | |
| Shares repurchased | | | (733,563 | ) | | | (7,326,792 | ) | | | (4,220 | ) | | | (38,619 | ) | | | (141,191 | ) | | | (1,622,283 | ) | |
| Shares converted from Class B to Class A | | | 4,436 | | | | 29,549 | | | | (4,723 | ) | | | (29,549 | ) | | | — | | | | — | | |
| Dividends reinvested | | | 562,820 | | | | 4,254,921 | | | | 4,671 | | | | 33,260 | | | | 114,037 | | | | 810,805 | | |
| Net increase (decrease) | | | 141,977 | | | $ | (213,626 | ) | | | (3,644 | ) | | $ | (29,273 | ) | | | 2,177 | | | $ | (547,750 | ) | |
| | | Class Y | | Class P | | | |
| | | Shares | | Amount | | Shares | | Amount | | | | | |
| Shares sold | | | 1,968,886 | | | $ | 16,393,043 | | | | 5,348,327 | | | $ | 48,647,585 | | | | | | | | | | |
| Shares repurchased | | | (1,088,099 | ) | | | (11,160,497 | ) | | | (9,634,416 | ) | | | (92,330,347 | ) | | | | | | | | | |
| Dividends reinvested | | | 591,234 | | | | 4,540,675 | | | | 6,768,940 | | | | 51,850,076 | | | | | | | | | | |
| Net increase | | | 1,472,021 | | | $ | 9,773,221 | | | | 2,482,851 | | | $ | 8,167,314 | | | | | | | | | | |
For the year ended July 31, 2008:
| | | Class A | | Class B | | Class C | |
| | | Shares | | Amount | | Shares | | Amount | | Shares | | Amount | |
| Shares sold | | | 337,939 | | | $ | 7,546,874 | | | | 379 | | | $ | 8,116 | | | | 30,565 | | | $ | 684,349 | | |
| Shares repurchased | | | (358,590 | ) | | | (7,779,279 | ) | | | (6,042 | ) | | | (126,181 | ) | | | (64,606 | ) | | | (1,315,297 | ) | |
| Shares converted from Class B to Class A | | | 4,412 | | | | 92,844 | | | | (4,537 | ) | | | (92,844 | ) | | | — | | | | — | | |
| Dividends reinvested | | | 232,817 | | | | 4,991,598 | | | | 3,770 | | | | 77,276 | | | | 57,773 | | | | 1,182,038 | | |
| Net increase (decrease) | | | 216,578 | | | $ | 4,852,037 | | | | (6,430 | ) | | $ | (133,633 | ) | | | 23,732 | | | $ | 551,090 | | |
| | | Class Y | | Class P | | | |
| | | Shares | | Amount | | Shares | | Amount | | | | | |
| Shares sold | | | 530,628 | | | $ | 12,357,584 | | | | 3,365,541 | | | $ | 76,688,847 | | | | | | | | | | |
| Shares repurchased | | | (424,627 | ) | | | (9,297,322 | ) | | | (4,706,298 | ) | | | (105,092,624 | ) | | | | | | | | | |
| Dividends reinvested | | | 254,370 | | | | 5,535,105 | | | | 2,784,776 | | | | 60,373,941 | | | | | | | | | | |
| Net increase | | | 360,371 | | | $ | 8,595,367 | | | | 1,444,019 | | | $ | 31,970,164 | | | | | | | | | | |
UBS PACE Global Real Estate Securities Investments
For the year ended July 31, 2009:
| | | Class A | | Class C | | | |
| | | Shares | | Amount | | Shares | | Amount | | | | | |
| Shares sold | | | 290,554 | | | $ | 1,287,894 | | | | 30,714 | | | $ | 122,298 | | | | | | |
| Shares repurchased | | | (493,143 | ) | | | (2,608,638 | ) | | | (30,405 | ) | | | (125,190 | ) | | | | | |
| Dividends reinvested | | | 8,852 | | | | 39,833 | | | | 92 | | | | 416 | | | | | | |
| Net increase (decrease) | | | (193,737 | ) | | $ | (1,280,911 | ) | | | 401 | | | $ | (2,476 | ) | | | | | |
| | | Class Y1 | | Class P | | | |
| | | Shares | | Amount | | Shares | | Amount | | | | | |
| Shares sold | | | 2,675 | | | $ | 11,127 | | | | 6,764,544 | | | $ | 28,974,209 | | | | | | |
| Shares repurchased | | | — | | | | — | | | | (5,105,255 | ) | | | (22,874,570 | ) | | | | | |
| Dividends reinvested | | | — | | | | — | | | | 176,684 | | | | 793,310 | | | | | | |
| Net increase | | | 2,675 | | | $ | 11,127 | | | | 1,835,973 | | | $ | 6,892,949 | | | | | | |
1 For the period December 26, 2008 (recommencement of issuance) through July 31, 2009.
328
UBS PACE Select Advisors Trust
Notes to financial statements
UBS PACE Global Real Estate Securities Investments (concluded)
For the year ended July 31, 2008:
| | | Class A | | Class C | | Class P | |
| | | Shares | | Amount | | Shares | | Amount | | Shares | | Amount | |
| Shares sold | | | 928,836 | | | $ | 8,419,221 | | | | 8,915 | | | $ | 90,056 | | | | 5,836,434 | | | $ | 52,683,971 | | |
| Shares repurchased | | | (533,330 | ) | | | (4,560,320 | ) | | | (18,320 | ) | | | (164,946 | ) | | | (1,701,916 | ) | | | (14,802,302 | ) | |
| Dividends reinvested | | | 24,271 | | | | 211,398 | | | | 999 | | | | 8,703 | | | | 228,096 | | | | 1,991,283 | | |
| Net increase (decrease) | | | 419,777 | | | $ | 4,070,299 | | | | (8,406 | ) | | $ | (66,187 | ) | | | 4,362,614 | | | $ | 39,872,952 | | |
UBS PACE Alternative Strategies Investments
For the year ended July 31, 2009:
| | | Class A | | Class B | | Class C | |
| | | Shares | | Amount | | Shares | | Amount | | Shares | | Amount | |
| Shares sold | | | 2,260,653 | | | $ | 20,193,719 | | | | 5,986 | | | $ | 47,632 | | | | 245,008 | | | $ | 2,036,513 | | |
| Shares repurchased | | | (9,335,513 | ) | | | (79,934,791 | ) | | | — | | | | — | | | | (258,877 | ) | | | (2,217,887 | ) | |
| Shares converted from Class B to Class A | | | 4,796 | | | | 39,330 | | | | (4,874 | ) | | | (39,330 | ) | | | — | | | | — | | |
| Dividends reinvested | | | 123,559 | | | | 1,014,423 | | | | 82 | | | | 660 | | | | 7,203 | | | | 58,485 | | |
| Net increase (decrease) | | | (6,946,505 | ) | | $ | (58,687,319 | ) | | | 1,194 | | | $ | 8,962 | | | | (6,666 | ) | | $ | (122,889 | ) | |
| | | Class Y | | Class P | | | |
| | | Shares | | Amount | | Shares | | Amount | | | | | |
| Shares sold | | | 485,333 | | | $ | 4,304,423 | | | | 11,356,471 | | | $ | 100,000,134 | | | | | | | | | | |
| Shares repurchased | | | (4,466,050 | ) | | | (38,519,549 | ) | | | (24,491,823 | ) | | | (208,257,527 | ) | | | | | | | | | |
| Dividends reinvested | | | 60,793 | | | | 499,722 | | | | 687,645 | | | | 5,659,320 | | | | | | | | | | |
| Net decrease | | | (3,919,924 | ) | | $ | (33,715,404 | ) | | | (12,447,707 | ) | | $ | (102,598,073 | ) | | | | | | | | | |
For the year ended July 31, 2008:
| | | Class A | | Class B | | Class C | |
| | | Shares | | Amount | | Shares | | Amount | | Shares | | Amount | |
| Shares sold | | | 11,999,043 | | | $ | 130,223,796 | | | | 1,203 | | | $ | 13,117 | | | | 734,939 | | | $ | 7,919,032 | | |
| Shares repurchased | | | (3,499,573 | ) | | | (37,898,870 | ) | | | (654 | ) | | | (7,060 | ) | | | (321,449 | ) | | | (3,417,630 | ) | |
| Dividends reinvested | | | 176,113 | | | | 1,916,110 | | | | 44 | | | | 474 | | | | 9,381 | | | | 101,320 | | |
| Net increase | | | 8,675,583 | | | $ | 94,241,036 | | | | 593 | | | $ | 6,531 | | | | 422,871 | | | $ | 4,602,722 | | |
| | | Class Y | | Class P | | | |
| | | Shares | | Amount | | Shares | | Amount | | | | | |
| Shares sold | | | 5,687,399 | | | $ | 59,733,844 | | | | 25,986,192 | | | $ | 284,354,452 | | | | | | | | | | |
| Shares repurchased | | | (210,638 | ) | | | (2,205,286 | ) | | | (8,207,779 | ) | | | (89,122,799 | ) | | | | | | | | | |
| Dividends reinvested | | | — | | | | — | | | | 1,017,460 | | | | 11,100,483 | | | | | | | | | | |
| Net increase | | | 5,476,761 | | | $ | 57,528,558 | | | | 18,795,873 | | | $ | 206,332,136 | | | | | | | | | | |
329
UBS PACE Select Advisors Trust
Notes to financial statements
US Treasury Temporary Guarantee Program for Money Market Funds
UBS PACE Money Market Investments Portfolio participated in the US Treasury Department Temporary Guarantee Program for Money Market Funds. The program covered shareholders of mutual funds as of the close of business on September 19, 2008. The program expired on September 18, 2009. UBS PACE Money Market Investments Portfolio bore the cost of participating in this program, as this is not an expense borne by the advisor. UBS PACE Money Market Investments Portfolio paid a fee of 0.01% of the value of its outstanding shares on September 19, 2008 (valued at $1.00 per share) for participation in the program for the initial coverage period of September 19, 2008, through December 18, 2008. The program was first extended until April 30, 2009, and the UBS PACE Money Market Investments Portfolio paid a fee calculated in the same manner but at the rate of 0.015% for continued participation in the program through that date. In April, the prog ram was extended a final time, providing coverage through September 18, 2009. UBS PACE Money Market Investments Portfolio paid an additional fee for continued coverage for the period May 1, 2009 through September 18, 2009, calculated in the same manner and at the same 0.015% rate as for the initial extension period.
Subsequent events
In accordance with the provisions set forth in FAS 165 "Subsequent Events," management has evaluated the effect of subsequent events on the Portfolio's financial statements through September 25, 2009. Management has determined that there are no material subsequent events that would require disclosure in the Portfolio's financial statements through this date.
330
UBS PACE Select Advisors Trust
Report of Ernst & Young LLP, independent registered public accounting firm
The Board of Trustees and Shareholders of
UBS PACE Select Advisors Trust
We have audited the accompanying statements of assets and liabilities, including the portfolios of investments, of UBS PACE Select Advisors Trust (comprising, respectively, UBS PACE Money Market Investments, UBS PACE Government Securities Fixed Income Investments, UBS PACE Intermediate Fixed Income Investments, UBS PACE Strategic Fixed Income Investments, UBS PACE Municipal Fixed Income Investments, UBS PACE Global Fixed Income Investments, UBS PACE High Yield Investments, UBS PACE Large Co Value Equity Investments, UBS PACE Large Co Growth Equity Investments, UBS PACE Small/Medium Co Value Equity Investments, UBS PACE Small/Medium Co Growth Equity Investments, UBS PACE International Equity Investments, UBS PACE International Emerging Markets Equity Investments, UBS PACE Global Real Estate Securities Investments and UBS PACE Alternative Strategies Investments, collectively the "Trust") as of July 31, 2009, and the related statements of operations for the year then ended, the statements of changes in net assets for each of the two years in the period then ended, and the financial highlights for each of the periods indicated therein. These financial statements and financial highlights are the responsibility of the Trust's management. Our responsibility is to express an opinion on these financial statements and financial highlights based on our audits.
We conducted our audits in accordance with the standards of the Public Company Accounting Oversight Board (United States). Those standards require that we plan and perform the audit to obtain reasonable assurance about whether the financial statements and financial highlights are free of material misstatement. We were not engaged to perform an audit of the Trust's internal control over financial reporting. Our audits included consideration of internal control over financial reporting as a basis for designing audit procedures that are appropriate in the circumstances, but not for the purpose of expressing an opinion on the effectiveness of the Trust's internal control over financial reporting. Accordingly, we express no such opinion. An audit also includes examining, on a test basis, evidence supporting the amounts and disclosures in the financial statements and financial highlights, assessing the accounting principles used and s ignificant estimates made by management, and evaluating the overall financial statement presentation. Our procedures included confirmation of securities owned as of July 31, 2009, by correspondence with the custodian and others, or by other appropriate auditing procedures where replies from others were not received. We believe that our audits provide a reasonable basis for our opinion.
In our opinion, the financial statements and financial highlights referred to above present fairly, in all material respects, the financial position of each of the respective series constituting UBS PACE Select Advisors Trust at July 31, 2009, the results of their operations for the year then ended, the changes in their net assets for each of the two years in the period then ended, and the financial highlights for each of the indicated periods, in conformity with US generally accepted accounting principles.

New York, New York
September 25, 2009
331
UBS PACE Select Advisors Trust
Tax information (unaudited)
We are required by subchapter M of the Internal Revenue Code of 1986, as amended, to advise you within 60 days of each Portfolio's fiscal year end (July 31, 2009) as to the federal tax status of distributions received by shareholders during such fiscal year. Accordingly, the percentage of dividends paid that qualify for the dividends received deduction for corporate shareholders and the amount of foreign tax credit to be passed through to shareholders are as follows:
| Portfolio | | Dividend
Received
Deduction | | Foreign
Tax
Credit | |
| UBS PACE Large Co Value Equity Investments | | | 100 | % | | | — | | |
| UBS PACE Large Co Growth Equity Investments | | | 100 | % | | | — | | |
| UBS PACE Small/Medium Co Value Equity Investments | | | 98.39 | % | | | — | | |
| UBS PACE International Equity Investments | | | — | | | $ | 2,756,839 | | |
| UBS PACE International Emerging Markets Equity Investments | | | — | | | | 1,047,975 | | |
| UBS PACE Global Real Estate Securities Investments | | | 6.64 | % | | | — | | |
| UBS PACE Alternative Strategies Investments | | | 55.68 | % | | | — | | |
Also, for the fiscal year ended July 31, 2009, the foreign source income for information reporting purposes for UBS PACE International Equity Investments and UBS PACE International Emerging Markets Equity Investments is $32,146,666 and $10,236,530, respectively.
For the period ended July 31, 2009, certain dividends paid by the Portfolios below may be subject to a maximum tax rate of 15%, as provided for by the Jobs and Growth Tax Relief Reconciliation Act of 2003. Of the distributions paid during the period, the amounts below represent the maximum amount that may be considered qualified dividend income.
| Portfolio | | Maximum amount
considered qualified
dividend income | |
| UBS PACE Large Co Value Equity Investments | | $ | 24,067,706 | | |
| UBS PACE Large Co Growth Equity Investments | | | 1,291,989 | | |
| UBS PACE Small/Medium Co Value Equity Investments | | | 3,121,118 | | |
| UBS PACE International Equity Investments | | | 37,591,109 | | |
| UBS PACE International Emerging Markets Equity Investments | | | 5,178,821 | | |
| UBS PACE Global Real Estate Securities Investments | | | 854,192 | | |
| UBS PACE Alternative Strategies Investments | | | 2,920,045 | | |
Dividends received by tax-exempt recipients (e.g., IRAs and Keoghs) need not be reported as taxable income. Some retirement trusts (e.g., corporate, Keogh and 403(b)(7) plans) may need this information for their annual information reporting.
Shareholders should not use the above information to prepare their tax returns. Since each Portfolio's fiscal year is not the calendar year, another notification will be sent with respect to calendar year 2009. Such notification, which will reflect the amount to be used by calendar year taxpayers on their federal income tax returns, will be made in conjunction with Form 1099 DIV and will be mailed in February 2010. Shareholders are advised to consult their own tax advisers with respect to the tax consequences of their investment in each of the Portfolios.
332
UBS PACE Select Advisors Trust
General information (unaudited)
Quarterly Form N-Q portfolio schedule
Each Portfolio will file its complete schedule of portfolio holdings with the Securities and Exchange Commission ("SEC") for the first and third quarters of each fiscal year on Form N-Q. The Portfolios' Forms N-Q are available on the SEC's Web site at http://www.sec.gov. The Portfolios' Forms N-Q may be reviewed and copied at the SEC's Public Reference Room in Washington, D.C. Information on the operation of the SEC's Public Reference Room may be obtained by calling 1-800-SEC 0330. Additionally, you may obtain copies of Forms N-Q from the Portfolios upon request by calling 1-800-647 1568.
Proxy voting policies, procedures and record
You may obtain a description of each Portfolio's (1) proxy voting policies, (2) proxy voting procedures and (3) information regarding how a Portfolio voted any proxies related to portfolio securities during the most recent 12-month period ended June 30 for which an SEC filing has been made, without charge, upon request by contacting a Portfolio directly at 1-800-647 1568, online on a Portfolio's Web site: www.ubs.com/ubsglobalam-proxy, or on the EDGAR Database on the SEC's Web site (http://www.sec.gov).
Other tax information
Pursuant to Section 871(k)(2)(C) of the Internal Revenue Code, UBS PACE Money Market Investments designates 100% of its "qualified short-term gains" (as defined in Section 871(k)(2)(D)) related to the distribution made in December 2008 as short-term capital gain dividends.
333
UBS PACE Select Advisors Trust
Board Approvals of Investment Management and Administration Agreement and Subadvisory Agreements (unaudited)
February 2009 Board Meeting:
First Quadrant L.P.
Background—At a meeting of the Board of UBS PACESM Select Advisors Trust (the "Trust") on February 11, 2009, the members of the board, including the Trustees who are not "interested persons" of the Trust ("Independent Trustees"), as defined in the Investment Company Act of 1940, as amended (the "1940 Act"), considered and approved a proposed sub-advisory agreement between UBS Global Asset Management (Americas) Inc. ("UBS Global AM") and First Quadrant, L.P. ("First Quadrant") with respect to UBS PACE Alternative Strategies Investments (the "Portfolio") (the "Sub-Advisory Agreement"). In considering the approval of the Sub-Advisory Agreement, the board was able to draw on its knowledge of the Tr ust, its portfolios and UBS Global AM. The board took note of its knowledge of UBS Global AM and the investment advisory and sub-advisory agreements for the Portfolio and the other portfolios of the Trust, including the extensive materials the board had reviewed at its last annual contract renewal meeting for the portfolios in July 2008, and noted that it had at that time received a memorandum from its independent legal counsel discussing, among other things, the duties of the Trustees in considering approval of investment advisory and sub-advisory agreements. The board also received a memorandum from UBS Global AM discussing UBS Global AM's reasons for recommending First Quadrant as an investment advisor for the Portfolio.
In its consideration of the approval of the Sub-Advisory Agreement, the board considered the following factors:
Nature, Extent and Quality of the Services under the Sub-Advisory Agreement—The board's evaluation of the services to be provided by First Quadrant to the Portfolio took into account the board's knowledge and familiarity gained as board members of funds in the UBS New York fund complex, including the Trust and its portfolios. The board considered UBS Global AM's reasons for recommending First Quadrant as an investment advisor for the Portfolio, including that the Portfolio had reached a size sufficient to support the retention of a fourth investment advisor with a strategy that complements those of the current investment advisors for the Portfolio. In that connection, the board also approved certain changes to the allocations and investment strategies of Analytic Investors, LLC and Wellington Management Company, LLP, two other investment advisors for the Portfolio, to reflect the addition of First Quadrant and its global macro strategy. The board also received materials from First Quadrant detailing First Quadrant's global macro strategy and met with representatives of First Quadrant, who discussed with the board their investment process and the backgrounds and qualifications of the portfolio management team members. The board concluded that, overall, it was satisfied with the nature, extent and quality of services expected to be provided to the Portfolio under the Sub-Advisory Agreement.
Sub-Advisory Fee—The board reviewed and considered the proposed contractual sub-advisory fee to be payable by UBS Global AM in light of the nature, extent and quality of the sub-advisory services anticipated to be provided by First Quadrant. The board noted that, as explained by UBS Global AM, the fee payable to First Quadrant was based on the use of the global macro strategy and that, as a result of certain other changes, the overall blended fee rate charged by the investment advisors and paid by UBS Global AM was expected to decrease. However, the board also considered that the compensation to be paid to First Quadrant would be paid by UBS Global AM, not the Portfolio and, accordingly, that the retention of First Quadrant would not affect the fees otherwise incurred by the Portfolio's shareholders. Taking all of the above into consideration, th e board determined that the proposed sub-advisory fee was reasonable in light of the nature, extent and quality of the services proposed to be provided to the Portfolio under the Sub-Advisory Agreement.
334
UBS PACE Select Advisors Trust
Board Approvals of Investment Management and Administration Agreement and Subadvisory Agreements (unaudited)
Fund Performance—The board received and considered composite performance information and certain other performance information provided by management and First Quadrant with respect to accounts managed by First Quadrant in the global macro style. The board also noted that, as First Quadrant would be a new investment advisor for the Portfolio, the current performance of the Portfolio was not directly relevant to the consideration of the approval of the Sub-Advisory Agreement.
Advisor Profitability—Profitability of UBS Global AM or its affiliates in providing services to the Portfolio was not a factor considered by the board, as the sub-advisory fee would be paid by UBS Global AM out of the management fee paid to it by the Portfolio, and not by the Portfolio. However, the board did take note that the overall blended advisory fee rate paid by UBS Global AM to the Portfolio's investment advisors was expected to decrease. Given that the board routinely reviews the profitability of UBS Global AM on an annual basis, the board decided to take into account the new fee retention levels as part of its next annual contract review later in 2009.
Economies of Scale—The board noted that, as the sub-advisory fee for the Portfolio would be paid by UBS Global AM, not by the Portfolio, consideration of economies of scale with respect specifically to the sub-advisory fee were not relevant.
Other Benefits to First Quadrant—The board was informed by management that First Quadrant's relationship with the Portfolio would be limited to its provision of sub-advisory services to the Portfolio and that therefore management believed that First Quadrant did not receive tangible ancillary benefits as a result of its relationship with the Portfolio, with the exception of possible benefits from soft dollars for the Portfolio (which would also potentially benefit the Portfolio). The board recognized that First Quadrant could receive intangible benefits from its association with the Portfolio, such as increased name recognition or publicity from being selected as an investment advisor for the Portfolio after an extensive review process. Similarly, the Portfolio could benefit from having an investment advisor with an established or well-regarded r eputation.
In light of all of the foregoing, the board approved the Sub-Advisory Agreement for the Portfolio, contingent upon the favorable completion by UBS Global AM's compliance department of its review of First Quadrant, which was completed subsequent to the board's meeting on February 11, 2009.
No single factor reviewed by the board was identified by the board as the principal factor in determining whether to approve the Sub-Advisory Agreement. The Independent Trustees were advised by separate independent legal counsel throughout the process. The board discussed the proposed approval of the Sub-Advisory Agreement in a private session with their independent legal counsel at which no representatives of UBS Global AM or First Quadrant were present.
Analytic Investors, LLC
At the same meeting, the members of the board, including the Independent Trustees, also considered and approved a proposed sub-advisory agreement (the "Analytic Investors Sub-Advisory Agreement") between UBS Global AM and Analytic Investors with respect to the Portfolio. The board was asked to approve the Analytic Investors Sub-Advisory Agreement as Analytic Investors had agreed to a reduced sub-advisory fee schedule to reflect the fact that Analytic Investors would no longer be providing its complex global tactical asset allocation and index option strategies to the Portfolio. (It was proposed that the then effective sub-advisory agreement with Analytic Investors be replaced by a newer, substantially similar agreement, but with a lower fee schedule.)
335
UBS PACE Select Advisors Trust
Board Approvals of Investment Management and Administration Agreement and Subadvisory Agreements (unaudited)
In its consideration of the approval of the proposed Analytic Investors Sub-Advisory Agreement, the board considered the following factors:
Nature, Extent and Quality of the Services under the Analytic Investors Sub-Advisory Agreement—The board's evaluation of the services expected to be provided by Analytic Investors to the Portfolio took into account the board's knowledge and familiarity gained as board members of funds in the UBS New York fund complex, including the Trust and its portfolios. The board noted that Analytic Investors had served as a sub-advisor to the Portfolio since April 2006 and the portfolio management services provided by Analytic Investors were proposed to change in connection with the approval of the proposed sub-advisory agreement with First Quadrant, as First Quadrant would now provide a global macro strategy for the Portfolio. The board considered a presentation by management on the sub-adviser reallocations and the investment strategies to be implemented b y the sub-advisers for the Portfolio. The board concluded that, overall, it was satisfied with the nature, extent and quality of services expected to be provided to the Portfolio under the proposed Analytic Investors Sub-Advisory Agreement.
Sub-Advisory Fee—The board reviewed and considered the proposed contractual sub-advisory fee to be payable by UBS Global AM in light of the nature, extent and quality of the sub-advisory services anticipated to be provided by Analytic Investors. The board considered that the sub-advisory fee rate was proposed to be reduced as a result of management's proposal to no longer employ two of the three investment strategies then being used by Analytic Investors in sub-advising Portfolio assets. The board considered that the compensation to be paid to Analytic Investors would be paid by UBS Global AM, not the Portfolio and, accordingly, that the continued retention of Analytic Investors would not reduce the fees otherwise incurred by the Portfolio's shareholders. The board considered the impact to UBS Global AM of the reduced fees it would pay to Analyti c Investors. The board determined that the proposed sub-advisory fee was reasonable in light of the nature, extent and quality of the services proposed to be provided to the Portfolio under the Analytic Investors Sub-Advisory Agreement.
Other Factors—Portfolio performance, profitability, economies of scale and other benefits to Analytic Investors were not factors specifically considered by the board in its approval of the Analytic Investors Sub-Advisory Agreement, although the board reviewed Portfolio performance generally, as it does at each regular board meeting. The board noted that, as Analytic Investors would be providing only one of the three investment strategies it was then employing with respect to Portfolio assets, prior Portfolio performance was of limited relevance to the board's consideration of Analytic Investors. The board took note that it would review the Analytic Investors Sub-Advisory Agreement and Analytic Investors again at its July 2009 annual contract renewal meeting for the Trust and would consider these factors at that time.
In light of all of the foregoing, the board approved the proposed Analytic Investors Sub-Advisory Agreement for the Portfolio. No single factor reviewed by the board was identified by the board as the principal factor in determining whether to approve the Analytic Investors Sub-Advisory Agreement. The Independent Trustees were advised by separate independent legal counsel throughout the process.
336
UBS PACE Select Advisors Trust
Board Approvals of Investment Management and Administration Agreement and Subadvisory Agreements (unaudited)
May 2009 Board Meeting:
Buckhead Capital Management, LLC and Systematic Financial Management, L.P.
Background—At a meeting of the board of UBS PACESM Select Advisors Trust (the "Trust") on May 6, 2009, the members of the board, including the Trustees who are not "interested persons" of the Trust ("Independent Trustees"), as defined in the Investment Company Act of 1940, as amended (the "1940 Act"), considered and approved (1) a proposed sub-advisory agreement between UBS Global Asset Management (Americas) Inc. ("UBS Global AM") and Buckhead Capital Management, LLC ("Buckhead") and (2) a proposed sub-advisory agreement between UBS Global AM and Systematic Financial Management, L.P. ("Systematic"), each with respect to UBS PACE Small/Medium Co Value Equity Investments (the "Portfolio") (each a "Sub-Advisory Agreement"). In considering the approval of the Sub-Advisory Agreements, the board was able to draw on its knowledge of the Trust , its portfolios and UBS Global AM. The board took note of its knowledge of UBS Global AM and the investment advisory and sub-advisory agreements for the other portfolios of the Trust, including the extensive materials the board had reviewed at its last annual contract renewal meeting for the portfolios in July 2008, and noted that it had at that time received a memorandum from its independent legal counsel discussing, among other things, the duties of the Trustees in considering approval of advisory and sub-advisory agreements. The board also received a memorandum from UBS Global AM discussing UBS Global AM's reasons for recommending Buckhead and Systematic as investment advisors for the Portfolio.
In its consideration of the approval of the Sub-Advisory Agreements, the Board considered the following factors:
Nature, Extent and Quality of the Services under the Sub-Advisory Agreements—The board's evaluation of the services to be provided by Buckhead and Systematic to the Portfolio took into account the board's knowledge and familiarity gained as board members of funds in the UBS New York fund complex, including the Trust and its portfolios. The board took note of management's reasons for recommending Buckhead and Systematic as investment advisors to the Portfolio, including that the changes would result in a portfolio less dependent upon specific style factors. The board also received materials from each of Buckhead and Systematic detailing each investment advisor's investment strategy and met with the portfolio management team and other representatives of each of Buckhead and Systematic, who discussed with the board their investment process and the b ackgrounds and qualifications of the portfolio management team. The board concluded that, overall, it was satisfied with the nature, extent and quality of services expected to be provided to the Portfolio under the proposed Sub-Advisory Agreements.
Sub-Advisory Fees—The board reviewed and considered the proposed contractual sub-advisory fees to be payable by UBS Global AM to each of Buckhead and Systematic in light of the nature, extent and quality of the sub-advisory services anticipated to be provided by Buckhead and Systematic, respectively. The board took note that the proposed sub-advisory fees, in the aggregate with the sub-advisory fees of MetWest Capital Management, LLC (the Portfolio's remaining other sub-advisor), would be equal to the current aggregate sub-advisory fees. (Buckhead and Systematic were being proposed as sub-advisors in conjunction with the proposal to terminate two other firms that had been serving as sub-advisors to the Portfolio—namely, Ariel Investments, LLC and Opus Capital Management.) The board also considered that the compensation to be paid to Buckhead and Systematic would be paid by UBS Global AM, not the Portfolio, and, accordingly, that the retention of Buckhead and Systematic would not affect the fees otherwise incurred by the Portfolio's shareholders. Taking all of the above into consideration, the board determined
337
UBS PACE Select Advisors Trust
Board Approvals of Investment Management and Administration Agreement and Subadvisory Agreements (unaudited)
that each proposed sub-advisory fee was reasonable in light of the nature, extent and quality of the services proposed to be provided to the Portfolio under the applicable Sub-Advisory Agreement.
Fund Performance—The board received and considered composite performance information provided by each of Buckhead and Systematic. The board also noted that, as each of Buckhead and Systematic would be a new investment advisor to the Portfolio, the current performance of the Portfolio was not relevant to the consideration of the approval of either Sub-Advisory Agreement.
Advisor Profitability—Profitability of UBS Global AM or its affiliates in providing services to the Portfolio was not a factor considered by the board, as the sub-advisory fees would be paid by UBS Global AM out of the management fee paid to it by the Portfolio, and not by the Portfolio.
Economies of Scale—The board noted that, as the sub-advisory fees for the Portfolio would be paid by UBS Global AM, not by the Portfolio, considerations of economies of scale with respect specifically to the sub-advisory fees were not relevant.
Other Benefits to Buckhead and Systematic—The board was informed by management that each of Buckhead's and Systematic's relationship with the Portfolio would be limited to its provision of sub-advisory services to the Portfolio and that therefore management believed that neither Buckhead nor Systematic would receive tangible ancillary benefits as a result of its relationship with the Portfolio, with the exception of possible benefits from soft dollars for the Portfolio (which also would potentially benefit the Portfolio). The board recognized that Buckhead and Systematic could each receive intangible benefits from its association with the Portfolio, such as increased name recognition or publicity from being selected as an investment advisor to the Portfolio after an extensive review process. Similarly, the Portfolio could benefit from having an i nvestment advisor with an established or well-regarded reputation.
In light of all of the foregoing, the board approved the Sub-Advisory Agreements for the Portfolio contingent, with respect to Buckhead, upon the favorable completion by UBS Global AM's compliance department of its review of Buckhead, which was completed subsequent to the board's meeting on May 6, 2009.
No single factor reviewed by the board was identified by the board as the principal factor in determining whether to approve either Sub-Advisory Agreement. The Independent Trustees were advised by separate independent legal counsel throughout the process. The board discussed the proposed approval of each Sub-Advisory Agreement in a private session with its independent legal counsel at which no representatives of UBS Global AM, Buckhead or Systematic were present.
Goldman Sachs Asset Management, L.P.
At the same meeting, the members of the board, including the Independent Trustees, considered and approved a proposed sub-advisory agreement (the "GSAM Sub-Advisory Agreement") between UBS Global AM and Goldman Sachs Asset Management, L.P. ("GSAM") with respect to UBS PACE Alternative Strategies Investments (the "Portfolio"). The board was asked to approve the GSAM Sub-Advisory Agreement as GSAM had agreed to a reduced sub-advisory fee schedule. (It was proposed that the then effective sub-advisory agreement with GSAM be replaced by a newer, substantially similar agreement, but with a lower fee schedule.)
338
UBS PACE Select Advisors Trust
Board Approvals of Investment Management and Administration Agreement and Subadvisory Agreements (unaudited)
In its consideration of the approval of the GSAM Sub-Advisory Agreement, the board considered the following factors:
Nature, Extent and Quality of the Services under the GSAM Sub-Advisory Agreement—The board's evaluation of the services currently provided and expected to be provided by GSAM to the Portfolio took into account the board's knowledge and familiarity gained as board members of funds in the UBS New York fund complex, including the Trust and its portfolios. The board noted that GSAM had served as a sub-advisor to the Portfolio since September 2007 and that no terms of the then-current sub-advisory agreement between GSAM and UBS Global AM, other than the reduction in the sub-advisory fee, and no changes from the services provided by GSAM to the Portfolio under the then-current sub-advisory agreement, were being proposed. The board concluded that, overall, it was satisfied with the nature, extent and quality of services expected to be provided to the Po rtfolio under the proposed GSAM Sub-Advisory Agreement.
Sub-Advisory Fee—The board reviewed and considered the proposed contractual sub-advisory fee to be payable by UBS Global AM in light of the nature, extent and quality of the sub-advisory services anticipated to be provided by GSAM. The board considered that the compensation to be paid to GSAM would be paid by UBS Global AM, not the Portfolio and, accordingly, that the continued retention of GSAM would not reduce the fees otherwise incurred by the Portfolio's shareholders. The board considered the impact to UBS Global AM of the reduced fees it would pay to GSAM. The board determined that the proposed sub-advisory fee was reasonable in light of the nature, extent and quality of the services proposed to be provided to the Portfolio under the GSAM Sub-Advisory Agreement.
Other Factors—Portfolio performance, profitability, economies of scale and other benefits to GSAM were not factors specifically considered by the board in its approval of the GSAM Sub-Advisory Agreement (although the board reviewed Portfolio performance generally, as it does at each regular board meeting), as no changes to the then-current sub-advisory agreement for GSAM, other than the reduced sub-advisory fee schedule, were being proposed. The board took note that it would review the GSAM Sub-Advisory Agreement and GSAM again at its July 2009 annual contract renewal meeting for the Trust and would consider these factors at that time.
In light of all of the foregoing, the board approved the proposed GSAM Sub-Advisory Agreement for the Portfolio. No single factor reviewed by the board was identified by the board as the principal factor in determining whether to approve the GSAM Sub-Advisory Agreement. The Independent Trustees were advised by separate independent legal counsel throughout the process.
339
UBS PACE Select Advisors Trust
Board Approvals of Investment Management and Administration Agreement and Subadvisory Agreements (unaudited)
Background—At a meeting of the board of UBS PACESM Select Advisors Trust (the "Trust") on July 15-16, 2009, the members of the board, including the Trustees who are not "interested persons" of the Trust ("Independent Trustees"), as defined in the Investment Company Act of 1940, as amended (the "1940 Act"), considered and approved the continuance of the investment management and administration agreement (the "Investment Management and Administration Agreement") between UBS Global Asset Management (Americas) Inc. ("UBS Global AM") and the Trust, on behalf of each series of the Trust (each a "Portfolio" and together the "Portfolios") and, for those Portfolios with Subadvisors, the subadvisory agreements for the Portfolios. (Throughout this discussion, each subadvisor to a Portfolio is referred to as a "Subadvisor" and each subadvisory agr eement is referred to as a "Subadvisory Agreement.") In preparing for the meeting, the board members had requested and received extensive information from UBS Global AM to assist them, including information about the Portfolios' Subadvisors, as well as the management, subadvisory, administrative and distribution arrangements for the Portfolios. The Independent Trustees discussed the materials initially provided by management prior to the scheduled board meeting. The Independent Trustees also met in executive session after management's presentation was completed to review the disclosure that had been made to them at the meeting. At all of these sessions the Independent Trustees were joined by their independent legal counsel. The Independent Trustees also received a memorandum from their independent legal counsel discussing the duties of board members in considering approval of management, subadvisory, administration and distribution agreements.
In its consideration of the approval of the Investment Management and Administration Agreement and the Subadvisory Agreements, the board considered the following factors:
Nature, extent and quality of the services under the Investment Management and Administration Agreement and the Subadvisory Agreements—The board received and considered information regarding the nature, extent and quality of management services provided to the Portfolios by UBS Global AM and, for those Portfolios with Subadvisor(s), subadvisory services provided by the particular Subadvisor during the past year. The board also considered the nature, extent and quality of administrative, distribution, and shareholder services performed by UBS Global AM and its affiliates for the Portfolios and the resources devoted to, and the record of compliance with, each Portfolio's compliance policies and procedures. The board noted that it received information at regular meetings throughout the year regarding the services rendered by UBS Global AM concerning the management of each Portfolio's affairs and UBS Global AM's role in coordinating providers of other services to the Portfolios. The board noted the complexity of this process for the Portfolios, given their broad range of investment strategies. The board noted that UBS Global AM provided extensive oversight of the Subadvisors for the Portfolios and reported to the board at each meeting on the Subadvisors' performance and made recommendations with respect to Subadvisor changes from time to time based on the performance of the Subadvisors and certain other relevant factors. The board's evaluation of the services provided by UBS Global AM and the Subadvisors took into account the board's knowledge and familiarity gained as board members of funds in the UBS New York fund complex, including the scope and quality of UBS Global AM's investment management and other capabilities and the quality of its administrative and other services. The board observed that the scope of services provided by UBS Global AM had ex panded over time as a result of regulatory and other developments, including maintaining and monitoring its own and the Portfolios' expanded compliance programs. It also was noted that the Investment Management and Administration Agreement under consideration had been approved by shareholders at a special meeting of shareholders held in 2008, relatively recently.
The board had available to it information regarding the qualifications, backgrounds and responsibilities of the senior personnel at UBS Global AM responsible for the Portfolios and had previously received information regarding the person, persons or portfolio management team primarily responsible for the day-to-day portfolio
340
UBS PACE Select Advisors Trust
Board Approvals of Investment Management and Administration Agreement and Subadvisory Agreements (unaudited)
management of each Portfolio and recognized that the Portfolios' senior personnel at UBS Global AM report to the board regularly and that at each regular meeting the board receives a detailed report on each Portfolio's performance and receives more extensive information periodically from each Subadvisor. The board also considered, based on its knowledge of UBS Global AM and its affiliates, the financial resources available to UBS Global AM and its parent organization, UBS AG. In that regard, the board received extensive financial information regarding UBS Global AM and noted that it was a wholly owned, indirect subsidiary of one of the largest financial services firms in the world. It was also noted that UBS Global AM had approximately $142 billion in assets under management and was part of the UBS Global Asset Management Division, which had approximately $507 billion of assets under management worldwide as of March 31, 2009. The board was also cognizant of, and considered, the regulatory and litigation actions and investigations occurring in the past few years involving UBS AG, UBS Global AM and certain of their affiliates.
The board concluded that, overall, it was satisfied with the nature, extent and quality of services provided (and expected to be provided) to the Portfolios under the Investment Management and Administration Agreement as well as under the Subadvisory Agreements.
Management and subadvisory fees and expense ratios—For each Portfolio, the board reviewed and considered the contractual management fee (each, a "Contractual Management Fee") payable by the Portfolio to UBS Global AM in light of the nature, extent and quality of the advisory and administrative services provided by UBS Global AM. The board also reviewed and considered the fee waiver and/or expense reimbursement arrangements for the Portfolio (if any) and considered the actual fee rate (after taking any waivers and reimbursements into account) (the "Actual Management Fee"). The board considered whether UBS Global AM had entered into one or more fee waiver and/or expense reimbursement agreements with a Portfolio under which UBS Global AM was contractually obligated to waive its management fees and/or reimburse the Portfolio so that the total ordinar y operating expenses of certain or all classes of a given Portfolio through November 30, 2009 (excluding extraordinary items, dividend expense, borrowing costs and/or interest expense, if any) would not exceed specified limits for each class (or, with respect to certain Portfolios, an agreement to waive a portion of its management fee). The board also considered that each Portfolio with such a fee waiver/reimbursement agreement had agreed to repay UBS Global AM for those waived fees and/or reimbursed expenses if the Portfolio can do so over the following three fiscal years without causing its expenses in any of those years to exceed the expense caps. Additionally, the board received and considered information comparing each Portfolio's Contractual Management Fee, Actual Management Fee and overall expenses with those of funds in a group of funds selected and provided by Lipper, Inc. ("Lipper"), an independent provider of investment company data (the "Expense Group"), and, when available, the board also receiv ed comparative data on a subset of the Expense Group that included only subadvised funds. A discussion of the board's considerations with respect to each Portfolio's fees is set forth below.
In addition, management explained the effect the past year's financial crisis and shareholder purchase/redemption activity had on each Portfolio's assets and the corresponding effect that that had on each Portfolio's "fixed" costs (i.e., those costs that can be relatively independent of increases/decreases in overall levels of Portfolio assets), specifically transfer agency fees and other non-management expenses. Management noted that the Lipper data that the board received for each Portfolio's Expense Group was calculated based on a full year of financial results for periods ended during 2008, which may not reflect the full impact of the financial crisis and resulting overall general decline in assets, whereas each Portfolio's expense data which Lipper used in its quintile comparison rankings was annualized based on the six-month period ended January 31, 2009, which reflected most of the impact of the financial crisis. Therefor e, management explained that this timing and methodology difference could affect the comparability of the Lipper data with respect to each Portfolio's expenses and the Lipper results of quintile comparison rankings of the Portfolios, as the reduced asset levels of a Portfolio in comparison with its Expense Group could cause the Portfolio's comparative total expenses to
341
UBS PACE Select Advisors Trust
Board Approvals of Investment Management and Administration Agreement and Subadvisory Agreements (unaudited)
appear worse than they otherwise would, and that this effect had occurred for several Portfolios. The board acknowledged this issue, recognizing that comparisons of annualized Portfolio data each year with industry data for a full year would produce some anomalies; however, such data was still viewed as useful and relevant to the Board's analysis.
In connection with its consideration of each Portfolio's management fees, the board also received information on UBS Global AM's standard institutional account fees for accounts of a similar investment type to each of the Portfolios. The board noted that, in general, these fees were lower than the Contractual Management Fees and Actual Management Fees for the Portfolios, but also noted management's explanation that comparisons with such accounts may be of limited relevance given the different structures and regulatory requirements of mutual funds versus such accounts and the differences in the levels of services required by mutual funds and such accounts. The board also received information on fees charged to other mutual funds managed by UBS Global AM. The board did not receive comparative information from Lipper with respect to the subadvisory fees for those Portfolios with Subadvisors in connection with its consideration of s ubadvisory fees. The board observed that it had received certain information regarding fees, profitability, compensation from other similar funds, and economies of scale from certain Subadvisors as part of the summary of each Subadvisor's responses to requests for due diligence materials in connection with the board's consideration of the approvals of the Subadvisory Agreements; however, the board also observed that the compensation paid to a Subadvisor is paid by UBS Global AM, not the particular Portfolio and, accordingly, that the retention of a Subadvisor generally does not increase the fees otherwise incurred by a Portfolio's shareholders (unless a management fee waiver level was affected by a subadvisory fee increase).
Portfolio performance—For each Portfolio, the board received and considered (a) annualized total return information of the Portfolio compared to other funds (the "Performance Universe") selected by Lipper over the one-, three-, five-, ten- (or shorter for newer Portfolios) year and since inception periods ended April 30, 2009, and (b) annualized performance information for each year in the ten-year (or shorter) period ended April 30, 2009. The board was provided with a description of the methodology Lipper used to determine the similarity of a Portfolio with the funds included in its Performance Universe. The board also considered UBS Global AM's statement that while management believed that the Lipper peer groups were useful in evaluating Portfolio expenses relative to peers, they were less useful in evaluating performance, as in many cases they were broad-based and consisted of funds that did not necessarily have similar investment parameters to the applicable Portfolio. The board also noted that it had received information throughout the year at periodic intervals with respect to each Portfolio's performance, including in most cases with respect to certain benchmark indices, including with respect to each Subadvisor's performance. Further discussion of the board's considerations with respect to each Portfolio's performance is set forth below.
Adviser profitability—The board received and considered a profitability analysis of UBS Global AM and its affiliates in providing services to each Portfolio. The board also received profitability information with respect to the UBS New York fund complex as a whole. UBS Global AM's profitability was considered not excessive in light of the nature, extent and quality of the services provided to the Portfolios. To the extent provided by a Subadvisor, the board also reviewed information with respect to the Subadvisor's profitability in providing services to the Portfolios. The board did not consider such Subadvisor profitability information highly relevant as the subadvisory fees are paid by UBS Global AM, not by the relevant Portfolio.
Economies of scale—The board received and considered information from management regarding whether UBS Global AM realized economies of scale as the Portfolios' assets grew, whether the Portfolios have appropriately benefited from any economies of scale, and whether there is potential for realization of any
342
UBS PACE Select Advisors Trust
Board Approvals of Investment Management and Administration Agreement and Subadvisory Agreements (unaudited)
further economies of scale for the Portfolios. The board considered whether economies of scale in the provision of services to the Portfolios were being passed along to the shareholders. The board noted that each Portfolio's Contractual Management Fee contained breakpoints, with the exception of UBS PACE Money Market Investments. The board also noted that as of April 30, 2009, with the exception of UBS PACE Small/Medium Co Growth Equity Investments, UBS PACE Small/Medium Co Value Equity Investments, UBS PACE International Emerging Markets Equity Investments, UBS PACE Alternative Strategies Investments, UBS PACE Global Real Estate Securities Investments, UBS PACE High Yield Investments and UBS Global Fixed Income Investments for those Portfolios having breakpoints, each Portfolio's asset level exceeded its first breakpoint. Accordingly, the board determined that actual economies of scale existed for those Portfolios whose assets had reached the first breakpoint level and potential economies of scale existed for those Portfolios whose assets had not yet reached their first breakpoint level. The board also noted that to the extent a Portfolio's assets have increased over time, it has realized other economies of scale as certain expenses, such as fees for Trustees, auditor and legal fees and printing and postage, become a smaller percentage of overall assets. The board also took note of the relationship between any breakpoints in a subadvisory fee and the breakpoints in fees paid by the Portfolios to UBS Global AM.
Generally, in light of UBS Global AM's profitability data, the Actual Management Fee, the Contractual Management Fee and the breakpoints currently in place for the Portfolios, the board believed that UBS Global AM's sharing of potential and current economies of scale with the Portfolios was acceptable.
Other benefits to UBS Global AM and the Subadvisors—The board considered other benefits received by UBS Global AM and its affiliates as a result of their relationships with the Portfolios, including the opportunity to offer additional products and services to Portfolio shareholders. The board was informed by management that the Subadvisors' relationships with the subadvised Portfolios were limited to their provision of subadvisory services to these Portfolios, and that therefore, management believed that the Subadvisors and their affiliates did not receive tangible ancillary benefits as a result of their relationships with the subadvised Portfolios, with the exception of possible benefits from soft dollars for the equity Portfolios (which would also potentially benefit such Portfolios) and possible limited benefits to certain affiliates of a Suba dvisor, such as broker-dealers (e.g., an affiliate's execution of Portfolio transactions subject to detailed restrictions in SEC rules and board oversight procedures). The board recognized that certain Subadvisors could receive intangible benefits from their association with the Trust, such as increased name recognition or publicity from being selected as Subadvisors to the Trust after an extensive review process. Similarly, a Portfolio could benefit from having a Subadvisor with an established or well-regarded reputation. In light of the costs of providing investment management, administrative and other services to the Portfolios and UBS Global AM's ongoing commitment to the Portfolios, the profits and other ancillary benefits that UBS Global AM and its affiliates received were considered reasonable.
In the discussions that follow, reference is made to "quintile" placement in Lipper expense group and performance universe categories. With respect to expenses, the first quintile represents that 20% of the funds in the Expense Group with the lowest fees or expenses, as applicable, and the fifth quintile represents that 20% of the funds in the Expense Group with the highest fees or expenses, as applicable. With respect to performance, the first quintile represents that 20% of the funds in the Performance Universe with the best relative performance, and the fifth quintile represents that 20% of the funds in the Performance Universe with the worst relative performance. Lipper quintile placement information is calculated on a share class basis. References to quintile placement appearing below relate to Class A shares, and the Board had information relevant to other share classes (e.g., Class P shares) during its considerations.
343
UBS PACE Select Advisors Trust
Board Approvals of Investment Management and Administration Agreement and Subadvisory Agreements (unaudited)
UBS PACE Large Co Growth Equity Investments
In approving the Investment Management and Administration Agreement and the Subadvisory Agreements with each of Delaware Management Company, Wellington Management Company, LLP, Marsico Capital Management, LLC and SSgA Funds Management, Inc., the board, including the Independent Trustees, also considered the following factors:
Portfolio performance—The comparative Lipper information showed that the Portfolio's performance was in the third quintile for the one-, three- and five-year periods and in the fourth quintile since inception. Management noted the Portfolio's improving performance relative to its Performance Universe over the short- and intermediate-term periods.
Management and subadvisory fees and expense ratios—The comparative Lipper information showed that the Portfolio's Contractual Management Fee and Actual Management Fee were in the fourth quintile and that its total expenses were in the third quintile in the Portfolio's Expense Group for the comparison periods utilized in the Lipper report. Management explained that although the Portfolio's Contractual and Actual Management Fee were above the median for the Portfolio's Expense Group, the Portfolio's Actual Management Fee was close to the Expense Group's median and the Portfolio's total expenses were only slightly above the Expense Group's median. In addition, management noted that the Portfolio's total expenses were below the medians of a subset of the Portfolio's Expense Group that consisted of only sub-advised funds.
UBS PACE Large Co Value Equity Investments
In approving the Investment Management and Administration Agreement and the Subadvisory Agreements with each of Pzena Investment Management, LLC, Westwood Management Corporation and Institutional Capital LLC, the board, including the Independent Trustees, also considered the following factors:
Portfolio performance—The comparative Lipper information showed that the Portfolio's performance was in the third quintile for the one- and three-year periods and in the second quintile for the five-year period and since inception.
Management and subadvisory fees and expense ratios—The comparative Lipper information showed that the Portfolio's Contractual Management Fee was in the fourth quintile and its Actual Management Fee and total expenses were in the fifth quintile. Management noted that the Portfolio's Actual Management Fee and total expenses were slightly below the median of a subset of the Portfolio's Expense Group that consisted of only sub-advised funds.
UBS PACE Small/Medium Co Growth Equity Investments
In approving the Investment Management and Administration Agreement and the Subadvisory Agreements with Copper Rock Capital Partners, LLC, Palisade Capital Management L.L.C. and Riverbridge Partners, LLC, the board, including the Independent Trustees, also considered the following factors:
Portfolio performance—The comparative Lipper information showed that the Portfolio's performance was in the first quintile for the one-year period, the third quintile for the three-year period and since inception and the fourth quintile for the five-year period. Management noted the Portfolio's improving performance relative
344
UBS PACE Select Advisors Trust
Board Approvals of Investment Management and Administration Agreement and Subadvisory Agreements (unaudited)
to its Performance Universe and that taking into account the Performance Group's volatility, the Portfolio's performance was close to the Performance Group's median for the five year period and since inception.
Management and subadvisory fees and expense ratios—The comparative Lipper information showed that the Portfolio's Contractual Management Fee and Actual Management Fee were in the third quintile and its total expenses were in the fourth quintile. Management noted that the Portfolio's Actual Management Fee and total expenses were below the median of a subset of the Portfolio's Expense Group that consisted of only sub-advised funds.
UBS PACE Small/Medium Co Value Equity Investments
Background—In approving the Investment Management and Administration Agreement and the Subadvisory Agreements with each of Buckhead Capital Management, LLC, Metropolitan West Capital Management, LLC and Systematic Financial Management L.P., the board, including the Independent Trustees, also considered the following factors:
Portfolio performance—The comparative Lipper information showed that the Portfolio's performance was in the second quintile for the one- and three-year periods and in the fourth quintile for the five-year period and since inception. Management noted the Portfolio's improving performance relative to its Performance Universe and that taking into account the Performance Group's volatility, the Portfolio's performance was close to the Performance Group's median for the five year period and since inception.
Management and subadvisory fees and expense ratios—The comparative Lipper information showed that the Portfolio's Contractual Management Fee and total expenses were in the second quintile and its Actual Management Fee was in the first quintile in the Portfolio's Expense Group for the comparison periods utilized in the Lipper report.
UBS PACE International Equity Investments
In approving the Investment Management and Administration Agreement and the Subadvisory Agreements with each of Martin Currie Inc., Mondrian Investment Partners Ltd. and J.P. Morgan Investment Management Inc., the board, including the Independent Trustees, also considered the following factors:
Portfolio performance—The comparative Lipper information showed that the Portfolio's performance was in the third quintile for the one- and five-year periods and since inception and in the fourth quintile for the three-year period. Management noted to the board that although the Portfolio's three-year return was below the Portfolio's Performance Universe median, taking into account the volatility of the Portfolio's returns the three-year return was close to the median. In addition, Management noted the Portfolio's most recent improving performance relative to its Performance Universe.
Management and subadvisory fees and expense ratios—The comparative Lipper information showed that the Portfolio's Contractual Management Fee was in the second quintile and its Actual Management Fee and total expenses were in the third quintile in the Portfolio's Expense Group for the comparison periods utilized in the Lipper report.
345
UBS PACE Select Advisors Trust
Board Approvals of Investment Management and Administration Agreement and Subadvisory Agreements (unaudited)
UBS PACE International Emerging Markets Equity Investments
In approving the Investment Management and Administration Agreement and the Subadvisory Agreements with each of Gartmore Global Partners and Mondrian Investment Partners Ltd., the board, including the Independent Trustees, also considered the following factors:
Portfolio performance—The comparative Lipper information showed that the Portfolio's performance was in the third quintile for the one- and five-year periods, in the second quintile for the three-year period and in the fifth quintile since inception. Management noted the Portfolio's improving performance relative to its Performance Universe over the short- and intermediate-term periods and that earlier performance was primarily attributable to previous subadvisors.
Management and subadvisory fees and expense ratios—The comparative Lipper information showed that the Portfolio's Contractual Management Fee was in the third quintile and its Actual Management Fee was in the fourth quintile, while its total expenses were in the fifth quintile in the Portfolio's Expense Group for the comparison periods utilized in the Lipper report. Management noted that the Portfolio's total expenses were at the median of a subset of the Portfolio's Expense Group that consisted of only sub-advised funds.
UBS PACE Alternative Strategies Investments
In approving the Investment Management and Administration Agreement and the Subadvisory Agreements with each of Analytic Investors, LLC, Goldman Sachs Asset Management, L.P., First Quadrant L.P. and Wellington Management Company, LLP, the board, including the Independent Trustees, also considered the following factors:
Portfolio performance—The comparative Lipper information showed that the Portfolio's performance was in the second quintile for the one-year period and in the third-quintile for the three-year period and since inception.
Management and subadvisory fees and expense ratios—The comparative Lipper information showed that the Portfolio's Contractual Management Fee, Actual Management Fee and total expenses were in the fourth quintile in the Portfolio's Expense Group for the comparison periods utilized in the Lipper report. Management discussed with the board the heterogeneous nature of the relatively small Lipper Expense Group Universe. In light of the complex strategies employed by the Portfolio, the board determined that the management fee and the subadvisory fees were reasonable in light of the nature, extent and quality of the services provided to the Portfolio.
UBS PACE Global Real Estate Securities Investments
In approving the Investment Management and Administration Agreement and the Subadvisory Agreement with Goldman Sachs Asset Management, L.P., the board, including the Independent Trustees, also considered the following factors:
Portfolio performance—The comparative Lipper information showed that the Portfolio's performance was in the fifth quintile for the one-year period and in the fourth quintile for the period since inception. Management believed that the main contributor to the Portfolio's underperformance was its defensive positioning when compared to its Performance Universe during a strong market rally in high risk real estate securities during a key portion of the year. Management stated that it would continue to closely monitor the Portfolio and the Subadvisor's ability to select securities that are expected to fare well through a market cycle.
346
UBS PACE Select Advisors Trust
Board Approvals of Investment Management and Administration Agreement and Subadvisory Agreements (unaudited)
Management and subadvisory fees and expense ratios—The comparative Lipper information showed that the Portfolio's Contractual Management Fee was in the second quintile, its Actual Management Fee was in the first quintile and its total expenses were in the fourth quintile in the Portfolio's Expense Group for the comparison periods utilized in the Lipper report. Management noted that the Portfolio's total expenses, although in the fourth quintile, were close to the Portfolio's Expense Group's median and attributed its ranking in part to the relatively small size of the Portfolio versus peers.
UBS PACE Government Securities Fixed Income Investments
In approving the Investment Management and Administration Agreement and the Subadvisory Agreement with Pacific Investment Management Company LLC, the board, including the Independent Trustees, also considered the following factors:
Portfolio performance—The comparative Lipper information showed that the Portfolio's performance was in the first quintile for the one-, three- and five-year periods and in the second quintile since inception.
Management and subadvisory fees and expense ratios—The comparative Lipper information showed that the Portfolio's Contractual Management Fee, Actual Management Fee and total expenses were in the fifth quintile in the Portfolio's Expense Group for the comparison periods utilized in the Lipper report. In making its determination, the board recognized that the Portfolio's Actual Management Fee was a significant cause of the Portfolio's high total expenses relative to its Expense Group; however, in light of the Portfolio's significant outperformance versus its peers, the board determined that the management fee and the subadvisory fees were satisfactory. Nonetheless, the board noted that it would continue to monitor the Portfolio's expenses over the next year.
UBS PACE High Yield Investments
In approving the Investment Management and Administration Agreement and the Subadvisory Agreement with MacKay Shields LLC, the board, including the Independent Trustees, also considered the following factors:
Portfolio performance—The comparative Lipper information showed that the Portfolio was in the first quintile for the one-year period and since inception.
Management and subadvisory fees and expense ratios—The comparative Lipper information showed that the Portfolio's Contractual Management Fee and total expenses were in the fourth quintile, while its Actual Management Fee was in the third quintile in the Portfolio's Expense Group for the comparison periods utilized in the Lipper report. Management noted that the Portfolio's Actual Management Fee and total expenses were significantly lower than or very close to, respectively, the median of a subset of the Portfolio's Expense Group that consisted of only sub-advised funds.
UBS PACE Intermediate Fixed Income Investments
In approving the Investment Management and Administration Agreement and the Subadvisory Agreement with BlackRock Financial Management, Inc., the board, including the Independent Trustees, also considered the following factors:
Portfolio performance—The comparative Lipper information showed that the Portfolio's performance was in the third quintile for the one-year period, the second quintile for the three- and five-year periods and in
347
UBS PACE Select Advisors Trust
Board Approvals of Investment Management and Administration Agreement and Subadvisory Agreements (unaudited)
the fifth quintile since inception. Management noted the Portfolio's improving performance relative to its Performance Universe over the short- and intermediate-term periods and that its earlier performance was primarily attributable to previous subadvisors.
Management and subadvisory fees and expense ratios—The comparative Lipper information showed that the Portfolio's Contractual Management Fee and its Actual Management Fee was in the third quintile and total expenses were in the fourth quintile in the Portfolio's Expense Group for the comparison periods utilized in the Lipper report.
UBS PACE Municipal Fixed Income Investments
In approving the Investment Management and Administration Agreement and the Subadvisory Agreement with Standish Mellon Asset Management Company LLC, the board, including the Independent Trustees, also considered the following factors:
Portfolio performance—The comparative Lipper information showed that the Portfolio's performance was in the second quintile for the one-year period, the third quintile for the three- and five-year periods, and the fourth quintile since inception. Management reminded the board of the portfolio management strategy changes made in 2007 and the Portfolio's improving performance over the short and intermediate periods.
Management and subadvisory fees and expense ratios—The comparative Lipper information showed that the Portfolio's Contractual Management Fee, Actual Management Fee and its total expenses were in the fourth quintile in the Portfolio's Expense Group for the comparison periods utilized in the Lipper report.
UBS PACE Strategic Fixed Income Investments
In approving the Investment Management and Administration Agreement and the Subadvisory Agreement with Pacific Investment Management Company LLC, the board, including the Independent Trustees, also considered the following factors:
Portfolio performance—The comparative Lipper information showed that the Portfolio's performance was in the third quintile for the one-year period and in the second quintile for the three- and five-year periods and since inception.
Management and subadvisory fees and expense ratios—The comparative Lipper information showed that the Portfolio's Contractual Management Fee and Actual Management Fee were in the fourth quintile and its total expenses were in the fifth quintile. Management believed that the Portfolio uses more complex strategies and investments in comparison with many other funds in its Expense Group.
UBS PACE Global Fixed Income Investments
In approving the Investment Management and Administration Agreement and the Subadvisory Agreement with Rogge Global Partners plc, the board, including the Independent Trustees, also considered the following factors:
Portfolio performance—The comparative Lipper information showed that the Portfolio's performance was in the fourth quintile for the one-year period and the third quintile for the three- and five-year periods and since inception. Management believed that the primary cause of the Portfolio's relative underperformance
348
UBS PACE Select Advisors Trust
Board Approvals of Investment Management and Administration Agreement and Subadvisory Agreements (unaudited)
for the one-year period was the Portfolio's relative overweighting in the global financial services corporate debt sector in comparison to its Performance Universe, which consists of a number of funds which had larger sovereign debt exposure. Management noted that with the recent improvement in liquidity and greater visibility on the impact of global stimulus packages on the financial sector, the Portfolio's performance had recently improved.
Management and subadvisory fees and expense ratios—The comparative Lipper information showed that the Portfolio's Contractual Management Fee and Actual Management Fee were in the fourth quintile and its total expenses were in the second quintile in the Portfolio's Expense Group for the comparison periods utilized in the Lipper report. In reviewing the Portfolio's fees, the board noted that although the Actual Management Fees were slightly above the Portfolio's Expense Group median, the Portfolio's total expenses were slightly below the Expense Group median.
UBS PACE Money Market Investments
In approving the Investment Management and Administration Agreement, the board, including the Independent Trustees, also considered the following factors:
Portfolio performance—The comparative Lipper information showed that the Portfolio's performance was in the second quintile for the one-, three-, five- and ten-year periods and since inception.
Management fees and expense ratios—The comparative Lipper information showed that the Portfolio's Contractual Management Fee was in the second quintile, its Actual Management Fee was in the first quintile and its total expenses were in the third quintile in the Portfolio's Expense Group for the comparison periods utilized in the Lipper report.
Conclusion
Based on its review and, in certain instances, management's explanations upon further questioning, the board concluded that each Portfolio's investment performance was satisfactory or acceptable and that each management fee and subadvisory fee was reasonable in light of the nature, extent and quality of the services provided to the Portfolio under the applicable Investment Management and Administration Agreement and Subadvisory Agreement or Subadvisory Agreements, respectively.
In light of all of the foregoing, the board approved the Investment Management and Administration Agreement for each Portfolio and, for those Portfolios with Subadvisors, the Subadvisory Agreement(s). No single factor reviewed by the board was identified by the board as the principal factor in determining whether to approve the Investment Management and Administration Agreement or, for the subadvised Portfolios, the Subadvisory Agreements. The Independent Trustees were advised by separate independent legal counsel throughout the process. The board discussed the proposed continuance of the Investment Management and Administration Agreement and the Subadvisory Agreements in a private session with their independent legal counsel at which no representatives of UBS Global AM or the Subadvisors were present.
349
UBS PACE Select Advisors Trust
Supplemental information (unaudited)
Board of Trustees & Officers
The Trust is governed by a Board of Trustees which oversees the Portfolios' operations. Each Trustee serves an indefinite term of office. Officers are appointed by the trustees and serve at the pleasure of the Board. The table below shows, for each trustee and officer, his or her name, address and age, the position held with the Trust, the length of time served as a trustee or officer of the Trust, the trustee's or officer's principal occupations during the last five years, the number of portfolios in the UBS fund complex overseen by the trustee or for which a person served as an officer, and other directorships held by the trustee.
The Trust's Statement of Additional Information contains additional information about the trustees and is available, without charge, upon request by calling 1-800-647 1568.
Interested Trustee
| Name, address, and age | | Position(s)
held with
Trust | | Term of
office†
and
length of
time
served | | Principal
occupation(s)
during past
5 years | | Number of portfolios
in fund complex
overseen by trustee | | Other directorships
held by trustee | |
Meyer Feldberg††; 67
Morgan Stanley
1585 Broadway
36th Floor
New York, NY 10036 | | Trustee | | Since 2001 | | Professor Feldberg is Dean Emeritus and Professor of Leadership and Ethics at Columbia Business School, although on an extended leave of absence. He is also a senior advisor to Morgan Stanley (financial services) (since March 2005). Professor Feldberg also serves as president of New York City Global Partners (an organization located in part of the Office of the Mayor of the City of New York that promotes interaction with other cities around the world) (since May 2007). Prior to July 2004, he was Dean and Professor of Leadership and Ethics of the Graduate School of Business at Columbia University (since 1989). | | Professor Feldberg is a director or trustee of 29 investment companies (consisting of 60 portfolios) for which UBS Global AM or one of its affiliates serves as investment advisor, sub-advisor or manager. | | Professor Feldberg is also a director of Primedia Inc. (publishing), Macy's, Inc. (operator of department stores), Revlon, Inc. (cosmetics), SAPPI, Ltd. (producer of paper) and the New York City Ballet. | |
|
350
UBS PACE Select Advisors Trust
Supplemental information (unaudited)
Independent Trustees
| Name, address, and age | | Position(s)
held with
Trust | | Term of
office†
and
length of
time
served | | Principal
occupation(s)
during past
5 years | | Number of portfolios
in fund complex
overseen by trustee | | Other directorships
held by trustee | |
Richard Q. Armstrong; 74 c/o Willkie Farr & Gallagher LLP
787 Seventh Avenue
New York, NY 10019-6099 | | Trustee and Chairman of the Board of Trustees | | Since 2001 (Trustee) Since 2004 (Chairman of the Board of Trustees) | | Mr. Armstrong is chairman and principal of R.Q.A. Enterprises (management consulting firm) (since April 1991 and principal occupation since March 1995). | | Mr. Armstrong is a director or trustee of 17 investment companies (consisting of 48 portfolios) for which UBS Global AM or one of its affiliates serves as investment advisor, sub-advisor or manager. | | None | |
|
Alan S. Bernikow; 68
207 Benedict Ave.
Staten Island, NY 10314 | | Trustee | | Since 2005 | | Mr. Bernikow is retired. He was a consultant on non-management matters for the firm of Deloitte & Touche (international accounting and consulting firm) (from June 2003 until 2007). Previously, he was deputy chief executive officer at Deloitte & Touche. | | Mr. Bernikow is a director or trustee of 17 investment companies (consisting of 48 portfolios) for which UBS Global AM or one of its affiliates serves as investment advisor, sub-advisor or manager. | | Mr. Bernikow is also a director of Revlon, Inc. (cosmetics) (and serves as the chair of its audit committee and as a member of its nominating and corporate governance committee), a director of Mack-Cali Realty Corporation (real estate investment trust) (and serves as the chair of its audit committee); and a director of the Casual Male Retail Group, Inc. (menswear) (and serves as a member of its audit committee and as a member of its nominating and corporate governance committee). | |
|
Richard R. Burt; 62
McLarty Associates
900 17th Street, 8th Floor
Washington, D.C. 20006 | | Trustee | | Since 2001 | | Mr. Burt is a managing director to McLarty Associates (a consulting firm) (since April 2007) and chairman of IEP Advisors (international investments and consulting firm). Prior to April 2007, he was chairman of Diligence Inc. (information and risk management firm). | | Mr. Burt is a director or trustee of 17 investment companies (consisting of 48 portfolios) for which UBS Global AM or one of its affiliates serves as investment advisor, sub-advisor or manager. | | Mr. Burt is also a director of The Central European Fund, Inc., The Germany Fund, Inc., The New Germany Fund, Inc. and IGT, Inc. (provides technology to gaming and wagering industry). | |
|
351
UBS PACE Select Advisors Trust
Supplemental information (unaudited)
| Independent Trustees (concluded) | |
| Name, address, and age | | Position(s)
held with
Trust | | Term of
office†
and
length of
time
served | | Principal
occupation(s)
during past
5 years | | Number of portfolios
in fund complex
overseen by trustee | | Other directorships
held by trustee | |
Bernard H. Garil; 69
6754 Casa Grande Way
Delray Beach, FL 33446 | | Trustee | | Since 2005 | | Mr. Garil is retired (since 2001). He was a managing director at PIMCO Advisory Services (from 1999 to 2001) where he served as president of closed-end funds and vice-president of the variable insurance product funds advised by OpCap Advisors (until 2001). | | Mr. Garil is a director or trustee of 17 investment companies (consisting of 48 portfolios) for which UBS Global AM or one of its affiliates serves as investment advisor, sub-advisor or manager. | | Mr. Garil is also a director of OFI Trust Company (commercial trust company) and a trustee for the Brooklyn College Foundation, Inc. (charitable foundation). | |
|
Heather R. Higgins; 50
255 E. 49th St., Suite 23D
New York, NY 10017 | | Trustee | | Since 2005 | | Ms. Higgins is the President and Director of The Randolph Foundation (charitable foundation) (since 1991). Ms. Higgins also serves on the boards of several non-profit charitable groups, including the Independent Women's Forum (chairman), and the Philanthropy Roundtable (vice chairman). She also serves on the board of the Hoover Institution (since January 2009), on which she had previously served from 2001 - 2007 (executive committee). | | Ms. Higgins is a director or trustee of 17 investment companies (consisting of 48 portfolios) for which UBS Global AM or one of its affiliates serves as investment advisor, sub-advisor or manager. | | None | |
|
352
UBS PACE Select Advisors Trust
Supplemental information (unaudited)
Officers
| Name, address, and age | | Position(s)
held with
Trust | | Term of
office†
and
length of
time
served | | Principal occupation(s) during past 5 years;
number of portfolios in fund complex for which person serves as officer | |
| Joseph Allessie*; 44 | | Vice President and Assistant Secretary | | Since 2005 | | Mr. Allessie is an executive director (since 2007) (prior to which he was a director) and deputy general counsel (since 2005) at UBS Global Asset Management (US) Inc. and UBS Global Asset Management (Americas) Inc. (collectively, "UBS Global AM-Americas region"). Prior to joining UBS Global AM-Americas region, he was senior vice president and general counsel of Kenmar Advisory Corp. (from 2004 to 2005). Prior to that Mr. Allessie was general counsel and secretary of GAM USA Inc., GAM Investments, GAM Services, GAM Funds, Inc. and the GAM Avalon Funds (from 1999 to 2004). Mr. Allessie is a vice president and assistant secretary of 21 investment companies (consisting of 104 portfolios) for which UBS Global AM-Americas region or one of its affiliates serves as investment advisor, sub-advisor or manager. | |
|
| Caren Cunningham*; 50 | | Vice President and Assistant Secretary* | | Since 2007 | | Ms. Cunningham is an executive director and senior associate general counsel of UBS Global AM-Americas region (since 2007). Prior to joining UBS Global AM-Americas region, she was vice president and senior legal manager (distribution) of Pioneer Investment Management Limited (from 2005 to 2006). Prior to that Ms. Cunningham was assistant general counsel of Fidelity Investments (1999 - 2006). Ms. Cunningham is a vice president and assistant secretary of UBS PACE Select Advisors Trust (consisting of 15 portfolios) and an assistant secretary of 20 other investment companies (consisting of 90 portfolios) for which UBS Global AM-Americas region or one of its affiliates serves as investment advisor, sub-advisor or manager. | |
|
| Thomas Disbrow*; 43 | | Vice President and Treasurer | | Since 2000 (Vice President) Since 2004 (Treasurer) | | Mr. Disbrow is an executive director (since 2007) (prior to which he was a director) (since 2000) and head of the US mutual fund treasury administration department (since September 2006) of UBS Global AM-Americas region. Mr. Disbrow is a vice president and treasurer and/or principal accounting officer of 21 investment companies (consisting of 104 portfolios) for which UBS Global AM-Americas region or one of its affiliates serves as investment advisor, sub-advisor or manager. | |
|
| Michael J. Flook*; 44 | | Vice President and Assistant Treasurer | | Since 2006 | | Mr. Flook is an associate director and a senior manager of the US mutual fund treasury administration department of UBS Global AM-Americas region (since 2006). Prior to joining UBS Global AM-Americas region, he was a senior manager with The Reserve (asset management firm) from May 2005 to May 2006. Prior to that he was a senior manager with PFPC Worldwide since October 2000. Mr. Flook is a vice president and assistant treasurer of 21 investment companies (consisting of 104 portfolios) for which UBS Global AM-Americas region or one of its affiliates serves as investment advisor, sub-advisor or manager. | |
|
| Mark F. Kemper**; 51 | | Vice President and Secretary | | Since 2004 | | Mr. Kemper is a managing director (since 2006) and head of the legal department of UBS Global AM-Americas region (since 2004). He was deputy general counsel of UBS Global AM-Americas region (from July 2001 to July 2004). He has been secretary of UBS Global AM-Americas since 1999 and assistant secretary of UBS Global Asset Management Trust Company since 1993 and secretary of UBS AM Holdings (USA) Inc. (since 2001). Mr. Kemper is secretary of UBS Global AM-Americas region (since 2004). Mr. Kemper is vice president and secretary of 21 investment companies (consisting of 104 portfolios) for which UBS Global AM-Americas region or one of its affiliates serves as investment advisor, sub-advisor or manager. | |
|
353
UBS PACE Select Advisors Trust
Supplemental information (unaudited)
Officers (continued)
| Name, address, and age | | Position(s)
held with
Trust | | Term of
office†
and
length of
time
served | | Principal occupation(s) during past 5 years;
number of portfolios in fund complex for which person serves as officer | |
| Joanne M. Kilkeary*; 41 | | Vice President and Assistant Treasurer | | Since 1999 | | Ms. Kilkeary is a director (since March 2008) (prior to which she was an associate director) (since 2000) and a senior manager (since 2004) of the US mutual fund treasury administration department of UBS Global AM-Americas region. Ms. Kilkeary is a vice president and assistant treasurer of 21 investment companies (consisting of 104 portfolios) for which UBS Global AM-Americas region or one of its affiliates serves as investment advisor, sub-advisor or manager. | |
|
| Tammie Lee*; 38 | | Vice President and Assistant Secretary | | Since 2005 | | Ms. Lee is a director and associate general counsel of UBS Global AM-Americas region (since 2005). Prior to joining UBS Global AM-Americas region, she was vice president and counsel at Deutsche Asset Management/Scudder Investments from 2003 to 2005. Prior to that she was assistant vice president and counsel at Deutsche Asset Management/Scudder Investments from 2000 to 2003. Ms. Lee is a vice president and assistant secretary of 21 investment companies (consisting of 104 portfolios) for which UBS Global AM-Americas region or one of its affiliates serves as investment advisor, sub-advisor or manager. | |
|
| Steven J. LeMire*; 40 | | Vice President and Assistant Treasurer | | Since 2007 | | Mr. LeMire is a director and senior manager of the US mutual fund treasury administration department of UBS Global AM—Americas region (since October 2007). Prior to joining UBS Global AM—Americas region, he was an independent consultant with Third River Capital, LLC (formerly Two Rivers Capital, LLC) (from 2005 to 2007). Prior to that, he was vice president of operations and fund administration with Oberweis Asset Management, Inc. (from 1997 to 2005). Mr. LeMire is a vice President and assistant treasurer of 21 investment companies (consisting of 104 portfolios) for which UBS Global AM—Americas region or one of its affiliates serves as investment advisor, sub-advisor or manager. | |
|
Joseph McGill*;
47 | | Vice President and Chief Compliance Officer | | Since 2004 | | Mr. McGill is a managing director (since 2006) and chief compliance officer (since 2003) at UBS Global AM-Americas region. Prior to joining UBS Global AM-Americas region, he was assistant general counsel at JPMorgan Investment Management (from 1999 to 2003). Mr. McGill is a vice president and chief compliance officer of 21 investment companies (consisting of 104 portfolios) for which UBS Global AM-Americas region or one of its affiliates serves as investment advisor, sub-advisor or manager. | |
|
Nancy D. Osborn*;
43 | | Vice President and Assistant Treasurer | | Since 2007 | | Mrs. Osborn is an associate director and a senior manager of the US mutual fund treasury administration department of UBS Global AM-Americas region (since 2006). Prior to joining UBS Global AM-Americas region, she was an assistant vice president with Brown Brothers Harriman since April 1996. Mrs. Osborn is a vice president and assistant treasurer of 21 investment companies (consisting of 104 portfolios) for which UBS Global AM-Americas region or one of its affiliates serves as investment advisor, sub-advisor or manager. | |
|
| Robert Sabatino**; 36 | | Vice President | | Since 2001 | | Mr. Sabatino is an executive director (since 2007) (prior to which he was a director) and portfolio manager of UBS Global AM—Americas region in the short duration fixed income group (since 2001). From 1995 to 2001 he was a portfolio manager at Merrill Lynch Investment Managers responsible for the management of several retail and institutional money market funds. Mr. Sabatino is a vice president of 4 investment companies (consisting of 33 portfolios) for which UBS Global AM—Americas region or one of its affiliates serves as investment advisor, sub-advisor or manager. | |
|
354
UBS PACE Select Advisors Trust
Supplemental information (unaudited)
Officers (concluded)
| Name, address, and age | | Position(s)
held with
Trust | | Term of
office†
and
length of
time
served | | Principal occupation(s) during past 5 years;
number of portfolios in fund complex for which person serves as officer | |
Eric Sanders*;
43 | | Vice President and Assistant Secretary | | Since 2005 | | Mr. Sanders is a director and associate general counsel of UBS Global AM-Americas region (since 2005). From 1996 until June 2005, he held various positions at Fred Alger & Company, Incorporated, the most recent being assistant vice president and associate general counsel. Mr. Sanders is a vice president and assistant secretary of 21 investment companies (consisting of 104 portfolios) for which UBS Global AM-Americas region or one of its affiliates serves as investment advisor, sub-advisor or manager. | |
|
Andrew Shoup*;
53 | | Vice President and Chief Operating Officer | | Since 2006 | | Mr. Shoup is a managing director and global head of the treasury administration department of UBS Global AM-Americas region (since July 2006). Mr. Shoup is also a director of UBS (IRL) Fund p.l.c. (since December 2008). Prior to joining UBS Global AM-Americas region, he was chief administrative officer for the Legg Mason Partner Funds (formerly Smith Barney, Salomon Brothers, and CitiFunds mutual funds) from November 2003 to July 2006. Prior to that, he held various positions with Citigroup Asset Management and related companies with their domestic and offshore mutual funds since 1993. Additionally, he has worked for another mutual fund complex as well as spending eleven years in public accounting. Mr. Shoup is a vice president and chief operating officer of 21 investment companies (consisting of 104 po rtfolios) for which UBS Global AM-Americas region or one of its affiliates serves as investment advisor, sub-advisor or manager. | |
|
Kai R. Sotorp**;
50 | | President | | Since 2006 | | Mr. Sotorp is Head—Americas for UBS Global Asset Management (since 2004); a member of the UBS Group Managing Board (since 2003) and a member of the UBS Global Asset Management Executive Committee (since 2001). Mr. Sotorp is a director and president of UBS AM Holdings (USA) Inc. (since 2004). Prior to his current role, Mr. Sotorp was head of UBS Global Asset Management—Asia Pacific (2002-2004), covering Australia, Japan, Hong Kong, Singapore and Taiwan; head of UBS Global Asset Management (Japan) Ltd. (2001-2004); representative director and president of UBS Global Asset Management (Japan) Ltd. (2000-2004); and member of the board of Mitsubishi Corp.—UBS Realty Inc. (2000-2004). Mr. Sotorp is president of 21 investment companies (consisting of 104 portfolios) for which UBS Global AM—Americas region or one of its affiliates serves as investment advisor, sub-advisor or manager. | |
|
Keith A. Weller*;
48 | | Vice President and Assistant Secretary | | Since 2000 | | Mr. Weller is an executive director and senior associate general counsel of UBS Global AM-Americas region (since 2005) and has been an attorney with affiliated entities since 1995. Mr. Weller is a vice president and assistant secretary of 21 investment companies (consisting of 104 portfolios) for which UBS Global AM-Americas region or one of its affiliates serves as investment advisor, sub-advisor or manager. | |
|
* This person's business address is 51 West 52nd Street, New York, New York 10019-6114.
** This person's business address is One North Wacker Drive, Chicago, Illinois 60606.
† Each trustee holds office for an indefinite term. Each trustee who has attained the age of seventy-five (75) years will be subject to retirement on the last day of the month in which he or she attains such age unless the Trust's board, including a majority of its Independent Trustees, determines to grant a waiver of the retirement policy with respect to a specified individual for a set period of time. The retirement policy has been waived with respect to Mr. Armstrong, the Chairman of the Board, until 2011. Officers are appointed by the trustees and serve at the pleasure of the Board.
†† Professor Feldberg is deemed an "interested person" of the Trust as defined in the Investment Company Act because he is a senior advisor to Morgan Stanley, a financial services firm with which the Trust may conduct transactions.
355
(This page has been left blank intentionally)
356

UBS PACE Money Market
Investments
Annual Report
July 31, 2009
UBS PACE Money Market Investments
September 21, 2009
Dear Shareholder,
For the 12 months ended July 31, 2009, the Portfolio returned 0.81% (before the deduction of the maximum UBS PACE program fee; after the deduction of the maximum UBS PACE program fee, the Portfolio declined 0.70%). In comparison, the 90-Day US T-Bill Index (the "benchmark") returned 0.65%, and the Lipper Money Market Funds category posted a median return of 0.77%. (Returns over various time periods are shown in the "Performance at a glance" table on page 7. Please note that the returns shown do not reflect the deduction of taxes that a shareholder would pay on Portfolio distributions.)
Market Review
The 12-month reporting period was marked by some of the most challenging economic and market conditions in a generation. The bursting of the housing bubble, a severe credit crunch, lower business and consumer spending and surging unemployment caused the US economy to weaken significantly, with US gross domestic product declining in each quarter of the reporting period. Following the conclusion of the reporting period, however, signs of recovery were seen to be emerging. The Federal Reserve Board (the "Fed") issued a statement on August 12, 2009 acknowledging that the economy had stabilized. In that statement, the Fed wrote that it expects the US economy to remain weak for a time, noting that "economic activity is leveling out,"
UBS PACE Money
Market Investments
Investment Advisor:
UBS Global Asset Management (Americas) Inc.
Portfolio Manager:
Robert Sabatino
Objective:
Current income consistent with preservation of capital and liquidity
Investment process:
The Portfolio is a money market mutual fund and seeks to maintain a stable price of $1.00 per share, although it may be possible to lose money by investing in this Portfolio. The Portfolio invests in a diversified portfolio of high-quality money market instruments of governmental and private issuers. Security selection is based on the assessment of relative values and changes in market and economic conditions.
1
UBS PACE Money Market Investments
and adding that "conditions in financial markets have improved further in recent weeks".
The Fed reduced the federal funds rate on several occasions during the reporting period. (The federal funds rate, or "fed funds" rate, is the rate that banks charge one another for funds they borrow on an overnight basis.) When the reporting period began, the fed funds rate was 2.00%. The Fed then held rates steady, citing inflationary pressures on the back of soaring oil and food prices.
However, with the global financial crisis rapidly escalating and oil prices falling sharply, the Fed lowered rates on October 8, as the Fed joined several other central banks from around the world in a coordinated interest rate cut. This was followed by another rate reduction at the Fed's regularly scheduled meeting on October 29. Together, these cuts brought the federal funds rate to 1.00%. During its meeting on December 16, the Fed aggressively cut the fed funds rate to a range of 0.00% to 0.25%—a record low. The Fed maintained this historically low rate throughout the reporting period.
Portfolio Performance
Given the issues impacting the credit markets, we sought to maintain a high degree of liquidity in the Portfolio in order to minimize pricing volatility and to meet redemption requests. We did so by investing a significant portion of the Portfolio's new subscriptions in shorter-dated money market securities maturing within one to three months.
At the security level, we maintained a greater than usual level of diversification over the reporting period by investing in smaller positions. While the Portfolio is generally able to hold up to 5.00% in any one security (subject to certain exceptions), we typically purchased no more than 1.00% to 2.00% in any one nongovernment issuer, as part of our efforts to reduce risk and keep the Portfolio highly diversified.
In terms of the securities that we emphasized, at the beginning of the reporting period, the Portfolio held a significant exposure to commercial paper and US government and agency obligations. As the period continued, we increased the Portfolio's exposure to asset-backed commercial paper. This move followed measures
2
UBS PACE Money Market Investments
taken by the Fed to improve the liquidity of asset-backed commercial paper in response to the turmoil in the credit markets. In addition, we increased the Portfolio's exposure to US government and agency obligations, while decreasing exposure to certificates of deposit and repurchase agreements over the period. (Repurchase agreements are transactions in which the seller of a security agrees to buy it back at a predetermined time and price or upon demand.)
As always, we thank you for your continued support and welcome any comments or questions you may have.
Sincerely,
 | |  | |
|
Kai R. Sotorp
President
UBS PACE Select Advisors Trust
Head—Americas
UBS Global Asset Management (Americas) Inc. | | Robert Sabatino
Portfolio Manager
UBS PACE Money Market Investments
Executive Director
UBS Global Asset Management (Americas) Inc. | |
|
This letter is intended to assist shareholders in understanding how the Portfolio performed during the 12 months ended July 31, 2009. The views and opinions in this letter were current as of September 21, 2009. They are not guarantees of performance or investment results and should not be taken as investment advice.
Investment decisions reflect a variety of factors, and we reserve the right to change our views about individual securities, sectors and markets at any time. As a result, the views expressed should not be relied upon as a forecast of the Portfolio's future investment intent. We encourage you to consult your financial advisor regarding your personal investment program. Investors should carefully read and consider a mutual fund's investment objectives, risks, charges, and expenses before investing. The prospectus contains this and other information about a mutual fund. For a current prospectus, contact UBS Global Asset Management at 888-793 8637, or visit us on the Web at www.ubs.com/globalam-us.
3
UBS PACE Money Market Investments
A Note about the Temporary Guarantee Program for Money Market Funds
Following unprecedented turmoil in the credit markets, the US government announced the Temporary Guarantee Program for Money Market Funds (the "Program"). The Portfolio participated in the Program from the Program's inception in the fall of 2008 until it expired on September 18, 2009. Under the Program, the US Treasury guaranteed the share price of any publicly offered eligible money market mutual fund that applied and was accepted into it. Shareholders in money market funds enrolled in the Program were covered for the amounts they held as of the close of business on September 19, 2008 until September 18, 2009. The Portfolio did not encounter circumstances triggering a need to invoke the guarantee provided by the Program.
The Portfolio has maintained its net asset value ("NAV") of $1.00 per share* throughout the recent unprecedented turmoil and has continued to meet its stated goal, which is to provide current income consistent with preservation of capital and liquidity. We were pleased to have the Portfolio participate in the Program to provide an added level of protection for covered shareholders, until it expired. We want to reassure shareholders of the following:
• The Portfolio holds very high-quality assets. While we consider rating agencies' credit ratings, we rely first and foremost on our own proprietary research, conducted by dedicated teams of credit analysts. This approach benefited the Portfolio in the volatile environment that prevailed during the reporting period.
• UBS Global Asset Management (Americas) Inc. and its predecessor firms have been managing money market funds for
* An investment in the Portfolio is not insured or guaranteed by the Federal Deposit Insurance Corporation (FDIC) or any other government agency. Although the Portfolio seeks to preserve the value of your investment at $1.00 per share, it is possible to lose money by investing in the Portfolio.
4
UBS PACE Money Market Investments
more than 30 years; this is a key line of business for the firm, and we have dedicated significant resources to the management of the assets entrusted to us.
When the Program was introduced, it had an initial termination date of December 18, 2008. The Portfolio paid a fee of 0.01% of the value of the Portfolio's outstanding shares (valued at $1.00 per share for this purpose) as of September 19, 2008. This ensured Program coverage for the period from September 19, 2008 through December 18, 2008. The Program was extended twice—first through April 30, 2009, and then, finally, through September 18, 2009. The Portfolio paid additional fees calculated on the same basis, but at the rate of 0.015% for each of the two extension election periods, to continue to participate through September 18, 2009. This cost was absorbed by the Portfolio as a fund expense.
The Portfolio's yield did decline during the coverage period as a result of the Program participation fees through September 18, 2009.
5
UBS PACE Money Market Investments
Comparison of change in value of a $10,000 investment in the Portfolio and the 90-Day US T-Bill Index (unaudited)
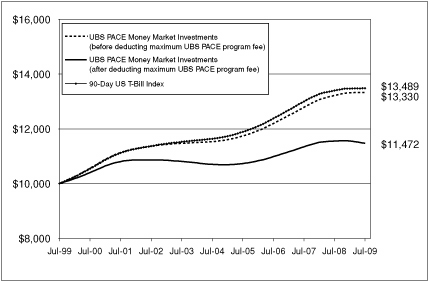
The graph depicts the performance of UBS PACE Money Market Investments versus the 90-Day US T-Bill Index over the 10 years ended July 31, 2009. Past performance does not predict future performance and the performance provided does not reflect the deduction of taxes that a shareholder would pay on Portfolio distributions. It is important to note that UBS PACE Money Market Investments is a professionally managed portfolio while the Index is not available for investment and is unmanaged. The comparison is shown for illustrative purposes only.
6
UBS PACE Money Market Investments
Performance at a glance (unaudited)
Average annual total returns for periods ended 07/31/09
| | | 1 year | | 5 years | | 10 years | |
UBS PACE Money Market Investments
before deducting maximum UBS PACE
program fee1 | | | 0.81 | % | | | 2.94 | % | | | 2.92 | % | |
UBS PACE Money Market Investments
after deducting maximum UBS PACE
program fee1 | | | (0.70 | )% | | | 1.41 | % | | | 1.38 | % | |
| 90-Day US T-Bill Index2 | | | 0.65 | % | | | 3.00 | % | | | 3.04 | % | |
| Lipper Money Market Funds median | | | 0.77 | % | | | 2.81 | % | | | 2.77 | % | |
For UBS PACE Money Market Investments, average annual total returns for periods ended June 30, 2009, after deduction of the maximum UBS PACE program fee, were as follows: 1-year period, (0.53)%; 5-year period, 1.42%; 10-year period, 1.42%.
For UBS PACE Money Market Investments, the 7-day current yield for the period ended July 31, 2009 was 0.01% (without maximum UBS PACE program fee and after fee waivers and/or expense reimbursements; the yield was (0.05)% before fee waivers and/or expense reimbursements). With the maximum UBS PACE program fee, the 7-day current yield was (1.49)% after fee waivers and/or expense reimbursements; the yield was (1.55)% before fee waivers and/or expense reimbursements. The Portfolio's yield quotation more closely reflects the current earnings of the Portfolio than the total return quotation. Yields will fluctuate and reflect fee waivers.
1 The maximum annual UBS PACE program fee is 1.5% of the value of UBS PACE assets.
2 90-Day US T-Bills are promissory notes issued by the US Treasury and sold through competitive bidding, with a short-term maturity date, in this case, of three months. This Index is derived from secondary market interest rates as published by the Federal Reserve Bank. Investors should note that indices do not reflect the deduction of fees, expenses or taxes.
Past performance does not predict future performance and the performance information provided does not reflect the deduction of taxes that a shareholder would pay on Portfolio distributions. The return of an investment will fluctuate. Performance results assume reinvestment of all dividends and capital gain distributions at net asset value on the payable dates. Current performance may be higher or lower than the performance data quoted.
Lipper peer group data calculated by Lipper Inc.; used with permission. The Lipper median is the return of the fund that places in the middle of a Lipper peer group.
An investment in UBS PACE Money Market Investments is not insured or guaranteed by the Federal Deposit Insurance Corporation or any other government agency. Although the Portfolio seeks to preserve the value of your investment at $1.00 per share, it is possible to lose money by investing in the Portfolio.
Not FDIC Insured. May lose value. No Bank guarantee.
7
UBS PACE Money Market Investments
Understanding your Portfolio's expenses (unaudited)
As a shareholder of the Portfolio, you incur two types of costs: (1) ongoing program fees; and (2) ongoing Portfolio costs, including management fees and other Portfolio expenses. This example is intended to help you understand your ongoing costs (in dollars) of investing in the Portfolio and to compare these costs with the ongoing costs of investing in other mutual funds.
The example below is based on an investment of $1,000 invested at the beginning of the period and held for the entire period, February 1, 2009 to July 31, 2009.
Actual expenses
The first line in the table below provides information about actual account values and actual expenses. You may use the information in this line, together with the amount you invested, to estimate the expenses that you paid over a period. Simply divide your account value by $1,000 (for example, an $8,600 account value divided by $1,000 = 8.6), then multiply the result by the number in the first line under the heading entitled "Expenses paid during period" to estimate the expenses you paid on your account during this period.
Hypothetical example for comparison purposes
The second line in the table below provides information about hypothetical account values and hypothetical expenses based on the Portfolio's actual expense ratio and an assumed rate of return of 5% per year before expenses, which is not the Portfolio's actual return. The hypothetical account values and expenses may not be used to estimate the actual ending account balance or expenses you paid for the period. You may use this information to compare the ongoing costs of investing in the Portfolio and other funds. To do so, compare this 5% hypothetical example with the 5% hypothetical examples that appear in the shareholder reports of other funds.
8
UBS PACE Money Market Investments
Understanding your Portfolio's expenses (unaudited)
(concluded)
Please note that the expenses shown in the table are meant to highlight your ongoing Portfolio costs only and do not reflect any program fees. Therefore, the second line in the table is useful in comparing ongoing Portfolio costs only, and will not help you determine the relative total costs of owning different funds. In addition, if these program fees were included, your costs would have been higher.
| Class P | | Beginning
account value
February 1, 2009 | | Ending
account value
July 31, 2009 | | Expenses paid
during period1
02/01/09 to
07/31/09 | | Expense
ratio
during the
period | |
| Actual | | $ | 1,000.00 | | | $ | 1,000.60 | | | $ | 2.73 | | | | 0.55 | % | |
Hypothetical (5% annual
return before expenses) | | | 1,000.00 | | | | 1,022.07 | | | | 2.76 | | | | 0.55 | | |
1 Expenses are equal to the Portfolio's annualized net expense ratio, multiplied by the average account value over the period, multiplied by 181 divided by 365 (to reflect the one-half year period).
9
UBS PACE Money Market Investments
Portfolio statistics (unaudited)
| Characteristics | | 07/31/09 | |
| Net assets (mm) | | $ | 530.0 | | |
| Number of holdings | | | 92 | | |
| Weighted average maturity | | | 45 days | | |
| Portfolio composition1 | | 07/31/09 | |
| Commercial paper | | | 39.7 | % | |
| US government and agency obligations | | | 31.5 | | |
| Repurchase agreements | | | 14.1 | | |
| Certificates of deposit | | | 10.0 | | |
| Short-term corporate obligations | | | 3.2 | | |
| Bank notes | | | 2.5 | | |
| Money market fund | | | 1.9 | | |
| Other assets less liabilities | | | (2.9 | ) | |
| Total | | | 100.0 | % | |
| Top 10 holdings1 | | 07/31/09 | |
Repurchase agreement with Deutsche Bank Securities,
0.190% due 08/03/09 | | | 9.2 | % | |
| Repurchase agreement with Barclays Bank PLC, 0.180% due 08/03/09 | | | 4.7 | | |
| Federal National Mortgage Association, 0.300% due 08/24/09 | | | 2.8 | | |
| US Treasury Bills, 0.285% due 10/29/09 | | | 2.3 | | |
| Federal Home Loan Bank, 0.650% due 09/10/09 | | | 1.9 | | |
| Federal Home Loan Mortgage Corp., 0.620% due 08/03/09 | | | 1.9 | | |
| Thames Asset Global Securitization No.1, 0.280% due 08/07/09 | | | 1.9 | | |
| Federal Home Loan Mortgage Corp., 0.215% due 08/28/09 | | | 1.9 | | |
| Federal Home Loan Bank, 0.210% due 08/17/09 | | | 1.9 | | |
| Dexia Delaware LLC, 0.290% due 08/13/09 | | | 1.9 | | |
| Total | | | 30.4 | % | |
1 Weightings represent percentages of the Portfolio's net assets as of July 31, 2009. The Portfolio is actively managed and its composition will vary over time.
10
UBS PACE Money Market Investments
Statement of net assets—July 31, 2009
| Security description | | Face
amount | | Value | |
| US government and agency obligations—31.50% | |
| Federal Home Loan Bank | |
| 0.476%, due 08/13/091 | | $ | 5,000,000 | | | $ | 5,000,000 | | |
| 0.210%, due 08/17/092 | | | 10,000,000 | | | | 9,999,067 | | |
| 0.210%, due 08/21/092 | | | 10,000,000 | | | | 9,998,833 | | |
| 0.650%, due 09/10/091 | | | 10,000,000 | | | | 10,004,552 | | |
| 0.220%, due 09/28/092 | | | 5,000,000 | | | | 4,998,228 | | |
| 0.320%, due 12/21/092 | | | 3,000,000 | | | | 2,996,213 | | |
| 0.520%, due 06/01/10 | | | 3,000,000 | | | | 2,999,083 | | |
| Federal Home Loan Mortgage Corp.* | |
| 0.620%, due 08/03/091 | | | 10,000,000 | | | | 10,000,000 | | |
| 0.570%, due 08/17/092 | | | 5,000,000 | | | | 4,998,733 | | |
| 0.215%, due 08/28/091 | | | 10,000,000 | | | | 9,999,425 | | |
| 4.125%, due 11/30/09 | | | 7,000,000 | | | | 7,042,350 | | |
| 0.350%, due 02/16/102 | | | 5,000,000 | | | | 4,990,326 | | |
| 0.520%, due 07/16/102 | | | 5,000,000 | | | | 4,974,794 | | |
| Federal National Mortgage Association* | |
| 0.410%, due 08/03/091 | | | 7,000,000 | | | | 7,000,000 | | |
| 0.300%, due 08/24/092 | | | 15,000,000 | | | | 14,997,125 | | |
| 0.400%, due 10/13/091 | | | 5,000,000 | | | | 5,000,000 | | |
| 0.250%, due 10/26/092 | | | 5,000,000 | | | | 4,997,014 | | |
| 0.250%, due 11/16/092 | | | 10,000,000 | | | | 9,992,570 | | |
| 0.530%, due 12/21/092 | | | 5,000,000 | | | | 4,989,547 | | |
| US Treasury Bills | |
| 0.180%, due 09/24/092 | | | 10,000,000 | | | | 9,997,300 | | |
| 0.285%, due 10/29/092,3 | | | 12,000,000 | | | | 11,991,545 | | |
| 0.235%, due 11/19/092 | | | 10,000,000 | | | | 9,992,820 | | |
Total US government and agency obligations
(cost—$166,959,525) | | | 166,959,525 | | |
| Bank notes—2.54% | |
| Banking-US—2.54% | |
| Bank of America N.A. | |
| 1.207%, due 08/06/091 | | | 5,000,000 | | | | 5,000,000 | | |
| HSBC Bank USA, Inc. | |
| 3.875%, due 09/15/09 | | | 2,470,000 | | | | 2,471,632 | | |
11
UBS PACE Money Market Investments
Statement of net assets—July 31, 2009
| Security description | | Face
amount | | Value | |
| Bank notes—(concluded) | |
| Banking-US—(concluded) | |
| Wells Fargo Bank N.A. | |
| 0.389%, due 08/19/091 | | $ | 4,000,000 | | | $ | 4,000,000 | | |
| Westpac Banking Corp. | |
| 0.593%, due 08/14/091 | | | 2,000,000 | | | | 2,000,000 | | |
| Total bank notes (cost—$13,471,632) | | | 13,471,632 | | |
| Certificates of deposit—10.03% | |
| Banking-non-US—9.09% | |
| Bank of Nova Scotia | |
| 0.430%, due 11/17/09 | | | 1,600,000 | | | | 1,597,936 | | |
| 1.100%, due 05/11/10 | | | 1,600,000 | | | | 1,600,000 | | |
| BNP Paribas | |
| 0.500%, due 11/25/09 | | | 3,000,000 | | | | 3,000,000 | | |
| Calyon N.A., Inc./New York | |
| 0.330%, due 11/02/09 | | | 5,000,000 | | | | 5,000,000 | | |
| 0.530%, due 12/18/09 | | | 2,000,000 | | | | 2,000,000 | | |
| Canadian Imperial Bank of Commerce/Canada | |
| 0.250%, due 09/03/09 | | | 4,250,000 | | | | 4,250,000 | | |
| Lloyds TSB Bank PLC | |
| 0.460%, due 10/19/09 | | | 5,700,000 | | | | 5,700,000 | | |
| Natixis | |
| 0.650%, due 10/09/09 | | | 6,000,000 | | | | 6,000,000 | | |
| Rabobank Nederland NV | |
| 0.520%, due 12/07/09 | | | 1,000,000 | | | | 1,000,000 | | |
| Royal Bank of Canada | |
| 0.280%, due 08/24/09 | | | 5,000,000 | | | | 5,000,000 | | |
| Societe Generale | |
| 0.500%, due 02/01/10 | | | 2,000,000 | | | | 2,000,000 | | |
| Svenska Handelsbanken | |
| 0.350%, due 08/24/09 | | | 5,000,000 | | | | 5,000,000 | | |
| Toronto-Dominion Bank | |
| 1.150%, due 08/20/09 | | | 5,000,000 | | | | 5,000,390 | | |
| 0.520%, due 01/25/10 | | | 1,000,000 | | | | 1,000,343 | | |
| | | | 48,148,669 | | |
12
UBS PACE Money Market Investments
Statement of net assets—July 31, 2009
| Security description | | Face
amount | | Value | |
| Certificates of deposit—(concluded) | |
| Banking-US—0.94% | |
| Bank of America N.A. | |
| 0.400%, due 09/10/09 | | $ | 5,000,000 | | | $ | 5,000,000 | | |
| Total certificates of deposit (cost—$53,148,669) | | | 53,148,669 | | |
| Commercial paper2—39.68% | |
| Asset backed-banking—0.94% | |
| Atlantis One Funding | |
| 0.400%, due 09/09/09 | | | 5,000,000 | | | | 4,997,833 | | |
| Asset backed-miscellaneous—18.65% | |
| Amsterdam Funding Corp. | |
| 0.320%, due 08/10/09 | | | 5,000,000 | | | | 4,999,600 | | |
| 0.360%, due 09/18/09 | | | 5,000,000 | | | | 4,997,600 | | |
| Barton Capital LLC | |
| 0.250%, due 08/07/09 | | | 2,876,000 | | | | 2,875,880 | | |
| Chariot Funding LLC | |
| 0.250%, due 08/13/09 | | | 1,438,000 | | | | 1,437,880 | | |
| 0.230%, due 08/25/09 | | | 5,000,000 | | | | 4,999,234 | | |
| Enterprise Funding Co. LLC | |
| 0.310%, due 10/05/09 | | | 5,000,000 | | | | 4,997,202 | | |
| Kitty Hawk Funding Corp. | |
| 0.380%, due 09/18/09 | | | 7,541,000 | | | | 7,537,179 | | |
| Market Street Funding LLC | |
| 0.350%, due 08/17/09 | | | 5,000,000 | | | | 4,999,222 | | |
| Ranger Funding Co. LLC | |
| 0.400%, due 08/18/09 | | | 8,000,000 | | | | 7,998,489 | | |
| 0.300%, due 10/13/09 | | | 5,000,000 | | | | 4,996,958 | | |
| Regency Markets No. 1 LLC | |
| 0.280%, due 08/20/09 | | | 5,000,000 | | | | 4,999,261 | | |
| Sheffield Receivables Corp. | |
| 0.250%, due 08/25/09 | | | 5,000,000 | | | | 4,999,167 | | |
| Thames Asset Global Securitization No. 1 | |
| 0.280%, due 08/07/09 | | | 10,000,000 | | | | 9,999,533 | | |
13
UBS PACE Money Market Investments
Statement of net assets—July 31, 2009
| Security description | | Face
amount | | Value | |
| Commercial paper2—(continued) | |
| Asset backed-miscellaneous—(concluded) | |
| Variable Funding Capital Corp. | |
| 0.280%, due 09/09/09 | | $ | 4,000,000 | | | $ | 3,998,787 | | |
| 0.350%, due 09/28/09 | | | 10,000,000 | | | | 9,994,361 | | |
| Windmill Funding Corp. | |
| 0.260%, due 08/10/09 | | | 5,000,000 | | | | 4,999,675 | | |
| Yorktown Capital LLC | |
| 0.350%, due 10/09/09 | | | 5,000,000 | | | | 4,996,646 | | |
| 0.300%, due 10/13/09 | | | 5,000,000 | | | | 4,996,958 | | |
| | | | 98,823,632 | | |
| Asset backed-securities—1.89% | |
| Clipper Receivables Co. LLC | |
| 0.170%, due 08/03/09 | | | 5,000,000 | | | | 4,999,953 | | |
| 0.300%, due 08/03/09 | | | 5,000,000 | | | | 4,999,917 | | |
| | | | 9,999,870 | | |
| Banking-non-US—1.51% | |
| Dnb NOR ASA | |
| 1.000%, due 08/04/09 | | | 3,000,000 | | | | 2,999,750 | | |
| Svenska Handelsbanken | |
| 0.540%, due 08/05/09 | | | 5,000,000 | | | | 4,999,700 | | |
| | | | 7,999,450 | | |
| Banking-US—13.39% | |
| ANZ (Delaware), Inc. | |
| 0.500%, due 08/10/09 | | | 5,000,000 | | | | 4,999,375 | | |
| Calyon N.A., Inc. | |
| 0.400%, due 09/01/09 | | | 5,000,000 | | | | 4,998,278 | | |
| 0.540%, due 01/19/10 | | | 2,000,000 | | | | 1,994,870 | | |
| Danske Corp. | |
| 0.270%, due 08/03/09 | | | 3,000,000 | | | | 2,999,955 | | |
| 0.310%, due 08/17/09 | | | 5,000,000 | | | | 4,999,311 | | |
| 0.350%, due 10/09/09 | | | 5,000,000 | | | | 4,996,646 | | |
14
UBS PACE Money Market Investments
Statement of net assets—July 31, 2009
| Security description | | Face
amount | | Value | |
| Commercial paper2—(concluded) | |
| Banking-US—(concluded) | |
| Deutsche Bank Financial LLC | |
| 0.300%, due 10/27/09 | | $ | 2,000,000 | | | $ | 1,998,550 | | |
| Dexia Delaware LLC | |
| 0.290%, due 08/13/09 | | | 10,000,000 | | | | 9,999,034 | | |
| ING (US) Funding LLC | |
| 0.250%, due 08/11/09 | | | 4,000,000 | | | | 3,999,722 | | |
| 0.400%, due 08/17/09 | | | 5,000,000 | | | | 4,999,111 | | |
| 0.400%, due 09/02/09 | | | 5,000,000 | | | | 4,998,222 | | |
| Morgan (J.P.) Chase Funding, Inc. | |
| 0.310%, due 09/03/09 | | | 10,000,000 | | | | 9,997,158 | | |
| Natexis Banques Populaires US Finance Co. LLC | |
| 0.260%, due 08/31/09 | | | 5,000,000 | | | | 4,998,917 | | |
| Societe Generale N.A., Inc. | |
| 0.600%, due 08/06/09 | | | 5,000,000 | | | | 4,999,583 | | |
| | | | 70,978,732 | | |
| Brokerage—0.94% | |
| RBS Holdings USA, Inc. | |
| 0.160%, due 08/03/09 | | | 5,000,000 | | | | 4,999,956 | | |
| Finance-captive automotive—0.57% | |
| Toyota Motor Credit Corp. | |
| 0.280%, due 08/12/09 | | | 3,000,000 | | | | 2,999,743 | | |
| Food/beverage—0.28% | |
| Nestle Capital Corp. | |
| 0.650%, due 02/16/10 | | | 1,500,000 | | | | 1,494,610 | | |
| Pharmaceuticals—1.51% | |
| Pfizer, Inc. | |
| 0.230%, due 08/20/09 | | | 5,000,000 | | | | 4,999,393 | | |
| 0.320%, due 11/03/09 | | | 3,000,000 | | | | 2,997,493 | | |
| | | | 7,996,886 | | |
| Total commercial paper (cost—$210,290,712) | | | 210,290,712 | | |
15
UBS PACE Money Market Investments
Statement of net assets—July 31, 2009
| Security description | | Face
amount | | Value | |
| Short-term corporate obligations—3.17% | |
| Banking-non-US—1.32% | |
| Lloyds TSB Group PLC | |
| 1.286%, due 08/07/091,4 | | $ | 5,000,000 | | | $ | 5,000,000 | | |
| Nordea Bank AB | |
| 0.717%, due 09/24/091,4 | | | 2,000,000 | | | | 2,000,000 | | |
| | | | 7,000,000 | | |
| Banking-US—1.47% | |
| HSBC Bank USA, Inc. | |
| 0.925%, due 10/14/091 | | | 4,000,000 | | | | 4,000,000 | | |
| Wells Fargo & Co. | |
| 0.782%, due 09/23/091 | | | 3,800,000 | | | | 3,802,304 | | |
| | | | 7,802,304 | | |
| Finance-noncaptive consumer—0.38% | |
| General Electric Capital Corp. | |
| 0.580%, due 10/20/091 | | | 2,000,000 | | | | 1,999,363 | | |
| Total short-term corporate obligations (cost—$16,801,667) | | | 16,801,667 | | |
| Repurchase agreements—14.13% | |
Repurchase agreement dated 07/31/09
with Barclays Bank PLC, 0.180% due
08/03/09, collateralized by $25,534,000
Federal Home Loan Bank obligations,
zero coupon due 01/08/10;
(value—$25,500,806);
proceeds: $25,000,375 | | | 25,000,000 | | | | 25,000,000 | | |
Repurchase agreement dated 07/31/09
with Deutsche Bank Securities, 0.190%
due 08/03/09, collateralized by $40,000,000
Federal Home Loan Bank obligations,
3.000% due 06/11/10, $6,631,000
Federal National Mortgage Association
obligations, 6.125% due 08/17/26 and
$6,603,000 Resolution Funding Principal
Strips, zero coupon due 04/15/30;
(value—$49,980,300);
proceeds: $49,000,776 | | | 49,000,000 | | | | 49,000,000 | | |
16
UBS PACE Money Market Investments
Statement of net assets—July 31, 2009
| Security description | | Face
amount | | Value | |
| Repurchase agreements—(concluded) | |
Repurchase agreement dated 07/31/09
with State Street Bank & Trust Co., 0.010%
due 08/03/09, collateralized by $882,425
US Treasury Bills, zero coupon
due 08/27/09 to 09/10/09;
(value—$882,336);
proceeds: $865,001 | | $ | 865,000 | | | $ | 865,000 | | |
| Total repurchase agreements (cost—$74,865,000) | | | 74,865,000 | | |
| | | Number of
shares | | | |
| Investment of cash collateral from securities loaned—1.87% | |
| Money market fund—1.87% | |
| UBS Private Money Market Fund LLC5 | |
| (cost—$9,894,000) | | | 9,894,000 | | | | 9,894,000 | | |
Total investments (cost—$545,431,205 which
approximates cost for federal income
tax purposes)—102.92% | | | 545,431,205 | | |
| Liabilities in excess of other assets—(2.92)% | | | (15,472,696 | ) | |
Net assets (applicable to 529,948,181
shares of beneficial interest outstanding
equivalent to $1.00 per share)—100.00% | | $ | 529,958,509 | | |
* On September 7, 2008, the Federal Housing Finance Agency placed the Federal National Mortgage Association and the Federal Home Loan Mortgage Corporation into conservatorship, and the US Treasury guaranteed the debt issued by those organizations.
1 Variable rate security. The maturity dates reflect earlier of reset dates or stated maturity dates. The interest rates shown are the current rates as of July 31, 2009, and reset periodically.
2 Rates shown are the discount rates at date of purchase.
3 Security, or portion thereof, was on loan at July 31, 2009.
4 Security exempt from registration under Rule 144A of the Securities Act of 1933. These securities, which represent 1.32% of net assets as of July 31, 2009, are considered liquid and may be resold in transactions exempt from registration, normally to qualified institutional buyers.
17
UBS PACE Money Market Investments
Statement of net assets—July 31, 2009
5 The table below details the Portfolio's transaction activity in an affiliated issuer during the year ended July 31, 2009.
Security
description | | Value at
07/31/08 | | Purchases
during
the year
ended
07/31/09 | | Sales
during
the year
ended
07/31/09 | | Value at
07/31/09 | | Net
income
earned
from
affiliate
for the
year ended
07/31/09 | |
UBS Private
Money Market
Fund LLC | | $ | 0 | | | $ | 151,079,000 | | | $ | 141,185,000 | | | $ | 9,894,000 | | | $ | 5,504 | | |
The following is a summary of the fair valuations used as of July 31, 2009 in valuing the Portfolio's investments:
| Measurements at 07/31/09 | |
| | | Quoted
prices
in active
markets for
identical
investments
(Level 1) | | Significant
other
observable
inputs
(Level 2) | | Unobservable
inputs
(Level 3) | | Total | |
US government and
agency obligations | | $ | — | | | $ | 166,959,525 | | | $ | — | | | $ | 166,959,525 | | |
| Bank notes | | | — | | | | 13,471,632 | | | | — | | | | 13,471,632 | | |
| Certificates of deposit | | | — | | | | 53,148,669 | | | | — | | | | 53,148,669 | | |
| Commercial paper | | | — | | | | 210,290,712 | | | | — | | | | 210,290,712 | | |
Short-term corporate
obligations | | | — | | | | 16,801,667 | | | | — | | | | 16,801,667 | | |
Repurchase
agreements | | | — | | | | 74,865,000 | | | | — | | | | 74,865,000 | | |
Investment of cash
collateral from
securities loaned | | | — | | | | 9,894,000 | | | | — | | | | 9,894,000 | | |
| Total | | $ | — | | | $ | 545,431,205 | | | $ | — | | | $ | 545,431,205 | | |
18
UBS PACE Money Market Investments
Statement of net assets—July 31, 2009
Issuer breakdown by country of origin (unaudited)
| | | Percentage of
total investments | |
| United States | | | 86.7 | % | |
| Canada | | | 3.4 | | |
| France | | | 3.3 | | |
| United Kingdom | | | 2.9 | | |
| Sweden | | | 2.2 | | |
| Norway | | | 0.5 | | |
| Japan | | | 0.5 | | |
| Switzerland | | | 0.3 | | |
| Netherlands | | | 0.2 | | |
| Total | | | 100.0 | % | |
Weighted average maturity—45 days
See accompanying notes to financial statements
19
UBS PACE Money Market Investments
Statement of operations
| | | For the year
ended
July 31, 2009 | |
| Investment income: | |
| Interest | | $ | 8,987,395 | | |
| Affiliated securities lending income | | | 5,504 | | |
| | | | 8,992,899 | | |
| Expenses: | |
| Transfer agency and related services fees | | | 2,735,628 | | |
| Investment management and administration fees | | | 2,298,428 | | |
| Reports and notices to shareholders | | | 349,482 | | |
| US Treasury Temporary Guarantee Program Participation fees | | | 197,324 | | |
| Professional fees | | | 101,796 | | |
| Custody and accounting fees | | | 91,158 | | |
| State registration fees | | | 48,364 | | |
| Trustees' fees | | | 18,245 | | |
| Insurance expense | | | 15,524 | | |
| Other expenses | | | 10,870 | | |
| | | | 5,866,819 | | |
Less: Fee waivers and/or expense reimbursements by
investment manager and administrator | | | (1,987,435 | ) | |
| Net expenses | | | 3,879,384 | | |
| Net investment income | | | 5,113,515 | | |
| Net realized gain from investment activities | | | 43,603 | | |
| Net increase in net assets resulting from operations | | $ | 5,157,118 | | |
Statement of changes in net assets
| | | For the years ended July 31, | |
| | | 2009 | | 2008 | |
| From operations: | |
| Net investment income | | $ | 5,113,515 | | | $ | 16,388,771 | | |
| Net realized gains from investment activities | | | 43,603 | | | | 42,669 | | |
| Net increase in net assets resulting from operations | | | 5,157,118 | | | | 16,431,440 | | |
Dividends and distributions to
shareholders from: | |
| Net investment income | | | (5,113,515 | ) | | | (16,388,771 | ) | |
| Net realized gains from investment activities | | | (75,184 | ) | | | — | | |
| Total dividends and distributions to shareholders | | | (5,188,699 | ) | | | (16,388,771 | ) | |
| From beneficial interest transactions: | |
Net increase in net assets from beneficial
interest transactions | | | 6,747,394 | | | | 114,637,685 | | |
| Net increase in net assets | | | 6,715,813 | | | | 114,680,354 | | |
| Net assets: | |
| Beginning of year | | | 523,242,696 | | | | 408,562,342 | | |
| End of year | | $ | 529,958,509 | | | $ | 523,242,696 | | |
Accumulated undistributed net
investment income | | $ | — | | | $ | — | | |
See accompanying notes to financial statements
20
UBS PACE Money Market Investments
Financial highlights
Selected data for a share of beneficial interest outstanding throughout each year is presented below:
| | | For the years ended July 31, | |
| | | 2009 | | 2008 | | 2007 | | 2006 | | 2005 | |
Net asset value,
beginning of year | | $ | 1.00 | | | $ | 1.00 | | | $ | 1.00 | | | $ | 1.00 | | | $ | 1.00 | | |
| Net investment income | | | 0.008 | | | | 0.033 | | | | 0.048 | | | | 0.038 | | | | 0.018 | | |
Dividends from net
investment income | | | (0.008 | ) | | | (0.033 | ) | | | (0.048 | ) | | | (0.038 | ) | | | (0.018 | ) | |
Distributions from net
realized gains from
investment activities | | | (0.000 | )1 | | | — | | | | — | | | | — | | | | — | | |
Total dividends and
distributions | | | (0.008 | ) | | | (0.033 | ) | | | (0.048 | ) | | | (0.038 | ) | | | (0.018 | ) | |
Net asset value,
end of year | | $ | 1.00 | | | $ | 1.00 | | | $ | 1.00 | | | $ | 1.00 | | | $ | 1.00 | | |
| Total investment return2 | | | 0.81 | % | | | 3.40 | % | | | 4.86 | % | | | 3.89 | % | | | 1.80 | % | |
| Ratios/supplemental data: | |
Net assets, end of
year (000's) | | $ | 529,959 | | | $ | 523,243 | | | $ | 408,562 | | | $ | 342,573 | | | $ | 227,528 | | |
Expenses to average net
assets, net of fee waivers
and/or expense
reimbursements by manager | | | 0.59 | % | | | 0.60 | % | | | 0.60 | % | | | 0.60 | % | | | 0.60 | % | |
Expenses to average net
assets, before fee waivers
and/or expense
reimbursements by manager | | | 0.89 | % | | | 0.93 | % | | | 0.92 | % | | | 0.99 | % | | | 0.97 | % | |
Net investment income to
average net assets | | | 0.78 | % | | | 3.27 | % | | | 4.75 | % | | | 3.89 | % | | | 1.85 | % | |
1 Amount of distribution paid represents less than $0.0005 per share.
2 Total investment return is calculated assuming a $10,000 investment on the first day of each year reported, reinvestment of all dividends and other distributions, if any, at net asset value on the payable dates, and a sale at net asset value on the last day of each year reported. The figures do not include program fees; results would be lower if these fees were included. Returns do not reflect the deduction of taxes that a shareholder would pay on Portfolio distributions.
See accompanying notes to financial statements
21
UBS PACE Money Market Investments
Notes to financial statements
Organization and significant accounting policies
UBS PACE Money Market Investments (the "Portfolio") is a diversified portfolio of UBS PACESM Select Advisors Trust (the "Trust"), which was organized as a Delaware statutory trust under the laws of the State of Delaware by Certificate of Trust dated September 9, 1994, as amended June 9, 1995 and thereafter, and is registered with the Securities and Exchange Commission under the Investment Company Act of 1940, as amended, as an open-end management investment company. The trustees of the Trust have authority to issue an unlimited number of shares of beneficial interest, par value $0.001 per share.
The Trust currently offers fifteen Portfolios available for investment, each having its own investment objectives and policies. Shares of the Portfolio currently are available only to participants in the UBS PACESM Select Advisors Program and the UBS PACESM Multi Advisor Program.
The Trust accounts separately for the assets, liabilities and operations of each Portfolio. Expenses directly attributable to each Portfolio are charged to that Portfolio's operations; expenses which are applicable to all Portfolios are allocated among them on a pro rata basis.
In the normal course of business the Portfolio may enter into contracts that contain a variety of representations or that provide indemnification for certain liabilities. The Portfolio's maximum exposure under these arrangements is unknown, as this would involve future claims that may be made against the Portfolio that have not yet occurred. However, the Portfolio has not had prior claims or losses pursuant to these contracts and expects the risk of loss to be remote.
The preparation of financial statements in accordance with US generally accepted accounting principles requires the Portfolio's management to make estimates and assumptions that affect the reported amounts and disclosures in the financial statements.
22
UBS PACE Money Market Investments
Notes to financial statements
Actual results could differ from those estimates. The following is a summary of significant accounting policies:
Valuation and accounting for investments and investment income—Investments are valued at amortized cost, unless the Trust's Board of Trustees (the "Board") determines that this does not represent fair value. Periodic review and monitoring of the valuation of the securities held by the Portfolio is performed in an effort to ensure that amortized cost approximates market value. Investment transactions are recorded on the trade date. Realized gains and losses from investment transactions are calculated using the identified cost method. Interest income is recorded on an accrual basis. Premiums are amortized and discounts are accreted as adjustments to interest income and the identified cost of investments.
On August 1, 2008, the Portfolio adopted the Financial Accounting Standards Board ("FASB") Statement of Financial Accounting Standards No. 157, "Fair Value Measurements" ("FAS 157"). FAS 157 requires disclosure surrounding the various inputs that are used in determining the value of the Portfolio's investments. These inputs are summarized into the three broad levels listed below:
Level 1—Quoted prices in active markets for identical investments.
Level 2—Other significant observable inputs, including but not limited to, quoted prices for similar investments, interest rates, prepayment speeds and credit risks.
Level 3—Unobservable inputs inclusive of the Portfolio's own assumptions in determining the fair value of investments.
In accordance with the requirements of FAS 157, a fair value hierarchy has been included near the end of the Portfolio's Statement of net assets.
23
UBS PACE Money Market Investments
Notes to financial statements
Repurchase agreements—The Portfolio may purchase securities or other obligations from a bank or securities dealer (or its affiliate), subject to the seller's agreement to repurchase them at an agreed upon date (or upon demand) and price. The Portfolio maintains custody of the underlying obligations prior to their repurchase, either through its regular custodian or through a special "tri-party" custodian or sub-custodian that maintains a separate account for both the Portfolio and its counterparty. The underlying collateral is valued daily to ensure that the value, including accrued interest, is at least equal to the repurchase price. In the event of default of the obligation to repurchase, the Portfolio generally has the right to liquidate the collateral and apply the proceeds in satisfaction of the obligation. Repurchase agreements involving obl igations other than US government securities (such as commercial paper, corporate bonds and mortgage loans) may be subject to special risks and may not have the benefit of certain protections in the event of counterparty insolvency. If the seller (or seller's guarantor, if any) becomes insolvent, the Portfolio may suffer delays, costs and possible losses in connection with the disposition or retention of the collateral. Under certain circumstances, in the event of default or bankruptcy by the other party to the agreement, realization and/or retention of the collateral may be subject to legal proceedings. The Portfolio may participate in joint repurchase agreement transactions with other funds managed, advised or sub-advised by UBS Global Asset Management (Americas) Inc. ("UBS Global AM").
Dividends and distributions—Dividends and distributions to shareholders are recorded on the ex-dividend date. The amount of dividends and distributions is determined in accordance with federal income tax regulations, which may differ from US generally accepted accounting principles. These "book/tax" differences are either considered temporary or permanent in nature. To the extent these differences are permanent in nature, such amounts are reclassified within the capital accounts based on their federal
24
UBS PACE Money Market Investments
Notes to financial statements
tax-basis treatment; temporary differences do not require reclassification.
Concentration of risk
The ability of the issuers of debt securities held by the Portfolio to meet their obligations may be affected by economic and political developments, including those particular to a specific industry, country, state or region.
Investment management and administration fees and other transactions with affiliates
The Board has approved an investment management and administration contract ("Management Contract") with UBS Global AM. In accordance with the Management Contract, the Portfolio pays UBS Global AM an investment management and administration fee, which is accrued daily and paid monthly, at an annual rate of 0.35% of the Portfolio's average daily net assets. At July 31, 2009, the Portfolio is owed $17,719 from UBS Global AM, representing investment management and administration fees net of fee waivers/expense reimbursements.
UBS Global AM has contractually undertaken to waive a portion of the Portfolio's investment management and administration fees and/or reimburse a portion of the Portfolio's other expenses, when necessary, to maintain the total ordinary annual operating expenses (excluding dividend expense, borrowing costs and interest expense, if any) through November 30, 2009 at a level not to exceed 0.60%. The Portfolio will make a payment to UBS Global AM for any previously waived fees/reimbursed expenses during the following three fiscal years to the extent that operating expenses are otherwise below the expense cap.
25
UBS PACE Money Market Investments
Notes to financial statements
At July 31, 2009, the Portfolio had fee waivers/expense reimbursements subject to repayment and respective dates of expiration as follows:
Fee waivers/expense
reimbursements
subject to repayment | | Expires
July 31,
2010 | | Expires
July 31,
2011 | | Expires
July 31,
2012 | |
| $ | 4,355,534 | | | $ | 1,199,238 | | | $ | 1,426,962 | | | $ | 1,729,334 | | |
Additionally, UBS Global AM may voluntarily waive fees and/or reimburse expenses from time to time in the event that the Portfolio's yield falls below a certain level. Once started, there is no guarantee that UBS Global AM would continue to voluntarily waive an additional portion of its fees and/or reimburse expenses. For the year ended July 31, 2009, UBS Global AM voluntarily waived and/or reimbursed expenses of $258,101 for that purpose.
For the year ended July 31, 2009, UBS Global AM waived fees/reimbursed expenses of $1,987,435.
Additional information regarding compensation to affiliate of a board member
Professor Meyer Feldberg serves as a senior advisor to Morgan Stanley, resulting in him being an interested director of the Portfolio. The Portfolio has been informed that Professor Feldberg's role at Morgan Stanley does not involve matters directly affecting any UBS funds. Portfolio transactions are executed through Morgan Stanley based on that firm's ability to provide best execution of the transactions.
During the year ended July 31, 2009, the Portfolio purchased and sold certain securities (e.g., fixed income securities) in principal trades with Morgan Stanley having an aggregate value of $184,331,956. Morgan Stanley received compensation in connection with these trades, which may have been in the form of a "mark-up" or "mark-down" of the price of the securities, a fee from the issuer for maintaining a commercial paper program, or some other form of compensation. Although the precise amount
26
UBS PACE Money Market Investments
Notes to financial statements
of this compensation is not generally known by the Portfolio's investment manager, it is believed that under normal circumstances it represents a small portion of the total value of the transactions.
Transfer agency related services fees
UBS Financial Services Inc., provides certain services pursuant to a delegation of authority from PNC Global Investment Servicing (U.S.) Inc. ("PNC"), the Portfolio's transfer agent, and is compensated for these services by PNC, not the Portfolio.
For the year ended July 31, 2009, UBS Financial Services, Inc. received from PNC, not the Portfolio, $1,367,378 of the total transfer agency and related services fees paid by the Portfolio to PNC.
Securities lending
The Portfolio may lend securities up to 331/3% of its total assets to qualified broker-dealers or institutional investors. The loans are secured at all times by cash, US government securities or irrevocable letters of credit in an amount at least equal to the market value of the securities loaned, plus accrued interest and dividends, determined on a daily basis and adjusted accordingly. The Portfolio will regain ownership of loaned securities to exercise certain beneficial rights; however, the Portfolio may bear the risk of delay in recovery of, or even loss of rights in, the securities loaned should the borrower fail financ ially. The Portfolio receives compensation for lending its securities from interest or dividends earned on the cash, US government securities or irrevocable letters of credit held as collateral, net of fee rebates paid to the borrower plus reasonable administrative and custody fees. Until November 12, 2008, UBS Financial Services Inc., an indirect wholly owned subsidiary of UBS AG, and other affiliated broker-dealers had been approved as borrowers under the Portfolio's securities lending program. As of November 12, 2008 State Street Bank & Trust Company is the Portfolio's lending agent. Prior to
27
UBS PACE Money Market Investments
Notes to financial statements
November 12, 2008, UBS Securities LLC was the Portfolio's lending agent. For the period August 1, 2008 through November 11, 2008, UBS Securities LLC did not earn any compensation as the Portfolio's lending agent since no securities were loaned during that period. At July 31, 2009, the Fund had securities on loan having a market value of $9,695,781.
Other liabilities and components of net assets
At July 31, 2009, the Portfolio had the following liabilities outstanding:
| Payable for cash collateral from securities loaned | | $ | 9,894,000 | | |
| Payable for shares of beneficial interest repurchased | | | 4,487,995 | | |
| Payable for investments purchased | | | 1,999,847 | | |
| Dividends payable to shareholders | | | 2,574 | | |
| Other accrued expenses* | | | 516,984 | | |
* Excludes investment management and administration fees.
At July 31, 2009, the components of net assets were as follows:
| Accumulated paid in capital | | $ | 529,948,020 | | |
| Accumulated net realized gains from investment activities | | | 10,489 | | |
| Net assets | | $ | 529,958,509 | | |
Federal tax status
The Portfolio intends to distribute substantially all of its income and to comply with the other requirements of the Internal Revenue Code applicable to regulated investment companies. Accordingly, no provision for federal income taxes is required. In addition, by distributing during each calendar year substantially all of its net investment income, net realized capital gains and certain other amounts, if any, the Portfolio intends not to be subject to a federal excise tax.
The tax character of distributions paid during the fiscal years ended July 31, 2009 and July 31, 2008 was ordinary income.
28
UBS PACE Money Market Investments
Notes to financial statements
At July 31, 2009 the components of accumulated earnings on a tax basis was undistributed ordinary income of $13,063.
As of and during the year ended July 31, 2009, the Portfolio did not have any liabilities for any unrecognized tax positions. The Portfolio recognizes interest and penalties, if any, related to unrecognized tax positions as income tax expense in the Statement of operations. During the year ended July 31, 2009, the Portfolio did not incur any interest or penalties.
Each of the tax years in the four year period ended July 31, 2009, remains subject to examination by the Internal Revenue Service and state taxing authorities.
Shares of beneficial interest
There is an unlimited amount of $0.001 par value shares of beneficial interest authorized. Transactions in shares of beneficial interest, at $1.00 per share, were as follows:
| | | For the years ended July 31, | |
| | | 2009 | | 2008 | |
| Shares sold | | | 993,352,180 | | | | 687,863,695 | | |
| Shares repurchased | | | (992,040,001 | ) | | | (589,650,962 | ) | |
| Dividends reinvested | | | 5,435,215 | | | | 16,424,952 | | |
| Net increase in shares outstanding | | | 6,747,394 | | | | 114,637,685 | | |
US Treasury Temporary Guarantee Program for Money Market Funds
The Portfolio participated in the US Treasury Department Temporary Guarantee Program for Money Market Funds. The program covered shareholders of mutual funds as of the close of business on September 19, 2008. The program expired on September 18, 2009. The Portfolio bore the cost of participating in this program, as this is not an expense borne by the Portfolio's advisor. The Portfolio paid a fee of 0.01% of the value of the Portfolio's outstanding shares on September 19, 2008 (valued at $1.00 per share) for participation in the program for the initial
29
UBS PACE Money Market Investments
Notes to financial statements
coverage period of September 19, 2008, through December 18, 2008. The program was first extended until April 30, 2009, and the Portfolio paid a fee calculated in the same manner but at the rate of 0.015% for continued participation in the program through that date. In April, the program was extended a final time, providing coverage through September 18, 2009. The Portfolio paid an additional fee for continued coverage for the period May 1, 2009, through September 18, 2009, calculated in the same manner and at the same 0.015% rate as for the initial extension period.
Subsequent events
In accordance with the provisions set forth in FAS 165 "Subsequent Events," management has evaluated the effect of subsequent events on the Portfolio's financial statements through September 25, 2009. Management has determined that there are no material subsequent events that would require disclosure in the Portfolio's financial statements through this date.
30
UBS PACE Money Market Investments
Report of Ernst & Young LLP, independent
registered public accounting firm
The Board of Trustees and Shareholders of
UBS PACE Select Advisors Trust
We have audited the accompanying statement of net assets of UBS PACE Money Market Investments (one of the series comprising UBS PACE Select Advisors Trust) (the "Portfolio") as of July 31, 2009, and the related statement of operations for the year then ended, the statements of changes in net assets for each of the two years in the period then ended, and the financial highlights for each of the five years in the period then ended. These financial statements and financial highlights are the responsibility of the Portfolio's management. Our responsibility is to express an opinion on these financial statements and financial highlights based on our audits.
We conducted our audits in accordance with the standards of the Public Company Accounting Oversight Board (United States). Those standards require that we plan and perform the audit to obtain reasonable assurance about whether the financial statements and financial highlights are free of material misstatement. We were not engaged to perform an audit of the Portfolio's internal control over financial reporting. Our audits included consideration of internal control over financial reporting as a basis for designing audit procedures that are appropriate in the circumstances, but not for the purpose of expressing an opinion on the effectiveness of the Portfolio's internal control over financial reporting. Accordingly, we express no such opinion. An audit also includes examining, on a test basis, evidence supporting the amounts and disclosures in the financial statements and financial highlights, assessing the accounting principles us ed and significant estimates made by management, and evaluating the overall financial statement presentation. Our procedures included confirmation of securities owned as of July 31, 2009, by correspondence with the custodian and others, or by other appropriate auditing procedures where replies from others were not received. We believe that our audits provide a reasonable basis for our opinion.
31
UBS PACE Money Market Investments
Report of Ernst & Young LLP, independent
registered public accounting firm (concluded)
In our opinion, the financial statements and financial highlights referred to above present fairly, in all material respects, the financial position of UBS PACE Money Market Investments at July 31, 2009, the results of its operations for the year then ended, the changes in its net assets for each of the two years in the period then ended, and the financial highlights for each of the five years in the period then ended, in conformity with US generally accepted accounting principles.

New York, New York
September 25, 2009
32
UBS PACE Money Market Investments
General information (unaudited)
Quarterly Form N-Q portfolio schedule
The Portfolio will file its complete schedule of portfolio holdings with the Securities and Exchange Commission ("SEC") for the first and third quarters of each fiscal year on Form N-Q. The Portfolio's Forms N-Q are available on the SEC's Web site at http://www.sec.gov. The Portfolio's Forms N-Q may be reviewed and copied at the SEC's Public Reference Room in Washington, D.C. Information on the operation of the SEC's Public Reference Room may be obtained by calling 1-800-SEC 0330. Additionally, you may obtain copies of Forms N-Q from the Portfolio upon request by calling 1-800-647 1568.
Proxy voting policies, procedures and record
You may obtain a description of the Portfolio's (1) proxy voting policies, (2) proxy voting procedures and (3) information regarding how the Portfolio voted any proxies related to portfolio securities during the most recent 12-month period ended June 30 for which an SEC filing has been made, without charge, upon request by contacting the Portfolio directly at 1-800-647 1568, online on the Portfolio's Web site: www.ubs.com/ubsglobalam-proxy, or on the EDGAR Database on the SEC's Web site (http://www.sec.gov).
Other tax information
Pursuant to Section 871(k)(2)(C) of the Internal Revenue Code, UBS PACE Money Market Investments designates 100% of its "qualified short-term gains" (as defined in Section 871(k)(2)(D)) related to the distribution made in December 2008 as short-term capital gain dividends.
33
UBS PACE Money Market Investments
Board approval of investment management and administration agreement (unaudited)
Background—At a meeting of the board of UBS PACESM Select Advisors Trust (the "Trust") on July 15-16, 2009, the members of the board, including the Trustees who are not "interested persons" of the Trust ("Independent Trustees"), as defined in the Investment Company Act of 1940, as amended (the "1940 Act"), considered and approved the continuance of the investment management and administration agreement (the "Investment Management and Administrative Agreement") between UBS Global Asset Management (Americas) Inc. ("UBS Global AM") and the Trust, on behalf of UBS PACE Money Market Investments (the "Portfolio"). In preparing for the meeting, the board members had requested and received extensive information from UBS Global AM to assist them, including performance and expense information for other investment companies with similar investmen t objectives to the Portfolio. The Independent Trustees discussed the materials initially provided by management prior to the scheduled board meeting. The Independent Trustees also met in executive session after management's presentation was completed to review the disclosure that had been made to them at the meeting. At all of these sessions the Independent Trustees met in session with their independent legal counsel. The Independent Trustees also received a memorandum from their independent legal counsel discussing the duties of board members in considering approval of management, administration and distribution agreements.
In its consideration of the approval of the Investment Management and Administration Agreement, the board considered the following factors:
Nature, extent and quality of the services under the Investment Management and Administration Agreement—The board received and considered information regarding the nature, extent and quality of management services provided to the Portfolio by UBS Global AM. The board also considered the nature, extent and quality of administrative,
34
UBS PACE Money Market Investments
Board approval of investment management and administration agreement (unaudited)
distribution, and shareholder services performed by UBS Global AM and its affiliates for the Portfolio and the resources devoted to, and the record of compliance with, the Portfolio's compliance policies and procedures. The board noted that it received information at regular meetings throughout the year regarding the services rendered by UBS Global AM concerning the management of the Portfolio's affairs and UBS Global AM's role in coordinating providers of other services to the Portfolio. The board's evaluation of the services provided by UBS Global AM took into account the board's knowledge and familiarity gained as board members of funds in the UBS New York fund complex, including the scope and quality of UBS Global AM's investment management and other capabilities and the quality of its administrative and other services. The board observed that the scope of services provided by UBS Global AM had expanded over time as a result of regulatory and other developments, including maintaining and monitoring its own and the Portfolio's expanded compliance programs.
The board had information regarding the qualifications, backgrounds and responsibilities of the Portfolio's senior personnel at UBS Global AM and had received information regarding the person primarily responsible for the day-to-day portfolio management of the Portfolio and recognized that the Portfolio's senior personnel at UBS Global AM report to the board regularly and that at each regular meeting the board receives a detailed report on the Portfolio's performance. The board also considered, based on its knowledge of UBS Global AM and its affiliates, the financial resources available to UBS Global AM and its parent organization, UBS AG. In that regard, the board received extensive financial information regarding UBS Global AM and noted that it was a wholly owned, indirect subsidiary of one of the largest financial services firms in the world. It was also noted that UBS Global AM had approximately $142 billion in assets under management and was part of the UBS Global Asset Management Division, which had approximately $507 billion of assets under management
35
UBS PACE Money Market Investments
Board approval of investment management and administration agreement (unaudited)
worldwide as of March 31, 2009. The board was also cognizant of, and considered, the regulatory and litigation actions and investigations occurring in the past few years involving UBS AG, UBS Global AM and certain of their affiliates.
The board concluded that, overall, it was satisfied with the nature, extent and quality of services provided (and expected to be provided) to the Portfolio under the Investment Management and Administration Agreement.
Management fees and expense ratios—The board reviewed and considered the contractual management fee (the "Contractual Management Fee") payable by the Portfolio to UBS Global AM in light of the nature, extent and quality of the management and administrative services provided by UBS Global AM. The board also reviewed and considered the fee waiver and/or expense reimbursement arrangements for the Portfolio and considered the actual fee rate (after taking any waivers and reimbursements into account) (the "Actual Management Fee"). The board considered that UBS Global AM had entered into an agreement with the Portfolio under which UBS Global AM was contractually obligated to waive its management fees and/or reimburse the Portfolio so that the total ordinary operating expenses of the Portfolio through November 30, 2009 (excluding extraordinary items, di vidend expense, borrowing costs and/or interest expense, if any) would not exceed a specified limit. The board also considered that the Portfolio with such a fee waiver/reimbursement agreement had agreed to repay UBS Global AM for those waived fees and/or reimbursed expenses if the Portfolio can do so over the following three fiscal years without causing its expenses in any of those years to exceed the expense cap. Additionally, the board received and considered information comparing the Portfolio's Contractual Management Fee, Actual Management Fee and overall expenses with those of funds in a group of funds selected and provided by Lipper, Inc. ("Lipper"), an independent provider of investment company data (the
36
UBS PACE Money Market Investments
Board approval of investment management and administration agreement (unaudited)
"Expense Group"). A discussion of the board's considerations with respect to the Portfolio's fees is set forth below.
In connection with its consideration of the Portfolio's management fees, the board also received information from UBS Global AM with respect to fees paid by institutional or separate accounts however, in management's view, such fee information was not very relevant to the Portfolio because, among other reasons, separately managed and institutional accounts with a "cash" mandate were not subject to all of the constraints of Rule 2a-7 under the 1940 Act to which the Portfolio is subject and, therefore, were not totally comparable. The board also received information on fees charged to other mutual funds managed by UBS Global AM.
The comparative Lipper information showed that the Portfolio's Contractual Management Fee was in the second quintile, its Actual Management Fee was in the first quintile and its total expenses were in the third quintile in the Portfolio's Expense Group for the comparison periods utilized in the Lipper report.
Portfolio performance—The board received and considered (a) annualized total return information of the Portfolio compared to other funds (the "Performance Universe") selected by Lipper over the one-, three-, five-, ten-year and since inception periods ended April 30, 2009 and (b) annualized performance information for each year in the ten-year period ended April 30, 2009. The board was provided with a description of the methodology Lipper used to determine the similarity of a Portfolio with the funds included in its Performance Universe. The board also considered UBS Global AM's statement that while management believed that the Lipper peer groups were useful in evaluating Portfolio expenses relative to peers, they were less useful in evaluating performance, as in many cases they were broad-based and consisted of funds that did not necessarily hav e similar investment parameters to the Portfolio. The board also noted
37
UBS PACE Money Market Investments
Board approval of investment management and administration agreement (unaudited)
that it had received information throughout the year at periodic intervals with respect to the Portfolio's performance.
The comparative Lipper information showed that the Portfolio's performance was in the second quintile for all comparative periods.
Adviser profitability—The board received and considered a profitability analysis of UBS Global AM and its affiliates in providing services to the Portfolio. The board also received profitability information with respect to the UBS New York fund complex as a whole. UBS Global AM's profitability was considered not excessive in light of the nature, extent and quality of the services provided to the Portfolio.
Economies of scale—The board received and considered information from management regarding whether UBS Global AM realized economies of scale as the Portfolio's assets grew, whether the Portfolio has appropriately benefited from any economies of scale, and whether there is potential for realization of any further economies of scale for the Portfolio. The board considered whether economies of scale in the provision of services to the Portfolio were being passed along to the shareholders. The board noted that the Portfolio's Contractual Management Fee did not contain breakpoints. The board also noted that to the extent a Portfolio's assets have increased over time, it has realized other economies of scale as certain expenses, such as fees for Trustees, auditor and legal fees and printing and postage, become a smaller percentage of overall assets.
Generally, in light of UBS Global AM's profitability data, the Actual Management Fee and the Contractual Management Fee, the board believed that UBS Global AM's sharing of potential and current economies of scale with the Portfolio was acceptable.
38
UBS PACE Money Market Investments
Board approval of investment management and administration agreement (unaudited)
Other benefits to UBS Global AM—The board considered other benefits received by UBS Global AM and its affiliates as a result of its relationship with the Portfolio, including the opportunity to offer additional products and services to Portfolio shareholders. In light of the costs of providing investment management, administrative and other services to the Portfolio and UBS Global AM's ongoing commitment to the Portfolio, the profits and other ancillary benefits that UBS Global AM and its affiliates received were considered reasonable.
In light of all of the foregoing, the board approved the Investment Management and Administration Agreement for the Portfolio. No single factor reviewed by the board was identified by the board as the principal factor in determining whether to approve the Investment Management and Administration Agreement. The Independent Trustees were advised by separate independent legal counsel throughout the process. The board discussed the proposed continuance of the Investment Management and Administration Agreement in a private session with their independent legal counsel at which no representatives of UBS Global AM were present.
39
UBS PACE Money Market Investments
Supplemental information (unaudited)
Board of Trustees & Officers
The Trust is governed by a Board of Trustees which oversees the Portfolios' operations. Each Trustee serves an indefinite term of office. Officers are appointed by the trustees and serve at the pleasure of the Board. The table below shows, for each trustee and officer, his or her name, address and age, the position held with the Trust, the length of time served as a trustee or officer of the Trust, the trustee's or officer's principal occupations during the last five years, the number of portfolios in the UBS fund complex overseen by the trustee or for which a person served as an officer, and other directorships held by the trustee.
The Trust's Statement of Additional Information contains additional information about the trustees and is available, without charge, upon request by calling 1-800-647 1568.
Interested Trustee
| Name, address, and age | | Position(s)
held with
Trust | | Term of
office† and
length of
time served | | Principal occupation(s)
during past 5 years | | Number of portfolios
in fund complex
overseen by trustee | | Other directorships
held by trustee | |
Meyer Feldberg††; 67
Morgan Stanley
1585 Broadway
36th Floor
New York, NY 10036 | | Trustee | | Since 2001 | | Professor Feldberg is Dean Emeritus and Professor of Leadership and Ethics at Columbia Business School, although on an extended leave of absence. He is also a senior advisor to Morgan Stanley (financial services) (since March 2005). Professor Feldberg also serves as president of New York City Global Partners (an organization located in part of the Office of the Mayor of the City of New York that promotes interaction with other cities around the world) (since May 2007). Prior to July 2004, he was Dean and Professor of Leadership and Ethics of the Graduate School of Business at Columbia University (since 1989). | | Professor Feldberg is a director or trustee of 29 investment companies (consisting of 60 portfolios) for which UBS Global AM or one of its affiliates serves as investment advisor, sub-advisor or manager. | | Professor Feldberg is also a director of Primedia Inc. (publishing), Macy's, Inc. (operator of department stores), Revlon, Inc. (cosmetics), SAPPI, Ltd. (producer of paper) and the New York City Ballet. | |
|
40
UBS PACE Money Market Investments
Supplemental information (unaudited)
41
UBS PACE Money Market Investments
Supplemental information (unaudited)
Independent Trustees
| Name, address, and age | | Position(s)
held with
Trust | | Term of
office† and
length of
time served | | Principal occupation(s)
during past 5 years | | Number of portfolios
in fund complex
overseen by trustee | | Other directorships
held by trustee | |
Richard Q. Armstrong; 74
c/o Willkie Farr &
Gallagher LLP
787 Seventh Avenue
New York, NY 10019-6099 | | Trustee and Chairman of the Board of Trustees | | Since 2001 (Trustee) Since 2004 (Chairman of the Board of Trustees) | | Mr. Armstrong is chairman and principal of R.Q.A. Enterprises (management consulting firm) (since April 1991 and principal occupation since March 1995). | | Mr. Armstrong is a director or trustee of 17 investment companies (consisting of 48 portfolios) for which UBS Global AM or one of its affiliates serves as investment advisor, sub-advisor or manager. | | None | |
|
Alan S. Bernikow; 68
207 Benedict Ave.
Staten Island, NY 10314 | | Trustee | | Since 2005 | | Mr. Bernikow is retired. He was a consultant on non-management matters for the firm of Deloitte & Touche (international accounting and consulting firm) (from June 2003 until 2007). Previously, he was deputy chief executive officer at Deloitte & Touche. | | Mr. Bernikow is a director or trustee of 17 investment companies (consisting of 48 portfolios) for which UBS Global AM or one of its affiliates serves as investment advisor, sub-advisor or manager. | | Mr. Bernikow is also a director of Revlon, Inc. (cosmetics) (and serves as the chair of its audit committee and as a member of its nominating and corporate governance committee), a director of Mack-Cali Realty Corporation (real estate investment trust) (and serves as the chair of its audit committee); and a director of the Casual Male Retail Group, Inc. (menswear) (and serves as a member of its audit committee and as a member of its nominating and corporate governance committee). | |
|
Richard R. Burt; 62
McLarty Associates
900 17th Street, 8th Floor
Washington, D.C. 20006 | | Trustee | | Since 2001 | | Mr. Burt is a managing director to McLarty Associates (a consulting firm) (since April 2007) and chairman of IEP Advisors (international investments and consulting firm). Prior to April 2007, he was chairman of Diligence Inc. (information and risk management firm). | | Mr. Burt is a director or trustee of 17 investment companies (consisting of 48 portfolios) for which UBS Global AM or one of its affiliates serves as investment advisor, sub-advisor or manager. | | Mr. Burt is also a director of The Central European Fund, Inc., The Germany Fund, Inc., The New Germany Fund, Inc. and IGT, Inc. (provides technology to gaming and wagering industry). | |
|
Bernard H. Garil; 69
6754 Casa Grande Way
Delray Beach, FL 33446 | | Trustee | | Since 2005 | | Mr. Garil is retired (since 2001). He was a managing director at PIMCO Advisory Services (from 1999 to 2001) where he served as president of closed-end funds and vice-president of the variable insurance product funds advised by OpCap Advisors (until 2001). | | Mr. Garil is a director or trustee of 17 investment companies (consisting of 48 portfolios) for which UBS Global AM or one of its affiliates serves as investment advisor, sub-advisor or manager. | | Mr. Garil is also a director of OFI Trust Company (commercial trust company) and a trustee for the Brooklyn College Foundation, Inc. (charitable foundation). | |
|
42
UBS PACE Money Market Investments
Supplemental information (unaudited)
43
UBS PACE Money Market Investments
Supplemental information (unaudited)
Independent Trustees (continued)
| Name, address, and age | | Position(s)
held with
Trust | | Term of
office† and
length of
time served | | Principal occupation(s)
during past 5 years | | Number of portfolios
in fund complex
overseen by trustee | | Other directorships
held by trustee | |
Heather R. Higgins; 50
255 E. 49th St., Suite 23D
New York, NY 10017 | | Trustee | | Since 2005 | | Ms. Higgins is the president and director of The Randolph Foundation (charitable foundation) (since 1991). Ms. Higgins also serves on the boards of several non-profit charitable groups, including the Independent Women's Forum (chairman), and the Philanthropy Roundtable (vice chairman). She also serves on the board of the Hoover Institution (since January 2009), on which she had previously served from 2001-2007 (executive committee). | | Ms. Higgins is a director or trustee of 17 investment companies (consisting of 48 portfolios) for which UBS Global AM or one of its affiliates serves as investment advisor, sub-advisor or manager. | | None | |
|
44
UBS PACE Money Market Investments
Supplemental information (unaudited)
45
UBS PACE Money Market Investments
Supplemental information (unaudited)
Officers
| Name, address, and age | | Position(s)
held with
Trust | | Term of
office† and
length of
time served | | Principal occupation(s)
during past 5 years;
number of portfolios in fund complex
for which person serves as officer | |
| Joseph Allessie*; 44 | | Vice President and Assistant Secretary | | Since 2005 | | Mr. Allessie is an executive director (since 2007) (prior to which he was a director) and deputy general counsel (since 2005) at UBS Global Asset Management (US) Inc. and UBS Global Asset Management (Americas) Inc. (collectively, "UBS Global AM—Americas region"). Prior to joining UBS Global AM—Americas region, he was senior vice president and general counsel of Kenmar Advisory Corp. (from 2004 to 2005). Prior to that Mr. Allessie was general counsel and secretary of GAM USA Inc., GAM Investments, GAM Services, GAM Funds, Inc. and the GAM Avalon Funds (from 1999 to 2004). Mr. Allessie is a vice president and assistant secretary of 21 investment companies (consisting of 104 portfolios) for which UBS Global AM—Americas region or one of its affiliates serves as investment advisor, sub-advisor or manager. | |
|
46
UBS PACE Money Market Investments
Supplemental information (unaudited)
Officers (continued)
| Name, address, and age | | Position(s)
held with
Trust | | Term of
office† and
length of
time served | | Principal occupation(s)
during past 5 years;
number of portfolios in fund complex
for which person serves as officer | |
| Caren Cunningham*; 50 | | Vice President and Assistant Secretary* | | Since 2007 | | Ms. Cunningham is an executive director and senior associate general counsel of UBS Global AM—Americas region (since 2007). Prior to joining UBS Global AM—Americas region, she was vice president and senior legal manager (distribution) of Pioneer Investment Management Limited (from 2005 to 2006). Prior to that Ms. Cunningham was assistant general counsel of Fidelity Investments (1999-2006). Ms. Cunningham is a vice president and assistant secretary of UBS PACE Select Advisors Trust (consisting of 15 portfolios) and an assistant secretary of 20 other investment companies (consisting of 90 portfolios) for which UBS Global AM—Americas region or one of its affiliates serves as investment advisor, sub-advisor or manager. | |
|
| Thomas Disbrow*; 43 | | Vice President and Treasurer | | Since 2000 (Vice President) Since 2004 (Treasurer) | | Mr. Disbrow is an executive director (since 2007) (prior to which he was a director) (since 2000) and head of the US mutual fund treasury administration department (since September 2006) of UBS Global AM—Americas region. Mr. Disbrow is a vice president and treasurer and/or principal accounting officer of 21 investment companies (consisting of 104 portfolios) for which UBS Global AM—Americas region or one of its affiliates serves as investment advisor, sub-advisor or manager. | |
|
47
UBS PACE Money Market Investments
Supplemental information (unaudited)
Officers (continued)
| Name, address, and age | | Position(s)
held with
Trust | | Term of
office† and
length of
time served | | Principal occupation(s)
during past 5 years;
number of portfolios in fund complex
for which person serves as officer | |
| Michael J. Flook*; 44 | | Vice President and Assistant Treasurer | | Since 2006 | | Mr. Flook is an associate director and a senior manager of the US mutual fund treasury administration department of UBS Global AM—Americas region (since 2006). Prior to joining UBS Global AM—Americas region, he was a senior manager with The Reserve (asset management firm) from May 2005 to May 2006. Prior to that he was a senior manager with PFPC Worldwide since October 2000. Mr. Flook is a vice president and assistant treasurer of 21 investment companies (consisting of 104 portfolios) for which UBS Global AM—Americas region or one of its affiliates serves as investment advisor, sub-advisor or manager. | |
|
| Mark F. Kemper**; 51 | | Vice President and Secretary | | Since 2004 | | Mr. Kemper is a managing director (since 2006) and head of the legal department of UBS Global AM—Americas region (since 2004). He was deputy general counsel of UBS Global AM—Americas region (from July 2001 to July 2004). He has been secretary of UBS Global AM—Americas since 1999 and assistant secretary of UBS Global Asset Management Trust Company since 1993 and secretary of UBS AM Holdings (USA) Inc. (since 2001). Mr. Kemper is secretary of UBS Global AM—Americas region (since 2004). Mr. Kemper is vice president and secretary of 21 investment companies (consisting of 104 portfolios) for which UBS Global AM—Americas region or one of its affiliates serves as investment advisor, sub-advisor or manager. | |
|
48
UBS PACE Money Market Investments
Supplemental information (unaudited)
Officers (continued)
| Name, address, and age | | Position(s)
held with
Trust | | Term of
office† and
length of
time served | | Principal occupation(s)
during past 5 years;
number of portfolios in fund complex
for which person serves as officer | |
| Joanne M. Kilkeary*; 41 | | Vice President and Assistant Treasurer | | Since 1999 | | Ms. Kilkeary is a director (since March 2008) (prior to which she was an associate director) (since 2000) and a senior manager (since 2004) of the US mutual fund treasury administration department of UBS Global AM—Americas region. Ms. Kilkeary is a vice president and assistant treasurer of 21 investment companies (consisting of 104 portfolios) for which UBS Global AM—Americas region or one of its affiliates serves as investment advisor, sub-advisor or manager. | |
|
| Tammie Lee*; 38 | | Vice President and Assistant Secretary | | Since 2005 | | Ms. Lee is a director and associate general counsel of UBS Global AM—Americas region (since 2005). Prior to joining UBS Global AM—Americas region, she was vice president and counsel at Deutsche Asset Management/Scudder Investments from 2003 to 2005. Prior to that she was assistant vice president and counsel at Deutsche Asset Management/Scudder Investments from 2000 to 2003. Ms. Lee is a vice president and assistant secretary of 21 investment companies (consisting of 104 portfolios) for which UBS Global AM—Americas region or one of its affiliates serves as investment advisor, sub-advisor or manager. | |
|
49
UBS PACE Money Market Investments
Supplemental information (unaudited)
Officers (continued)
| Name, address, and age | | Position(s)
held with
Trust | | Term of
office† and
length of
time served | | Principal occupation(s)
during past 5 years;
number of portfolios in fund complex
for which person serves as officer | |
| Steven J. LeMire*; 40 | | Vice President and Assistant Treasurer | | Since 2007 | | Mr. LeMire is a director and senior manager of the US mutual fund treasury administration department of UBS Global AM—Americas region (since October 2007). Prior to joining UBS Global AM—Americas region, he was an independent consultant with Third River Capital, LLC (formerly Two Rivers Capital, LLC) (from 2005 to 2007). Prior to that, he was vice president of operations and fund administration with Oberweis Asset Management, Inc. (from 1997 to 2005). Mr. LeMire is a vice President and assistant treasurer of 21 investment companies (consisting of 104 portfolios) for which UBS Global AM—Americas region or one of its affiliates serves as investment advisor, sub-advisor or manager. | |
|
| Joseph McGill*; 47 | | Vice President and Chief Compliance Officer | | Since 2004 | | Mr. McGill is a managing director (since 2006) and chief compliance officer (since 2003) at UBS Global AM—Americas region. Prior to joining UBS Global AM—Americas region, he was assistant general counsel at JPMorgan Investment Management (from 1999 to 2003). Mr. McGill is a vice president and chief compliance officer of 21 investment companies (consisting of 104 portfolios) for which UBS Global AM—Americas region or one of its affiliates serves as investment advisor, sub-advisor or manager. | |
|
50
UBS PACE Money Market Investments
Supplemental information (unaudited)
Officers (continued)
| Name, address, and age | | Position(s)
held with
Trust | | Term of
office† and
length of
time served | | Principal occupation(s)
during past 5 years;
number of portfolios in fund complex
for which person serves as officer | |
| Nancy D. Osborn*; 43 | | Vice President and Assistant Treasurer | | Since 2007 | | Mrs. Osborn is an associate director and a senior manager of the US mutual fund treasury administration department of UBS Global AM—Americas region (since 2006). Prior to joining UBS Global AM—Americas region, she was an assistant vice president with Brown Brothers Harriman since April 1996. Mrs. Osborn is a vice president and assistant treasurer of 21 investment companies (consisting of 104 portfolios) for which UBS Global AM—Americas region or one of its affiliates serves as investment advisor, sub-advisor or manager. | |
|
| Robert Sabatino**; 36 | | Vice President | | Since 2001 | | Mr. Sabatino is an executive director (since 2007) (prior to which he was a director) and portfolio manager of UBS Global AM—Americas region in the short duration fixed income group (since 2001). From 1995 to 2001 he was a portfolio manager at Merrill Lynch Investment Managers responsible for the management of several retail and institutional money market funds. Mr. Sabatino is a vice president of 4 investment companies (consisting of 33 portfolios) for which UBS Global AM—Americas region or one of its affiliates serves as investment advisor, sub-advisor or manager. | |
|
51
UBS PACE Money Market Investments
Supplemental information (unaudited)
Officers (continued)
| Name, address, and age | | Position(s)
held with
Trust | | Term of
office† and
length of
time served | | Principal occupation(s)
during past 5 years;
number of portfolios in fund complex
for which person serves as officer | |
| Eric Sanders*; 43 | | Vice President and Assistant Secretary | | Since 2005 | | Mr. Sanders is a director and associate general counsel of UBS Global AM—Americas region (since 2005). From 1996 until June 2005, he held various positions at Fred Alger & Company, Incorporated, the most recent being assistant vice president and associate general counsel. Mr. Sanders is a vice president and assistant secretary of 21 investment companies (consisting of 104 portfolios) for which UBS Global AM—Americas region or one of its affiliates serves as investment advisor, sub-advisor or manager. | |
|
52
UBS PACE Money Market Investments
Supplemental information (unaudited)
Officers (continued)
| Name, address, and age | | Position(s)
held with
Trust | | Term of
office† and
length of
time served | | Principal occupation(s)
during past 5 years;
number of portfolios in fund complex
for which person serves as officer | |
| Andrew Shoup*; 53 | | Vice President and Chief Operating Officer | | Since 2006 | | Mr. Shoup is a managing director and global head of the treasury administration department of UBS Global AM—Americas region (since July 2006). Mr. Shoup is also a director of UBS (IRL) Fund p.l.c. (since December 2008). Prior to joining UBS Global AM—Americas region, he was chief administrative officer for the Legg Mason Partner Funds (formerly Smith Barney, Salomon Brothers, and CitiFunds mutual funds) from November 2003 to July 2006. Prior to that, he held various positions with Citigroup Asset Management and related companies with their domestic and offshore mutual funds since 1993. Additionally, he has worked for another mutual fund complex as well as spending eleven years in public accounting. Mr. Shoup is a vice president and chief operating officer of 21 investment companies (consisting of 104 portfolios) for which UBS Global AM—Americas region or one of its affiliates serves as investment advisor, sub-advisor or manager. | |
|
53
UBS PACE Money Market Investments
Supplemental information (unaudited)
Officers (continued)
| Name, address, and age | | Position(s)
held with
Trust | | Term of
office† and
length of
time served | | Principal occupation(s)
during past 5 years;
number of portfolios in fund complex
for which person serves as officer | |
| Kai R. Sotorp**; 50 | | President | | Since 2006 | | Mr. Sotorp is Head—Americas for UBS Global Asset Management (since 2004); a member of the UBS Group Managing Board (since 2003) and a member of the UBS Global Asset Management Executive Committee (since 2001). Mr. Sotorp is a director and president of UBS AM Holdings (USA) Inc. (since 2004). Prior to his current role, Mr. Sotorp was head of UBS Global Asset Management—Asia Pacific (2002-2004), covering Australia, Japan, Hong Kong, Singapore and Taiwan; head of UBS Global Asset Management (Japan) Ltd. (2001-2004); representative director and president of UBS Global Asset Management (Japan) Ltd. (2000-2004); and member of the board of Mitsubishi Corp.—UBS Realty Inc. (2000-2004). Mr. Sotorp is president of 21 investment companies (consisting of 104 portfolios) for which UBS Global AM—Americas region or one of its affiliates serves as investment advisor, sub-advisor or manager. | |
|
54
UBS PACE Money Market Investments
Supplemental information (unaudited)
Officers (concluded)
| Name, address, and age | | Position(s)
held with
Trust | | Term of
office† and
length of
time served | | Principal occupation(s)
during past 5 years;
number of portfolios in fund complex
for which person serves as officer | |
| Keith A. Weller*; 48 | | Vice President and Assistant Secretary | | Since 2000 | | Mr. Weller is an executive director and senior associate general counsel of UBS Global AM—Americas region (since 2005) and has been an attorney with affiliated entities since 1995. Mr. Weller is a vice president and assistant secretary of 21 investment companies (consisting of 104 portfolios) for which UBS Global AM—Americas region or one of its affiliates serves as investment advisor, sub-advisor or manager. | |
|
* This person's business address is 51 West 52nd Street, New York, New York 10019-6114.
** This person's business address is One North Wacker Drive, Chicago, Illinois 60606.
† Each trustee holds office for an indefinite term. Each trustee who has attained the age of seventy-five (75) years will be subject to retirement on the last day of the month in which he or she attains such age unless the Trust's board, including a majority of its Independent Trustees, determines to grant a waiver of the retirement policy with respect to a specified individual for a set period of time. The retirement policy has been waived with respect to Mr. Armstrong, the Chairman of the Board, until 2011. Officers are appointed by the trustees and serve at the pleasure of the Board.
†† Professor Feldberg is deemed an "interested person" of the Trust as defined in the Investment Company Act because he is a senior advisor to Morgan Stanley, a financial services firm with which the Trust may conduct transactions.
55
(This page intentionally left blank)
56
Trustees
Richard Q. Armstrong
Chairman | |
|
| Alan S. Bernikow | |
|
| Richard R. Burt | |
|
| Meyer Feldberg | |
|
| Bernard H. Garil | |
|
| Heather R. Higgins | |
|
Principal Officers
Kai R. Sotorp
President | | Thomas Disbrow
Vice President and Treasurer | |
|
Mark F. Kemper
Vice President and Secretary | | Robert Sabatino
Vice President | |
|
Investment Manager and
Administrator
UBS Global Asset Management (Americas) Inc.
51 West 52nd Street
New York, New York 10019-6114 | |
|
Principal Underwriter
UBS Global Asset Management (US) Inc.
51 West 52nd Street
New York, New York 10019-6114 | |
|
This report is not to be used in connection with the offering of shares of the Portfolio unless accompanied or preceded by an effective prospectus.
© 2009 UBS Global Asset Management (Americas) Inc. All rights reserved.
PRESORTED
STANDARD
U.S. POSTAGE
PAID
COMPUTERSHARE

UBS Global Asset Management (Americas) Inc.
51 West 52nd Street
New York, New York 10019-6114
Item 2. Code of Ethics.
The registrant has adopted a code of ethics that applies to its principal executive officer, principal financial officer, principal accounting officer or controller, or persons performing similar functions pursuant to Section 406 of the Sarbanes-Oxley Act of 2002. (The registrant has designated the code of ethics adopted pursuant to Sarbanes-Oxley as a “Code of Conduct” to lessen the risk of confusion with its separate code of ethics adopted pursuant to Rule 17j-1 under the Investment Company Act of 1940, as amended.)
Item 3. Audit Committee Financial Expert.
The registrant’s Board has determined that the following person serving on the registrant’s Audit Committee is an “audit committee financial expert” as defined in item 3 of Form N-CSR: Alan S. Bernikow. Mr. Bernikow is independent as defined in item 3 of Form N-CSR.
Item 4. Principal Accountant Fees and Services.
(a) Audit Fees:
For the fiscal years ended July 31, 2009 and July 31, 2008, the aggregate Ernst & Young LLP (E&Y) audit fees for professional services rendered to the registrant were approximately $854,350 and $814,200, respectively.
Fees included in the audit fees category are those associated with the annual audits of financial statements and services that are normally provided in connection with statutory and regulatory filings.
(b) Audit-Related Fees:
In each of the fiscal years ended July 31, 2009 and July 31, 2008, the aggregate audit-related fees billed by E&Y for services rendered to the registrant that are reasonably related to the performance of the audits of the financial statements, but not reported as audit fees, were approximately $60,099 and $43,000, respectively.
Fees included in the audit-related fees category are those associated with (1) the reading and providing of comments on the 2009 and 2008 semiannual financial statements and (2) review of the consolidated 2008, 2007 and 2006 reports on the profitability of the UBS Funds to UBS Global Asset Management (Americas) Inc. and its affiliates to assist the board members in their annual advisory/administration contract and service/distribution plan reviews.
There were no audit-related fees required to be approved pursuant to paragraph (c)(7)(ii) of Rule 2-01 of Regulation S-X during the fiscal years indicated above.
(c) Tax Fees:
In each of the fiscal years ended July 31, 2009 and July 31, 2008, the aggregate tax fees billed by E&Y for professional services rendered to the registrant were approximately $276,980 and $263,100, respectively.
Fees included in the tax fees category comprise all services performed by professional staff in the independent accountant’s tax division except those services related to the audits. This category comprises fees for review of tax compliance, tax return preparation and excise tax calculations.
There were no tax fees required to be approved pursuant to paragraph (c)(7)(ii) of Rule 2-01 of Regulation S-X during the fiscal years indicated above.
(d) All Other Fees:
In each of the fiscal years ended July 31, 2009 and July 31, 2008, there were no fees billed by E&Y for products and services, other than the services reported in Item 4(a)-(c) above, rendered to the registrant.
Fees included in the all other fees category would consist of services related to internal control reviews, strategy and other consulting, financial information systems design and implementation, consulting on other information systems, and other tax services unrelated to the registrant.
There were no “all other fees” required to be approved pursuant to paragraph (c)(7)(ii) of Rule 2-01 of Regulation S-X during the fiscal years indicated above.
(e) (1) Audit Committee Pre-Approval Policies and Procedures:
The registrant’s Audit Committee (“audit committee”) has adopted an “Audit Committee Charter (Amended and Restated as of May 12, 2004 — with revisions through July 2008)” (the “charter”). The charter contains the audit committee’s pre-approval policies and procedures. Reproduced below is an excerpt from the charter regarding pre-approval policies and procedures:
The [audit] Committee shall:
…
2. Pre-approve (a) all audit and permissible non-audit services(1) to be provided to the Fund and (b) all permissible non-audit services to be provided by the Fund’s independent auditors to UBS Global [Asset Management (Americas) Inc. (“UBS Global AM”)] and any Covered Service Providers, if the engagement relates directly to the operations and financial reporting of the Fund. In carrying out this responsibility, the Committee shall seek periodically from UBS Global [AM] and from the independent auditors a list of such audit and permissible non-audit services that can be expected to be rendered to the Fund, UBS Global [AM] or any Covered Service Providers by the Fund’s independent auditors, and an estimate of the fees sought to be paid in connection with such services. The Committee may delegate its responsibility to pre-approve any such audit and permissible non-audit services to a sub-committee consisting of the Chairperson of the Committee
and two other members of the Committee as the Chairperson, from time to time, may determine and appoint, and such sub-committee shall report to the Committee, at its next regularly scheduled meeting after the sub-committee’s meeting, its decision(s). From year to year, the Committee shall report to the Board whether this system of pre-approval has been effective and efficient or whether this Charter should be amended to allow for pre-approval pursuant to such policies and procedures as the Committee shall approve, including the delegation of some or all of the Committee’s pre-approval responsibilities to other persons (other than UBS Global [AM] or the Fund’s officers).
(1) The Committee will not approve non-audit services that the Committee believes may taint the independence of the auditors. Currently, permissible non-audit services include any professional services (including tax services) that are not prohibited services as described below, provided to the Fund by the independent auditors, other than those provided to the Fund in connection with an audit or a review of the financial statements of the Fund. Permissible non-audit services may not include: (i) bookkeeping or other services related to the accounting records or financial statements of the Fund; (ii) financial information systems design and implementation; (iii) appraisal or valuation services, fairness opinions or contribution-in-kind reports; (iv) actuarial services; (v) internal audit outsourcing services; (vi) management functions or human resources; (vii) broker or dealer, investment adviser or investment banking services; (viii) legal services and expert services unrelated to the audit; and (ix) any other service the Public Company Accounting Oversight Board determines, by regulation, is impermissible.
Pre-approval by the Committee of any permissible non-audit services is not required so long as: (i) the aggregate amount of all such permissible non-audit services provided to the Fund, UBS Global [AM] and any service providers controlling, controlled by or under common control with UBS Global [AM] that provide ongoing services to the Fund (“Covered Service Providers”) constitutes not more than 5% of the total amount of revenues paid to the independent auditors (during the fiscal year in which the permissible non-audit services are provided) by (a) the Fund, (b) its investment adviser and (c) any entity controlling, controlled by, or under common control with the investment adviser that provides ongoing services to the Fund during the fiscal year in which the services are provided that would have to be approved by the Committee; (ii) the permissible non-audit services were not recognized by the Fund at the time of the engagement to be non-audit services; and (iii) such services are promptly brought to the attention of the Committee and approved by the Committee (or its delegate(s)) prior to the completion of the audit.
(e) (2) Services approved pursuant to paragraph (c)(7)(i)(C) of Rule 2-01 of Regulation S-X:
Audit-Related Fees:
There were no amounts that were approved by the audit committee pursuant to the de minimis exception for the fiscal years ended July 31, 2009 and July 31, 2008 on behalf of the registrant.
There were no amounts that were required to be approved by the audit committee pursuant to the de minimis exception for the fiscal years ended July 31, 2009 and July 31, 2008 on behalf of the registrant’s service providers that relate directly to the operations and financial reporting of the registrant.
Tax Fees:
There were no amounts that were approved by the audit committee pursuant to the de minimis exception for the fiscal years ended July 31, 2009 and July 31, 2008 on behalf of the registrant.
There were no amounts that were required to be approved by the audit committee pursuant to the de minimis exception for the fiscal years ended July 31, 2009 and July 31, 2008 on behalf of the registrant’s service providers that relate directly to the operations and financial reporting of the registrant.
All Other Fees:
There were no amounts that were approved by the audit committee pursuant to the de minimis exception for the fiscal years ended July 31, 2009 and July 31, 2008 on behalf of the registrant.
There were no amounts that were required to be approved by the audit committee pursuant to the de minimis exception for the fiscal years ended July 31, 2009 and July 31, 2008 on behalf of the registrant’s service providers that relate directly to the operations and financial reporting of the registrant.
(f) According to E&Y, for the fiscal year ended July 31, 2009, the percentage of hours spent on the audit of the registrant’s financial statements for the most recent fiscal year that were attributed to work performed by persons who are not full-time, permanent employees of E&Y was 0%.
(g) For the fiscal years ended July 31, 2009 and July 31, 2008, the aggregate fees billed by E&Y of $2,376,239 and $2,008,498, respectively, for non-audit services rendered on behalf of the registrant (“covered”), its investment adviser (not including any sub-adviser whose role is primarily portfolio management and is subcontracted with or overseen by another investment adviser) and any entity controlling, controlled by, or under common control with the adviser (“non-covered”) that provides ongoing services to the registrant for each of the last two fiscal years of the registrant is shown in the table below:
| | 2009 | | 2008 | |
Covered Services | | $ | 337,079 | | $ | 306,100 | |
Non-Covered Services | | 2,039,160 | | 1,702,398 | |
| | | | | | | |
(h) The registrant’s audit committee was not required to consider whether the provision of non-audit services that were rendered to the registrant’s investment adviser (not including any sub-adviser whose role is primarily portfolio management and is subcontracted with or
overseen by another investment adviser), and any entity controlling, controlled by, or under common control with the investment adviser that provides ongoing services to the registrant that were not pre-approved pursuant to paragraph (c)(7)(ii) of Rule 2-01 of Regulation S-X is compatible with maintaining the principal accountant’s independence.
Item 5. Audit Committee of Listed Registrants.
Not applicable to the registrant.
Item 6. Schedule of Investments.
(a) Included as part of the report to shareholders filed under Item 1 of this form.
(b) Not applicable.
Item 7. Disclosure of Proxy Voting Policies and Procedures for Closed-End Management Investment Companies.
Not applicable to the registrant.
Item 8. Portfolio Managers of Closed-End Management Investment Companies.
Not applicable to the registrant.
Item 9. Purchases of Equity Securities by Closed-End Management Investment Company and Affiliated Purchasers.
Not applicable to the registrant.
Item 10. Submission of Matters to a Vote of Security Holders.
The registrant’s Board has established a Nominating and Corporate Governance Committee. The Nominating and Corporate Governance Committee will consider nominees recommended by shareholders if a vacancy occurs among those board members who are not “interested persons” as defined in Section 2(a)(19) of the Investment Company Act of 1940, as amended. In order to recommend a nominee, a shareholder should send a letter to the chairperson of the Nominating and Corporate Governance Committee, Richard R. Burt, care of the Secretary of the registrant at UBS Global Asset Management (Americas) Inc., UBS Building, One North Wacker Drive, Chicago, IL 60606, and indicate on the envelope “Nominating and Corporate Governance Committee.” The shareholder’s letter should state the nominee’s name and should include the nominee’s resume or curriculum vitae, and must be accompanied by a written consent of the individual to stand for election if nominated for the Board and to serve if elected by shareholders.
Item 11. Controls and Procedures.
(a) The registrant’s principal executive officer and principal financial officer have concluded that the registrant’s disclosure controls and procedures (as defined in Rule 30a-3(c) under the Investment Company Act of 1940, as amended) are effective based on their evaluation of these controls and procedures as of a date within 90 days of the filing date of this document.
(b) The registrant’s principal executive officer and principal financial officer are aware of no changes in the registrant’s internal control over financial reporting (as defined in Rule 30a-3(d) under the Investment Company Act of 1940, as amended) that occurred during the registrant’s most recent fiscal half-year that has materially affected, or is reasonably likely to materially affect, the registrant’s internal control over financial reporting.
Item 12. Exhibits.
(a) (1) Code of Ethics as required pursuant to Section 406 of the Sarbanes-Oxley Act of 2002 (and designated by registrant as a “Code of Conduct”) is filed herewith as Exhibit EX-99.CODE ETH.
(a) (2) Certifications of principal executive officer and principal financial officer pursuant to Section 302 of the Sarbanes-Oxley Act of 2002 are attached hereto as Exhibit EX-99.CERT.
(a) (3) Written solicitation to purchase securities under Rule 23c-1 under the Investment Company Act of 1940 sent or given during the period covered by the report by or on behalf of the registrant to 10 or more persons — not applicable to the registrant.
(b) Certifications of principal executive officer and principal financial officer pursuant to Section 906 of the Sarbanes-Oxley Act of 2002 are attached hereto as Exhibit EX-99.906CERT.
SIGNATURES
Pursuant to the requirements of the Securities Exchange Act of 1934 and the Investment Company Act of 1940, the registrant has duly caused this report to be signed on its behalf by the undersigned, thereunto duly authorized.
UBS PACE Select Advisors Trust
By: | /s/ Kai R. Sotorp | |
| Kai R. Sotorp | |
| President | |
| | |
Date: | October 9, 2009 | |
Pursuant to the requirements of the Securities Exchange Act of 1934 and the Investment Company Act of 1940, this report has been signed below by the following persons on behalf of the registrant and in the capacities and on the dates indicated.
By: | /s/ Kai R. Sotorp | |
| Kai R. Sotorp | |
| President | |
| | |
Date: | October 9, 2009 | |
| | |
By: | /s/ Thomas Disbrow | |
| Thomas Disbrow | |
| Vice President and Treasurer | |
| | |
Date: | October 9, 2009 | |