UNITED STATES
SECURITIES AND EXCHANGE COMMISSION
Washington, D.C. 20549
FORM N-CSR
CERTIFIED SHAREHOLDER REPORT OF REGISTERED
MANAGEMENT INVESTMENT COMPANIES
Investment Company Act file number | 811-08764 |
|
UBS PACE Select Advisors Trust |
(Exact name of registrant as specified in charter) |
|
1285 Avenue of the Americas, New York, New York | | 10019-6028 |
(Address of principal executive offices) | | (Zip code) |
|
Mark F. Kemper, Esq. UBS Global Asset Management 1285 Avenue of the Americas New York, NY 10019-6028 |
(Name and address of agent for service) |
|
Copy to: |
Jack W. Murphy, Esq. Dechert LLP 1775 I Street, N.W. Washington, DC 20006-2401 |
|
Registrant’s telephone number, including area code: | 212-713 3000 | |
|
Date of fiscal year end: | July 31 | |
|
Date of reporting period: | July 31, 2010 | |
| | | | | | | | |
Item 1. Reports to Stockholders.
UBS PACE® Select Advisors Trust
Annual Report
July 31, 2010
Table of contents
| Introduction | | | 2 | | |
|
| Portfolio Advisor's and Sub-Advisors' commentaries and schedules of investments | |
|
| UBS PACE® Money Market Investments | | | 5 | | |
|
| UBS PACE® Government Securities Fixed Income Investments | | | 14 | | |
|
| UBS PACE® Intermediate Fixed Income Investments | | | 28 | | |
|
| UBS PACE® Strategic Fixed Income Investments | | | 42 | | |
|
| UBS PACE® Municipal Fixed Income Investments | | | 61 | | |
|
| UBS PACE® Global Fixed Income Investments | | | 74 | | |
|
| UBS PACE® High Yield Investments | | | 87 | | |
|
| UBS PACE® Large Co Value Equity Investments | | | 102 | | |
|
| UBS PACE® Large Co Growth Equity Investments | | | 111 | | |
|
| UBS PACE® Small/Medium Co Value Equity Investments | | | 124 | | |
|
| UBS PACE® Small/Medium Co Growth Equity Investments | | | 135 | | |
|
| UBS PACE® International Equity Investments | | | 146 | | |
|
| UBS PACE® International Emerging Markets Equity Investments | | | 159 | | |
|
| UBS PACE® Global Real Estate Securities Investments | | | 171 | | |
|
| UBS PACE® Alternative Strategies Investments | | | 182 | | |
|
| Understanding your Portfolio's expenses | | | 214 | | |
|
| Statement of assets and liabilities | | | 220 | | |
|
| Statement of operations | | | 228 | | |
|
| Statement of changes in net assets | | | 232 | | |
|
| Financial highlights | | | 239 | | |
|
| Notes to financial statements | | | 292 | | |
|
| Report of independent registered public accounting firm | | | 333 | | |
|
| General information | | | 335 | | |
|
Board approvals of investment management and administration agreements
and subadvisory agreements | | | 336 | | |
|
| Trustees and officers | | | 351 | | |
|
UBS PACE Select Advisors Trust offers multiple share classes representing interests in 15 separate Portfolios. (UBS PACE Money Market Investments offers only one share class.) Different classes of shares and/or Portfolios are offered by separate prospectuses.
For more information on a portfolio or class of shares, contact your financial advisor. He or she can send you a current prospectus relating to a portfolio or class of shares. Investors should carefully read and consider a mutual fund's investment objectives, risks, charges, and expenses before investing. The prospectus contains this and other information about a mutual fund. For a current prospectus, contact UBS Global Asset Management (Americas) Inc. at 888-793 8637, or visit us on the Web at www.ubs.com/globalam-us.
1
UBS PACE Select Advisors Trust
Introduction
September 14, 2010
Dear UBS PACE Shareholder,
We are pleased to provide you with the annual report for the UBS PACE portfolios (the "Portfolios"), comprising the UBS PACE Select Advisors Trust. This report includes summaries of the performance of each Portfolio, as well as commentaries from the investment advisor and sub-advisors regarding the events that affected Portfolio performance during the 12 months ended July 31, 2010. Please note that the opinions of the sub-advisors do not necessarily represent those of UBS Global Asset Management (Americas) Inc.
Moderating Economic Growth
While economic growth in the US moderated as the review period progressed, it continued to expand over the 12-months ended July 31, 2010. After four consecutive quarters of declining gross domestic product ("GDP") growth, the US economy started to expand in the third quarter of 2009. During that time, GDP grew 1.6%. Economic activity then accelerated over the last three months of the year, as the Commerce Department reported that GDP increased a strong 5.0% in the fourth quarter. The US economy's turnaround was due, in part, to the Federal Reserve Board's (the "Fed's") accommodative monetary policy and the federal government's $787 billion stimulus program. Economic growth has continued thus far in 2010, albeit at a much slower pace. GDP expanded 3.7% during the first quarter and a much slower 1.6% growth rate in the second quarter of this year.
While economic growth outside the US was also generally positive, the developed countries lagged their emerging markets counterparts. For example, growth rates in the Eurozone and in the UK were negatively impacted by the escalating debt crisis. In addition, there were concerns that the situation in Greece could spread to other countries in the region. In contrast, growth was so strong in developing countries such as China and India that their central banks raised interest rates in an effort to ward off inflation.
The global equity markets overcome a late stumble
For much of the reporting period, global equity markets continued their ascent that began in the spring of 2009. In the US, the S&P 500 Index1 posted positive returns during seven of the first nine months of the reporting period. Improving economic conditions, better-than-expected corporate profits and robust investor demand supported the market. Then, in an about-face, the market reversed course, and the S&P 500 Index declined 7.99% and 5.23% in May and June, respectively. The market's weakness was triggered by a series of events, including unfolding events in Europe, uncertainties regarding financial reform legislation in the US, declining consumer confidence and some disappointing economic data. The market then regained its footing in July, with the S&P 500 Index rising 7.01% for the month. All told, the S&P 500 Index gained 13.84% during the 12-months ended July 31, 2010.
International equities often moved in tandem with the US stock market throughout the review period. After an initial rise, international developed stocks, as measured by the MSCI EAFE Index (net),2 declined during three of the last four months of the period, ultimately gaining a relatively modest 6.26% during the
1 The S&P 500 Index is an unmanaged, weighted index composed of 500 widely held common stocks varying in composition, and is not available for direct investment. Investors should note that indices do not reflect the deduction of fees and expenses.
2 The MSCI EAFE Index (net) is an index of stocks from 22 countries designed to measure the investment returns of developed economies outside of North America. Dividends are reinvested after the deduction of withholding tax, using tax rates applicable to Luxembourg holding companies, as Luxembourg applies the highest rates. The Index is constructed and managed with a view to being fully investable from the perspective of international institutional investors. Investors should note that indices do not reflect the deduction of fees and expenses.
2
UBS PACE Select Advisors Trust
12 months ended July 31, 2010. Emerging markets equities, on the other hand, performed significantly better, with the MSCI Emerging Markets Index3 gaining 20.24% over the same period. Stronger economic growth, rising commodity prices and solid demand during much of the period supported emerging markets equity prices.
The fixed income markets produce solid results
Many of the same factors that initially propelled the US stock market higher helped US spread sectors (non-Treasuries) post strong results during much of the reporting period. Also supporting spread sectors was the Fed's ongoing commitment to keep short-term interest rates at historically low levels for "an extended period." As a result, some investors were willing to assume greater risks in order to generate additional income from their investments, which was a sharp reversal from the end of April and in May 2010, when risk aversion increased in the wake of the European debt crisis and concerns regarding the sustainability of the US economic recovery. Against this backdrop, demand for US Treasuries increased and investors sold securities that they considered risky.
The US bond market, as measured by the Barclays Capital US Aggregate Index,4 returned 8.91% for the 12 months ended July 31, 2010. Despite giving back a portion of its gains in May 2010, riskier fixed income asset classes generated strong returns, as the BofA Merrill Lynch US High Yield Cash Pay Constrained Index5 gained 23.93% and the J.P. Morgan Emerging Markets Bond Index Global (EMBI Global)6 rose 19.08%.
Sincerely,

Mark E. Carver
President, UBS PACE Select Advisors Trust
Managing Director, UBS Global Asset Management (Americas) Inc.
3 The MSCI Emerging Markets Index is a market capitalization-weighted index composed of companies representative of the market structure of 21 emerging market countries in Europe, Latin America, and the Pacific Basin. The Index is constructed and managed with a view to being fully investable from the perspective of international institutional investors. Investors should note that indices do not reflect the deduction of fees and expenses.
4 The Barclays Capital US Aggregate Index is an unmanaged broad based index designed to measure the US dollar-denominated, investment-grade, fixed rate taxable bond market. The index includes bonds from the Treasury, government-related, corporate, mortgage-backed, asset-backed and commercial mortgage-backed sectors. US agency hybrid adjustable rate mortgage (ARM) securities were added to the index on April 1, 2007. Investors should note that indices do not reflect the deduction of fees and expenses.
5 The BofA Merrill Lynch US High Yield Cash Pay Constrained Index is an unmanaged index of publicly placed non-convertible, coupon-bearing US dollar denominated below investment grade corporate debt with a term to maturity of at least one year. The index is market weighted, so that larger bond issuers have a greater effect on the index's return. However, the representation of any single bond issuer is restricted to a maximum of 2% of the total index. Investors should note that indices do not reflect the deduction of fees and expenses.
6 The J.P. Morgan Emerging Markets Bond Index Global (EMBI Global) is an unmanaged index which is designed to track total returns for US-dollar-denominated debt instruments issued by emerging market sovereign and quasi-sovereign entities: Brady bonds, loans, Eurobonds. Investors should note that indices do not reflect the deduction of fees and expenses.
3
UBS PACE Select Advisors Trust
This report is intended to assist investors in understanding how the Portfolios performed during the 12-month period ended July 31, 2010. The views expressed in the Advisor's and Sub-Advisors' Comments sections are as of the end of the reporting period, reflect performance results gross of fees and expenses, and are those of the investment advisor (with respect to UBS PACE Money Market Investments only) and sub-advisors. Sub-advisors' comments on Portfolios that have more than one subadvisor are reflective of their portion of the Portfolio only. The views and opinions in this report were current as of September 14, 2010. They are not guarantees of performance or investment results and should not be taken as investment advice. Investment decisions reflect a variety of factors, and the investment advisor and sub-advisors reserve the right to change their views about individual securities, sectors and the markets at any time. As a result, the views expressed should not be relied upon as a forecast of a Portfolio's future investment intent.
4
UBS PACE Select Advisors Trust
UBS PACE Money Market Investments
Performance
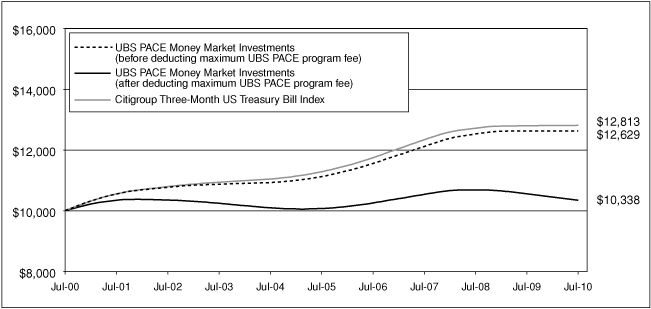
For the 12 months ended July 31, 2010, the Portfolio returned 0.01%, before the deduction of the maximum UBS PACE program fee. (The Portfolio declined 1.97%, after the deduction of the maximum UBS PACE program fee, for the same 12-month period.) Please remember that the UBS PACE program fee is assessed outside the Portfolio at the UBS PACE program account level. The program fee does not impact the determination of the Portfolio's net asset value per share. In comparison, the Citigroup Three-Month US Treasury Bill Index (the "benchmark") returned 0.12%, and the median return of the Lipper Money Market Funds category was 0.02%. (Returns over various time periods are shown in the "Performance at a glance" table on page 8. Please note that the returns shown do not reflect the deduction of taxes that a shareholder would pay on Portfolio distributions.) For a detailed commentary on the market environment in general during the reportin g period, please refer to page 2.
Advisor's comments
Given pockets of weakness in the economy, including continued high unemployment, the Federal Reserve Board (the "Fed") maintained the federal funds rate at a historically low range between 0.00% and 0.25% during the reporting period. (The federal funds rate, or "fed funds" rate, is the rate that banks charge one another for funds they borrow on an overnight basis.) This caused the yields of the securities in which the Portfolio invests to remain very low, which, in turn, negatively impacted the Portfolio's yield.
When the reporting period began, the Portfolio's weighted average maturity was 45 days. However, as the reporting period progressed `and the credit markets stabilized, we increased the Portfolio's weighted average maturity, reaching 53 days on January 31, 2010. During the second half of the reporting period, we reduced the Portfolio's weighted average maturity, ending the period at 46 days, in order to minimize pricing volatility and to meet potential redemption requests in light of the effectiveness of the Securities and Exchange Commission's ("SEC") new requirements related to money market funds (see below for details). In addition, it was our expectation that interest rates would rise as the Fed began to take steps—ahead of any moves to increase the fed funds rate—to remove current high levels of liquidity from the market.
At the issuer level, we maintained a greater-than-usual level of diversification over the fiscal year by investing in smaller positions (typically around 5%), with the goal of reducing risk and keeping the Portfolio highly liquid. As the economic environment improved over the period, however, we gradually increased our single issuer exposure, typically purchasing up to 3% in single nongovernment issuers by
UBS PACE Select Advisors Trust – UBS PACE Money Market Investments
Investment Advisor:
UBS Global Asset Management (Americas) Inc.
Portfolio Manager:
Robert Sabatino
Objective:
Current income consistent with preservation of capital and liquidity
Investment process:
The Portfolio is a money market mutual fund and seeks to maintain a stable price of $1.00 per share, although it may be possible to lose money by investing in this Portfolio. The Portfolio invests in a diversified portfolio of high-quality money market instruments of governmental and private issuers. Security selection is based on the assessment of relative values and changes in market and economic conditions.
5
UBS PACE Select Advisors Trust
UBS PACE Money Market Investments
Advisor's comments – concluded
the end of the reporting period. The Fund is generally able to hold up to 5% in any one issuer (subject to certain exceptions).
On a final note, on January 27, 2010, the SEC adopted rule amendments designed to strengthen the regulations governing money market funds. The amendments impose new liquidity, credit quality and maturity limits. They also enhance disclosures by, among other stipulations, requiring the monthly posting of portfolio holdings reports (beginning in October 2010). UBS Global Asset Management (Americas) Inc. ("UBS Global AM") welcomes the SEC's approval of these new requirements. We believe that they will fortify the money market sector and are consistent with our long-standing conservative approach to the management of the Portfolio.
6
UBS PACE Select Advisors Trust
UBS PACE Money Market Investments
Illustration of an assumed investment of $10,000 in the Portfolio (unaudited)
The following graph depicts the performance of UBS PACE Money Market Investments versus the Citigroup Three-Month US Treasury Bill Index over the 10 years ended July 31, 2010. The performance provided does not reflect the deduction of taxes that a shareholder would pay on Portfolio distributions. Past performance is no guarantee of future results. Returns will vary with market conditions. It is important to note that UBS PACE Money Market Investments is a professionally managed portfolio while the Index is not available for investment and is unmanaged. The comparison is shown for illustration purposes only.
7
UBS PACE Select Advisors Trust
UBS PACE Money Market Investments
Performance at a glance (unaudited)
| Average annual total returns for periods ended 07/31/10 | | 1 year | | 5 years | | 10 years | |
UBS PACE Money Market Investments before deducting
maximum UBS PACE program fee1 | | | 0.01 | % | | | 2.58 | % | | | 2.36 | % | |
UBS PACE Money Market Investments after deducting
maximum UBS PACE program fee1 | | | (1.97 | )% | | | 0.54 | % | | | 0.33 | % | |
| Citigroup Three-Month US Treasury Bill Index2 | | | 0.12 | % | | | 2.58 | % | | | 2.51 | % | |
| Lipper Money Market Funds median | | | 0.02 | % | | | 2.52 | % | | | 2.24 | % | |
For UBS PACE Money Market Investments, average annual total returns for periods ended June 30, 2010, after deduction of the maximum UBS PACE program fee, were as follows: 1-year period, (1.97)%; 5-year period, 0.59%; 10-year period, 0.39%.
For UBS PACE Money Market Investments, the 7-day current yield for the period ended July 31, 2010 was 0.01% (without maximum UBS PACE program fee and after fee waivers and/or expense reimbursements; the yield was (0.51)% before fee waivers and/or expense reimbursements). With the maximum UBS PACE program fee, the 7-day current yield was (1.99)% after fee waivers and/or expense reimbursements; the yield was (2.51)% before fee waivers and/or expense reimbursements. The Portfolio's yield quotation more closely reflects the current earnings of the Portfolio than the total return quotation. Yields will fluctuate and reflect fee waivers and/or expense reimbursements.
1 The maximum annual UBS PACE program fee is 2% of the value of UBS PACE assets. Prior to June 14, 2010, the maximum annual UBS PACE program fee was 1.5% of the value of UBS PACE assets.
2 The Citigroup Three-Month US Treasury Bill Index is an unmanaged index reflecting monthly return equivalents of yield averages that are not marked to the market and an average of the last three 3-month T-bill month-end rates. 3-month T-bills are the short-term debt obligations of the US government. Investors should note that indices do not reflect the deduction of fees and expenses.
Past performance does not predict future performance and the performance information provided does not reflect the deduction of taxes that a shareholder would pay on Portfolio distributions. The return of an investment will fluctuate. Performance results assume reinvestment of all dividends and capital gain distributions at net asset value on the payable dates. Current performance may be higher or lower than the performance data quoted.
Lipper peer group data calculated by Lipper Inc.; used with permission. The Lipper median is the return of the fund that places in the middle of a Lipper peer group.
An investment in UBS PACE Money Market Investments is not insured or guaranteed by the Federal Deposit Insurance Corporation or any other government agency. Although the Portfolio seeks to preserve the value of your investment at $1.00 per share, it is possible to lose money by investing in the Portfolio.
Not FDIC Insured. May lose value. No Bank guarantee.
8
UBS PACE Select Advisors Trust
UBS PACE Money Market Investments
Portfolio statistics (unaudited)
| Characteristics | | 07/31/10 | |
| Net assets (mm) | | $ | 386.2 | | |
| Number of holdings | | | 84 | | |
| Weighted average maturity | | | 46 days | | |
| Portfolio composition1 | | 07/31/10 | |
| Commercial paper | | | 40.8 | % | |
| US government and agency obligations | | | 26.6 | | |
| Certificates of deposit | | | 18.3 | | |
| Repurchase agreements | | | 12.5 | | |
| Short-term corporate obligations | | | 1.8 | | |
| Other assets less liabilities | | | 0.0 | 2 | |
| Total | | | 100.0 | % | |
| Top 10 holdings1 | | 07/31/10 | |
| Repurchase agreement with Deutsche Bank Securities, 0.200% due 08/02/10 | | | 12.3 | % | |
| Federal Home Loan Bank, 0.170% due 08/03/10 | | | 3.9 | | |
| PepsiCo, Inc., 0.150% due 08/03/10 | | | 2.6 | | |
| Federal Home Loan Bank, 0.120% due 08/25/10 | | | 2.6 | | |
| Nestle Finance International Ltd., 0.220% due 08/23/10 | | | 2.6 | | |
| Falcon Asset Securitization Corp., 0.200% due 08/02/10 | | | 1.9 | | |
| Dexia Credit Local, 0.430% due 08/05/10 | | | 1.7 | | |
| BNP Paribas Finance, 0.280% due 08/16/10 | | | 1.6 | | |
| Variable Funding Capital Corp., 0.270% due 08/20/10 | | | 1.6 | | |
| Federal National Mortgage Association, 0.350% due 04/26/11 | | | 1.5 | | |
| Total | | | 32.3 | % | |
1 Weightings represent percentages of the Portfolio's net assets as of July 31, 2010. The Portfolio is actively managed and its composition will vary over time.
2 Weighting represents less than 0.05% of the Portfolio's net assets as of July 31, 2010.
9
UBS PACE Select Advisors Trust
UBS PACE Money Market Investments
Portfolio of investments—July 31, 2010
| Security description | | Face
amount | | Value | |
US government and agency
obligations—26.65% | |
Federal Farm Credit Bank
0.500%, due 08/09/101 | | $ | 5,000,000 | | | $ | 4,999,444 | | |
Federal Home Loan Bank
0.170%, due 08/03/101 | | | 15,000,000 | | | | 14,999,858 | | |
| 0.120%, due 08/25/101 | | | 10,000,000 | | | | 9,999,200 | | |
| 0.180%, due 08/25/101 | | | 5,000,000 | | | | 4,999,400 | | |
| 0.500%, due 10/15/10 | | | 2,100,000 | | | | 2,099,972 | | |
| 0.500%, due 10/29/10 | | | 4,000,000 | | | | 4,001,924 | | |
| 0.400%, due 01/04/11 | | | 2,000,000 | | | | 1,999,342 | | |
| 0.250%, due 01/14/111 | | | 5,000,000 | | | | 4,994,236 | | |
| 0.370%, due 02/22/111 | | | 2,000,000 | | | | 1,995,786 | | |
| 0.440%, due 04/19/111 | | | 2,000,000 | | | | 1,993,620 | | |
| 0.500%, due 05/17/111 | | | 2,000,000 | | | | 1,991,972 | | |
| 0.580%, due 05/27/11 | | | 2,000,000 | | | | 2,000,000 | | |
Federal Home Loan
Mortgage Corp.*
0.250%, due 10/05/101 | | | 4,000,000 | | | | 3,998,194 | | |
| 0.310%, due 11/16/101 | | | 2,000,000 | | | | 1,998,157 | | |
| 0.310%, due 12/07/101 | | | 5,000,000 | | | | 4,994,489 | | |
| 0.330%, due 12/07/101 | | | 4,000,000 | | | | 3,995,307 | | |
| 0.270%, due 01/14/111 | | | 4,000,000 | | | | 3,995,020 | | |
| 0.330%, due 05/02/111 | | | 4,000,000 | | | | 3,989,953 | | |
Federal National Mortgage
Association*
2.875%, due 10/12/10 | | | 1,300,000 | | | | 1,306,057 | | |
| 0.350%, due 04/26/111 | | | 6,000,000 | | | | 5,984,367 | | |
| 0.410%, due 07/06/111 | | | 4,000,000 | | | | 3,984,557 | | |
US Treasury Bills
0.151%, due 08/19/101 | | | 5,000,000 | | | | 4,999,624 | | |
| 0.295%, due 07/28/111 | | | 2,000,000 | | | | 1,994,084 | | |
US Treasury Notes
2.000%, due 09/30/10 | | | 3,000,000 | | | | 3,008,720 | | |
| 4.875%, due 04/30/11 | | | 2,500,000 | | | | 2,585,519 | | |
Total US government and
agency obligations
(cost—$102,908,802) | | | | | | | 102,908,802 | | |
| Certificates of deposit—18.25% | |
| Banking-non-US—18.25% | |
Bank of Montreal
0.270%, due 08/11/10 | | | 5,000,000 | | | | 5,000,000 | | |
Bank of Nova Scotia
0.351%, due 08/17/102 | | | 2,750,000 | | | | 2,749,955 | | |
Bank of Tokyo-Mitsubishi UFJ Ltd.
0.380%, due 08/06/10 | | | 5,000,000 | | | | 5,000,000 | | |
| 0.290%, due 08/20/10 | | | 3,000,000 | | | | 3,000,000 | | |
Canadian Imperial Bank of
Commerce
0.330%, due 08/02/102 | | | 3,500,000 | | | | 3,500,000 | | |
Credit Agricole CIB
0.420%, due 09/27/10 | | | 3,000,000 | | | | 3,000,000 | | |
Dexia Credit Local
0.430%, due 08/05/10 | | | 6,500,000 | | | | 6,500,000 | | |
| Security description | | Face
amount | | Value | |
| Certificates of deposit—(concluded) | |
| Banking-non-US—(concluded) | |
Dnb NOR ASA
0.500%, due 09/07/10 | | $ | 4,000,000 | | | $ | 4,000,000 | | |
Lloyds TSB Bank PLC
0.300%, due 08/02/10 | | | 5,000,000 | | | | 5,000,000 | | |
Mizuho Corporate Bank Ltd.
0.280%, due 08/23/10 | | | 4,000,000 | | | | 4,000,000 | | |
National Australia Bank Ltd.
0.425%, due 08/31/102 | | | 3,000,000 | | | | 3,000,000 | | |
National Bank of Canada
0.427%, due 08/03/102 | | | 4,000,000 | | | | 4,000,000 | | |
Natixis
0.330%, due 08/02/102 | | | 5,000,000 | | | | 5,000,000 | | |
Nordea Bank Finland
0.220%, due 08/30/10 | | | 2,000,000 | | | | 2,000,000 | | |
Rabobank Nederland NV
0.200%, due 08/06/10 | | | 3,000,000 | | | | 3,000,000 | | |
| 0.347%, due 08/27/102 | | | 3,000,000 | | | | 3,000,000 | | |
Royal Bank of Canada
0.430%, due 08/02/102 | | | 2,750,000 | | | | 2,750,000 | | |
Royal Bank of Scotland PLC
0.510%, due 10/20/10 | | | 4,000,000 | | | | 4,000,000 | | |
Westpac Banking Corp.
0.270%, due 08/02/102 | | | 1,000,000 | | | | 1,000,000 | | |
| 0.280%, due 08/02/102 | | | 1,000,000 | | | | 1,000,000 | | |
Total certificates of deposit
(cost—$70,499,955) | | | | | | | 70,499,955 | | |
| Commercial paper1—40.82% | |
| Asset backed-banking—0.52% | |
Atlantis One Funding
0.500%, due 09/09/10 | | | 2,000,000 | | | | 1,998,916 | | |
| Asset backed-miscellaneous—16.28% | |
Atlantic Asset Securitization LLC
0.280%, due 08/18/10 | | | 5,000,000 | | | | 4,999,339 | | |
Barton Capital LLC
0.300%, due 08/11/10 | | | 5,000,000 | | | | 4,999,583 | | |
| 0.290%, due 08/12/10 | | | 5,000,000 | | | | 4,999,557 | | |
Bryant Park Funding LLC
0.300%, due 08/10/10 | | | 5,000,000 | | | | 4,999,625 | | |
Ciesco LLC
0.270%, due 08/26/10 | | | 3,000,000 | | | | 2,999,438 | | |
Fairway Finance Co. LLC
0.270%, due 08/24/10 | | | 3,000,000 | | | | 2,999,482 | | |
Falcon Asset Securitization Corp.
0.200%, due 08/02/10 | | | 7,500,000 | | | | 7,499,958 | | |
Liberty Street Funding LLC
0.300%, due 08/04/10 | | | 5,000,000 | | | | 4,999,875 | | |
Ranger Funding Co. LLC
0.300%, due 08/26/10 | | | 4,000,000 | | | | 3,999,167 | | |
Regency Markets No. 1 LLC
0.320%, due 08/16/10 | | | 5,000,000 | | | | 4,999,333 | | |
Salisbury Receivables Co. LLC
0.300%, due 08/03/10 | | | 4,401,000 | | | | 4,400,927 | | |
10
UBS PACE Select Advisors Trust
UBS PACE Money Market Investments
Portfolio of investments—July 31, 2010
| Security description | | Face
amount | | Value | |
| Commercial paper1—(continued) | |
| Asset backed-miscellaneous—(concluded) | |
Thunderbay Funding
0.290%, due 08/16/10 | | $ | 5,000,000 | | | $ | 4,999,396 | | |
Variable Funding Capital Corp.
0.270%, due 08/20/10 | | | 5,992,000 | | | | 5,991,146 | | |
| | | | 62,886,826 | | |
| Asset backed-securities—3.10% | |
Clipper Receivables Co. LLC
0.470%, due 09/21/10 | | | 3,000,000 | | | | 2,998,002 | | |
| 0.370%, due 10/20/10 | | | 2,000,000 | | | | 1,998,356 | | |
Grampian Funding LLC
0.570%, due 09/10/10 | | | 5,000,000 | | | | 4,996,833 | | |
| 0.510%, due 10/19/10 | | | 2,000,000 | | | | 1,997,762 | | |
| | | | 11,990,953 | | |
| Banking-non-US—2.07% | |
Credit Suisse First Boston
0.370%, due 08/11/10 | | | 5,000,000 | | | | 4,999,486 | | |
Natixis
0.530%, due 11/02/10 | | | 2,000,000 | | | | 1,997,262 | | |
Westpac Securitization NZ Ltd.
0.417%, due 08/23/102,3 | | | 1,000,000 | | | | 1,000,000 | | |
| | | | 7,996,748 | | |
| Banking-US—7.77% | |
Bank of America Corp.
0.220%, due 08/09/10 | | | 5,000,000 | | | | 4,999,756 | | |
BNP Paribas Finance
0.280%, due 08/16/10 | | | 6,000,000 | | | | 5,999,300 | | |
Danske Corp.
0.265%, due 08/18/10 | | | 5,000,000 | | | | 4,999,374 | | |
JPMorgan Chase & Co.
0.220%, due 08/05/10 | | | 4,000,000 | | | | 3,999,902 | | |
Societe Generale N.A., Inc.
0.220%, due 08/02/10 | | | 5,000,000 | | | | 4,999,969 | | |
Toronto-Dominion
Holdings USA, Inc.
0.230%, due 08/13/10 | | | 5,000,000 | | | | 4,999,617 | | |
| | | | 29,997,918 | | |
| Beverage/bottling—2.59% | |
PepsiCo, Inc.
0.150%, due 08/03/10 | | | 10,000,000 | | | | 9,999,917 | | |
| Energy-integrated—1.29% | |
BP Capital Markets PLC
0.530%, due 08/26/10 | | | 5,000,000 | | | | 4,998,160 | | |
| Finance-captive automotive—1.07% | |
Toyota Motor Credit Corp.
0.410%, due 10/13/10 | | | 4,120,000 | | | | 4,116,575 | | |
| Security description | | Face
amount | | Value | |
| Commercial paper1—(concluded) | |
| Finance-noncaptive diversified—1.04% | |
General Electric Capital Corp.
0.370%, due 10/13/10 | | $ | 4,000,000 | | | $ | 3,996,999 | | |
| Food/beverage—2.59% | |
Nestle Finance International Ltd.
0.220%, due 08/23/10 | | | 10,000,000 | | | | 9,998,655 | | |
| Insurance-life—1.29% | |
AXA Financial, Inc.
0.320%, due 08/04/10 | | | 5,000,000 | | | | 4,999,867 | | |
| Technology-software—1.21% | |
Microsoft Corp.
0.160%, due 08/04/10 | | | 4,660,000 | | | | 4,659,938 | | |
Total commercial paper
(cost—$157,641,472) | | | | | | | 157,641,472 | | |
| Short-term corporate obligations—1.81% | |
| Banking-non-US—0.26% | |
Commonwealth Bank of Australia
0.508%, due 10/28/102,3 | | | 1,000,000 | | | | 1,000,000 | | |
| Supranationals—1.55% | |
International Bank for
Reconstruction & Development
0.340%, due 08/23/101 | | | 5,000,000 | | | | 4,998,961 | | |
| 0.410%, due 11/01/101 | | | 1,000,000 | | | | 998,953 | | |
| | | | 5,997,914 | | |
Total short-term
corporate obligations
(cost—$6,997,914) | | | | | | | 6,997,914 | | |
| Repurchase agreements—12.45% | |
Repurchase agreement dated
07/30/10 with Deutsche Bank
Securities, 0.200% due
08/02/10, collateralized by
$9,130,000 Federal Home Loan
Bank obligations, 2.500%
to 5.500% due 06/03/14 to
07/15/36, $4,865,000
Federal Home Loan Mortgage
Corp. obligations, 0.579%
due 02/03/12 and $32,716,000
Federal National Mortgage
Association obligations,
zero coupon to 6.125%
due 01/03/11 to 10/13/15;
(value—$48,454,779);
proceeds: $47,500,792 | | | 47,500,000 | | | | 47,500,000 | | |
11
UBS PACE Select Advisors Trust
UBS PACE Money Market Investments
Portfolio of investments—July 31, 2010
| Security description | | Face
amount | | Value | |
| Repurchase agreements—(concluded) | |
Repurchase agreement dated
07/30/10 with State Street
Bank & Trust Co., 0.010%
due 08/02/10, collateralized
by $573,301 US Treasury
Notes, 2.125% to 3.125%
due 04/30/15 to 04/30/17;
(value—$591,605); proceeds:
$580,000 | | $ | 580,000 | | | $ | 580,000 | | |
Total repurchase agreements
(cost—$48,080,000) | | | | | 48,080,000 | | |
Total investments
(cost—$386,128,143) which
approximates cost for federal
income tax purposes—
99.98% | | | | | 386,128,143 | | |
Other assets in excess
of liabilities—0.02% | | | | | 89,055 | | |
Net assets (applicable to
386,217,453 shares of
beneficial interest outstanding
equivalent to $1.00 per share)—
100.00% | | $ | 386,217,198 | | |
* On September 7, 2008, the Federal Housing Finance Agency placed the Federal National Mortgage Association and the Federal Home Loan Mortgage Corporation into conservatorship, and the US Treasury guaranteed the debt issued by those organizations.
1 Rates shown are the discount rates at date of purchase.
2 Variable rate security. The maturity date reflects earlier of reset dates or stated maturity dates. The interest rate shown is the current rate as of July 31, 2010, and resets periodically.
3 Security exempt from registration pursuant to Rule 144A under the Securities Act of 1933. These securities, which represent 0.52% of net assets as of July 31, 2010, are considered liquid and may be resold in transactions exempt from registration, normally to qualified institutional buyers.
Affiliated issuer activity
The table below details the Portfolio's activity in an affiliated issuer during the year ended July 31, 2010. The advisor earns a management fee from UBS Private Money Market Fund LLC.
| Security description | | Value at
07/31/09 | | Purchases
during the
year ended
07/31/10 | | Sales
during the
year ended
07/31/10 | | Value at
07/31/10 | | Net income
earned from
affiliate for the
year ended
07/31/10 | |
| UBS Private Money Market Fund LLC | | $ | 9,894,000 | | | $ | — | | | $ | 9,894,000 | | | $ | — | | | $ | 87 | | |
12
UBS PACE Select Advisors Trust
UBS PACE Money Market Investments
Portfolio of investments—July 31, 2010
The following is a summary of the fair valuations according to the inputs used as of July 31, 2010 in valuing the Portfolio's investments:
| | | Unadjusted
quoted prices in
active markets for
identical investments
(Level 1) | | Other significant
observable inputs
(Level 2) | | Unobservable
inputs
(Level 3) | | Total | |
| US government and agency obligations | | $ | — | | | $ | 102,908,802 | | | $ | — | | | $ | 102,908,802 | | |
| Certificates of deposit | | | — | | | | 70,499,955 | | | | — | | | | 70,499,955 | | |
| Commercial paper | | | — | | | | 157,641,472 | | | | — | | | | 157,641,472 | | |
| Short-term corporate obligations | | | — | | | | 6,997,914 | | | | — | | | | 6,997,914 | | |
| Repurchase agreements | | | — | | | | 48,080,000 | | | | — | | | | 48,080,000 | | |
| Total | | $ | — | | | $ | 386,128,143 | | | $ | — | | | $ | 386,128,143 | | |
At July 31, 2010, there were no transfers between Level 1 and Level 2.
Issuer breakdown by country of origin (unaudited)
| | | Percentage of
total investments | |
| United States | | | 74.4 | % | |
| Canada | | | 4.7 | | |
| Japan | | | 4.2 | | |
| Switzerland | | | 3.9 | | |
| United Kingdom | | | 3.6 | | |
| France | | | 2.6 | | |
| Australia | | | 1.8 | | |
| Belgium | | | 1.7 | | |
| Netherlands | | | 1.6 | | |
| Norway | | | 1.0 | | |
| Finland | | | 0.5 | | |
| Total | | | 100.0 | % | |
Weighted average maturity—46 days
See accompanying notes to financial statements.
13
UBS PACE Select Advisors Trust
UBS PACE Government Securities Fixed Income Investments
Performance
For the 12 months ended July 31, 2010, the Portfolio's Class P shares returned 10.20%, before the deduction of the maximum UBS PACE Select program fee. (The Class P shares returned 8.01%, after the deduction of the maximum UBS PACE Select program fee, for the same 12-month period.) In comparison, the Barclays Capital US Mortgage-Backed Securities Index (the "benchmark") returned 7.52%, and the Lipper US Mortgage Funds category posted a median return of 9.35%. (Returns for all share classes over various time periods are shown in the "Performance at a glance" table on page 17. Please note that the returns shown do not reflect the deduction of taxes that a shareholder would pay on Portfolio distributions or the redemption of Portfolio shares.) For a detailed commentary on the market environment in general during the reporting period, please refer to page 2.
Sub-Advisor's comments
The Portfolio outperformed its benchmark during the reporting period. An emphasis on what we believed to be attractively priced high-quality assets, especially those with government support, was a significant driver of performance during the review period.
Our exposure to senior non-agency mortgage backed securities ("MBS") benefited the Portfolio, as the sector rallied due to strong demand from Public Private Investment Program ("PPIP") buyers, the continued absence of new supply and the improved availability of financing. (PPIP is a government-sponsored program between the US Treasury, the FDIC and the Federal Reserve Board designed to improve the health of financial institutions holding real estate-related assets by increasing the flow of credit throughout the US economy.) Additionally, an allocation to super senior commercial mortgage-backed securities ("CMBS") benefited the Portfolio as their spreads—that is, the difference between the yields paid on these securities versus those paid on Treasuries—tightened given continued technical support from the Term Asset-Backed Securities Loan Facility ("TALF") and PPIP. (The TALF was created by the Federal Reserve Board to h elp market participants meet the credit needs of households and small businesses by supporting the issuance of asset-backed securities.)
UBS PACE Select Advisors Trust – UBS PACE Government Securities Fixed Income Investments
Investment Sub-Advisor:
Pacific Investment Management Company LLC ("PIMCO")
Portfolio Manager:
W. Scott Simon
Objective:
Current income
Investment process:
The Portfolio invests primarily in government fixed income securities which include US bonds, including those backed by mortgages, and related repurchase agreements. Mortgage-backed securities include "to be announced" or "TBA" securities which usually are traded on a forward commitment basis with an approximate principal amount and no defined maturity date; issued or guaranteed by US government agencies and instrumentalities. The Portfolio also invests, to a lesser extent, in investment grade bonds of private issuers, including those backed by mortgages or other assets. The Portfolio may invest in bonds of varying maturities, but normally limits its duration to within two years (plus or minus) of the effective duration of the Portfolio's benchmark index. (Duration is a measure of a portfolio's sensitivity to interest rate changes.) PIMCO establishes duration targets based on its expectations for changes in interest rates, and t hen positions the Portfolio to take advantage of yield curve shifts. PIMCO decides to buy and sell specific bonds based on an analysis of their values relative to other similar securities.
14
UBS PACE Select Advisors Trust
UBS PACE Government Securities Fixed Income Investments
Sub-Advisor's comments – concluded
A longer-than-benchmark duration during the fourth quarter of 2009 detracted from relative performance as interest rates rose over the period. (Duration measures a portfolio's sensitivity to interest rate changes. A longer duration means that changes in market interest rates are likely to have a larger effect on the value of assets in the portfolio.) We then moved to a shorter-than-benchmark duration during the second quarter of 2010. This was also negative for performance, relative to the benchmark, as yields then fell throughout the remainder of the period.
Finally, a curve-flattening bias detracted from performance as the yield curve steepened during the fiscal year. (The yield curve plots the interest rates, at a set point in time, of bonds having equal credit quality, but differing maturity dates. A "steepening yield curve" is one in which long-term bond yields increase relative to those of short-term bonds.)
Special considerations
The Portfolio may be appropriate for long-term investors seeking current income who are able to withstand short-term fluctuations in the fixed income markets in return for potentially higher returns over the long term. The yield and value of the Portfolio change every day and can be affected by changes in interest rates, general market conditions and other political, social and economic developments, as well as specific matters relating to the issuers in which the Portfolio invests. It is important to note that an investment in the Portfolio is only one component of a balanced investment plan.
15
UBS PACE Select Advisors Trust
UBS PACE Government Securities Fixed Income Investments
Illustration of an assumed investment of $10,000 in Class P shares of the Portfolio (unaudited)
The following graph depicts the performance of UBS PACE Government Securities Fixed Income Investments Class P shares versus the Barclays Capital US Mortgage-Backed Securities Index over the 10 years ended July 31, 2010. The performance of the other classes will vary based upon the different class specific expenses and sales charges. The performance provided does not reflect the deduction of taxes that a shareholder would pay on Portfolio distributions or the redemption of Portfolio shares. Past performance is no guarantee of future results. Share price and returns will vary with market conditions; investors may realize a gain or loss upon redemption. It is important to note that UBS PACE Government Securities Fixed Income Investments is a professionally managed portfolio while the Index is not available for investment and is unmanaged. The comparison is shown for illustration purposes only.

16
UBS PACE Select Advisors Trust
UBS PACE Government Securities Fixed Income Investments
Performance at a glance (unaudited)
| Average annual total returns for periods ended 07/31/10 | | 1 year | | 5 years | | 10 years | | Since
inception1 | |
| Before deducting | | Class A2 | | | 9.92 | % | | | 6.09 | % | | N/A | | | 5.51 | % | |
| maximum sales charge | | Class B3 | | | 9.12 | % | | | 5.29 | % | | N/A | | | 5.22 | %7 | |
| or UBS PACE Select | | Class C4 | | | 9.37 | % | | | 5.55 | % | | N/A | | | 5.29 | % | |
| program fee | | Class Y5 | | | 10.20 | % | | | 6.40 | % | | N/A | | | 5.82 | % | |
| | | Class P6 | | | 10.20 | % | | | 6.35 | % | | | 6.38 | % | | | 6.30 | % | |
| After deducting | | Class A2 | | | 4.97 | % | | | 5.12 | % | | N/A | | | 5.00 | % | |
| maximum sales charge | | Class B3 | | | 4.12 | % | | | 4.96 | % | | N/A | | | 5.22 | %7 | |
| or UBS PACE Select | | Class C4 | | | 8.62 | % | | | 5.55 | % | | N/A | | | 5.29 | % | |
| program fee | | Class P6 | | | 8.01 | % | | | 4.25 | % | | | 4.27 | % | | | 4.20 | % | |
| Barclays Capital US Mortgage-Backed Securities Index8 | | | 7.52 | % | | | 6.54 | % | | | 6.56 | % | | | 6.56 | % | |
| Lipper US Mortgage Funds median | | | 9.35 | % | | | 5.29 | % | | | 5.52 | % | | | 5.41 | % | |
Average annual total returns for periods ended June 30, 2010, after deduction of the maximum sales charge or UBS PACE Select program fee, were as follows: Class A—1-year period, 5.21%; 5-year period, 4.80%; since inception, 4.92%; Class B—1-year period, 4.41%; 5-year period, 4.65%; since inception, 5.15%; Class C—1-year period, 8.83%; 5-year period, 5.23%; since inception, 5.22%; Class Y—1-year period, 10.41%; 5-year period, 6.07%; since inception, 5.75%; Class P—1-year period, 8.30%; 5-year period, 3.93%; 10-year period, 4.23%; since inception, 4.16%.
The annualized gross and net expense ratios, respectively, for each class of shares as in the November 28, 2009 prospectuses, were as follows: Class A—1.07% and 1.02%; Class B—1.86% and 1.77%; Class C—1.63% and 1.52%; Class Y—0.92% and 0.77%; and Class P—0.86% and 0.77%. Net expenses reflect fee waivers and/or expense reimbursements, if any, pursuant to an agreement that is in effect to cap the expenses. The Portfolio and UBS Global AM have entered into a written fee waiver agreement pursuant to which UBS Global AM is contractually obligated to waive its management fees through November 30, 2010 to the extent necessary to reflect the lower sub-advisory fee paid by UBS Global AM to PIMCO. The Portfolio and UBS Global AM have also entered into an additional written fee waiver/expense reimbursement agreement pursuant to which UBS Global AM is contractually obligated to waive its management fees and/or reimb urse expenses so that the Portfolio's ordinary total operating expenses of each class through November 30, 2010 (excluding dividend expense, borrowing costs and interest expense, if any) would not exceed Class A—1.02%; Class B—1.77%; Class C—1.52%; Class Y—0.77%; and Class P—0.77%. The Portfolio has agreed to repay UBS Global AM for any waived fees/reimbursed expenses under the preceding sentence to the extent that it can do so over the following three fiscal years without causing the Portfolio's expenses in any of those three years to exceed the expense caps described above.
1 Since inception returns are calculated as of commencement of issuance or reissuance on August 24, 1995 for Class P shares, January 31, 2001 for Class A shares, December 18, 2000 for Class B shares, December 4, 2000 for Class C shares and February 2, 2001 for Class Y shares. Since inception returns for the Index and Lipper median are shown as of August 31, 1995, which is the month-end after the inception date of the oldest share class (Class P).
2 Maximum sales charge for Class A shares is 4.5%. Class A shares bear ongoing 12b-1 service fees.
3 Maximum contingent deferred sales charge for Class B shares is 5% imposed on redemptions and is reduced to 0% after a maximum of six years. Class B shares bear ongoing 12b-1 service and distribution fees.
4 Maximum contingent deferred sales charge for Class C shares is 0.75% imposed on redemptions and is reduced to 0% after one year. Class C shares bear ongoing 12b-1 service and distribution fees. Prior to September 30, 2003, Class C shares were subject to a maximum front-end sales charge of 1.00%; this front-end sales charge is not reflected in the average annual total return presented for the Class C shares shown above.
5 The Portfolio offers Class Y shares to a limited group of eligible investors, including certain qualifying retirement plans. Class Y shares do not bear initial or contingent deferred sales charges or ongoing 12b-1 service and distribution fees.
6 Class P shares do not bear initial or contingent deferred sales charges or ongoing 12b-1 service and distribution fees, but are subject to a maximum annual UBS PACE Select program fee of 2% of the value of Class P shares. Prior to June 14, 2010, the maximum annual UBS PACE Select program fee was 1.5% of the value of Class P shares.
7 Assumes the conversion of Class B to Class A shares at the end of the sixth year.
8 The Barclays Capital US Mortgage-Backed Securities Index is an unmanaged index which primarily covers agency mortgage-backed pass-through securities issued by Ginnie Mae (formally known as Government National Mortgage Association or GNMA), Freddie Mac (formally known as Federal Home Loan Mortgage Corporation or FHLMC), and Fannie Mae (formally known as Federal National Mortgage Association or FNMA). Investors should note that indices do not reflect the deduction of fees and expenses.
If an investor sells or exchanges shares less than 90 days after purchase, a redemption fee of 1.00% of the amount sold or exchanged will be deducted at the time of the transaction, except as noted otherwise in the prospectuses.
Past performance does not predict future performance, and the performance information provided does not reflect the deduction of taxes that a shareholder would pay on Portfolio distributions or the redemption of Portfolio shares. The return and principal value of an investment will fluctuate, so that an investor's shares, when redeemed, may be worth more or less than their original cost. Performance results assume reinvestment of all dividends and capital gain distributions at net asset value on the ex-dividend dates. Current performance may be higher or lower than the performance data quoted. For month-end performance figures, please visit http://www.ubs.com.
Lipper peer group data calculated by Lipper Inc.; used with permission. The Lipper median is the return of the fund that places in the middle of a Lipper peer group.
17
UBS PACE Select Advisors Trust
UBS PACE Government Securities Fixed Income Investments
Portfolio statistics (unaudited)
| Characteristics | | 07/31/10 | |
| Weighted average duration | | | 1.9 | yrs. | |
| Weighted average maturity | | | 2.4 | yrs | |
| Average coupon | | | 2.01 | % | |
| Average quality1 | | | AAA | | |
| Net assets (mm) | | $ | 643.6 | | |
| Number of holdings | | | 372 | | |
| Portfolio composition2 | | 07/31/10 | |
| Bonds | | | 113.7 | % | |
| Options, futures and swaps | | | 0.1 | | |
| Investments sold short | | | (7.0 | ) | |
| Cash equivalents and other assets less liabilities | | | (6.8 | ) | |
| Total | | | 100.0 | % | |
| Asset allocation2 | | 07/31/10 | |
| US government agency mortgage pass-through certificates | | | 99.3 | % | |
| Collateralized mortgage obligations | | | 13.6 | | |
| Asset-backed securities | | | 0.7 | | |
| US government obligation | | | 0.1 | | |
| Stripped mortgage-backed securities | | | 0.0 | 3 | |
| Options, futures and swaps | | | 0.1 | | |
| Investments sold short | | | (7.0 | ) | |
| Cash equivalents and other assets less liabilities | | | (6.8 | ) | |
| Total | | | 100.0 | % | |
1 Credit quality ratings shown are based on the ratings assigned to portfolio holdings by Standard & Poor's Ratings Group, an independent rating agency.
2 Weightings represent percentages of the Portfolio's net assets as of July 31, 2010. The Portfolio is actively managed and its composition will vary over time.
3 Weighting represents less than 0.05% of the Portfolio's net assets as of July 31, 2010.
18
UBS PACE Select Advisors Trust
UBS PACE Government Securities Fixed Income Investments
Portfolio of investments—July 31, 2010
| Security description | | Face
amount | | Value | |
| US government obligation—0.11% | |
US Treasury Notes
3.500%, due 05/15/20
(cost—$729,874) | | $ | 700,000 | | | $ | 735,112 | | |
| Government national mortgage association certificates—19.07% | |
GNMA
4.500%, due 01/15/391 | | | 652,564 | | | | 689,440 | | |
| 4.500%, due 02/15/391 | | | 1,972,525 | | | | 2,083,990 | | |
| 4.500%, due 03/15/391 | | | 197,428 | | | | 208,584 | | |
| 4.500%, due 04/15/391 | | | 1,673,289 | | | | 1,767,843 | | |
| 4.500%, due 05/15/391 | | | 1,975,517 | | | | 2,087,151 | | |
| 4.500%, due 06/15/391 | | | 998,809 | | | | 1,055,250 | | |
| 4.500%, due 08/15/391 | | | 1,678,191 | | | | 1,773,023 | | |
| 4.500%, due 09/15/391 | | | 2,945,661 | | | | 3,112,116 | | |
| 4.500%, due 11/15/391 | | | 94,883 | | | | 100,245 | | |
| 4.500%, due 02/15/401 | | | 1,710,482 | | | | 1,807,139 | | |
| 4.500%, due 03/15/401 | | | 702,957 | | | | 742,680 | | |
| 4.500%, due 04/15/401 | | | 1,802,656 | | | | 1,904,522 | | |
| 4.500%, due 05/15/401 | | | 9,960,147 | | | | 10,522,980 | | |
| 4.500%, due 06/15/401 | | | 9,986,818 | | | | 10,551,157 | | |
| 6.000%, due 10/15/31 | | | 4,737 | | | | 5,263 | | |
| 6.000%, due 03/15/34 | | | 6,791 | | | | 7,503 | | |
| 6.000%, due 08/15/34 | | | 6,431 | | | | 7,104 | | |
| 6.000%, due 07/15/36 | | | 154,992 | | | | 170,211 | | |
| 6.500%, due 02/15/29 | | | 3,440 | | | | 3,873 | | |
| 6.500%, due 11/15/34 | | | 18,147 | | | | 20,228 | | |
| 6.500%, due 01/15/361 | | | 47,462 | | | | 52,460 | | |
| 6.500%, due 03/15/361 | | | 4,121 | | | | 4,555 | | |
| 6.500%, due 09/15/361 | | | 1,034,510 | | | | 1,143,446 | | |
| 6.500%, due 02/15/371 | | | 59,084 | | | | 65,205 | | |
| 6.500%, due 04/15/371 | | | 176,347 | | | | 194,614 | | |
| 6.500%, due 01/15/381 | | | 35,993 | | | | 39,716 | | |
| 6.500%, due 04/15/381 | | | 1,164,704 | | | | 1,285,165 | | |
| 6.500%, due 06/15/381 | | | 196,257 | | | | 216,555 | | |
| 6.500%, due 07/15/381 | | | 624,181 | | | | 688,739 | | |
| 6.500%, due 08/15/381 | | | 163,373 | | | | 180,269 | | |
| 6.500%, due 09/15/381 | | | 375,275 | | | | 414,089 | | |
| 6.500%, due 10/15/381 | | | 796,197 | | | | 878,549 | | |
| 6.500%, due 11/15/381 | | | 81,022 | | | | 89,401 | | |
| 6.500%, due 12/15/381 | | | 38,174 | | | | 42,123 | | |
| 6.500%, due 01/15/391 | | | 369,061 | | | | 407,257 | | |
| 7.500%, due 08/15/21 | | | 6,486 | | | | 7,381 | | |
| 7.500%, due 09/15/23 | | | 988 | | | | 1,134 | | |
| 8.000%, due 02/15/23 | | | 1,590 | | | | 1,858 | | |
| 8.250%, due 04/15/19 | | | 427,809 | | | | 488,806 | | |
| 10.500%, due 02/15/19 | | | 29,631 | | | | 33,884 | | |
| 10.500%, due 06/15/19 | | | 36,050 | | | | 41,225 | | |
| 10.500%, due 07/15/19 | | | 73,784 | | | | 84,287 | | |
| 10.500%, due 07/15/20 | | | 3,700 | | | | 4,163 | | |
| 10.500%, due 08/15/20 | | | 32,431 | | | | 37,125 | | |
| 10.500%, due 09/15/20 | | | 3,518 | | | | 4,028 | | |
| 11.500%, due 05/15/19 | | | 3,327 | | | | 3,856 | | |
GNMA II
9.000%, due 04/20/25 | | | 23,936 | | | | 28,120 | | |
| Security description | | Face
amount | | Value | |
| Government national mortgage association certificates—(continued) | |
| 9.000%, due 12/20/26 | | $ | 4,293 | | | $ | 5,045 | | |
| 9.000%, due 01/20/27 | | | 12,935 | | | | 15,203 | | |
| 9.000%, due 06/20/30 | | | 1,602 | | | | 1,898 | | |
| 9.000%, due 09/20/30 | | | 1,312 | | | | 1,450 | | |
| 9.000%, due 10/20/30 | | | 8,555 | | | | 10,135 | | |
| 9.000%, due 11/20/30 | | | 29,296 | | | | 34,707 | | |
GNMA II ARM
3.125%, due 11/20/21 | | | 32,912 | | | | 33,800 | | |
| 3.125%, due 11/20/22 | | | 63,957 | | | | 65,684 | | |
| 3.125%, due 12/20/24 | | | 1,133 | | | | 1,164 | | |
| 3.125%, due 10/20/25 | | | 33,663 | | | | 34,572 | | |
| 3.125%, due 12/20/25 | | | 7,213 | | | | 7,408 | | |
| 3.125%, due 10/20/26 | | | 23,105 | | | | 23,729 | | |
| 3.125%, due 12/20/26 | | | 31,088 | | | | 31,927 | | |
| 3.125%, due 11/20/27 | | | 90,393 | | | | 92,833 | | |
| 3.125%, due 12/20/27 | | | 10,521 | | | | 10,805 | | |
| 3.125%, due 10/20/29 | | | 12,481 | | | | 12,818 | | |
| 3.125%, due 10/20/30 | | | 39,774 | | | | 40,847 | | |
| 3.250%, due 02/20/28 | | | 4,535 | | | | 4,654 | | |
| 3.375%, due 01/20/23 | | | 120,519 | | | | 123,742 | | |
| 3.375%, due 03/20/23 | | | 60,261 | | | | 61,872 | | |
| 3.375%, due 01/20/24 | | | 167,889 | | | | 172,379 | | |
| 3.375%, due 01/20/25 | | | 14,211 | | | | 14,591 | | |
| 3.375%, due 02/20/25 | | | 39,159 | | | | 40,206 | | |
| 3.375%, due 03/20/25 | | | 50,377 | | | | 51,724 | | |
| 3.375%, due 03/20/26 | | | 29,645 | | | | 30,438 | | |
| 3.375%, due 01/20/27 | | | 179,700 | | | | 184,505 | | |
| 3.375%, due 02/20/27 | | | 20,476 | | | | 21,023 | | |
| 3.375%, due 01/20/28 | | | 21,641 | | | | 22,220 | | |
| 3.375%, due 02/20/28 | | | 12,345 | | | | 12,675 | | |
| 3.500%, due 03/20/25 | | | 26,115 | | | | 26,830 | | |
| 3.625%, due 07/20/17 | | | 9,031 | | | | 9,307 | | |
| 3.625%, due 09/20/21 | | | 167,308 | | | | 172,410 | | |
| 3.625%, due 08/20/25 | | | 39,442 | | | | 40,645 | | |
| 3.625%, due 09/20/25 | | | 47,130 | | | | 48,567 | | |
| 3.625%, due 08/20/26 | | | 52,522 | | | | 54,124 | | |
| 3.625%, due 09/20/26 | | | 7,651 | | | | 7,884 | | |
| 3.625%, due 07/20/27 | | | 20,163 | | | | 20,776 | | |
| 3.625%, due 08/20/27 | | | 49,998 | | | | 51,523 | | |
| 3.625%, due 07/20/30 | | | 253,288 | | | | 261,012 | | |
| 3.625%, due 08/20/30 | | | 197,128 | | | | 203,139 | | |
| 4.000%, due 01/20/18 | | | 173,176 | | | | 178,348 | | |
| 4.375%, due 04/20/18 | | | 14,216 | | | | 14,724 | | |
| 4.375%, due 05/20/21 | | | 7,645 | | | | 7,918 | | |
| 4.375%, due 06/20/22 | | | 156,890 | | | | 162,498 | | |
| 4.375%, due 04/20/24 | | | 160,404 | | | | 166,138 | | |
| 4.375%, due 05/20/25 | | | 115,761 | | | | 119,899 | | |
| 4.375%, due 06/20/25 | | | 32,805 | | | | 33,978 | | |
| 4.375%, due 04/20/26 | | | 266,045 | | | | 275,553 | | |
| 4.375%, due 06/20/26 | | | 117,882 | | | | 122,096 | | |
| 4.375%, due 04/20/27 | | | 68,458 | | | | 70,904 | | |
| 4.375%, due 04/20/30 | | | 49,118 | | | | 50,873 | | |
| 4.375%, due 05/20/30 | | | 979,798 | | | | 1,014,818 | | |
| 4.500%, due 05/20/18 | | | 7,217 | | | | 7,480 | | |
19
UBS PACE Select Advisors Trust
UBS PACE Government Securities Fixed Income Investments
Portfolio of investments—July 31, 2010
| Security description | | Face
amount | | Value | |
| Government national mortgage association certificates—(concluded) | | | |
| 4.500%, due 06/20/19 | | $ | 46,492 | | | $ | 48,183 | | |
| 4.500%, due 06/20/30 | | | 24,904 | | | | 25,810 | | |
GNMA TBA
4.000%, TBA | | | 13,000,000 | | | | 13,363,597 | | |
| 4.500%, TBA1 | | | 26,000,000 | | | | 27,413,750 | | |
| 5.000%, TBA | | | 6,000,000 | | | | 6,430,314 | | |
| 5.500%, TBA | | | 7,000,000 | | | | 7,585,158 | | |
| 6.000%, TBA | | | 17,000,000 | | | | 18,545,946 | | |
Total government national
mortgage association
certificates
(cost—$120,887,624) | | | | | | | 122,756,568 | | |
| Federal home loan mortgage corporation certificates*—24.15% | | | |
FHLMC
4.500%, due 07/01/39 | | | 476,042 | | | | 498,010 | | |
| 4.500%, due 09/01/39 | | | 3,800,819 | | | | 3,976,218 | | |
| 4.500%, due 10/01/39 | | | 5,345,878 | | | | 5,592,579 | | |
| 5.500%, due 02/01/33 | | | 1,423,348 | | | | 1,540,514 | | |
| 5.500%, due 12/01/33 | | | 499,580 | | | | 540,704 | | |
| 5.500%, due 12/01/34 | | | 544,972 | | | | 589,577 | | |
| 5.500%, due 06/01/36 | | | 5,349,873 | | | | 5,781,062 | | |
| 5.500%, due 03/01/37 | | | 1,011,906 | | | | 1,090,719 | | |
| 6.000%, due 07/01/37 | | | 366,107 | | | | 398,203 | | |
| 7.000%, due 08/01/25 | | | 1,483 | | | | 1,680 | | |
| 7.500%, due 10/01/17 | | | 2,516 | | | | 2,529 | | |
| 8.000%, due 03/01/13 | | | 24,019 | | | | 24,438 | | |
| 9.000%, due 04/01/25 | | | 38,439 | | | | 45,074 | | |
| 9.750%, due 11/01/16 | | | 9,582 | | | | 9,650 | | |
| 11.000%, due 05/01/11 | | | 708 | | | | 710 | | |
| 11.000%, due 03/01/13 | | | 128 | | | | 129 | | |
| 11.000%, due 09/01/15 | | | 1,148 | | | | 1,299 | | |
| 11.000%, due 10/01/15 | | | 366 | | | | 400 | | |
| 11.000%, due 12/01/15 | | | 4,871 | | | | 5,489 | | |
| 11.000%, due 04/01/19 | | | 4,769 | | | | 5,641 | | |
| 11.000%, due 06/01/19 | | | 422 | | | | 470 | | |
| 11.000%, due 08/01/20 | | | 44 | | | | 45 | | |
| 11.000%, due 09/01/20 | | | 1,952 | | | | 2,286 | | |
| 11.500%, due 01/01/16 | | | 2,668 | | | | 2,712 | | |
| 11.500%, due 01/01/18 | | | 8,934 | | | | 10,453 | | |
| 11.500%, due 05/01/19 | | | 3,893 | | | | 3,914 | | |
| 11.500%, due 06/01/19 | | | 19,816 | | | | 23,797 | | |
FHLMC ARM
2.544%, due 01/01/28 | | | 100,058 | | | | 103,932 | | |
| 2.625%, due 11/01/27 | | | 181,625 | | | | 189,674 | | |
| 2.696%, due 07/01/24 | | | 338,872 | | | | 353,233 | | |
| 2.710%, due 07/01/28 | | | 204,344 | | | | 213,013 | | |
| 2.780%, due 04/01/29 | | | 323,669 | | | | 337,694 | | |
| 2.790%, due 11/01/25 | | | 393,811 | | | | 412,336 | | |
| 2.792%, due 11/01/29 | | | 638,714 | | | | 666,469 | | |
| 2.813%, due 12/01/29 | | | 149,806 | | | | 156,593 | | |
| 2.816%, due 10/01/23 | | | 165,260 | | | | 172,897 | | |
| Security description | | Face
amount | | Value | |
| Federal home loan mortgage corporation certificates*—(concluded) | | | |
| 2.824%, due 06/01/28 | | $ | 513,953 | | | $ | 536,230 | | |
| 2.882%, due 01/01/29 | | | 306,852 | | | | 321,281 | | |
| 3.062%, due 10/01/27 | | | 415,777 | | | | 435,248 | | |
| 3.139%, due 10/01/27 | | | 453,504 | | | | 473,738 | | |
| 3.375%, due 01/01/30 | | | 38,012 | | | | 39,237 | | |
| 5.097%, due 10/01/29 | | | 17,288 | | | | 18,130 | | |
FHLMC TBA
4.000%, TBA | | | 12,034,000 | | | | 12,310,409 | | |
| 4.500%, TBA | | | 51,000,000 | | | | 53,137,044 | | |
| 5.000%, TBA | | | 23,000,000 | | | | 24,423,125 | | |
| 5.500%, TBA | | | 15,000,000 | | | | 16,103,910 | | |
| 6.000%, TBA | | | 23,000,000 | | | | 24,915,463 | | |
Total federal home loan mortgage
corporation certificates
(cost—$153,494,044) | | | | | | | 155,467,958 | | |
Federal housing administration
certificates—0.20% | | | |
FHA GMAC
7.400%, due 02/01/21 | | | 497,784 | | | | 492,806 | | |
FHA Reilly
6.896%, due 07/01/20 | | | 764,772 | | | | 764,772 | | |
Total federal housing
administration certificates
(cost—$1,264,730) | | | | | | | 1,257,578 | | |
| Federal national mortgage association certificates*—55.82% | | | |
FNMA
4.000%, due 03/01/251 | | | 241,388 | | | | 252,855 | | |
| 4.000%, due 04/01/251 | | | 1,186,849 | | | | 1,243,231 | | |
| 4.000%, due 05/01/251 | | | 18,311,885 | | | | 19,181,797 | | |
| 4.000%, due 06/01/251 | | | 8,953,190 | | | | 9,378,514 | | |
| 4.000%, due 01/01/39 | | | 37,521 | | | | 38,508 | | |
| 4.000%, due 02/01/39 | | | 740,256 | | | | 759,611 | | |
| 4.000%, due 05/01/39 | | | 1,071,361 | | | | 1,099,449 | | |
| 4.000%, due 09/01/39 | | | 968,058 | | | | 995,838 | | |
| 4.500%, due 03/01/231 | | | 33,714 | | | | 35,800 | | |
| 4.500%, due 04/01/231 | | | 25,868 | | | | 27,469 | | |
| 4.500%, due 03/01/241 | | | 915,477 | | | | 971,826 | | |
| 4.500%, due 04/01/241 | | | 1,329,191 | | | | 1,411,005 | | |
| 4.500%, due 05/01/241 | | | 1,788,373 | | | | 1,899,010 | | |
| 4.500%, due 06/01/241 | | | 171,366 | | | | 181,914 | | |
| 4.500%, due 07/01/241 | | | 860,989 | | | | 913,984 | | |
| 4.500%, due 11/01/241 | | | 898,908 | | | | 954,237 | | |
| 4.500%, due 12/01/241 | | | 283,994 | | | | 301,474 | | |
| 4.500%, due 01/01/251 | | | 28,158 | | | | 29,891 | | |
| 4.500%, due 02/01/251 | | | 1,015,483 | | | | 1,078,000 | | |
| 4.500%, due 03/01/251 | | | 243,883 | | | | 258,780 | | |
| 4.500%, due 04/01/251 | | | 7,329,605 | | | | 7,777,331 | | |
| 4.500%, due 05/01/251 | | | 431,670 | | | | 458,038 | | |
| 4.500%, due 06/01/251 | | | 906,610 | | | | 961,989 | | |
20
UBS PACE Select Advisors Trust
UBS PACE Government Securities Fixed Income Investments
Portfolio of investments—July 31, 2010
| Security description | | Face
amount | | Value | |
| Federal national mortgage association certificates*—(continued) | |
| 4.500%, due 05/01/38 | | $ | 845,853 | | | $ | 886,077 | | |
| 4.500%, due 08/01/38 | | | 1,453,325 | | | | 1,522,437 | | |
| 4.500%, due 02/01/39 | | | 865,260 | | | | 906,406 | | |
| 4.500%, due 07/01/39 | | | 25,388 | | | | 26,583 | | |
| 4.500%, due 09/01/39 | | | 4,382,957 | | | | 4,589,330 | | |
| 4.500%, due 04/01/40 | | | 596,999 | | | | 625,015 | | |
| 4.500%, due 07/01/40 | | | 883,150 | | | | 924,595 | | |
| 5.000%, due 01/01/23 | | | 1,904,862 | | | | 2,036,930 | | |
| 5.000%, due 02/01/23 | | | 171,476 | | | | 183,364 | | |
| 5.000%, due 03/01/23 | | | 29,481 | | | | 31,525 | | |
| 5.000%, due 04/01/23 | | | 193,090 | | | | 206,477 | | |
| 5.000%, due 05/01/23 | | | 49,534 | | | | 52,968 | | |
| 5.000%, due 06/01/23 | | | 1,100,559 | | | | 1,176,863 | | |
| 5.000%, due 07/01/23 | | | 29,489 | | | | 31,534 | | |
| 5.000%, due 09/01/23 | | | 68,147 | | | | 72,871 | | |
| 5.000%, due 10/01/23 | | | 64,692 | | | | 69,177 | | |
| 5.000%, due 12/01/23 | | | 1,698,969 | | | | 1,816,762 | | |
| 5.000%, due 01/01/24 | | | 1,640,321 | | | | 1,754,048 | | |
| 5.000%, due 05/01/24 | | | 49,426 | | | | 52,852 | | |
| 5.000%, due 12/01/33 | | | 5,456,753 | | | | 5,859,517 | | |
| 5.500%, due 06/01/17 | | | 101,656 | | | | 105,127 | | |
| 5.500%, due 02/01/32 | | | 56,005 | | | | 60,651 | | |
| 5.500%, due 11/01/32 | | | 933,394 | | | | 1,010,812 | | |
| 5.500%, due 09/01/33 | | | 321,327 | | | | 347,878 | | |
| 5.500%, due 10/01/33 | | | 631,230 | | | | 683,387 | | |
| 5.500%, due 11/01/33 | | | 21,296 | | | | 23,055 | | |
| 5.500%, due 12/01/33 | | | 521,286 | | | | 564,360 | | |
| 5.500%, due 01/01/34 | | | 204,131 | | | | 220,999 | | |
| 5.500%, due 04/01/34 | | | 439,449 | | | | 475,441 | | |
| 5.500%, due 07/01/34 | | | 353,897 | | | | 383,140 | | |
| 5.500%, due 11/01/34 | | | 1,567,079 | | | | 1,694,607 | | |
| 5.500%, due 12/01/34 | | | 1,000,000 | | | | 1,081,379 | | |
| 5.500%, due 01/01/35 | | | 245,399 | | | | 265,139 | | |
| 5.500%, due 05/01/37 | | | 2,377,820 | | | | 2,564,875 | | |
| 5.500%, due 06/01/39 | | | 11,894,630 | | | | 12,834,120 | | |
| 6.000%, due 11/01/21 | | | 851,577 | | | | 928,462 | | |
| 6.000%, due 06/01/22 | | | 193,734 | | | | 210,862 | | |
| 6.000%, due 01/01/23 | | | 1,061,479 | | | | 1,160,314 | | |
| 6.000%, due 03/01/23 | | | 2,951,465 | | | | 3,217,940 | | |
| 6.000%, due 11/01/26 | | | 277,835 | | | | 303,360 | | |
| 6.000%, due 01/01/32 | | | 42,336 | | | | 46,795 | | |
| 6.000%, due 04/01/32 | | | 56,039 | | | | 61,907 | | |
| 6.000%, due 09/01/32 | | | 61,285 | | | | 67,701 | | |
| 6.000%, due 10/01/32 | | | 68,315 | | | | 75,467 | | |
| 6.000%, due 12/01/32 | | | 144,577 | | | | 159,714 | | |
| 6.000%, due 01/01/33 | | | 264,868 | | | | 292,600 | | |
| 6.000%, due 02/01/33 | | | 174,099 | | | | 192,000 | | |
| 6.000%, due 09/01/34 | | | 1,133,765 | | | | 1,245,382 | | |
| 6.000%, due 04/01/35 | | | 5,990 | | | | 6,539 | | |
| 6.000%, due 05/01/35 | | | 618,354 | | | | 675,362 | | |
| 6.000%, due 06/01/35 | | | 145,876 | | | | 159,235 | | |
| 6.000%, due 07/01/35 | | | 712,243 | | | | 777,466 | | |
| 6.000%, due 08/01/35 | | | 336,327 | | | | 367,125 | | |
| 6.000%, due 09/01/35 | | | 165,535 | | | | 180,694 | | |
| Security description | | Face
amount | | Value | |
| Federal national mortgage association certificates*—(continued) | |
| 6.000%, due 01/01/36 | | $ | 335,804 | | | $ | 366,555 | | |
| 6.000%, due 09/01/36 | | | 434,194 | | | | 472,869 | | |
| 6.000%, due 11/01/36 | | | 14,650 | | | | 15,955 | | |
| 6.000%, due 01/01/37 | | | 511,802 | | | | 557,389 | | |
| 6.000%, due 03/01/37 | | | 132,692 | | | | 144,346 | | |
| 6.000%, due 04/01/37 | | | 360,145 | | | | 391,774 | | |
| 6.000%, due 07/01/37 | | | 192,359 | | | | 209,493 | | |
| 6.000%, due 11/01/37 | | | 535,600 | | | | 582,639 | | |
| 6.000%, due 09/01/38 | | | 4,477,430 | | | | 4,922,241 | | |
| 6.000%, due 10/01/38 | | | 2,962,188 | | | | 3,226,039 | | |
| 6.000%, due 11/01/38 | | | 2,913,828 | | | | 3,167,909 | | |
| 6.000%, due 01/01/39 | | | 4,000,000 | | | | 4,345,625 | | |
| 6.000%, due 04/01/39 | | | 161,156 | | | | 175,502 | | |
| 6.500%, due 09/01/12 | | | 2,448 | | | | 2,661 | | |
| 6.500%, due 12/01/12 | | | 6,028 | | | | 6,552 | | |
| 6.500%, due 01/01/13 | | | 2,054 | | | | 2,232 | | |
| 6.500%, due 02/01/13 | | | 9,810 | | | | 10,661 | | |
| 6.500%, due 03/01/13 | | | 12,538 | | | | 13,627 | | |
| 6.500%, due 04/01/13 | | | 1,061 | | | | 1,154 | | |
| 6.500%, due 06/01/13 | | | 24,087 | | | | 26,179 | | |
| 6.500%, due 07/01/13 | | | 4,212 | | | | 4,578 | | |
| 6.500%, due 08/01/13 | | | 4,699 | | | | 5,107 | | |
| 6.500%, due 09/01/13 | | | 18,061 | | | | 19,630 | | |
| 6.500%, due 10/01/13 | | | 13,165 | | | | 14,307 | | |
| 6.500%, due 11/01/13 | | | 26,744 | | | | 29,065 | | |
| 6.500%, due 07/01/19 | | | 71,852 | | | | 79,686 | | |
| 6.500%, due 09/01/36 | | | 4,119,069 | | | | 4,527,802 | | |
| 6.500%, due 10/01/36 | | | 2,087,806 | | | | 2,294,978 | | |
| 6.500%, due 11/01/36 | | | 73,132 | | | | 80,934 | | |
| 6.500%, due 05/01/37 | | | 32,152 | | | | 35,292 | | |
| 6.500%, due 08/01/37 | | | 3,214,319 | | | | 3,557,071 | | |
| 6.500%, due 11/01/37 | | | 4,044,745 | | | | 4,476,313 | | |
| 7.500%, due 11/01/26 | | | 27,496 | | | | 31,163 | | |
| 8.000%, due 11/01/26 | | | 42,601 | | | | 48,812 | | |
| 9.000%, due 10/01/19 | | | 23,408 | | | | 23,650 | | |
| 9.000%, due 02/01/26 | | | 31,878 | | | | 36,821 | | |
| 10.500%, due 02/01/12 | | | 220 | | | | 222 | | |
| 10.500%, due 07/01/13 | | | 150 | | | | 151 | | |
| 10.500%, due 09/01/15 | | | 8,401 | | | | 9,426 | | |
| 10.500%, due 08/01/20 | | | 1,228 | | | | 1,332 | | |
| 10.500%, due 04/01/22 | | | 1,027 | | | | 1,142 | | |
| 11.000%, due 10/01/15 | | | 1,989 | | | | 2,038 | | |
| 11.000%, due 02/01/16 | | | 1,437 | | | | 1,447 | | |
FNMA ARM
1.599%, due 10/01/26 | | | 753,397 | | | | 755,691 | | |
| 1.617%, due 03/01/44 | | | 737,122 | | | | 748,088 | | |
| 2.454%, due 02/01/26 | | | 53,497 | | | | 55,625 | | |
| 2.595%, due 09/01/15 | | | 92,004 | | | | 94,993 | | |
| 2.630%, due 02/01/29 | | | 8,076 | | | | 8,433 | | |
| 2.752%, due 02/01/30 | | | 69,608 | | | | 72,385 | | |
| 2.907%, due 12/01/27 | | | 45,978 | | | | 48,102 | | |
| 3.095%, due 09/01/26 | | | 41,075 | | | | 42,938 | | |
| 3.645%, due 07/01/30 | | | 27,008 | | | | 27,362 | | |
| 3.905%, due 05/01/30 | | | 123,553 | | | | 127,935 | | |
| 4.135%, due 03/01/25 | | | 263,744 | | | | 273,823 | | |
21
UBS PACE Select Advisors Trust
UBS PACE Government Securities Fixed Income Investments
Portfolio of investments—July 31, 2010
| Security description | | Face
amount | | Value | |
| Federal national mortgage association certificates*—(concluded) | | | |
FNMA TBA
3.500%, TBA | | $ | 8,000,000 | | | $ | 8,193,440 | | |
| 4.000%, TBA | | | 9,000,000 | | | | 9,153,279 | | |
| 4.000%, TBA1 | | | 4,000,000 | | | | 4,169,376 | | |
| 4.500%, TBA | | | 81,000,000 | | | | 84,418,125 | | |
| 4.500%, TBA1 | | | 4,000,000 | | | | 4,238,124 | | |
| 5.000%, TBA | | | 20,000,000 | | | | 21,308,441 | | |
| 5.500%, TBA | | | 73,000,000 | | | | 78,446,250 | | |
| 6.500%, TBA | | | 7,000,000 | | | | 7,663,594 | | |
Total federal national mortgage
association certificates
(cost—$353,182,376) | | | | | | | 359,248,150 | | |
| Collateralized mortgage obligations—13.56% | | | |
Adjustable Rate Mortgage Trust,
Series 2005-8, Class 3A21
5.341%, due 11/25/35 | | | 2,621,207 | | | | 2,078,874 | | |
Banc of America Commercial
Mortgage, Inc.,
Series 2006-3, Class A4
5.889%, due 07/10/442 | | | 2,000,000 | | | | 2,099,697 | | |
Bear Stearns Asset Backed
Securities Trust,
Series 2003-AC5, Class A1
5.250%, due 10/25/333 | | | 3,065,720 | | | | 3,076,747 | | |
Series 2004-AC3, Class A2
5.500%, due 06/25/343 | | | 3,074,734 | | | | 2,820,774 | | |
Bear Stearns Commercial
Mortgage Securities, Inc.,
Series 2006-BBA7, Class A2
0.500%, due 03/15/194,5 | | | 3,500,000 | | | | 3,104,706 | | |
Chevy Chase Funding LLC,
Series 2004-1, Class A1
0.609%, due 01/25/354,5 | | | 273,475 | | | | 205,755 | | |
Chevy Chase Mortgage
Funding Corp.,
Series 2007-2A, Class A1
0.459%, due 05/25/484,5 | | | 2,018,535 | | | | 750,578 | | |
Countrywide Alternative
Loan Trust,
Series 2006-0A2, Class A1
0.548%, due 05/20/465 | | | 4,454,240 | | | | 2,276,126 | | |
Federal Agricultural
Mortgage Corp. ARM,
Series 2002, Class AA1
7.863%, due 04/25/116 | | | 562,678 | | | | 574,366 | | |
FHLMC REMIC,*
Series 0023, Class KZ
6.500%, due 11/25/23 | | | 77,317 | | | | 85,112 | | |
Series 0159, Class H
4.500%, due 09/15/21 | | | 19,833 | | | | 19,868 | | |
Series 1003, Class H
1.125%, due 10/15/205 | | | 88,348 | | | | 88,367 | | |
| Security description | | Face
amount | | Value | |
| Collateralized mortgage obligations—(continued) | |
Series 1349, Class PS
7.500%, due 08/15/22 | | $ | 4,026 | | | $ | 4,491 | | |
Series 1502, Class PX
7.000%, due 04/15/23 | | | 599,037 | | | | 617,562 | | |
Series 1534, Class Z
5.000%, due 06/15/23 | | | 294,677 | | | | 294,689 | | |
Series 1573, Class PZ
7.000%, due 09/15/23 | | | 100,116 | | | | 111,582 | | |
Series 1658, Class GZ
7.000%, due 01/15/24 | | | 49,650 | | | | 53,194 | | |
Series 1694, Class Z
6.500%, due 03/15/24 | | | 425,403 | | | | 489,369 | | |
Series 1775, Class Z
8.500%, due 03/15/25 | | | 9,865 | | | | 11,076 | | |
Series 2411, Class FJ
0.691%, due 12/15/295 | | | 69,993 | | | | 70,033 | | |
Series 3312, Class FN
0.561%, due 07/15/36 | | | 4,514,572 | | | | 4,495,559 | | |
FNMA REMIC,*
Trust 1987-002, Class Z
11.000%, due 11/25/17 | | | 264,327 | | | | 303,770 | | |
Trust 1988-007, Class Z
9.250%, due 04/25/18 | | | 227,398 | | | | 255,019 | | |
Trust 1992-074, Class Z
8.000%, due 05/25/22 | | | 326 | | | | 364 | | |
Trust 1992-129, Class L
6.000%, due 07/25/22 | | | 14,112 | | | | 15,223 | | |
Trust 1992-158, Class ZZ
7.750%, due 08/25/22 | | | 40,802 | | | | 45,455 | | |
Trust 1993-037, Class PX
7.000%, due 03/25/23 | | | 542,993 | | | | 596,295 | | |
Trust 1993-240, Class Z
6.250%, due 12/25/13 | | | 1,812 | | | | 1,923 | | |
Trust 1993-250, Class Z
7.000%, due 12/25/23 | | | 18,966 | | | | 20,329 | | |
Trust 2004-72, Class F
0.829%, due 09/25/345 | | | 3,735,808 | | | | 3,741,425 | | |
Trust 2005-088, Class A
0.479%, due 10/25/355 | | | 3,889,426 | | | | 3,784,889 | | |
Trust 2007-4, Class DF
0.774%, due 02/25/375 | | | 4,126,688 | | | | 4,116,639 | | |
Trust G92-040, Class ZC
7.000%, due 07/25/22 | | | 55,725 | | | | 62,871 | | |
Trust G94-006, Class PJ
8.000%, due 05/17/24 | | | 69,443 | | | | 78,145 | | |
GNMA REMIC,
Trust 2000-009, Class FH
0.841%, due 02/16/305 | | | 55,230 | | | | 55,470 | | |
Trust 2010-H01, Class FA
1.158%, due 01/20/605,6 | | | 5,966,503 | | | | 6,054,993 | | |
Indymac Index Mortgage
Loan Trust,
Series 2005-AR2, Class 2A1A
0.649%, due 02/25/355 | | | 1,258,083 | | | | 756,890 | | |
22
UBS PACE Select Advisors Trust
UBS PACE Government Securities Fixed Income Investments
Portfolio of investments—July 31, 2010
| Security description | | Face
amount | | Value | |
| Collateralized mortgage obligations—(continued) | |
JPMorgan Alternative Loan Trust,
Series 2008-R4, Class 2A1
0.827%, due 06/27/374,5 | | $ | 4,598,564 | | | $ | 3,955,419 | | |
JPMorgan Chase Commercial
Mortgage Securities Corp.,
Series 2007-FL1A, Class A1
0.716%, due 07/15/194,5 | | | 9,254,473 | | | | 7,869,380 | | |
MLCC Mortgage Investors, Inc.,
Series 2004-1, Class 2A2
2.172%, due 12/25/345 | | | 1,217,013 | | | | 1,153,146 | | |
Mortgage Equity Conversion
Asset Trust,
Series 2006-SFG3, Class A
0.820%, due 10/25/414,5,6 | | | 1,461,867 | | | | 1,408,672 | | |
Series 2007-FF1, Class A
0.910%, due 01/25/424,5,6 | | | 1,728,996 | | | | 1,666,620 | | |
Series 2007-FF3, Class A
0.920%, due 05/25/424,5,6 | | | 6,624,911 | | | | 6,381,772 | | |
RBSSP Resecuritization
Trust Certificate,
Series 2009-6, Class 18A1
0.847%, due 12/26/364,5 | | | 4,077,545 | | | | 3,765,001 | | |
Sequoia Mortgage Trust,
Series 5, Class A
0.691%, due 10/19/265 | | | 585,004 | | | | 488,145 | | |
Small Business Administration,
Series 2000-10, Class B1
7.449%, due 08/10/10 | | | 69,911 | | | | 70,042 | | |
Structured ARM Loan,
Series 2007-4, Class 1A2
0.549%, due 05/25/37 | | | 627,784 | | | | 368,480 | | |
Structured Asset Mortgage
Investments, Inc.,
Series 2006-AR3, Class 11A1
0.539%, due 04/25/365 | | | 2,000,226 | | | | 1,031,382 | | |
Series 2007-AR5, Class A2
0.879%, due 09/25/475 | | | 10,881,719 | | | | 3,768,165 | | |
WaMu Mortgage Pass
Through Certificates,
Series 2003-R1, Class X
0.616%, due 12/25/276,7,8 | | | 1,411,048 | | | | 10,583 | | |
Washington Mutual Mortgage
Pass-Through Certificates,
Series 2003-AR9, Class 1A6
2.829%, due 09/25/335 | | | 4,381,462 | | | | 4,374,237 | | |
Series 2003-AR9, Class 2A
2.883%, due 09/25/335 | | | 1,017,404 | | | | 1,019,316 | | |
Washington Mutual,
Series 2003-R1, Class A1
0.869%, due 12/25/275 | | | 1,387,943 | | | | 1,247,876 | | |
| Security description | | Face
amount | | Value | |
| Collateralized mortgage obligations—(concluded) | |
Wells Fargo Mortgage Backed
Securities Trust,
Series 2007-14, Class 1A1
6.000%, due 10/25/37 | | $ | 6,186,882 | | | $ | 5,506,090 | | |
Total collateralized mortgage
obligations
(cost—$92,688,971) | | | | | | | 87,302,551 | | |
| Asset-backed securities—0.74% | |
Bank of America Credit
Card Trust,
Series 2008-A5, Class A5
1.541%, due 12/16/135 | | | 2,730,000 | | | | 2,755,043 | | |
Countrywide Asset-Backed
Certificates,
Series 2005-13, Class 3AV3
0.579%, due 04/25/365 | | | 1,417,540 | | | | 1,189,801 | | |
EMC Mortgage Loan Trust,
Series 2003-A, Class A2
1.079%, due 08/25/404,5 | | | 348,510 | | | | 226,926 | | |
Green Tree Financial Corp.,
Series 1998-2, Class A5
6.240%, due 12/01/28 | | | 56,540 | | | | 57,302 | | |
Renaissance Home Equity
Loan Trust,
Series 2003-2, Class A
0.769%, due 08/25/335 | | | 511,063 | | | | 434,200 | | |
Specialty Underwriting &
Residential Financing,
Series 2003-BC1, Class A
1.009%, due 01/25/345 | | | 57,784 | | | | 43,480 | | |
Wells Fargo Home Equity Trust,
Series 2005-2, Class AII2
0.569%, due 10/25/355 | | | 91,565 | | | | 90,774 | | |
Total asset-backed securities
(cost—$5,111,502) | | | | | | | 4,797,526 | | |
| Stripped mortgage-backed securities—0.02% | |
FHLMC REMIC,*
Series 0013, Class B
7.000%, due 06/25/237,8 | | | 207,394 | | | | 38,498 | | |
Series 2136, Class GD
7.000%, due 03/15/297,8 | | | 14,209 | | | | 3,038 | | |
Series 2178, Class PI
7.500%, due 08/15/297,8 | | | 82,315 | | | | 18,741 | | |
Hilton Hotel Pool Trust,
Series 2000-HLTA, Class X
0.580%, due 10/03/152,4,8 | | | 35,894,187 | | | | 43,177 | | |
Total stripped mortgage-backed
securities
(cost—$88,424) | | | | | | | 103,454 | | |
23
UBS PACE Select Advisors Trust
UBS PACE Government Securities Fixed Income Investments
Portfolio of investments—July 31, 2010
| Security description | | Face
amount | | Value | |
| Short-term US government and agency obligations—36.34% | |
FHLMC*
0.250%, due 10/13/109 | | $ | 2,904,000 | | | $ | 2,903,129 | | |
US Treasury Bills
0.183%, due 09/02/109,10 | | | 345,000 | | | | 344,941 | | |
| 0.284%, due 09/23/109 | | | 230,000,000 | | | | 229,947,515 | | |
| 0.192%, due 01/20/119,10 | | | 690,000 | | | | 689,377 | | |
Total short-term US government and
agency obligations
(cost—$233,884,361) | | | | | | | 233,884,962 | | |
| Repurchase agreements—12.95% | |
Repurchase agreement dated
07/30/10 with Bank of America
Securities LLC, 0.220%
due 08/02/10, collateralized by
$30,472,000 US Treasury Notes,
0.750% due 05/31/12;
(value—$30,596,935)
proceeds: $30,000,550 | | | 30,000,000 | | | | 30,000,000 | | |
Repurchase agreement dated
07/30/10 with Credit Suisse
Securities (USA) LLC, 0.220%
due 08/02/10, collateralized by
$30,374,000 US Treasury Notes,
1.000% due 10/31/11;
(value—$30,611,297);
proceeds: $30,000,550 | | | 30,000,000 | | | | 30,000,000 | | |
| Security description | | Face
amount | | Value | |
| Repurchase agreements—(concluded) | |
Repurchase agreement dated
07/30/10 with State Street
Bank & Trust Co., 0.010%
due 08/02/10, collateralized by
$23,065,485 US Treasury Notes,
2.125% to 3.125%
due 04/30/15 to 04/30/17,
(value—$23,801,919);
proceeds: $23,335,019 | | $ | 23,335,000 | | | $ | 23,335,000 | | |
Total repurchase agreements
(cost—$83,335,000) | | | | | | | 83,335,000 | | |
Total investments before
investments sold short
(cost—$1,044,666,906)—
162.96% | | | | | | | 1,048,888,859 | | |
| Investments sold short—(7.02)% | |
FNMA TBA*
4.000%, TBA | | | (16,000,000 | ) | | | (16,732,496 | ) | |
| 4.500%, TBA | | | (2,000,000 | ) | | | (2,114,062 | ) | |
GNMA TBA
4.500%, TBA | | | (23,000,000 | ) | | | (24,164,375 | ) | |
| 6.500%, TBA | | | (2,000,000 | ) | | | (2,198,750 | ) | |
Total investments sold short
(proceeds—$44,943,750)—
(7.02)% | | | | | | | (45,209,683 | ) | |
Liabilities in excess of other
assets—(55.94)% | | | | | | | (360,054,201 | ) | |
| Net assets—100.00% | | $ | 643,624,975 | | |
Aggregate cost for federal income tax purposes before investments sold short was $1,045,095,255; and net unrealized appreciation consisted of:
| Gross unrealized appreciation | | $ | 12,051,355 | | |
| Gross unrealized depreciation | | | (8,257,751 | ) | |
| Net unrealized appreciation | | $ | 3,793,604 | | |
* On September 7, 2008, the Federal Housing Finance Agency placed the Federal National Mortgage Association and the Federal Home Loan Mortgage Corporation into conservatorship, and the US Treasury guaranteed the debt issued by those organizations.
1 Entire amount pledged as collateral for investments sold short.
2 Variable rate security. The interest rate shown is the current rate as of July 31, 2010.
3 Step bond that converts to the noted fixed rate at a designated future date.
4 Security exempt from registration pursuant to Rule 144A under the Securities Act of 1933. These securities, which represent 4.56% of net assets as of July 31, 2010, are considered liquid and may be resold in transactions exempt from registration, normally to qualified institutional buyers.
5 Floating rate security. The interest rate shown is the current rate as of July 31, 2010.
6 Security is being fair valued by a valuation committee under the direction of the board of trustees.
7 Illiquid security representing 0.27% of net assets as of July 31, 2010.
8 Interest Only Security. This security entitles the holder to receive interest payments from an underlying pool of mortgages. The risk associated with this security is related to the speed of the principal paydowns. High prepayments would result in a smaller amount of interest being received and cause the yield to decrease. Low prepayments would result in a greater amount of interest being received and cause the yield to increase.
9 Rate shown is the discount rate at date of purchase.
10 Partial amount delivered to broker as collateral for swap and futures transactions.
24
UBS PACE Select Advisors Trust
UBS PACE Government Securities Fixed Income Investments
Portfolio of investments—July 31, 2010
ARM Adjustable Rate Mortgage—The interest rate shown is the current rate as of July 31, 2010.
FHA Federal Housing Administration
FHLMC Federal Home Loan Mortgage Corporation
FNMA Federal National Mortgage Association
GMAC General Motors Acceptance Corporation
GNMA Government National Mortgage Association
MLCC Merrill Lynch Credit Corporation
REMIC Real Estate Mortgage Investment Conduit
TBA (To Be Announced) Security is purchased on a forward commitment basis with an approximate principal amount (generally +/- 1.0%) and no definite maturity date. The actual principal amount and maturity date will be determined upon settlement when the specific mortgage pools are assigned.
Written options
Number of
contracts/
Notional
amount
(000) | | Call options written | | Counterparty | | Pay/
receive
floating
rate | | Expiration
dates | | Premiums
received | | Current
value | | Unrealized
appreciation
(depreciation) | |
| | 2,500 | | | USD 3 Month LIBOR11
strike @ 3.250%7 | | Interest Rate Swap,
International | | Credit Suisse
Receive | | 01/24/11 | | $ | 15,250 | | | $ | (78,670 | ) | | $ | (63,420 | ) | |
| | 7,400 | | | USD 3 Month LIBOR11
strike @ 3.250%7 | | Interest Rate Swap,
Bank AG | | Deutsche
Receive | | 01/24/11 | | | 44,400 | | | | (232,864 | ) | | | (188,464 | ) | |
| | 12,500 | | | USD 3 Month LIBOR11
strike @ 3.500%7 | | Interest Rate Swap,
Bank PLC | | Barclays
Receive | | 08/31/10 | | | 60,000 | | | | (643,443 | ) | | | (583,443 | ) | |
| | | $ | 119,650 | | | $ | (954,977 | ) | | $ | (835,327 | ) | |
| | | Put options written | | | | | | | | | | | | | |
| | 1 | | | Eurodollar Mid Curve
strike @ $97.375 | | 1 Year Futures,
N/A | | N/A | | 09/10/10 | | $ | 180,178 | | | $ | (3,487 | ) | | $ | 176,691 | | |
| | 27,100 | | | USD 3 Month LIBOR11
strike @ 4.000%7 | | Morgan
Interest Rate Swap,
Services Inc. | | Stanley Capital
Pay | | 10/29/10 | | | 142,275 | | | | (236 | ) | | | 142,039 | | |
| | 12,500 | | | USD 3 Month LIBOR11
strike @ 4.500%7 | | Interest Rate Swap,
Bank PLC | | Barclays
Pay | | 08/31/10 | | | 85,000 | | | | (1 | ) | | | 84,999 | | |
| | 2,500 | | | USD 3 Month LIBOR11
strike @ 5.000%7 | | Interest Rate Swap,
International | | Credit Suisse
Pay | | 01/24/11 | | | 24,000 | | | | (754 | ) | | | 23,246 | | |
| | 7,400 | | | USD 3 Month LIBOR11
strike @ 5.000%7 | | Interest Rate Swap,
Bank AG | | Deutsche
Pay | | 01/24/11 | | | 76,960 | | | | (2,232 | ) | | | 74,728 | | |
| | 40,000 | | | USD 3 Month LIBOR11
strike @ 5.500%7 | | Morgan
Interest Rate Swap,
Services, Inc. | | Stanley Capital
Pay | | 08/31/10 | | | 442,800 | | | | (4 | ) | | | 442,796 | | |
| | 2,600 | | | USD 3 Month LIBOR11
strike @ 6.000%7 | | Morgan
Interest Rate Swap,
Services, Inc. | | Stanley Capital
Pay | | 08/31/10 | | | 21,190 | | | | (0 | ) | | | 21,190 | | |
| | | | 972,403 | | | | (6,714 | ) | | | 965,689 | | |
| | | $ | 1,092,053 | | | $ | (961,691 | ) | | $ | 130,362 | | |
25
UBS PACE Select Advisors Trust
UBS PACE Government Securities Fixed Income Investments
Portfolio of investments—July 31, 2010
11 3 Month LIBOR (USD on London Interbank Offered Rate) at July 31, 2010 was 0.454%.
LIBOR London Interbank Offered Rate
N/A Not applicable
Currency type abbreviation:
USD United States Dollar
Written option activity for the year ended July 31, 2010 was as follows:
| | | Number of
contracts/
Notional
amount
(000) | | Premiums
received | |
| Options outstanding at July 31, 2009 | | | 0 | 12 | | $ | 25,587 | | |
| Options written | | | 291,802 | | | | 2,515,506 | | |
| Options expired prior to exercise | | | (88,301 | ) | | | (655,530 | ) | |
| Options terminated in closing purchase transactions | | | (89,000 | ) | | | (793,510 | ) | |
| Options outstanding at July 31, 2010 | | | 114,501 | | | $ | 1,092,053 | | |
12 Amount represents less than 500 contracts.
Futures contracts
Number of
contracts | | Currency | | Buy contracts | | Expiration
date | | Cost | | Current
value | | Unrealized
appreciation | |
| | 71 | | | | USD | | | US Treasury Note 10 Year Futures | | September 2010 | | $ | 8,528,797 | | | $ | 8,790,688 | | | $ | 261,891 | | |
Currency type abbreviation:
USD United States Dollar
Credit default swaps on credit indices—buy protection13
| | | | | | | Rate type | | | | | | | |
| Counterparty | | Notional
amount
(000) | | Termination
date | | Payments
made by
the Portfolio | | Payments
received by
the Portfolio | | Upfront
payments
made | | Value | | Unrealized
appreciation | |
Morgan
Stanley
Capital
Services, Inc. | | USD | 5,000 | | | | 02/17/51 | | | | 0.350 | %14 | | | — | 15 | | $ | (550,664 | ) | | $ | 587,500 | | | $ | 36,836 | 7 | |
13 If the Portfolio is a buyer of protection and a credit event occurs, as defined under the terms of that particular swap agreement, the Portfolio will either (i) receive from the seller of protection an amount equal to the notional value of the swap and take delivery of the referenced obligation or underlying securities comprising the referenced index or (ii) receive a net settlement amount in the form of cash or securities equal to the notional amount of the swap less the recovery value of the referenced obligation or underlying securities comprising the referenced index.
14 Payments are based on the notional amount.
15 Payment from the counterparty will be received upon the occurrence of bankruptcy and/or by a restructuring event with respect to the CMBX.NA.AAA Index.
Currency type abbreviation:
USD United States Dollar
26
UBS PACE Select Advisors Trust
UBS PACE Government Securities Fixed Income Investments
Portfolio of investments—July 31, 2010
The following is a summary of the fair valuations according to the inputs used as of July 31, 2010 in valuing the Portfolio's investments:
| | | Unadjusted
quoted prices in
active markets for
identical investments
(Level 1) | | Other significant
observable inputs
(Level 2) | | Unobservable
inputs
(Level 3) | | Total | |
| US Government obligation | | $ | — | | | $ | 735,112 | | | $ | — | | | $ | 735,112 | | |
Government national mortgage
association certificates | | | — | | | | 122,756,568 | | | | — | | | | 122,756,568 | | |
Federal home loan mortgage
corporation certificates | | | — | | | | 155,467,958 | | | | — | | | | 155,467,958 | | |
| Federal housing administration certificates | | | — | | | | — | | | | 1,257,578 | | | | 1,257,578 | | |
Federal national mortgage association
certificates | | | — | | | | 359,248,150 | | | | — | | | | 359,248,150 | | |
| Collateralized mortgage obligations | | | — | | | | 71,205,545 | | | | 16,097,006 | | | | 87,302,551 | | |
| Asset-backed securities | | | — | | | | 4,797,526 | | | | — | | | | 4,797,526 | | |
| Stripped mortgage-backed securities | | | — | | | | 103,454 | | | | — | | | | 103,454 | | |
Short-term US government and agency
obligations | | | — | | | | 233,884,962 | | | | — | | | | 233,884,962 | | |
| Repurchase agreements | | | — | | | | 83,335,000 | | | | — | | | | 83,335,000 | | |
Federal national mortgage association and
government national mortgage
association certificates sold short | | | — | | | | (45,209,683 | ) | | | — | | | | (45,209,683 | ) | |
| Written options | | | (3,487 | ) | | | (958,204 | ) | | | | | | | (961,691 | ) | |
| Futures contracts | | | 261,891 | | | | — | | | | | | | | 261,891 | | |
| Swap agreements | | | — | | | | 587,500 | | | | — | | | | 587,500 | | |
| Total | | $ | 258,404 | | | $ | 985,953,888 | | | $ | 17,354,584 | | | $ | 1,003,566,876 | | |
At July 31, 2010, there were no transfers between Level 1 and Level 2.
The following is a rollforward of the Portfolio's investments that were valued using unobservable inputs (Level 3) for the year ended July 31, 2010:
| | | Federal housing
administration
certificates | | Collateralized
mortgage
obligations | | Total | |
| Beginning balance | | $ | 1,434,238 | | | $ | 4,550,000 | | | $ | 5,984,238 | | |
| Net purchases/(sales) | | | (201,329 | ) | | | 10,064,962 | | | | 9,863,633 | | |
| Accrued discounts/(premiums) | | | (490 | ) | | | 70,242 | | | | 69,752 | | |
| Total realized gain/(loss) | | | (0 | ) | | | (21,875 | ) | | | (21,875 | ) | |
| Total unrealized appreciation/depreciation | | | 25,159 | | | | 765,045 | | | | 790,204 | | |
| Net transfers in/(out) of Level 3 | | | — | | | | 668,632 | | | | 668,632 | | |
| Ending balance | | $ | 1,257,578 | | | $ | 16,097,006 | | | $ | 17,354,584 | | |
The change in unrealized appreciation/depreciation relating to the Level 3 investments held at July 31, 2010 was $340,205.
See accompanying notes to financial statements.
27
UBS PACE Select Advisors Trust
UBS PACE Intermediate Fixed Income Investments
Performance
For the 12 months ended July 31, 2010, the Portfolio's Class P shares returned 7.51%, before the deduction of the maximum UBS PACE Select program fee. (The Class P shares returned 5.38%, after the deduction of the maximum UBS PACE Select program fee, for the same 12-month period.) In comparison, the Barclays Capital US Intermediate Government/Credit Index (the "benchmark") returned 7.99%, and the Lipper Short-Intermediate Investment-Grade Debt Funds category posted a median return of 8.11%. (Returns for all share classes over various time periods are shown in the "Performance at a glance" table on page 31. Please note that the returns shown do not reflect the deduction of taxes that a shareholder would pay on Portfolio distributions or the redemption of Portfolio shares.) For a detailed commentary on the market environment in general during the reporting period, please refer to page 2.
Sub-Advisor's comments
The Portfolio slightly lagged its benchmark during the reporting period. Overall, the Portfolio's positioning in the corporate bond sector detracted from results. Specifically, the Portfolio's initial underweight to corporate bonds was a negative as the sector rallied in the first half of the review period. We moved closer to a neutral weighting versus the benchmark toward the end of 2009 and then to an overweight position starting in late February of 2010, which helped relative performance during the second half of the review period. Security selection within the corporate bond sector also detracted from performance during the period. In particular, our holdings in industrials and financials detracted from relative results, as they lagged the benchmark.
Our allocation to commercial mortgage-backed securities ("CMBS") was the largest contributor to results during the review period. CMBS outperformed Treasuries with relatively the same duration during the reporting period, and outpaced all other investment grade subsectors. CMBS was a large beneficiary of strong demand from both the Federal Reserve Board's Term Asset-Backed Securities Loan Facility ("TALF") and the Public Private Investment Program ("PPIP"). Additionally, positive economic news created solid demand for CMBS from investors seeking incremental yield in the low interest rate environment. We also benefited from the Portfolio's focus on owning high quality CMBS with seasoned issues (securities with an established market), versus lower-quality and more recently issued CMBS.
UBS PACE Select Advisors Trust –
UBS PACE Intermediate Fixed Income Investments
Investment Sub-Advisor:
BlackRock Financial Management, Inc. ("BlackRock")
Portfolio Managers:
Curtis Arledge and Matthew Marra
Objective:
Current income, consistent with reasonable stability of principal
Investment process:
The Portfolio invests primarily in fixed income securities. BlackRock decides to buy specific bonds based on its credit analysis and review. BlackRock strives to add value by controlling the Portfolio's duration within a narrow band relative to the Barclays Capital US Intermediate Government/Credit Index. To accomplish this, BlackRock employs an analytical process that involves evaluating macroeconomic trends, technical market factors, yield-curve exposure and market volatility. Once BlackRock establishes the investment themes on duration, yield curve exposure, convexity, sector weighting, credit quality and liquidity, the Portfolio's investments are diversified by sector, subsector and security.
28
UBS PACE Select Advisors Trust
UBS PACE Intermediate Fixed Income Investments
Sub-Advisor's comments – concluded
Our allocation to agency and non-agency mortgages also contributed to performance, relative to the benchmark. In an attempt to keep mortgage rates low, the federal government purchased over $1 trillion dollars in agency mortgages. This, in turn, helped the agency mortgage-backed securities sector during the period. The Portfolio's non-agency mortgage allocation was also beneficial to performance, as there was solid demand from certain investors and the PPIP program. Also at the sector level, our exposure to asset-backed securities was rewarded, as the sector outperformed Treasuries, given generally strong demand from investors.
Our tactical trading of duration—a measure of a portfolio's sensitivity to interest rate changes—contributed to relative performance during the period. However, our curve positioning—the Portfolio held a flattening bias during the latter portion of the period, while the curve steepened—detracted from performance. (The yield curve plots the interest rates, at a set point in time, of bonds having equal credit quality, but differing maturity dates. A "steepening yield curve" is one in which long-term bond yields increase relative to those of short-term bonds.)
Special considerations
The Portfolio may be appropriate for long-term investors seeking current income with reasonable stability of principal. Investors should be able to withstand short-term fluctuations in the fixed income markets. The value of the Portfolio changes every day and can be affected by changes in interest rates, general market conditions and other political, social and economic developments, as well as specific matters relating to the companies in whose securities the Portfolio invests. It is important to note that an investment in the Portfolio is only one component of a balanced investment plan.
29
UBS PACE Select Advisors Trust
UBS PACE Intermediate Fixed Income Investments
Illustration of an assumed investment of $10,000 in Class P shares of the Portfolio (unaudited)
The following graph depicts the performance of UBS PACE Intermediate Fixed Income Investments Class P shares versus the Barclays Capital US Intermediate Government/Credit Index over the 10 years ended July 31, 2010. The performance of the other classes will vary based upon the different class specific expenses and sales charges. The performance provided does not reflect the deduction of taxes that a shareholder would pay on Portfolio distributions or the redemption of Portfolio shares. Past performance is no guarantee of future results. Share price and returns will vary with market conditions; investors may realize a gain or loss upon redemption. It is important to note that UBS PACE Intermediate Fixed Income Investments is a professionally managed portfolio while the Index is not available for investment and is unmanaged. The comparison is shown for illustration purposes only.
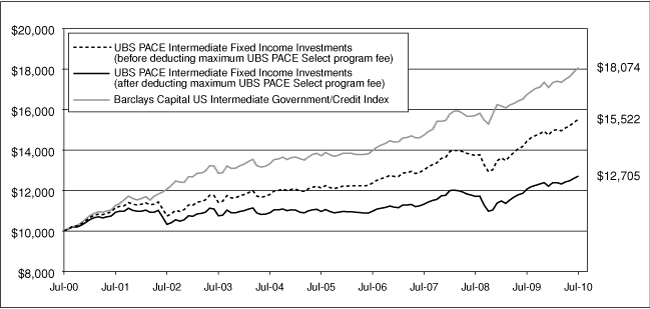
30
UBS PACE Select Advisors Trust
UBS PACE Intermediate Fixed Income Investments
Performance at a glance (unaudited)
| Average annual total returns for periods ended 07/31/10 | | 1 year | | 5 years | | 10 years | | Since
inception1 | |
| Before deducting | | Class A2 | | | 7.24 | % | | | 4.84 | % | | N/A | | | 3.76 | % | |
| maximum sales charge | | Class B3 | | | 6.43 | % | | | 4.04 | % | | N/A | | | 3.45 | %7 | |
| or UBS PACE Select | | Class C4 | | | 6.70 | % | | | 4.29 | % | | N/A | | | 3.50 | % | |
| program fee | | Class Y5 | | | 7.53 | % | | | 5.09 | % | | N/A | | | 4.03 | % | |
| | | Class P6 | | | 7.51 | % | | | 5.09 | % | | | 4.49 | % | | | 4.72 | % | |
| After deducting | | Class A2 | | | 2.38 | % | | | 3.87 | % | | N/A | | | 3.26 | % | |
| maximum sales charge | | Class B3 | | | 1.43 | % | | | 3.70 | % | | N/A | | | 3.45 | %7 | |
| or UBS PACE Select | | Class C4 | | | 5.95 | % | | | 4.29 | % | | N/A | | | 3.50 | % | |
| program fee | | Class P6 | | | 5.38 | % | | | 3.00 | % | | | 2.42 | % | | | 2.65 | % | |
| Barclays Capital US Intermediate Government/Credit Index8 | | | 7.99 | % | | | 5.67 | % | | | 6.10 | % | | | 6.03 | % | |
| Lipper Short-Intermediate Investment Grade Debt Funds median | | | 8.11 | % | | | 4.91 | % | | | 5.29 | % | | | 5.39 | % | |
Average annual total returns for periods ended June 30, 2010, after deduction of the maximum sales charge or UBS PACE Select program fee, were as follows: Class A—1-year period, 3.31%; 5-year period, 3.52%; since inception, 3.18%; Class B—1-year period, 2.38%; 5-year period, 3.32%; since inception, 3.37%; Class C—1-year period, 6.90%; 5-year period, 3.92%; since inception, 3.43%; Class Y—1-year period, 8.49%; 5-year period, 4.72%; since inception, 3.96%; Class P—1-year period, 6.33%; 5-year period, 2.64%; 10-year period, 2.39%; since inception, 2.61%.
The annualized gross and net expense ratios, respectively, for each class of shares as in the November 28, 2009 prospectuses, were as follows: Class A—1.02% and 0.93%; Class B—1.82% and 1.68%; Class C—1.53% and 1.43%; Class Y—0.68% and 0.68%; and Class P—0.74% and 0.68%. Net expenses reflect fee waivers and/or expense reimbursements, if any, pursuant to an agreement that is in effect to cap the expenses. The Portfolio and UBS Global AM have entered into a written fee waiver/expense reimbursement agreement pursuant to which UBS Global AM is contractually obligated to waive its management fees and/or reimburse expenses so that the ordinary total operating expenses of each class through November 30, 2010 (excluding dividend expense, borrowing costs and interest expense, if any) would not exceed Class A—0.93%; Class B—1.68%; Class C—1.43%; Class Y—0.68%; and Class P—0.68%. The Portfo lio has agreed to repay UBS Global AM for any waived fees/reimbursed expenses to the extent that it can do so over the following three fiscal years without causing the Portfolio's expenses in any of those three years to exceed the expense caps described above.
1 Since inception returns are calculated as of commencement of issuance or reissuance on August 24, 1995 for Class P shares, January 31, 2001 for Class A shares, December 14, 2000 for Class B shares, December 1, 2000 for Class C shares and February 2, 2001 for Class Y shares. Since inception returns for the Index and Lipper median are shown as of August 31, 1995, which is the month-end after the inception date of the oldest share class (Class P).
2 Maximum sales charge for Class A shares is 4.5%. Class A shares bear ongoing 12b-1 service fees.
3 Maximum contingent deferred sales charge for Class B shares is 5% imposed on redemptions and is reduced to 0% after a maximum of six years. Class B shares bear ongoing 12b-1 service and distribution fees.
4 Maximum contingent deferred sales charge for Class C shares is 0.75% imposed on redemptions and is reduced to 0% after one year. Class C shares bear ongoing 12b-1 service and distribution fees. Prior to September 30, 2003, Class C shares were subject to a maximum front-end sales charge of 1.00%; this front-end sales charge is not reflected in the average annual total return presented for the Class C shares shown above.
5 The Portfolio offers Class Y shares to a limited group of eligible investors, including certain qualifying retirement plans. Class Y shares do not bear initial or contingent deferred sales charges or ongoing 12b-1 service and distribution fees.
6 Class P shares do not bear initial or contingent deferred sales charges or ongoing 12b-1 service and distribution fees, but are subject to a maximum annual UBS PACE Select program fee of 2% of the value of Class P shares. Prior to June 14, 2010, the maximum annual UBS PACE Select program fee was 1.5% of the value of Class P shares.
7 Assumes the conversion of Class B to Class A shares at the end of the sixth year.
8 The Barclays Capital US Intermediate Government/Credit Index is an unmanaged subset of the Barclays Capital US Government/Credit Index covering all investment grade issues with maturities from one up to (but not including) 10 years. The average-weighted maturity is typically between four and five years. Investors should note that indices do not reflect the deduction of fees and expenses.
If an investor sells or exchanges shares less than 90 days after purchase, a redemption fee of 1.00% of the amount sold or exchanged will be deducted at the time of the transaction, except as noted otherwise in the prospectuses.
Past performance does not predict future performance, and the performance information provided does not reflect the deduction of taxes that a shareholder would pay on Portfolio distributions or the redemption of Portfolio shares. The return and principal value of an investment will fluctuate, so that an investor's shares, when redeemed, may be worth more or less than their original cost. Performance results assume reinvestment of all dividends and capital gain distributions at net asset value on the ex-dividend dates. Current performance may be higher or lower than the performance data quoted. For month-end performance figures, please visit http://www.ubs.com.
Lipper peer group data calculated by Lipper Inc.; used with permission. The Lipper median is the return of the fund that places in the middle of a Lipper peer group.
31
UBS PACE Select Advisors Trust
UBS PACE Intermediate Fixed Income Investments
Portfolio statistics (unaudited)
| Characteristics | | 07/31/10 | |
| Weighted average duration | | | 4.4 | yrs. | |
| Weighted average maturity | | | 6.6 | yrs. | |
| Average coupon | | | 4.01 | % | |
| Net assets (mm) | | $ | 470.5 | | |
| Number of holdings | | | 231 | | |
| Portfolio composition1 | | 07/31/10 | |
| Bonds and notes | | | 98.3 | % | |
| Reverse repurchase agreement, futures and forward foreign currency contracts | | | (1.2 | ) | |
| Investments sold short | | | (3.3 | ) | |
| Cash equivalents and other assets less liabilities | | | 6.2 | | |
| Total | | | 100.0 | % | |
| Quality diversification1 | | 07/31/10 | |
| US government and agency securities | | | 45.9 | % | |
| AAA | | | 11.6 | | |
| AA | | | 10.7 | | |
| A | | | 15.6 | | |
| BBB and below/non-rated | | | 14.5 | | |
| Reverse repurchase agreement, futures and forward foreign currency contracts | | | (1.2 | ) | |
| Investments sold short | | | (3.3 | ) | |
| Cash equivalents and other assets less liabilities | | | 6.2 | | |
| Total | | | 100.0 | % | |
| Asset allocation1 | | 07/31/10 | |
| Corporate notes | | | 36.1 | % | |
| US government obligations | | | 34.7 | | |
| Collateralized mortgage obligations | | | 10.9 | | |
| US government agency mortgage pass-through certificates | | | 9.8 | | |
| Asset-backed securities | | | 4.3 | | |
| Municipal bonds and notes | | | 1.4 | | |
| Non-US government obligations | | | 1.1 | | |
| Reverse repurchase agreement, futures and forward foreign currency contracts | | | (1.2 | ) | |
| Investments sold short | | | (3.3 | ) | |
| Cash equivalents and other assets less liabilities | | | 6.2 | | |
| Total | | | 100.0 | % | |
1 Weightings represent percentages of the Portfolio's net assets as of July 31, 2010. The Portfolio is actively managed and its composition will vary over time. Credit quality ratings shown are based on the ratings assigned to portfolio holdings by Standard & Poor's Ratings Group, an independent rating agency.
32
UBS PACE Select Advisors Trust
UBS PACE Intermediate Fixed Income Investments
Portfolio of investments—July 31, 2010
| Security description | | Face
amount | | Value | |
| US government obligations—34.71% | |
US Treasury Bonds
4.375%, due 05/15/401 | | $ | 19,140,000 | | | $ | 20,458,937 | | |
| 8.000%, due 11/15/21 | | | 8,925,000 | | | | 13,045,842 | | |
| 8.125%, due 05/15/21 | | | 4,265,000 | | | | 6,251,556 | | |
| 8.125%, due 08/15/21 | | | 1,615,000 | | | | 2,374,050 | | |
| 8.750%, due 08/15/20 | | | 750,000 | | | | 1,129,922 | | |
US Treasury Notes
0.750%, due 05/31/12 | | | 11,610,000 | | | | 11,658,530 | | |
| 1.000%, due 04/30/12 | | | 7,210,000 | | | | 7,273,087 | | |
| 1.000%, due 07/15/13 | | | 27,515,000 | | | | 27,654,776 | | |
| 1.750%, due 07/31/15 | | | 22,155,000 | | | | 22,317,618 | | |
| 3.500%, due 05/15/20 | | | 48,705,000 | | | | 51,148,043 | | |
Total US government obligations
(cost—$161,567,006) | | | | | | | 163,312,361 | | |
| Federal farm credit bank certificate—1.34% | |
FFCB
2.625% , due 04/17/14
(cost—$5,989,905) | | | 6,000,000 | | | | 6,286,140 | | |
| Federal home loan bank certificate—0.49% | |
FHLB
5.625% , due 06/13/162
(cost—$2,013,274) | | | 2,085,000 | | | | 2,289,205 | | |
| Federal home loan mortgage corporation certificates*—1.41% | |
FHLMC
1.750%, due 06/15/12 | | | 5,900,000 | | | | 6,021,351 | | |
| 5.000%, due 02/16/17 | | | 540,000 | | | | 625,408 | | |
Total federal home loan mortgage
corporation certificates
(cost—$6,548,058) | | | | | | | 6,646,759 | | |
| Federal national mortgage association certificates*—6.57% | |
FNMA
4.500%, due 12/01/393 | | | 99,991 | | | | 104,699 | | |
| 4.500%, due 07/01/403 | | | 600,000 | | | | 628,158 | | |
| 4.625%, due 05/01/13 | | | 845,000 | | | | 914,349 | | |
| 5.000%, due 07/01/403 | | | 14,032,231 | | | | 14,969,729 | | |
| 5.250%, due 08/01/12 | | | 1,460,000 | | | | 1,574,347 | | |
| 6.000%, due 04/01/353 | | | 3,242,652 | | | | 3,582,152 | | |
FNMA TBA
4.000%, TBA | | | 2,200,000 | | | | 2,300,718 | | |
| 4.500%, TBA3 | | | 100,000 | | | | 104,563 | | |
| 5.000%, TBA | | | 100,000 | | | | 106,812 | | |
| 5.500%, TBA | | | 1,700,000 | | | | 1,838,125 | | |
| 6.000%, TBA | | | 4,400,000 | | | | 4,779,500 | | |
Total federal national mortgage
association certificates
(cost—$30,503,152) | | | | | | | 30,903,152 | | |
| Security description | | Face
amount | | Value | |
| Collateralized mortgage obligations—10.87% | |
Banc of America Commercial
Mortgage, Inc.,
Series 2001-1, Class A2
6.503%, due 04/15/36 | | $ | 1,241,624 | | | $ | 1,263,561 | | |
Series 2002-PB2, Class A4
6.186%, due 06/11/35 | | | 2,118,973 | | | | 2,229,430 | | |
Bear Stearns Alternative Loan
Trust-A Trust,
Series 2004-13, Class A1
1.069%, due 11/25/344 | | | 484,877 | | | | 343,094 | | |
Bear Stearns ARM Trust,
Series 2004-5, Class 2A
3.325%, due 07/25/34 | | | 1,076,436 | | | | 939,120 | | |
Bear Stearns Commercial
Mortgage Securities,
Series 2003-T12, Class A4
4.680%, due 08/13/39 | | | 2,400,000 | | | | 2,553,254 | | |
Commercial Mortgage
Pass-Through Certificates,
Series 2004-LB3A, Class A3
5.090%, due 07/10/374 | | | 1,280,000 | | | | 1,310,440 | | |
Countrywide Home Loans,
Series 2006-0A5, Class 2A1
0.529%, due 04/25/464 | | | 500,060 | | | | 272,938 | | |
CWCapital COBALT,
Series 2007-C3, Class A4
6.013%, due 05/15/464 | | | 840,000 | | | | 836,293 | | |
FHLMC REMIC,*
Trust 2626, Class NA
5.000%, due 06/15/23 | | | 358,368 | | | | 360,220 | | |
Trust 2964, Class NA
5.500%, due 02/15/26 | | | 124,769 | | | | 124,887 | | |
Trust 3154, Class PJ
5.500%, due 03/15/27 | | | 685,007 | | | | 689,520 | | |
Trust 3159, Class TA
5.500%, due 11/15/26 | | | 607,961 | | | | 614,549 | | |
Trust 3162, Class OA
6.000%, due 10/15/26 | | | 523,376 | | | | 530,548 | | |
Trust 3184, Class LA
6.000%, due 03/15/28 | | | 560,232 | | | | 564,258 | | |
Trust 3303, Class PA
5.500%, due 01/15/22 | | | 1,099,618 | | | | 1,102,738 | | |
First Horizon Alternative
Mortgage Securities,
Series 2006-FA2, Class 1A5
6.000%, due 05/25/36 | | | 1,399,043 | | | | 1,043,222 | | |
First Union National Bank
Commercial Mortgage Trust,
Series 2001-C2, Class A2
6.663%, due 01/12/43 | | | 2,501,309 | | | | 2,548,310 | | |
Series 2001-C3, Class A3
6.423%, due 08/15/33 | | | 2,692,369 | | | | 2,771,585 | | |
FNMA REMIC,*
Trust 2004-25, Class PA
5.500%, due 10/25/30 | | | 401,610 | | | | 408,080 | | |
33
UBS PACE Select Advisors Trust
UBS PACE Intermediate Fixed Income Investments
Portfolio of investments—July 31, 2010
| Security description | | Face
amount | | Value | |
| Collateralized mortgage obligations—(continued) | |
Trust 2004-36, Class BS
5.500%, due 11/25/30 | | $ | 319,546 | | | $ | 325,372 | | |
Trust 2005-97, Class HM
5.000%, due 01/25/26 | | | 458,900 | | | | 461,688 | | |
Trust 2005-109, Class PV
6.000%, due 10/25/32 | | | 1,356,868 | | | | 1,480,772 | | |
Trust 2005-118, Class MC
6.000%, due 01/25/32 | | | 725,279 | | | | 734,948 | | |
Trust 2005-118, Class WA
6.000%, due 10/25/33 | | | 746,731 | | | | 756,805 | | |
Trust 2006-26, Class QA
5.500%, due 06/25/26 | | | 428,417 | | | | 434,925 | | |
Trust 2006-62, Class TA
5.500%, due 06/25/28 | | | 223,099 | | | | 228,047 | | |
GMAC Commercial Mortgage
Securities, Inc.,
Series 2000-C3, Class A2
6.957%, due 09/15/35 | | | 1,016,504 | | | | 1,019,947 | | |
Series 2001-C1, Class A2
6.465%, due 04/15/34 | | | 2,278,753 | | | | 2,316,258 | | |
Series 2004-C3, Class A3
4.207%, due 12/10/41 | | | 671,029 | | | | 673,302 | | |
Greenwich Capital Commercial
Funding Corp.,
Series 2007-GG11, Class A4
5.736%, due 12/10/49 | | | 1,451,000 | | | | 1,470,726 | | |
JPMorgan Chase Commercial
Mortgage Securities,
Series 2004-CB8, Class A1A
4.158%, due 01/12/395 | | | 2,298,666 | | | | 2,343,056 | | |
Series 2004-CBX, Class A4
4.529%, due 01/12/37 | | | 2,090,000 | | | | 2,131,210 | | |
Series 2006-LDP8, Class A4,
5.399%, due 05/15/45 | | | 385,000 | | | | 409,771 | | |
JPMorgan Mortgage Trust,
Series 2006-S2, Class 2A2
5.875%, due 07/25/36 | | | 247,665 | | | | 228,959 | | |
Series 2007-S1, Class 1A2
5.500%, due 03/25/22 | | | 197,826 | | | | 181,642 | | |
Morgan Stanley Capital I,
Series 2005-HQ6, Class A4A
4.989%, due 08/13/42 | | | 2,980,000 | | | | 3,194,851 | | |
Series 2007-IQ14, Class A
5.692%, due 04/15/494 | | | 2,000,000 | | | | 1,998,274 | | |
Small Business Administration,
Series 2004-P10B, Class 1
4.754%, due 08/10/14 | | | 537,336 | | | | 569,408 | | |
Structured ARM Loan Trust,
Series 2004-13, Class A2
0.629%, due 09/25/34 | | | 219,709 | | | | 163,636 | | |
Structured Asset Securities Corp.,
Series 2003-AL1, Class A
3.357%, due 04/25/315 | | | 619,079 | | | | 569,710 | | |
Series 2004-6, Class 4A1 ARM
4.858%, due 06/25/34 | | | 2,427,949 | | | | 2,272,283 | | |
| Security description | | Face
amount | | Value | |
| Collateralized mortgage obligations—(concluded) | |
TIAA Seasoned Commercial
Mortgage Trust,
Series 2007-C4, Class A1
5.641%, due 08/15/394 | | $ | 2,183,274 | | | $ | 2,243,279 | | |
Wachovia Bank Commercial
Mortgage Trust,
Series 2005-C21, Class A3
5.380%, due 10/15/444 | | | 1,215,000 | | | | 1,218,142 | | |
Series 2006-C28, Class A4
5.572%, due 10/15/48 | | | 1,385,000 | | | | 1,434,228 | | |
WaMu Mortgage Pass
Through Certificates,
Series 2007-0A4, Class 1A
1.172%, due 05/25/474 | | | 578,753 | | | | 351,330 | | |
Washington Mutual Asset
Securities Corp.,
Series 2005-C1A, Class A2
5.150%, due 05/25/364,5 | | | 357,565 | | | | 359,583 | | |
Wells Fargo Mortgage Backed
Securities Trust,
Series 2006-AR4, Class 2A4
5.692%, due 04/25/364 | | | 1,200,000 | | | | 1,055,968 | | |
Total collateralized
mortgage obligations
(cost—$51,038,252) | | | | | | | 51,134,167 | | |
| Asset-backed securities—4.26% | |
Bank of America Auto Trust,
Series 2009-2A, Class A2
1.160%, due 02/15/125 | | | 1,719,142 | | | | 1,721,292 | | |
Chase Issuance Trust,
Series 2009-A7, Class A7
0.791%, due 09/17/124 | | | 4,045,000 | | | | 4,046,938 | | |
Countrywide Asset-Backed
Certificates,
Series 2006-2, Class 2A2
0.519%, due 06/25/364 | | | 937,790 | | | | 800,017 | | |
Lehman XS Trust,
Series 2005-6, Class 1A1
0.589%, due 11/25/354 | | | 523,178 | | | | 277,840 | | |
Sallie Mae Student Loan Trust,
Series 2005-8, Class A4
1.248%, due 01/25/284 | | | 3,300,000 | | | | 3,219,949 | | |
Series 2008-5, Class A2
1.598%, due 10/25/164 | | | 4,330,000 | | | | 4,394,117 | | |
Series 2008-5, Class A3
1.798%, due 01/25/184 | | | 1,100,000 | | | | 1,134,102 | | |
Series 2008-5, Class A4
2.198%, due 07/25/234 | | | 2,950,000 | | | | 3,102,306 | | |
Series 2010-C, Class A1
1.983%, due 12/15/174,5 | | | 1,350,000 | | | | 1,350,528 | | |
Total asset-backed securities
(cost—$20,035,734) | | | | | | | 20,047,089 | | |
34
UBS PACE Select Advisors Trust
UBS PACE Intermediate Fixed Income Investments
Portfolio of investments—July 31, 2010
| Security description | | Face
amount | | Value | |
| Corporate notes—36.15% | |
| Aerospace & defense—0.08% | |
BAE Systems Holdings, Inc.
5.200%, due 08/15/155 | | $ | 330,000 | | | $ | 356,983 | | |
| Airlines—0.06% | |
Continental Airlines
1999-1 Pass Through Trust,
Class A
6.545%, due 02/02/19 | | | 303,871 | | | | 306,910 | | |
| Automotive—0.30% | |
DaimlerChrysler N.A. Holding
5.750%, due 09/08/11 | | | 1,150,000 | | | | 1,202,332 | | |
| 6.500%, due 11/15/13 | | | 200,000 | | | | 226,141 | | |
| | | | 1,428,473 | | |
| Banking-non-US—3.30% | |
Achmea Hypotheekbank N.V.
3.200%, due 11/03/145 | | | 1,605,000 | | | | 1,677,345 | | |
Barclays Bank PLC
7.434%, due 12/15/175,6,7 | | | 850,000 | | | | 828,750 | | |
Deutsche Bank AG London
5.375%, due 10/12/12 | | | 2,450,000 | | | | 2,672,288 | | |
Eksportfinans A/S
1.875%, due 04/02/13 | | | 3,585,000 | | | | 3,645,805 | | |
| 5.500%, due 05/25/16 | | | 1,275,000 | | | | 1,461,466 | | |
HSBC Bank PLC
3.500%, due 06/28/155 | | | 1,020,000 | | | | 1,056,138 | | |
Kreditanstalt fuer Wiederaufbau
1.375%, due 07/15/13 | | | 840,000 | | | | 847,046 | | |
Landwirtschaftliche Rentenbank
4.125%, due 07/15/13 | | | 145,000 | | | | 156,565 | | |
Landwirtschaftliche Rentenbank MTN
4.000%, due 02/02/15 | | | 290,000 | | | | 316,507 | | |
| 4.375%, due 01/15/13 | | | 320,000 | | | | 346,139 | | |
| 5.250%, due 07/02/12 | | | 500,000 | | | | 540,082 | | |
Toronto-Dominion Bank
2.200%, due 07/29/155 | | | 2,000,000 | | | | 1,999,340 | | |
| | | | 15,547,471 | | |
| Banking-US—6.39% | |
Bank of America Corp.
5.625%, due 07/01/20 | | | 1,690,000 | | | | 1,743,779 | | |
| 5.750%, due 12/01/17 | | | 2,775,000 | | | | 2,932,498 | | |
| 7.625%, due 06/01/19 | | | 1,500,000 | | | | 1,753,075 | | |
DEPFA Asset Covered Securities Bank
4.875%, due 10/28/155 | | | 1,300,000 | | | | 1,314,924 | | |
Dexia Credit Local
2.750%, due 04/29/145 | | | 15,375,000 | | | | 15,552,135 | | |
Dexia Credit Local SA
2.000%, due 03/05/135 | | | 1,345,000 | | | | 1,349,954 | | |
JPMorgan Chase Bank N.A.
6.000%, due 07/05/17 | | | 1,825,000 | | | | 2,027,097 | | |
| 6.000%, due 10/01/17 | | | 1,450,000 | | | | 1,629,671 | | |
State Street Capital Trust III
8.250%, due 03/15/116,7 | | | 1,725,000 | | | | 1,750,789 | | |
| | | | 30,053,922 | | |
| Security description | | Face
amount | | Value | |
| Corporate notes—(continued) | |
| Beverages—0.93% | |
Anheuser-Busch InBev Worldwide, Inc.
3.000%, due 10/15/12 | | $ | 4,175,000 | | | $ | 4,315,201 | | |
| 5.375%, due 01/15/20 | | | 75,000 | | | | 82,859 | | |
| | | | 4,398,060 | | |
| Diversified financial services—1.93% | |
General Electric Capital Corp.
2.125%, due 12/21/12 | | | 885,000 | | | | 911,541 | | |
| 5.000%, due 11/15/11 | | | 1,696,000 | | | | 1,778,173 | | |
| 5.500%, due 01/08/20 | | | 1,220,000 | | | | 1,315,992 | | |
General Electric Capital Corp. MTN
0.648%, due 04/10/124 | | | 2,850,000 | | | | 2,825,074 | | |
| 2.000%, due 09/28/12 | | | 2,200,000 | | | | 2,255,367 | | |
| | | | 9,086,147 | | |
| Electric-integrated—2.27% | |
Carolina Power & Light Co.
5.300%, due 01/15/19 | | | 975,000 | | | | 1,109,473 | | |
Duke Energy Corp.
3.950%, due 09/15/14 | | | 1,845,000 | | | | 1,960,299 | | |
EDP Finance BV
5.375%, due 11/02/125 | | | 5,300,000 | | | | 5,529,437 | | |
Florida Power & Light Co.
5.625%, due 04/01/34 | | | 105,000 | | | | 115,164 | | |
Florida Power Corp.
4.800%, due 03/01/13 | | | 340,000 | | | | 367,112 | | |
Pacificorp
5.500%, due 01/15/19 | | | 1,400,000 | | | | 1,613,492 | | |
| | | | 10,694,977 | | |
| Financial services—3.63% | |
Ameriprise Financial, Inc.
5.300%, due 03/15/20 | | | 610,000 | | | | 652,380 | | |
Credit Suisse Guernsey
5.860%, due 05/15/176,7 | | | 2,290,000 | | | | 2,083,900 | | |
Goldman Sachs Group, Inc.
3.700%, due 08/01/15 | | | 1,030,000 | | | | 1,037,344 | | |
| 5.250%, due 10/15/13 | | | 2,530,000 | | | | 2,741,981 | | |
| 5.375%, due 03/15/20 | | | 1,500,000 | | | | 1,544,000 | | |
| 6.000%, due 06/15/20 | | | 620,000 | | | | 666,796 | | |
JPMorgan Chase & Co.
7.900%, due 04/30/186,7 | | | 1,850,000 | | | | 1,932,547 | | |
Morgan Stanley
4.000%, due 07/24/15 | | | 520,000 | | | | 519,824 | | |
| 4.200%, due 11/20/14 | | | 2,180,000 | | | | 2,213,596 | | |
| 6.600%, due 04/01/12 | | | 345,000 | | | | 368,435 | | |
Morgan Stanley MTN
5.550%, due 04/27/17 | | | 305,000 | | | | 314,176 | | |
| 5.625%, due 09/23/19 | | | 795,000 | | | | 808,081 | | |
| 6.250%, due 08/28/17 | | | 740,000 | | | | 789,161 | | |
SLM Corp.
4.141%, due 01/31/144 | | | 1,700,000 | | | | 1,426,487 | | |
| | | | 17,098,708 | | |
35
UBS PACE Select Advisors Trust
UBS PACE Intermediate Fixed Income Investments
Portfolio of investments—July 31, 2010
| Security description | | Face
amount | | Value | |
| Corporate notes—(continued) | |
| Food products—0.80% | |
Kraft Foods, Inc.
5.375%, due 02/10/20 | | $ | 890,000 | | | $ | 973,528 | | |
| 6.000%, due 02/11/13 | | | 575,000 | | | | 635,830 | | |
| 6.500%, due 08/11/17 | | | 1,625,000 | | | | 1,916,237 | | |
| 6.500%, due 02/09/40 | | | 200,000 | | | | 230,323 | | |
| | | | 3,755,918 | | |
| Health care equipment & supplies—0.24% | |
CareFusion Corp.
6.375%, due 08/01/19 | | | 725,000 | | | | 837,376 | | |
Covidien International Finance SA
2.800%, due 06/15/15 | | | 300,000 | | | | 307,042 | | |
| | | | 1,144,418 | | |
| Insurance—2.08% | |
Chubb Corp.
6.375%, due 03/29/674 | | | 425,000 | | | | 414,375 | | |
Hartford Life Global Funding
Trusts MTN
0.717%, due 06/16/144 | | | 71,000 | | | | 66,994 | | |
Metropolitan Life Global Funding I
2.875%, due 09/17/125 | | | 2,050,000 | | | | 2,101,926 | | |
| 5.125%, due 04/10/135 | | | 1,850,000 | | | | 2,015,270 | | |
| 5.125%, due 06/10/145 | | | 245,000 | | | | 268,843 | | |
Pricoa Global Funding I
5.400%, due 10/18/125 | | | 2,175,000 | | | | 2,339,365 | | |
Prudential Financial, Inc. MTN
4.750%, due 09/17/15 | | | 360,000 | | | | 381,730 | | |
| 5.800%, due 06/15/12 | | | 975,000 | | | | 1,043,418 | | |
Teachers Insurance & Annuity
Association of America
6.850%, due 12/16/395 | | | 625,000 | | | | 733,855 | | |
Travelers Cos., Inc.
6.250%, due 03/15/374 | | | 450,000 | | | | 426,482 | | |
| | | | 9,792,258 | | |
| Media—2.61% | |
Comcast Cable Communications
Holdings, Inc.
8.375%, due 03/15/13 | | | 1,585,000 | | | | 1,846,554 | | |
| 9.455%, due 11/15/22 | | | 650,000 | | | | 898,120 | | |
Comcast Cable Holdings LLC
8.750%, due 08/01/15 | | | 50,000 | | | | 62,363 | | |
Comcast Corp.
5.150%, due 03/01/20 | | | 625,000 | | | | 669,510 | | |
| 5.450%, due 11/15/10 | | | 1,525,000 | | | | 1,545,098 | | |
| 5.850%, due 11/15/15 | | | 285,000 | | | | 327,425 | | |
| 5.900%, due 03/15/16 | | | 550,000 | | | | 630,998 | | |
| 6.450%, due 03/15/37 | | | 120,000 | | | | 132,824 | | |
COX Communications, Inc.
7.125%, due 10/01/12 | | | 350,000 | | | | 389,448 | | |
| 8.375%, due 03/01/395 | | | 1,030,000 | | | | 1,379,967 | | |
Discovery Communications LLC
3.700%, due 06/01/15 | | | 610,000 | | | | 637,407 | | |
| Security description | | Face
amount | | Value | |
| Corporate notes—(continued) | |
| Media—(concluded) | |
NBC Universal, Inc.
5.150%, due 04/30/205 | | $ | 865,000 | | | $ | 919,403 | | |
News America Holdings
8.500%, due 02/23/25 | | | 200,000 | | | | 245,540 | | |
| 9.500%, due 07/15/24 | | | 225,000 | | | | 301,362 | | |
News America, Inc.
6.200%, due 12/15/34 | | | 600,000 | | | | 632,668 | | |
| 7.625%, due 11/30/28 | | | 170,000 | | | | 195,610 | | |
TCI Communications, Inc.
7.875%, due 08/01/13 | | | 100,000 | | | | 115,042 | | |
Time Warner Cable, Inc.
5.850%, due 05/01/17 | | | 810,000 | | | | 899,900 | | |
Time Warner, Inc.
7.570%, due 02/01/24 | | | 350,000 | | | | 432,146 | | |
| | | | 12,261,385 | | |
| Medical providers—0.52% | |
UnitedHealth Group
5.250%, due 03/15/11 | | | 1,425,000 | | | | 1,459,468 | | |
WellPoint, Inc.
5.000%, due 01/15/11 | | | 950,000 | | | | 966,458 | | |
| | | | 2,425,926 | | |
| Multi-line insurance—0.20% | |
MetLife, Inc.
7.717%, due 02/15/19 | | | 750,000 | | | | 919,289 | | |
| Oil & gas—0.92% | |
BP Capital Markets PLC
3.125%, due 03/10/128 | | | 1,690,000 | | | | 1,661,912 | | |
Cenovus Energy, Inc.
6.750%, due 11/15/39 | | | 965,000 | | | | 1,162,458 | | |
XTO Energy, Inc.
6.250%, due 08/01/17 | | | 1,250,000 | | | | 1,506,833 | | |
| | | | 4,331,203 | | |
| Oil refining—0.52% | |
Canadian Natural Resources Ltd.
5.700%, due 05/15/17 | | | 380,000 | | | | 434,314 | | |
| 5.900%, due 02/01/18 | | | 110,000 | | | | 126,041 | | |
| 6.500%, due 02/15/37 | | | 620,000 | | | | 698,749 | | |
Valero Energy Corp.
6.625%, due 06/15/37 | | | 1,110,000 | | | | 1,166,724 | | |
| | | | 2,425,828 | | |
| Oil services—0.68% | |
Halliburton Co.
5.500%, due 10/15/10 | | | 850,000 | | | | 857,549 | | |
Petrobras International Finance Co.
5.750%, due 01/20/20 | | | 2,120,000 | | | | 2,253,927 | | |
| 5.875%, due 03/01/18 | | | 95,000 | | | | 102,499 | | |
| | | | 3,213,975 | | |
| Paper & forest products—0.11% | |
International Paper Co.
7.300%, due 11/15/39 | | | 460,000 | | | | 527,206 | | |
36
UBS PACE Select Advisors Trust
UBS PACE Intermediate Fixed Income Investments
Portfolio of investments—July 31, 2010
| Security description | | Face
amount | | Value | |
| Corporate notes—(continued) | |
| Pharmaceuticals—0.69% | |
Abbott Laboratories
5.600%, due 05/15/11 | | $ | 535,000 | | | $ | 556,140 | | |
Eli Lilly & Co.
3.550%, due 03/06/12 | | | 810,000 | | | | 843,988 | | |
Merck & Co., Inc.
4.000%, due 06/30/15 | | | 1,325,000 | | | | 1,451,359 | | |
| 5.300%, due 12/01/134 | | | 340,000 | | | | 382,393 | | |
| | | | 3,233,880 | | |
| Pipelines—0.12% | |
Enterprise Products Operating LLC
6.125%, due 10/15/39 | | | 550,000 | | | | 578,155 | | |
| Real estate investment trusts—0.62% | |
AvalonBay Communities, Inc. MTN
6.125%, due 11/01/12 | | | 148,000 | | | | 161,267 | | |
ERP Operating LP
6.625%, due 03/15/12 | | | 780,000 | | | | 838,540 | | |
Qatari Diar Finance QSC
3.500%, due 07/21/155 | | | 1,895,000 | | | | 1,900,685 | | |
| | | | 2,900,492 | | |
| Special purpose entity—0.68% | |
AEP Texas Central Transition,
Series A-4
5.170%, due 01/01/18 | | | 425,000 | | | | 489,496 | | |
AngloGold Ashanti Holdings PLC
5.375%, due 04/15/20 | | | 340,000 | | | | 352,933 | | |
Crown Castle Towers LLC
6.113%, due 01/15/205 | | | 1,805,000 | | | | 1,983,706 | | |
Goldman Sachs Capital II
5.793%, due 06/01/126,7 | | | 450,000 | | | | 360,900 | | |
| | | | 3,187,035 | | |
| Telecommunications—3.84% | |
AT&T, Inc.
5.800%, due 02/15/19 | | | 2,300,000 | | | | 2,642,026 | | |
| 5.875%, due 02/01/12 | | | 95,000 | | | | 101,761 | | |
Rogers Communications, Inc.
6.250%, due 06/15/13 | | | 825,000 | | | | 927,623 | | |
SBA Tower Trust
4.254%, due 04/15/155,9 | | | 1,200,000 | | | | 1,267,884 | | |
Telecom Italia Capital SA
5.250%, due 11/15/13 | | | 1,665,000 | | | | 1,755,794 | | |
| 5.250%, due 10/01/15 | | | 205,000 | | | | 215,878 | | |
| 6.200%, due 07/18/11 | | | 1,750,000 | | | | 1,819,984 | | |
Telefonica Emisiones SAU
5.855%, due 02/04/13 | | | 925,000 | | | | 1,005,036 | | |
| 5.984%, due 06/20/11 | | | 1,500,000 | | | | 1,558,350 | | |
| 6.421%, due 06/20/16 | | | 950,000 | | | | 1,080,170 | | |
Telefonica Europe BV
7.750%, due 09/15/10 | | | 235,000 | | | | 236,813 | | |
Verizon Communications, Inc.
6.350%, due 04/01/19 | | | 775,000 | | | | 916,652 | | |
| 8.750%, due 11/01/18 | | | 1,800,000 | | | | 2,376,182 | | |
| Security description | | Face
amount | | Value | |
| Corporate notes—(concluded) | |
| Telecommunications—(concluded) | |
Verizon New Jersey, Inc.
5.875%, due 01/17/12 | | $ | 2,030,000 | | | $ | 2,153,990 | | |
| | | | 18,058,143 | | |
| Tobacco—0.31% | |
Philip Morris International, Inc.
4.500%, due 03/26/20 | | | 1,400,000 | | | | 1,468,071 | | |
| Utilities—0.73% | |
Nisource Finance Corp.
7.875%, due 11/15/10 | | | 1,075,000 | | | | 1,093,949 | | |
Tennessee Valley Authority
5.250%, due 09/15/39 | | | 2,095,000 | | | | 2,323,697 | | |
| | | | 3,417,646 | | |
| Wireless telecommunications—1.59% | |
Cellco Partnership/Verizon Wireless
Capital LLC
3.750%, due 05/20/11 | | | 3,930,000 | | | | 4,026,415 | | |
Vodafone Group PLC
4.150%, due 06/10/14 | | | 2,150,000 | | | | 2,283,693 | | |
| 5.000%, due 12/16/13 | | | 1,068,000 | | | | 1,166,135 | | |
| | | | 7,476,243 | | |
Total corporate notes
(cost—$161,143,661) | | | | | | | 170,088,722 | | |
| Non-US government obligations—1.09% | |
Japan Finance Corp.
2.000%, due 06/24/11 | | | 1,120,000 | | | | 1,130,812 | | |
Province of Ontario
1.875%, due 11/19/12 | | | 1,455,000 | | | | 1,480,307 | | |
| 4.100%, due 06/16/14 | | | 1,470,000 | | | | 1,604,060 | | |
United Mexican States
5.125%, due 01/15/20 | | | 844,000 | | | | 903,080 | | |
Total non-US government
obligations
(cost—$4,939,371) | | | | | | | 5,118,259 | | |
| Municipal bonds and notes—1.36% | |
| General obligation—0.57% | |
California State (Build America Bonds)
6.650%, due 03/01/22 | | | 750,000 | | | | 796,500 | | |
| 7.500%, due 04/01/34 | | | 460,000 | | | | 510,954 | | |
| 7.300%, due 10/01/39 | | | 300,000 | | | | 325,344 | | |
| 7.350%, due 11/01/39 | | | 450,000 | | | | 472,208 | | |
Illinois State (Build America Bonds),
Series 3
6.725%, due 04/01/35 | | | 600,000 | | | | 573,864 | | |
| | | | 2,678,870 | | |
| Transportation—0.60% | |
Chicago O'Hare International
Airport (Build America Bonds)
6.395%, due 01/01/40 | | | 400,000 | | | | 419,968 | | |
37
UBS PACE Select Advisors Trust
UBS PACE Intermediate Fixed Income Investments
Portfolio of investments—July 31, 2010
| Security description | | Face
amount | | Value | |
| Municipal bonds and notes—(concluded) | |
| Transportation—(concluded) | |
Metropolitan Transportation
Authority Revenue
(Build America Bonds)
6.548%, due 11/15/31 | | $ | 850,000 | | | $ | 875,236 | | |
New Jersey Transportation Trust
Fund Authority
(Build America Bonds),
Series B
6.561%, due 12/15/40 | | | 1,425,000 | | | | 1,532,445 | | |
| | | | 2,827,649 | | |
| Water utilities—0.19% | |
New York City Municipal Water
Finance Authority
Water & Sewer Revenue
(Build America Bonds)
5.724%, due 06/15/42 | | | 890,000 | | | | 917,029 | | |
Total municipal bonds and notes
(cost—$6,287,527) | | | | | | | 6,423,548 | | |
| Repurchase agreement—10.42% | |
Repurchase agreement dated
07/30/10 with State Street
Bank & Trust Co., 0.010%
due 08/02/10, collateralized by
$48,450,863 US Treasury Notes,
2.125% to 3.125%
due 04/30/15 to 04/30/17;
(value—$49,997,801);
proceeds: $49,017,041
(cost—$49,017,000) | | | 49,017,000 | | | | 49,017,000 | | |
| Security description | | Number of
shares | | Value | |
| Investment of cash collateral from securities loaned—0.36% | |
| Money market fund—0.36% | |
UBS Private Money Market
Fund LLC10
(cost—$1,702,277) | | | 1,702,277 | | | $ | 1,702,277 | | |
Total investments
before investments sold short
(cost—$500,785,217)—
109.03% | | | | | | | 512,968,679 | | |
| | | Face
amount | | | |
| Investments sold short—(3.32)% | |
FNMA TBA*
4.500%, TBA | | $ | (700,000 | ) | | | (732,943 | ) | |
| 5.000%, TBA | | | (14,000,000 | ) | | | (14,870,632 | ) | |
Total investments sold short
(proceeds—$15,590,094)—
(3.32)% | | | | | | | (15,603,575 | ) | |
Liabilities in excess of other
assets—(5.71)% | | | | | | | (26,859,108 | ) | |
| Net assets—100.00% | | $ | 470,505,996 | | |
Aggregate cost for federal income tax purposes before investments sold short was $501,769,988; and net unrealized appreciation consisted of:
| Gross unrealized appreciation | | $ | 13,302,118 | | |
| Gross unrealized depreciation | | | (2,103,427 | ) | |
| Net unrealized appreciation | | $ | 11,198,691 | | |
* On September 7, 2008, the Federal Housing Finance Agency placed the Federal National Mortgage Association and the Federal Home Loan Mortgage Corporation into conservatorship, and the US Treasury guaranteed the debt issued by those organizations.
1 Partial amount delivered to broker as collateral for reverse repurchase agreement.
2 Partial amount delivered to broker as collateral for futures transactions.
3 Entire amount delivered to broker as collateral for investments sold short.
4 Floating rate security. The interest rate shown is the current rate as of July 31, 2010.
5 Security exempt from registration pursuant to Rule 144A under the Securities Act of 1933. These securities, which represent 10.82% of net assets as of July 31, 2010, are considered liquid and may be resold in transactions exempt from registration, normally to qualified institutional buyers.
6 Variable rate security. The interest rate shown is the current rate as of July 31, 2010, and resets at the next call date.
7 Perpetual bond security. The maturity date reflects the next call date.
8 Security, or portion thereof, was on loan at July 31, 2010.
9 Step bond that converts to the noted fixed rate at a designated future date.
38
UBS PACE Select Advisors Trust
UBS PACE Intermediate Fixed Income Investments
Portfolio of investments—July 31, 2010
10 The table below details the Portfolio's transaction activity in an affiliated issuer during the year ended July 31, 2010.
| Security description | | Value at
07/31/09 | | Purchases
during the
year ended
07/31/10 | | Sales
during the
year ended
07/31/10 | | Value at
07/31/10 | | Net income
earned from
affiliate for the
year ended
07/31/10 | |
| UBS Private Money Market Fund LLC | | $ | 7,903,377 | | | $ | 407,956,700 | | | $ | 414,157,800 | | | $ | 1,702,277 | | | $ | 9,953 | | |
ARM Adjustable Rate Mortgage—The interest rate shown is the current rate as of July 31, 2010.
FFCB Federal Farm Credit Bank
FHLB Federal Home Loan Bank
FHLMC Federal Home Loan Mortgage Corporation
FNMA Federal National Mortgage Association
GMAC General Motors Acceptance Corporation
MTN Medium Term Note
REMIC Real Estate Mortgage Investment Conduit
TBA (To Be Announced) Security is purchased on a forward commitment basis with an approximate principal amount (generally +/- 1.0%) and no definite maturity date. The actual principal amount and maturity date will be determined upon settlement when the specific mortgage pools are assigned.
TIAA Teachers Insurance and Annuity Association
Reverse repurchase agreement
Reverse repurchase agreement outstanding as of July 31, 2010 was as follows:
| Counterparty | | Interest rate | | Maturity date | | Face amount | |
| Barclays Capital, Inc. | | | 0.230 | % | | | 08/02/10 | | | $ | 5,412,500 | | |
Futures contracts
Number of
contracts | | Currency | | Buy contracts | | Expiration
dates | | Cost | | Current
value | | Unrealized
appreciation
(depreciation) | |
| 46 | | EUR | | German Euro Bund Futures | | September 2010 | | $ | 7,666,039 | | | $ | 7,709,169 | | | $ | 43,130 | | |
| 24 | | USD | | US Treasury Note 2 Year Futures | | September 2010 | | | 5,256,438 | | | | 5,259,000 | | | | 2,562 | | |
| 179 | | USD | | US Treasury Note 5 Year Futures | | September 2010 | | | 21,268,442 | | | | 21,449,234 | | | | 180,792 | | |
| 112 | | USD | | US Treasury Note 10 Year Futures | | September 2010 | | | 13,817,294 | | | | 13,867,000 | | | | 49,706 | | |
| | | | | | | | | | 48,008,213 | | | | 48,284,403 | | | | 276,190 | | |
| | | | | Sale contracts | | | | Proceeds | | | | | |
| 79 | | USD | | 90 Day Euro Dollar Futures | | December 2011 | | $ | 19,534,528 | | | $ | 19,558,425 | | | $ | (23,897 | ) | |
| 69 | | USD | | Ultra Long-Term US Treasury Bond Futures | | September 2010 | | | 8,927,801 | | | | 9,332,250 | | | | (404,449 | ) | |
| 94 | | USD | | US Treasury Bond 30 Year Futures | | September 2010 | | | 11,683,700 | | | | 12,099,563 | | | | (415,863 | ) | |
| | | | | | | | | | 40,146,029 | | | | 40,990,238 | | | | (844,209 | ) | |
| | | | | | | | | | | | | | | | | $ | (568,019 | ) | |
Currency type abbreviations:
EUR Euro
USD United States Dollar
39
UBS PACE Select Advisors Trust
UBS PACE Intermediate Fixed Income Investments
Portfolio of investments—July 31, 2010
Forward foreign currency contracts
| Counterparty | | Contracts to
deliver | | In
exchange for | | Maturity dates | | Unrealized
appreciation
(depreciation) | |
| BNP Paribas SA | | EUR | 3,610,000 | | | USD | 4,655,395 | | | 08/16/10 | | $ | (48,949 | ) | |
| BNP Paribas SA | | USD | 3,058,339 | | | EUR | 2,400,000 | | | 08/16/10 | | | 69,202 | | |
| Citibank N.A. | | EUR | 12,855,000 | | | USD | 16,217,895 | | | 08/16/10 | | | (533,998 | ) | |
| Citibank N.A. | | USD | 14,209,724 | | | EUR | 11,375,000 | | | 08/16/10 | | | 613,519 | | |
Goldman Sachs
Capital Markets LP | | EUR | 3,495,000 | | | USD | 4,517,917 | | | 08/16/10 | | | (36,565 | ) | |
Goldman Sachs
Capital Markets LP | | USD | 7,752,450 | | | EUR | 6,185,000 | | | 08/16/10 | | | 307,485 | | |
| | | $ | 370,694 | | |
Currency type abbreviations:
EUR Euro
USD United States Dollar
The following is a summary of the fair valuations according to the inputs used as of July 31, 2010 in valuing the Portfolio's investments:
| | | Unadjusted
quoted prices in
active markets for
identical investments
(Level 1) | | Other significant
observable inputs
(Level 2) | | Unobservable
inputs
(Level 3) | | Total | |
| US government obligations | | $ | — | | | $ | 163,312,361 | | | $ | — | | | $ | 163,312,361 | | |
| Federal farm credit bank certificate | | | — | | | | 6,286,140 | | | | — | | | | 6,286,140 | | |
| Federal home loan bank certificate | | | — | | | | 2,289,205 | | | | — | | | | 2,289,205 | | |
Federal home loan mortgage corporation
certificates | | | — | | | | 6,646,759 | | | | — | | | | 6,646,759 | | |
Federal national mortgage association
certificates | | | — | | | | 30,903,152 | | | | — | | | | 30,903,152 | | |
| Collateralized mortgage obligations | | | — | | | | 51,134,167 | | | | — | | | | 51,134,167 | | |
| Asset-backed securities | | | — | | | | 20,047,089 | | | | — | | | | 20,047,089 | | |
| Corporate notes | | | — | | | | 170,088,722 | | | | — | | | | 170,088,722 | | |
| Non-US government obligations | | | — | | | | 5,118,259 | | | | — | | | | 5,118,259 | | |
| Municipal bonds and notes | | | — | | | | 6,423,548 | | | | — | | | | 6,423,548 | | |
| Repurchase agreement | | | — | | | | 49,017,000 | | | | — | | | | 49,017,000 | | |
Investment of cash collateral from
securities loaned | | | — | | | | 1,702,277 | | | | — | | | | 1,702,277 | | |
Federal national mortgage association
certificates sold short | | | — | | | | (15,603,575 | ) | | | — | | | | (15,603,575 | ) | |
| Reverse repurchase agreement | | | — | | | | (5,412,500 | ) | | | — | | | | (5,412,500 | ) | |
| Futures contracts, net | | | (568,019 | ) | | | — | | | | — | | | | (568,019 | ) | |
| Forward foreign currency contracts, net | | | — | | | | 370,694 | | | | — | | | | 370,694 | | |
| Total | | $ | (568,019 | ) | | $ | 492,323,298 | | | $ | — | | | $ | 491,755,279 | | |
At July 31, 2010, there were no transfers between Level 1 and Level 2.
40
UBS PACE Select Advisors Trust
UBS PACE Intermediate Fixed Income Investments
Portfolio of investments—July 31, 2010
Issuer breakdown by country or territory of origin (unaudited)
| | | Percentage of
total investments | |
| United States | | | 86.6 | % | |
| France | | | 3.3 | | |
| Canada | | | 1.6 | | |
| Netherlands | | | 1.5 | | |
| United Kingdom | | | 1.4 | | |
| Norway | | | 1.0 | | |
| Germany | | | 1.0 | | |
| Luxembourg | | | 0.8 | | |
| Spain | | | 0.7 | | |
| Cayman Islands | | | 0.5 | | |
| Switzerland | | | 0.4 | | |
| Qatar | | | 0.4 | | |
| Ireland | | | 0.3 | | |
| Japan | | | 0.2 | | |
| Mexico | | | 0.2 | | |
| Isle of Man | | | 0.1 | | |
| | | | 100.0 | % | |
See accompanying notes to financial statements.
41
UBS PACE Select Advisors Trust
UBS PACE Strategic Fixed Income Investments
Performance
For the 12 months ended July 31, 2010, the Portfolio's Class P shares returned 16.39%, before the deduction of the maximum UBS PACE Select program fee. (The Class P shares returned 14.09%, after the deduction of the maximum UBS PACE Select program fee, for the same 12-month period.) In comparison, the Barclays Capital US Government/Credit Index (the "benchmark") returned 8.94%, and the Lipper Intermediate Investment Grade Debt Funds category posted a median return of 11.10%. (Returns for all share classes over various time periods are shown in the "Performance at a glance" table on page 45. Please note that the returns shown do not reflect the deduction of taxes that a shareholder would pay on Portfolio distributions or the redemption of Portfolio shares.) For a detailed commentary on the market environment in general during the reporting period, please refer to page 2.
Sub-Advisor's comments
The Portfolio outperformed its benchmark during the reporting period. An emphasis on attractively priced high-quality assets, especially those with government support, was a significant driver of performance during the review period.
A longer-than-benchmark duration—a measure of a portfolio's sensitivity to interest rate changes—benefited the Portfolio as interest rates fell during the period. A US yield curve-steepening bias—one in which long-term bond yields increase relative to those of short-term bonds—also added to performance as the yield curve steepened during the fiscal year.
An emphasis on agency mortgage-backed securities ("MBS") was a strong contributor to performance as this sector outperformed Treasuries during the fiscal year. Similarly, our exposure to emerging markets bonds also enhanced the Portfolio's results, as they outperformed Treasuries.
Senior non-agency MBS positions benefited the Portfolio as the sector rallied due to strong demand from Public Private Investment Program ("PPIP") buyers, the continued absence of new supply and the improved availability of financing.
UBS PACE Select Advisors Trust – UBS PACE Strategic Fixed Income Investments
Investment Sub-Advisor:
Pacific Investment Management Company LLC ("PIMCO")
Portfolio Manager:
Saumil H. Parikh
Objective:
Total return consisting of income and capital appreciation
Investment process:
The Portfolio invests primarily in investment grade fixed income securities of governmental and private issuers in the United States and foreign countries. Its duration (a measure of a portfolio's sensitivity to interest rate changes) is normally limited to within two years (plus or minus) of the effective duration of the Portfolio's benchmark index. PIMCO seeks to invest in the areas of the bond market it considers undervalued, based on such factors as quality, sector, coupon and maturity. PIMCO decides to buy or sell specific bonds based on an analysis of their values relative to other similar bonds. PIMCO monitors the prepayment experience of the Portfolio's mortgage-backed bonds, and will also buy and sell securities to adjust the average portfolio duration, credit quality, yield curve, sector and prepayment exposure, as appropriate.
42
UBS PACE Select Advisors Trust
UBS PACE Strategic Fixed Income Investments
Sub-Advisor's comments – concluded
On the negative side, an underweight to utilities detracted from relative results as the sector rallied in the first half of the review period. However, an overweight to bonds issued by financial companies was a strong contributor to relative results, as this area of the market benefited from strong profits and continued government support.
Special considerations
The Portfolio may be appropriate for long-term investors seeking total return consisting of income and capital appreciation and who are able to withstand short-term fluctuations in the fixed income markets in return for potentially higher returns over the long term. The value of the Portfolio changes every day and can be affected by changes in interest rates, general market conditions and other political, social and economic developments, as well as specific matters relating to the companies in whose securities the Portfolio invests. In addition, investments in foreign bonds involve special risks. It is important to note that an investment in the Portfolio is only one component of a balanced investment plan.
43
UBS PACE Select Advisors Trust
UBS PACE Strategic Fixed Income Investments
Illustration of an assumed investment of $10,000 in Class P shares of the Portfolio (unaudited)
The following graph depicts the performance of UBS PACE Strategic Fixed Income Investments Class P shares versus the Barclays Capital US Government/Credit Index over the 10 years ended July 31, 2010. The performance of the other classes will vary based upon the different class specific expenses and sales charges. The performance provided does not reflect the deduction of taxes that a shareholder would pay on Portfolio distributions or the redemption of Portfolio shares. Past performance is no guarantee of future results. Share price and returns will vary with market conditions; investors may realize a gain or loss upon redemption. It is important to note that UBS PACE Strategic Fixed Income Investments is a professionally managed portfolio while the Index is not available for investment and is unmanaged. The comparison is shown for illustration purposes only.
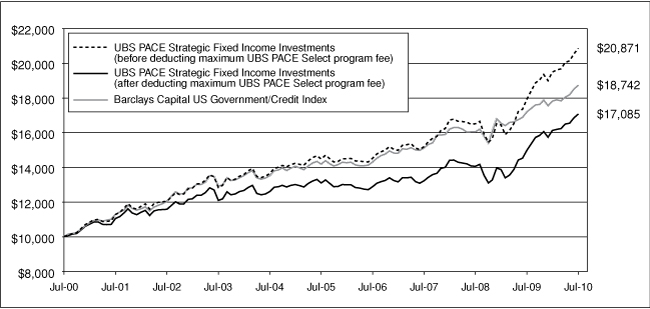
44
UBS PACE Select Advisors Trust
UBS PACE Strategic Fixed Income Investments
Performance at a glance (unaudited)
| Average annual total returns for periods ended 07/31/10 | | 1 year | | 5 years | | 10 years | | Since
inception1 | |
| Before deducting | | Class A2 | | | 16.09 | % | | | 7.31 | % | | N/A | | | 7.08 | % | |
| maximum sales charge | | Class B3 | | | 15.23 | % | | | 6.50 | % | | N/A | | | 6.45 | %7 | |
| or UBS PACE Select | | Class C4 | | | 15.52 | % | | | 6.78 | % | | N/A | | | 6.62 | % | |
| program fee | | Class Y5 | | | 16.47 | % | | | 7.67 | % | | N/A | | | 7.18 | % | |
| | | Class P6 | | | 16.39 | % | | | 7.58 | % | | | 7.63 | % | | | 7.33 | % | |
| After deducting | | Class A2 | | | 10.84 | % | | | 6.33 | % | | N/A | | | 6.57 | % | |
| maximum sales charge | | Class B3 | | | 10.23 | % | | | 6.19 | % | | N/A | | | 6.45 | %7 | |
| or UBS PACE Select | | Class C4 | | | 14.77 | % | | | 6.78 | % | | N/A | | | 6.62 | % | |
| program fee | | Class P6 | | | 14.09 | % | | | 5.45 | % | | | 5.50 | % | | | 5.20 | % | |
| Barclays Capital US Government/Credit Index8 | | | 8.94 | % | | | 5.74 | % | | | 6.48 | % | | | 6.40 | % | |
| Lipper Intermediate Investment Grade Debt Funds median | | | 11.10 | % | | | 5.47 | % | | | 5.97 | % | | | 5.82 | % | |
Average annual total returns for periods ended June 30, 2010, after deduction of the maximum sales charge or UBS PACE Select program fee, were as follows: Class A—1-year period, 12.92%; 5-year period, 5.76%; since inception, 6.47%; Class B—1-year period, 12.28%; 5-year period, 5.59%; since inception, 6.35%; Class C—1-year period, 16.93%; 5-year period, 6.21%; since inception, 6.52%; Class Y—1-year period, 18.55%; 5-year period, 7.09%; since inception, 7.07%; Class P—1-year period, 16.12%; 5-year period, 4.87%; 10-year period, 5.41%; since inception, 5.14%.
The annualized gross and net expense ratios, respectively, for each class of shares as in the November 28, 2009 prospectuses, were as follows: Class A—1.09% and 1.06%; Class B—1.92% and 1.81%; Class C—1.57% and 1.56%; Class Y—0.72% and 0.72%; and Class P—0.86% and 0.81%. Net expenses reflect fee waivers and/or expense reimbursements, if any, pursuant to an agreement that is in effect to cap the expenses. The Portfolio and UBS Global AM have entered into a written fee waiver/expense reimbursement agreement pursuant to which UBS Global AM is contractually obligated to waive its management fees and/or reimburse expenses so that the ordinary total operating expenses of each class through November 30, 2010 (excluding dividend expense, borrowing costs and interest expense, if any) would not exceed Class A—1.06%; Class B—1.81%; Class C—1.56%; Class Y—0.81%; and Class P—0.81%. The Portfo lio has agreed to repay UBS Global AM for any waived fees/reimbursed expenses to the extent that it can do so over the following three fiscal years without causing the Portfolio's expenses in any of those three years to exceed the expense caps described above.
1 Since inception returns are calculated as of commencement of issuance or reissuance on August 24, 1995 for Class P shares, December 11, 2000 for Class A shares, January 30, 2001 for Class B shares, December 1, 2000 for Class C shares and February 2, 2001 for Class Y shares. Since inception returns for the Index and Lipper median are shown as of August 31, 1995, which is the month-end after the inception date of the oldest share class (Class P).
2 Maximum sales charge for Class A shares is 4.5%. Class A shares bear ongoing 12b-1 service fees.
3 Maximum contingent deferred sales charge for Class B shares is 5% imposed on redemptions and is reduced to 0% after a maximum of six years. Class B shares bear ongoing 12b-1 service and distribution fees.
4 Maximum contingent deferred sales charge for Class C shares is 0.75% imposed on redemptions and is reduced to 0% after one year. Class C shares bear ongoing 12b-1 service and distribution fees. Prior to September 30, 2003, Class C shares were subject to a maximum front-end sales charge of 1.00%; this front-end sales charge is not reflected in the average annual total return presented for the Class C shares shown above.
5 The Portfolio offers Class Y shares to a limited group of eligible investors, including certain qualifying retirement plans. Class Y shares do not bear initial or contingent deferred sales charges or ongoing 12b-1 service and distribution fees.
6 Class P shares do not bear initial or contingent deferred sales charges or ongoing 12b-1 service and distribution fees, but are subject to a maximum annual UBS PACE Select program fee of 2% of the value of Class P shares. Prior to June 14, 2010, the maximum annual UBS PACE Select program fee was 1.5% of the value of Class P shares.
7 Assumes the conversion of Class B to Class A shares at the end of the sixth year.
8 The Barclays Capital US Government/Credit Index is an unmanaged index which is composed of all investment-grade bonds that have at least one year to maturity. The Index's total return comprises price appreciation/depreciation and income as a percentage of the original investment. The Index is rebalanced monthly by market capitalization. Investors should note that indices do not reflect the deduction of fees and expenses.
If an investor sells or exchanges shares less than 90 days after purchase, a redemption fee of 1.00% of the amount sold or exchanged will be deducted at the time of the transaction, except as noted otherwise in the prospectuses.
Past performance does not predict future performance, and the performance information provided does not reflect the deduction of taxes that a shareholder would pay on Portfolio distributions or the redemption of Portfolio shares. The return and principal value of an investment will fluctuate, so that an investor's shares, when redeemed, may be worth more or less than their original cost. Performance results assume reinvestment of all dividends and capital gain distributions at net asset value on the ex-dividend dates. Current performance may be higher or lower than the performance data quoted. For month-end performance figures, please visit http://www.ubs.com.
Lipper peer group data calculated by Lipper Inc.; used with permission. The Lipper median is the return of the fund that places in the middle of a Lipper peer group.
45
UBS PACE Select Advisors Trust
UBS PACE Strategic Fixed Income Investments
Portfolio statistics (unaudited)
| Characteristics | | 07/31/10 | |
| Weighted average duration | | | 6.0 | yrs. | |
| Weighted average maturity | | | 8.9 | yrs. | |
| Average coupon | | | 4.35 | % | |
| Net assets (mm) | | $ | 752.3 | | |
| Number of holdings | | | 279 | | |
| Portfolio composition1 | | 07/31/10 | |
| Bonds, notes and loan assignments | | | 104.1 | % | |
| Preferred stock | | | 0.8 | | |
| Options, futures, swaps and forward foreign currency contracts | | | (0.1 | ) | |
| Cash equivalents and other assets less liabilities | | | (4.8 | ) | |
| Total | | | 100.0 | % | |
| Quality diversification1 | | 07/31/10 | |
| US government and agency securities | | | 56.6 | % | |
| AAA | | | 12.9 | | |
| AA | | | 6.1 | | |
| A | | | 13.7 | | |
| BBB | | | 6.5 | | |
| BB | | | 1.6 | | |
| B | | | 1.9 | | |
| Below B/non-rated | | | 4.8 | | |
| Preferred stock | | | 0.8 | | |
| Options, futures, swaps and forward foreign currency contracts | | | (0.1 | ) | |
| Cash equivalents and other assets less liabilities | | | (4.8 | ) | |
| Total | | | 100.0 | % | |
| Asset allocation1 | | 07/31/10 | |
| US government obligations | | | 35.4 | % | |
| Collateralized mortgage obligations | | | 26.5 | | |
| Corporate notes | | | 25.5 | | |
| Non-US government obligations | | | 7.3 | | |
| Asset-backed securities | | | 3.0 | | |
| Municipal bonds and notes | | | 3.0 | | |
| US government agency mortgage pass-through certificates | | | 2.8 | | |
| Preferred stock | | | 0.8 | | |
| Loan assignments | | | 0.6 | | |
| Options, futures, swaps and forward foreign currency contracts | | | (0.1 | ) | |
| Cash equivalents and other assets less liabilities | | | (4.8 | ) | |
| Total | | | 100.0 | % | |
1 Weightings represent percentages of the Portfolio's net assets as of July 31, 2010. The Portfolio is actively managed and its composition will vary over time. Credit quality ratings shown are based on the ratings assigned to portfolio holdings by Standard & Poor's Ratings Group, an independent rating agency.
46
UBS PACE Select Advisors Trust
UBS PACE Strategic Fixed Income Investments
Portfolio of investments—July 31, 2010
| Security description | | Face
amount1 | | Value | |
| US government obligations—35.45% | |
US Treasury Bonds
4.375%, due 05/15/40 | | | 22,600,000 | | | $ | 24,157,366 | | |
US Treasury Inflation Index
Bonds (TIPS)
2.125%, due 02/15/40 | | | 2,321,643 | | | | 2,463,119 | | |
US Treasury Notes
3.000%, due 08/31/16 | | | 67,100,000 | | | | 70,759,030 | | |
| 3.125%, due 10/31/16 | | | 15,900,000 | | | | 16,841,582 | | |
| 3.125%, due 05/15/19 | | | 1,800,000 | | | | 1,854,562 | | |
| 3.375%, due 11/15/192 | | | 29,040,000 | | | | 30,274,200 | | |
| 3.500%, due 05/15/20 | | | 10,800,000 | | | | 11,341,728 | | |
| 3.625%, due 08/15/19 | | | 97,800,000 | | | | 104,248,736 | | |
| 4.000%, due 08/15/18 | | | 4,300,000 | | | | 4,776,023 | | |
Total US government obligations
(cost—$260,174,933) | | | | | | | 266,716,346 | | |
| Government national mortgage association certificates—0.03% | |
GNMA
8.000%, due 06/15/17 | | | 41,429 | | | | 45,931 | | |
| 8.000%, due 07/15/17 | | | 32,246 | | | | 36,289 | | |
| 8.000%, due 09/15/17 | | | 24,707 | | | | 27,136 | | |
| 8.000%, due 11/15/17 | | | 53,581 | | | | 59,612 | | |
GNMA II ARM
3.125%, due 11/20/23 | | | 7,913 | | | | 8,127 | | |
| 3.375%, due 01/20/26 | | | 16,779 | | | | 17,228 | | |
| 3.625%, due 07/20/25 | | | 9,776 | | | | 10,074 | | |
| 4.375%, due 05/20/26 | | | 29,339 | | | | 30,387 | | |
Total government national
mortgage association
certificates
(cost—$220,195) | | | | | | | 234,784 | | |
| Federal home loan mortgage corporation certificates*—0.23% | |
FHLMC
7.645%, due 05/01/25 | | | 1,367,310 | | | | 1,464,731 | | |
FHLMC ARM
5.699%, due 03/01/36 | | | 243,251 | | | | 262,355 | | |
Total federal home loan mortgage
corporation certificates
(cost—$1,615,745) | | | | | | | 1,727,086 | | |
Federal housing administration
certificates—0.01% | |
FHA GMAC
7.430%, due 06/01/21 | | | 43,868 | | | | 43,868 | | |
FHA Reilly
7.430%, due 10/01/20 | | | 13,774 | | | | 13,774 | | |
Total federal housing
administration certificates
(cost—$61,402) | | | | | | | 57,642 | | |
| Security description | | Face
amount1 | | Value | |
| Federal national mortgage association certificates*—2.49% | |
FNMA
5.396%, due 11/01/34 | | | 11,662,407 | | | $ | 12,573,841 | | |
| 6.000%, due 10/01/36 | | | 71,668 | | | | 78,052 | | |
FNMA ARM
1.813%, due 08/01/40 | | | 180,621 | | | | 183,603 | | |
| 2.720%, due 05/01/27 | | | 45,689 | | | | 47,768 | | |
| 2.799%, due 04/01/27 | | | 36,964 | | | | 38,557 | | |
| 3.905%, due 05/01/30 | | | 123,553 | | | | 127,935 | | |
| 5.172%, due 10/01/35 | | | 407,345 | | | | 435,017 | | |
| 5.222%, due 09/01/35 | | | 342,394 | | | | 364,443 | | |
| 5.356%, due 11/01/35 | | | 486,249 | | | | 522,313 | | |
| 5.378%, due 01/01/36 | | | 537,515 | | | | 576,495 | | |
| 5.537%, due 03/01/36 | | | 328,999 | | | | 353,916 | | |
| 5.547%, due 01/01/36 | | | 291,696 | | | | 312,487 | | |
| 5.579%, due 02/01/36 | | | 675,477 | | | | 727,072 | | |
| 5.608%, due 03/01/36 | | | 264,644 | | | | 282,786 | | |
| 5.622%, due 12/01/35 | | | 348,838 | | | | 375,987 | | |
| 5.664%, due 03/01/36 | | | 433,795 | | | | 467,358 | | |
| 5.718%, due 03/01/36 | | | 473,955 | | | | 511,180 | | |
| 5.872%, due 06/01/36 | | | 111,932 | | | | 120,687 | | |
FNMA ARM COFI
4.683%, due 11/01/26 | | | 118,963 | | | | 117,773 | | |
FNMA TBA
6.000%, TBA | | | 500,000 | | | | 543,125 | | |
Total federal national mortgage
association certificates
(cost—$17,691,642) | | | | | | | 18,760,395 | | |
| Collateralized mortgage obligations—26.50% | |
ARM Trust, Series 2005-5,
Class 2A1
2.871%, due 09/25/35 | | | 478,970 | | | | 350,762 | | |
Banc of America Funding Corp.,
Series 2005-D, Class A1
2.915%, due 05/25/353 | | | 4,092,042 | | | | 4,038,784 | | |
Series 2007-3, Class 2A1
5.500%, due 09/25/34 | | | 1,769,867 | | | | 1,597,351 | | |
Bank of America Mortgage
Securities, Inc.,
Series 2002-G, Class 1A3
3.794%, due 07/20/323 | | | 6,867 | | | | 6,660 | | |
Bear Stearns Alternative Loan
Trust-A Trust,
Series 2005-7, Class 22A1
3.805%, due 09/25/353 | | | 1,705,171 | | | | 1,283,036 | | |
Series 2006-1, Class 21A2
5.552%, due 02/25/363 | | | 1,764,008 | | | | 934,328 | | |
Bear Stearns ARM Trust,
Series 2003-5, Class 2A1
2.764%, due 08/25/33 | | | 741,035 | | | | 718,386 | | |
Series 2004-9, Class 22A1
4.034%, due 11/25/34 | | | 74,972 | | | | 70,400 | | |
Series 2005-2, Class A1
2.760%, due 03/25/35 | | | 2,476,412 | | | | 2,235,636 | | |
47
UBS PACE Select Advisors Trust
UBS PACE Strategic Fixed Income Investments
Portfolio of investments—July 31, 2010
| Security description | | Face
amount1 | | Value | |
| Collateralized mortgage obligations—(continued) | |
Series 2005-5, Class A2
2.560%, due 08/25/35 | | | 4,188,785 | | | $ | 3,955,507 | | |
Series 2005-9, Class A1
4.625%, due 10/25/35 | | | 1,860,890 | | | | 1,635,732 | | |
Series 2005-10, Class A1
3.577%, due 10/25/35 | | | 1,295,740 | | | | 1,291,721 | | |
Bear Stearns Commercial
Mortgage Securities,
Series 2006-BBA7, Class A1
0.450%, due 03/15/193,4 | | | 3,744,572 | | | | 3,503,452 | | |
Bear Stearns,
Series 2003-1, Class 5A1
5.445%, due 04/25/333 | | | 48,663 | | | | 47,596 | | |
Series 2003-1, Class 6A1
2.960%, due 04/25/333 | | | 116,316 | | | | 113,134 | | |
Series 2003-3, Class 1A
2.848%, due 10/25/333 | | | 63,333 | | | | 51,889 | | |
Series 2004-3, Class 1A2
2.982%, due 07/25/343 | | | 571,862 | | | | 507,169 | | |
Series 2004-6, Class 2A1
3.359%, due 09/25/343 | | | 2,568,799 | | | | 2,146,539 | | |
Series 2004-7, Class 1A1
3.903%, due 10/25/343 | | | 758,809 | | | | 527,900 | | |
Series 2004-9, Class 2A1
3.433%, due 09/25/343 | | | 1,143,797 | | | | 817,977 | | |
Citicorp Mortgage Securities, Inc.,
Series 2002-12, Class 2A1
5.250%, due 12/25/32 | | | 80,971 | | | | 84,621 | | |
Citigroup Mortgage Loan Trust, Inc.,
Series 2005-6, Class A2
2.560%, due 08/25/353 | | | 284,755 | | | | 246,224 | | |
Series 2005-6, Class A3
2.210%, due 08/25/353 | | | 51,798 | | | | 47,397 | | |
Series 2005-11, Class A1A
2.820%, due 12/25/353 | | | 1,185,242 | | | | 1,045,080 | | |
Series 2006-AR1, Class 1A1
2.740%, due 10/25/353 | | | 2,954,199 | | | | 2,381,619 | | |
Countrywide Alternative Loan Trust,
Series 2003-J3, Class 2A1
6.250%, due 12/25/33 | | | 457,780 | | | | 470,171 | | |
Series 2005-62, Class 2A1
1.402%, due 12/25/353 | | | 862,188 | | | | 495,871 | | |
Series 2006-41CB, Class 1A9
6.000%, due 01/25/37 | | | 1,710,613 | | | | 1,131,214 | | |
Countrywide Home Loan
Mortgage Pass Through Trust,
Series 2003-R4, Class 2A
6.500%, due 01/25/343,4 | | | 1,468,991 | | | | 1,436,360 | | |
Series 2004-12, Class 11A1
2.992%, due 08/25/343 | | | 864,235 | | | | 614,884 | | |
Series 2004-12, Class 11A2
2.992%, due 08/25/343 | | | 555,580 | | | | 430,726 | | |
Series 2004-12, Class 12A1
2.948%, due 08/25/343 | | | 202,926 | | | | 163,465 | | |
| Security description | | Face
amount1 | | Value | |
| Collateralized mortgage obligations—(continued) | |
Series 2005-HYB9, Class 5A1
5.250%, due 02/20/363 | | | 504,790 | | | $ | 322,166 | | |
FHLMC REMIC,*
Series 1278, Class K
7.000%, due 05/15/22 | | | 122,512 | | | | 136,544 | | |
Series 1367, Class KA
6.500%, due 09/15/22 | | | 2,474 | | | | 2,757 | | |
Series 1502, Class PXZ
7.000%, due 04/15/23 | | | 666,395 | | | | 687,003 | | |
Series 1503, Class PZ
7.000%, due 05/15/23 | | | 229,849 | | | | 236,028 | | |
Series 1534, Class Z
5.000%, due 06/15/23 | | | 235,741 | | | | 235,751 | | |
Series 1548, Class Z
7.000%, due 07/15/23 | | | 179,429 | | | | 186,962 | | |
Series 1562, Class Z
7.000%, due 07/15/23 | | | 278,360 | | | | 310,240 | | |
Series 1694, Class Z
6.500%, due 03/15/24 | | | 129,610 | | | | 149,099 | | |
Series 2061, Class Z
6.500%, due 06/15/28 | | | 509,543 | | | | 540,847 | | |
Series 2400, Class FQ
0.841%, due 01/15/323 | | | 218,485 | | | | 219,219 | | |
Series 2579, Class DZ
5.000%, due 03/15/34 | | | 6,858,211 | | | | 7,420,620 | | |
Series 2764, Class LZ
4.500%, due 03/15/34 | | | 2,658,107 | | | | 2,781,012 | | |
Series 2764, Class ZG
5.500%, due 03/15/34 | | | 4,954,521 | | | | 5,475,534 | | |
Series 2835, Class JZ
5.000%, due 08/15/34 | | | 3,761,576 | | | | 4,123,444 | | |
Series 2921, Class PG
5.000%, due 01/15/35 | | | 6,200,000 | | | | 6,785,281 | | |
Series 2983, Class TZ
6.000%, due 05/15/35 | | | 5,858,201 | | | | 6,447,587 | | |
Series 3149, Class CZ
6.000%, due 05/15/36 | | | 8,158,381 | | | | 8,982,212 | | |
Series G23, Class KZ
6.500%, due 11/25/23 | | | 175,720 | | | | 193,436 | | |
Series T-054, Class 2A
6.500%, due 02/25/43 | | | 1,079,421 | | | | 1,196,976 | | |
Series T-058, Class 2A
6.500%, due 09/25/43 | | | 4,087,964 | | | | 4,531,252 | | |
Series T-075, Class A1
0.367%, due 12/25/363 | | | 2,493,711 | | | | 2,478,456 | | |
First Horizon Mortgage
Pass-Through Trust,
Series 2005-AR3, Class 2A1
3.006%, due 08/25/353 | | | 127,083 | | | | 121,609 | | |
FNMA REMIC,*
Series 1991-065, Class Z
6.500%, due 06/25/21 | | | 11,267 | | | | 12,452 | | |
Series 1992-040, Class ZC
7.000%, due 07/25/22 | | | 27,944 | | | | 31,527 | | |
48
UBS PACE Select Advisors Trust
UBS PACE Strategic Fixed Income Investments
Portfolio of investments—July 31, 2010
| Security description | | Face
amount1 | | Value | |
| Collateralized mortgage obligations—(continued) | |
Series 1992-129, Class L
6.000%, due 07/25/22 | | | 13,685 | | | $ | 14,762 | | |
Series 1993-037, Class PX
7.000%, due 03/25/23 | | | 37,648 | | | | 41,343 | | |
Series 1993-060, Class Z
7.000%, due 05/25/23 | | | 194,760 | | | | 219,754 | | |
Series 1993-065, Class ZZ
7.000%, due 06/25/13 | | | 148,268 | | | | 163,512 | | |
Series 1993-070, Class Z
6.900%, due 05/25/23 | | | 32,370 | | | | 36,472 | | |
Series 1993-096, Class PZ
7.000%, due 06/25/23 | | | 202,844 | | | | 229,047 | | |
Series 1993-160, Class ZB
6.500%, due 09/25/23 | | | 68,188 | | | | 70,459 | | |
Series 1993-163, Class ZB
7.000%, due 09/25/23 | | | 18,142 | | | | 19,558 | | |
Series 1994-023, Class PX
6.000%, due 08/25/23 | | | 381,967 | | | | 415,866 | | |
Series 1998-M7, Class Z
6.390%, due 05/25/36 | | | 481,343 | | | | 548,372 | | |
Series 1999-W4, Class A9
6.250%, due 02/25/29 | | | 974,377 | | | | 1,039,227 | | |
Series 1998-066, Class FG
0.629%, due 12/25/283 | | | 112,198 | | | | 111,932 | | |
Series 2000-034, Class F
0.779%, due 10/25/303 | | | 16,517 | | | | 16,552 | | |
Series 2002-080, Class A1
6.500%, due 11/25/42 | | | 2,043,927 | | | | 2,266,524 | | |
Series 2003-064, Class AH
6.000%, due 07/25/33 | | | 10,695,800 | | | | 11,780,797 | | |
Series 2003-106, Class US
8.582%, due 11/25/235,6 | | | 333,000 | | | | 334,586 | | |
Series 2003-W8, Class 2A
7.000%, due 10/25/42 | | | 142,834 | | | | 159,661 | | |
Series 2004-T1, Class 1A1
6.000%, due 01/25/44 | | | 2,459,509 | | | | 2,718,623 | | |
Series 2004-W8, Class 2A
6.500%, due 06/25/44 | | | 2,655,203 | | | | 2,944,371 | | |
Series 2005-024, Class ZE
5.000%, due 04/25/35 | | | 1,484,956 | | | | 1,606,471 | | |
Series 2005-116, Class TZ
5.500%, due 01/25/36 | | | 7,072,793 | | | | 7,786,421 | | |
Series 2005-120, Class ZU
5.500%, due 01/25/36 | | | 7,715,775 | | | | 8,560,405 | | |
Series 2006-065, Class GD
6.000%, due 07/25/26 | | | 2,800,000 | | | | 3,190,993 | | |
GNMA REMIC,
Trust, Series 2000-009, Class FG
0.941%, due 02/16/303 | | | 152,225 | | | | 153,222 | | |
Trust, Series 2002-031, Class FW
0.741%, due 06/16/313 | | | 152,456 | | | | 152,488 | | |
Trust, Series 2003-98, Class Z
6.000%, due 11/20/33 | | | 14,903,386 | | | | 16,576,148 | | |
| Security description | | Face
amount1 | | Value | |
| Collateralized mortgage obligations—(continued) | |
Trust, Series 2005-26, Class ZA
5.500%, due 01/20/35 | | | 6,431,958 | | | $ | 7,030,742 | | |
GS Mortgage Securities Corp. II,
Series 2007-EOP, Class A1
0.438%, due 03/06/203,4 | | | 2,057,083 | | | | 1,988,368 | | |
GS Residential Mortgage Loan Trust,
Series 2005-AR6, Class 2A1
2.943%, due 09/25/353 | | | 2,257,180 | | | | 2,125,848 | | |
Harborview Mortgage Loan Trust,
Series 2004-11, Class 3A1A
0.691%, due 01/19/353 | | | 149,231 | | | | 80,188 | | |
Series 2005-4, Class 3A1
2.960%, due 07/19/353 | | | 755,071 | | | | 600,805 | | |
Housing Security, Inc.,
Series 1992-8, Class B
3.613%, due 06/25/243 | | | 293,874 | | | | 289,943 | | |
Lehman Brothers Mortgage Trust,
Series 1991-2, Class A3
8.443%, due 01/20/173,7 | | | 338,319 | | | | 356,174 | | |
Residential Accredit Loans, Inc.,
Series 2006-Q03, Class A1
0.539%, due 04/25/463 | | | 2,172,568 | | | | 849,053 | | |
Residential Asset Securitization Trust,
Series 2006-A14C, Class 2A6
0.779%, due 12/25/363 | | | 1,968,707 | | | | 650,418 | | |
Residential Funding
Mortgage Security I,
Series 2004-S2, Class A1
5.250%, due 03/25/34 | | | 568,286 | | | | 564,232 | | |
Series 2004-S9, Class 1A23
5.500%, due 12/25/34 | | | 2,300,000 | | | | 2,313,621 | | |
Small Business Administration,
Series 1999-20K, Class 1
7.060%, due 11/01/19 | | | 392,736 | | | | 432,336 | | |
Series 2000-20K, Class 1
7.220%, due 11/01/20 | | | 613,841 | | | | 676,213 | | |
Series 2001-P10B, Class 1
6.344%, due 08/01/11 | | | 165,981 | | | | 172,488 | | |
Series 2002-20K, Class 1
5.080%, due 11/01/22 | | | 2,742,498 | | | | 2,947,950 | | |
Series 2003-20I, Class 1
5.130%, due 09/01/23 | | | 520,284 | | | | 560,509 | | |
Series 2003-20L, Class 1
4.890%, due 12/01/23 | | | 1,456,642 | | | | 1,575,539 | | |
Series 2004-P10A, Class 1
4.504%, due 02/10/14 | | | 2,057,757 | | | | 2,155,640 | | |
Series 2005-20H, Class 1
5.110%, due 08/01/25 | | | 1,878,497 | | | | 2,038,560 | | |
Series 2007-20D, Class 1
5.320%, due 04/01/27 | | | 5,395,006 | | | | 5,934,803 | | |
Structured ARM Loan Trust,
Series 2004-8, Class 3A
2.589%, due 07/25/34 | | | 1,428,903 | | | | 1,269,477 | | |
49
UBS PACE Select Advisors Trust
UBS PACE Strategic Fixed Income Investments
Portfolio of investments—July 31, 2010
| Security description | | Face
amount1 | | Value | |
| Collateralized mortgage obligations—(concluded) | |
Structured Asset Mortgage
Investments, Inc.,
Series 2002-AR3, Class A1
1.001%, due 09/19/323 | | | 456,310 | | | $ | 388,466 | | |
Series 2006-AR3, Class 11A1
0.539%, due 04/25/363 | | | 5,560,627 | | | | 2,867,243 | | |
Structured Asset Securities Corp.,
Series 2001-SB1, Class A2
3.375%, due 08/25/31 | | | 2,362,214 | | | | 2,105,712 | | |
WaMu Mortgage Pass
Through Certificates,
Series 2002-AR6, Class A
1.813%, due 06/25/423 | | | 64,268 | | | | 51,132 | | |
Series 2005-AR1, Class A1A
0.649%, due 01/25/453 | | | 175,234 | | | | 137,984 | | |
Series 2005-AR2, Class 2A1A
0.639%, due 01/25/453 | | | 210,803 | | | | 162,269 | | |
Series 2006-AR7, Class 3A
3.325%, due 07/25/463 | | | 3,114,177 | | | | 2,072,712 | | |
Series 2006-AR9, Class 1A
1.402%, due 08/25/463 | | | 2,196,897 | | | | 1,349,233 | | |
Series 2006-AR9, Class 2A
3.325%, due 08/25/463 | | | 1,708,204 | | | | 1,150,961 | | |
Wells Fargo Mortgage
Backed Securities Trust,
Series 2003-M, Class A1
4.675%, due 12/25/333 | | | 1,255,362 | | | | 1,268,684 | | |
Series 2004-CC, Class A1
4.913%, due 01/25/353 | | | 467,941 | | | | 455,145 | | |
Series 2006-AR2, Class 2A1
4.721%, due 03/25/363 | | | 2,779,463 | | | | 2,466,890 | | |
Series 2006-AR8, Class 1A1
3.021%, due 04/25/363 | | | 1,179,782 | | | | 1,103,748 | | |
Total collateralized mortgage
obligations
(cost—$194,133,063) | | | | | | | 199,340,257 | | |
| Asset-backed securities—3.05% | |
Chase Issuance Trust,
Series 2008-A13, Class A13
2.037%, due 09/15/153 | | | 2,200,000 | | | | 2,282,395 | | |
Countrywide Asset-Backed
Certificates,
Series 2007-5, Class 2A1
0.429%, due 09/25/473 | | | 806,416 | | | | 773,111 | | |
CSAB Mortgage Backed Trust,
Series 2006-1, Class A6A
6.172%, due 06/25/368 | | | 755,576 | | | | 426,207 | | |
Delta Funding Home Equity
Loan Trust,
Series 1999-003, Class A1A
1.161%, due 09/15/293 | | | 60,720 | | | | 31,539 | | |
| Security description | | Face
amount1 | | Value | |
| Asset-backed securities—(concluded) | |
EFS Volunteer LLC,
Series 2010-1, Class A1
1.389%, due 10/26/263,4 | | | 1,000,000 | | | $ | 1,000,010 | | |
Ford Credit Auto Owner Trust,
Series 2008-C, Class A3
1.761%, due 06/15/123 | | | 2,797,617 | | | | 2,812,238 | | |
Mid-State Trust
Series 4, Class A
8.330%, due 04/01/30 | | | 335,576 | | | | 340,869 | | |
SLC Student Loan Trust,
Series 2008-2, Class A2
0.987%, due 06/15/173 | | | 8,300,000 | | | | 8,306,465 | | |
SLM Student Loan Trust,
Series 2008-9, Class A
1.998%, due 04/25/233 | | | 6,715,783 | | | | 6,947,880 | | |
Total asset-backed securities
(cost—$22,869,633) | | | | | | | 22,920,714 | | |
| Corporate notes—25.50% | |
| Airlines—1.05% | |
American Airlines Pass Through
Trust 2009-1A
10.375%, due 07/02/19 | | | 2,958,749 | | | | 3,313,799 | | |
Continental Airlines Pass Through
Trust 2009-2, Series A
7.250%, due 11/10/19 | | | 200,000 | | | | 213,000 | | |
Northwest Airlines,
Series 2000-1, Class G
7.150%, due 10/01/193 | | | 3,930,323 | | | | 3,792,761 | | |
United Air Lines,
1991 Equipment Trust
10.360%, due 11/27/126,9 | | | 231,906 | | | | 1,044 | | |
United Air Lines,
2000 Pass Through Trust,
Series 2000-1, Class B
8.030%, due 07/01/116 | | | 465,202 | | | | 565,221 | | |
| | | | 7,885,825 | | |
| Banking-non-US—3.38% | |
Banco Mercantil del Norte SA
4.375%, due 07/19/154 | | | 1,800,000 | | | | 1,792,674 | | |
Bank of Scotland PLC
0.597%, due 12/08/103,4 | | | 200,000 | | | | 199,749 | | |
Barclays Bank PLC
7.434%, due 12/15/174,10,11 | | | 1,000,000 | | | | 975,000 | | |
BNP Paribas
5.186%, due 06/29/154,10,11 | | | 3,100,000 | | | | 2,697,000 | | |
Commonwealth Bank of Australia
2.750%, due 10/15/124 | | | 4,600,000 | | | | 4,713,307 | | |
Export-Import Bank of Korea
5.125%, due 06/29/20 | | | 400,000 | | | | 418,025 | | |
| 5.875%, due 01/14/15 | | | 2,600,000 | | | | 2,868,611 | | |
ING Bank N.V.
3.900%, due 03/19/144 | | | 2,000,000 | | | | 2,162,598 | | |
50
UBS PACE Select Advisors Trust
UBS PACE Strategic Fixed Income Investments
Portfolio of investments—July 31, 2010
| Security description | | Face
amount1 | | Value | |
| Corporate notes—(continued) | |
| Banking-non-US—(concluded) | |
LBG Capital No.1 PLC
8.500%, due 12/17/214,10,11 | | | 2,400,000 | | | $ | 2,016,000 | | |
Royal Bank of Scotland
Group PLC
7.640%, due 09/27/1710,11 | | | 5,500,000 | | | | 3,410,000 | | |
Santander US Debt SA Unipersonal
1.333%, due 03/30/123,4 | | | 4,300,000 | | | | 4,179,725 | | |
| | | | 25,432,689 | | |
| Banking-US—2.89% | |
Bank of America Corp.
5.750%, due 12/01/17 | | | 3,200,000 | | | | 3,381,619 | | |
Bank of America N.A.
5.300%, due 03/15/17 | | | 3,500,000 | | | | 3,574,578 | | |
| 6.100%, due 06/15/17 | | | 4,400,000 | | | | 4,685,001 | | |
CIT Group, Inc.
7.000%, due 05/01/13 | | | 2,500,000 | | | | 2,475,000 | | |
| 7.000%, due 05/01/14 | | | 1,300,000 | | | | 1,264,250 | | |
Credit Suisse New York MTN
5.000%, due 05/15/13 | | | 2,700,000 | | | | 2,923,244 | | |
JPMorgan Chase Bank N.A.
0.866%, due 06/13/163 | | | 400,000 | | | | 376,657 | | |
US Central Federal Credit Union
1.900%, due 10/19/12 | | | 3,000,000 | | | | 3,071,925 | | |
| | | | 21,752,274 | | |
| Computers—0.55% | |
Hewlett-Packard Co.
2.250%, due 05/27/11 | | | 4,100,000 | | | | 4,158,081 | | |
| Diversified financials—5.22% | |
American Express Co.
6.150%, due 08/28/17 | | | 5,400,000 | | | | 6,062,591 | | |
General Electric Capital Corp.
5.500%, due 09/15/673,4 | | EUR | 5,000,000 | | | | 5,570,969 | | |
General Electric Capital Corp. MTN
0.689%, due 12/28/183 | | | 800,000 | | | | 685,283 | | |
| 1.384%, due 05/22/133 | | | 3,500,000 | | | | 3,475,962 | | |
Goldman Sachs Group, Inc.
0.988%, due 03/22/163 | | | 1,000,000 | | | | 926,019 | | |
LeasePlan Corp. N.V. MTN
3.250%, due 05/22/14 | | EUR | 4,300,000 | | | | 5,869,604 | | |
Lehman Brothers Holdings,
Inc. MTN
5.625%, due 01/24/139 | | | 4,500,000 | | | | 973,125 | | |
Macquarie Bank Ltd.
2.600%, due 01/20/124 | | | 900,000 | | | | 917,482 | | |
Merrill Lynch & Co. MTN
6.875%, due 04/25/18 | | | 8,200,000 | | | | 9,148,543 | | |
Temasek Financial I Ltd.
4.300%, due 10/25/194 | | | 5,400,000 | | | | 5,660,917 | | |
| | | | 39,290,495 | | |
| Security description | | Face
amount1 | | Value | |
| Corporate notes—(continued) | |
| Education—0.50% | |
Stanford University
4.250%, due 05/01/16 | | | 3,500,000 | | | $ | 3,776,955 | | |
| Electric utilities—0.26% | |
PSE&G Power LLC
5.000%, due 04/01/14 | | | 1,800,000 | | | | 1,953,241 | | |
| Electric-generation—0.94% | |
Korea Hydro & Nuclear
Power Co. Ltd.
6.250%, due 06/17/14 | | | 100,000 | | | | 111,298 | | |
| 6.250%, due 06/17/144 | | | 6,278,000 | | | | 6,987,296 | | |
| | | | 7,098,594 | | |
| Electric-integrated—0.03% | |
Centrais Eletricas Brasileiras SA
6.875%, due 07/30/194 | | | 200,000 | | | | 225,000 | | |
| Financial services—2.26% | |
Ally Financial, Inc.
7.250%, due 03/02/11 | | | 1,300,000 | | | | 1,324,016 | | |
Citigroup, Inc.
0.535%, due 05/18/113 | | | 700,000 | | | | 696,807 | | |
| 2.136%, due 05/15/183 | | | 900,000 | | | | 831,622 | | |
| 8.500%, due 05/22/19 | | | 3,700,000 | | | | 4,496,303 | | |
Morgan Stanley MTN
0.997%, due 11/29/133 | | EUR | 5,900,000 | | | | 7,152,794 | | |
SLM Corp.
0.737%, due 03/15/113 | | | 2,600,000 | | | | 2,526,948 | | |
| | | | 17,028,490 | | |
| Health care—0.07% | |
DaVita, Inc.
6.625%, due 03/15/13 | | | 544,000 | | | | 551,480 | | |
| Insurance—3.09% | |
American International Group, Inc.
8.175%, due 05/15/583 | | | 6,400,000 | | | | 5,536,000 | | |
| 8.250%, due 08/15/18 | | | 4,100,000 | | | | 4,397,250 | | |
| 8.625%, due 05/22/383 | | GBP | 1,600,000 | | | | 2,096,383 | | |
American International Group,
Inc. MTN
4.000%, due 09/20/11 | | EUR | 1,500,000 | | | | 1,942,128 | | |
Progressive Corp.
6.700%, due 06/15/373 | | | 2,800,000 | | | | 2,684,640 | | |
Prudential Financial, Inc. MTN
6.000%, due 12/01/17 | | | 6,000,000 | | | | 6,581,652 | | |
| | | | 23,238,053 | | |
| Media—0.22% | |
Historic TW, Inc.
9.125%, due 01/15/13 | | | 1,400,000 | | | | 1,650,894 | | |
| Oil refining—0.04% | |
Valero Energy Corp.
6.625%, due 06/15/37 | | | 300,000 | | | | 315,331 | | |
51
UBS PACE Select Advisors Trust
UBS PACE Strategic Fixed Income Investments
Portfolio of investments—July 31, 2010
| Security description | | Face
amount1 | | Value | |
| Corporate notes—(concluded) | |
| Oil services—1.80% | |
BP Capital Markets PLC
0.667%, due 04/11/113 | | | 700,000 | | | $ | 683,935 | | |
| 3.625%, due 05/08/1412 | | | 200,000 | | | | 192,165 | | |
BP Capital Markets PLC MTN
2.750%, due 02/27/12 | | | 200,000 | | | | 193,151 | | |
Cameron International Corp.
6.375%, due 07/15/18 | | | 8,400,000 | | | | 9,037,241 | | |
El Paso Corp.
7.000%, due 06/15/17 | | | 1,700,000 | | | | 1,779,071 | | |
Shell International Finance BV
4.300%, due 09/22/19 | | | 1,600,000 | | | | 1,681,752 | | |
| | | | 13,567,315 | | |
| Paper & forest products—0.08% | |
Celulosa Arauco y Constitucion SA
7.250%, due 07/29/19 | | | 500,000 | | | | 574,501 | | |
| Pipelines—0.26% | |
Kinder Morgan Finance Co.
5.350%, due 01/05/11 | | | 1,900,000 | | | | 1,923,750 | | |
| Retail—0.46% | |
Macy's Retail Holdings, Inc.
8.375%, due 07/15/158 | | | 3,100,000 | | | | 3,468,125 | | |
| Telecommunication services—0.63% | |
Vodafone Group PLC
5.450%, due 06/10/19 | | | 4,300,000 | | | | 4,694,624 | | |
| Telephone-integrated—0.21% | |
Sprint Capital Corp.
7.625%, due 01/30/11 | | | 1,500,000 | | | | 1,533,750 | | |
| Tobacco—0.22% | |
Reynolds American, Inc.
7.250%, due 06/15/37 | | | 1,600,000 | | | | 1,665,838 | | |
| Wireless telecommunications—1.34% | |
America Movil SAB de C.V.
3.625%, due 03/30/154 | | | 2,500,000 | | | | 2,607,485 | | |
Cellco Partnership/Verizon
Wireless Capital LLC
3.750%, due 05/20/11 | | | 7,300,000 | | | | 7,479,091 | | |
| | | | 10,086,576 | | |
Total corporate notes
(cost—$188,779,014) | | | | | | | 191,871,881 | | |
| Loan assignments3—0.61% | |
| Diversified financials—0.37% | |
AGFS Funding Co., Term Loan B
7.250%, due 08/23/10 | | | 2,000,000 | | | | 1,975,420 | | |
First Data Corp. Term Loan B2
3.066%, due 08/31/10 | �� | | 43,947 | | | | 38,135 | | |
| 3.079%, due 08/24/10 | | | 930,990 | | | | 807,848 | | |
| | | | 2,821,403 | | |
| Security description | | Face
amount1 | | Value | |
| Loan assignments3—(concluded) | |
| Health care—0.14% | |
DaVita, Inc., Tranche B1
Term Loan
1.830%, due 08/26/10 | | | 756,563 | | | $ | 737,460 | | |
| 1.840%, due 08/23/10 | | | 32,242 | | | | 31,427 | | |
| 1.850%, due 08/02/10 | | | 182,230 | | | | 177,628 | | |
| 2.040%, due 09/30/10 | | | 128,966 | | | | 125,710 | | |
| | | | 1,072,225 | | |
| Raw materials/paper—0.10% | |
Georgia-Pacific Corp.
New Term Loan B
2.475%, due 08/31/10 | | | 110,732 | | | | 108,956 | | |
| 2.533%, due 09/30/10 | | | 17,302 | | | | 17,024 | | |
| 2.537%, due 09/10/10 | | | 623,500 | | | | 613,499 | | |
| | | | 739,479 | | |
Total loan assignments
(cost—$4,691,230) | | | | | | | 4,633,107 | | |
| Non-US government obligations—7.27% | |
Canadian Government Bond
2.000%, due 12/01/14 | | CAD | 3,000,000 | | | | 2,893,196 | | |
| 4.500%, due 06/01/15 | | CAD | 10,000,000 | | | | 10,710,471 | | |
Emirate of Abu Dhabi
6.750%, due 04/08/194 | | | 2,300,000 | | | | 2,723,214 | | |
Federal Republic of Brazil
6.000%, due 01/17/17 | | | 5,500,000 | | | | 6,242,500 | | |
Government of Norway
6.500%, due 05/15/13 | | NOK | 19,887,000 | | | | 3,637,356 | | |
Kingdom of Denmark
4.000%, due 11/15/19 | | DKK | 34,200,000 | | | | 6,604,920 | | |
Notas do Tesouro Nacional, Series F
10.000%, due 01/01/17 | | BRL | 28,400,000 | | | | 14,972,702 | | |
State of Qatar
4.000%, due 01/20/154 | | | 4,300,000 | | | | 4,455,875 | | |
| 5.250%, due 01/20/204 | | | 2,100,000 | | | | 2,223,375 | | |
| 6.400%, due 01/20/404 | | | 200,000 | | | | 220,500 | | |
Total non-US government
obligations
(cost—$53,218,095) | | | | | | | 54,684,109 | | |
| Municipal bonds and notes—2.98% | |
| Education—1.40% | |
Clark County School District,
Limited Tax (Building), Series A
5.000%, due 06/15/19 | | | 300,000 | | | | 335,721 | | |
Los Angeles Unified School
District Refunding,
Series A-1 (NATL-RE Insured)
4.500%, due 07/01/25 | | | 3,200,000 | | | | 3,175,840 | | |
| 4.500%, due 01/01/28 | | | 3,800,000 | | | | 3,657,652 | | |
New York City Transitional
Finance Authority Building Aid
Revenue Fiscal 2008, Series S-1
5.000%, due 01/15/25 | | | 100,000 | | | | 108,257 | | |
52
UBS PACE Select Advisors Trust
UBS PACE Strategic Fixed Income Investments
Portfolio of investments—July 31, 2010
| Security description | | Face
amount1 | | Value | |
| Municipal bonds and notes—(continued) | |
| Education—(concluded) | |
University of Toledo General
Receipts Bonds
(Build America Bonds)
6.750%, due 06/01/22 | | | 2,000,000 | | | $ | 2,254,960 | | |
Will County Community High
School District No. 210
Lincoln-Way (Capital
Appreciation) (AGM Insured)
4.980%, due 01/01/2113 | | | 1,600,000 | | | | 990,080 | | |
| | | | 10,522,510 | | |
| General obligation—0.37% | |
California State Build
America Bonds
7.500%, due 04/01/34 | | | 1,400,000 | | | | 1,555,078 | | |
Cook County Build America
Bonds (Recovery Zone
Economic Development)
6.360%, due 11/15/33 | | | 1,200,000 | | | | 1,253,280 | | |
| | | | 2,808,358 | | |
| Tobacco—0.21% | |
Buckeye Tobacco Settlement
Financing Authority
(Asset Backed Series Turbo),
Series A-2
5.875%, due 06/01/47 | | | 500,000 | | | | 355,635 | | |
Tobacco Settlement Funding
Corp., Louisiana,
Series 2001-B
5.875%, due 05/15/39 | | | 1,075,000 | | | | 1,050,813 | | |
Tobacco Settlement Funding
Corp., Rhode Island,
Series A
6.250%, due 06/01/42 | | | 200,000 | | | | 189,446 | | |
| | | | 1,595,894 | | |
| Transportation—0.75% | |
Bay Area Toll Authority Toll
Bridge Revenue
(Build America Bonds)
6.263%, due 04/01/49 | | | 1,500,000 | | | | 1,567,455 | | |
Harris County Metropolitan
Transportation Authority
(Build America Bonds),
Series C
6.875%, due 11/01/38 | | | 3,100,000 | | | | 3,282,280 | | |
Port Authority of New York &
New Jersey Consolidated
(One Hundred Fifty-Eight)
5.859%, due 12/01/24 | | | 700,000 | | | | 771,568 | | |
| | | | 5,621,303 | | |
| Security description | | Face
amount1 | | Value | |
| Municipal bonds and notes—(concluded) | |
| Utilities—0.25% | |
Cincinnati Water System Revenue
(Build America Bonds),
Series B
6.458%, due 12/01/34 | | | 100,000 | | | $ | 106,132 | | |
Metropolitan Water District
Southern California
(Build America Bonds)
5.906%, due 07/01/25 | | | 1,700,000 | | | | 1,759,619 | | |
| | | | 1,865,751 | | |
Total municipal bonds and notes
(cost—$20,904,375) | | | | | | | 22,413,816 | | |
| | | Number of
shares | | | |
| Preferred stock14—0.83% | |
| Commercial banks—0.83% | |
Wells Fargo & Co.
(cost—$3,810,820) | | | 6,400 | | | | 6,220,800 | | |
| | | Face
amount1 | | | |
Short-term US government
obligations—0.17% | |
US Treasury Bills
0.186%, due 08/26/1015 | | | 280,000 | | | | 279,976 | | |
| 0.191%, due 01/06/1115 | | | 410,000 | | | | 409,652 | | |
| 0.194%, due 01/13/1115 | | | 520,000 | | | | 519,559 | | |
| 0.217%, due 01/13/1115 | | | 100,000 | | | | 99,912 | | |
Total short-term US government
obligations
(cost—$1,309,099) | | | | | | | 1,309,099 | | |
| Repurchase agreement—0.57% | |
Repurchase agreement dated
07/30/10 with State Street
Bank & Trust Co.,
0.010% due 08/02/10,
collateralized by $4,227,601
US Treasury Notes, 2.125% to
3.125% due 04/30/15 to
04/30/17, (value—$4,362,580);
proceeds: $4,277,004
(cost—$4,277,000) | | | 4,277,000 | | | | 4,277,000 | | |
53
UBS PACE Select Advisors Trust
UBS PACE Strategic Fixed Income Investments
Portfolio of investments—July 31, 2010
| Security description | | Number of
shares | | Value | |
| Investment of cash collateral from securities loaned—0.03% | |
| Money market fund — 0.03% | |
UBS Private Money Market
Fund LLC16
(cost—$196,020) | | | 196,020 | | | $ | 196,020 | | |
Total investments
(cost—$773,952,266)—
105.72% | | | | | 795,363,056 | | |
Liabilities in excess of
other assets—(5.72)% | | | | | (43,030,431 | ) | |
| Net assets—100.00% | | $ | 752,332,625 | | |
Aggregate cost for federal income tax purposes was $774,206,403; and net unrealized appreciation consisted of:
| Gross unrealized appreciation | | $ | 41,068,481 | | |
| Gross unrealized depreciation | | | (19,911,828 | ) | |
| Net unrealized appreciation | | $ | 21,156,653 | | |
* On September 7, 2008, the Federal Housing Finance Agency placed the Federal National Mortgage Association and the Federal Home Loan Mortgage Corporation into conservatorship, and the US Treasury guaranteed the debt issued by those organizations.
1 In US Dollars unless otherwise indicated.
2 Partial amount delivered to broker as collateral for futures transactions.
3 Floating rate security. The interest rate shown is the current rate as of July 31, 2010.
4 Security exempt from registration pursuant to Rule 144A under the Securities Act of 1933. These securities, which represent 7.74% of net assets as of July 31, 2010, are considered liquid and may be resold in transactions exempt from registration, normally to qualified institutional buyers.
5 Inverse variable rate security. The interest rate shown is the current rate as of July 31, 2010.
6 Illiquid securities representing 0.41% of net assets as of July 31, 2010.
7 Security is being fair valued by a valuation committee under the direction of the board of trustees.
8 Step bond that converts to the noted fixed rate at a designated future date.
9 Bond interest in default.
10 Variable rate security. The interest rate shown is the current rate as of July 31, 2010. and resets at the next call date.
11 Perpetual bond security. The maturity date reflects the next call date.
12 Security, or portion thereof, was on loan at July 31, 2010.
13 Zero coupon bond. The interest rate represents annualized yield at date of purchase.
14 Non cumulative preferred stock. Convertible until 12/31/49.
15 Rates shown are the discount rates at date of purchase.
16 The table below details the Portfolios's transaction activity in an affiliated issuer during the year ended July 31, 2010.
| Security description | | Value at
07/31/09 | | Purchases
during the
year ended
07/31/10 | | Sales
during the
year ended
07/31/10 | | Value at
07/31/10 | | Net income
earned from
affiliate for the
year ended
07/31/10 | |
| UBS Private Money Market Fund LLC | | $ | 16,758,475 | | | $ | 246,010,252 | | | $ | 262,572,707 | | | $ | 196,020 | | | $ | 8,191 | | |
AGM Assured Guaranty Municipal Corporation
ARM Adjustable Rate Mortgage—The interest rate shown is the current rate as of July 31, 2010.
BRL Brazilian Real
CAD Canadian Dollar
COFI Cost of Funds Index
DKK Danish Krone
EUR Euro
54
UBS PACE Select Advisors Trust
UBS PACE Strategic Fixed Income Investments
Portfolio of investments—July 31, 2010
FHA Federal Housing Administration
FHLMC Federal Home Loan Mortgage Corporation
FNMA Federal National Mortgage Association
GBP Great Britain Pound
GMAC General Motors Acceptance Corporation
GNMA Government National Mortgage Association
GS Goldman Sachs
MTN Medium Term Note
NATL-RE National Reinsurance
NOK Norwegian Krone
REMIC Real Estate Mortgage Investment Conduit
TBA (To Be Announced) Security is purchased on a forward commitment basis with an approximate principal amount (generally +/- 1.0%) and no definite maturity date. The actual principal amount and maturity date will be determined upon settlement when the specific mortgage pools are assigned.
TIPS Treasury inflation protected securities ("TIPS") are debt securities issued by the US Treasury whose principal and/or interest payments are adjusted for inflation, unlike debt securities that make fixed principal and interest payments. The interest rate paid by the TIPS is fixed, while the principal value rises or falls based on changes in a published Consumer Price Index ("CPI"). Thus, if inflation occurs, the principal and interest payments on TIPS are adjusted accordingly to protect investors from inflationary loss. During a deflationary period, the principal and interest payments decrease, although the TIPS principal amounts will not drop below their face amounts at maturity. In exchange for the inflation protection, the TIPS generally pay lower interest rates than typical US Treasury securities. Only if inflation occurs will TIPS offer a higher real yield than a conventional Treasury bond of the same maturit y.
Written options6
Notional
amount
(000) | | Call options written | | Counterparty | | Pay/
receive
floating
rate | | Expiration
dates | | Premiums
received | | Current
value | | Unrealized
appreciation
(depreciation) | |
| $ | 58,700 | | | USD 3 Month LIBOR17 Interest Rate Swap,
strike @ 3.250% | | Barclays Bank
PLC | |
Receive | |
08/31/10 | | $ | 275,890 | | | $ | (1,782,461 | ) | | $ | (1,506,571 | ) | |
| | | Put options written | | | | | | | | | | | | | |
| | 61,700 | | | USD 3 Month LIBOR17 Interest Rate Swap,
strike @ 4.750% | | Barclays Bank
PLC | |
Pay | |
08/31/10 | | | 431,900 | | | | (6 | ) | | | 431,894 | | |
| | | | | | | | | | | $ | 707,790 | | | $ | (1,782,467 | ) | | $ | (1,074,677 | ) | |
17 3 Month LIBOR (USD on London Interbank Offered Rate) at July 31, 2010 was 0.454%.
LIBOR London Interbank Offered Rate
Currency type abbreviation:
USD United States Dollar
Written option activity for the year ended July 31, 2010 was as follows:
| | | Notional
amount
(000) | | Premiums
received | |
| Options outstanding at July 31, 2009 | | $ | 77,900 | | | $ | 518,914 | | |
| Options written | | | 174,201 | | | | 1,722,145 | | |
| Options terminated in closing purchase transactions | | | (102,300 | ) | | | (795,079 | ) | |
| Options expired prior to exercise | | | (29,401 | ) | | | (738,190 | ) | |
| Options outstanding at July 31, 2010 | | $ | 120,400 | | | $ | 707,790 | | |
55
UBS PACE Select Advisors Trust
UBS PACE Strategic Fixed Income Investments
Portfolio of investments—July 31, 2010
Futures contracts
Number of
contracts | | Currency | | Buy contracts | | Expiration
dates | | Cost | | Current
value | | Unrealized
appreciation | |
| | 569 | | | USD | | 90 Day Euro Dollar Futures | | March 2012 | | $ | 140,139,413 | | | $ | 140,607,013 | | | $ | 467,600 | | |
| | 128 | | | USD | | US Treasury Note 10 Year Futures | | September 2010 | | | 15,408,032 | | | | 15,848,000 | | | | 439,968 | | |
| | | | | | | | | $ | 155,547,445 | | | $ | 156,455,013 | | | $ | 907,568 | | |
Currency type abbreviation:
USD United States Dollar
Forward foreign currency contracts
| Counterparty | | Contracts to
deliver | | In
exchange for | | Maturity
dates | | Unrealized
appreciation
(depreciation) | |
| Bank of America N.A. | | GBP | 1,518,000 | | | USD | 2,249,722 | | | 09/23/10 | | $ | (131,692 | ) | |
| Barclays Bank PLC Wholesale | | EUR | 19,881,000 | | | USD | 25,487,442 | | | 10/26/10 | | | (415,883 | ) | |
| Barclays Bank PLC Wholesale | | USD | 954,099 | | | SGD | 1,338,000 | | | 09/16/10 | | | 29,948 | | |
| Barclays Capital | | INR | 78,659,000 | | | USD | 1,728,769 | | | 11/12/10 | | | 58,271 | | |
| Barclays Capital | | TWD | 326,115 | | | USD | 10,427 | | | 10/12/10 | | | 215 | | |
| Barclays Capital | | KRW | 8,240,000,000 | | | USD | 6,998,471 | | | 11/12/10 | | | 62,937 | | |
| Barclays Capital | | USD | 4,550,426 | | | KRW | 5,327,639,000 | | | 11/12/10 | | | (66,200 | ) | |
| Citibank N.A. | | DKK | 109,000 | | | USD | 18,050 | | | 09/21/10 | | | (1,012 | ) | |
| Citibank N.A. | | EUR | 3,898,000 | | | USD | 5,061,288 | | | 10/26/10 | | | (17,489 | ) | |
| Citibank N.A. | | JPY | 240,092,400 | | | USD | 2,760,000 | | | 10/26/10 | | | (21,128 | ) | |
| Citibank N.A. | | TWD | 716,000 | | | USD | 22,824 | | | 10/12/10 | | | 404 | | |
| Citibank N.A. | | USD | 244,647 | | | CAD | 255,000 | | | 08/16/10 | | | 3,357 | | |
| Citibank N.A. | | USD | 2,493,994 | | | KRW | 2,912,361,000 | | | 11/12/10 | | | (42,685 | ) | |
| Citibank N.A. | | USD | 3,093,929 | | | NOK | 19,887,000 | | | 09/21/10 | | | 170,899 | | |
| Citibank N.A. | | USD | 488 | | | TWD | 15,164 | | | 10/12/10 | | | (13 | ) | |
| Credit Suisse London Branch | | NOK | 22,367,000 | | | USD | 3,430,942 | | | 09/21/10 | | | (241,025 | ) | |
| Deutsche Bank AG London | | TWD | 566,097 | | | USD | 18,195 | | | 01/14/11 | | | 362 | | |
| Deutsche Bank AG London | | USD | 10,400,000 | | | CNY | 62,712,000 | | | 01/28/15 | | | (525,348 | ) | |
| Deutsche Bank AG London | | USD | 814,144 | | | SGD | 1,142,163 | | | 09/16/10 | | | 25,872 | | |
| Goldman Sachs International | | CAD | 13,938,000 | | | USD | 13,096,055 | | | 08/16/10 | | | (459,550 | ) | |
| Goldman Sachs International | | JPY | 321,896,300 | | | USD | 3,700,000 | | | 10/26/10 | | | (28,709 | ) | |
| HSBC Bank USA | | USD | 1,700,000 | | | INR | 78,659,000 | | | 11/12/10 | | | (29,502 | ) | |
| JPMorgan Chase Bank | | BRL | 26,511,000 | | | USD | 14,700,566 | | | 10/04/10 | | | (174,035 | ) | |
| JPMorgan Chase Bank | | MXN | 318,429 | | | USD | 24,667 | | | 09/24/10 | | | (354 | ) | |
| JPMorgan Chase Bank | | TWD | 487,000 | | | USD | 15,421 | | | 01/14/11 | | | 79 | | |
| JPMorgan Chase Bank | | SGD | 9,304 | | | USD | 6,648 | | | 09/16/10 | | | (195 | ) | |
| Morgan Stanley & Co., Inc. | | CAD | 19,865,000 | | | USD | 18,859,416 | | | 08/16/10 | | | (460,579 | ) | |
| Morgan Stanley & Co., Inc. | | TWD | 468,000 | | | USD | 14,893 | | | 01/14/11 | | | 149 | | |
| Royal Bank of Scotland PLC | | USD | 460,647 | | | AUD | 520,000 | | | 10/29/10 | | | 5,057 | | |
| | | $ | (2,257,849 | ) | |
Currency type abbrevations:
AUD Australian Dollar
CAD Canadian Dollar
CNY Chinese Yuan Renminbi
DKK Danish Krone
EUR Euro
56
UBS PACE Select Advisors Trust
UBS PACE Strategic Fixed Income Investments
Portfolio of investments—July 31, 2010
INR Indian Rupee
KRW South Korean Won
NOK Norwegian Krone
SGD Singapore Dollar
TWD New Taiwan Dollar
USD United States Dollar
Interest rate swaps
| | | | | | | Rate type | | | | | | | |
| Counterparty | | Notional
amount
(000) | | Termination
dates | | Payments
made by the
Portfolio | | Payments
received by
the Portfolio | | Upfront
payments
(made)
received | | Value | | Unrealized
appreciation | |
Merrill Lynch
Capital
Services, Inc. | | CAD | 19,800 | | | 03/14/16 | | | 0.987 | %18 | | | 2.500 | % | | $ | 349,862 | | | $ | (249,641 | ) | | $ | 100,221 | | |
| Citibank N.A. | | USD | 6,500 | | | 12/16/16 | | | 0.454 | 17 | | | 4.000 | | | | (95,875 | ) | | | 708,956 | | | | 613,081 | | |
Deutsche
Bank AG | | USD | 1,900 | | | 12/15/20 | | | 0.454 | 17 | | | 4.000 | | | | (109,630 | ) | | | 160,468 | | | | 50,838 | | |
Morgan
Stanley
Capital
Services, Inc. | | USD | 8,000 | | | 12/16/16 | | | 0.454 | 17 | | | 4.000 | | | | (234,860 | ) | | | 872,561 | | | | 637,701 | | |
Morgan
Stanley
Capital
Services, Inc. | | USD | 1,700 | | | 12/15/20 | | | 0.454 | 17 | | | 4.000 | | | | (100,130 | ) | | | 143,577 | | | | 43,447 | | |
Royal Bank of
Scotland PLC | | USD | 1,900 | | | 06/16/20 | | | 0.454 | 17 | | | 4.000 | | | | (109,345 | ) | | | 189,558 | | | | 80,213 | | |
Royal Bank of
Scotland PLC | | USD | 9,800 | | | 12/15/20 | | | 0.454 | 17 | | | 4.000 | | | | (578,200 | ) | | | 827,678 | | | | 249,478 | | |
| | | | | | | | | | | | | | | | | $ | (878,178 | ) | | $ | 2,653,157 | | | $ | 1,774,979 | | |
18 Rate based on 3 Month LIBOR (CAD on Interbank Offered Rate).
CAD Canadian Dollar
USD United States Dollar
Credit default swaps on corporate issues—buy protection19
| | | | | | | Rate type | | | | | | | |
| Counterparty | | Notional
amount
(000) | | Termination
dates | | Payments
made by
the Portfolio | | Payments
received by
the Portfolio | | Upfront
payments
(made) | | Value | | Unrealized
appreciation
(depreciation) | |
Barclays
Bank PLC | | USD | 3,100 | | | 09/20/15 | | | 7.150 | %20 | | | — | 21 | | $ | — | | | $ | (734,081 | ) | | $ | (734,081 | ) | |
| Citibank N.A. | | USD | 5,000 | | | 12/20/11 | | | 2.470 | 20 | | | — | 22 | | | — | | | | (131,529 | ) | | | (131,529 | ) | |
| Citibank N.A. | | USD | 300 | | | 12/20/13 | | | 3.400 | 20 | | | — | 23 | | | — | | | | (21,003 | ) | | | (21,003 | ) | |
Credit Suisse
First Boston | | USD | 1,400 | | | 03/20/13 | | | 1.450 | 20 | | | — | 24 | | | — | | | | (39,224 | ) | | | (39,224 | ) | |
Deutsche
Bank AG | | USD | 3,200 | | | 12/20/17 | | | 1.020 | 20 | | | — | 25 | | | — | | | | 83,684 | | | | 83,684 | | |
Deutsche
Bank AG | | USD | 1,000 | | | 06/20/18 | | | 1.370 | 20 | | | — | 26 | | | (45,996 | ) | | | 20,608 | | | | (25,388 | ) | |
Deutsche
Bank AG | | USD | 8,400 | | | 09/20/18 | | | 0.820 | 20 | | | — | 27 | | | — | | | | 433,443 | | | | 433,443 | | |
| | | | | | | | | | | | | | | | | $ | (45,996 | ) | | $ | (388,102 | ) | | $ | (434,098 | ) | |
57
UBS PACE Select Advisors Trust
UBS PACE Strategic Fixed Income Investments
Portfolio of investments—July 31, 2010
19 If the Portfolio is a buyer of protection and a credit event occurs, as defined under the terms of the particular swap agreement, the Portfolio will either (i) receive from the seller of protection an amount equal to the notional amount of the swap and take delivery of the referenced obligation or underlying securities comprising the referenced obligation or (ii) receive a net settlement amount in the form of cash or securities equal to the notional amount of the swap less the recovery value of the referenced obligation.
20 Payments made are based on the notional amount.
21 Payment from the counterparty will be received upon the occurrence of bankruptcy and/or by a restructuring event with respect to the Macy's Retail Holdings, Inc. bond, 8.875%, due 07/15/15.
22 Payment from the counterparty will be received upon the occurrence of bankruptcy and/or by a restructuring event with respect to the Wachovia Corp. bond 5.300%, due 10/15/11.
23 Payment from the counterparty will be received upon the occurrence of bankruptcy and/or by a restructuring event with respect to the Valero Energy Corp. bond, 8.750%, due 06/15/30.
24 Payment from the counterparty will be received upon the occurrence of bankruptcy and/or by a restructuring event with respect to the Historic TW, Inc. bond, 9.125%, due 01/15/13.
25 Payment from the counterparty will be received upon the occurrence of bankruptcy and/or by a restructuring event with respect to the Bank of America Corp. bond, 5.750%, due 12/01/17.
26 Payment from the counterparty will be received upon the occurrence of bankruptcy and/or by a restructuring event with respect to the Merrill Lynch & Co. bond, 6.875%, due 04/25/18.
27 Payment from the counterparty will be received upon the occurrence of bankruptcy and/or by a restructuring event with respect to the Cameron International Corp. bond, 6.375%, due 07/15/18.
USD United States Dollar
Credit default swaps on corporate and sovereign issues—sell protection28
| | | | | | | Rate type | | | | | | | | | |
| Counterparty | | Notional
amount
(000) | | Termination
dates | | Payments
made by
the Portfolio | | Payments
received by
the Portfolio | | Upfront
payments
(made)
received | | Value | | Unrealized
appreciation
(depreciation) | | Credit spread29 | |
Barclays
Bank PLC | | EUR | 300 | | | 06/20/12 | | | — | 30 | | | 1.000 | %31 | | $ | 32,958 | | | $ | (16,233 | ) | | $ | 16,725 | 6 | | | 3.34 | % | |
Barclays
Bank PLC | | EUR | 500 | | | 06/20/15 | | | — | 30 | | | 1.000 | 31 | | | 75,251 | | | | (57,612 | ) | | | 17,639 | 7 | | | 3.20 | | |
Barclays
Bank PLC | | USD | 3,900 | | | 03/20/13 | | | — | 32 | | | 2.030 | 31 | | | — | | | | (27,254 | ) | | | (27,254 | ) | | | 2.31 | | |
Barclays
Bank PLC | | USD | 2,800 | | | 09/20/10 | | | — | 33 | | | 1.000 | 31 | | | 5,721 | | | | (1,215 | ) | | | 4,506 | | | | 1.30 | | |
| BNP Paribas | | USD | 1,000 | | | 12/20/12 | | | — | 34 | | | 2.870 | 31 | | | — | | | | (78,753 | ) | | | (78,753 | ) | | | 6.61 | | |
| Citibank N.A. | | USD | 1,800 | | | 03/20/14 | | | — | 35 | | | 5.000 | 31 | | | 88,920 | | | | 170,906 | | | | 259,826 | | | | 2.25 | | |
| Citibank N.A. | | USD | 200 | | | 06/20/15 | | | — | 30 | | | 5.000 | 31 | | | (3,642 | ) | | | 14,550 | | | | 10,908 | 7 | | | 3.20 | | |
Credit Suisse
First Boston | | USD | 1,200 | | | 06/20/15 | | | — | 30 | | | 5.000 | 31 | | | (18,409 | ) | | | 87,301 | | | | 68,892 | 6 | | | 3.20 | | |
Deutsche
Bank AG | | USD | 3,000 | | | 03/20/13 | | | — | 32 | | | 2.073 | 31 | | | — | | | | (17,699 | ) | | | (17,699 | ) | | | 2.31 | | |
Deutsche
Bank AG | | USD | 1,700 | | | 03/20/15 | | | — | 36 | | | 1.000 | 31 | | | (27,689 | ) | | | 44,064 | | | | 16,375 | 7 | | | 0.43 | | |
Deutsche
Bank AG | | USD | 700 | | | 06/20/15 | | | — | 30 | | | 5.000 | 31 | | | (24,474 | ) | | | 50,925 | | | | 26,451 | 6 | | | 3.20 | | |
Deutsche
Bank AG | | USD | 1,000 | | | 12/20/12 | | | — | 34 | | | 2.900 | 31 | | | — | | | | (78,121 | ) | | | (78,121 | ) | | | 6.61 | | |
| | | | | | | | | | | | | | | | | $ | 128,636 | | | $ | 90,859 | | | $ | 219,495 | | | | | | |
28 If the Portfolio is a seller of protection and a credit event occurs, as defined under the terms of the particular swap agreement, the Portfolio will either (i) pay to the buyer of protection an amount equal to the notional amount of the swap and take delivery of the referenced obligation or (ii) pay a net settlement amount in the form of cash or securities equal to the notional amount of the swap less the recovery value of the referenced obligation.
58
UBS PACE Select Advisors Trust
UBS PACE Strategic Fixed Income Investments
Portfolio of investments—July 31, 2010
29 Credit spreads, where applicable, represented in absolute terms, utilized in determining the market value as of period end serve as an indicator of the current status of the payment/performance risk and represent the likelihood or risk of default for the credit derivative. The credit spread of a particular referenced entity reflects the cost of buying/selling protection and may include upfront payments required to be made to enter into the agreement. Wider credit spreads represent a deterioration of the referenced entity's credit soundness and a greater likelihood or risk of default or other credit event occurring as defined under the terms of the agreement. A credit spread identified as "Defaulted" indicates a credit event has occurred for the referenced entity.
30 Payment to the counterparty will be made upon the occurrence of bankruptcy and/or by a restructuring event with respect to the BP Capital Markets America bond, 4.200%, due 06/15/18.
31 Payments received are based on the notional amount.
32 Payment to the counterparty will be made upon the occurrence of bankruptcy and/or by a restructuring event with respect to the MetLife, Inc. bond, 5.000%, due 06/15/15.
33 Payment to the counterparty will be made upon the occurrence of bankruptcy and/or by a restructuring event with respect to the RSHB Capital SA bond, 6.299%, due 05/15/17.
34 Payment to the counterparty will be made upon the occurrence of bankruptcy and/or by a restructuring event with respect to the SLM Corp. bond, 5.125%, due 08/27/12.
35 Payment to the counterparty will be made upon the occurrence of bankruptcy and/or by a restructuring event with respect to the El Paso Corp. bond, 6.875%, due 06/15/14.
36 Payment to the counterparty will be made upon the occurrence of bankruptcy and/or by a restructuring event with respect to the Australian Government bond, 6.500%, due 05/15/23.
EUR Euro
USD United States Dollar
The following is a summary of the fair valuations according to the inputs used as of July 31, 2010 in valuing the Portfolio's investments:
| | | Unadjusted
quoted prices in
active markets for
identical investments
(Level 1) | | Other significant
observable inputs
(Level 2) | | Unobservable
inputs
(Level 3) | | Total | |
| US government obligations | | $ | — | | | $ | 266,716,346 | | | $ | — | | | $ | 266,716,346 | | |
Government national mortgage
association certificates | | | — | | | | 234,784 | | | | — | | | | 234,784 | | |
Federal home loan mortgage corporation
certificates | | | — | | | | 262,355 | | | | 1,464,731 | | | | 1,727,086 | | |
| Federal housing administration certificates | | | — | | | | — | | | | 57,642 | | | | 57,642 | | |
Federal national mortgage association
certificates | | | — | | | | 18,642,622 | | | | 117,773 | | | | 18,760,395 | | |
| Collateralized mortgage obligations | | | — | | | | 198,984,083 | | | | 356,174 | | | | 199,340,257 | | |
| Asset-backed securities | | | — | | | | 22,920,714 | | | | — | | | | 22,920,714 | | |
| Corporate notes | | | — | | | | 191,871,881 | | | | — | | | | 191,871,881 | | |
| Loan assignments | | | — | | | | 4,633,107 | | | | — | | | | 4,633,107 | | |
| Non-US government obligations | | | — | | | | 54,684,109 | | | | — | | | | 54,684,109 | | |
| Municipal bonds and notes | | | — | | | | 22,413,816 | | | | — | | | | 22,413,816 | | |
| Preferred stock | | | — | | | | 6,220,800 | | | | — | | | | 6,220,800 | | |
| Short-term US government obligations | | | — | | | | 1,309,099 | | | | — | | | | 1,309,099 | | |
| Repurchase agreement | | | — | | | | 4,277,000 | | | | — | | | | 4,277,000 | | |
| Investment of cash collateral for securities loaned | | | — | | | | 196,020 | | | | — | | | | 196,020 | | |
| Written options | | | — | | | | (1,782,467 | ) | | | — | | | | (1,782,467 | ) | |
| Futures contracts | | | 907,568 | | | | — | | | | — | | | | 907,568 | | |
| Forward foreign currency contracts, net | | | — | | | | (2,257,849 | ) | | | — | | | | (2,257,849 | ) | |
| Swap agreements, net | | | — | | | | 2,355,914 | | | | — | | | | 2,355,914 | | |
| Total | | $ | 907,568 | | | $ | 791,682,334 | | | $ | 1,996,320 | | | $ | 794,586,222 | | |
At July 31, 2010, there were no transfers between Level 1 and Level 2.
59
UBS PACE Select Advisors Trust
UBS PACE Strategic Fixed Income Investments
Portfolio of investments—July 31, 2010
The following is a rollforward of the Portfolio's investments that were valued using unobservable inputs (Level 3) for the year ended July 31, 2010:
| | | Federal home
loan mortgage
corporation
certificates | | Federal
housing
administration
certificates | | Federal national
mortgage
association
certificates | | Collateralized
mortgage
obligations | | Total | |
| Beginning balance | | $ | 1,512,265 | | | $ | 104,298 | | | $ | 149,678 | | | $ | 3,395,174 | | | $ | 5,161,415 | | |
| Net purchases/(sales) | | | (46,050 | ) | | | (47,700 | ) | | | (33,770 | ) | | | (759,298 | ) | | | (886,818 | ) | |
| Accrued discounts/(premiums) | | | — | | | | (2,906 | ) | | | — | | | | — | | | | (2,906 | ) | |
| Total realized gain/(loss) | | | — | | | | — | | | | — | | | | — | | | | — | | |
Net change in unrealized
appreciation/depreciation | | | (1,484 | ) | | | 3,950 | | | | 1,865 | | | | 198,753 | | | | 203,084 | | |
| Net transfers in/(out) of Level 3 | | | — | | | | — | | | | — | | | | (2,478,455 | ) | | | (2,478,455 | ) | |
| Ending balance | | $ | 1,464,731 | | | $ | 57,642 | | | $ | 117,773 | | | $ | 356,174 | | | $ | 1,996,320 | | |
The change in unrealized appreciation/depreciation relating to the Level 3 investments held at July 31, 2010 was $20,015.
Issuer breakdown by country or territory of origin (unaudited)
| | | Percentage of
total investments | |
| United States | | | 85.4 | % | |
| Brazil | | | 2.7 | | |
| Canada | | | 2.0 | | |
| United Kingdom | | | 1.6 | | |
| South Korea | | | 1.3 | | |
| Netherlands | | | 1.2 | | |
| Qatar | | | 0.9 | | |
| Denmark | | | 0.8 | | |
| Singapore | | | 0.7 | | |
| Australia | | | 0.7 | | |
| Mexico | | | 0.6 | | |
| Spain | | | 0.5 | | |
| Norway | | | 0.5 | | |
| Switzerland | | | 0.4 | | |
| United Arab Emirates | | | 0.3 | | |
| France | | | 0.3 | | |
| Chile | | | 0.1 | | |
| Total | | | 100.0 | % | |
See accompanying notes to financial statements.
60
UBS PACE Select Advisors Trust
UBS PACE Municipal Fixed Income Investments
Performance
For the 12 months ended July 31, 2010, the Portfolio's Class P shares returned 7.54%, before the deduction of the maximum UBS PACE Select program fee. (The Class P shares returned 5.40%, after the deduction of the maximum UBS PACE Select program fee, for the same 12-month period.) In comparison, the Barclays Capital US Municipal 3-15 year Blend Index (the "benchmark") returned 7.55%, and the Lipper Intermediate Municipal Debt Funds category posted a median return of 7.59%. (Returns for all share classes over various time periods are shown in the "Performance at a glance" table on page 64. Please note that the returns shown do not reflect the deduction of taxes that a shareholder could pay on Portfolio distributions or the redemption of Portfolio shares.) For a detailed commentary on the market environment in general during the reporting period, please refer to page 2.
Sub-Advisor's comments
During the reporting period, the Portfolio performed largely in line with its benchmark. Contributing to performance was favorable sector allocation and revenue bond security selection, along with a positive impact from yield curve exposure. (The yield curve plots the interest rates, at a set point in time, of bonds having equal credit quality, but differing maturity dates.)
The municipal bond market was supported by favorable supply-and-demand dynamics with relatively light tax-exempt issuance, coupled with intensifying demand by individual investors. Within the municipal bond market, investor sentiment generally reflected a high risk tolerance and a preference for securities with attractive yields. Against this backdrop, the Portfolio was well-positioned with an overweight to high-quality and research-intensive revenue bond sectors, as well as underweights to low-yielding pre-refunded and general obligation bonds. (Pre-refunded bonds are issued to fund another callable bond, where the issuer actually decides to exercise its right to buy its bonds back before the scheduled maturity date.) Additionally, the Portfolio's underweight bias toward pre-refunded bonds was a plus overall, relative to the benchmark, as the sector lagged other higher-yielding securities.
With tax-exempt interest rates hovering near 40-year lows and investors focused on incremental yield, the Portfolio's strategic emphasis toward bonds backed by revenue streams from essential service providers such as water, sewer, utility and transportation was advantageous. These operating entities are less tied to the cyclical swings in the economy than general obligation bonds. Exposure to corporate-backed securities, such as tobacco securitization and prepaid natural gas, was reduced during this period to both capture strong performance and lower the overall risk profile of the Portfolio.
UBS PACE Select Advisors Trust –
UBS PACE Municipal Fixed Income Investments
Investment Sub-Advisor:
Standish Mellon Asset Management Company LLC ("Standish Mellon")
Portfolio Manager:
Christine L. Todd
Objective:
High current income exempt from federal income tax
Investment process:
In deciding which securities to buy for the Portfolio, Standish Mellon seeks to identify undervalued sectors or geographical regions of the municipal market, or undervalued individual securities. To do this, Standish Mellon uses credit research and valuation analysis, and monitors the relationship of the municipal yield curve to the Treasury yield curve. Standish Mellon may also make modest duration adjustments based on economic analyses and interest rate forecasts. Standish Mellon generally sells securities if it identifies more attractive investment opportunities within its investment criteria that may improve the Portfolio's return. Standish Mellon also may sell securities with weakening credit profiles or to adjust the average duration of the Portfolio.
61
UBS PACE Select Advisors Trust
UBS PACE Municipal Fixed Income Investments
Sub-Advisor's comments – concluded
The fundamental credit picture for state and local governments is being supported by ongoing spending cuts (including those to payrolls, capital projects and services) and tax/fee hikes. State tax collections are recently showing signs of stabilization. The market witnessed strong relative performance from many general obligation bonds due to retail investors' faith in issuers raising taxes if necessary to meet their debt obligations.
Notably, bonds issued by the State of California, New York City and Puerto Rico were the top performers in the market. In fact, the results generated by the Portfolio's overweight to strong-performing Puerto Rico bonds was enough to offset the impact from the Portfolio's relative underweight to California and New York City bonds. This underweight position detracted from performance when these bonds rallied during the review period.
With continued evidence of a weak economic recovery, as well as stable and low inflation expectations, the Federal Reserve Board continues to be committed to an extended period of low rates. Duration positioning of the Portfolio—duration being a measure of a portfolio's sensitivity to interest rate changes—was kept within a relatively tight band around the benchmark. However, being modestly long to the benchmark was a positive, as interest rates declined during the period. The Portfolio's overweighting to 8- to 12-year maturities was also a plus as longer maturity bonds performed strongly, versus their shorter duration counterparts. Municipal bonds with call features which allow the issuer to opportunistically redeem bonds at a set price were poor performers overall during the period, making the Portfolio's underweight a positive contributor to relative returns.
Special considerations
The Portfolio may be appropriate for long-term investors seeking high current income exempt from federal income taxes. Investors should be able to withstand short-term fluctuations in the fixed income markets in return for potentially higher returns over the long term. The yield and value of the Portfolio change every day and can be affected by changes in interest rates, general market conditions and other political, social and economic developments, as well as specific matters relating to the issuers in which the Portfolio invests. It is important to note that an investment in the Portfolio is only one component of a balanced investment plan.
62
UBS PACE Select Advisors Trust
UBS PACE Municipal Fixed Income Investments
Illustration of an assumed investment of $10,000 in Class P shares of the Portfolio (unaudited)
The following graph depicts the performance of UBS PACE Municipal Fixed Income Investments Class P shares versus the Barclays Capital US Municipal 3-15 Year Blend Index over the 10 years ended July 31, 2010. The performance of the other classes will vary based upon the different class specific expenses and sales charges. The performance provided does not reflect the deduction of taxes that a shareholder could pay on Portfolio distributions or the redemption of Portfolio shares. Past performance is no guarantee of future results. Share price and returns will vary with market conditions; investors may realize a gain or loss upon redemption. It is important to note that UBS PACE Municipal Fixed Income Investments is a professionally managed portfolio while the Index is not available for investment and is unmanaged. The comparison is shown for illustration purposes only.

63
UBS PACE Select Advisors Trust
UBS PACE Municipal Fixed Income Investments
Performance at a glance (unaudited)
| Average annual total returns for periods ended 07/31/10 | | 1 year | | 5 years | | 10 years | | Since
inception1 | |
| Before deducting | | Class A2 | | | 7.18 | % | | | 4.02 | % | | N/A | | | 3.86 | % | |
| maximum sales charge | | Class B3 | | | 6.37 | % | | | 3.24 | % | | N/A | | | 3.36 | %7 | |
| or UBS PACE Select | | Class C4 | | | 6.65 | % | | | 3.50 | % | | N/A | | | 3.56 | % | |
| program fee | | Class Y5 | | | 7.45 | % | | | 4.29 | % | | N/A | | | 4.12 | % | |
| | | Class P6 | | | 7.54 | % | | | 4.29 | % | | | 4.42 | % | | | 4.57 | % | |
| After deducting | | Class A2 | | | 2.33 | % | | | 3.07 | % | | N/A | | | 3.35 | % | |
| maximum sales charge | | Class B3 | | | 1.37 | % | | | 2.89 | % | | N/A | | | 3.36 | %7 | |
| or UBS PACE Select | | Class C4 | | | 5.90 | % | | | 3.50 | % | | N/A | | | 3.56 | % | |
| program fee | | Class P6 | | | 5.40 | % | | | 2.23 | % | | | 2.35 | % | | | 2.50 | % | |
| Barclays Capital US Municipal 3-15 Year Blend Index8 | | | 7.55 | % | | | 5.15 | % | | | 5.55 | % | | | 5.55 | % | |
| Lipper Intermediate Municipal Debt Funds median | | | 7.59 | % | | | 4.11 | % | | | 4.61 | % | | | 4.69 | % | |
Average annual total returns for periods ended June 30, 2010, after deduction of the maximum sales charge or UBS PACE Select program fee, were as follows: Class A—1-year period, 2.74%; 5-year period, 2.65%; since inception, 3.22%; Class B—1-year period, 1.79%; 5-year period, 2.47%; since inception, 3.23%; Class C—1-year period, 6.32%; 5-year period, 3.08%; since inception, 3.44%; Class Y—1-year period, 7.87%; 5-year period, 3.85%; since inception, 3.99%; Class P—1-year period, 5.82%; 5-year period, 1.81%; 10-year period, 2.31%; since inception, 2.42%.
The annualized gross and net expense ratios, respectively, for each class of shares as in the November 28, 2009 prospectuses, were as follows: Class A—0.96% and 0.93%; Class B—1.74% and 1.68%; Class C—1.47% and 1.43%; Class Y—0.76% and 0.68%; and Class P—0.74% and 0.68%. Net expenses reflect fee waivers and/or expense reimbursements, if any, pursuant to an agreement that is in effect to cap the expenses. The Portfolio and UBS Global AM have entered into a written fee waiver/expense reimbursement agreement pursuant to which UBS Global AM is contractually obligated to waive its management fees and/or reimburse expenses so that the ordinary total operating expenses of each class through November 30, 2010 (excluding dividend expense, borrowing costs and interest expense, if any) would not exceed Class A—0.93%; Class B—1.68%; Class C—1.43%; Class Y—0.68%; and Class P—0.68%. The Portfo lio has agreed to repay UBS Global AM for any waived fees/reimbursed expenses to the extent that it can do so over the following three fiscal years without causing the Portfolio's expenses in any of those three years to exceed the expense caps described above.
1 Since inception returns are calculated as of commencement of issuance on August 24, 1995 for Class P shares, January 23, 2001 for Class A shares, February 23, 2001 for Class B shares, December 4, 2000 for Class C shares and February 23, 2001 for Class Y shares. Since inception returns for the Index and Lipper median are shown as of August 31, 1995, which is the month-end after the inception date of the oldest share class (Class P).
2 Maximum sales charge for Class A shares is 4.5%. Class A shares bear ongoing 12b-1 service fees.
3 Maximum contingent deferred sales charge for Class B shares is 5% imposed on redemptions and is reduced to 0% after a maximum of six years. Class B shares bear ongoing 12b-1 service and distribution fees.
4 Maximum contingent deferred sales charge for Class C shares is 0.75% imposed on redemptions and is reduced to 0% after one year. Class C shares bear ongoing 12b-1 service and distribution fees. Prior to September 30, 2003, Class C shares were subject to a maximum front-end sales charge of 1.00%; this front-end sales charge is not reflected in the average annual total return presented for the Class C shares shown above.
5 The Portfolio offers Class Y shares to a limited group of eligible investors, including certain qualifying retirement plans. Class Y shares do not bear initial or contingent deferred sales charges or ongoing 12b-1 service and distribution fees.
6 Class P shares do not bear initial or contingent deferred sales charges or ongoing 12b-1 service and distribution fees, but are subject to a maximum annual UBS PACE Select program fee of 2% of the value of Class P shares. Prior to June 14, 2010, the maximum annual UBS PACE Select program fee was 1.5% of the value of Class P shares.
7 Assumes the conversion of Class B to Class A shares at the end of the sixth year.
8 The Barclays Capital US Municipal 3-15 Year Blend Index is an unmanaged total return performance benchmark for the tax-exempt bond market. The Index includes municipal bonds with an effective maturity between 2 and 17 years that have at least one year to maturity and are investment grade. Investors should note that indices do not reflect the deduction of fees and expenses.
If an investor sells or exchanges shares less than 90 days after purchase, a redemption fee of 1.00% of the amount sold or exchanged will be deducted at the time of the transaction, except as noted otherwise in the prospectuses.
Past performance does not predict future performance, and the performance information provided does not reflect the deduction of taxes that a shareholder could pay on Portfolio distributions or the redemption of Portfolio shares. The return and principal value of an investment will fluctuate, so that an investor's shares, when redeemed, may be worth more or less than their original cost. Performance results assume reinvestment of all dividends and capital gain distributions at net asset value on the ex-dividend dates. Current performance may be higher or lower than the performance data quoted. For month-end performance figures, please visit http://www.ubs.com.
Lipper peer group data calculated by Lipper Inc.; used with permission. The Lipper median is the return of the fund that places in the middle of a Lipper peer group.
64
UBS PACE Select Advisors Trust
UBS PACE Municipal Fixed Income Investments
Portfolio statistics (unaudited)
| Characteristics | | 07/31/10 | |
| Weighted average duration | | | 4.9 | yrs. | |
| Weighted average maturity | | | 5.9 | yrs. | |
| Average coupon | | | 5.22 | % | |
| Net assets (mm) | | $ | 328.5 | | |
| Number of holdings | | | 165 | | |
| Portfolio composition1 | | 07/31/10 | |
| Municipal bonds and notes | | | 98.8 | % | |
| Tax-free money market fund | | | 1.1 | | |
| Cash equivalents and other assets less liabilities | | | 0.1 | | |
| Total | | | 100.0 | % | |
| Top five sectors1 | | 07/31/10 | |
| Revenue | | | 46.7 | % | |
| General obligations | | | 23.8 | | |
| Lease revenue/special revenue | | | 18.8 | | |
| Pre-refunded | | | 4.6 | | |
| Housing | | | 2.0 | | |
| Total | | | 95.9 | % | |
| Top five states1 | | 07/31/10 | |
| Texas | | | 14.5 | % | |
| California | | | 12.2 | | |
| Florida | | | 8.2 | | |
| Illinois | | | 7.8 | | |
| Washington | | | 6.6 | | |
| Total | | | 49.3 | % | |
| Quality diversification1 | | 07/31/10 | |
| AAA and agency backed securities | | | 34.9 | % | |
| AA | | | 30.6 | | |
| A | | | 20.5 | | |
| BBB | | | 6.6 | | |
| Non-rated | | | 6.2 | | |
| Tax-free money market fund | | | 1.1 | | |
| Cash equivalents and other assets less liabilities | | | 0.1 | | |
| Total | | | 100.0 | % | |
1 Weightings represent percentages of the Portfolio's net assets as of July 31, 2010. The Portfolio is actively managed and its composition will vary over time. Credit quality ratings shown are based on the ratings assigned to portfolio holdings by Standard & Poor's Ratings Group, an independent rating agency.
65
UBS PACE Select Advisors Trust
UBS PACE Municipal Fixed Income Investments
Portfolio of investments—July 31, 2010
| Security description | | Face
amount | | Value | |
| Municipal bonds and notes—98.75% | |
| Alabama—0.67% | |
Birmingham Waterworks Board
Water Revenue Series A
(Assured Guaranty Insured)
5.000%, due 01/01/24 | | $ | 2,005,000 | | | $ | 2,192,026 | | |
| Alaska—2.76% | |
Alaska Housing Finance Corp.
General Housing Series C
(NATL-RE Insured)
5.000%, due 12/01/13 | | | 1,110,000 | | | | 1,237,239 | | |
Alaska Housing Finance Corp.
Mortgage Series A-2
5.650%, due 12/01/101 | | | 970,000 | | | | 972,571 | | |
Alaska International Airports
Revenue Refunding Series A
(NATL-RE Insured)
5.500%, due 10/01/151 | | | 3,500,000 | | | | 3,830,785 | | |
North Slope Boro Series A
(NATL-RE Insured)
5.000%, due 06/30/16 | | | 2,000,000 | | | | 2,317,580 | | |
Northern Tobacco Securitization
Corp. Alaska Tobacco Settlement
Asset-Backed Bonds Series A
4.625%, due 06/01/23 | | | 730,000 | | | | 694,281 | | |
| | | | 9,052,456 | | |
| Arizona—1.69% | |
Arizona State Transportation Board
Excise Tax Revenue Maricopa
County Regional Area Road Fund
5.000%, due 07/01/15 | | | 2,000,000 | | | | 2,333,840 | | |
Pima County Sewer Revenue
System (AGM Insured)
5.000%, due 07/01/23 | | | 1,500,000 | | | | 1,635,900 | | |
San Manuel Entertainment
Series 04-C
4.500%, due 12/01/162 | | | 1,800,000 | | | | 1,581,534 | | |
| | | | 5,551,274 | | |
| California—12.23% | |
California State
5.000%, due 03/01/17 | | | 2,000,000 | | | | 2,218,820 | | |
| 5.000%, due 08/01/19 | | | 3,000,000 | | | | 3,276,450 | | |
| 5.250%, due 10/01/20 | | | 1,000,000 | | | | 1,125,760 | | |
| 5.500%, due 04/01/21 | | | 3,000,000 | | | | 3,391,260 | | |
California State Department of
Water Resources Power Supply
Revenue Series L
5.000%, due 05/01/14 | | | 1,250,000 | | | | 1,427,925 | | |
| 5.000%, due 05/01/17 | | | 1,000,000 | | | | 1,164,550 | | |
California State Economic Recovery
Refunding Series A
5.000%, due 07/01/20 | | | 3,000,000 | | | | 3,411,060 | | |
| Security description | | Face
amount | | Value | |
| Municipal bonds and notes—(continued) | |
| California—(concluded) | |
California Statewide Communities
Development Authority Pollution
Control Revenue Refunding
Southern California Edison
Company Series A
(Mandatory Put 04/01/13 @ 100)
(XL Capital Insured)
4.100%, due 04/01/283 | | $ | 1,000,000 | | | $ | 1,068,720 | | |
California Statewide Communities
Development Authority Revenue
Kaiser Permanente Series A
5.000%, due 04/01/19 | | | 3,000,000 | | | | 3,332,670 | | |
California Statewide Communities
Development Authority Revenue
St. Joseph Series F (AGM Insured)
5.250%, due 07/01/18 | | | 1,500,000 | | | | 1,704,030 | | |
Golden State Tobacco Securitization
Corp. Tobacco Settlement Revenue
Asset-Backed Senior Series A-1
4.500%, due 06/01/27 | | | 4,885,000 | | | | 4,231,582 | | |
Los Angeles Wastewater System
Revenue Refunding Series A
(NATL-RE-FGIC Insured)
6.000%, due 06/01/22 | | | 2,000,000 | | | | 2,520,520 | | |
San Diego Public Facilities Financing
Authority Sewer Revenue Senior
Series A
5.000%, due 05/15/25 | | | 2,500,000 | | | | 2,708,675 | | |
Southern California Public Power
Authority Power Project Revenue
Canyon Power Series A
5.000%, due 07/01/22 | | | 2,000,000 | | | | 2,240,620 | | |
Tobacco Securitization Authority
Northern California Tobacco
Settlement Revenue Asset-Backed
Bonds Series A-1
4.750%, due 06/01/23 | | | 825,000 | | | | 751,468 | | |
Tuolumne Wind Project Authority
Revenue Tuolumne Co. Project
Series A
5.250%, due 01/01/24 | | | 2,590,000 | | | | 2,798,262 | | |
University of California Revenue
Series Q
5.250%, due 05/15/23 | | | 2,500,000 | | | | 2,818,075 | | |
| | | | 40,190,447 | | |
| Delaware—0.54% | |
Delaware State Series 2009B
5.000%, due 01/01/17 | | | 1,500,000 | | | | 1,780,740 | | |
| District of Columbia—0.33% | |
Metropolitan Airport Authority
System Refunding Series A
(NATL-RE-FGIC Insured)
5.750%, due 10/01/141 | | | 1,000,000 | | | | 1,077,930 | | |
66
UBS PACE Select Advisors Trust
UBS PACE Municipal Fixed Income Investments
Portfolio of investments—July 31, 2010
| Security description | | Face
amount | | Value | |
| Municipal bonds and notes—(continued) | |
| Florida—8.21% | |
Citizens Property Insurance Corp.
Refunding Senior Secured High
Risk Account Series A
(NATL-RE Insured)
5.000%, due 03/01/14 | | $ | 2,000,000 | | | $ | 2,115,080 | | |
Citizens Property Insurance Corp.
Senior Secured High Account
Series A-1
5.500%, due 06/01/14 | | | 1,000,000 | | | | 1,079,440 | | |
Citizens Property Insurance Corp.
Senior Secured High Risk
Series A-1
5.000%, due 06/01/15 | | | 1,600,000 | | | | 1,692,992 | | |
Florida Department of Children's &
Family Services Certificates of
Participation (Florida Civil
Commitment Center)
(NATL-RE Insured)
5.000%, due 04/01/14 | | | 1,065,000 | | | | 1,202,183 | | |
Florida Hurricane Catastrophe Fund
Finance Corp. Revenue Series A
5.000%, due 07/01/15 | | | 1,000,000 | | | | 1,082,060 | | |
Florida State Board of Education
Lottery Revenue Refunding
Series C
5.000%, due 07/01/16 | | | 1,000,000 | | | | 1,151,000 | | |
Florida State Municipal Power
Agency Revenue All Requirements
Power Series A
5.250%, due 10/01/20 | | | 1,555,000 | | | | 1,781,905 | | |
| 5.250%, due 10/01/21 | | | 2,000,000 | | | | 2,236,180 | | |
Gainesville Utilities Systems Revenue
Series B
6.500%, due 10/01/12 | | | 1,795,000 | | | | 2,013,757 | | |
Miami-Dade County Water & Sewer
Revenue Refunding Series C
5.250%, due 10/01/18 | | | 2,000,000 | | | | 2,318,000 | | |
Miami-Dade County Water & Sewer
Revenue Refunding Systems
Series B (AGM Insured)
5.250%, due 10/01/18 | | | 2,500,000 | | | | 2,924,900 | | |
Orlando & Orange County
Expressway Authority Expressway
Revenue Junior Lien
(NATL-RE-IBC/FGIC Insured)
8.250%, due 07/01/16 | | | 2,595,000 | | | | 3,382,894 | | |
Tampa Solid Waste System Revenue
Refunding (AGM Insured)
5.000%, due 10/01/151,4 | | | 1,000,000 | | | | 1,083,440 | | |
Tampa Utilities Tax & Special
Revenue Refunding Series B
(AMBAC Insured)
5.750%, due 10/01/15 | | | 1,000,000 | | | | 1,178,960 | | |
| Security description | | Face
amount | | Value | |
| Municipal bonds and notes—(continued) | |
| Florida—(concluded) | |
Tampa-Hillsborough County
Expressway Authority Revenue
(AMBAC Insured)
5.000%, due 07/01/14 | | $ | 1,535,000 | | | $ | 1,721,610 | | |
| | | | 26,964,401 | | |
| Georgia—1.86% | |
De Kalb County Water & Sewer
Revenue Refunding Series B
5.250%, due 10/01/24 | | | 2,000,000 | | | | 2,428,320 | | |
Fulton De Kalb Hospital Authority
Hospital Revenue Refunding
Certificates (AGM Insured)
5.250%, due 01/01/15 | | | 2,000,000 | | | | 2,249,760 | | |
Gwinnett County Development
Authority Certificates of
Participation, Gwinnett County
Public Schools Project
(Pre-refunded with State and
Local Government Securities to
01/01/14 @ 100)
(NATL-RE Insured)
5.250 %, due 01/01/20 | | | 1,250,000 | | | | 1,434,050 | | |
| | | | 6,112,130 | | |
| Guam—0.31% | |
Guam Education Financing
Foundation Certificates of
Participation, Guam Public
Schools Project Series A
5.000%, due 10/01/12 | | | 1,000,000 | | | | 1,031,130 | | |
| Hawaii—0.33% | |
Hawaii State Harbor Systems
Revenue Series A (AGM Insured)
5.000%, due 01/01/131 | | | 1,000,000 | | | | 1,069,510 | | |
| Idaho—0.15% | |
Idaho Housing & Finance Association
Single-Family Mortgage
Series G-2, Class III
5.950%, due 07/01/191 | | | 405,000 | | | | 425,234 | | |
Subseries D-3
5.150%, due 07/01/131 | | | 75,000 | | | | 76,722 | | |
| | | | 501,956 | | |
| Illinois—7.85% | |
Chicago (Pre-refunded with State and
Local Government Securities
to 01/01/14 @ 100) Series A
(AGM Insured)
5.000%, due 01/01/34 | | | 2,000,000 | | | | 2,282,040 | | |
Cook County Forest Preservation
District (AMBAC Insured)
5.000%, due 11/15/19 | | | 5,180,000 | | | | 5,989,893 | | |
67
UBS PACE Select Advisors Trust
UBS PACE Municipal Fixed Income Investments
Portfolio of investments—July 31, 2010
| Security description | | Face
amount | | Value | |
| Municipal bonds and notes—(continued) | |
| Illinois—(concluded) | |
Illinois Development Finance
Authority Revenue DePaul
University Series C
5.500%, due 10/01/13 | | $ | 1,000,000 | | | $ | 1,101,430 | | |
Illinois Development Finance
Authority Revenue School District
Program School District No. U-46
(AGM Insured)
5.150%, due 01/01/19 | | | 2,000,000 | | | | 2,271,580 | | |
Illinois Educational Facilities
Authority Revenue Evangelical
Hospital Series A
(Escrowed to Maturity)
6.750%, due 04/15/17 | | | 660,000 | | | | 793,808 | | |
Illinois Health Facilities Authority
Revenue University of Chicago
Hospital & Health
(NATL-RE Insured)
5.000%, due 08/15/12 | | | 2,000,000 | | | | 2,142,020 | | |
Illinois Municipal Electric Agency
Power Supply Refunding Series C
(NATL-RE-FGIC Insured)
5.000%, due 02/01/16 | | | 1,200,000 | | | | 1,343,052 | | |
llinois State Refunding
5.000%, due 01/01/22 | | | 2,500,000 | | | | 2,642,225 | | |
Illinois Toll Highway Authority Toll
Highway Revenue Refunding
Senior Series A-1
5.000%, due 01/01/25 | | | 1,250,000 | | | | 1,324,100 | | |
Regional Transportation Authority
Series A (AGM Insured)
5.750%, due 06/01/18 | | | 3,000,000 | | | | 3,599,520 | | |
Springfield Electric Revenue Senior
Lien Electric
5.000%, due 03/01/16 | | | 2,000,000 | | | | 2,293,600 | | |
| | | | 25,783,268 | | |
| Indiana—1.54% | |
Carmel Industry School Building
Corp. First Mortgage (Pre-refunded
with State and Local Government
Securities to 07/15/13 @ 100)
(NATL-RE Insured)
5.000%, due 07/15/20 | | | 1,800,000 | | | | 2,032,956 | | |
Indiana State Finance Authority
Environmental Facilities Revenue
Refunding Industrial Power &
Light Co. Series C
4.900%, due 01/01/16 | | | 1,500,000 | | | | 1,632,150 | | |
Indiana University Revenues Student
Fees Series S
5.000%, due 08/01/19 | | | 1,185,000 | | | | 1,396,973 | | |
| | | | 5,062,079 | | |
| Security description | | Face
amount | | Value | |
| Municipal bonds and notes—(continued) | |
| Iowa—1.10% | |
Iowa Finance Authority Revenue
Revolving Fund
5.250%, due 02/01/14 | | $ | 3,310,000 | | | $ | 3,599,790 | | |
| Kentucky—0.48% | |
Louisville & Jefferson County
Regional Airport Authority Airport
Systems Revenue Series A
(AGM Insured)
5.750%, due 07/01/131 | | | 1,505,000 | | | | 1,569,565 | | |
| Louisiana—1.75% | |
Jefferson Parish Home Mortgage
Authority Single-Family Mortgage
Revenue Series A (GNMA/FNMA
and FHA/VA/USDA Mortgages
Insured)
5.125%, due 06/01/261 | | | 765,000 | | | | 801,950 | | |
Louisiana Public Facilities Authority
Revenue Hurricane Recovery
Project (AMBAC Insured)
5.000%, due 06/01/15 | | | 2,880,000 | | | | 3,230,093 | | |
New Orleans Aviation Board
Revenue New Orleans Aviation
Series B2 Refunding (AGM Insured)
5.000%, due 01/01/121 | | | 1,655,000 | | | | 1,728,399 | | |
| | | | 5,760,442 | | |
| Maryland—0.71% | |
Maryland State & Local Facilities
Lien First Series
5.000%, due 08/01/15 | | | 2,000,000 | | | | 2,316,380 | | |
| Massachusetts—4.67% | |
Massachusetts Bay Transportation
Authority Massachusetts Sales
Tax Revenue
Series A
5.000%, due 07/01/22 | | | 2,000,000 | | | | 2,389,440 | | |
Series B
5.250%, due 07/01/21 | | | 6,000,000 | | | | 7,320,900 | | |
Massachusetts Health & Educational
Facilities Authority Revenue
Massachusetts Institute of
Technology Series M
5.250%, due 07/01/29 | | | 1,000,000 | | | | 1,211,060 | | |
Massachusetts Health & Educational
Facilities Authority Revenue
Partners Healthcare Systems
Series G-5
5.000%, due 07/01/19 | | | 1,000,000 | | | | 1,094,020 | | |
Massachusetts State Development
Finance Agency Solid Waste
Disposal Revenue Waste
Management Income Project
5.450%, due 06/01/141 | | | 2,000,000 | | | | 2,140,620 | | |
68
UBS PACE Select Advisors Trust
UBS PACE Municipal Fixed Income Investments
Portfolio of investments—July 31, 2010
| Security description | | Face
amount | | Value | |
| Municipal bonds and notes—(continued) | |
| Massachusetts—(concluded) | |
Massachusetts State Water Resources
Authority Refunding General
Series B
5.000%, due 08/01/15 | | $ | 1,000,000 | | | $ | 1,175,730 | | |
| | | | 15,331,770 | | |
| Michigan—3.00% | |
Detroit Sewer Disposal Revenue
Refunding Senior Lien Series C-1
6.500%, due 07/01/24 | | | 2,250,000 | | | | 2,521,305 | | |
Detroit Sewer Disposal Revenue
Second Lien Series D-2
(Mandatory Put 01/01/12 @ 100)
(NATL-RE Insured)
5.500%, due 07/01/323 | | | 2,000,000 | | | | 2,065,820 | | |
Detroit Sewer Disposal Revenue
Senior Lien Series A
(AGM Insured)
5.250%, due 07/01/19 | | | 2,500,000 | | | | 2,754,100 | | |
Michigan State Housing
Development Authority
Series A
4.550%, due 12/01/141 | | | 2,395,000 | | | | 2,508,715 | | |
| | | | 9,849,940 | | |
| Minnesota—0.00% | |
Moorhead Residential Mortgage
(Escrowed to Maturity)
(FHA/VA Insured)
7.100%, due 08/01/11 | | | 15,000 | | | | 15,690 | | |
| Missouri—2.93% | |
Missouri State Health & Educational
Facilities Authority Health Facilities
Revenue St. Lukes Health Systems
Series A (AGM Insured)
5.000%, due 11/15/16 | | | 2,000,000 | | | | 2,231,960 | | |
| 5.000%, due 11/15/17 | | | 2,500,000 | | | | 2,787,725 | | |
Missouri State Highways & Transit
Commission State Road Revenue
Second Lien
5.000%, due 05/01/16 | | | 2,000,000 | | | | 2,359,840 | | |
Springfield Public Building Corp.
Leasehold Revenue Springfield
Branson Airport Series B
(AMBAC Insured)
5.000%, due 07/01/131 | | | 2,075,000 | | | | 2,252,495 | | |
| | | | 9,632,020 | | |
| Nevada—0.52% | |
Las Vegas Valley Water District
Refunding & Improvement Series A
5.000%, due 02/01/17 | | | 1,500,000 | | | | 1,717,005 | | |
| Security description | | Face
amount | | Value | |
| Municipal bonds and notes—(continued) | |
| New Jersey—0.95% | |
New Jersey Economic Development
Authority Water Facilities Revenue
Refunding American Water Co.
Series C
5.100%, due 06/01/231 | | $ | 1,000,000 | | | $ | 1,013,840 | | |
New Jersey Transportation Trust
Fund Authority Transportation
System Series B
(AGC-ICC/FGIC Insured)
5.500%, due 12/15/20 | | | 1,500,000 | | | | 1,770,945 | | |
Tobacco Settlement Financing Corp.
Series 1-A
4.500%, due 06/01/23 | | | 365,000 | | | | 334,205 | | |
| | | | 3,118,990 | | |
| New York—5.90% | |
New York City Industrial
Development Agency Special
Facility Revenue Terminal One
Group Association Project
5.000%, due 01/01/111 | | | 4,000,000 | | | | 4,048,920 | | |
New York City Transitional Finance
Authority Revenue Refunding
Future Tax Secured Series A
5.500%, due 11/01/263 | | | 2,000,000 | | | | 2,107,160 | | |
New York City, Series B
5.000%, due 08/01/174 | | | 1,750,000 | | | | 2,026,535 | | |
New York State Dorm Authority
Lease Revenue Series B
(Mandatory Put 07/01/13 @ 100)
(XL Capital Insured)
5.250%, due 07/01/323 | | | 1,500,000 | | | | 1,667,805 | | |
New York State Dorm Authority
State Personal Income Tax Revenue
Education Series D
5.000%, due 03/15/15 | | | 2,500,000 | | | | 2,904,100 | | |
Port Authority of New York &
New Jersey (NATL-RE-FGIC Insured)
5.000%, due 10/01/131 | | | 6,000,000 | | | | 6,612,180 | | |
| | | | 19,366,700 | | |
| North Carolina—1.77% | |
Iredell County Certificates of
Participation Iredell County School
Project (AGM Insured)
5.250%, due 06/01/15 | | | 1,000,000 | | | | 1,168,930 | | |
North Carolina Capital Facilities
Finance Agency Revenue Duke
University Project (Pre-refunded
with State and Local Government
Securities to 10/01/12 @ 100)
Series A
5.125%, due 07/01/42 | | | 2,700,000 | | | | 2,974,050 | | |
69
UBS PACE Select Advisors Trust
UBS PACE Municipal Fixed Income Investments
Portfolio of investments—July 31, 2010
| Security description | | Face
amount | | Value | |
| Municipal bonds and notes—(continued) | |
| North Carolina—(concluded) | |
North Carolina State Refunding
Series E
5.000%, due 02/01/13 | | $ | 1,510,000 | | | $ | 1,678,712 | | |
| | | | 5,821,692 | | |
| Ohio—1.94% | |
Cleveland Waterworks Revenue
Refunding First Mortgage Series G
(NATL-RE Insured)
5.500%, due 01/01/13 | | | 1,555,000 | | | | 1,612,162 | | |
Kent State University Revenue
General Receipts Series B
(Assured Guaranty Insured)
5.000%, due 05/01/21 | | | 3,000,000 | | | | 3,411,690 | | |
Ohio Housing Finance Agency
Mortgage Revenue Residential
Series B-2 (GNMA Collateralized)
5.350%, due 09/01/181 | | | 245,000 | | | | 251,524 | | |
Ohio State Water Development
Authority Water Pollution
Control Revenue Loan Fund
(Pre-refunded with State and
Local Government Securities to
06/01/12 @ 100)
5.050%, due 12/01/21 | | | 1,000,000 | | | | 1,085,500 | | |
| | | | 6,360,876 | | |
| Oklahoma—0.34% | |
Oklahoma Department of
Transportation Revenue
Grant Anticipation Notes
Series A
5.000%, due 09/01/13 | | | 1,000,000 | | | | 1,123,950 | | |
| Oregon—0.36% | |
Oregon State Department of
Transportation Highway User Tax
Revenue Series A
5.250%, due 11/15/14 | | | 1,000,000 | | | | 1,178,920 | | |
| Pennsylvania—2.98% | |
Allegheny County Sanitation
Authority Sewer Revenue
(Pre-refunded with US Government
Securities and a Repurchase
Agreement to 12/01/10 @ 101)
(NATL-RE Insured)
5.750%, due 12/01/15 | | | 800,000 | | | | 820,792 | | |
Lancaster Sewer Authority
(Escrowed to Maturity)
6.000%, due 04/01/12 | | | 20,000 | | | | 21,092 | | |
Pennsylvania Intergovernmental
Cooperative Authority Special Tax
Revenue Refunding Philadelphia
Funding Program
5.000%, due 06/15/17 | | | 2,000,000 | | | | 2,335,560 | | |
| Security description | | Face
amount | | Value | |
| Municipal bonds and notes—(continued) | |
| Pennsylvania—(concluded) | |
Pennsylvania State Higher
Educational Facilties Authority
Revenue University of
Pennsylvania Series A
5.000%, due 09/01/17 | | $ | 1,150,000 | | | $ | 1,363,256 | | |
Pennsylvania Third Series
(AGM Insured)
5.000%, due 09/01/15 | | | 1,000,000 | | | | 1,148,920 | | |
Philadelphia Water & Wastewater
Revenue Refunding Series A
5.000%, due 06/15/15 | | | 1,500,000 | | | | 1,699,860 | | |
University of Pittsburgh of the
Commonwealth System of Higher
Education Capital Project Series B
5.500%, due 09/15/21 | | | 2,000,000 | | | | 2,399,120 | | |
| | | | 9,788,600 | | |
| Puerto Rico—4.60% | |
Puerto Rico Commonwealth
Government Development Bank
Senior Notes
Series B
5.000%, due 12/01/14 | | | 1,500,000 | | | | 1,627,995 | | |
Series C
5.250%, due 01/01/151 | | | 1,000,000 | | | | 1,047,670 | | |
Puerto Rico Commonwealth
Highway & Transportation
Authority Highway Revenue
Refunding Series CC
5.000%, due 07/01/13 | | | 1,070,000 | | | | 1,150,196 | | |
Puerto Rico Commonwealth
Highway & Transportation
Authority Transportation Revenue
(AGM Insured)
5.500%, due 07/01/25 | | | 2,000,000 | | | | 2,244,560 | | |
Puerto Rico Commonwealth
Refunding Series A
(Mandatory Put 07/01/12 @ 100)
5.000%, due 07/01/303 | | | 1,000,000 | | | | 1,039,670 | | |
Puerto Rico Public Buildings
Authority Revenue Guaranteed
Refunding Government Facilities
Series J (Mandatory Put
07/01/12 @ 100)
(Commonwealth GTD)
5.000%, due 07/01/283 | | | 3,000,000 | | | | 3,115,590 | | |
Puerto Rico Public Finance Corp.
Refunding Commonwealth
Appropriations Series A
(Mandatory Put 02/01/12 @ 100)
5.750%, due 08/01/273 | | | 500,000 | | | | 519,435 | | |
70
UBS PACE Select Advisors Trust
UBS PACE Municipal Fixed Income Investments
Portfolio of investments—July 31, 2010
| Security description | | Face
amount | | Value | |
| Municipal bonds and notes—(continued) | |
| Puerto Rico—(concluded) | |
Puerto Rico Sales Tax Financing
Corp. Sales Tax Revenue
First Sub- Series A
5.500%, due 08/01/23 | | $ | 4,000,000 | | | $ | 4,371,120 | | |
| | | | 15,116,236 | | |
| South Carolina—0.71% | |
Richland County School
District No. 002 Series A
(SCSDE Insured)
5.000%, due 02/01/21 | | | 2,000,000 | | | | 2,327,100 | | |
| South Dakota—0.58% | |
South Dakota Health & Educational
Facilities Authority Revenue
Refunding Prairie Lakes Health
Care (ACA/CBI Insured)
5.450%, due 04/01/13 | | | 1,915,000 | | | | 1,918,696 | | |
| Tennessee—2.37% | |
Memphis Electric System Revenue
Refunding Sub
5.000%, due 12/01/15 | | | 2,625,000 | | | | 3,078,941 | | |
Metropolitan Government
Nashville & Davidson County
Water Sewer Revenue Cab
Converter Refunding
(NATL-RE-FGIC/TCRs)
7.700%, due 01/01/125 | | | 4,455,000 | | | | 4,720,028 | | |
| | | | 7,798,969 | | |
| Texas—14.52% | |
Aldine Independent School District
School Building (PSF-GTD)
5.000%, due 02/15/19 | | | 1,435,000 | | | | 1,677,702 | | |
Cypress-Fairbanks Independent
School District Refunding
(PSF-GTD)
5.000%, due 02/15/22 | | | 2,000,000 | | | | 2,216,580 | | |
Cypress-Fairbanks Independent
School District Schoolhouse
(PSF-GTD)
5.000%, due 02/15/18 | | | 2,500,000 | | | | 2,913,375 | | |
Dallas-Fort Worth International
Airport Revenue Refunding &
Improvement Series A
(NATL-RE-FGIC Insured)
5.750%, due 11/01/131 | | | 2,000,000 | | | | 2,117,120 | | |
Dickinson Independent School
District Refunding Schoolhouse
(PSF-GTD)
5.000%, due 02/15/23 | | | 1,920,000 | | | | 2,060,621 | | |
Fort Worth Independent
School District (PSF-GTD)
5.000%, due 02/15/15 | | | 2,000,000 | | | | 2,335,720 | | |
| Security description | | Face
amount | | Value | |
| Municipal bonds and notes—(continued) | |
| Texas—(continued) | |
Harris County Flood Control District
Refunding Contract Series A
5.250%, due 10/01/18 | | $ | 2,000,000 | | | $ | 2,421,000 | | |
Harris County Hospital District
Revenue Refunding Senior Lien
Series A (NATL-RE Insured)
5.000%, due 02/15/18 | | | 1,675,000 | | | | 1,826,470 | | |
Houston Utilities Systems Revenue
Refunding Combined First Lien
Series A (AGM Insured)
5.250%, due 11/15/17 | | | 2,500,000 | | | | 2,995,750 | | |
Katy Independent School District
School Building Series A
(Pre-refunded with FHLMC, FNMA
and US Government obligations
to 02/15/13 @ 100) (PSF-GTD)
5.000%, due 02/15/14 | | | 2,000,000 | | | | 2,223,240 | | |
Keller Independent School District
Refunding (PSF-GTD)
5.000%, due 08/15/16 | | | 1,500,000 | | | | 1,734,645 | | |
Lower Colorado River Authority
Refunding LCRA Transmission
Services (BHAC Insured)
5.000%, due 05/15/20 | | | 1,765,000 | | | | 1,996,515 | | |
North East Independent School
District School Building Series A
(PSF-GTD)
5.000%, due 08/01/21 | | | 2,000,000 | | | | 2,282,540 | | |
North Texas Health Facilities
Development Corp. Hospital
Revenue United Regional Health
Care Systems (AGM Insured)
5.000%, due 09/01/21 | | | 1,450,000 | | | | 1,524,037 | | |
| 5.000%, due 09/01/22 | | | 1,400,000 | | | | 1,460,746 | | |
Pasadena Independent School
District Refunding (PSF-GTD)
5.000%, due 02/15/19 | | | 2,000,000 | | | | 2,344,400 | | |
Round Rock Independent School
District (PSF-GTD)
5.000%, due 08/01/16 | | | 2,750,000 | | | | 3,259,410 | | |
San Antonio Electric & Gas
Refunding Series A
5.000%, due 02/01/17 | | | 1,295,000 | | | | 1,514,269 | | |
Schertz-Cibolo-Universal City
Independent School District
School Building Series A
(PSF-GTD)
5.000%, due 02/01/14 | | | 1,500,000 | | | | 1,713,435 | | |
Texas Municipal Power Agency
Revenue (Escrowed to Maturity)
(NATL-RE Insured)
6.100%, due 09/01/136 | | | 25,000 | | | | 24,205 | | |
71
UBS PACE Select Advisors Trust
UBS PACE Municipal Fixed Income Investments
Portfolio of investments—July 31, 2010
| Security description | | Face
amount | | Value | |
| Municipal bonds and notes—(continued) | |
| Texas—(concluded) | |
Texas Water Development Board
Revenue State Revolving Fund
Subseries A-1
5.000%, due 07/15/24 | | $ | 1,885,000 | | | $ | 2,141,567 | | |
Tyler Independent School District
School Building
5.000%, due 02/15/18 | | | 2,165,000 | | | | 2,539,935 | | |
University of Texas University
Revenues Refunding Financing
System
Series D (Pre-refunded with
State and Local Government
Securities to 02/15/17 @ 100)
5.000%, due 08/15/17 | | | 1,805,000 | | | | 2,131,344 | | |
Series D Unrefunded Balance
5.000%, due 08/15/17 | | | 195,000 | | | | 228,601 | | |
| | | | 47,683,227 | | |
| Utah—0.52% | |
Riverton Hospital Revenue
IHC Health Services, Inc.
5.000%, due 08/15/15 | | | 1,200,000 | | | | 1,358,892 | | |
Utah State Housing Finance Agency
Single-Family Mortgage Series G-3,
Class III
5.700%, due 07/01/151 | | | 340,000 | | | | 351,234 | | |
| | | | 1,710,126 | | |
| Virginia—0.70% | |
Virginia College Building Authority
Educational Facilities Revenue
21st Century College & Equipment
(Pre-refunded with State and Local
Government Securities to
02/01/14 @ 100) Series A
5.000%, due 02/01/21 | | | 2,000,000 | | | | 2,287,560 | | |
| Washington—6.57% | |
Energy Northwest Electric Revenue
Columbia Station Series A
5.000%, due 07/01/23 | | | 2,500,000 | | | | 2,736,625 | | |
Energy Northwest Electric Revenue
Refunding Columbia Station
Series A
5.000%, due 07/01/21 | | | 2,000,000 | | | | 2,217,140 | | |
Energy Northwest Electric Revenue
Refunding Project 1 Series A
5.000%, due 07/01/16 | | | 1,515,000 | | | | 1,782,321 | | |
Energy Northwest Electric Revenue
Refunding Project 3 Series A
5.500%, due 07/01/13 | | | 1,000,000 | | | | 1,139,710 | | |
Port of Seattle Revenue Refunding
Intermediate Lien Series C
5.000%, due 02/01/161 | | | 1,000,000 | | | | 1,093,700 | | |
| Security description | | Face
amount | | Value | |
| Municipal bonds and notes—(concluded) | |
| Washington—(concluded) | |
Seattle Municipal Lighting & Power
Revenue Refunding &
Improvement Series B
5.000%, due 02/01/14 | | $ | 1,000,000 | | | $ | 1,142,290 | | |
Washington Health Care Facilities
Authority Overlake Hospital
Medical Center Series A
(Assured Guaranty Insured)
5.000%, due 07/01/16 | | | 1,000,000 | | | | 1,093,690 | | |
Washington State Public Power
Supply Systems Nuclear
Project No. 1 Revenue Refunding
Series B
7.125%, due 07/01/16 | | | 3,000,000 | | | | 3,829,170 | | |
Washington State
Series 93-A (Escrowed to Maturity)
5.750%, due 10/01/12 | | | 10,000 | | | | 10,566 | | |
Series A-Various Purpose
5.000%, due 07/01/17 | | | 2,130,000 | | | | 2,522,836 | | |
| 5.000%, due 07/01/20 | | | 2,625,000 | | | | 3,036,626 | | |
Washington State Unrefunded
Balance Series 93-A
(AGM-CR Insured)
5.750%, due 10/01/12 | | | 940,000 | | | | 989,698 | | |
| | | | 21,594,372 | | |
| Wyoming—0.31% | |
Sweetwater County Improvement
Projects Joint Powers Board Lease
Revenue Bonds (NATL-RE Insured)
5.000%, due 06/15/13 | | | 1,000,000 | | | | 1,033,440 | | |
Total municipal bonds and notes
(cost—$307,838,783) | | | | | | | 324,391,403 | | |
| Short-term municipal note—0.37% | |
| New York—0.37% | |
New York City, Series E,
0.250%, due 08/02/107
(cost—$1,200,000) | | | 1,200,000 | | | | 1,200,000 | | |
| | | Number of
shares | | | |
| Tax-free money market fund—1.13% | |
State Street Global Advisors
Tax Free Money Market Fund
(cost—$3,699,117) | | | 3,699,117 | | | | 3,699,117 | | |
Total investments
(cost—$312,737,900)—
100.25% | | | | | | | 329,290,520 | | |
Liabilities in excess of other
assets—(0.25)% | | | | | | | (808,777 | ) | |
| Net assets—100.00% | | $ | 328,481,743 | | |
72
UBS PACE Select Advisors Trust
UBS PACE Municipal Fixed Income Investments
Portfolio of investments—July 31, 2010
Aggregate cost for federal income tax purposes was $312,737,900; and net unrealized appreciation consisted of:
| Gross unrealized appreciation | | $ | 17,651,411 | | |
| Gross unrealized depreciation | | | (1,098,791 | ) | |
| Net unrealized appreciation | | $ | 16,552,620 | | |
1 Security subject to Alternative Minimum Tax.
2 Security exempt from registration pursuant to Rule 144A under the Securities Act of 1933. This security, which represents 0.48% of net assets as of July 31, 2010, is considered liquid and may be resold in transactions exempt from registration, normally to qualified institutional buyers.
3 Variable rate security. The interest rate shown is the current rate as of July 31, 2010, and resets periodically.
4 Security purchased on a when-issued basis. When issued refers to a transaction made conditionally because a security, although authorized, has not yet been issued.
5 Step bond that converts to the noted fixed rate at a designated future date.
6 Zero coupon bond; interest rate represents annualized yield at date of purchase.
7 Variable rate demand notes are payable on demand. The maturity date shown is the next interest rate reset date. The interest rate shown is the current rates as of July 31, 2010.
ACA American Capital Access
AGC Associated General Contrators
AGM Assured Guaranty Municipal Corporation
AMBAC American Municipal Bond Assurance Corporation
BHAC Berkshire Hathaway Assurance Corporation
CBI Certificates of Bond Insurance
CR Custodial Receipts
FGIC Financial Guaranty Insurance Company
FHA Federal Housing Administration
FHLMC Federal Home Loan Mortgage Corporation
FNMA Federal National Mortgage Association
GNMA Government National Mortgage Association
GTD Guaranteed
IBC Insured Bond Certificate
ICC International Code Council
NATL-RE National Reinsurance
PSF Permanent School Fund
SCSDE South Carolina School District Enhancement
TCRs Transferable Custodial Receipts
USDA United States Department of Agriculture
VA Veterans Administration
The following is a summary of the fair valuations according to the inputs used as of July 31, 2010 in valuing the Portfolio's investments:
| | | Unadjusted
quoted prices in
active markets for
identical investments
(Level 1) | | Other significant
observable inputs
(Level 2) | | Unobservable
inputs
(Level 3) | | Total | |
| Municipal bonds and notes | | $ | — | | | $ | 324,391,403 | | | $ | — | | | $ | 324,391,403 | | |
| Short-term municipal note | | | — | | | | 1,200,000 | | | | — | | | | 1,200,000 | | |
| Tax-free money market fund | | | — | | | | 3,699,117 | | | | — | | | | 3,699,117 | | |
| Total | | $ | — | | | $ | 329,290,520 | | | $ | — | | | $ | 329,290,520 | | |
At July 31, 2010, there were no transfers between Level 1 and Level 2.
See accompanying notes to financial statements.
73
UBS PACE Select Advisors Trust
UBS PACE Global Fixed Income Investments
Performance
For the 12 months ended July 31, 2010, the Portfolio's Class P shares returned 4.65%, before the deduction of the maximum UBS PACE Select program fee. (The Class P shares returned 2.58%, after the deduction of the maximum UBS PACE Select program fee, for the same 12-month period.) In comparison, the Barclays Capital Global Aggregate ex US Index (the "benchmark") returned 4.35%, and the Lipper International Income Funds category posted a median return of 5.32%. (Returns for all share classes over various time periods are shown in the "Performance at a glance" table on page 77. Please note that the returns shown do not reflect the deduction of taxes that a shareholder would pay on Portfolio distributions or the redemption of Portfolio shares.) For a detailed commentary on the market environment in general during the reporting period, please refer to page 2.
Sub-Advisor's comments
The Portfolio slightly outperformed its benchmark during the reporting period. Based on our in-depth country analysis, we continue to have a preference for developed countries with improving economic fundamentals. For example, the Portfolio's overweight to Australia added to returns, relative to the benchmark, as did overweights to core Eurozone and Swedish bonds.
In addition, an underweight position in Canadian bonds during the first half of the review period, which was driven by the negative impact that exceptionally weak US economic growth was having on the Canadian economy, added to relative returns when Canadian bonds underperformed the benchmark. We moved to a neutral stance in Canada at the start of 2010, and then to an overweight position in May 2010 given the country's improving fiscal position, relative to other developed economies. This was due, in part, to a stronger-than-expected Canadian economic recovery. As a result, our overweight toward the end of the reporting period added to relative returns as Canadian bonds outperformed the benchmark.
An underweight to Japanese bonds added to returns, relative to the benchmark as well over the period, as these bonds lagged the benchmark, given Japan's weak fiscal position. Elsewhere, a small exposure to emerging markets debt added to returns. On the downside, our underweights to the US and the UK were negative for relative performance, as these bonds outperformed the benchmark.
UBS PACE Select Advisors Trust – UBS PACE Global Fixed Income Investments
Investment Sub-Advisor:
Rogge Global Partners plc ("Rogge Global Partners")
Portfolio Managers:
Olaf Rogge, John Graham, Richard Bell, Adrian James, Malie Conway and Richard Gray
Objective:
High total return
Investment process:
Rogge Global Partners seeks to invest the Portfolio assets in fixed income securities of financially healthy issuers, because it believes that these investments produce the highest bond and currency returns over time. In deciding which fixed income securities to buy for the Portfolio, Rogge Global Partners uses a top-down analysis to find value across countries and to forecast interest and currency-exchange rates over a one-year horizon in those countries. Rogge Global Partners also uses an optimization model to help determine country, currency and duration positions for the Portfolio. Rogge Global Partners generally sells securities that no longer meet these selection criteria or when it identifies more attractive investment opportunities, and may also sell securities to adjust the average duration of the Portfolio assets it manages.
74
UBS PACE Select Advisors Trust
UBS PACE Global Fixed Income Investments
Sub-Advisor's comments – concluded
From a currency perspective, we maintained positions in countries where we felt there were signs of improvement in their debt profiles. For example, we believed that the growth outlook in the emerging markets was far better than that in developed countries. We also believed that a sustained level of currency appreciation in Asia and in other key emerging economies would continue for the foreseeable future. In particular, overweight positions in the Australian dollar, the Norwegian krone, Russian ruble, and a basket of Asian and Latin American currencies contributed to relative performance, as they generated strong results. This was due, in part, to a robust economic growth outlook for these countries. Positioning in the Canadian dollar also added to results. In contrast, underweights to the Japanese yen and Swiss franc detracted from performance, relative to the benchmark, as they performed well during the fiscal year, especiall y in periods of risk aversion in the financial markets.
During the first half of the period, we maintained a duration that was generally longer than that of the benchmark. (Duration measures a portfolio's sensitivity to interest rate changes.) This positioning added value in an environment of falling yields. Over the second half of the period, we were broadly neutral in duration, based on our views that government bond supply and medium-term inflation risks were balanced by steep government yield curves, economic growth uncertainties and weak bank lending. (The yield curve plots the interest rates, at a set point in time, of bonds having equal credit quality, but differing maturity dates.) With the Portfolio's duration and yield curves positioned relatively neutral compared to the benchmark during the second half of the period, they had little impact on relative performance.
We believed that investment grade bond markets offered better value versus government debt, although event risk—the risk that an issuer's ability to make interest and principal payments could change, based on an unanticipated event—would continue to be a key differentiator in credit performance. Based on this view, we were overweight to investment grade bonds, primarily in the financial and industrial sectors. We also avoided narrowly focused, undiversified names. This positioning was beneficial for relative performance. However, an underweight to Sterling corporate bonds versus Eurozone and US dollar credits detracted from performance, as the former generated stronger returns. Eurozone credits, in particular, underperformed in an environment where sovereign debt-related concerns in the peripheral Eurozone economies weighed on market sentiment. Finally, overweighting UK inflation-linked bonds and US inflation-linked bo nds through May 2010 added to relative returns as the US economy continued to recover from the deep recession in 2009. We moved to a neutral position versus the benchmark in US inflation-linked bonds during May as certain economic data suggested that the US was facing disinflationary forces over the short term. An overweight to UK inflation-linked bonds also added to relative returns as inflation in the UK was higher than expected during the reporting period.
Special considerations
The Portfolio may be appropriate for long-term investors seeking high total return and who are able to withstand short-term fluctuations in the fixed income markets in return for potentially higher returns over the long term. The yield and value of the Portfolio change every day and can be affected by changes in interest rates, general market conditions and other political, social and economic developments, as well as specific matters relating to the issuers in which the Portfolio invests. It is important to note that an investment in the Portfolio is only one component of a balanced investment plan. The value of the Portfolio's investments in foreign securities may fall due to adverse political, social and economic developments abroad and due to decreases in foreign currency values relative to the US dollar. These risks are greater for investments in emerging markets than in more developed countries.
75
UBS PACE Select Advisors Trust
UBS PACE Global Fixed Income Investments
Illustration of an assumed investment of $10,000 in Class P shares of the Portfolio (unaudited)
The following graph depicts the performance of UBS PACE Global Fixed Income Investments Class P shares versus the Barclays Capital Global Aggregate ex US Index over the 10 years ended July 31, 2010. The performance of the other classes will vary based upon the different class specific expenses and sales charges. The performance provided does not reflect the deduction of taxes that a shareholder would pay on Portfolio distributions or the redemption of Portfolio shares. Past performance is no guarantee of future results. Share price and returns will vary with market conditions; investors may realize a gain or loss upon redemption. It is important to note that UBS PACE Global Fixed Income Investments is a professionally managed portfolio while the Index is not available for investment and is unmanaged. The comparison is shown for illustration purposes only
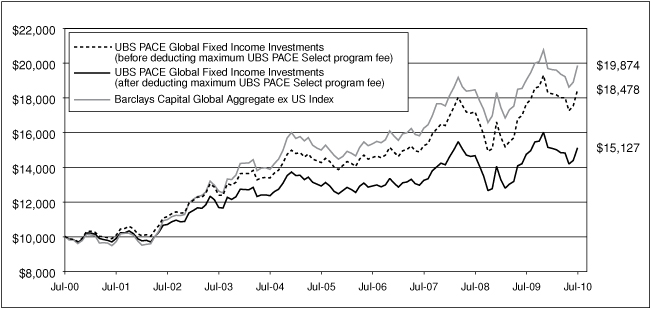 .
.
76
UBS PACE Select Advisors Trust
UBS PACE Global Fixed Income Investments
Performance at a glance (unaudited)
| Average annual total returns for periods ended 07/31/10 | | 1 year | | 5 years | | 10 years | | Since
inception1 | |
| Before deducting | | Class A2 | | | 4.32 | % | | | 5.06 | % | | N/A | | | 6.37 | % | |
| maximum sales charge | | Class B3 | | | 3.51 | % | | | 4.27 | % | | N/A | | | 5.51 | %7 | |
| or UBS PACE Select | | Class C4 | | | 3.81 | % | | | 4.54 | % | | N/A | | | 5.90 | % | |
| program fee | | Class Y5 | | | 4.68 | % | | | 5.41 | % | | N/A | | | 6.43 | % | |
| | | Class P6 | | | 4.65 | % | | | 5.32 | % | | | 6.33 | % | | | 5.31 | % | |
| After deducting | | Class A2 | | | (0.39 | )% | | | 4.10 | % | | N/A | | | 5.87 | % | |
| maximum sales charge | | Class B3 | | | (1.40 | )% | | | 3.93 | % | | N/A | | | 5.51 | %7 | |
| or UBS PACE Select | | Class C4 | | | 3.08 | % | | | 4.54 | % | | N/A | | | 5.90 | % | |
| program fee | | Class P6 | | | 2.58 | % | | | 3.23 | % | | | 4.23 | % | | | 3.23 | % | |
| Barclays Capital Global Aggregate ex US Index8 | | | 4.35 | % | | | 5.80 | % | | | 7.11 | % | | | 5.51 | % | |
| Lipper International Income Funds median | | | 5.32 | % | | | 5.29 | % | | | 6.51 | % | | | 6.23 | % | |
Average annual total returns for periods ended June 30, 2010, after deduction of the maximum sales charge or UBS PACE Select program fee, were as follows: Class A—1-year period, (1.66)%; 5-year period, 2.86%; since inception, 5.35%; Class B—1-year period, (2.64)%; 5-year period, 2.71%; since inception, 4.98%; Class C—1-year period, 1.76%; 5-year period, 3.31%; since inception, 5.39%; Class Y—1-year period, 3.35%; 5-year period, 4.16%; since inception, 5.91%; Class P—1-year period, 1.28%; 5-year period, 2.01%; 10-year period, 3.50%; since inception, 2.90%.
The annualized gross and net expense ratios, respectively, for each class of shares as in the November 28, 2009 prospectuses, were as follows: Class A—1.32% and 1.25%; Class B—2.10% and 2.00%; Class C—1.80% and 1.75%; Class Y—0.94% and 0.89%; and Class P—1.17% and 1.00%. Net expenses reflect fee waivers and/or expense reimbursements, if any, pursuant to an agreement that is in effect to cap the expenses. The Portfolio and UBS Global AM have entered into a written fee waiver agreement pursuant to which UBS Global AM is contractually obligated to waive its management fees through November 30, 2010 to the extent necessary to reflect the lower sub-advisory fee paid by UBS Global AM to Rogge Global Partners. The Portfolio and UBS Global AM also entered into an additional written fee waiver/expense reimbursement agreement pursuant to which UBS Global AM is contractually obligated to waive its management fees a nd/or reimburse expenses so that the ordinary total operating expenses of each class through November 30, 2010 (excluding dividend expense, borrowing costs and interest expense, if any) would not exceed Class A—1.25%; Class B—2.00%; Class C—1.75%; Class Y—1.00%; and Class P—1.00%. The Portfolio has agreed to repay UBS Global AM for any waived fees/reimbursed expenses under the preceding sentence to the extent that it can do so over the following three fiscal years without causing the Portfolio's expenses in any of those three years to exceed the expense caps described above.
1 Since inception returns are calculated as of commencement of issuance on August 24, 1995 for Class P shares, December 11, 2000 for Class A shares, February 5, 2001 for Class B shares, December 1, 2000 for Class C shares and January 16, 2001 for Class Y shares. Since inception returns for the Indices and Lipper median are shown as of August 31, 1995, which is the month-end after the inception date of the oldest share class (Class P).
2 Maximum sales charge for Class A shares is 4.5%. Class A shares bear ongoing 12b-1 service fees.
3 Maximum contingent deferred sales charge for Class B shares is 5% imposed on redemptions and is reduced to 0% after a maximum of six years. Class B shares bear ongoing 12b-1 service and distribution fees.
4 Maximum contingent deferred sales charge for Class C shares is 0.75% imposed on redemptions and is reduced to 0% after one year. Class C shares bear ongoing 12b-1 service and distribution fees. Prior to September 30, 2003, Class C shares were subject to a maximum front-end sales charge of 1.00%; this front-end sales charge is not reflected in the average annual total return presented for the Class C shares shown above.
5 The Portfolio offers Class Y shares to a limited group of eligible investors, including certain qualifying retirement plans. Class Y shares do not bear initial or contingent deferred sales charges or ongoing 12b-1 service and distribution fees.
6 Class P shares do not bear initial or contingent deferred sales charges or ongoing 12b-1 service and distribution fees, but are subject to a maximum annual UBS PACE Select program fee of 2% of the value of Class P shares. Prior to June 14, 2010, the maximum annual UBS PACE Select program fee was 1.5% of the value of Class P shares.
7 Assumes the conversion of Class B to Class A shares at the end of the sixth year.
8 The Barclays Capital Global Aggregate ex US Index is an unmanaged index which provides a broad-based measure of the global investment-grade fixed income markets excluding the US market. The two major components of this Index are the Pan-European Aggregate and the Asian-Pacific Aggregate Indices. The Index also includes Eurodollar and Euro-Yen corporate bonds, Canadian government, agency and corporate securities. Investors should note that indices do not reflect the deduction of fees and expenses.
If an investor sells or exchanges shares less than 90 days after purchase, a redemption fee of 1.00% of the amount sold or exchanged will be deducted at the time of the transaction, except as noted otherwise in the prospectuses.
Past performance does not predict future performance, and the performance information provided does not reflect the deduction of taxes that a shareholder would pay on Portfolio distributions or the redemption of Portfolio shares. The return and principal value of an investment will fluctuate, so that an investor's shares, when redeemed, may be worth more or less than their original cost. Performance results assume reinvestment of all dividends and capital gain distributions at net asset value on the ex-dividend dates. Current performance may be higher or lower than the performance data quoted. For month-end performance figures, please visit http://www.ubs.com.
Lipper peer group data calculated by Lipper Inc.; used with permission. The Lipper median is the return of the fund that places in the middle of a Lipper peer group.
77
UBS PACE Select Advisors Trust
UBS PACE Global Fixed Income Investments
Portfolio statistics (unaudited)
| Characteristics | | 07/31/10 | |
| Weighted average duration | | | 6.09 | yrs. | |
| Weighted average maturity | | | 9.01 | yrs. | |
| Average coupon | | | 4.75 | % | |
| Net assets (mm) | | $ | 515.9 | | |
| Number of holdings | | | 124 | | |
| Portfolio composition1 | | 07/31/10 | |
| Long-term global debt securities | | | 96.5 | % | |
| Futures and forward foreign currency contracts | | | 0.6 | | |
| Cash equivalents and other assets less liabilities | | | 2.9 | | |
| Total | | | 100.0 | % | |
| Quality diversification1 | | 07/31/10 | |
| AAA | | | 36.1 | % | |
| AA | | | 23.1 | | |
| A | | | 27.8 | | |
| BBB | | | 3.6 | | |
| BB | | | 1.2 | | |
| Non-rated | | | 4.7 | | |
| Futures and forward foreign currency contracts | | | 0.6 | | |
| Cash equivalents and other assets less liabilities | | | 2.9 | | |
| Total | | | 100.0 | % | |
| Top five countries of incorporation1 | | 07/31/10 | |
| Japan | | | 19.0 | % | |
| United Kingdom | | | 16.9 | | |
| Germany | | | 14.5 | | |
| United States | | | 7.5 | | |
| Canada | | | 7.3 | | |
| Total | | | 65.2 | % | |
1 Weightings represent percentages of the Portfolio's net assets as of July 31, 2010. The Portfolio is actively managed and its composition will vary over time. Credit quality ratings shown are based on the ratings assigned to portfolio holdings by Standard & Poor's Ratings Group, an independent rating agency.
78
UBS PACE Select Advisors Trust
UBS PACE Global Fixed Income Investments
Portfolio of investments—July 31, 2010
| Security description | | Face
amount1 | | Value | |
| Long-term global debt securities—96.50% | |
| Australia—0.23% | |
BHP Billiton Finance Ltd.
4.125%, due 05/05/11 | | EUR | 900,000 | | | $ | 1,195,202 | | |
| Brazil—0.37% | |
Federal Republic of Brazil
8.000%, due 01/15/18 | | USD | 458,333 | | | | 544,271 | | |
| 11.000%, due 08/17/40 | | USD | 1,000,000 | | | | 1,367,000 | | |
| | | | 1,911,271 | | |
| Canada—7.27% | |
Canadian Government Bond
3.750%, due 06/01/19 | | | 10,040,000 | | | | 10,310,813 | | |
| 4.250%, due 06/01/18 | | | 17,100,000 | | | | 18,219,264 | | |
Cards II Trust
3.048%, due 05/15/13 | | | 3,100,000 | | | | 3,068,760 | | |
Toronto-Dominion Bank
5.375%, due 05/14/15 | | EUR | 4,000,000 | | | | 5,906,077 | | |
| | | | 37,504,914 | | |
| Denmark—1.28% | |
Kingdom of Denmark
4.000%, due 11/15/15 | | | 11,760,000 | | | | 2,259,249 | | |
| 5.000%, due 11/15/13 | | | 14,180,000 | | | | 2,764,325 | | |
Nykredit Realkredit A/S
4.000%, due 01/01/12 | | | 8,613,000 | | | | 1,558,525 | | |
| | | | 6,582,099 | | |
| France—5.03% | |
BNP Paribas
3.125%, due 12/06/152 | | | 750,000 | | | | 972,113 | | |
Caisse d'Amortissement
de la Dette Sociale
3.625%, due 04/25/15 | | | 10,325,000 | | | | 14,351,552 | | |
Crown European Holdings SA
7.125%, due 08/15/18 | | | 550,000 | | | | 731,068 | | |
Electricite De France
5.375%, due 05/29/20 | | | 1,000,000 | | | | 1,483,008 | | |
Republic of France
4.000%, due 04/25/55 | | | 1,250,000 | | | | 1,765,166 | | |
| 5.750%, due 10/25/32 | | | 2,520,000 | | | | 4,368,559 | | |
Societe Generale
5.250%, due 03/28/13 | | | 1,000,000 | | | | 1,401,340 | | |
| 6.125%, due 08/20/18 | | | 600,000 | | | | 899,550 | | |
| | | | 25,972,356 | | |
| Germany—14.46% | |
Bayerische Landesbank
4.000%, due 01/16/12 | | | 7,340,000 | | | | 9,929,260 | | |
Bundesobligation,
Series 155
2.500%, due 10/10/14 | | | 4,560,000 | | | | 6,192,422 | | |
Series 156
2.500%, due 02/27/15 | | | 3,580,000 | | | | 4,843,726 | | |
| Security description | | Face
amount1 | | Value | |
| Long-term global debt securities—(continued) | |
| Germany—(concluded) | |
Bundesrepublik Deutschland,
Series 03
4.500%, due 01/04/13 | | | 2,400,000 | | | $ | 3,396,407 | | |
Series 05
3.500%, due 01/04/16 | | | 2,600,000 | | | | 3,668,463 | | |
Series 06
3.750%, due 01/04/17 | | | 1,800,000 | | | | 2,574,538 | | |
Series 07
4.250%, due 07/04/17 | | | 830,000 | | | | 1,220,754 | | |
Series 08
4.750%, due 07/04/40 | | | 2,200,000 | | | | 3,604,793 | | |
Series 09
3.250%, due 01/04/20 | | | 1,650,000 | | | | 2,262,310 | | |
| 3.500%, due 07/04/19 | | | 800,000 | | | | 1,118,562 | | |
| 3.750%, due 01/04/19 | | | 12,630,000 | | | | 17,992,916 | | |
Series 98
5.625%, due 01/04/28 | | | 1,950,000 | | | | 3,322,520 | | |
Daimler AG
4.125%, due 01/19/17 | | | 1,100,000 | | | | 1,509,505 | | |
Deutsche Bank AG
3.625%, due 03/09/172 | | | 2,250,000 | | | | 2,815,128 | | |
Kreditanstalt Fuer Wiederaufbau
5.250%, due 07/04/12 | | | 4,100,000 | | | | 5,773,835 | | |
NRW Bank
3.875%, due 01/27/20 | | | 2,300,000 | | | | 3,185,324 | | |
Unitymedia Hessen GmbH & Co.
KG/Unitymedia NRW GmbH
8.125%, due 12/01/17 | | | 900,000 | | | | 1,205,089 | | |
| | | | 74,615,552 | | |
| India—0.16% | |
Bank of India London
4.750%, due 09/30/15 | | USD | 200,000 | | | | 201,827 | | |
ICICI Bank Ltd.
5.500%, due 03/25/15 | | USD | 300,000 | | | | 311,824 | | |
State Bank of India London
4.500%, due 10/23/14 | | USD | 300,000 | | | | 305,720 | | |
| | | | 819,371 | | |
| Indonesia—0.10% | |
Republic of Indonesia
5.875%, due 03/13/20 | | USD | 450,000 | | | | 499,500 | | |
| Ireland—0.15% | |
Smurfit Kappa Acquisitions
7.250%, due 11/15/17 | | | 600,000 | | | | 797,528 | | |
| Italy—3.81% | |
Buoni Poliennali Del Tesoro
4.500%, due 02/01/20 | | | 10,800,000 | | | | 14,784,484 | | |
Intesa Sanpaolo SpA
3.875%, due 04/01/15 | | | 3,600,000 | | | | 4,853,498 | | |
| | | | 19,637,982 | | |
79
UBS PACE Select Advisors Trust
UBS PACE Global Fixed Income Investments
Portfolio of investments—July 31, 2010
| Security description | | Face
amount1 | | Value | |
| Long-term global debt securities—(continued) | |
| Japan—19.03% | |
Bank of Tokyo-Mitsubishi UFJ Ltd.
3.500%, due 12/16/152 | | EUR | 2,300,000 | | | $ | 2,997,351 | | |
| 3.850%, due 01/22/153 | | USD | 1,900,000 | | | | 2,020,422 | | |
Development Bank of Japan
1.750%, due 03/17/17 | | | 130,000,000 | | | | 1,612,164 | | |
| 2.300%, due 03/19/26 | | | 500,000,000 | | | | 6,251,918 | | |
Government of Japan
1.300%, due 12/20/18 | | | 549,000,000 | | | | 6,601,097 | | |
| 1.700%, due 12/20/16 | | | 1,755,000,000 | | | | 21,824,566 | | |
| 1.700%, due 03/20/17 | | | 360,600,000 | | | | 4,487,317 | | |
| 2.000%, due 03/20/16 | | | 2,906,000,000 | | | | 36,576,414 | | |
| 2.000%, due 12/20/24 | | | 685,000,000 | | | | 8,464,672 | | |
| 2.200%, due 09/20/26 | | | 159,700,000 | | | | 2,007,793 | | |
| 2.300%, due 12/20/36 | | | 380,000,000 | | | | 4,826,095 | | |
Japan Finance Organization
for Municipalities
1.900%, due 06/22/18 | | | 40,000,000 | | | | 501,066 | | |
| | | | 98,170,875 | | |
| Luxembourg—1.81% | |
Gazprom Via Gaz Capital SA
4.560%, due 12/09/12 | | | 3,200,000 | | | | 4,300,397 | | |
| 8.125%, due 02/04/15 | | | 2,000,000 | | | | 2,990,731 | | |
| 8.625%, due 04/28/34 | | USD | 100,000 | | | | 119,000 | | |
John Deere Bank SA
6.000%, due 06/23/11 | | | 1,000,000 | | | | 1,348,843 | | |
Prologis International Funding SA
7.625%, due 10/23/144 | | | 450,000 | | | | 557,097 | | |
| | | | 9,316,068 | | |
| Mexico—2.75% | |
Mexican Bonos
8.500%, due 12/13/18 | | | 140,200,000 | | | | 12,696,609 | | |
United Mexican States
5.500%, due 02/17/20 | | EUR | 1,100,000 | | | | 1,506,142 | | |
| | | | 14,202,751 | | |
| Netherlands—3.34% | |
Bank Nederlandse Gemeenten
4.375%, due 01/19/15 | | GBP | 660,000 | | | | 1,108,349 | | |
BMW Finance N.V.
4.000%, due 09/17/14 | | | 600,000 | | | | 824,388 | | |
ENBW International Finance BV
4.875%, due 01/16/25 | | | 1,580,000 | | | | 2,217,692 | | |
Generali Finance BV
6.214%, due 06/16/165,6 | | GBP | 550,000 | | | | 720,632 | | |
Government of the Netherlands
5.500%, due 01/15/28 | | | 1,830,500 | | | | 3,058,987 | | |
HeidelbergCement Finance BV
7.500%, due 10/31/14 | | | 800,000 | | | | 1,081,615 | | |
ING Bank N.V.
6.125%, due 05/29/232 | | | 800,000 | | | | 1,060,890 | | |
RWE Finance BV
5.125%, due 07/23/18 | | | 3,400,000 | | | | 4,957,276 | | |
| Security description | | Face
amount1 | | Value | |
| Long-term global debt securities—(continued) | |
| Netherlands—(concluded) | |
Urenco Finance N.V.
5.375%, due 05/22/15 | | | 1,500,000 | | | $ | 2,178,628 | | |
| | | | 17,208,457 | | |
| Norway—0.55% | |
DnB NOR Boligkreditt
3.375%, due 01/20/17 | | EUR | 2,100,000 | | | | 2,821,591 | | |
| Peru—0.20% | |
Republic of Peru
6.550%, due 03/14/37 | | USD | 900,000 | | | | 1,044,000 | | |
| Philippines—0.12% | |
Republic of Philippines
6.375%, due 10/23/34 | | USD | 550,000 | | | | 602,250 | | |
| Russia—0.02% | |
Russian Foreign Bond
5.000%, due 04/29/20 | | USD | 100,000 | | | | 101,000 | | |
| Singapore—1.22% | |
DBS Bank Ltd.
5.000%, due 11/15/192,3 | | USD | 2,400,000 | | | | 2,550,963 | | |
Oversea-Chinese Banking
Corp., Ltd.
4.250%, due 11/18/192 | | USD | 2,300,000 | | | | 2,360,354 | | |
United Overseas Bank Ltd.
5.375%, due 09/03/192,3 | | USD | 1,300,000 | | | | 1,396,659 | | |
| | | | 6,307,976 | | |
| South Korea—3.35% | |
Korea Treasury Bond
5.750%, due 09/10/18 | | | 15,585,830,000 | | | | 13,980,973 | | |
Series 1012
5.750%, due 12/10/10 | | | 3,896,110,000 | | | | 3,329,224 | | |
| | | | 17,310,197 | | |
| Spain—0.81% | |
Obrascon Huarte Lain SA
7.375%, due 04/28/15 | | | 650,000 | | | | 798,427 | | |
Telefonica Emisiones SAU
6.221%, due 07/03/17 | | USD | 3,000,000 | | | | 3,360,996 | | |
| | | | 4,159,423 | | |
| Supranationals—2.75% | |
European Investment Bank
6.000%, due 12/07/28 | | GBP | 3,200,000 | | | | 6,038,503 | | |
Inter-American Development
Bank
5.125%, due 09/13/16 | | | 7,000,000 | | | | 8,132,047 | | |
| | | | 14,170,550 | | |
| Sweden—2.53% | |
Government of Sweden
4.250%, due 03/12/19 | | | 14,830,000 | | | | 2,303,075 | | |
Nordea Bank AB
4.000%, due 09/30/162 | | EUR | 1,900,000 | | | | 2,504,792 | | |
80
UBS PACE Select Advisors Trust
UBS PACE Global Fixed Income Investments
Portfolio of investments—July 31, 2010
| Security description | | Face
amount1 | | Value | |
| Long-term global debt securities—(continued) | |
| Sweden—(concluded) | |
Nordea Hypotek AB
3.500%, due 01/18/17 | | EUR | 2,100,000 | | | $ | 2,835,104 | | |
Skandinaviska Enskilda
Banken AB
4.500%, due 04/25/13 | | EUR | 3,880,000 | | | | 5,400,958 | | |
| | | | 13,043,929 | | |
| Switzerland—0.55% | |
Credit Suisse London
5.125%, due 09/18/17 | | EUR | 2,000,000 | | | | 2,846,232 | | |
| Turkey—0.09% | |
Republic of Turkey
7.000%, due 06/05/20 | | USD | 400,000 | | | | 458,500 | | |
| United Kingdom—16.93% | |
Abbey National Treasury
Services PLC
3.625%, due 10/14/16 | | EUR | 2,000,000 | | | | 2,583,225 | | |
| 3.875%, due 11/10/143 | | USD | 2,700,000 | | | | 2,718,692 | | |
Anglian Water Services
Finance PLC
6.250%, due 06/27/16 | | EUR | 900,000 | | | | 1,356,197 | | |
Aviva PLC
5.250%, due 10/02/232 | | EUR | 1,500,000 | | | | 1,954,726 | | |
Barclays Bank PLC
4.500%, due 03/04/192 | | EUR | 1,450,000 | | | | 1,870,550 | | |
Diageo Finance PLC
6.625%, due 12/05/14 | | EUR | 1,900,000 | | | | 2,885,910 | | |
HSBC Holdings PLC
3.625%, due 06/29/202 | | EUR | 1,050,000 | | | | 1,358,930 | | |
| 6.250%, due 03/19/18 | | EUR | 4,000,000 | | | | 5,970,770 | | |
Lloyds TSB Bank PLC
5.625%, due 03/05/182 | | EUR | 1,800,000 | | | | 2,272,517 | | |
National Grid Gas PLC
5.125%, due 05/14/13 | | EUR | 1,700,000 | | | | 2,382,197 | | |
Network Rail Infrastructure
Finance PLC
4.875%, due 11/27/15 | | | 705,000 | | | | 1,223,312 | | |
Royal Bank of Scotland
Group PLC
5.250%, due 05/15/13 | | EUR | 1,350,000 | | | | 1,833,865 | | |
Royal Bank of Scotland PLC
4.875%, due 08/25/143 | | | 3,000,000 | | | | 3,097,704 | | |
Scottish & Southern Energy PLC
6.125%, due 07/29/13 | | EUR | 900,000 | | | | 1,293,266 | | |
Standard Chartered Bank
3.625%, due 02/03/172 | | EUR | 1,400,000 | | | | 1,811,436 | | |
Standard Chartered PLC
3.625%, due 12/15/15 | | EUR | 4,500,000 | | | | 5,881,178 | | |
United Kingdom Treasury Bonds
4.000%, due 03/07/22 | | | 2,750,000 | | | | 4,466,622 | | |
| 4.250%, due 12/07/55 | | | 3,770,000 | | | | 5,907,411 | | |
| 4.500%, due 03/07/19 | | | 17,800,000 | | | | 30,687,074 | | |
| 4.750%, due 09/07/15 | | | 340,000 | | | | 599,079 | | |
| Security description | | Face
amount1 | | Value | |
| Long-term global debt securities—(concluded) | |
| United Kingdom—(concluded) | |
United Kingdom Treasury
Inflation Linked Bonds
1.250%, due 11/22/17 | | | 3,116,016 | | | $ | 5,182,815 | | |
| | | | 87,337,476 | | |
| United States—7.45% | |
Bank of America Corp.
5.750%, due 12/01/17 | | | 5,000,000 | | | | 5,283,780 | | |
BMW US Capital LLC
5.000%, due 05/28/15 | | EUR | 600,000 | | | | 861,974 | | |
Citigroup, Inc.
6.000%, due 08/15/17 | | | 1,800,000 | | | | 1,906,218 | | |
IBM Corp.
5.700%, due 09/14/17 | | | 4,200,000 | | | | 4,923,862 | | |
JPMorgan Chase Bank N.A.
6.000%, due 10/01/17 | | | 4,850,000 | | | | 5,450,968 | | |
OBP Depositor LLC Trust,
Series 2010-OBP, Class A
4.646%, due 07/15/453 | | | 700,000 | | | | 728,346 | | |
Pfizer, Inc.
5.750%, due 06/03/21 | | EUR | 3,900,000 | | | | 6,038,601 | | |
Philip Morris International, Inc.
5.650%, due 05/16/18 | | | 1,200,000 | | | | 1,353,032 | | |
| 6.875%, due 03/17/14 | | | 1,800,000 | | | | 2,093,456 | | |
PNC Funding Corp.
5.125%, due 02/08/20 | | | 2,550,000 | | | | 2,701,506 | | |
Procter & Gamble Co.
4.875%, due 05/11/27 | | EUR | 1,610,000 | | | | 2,296,527 | | |
Roche Holdings, Inc.
6.500%, due 03/04/21 | | EUR | 2,900,000 | | | | 4,786,481 | | |
| | | | 38,424,751 | | |
| Uruguay—0.14% | |
Republica Orient Uruguay
7.625%, due 03/21/36 | | USD | 600,000 | | | | 727,500 | | |
Total long-term global
debt securities
(cost—$472,661,456) | | | | | | | 497,789,301 | | |
| Repurchase agreement—1.07% | |
Repurchase agreement dated
07/30/10 with State Street
Bank & Trust Co., 0.010%
due 08/02/10, collateralized
by $5,485,899 US Treasury
Notes, 2.125% to 3.125%
due 04/30/15 to 04/30/17;
(value — $5,661,052);
proceeds: $5,550,005
(cost—$5,550,000) | | | 5,550,000 | | | | 5,550,000 | | |
Total investments
(cost—$478,211,456)—
97.57% | | | | | | | 503,339,301 | | |
Other assets in excess
of liabilities—2.43% | | | | | | | 12,524,599 | | |
| Net assets—100.00% | | $ | 515,863,900 | | |
81
UBS PACE Select Advisors Trust
UBS PACE Global Fixed Income Investments
Portfolio of investments—July 31, 2010
Aggregate cost for federal income tax purposes was $479,968,471; and net unrealized appreciation consisted of:
| Gross unrealized appreciation | | $ | 36,427,952 | | |
| Gross unrealized depreciation | | | (13,057,122 | ) | |
| Net unrealized appreciation | | $ | 23,370,830 | | |
Note: The portfolio of investments is listed by the issuer's country of incorporation.
1 In local currency unless otherwise indicated.
2 Floating rate security. The interest rate shown is the current rate as of July 31, 2010.
3 Security exempt from registration pursuant to Rule 144A under the Securities Act of 1933. These securities, which represent 2.43% of net assets as of July 31, 2010, are considered liquid and may be resold in transactions exempt from registration, normally to qualified institutional buyers.
4 Step bond that converts to the noted fixed rate at a designated future date.
5 Variable rate security. The interest rate shown is the current rate as of July 31, 2010, and resets periodically.
6 Perpetual bond security. The maturity date reflects the next call date.
EUR Euro
GBP Great Britain Pound
USD United States Dollar
Affiliated issuer activity
The table below details the Portfolio's transaction activity in an affiliated issuer during the year ended July 31, 2010.
| Security description | | Value at
07/31/09 | | Purchases
during the
year ended
07/31/10 | | Sales
during the
year ended
07/31/10 | | Value at
07/31/10 | | Net income
earned from
affiliate for the
year ended
07/31/10 | |
| UBS Private Money Market Fund LLC | | $ | 3,705,975 | | | $ | 46,308,437 | | | $ | 50,014,412 | | | $ | — | | | $ | 58 | | |
Futures contracts
Number of
contracts | | Currency | | Buy contracts | | Expiration
dates | | Cost | | Current
value | | Unrealized
appreciation
(depreciation) | |
| | 213 | | | AUD | | Australian Bond 10 Year Futures | | September 2010 | | $ | 20,227,913 | | | $ | 20,434,240 | | | $ | 206,327 | | |
| | 70 | | | CAD | | Canada Government Bond
10 Year Futures | | September 2010 | | | 8,247,166 | | | | 8,436,482 | | | | 189,316 | | |
| | 354 | | | EUR | | German Euro Bund Futures | | September 2010 | | | 59,051,080 | | | | 59,397,620 | | | | 346,540 | | |
| | 6 | | | JPY | | Japan Government Bond
10 Year Futures | | September 2010 | | | 9,848,042 | | | | 9,856,276 | | | | 8,234 | | |
| | | | | | | | | | | $ | 97,374,201 | | | $ | 98,124,618 | | | $ | 750,417 | | |
| | | | | Sale contracts | | | | Proceeds | | | | | |
| | 325 | | | EUR | | German Euro BOBL Futures | | September 2010 | | $ | 50,896,884 | | | $ | 50,917,476 | | | $ | (20,592 | ) | |
| | 79 | | | GBP | | United Kingdom Long Gilt
10 Year Futures | | September 2010 | | | 14,814,744 | | | | 15,066,566 | | | | (251,822 | ) | |
| | 112 | | | USD | | US Treasury Bond 30 Year Futures | | September 2010 | | | 13,891,350 | | | | 14,416,500 | | | | (525,150 | ) | |
| | 192 | | | USD | | US Treasury Note 5 Year Futures | | September 2010 | | | 22,466,169 | | | | 23,007,000 | | | | (540,831 | ) | |
| | 373 | | | USD | | US Treasury Note 10 Year Futures | | September 2010 | | | 44,919,921 | | | | 46,182,063 | | | | (1,262,142 | ) | |
| | | | | | | | | | | | 146,989,068 | | | | 149,589,605 | | | | (2,600,537 | ) | |
| | | | | | | | | | | | | | | | | | | $ | (1,850,120 | ) | |
Currency type abbreviations:
AUD Australian Dollar
CAD Canadian Dollar
82
UBS PACE Select Advisors Trust
UBS PACE Global Fixed Income Investments
Portfolio of investments—July 31, 2010
EUR Euro
GBP Great Britain Pound
JPY Japanese Yen
USD United States Dollar
Forward foreign currency contracts
| Counterparty | | Contracts to
deliver | | In
exchange for | | Maturity
dates | | Unrealized
appreciation
(depreciation) | |
| Barclays Bank PLC | | AUD | 7,994,426 | | | USD | 6,884,000 | | | 08/18/10 | | $ | (336,843 | ) | |
| Barclays Bank PLC | | CAD | 5,301,886 | | | USD | 4,970,223 | | | 08/18/10 | | | (186,081 | ) | |
| Barclays Bank PLC | | DKK | 118,779,266 | | | USD | 19,199,545 | | | 08/18/10 | | | (1,573,054 | ) | |
| Barclays Bank PLC | | EUR | 5,865,541 | | | CAD | 7,491,000 | | | 08/18/10 | | | (358,319 | ) | |
| Barclays Bank PLC | | EUR | 2,649,635 | | | GBP | 2,178,000 | | | 08/18/10 | | | (35,483 | ) | |
| Barclays Bank PLC | | EUR | 4,130,053 | | | USD | 5,170,000 | | | 08/18/10 | | | (212,041 | ) | |
| Barclays Bank PLC | | GBP | 21,000 | | | EUR | 25,526 | | | 08/18/10 | | | 315 | | |
| Barclays Bank PLC | | GBP | 486,000 | | | USD | 741,803 | | | 08/18/10 | | | (20,750 | ) | |
| Barclays Bank PLC | | JPY | 6,920,096 | | | USD | 79,497 | | | 08/18/10 | | | (611 | ) | |
| Barclays Bank PLC | | USD | 5,220,842 | | | AUD | 6,332,996 | | | 08/18/10 | | | 499,339 | | |
| Barclays Bank PLC | | USD | 7,382,150 | | | CAD | 7,491,000 | | | 08/18/10 | | | (96,843 | ) | |
| Barclays Bank PLC | | USD | 8,421,270 | | | DKK | 50,948,686 | | | 08/18/10 | | | 488,842 | | |
| Barclays Bank PLC | | USD | 22,828,809 | | | EUR | 18,207,202 | | | 08/18/10 | | | 897,741 | | |
| Barclays Bank PLC | | USD | 987,362 | | | KRW | 1,211,000,000 | | | 12/01/10 | | | 31,365 | | |
| Barclays Bank PLC | | USD | 12,285,818 | | | NOK | 81,837,063 | | | 08/18/10 | | | 1,173,586 | | |
| Barclays Bank PLC | | USD | 2,270,000 | | | PLN | 7,589,745 | | | 12/01/10 | | | 181,013 | | |
| Citibank N.A. | | EUR | 376,000 | | | USD | 488,295 | | | 08/18/10 | | | (1,686 | ) | |
| Citibank N.A. | | GBP | 5,205,661 | | | USD | 7,782,011 | | | 08/18/10 | | | (385,869 | ) | |
| Citibank N.A. | | USD | 736,762 | | | AUD | 840,572 | | | 08/18/10 | | | 22,472 | | |
| Citibank N.A. | | USD | 405,625 | | | BRL | 750,000 | | | 10/20/10 | | | 13,693 | | |
| Citibank N.A. | | USD | 149,351 | | | CAD | 154,701 | | | 08/18/10 | | | 1,102 | | |
| Citibank N.A. | | USD | 4,570,329 | | | CNY | 30,400,000 | | | 10/20/10 | | | (81,936 | ) | |
| Citibank N.A. | | USD | 2,042,745 | | | EUR | 1,608,050 | | | 08/18/10 | | | 52,770 | | |
Credit Suisse
London Branch | | EUR | 604,678 | | | USD | 790,955 | | | 08/18/10 | | | 2,974 | | |
Credit Suisse
London Branch | | GBP | 68,000 | | | USD | 98,378 | | | 08/18/10 | | | (8,317 | ) | |
Credit Suisse
London Branch | | KRW | 500,000,000 | | | USD | 414,388 | | | 10/20/10 | | | (6,799 | ) | |
Credit Suisse
London Branch | | USD | 19,079,818 | | | AUD | 23,587,363 | | | 08/18/10 | | | 2,225,106 | | |
Credit Suisse
London Branch | | USD | 6,463,588 | | | CAD | 6,859,996 | | | 08/18/10 | | | 208,042 | | |
Credit Suisse
London Branch | | USD | 10,154,151 | | | EUR | 8,170,998 | | | 08/18/10 | | | 493,812 | | |
Credit Suisse
London Branch | | USD | 22,924,589 | | | JPY | 2,099,754,780 | | | 08/18/10 | | | 1,382,523 | | |
Credit Suisse
London Branch | | USD | 426,530 | | | KRW | 500,000,000 | | | 10/20/10 | | | (5,343 | ) | |
Credit Suisse
London Branch | | USD | 461,292 | | | MXN | 6,024,706 | | | 12/01/10 | | | 8,539 | | |
83
UBS PACE Select Advisors Trust
UBS PACE Global Fixed Income Investments
Portfolio of investments—July 31, 2010
Forward foreign currency contracts—(continued)
| Counterparty | | Contracts to
deliver | | In
exchange for | | Maturity
dates | | Unrealized
appreciation
(depreciation) | |
Credit Suisse
London Branch | | USD | 3,659,787 | | | PHP | 172,010,000 | | | 12/01/10 | | $ | 70,740 | | |
Credit Suisse
London Branch | | USD | 2,194,877 | | | SEK | 17,676,882 | | | 08/18/10 | | | 253,375 | | |
Deutsche Bank
AG London | | CAD | 16,459,880 | | | USD | 15,702,249 | | | 08/18/10 | | | (305,665 | ) | |
Deutsche Bank
AG London | | EUR | 3,740,000 | | | JPY | 410,681,172 | | | 08/18/10 | | | (119,633 | ) | |
Deutsche Bank
AG London | | GBP | 43,000 | | | USD | 64,521 | | | 08/18/10 | | | (2,948 | ) | |
Deutsche Bank
AG London | | JPY | 384,116,040 | | | USD | 4,340,000 | | | 08/18/10 | | | (106,591 | ) | |
Deutsche Bank
AG London | | USD | 3,566,017 | | | BRL | 6,590,000 | | | 10/20/10 | | | 118,387 | | |
Deutsche Bank
AG London | | USD | 1,533,036 | | | CLP | 826,000,000 | | | 12/01/10 | | | 48,935 | | |
Deutsche Bank
AG London | | USD | 659,455 | | | CNY | 4,450,000 | | | 12/01/10 | | | (1,818 | ) | |
Deutsche Bank
AG London | | USD | 4,279,589 | | | DKK | 25,942,866 | | | 08/18/10 | | | 257,405 | | |
Deutsche Bank
AG London | | USD | 1,104,906 | | | EUR | 897,937 | | | 08/18/10 | | | 65,232 | | |
Deutsche Bank
AG London | | USD | 1,249,177 | | | GBP | 832,310 | | | 08/18/10 | | | 56,749 | | |
Deutsche Bank
AG London | | USD | 3,480,859 | | | INR | 165,400,000 | | | 12/01/10 | | | 23,975 | | |
Deutsche Bank
AG London | | USD | 92,237 | | | MXN | 1,218,729 | | | 12/01/10 | | | 2,804 | | |
Deutsche Bank
AG London | | USD | 5,362,119 | | | MYR | 17,262,000 | | | 10/20/10 | | | 38,084 | | |
Deutsche Bank
AG London | | USD | 973,202 | | | PEN | 2,760,000 | | | 12/01/10 | | | 4,293 | | |
Deutsche Bank
AG London | | USD | 3,647,819 | | | RUB | 112,900,000 | | | 10/20/10 | | | 59,629 | | |
JPMorgan
Chase Bank | | KRW | 8,472,000,000 | | | USD | 7,592,078 | | | 10/20/10 | | | 455,489 | | |
JPMorgan
Chase Bank | | USD | 117,753 | | | CAD | 122,926 | | | 08/18/10 | | | 1,798 | | |
JPMorgan
Chase Bank | | USD | 2,453,526 | | | CNY | 16,300,000 | | | 10/20/10 | | | (46,920 | ) | |
JPMorgan
Chase Bank | | USD | 4,295,145 | | | DKK | 25,944,790 | | | 08/18/10 | | | 242,186 | | |
JPMorgan
Chase Bank | | USD | 27,262 | | | GBP | 18,177 | | | 08/18/10 | | | 1,258 | | |
JPMorgan
Chase Bank | | USD | 335,081 | | | JPY | 29,926,001 | | | 08/18/10 | | | 11,347 | | |
JPMorgan
Chase Bank | | USD | 7,236,387 | | | KRW | 8,472,000,000 | | | 10/20/10 | | | (99,797 | ) | |
84
UBS PACE Select Advisors Trust
UBS PACE Global Fixed Income Investments
Portfolio of investments—July 31, 2010
Forward foreign currency contracts—(concluded)
| Counterparty | | Contracts to
deliver | | In
exchange for | | Maturity
dates | | Unrealized
appreciation
(depreciation) | |
JPMorgan
Chase Bank | | USD | 1,465,631 | | | MYR | 5,000,000 | | | 10/20/10 | | $ | 98,557 | | |
JPMorgan
Chase Bank | | USD | 1,376,378 | | | SGD | 1,910,000 | | | 10/20/10 | | | 28,486 | | |
JPMorgan
Chase Bank | | USD | 3,218,210 | | | TWD | 102,500,000 | | | 12/01/10 | | | 1,679 | | |
Morgan
Stanley & Co.
International PLC | | EUR | 4,435,853 | | | CHF | 6,173,067 | | | 08/18/10 | | | 146,376 | | |
Morgan
Stanley & Co.
International PLC | | EUR | 15,272,636 | | | JPY | 1,675,950,339 | | | 08/18/10 | | | (501,316 | ) | |
Morgan
Stanley & Co.
International PLC | | EUR | 1,384,241 | | | USD | 1,703,479 | | | 08/18/10 | | | (100,382 | ) | |
Morgan
Stanley & Co.
International PLC | | GBP | 3,599,630 | | | CAD | 5,517,513 | | | 08/18/10 | | | (281,946 | ) | |
Royal Bank of
Scotland PLC | | GBP | 85,000 | | | USD | 122,867 | | | 08/18/10 | | | (10,501 | ) | |
Royal Bank of
Scotland PLC | | USD | 54,583 | | | AUD | 64,957 | | | 08/18/10 | | | 4,088 | | |
| | | $ | 4,786,614 | | |
Currency type abbrevations:
AUD Australian Dollar
BRL Brazilian Real
CAD Canadian Dollar
CHF Swiss Franc
CLP Chilean Peso
CNY Chinese Yuan Renminbi
DKK Danish Krone
EUR Euro
GBP Great Britain Pound
INR Indian Rupee
JPY Japanese Yen
KRW South Korean Won
MXN Mexican Peso
MYR Malaysian Ringgit
PEN Peruvian Nuevo Sol
PHP Philippine Peso
PLN Polish Zloty
NOK Norwegian Krone
RUB Russian Ruble
SEK Swedish Krona
SGD Singapore Dollar
TWD New Taiwan Dollar
USD United States Dollar
85
UBS PACE Select Advisors Trust
UBS PACE Global Fixed Income Investments
Portfolio of investments—July 31, 2010
The following is a summary of the fair valuations according to the inputs used as of July 31, 2010 in valuing the Portfolio's investments:
| | | Unadjusted quoted
prices in active
markets for identical
investments
(Level 1) | | Other significant
observable inputs
(Level 2) | | Unobservable
inputs
(Level 3) | | Total | |
| Long-term global debt securities | | $ | — | | | $ | 497,789,301 | | | $ | — | | | $ | 497,789,301 | | |
| Repurchase agreement | | | — | | | | 5,550,000 | | | | — | | | | 5,550,000 | | |
| Futures contracts, net | | | (1,850,120 | ) | | | — | | | | — | | | | (1,850,120 | ) | |
| Forward foreign currency contracts, net | | | — | | | | 4,786,614 | | | | — | | | | 4,786,614 | | |
| Total | | $ | (1,850,120 | ) | | $ | 508,125,915 | | | $ | — | | | $ | 506,275,795 | | |
At July 31, 2010, there were no transfers between Level 1 and Level 2.
Investments by type of issuer (unaudited)
| | | Percentage of total investments | |
| | | Long-term | | Short-term | |
| Government and other public issuers | | | 59.85 | % | | | — | | |
| Repurchase agreement | | | — | | | | 1.10 | % | |
| Banks and other financial institutions | | | 27.70 | | | | — | | |
| Industrial | | | 11.35 | | | | — | | |
| | | | 98.90 | % | | | 1.10 | % | |
See accompanying notes to financial statements.
86
UBS PACE Select Advisors Trust
UBS PACE High Yield Investments
Performance
For the 12 months ended July 31, 2010, the Portfolio's Class P shares returned 23.60%, before the deduction of the maximum UBS PACE Select program fee. (The Class P shares returned 21.15%, after the deduction of the maximum UBS PACE Select program fee, for the same 12-month period.) In comparison, the BofA Merrill Lynch Global High Yield Index (hedged in USD) (the "benchmark") returned 25.66%, and the Lipper High Current Yield Funds category posted a median return of 20.65%. (Returns for all share classes over various time periods are shown in the "Performance at a glance" table on page 90. Please note that the returns shown do not reflect the deduction of taxes that a shareholder would pay on Portfolio distributions or the redemption of Portfolio shares.) For a detailed commentary on the market environment in general during the reporting period, please refer to page 2.
Sub-Advisor's comments
The Portfolio lagged its benchmark during the reporting period. Primary drivers of underperformance were our higher-quality bias early in the reporting period and the weak results of several individual holdings.
The high yield market had a tremendous rally that started in March 2009. Despite a small correction in May 2010 that brought the 14-month rally to an end, the market has since resumed its upward climb. During the 12-month reporting period, the high yield market experienced record-setting issuance as a result of companies refinancing in the reopened credit markets, coupled with strong investor demand.
When the fiscal year began, the Portfolio's overall credit quality was higher than that of the benchmark. In the third quarter of 2009, we were making our final positioning adjustments to achieve a portfolio beta that was in line with that of the benchmark. (Beta is a measure of market-related risk.) We achieved this through our overweight exposure to banks and lower-rated credits. Banks were one of the top-performing sectors during the period, and CCC and lower-rated bonds outperformed the broader market in the review period. The top-performing issuers in the Portfolio during the period were Ford, General Motors (GM) and CIT Group. Ford's performance was a continuation of its remarkable turnaround story. GM emerged from bankruptcy just prior to this reporting period, and our position rebounded from very distressed levels. CIT Group, the small business lender, has performed well since its emergence from bankruptcy at the end of 2009.
The bottom-performing issuers in the Portfolio were Station Casinos, US Concrete and SLM Holdings (Sallie Mae). We had a small position in Station Casinos, which entered into bankruptcy in the first half of 2009. As a result, its securities declined significantly during the review period. US Concrete faced difficulties as the
UBS PACE Select Advisors Trust – UBS PACE High Yield Investments
Investment Sub-Advisor:
MacKay Shields LLC ("MacKay Shields")
Portfolio Managers:
Dan Roberts, Taylor Wagenseil, Michael Kimble and Louis Cohen
Objective:
Total return
Investment process:
MacKay Shields attempts to deliver attractive risk-adjusted returns by avoiding most of the unusually large losses in the high yield market, even if it means giving up much of the large gains. MacKay Shields believes that there is a very small subset of bonds that delivers outsized gains in the market. Due to the limited upside inherent in most bonds, over time, outsized gains are expected to be smaller than unusually large losses. By attempting to limit the Portfolio's participation in the extremes of the market, MacKay Shields strives to add value over a market cycle with lower volatility. MacKay Shields does this through a rigorous process that attempts to screen out what it believes to be the riskiest issuers in the market.
87
UBS PACE Select Advisors Trust
UBS PACE High Yield Investments
Sub-Advisor's comments – concluded
housing market remained under pressure during the review period. The company filed for bankruptcy in the second quarter of 2010 and is currently restructuring its business. We purchased Sallie Mae during the period, and its shares have subsequently declined, driven, in part, by declining student loan originations.
Special considerations
The Portfolio may be appropriate for long-term investors seeking total return and who are able to withstand short-term fluctuations in the fixed income markets in return for potentially higher returns over the long term. The Portfolio seeks to achieve its objective by investing primarily in a professionally managed, diversified portfolio of fixed income securities rated below investment grade or considered to be of comparable quality (commonly referred to as "junk bonds"). These securities are subject to higher risks than investment grade securities, including greater price volatility and a greater risk of loss of principal and nonpayment of interest. Issuers of such securities are typically in poor financial health, and their ability to pay interest and principal is uncertain. The prices of such securities may be more vulnerable to bad economic news, or even the expectation of bad news, than higher-rated or investment grade bon ds and other fixed income securities. The value of the Portfolio changes every day and can be affected by changes in interest rates, general market conditions and other political, social and economic developments, as well as specific matters relating to the issuers in which the Portfolio invests. In addition, investments in foreign bonds involve special risks. It is important to note that an investment in the Portfolio is only one component of a balanced investment plan.
88
UBS PACE Select Advisors Trust
UBS PACE High Yield Investments
Illustration of an assumed investment of $10,000 in Class P shares of the Portfolio (unaudited)
The following graph depicts the performance of UBS PACE High Yield Investments Class P shares versus the BofA Merrill Lynch Global High Yield Index (hedged in USD) from April 30, 2006, which is the month-end after the inception date of the Class P shares, through July 31, 2010. The performance of the other classes will vary based upon the different class specific expenses and sales charges. The performance provided does not reflect the deduction of taxes that a shareholder would pay on Portfolio distributions or the redemption of Portfolio shares. Past performance is no guarantee of future results. Share price and returns will vary with market conditions; investors may realize a gain or loss upon redemption. It is important to note that UBS PACE High Yield Investments is a professionally managed portfolio while the Index is not available for investment and is unmanaged. The comparison is shown for illustration purposes only.

89
UBS PACE Select Advisors Trust
UBS PACE High Yield Investments
Performance at a glance (unaudited)
| Average annual total returns for periods ended 07/31/10 | | 1 year | | Since
inception1 | |
| Before deducting | | Class A2 | | | 23.35 | % | | | 8.42 | % | |
| maximum sales charge | | Class C3 | | | 22.81 | % | | | 32.71 | % | |
| or UBS PACE Select | | Class Y4 | | | 23.82 | % | | | 39.91 | % | |
| program fee | | Class P5 | | | 23.60 | % | | | 8.66 | % | |
After deducting
maximum sales charge | | Class A2 | | | 17.82 | % | | | 7.25 | % | |
| or UBS PACE Select | | Class C3 | | | 22.06 | % | | | 32.71 | % | |
| program fee | | Class P5 | | | 21.15 | % | | | 6.50 | % | |
| BofA Merrill Lynch Global High Yield Index (hedged in USD)6 | | | | | 25.66 | % | | | 8.32 | % | |
| Lipper High Current Yield Funds median | | | | | 20.65 | % | | | 5.84 | % | |
Average annual total returns for periods ended June 30, 2010, after deduction of the maximum sales charge or UBS PACE Select program fee, were as follows: Class A—1-year period, 19.79%; since inception, 6.44%; Class C—1-year period, 24.13%; since inception, 31.48%; Class Y—1 year period, 25.88%; since inception, 39.05%; Class P—1-year period, 23.32%; since inception, 5.73%.
The annualized gross and net expense ratios, respectively, for each class of shares as in the November 28, 2009 prospectuses, were as follows: Class A—1.46% and 1.35%; Class B—2.17% and 2.10%; Class C—1.92% and 1.85%; Class Y—1.37% and 1.10%; and Class P—1.34% and 1.10%. Class B shares were not operational as of November 28, 2009. Therefore these amounts have been estimated. Net expenses reflect fee waivers and/or expense reimbursements, if any, pursuant to an agreement that is in effect to cap the expenses. The Portfolio and UBS Global AM have entered into a written fee waiver/expense reimbursement agreement pursuant to which UBS Global AM is contractually obligated to waive its management fees and/or reimburse expenses so that the ordinary total operating expenses of each class through November 30, 2010 (excluding dividend expense, borrowing costs and interest expense, if any) would not exceed Class A& #151;1.35%; Class B—2.10%; Class C—1.85%; Class Y—1.10%; and Class P—1.10%. The Portfolio has agreed to repay UBS Global AM for any waived fees/reimbursed expenses to the extent that it can do so over the following three fiscal years without causing the Portfolio's expenses in any of those three years to exceed the expense caps described above.
1 Since inception returns are calculated as of commencement of issuance on April 10, 2006 for Class P shares, May 1, 2006 for Class A shares and January 21, 2009 for Class C shares. Class Y shares commenced issuance on April 3, 2006 and had fully redeemed by July 24, 2006 remaining inactive through December 25, 2008. The inception return of Class Y shares is calculated from December 26, 2008, which is the date the Class Y shares recommenced investment operations. Since inception returns for the Index and Lipper median are shown as of April 30, 2006, which is the month-end after the inception date of the oldest share class (Class P).
2 Maximum sales charge for Class A shares is 4.5%. Class A shares bear ongoing 12b-1 service fees.
3 Maximum contingent deferred sales charge for Class C shares is 0.75% imposed on redemptions and is reduced to 0% after one year. Class C shares bear ongoing 12b-1 service and distribution fees.
4 The Portfolio offers Class Y shares to a limited group of eligible investors, including certain qualifying retirement plans. Class Y shares do not bear initial or contingent deferred sales charges or ongoing 12b-1 service and distribution fees.
5 Class P shares do not bear initial or contingent deferred sales charges or ongoing 12b-1 service and distribution fees, but are subject to a maximum annual UBS PACE Select program fee of 2% of the value of Class P shares. Prior to June 14, 2010, the maximum annual UBS PACE Select program fee was 1.5% of the value of Class P shares.
6 The BofA Merrill Lynch Global High Yield Index (hedged in USD) is an unmanaged index which covers US dollar, Canadian dollar, sterling and euro-denominated fixed rate debt of corporate issuers domiciled in an investment grade rated country (i.e., BBB or higher foreign currency long-term debt rating). Individual bonds must be rated below investment grade (i.e., BB or lower based on a composite of Moody's and S&P) but not in default; and must have at least one year remaining term to maturity; a minimum face value outstanding of $100 million, C$50 million, 50 million pounds sterling or 50 million euros; and have available price quotations. New issues qualify for inclusion after they settle. Investors should note that indices do not reflect the deduction of fees and expenses.
If an investor sells or exchanges shares less than 90 days after purchase, a redemption fee of 1.00% of the amount sold or exchanged will be deducted at the time of the transaction, except as noted otherwise in the prospectuses.
Past performance does not predict future performance, and the performance information provided does not reflect the deduction of taxes that a shareholder would pay on Portfolio distributions or the redemption of Portfolio shares. The return and principal value of an investment will fluctuate, so that an investor's shares, when redeemed, may be worth more or less than their original cost. Performance results assume reinvestment of all dividends and capital gain distributions at net asset value on the ex-dividend dates. Current performance may be higher or lower than the performance data quoted. For month-end performance figures, please visit http://www.ubs.com.
Lipper peer group data calculated by Lipper Inc.; used with permission. The Lipper median is the return of the fund that places in the middle of a Lipper peer group.
90
UBS PACE Select Advisors Trust
UBS PACE High Yield Investments
Portfolio statistics (unaudited)
| Characteristics | | 07/31/10 | |
| Weighted average duration | | | 3.7 | yrs. | |
| Weighted average maturity | | | 6.6 | yrs. | |
| Average coupon | | | 6.76 | % | |
| Net assets (mm) | | $ | 225.7 | | |
| Number of holdings | | | 260 | | |
| Portfolio composition1 | | 07/31/10 | |
| Bonds and loan assignments | | | 92.5 | % | |
| Common stocks, preferred stock and warrants | | | 3.8 | | |
| Collateralized mortgage obligations | | | 1.0 | | |
| Forward foreign currency contracts | | | (0.4 | ) | |
| Cash equivalents and other assets less liabilities | | | 3.1 | | |
| Total | | | 100.0 | % | |
| Quality diversification1 | | 07/31/10 | |
| BB & higher | | | 35.9 | % | |
| B | | | 35.1 | | |
| CCC & lower | | | 15.6 | | |
| Not rated | | | 10.7 | | |
| Forward foreign currency contracts | | | (0.4 | ) | |
| Cash equivalents and other assets less liabilities | | | 3.1 | | |
| Total | | | 100.0 | % | |
| Asset allocation1 | | 07/31/10 | |
| Corporate bonds | | | 85.8 | % | |
| Common stocks, preferred stock and warrants | | | 3.8 | | |
| Loan assignments | | | 3.6 | | |
| Asset-backed securities | | | 3.1 | | |
| Collateralized mortgage obligations | | | 1.0 | | |
| Forward foreign currency contracts | | | (0.4 | ) | |
| Cash equivalents and other assets less liabilities | | | 3.1 | | |
| Total | | | 100.0 | % | |
1 Weightings represent percentages of the Portfolio's net assets as of July 31, 2010. The Portfolio is actively managed and its composition will vary over time. Credit quality ratings shown are based on the ratings assigned to portfolio holdings by Standard & Poor's Ratings Group, an independent rating agency.
91
UBS PACE Select Advisors Trust
UBS PACE High Yield Investments
Portfolio of investments—July 31, 2010
| Security description | | Face
amount1 | | Value | |
| Corporate bonds—85.84% | |
| Aerospace & defense—0.91% | |
Alliant Techsystems, Inc.
6.750%, due 04/01/16 | | | 55,000 | | | $ | 54,863 | | |
BE Aerospace, Inc.
8.500%, due 07/01/18 | | | 600,000 | | | | 652,500 | | |
Hexcel Corp.
6.750%, due 02/01/15 | | | 1,360,000 | | | | 1,346,400 | | |
| | | | 2,053,763 | | |
| Airlines—2.07% | |
American Airlines Pass Through
Trust 2001-01
6.977%, due 05/23/21 | | | 363,793 | | | | 305,586 | | |
Class B
7.377%, due 05/23/19 | | | 406,670 | | | | 345,669 | | |
Continental Airlines Pass
Through Trust 2001-1, Class C
7.033%, due 06/15/11 | | | 120,234 | | | | 118,130 | | |
Continental Airlines Pass Through
Trust 2003-ERJ1, Series RJ03
7.875%, due 07/02/18 | | | 934,667 | | | | 897,281 | | |
Continental Airlines Pass Through
Trust 2004-ERJ1, Series RJ04
9.558%, due 09/01/19 | | | 853,997 | | | | 802,757 | | |
Continental Airlines Pass Through
Trust 2005-ERJ1, Series ERJ1
9.798%, due 04/01/21 | | | 1,207,952 | | | | 1,135,475 | | |
Delta Air Lines, Inc.
7.711%, due 09/18/11 | | | 280,000 | | | | 286,636 | | |
United Air Lines Pass Through
Trust 2009-2A
9.750%, due 01/15/17 | | | 728,070 | | | | 787,226 | | |
| | | | 4,678,760 | | |
| Auto & truck—3.94% | |
Ford Holdings, Inc.
9.300%, due 03/01/30 | | | 1,145,000 | | | | 1,196,525 | | |
| 9.375%, due 03/01/20 | | | 285,000 | | | | 294,975 | | |
Ford Motor Co.
6.625%, due 10/01/28 | | | 1,595,000 | | | | 1,355,750 | | |
Motors Liquidation Co.
8.375%, due 07/05/332 | | EUR | 2,000,000 | | | | 938,268 | | |
| 8.375%, due 07/15/332,3 | | | 11,910,000 | | | | 4,108,950 | | |
Navistar International Corp.
8.250%, due 11/01/21 | | | 935,000 | | | | 988,763 | | |
| | | | 8,883,231 | | |
| Automotive parts—0.69% | |
Goodyear Tire & Rubber Co.
10.500%, due 05/15/16 | | | 1,390,000 | | | | 1,556,800 | | |
| Banking-non-US—2.61% | |
Anglo Irish Bank Corp. Ltd.
0.979%, due 06/19/174 | | EUR | 1,000,000 | | | | 458,153 | | |
| Security description | | Face
amount1 | | Value | |
| Corporate bonds—(continued) | |
| Banking-non-US—(concluded) | |
EGG Banking PLC
7.500%, due 12/09/135,6 | | GBP | 1,560,000 | | | $ | 2,202,696 | | |
HBOS Capital Funding LP
6.461%, due 11/30/185,6 | | GBP | 705,000 | | | | 815,306 | | |
HT1 Funding GmbH
6.352%, due 06/30/175,6 | | EUR | 1,600,000 | | | | 1,313,597 | | |
IKB Deutsche
Industriebank AG
4.500%, due 07/09/13 | | EUR | 1,000,000 | | | | 1,101,162 | | |
| | | | 5,890,914 | | |
| Banking-US—0.93% | |
Fifth Third Capital Trust IV
6.500%, due 04/15/374 | | | 1,080,000 | | | | 928,800 | | |
Wachovia Capital Trust III
5.800%, due 03/15/115,6 | | | 750,000 | | | | 634,725 | | |
Wells Fargo & Co., Series K
7.980%, due 03/15/185,6 | | | 525,000 | | | | 540,750 | | |
| | | | 2,104,275 | | |
| Beverages—0.52% | |
Constellation Brands, Inc.
7.250%, due 09/01/16 | | | 590,000 | | | | 615,075 | | |
| 7.250%, due 05/15/17 | | | 225,000 | | | | 234,000 | | |
| 8.375%, due 12/15/14 | | | 300,000 | | | | 324,000 | | |
| | | | 1,173,075 | | |
| Broadcast—0.50% | |
Clear Channel Communications, Inc.
4.900%, due 05/15/15 | | | 985,000 | | | | 541,750 | | |
| 6.875%, due 06/15/18 | | | 730,000 | | | | 375,950 | | |
| 7.250%, due 10/15/27 | | | 445,000 | | | | 213,600 | | |
| | | | 1,131,300 | | |
| Building & construction—2.51% | |
D.R. Horton, Inc.
5.625%, due 01/15/16 | | | 195,000 | | | | 187,687 | | |
| 6.500%, due 04/15/16 | | | 255,000 | | | | 255,000 | | |
K. Hovnanian Enterprises, Inc.
6.500%, due 01/15/14 | | | 770,000 | | | | 608,300 | | |
| 7.750%, due 05/15/133 | | | 80,000 | | | | 72,200 | | |
| 10.625%, due 10/15/16 | | | 1,195,000 | | | | 1,206,950 | | |
PERI GmbH
5.625%, due 12/15/11 | | EUR | 335,000 | | | | 448,561 | | |
Pulte Group, Inc.
6.375%, due 05/15/33 | | | 567,000 | | | | 442,260 | | |
Standard Pacific Corp.
8.375%, due 05/15/18 | | | 1,365,000 | | | | 1,327,462 | | |
Taylor Wimpey PLC
7.925%, due 05/24/195 | | GBP | 341,522 | | | | 519,822 | | |
| 8.175%, due 07/03/125 | | GBP | 287,814 | | | | 429,042 | | |
William Lyon Homes, Inc.
10.750%, due 04/01/13 | | | 200,000 | | | | 166,000 | | |
| | | | 5,663,284 | | |
92
UBS PACE Select Advisors Trust
UBS PACE High Yield Investments
Portfolio of investments—July 31, 2010
| Security description | | Face
amount1 | | Value | |
| Corporate bonds—(continued) | |
| Building materials—0.31% | |
Interface, Inc., Series B
11.375%, due 11/01/13 | | | 625,000 | | | $ | 706,250 | | |
| Building products—1.75% | |
Nortek, Inc.
11.000%, due 12/01/13 | | | 1,381,111 | | | | 1,474,336 | | |
US Concrete, Inc.
8.375%, due 04/01/142 | | | 1,370,000 | | | | 719,250 | | |
USG Corp.
6.300%, due 11/15/16 | | | 1,235,000 | | | | 1,071,362 | | |
| 9.500%, due 01/15/187 | | | 690,000 | | | | 677,925 | | |
| | | | 3,942,873 | | |
| Building products-cement—0.86% | |
Hanson Ltd.
6.125%, due 08/15/16 | | | 600,000 | | | | 589,500 | | |
HeidelbergCement Finance BV
7.500%, due 04/03/20 | | EUR | 395,000 | | | | 504,450 | | |
Texas Industries, Inc.
7.250%, due 07/15/13 | | | 837,000 | | | | 851,647 | | |
| | | | 1,945,597 | | |
| Cable—1.00% | |
Cequel Communications
Holdings I LLC/Cequel
Capital Corp.
8.625%, due 11/15/178 | | | 1,405,000 | | | | 1,433,100 | | |
Dish DBS Corp.
6.625%, due 10/01/14 | | | 800,000 | | | | 818,000 | | |
| | | | 2,251,100 | | |
| Car rental—1.59% | |
Avis Budget Car Rental LLC/Avis
Budget Finance, Inc.
2.936%, due 05/15/144 | | | 200,000 | | | | 177,000 | | |
| 7.625%, due 05/15/147 | | | 605,000 | | | | 597,437 | | |
Europcar Groupe SA
4.183%, due 05/15/134 | | EUR | 300,000 | | | | 351,851 | | |
Hertz Corp.
8.875%, due 01/01/14 | | | 1,065,000 | | | | 1,096,950 | | |
Hertz Holdings Netherlands BV
8.500%, due 07/31/15 | | EUR | 1,000,000 | | | | 1,358,535 | | |
| | | | 3,581,773 | | |
| Chemicals—3.57% | |
Hexion US Finance Corp./Hexion
Nova Scotia Finance ULC
8.875%, due 02/01/18 | | | 615,000 | | | | 592,706 | | |
| 9.750%, due 11/15/143 | | | 725,000 | | | | 722,281 | | |
Huntsman International LLC
6.875%, due 11/15/13 | | EUR | 600,000 | | | | 766,253 | | |
| 7.375%, due 01/01/157 | | | 1,440,000 | | | | 1,429,200 | | |
| 7.500%, due 01/01/15 | | EUR | 650,000 | | | | 813,166 | | |
| Security description | | Face
amount1 | | Value | |
| Corporate bonds—(continued) | |
| Chemicals—(concluded) | |
Innophos, Inc.
8.875%, due 08/15/147 | | | 960,000 | | | $ | 990,000 | | |
Invista
9.250%, due 05/01/128 | | | 441,000 | | | | 445,961 | | |
LBI Escrow Corp.
8.000%, due 11/01/178 | | | 1,290,000 | | | | 1,356,112 | | |
Nalco Co.
9.000%, due 11/15/13 | | EUR | 430,000 | | | | 571,562 | | |
Rockwood Specialties Group, Inc.
7.625%, due 11/15/14 | | EUR | 270,000 | | | | 358,888 | | |
| | | | 8,046,129 | | |
| Coal—0.64% | |
Cloud Peak Energy
Resources LLC/Cloud Peak
Energy Finance Corp.
8.250%, due 12/15/178 | | | 770,000 | | | | 804,650 | | |
| 8.500%, due 12/15/198 | | | 605,000 | | | | 635,250 | | |
| | | | 1,439,900 | | |
| Commercial services—1.67% | |
Ashtead Holdings PLC
8.625%, due 08/01/158 | | | 765,000 | | | | 774,562 | | |
Corrections Corp. of America
6.250%, due 03/15/13 | | | 430,000 | | | | 436,450 | | |
Iron Mountain, Inc.
6.750%, due 10/15/18 | | EUR | 495,000 | | | | 617,645 | | |
| 7.750%, due 01/15/15 | | | 390,000 | | | | 393,900 | | |
United Rentals North America, Inc.
7.000%, due 02/15/143 | | | 155,000 | | | | 153,838 | | |
| 9.250%, due 12/15/19 | | | 1,315,000 | | | | 1,387,325 | | |
| | | | 3,763,720 | | |
| Computer software & services—0.28% | |
Sungard Data Systems, Inc.
10.250%, due 08/15/15 | | | 600,000 | | | | 630,000 | | |
| Consumer products—0.61% | |
Jarden Corp.
7.500%, due 01/15/20 | | | 670,000 | | | | 683,400 | | |
| 7.500%, due 01/15/20 | | EUR | 550,000 | | | | 702,398 | | |
| | | | 1,385,798 | | |
| Containers & packaging—1.92% | |
IFCO Systems N.V.
10.000%, due 06/30/16 | | EUR | 500,000 | | | | 739,538 | | |
Impress Holdings BV
3.960%, due 09/15/134 | | EUR | 900,000 | | | | 1,127,388 | | |
OI European Group BV
6.875%, due 03/31/17 | | EUR | 115,000 | | | | 151,361 | | |
Owens-Brockway Glass
Container, Inc.
6.750%, due 12/01/14 | | EUR | 435,000 | | | | 572,539 | | |
93
UBS PACE Select Advisors Trust
UBS PACE High Yield Investments
Portfolio of investments—July 31, 2010
| Security description | | Face
amount1 | | Value | |
| Corporate bonds—(continued) | |
| Containers & packaging—(concluded) | |
Rexam PLC
6.750%, due 06/29/675 | | EUR | 1,406,000 | | | $ | 1,731,421 | | |
| | | | 4,322,247 | | |
| Diversified capital goods—0.46% | |
Mueller Water Products, Inc.
7.375%, due 06/01/17 | | | 1,145,000 | | | | 1,043,381 | | |
| Diversified financial services—3.61% | |
Ally Financial, Inc.
8.000%, due 11/01/31 | | | 2,720,000 | | | | 2,646,739 | | |
| 8.300%, due 02/12/158 | | | 645,000 | | | | 678,863 | | |
Bank of America Corp.
8.000%, due 01/30/185,6 | | | 345,000 | | | | 347,198 | | |
Capital One Capital III
7.686%, due 08/15/36 | | | 2,000,000 | | | | 1,990,000 | | |
GE Capital Trust III
6.500%, due 09/15/674 | | GBP | 1,750,000 | | | | 2,471,410 | | |
| | | | 8,134,210 | | |
| Diversified operations—0.36% | |
Icahn Enterprises LP
4.000%, due 08/15/134 | | | 900,000 | | | | 801,000 | | |
| Electric utilities—2.63% | |
Edison Mission Energy
7.200%, due 05/15/19 | | | 15,000 | | | | 10,125 | | |
| 7.500%, due 06/15/133 | | | 1,375,000 | | | | 1,161,875 | | |
| 7.625%, due 05/15/27 | | | 65,000 | | | | 40,950 | | |
Energy Future Holdings Corp.
11.250%, due 11/01/179 | | | 4,311,619 | | | | 2,802,552 | | |
NRG Energy, Inc.
7.250%, due 02/01/14 | | | 1,580,000 | | | | 1,619,500 | | |
| 8.500%, due 06/15/19 | | | 295,000 | | | | 309,750 | | |
| | | | 5,944,752 | | |
| Electric-generation—0.57% | |
Intergen N.V.
8.500%, due 06/30/17 | | EUR | 205,000 | | | | 273,825 | | |
| 9.500%, due 06/30/17 | | GBP | 490,000 | | | | 795,794 | | |
Tenaska Alabama Partners LP
7.000%, due 06/30/218 | | | 225,363 | | | | 223,109 | | |
| | | | 1,292,728 | | |
| Electronics—1.07% | |
Freescale Semiconductor, Inc.
9.250%, due 04/15/188 | | | 1,180,000 | | | | 1,218,350 | | |
| 10.125%, due 03/15/188 | | | 570,000 | | | | 607,050 | | |
SGL Carbon SE
1.933%, due 05/16/154 | | EUR | 500,000 | | | | 589,676 | | |
| | | | 2,415,076 | | |
| Security description | | Face
amount1 | | Value | |
| Corporate bonds—(continued) | |
| Finance-captive automotive—0.65% | |
FCE Bank PLC
7.125%, due 01/15/13 | | EUR | 800,000 | | | $ | 1,068,584 | | |
GMAC Canada Ltd.
6.000%, due 05/23/12 | | EUR | 300,000 | | | | 390,945 | | |
| | | | 1,459,529 | | |
| Finance-noncaptive consumer—1.43% | |
CIT Group, Inc.
7.000%, due 05/01/143 | | | 847,342 | | | | 824,040 | | |
| 7.000%, due 05/01/15 | | | 506,342 | | | | 487,987 | | |
| 7.000%, due 05/01/16 | | | 843,905 | | | | 803,819 | | |
| 7.000%, due 05/01/17 | | | 1,181,469 | | | | 1,113,535 | | |
| | | | 3,229,381 | | |
| Finance-other—1.68% | |
American General Finance Corp.
3.250%, due 01/16/13 | | EUR | 1,000,000 | | | | 1,097,188 | | |
American General Finance
Corp. MTN
6.500%, due 09/15/17 | | | 545,000 | | | | 453,712 | | |
| 6.900%, due 12/15/17 | | | 350,000 | | | | 298,375 | | |
Series H
5.375%, due 10/01/12 | | | 175,000 | | | | 164,500 | | |
SLM Corp. MTN
8.000%, due 03/25/20 | | | 2,000,000 | | | | 1,775,000 | | |
| | | | 3,788,775 | | |
| Financial services—1.81% | |
Bear Stearns Cos., Inc.
11.000%, due 02/02/175,10,11 | | | 320,000 | | | | 358,720 | | |
HSBC Finance Capital Trust IX
5.911%, due 11/30/355 | | | 1,450,000 | | | | 1,268,750 | | |
Northern Rock Asset
Management PLC
9.375%, due 10/17/21 | | GBP | 2,000,000 | | | | 2,455,719 | | |
| | | | 4,083,189 | | |
| Firearms & ammunition—0.30% | |
Colt Defense LLC/Colt
Finance Corp.
8.750%, due 11/15/178 | | | 840,000 | | | | 674,100 | | |
| Food—0.82% | |
Smithfield Foods, Inc.
7.000%, due 08/01/113 | | | 1,360,000 | | | | 1,383,800 | | |
| 10.000%, due 07/15/148 | | | 410,000 | | | | 458,175 | | |
| | | | 1,841,975 | | |
| Food-wholesale—0.08% | |
Barry Callebaut Services N.V.
6.000%, due 07/13/17 | | EUR | 140,000 | | | | 186,546 | | |
| Gaming—5.32% | |
Harrah's Operating Co., Inc.
10.000%, due 12/15/183 | | | 2,479,000 | | | | 2,085,459 | | |
| 12.750%, due 04/15/183,8 | | | 370,000 | | | | 359,825 | | |
94
UBS PACE Select Advisors Trust
UBS PACE High Yield Investments
Portfolio of investments—July 31, 2010
| Security description | | Face
amount1 | | Value | |
| Corporate bonds—(continued) | |
| Gaming—(concluded) | |
Isle of Capri Casinos, Inc.
7.000%, due 03/01/143 | | | 1,380,000 | | | $ | 1,266,150 | | |
Mandalay Resort Group
6.375%, due 12/15/11 | | | 790,000 | | | | 759,387 | | |
MGM Resorts International
5.875%, due 02/27/143 | | | 395,000 | | | | 332,294 | | |
| 6.625%, due 07/15/153 | | | 790,000 | | | | 661,625 | | |
| 7.500%, due 06/01/163 | | | 1,485,000 | | | | 1,232,550 | | |
Mohegan Tribal Gaming Authority
6.125%, due 02/15/13 | | | 1,475,000 | | | | 1,235,312 | | |
| 8.000%, due 04/01/12 | | | 155,000 | | | | 132,525 | | |
| 11.500%, due 11/01/173,8 | | | 285,000 | | | | 278,588 | | |
Pinnacle Entertainment, Inc.
7.500%, due 06/15/15 | | | 1,260,000 | | | | 1,222,200 | | |
River Rock Entertainment Authority
9.750%, due 11/01/11 | | | 380,000 | | | | 355,300 | | |
Station Casinos, Inc.
6.000%, due 04/01/122,3 | | | 575,000 | | | | 11,500 | | |
Wynn Las Vegas LLC/Wynn
Las Vegas Capital Corp.
6.625%, due 12/01/143 | | | 1,440,000 | | | | 1,494,000 | | |
| 7.750%, due 08/15/208 | | | 580,000 | | | | 587,975 | | |
| | | | 12,014,690 | | |
| Health care providers & services—1.40% | |
HCA, Inc.
6.500%, due 02/15/16 | | | 3,165,000 | | | | 3,101,700 | | |
| 9.250%, due 11/15/16 | | | 55,000 | | | | 59,400 | | |
| | | | 3,161,100 | | |
| Hotels, restaurants & leisure—0.50% | |
Royal Caribbean Cruises Ltd.
5.625%, due 01/27/14 | | EUR | 925,000 | | | | 1,121,059 | | |
| Household durables—0.57% | |
Libbey Glass, Inc.
10.000%, due 02/15/158 | | | 1,215,000 | | | | 1,293,975 | | |
| Insurance—2.21% | |
American International Group, Inc.
5.000%, due 04/26/23 | | GBP | 750,000 | | | | 903,159 | | |
Hartford Life, Inc.
7.650%, due 06/15/27 | | | 885,000 | | | | 905,139 | | |
Liberty Mutual Group, Inc.
7.800%, due 03/15/378 | | | 2,000,000 | | | | 1,780,000 | | |
Lincoln National Corp.
7.000%, due 05/17/665 | | | 1,555,000 | | | | 1,406,342 | | |
| | | | 4,994,640 | | |
| Machinery—0.72% | |
AGCO Corp.
6.875%, due 04/15/14 | | EUR | 300,000 | | | | 392,900 | | |
Terex Corp.
7.375%, due 01/15/14 | | | 1,220,000 | | | | 1,241,350 | | |
| | | | 1,634,250 | | |
| Security description | | Face
amount1 | | Value | |
| Corporate bonds—(continued) | |
| Machinery-agriculture & construction—0.29% | |
CNH America LLC
7.250%, due 01/15/16 | | | 625,000 | | | $ | 653,125 | | |
| Manufacturing-diversified—1.61% | |
American Railcar Industries, Inc.
7.500%, due 03/01/14 | | | 1,520,000 | | | | 1,489,600 | | |
Amsted Industries, Inc.
8.125%, due 03/15/188 | | | 1,110,000 | | | | 1,137,750 | | |
SPX Corp.
7.625%, due 12/15/14 | | | 955,000 | | | | 1,000,363 | | |
| | | | 3,627,713 | | |
| Media—0.27% | |
Lamar Media Corp.
6.625%, due 08/15/15 | | | 285,000 | | | | 283,575 | | |
Series C,
6.625%, due 08/15/15 | | | 105,000 | | | | 103,425 | | |
Lighthouse International Co. SA
8.000%, due 04/30/14 | | EUR | 275,000 | | | | 218,604 | | |
| | | | 605,604 | | |
| Medical products—0.74% | |
Bausch & Lomb, Inc.
9.875%, due 11/01/15 | | | 1,215,000 | | | | 1,281,825 | | |
FMC Finance III SA
6.875%, due 07/15/17 | | | 365,000 | | | | 378,688 | | |
| | | | 1,660,513 | | |
| Metals—2.37% | |
Aleris International, Inc.
6.000%, due 06/01/2010,12 | | | 13,347 | | | | 14,375 | | |
Century Aluminum Co.
8.000%, due 05/15/14 | | | 2,608,150 | | | | 2,517,126 | | |
Novelis, Inc.
7.250%, due 02/15/157 | | | 2,745,000 | | | | 2,806,762 | | |
| | | | 5,338,263 | | |
| Metals & mining—3.05% | |
Arch Western Finance LLC
6.750%, due 07/01/137 | | | 985,000 | | | | 989,925 | | |
FMG Finance Pty Ltd.
9.750%, due 09/01/13 | | EUR | 725,000 | | | | 1,001,471 | | |
| 10.000%, due 09/01/138 | | | 650,000 | | | | 711,750 | | |
| 10.625%, due 09/01/168 | | | 685,000 | | | | 780,900 | | |
Foundation PA Coal Co.
7.250%, due 08/01/14 | | | 1,160,000 | | | | 1,184,650 | | |
Glencore Finance Europe SA
6.500%, due 02/27/19 | | GBP | 500,000 | | | | 772,461 | | |
Massey Energy Co.
6.875%, due 12/15/13 | | | 1,065,000 | | | | 1,061,006 | | |
Teck Resources Ltd.
10.750%, due 05/15/19 | | | 305,000 | | | | 380,884 | | |
| | | | 6,883,047 | | |
95
UBS PACE Select Advisors Trust
UBS PACE High Yield Investments
Portfolio of investments—July 31, 2010
| Security description | | Face
amount1 | | Value | |
| Corporate bonds—(continued) | |
| Oil & gas—6.82% | |
Chesapeake Energy Corp.
6.250%, due 01/15/17 | | EUR | 515,000 | | | $ | 664,411 | | |
Compton Petroleum
Finance Corp.
7.625%, due 12/01/13 | | | 995,000 | | | | 859,431 | | |
Delta Petroleum Corp.
7.000%, due 04/01/15 | | | 1,490,000 | | | | 1,177,100 | | |
Denbury Resources, Inc.
7.500%, due 12/15/15 | | | 825,000 | | | | 847,688 | | |
| 9.750%, due 03/01/16 | | | 200,000 | | | | 220,250 | | |
El Paso Corp.
6.875%, due 06/15/14 | | | 2,055,000 | | | | 2,159,478 | | |
Ferrellgas Partners LP/Ferrellgas
Partners Finance Corp.
8.625%, due 06/15/20 | | | 1,100,000 | | | | 1,149,500 | | |
Forest Oil Corp.
8.000%, due 12/15/11 | | | 75,000 | | | | 79,125 | | |
Hilcorp Energy I LP/Hilcorp
Finance Co.
8.000%, due 02/15/208 | | | 355,000 | | | | 365,650 | | |
| 9.000%, due 06/01/168 | | | 510,000 | | | | 538,050 | | |
Inergy LP/Inergy Finance Corp.
6.875%, due 12/15/14 | | | 1,475,000 | | | | 1,482,375 | | |
Linn Energy LLC
9.875%, due 07/01/18 | | | 1,230,000 | | | | 1,353,000 | | |
Linn Energy LLC/Linn Energy
Finance Corp.
8.625%, due 04/15/208 | | | 600,000 | | | | 637,500 | | |
MarkWest Energy
Partners LP/MarkWest
Energy Finance Corp.
8.500%, due 07/15/16 | | | 975,000 | | | | 1,028,625 | | |
Regency Energy
Partners LP/Regency Energy
Finance Corp.
8.375%, due 12/15/13 | | | 1,198,000 | | | | 1,254,905 | | |
Swift Energy Co.
8.875%, due 01/15/20 | | | 895,000 | | | | 912,900 | | |
Targa Resources
Partners LP/Targa Resources
Partners Finance Corp.
8.250%, due 07/01/16 | | | 630,000 | | | | 658,350 | | |
| | | | 15,388,338 | | |
| Oil refining—1.07% | |
Petroplus Finance Ltd.
6.750%, due 05/01/148 | | | 430,000 | | | | 387,000 | | |
Tesoro Corp.
6.250%, due 11/01/12 | | | 1,835,000 | | | | 1,869,406 | | |
| 6.500%, due 06/01/17 | | | 160,000 | | | | 154,400 | | |
| | | | 2,410,806 | | |
| Security description | | Face
amount1 | | Value | |
| Corporate bonds—(continued) | |
| Oil services—2.81% | |
Basic Energy Services, Inc.
7.125%, due 04/15/16 | | | 1,535,000 | | | $ | 1,389,175 | | |
CIE Generale de Geophysique
7.500%, due 05/15/15 | | | 1,270,000 | | | | 1,244,600 | | |
Geokinetics Holdings, Inc.
9.750%, due 12/15/148 | | | 1,325,000 | | | | 1,172,625 | | |
Helix Energy Solutions Group, Inc.
9.500%, due 01/15/168 | | | 1,005,000 | | | | 974,850 | | |
Hornbeck Offshore Services, Inc.
8.000%, due 09/01/17 | | | 335,000 | | | | 313,644 | | |
Series B
6.125%, due 12/01/14 | | | 1,375,000 | | | | 1,234,062 | | |
| | | | 6,328,956 | | |
| Packaging—1.45% | |
Reynolds Group Escrow
7.750%, due 10/15/16 | | EUR | 1,100,000 | | | | 1,465,719 | | |
Reynolds Group Issuer
8.500%, due 05/15/188 | | | 1,765,000 | | | | 1,813,537 | | |
| | | | 3,279,256 | | |
| Paper & forest products—2.70% | |
Boise Cascade LLC
7.125%, due 10/15/14 | | | 1,980,000 | | | | 1,861,200 | | |
Boise Paper Holdings LLC/Boise
Finance Co.
9.000%, due 11/01/17 | | | 850,000 | | | | 892,500 | | |
Domtar Corp.
9.500%, due 08/01/16 | | | 250,000 | | | | 287,500 | | |
| 10.750%, due 06/01/173 | | | 1,185,000 | | | | 1,460,512 | | |
Norske Skogindustrier ASA
7.000%, due 06/26/17 | | EUR | 505,000 | | | | 447,502 | | |
| 7.125%, due 10/15/338 | | | 1,850,000 | | | | 1,137,750 | | |
| | | | 6,086,964 | | |
| Railroads—0.40% | |
RailAmerica, Inc.
9.250%, due 07/01/17 | | | 824,000 | | | | 891,980 | | |
| Real estate investment trusts—0.58% | |
iStar Financial, Inc.
5.875%, due 03/15/163 | | | 550,000 | | | | 391,187 | | |
Prologis International Funding SA
7.625%, due 10/23/14 | | EUR | 750,000 | | | | 928,495 | | |
| | | | 1,319,682 | | |
| Retail—0.65% | |
Neiman Marcus Group, Inc.
9.000%, due 10/15/153,9 | | | 1,442,704 | | | | 1,476,968 | | |
| Steel—1.06% | |
California Steel Industries
6.125%, due 03/15/14 | | | 1,280,000 | | | | 1,235,200 | | |
96
UBS PACE Select Advisors Trust
UBS PACE High Yield Investments
Portfolio of investments—July 31, 2010
| Security description | | Face
amount1 | | Value | |
| Corporate bonds—(concluded) | |
| Steel—(concluded) | |
RathGibson, Inc.
11.250%, due 02/15/142,3,10 | | | 335,000 | | | $ | 4,188 | | |
US Steel Corp.
7.000%, due 02/01/18 | | | 1,170,000 | | | | 1,161,225 | | |
| | | | 2,400,613 | | |
| Support-services—0.22% | |
KAR Auction Services, Inc.
10.000%, due 05/01/15 | | | 33,000 | | | | 34,320 | | |
TUI AG
5.125%, due 12/10/12 | | EUR | 380,000 | | | | 472,913 | | |
| | | | 507,233 | | |
| Telecommunication services—1.35% | |
Alcatel-Lucent USA, Inc.
6.450%, due 03/15/29 | | | 1,020,000 | | | | 688,500 | | |
Angel Lux Common SA
6.159%, due 05/01/164 | | EUR | 317,684 | | | | 412,955 | | |
Softbank Corp.
7.750%, due 10/15/13 | | EUR | 1,450,000 | | | | 1,955,703 | | |
| | | | 3,057,158 | | |
| Telephone-integrated—1.14% | |
Frontier Communications Corp.
7.000%, due 11/01/25 | | | 965,000 | | | | 834,725 | | |
| 7.050%, due 10/01/46 | | | 905,000 | | | | 714,950 | | |
Virgin Media Finance PLC
9.500%, due 08/15/16 | | EUR | 700,000 | | | | 1,017,109 | | |
| | | | 2,566,784 | | |
| Transportation—1.13% | |
Stena AB
5.875%, due 02/01/19 | | EUR | 650,000 | | | | 745,402 | | |
| 6.125%, due 02/01/17 | | EUR | 1,500,000 | | | | 1,808,122 | | |
| | | | 2,553,524 | | |
| Transportation services—0.85% | |
Bristow Group, Inc.
6.125%, due 06/15/13 | | | 947,000 | | | | 949,368 | | |
PHI, Inc.
7.125%, due 04/15/13 | | | 805,000 | | | | 768,775 | | |
Teekay Corp.
8.500%, due 01/15/20 | | | 195,000 | | | | 204,750 | | |
| | | | 1,922,893 | | |
| Wireless telecommunication services—0.21% | |
Crown Castle International Corp.
9.000%, due 01/15/15 | | | 430,000 | | | | 470,850 | | |
Total corporate bonds
(cost—$182,268,049) | | | | | | | 193,695,415 | | |
| Security description | | Face
amount1 | | Value | |
| Loan assignments4—3.59% | |
| Cable—0.45% | |
Charter Communications
Operating, LLC Extended
Term Loan
3.790%, due 09/30/10 | | | 959,762 | | | $ | 909,777 | | |
Charter Communications
Operating, LLC Replacement
Term Loan
2.320%, due 08/31/10 | | | 118,226 | | | | 112,069 | | |
| | | | 1,021,846 | | |
| Commercial services—0.49% | |
Aramark Corp. Extended
Letter of Credit
3.598%, due 09/30/10 | | | 47,556 | | | | 45,838 | | |
Aramark Corp. Extended
Term Loan B
3.783%, due 09/30/10 | | | 723,113 | | | | 696,987 | | |
Aramark Corp. Synthetic
Letter of Credit
2.223%, due 09/30/10 | | | 26,400 | | | | 24,684 | | |
Aramark Corp. Term Loan
2.408%, due 09/30/10 | | | 364,576 | | | | 340,875 | | |
| | | | 1,108,384 | | |
| Computer software & services—0.79% | |
Sungard Data Systems, Inc.
Tranche B
4.043%, due 08/09/10 | | | 1,730,299 | | | | 1,666,503 | | |
| 3.970%, due 08/09/10 | | | 126,410 | | | | 121,749 | | |
| | | | 1,788,252 | | |
| Defense/aerospace—0.39% | |
Hawker Beechcraft Acquisition
Co. LLC LC Facility Deposits
2.533%, due 09/30/10 | | | 60,863 | | | | 49,191 | | |
Hawker Beechcraft Acquisition
Co. LLC Term Loan
2.316%, due 08/31/10 | | | 748,820 | | | | 605,218 | | |
| 2.533%, due 09/30/10 | | | 271,855 | | | | 219,722 | | |
| | | | 874,131 | | |
| Energy equipment & services—0.38% | |
Precision Drilling Corp.
Tranche B-1 Term Loan
7.250%, due 09/30/10 | | | 844,742 | | | | 844,041 | | |
| Machinery—0.21% | |
Manitowoc Co., Inc. Term Loan B
8.000%, due 08/23/10 | | | 468,808 | | | | 470,078 | | |
97
UBS PACE Select Advisors Trust
UBS PACE High Yield Investments
Portfolio of investments—July 31, 2010
| Security description | | Face
amount1 | | Value | |
| Loan assignments4—(concluded) | |
| Paper & packaging—0.51% | |
Georgia-Pacific Corp. New Term Loan B
2.475%, due 08/31/10 | | | 171,918 | | | $ | 169,160 | | |
| 2.533%, due 09/30/10 | | | 26,862 | | | | 26,431 | | |
| 2.537%, due 09/10/10 | | | 968,017 | | | | 952,490 | | |
| | | | 1,148,081 | | |
| Wireless telecommunication services—0.37% | |
MetroPCS Wireless, Inc.
Extended Term Loan
3.875%, due 08/02/10 | | | 509,820 | | | | 501,536 | | |
| 3.875%, due 08/31/10 | | | 275,303 | | | | 270,829 | | |
MetroPCS Wireless, Inc.
Term Loan B
2.625%, due 08/02/10 | | | 46,796 | | | | 45,509 | | |
| 2.625%, due 08/31/10 | | | 25,271 | | | | 24,574 | | |
| | | | 842,448 | | |
Total loan assignments
(cost—$7,692,752) | | | | | | | 8,097,261 | | |
| Asset-backed securities—3.09% | |
Citigroup Mortgage Loan
Trust, Inc., Series 2007-AHL2,
Class A3A
0.399%, due 05/25/374 | | | 989,216 | | | | 730,385 | | |
GSAA Home Equity Trust,
Series 2006-14, Class A1
0.379%, due 09/25/364 | | | 969,664 | | | | 444,835 | | |
Home Equity Loan Trust,
Series 2007-FRE1, Class 2AV1
0.459%, due 04/25/374 | | | 903,891 | | | | 734,069 | | |
Merrill Lynch Mortgage Investors
Trust, Series 2007-MLN1,
Class A2A
0.439%, due 03/25/374 | | | 1,063,922 | | | | 702,037 | | |
Morgan Stanley Capital, Inc.,
Series 2006-HE8, Class A2B
0.429%, due 10/25/364 | | | 390,000 | | | | 318,305 | | |
Renaissance Home Equity Loan
Trust, Series 2007-2, Class AF1
5.893%, due 06/25/377 | | | 1,525,218 | | | | 1,150,345 | | |
Rutland Rated Investments,
Series DRYD-1A, Class A1AL
0.889%, due 06/20/134,10,11 | | | 1,440,000 | | | | 1,119,456 | | |
Soundview Home Equity
Loan Trust,
Series 2006-EQ2, Class A2
0.439%, due 01/25/374 | | | 1,152,150 | | | | 956,236 | | |
Series 2007-OPT1, Class 2A1
0.409%, due 06/25/374 | | | 989,703 | | | | 814,863 | | |
Total asset-backed securities
(cost—$7,432,936) | | | | | | | 6,970,531 | | |
| Security description | | Face
amount1 | | Value | |
| Collateralized mortgage obligations—0.97% | |
Banc of America Mortgage
Securities, Series 2005-J,
Class 1A1
3.388%, due 11/25/354 | | | 963,595 | | | $ | 797,494 | | |
Countrywide Alternative Loan
Trust, Series 2006-OC6,
Class 2A1
0.399%, due 07/25/364 | | | 590,594 | | | | 568,640 | | |
WaMu Mortgage Pass-Through
Certificates, Series 2006-AR14,
Class 1A1
5.521%, due 11/25/365 | | | 919,491 | | | | 823,817 | | |
Total collateralized mortgage
obligations
(cost—$2,164,631) | | | | | | | 2,189,951 | | |
| | | Number of
shares | | | |
| Common stocks—0.73% | |
| Building products—0.02% | |
| Nortek, Inc.* | | | 1,375 | | | | 55,000 | | |
| Diversified financial services—0.47% | |
| CIT Group, Inc.* | | | 29,055 | | | | 1,056,440 | | |
| Metals—0.24% | |
| Aleris International, Inc.10,12 | | | 15,446 | | | | 540,610 | | |
Total common stocks
(cost—$1,289,978) | | | | | | | 1,652,050 | | |
| Preferred stock—3.03% | |
| Finance-captive automotive—3.03% | |
Ford Motor Co. Capital Trust II3
(cost—$6,881,323) | | | 147,220 | | | | 6,851,619 | | |
| | | Number of
warrants | | | |
| Warrants—0.01% | |
| Cable—0.01% | |
Charter Communications, Inc.,
strike price $46.86,
expires 11/30/14*
(cost—$3,635) | | | 1,818 | | | | 14,126 | | |
98
UBS PACE Select Advisors Trust
UBS PACE High Yield Investments
Portfolio of investments—July 31, 2010
| Security description | | Face
amount1 | | Value | |
| Repurchase agreement—2.29% | |
Repurchase agreement dated
07/30/10 with State Street
Bank & Trust Co., 0.010%
due 08/02/10, collateralized
by $5,117,207 US Treasury
Notes, 2.125% to 3.125%
due 04/30/15 to 04/30/17;
(value—$5,280,589);
proceeds: $5,177,004
(cost—$5,177,000) | | | 5,177,000 | | | $ | 5,177,000 | | |
| Security description | | Number of
shares | | Value | |
| Investment of cash collateral from securities loaned—9.81% | |
| Money market fund—9.81% | |
UBS Private Money Market
Fund LLC13
(cost—$22,131,690) | | | 22,131,690 | | | $ | 22,131,690 | | |
Total investments
(cost—$235,041,994)—
109.36% | | | | | 246,779,643 | | |
Liabilities in excess of other
assets—(9.36)% | | | | | (21,128,810 | ) | |
| Net assets—100.00% | | | | $ | 225,650,833 | | |
Aggregate cost for federal income tax purposes was $235,110,225; and net unrealized appreciation consisted of:
| Gross unrealized appreciation | | $ | 17,387,415 | | |
| Gross unrealized depreciation | | | (5,717,997 | ) | |
| Net unrealized appreciation | | $ | 11,669,418 | | |
* Non-income producing security.
1 In US Dollars unless otherwise indicated.
2 Bond interest in default.
3 Security, or portion thereof, was on loan at July 31, 2010.
4 Floating rate security. The interest rate shown is the current rate as of July 31, 2010.
5 Variable rate security. The interest rate shown is the current rate as of July 31, 2010, and resets periodically.
6 Perpetual bond security. The maturity date reflects the next call date.
7 Step bond that converts to the noted fixed rate at a designated future date.
8 Security exempt from registration pursuant to Rule 144A under the Securities Act of 1933. These securities, which represent 10.31% of net assets as of July 31, 2010, are considered liquid and may be resold in transactions exempt from registration, normally to qualified institutional buyers.
9 Payment-in-kind security for which part of the income earned may be paid as additional principal.
10 Illiquid securities representing 0.90% of net assets as of July 31, 2010.
11 Security exempt from registration pursuant to Rule 144A under the Securities Act of 1933. These securities, which represent 0.66% of net assets as of July 31, 2010, are considered illiquid and may be resold in transactions exempt from registration, normally to qualified institutional buyers.
12 Security is being fair valued by a valuation committee under the direction of the board of trustees.
13 The table below details the Portfolio's transaction activity in an affiliated issuer during the year ended July 31, 2010.
| Security description | | Value at
07/31/09 | | Purchases
during the
year ended
07/31/10 | | Sales
during the
year ended
07/31/10 | | Value at
07/31/10 | | Net income
earned from
affiliate for the
year ended
07/31/10 | |
| UBS Private Money Market Fund LLC | | $ | 21,770,202 | | | $ | 102,059,328 | | | $ | 101,697,840 | | | $ | 22,131,690 | | | $ | 171,295 | | |
EUR Euro
GBP Great Britain Pound
GMAC General Motors Acceptance Corporation
MTN Medium Term Note
99
UBS PACE Select Advisors Trust
UBS PACE High Yield Investments
Portfolio of investments—July 31, 2010
Forward foreign currency contracts
| Counterparty | | Contracts to
deliver | | In
exchange for | | Maturity
dates | | Unrealized
depreciation | |
JPMorgan
Securities, Inc. | | EUR | 23,300,000 | | | USD | 29,677,443 | | | 08/18/10 | | $ | (685,741 | ) | |
JPMorgan
Securities, Inc. | | GBP | 6,500,000 | | | USD | 9,917,375 | | | 08/18/10 | | | (281,372 | ) | |
| | | | | | | | | $ | (967,113 | ) | |
Currency type abbreviation:
EUR Euro
GBP Great Britain Pound
USD United States Dollar
The following is a summary of the fair valuations according to the inputs used as of July 31, 2010 in valuing the Portfolio's investments:
| | | Unadjusted
quoted prices in
active markets for
identical investments
(Level 1) | | Other significant
observable inputs
(Level 2) | | Unobservable
inputs
(Level 3) | | Total | |
| Corporate bonds | | $ | — | | | $ | 193,681,040 | | | $ | 14,375 | | | $ | 193,695,415 | | |
| Loan assignments | | | — | | | | 8,097,261 | | | | — | | | | 8,097,261 | | |
| Asset-backed securities | | | — | | | | 5,851,075 | | | | 1,119,456 | | | | 6,970,531 | | |
| Collateralized mortgage obligations | | | — | | | | 2,189,951 | | | | — | | | | 2,189,951 | | |
| Common stocks | | | 1,111,440 | | | | — | | | | 540,610 | | | | 1,652,050 | | |
| Preferred stock | | | 6,851,619 | | | | — | | | | — | | | | 6,851,619 | | |
| Warrants | | | 14,126 | | | | — | | | | — | | | | 14,126 | | |
| Repurchase agreement | | | — | | | | 5,177,000 | | | | — | | | | 5,177,000 | | |
Investment of cash collateral
from securities loaned | | | — | | | | 22,131,690 | | | | — | | | | 22,131,690 | | |
| Forward foreign currency contracts | | | — | | | | (967,113 | ) | | | — | | | | (967,113 | ) | |
| Total | | $ | 7,977,185 | | | $ | 236,160,904 | | | $ | 1,674,441 | | | $ | 245,812,530 | | |
At July 31, 2010, there were no transfers between Level 1 and Level 2.
The following is a rollforward of the Portfolio's investments that were valued using unobservable inputs (Level 3) for the year ended July 31, 2010:
| | | Corporate
bond | | Asset-backed
security | | Common
stock | | Total | |
| Beginning balance | | $ | — | | | $ | 636,437 | | | $ | — | | | $ | 636,437 | | |
| Net purchases/(sales) | | | 14,375 | | | | — | | | | 539,220 | | | | 553,595 | | |
| Accrued discounts/(premiums) | | | — | | | | 86,388 | | | | — | | | | 86,388 | | |
| Total realized gain/(loss) | | | — | | | | — | | | | — | | | | — | | |
| Net change in unrealized appreciation/depreciation | | | — | | | | 396,631 | | | | 1,390 | | | | 398,021 | | |
| Net transfers in/(out) of Level 3 | | | — | | | | — | | | | — | | | | — | | |
| Ending balance | | $ | 14,375 | | | $ | 1,119,456 | | | $ | 540,610 | | | $ | 1,674,441 | | |
The change in unrealized appreciation/depreciation relating to the Level 3 investments held at July 31, 2010 was $398,021.
100
UBS PACE Select Advisors Trust
UBS PACE High Yield Investments
Portfolio of investments—July 31, 2010
Issuer breakdown by country or territory of origin (unaudited)
| | | Percentage of
total investments | |
| United States | | | 83.2 | % | |
| United Kingdom | | | 4.4 | | |
| Netherlands | | | 2.0 | | |
| Canada | | | 1.8 | | |
| Germany | | | 1.6 | | |
| Luxembourg | | | 1.1 | | |
| Sweden | | | 1.0 | | |
| Australia | | | 1.0 | | |
| Japan | | | 0.8 | | |
| France | | | 0.6 | | |
| Norway | | | 0.6 | | |
| Liberia | | | 0.5 | | |
| Cayman Islands | | | 0.5 | | |
| Jersey | | | 0.3 | | |
| Ireland | | | 0.2 | | |
| Bermuda | | | 0.2 | | |
| Marshall Islands | | | 0.1 | | |
| Belgium | | | 0.1 | | |
| Total | | | 100.0 | % | |
See accompanying notes to financial statements.
101
UBS PACE Select Advisors Trust
UBS PACE Large Co Value Equity Investments
Performance
For the 12 months ended July 31, 2010, the Portfolio's Class P shares returned 13.48%, before the deduction of the maximum UBS PACE Select program fee. (The Class P shares returned 11.23%, after the deduction of the maximum UBS PACE Select program fee, for the same 12-month period.) In comparison, the Russell 1000 Value Index (the "benchmark") returned 15.39%, and the Lipper Large-Cap Value Funds category posted a median return of 11.72%. (Returns for all share classes over various time periods are shown in the "Performance at a glance" table on page 106. Please note that the returns shown do not reflect the deduction of taxes that a shareholder would pay on Portfolio distributions or the redemption of Portfolio shares.) For a detailed commentary on the market environment in general during the reporting period, please refer to page 2.
Sub-Advisors' comments
ICAP
Our portion of the Portfolio underperformed the benchmark during the reporting period. Performance for the period was driven largely by individual stock selection. For example, global pharmaceutical firm Sanofi-Aventis's shares declined and detracted from performance. We continue to hold the position as we believe the stock will benefit from the company's aggressive restructuring plan to cut costs, as well as its closing of unproductive research and development (R&D) projects. We also feel that it will grow through the acquisition of other health care businesses, particularly in emerging markets.
In the retail sector, CVS Caremark detracted from returns. The company's sales figures and outlook disappointed investors, as expected gains from the integration of CVS and Caremark have not materialized as planned. As a result, the position was eliminated from our portion of the Portfolio. Home improvement retailer Lowe's also detracted from returns. We continue to maintain the holding, as we believe the stock is well-positioned to benefit from what we believe will be stabilizing trends in housing sales. In addition, the company has made significant improvements in its distribution, inventory and expense control systems. Elsewhere, an underweight to the property sector detracted from relative performance as it rebounded from the previous year's lows.
UBS PACE Select Advisors Trust – UBS PACE Large Co Value Equity Investments
Investment Sub-Advisors:
Institutional Capital LLC ("ICAP"), Westwood Management Corp. ("Westwood") and Pzena Investment Management, LLC ("Pzena")
Portfolio Managers:
ICAP: Jerrold Senser and Thomas Wenzel;
Westwood: Susan M. Byrne;
Pzena: Richard S. Pzena, John P. Goetz and Antonio DeSpirito, III
Objective:
Capital appreciation and dividend income
Investment process:
ICAP uses its proprietary valuation model to identify large capitalization companies that it believes offer the best relative values because they sell below the price-to-earnings ratio warranted by their prospects. ICAP looks for companies where there is a catalyst for positive change with potential to produce stock appreciation of 15% or more relative to the market over a 12- to 18-month period.
ICAP also uses internally generated research to evaluate the financial condition and business prospects of every company it considers. ICAP monitors each stock purchased and sells the stock when its target price is achieved, the catalyst becomes inoperative, or ICAP identifies another stock with greater opportunity for appreciation.
Westwood utilizes a value style of investing in which it chooses common stocks it believes are currently undervalued.
Other key metrics it considers are return on equity, debt/equity ratio and, in the case of
(continued on next page)
102
UBS PACE Select Advisors Trust
UBS PACE Large Co Value Equity Investments
Sub-Advisors' comments – continued
On the upside, Cummins, a global leader in manufacturing engines and power generation systems, was a top contributor. The company was well-positioned to benefit coming out of the economic downturn, as pent-up demand and its strong presence in emerging markets resulted in increased orders. Construction equipment manufacturer Caterpillar was also a large contributor to results, as improved pricing and cost control helped the company improve margins.
Other top contributors included gold miner and producer Newmont Mining, which benefited from the continued high price of gold. Rail operator CSX Corp. added to performance as it was able to maintain strong pricing and reduce costs during the economic downturn. The company was then able to take advantage of its position to boost margins and earnings as the economy improved. Following this period of strong performance, CSX showed less potential upside, according to our research, than other stocks in our portion of the Portfolio, on a relative valuation basis. As a result, we sold the position prior to the end of the review period.
Media company Viacom enhanced our results, as improvements in the ratings of its cable networks have led to higher affiliate fees and advertising revenues.
Westwood
Our portion of the Portfolio underperformed the benchmark during the reporting period. Our results were hindered throughout much of the review period by an increase in investor appetite that generally led to strong performance for low-quality, high-risk securities.
Investor sentiment generally remained positive as the stock rally that began in March 2009 continued through April 2010. In May and June 2010, however, fears over European sovereign debt and Chinese growth led to a selloff and lost confidence in companies with foreign sales exposure. In July 2010, however, we saw a return to investor preferences for higher-quality, lower-risk securities. Against this backdrop, companies with strong fundamentals and good earnings prospects began to perform better. As a result, we believe our focus on companies with strong fundamentals has positioned us well for the future.
Our relative performance was hindered by our positioning in the information technology, consumer discretionary and REIT (real estate investment trust) sectors, coupled with security selection in the utilities sector. The information technology and consumer discretionary sectors were heavily impacted by the market's rally. While holdings such as DIRECTV and EMC Corp. benefited, our more defensive names, such as Wal-Mart, underperformed. We sold our position in Wal-mart before the end of the reporting period. Likewise, we also sold our position in data storage company Western Digital, which was hurt by its high degree of foreign revenues and a seasonal slowdown in sales. The REIT sector performed well as fundamentals appeared to have bottomed out, but our portion of the Portfolio's underweight position negatively impacted relative performance. Lastly, our holdings in utilities hurt performance. Specifically, NextEra Energy (former ly FPL Group), which fell after receiving an unfavorable electric rate ruling in Florida. We subsequently sold the position before the end of the reporting period.
Investment process (concluded)
common equities, positive earnings surprises without a corresponding increase in Wall Street estimates.
Westwood has disciplines in place that serve as sell signals, such as a security reaching a pre-determined price target or a change to a company's fundamentals that negatively impacts the original investment thesis.
Pzena follows a disciplined investment process to implement its value philosophy, focusing exclusively on companies that are underperforming their historically demonstrated earnings power. Pzena applies intensive fundamental research to these companies in an effort to determine whether the problems that caused the earnings shortfall are temporary or permanent. The research process incorporates perspectives on valuation, earnings, management strategy, and downside protection.
103
UBS PACE Select Advisors Trust
UBS PACE Large Co Value Equity Investments
Sub-Advisors' comments – concluded
On the positive side, performance in the financial services and producer durables sectors helped returns the most during the reporting period. Within financial services, our underweight to larger names aided relative performance, including Bank of America and other large banks that underperformed, given recent concerns over the impact of financial reform legislation. Additionally, our portion of the Portfolio benefited from holding securities in other industries, such as insurance and asset management. Three of our top contributors to performance during the fiscal year were in the producer durables sector. Power generator company Cummins Inc., farm machinery leader Deere & Co., and industrial conglomerate United Technologies Corp. all benefited from the market's preference for cyclical stocks, as well as data showing continued strength in their businesses. Ultimately, we sold United Technologies Corp. as we felt that much of the growth potential was already priced into the stock.
Pzena
Our portion of the Portfolio outperformed the benchmark during the reporting period. The financial services, producer durable, technology and consumer discretionary sectors were the biggest contributors to relative performance.
At the stock level, Boeing and Northrop Grumman, both aerospace and defense companies, were our two largest contributors to results. Boeing rallied on an improved outlook for commercial aircraft as the global economy strengthened. Northrop Grumman performed well as investors perceived the company's portfolio of defense programs as being less susceptible to budget cuts. Additionally, two regional banks, Comerica and PNC Financial, were also top contributors, as the credit outlook continued to improve at both banks. In addition, PNC Financial benefited from cost savings due to its merger with National City Bank.
Detractors during the period included Masco Corp. and Fortune Brands, both of which are leading manufacturers of cabinets and plumbing products for residential use. They performed poorly given concerns related to housing market recovery. We recently added these names to our portion of the Portfolio, as we believed that their valuations were attractive due to investor skepticism over a recovery in housing activity. Other detractors included energy holdings Exxon Mobil and BP, which both declined after BP's Gulf of Mexico oil spill. Elsewhere, retailer J.C. Penney detracted from results. Despite strong margin performance, the company reported weak same store sales (that is, sales in stores that have been open for a year or more) during the reporting period.
The scenario that has unfolded to date—a traditional inventory restocking cycle, followed by slow growth—is very much what most companies expected and planned for. As a result, the corporate landscape looks quite healthy; operating margins (except for financials and energy) have recovered to prerecession levels, and corporate leverage is below normal, with many companies having cash-rich positions. Our portion of the Portfolio is valued on a price-to-normalized earnings basis at one of the lowest levels in our history. It contains a number of leading business franchises that, in our opinion, possess solid balance sheets and generate strong cash flows, selling at what we believe to be attractive valuations.
Special considerations
The Portfolio may be appropriate for long-term investors seeking capital appreciation and dividend income and who are able to withstand short-term fluctuations in the equity markets in return for potentially higher returns over the long term. The value of the Portfolio changes every day and can be affected by changes in interest rates, general market conditions and other political, social and economic developments, as well as specific matters relating to the companies in whose securities the Portfolio invests. It is important to note that an investment in the Portfolio is only one component of a balanced investment plan.
104
UBS PACE Select Advisors Trust
UBS PACE Large Co Value Equity Investments
Illustration of an assumed investment of $10,000 in Class P shares of the Portfolio (unaudited)
The following graph depicts the performance of UBS PACE Large Co Value Equity Investments Class P shares versus the Russell 1000 Value Index over the 10 years ended July 31, 2010. The performance of the other classes will vary based upon the different class specific expenses and sales charges. The performance provided does not reflect the deduction of taxes that a shareholder would pay on Portfolio distributions or the redemption of Portfolio shares. Past performance is no guarantee of future results. Share price and returns will vary with market conditions; investors may realize a gain or loss upon redemption. It is important to note that UBS PACE Large Co Value Equity Investments is a professionally managed portfolio while the Index is not available for investment and is unmanaged. The comparison is shown for illustration purposes only.
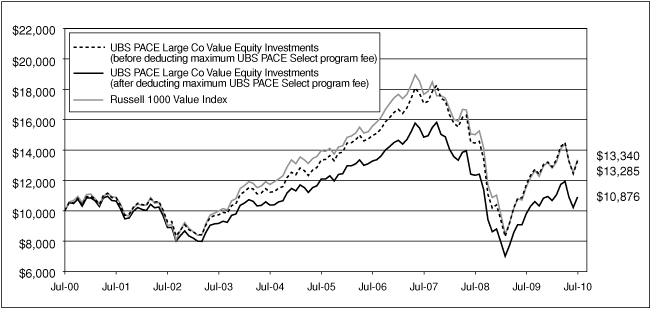
105
UBS PACE Select Advisors Trust
UBS PACE Large Co Value Equity Investments
Performance at a glance (unaudited)
| Average annual total returns for periods ended 07/31/10 | | 1 year | | 5 years | | 10 years | | Since
inception1 | |
| Before deducting | | Class A2 | | | 13.20 | % | | | (0.35 | )% | | N/A | | | 2.36 | % | |
| maximum sales charge | | Class B3 | | | 12.35 | % | | | (1.19 | )% | | N/A | | | 1.86 | %7 | |
| or UBS PACE Select | | Class C4 | | | 12.31 | % | | | (1.13 | )% | | N/A | | | 1.58 | % | |
| program fee | | Class Y5 | | | 13.55 | % | | | 0.01 | % | | N/A | | | 2.49 | % | |
| | | Class P6 | | | 13.48 | % | | | (0.09 | )% | | | 2.88 | % | | | 6.24 | % | |
| After deducting | | Class A2 | | | 6.95 | % | | | (1.47 | )% | | N/A | | | 1.76 | % | |
| maximum sales charge | | Class B3 | | | 7.35 | % | | | (1.50 | )% | | N/A | | | 1.86 | %7 | |
| or UBS PACE Select | | Class C4 | | | 11.31 | % | | | (1.13 | )% | | N/A | | | 1.58 | % | |
| program fee | | Class P6 | | | 11.23 | % | | | (2.07 | )% | | | 0.84 | % | | | 4.13 | % | |
| Russell 1000 Value Index8 | | | 15.39 | % | | | (0.91 | )% | | | 2.92 | % | | | 7.44 | % | |
| Lipper Large-Cap Value Funds median | | | 11.72 | % | | | (1.15 | )% | | | 2.43 | % | | | 6.10 | % | |
Average annual total returns for periods ended June 30, 2010, after deduction of the maximum sales charge or UBS PACE Select program fee, were as follows: Class A—1-year period, 8.22%; 5-year period, (2.00)%; since inception, 1.08%; Class B—1-year period, 8.57%; 5-year period, (2.03)%; since inception, 1.18%; Class C—1-year period, 12.69%; 5-year period, (1.66)%; since inception, 0.91%; Class Y—1-year period, 14.96%; 5-year period, (0.51)%; since inception, 1.81%; Class P—1-year period, 12.62%; 5-year period, (2.59)%; 10-year period, 0.03%; since inception, 3.71%.
The annualized gross and net expense ratios, respectively, for each class of shares as in the November 28, 2009 prospectuses, were as follows: Class A—1.24% and 1.24%; Class B—2.30% and 2.02%; Class C—2.05% and 2.02%; Class Y—0.86% and 0.86%; and Class P—0.99% and 0.99%. Net expenses reflect fee waivers and/or expense reimbursements, if any, pursuant to an agreement that is in effect to cap the expenses. The Portfolio and UBS Global AM have entered into a written fee waiver/expense reimbursement agreement pursuant to which UBS Global AM is contractually obligated to waive its management fees and/or reimburse expenses so that the ordinary total operating expenses of each class through November 30, 2010 (excluding dividend expense, borrowing costs and interest expense, if any) would not exceed Class A—1.27%; Class B—2.02%; Class C—2.02%; Class Y—1.02%; and Class P—1.02%. The Portfo lio has agreed to repay UBS Global AM for any waived fees/reimbursed expenses to the extent that it can do so over the following three fiscal years without causing the Portfolio's expenses in any of those three years to exceed the expense caps described above.
1 Since inception returns are calculated as of commencement of issuance on August 24, 1995 for Class P shares, November 27, 2000 for Class A, B, and C shares and January 19, 2001 for Class Y shares. Since inception returns for the Index and Lipper median are shown as of August 31, 1995, which is the month-end after the inception date of the oldest share class (Class P).
2 Maximum sales charge for Class A shares is 5.5%. Class A shares bear ongoing 12b-1 service fees.
3 Maximum contingent deferred sales charge for Class B shares is 5% imposed on redemptions and is reduced to 0% after a maximum of six years. Class B shares bear ongoing 12b-1 service and distribution fees.
4 Maximum contingent deferred sales charge for Class C shares is 1% imposed on redemptions and is reduced to 0% after one year. Class C shares bear ongoing 12b-1 service and distribution fees. Prior to September 30, 2003, Class C shares were subject to a maximum front-end sales charge of 1.00%; this front-end sales charge is not reflected in the average annual total return presented for the Class C shares shown above.
5 The Portfolio offers Class Y shares to a limited group of eligible investors, including certain qualifying retirement plans. Class Y shares do not bear initial or contingent deferred sales charges or ongoing 12b-1 service and distribution fees.
6 Class P shares do not bear initial or contingent deferred sales charges or ongoing 12b-1 service and distribution fees, but are subject to a maximum annual UBS PACE Select program fee of 2% of the value of Class P shares. Prior to June 14, 2010, the maximum annual UBS PACE Select program fee was 1.5% of the value of Class P shares.
7 Assumes the conversion of Class B to Class A shares at the end of the sixth year.
8 The Russell 1000 Value Index is designed to measure the performance of the large-cap value segment of the US equity universe. It includes those Russell 1000 companies with lower price-to-book ratios and lower expected growth values. The Russell 1000 Value Index is constructed to provide a comprehensive and unbiased barometer for the large-cap value segment. The Index is completely reconstituted annually to ensure new and growing equities are included and that the represented companies continue to reflect value characteristics. Investors should note that indices do not reflect the deduction of fees and expenses.
If an investor sells or exchanges shares less than 90 days after purchase, a redemption fee of 1.00% of the amount sold or exchanged will be deducted at the time of the transaction, except as noted otherwise in the prospectuses.
Past performance does not predict future performance, and the performance information provided does not reflect the deduction of taxes that a shareholder would pay on Portfolio distributions or the redemption of Portfolio shares. The return and principal value of an investment will fluctuate, so that an investor's shares, when redeemed, may be worth more or less than their original cost. Performance results assume reinvestment of all dividends and capital gain distributions at net asset value on the ex-dividend dates. Current performance may be higher or lower than the performance data quoted. For month-end performance figures, please visit http://www.ubs.com.
Lipper peer group data calculated by Lipper Inc.; used with permission. The Lipper median is the return of the fund that places in the middle of a Lipper peer group.
106
UBS PACE Select Advisors Trust
UBS PACE Large Co Value Equity Investments
Portfolio statistics (unaudited)
| Characteristics | | 07/31/10 | |
| Net assets (mm) | | $ | 1,076.0 | | |
| Number of holdings | | | 112 | | |
| Portfolio composition1 | | 07/31/10 | |
| Common stocks | | | 94.1 | % | |
| ADRs | | | 4.7 | | |
| Cash equivalents and other assets less liabilities | | | 1.2 | | |
| Total | | | 100.0 | % | |
| Top five sectors1 | | 07/31/10 | |
| Financials | | | 22.7 | % | |
| Information technology | | | 14.7 | | |
| Industrials | | | 13.0 | | |
| Energy | | | 11.8 | | |
| Health care | | | 11.4 | | |
| Total | | | 73.6 | % | |
| Top ten equity holdings1 | | 07/31/10 | |
| JPMorgan Chase & Co. | | | 2.4 | % | |
| Pfizer, Inc. | | | 2.3 | | |
| Wells Fargo & Co. | | | 2.2 | | |
| Exxon Mobil Corp. | | | 2.1 | | |
| Merck & Co., Inc. | | | 2.1 | | |
| PepsiCo, Inc. | | | 2.1 | | |
| Cisco Systems, Inc. | | | 2.0 | | |
| ConocoPhillips | | | 1.9 | | |
| Occidental Petroleum Corp. | | | 1.8 | | |
| Honeywell International, Inc. | | | 1.8 | | |
| Total | | | 20.7 | % | |
1 Weightings represent percentages of the Portfolio's net assets as of July 31, 2010. The Portfolio is actively managed and its composition will vary over time.
ADR American Depositary Receipt
107
UBS PACE Select Advisors Trust
UBS PACE Large Co Value Equity Investments
Portfolio of investments—July 31, 2010
| Security description | | Number of
shares | | Value | |
| Common stocks—98.78% | |
| Aerospace & defense—6.46% | |
| Boeing Co. | | | 235,250 | | | $ | 16,029,935 | | |
| Honeywell International, Inc. | | | 456,900 | | | | 19,582,734 | | |
| ITT Corp. | | | 83,800 | | | | 3,948,656 | | |
L-3 Communications
Holdings, Inc. | | | 144,729 | | | | 10,571,006 | | |
| Northrop Grumman Corp. | | | 264,125 | | | | 15,488,290 | | |
| Raytheon Co. | | | 83,600 | | | | 3,868,172 | | |
| | | | 69,488,793 | | |
| Air freight & logistics—0.34% | |
| FedEx Corp. | | | 44,100 | | | | 3,640,455 | | |
| Auto components—0.92% | |
| Johnson Controls, Inc. | | | 344,400 | | | | 9,922,164 | | |
| Beverages—3.81% | |
Molson Coors Brewing Co.,
Class B | | | 99,550 | | | | 4,480,746 | | |
| PepsiCo, Inc. | | | 344,700 | | | | 22,374,477 | | |
| The Coca-Cola Co. | | | 256,950 | | | | 14,160,514 | | |
| | | | 41,015,737 | | |
| Building products—0.80% | |
| Masco Corp. | | | 836,250 | | | | 8,596,650 | | |
| Capital markets—3.29% | |
| Ameriprise Financial, Inc. | | | 169,400 | | | | 7,180,866 | | |
| Franklin Resources, Inc. | | | 76,600 | | | | 7,704,428 | | |
| Goldman Sachs Group, Inc. | | | 40,050 | | | | 6,040,341 | | |
| Morgan Stanley | | | 275,125 | | | | 7,425,624 | | |
| State Street Corp. | | | 181,425 | | | | 7,061,061 | | |
| | | | 35,412,320 | | |
| Chemicals—1.85% | |
| E.I. du Pont de Nemours and Co. | | | 200,600 | | | | 8,158,402 | | |
| PPG Industries, Inc. | | | 72,825 | | | | 5,059,153 | | |
| The Sherwin-Williams Co. | | | 96,350 | | | | 6,662,602 | | |
| | | | 19,880,157 | | |
| Commercial banks—4.53% | |
| BB&T Corp. | | | 188,400 | | | | 4,677,972 | | |
| Comerica, Inc. | | | 143,150 | | | | 5,491,234 | | |
PNC Financial Services
Group, Inc. | | | 88,750 | | | | 5,270,863 | | |
| US Bancorp | | | 423,450 | | | | 10,120,455 | | |
| Wells Fargo & Co. | | | 834,450 | | | | 23,139,298 | | |
| | | | 48,699,822 | | |
| Communications equipment—3.91% | |
| Alcatel-Lucent, ADR* | | | 2,550,475 | | | | 7,600,416 | | |
| Cisco Systems, Inc.* | | | 921,850 | | | | 21,267,079 | | |
| Motorola, Inc.* | | | 216,805 | | | | 1,623,869 | | |
| QUALCOMM, Inc. | | | 302,850 | | | | 11,532,528 | | |
| | | | 42,023,892 | | |
| Security description | | Number of
shares | | Value | |
| Common stocks—(continued) | |
| Computers & peripherals—2.56% | |
| Dell, Inc.* | | | 516,025 | | | $ | 6,832,171 | | |
| EMC Corp.* | | | 359,800 | | | | 7,120,442 | | |
| Hewlett-Packard Co. | | | 294,375 | | | | 13,553,025 | | |
| | | | 27,505,638 | | |
| Consumer finance—0.54% | |
| Capital One Financial Corp. | | | 138,050 | | | | 5,843,657 | | |
| Diversified financial services—5.15% | |
| Bank of America Corp. | | | 1,381,400 | | | | 19,394,856 | | |
| Citigroup, Inc.* | | | 2,357,564 | | | | 9,666,012 | | |
| JPMorgan Chase & Co. | | | 653,243 | | | | 26,312,628 | | |
| | | | 55,373,496 | | |
| Diversified telecommunication services—0.68% | |
| AT&T, Inc. | | | 282,000 | | | | 7,315,080 | | |
| Electric utilities—1.27% | |
| American Electric Power Co., Inc. | | | 198,600 | | | | 7,145,628 | | |
| Edison International | | | 195,150 | | | | 6,469,223 | | |
| | | | 13,614,851 | | |
| Electrical equipment—0.48% | |
| Cooper Industries PLC | | | 114,025 | | | | 5,148,229 | | |
| Electronic equipment, instruments & components—1.98% | |
| Corning, Inc. | | | 389,900 | | | | 7,064,988 | | |
| Tyco Electronics Ltd. | | | 528,850 | | | | 14,278,950 | | |
| | | | 21,343,938 | | |
| Energy equipment & services—0.34% | |
| National-Oilwell Varco, Inc. | | | 93,300 | | | | 3,653,628 | | |
| Food & staples retailing—1.00% | |
| CVS Caremark Corp. | | | 229,900 | | | | 7,055,631 | | |
| Sysco Corp. | | | 118,500 | | | | 3,669,945 | | |
| | | | 10,725,576 | | |
| Food products—0.66% | |
| Kraft Foods, Inc., Class A | | | 244,075 | | | | 7,129,431 | | |
| Gas utilities—0.64% | |
| EQT Corp. | | | 187,100 | | | | 6,862,828 | | |
| Health care equipment & supplies—1.73% | |
| Covidien PLC | | | 261,300 | | | | 9,751,716 | | |
| Zimmer Holdings, Inc.* | | | 168,050 | | | | 8,904,969 | | |
| | | | 18,656,685 | | |
| Health care providers & services—1.08% | |
| Aetna, Inc. | | | 335,275 | | | | 9,337,409 | | |
Laboratory Corp. of
America Holdings* | | | 31,650 | | | | 2,309,817 | | |
| | | | 11,647,226 | | |
| Household durables—0.82% | |
| Fortune Brands, Inc. | | | 202,217 | | | | 8,873,282 | | |
108
UBS PACE Select Advisors Trust
UBS PACE Large Co Value Equity Investments
Portfolio of investments—July 31, 2010
| Security description | | Number of
shares | | Value | |
| Common stocks—(continued) | |
| Industrial conglomerates—1.09% | |
| General Electric Co. | | | 465,100 | | | $ | 7,497,412 | | |
| Textron, Inc. | | | 202,950 | | | | 4,213,242 | | |
| | | | 11,710,654 | | |
| Insurance—9.14% | |
| ACE Ltd. | | | 126,000 | | | | 6,688,080 | | |
| Aflac, Inc. | | | 194,550 | | | | 9,569,914 | | |
| Allstate Corp. | | | 485,800 | | | | 13,718,992 | | |
| Aon Corp. | | | 195,100 | | | | 7,349,417 | | |
| Axis Capital Holdings Ltd. | | | 303,950 | | | | 9,474,122 | | |
Fidelity National Financial, Inc.,
Class A | | | 428,475 | | | | 6,328,576 | | |
Hartford Financial Services
Group, Inc. | | | 271,325 | | | | 6,351,718 | | |
| MetLife, Inc. | | | 177,000 | | | | 7,444,620 | | |
| The Travelers Cos., Inc. | | | 137,000 | | | | 6,911,650 | | |
| Torchmark Corp. | | | 287,350 | | | | 15,249,664 | | |
| Willis Group Holdings PLC | | | 303,825 | | | | 9,297,045 | | |
| | | | 98,383,798 | | |
| Internet software & services—0.34% | |
| eBay, Inc.* | | | 172,600 | | | | 3,609,066 | | |
| IT services—1.31% | |
| Accenture PLC, Class A | | | 173,750 | | | | 6,887,450 | | |
International Business
Machines Corp. | | | 56,350 | | | | 7,235,340 | | |
| | | | 14,122,790 | | |
| Machinery—3.15% | |
| Caterpillar, Inc. | | | 176,850 | | | | 12,335,287 | | |
| Cummins, Inc. | | | 178,700 | | | | 14,226,307 | | |
| Deere & Co. | | | 109,900 | | | | 7,328,132 | | |
| | | | 33,889,726 | | |
| Media—4.47% | |
| Comcast Corp., Class A | | | 370,100 | | | | 7,205,847 | | |
| DIRECTV, Class A* | | | 181,400 | | | | 6,740,824 | | |
| Omnicom Group, Inc. | | | 369,625 | | | | 13,772,227 | | |
| The Walt Disney Co. | | | 207,400 | | | | 6,987,306 | | |
| Viacom, Inc., Class B | | | 406,100 | | | | 13,417,544 | | |
| | | | 48,123,748 | | |
| Metals & mining—1.56% | |
| Newmont Mining Corp. | | | 236,300 | | | | 13,209,170 | | |
| Nucor Corp. | | | 90,300 | | | | 3,534,342 | | |
| | | | 16,743,512 | | |
| Multi-utilities—1.02% | |
| Dominion Resources, Inc. | | | 170,900 | | | | 7,176,091 | | |
| Sempra Energy | | | 76,775 | | | | 3,819,556 | | |
| | | | 10,995,647 | | |
| Multiline retail—1.07% | |
J.C. Penney Co., Inc.
(Holding Co.) | | | 469,025 | | | | 11,552,086 | | |
| Security description | | Number of
shares | | Value | |
| Common stocks—(concluded) | |
| Office electronics—0.34% | |
| Xerox Corp. | | | 374,400 | | | $ | 3,646,656 | | |
| Oil, gas & consumable fuels—11.47% | |
| Anadarko Petroleum Corp. | | | 96,500 | | | | 4,743,940 | | |
| Apache Corp. | | | 159,077 | | | | 15,204,580 | | |
| BP PLC, ADR1 | | | 252,125 | | | | 9,699,249 | | |
| Chevron Corp. | | | 148,400 | | | | 11,309,564 | | |
| ConocoPhillips | | | 361,750 | | | | 19,975,835 | | |
| Exxon Mobil Corp. | | | 386,887 | | | | 23,089,416 | | |
| Marathon Oil Corp. | | | 427,050 | | | | 14,284,822 | | |
| Occidental Petroleum Corp. | | | 251,447 | | | | 19,595,265 | | |
| Valero Energy Corp. | | | 322,425 | | | | 5,478,001 | | |
| | | | 123,380,672 | | |
| Personal products—0.92% | |
| Avon Products, Inc. | | | 318,475 | | | | 9,914,127 | | |
| Pharmaceuticals—8.57% | |
| Bristol-Myers Squibb Co. | | | 280,600 | | | | 6,992,552 | | |
| Johnson & Johnson | | | 293,300 | | | | 17,037,797 | | |
| Merck & Co., Inc. | | | 666,225 | | | | 22,958,113 | | |
| Pfizer, Inc. | | | 1,643,852 | | | | 24,657,780 | | |
| Sanofi-Aventis, ADR1 | | | 571,400 | | | | 16,650,596 | | |
Teva Pharmaceutical
Industries Ltd., ADR | | | 80,600 | | | | 3,937,310 | | |
| | | | 92,234,148 | | |
| Road & rail—0.66% | |
| Union Pacific Corp. | | | 95,000 | | | | 7,093,650 | | |
| Semiconductors & semiconductor equipment—1.54% | |
| Intel Corp. | | | 214,700 | | | | 4,422,820 | | |
| Texas Instruments, Inc. | | | 492,750 | | | | 12,165,998 | | |
| | | | 16,588,818 | | |
| Software—2.71% | |
| CA, Inc. | | | 550,325 | | | | 10,764,357 | | |
| Microsoft Corp. | | | 573,402 | | | | 14,799,506 | | |
| Oracle Corp. | | | 150,800 | | | | 3,564,912 | | |
| | | | 29,128,775 | | |
| Specialty retail—2.27% | |
| Lowe's Cos., Inc. | | | 660,150 | | | | 13,691,511 | | |
| The Gap, Inc. | | | 376,700 | | | | 6,822,037 | | |
| TJX Cos., Inc. | | | 94,700 | | | | 3,931,944 | | |
| | | | 24,445,492 | | |
| Textiles, apparel & luxury goods—0.46% | |
| Nike, Inc., Class B | | | 67,300 | | | | 4,955,972 | | |
| Tobacco—0.68% | |
| Philip Morris International, Inc. | | | 144,300 | | | | 7,365,072 | | |
| Wireless telecommunication services—1.17% | |
| Vodafone Group PLC, ADR | | | 535,900 | | | | 12,582,932 | | |
Total common stocks
(cost—$1,020,831,726) | | | | | | | 1,062,840,876 | | |
109
UBS PACE Select Advisors Trust
UBS PACE Large Co Value Equity Investments
Portfolio of investments—July 31, 2010
| Security description | | Face
amount | | Value | |
| Repurchase agreement—1.82% | |
Repurchase agreement dated
07/30/10 with State Street
Bank & Trust Co., 0.010%
due 08/02/10, collateralized
by $19,354,843 US Treasury
Notes, 2.125% to 3.125%
due 04/30/15 to 04/30/17,
(value—$19,972,804);
proceeds: $19,581,016
(cost—$19,581,000) | | $ | 19,581,000 | | | $ | 19,581,000 | | |
| Security description | | Number of
shares | | Value | |
| Investment of cash collateral from securities loaned—0.92% | |
| Money market fund—0.92% | |
UBS Private Money Market
Fund LLC2
(cost—$9,903,388) | | | 9,903,388 | | | $ | 9,903,388 | | |
Total investments
(cost—$1,050,316,114)—
101.52% | | | | | 1,092,325,264 | | |
Liabilities in excess of other
assets—(1.52)% | | | | | (16,332,875 | ) | |
| Net assets—100.00% | | $ | 1,075,992,389 | | |
Aggregate cost for federal income tax purposes was $1,093,472,713; and net unrealized depreciation consisted of:
| Gross unrealized appreciation | | $ | 68,177,706 | | |
| Gross unrealized depreciation | | | (69,325,155 | ) | |
| Net unrealized depreciation | | $ | (1,147,449 | ) | |
* Non-income producing security.
1 Security, or portion thereof, was on loan at July 31, 2010.
2 The table below details the Portfolio's transaction activity in an affiliated issuer during the year ended July 31, 2010.
| Security description | | Value at
07/31/09 | | Purchases
during the
year ended
07/31/10 | | Sales
during the
year ended
07/31/10 | | Value at
07/31/10 | | Net income
earned from
affiliate for the
year ended
07/31/10 | |
| UBS Private Money Market Fund LLC | | $ | 147,996,105 | | | $ | 444,387,800 | | | $ | 582,480,517 | | | $ | 9,903,388 | | | $ | 86,573 | | |
ADR American Depositary Receipt
The following is a summary of the fair valuations according to the inputs used as of July 31, 2010 in valuing the Portfolio's investments:
| | | Unadjusted
quoted prices in
active markets for
identical investments
(Level 1) | | Other significant
observable inputs
(Level 2) | | Unobservable
inputs
(Level 3) | | Total | |
| Common stocks | | $ | 1,062,840,876 | | | $ | — | | | $ | — | | | $ | 1,062,840,876 | | |
| Repurchase agreement | | | — | | | | 19,581,000 | | | | — | | | | 19,581,000 | | |
Investment of cash collateral
from securities loaned | | | — | | | | 9,903,388 | | | | — | | | | 9,903,388 | | |
| Total | | $ | 1,062,840,876 | | | $ | 29,484,388 | | | $ | — | | | $ | 1,092,325,264 | | |
At July 31, 2010, there were no transfers between Level 1 and Level 2.
Issuer breakdown by country or territory of origin (unaudited)
| | | Percentage of
total investments | |
| United States | | | 89.8 | % | |
| Ireland | | | 2.8 | | |
| France | | | 2.2 | | |
| United Kingdom | | | 2.0 | | |
| Switzerland | | | 1.9 | | |
| Bermuda | | | 0.9 | | |
| Israel | | | 0.4 | | |
| Total | | | 100.0 | % | |
See accompanying notes to financial statements.
110
UBS PACE Select Advisors Trust
UBS PACE Large Co Growth Equity Investments
Performance
For the 12 months ended July 31, 2010, the Portfolio's Class P shares returned 12.42%, before the deduction of the maximum UBS PACE Select program fee. (The Class P shares returned 10.19%, after the deduction of the maximum UBS PACE Select program fee, for the same 12-month period.) In comparison, the Russell 1000 Growth Index (the "benchmark") returned 13.65%, and the Lipper Large-Cap Growth Funds category posted a median return of 10.99%. (Returns for all share classes over various time periods are shown in the "Performance at a glance" table on page 117. Please note that the returns shown do not reflect the deduction of taxes that a shareholder would pay on Portfolio distributions or the redemption of Portfolio shares.) For a detailed commentary on the market environment in general during the reporting period, please refer to page 2.
Sub-Advisors' Comments
Wellington Management
Our portion of the Portfolio underperformed the benchmark during the reporting period. The consumer discretionary sector was the biggest detractor from relative performance, primarily due to weak stock selection. For example, positions in Apollo Group, which owns several for-profit educational institutions, and International Game Technology, a leading manufacturer of gaming machines, hurt our relative results. We eliminated our position in Apollo Group prior to the end of the reporting period due to increasing concerns about a changing regulatory environment that would potentially impact student's access to federal loans, as well as the SEC's announcement of an informal inquiry into the company's revenue recognition practices. Not owning fast food giant McDonald's Corp. was also a negative for relative performance, as it generated solid results. In addition, stock selection within the health care sector was a detractor due to po sitions in Teva Pharmaceutical and St. Jude Medical, as well as not owning Merck. St. Jude Medical, a cardiovascular medical device company, detracted after management reduced its sales forecast for the company's cardiac rhythmic management products, citing a slowdown in hospital capital equipment spending. We exited our position prior to the end of the reporting period.
The industrials sector was the largest contributor to relative performance during the period primarily due to
UBS PACE Select Advisors Trust –
UBS PACE Large Co Growth Equity Investments
Investment Sub-Advisors:
Wellington Management Company, LLP ("Wellington"), Marsico Capital Management, LLC ("Marsico"), SSgA Funds Management, Inc. ("SSgA"), Delaware Management Company ("Delaware") and Roxbury Capital Management, LLC ("Roxbury"), commencing May 25, 2010
Portfolio Managers:
Wellington: Andrew Shilling;
Marsico: Thomas Marsico; A. Douglas Rao;
SSgA: J. Lee Montag and Brian Shannahan;
Delaware: Jeffrey Van Harte, Christopher Bonavico, Daniel Prislin and Christopher Ericksen; Roxbury: Brian L. Massey and Silas A. Myers
Objective:
Capital appreciation
Investment process:
Wellington applies in-depth fundamental research in its effort to identify corporate change early, differentiate sustainable growth opportunities from short-lived events, identify superior business models, and develop strict valuation parameters for the companies it evaluates. Wellington's strategy is focused on investing in companies that appear well-positioned to benefit from long-lasting trends and that have structural advantages to maintaining their position.
Marsico uses an approach that combines top-down macro-economic analysis with bottom-up stock selection. It considers macro-economic factors such as interest rates, inflation, demographics, the regulatory environment and the global competitive environment. It then seeks to identify companies with earnings growth
(continued on next page)
111
UBS PACE Select Advisors Trust
UBS PACE Large Co Growth Equity Investments
Sub-Advisors' comments – continued
strong security selection, though an overweight to the sector also aided results. Examples of strong performers in the sector included power generation equipment firm Cummins Inc., industrial goods and metal fabrication company Precision Castparts, and aerospace and defense leader Boeing.
Sector allocation modestly added to relative performance during the reporting period. An underweight to health care and overweights to the consumer discretionary and industrials sectors more than offset weak performance from overweight allocations to the financials and energy sectors.
As of the end of the period, our portion of the Portfolio was positioned with overweights to the information technology, financials, industrials and consumer discretionary sectors. In contrast, it was underweight to the consumer staples, health care, energy, materials, telecommunications services and utilities sectors, all of which were driven by stock selection.
Marsico
Our portion of the Portfolio outperformed the benchmark during the reporting period. Select holdings in the software and services industry contributed to relative performance. In particular, positions in Baidu, Inc., a Chinese Internet search company, and Visa Inc. were strong individual contributors. We eliminated our position in Visa, Inc. during the review period, as we became more concerned about the impact of the federal financial regulation bill on the credit card industry and, in particular, the company itself.
Elsewhere, stock selection in the consumer services industry significantly outpaced the benchmark. Examples of strong performers were hotel and casino operator Wynn Resorts Ltd. and global fast food operator McDonald's Corp. We also benefited from an underweight position in health care, as the sector was one of the weakest-performing areas in the benchmark. Select holdings in the materials sector, including an underweight versus the benchmark in poor-performing Monsanto Co. and our overweight in strong-performing Dow Chemical Co., helped performance during the reporting period. In the consumer staples sector, infant
Investment process (continued)
potential that may not be recognizable by the market at large. Marsico's stock selection process may focus on factors such as market expertise or dominance, franchise durability and pricing power, solid company fundamentals, as well as strong management and reasonable valuations.
SSgA uses several quantitative measures based on valuation, sentiment and quality to identify investment opportunities within a large cap growth universe and combines factors to produce an overall rank. Using comprehensive research, it seeks to determine the optimal weighting of these perspectives to arrive at strategies that vary by industry. SSgA ranks all companies within the investable universe from top to bottom based on their relative attractiveness. SSgA then constructs its portion of the Portfolio by selecting the highest-ranked stocks from the universe, and manages deviations from the benchmark to maximize the risk/reward trade-off. The aim is to have a resulting Portfolio with characteristics similar to the benchmark. SSgA generally sells stocks that no longer meet its selection criteria or that it believes otherwise may adversely affect per formance relative to the benchmark.
Delaware invests primarily in common stocks of large capitalization growth-oriented companies that Delaware believes have long-term capital appreciation potential and are expected to grow faster than the US economy. Using a bottom-up approach, Delaware seeks to select securities of companies that it believes have attractive end market potential, dominant business models and strong free cash flow generation that are attractively priced compared to the intrinsic value of the securities. Delaware also considers a company's operational efficiencies, management's plans for capital allocation
(continued on next page)
112
UBS PACE Select Advisors Trust
UBS PACE Large Co Growth Equity Investments
Sub-Advisors' comments – continued
formula manufacturer Mead Johnson Nutrition Co. also enhanced our results.
On the downside, stock selection in the energy sector hampered our relative performance. For example, positions in deep-water rig operator Transocean Ltd. and natural gas exploration company Southwestern Energy Co. detracted from performance, and were both sold prior to the end of the review period. Stock selection and an overweight position in the financials sector also hurt returns. Although the sector posted a double-digit return for the 12-month period during the period, it underperformed the benchmark. Within the sector, positions in Goldman Sachs Group Inc. and HSBC Holdings PLC hurt performance. HSBC Holdings PLC performed poorly at the end of 2009 due to disappointing results in its insurance business. In addition, the low interest rate environment negatively impacted the company's interest income. Given these issues, we eliminated the holding from our portion of the Portfolio.
As of July 31, 2010, our portion of the Portfolio's largest overweight positions, relative to the benchmark, were in the financials, materials, industrials and consumer discretionary sectors. In contrast, we were underweight the information technology, consumer staples, healthcare, energy, and telecommunications services and utilities sectors, all largely driven by stock selection.
SSgA
Our portion of the Portfolio modestly outperformed the benchmark during the reporting period. Our investment process incorporates model-driven quantitative measures such as valuation, quality and investor sentiment, which are designed to generate buy/hold/sell "signals." Our performance was driven by our model's stock selection power. In particular, we saw significant improvement in our model's performance in the third quarter of 2009. As the stock market rally faded in early 2010, it gave us additional time to gather new information as it came to the market, and we then positioned our portion of the Portfolio in an effort to benefit from an economic recovery.
While there has been improved clarity for the economy based on certain economic data, there is still uncertainty regarding the speed and strength of the recovery. With investors moving between optimism and pessimism, no discernable trend has formed, thereby limiting the power of our investor sentiment signals. However, our signals that are based on company valuations and quality, which are driven by balance sheet and income statement data, have performed well.
Overall market conditions appear to have normalized, although we have seen periods of risk aversion, such as in early 2010. With the onset of debt concerns in Greece and contagion in the broader European financial markets, risk aversion came to the forefront again in April 2010. Our fear/greed model, which measures changes in investors' risk appetite, indicates that "greed" stocks outperformed until April. They then gave way to "fear" stocks, particularly in June, as fresh signs of financial strains in Europe, weakness in
Investment process (concluded)
and the company's shareholder orientation.
Roxbury employs a bottom-up approach to stock selection, seeking high quality growth companies whose stocks are trading at discounts to fair value. Roxbury looks for companies with sustainable competitive advantages and opportunities to grow and reinvest capital at higher rates than their cost of capital. Roxbury also seeks to invest in companies with management teams with a proven ability to allocate capital in ways that maximize shareholder value. Roxbury's investment approach seeks to balance both the protection of capital as well as the appreciation potential of a stock.
113
UBS PACE Select Advisors Trust
UBS PACE Large Co Growth Equity Investments
Sub-Advisors' comments – continued
US home sales, persistently high jobless claims and a downbeat report on consumer confidence kept buyers on the defensive.
Solid stock selection was the main driver of the outperformance and added value in seven out of 10 sectors within the benchmark. Consumer staples, materials and financials led the way. Within consumer staples, positions in Estee Lauder, Coca-Cola Enterprises and Del Monte Foods were the top contributors to performance. We sold Estee Lauder in July 2010 due to its deteriorating outlook. Within the materials sector, not owning Monsanto Co., helped relative performance. Positions in Lubrizol Corp. and Walter Energy, were the top contributors to performance in the review period. We eliminated Walter Energy in March 2010, as we felt its outlook was weakening. American Express was the top relative contributor in the financials sector.
In contrast, stock selection within information technology and industrials detracted from relative performance. Within information technology, positions in Garmin, Microsoft and Seagate Technology hurt our returns, while positions in Apollo Group, Raytheon and Career Education hindered our results in the industrials sector. We sold Raytheon and Apollo Group in October 2009 and January 2010, respectively, given both companies' deteriorating outlooks.
Delaware
Our portion of the Portfolio underperformed the benchmark during the reporting period, primarily due to stock selection. In particular, solid stock selection in the technology and energy sectors was offset by underperformance in the financials and material sectors. In addition, our underweight in the producer durables sector detracted from results, as companies in this area experienced significant market appreciation, which was consistent with investor anticipation of an economic cyclical recovery.
From an individual stock perspective, our largest detractors were Gilead and Qualcomm. Despite Gilead's position as the leading global manufacturer of AIDS drugs, investors appeared concerned with patent expirations over the next several years on some of the company's core drugs. We believe the company's lead in HIV treatment is sustainable and that the stock was oversold during the period. Qualcomm detracted from results as it released controversial earnings reports during the last two quarters, and communicated a potentially slower earnings growth trajectory. This was based on lower average selling prices for its products than originally expected. We believe the pricing pressure issue is overblown and can be attributed to a manageable tradeoff between price and functionality, as consumers decide how fast to make the transition from low-end wireless handsets to high-end smart phones.
Contributors to performance included Apple, Crown Castle and Novo Nordisk. Apple continued to show strong growth through a difficult economic environment. The latest release of the iPhone and the iPad—both game-changing products in the wireless area—appear to have created long-term growth for the company, and they helped drive sales across the Apple product suite. Crown Castle's strong performance was in stark contrast to the previous annual reporting period, when the stock sold off due to the lack of investor confidence in the credit markets. We believed at that time that the sell-off significantly overstated the company's actual refinancing risk. We, therefore, added to the position meaningfully on weakness. Once the credit markets stabilized in 2009, Crown Castle was able to address any remaining liquidity concerns by refinancing portions of its debt, causing the stock to rally. Novo Nordisk experienced continued su ccess in rolling out its latest diabetes drug, Victoza, which was recently approved by the US Food and Drug Administration. The initial stages of the product launch looked promising in terms of market share growth, and we expect the drug to enhance the company's position as one of the leading global franchises in diabetes treatment.
114
UBS PACE Select Advisors Trust
UBS PACE Large Co Growth Equity Investments
Sub-Advisors' comments – concluded
Roxbury
Roxbury Capital Management, LLC became a sub-advisor for this Portfolio effective May 25, 2010.
For the period from May 25, 2010 through July 31, 2010, our portion of the Portfolio outperformed the benchmark. Sector performance was somewhat mixed, with seven of the 10 sectors in the benchmark posting gains, and three posting modest losses. During the reporting period, our overweight positions in the financials, materials and telecommunication services sectors were the largest contributors to relative performance. In terms of individual holdings, wireless and broadband tower provider American Tower, agricultural company Monsanto and conglomerate holding company Berkshire Hathaway were big winners, all positing returns in excess of 10%.
Holdings in the consumer discretionary, health care and industrial sectors underperformed as evidenced by the three largest negative contributors in our portion of the Portfolio for the period: home improvement firm Lowes Companies, life sciences supply company Thermo Fisher Scientific and technical, professional, and construction service provider Jacobs Engineering. Jacobs Engineering was sold during the period and was replaced by US defense conglomerate General Dynamics, as we felt it had better risk/reward characteristics. Overweight positions in the health care and industrial sectors also detracted from relative results.
Since the fall of 2009, we have found more investment opportunities in larger dominant franchises than in other areas of the market. The willingness of investors to price smaller-cap and faster-growing cyclical businesses for continued future long-term growth has generally, in our view, resulted in excessive valuations.
Special considerations
The Portfolio may be appropriate for long-term investors seeking capital appreciation who are able to withstand short-term fluctuations in the equity markets in return for potentially higher returns over the long term. The value of the Portfolio changes every day and can be affected by changes in interest rates, general market conditions and other political, social and economic developments, as well as specific matters relating to the companies in whose securities the Portfolio invests. Also, to the extent the Portfolio invests a large portion of its assets in a particular sector, the Portfolio may experience greater volatility and risk of loss due to unfavorable developments in that sector. It is important to note that an investment in the Portfolio is only one component of a balanced investment plan.
115
UBS PACE Select Advisors Trust
UBS PACE Large Co Growth Equity Investments
Illustration of an assumed investment of $10,000 in Class P shares of the Portfolio (unaudited)
The following graph depicts the performance of UBS PACE Large Co Growth Equity Investments Class P shares versus the Russell 1000 Growth Index over the 10 years ended July 31, 2010. The performance of the other classes will vary based upon the different class specific expenses and sales charges. The performance provided does not reflect the deduction of taxes that a shareholder would pay on Portfolio distributions or the redemption of Portfolio shares. Past performance is no guarantee of future results. Share price and returns will vary with market conditions; investors may realize a gain or loss upon redemption. It is important to note that UBS PACE Large Co Growth Equity Investments is a professionally managed portfolio while the Index is not available for investment and is unmanaged. The comparison is shown for illustration purposes only.
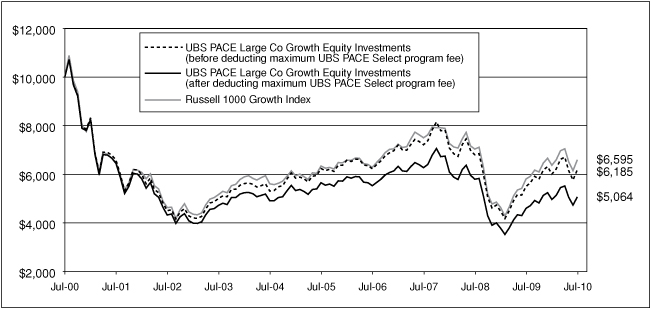
116
UBS PACE Select Advisors Trust
UBS PACE Large Co Growth Equity Investments
Performance at a glance (unaudited)
| Average annual total returns for periods ended 07/31/10 | | 1 year | | 5 years | | 10 years | | Since
inception1 | |
| Before deducting | | Class A2 | | | 12.12 | % | | | (0.48 | )% | | N/A | | | (3.41 | )% | |
| maximum sales charge | | Class B3 | | | 11.28 | % | | | (1.31 | )% | | N/A | | | (3.90 | )%7 | |
| or UBS PACE Select | | Class C4 | | | 11.24 | % | | | (1.28 | )% | | N/A | | | (4.17 | )% | |
| program fee | | Class Y5 | | | 12.49 | % | | | (0.10 | )% | | N/A | | | (2.34 | )% | |
| | | Class P6 | | | 12.42 | % | | | (0.20 | )% | | | (4.69 | )% | | | 3.92 | % | |
| After deducting | | Class A2 | | | 5.93 | % | | | (1.60 | )% | | N/A | | | (3.97 | )% | |
| maximum sales charge | | Class B3 | | | 6.28 | % | | | (1.70 | )% | | N/A | | | (3.90 | )%7 | |
| or UBS PACE Select | | Class C4 | | | 10.24 | % | | | (1.28 | )% | | N/A | | | (4.17 | )% | |
| program fee | | Class P6 | | | 10.19 | % | | | (2.18 | )% | | | (6.58 | )% | | | 1.86 | % | |
| Russell 1000 Growth Index8 | | | 13.65 | % | | | 0.80 | % | | | (4.08 | )% | | | 5.23 | % | |
| Lipper Large-Cap Growth Funds median | | | 10.99 | % | | | (0.08 | )% | | | (3.16 | )% | | | 4.81 | % | |
Average annual total returns for periods ended June 30, 2010, after deduction of the maximum sales charge or UBS PACE Select program fee, were as follows: Class A—1-year period, 5.58%; 5-year period, (2.06)%; since inception, (4.72)%; Class B—1-year period, 5.85%; 5-year period, (2.16)%; since inception, (4.64)%; Class C—1-year period, 9.91%; 5-year period, (1.76)%; since inception, (4.90)%; Class Y—1-year period, 12.23%; 5-year period, (0.55)%; since inception, (3.10)%; Class P—1-year period, 9.85%; 5-year period, (2.63)%; 10-year period, (7.35)%; since inception, 1.40%.
The annualized gross and net expense ratios, respectively, for each class of shares as in the November 28, 2009 prospectuses, were as follows: Class A—1.30% and 1.26%; Class B—2.32% and 2.05%; Class C—2.20% and 2.05%; Class Y—0.88% and 0.84%; and Class P—1.01% and 0.97%. Net expenses reflect fee waivers and/or expense reimbursements, if any, pursuant to an agreement that is in effect to cap the expenses. The Portfolio and UBS Global AM have entered into a written fee waiver agreement pursuant to which UBS Global AM is contractually obligated to waive its management fees through November 30, 2010 to the extent necessary to reflect the lower sub-advisory fees paid by UBS Global AM to SSgA FM. The Portfolio and UBS Global AM have entered into an additional written fee waiver/expense reimbursement agreement pursuant to which UBS Global AM is contractually obligated to waive its management fees and/or reimbur se expenses so that the ordinary total operating expenses of each class through November 30, 2010 (excluding dividend expense, borrowing costs and interest expense, if any) would not exceed Class A—1.30%; Class B—2.05%; Class C—2.05%; Class Y—1.05%; and Class P—1.05%. The Portfolio has agreed to repay UBS Global AM for any waived fees/reimbursed expenses to the extent that it can do so over the following three fiscal years without causing the Portfolio's expenses in any of those three years to exceed the expense caps described above.
1 Since inception returns are calculated as of commencement of issuance on August 24, 1995 for Class P shares, November 27, 2000 for Class A, B, and C shares and February 15, 2001 for Class Y shares. Since inception returns for the Index and Lipper median are shown as of August 31, 1995, which is the month-end after the inception date of the oldest share class (Class P).
2 Maximum sales charge for Class A shares is 5.5%. Class A shares bear ongoing 12b-1 service fees.
3 Maximum contingent deferred sales charge for Class B shares is 5% imposed on redemptions and is reduced to 0% after a maximum of six years. Class B shares bear ongoing 12b-1 service and distribution fees.
4 Maximum contingent deferred sales charge for Class C shares is 1% imposed on redemptions and is reduced to 0% after one year. Class C shares bear ongoing 12b-1 service and distribution fees. Prior to September 30, 2003, Class C shares were subject to a maximum front-end sales charge of 1.00%; this front-end sales charge is not reflected in the average annual total return presented for the Class C shares shown above.
5 The Portfolio offers Class Y shares to a limited group of eligible investors, including certain qualifying retirement plans. Class Y shares do not bear initial or contingent deferred sales charges or ongoing 12b-1 service and distribution fees.
6 Class P shares do not bear initial or contingent deferred sales charges or ongoing 12b-1 service and distribution fees, but are subject to a maximum annual UBS PACE Select program fee of 2% of the value of Class P shares. Prior to June 14, 2010, the maximum annual UBS PACE Select program fee was 1.5% of the value of Class P shares.
7 Assumes the conversion of Class B to Class A shares at the end of the sixth year.
8 The Russell 1000 Growth Index is designed to measure the performance of the large-cap growth segment of the US equity universe. It includes those Russell 1000 companies with higher price-to-book ratios and higher forecasted growth values. The Russell 1000 Growth Index is constructed to provide a comprehensive and unbiased barometer for the large-cap growth segment. The Index is completely reconstituted annually to ensure new and growing equities are included and that the represented companies continue to reflect growth characteristics. Investors should note that indices do not reflect the deduction of fees and expenses.
If an investor sells or exchanges shares less than 90 days after purchase, a redemption fee of 1.00% of the amount sold or exchanged will be deducted at the time of the transaction, except as noted otherwise in the prospectuses.
Past performance does not predict future performance, and the performance information provided does not reflect the deduction of taxes that a shareholder would pay on Portfolio distributions or the redemption of Portfolio shares. The return and principal value of an investment will fluctuate, so that an investor's shares, when redeemed, may be worth more or less than their original cost. Performance results assume reinvestment of all dividends and capital gain distributions at net asset value on the ex-dividend dates. Current performance may be higher or lower than the performance data quoted. For month-end performance figures, please visit http://www.ubs.com.
Lipper peer group data calculated by Lipper Inc.; used with permission. The Lipper median is the return of the fund that places in the middle of a Lipper peer group.
117
UBS PACE Select Advisors Trust
UBS PACE Large Co Growth Equity Investments
Portfolio statistics (unaudited)
| Characteristics | | 07/31/10 | |
| Net assets (mm) | | $ | 968.5 | | |
| Number of holdings | | | 199 | | |
| Portfolio composition1 | | 07/31/10 | |
| Common stocks | | | 92.9 | % | |
| ADRs | | | 4.9 | | |
| Cash equivalents and other assets less liabilities | | | 2.2 | | |
| Total | | | 100.0 | % | |
| Top five sectors1 | | 07/31/10 | |
| Information technology | | | 35.1 | % | |
| Consumer discretionary | | | 15.5 | | |
| Industrials | | | 13.7 | | |
| Financials | | | 10.9 | | |
| Health care | | | 8.1 | | |
| Total | | | 83.3 | % | |
| Top ten equity holdings1 | | 07/31/10 | |
| Apple, Inc. | | | 5.3 | % | |
| Cisco Systems, Inc. | | | 2.7 | | |
| Google, Inc. | | | 2.7 | | |
| Microsoft Corp. | | | 2.1 | | |
| Oracle Corp. | | | 1.9 | | |
| Wells Fargo & Co. | | | 1.9 | | |
| Priceline.com, Inc. | | | 1.8 | | |
| QUALCOMM, Inc. | | | 1.7 | | |
| EOG Resources, Inc. | | | 1.6 | | |
| Intel Corp. | | | 1.6 | | |
| Total | | | 23.3 | % | |
1 Weightings represent percentages of the Portfolio's net assets as of July 31, 2010. The Portfolio is actively managed and its composition will vary over time.
ADR American Depositary Receipt
118
UBS PACE Select Advisors Trust
UBS PACE Large Co Growth Equity Investments
Portfolio of investments—July 31, 2010
| Security description | | Number of
shares | | Value | |
| Common stocks—97.75% | |
| Aerospace & defense—3.60% | |
| Boeing Co. | | | 87,650 | | | $ | 5,972,471 | | |
| General Dynamics Corp. | | | 139,674 | | | | 8,555,032 | | |
| Goodrich Corp. | | | 94,946 | | | | 6,918,715 | | |
| Honeywell International, Inc. | | | 134,630 | | | | 5,770,242 | | |
| Precision Castparts Corp. | | | 28,390 | | | | 3,468,974 | | |
| United Technologies Corp. | | | 59,505 | | | | 4,230,806 | | |
| | | | 34,916,240 | | |
| Air freight & logistics—1.23% | |
Expeditors International of
Washington, Inc. | | | 142,200 | | | | 6,063,408 | | |
| FedEx Corp. | | | 65,347 | | | | 5,394,395 | | |
United Parcel Service, Inc.,
Class B | | | 7,800 | | | | 507,000 | | |
| | | | 11,964,803 | | |
| Auto components—0.59% | |
| Johnson Controls, Inc. | | | 198,280 | | | | 5,712,447 | | |
| Automobiles—1.28% | |
| Ford Motor Co.* | | | 532,540 | | | | 6,800,536 | | |
| Harley-Davidson, Inc. | | | 206,000 | | | | 5,609,380 | | |
| | | | 12,409,916 | | |
| Beverages—0.70% | |
| Dr. Pepper Snapple Group, Inc. | | | 55,900 | | | | 2,099,045 | | |
| PepsiCo, Inc. | | | 37,793 | | | | 2,453,144 | | |
| The Coca-Cola Co. | | | 41,008 | | | | 2,259,951 | | |
| | | | 6,812,140 | | |
| Biotechnology—0.93% | |
| Celgene Corp.* | | | 61,760 | | | | 3,406,064 | | |
| Gilead Sciences, Inc.* | | | 155,300 | | | | 5,174,596 | | |
| Regeneron Pharmaceuticals, Inc.* | | | 16,600 | | | | 401,554 | | |
| | | | 8,982,214 | | |
| Building products—0.26% | |
| Masco Corp. | | | 182,100 | | | | 1,871,988 | | |
| Owens Corning, Inc.* | | | 19,700 | | | | 620,156 | | |
| | | | 2,492,144 | | |
| Capital markets—2.41% | |
| Ameriprise Financial, Inc. | | | 118,440 | | | | 5,020,672 | | |
| Bank of New York Mellon Corp. | | | 207,100 | | | | 5,191,997 | | |
| Goldman Sachs Group, Inc. | | | 86,964 | | | | 13,115,910 | | |
| | | | 23,328,579 | | |
| Chemicals—3.13% | |
| Ashland, Inc. | | | 29,300 | | | | 1,489,905 | | |
| Dow Chemical Co. | | | 411,510 | | | | 11,246,568 | | |
| Lubrizol Corp. | | | 22,080 | | | | 2,064,259 | | |
| Monsanto Co. | | | 142,623 | | | | 8,249,314 | | |
| Syngenta AG, ADR | | | 104,900 | | | | 4,629,237 | | |
| The Mosaic Co. | | | 31,090 | | | | 1,481,439 | | |
| Valspar Corp. | | | 37,200 | | | | 1,168,452 | | |
| | | | 30,329,174 | | |
| Security description | | Number of
shares | | Value | |
| Common stocks—(continued) | |
| Commercial banks—3.72% | |
| ICICI Bank Ltd., ADR | | | 93,659 | | | $ | 3,644,272 | | |
Itau Unibanco Banco
Multiplo SA, ADR | | | 147,968 | | | | 3,313,003 | | |
PNC Financial Services
Group, Inc. | | | 66,792 | | | | 3,966,777 | | |
| US Bancorp | | | 298,470 | | | | 7,133,433 | | |
| Wells Fargo & Co. | | | 648,494 | | | | 17,982,739 | | |
| | | | 36,040,224 | | |
| Commercial services & supplies—0.28% | |
| Stericycle, Inc.* | | | 42,935 | | | | 2,704,905 | | |
| Communications equipment—5.34% | |
| Cisco Systems, Inc.* | | | 1,152,141 | | | | 26,579,893 | | |
| Harris Corp. | | | 59,500 | | | | 2,649,535 | | |
| Juniper Networks, Inc.* | | | 206,800 | | | | 5,744,904 | | |
| Polycom, Inc.* | | | 13,300 | | | | 394,744 | | |
| QUALCOMM, Inc. | | | 428,250 | | | | 16,307,760 | | |
| | | | 51,676,836 | | |
| Computers & peripherals—9.00% | |
| Apple, Inc.* | | | 201,166 | | | | 51,749,953 | | |
| Dell, Inc.* | | | 442,090 | | | | 5,853,272 | | |
| EMC Corp.* | | | 583,250 | | | | 11,542,518 | | |
| Hewlett-Packard Co. | | | 67,108 | | | | 3,089,652 | | |
| NetApp, Inc.* | | | 279,670 | | | | 11,830,041 | | |
| SanDisk Corp.* | | | 40,500 | | | | 1,769,850 | | |
| Seagate Technology* | | | 104,740 | | | | 1,314,487 | | |
| | | | 87,149,773 | | |
| Consumer finance—0.77% | |
| American Express Co. | | | 166,415 | | | | 7,428,766 | | |
| Diversified consumer services—0.21% | |
| Career Education Corp.* | | | 42,000 | | | | 1,026,060 | | |
| H&R Block, Inc. | | | 61,700 | | | | 967,456 | | |
| | | | 1,993,516 | | |
| Diversified financial services—1.79% | |
| CME Group, Inc. | | | 21,400 | | | | 5,966,320 | | |
| IntercontinentalExchange, Inc.* | | | 62,600 | | | | 6,611,812 | | |
| JPMorgan Chase & Co. | | | 117,428 | | | | 4,730,000 | | |
| | | | 17,308,132 | | |
| Electrical equipment—0.55% | |
| Emerson Electric Co. | | | 65,200 | | | | 3,230,008 | | |
| Hubbell, Inc., Class B | | | 35,800 | | | | 1,689,402 | | |
| Regal-Beloit Corp. | | | 6,600 | | | | 401,478 | | |
| | | | 5,320,888 | | |
| Electronic equipment, instruments & components—0.08% | |
| National Instruments Corp. | | | 23,500 | | | | 749,650 | | |
| Energy equipment & services—1.07% | |
| National-Oilwell Varco, Inc. | | | 69,910 | | | | 2,737,676 | | |
| Schlumberger Ltd. | | | 128,120 | | | | 7,643,639 | | |
| | | | 10,381,315 | | |
119
UBS PACE Select Advisors Trust
UBS PACE Large Co Growth Equity Investments
Portfolio of investments—July 31, 2010
| Security description | | Number of
shares | | Value | |
| Common stocks—(continued) | |
| Food & staples retailing—0.70% | |
| Wal-Mart Stores, Inc. | | | 47,381 | | | $ | 2,425,433 | | |
| Walgreen Co. | | | 153,300 | | | | 4,376,715 | | |
| | | | 6,802,148 | | |
| Food products—1.17% | |
| Del Monte Foods Co. | | | 140,600 | | | | 1,951,528 | | |
| Mead Johnson Nutrition Co. | | | 107,777 | | | | 5,727,270 | | |
| Tyson Foods, Inc. Class A | | | 119,700 | | | | 2,095,947 | | |
| Unilever NV, ADR | | | 53,215 | | | | 1,569,310 | | |
| | | | 11,344,055 | | |
| Gas utilities—0.14% | |
| ONEOK, Inc. | | | 28,300 | | | | 1,316,799 | | |
| Health care equipment & supplies—1.53% | |
| Baxter International, Inc. | | | 28,420 | | | | 1,243,943 | | |
| Covidien PLC | | | 83,950 | | | | 3,133,014 | | |
| Hospira, Inc.* | | | 41,129 | | | | 2,142,821 | | |
| Intuitive Surgical, Inc.* | | | 23,021 | | | | 7,559,406 | | |
| Kinetic Concepts, Inc.* | | | 19,900 | | | | 706,649 | | |
| | | | 14,785,833 | | |
| Health care providers & services—2.07% | |
| Aetna, Inc. | | | 43,100 | | | | 1,200,335 | | |
| AmerisourceBergen Corp. | | | 51,600 | | | | 1,546,452 | | |
| Cardinal Health, Inc. | | | 44,800 | | | | 1,445,696 | | |
| Humana, Inc.* | | | 40,800 | | | | 1,918,416 | | |
| Lincare Holdings, Inc. | | | 41,850 | | | | 994,356 | | |
| McKesson Corp. | | | 15,700 | | | | 986,274 | | |
| Medco Health Solutions, Inc.* | | | 152,000 | | | | 7,296,000 | | |
| UnitedHealth Group, Inc. | | | 154,700 | | | | 4,710,615 | | |
| | | | 20,098,144 | | |
| Hotels, restaurants & leisure—2.58% | |
| Darden Restaurants, Inc. | | | 24,500 | | | | 1,026,305 | | |
| International Game Technology | | | 195,220 | | | | 2,975,153 | | |
| McDonald's Corp. | | | 138,426 | | | | 9,652,445 | | |
| MGM Resorts International1,* | | | 303,090 | | | | 3,291,557 | | |
| Starbucks Corp. | | | 151,720 | | | | 3,770,242 | | |
| Wynn Resorts Ltd. | | | 48,746 | | | | 4,274,049 | | |
| | | | 24,989,751 | | |
| Household durables—0.34% | |
| Garmin Ltd.1 | | | 54,380 | | | | 1,550,374 | | |
| Leggett & Platt, Inc. | | | 57,300 | | | | 1,194,132 | | |
| Whirlpool Corp. | | | 6,900 | | | | 574,770 | | |
| | | | 3,319,276 | | |
| Household products—0.53% | |
| Procter & Gamble Co. | | | 84,100 | | | | 5,143,556 | | |
| Industrial conglomerates—1.08% | |
| 3M Co. | | | 86,380 | | | | 7,388,945 | | |
| Siemens AG, ADR | | | 31,300 | | | | 3,048,307 | | |
| | | | 10,437,252 | | |
| Security description | | Number of
shares | | Value | |
| Common stocks—(continued) | |
| Insurance—2.11% | |
| Aflac, Inc. | | | 9,300 | | | $ | 457,467 | | |
Berkshire Hathaway, Inc.,
Class B* | | | 36,285 | | | | 2,834,584 | | |
| First American Financial Corp. | | | 182,019 | | | | 2,684,780 | | |
Hartford Financial Services
Group, Inc. | | | 409,950 | | | | 9,596,929 | | |
| Lincoln National Corp. | | | 106,200 | | | | 2,765,448 | | |
| Progressive Corp. | | | 65,220 | | | | 1,280,921 | | |
| Prudential Financial, Inc. | | | 14,540 | | | | 832,997 | | |
| | | | 20,453,126 | | |
| Internet & catalog retail—2.45% | |
| Amazon.com, Inc.* | | | 57,678 | | | | 6,799,659 | | |
| Priceline.com, Inc.* | | | 75,657 | | | | 16,977,431 | | |
| | | | 23,777,090 | | |
| Internet software & services—5.27% | |
| Baidu, Inc., ADR* | | | 105,239 | | | | 8,567,507 | | |
| eBay, Inc.* | | | 322,540 | | | | 6,744,311 | | |
| Google, Inc., Class A* | | | 53,883 | | | | 26,125,173 | | |
| VeriSign, Inc.* | | | 341,030 | | | | 9,599,994 | | |
| | | | 51,036,985 | | |
| IT services—4.33% | |
| Accenture PLC, Class A | | | 98,270 | | | | 3,895,423 | | |
Cognizant Technology Solutions
Corp., Class A* | | | 65,760 | | | | 3,587,866 | | |
| CoreLogic, Inc. | | | 63,495 | | | | 1,271,805 | | |
International Business
Machines Corp. | | | 58,269 | | | | 7,481,739 | | |
| MasterCard, Inc., Class A | | | 34,500 | | | | 7,246,380 | | |
| Teradata Corp.* | | | 179,100 | | | | 5,695,380 | | |
| Visa, Inc., Class A | | | 133,500 | | | | 9,792,225 | | |
| Western Union Co. | | | 180,480 | | | | 2,929,190 | | |
| | | | 41,900,008 | | |
| Life sciences tools & services—0.35% | |
Bio-Rad Laboratories, Inc.,
Class A* | | | 13,200 | | | | 1,172,160 | | |
| Thermo Fisher Scientific, Inc.* | | | 50,600 | | | | 2,269,916 | | |
| | | | 3,442,076 | | |
| Machinery—4.97% | |
| Caterpillar, Inc. | | | 75,310 | | | | 5,252,872 | | |
| Cummins, Inc. | | | 55,900 | | | | 4,450,199 | | |
| Deere & Co. | | | 20,500 | | | | 1,366,940 | | |
| Eaton Corp. | | | 153,699 | | | | 12,059,224 | | |
| Illinois Tool Works, Inc. | | | 98,790 | | | | 4,297,365 | | |
| Ingersoll-Rand PLC | | | 167,380 | | | | 6,270,055 | | |
| Navistar International Corp.* | | | 18,800 | | | | 972,148 | | |
| PACCAR, Inc. | | | 161,250 | | | | 7,388,475 | | |
| Parker Hannifin Corp. | | | 38,400 | | | | 2,385,408 | | |
| Timken Co. | | | 33,200 | | | | 1,116,184 | | |
| Toro Co. | | | 27,300 | | | | 1,420,965 | | |
| Valmont Industries, Inc. | | | 16,700 | | | | 1,186,535 | | |
| | | | 48,166,370 | | |
120
UBS PACE Select Advisors Trust
UBS PACE Large Co Growth Equity Investments
Portfolio of investments—July 31, 2010
| Security description | | Number of
shares | | Value | |
| Common stocks—(continued) | |
| Media—1.79% | |
| DIRECTV, Class A* | | | 105,583 | | | $ | 3,923,464 | | |
| John Wiley & Sons, Inc., Class A | | | 32,200 | | | | 1,268,036 | | |
| News Corp., Class A | | | 345,720 | | | | 4,511,646 | | |
| Omnicom Group, Inc. | | | 21,100 | | | | 786,186 | | |
| The Walt Disney Co. | | | 203,182 | | | | 6,845,202 | | |
| | | | 17,334,534 | | |
| Metals & mining—1.63% | |
| Barrick Gold Corp. | | | 33,030 | | | | 1,357,533 | | |
| BHP Billiton Ltd., ADR1 | | | 46,320 | | | | 3,345,694 | | |
| BHP Billiton PLC, ADR | | | 119,058 | | | | 7,326,829 | | |
Freeport-McMoRan Copper &
Gold, Inc. | | | 52,000 | | | | 3,720,080 | | |
| | | | 15,750,136 | | |
| Multi-utilities—0.13% | |
| DTE Energy Co. | | | 26,700 | | | | 1,232,472 | | |
| Multiline retail—1.06% | |
| Big Lots, Inc.* | | | 26,900 | | | | 922,939 | | |
| Kohl's Corp.* | | | 85,100 | | | | 4,058,419 | | |
| Macy's, Inc. | | | 19,300 | | | | 359,945 | | |
| Nordstrom, Inc. | | | 85,838 | | | | 2,918,492 | | |
| Target Corp. | | | 39,300 | | | | 2,016,876 | | |
| | | | 10,276,671 | | |
| Oil, gas & consumable fuels—3.71% | |
| Anadarko Petroleum Corp. | | | 67,081 | | | | 3,297,702 | | |
| Cimarex Energy Co. | | | 28,500 | | | | 1,962,795 | | |
| ConocoPhillips | | | 14,500 | | | | 800,690 | | |
| CONSOL Energy, Inc. | | | 81,190 | | | | 3,043,001 | | |
| EOG Resources, Inc. | | | 162,122 | | | | 15,806,895 | | |
| Exxon Mobil Corp. | | | 165,318 | | | | 9,866,178 | | |
| SM Energy Co. | | | 27,900 | | | | 1,155,618 | | |
| | | | 35,932,879 | | |
| Paper & forest products—0.06% | |
| International Paper Co. | | | 24,100 | | | | 583,220 | | |
| Pharmaceuticals—3.24% | |
| Abbott Laboratories | | | 33,400 | | | | 1,639,272 | | |
| Allergan, Inc. | | | 140,000 | | | | 8,548,400 | | |
| Johnson & Johnson | | | 38,095 | | | | 2,212,939 | | |
| Merck & Co., Inc. | | | 211,141 | | | | 7,275,919 | | |
| Novartis AG, ADR | | | 35,075 | | | | 1,709,555 | | |
| Novo Nordisk A/S, ADR | | | 87,000 | | | | 7,484,610 | | |
Teva Pharmaceutical
Industries Ltd., ADR | | | 51,020 | | | | 2,492,327 | | |
| | | | 31,363,022 | | |
| Professional services—0.14% | |
| Dun & Bradstreet Corp. | | | 19,955 | | | | 1,364,124 | | |
| Real estate investment trusts (REITs)—0.12% | |
| Simon Property Group, Inc. | | | 13,200 | | | | 1,177,704 | | |
| Security description | | Number of
shares | | Value | |
| Common stocks—(continued) | |
| Road & rail—1.59% | |
| Norfolk Southern Corp. | | | 75,831 | | | $ | 4,267,010 | | |
| Ryder System, Inc. | | | 8,800 | | | | 384,296 | | |
| Union Pacific Corp. | | | 144,128 | | | | 10,762,038 | | |
| | | | 15,413,344 | | |
| Semiconductors & semiconductor equipment—3.73% | |
| Advanced Micro Devices, Inc.1,* | | | 120,100 | | | | 899,549 | | |
| Altera Corp. | | | 217,190 | | | | 6,020,507 | | |
| Analog Devices, Inc. | | | 156,320 | | | | 4,644,267 | | |
| Broadcom Corp., Class A | | | 81,230 | | | | 2,926,717 | | |
| Intel Corp. | | | 735,586 | | | | 15,153,072 | | |
| Teradyne, Inc.* | | | 170,300 | | | | 1,832,428 | | |
| Texas Instruments, Inc. | | | 188,170 | | | | 4,645,917 | | |
| | | | 36,122,457 | | |
| Software—7.31% | |
| Adobe Systems, Inc.* | | | 175,300 | | | | 5,034,616 | | |
| BMC Software, Inc.* | | | 144,690 | | | | 5,148,070 | | |
| Citrix Systems, Inc.* | | | 61,530 | | | | 3,385,381 | | |
| Compuware Corp.* | | | 100,700 | | | | 823,726 | | |
| Intuit, Inc.* | | | 274,700 | | | | 10,919,325 | | |
| Microsoft Corp. | | | 784,800 | | | | 20,255,688 | | |
| Oracle Corp. | | | 777,746 | | | | 18,385,915 | | |
| Rovi Corp.* | | | 67,120 | | | | 2,986,840 | | |
| Symantec Corp.* | | | 301,800 | | | | 3,914,346 | | |
| | | | 70,853,907 | | |
| Specialty retail—3.22% | |
| Advance Auto Parts, Inc. | | | 34,900 | | | | 1,868,197 | | |
| Aeropostale, Inc.* | | | 36,350 | | | | 1,033,430 | | |
| Home Depot, Inc. | | | 21,200 | | | | 604,412 | | |
| Limited Brands, Inc. | | | 58,900 | | | | 1,510,196 | | |
| Lowe's Cos., Inc. | | | 500,000 | | | | 10,370,000 | | |
| PetSmart, Inc. | | | 56,700 | | | | 1,760,535 | | |
| Ross Stores, Inc. | | | 34,400 | | | | 1,811,504 | | |
| Staples, Inc. | | | 464,790 | | | | 9,449,181 | | |
| TJX Cos., Inc. | | | 40,600 | | | | 1,685,712 | | |
| Williams-Sonoma, Inc. | | | 41,900 | | | | 1,119,149 | | |
| | | | 31,212,316 | | |
| Textiles, apparel & luxury goods—2.01% | |
| Coach, Inc. | | | 98,150 | | | | 3,628,606 | | |
| Fossil, Inc.* | | | 9,900 | | | | 392,040 | | |
| Hanesbrands, Inc.* | | | 24,600 | | | | 616,230 | | |
| Nike, Inc., Class B | | | 148,880 | | | | 10,963,523 | | |
| Polo Ralph Lauren Corp. | | | 48,440 | | | | 3,827,244 | | |
| | | | 19,427,643 | | |
| Tobacco—0.24% | |
| Philip Morris International, Inc. | | | 45,093 | | | | 2,301,547 | | |
121
UBS PACE Select Advisors Trust
UBS PACE Large Co Growth Equity Investments
Portfolio of investments—July 31, 2010
| Security description | | Number of
shares | | Value | |
| Common stocks—(concluded) | |
| Wireless telecommunication services—1.21% | |
| American Tower Corp., Class A* | | | 69,545 | | | $ | 3,215,761 | | |
Crown Castle
International Corp.* | | | 215,000 | | | | 8,494,650 | | |
| | | | 11,710,411 | | |
Total common stocks
(cost—$858,069,059) | | | | | | | 946,770,518 | | |
| Money market fund—0.17% | |
Blackrock Liquidity Funds
TempFund Institutional Shares
(cost—$1,656,088) | | | 1,656,088 | | | | 1,656,088 | | |
| | | Face
amount | | | |
| Repurchase agreement—2.11% | |
Repurchase agreement dated
07/30/10 with State Street
Bank & Trust Co., 0.010%
due 08/02/10, collateralized
by $20,189,095 US Treasury
Notes, 2.125% to 3.125%
due 04/30/15 to 04/30/17,
(value—$20,833,692);
proceeds: $20,425,017
(cost—$20,425,000) | | $ | 20,425,000 | | | | 20,425,000 | | |
| Security description | | Number of
shares | | Value | |
| Investment of cash collateral from securities loaned—0.92% | |
| Money market fund—0.92% | |
UBS Private Money Market
Fund LLC2
(cost—$8,858,229) | | | 8,858,229 | | | $ | 8,858,229 | | |
Total investments
(cost—$889,008,376)—
100.95% | | | | | 977,709,835 | | |
Liabilities in excess of other
assets—(0.95)% | | | | | (9,182,464 | ) | |
| Net assets—100.00% | | $ | 968,527,371 | | |
Aggregate cost for federal income tax purposes was $914,241,075; and net unrealized appreciation consisted of:
| Gross unrealized appreciation | | $ | 85,518,743 | | |
| Gross unrealized depreciation | | | (22,049,983 | ) | |
| Net unrealized appreciation | | $ | 63,468,760 | | |
* Non-income producing security.
1 Security, or portion thereof, was on loan at July 31, 2010.
2 The table below details the Portfolio's transaction activity in an affiliated issuer for the year ended July 31, 2010.
| Security description | | Value at
07/31/09 | | Purchases
during the
year ended
07/31/10 | | Sales
during the
year ended
07/31/10 | | Value at
07/31/10 | | Net income
earned from
affiliate for the
year ended
07/31/10 | |
| UBS Private Money Market Fund LLC | | $ | 150,213,457 | | | $ | 425,739,624 | | | $ | 567,094,852 | | | $ | 8,858,229 | | | $ | 101,280 | | |
ADR American Depositary Receipt
122
UBS PACE Select Advisors Trust
UBS PACE Large Co Growth Equity Investments
Portfolio of investments—July 31, 2010
The following is a summary of the fair valuations according to the inputs used as of July 31, 2010 in valuing the Portfolio's investments:
| | | Unadjusted
quoted prices in
active markets for
identical investments
(Level 1) | | Other significant
observable inputs
(Level 2) | | Unobservable
inputs
(Level 3) | | Total | |
| Common stocks | | $ | 946,770,518 | | | $ | — | | | $ | — | | | $ | 946,770,518 | | |
| Money market fund | | | — | | | | 1,656,088 | | | | — | | | | 1,656,088 | | |
| Repurchase agreement | | | — | | | | 20,425,000 | | | | — | | | | 20,425,000 | | |
Investment of cash collateral
from securities loaned | | | — | | | | 8,858,229 | | | | — | | | | 8,858,229 | | |
| Total | | $ | 946,770,518 | | | $ | 30,939,317 | | | $ | — | | | $ | 977,709,835 | | |
At July 31, 2010, there were no transfers between Level 1 and Level 2.
Issuer breakdown by country or territory of origin (unaudited)
| | | Percentage of
total investments | |
| United States | | | 92.6 | % | |
| Ireland | | | 1.5 | | |
| Cayman Islands | | | 0.9 | | |
| Switzerland | | | 0.8 | | |
| Netherlands Antilles | | | 0.8 | | |
| Denmark | | | 0.8 | | |
| United Kingdom | | | 0.7 | | |
| India | | | 0.4 | | |
| Australia | | | 0.3 | | |
| Brazil | | | 0.3 | | |
| Germany | | | 0.3 | | |
| Israel | | | 0.3 | | |
| Netherlands | | | 0.2 | | |
| Canada | | | 0.1 | | |
| Total | | | 100.0 | % | |
See accompanying notes to financial statements.
123
UBS PACE Select Advisors Trust
UBS PACE Small/Medium Co Value Equity Investments
Performance
For the 12 months ended July 31, 2010, the Portfolio's Class P shares returned 19.38%, before the deduction of the maximum UBS PACE Select program fee. (The Class P shares returned 17.02%, after the deduction of the maximum UBS PACE Select program fee, for the same 12-month period.) In comparison, the Russell 2500 Value Index (the "benchmark") returned 23.20% and the Lipper Small-Cap Core Funds category posted a median return of 18.03%. (Returns for all share classes over various time periods are shown in the "Performance at a glance" table on page 128. Please note that the returns shown do not reflect the deduction of taxes that a shareholder would pay on Portfolio distributions or the redemption of Portfolio shares.) For a detailed commentary on the market environment in general during the reporting period, please refer to page 2.
Sub-Advisors' comments
MetWest Capital
Our portion of the Portfolio outperformed the benchmark during the reporting period. Stock selection was strongest in the information technology and financials sectors. In addition, an underweight in financials contributed to relative results, as the sector lagged the market. In our portion of the Portfolio, sector overweights and underweights are the result of bottom-up stock selection rather than tactical sector allocation decisions.
Within information technology, the global leader in producing point-of-sale scanners, VeriFone Systems Inc., added the most value. We believe that VeriFone's business stands to benefit in the coming years from growth in non-cash payment methods (credit and debit cards) and the proliferation of new products, from point-of-sale terminals in cabs, to handheld scanners in restaurants and on airplanes. Nonetheless, we reduced this position in order to manage the overall risk within our portion of the Portfolio. In financials, Zions Bancorporation and International Bancshares Corp. were the top contributors. We continue to find value in Utah-based regional bank Zions Bancorporation, but we eliminated our position in Texas-based regional bank International Bancshares as the company's stock approached our estimate of its intrinsic value.
UBS PACE Select Advisors Trust –
UBS PACE Small/Medium Co Value Equity Investments
Investment Sub-Advisors:
Metropolitan West Capital Management, LLC ("MetWest Capital"), Buckhead Capital Management, LLC ("Buckhead") and Systematic Financial Management, L.P. ("Systematic")
Portfolio Managers:
MetWest Capital: Samir Sikka;
Buckhead: Matthew D. Reams and David S. Griffin;
Systematic: Ronald M. Mushock and D. Kevin McCreesh
Objective:
Capital appreciation
Investment process:
MetWest Capital utilizes a bottom-up, fundamental, research-driven style that it believes is well suited to the small cap market segment. MetWest Capital seeks to identify high-quality companies selling below intrinsic value with clear catalysts to realize full value within its investment time horizon and constructs a portfolio of its highest conviction ideas.
Buckhead utilizes a fundamental, bottom-up, research-driven investment style and a disciplined investment process that is designed to identify companies that it believes are attractively valued, have strong underlying fundamental characteristics and are likely to have one or more catalysts that are expected to drive their share prices higher. Buckhead seeks to build concentrated portfolios with the largest positions in those companies that it believes have the highest likelihood of outperforming the market and/or the portfolio's benchmark.
(continued on next page)
124
UBS PACE Select Advisors Trust
UBS PACE Small/Medium Co Value Equity Investments
Sub-Advisors' comments – continued
On the downside, security selection in the consumer discretionary, health care and industrial sectors was the main detractor from relative performance. In consumer discretionary, book retailer Borders Group Inc. detracted most from returns, as it sold off, given concerns over weak sales. Within health care, drug development services provider Covance Inc. detracted from results. The stock sold off as the company lowered revenue guidance, citing cautious spending by its pharmaceutical customers. We added to the position during the review period as our investment thesis remained intact. Professional staffing and services firm Resources Connection Inc. was a primary detractor in the industrials sector. Resources Connection struggled as the economic recovery waxed and waned. However, the firm recently made two small acquisitions, which should act as a platform to build its businesses in corporate restructuring and strategic communica tion consulting, longer term.
Amidst the market volatility, we remain committed to our long-term focus on high-quality investments in our efforts to continue to add value for shareholders over a complete market cycle.
Buckhead
Our portion of the Portfolio underperformed the benchmark during the reporting period. Sector allocation was a positive contributor to relative performance, but it was more than offset by individual security selection in our portion of the Portfolio.
Holdings in the energy sector were among our weaker performers during the reporting period. Comstock Resources, which is involved in oil and gas exploration and production, was negatively impacted by weak prices for natural gas. In addition, Tidewater, a service provider to the offshore oil industry, was held back by investor fears concerning pricing trends and capacity issues. Several holdings in the financial services sector also detracted from performance. In particular, Synovus, Wilmington Trust and United Community Banks continued to deal with issues created during the real estate bubble and financial crisis. These included increased problem loans and portfolio write-downs.
On the positive side, our portion of the Portfolio benefited from its investments in certain consumer, financial services and technology holdings. Coinstar appreciated significantly as the company continued to deliver exceptional operating results, with strength coming from the company's Redbox movie rental division. New York Community Bancorp rallied in the review period, following news of the company's participation in an FDIC-assisted transaction. MPS Group, a professional staffing company, rose sharply after they agreed to be purchased by Swiss-based ADECCO. Given this, MPS Group was eliminated from our portion of the Portfolio to capture profits. Elsewhere, media and marketing services company Valassis Communications benefited from the resolution of a long-standing lawsuit. We sold Valassis Communications to capture profits.
Investment process (concluded)
Systematic employs a two-pronged investment approach that utilizes both quantitative screening and fundamental research. Systematic's investment philosophy is predicated on its belief that stock prices reflect the market's estimates of earnings, and as revisions to those estimates are made by the market, stock prices will follow suit.
Systematic conducts a quantitative screening of all companies within the small/mid capitalization universe, and then uses fundamental research analysis to gauge investor expectations by focusing on key revenue and margin assumptions underlying earnings estimates.
125
UBS PACE Select Advisors Trust
UBS PACE Small/Medium Co Value Equity Investments
Sub-Advisors' comments – concluded
At the sector level, our portion of the Portfolio maintains an overweight to consumer discretionary and producer durables, while being underweight to health care and utility stocks. Apart from these positions, our Portfolio is fairly neutral to the market.
We continue to be committed to our investment discipline, and we remain confident that our long-term returns from small/mid cap value stocks will reward patient investors. However, given the current structural imbalances in the economy, the market may continue to struggle. Given this possibility, it will be important for us to be active in our trading strategy, taking advantage of market volatility to buy and sell shares opportunistically.
Systematic Financial Management
Our portion of the Portfolio outperformed the benchmark during the review period. Despite the inconsistent performance in the past year of many of the quantitative factors that we use to screen for what we believe are winning stocks, we are encouraged by the recent news of positive earnings surprises and higher earnings estimate revisions as this information helps us to identify strong performing stocks.
A year ago, the stock market's rally was just one-quarter old and we witnessed a broad-based, powerful rally, led by the shares of some of the lowest-quality, financially strapped companies in the Russell 2500® Value Index universe. The shares of many of these companies rose sharply, as it became apparent among investors that these entities would not go bankrupt. As we anticipated, our focus on good-quality companies demonstrating favorable earnings dynamics went unrewarded in the earliest stages of the market's rally. This was especially true in the financials sector, where previous strong performers in our portion of the Portfolio such as Hudson City Bancorp and First Niagara Financial, could not keep pace, as the market failed to differentiate one stock from another on the basis of earnings. Likewise, defensive property and casualty insurance companies like Arch Capital underperformed the life insurers, where w e had an underweight position versus the benchmark.
Today, we believe that investors have once again begun to identify companies showing signs of improving performance, a positive trend for our investment process focus on improved earnings dynamics. For example, we purchased Cirrus Logic, Dupont Fabros Technology and PolyOne Corp during the review period and all three have performed well amid signs of recovering earnings trends. Bare Escentuals, was another relatively recent purchase that enhanced our results. While our discipline remains bottom-up in nature, we are examining companies in light of a macroeconomic backdrop that continues to improve, albeit at a slower pace than earlier this year. A period of muted but sustained economic expansion may well continue to contribute to earnings surprises, estimate revisions and similar metrics that may be significant differentiators between winning and losing stocks going forward.
Special considerations
The Portfolio may be appropriate for long-term investors seeking capital appreciation who are able to withstand short-term fluctuations in the equity markets in return for potentially higher returns over the long term. The value of the Portfolio changes every day and can be affected by changes in interest rates, general market conditions and other political, social and economic developments, as well as specific matters relating to the companies in whose securities the Portfolio invests. It is important to note that an investment in the Portfolio is only one component of a balanced investment plan. In addition, small- and mid-cap companies are typically subject to a greater degree of change in earnings and business prospects than are larger, more established companies. Therefore, they are considered to have a higher level of volatility and risk.
126
UBS PACE Select Advisors Trust
UBS PACE Small/Medium Co Value Equity Investments
Illustration of an assumed investment of $10,000 in Class P shares of the Portfolio (unaudited)
The following graph depicts the performance of UBS PACE Small/Medium Co Value Equity Investments Class P shares versus the Russell 2500 Value Index over the 10 years ended July 31, 2010. The performance of the other classes will vary based upon the different class specific expenses and sales charges. The performance provided does not reflect the deduction of taxes that a shareholder would pay on Portfolio distributions or the redemption of Portfolio shares. Past performance is no guarantee of future results. Share price and returns will vary with market conditions; investors may realize a gain or loss upon redemption. It is important to note that UBS PACE Small/Medium Co Value Equity Investments is a professionally managed portfolio while the Index is not available for investment and is unmanaged. The comparison is shown for illustration purposes only.
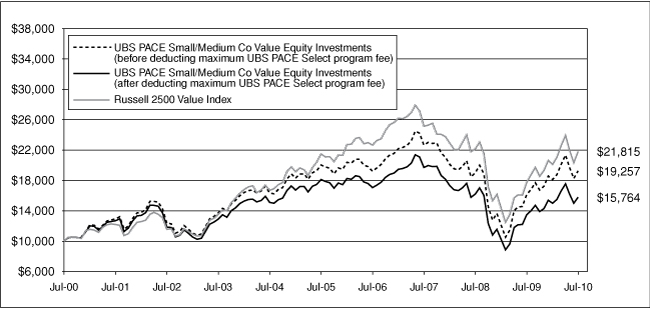
127
UBS PACE Select Advisors Trust
UBS PACE Small/Medium Co Value Equity Investments
Performance at a glance (unaudited)
| Average annual total returns for periods ended 07/31/10 | | 1 year | | 5 years | | 10 years | | Since
inception1 | |
| Before deducting | | Class A2 | | | 19.17 | % | | | (0.93 | )% | | N/A | | | 6.21 | % | |
| maximum sales charge | | Class B3 | | | 18.31 | % | | | (1.72 | )% | | N/A | | | 5.73 | %7 | |
| or UBS PACE Select | | Class C4 | | | 18.34 | % | | | (1.69 | )% | | N/A | | | 5.41 | % | |
| program fee | | Class Y5 | | | 19.50 | % | | | (0.59 | )% | | N/A | | | 6.76 | % | |
| | | Class P6 | | | 19.38 | % | | | (0.77 | )% | | | 6.77 | % | | | 7.17 | % | |
| After deducting | | Class A2 | | | 12.60 | % | | | (2.05 | )% | | N/A | | | 5.59 | % | |
| maximum sales charge | | Class B3 | | | 13.31 | % | | | (1.99 | )% | | N/A | | | 5.73 | %7 | |
| or UBS PACE Select | | Class C4 | | | 17.34 | % | | | (1.69 | )% | | N/A | | | 5.41 | % | |
| program fee | | Class P6 | | | 17.02 | % | | | (2.74 | )% | | | 4.66 | % | | | 5.05 | % | |
| Russell 2500 Value Index8 | | | 23.20 | % | | | 0.29 | % | | | 8.11 | % | | | 9.67 | % | |
| Lipper Small-Cap Core Funds median9 | | | 18.03 | % | | | 0.63 | % | | | 5.85 | % | | | 8.32 | % | |
| Lipper Small-Cap Value Funds median9 | | | 20.48 | % | | | 0.58 | % | | | 8.43 | % | | | 8.93 | % | |
Average annual total returns for periods ended June 30, 2010, after deduction of the maximum sales charge or UBS PACE Select program fee, were as follows: Class A—1-year period, 18.22%; 5-year period, (2.34)%; since inception, 5.05%; Class B—1-year period, 18.97%; 5-year period, (2.32)%; since inception, 5.20%; Class C—1-year period, 23.08%; 5-year period, (2.00)%; since inception, 4.87%; Class Y—1-year period, 25.43%; 5-year period, (0.88)%; since inception, 6.22%; Class P—1-year period, 22.86%; 5-year period, (3.03)%; 10-year period, 4.43%; since inception, 4.72%.
The annualized gross and net expense ratios, respectively, for each class of shares as in the November 28, 2009 prospectuses, were as follows: Class A—1.39% and 1.39%; Class B—2.47% and 2.16%; Class C—2.15% and 2.15%; Class Y—0.98% and 0.98%; and Class P—1.32% and 1.16%. Net expenses reflect fee waivers and/or expense reimbursements, if any, pursuant to an agreement that is in effect to cap the expenses. The Portfolio and UBS Global AM have entered into a written fee waiver/expense reimbursement agreement pursuant to which UBS Global AM is contractually obligated to waive its management fees and/or reimburse expenses so that the Portfolio's ordinary total operating expenses through November 30, 2010 (excluding dividend expense, borrowing costs and interest expense, if any) would not exceed Class A—1.41%; Class B—2.16%; Class C—2.16%; Class Y—1.16%; and Class P—1.16%. The Portfoli o has agreed to repay UBS Global AM for any waived fees/reimbursed expenses to the extent that it can do so over the following three fiscal years without causing the Portfolio's expenses in any of those three years to exceed the expense caps described above.
1 Since inception returns are calculated as of commencement of issuance on August 24, 1995 for Class P shares, November 27, 2000 for Class A and C shares, November 28, 2000 for Class B shares, and December 20, 2000 for Class Y shares. Since inception returns for the Index and Lipper median are shown as of August 31, 1995, which is the month-end after the inception date of the oldest share class (Class P).
2 Maximum sales charge for Class A shares is 5.5%. Class A shares bear ongoing 12b-1 service fees.
3 Maximum contingent deferred sales charge for Class B shares is 5% imposed on redemptions and is reduced to 0% after a maximum of six years. Class B shares bear ongoing 12b-1 service and distribution fees.
4 Maximum contingent deferred sales charge for Class C shares is 1% imposed on redemptions and is reduced to 0% after one year. Class C shares bear ongoing 12b-1 service and distribution fees. Prior to September 30, 2003, Class C shares were subject to a maximum front-end sales charge of 1.00%; this front-end sales charge is not reflected in the average annual total return presented for the Class C shares shown above.
5 The Portfolio offers Class Y shares to a limited group of eligible investors, including certain qualifying retirement plans. Class Y shares do not bear initial or contingent deferred sales charges or ongoing 12b-1 service and distribution fees.
6 Class P shares do not bear initial or contingent deferred sales charges or ongoing 12b-1 service and distribution fees, but are subject to a maximum annual UBS PACE Select program fee of 2% of the value of Class P shares. Prior to June 14, 2010, the maximum annual UBS PACE Select program fee was 1.5% of the value of Class P shares.
7 Assumes the conversion of Class B to Class A shares at the end of the sixth year.
8 The Russell 2500 Value Index is designed to measure the performance of the small to mid-cap value segment of the US equity universe. It includes those Russell 2500 companies with lower price-to-book ratios and lower forecasted growth values. The Russell 2500 Value Index is constructed to provide a comprehensive and unbiased barometer of the small to mid-cap value market. The Index is completely reconstituted annually to ensure larger stocks do not distort the performance and characteristics of the true small to mid-cap opportunity set and that the represented companies continue to reflect value characteristics. Investors should note that indices do not reflect the deduction of fees and expenses.
9 On June 15, 2010, Lipper changed the peer group classification for UBS Small/Medium Co Value Equity Investments from the Lipper Small-Cap Value Funds category to the Lipper Small-Cap Core Funds category.
If an investor sells or exchanges shares less than 90 days after purchase, a redemption fee of 1.00% of the amount sold or exchanged will be deducted at the time of the transaction, except as noted otherwise in the prospectuses.
Past performance does not predict future performance, and the performance information provided does not reflect the deduction of taxes that a shareholder would pay on Portfolio distributions or the redemption of Portfolio shares. The return and principal value of an investment will fluctuate, so that an investor's shares, when redeemed, may be worth more or less than their original cost. Performance results assume reinvestment of all dividends and capital gain distributions at net asset value on the ex-dividend dates. Current performance may be higher or lower than the performance data quoted. For month-end performance figures, please visit http://www.ubs.com.
Lipper peer group data calculated by Lipper Inc.; used with permission. The Lipper median is the return of the fund that places in the middle of a Lipper peer group.
128
UBS PACE Select Advisors Trust
UBS PACE Small/Medium Co Value Equity Investments
Portfolio statistics (unaudited)
| Characteristics | | 07/31/10 | |
| Net assets (mm) | | $ | 379.0 | | |
| Number of holdings | | | 178 | | |
| Portfolio composition1 | | 07/31/10 | |
| Common stocks | | | 98.2 | % | |
| Cash equivalents and other assets less liabilities | | | 1.8 | | |
| Total | | | 100.0 | % | |
| Top five sectors1 | | 07/31/10 | |
| Financials | | | 25.3 | % | |
| Industrials | | | 17.4 | | |
| Consumer discretionary | | | 15.7 | | |
| Information technology | | | 12.4 | | |
| Health care | | | 6.7 | | |
| Total | | | 77.5 | % | |
| Top ten equity holdings1 | | 07/31/10 | |
| Raymond James Financial, Inc. | | | 1.9 | % | |
| Coinstar, Inc. | | | 1.4 | | |
| United Stationers, Inc. | | | 1.1 | | |
| Tidewater, Inc. | | | 1.1 | | |
| Cathay General Bancorp | | | 1.1 | | |
| Plantronics, Inc. | | | 1.0 | | |
| Copart, Inc. | | | 1.0 | | |
| Fresh Del Monte Produce, Inc. | | | 1.0 | | |
| American Greetings Corp. | | | 1.0 | | |
| Comstock Resources, Inc. | | | 1.0 | | |
| Total | | | 11.6 | % | |
1 Weightings represent percentages of the Portfolio's net assets as of July 31, 2010. The Portfolio is actively managed and its composition will vary over time.
129
UBS PACE Select Advisors Trust
UBS PACE Small/Medium Co Value Equity Investments
Portfolio of investments—July 31, 2010
| Security description | | Number of
shares | | Value | |
| Common stocks—98.16% | |
| Aerospace & defense—0.23% | |
| Triumph Group, Inc. | | | 11,325 | | | $ | 859,568 | | |
| Air freight & logistics—1.48% | |
Atlas Air Worldwide
Holdings, Inc.* | | | 47,375 | | | | 2,770,490 | | |
| Forward Air Corp. | | | 97,500 | | | | 2,831,400 | | |
| | | | 5,601,890 | | |
| Auto components—1.30% | |
| Cooper Tire & Rubber Co. | | | 113,315 | | | | 2,448,737 | | |
| Lear Corp.* | | | 31,650 | | | | 2,474,081 | | |
| | | | 4,922,818 | | |
| Automobiles—0.68% | |
| Thor Industries, Inc. | | | 92,000 | | | | 2,561,280 | | |
| Beverages—0.63% | |
Central European Distribution
Corp. (CEDC)* | | | 91,010 | | | | 2,372,631 | | |
| Capital markets—2.49% | |
| Ameriprise Financial, Inc. | | | 56,000 | | | | 2,373,840 | | |
| Raymond James Financial, Inc. | | | 265,300 | | | | 7,078,204 | | |
| | | | 9,452,044 | | |
| Chemicals—1.31% | |
| Celanese Corp., Series A | | | 10,000 | | | | 280,900 | | |
| CF Industries Holdings, Inc. | | | 14,400 | | | | 1,169,136 | | |
| Eastman Chemical Co. | | | 20,150 | | | | 1,262,196 | | |
| PolyOne Corp.* | | | 119,700 | | | | 1,234,107 | | |
| RPM International, Inc. | | | 54,155 | | | | 1,016,489 | | |
| | | | 4,962,828 | | |
| Commercial banks—12.46% | |
| Associated Banc-Corp | | | 220,000 | | | | 2,989,800 | | |
| Bank of Hawaii Corp. | | | 73,955 | | | | 3,683,699 | | |
| Cathay General Bancorp | | | 345,000 | | | | 4,057,200 | | |
| Comerica, Inc. | | | 67,550 | | | | 2,591,218 | | |
| CVB Financial Corp.1 | | | 292,000 | | | | 2,972,560 | | |
| East West Bancorp, Inc. | | | 214,220 | | | | 3,339,690 | | |
| Fifth Third Bancorp | | | 274,185 | | | | 3,484,891 | | |
| First Horizon National Corp.* | | | 291,084 | | | | 3,338,733 | | |
| FirstMerit Corp. | | | 33,600 | | | | 662,256 | | |
| Fulton Financial Corp. | | | 116,600 | | | | 1,062,226 | | |
| IBERIABANK Corp. | | | 32,100 | | | | 1,667,916 | | |
| KeyCorp | | | 217,900 | | | | 1,843,434 | | |
| Prosperity Bancshares, Inc. | | | 50,900 | | | | 1,724,492 | | |
| Sterling Bancshares, Inc. | | | 358,000 | | | | 1,858,020 | | |
| Synovus Financial Corp. | | | 567,090 | | | | 1,485,776 | | |
| Texas Capital Bancshares, Inc.* | | | 171,750 | | | | 2,866,507 | | |
| United Community Banks, Inc.* | | | 325,258 | | | | 1,008,300 | | |
| Wilmington Trust Corp.1 | | | 285,650 | | | | 2,896,491 | | |
| Wintrust Financial Corp. | | | 32,685 | | | | 1,017,157 | | |
| Zions Bancorporation1 | | | 121,000 | | | | 2,684,990 | | |
| | | | 47,235,356 | | |
| Security description | | Number of
shares | | Value | |
| Common stocks—(continued) | |
| Commercial services & supplies—4.79% | |
| ATC Technology Corp.* | | | 41,200 | | | $ | 987,976 | | |
| Copart, Inc.* | | | 108,000 | | | | 3,935,520 | | |
| KAR Auction Services, Inc.* | | | 120,500 | | | | 1,525,530 | | |
| Republic Services, Inc. | | | 45,260 | | | | 1,441,984 | | |
| Schawk, Inc. | | | 153,920 | | | | 2,282,634 | | |
| United Stationers, Inc.* | | | 80,000 | | | | 4,332,000 | | |
| Waste Connections, Inc.* | | | 95,455 | | | | 3,643,517 | | |
| | | | 18,149,161 | | |
| Communications equipment—1.85% | |
Brocade Communications
Systems, Inc.* | | | 437,500 | | | | 2,165,625 | | |
| JDS Uniphase Corp.* | | | 82,900 | | | | 899,465 | | |
| Plantronics, Inc. | | | 132,000 | | | | 3,956,040 | | |
| | | | 7,021,130 | | |
| Computers & peripherals—1.38% | |
| Avid Technology, Inc.* | | | 204,100 | | | | 2,639,013 | | |
| Electronics for Imaging, Inc.* | | | 244,000 | | | | 2,598,600 | | |
| | | | 5,237,613 | | |
| Construction & engineering—1.25% | |
| Dycom Industries, Inc.* | | | 250,605 | | | | 2,267,975 | | |
| Pike Electric Corp.* | | | 263,500 | | | | 2,474,265 | | |
| | | | 4,742,240 | | |
| Consumer finance—1.39% | |
| Discover Financial Services | | | 200,100 | | | | 3,055,527 | | |
| EZCORP, Inc., Class A* | | | 110,885 | | | | 2,206,611 | | |
| | | | 5,262,138 | | |
| Containers & packaging—1.89% | |
| Ball Corp. | | | 61,235 | | | | 3,566,326 | | |
| Boise, Inc.* | | | 412,900 | | | | 2,473,271 | | |
| Owens-Illinois, Inc.* | | | 40,200 | | | | 1,111,530 | | |
| | | | 7,151,127 | | |
| Diversified consumer services—1.41% | |
| Coinstar, Inc.* | | | 117,135 | | | | 5,329,642 | | |
| Diversified telecommunication services—2.26% | |
General Communication, Inc.,
Class A* | | | 343,310 | | | | 2,911,269 | | |
| Premiere Global Services, Inc.* | | | 203,265 | | | | 1,272,439 | | |
Qwest Communications
International, Inc. | | | 243,200 | | | | 1,376,512 | | |
| tw telecom, Inc.* | | | 158,525 | | | | 2,999,293 | | |
| | | | 8,559,513 | | |
| Electric utilities—1.22% | |
| El Paso Electric Co.* | | | 96,000 | | | | 2,064,000 | | |
| Westar Energy, Inc. | | | 107,000 | | | | 2,555,160 | | |
| | | | 4,619,160 | | |
130
UBS PACE Select Advisors Trust
UBS PACE Small/Medium Co Value Equity Investments
Portfolio of investments—July 31, 2010
| Security description | | Number of
shares | | Value | |
| Common stocks—(continued) | |
| Electrical equipment—0.82% | |
| AMETEK, Inc. | | | 37,500 | | | $ | 1,660,125 | | |
| General Cable Corp.* | | | 54,700 | | | | 1,451,738 | | |
| | | | 3,111,863 | | |
| Electronic equipment, instruments & components—1.73% | |
| Ingram Micro, Inc., Class A* | | | 172,360 | | | | 2,849,111 | | |
| Jabil Circuit, Inc. | | | 207,500 | | | | 3,010,825 | | |
| Molex, Inc. | | | 35,800 | | | | 705,618 | | |
| | | | 6,565,554 | | |
| Energy equipment & services—3.07% | |
Complete Production
Services, Inc.* | | | 92,000 | | | | 1,771,000 | | |
| Oceaneering International, Inc.* | | | 37,500 | | | | 1,855,500 | | |
| Oil States International, Inc.* | | | 41,200 | | | | 1,892,728 | | |
| TETRA Technologies, Inc.* | | | 179,500 | | | | 1,870,390 | | |
| Tidewater, Inc. | | | 103,850 | | | | 4,255,773 | | |
| | | | 11,645,391 | | |
| Food & staples retailing—0.23% | |
| United Natural Foods, Inc.* | | | 25,400 | | | | 856,742 | | |
| Food products—3.23% | |
Brooklyn Cheesecake &
Desserts Co., Inc.2,* | | | 34,680 | | | | 347 | | |
| Del Monte Foods Co. | | | 59,400 | | | | 824,472 | | |
| Flowers Foods, Inc. | | | 93,000 | | | | 2,253,390 | | |
| Fresh Del Monte Produce, Inc.* | | | 187,920 | | | | 3,916,253 | | |
| J&J Snack Foods Corp. | | | 38,000 | | | | 1,584,980 | | |
| Ralcorp Holdings, Inc.* | | | 48,600 | | | | 2,838,240 | | |
| Tyson Foods, Inc. Class A | | | 46,200 | | | | 808,962 | | |
| | | | 12,226,644 | | |
| Gas utilities—0.47% | |
| Questar Corp. | | | 108,350 | | | | 1,782,358 | | |
| Health care equipment & supplies—0.99% | |
| ICU Medical, Inc.* | | | 35,500 | | | | 1,320,955 | | |
| STERIS Corp. | | | 76,000 | | | | 2,416,040 | | |
| | | | 3,736,995 | | |
| Health care providers & services—3.50% | |
| Amedisys, Inc.1,* | | | 68,500 | | | | 1,799,495 | | |
| AmerisourceBergen Corp. | | | 71,650 | | | | 2,147,350 | | |
| AMN Healthcare Services, Inc.* | | | 339,600 | | | | 2,044,392 | | |
| Chemed Corp. | | | 34,800 | | | | 1,841,616 | | |
Health Management
Associates, Inc., Class A* | | | 423,700 | | | | 3,033,692 | | |
| Health Net, Inc.* | | | 101,925 | | | | 2,400,334 | | |
| | | | 13,266,879 | | |
| Hotels, restaurants & leisure—2.58% | |
| Burger King Holdings, Inc. | | | 171,000 | | | | 2,954,880 | | |
| Papa John's International, Inc.* | | | 94,350 | | | | 2,389,885 | | |
| Sonic Corp.* | | | 193,750 | | | | 1,705,000 | | |
| Wyndham Worldwide Corp. | | | 107,000 | | | | 2,731,710 | | |
| | | | 9,781,475 | | |
| Security description | | Number of
shares | | Value | |
| Common stocks—(continued) | |
| Household durables—2.67% | |
American Greetings Corp.,
Class A | | | 187,950 | | | $ | 3,851,095 | | |
| Ethan Allen Interiors, Inc.1 | | | 107,000 | | | | 1,641,380 | | |
| MDC Holdings, Inc. | | | 76,000 | | | | 2,213,120 | | |
| Newell Rubbermaid, Inc. | | | 38,900 | | | | 602,950 | | |
| Stanley Black & Decker, Inc. | | | 21,950 | | | | 1,273,539 | | |
| Whirlpool Corp. | | | 6,500 | | | | 541,450 | | |
| | | | 10,123,534 | | |
| Industrial conglomerates—0.25% | |
| Carlisle Cos., Inc. | | | 28,200 | | | | 949,776 | | |
| Insurance—3.81% | |
| Brown & Brown, Inc. | | | 147,855 | | | | 2,960,057 | | |
| Everest Re Group, Ltd. | | | 5,850 | | | | 454,077 | | |
| HCC Insurance Holdings, Inc. | | | 98,425 | | | | 2,570,861 | | |
| Horace Mann Educators Corp. | | | 172,000 | | | | 2,893,040 | | |
| Selective Insurance Group, Inc. | | | 177,000 | | | | 2,754,120 | | |
| XL Group PLC | | | 158,300 | | | | 2,806,659 | | |
| | | | 14,438,814 | | |
| Internet & catalog retail—0.37% | |
| HSN, Inc.* | | | 48,300 | | | | 1,420,020 | | |
| Internet software & services—0.65% | |
| DealerTrack Holdings, Inc.* | | | 157,500 | | | | 2,458,575 | | |
| IT services—1.30% | |
| Amdocs Ltd.* | | | 79,700 | | | | 2,178,201 | | |
| TeleTech Holdings, Inc.* | | | 19,960 | | | | 277,444 | | |
| VeriFone Holdings, Inc.* | | | 113,000 | | | | 2,472,440 | | |
| | | | 4,928,085 | | |
| Leisure equipment & products—0.67% | |
| RC2 Corp.* | | | 153,000 | | | | 2,532,150 | | |
| Life sciences tools & services—2.22% | |
Bio-Rad Laboratories, Inc.,
Class A* | | | 29,500 | | | | 2,619,600 | | |
Charles River Laboratories
International, Inc.* | | | 73,000 | | | | 2,268,840 | | |
| Covance, Inc.* | | | 91,000 | | | | 3,527,160 | | |
| | | | 8,415,600 | | |
| Machinery—4.51% | |
| Briggs & Stratton Corp. | | | 130,125 | | | | 2,468,471 | | |
| Bucyrus International, Inc. | | | 27,800 | | | | 1,729,716 | | |
| CIRCOR International, Inc. | | | 5,425 | | | | 169,694 | | |
| Crane Co. | | | 24,400 | | | | 867,176 | | |
| Harsco Corp. | | | 71,155 | | | | 1,647,950 | | |
| Kennametal, Inc. | | | 135,300 | | | | 3,705,867 | | |
| Pentair, Inc. | | | 83,200 | | | | 2,845,440 | | |
| Snap-on, Inc. | | | 26,310 | | | | 1,175,268 | | |
| Wabtec Corp. | | | 55,500 | | | | 2,475,855 | | |
| | | | 17,085,437 | | |
131
UBS PACE Select Advisors Trust
UBS PACE Small/Medium Co Value Equity Investments
Portfolio of investments—July 31, 2010
| Security description | | Number of
shares | | Value | |
| Common stocks—(continued) | |
| Media—1.63% | |
| Gannett Co., Inc. | | | 32,175 | | | $ | 424,067 | | |
| John Wiley & Sons, Inc., Class A | | | 85,685 | | | | 3,374,275 | | |
| Scholastic Corp. | | | 93,985 | | | | 2,380,640 | | |
| | | | 6,178,982 | | |
| Metals & mining—0.44% | |
| Cliffs Natural Resources, Inc. | | | 11,575 | | | | 654,798 | | |
| Reliance Steel & Aluminum Co. | | | 26,250 | | | | 1,031,100 | | |
| | | | 1,685,898 | | |
| Multi-utilities—1.59% | |
| CMS Energy Corp. | | | 183,300 | | | | 2,918,136 | | |
| NiSource, Inc. | | | 71,300 | | | | 1,176,450 | | |
| NSTAR | | | 27,000 | | | | 1,003,320 | | |
| TECO Energy, Inc. | | | 56,200 | | | | 918,308 | | |
| | | | 6,016,214 | | |
| Oil, gas & consumable fuels—2.86% | |
| Alpha Natural Resources, Inc.* | | | 52,925 | | | | 2,028,615 | | |
| Comstock Resources, Inc.* | | | 151,755 | | | | 3,840,919 | | |
| Newfield Exploration Co.* | | | 39,300 | | | | 2,100,978 | | |
| Rex Energy Corp.* | | | 122,900 | | | | 1,302,740 | | |
| Whiting Petroleum Corp.* | | | 17,900 | | | | 1,575,379 | | |
| | | | 10,848,631 | | |
| Paper & forest products—0.69% | |
| Glatfelter | | | 171,500 | | | | 1,960,245 | | |
| Neenah Paper, Inc. | | | 37,400 | | | | 670,956 | | |
| | | | 2,631,201 | | |
| Personal products—0.56% | |
Nu Skin Enterprises, Inc.,
Class A | | | 75,150 | | | | 2,140,272 | | |
| Professional services—2.55% | |
| FTI Consulting, Inc.* | | | 92,000 | | | | 3,252,200 | | |
Heidrick & Struggles
International, Inc. | | | 57,500 | | | | 1,155,750 | | |
| Resources Connection, Inc.* | | | 187,500 | | | | 2,435,625 | | |
| School Specialty, Inc.* | | | 115,000 | | | | 2,204,550 | | |
| SFN Group, Inc.* | | | 80,700 | | | | 604,443 | | |
| | | | 9,652,568 | | |
| Real estate investment trusts (REITs)—3.09% | |
| BioMed Realty Trust, Inc. | | | 96,800 | | | | 1,746,272 | | |
| CBL & Associates Properties, Inc. | | | 189,900 | | | | 2,671,893 | | |
| DiamondRock Hospitality Co.* | | | 144,200 | | | | 1,338,176 | | |
| DuPont Fabros Technology, Inc. | | | 94,775 | | | | 2,392,121 | | |
| Home Properties, Inc. | | | 60,600 | | | | 3,010,002 | | |
| Mack-Cali Realty Corp. | | | 17,050 | | | | 549,351 | | |
| | | | 11,707,815 | | |
| Real estate management & development—0.56% | |
CB Richard Ellis Group, Inc.,
Class A* | | | 124,500 | | | | 2,116,500 | | |
| Security description | | Number of
shares | | Value | |
| Common stocks—(concluded) | |
| Road & rail—1.54% | |
| Con-way, Inc. | | | 108,295 | | | $ | 3,648,459 | | |
| Landstar System, Inc. | | | 54,500 | | | | 2,209,430 | | |
| | | | 5,857,889 | | |
| Semiconductors & semiconductor equipment—4.74% | |
| Advanced Energy Industries, Inc.* | | | 75,125 | | | | 1,322,951 | | |
| ATMI, Inc.* | | | 119,000 | | | | 1,765,960 | | |
| Entegris, Inc.* | | | 694,000 | | | | 3,199,340 | | |
| Micron Technology, Inc.* | | | 197,300 | | | | 1,436,344 | | |
| NVIDIA Corp.* | | | 154,535 | | | | 1,420,177 | | |
| ON Semiconductor Corp.* | | | 323,075 | | | | 2,180,756 | | |
| Teradyne, Inc.* | | | 204,400 | | | | 2,199,344 | | |
Varian Semiconductor Equipment
Associates, Inc.* | | | 103,500 | | | | 2,924,910 | | |
| Veeco Instruments, Inc.1,* | | | 35,200 | | | | 1,524,160 | | |
| | | | 17,973,942 | | |
| Software—0.75% | |
| Informatica Corp.* | | | 54,000 | | | | 1,627,020 | | |
| NetScout Systems, Inc.* | | | 76,090 | | | | 1,206,026 | | |
| | | | 2,833,046 | | |
| Specialty retail—3.05% | |
| Borders Group, Inc.1,* | | | 532,460 | | | | 708,172 | | |
| Group 1 Automotive, Inc.1,* | | | 100,000 | | | | 2,772,000 | | |
| Gymboree Corp.* | | | 62,500 | | | | 2,706,250 | | |
| OfficeMax, Inc.* | | | 139,500 | | | | 1,993,455 | | |
| PetSmart, Inc. | | | 73,100 | | | | 2,269,755 | | |
| Williams-Sonoma, Inc. | | | 41,800 | | | | 1,116,478 | | |
| | | | 11,566,110 | | |
| Textiles, apparel & luxury goods—1.32% | |
| Phillips-Van Heusen Corp. | | | 54,725 | | | | 2,839,680 | | |
| Volcom, Inc.* | | | 132,000 | | | | 2,147,640 | | |
| | | | 4,987,320 | | |
| Thrifts & mortgage finance—1.48% | |
| First Niagara Financial Group, Inc. | | | 239,800 | | | | 3,215,718 | | |
New York Community
Bancorp, Inc. | | | 137,785 | | | | 2,378,169 | | |
| | | | 5,593,887 | | |
| Trading companies & distributors—0.02% | |
| Huttig Building Products, Inc.1,2,* | | | 65,450 | | | | 66,105 | | |
| Wireless telecommunication services—0.20% | |
| NTELOS Holdings Corp. | | | 41,625 | | | | 778,804 | | |
Total common stocks
(cost—$348,699,956) | | | | | | | 372,001,215 | | |
132
UBS PACE Select Advisors Trust
UBS PACE Small/Medium Co Value Equity Investments
Portfolio of investments—July 31, 2010
| Security description | | Face
amount | | Value | |
| Repurchase agreement—2.59% | |
Repurchase agreement dated
07/30/10 with State Street
Bank & Trust Co., 0.010%
due 08/02/10 collateralized
by $9,705,592 US Treasury
Notes, 2.125% to 3.125%
due 04/30/15 to 04/30/17;
(value—$10,015,472);
proceeds: $9,819,008
(cost—$9,819,000) | | $ | 9,819,000 | | | $ | 9,819,000 | | |
| Security description | | Number of
shares | | Value | |
| Investment of cash collateral from securities loaned—2.96% | |
| Money market fund—2.96% | |
UBS Private Money Market
Fund LLC3
(cost—$11,194,599) | | | 11,194,599 | | | $ | 11,194,599 | | |
Total investments
(cost—$369,713,555)—
103.71% | | | | | 393,014,814 | | |
Liabilities in excess of other
assets—(3.71)% | | | | | (14,048,768 | ) | |
| Net assets—100.00% | | $ | 378,966,046 | | |
Aggregate cost for federal income tax purposes was $371,927,989; and net unrealized appreciation consisted of:
| Gross unrealized appreciation | | $ | 44,977,875 | | |
| Gross unrealized depreciation | | | (23,891,050 | ) | |
| Net unrealized appreciation | | $ | 21,086,825 | | |
* Non-income producing security.
1 Security, or portion thereof, was on loan at July 31, 2010.
2 Illiquid securities representing 0.02% of net assets as of July 31, 2010.
3 The table below details the Portfolio's transaction activity in an affiliated issuer during the year ended July 31, 2010.
| Security description | | Value at
07/31/09 | | Purchases
during the
year ended
07/31/10 | | Sales
during the
year ended
07/31/10 | | Value at
07/31/10 | | Net income
earned from
affiliate for the
year ended
07/31/10 | |
| UBS Private Money Market Fund LLC | | $ | 86,696,079 | | | $ | 271,092,395 | | | $ | 346,593,875 | | | $ | 11,194,599 | | | $ | 236,878 | | |
The following is a summary of the fair valuations according to the inputs used as of July 31, 2010 in valuing the Portfolio's investments:
| | | Unadjusted
quoted prices in
active markets for
identical investments
(Level 1) | | Other significant
observable inputs
(Level 2) | | Unobservable
inputs
(Level 3) | | Total | |
| Common stocks | | $ | 371,934,763 | | | $ | 66,452 | | | $ | — | | | $ | 372,001,215 | | |
| Repurchase agreement | | | — | | | | 9,819,000 | | | | — | | | | 9,819,000 | | |
Investment of cash collateral
from securities loaned | | | — | | | | 11,194,599 | | | | — | | | | 11,194,599 | | |
| Total | | $ | 371,934,763 | | | $ | 21,080,051 | | | $ | — | | | $ | 393,014,814 | | |
At July 31, 2010, there were no transfers between Level 1 and Level 2.
133
UBS PACE Select Advisors Trust
UBS PACE Small/Medium Co Value Equity Investments
Portfolio of investments—July 31, 2010
The following is a rollforward of the Portfolio's investment that was valued using unobservable inputs (Level 3) during the year ended July 31, 2010:
| | | Preferred
stock | |
| Beginning balance | | $ | 1,710,535 | | |
| Net purchases/(sales) | | | (2,931,883 | ) | |
| Accrued discounts/(premiums) | | | — | | |
| Total realized gain/(loss) | | | 743,883 | | |
| Net change in unrealized appreciation/depreciation | | | 477,465 | | |
| Net transfers in/(out) of Level 3 | | | — | | |
| Ending balance | | $ | — | | |
Issuer breakdown by country or territory of origin (unaudited)
| | | Percentage of
total investments | |
| United States | | | 97.6 | % | |
| Cayman Islands | | | 1.0 | | |
| Ireland | | | 0.7 | | |
| Guernsey | | | 0.6 | | |
| Bermuda | | | 0.1 | | |
| Total | | | 100.0 | % | |
See accompanying notes to financial statements.
134
UBS PACE Select Advisors Trust
UBS PACE Small/Medium Co Growth Equity Investments
Performance
For the 12 months ended July 31, 2010, the Portfolio's Class P shares returned 15.78%, before the deduction of the maximum UBS PACE Select program fee. (The Class P shares returned 13.48%, after the deduction of the maximum UBS PACE Select program fee, for the same 12-month period.) In comparison, the Russell 2500 Growth Index (the "benchmark") returned 20.21%, and the Lipper Small-Cap Growth Funds category posted a median return of 17.25%. (Returns for all share classes over various time periods are shown in the "Performance at a glance" table on page 139. Please note that the returns shown do not reflect the deduction of taxes that a shareholder would pay on Portfolio distributions or the redemption of Portfolio shares.) For a detailed commentary on the market environment in general during the reporting period, please refer to page 2.
Sub-Advisors' comments
Copper Rock
Our portion of the Portfolio lagged the benchmark during the reporting period. We faced some negative headwinds as lower-quality, micro cap stocks continued to perform well throughout most of 2009. In addition, volatility crept back into the markets in 2010 due to concerns about a possible global double-dip recession. However, these headwinds were partially offset in our portion of the Portfolio by strong stock selection within the consumer staples and energy sectors, as well as several individual contributors to performance in the consumer discretionary, industrials, health care and information technology sectors.
Within the information technology sector, the Portfolio's holdings in STEC, Emulex and TIVO detracted from performance in the review period. STEC, which manufactures flash memory storage solutions, was a leader in this fast-growing category, but it was down over the reporting period. Our thesis for the stock was based on the company holding a sole sourced position at customers like EMC for the next 12 to18 months. (Sole sourced positions refer to specific products or services available from only one source or company.) However, formidable competition emerged much earlier than expected, causing our original investment thesis and timing estimates to change. As a result, we eliminated STEC from our portion of the Portfolio.
Emulex underperformed on news of a proposed acquisition of ServerEngines Corp., a privately held semiconductor company. We believe Emulex's underperformance will be short-term, as we believe that its revenues and operating margins will increase in the latter half of 2010 and early 2011.
TIVO detracted from results when, in March 2010, the US Court of Appeals upheld a lower court ruling that Dish's DVR technology violated TIVO's patents in a long-running patent infringement case. Surprisingly, the
UBS PACE Select Advisors Trust – UBS PACE Small/Medium Co Growth
Equity Investments
Investment Sub-Advisors:
Copper Rock Capital Partners, LLC ("Copper Rock"), Riverbridge Partners, LLC ("Riverbridge"), and Palisade Capital Management, L.L.C. ("Palisade")
Portfolio Managers:
Copper Rock: Tucker Walsh;
Riverbridge: Mark Thompson;
Palisade: Sammy Oh
Objective:
Capital appreciation
Investment process:
Copper Rock employs a fundamental, bottom-up investment approach that focuses on identifying emerging companies that exhibit the potential for strong and sustainable revenue growth over each of the following two years. Copper Rock utilizes a "pure" growth investment style that emphasizes growth and momentum characteristics. Copper Rock attempts to manage risk by diversifying and understanding its holdings and employing a stringent sell discipline.
(continued on next page)
135
UBS PACE Select Advisors Trust
UBS PACE Small/Medium Co Growth Equity Investments
Sub-Advisor's comments – continued
court agreed to grant DISH a review of the decision, which generally happens in less than 10% of similar cases. Due to the nature of court reviews, though, we had only a moderate position in the stock to limit our Portfolio's downside risk. While we still believe TIVO will ultimately prevail, we eliminated the position during the period.
Leading contributors in our portion of the Portfolio included Bucyrus within industrials, and Green Mountain Coffee Roasters within the consumer staples sectors. Higher commodity prices drove better-than-expected orders at Bucyrus, while significant cost controls and aftermarket sales drove better-than-expected margins. Bucyrus entered into an agreement to purchase Terex's mining business, which we viewed as a positive when combined with its existing infrastructure and customer relationships. We believe that Green Mountain Coffee Roasters has a superior product and good margin expansion. The company beat analysts' expectations in the fourth quarter of 2009 on strong holiday sales and further market penetration, and its expansion has continued to do so through the second quarter of 2010, due to its acquisition of Deidrich Coffee.
Riverbridge Partners
Our portion of the Portfolio outperformed the benchmark during the reporting period. Stock selection within the health care sector helped performance during the review period. We focused on companies that we believe deliver a product or service that compels the ultimate payer—whether a central system or the actual receiver of health care—to consume their products or services. One of our top performers was Cepheid, a company that facilitates the rapid detection of a biological condition, that allows for an expedited diagnosis and for more targeted medical treatments.
Stock selection within the financials sector also contributed to our relative performance. Generally speaking, we believe most financial institutions need to deploy leverage for growth to maximize their opportunities and, as a group, they often generate relatively low returns on invested capital. However, we focus on identifying niche players within the financials sector that, in our view, provide a differentiated service. Unlike traditional financial institutions, these types of companies have greater barriers to entry, but higher returns on invested capital, while utilizing much less debt. Portfolio Recovery Associates, a company that purchases and manages portfolios of defaulted and bankrupt consumer receivables and provides a broad range of accounts receivable services to lenders, service providers and governments, is an example of one such company. This position generated positive results for our portion of the Portfolio du ring the review period.
A detractor from performance during the period was stock selection in the industrials sector. For example, Resources Connection, a temporary staffing company, faced some challenges in an environment of continued high unemployment in both the public and the private sector.
Investment process (concluded)
Riverbridge believes that earnings power determines the value of a franchise. Riverbridge focuses on companies that are viewed as building their earnings power and building the intrinsic value of the company over long periods of time. Riverbridge looks to invest in high-quality growth companies that demonstrate the ability to sustain strong secular earnings growth, regardless of overall economic conditions.
Palisade seeks fundamentally strong and dynamic small- and mid-cap companies that are trading at a discount to their growth rates. Palisade's goal is to ascertain a dynamic of change before it manifests in consensus estimates. Palisade believes that it can be successful because it views the small- and mid-cap market to be inherently less efficient than the large-cap market.
136
UBS PACE Select Advisors Trust
UBS PACE Small/Medium Co Growth Equity Investments
Sub-Advisor's comments – concluded
We continue to focus on identifying and investing in high-quality, long-term growth companies based on our time-tested investment process, and we will not deviate from this philosophy to achieve short-term gains. Since our holdings have the ability to internally finance their growth, we believe they will less likely be impacted by tight credit markets. Additionally, we will continue to favor those companies that are not heavily leveraged and that possess differentiated products and services—characteristics that we believe provide them with the agility to respond to the opportunities in an uncertain economy.
Palisade
Our portion of the Portfolio lagged the benchmark during the reporting period, primarily due to our holdings in the energy, financials and information technology sectors. In energy, GMX Resources and Comstock Resources performed particularly poorly as production and natural gas pricing have been worse than expected. In information technology, Brocade Communication Systems and SunPower Corp. underperformed after reporting disappointing results. We eliminated SunPower Corp. from our portion of the Portfolio given the company's deteriorating fundamentals.
On the positive side, stock selection in the industrials, heath care and consumer discretionary sectors contributed to relative performance. Within industrials, Kansas City Southern, Dollar Thrifty Automotive Group and Atlas Air Worldwide Holdings helped Portfolio performance. In particular, Dollar Thrifty Automotive Group is currently a takeover target in a bidding war between Hertz Global Holdings and Avis Budget Group. We believe that acquisitions of small- to medium-sized companies will continue to be an important theme, as larger companies look to acquire growth. Another example is enterprise software and services company Sybase, which was acquired by SAP. We eliminated our position in Sybase after this acquisition. Top performers in the consumer discretionary sector were hospitality company Wyndham Worldwide Corp. and Internet travel discount provider priceline.com Inc. We sold our position in priceline.com Inc. during the reporting period to capture profits. In addition, the company's market capitalization had grown larger than our small/mid capitalization range.
We raised our weighting in the health care sector during the course of 2009, as we believed that health care reform would not be as draconian as originally feared. Many of our stocks within the sector have performed well, including Human Genome Sciences, Health Net and ResMed.
We remain disciplined in our approach to identify growth companies that are trading at a discount to their long-term potential, and we believe that our approach will be rewarded in the long run.
Special considerations
The Portfolio may be appropriate for long-term investors seeking capital appreciation who are able to withstand short-term fluctuations in the equity markets in return for potentially higher returns over the long term. The value of the Portfolio changes every day and can be affected by changes in interest rates, general market conditions and other political, social and economic developments, as well as specific matters relating to the companies in whose securities the Portfolio invests. It is important to note that an investment in the Portfolio is only one component of a balanced investment plan. In addition, small- and mid-cap companies are typically subject to a greater degree of change in earnings and business prospects than are larger, more established companies. Therefore, they are considered to have a higher level of volatility and risk. Also, to the extent the Portfolio invests a large portion of its assets in a particul ar sector, the Portfolio may experience greater volatility and risk of loss due to unfavorable developments in that sector.
137
UBS PACE Select Advisors Trust
UBS PACE Small/Medium Co Growth Equity Investments
Illustration of an assumed investment of $10,000 in Class P shares of the Portfolio (unaudited)
The following graph depicts the performance of UBS PACE Small/Medium Co Growth Equity Investments Class P shares versus the Russell 2500 Growth Index over the 10 years ended July 31, 2010. The performance of the other classes will vary based upon the different class specific expenses and sales charges. The performance provided does not reflect the deduction of taxes that a shareholder would pay on Portfolio distributions or the redemption of Portfolio shares. Past performance is no guarantee of future results. Share price and returns will vary with market conditions; investors may realize a gain or loss upon redemption. It is important to note that UBS PACE Small/Medium Co Growth Equity Investments is a professionally managed portfolio while the Index is not available for investment and is unmanaged. The comparison is shown for illustration purposes only.
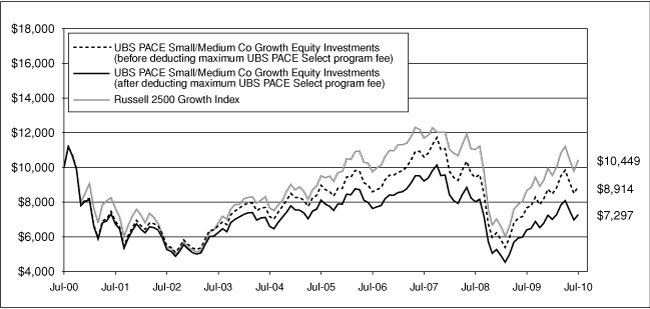
138
UBS PACE Select Advisors Trust
UBS PACE Small/Medium Co Growth Equity Investments
Performance at a glance (unaudited)
| Average annual total returns for periods ended 07/31/10 | | 1 year | | 5 years | | 10 years | | Since
inception1 | |
| Before deducting | | Class A2 | | | 15.52 | % | | | (0.37 | )% | | N/A | | | 0.04 | % | |
| maximum sales charge | | Class B3 | | | 14.86 | % | | | (1.15 | )% | | N/A | | | (0.48 | )%7 | |
| or UBS PACE Select | | Class C4 | | | 14.65 | % | | | (1.12 | )% | | N/A | | | (0.71 | )% | |
| program fee | | Class Y5 | | | 15.71 | % | | | (0.02 | )% | | N/A | | | 1.87 | % | |
| | | Class P6 | | | 15.78 | % | | | (0.16 | )% | | | (1.14 | )% | | | 6.78 | % | |
| After deducting | | Class A2 | | | 9.16 | % | | | (1.49 | )% | | N/A | | | (0.54 | )% | |
| maximum sales charge | | Class B3 | | | 9.86 | % | | | (1.42 | )% | | N/A | | | (0.48 | )%7 | |
| or UBS PACE Select | | Class C4 | | | 13.65 | % | | | (1.12 | )% | | N/A | | | (0.71 | )% | |
| program fee | | Class P6 | | | 13.48 | % | | | (2.14 | )% | | | (3.10 | )% | | | 4.67 | % | |
| Russell 2500 Growth Index8 | | | 20.21 | % | | | 1.84 | % | | | 0.44 | % | | | 5.62 | % | |
| Lipper Small-Cap Growth Funds median9 | | | 17.25 | % | | | 0.29 | % | | | 0.52 | % | | | 6.03 | % | |
| Lipper Mid-Cap Growth Funds median9 | | | 19.42 | % | | | 1.20 | % | | | 0.28 | % | | | 6.54 | % | |
Average annual total returns for periods ended June 30, 2010, after deduction of the maximum sales charge or UBS PACE Select program fee, were as follows: Class A—1-year period, 11.81%; 5-year period, (1.06)%; since inception, (1.01)%; Class B—1-year period, 12.46%; 5-year period, (1.04)%; since inception, (0.95)%; Class C—1-year period, 16.45%; 5-year period, (0.71)%; since inception, (1.18)%; Class Y—1-year period, 18.38%; 5-year period, 0.39%; since inception, 1.39%; Class P—1-year period, 16.33%; 5-year period, (1.71)%; 10-year period, (3.64)%; since inception, 4.39%.
The annualized gross and net expense ratios, respectively, for each class of shares as in the November 28, 2009 prospectuses, were as follows: Class A—1.40% and 1.38%; Class B—2.61% and 2.13%; Class C—2.19% and 2.13%; Class Y—0.96% and 0.96%; and Class P—1.31% and 1.13%. Net expenses reflect fee waivers and/or expense reimbursements, if any, pursuant to an agreement that is in effect to cap the expenses. The Portfolio and UBS Global AM have entered into a written fee waiver/expense reimbursement agreement pursuant to which UBS Global AM is contractually obligated to waive its management fees and/or reimburse expenses so that the Portfolio's ordinary total operating expenses through November 30, 2010 (excluding dividend expense, borrowing costs and interest expense, if any) would not exceed Class A—1.38%; Class B—2.13%; Class C—2.13%; Class Y—1.13%; and Class P—1.13%. The Portfoli o has agreed to repay UBS Global AM for any waived fees/reimbursed expenses to the extent that it can do so over the following three fiscal years without causing the Portfolio's expenses in any of those three years to exceed the expense caps described above.
1 Since inception returns are calculated as of commencement of issuance on August 24, 1995 for Class P shares, November 27, 2000 for Class A, B, and C shares and February 12, 2001 for Class Y shares. Since inception returns for the Index and Lipper median are shown as of August 31, 1995, which is the month-end after the inception date of the oldest share class (Class P).
2 Maximum sales charge for Class A shares is 5.5%. Class A shares bear ongoing 12b-1 service fees.
3 Maximum contingent deferred sales charge for Class B shares is 5% imposed on redemptions and is reduced to 0% after a maximum of six years. Class B shares bear ongoing 12b-1 service and distribution fees.
4 Maximum contingent deferred sales charge for Class C shares is 1% imposed on redemptions and is reduced to 0% after one year. Class C shares bear ongoing 12b-1 service and distribution fees. Prior to September 30, 2003, Class C shares were subject to a maximum front-end sales charge of 1.00%; this front-end sales charge is not reflected in the average annual total return presented for the Class C shares shown above.
5 The Portfolio offers Class Y shares to a limited group of eligible investors, including certain qualifying retirement plans. Class Y shares do not bear initial or contingent deferred sales charges or ongoing 12b-1 service and distribution fees.
6 Class P shares do not bear initial or contingent deferred sales charges or ongoing 12b-1 service and distribution fees, but are subject to a maximum annual UBS PACE Select program fee of 2% of the value of Class P shares. Prior to June 14, 2010, the maximum annual UBS PACE Select program fee was 1.5% of the value of Class P shares.
7 Assumes the conversion of Class B to Class A shares at the end of the sixth year.
8 The Russell 2500 Growth Index is designed to measure the performance of the small to mid-cap growth segment of the US equity universe. It includes those Russell 2500 companies with higher price-to-book ratios and higher forecasted growth values. The Russell 2500 Growth Index is constructed to provide a comprehensive and unbiased barometer of the small to mid-cap growth market. The Index is completely reconstituted annually to ensure larger stocks do not distort the performance and characteristics of the true small to mid-cap opportunity set and that the represented companies continue to reflect growth characteristics. Investors should note that indices do not reflect the deduction of fees and expenses.
9 On June 15, 2010, Lipper changed the peer group classification for UBS Small/Medium Co Growth Equity Investments from the Lipper Mid-Cap Growth Funds category to the Lipper Small-Cap Growth Funds category.
If an investor sells or exchanges shares less than 90 days after purchase, a redemption fee of 1.00% of the amount sold or exchanged will be deducted at the time of the transaction, except as noted otherwise in the prospectuses.
Past performance does not predict future performance, and the performance information provided does not reflect the deduction of taxes that a shareholder would pay on Portfolio distributions or the redemption of Portfolio shares. The return and principal value of an investment will fluctuate, so that an investor's shares, when redeemed, may be worth more or less than their original cost. Performance results assume reinvestment of all dividends and capital gain distributions at net asset value on the ex-dividend dates. Current performance may be higher or lower than the performance data quoted. For month-end performance figures, please visit http://www.ubs.com.
Lipper peer group data calculated by Lipper Inc.; used with permission. The Lipper median is the return of the fund that places in the middle of a Lipper peer group.
139
UBS PACE Select Advisors Trust
UBS PACE Small/Medium Co Growth Equity Investments
Portfolio statistics (unaudited)
| Characteristics | | 07/31/10 | |
| Net assets (mm) | | $ | 374.3 | | |
| Number of holdings | | | 214 | | |
| Portfolio composition1 | | 07/31/10 | |
| Common stocks | | | 95.3 | % | |
| ADRs | | | 0.6 | | |
| Investment companies | | | 1.2 | | |
| Cash equivalents and other assets less liabilities | | | 2.9 | | |
| Total | | | 100.0 | % | |
| Top five sectors1 | | 07/31/10 | |
| Information technology | | | 27.7 | % | |
| Health care | | | 18.4 | | |
| Consumer discretionary | | | 16.8 | | |
| Industrials | | | 15.6 | | |
| Financials | | | 6.1 | | |
| Total | | | 84.6 | % | |
| Top ten equity holdings1 | | 07/31/10 | |
| Affiliated Managers Group, Inc. | | | 1.5 | % | |
| Portfolio Recovery Associates, Inc. | | | 1.5 | | |
| Roper Industries, Inc. | | | 1.5 | | |
| Ultimate Software Group, Inc. | | | 1.4 | | |
| Rovi Corp. | | | 1.3 | | |
| Thoratec Corp. | | | 1.1 | | |
| Netlogic Microsystems, Inc. | | | 1.1 | | |
| Green Mountain Coffee Roasters, Inc. | | | 1.0 | | |
| Aegean Marine Petroleum Network, Inc. | | | 1.0 | | |
| Coinstar, Inc. | | | 1.0 | | |
| Total | | | 12.4 | % | |
1 Weightings represent percentages of the Portfolio's net assets as of July 31, 2010. The Portfolio is actively managed and its composition will vary over time.
ADR American Depositary Receipt
140
UBS PACE Select Advisors Trust
UBS PACE Small/Medium Co Growth Equity Investments
Portfolio of investments—July 31, 2010
| Security description | | Number of
shares | | Value | |
| Common stocks—95.90% | |
| Aerospace & defense—1.52% | |
| Orbital Sciences Corp.* | | | 160,440 | | | $ | 2,348,842 | | |
| TransDigm Group, Inc. | | | 61,911 | | | | 3,353,719 | | |
| | | | 5,702,561 | | |
| Air freight & logistics—1.32% | |
Atlas Air Worldwide
Holdings, Inc.* | | | 30,788 | | | | 1,800,482 | | |
| Dynamex, Inc.* | | | 34,500 | | | | 464,370 | | |
| Forward Air Corp. | | | 36,200 | | | | 1,051,248 | | |
| Hub Group, Inc., Class A* | | | 50,168 | | | | 1,612,901 | | |
| | | | 4,929,001 | | |
| Auto components—0.75% | |
| Gentex Corp. | | | 132,500 | | | | 2,553,275 | | |
| Tenneco, Inc.* | | | 9,366 | | | | 258,502 | | |
| | | | 2,811,777 | | |
| Biotechnology—2.95% | |
| Alexion Pharmaceuticals, Inc.* | | | 31,700 | | | | 1,723,212 | | |
| Cepheid, Inc.* | | | 186,300 | | | | 3,083,265 | | |
| Dendreon Corp.* | | | 32,270 | | | | 1,062,006 | | |
| Human Genome Sciences, Inc.* | | | 55,000 | | | | 1,426,700 | | |
| Onyx Pharmaceuticals, Inc.* | | | 78,921 | | | | 2,051,946 | | |
| Seattle Genetics, Inc.* | | | 59,307 | | | | 722,359 | | |
| United Therapeutics Corp.* | | | 20,200 | | | | 987,578 | | |
| | | | 11,057,066 | | |
| Capital markets—2.29% | |
Affiliated Managers
Group, Inc.* | | | 80,265 | | | | 5,685,170 | | |
| Greenhill & Co., Inc.1 | | | 24,068 | | | | 1,637,827 | | |
| Lazard Ltd., Class A | | | 41,785 | | | | 1,239,761 | | |
| | | | 8,562,758 | | |
| Chemicals—2.04% | |
| FMC Corp. | | | 19,500 | | | | 1,218,555 | | |
| Intrepid Potash, Inc.1,* | | | 97,640 | | | | 2,362,888 | | |
| Landec Corp.* | | | 100,700 | | | | 649,515 | | |
| Solutia, Inc.* | | | 190,387 | | | | 2,686,361 | | |
| Zoltek Companies, Inc.* | | | 69,600 | | | | 727,320 | | |
| | | | 7,644,639 | | |
| Commercial banks—0.64% | |
| Hancock Holding Co. | | | 44,800 | | | | 1,366,848 | | |
| Signature Bank* | | | 26,945 | | | | 1,035,766 | | |
| | | | 2,402,614 | | |
| Commercial services & supplies—3.34% | |
| Cenveo, Inc.* | | | 237,650 | | | | 1,463,924 | | |
| Clean Harbors, Inc.* | | | 25,600 | | | | 1,616,896 | | |
| EnerNOC, Inc.1,* | | | 36,914 | | | | 1,230,713 | | |
| Higher One Holdings, Inc.* | | | 59,371 | | | | 830,007 | | |
| Innerworkings, Inc.1,* | | | 143,700 | | | | 994,404 | | |
| Mobile Mini, Inc.* | | | 44,900 | | | | 769,586 | | |
| Security description | | Number of
shares | | Value | |
| Common stocks—(continued) | |
| Commercial services & supplies—(concluded) | |
Ritchie Brothers
Auctioneers, Inc.1 | | | 67,800 | | | $ | 1,261,758 | | |
| Rollins, Inc. | | | 124,000 | | | | 2,708,160 | | |
| Sykes Enterprises, Inc.* | | | 102,392 | | | | 1,622,913 | | |
| | | | 12,498,361 | | |
| Communications equipment—4.16% | |
| Acme Packet, Inc.* | | | 11,661 | | | | 329,540 | | |
Brocade Communications
Systems, Inc.* | | | 353,700 | | | | 1,750,815 | | |
| CommScope, Inc.* | | | 78,400 | | | | 1,594,656 | | |
| Digi International, Inc.* | | | 156,000 | | | | 1,296,360 | | |
| Emulex Corp.* | | | 251,323 | | | | 2,186,510 | | |
| F5 Networks, Inc.* | | | 18,900 | | | | 1,659,987 | | |
| Finisar Corp.1,* | | | 106,077 | | | | 1,700,414 | | |
| Polycom, Inc.* | | | 116,591 | | | | 3,460,421 | | |
| Riverbed Technology, Inc.* | | | 42,770 | | | | 1,586,339 | | |
| | | | 15,565,042 | | |
| Computers & peripherals—1.25% | |
| Netezza Corp.* | | | 158,100 | | | | 2,450,550 | | |
SMART Technologies, Inc.,
Class A* | | | 43,500 | | | | 669,465 | | |
| Stratasys, Inc.1,* | | | 67,800 | | | | 1,539,738 | | |
| | | | 4,659,753 | | |
| Construction & engineering—0.30% | |
| Foster Wheeler AG* | | | 48,600 | | | | 1,118,772 | | |
| Construction materials—0.55% | |
| Martin Marietta Materials, Inc.1 | | | 24,030 | | | | 2,052,162 | | |
| Distributors—0.55% | |
| LKQ Corp.* | | | 103,800 | | | | 2,053,164 | | |
| Diversified consumer services—3.78% | |
| Bridgepoint Education, Inc.1,* | | | 83,800 | | | | 1,554,490 | | |
| Capella Education Co.* | | | 20,830 | | | | 1,935,524 | | |
| Coinstar, Inc.* | | | 83,967 | | | | 3,820,499 | | |
| DeVry, Inc. | | | 34,598 | | | | 1,861,372 | | |
| Grand Canyon Education, Inc.* | | | 32,400 | | | | 786,348 | | |
| Sotheby's | | | 73,793 | | | | 2,002,004 | | |
| Strayer Education, Inc.1 | | | 6,516 | | | | 1,559,930 | | |
| Universal Technical Institute, Inc. | | | 30,700 | | | | 625,359 | | |
| | | | 14,145,526 | | |
| Diversified financial services—2.36% | |
| MSCI, Inc., Class A* | | | 32,321 | | | | 1,042,999 | | |
Portfolio Recovery
Associates, Inc.1,* | | | 80,462 | | | | 5,606,592 | | |
| The NASDAQ OMX Group, Inc.* | | | 112,000 | | | | 2,180,640 | | |
| | | | 8,830,231 | | |
| Electric utilities—0.38% | |
| ITC Holdings Corp. | | | 25,300 | | | | 1,435,522 | | |
141
UBS PACE Select Advisors Trust
UBS PACE Small/Medium Co Growth Equity Investments
Portfolio of investments—July 31, 2010
| Security description | | Number of
shares | | Value | |
| Common stocks—(continued) | |
| Electrical equipment—2.43% | |
| Acuity Brands, Inc. | | | 37,641 | | | $ | 1,585,815 | | |
| AMETEK, Inc. | | | 39,700 | | | | 1,757,519 | | |
| Baldor Electric Co. | | | 6,713 | | | | 256,571 | | |
| Roper Industries, Inc. | | | 87,931 | | | | 5,495,688 | | |
| | | | 9,095,593 | | |
| Electronic equipment, instruments & components—1.09% | |
| Echelon Corp.1,* | | | 77,400 | | | | 587,466 | | |
| FARO Technologies, Inc.* | | | 34,800 | | | | 715,836 | | |
| Napco Security Systems, Inc.* | | | 57,850 | | | | 100,081 | | |
| National Instruments Corp. | | | 83,900 | | | | 2,676,410 | | |
| | | | 4,079,793 | | |
| Energy equipment & services—1.21% | |
| ION Geophysical Corp.* | | | 327,200 | | | | 1,436,408 | | |
| Rowan Cos., Inc.* | | | 71,842 | | | | 1,814,729 | | |
| Superior Energy Services, Inc.* | | | 56,700 | | | | 1,292,193 | | |
| | | | 4,543,330 | | |
| Food & staples retailing—0.96% | |
| BJ's Wholesale Club, Inc.* | | | 30,372 | | | | 1,383,444 | | |
| United Natural Foods, Inc.* | | | 65,053 | | | | 2,194,238 | | |
| | | | 3,577,682 | | |
| Food products—1.59% | |
| Diamond Foods, Inc.1 | | | 46,600 | | | | 2,075,564 | | |
Green Mountain Coffee
Roasters, Inc.* | | | 125,981 | | | | 3,878,955 | | |
| | | | 5,954,519 | | |
| Health care equipment & supplies—5.99% | |
| Abaxis, Inc.* | | | 42,400 | | | | 850,120 | | |
| AngioDynamics, Inc.* | | | 111,400 | | | | 1,716,674 | | |
| Edwards Lifesciences Corp.* | | | 40,867 | | | | 2,362,113 | | |
| Neogen Corp.* | | | 65,700 | | | | 1,961,802 | | |
| NuVasive, Inc.1,* | | | 58,328 | | | | 1,911,409 | | |
| Orthofix International N.V.* | | | 55,476 | | | | 1,679,813 | | |
| ResMed, Inc.* | | | 36,000 | | | | 2,364,840 | | |
| Sirona Dental Systems, Inc.* | | | 103,043 | | | | 3,171,663 | | |
| Thoratec Corp.* | | | 113,465 | | | | 4,173,243 | | |
| Volcano Corp.* | | | 17,633 | | | | 389,160 | | |
| Zoll Medical Corp.* | | | 69,287 | | | | 1,833,334 | | |
| | | | 22,414,171 | | |
| Health care providers & services—6.52% | |
| Bio-Reference Laboratories, Inc.* | | | 56,500 | | | | 1,184,805 | | |
| Catalyst Health Solutions, Inc.* | | | 38,376 | | | | 1,327,042 | | |
| Chemed Corp. | | | 52,800 | | | | 2,794,176 | | |
Community Health
Systems, Inc.* | | | 45,600 | | | | 1,478,808 | | |
Emergency Medical Services
Corp., Class A* | | | 32,200 | | | | 1,440,628 | | |
| Health Net, Inc.* | | | 66,700 | | | | 1,570,785 | | |
| HMS Holdings Corp.* | | | 30,345 | | | | 1,709,030 | | |
| IPC The Hospitalist Co.* | | | 105,700 | | | | 2,721,775 | | |
| Security description | | Number of
shares | | Value | |
| Common stocks—(continued) | |
| Health care providers & services—(concluded) | |
| Lincare Holdings, Inc. | | | 111,750 | | | $ | 2,655,180 | | |
| Magellan Health Services, Inc.* | | | 60,800 | | | | 2,559,072 | | |
| MEDNAX, Inc.* | | | 73,462 | | | | 3,463,733 | | |
| Omnicare, Inc. | | | 61,585 | | | | 1,516,839 | | |
| | | | 24,421,873 | | |
| Health care technology—1.01% | |
Allscripts Healthcare
Solutions, Inc.1,* | | | 99,800 | | | | 1,665,662 | | |
| Quality Systems, Inc.1 | | | 17,000 | | | | 933,640 | | |
| SXC Health Solutions Corp.* | | | 17,540 | | | | 1,190,966 | | |
| | | | 3,790,268 | | |
| Hotels, restaurants & leisure—2.87% | |
| Buffalo Wild Wings, Inc.1,* | | | 43,259 | | | | 1,844,564 | | |
| Cheesecake Factory, Inc.* | | | 74,500 | | | | 1,746,280 | | |
| Chipotle Mexican Grill, Inc.* | | | 9,296 | | | | 1,374,878 | | |
Home Inns & Hotels
Management, Inc., ADR* | | | 20,043 | | | | 843,209 | | |
| Penn National Gaming, Inc.* | | | 66,700 | | | | 1,826,913 | | |
| Wyndham Worldwide Corp. | | | 122,100 | | | | 3,117,213 | | |
| | | | 10,753,057 | | |
| Household durables—0.50% | |
| Tempur-Pedic International, Inc.* | | | 60,797 | | | | 1,864,644 | | |
| Internet & catalog retail—0.75% | |
| NutriSystem, Inc.1 | | | 75,549 | | | | 1,477,738 | | |
| Shutterfly, Inc.* | | | 53,083 | | | | 1,331,322 | | |
| | | | 2,809,060 | | |
| Internet software & services—3.72% | |
| Art Technology Group, Inc.* | | | 402,200 | | | | 1,447,920 | | |
| comScore, Inc.* | | | 51,666 | | | | 1,023,503 | | |
| Constant Contact, Inc.1,* | | | 35,200 | | | | 686,048 | | |
| DealerTrack Holdings, Inc.* | | | 66,800 | | | | 1,042,748 | | |
| Equinix, Inc.1,* | | | 21,213 | | | | 1,983,628 | | |
| GSI Commerce, Inc.* | | | 27,338 | | | | 615,652 | | |
| LogMeIn, Inc.* | | | 37,700 | | | | 1,074,450 | | |
| Monster Worldwide, Inc.* | | | 225,045 | | | | 3,087,617 | | |
| QuinStreet, Inc.1,* | | | 110,061 | | | | 1,326,235 | | |
| VistaPrint NV1,* | | | 50,032 | | | | 1,653,558 | | |
| | | | 13,941,359 | | |
| IT services—3.87% | |
| Acxiom Corp.* | | | 111,410 | | | | 1,709,029 | | |
| Alliance Data Systems Corp.1,* | | | 40,322 | | | | 2,317,709 | | |
| Cass Information Systems, Inc. | | | 34,200 | | | | 1,188,108 | | |
| Forrester Research, Inc.* | | | 45,500 | | | | 1,468,740 | | |
| Lender Processing Services, Inc. | | | 54,700 | | | | 1,747,118 | | |
| MAXIMUS, Inc. | | | 30,200 | | | | 1,817,738 | | |
| SAIC, Inc.* | | | 98,933 | | | | 1,645,256 | | |
| Telvent GIT SA1,* | | | 36,000 | | | | 775,080 | | |
| VeriFone Systems, Inc.* | | | 83,000 | | | | 1,816,040 | | |
| | | | 14,484,818 | | |
142
UBS PACE Select Advisors Trust
UBS PACE Small/Medium Co Growth Equity Investments
Portfolio of investments—July 31, 2010
| Security description | | Number of
shares | | Value | |
| Common stocks—(continued) | |
| Life sciences tools & services—1.57% | |
| Bruker Corp.* | | | 98,400 | | | $ | 1,295,928 | | |
| MEDTOX Scientific, Inc.* | | | 31,000 | | | | 355,570 | | |
| PAREXEL International Corp.* | | | 134,710 | | | | 2,765,596 | | |
| Techne Corp. | | | 25,300 | | | | 1,477,520 | | |
| | | | 5,894,614 | | |
| Machinery—2.02% | |
| Bucyrus International, Inc. | | | 4,054 | | | | 252,240 | | |
| Flowserve Corp. | | | 31,524 | | | | 3,125,920 | | |
| IDEX Corp. | | | 64,222 | | | | 2,066,022 | | |
| Kaydon Corp. | | | 31,005 | | | | 1,177,880 | | |
| Middleby Corp.* | | | 16,258 | | | | 934,997 | | |
| | | | 7,557,059 | | |
| Media—1.45% | |
| Cinemark Holdings, Inc. | | | 245,358 | | | | 3,579,773 | | |
Regal Entertainment Group,
Class A | | | 139,000 | | | | 1,855,650 | | |
| | | | 5,435,423 | | |
| Multiline retail—0.56% | |
| Saks, Inc.1,* | | | 256,900 | | | | 2,109,149 | | |
| Oil, gas & consumable fuels—3.20% | |
| Atlas Energy, Inc.* | | | 60,794 | | | | 1,798,894 | | |
| Brigham Exploration Co.* | | | 82,256 | | | | 1,419,739 | | |
| Comstock Resources, Inc.* | | | 52,600 | | | | 1,331,306 | | |
| GMX Resources, Inc.1,* | | | 165,400 | | | | 1,023,826 | | |
| Goodrich Petroleum Corp.1,* | | | 57,296 | | | | 712,762 | | |
| Holly Corp. | | | 83,687 | | | | 2,236,953 | | |
| Oasis Petroleum, Inc.* | | | 70,824 | | | | 1,218,173 | | |
Plains Exploration &
Production Co.* | | | 92,585 | | | | 2,087,792 | | |
| Rosetta Resources, Inc.* | | | 6,185 | | | | 136,503 | | |
| | | | 11,965,948 | | |
| Personal products—0.65% | |
| Herbalife Ltd. | | | 37,800 | | | | 1,876,392 | | |
| USANA Health Sciences, Inc.* | | | 13,500 | | | | 565,650 | | |
| | | | 2,442,042 | | |
| Pharmaceuticals—0.32% | |
| Nektar Therapeutics* | | | 29,173 | | | | 380,999 | | |
| Salix Pharmaceuticals Ltd.* | | | 18,948 | | | | 803,585 | | |
| | | | 1,184,584 | | |
| Professional services—1.04% | |
| CoStar Group, Inc.* | | | 22,100 | | | | 968,643 | | |
| Resources Connection, Inc.* | | | 94,900 | | | | 1,232,751 | | |
| Robert Half International, Inc. | | | 66,657 | | | | 1,678,423 | | |
| | | | 3,879,817 | | |
| Real estate investment trusts (REITs)—0.40% | |
| UDR, Inc. | | | 70,100 | | | | 1,479,811 | | |
| Security description | | Number of
shares | | Value | |
| Common stocks—(continued) | |
| Road & rail—1.15% | |
Dollar Thrifty Automotive
Group, Inc.* | | | 33,400 | | | $ | 1,665,658 | | |
| Kansas City Southern* | | | 71,385 | | | | 2,619,830 | | |
| | | | 4,285,488 | | |
| Semiconductors & semiconductor equipment—5.08% | |
| Atmel Corp.* | | | 374,030 | | | | 1,956,177 | | |
| Avago Technologies Ltd.* | | | 105,850 | | | | 2,303,296 | | |
| Cabot Microelectronics Corp.* | | | 31,400 | | | | 1,026,466 | | |
| Cavium Networks, Inc.* | | | 13,362 | | | | 358,502 | | |
| Netlogic Microsystems, Inc.1,* | | | 139,573 | | | | 4,125,778 | | |
| Power Integrations, Inc. | | | 51,900 | | | | 1,834,665 | | |
| Semtech Corp.* | | | 115,100 | | | | 2,000,438 | | |
| Skyworks Solutions, Inc.* | | | 139,533 | | | | 2,446,013 | | |
Varian Semiconductor Equipment
Associates, Inc.* | | | 62,875 | | | | 1,776,848 | | |
| Veeco Instruments, Inc.* | | | 27,160 | | | | 1,176,028 | | |
| | | | 19,004,211 | | |
| Software—8.52% | |
| ANSYS, Inc.* | | | 40,200 | | | | 1,806,990 | | |
| ArcSight, Inc.* | | | 75,757 | | | | 1,894,683 | | |
| Blackboard, Inc.1,* | | | 85,759 | | | | 3,256,269 | | |
| CommVault Systems, Inc.* | | | 61,500 | | | | 1,138,980 | | |
| Concur Technologies, Inc.* | | | 20,800 | | | | 962,624 | | |
| Guidance Software, Inc.1,* | | | 74,000 | | | | 352,980 | | |
| Informatica Corp.* | | | 72,379 | | | | 2,180,779 | | |
| MICROS Systems, Inc.* | | | 33,942 | | | | 1,214,445 | | |
| NetSuite, Inc.1,* | | | 119,060 | | | | 1,766,850 | | |
| Nuance Communications, Inc.* | | | 124,190 | | | | 2,050,377 | | |
| RealD, Inc.1,* | | | 43,902 | | | | 746,334 | | |
| Rovi Corp.* | | | 111,805 | | | | 4,975,323 | | |
| Sourcefire, Inc.* | | | 84,300 | | | | 1,798,962 | | |
| Ultimate Software Group, Inc.* | | | 160,155 | | | | 5,166,600 | | |
VanceInfo Technologies,
Inc., ADR* | | | 51,924 | | | | 1,318,350 | | |
| Verint Systems, Inc.1,* | | | 54,900 | | | | 1,246,230 | | |
| | | | 31,876,776 | | |
| Specialty retail—5.26% | |
| Abercrombie & Fitch Co., Class A | | | 42,700 | | | | 1,577,338 | | |
| AnnTaylor Stores Corp.* | | | 77,500 | | | | 1,359,350 | | |
| Coldwater Creek, Inc.* | | | 233,400 | | | | 914,928 | | |
| Express, Inc.* | | | 142,490 | | | | 2,500,700 | | |
| Foot Locker, Inc. | | | 118,800 | | | | 1,614,492 | | |
| GameStop Corp., Class A1,* | | | 130,400 | | | | 2,614,520 | | |
| Guess?, Inc. | | | 32,262 | | | | 1,151,753 | | |
| Gymboree Corp.* | | | 35,031 | | | | 1,516,842 | | |
| Rue21, Inc.* | | | 516 | | | | 15,650 | | |
| Talbots, Inc.* | | | 198,300 | | | | 2,278,467 | | |
| The Men's Wearhouse, Inc. | | | 68,200 | | | | 1,327,172 | | |
| Tiffany & Co. | | | 33,318 | | | | 1,401,688 | | |
Ulta Salon, Cosmetics &
Fragrance, Inc.* | | | 56,495 | | | | 1,427,064 | | |
| | | | 19,699,964 | | |
143
UBS PACE Select Advisors Trust
UBS PACE Small/Medium Co Growth Equity Investments
Portfolio of investments—July 31, 2010
| Security description | | Number of
shares | | Value | |
| Common stocks—(concluded) | |
| Textiles, apparel & luxury goods—0.33% | |
| Deckers Outdoor Corp.* | | | 14,709 | | | $ | 748,541 | | |
| Steven Madden Ltd.* | | | 6,242 | | | | 241,129 | | |
| Under Armour, Inc., Class A* | | | 6,975 | | | | 261,981 | | |
| | | | 1,251,651 | | |
| Thrifts & mortgage finance—0.38% | |
| First Niagara Financial Group, Inc. | | | 105,600 | | | | 1,416,096 | | |
| Trading companies & distributors—1.48% | |
| Beacon Roofing Supply, Inc.* | | | 96,400 | | | | 1,644,584 | | |
| Watsco, Inc.1 | | | 24,668 | | | | 1,374,254 | | |
| WESCO International, Inc.* | | | 69,651 | | | | 2,502,561 | | |
| | | | 5,521,399 | | |
| Transportation infrastructure—1.02% | |
Aegean Marine Petroleum
Network, Inc. | | | 185,990 | | | | 3,823,954 | | |
| Wireless telecommunication services—0.78% | |
SBA Communications Corp.,
Class A* | | | 50,616 | | | | 1,831,287 | | |
| Syniverse Holdings, Inc.* | | | 49,000 | | | | 1,094,170 | | |
| | | | 2,925,457 | | |
Total common stocks
(cost—$334,318,061) | | | | | | | 358,952,559 | | |
| Investment companies—1.21% | |
iShares Russell 2000 Growth
Index Fund1 | | | 24,297 | | | | 1,720,228 | | |
iShares Russell Midcap Growth
Index Fund | | | 60,104 | | | | 2,800,245 | | |
Total investment companies
(cost—$4,444,968) | | | | | | | 4,520,473 | | |
| Security description | | Face
amount | | Value | |
| Repurchase agreement—2.90% | |
Repurchase agreement dated
07/30/10 with State Street
Bank & Trust Co., 0.010%
due 08/02/10, collateralized
by $10,714,800 US Treasury
Notes, 2.125% to 3.125%
due 04/30/15 to 04/30/17;
(value—$11,056,902);
proceeds: $10,840,009
(cost—$10,840,000) | | $ | 10,840,000 | | | $ | 10,840,000 | | |
| | | Number of
shares | | | |
| Investment of cash collateral from securities loaned—13.24% | |
| Money market fund—13.24% | |
UBS Private Money Market
Fund LLC2
(cost—$49,573,183) | | | 49,573,183 | | | | 49,573,183 | | |
Total investments
(cost—$399,176,212)—
113.25% | | | | | 423,886,215 | | |
Liabilities in excess of other
assets—(13.25)% | | | | | (49,587,551 | ) | |
| Net assets—100.00% | | $ | 374,298,664 | | |
Aggregate cost for federal income tax purposes was $403,829,350; and net unrealized appreciation consisted of:
| Gross unrealized appreciation | | $ | 43,202,837 | | |
| Gross unrealized depreciation | | | (23,145,972 | ) | |
| Net unrealized appreciation | | $ | 20,056,865 | | |
* Non-income producing security.
1 Security, or portion thereof, was on loan at July 31, 2010.
2 The table below details the Portfolio's transaction activity in an affiliated issuer during the year ended July 31, 2010.
| Security description | | Value at
07/31/09 | | Purchases
during the
year ended
07/31/10 | | Sales
during the
year ended
07/31/10 | | Value at
07/31/10 | | Net income
earned from
affiliate for the
year ended
07/31/10 | |
| UBS Private Money Market Fund LLC | | $ | 98,587,174 | | | $ | 233,608,572 | | | $ | 282,622,563 | | | $ | 49,573,183 | | | $ | 301,153 | | |
ADR American Depositary Receipt
144
UBS PACE Select Advisors Trust
UBS PACE Small/Medium Co Growth Equity Investments
Portfolio of investments—July 31, 2010
The following is a summary of the fair valuations according to the inputs used as of July 31, 2010 in valuing the Portfolio's investments:
| | | Unadjusted
quoted prices in
active markets for
identical investments
(Level 1) | | Other significant
observable inputs
(Level 2) | | Unobservable
inputs
(Level 3) | | Total | |
| Common stocks | | $ | 358,952,559 | | | $ | — | | | $ | — | | | $ | 358,952,559 | | |
| Investment companies | | | 4,520,473 | | | | — | | | | — | | | | 4,520,473 | | |
| Repurchase agreement | | | — | | | | 10,840,000 | | | | — | | | | 10,840,000 | | |
Investment of cash collateral
from securities loaned | | | — | | | | 49,573,183 | | | | — | | | | 49,573,183 | | |
| Total | | $ | 363,473,032 | | | $ | 60,413,183 | | | $ | — | | | $ | 423,886,215 | | |
At July 31, 2010, there were no transfers between Level 1 and Level 2.
Issuer breakdown by country or territory of origin (unaudited)
| | | Percentage of
total investments | |
| United States | | | 95.3 | % | |
| Cayman Islands | | | 1.0 | | |
| Marshall Islands | | | 0.9 | | |
| Canada | | | 0.7 | | |
| Singapore | | | 0.5 | | |
| Netherlands Antilles | | | 0.4 | | |
| Netherlands | | | 0.4 | | |
| Bermuda | | | 0.3 | | |
| Switzerland | | | 0.3 | | |
| Spain | | | 0.2 | | |
| Total | | | 100.0 | % | |
See accompanying notes to financial statements.
145
UBS PACE Select Advisors Trust
UBS PACE International Equity Investments
Performance
For the 12 months ended July 31, 2010, the Portfolio's Class P shares returned 2.21%, before the deduction of the maximum UBS PACE Select program fee. (The Class P shares returned 0.18%, after the deduction of the maximum UBS PACE Select program fee, for the same 12-month period.) In comparison, the MSCI EAFE Index (net) (the "benchmark") returned 6.26%, and the Lipper International Large-Cap Core Funds category posted a median return of 5.83%. (Returns for all share classes over various time periods are shown in the "Performance at a glance" table on page 150. Please note that the returns shown do not reflect the deduction of taxes that a shareholder would pay on Portfolio distributions or the redemption of Portfolio shares.) For a detailed commentary on the market environment in general during the reporting period, please refer to page 2.
Sub-Advisors' comments
Martin Currie
Our portion of the Portfolio underperformed the benchmark during the reporting period. It is evident that the unusual market conditions experienced in 2009 do not favor our investment process, which is based on fundamental stock picking. After performing well in the first quarter of 2009, stocks with successful characteristics, such as financial quality, good value, strong growth and positive change were penalized for the remainder of the year. This trend has largely continued into 2010, with company fundamentals taking a back seat to macroeconomic considerations such as the Greek debt crisis. In this environment, our stock selection has been negative in all sectors except for information technology, where results were in line with the benchmark.
From a country allocation perspective, underweights to Japan and developed Asia (later a neutral position) were unhelpful. Conversely, an overweight to emerging markets, contributed to our portion of the Portfolio's relative performance. On a sector basis, our overweight to information technology and an underweight to utilities were beneficial, but underweights in consumer staples and materials detracted from relative results.
At the individual stock level, some of our key positions resulted in negative performance results. Israeli health care firm Teva was the biggest detractor, as its shares fell sharply in July 2010 after two decisions from the US Food and Drug Administration (FDA) went against the
UBS PACE Select Advisors Trust – UBS PACE International Equity Investments
Investment Sub-Advisors:
Martin Currie Inc. ("Martin Currie"), Mondrian Investment Partners Limited ("Mondrian") and J.P. Morgan Investment Management Inc. ("J.P. Morgan")
Portfolio Managers:
Martin Currie: James Fairweather; Mondrian: Elizabeth A. Desmond, Nigel G. May and Emma R. E. Lewis;
J.P. Morgan: Beltran Lastra and Jaco Venter
Objective:
Capital appreciation
Investment process:
Martin Currie has a highly active "conviction" approach, seeking the best opportunities for growth across global stock markets. Martin Currie identifies change as the central dynamic behind stock price movement. This means recognizing change at the company level (management changes, product strategies, acquisitions, etc.) and at the macro level (legislative changes, economic prospects, sector dynamics, etc.). Determining the impact of these changes may lead to outperformance. Martin Currie believes its investment process allows it to identify, evaluate and exploit change at an early stage. In managing its segment of the Portfolio's assets, Martin Currie uses a fully integrated international investment process. So rather than running distinct regional portfolios, it compares and ranks stock opportunities across the whole investment universe. To help id entify and evaluate the best stock ideas, Martin Currie employs fundamental company and sector research, together with its own proprietary quantitative screening tool.
(continued on next page)
146
UBS PACE Select Advisors Trust
UBS PACE International Equity Investments
Sub-Advisors' comments – continued
company's interests. Pharmaceutical giant Roche, another of our weakest performers, fell when the FDA recommended that the US government no longer endorse Avastin as a breast-cancer treatment. Elsewhere, Chinese online gaming firm NetEase suffered after a protracted dispute with domestic regulators over a key title. We eliminated this holding in January 2010, as it appeared unlikely that this dispute would be resolved in the short-term. Other detractors included UK homebuilder Persimmon, which plummeted in May 2010's market selloff as concerns over Eurozone debt and China's monetary tightening particularly hurt cyclical stocks.
The best performer was UK educational and business publisher Pearson, due to strong results and positive corporate actions. Other top contributors over the reporting period included information technology stocks ASM Lithography and Autonomy, industrial group Siemens, brewer Carlsberg, shipper Nippon Yusen and financials DnB NOR and ING Groep. We sold Autonomy in early 2010, as we became concerned about the company's use of cash following its surprise £500 million convertible bond issue. We also eliminated Carlsberg from our portion of the Portfolio to capture profits.
The austerity fears gripping investors have overwhelmed the potential for repricing of sectors, such as financials. We retain significant exposure to developed markets, both directly (through stocks such as CTrip and SJM), and indirectly, through developed-market stocks that export to China. More broadly, our portion of the Portfolio holds solid growth stocks that exhibit better earnings growth rates, relative to the benchmark.
Mondrian
Our portion of the Portfolio outperformed the benchmark during the reporting period. In particular, stock and currency selection were positive contributors to relative performance. Our exposure to the Pacific region was also positive, whereas our European weightings were not beneficial.
Our overweight positions in the outperforming markets of Australia and Singapore were especially helpful, while not having any exposure to the outperforming Danish and Swedish markets hurt relative performance. From a currency perspective, our underweight positions in the underperforming sterling and euro were relatively beneficial, as were our overweight positions in the strong-performing Australian and Singapore dollars.
Investment process (concluded)
Mondrian conducts research on a global basis in an effort to identify securities that have the potential for capital appreciation over a market cycle. The center of its research effort is a value-oriented dividend discount methodology toward individual securities and market analysis that attempts to identify value across country boundaries. This approach focuses on future anticipated dividends, and discounts the value of those dividends back to what they would be worth if they were being paid today. Comparisons of the values of different possible investments are then made. In an international portfolio, currency returns can be an integral component of an investment's total return. Mondrian uses a purchasing power parity approach to assess the value of individual currencies. Purchasing power parity attempts to identify the amount of goods and services that a dollar will buy in the United States, and compares that to the amount of a foreign currency required to buy the same amount of goods and services in another country.
J.P. Morgan manages its segment of the Portfolio's assets using a bottom-up, research-driven strategy that seeks to generate risk characteristics that closely match those of the benchmark, yet at the same time capitalize on the information advantage created by the firm's proprietary research capabilities to generate outperformance. The strategy is driven by valuation-based fundamental analysis, focused on normalized earnings and earnings growth. It seeks to maintain regional weights and sector/industry weights close to those of the benchmark. Stock selection is the focus, being the expected primary source of added value.
147
UBS PACE Select Advisors Trust
UBS PACE International Equity Investments
Sub-Advisors' comments – concluded
Stock selection was, overall, a positive contributor to performance and was particularly strong in Japan, Finland and Hong Kong, but not in Germany, France or the UK. In terms of individual holdings, Compass, a British food services company, UPM Kymenne, a Finnish pulp and paper stock, and Amcor, an Australian packaging company, all helped performance during the review period. Compass generated strong results as management provided a positive outlook for the company's medium-term growth prospects. UPM Kymenne benefited from rising pulp prices due to supply disruptions that were triggered by an earthquake in Chile and a Finnish dockworkers strike. Amcor's shares moved higher as it benefited from its acquisition of Plastics Packaging Americas.
Conversely, Toyota Motor Corp., the Japanese automobile manufacturer, generated disappointing results. Its shares fell following a large global recall, that weighed heavily on its stock. Elsewehere, Ageas, a Belgian financial stock, was down considerably, along with Telecom Corporation of New Zealand, as regulatory concerns pushed its stock price lower.
From a sector perspective, our underweight position in the underperforming financials sector was helpful, as was our overweight position in the strong-performing telecommunications sector. While stock selection in consumer staples and telecommunication services was not helpful, our holdings in the information technology, industrials and materials sectors contributed to performance. Our sector overweights and underweights are a by-product of our bottom-up stock selection process.
J.P. Morgan
Our portion of the Portfolio outperformed the benchmark during the reporting period. Regionally, Europe contributed to our relative performance, while the Pacific Rim detracted from results. At the sector level, industrial cyclicals added the most value, while consumer non-durables hurt our performance.
At the stock level, Volkswagen, one of the world's largest automobile manufacturers, was a strong contributor to results during the reporting period. Its net income surged to €1.25 billion in the second quarter of 2010, up sharply from €283 million the year prior. The increase reflects, in part, the weakness of the euro, as well as the broad recovery in the automobile industry. Volkswagen's strong presence in China and the success of both its Audi and Volkswagen brands further supported its share price.
On the downside, BP plc., a global energy company, detracted from performance. The stock plunged in the second quarter of 2010 after one of the worst environmental disasters in history. Investors fled the stock over concerns that the costs associated with capping the well, cleaning up the spill, and potential litigation and punitive liabilities might bankrupt the company. At one point, the stock had lost over $80 billion in market capitalization—a figure that dwarfed even the most aggressive estimates of what it would cost to clean up the oil spill and settle BP's legal claims. Given the company's earnings power, its ability to generate free cash and the size of its assets, we did not believe that BP was in any danger of going bankrupt. The stock has regained some ground since the end of June.
Special considerations
The Portfolio may be appropriate for long-term investors seeking capital appreciation who are able to withstand short-term fluctuations in the equity markets in return for potentially higher returns over the long term. The value of the Portfolio changes every day and can be affected by changes in interest rates, general market conditions and other political, social and economic developments, as well as specific matters relating to the companies in whose securities the Portfolio invests. It is important to note that an investment in the Portfolio is only one component of a balanced investment plan. The value of the Portfolio's investments in foreign securities may fall due to adverse political, social, and economic developments abroad and due to decreases in foreign currency values relative to the US dollar. These risks are greater for investments in emerging market issuers than for issuers in more developed countries.
148
UBS PACE Select Advisors Trust
UBS PACE International Equity Investments
Illustration of an assumed investment of $10,000 in Class P shares of the Portfolio (unaudited)
The following graph depicts the performance of UBS PACE International Equity Investments Class P shares versus the MSCI EAFE Index (net) over the 10 years ended July 31, 2010. The performance of the other classes will vary based upon the different class specific expenses and sales charges. The performance provided does not reflect the deduction of taxes that a shareholder would pay on Portfolio distributions or the redemption of Portfolio shares. Past performance is no guarantee of future results. Share price and returns will vary with market conditions; investors may realize a gain or loss upon redemption. It is important to note that UBS PACE International Equity Investments is a professionally managed portfolio while the Index is not available for investment and is unmanaged. The comparison is shown for illustration purposes only.
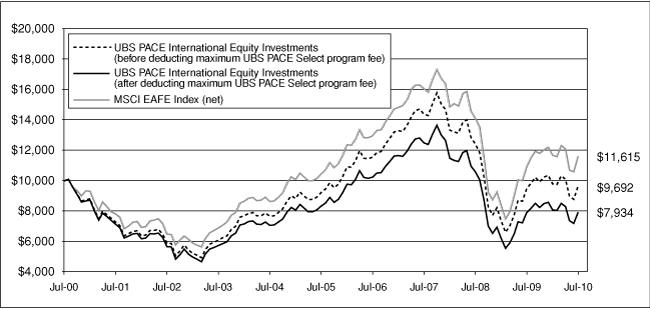
149
UBS PACE Select Advisors Trust
UBS PACE International Equity Investments
Performance at a glance (unaudited)
| Average annual total returns for periods ended 07/31/10 | | 1 year | | 5 years | | 10 years | | Since
inception1 | |
| Before deducting | | Class A2 | | | 2.05 | % | | | 0.71 | % | | N/A | | | 0.70 | % | |
| maximum sales charge | | Class B3 | | | 1.14 | % | | | (0.24 | )% | | N/A | | | 0.11 | %7 | |
| or UBS PACE Select | | Class C4 | | | 1.10 | % | | | (0.15 | )% | | N/A | | | (0.12 | )% | |
| program fee | | Class Y5 | | | 2.43 | % | | | 1.09 | % | | N/A | | | 1.29 | % | |
| | | Class P6 | | | 2.21 | % | | | 0.97 | % | | | (0.31 | )% | | | 3.77 | % | |
| After deducting | | Class A2 | | | (3.54 | )% | | | (0.42 | )% | | N/A | | | 0.11 | % | |
| maximum sales charge | | Class B3 | | | (3.86 | )% | | | (0.56 | )% | | N/A | | | 0.11 | %7 | |
| or UBS PACE Select | | Class C4 | | | 0.10 | % | | | (0.15 | )% | | N/A | | | (0.12 | )% | |
| program fee | | Class P6 | | | 0.18 | % | | | (1.04 | )% | | | (2.29 | )% | | | 1.71 | % | |
| MSCI EAFE Index (net)8 | | | 6.26 | % | | | 2.10 | % | | | 1.51 | % | | | 4.26 | % | |
| Lipper International Large-Cap Core Funds median | | | 5.83 | % | | | 1.78 | % | | | 0.77 | % | | | 4.49 | % | |
Average annual total returns for periods ended June 30, 2010, after deduction of the maximum sales charge or UBS PACE Select program fee, were as follows: Class A—1-year period, (4.42)%; 5-year period, (1.72)%; since inception, (0.90)%; Class B—1-year period, (4.75)%; 5-year period, (1.86)%; since inception, (0.90)%; Class C—1-year period, (0.68)%; 5-year period, (1.42)%; since inception, (1.12)%; Class Y—1-year period, 1.47%; 5-year period, (0.21)%; since inception, 0.26%; Class P—1-year period, (0.57)%; 5-year period, (2.31)%; 10-year period, (3.54)%; since inception, 1.07%.
The annualized gross and net expense ratios, respectively, for each class of shares as in the November 28, 2009 prospectuses, were as follows: Class A—1.46% and 1.46%; Class B—2.63% and 2.40%; Class C—2.31% and 2.31%; Class Y—1.06% and 1.06%; and Class P—1.22% and 1.22%. Net expenses reflect fee waivers and/or expense reimbursements, if any, pursuant to an agreement that is in effect to cap the expenses. The Portfolio and UBS Global AM have entered into a written fee waiver/expense reimbursement agreement pursuant to which UBS Global AM is contractually obligated to waive its management fees and/or reimburse expenses so that the Portfolio's ordinary total operating expenses of each class through November 30, 2010 (excluding dividend expense, borrowing costs and interest expense, if any) would not exceed Class A—1.65%; Class B—2.40%; Class C—2.40%; Class Y—1.40%; and Class P—1.40% . The Portfolio has agreed to repay UBS Global AM for any waived fees/reimbursed expenses to the extent that it can do so over the following three fiscal years without causing the Portfolio's expenses in any of those three years to exceed the expense caps described above.
1 Since inception returns are calculated as of commencement of issuance on August 24, 1995 for Class P shares, November 27, 2000 for Class A, B, and C shares and January 17, 2001 for Class Y shares. Since inception returns for the Index and Lipper median are shown as of August 31, 1995, which is the month-end after the inception date of the oldest share class (Class P).
2 Maximum sales charge for Class A shares is 5.5%. Class A shares bear ongoing 12b-1 service fees.
3 Maximum contingent deferred sales charge for Class B shares is 5% imposed on redemptions and is reduced to 0% after a maximum of six years. Class B shares bear ongoing 12b-1 service and distribution fees.
4 Maximum contingent deferred sales charge for Class C shares is 1% imposed on redemptions and is reduced to 0% after one year. Class C shares bear ongoing 12b-1 service and distribution fees. Prior to September 30, 2003, Class C shares were subject to a maximum front-end sales charge of 1.00%; this front-end sales charge is not reflected in the average annual total return presented for the Class C shares shown above.
5 The Portfolio offers Class Y shares to a limited group of eligible investors, including certain qualifying retirement plans. Class Y shares do not bear initial or contingent deferred sales charges or ongoing 12b-1 service and distribution fees.
6 Class P shares do not bear initial or contingent deferred sales charges or ongoing 12b-1 service and distribution fees, but are subject to a maximum annual UBS PACE Select program fee of 2% of the value of Class P shares. Prior to June 14, 2010, the maximum annual UBS PACE Select program fee was 1.5% of the value of Class P shares.
7 Assumes the conversion of Class B to Class A shares at the end of the sixth year.
8 The MSCI EAFE Index (net) is an index of stocks from 22 countries designed to measure the investment returns of developed economies outside of North America. Dividends are reinvested after the deduction of withholding tax, using tax rates applicable to Luxembourg holding companies, as Luxembourg applies the highest rates. The Index is constructed and managed with a view to being fully investable from the perspective of international institutional investors. Investors should note that indices do not reflect the deduction of fees and expenses.
If an investor sells or exchanges shares less than 90 days after purchase, a redemption fee of 1.00% of the amount sold or exchanged will be deducted at the time of the transaction, except as noted otherwise in the prospectuses.
Past performance does not predict future performance, and the performance information provided does not reflect the deduction of taxes that a shareholder would pay on Portfolio distributions or the redemption of Portfolio shares. The return and principal value of an investment will fluctuate, so that an investor's shares, when redeemed, may be worth more or less than their original cost. Performance results assume reinvestment of all dividends and capital gain distributions at net asset value on the ex-dividend dates. Current performance may be higher or lower than the performance data quoted. For month-end performance figures, please visit http://www.ubs.com.
Lipper peer group data calculated by Lipper Inc.; used with permission. The Lipper median is the return of the fund that places in the middle of a Lipper peer group.
150
UBS PACE Select Advisors Trust
UBS PACE International Equity Investments
Portfolio statistics (unaudited)
| Characteristics | | 07/31/10 | |
| Net assets (mm) | | $ | 792.1 | | |
| Number of holdings | | | 268 | | |
| Portfolio composition1 | | 07/31/10 | |
| Common and preferred stocks | | | 93.7 | % | |
| ADRs | | | 4.6 | | |
| Futures and forward foreign currency contracts | | | 0.0 | 2 | |
| Cash equivalents and other assets less liabilities | | | 1.7 | | |
| Total | | | 100.0 | % | |
| Regional allocation (equity investments)1 | | 07/31/10 | |
| Europe and European territories | | | 59.1 | % | |
| Asia | | | 29.6 | | |
| Oceania | | | 8.4 | | |
| Africa | | | 1.2 | | |
| Total | | | 98.3 | % | |
| Top five countries (equity investments)1 | | 07/31/10 | |
| Japan | | | 21.1 | % | |
| United Kingdom | | | 19.0 | | |
| France | | | 9.2 | | |
| Australia | | | 8.2 | | |
| Netherlands | | | 6.8 | | |
| Total | | | 64.3 | % | |
| Top five sectors1 | | 07/31/10 | |
| Financials | | | 19.3 | % | |
| Consumer discretionary | | | 13.5 | | |
| Consumer staples | | | 11.9 | | |
| Health care | | | 10.4 | | |
| Telecommunication services | | | 10.0 | | |
| Total | | | 65.1 | % | |
| Top ten equity holdings1 | | 07/31/10 | |
| Sanofi-Aventis SA | | | 2.0 | % | |
| Compass Group PLC | | | 1.8 | | |
| Telefonica SA | | | 1.6 | | |
| GlaxoSmithKline PLC | | | 1.6 | | |
| ING Groep N.V. | | | 1.5 | | |
| Total SA | | | 1.5 | | |
| British American Tobacco PLC | | | 1.4 | | |
| Novartis AG | | | 1.4 | | |
| Unilever PLC | | | 1.3 | | |
| Roche Holding AG | | | 1.3 | | |
| Total | | | 15.4 | % | |
1 Weightings represent percentages of the Portfolio's net assets as of July 31, 2010. The Portfolio is actively managed and its composition will vary over time.
2 Weighting represents less than 0.05% of the Portfolio's net assets as of July 31, 2010.
ADR American Depositary Receipt
151
UBS PACE Select Advisors Trust
UBS PACE International Equity Investments
Industry diversification—(unaudited)
As a percentage of net assets as of July 31, 2010
Common stocks
| Aerospace & defense | | | 0.05 | % | |
| Air freight & logistics | | | 0.03 | | |
| Airlines | | | 0.09 | | |
| Auto components | | | 1.66 | | |
| Automobiles | | | 1.23 | | |
| Beverages | | | 2.47 | | |
| Building products | | | 0.73 | | |
| Capital markets | | | 1.89 | | |
| Chemicals | | | 2.46 | | |
| Commercial banks | | | 10.16 | | |
| Commercial services & supplies | | | 0.09 | | |
| Communications equipment | | | 0.21 | | |
| Computers & peripherals | | | 0.61 | | |
| Construction & engineering | | | 1.11 | | |
| Construction materials | | | 0.06 | | |
| Consumer finance | | | 0.07 | | |
| Containers & packaging | | | 0.70 | | |
| Distributors | | | 0.54 | | |
| Diversified consumer services | | | 0.07 | | |
| Diversified financial services | | | 1.51 | | |
| Diversified telecommunication services | | | 7.21 | | |
| Electrical equipment | | | 1.23 | | |
| Electric utilities | | | 1.82 | | |
| Electronic equipment, instruments & components | | | 0.77 | | |
| Energy equipment & services | | | 1.46 | | |
| Food & staples retailing | | | 3.70 | | |
| Food products | | | 2.62 | | |
| Gas utilities | | | 0.30 | | |
| Health care equipment & supplies | | | 0.38 | | |
| Health care providers & services | | | 0.09 | | |
| Hotels, restaurants & leisure | | | 3.48 | | |
| Household durables | | | 2.22 | | |
| Household products | | | 0.09 | | |
| Independent power producers & energy traders | | | 0.07 | | |
| Industrial conglomerates | | | 3.10 | | |
| Insurance | | | 4.66 | | |
| Internet & catalog retail | | | 0.04 | | |
| IT services | | | 0.10 | | |
| Machinery | | | 0.31 | | |
| Marine | | | 0.94 | | |
| Media | | | 2.54 | | |
| Metals & mining | | | 3.61 | | |
| Multiline retail | | | 0.07 | | |
| Multi-utilities | | | 1.42 | | |
| Office electronics | | | 1.96 | | |
| Oil, gas & consumable fuels | | | 6.46 | | |
Common stocks—(concluded)
| Paper & forest products | | | 0.23 | % | |
| Personal products | | | 1.31 | | |
| Pharmaceuticals | | | 9.91 | | |
| Professional services | | | 0.44 | | |
| Real estate investment trusts (REITs) | | | 0.12 | | |
| Real estate management & development | | | 0.92 | | |
| Road & rail | | | 0.34 | | |
| Semiconductors & semiconductor equipment | | | 2.13 | | |
| Software | | | 0.06 | | |
| Specialty retail | | | 0.81 | | |
| Textiles, apparel & luxury goods | | | 0.79 | | |
| Tobacco | | | 1.59 | | |
| Trading companies & distributors | | | 0.18 | | |
| Transportation infrastructure | | | 0.11 | | |
| Water utilities | | | 0.08 | | |
| Wireless telecommunication services | | | 2.79 | | |
| Total common stocks | | | 98.20 | | |
Preferred stock
| Household products | | | 0.12 | | |
| Repurchase agreement | | | 1.38 | | |
| Investment of cash collateral from securities loaned | | | 4.69 | | |
| Liabilities in excess of other assets | | | (4.39 | ) | |
| Net assets | | | 100.00 | % | |
152
UBS PACE Select Advisors Trust
UBS PACE International Equity Investments
Portfolio of investments—July 31, 2010
| Security description | | Number of
shares | | Value | |
| Common stocks—98.20% | |
| Australia—8.22% | |
| Amcor Ltd. | | | 927,765 | | | $ | 5,506,128 | | |
Australia & New Zealand
Banking Group Ltd. | | | 68,669 | | | | 1,431,978 | | |
| BHP Billiton Ltd. | | | 70,169 | | | | 2,546,893 | | |
| BlueScope Steel Ltd.* | | | 94,252 | | | | 202,089 | | |
Commonwealth Bank
of Australia | | | 19,924 | | | | 947,407 | | |
| Foster's Group Ltd. | | | 1,224,606 | | | | 6,381,509 | | |
| Incitec Pivot Ltd. | | | 1,744,759 | | | | 5,130,070 | | |
| Intoll Group* | | | 360,861 | | | | 479,912 | | |
| Leighton Holdings Ltd.1 | | | 176,002 | | | | 4,695,663 | | |
| Macquarie Group Ltd. | | | 19,706 | | | | 663,202 | | |
| National Australia Bank Ltd. | | | 27,415 | | | | 623,283 | | |
| Newcrest Mining Ltd.1 | | | 219,171 | | | | 6,485,869 | | |
| QBE Insurance Group Ltd. | | | 418,799 | | | | 6,327,419 | | |
| Rio Tinto Ltd. | | | 17,445 | | | | 1,114,402 | | |
| Santos Ltd. | | | 40,305 | | | | 484,970 | | |
| Telstra Corp. Ltd. | | | 2,946,427 | | | | 8,583,335 | | |
| Wesfarmers Ltd. | | | 230,639 | | | | 6,487,210 | | |
| Westfield Group | | | 61,013 | | | | 673,973 | | |
| Westpac Banking Corp. | | | 265,875 | | | | 5,770,484 | | |
| Woodside Petroleum Ltd. | | | 15,695 | | | | 590,689 | | |
| Total Australia common stocks | | | 65,126,485 | | |
| Austria—0.06% | |
bwin Interactive
Entertainment AG | | | 8,108 | | | | 450,955 | | |
| Belgium—0.34% | |
| Ageas | | | 407,261 | | | | 1,121,416 | | |
| Ageas STRIP VVPR2,* | | | 151,262 | | | | 197 | | |
| Anheuser-Busch InBev N.V. | | | 6,808 | | | | 360,508 | | |
| KBC GROEP N.V.* | | | 15,025 | | | | 663,757 | | |
| Nyrstar1 | | | 44,850 | | | | 520,172 | | |
| Total Belgium common stocks | | | 2,666,050 | | |
| Bermuda—1.03% | |
| Esprit Holdings Ltd. | | | 76,718 | | | | 481,494 | | |
GOME Electrical Appliances
Holdings Ltd.* | | | 10,059,000 | | | | 3,483,580 | | |
| Jardine Matheson Holdings Ltd. | | | 99,600 | | | | 3,944,160 | | |
| Li & Fung Ltd. | | | 60,000 | | | | 274,992 | | |
| Total Bermuda common stocks | | | 8,184,226 | | |
| Cayman Islands—1.02% | |
Ctrip.com
International Ltd., ADR* | | | 136,600 | | | | 5,499,516 | | |
Mindray Medical
International Ltd., ADR1 | | | 83,600 | | | | 2,586,584 | | |
Total Cayman Islands
common stocks | | | 8,086,100 | | |
| China—0.75% | |
| Bank of China Ltd., Class H | | | 11,310,000 | | | | 5,969,874 | | |
| Security description | | Number of
shares | | Value | |
| Common stocks—(continued) | |
| Denmark—0.32% | |
| AP Moller - Maersk A/S, Class B | | | 63 | | | $ | 531,276 | | |
| Carlsberg A/S, Class B | | | 8,326 | | | | 738,238 | | |
| Novo-Nordisk A/S, Class B | | | 14,935 | | | | 1,277,482 | | |
| Total Denmark common stocks | | | 2,546,996 | | |
| Finland—0.34% | |
| Nokia Oyj | | | 62,388 | | | | 576,830 | | |
| Stora Enso Oyj, R Shares | | | 77,829 | | | | 630,343 | | |
| UPM-Kymmene Oyj | | | 67,003 | | | | 972,689 | | |
| YIT Oyj | | | 25,163 | | | | 551,548 | | |
| Total Finland common stocks | | | 2,731,410 | | |
| France—9.19% | |
| Arkema SA | | | 8,782 | | | | 382,811 | | |
| Atos Origin SA* | | | 14,901 | | | | 639,831 | | |
| AXA SA | | | 30,429 | | | | 560,900 | | |
| BNP Paribas | | | 22,636 | | | | 1,554,846 | | |
| Carrefour SA | | | 201,565 | | | | 9,278,802 | | |
| Casino Guichard-Perrachon SA | | | 8,580 | | | | 747,228 | | |
| Cie de Saint-Gobain | | | 116,284 | | | | 4,949,909 | | |
| France Telecom SA | | | 417,352 | | | | 8,740,031 | | |
| GDF Suez | | | 18,184 | | | | 604,024 | | |
| GDF Suez, STRIP VVPR2,* | | | 23,226 | | | | 30 | | |
| L'Oreal SA | | | 4,129 | | | | 433,255 | | |
| Lafarge SA1 | | | 8,970 | | | | 488,611 | | |
| PagesJaunes Groupe1 | | | 50,258 | | | | 556,304 | | |
| PPR | | | 4,286 | | | | 573,331 | | |
| Rhodia SA | | | 36,137 | | | | 745,937 | | |
| Sanofi-Aventis SA | | | 277,362 | | | | 16,109,580 | | |
| Schneider Electric SA | | | 4,130 | | | | 476,308 | | |
| Societe Generale | | | 87,148 | | | | 5,023,635 | | |
| Technip SA | | | 88,952 | | | | 5,923,402 | | |
| Total SA | | | 233,498 | | | | 11,778,798 | | |
| Vinci SA | | | 67,191 | | | | 3,252,854 | | |
| Total France common stocks | | | 72,820,427 | | |
| Germany—5.83% | |
| Adidas AG | | | 115,042 | | | | 6,230,553 | | |
| Aixtron AG1 | | | 144,884 | | | | 4,332,146 | | |
| Allianz SE | | | 10,357 | | | | 1,202,559 | | |
| BASF SE | | | 14,818 | | | | 865,285 | | |
| Bayer AG | | | 16,609 | | | | 954,826 | | |
| Continental AG* | | | 3,349 | | | | 213,630 | | |
| Daimler AG* | | | 15,578 | | | | 839,932 | | |
| Deutsche Bank AG | | | 18,243 | | | | 1,274,253 | | |
| Deutsche Post AG | | | 13,918 | | | | 241,679 | | |
| Deutsche Telekom AG | | | 568,301 | | | | 7,635,399 | | |
| E.ON AG | | | 31,843 | | | | 950,056 | | |
Hamburger Hafen und
Logistik AG (HHLA)1 | | | 10,871 | | | | 397,089 | | |
| Infineon Technologies AG* | | | 41,062 | | | | 277,128 | | |
| MTU Aero Engines Holding AG | | | 6,577 | | | | 381,916 | | |
| RWE AG | | | 130,659 | | | | 9,226,842 | | |
153
UBS PACE Select Advisors Trust
UBS PACE International Equity Investments
Portfolio of investments—July 31, 2010
| Security description | | Number of
shares | | Value | |
| Common stocks—(continued) | |
| Germany—(concluded) | |
| Siemens AG | | | 103,896 | | | $ | 10,125,978 | | |
| Volkswagen AG1 | | | 10,872 | | | | 1,030,286 | | |
| Total Germany common stocks | | | 46,179,557 | | |
| Hong Kong—2.40% | |
| BOC Hong Kong (Holdings) Ltd. | | | 212,500 | | | | 545,510 | | |
| CNOOC Ltd., ADR1 | | | 32,600 | | | | 5,490,492 | | |
| Hang Lung Properties Ltd. | | | 137,000 | | | | 571,458 | | |
| Hang Seng Bank Ltd. | | | 30,300 | | | | 419,734 | | |
| Hong Kong Electric Holdings | | | 613,500 | | | | 3,716,147 | | |
| Hutchison Whampoa Ltd. | | | 124,000 | | | | 818,951 | | |
| Link REIT | | | 109,500 | | | | 284,763 | | |
| SJM Holdings Ltd. | | | 7,174,000 | | | | 6,326,605 | | |
| Sun Hung Kai Properties Ltd. | | | 59,000 | | | | 866,675 | | |
| Total Hong Kong common stocks | | | 19,040,335 | | |
| Ireland—0.03% | |
| Paddy Power PLC | | | 5,963 | | | | 217,579 | | |
| Israel—0.72% | |
Teva Pharmaceutical
Industries Ltd., ADR | | | 116,800 | | | | 5,705,680 | | |
| Italy—1.19% | |
| Intesa Sanpaolo | | | 164,362 | | | | 427,306 | | |
| Intesa Sanpaolo SpA EURO 52 | | | 1,349,372 | | | | 4,466,425 | | |
| Snam Rete Gas SpA | | | 317,011 | | | | 1,488,240 | | |
| UniCredito Italiano SpA | | | 1,093,442 | | | | 3,063,577 | | |
| Total Italy common stocks | | | 9,445,548 | | |
| Japan—21.09% | |
| Aisin Seiki Co. Ltd. | | | 16,800 | | | | 469,611 | | |
| Amada Co. Ltd. | | | 69,000 | | | | 451,241 | | |
| Asahi Kasei Corp. | | | 83,000 | | | | 434,238 | | |
| Astellas Pharma, Inc. | | | 244,000 | | | | 8,277,840 | | |
| Benesse Corp. | | | 13,300 | | | | 588,836 | | |
| Bridgestone Corp. | | | 397,000 | | | | 7,108,733 | | |
| Canon, Inc. | | | 228,200 | | | | 9,944,707 | | |
| Chugai Pharmaceutical Co. Ltd. | | | 28,300 | | | | 495,279 | | |
| COMSYS Holdings Corp.1 | | | 33,800 | | | | 324,327 | | |
| Dai-ichi Life Insurance Co. Ltd. | | | 3,365 | | | | 4,775,149 | | |
| Daikin Industries Ltd. | | | 6,095 | | | | 226,107 | | |
| DIC Corp. | | | 192,000 | | | | 317,796 | | |
| East Japan Railway Co. | | | 14,300 | | | | 921,940 | | |
Electric Power
Development Co. Ltd.1 | | | 17,700 | | | | 548,650 | | |
| Elpida Memory, Inc.1,* | | | 33,000 | | | | 496,556 | | |
| FUJIFILM Holdings Corp. | | | 18,700 | | | | 584,409 | | |
| Fukuoka Financial Group, Inc. | | | 81,000 | | | | 337,520 | | |
| Honda Motor Co. Ltd. | | | 12,200 | | | | 382,543 | | |
| Japan Tobacco, Inc. | | | 337 | | | | 1,084,391 | | |
| JFE Holdings, Inc. | | | 22,300 | | | | 690,462 | | |
| JS Group Corp. | | | 19,800 | | | | 399,461 | | |
| JX Holdings, Inc.* | | | 112,100 | | | | 607,243 | | |
| Kao Corp. | | | 383,100 | | | | 9,063,677 | | |
| Security description | | Number of
shares | | Value | |
| Common stocks—(continued) | |
| Japan—(concluded) | |
| Kawasaki Kisen Kaisha Ltd.* | | | 200,000 | | | $ | 854,216 | | |
| KDDI Corp. | | | 1,136 | | | | 5,529,116 | | |
| Kirin Holdings Co. Ltd. | | | 509,000 | | | | 6,798,843 | | |
| Kyushu Electric Power Co., Inc. | | | 27,900 | | | | 631,339 | | |
| Minebea Co. Ltd. | | | 142,000 | | | | 784,004 | | |
| Mitsubishi Electric Corp. | | | 157,000 | | | | 1,368,378 | | |
Mitsubishi UFJ Financial
Group, Inc. (MUFG) | | | 282,900 | | | | 1,404,758 | | |
| Mitsui & Co. Ltd. | | | 13,700 | | | | 175,700 | | |
| Mitsui Fudosan Co. Ltd. | | | 302,000 | | | | 4,474,333 | | |
| NGK Spark Plug Co. Ltd. | | | 34,000 | | | | 439,586 | | |
| Nintendo Co. Ltd. | | | 1,800 | | | | 503,362 | | |
| Nippon Electric Glass Co. Ltd. | | | 43,000 | | | | 547,983 | | |
Nippon Telegraph & Telephone
Corp. (NTT) | | | 23,300 | | | | 968,193 | | |
| Nippon Yusen Kabushiki Kaisha | | | 1,426,000 | | | | 6,041,044 | | |
| Nissan Motor Co. Ltd.* | | | 130,900 | | | | 1,006,049 | | |
| Nitori Co. Ltd. | | | 7,050 | | | | 607,934 | | |
| Nitto Denko Corp. | | | 101,300 | | | | 3,510,530 | | |
| Nomura Holdings, Inc. | | | 696,200 | | | | 3,876,060 | | |
| NTT DoCoMo, Inc. | | | 3,599 | | | | 5,727,907 | | |
| Olympus Corp. | | | 15,800 | | | | 423,552 | | |
| ORIX Corp. | | | 6,970 | | | | 548,597 | | |
| Panasonic Corp. | | | 455,600 | | | | 6,022,284 | | |
| Ricoh Co. Ltd. | | | 403,000 | | | | 5,583,552 | | |
| Sekisui House Ltd. | | | 692,000 | | | | 6,143,457 | | |
| Seven & I Holdings Co. Ltd. | | | 369,900 | | | | 8,858,419 | | |
| Shin-Etsu Chemical Co. Ltd. | | | 122,800 | | | | 6,119,035 | | |
| Shiseido Co. Ltd. | | | 37,600 | | | | 841,697 | | |
| Softbank Corp. | | | 35,900 | | | | 1,074,154 | | |
| Sony Corp. | | | 11,900 | | | | 372,585 | | |
| Sony Financial Holdings, Inc.1 | | | 132 | | | | 478,986 | | |
| Sumco Corp.* | | | 26,100 | | | | 495,445 | | |
| Sumitomo Corp. | | | 70,400 | | | | 748,043 | | |
| Sumitomo Heavy Industries Ltd. | | | 52,000 | | | | 304,555 | | |
Sumitomo Mitsui Financial
Group, Inc. | | | 46,232 | | | | 1,431,991 | | |
Sumitomo Realty &
Development Co. Ltd. | | | 25,000 | | | | 450,258 | | |
| Sundrug Co. Ltd.1 | | | 17,900 | | | | 463,479 | | |
| Suzuken Co. Ltd. | | | 20,300 | | | | 710,776 | | |
| Takeda Pharmaceutical Co. Ltd. | | | 215,800 | | | | 9,903,895 | | |
| TDK Corp. | | | 11,500 | | | | 693,501 | | |
| The Bank of Yokohama Ltd. | | | 1,019,000 | | | | 4,706,071 | | |
| Tokio Marine Holdings, Inc. | | | 221,200 | | | | 6,057,749 | | |
| Tokyo Electric Power Co., Inc. | | | 8,200 | | | | 225,228 | | |
| Tokyo Gas Co. Ltd. | | | 193,000 | | | | 877,933 | | |
| TOTO Ltd. | | | 35,000 | | | | 238,613 | | |
| Toyota Motor Corp. | | | 184,307 | | | | 6,506,584 | | |
| Ube Industries Ltd. | | | 355,000 | | | | 887,551 | | |
| West Japan Railway Co. | | | 484 | | | | 1,792,696 | | |
| Yamazaki Baking Co. Ltd. | | | 21,000 | | | | 266,161 | | |
| Total Japan common stocks | | | 167,006,898 | | |
154
UBS PACE Select Advisors Trust
UBS PACE International Equity Investments
Portfolio of investments—July 31, 2010
| Security description | | Number of
shares | | Value | |
| Common stocks—(continued) | |
| Jersey—1.33% | |
| Beazley PLC | | | 238,788 | | | $ | 449,633 | | |
| Experian PLC | | | 354,755 | | | | 3,493,064 | | |
| Petrofac Ltd. | | | 278,285 | | | | 5,458,384 | | |
| Shire Ltd. | | | 51,242 | | | | 1,169,912 | | |
| Total Jersey common stocks | | | 10,570,993 | | |
| Luxembourg—0.89% | |
| ArcelorMittal | | | 28,404 | | | | 865,774 | | |
| SES SA | | | 251,070 | | | | 6,201,735 | | |
Total Luxembourg
common stocks | | | 7,067,509 | | |
| Netherlands—6.76% | |
| ASML Holding N.V. | | | 203,192 | | | | 6,479,406 | | |
| Gemalto N.V.1 | | | 117,898 | | | | 4,839,624 | | |
| Heineken N.V. | | | 116,500 | | | | 5,272,606 | | |
| ING Groep N.V.* | | | 1,245,848 | | | | 11,981,634 | | |
| Koninklijke Ahold N.V. | | | 86,992 | | | | 1,116,632 | | |
| Koninklijke DSM N.V. | | | 8,122 | | | | 385,423 | | |
Koninklijke Philips
Electronics N.V. | | | 287,901 | | | | 8,970,515 | | |
| Koninklijke (Royal) KPN N.V.1 | | | 74,722 | | | | 1,039,955 | | |
| Reed Elsevier N.V. | | | 464,706 | | | | 6,013,428 | | |
| Unilever N.V. | | | 252,211 | | | | 7,419,701 | | |
Total Netherlands
common stocks | | | 53,518,924 | | |
| New Zealand—0.23% | |
Telecom Corp. of
New Zealand Ltd. | | | 1,265,864 | | | | 1,827,962 | | |
| Norway—1.11% | |
| DnB NOR ASA | | | 619,260 | | | | 7,690,487 | | |
| Orkla ASA1 | | | 42,561 | | | | 353,072 | | |
| Sevan Marine ASA1,* | | | 217,644 | | | | 221,210 | | |
| Statoil ASA | | | 25,582 | | | | 517,076 | | |
| Total Norway common stocks | | | 8,781,845 | | |
| Singapore—2.53% | |
| CapitaLand Ltd. | | | 151,000 | | | | 439,741 | | |
| City Developments Ltd. | | | 58,000 | | | | 516,105 | | |
| DBS Group Holdings Ltd. | | | 600,000 | | | | 6,353,876 | | |
| Singapore Airlines Ltd. | | | 62,740 | | | | 720,693 | | |
Singapore
Telecommunications Ltd. | | | 2,714,120 | | | | 6,227,426 | | |
| United Overseas Bank Ltd. | | | 395,060 | | | | 5,769,887 | | |
| Total Singapore common stocks | | | 20,027,728 | | |
| South Africa—1.16% | |
| Gold Fields Ltd., ADR1 | | | 458,500 | | | | 6,203,505 | | |
| Sasol Ltd. | | | 74,531 | | | | 2,952,532 | | |
Total South Africa
common stocks | | | 9,156,037 | | |
| South Korea—0.57% | |
| KT Corp., ADR1 | | | 237,600 | | | | 4,478,760 | | |
| Security description | | Number of
shares | | Value | |
| Common stocks—(continued) | |
| Spain—3.87% | |
Banco Bilbao Vizcaya
Argentaria SA | | | 80,687 | | | $ | 1,086,697 | | |
| Banco Santander SA1 | | | 552,674 | | | | 7,179,848 | | |
| Iberdrola SA | | | 1,259,622 | | | | 8,888,599 | | |
Industria de Diseno
Textil SA (Inditex) | | | 9,636 | | | | 637,276 | | |
Prosegur, Compania de
Seguridad SA | | | 7,408 | | | | 364,236 | | |
| Telefonica SA | | | 551,261 | | | | 12,514,112 | | |
| Total Spain common stocks | | | 30,670,768 | | |
| Sweden—0.50% | |
| Electrolux AB, Series B | | | 25,305 | | | | 564,308 | | |
| Intrum Justitia AB | | | 31,872 | | | | 366,413 | | |
| Nordea Bank AB | | | 55,052 | | | | 550,547 | | |
Svenska Cellulosa AB (SCA),
B Shares | | | 15,849 | | | | 228,746 | | |
| Tele2 AB, B Shares | | | 62,306 | | | | 1,104,647 | | |
Telefonaktiebolaget LM Ericsson,
B Shares1 | | | 101,832 | | | | 1,124,156 | | |
| Total Sweden common stocks | | | 3,938,817 | | |
| Switzerland—6.19% | |
| ABB Ltd.* | | | 390,716 | | | | 7,884,084 | | |
| Clariant AG* | | | 52,148 | | | | 690,835 | | |
| Credit Suisse Group | | | 182,593 | | | | 8,315,457 | | |
| Nestle SA | | | 53,552 | | | | 2,647,526 | | |
| Novartis AG | | | 221,692 | | | | 10,757,925 | | |
| Roche Holding AG | | | 79,238 | | | | 10,306,949 | | |
| Zurich Financial Services AG | | | 35,930 | | | | 8,388,381 | | |
Total Switzerland
common stocks | | | 48,991,157 | | |
| Taiwan—1.51% | |
Chunghwa Telecom
Co. Ltd., ADR | | | 148,899 | | | | 3,149,214 | | |
HON HAI Precision
Industry Co. Ltd.* | | | 994,000 | | | | 4,001,623 | | |
Taiwan Semiconductor
Manufacturing Co. Ltd. | | | 707,000 | | | | 1,376,778 | | |
Taiwan Semiconductor
Manufacturing Co. Ltd., ADR | | | 341,290 | | | | 3,447,029 | | |
| Total Taiwan common stocks | | | 11,974,644 | | |
| United Kingdom—19.02% | |
| Afren PLC* | | | 248,733 | | | | 356,929 | | |
| Amlin PLC | | | 654,707 | | | | 4,364,111 | | |
| Anglo American PLC* | | | 23,487 | | | | 930,395 | | |
| AstraZeneca PLC | | | 20,883 | | | | 1,061,045 | | |
| Aviva PLC | | | 439,056 | | | | 2,462,287 | | |
| Barclays PLC | | | 1,494,838 | | | | 7,806,237 | | |
| BG Group PLC | | | 375,104 | | | | 6,012,489 | | |
| BP PLC | | | 1,416,639 | | | | 9,023,936 | | |
| British American Tobacco PLC | | | 322,091 | | | | 11,088,670 | | |
| BT Group PLC | | | 363,720 | | | | 811,579 | | |
155
UBS PACE Select Advisors Trust
UBS PACE International Equity Investments
Portfolio of investments—July 31, 2010
| Security description | | Number of
shares | | Value | |
| Common stocks—(concluded) | |
| United Kingdom—(concluded) | |
| Cairn Energy PLC* | | | 61,478 | | | $ | 450,313 | | |
| Compass Group PLC | | | 1,683,428 | | | | 14,000,214 | | |
| Cookson Group PLC* | | | 46,056 | | | | 320,873 | | |
| Domino's Pizza UK & IRL PLC | | | 99,527 | | | | 639,059 | | |
| GKN PLC* | | | 2,318,137 | | | | 4,914,267 | | |
| GlaxoSmithKline PLC | | | 713,524 | | | | 12,439,041 | | |
| Home Retail Group PLC | | | 77,472 | | | | 290,541 | | |
| HSBC Holdings PLC3 | | | 34,266 | | | | 351,814 | | |
| HSBC Holdings PLC4 | | | 186,874 | | | | 1,894,286 | | |
| IMI PLC | | | 79,518 | | | | 890,274 | | |
| Imperial Tobacco Group PLC | | | 13,600 | | | | 384,981 | | |
| Inchcape PLC* | | | 857,149 | | | | 4,017,499 | | |
Intercontinental Hotels
Group PLC | | | 25,597 | | | | 443,026 | | |
| Kesa Electricals PLC | | | 149,893 | | | | 294,946 | | |
| Kingfisher PLC | | | 259,218 | | | | 875,736 | | |
| Lloyds Banking Group PLC* | | | 1,297,384 | | | | 1,409,988 | | |
| Logica PLC | | | 104,184 | | | | 177,213 | | |
| Man Group PLC | | | 251,248 | | | | 856,696 | | |
| National Grid PLC | | | 174,908 | | | | 1,398,357 | | |
| Northumbrian Water Group PLC | | | 66,278 | | | | 345,488 | | |
| Pearson PLC | | | 471,592 | | | | 7,322,283 | | |
| Pennon Group PLC | | | 33,682 | | | | 311,827 | | |
| Persimmon PLC* | | | 813,626 | | | | 4,508,030 | | |
| Petropavlovsk PLC | | | 21,614 | | | | 342,547 | | |
| Premier Farnell PLC | | | 62,490 | | | | 234,648 | | |
| Prudential PLC | | | 85,452 | | | | 743,512 | | |
| Reckitt Benckiser Group PLC | | | 14,243 | | | | 698,419 | | |
| Rio Tinto PLC | | | 25,813 | | | | 1,338,470 | | |
Royal Dutch Shell PLC,
A Shares4 | | | 82,475 | | | | 2,270,596 | | |
Royal Dutch Shell PLC,
A Shares5 | | | 365,657 | | | | 10,068,575 | | |
Royal Dutch Shell PLC,
B Shares4 | | | 20,349 | | | | 536,275 | | |
| SIG PLC* | | | 126,823 | | | | 201,392 | | |
| Standard Chartered PLC | | | 54,307 | | | | 1,569,675 | | |
| Tesco PLC | | | 378,835 | | | | 2,322,214 | | |
| Unilever PLC | | | 367,602 | | | | 10,446,254 | | |
| Vodafone Group PLC | | | 4,175,433 | | | | 9,745,918 | | |
| Wolseley PLC* | | | 14,299 | | | | 322,648 | | |
| Xstrata PLC | | | 459,533 | | | | 7,322,526 | | |
Total United Kingdom
common stocks | | | 150,618,099 | | |
Total common stocks
(cost—$800,185,472) | | | 777,801,363 | | |
| Security description | | Number of
shares | | Value | |
| Preferred stock—0.12% | |
| Germany—0.12% | |
Henkel AG & Co. KGaA Vorzug
(cost—$978,687) | | | 19,031 | | | $ | 944,518 | | |
| | | Face
amount | | | |
| Repurchase agreement—1.38% | |
Repurchase agreement dated
07/30/10 with State Street
Bank & Trust Co., 0.010%
due 08/02/10, collateralized
by $10,805,737 US Treasury
Notes, 2.125% to 3.125%
due 04/30/15 to 04/30/17;
(value—$11,150,743);
proceeds: $10,932,009
(cost—$10,932,000) | | $ | 10,932,000 | | | | 10,932,000 | | |
| | | Number of
shares | | | |
| Investment of cash collateral from securities loaned—4.69% | |
| Money market fund—4.69% | |
UBS Private Money Market
Fund LLC6
(cost—$37,141,889) | | | 37,141,889 | | | | 37,141,889 | | |
Total investments
(cost—$849,238,048)—
104.39% | | | | | | | 826,819,770 | | |
Liabilities in excess of other
assets—(4.39)% | | | (34,762,520 | ) | |
| Net assets—100.00% | | $ | 792,057,250 | | |
156
UBS PACE Select Advisors Trust
UBS PACE International Equity Investments
Portfolio of investments—July 31, 2010
Aggregate cost for federal income tax purposes was $860,111,186; and net unrealized depreciation consisted of:
| Gross unrealized appreciation | | $ | 45,111,204 | | |
| Gross unrealized depreciation | | | (78,402,620 | ) | |
| Net unrealized depreciation | | $ | (33,291,416 | ) | |
* Non-income producing security.
1 Security, or portion thereof, was on loan at July 31, 2010.
2 Illiquid securities representing 0.00% of net assets as of July 31, 2010.
3 Security is traded on the Hong Kong Exchange.
4 Security is traded on the London Exchange.
5 Security is traded on the Netherlands Exchange.
6 The table below details the Portfolio's transaction activity in an affiliated issuer during the year ended July 31, 2010.
| Security description | | Value at
07/31/09 | | Purchases
during the
year ended
07/31/10 | | Sales
during the
year ended
07/31/10 | | Value at
07/31/10 | | Net income
earned from
affiliate for the
year ended
07/31/10 | |
| UBS Private Money Market Fund LLC | | $ | 113,067,670 | | | $ | 576,999,231 | | | $ | 652,925,012 | | | $ | 37,141,889 | | | $ | 591,491 | | |
ADR American Depositary Receipt
REIT Real Estate Investment Trust
STRIP Separate Trading of Registered Interest and Principal of Securities
VVPR Verminderde Voorheffing Precompte Reduit (Belgium dividend coupon)
Futures contracts
Number of
contracts | | Currency | | Buy contracts | | Expiration
dates | | Cost | | Current
value | | Unrealized
appreciation | |
| | 43 | | | EUR | | DJ Euro Stoxx 50 Index Futures | | September 2010 | | $ | 1,495,295 | | | $ | 1,537,759 | | | $ | 42,464 | | |
| | 8 | | | GBP | | FTSE 100 Index Futures | | September 2010 | | | 643,354 | | | | 657,135 | | | | 13,781 | | |
| | | | | | | | | $ | 2,138,649 | | | $ | 2,194,894 | | | $ | 56,245 | | |
Currency type abbreviations:
EUR Euro
GBP Great Britain Pound
Forward foreign currency contracts
| Counterparty | | Contracts to
deliver | | In
exchange for | | Maturity
dates | | Unrealized
appreciation
(depreciation) | |
| Barclays Bank PLC | | USD | 799,022 | | | EUR | 635,276 | | | 10/13/10 | | $ | 28,740 | | |
| Barclays Bank PLC | | USD | 1,207,295 | | | GBP | 794,740 | | | 10/13/10 | | | 39,369 | | |
| Barclays Bank PLC | | USD | 2,215,589 | | | SEK | 16,957,053 | | | 10/13/10 | | | 131,656 | | |
| BNP Paribas SA | | GBP | 1,828,248 | | | USD | 2,762,482 | | | 10/13/10 | | | (105,386 | ) | |
| Citibank N.A. | | SEK | 7,885,058 | | | USD | 1,022,830 | | | 10/13/10 | | | (68,643 | ) | |
| Credit Suisse London Branch | | USD | 1,600,125 | | | CHF | 1,691,652 | | | 10/13/10 | | | 24,984 | | |
| Toronto Dominion Bank | | HKD | 3,165,834 | | | USD | 406,642 | | | 10/13/10 | | | (1,142 | ) | |
| Toronto Dominion Bank | | JPY | 189,611,273 | | | USD | 2,177,338 | | | 10/13/10 | | | (18,746 | ) | |
| Toronto Dominion Bank | | USD | 1,037,719 | | | AUD | 1,240,000 | | | 10/13/10 | | | 74,917 | | |
| | | | | | | | | | | | | $ | 105,749 | | |
157
UBS PACE Select Advisors Trust
UBS PACE International Equity Investments
Portfolio of investments—July 31, 2010
Currency type abbreviations:
AUD Australian Dollar
CHF Swiss Franc
EUR Euro
GBP Great Britain Pound
HKD Hong Kong Dollar
JPY Japanese Yen
SEK Swedish Krona
USD United States Dollar
The following is a summary of the fair valuations according to the inputs used as of July 31, 2010 in valuing the Portfolio's investments:
| | | Unadjusted
quoted prices in
active markets for
identical investments
(Level 1) | | Other significant
observable inputs
(Level 2) | | Unobservable
inputs
(Level 3) | | Total | |
| Common stocks | | $ | 777,801,363 | | | $ | — | | | $ | — | | | $ | 777,801,363 | | |
| Preferred stock | | | 944,518 | | | | — | | | | — | | | | 944,518 | | |
| Repurchase agreement | | | — | | | | 10,932,000 | | | | — | | | | 10,932,000 | | |
Investment of cash collateral from
securities loaned | | | — | | | | 37,141,889 | | | | — | | | | 37,141,889 | | |
| Futures contracts | | | 56,245 | | | | — | | | | — | | | | 56,245 | | |
| Forward foreign currency contracts | | | — | | | | 105,749 | | | | — | | | | 105,749 | | |
| Total | | $ | 778,802,126 | | | $ | 48,179,638 | | | $ | — | | | $ | 826,981,764 | | |
At July 31, 2010, there were no transfers between Level 1 and Level 2.
The following is a rollforward of the Portfolio's investment that was valued using unobservable inputs (Level 3) for the year ended July 31, 2010:
| | | Rights | |
| Beginning balance | | $ | 0 | | |
| Net purchases/(sales) | | | (0 | ) | |
| Accrued discounts/(premiums) | | | — | | |
| Total realized gain/(loss) | | | 0 | | |
| Net change in unrealized appreciation/depreciation | | | — | | |
| Net transfers in/(out) of Level 3 | | | — | | |
| Ending balance | | $ | — | | |
See accompanying notes to financial statements.
158
UBS PACE Select Advisors Trust
UBS PACE International Emerging Markets Equity Investments
Performance
For the 12 months ended July 31, 2010, the Portfolio's Class P shares returned 16.85%, before the deduction of the maximum UBS PACE Select program fee. (The Class P shares returned 14.53%, after the deduction of the maximum UBS PACE Select program fee, for the same 12-month period.) In comparison, the MSCI Emerging Markets Index (the "benchmark") returned 20.24%, and the Lipper Emerging Markets Funds category posted a median return of 19.66%. (Returns for all share classes over various time periods are shown in the "Performance at a glance" table on page 163. Please note that the returns shown do not reflect the deduction of taxes that a shareholder would pay on Portfolio distributions or the redemption of Portfolio shares.) For a detailed commentary on the market environment in general during the reporting period, please refer to page 2.
Sub-Advisors' Comments
Gartmore
Our portion of the Portfolio underperformed the benchmark during the reporting period. Among our key detractors were overweight positions in Sino-Ocean, Bumi and Grasim. Hong Kong property stocks came under pressure during the third quarter of 2009. Despite reporting a 7% rise in annual underlying net profits due to higher sales, Hong Kong property developer Sino-Ocean Land underperformed during the period, as some investors became concerned that the government would act to stem credit growth. Indonesia's Bumi, the world's second-largest thermal coal exporter, performed very strongly prior to the review period, and earnings growth was well ahead of consensus expectations. However, by the fourth quarter of 2009, concerns that Bumi might need additional debt funding as it acquired new coal assets weighed on its stock. During the second quarter of 2010, Indian materials company Grasim struggled after the Bombay Stock Exchange annou nced that the company will be eliminated from its main indices. During the period under review, we eliminated our holdings in Sino-Ocean, Bumi and Grasim given the issues described above.
Among our key contributors were overweight positions in Pruksa Real Estate, Baidu, Banpu and Shoprite. Thai house builder Pruksa reported record presales in the third quarter of 2009, the vast majority of which came from low-rise housing projects. Thai banks loosened their mortgage lending requirements and demand in the property market began to recover. In the first quarter of
UBS PACE Select Advisors Trust – UBS PACE International Emerging Markets Equity Investments
Investment Sub-Advisors:
Gartmore Global Partners ("Gartmore") and Mondrian Investment Partners Limited ("Mondrian")
Portfolio Managers:
Gartmore: Christopher Palmer;
Mondrian: Robert Akester, Ginny Chong, and Gregory Halton
Objective:
Capital appreciation
Investment process:
Gartmore seeks to identify companies where it believes the market has underestimated the prospects for earnings potential. Gartmore employs a stringent analysis of strategic factors, industry dynamics and the assessment of individual company franchises. It focuses on bottom-up stock picking within a risk-controlled environment.
Mondrian conducts research on a global basis in an effort to identify securities that have the potential for capital appreciation over a market cycle. The center of its research effort is a value-oriented dividend discount methodology toward individual securities and market analysis that identifies value across country boundaries. This approach focuses on future anticipated dividends, and discounts the value of those dividends back to what they would be worth if they were being paid today. Comparisons of the values of different possible investments are then made. In an international portfolio, currency returns can be an integral component of an investment's total return. Mondrian uses a
(continued on next page)
159
UBS PACE Select Advisors Trust
UBS PACE International Emerging Markets Equity Investments
Sub-Advisors' comments – continued
2010, Chinese technology company Baidu continued to perform strongly following Google's exit from China. The company controls over 64% of China's Internet search market, and is believed to be on target to grow this share to 79% next year. Banpu, a Thailand-based coal mine operator and power generator, was exceptionally well-placed to benefit from rising commodity prices, with higher demand from China boosting coal prices. In the third quarter of 2009, Banpu reported quarterly profits that exceeded forecasts, and the company offered considerable scope for a future positive earnings surprise. In the second quarter of 2010, South African retailer Shoprite rose after speculation that Wal-Mart may try to buy the company should it decide to expand into Africa.
Our portion of the Portfolio remains positioned for a shallow, yet broad-based global economic recovery. Overweight positions in the information technology and materials sectors have been maintained. Conversely, we maintain underweight positions in defensive market areas with lesser growth prospects, such as utilities, telecommunications and health care. We are seeking to emphasize stocks whose valuations remain attractive, relative to their industry, and are also looking for holdings poised to deliver strong growth in an economic recovery.
Mondrian
Our portion of the Portfolio underperformed the benchmark during the reporting period. Stock selection provided the greatest source of positive relative performance, with particularly strong results in Latin America and Asia. Market positioning also helped returns, although the effects of currency movements detracted from performance.
At the sector level, an overweight exposure to telecommunication services and stock selection within information technology negatively impacted relative returns. This was offset by good stock selection within the energy and financials sectors.
In Asia, stock selection was the primary factor driving returns, particularly in China, whereas our holdings in Korea and India detracted from results. At the stock level, Chinese company China Yurun Food Group and Hengan International produced significant gains, as increasing consumption of products ranging from pork to diapers drove robust profit growth for both companies. Returns in our portion of the Portfolio representing Korea and India were negatively impacted by the disappointing performance of Korea Tobacco and Ginseng ("KT&G") and Bharti Airtel. KT&G's defensive nature was out of favor in a rising market, while Bharti continued to suffer from increased competition in its core Indian telecommunication business. We eliminated Bharti from our portion of the Portfolio in June 2010 as its fundamentals had weakened.
In Latin America, our portion of the Portfolio benefited from overweights to Chile and Colombia, along with good stock selection in several markets. Our portion of the Portfolio also produced solid returns in the financials sector, where holdings in Bancolombia, Itausa (Brazil), Banco Santander Chile and Banco
Investment process (concluded)
purchasing power parity approach to assess the value of individual currencies. Purchasing power parity attempts to identify the amount of goods and services that a dollar will buy in the United States, and compares that to the amount of a foreign currency required to buy the same amount of goods and services in another country.
160
UBS PACE Select Advisors Trust
UBS PACE International Emerging Markets Equity Investments
Sub-Advisors' comments – concluded
Compartamos (Mexico) performed well. We believe the robust earnings growth of these companies demonstrates the resilience of their core lending business.
Our portion of the Portfolio was negatively impacted by an overweight to the weak European market, its exposure to the currency of the Czech Republic, and the poor performance of KazMunaiGas, a Kazakhstan company. However, we benefited from an overweight position to the strong-performing Turkish market.
In Africa and the Middle East, our portion of the Portfolio experienced mixed results from its telecommunication services holdings. In Egypt, Orascom Telecom was negatively impacted by an ongoing tax dispute with the Algerian government, while Mobinil declined in value as hopes of a takeover faded. However, the Israeli telecommunication operator Bezeq continued to perform well as its restructuring plan began to yield results. Bezeq was sold during the period under review to capture profits.
Special considerations
The Portfolio may be appropriate for long-term investors seeking capital appreciation who are able to withstand short-term fluctuations in the equity markets in return for potentially higher returns over the long term. The value of the Portfolio changes every day and can be affected by changes in interest rates, general market conditions and other political, social and economic developments, as well as specific matters relating to the companies in whose securities the Portfolio invests. It is important to note that an investment in the Portfolio is only one component of a balanced investment plan. The value of the Portfolio's investments in foreign securities may fall due to adverse political, social, and economic developments abroad and due to decreases in foreign currency values relative to the US dollar. These risks are greater for investments in emerging market issuers than for issuers in more developed countries.
161
UBS PACE Select Advisors Trust
UBS PACE International Emerging Markets Equity Investments
Illustration of an assumed investment of $10,000 in Class P shares of the Portfolio (unaudited)
The following graph depicts the performance of UBS PACE International Emerging Markets Equity Investments Class P shares versus the MSCI Emerging Markets Index over the 10 years ended July 31, 2010. The performance of the other classes will vary based upon the different class specific expenses and sales charges. The performance provided does not reflect the deduction of taxes that a shareholder would pay on Portfolio distributions or the redemption of Portfolio shares. Past performance is no guarantee of future results. Share price and returns will vary with market conditions; investors may realize a gain or loss upon redemption. It is important to note that UBS PACE International Emerging Markets Equity Investments is a professionally managed portfolio while the Index is not available for investment and is unmanaged. The comparison is shown for illustration purposes only.
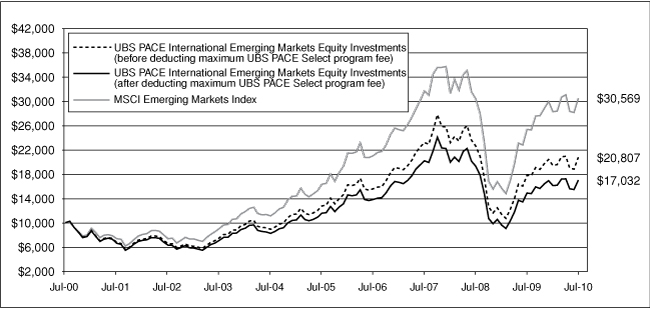
162
UBS PACE Select Advisors Trust
UBS PACE International Emerging Markets Equity Investments
Performance at a glance (unaudited)
| Average annual total returns for periods ended 07/31/10 | | 1 year | | 5 years | | 10 years | | Since
inception1 | |
| Before deducting | | Class A2 | | | 16.81 | % | | | 10.23 | % | | N/A | | | 10.01 | % | |
| maximum sales charge | | Class B3 | | | 15.84 | % | | | 9.31 | % | | N/A | | | 10.28 | %7 | |
| or UBS PACE Select | | Class C4 | | | 15.96 | % | | | 9.40 | % | | N/A | | | 9.96 | % | |
| program fee | | Class Y5 | | | 17.15 | % | | | 10.67 | % | | N/A | | | 10.38 | % | |
| | | Class P6 | | | 16.85 | % | | | 10.27 | % | | | 7.60 | % | | | 5.17 | % | |
| After deducting | | Class A2 | | | 10.34 | % | | | 8.99 | % | | N/A | | | 9.37 | % | |
| maximum sales charge | | Class B3 | | | 10.84 | % | | | 9.09 | % | | N/A | | | 10.28 | %7 | |
| or UBS PACE Select | | Class C4 | | | 14.96 | % | | | 9.40 | % | | N/A | | | 9.96 | % | |
| program fee | | Class P6 | | | 14.53 | % | | | 8.08 | % | | | 5.47 | % | | | 3.09 | % | |
| MSCI Emerging Markets Index8 | | | 20.24 | % | | | 13.35 | % | | | 11.82 | % | | | 7.76 | % | |
| Lipper Emerging Markets Funds median | | | 19.66 | % | | | 11.08 | % | | | 11.01 | % | | | 7.44 | % | |
Average annual total returns for periods ended June 30, 2010, after deduction of the maximum sales charge or UBS PACE Select program fee, were as follows: Class A—1-year period, 11.15%; 5-year period, 8.18%; since inception, 8.33%; Class B—1-year period, 11.59%; 5-year period, 8.27%; since inception, 9.23%; Class C—1-year period, 15.70%; 5-year period, 8.59%; since inception, 8.93%; Class Y—1-year period, 17.82%; 5-year period, 9.84%; since inception, 9.31%; Class P��1-year period, 15.19%; 5-year period, 7.27%; 10-year period, 3.81%; since inception, 2.43%.
The annualized gross and net expense ratios, respectively, for each class of shares as in the November 28, 2009 prospectuses, were as follows: Class A—1.93% and 1.93%; Class B—2.72% and 2.72%; Class C—2.67% and 2.67%; Class Y—1.47% and 1.47%; and Class P—1.97% and 1.97%. Net expenses reflect fee waivers and/or expense reimbursements, if any, pursuant to an agreement that is in effect to cap the expenses.
1 Since inception returns are calculated as of commencement of issuance on August 24, 1995 for Class P shares, December 11, 2000 for Class A shares, December 22, 2000 for Class B shares, December 1, 2000 for Class C shares and February 9, 2001 for Class Y shares. Since inception returns for the Index and Lipper median are shown as of August 31, 1995, which is the month-end after the inception date of the oldest share class (Class P).
2 Maximum sales charge for Class A shares is 5.5%. Class A shares bear ongoing 12b-1 service fees.
3 Maximum contingent deferred sales charge for Class B shares is 5% imposed on redemptions and is reduced to 0% after a maximum of six years. Class B shares bear ongoing 12b-1 service and distribution fees.
4 Maximum contingent deferred sales charge for Class C shares is 1% imposed on redemptions and is reduced to 0% after one year. Class C shares bear ongoing 12b-1 service and distribution fees. Prior to September 30, 2003, Class C shares were subject to a maximum front-end sales charge of 1.00%; this front-end sales charge is not reflected in the average annual total return presented for the Class C shares shown above.
5 The Portfolio offers Class Y shares to a limited group of eligible investors, including certain qualifying retirement plans. Class Y shares do not bear initial or contingent deferred sales charges or ongoing 12b-1 service and distribution fees.
6 Class P shares do not bear initial or contingent deferred sales charges or ongoing 12b-1 service and distribution fees, but are subject to a maximum annual UBS PACE Select program fee of 2% of the value of Class P shares. Prior to June 14, 2010, the maximum annual UBS PACE Select program fee was 1.5% of the value of Class P shares.
7 Assumes the conversion of Class B to Class A shares at the end of the sixth year.
8 The MSCI Emerging Markets Index is a market capitalization-weighted index composed of companies representative of the market structure of 21 emerging market countries in Europe, Latin America, and the Pacific Basin. The Index is constructed and managed with a view to being fully investable from the perspective of international institutional investors. Investors should note that indices do not reflect the deduction of fees and expenses.
If an investor sells or exchanges shares less than 90 days after purchase, a redemption fee of 1.00% of the amount sold or exchanged will be deducted at the time of the transaction, except as noted otherwise in the prospectuses.
Past performance does not predict future performance, and the performance information provided does not reflect the deduction of taxes that a shareholder would pay on Portfolio distributions or the redemption of Portfolio shares. The return and principal value of an investment will fluctuate, so that an investor's shares, when redeemed, may be worth more or less than their original cost. Performance results assume reinvestment of all dividends and capital gain distributions at net asset value on the ex-dividend dates. Current performance may be higher or lower than the performance data quoted. For month-end performance figures, please visit http://www.ubs.com.
Lipper peer group data calculated by Lipper Inc.; used with permission. The Lipper median is the return of the fund that places in the middle of a Lipper peer group.
163
UBS PACE Select Advisors Trust
UBS PACE International Emerging Markets Equity Investments
Portfolio statistics (unaudited)
| Characteristics | | 07/31/10 | |
| Net assets (mm) | | $ | 277.3 | | |
| Number of holdings | | | 157 | | |
| Portfolio composition1 | | 07/31/10 | |
| Common stocks, preferred stocks and warrants | | | 77.5 | % | |
| ADRs, GDRs and NVDRs | | | 21.7 | | |
| Cash equivalents and other assets less liabilities | | | 0.8 | | |
| Total | | | 100.0 | % | |
| Regional allocation (equity investments)1 | | 07/31/10 | |
| Asia | | | 52.3 | % | |
| The Americas | | | 23.8 | | |
| Europe and European territories | | | 9.3 | | |
| Africa | | | 7.8 | | |
| Russia | | | 6.0 | | |
| Total | | | 99.2 | % | |
| Top five countries (equity investments)1 | | 07/31/10 | |
| Brazil | | | 15.5 | % | |
| Taiwan | | | 10.0 | | |
| South Korea | | | 8.0 | | |
| China | | | 8.0 | | |
| Hong Kong | | | 7.0 | | |
| Total | | | 48.5 | % | |
| Top five sectors1 | | 07/31/10 | |
| Financials | | | 26.2 | % | |
| Information technology | | | 13.6 | | |
| Energy | | | 11.6 | | |
| Consumer staples | | | 10.0 | | |
| Materials | | | 9.7 | | |
| Total | | | 71.1 | % | |
| Top ten equity holdings1 | | 07/31/10 | |
| Itau Unibanco Holdings SA, ADR | | | 2.4 | % | |
| China Construction Bank Corp. | | | 2.4 | | |
| China Mobile Ltd. | | | 2.1 | | |
| Taiwan Semiconductor Manufacturing Co. Ltd. | | | 1.9 | | |
| Samsung Electronics Co. Ltd. | | | 1.8 | | |
| Turkiye Garanti Bankasi A.S. | | | 1.6 | | |
| PT Perusahaan Gas Negara | | | 1.5 | | |
| Companhia de Concessoes Rodoviarias (CCR) | | | 1.5 | | |
| Vale SA | | | 1.5 | | |
| Bancolombia SA, ADR | | | 1.5 | | |
| Total | | | 18.2 | % | |
1 Weightings represent percentages of the Portfolio's net assets as of July 31, 2010. The Portfolio is actively managed and its composition will vary over time.
ADR American Depositary Receipt
GDR Global Depositary Receipt
NVDR Non Voting Depositary Receipt
164
UBS PACE Select Advisors Trust
UBS PACE International Emerging Markets Equity Investments
Industry diversification—(unaudited)
As a percentage of net assets as of July 31, 2010
Common stocks
| Airlines | | | 0.23 | % | |
| Automobiles | | | 1.41 | | |
| Chemicals | | | 1.97 | | |
| Commercial banks | | | 16.63 | | |
| Communications equipment | | | 0.67 | | |
| Computers & peripherals | | | 2.32 | | |
| Construction & engineering | | | 0.12 | | |
| Construction materials | | | 0.90 | | |
| Consumer finance | | | 0.62 | | |
| Distributors | | | 0.51 | | |
| Diversified financial services | | | 2.25 | | |
| Diversified telecommunication services | | | 1.43 | | |
| Electric utilities | | | 3.68 | | |
| Electronic equipment, instruments & components | | | 1.02 | | |
| Food & staples retailing | | | 3.53 | | |
| Food products | | | 2.58 | | |
| Gas utilities | | | 2.13 | | |
| Hotels, restaurants & leisure | | | 0.50 | | |
| Household products | | | 0.39 | | |
| Independent power producers & energy traders | | | 1.31 | | |
| Industrial conglomerates | | | 0.54 | | |
| Insurance | | | 0.97 | | |
| Internet software & services | | | 0.70 | | |
| IT services | | | 2.83 | | |
| Machinery | | | 1.58 | | |
| Marine | | | 0.82 | | |
| Media | | | 0.32 | | |
| Metals & mining | | | 4.06 | | |
| Oil, gas & consumable fuels | | | 11.56 | | |
| Personal products | | | 0.50 | | |
| Pharmaceuticals | | | 0.63 | | |
| Real estate investment trusts (REITs) | | | 0.38 | | |
| Real estate management & development | | | 1.77 | | |
| Semiconductors & semiconductor equipment | | | 5.63 | | |
| Specialty retail | | | 0.52 | | |
| Tobacco | | | 1.27 | | |
| Transportation infrastructure | | | 4.23 | | |
| Water utilities | | | 0.16 | | |
| Wireless telecommunication services | | | 7.48 | | |
| Total common stocks | | | 90.15 | | |
| Preferred stocks | |
| Automobiles | | | 0.24 | % | |
| Beverages | | | 1.18 | | |
| Commercial banks | | | 3.55 | | |
| Food & staples retailing | | | 0.58 | | |
| Independent power producers & energy traders | | | 0.23 | | |
| Metals & mining | | | 2.75 | | |
| Semiconductors & semiconductor equipment | | | 0.48 | | |
| Total preferred stocks | | | 9.01 | | |
| Warrants | | | 0.00 | | |
| Repurchase agreement | | | 0.95 | | |
| Investment of cash collateral from securities loaned | | | 2.64 | | |
| Liabilities in excess of other assets | | | (2.75 | ) | |
| Net assets | | | 100.00 | % | |
165
UBS PACE Select Advisors Trust
UBS PACE International Emerging Markets Equity Investments
Portfolio of investments—July 31, 2010
| Security description | | Number of
shares | | Value | |
| Common stocks—90.15% | |
| Bermuda—2.10% | |
| China Gas Holdings Ltd. | | | 1,372,000 | | | $ | 695,936 | | |
| China Yurun Food Group Ltd. | | | 579,000 | | | | 1,900,804 | | |
| Credicorp Ltd. | | | 17,011 | | | | 1,662,315 | | |
| Kunlun Energy Co. Ltd. | | | 1,207,500 | | | | 1,573,209 | | |
| Total Bermuda common stocks | | | | | | | 5,832,264 | | |
| Brazil—7.21% | |
| AES Tiete SA | | | 41,600 | | | | 444,194 | | |
| Brasil Foods SA | | | 119,052 | | | | 1,672,603 | | |
| Cielo SA | | | 309,740 | | | | 2,782,518 | | |
Companhia de Concessoes
Rodoviarias (CCR) | | | 182,790 | | | | 4,163,388 | | |
Companhia Siderurgica
Nacional SA (CSN), ADR | | | 83,295 | | | | 1,398,523 | | |
| CPFL Energia SA | | | 121,900 | | | | 2,813,930 | | |
| CPFL Energia SA, ADR1 | | | 3,500 | | | | 244,545 | | |
OGX Petroleo e Gas
Participacoes SA* | | | 82,200 | | | | 868,830 | | |
Petroleo Brasileiro
SA—Petrobras, ADR | | | 73,514 | | | | 2,675,910 | | |
| Redecard SA | | | 165,100 | | | | 2,493,209 | | |
| Santos Brasil Participacoes SA | | | 44,900 | | | | 428,117 | | |
| Total Brazil common stocks | | | | | | | 19,985,767 | | |
| Cayman Islands—3.41% | |
| Agile Property Holdings Ltd. | | | 924,000 | | | | 1,203,847 | | |
| Baidu, Inc., ADR* | | | 23,800 | | | | 1,937,558 | | |
Hengan International
Group Co. Ltd. | | | 162,000 | | | | 1,395,275 | | |
Kingboard Chemical
Holdings Ltd. | | | 323,000 | | | | 1,494,927 | | |
| Want Want China Holdings Ltd. | | | 1,305,000 | | | | 1,021,487 | | |
| Wynn Macau Ltd.* | | | 819,000 | | | | 1,393,908 | | |
| Xinao Gas Holdings Ltd. | | | 430,000 | | | | 1,017,496 | | |
Total Cayman Islands
common stocks | | | | | | | 9,464,498 | | |
| Chile—1.89% | |
| Banco Santander Chile SA, ADR | | | 19,300 | | | | 1,602,093 | | |
| Enersis SA, ADR | | | 153,000 | | | | 3,173,220 | | |
Inversiones Aguas Metropolitanas
SA (IAM), ADR2 | | | 17,100 | | | | 452,199 | | |
| Total Chile common stocks | | | | | | | 5,227,512 | | |
| China—7.99% | |
| China Bluechemical Ltd., Class H | | | 1,274,000 | | | | 816,803 | | |
| China Construction Bank Corp. | | | 7,736,900 | | | | 6,564,039 | | |
China Merchants Bank Co. Ltd.,
Class H | | | 686,445 | | | | 1,833,760 | | |
China Pacific Insurance (Group)
Co. Ltd., Class H | | | 326,200 | | | | 1,301,860 | | |
China Shenhua Energy
Co. Ltd., Class H | | | 215,500 | | | | 829,540 | | |
| Security description | | Number of
shares | | Value | |
| Common stocks—(continued) | |
| China—(concluded) | |
China Shipping Development
Co. Ltd., Class H | | | 1,548,000 | | | $ | 2,275,914 | | |
Industrial & Commercial
Bank of China Ltd., Class H | | | 5,116,930 | | | | 3,906,456 | | |
Jiangsu Expressway Co. Ltd.,
Class H | | | 1,632,000 | | | | 1,588,403 | | |
Lianhua Supermarket Holdings
Co. Ltd., Class H | | | 365,000 | | | | 1,574,187 | | |
| Weichai Power Co. Ltd., Class H | | | 178,800 | | | | 1,477,819 | | |
| Total China common stocks | | | | | | | 22,168,781 | | |
| Colombia—1.49% | |
| Bancolombia SA, ADR | | | 70,687 | | | | 4,144,379 | | |
| Czech Republic—1.51% | |
| CEZ A.S. | | | 45,635 | | | | 2,086,461 | | |
| Komercni Banka A.S. | | | 5,268 | | | | 1,022,829 | | |
| Telefonica O2 Czech Republic A.S. | | | 47,139 | | | | 1,077,488 | | |
Total Czech Republic
common stocks | | | | | | | 4,186,778 | | |
| Egypt—1.23% | |
Commercial International Bank
Egypt S.A.E. (CIB) | | | 197,210 | | | | 1,346,327 | | |
Egyptian Co. for Mobile Services
(MobiNil) | | | 17,292 | | | | 490,461 | | |
Orascom Telecom Holding
S.A.E., GDR | | | 334,926 | | | | 1,567,454 | | |
| Total Egypt common stocks | | | | | | | 3,404,242 | | |
| Hong Kong—6.97% | |
| Beijing Enterprises Holdings Ltd. | | | 227,000 | | | | 1,500,669 | | |
| China Agri-Industries Holdings Ltd. | | | 1,093,000 | | | | 1,236,881 | | |
China Merchants Holdings
International Co. Ltd. | | | 1,044,000 | | | | 3,951,542 | | |
| China Mobile Ltd. | | | 563,500 | | | | 5,698,478 | | |
China Power International
Development Ltd. | | | 1,367,000 | | | | 300,942 | | |
China Resources Power
Holdings Co. Ltd. | | | 750,000 | | | | 1,637,592 | | |
| CNOOC Ltd. | | | 2,345,900 | | | | 3,950,354 | | |
| Link REIT | | | 400,000 | | | | 1,040,232 | | |
| Total Hong Kong common stocks | | | | | | | 19,316,690 | | |
| India—5.72% | |
| Ashok Leyland Ltd. | | | 1,002,200 | | | | 1,532,294 | | |
| Axis Bank Ltd. | | | 123,893 | | | | 3,586,770 | | |
| Cairn India Ltd.* | | | 217,600 | | | | 1,567,817 | | |
| Canara Bank Ltd. | | | 179,372 | | | | 1,851,701 | | |
| HCL Technologies Ltd. | | | 96,806 | | | | 818,173 | | |
| Mphasis Ltd. | | | 136,554 | | | | 1,738,669 | | |
| Rural Electrification Corp. Ltd. | | | 341,249 | | | | 2,230,013 | | |
| Sesa Goa Ltd. | | | 167,819 | | | | 1,306,424 | | |
166
UBS PACE Select Advisors Trust
UBS PACE International Emerging Markets Equity Investments
Portfolio of investments—July 31, 2010
| Security description | | Number of
shares | | Value | |
| Common stocks—(continued) | |
| India—(concluded) | |
| Tata Power Co. Ltd. | | | 43,408 | | | $ | 1,235,638 | | |
| Total India common stocks | | | | | | | 15,867,499 | | |
| Indonesia—2.80% | |
| Adhi Karya Tbk PT | | | 4,584,000 | | | | 332,972 | | |
| PT Bank Mandiri Tbk | | | 2,707,600 | | | | 1,815,455 | | |
| PT Perusahaan Gas Negara | | | 9,281,100 | | | | 4,200,532 | | |
| PT Semen Gresik (Persero) Tbk | | | 1,380,900 | | | | 1,427,426 | | |
| Total Indonesia common stocks | | | | | | | 7,776,385 | | |
| Kazakhstan—0.52% | |
KazMunaiGas Exploration
Production, GDR | | | 74,143 | | | | 1,450,237 | | |
| Malaysia—1.66% | |
| Axiata Group Berhad* | | | 1,165,700 | | | | 1,561,107 | | |
| CIMB Group Holdings Berhad | | | 589,700 | | | | 1,371,827 | | |
| Maxis Berhad | | | 996,800 | | | | 1,657,677 | | |
| Total Malaysia common stocks | | | | | | | 4,590,611 | | |
| Mexico—4.93% | |
America Movil SA de C.V., ADR,
Series L | | | 61,871 | | | | 3,069,420 | | |
| Banco Compartamos SA de C.V. | | | 286,200 | | | | 1,704,978 | | |
Genomma Lab Internacional SA,
Series B* | | | 411,400 | | | | 1,400,940 | | |
Grupo Aeroportuario del Pacifico
SA de C.V., ADR | | | 49,500 | | | | 1,608,255 | | |
Grupo Mexico SAB de C.V.,
Series B | | | 603,211 | | | | 1,598,014 | | |
| Grupo Televisa SA, ADR | | | 46,600 | | | | 885,400 | | |
Kimberly-Clark de Mexico SA de
C.V., Series A | | | 170,500 | | | | 1,070,950 | | |
| Mexichem SA de C.V. | | | 360,300 | | | | 997,769 | | |
Wal-Mart de Mexico SA de
C.V., Series V | | | 571,433 | | | | 1,347,682 | | |
| Total Mexico common stocks | | | | | | | 13,683,408 | | |
| Morocco—0.18% | |
| Compagnie Generale Immobiliere* | | | 2,470 | | | | 491,698 | | |
| Philippines—1.25% | |
| Megaworld Corp. | | | 32,541,800 | | | | 1,071,629 | | |
Philippine Long Distance
Telephone Co., ADR | | | 44,500 | | | | 2,389,650 | | |
| Total Philippines common stocks | | | | | | | 3,461,279 | | |
| Poland—1.28% | |
| Bank Pekao SA | | | 12,972 | | | | 691,643 | | |
| KGHM Polska Miedz SA | | | 23,751 | | | | 824,409 | | |
| Polska Grupa Energetyczna SA* | | | 91,202 | | | | 656,868 | | |
Powszechny Zaklad
Ubezpieczen SA* | | | 10,741 | | | | 1,376,693 | | |
| Total Poland common stocks | | | | | | | 3,549,613 | | |
| Security description | | Number of
shares | | Value | |
| Common stocks—(continued) | |
| Russia—5.97% | |
| Gazprom, ADR | | | 80,946 | | | $ | 1,748,434 | | |
| LUKOIL, ADR | | | 45,712 | | | | 2,610,155 | | |
| Magnit3,4 | | | 16,126 | | | | 1,580,407 | | |
Magnitogorsk Iron & Steel
Works, GDR | | | 106,450 | | | | 1,135,821 | | |
Mining and Metallurgical Co.
Norilsk Nickel, ADR * | | | 78,800 | | | | 1,295,472 | | |
| Mobile TeleSystems, ADR | | | 29,250 | | | | 649,350 | | |
| NovaTek OAO, GDR | | | 23,083 | | | | 1,731,225 | | |
| Raspadskaya* | | | 151,575 | | | | 592,658 | | |
| Rosneft Oil Co., GDR | | | 201,516 | | | | 1,346,127 | | |
| Sberbank | | | 646,274 | | | | 1,809,567 | | |
| SOLLERS3,4,* | | | 52,793 | | | | 783,925 | | |
| Tatneft, ADR5 | | | 3,400 | | | | 105,094 | | |
| Tatneft, ADR6 | | | 38,000 | | | | 1,174,580 | | |
| Total Russia common stocks | | | | | | | 16,562,815 | | |
| South Africa—6.42% | |
| Adcock Ingram Holdings Ltd. | | | 42,000 | | | | 355,505 | | |
| African Bank Investments Ltd. | | | 568,711 | | | | 2,611,538 | | |
| Imperial Holdings Ltd. | | | 107,305 | | | | 1,418,672 | | |
| Kumba Iron Ore Ltd. | | | 31,403 | | | | 1,592,695 | | |
| Mr. Price Group Ltd. | | | 209,600 | | | | 1,450,629 | | |
Pretoria Portland
Cement Co. Ltd. | | | 240,809 | | | | 1,064,541 | | |
| Sasol Ltd. | | | 86,183 | | | | 3,414,124 | | |
| Shoprite Holdings Ltd. | | | 192,083 | | | | 2,406,550 | | |
| Standard Bank Group Ltd. | | | 139,078 | | | | 2,163,785 | | |
| Tiger Brands Ltd. | | | 52,988 | | | | 1,314,668 | | |
Total South Africa
common stocks | | | | | | | 17,792,707 | | |
| South Korea—7.31% | |
| Hyundai Heavy Industries Co. Ltd. | | | 6,062 | | | | 1,375,777 | | |
| Hyundai Motor Co. | | | 15,716 | | | | 1,979,320 | | |
| KB Financial Group, Inc. | | | 51,260 | | | | 2,231,380 | | |
| KB Financial Group, Inc., ADR1 | | | 30,116 | | | | 1,288,362 | | |
| KT&G Corp. | | | 70,026 | | | | 3,515,875 | | |
| LG Chem Ltd. | | | 7,804 | | | | 2,170,206 | | |
| Melfas, Inc.* | | | 12,341 | | | | 689,508 | | |
| Samsung Electronics Co. Ltd. | | | 7,201 | | | | 4,930,212 | | |
| Seoul Semiconductor Co. Ltd.1 | | | 23,453 | | | | 863,325 | | |
| Woori Finance Holdings Co. Ltd. | | | 98,830 | | | | 1,227,987 | | |
Total South Korea
common stocks | | | | | | | 20,271,952 | | |
| Taiwan—9.99% | |
| Asustek Computer, Inc. | | | 185,777 | | | | 1,400,132 | | |
| Chunghwa Telecom Co. Ltd. | | | 257,272 | | | | 545,158 | | |
Chunghwa Telecom
Co. Ltd., ADR* | | | 110,493 | | | | 2,336,927 | | |
| Compal Electronics, Inc. | | | 1,350,500 | | | | 1,768,018 | | |
167
UBS PACE Select Advisors Trust
UBS PACE International Emerging Markets Equity Investments
Portfolio of investments—July 31, 2010
| Security description | | Number of
shares | | Value | |
| Common stocks—(concluded) | |
| Taiwan—(concluded) | |
| Delta Electronics, Inc. | | | 390,000 | | | $ | 1,344,891 | | |
Far EasTone Telecommunications
Co. Ltd. | | | 822,530 | | | | 1,144,845 | | |
| Fubon Financial Holding Co. Ltd.* | | | 1,130,000 | | | | 1,385,897 | | |
| HTC Corp. | | | 100,800 | | | | 1,849,686 | | |
| Lite-On Technology Corp. | | | 2,561,613 | | | | 3,269,617 | | |
| MediaTek, Inc. | | | 183,652 | | | | 2,484,533 | | |
| Powertech Technology, Inc. | | | 434,100 | | | | 1,327,626 | | |
| President Chain Store Corp. | | | 627,680 | | | | 2,056,779 | | |
Taiwan Semiconductor
Manufacturing Co. Ltd. | | | 2,723,285 | | | | 5,303,197 | | |
| TSRC Corp. | | | 1,022,000 | | | | 1,484,672 | | |
| Total Taiwan common stocks | | | | | | | 27,701,978 | | |
| Thailand—3.12% | |
| Banpu Public Co. Ltd., NVDR | | | 98,038 | | | | 1,895,452 | | |
Kasikornbank Public
Co. Ltd., NVDR | | | 173,900 | | | | 538,807 | | |
Kasikornbank Public
Co. Ltd., PLC | | | 311,200 | | | | 1,002,782 | | |
Preuksa Real Estate Public
Co. Ltd.3,4 | | | 2,899,900 | | | | 2,147,409 | | |
| PTT Public Co. Ltd.4 | | | 306,200 | | | | 2,419,241 | | |
Thai Airways International
Public Co. Ltd., NVDR | | | 600,000 | | | | 641,363 | | |
| Total Thailand common stocks | | | | | | | 8,645,054 | | |
| Turkey—4.20% | |
| BIM Birlesik Magazalar A.S. | | | 26,552 | | | | 814,776 | | |
| Tofas Turk Otomobil Fabrikasi A.S. | | | 301,957 | | | | 1,151,972 | | |
Tupras-Turkiye Petrol
Rafinerileri A.S. | | | 118,418 | | | | 2,690,961 | | |
Turkcell Iletisim Hizmetleri A.S.
(Turkcell) | | | 429,385 | | | | 2,521,270 | | |
| Turkiye Garanti Bankasi A.S. | | | 862,172 | | | | 4,461,877 | | |
| Total Turkey common stocks | | | | | | | 11,640,856 | | |
| United Kingdom—1.00% | |
| Antofagasta PLC | | | 97,943 | | | | 1,518,430 | | |
| Tanjong PLC4 | | | 199,800 | | | | 1,246,159 | | |
Total United Kingdom
common stocks | | | | | | | 2,764,589 | | |
Total common stocks
(cost—$212,443,400) | | | | | | | 249,981,592 | | |
| Preferred stocks—9.01% | |
| Brazil—8.29% | |
| AES Tiete SA | | | 50,500 | | | | 634,552 | | |
Companhia Brasileira de
Distribuicao Grupo Pao de
Acucar, ADR1 | | | 24,544 | | | | 1,596,833 | | |
Companhia de Bebidas das
Americas (AmBev), ADR1 | | | 30,074 | | | | 3,284,682 | | |
| Itau Unibanco Holdings SA, ADR | | | 302,463 | | | | 6,772,146 | | |
| Security description | | Number of
shares | | Value | |
| Preferred stocks—(concluded) | |
| Brazil—(concluded) | |
| Itausa-Investimentos Itau SA | | | 412,098 | | | $ | 3,064,727 | | |
| Vale SA, ADR | | | 143,300 | | | | 3,472,159 | | |
| Vale SA, Class A | | | 171,478 | | | | 4,160,204 | | |
| Total Brazil preferred stocks | | | | | | | 22,985,303 | | |
| South Korea—0.72% | |
| Hyundai Motor Co. | | | 14,994 | | | | 656,501 | | |
| Samsung Electronics Co. Ltd. | | | 2,840 | | | | 1,337,092 | | |
| Total South Korea preferred stocks | | | | | | | 1,993,593 | | |
Total preferred stocks
(cost—$19,781,331) | | | | | | | 24,978,896 | | |
| | | Number of
warrants | | | |
| Warrants*—0.00% | |
| Cayman Islands—0.00% | |
Kingboard Chemical
Holdings Ltd.,
strike price 40 HKD,
expires 10/31/12
(cost—$0) | | | 32,800 | | | | 13,048 | | |
| | | Face
amount | | | |
| Repurchase agreement—0.95% | |
Repurchase agreement dated
07/30/10 with State Street
Bank & Trust Co., 0.010%
due 08/02/10, collateralized
by $2,589,739 US Treasury
Notes, 2.125% to 3.125%
due 04/30/15 to 04/30/17,
(value—$2,672,425);
proceeds: $2,620,002
(cost—$2,620,000) | | $ | 2,620,000 | | | | 2,620,000 | | |
| | | Number of
shares | | | |
| Investment of cash collateral from securities loaned—2.64% | |
| Money market fund—2.64% | |
UBS Private Money Market
Fund LLC7
(cost—$7,322,675) | | | 7,322,675 | | | | 7,322,675 | | |
Total investments
(cost—$242,167,406)—
102.75% | | | | | | | 284,916,211 | | |
Liabilities in excess
of other assets—(2.75)% | | | | | | | (7,631,488 | ) | |
| Net assets—100.00% | | $ | 277,284,723 | | |
168
UBS PACE Select Advisors Trust
UBS PACE International Emerging Markets Equity Investments
Portfolio of investments—July 31, 2010
Aggregate cost for federal income tax purposes was $248,189,724; and net unrealized appreciation consisted of:
| Gross unrealized appreciation | | $ | 42,904,422 | | |
| Gross unrealized depreciation | | | (6,177,935 | ) | |
| Net unrealized appreciation | | $ | 36,726,487 | | |
* Non-income producing security.
1 Security, or portion thereof, was on loan at July 31, 2010.
2 Security exempt from registration pursuant to Rule 144A under the Securities Act of 1933. This security, which represents 0.16% of net assets as of July 31, 2010, is considered liquid and may be resold in transactions exempt from registration, normally to qualified institutional buyers.
3 Illiquid securities representing 1.63% of net assets as of July 31, 2010.
4 Security is being fair valued by a valuation committee under the direction of the board of trustees.
5 Security is traded on the OTC Market.
6 Security is traded on the Turquoise Exchange.
7 The table below details the Portfolio's transaction activity in an affiliated issuer for the year ended July 31, 2010.
| Security description | | Value at
07/31/09 | | Purchases
during the
year ended
07/31/10 | | Sales
during the
year ended
07/31/10 | | Value at
07/31/10 | | Net income
earned from
affiliate for the
year ended
07/31/10 | |
| UBS Private Money Market Fund LLC | | $ | 18,398,485 | | | $ | 109,276,736 | | | $ | 120,352,546 | | | $ | 7,322,675 | | | $ | 41,142 | | |
ADR American Depositary Receipt
GDR Global Depositary Receipt
HKD Hong Kong Dollar
NVDR Non Voting Depositary Receipt
OTC Over The Counter
REIT Real Estate Investment Trust
The following is a summary of the fair valuations according to the inputs used as of July 31, 2010 in valuing the Portfolio's investments:
| | | Unadjusted
quoted prices in
active markets for
identical investments
(Level 1) | | Other significant
observable inputs
(Level 2) | | Unobservable
inputs
(Level 3) | | Total | |
| Common stocks | | $ | 243,771,493 | | | $ | 6,210,099 | | | $ | — | | | $ | 249,981,592 | | |
| Preferred stocks | | | 24,978,896 | | | | — | | | | — | | | | 24,978,896 | | |
| Warrants | | | 13,048 | | | | — | | | | — | | | | 13,048 | | |
| Repurchase agreement | | | — | | | | 2,620,000 | | | | — | | | | 2,620,000 | | |
Investment of cash collateral from
securities loaned | | | — | | | | 7,322,675 | | | | — | | | | 7,322,675 | | |
| Total | | $ | 268,763,437 | | | $ | 16,152,774 | | | $ | — | | | $ | 284,916,211 | | |
At July 31, 2010, there were no transfers between Level 1 and Level 2.
169
UBS PACE Select Advisors Trust
UBS PACE International Emerging Markets Equity Investments
Portfolio of investments—July 31, 2010
The following is a rollforward of the Portfolio's investment that was valued using unobservable inputs (Level 3) for the year ended July 31, 2010:
| | | Corporate
bond | |
| Beginning balance | | $ | 0 | | |
| Net purchases/(sales) | | | (0 | ) | |
| Accrued discounts/(premiums) | | | — | | |
| Total realized gain/(loss) | | | 0 | | |
| Net change in unrealized appreciation/depreciation | | | — | | |
| Net transfers in/(out) of Level 3 | | | — | | |
| Ending balance | | $ | — | | |
See accompanying notes to financial statements.
170
UBS PACE Select Advisors Trust
UBS PACE Global Real Estate Securities Investments
Performance
For the 12 months ended July 31, 2010, the Portfolio's Class P shares returned 20.10%, before the deduction of the maximum UBS PACE Select program fee. (The Class P shares returned 17.72%, after the deduction of the maximum UBS PACE Select program fee, for the same 12-month period.) In comparison, the FTSE EPRA/NAREIT Developed Index (the "benchmark") returned 24.60%, while the Lipper Global Real Estate Funds category (which is inclusive of US and international funds) posted a median return of 22.41%. (Returns for all share classes over various time periods are shown in the "Performance at a glance" table on page 175. Please note that the returns shown do not reflect the deduction of taxes that a shareholder would pay on Portfolio distributions or the redemption of Portfolio shares.) For a detailed commentary on the market environment in general during the reporting period, please refer to page 2.
Sub-Advisors' comments
Goldman Sachs Asset Management, L.P. was replaced by ING Clarion Real Estate Securities and Brookfield Investment Management Inc. effective November 17, 2009.
GSAM
During the period from August 1, 2009 through November 16, 2009, we outperformed the benchmark, primarily due to stock selection. Within our portion of the Portfolio, stock selection in China was the largest contributor to relative results, primarily due to our zero weight in Country Garden Holdings. Its stock significantly underperformed the Chinese property sector, which has been under pressure since the middle of 2009, given fears that the central government would raise interest rates. Additionally, stock selection in Continental Europe was beneficial for relative performance, primarily due to our overweight position in Unibail-Rodamco, which owns prime retail centers across Europe and high-quality office assets in Paris. The third largest contributor to relative returns stemmed from Hong Kong, primarily due to the fact that our portion of the Portfolio held no position in New World Development. It significantly underperforme d the Hong Kong property sector during the reporting period.
Conversely, stock selection in Australia was the largest detractor from results, in large part due to our underweight position in Westfield Group. We underweighted Westfield Group because of its exposure to the US retail market, which we believe will be affected by a sustained period of weak discretionary spending.
Additionally, stock selection in Japan was a detractor, primarily because of our overweight position in Mitsui Fudosan, which underperformed the Japanese property sector. The third largest detractor stemmed from
UBS PACE Select Advisors Trust – UBS PACE Global Real Estate Securities Investments
Investment Sub-Advisors:
Goldman Sachs Asset Management, L.P. ("GSAM") until November 16, 2009, ING Clarion Real Estate Securities ("ING CRES") and Brookfield Investment Management Inc. ("Brookfield") commencing November 17, 2009
Portfolio Managers:
GSAM: David Kruth and James Otness
ING CRES: T. Ritson Ferguson, Steven D. Burton and Joseph P. Smith;
Brookfield: Jason Baine, Bernhard Krieg and Brett Ward
Objective:
Total return
Investment process:
GSAM invests primarily in real estate investment trusts (REITs) and other real estate related securities. Under normal market conditions, the Portfolio will maintain exposure to real estate related securities of issues in the US and at least three non-US countries.
GSAM employs a bottom-up investment process focusing on fundamental research seeking to identify undervalued, well-managed businesses with strong growth potential that offer an attractive level of income and capital appreciation.
(continued on next page)
171
UBS PACE Select Advisors Trust
UBS PACE Global Real Estate Securities Investments
Sub-Advisors' comments – continued
Singapore, primarily due to our zero weight in CapitaCommercial Trust.
ING CRES
During the period from November 17, 2009 through July 31, 2010, our portion of the Portfolio underperformed the benchmark. While our absolute performance was positive, both asset allocation and stock selection detracted from relative performance.
An underweight to the outperforming US market, an overweight to the underperforming Hong Kong market, and an underweight to the French market later in the period were the primary drivers of the asset allocation shortfall.
In addition, positive stock selection in the Americas was more than offset by weak stock selection elsewhere during the period. For example, in the Asia-Pacific region, an overweight in SunHung Kai, a high-quality diversified property company based in Hong Kong, along with weak results from mainland China residential developers China Resources Land and Shimao Property Holdings, accounted for the majority of underperformance. We sold our positions in China Resources Land and Shimao Property Holdings, as we significantly reduced our exposure to mainland China residential development stocks based on our cautious outlook for future appreciation of home prices in China and the Chinese government's austerity measures. In Europe, positions in French retail companies Klepierre and Unibail-Rodamco hurt performance, as both posted negative returns. We eliminated Klepierre from our portion of the Portfolio as we looked to pare our exposure to Continental Europe, given the region's low growth prospects. The notable bright spot was stock selection in the US, which benefited from the strong performance of our holdings, such as Macerich in the shopping mall sector, Host Hotels and Starwood Hotels in the lodging sector, and UDR, AvalonBay and BRE Properties in the residential sector.
We continue to be positioned with a positive bias to the North American and Asia-Pacific regions. We also maintain a cautious stance toward property companies in Europe, which we expect will continue to lag despite their recent outperformance. In terms of property type, we remain overweight in sectors that we believe may benefit from an economic recovery, including the shorter-lease length hotel and apartment sectors, as well as certain office markets in the Asia-Pacific region. On the other hand, we remain underweight to property types that we think may react more slowly to an economic recovery, including health care facilities and most office markets in North America and Europe. Our outlook remains predicated on the assumption of gradual but steady global economic growth.
The rebound that occurred in the real estate securities market in July provided some indication to us that global property companies appear to continue to be on track to provide positive total returns for the year, anchored by an approximate 4% dividend yield. With economic improvement seemingly taking one step backward for each two steps forward, patience will be required. Real estate fundamentals, which are driven,
Investment process (concluded)
ING CRES uses a multi-step investment process for constructing the investment portfolio. This process combines top-down region and sector allocation with bottom-up individual stock selection. First, ING CRES selects property sectors and geographic regions in which to invest and determines the degree of representation of such sectors and regions, through a systematic evaluation of public and private real estate market trends and conditions. Second, ING CRES uses a proprietary valuation process in an effort to identify investments with superior current income and growth potential relative to their peers.
Brookfield invests in a diversified portfolio of global securities of companies primarily in the real estate industry, including real estate investment trusts, real estate operating companies, companies whose value is significantly affected by the value of such companies' real estate holdings, and related entities and structures. Brookfield utilizes a fundamental, bottom-up, value-based stock selection methodology.
172
UBS PACE Select Advisors Trust
UBS PACE Global Real Estate Securities Investments
Sub-Advisors' comments – concluded
in part, by their underlying lease structures will, as always, lag improving economic conditions. We continue to believe that listed property companies may be well-positioned to increase their cash flow per share on a sustained basis in the current economic environment, and that they are trading at reasonable valuations.
Brookfield
During the period from November 17, 2009 through July 31, 2010, our portion of the Portfolio underperformed the benchmark, with an overweight position to Asia detracting from relative returns. Although the medium-term prospects for the region remained strong, the severity of the short-term impacts from government policy changes, particularly in China and Hong Kong, was greater than anticipated. While our exposure in Hong Kong was significantly reduced in response to deteriorating conditions, it was still a negative contributor to results. Additionally, an underweight position in Japan also detracted from relative performance. As investors in the region became more risk averse early in 2010, Japan was perceived as a relatively "safe" option. However, as we believe the longer-term outlook for Japan remains muted, we continue to maintain our underweight position in Japanese real estate companies.
Alternately, exposure to high-quality companies with strong management teams and balance sheets benefited performance over the reporting period. In particular, exposures to US regional malls, urban office developments and hotels helped performance. Although the hotel sector sold off toward the end of the reporting period as investor confidence waned, our exposure to companies with high-quality international portfolios and improving underlying fundamentals, including positive revenue per available room (RevPAR) growth, benefited results. (RevPAR is an important metric relevant to the hotel industry. Often it is utilized as a primary statistic indicating the overall financial performance of a property.)
We became more conservative in our investment approach over the course of the last six months of the review period, in light of uncertainty in the market. As a result, we maintained a focus on companies with strong balance sheets with holdings in more desirable markets and leased portfolios. By the close of the period, we had a general preference for REIT-like companies, primarily real estate investors versus firms that generally derive their revenue from development activities. Given this, we had reduced our exposure to developers, particularly in Asia, to reduce our risk exposure.
In contrast, we had exposure to defensive sectors, including US health care companies, which we believe possess attractive valuations and stable cash flows. We also favored high-quality companies, such as those in the Australian retail sector.
Special considerations
The Portfolio may be appropriate for long-term investors seeking to diversify a portion of their assets into real-estate-related investments. Investors should be willing to withstand short-term fluctuations in the equity and real estate markets in return for potentially higher returns over the long term. The value of the Portfolio changes every day and can be affected by changes in interest rates, general market conditions and other political, social and economic developments, as well as specific matters relating to the companies or issuers in whose securities the Portfolio invests. The value of the Portfolio's investments in foreign securities may fall due to adverse political, social, and economic developments abroad and due to decreases in foreign currency values relative to the US dollar. These risks are greater for investments in emerging market issuers than for issuers in more developed countries. There are certain risks a ssociated with investing in real estate-related investments, including sensitivity to economic downturns, interest rates, declines in property values and variation in property management.
173
UBS PACE Select Advisors Trust
UBS PACE Global Real Estate Securities Investments
Illustration of an assumed investment of $10,000 in Class A shares of the Portfolio (unaudited)
The following graph depicts the performance of UBS PACE Global Real Estate Securities Investments Class A shares versus the FTSE EPRA/NAREIT Developed Index and the FTSE NAREIT Equity REIT Index from December 31, 2006, the month-end after the inception date of the Class A shares, through July 31, 2010. The performance of the other classes will vary based upon the different class specific expenses and sales charges. The performance provided does not reflect the deduction of taxes that a shareholder would pay on Portfolio distributions or the redemption of Portfolio shares. Past performance is no guarantee of future results. Share price and returns will vary with market conditions; investors may realize a gain or loss upon redemption. It is important to note that UBS PACE Global Real Estate Securities Investments is a professionally managed portfolio while the Indices are not available for investment and are unmanaged. The compari son is shown for illustration purposes only.
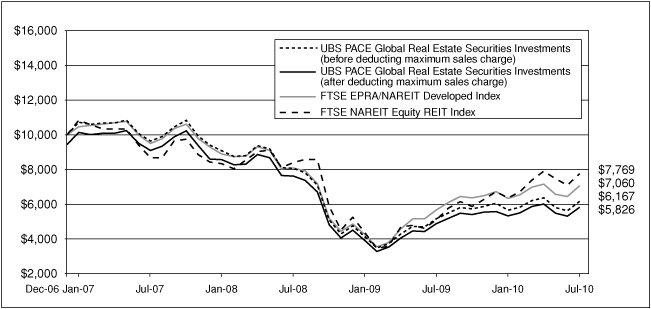
174
UBS PACE Select Advisors Trust
UBS PACE Global Real Estate Securities Investments
Performance at a glance (unaudited)
| Average annual total returns for periods ended 07/31/10 | | 1 year | | Since
inception1 | |
| Before deducting | | Class A2 | | | 19.70 | % | | | (12.28 | )% | |
| maximum sales charge | | Class C3 | | | 18.74 | % | | | (12.98 | )% | |
| or UBS PACE Select | | Class Y4 | | | 20.15 | % | | | 20.36 | % | |
| program fee | | Class P5 | | | 20.10 | % | | | (13.49 | )% | |
After deducting
maximum sales charge | | Class A2 | | | 13.18 | % | | | (13.64 | )% | |
| or UBS PACE Select | | Class C3 | | | 17.74 | % | | | (12.98 | )% | |
| program fee | | Class P5 | | | 17.72 | % | | | (15.21 | )% | |
| FTSE EPRA/NAREIT Developed Index6 | | | | | 24.60 | % | | | (9.26 | )% | |
| FTSE NAREIT Equity REIT Index7 | | | | | 52.57 | % | | | (6.80 | )% | |
| Lipper Global Real Estate Funds median | | | | | 22.41 | % | | | (10.04 | )% | |
Average annual total returns for periods ended June 30, 2010, after deduction of the maximum sales charge or UBS PACE Select program fee, were as follows: Class A—1-year period, 13.30%; since inception, (16.17)%; Class C—1-year period, 17.99%; since inception, (15.52)%; Class Y—1-year period, 20.46%; since inception, 14.27%; Class P—1-year period, 17.76%; since inception, (17.81)%.
The annualized gross and net expense ratios, respectively, for each class of shares as in the November 28, 2009 prospectuses, were as follows: Class A—2.06% and 1.45%; Class C—2.96% and 2.20%; Class Y—1.87% and 1.20%; and Class P—2.17% and 1.20%. Net expenses reflect fee waivers and/or expense reimbursements, if any, pursuant to an agreement that is in effect to cap the expenses. The Portfolio and UBS Global AM have entered into a written fee waiver/expense reimbursement agreement pursuant to which UBS Global AM is contractually obligated to waive its management fees and/or reimburse expenses so that the ordinary total operating expenses of each class through November 30, 2010 (excluding dividend expense, borrowing costs and interest expense, if any) would not exceed Class A—1.45%; Class C—2.20%; Class Y—1.20%; and Class P—1.20%. The Portfolio has agreed to repay UBS Global AM for any waiv ed fees/reimbursed expenses to the extent that it can do so over the following three fiscal years without causing the Portfolio's expenses in any of those three years to exceed the expense caps described above.
1 Since inception returns are calculated as of commencement of issuance on December 18, 2006 for Class A and C shares, and January 22, 2007 for Class P shares. Class Y shares commenced issuance on November 30, 2006 and had fully redeemed by February 15, 2007 remaining inactive through December 25, 2008. The inception return of Class Y shares is calculated from December 26, 2008, which is the date the Class Y shares recommenced investment operations. Since inception returns for the Indices and Lipper median are shown as of December 31, 2006, which is the month-end after the inception date of the oldest share classes (Class A & Class C).
2 Maximum sales charge for Class A shares is 5.5%. Class A shares bear ongoing 12b-1 service fees.
3 Maximum contingent deferred sales charge for Class C shares is 1% imposed on redemptions and is reduced to 0% after one year. Class C shares bear ongoing 12b-1 service and distribution fees.
4 The Portfolio offers Class Y shares to a limited group of eligible investors, including certain qualifying retirement plans. Class Y shares do not bear initial or contingent deferred sales charges or ongoing 12b-1 service and distribution fees.
5 Class P shares do not bear initial or contingent deferred sales charges or ongoing 12b-1 service and distribution fees, but are subject to a maximum annual UBS PACE Select program fee of 2% of the value of Class P shares. Prior to June 14, 2010, the maximum annual UBS PACE Select program fee was 1.5% of the value of Class P shares.
6 The FTSE EPRA/NAREIT Developed Index is designed to track the performance of listed real estate companies and real estate investment trusts ("REITs") worldwide. By making the index constituents free-float adjusted, liquidity, size and revenue screened, the series is suitable for use as the basis for investment products, such as derivatives and exchange traded funds. Investors should note that indices do not reflect the deduction of fees and expenses.
7 The FTSE NAREIT Equity REIT Index is an unmanaged market weighted index of publicly traded US equity real estate investment trusts ("REITs"). Equity REITs include those firms that own, manage and lease investment grade commercial real estate. A company is classified as an Equity REIT if 75% or more of its gross invested book assets is invested in real property. Investors should note that indices do not reflect the deduction of fees and expenses.
If an investor sells or exchanges shares less than 90 days after purchase, a redemption fee of 1.00% of the amount sold or exchanged will be deducted at the time of the transaction, except as noted otherwise in the prospectuses.
Past performance does not predict future performance, and the performance information provided does not reflect the deduction of taxes that a shareholder would pay on Portfolio distributions or the redemption of Portfolio shares. The return and principal value of an investment will fluctuate, so that an investor's shares, when redeemed, may be worth more or less than their original cost. Performance results assume reinvestment of all dividends and capital gain distributions at net asset value on the ex-dividend dates. Current performance may be higher or lower than the performance data quoted. For month-end performance figures, please visit http://www.ubs.com.
Lipper peer group data calculated by Lipper Inc.; used with permission. The Lipper median is the return of the fund that places in the middle of a Lipper peer group.
175
UBS PACE Select Advisors Trust
UBS PACE Global Real Estate Securities Investments
Portfolio statistics (unaudited)
| Characteristics | | 07/31/10 | |
| Net assets (mm) | | $ | 78.1 | | |
| Number of holdings | | | 123 | | |
| Portfolio composition1 | | 07/31/10 | |
| Common stocks | | | 98.5 | % | |
| Warrants | | | 0.0 | 2 | |
| Cash equivalents and other assets less liabilities | | | 1.5 | | |
| Total | | | 100.0 | % | |
| Top five countries (equity investments)1 | | 07/31/10 | |
| United States | | | 41.9 | % | |
| Hong Kong | | | 12.3 | | |
| Australia | | | 10.9 | | |
| Japan | | | 8.7 | | |
| United Kingdom | | | 5.6 | | |
| Total | | | 79.4 | % | |
| Top ten equity holdings1 | | 07/31/10 | |
| Sun Hung Kai Properties Ltd. | | | 6.8 | % | |
| Simon Property Group, Inc. | | | 5.1 | | |
| Westfield Group | | | 4.4 | | |
| Vornado Realty Trust | | | 3.0 | | |
| Boston Properties, Inc. | | | 2.8 | | |
| Mitsubishi Estate Co. Ltd. | | | 2.8 | | |
| Hongkong Land Holdings Ltd. | | | 2.7 | | |
| Capitaland Ltd. | | | 2.4 | | |
| Unibail Rodamco | | | 2.3 | | |
| Equity Residential | | | 2.3 | | |
| Total | | | 34.6 | % | |
1 Weightings represent percentages of the Portfolio's net assets as of July 31, 2010. The Portfolio is actively managed and its composition will vary over time.
2 Weighting represents less than 0.05% of the Portfolio's net assets as of July 31, 2010.
176
UBS PACE Select Advisors Trust
UBS PACE Global Real Estate Securities Investments
Industry diversification—(unaudited)
As a percentage of net assets as of July 31, 2010
Common stocks
| Apartments | | | 7.90 | % | |
| Building-residential/commercial | | | 0.53 | | |
| Diversified | | | 20.11 | | |
| Diversified operations | | | 2.11 | | |
| Health care | | | 2.85 | | |
| Hotels & motels | | | 3.47 | | |
| Office property | | | 9.05 | | |
| Paper & related products | | | 0.52 | | |
| Real estate management/service | | | 4.38 | | |
| Real estate operations/development | | | 21.30 | | |
| Regional malls | | | 8.12 | | |
| Retirement/aged care | | | 0.72 | | |
| Shopping centers | | | 13.87 | | |
| Storage | | | 1.72 | | |
| Storage/warehousing | | | 0.31 | | |
| Warehouse/industrial | | | 1.57 | | |
| Total common stocks | | | 98.53 | | |
| Warrants | | | 0.00 | 1 | |
| Repurchase agreement | | | 1.50 | | |
| Investment of cash collateral from securities loaned | | | 5.64 | | |
| Liabilities in excess of other assets | | | (5.67 | ) | |
| Net assets | | | 100.00 | % | |
1 Weighting represents less than 0.05% of the Portfolio's net assets as of July 31, 2010.
177
UBS PACE Select Advisors Trust
UBS PACE Global Real Estate Securities Investments
Portfolio of investments—July 31, 2010
| Security description | | Number of
shares | | Value | |
| Common stocks—98.53% | |
| Australia—10.91% | |
| CFS Retail Property Trust1 | | | 361,369 | | | $ | 614,629 | | |
| Charter Hall Group | | | 201,755 | | | | 109,517 | | |
Commonwealth Property
Office Fund1 | | | 218,950 | | | | 183,228 | | |
| Dexus Property Group | | | 727,087 | | | | 536,103 | | |
| Goodman Group | | | 1,546,245 | | | | 860,316 | | |
| GPT Group | | | 172,410 | | | | 446,101 | | |
| ING Office Fund | | | 1,091,648 | | | | 597,506 | | |
| Macquarie Office Trust | | | 606,401 | | | | 134,410 | | |
| Mirvac Group | | | 336,921 | | | | 403,876 | | |
| Stockland | | | 341,962 | | | | 1,172,523 | | |
| Westfield Group | | | 313,957 | | | | 3,468,090 | | |
| Total Australia common stocks | | | 8,526,299 | | |
| Bermuda—3.42% | |
| Great Eagle Holdings Ltd. | | | 44,000 | | | | 114,425 | | |
| Hongkong Land Holdings Ltd.1 | | | 398,196 | | | | 2,134,331 | | |
| Kerry Properties Ltd. | | | 84,500 | | | | 425,900 | | |
| Total Bermuda common stocks | | | 2,674,656 | | |
| Canada—4.49% | |
Boardwalk Real Estate
Investment Trust | | | 16,770 | | | | 675,009 | | |
| Brookfield Properties Corp. | | | 47,400 | | | | 712,896 | | |
Calloway Real Estate
Investment Trust | | | 22,200 | | | | 467,300 | | |
Canadian Real Estate
Investment Trust | | | 3,100 | | | | 91,608 | | |
Cominar Real Estate
Investment Trust2 | | | 4,700 | | | | 89,835 | | |
Cominar Real Estate
Investment Trust3,4,5 | | | 5,731 | | | | 109,542 | | |
| H&R Real Estate Investment Trust | | | 10,000 | | | | 177,034 | | |
Primaris Retail Real Estate
Investment Trust | | | 5,600 | | | | 101,427 | | |
RioCan Real Estate
Investment Trust3,4,5 | | | 2,200 | | | | 44,126 | | |
RioCan Real Estate
Investment Trust2 | | | 52,500 | | | | 1,041,778 | | |
| Total Canada common stocks | | | 3,510,555 | | |
| Cayman Islands—0.30% | |
| Shimao Property Holdings Ltd. | | | 120,500 | | | | 231,149 | | |
| Finland—0.13% | |
| Citycon Oyj | | | 29,100 | | | | 99,734 | | |
| France—3.15% | |
| Gecina SA | | | 788 | | | | 80,713 | | |
| Klepierre | | | 6,056 | | | | 193,233 | | |
| Mercialys SA | | | 7,393 | | | | 241,529 | | |
Societe Immobiliere de
Location pour l'Industrie
et le Commerce (Silic) | | | 1,560 | | | | 175,298 | | |
| Unibail Rodamco | | | 8,952 | | | | 1,766,203 | | |
| Total France common stocks | | | 2,456,976 | | |
| Security description | | Number of
shares | | Value | |
| Common stocks—(continued) | |
| Hong Kong—12.33% | |
| Cheung Kong (Holdings) Ltd. | | | 49,000 | | | $ | 592,037 | | |
China Overseas Land &
Investment Ltd. | | | 326,931 | | | | 700,371 | | |
| Hang Lung Properties Ltd. | | | 133,000 | | | | 554,773 | | |
| Hysan Development Co. Ltd. | | | 42,000 | | | | 130,583 | | |
| Link REIT | | | 115,300 | | | | 299,847 | | |
| Sino Land Co. Ltd. | | | 203,500 | | | | 385,124 | | |
| Sun Hung Kai Properties Ltd. | | | 362,060 | | | | 5,318,448 | | |
| Wharf (Holdings) Ltd. | | | 301,700 | | | | 1,650,756 | | |
| Total Hong Kong common stocks | | | 9,631,939 | | |
| Italy—0.14% | |
| Beni Stabili SpA | | | 128,379 | | | | 106,150 | | |
| Japan—8.69% | |
Frontier Real Estate
Investment Corp.1 | | | 48 | | | | 346,131 | | |
| Japan Logistics Fund, Inc.1 | | | 21 | | | | 172,336 | | |
Japan Real Estate
Investment Corp. | | | 58 | | | | 513,572 | | |
Japan Retail Fund
Investment Corp.1 | | | 112 | | | | 144,286 | | |
| Kenedix Realty Investment Corp. | | | 58 | | | | 190,525 | | |
| Mitsubishi Estate Co. Ltd. | | | 153,620 | | | | 2,165,741 | | |
| Mitsui Fudosan Co. Ltd. | | | 103,045 | | | | 1,526,681 | | |
| Mori Trust Sogo Reit, Inc. | | | 17 | | | | 133,804 | | |
Nippon Accommodations
Fund, Inc.1 | | | 16 | | | | 88,616 | | |
Sumitomo Realty &
Development Co. Ltd. | | | 60,600 | | | | 1,091,424 | | |
| United Urban Investment Corp.1 | | | 63 | | | | 418,566 | | |
| Total Japan common stocks | | | 6,791,682 | | |
| Jersey—0.08% | |
| Atrium European Real Estate Ltd. | | | 11,837 | | | | 60,930 | | |
| Luxembourg—0.14% | |
| GAGFAH SA | | | 13,545 | | | | 110,320 | | |
| Netherlands—0.59% | |
| Corio NV | | | 5,348 | | | | 313,756 | | |
| Eurocommercial Properties N.V. | | | 3,964 | | | | 149,727 | | |
| Total Netherlands common stocks | | | 463,483 | | |
| Norway—0.47% | |
| Norwegian Property ASA* | | | 234,406 | | | | 363,061 | | |
| Singapore—4.93% | |
Ascendas Real Estate Investment
Trust (A-REIT) | | | 201,066 | | | | 313,472 | | |
| CapitaCommercial Trust1 | | | 659,000 | | | | 639,712 | | |
| Capitaland Ltd. | | | 656,700 | | | | 1,912,437 | | |
| CapitaMall Trust | | | 541,000 | | | | 759,899 | | |
| City Developments Ltd.* | | | 17,800 | | | | 158,391 | | |
| Frasers Centrepoint Trust | | | 66,300 | | | | 66,797 | | |
| Total Singapore common stocks | | | 3,850,708 | | |
178
UBS PACE Select Advisors Trust
UBS PACE Global Real Estate Securities Investments
Portfolio of investments—July 31, 2010
| Security description | | Number of
shares | | Value | |
| Common stocks—(continued) | |
| Sweden—0.83% | |
| Castellum AB | | | 33,096 | | | $ | 342,895 | | |
| Hufvudstaden AB, Class A | | | 35,267 | | | | 302,129 | | |
| Total Sweden common stocks | | | 645,024 | | |
| Switzerland—0.44% | |
| PSP Swiss Property AG* | | | 2,424 | | | | 159,979 | | |
| Swiss Prime Site AG* | | | 2,946 | | | | 184,673 | | |
| Total Switzerland common stocks | | | 344,652 | | |
| United Kingdom—5.62% | |
| Big Yellow Group PLC | | | 20,235 | | | | 98,430 | | |
| British Land Co. PLC | | | 81,796 | | | | 592,721 | | |
| Derwent London PLC | | | 29,414 | | | | 618,938 | | |
| Grainger PLC | | | 60,731 | | | | 107,589 | | |
| Great Portland Estates PLC | | | 74,212 | | | | 350,863 | | |
| Hammerson PLC | | | 72,153 | | | | 439,742 | | |
| Helical Bar PLC | | | 1,540 | | | | 7,167 | | |
| Land Securities Group PLC | | | 136,302 | | | | 1,310,004 | | |
| Safestore Holdings PLC | | | 127,441 | | | | 239,969 | | |
| Segro PLC | | | 71,296 | | | | 313,247 | | |
| Shaftesbury PLC | | | 15,600 | | | | 97,915 | | |
| Songbird Estates PLC* | | | 43,748 | | | | 102,971 | | |
| St. Modwen Properties PLC* | | | 30,868 | | | | 84,183 | | |
| Unite Group PLC* | | | 10,200 | | | | 30,362 | | |
Total United Kingdom
common stocks | | | 4,394,101 | | |
| United States—41.87% | |
| Acadia Realty Trust | | | 8,100 | | | | 150,174 | | |
Alexandria Real Estate
Equities, Inc. | | | 7,400 | | | | 522,070 | | |
| AMB Property Corp. | | | 11,800 | | | | 294,528 | | |
Apartment Investment &
Management Co., Class A | | | 24,100 | | | | 517,427 | | |
| AvalonBay Communities, Inc. | | | 13,083 | | | | 1,374,893 | | |
| BioMed Realty Trust, Inc. | | | 21,300 | | | | 384,252 | | |
| Boston Properties, Inc. | | | 26,942 | | | | 2,206,550 | | |
| Brandywine Realty Trust | | | 43,083 | | | | 489,423 | | |
| BRE Properties, Inc. | | | 11,200 | | | | 464,800 | | |
| Brookdale Senior Living, Inc.* | | | 39,682 | | | | 562,691 | | |
| Camden Property Trust | | | 8,920 | | | | 406,038 | | |
| Developers Diversified Realty Corp. | | | 78,500 | | | | 890,975 | | |
| Digital Realty Trust, Inc.1 | | | 15,547 | | | | 982,881 | | |
| Equity One, Inc.1 | | | 14,108 | | | | 240,400 | | |
| Equity Residential | | | 38,518 | | | | 1,766,050 | | |
| Extra Space Storage, Inc. | | | 12,700 | | | | 196,977 | | |
| Federal Realty Investment Trust | | | 6,500 | | | | 508,235 | | |
| Highwoods Properties, Inc. | | | 14,200 | | | | 444,602 | | |
| Host Hotels & Resorts, Inc. | | | 94,783 | | | | 1,359,188 | | |
| Hyatt Hotels Corp., Class A* | | | 8,200 | | | | 320,702 | | |
| Kilroy Realty Corp. | | | 7,989 | | | | 268,271 | | |
| Liberty Property Trust | | | 21,600 | | | | 684,720 | | |
| Nationwide Health Properties, Inc. | | | 15,900 | | | | 594,978 | | |
| OMEGA Healthcare Investors, Inc. | | | 21,600 | | | | 474,768 | | |
| Security description | | Number of
shares | | Value | |
| Common stocks—(concluded) | |
| United States—(concluded) | |
| Pebblebrook Hotel Trust* | | | 7,900 | | | $ | 144,491 | | |
| ProLogis | | | 70,300 | | | | 763,458 | | |
| Public Storage, Inc. | | | 10,677 | | | | 1,047,627 | | |
| Rayonier, Inc. | | | 8,263 | | | | 403,482 | | |
| Regency Centers Corp. | | | 16,800 | | | | 634,032 | | |
| Simon Property Group, Inc. | | | 44,322 | | | | 3,954,409 | | |
| SL Green Realty Corp. | | | 11,100 | | | | 668,664 | | |
Starwood Hotels & Resorts
Worldwide, Inc. | | | 15,100 | | | | 731,595 | | |
Tanger Factory Outlet
Centers, Inc. | | | 8,600 | | | | 384,420 | | |
| Taubman Centers, Inc. | | | 22,433 | | | | 919,529 | | |
| The Macerich Co. | | | 35,426 | | | | 1,468,408 | | |
| Toll Brothers, Inc.* | | | 23,700 | | | | 411,432 | | |
| UDR, Inc. | | | 41,600 | | | | 878,176 | | |
| Ventas, Inc. | | | 22,800 | | | | 1,156,416 | | |
| Vornado Realty Trust | | | 28,591 | | | | 2,366,763 | | |
| Weingarten Realty Investors1 | | | 31,774 | | | | 672,656 | | |
Total United States
common stocks | | | 32,711,151 | | |
Total common stocks
(cost—$68,468,480) | | | 76,972,570 | | |
| | | Number of
warrants | | | |
| Warrants*—0.00% | |
| Hong Kong—0.00% | |
Henderson Land Development
Co. Ltd., strike price 58 HKD,
expires 06/01/11
(cost—$0) | | | 15,900 | | | | 2,456 | | |
| | | Face
amount | | | |
| Repurchase agreement—1.50% | |
Repurchase agreement dated
07/30/10 with State Street
Bank & Trust Co., 0.010%
due 08/02/10, collateralized
by $1,159,452 US Treasury
Notes, 2.125% to 3.125%
due 04/30/15 to 04/30/17;
(value—$1,196,471);
proceeds: $1,173,001
(cost—$1,173,000) | | $ | 1,173,000 | | | | 1,173,000 | | |
179
UBS PACE Select Advisors Trust
UBS PACE Global Real Estate Securities Investments
Portfolio of investments—July 31, 2010
| Security description | | Number of
shares | | Value | |
| Investment of cash collateral from securities loaned—5.64% | |
| Money market fund—5.64% | |
UBS Private Money Market
Fund LLC6
(cost—$4,402,048) | | | 4,402,048 | | | $ | 4,402,048 | | |
Total investments
(cost—$74,043,528)—
105.67% | | | | | 82,550,074 | | |
Liabilities in excess of other
assets—(5.67)% | | | | | (4,427,412 | ) | |
| Net assets—100.00% | | $ | 78,122,662 | | |
Aggregate cost for federal income tax purposes was $79,155,908; and net unrealized appreciation consisted of:
| Gross unrealized appreciation | | $ | 4,656,993 | | |
| Gross unrealized depreciation | | | (1,262,827 | ) | |
| Net unrealized appreciation | | $ | 3,394,166 | | |
* Non-income producing security.
1 Security, or portion thereof, was on loan at July 31, 2010.
2 Security is traded on the Toronto Stock Exchange.
3 Security is traded on the Over-the-counter ("OTC") Market.
4 Security is being fair valued by a valuation committee under the direction of the board of trustees.
5 Security exempt from registration pursuant to Rule 144A under the Securities Act of 1933. These securities, which represent 0.20% of net assets as of July 31, 2010, are considered liquid and may be resold in transactions exempt from registration, normally to qualified institutional buyers.
6 The table below details the Portolio's transaction activity in an affiliated issuer during the year ended July 31, 2010.
| Security description | | Value at
07/31/09 | | Purchases
during the
year ended
07/31/10 | | Sales
during the
year ended
07/31/10 | | Value at
07/31/10 | | Net income
earned from
affiliate for the
year ended
07/31/10 | |
| UBS Private Money Market Fund LLC | | $ | 15,057,573 | | | $ | 100,425,436 | | | $ | 111,080,961 | | | $ | 4,402,048 | | | $ | 16,950 | | |
HKD Hong Kong Dollar
REIT Real Estate Investment Trust
180
UBS PACE Select Advisors Trust
UBS PACE Global Real Estate Securities Investments
Portfolio of investments—July 31, 2010
The following is a summary of the fair valuations according to the inputs used as of July 31, 2010 in valuing the Portfolio's investments:
| | | Unadjusted
quoted prices in
active markets for
identical investments
(Level 1) | | Other significant
observable inputs
(Level 2) | | Unobservable
inputs
(Level 3) | | Total | |
| Common stocks | | $ | 76,818,902 | | | $ | 153,668 | | | $ | — | | | $ | 76,972,570 | | |
| Warrants | | | 2,456 | | | | — | | | | — | | | | 2,456 | | |
| Repurchase agreement | | | — | | | | 1,173,000 | | | | — | | | | 1,173,000 | | |
Investment of cash collateral
from securities loaned | | | — | | | | 4,402,048 | | | | — | | | | 4,402,048 | | |
| Total | | $ | 76,821,358 | | | $ | 5,728,716 | | | $ | — | | | $ | 82,550,074 | | |
At July 31, 2010, there were no transfers between Level 1 and Level 2.
See accompanying notes to financial statements.
181
UBS PACE Select Advisors Trust
UBS PACE Alternative Strategies Investments
Performance
For the 12 months ended July 31, 2010, the Portfolio's Class P shares returned 4.71%, before the deduction of the maximum UBS PACE Select program fee. (The Class P shares returned 2.64%, after the deduction of the maximum UBS PACE Select program fee, for the same 12-month period.) In comparison, the MSCI World Free Index (net) (the "benchmark") returned 9.83%, the Barclays Capital Global Aggregate Index returned 6.22%, and the US Consumer Price Index (CPI) increased by 1.24%, while the Lipper Global Flexible Portfolio Funds category posted a median return of 8.49%. (Returns for all share classes over various time periods are also shown in the "Performance at a glance" table on page 187. Please note that the returns shown do not reflect the deduction of taxes that a shareholder would pay on Portfolio distributions or the redemption of Portfolio shares.) For a detailed commentary on the market environment in general during the rep orting period, please refer to page 2.
Sub-Advisors' comments
Analytic Investors
Our portion of the Portfolio consists of long-short equity positions.1 Our investment process is based on the premise that investor behavior changes—but it changes slowly—and is fairly persistent from month to month. To support this premise, our model is driven by specific security characteristics within seven groups (such as valuation, quality, and liquidity), to help us identify potential investment opportunities.
For example, positive exposure to the valuation category, which includes a company's sales-to-price ratio, helped performance during the review period. Negatively impacting performance was an emphasis on higher-quality companies, as more efficiently run businesses underperformed during the 12-month period.
The top equity performers in our portion of the Portfolio were long positions in Darden Restaurants Inc., Tyson Foods Inc. and Lubrizol Corp. Darden Restaurant's share price rose during the review period as the company increased profits and earnings estimates, resulting in analyst upgrades. We subsequently sold the position before the end of the reporting period. Tyson Foods added to results as the company announced that it expected revenue to increase for the 2010 fiscal year. Lubrizol Corp. added value as the chemical company announced an expansion of its share repurchase program toward the end of the period.
UBS PACE Select Advisors Trust – UBS PACE Alternative Strategies Investments
Investment Sub-Advisors:
Analytic Investors, LLC ("Analytic Investors"); Wellington Management Company, LLP ("Wellington Management"); Goldman Sachs Asset Management, L.P. ("GSAM"); First Quadrant L.P. ("First Quadrant") and Standard Life Investments (Corporate Funds) Limited, commenced after the close of the reporting period
Portfolio Managers:
Analytic Investors: Dennis Bein;
Wellington Management: Scott M. Elliott;
GSAM: James Clark and Michael Swell;
First Quadrant: Ken Ferguson, Dori Levanoni and Chuck Fannin
Objective:
Long-term capital appreciation
Investment process:
Analytic Investors primarily employs a long/short global equity strategy. This strategy is implemented by taking long and short positions of equity securities publicly traded in the United States and in foreign markets both by direct equity investment and through derivatives. Analytic Investors' strategy may also employ the use of derivatives, such as swaps, futures, non-deliverable forwards ("NDFs"), and forward contracts.
(continued on next page)
1 When a long position is taken, a security is purchased with the expectation that it will rise in value. A short position is taken when we believe, based on our research, that securities are overpriced, and, therefore, we hope to make a profit when the security falls in value. When shorting an investment, we borrow the security, sell it, and then buy an equal number of shares later—hopefully at a lower price—to replace those we borrowed.
182
UBS PACE Select Advisors Trust
UBS PACE Alternative Strategies Investments
Sub-Advisors' comments – continued
A long position in BP, and short positions in both Cairn Energy plc and Ivanhoe Mines Ltd., detracted from relative performance, and these were the worst-performing stocks in our portion of the Portfolio. Our long position in BP detracted from performance as shares of the oil company fell sharply following the oil leak in the Gulf of Mexico. Our short position in Cairn Energy detracted from results as its shares rose in tandem with the rise in crude oil prices toward the end of the review period. Likewise, a short position in Ivanhoe Mines was not rewarded, since its shares rose sharply toward the end of the review period following an announcement to proceed with the sale of 5% of its common shares to a major competitor.
From a sector perspective, our positions in healthcare and consumer discretionary performed well. However, our positions in the information technology and utility sectors had a negative impact on performance.
Wellington Management
During the review period, our portion of the Portfolio benefited the most from our holdings in the consumer discretionary sector. Specifically, shares of casino operator Las Vegas Sands performed well due to strong growth in its new retail location in Singapore. Our holding in media and marketing information services firm Arbitron also performed well as the company continued to make progress in the rollout of its Portable People Meter ("PPM") technology for the electronic measurement of radio audiences. PPM technology tracks consumers' exposure to media and entertainment. International cable operator Liberty Global also contributed to performance as the company announced strong results and operational improvements. Our exposure to the materials sector also contributed to performance, namely in metals and mining companies Newmont Mining, Freeport-McMoRan and Anglo American. Strong demand and price appreciation in gold and copper helped contribute to positive performance in these stocks.
Emerging markets equities experienced strong returns toward the end of 2009. However, the asset class faced headwinds in the first half of 2010, as investors looked to what they considered safer investments, while equities were negatively impacted by weak energy and
Investment process (concluded)
Wellington Management pursues an "opportunistic equity plus Alpha" strategy by opportunistically seeking non-core equity exposures that Wellington Management believes are attractively valued, have positive structural characteristics in the current market environment or are expected to benefit from anticipated economic cycles. In addition, Wellington Management may employ other investment approaches, for example, by allocating assets to fixed income securities or other non-equity investments that are expected to beat their respective benchmarks over time. Wellington Management may buy and sell, directly or indirectly, listed or unlisted equity and fixed income securities issued by entities around the world, as well as derivative instruments.
GSAM seeks to employ a number of diverse strategies and seeks to allocate capital tactically to strategies it believes offer the best opportunities at a given point in time in a given market or sector. GSAM focuses mainly on the global fixed income and currency markets, across variable investment grade and sub-investment grade sectors. GSAM invests mainly in currencies, fixed income securities, and derivative investments.
First Quadrant employs a global macro strategy that seeks to add value through a disciplined, active quantitative investment process. It uses independent alpha categories (comprised of more than 20 strategies believed by First Quadrant to be uncorrelated) that span a wide variety of asset classes. The global macro strategy tactically allocates risk between these different alpha categories and attempts to take advantage of inefficiencies when there are potential opportunities for gains. Currently, First Quadrant looks at the following alpha categories: (i) global asset class selection; (ii) stock country selection; (iii) bond country selection; (iv) currency selection; and (v) volatility management. However, the number and nature of alpha categories may change over time.
183
UBS PACE Select Advisors Trust
UBS PACE Alternative Strategies Investments
Sub-Advisors' comments – continued
commodity prices in the review period. Overall, our emerging markets exposure helped performance relative to other equity exposures within the Portfolio, as emerging markets equities outperformed the broader market. Information technology holdings also contributed to performance. Specifically, China-based firms Baidu.com and Tencent Holdings, Taiwan-based HTC, US-based Apple and VMWare aided the Portfolio's relative performance.
Our relative value positions in countries, which are intended to exploit spread inefficiencies in developed government bond markets, were among the largest detractors from absolute returns during the period. Specifically, our long 10- and 30-year US Treasury bond positions versus short German Bund positions detracted from results. During the second quarter of 2010, we exited these positions as spreads reverted to fair value.
Lastly, our energy-related holdings detracted from absolute performance. The energy sector as a whole struggled during the review period, however the results in our portion of the Portfolio were largely attributable to weak stock selection. Positions in Australian uranium mining and processing firms Energy Resources Australia and Paladin Energy detracted the most from performance during the reporting period.
GSAM
Within our portion of the Portfolio, duration—a measure of a portfolio's sensitivity to interest rate changes—and overall yield curve positioning detracted from performance. (A yield curve is a line that plots interest rates, at a set point in time, of bonds having equal credit quality, but differing maturity dates. A yield curve steepens when long-term bond yields increase relative to those of short-term bonds; conversely, it flattens when long-term bond yields decrease relative to those of short-term bonds).
During the first half of the review period, our yield curve steepening bias in the US contributed to results. During this time, short-term interest rates were anchored by the Federal Reserve Board's commitment to an extended period of low rates. In contrast, long-term rates rose, given concerns regarding the increased supply of longer-term US Treasuries. This positive result was partially offset by the Portfolio's short position in the seven-year area of the Japanese yield curve, when interest rates fell due to supply/demand factors.
As we entered into the second half of the review period, a two- to 10-year flattening bias in the Canadian yield curve contributed to performance. However, this was partially offset by a net long bias in the US, as interest rates rose sharply in March. We shifted to an underweight duration bias in the US by the end of the review period, which hampered relative results as interest rates declined amid heightened risk aversion and concerns surrounding the growth outlook for the US economy.
From a currency perspective, we saw strong performance mid-period from our exposure to the Australian, New Zealand and Canadian dollars, amid prospects of increased fiscal spending in China's infrastructure. Elsewhere, the Portfolio's short euro position also contributed to performance, as the market turmoil stemming from peripheral Europe's fiscal worries drove a further decline in the currency.
From a sector perspective, positioning across sectors was the primary driver of our portion of the Portfolio's performance during the review period. Our portion of the Portfolio's exposure to mortgage-backed securities ("MBS") was the key contributor. Our corporate bond exposure also contributed, albeit to a lesser extent.
Finally, security selection negatively impacted performance. In particular, our selection within residential MBS and corporate bonds detracted the most from results over the period. Specifically, our exposure to nonagency adjustable-rate mortgage securities hurt performance results mid-period as they declined given
184
UBS PACE Select Advisors Trust
UBS PACE Alternative Strategies Investments
Sub-Advisors' comments – concluded
supply/demand trends with falling real estate prices and increasing defaults nationally. These losses were partially mitigated by selection within the government/agency sector over the review period.
First Quadrant
From a strategy standpoint, currency selection and bond country selection were the main contributors to performance. Stock country selection also contributed to results, albeit to a lesser extent. In contrast, global asset class selection detracted slightly from performance.
In our stock and bond country selection process, we engage in country selection and then take positions in the overall market of that region. Our relative valuation model, which measures the relative attractiveness of each bond market, helped drive performance in bond country selection. The Portfolio benefited from positions in the US, Japan and Canada. In contrast, our positions in Australia and the UK detracted modestly from results.
From a stock country selection perspective, our exposures in the UK, Japan and the US helped returns, which were partially offset by positions in the Netherlands and Spain. The positive performance in stock country selection over the review period is primarily attributable to the success of a factor that considers whether a market's currency is cheap or expensive. For example, the attractiveness of a particular equity market will generally fall when a currency is expensive, all else being equal.
In terms of currency selection, our positions in the euro, the Swedish krona, the Japanese yen, the New Zealand dollar, the British pound and the Swiss franc enhanced our results. Our trade flow model, which targets currency flows caused by short-term price fluctuations in traded goods, helped drive performance in our currency positions.
Lastly, global asset class selection detracted from overall results. During much of the review period, we favored global stocks over global bonds, based on our research and what we believed to be their relative value. However, in May 2010 we found bonds to be more attractive than stocks and moved to an overweight to bonds. By the end of the period, we moved back to an overweight to global stocks versus global bonds, as the former appeared to be more attractively valued, in our view. Overall, the changes in asset class positioning resulted in mildly negative performance due partially to the underlying performance of individual markets during the period under review.
(Please note: After the close of the fiscal reporting period, Standard Life Investments was appointed to serve as an additional advisor to the Portfolio.)
Special considerations
The Portfolio may be appropriate for investors seeking long-term capital appreciation who are able to withstand short-term fluctuations in the equity markets and fixed income markets in return for potentially higher returns over the long term. The Portfolio may employ investment strategies that involve greater risks than the strategies used by many other mutual funds, including increased use of short sales (which involve the risk of an unlimited increase in the market value of the security sold short, which could result in a theoretically unlimited loss), leverage and derivative transactions, and hedging strategies. The value of the Portfolio changes every day and can be affected by changes in interest rates, general market conditions and other political, social and economic developments, as well as specific matters relating to the issuers of securities in which the Portfolio invests. The value of the Portfolio's investments in foreign securities may fall due to adverse political, social and economic developments abroad and due to decreases in foreign currency values relative to the US dollar. It is important to note that an investment in the Portfolio is only one component of a balanced investment plan.
185
UBS PACE Select Advisors Trust
UBS PACE Alternative Strategies Investments
Illustration of an assumed investment of $10,000 in Class P shares of the Portfolio (unaudited)
The following graph depicts the performance of UBS PACE Alternative Strategies Investments Class P shares versus the MSCI World Free Index (net), the Barclays Capital Global Aggregate Index and the US Consumer Price Index (CPI) from April 30, 2006, the month-end after the inception date of the Class P shares, through July 31, 2010. The performance of the other classes will vary based upon the different class specific expenses and sales charges. The performance provided does not reflect the deduction of taxes that a shareholder would pay on Portfolio distributions or the redemption of Portfolio shares. Past performance is no guarantee of future results. Share price and returns will vary with market conditions; investors may realize a gain or loss upon redemption. It is important to note that UBS PACE Alternative Strategies Investments is a professionally managed portfolio while the Indices are not available for investment and are unmanaged. The comparison is shown for illustration purposes only.
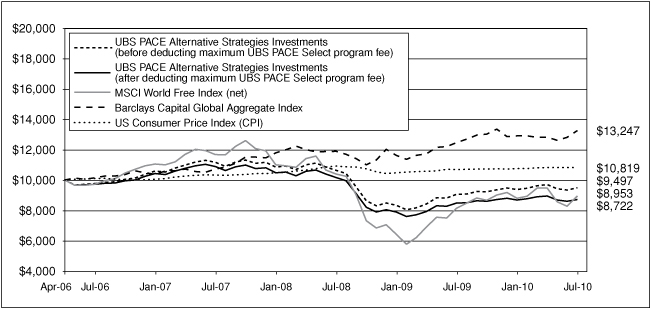
186
UBS PACE Select Advisors Trust
UBS PACE Alternative Strategies Investments
Performance at a glance (unaudited)
| Average annual total returns for periods ended 07/31/10 | | 1 year | | Since
inception1 | |
| Before deducting | | Class A2 | | | 4.41 | % | | | (1.06 | )% | |
| maximum sales charge | | Class C3 | | | 3.70 | % | | | (1.69 | )% | |
| or UBS PACE Select | | Class Y4 | | | 4.83 | % | | | (5.48 | )% | |
| program fee | | Class P5 | | | 4.71 | % | | | (0.80 | )% | |
After deducting
maximum sales charge | | Class A2 | | | (1.31 | )% | | | (2.34 | )% | |
| or UBS PACE Select | | Class C3 | | | 2.70 | % | | | (1.69 | )% | |
| program fee | | Class P5 | | | 2.64 | % | | | (2.77 | )% | |
| MSCI World Free Index (net)6 | | | | | 9.83 | % | | | (2.57 | )% | |
| Barclays Capital Global Aggregate Index7 | | | | | 6.22 | % | | | 6.84 | % | |
| US Consumer Price Index (CPI)8 | | | | | 1.24 | % | | | 1.87 | % | |
| Lipper Global Flexible Portfolio Funds median | | | | | 8.49 | % | | | 1.59 | % | |
Average annual total returns for periods ended June 30, 2010, after deduction of the maximum sales charge or UBS PACE Select program fee, were as follows: Class A—1-year period, (0.02)%; since inception, (2.74)%; Class C—1-year period, 4.11%; since inception, (2.07)%; Class Y—1-year period, 6.37%;since inception, (6.40)%; Class P—1-year period, 4.02%; since inception, (3.14)%.
The annualized gross and net expense ratios, respectively, for each class of shares as in the November 28, 2009 prospectuses, were as follows: Class A—2.23% and 2.20%; Class B—3.13% and 3.00%; Class C—2.96% and 2.96%; Class Y—1.98% and 1.95%; and Class P—1.96% and 1.95%. Net expenses reflect fee waivers and/or expense reimbursements, if any, pursuant to an agreement that is in effect to cap the expenses. The Portfolio and UBS Global AM have entered into a written fee waiver/expense reimbursement agreement pursuant to which UBS Global AM is contractually obligated to waive its management fees and/or reimburse expenses so that the ordinary total operating expenses of each class through November 30, 2010 (excluding dividend expense, borrowing costs and interest expense, if any) would not exceed Class A—1.95%; Class B—2.70%; Class C—2.70%; Class Y—1.70%; and Class P—1.70%. The Portfo lio has agreed to repay UBS Global AM for any waived fees/reimbursed expenses to the extent that it can do so over the following three fiscal years without causing the Portfolio's expenses in any of those three years to exceed the expense caps described above.
1 Since inception returns are calculated as of commencement of issuance on April 10, 2006 for Class P and A shares, April 11, 2006 for Class C shares. Class Y shares commenced issuance on April 3, 2006, and had fully redeemed by July 26, 2006 remaining inactive through July 22, 2008. The inception return of Class Y shares is calculated from July 23, 2008, which is the date the Class Y shares recommenced investment operations. Class B shares commenced issuance on May 19, 2006, and had fully redeemed by April 8, 2010. Since inception returns for the Indices and Lipper median are shown as of April 30, 2006, which is the month-end after the inception date of the oldest share classes (Class P and Class A).
2 Maximum sales charge for Class A shares is 5.5%. Class A shares bear ongoing 12b-1 service fees.
3 Maximum contingent deferred sales charge for Class C shares is 1% imposed on redemptions and is reduced to 0% after one year. Class C shares bear ongoing 12b-1 service and distribution fees.
4 The Portfolio offers Class Y shares to a limited group of eligible investors, including certain qualifying retirement plans. Class Y shares do not bear initial or contingent deferred sales charges or ongoing 12b-1 service and distribution fees.
5 Class P shares do not bear initial or contingent deferred sales charges or ongoing 12b-1 service and distribution fees, but are subject to a maximum annual UBS PACE Select program fee of 2% of the value of Class P shares. Prior to June 14, 2010, the maximum annual UBS PACE Select program fee was 1.5% of the value of Class P shares.
6 The MSCI World Free Index (net) is a free float-adjusted market capitalization weighted index that is designed to measure the equity market performance of developed markets. As of May 2010, the index consisted of 24 developed market country indices. Dividends are reinvested after deduction of withholding tax, using tax rates applicable to Luxembourg holding companies, as Luxembourg applies the highest rates. Had US tax rates been applied, the performance of the index would be different. The index is constructed and managed with a view to being fully investable from the perspective of international institutional investors. Investors should note that indices do not reflect the deduction of fees and expenses.
7 The Barclays Capital Global Aggregate Index is an unmanaged broad-based, market capitalization weighted index which is designed to measure the broad global markets for US and non US corporate, government, governmental agency, supranational, mortgage-backed and asset-backed fixed income securities. Investors should note that indices do not reflect the deduction of fees and expenses.
8 The US Consumer Price Index (CPI) produces monthly data on changes in the prices paid by urban consumers for a representative basket of goods and services. The Index is calculated by the Bureau of Labor Statistics. Investors should note that indices do not reflect the deduction of fees and expenses.
If an investor sells or exchanges shares less than 90 days after purchase, a redemption fee of 1.00% of the amount sold or exchanged will be deducted at the time of the transaction, except as noted otherwise in the prospectuses.
Past performance does not predict future performance, and the performance information provided does not reflect the deduction of taxes that a shareholder would pay on Portfolio distributions or the redemption of Portfolio shares. The return and principal value of an investment will fluctuate, so that an investor's shares, when redeemed, may be worth more or less than their original cost. Performance results assume reinvestment of all dividends and capital gain distributions at net asset value on the ex-dividend dates. Current performance may be higher or lower than the performance data quoted. For month-end performance figures, please visit http://www.ubs.com.
Lipper peer group data calculated by Lipper Inc.; used with permission. The Lipper median is the return of the fund that places in the middle of a Lipper peer group.
187
UBS PACE Select Advisors Trust
UBS PACE Alternative Strategies Investments
Portfolio statistics (unaudited)
| Characteristics | | 07/31/10 | |
| Net assets (mm) | | $ | 465.1 | | |
| Number of holdings | | | 800 | | |
| Portfolio composition1 | | 07/31/10 | |
| Common and preferred stocks | | | 31.6 | % | |
| Bonds and notes | | | 24.2 | | |
| ADRs and GDRs | | | 1.2 | | |
| Investment companies | | | 0.7 | | |
| Unit trust | | | 0.0 | 2 | |
| Investments sold short | | | (4.7 | ) | |
| Options, futures, swaps and forward foreign currency contracts | | | (0.1 | ) | |
| Cash equivalents and other assets less liabilities | | | 47.1 | | |
| Total | | | 100.0 | % | |
| Top five countries (long holdings)1 | | 07/31/10 | |
| United States | | | 35.3 | % | |
| Canada | | | 3.6 | | |
| Japan | | | 2.9 | | |
| United Kingdom | | | 1.6 | | |
| Australia | | | 1.5 | | |
| Total | | | 44.9 | % | |
| Top five equity sectors (long holdings)1 | | 07/31/10 | |
| Information technology | | | 6.6 | % | |
| Consumer discretionary | | | 6.1 | | |
| Materials | | | 4.5 | | |
| Financials | | | 4.1 | | |
| Industrials | | | 3.1 | | |
| Total | | | 24.4 | % | |
| Top five countries (short holdings)1 | | 07/31/10 | |
| Japan | | | (1.3 | )% | |
| United States | | | (0.8 | ) | |
| Australia | | | (0.8 | ) | |
| Canada | | | (0.6 | ) | |
| United Kingdom | | | (0.6 | ) | |
| Total | | | (4.1 | )% | |
| Top five equity sectors (short holdings)1 | | 07/31/10 | |
| Materials | | | (1.3 | )% | |
| Energy | | | (1.1 | ) | |
| Financials | | | (0.9 | ) | |
| Health care | | | (0.6 | ) | |
| Consumer discretionary | | | (0.4 | ) | |
| Total | | | (4.3 | )% | |
1 Weightings represent percentages of the Portfolio's net assets as of July 31, 2010. The Portfolio is actively managed and its composition will vary over time.
2 Weighting represents less than 0.05% of the Portfolio's net assets as of July 31, 2010.
ADR American Depositary Receipt
GDR Global Depositary Receipt
188
UBS PACE Select Advisors Trust
UBS PACE Alternative Strategies Investments
Portfolio statistics (unaudited) (concluded)
| Top ten equity holdings (long holdings)1 | | 07/31/10 | |
| Emerson Electric Co. | | | 0.5 | % | |
| Mattel, Inc. | | | 0.4 | | |
| Annaly Capital Management, Inc. | | | 0.4 | | |
| Link REIT | | | 0.4 | | |
| TJX Cos., Inc. | | | 0.4 | | |
| Baidu, Inc., ADR | | | 0.4 | | |
| Arbitron, Inc. | | | 0.4 | | |
| Discovery Communications, Inc. | | | 0.4 | | |
| Newmont Mining Corp. | | | 0.4 | | |
| Ross Stores, Inc. | | | 0.3 | | |
| Total | | | 4.0 | % | |
| Top ten equity holdings (short holdings)1 | | 07/31/10 | |
| Weatherford International Ltd. | | | (0.3 | )% | |
| Cairn Energy PLC | | | (0.2 | ) | |
| Boston Scientific Corp. | | | (0.2 | ) | |
| Mitsubishi Motors Corp. | | | (0.2 | ) | |
| Paladin Energy Ltd. | | | (0.2 | ) | |
| Alumina Ltd. | | | (0.2 | ) | |
| Vertex Pharmaceuticals, Inc. | | | (0.2 | ) | |
| Prudential PLC | | | (0.2 | ) | |
| Daiwa Securities Group, Inc. | | | (0.2 | ) | |
| Ivanhoe Mines Ltd. | | | (0.2 | ) | |
| Total | | | (2.1 | )% | |
Top ten long-term fixed income holdings
(long holdings)1 | | 07/31/10 | |
| US Treasury Notes, 0.625%, due 06/30/12 | | | 1.6 | % | |
| FFCB, 4.500%, due 05/21/15 | | | 1.1 | | |
FHLMC REMIC, Series 2882, Class UL,
4.500%, due 02/15/19 | | | 0.9 | | |
Kreditanstalt fuer Wiederaufbau,
3.250%, due 02/15/11 | | | 0.6 | | |
| Suncorp-Metway Ltd., 1.776%, due 04/15/11 | | | 0.5 | | |
| FNMA, 3.134%, due 04/01/37 | | | 0.5 | | |
FNMA REMIC, Series 2009-70, Class AL,
5.000%, due 08/25/19 | | | 0.4 | | |
US Treasury Inflation Index Notes (TIPS),
2.375%, due 04/15/11 | | | 0.4 | | |
| Bank of Nova Scotia, 1.450%, due 07/26/13 | | | 0.4 | | |
Harborview Mortgage Loan Trust, Series 2005-10,
Class 2A1A, 0.651%, due 11/19/35 | | | 0.4 | | |
| Total | | | 6.8 | % | |
1 Weightings represent percentages of the Portfolio's net assets as of July 31, 2010. The Portfolio is actively managed and its composition will vary over time.
189
UBS PACE Select Advisors Trust
UBS PACE Alternative Strategies Investments
Industry diversification—(unaudited)
As a percentage of net assets as of July 31, 2010
Common stocks
| Aerospace & defense | | | 0.04 | % | |
| Air freight & logistics | | | 0.14 | | |
| Airlines | | | 0.06 | | |
| Auto components | | | 0.16 | | |
| Automobiles | | | 0.49 | | |
| Beverages | | | 0.23 | | |
| Biotechnology | | | 0.42 | | |
| Building products | | | 0.01 | | |
| Capital markets | | | 0.03 | | |
| Chemicals | | | 1.47 | | |
| Commercial banks | | | 1.19 | | |
| Commercial services & supplies | | | 0.23 | | |
| Communications equipment | | | 0.59 | | |
| Computers & peripherals | | | 1.55 | | |
| Construction & engineering | | | 0.03 | | |
| Construction materials | | | 0.01 | | |
| Consumer finance | | | 0.30 | | |
| Distributors | | | 0.05 | | |
| Diversified financial services | | | 0.07 | | |
| Diversified telecommunication services | | | 0.17 | | |
| Electric utilities | | | 0.13 | | |
| Electrical equipment | | | 1.14 | | |
| Electronic equipment, instruments & components | | | 0.45 | | |
| Energy equipment & services | | | 0.19 | | |
| Food & staples retailing | | | 0.22 | | |
| Food products | | | 0.96 | | |
| Gas utilities | | | 0.05 | | |
| Health care equipment & supplies | | | 0.17 | | |
| Health care providers & services | | | 0.66 | | |
| Hotels, restaurants & leisure | | | 1.16 | | |
| Household durables | | | 0.25 | | |
| Household products | | | 0.40 | | |
| Independent power producers & energy traders | | | 0.34 | | |
| Industrial conglomerates | | | 0.48 | | |
| Insurance | | | 0.40 | | |
| Internet & catalog retail | | | 0.17 | | |
| Internet software & services | | | 0.58 | | |
| IT services | | | 0.72 | | |
| Leisure equipment & products | | | 0.42 | | |
| Life sciences tools & services | | | 0.12 | | |
| Machinery | | | 0.39 | | |
| Marine | | | 0.02 | | |
| Media | | | 1.79 | | |
| Metals & mining | | | 2.85 | | |
| Multiline retail | | | 0.08 | | |
| Multi-utilities | | | 0.01 | | |
Common stocks—(concluded)
| Oil, gas & consumable fuels | | | 1.95 | % | |
| Paper & forest products | | | 0.13 | | |
| Personal products | | | 0.05 | | |
| Pharmaceuticals | | | 1.43 | | |
| Professional services | | | 0.01 | | |
| Real estate investment trusts (REITs) | | | 1.67 | | |
| Real estate management & development | | | 0.12 | | |
| Road & rail | | | 0.27 | | |
| Semiconductors & semiconductor equipment | | | 1.55 | | |
| Software | | | 1.13 | | |
| Specialty retail | | | 1.24 | | |
| Textiles, apparel & luxury goods | | | 0.28 | | |
| Thrifts & mortgage finance | | | 0.26 | | |
| Tobacco | | | 0.27 | | |
| Trading companies & distributors | | | 0.21 | | |
| Transportation infrastructure | | | 0.03 | | |
| Water utilities | | | 0.01 | | |
| Wireless telecommunication services | | | 0.83 | | |
| Total common stocks | | | 32.83 | | |
Preferred stock
| Chemicals | | | 0.01 | | |
| Investment companies | | | 0.72 | | |
| Unit trust | | | 0.02 | | |
| US government obligations | | | 2.69 | | |
| Federal farm credit bank certificate | | | 1.14 | | |
| Federal home loan bank certificate | | | 0.32 | | |
| Federal home loan mortgage corporation certificates | | | 0.58 | | |
| Federal national mortgage association certificates | | | 0.64 | | |
| Collateralized mortgage obligations | | | 5.06 | | |
| Asset-backed securities | | | 3.32 | | |
Corporate notes
| Advertising | | | 0.05 | | |
| Agriculture | | | 0.04 | | |
| Appliances | | | 0.04 | | |
| Banking Non-US | | | 3.40 | | |
| Banking US | | | 0.87 | | |
| Beverages | | | 0.12 | | |
| Cable | | | 0.43 | | |
| Chemicals | | | 0.06 | | |
190
UBS PACE Select Advisors Trust
UBS PACE Alternative Strategies Investments
Industry diversification—(unaudited)
As a percentage of net assets as of July 31, 2010
Corporate notes—(concluded)
| Commercial services | | | 0.09 | % | |
| Containers | | | 0.07 | | |
| Diversified financial services | | | 0.48 | | |
| Electric-integrated | | | 0.33 | | |
| Food-miscellaneous | | | 0.04 | | |
| Health care providers & services | | | 0.03 | | |
| Insurance | | | 0.42 | | |
| Investment companies | | | 0.30 | | |
| Medical products | | | 0.09 | | |
| Mining | | | 0.19 | | |
| Oil & gas | | | 0.36 | | |
| Paper & forest products | | | 0.02 | | |
| Pipelines | | | 0.61 | | |
| Real estate | | | 0.35 | | |
| Software | | | 0.06 | | |
| Sovereign agency | | | 0.13 | | |
| Steel | | | 0.06 | | |
| Supranational bank | | | 0.17 | | |
| Telecommunications | | | 0.30 | | |
| Television | | | 0.10 | | |
| Total corporate notes | | | 9.21 | | |
| Municipal bonds and notes | | | 0.61 | | |
| Non-US government obligations | | | 0.67 | | |
| Time deposits | | | 4.60 | | |
| Short-term US government obligations | | | 19.01 | | |
| Repurchase agreement | | | 17.92 | | |
Options
| Call options purchased | | | 0.01 | | |
| Put options purchased | | | 0.03 | | |
| Total options | | | 0.04 | | |
Investments sold short
Common stocks
| Automobiles | | | (0.22 | )% | |
| Biotechnology | | | (0.37 | ) | |
| Capital markets | | | (0.33 | ) | |
| Chemicals | | | (0.28 | ) | |
| Commercial banks | | | (0.07 | ) | |
| Diversified financial services | | | (0.05 | ) | |
| Diversified telecommunication services | | | (0.07 | ) | |
| Energy equipment & services | | | (0.27 | ) | |
| Health care equipment & supplies | | | (0.23 | ) | |
| Hotels, restaurants & leisure | | | (0.03 | ) | |
| Household durables | | | (0.18 | ) | |
| Industrial conglomerates | | | (0.17 | ) | |
| Insurance | | | (0.34 | ) | |
| Machinery | | | (0.08 | ) | |
| Metals & mining | | | (1.00 | ) | |
| Oil, gas & consumable fuels | | | (0.80 | ) | |
| Real estate management & development | | | (0.16 | ) | |
| Semiconductors & semiconductor equipment | | | (0.07 | ) | |
| Total investments sold short | | | (4.72 | ) | |
| Other assets in excess of liabilities | | | 5.33 | | |
| Net assets | | | 100.00 | % | |
191
UBS PACE Select Advisors Trust
UBS PACE Alternative Strategies Investments
Portfolio of investments—July 31, 2010
| Security description | | Number of
shares | | Value | |
| Common stocks—32.83% | |
| Australia—0.57% | |
| Asciano Group* | | | 11,342 | | | $ | 17,341 | | |
Energy Resources of
Australia Ltd. | | | 18,795 | | | | 234,313 | | |
| Incitec Pivot Ltd. | | | 12,665 | | | | 37,239 | | |
| Karoon Gas Australia Ltd.* | | | 2,489 | | | | 15,582 | | |
| Paladin Energy Ltd.* | | | 167,807 | | | | 584,488 | | |
| TABCORP Holdings Ltd.1 | | | 261,378 | | | | 1,622,175 | | |
| Tatts Group Ltd.1 | | | 52,414 | | | | 116,176 | | |
| Total Australia common stocks | | | | | | | 2,627,314 | | |
| Bermuda—0.45% | |
| Bunge Ltd. | | | 520 | | | | 25,818 | | |
| China Foods Ltd. | | | 18,877 | | | | 11,908 | | |
| China Green (Holdings) Ltd. | | | 39,000 | | | | 40,469 | | |
| China Yurun Food Group Ltd. | | | 26,267 | | | | 86,232 | | |
| CNPC Hong Kong Ltd. | | | 6,876 | | | | 8,959 | | |
| Cosan Ltd., Class A* | | | 3,276 | | | | 37,215 | | |
| COSCO Pacific Ltd. | | | 1,377 | | | | 1,879 | | |
| Digital China Holdings Ltd. | | | 73,000 | | | | 118,417 | | |
| Esprit Holdings Ltd. | | | 3,748 | | | | 23,523 | | |
GOME Electrical Appliances
Holdings Ltd.* | | | 152,927 | | | | 52,961 | | |
Haier Electronics Group
Co. Ltd.* | | | 108,000 | | | | 75,499 | | |
| Hi Sun Technology (China) Ltd.* | | | 71,000 | | | | 27,696 | | |
Hopson Development
Holdings Ltd. | | | 4,849 | | | | 6,592 | | |
Huabao International
Holdings Ltd. | | | 79,013 | | | | 101,926 | | |
| Mongolia Energy Co. Ltd.* | | | 21,212 | | | | 8,001 | | |
Nine Dragons Paper
Holdings Ltd. | | | 7,445 | | | | 10,812 | | |
| Shangri-La Asia Ltd. | | | 87,333 | | | | 176,971 | | |
| Sinofert Holdings Ltd.* | | | 210,137 | | | | 92,793 | | |
Yue Yuen Industrial
Holdings Ltd.1 | | | 363,500 | | | | 1,179,298 | | |
| Total Bermuda common stocks | | | | | | | 2,086,969 | | |
| Brazil—0.17% | |
| Brasil Foods SA | | | 6,992 | | | | 98,233 | | |
Companhia de Saneamento
de Minas Gerais-Copasa MG | | | 2,483 | | | | 35,718 | | |
Companhia Energetica de
Minas Gerais-CEMIG, ADR | | | 2,390 | | | | 36,328 | | |
| Cosan SA Industria e Comercio* | | | 6,200 | | | | 88,128 | | |
| SLC Agricola SA | | | 9,592 | | | | 82,079 | | |
| Vale SA, ADR | | | 15,563 | | | | 432,651 | | |
| Total Brazil common stocks | | | | | | | 773,137 | | |
| Canada—2.77% | |
| Agrium, Inc.2 | | | 258 | | | | 16,254 | | |
| Agrium, Inc.3 | | | 2,497 | | | | 157,148 | | |
| Bank of Nova Scotia1 | | | 2,200 | | | | 110,401 | | |
| Barrick Gold Corp. | | | 37,756 | | | | 1,551,772 | | |
| Security description | | Number of
shares | | Value | |
| Common stocks—(continued) | |
| Canada— (concluded) | |
Brookfield Asset
Management, Inc. | | | 1,082 | | | $ | 27,147 | | |
| Cameco Corp. | | | 10,419 | | | | 265,580 | | |
Canadian Imperial Bank of
Commerce1 | | | 23,500 | | | | 1,613,832 | | |
| Canadian National Railway Co. | | | 468 | | | | 29,440 | | |
| Canadian Solar, Inc.* | | | 846 | | | | 10,237 | | |
| Empire Co. Ltd.1 | | | 6,800 | | | | 370,410 | | |
| Encana Corp.1 | | | 38,200 | | | | 1,167,867 | | |
| Genworth MI Canada, Inc.1 | | | 47,900 | | | | 1,222,602 | | |
| Goldcorp, Inc. | | | 37,030 | | | | 1,449,354 | | |
| Groupe Aeroplan, Inc.1 | | | 52,900 | | | | 507,877 | | |
| Kinross Gold Corp. | | | 69,540 | | | | 1,139,761 | | |
| Metro, Inc., Class A1 | | | 7,300 | | | | 312,010 | | |
| National Bank of Canada1 | | | 13,600 | | | | 780,374 | | |
Potash Corp. of
Saskatchewan, Inc. | | | 3,991 | | | | 417,754 | | |
Rogers Communications, Inc.,
Class B1 | | | 32,600 | | | | 1,133,651 | | |
| Sino-Forest Corp.* | | | 7,936 | | | | 122,199 | | |
SouthGobi Energy
Resources Ltd.* | | | 100 | | | | 1,263 | | |
| Teck Resources Ltd., Class B1 | | | 9,259 | | | | 325,941 | | |
| Ultra Petroleum Corp.* | | | 538 | | | | 22,795 | | |
| Uranium One, Inc.* | | | 49,311 | | | | 133,824 | | |
| Total Canada common stocks | | | | | | | 12,889,493 | | |
| Cayman Islands—1.25% | |
| 3SBio, Inc., ADR* | | | 2,200 | | | | 33,110 | | |
AAC Acoustic Technologies
Holdings, Inc. | | | 4,594 | | | | 8,162 | | |
| Agile Property Holdings Ltd. | | | 1,525 | | | | 1,987 | | |
| Alibaba.com Ltd. | | | 153,000 | | | | 316,341 | | |
| Anta Sports Products Ltd. | | | 7,099 | | | | 12,539 | | |
| ASM Pacific Technology Ltd.1 | | | 109,700 | | | | 1,002,729 | | |
| Baidu, Inc., ADR* | | | 21,537 | | | | 1,753,327 | | |
| Belle International Holdings Ltd. | | | 38,856 | | | | 59,929 | | |
Bosideng International
Holdings Ltd. | | | 6,471 | | | | 1,999 | | |
Chaoda Modern Agriculture
(Holdings) Ltd. | | | 56,796 | | | | 61,055 | | |
| China Dongxiang Group Co. | | | 14,202 | | | | 8,045 | | |
China High Speed Transmission
Equipment Group Co. Ltd. | | | 12,094 | | | | 27,652 | | |
| China Mengniu Dairy Co. Ltd. | | | 4,693 | | | | 14,591 | | |
| China Resources Land Ltd. | | | 2,974 | | | | 6,310 | | |
China Zhongwang
Holdings Ltd. | | | 8,248 | | | | 5,193 | | |
| CNinsure, Inc., ADR | | | 200 | | | | 4,716 | | |
| Country Garden Holdings Co. | | | 22,355 | | | | 7,080 | | |
Ctrip.com International
Ltd., ADR* | | | 5,334 | | | | 214,747 | | |
Daphne International
Holdings Ltd. | | | 72,000 | | | | 66,647 | | |
192
UBS PACE Select Advisors Trust
UBS PACE Alternative Strategies Investments
Portfolio of investments—July 31, 2010
| Security description | | Number of
shares | | Value | |
| Common stocks—(continued) | |
| Cayman Islands—(continued) | |
Fantasia Holdings
Group Co. Ltd. | | | 133,500 | | | $ | 25,609 | | |
Focus Media Holding
Ltd., ADR* | | | 586 | | | | 10,624 | | |
Golden Eagle Retail
Group Ltd. | | | 7,165 | | | | 17,028 | | |
Greentown China
Holdings Ltd. | | | 4,416 | | | | 5,492 | | |
Hengan International
Group Co. Ltd. | | | 25,583 | | | | 220,342 | | |
| Hengdeli Holdings Ltd. | | | 48,000 | | | | 21,999 | | |
Hidili Industry International
Development Ltd. | | | 11,669 | | | | 10,546 | | |
Home Inns & Hotels
Management, Inc., ADR* | | | 700 | | | | 29,449 | | |
Intime Department Store
Group Co. Ltd. | | | 54,000 | | | | 55,894 | | |
JA Solar Holdings Co.
Ltd., ADR* | | | 679 | | | | 4,040 | | |
Kingboard Chemical
Holdings Ltd. | | | 2,074 | | | | 9,599 | | |
Lee & Man Paper
Manufacturing Ltd. | | | 13,287 | | | | 9,767 | | |
| Li Ning Co. Ltd. | | | 3,516 | | | | 11,588 | | |
Lijun International
Pharmaceutical (Holding)
Co. Ltd. | | | 149,000 | | | | 45,654 | | |
Longtop Financial Technologies
Ltd., ADR* | | | 156 | | | | 5,200 | | |
Melco Crown Entertainment
Ltd., ADR* | | | 2,714 | | | | 10,557 | | |
Mindray Medical International
Ltd., ADR | | | 940 | | | | 29,084 | | |
| NetEase.com, Inc., ADR* | | | 899 | | | | 34,432 | | |
New Oriental Education &
Technology Group, Inc., ADR* | | | 106 | | | | 10,367 | | |
| New World China Land Ltd. | | | 18,030 | | | | 6,267 | | |
| Parkson Retail Group Ltd. | | | 102,956 | | | | 176,818 | | |
Renhe Commercial Holdings
Co. Ltd. | | | 27,039 | | | | 5,813 | | |
Semiconductor Manufacturing
International Corp.* | | | 77,794 | | | | 5,408 | | |
| Shanda Games Ltd., ADR* | | | 520 | | | | 3,448 | | |
Shanda Interactive
Entertainment Ltd., ADR* | | | 99 | | | | 3,951 | | |
| Shimao Property Holdings Ltd. | | | 1,329 | | | | 2,549 | | |
| Shui On Land Ltd. | | | 12,158 | | | | 5,541 | | |
Simcere Pharmaceutical
Group, ADR* | | | 8,800 | | | | 79,640 | | |
| SINA Corp.* | | | 112 | | | | 4,791 | | |
| Soho China Ltd. | | | 10,898 | | | | 6,721 | | |
Suntech Power Holdings
Co. Ltd., ADR* | | | 617 | | | | 6,133 | | |
| Tencent Holdings Ltd. | | | 28,855 | | | | 556,111 | | |
| Security description | | Number of
shares | | Value | |
| Common stocks—(continued) | |
| Cayman Islands—(concluded) | |
Tingyi (Cayman Islands)
Holding Corp. | | | 150,704 | | | $ | 382,217 | | |
| Towngas China Co. Ltd. | | | 61,000 | | | | 24,031 | | |
| Trauson Holdings Co. Ltd.* | | | 69,000 | | | | 32,246 | | |
| Trina Solar Ltd., ADR* | | | 881 | | | | 19,153 | | |
VanceInfo Technologies,
Inc., ADR* | | | 1,200 | | | | 30,468 | | |
| Want Want China Holdings Ltd. | | | 26,069 | | | | 20,406 | | |
| Wynn Macau Ltd.* | | | 138,400 | | | | 235,552 | | |
| Xinao Gas Holdings Ltd. | | | 10,938 | | | | 25,882 | | |
Yingli Green Energy Holding
Co. Ltd., ADR* | | | 286 | | | | 3,123 | | |
Total Cayman Islands
common stocks | | | | | | | 5,809,699 | | |
| Chile—0.22% | |
| Banco Santander Chile, ADR | | | 1,370 | | | | 113,724 | | |
| CAP SA | | | 2,972 | | | | 109,187 | | |
Centros Comerciales
Sudamericanos SA | | | 20,480 | | | | 104,315 | | |
Empresa Nacional de
Electricidad SA | | | 58,987 | | | | 97,095 | | |
| Empresas CMPC SA | | | 2,026 | | | | 91,729 | | |
| Empresas COPEC SA | | | 5,761 | | | | 94,331 | | |
| Enersis SA, ADR | | | 4,583 | | | | 95,052 | | |
| Lan Airlines SA, ADR | | | 4,722 | | | | 112,714 | | |
| S.A.C.I. Falabella | | | 14,251 | | | | 111,547 | | |
Sociedad Quimica y Minera de
Chile SA, ADR | | | 2,689 | | | | 102,155 | | |
| Total Chile common stocks | | | | | | | 1,031,849 | | |
| China—0.88% | |
Agricultural Bank of China,
Class H* | | | 155,000 | | | | 69,842 | | |
| Air China Ltd., Class H* | | | 8,582 | | | | 9,844 | | |
Aluminum Corp. of China Ltd.,
Class H* | | | 17,599 | | | | 15,588 | | |
| Angang Steel Co. Ltd., Class H | | | 64,138 | | | | 96,775 | | |
Anhui Conch Cement Co. Ltd.,
Class H | | | 4,426 | | | | 15,470 | | |
AviChina Industry & Technology
Co. Ltd., Class H* | | | 27,720 | | | | 11,349 | | |
| Bank of China Ltd., Class H | | | 68,736 | | | | 36,282 | | |
Bank of Communications Co.
Ltd., Class H | | | 18,863 | | | | 20,933 | | |
| BBMG Corp., Class H | | | 12,765 | | | | 15,070 | | |
Beijing Capital International
Airport Co. Ltd., Class H | | | 15,075 | | | | 7,957 | | |
| BYD Co. Ltd., Class H | | | 22,781 | | | | 156,761 | | |
China Bluechemical Ltd.,
Class H | | | 15,586 | | | | 9,993 | | |
| China CITIC Bank, Class H | | | 16,239 | | | | 10,955 | | |
China Coal Energy Co.,
Class H | | | 11,520 | | | | 16,077 | | |
193
UBS PACE Select Advisors Trust
UBS PACE Alternative Strategies Investments
Portfolio of investments—July 31, 2010
| Security description | | Number of
shares | | Value | |
| Common stocks—(continued) | |
| China—(continued) | |
China Communications
Construction Co. Ltd.,
Class H | | | 7,837 | | | $ | 7,396 | | |
China Communications Services
Corp. Ltd., Class H | | | 42,819 | | | | 21,720 | | |
China Construction Bank Corp.,
Class H | | | 614,291 | | | | 521,169 | | |
China COSCO Holdings Co.
Ltd., Class H* | | | 10,624 | | | | 11,899 | | |
China Eastern Airlines Corp.
Ltd., Class H* | | | 23,744 | | | | 13,297 | | |
China Life Insurance Co.,
Class H | | | 155,933 | | | | 692,589 | | |
China Longyuan Power Group
Corp., Class H* | | | 18,444 | | | | 19,376 | | |
China Merchants Bank Co. Ltd.,
Class H | | | 29,283 | | | | 78,226 | | |
China Minsheng Banking Corp.
Ltd., Class H | | | 9,393 | | | | 8,767 | | |
China Molybdenum Co. Ltd.,
Class H | | | 15,443 | | | | 9,603 | | |
China National Building
Material Co. Ltd., Class H | | | 3,974 | | | | 7,500 | | |
China National Materials Co.
Ltd., Class H | | | 11,625 | | | | 9,099 | | |
China Oilfield Services Ltd.,
Class H | | | 5,981 | | | | 7,854 | | |
China Pacific Insurance (Group)
Co. Ltd., Class H | | | 1,460 | | | | 5,827 | | |
China Petroleum & Chemical
Corp., Class H | | | 49,552 | | | | 39,935 | | |
China Railway Construction
Corp. Ltd., Class H | | | 10,717 | | | | 14,929 | | |
China Railway Group Ltd.,
Class H* | | | 14,049 | | | | 10,490 | | |
China Shenhua Energy Co. Ltd.,
Class H | | | 74,021 | | | | 284,934 | | |
China Shipping Container Lines
Co. Ltd., Class H* | | | 19,616 | | | | 7,248 | | |
China Shipping Development
Co. Ltd., Class H | | | 38,261 | | | | 56,252 | | |
China Southern Airlines Co. Ltd.,
Class H* | | | 24,020 | | | | 11,596 | | |
China Telecom Corp. Ltd.,
Class H | | | 390,772 | | | | 195,700 | | |
| CSR Corp. Ltd., Series H | | | 15,269 | | | | 12,620 | | |
Datang International Power
Generation Co. Ltd., Class H | | | 42,594 | | | | 18,261 | | |
Dongfang Electric Corp. Ltd.,
Class H | | | 3,061 | | | | 10,522 | | |
Dongfeng Motor Group Co. Ltd.,
Class H | | | 11,748 | | | | 16,395 | | |
Great Wall Motor Co. Ltd.,
Class H | | | 1,353 | | | | 2,696 | | |
| Security description | | Number of
shares | | Value | |
| Common stocks—(continued) | |
| China��(concluded) | |
Guangshen Railway Co. Ltd.,
Class H | | | 17,767 | | | $ | 6,519 | | |
Guangzhou R&F Properties Co.
Ltd., Class H | | | 1,492 | | | | 2,336 | | |
Huaneng Power International,
Inc., Class H | | | 23,114 | | | | 13,450 | | |
Industrial & Commercial Bank of
China, Class H | | | 355,124 | | | | 271,115 | | |
Jiangsu Expressway Co. Ltd.,
Class H | | | 9,379 | | | | 9,129 | | |
Jiangxi Copper Co. Ltd.,
Class H | | | 6,760 | | | | 15,004 | | |
Maanshan Iron & Steel Co. Ltd.,
Class H | | | 21,132 | | | | 11,780 | | |
Metallurgical Corp. of China
Ltd., Class H* | | | 20,534 | | | | 9,570 | | |
| PetroChina Co. Ltd., Class H | | | 255,205 | | | | 289,457 | | |
PICC Property & Casualty Co.
Ltd., Class H* | | | 4,376 | | | | 4,428 | | |
Ping An Insurance (Group) Co.
of China Ltd., Class H4 | | | 8,607 | | | | 71,305 | | |
Shandong Weigao Group
Medical Polymer Co. Ltd.,
Class H | | | 54,989 | | | | 247,778 | | |
Shanghai Electric Group Co.
Ltd., Class H* | | | 21,287 | | | | 10,003 | | |
Shenzhen Expressway Co. Ltd.,
Class H | | | 190,000 | | | | 91,973 | | |
Sinopec Shanghai Petrochemical
Co. Ltd., Class H | | | 30,149 | | | | 11,761 | | |
| Sinopharm Group Co., Class H | | | 14,251 | | | | 53,298 | | |
Tsingtao Brewery Co. Ltd.,
Class H | | | 4,671 | | | | 22,130 | | |
Weichai Power Co. Ltd.,
Class H | | | 10,426 | | | | 86,173 | | |
| Wumart Stores, Inc., Class H | | | 5,802 | | | | 12,683 | | |
Yanzhou Coal Mining Co. Ltd.,
Class H | | | 37,404 | | | | 80,322 | | |
Zhaojin Mining Industry Co.
Ltd., Class H | | | 6,083 | | | | 13,157 | | |
Zhejiang Expressway Co. Ltd.,
Class H | | | 9,389 | | | | 8,860 | | |
Zhuzhou CSR Times Electric Co.
Ltd., Class H | | | 19,182 | | | | 51,366 | | |
| Zijin Mining Group Co. Ltd. | | | 105,521 | | | | 68,061 | | |
| ZTE Corp., Class H | | | 10,274 | | | | 32,869 | | |
| Total China common stocks | | | | | | | 4,083,323 | | |
| Denmark—0.05% | |
AP Moller - Maersk A/S,
Class B | | | 1 | | | | 8,433 | | |
| Coloplast A/S, Class B1 | | | 1,576 | | | | 163,718 | | |
| Vestas Wind Systems A/S* | | | 1,308 | | | | 63,592 | | |
| Total Denmark common stocks | | | | | | | 235,743 | | |
194
UBS PACE Select Advisors Trust
UBS PACE Alternative Strategies Investments
Portfolio of investments—July 31, 2010
| Security description | | Number of
shares | | Value | |
| Common stocks—(continued) | |
| Finland—0.31% | |
| Fortum Oyj | | | 2,088 | | | $ | 48,570 | | |
| Orion Oyj, Class B1 | | | 71,195 | | | | 1,374,967 | | |
| Total Finland common stocks | | | | | | | 1,423,537 | | |
| France—0.35% | |
| Aeroports de Paris (ADP) | | | 336 | | | | 24,765 | | |
| Compagnie de Saint-Gobain | | | 490 | | | | 20,858 | | |
| Eramet | | | 486 | | | | 134,551 | | |
| PagesJaunes Groupe1 | | | 125,048 | | | | 1,384,152 | | |
| Schneider Electric SA | | | 201 | | | | 23,181 | | |
| Suez Environnement SA | | | 606 | | | | 11,277 | | |
| Vallourec SA | | | 191 | | | | 18,596 | | |
| Vinci SA | | | 535 | | | | 25,900 | | |
| Total France common stocks | | | | | | | 1,643,280 | | |
| Germany—0.07% | |
| Deutsche Lufthansa AG* | | | 1,647 | | | | 26,775 | | |
| Deutsche Post AG | | | 1,832 | | | | 31,812 | | |
| K+S AG | | | 2,801 | | | | 148,706 | | |
| Siemens AG | | | 919 | | | | 89,568 | | |
| SMA Solar Technology AG | | | 191 | | | | 23,608 | | |
| Total Germany common stocks | | | | | | | 320,469 | | |
| Guernsey—0.03% | |
| Resolution Ltd.1 | | | 35,274 | | | | 131,899 | | |
| Hong Kong—1.08% | |
| Bank of East Asia Ltd. | | | 2,190 | | | | 8,599 | | |
| Beijing Enterprises Holdings Ltd. | | | 103,632 | | | | 685,099 | | |
| BOC Hong Kong (Holdings) Ltd. | | | 4,772 | | | | 12,250 | | |
BYD Electronic International
Co. Ltd. | | | 8,952 | | | | 4,990 | | |
| Cathay Pacific Airways Ltd. | | | 2,788 | | | | 6,210 | | |
Champion Real Estate
Investment Trust | | | 12,135 | | | | 5,937 | | |
| Cheung Kong (Holdings) Ltd. | | | 935 | | | | 11,297 | | |
China Agri-Industries
Holdings Ltd. | | | 38,538 | | | | 43,611 | | |
China Everbright
International Ltd. | | | 38,736 | | | | 17,803 | | |
| China Everbright Ltd. | | | 2,090 | | | | 5,449 | | |
China Merchants Holdings
International Co. Ltd. | | | 2,094 | | | | 7,926 | | |
| China Mobile Ltd. | | | 37,979 | | | | 384,068 | | |
China Overseas Land &
Investment Ltd. | | | 62,799 | | | | 134,532 | | |
| China Resources Enterprise Ltd. | | | 32,920 | | | | 125,026 | | |
China Resources Power
Holdings Co. Ltd. | | | 49,306 | | | | 107,658 | | |
China Taiping Insurance
Holdings Co. Ltd.* | | | 2,454 | | | | 8,277 | | |
| China Unicom (Hong Kong) Ltd. | | | 91,741 | | | | 124,014 | | |
| Citic Pacific Ltd. | | | 4,040 | | | | 8,311 | | |
| CLP Holdings Ltd. | | | 3,606 | | | | 26,624 | | |
| CNOOC Ltd. | | | 303,107 | | | | 510,414 | | |
| Security description | | Number of
shares | | Value | |
| Common stocks—(continued) | |
| Hong Kong—(concluded) | |
| Denway Motors Ltd. | | | 18,844 | | | $ | 9,607 | | |
| Fosun International | | | 17,104 | | | | 13,080 | | |
| Franshion Properties China Ltd. | | | 21,090 | | | | 6,109 | | |
Fushan International Energy
Group Ltd. | | | 13,740 | | | | 7,925 | | |
| Guangdong Investment Ltd. | | | 34,062 | | | | 17,058 | | |
| Hang Lung Group Ltd. | | | 1,812 | | | | 10,638 | | |
| Hang Lung Properties Ltd. | | | 45,960 | | | | 191,710 | | |
| Hang Seng Bank Ltd. | | | 737 | | | | 10,209 | | |
Henderson Land Development
Co. Ltd. | | | 1,010 | | | | 6,287 | | |
Hong Kong & China Gas
Co. Ltd. | | | 11,890 | | | | 29,696 | | |
Hong Kong Electric
Holdings Ltd. | | | 3,646 | | | | 22,085 | | |
Hong Kong Exchanges &
Clearing Ltd. | | | 20,600 | | | | 338,670 | | |
| Hopewell Holdings Ltd. | | | 2,018 | | | | 6,378 | | |
| Hutchison Whampoa Ltd. | | | 5,021 | | | | 33,161 | | |
| Hysan Development Co. Ltd. | | | 2,676 | | | | 8,320 | | |
| Lenovo Group Ltd. | | | 231,624 | | | | 148,800 | | |
| Link REIT1 | | | 692,006 | | | | 1,799,617 | | |
| MTR Corp. | | | 3,760 | | | | 13,215 | | |
New World Development
Co. Ltd. | | | 2,119 | | | | 3,787 | | |
| PCCW Ltd. | | | 73,239 | | | | 22,535 | | |
Poly (Hong Kong)
Investments Ltd. | | | 5,047 | | | | 6,088 | | |
Shanghai Industrial
Holdings Ltd. | | | 1,442 | | | | 6,572 | | |
| Sino Land Co. Ltd. | | | 1,884 | | | | 3,565 | | |
| Sino-Ocean Land Holdings Ltd. | | | 3,649 | | | | 2,786 | | |
| Sinotrans Shipping Ltd. | | | 15,906 | | | | 6,901 | | |
| Sinotruk Hong Kong Ltd. | | | 7,664 | | | | 7,045 | | |
| SJM Holdings Ltd. | | | 16,643 | | | | 14,677 | | |
| Sun Hung Kai Properties Ltd. | | | 921 | | | | 13,529 | | |
| Swire Pacific Ltd., Class A | | | 980 | | | | 11,910 | | |
| Television Broadcasts Ltd. | | | 2,575 | | | | 11,934 | | |
| Wharf (Holdings) Ltd.1 | | | 1,591 | | | | 8,705 | | |
| Wing Hang Bank Ltd. | | | 831 | | | | 8,971 | | |
Total Hong Kong
common stocks | | | | | | | 5,039,665 | | |
| India—0.10% | |
| Jain Irrigation Systems Ltd. | | | 756 | | | | 20,128 | | |
| JSW Steel Ltd. | | | 5,775 | | | | 139,045 | | |
| Sterlite Industries (India) Ltd. | | | 41,468 | | | | 156,248 | | |
| Tata Steel Ltd. | | | 12,756 | | | | 147,613 | | |
| Total India common stocks | | | | | | | 463,034 | | |
| Indonesia—0.51% | |
| PT Adaro Energy Tbk | | | 1,714,186 | | | | 383,122 | | |
| PT Astra International Tbk | | | 72,976 | | | | 413,464 | | |
| PT Bank Central Asia Tbk | | | 606,526 | | | | 403,289 | | |
195
UBS PACE Select Advisors Trust
UBS PACE Alternative Strategies Investments
Portfolio of investments—July 31, 2010
| Security description | | Number of
shares | | Value | |
| Common stocks—(continued) | |
| Indonesia—(concluded) | |
| PT Bank Mandiri | | | 590,490 | | | $ | 395,925 | | |
| PT Bank Rakyat Indonesia | | | 89,500 | | | | 99,017 | | |
PT Telekomunikasi
Indonesia Tbk | | | 427,882 | | | | 404,046 | | |
| PT United Tractors Tbk | | | 128,500 | | | | 289,353 | | |
| Total Indonesia common stocks | | | | | | | 2,388,216 | | |
| Ireland—0.64% | |
| Accenture PLC, Class A1 | | | 24,800 | | | | 983,072 | | |
| Seagate Technology PLC1,* | | | 83,100 | | | | 1,042,905 | | |
| Warner Chilcott PLC, Class A1,* | | | 38,000 | | | | 972,800 | | |
| Total Ireland common stocks | | | | | | | 2,998,777 | | |
| Israel—0.01% | |
| Israel Chemicals Ltd. | | | 4,856 | | | | 60,430 | | |
| Japan—2.94% | |
| Asahi Breweries Ltd.1 | | | 34,200 | | | | 606,056 | | |
| Daicel Chemical Industries Ltd.1 | | | 101,000 | | | | 715,458 | | |
| DeNA Co. Ltd.1 | | | 28,000 | | | | 777,175 | | |
| Fuji Heavy Industries Ltd.1,* | | | 178,000 | | | | 982,765 | | |
| Hankyu Hanshin Holdings, Inc. | | | 5,761 | | | | 26,073 | | |
| Hitachi Chemical Co. Ltd.1 | | | 10,700 | | | | 213,269 | | |
| Idemitsu Kosan Co. Ltd.1 | | | 11,300 | | | | 841,009 | | |
ITOCHU Techno-
Solutions Corp.1 | | | 3,500 | | | | 127,612 | | |
Japan Retail Fund
Investment Corp.1 | | | 784 | | | | 1,010,003 | | |
| Koito Manufacturing Co. Ltd.1 | | | 9,000 | | | | 131,466 | | |
| Komatsu Ltd. | | | 1,217 | | | | 25,581 | | |
Mitsubishi Chemical
Holdings Corp.1 | | | 228,000 | | | | 1,177,013 | | |
| Mitsubishi Corp. | | | 1,185 | | | | 25,635 | | |
| Mitsubishi Electric Corp. | | | 1,817 | | | | 15,837 | | |
| Nidec Corp.1 | | | 15,300 | | | | 1,436,229 | | |
| Nippon Express Co. Ltd.1 | | | 275,000 | | | | 1,120,435 | | |
| Nippon Yusen Kabushiki Kaisha | | | 4,920 | | | | 20,843 | | |
| Nishi-Nippon City Bank Ltd.1 | | | 34,000 | | | | 99,172 | | |
Sumitomo Rubber
Industries Ltd.1 | | | 11,600 | | | | 115,067 | | |
| Suzuken Co. Ltd.1 | | | 39,800 | | | | 1,393,541 | | |
| Toho Gas Co. Ltd.1 | | | 19,000 | | | | 96,105 | | |
| Toyota Motor Corp.1 | | | 6,500 | | | | 229,469 | | |
| Toyota Tsusho Corp. | | | 1,586 | | | | 24,122 | | |
| Trend Micro, Inc.1 | | | 34,100 | | | | 1,006,482 | | |
| Yamada Denki Co. Ltd.1 | | | 12,830 | | | | 867,263 | | |
| Yamato Holdings Co. Ltd.1 | | | 46,700 | | | | 579,459 | | |
| Total Japan common stocks | | | | | | | 13,663,139 | | |
| Jersey—0.22% | |
| Randgold Resources Ltd., ADR | | | 11,632 | | | | 1,045,484 | | |
| Luxembourg—0.09% | |
| ArcelorMittal | | | 8,569 | | | | 261,189 | | |
| Evraz Group SA, GDR* | | | 5,022 | | | | 133,836 | | |
Total Luxembourg
common stocks | | | | | | | 395,025 | | |
| Security description | | Number of
shares | | Value | |
| Common stocks—(continued) | |
| Mauritius—0.02% | |
| Golden Agri-Resources Ltd. | | | 164,614 | | | $ | 69,608 | | |
| Mexico—0.24% | |
America Movil SA de CV, ADR,
Series L | | | 17,800 | | | | 883,058 | | |
Grupo Mexico SAB de CV,
Series B | | | 79,499 | | | | 210,607 | | |
| Total Mexico common stocks | | | | | | | 1,093,665 | | |
| Netherlands—0.04% | |
| CNH Global N.V.* | | | 590 | | | | 18,160 | | |
Koninklijke Philips
Electronics N.V. | | | 976 | | | | 30,411 | | |
| Unilever N.V. | | | 4,094 | | | | 120,440 | | |
Total Netherlands
common stocks | | | | | | | 169,011 | | |
| Norway—0.02% | |
| Yara International ASA | | | 2,379 | | | | 89,671 | | |
| Russia—0.09% | |
Mining and Metallurgical Co.
Norilsk Nickel, ADR | | | 13,794 | | | | 226,773 | | |
| Novolipetsk Steel (NLMK), GDR | | | 4,314 | | | | 134,122 | | |
| Uralkali, GDR | | | 1,787 | | | | 37,563 | | |
| Total Russia common stocks | | | | | | | 398,458 | | |
| Singapore—0.62% | |
Ascendas Real Estate Investment
Trust (A-REIT)1 | | | 958,000 | | | | 1,493,572 | | |
| Flextronics International Ltd.1,* | | | 153,700 | | | | 956,014 | | |
| Indofood Agri Resources Ltd.* | | | 43,153 | | | | 73,625 | | |
| Jardine Cycle & Carriage Ltd. | | | 8,000 | | | | 210,619 | | |
| Olam International Ltd. | | | 35,438 | | | | 73,232 | | |
| Wilmar International Ltd. | | | 15,945 | | | | 73,405 | | |
Total Singapore
common stocks | | | | | | | 2,880,467 | | |
| South Africa—0.18% | |
| Anglo Platinum Ltd.* | | | 8,388 | | | | 808,302 | | |
| Sasol Ltd. | | | 963 | | | | 38,149 | | |
Total South Africa
common stocks | | | | | | | 846,451 | | |
| South Korea—0.26% | |
Samsung Electro-Mechanics
Co. Ltd. | | | 141 | | | | 16,268 | | |
| Samsung Electronics Co. Ltd. | | | 891 | | | | 610,029 | | |
| Samsung SDI Co. Ltd. | | | 4,188 | | | | 601,788 | | |
Total South Korea
common stocks | | | | | | | 1,228,085 | | |
| Spain—0.40% | |
ACS, Actividades de
Contruccion y Servicios SA | | | 670 | | | | 29,066 | | |
196
UBS PACE Select Advisors Trust
UBS PACE Alternative Strategies Investments
Portfolio of investments—July 31, 2010
| Security description | | Number of
shares | | Value | |
| Common stocks—(continued) | |
| Spain—(concluded) | |
Gamesa Corp. Tecnologica SA
(Gamesa)* | | | 775 | | | $ | 6,765 | | |
| Iberdrola Renovables SA | | | 3,355 | | | | 11,743 | | |
| Iberdrola SA | | | 4,128 | | | | 29,129 | | |
Iberia Lineas Aereas de
Espana SA1,* | | | 34,898 | | | | 118,696 | | |
| Red Electrica Corp. SA | | | 628 | | | | 27,498 | | |
| Repsol YPF SA1 | | | 68,866 | | | | 1,624,793 | | |
| Total Spain common stocks | | | | | | | 1,847,690 | | |
| Sweden—0.13% | |
| Atlas Copco AB, A Shares | | | 18,578 | | | | 303,901 | | |
| Electrolux AB, Class B1 | | | 13,397 | | | | 298,757 | | |
| Sandvik AB | | | 1,572 | | | | 20,304 | | |
| Total Sweden common stocks | | | | | | | 622,962 | | |
| Switzerland—0.13% | |
| ABB Ltd.* | | | 1,438 | | | | 29,017 | | |
| Adecco SA | | | 542 | | | | 27,628 | | |
| Geberit AG | | | 178 | | | | 29,100 | | |
| Nestle SA | | | 2,808 | | | | 138,823 | | |
| Schindler Holding AG1 | | | 2,207 | | | | 193,857 | | |
| Syngenta AG | | | 791 | | | | 174,647 | | |
Total Switzerland
common stocks | | | | | | | 593,072 | | |
| Taiwan—0.26% | |
| Acer, Inc. | | | 2,737 | | | | 7,329 | | |
Advanced Semiconductor
Engineering, Inc. | | | 7,378 | | | | 5,791 | | |
| Asustek Computer, Inc. | | | 1,044 | | | | 7,868 | | |
| AU Optronics Corp. | | | 7,849 | | | | 7,434 | | |
| Chimei Innolux Corp. | | | 7,252 | | | | 7,831 | | |
| Chunghwa Picture Tubes Ltd.* | | | 69,035 | | | | 4,503 | | |
| Compal Electronics, Inc. | | | 4,646 | | | | 6,082 | | |
| Delta Electronics, Inc. | | | 15,247 | | | | 52,578 | | |
| Epistar Corp. | | | 4,351 | | | | 11,963 | | |
| Foxconn Technology Co. Ltd.* | | | 2,269 | | | | 7,718 | | |
HON HAI Precision Industry
Co. Ltd.* | | | 63,341 | | | | 254,997 | | |
| HTC Corp. | | | 16,492 | | | | 302,629 | | |
| Inotera Memories, Inc.* | | | 11,043 | | | | 5,824 | | |
| Lite-On Technology Corp. | | | 5,977 | | | | 7,629 | | |
| MediaTek, Inc. | | | 14,855 | | | | 200,966 | | |
Nan Ya Printed Circuit
Board Corp. | | | 1,831 | | | | 7,485 | | |
| Nanya Technology Corp.* | | | 9,000 | | | | 6,081 | | |
| Pegatron Corp.* | | | 2,811 | | | | 3,246 | | |
| Powertech Technology, Inc. | | | 2,311 | | | | 7,068 | | |
| Quanta Computer, Inc. | | | 4,709 | | | | 8,523 | | |
Siliconware Precision
Industries Co. | | | 4,162 | | | | 4,052 | | |
Synnex Technology
International Corp. | | | 18,007 | | | | 41,023 | | |
| Security description | | Number of
shares | | Value | |
| Common stocks—(continued) | |
| Taiwan—(concluded) | |
Taiwan Semiconductor
Manufacturing Co. Ltd. | | | 125,372 | | | $ | 244,143 | | |
| United Microelectronics Corp. | | | 21,450 | | | | 9,506 | | |
| Wistron Corp. | | | 4,633 | | | | 7,475 | | |
| Total Taiwan common stocks | | | | | | | 1,229,744 | | |
| United Kingdom—1.28% | |
| Anglo American PLC* | | | 7,797 | | | | 308,864 | | |
| Antofagasta PLC | | | 12,237 | | | | 189,713 | | |
| AstraZeneca PLC1 | | | 29,338 | | | | 1,490,636 | | |
| BHP Billiton PLC | | | 23,072 | | | | 706,510 | | |
| BP PLC1 | | | 62,153 | | | | 395,912 | | |
Eurasian Natural Resources
Corp. PLC | | | 11,811 | | | | 168,004 | | |
| Kazakhmys PLC | | | 8,371 | | | | 159,726 | | |
| National Grid PLC | | | 2,710 | | | | 21,666 | | |
| Rio Tinto PLC | | | 9,938 | | | | 515,310 | | |
Royal Dutch Shell PLC,
A Shares1 | | | 20,149 | | | | 554,716 | | |
Scottish & Southern
Energy PLC | | | 2,634 | | | | 45,795 | | |
| Thomas Cook Group PLC1 | | | 338,116 | | | | 964,548 | | |
| Vedanta Resources PLC | | | 4,353 | | | | 166,733 | | |
| Xstrata PLC | | | 17,945 | | | | 285,948 | | |
Total United Kingdom
common stocks | | | | | | | 5,974,081 | | |
| United States—16.45% | |
| 3M Co. | | | 421 | | | | 36,012 | | |
| ACCO Brands Corp.* | | | 96,900 | | | | 573,648 | | |
| Acuity Brands, Inc. | | | 824 | | | | 34,715 | | |
| Alleghany Corp.* | | | 1,301 | | | | 390,586 | | |
| Allergan, Inc. | | | 6,400 | | | | 390,784 | | |
| Altria Group, Inc. | | | 26,800 | | | | 593,888 | | |
American Tower Corp.,
Class A* | | | 21,700 | | | | 1,003,408 | | |
| AmerisourceBergen Corp.1 | | | 53,700 | | | | 1,609,389 | | |
| Amgen, Inc.1,* | | | 2,000 | | | | 109,060 | | |
Annaly Capital
Management, Inc.1 | | | 111,200 | | | | 1,934,880 | | |
| Apple, Inc.* | | | 3,750 | | | | 964,688 | | |
| Applied Materials, Inc. | | | 265 | | | | 3,127 | | |
| Arbitron, Inc. | | | 59,650 | | | | 1,723,885 | | |
| Archer-Daniels-Midland Co. | | | 10,925 | | | | 298,908 | | |
| AsiaInfo-Linkage, Inc.* | | | 1,300 | | | | 26,520 | | |
| AvalonBay Communities, Inc. | | | 2,100 | | | | 220,689 | | |
| Belden, Inc. | | | 52,400 | | | | 1,251,836 | | |
Berkshire Hathaway, Inc.,
Class B* | | | 6,900 | | | | 539,028 | | |
| Biogen Idec, Inc.1,* | | | 2,700 | | | | 150,876 | | |
| BMC Software, Inc.1,* | | | 12,200 | | | | 434,076 | | |
| BorgWarner, Inc.* | | | 9,863 | | | | 432,591 | | |
| Bristol-Myers Squibb Co. | | | 46,000 | | | | 1,146,320 | | |
| Broadcom Corp., Class A | | | 35,100 | | | | 1,264,653 | | |
197
UBS PACE Select Advisors Trust
UBS PACE Alternative Strategies Investments
Portfolio of investments—July 31, 2010
| Security description | | Number of
shares | | Value | |
| Common stocks—(continued) | |
| United States—(continued) | |
| CA, Inc.1 | | | 47,100 | | | $ | 921,276 | | |
| Cabot Oil & Gas Corp. | | | 562 | | | | 17,124 | | |
| CareFusion Corp.1,* | | | 16,000 | | | | 337,120 | | |
| Carlisle Cos., Inc. | | | 35,800 | | | | 1,205,744 | | |
| Caterpillar, Inc. | | | 498 | | | | 34,736 | | |
| CBS Corp., Class B | | | 8,600 | | | | 127,108 | | |
| Cephalon, Inc.1,* | | | 23,400 | | | | 1,327,950 | | |
| CF Industries Holdings, Inc. | | | 1,359 | | | | 110,337 | | |
| Cimarex Energy Co.1 | | | 1,400 | | | | 96,418 | | |
| Citrix Systems, Inc.* | | | 12,600 | | | | 693,252 | | |
| Clorox Co. | | | 6,900 | | | | 447,672 | | |
Cognizant Technology Solutions
Corp., Class A* | | | 14,400 | | | | 785,664 | | |
| Comcast Corp., Class A | | | 35,400 | | | | 689,238 | | |
Constellation Energy
Group, Inc.1 | | | 41,800 | | | | 1,320,880 | | |
| Covanta Holding Corp. | | | 1,835 | | | | 27,653 | | |
| Cree, Inc.* | | | 10,120 | | | | 716,901 | | |
Crown Castle
International Corp.* | | | 11,500 | | | | 454,365 | | |
| CSX Corp. | | | 469 | | | | 24,726 | | |
| Cummins, Inc. | | | 671 | | | | 53,418 | | |
| Deere & Co. | | | 8,550 | | | | 570,114 | | |
| Deltic Timber Corp. | | | 7,199 | | | | 329,570 | | |
| Diebold, Inc. | | | 11,900 | | | | 340,578 | | |
| Discover Financial Services1 | | | 92,000 | | | | 1,404,840 | | |
Discovery Communications, Inc.,
Class C1,* | | | 49,800 | | | | 1,712,124 | | |
| Dr. Pepper Snapple Group, Inc. | | | 11,600 | | | | 435,580 | | |
| Eli Lilly & Co. | | | 32,200 | | | | 1,146,320 | | |
| EMC Corp.* | | | 68,100 | | | | 1,347,699 | | |
| Emerson Electric Co.1 | | | 45,960 | | | | 2,276,858 | | |
Energy Conversion
Devices, Inc.* | | | 509 | | | | 2,464 | | |
| Entergy Corp. | | | 325 | | | | 25,191 | | |
| EOG Resources, Inc. | | | 5,400 | | | | 526,500 | | |
| EQT Corp. | | | 1,162 | | | | 42,622 | | |
| ESCO Technologies, Inc. | | | 705 | | | | 21,016 | | |
| Exelon Corp. | | | 1,362 | | | | 56,973 | | |
| Exterran Holdings, Inc.* | | | 482 | | | | 12,855 | | |
| F5 Networks, Inc.* | | | 10,600 | | | | 930,998 | | |
| First Solar, Inc.* | | | 408 | | | | 51,184 | | |
| Fiserv, Inc.* | | | 24,900 | | | | 1,247,490 | | |
| Flowserve Corp. | | | 139 | | | | 13,783 | | |
| FMC Corp. | | | 1,408 | | | | 87,986 | | |
| Ford Motor Co.* | | | 37,100 | | | | 473,767 | | |
Freeport-McMoRan Copper &
Gold, Inc. | | | 3,273 | | | | 234,150 | | |
| GATX Corp. | | | 33,178 | | | | 937,610 | | |
| General Electric Co. | | | 1,730 | | | | 27,888 | | |
| Gilead Sciences, Inc.1,* | | | 10,000 | | | | 333,200 | | |
| Goldman Sachs Group, Inc.1 | | | 1,073 | | | | 161,830 | | |
| Harris Corp.1 | | | 32,600 | | | | 1,451,678 | | |
| HCP, Inc. | | | 15,400 | | | | 546,238 | | |
| Security description | | Number of
shares | | Value | |
| Common stocks—(continued) | |
| United States—(continued) | |
| Honeywell International, Inc. | | | 678 | | | $ | 29,059 | | |
| ITC Holdings Corp. | | | 922 | | | | 52,314 | | |
| Itron, Inc.* | | | 443 | | | | 28,826 | | |
| Kimberly-Clark Corp.1 | | | 22,300 | | | | 1,429,876 | | |
L-3 Communications
Holdings, Inc. | | | 184 | | | | 13,439 | | |
| Lance, Inc. | | | 11,300 | | | | 238,769 | | |
| Las Vegas Sands Corp.* | | | 24,600 | | | | 660,756 | | |
| Liberty Global, Inc., Series C* | | | 40,900 | | | | 1,196,325 | | |
| Limited Brands, Inc.1 | | | 34,000 | | | | 871,760 | | |
| Lockheed Martin Corp. | | | 213 | | | | 16,007 | | |
| Lorillard, Inc.1 | | | 3,800 | | | | 289,712 | | |
| Lubrizol Corp.1 | | | 16,400 | | | | 1,533,236 | | |
| Mattel, Inc. | | | 92,000 | | | | 1,946,720 | | |
| Maxim Integrated Products, Inc. | | | 74,200 | | | | 1,300,726 | | |
MEMC Electronic
Materials, Inc.* | | | 1,416 | | | | 13,537 | | |
| Micron Technology, Inc.1,* | | | 46,100 | | | | 335,608 | | |
| Monsanto Co. | | | 8,323 | | | | 481,402 | | |
| Moog, Inc., Class A* | | | 503 | | | | 18,012 | | |
| NetApp, Inc.* | | | 27,700 | | | | 1,171,710 | | |
| Newmont Mining Corp. | | | 29,164 | | | | 1,630,268 | | |
| NextEra Energy, Inc. | | | 1,595 | | | | 83,419 | | |
| Northeast Utilities | | | 2,403 | | | | 66,900 | | |
| O'Reilly Automotive, Inc.* | | | 6,100 | | | | 300,608 | | |
| ON Semiconductor Corp.* | | | 3,566 | | | | 24,071 | | |
| Ormat Technologies, Inc. | | | 566 | | | | 15,746 | | |
| Pall Corp. | | | 2,900 | | | | 110,896 | | |
Penske Automotive
Group, Inc.* | | | 2,144 | | | | 30,016 | | |
| PG&E Corp. | | | 282 | | | | 12,521 | | |
| Precision Castparts Corp. | | | 120 | | | | 14,663 | | |
| QEP Resources, Inc.* | | | 922 | | | | 31,735 | | |
| Quanta Services, Inc.* | | | 1,848 | | | | 39,695 | | |
| Questar Corp. | | | 922 | | | | 15,167 | | |
| Ralcorp Holdings, Inc.* | | | 20,300 | | | | 1,185,520 | | |
| Raytheon Co. | | | 562 | | | | 26,004 | | |
| Regal-Beloit Corp. | | | 602 | | | | 36,620 | | |
| Republic Services, Inc. | | | 14,500 | | | | 461,970 | | |
| Reynolds American, Inc. | | | 6,200 | | | | 358,484 | | |
| Ross Stores, Inc.1 | | | 30,900 | | | | 1,627,194 | | |
| Salesforce.com, Inc.* | | | 11,200 | | | | 1,108,240 | | |
| SanDisk Corp.1,* | | | 25,300 | | | | 1,105,610 | | |
| SEACOR Holdings, Inc.* | | | 10,650 | | | | 882,033 | | |
| SM Energy Co. | | | 1,162 | | | | 48,130 | | |
| Smithfield Foods, Inc.* | | | 1,700 | | | | 24,225 | | |
| Sohu.com, Inc.* | | | 700 | | | | 32,914 | | |
| Southern Copper Corp. | | | 7,361 | | | | 231,209 | | |
| Spectra Energy Corp.1 | | | 39,600 | | | | 823,284 | | |
| Starbucks Corp.1 | | | 25,300 | | | | 628,705 | | |
Starwood Hotels & Resorts
Worldwide, Inc. | | | 4,600 | | | | 222,870 | | |
| SunPower Corp., Class A* | | | 873 | | | | 10,851 | | |
| SunPower Corp., Class B* | | | 1,134 | | | | 13,086 | | |
198
UBS PACE Select Advisors Trust
UBS PACE Alternative Strategies Investments
Portfolio of investments—July 31, 2010
| Security description | | Number of
shares | | Value | |
| Common stocks—(concluded) | |
| United States—(concluded) | |
| Tenneco, Inc.* | | | 1,115 | | | $ | 30,774 | | |
| Teradata Corp.* | | | 6,000 | | | | 190,800 | | |
| The Boeing Co. | | | 401 | | | | 27,324 | | |
| The Gap, Inc.1 | | | 6,300 | | | | 114,093 | | |
| The J.M. Smucker Co. | | | 600 | | | | 36,858 | | |
| The Mosaic Co. | | | 12,702 | | | | 605,250 | | |
| Time Warner Cable, Inc. | | | 5,800 | | | | 331,586 | | |
| TJX Cos., Inc.1 | | | 42,900 | | | | 1,781,208 | | |
TRW Automotive
Holdings Corp.* | | | 863 | | | | 30,283 | | |
| Tyson Foods, Inc., Class A1 | | | 68,600 | | | | 1,201,186 | | |
| Union Pacific Corp. | | | 442 | | | | 33,004 | | |
United Parcel Service, Inc.,
Class B | | | 476 | | | | 30,940 | | |
| United Technologies Corp. | | | 460 | | | | 32,706 | | |
| Ventas, Inc. | | | 10,700 | | | | 542,704 | | |
| Virgin Media, Inc. | | | 29,200 | | | | 628,676 | | |
| VMware, Inc., Class A* | | | 9,400 | | | | 728,782 | | |
| Vornado Realty Trust | | | 2,700 | | | | 223,506 | | |
| Waters Corp.1,* | | | 8,400 | | | | 538,944 | | |
| Websense, Inc.* | | | 16,500 | | | | 306,240 | | |
| Wells Fargo & Co. | | | 31,400 | | | | 870,722 | | |
| Western Digital Corp.1,* | | | 39,900 | | | | 1,052,961 | | |
| Weyerhaeuser Co. | | | 1,000 | | | | 16,220 | | |
| Whirlpool Corp.1 | | | 9,700 | | | | 808,010 | | |
| Wynn Resorts Ltd. | | | 5,800 | | | | 508,544 | | |
| Xilinx, Inc. | | | 47,000 | | | | 1,312,240 | | |
| Zep, Inc. | | | 22,900 | | | | 436,016 | | |
Total United States
common stocks | | | | | | | 76,524,280 | | |
Total common stocks
(cost—$148,047,106) | | | | | | | 152,677,727 | | |
| Preferred stock—0.01% | |
| Brazil—0.01% | |
Fertilizantes Fosfatados SA*
(cost—$45,425) | | | 4,484 | | | | 39,262 | | |
| Investment companies—0.72% | |
| United States—0.72% | |
| iShares MSCI Brazil Index Fund | | | 24,608 | | | | 1,731,911 | | |
iShares MSCI South Korea
Index Fund | | | 24,511 | | | | 1,202,264 | | |
Market Vectors
Agribusiness ETF | | | 10,196 | | | | 423,440 | | |
Total investment companies
(cost—$3,268,992) | | | | | | | 3,357,615 | | |
| Unit trust—0.02% | |
| Brazil—0.02% | |
All America Latina Logistica
SA (ALL)
(cost—$82,860) | | | 7,660 | | | | 72,297 | | |
| Security description | | Face
amount5 | | Value | |
| US government obligations—2.69% | |
US Treasury Bonds
4.375%, due 05/15/40 | | | 150,000 | | | $ | 160,336 | | |
| 4.625%, due 02/15/40 | | | 100,000 | | | | 111,203 | | |
US Treasury Inflation Index
Notes (TIPS)
2.375%, due 04/15/11 | | | 1,868,606 | | | | 1,896,344 | | |
US Treasury Notes
0.625%, due 06/30/12 | | | 7,300,000 | | | | 7,312,556 | | |
| 1.875%, due 06/30/15 | | | 1,500,000 | | | | 1,522,149 | | |
| 2.750%, due 02/15/19 | | | 1,000,000 | | | | 1,006,875 | | |
| 3.125%, due 05/15/19 | | | 400,000 | | | | 412,125 | | |
| 3.625%, due 08/15/19 | | | 100,000 | | | | 106,594 | | |
Total US government obligations
(cost—$12,416,318) | | | | | | | 12,528,182 | | |
| Federal farm credit bank certificate—1.14% | |
FFCB
4.500%, due 05/21/15
(cost—$4,743,433) | | | 4,700,000 | | | | 5,288,886 | | |
| Federal home loan bank certificate—0.32% | |
FHLB
0.497%, due 10/13/116
(cost—$1,501,294) | | | 1,500,000 | | | | 1,501,506 | | |
| Federal home loan mortgage corporation certificates**—0.58% | |
FHLMC
4.500%, due 05/01/23 | | | 27,429 | | | | 29,109 | | |
| 5.000%, due 11/01/16 | | | 9,428 | | | | 10,142 | | |
| 5.000%, due 01/01/17 | | | 24,063 | | | | 25,885 | | |
| 5.000%, due 02/01/17 | | | 51,561 | | | | 55,451 | | |
| 5.000%, due 03/01/17 | | | 36,607 | | | | 39,347 | | |
| 5.000%, due 04/01/17 | | | 86,605 | | | | 93,163 | | |
| 5.000%, due 09/01/17 | | | 236,579 | | | | 254,487 | | |
| 5.000%, due 10/01/17 | | | 524,504 | | | | 564,048 | | |
| 5.000%, due 11/01/17 | | | 413,057 | | | | 443,971 | | |
| 5.000%, due 12/01/17 | | | 113,494 | | | | 122,088 | | |
| 5.000%, due 01/01/18 | | | 46,220 | | | | 49,720 | | |
| 5.000%, due 02/01/18 | | | 167,234 | | | | 179,901 | | |
| 5.000%, due 03/01/18 | | | 84,659 | | | | 91,071 | | |
| 5.000%, due 04/01/18 | | | 65,505 | | | | 70,467 | | |
| 5.000%, due 05/01/18 | | | 27,550 | | | | 29,637 | | |
| 5.000%, due 06/01/18 | | | 26,720 | | | | 28,744 | | |
| 5.000%, due 07/01/18 | | | 67,524 | | | | 72,639 | | |
| 5.000%, due 08/01/18 | | | 24,117 | | | | 25,945 | | |
| 5.000%, due 10/01/18 | | | 9,855 | | | | 10,601 | | |
| 5.000%, due 11/01/18 | | | 17,919 | | | | 19,277 | | |
| 5.000%, due 10/01/39 | | | 290,282 | | | | 309,585 | | |
| 5.500%, due 01/01/20 | | | 152,999 | | | | 166,023 | | |
Total federal home loan mortgage
corporation certificates
(cost—$2,644,097) | | | | | | | 2,691,301 | | |
199
UBS PACE Select Advisors Trust
UBS PACE Alternative Strategies Investments
Portfolio of investments—July 31, 2010
| Security description | | Face
amount5 | | Value | |
| Federal national mortgage association certificates**—0.64% | |
FNMA
3.000%, due 07/28/14 | | | 300,000 | | | $ | 306,515 | | |
| 3.134%, due 04/01/376 | | | 2,190,112 | | | | 2,289,254 | | |
| 5.000%, due 01/01/20 | | | 15,076 | | | | 16,202 | | |
| 6.000%, due 03/01/32 | | | 153 | | | | 169 | | |
| 6.000%, due 05/01/33 | | | 10,152 | | | | 11,215 | | |
| 6.000%, due 12/01/33 | | | 4,586 | | | | 5,058 | | |
| 6.000%, due 04/01/35 | | | 5,167 | | | | 5,640 | | |
| 6.000%, due 07/01/35 | | | 37,976 | | | | 41,453 | | |
| 6.000%, due 08/01/35 | | | 645 | | | | 704 | | |
| 6.000%, due 11/01/35 | | | 112,041 | | | | 122,301 | | |
| 6.000%, due 01/01/36 | | | 131,793 | | | | 143,862 | | |
| 6.000%, due 02/01/36 | | | 11,829 | | | | 12,882 | | |
Total federal national mortgage
association certificates
(cost—$2,827,529) | | | | | | | 2,955,255 | | |
| Collateralized mortgage obligations—5.06% | |
American Home Mortgage Assets,
Series 2006-3, Class 1A1
1.372%, due 10/25/466 | | | 690,019 | | | | 393,482 | | |
Series 2006-3, Class 2A11
1.342%, due 10/25/466 | | | 718,172 | | | | 372,150 | | |
Series 2006-4, Class 1A11
0.519%, due 10/25/466 | | | 1,176,624 | | | | 589,612 | | |
Series 2007-1, Class A1
1.102%, due 02/25/476 | | | 710,622 | | | | 346,459 | | |
American Home Mortgage
Investment Trust,
Series 2004-3, Class 1A
0.699%, due 10/25/346 | | | 33,500 | | | | 31,420 | | |
Series 2005-4, Class 1A1
0.619%, due 11/25/456 | | | 905,044 | | | | 555,840 | | |
Banc of America Funding Corp.,
Series 2007-D, Class 1A5
0.618%, due 06/20/476 | | | 600,000 | | | | 193,327 | | |
BCAP LLC Trust,
Series 2006-RR1, Class CF
0.969%, due 11/25/366 | | | 120,083 | | | | 106,083 | | |
Citimortgage Alternative
Loan Trust,
Series 2006-A7, Class 1A12
6.000%, due 12/25/36 | | | 1,050,806 | | | | 769,026 | | |
Countrywide Alternative
Loan Trust,
Series 2005-61, Class 1A1
0.589%, due 12/25/356 | | | 1,074,762 | | | | 660,727 | | |
Series 2006-23CB, Class 1A6
6.000%, due 08/25/36 | | | 286,343 | | | | 211,810 | | |
Series 2006-5T2, Class A3
6.000%, due 04/25/36 | | | 899,250 | | | | 694,757 | | |
| Security description | | Face
amount5 | | Value | |
| Collateralized mortgage obligations—(continued) | |
Countrywide Home Loan
Mortgage Pass Through Trust.
Series 2007-14, Class A19
6.000%, due 09/25/37 | | | 704,183 | | | $ | 626,735 | | |
Credit Suisse Mortgage
Capital Certificates,
Series 2006-8, Class 4A1
6.500%, due 10/25/21 | | | 1,070,601 | | | | 727,286 | | |
Downey Savings & Loan
Association Mortgage
Loan Trust,
Series 2004-AR2, Class A2A
0.731%, due 11/19/446 | | | 1,144,358 | | | | 705,593 | | |
Series 2006-AR2, Class 2A1A
0.541%, due 11/19/376 | | | 557,941 | | | | 357,205 | | |
FHLMC REMIC,
Series 2882, Class UL**
4.500%, due 02/15/19 | | | 3,979,324 | | | | 4,187,589 | | |
FNMA REMIC,
Series 2009-70, Class AL**
5.000%, due 08/25/19 | | | 1,863,052 | | | | 2,005,820 | | |
Greenpoint Mortgage
Funding Trust,
Series 2007-AR3, Class A1
0.549%, due 06/25/376 | | | 591,789 | | | | 355,340 | | |
Harborview Mortgage
Loan Trust,
Series 2005-10, Class 2A1A
0.651%, due 11/19/356 | | | 2,644,572 | | | | 1,668,246 | | |
Series 2005-11, Class 2A1A
0.651%, due 08/19/456 | | | 273,140 | | | | 169,856 | | |
Series 2005-3, Class 2A1A
0.581%, due 06/19/356 | | | 1,446,850 | | | | 889,551 | | |
Series 2005-9, Class 2A1A
0.678%, due 06/20/356 | | | 568,979 | | | | 462,929 | | |
Indymac Index Mortgage
Loan Trust,
Series 2006-AR4, Class A1A
0.539%, due 05/25/466 | | | 1,992,580 | | | | 1,051,303 | | |
Lehman Mortgage Trust,
Series 2006-8, Class 2A1
0.749%, due 12/25/366 | | | 1,369,829 | | | | 698,362 | | |
Luminent Mortgage Trust,
Series 2006-2, Class A1A
0.529%, due 02/25/466 | | | 2,267,600 | | | | 1,185,234 | | |
Residential Accredit Loans, Inc.,
Series 2007-QH9, Class A1
6.424%, due 11/25/376 | | | 522,867 | | | | 240,554 | | |
Series 2007-QS1, Class 2A2
0.689%, due 01/25/376 | | | 1,961,679 | | | | 1,076,860 | | |
Residential Asset
Securitization Trust,
Series 2007-A2, Class 1A3
6.000%, due 04/25/37 | | | 888,137 | | | | 632,481 | | |
200
UBS PACE Select Advisors Trust
UBS PACE Alternative Strategies Investments
Portfolio of investments—July 31, 2010
| Security description | | Face
amount5 | | Value | |
| Collateralized mortgage obligations—(concluded) | |
Sequoia Mortgage Trust,
Series 2004-10, Class A3A
0.794%, due 11/20/346 | | | 111,169 | | | $ | 99,251 | | |
WaMu Mortgage Pass
Through Certificates,
Series 2007-OA6, Class 1A
1.212%, due 07/25/476 | | | 814,445 | | | | 495,359 | | |
Wells Fargo Alternative
Loan Trust,
Series 2007-PA2, Class 1A1
6.000%, due 06/25/37 | | | 1,315,033 | | | | 996,131 | | |
Total collateralized mortgage
obligations
(cost—$28,849,578) | | | | | | | 23,556,378 | | |
| Asset-backed securities—3.32% | |
Access Group, Inc.,
Series 2002-1, Class A2
0.718%, due 09/25/256 | | | 580,008 | | | | 578,681 | | |
Bank of America Auto Trust,
Series 2009-1A, Class A2
1.700%, due 12/15/114,7 | | | 653,071 | | | | 654,051 | | |
Series 2009-2A, Class A3
2.130%, due 09/15/134,7 | | | 1,200,000 | | | | 1,217,770 | | |
Bank of America Student
Loan Trust,
Series 2010-1A, Class A
1.362%, due 02/25/434,6,7 | | | 500,000 | | | | 499,956 | | |
Brazos Higher Education
Authority, Inc.,
Series 2004-I, Class A2
0.698%, due 06/27/226 | | | 885,276 | | | | 874,706 | | |
Series 2005-1, Class 1A2
0.618%, due 12/26/186 | | | 878,000 | | | | 868,333 | | |
Series 2005-2, Class A9
0.638%, due 12/26/176 | | | 1,000,000 | | | | 994,502 | | |
Series 2005-3, Class A14
0.648%, due 09/25/236 | | | 468,595 | | | | 465,993 | | |
Brazos Student Loan
Finance Corp.,
Series 2010-1, Class A1
1.438%, due 06/25/356 | | | 944,752 | | | | 943,839 | | |
College Loan Corp. Trust,
Series 2004-1, Class A3
0.658%, due 04/25/216 | | | 1,000,000 | | | | 997,690 | | |
Series 2005-1, Class A2
0.598%, due 07/25/246 | | | 1,000,000 | | | | 995,048 | | |
Series 2005-2, Class A2
0.636%, due 10/15/216 | | | 334,958 | | | | 333,801 | | |
Collegiate Funding Services
Education Loan Trust,
Series 2003-A, Class A2
0.837%, due 09/28/206 | | | 304,034 | | | | 303,865 | | |
| Security description | | Face
amount5 | | Value | |
| Asset-backed securities—(concluded) | |
Education Funding Capital Trust,
Series 2003-3, Class A3
0.807%, due 03/16/206 | | | 719,748 | | | $ | 719,483 | | |
Series 2004-1, Class A2
0.697%, due 12/15/226 | | | 571,417 | | | | 567,393 | | |
GCO Education Loan
Funding Trust,
Series 2005-1, Class A3L
0.577%, due 11/25/206 | | | 888,191 | | | | 885,479 | | |
GMAC Mortgage Corp.
Loan Trust,
Series 2007-HE3, Class 1A1
7.000%, due 09/25/37 | | | 52,148 | | | | 30,568 | | |
Series 2007-HE3, Class 2A1
7.000%, due 09/25/37 | | | 93,770 | | | | 51,241 | | |
Household Home Equity
Loan Trust,
Series 2007-3, Class APT
1.538%, due 11/20/366 | | | 310,293 | | | | 261,309 | | |
Northstar Education Finance, Inc.,
Series 2004-2, Class A1
0.608%, due 04/28/166 | | | 719,254 | | | | 690,132 | | |
SLM Student Loan Trust,
Series 2004-9, Class A4
0.628%, due 04/25/176 | | | 400,617 | | | | 399,924 | | |
Series 2006, Class A3
0.538%, due 10/25/166 | | | 689,602 | | | | 688,741 | | |
Series 2007-1, Class A3
0.528%, due 07/25/186 | | | 1,000,000 | | | | 995,113 | | |
Series 2008-6, Class A1
0.898%, due 10/27/146 | | | 382,981 | | | | 383,440 | | |
USAA Auto Owner Trust,
Series 2007-2, Class A3
4.900%, due 02/15/12 | | | 32,426 | | | | 32,485 | | |
Total asset-backed securities
(cost—$15,521,254) | | | | | | | 15,433,543 | | |
| Corporate notes—9.21% | |
| Australia—1.03% | |
QBE Insurance Group Ltd.
9.750%, due 03/14/144,7 | | | 105,000 | | | | 127,284 | | |
Suncorp-Metway Ltd.
0.914%, due 12/17/106,8 | | | 1,000,000 | | | | 1,000,622 | | |
| 1.776%, due 04/15/116.8 | | | 2,500,000 | | | | 2,520,227 | | |
Westfield Capital/
Westfield Financial
4.375%, due 11/15/108 | | | 325,000 | | | | 328,176 | | |
Westpac Banking Corp.
1.900%, due 12/14/128 | | | 800,000 | | | | 810,672 | | |
| Total Australia corporate notes | | | | | | | 4,786,981 | | |
| Bermuda—0.05% | |
Endurance Specialty Holdings Ltd.
7.000%, due 07/15/34 | | | 75,000 | | | | 70,148 | | |
201
UBS PACE Select Advisors Trust
UBS PACE Alternative Strategies Investments
Portfolio of investments—July 31, 2010
| Security description | | Face
amount5 | | Value | |
| Corporate notes—(continued) | |
| Bermuda—(concluded) | |
White Mountains Re Group
6.375%, due 03/20/174,7 | | | 150,000 | | | $ | 150,531 | | |
| Total Bermuda corporate notes | | | | | | | 220,679 | | |
| Canada—0.79% | |
Bank of Nova Scotia
1.450%, due 07/26/134,7 | | | 1,800,000 | | | | 1,808,647 | | |
Canadian Imperial Bank
of Commerce
2.000%, due 02/04/134,7 | | | 600,000 | | | | 611,266 | | |
| 2.600%, due 07/02/154,7 | | | 200,000 | | | | 202,797 | | |
Canadian Natural Resources Ltd.
5.150%, due 02/01/13 | | | 250,000 | | | | 271,114 | | |
Nexen, Inc.
7.500%, due 07/30/39 | | | 60,000 | | | | 74,461 | | |
Teck Resources Ltd.
10.750%, due 05/15/19 | | | 225,000 | | | | 280,980 | | |
TransCanada PipeLines Ltd.
6.350%, due 05/15/679 | | | 450,000 | | | | 409,500 | | |
| Total Canada corporate notes | | | | | | | 3,658,765 | | |
| Cayman Islands—0.20% | |
Resona Preferred Global
Securities Cayman Ltd.
7.191%, due 07/30/158,9,10 | | | 425,000 | | | | 403,552 | | |
Transocean, Inc., Series B
1.500%, due 12/15/37 | | | 600,000 | | | | 552,000 | | |
Total Cayman Islands
corporate notes | | | | | | | 955,552 | | |
| Denmark—0.60% | |
Angel Lux Common SA
8.250%, due 05/01/16 | | EUR | 125,000 | | | | 171,038 | | |
Danske Bank A/S
1.334%, due 08/23/106 | | | 1,200,000 | | | | 1,200,133 | | |
FIH Erhvervsbank A/S
2.000%, due 06/12/138 | | | 1,400,000 | | | | 1,414,972 | | |
| Total Denmark corporate notes | | | | | | | 2,786,143 | | |
| France—0.60% | |
Caisse d'Amortissement de
la Dette Sociale
2.625%, due 02/21/11 | | | 600,000 | | | | 605,484 | | |
Cie de Financement Foncier
1.625%, due 07/23/124,7 | | | 500,000 | | | | 500,685 | | |
| 2.125%, due 04/22/134,7 | | | 300,000 | | | | 303,327 | | |
Credit Agricole SA
8.375%, due 10/13/198,9,10 | | | 150,000 | | | | 156,000 | | |
Dexia Credit Local
2.375%, due 09/23/118 | | | 1,200,000 | | | | 1,215,172 | | |
| Total France corporate notes | | | | | | | 2,780,668 | | |
| Germany—0.64% | |
Deutsche Bank AG London
10.500%, due 08/19/308 | | IDR | 1,000,000,000 | | | | 123,764 | | |
| Security description | | Face
amount5 | | Value | |
| Corporate notes—(continued) | |
| Germany—(concluded) | |
Kreditanstalt fuer Wiederaufbau
3.250%, due 02/15/11 | | | 2,800,000 | | | $ | 2,837,996 | | |
| Total Germany corporate notes | | | | | | | 2,961,760 | | |
| Ireland—0.02% | |
VIP Fin (Vimpelcom)
9.125%, due 04/30/18 | | | 100,000 | | | | 114,500 | | |
| Luxembourg—0.26% | |
ArcelorMittal
6.125%, due 06/01/18 | | | 275,000 | | | | 298,384 | | |
Covidien International
Finance SA
4.200%, due 06/15/20 | | | 150,000 | | | | 155,806 | | |
Hellas Telecommunications
Luxembourg V
4.835%, due 10/15/124,6 | | | 250,000 | | | | 105,881 | | |
Telecom Italia Capital SA
6.200%, due 07/18/11 | | | 325,000 | | | | 337,997 | | |
| 7.200%, due 07/18/36 | | | 300,000 | | | | 318,442 | | |
Total Luxembourg
corporate notes | | | | | | | 1,216,510 | | |
| Mexico—0.21% | |
BBVA Bancomer SA Texas
7.250%, due 04/22/208 | | | 325,000 | | | | 341,165 | | |
Petroleos Mexicanos
8.000%, due 05/03/19 | | | 510,000 | | | | 618,375 | | |
| Total Mexico corporate notes | | | | | | | 959,540 | | |
| Netherlands—0.22% | |
Impress Holdings BV
3.960%, due 09/15/136 | | EUR | 250,000 | | | | 313,163 | | |
LeasePlan Corp. N.V.
3.000%, due 05/07/128 | | | 700,000 | | | | 721,553 | | |
Total Netherlands
corporate notes | | | | | | | 1,034,716 | | |
| New Zealand—0.26% | |
ANZ National (International) Ltd.
3.250%, due 04/02/128 | | | 1,200,000 | | | | 1,236,539 | | |
| Supranational—0.17% | |
European Investment Bank
2.625%, due 05/16/11 | | | 800,000 | | | | 812,018 | | |
| United Arab Emirates—0.04% | |
Dolphin Energy Ltd.
5.888%, due 06/15/198 | | | 163,081 | | | | 170,990 | | |
| United Kingdom—0.32% | |
Anglo American Capital PLC
9.375%, due 04/08/198 | | | 250,000 | | | | 330,851 | | |
HSBC Holdings PLC
6.500%, due 09/15/37 | | | 250,000 | | | | 270,863 | | |
Lloyds TSB Bank PLC
4.375%, due 01/12/158 | | | 250,000 | | | | 253,295 | | |
202
UBS PACE Select Advisors Trust
UBS PACE Alternative Strategies Investments
Portfolio of investments—July 31, 2010
| Security description | | Face
amount5 | | Value | |
| Corporate notes—(continued) | |
| United Kingdom—(concluded) | |
Royal Bank of Scotland
Group PLC
4.875%, due 08/25/148 | | | 400,000 | | | $ | 413,027 | | |
WPP Finance (UK)
8.000%, due 09/15/14 | | | 200,000 | | | | 237,254 | | |
Total United Kingdom
corporate notes | | | | | | | 1,505,290 | | |
| United States—3.80% | |
Ally Financial, Inc.
6.875%, due 09/15/11 | | | 750,000 | | | | 765,124 | | |
Altria Group, Inc.
9.700%, due 11/10/18 | | | 125,000 | | | | 163,770 | | |
Anheuser-Busch InBev
Worldwide, Inc.
4.125%, due 01/15/15 | | | 250,000 | | | | 265,371 | | |
| 7.750%, due 01/15/198 | | | 250,000 | | | | 311,348 | | |
ANZ Capital Trust II
5.360%, due 12/15/138,10 | | | 325,000 | | | | 313,082 | | |
Arizona Public Service Co.
8.750%, due 03/01/19 | | | 300,000 | | | | 381,098 | | |
Boardwalk Pipelines LP
5.875%, due 11/15/16 | | | 225,000 | | | | 251,092 | | |
Boston Scientific Corp.
4.500%, due 01/15/15 | | | 125,000 | | | | 126,252 | | |
| 7.000%, due 11/15/3511 | | | 125,000 | | | | 119,850 | | |
CBS Corp.
8.875%, due 05/15/19 | | | 350,000 | | | | 449,428 | | |
Comcast Corp.
5.500%, due 03/15/11 | | | 225,000 | | | | 231,116 | | |
Comcast Holdings Corp.
10.625%, due 07/15/12 | | | 250,000 | | | | 291,741 | | |
COX Communications, Inc.
6.250%, due 06/01/188 | | | 375,000 | | | | 427,952 | | |
CSC Holdings, Inc., Series B
7.625%, due 04/01/11 | | | 250,000 | | | | 258,125 | | |
Darden Restaurants, Inc.
5.625%, due 10/15/12 | | | 225,000 | | | | 244,362 | | |
DCP Midstream LLC
9.750%, due 03/15/198 | | | 125,000 | | | | 161,978 | | |
Developers Diversified
Realty Corp.
7.500%, due 04/01/17 | | | 200,000 | | | | 198,022 | | |
DIRECTV Holdings LLC/DIRECTV
Financing Co. Ltd.
7.625%, due 05/15/16 | | | 500,000 | | | | 555,000 | | |
Discover Bank
8.700%, due 11/18/19 | | | 250,000 | | | | 290,041 | | |
DISH DBS Corp.
7.125%, due 02/01/16 | | | 250,000 | | | | 256,875 | | |
Dow Chemical Co.
7.600%, due 05/15/14 | | | 250,000 | | | | 291,865 | | |
Energy Transfer Partners LP
5.950%, due 02/01/15 | | | 350,000 | | | | 384,287 | | |
| Security description | | Face
amount5 | | Value | |
| Corporate notes—(continued) | |
| United States—(continued) | |
Enterprise Products
Operating LLC
6.650%, due 04/15/18 | | | 425,000 | | | $ | 492,922 | | |
| 8.375%, due 08/01/666 | | | 200,000 | | | | 203,750 | | |
First Niagara Financial
Group, Inc.
6.750%, due 03/19/20 | | | 150,000 | | | | 163,190 | | |
Fiserv, Inc.
6.125%, due 11/20/12 | | | 250,000 | | | | 274,004 | | |
Freeport-McMoRan Copper &
Gold, Inc.
8.375%, due 04/01/17 | | | 250,000 | | | | 279,375 | | |
Hartford Financial Services
Group, Inc.
6.625%, due 03/30/40 | | | 50,000 | | | | 46,779 | | |
HCA, Inc.
7.875%, due 02/15/20 | | | 125,000 | | | | 135,625 | | |
Huntington National Bank
0.938%, due 06/01/126 | | | 700,000 | | | | 706,941 | | |
International Paper Co.
7.950%, due 06/15/18 | | | 75,000 | | | | 90,530 | | |
JPMorgan Chase Bank NA
11.000%, due 11/17/20 | | IDR | 2,673,000,000 | | | | 359,676 | | |
Kraft Foods, Inc.
6.500%, due 02/09/40 | | | 175,000 | | | | 201,533 | | |
MetLife Capital Trust X
9.250%, due 04/08/386,8 | | | 300,000 | | | | 339,000 | | |
Morgan Stanley
5.500%, due 07/24/20 | | | 500,000 | | | | 503,096 | | |
Nevada Power Co.
6.500%, due 05/15/18 | | | 375,000 | | | | 439,671 | | |
Nisource Finance Corp.
10.750%, due 03/15/16 | | | 150,000 | | | | 195,285 | | |
Northwestern Mutual
Life Insurance
6.063%, due 03/30/408 | | | 325,000 | | | | 361,998 | | |
ONEOK Partners, LP
6.150%, due 10/01/16 | | | 75,000 | | | | 86,158 | | |
| 6.850%, due 10/15/37 | | | 50,000 | | | | 56,190 | | |
PNC Bank NA
6.875%, due 04/01/18 | | | 200,000 | | | | 228,248 | | |
Progress Energy, Inc.
7.050%, due 03/15/19 | | | 300,000 | | | | 363,494 | | |
ProLogis
1.875%, due 11/15/37 | | | 175,000 | | | | 160,563 | | |
Prudential Financial, Inc. MTN
3.875%, due 01/14/15 | | | 400,000 | | | | 411,807 | | |
| 6.000%, due 12/01/17 | | | 250,000 | | | | 274,235 | | |
Puget Sound Energy, Inc.,
Series A
6.974%, due 06/01/676 | | | 150,000 | | | | 139,695 | | |
Qwest Corp.
8.375%, due 05/01/16 | | | 200,000 | | | | 227,500 | | |
203
UBS PACE Select Advisors Trust
UBS PACE Alternative Strategies Investments
Portfolio of investments—July 31, 2010
| Security description | | Face
amount5 | | Value | |
| Corporate notes—(concluded) | |
| United States—(concluded) | |
Rensselaer Polytechnic Institute
5.600%, due 09/01/20 | | | 375,000 | | | $ | 407,790 | | |
Simon Property Group LP
10.350%, due 04/01/19 | | | 500,000 | | | | 677,624 | | |
Sprint Capital Corp.
8.375%, due 03/15/12 | | | 125,000 | | | | 132,500 | | |
Tennessee Gas Pipeline
8.000%, due 02/01/16 | | | 225,000 | | | | 264,375 | | |
| 8.375%, due 06/15/32 | | | 350,000 | | | | 417,787 | | |
Transatlantic Holdings, Inc.
8.000%, due 11/30/39 | | | 175,000 | | | | 171,832 | | |
US Bank NA
4.375%, due 02/28/179 | | EUR | 150,000 | | | | 194,083 | | |
US Central Federal Credit Union
1.900%, due 10/19/12 | | | 400,000 | | | | 409,590 | | |
Western Corporate Federal
Credit Union
1.750%, due 11/02/12 | | | 400,000 | | | | 408,289 | | |
Whirlpool Corp.
8.000%, due 05/01/12 | | | 75,000 | | | | 82,113 | | |
| 8.600%, due 05/01/14 | | | 100,000 | | | | 119,293 | | |
Williams Cos., Inc.
6.375%, due 10/01/108 | | | 250,000 | | | | 251,517 | | |
Williams Partners LP
5.250%, due 03/15/20 | | | 100,000 | | | | 106,786 | | |
ZFS Finance USA Trust I
6.150%, due 12/15/656,8 | | | 550,000 | | | | 533,500 | | |
Total United States
corporate notes | | | | | | | 17,656,123 | | |
Total corporate notes
(cost—$41,340,059) | | | | | | | 42,856,774 | | |
| Municipal bonds and notes—0.61% | |
| United States—0.61% | |
California (Build America Bonds)
7.500%, due 04/01/34 | | | 325,000 | | | | 361,000 | | |
| 7.550%, due 04/01/39 | | | 225,000 | | | | 253,908 | | |
| 7.625%, due 03/01/40 | | | 375,000 | | | | 425,212 | | |
Illinois (Build America Bonds)
7.350%, due 07/01/35 | | | 225,000 | | | | 233,978 | | |
Pennsylvania Higher Education
Assistance Agency Student
Loan Revenue,
Series 2, Class A-1
1.098%, due 04/25/196 | | | 562,285 | | | | 562,831 | | |
South Carolina Student Loan
Corp. Education Loan Revenue,
Series A-1
0.638%, due 12/03/186 | | | 1,000,000 | | | | 993,983 | | |
Total municipal bonds and notes
(cost—$2,679,103) | | | | | | | 2,830,912 | | |
| Security description | | Face
amount5 | | Value | |
| Non-US government obligations—0.67% | |
| Greece—0.11% | |
Hellenic Republic
Government Bond
2.300%, due 07/25/30 | | EUR | 235,750 | | | $ | 148,309 | | |
| 4.500%, due 09/20/37 | | EUR | 510,000 | | | | 370,745 | | |
| Total Greece | | | | | | | 519,054 | | |
| Mexico—0.31% | |
Mexican Bonos
9.000%, due 12/20/12 | | MXN | 16,790,000 | | | | 1,438,894 | | |
| Peru—0.07% | |
Republic of Peru
7.125%, due 03/30/19 | | | 250,000 | | | | 305,625 | | |
| Qatar—0.18% | |
State of Qatar
5.250%, due 01/20/208 | | | 800,000 | | | | 847,000 | | |
Total non-US government
obligations
(cost—$2,938,574) | | | | | | | 3,110,573 | | |
| Time deposits—4.60% | |
JPMorgan Chase
0.130%, due 08/02/10 | | | 9,317,311 | | | | 9,317,311 | | |
Rabobank Nederland N.V.
0.180%, due 08/02/10 | | | 12,095,750 | | | | 12,095,750 | | |
Total time deposits
(cost—$21,413,061) | | | | | | | 21,413,061 | | |
Short-term US government
obligations12—19.01% | |
US Treasury Bills
0.155%, due 08/12/10 | | | 15,450,000 | | | | 15,449,268 | | |
| 0.227%, due 09/30/101 | | | 1,000,000 | | | | 999,621 | | |
| 0.230%, due 10/14/101 | | | 5,000,000 | | | | 4,997,636 | | |
| 0.230%, due 10/21/10 | | | 3,000,000 | | | | 2,998,447 | | |
| 0.146%, due 10/28/101 | | | 6,953,000 | | | | 6,950,519 | | |
| 0.220%, due 11/12/101 | | | 54,050,000 | | | | 54,015,979 | | |
| 0.195%, due 01/06/11 | | | 3,000,000 | | | | 2,997,432 | | |
Total short-term US government
obligations
(cost—$88,408,902) | | | | | | | 88,408,902 | | |
| Repurchase agreement—17.92% | |
Repurchase agreement dated
07/30/10 with State Street
Bank & Trust Co., 0.010%
due 08/02/10, collateralized
by $82,390,289 US Treasury
Notes, 2.125% to 3.125%
due 04/30/15 to 04/30/17;
(value—$85,020,843);
proceeds: $83,353,069
(cost—$83,353,000) | | | 83,353,000 | | | | 83,353,000 | | |
204
UBS PACE Select Advisors Trust
UBS PACE Alternative Strategies Investments
Portfolio of investments—July 31, 2010
| Security description | | Number of
contracts | | Value | |
| Options*—0.04% | |
| Call options purchased—0.01% | |
CBOE SPX Volitility Index,
strike @ 42.5,
expires 08/18/10 | | | 129 | | | $ | 3,225 | | |
Russell 2000 Index,
strike @ 730,
expires 08/21/10 | | | 44 | | | | 1,452 | | |
S&P 500 Index,
strike @ 1,150,
expires 08/21/10 | | | 61 | | | | 19,520 | | |
| Total call options purchased | | | | | | | 24,197 | | |
| Put options purchased—0.03% | |
S&P 500 Index,
strike @ 975,
expires 10/16/10 | | | 119 | | | | 176,953 | | |
Total options
(cost—$216,571) | | | | | | | 201,150 | | |
Total investments before
investments sold short
(cost—$460,297,156)—
99.39% | | | | | | | 462,276,324 | | |
| | | Number of
shares | | | |
| Investments sold short—(4.72)% | |
| Common stocks—(4.72)% | |
| Australia—(0.78)% | |
| Alumina Ltd. | | | (693,586 | ) | | | (972,605 | ) | |
| CSR Ltd. | | | (516,942 | ) | | | (804,405 | ) | |
| OZ Minerals Ltd. | | | (786,989 | ) | | | (875,746 | ) | |
| Paladin Energy Ltd. | | | (280,338 | ) | | | (976,444 | ) | |
| Total Australia common stocks | | | | | | | (3,629,200 | ) | |
| Canada—(0.59)% | |
| Agnico-Eagle Mines Ltd. | | | (11,000 | ) | | | (614,493 | ) | |
| Athabasca Oil Sands Corp. | | | (65,916 | ) | | | (753,381 | ) | |
| Ivanhoe Mines Ltd. | | | (50,800 | ) | | | (896,369 | ) | |
Progress Energy
Resources Corp. | | | (38,500 | ) | | | (464,749 | ) | |
| Total Canada common stocks | | | | | | | (2,728,992 | ) | |
| Finland—(0.06)% | |
| Rautaruukki OYJ | | | (13,591 | ) | | | (262,479 | ) | |
| Germany—(0.17)% | |
| K+S AG | | | (7,302 | ) | | | (387,666 | ) | |
| Wacker Chemie AG | | | (2,462 | ) | | | (395,109 | ) | |
| Total Germany common stocks | | | | | | | (782,775 | ) | |
| Japan—(1.28)% | |
| Daiwa Securities Group, Inc. | | | (220,000 | ) | | | (952,370 | ) | |
| Japan Steel Works Ltd. | | | (40,000 | ) | | | (386,133 | ) | |
| Mitsubishi Motors Corp. | | | (786,000 | ) | | | (1,028,046 | ) | |
Mizuho Trust & Banking
Co. Ltd. | | | (389,000 | ) | | | (328,688 | ) | |
| Security description | | Number of
shares | | Value | |
| Investments sold short—(concluded) | |
| Common stocks—(concluded) | |
| Japan—(concluded) | |
MS&AD Insurance Group
Holdings, Inc. | | | (27,600 | ) | | $ | (613,688 | ) | |
| Nomura Holdings, Inc. | | | (99,500 | ) | | | (553,961 | ) | |
| NTT Urban Development Corp. | | | (908 | ) | | | (736,742 | ) | |
| Sanyo Electric Co. Ltd. | | | (529,000 | ) | | | (832,733 | ) | |
| Tokuyama Corp. | | | (106,000 | ) | | | (532,485 | ) | |
| Total Japan common stocks | | | | | | | (5,964,846 | ) | |
| Jersey—(0.15)% | |
| Randgold Resources Ltd. | | | (8,060 | ) | | | (724,693 | ) | |
| Switzerland—(0.27)% | |
| Weatherford International Ltd. | | | (77,900 | ) | | | (1,261,980 | ) | |
| United Kingdom—(0.57)% | |
| Cairn Energy PLC | | | (149,269 | ) | | | (1,093,364 | ) | |
| Lonmin PLC | | | (12,105 | ) | | | (298,214 | ) | |
| Prudential PLC | | | (110,931 | ) | | | (965,203 | ) | |
| Tullow Oil PLC | | | (16,671 | ) | | | (322,021 | ) | |
Total United Kingdom
common stocks | | | | | | | (2,678,802 | ) | |
| United States—(0.85)% | |
| Boston Scientific Corp. | | | (192,900 | ) | | | (1,080,240 | ) | |
| Denbury Resources, Inc. | | | (7,900 | ) | | | (125,136 | ) | |
| Human Genome Sciences, Inc. | | | (27,800 | ) | | | (721,132 | ) | |
| Las Vegas Sands Corp. | | | (4,700 | ) | | | (126,242 | ) | |
| Leucadia National Corp. | | | (11,000 | ) | | | (242,990 | ) | |
| Level 3 Communications, Inc. | | | (297,700 | ) | | | (336,401 | ) | |
| MEMC Electronic Materials, Inc. | | | (35,500 | ) | | | (339,380 | ) | |
| Vertex Pharmaceuticals, Inc. | | | (28,800 | ) | | | (969,408 | ) | |
Total United States
common stocks | | | | | | | (3,940,929 | ) | |
Total investments sold short
(proceeds—$21,698,169)—
(4.72)% | | | | | | | (21,974,696 | ) | |
Other assets in excess of
liabilities—5.33% | | | | | | | 24,810,793 | | |
| Net assets—100.00% | | $ | 465,112,421 | | |
205
UBS PACE Select Advisors Trust
UBS PACE Alternative Strategies Investments
Portfolio of investments—July 31, 2010
Aggregate cost for federal income tax purposes before investments sold short was $463,624,314; and net unrealized depreciation consisted of:
| Gross unrealized appreciation | | $ | 10,520,760 | | |
| Gross unrealized depreciation | | | (11,868,750 | ) | |
| Net unrealized depreciation | | $ | (1,347,990 | ) | |
* Non-income producing security.
** On September 7, 2008, the Federal Housing Finance Agency placed the Federal National Mortgage Association and the Federal Home Loan Mortgage Corporation into conservatorship, and the US Treasury guaranteed the debt issued by those organizations.
1 Security, or portion thereof, pledged as collateral for investments sold short, written options and futures.
2 Security is traded on the New York Stock Exchange.
3 Security is traded on the Toronto Stock Exchange.
4 Illiquid securities representing 3.52% of net assets as of July 31, 2010.
5 In US Dollars unless otherwise indicated.
6 Floating rate security. The interest rate shown is the current rate as of July 31, 2010.
7 Security exempt from registration pursuant to Rule 144A under the Securities Act of 1933. These securities, which represent 1.31% of net assets as of July 31, 2010, are considered illiquid and may be resold in transactions exempt from registration, normally to qualified institutional buyers.
8 Security exempt from registration pursuant to Rule 144A under the Securities Act of 1933. These securities, which represent 3.22% of net assets as of July 31, 2010, are considered liquid and may be resold in transactions exempt from registration, normally to qualified institutional buyers.
9 Variable rate security. The interest rate shown is the current rate as of July 31, 2010, and resets at the next call date.
10 Perpetual bond security. The maturity date reflects the next call date.
11 Step bond that converts to the noted fixed rate at a designated future date.
12 Rate shown is the discount rate at date of purchase.
ADR American Depositary Receipt
EUR Euro
FFCB Federal Farm Credit Bank
FHLB Federal Home Loan Bank
FHLMC Federal Home Loan Mortgage Corporation
FNMA Federal National Mortgage Association
GDR Global Depositary Receipt
GMAC General Motors Acceptance Corporation
IDR Indonesian Rupiah
MSCI Morgan Stanley Capital International
MTN Medium Term Note
MXN Mexican Peso
REIT Real Estate Investment Trust
REMIC Real Estate Mortgage Investment Conduit
TIPS Treasury inflation protected securities ("TIPS") are debt securities issued by the US Treasury whose principal and/or interest payments are adjusted for inflation, unlike debt securities that make fixed principal and interest payments. The interest rate paid by the TIPS is fixed, while the principal value rises or falls based on changes in a published Consumer Price Index ("CPI"). Thus, if inflation occurs, the principal and interest payments on TIPS are adjusted accordingly to protect investors from inflationary loss. During a deflationary period, the principal and interest payments decrease, although the TIPS principal amounts will not drop below their face amounts at maturity. In exchange for the inflation protection, the TIPS generally pay lower interest rates than typical US Treasury securities. Only if inflation occurs will TIPS offer a higher real yield than a conventional Treasury bond of the same maturi ty.
206
UBS PACE Select Advisors Trust
UBS PACE Alternative Strategies Investments
Portfolio of investments—July 31, 2010
Written options
Number of
contracts | | Call options written | | Expiration
dates | | Premiums
received | | Current
value | | Unrealized
appreciation
(depreciation) | |
| | 44 | | | Russell 2000 Index, strike @ 700 | | 08/21/10 | | $ | 34,538 | | | $ | (7,480 | ) | | $ | 27,058 | | |
| | 61 | | | S&P 500 Index, strike @ 1,100 | | 08/21/10 | | | 68,173 | | | | (135,420 | ) | | | (67,247 | ) | |
| | | | | | | | | $ | 102,711 | | | $ | (142,900 | ) | | $ | (40,189 | ) | |
| | | Put options written | | | | | | | | | |
| | 119 | | | S&P 500 Index, strike @ 1,025 | | 09/18/10 | | $ | 166,352 | | | $ | (178,500 | ) | | $ | (12,148 | ) | |
| | | | | | | | | $ | 269,063 | | | $ | (321,400 | ) | | $ | (52,337 | ) | |
Written option activity for the year ended July 31, 2010 was as follows:
| | | Number of
contracts | | Premiums
received | |
| Options outstanding at July 31, 2009 | | | 447 | | | $ | 231,372 | | |
| Options written | | | 11,377 | | | | 8,375,974 | | |
| Options terminated in closing purchase transactions | | | (10,801 | ) | | | (7,891,719 | ) | |
| Options expired prior to exercise | | | (799 | ) | | | (446,564 | ) | |
| Options outstanding at July 31, 2010 | | | 224 | | | $ | 269,063 | | |
Futures contracts
Number of
contracts | | Currency | | Buy contracts | | Expiration
dates | | Cost | | Current
value | | Unrealized
appreciation
(depreciation) | |
| | 11 | | | EUR | | AEX Index Futures | | August 2010 | | $ | 962,073 | | | $ | 943,396 | | | $ | (18,677 | ) | |
| | 47 | | | EUR | | CAC 40 Index Futures | | August 2010 | | | 2,229,615 | | | | 2,229,747 | | | | 132 | | |
| | 10 | | | EUR | | DAX Index Futures | | September 2010 | | | 2,020,430 | | | | 2,008,591 | | | | (11,839 | ) | |
| | 26 | | | GBP | | FTSE 100 Index Futures | | September 2010 | | | 2,136,787 | | | | 2,135,690 | | | | (1,097 | ) | |
| | 19 | | | EUR | | FTSE MIB Index Futures | | September 2010 | | | 2,539,998 | | | | 2,606,139 | | | | 66,141 | | |
| | 87 | | | EUR | | German Euro BOBL Futures | | September 2010 | | | 13,597,751 | | | | 13,604,624 | | | | 6,873 | | |
| | 288 | | | EUR | | German Euro Bund Futures | | September 2010 | | | 48,242,368 | | | | 48,232,753 | | | | (9,615 | ) | |
| | 21 | | | EUR | | IBEX 35 Index Futures | | August 2010 | | | 2,795,201 | | | | 2,862,686 | | | | 67,485 | | |
| | 137 | | | JPY | | Japan Government Bond 10 Year
Mini Futures SGX | |
September 2010 | | | 22,277,971 | | | | 22,431,260 | | | | 153,289 | | |
| | 7 | | | JPY | | TOPIX Index Futures | | September 2010 | | | 683,535 | | | | 684,168 | | | | 633 | | |
| | 196 | | | USD | | NASDAQ 100 E-Mini Index Futures | | September 2010 | | | 7,222,112 | | | | 7,300,020 | | | | 77,908 | | |
| | 3 | | | USD | | Russell 2000 Mini Index Futures | | September 2010 | | | 198,246 | | | | 194,880 | | | | (3,366 | ) | |
| | 45 | | | USD | | S&P 500 E-Mini Index Futures | | September 2010 | | | 2,456,200 | | | | 2,471,175 | | | | 14,975 | | |
| | 262 | | | USD | | US Treasury Bond 30 Year Futures | | September 2010 | | | 33,272,745 | | | | 33,724,312 | | | | 451,567 | | |
| | 31 | | | USD | | US Treasury Note 2 Year Futures | | September 2010 | | | 6,792,926 | | | | 6,792,875 | | | | (51 | ) | |
| | 369 | | | USD | | US Treasury Note 10 Year Futures | | September 2010 | | | 44,497,405 | | | | 45,686,813 | | | | 1,189,408 | | |
| | | | | | | | | | | $ | 191,925,363 | | | $ | 193,909,129 | | | $ | 1,983,766 | | |
| | | | | Sale contracts | | | | Proceeds | | | | | |
| | 5 | | | AUD | | ASX SPI 200 Index Futures | | September 2010 | | $ | 497,171 | | | $ | 505,016 | | | $ | (7,845 | ) | |
| | 357 | | | AUD | | Australian Treasury Bond
10 Year Futures | |
September 2010 | | | 34,036,036 | | | | 34,326,680 | | | | (290,644 | ) | |
| | 335 | | | CAD | | Canadian Government Bond
10 Year Futures | |
September 2010 | | | 39,452,226 | | | | 40,315,792 | | | | (863,566 | ) | |
| | 10 | | | CAD | | S&P TSE 60 Index Futures | | September 2010 | | | 1,316,931 | | | | 1,327,443 | | | | (10,512 | ) | |
| | 82 | | | EUR | | German Euro Bund Futures | | September 2010 | | | 13,717,372 | | | | 13,732,937 | | | | (15,565 | ) | |
207
UBS PACE Select Advisors Trust
UBS PACE Alternative Strategies Investments
Portfolio of investments—July 31, 2010
Futures contracts—(concluded)
Number of
contracts | | Currency | | Sales contracts | | Expiration
dates | | Proceeds | | Current
value | | Unrealized
appreciation
(depreciation) | |
| | 113 | | | EUR | | German Euro Buxl Futures | | September 2010 | | $ | 16,422,720 | | | $ | 16,267,402 | | | $ | 155,318 | | |
| | 246 | | | GBP | | United Kingdom Long Gilt 10 Year
Bond Futures | |
September 2010 | | | 45,931,104 | | | | 46,813,003 | | | | (881,899 | ) | |
| | 10 | | | HKD | | Hang Seng Index Futures | | August 2010 | | | 1,343,900 | | | | 1,350,285 | | | | (6,385 | ) | |
| | 12 | | | JPY | | Japan Government Bond 10 Year
Futures TSE | |
September 2010 | | | 19,388,460 | | | | 19,640,895 | | | | (252,435 | ) | |
| | 8 | | | USD | | 90 Day Euro Dollar Futures | | September 2010 | | | 1,991,953 | | | | 1,991,800 | | | | 153 | | |
| | 46 | | | USD | | 90 Day Euro Dollar Futures | | December 2010 | | | 11,417,362 | | | | 11,448,825 | | | | (31,463 | ) | |
| | 35 | | | USD | | 90 Day Euro Dollar Futures | | March 2011 | | | 8,677,792 | | | | 8,705,375 | | | | (27,583 | ) | |
| | 35 | | | USD | | 90 Day Euro Dollar Futures | | June 2011 | | | 8,663,142 | | | | 8,695,313 | | | | (32,171 | ) | |
| | 35 | | | USD | | 90 Day Euro Dollar Futures | | September 2011 | | | 8,645,955 | | | | 8,682,188 | | | | (36,233 | ) | |
| | 8 | | | USD | | 90 Day Euro Dollar Futures | | December 2011 | | | 1,980,120 | | | | 1,980,600 | | | | (480 | ) | |
| | 8 | | | USD | | 90 Day Euro Dollar Futures | | March 2012 | | | 1,976,353 | | | | 1,976,900 | | | | (547 | ) | |
| | 274 | | | USD | | S&P 500 E-Mini Index Futures | | September 2010 | | | 14,863,223 | | | | 15,046,710 | | | | (183,487 | ) | |
| | 17 | | | USD | | Ultra Long-Term US Treasury Bond
Futures | |
September 2010 | | | 2,197,488 | | | | 2,299,250 | | | | (101,762 | ) | |
| | 235 | | | USD | | US Treasury Note 5 Year Futures | | September 2010 | | | 27,990,581 | | | | 28,159,609 | | | | (169,028 | ) | |
| | 39 | | | USD | | US Treasury Note 10 Year Futures | | September 2010 | | | 4,789,520 | | | | 4,828,688 | | | | (39,168 | ) | |
| | | | | | | | | | | $ | 265,299,409 | | | $ | 268,094,711 | | | | (2,795,302 | ) | |
| | | | | | | | | | | | | | | | | | | $ | (811,536 | ) | |
Currency type abbreviations:
AUD Australian Dollar
CAD Canadian Dollar
EUR Euro
GBP Great Britain Pound
HKD Hong Kong Dollar
JPY Japanese Yen
USD United States Dollar
Forward foreign currency contracts
| Counterparty | | Contracts to
deliver | | In
exchange for | | Maturity
dates | | Unrealized
appreciation
(depreciation) | |
| Bank of America N.A. | | USD | 945,870 | | | SEK | 6,918,000 | | | 10/21/10 | | $ | 11,639 | | |
| Citibank N.A. | | USD | 279,559 | | | CLP | 149,634,000 | | | 10/21/10 | | | 7,483 | | |
| Credit Suisse London Branch | | USD | 604,168 | | | TRY | 948,000 | | | 10/21/10 | | | 16,323 | | |
| Deutsche Bank AG London | | USD | 1,438,846 | | | CNY | 9,223,000 | | | 03/30/12 | | | (48,960 | ) | |
| JPMorgan Chase Bank | | AUD | 935,000 | | | CHF | 894,374 | | | 09/15/10 | | | 17,181 | | |
| JPMorgan Chase Bank | | AUD | 1,826,103 | | | EUR | 1,239,000 | | | 09/15/10 | | | (29,477 | ) | |
| JPMorgan Chase Bank | | AUD | 4,776,554 | | | USD | 4,019,704 | | | 09/15/10 | | | (280,569 | ) | |
| JPMorgan Chase Bank | | CAD | 796,202 | | | AUD | 877,000 | | | 09/15/10 | | | 15,509 | | |
| JPMorgan Chase Bank | | CAD | 2,416,619 | | | EUR | 1,875,000 | | | 09/15/10 | | | 93,949 | | |
| JPMorgan Chase Bank | | CAD | 817,000 | | | SEK | 5,839,099 | | | 09/15/10 | | | 14,276 | | |
| JPMorgan Chase Bank | | CNY | 6,678,000 | | | USD | 1,039,377 | | | 09/14/11 | | | 42,063 | | |
| JPMorgan Chase Bank | | EUR | 1,277,000 | | | CAD | 1,621,412 | | | 09/15/10 | | | (87,771 | ) | |
208
UBS PACE Select Advisors Trust
UBS PACE Alternative Strategies Investments
Portfolio of investments—July 31, 2010
Forward foreign currency contracts—(continued)
| Counterparty | | Contracts to
deliver | | In
exchange for | | Maturity
dates | | Unrealized
appreciation
(depreciation) | |
| JPMorgan Chase Bank | | EUR | 2,359,320 | | | CHF | 3,298,675 | | | 09/15/10 | | $ | 93,592 | | |
| JPMorgan Chase Bank | | EUR | 1,292,000 | | | GBP | 1,065,688 | | | 09/15/10 | | | (11,713 | ) | |
| JPMorgan Chase Bank | | EUR | 645,000 | | | JPY | 71,528,500 | | | 09/15/10 | | | (12,274 | ) | |
| JPMorgan Chase Bank | | EUR | 1,737,701 | | | NOK | 13,774,239 | | | 09/15/10 | | | (2,373 | ) | |
| JPMorgan Chase Bank | | EUR | 616,299 | | | SEK | 5,870,860 | | | 09/15/10 | | | 9,838 | | |
| JPMorgan Chase Bank | | EUR | 1,000,859 | | | USD | 1,259,640 | | | 08/23/10 | | | (44,618 | ) | |
| JPMorgan Chase Bank | | EUR | 5,927,305 | | | USD | 7,242,217 | | | 09/15/10 | | | (481,653 | ) | |
| JPMorgan Chase Bank | | GBP | 1,030,940 | | | EUR | 1,256,000 | | | 09/15/10 | | | 19,315 | | |
| JPMorgan Chase Bank | | GBP | 791,655 | | | USD | 1,185,662 | | | 08/09/10 | | | (56,528 | ) | |
| JPMorgan Chase Bank | | GBP | 1,047,748 | | | USD | 1,595,161 | | | 09/15/10 | | | (48,585 | ) | |
| JPMorgan Chase Bank | | IDR | 11,190,595,985 | | | USD | 1,217,693 | | | 10/14/10 | | | (17,768 | ) | |
| JPMorgan Chase Bank | | JPY | 71,400,384 | | | EUR | 649,000 | | | 09/15/10 | | | 18,970 | | |
| JPMorgan Chase Bank | | JPY | 70,858,774 | | | NOK | 5,123,000 | | | 09/15/10 | | | 20,836 | | |
| JPMorgan Chase Bank | | JPY | 29,478,615 | | | USD | 333,092 | | | 08/17/10 | | | (8,155 | ) | |
| JPMorgan Chase Bank | | JPY | 71,072,190 | | | USD | 777,000 | | | 09/15/10 | | | (45,942 | ) | |
| JPMorgan Chase Bank | | NZD | 2,225,150 | | | AUD | 1,824,000 | | | 09/15/10 | | | 32,878 | | |
| JPMorgan Chase Bank | | NZD | 1,155,388 | | | USD | 813,739 | | | 09/15/10 | | | (21,847 | ) | |
| JPMorgan Chase Bank | | NOK | 15,037,004 | | | EUR | 1,882,000 | | | 09/15/10 | | | (16,964 | ) | |
| JPMorgan Chase Bank | | NOK | 4,957,000 | | | SEK | 5,847,773 | | | 09/15/10 | | | (4,306 | ) | |
| JPMorgan Chase Bank | | SEK | 12,025,739 | | | EUR | 1,253,000 | | | 09/15/10 | | | (32,416 | ) | |
| JPMorgan Chase Bank | | SEK | 23,683,770 | | | USD | 2,981,892 | | | 09/15/10 | | | (297,592 | ) | |
| JPMorgan Chase Bank | | CHF | 1,703,028 | | | AUD | 1,826,000 | | | 09/15/10 | | | 8,351 | | |
| JPMorgan Chase Bank | | CHF | 810,124 | | | CAD | 792,000 | | | 09/15/10 | | | (8,079 | ) | |
| JPMorgan Chase Bank | | CHF | 2,514,022 | | | EUR | 1,869,000 | | | 09/15/10 | | | 21,047 | | |
| JPMorgan Chase Bank | | USD | 1,126,933 | | | AUD | 1,291,443 | | | 09/15/10 | | | 35,737 | | |
| JPMorgan Chase Bank | | USD | 2,323,660 | | | CAD | 2,408,409 | | | 09/15/10 | | | 17,722 | | |
| JPMorgan Chase Bank | | USD | 22,843 | | | CHF | 24,000 | | | 09/15/10 | | | 207 | | |
| JPMorgan Chase Bank | | USD | 4,736,511 | | | CNY | 31,317,000 | | | 09/14/11 | | | (59,528 | ) | |
| JPMorgan Chase Bank | | USD | 2,195,912 | | | CNY | 14,504,000 | | | 03/30/12 | | | (10,192 | ) | |
| JPMorgan Chase Bank | | USD | 375,750 | | | EUR | 298,556 | | | 08/23/10 | | | 13,310 | | |
| JPMorgan Chase Bank | | USD | 6,296,153 | | | EUR | 5,010,626 | | | 09/15/10 | | | 233,192 | | |
| JPMorgan Chase Bank | | USD | 755,602 | | | GBP | 504,509 | | | 08/09/10 | | | 36,024 | | |
| JPMorgan Chase Bank | | USD | 1,541,529 | | | GBP | 1,014,000 | | | 09/15/10 | | | 49,273 | | |
| JPMorgan Chase Bank | | USD | 303,602 | | | IDR | 2,773,100,000 | | | 10/14/10 | | | 2,553 | | |
| JPMorgan Chase Bank | | USD | 1,605,005 | | | JPY | 141,802,848 | | | 09/15/10 | | | 36,924 | | |
| JPMorgan Chase Bank | | USD | 268,201 | | | KRW | 323,236,000 | | | 10/21/10 | | | 4,074 | | |
| JPMorgan Chase Bank | | USD | 174,339 | | | NOK | 1,096,764 | | | 09/15/10 | | | 5,774 | | |
| JPMorgan Chase Bank | | USD | 3,086,240 | | | NZD | 4,437,539 | | | 09/15/10 | | | 123,025 | | |
| JPMorgan Chase Bank | | USD | 2,326,000 | | | SEK | 18,151,778 | | | 09/15/10 | | | 187,470 | | |
Morgan Stanley Capital
Services, Inc. | | AUD | 26,600,135 | | | USD | 22,321,477 | | | 09/15/10 | | | (1,626,299 | ) | |
Morgan Stanley Capital
Services, Inc. | | CAD | 26,682,266 | | | USD | 25,622,792 | | | 09/15/10 | | | (316,888 | ) | |
209
UBS PACE Select Advisors Trust
UBS PACE Alternative Strategies Investments
Portfolio of investments—July 31, 2010
Forward foreign currency contracts—(concluded)
| Counterparty | | Contracts to
deliver | | In
exchange for | | Maturity
dates | | Unrealized
appreciation
(depreciation) | |
Morgan Stanley Capital
Services, Inc. | | EUR | 17,394,112 | | | USD | 21,605,369 | | | 09/15/10 | | $ | (1,060,893 | ) | |
Morgan Stanley Capital
Services, Inc. | | GBP | 3,398,309 | | | USD | 5,093,185 | | | 09/15/10 | | | (238,211 | ) | |
Morgan Stanley Capital
Services, Inc. | | JPY | 788,101,900 | | | USD | 8,871,953 | | | 09/15/10 | | | (253,443 | ) | |
Morgan Stanley Capital
Services, Inc. | | NZD | 19,063,809 | | | USD | 13,219,184 | | | 09/15/10 | | | (567,919 | ) | |
Morgan Stanley Capital
Services, Inc. | | SEK | 41,210,076 | | | USD | 5,367,593 | | | 09/15/10 | | | (338,752 | ) | |
Morgan Stanley Capital
Services, Inc. | | CHF | 8,624,193 | | | USD | 8,140,276 | | | 09/15/10 | | | (142,329 | ) | |
Morgan Stanley Capital
Services, Inc. | | USD | 7,692,526 | | | AUD | 9,029,738 | | | 09/15/10 | | | 436,836 | | |
Morgan Stanley Capital
Services, Inc. | | USD | 10,661,676 | | | CAD | 11,122,083 | | | 09/15/10 | | | 150,871 | | |
Morgan Stanley Capital
Services, Inc. | | USD | 11,865,982 | | | CHF | 12,935,361 | | | 09/15/10 | | | 557,034 | | |
Morgan Stanley Capital
Services, Inc. | | USD | 15,521,736 | | | EUR | 12,717,144 | | | 09/15/10 | | | 1,049,970 | | |
Morgan Stanley Capital
Services, Inc. | | USD | 20,948,434 | | | GBP | 14,125,982 | | | 09/15/10 | | | 1,212,943 | | |
Morgan Stanley Capital
Services, Inc. | | USD | 8,844,201 | | | JPY | 805,647,781 | | | 09/15/10 | | | 484,357 | | |
Morgan Stanley Capital
Services, Inc. | | USD | 4,851,509 | | | NZD | 6,968,271 | | | 09/15/10 | | | 188,002 | | |
Morgan Stanley Capital
Services, Inc. | | USD | 15,631,272 | | | SEK | 120,811,998 | | | 09/15/10 | | | 1,097,524 | | |
| Royal Bank of Scotland PLC | | USD | 2,397,144 | | | CAD | 2,478,000 | | | 10/21/10 | | | 10,351 | | |
| Royal Bank of Scotland PLC | | USD | 724,954 | | | GBP | 478,000 | | | 10/21/10 | | | 24,829 | | |
| Westpac Banking Corp. | | USD | 1,109,888 | | | AUD | 1,275,000 | | | 10/21/10 | | | 33,068 | | |
| | | $ | 262,276 | | |
Currency type abbreviations:
AUD Australian Dollar
CAD Canadian Dollar
CHF Swiss Franc
CLP Chilean Peso
CNY Chinese Yuan Renminbi
EUR Euro
GBP Great Britain Pound
IDR Indonesian Rupiah
JPY Japanese Yen
KRW South Korean Won
NOK Norwegian Krone
NZD New Zealand Dollar
SEK Swedish Krona
TRY Turkish Lira
USD United States Dollar
210
UBS PACE Select Advisors Trust
UBS PACE Alternative Strategies Investments
Portfolio of investments—July 31, 2010
Interest rate swaps4
| | | | | Rate type | | | |
| Counterparty | | Notional
amount (000) | | Termination
dates | | Payments
made by
the Portfolio | | Payments
received by
the Portfolio | | Upfront
payments
received
(made) | | Value | | Unrealized
appreciation
(depreciation) | |
| Citibank N.A. | | EUR | 8,000 | | | 04/23/20 | | | 1.145 | %13 | | | 4.262 | % | | $ | — | | | $ | 188,215 | | | $ | 188,215 | | |
| Citibank N.A. | | EUR | 8,020 | | | 04/23/20 | | | 1.145 | 13 | | | 4.286 | | | | — | | | | 198,979 | | | | 198,979 | | |
| Citibank N.A. | | EUR | 2,410 | | | 04/23/40 | | | 4.119 | | | | 1.145 | 13 | | | — | | | | (163,785 | ) | | | (163,785 | ) | |
| Citibank N.A. | | EUR | 2,400 | | | 04/23/40 | | | 4.076 | | | | 1.145 | 13 | | | — | | | | (143,916 | ) | | | (143,916 | ) | |
| Citibank N.A. | | EUR | 6,640 | | | 05/14/20 | | | 1.145 | 13 | | | 4.348 | | | | — | | | | 181,908 | | | | 181,908 | | |
| Citibank N.A. | | EUR | 1,960 | | | 05/14/40 | | | 4.044 | | | | 1.145 | 13 | | | — | | | | (105,644 | ) | | | (105,644 | ) | |
| Citibank N.A. | | EUR | 3,190 | | | 05/14/20 | | | 1.145 | 13 | | | 4.270 | | | | — | | | | 74,310 | | | | 74,310 | | |
| Citibank N.A. | | EUR | 950 | | | 05/14/40 | | | 3.935 | | | | 1.145 | 13 | | | — | | | | (32,027 | ) | | | (32,027 | ) | |
| Citibank N.A. | | USD | 11,900 | | | 11/04/12 | | | 0.305 | 14 | | | 1.740 | | | | — | | | | 176,225 | | | | 176,225 | | |
| Citibank N.A. | | USD | 11,900 | | | 11/04/12 | | | 1.740 | | | | 0.668 | 15 | | | — | | | | (175,922 | ) | | | (175,922 | ) | |
| Credit Suisse International | | EUR | 4,990 | | | 12/15/15 | | | 2.750 | | | | 1.145 | 13 | | | 103,150 | | | | (135,797 | ) | | | (32,647 | ) | |
| Credit Suisse International | | EUR | 3,900 | | | 12/15/20 | | | 3.500 | | | | 1.145 | 13 | | | 199,930 | | | | (195,956 | ) | | | 3,974 | | |
| Credit Suisse International | | JPY | 460,000 | | | 12/15/17 | | | 1.250 | | | | 0.441 | 16 | | | 127,710 | | | | (154,374 | ) | | | (26,664 | ) | |
| Deutsche Bank AG | | GBP | 10 | | | 12/17/11 | | | 5.250 | | | | 1.032 | 17 | | | 963 | | | | (876 | ) | | | 87 | | |
| Deutsche Bank AG | | GBP | 10,130 | | | 08/24/15 | | | 3.332 | | | | 1.032 | 17 | | | — | | | | (659,877 | ) | | | (659,877 | ) | |
| Deutsche Bank AG | | GBP | 14,110 | | | 08/25/15 | | | 3.286 | | | | 1.032 | 17 | | | — | | | | (868,862 | ) | | | (868,862 | ) | |
| Deutsche Bank AG | | GBP | 16,980 | | | 08/24/20 | | | 1.032 | 17 | | | 4.150 | | | | — | | | | 1,713,474 | | | | 1,713,474 | | |
| Deutsche Bank AG | | GBP | 23,640 | | | 08/25/20 | | | 1.032 | 17 | | | 4.140 | | | | — | | | | 2,349,749 | | | | 2,349,749 | | |
| Deutsche Bank AG | | GBP | 8,490 | | | 08/24/25 | | | 4.437 | | | | 1.032 | 17 | | | — | | | | (986,436 | ) | | | (986,436 | ) | |
| Deutsche Bank AG | | GBP | 11,820 | | | 08/25/25 | | | 4.446 | | | | 1.032 | 17 | | | — | | | | (1,391,219 | ) | | | (1,391,219 | ) | |
| Deutsche Bank AG | | KRW | 660,000 | | | 01/28/11 | | | 2.630 | 18 | | | 2.820 | | | | — | | | | 65 | | | | 65 | | |
| Deutsche Bank AG | | KRW | 200,000 | | | 06/12/11 | | | 2.630 | 18 | | | 3.870 | | | | — | | | | 1,260 | | | | 1,260 | | |
| Deutsche Bank AG | | KRW | 1,420,000 | | | 06/26/11 | | | 2.630 | 18 | | | 3.692 | | | | — | | | | 7,301 | | | | 7,301 | | |
| Deutsche Bank AG | | KRW | 613,856 | | | 07/06/11 | | | 2.630 | 18 | | | 3.620 | | | | — | | | | 2,847 | | | | 2,847 | | |
| Deutsche Bank AG | | KRW | 1,025,603 | | | 07/07/11 | | | 2.630 | 18 | | | 3.626 | | | | — | | | | 4,811 | | | | 4,811 | | |
| Deutsche Bank AG | | USD | 8,400 | | | 12/15/15 | | | 3.000 | | | | 0.454 | 19 | | | 116,000 | | | | (399,572 | ) | | | (283,572 | ) | |
| Deutsche Bank AG | | USD | 4,500 | | | 12/15/20 | | | 4.000 | | | | 0.454 | 19 | | | 171,583 | | | | (380,056 | ) | | | (208,473 | ) | |
| JPMorgan Chase Bank | | GBP | 2,450 | | | 12/15/20 | | | 1.032 | 17 | | | 4.000 | | | | (100,956 | ) | | | 154,562 | | | | 53,606 | | |
| JPMorgan Chase Bank | | KRW | 641,000 | | | 01/28/11 | | | 2.630 | 18 | | | 2.830 | | | | — | | | | 89 | | | | 89 | | |
| JPMorgan Chase Bank | | KRW | 500,000 | | | 06/15/11 | | | 2.630 | 18 | | | 3.900 | | | | — | | | | 3,271 | | | | 3,271 | | |
| JPMorgan Chase Bank | | KRW | 1,500,000 | | | 06/22/11 | | | 2.630 | 18 | | | 3.719 | | | | — | | | | 7,943 | | | | 7,943 | | |
| JPMorgan Chase Bank | | KRW | 487,792 | | | 07/08/11 | | | 2.630 | 18 | | | 3.660 | | | | — | | | | 2,417 | | | | 2,417 | | |
| | | $ | 618,380 | | | $ | (726,893 | ) | | $ | (108,513 | ) | |
13 Rate based on the 6 Month Euribor.
14 Rate based on 1 Month LIBOR (USD on London Interbank Offered Rate).
15 Rate based on 6 Month LIBOR (USD on London Interbank Offered Rate).
16 Rate based on 6 Month LIBOR (JPY on London Interbank Offered Rate).
17 Rate based on 6 Month LIBOR (GBP on Interbank Offered Rate).
18 Rate based on 3 Month Korean Won CD.
19 Rate based on 3 Month LIBOR (USD on London Interbank Offered Rate).
EUR Euro
GBP Great Britain Pound
JPY Japanese Yen
KRW South Korean Won
USD United States Dollar
211
UBS PACE Select Advisors Trust
UBS PACE Alternative Strategies Investments
Portfolio of investments—July 31, 2010
Credit default swaps on sovereign issues—buy protection4,20
| | | | | Rate type | | | |
| Counterparty | | Notional
amount (000) | | Termination
dates | | Payments
made by
the Portfolio | | Payments
received by
the Portfolio | | Upfront
payments
made | | Value | | Unrealized
appreciation
(depreciation) | |
| Bank of America NA | | USD | 100 | | | 09/20/15 | | | 1.000 | %21 | | | — | 22 | | $ | (28,738 | ) | | $ | 23,055 | | | $ | (5,683 | ) | |
| Bank of America NA | | USD | 200 | | | 09/20/15 | | | 1.000 | 21 | | | — | 22 | | | (52,898 | ) | | | 46,109 | | | | (6,789 | ) | |
| Deutsche Bank AG | | USD | 200 | | | 09/20/15 | | | 1.000 | 21 | | | — | 22 | | | (53,169 | ) | | | 46,109 | | | | (7,060 | ) | |
Morgan Stanley & Co.
International PLC | | USD | 430 | | | 06/20/15 | | | 1.000 | 21 | | | — | 22 | | | (86,084 | ) | | | 96,906 | | | | 10,822 | | |
Morgan Stanley & Co.
International PLC | | USD | 1,110 | | | 06/20/20 | | | 0.250 | 21 | | | — | 23 | | | (29,148 | ) | | | 45,169 | | | | 16,021 | | |
Morgan Stanley & Co.
International PLC | | USD | 1,110 | | | 06/20/20 | | | 0.250 | 21 | | | — | 23 | | | (26,314 | ) | | | 45,169 | | | | 18,855 | | |
Morgan Stanley & Co.
International PLC | | USD | 1,120 | | | 06/20/20 | | | 0.250 | 21 | | | — | 23 | | | (28,351 | ) | | | 45,576 | | | | 17,225 | | |
| | | | | | | $ | (304,702 | ) | | $ | 348,093 | | | $ | 43,391 | | |
20 If the Portfolio is a buyer of protection and a credit event occurs, as defined under the terms of the particular swap agreement, the Portfolio will either (i) receive from the seller of protection an amount equal to the notional amount of the swap and take delivery of the referenced obligation or underlying securities comprising the referenced obligation or (ii) receive a net settlement amount in the form of cash or securities equal to the notional amount of the swap less the recovery value of the referenced obligation.
21 Payments made are based on the notional amount.
22 Payment from the counterparty will be received upon the occurrence of bankruptcy and/or by a restructuring event with respect to the Hellenic Republic bond, 5.900%, due 10/22/22.
23 Payment from the counterparty will be received upon the occurrence of bankruptcy and/or by a restructuring event with respect to the French Republic bond, 4.250%, due 04/25/19.
USD United States Dollar
212
UBS PACE Select Advisors Trust
UBS PACE Alternative Strategies Investments
Portfolio of investments—July 31, 2010
The following is a summary of the fair valuations according to the inputs used as of July 31, 2010 in valuing the Portfolio's investments:
| | | Unadjusted quoted
prices in active
markets for identical
investments
(Level 1) | | Other significant
observable inputs
(Level 2) | | Unobservable
inputs
(Level 3) | | Total | |
| Common stocks | | $ | 152,677,727 | | | $ | — | | | $ | — | | | $ | 152,677,727 | | |
| Preferred stock | | | 39,262 | | | | — | | | | — | | | | 39,262 | | |
| Investment companies | | | 3,357,615 | | | | — | | | | — | | | | 3,357,615 | | |
| Unit trust | | | 72,297 | | | | — | | | | — | | | | 72,297 | | |
| US government obligations | | | — | | | | 12,528,182 | | | | — | | | | 12,528,182 | | |
| Federal farm credit bank certificate | | | — | | | | 5,288,886 | | | | — | | | | 5,288,886 | | |
| Federal home loan bank certificate | | | — | | | | 1,501,506 | | | | — | | | | 1,501,506 | | |
Federal home loan mortgage
corporation certificates | | | — | | | | 2,691,301 | | | | — | | | | 2,691,301 | | |
Federal national mortgage
association certificates | | | — | | | | 2,955,255 | | | | — | | | | 2,955,255 | | |
| Collateralized mortgage obligations | | | — | | | | 23,556,378 | | | | — | | | | 23,556,378 | | |
| Asset-backed securities | | | — | | | | 15,433,543 | | | | — | | | | 15,433,543 | | |
| Corporate notes | | | — | | | | 42,856,774 | | | | — | | | | 42,856,774 | | |
| Municipal bonds and notes | | | — | | | | 2,830,912 | | | | — | | | | 2,830,912 | | |
| Non-US government obligations | | | — | | | | 3,110,573 | | | | — | | | | 3,110,573 | | |
| Time deposit | | | — | | | | 21,413,061 | | | | — | | | | 21,413,061 | | |
| Short-term US government obligations | | | — | | | | 88,408,902 | | | | — | | | | 88,408,902 | | |
| Repurchase agreement | | | — | | | | 83,353,000 | | | | — | | | | 83,353,000 | | |
| Options purchased | | | 201,150 | | | | — | | | | — | | | | 201,150 | | |
| Common stocks sold short | | | (21,974,696 | ) | | | — | | | | — | | | | (21,974,696 | ) | |
| Written options | | | (321,400 | ) | | | — | | | | — | | | | (321,400 | ) | |
| Futures, net | | | (811,536 | ) | | | — | | | | — | | | | (811,536 | ) | |
| Forward foreign currency contracts, net | | | — | | | | 262,276 | | | | — | | | | 262,276 | | |
| Swap agreements, net | | | — | | | | (378,800 | ) | | | — | | | | (378,800 | ) | |
| Total | | $ | 133,240,419 | | | $ | 305,811,749 | | | $ | — | | | $ | 439,052,168 | | |
At July 31, 2010, there were no transfers between Level 1 and Level 2.
The following is a rollforward of the Portfolio's investments that were valued using unobservable inputs (Level 3) during the nine months ended July 31, 2010:
| | | Asset backed
securities | |
| Beginning balance | | $ | 322,737 | | |
| Net purchases/(sales) | | | (431,270 | ) | |
| Accrued discounts/(premiums) | | | — | | |
| Total realized gain/(loss) | | | (204,437 | ) | |
| Net change in unrealized appreciation/depreciation | | | 312,970 | | |
| Net transfers in/(out) of Level 3 | | | — | | |
| Ending balance | | $ | — | | |
See accompanying notes to financial statements.
213
UBS PACE Select Advisors Trust
Understanding your Portfolio's expenses (unaudited)
As a shareholder of a Portfolio, you incur two types of costs: (1) transactional costs (as applicable), including sales charges (loads), or ongoing program fees; and (2) ongoing Portfolio costs, including management fees; service and/or distribution (12b-1) fees (if applicable); and other Portfolio expenses. These examples are intended to help you understand your ongoing costs (in dollars) of investing in each Portfolio and to compare these costs with the ongoing costs of investing in other mutual funds.
The examples below are based on an investment of $1,000 invested at the beginning of the period and held for the entire period, February 1, 2010 to July 31, 2010.
Actual expenses
The first line for each class of shares in the table below for each Portfolio provides information about its actual account values and actual expenses. You may use the information in this line, together with the amount you invested, to estimate the expenses that you paid over a period. Simply divide your account value by $1,000 (for example, an $8,600 account value divided by $1,000 = 8.6), then multiply the result by the number in the first line for each class of shares for each respective Portfolio under the heading entitled "Expenses paid during period" to estimate the expenses you paid on your account during the period.
Hypothetical example for comparison purposes
The second line for each class of shares in the table below for each Portfolio provides information about hypothetical account values and hypothetical expenses based on that Portfolio's actual expense ratios for each class of shares and an assumed rate of return of 5% per year before expenses, which is not that Portfolio's actual return for each class of shares. The hypothetical account values and expenses may not be used to estimate the actual ending account balance or expenses you paid for the period. You may use this information to compare the ongoing costs of investing in a Portfolio and other funds. To do so, compare this 5% hypothetical example with the 5% hypothetical examples that appear in the shareholder reports of other funds.
Please note that the expenses shown in the table are meant to highlight your ongoing Portfolio costs only and do not reflect any transactional costs (as applicable), such as sales charges (loads), or program fees. Therefore, the second line in the table for each class of shares for each Portfolio is useful in comparing ongoing Portfolio costs only, and will not help you determine the relative total costs of owning different funds. In addition, if these transactional costs or program fees were included, your costs would have been higher.
214
UBS PACE Select Advisors Trust
| |
| | Beginning
account value
February 1, 2010 | | Ending
account value
July 31, 2010 | | Expenses paid
during period1
02/01/10 to 07/31/10 | | Expense
ratio
during the period | |
| UBS PACE Money Market Investments | |
| Class P | | Actual | | $ | 1,000.00 | | | $ | 1,000.00 | | | $ | 1.24 | | | | 0.25 | % | |
| | Hypothetical
(5% annual return before expenses) | | |
1,000.00 | | | |
1,023.55 | | | |
1.25 | | | |
0.25 | | |
| UBS PACE Government Securities Fixed Income Investments | |
| Class A | | Actual | | | 1,000.00 | | | | 1,047.90 | | | | 5.18 | | | | 1.02 | | |
| | Hypothetical
(5% annual return before expenses) | | |
1,000.00 | | | |
1,019.74 | | | |
5.11 | | | |
1.02 | | |
| Class B | | Actual | | | 1,000.00 | | | | 1,043.40 | | | | 8.97 | | | | 1.77 | | |
| | Hypothetical
(5% annual return before expenses) | | |
1,000.00 | | | |
1,016.02 | | | |
8.85 | | | |
1.77 | | |
| Class C | | Actual | | | 1,000.00 | | | | 1,045.30 | | | | 7.71 | | | | 1.52 | | |
| | Hypothetical
(5% annual return before expenses) | | |
1,000.00 | | | |
1,017.26 | | | |
7.60 | | | |
1.52 | | |
| Class Y | | Actual | | | 1,000.00 | | | | 1,049.20 | | | | 3.91 | | | | 0.77 | | |
| | Hypothetical
(5% annual return before expenses) | | |
1,000.00 | | | |
1,020.98 | | | |
3.86 | | | |
0.77 | | |
| Class P | | Actual | | | 1,000.00 | | | | 1,048.40 | | | | 3.91 | | | | 0.77 | | |
| | Hypothetical
(5% annual return before expenses) | | |
1,000.00 | | | |
1,020.98 | | | |
3.86 | | | |
0.77 | | |
| UBS PACE Intermediate Fixed Income Investments | |
| Class A | | Actual | | | 1,000.00 | | | | 1,036.10 | | | | 4.70 | | | | 0.93 | | |
| | Hypothetical
(5% annual return before expenses) | | |
1,000.00 | | | |
1,020.18 | | | |
4.66 | | | |
0.93 | | |
| Class B | | Actual | | | 1,000.00 | | | | 1,032.20 | | | | 8.47 | | | | 1.68 | | |
| | Hypothetical
(5% annual return before expenses) | | |
1,000.00 | | | |
1,016.46 | | | |
8.40 | | | |
1.68 | | |
| Class C | | Actual | | | 1,000.00 | | | | 1,032.60 | | | | 7.21 | | | | 1.43 | | |
| | Hypothetical
(5% annual return before expenses) | | |
1,000.00 | | | |
1,017.70 | | | |
7.15 | | | |
1.43 | | |
| Class Y | | Actual | | | 1,000.00 | | | | 1,036.50 | | | | 3.43 | | | | 0.68 | | |
| | Hypothetical
(5% annual return before expenses) | | |
1,000.00 | | | |
1,021.42 | | | |
3.41 | | | |
0.68 | | |
| Class P | | Actual | | | 1,000.00 | | | | 1,036.50 | | | | 3.43 | | | | 0.68 | | |
| | Hypothetical
(5% annual return before expenses) | | |
1,000.00 | | | |
1,021.42 | | | |
3.41 | | | |
0.68 | | |
215
UBS PACE Select Advisors Trust
| |
| | Beginning
account value
February 1, 2010 | | Ending
account value
July 31, 2010 | | Expenses paid
during period1
02/01/10 to 07/31/10 | | Expense
ratio
during the period | |
| UBS PACE Strategic Fixed Income Investments | |
| Class A | | Actual | | $ | 1,000.00 | | | $ | 1,068.60 | | | $ | 5.44 | | | | 1.06 | % | |
| | Hypothetical
(5% annual return before expenses) | | |
1,000.00 | | | |
1,019.54 | | | |
5.31 | | | |
1.06 | | |
| Class B | | Actual | | | 1,000.00 | | | | 1,064.60 | | | | 9.27 | | | | 1.81 | | |
| | Hypothetical
(5% annual return before expenses) | | |
1,000.00 | | | |
1,015.82 | | | |
9.05 | | | |
1.81 | | |
| Class C | | Actual | | | 1,000.00 | | | | 1,066.00 | | | | 7.99 | | | | 1.56 | | |
| | Hypothetical
(5% annual return before expenses) | | |
1,000.00 | | | |
1,017.06 | | | |
7.80 | | | |
1.56 | | |
| Class Y | | Actual | | | 1,000.00 | | | | 1,070.10 | | | | 4.72 | | | | 0.92 | | |
| | Hypothetical
(5% annual return before expenses) | | |
1,000.00 | | | |
1,020.23 | | | |
4.61 | | | |
0.92 | | |
| Class P | | Actual | | | 1,000.00 | | | | 1,069.90 | | | | 4.16 | | | | 0.81 | | |
| | Hypothetical
(5% annual return before expenses) | | |
1,000.00 | | | |
1,020.78 | | | |
4.06 | | | |
0.81 | | |
| UBS PACE Municipal Fixed Income Investments | |
| Class A | | Actual | | | 1,000.00 | | | | 1,035.40 | | | | 4.69 | | | | 0.93 | | |
| | Hypothetical
(5% annual return before expenses) | | |
1,000.00 | | | |
1,020.18 | | | |
4.66 | | | |
0.93 | | |
| Class B | | Actual | | | 1,000.00 | | | | 1,031.50 | | | | 8.46 | | | | 1.68 | | |
| | Hypothetical
(5% annual return before expenses) | | |
1,000.00 | | | |
1,016.46 | | | |
8.40 | | | |
1.68 | | |
| Class C | | Actual | | | 1,000.00 | | | | 1,032.80 | | | | 7.21 | | | | 1.43 | | |
| | Hypothetical
(5% annual return before expenses) | | |
1,000.00 | | | |
1,017.70 | | | |
7.15 | | | |
1.43 | | |
| Class Y | | Actual | | | 1,000.00 | | | | 1,036.60 | | | | 3.43 | | | | 0.68 | | |
| | Hypothetical
(5% annual return before expenses) | | |
1,000.00 | | | |
1,021.42 | | | |
3.41 | | | |
0.68 | | |
| Class P | | Actual | | | 1,000.00 | | | | 1,037.50 | | | | 3.44 | | | | 0.68 | | |
| | Hypothetical
(5% annual return before expenses) | | |
1,000.00 | | | |
1,021.42 | | | |
3.41 | | | |
0.68 | | |
| UBS PACE Global Fixed Income Investments | |
| Class A | | Actual | | | 1,000.00 | | | | 1,011.30 | | | | 6.23 | | | | 1.25 | | |
| | Hypothetical
(5% annual return before expenses) | | |
1,000.00 | | | |
1,018.60 | | | |
6.26 | | | |
1.25 | | |
| Class B | | Actual | | | 1,000.00 | | | | 1,007.40 | | | | 9.95 | | | | 2.00 | | |
| | Hypothetical
(5% annual return before expenses) | | |
1,000.00 | | | |
1,014.88 | | | |
9.99 | | | |
2.00 | | |
| Class C | | Actual | | | 1,000.00 | | | | 1,008.90 | | | | 8.57 | | | | 1.72 | | |
| | Hypothetical
(5% annual return before expenses) | | |
1,000.00 | | | |
1,016.27 | | | |
8.60 | | | |
1.72 | | |
| Class Y | | Actual | | | 1,000.00 | | | | 1,012.90 | | | | 5.44 | | | | 1.09 | | |
| | Hypothetical
(5% annual return before expenses) | | |
1,000.00 | | | |
1,019.39 | | | |
5.46 | | | |
1.09 | | |
| Class P | | Actual | | | 1,000.00 | | | | 1,012.50 | | | | 4.99 | | | | 1.00 | | |
| | Hypothetical
(5% annual return before expenses) | | |
1,000.00 | | | |
1,019.84 | | | |
5.01 | | | |
1.00 | | |
216
UBS PACE Select Advisors Trust
| |
| | Beginning
account value
February 1, 2010 | | Ending
account value
July 31, 2010 | | Expenses paid
during period1
02/01/10 to 07/31/10 | | Expense
ratio
during the period | |
| UBS PACE High Yield Investments | |
| Class A | | Actual | | $ | 1,000.00 | | | $ | 1,055.10 | | | $ | 6.88 | | | | 1.35 | % | |
| | Hypothetical
(5% annual return before expenses) | | |
1,000.00 | | | |
1,018.10 | | | |
6.76 | | | |
1.35 | | |
| Class C | | Actual | | | 1,000.00 | | | | 1,053.90 | | | | 9.22 | | | | 1.81 | | |
| | Hypothetical
(5% annual return before expenses) | | |
1,000.00 | | | |
1,015.82 | | | |
9.05 | | | |
1.81 | | |
| Class Y | | Actual | | | 1,000.00 | | | | 1,057.30 | | | | 5.61 | | | | 1.10 | | |
| | Hypothetical
(5% annual return before expenses) | | |
1,000.00 | | | |
1,019.34 | | | |
5.51 | | | |
1.10 | | |
| Class P | | Actual | | | 1,000.00 | | | | 1,056.30 | | | | 5.61 | | | | 1.10 | | |
| | Hypothetical
(5% annual return before expenses) | | |
1,000.00 | | | |
1,019.34 | | | |
5.51 | | | |
1.10 | | |
| UBS PACE Large Co Value Equity Investments | |
| Class A | | Actual | | | 1,000.00 | | | | 1,030.00 | | | | 5.99 | | | | 1.19 | | |
| | Hypothetical
(5% annual return before expenses) | | |
1,000.00 | | | |
1,018.89 | | | |
5.96 | | | |
1.19 | | |
| Class B | | Actual | | | 1,000.00 | | | | 1,026.30 | | | | 10.15 | | | | 2.02 | | |
| | Hypothetical
(5% annual return before expenses) | | |
1,000.00 | | | |
1,014.78 | | | |
10.09 | | | |
2.02 | | |
| Class C | | Actual | | | 1,000.00 | | | | 1,026.50 | | | | 10.15 | | | | 2.02 | | |
| | Hypothetical
(5% annual return before expenses) | | |
1,000.00 | | | |
1,014.78 | | | |
10.09 | | | |
2.02 | | |
| Class Y | | Actual | | | 1,000.00 | | | | 1,031.30 | | | | 4.84 | | | | 0.96 | | |
| | Hypothetical
(5% annual return before expenses) | | |
1,000.00 | | | |
1,020.03 | | | |
4.81 | | | |
0.96 | | |
| Class P | | Actual | | | 1,000.00 | | | | 1,031.40 | | | | 4.78 | | | | 0.95 | | |
| | Hypothetical
(5% annual return before expenses) | | |
1,000.00 | | | |
1,020.08 | | | |
4.76 | | | |
0.95 | | |
| UBS PACE Large Co Growth Equity Investments | |
| Class A | | Actual | | | 1,000.00 | | | | 1,028.20 | | | | 6.14 | | | | 1.22 | | |
| | Hypothetical
(5% annual return before expenses) | | |
1,000.00 | | | |
1,018.74 | | | |
6.11 | | | |
1.22 | | |
| Class B | | Actual | | | 1,000.00 | | | | 1,024.50 | | | | 10.29 | | | | 2.05 | | |
| | Hypothetical
(5% annual return before expenses) | | |
1,000.00 | | | |
1,014.63 | | | |
10.24 | | | |
2.05 | | |
| Class C | | Actual | | | 1,000.00 | | | | 1,024.40 | | | | 10.29 | | | | 2.05 | | |
| | Hypothetical
(5% annual return before expenses) | | |
1,000.00 | | | |
1,014.63 | | | |
10.24 | | | |
2.05 | | |
| Class Y | | Actual | | | 1,000.00 | | | | 1,029.60 | | | | 4.98 | | | | 0.99 | | |
| | Hypothetical
(5% annual return before expenses) | | |
1,000.00 | | | |
1,019.89 | | | |
4.96 | | | |
0.99 | | |
| Class P | | Actual | | | 1,000.00 | | | | 1,029.10 | | | | 4.83 | | | | 0.96 | | |
| | Hypothetical
(5% annual return before expenses) | | |
1,000.00 | | | |
1,020.03 | | | |
4.81 | | | |
0.96 | | |
217
UBS PACE Select Advisors Trust
| |
| | Beginning
account value
February 1, 2010 | | Ending
account value
July 31, 2010 | | Expenses paid
during period1
02/01/10 to 07/31/10 | | Expense
ratio
during the period | |
| UBS PACE Small/Medium Co Value Equity Investments | |
| Class A | | Actual | | $ | 1,000.00 | | | $ | 1,062.50 | | | $ | 7.01 | | | | 1.37 | % | |
| | Hypothetical
(5% annual return before expenses) | | |
1,000.00 | | | |
1,018.00 | | | |
6.85 | | | |
1.37 | | |
| Class B | | Actual | | | 1,000.00 | | | | 1,060.10 | | | | 11.03 | | | | 2.16 | | |
| | Hypothetical
(5% annual return before expenses) | | |
1,000.00 | | | |
1,014.08 | | | |
10.79 | | | |
2.16 | | |
| Class C | | Actual | | | 1,000.00 | | | | 1,059.00 | | | | 10.77 | | | | 2.11 | | |
| | Hypothetical
(5% annual return before expenses) | | |
1,000.00 | | | |
1,014.33 | | | |
10.54 | | | |
2.11 | | |
| Class Y | | Actual | | | 1,000.00 | | | | 1,063.20 | | | | 5.88 | | | | 1.15 | | |
| | Hypothetical
(5% annual return before expenses) | | |
1,000.00 | | | |
1,019.09 | | | |
5.76 | | | |
1.15 | | |
| Class P | | Actual | | | 1,000.00 | | | | 1,062.90 | | | | 5.93 | | | | 1.16 | | |
| | Hypothetical
(5% annual return before expenses) | | |
1,000.00 | | | |
1,019.04 | | | |
5.81 | | | |
1.16 | | |
| UBS PACE Small/Medium Co Growth Equity Investments | |
| Class A | | Actual | | | 1,000.00 | | | | 1,048.70 | | | | 6.76 | | | | 1.33 | | |
| | Hypothetical
(5% annual return before expenses) | | |
1,000.00 | | | |
1,018.20 | | | |
6.66 | | | |
1.33 | | |
| Class B | | Actual | | | 1,000.00 | | | | 1,046.10 | | | | 10.81 | | | | 2.13 | | |
| | Hypothetical
(5% annual return before expenses) | | |
1,000.00 | | | |
1,014.23 | | | |
10.64 | | | |
2.13 | | |
| Class C | | Actual | | | 1,000.00 | | | | 1,044.80 | | | | 10.80 | | | | 2.13 | | |
| | Hypothetical
(5% annual return before expenses) | | |
1,000.00 | | | |
1,014.23 | | | |
10.64 | | | |
2.13 | | |
| Class Y | | Actual | | | 1,000.00 | | | | 1,047.70 | | | | 5.53 | | | | 1.09 | | |
| | Hypothetical
(5% annual return before expenses) | | |
1,000.00 | | | |
1,019.39 | | | |
5.46 | | | |
1.09 | | |
| Class P | | Actual | | | 1,000.00 | | | | 1,049.10 | | | | 5.74 | | | | 1.13 | | |
| | Hypothetical
(5% annual return before expenses) | | |
1,000.00 | | | |
1,019.19 | | | |
5.66 | | | |
1.13 | | |
| UBS PACE International Equity Investments | |
| Class A | | Actual | | | 1,000.00 | | | | 987.40 | | | | 7.05 | | | | 1.43 | | |
| | Hypothetical
(5% annual return before expenses) | | |
1,000.00 | | | |
1,017.70 | | | |
7.15 | | | |
1.43 | | |
| Class B | | Actual | | | 1,000.00 | | | | 984.00 | | | | 11.81 | | | | 2.40 | | |
| | Hypothetical
(5% annual return before expenses) | | |
1,000.00 | | | |
1,012.89 | | | |
11.98 | | | |
2.40 | | |
| Class C | | Actual | | | 1,000.00 | | | | 982.90 | | | | 11.06 | | | | 2.25 | | |
| | Hypothetical
(5% annual return before expenses) | | |
1,000.00 | | | |
1,013.64 | | | |
11.23 | | | |
2.25 | | |
| Class Y | | Actual | | | 1,000.00 | | | | 989.00 | | | | 5.87 | | | | 1.19 | | |
| | Hypothetical
(5% annual return before expenses) | | |
1,000.00 | | | |
1,018.89 | | | |
5.96 | | | |
1.19 | | |
| Class P | | Actual | | | 1,000.00 | | | | 988.20 | | | | 5.87 | | | | 1.19 | | |
| | Hypothetical
(5% annual return before expenses) | | |
1,000.00 | | | |
1,018.89 | | | |
5.96 | | | |
1.19 | | |
218
UBS PACE Select Advisors Trust
| |
| | Beginning
account value
February 1, 2010 | | Ending
account value
July 31, 2010 | | Expenses paid
during period1
02/01/10 to 07/31/10 | | Expense
ratio
during the period | |
| UBS PACE International Emerging Markets Equity Investments | |
| Class A | | Actual | | $ | 1,000.00 | | | $ | 1,068.40 | | | $ | 9.64 | | | | 1.88 | % | |
| | Hypothetical
(5% annual return before expenses) | | |
1,000.00 | | | |
1,015.47 | | | |
9.39 | | | |
1.88 | | |
| Class B | | Actual | | | 1,000.00 | | | | 1,063.90 | | | | 13.77 | | | | 2.69 | | |
| | Hypothetical
(5% annual return before expenses) | | |
1,000.00 | | | |
1,011.46 | | | |
13.42 | | | |
2.69 | | |
| Class C | | Actual | | | 1,000.00 | | | | 1,063.60 | | | | 13.41 | | | | 2.62 | | |
| | Hypothetical
(5% annual return before expenses) | | |
1,000.00 | | | |
1,011.80 | | | |
13.07 | | | |
2.62 | | |
| Class Y | | Actual | | | 1,000.00 | | | | 1,069.80 | | | | 8.88 | | | | 1.73 | | |
| | Hypothetical
(5% annual return before expenses) | | |
1,000.00 | | | |
1,016.22 | | | |
8.65 | | | |
1.73 | | |
| Class P | | Actual | | | 1,000.00 | | | | 1,068.30 | | | | 9.59 | | | | 1.87 | | |
| | Hypothetical
(5% annual return before expenses) | | |
1,000.00 | | | |
1,015.52 | | | |
9.35 | | | |
1.87 | | |
| UBS PACE Global Real Estate Securities Investments | |
| Class A | | Actual | | | 1,000.00 | | | | 1,092.60 | | | | 7.52 | | | | 1.45 | | |
| | Hypothetical
(5% annual return before expenses) | | |
1,000.00 | | | |
1,017.60 | | | |
7.25 | | | |
1.45 | | |
| Class C | | Actual | | | 1,000.00 | | | | 1,090.70 | | | | 11.40 | | | | 2.20 | | |
| | Hypothetical
(5% annual return before expenses) | | |
1,000.00 | | | |
1,013.88 | | | |
10.99 | | | |
2.20 | | |
| Class Y | | Actual | | | 1,000.00 | | | | 1,094.50 | | | | 6.23 | | | | 1.20 | | |
| | Hypothetical
(5% annual return before expenses) | | |
1,000.00 | | | |
1,018.84 | | | |
6.01 | | | |
1.20 | | |
| Class P | | Actual | | | 1,000.00 | | | | 1,094.60 | | | | 6.23 | | | | 1.20 | | |
| | Hypothetical
(5% annual return before expenses) | | |
1,000.00 | | | |
1,018.84 | | | |
6.01 | | | |
1.20 | | |
| UBS PACE Alternative Strategies Investments | |
| Class A | | Actual | | | 1,000.00 | | | | 1,012.20 | | | | 9.93 | | | | 1.99 | | |
| | Hypothetical
(5% annual return before expenses) | | |
1,000.00 | | | |
1,014.93 | | | |
9.94 | | | |
1.99 | | |
| Class C | | Actual | | | 1,000.00 | | | | 1,007.90 | | | | 13.79 | | | | 2.77 | | |
| | Hypothetical
(5% annual return before expenses) | | |
1,000.00 | | | |
1,011.06 | | | |
13.81 | | | |
2.77 | | |
| Class Y | | Actual | | | 1,000.00 | | | | 1,014.30 | | | | 8.69 | | | | 1.74 | | |
| | Hypothetical
(5% annual return before expenses) | | |
1,000.00 | | | |
1,016.17 | | | |
8.70 | | | |
1.74 | | |
| Class P | | Actual | | | 1,000.00 | | | | 1,013.20 | | | | 8.69 | | | | 1.74 | | |
| | Hypothetical
(5% annual return before expenses) | | |
1,000.00 | | | |
1,016.17 | | | |
8.70 | | | |
1.74 | | |
1 Expenses are equal to the Portfolios' annualized net expense ratios, multiplied by the average account value over the period, multiplied by 181 divided by 365 (to reflect the one-half year period).
219
UBS PACE Select Advisors Trust
Statement of assets and liabilities
July 31, 2010
| | | UBS PACE
Money Market
Investments | | UBS PACE
Government
Securities
Fixed Income
Investments | | UBS PACE
Intermediate
Fixed Income
Investments | | UBS PACE
Strategic
Fixed Income
Investments | |
| Assets: | |
Investments in unaffiliated securities, at value (cost—$338,048,143;
$961,331,906; $450,065,940; $769,479,246; $312,737,900;
$472,661,456; $207,733,304, respectively)1 | | $ | 338,048,143 | | | $ | 965,553,859 | | | $ | 462,249,402 | | | $ | 790,890,036 | | |
Investment in an affiliated security, at value (cost—$0; $0; $1,702,277;
$196,020; $0; $0; $22,131,690, respectively) | | | — | | | | — | | | | 1,702,277 | | | | 196,020 | | |
Repurchase agreements, at value (cost—$48,080,000; $83,335,000;
$49,017,000; $4,277,000; $0; $5,550,000; $5,177,000, respectively) | | | 48,080,000 | | | | 83,335,000 | | | | 49,017,000 | | | | 4,277,000 | | |
Total investments in securities, at value (cost—$386,128,143;
$1,044,666,906; $500,785,217; $773,952,266; $312,737,900;
$478,211,456; $235,041,994, respectively) | | $ | 386,128,143 | | | $ | 1,048,888,859 | | | $ | 512,968,679 | | | $ | 795,363,056 | | |
| Cash | | | 819 | | | | — | | | | — | | | | 471 | | |
Foreign currency, at value (cost—$0; $0; $126; $288,194; $0;
$914,890; $95,503, respectively) | | | — | | | | — | | | | 156 | | | | 301,339 | | |
| Receivable from affiliate | | | 79,116 | | | | — | | | | — | | | | — | | |
| Receivable for investments sold | | | — | | | | 835,043,452 | | | | 105,487,765 | | | | 27,730,211 | | |
| Receivable for shares of beneficial interest sold | | | 1,274,324 | | | | 738,990 | | | | 846,976 | | | | 981,097 | | |
| Receivable for interest | | | 102,162 | | | | 1,088,230 | | | | 3,445,654 | | | | 7,029,820 | | |
| Swap agreements, at value3 | | | — | | | | 587,500 | | | | — | | | | 3,808,279 | | |
| Due from broker | | | — | | | | — | | | | — | | | | 133,158 | | |
| Unrealized appreciation on forward foreign currency contracts | | | — | | | | — | | | | 990,206 | | | | 357,550 | | |
| Receivable for variation margin | | | — | | | | 51,031 | | | | — | | | | 183,609 | | |
| Receivable for foreign tax reclaims | | | — | | | | — | | | | 655 | | | | 33,701 | | |
| Other assets | | | 26,523 | | | | 40,333 | | | | 36,421 | | | | 632,492 | | |
| Total assets | | | 387,611,087 | | | | 1,886,438,395 | | | | 623,776,512 | | | | 836,554,783 | | |
| Liabilities: | |
| Payable for shares of beneficial interest repurchased | | | 990,975 | | | | 784,332 | | | | 725,356 | | | | 1,059,436 | | |
| Payable to custodian | | | 4,628 | | | | 60,565 | | | | 1,092,618 | | | | 33,417 | | |
| Dividends payable to shareholders | | | 1,760 | | | | — | | | | — | | | | — | | |
| Payable for investments purchased | | | — | | | | 1,192,720,765 | | | | 127,626,152 | | | | 72,333,704 | | |
Investments sold short, at value (proceeds—$0; $44,943,750;
$15,590,094; $0; $0; $0; $0, respectively) | | | — | | | | 45,209,683 | | | | 15,603,575 | | | | — | | |
| Due to broker | | | — | | | | 2,490,292 | | | | 311 | | | | 4,077,159 | | |
Options written, at value (premiums received—$0; $1,092,053; $0;
$707,790; $0; $0; $0, respectively) | | | — | | | | 961,691 | | | | — | | | | 1,782,467 | | |
| Payable to affiliate | | | — | | | | 313,369 | | | | 201,718 | | | | 364,141 | | |
| Payable for open reverse repurchase agreement | | | — | | | | — | | | | 5,412,500 | | | | — | | |
| Payable for cash collateral from securities loaned | | | — | | | | — | | | | 1,702,277 | | | | 196,020 | | |
| Unrealized depreciation on forward foreign currency contracts | | | — | | | | — | | | | 619,512 | | | | 2,615,399 | | |
| Payable for variation margin | | | — | | | | — | | | | 115,617 | | | | — | | |
| Swap agreements, at value3 | | | — | | | | — | | | | — | | | | 1,452,365 | | |
| Payable for foreign withholding taxes | | | — | | | | — | | | | — | | | | 369 | | |
| Accrued expenses and other liabilities | | | 396,526 | | | | 272,723 | | | | 170,880 | | | | 307,681 | | |
| Total liabilities | | | 1,393,889 | | | | 1,242,813,420 | | | | 153,270,516 | | | | 84,222,158 | | |
1 Includes $0; $0; $1,665,620; $191,869; $0; $0; $21,542,341, respectively, of investments in securities on loan, at value plus accrued interest and dividends, if any.
2 Includes restricted cash of $7,043,136 delivered to broker as initial margin for futures contracts for UBS PACE Global Fixed Income Investments.
3 Includes net upfront payments made by UBS PACE Government Securities Fixed Income Investments of $550,664 and net upfront payments made by UBS PACE Strategic Fixed Income Investments of $795,538.
220
| | | UBS PACE
Municipal
Fixed Income
Investments | | UBS PACE
Global
Fixed Income
Investments | | UBS PACE
High Yield
Investments | |
| Assets: | |
Investments in unaffiliated securities, at value (cost—$338,048,143;
$961,331,906; $450,065,940; $769,479,246; $312,737,900;
$472,661,456; $207,733,304, respectively)1 | | $ | 329,290,520 | | | $ | 497,789,301 | | | $ | 219,470,953 | | |
Investment in an affiliated security, at value (cost—$0; $0; $1,702,277;
$196,020; $0; $0; $22,131,690, respectively) | | | — | | | | — | | | | 22,131,690 | | |
Repurchase agreements, at value (cost—$48,080,000; $83,335,000;
$49,017,000; $4,277,000; $0; $5,550,000; $5,177,000, respectively) | | | — | | | | 5,550,000 | | | | 5,177,000 | | |
Total investments in securities, at value (cost—$386,128,143;
$1,044,666,906; $500,785,217; $773,952,266; $312,737,900;
$478,211,456; $235,041,994, respectively) | | $ | 329,290,520 | | | $ | 503,339,301 | | | $ | 246,779,643 | | |
| Cash | | | — | | | | 7,043,7222 | | | | 410 | | |
Foreign currency, at value (cost—$0; $0; $126; $288,194; $0;
$914,890; $95,503, respectively) | | | — | | | | 915,631 | | | | 97,440 | | |
| Receivable from affiliate | | | — | | | | — | | | | — | | |
| Receivable for investments sold | | | — | | | | — | | | | 126,458 | | |
| Receivable for shares of beneficial interest sold | | | 548,185 | | | | 531,579 | | | | 614,061 | | |
| Receivable for interest | | | 3,589,940 | | | | 6,796,337 | | | | 4,083,033 | | |
| Swap agreements, at value3 | | | — | | | | — | | | | — | | |
| Due from broker | | | — | | | | — | | | | — | | |
| Unrealized appreciation on forward foreign currency contracts | | | — | | | | 9,674,106 | | | | — | | |
| Receivable for variation margin | | | — | | | | — | | | | — | | |
| Receivable for foreign tax reclaims | | | — | | | | 53,946 | | | | 11,464 | | |
| Other assets | | | 30,605 | | | | 37,302 | | | | 32,404 | | |
| Total assets | | | 333,459,250 | | | | 528,391,924 | | | | 251,744,913 | | |
| Liabilities: | |
| Payable for shares of beneficial interest repurchased | | | 489,276 | | | | 813,088 | | | | 230,544 | | |
| Payable to custodian | | | 9,592 | | | | 38,608 | | | | 8,020 | | |
| Dividends payable to shareholders | | | — | | | | — | | | | — | | |
| Payable for investments purchased | | | 4,193,563 | | | | — | | | | 2,459,345 | | |
Investments sold short, at value (proceeds—$0; $44,943,750;
$15,590,094; $0; $0; $0; $0, respectively) | | | — | | | | — | | | | — | | |
| Due to broker | | | — | | | | 4,308,350 | | | | — | | |
Options written, at value (premiums received—$0; $1,092,053; $0;
$707,790; $0; $0; $0, respectively) | | | — | | | | — | | | | — | | |
| Payable to affiliate | | | 168,224 | | | | 306,881 | | | | 131,006 | | |
| Payable for open reverse repurchase agreement | | | — | | | | — | | | | — | | |
| Payable for cash collateral from securities loaned | | | — | | | | — | | | | 22,131,690 | | |
| Unrealized depreciation on forward foreign currency contracts | | | — | | | | 4,887,492 | | | | 967,113 | | |
| Payable for variation margin | | | — | | | | 1,846,684 | | | | — | | |
| Swap agreements, at value3 | | | — | | | | — | | | | — | | |
| Payable for foreign withholding taxes | | | — | | | | 15,836 | | | | 2,708 | | |
| Accrued expenses and other liabilities | | | 116,852 | | | | 311,085 | | | | 163,654 | | |
| Total liabilities | | | 4,977,507 | | | | 12,528,024 | | | | 26,094,080 | | |
See accompanying notes to financial statements.
221
UBS PACE Select Advisors Trust
Statement of assets and liabilities (continued)
July 31, 2010
| | | UBS PACE
Money Market
Investments | | UBS PACE
Government
Securities
Fixed Income
Investments | | UBS PACE
Intermediate
Fixed Income
Investments | | UBS PACE
Strategic
Fixed Income
Investments | |
| Net assets: | |
| Beneficial interest shares of $0.001 par value (unlimited amount authorized) | | $ | 386,217,292 | | | $ | 616,608,594 | | | $ | 478,427,935 | | | $ | 714,722,628 | | |
| Accumulated undistributed (distributions in excess of) net investment income | | | — | | | | 53,465 | | | | (269,948 | ) | | | 6,329,490 | | |
| Accumulated net realized gains (losses) | | | (94 | ) | | | 22,577,807 | | | | (19,624,677 | ) | | | 10,670,282 | | |
| Net unrealized appreciation | | | — | | | | 4,385,109 | | | | 11,972,686 | | | | 20,610,225 | | |
| Net assets | | $ | 386,217,198 | | | $ | 643,624,975 | | | $ | 470,505,996 | | | $ | 752,332,625 | | |
| Class A | |
| Net assets | | $ | — | | | $ | 92,416,258 | | | $ | 42,904,780 | | | $ | 45,499,184 | | |
| Shares outstanding | | | — | | | | 6,743,200 | | | | 3,570,855 | | | | 3,125,970 | | |
| Net asset value per share | | $ | — | | | $ | 13.71 | | | $ | 12.02 | | | $ | 14.56 | | |
| Maximum offering price per share | | $ | — | | | $ | 14.36 | | | $ | 12.59 | | | $ | 15.25 | | |
| Class B | |
| Net assets | | $ | — | | | $ | 156,522 | | | $ | 156,544 | | | $ | 299,836 | | |
| Shares outstanding | | | — | | | | 11,416 | | | | 13,004 | | | | 20,608 | | |
| Net asset value and offering price per share | | $ | — | | | $ | 13.71 | | | $ | 12.04 | | | $ | 14.55 | | |
| Class C | |
| Net assets | | $ | — | | | $ | 24,393,974 | | | $ | 4,646,411 | | | $ | 12,288,777 | | |
| Shares outstanding | | | — | | | | 1,778,259 | | | | 386,258 | | | | 844,178 | | |
| Net asset value and offering price per share | | $ | — | | | $ | 13.72 | | | $ | 12.03 | | | $ | 14.56 | | |
| Class Y | |
| Net assets | | $ | — | | | $ | 49,486,132 | | | $ | 1,997,405 | | | $ | 3,058,346 | | |
| Shares outstanding | | | — | | | | 3,609,984 | | | | 166,215 | | | | 210,338 | | |
| Net asset value, offering price and redemption value per share1 | | $ | — | | | $ | 13.71 | | | $ | 12.02 | | | $ | 14.54 | | |
| Class P | |
| Net assets | | $ | 386,217,198 | | | $ | 477,172,089 | | | $ | 420,800,856 | | | $ | 691,186,482 | | |
| Shares outstanding | | | 386,217,453 | | | | 34,799,427 | | | | 35,010,353 | | | | 47,511,044 | | |
| Net asset value, offering price and redemption value per share1 | | $ | 1.00 | | | $ | 13.71 | | | $ | 12.02 | | | $ | 14.55 | | |
1 Assumes shares were held a sufficient period or are otherwise not subject to a redemption fee.
222
| | | UBS PACE
Municipal
Fixed Income
Investments | | UBS PACE
Global
Fixed Income
Investments | | UBS PACE
High Yield
Investments | |
| Net assets: | |
| Beneficial interest shares of $0.001 par value (unlimited amount authorized) | | $ | 315,446,672 | | | $ | 521,580,241 | | | $ | 214,824,555 | | |
| Accumulated undistributed (distributions in excess of) net investment income | | | — | | | | (14,446,493 | ) | | | (863,267 | ) | |
| Accumulated net realized gains (losses) | | | (3,517,549 | ) | | | (19,348,037 | ) | | | 898,881 | | |
| Net unrealized appreciation | | | 16,552,620 | | | | 28,078,189 | | | | 10,790,664 | | |
| Net assets | | $ | 328,481,743 | | | $ | 515,863,900 | | | $ | 225,650,833 | | |
| Class A | |
| Net assets | | $ | 83,501,031 | | | $ | 98,038,607 | | | $ | 13,158,458 | | |
| Shares outstanding | | | 6,452,031 | | | | 8,579,886 | | | | 1,293,826 | | |
| Net asset value per share | | $ | 12.94 | | | $ | 11.43 | | | $ | 10.17 | | |
| Maximum offering price per share | | $ | 13.55 | | | $ | 11.97 | | | $ | 10.65 | | |
| Class B | |
| Net assets | | $ | 61,557 | | | $ | 165,998 | | | $ | — | | |
| Shares outstanding | | | 4,753 | | | | 14,484 | | | | — | | |
| Net asset value and offering price per share | | $ | 12.95 | | | $ | 11.46 | | | $ | — | | |
| Class C | |
| Net assets | | $ | 15,767,397 | | | $ | 7,154,310 | | | $ | 2,834,319 | | |
| Shares outstanding | | | 1,218,223 | | | | 626,042 | | | | 279,001 | | |
| Net asset value and offering price per share | | $ | 12.94 | | | $ | 11.43 | | | $ | 10.16 | | |
| Class Y | |
| Net assets | | $ | 123,465 | | | $ | 5,824,534 | | | $ | 8,554 | | |
| Shares outstanding | | | 9,534 | | | | 510,920 | | | | 839 | | |
| Net asset value, offering price and redemption value per share1 | | $ | 12.95 | | | $ | 11.40 | | | $ | 10.20 | | |
| Class P | |
| Net assets | | $ | 229,028,293 | | | $ | 404,680,451 | | | $ | 209,649,502 | | |
| Shares outstanding | | | 17,691,618 | | | | 35,416,701 | | | | 20,589,969 | | |
| Net asset value, offering price and redemption value per share1 | | $ | 12.95 | | | $ | 11.43 | | | $ | 10.18 | | |
See accompanying notes to financial statements.
223
UBS PACE Select Advisors Trust
Statement of assets and liabilities (continued)
July 31, 2010
| | | UBS PACE
Large Co
Value Equity
Investments | | UBS PACE
Large Co
Growth Equity
Investments | | UBS PACE
Small/Medium Co
Value Equity
Investments | | UBS PACE
Small/Medium Co
Growth Equity
Investments | |
| Assets: | |
Investments in unaffiliated securities, at value (cost—$1,020,831,726;
$859,725,147; $348,699,956; $338,763,029; $801,164,159;
$232,224,731; $68,468,480; $376,944,156, respectively)1 | | $ | 1,062,840,876 | | | $ | 948,426,606 | | | $ | 372,001,215 | | | $ | 363,473,032 | | |
Investment in an affiliated security, at value (cost—$9,903,388;
$8,858,229; $11,194,599; $49,573,183; $37,141,889; $7,322,675;
$4,402,048; $0, respectively) | | | 9,903,388 | | | | 8,858,229 | | | | 11,194,599 | | | | 49,573,183 | | |
Repurchase agreements, at value (cost—$19,581,000; $20,425,000;
$9,819,000; $10,840,000; $10,932,000; $2,620,000; $1,173,000;
$83,353,000, respectively) | | | 19,581,000 | | | | 20,425,000 | | | | 9,819,000 | | | | 10,840,000 | | |
Total investments in securities, at value (cost—$1,050,316,114;
$889,008,376; $369,713,555; $399,176,212; $849,238,048;
$242,167,406; $74,043,528; $460,297,156, respectively) | | $ | 1,092,325,264 | | | $ | 977,709,835 | | | $ | 393,014,814 | | | $ | 423,886,215 | | |
| Cash | | | 1,228 | | | | 2,665 | | | | 2,519 | | | | — | | |
Foreign currency, at value (cost—$0; $0; $0; $0; $770,027; $456,449;
$15,904; $147,921, respectively) | | | — | | | | — | | | | — | | | | — | | |
| Receivable from affiliate | | | — | | | | 4,985 | | | | — | | | | — | | |
| Receivable for investments sold | | | 4,121,208 | | | | 1,670,802 | | | | 3,563,640 | | | | 16,646,073 | | |
| Receivable for shares of beneficial interest sold | | | 1,037,463 | | | | 998,184 | | | | 331,520 | | | | 341,637 | | |
| Receivable for dividends and interest | | | 1,693,949 | | | | 469,041 | | | | 102,849 | | | | 23,048 | | |
| Swap agreements, at value3 | | | — | | | | — | | | | — | | | | — | | |
| Due from broker | | | — | | | | — | | | | — | | | | — | | |
| Unrealized appreciation on forward foreign currency contracts | | | — | | | | — | | | | — | | | | — | | |
| Receivable for variation margin | | | — | | | | — | | | | — | | | | — | | |
| Receivable for foreign tax reclaims | | | 54,433 | | | | 44,634 | | | | — | | | | — | | |
| Other assets | | | 47,988 | | | | 66,022 | | | | 33,281 | | | | 33,565 | | |
| Total assets | | | 1,099,281,533 | | | | 980,966,168 | | | | 397,048,623 | | | | 440,930,538 | | |
| Liabilities: | |
| Payable for investments purchased | | | 10,333,599 | | | | 1,204,557 | | | | 5,929,058 | | | | 16,046,061 | | |
| Payable for cash collateral from securities loaned | | | 9,903,388 | | | | 8,858,229 | | | | 11,194,599 | | | | 49,573,183 | | |
| Payable for shares of beneficial interest repurchased | | | 1,942,666 | | | | 1,396,526 | | | | 412,472 | | | | 411,072 | | |
| Payable to affiliate | | | 719,808 | | | | 633,233 | | | | 236,578 | | | | 236,455 | | |
| Payable to custodian | | | 35,242 | | | | 31,739 | | | | 12,422 | | | | 69,432 | | |
| Unrealized depreciation on forward foreign currency contracts | | | — | | | | — | | | | — | | | | — | | |
| Payable for foreign withholding taxes | | | — | | | | — | | | | — | | | | — | | |
| Payable for variation margin | | | — | | | | — | | | | — | | | | — | | |
Investments sold short, at value (proceeds—$0; $0; $0; $0; $0;
$0; $0; $21,698,169, respectively) | | | — | | | | — | | | | — | | | | — | | |
| Swap agreements, at value3 | | | — | | | | — | | | | — | | | | — | | |
Options written, at value (premiums received $0; $0; $0; $0; $0;
$0; $0; $269,063, respectively) | | | — | | | | — | | | | — | | | | — | | |
| Due to broker | | | — | | | | — | | | | — | | | | — | | |
| Accrued expenses and other liabilities | | | 354,441 | | | | 314,513 | | | | 297,448 | | | | 295,671 | | |
| Total liabilities | | | 23,289,144 | | | | 12,438,797 | | | | 18,082,577 | | | | 66,631,874 | | |
1 Includes $9,705,645; $8,538,533; $10,849,032; $48,363,302; $35,508,561; $7,108,056; $4,223,513; $0, respectively, of investments in securities on loan, at value plus accrued interest and dividends, if any.
2 Includes restricted cash of $182,000 and $23,825,408 delivered to broker as initial margin for investments sold short, futures contracts and/or swaps for UBS PACE International Equity Investments and UBS PACE Alternative Strategies Investments, respectively.
3 Includes net upfront payments received by UBS PACE Alternative Strategies Investments of $313,678.
224
| | | UBS PACE
International
Equity
Investments | | UBS PACE
International
Emerging
Markets Equity
Investments | | UBS PACE
Global
Real Estate
Securities
Investments | | UBS PACE
Alternative
Strategies
Investments | |
| Assets: | |
Investments in unaffiliated securities, at value (cost—$1,020,831,726;
$859,725,147; $348,699,956; $338,763,029; $801,164,159;
$232,224,731; $68,468,480; $376,944,156, respectively)1 | | $ | 778,745,881 | | | $ | 274,973,536 | | | $ | 76,975,026 | | | $ | 378,923,324 | | |
Investment in an affiliated security, at value (cost—$9,903,388;
$8,858,229; $11,194,599; $49,573,183; $37,141,889; $7,322,675;
$4,402,048; $0, respectively) | | | 37,141,889 | | | | 7,322,675 | | | | 4,402,048 | | | | — | | |
Repurchase agreements, at value (cost—$19,581,000; $20,425,000;
$9,819,000; $10,840,000; $10,932,000; $2,620,000; $1,173,000;
$83,353,000, respectively) | | | 10,932,000 | | | | 2,620,000 | | | | 1,173,000 | | | | 83,353,000 | | |
Total investments in securities, at value (cost—$1,050,316,114;
$889,008,376; $369,713,555; $399,176,212; $849,238,048;
$242,167,406; $74,043,528; $460,297,156, respectively) | | $ | 826,819,770 | | | $ | 284,916,211 | | | $ | 82,550,074 | | | $ | 462,276,324 | | |
| Cash | | | 183,435 | 2 | | | 19,750 | | | | 1,576 | | | | 23,852,045 | 2 | |
Foreign currency, at value (cost—$0; $0; $0; $0; $770,027; $456,449;
$15,904; $147,921, respectively) | | | 779,495 | | | | 458,143 | | | | 15,914 | | | | 149,099 | | |
| Receivable from affiliate | | | — | | | | — | | | | 22,428 | | | | — | | |
| Receivable for investments sold | | | 967,608 | | | | 1,351,371 | | | | 130,500 | | | | 7,705,029 | | |
| Receivable for shares of beneficial interest sold | | | 832,481 | | | | 233,842 | | | | 147,195 | | | | 982,745 | | |
| Receivable for dividends and interest | | | 1,181,160 | | | | 963,741 | | | | 252,931 | | | | 939,772 | | |
| Swap agreements, at value3 | | | — | | | | — | | | | — | | | | 5,415,519 | | |
| Due from broker | | | — | | | | — | | | | — | | | | 16,838 | | |
| Unrealized appreciation on forward foreign currency contracts | | | 299,666 | | | | — | | | | — | | | | 6,434,320 | | |
| Receivable for variation margin | | | — | | | | — | | | | — | | | | 236,826 | | |
| Receivable for foreign tax reclaims | | | 934,479 | | | | 24,106 | | | | 12,831 | | | | 131,579 | | |
| Other assets | | | 43,117 | | | | 31,028 | | | | 16,970 | | | | 42,916 | | |
| Total assets | | | 832,041,211 | | | | 287,998,192 | | | | 83,150,419 | | | | 508,183,012 | | |
| Liabilities: | |
| Payable for investments purchased | | | 465,475 | | | | 1,601,581 | | | | 298,416 | | | | 5,972,722 | | |
| Payable for cash collateral from securities loaned | | | 37,141,889 | | | | 7,322,675 | | | | 4,402,048 | | | | — | | |
| Payable for shares of beneficial interest repurchased | | | 1,137,632 | | | | 433,596 | | | | 96,732 | | | | 784,512 | | |
| Payable to affiliate | | | 598,196 | | | | 256,680 | | | | 941 | | | | 521,534 | | |
| Payable to custodian | | | 61,443 | | | | 47,998 | | | | 4,602 | | | | 35,235 | | |
| Unrealized depreciation on forward foreign currency contracts | | | 193,917 | | | | — | | | | — | | | | 6,172,044 | | |
| Payable for foreign withholding taxes | | | 29,667 | | | | 767,509 | | | | 60,641 | | | | 16,661 | | |
| Payable for variation margin | | | 16,369 | | | | — | | | | — | | | | 752,153 | | |
Investments sold short, at value (proceeds—$0; $0; $0; $0; $0;
$0; $0; $21,698,169, respectively) | | | — | | | | — | | | | — | | | | 21,974,696 | | |
| Swap agreements, at value3 | | | — | | | | — | | | | — | | | | 5,794,319 | | |
Options written, at value (premiums received $0; $0; $0; $0; $0;
$0; $0; $269,063, respectively) | | | — | | | | — | | | | — | | | | 321,400 | | |
| Due to broker | | | — | | | | — | | | | — | | | | 516,181 | | |
| Accrued expenses and other liabilities | | | 339,373 | | | | 283,430 | | | | 164,377 | | | | 209,134 | | |
| Total liabilities | | | 39,983,961 | | | | 10,713,469 | | | | 5,027,757 | | | | 43,070,591 | | |
See accompanying notes to financial statements.
225
UBS PACE Select Advisors Trust
Statement of assets and liabilities (concluded)
July 31, 2010
| | | UBS PACE
Large Co
Value Equity
Investments | | UBS PACE
Large Co
Growth Equity
Investments | | UBS PACE
Small/Medium Co
Value Equity
Investments | | UBS PACE
Small/Medium Co
Growth Equity
Investments | |
| Net assets: | |
| Beneficial interest shares of $0.001 par value (unlimited amount authorized) | | $ | 1,415,801,147 | | | $ | 1,142,471,991 | | | $ | 451,297,232 | | | $ | 444,739,958 | | |
| Accumulated undistributed net investment income | | | 6,223,572 | | | | 1,654,665 | | | | 178,159 | | | | — | | |
| Accumulated net realized loss | | | (388,041,480 | ) | | | (264,300,744 | ) | | | (95,810,604 | ) | | | (95,151,297 | ) | |
| Net unrealized appreciation (depreciation) | | | 42,009,150 | | | | 88,701,459 | | | | 23,301,259 | | | | 24,710,003 | | |
| Net assets | | $ | 1,075,992,389 | | | $ | 968,527,371 | | | $ | 378,966,046 | | | $ | 374,298,664 | | |
| Class A | |
| Net assets | | $ | 143,284,090 | | | $ | 55,977,933 | | | $ | 27,919,871 | | | $ | 32,052,832 | | |
| Shares outstanding | | | 9,705,347 | | | | 3,744,879 | | | | 1,955,654 | | | | 2,609,569 | | |
| Net asset value per share | | $ | 14.76 | | | $ | 14.95 | | | $ | 14.28 | | | $ | 12.28 | | |
| Maximum offering price per share | | $ | 15.62 | | | $ | 15.82 | | | $ | 15.11 | | | $ | 12.99 | | |
| Class B | |
| Net assets | | $ | 165,416 | | | $ | 86,347 | | | $ | 56,524 | | | $ | 15,734 | | |
| Shares outstanding | | | 11,158 | | | | 6,255 | | | | 4,338 | | | | 1,416 | | |
| Net asset value and offering price per share | | $ | 14.82 | | | $ | 13.80 | | | $ | 13.03 | | | $ | 11.11 | | |
| Class C | |
| Net assets | | $ | 15,271,647 | | | $ | 3,955,628 | | | $ | 5,177,992 | | | $ | 3,217,083 | | |
| Shares outstanding | | | 1,036,474 | | | | 285,749 | | | | 395,394 | | | | 287,610 | | |
| Net asset value and offering price per share | | $ | 14.73 | | | $ | 13.84 | | | $ | 13.10 | | | $ | 11.19 | | |
| Class Y | |
| Net assets | | $ | 17,345,289 | | | $ | 12,618,861 | | | $ | 317,781 | | | $ | 62,431 | | |
| Shares outstanding | | | 1,171,388 | | | | 825,476 | | | | 21,720 | | | | 4,902 | | |
| Net asset value, offering price and redemption value per share1 | | $ | 14.81 | | | $ | 15.29 | | | $ | 14.63 | | | $ | 12.74 | | |
| Class P | |
| Net assets | | $ | 899,925,947 | | | $ | 895,888,602 | | | $ | 345,493,878 | | | $ | 338,950,584 | | |
| Shares outstanding | | | 60,963,067 | | | | 58,883,708 | | | | 23,771,425 | | | | 26,849,792 | | |
| Net asset value, offering price and redemption value per share1 | | $ | 14.76 | | | $ | 15.21 | | | $ | 14.53 | | | $ | 12.62 | | |
1 Assumes shares were held a sufficient period or are otherwise not subject to a redemption fee.
226
| | | UBS PACE
International
Equity
Investments | | UBS PACE
International
Emerging
Markets Equity
Investments | | UBS PACE
Global
Real Estate
Securities
Investments | | UBS PACE
Alternative
Strategies
Investments | |
| Net assets: | |
| Beneficial interest shares of $0.001 par value (unlimited amount authorized) | | $ | 1,105,346,598 | | | $ | 295,883,739 | | | $ | 119,266,862 | | | $ | 590,410,630 | | |
| Accumulated undistributed net investment income | | | 9,642,793 | | | | 1,933,910 | | | | 424,617 | | | | 4,954,050 | | |
| Accumulated net realized loss | | | (300,746,990 | ) | | | (62,683,765 | ) | | | (50,079,215 | ) | | | (131,288,548 | ) | |
| Net unrealized appreciation (depreciation) | | | (22,185,151 | ) | | | 42,150,839 | | | | 8,510,398 | | | | 1,036,289 | | |
| Net assets | | $ | 792,057,250 | | | $ | 277,284,723 | | | $ | 78,122,662 | | | $ | 465,112,421 | | |
| Class A | |
| Net assets | | $ | 66,354,833 | | | $ | 19,110,645 | | | $ | 3,975,102 | | | $ | 56,772,025 | | |
| Shares outstanding | | | 5,663,222 | | | | 1,567,458 | | | | 748,537 | | | | 6,199,698 | | |
| Net asset value per share | | $ | 11.72 | | | $ | 12.19 | | | $ | 5.31 | | | $ | 9.16 | | |
| Maximum offering price per share | | $ | 12.40 | | | $ | 12.90 | | | $ | 5.62 | | | $ | 9.69 | | |
| Class B | |
| Net assets | | $ | 19,572 | | | $ | 60,005 | | | $ | — | | | $ | — | | |
| Shares outstanding | | | 1,675 | | | | 5,227 | | | | — | | | | — | | |
| Net asset value and offering price per share | | $ | 11.68 | | | $ | 11.48 | | | $ | — | | | $ | — | | |
| Class C | |
| Net assets | | $ | 3,768,774 | | | $ | 3,682,193 | | | $ | 170,612 | | | $ | 6,886,755 | | |
| Shares outstanding | | | 328,440 | | | | 323,706 | | | | 32,276 | | | | 767,840 | | |
| Net asset value and offering price per share | | $ | 11.47 | | | $ | 11.38 | | | $ | 5.29 | | | $ | 8.97 | | |
| Class Y | |
| Net assets | | $ | 23,368,337 | | | $ | 21,524,310 | | | $ | 110,956 | | | $ | 1,976,712 | | |
| Shares outstanding | | | 1,994,836 | | | | 1,735,090 | | | | 20,817 | | | | 215,187 | | |
| Net asset value, offering price and redemption value per share1 | | $ | 11.71 | | | $ | 12.41 | | | $ | 5.33 | | | $ | 9.19 | | |
| Class P | |
| Net assets | | $ | 698,545,734 | | | $ | 232,907,570 | | | $ | 73,865,992 | | | $ | 399,476,929 | | |
| Shares outstanding | | | 59,731,678 | | | | 18,846,396 | | | | 13,888,873 | | | | 43,478,804 | | |
| Net asset value, offering price and redemption value per share1 | | $ | 11.69 | | | $ | 12.36 | | | $ | 5.32 | | | $ | 9.19 | | |
See accompanying notes to financial statements.
227
UBS PACE Select Advisors Trust
Statement of operations
For the year ended July 31, 2010
| | | UBS PACE
Money Market
Investments | | UBS PACE
Government
Securities
Fixed Income
Investments | | UBS PACE
Intermediate
Fixed Income
Investments | | UBS PACE
Strategic
Fixed Income
Investments | |
| Investment income: | |
Interest (net of foreign withholding taxes of $0; $1,993; $0; $3,514;
$0; $7,502; $0, respectively) | | $ | 1,222,973 | | | $ | 24,861,186 | | | $ | 16,825,840 | | | $ | 30,649,752 | | |
| Dividends | | | — | | | | — | | | | — | | | | 480,000 | | |
| Affiliated securities lending income | | | 87 | | | | — | | | | 9,953 | | | | 8,191 | | |
| | | | 1,223,060 | | | | 24,861,186 | | | | 16,835,793 | | | | 31,137,943 | | |
| Expenses: | |
| Investment management and administration fees | | | 1,521,353 | | | | 3,760,135 | | | | 2,314,708 | | | | 4,294,430 | | |
| Service fees–Class A | | | — | | | | 226,685 | | | | 108,549 | | | | 95,146 | | |
| Service and distribution fees–Class B | | | — | | | | 1,366 | | | | 1,581 | | | | 3,246 | | |
| Service and distribution fees–Class C | | | — | | | | 180,888 | | | | 35,612 | | | | 76,433 | | |
| Transfer agency and related services fees | | | 1,857,526 | | | | 850,036 | | | | 403,090 | | | | 1,003,177 | | |
| Reports and notices to shareholders | | | 226,677 | | | | 82,273 | | | | 42,360 | | | | 97,833 | | |
| Professional fees | | | 108,660 | | | | 215,439 | | | | 160,141 | | | | 213,604 | | |
| Custody and accounting fees | | | 58,109 | | | | 267,113 | | | | 159,444 | | | | 369,841 | | |
| State registration fees | | | 46,895 | | | | 67,204 | | | | 64,503 | | | | 67,536 | | |
| US Treasury Temporary Guarantee Program Participation fees | | | 29,569 | | | | — | | | | — | | | | — | | |
| Insurance expense | | | 20,476 | | | | 20,397 | | | | 13,326 | | | | 22,537 | | |
| Trustees' fees | | | 17,615 | | | | 18,875 | | | | 17,359 | | | | 19,815 | | |
| Interest expense | | | — | | | | 1,075 | | | | 1,359 | | | | — | | |
| Other expenses | | | 13,444 | | | | 40,193 | | | | 37,991 | | | | 38,988 | | |
| | | | 3,900,324 | | | | 5,731,679 | | | | 3,360,023 | | | | 6,302,586 | | |
Less: Fee waivers and/or expense reimbursements by investment
manager and administrator | | | (2,720,825 | ) | | | (621,136 | ) | | | (234,920 | ) | | | (430,389 | ) | |
| Net expenses | | | 1,179,499 | | | | 5,110,543 | | | | 3,125,103 | | | | 5,872,197 | | |
| Net investment income | | | 43,561 | | | | 19,750,643 | | | | 13,710,690 | | | | 25,265,746 | | |
| Net realized and unrealized gains (losses) from investment activities: | |
| Net realized gains (losses) from: | |
| Investments | | | (94 | ) | | | 24,038,084 | | | | 7,016,345 | | | | 8,287,001 | | |
| Futures | | | — | | | | 601,022 | | | | (1,866,548 | ) | | | 6,667,807 | | |
| Options written | | | — | | | | 1,428,484 | | | | — | | | | 1,463,453 | | |
| Investments sold short | | | — | | | | 289,829 | | | | 7,764 | | | | (167,566 | ) | |
| Swaps | | | — | | | | (292,984 | ) | | | — | | | | 9,977,020 | | |
| Forward foreign currency contracts and foreign currency transactions | | | — | | | | — | | | | (177,580 | ) | | | 2,447,319 | | |
| Net realized gain (loss) | | | (94 | ) | | | 26,064,435 | | | | 4,979,981 | | | | 28,675,034 | | |
| Net change in unrealized appreciation/depreciation of: | |
| Investments | | | — | | | | 10,788,844 | | | | 13,300,028 | | | | 53,067,094 | | |
| Futures | | | — | | | | 261,891 | | | | (785,401 | ) | | | 1,207,768 | | |
| Options written | | | — | | | | 106,931 | | | | — | | | | (1,542,657 | ) | |
| Investments sold short | | | — | | | | 501,962 | | | | 126,359 | | | | 105,632 | | |
| Swaps | | | — | | | | 1,273,904 | | | | — | | | | 310,163 | | |
Other assets and liabilities denominated in foreign currency and
forward foreign currency contracts | | | — | | | | — | | | | 476,637 | | | | (1,168,430 | ) | |
| Net change in unrealized appreciation/depreciation | | | — | | | | 12,933,532 | | | | 13,117,623 | | | | 51,979,570 | | |
| Net realized and unrealized gains (losses) from investment activities | | | (94 | ) | | | 38,997,967 | | | | 18,097,604 | | | | 80,654,604 | | |
| Net increase in net assets resulting from operations | | $ | 43,467 | | | $ | 58,748,610 | | | $ | 31,808,294 | | | $ | 105,920,350 | | |
228
| | | UBS PACE
Municipal
Fixed Income
Investments | | UBS PACE
Global
Fixed Income
Investments | | UBS PACE
High Yield
Investments | |
| Investment income: | |
Interest (net of foreign withholding taxes of $0; $1,993; $0; $3,514;
$0; $7,502; $0, respectively) | | $ | 12,513,993 | | | $ | 17,998,661 | | | $ | 18,366,944 | | |
| Dividends | | | — | | | | — | | | | 640,836 | | |
| Affiliated securities lending income | | | — | | | | 58 | | | | 171,295 | | |
| | | | 12,513,993 | | | | 17,998,719 | | | | 19,179,075 | | |
| Expenses: | |
| Investment management and administration fees | | | 1,686,314 | | | | 3,806,678 | | | | 1,582,556 | | |
| Service fees–Class A | | | 215,102 | | | | 254,132 | | | | 25,945 | | |
| Service and distribution fees–Class B | | | 792 | | | | 1,875 | | | | — | | |
| Service and distribution fees–Class C | | | 117,035 | | | | 54,098 | | | | 16,571 | | |
| Transfer agency and related services fees | | | 191,904 | | | | 1,044,399 | | | | 408,570 | | |
| Reports and notices to shareholders | | | 22,748 | | | | 98,126 | | | | 34,701 | | |
| Professional fees | | | 134,941 | | | | 163,281 | | | | 141,162 | | |
| Custody and accounting fees | | | 107,983 | | | | 452,999 | | | | 85,128 | | |
| State registration fees | | | 65,828 | | | | 61,810 | | | | 52,147 | | |
| US Treasury Temporary Guarantee Program Participation fees | | | — | | | | — | | | | — | | |
| Insurance expense | | | 9,518 | | | | 17,523 | | | | 4,789 | | |
| Trustees' fees | | | 16,397 | | | | 18,038 | | | | 15,444 | | |
| Interest expense | | | — | | | | — | | | | — | | |
| Other expenses | | | 25,349 | | | | 27,867 | | | | 22,959 | | |
| | | | 2,593,911 | | | | 6,000,826 | | | | 2,389,972 | | |
Less: Fee waivers and/or expense reimbursements by investment
manager and administrator | | | (137,595 | ) | | | (639,593 | ) | | | (174,480 | ) | |
| Net expenses | | | 2,456,316 | | | | 5,361,233 | | | | 2,215,492 | | |
| Net investment income | | | 10,057,677 | | | | 12,637,486 | | | | 16,963,583 | | |
| Net realized and unrealized gains (losses) from investment activities: | |
| Net realized gains (losses) from: | |
| Investments | | | (337,288 | ) | | | 8,115,423 | | | | 6,182,162 | | |
| Futures | | | — | | | | (1,270,260 | ) | | | — | | |
| Options written | | | — | | | | — | | | | — | | |
| Investments sold short | | | — | | | | — | | | | — | | |
| Swaps | | | — | | | | — | | | | — | | |
| Forward foreign currency contracts and foreign currency transactions | | | — | | | | 5,706,480 | | | | 3,543,903 | | |
| Net realized gain (loss) | | | (337,288 | ) | | | 12,551,643 | | | | 9,726,065 | | |
| Net change in unrealized appreciation/depreciation of: | |
| Investments | | | 12,365,344 | | | | (910,364 | ) | | | 14,106,496 | | |
| Futures | | | — | | | | (4,117,754 | ) | | | — | | |
| Options written | | | — | | | | — | | | | — | | |
| Investments sold short | | | — | | | | — | | | | — | | |
| Swaps | | | — | | | | — | | | | — | | |
Other assets and liabilities denominated in foreign currency and
forward foreign currency contracts | | | — | | | | 1,638,832 | | | | (782,787 | ) | |
| Net change in unrealized appreciation/depreciation | | | 12,365,344 | | | | (3,389,286 | ) | | | 13,323,709 | | |
| Net realized and unrealized gains (losses) from investment activities | | | 12,028,056 | | | | 9,162,357 | | | | 23,049,774 | | |
| Net increase in net assets resulting from operations | | $ | 22,085,733 | | | $ | 21,799,843 | | | $ | 40,013,357 | | |
See accompanying notes to financial statements.
229
UBS PACE Select Advisors Trust
Statement of operations (concluded)
For the year ended July 31, 2010
| | | UBS PACE
Large Co
Value Equity
Investments | | UBS PACE
Large Co
Growth Equity
Investments | | UBS PACE
Small/Medium Co
Value Equity
Investments | | UBS PACE
Small/Medium Co
Growth Equity
Investments | |
| Investment income: | |
Interest (net of foreign withholding taxes of $0; $0; $0; $0; $0; $27;
$0; $2,810, respectively) | | $ | 1,044 | | | $ | 2,173 | | | $ | 897 | | | $ | 1,840 | | |
Dividends (net of foreign witholding taxes of $134,106; $55,284;
$2,733; $5,076; $2,038,567; $911,832; $95,832; $144,768, respectively) | | | 22,082,708 | | | | 11,264,839 | | | | 4,767,436 | | | | 2,138,623 | | |
| Affiliated securities lending income | | | 86,573 | | | | 101,280 | | | | 236,878 | | | | 301,153 | | |
| | | | 22,170,325 | | | | 11,368,292 | | | | 5,005,211 | | | | 2,441,616 | | |
| Expenses: | |
| Investment management and administration fees | | | 8,319,963 | | | | 7,802,228 | | | | 3,078,916 | | | | 3,080,454 | | |
| Service fees–Class A | | | 384,049 | | | | 146,991 | | | | 70,658 | | | | 82,243 | | |
| Service and distribution fees–Class B | | | 2,739 | | | | 1,267 | | | | 829 | | | | 436 | | |
| Service and distribution fees–Class C | | | 167,239 | | | | 42,995 | | | | 56,334 | | | | 34,277 | | |
| Transfer agency and related services fees | | | 1,295,296 | | | | 1,177,381 | | | | 1,081,398 | | | | 1,084,783 | | |
| Custody and accounting fees | | | 437,719 | | | | 392,069 | | | | 152,321 | | | | 152,117 | | |
| Professional fees | | | 148,278 | | | | 151,307 | | | | 181,822 | | | | 141,628 | | |
| Reports and notices to shareholders | | | 131,267 | | | | 113,084 | | | | 128,894 | | | | 94,890 | | |
| State registration fees | | | 69,501 | | | | 68,265 | | | | 59,497 | | | | 59,295 | | |
| Insurance expense | | | 32,171 | | | | 29,926 | | | | 10,935 | | | | 11,168 | | |
| Trustees' fees | | | 23,330 | | | | 22,357 | | | | 17,094 | | | | 17,103 | | |
| Interest expense | | | — | | | | — | | | | — | | | | — | | |
Dividend expense, interest expense and other borrowing costs for
investments sold short | | | — | | | | — | | | | — | | | | — | | |
| Other expenses | | | 44,498 | | | | 53,879 | | | | 31,785 | | | | 27,114 | | |
| | | | 11,056,050 | | | | 10,001,749 | | | | 4,870,483 | | | | 4,785,508 | | |
Less: Fee waivers and/or expense reimbursements by investment
manager and administrator | | | (859 | ) | | | (292,992 | ) | | | (300,298 | ) | | | (338,574 | ) | |
| Net expenses | | | 11,055,191 | | | | 9,708,757 | | | | 4,570,185 | | | | 4,446,934 | | |
| Net investment income (loss) | | | 11,115,134 | | | | 1,659,535 | | | | 435,026 | | | | (2,005,318 | ) | |
| Net realized and unrealized gains (losses) from investment activities: | |
| Net realized gains (losses) from: | |
Investments (net of foreign tax expense of $0; $0; $0; $0; $0;
$226,664; $0; $0, respectively) | | | 64,628,748 | | | | 57,779,334 | | | | 51,988,748 | | | | 57,725,409 | | |
| Futures | | | — | | | | — | | | | — | | | | — | | |
| Options written | | | — | | | | — | | | | — | | | | — | | |
| Investments sold short | | | — | | | | — | | | | — | | | | — | | |
| Swaps | | | — | | | | — | | | | — | | | | — | | |
| Forward foreign currency contracts and foreign currency transactions | | | — | | | | — | | | | (271 | ) | | | — | | |
| Net realized gain | | | 64,628,748 | | | | 57,779,334 | | | | 51,988,477 | | | | 57,725,409 | | |
| Net change in unrealized appreciation/depreciation of: | |
| Investments | | | 59,307,694 | | | | 52,043,717 | | | | 13,559,055 | | | | (1,119,645 | ) | |
| Futures | | | — | | | | — | | | | — | | | | — | | |
| Options written | | | — | | | | — | | | | — | | | | — | | |
| Investments sold short | | | — | | | | — | | | | — | | | | — | | |
| Swaps | | | — | | | | — | | | | — | | | | — | | |
Other assets and liabilities denominated in foreign currency and
forward foreign currency contracts | | | — | | | | — | | | | — | | | | — | | |
| Net change in unrealized appreciation/depreciation | | | 59,307,694 | | | | 52,043,717 | | | | 13,559,055 | | | | (1,119,645 | ) | |
| Net realized and unrealized gains from investment activities | | | 123,936,442 | | | | 109,823,051 | | | | 65,547,532 | | | | 56,605,764 | | |
| Net increase in net assets resulting from operations | | $ | 135,051,576 | | | $ | 111,482,586 | | | $ | 65,982,558 | | | $ | 54,600,446 | | |
230
| | | UBS PACE
International
Equity
Investments | | UBS PACE
International
Emerging
Markets Equity
Investments | | UBS PACE
Global
Real Estate
Securities
Investments | | UBS PACE
Alternative
Strategies
Investments | |
| Investment income: | |
Interest (net of foreign withholding taxes of $0; $0; $0; $0; $0; $27;
$0; $2,810, respectively) | | $ | 578 | | | $ | 335 | | | $ | 21 | | | $ | 6,409,346 | | |
Dividends (net of foreign witholding taxes of $134,106; $55,284;
$2,733; $5,076; $2,038,567; $911,832; $95,832; $144,768, respectively) | | | 23,864,484 | | | | 7,219,204 | | | | 2,499,706 | | | | 2,908,191 | | |
| Affiliated securities lending income | | | 591,491 | | | | 41,142 | | | | 16,950 | | | | — | | |
| | | | 24,456,553 | | | | 7,260,681 | | | | 2,516,677 | | | | 9,317,537 | | |
| Expenses: | |
| Investment management and administration fees | | | 7,315,510 | | | | 3,056,935 | | | | 565,340 | | | | 6,412,941 | | |
| Service fees–Class A | | | 179,132 | | | | 46,819 | | | | 8,982 | | | | 150,513 | | |
| Service and distribution fees–Class B | | | 455 | | | | 910 | | | | — | | | | 88 | | |
| Service and distribution fees–Class C | | | 41,618 | | | | 38,852 | | | | 1,570 | | | | 68,468 | | |
| Transfer agency and related services fees | | | 1,145,813 | | | | 986,745 | | | | 382,072 | | | | 489,843 | | |
| Custody and accounting fees | | | 776,749 | | | | 597,492 | | | | 51,920 | | | | 472,222 | | |
| Professional fees | | | 162,435 | | | | 148,539 | | | | 181,631 | | | | 345,954 | | |
| Reports and notices to shareholders | | | 108,097 | | | | 91,755 | | | | 54,182 | | | | 68,507 | | |
| State registration fees | | | 67,311 | | | | 66,624 | | | | 44,152 | | | | 69,637 | | |
| Insurance expense | | | 24,791 | | | | 7,764 | | | | 1,786 | | | | 16,197 | | |
| Trustees' fees | | | 20,951 | | | | 16,177 | | | | 14,380 | | | | 17,634 | | |
| Interest expense | | | 322 | | | | 3,159 | | | | — | | | | 488 | | |
Dividend expense, interest expense and other borrowing costs for
investments sold short | | | — | | | | — | | | | — | | | | 242,812 | | |
| Other expenses | | | 57,252 | | | | 48,160 | | | | 42,356 | | | | 64,142 | | |
| | | | 9,900,436 | | | | 5,109,931 | | | | 1,348,371 | | | | 8,419,446 | | |
Less: Fee waivers and/or expense reimbursements by investment
manager and administrator | | | (86 | ) | | | — | | | | (489,809 | ) | | | (171,663 | ) | |
| Net expenses | | | 9,900,350 | | | | 5,109,931 | | | | 858,562 | | | | 8,247,783 | | |
| Net investment income (loss) | | | 14,556,203 | | | | 2,150,750 | | | | 1,658,115 | | | | 1,069,754 | | |
| Net realized and unrealized gains (losses) from investment activities: | |
| Net realized gains (losses) from: | |
Investments (net of foreign tax expense of $0; $0; $0; $0; $0;
$226,664; $0; $0, respectively) | | | 16,308,043 | | | | 191,922 | | | | 8,230,121 | | | | 23,208,514 | | |
| Futures | | | 26,639 | | | | — | | | | — | | | | (3,900,130 | ) | |
| Options written | | | — | | | | — | | | | — | | | | 2,046,260 | | |
| Investments sold short | | | — | | | | — | | | | — | | | | (5,910,185 | ) | |
| Swaps | | | — | | | | — | | | | — | | | | (3,855,182 | ) | |
| Forward foreign currency contracts and foreign currency transactions | | | 217,594 | | | | (32,690 | ) | | | (34,764 | ) | | | 3,754,549 | | |
| Net realized gain | | | 16,552,276 | | | | 159,232 | | | | 8,195,357 | | | | 15,343,826 | | |
| Net change in unrealized appreciation/depreciation of: | |
| Investments | | | (13,825,456 | ) | | | 40,674,857 | | | | 1,811,952 | | | | (3,095,658 | ) | |
| Futures | | | (18,458 | ) | | | — | | | | — | | | | 43,833 | | |
| Options written | | | — | | | | — | | | | — | | | | 88,998 | | |
| Investments sold short | | | — | | | | — | | | | — | | | | 2,898,288 | | |
| Swaps | | | — | | | | — | | | | — | | | | 4,069,871 | | |
Other assets and liabilities denominated in foreign currency and
forward foreign currency contracts | | | (15,019 | ) | | | (356,462 | ) | | | (2,694 | ) | | | 132,397 | | |
| Net change in unrealized appreciation/depreciation | | | (13,858,933 | ) | | | 40,318,395 | | | | 1,809,258 | | | | 4,137,729 | | |
| Net realized and unrealized gains from investment activities | | | 2,693,343 | | | | 40,477,627 | | | | 10,004,615 | | | | 19,481,555 | | |
| Net increase in net assets resulting from operations | | $ | 17,249,546 | | | $ | 42,628,377 | | | $ | 11,662,730 | | | $ | 20,551,309 | | |
See accompanying notes to financial statements.
231
UBS PACE Select Advisors Trust
Statement of changes in net assets
| | | UBS PACE
Money Market
Investments | | UBS PACE
Government Securities
Fixed Income Investments | | UBS PACE
Intermediate Fixed Income
Investments | |
| | | Years ended July 31, | | Years ended July 31, | | Years ended July 31, | |
| | | 2010 | | 2009 | | 2010 | | 2009 | | 2010 | | 2009 | |
| From operations: | |
| Net investment income | | $ | 43,561 | | | $ | 5,113,515 | | | $ | 19,750,643 | | | $ | 28,664,138 | | | $ | 13,710,690 | | | $ | 16,996,144 | | |
| Net realized gains (losses) | | | (94 | ) | | | 43,603 | | | | 26,064,435 | | | | 23,839,002 | | | | 4,979,981 | | | | (7,318,777 | ) | |
| Net change in unrealized appreciation/depreciation | | | — | | | | — | | | | 12,933,532 | | | | 458,752 | | | | 13,117,623 | | | | 7,680,570 | | |
| Net increase in net assets resulting from operations | | | 43,467 | | | | 5,157,118 | | | | 58,748,610 | | | | 52,961,892 | | | | 31,808,294 | | | | 17,357,937 | | |
| Dividends and distributions to shareholders from: | |
| Net investment income–Class A | | | — | | | | — | | | | (3,092,475 | ) | | | (4,459,286 | ) | | | (1,454,509 | ) | | | (1,795,305 | ) | |
| Net investment income–Class B | | | — | | | | — | | | | (3,663 | ) | | | (17,093 | ) | | | (4,138 | ) | | | (6,035 | ) | |
| Net investment income–Class C | | | — | | | | — | | | | (700,042 | ) | | | (1,065,359 | ) | | | (134,304 | ) | | | (154,820 | ) | |
| Net investment income–Class Y | | | — | | | | — | | | | (1,558,291 | ) | | | (1,813,866 | ) | | | (78,814 | ) | | | (80,494 | ) | |
| Net investment income–Class P | | | (43,561 | ) | | | (5,113,515 | ) | | | (16,487,839 | ) | | | (24,117,548 | ) | | | (13,904,993 | ) | | | (15,303,630 | ) | |
| Net realized gains–Class A | | | — | | | | — | | | | (3,082,896 | ) | | | — | | | | — | | | | — | | |
| Net realized gains–Class B | | | — | | | | — | | | | (4,285 | ) | | | — | | | | — | | | | — | | |
| Net realized gains–Class C | | | — | | | | — | | | | (821,564 | ) | | | — | | | | — | | | | — | | |
| Net realized gains–Class Y | | | — | | | | — | | | | (1,438,485 | ) | | | — | | | | — | | | | — | | |
| Net realized gains–Class P | | | (10,489 | ) | | | (75,184 | ) | | | (15,257,195 | ) | | | — | | | | — | | | | — | | |
| | | | (54,050 | ) | | | (5,188,699 | ) | | | (42,446,735 | ) | | | (31,473,152 | ) | | | (15,576,758 | ) | | | (17,340,284 | ) | |
| From beneficial interest transactions: | |
| Net proceeds from shares sold | | | 409,092,964 | | | | 993,352,180 | | | | 162,167,465 | | | | 180,737,884 | | | | 146,111,607 | | | | 156,868,298 | | |
| Cost of shares repurchased | | | (552,857,220 | ) | | | (992,040,001 | ) | | | (150,566,609 | ) | | | (340,376,987 | ) | | | (112,192,313 | ) | | | (223,675,213 | ) | |
| Proceeds from dividends reinvested | | | 33,528 | | | | 5,435,215 | | | | 39,428,168 | | | | 29,363,558 | | | | 14,435,941 | | | | 16,380,092 | | |
Net increase (decrease) in net assets from beneficial
interest transactions | | | (143,730,728 | ) | | | 6,747,394 | | | | 51,029,024 | | | | (130,275,545 | ) | | | 48,355,235 | | | | (50,426,823 | ) | |
| Redemption fees | | | — | | | | — | | | | 35,049 | | | | 120,261 | | | | 33,544 | | | | 113,274 | | |
| Net increase (decrease) in net assets | | | (143,741,311 | ) | | | 6,715,813 | | | | 67,365,948 | | | | (108,666,544 | ) | | | 64,620,315 | | | | (50,295,896 | ) | |
| Net assets: | |
| Beginning of year | | | 529,958,509 | | | | 523,242,696 | | | | 576,259,027 | | | | 684,925,571 | | | | 405,885,681 | | | | 456,181,577 | | |
| End of year | | $ | 386,217,198 | | | $ | 529,958,509 | | | $ | 643,624,975 | | | $ | 576,259,027 | | | $ | 470,505,996 | | | $ | 405,885,681 | | |
Accumulated undistributed (distributions in excess of)
net investment income | | $ | — | | | $ | — | | | $ | 53,465 | | | $ | 1,237,067 | | | $ | (269,948 | ) | | $ | 1,710,474 | | |
232
| | | UBS PACE
Strategic Fixed Income
Investments | | UBS PACE
Municipal Fixed Income
Investments | |
| | | Years ended July 31, | | Years ended July 31, | |
| | | 2010 | | 2009 | | 2010 | | 2009 | |
| From operations: | |
| Net investment income | | $ | 25,265,746 | | | $ | 33,654,966 | | | $ | 10,057,677 | | | $ | 10,744,740 | | |
| Net realized gains (losses) | | | 28,675,034 | | | | 7,967,596 | | | | (337,288 | ) | | | (1,123,099 | ) | |
| Net change in unrealized appreciation/depreciation | | | 51,979,570 | | | | 1,880,036 | | | | 12,365,344 | | | | 7,206,351 | | |
| Net increase in net assets resulting from operations | | | 105,920,350 | | | | 43,502,598 | | | | 22,085,733 | | | | 16,827,992 | | |
| Dividends and distributions to shareholders from: | |
| Net investment income–Class A | | | (1,573,552 | ) | | | (1,614,614 | ) | | | (2,642,625 | ) | | | (2,879,884 | ) | |
| Net investment income–Class B | | | (11,180 | ) | | | (11,303 | ) | | | (1,834 | ) | | | (3,929 | ) | |
| Net investment income–Class C | | | (372,694 | ) | | | (334,904 | ) | | | (401,842 | ) | | | (421,556 | ) | |
| Net investment income–Class Y | | | (159,112 | ) | | | (174,389 | ) | | | (4,175 | ) | | | (5,020 | ) | |
| Net investment income–Class P | | | (28,715,448 | ) | | | (37,539,805 | ) | | | (7,008,463 | ) | | | (7,435,480 | ) | |
| Net realized gains–Class A | | | (41,715 | ) | | | (1,866,391 | ) | | | — | | | | — | | |
| Net realized gains–Class B | | | (395 | ) | | | (13,019 | ) | | | — | | | | — | | |
| Net realized gains–Class C | | | (11,433 | ) | | | (398,362 | ) | | | — | | | | — | | |
| Net realized gains–Class Y | | | (4,631 | ) | | | (189,340 | ) | | | — | | | | — | | |
| Net realized gains–Class P | | | (741,454 | ) | | | (43,989,249 | ) | | | — | | | | — | | |
| | | | (31,631,614 | ) | | | (86,131,376 | ) | | | (10,058,939 | ) | | | (10,745,869 | ) | |
| From beneficial interest transactions: | |
| Net proceeds from shares sold | | | 193,295,918 | | | | 152,450,169 | | | | 84,935,927 | | | | 90,502,777 | | |
| Cost of shares repurchased | | | (175,530,436 | ) | | | (385,082,637 | ) | | | (68,680,922 | ) | | | (157,640,422 | ) | |
| Proceeds from dividends reinvested | | | 30,395,726 | | | | 83,799,182 | | | | 8,481,872 | | | | 9,402,735 | | |
Net increase (decrease) in net assets from beneficial
interest transactions | | | 48,161,208 | | | | (148,833,286 | ) | | | 24,736,877 | | | | (57,734,910 | ) | |
| Redemption fees | | | 38,697 | | | | 80,018 | | | | 14,907 | | | | 48,672 | | |
| Net increase (decrease) in net assets | | | 122,488,641 | | | | (191,382,046 | ) | | | 36,778,578 | | | | (51,604,115 | ) | |
| Net assets: | |
| Beginning of year | | | 629,843,984 | | | | 821,226,030 | | | | 291,703,165 | | | | 343,307,280 | | |
| End of year | | $ | 752,332,625 | | | $ | 629,843,984 | | | $ | 328,481,743 | | | $ | 291,703,165 | | |
Accumulated undistributed (distributions in excess of)
net investment income | | $ | 6,329,490 | | | $ | 5,309,230 | | | $ | — | | | $ | — | | |
See accompanying notes to financial statements.
233
UBS PACE Select Advisors Trust
Statement of changes in net assets (continued)
| | | UBS PACE
Global Fixed Income
Investments | | UBS PACE
High Yield
Investments | | UBS PACE
Large Co Value Equity
Investments | |
| | | Years ended July 31, | | Years ended July 31, | | Years ended July 31, | |
| | | 2010 | | 2009 | | 2010 | | 2009 | | 2010 | | 2009 | |
| From operations: | |
| Net investment income | | $ | 12,637,486 | | | $ | 15,615,747 | | | $ | 16,963,583 | | | $ | 11,200,822 | | | $ | 11,115,134 | | | $ | 16,958,970 | | |
| Net realized gains (losses) | | | 12,551,643 | | | | (26,365,308 | ) | | | 9,726,065 | | | | (5,007,629 | ) | | | 64,628,748 | | | | (420,037,775 | ) | |
| Net change in unrealized appreciation/depreciation | | | (3,389,286 | ) | | | 5,063,248 | | | | 13,323,709 | | | | 6,220,614 | | | | 59,307,694 | | | | 122,875,680 | | |
Net increase (decrease) in net assets resulting
from operations | | | 21,799,843 | | | | (5,686,313 | ) | | | 40,013,357 | | | | 12,413,807 | | | | 135,051,576 | | | | (280,203,125 | ) | |
| Dividends and distributions to shareholders from: | |
| Net investment income–Class A | | | (6,049,909 | ) | | | (4,095,955 | ) | | | (765,754 | ) | | | (341,107 | ) | | | (1,427,479 | ) | | | (3,178,460 | ) | |
| Net investment income–Class B | | | (9,958 | ) | | | (9,089 | ) | | | — | | | | — | | | | — | | | | (4,380 | ) | |
| Net investment income–Class C | | | (393,818 | ) | | | (240,524 | ) | | | (152,806 | ) | | | (33,225 | ) | | | (31,970 | ) | | | (172,642 | ) | |
| Net investment income–Class Y | | | (454,829 | ) | | | (350,713 | ) | | | (605 | ) | | | (309 | ) | | | (316,414 | ) | | | (628,808 | ) | |
| Net investment income–Class P | | | (23,807,959 | ) | | | (17,151,555 | ) | | | (14,154,934 | ) | | | (12,387,174 | ) | | | (10,516,247 | ) | | | (20,083,416 | ) | |
| Net realized gains–Class A | | | — | | | | — | | | | (78,625 | ) | | | — | | | | — | | | | — | | |
| Net realized gains–Class B | | | — | | | | — | | | | — | | | | — | | | | — | | | | — | | |
| Net realized gains–Class C | | | — | | | | — | | | | (16,928 | ) | | | — | | | | — | | | | — | | |
| Net realized gains–Class Y | | | — | | | | — | | | | (51 | ) | | | — | | | | — | | | | — | | |
| Net realized gains–Class P | | | — | | | | — | | | | (1,255,813 | ) | | | — | | | | — | | | | — | | |
| Return of capital–Class A | | | (192,113 | ) | | | — | | | | — | | | | — | | | | — | | | | — | | |
| Return of capital–Class B | | | (248 | ) | | | — | | | | — | | | | — | | | | — | | | | — | | |
| Return of capital–Class C | | | (11,357 | ) | | | — | | | | — | | | | — | | | | — | | | | — | | |
| Return of capital–Class Y | | | (13,488 | ) | | | — | | | | — | | | | — | | | | — | | | | — | | |
| Return of capital–Class P | | | (833,372 | ) | | | — | | | | — | | | | — | | | | — | | | | — | | |
| | | | (31,767,051 | ) | | | (21,847,836 | ) | | | (16,425,516 | ) | | | (12,761,815 | ) | | | (12,292,110 | ) | | | (24,067,706 | ) | |
| From beneficial interest transactions: | |
| Net proceeds from shares sold | | | 113,913,467 | | | | 76,168,397 | | | | 78,982,899 | | | | 64,069,371 | | | | 189,228,067 | | | | 241,241,795 | | |
| Cost of shares repurchased | | | (101,037,675 | ) | | | (256,422,347 | ) | | | (48,839,004 | ) | | | (64,890,905 | ) | | | (254,574,170 | ) | | | (390,942,993 | ) | |
| Proceeds from dividends reinvested | | | 29,414,162 | | | | 20,468,390 | | | | 15,514,240 | | | | 12,364,524 | | | | 11,815,305 | | | | 23,321,670 | | |
Net increase (decrease) in net assets from beneficial
interest transactions | | | 42,289,954 | | | | (159,785,560 | ) | | | 45,658,135 | | | | 11,542,990 | | | | (53,530,798 | ) | | | (126,379,528 | ) | |
| Redemption fees | | | 18,579 | | | | 42,336 | | | | 11,666 | | | | 31,454 | | | | 34,372 | | | | 140,448 | | |
| Net increase (decrease) in net assets | | | 32,341,325 | | | | (187,277,373 | ) | | | 69,257,642 | | | | 11,226,436 | | | | 69,263,040 | | | | (430,509,911 | ) | |
| Net assets: | |
| Beginning of year | | | 483,522,575 | | | | 670,799,948 | | | | 156,393,191 | | | | 145,166,755 | | | | 1,006,729,349 | | | | 1,437,239,260 | | |
| End of year | | $ | 515,863,900 | | | $ | 483,522,575 | | | $ | 225,650,833 | | | $ | 156,393,191 | | | $ | 1,075,992,389 | | | $ | 1,006,729,349 | | |
Accumulated undistributed (distributions in excess of)
net investment income | | $ | (14,446,493 | ) | | $ | (6,709,415 | ) | | $ | (863,267 | ) | | $ | (1,125,494 | ) | | $ | 6,223,572 | | | $ | 7,394,177 | | |
234
| | | UBS PACE
Large Co Growth Equity
Investments | | UBS PACE
Small/Medium Co Value
Equity Investments | |
| | | Years ended July 31, | | Years ended July 31, | |
| | | 2010 | | 2009 | | 2010 | | 2009 | |
| From operations: | |
| Net investment income | | $ | 1,659,535 | | | $ | 4,348,619 | | | $ | 435,026 | | | $ | 2,067,550 | | |
| Net realized gains (losses) | | | 57,779,334 | | | | (307,971,318 | ) | | | 51,988,477 | | | | (126,526,202 | ) | |
| Net change in unrealized appreciation/depreciation | | | 52,043,717 | | | | 32,566,206 | | | | 13,559,055 | | | | 47,722,997 | | |
Net increase (decrease) in net assets resulting
from operations | | | 111,482,586 | | | | (271,056,493 | ) | | | 65,982,558 | | | | (76,735,655 | ) | |
| Dividends and distributions to shareholders from: | |
| Net investment income–Class A | | | (116,030 | ) | | | — | | | | (16,813 | ) | | | (180,976 | ) | |
| Net investment income–Class B | | | — | | | | — | | | | — | | | | — | | |
| Net investment income–Class C | | | — | | | | — | | | | — | | | | — | | |
| Net investment income–Class Y | | | (100,359 | ) | | | (44,473 | ) | | | (13,258 | ) | | | (41,898 | ) | |
| Net investment income–Class P | | | (4,102,688 | ) | | | (1,242,075 | ) | | | (818,895 | ) | | | (2,895,233 | ) | |
| Net realized gains–Class A | | | — | | | | (294,201 | ) | | | — | | | | (6,943 | ) | |
| Net realized gains–Class B | | | — | | | | (1,255 | ) | | | — | | | | (57 | ) | |
| Net realized gains–Class C | | | — | | | | (24,776 | ) | | | — | | | | (1,751 | ) | |
| Net realized gains–Class Y | | | — | | | | (89,212 | ) | | | — | | | | (938 | ) | |
| Net realized gains–Class P | | | — | | | | (4,536,274 | ) | | | — | | | | (83,038 | ) | |
| Return of capital–Class A | | | — | | | | — | | | | — | | | | — | | |
| Return of capital–Class B | | | — | | | | — | | | | — | | | | — | | |
| Return of capital–Class C | | | — | | | | — | | | | — | | | | — | | |
| Return of capital–Class Y | | | — | | | | — | | | | — | | | | — | | |
| Return of capital–Class P | | | — | | | | — | | | | — | | | | — | | |
| | | | (4,319,077 | ) | | | (6,232,266 | ) | | | (848,966 | ) | | | (3,210,834 | ) | |
| From beneficial interest transactions: | |
| Net proceeds from shares sold | | | 186,545,357 | | | | 217,727,567 | | | | 64,946,583 | | | | 83,578,030 | | |
| Cost of shares repurchased | | | (228,881,459 | ) | | | (384,750,899 | ) | | | (95,629,678 | ) | | | (142,331,683 | ) | |
| Proceeds from dividends reinvested | | | 4,184,445 | | | | 6,083,258 | | | | 826,718 | | | | 3,140,822 | | |
Net increase (decrease) in net assets from beneficial
interest transactions | | | (38,151,657 | ) | | | (160,940,074 | ) | | | (29,856,377 | ) | | | (55,612,831 | ) | |
| Redemption fees | | | 31,168 | | | | 126,320 | | | | 13,369 | | | | 54,836 | | |
| Net increase (decrease) in net assets | | | 69,043,020 | | | | (438,102,513 | ) | | | 35,290,584 | | | | (135,504,484 | ) | |
| Net assets: | |
| Beginning of year | | | 899,484,351 | | | | 1,337,586,864 | | | | 343,675,462 | | | | 479,179,946 | | |
| End of year | | $ | 968,527,371 | | | $ | 899,484,351 | | | $ | 378,966,046 | | | $ | 343,675,462 | | |
Accumulated undistributed (distributions in excess of)
net investment income | | $ | 1,654,665 | | | $ | 4,314,260 | | | $ | 178,159 | | | $ | 662,945 | | |
See accompanying notes to financial statements.
235
UBS PACE Select Advisors Trust
Statement of changes in net assets (concluded)
| | | UBS PACE
Small/Medium Co Growth
Equity Investments | | UBS PACE
International
Equity Investments | | UBS PACE
International Emerging
Markets Equity Investments | |
| | | Years ended July 31, | | Years ended July 31, | | Years ended July 31, | |
| | | 2010 | | 2009 | | 2010 | | 2009 | | 2010 | | 2009 | |
| From operations: | |
| Net investment income (loss) | | $ | (2,005,318 | ) | | $ | (1,149,411 | ) | | $ | 14,556,203 | | | $ | 20,679,617 | | | $ | 2,150,750 | | | $ | 4,845,993 | | |
| Net realized gains (losses) | | | 57,725,409 | | | | (116,971,532 | ) | | | 16,552,276 | | | | (299,943,189 | ) | | | 159,232 | | | | (63,264,904 | ) | |
| Net change in unrealized appreciation/depreciation | | | (1,119,645 | ) | | | 17,977,754 | | | | (13,858,933 | ) | | | (19,043,944 | ) | | | 40,318,395 | | | | (37,183,536 | ) | |
Net increase (decrease) in net assets resulting
from operations | | | 54,600,446 | | | | (100,143,189 | ) | | | 17,249,546 | | | | (298,307,516 | ) | | | 42,628,377 | | | | (95,602,447 | ) | |
| Dividends and distributions to shareholders from: | |
| Net investment income–Class A | | | — | | | | — | | | | (1,498,115 | ) | | | (3,074,397 | ) | | | (253,419 | ) | | | (167,345 | ) | |
| Net investment income–Class B | | | — | | | | — | | | | (401 | ) | | | (1,520 | ) | | | — | | | | — | | |
| Net investment income–Class C | | | — | | | | — | | | | (54,114 | ) | | | (139,987 | ) | | | (38,834 | ) | | | — | | |
| Net investment income–Class Y | | | — | | | | — | | | | (812,371 | ) | | | (1,620,207 | ) | | | (551,002 | ) | | | (285,985 | ) | |
| Net investment income–Class P | | | — | | | | — | | | | (16,405,498 | ) | | | (32,754,998 | ) | | | (3,017,588 | ) | | | (2,344,776 | ) | |
| Net realized gains–Class A | | | — | | | | — | | | | — | | | | — | | | | — | | | | (4,223,244 | ) | |
| Net realized gains–Class B | | | — | | | | — | | | | — | | | | — | | | | — | | | | (44,804 | ) | |
| Net realized gains–Class C | | | — | | | | — | | | | — | | | | — | | | | — | | | | (852,014 | ) | |
| Net realized gains–Class Y | | | — | | | | — | | | | — | | | | — | | | | — | | | | (4,254,851 | ) | |
| Net realized gains–Class P | | | — | | | | — | | | | — | | | | — | | | | — | | | | (50,552,316 | ) | |
| | | | — | | | | — | | | | (18,770,499 | ) | | | (37,591,109 | ) | | | (3,860,843 | ) | | | (62,725,335 | ) | |
| From beneficial interest transactions: | |
| Net proceeds from shares sold | | | 65,977,633 | | | | 81,226,131 | | | | 169,969,986 | | | | 202,345,602 | | | | 53,575,620 | | | | 68,138,687 | | |
| Cost of shares repurchased | | | (93,868,360 | ) | | | (142,190,090 | ) | | | (187,811,537 | ) | | | (322,151,375 | ) | | | (84,031,041 | ) | | | (112,478,538 | ) | |
| Proceeds from dividends reinvested | | | — | | | | — | | | | 18,146,234 | | | | 36,549,444 | | | | 3,764,075 | | | | 61,489,737 | | |
Net increase (decrease) in net assets from beneficial
interest transactions | | | (27,890,727 | ) | | | (60,963,959 | ) | | | 304,683 | | | | (83,256,329 | ) | | | (26,691,346 | ) | | | 17,149,886 | | |
| Redemption fees | | | 14,263 | | | | 50,018 | | | | 29,308 | | | | 123,290 | | | | 16,208 | | | | 40,596 | | |
| Net increase (decrease) in net assets | | | 26,723,982 | | | | (161,057,130 | ) | | | (1,186,962 | ) | | | (419,031,664 | ) | | | 12,092,396 | | | | (141,137,300 | ) | |
| Net assets: | |
| Beginning of year | | | 347,574,682 | | | | 508,631,812 | | | | 793,244,212 | | | | 1,212,275,876 | | | | 265,192,327 | | | | 406,329,627 | | |
| End of year | | $ | 374,298,664 | | | $ | 347,574,682 | | | $ | 792,057,250 | | | $ | 793,244,212 | | | $ | 277,284,723 | | | $ | 265,192,327 | | |
| Accumulated undistributed net investment income | | $ | — | | | $ | — | | | $ | 9,642,793 | | | $ | 13,620,567 | | | $ | 1,933,910 | | | $ | 3,826,880 | | |
236
| | | UBS PACE
Global Real Estate
Securities Investments | | UBS PACE
Alternative
Strategies Investments | |
| | | Years ended July 31, | | Years ended July 31, | |
| | | 2010 | | 2009 | | 2010 | | 2009 | |
| From operations: | |
| Net investment income (loss) | | $ | 1,658,115 | | | $ | 1,794,014 | | | $ | 1,069,754 | | | $ | 4,615,054 | | |
| Net realized gains (losses) | | | 8,195,357 | | | | (44,883,601 | ) | | | 15,343,826 | | | | (151,442,276 | ) | |
| Net change in unrealized appreciation/depreciation | | | 1,809,258 | | | | 17,629,861 | | | | 4,137,729 | | | | 19,854,714 | | |
Net increase (decrease) in net assets resulting
from operations | | | 11,662,730 | | | | (25,459,726 | ) | | | 20,551,309 | | | | (126,972,508 | ) | |
| Dividends and distributions to shareholders from: | |
| Net investment income–Class A | | | (294,268 | ) | | | (41,094 | ) | | | (183,571 | ) | | | (277,728 | ) | |
| Net investment income–Class B | | | — | | | | — | | | | — | | | | (159 | ) | |
| Net investment income–Class C | | | (12,411 | ) | | | (416 | ) | | | — | | | | — | | |
| Net investment income–Class Y | | | (4,423 | ) | | | — | | | | (28,303 | ) | | | (232,481 | ) | |
| Net investment income–Class P | | | (5,852,048 | ) | | | (812,682 | ) | | | (2,293,558 | ) | | | (2,404,742 | ) | |
| Net realized gains–Class A | | | — | | | | — | | | | — | | | | (763,753 | ) | |
| Net realized gains–Class B | | | — | | | | — | | | | — | | | | (502 | ) | |
| Net realized gains–Class C | | | — | | | | — | | | | — | | | | (59,017 | ) | |
| Net realized gains–Class Y | | | — | | | | — | | | | — | | | | (267,241 | ) | |
| Net realized gains–Class P | | | — | | | | — | | | | — | | | | (3,358,184 | ) | |
| | | | (6,163,150 | ) | | | (854,192 | ) | | | (2,505,432 | ) | | | (7,363,807 | ) | |
| From beneficial interest transactions: | |
| Net proceeds from shares sold | | | 26,534,560 | | | | 30,395,528 | | | | 147,143,220 | | | | 126,582,421 | | |
| Cost of shares repurchased | | | (16,205,411 | ) | | | (25,608,398 | ) | | | (144,625,395 | ) | | | (328,929,754 | ) | |
| Proceeds from dividends reinvested | | | 5,976,100 | | | | 833,559 | | | | 2,436,809 | | | | 7,232,610 | | |
Net increase (decrease) in net assets from beneficial
interest transactions | | | 16,305,249 | | | | 5,620,689 | | | | 4,954,634 | | | | (195,114,723 | ) | |
| Redemption fees | | | 5,061 | | | | 21,004 | | | | 29,553 | | | | 77,746 | | |
| Net increase (decrease) in net assets | | | 21,809,890 | | | | (20,672,225 | ) | | | 23,030,064 | | | | (329,373,292 | ) | |
| Net assets: | |
| Beginning of year | | | 56,312,772 | | | | 76,984,997 | | | | 442,082,357 | | | | 771,455,649 | | |
| End of year | | $ | 78,122,662 | | | $ | 56,312,772 | | | $ | 465,112,421 | | | $ | 442,082,357 | | |
| Accumulated undistributed net investment income | | $ | 424,617 | | | $ | 1,070,627 | | | $ | 4,954,050 | | | $ | 3,750,219 | | |
See accompanying notes to financial statements.
237
(This page has been left blank intentionally)
238
UBS PACE Select Advisors Trust
Financial highlights
UBS PACE Money Market Investments
Selected data for a share of beneficial interest outstanding throughout each year is presented below:
| | | Class P | |
| | | Years ended July 31, | |
| | | 2010 | | 2009 | | 2008 | | 2007 | | 2006 | |
| Net asset value, beginning of year | | $ | 1.00 | | | $ | 1.00 | | | $ | 1.00 | | | $ | 1.00 | | | $ | 1.00 | | |
| Net investment income | | | 0.0001 | | | | 0.008 | | | | 0.033 | | | | 0.048 | | | | 0.038 | | |
| Dividends from net investment income | | | (0.000 | )1 | | | (0.008 | ) | | | (0.033 | ) | | | (0.048 | ) | | | (0.038 | ) | |
| Distributions from net realized gains | | | (0.000 | )1 | | | (0.000 | )1 | | | — | | | | — | | | | — | | |
| Total dividends and distributions | | | (0.000 | )1 | | | (0.008 | ) | | | (0.033 | ) | | | (0.048 | ) | | | (0.038 | ) | |
| Net asset value, end of year | | $ | 1.00 | | | $ | 1.00 | | | $ | 1.00 | | | $ | 1.00 | | | $ | 1.00 | | |
| Total investment return2 | | | 0.01 | % | | | 0.81 | % | | | 3.40 | % | | | 4.86 | % | | | 3.89 | % | |
| Ratios/supplemental data: | |
| Net assets, end of year (000's) | | $ | 386,217 | | | $ | 529,959 | | | $ | 523,243 | | | $ | 408,562 | | | $ | 342,573 | | |
Expenses to average net assets, net of fee waivers and/or expense
reimbursements by manager | | | 0.27 | % | | | 0.59 | % | | | 0.60 | % | | | 0.60 | % | | | 0.60 | % | |
Expenses to average net assets, before fee waivers and/or expense
reimbursements by manager | | | 0.90 | % | | | 0.89 | % | | | 0.93 | % | | | 0.92 | % | | | 0.99 | % | |
| Net investment income to average net assets | | | 0.01 | % | | | 0.78 | % | | | 3.27 | % | | | 4.75 | % | | | 3.89 | % | |
1 Amount represents less than $0.0005 per share.
2 Total investment return is calculated assuming a $10,000 investment on the first day of each year reported, reinvestment of all dividends and other distributions, if any, at net asset value on the payable dates, and a sale at net asset value on the last day of each year reported. The figures do not include program fees; results would be lower if these fees were included. Returns do not reflect the deduction of taxes that a shareholder would pay on Portfolio distributions.
See accompanying notes to financial statements.
239
UBS PACE Select Advisors Trust
Financial highlights
UBS PACE Government Securities Fixed Income Investments
Selected data for a share of beneficial interest outstanding throughout each year is presented below:
| | | Class A | |
| | | Years ended July 31, | |
| | | 2010 | | 2009 | | 2008 | | 2007 | | 2006 | |
| Net asset value, beginning of year | | $ | 13.36 | | | $ | 12.87 | | | $ | 12.72 | | | $ | 12.71 | | | $ | 13.20 | | |
| Net investment income | | | 0.411 | | | | 0.571 | | | | 0.561 | | | | 0.571 | | | | 0.51 | | |
| Net realized and unrealized gains (losses) | | | 0.86 | | | | 0.56 | | | | 0.15 | | | | 0.002 | | | | (0.31 | ) | |
| Net increase from operations | | | 1.27 | | | | 1.13 | | | | 0.71 | | | | 0.57 | | | | 0.20 | | |
| Dividends from net investment income | | | (0.46 | ) | | | (0.64 | ) | | | (0.56 | ) | | | (0.56 | ) | | | (0.53 | ) | |
| Distributions from net realized gains | | | (0.46 | ) | | | — | | | | — | | | | — | | | | (0.16 | ) | |
| Total dividends and distributions | | | (0.92 | ) | | | (0.64 | ) | | | (0.56 | ) | | | (0.56 | ) | | | (0.69 | ) | |
| Net asset value, end of year | | $ | 13.71 | | | $ | 13.36 | | | $ | 12.87 | | | $ | 12.72 | | | $ | 12.71 | | |
| Total investment return3 | | | 9.92 | % | | | 9.09 | % | | | 5.53 | % | | | 4.52 | % | | | 1.61 | % | |
| Ratios/supplemental data: | |
| Net assets, end of year (000's) | | $ | 92,416 | | | $ | 90,386 | | | $ | 91,614 | | | $ | 99,378 | | | $ | 114,663 | | |
Expenses to average net assets, net of fee waivers and/or expense
reimbursements by manager | | | 1.02 | % | | | 1.02 | % | | | 1.07 | % | | | 1.12 | % | | | 1.11 | % | |
Expenses to average net assets, before fee waivers and/or expense
reimbursements by manager | | | 1.08 | % | | | 1.07 | % | | | 1.12 | % | | | 1.13 | % | | | 1.17 | % | |
| Net investment income to average net assets | | | 3.06 | % | | | 4.41 | % | | | 4.30 | % | | | 4.40 | % | | | 3.97 | % | |
| Portfolio turnover | | | 1,065 | % | | | 877 | % | | | 588 | % | | | 495 | % | | | 575 | % | |
| | | Class C | |
| | | Years ended July 31, | |
| | | 2010 | | 2009 | | 2008 | | 2007 | | 2006 | |
| Net asset value, beginning of year | | $ | 13.37 | | | $ | 12.88 | | | $ | 12.73 | | | $ | 12.72 | | | $ | 13.21 | | |
| Net investment income | | | 0.351 | | | | 0.511 | | | | 0.501 | | | | 0.501 | | | | 0.45 | | |
| Net realized and unrealized gains (losses) | | | 0.85 | | | | 0.55 | | | | 0.14 | | | | 0.01 | | | | (0.32 | ) | |
| Net increase from operations | | | 1.20 | | | | 1.06 | | | | 0.64 | | | | 0.51 | | | | 0.13 | | |
| Dividends from net investment income | | | (0.39 | ) | | | (0.57 | ) | | | (0.49 | ) | | | (0.50 | ) | | | (0.46 | ) | |
| Distributions from net realized gains | | | (0.46 | ) | | | — | | | | — | | | | — | | | | (0.16 | ) | |
| Total dividends and distributions | | | (0.85 | ) | | | (0.57 | ) | | | (0.49 | ) | | | (0.50 | ) | | | (0.62 | ) | |
| Net asset value, end of year | | $ | 13.72 | | | $ | 13.37 | | | $ | 12.88 | | | $ | 12.73 | | | $ | 12.72 | | |
| Total investment return3 | | | 9.37 | % | | | 8.45 | % | | | 5.06 | % | | | 4.00 | % | | | 1.09 | % | |
| Ratios/supplemental data: | |
| Net assets, end of year (000's) | | $ | 24,394 | | | $ | 24,477 | | | $ | 24,536 | | | $ | 26,449 | | | $ | 30,338 | | |
Expenses to average net assets, net of fee waivers and/or expense
reimbursements by manager | | | 1.52 | % | | | 1.52 | % | | | 1.57 | % | | | 1.62 | % | | | 1.62 | % | |
Expenses to average net assets, before fee waivers and/or expense
reimbursements by manager | | | 1.61 | % | | | 1.63 | % | | | 1.68 | % | | | 1.70 | % | | | 1.75 | % | |
| Net investment income to average net assets | | | 2.56 | % | | | 3.90 | % | | | 3.80 | % | | | 3.90 | % | | | 3.45 | % | |
| Portfolio turnover | | | 1,065 | % | | | 877 | % | | | 588 | % | | | 495 | % | | | 575 | % | |
1 Calculated using the average shares method.
2 Amount represents less than $0.005 per share.
3 Total investment return is calculated assuming a $10,000 investment on the first day of each year reported, reinvestment of all dividends and other distributions, if any, at net asset value on the ex-dividend dates, and a sale at net asset value on the last day of each year reported. The figures do not include any applicable sales charges or redemption fees; results would be lower if they were included. Returns do not reflect the deduction of taxes that a shareholder would pay on Portfolio distributions or the redemption of Portfolio shares.
240
| | | Class B | |
| | | Years ended July 31, | |
| | | 2010 | | 2009 | | 2008 | | 2007 | | 2006 | |
| Net asset value, beginning of year | | $ | 13.36 | | | $ | 12.87 | | | $ | 12.73 | | | $ | 12.72 | | | $ | 13.20 | | |
| Net investment income | | | 0.301 | | | | 0.461 | | | | 0.451 | | | | 0.461 | | | | 0.40 | | |
| Net realized and unrealized gains (losses) | | | 0.87 | | | | 0.56 | | | | 0.15 | | | | 0.01 | | | | (0.29 | ) | |
| Net increase from operations | | | 1.17 | | | | 1.02 | | | | 0.60 | | | | 0.47 | | | | 0.11 | | |
| Dividends from net investment income | | | (0.36 | ) | | | (0.53 | ) | | | (0.46 | ) | | | (0.46 | ) | | | (0.43 | ) | |
| Distributions from net realized gains | | | (0.46 | ) | | | — | | | | — | | | | — | | | | (0.16 | ) | |
| Total dividends and distributions | | | (0.82 | ) | | | (0.53 | ) | | | (0.46 | ) | | | (0.46 | ) | | | (0.59 | ) | |
| Net asset value, end of year | | $ | 13.71 | | | $ | 13.36 | | | $ | 12.87 | | | $ | 12.73 | | | $ | 12.72 | | |
| Total investment return3 | | | 9.12 | % | | | 8.16 | % | | | 4.72 | % | | | 3.73 | % | | | 0.92 | % | |
| Ratios/supplemental data: | |
| Net assets, end of year (000's) | | $ | 157 | | | $ | 173 | | | $ | 769 | | | $ | 1,617 | | | $ | 2,776 | | |
Expenses to average net assets, net of fee waivers and/or expense
reimbursements by manager | | | 1.77 | % | | | 1.77 | % | | | 1.82 | % | | | 1.87 | % | | | 1.86 | % | |
Expenses to average net assets, before fee waivers and/or expense
reimbursements by manager | | | 1.91 | % | | | 1.86 | % | | | 1.89 | % | | | 1.88 | % | | | 1.93 | % | |
| Net investment income to average net assets | | | 2.29 | % | | | 3.70 | % | | | 3.55 | % | | | 3.64 | % | | | 3.20 | % | |
| Portfolio turnover | | | 1,065 | % | | | 877 | % | | | 588 | % | | | 495 | % | | | 575 | % | |
| | | Class Y | |
| | | Years ended July 31, | |
| | | 2010 | | 2009 | | 2008 | | 2007 | | 2006 | |
| Net asset value, beginning of year | | $ | 13.36 | | | $ | 12.87 | | | $ | 12.73 | | | $ | 12.72 | | | $ | 13.20 | | |
| Net investment income | | | 0.441 | | | | 0.611 | | | | 0.591 | | | | 0.611 | | | | 0.55 | | |
| Net realized and unrealized gains (losses) | | | 0.86 | | | | 0.55 | | | | 0.15 | | | | 0.002 | | | | (0.30 | ) | |
| Net increase from operations | | | 1.30 | | | | 1.16 | | | | 0.74 | | | | 0.61 | | | | 0.25 | | |
| Dividends from net investment income | | | (0.49 | ) | | | (0.67 | ) | | | (0.60 | ) | | | (0.60 | ) | | | (0.57 | ) | |
| Distributions from net realized gains | | | (0.46 | ) | | | — | | | | — | | | | — | | | | (0.16 | ) | |
| Total dividends and distributions | | | (0.95 | ) | | | (0.67 | ) | | | (0.60 | ) | | | (0.60 | ) | | | (0.73 | ) | |
| Net asset value, end of year | | $ | 13.71 | | | $ | 13.36 | | | $ | 12.87 | | | $ | 12.73 | | | $ | 12.72 | | |
| Total investment return3 | | | 10.20 | % | | | 9.29 | % | | | 5.86 | % | | | 4.87 | % | | | 1.97 | % | |
| Ratios/supplemental data: | |
| Net assets, end of year (000's) | | $ | 49,486 | | | $ | 39,199 | | | $ | 25,669 | | | $ | 13,658 | | | $ | 8,460 | | |
Expenses to average net assets, net of fee waivers and/or expense
reimbursements by manager | | | 0.77 | % | | | 0.77 | % | | | 0.82 | % | | | 0.79 | % | | | 0.81 | % | |
Expenses to average net assets, before fee waivers and/or expense
reimbursements by manager | | | 0.89 | % | | | 0.92 | % | | | 0.90 | % | | | 0.79 | % | | | 0.84 | % | |
| Net investment income to average net assets | | | 3.29 | % | | | 4.65 | % | | | 4.56 | % | | | 4.74 | % | | | 4.27 | % | |
| Portfolio turnover | | | 1,065 | % | | | 877 | % | | | 588 | % | | | 495 | % | | | 575 | % | |
See accompanying notes to financial statements.
241
UBS PACE Select Advisors Trust
Financial highlights
UBS PACE Government Securities Fixed Income Investments
(concluded)
Selected data for a share of beneficial interest outstanding throughout each year is presented below:
| | | Class P | |
| | | Years ended July 31, | |
| | | 2010 | | 2009 | | 2008 | | 2007 | | 2006 | |
| Net asset value, beginning of year | | $ | 13.36 | | | $ | 12.87 | | | $ | 12.72 | | | $ | 12.72 | | | $ | 13.20 | | |
| Net investment income | | | 0.441 | | | | 0.611 | | | | 0.591 | | | | 0.601 | | | | 0.54 | | |
| Net realized and unrealized gains (losses) | | | 0.86 | | | | 0.55 | | | | 0.15 | | | | (0.01 | ) | | | (0.30 | ) | |
| Net increase from operations | | | 1.30 | | | | 1.16 | | | | 0.74 | | | | 0.59 | | | | 0.24 | | |
| Dividends from net investment income | | | (0.49 | ) | | | (0.67 | ) | | | (0.59 | ) | | | (0.59 | ) | | | (0.56 | ) | |
| Distributions from net realized gains | | | (0.46 | ) | | | — | | | | — | | | | — | | | | (0.16 | ) | |
| Total dividends and distributions | | | (0.95 | ) | | | (0.67 | ) | | | (0.59 | ) | | | (0.59 | ) | | | (0.72 | ) | |
| Net asset value, end of year | | $ | 13.71 | | | $ | 13.36 | | | $ | 12.87 | | | $ | 12.72 | | | $ | 12.72 | | |
| Total investment return2 | | | 10.20 | % | | | 9.27 | % | | | 5.87 | % | | | 4.71 | % | | | 1.94 | % | |
| Ratios/supplemental data: | |
| Net assets, end of year (000's) | | $ | 477,172 | | | $ | 422,024 | | | $ | 542,337 | | | $ | 469,556 | | | $ | 384,472 | | |
Expenses to average net assets, net of fee waivers and/or expense
reimbursements by manager | | | 0.77 | % | | | 0.77 | % | | | 0.82 | % | | | 0.87 | % | | | 0.87 | % | |
Expenses to average net assets, before fee waivers and/or expense
reimbursements by manager | | | 0.88 | % | | | 0.86 | % | | | 0.90 | % | | | 0.91 | % | | | 0.96 | % | |
| Net investment income to average net assets | | | 3.30 | % | | | 4.66 | % | | | 4.55 | % | | | 4.66 | % | | | 4.22 | % | |
| Portfolio turnover | | | 1,065 | % | | | 877 | % | | | 588 | % | | | 495 | % | | | 575 | % | |
1 Calculated using the average shares method.
2 Total investment return is calculated assuming a $10,000 investment on the first day of each year reported, reinvestment of all dividends and other distributions, if any, at net asset value on the ex-dividend dates, and a sale at net asset value on the last day of each year reported. The figures do not include any applicable program or redemption fees; results would be lower if they were included. Returns do not reflect the deduction of taxes that a shareholder would pay on Portfolio distributions or the redemption of Portfolio shares.
See accompanying notes to financial statements.
242
(This page has been left blank intentionally)
243
UBS PACE Select Advisors Trust
Financial highlights
UBS PACE Intermediate Fixed Income Investments
Selected data for a share of beneficial interest outstanding throughout each year is presented below:
| | | Class A | |
| | | Years ended July 31, | |
| | | 2010 | | 2009 | | 2008 | | 2007 | | 2006 | |
| Net asset value, beginning of year | | $ | 11.58 | | | $ | 11.51 | | | $ | 11.39 | | | $ | 11.27 | | | $ | 11.44 | | |
| Net investment income1 | | | 0.34 | | | | 0.44 | | | | 0.48 | | | | 0.43 | | | | 0.38 | | |
| Net realized and unrealized gains (losses) | | | 0.49 | | | | 0.08 | | | | 0.12 | | | | 0.12 | | | | (0.17 | ) | |
| Net increase from operations | | | 0.83 | | | | 0.52 | | | | 0.60 | | | | 0.55 | | | | 0.21 | | |
| Dividends from net investment income | | | (0.39 | ) | | | (0.45 | ) | | | (0.48 | ) | | | (0.43 | ) | | | (0.38 | ) | |
| Net asset value, end of year | | $ | 12.02 | | | $ | 11.58 | | | $ | 11.51 | | | $ | 11.39 | | | $ | 11.27 | | |
| Total investment return2 | | | 7.24 | % | | | 4.88 | % | | | 5.26 | % | | | 4.96 | % | | | 1.90 | % | |
| Ratios/supplemental data: | |
| Net assets, end of year (000's) | | $ | 42,905 | | | $ | 45,165 | | | $ | 46,257 | | | $ | 51,800 | | | $ | 59,884 | | |
Expenses to average net assets, net of fee waivers and/or expense reimbursements
by manager | | | 0.93 | %3 | | | 0.93 | % | | | 0.93 | % | | | 1.05 | % | | | 1.06 | % | |
Expenses to average net assets, before fee waivers and/or expense reimbursements
by manager | | | 1.00 | %3 | | | 1.02 | % | | | 1.05 | % | | | 1.08 | % | | | 1.10 | % | |
| Net investment income to average net assets | | | 2.93 | % | | | 3.97 | % | | | 4.10 | % | | | 3.81 | % | | | 3.36 | % | |
| Portfolio turnover | | | 974 | % | | | 512 | % | | | 387 | % | | | 255 | % | | | 349 | % | |
| | | Class C | |
| | | Years ended July 31, | |
| | | 2010 | | 2009 | | 2008 | | 2007 | | 2006 | |
| Net asset value, beginning of year | | $ | 11.59 | | | $ | 11.52 | | | $ | 11.40 | | | $ | 11.28 | | | $ | 11.46 | | |
| Net investment income1 | | | 0.29 | | | | 0.38 | | | | 0.42 | | | | 0.38 | | | | 0.32 | | |
| Net realized and unrealized gains (losses) | | | 0.48 | | | | 0.09 | | | | 0.12 | | | | 0.11 | | | | (0.17 | ) | |
| Net increase from operations | | | 0.77 | | | | 0.47 | | | | 0.54 | | | | 0.49 | | | | 0.15 | | |
| Dividends from net investment income | | | (0.33 | ) | | | (0.40 | ) | | | (0.42 | ) | | | (0.37 | ) | | | (0.33 | ) | |
| Net asset value, end of year | | $ | 12.03 | | | $ | 11.59 | | | $ | 11.52 | | | $ | 11.40 | | | $ | 11.28 | | |
| Total investment return2 | | | 6.70 | % | | | 4.36 | % | | | 4.72 | % | | | 4.43 | % | | | 1.30 | % | |
| Ratios/supplemental data: | |
| Net assets, end of year (000's) | | $ | 4,646 | | | $ | 5,185 | | | $ | 3,992 | | | $ | 4,116 | | | $ | 5,301 | | |
Expenses to average net assets, net of fee waivers and/or expense reimbursements
by and recoupments to manager | | | 1.43 | %3 | | | 1.43 | % | | | 1.43 | % | | | 1.55 | % | | | 1.55 | % | |
Expenses to average net assets, before fee waivers and/or expense reimbursements
by manager | | | 1.50 | %3 | | | 1.53 | % | | | 1.57 | % | | | 1.57 | % | | | 1.59 | % | |
| Net investment income to average net assets | | | 2.43 | % | | | 3.43 | % | | | 3.60 | % | | | 3.31 | % | | | 2.86 | % | |
| Portfolio turnover | | | 974 | % | | | 512 | % | | | 387 | % | | | 255 | % | | | 349 | % | |
1 Calculated using the average shares method.
2 Total investment return is calculated assuming a $10,000 investment on the first day of each year reported, reinvestment of all dividends and other distributions, if any, at net asset value on the ex-dividend dates, and a sale at net asset value on the last day of each year reported. The figures do not include any applicable sales charges or redemption fees; results would be lower if they were included. Returns do not reflect the deduction of taxes that a shareholder would pay on Portfolio distributions or the redemption of Portfolio shares.
3 Includes interest expense representing less than 0.005%.
4 During the year ended July 31, 2009, UBS Global Asset Management (Americas) Inc. reimbursed a portion of its ordinary operating expenses. The ratios net and before fee waivers and/or expense reimbursements are the same since the reimbursement represents less than 0.01%.
5 The investment manager recouped expenses previously reimbursed by the investment manager on behalf of the Portfolio, not to exceed the expense cap.
244
| | | Class B | |
| | | Years ended July 31, | |
| | | 2010 | | 2009 | | 2008 | | 2007 | | 2006 | |
| Net asset value, beginning of year | | $ | 11.60 | | | $ | 11.53 | | | $ | 11.41 | | | $ | 11.29 | | | $ | 11.46 | | |
| Net investment income1 | | | 0.25 | | | | 0.36 | | | | 0.38 | | | | 0.34 | | | | 0.28 | | |
| Net realized and unrealized gains (losses) | | | 0.50 | | | | 0.08 | | | | 0.13 | | | | 0.13 | | | | (0.15 | ) | |
| Net increase from operations | | | 0.75 | | | | 0.44 | | | | 0.51 | | | | 0.47 | | | | 0.13 | | |
| Dividends from net investment income | | | (0.31 | ) | | | (0.37 | ) | | | (0.39 | ) | | | (0.35 | ) | | | (0.30 | ) | |
| Net asset value, end of year | | $ | 12.04 | | | $ | 11.60 | | | $ | 11.53 | | | $ | 11.41 | | | $ | 11.29 | | |
| Total investment return2 | | | 6.43 | % | | | 4.08 | % | | | 4.45 | % | | | 4.18 | % | | | 1.13 | % | |
| Ratios/supplemental data: | |
| Net assets, end of year (000's) | | $ | 157 | | | $ | 155 | | | $ | 166 | | | $ | 324 | | | $ | 637 | | |
Expenses to average net assets, net of fee waivers and/or expense reimbursements
by manager | | | 1.68 | %3 | | | 1.68 | % | | | 1.68 | % | | | 1.80 | % | | | 1.80 | % | |
Expenses to average net assets, before fee waivers and/or expense reimbursements
by manager | | | 1.82 | %3 | | | 1.82 | % | | | 1.91 | % | | | 1.84 | % | | | 1.89 | % | |
| Net investment income to average net assets | | | 2.18 | % | | | 3.23 | % | | | 3.35 | % | | | 3.04 | % | | | 2.56 | % | |
| Portfolio turnover | | | 974 | % | | | 512 | % | | | 387 | % | | | 255 | % | | | 349 | % | |
| | | Class Y | |
| | | Years ended July 31, | |
| | | 2010 | | 2009 | | 2008 | | 2007 | | 2006 | |
| Net asset value, beginning of year | | $ | 11.59 | | | $ | 11.51 | | | $ | 11.39 | | | $ | 11.28 | | | $ | 11.45 | | |
| Net investment income1 | | | 0.38 | | | | 0.47 | | | | 0.51 | | | | 0.47 | | | | 0.41 | | |
| Net realized and unrealized gains (losses) | | | 0.48 | | | | 0.09 | | | | 0.11 | | | | 0.10 | | | | (0.17 | ) | |
| Net increase from operations | | | 0.86 | | | | 0.56 | | | | 0.62 | | | | 0.57 | | | | 0.24 | | |
| Dividends from net investment income | | | (0.43 | ) | | | (0.48 | ) | | | (0.50 | ) | | | (0.46 | ) | | | (0.41 | ) | |
| Net asset value, end of year | | $ | 12.02 | | | $ | 11.59 | | | $ | 11.51 | | | $ | 11.39 | | | $ | 11.28 | | |
| Total investment return2 | | | 7.53 | % | | | 5.15 | % | | | 5.52 | % | | | 5.17 | % | | | 2.17 | % | |
| Ratios/supplemental data: | |
| Net assets, end of year (000's) | | $ | 1,997 | | | $ | 2,313 | | | $ | 1,359 | | | $ | 1,249 | | | $ | 1,074 | | |
Expenses to average net assets, net of fee waivers and/or expense reimbursements
by and recoupments to manager | | | 0.68 | %3 | | | 0.68 | %4 | | | 0.68 | % | | | 0.80 | %5 | | | 0.80 | % | |
Expenses to average net assets, before fee waivers and/or expense reimbursements
by manager | | | 0.74 | %3 | | | 0.68 | % | | | 0.76 | % | | | 0.80 | % | | | 0.83 | % | |
| Net investment income to average net assets | | | 3.19 | % | | | 4.17 | % | | | 4.34 | % | | | 4.07 | % | | | 3.63 | % | |
| Portfolio turnover | | | 974 | % | | | 512 | % | | | 387 | % | | | 255 | % | | | 349 | % | |
See accompanying notes to financial statements.
245
UBS PACE Select Advisors Trust
Financial highlights
UBS PACE Intermediate Fixed Income Investments
(concluded)
Selected data for a share of beneficial interest outstanding throughout each year is presented below:
| | | Class P | |
| | | Years ended July 31, | |
| | | 2010 | | 2009 | | 2008 | | 2007 | | 2006 | |
| Net asset value, beginning of year | | $ | 11.59 | | | $ | 11.51 | | | $ | 11.39 | | | $ | 11.28 | | | $ | 11.45 | | |
| Net investment income1 | | | 0.37 | | | | 0.47 | | | | 0.51 | | | | 0.46 | | | | 0.41 | | |
| Net realized and unrealized gains (losses) | | | 0.48 | | | | 0.09 | | | | 0.11 | | | | 0.11 | | | | (0.17 | ) | |
| Net increase from operations | | | 0.85 | | | | 0.56 | | | | 0.62 | | | | 0.57 | | | | 0.24 | | |
| Dividends from net investment income | | | (0.42 | ) | | | (0.48 | ) | | | (0.50 | ) | | | (0.46 | ) | | | (0.41 | ) | |
| Net asset value, end of year | | $ | 12.02 | | | $ | 11.59 | | | $ | 11.51 | | | $ | 11.39 | | | $ | 11.28 | | |
| Total investment return2 | | | 7.51 | % | | | 5.14 | % | | | 5.52 | % | | | 5.17 | % | | | 2.17 | % | |
| Ratios/supplemental data: | |
| Net assets, end of year (000's) | | $ | 420,801 | | | $ | 353,068 | | | $ | 404,407 | | | $ | 381,254 | | | $ | 346,298 | | |
Expenses to average net assets, net of fee waivers and/or expense
reimbursements by and recoupments to manager | | | 0.68 | %3 | | | 0.68 | % | | | 0.68 | % | | | 0.80 | %4 | | | 0.80 | % | |
Expenses to average net assets, before fee waivers and/or expense
reimbursements by manager | | | 0.73 | %3 | | | 0.74 | % | | | 0.77 | % | | | 0.80 | % | | | 0.81 | % | |
| Net investment income to average net assets | | | 3.16 | % | | | 4.22 | % | | | 4.35 | % | | | 4.07 | % | | | 3.64 | % | |
| Portfolio turnover | | | 974 | % | | | 512 | % | | | 387 | % | | | 255 | % | | | 349 | % | |
1 Calculated using the average shares method.
2 Total investment return is calculated assuming a $10,000 investment on the first day of each year reported, reinvestment of all dividends and other distributions, if any, at net asset value on the ex-dividend dates, and a sale at net asset value on the last day of each year reported. The figures do not include any applicable program or redemption fees; results would be lower if they were included. Returns do not reflect the deduction of taxes that a shareholder would pay on Portfolio distributions or the redemption of Portfolio shares.
3 Includes interest expense during the year ended July 31, 2010 representing less than 0.005%.
4 The investment manager recouped expenses previously reimbursed by the investment manager on behalf of the Portfolio, not to exceed the expense cap.
See accompanying notes to financial statements.
246
(This page has been left blank intentionally)
247
UBS PACE Select Advisors Trust
Financial highlights
UBS PACE Strategic Fixed Income Investments
Selected data for a share of beneficial interest outstanding throughout each year is presented below:
| | | Class A | |
| | | Years ended July 31, | |
| | | 2010 | | 2009 | | 2008 | | 2007 | | 2006 | |
| Net asset value, beginning of year | | $ | 13.09 | | | $ | 13.75 | | | $ | 13.25 | | | $ | 13.26 | | | $ | 13.89 | | |
| Net investment income1 | | | 0.47 | | | | 0.60 | | | | 0.61 | | | | 0.56 | | | | 0.60 | | |
| Net realized and unrealized gains (losses) | | | 1.60 | | | | 0.39 | | | | 0.51 | | | | 0.002 | | | | (0.59 | ) | |
| Net increase (decrease) from operations | | | 2.07 | | | | 0.99 | | | | 1.12 | | | | 0.56 | | | | 0.01 | | |
| Dividends from net investment income | | | (0.58 | ) | | | (0.73 | ) | | | (0.62 | ) | | | (0.55 | ) | | | (0.62 | ) | |
| Distributions from net realized gains | | | (0.02 | ) | | | (0.92 | ) | | | — | | | | — | | | | — | | |
| Returns of capital | | | — | | | | — | | | | — | | | | (0.02 | ) | | | (0.02 | ) | |
| Total dividends, distributions and returns of capital | | | (0.60 | ) | | | (1.65 | ) | | | (0.62 | ) | | | (0.57 | ) | | | (0.64 | ) | |
| Net asset value, end of year | | $ | 14.56 | | | $ | 13.09 | | | $ | 13.75 | | | $ | 13.25 | | | $ | 13.26 | | |
| Total investment return3 | | | 16.09 | % | | | 8.31 | % | | | 8.42 | % | | | 4.32 | % | | | 0.06 | % | |
| Ratios/supplemental data: | |
| Net assets, end of year (000's) | | $ | 45,499 | | | $ | 33,293 | | | $ | 27,180 | | | $ | 21,711 | | | $ | 20,735 | | |
Expenses to average net assets, net of fee waivers and/or expense reimbursements
by and recoupments to manager, including interest expense | | | 1.06 | % | | | 1.07 | % | | | 1.06 | % | | | 1.15 | %4 | | | 1.20 | %4 | |
Expenses to average net assets, before fee waivers and/or expense reimbursements
by manager, including interest expense | | | 1.09 | % | | | 1.10 | % | | | 1.13 | % | | | 1.15 | % | | | 1.20 | % | |
Expenses to average net assets, net of fee waivers and/or expense reimbursements
by and recoupments to manager, excluding interest expense | | | 1.06 | % | | | 1.06 | % | | | 1.06 | % | | | 1.15 | %4 | | | 1.20 | %4 | |
| Net investment income to average net assets | | | 3.36 | % | | | 4.75 | % | | | 4.40 | % | | | 4.17 | % | | | 4.46 | % | |
| Portfolio turnover | | | 239 | % | | | 178 | % | | | 236 | % | | | 188 | % | | | 196 | % | |
| | | Class C | |
| | | Years ended July 31, | |
| | | 2010 | | 2009 | | 2008 | | 2007 | | 2006 | |
| Net asset value, beginning of year | | $ | 13.09 | | | $ | 13.75 | | | $ | 13.26 | | | $ | 13.26 | | | $ | 13.89 | | |
| Net investment income1 | | | 0.40 | | | | 0.54 | | | | 0.54 | | | | 0.50 | | | | 0.54 | | |
| Net realized and unrealized gains (losses) | | | 1.60 | | | | 0.39 | | | | 0.50 | | | | 0.002 | | | | (0.60 | ) | |
| Net increase (decrease) from operations | | | 2.00 | | | | 0.93 | | | | 1.04 | | | | 0.50 | | | | (0.06 | ) | |
| Dividends from net investment income | | | (0.51 | ) | | | (0.67 | ) | | | (0.55 | ) | | | (0.48 | ) | | | (0.55 | ) | |
| Distributions from net realized gains | | | (0.02 | ) | | | (0.92 | ) | | | — | | | | — | | | | — | | |
| Returns of capital | | | — | | | | — | | | | — | | | | (0.02 | ) | | | (0.02 | ) | |
| Total dividends, distributions and returns of capital | | | (0.53 | ) | | | (1.59 | ) | | | (0.55 | ) | | | (0.50 | ) | | | (0.57 | ) | |
| Net asset value, end of year | | $ | 14.56 | | | $ | 13.09 | | | $ | 13.75 | | | $ | 13.26 | | | $ | 13.26 | | |
| Total investment return3 | | | 15.52 | % | | | 7.78 | % | | | 7.79 | % | | | 3.87 | % | | | (0.43 | )% | |
| Ratios/supplemental data: | |
| Net assets, end of year (000's) | | $ | 12,289 | | | $ | 8,797 | | | $ | 5,592 | | | $ | 5,531 | | | $ | 6,280 | | |
Expenses to average net assets, net of fee waivers and/or expense reimbursements
by and recoupments to manager, including interest expense | | | 1.56 | % | | | 1.57 | % | | | 1.56 | % | | | 1.63 | % | | | 1.68 | %4 | |
Expenses to average net assets, before fee waivers and/or expense reimbursements
by manager, including interest expense | | | 1.56 | % | | | 1.58 | % | | | 1.61 | % | | | 1.63 | % | | | 1.68 | % | |
Expenses to average net assets, net of fee waivers and/or expense reimbursements
by and recoupments to manager, excluding interest expense | | | 1.56 | % | | | 1.56 | % | | | 1.56 | % | | | 1.63 | % | | | 1.68 | %4 | |
| Net investment income to average net assets | | | 2.86 | % | | | 4.24 | % | | | 3.90 | % | | | 3.69 | % | | | 3.97 | % | |
| Portfolio turnover | | | 239 | % | | | 178 | % | | | 236 | % | | | 188 | % | | | 196 | % | |
1 Calculated using the average shares method.
2 Amount represents less than $0.005 per share.
3 Total investment return is calculated assuming a $10,000 investment on the first day of each year reported, reinvestment of all dividends and other distributions, if any, at net asset value on the ex-dividend dates, and a sale at net asset value on the last day of each year reported. The figures do not include any applicable sales charges or redemption fees; results would be lower if they were included. Returns do not reflect the deduction of taxes that a shareholder would pay on Portfolio distributions or the redemption of Portfolio shares.
248
| | | Class B | |
| | | Years ended July 31, | |
| | | 2010 | | 2009 | | 2008 | | 2007 | | 2006 | |
| Net asset value, beginning of year | | $ | 13.08 | | | $ | 13.75 | | | $ | 13.25 | | | $ | 13.26 | | | $ | 13.88 | | |
| Net investment income1 | | | 0.36 | | | | 0.49 | | | | 0.48 | | | | 0.44 | | | | 0.48 | | |
| Net realized and unrealized gains (losses) | | | 1.60 | | | | 0.40 | | | | 0.53 | | | | 0.01 | | | | (0.56 | ) | |
| Net increase (decrease) from operations | | | 1.96 | | | | 0.89 | | | | 1.01 | | | | 0.45 | | | | (0.08 | ) | |
| Dividends from net investment income | | | (0.47 | ) | | | (0.64 | ) | | | (0.51 | ) | | | (0.44 | ) | | | (0.52 | ) | |
| Distributions from net realized gains | | | (0.02 | ) | | | (0.92 | ) | | | — | | | | — | | | | — | | |
| Returns of capital | | | — | | | | — | | | | — | | | | (0.02 | ) | | | (0.02 | ) | |
| Total dividends, distributions and returns of capital | | | (0.49 | ) | | | (1.56 | ) | | | (0.51 | ) | | | (0.46 | ) | | | (0.54 | ) | |
| Net asset value, end of year | | $ | 14.55 | | | $ | 13.08 | | | $ | 13.75 | | | $ | 13.25 | | | $ | 13.26 | | |
| Total investment return3 | | | 15.23 | % | | | 7.45 | % | | | 7.58 | % | | | 3.55 | % | | | (0.68 | )% | |
| Ratios/supplemental data: | |
| Net assets, end of year (000's) | | $ | 300 | | | $ | 333 | | | $ | 142 | | | $ | 456 | | | $ | 1,098 | | |
Expenses to average net assets, net of fee waivers and/or expense reimbursements
by and recoupments to manager, including interest expense | | | 1.81 | % | | | 1.82 | % | | | 1.81 | % | | | 1.93 | %5 | | | 1.93 | % | |
Expenses to average net assets, before fee waivers and/or expense reimbursements
by manager, including interest expense | | | 1.90 | % | | | 1.93 | % | | | 2.03 | % | | | 1.93 | %5 | | | 1.98 | % | |
Expenses to average net assets, net of fee waivers and/or expense reimbursements
by and recoupments to manager, excluding interest expense | | | 1.81 | % | | | 1.81 | % | | | 1.81 | % | | | 1.93 | %5 | | | 1.93 | % | |
| Net investment income to average net assets | | | 2.63 | % | | | 4.02 | % | | | 3.59 | % | | | 3.36 | % | | | 3.64 | % | |
| Portfolio turnover | | | 239 | % | | | 178 | % | | | 236 | % | | | 188 | % | | | 196 | % | |
| | | Class Y | |
| | | Years ended July 31, | |
| | | 2010 | | 2009 | | 2008 | | 2007 | | 2006 | |
| Net asset value, beginning of year | | $ | 13.08 | | | $ | 13.74 | | | $ | 13.25 | | | $ | 13.26 | | | $ | 13.88 | | |
| Net investment income1 | | | 0.51 | | | | 0.64 | | | | 0.66 | | | | 0.61 | | | | 0.65 | | |
| Net realized and unrealized gains (losses) | | | 1.59 | | | | 0.39 | | | | 0.49 | | | | (0.01 | ) | | | (0.59 | ) | |
| Net increase (decrease) from operations | | | 2.10 | | | | 1.03 | | | | 1.15 | | | | 0.60 | | | | 0.06 | | |
| Dividends from net investment income | | | (0.62 | ) | | | (0.77 | ) | | | (0.66 | ) | | | (0.59 | ) | | | (0.66 | ) | |
| Distributions from net realized gains | | | (0.02 | ) | | | (0.92 | ) | | | — | | | | — | | | | — | | |
| Returns of capital | | | — | | | | — | | | | — | | | | (0.02 | ) | | | (0.02 | ) | |
| Total dividends, distributions and returns of capital | | | (0.64 | ) | | | (1.69 | ) | | | (0.66 | ) | | | (0.61 | ) | | | (0.68 | ) | |
| Net asset value, end of year | | $ | 14.54 | | | $ | 13.08 | | | $ | 13.74 | | | $ | 13.25 | | | $ | 13.26 | | |
| Total investment return3 | | | 16.47 | % | | | 8.68 | % | | | 8.67 | % | | | 4.76 | % | | | 0.41 | % | |
| Ratios/supplemental data: | |
| Net assets, end of year (000's) | | $ | 3,058 | | | $ | 3,186 | | | $ | 3,045 | | | $ | 1,208 | | | $ | 716 | | |
Expenses to average net assets, net of fee waivers and/or expense reimbursements
by and recoupments to manager, including interest expense | | | 0.81 | % | | | 0.73 | % | | | 0.78 | % | | | 0.79 | % | | | 0.85 | % | |
Expenses to average net assets, before fee waivers and/or expense reimbursements
by manager, including interest expense | | | 0.85 | % | | | 0.73 | % | | | 0.78 | % | | | 0.79 | % | | | 0.85 | % | |
Expenses to average net assets, net of fee waivers and/or expense reimbursements
by and recoupments to manager, excluding interest expense | | | 0.81 | % | | | 0.72 | % | | | 0.78 | % | | | 0.79 | % | | | 0.85 | % | |
| Net investment income to average net assets | | | 3.63 | % | | | 5.09 | % | | | 4.71 | % | | | 4.55 | % | | | 4.79 | % | |
| Portfolio turnover | | | 239 | % | | | 178 | % | | | 236 | % | | | 188 | % | | | 196 | % | |
4 The investment manager recouped expenses previously reimbursed by the investment manager on behalf of the Portfolio, not to exceed the expense cap.
5 For the year ended July 31, 2007, UBS Global Asset Management (Americas) Inc. reimbursed a portion of its ordinary operating expenses. The ratios net and before fee waivers and/or expense reimbursements are the same since the fee waivers/reimbursement represents less than 0.01%.
See accompanying notes to financial statements.
249
UBS PACE Select Advisors Trust
Financial highlights
UBS PACE Strategic Fixed Income Investments
(concluded)
Selected data for a share of beneficial interest outstanding throughout each year is presented below:
| | | Class P | |
| | | Years ended July 31, | |
| | | 2010 | | 2009 | | 2008 | | 2007 | | 2006 | |
| Net asset value, beginning of year | | $ | 13.08 | | | $ | 13.74 | | | $ | 13.25 | | | $ | 13.26 | | | $ | 13.88 | | |
| Net investment income1 | | | 0.50 | | | | 0.64 | | | | 0.64 | | | | 0.59 | | | | 0.64 | | |
| Net realized and unrealized gains (losses) | | | 1.60 | | | | 0.38 | | | | 0.50 | | | | 0.002 | | | | (0.59 | ) | |
| Net increase from operations | | | 2.10 | | | | 1.02 | | | | 1.14 | | | | 0.59 | | | | 0.05 | | |
| Dividends from net investment income | | | (0.61 | ) | | | (0.76 | ) | | | (0.65 | ) | | | (0.58 | ) | | | (0.65 | ) | |
| Distributions from net realized gains | | | (0.02 | ) | | | (0.92 | ) | | | — | | | | — | | | | — | | |
| Returns of capital | | | — | | | | — | | | | — | | | | (0.02 | ) | | | (0.02 | ) | |
| Total dividends, distributions and returns of capital | | | (0.63 | ) | | | (1.68 | ) | | | (0.65 | ) | | | (0.60 | ) | | | (0.67 | ) | |
| Net asset value, end of year | | $ | 14.55 | | | $ | 13.08 | | | $ | 13.74 | | | $ | 13.25 | | | $ | 13.26 | | |
| Total investment return3 | | | 16.39 | % | | | 8.58 | % | | | 8.62 | % | | | 4.63 | % | | | 0.34 | % | |
| Ratios/supplemental data: | |
| Net assets, end of year (000's) | | $ | 691,186 | | | $ | 584,235 | | | $ | 785,267 | | | $ | 679,623 | | | $ | 539,286 | | |
Expenses to average net assets, net of fee waivers and/or expense reimbursements
by and recoupments to manager, including interest expense | | | 0.81 | % | | | 0.82 | % | | | 0.81 | % | | | 0.93 | %4 | | | 0.93 | % | |
Expenses to average net assets, before fee waivers and/or expense reimbursements
by manager, including interest expense | | | 0.87 | % | | | 0.87 | % | | | 0.89 | % | | | 0.93 | % | | | 0.98 | % | |
Expenses to average net assets, net of fee waivers and/or expense reimbursements
by and recoupments to manager, excluding interest expense | | | 0.81 | % | | | 0.81 | % | | | 0.81 | % | | | 0.93 | %4 | | | 0.93 | % | |
| Net investment income to average net assets | | | 3.62 | % | | | 5.00 | % | | | 4.65 | % | | | 4.40 | % | | | 4.77 | % | |
| Portfolio turnover | | | 239 | % | | | 178 | % | | | 236 | % | | | 188 | % | | | 196 | % | |
1 Calculated using the average shares method.
2 Amount represents less than $0.005 per share.
3 Total investment return is calculated assuming a $10,000 investment on the first day of each year reported, reinvestment of all dividends and other distributions, if any, at net asset value on the ex-dividend dates, and a sale at net asset value on the last day of each year reported. The figures do not include any applicable program or redemption fees; results would be lower if they were included. Returns do not reflect the deduction of taxes that a shareholder would pay on Portfolio distributions or the redemption of Portfolio shares.
4 The investment manager recouped expenses previously reimbursed by the investment manager on behalf of the Portfolio, not to exceed the expense cap.
See accompanying notes to financial statements.
250
(This page has been left blank intentionally)
251
UBS PACE Select Advisors Trust
Financial highlights
UBS PACE Municipal Fixed Income Investments
Selected data for a share of beneficial interest outstanding throughout each year is presented below:
| | | Class A | |
| | | Years ended July 31, | |
| | | 2010 | | 2009 | | 2008 | | 2007 | | 2006 | |
| Net asset value, beginning of year | | $ | 12.45 | | | $ | 12.15 | | | $ | 12.22 | | | $ | 12.27 | | | $ | 12.49 | | |
| Net investment income1 | | | 0.39 | | | | 0.41 | | | | 0.41 | | | | 0.40 | | | | 0.39 | | |
| Net realized and unrealized gains (losses) | | | 0.49 | | | | 0.30 | | | | (0.07 | ) | | | (0.05 | ) | | | (0.22 | ) | |
| Net increase from operations | | | 0.88 | | | | 0.71 | | | | 0.34 | | | | 0.35 | | | | 0.17 | | |
| Dividends from net investment income | | | (0.39 | ) | | | (0.41 | ) | | | (0.41 | ) | | | (0.40 | ) | | | (0.39 | ) | |
| Net asset value, end of year | | $ | 12.94 | | | $ | 12.45 | | | $ | 12.15 | | | $ | 12.22 | | | $ | 12.27 | | |
| Total investment return2 | | | 7.18 | % | | | 5.97 | % | | | 2.81 | % | | | 2.84 | % | | | 1.42 | % | |
| Ratios/supplemental data: | |
| Net assets, end of year (000's) | | $ | 83,501 | | | $ | 88,167 | | | $ | 87,036 | | | $ | 90,219 | | | $ | 99,169 | | |
Expenses to average net assets, net of fee waivers and/or expense
reimbursements by manager | | | 0.93 | % | | | 0.93 | % | | | 0.93 | % | | | 1.01 | % | | | 0.99 | % | |
Expenses to average net assets, before fee waivers and/or expense
reimbursements by manager | | | 0.95 | % | | | 0.96 | % | | | 1.01 | % | | | 1.02 | % | | | 1.04 | % | |
| Net investment income to average net assets | | | 3.08 | % | | | 3.35 | % | | | 3.34 | % | | | 3.21 | % | | | 3.19 | % | |
| Portfolio turnover | | | 10 | % | | | 25 | % | | | 16 | % | | | 48 | % | | | 27 | % | |
| | | Class C | |
| | | Years ended July 31, | |
| | | 2010 | | 2009 | | 2008 | | 2007 | | 2006 | |
| Net asset value, beginning of year | | $ | 12.45 | | | $ | 12.16 | | | $ | 12.22 | | | $ | 12.27 | | | $ | 12.49 | | |
| Net investment income1 | | | 0.33 | | | | 0.35 | | | | 0.35 | | | | 0.33 | | | | 0.33 | | |
| Net realized and unrealized gains (losses) | | | 0.49 | | | | 0.29 | | | | (0.06 | ) | | | (0.05 | ) | | | (0.22 | ) | |
| Net increase from operations | | | 0.82 | | | | 0.64 | | | | 0.29 | | | | 0.28 | | | | 0.11 | | |
| Dividends from net investment income | | | (0.33 | ) | | | (0.35 | ) | | | (0.35 | ) | | | (0.33 | ) | | | (0.33 | ) | |
| Net asset value, end of year | | $ | 12.94 | | | $ | 12.45 | | | $ | 12.16 | | | $ | 12.22 | | | $ | 12.27 | | |
| Total investment return2 | | | 6.65 | % | | | 5.36 | % | | | 2.38 | % | | | 2.32 | % | | | 0.91 | % | |
| Ratios/supplemental data: | |
| Net assets, end of year (000's) | | $ | 15,767 | | | $ | 15,474 | | | $ | 13,905 | | | $ | 14,777 | | | $ | 17,315 | | |
Expenses to average net assets, net of fee waivers and/or expense
reimbursements by manager | | | 1.43 | % | | | 1.43 | % | | | 1.43 | % | | | 1.51 | % | | | 1.50 | % | |
Expenses to average net assets, before fee waivers and/or expense
reimbursements by manager | | | 1.46 | % | | | 1.47 | % | | | 1.52 | % | | | 1.53 | % | | | 1.55 | % | |
| Net investment income to average net assets | | | 2.58 | % | | | 2.85 | % | | | 2.84 | % | | | 2.71 | % | | | 2.68 | % | |
| Portfolio turnover | | | 10 | % | | | 25 | % | | | 16 | % | | | 48 | % | | | 27 | % | |
1 Calculated using the average shares method.
2 Total investment return is calculated assuming a $10,000 investment on the first day of each year reported, reinvestment of all dividends and other distributions, if any, at net asset value on the ex-dividend dates, and a sale at net asset value on the last day of each year reported. The figures do not include any applicable sales charges or redemption fees; results would be lower if they were included. Returns do not reflect the deduction of taxes that a shareholder could pay on Portfolio distributions or the redemption of Portfolio shares.
252
| | | Class B | |
| | | Years ended July 31, | |
| | | 2010 | | 2009 | | 2008 | | 2007 | | 2006 | |
| Net asset value, beginning of year | | $ | 12.46 | | | $ | 12.16 | | | $ | 12.23 | | | $ | 12.27 | | | $ | 12.49 | | |
| Net investment income1 | | | 0.29 | | | | 0.31 | | | | 0.31 | | | | 0.30 | | | | 0.29 | | |
| Net realized and unrealized gains (losses) | | | 0.50 | | | | 0.31 | | | | (0.06 | ) | | | (0.04 | ) | | | (0.21 | ) | |
| Net increase from operations | | | 0.79 | | | | 0.62 | | | | 0.25 | | | | 0.26 | | | | 0.08 | | |
| Dividends from net investment income | | | (0.30 | ) | | | (0.32 | ) | | | (0.32 | ) | | | (0.30 | ) | | | (0.30 | ) | |
| Net asset value, end of year | | $ | 12.95 | | | $ | 12.46 | | | $ | 12.16 | | | $ | 12.23 | | | $ | 12.27 | | |
| Total investment return2 | | | 6.37 | % | | | 5.17 | % | | | 2.05 | % | | | 2.10 | % | | | 0.65 | % | |
| Ratios/supplemental data: | |
| Net assets, end of year (000's) | | $ | 62 | | | $ | 103 | | | $ | 196 | | | $ | 259 | | | $ | 985 | | |
Expenses to average net assets, net of fee waivers and/or expense
reimbursements by manager | | | 1.68 | % | | | 1.68 | % | | | 1.68 | % | | | 1.76 | % | | | 1.74 | % | |
Expenses to average net assets, before fee waivers and/or expense
reimbursements by manager | | | 1.77 | % | | | 1.74 | % | | | 1.89 | % | | | 1.78 | % | | | 1.80 | % | |
| Net investment income to average net assets | | | 2.33 | % | | | 2.63 | % | | | 2.57 | % | | | 2.44 | % | | | 2.43 | % | |
| Portfolio turnover | | | 10 | % | | | 25 | % | | | 16 | % | | | 48 | % | | | 27 | % | |
| | | Class Y | |
| | | Years ended July 31, | |
| | | 2010 | | 2009 | | 2008 | | 2007 | | 2006 | |
| Net asset value, beginning of year | | $ | 12.45 | | | $ | 12.16 | | | $ | 12.23 | | | $ | 12.28 | | | $ | 12.49 | | |
| Net investment income1 | | | 0.42 | | | | 0.44 | | | | 0.44 | | | | 0.43 | | | | 0.43 | | |
| Net realized and unrealized gains (losses) | | | 0.50 | | | | 0.29 | | | | (0.07 | ) | | | (0.05 | ) | | | (0.22 | ) | |
| Net increase from operations | | | 0.92 | | | | 0.73 | | | | 0.37 | | | | 0.38 | | | | 0.21 | | |
| Dividends from net investment income | | | (0.42 | ) | | | (0.44 | ) | | | (0.44 | ) | | | (0.43 | ) | | | (0.42 | ) | |
| Net asset value, end of year | | $ | 12.95 | | | $ | 12.45 | | | $ | 12.16 | | | $ | 12.23 | | | $ | 12.28 | | |
| Total investment return2 | | | 7.45 | % | | | 6.23 | % | | | 3.05 | % | | | 3.09 | % | | | 1.75 | % | |
| Ratios/supplemental data: | |
| Net assets, end of year (000's) | | $ | 123 | | | $ | 145 | | | $ | 136 | | | $ | 137 | | | $ | 176 | | |
Expenses to average net assets, net of fee waivers and/or expense
reimbursements by manager | | | 0.68 | % | | | 0.68 | % | | | 0.68 | % | | | 0.76 | % | | | 0.75 | % | |
Expenses to average net assets, before fee waivers and/or expense
reimbursements by manager | | | 0.74 | % | | | 0.76 | % | | | 0.96 | % | | | 0.83 | % | | | 0.84 | % | |
| Net investment income to average net assets | | | 3.33 | % | | | 3.60 | % | | | 3.59 | % | | | 3.46 | % | | | 3.44 | % | |
| Portfolio turnover | | | 10 | % | | | 25 | % | | | 16 | % | | | 48 | % | | | 27 | % | |
See accompanying notes to financial statements.
253
UBS PACE Select Advisors Trust
Financial highlights
UBS PACE Municipal Fixed Income Investments
(concluded)
Selected data for a share of beneficial interest outstanding throughout each year is presented below:
| | | Class P | |
| | | Years ended July 31, | |
| | | 2010 | | 2009 | | 2008 | | 2007 | | 2006 | |
| Net asset value, beginning of year | | $ | 12.45 | | | $ | 12.16 | | | $ | 12.22 | | | $ | 12.27 | | | $ | 12.49 | | |
| Net investment income1 | | | 0.42 | | | | 0.44 | | | | 0.44 | | | | 0.43 | | | | 0.42 | | |
| Net realized and unrealized gains (losses) | | | 0.50 | | | | 0.29 | | | | (0.06 | ) | | | (0.05 | ) | | | (0.22 | ) | |
| Net increase from operations | | | 0.92 | | | | 0.73 | | | | 0.38 | | | | 0.38 | | | | 0.20 | | |
| Dividends from net investment income | | | (0.42 | ) | | | (0.44 | ) | | | (0.44 | ) | | | (0.43 | ) | | | (0.42 | ) | |
| Net asset value, end of year | | $ | 12.95 | | | $ | 12.45 | | | $ | 12.16 | | | $ | 12.22 | | | $ | 12.27 | | |
| Total investment return2 | | | 7.54 | % | | | 6.14 | % | | | 3.14 | % | | | 3.10 | % | | | 1.66 | % | |
| Ratios/supplemental data: | |
| Net assets, end of year (000's) | | $ | 229,028 | | | $ | 187,814 | | | $ | 242,033 | | | $ | 194,370 | | | $ | 140,320 | | |
Expenses to average net assets, net of fee waivers and/or expense
reimbursements by manager | | | 0.68 | % | | | 0.68 | % | | | 0.68 | % | | | 0.76 | % | | | 0.76 | % | |
Expenses to average net assets, before fee waivers and/or expense
reimbursements by manager | | | 0.74 | % | | | 0.74 | % | | | 0.79 | % | | | 0.81 | % | | | 0.84 | % | |
| Net investment income to average net assets | | | 3.33 | % | | | 3.61 | % | | | 3.59 | % | | | 3.47 | % | | | 3.43 | % | |
| Portfolio turnover | | | 10 | % | | | 25 | % | | | 16 | % | | | 48 | % | | | 27 | % | |
1 Calculated using the average shares method.
2 Total investment return is calculated assuming a $10,000 investment on the first day of each year reported, reinvestment of all dividends and other distributions, if any, at net asset value on the ex-dividend dates, and a sale at net asset value on the last day of each year reported. The figures do not include any applicable program or redemption fees; results would be lower if they were included. Returns do not reflect the deduction of taxes that a shareholder could pay on Portfolio distributions or the redemption of Portfolio shares.
See accompanying notes to financial statements.
254
(This page has been left blank intentionally)
255
UBS PACE Select Advisors Trust
Financial highlights
UBS PACE Global Fixed Income Investments
Selected data for a share of beneficial interest outstanding throughout each year is presented below:
| | | Class A | |
| | | Years ended July 31, | |
| | | 2010 | | 2009 | | 20081 | | 2007 | | 2006 | |
| Net asset value, beginning of year | | $ | 11.64 | | | $ | 11.84 | | | $ | 11.38 | | | $ | 11.20 | | | $ | 11.76 | | |
| Net investment income2 | | | 0.27 | | | | 0.30 | | | | 0.25 | | | | 0.25 | | | | 0.25 | | |
| Net realized and unrealized gains (losses) | | | 0.24 | | | | (0.06 | ) | | | 1.14 | | | | 0.23 | | | | (0.06 | ) | |
| Net increase from operations | | | 0.51 | | | | 0.24 | | | | 1.39 | | | | 0.48 | | | | 0.19 | | |
| Dividends from net investment income | | | (0.70 | ) | | | (0.44 | ) | | | (0.93 | ) | | | (0.30 | ) | | | (0.57 | ) | |
| Distributions from net realized gains | | | — | | | | — | | | | — | | | | — | | | | (0.18 | ) | |
| Return of capital | | | (0.02 | ) | | | — | | | | — | | | | — | | | | — | | |
| Total dividends and distributions | | | (0.72 | ) | | | (0.44 | ) | | | (0.93 | ) | | | (0.30 | ) | | | (0.75 | ) | |
| Net asset value, end of year | | $ | 11.43 | | | $ | 11.64 | | | $ | 11.84 | | | $ | 11.38 | | | $ | 11.20 | | |
| Total investment return3 | | | 4.32 | % | | | 2.35 | % | | | 12.76 | % | | | 4.36 | % | | | 1.86 | % | |
| Ratios/supplemental data: | |
| Net assets, end of year (000's) | | $ | 98,039 | | | $ | 103,708 | | | $ | 118,784 | | | $ | 111,910 | | | $ | 124,045 | | |
Expenses to average net assets, net of fee waivers and/or expense
reimbursements by and recoupments to manager | | | 1.25 | %4 | | | 1.25 | % | | | 1.25 | % | | | 1.37 | % | | | 1.37 | % | |
Expenses to average net assets, before fee waivers and/or expense
reimbursements by manager | | | 1.30 | % | | | 1.32 | % | | | 1.35 | % | | | 1.37 | % | | | 1.40 | % | |
| Net investment income to average net assets | | | 2.30 | % | | | 2.83 | % | | | 2.07 | % | | | 2.23 | % | | | 2.25 | % | |
| Portfolio turnover | | | 67 | % | | | 37 | % | | | 65 | % | | | 111 | % | | | 175 | % | |
| | | Class C | |
| | | Years ended July 31, | |
| | | 2010 | | 2009 | | 20081 | | 2007 | | 2006 | |
| Net asset value, beginning of year | | $ | 11.64 | | | $ | 11.85 | | | $ | 11.38 | | | $ | 11.20 | | | $ | 11.76 | | |
| Net investment income2 | | | 0.21 | | | | 0.25 | | | | 0.19 | | | | 0.20 | | | | 0.20 | | |
| Net realized and unrealized gains (losses) | | | 0.24 | | | | (0.08 | ) | | | 1.15 | | | | 0.23 | | | | (0.06 | ) | |
| Net increase from operations | | | 0.45 | | | | 0.17 | | | | 1.34 | | | | 0.43 | | | | 0.14 | | |
| Dividends from net investment income | | | (0.64 | ) | | | (0.38 | ) | | | (0.87 | ) | | | (0.25 | ) | | | (0.52 | ) | |
| Distributions from net realized gains | | | — | | | | — | | | | — | | | | — | | | | (0.18 | ) | |
| Return of capital | | | (0.02 | ) | | | — | | | | — | | | | — | | | | — | | |
| Total dividends and distributions | | | (0.66 | ) | | | (0.38 | ) | | | (0.87 | ) | | | (0.25 | ) | | | (0.70 | ) | |
| Net asset value, end of year | | $ | 11.43 | | | $ | 11.64 | | | $ | 11.85 | | | $ | 11.38 | | | $ | 11.20 | | |
| Total investment return3 | | | 3.81 | % | | | 1.85 | % | | | 12.20 | % | | | 3.86 | % | | | 1.35 | % | |
| Ratios/supplemental data: | |
| Net assets, end of year (000's) | | $ | 7,154 | | | $ | 7,234 | | | $ | 7,161 | | | $ | 6,347 | | | $ | 7,499 | | |
Expenses to average net assets, net of fee waivers and/or expense
reimbursements by and recoupments to manager | | | 1.72 | %4 | | | 1.75 | %4 | | | 1.75 | % | | | 1.85 | % | | | 1.87 | % | |
Expenses to average net assets, before fee waivers and/or expense
reimbursements by manager | | | 1.77 | % | | | 1.80 | % | | | 1.84 | % | | | 1.85 | % | | | 1.89 | % | |
| Net investment income to average net assets | | | 1.83 | % | | | 2.32 | % | | | 1.57 | % | | | 1.74 | % | | | 1.75 | % | |
| Portfolio turnover | | | 67 | % | | | 37 | % | | | 65 | % | | | 111 | % | | | 175 | % | |
1 Effective August 23, 2007, Rogge Global Partners plc ("Rogge") assumed the role of sole manager of the Portfolio. Prior to August 23, 2007, the investment advisory function for this Portfolio was performed by Rogge and Fischer Francis Trees & Watts, Inc., who were each responsible for a portion of the Portfolio.
2 Calculated using the average shares method.
3 Total investment return is calculated assuming a $10,000 investment on the first day of each year reported, reinvestment of all dividends and other distributions, if any, at net asset value on the ex-dividend dates, and a sale at net asset value on the last day of each year reported. The figures do not include any applicable sales charges or redemption fees; results would be lower if they were included. Returns do not reflect the deduction of taxes that a shareholder would pay on Portfolio distributions or the redemption of Portfolio shares.
4 The investment manager recouped expenses previously reimbursed by the investment manager on behalf of the Portfolio, not to exceed the expense cap.
256
| | | Class B | |
| | | Years ended July 31, | |
| | | 2010 | | 2009 | | 20081 | | 2007 | | 2006 | |
| Net asset value, beginning of year | | $ | 11.68 | | | $ | 11.87 | | | $ | 11.40 | | | $ | 11.22 | | | $ | 11.78 | | |
| Net investment income2 | | | 0.18 | | | | 0.22 | | | | 0.15 | | | | 0.16 | | | | 0.17 | | |
| Net realized and unrealized gains (losses) | | | 0.23 | | | | (0.06 | ) | | | 1.16 | | | | 0.24 | | | | (0.06 | ) | |
| Net increase from operations | | | 0.41 | | | | 0.16 | | | | 1.31 | | | | 0.40 | | | | 0.11 | | |
| Dividends from net investment income | | | (0.61 | ) | | | (0.35 | ) | | | (0.84 | ) | | | (0.22 | ) | | | (0.49 | ) | |
| Distributions from net realized gains | | | — | | | | — | | | | — | | | | — | | | | (0.18 | ) | |
| Return of capital | | | (0.02 | ) | | | — | | | | — | | | | — | | | | — | | |
| Total dividends and distributions | | | (0.63 | ) | | | (0.35 | ) | | | (0.84 | ) | | | (0.22 | ) | | | (0.67 | ) | |
| Net asset value, end of year | | $ | 11.46 | | | $ | 11.68 | | | $ | 11.87 | | | $ | 11.40 | | | $ | 11.22 | | |
| Total investment return3 | | | 3.51 | % | | | 1.64 | % | | | 11.89 | % | | | 3.57 | % | | | 1.08 | % | |
| Ratios/supplemental data: | |
| Net assets, end of year (000's) | | $ | 166 | | | $ | 191 | | | $ | 505 | | | $ | 723 | | | $ | 878 | | |
Expenses to average net assets, net of fee waivers and/or expense
reimbursements by and recoupments to manager | | | 2.00 | % | | | 2.00 | % | | | 2.00 | % | | | 2.13 | % | | | 2.12 | % | |
Expenses to average net assets, before fee waivers and/or expense
reimbursements by manager | | | 2.09 | % | | | 2.10 | % | | | 2.15 | % | | | 2.13 | % | | | 2.16 | % | |
| Net investment income to average net assets | | | 1.55 | % | | | 2.11 | % | | | 1.31 | % | | | 1.47 | % | | | 1.50 | % | |
| Portfolio turnover | | | 67 | % | | | 37 | % | | | 65 | % | | | 111 | % | | | 175 | % | |
| | | Class Y | |
| | | Years ended July 31, | |
| | | 2010 | | 2009 | | 20081 | | 2007 | | 2006 | |
| Net asset value, beginning of year | | $ | 11.63 | | | $ | 11.83 | | | $ | 11.36 | | | $ | 11.19 | | | $ | 11.75 | | |
| Net investment income2 | | | 0.30 | | | | 0.34 | | | | 0.29 | | | | 0.29 | | | | 0.29 | | |
| Net realized and unrealized gains (losses) | | | 0.23 | | | | (0.07 | ) | | | 1.15 | | | | 0.22 | | | | (0.06 | ) | |
| Net increase from operations | | | 0.53 | | | | 0.27 | | | | 1.44 | | | | 0.51 | | | | 0.23 | | |
| Dividends from net investment income | | | (0.74 | ) | | | (0.47 | ) | | | (0.97 | ) | | | (0.34 | ) | | | (0.61 | ) | |
| Distributions from net realized gains | | | — | | | | — | | | | — | | | | — | | | | (0.18 | ) | |
| Return of capital | | | (0.02 | ) | | | — | | | | — | | | | — | | | | — | | |
| Total dividends and distributions | | | (0.76 | ) | | | (0.47 | ) | | | (0.97 | ) | | | (0.34 | ) | | | (0.79 | ) | |
| Net asset value, end of year | | $ | 11.40 | | | $ | 11.63 | | | $ | 11.83 | | | $ | 11.36 | | | $ | 11.19 | | |
| Total investment return3 | | | 4.68 | % | | | 2.71 | % | | | 13.16 | % | | | 4.67 | % | | | 2.21 | % | |
| Ratios/supplemental data: | |
| Net assets, end of year (000's) | | $ | 5,825 | | | $ | 7,773 | | | $ | 10,253 | | | $ | 7,113 | | | $ | 7,077 | | |
Expenses to average net assets, net of fee waivers and/or expense
reimbursements by and recoupments to manager | | | 0.96 | % | | | 0.89 | % | | | 0.93 | % | | | 1.03 | %4 | | | 1.05 | %4 | |
Expenses to average net assets, before fee waivers and/or expense
reimbursements by manager | | | 1.01 | % | | | 0.94 | % | | | 0.99 | % | | | 1.03 | % | | | 1.05 | % | |
| Net investment income to average net assets | | | 2.57 | % | | | 3.19 | % | | | 2.40 | % | | | 2.58 | % | | | 2.57 | % | |
| Portfolio turnover | | | 67 | % | | | 37 | % | | | 65 | % | | | 111 | % | | | 175 | % | |
See accompanying notes to financial statements.
257
UBS PACE Select Advisors Trust
Financial highlights
UBS PACE Global Fixed Income Investments
(concluded)
Selected data for a share of beneficial interest outstanding throughout each year is presented below:
| | | Class P | |
| | | Years ended July 31, | |
| | | 2010 | | 2009 | | 20081 | | 2007 | | 2006 | |
| Net asset value, beginning of year | | $ | 11.64 | | | $ | 11.84 | | | $ | 11.38 | | | $ | 11.20 | | | $ | 11.76 | | |
| Net investment income2 | | | 0.30 | | | | 0.33 | | | | 0.28 | | | | 0.28 | | | | 0.28 | | |
| Net realized and unrealized gains (losses) | | | 0.23 | | | | (0.07 | ) | | | 1.14 | | | | 0.23 | | | | (0.06 | ) | |
| Net increase from operations | | | 0.53 | | | | 0.26 | | | | 1.42 | | | | 0.51 | | | | 0.22 | | |
| Dividends from net investment income | | | (0.72 | ) | | | (0.46 | ) | | | (0.96 | ) | | | (0.33 | ) | | | (0.60 | ) | |
| Distributions from net realized gains | | | — | | | | — | | | | — | | | | — | | | | (0.18 | ) | |
| Return of capital | | | (0.02 | ) | | | — | | | | — | | | | — | | | | — | | |
| Total dividends and distributions | | | (0.74 | ) | | | (0.46 | ) | | | (0.96 | ) | | | (0.33 | ) | | | (0.78 | ) | |
| Net asset value, end of year | | $ | 11.43 | | | $ | 11.64 | | | $ | 11.84 | | | $ | 11.38 | | | $ | 11.20 | | |
| Total investment return3 | | | 4.65 | % | | | 2.60 | % | | | 12.95 | % | | | 4.62 | % | | | 2.11 | % | |
| Ratios/supplemental data: | |
| Net assets, end of year (000's) | | $ | 404,680 | | | $ | 364,616 | | | $ | 534,097 | | | $ | 440,787 | | | $ | 349,676 | | |
Expenses to average net assets, net of fee waivers and/or expense
reimbursements by manager | | | 1.00 | % | | | 1.00 | % | | | 1.00 | % | | | 1.13 | % | | | 1.13 | % | |
Expenses to average net assets, before fee waivers and/or expense
reimbursements by manager | | | 1.15 | % | | | 1.17 | % | | | 1.18 | % | | | 1.22 | % | | | 1.27 | % | |
| Net investment income to average net assets | | | 2.56 | % | | | 3.09 | % | | | 2.32 | % | | | 2.49 | % | | | 2.49 | % | |
| Portfolio turnover | | | 67 | % | | | 37 | % | | | 65 | % | | | 111 | % | | | 175 | % | |
1 Effective August 23, 2007, Rogge Global Partners plc ("Rogge") assumed the role of sole manager of the Portfolio. Prior to August 23, 2007, the investment advisory function for this Portfolio was performed by Rogge and Fischer Francis Trees & Watts, Inc., who were each responsible for a portion of the Portfolio.
2 Calculated using the average shares method.
3 Total investment return is calculated assuming a $10,000 investment on the first day of each year reported, reinvestment of all dividends and other distributions, if any, at net asset value on the ex-dividend dates, and a sale at net asset value on the last day of each year reported. The figures do not include any applicable program or redemption fees; results would be lower if they were included. Returns do not reflect the deduction of taxes that a shareholder would pay on Portfolio distributions or the redemption of Portfolio shares.
See accompanying notes to financial statements.
258
(This page has been left blank intentionally)
259
UBS PACE Select Advisors Trust
Financial highlights
UBS PACE High Yield Investments
Selected data for a share of beneficial interest outstanding throughout each period is presented below:
| | | Class A | |
| | | Years ended July 31, | | Period ended
July 31, | |
| | | 2010 | | 2009 | | 2008 | | 2007 | | 20061 | |
| Net asset value, beginning of period | | $ | 8.94 | | | $ | 9.04 | | | $ | 9.60 | | | $ | 9.81 | | | $ | 9.95 | | |
| Net investment income6 | | | 0.82 | | | | 0.66 | | | | 0.60 | | | | 0.60 | | | | 0.11 | | |
| Net realized and unrealized gains (losses) | | | 1.21 | | | | 0.02 | | | | (0.54 | ) | | | (0.23 | ) | | | (0.10 | ) | |
| Net increase (decrease) from operations | | | 2.03 | | | | 0.68 | | | | 0.06 | | | | 0.37 | | | | 0.01 | | |
| Dividends from net investment income | | | (0.74 | ) | | | (0.78 | ) | | | (0.59 | ) | | | (0.58 | ) | | | (0.15 | ) | |
| Distributions from net realized gains | | | (0.06 | ) | | | — | | | | (0.01 | ) | | | — | | | | — | | |
| Return of capital | | | — | | | | — | | | | (0.02 | ) | | | — | | | | — | | |
| Total dividends, distributions and return of capital | | | (0.80 | ) | | | (0.78 | ) | | | (0.62 | ) | | | (0.58 | ) | | | (0.15 | ) | |
| Net asset value, end of period | | $ | 10.17 | | | $ | 8.94 | | | $ | 9.04 | | | $ | 9.60 | | | $ | 9.81 | | |
| Total investment return7 | | | 23.35 | % | | | 9.49 | % | | | 0.58 | % | | | 3.66 | % | | | 0.15 | % | |
| Ratios/supplemental data: | |
| Net assets, end of period (000's) | | $ | 13,158 | | | $ | 7,538 | | | $ | 2,181 | | | $ | 741 | | | $ | 345 | | |
Expenses to average net assets, net of fee waivers and/or expense
reimbursements by and recoupments to manager | | | 1.35 | %8 | | | 1.35 | % | | | 1.35 | % | | | 1.35 | % | | | 1.35 | %9 | |
Expenses to average net assets, before fee waivers and/or expense
reimbursements by manager | | | 1.35 | % | | | 1.46 | % | | | 1.59 | % | | | 1.96 | % | | | 7.56 | %9 | |
| Net investment income to average net assets | | | 8.36 | % | | | 8.46 | % | | | 6.43 | % | | | 5.96 | % | | | 6.04 | %9 | |
| Portfolio turnover | | | 30 | % | | | 49 | % | | | 25 | % | | | 26 | % | | | 39 | % | |
| | | Class P | |
| | | Years ended July 31, | | Period ended
July 31, | |
| | | 2010 | | 2009 | | 2008 | | 2007 | | 20065 | |
| Net asset value, beginning of period | | $ | 8.95 | | | $ | 9.04 | | | $ | 9.61 | | | $ | 9.81 | | | $ | 9.95 | | |
| Net investment income6 | | | 0.85 | | | | 0.69 | | | | 0.63 | | | | 0.62 | | | | 0.14 | | |
| Net realized and unrealized gains (losses) | | | 1.20 | | | | 0.02 | | | | (0.56 | ) | | | (0.22 | ) | | | (0.09 | ) | |
| Net increase from operations | | | 2.05 | | | | 0.71 | | | | 0.07 | | | | 0.40 | | | | 0.05 | | |
| Dividends from net investment income | | | (0.76 | ) | | | (0.80 | ) | | | (0.61 | ) | | | (0.60 | ) | | | (0.19 | ) | |
| Distributions from net realized gains | | | (0.06 | ) | | | — | | | | (0.01 | ) | | | — | | | | — | | |
| Return of capital | | | — | | | | — | | | | (0.02 | ) | | | — | | | | — | | |
| Total dividends, distributions and return of capital | | | (0.82 | ) | | | (0.80 | ) | | | (0.64 | ) | | | (0.60 | ) | | | (0.19 | ) | |
| Net asset value, end of period | | $ | 10.18 | | | $ | 8.95 | | | $ | 9.04 | | | $ | 9.61 | | | $ | 9.81 | | |
| Total investment return7 | | | 23.60 | % | | | 9.87 | % | | | 0.71 | % | | | 3.96 | % | | | 0.56 | % | |
| Ratios/supplemental data: | |
| Net assets, end of period (000's) | | $ | 209,650 | | | $ | 147,029 | | | $ | 142,985 | | | $ | 87,171 | | | $ | 11,103 | | |
Expenses to average net assets, net of fee waivers and/or expense
reimbursements by manager | | | 1.10 | % | | | 1.10 | % | | | 1.10 | % | | | 1.10 | % | | | 1.10 | %9 | |
Expenses to average net assets, before fee waivers and/or expense
reimbursements by manager | | | 1.19 | % | | | 1.34 | % | | | 1.31 | % | | | 1.72 | % | | | 8.16 | %9 | |
| Net investment income to average net assets | | | 8.60 | % | | | 8.80 | % | | | 6.68 | % | | | 6.24 | % | | | 6.34 | %9 | |
| Portfolio turnover | | | 30 | % | | | 49 | % | | | 25 | % | | | 26 | % | | | 39 | % | |
1 For the period May 1, 2006 (commencement of issuance) through July 31, 2006.
2 For the period January 21, 2009 (commencement of issuance) through July 31, 2009.
3 For the period December 26, 2008 (recommencement of issuance) through July 31, 2009.
4 For the period April 3, 2006 (commencement of issuance) through July 24, 2006. There were no shares outstanding from July 25, 2006 through December 25, 2008.
5 For the period April 10, 2006 (commencement of issuance) through July 31, 2006.
6 Calculated using the average shares method.
260
| | | Class C | | Class Y | |
| | | Year ended
July 31, | | Period ended
July 31, | | Year ended
July 31, | | Period ended
July 31, | | Period ended
July 24, | |
| | | 2010 | | 20092 | | 2010 | | 20093 | | 20064 | |
| Net asset value, beginning of period | | $ | 8.93 | | | $ | 7.49 | | | $ | 8.95 | | | $ | 6.83 | | | $ | 10.00 | | |
| Net investment income6 | | | 0.77 | | | | 0.29 | | | | 0.85 | | | | 0.42 | | | | 0.17 | | |
| Net realized and unrealized gains (losses) | | | 1.21 | | | | 1.54 | | | | 1.22 | | | | 2.11 | | | | (0.22 | ) | |
| Net increase (decrease) from operations | | | 1.98 | | | | 1.83 | | | | 2.07 | | | | 2.53 | | | | (0.05 | ) | |
| Dividends from net investment income | | | (0.69 | ) | | | (0.39 | ) | | | (0.76 | ) | | | (0.41 | ) | | | (0.14 | ) | |
| Distributions from net realized gains | | | (0.06 | ) | | | — | | | | (0.06 | ) | | | — | | | | — | | |
| Return of capital | | | — | | | | — | | | | — | | | | — | | | | — | | |
| Total dividends, distributions and return of capital | | | (0.75 | ) | | | (0.39 | ) | | | (0.82 | ) | | | (0.41 | ) | | | (0.14 | ) | |
| Net asset value, end of period | | $ | 10.16 | | | $ | 8.93 | | | $ | 10.20 | | | $ | 8.95 | | | $ | 9.81 | | |
| Total investment return7 | | | 22.81 | % | | | 25.40 | % | | | 23.82 | % | | | 38.23 | % | | | (0.45 | )% | |
| Ratios/supplemental data: | |
| Net assets, end of period (000's) | | $ | 2,834 | | | $ | 1,819 | | | $ | 9 | | | $ | 7 | | | $ | — | | |
Expenses to average net assets, net of fee waivers and/or expense
reimbursements by and recoupments to manager | | | 1.81 | %8 | | | 1.85 | %9 | | | 1.10 | % | | | 1.10 | %9 | | | 1.10 | %9 | |
Expenses to average net assets, before fee waivers and/or expense
reimbursements by manager | | | 1.81 | % | | | 1.92 | %9 | | | 1.10 | % | | | 1.37 | %9 | | | 2.32 | %9 | |
| Net investment income to average net assets | | | 7.91 | % | | | 6.96 | %9 | | | 8.61 | % | | | 9.13 | %9 | | | 5.94 | %9 | |
| Portfolio turnover | | | 30 | % | | | 49 | % | | | 30 | % | | | 49 | % | | | 39 | % | |
7 Total investment return is calculated assuming a $10,000 investment on the first day of each period reported, reinvestment of all dividends and other distributions, if any, at net asset value on the ex-dividend dates, and a sale at net asset value on the last day of each period reported. The figures do not include any applicable sales charges, redemption fees or program fees; results would be lower if they were included. Total investment return for periods of less than one year has not been annualized. Returns do not reflect the deduction of taxes that a shareholder would pay on Portfolio distributions or the redemption of Portfolio shares.
8 The investment manager recouped expenses previously reimbursed by the investment manager on behalf of the Portfolio, not to exceed the expense cap.
9 Annualized.
See accompanying notes to financial statements.
261
UBS PACE Select Advisors Trust
Financial highlights
UBS PACE Large Co Value Equity Investments
Selected data for a share of beneficial interest outstanding throughout each year is presented below:
| | | Class A | |
| | | Years ended July 31, | |
| | | 2010 | | 2009 | | 20081 | | 2007 | | 2006 | |
| Net asset value, beginning of year | | $ | 13.16 | | | $ | 16.67 | | | $ | 22.41 | | | $ | 22.35 | | | $ | 20.64 | | |
| Net investment income (loss)2 | | | 0.12 | | | | 0.19 | | | | 0.25 | | | | 0.23 | | | | 0.22 | | |
| Net realized and unrealized gains (losses) | | | 1.62 | | | | (3.44 | ) | | | (3.34 | ) | | | 2.80 | | | | 2.16 | | |
| Net increase (decrease) from operations | | | 1.74 | | | | (3.25 | ) | | | (3.09 | ) | | | 3.03 | | | | 2.38 | | |
| Dividends from net investment income | | | (0.14 | ) | | | (0.26 | ) | | | (0.11 | ) | | | (0.23 | ) | | | (0.20 | ) | |
| Distributions from net realized gains | | | — | | | | — | | | | (2.54 | ) | | | (2.74 | ) | | | (0.47 | ) | |
| Total dividends and distributions | | | (0.14 | ) | | | (0.26 | ) | | | (2.65 | ) | | | (2.97 | ) | | | (0.67 | ) | |
| Net asset value, end of year | | $ | 14.76 | | | $ | 13.16 | | | $ | 16.67 | | | $ | 22.41 | | | $ | 22.35 | | |
| Total investment return4 | | | 13.20 | % | | | (19.27 | )% | | | (15.56 | )% | | | 13.94 | % | | | 11.77 | % | |
| Ratios/supplemental data: | |
| Net assets, end of year (000's) | | $ | 143,284 | | | $ | 146,510 | | | $ | 217,986 | | | $ | 291,942 | | | $ | 292,632 | | |
Expenses to average net assets, net of fee waivers and/or expense
reimbursements by and recoupments to manager | | | 1.20 | % | | | 1.24 | % | | | 1.09 | % | | | 1.08 | % | | | 1.14 | %5 | |
Expenses to average net assets, before fee waivers and/or expense
reimbursements by manager | | | 1.20 | % | | | 1.24 | % | | | 1.22 | % | | | 1.21 | % | | | 1.27 | % | |
| Net investment income (loss) to average net assets | | | 0.81 | % | | | 1.52 | % | | | 1.26 | % | | | 0.99 | % | | | 1.03 | % | |
| Portfolio turnover | | | 61 | % | | | 87 | % | | | 161 | % | | | 105 | % | | | 95 | % | |
| | | Class C | |
| | | Years ended July 31, | |
| | | 2010 | | 2009 | | 20081 | | 2007 | | 2006 | |
| Net asset value, beginning of year | | $ | 13.15 | | | $ | 16.59 | | | $ | 22.36 | | | $ | 22.29 | | | $ | 20.58 | | |
| Net investment income (loss)2 | | | (0.00 | )3 | | | 0.09 | | | | 0.09 | | | | 0.05 | | | | 0.05 | | |
| Net realized and unrealized gains (losses) | | | 1.61 | | | | (3.41 | ) | | | (3.32 | ) | | | 2.80 | | | | 2.15 | | |
| Net increase (decrease) from operations | | | 1.61 | | | | (3.32 | ) | | | (3.23 | ) | | | 2.85 | | | | 2.20 | | |
| Dividends from net investment income | | | (0.03 | ) | | | (0.12 | ) | | | — | | | | (0.04 | ) | | | (0.02 | ) | |
| Distributions from net realized gains | | | — | | | | — | | | | (2.54 | ) | | | (2.74 | ) | | | (0.47 | ) | |
| Total dividends and distributions | | | (0.03 | ) | | | (0.12 | ) | | | (2.54 | ) | | | (2.78 | ) | | | (0.49 | ) | |
| Net asset value, end of year | | $ | 14.73 | | | $ | 13.15 | | | $ | 16.59 | | | $ | 22.36 | | | $ | 22.29 | | |
| Total investment return4 | | | 12.31 | % | | | (19.89 | )% | | | (16.24 | )% | | | 13.11 | % | | | 10.86 | % | |
| Ratios/supplemental data: | |
| Net assets, end of year (000's) | | $ | 15,272 | | | $ | 16,560 | | | $ | 24,765 | | | $ | 35,110 | | | $ | 36,374 | | |
Expenses to average net assets, net of fee waivers and/or expense
reimbursements by and recoupments to manager | | | 2.02 | %5 | | | 2.02 | % | | | 1.88 | % | | | 1.86 | % | | | 1.93 | %5 | |
Expenses to average net assets, before fee waivers and/or expense
reimbursements by manager | | | 2.02 | % | | | 2.05 | % | | | 2.01 | % | | | 2.00 | % | | | 2.06 | % | |
| Net investment income (loss) to average net assets | | | (0.01 | )% | | | 0.74 | % | | | 0.47 | % | | | 0.21 | % | | | 0.24 | % | |
| Portfolio turnover | | | 61 | % | | | 87 | % | | | 161 | % | | | 105 | % | | | 95 | % | |
1 A portion of the investment advisory function for this Portfolio was transferred from SSgA Funds Management, Inc. to Pzena Investment Management, LLC on May 27, 2008. Institutional Capital LLC and Westwood Management Corp. continue to provide a portion of the investment advisory function.
2 Calculated using the average shares method.
3 Amount represents less than $0.005 per share.
4 Total investment return is calculated assuming a $10,000 investment on the first day of each year reported, reinvestment of all dividends and other distributions, if any, at net asset value on the ex-dividend dates, and a sale at net asset value on the last day of each year reported. The figures do not include any applicable sales charges or redemption fees; results would be lower if they were included. Returns do not reflect the deduction of taxes that a shareholder would pay on Portfolio distributions or the redemption of Portfolio shares.
5 The investment manager recouped expenses previously reimbursed by the investment manager on behalf of the Portfolio, not to exceed the expense cap.
262
| | | Class B | |
| | | Years ended July 31, | |
| | | 2010 | | 2009 | | 20081 | | 2007 | | 2006 | |
| Net asset value, beginning of year | | $ | 13.20 | | | $ | 16.62 | | | $ | 22.43 | | | $ | 22.34 | | | $ | 20.62 | | |
| Net investment income (loss)2 | | | (0.00 | )3 | | | 0.09 | | | | 0.06 | | | | 0.04 | | | | 0.03 | | |
| Net realized and unrealized gains (losses) | | | 1.62 | | | | (3.41 | ) | | | (3.33 | ) | | | 2.79 | | | | 2.16 | | |
| Net increase (decrease) from operations | | | 1.62 | | | | (3.32 | ) | | | (3.27 | ) | | | 2.83 | | | | 2.19 | | |
| Dividends from net investment income | | | — | | | | (0.10 | ) | | | — | | | | — | | | | — | | |
| Distributions from net realized gains | | | — | | | | — | | | | (2.54 | ) | | | (2.74 | ) | | | (0.47 | ) | |
| Total dividends and distributions | | | — | | | | (0.10 | ) | | | (2.54 | ) | | | (2.74 | ) | | | (0.47 | ) | |
| Net asset value, end of year | | $ | 14.82 | | | $ | 13.20 | | | $ | 16.62 | | | $ | 22.43 | | | $ | 22.34 | | |
| Total investment return4 | | | 12.35 | % | | | (19.92 | )% | | | (16.38 | )% | | | 13.00 | % | | | 10.77 | % | |
| Ratios/supplemental data: | |
| Net assets, end of year (000's) | | $ | 165 | | | $ | 405 | | | $ | 765 | | | $ | 1,872 | | | $ | 5,289 | | |
Expenses to average net assets, net of fee waivers and/or expense
reimbursements by and recoupments to manager | | | 2.02 | % | | | 2.02 | % | | | 2.02 | % | | | 1.98 | % | | | 2.00 | % | |
Expenses to average net assets, before fee waivers and/or expense
reimbursements by manager | | | 2.33 | % | | | 2.30 | % | | | 2.16 | % | | | 2.11 | % | | | 2.13 | % | |
| Net investment income (loss) to average net assets | | | (0.02 | )% | | | 0.76 | % | | | 0.29 | % | | | 0.18 | % | | | 0.16 | % | |
| Portfolio turnover | | | 61 | % | | | 87 | % | | | 161 | % | | | 105 | % | | | 95 | % | |
| | | Class Y | |
| | | Years ended July 31, | |
| | | 2010 | | 2009 | | 20081 | | 2007 | | 2006 | |
| Net asset value, beginning of year | | $ | 13.21 | | | $ | 16.75 | | | $ | 22.51 | | | $ | 22.45 | | | $ | 20.70 | | |
| Net investment income (loss)2 | | | 0.16 | | | | 0.23 | | | | 0.32 | | | | 0.30 | | | | 0.30 | | |
| Net realized and unrealized gains (losses) | | | 1.63 | | | | (3.45 | ) | | | (3.35 | ) | | | 2.82 | | | | 2.17 | | |
| Net increase (decrease) from operations | | | 1.79 | | | | (3.22 | ) | | | (3.03 | ) | | | 3.12 | | | | 2.47 | | |
| Dividends from net investment income | | | (0.19 | ) | | | (0.32 | ) | | | (0.19 | ) | | | (0.32 | ) | | | (0.25 | ) | |
| Distributions from net realized gains | | | — | | | | — | | | | (2.54 | ) | | | (2.74 | ) | | | (0.47 | ) | |
| Total dividends and distributions | | | (0.19 | ) | | | (0.32 | ) | | | (2.73 | ) | | | (3.06 | ) | | | (0.72 | ) | |
| Net asset value, end of year | | $ | 14.81 | | | $ | 13.21 | | | $ | 16.75 | | | $ | 22.51 | | | $ | 22.45 | | |
| Total investment return4 | | | 13.55 | % | | | (18.93 | )% | | | (15.30 | )% | | | 14.36 | % | | | 12.20 | % | |
| Ratios/supplemental data: | |
| Net assets, end of year (000's) | | $ | 17,345 | | | $ | 23,834 | | | $ | 33,809 | | | $ | 45,177 | | | $ | 43,234 | | |
Expenses to average net assets, net of fee waivers and/or expense
reimbursements by and recoupments to manager | | | 0.89 | % | | | 0.86 | % | | | 0.76 | % | | | 0.74 | % | | | 0.77 | % | |
Expenses to average net assets, before fee waivers and/or expense
reimbursements by manager | | | 0.89 | % | | | 0.86 | % | | | 0.89 | % | | | 0.88 | % | | | 0.90 | % | |
| Net investment income (loss) to average net assets | | | 1.11 | % | | | 1.90 | % | | | 1.59 | % | | | 1.32 | % | | | 1.40 | % | |
| Portfolio turnover | | | 61 | % | | | 87 | % | | | 161 | % | | | 105 | % | | | 95 | % | |
See accompanying notes to financial statements.
263
UBS PACE Select Advisors Trust
Financial highlights
UBS PACE Large Co Value Equity Investments
(concluded)
Selected data for a share of beneficial interest outstanding throughout each year is presented below:
| | | Class P | |
| | | Years ended July 31, | |
| | | 2010 | | 2009 | | 20081 | | 2007 | | 2006 | |
| Net asset value, beginning of year | | $ | 13.16 | | | $ | 16.69 | | | $ | 22.44 | | | $ | 22.38 | | | $ | 20.66 | | |
| Net investment income2 | | | 0.16 | | | | 0.22 | | | | 0.30 | | | | 0.28 | | | | 0.28 | | |
| Net realized and unrealized gains (losses) | | | 1.61 | | | | (3.44 | ) | | | (3.34 | ) | | | 2.82 | | | | 2.16 | | |
| Net increase (decrease) from operations | | | 1.77 | | | | (3.22 | ) | | | (3.04 | ) | | | 3.10 | | | | 2.44 | | |
| Dividends from net investment income | | | (0.17 | ) | | | (0.31 | ) | | | (0.17 | ) | | | (0.30 | ) | | | (0.25 | ) | |
| Distributions from net realized gains | | | — | | | | — | | | | (2.54 | ) | | | (2.74 | ) | | | (0.47 | ) | |
| Total dividends and distributions | | | (0.17 | ) | | | (0.31 | ) | | | (2.71 | ) | | | (3.04 | ) | | | (0.72 | ) | |
| Net asset value, end of year | | $ | 14.76 | | | $ | 13.16 | | | $ | 16.69 | | | $ | 22.44 | | | $ | 22.38 | | |
| Total investment return3 | | | 13.48 | % | | | (19.01 | )% | | | (15.39 | )% | | | 14.26 | % | | | 12.07 | % | |
| Ratios/supplemental data: | |
| Net assets, end of year (000's) | | $ | 899,926 | | | $ | 819,420 | | | $ | 1,159,915 | | | $ | 1,306,425 | | | $ | 1,078,221 | | |
Expenses to average net assets, net of fee waivers and/or expense
reimbursements by manager | | | 0.95 | % | | | 0.99 | % | | | 0.85 | % | | | 0.83 | % | | | 0.86 | % | |
Expenses to average net assets, before fee waivers and/or expense
reimbursements by manager | | | 0.95 | % | | | 0.99 | % | | | 0.98 | % | | | 0.96 | % | | | 0.99 | % | |
| Net investment income to average net assets | | | 1.05 | % | | | 1.76 | % | | | 1.51 | % | | | 1.23 | % | | | 1.30 | % | |
| Portfolio turnover | | | 61 | % | | | 87 | % | | | 161 | % | | | 105 | % | | | 95 | % | |
1 A portion of the investment advisory function for this Portfolio was transferred from SSgA Funds Management, Inc. to Pzena Investment Management, LLC on May 27, 2008. Institutional Capital LLC and Westwood Management Corp. continue to provide a portion of the investment advisory function.
2 Calculated using the average shares method.
3 Total investment return is calculated assuming a $10,000 investment on the first day of each year reported, reinvestment of all dividends and other distributions, if any, at net asset value on the ex-dividend dates, and a sale at net asset value on the last day of each year reported. The figures do not include any applicable program or redemption fees; results would be lower if they were included. Returns do not reflect the deduction of taxes that a shareholder would pay on Portfolio distributions or the redemption of Portfolio shares.
See accompanying notes to financial statements.
264
(This page has been left blank intentionally)
265
UBS PACE Select Advisors Trust
Financial highlights
UBS PACE Large Co Growth Equity Investments
Selected data for a share of beneficial interest outstanding throughout each year is presented below:
| | | Class A | |
| | | Years ended July 31, | |
| | | 20101 | | 2009 | | 20082 | | 20073 | | 2006 | |
| Net asset value, beginning of year | | $ | 13.36 | | | $ | 16.67 | | | $ | 18.18 | | | $ | 15.75 | | | $ | 15.83 | | |
| Net investment income (loss)4 | | | (0.01 | ) | | | 0.03 | | | | 0.005 | | | | (0.02 | ) | | | (0.03 | ) | |
| Net realized and unrealized gains (losses) | | | 1.63 | | | | (3.27 | ) | | | (1.03 | ) | | | 2.45 | | | | (0.05 | ) | |
| Net increase (decrease) from operations | | | 1.62 | | | | (3.24 | ) | | | (1.03 | ) | | | 2.43 | | | | (0.08 | ) | |
| Dividends from net investment income | | | (0.03 | ) | | | — | | | | — | | | | — | | | | — | | |
| Distributions from net realized gains | | | — | | | | (0.07 | ) | | | (0.48 | ) | | | — | | | | — | | |
| Total dividends and distributions | | | (0.03 | ) | | | (0.07 | ) | | | (0.48 | ) | | | — | | | | — | | |
| Net asset value, end of year | | $ | 14.95 | | | $ | 13.36 | | | $ | 16.67 | | | $ | 18.18 | | | $ | 15.75 | | |
| Total investment return6 | | | 12.12 | % | | | (19.39 | )% | | | (5.94 | )% | | | 15.43 | % | | | (0.51 | )% | |
| Ratios/supplemental data: | |
| Net assets, end of year (000's) | | $ | 55,978 | | | $ | 56,038 | | | $ | 77,628 | | | $ | 80,334 | | | $ | 82,201 | | |
Expenses to average net assets, net of fee waivers and/or expense
reimbursements by manager | | | 1.23 | % | | | 1.26 | % | | | 1.20 | % | | | 1.20 | % | | | 1.23 | % | |
Expenses to average net assets, before fee waivers and/or expense
reimbursements by manager | | | 1.26 | % | | | 1.30 | % | | | 1.25 | % | | | 1.25 | % | | | 1.28 | % | |
| Net investment income (loss) to average net assets | | | (0.08 | )% | | | 0.21 | % | | | 0.00 | %7 | | | (0.10 | )% | | | (0.18 | )% | |
| Portfolio turnover | | | 91 | % | | | 100 | % | | | 120 | % | | | 95 | % | | | 64 | % | |
| | | Class C | |
| | | Years ended July 31, | |
| | | 20101 | | 2009 | | 20082 | | 20073 | | 2006 | |
| Net asset value, beginning of year | | $ | 12.45 | | | $ | 15.66 | | | $ | 17.26 | | | $ | 15.08 | | | $ | 15.27 | | |
| Net investment income (loss)4 | | | (0.12 | ) | | | (0.07 | ) | | | (0.14 | ) | | | (0.16 | ) | | | (0.16 | ) | |
| Net realized and unrealized gains (losses) | | | 1.51 | | | | (3.07 | ) | | | (0.98 | ) | | | 2.34 | | | | (0.03 | ) | |
| Net increase (decrease) from operations | | | 1.39 | | | | (3.14 | ) | | | (1.12 | ) | | | 2.18 | | | | (0.19 | ) | |
| Dividends from net investment income | | | — | | | | — | | | | — | | | | — | | | | — | | |
| Distributions from net realized gains | | | — | | | | (0.07 | ) | | | (0.48 | ) | | | — | | | | — | | |
| Total dividends and distributions | | | — | | | | (0.07 | ) | | | (0.48 | ) | | | — | | | | — | | |
| Net asset value, end of year | | $ | 13.84 | | | $ | 12.45 | | | $ | 15.66 | | | $ | 17.26 | | | $ | 15.08 | | |
| Total investment return6 | | | 11.24 | % | | | (20.00 | )% | | | (6.80 | )% | | | 14.46 | % | | | (1.24 | )% | |
| Ratios/supplemental data: | |
| Net assets, end of year (000's) | | $ | 3,956 | | | $ | 4,170 | | | $ | 6,120 | | | $ | 7,488 | | | $ | 7,586 | | |
Expenses to average net assets, net of fee waivers and/or expense
reimbursements by and recoupments to manager | | | 2.05 | % | | | 2.05 | % | | | 2.04 | %8 | | | 2.05 | %8 | | | 2.07 | %8 | |
Expenses to average net assets, before fee waivers and/or expense
reimbursements by manager | | | 2.13 | % | | | 2.20 | % | | | 2.09 | % | | | 2.09 | % | | | 2.12 | % | |
| Net investment income (loss) to average net assets | | | (0.90 | )% | | | (0.57 | )% | | | (0.84 | )% | | | (0.95 | )% | | | (1.03 | )% | |
| Portfolio turnover | | | 91 | % | | | 100 | % | | | 120 | % | | | 95 | % | | | 64 | % | |
1 A portion of the investment advisory function for this Portfolio was transferred to Roxbury Capital Management, LLC on May 25, 2010. Delaware Management Company, Marsico Capital Management, LLC, SSgA Funds Management, Inc. and Wellington Management Company, LLP continue to provide a portion of the investment advisory function.
2 A portion of the investment advisory function for this Portfolio was transferred to Delaware Management Company on December 5, 2007. Marsico Capital Management, LLC, SSgA Funds Management, Inc. and Wellington Management Company, LLP continue to provide a portion of the investment advisory function.
3 A portion of the investment advisory function for this Portfolio was transferred from GE Asset Management, Inc. to Wellington Management Company, LLP on June 1, 2007. Marsico Capital Management, LLC and SSgA Funds Management, Inc. continued to provide a portion of the investment advisory function.
4 Calculated using the average shares method.
266
| | | Class B | |
| | | Years ended July 31, | |
| | | 20101 | | 2009 | | 20082 | | 20073 | | 2006 | |
| Net asset value, beginning of year | | $ | 12.41 | | | $ | 15.62 | | | $ | 17.22 | | | $ | 15.05 | | | $ | 15.25 | | |
| Net investment income (loss)4 | | | (0.11 | ) | | | (0.07 | ) | | | (0.14 | ) | | | (0.15 | ) | | | (0.16 | ) | |
| Net realized and unrealized gains (losses) | | | 1.50 | | | | (3.07 | ) | | | (0.98 | ) | | | 2.32 | | | | (0.04 | ) | |
| Net increase (decrease) from operations | | | 1.39 | | | | (3.14 | ) | | | (1.12 | ) | | | 2.17 | | | | (0.20 | ) | |
| Dividends from net investment income | | | — | | | | — | | | | — | | | | — | | | | — | | |
| Distributions from net realized gains | | | — | | | | (0.07 | ) | | | (0.48 | ) | | | — | | | | — | | |
| Total dividends and distributions | | | — | | | | (0.07 | ) | | | (0.48 | ) | | | — | | | | — | | |
| Net asset value, end of year | | $ | 13.80 | | | $ | 12.41 | | | $ | 15.62 | | | $ | 17.22 | | | $ | 15.05 | | |
| Total investment return6 | | | 11.28 | % | | | (20.05 | )% | | | (6.81 | )% | | | 14.42 | % | | | (1.31 | )% | |
| Ratios/supplemental data: | |
| Net assets, end of year (000's) | | $ | 86 | | | $ | 199 | | | $ | 371 | | | $ | 643 | | | $ | 1,450 | | |
Expenses to average net assets, net of fee waivers and/or expense
reimbursements by manager | | | 2.05 | % | | | 2.05 | % | | | 2.05 | % | | | 2.05 | % | | | 2.10 | % | |
Expenses to average net assets, before fee waivers and/or expense
reimbursements by manager | | | 2.37 | % | | | 2.32 | % | | | 2.24 | % | | | 2.24 | % | | | 2.27 | % | |
| Net investment income (loss) to average net assets | | | (0.87 | )% | | | (0.58 | )% | | | (0.85 | )% | | | (0.90 | )% | | | (1.09 | )% | |
| Portfolio turnover | | | 91 | % | | | 100 | % | | | 120 | % | | | 95 | % | | | 64 | % | |
| | | Class Y | |
| | | Years ended July 31, | |
| | | 20101 | | 2009 | | 20082 | | 20073 | | 2006 | |
| Net asset value, beginning of year | | $ | 13.67 | | | $ | 17.03 | | | $ | 18.54 | | | $ | 16.05 | | | $ | 16.09 | | |
| Net investment income (loss)4 | | | 0.04 | | | | 0.08 | | | | 0.07 | | | | 0.05 | | | | 0.03 | | |
| Net realized and unrealized gains (losses) | | | 1.67 | | | | (3.34 | ) | | | (1.05 | ) | | | 2.49 | | | | (0.04 | ) | |
| Net increase (decrease) from operations | | | 1.71 | | | | (3.26 | ) | | | (0.98 | ) | | | 2.54 | | | | (0.01 | ) | |
| Dividends from net investment income | | | (0.09 | ) | | | (0.03 | ) | | | (0.05 | ) | | | (0.05 | ) | | | (0.03 | ) | |
| Distributions from net realized gains | | | — | | | | (0.07 | ) | | | (0.48 | ) | | | — | | | | — | | |
| Total dividends and distributions | | | (0.09 | ) | | | (0.10 | ) | | | (0.53 | ) | | | (0.05 | ) | | | (0.03 | ) | |
| Net asset value, end of year | | $ | 15.29 | | | $ | 13.67 | | | $ | 17.03 | | | $ | 18.54 | | | $ | 16.05 | | |
| Total investment return6 | | | 12.49 | % | | | (19.04 | )% | | | (5.64 | )% | | | 15.90 | % | | | (0.10 | )% | |
| Ratios/supplemental data: | |
| Net assets, end of year (000's) | | $ | 12,619 | | | $ | 16,885 | | | $ | 23,263 | | | $ | 26,125 | | | $ | 22,668 | | |
Expenses to average net assets, net of fee waivers and/or expense
reimbursements by and recoupments to manager | | | 0.91 | % | | | 0.84 | % | | | 0.82 | % | | | 0.82 | % | | | 0.85 | %8 | |
Expenses to average net assets, before fee waivers and/or expense
reimbursements by manager | | | 0.94 | % | | | 0.88 | % | | | 0.87 | % | | | 0.86 | % | | | 0.89 | % | |
| Net investment income (loss) to average net assets | | | 0.25 | % | | | 0.63 | % | | | 0.38 | % | | | 0.27 | % | | | 0.20 | % | |
| Portfolio turnover | | | 91 | % | | | 100 | % | | | 120 | % | | | 95 | % | | | 64 | % | |
5 Amount represents less than $0.005 per share.
6 Total investment return is calculated assuming a $10,000 investment on the first day of each year reported, reinvestment of all dividends and other distributions, if any, at net asset value on the ex-dividend dates, and a sale at net asset value on the last day of each year reported. The figures do not include any applicable sales charges or redemption fees; results would be lower if they were included. Returns do not reflect the deduction of taxes that a shareholder would pay on Portfolio distributions or the redemption of Portfolio shares.
7 Amount represents less than 0.005%.
8 The investment manager recouped expenses previously reimbursed by the investment manager on behalf of the Portfolio, not to exceed the expense cap.
See accompanying notes to financial statements.
267
UBS PACE Select Advisors Trust
Financial highlights
UBS PACE Large Co Growth Equity Investments
(concluded)
Selected data for a share of beneficial interest outstanding throughout each year is presented below:
| | | Class P | |
| | | Years ended July 31, | |
| | | 20101 | | 2009 | | 20082 | | 20073 | | 2006 | |
| Net asset value, beginning of year | | $ | 13.59 | | | $ | 16.94 | | | $ | 18.45 | | | $ | 15.97 | | | $ | 16.02 | | |
| Net investment income4 | | | 0.03 | | | | 0.06 | | | | 0.05 | | | | 0.03 | | | | 0.02 | | |
| Net realized and unrealized gains (losses) | | | 1.66 | | | | (3.32 | ) | | | (1.04 | ) | | | 2.49 | | | | (0.05 | ) | |
| Net increase (decrease) from operations | | | 1.69 | | | | (3.26 | ) | | | (0.99 | ) | | | 2.52 | | | | (0.03 | ) | |
| Dividends from net investment income | | | (0.07 | ) | | | (0.02 | ) | | | (0.04 | ) | | | (0.04 | ) | | | (0.02 | ) | |
| Distributions from net realized gains | | | — | | | | (0.07 | ) | | | (0.48 | ) | | | — | | | | — | | |
| Total dividends and distributions | | | (0.07 | ) | | | (0.09 | ) | | | (0.52 | ) | | | (0.04 | ) | | | (0.02 | ) | |
| Net asset value, end of year | | $ | 15.21 | | | $ | 13.59 | | | $ | 16.94 | | | $ | 18.45 | | | $ | 15.97 | | |
| Total investment return5 | | | 12.42 | % | | | (19.19 | )% | | | (5.68 | )% | | | 15.76 | % | | | (0.20 | )% | |
| Ratios/supplemental data: | |
| Net assets, end of year (000's) | | $ | 895,889 | | | $ | 822,192 | | | $ | 1,230,206 | | | $ | 1,231,468 | | | $ | 945,358 | | |
Expenses to average net assets, net of fee waivers and/or expense
reimbursements by and recoupments to manager | | | 0.96 | % | | | 0.97 | % | | | 0.91 | % | | | 0.91 | % | | | 0.95 | %6 | |
Expenses to average net assets, before fee waivers and/or expense
reimbursements by manager | | | 0.99 | % | | | 1.01 | % | | | 0.96 | % | | | 0.95 | % | | | 1.00 | % | |
| Net investment income to average net assets | | | 0.19 | % | | | 0.50 | % | | | 0.29 | % | | | 0.17 | % | | | 0.12 | % | |
| Portfolio turnover | | | 91 | % | | | 100 | % | | | 120 | % | | | 95 | % | | | 64 | % | |
1 A portion of the investment advisory function for this Portfolio was transferred to Roxbury Capital Management, LLC on May 25, 2010. Delaware Management Company, Marsico Capital Management, LLC, SSgA Funds Management, Inc. and Wellington Management Company, LLP continue to provide a portion of the investment advisory function.
2 A portion of the investment advisory function for this Portfolio was transferred to Delaware Management Company on December 5, 2007. Marsico Capital Management, LLC, SSgA Funds Management, Inc. and Wellington Management Company, LLP continue to provide a portion of the investment advisory function.
3 A portion of the investment advisory function for this Portfolio was transferred from GE Asset Management, Inc. to Wellington Management Company, LLP on June 1, 2007. Marsico Capital Management, LLC and SSgA Funds Management, Inc. continued to provide a portion of the investment advisory function.
4 Calculated using the average shares method.
5 Total investment return is calculated assuming a $10,000 investment on the first day of each year reported, reinvestment of all dividends and other distributions, if any, at net asset value on the ex-dividend dates, and a sale at net asset value on the last day of each year reported. The figures do not include any applicable program or redemption fees; results would be lower if they were included. Returns do not reflect the deduction of taxes that a shareholder would pay on Portfolio distributions or the redemption of Portfolio shares.
6 The investment manager recouped expenses previously reimbursed by the investment manager on behalf of the Portfolio, not to exceed the expense cap.
See accompanying notes to financial statements.
268
(This page has been left blank intentionally)
269
UBS PACE Select Advisors Trust
Financial highlights
UBS PACE Small/Medium Co Value Equity Investments
Selected data for a share of beneficial interest outstanding throughout each year is presented below:
| | | Class A | |
| | | Years ended July 31, | |
| | | 2010 | | 20091 | | 20082 | | 2007 | | 20062 | |
| Net asset value, beginning of year | | $ | 11.99 | | | $ | 14.27 | | | $ | 19.29 | | | $ | 17.07 | | | $ | 21.80 | | |
| Net investment income (loss)3 | | | (0.01 | ) | | | 0.05 | | | | 0.06 | | | | 0.01 | | | | (0.03 | ) | |
| Net realized and unrealized gains (losses) | | | 2.31 | | | | (2.25 | ) | | | (3.01 | ) | | | 2.97 | | | | (0.82 | ) | |
| Net increase (decrease) from operations | | | 2.30 | | | | (2.20 | ) | | | (2.95 | ) | | | 2.98 | | | | (0.85 | ) | |
| Dividends from net investment income | | | (0.01 | ) | | | (0.08 | ) | | | (0.00 | )4 | | | — | | | | — | | |
| Distributions from net realized gains | | | — | | | | (0.00 | )4 | | | (2.07 | ) | | | (0.76 | ) | | | (3.88 | ) | |
| Total dividends and distributions | | | (0.01 | ) | | | (0.08 | ) | | | (2.07 | ) | | | (0.76 | ) | | | (3.88 | ) | |
| Net asset value, end of year | | $ | 14.28 | | | $ | 11.99 | | | $ | 14.27 | | | $ | 19.29 | | | $ | 17.07 | | |
| Total investment return5 | | | 19.17 | % | | | (15.29 | )% | | | (16.25 | )% | | | 17.70 | % | | | (4.10 | )% | |
| Ratios/supplemental data: | |
| Net assets, end of year (000's) | | $ | 27,920 | | | $ | 24,661 | | | $ | 37,185 | | | $ | 47,845 | | | $ | 45,583 | | |
Expenses to average net assets, net of fee waivers and/or expense
reimbursements by and recoupments to manager | | | 1.35 | % | | | 1.38 | % | | | 1.29 | % | | | 1.27 | % | | | 1.30 | % | |
Expenses to average net assets, before fee waivers and/or expense
reimbursements by manager | | | 1.35 | % | | | 1.39 | % | | | 1.29 | % | | | 1.27 | % | | | 1.30 | % | |
| Net investment income (loss) to average net assets | | | (0.05 | )% | | | 0.44 | % | | | 0.34 | % | | | 0.05 | % | | | (0.16 | )% | |
| Portfolio turnover | | | 81 | % | | | 111 | % | | | 43 | % | | | 59 | % | | | 81 | % | |
| | | Class C | |
| | | Years ended July 31, | |
| | | 2010 | | 20091 | | 20082 | | 2007 | | 20062 | |
| Net asset value, beginning of year | | $ | 11.07 | | | $ | 13.18 | | | $ | 18.12 | | | $ | 16.19 | | | $ | 21.03 | | |
| Net investment income (loss)3 | | | (0.10 | ) | | | (0.03 | ) | | | (0.06 | ) | | | (0.13 | ) | | | (0.17 | ) | |
| Net realized and unrealized gains (losses) | | | 2.13 | | | | (2.08 | ) | | | (2.81 | ) | | | 2.82 | | | | (0.79 | ) | |
| Net increase (decrease) from operations | | | 2.03 | | | | (2.11 | ) | | | (2.87 | ) | | | 2.69 | | | | (0.96 | ) | |
| Dividends from net investment income | | | — | | | | — | | | | — | | | | — | | | | — | | |
| Distributions from net realized gains | | | — | | | | (0.00 | )4 | | | (2.07 | ) | | | (0.76 | ) | | | (3.88 | ) | |
| Total dividends and distributions | | | — | | | | (0.00 | )4 | | | (2.07 | ) | | | (0.76 | ) | | | (3.88 | ) | |
| Net asset value, end of year | | $ | 13.10 | | | $ | 11.07 | | | $ | 13.18 | | | $ | 18.12 | | | $ | 16.19 | | |
| Total investment return5 | | | 18.34 | % | | | (15.98 | )% | | | (16.93 | )% | | | 16.85 | % | | | (4.86 | )% | |
| Ratios/supplemental data: | |
| Net assets, end of year (000's) | | $ | 5,178 | | | $ | 5,603 | | | $ | 8,400 | | | $ | 11,964 | | | $ | 11,552 | | |
Expenses to average net assets, net of fee waivers and/or expense
reimbursements by manager | | | 2.11 | % | | | 2.14 | % | | | 2.06 | % | | | 2.04 | % | | | 2.08 | % | |
Expenses to average net assets, before fee waivers and/or expense
reimbursements by manager | | | 2.11 | % | | | 2.15 | % | | | 2.06 | % | | | 2.04 | % | | | 2.08 | % | |
| Net investment income (loss) to average net assets | | | (0.80 | )% | | | (0.32 | )% | | | (0.42 | )% | | | (0.71 | )% | | | (0.93 | )% | |
| Portfolio turnover | | | 81 | % | | | 111 | % | | | 43 | % | | | 59 | % | | | 81 | % | |
1 A portion of the investment advisory function for this Portfolio was transferred to Buckhead Capital Management, LLC and Systematic Financial Management, L.P. on May 28, 2009. Ariel Investments, LLC and Opus Capital Group, LLC ceased serving as investment advisors for the Portfolio effective May 29, 2009. Metropolitan West Capital Management, LLC continues to provide a portion of the investment advisory function.
2 A portion of the investment advisory function for this Portfolio was transferred from ICM Asset Management, Inc. to Metropolitan West Capital Management, LLC and Opus Capital Group, LLC on October 1, 2005. Ariel Investments, LLC continued to provide a portion of the investment advisory function. Ariel Capital Management, LLC changed its name to Ariel Investments, LLC on April 30, 2008.
3 Calculated using the average shares method.
4 Amount represents less than $0.005 per share.
270
| | | Class B | |
| | | Years ended July 31, | |
| | | 2010 | | 20091 | | 20082 | | 2007 | | 20062 | |
| Net asset value, beginning of year | | $ | 11.02 | | | $ | 13.12 | | | $ | 18.06 | | | $ | 16.15 | | | $ | 21.00 | | |
| Net investment income (loss)3 | | | (0.10 | ) | | | (0.02 | ) | | | (0.08 | ) | | | (0.14 | ) | | | (0.18 | ) | |
| Net realized and unrealized gains (losses) | | | 2.11 | | | | (2.08 | ) | | | (2.79 | ) | | | 2.81 | | | | (0.79 | ) | |
| Net increase (decrease) from operations | | | 2.01 | | | | (2.10 | ) | | | (2.87 | ) | | | 2.67 | | | | (0.97 | ) | |
| Dividends from net investment income | | | — | | | | — | | | | — | | | | — | | | | — | | |
| Distributions from net realized gains | | | — | | | | (0.00 | )4 | | | (2.07 | ) | | | (0.76 | ) | | | (3.88 | ) | |
| Total dividends and distributions | | | — | | | | (0.00 | )4 | | | (2.07 | ) | | | (0.76 | ) | | | (3.88 | ) | |
| Net asset value, end of year | | $ | 13.03 | | | $ | 11.02 | | | $ | 13.12 | | | $ | 18.06 | | | $ | 16.15 | | |
| Total investment return5 | | | 18.31 | % | | | (15.90 | )% | | | (16.99 | )% | | | 16.77 | % | | | (4.93 | )% | |
| Ratios/supplemental data: | |
| Net assets, end of year (000's) | | $ | 57 | | | $ | 97 | | | $ | 333 | | | $ | 1,006 | | | $ | 1,859 | | |
Expenses to average net assets, net of fee waivers and/or expense
reimbursements by and recoupments to manager | | | 2.16 | % | | | 2.16 | % | | | 2.16 | % | | | 2.13 | % | | | 2.14 | %6 | |
Expenses to average net assets, before fee waivers and/or expense
reimbursements by manager | | | 2.37 | % | | | 2.47 | % | | | 2.20 | % | | | 2.13 | % | | | 2.14 | % | |
| Net investment income (loss) to average net assets | | | (0.81 | )% | | | (0.25 | )% | | | (0.53 | )% | | | (0.80 | )% | | | (0.97 | )% | |
| Portfolio turnover | | | 81 | % | | | 111 | % | | | 43 | % | | | 59 | % | | | 81 | % | |
| | | Class Y | |
| | | Years ended July 31, | |
| | | 2010 | | 20091 | | 20082 | | 2007 | | 20062 | |
| Net asset value, beginning of year | | $ | 12.29 | | | $ | 14.64 | | | $ | 19.73 | | | $ | 17.39 | | | $ | 22.07 | | |
| Net investment income (loss)3 | | | 0.07 | | | | 0.09 | | | | 0.11 | | | | 0.07 | | | | 0.03 | | |
| Net realized and unrealized gains (losses) | | | 2.32 | | | | (2.31 | ) | | | (3.07 | ) | | | 3.03 | | | | (0.83 | ) | |
| Net increase (decrease) from operations | | | 2.39 | | | | (2.22 | ) | | | (2.96 | ) | | | 3.10 | | | | (0.80 | ) | |
| Dividends from net investment income | | | (0.05 | ) | | | (0.13 | ) | | | (0.06 | ) | | | — | | | | — | | |
| Distributions from net realized gains | | | — | | | | (0.00 | )4 | | | (2.07 | ) | | | (0.76 | ) | | | (3.88 | ) | |
| Total dividends and distributions | | | (0.05 | ) | | | (0.13 | ) | | | (2.13 | ) | | | (0.76 | ) | | | (3.88 | ) | |
| Net asset value, end of year | | $ | 14.63 | | | $ | 12.29 | | | $ | 14.64 | | | $ | 19.73 | | | $ | 17.39 | | |
| Total investment return5 | | | 19.50 | % | | | (14.92 | )% | | | (15.95 | )% | | | 18.07 | % | | | (3.78 | )% | |
| Ratios/supplemental data: | |
| Net assets, end of year (000's) | | $ | 318 | | | $ | 3,255 | | | $ | 4,443 | | | $ | 5,980 | | | $ | 4,311 | | |
Expenses to average net assets, net of fee waivers and/or expense
reimbursements by manager | | | 0.97 | % | | | 0.97 | % | | | 0.95 | % | | | 0.94 | % | | | 0.97 | % | |
Expenses to average net assets, before fee waivers and/or expense
reimbursements by manager | | | 0.97 | % | | | 0.98 | % | | | 0.95 | % | | | 0.94 | % | | | 0.97 | % | |
| Net investment income (loss) to average net assets | | | 0.47 | % | | | 0.85 | % | | | 0.68 | % | | | 0.37 | % | | | 0.17 | % | |
| Portfolio turnover | | | 81 | % | | | 111 | % | | | 43 | % | | | 59 | % | | | 81 | % | |
5 Total investment return is calculated assuming a $10,000 investment on the first day of each year reported, reinvestment of all dividends and other distributions, if any, at net asset value on the ex-dividend dates, and a sale at net asset value on the last day of each year reported. The figures do not include any applicable sales charges or redemption fees; results would be lower if they were included. Returns do not reflect the deduction of taxes that a shareholder would pay on Portfolio distributions or the redemption of Portfolio shares.
6 The investment manager recouped expenses previously reimbursed by the investment manager on behalf of the Portfolio, not to exceed the expense cap.
See accompanying notes to financial statements.
271
UBS PACE Select Advisors Trust
Financial highlights
UBS PACE Small/Medium Co Value Equity Investments
(concluded)
Selected data for a share of beneficial interest outstanding throughout each year is presented below:
| | | Class P | |
| | | Years ended July 31, | |
| | | 2010 | | 20091 | | 20082 | | 2007 | | 20062 | |
| Net asset value, beginning of year | | $ | 12.20 | | | $ | 14.53 | | | $ | 19.60 | | | $ | 17.31 | | | $ | 22.02 | | |
| Net investment income (loss)3 | | | 0.02 | | | | 0.07 | | | | 0.08 | | | | 0.03 | | | | (0.00 | )4 | |
| Net realized and unrealized gains (losses) | | | 2.34 | | | | (2.30 | ) | | | (3.05 | ) | | | 3.02 | | | | (0.83 | ) | |
| Net increase (decrease) from operations | | | 2.36 | | | | (2.23 | ) | | | (2.97 | ) | | | 3.05 | | | | (0.83 | ) | |
| Dividends from net investment income | | | (0.03 | ) | | | (0.10 | ) | | | (0.03 | ) | | | — | | | | — | | |
| Distributions from net realized gains | | | — | | | | (0.00 | )4 | | | (2.07 | ) | | | (0.76 | ) | | | (3.88 | ) | |
| Total dividends and distributions | | | (0.03 | ) | | | (0.10 | ) | | | (2.10 | ) | | | (0.76 | ) | | | (3.88 | ) | |
| Net asset value, end of year | | $ | 14.53 | | | $ | 12.20 | | | $ | 14.53 | | | $ | 19.60 | | | $ | 17.31 | | |
| Total investment return5 | | | 19.38 | % | | | (15.14 | )% | | | (16.13 | )% | | | 17.86 | % | | | (3.95 | )% | |
| Ratios/supplemental data: | |
| Net assets, end of year (000's) | | $ | 345,494 | | | $ | 310,059 | | | $ | 428,819 | | | $ | 483,873 | | | $ | 387,514 | | |
Expenses to average net assets, net of fee waivers and/or expense
reimbursements by and recoupments to manager | | | 1.16 | % | | | 1.16 | % | | | 1.16 | % | | | 1.16 | %6 | | | 1.16 | % | |
Expenses to average net assets, before fee waivers and/or expense
reimbursements by manager | | | 1.25 | % | | | 1.32 | % | | | 1.18 | % | | | 1.16 | % | | | 1.18 | % | |
| Net investment income (loss) to average net assets | | | 0.14 | % | | | 0.66 | % | | | 0.48 | % | | | 0.16 | % | | | (0.03 | )% | |
| Portfolio turnover | | | 81 | % | | | 111 | % | | | 43 | % | | | 59 | % | | | 81 | % | |
1 A portion of the investment advisory function for this Portfolio was transferred to Buckhead Capital Management, LLC and Systematic Financial Management, L.P. on May 28, 2009. Ariel Investments, LLC and Opus Capital Group, LLC ceased serving as investment advisors for the Portfolio effective May 29, 2009. Metropolitan West Capital Management, LLC continues to provide a portion of the investment advisory function.
2 A portion of the investment advisory function for this Portfolio was transferred from ICM Asset Management, Inc. to Metropolitan West Capital Management, LLC and Opus Capital Group, LLC on October 1, 2005. Ariel Investments, LLC continued to provide a portion of the investment advisory function. Ariel Capital Management, LLC changed its name to Ariel Investments, LLC on April 30, 2008.
3 Calculated using the average shares method.
4 Amount represents less than $0.005 per share.
5 Total investment return is calculated assuming a $10,000 investment on the first day of each year reported, reinvestment of all dividends and other distributions, if any, at net asset value on the ex-dividend dates, and a sale at net asset value on the last day of each year reported. The figures do not include any applicable program or redemption fees; results would be lower if they were included. Returns do not reflect the deduction of taxes that a shareholder would pay on Portfolio distributions or the redemption of Portfolio shares.
6 The investment manager recouped expenses previously reimbursed by the investment manager on behalf of the Portfolio, not to exceed the expense cap.
See accompanying notes to financial statements.
272
(This page has been left blank intentionally)
273
UBS PACE Select Advisors Trust
Financial highlights
UBS PACE Small/Medium Co Growth Equity Investments
Selected data for a share of beneficial interest outstanding throughout each year is presented below:
| | | Class A | |
| | | Years ended July 31, | |
| | | 2010 | | 20091 | | 2008 | | 20072 | | 20063 | |
| Net asset value, beginning of year | | $ | 10.63 | | | $ | 13.06 | | | $ | 17.30 | | | $ | 14.45 | | | $ | 17.52 | | |
| Net investment loss4 | | | (0.09 | ) | | | (0.05 | ) | | | (0.11 | ) | | | (0.12 | ) | | | (0.12 | ) | |
| Net realized and unrealized gains (losses) | | | 1.74 | | | | (2.38 | ) | | | (1.53 | ) | | | 3.40 | | | | (0.58 | ) | |
| Net increase (decrease) from operations | | | 1.65 | | | | (2.43 | ) | | | (1.64 | ) | | | 3.28 | | | | (0.70 | ) | |
| Distributions from net realized gains | | | — | | | | — | | | | (2.60 | ) | | | (0.43 | ) | | | (2.37 | ) | |
| Net asset value, end of year | | $ | 12.28 | | | $ | 10.63 | | | $ | 13.06 | | | $ | 17.30 | | | $ | 14.45 | | |
| Total investment return5 | | | 15.52 | % | | | (18.61 | )% | | | (11.39 | )% | | | 23.00 | % | | | (4.22 | )% | |
| Ratios/supplemental data: | |
| Net assets, end of year (000's) | | $ | 32,053 | | | $ | 29,429 | | | $ | 41,494 | | | $ | 49,562 | | | $ | 48,824 | | |
Expenses to average net assets, net of fee waivers and/or expense
reimbursements by and recoupments to manager | | | 1.35 | %6 | | | 1.38 | % | | | 1.31 | % | | | 1.30 | % | | | 1.32 | % | |
Expenses to average net assets, before fee waivers and/or expense
reimbursements by manager | | | 1.35 | % | | | 1.40 | % | | | 1.31 | % | | | 1.30 | % | | | 1.32 | % | |
| Net investment loss to average net assets | | | (0.71 | )% | | | (0.56 | )% | | | (0.70 | )% | | | (0.77 | )% | | | (0.78 | )% | |
| Portfolio turnover | | | 133 | % | | | 154 | % | | | 128 | % | | | 109 | % | | | 134 | % | |
| | | Class C | |
| | | Years ended July 31, | |
| | | 2010 | | 20091 | | 2008 | | 20072 | | 20063 | |
| Net asset value, beginning of year | | $ | 9.76 | | | $ | 12.07 | | | $ | 16.30 | | | $ | 13.74 | | | $ | 16.90 | | |
| Net investment loss4 | | | (0.16 | ) | | | (0.11 | ) | | | (0.21 | ) | | | (0.24 | ) | | | (0.24 | ) | |
| Net realized and unrealized gains (losses) | | | 1.59 | | | | (2.20 | ) | | | (1.42 | ) | | | 3.23 | | | | (0.55 | ) | |
| Net increase (decrease) from operations | | | 1.43 | | | | (2.31 | ) | | | (1.63 | ) | | | 2.99 | | | | (0.79 | ) | |
| Distributions from net realized gains | | | — | | | | — | | | | (2.60 | ) | | | (0.43 | ) | | | (2.37 | ) | |
| Net asset value, end of year | | $ | 11.19 | | | $ | 9.76 | | | $ | 12.07 | | | $ | 16.30 | | | $ | 13.74 | | |
| Total investment return5 | | | 14.65 | % | | | (19.21 | )% | | | (12.08 | )% | | | 22.14 | % | | | (4.98 | )% | |
| Ratios/supplemental data: | |
| Net assets, end of year (000's) | | $ | 3,217 | | | $ | 3,285 | | | $ | 4,991 | | | $ | 6,712 | | | $ | 6,709 | | |
Expenses to average net assets, net of fee waivers and/or expense
reimbursements by and recoupments to manager | | | 2.13 | %6 | | | 2.13 | % | | | 2.08 | % | | | 2.08 | % | | | 2.11 | % | |
Expenses to average net assets, before fee waivers and/or expense
reimbursements by manager | | | 2.13 | % | | | 2.19 | % | | | 2.08 | % | | | 2.08 | % | | | 2.11 | % | |
| Net investment loss to average net assets | | | (1.49 | )% | | | (1.30 | )% | | | (1.47 | )% | | | (1.55 | )% | | | (1.56 | )% | |
| Portfolio turnover | | | 133 | % | | | 154 | % | | | 128 | % | | | 109 | % | | | 134 | % | |
1 A portion of the investment advisory function for this Portfolio was transferred from AG Asset Management LLC to Palisade Capital Management, LLC on February 2, 2009. Copper Rock Capital Partners, LLC and Riverbridge Partners, LLC continue to provide a portion of the investment advisory function.
2 A portion of the investment advisory function for this Portfolio was transferred from Delaware Management Co., Inc. to Copper Rock Capital Partners, LLC on March 1, 2007. ForstmannLeff Associates, LLC changed its name to AG Asset Management LLC on May 1, 2007. AG Asset Management LLC and Riverbridge Partners, LLC continued to provide a portion of the investment advisory function.
3 A portion of the investment advisory function for this Portfolio was transferred from Delaware Management Co., Inc. to ForstmannLeff Associates, LLC and Riverbridge Partners, LLC on October 1, 2005.
4 Calculated using the average shares method.
5 Total investment return is calculated assuming a $10,000 investment on the first day of each year reported, reinvestment of all dividends and other distributions, if any, at net asset value on the ex-dividend dates, and a sale at net asset value on the last day of each year reported. The figures do not include any applicable sales charges or redemption fees; results would be lower if they were included. Returns do not reflect the deduction of taxes that a shareholder would pay on Portfolio distributions or the redemption of Portfolio shares.
6 The investment manager recouped expenses previously reimbursed by the investment manager on behalf of the Portfolio, not to exceed the expense cap.
274
| | | Class B | |
| | | Years ended July 31, | |
| | | 2010 | | 20091 | | 2008 | | 20072 | | 20063 | |
| Net asset value, beginning of year | | $ | 9.69 | | | $ | 11.99 | | | $ | 16.22 | | | $ | 13.68 | | | $ | 16.86 | | |
| Net investment loss4 | | | (0.15 | ) | | | (0.11 | ) | | | (0.22 | ) | | | (0.23 | ) | | | (0.24 | ) | |
| Net realized and unrealized gains (losses) | | | 1.57 | | | | (2.19 | ) | | | (1.41 | ) | | | 3.20 | | | | (0.57 | ) | |
| Net increase (decrease) from operations | | | 1.42 | | | | (2.30 | ) | | | (1.63 | ) | | | 2.97 | | | | (0.81 | ) | |
| Distributions from net realized gains | | | — | | | | — | | | | (2.60 | ) | | | (0.43 | ) | | | (2.37 | ) | |
| Net asset value, end of year | | $ | 11.11 | | | $ | 9.69 | | | $ | 11.99 | | | $ | 16.22 | | | $ | 13.68 | | |
| Total investment return5 | | | 14.86 | % | | | (19.18 | )% | | | (12.16 | )% | | | 22.02 | % | | | (5.13 | )% | |
| Ratios/supplemental data: | |
| Net assets, end of year (000's) | | $ | 16 | | | $ | 68 | | | $ | 123 | | | $ | 310 | | | $ | 696 | | |
Expenses to average net assets, net of fee waivers and/or expense
reimbursements by and recoupments to manager | | | 2.13 | % | | | 2.13 | % | | | 2.13 | % | | | 2.13 | % | | | 2.19 | % | |
Expenses to average net assets, before fee waivers and/or expense
reimbursements by manager | | | 2.73 | % | | | 2.61 | % | | | 2.43 | % | | | 2.30 | % | | | 2.27 | % | |
| Net investment loss to average net assets | | | (1.39 | )% | | | (1.29 | )% | | | (1.52 | )% | | | (1.58 | )% | | | (1.62 | )% | |
| Portfolio turnover | | | 133 | % | | | 154 | % | | | 128 | % | | | 109 | % | | | 134 | % | |
| | | Class Y | |
| | | Years ended July 31, | |
| | | 2010 | | 20091 | | 2008 | | 20072 | | 20063 | |
| Net asset value, beginning of year | | $ | 11.02 | | | $ | 13.47 | | | $ | 17.71 | | | $ | 14.72 | | | $ | 17.74 | | |
| Net investment loss4 | | | (0.02 | ) | | | (0.01 | ) | | | (0.05 | ) | | | (0.07 | ) | | | (0.07 | ) | |
| Net realized and unrealized gains (losses) | | | 1.74 | | | | (2.44 | ) | | | (1.59 | ) | | | 3.49 | | | | (0.58 | ) | |
| Net increase (decrease) from operations | | | 1.72 | | | | (2.45 | ) | | | (1.64 | ) | | | 3.42 | | | | (0.65 | ) | |
| Distributions from net realized gains | | | — | | | | — | | | | (2.60 | ) | | | (0.43 | ) | | | (2.37 | ) | |
| Net asset value, end of year | | $ | 12.74 | | | $ | 11.02 | | | $ | 13.47 | | | $ | 17.71 | | | $ | 14.72 | | |
| Total investment return5 | | | 15.71 | % | | | (18.26 | )% | | | (11.09 | )% | | | 23.54 | % | | | (3.86 | )% | |
| Ratios/supplemental data: | |
| Net assets, end of year (000's) | | $ | 62 | | | $ | 4,369 | | | $ | 5,671 | | | $ | 6,022 | | | $ | 4,279 | | |
Expenses to average net assets, net of fee waivers and/or expense
reimbursements by and recoupments to manager | | | 0.94 | % | | | 0.96 | % | | | 0.94 | % | | | 0.93 | % | | | 0.95 | % | |
Expenses to average net assets, before fee waivers and/or expense
reimbursements by manager | | | 0.94 | % | | | 0.96 | % | | | 0.94 | % | | | 0.93 | % | | | 0.95 | % | |
| Net investment loss to average net assets | | | (0.14 | )% | | | (0.15 | )% | | | (0.33 | )% | | | (0.41 | )% | | | (0.41 | )% | |
| Portfolio turnover | | | 133 | % | | | 154 | % | | | 128 | % | | | 109 | % | | | 134 | % | |
See accompanying notes to financial statements.
275
UBS PACE Select Advisors Trust
Financial highlights
UBS PACE Small/Medium Co Growth Equity Investments
(concluded)
Selected data for a share of beneficial interest outstanding throughout each year is presented below:
| | | Class P | |
| | | Years ended July 31, | |
| | | 2010 | | 20091 | | 2008 | | 20072 | | 20063 | |
| Net asset value, beginning of year | | $ | 10.90 | | | $ | 13.36 | | | $ | 17.61 | | | $ | 14.67 | | | $ | 17.72 | | |
| Net investment loss4 | | | (0.06 | ) | | | (0.03 | ) | | | (0.08 | ) | | | (0.10 | ) | | | (0.10 | ) | |
| Net realized and unrealized gains (losses) | | | 1.78 | | | | (2.43 | ) | | | (1.57 | ) | | | 3.47 | | | | (0.58 | ) | |
| Net increase (decrease) from operations | | | 1.72 | | | | (2.46 | ) | | | (1.65 | ) | | | 3.37 | | | | (0.68 | ) | |
| Distributions from net realized gains | | | — | | | | — | | | | (2.60 | ) | | | (0.43 | ) | | | (2.37 | ) | |
| Net asset value, end of year | | $ | 12.62 | | | $ | 10.90 | | | $ | 13.36 | | | $ | 17.61 | | | $ | 14.67 | | |
| Total investment return5 | | | 15.78 | % | | | (18.41 | )% | | | (11.22 | )% | | | 23.28 | % | | | (4.05 | )% | |
| Ratios/supplemental data: | |
| Net assets, end of year (000's) | | $ | 338,951 | | | $ | 310,425 | | | $ | 456,354 | | | $ | 500,929 | | | $ | 380,197 | | |
Expenses to average net assets, net of fee waivers and/or expense
reimbursements by manager | | | 1.13 | % | | | 1.13 | % | | | 1.13 | % | | | 1.13 | % | | | 1.13 | % | |
Expenses to average net assets, before fee waivers and/or expense
reimbursements by manager | | | 1.23 | % | | | 1.31 | % | | | 1.17 | % | | | 1.16 | % | | | 1.18 | % | |
| Net investment loss to average net assets | | | (0.50 | )% | | | (0.31 | )% | | | (0.52 | )% | | | (0.60 | )% | | | (0.59 | )% | |
| Portfolio turnover | | | 133 | % | | | 154 | % | | | 128 | % | | | 109 | % | | | 134 | % | |
1 A portion of the investment advisory function for this Portfolio was transferred from AG Asset Management LLC to Palisade Capital Management, LLC on February 2, 2009. Copper Rock Capital Partners, LLC and Riverbridge Partners, LLC continue to provide a portion of the investment advisory function.
2 A portion of the investment advisory function for this Portfolio was transferred from Delaware Management Co., Inc. to Copper Rock Capital Partners, LLC on March 1, 2007. ForstmannLeff Associates, LLC changed its name to AG Asset Management LLC on May 1, 2007. AG Asset Management LLC and Riverbridge Partners, LLC continued to provide a portion of the investment advisory function.
3 A portion of the investment advisory function for this Portfolio was transferred from Delaware Management Co., Inc. to ForstmannLeff Associates, LLC and Riverbridge Partners, LLC on October 1, 2005.
4 Calculated using the average shares method.
5 Total investment return is calculated assuming a $10,000 investment on the first day of each year reported, reinvestment of all dividends and other distributions, if any, at net asset value on the ex-dividend dates, and a sale at net asset value on the last day of each year reported. The figures do not include any applicable program or redemption fees; results would be lower if they were included. Returns do not reflect the deduction of taxes that a shareholder would pay on Portfolio distributions or the redemption of Portfolio shares.
See accompanying notes to financial statements.
276
(This page has been left blank intentionally)
277
UBS PACE Select Advisors Trust
Financial highlights
UBS PACE International Equity Investments
Selected data for a share of beneficial interest outstanding throughout each year is presented below:
| | | Class A | |
| | | Years ended July 31, | |
| | | 2010 | | 2009 | | 2008 | | 2007 | | 2006 | |
| Net asset value, beginning of year | | $ | 11.72 | | | $ | 16.17 | | | $ | 21.27 | | | $ | 19.03 | | | $ | 15.46 | | |
| Net investment income1 | | | 0.19 | | | | 0.27 | | | | 0.41 | | | | 0.29 | | | | 0.30 | | |
| Net realized and unrealized gains (losses) | | | 0.06 | | | | (4.22 | ) | | | (2.99 | ) | | | 4.09 | | | | 3.50 | | |
| Net increase (decrease) from operations | | | 0.25 | | | | (3.95 | ) | | | (2.58 | ) | | | 4.38 | | | | 3.80 | | |
| Dividends from net investment income | | | (0.25 | ) | | | (0.50 | ) | | | (0.28 | ) | | | (0.35 | ) | | | (0.23 | ) | |
| Distributions from net realized gains | | | — | | | | — | | | | (2.24 | ) | | | (1.79 | ) | | | — | | |
| Total dividends and distributions | | | (0.25 | ) | | | (0.50 | ) | | | (2.52 | ) | | | (2.14 | ) | | | (0.23 | ) | |
| Net asset value, end of year | | $ | 11.72 | | | $ | 11.72 | | | $ | 16.17 | | | $ | 21.27 | | | $ | 19.03 | | |
| Total investment return2 | | | 2.05 | % | | | (24.02 | )% | | | (13.73 | )% | | | 24.14 | % | | | 24.77 | % | |
| Ratios/supplemental data: | |
| Net assets, end of year (000's) | | $ | 66,355 | | | $ | 71,466 | | | $ | 106,380 | | | $ | 130,966 | | | $ | 111,153 | | |
Expenses to average net assets, net of fee waivers and/or expense
reimbursements by and recoupments to manager | | | 1.43 | % | | | 1.46 | % | | | 1.37 | % | | | 1.38 | % | | | 1.47 | %3 | |
Expenses to average net assets, before fee waivers and/or expense
reimbursements by manager | | | 1.43 | % | | | 1.46 | % | | | 1.37 | % | | | 1.38 | % | | | 1.47 | % | |
| Net investment income to average net assets | | | 1.54 | % | | | 2.47 | % | | | 2.16 | % | | | 1.42 | % | | | 1.73 | % | |
| Portfolio turnover | | | 60 | % | | | 60 | % | | | 54 | % | | | 61 | % | | | 52 | % | |
| | | Class C | |
| | | Years ended July 31, | |
| | | 2010 | | 2009 | | 2008 | | 2007 | | 2006 | |
| Net asset value, beginning of year | | $ | 11.49 | | | $ | 15.79 | | | $ | 20.81 | | | $ | 18.65 | | | $ | 15.16 | | |
| Net investment income1 | | | 0.08 | | | | 0.17 | | | | 0.25 | | | | 0.12 | | | | 0.14 | | |
| Net realized and unrealized gains (losses) | | | 0.05 | | | | (4.11 | ) | | | (2.92 | ) | | | 4.01 | | | | 3.44 | | |
| Net increase (decrease) from operations | | | 0.13 | | | | (3.94 | ) | | | (2.67 | ) | | | 4.13 | | | | 3.58 | | |
| Dividends from net investment income | | | (0.15 | ) | | | (0.36 | ) | | | (0.11 | ) | | | (0.18 | ) | | | (0.09 | ) | |
| Distributions from net realized gains | | | — | | | | — | | | | (2.24 | ) | | | (1.79 | ) | | | — | | |
| Total dividends and distributions | | | (0.15 | ) | | | (0.36 | ) | | | (2.35 | ) | | | (1.97 | ) | | | (0.09 | ) | |
| Net asset value, end of year | | $ | 11.47 | | | $ | 11.49 | | | $ | 15.79 | | | $ | 20.81 | | | $ | 18.65 | | |
| Total investment return2 | | | 1.10 | % | | | (24.67 | )% | | | (14.42 | )% | | | 23.13 | % | | | 23.68 | % | |
| Ratios/supplemental data: | |
| Net assets, end of year (000's) | | $ | 3,769 | | | $ | 4,342 | | | $ | 6,949 | | | $ | 8,856 | | | $ | 8,168 | | |
Expenses to average net assets, net of fee waivers and/or expense
reimbursements by and recoupments to manager | | | 2.26 | % | | | 2.31 | % | | | 2.18 | % | | | 2.18 | % | | | 2.32 | %3 | |
Expenses to average net assets, before fee waivers and/or expense
reimbursements by manager | | | 2.26 | % | | | 2.31 | % | | | 2.18 | % | | | 2.18 | % | | | 2.32 | % | |
| Net investment income to average net assets | | | 0.69 | % | | | 1.62 | % | | | 1.33 | % | | | 0.60 | % | | | 0.84 | % | |
| Portfolio turnover | | | 60 | % | | | 60 | % | | | 54 | % | | | 61 | % | | | 52 | % | |
1 Calculated using the average shares method.
2 Total investment return is calculated assuming a $10,000 investment on the first day of each year reported, reinvestment of all dividends and other distributions, if any, at net asset value on the ex-dividend dates, and a sale at net asset value on the last day of each year reported. The figures do not include any applicable sales charges or redemption fees; results would be lower if they were included. Returns do not reflect the deduction of taxes that a shareholder would pay on Portfolio distributions or the redemption of Portfolio shares.
3 The investment manager recouped expenses previously reimbursed by the investment manager on behalf of the Portfolio, not to exceed the expense cap.
278
| | | Class B | |
| | | Years ended July 31, | |
| | | 2010 | | 2009 | | 2008 | | 2007 | | 2006 | |
| Net asset value, beginning of year | | $ | 11.65 | | | $ | 15.79 | | | $ | 20.80 | | | $ | 18.60 | | | $ | 15.07 | | |
| Net investment income1 | | | 0.05 | | | | 0.14 | | | | 0.17 | | | | 0.07 | | | | 0.12 | | |
| Net realized and unrealized gains (losses) | | | 0.08 | | | | (4.09 | ) | | | (2.88 | ) | | | 4.04 | | | | 3.43 | | |
| Net increase (decrease) from operations | | | 0.13 | | | | (3.95 | ) | | | (2.71 | ) | | | 4.11 | | | | 3.55 | | |
| Dividends from net investment income | | | (0.10 | ) | | | (0.19 | ) | | | (0.06 | ) | | | (0.12 | ) | | | (0.02 | ) | |
| Distributions from net realized gains | | | — | | | | — | | | | (2.24 | ) | | | (1.79 | ) | | | — | | |
| Total dividends and distributions | | | (0.10 | ) | | | (0.19 | ) | | | (2.30 | ) | | | (1.91 | ) | | | (0.02 | ) | |
| Net asset value, end of year | | $ | 11.68 | | | $ | 11.65 | | | $ | 15.79 | | | $ | 20.80 | | | $ | 18.60 | | |
| Total investment return2 | | | 1.14 | % | | | (24.80 | )% | | | (14.57 | )% | | | 23.03 | % | | | 23.60 | % | |
| Ratios/supplemental data: | |
| Net assets, end of year (000's) | | $ | 20 | | | $ | 66 | | | $ | 186 | | | $ | 489 | | | $ | 740 | | |
Expenses to average net assets, net of fee waivers and/or expense
reimbursements by and recoupments to manager | | | 2.40 | % | | | 2.40 | % | | | 2.31 | % | | | 2.27 | % | | | 2.45 | %3 | |
Expenses to average net assets, before fee waivers and/or expense
reimbursements by manager | | | 2.59 | % | | | 2.63 | % | | | 2.31 | % | | | 2.27 | % | | | 2.45 | % | |
| Net investment income to average net assets | | | 0.43 | % | | | 1.36 | % | | | 0.89 | % | | | 0.37 | % | | | 0.73 | % | |
| Portfolio turnover | | | 60 | % | | | 60 | % | | | 54 | % | | | 61 | % | | | 52 | % | |
| | | Class Y | |
| | | Years ended July 31, | |
| | | 2010 | | 2009 | | 2008 | | 2007 | | 2006 | |
| Net asset value, beginning of year | | $ | 11.72 | | | $ | 16.20 | | | $ | 21.30 | | | $ | 19.06 | | | $ | 15.49 | | |
| Net investment income1 | | | 0.22 | | | | 0.31 | | | | 0.48 | | | | 0.36 | | | | 0.38 | | |
| Net realized and unrealized gains (losses) | | | 0.07 | | | | (4.23 | ) | | | (2.98 | ) | | | 4.10 | | | | 3.49 | | |
| Net increase (decrease) from operations | | | 0.29 | | | | (3.92 | ) | | | (2.50 | ) | | | 4.46 | | | | 3.87 | | |
| Dividends from net investment income | | | (0.30 | ) | | | (0.56 | ) | | | (0.36 | ) | | | (0.43 | ) | | | (0.30 | ) | |
| Distributions from net realized gains | | | — | | | | — | | | | (2.24 | ) | | | (1.79 | ) | | | — | | |
| Total dividends and distributions | | | (0.30 | ) | | | (0.56 | ) | | | (2.60 | ) | | | (2.22 | ) | | | (0.30 | ) | |
| Net asset value, end of year | | $ | 11.71 | | | $ | 11.72 | | | $ | 16.20 | | | $ | 21.30 | | | $ | 19.06 | | |
| Total investment return2 | | | 2.43 | % | | | (23.73 | )% | | | (13.38 | )% | | | 24.55 | % | | | 25.25 | % | |
| Ratios/supplemental data: | |
| Net assets, end of year (000's) | | $ | 23,368 | | | $ | 33,012 | | | $ | 50,655 | | | $ | 65,377 | | | $ | 53,388 | | |
Expenses to average net assets, net of fee waivers and/or expense
reimbursements by and recoupments to manager | | | 1.10 | % | | | 1.06 | % | | | 1.02 | % | | | 1.02 | % | | | 1.06 | % | |
Expenses to average net assets, before fee waivers and/or expense
reimbursements by manager | | | 1.10 | % | | | 1.06 | % | | | 1.02 | % | | | 1.02 | % | | | 1.06 | % | |
| Net investment income to average net assets | | | 1.77 | % | | | 2.89 | % | | | 2.51 | % | | | 1.78 | % | | | 2.14 | % | |
| Portfolio turnover | | | 60 | % | | | 60 | % | | | 54 | % | | | 61 | % | | | 52 | % | |
See accompanying notes to financial statements.
279
UBS PACE Select Advisors Trust
Financial highlights
UBS PACE International Equity Investments (concluded)
Selected data for a share of beneficial interest outstanding throughout each year is presented below:
| | | Class P | |
| | | Years ended July 31, | |
| | | 2010 | | 2009 | | 2008 | | 2007 | | 2006 | |
| Net asset value, beginning of year | | $ | 11.70 | | | $ | 16.16 | | | $ | 21.27 | | | $ | 19.03 | | | $ | 15.46 | | |
| Net investment income1 | | | 0.22 | | | | 0.29 | | | | 0.46 | | | | 0.35 | | | | 0.37 | | |
| Net realized and unrealized gains (losses) | | | 0.05 | | | | (4.21 | ) | | | (2.99 | ) | | | 4.09 | | | | 3.48 | | |
| Net increase (decrease) from operations | | | 0.27 | | | | (3.92 | ) | | | (2.53 | ) | | | 4.44 | | | | 3.85 | | |
| Dividends from net investment income | | | (0.28 | ) | | | (0.54 | ) | | | (0.34 | ) | | | (0.41 | ) | | | (0.28 | ) | |
| Distributions from net realized gains | | | — | | | | — | | | | (2.24 | ) | | | (1.79 | ) | | | — | | |
| Total dividends and distributions | | | (0.28 | ) | | | (0.54 | ) | | | (2.58 | ) | | | (2.20 | ) | | | (0.28 | ) | |
| Net asset value, end of year | | $ | 11.69 | | | $ | 11.70 | | | $ | 16.16 | | | $ | 21.27 | | | $ | 19.03 | | |
| Total investment return2 | | | 2.21 | % | | | (23.81 | )% | | | (13.53 | )% | | | 24.48 | % | | | 25.17 | % | |
| Ratios/supplemental data: | |
| Net assets, end of year (000's) | | $ | 698,546 | | | $ | 684,359 | | | $ | 1,048,105 | | | $ | 1,173,137 | | | $ | 900,603 | | |
Expenses to average net assets, net of fee waivers and/or expense
reimbursements by manager | | | 1.18 | % | | | 1.22 | % | | | 1.12 | % | | | 1.12 | % | | | 1.17 | % | |
Expenses to average net assets, before fee waivers and/or expense
reimbursements by manager | | | 1.18 | % | | | 1.22 | % | | | 1.12 | % | | | 1.12 | % | | | 1.17 | % | |
| Net investment income to average net assets | | | 1.80 | % | | | 2.72 | % | | | 2.44 | % | | | 1.70 | % | | | 2.09 | % | |
| Portfolio turnover | | | 60 | % | | | 60 | % | | | 54 | % | | | 61 | % | | | 52 | % | |
1 Calculated using the average shares method.
2 Total investment return is calculated assuming a $10,000 investment on the first day of each year reported, reinvestment of all dividends and other distributions, if any, at net asset value on the ex-dividend dates, and a sale at net asset value on the last day of each year reported. The figures do not include any applicable program or redemption fees; results would be lower if they were included. Returns do not reflect the deduction of taxes that a shareholder would pay on Portfolio distributions or the redemption of Portfolio shares.
See accompanying notes to financial statements.
280
(This page has been left blank intentionally)
281
UBS PACE Select Advisors Trust
Financial highlights
UBS PACE International Emerging Markets Equity Investments
Selected data for a share of beneficial interest outstanding throughout each year is presented below:
| | | Class A | |
| | | Years ended July 31, | |
| | | 2010 | | 2009 | | 2008 | | 2007 | | 2006 | |
| Net asset value, beginning of year | | $ | 10.58 | | | $ | 19.46 | | | $ | 23.61 | | | $ | 18.30 | | | $ | 15.13 | | |
| Net investment income (loss)1 | | | 0.09 | | | | 0.20 | | | | 0.25 | | | | 0.21 | | | | 0.21 | | |
| Net realized and unrealized gains (losses) | | | 1.68 | | | | (5.71 | ) | | | (0.49 | ) | | | 8.02 | | | | 3.10 | | |
| Net increase (decrease) from operations | | | 1.77 | | | | (5.51 | ) | | | (0.24 | ) | | | 8.23 | | | | 3.31 | | |
| Dividends from net investment income | | | (0.16 | ) | | | (0.13 | ) | | | (0.27 | ) | | | (0.22 | ) | | | (0.14 | ) | |
| Distributions from net realized gains | | | — | | | | (3.24 | ) | | | (3.64 | ) | | | (2.70 | ) | | | — | | |
| Total dividends and distributions | | | (0.16 | ) | | | (3.37 | ) | | | (3.91 | ) | | | (2.92 | ) | | | (0.14 | ) | |
| Net asset value, end of year | | $ | 12.19 | | | $ | 10.58 | | | $ | 19.46 | | | $ | 23.61 | | | $ | 18.30 | | |
| Total investment return2 | | | 16.81 | % | | | (21.37 | )% | | | (2.61 | )% | | | 49.16 | % | | | 21.97 | % | |
| Ratios/supplemental data: | |
| Net assets, end of year (000's) | | $ | 19,111 | | | $ | 17,784 | | | $ | 29,938 | | | $ | 31,216 | | | $ | 21,651 | | |
Expenses to average net assets, net of fee waivers and/or expense
reimbursements by and recoupments to manager | | | 1.87 | % | | | 1.93 | % | | | 1.86 | % | | | 1.89 | % | | | 1.97 | %3 | |
Expenses to average net assets, before fee waivers and/or expense
reimbursements by manager | | | 1.87 | % | | | 1.93 | % | | | 1.86 | % | | | 1.89 | % | | | 1.97 | % | |
| Net investment income (loss) to average net assets | | | 0.75 | % | | | 2.06 | % | | | 1.14 | % | | | 1.05 | % | | | 1.20 | % | |
| Portfolio turnover | | | 60 | % | | | 77 | % | | | 53 | % | | | 54 | % | | | 84 | % | |
| | | Class C | |
| | | Years ended July 31, | |
| | | 2010 | | 2009 | | 2008 | | 2007 | | 2006 | |
| Net asset value, beginning of year | | $ | 9.90 | | | $ | 18.48 | | | $ | 22.61 | | | $ | 17.62 | | | $ | 14.58 | | |
| Net investment income (loss)1 | | | (0.00 | )4 | | | 0.13 | | | | 0.08 | | | | 0.06 | | | | 0.07 | | |
| Net realized and unrealized gains (losses) | | | 1.58 | | | | (5.47 | ) | | | (0.46 | ) | | | 7.69 | | | | 3.00 | | |
| Net increase (decrease) from operations | | | 1.58 | | | | (5.34 | ) | | | (0.38 | ) | | | 7.75 | | | | 3.07 | | |
| Dividends from net investment income | | | (0.10 | ) | | | — | | | | (0.11 | ) | | | (0.06 | ) | | | (0.03 | ) | |
| Distributions from net realized gains | | | — | | | | (3.24 | ) | | | (3.64 | ) | | | (2.70 | ) | | | — | | |
| Total dividends and distributions | | | (0.10 | ) | | | (3.24 | ) | | | (3.75 | ) | | | (2.76 | ) | | | (0.03 | ) | |
| Net asset value, end of year | | $ | 11.38 | | | $ | 9.90 | | | $ | 18.48 | | | $ | 22.61 | | | $ | 17.62 | | |
| Total investment return2 | | | 15.96 | % | | | (21.97 | )% | | | (3.34 | )% | | | 48.03 | % | | | 21.06 | % | |
| Ratios/supplemental data: | |
| Net assets, end of year (000's) | | $ | 3,682 | | | $ | 3,525 | | | $ | 6,536 | | | $ | 7,461 | | | $ | 5,484 | | |
Expenses to average net assets, net of fee waivers and/or expense
reimbursements by and recoupments to manager | | | 2.61 | % | | | 2.67 | % | | | 2.60 | % | | | 2.64 | % | | | 2.78 | %3 | |
Expenses to average net assets, before fee waivers and/or expense
reimbursements by manager | | | 2.61 | % | | | 2.67 | % | | | 2.60 | % | | | 2.64 | % | | | 2.78 | % | |
| Net investment income (loss) to average net assets | | | (0.01 | )% | | | 1.35 | % | | | 0.39 | % | | | 0.30 | % | | | 0.40 | % | |
| Portfolio turnover | | | 60 | % | | | 77 | % | | | 53 | % | | | 54 | % | | | 84 | % | |
1 Calculated using the average shares method.
2 Total investment return is calculated assuming a $10,000 investment on the first day of each year reported, reinvestment of all dividends and other distributions, if any, at net asset value on the ex-dividend dates, and a sale at net asset value on the last day of each year reported. The figures do not include any applicable sales charges or redemption fees; results would be lower if they were included. Returns do not reflect the deduction of taxes that a shareholder would pay on Portfolio distributions or the redemption of Portfolio shares.
3 The investment manager recouped expenses previously reimbursed by the investment manager on behalf of the Portfolio, not to exceed the expense cap.
4 Amount represents less than $0.005 per share.
282
| | | Class B | |
| | | Years ended July 31, | |
| | | 2010 | | 2009 | | 2008 | | 2007 | | 2006 | |
| Net asset value, beginning of year | | $ | 9.91 | | | $ | 18.50 | | | $ | 22.61 | | | $ | 17.60 | | | $ | 14.55 | | |
| Net investment income (loss)1 | | | (0.03 | ) | | | 0.11 | | | | 0.06 | | | | 0.04 | | | | 0.05 | | |
| Net realized and unrealized gains (losses) | | | 1.60 | | | | (5.46 | ) | | | (0.46 | ) | | | 7.69 | | | | 3.00 | | |
| Net increase (decrease) from operations | | | 1.57 | | | | (5.35 | ) | | | (0.40 | ) | | | 7.73 | | | | 3.05 | | |
| Dividends from net investment income | | | — | | | | — | | | | (0.07 | ) | | | (0.02 | ) | | | — | | |
| Distributions from net realized gains | | | — | | | | (3.24 | ) | | | (3.64 | ) | | | (2.70 | ) | | | — | | |
| Total dividends and distributions | | | — | | | | (3.24 | ) | | | (3.71 | ) | | | (2.72 | ) | | | — | | |
| Net asset value, end of year | | $ | 11.48 | | | $ | 9.91 | | | $ | 18.50 | | | $ | 22.61 | | | $ | 17.60 | | |
| Total investment return2 | | | 15.84 | % | | | (22.05 | )% | | | (3.41 | )% | | | 47.95 | % | | | 20.96 | % | |
| Ratios/supplemental data: | |
| Net assets, end of year (000's) | | $ | 60 | | | $ | 135 | | | $ | 319 | | | $ | 535 | | | $ | 522 | | |
Expenses to average net assets, net of fee waivers and/or expense
reimbursements by and recoupments to manager | | | 2.72 | % | | | 2.72 | % | | | 2.68 | % | | | 2.69 | % | | | 2.86 | %3 | |
Expenses to average net assets, before fee waivers and/or expense
reimbursements by manager | | | 2.72 | % | | | 2.72 | % | | | 2.68 | % | | | 2.69 | % | | | 2.86 | % | |
| Net investment income (loss) to average net assets | | | (0.31 | )% | | | 1.14 | % | | | 0.28 | % | | | 0.20 | % | | | 0.29 | % | |
| Portfolio turnover | | | 60 | % | | | 77 | % | | | 53 | % | | | 54 | % | | | 84 | % | |
| | | Class Y | |
| | | Years ended July 31, | |
| | | 2010 | | 2009 | | 2008 | | 2007 | | 2006 | |
| Net asset value, beginning of year | | $ | 10.78 | | | $ | 19.79 | | | $ | 23.95 | | | $ | 18.53 | | | $ | 15.30 | | |
| Net investment income (loss)1 | | | 0.10 | | | | 0.28 | | | | 0.34 | | | | 0.30 | | | | 0.30 | | |
| Net realized and unrealized gains (losses) | | | 1.74 | | | | (5.83 | ) | | | (0.51 | ) | | | 8.12 | | | | 3.13 | | |
| Net increase (decrease) from operations | | | 1.84 | | | | (5.55 | ) | | | (0.17 | ) | | | 8.42 | | | | 3.43 | | |
| Dividends from net investment income | | | (0.21 | ) | | | (0.22 | ) | | | (0.35 | ) | | | (0.30 | ) | | | (0.20 | ) | |
| Distributions from net realized gains | | | — | | | | (3.24 | ) | | | (3.64 | ) | | | (2.70 | ) | | | — | | |
| Total dividends and distributions | | | (0.21 | ) | | | (3.46 | ) | | | (3.99 | ) | | | (3.00 | ) | | | (0.20 | ) | |
| Net asset value, end of year | | $ | 12.41 | | | $ | 10.78 | | | $ | 19.79 | | | $ | 23.95 | | | $ | 18.53 | | |
| Total investment return2 | | | 17.15 | % | | | (21.00 | )% | | | (2.22 | )% | | | 49.74 | % | | | 22.52 | % | |
| Ratios/supplemental data: | |
| Net assets, end of year (000's) | | $ | 21,524 | | | $ | 33,069 | | | $ | 31,579 | | | $ | 29,576 | | | $ | 20,201 | | |
Expenses to average net assets, net of fee waivers and/or expense
reimbursements by and recoupments to manager | | | 1.62 | % | | | 1.47 | % | | | 1.50 | % | | | 1.52 | % | | | 1.56 | % | |
Expenses to average net assets, before fee waivers and/or expense
reimbursements by manager | | | 1.62 | % | | | 1.47 | % | | | 1.50 | % | | | 1.52 | % | | | 1.56 | % | |
| Net investment income (loss) to average net assets | | | 0.88 | % | | | 2.87 | % | | | 1.49 | % | | | 1.44 | % | | | 1.64 | % | |
| Portfolio turnover | | | 60 | % | | | 77 | % | | | 53 | % | | | 54 | % | | | 84 | % | |
See accompanying notes to financial statements.
283
UBS PACE Select Advisors Trust
Financial highlights
UBS PACE International Emerging Markets Equity Investments (concluded)
Selected data for a share of beneficial interest outstanding throughout each year is presented below:
| | | Class P | |
| | | Years ended July 31, | |
| | | 2010 | | 2009 | | 2008 | | 2007 | | 2006 | |
| Net asset value, beginning of year | | $ | 10.72 | | | $ | 19.68 | | | $ | 23.84 | | | $ | 18.44 | | | $ | 15.25 | | |
| Net investment income1 | | | 0.09 | | | | 0.20 | | | | 0.28 | | | | 0.23 | | | | 0.21 | | |
| Net realized and unrealized gains (losses) | | | 1.71 | | | | (5.77 | ) | | | (0.51 | ) | | | 8.09 | | | | 3.13 | | |
| Net increase (decrease) from operations | | | 1.80 | | | | (5.57 | ) | | | (0.23 | ) | | | 8.32 | | | | 3.34 | | |
| Dividends from net investment income | | | (0.16 | ) | | | (0.15 | ) | | | (0.29 | ) | | | (0.22 | ) | | | (0.15 | ) | |
| Distributions from net realized gains | | | — | | | | (3.24 | ) | | | (3.64 | ) | | | (2.70 | ) | | | — | | |
| Total dividends and distributions | | | (0.16 | ) | | | (3.39 | ) | | | (3.93 | ) | | | (2.92 | ) | | | (0.15 | ) | |
| Net asset value, end of year | | $ | 12.36 | | | $ | 10.72 | | | $ | 19.68 | | | $ | 23.84 | | | $ | 18.44 | | |
| Total investment return2 | | | 16.85 | % | | | (21.42 | )% | | | (2.52 | )% | | | 49.31 | % | | | 21.98 | % | |
| Ratios/supplemental data: | |
| Net assets, end of year (000's) | | $ | 232,908 | | | $ | 210,680 | | | $ | 337,958 | | | $ | 374,910 | | | $ | 259,321 | | |
Expenses to average net assets, net of fee waivers and/or expense
reimbursements by and recoupments to manager | | | 1.85 | % | | | 1.97 | % | | | 1.78 | % | | | 1.82 | % | | | 1.98 | %3 | |
Expenses to average net assets, before fee waivers and/or expense
reimbursements by manager | | | 1.85 | % | | | 1.97 | % | | | 1.78 | % | | | 1.82 | % | | | 1.98 | % | |
| Net investment income to average net assets | | | 0.78 | % | | | 2.03 | % | | | 1.22 | % | | | 1.13 | % | | | 1.20 | % | |
| Portfolio turnover | | | 60 | % | | | 77 | % | | | 53 | % | | | 54 | % | | | 84 | % | |
1 Calculated using the average shares method.
2 Total investment return is calculated assuming a $10,000 investment on the first day of each year reported, reinvestment of all dividends and other distributions, if any, at net asset value on the ex-dividend dates, and a sale at net asset value on the last day of each year reported. The figures do not include any applicable program or redemption fees; results would be lower if they were included. Returns do not reflect the deduction of taxes that a shareholder would pay on Portfolio distributions or the redemption of Portfolio shares.
3 The investment manager recouped expenses previously reimbursed by the investment manager on behalf of the Portfolio, not to exceed the expense cap.
See accompanying notes to financial statements.
284
(This page has been left blank intentionally)
285
UBS PACE Select Advisors Trust
Financial highlights
UBS PACE Global Real Estate Securities Investments
Selected data for a share of beneficial interest outstanding throughout each period is presented below:
| | | Class A | |
| | | Years ended July 31, | | Period ended
July 31, | |
| | | 20101 | | 2009 | | 2008 | | 20072 | |
| Net asset value, beginning of period | | $ | 4.86 | | | $ | 7.73 | | | $ | 9.54 | | | $ | 9.84 | | |
| Net investment income6 | | | 0.11 | | | | 0.16 | | | | 0.19 | | | | 0.09 | | |
| Net realized and unrealized gains (losses) | | | 0.83 | | | | (2.97 | ) | | | (1.70 | ) | | | (0.35 | ) | |
| Net increase (decrease) from operations | | | 0.94 | | | | (2.81 | ) | | | (1.51 | ) | | | (0.26 | ) | |
| Dividends from net investment income | | | (0.49 | ) | | | (0.06 | ) | | | (0.27 | ) | | | (0.04 | ) | |
| Distributions from net realized gains | | | — | | | | — | | | | (0.03 | ) | | | — | | |
| Total dividends and distributions | | | (0.49 | ) | | | (0.06 | ) | | | (0.30 | ) | | | (0.04 | ) | |
| Net asset value, end of period | | $ | 5.31 | | | $ | 4.86 | | | $ | 7.73 | | | $ | 9.54 | | |
| Total investment return7 | | | 19.70 | % | | | (36.25 | )% | | | (16.22 | )% | | | (2.63 | )% | |
| Ratios/supplemental data: | |
| Net assets, end of period (000's) | | $ | 3,975 | | | $ | 3,238 | | | $ | 6,647 | | | $ | 4,199 | | |
Expenses to average net assets, net of fee waivers and/or expense
reimbursements by manager | | | 1.45 | % | | | 1.45 | % | | | 1.45 | % | | | 1.45 | %8 | |
Expenses to average net assets, before fee waivers and/or expense
reimbursements by manager | | | 1.89 | % | | | 2.06 | % | | | 1.74 | % | | | 3.06 | %8 | |
| Net investment income to average net assets | | | 2.13 | % | | | 3.32 | % | | | 2.10 | % | | | 1.47 | %8 | |
| Portfolio turnover | | | 117 | % | | | 127 | % | | | 68 | % | | | 38 | % | |
| | | Class Y | |
| | | Year ended
July 31, | | Period ended
July 31, | | Period ended
February 15, | |
| | | 20101 | | 20093 | | 20074 | |
| Net asset value, beginning of period | | $ | 4.87 | | | $ | 4.35 | | | $ | 10.00 | | |
| Net investment income6 | | | 0.12 | | | | 0.09 | | | | 0.06 | | |
| Net realized and unrealized gains (losses) | | | 0.84 | | | | 0.43 | | | | 0.97 | | |
| Net increase (decrease) from operations | | | 0.96 | | | | 0.52 | | | | 1.03 | | |
| Dividends from net investment income | | | (0.50 | ) | | | — | | | | (0.04 | ) | |
| Distributions from net realized gains | | | — | | | | — | | | | — | | |
| Total dividends and distributions | | | (0.50 | ) | | | — | | | | (0.04 | ) | |
| Net asset value, end of period | | $ | 5.33 | | | $ | 4.87 | | | $ | 10.99 | | |
| Total investment return7 | | | 20.15 | % | | | 11.95 | % | | | 10.39 | % | |
| Ratios/supplemental data: | |
| Net assets, end of period (000's) | | $ | 111 | | | $ | 13 | | | $ | — | | |
Expenses to average net assets, net of fee waivers and/or expense
reimbursements by manager | | | 1.20 | % | | | 1.20 | %8 | | | 1.20 | %8 | |
Expenses to average net assets, before fee waivers and/or expense
reimbursements by manager | | | 1.51 | % | | | 1.87 | %8 | | | 1.92 | %8 | |
| Net investment income to average net assets | | | 2.34 | % | | | 3.84 | %8 | | | 3.07 | %8 | |
| Portfolio turnover | | | 117 | % | | | 127 | % | | | 38 | % | |
1 Investment advisory functions for this Portfolio were transferred from Goldman Sachs Asset Management, L.P. to Brookfield Investment Management Inc. and ING Clarion Real Estate Securities, LLC on November 17, 2009.
2 For the period December 18, 2006 (commencement of issuance) through July 31, 2007.
3 For the period December 26, 2008 (recommencement of issuance) through July 31, 2009.
4 For the period November 30, 2006 (commencement of issuance) through February 15, 2007. There were no shares outstanding from February 16, 2007 through December 25, 2008.
5 For the period January 22, 2007 (commencement of issuance) through July 31, 2007.
286
| | | Class C | |
| | | Years ended July 31, | | Period ended
July 31, | |
| | | 20101 | | 2009 | | 2008 | | 20072 | |
| Net asset value, beginning of period | | $ | 4.85 | | | $ | 7.69 | | | $ | 9.49 | | | $ | 9.84 | | |
| Net investment income6 | | | 0.07 | | | | 0.12 | | | | 0.12 | | | | 0.05 | | |
| Net realized and unrealized gains (losses) | | | 0.82 | | | | (2.95 | ) | | | (1.69 | ) | | | (0.36 | ) | |
| Net increase (decrease) from operations | | | 0.89 | | | | (2.83 | ) | | | (1.57 | ) | | | (0.31 | ) | |
| Dividends from net investment income | | | (0.45 | ) | | | (0.01 | ) | | | (0.20 | ) | | | (0.04 | ) | |
| Distributions from net realized gains | | | — | | | | — | | | | (0.03 | ) | | | — | | |
| Total dividends and distributions | | | (0.45 | ) | | | (0.01 | ) | | | (0.23 | ) | | | (0.04 | ) | |
| Net asset value, end of period | | $ | 5.29 | | | $ | 4.85 | | | $ | 7.69 | | | $ | 9.49 | | |
| Total investment return7 | | | 18.74 | % | | | (36.73 | )% | | | (16.84 | )% | | | (3.16 | )% | |
| Ratios/supplemental data: | |
| Net assets, end of period (000's) | | $ | 171 | | | $ | 136 | | | $ | 213 | | | $ | 343 | | |
Expenses to average net assets, net of fee waivers and/or expense
reimbursements by manager | | | 2.20 | % | | | 2.20 | % | | | 2.20 | % | | | 2.20 | %8 | |
Expenses to average net assets, before fee waivers and/or expense
reimbursements by manager | | | 2.69 | % | | | 2.96 | % | | | 2.68 | % | | | 3.78 | %8 | |
| Net investment income to average net assets | | | 1.37 | % | | | 2.67 | % | | | 1.29 | % | | | 0.84 | %8 | |
| Portfolio turnover | | | 117 | % | | | 127 | % | | | 68 | % | | | 38 | % | |
| | | Class P | |
| | | Years ended July 31, | | Period ended
July 31, | |
| | | 20101 | | 2009 | | 2008 | | 20075 | |
| Net asset value, beginning of period | | $ | 4.86 | | | $ | 7.75 | | | $ | 9.56 | | | $ | 10.26 | | |
| Net investment income6 | | | 0.12 | | | | 0.17 | | | | 0.21 | | | | 0.09 | | |
| Net realized and unrealized gains (losses) | | | 0.83 | | | | (2.97 | ) | | | (1.71 | ) | | | (0.79 | ) | |
| Net increase (decrease) from operations | | | 0.95 | | | | (2.80 | ) | | | (1.50 | ) | | | (0.70 | ) | |
| Dividends from net investment income | | | (0.49 | ) | | | (0.09 | ) | | | (0.28 | ) | | | — | | |
| Distributions from net realized gains | | | — | | | | — | | | | (0.03 | ) | | | — | | |
| Total dividends and distributions | | | (0.49 | ) | | | (0.09 | ) | | | (0.31 | ) | | | — | | |
| Net asset value, end of period | | $ | 5.32 | | | $ | 4.86 | | | $ | 7.75 | | | $ | 9.56 | | |
| Total investment return7 | | | 20.10 | % | | | (36.09 | )% | | | (16.06 | )% | | | (6.82 | )% | |
| Ratios/supplemental data: | |
| Net assets, end of period (000's) | | $ | 73,866 | | | $ | 52,925 | | | $ | 70,125 | | | $ | 44,772 | | |
Expenses to average net assets, net of fee waivers and/or expense
reimbursements by manager | | | 1.20 | % | | | 1.20 | % | | | 1.20 | % | | | 1.20 | %8 | |
Expenses to average net assets, before fee waivers and/or expense
reimbursements by manager | | | 1.91 | % | | | 2.17 | % | | | 1.71 | % | | | 3.02 | %8 | |
| Net investment income to average net assets | | | 2.36 | % | | | 3.67 | % | | | 2.38 | % | | | 1.75 | %8 | |
| Portfolio turnover | | | 117 | % | | | 127 | % | | | 68 | % | | | 38 | % | |
6 Calculated using the average shares method.
7 Total investment return is calculated assuming a $10,000 investment on the first day of each period reported, reinvestment of all dividends and other distributions, if any, at net asset value on the ex-dividend dates, and a sale at net asset value on the last day of each period reported. The figures do not include any applicable sales charges, redemption fees or program fees; results would be lower if they were included. Total investment return for periods of less than one year has not been annualized. Returns do not reflect the deduction of taxes that a shareholder would pay on Portfolio distributions or the redemption of Portfolio shares.
8 Annualized.
See accompanying notes to financial statements.
287
UBS PACE Select Advisors Trust
Financial highlights
UBS PACE Alternative Strategies Investments
Selected data for a share of beneficial interest outstanding throughout each period is presented below:
| | | Class A | | Class B | |
| | | Years ended July 31, | | Period ended
July 31, | | Period ended
April 7, | | Years ended July 31, | | Period ended
July 31, | |
| | | 2010 | | 20091 | | 20082 | | 2007 | | 20063 | | 20104 | | 20091 | | 20082 | | 2007 | | 20065 | |
| Net asset value, beginning of period | | $ | 8.79 | | | $ | 10.46 | | | $ | 11.27 | | | $ | 9.93 | | | $ | 10.01 | | | $ | 8.64 | | | $ | 10.36 | | | $ | 11.19 | | | $ | 9.91 | | | $ | 9.84 | | |
| Net investment income (loss)7 | | | 0.008 | | | | 0.06 | | | | 0.09 | | | | 0.13 | | | | 0.03 | | | | (0.03 | ) | | | (0.01 | ) | | | 0.01 | | | | 0.02 | | | | 0.01 | | |
| Net realized and unrealized gains (losses) | | | 0.40 | | | | (1.63 | ) | | | (0.65 | ) | | | 1.26 | | | | (0.11 | ) | | | 0.56 | | | | (1.62 | ) | | | (0.64 | ) | | | 1.29 | | | | 0.06 | | |
| Net increase (decrease) from operations | | | 0.40 | | | | (1.57 | ) | | | (0.56 | ) | | | 1.39 | | | | (0.08 | ) | | | 0.53 | | | | (1.63 | ) | | | (0.63 | ) | | | 1.31 | | | | 0.07 | | |
| Dividends from net investment income | | | (0.03 | ) | | | (0.03 | ) | | | (0.07 | ) | | | (0.05 | ) | | | — | | | | — | | | | (0.02 | ) | | | (0.02 | ) | | | (0.03 | ) | | | — | | |
| Distributions from net realized gains | | | — | | | | (0.07 | ) | | | (0.18 | ) | | | — | | | | — | | | | — | | | | (0.07 | ) | | | (0.18 | ) | | | — | | | | — | | |
| Total dividends and distributions | | | (0.03 | ) | | | (0.10 | ) | | | (0.25 | ) | | | (0.05 | ) | | | — | | | | — | | | | (0.09 | ) | | | (0.20 | ) | | | (0.03 | ) | | | — | | |
| Net asset value, end of period | | $ | 9.16 | | | $ | 8.79 | | | $ | 10.46 | | | $ | 11.27 | | | $ | 9.93 | | | $ | 9.17 | | | $ | 8.64 | | | $ | 10.36 | | | $ | 11.19 | | | $ | 9.91 | | |
| Total investment return9 | | | 4.41 | % | | | (14.95 | )% | | | (4.94 | )% | | | 14.09 | % | | | (0.80 | )% | | | 6.01 | % | | | (15.54 | )% | | | (5.68 | )% | | | 13.26 | % | | | 0.71 | % | |
| Ratios/supplemental data: | |
| Net assets, end of period (000's) | | $ | 56,772 | | | $ | 65,429 | | | $ | 150,598 | | | $ | 64,409 | | | $ | 10,393 | | | $ | — | | | $ | 29 | | | $ | 23 | | | $ | 18 | | | $ | 3 | | |
Expenses to average net assets, net of fee waivers and/or expense reimbursements by and
recoupments to manager including dividend expense, interest expense and other borrowing
costs for investments sold short | | | 2.00 | % | | | 2.20 | % | | | 2.42 | %10 | | | 2.52 | % | | | 2.14 | %11 | | | 2.77 | %11 | | | 3.00 | % | | | 3.16 | % | | | 3.23 | % | | | 2.83 | %11 | |
Expenses to average net assets, before fee waivers and/or expense reimbursements by
manager including dividend expense, interest expense and other borrowing
costs for investments sold short | | | 2.06 | % | | | 2.23 | % | | | 2.42 | % | | | 2.69 | % | | | 4.24 | %11 | | | 3.20 | %11 | | | 3.13 | % | | | 4.51 | % | | | 3.68 | % | | | 5.09 | %11 | |
Expenses to average net assets, net of fee waivers and/or expense reimbursements by
and recoupments to manager, excluding dividend expense, interest expense and other
borrowing costs for investments sold short | | | 1.95 | % | | | 1.95 | % | | | 1.94 | %10 | | | 1.88 | % | | | 1.66 | %11 | | | 2.70 | %11 | | | 2.70 | % | | | 2.70 | % | | | 2.63 | % | | | 2.38 | %11 | |
| Net investment income (loss) to average net assets | | | 0.04 | % | | | 0.69 | % | | | 0.79 | % | | | 1.21 | % | | | 1.30 | %11 | | | (0.49 | )%11 | | | (0.08 | )% | | | 0.08 | % | | | 0.31 | % | | | 0.41 | %11 | |
| Portfolio turnover | | | 244 | % | | | 423 | % | | | 389 | % | | | 178 | % | | | 54 | % | | | 244 | % | | | 423 | % | | | 389 | % | | | 178 | % | | | 54 | % | |
1 A portion of the investment advisory function for this Portfolio was transferred to First Quadrant L.P. on April 8, 2009. Analytic Investors, LLC, Goldman Sachs Asset Management, L.P. and Wellington Management Company, LLP continue to provide a portion of the investment advisory function.
2 A portion of the investment advisory function for this Porftolio was transferred to Goldman Sachs Asset Managment, L.P. on September 10, 2007. Analytic Investors, LLC and Wellington Management Company, LLP continue to provide a portion of the investment advisory function.
3 For the period April 10, 2006 (commencement of issuance) through July 31, 2006.
4 For the period August 1, 2009 through April 7, 2010. There were no shares outstanding from April 8, 2010 through July 31, 2010.
5 For the period May 19, 2006 (commencement of issuance) through July 31, 2006.
6 For the period April 11, 2006 (commencement of issuance) through July 31, 2006.
7 Calculated using the average shares method.
8 Amount represents less than $0.005 per share.
9 Total investment return is calculated assuming a $10,000 investment on the first day of each period reported, reinvestment of all dividends and other distributions, if any, at net asset value on the ex-dividend dates, and a sale at net asset value on the last day of each period reported. The figures do not include any applicable sales charges or redemption fees; results would be lower if they were included. Total investment return for periods of less than one year has not been annualized. Returns do not reflect the deduction of taxes that a shareholder would pay on Portfolio distributions or the redemption of Portfolio shares.
10 The investment manager recouped expenses previously reimbursed by the investment manager on behalf of the Portfolio, not to exceed the expense cap.
11 Annualized.
288
| | | Class C | |
| | | Years ended July 31, | | Period ended
July 31, | |
| | | 2010 | | 20091 | | 20082 | | 2007 | | 20066 | |
| Net asset value, beginning of period | | $ | 8.64 | | | $ | 10.34 | | | $ | 11.20 | | | $ | 9.91 | | | $ | 9.97 | | |
| Net investment income (loss)7 | | | (0.06 | ) | | | (0.01 | ) | | | 0.01 | | | | 0.05 | | | | 0.02 | | |
| Net realized and unrealized gains (losses) | | | 0.39 | | | | (1.62 | ) | | | (0.64 | ) | | | 1.26 | | | | (0.08 | ) | |
| Net increase (decrease) from operations | | | 0.33 | | | | (1.63 | ) | | | (0.63 | ) | | | 1.31 | | | | (0.06 | ) | |
| Dividends from net investment income | | | — | | | | — | | | | (0.05 | ) | | | (0.02 | ) | | | — | | |
| Distributions from net realized gains | | | — | | | | (0.07 | ) | | | (0.18 | ) | | | — | | | | — | | |
| Total dividends and distributions | | | — | | | | (0.07 | ) | | | (0.23 | ) | | | (0.02 | ) | | | — | | |
| Net asset value, end of period | | $ | 8.97 | | | $ | 8.64 | | | $ | 10.34 | | | $ | 11.20 | | | $ | 9.91 | | |
| Total investment return9 | | | 3.70 | % | | | (15.61 | )% | | | (5.67 | )% | | | 13.23 | % | | | (0.60 | )% | |
| Ratios/supplemental data: | |
| Net assets, end of period (000's) | | $ | 6,887 | | | $ | 6,565 | | | $ | 7,921 | | | $ | 3,843 | | | $ | 302 | | |
Expenses to average net assets, net of fee waivers and/or expense reimbursements by and
recoupments to manager including dividend expense, interest expense and other borrowing
costs for investments sold short | | | 2.75 | % | | | 2.96 | % | | | 3.16 | %10 | | | 3.28 | % | | | 2.84 | %11 | |
Expenses to average net assets, before fee waivers and/or expense reimbursements by
manager including dividend expense, interest expense and other borrowing
costs for investments sold short | | | 2.75 | % | | | 2.96 | % | | | 3.16 | % | | | 3.45 | % | | | 4.35 | %11 | |
Expenses to average net assets, net of fee waivers and/or expense reimbursements by
and recoupments to manager, excluding dividend expense, interest expense and other
borrowing costs for investments sold short | | | 2.70 | % | | | 2.70 | % | | | 2.67 | %10 | | | 2.65 | % | | | 2.40 | %11 | |
| Net investment income (loss) to average net assets | | | (0.72 | )% | | | (0.08 | )% | | | 0.08 | % | | | 0.56 | % | | | 0.66 | %11 | |
| Portfolio turnover | | | 244 | % | | | 423 | % | | | 389 | % | | | 178 | % | | | 54 | % | |
See accompanying notes to financial statements.
289
UBS PACE Select Advisors Trust
Financial highlights
UBS PACE Alternative Strategies Investments (concluded)
Selected data for a share of beneficial interest outstanding throughout each period is presented below:
| | | Class Y | |
| | | Years ended July 31, | | Periods ended July 31, | |
| | | 2010 | | 20091 | | 20082,3 | | 20064 | |
| Net asset value, beginning of period | | $ | 8.80 | | | $ | 10.51 | | | $ | 10.52 | | | $ | 10.00 | | |
| Net investment income (loss)6 | | | 0.03 | | | | 0.08 | | | | (0.00 | )7 | | | 0.06 | | |
| Net realized and unrealized gains (losses) | | | 0.40 | | | | (1.66 | ) | | | (0.01 | ) | | | (0.20 | ) | |
| Net increase (decrease) from operations | | | 0.43 | | | | (1.58 | ) | | | (0.01 | ) | | | (0.14 | ) | |
| Dividends from net investment income | | | (0.04 | ) | | | (0.06 | ) | | | — | | | | — | | |
| Distributions from net realized gains | | | — | | | | (0.07 | ) | | | — | | | | — | | |
| Total dividends and distributions | | | (0.04 | ) | | | (0.13 | ) | | | — | | | | — | | |
| Net asset value, end of period | | $ | 9.19 | | | $ | 8.80 | | | $ | 10.51 | | | $ | 9.86 | | |
| Total investment return8 | | | 4.83 | % | | | (14.81 | )% | | | (0.10 | )% | | | (1.40 | )% | |
| Ratios/supplemental data: | |
| Net assets, end of period (000's) | | $ | 1,977 | | | $ | 13,707 | | | $ | 57,552 | | | $ | — | | |
Expenses to average net assets, net of fee waivers and/or expense reimbursements by and
recoupments to manager including dividend expense, interest expense and other borrowing
costs for investments sold short | | | 1.76 | %9 | | | 1.95 | % | | | 2.52 | %10 | | | 1.76 | %10 | |
Expenses to average net assets, before fee waivers and/or expense
reimbursements by manager including dividend expense, interest expense and other borrowing
costs for investments sold short | | | 1.76 | % | | | 1.98 | % | | | 2.69 | %10 | | | 2.34 | %10 | |
Expenses to average net assets, net of fee waivers and/or expense reimbursements
by and recoupments to manager excluding dividend expense, interest expense and other borrowing
costs for investments sold short | | | 1.70 | %9 | | | 1.70 | % | | | 1.70 | %10 | | | 1.41 | %10 | |
| Net investment income (loss) to average net assets | | | 0.37 | % | | | 0.95 | % | | | (1.77 | )%10 | | | 1.94 | %10 | |
| Portfolio turnover | | | 244 | % | | | 423 | % | | | 389 | % | | | 54 | % | |
1 A portion of the investment advisory function for this Portfolio was transferred to First Quadrant L.P. on April 8, 2009. Analytic Investors, LLC, Goldman Sachs Asset Management, L.P. and Wellington Management Company, LLP continue to provide a portion of the investment advisory function.
2 A portion of the investment advisory function for this Porftolio was transferred to Goldman Sachs Asset Managment, L.P. on September 10, 2007. Analytic Investors, LLC and Wellington Management Company, LLP continue to provide a portion of the investment advisory function.
3 For the period July 23, 2008 (recommencement of issuance) through July 31, 2008.
4 For the period April 3, 2006 (commencement of issuance) through July 26, 2006. There were no shares outstanding from July 27, 2006 through July 22, 2008.
5 For the period April 10, 2006 (commencement of issuance) through July 31, 2006.
6 Calculated using the average shares method.
7 Amount represents less than $0.005 per share.
8 Total investment return is calculated assuming a $10,000 investment on the first day of each period reported, reinvestment of all dividends and other distributions, if any, at net asset value on the ex-dividend dates, and a sale at net asset value on the last day of each period reported. The figures do not include any applicable sales charges, redemption fees or program fees; results would be lower if they were included. Total investment return for periods of less than one year has not been annualized. Returns do not reflect the deduction of taxes that a shareholder would pay on Portfolio distributions or the redemption of Portfolio shares.
9 The investment manager recouped expenses previously reimbursed by the investment manager on behalf of the Portfolio, not to exceed the expense cap.
10 Annualized.
290
| | | Class P | |
| | | Years ended July 31, | | Period ended
July 31, | |
| | | 2010 | | 20091 | | 20082 | | 2007 | | 20065 | |
| Net asset value, beginning of period | | $ | 8.82 | | | $ | 10.51 | | | $ | 11.30 | | | $ | 9.94 | | | $ | 10.01 | | |
| Net investment income (loss)6 | | | 0.03 | | | | 0.08 | | | | 0.12 | | | | 0.16 | | | | 0.03 | | |
| Net realized and unrealized gains (losses) | | | 0.40 | | | | (1.65 | ) | | | (0.65 | ) | | | 1.26 | | | | (0.10 | ) | |
| Net increase (decrease) from operations | | | 0.43 | | | | (1.57 | ) | | | (0.53 | ) | | | 1.42 | | | | (0.07 | ) | |
| Dividends from net investment income | | | (0.06 | ) | | | (0.05 | ) | | | (0.08 | ) | | | (0.06 | ) | | | — | | |
| Distributions from net realized gains | | | — | | | | (0.07 | ) | | | (0.18 | ) | | | — | | | | — | | |
| Total dividends and distributions | | | (0.06 | ) | | | (0.12 | ) | | | (0.26 | ) | | | (0.06 | ) | | | — | | |
| Net asset value, end of period | | $ | 9.19 | | | $ | 8.82 | | | $ | 10.51 | | | $ | 11.30 | | | $ | 9.94 | | |
| Total investment return8 | | | 4.71 | % | | | (14.73 | )% | | | (4.76 | )% | | | 14.38 | % | | | (0.70 | )% | |
| Ratios/supplemental data: | |
| Net assets, end of period (000's) | | $ | 399,477 | | | $ | 356,352 | | | $ | 555,361 | | | $ | 384,649 | | | $ | 46,920 | | |
Expenses to average net assets, net of fee waivers and/or expense reimbursements by and
recoupments to manager including dividend expense, interest expense and other borrowing
costs for investments sold short | | | 1.75 | % | | | 1.95 | % | | | 2.13 | %9 | | | 2.28 | % | | | 1.90 | %10 | |
Expenses to average net assets, before fee waivers and/or expense
reimbursements by manager including dividend expense, interest expense and other borrowing
costs for investments sold short | | | 1.79 | % | | | 1.96 | % | | | 2.13 | % | | | 2.43 | % | | | 4.12 | %10 | |
Expenses to average net assets, net of fee waivers and/or expense reimbursements
by and recoupments to manager excluding dividend expense, interest expense and other borrowing
costs for investments sold short | | | 1.70 | % | | | 1.70 | % | | | 1.68 | %9 | | | 1.64 | % | | | 1.41 | %10 | |
| Net investment income (loss) to average net assets | | | 0.28 | % | | | 0.93 | % | | | 1.10 | % | | | 1.44 | % | | | 1.47 | %10 | |
| Portfolio turnover | | | 244 | % | | | 423 | % | | | 389 | % | | | 178 | % | | | 54 | % | |
See accompanying notes to financial statements.
291
UBS PACE Select Advisors Trust
Notes to financial statements
Organization and significant accounting policies
UBS PACE Select Advisors Trust (the "Trust") is registered with the Securities and Exchange Commission under the Investment Company Act of 1940, as amended, as an open-end management investment company currently composed of fifteen separate investment portfolios and was organized as a Delaware statutory trust under the laws of the State of Delaware by Certificate of Trust dated September 9, 1994, as amended June 9, 1995 and thereafter. The trustees of the Trust have authority to issue an unlimited number of shares of beneficial interest, par value $0.001 per share.
The Trust has fifteen Portfolios available for investment, each having its own investment objectives and policies: UBS PACE Money Market Investments, UBS PACE Government Securities Fixed Income Investments, UBS PACE Intermediate Fixed Income Investments, UBS PACE Strategic Fixed Income Investments, UBS PACE Municipal Fixed Income Investments, UBS PACE Global Fixed Income Investments, UBS PACE High Yield Investments, UBS PACE Large Co Value Equity Investments, UBS PACE Large Co Growth Equity Investments, UBS PACE Small/Medium Co Value Equity Investments, UBS PACE Small/Medium Co Growth Equity Investments, UBS PACE International Equity Investments, UBS PACE International Emerging Markets Equity Investments, UBS PACE Global Real Estate Securities Investments and UBS PACE Alternative Strategies Investments (collectively, the "Portfolios").
Each of the Portfolios is classified as a diversified investment company with the exception of UBS PACE Intermediate Fixed Income Investments, UBS PACE Global Fixed Income Investments, UBS PACE Global Real Estate Securities Investments and UBS PACE Alternative Strategies Investments. With the exception of UBS PACE Money Market Investments (which currently offers Class P shares only) and UBS PACE Global Real Estate Securities Investments (which currently offers Class A, Class C, Class Y and Class P shares), each Portfolio currently offers Class A, Class B, Class C, Class Y and Class P shares. Each class represents interests in the same assets of the applicable Portfolio and the classes are identical except for differences in their sales charge structures, ongoing service and distribution charges and certain transfer agency and related services expenses. In addition, Class B shares and all corresponding reinvested dividend shares automatically convert to Class A shares within a certain number of years after issuance which varies depending upon the amount invested. All classes of shares have equal voting privileges except that each class has exclusive voting rights with respect to its service and/or distribution plan, if any. Class Y and Class P shares have no service or distribution plan. The Portfolios' Class P shares currently are available for purchase only to participants in the UBS PACESM Select Advisors Program, except that UBS PACE Money Market Investments shares are also available to participants in the UBS PACESM Multi Advisor Program.
As of October 1, 2007, new or additional investments into Class B shares, including investments through an automatic investment plan, are not permitted. Existing shareholders of Class B shares may: (i) continue as Class B shareholders; (ii) continue to reinvest dividends and distributions into Class B shares; and (iii) exchange their Class B shares for Class B shares of other series of the UBS Family of Funds, as permitted by existing exchange privileges. For Class B shares outstanding on October 1, 2007 and Class B shares acquired upon reinvestment of dividends and distributions or through exchanges, all Class B share attributes, including the associated Rule 12b-1 service plan and distribution fees, contingent deferred sales charges and conversion features will continue.
The Trust accounts separately for the assets, liabilities and operations of each Portfolio. Expenses directly attributable to each Portfolio are charged to that Portfolio's operations; expenses which are applicable to all Portfolios are allocated among them on a pro rata basis.
292
UBS PACE Select Advisors Trust
Notes to financial statements
In the normal course of business, the Portfolios may enter into contracts that contain a variety of representations or that provide indemnification for certain liabilities. The Portfolios' maximum exposure under these arrangements is unknown, as this would involve future claims that may be made against the Portfolios that have not yet occurred. However, the Portfolios have not had prior claims or losses pursuant to these contracts and expect the risk of loss to be remote.
In June 2009, the Financial Accounting Standards Board ("FASB") established the FASB Accounting Standards CodificationTM ("Codification") as the single source of authoritative accounting principles recognized by the FASB in the preparation of financial statements in conformity with US generally accepted accounting principles ("GAAP"). The Codification supersedes existing and nongrandfathered, non-SEC accounting and reporting standards. The Codification did not change GAAP but rather organized it into a hierarchy where all guidance within the Codification carries an equal level of authority. The Codification became effective on July 1, 2009. The Codification did not have a material effect on the Trust's financial statements.
The preparation of financial statements in accordance with GAAP requires the Trust's management to make estimates and assumptions that affect the reported amounts and disclosures in the financial statements. Actual results could differ from those estimates. The following is a summary of significant accounting policies:
Valuation of investments—Each Portfolio (except UBS PACE Money Market Investments) calculates its net asset value based on the current value for its portfolio securities. The Portfolios normally obtain values for their securities from independent pricing sources. Independent pricing sources may use last reported sale prices, official market closing prices, current market quotations or valuations from computerized "matrix" systems that derive values based on comparable securities. Securities traded in the over-the-counter ("OTC") market and listed on The NASDAQ Stock Market, Inc. ("NASDAQ") normally are valued at the NASDAQ Official Closing Price. Other OTC securities are valued at the last bid price available prior to valuation. Securities which are listed on US and foreign stock exchanges normally are valued at the market close, last sale price on the day the securities are valued or, lacking any sales on such day, at the last available bid price. Securities listed on foreign stock exchanges (and certain related derivatives) may be fair valued based on significant events that occur between the close of the foreign markets and 4:00 pm EST. UBS PACE International Equity Investments, UBS PACE International Emerging Markets Equity Investments, UBS PACE Global Real Estate Securities Investments and UBS PACE Alternative Strategies Investments may use a systematic fair valuation model provided by an independent third party to value securities principally traded in foreign markets (and certain related derivatives) in order to adjust for possible stale pricing that may occur between the close of the foreign exchanges and the time for valuation. If a security is valued at a "fair value", that value is likely to be different from the last quoted market price for the security. In cases where securities are traded on more than one exchange, the securities are v alued on the exchange designated as the primary market by UBS Global Asset Management (Americas) Inc. ("UBS Global AM"). If a market value is not available from an independent pricing source for a particular security, that security is valued at fair value as determined in good faith by or under the direction of the Trust's Board of Trustees (the "Board"). Various factors may be reviewed in order to make a good faith determination of a security's fair value. These factors include, but are not limited to, the type and cost of the security; contractual or legal restrictions on resale of the security; relevant financial or business developments of the issuer; actively traded similar or related securities; conversion or exchange rights on the security; related corporate actions; and changes in overall market conditions. If events occur that materially affect the value of securities (particularly non-US securities) between the close of trading in those securities and the close of regular trading on the New York St ock Exchange ("NYSE"), the securities are fair valued. The amortized cost method of valuation, which approximates market value, generally is used to value short-term debt instruments with sixty days or less remaining to maturity, unless the Board determines that this does not represent fair value. Investments of
293
UBS PACE Select Advisors Trust
Notes to financial statements
the UBS PACE Money Market Investments Portfolio are valued using the amortized cost method of valuation. All investments quoted in foreign currencies will be valued daily in US dollars on the basis of the foreign currency exchange rates prevailing at the time such valuation is determined by the Portfolios' custodian. Investments in open-end investment companies are valued at the daily closing net asset value of the respective investment company. Futures contracts are generally valued at the settlement price established each day on the exchange on which they are traded. Forward foreign currency contracts are valued daily using forward exchange rates quoted by independent pricing services. Swaps are marked to market daily based upon values from third party vendors or quotations from market makers to the extent available and the change in value, if any, is recorded on the Statement of assets and liabilities. In the event that marke t quotations are not readily available or deemed unreliable, swaps are valued at fair value as determined in good faith by or under the direction of the Board.
GAAP requires disclosure surrounding the various inputs that are used in determining the value of the Portfolio's investments. These inputs are summarized into the three broad levels listed below:
Level 1—Unadjusted quoted prices in active markets for identical investments.
Level 2—Other significant observable inputs, including but not limited to, quoted prices for similar investments, interest rates, prepayment speeds and credit risks.
Level 3—Unobservable inputs inclusive of the Portfolio's own assumptions in determining the fair value of investments.
In accordance with the requirements of GAAP, a fair value hierarchy has been included near the end of each Portfolio's Portfolio of investments.
In January 2010, FASB issued Accounting Standards Update ("ASU") No. 2010-06 "Improving Disclosures about Fair Value Measurements". ASU No. 2010-06 requires reporting entities to make new disclosures about amounts and reasons for significant transfers in and out of Level 1 and Level 2 fair value measurements as well as inputs and valuation techniques used to measure fair value for both recurring and nonrecurring fair value measurements that fall in either Level 2 or Level 3, and information on purchases, sales, issuances and settlements on a gross basis in the reconciliation of activity in Level 3 fair value measurements. The new and revised disclosures have been implemented for annual and interim periods beginning after December 15, 2009 except for the disclosures surrounding purchases, sales, issuances and settlements on a gross basis in the reconciliation of Level 3 fair value measurements, which are effective for annual and interim periods beginning after December 15, 2010.
In March 2008, the FASB amended Accounting Standards Codification Topic 815 Derivatives and Hedging ("ASC 815"), which changed the disclosure requirements for derivative and hedging activities. Since investment companies value their derivatives at fair value and recognize changes in fair value through the Statement of operations, they do not qualify for hedge accounting under ASC 815. Accordingly, even though a Portfolio's investments in derivatives may represent economic hedges, they are considered to be non-hedge transactions for purposes of disclosure under ASC 815. ASC 815 requires (1) objectives for using derivative instruments be disclosed in terms of underlying risk and accounting designation, (2) the fair values of derivative instruments and their gains and losses be disclosed in a tabular format, and (3) information be disclosed about credit-risk contingent features of derivatives contracts. ASC 815 is effective for fin ancial statements for fiscal years and interim periods beginning after November 15, 2008. Details of this disclosure can be found below as well as in the Portfolio of investments. The volume of derivatives that is presented in the Portfolio of investments of each Portfolio is consistent with the derivative activity during the year ended July 31, 2010. The Portfolios may be sellers of protection through credit default swap agreements which are
294
UBS PACE Select Advisors Trust
Notes to financial statements
by nature credit-risk contingent (the terms of these agreements can be found within the Portfolio of investments, with further discussion in the Notes to financial statements); however, the Portfolios are not aware of any additional credit-risk contingent features on other derivative contracts held by the Portfolios.
At July 31, 2010, the Portfolios had the following derivatives categorized by underlying risk:
| | | Asset derivatives1 | |
| | | | Interest rate
risk | | Foreign exchange
risk | | Credit
risk | | Equity
risk | | Total | |
UBS PACE Government
Securities Fixed Income
Investments | | Futures contracts
Swap agreements
Total value | | $261,891
—
$261,891 | | —
—
— | | —
$587,500
$587,500 | | —
—
— | | $261,891
587,500
$849,391 | |
UBS PACE Intermediate
Fixed Income
Investments | | Futures contracts
Forward foreign
currency contracts
Total value | | $276,190
—
$276,190 | | —
$990,206
$990,206 | | —
—
— | | —
—
— | | $276,190
990,206
$1,266,396 | |
UBS PACE Strategic
Fixed Income
Investments
| | Futures contracts
Forward foreign
currency contracts
Swap agreements
Total value | | $907,568
—
2,902,798
$3,810,366 | | —
$357,550
—
$357,550 | | —
—
$905,481
$905,481 | | —
—
—
— | | $907,568
357,550
3,808,279
$5,073,397 | |
UBS PACE Global Fixed
Income Investments
| | Futures contracts
Forward foreign
currency contracts
Total value | | $750,417
—
$750,417 | | —
$9,674,106
$9,674,106 | | —
—
— | | —
—
— | | $750,417
9,674,106
$10,424,523 | |
UBS PACE International
Equity Investments
| | Futures contracts
Forward foreign
currency contracts
Total value | | —
—
— | | —
$299,666
$299,666 | | —
—
— | | $56,245
—
$56,245 | | $56,245
299,666
$355,911 | |
UBS PACE Alternative
Strategies Investments
| | Futures contracts
Forward foreign
currency contracts
Swap agreements
Total value | | $1,956,608
—
5,067,426
$7,024,034 | | —
$6,434,320
—
$6,434,320 | | —
—
$348,093
$348,093 | | $227,274
—
—
$227,274 | | $2,183,882
6,434,320
5,415,519
$14,033,721 | |
1 In the Statement of assets and liabilities, swap agreements are shown at value while forward foreign currency contracts are shown using unrealized appreciation. Futures contracts are reported in the table above using the cumulative appreciation as detailed in the futures contract table at the end of the Portfolio of investments, but only the variation margin to be received, if any, is reported within the Statement of assets and liabilities.
| | | Liability derivatives2 | |
| | | | Interest rate
risk | | Foreign exchange
risk | | Credit
risk | | Equity
risk | | Total | |
UBS PACE Government
Securities Fixed Income
Investments | |
Written options
Total value | | $(961,691)
$(961,691) | | —
— | | —
— | | —
— | | $(961,691)
$(961,691) | |
UBS PACE Intermediate
Fixed Income
Investments
| | Futures contracts
Forward foreign
currency contracts
Total value | | $(844,209)
—
$(844,209) | | —
$(619,512)
$(619,512) | | —
—
— | | —
—
— | | $(844,209)
(619,512)
$(1,463,721) | |
295
UBS PACE Select Advisors Trust
Notes to financial statements
| | | Liability derivatives2 | |
| | | | Interest rate
risk | | Foreign exchange
risk | | Credit
risk | | Equity
risk | | Total | |
UBS PACE Strategic
Fixed Income
Investments
| | Written options
Forward foreign
currency contracts
Swap agreements
Total value | | $(1,782,467)
—
$(249,641)
$(2,032,108) | | —
$(2,615,399)
—
$(2,615,399) | | —
—
(1,202,724)
$(1,202,724) | | —
—
—
— | | $(1,782,467)
(2,615,399)
(1,452,365)
$(5,850,231) | |
UBS PACE Global Fixed
Income Investments
| | Futures contracts
Forward foreign
currency contracts
Total value | | $(2,600,537)
—
$(2,600,537) | | —
$(4,887,492)
$(4,887,492) | | —
—
— | | —
—
— | | $(2,600,537)
(4,887,492)
$(7,488,029) | |
UBS PACE High
Yield Investments
| | Forward foreign
currency contracts
Total value | | —
— | | $(967,113)
$(967,113) | | —
— | | —
— | | $(967,113)
$(967,113) | |
UBS PACE International
Equity Investments
| | Forward foreign
currency contracts
Total value | | —
— | | $(193,917)
$(193,917) | | —
— | | —
— | | $(193,917)
$(193,917) | |
UBS PACE Alternative
Strategies Investments
| | Futures contracts
Written options
Forward foreign
currency contracts
Swap agreements
Total value | | $(2,752,210)
—
—
(5,794,319)
$(8,546,529) | | —
—
$(6,172,044)
—
$(6,172,044) | | —
—
—
—
— | | $(243,208)
(321,400)
—
—
$(564,608) | | $(2,995,418)
(321,400)
(6,172,044)
(5,794,319)
$(15,283,181) | |
2 In the Statement of assets and liabilities, swap agreements and written options are shown at value while forward foreign currency contracts are shown using unrealized depreciation. Futures contracts are reported in the table above using the cumulative depreciation as detailed in the futures contract table at the end of the Portfolio of investments, but only the variation margin to be paid, if any, is reported within the Statement of assets and liabilities.
Transactions in derivative instruments during the year ended July 31, 2010, were as follows:
| | | | Interest rate
risk | | Foreign exchange
risk | | Credit
risk | | Equity
risk | | Total | |
| UBS PACE Government Securities Fixed Income Investments | |
| | Net realized gain (loss)3 | | | | | | | | | | | | | | | | | | | | | |
| | Futures contracts | | $ | 601,022 | | | | — | | | | — | | | | — | | | $ | 601,022 | | |
| | Written options | | | 1,428,484 | | | | — | | | | — | | | | — | | | | 1,428,484 | | |
| | Swap agreements | | | (10,626 | ) | | | — | | | $ | (282,358 | ) | | | — | | | | (292,984 | ) | |
| | Total net realized gain (loss) | | $ | 2,018,880 | | | | — | | | $ | (282,358 | ) | | | — | | | $ | 1,736,522 | | |
| | Net change in unrealized
appreciation/
depreciation4 | | | | | | | | | | | | | | | | | | | | | |
| | Futures contracts | | $ | 261,891 | | | | — | | | | — | | | | — | | | $ | 261,891 | | |
| | Written options | | | 106,931 | | | | — | | | | — | | | | — | | | | 106,931 | | |
| | Swap agreements | | | — | | | | — | | | $ | 1,273,904 | | | | — | | | | 1,273,904 | | |
| | Total net change in unrealized
appreciation/depreciation | | | $368,822 | | | | — | | | | $1,273,904 | | | | — | | | | $1,642,726 | | |
296
UBS PACE Select Advisors Trust
Notes to financial statements
| | | | Interest rate
risk | | Foreign exchange
risk | | Credit
risk | | Equity
risk | | Total | |
| UBS PACE Intermediate Fixed Income Investments | |
| | Net realized gain (loss)3 | | | | | | | | | | | | | | | | | | | | | |
| | Futures contracts | | $ | (1,866,548 | ) | | | — | | | | — | | | | — | | | $ | (1,866,548 | ) | |
| | Forward foreign
currency contracts | | | — | | | | $537,059 | | | | — | | | | — | | | | 537,059 | | |
| | Total net realized gain (loss) | | $ | (1,866,548 | ) | | $ | 537,059 | | | | — | | | | — | | | $ | (1,329,489 | ) | |
| | Net change in unrealized
appreciation/
depreciation4 | | | | | | | | | | | | | | | | | | | | | |
| | Futures contracts | | $ | (785,401 | ) | | | — | | | | — | | | | — | | | $ | (785,401 | ) | |
| | Forward foreign
currency contracts | | | — | | | $ | 478,416 | | | | — | | | | — | | | | 478,416 | | |
| | Total net change in unrealized
appreciation/depreciation | | | $(785,401) | | | | $478,416 | | | | — | | | | — | | | | (306,985) | | |
| UBS PACE Strategic Fixed Income Investments | |
| | Net realized gain (loss)3 | | | | | | | | | | | | | | | | | | | | | |
| | Futures contracts | | $ | 6,667,807 | | | | — | | | | — | | | | — | | | $ | 6,667,807 | | |
| | Written options | | | 1,463,453 | | | | — | | | | — | | | | — | | | | 1,463,453 | | |
| | Forward foreign
currency contracts | | | — | | | $ | 2,199,781 | | | | — | | | | — | | | | 2,199,781 | | |
| | Swap agreements | | | 10,049,063 | | | | — | | | $ | (72,043 | ) | | | — | | | | 9,977,020 | | |
| | Total net realized gain (loss) | | $ | 18,180,323 | | | $ | 2,199,781 | | | $ | (72,043 | ) | | | | | | $ | 20,308,061 | | |
| | Net change in unrealized
appreciation/
depreciation4 | | | | | | | | | | | | | | | | | | | | | |
| | Futures contracts | | $ | 1,207,768 | | | | — | | | | — | | | | — | | | $ | 1,207,768 | | |
| | Written options | | | (1,542,657 | ) | | | — | | | | — | | | | — | | | | (1,542,657 | ) | |
| | Forward foreign
currency contracts | | | — | | | $ | (1,177,282 | ) | | | — | | | | — | | | | (1,177,282 | ) | |
| | Swap agreements | | | (639,630 | ) | | | — | | | $ | 949,793 | | | | — | | | | 310,163 | | |
| | Total net change in unrealized
appreciation/depreciation | | | $(974,519) | | | | $(1,177,282) | | | | $949,793 | | | | — | | | | $(1,202,008) | | |
| UBS PACE Global Fixed Income Investments | |
| | Net realized gain (loss)3 | | | | | | | | | | | | | | | | | | | | | |
| | Futures contracts | | $ | (1,270,260 | ) | | | — | | | | — | | | | — | | | $ | (1,270,260 | ) | |
| | Forward foreign
currency contracts | | | — | | | | $11,377,241 | | | | — | | | | — | | | | 11,377,241 | | |
| | Total net realized gain (loss) | | $ | (1,270,260 | ) | | $ | 11,377,241 | | | | — | | | | — | | | $ | 10,106,981 | | |
| | Net change in unrealized
appreciation/
depreciation4 | | | | | | | | | | | | | | | | | | | | | |
| | Futures contracts | | $ | (4,117,754 | ) | | | — | | | | — | | | | — | | | $ | (4,117,754 | ) | |
| | Forward foreign
currency contracts | | | — | | | $ | 1,913,440 | | | | — | | | | — | | | | 1,913,440 | | |
| | Total net change in unrealized
appreciation/depreciation | | | $(4,117,754) | | | | $1,913,440 | | | | — | | | | — | | | | $(2,204,314) | | |
297
UBS PACE Select Advisors Trust
Notes to financial statements
| | | | Interest rate
risk | | Foreign exchange
risk | | Credit
risk | | Equity
risk | | Total | |
| UBS PACE High Yield Investments | |
| | Net realized gain3 | | | | | | | | | | | | | | | | | | | | | |
| | Forward foreign
currency contracts | | | — | | | | $3,738,857 | | | | — | | | | — | | | | $3,738,857 | | |
| | Total net realized gain | | | — | | | $ | 3,738,857 | | | | — | | | | — | | | $ | 3,738,857 | | |
| | Net change in unrealized
appreciation/
depreciation4 | | | | | | | | | | | | | | | | | | | | | |
| | Forward foreign
currency contracts | | | — | | | | $(730,178) | | | | — | | | | — | | | | $(730,178) | | |
| | Total net change in unrealized
appreciation/depreciation | | | — | | | | $(730,178) | | | | — | | | | — | | | | $(730,178) | | |
| UBS PACE International Equity Investments | |
| | Net realized gain3 | | | | | | | | | | | | | | | | | | | | | |
| | Futures contracts | | | — | | | | | | | | — | | | $ | 26.639 | | | $ | 26,639 | | |
| | Forward foreign
currency contracts | | | — | | | | $356,720 | | | | — | | | | — | | | | 356,720 | | |
| | Total net realized gain | | | — | | | $ | 356,720 | | | | — | | | $ | 26,639 | | | $ | 383,359 | | |
| | Net change in unrealized
appreciation/
depreciation4 | | | | | | | | | | | | | | | | | | | | | |
| | Futures contracts | | | — | | | | — | | | | — | | | $ | (18,458 | ) | | $ | (18,458 | ) | |
| | Forward foreign
currency contracts | | | — | | | | $(38,446) | | | | — | | | | — | | | | (38,446) | | |
| | Total net change in unrealized
appreciation/depreciation | | | — | | | | $(38,446) | | | | — | | | | $(18,458) | | | | $(56,904) | | |
| UBS PACE Alternative Strategies Investments | |
| | Net realized gain (loss)3 | | | | | | | | | | | | | | | | | | | | | |
| | Futures contracts | | $ | (497,555 | ) | | | — | | | | — | | | $ | (3,402,575 | ) | | $ | (3,900,130 | ) | |
| | Written options | | | — | | | | — | | | | — | | | | 2,046,260 | | | | 2,046,260 | | |
| | Forward foreign
currency contracts | | | — | | | | $3,653,091 | | | | — | | | | — | | | | 3,653,091 | | |
| | Swap agreements | | | (1,777,120 | ) | | | — | | | $ | (2,078,062 | ) | | | — | | | | (3,855,182 | ) | |
| | Total net realized gain (loss) | | $ | (2,274,675 | ) | | $ | 3,653,091 | | | $ | (2,078,062 | ) | | $ | (1,356,315 | ) | | $ | (2,055,961 | ) | |
| | Net change in unrealized
appreciation/
depreciation4 | | | | | | | | | | | | | | | | | | | | | |
| | Futures contracts | | $ | (1,037,728 | ) | | | — | | | | — | | | $ | 1,081,561 | | | $ | 43,833 | | |
| | Written options | | | — | | | | — | | | | — | | | | 88,998 | | | | 88,998 | | |
| | Forward foreign
currency contracts | | | — | | | | $145,742 | | | | — | | | | — | | | | 145,742 | | |
| | Swap agreements | | $ | 89,145 | | | | — | | | $ | 3,980,726 | | | | — | | | | 4,069,871 | | |
| | Total net change in unrealized
appreciation/depreciation | | | $(948,583) | | | | $145,742 | | | | $3,980,726 | | | | $1,170,559 | | | | $4,348,444 | | |
3 The net realized gains (losses) from futures, written options, and swaps are disclosed separately in the Statement of operations. The forward foreign currency contracts realized gains (losses) are included in the forward foreign currency contracts and foreign currency transactions in the Statement of operations.
4 The net change in unrealized appreciation/depreciation on futures, written options, and swaps are shown in the Statement of operations. The net change in unrealized appreciation/depreciation on forward foreign currency contracts is included in other assets and liabilities denominated in foreign currency and forward foreign currency contracts in the Statement of operations.
Repurchase agreements—The Portfolios may purchase securities or other obligations from a bank or securities dealer (or its affiliate), subject to the seller's agreement to repurchase them at an agreed upon date
298
UBS PACE Select Advisors Trust
Notes to financial statements
(or upon demand) and price. The Portfolios maintain custody of the underlying obligations prior to their repurchase, either through its regular custodian or through a special "tri-party" custodian or sub-custodian that maintains a separate account for both the Portfolios and their counterparty. The underlying collateral is valued daily to ensure that the value, including accrued interest, is at least equal to the repurchase price. In the event of default of the obligation to repurchase, the Portfolios generally have the right to liquidate the collateral and apply the proceeds in satisfaction of the obligation. Repurchase agreements involving obligations other than US government securities (such as commercial paper, corporate bonds and mortgage loans) may be subject to special risks and may not have the benefit of certain protections in the event of counterparty insolvency. If the seller (or seller's guarantor, if any) becomes in solvent, the Portfolios may suffer delays, costs and possible losses in connection with the disposition or retention of the collateral. Under certain circumstances, in the event of default or bankruptcy by the other party to the agreement, realization and/or retention of the collateral may be subject to legal proceedings. Each Portfolio (with the exception of UBS PACE Municipal Fixed Income Investments) may participate in joint repurchase agreement transactions with other funds managed, advised or sub-advised by UBS Global AM. Under certain circumstances, the Portfolios may engage in a repurchase agreement transaction with a yield of zero in order to invest cash amounts remaining in its portfolio at the end of the day in order to avoid having the Portfolios assessed a fee for uninvested cash held in a business account at a bank.
Restricted securities—The Portfolios may invest in securities that are subject to legal or contractual restrictions on resale. These securities generally may be resold in transactions exempt from registration or to the public if the securities are registered. Disposal of these securities may involve time-consuming negotiations and expense, and prompt sale at an acceptable price may be difficult. Information regarding restricted securities, if any, is included at the end of each Portfolio's Portfolio of investments.
Investment transactions, investment income and expenses—Investment transactions are recorded on the trade date. Realized gains and losses from investment transactions and foreign exchange transactions are calculated using the identified cost method. Dividend income is recorded net of withholding taxes on the ex-dividend date ("ex-date") (except in the case of certain dividends from foreign securities which are recorded as soon after the ex-date as the respective Portfolio, using reasonable diligence, becomes aware of such dividends). Interest income is recorded on an accrual basis. Discounts are accreted and premiums are amortized as adjustments to interest income and the identified cost of investments.
Income, expenses (excluding class-specific expenses) and realized/unrealized gains/losses are allocated proportionately to each class of shares based upon the relative net asset value of outstanding shares (or the value of dividend-eligible shares, as appropriate) of each class at the beginning of the day (after adjusting for current capital share activity of the respective classes). Class-specific expenses are charged directly to the applicable class of shares.
Foreign currency translation—The books and records of the Portfolios are maintained in US dollars. Foreign currency amounts are translated into US dollars as follows: (1) the foreign currency market value of investment securities and other assets and liabilities stated in foreign currencies are translated into US dollars based on the current exchange rates each business day; and (2) purchases, sales, income and expenses are translated at the rate of exchange prevailing on the respective dates of such transactions. The resulting exchange gains and losses are included on the Statement of operations.
The Portfolios do not generally isolate the effects of fluctuations in foreign exchange rates from the effects of fluctuations in the market prices of securities. However, the Portfolios do isolate the effect of fluctuations in foreign exchange rates when determining the realized gain or loss upon the sale or maturity of foreign currency-denominated debt obligations pursuant to US federal income tax regulations; such amount is categorized as realized foreign currency transaction gain or loss for both financial reporting and income tax
299
UBS PACE Select Advisors Trust
Notes to financial statements
purposes. Net realized foreign currency transaction gain (loss) is treated as ordinary income (loss) for income tax reporting purposes.
Forward foreign currency contracts—Certain Portfolios may enter into forward foreign currency contracts ("forward contracts") as part of its investment strategy, in connection with planned purchases or sales of securities or to hedge the US dollar value of portfolio securities denominated in a particular currency. The Portfolios may also engage in cross-hedging by using forward contracts in one currency to hedge fluctuations in the value of securities denominated in a different currency if the applicable investment sub-advisor anticipates that there is a correlation between the two currencies. Forward contracts may also be used to shift a Portfolio's exposure to foreign currency fluctuations from one country to another.
The Portfolios have no specific limitation on the percentage of assets which may be committed to such contracts; however, the value of all forward contracts will not exceed the value of a Portfolio's total assets. The Portfolios may enter into forward contracts or maintain a net exposure to forward contracts only if (1) the consummation of the contracts would not obligate the Portfolios to deliver an amount of foreign currency in excess of the value of the positions being hedged by such contracts or (2) the Portfolios maintain cash or liquid securities in a segregated account in an amount determined pursuant to the Portfolios' segregation policies as disclosed in the Trust's Statement of Additional Information.
Risks may arise upon entering into forward contracts from the potential inability of counterparties to meet the terms of their contracts and from unanticipated movements in the value of foreign currencies relative to the US dollar or each other.
Fluctuations in the value of open forward contracts are recorded for book purposes as unrealized gains or losses on forward foreign currency contracts by the Portfolios. Realized gains and losses on forward foreign currency contracts include net gains or losses recognized by the Portfolios on contracts which have matured.
Securities traded on to-be-announced basis—The Portfolios may from time to time purchase securities on a to-be-announced ("TBA") basis. In a TBA transaction, the Portfolio commits to purchasing or selling securities for which all specific information is not yet known at the time of the trade, particularly the face amount and maturity date of the underlying security transactions. Securities purchased on a TBA basis are not settled until they are delivered to the Portfolio, normally 15 to 45 days later. Beginning on the date the Portfolio enters into a TBA transaction, cash, US government securities or other liquid securities are segregated in an amount equal in value to the purchase price of the TBA security. These transactions are subject to market fluctuations, and their current value is determined in the same manner as for other securities.
Option writing—Certain Portfolios may write (sell) put and call options on securities or derivative instruments in order to gain exposure to or protect against changes in the markets. When a Portfolio writes a call or a put option, an amount equal to the premium received by the Portfolio is included on the Portfolio's Statement of assets and liabilities as an asset and as an equivalent liability. The amount of the liability is subsequently marked-to-market to reflect the current market value of the option written. If an option which the Portfolio has written either expires on its stipulated expiration date or the Portfolio enters into a closing purchase transaction, the Portfolio realizes a gain (or loss if the cost of a closing purchase transaction exceeds the premium received when the option was written) without regard to any unrealized gain or loss on the underlying security or derivative instrument, and the liability related to such option is extinguished. If a call option which the Portfolio has written is exercised, the Portfolio recognizes a realized gain or loss (long-term or short-term, depending on the holding period of the underlying security) from the
300
UBS PACE Select Advisors Trust
Notes to financial statements
sale of the underlying security or derivative instrument and the proceeds from the sale are increased by the premium originally received. If a put option which the Portfolio has written is exercised, the amount of the premium originally received reduces the cost of the security or derivative instrument which the Portfolio purchases upon exercise of the option.
In writing an option, the Portfolios bear the market risk of an unfavorable change in the price of the derivative instrument, security or currency underlying the written option. Exercise of an option written by a Portfolio could result in the Portfolio selling or buying a derivative instrument, security or currency at a price different from current market value.
Purchased options—Certain Portfolios may also purchase put and call options. Purchasing call options tends to increase exposure to the underlying instrument. Purchasing put options tends to decrease exposure to the underlying instrument. The Portfolio pays a premium which is included on the Statement of assets and liabilities as an investment and subsequently marked to market to reflect the current value of the option. Premiums paid for purchasing options which expire are treated as realized losses. The risk associated with purchasing put and call options is limited to the premium paid. Premiums paid for purchasing options which are exercised or closed are added to the amounts paid or offset against the proceeds on the underlying future, security or currency transaction to determine the realized gain or loss.
Futures contracts—Certain Portfolios may purchase or sell futures contracts to increase or reduce their exposure to an asset class without purchasing or selling the underlying securities. They may do this to enhance or realize gains, as a hedge and/or to manage the average duration of the Portfolio. Using futures contracts involves various market risks, including interest rate and equity risk as well as the risks that there may be an illiquid market or that a change in the value of the contract may not correlate with changes in the value of the underlying securities.
Upon entering into a futures contract, a Portfolio is required to deliver to a broker an amount of cash and/or government securities equal to a certain percentage of the contract amount. This amount is known as the "initial margin". Subsequent payments, known as "variation margin", generally are made or received by the Portfolio each day depending on the fluctuations in the value of the underlying futures contracts, except that in the case of certain futures contracts payments may be made or received at settlement. Such variation margin is recorded for financial statement purposes on a daily basis as an unrealized gain or loss on futures until the futures contract is closed, at which time the net gain or loss is reclassified to realized gain or loss on futures.
Loan assignments—Certain Portfolios may invest in secured or unsecured fixed or floating rate loans ("Loans") arranged through private negotiations between a borrowing corporation, government or other entity and one or more financial institutions ("Lenders") which may be in the form of participations ("Participations") in Loans or assignments ("Assignments") of all or a portion of Loans from third parties. A Portfolio may invest in multiple series or tranches of a Loan, which may have varying terms and carry different associated risks. Participations typically result in a Portfolio having a contractual relationship only with the Lender, not with the borrower. A Portfolio has the right to receive payments of principal, interest and any fees to which it is entitled only from the Lender selling the Participation and only upon receipt by the Lender o f the payments from the borrower. In connection with purchasing Participations, a Portfolio generally has no direct right to enforce compliance by the borrower with the terms of the loan agreement relating to the Loan, or any rights of set-off against the borrower, and a Portfolio may not directly benefit from any collateral supporting the Loan in which it has purchased the Participation. As a result, a Portfolio assumes the credit risk of both the borrower and the Lender that is selling the Participation. In the event of
301
UBS PACE Select Advisors Trust
Notes to financial statements
the insolvency of the selling Lender, the Portfolio may be treated as a general creditor of that Lender and may not benefit from any set-off between the Lender and the borrower. A Portfolio will acquire Participations only if its sub-advisor determines that the selling Lender is creditworthy. When a Portfolio purchases Assignments from Lenders, it acquires direct rights against the borrower on the Loan. In an Assignment, the Portfolio is entitled to receive payments directly from the borrower and, therefore, does not depend on the selling bank to pass these payments onto the Portfolio. However, because Assignments are arranged through private negotiations between potential assignees and assignors, the rights and obligations acquired by a Portfolio as the purchaser of an Assignment may differ from, and be more limited than, those held by the assigning Lender.
Short sales "Against the Box"—Each Portfolio (other than UBS PACE Money Market Investments and UBS PACE Municipal Fixed Income Investments) may engage in short sales of securities it owns or has the right to acquire at no added cost through conversion or exchange of other securities it owns (short sales "against the box"). To make delivery to the purchaser in a short sale, the executing broker borrows the securities being sold short on behalf of a Portfolio, and that Portfolio is obligated to replace the securities borrowed at a date in the future. When a Portfolio sells short, it establishes a margin account with the broker effecting the short sale and deposits collateral with the broker. In addition, the Portfolio maintains, in a segregated account with its custodian, the securities that could be used to cover the short sale. Each Portfolio may incur transaction costs, including dividend and interest expense, in connection with opening, maintaining and closing short sales "against the box".
A Portfolio might make a short sale "against the box" to hedge against market risks when its sub-advisor believes that the price of a security may decline, thereby causing a decline in the value of a security owned by the Portfolio or a security convertible into or exchangeable for a security owned by the Portfolio. In such case, any loss in the Portfolio's long position after the short sale should be reduced by a corresponding gain in the short position. Conversely, any gain in the long position after the short sale should be reduced by a corresponding loss in the short position. The extent to which gains or losses in the long position are reduced will depend upon the amount of the securities sold short relative to the amount of the securities a Portfolio owns, either directly or indirectly, and in the case where the Portfolio owns convertible securities, changes in the investment values or conversion premiums of such securitie s.
Short sales—UBS PACE Government Securities Fixed Income Investments (with respect to securities issued by the US Treasury and TBA securities coupon trades), UBS PACE Global Real Estate Securities Investments and UBS PACE Alternative Strategies Investments can enter into short sales whereby they sell a security they generally do not own, in anticipation of a decline in the security's price. The initial amount of a short sale is recorded as a liability which is marked to market daily. Fluctuations in the value of this liability are recorded as unrealized gains or losses on the Statement of operations. The Portfolio will realize a gain or loss upon closing of the short sale (returning the security to the counterparty by way of purchase or delivery of a long position owned). The Portfolio is liable to the buyer for any dividends and interest payable on securities while those securities are in a short position. These dividends and interest are booked as an expense of the Portfolio. UBS PACE Alternative Strategies Investments maintains one or more accounts containing cash and/or liquid assets at such a level that the amount deposited in the account plus that amount deposited with the broker as collateral will, at minimum, equal the current value of the investment sold short. UBS PACE Government Securities Fixed Income Investments and UBS PACE Global Real Estate Securities Investments did not engage in uncovered short sales during the year ended July 31, 2010.
302
UBS PACE Select Advisors Trust
Notes to financial statements
Treasury roll transactions—Certain Portfolios may enter into treasury roll transactions. A treasury roll transaction involves the sale of a Treasury security, with an agreement to repurchase the same security at an agreed upon price and date. Treasury rolls constitute a financing transaction and the difference between the sale and repurchase price represents interest expense at an agreed upon rate. Whether such a transaction produces a positive impact on performance depends upon whether the income and gains on the securities purchased with the proceeds received from the sale of the security exceeds the interest expense incurred by the Portfolio. Treasury rolls are not considered purchases and sales and any gains or losses incurred on the treasury rolls will be deferred until the Treasury securities are disposed.
Treasury roll transactions involve the risk that the market value of the securities that the Portfolio is required to purchase may decline below the agreed upon purchase price of those securities. If investment performance of securities purchased with proceeds from these transactions does not exceed the income, capital appreciation and gain or loss that would have been realized on the securities sold as part of the treasury roll, the use of this technique will adversely impact the investment performance of the Portfolio. At July 31, 2010, the only Portfolio utilizing treasury roll transactions is UBS PACE Intermediate Fixed Income Investments.
Reverse repurchase agreements—Certain Portfolios may enter into reverse repurchase agreements with qualified third party banks, securities dealers or their affiliates. Interest on the value of reverse repurchase agreements issued and outstanding is based upon competitive market rates at the time of issuance. At the time a Portfolio enters into reverse repurchase agreements, the Portfolio establishes and maintains a segregated account with the Portfolio's custodian containing liquid securities having a value not less than the repurchase price, including accrued interest, of the reverse repurchase agreement. For the year ended July 31, 2010, UBS PACE Intermediate Fixed Income Investments had an average daily reverse repurchase agreement of $5,412,500 for 10 days with a related weighted average annualized interest rate of 0.207%, which resulted in $ 311 of interest expense.
Interest rate swap agreements—Certain Portfolios may enter into interest rate swap agreements. This type of swap is an agreement that obligates two parties to exchange a series of cash flows at specified intervals based upon or calculated by reference to a specified interest rate(s) for a specified amount. The payment flows are usually netted against each other, with the difference being paid by one party to the other. Upfront payments made and/or received by the Portfolio are recorded as an adjustment to cost.
Risks may arise as a result of the failure of the counterparty to the swap contract to comply with the terms of the contract. The loss incurred by the failure of a counterparty is generally limited to the net interest payment to be received by the Portfolio. Therefore, the Portfolio considers the creditworthiness of the counterparty to a swap contract in evaluating potential credit risk.
The Portfolio accrues for interim payments on swap contracts on a daily basis, with the net amount recorded within unrealized appreciation/depreciation of swap contracts on the Statement of assets and liabilities. Once interim payments are settled in cash, the net amount is recorded as realized gain/loss on swaps, in addition to realized gain/loss recorded upon the termination of swap contracts on the Statement of operations. Fluctuations in the value of swap contracts are recorded for financial statement purposes as unrealized appreciation or depreciation of swaps.
303
UBS PACE Select Advisors Trust
Notes to financial statements
Credit default swap agreements—Credit default swap agreements involve commitments to make or receive payments in the event of a default of a security or a credit event. As a buyer, the Portfolio would make periodic payments to the counterparty, and the Portfolio would receive payments only upon the occurrence of a credit event. If no credit event occurs, the Portfolio will lose its periodic stream of payments over the term of the contract. However, if a credit event does occur, the Portfolio typically would receive full notional value for a reference obligation that may have little or no value. As a seller, the Portfolio would receive periodic payments from the counterparty, and the Portfolio would make payments only upon the occurrence of a credit event. If no default or credit event occurs, the Portfolio will gain the periodic stream of payment s it received over the term of the contract and the counterparty will lose its periodic stream of payments over the term of the contract. However, if a default or credit event occurs, the Portfolio typically pays full notional value for a reference obligation that may have little or no value. Credit default swaps may involve greater risks than if the Portfolio had invested in the reference obligation directly and are subject to general market risk, liquidity risk and credit risk.
Credit default swap agreements on credit indices involve one party making a stream of payments to another party in exchange for the right to receive a specified return in the event of a write-down, principal shortfall, interest shortfall or default of all or part of the referenced entities comprising the credit index. A credit index is a list of a basket of credit instruments or exposures designed to be representative of some part of the credit market as a whole. These indices are made up of referenced credits that are judged by a poll of dealers to be the most liquid entities in the credit default swap market based on the sector of the index. Components of the indices may include, but are not limited to, investment grade securities, high yield securities, asset backed securities, emerging markets, and/or various credit ratings within each sector. Credit indices are traded using credit default swaps with standardized terms inclu ding a fixed spread and standard maturity dates. An index credit default swap references all the names in the index, and if there is a default, the credit event is settled based on that name's weight in the index. The composition of the indices changes periodically, usually every six months, and for most indices, each name has an equal weight in the index. A Portfolio may use credit default swaps on credit indices to hedge a portfolio of credit default swaps or bonds with a credit default swap on indices which is less expensive than it would be to buy many credit default swaps to achieve a similar effect. Credit default swaps on indices are benchmarks for protecting investors owning bonds against default, and traders use them to speculate on changes in credit quality.
Credit default swap agreements on corporate issues or sovereign issues of an emerging country involve one party making a stream of payments to another party in exchange for the right to receive a specified return in the event of a default or other credit event. If a credit event occurs and cash settlement is not elected, a variety of other deliverable obligations may be delivered in lieu of the specific referenced obligation. The ability to deliver other obligations may result in a cheapest-to-deliver option (the buyer of protection's right to choose the deliverable obligation with the lowest value following a credit event). The Portfolio may use credit default swaps on corporate issues or sovereign issues of an emerging country to provide a measure of protection against defaults of the issuers (i.e., to reduce risk where the Portfolio owns or has exposure to the referenced obligation) or to take an active long or short position with respect to the likelihood of a particular issuer's default.
The maximum potential amount of future payments (undiscounted) that a Portfolio as a seller of protection could be required to make under a credit default swap agreement would be an amount equal to the notional amount of the agreement which may exceed the amount of unrealized appreciation or depreciation reflected on the Statement of assets and liabilities. Notional amounts of all credit default swap agreements outstanding as of July 31, 2010 for which a Portfolio is the seller of protection are disclosed under the sections "Credit default swaps on credit indices—sell protection" and "Credit default swaps on corporate
304
UBS PACE Select Advisors Trust
Notes to financial statements
issues—sell protection" in the Portfolios of investments. These potential amounts would be partially offset by any recovery values of the respective referenced obligations, upfront payments received upon entering into the agreement, or net amounts received from the settlement of buy protection credit default swap agreements entered into, if any, by a Portfolio for the same referenced entity or entities.
The use of swaps involves investment techniques and risks different from those associated with ordinary portfolio security transactions. If a Portfolio's sub-adviser is incorrect in its forecast of market values, interest rates and other applicable factors, the investment performance of the Portfolios will be less favorable than it would have been if this investment technique was never used. Swaps do not involve the delivery of securities and are subject to counterparty risk. If the other party to a swap defaults and fails to consummate the transaction, a Portfolio's risk of loss will consist of the net amount of interest or other payments that the Portfolio is contractually entitled to receive. Therefore, the Portfolio would consider the creditworthiness of the counterparty to a swap agreement in evaluating potential credit risk.
Total return swaps—Total return swap contracts involve commitments to pay interest in exchange for a market-linked return both based on notional amounts. To the extent the total return of the security or index underlying the transactions exceeds or falls short of the offsetting interest rate obligation, the Portfolio will receive a payment from or make a payment to the counterparty. At July 31, 2010, there were no Portfolios that were invested in total return swap contracts.
Dividends and distributions—Dividends and distributions to shareholders are recorded on the ex-dividend date. The amounts of dividends and distributions are determined in accordance with federal income tax regulations, which may differ from GAAP. These "book/tax" differences are either considered temporary or permanent in nature. To the extent these differences are permanent in nature, such amounts are reclassified within the capital accounts based on their federal tax-basis treatment; temporary differences do not require reclassification.
Concentration of risk
Investing in securities of foreign issuers and currency transactions may involve certain considerations and risks not typically associated with investments in the United States. These risks include revaluation of currencies, adverse fluctuations in foreign currency values and possible adverse political, social and economic developments, including those particular to a specific industry, country or region, which could cause the securities and their markets to be less liquid and prices more volatile than those of comparable US companies and US government securities. These risks are greater with respect to securities of issuers located in emerging market countries in which UBS PACE Global Fixed Income Investments, UBS PACE High Yield Investments, UBS PACE International Equity Investments, UBS PACE International Emerging Markets Equity Investments, UBS PACE Global Real Estate Securities Investments and UBS PACE Alternative Strategie s Investments are authorized to invest.
Small capitalization ("small cap") companies may be more vulnerable than larger capitalization companies to adverse business or economic developments. Small cap companies may also have limited product lines, markets or financial resources, and may be dependent on a relatively small management group. Securities of such companies may be less liquid and more volatile than securities of larger capitalization companies or the market averages in general and therefore may involve greater risk than investing in larger capitalization companies. In addition, small cap companies may not be well-known to the investing public, may not have institutional ownership and may have only cyclical, static or moderate growth prospects. These risks are greater with respect to the securities in which UBS PACE Small/Medium Co Value Equity Investments and UBS PACE Small/Medium Co Growth Equity Investments tend to invest.
305
UBS PACE Select Advisors Trust
Notes to financial statements
The ability of the issuers of debt securities held by the Portfolios to meet their obligations may be affected by economic and political developments particular to a specific industry, country, state or region.
Investment Management and Administration Fees and Other Transactions with Affiliates
The Trust has entered into an investment management and administration contract ("Management Contract") with UBS Global AM. In accordance with the Management Contract, each Portfolio paid UBS Global AM investment management and administration fees, which were accrued daily and paid monthly, in accordance with the following schedule as of July 31, 2010:
| Portfolio | | Annual rate
as a percentage of
each Portfolio's
average daily net assets | |
| UBS PACE Money Market Investments | | 0.350% | |
|
| UBS PACE Government Securities Fixed Income Investments | | 0.650% up to $250 million
0.600% above $250 million
up to $500 million
0.575% above $500 million
up to $750 million
0.550% above $750 million
up to $1 billion
0.525% above $1 billion | |
|
| UBS PACE Intermediate Fixed Income Investments | | 0.550% up to $250 million
0.500% above $250 million
up to $500 million
0.475% above $500 million
up to $750 million
0.450% above $750 million
up to $1 billion
0.425% above $1 billion | |
|
| UBS PACE Strategic Fixed Income Investments | | 0.650% up to $250 million
0.600% above $250 million
up to $500 million
0.575% above $500 million
up to $750 million
0.550% above $750 million
up to $1 billion
0.525% above $1 billion | |
|
| UBS PACE Municipal Fixed Income Investments | | 0.550% up to $250 million
0.500% above $250 million
up to $500 million
0.475% above $500 million
up to $750 million
0.450% above $750 million
up to $1 billion
0.425% above $1 billion | |
|
| UBS PACE Global Fixed Income Investments | | 0.750% up to $500 million
0.725% above $500 million
up to $1 billion
0.700% above $1 billion | |
|
306
UBS PACE Select Advisors Trust
Notes to financial statements
| Portfolio | | Annual rate
as a percentage of
each Portfolio's
average daily net assets | |
| UBS PACE High Yield Investments | | 0.800% up to $500 million
0.750% above $500 million
up to $1 billion
0.725% above $1 billion
up to $1.5 billion
0.700% above $1.5 billion
up to $2 billion
0.675% above $2 billion | |
|
| UBS PACE Large Co Value Equity Investments | | 0.800% up to $250 million
0.770% above $250 million
up to $500 million
0.730% above $500 million
up to $1 billion
0.700% above $1 billion | |
|
| UBS PACE Large Co Growth Equity Investments | | 0.800% up to $500 million
0.775% above $500 million
up to $1 billion
0.750% above $1 billion
up to $1.5 billion
0.725% above $1.5 billion
up to $2 billion
0.700% above $2 billion | |
|
| UBS PACE Small/Medium Co Value Equity Investments | | 0.800% up to $500 million
0.775% above $500 million | |
|
| UBS PACE Small/Medium Co Growth Equity Investments | | 0.800% up to $500 million
0.775% above $500 million | |
|
| UBS PACE International Equity Investments | | 0.900% up to $500 million
0.875% above $500 million
up to $1 billion
0.850% above $1 billion
up to $1.5 billion
0.825% above $1.5 billion
up to $2 billion
0.800% above $2 billion | |
|
| UBS PACE International Emerging Markets Equity Investments | | 1.100% up to $500 million
1.075% above $500 million
up to $1 billion
1.050% above $1 billion
up to $1.5 billion
1.025% above $1.5 billion
up to $2 billion
1.000% above $2 billion | |
|
| UBS PACE Global Real Estate Securities Investments | | 0.800% up to $500 million
0.750% above $500 million
up to $1 billion
0.725% above $1 billion
up to $1.5 billion
0.700% above $1.5 billion
up to $2 billion
0.675% above $2 billion | |
|
307
UBS PACE Select Advisors Trust
Notes to financial statements
| Portfolio | | Annual rate
as a percentage of
each Portfolio's
average daily net assets | |
| UBS PACE Alternative Strategies Investments | | 1.400% up to $500 million
1.350% above $500 million
up to $1 billion
1.300% above $1 billion
up to $1.5 billion
1.275% above $1.5 billion
up to $2 billion
1.250% above $2 billion | |
|
Under separate Sub-Advisory Agreements, with the exception of UBS PACE Money Market Investments, UBS Global AM (not the Portfolios) pays each investment sub-advisor a fee from the investment management and administration fees which UBS Global AM receives, which is accrued daily and paid monthly, in accordance with the following schedule:
| Portfolio | | Investment sub-advisor | | Annual rate
as a percentage of
each sub-advisor's
portion of the Portfolio's
average daily net assets | |
UBS PACE Government Securities Fixed Income
Investments | | Pacific Investment Management Company LLC
| | 0.200%
| |
|
UBS PACE Intermediate Fixed Income Investments
| | BlackRock Financial Management, Inc.
| | 0.200% up to $120 million
0.100% above $120 million | |
|
| UBS PACE Strategic Fixed Income Investments | | Pacific Investment Management Company LLC | | 0.250% | |
|
UBS PACE Municipal Fixed Income Investments
| | Standish Mellon Asset Management Company LLC
| | 0.200% up to $60 million
0.150% above $60 million | |
|
UBS PACE Global Fixed Income Investments
| | Rogge Global Partners plc
| | 0.250% up to $150 million
0.180% above $150 million
up to $500 million
0.150% above $500 million | |
|
| UBS PACE High Yield Investments | | MacKay Shields LLC | | 0.350% | |
|
UBS PACE Large Co Value Equity Investments
| | Institutional Capital LLC
Pzena Investment Management, LLC1
Westwood Management Corp. | | 0.300%
0.700% up to $25 million
0.500% above $25 million
up to $100 million
0.400% above $100 million
up to $300 million
0.350% above $300 million
0.300% | |
|
UBS PACE Large Co Growth Equity Investments
| | Delaware Management Company
Marsico Capital Management, LLC
Roxbury Capital Management, LLC2
SSgA Funds Management, Inc.
Wellington Management Company, LLP | | 0.400%
0.300%
0.250% up to $250 million
0.200% above $250 million
0.150%
0.300% | |
|
UBS PACE Small/Medium Co Value Equity
Investments
| | Buckhead Capital Management, LLC
Metropolitan West Capital Management, LLC
Systematic Financial Management, L.P. | | 0.400% up to $100 million
0.350% above $100 million
0.400%
0.400% | |
|
308
UBS PACE Select Advisors Trust
Notes to financial statements
| Portfolio | | Investment sub-advisor | | Annual rate
as a percentage of
each sub-advisor's
portion of the Portfolio's
average daily net assets | |
UBS PACE Small/Medium Co Growth Equity
Investments
| | Copper Rock Capital Partners, LLC
Palisade Capital Management, LLC
Riverbridge Partners, LLC | | 0.450% up to $100 million
0.400% above $100 million
0.450% up to $100 million
0.400% above $100 million
0.400% | |
|
UBS PACE International Equity Investments
| | J.P. Morgan Investment Management Inc.
Martin Currie Inc.
Mondrian Investment Partners Ltd.
| | 0.200%
0.350% up to $150 million
0.300% above $150 million
up to $250 million
0.250% above $250 million
up to $350 million
0.200% above $350 million
0.350% up to $150 million
0.300% above $150 million | |
|
UBS PACE International Emerging Markets Equity
Investments
| | Gartmore Global Partners
Mondrian Investment Partners Ltd.
| | 0.500%
0.650% up to $150 million
0.550% above $150 million
up to $250 million
0.500% above $250 million | |
|
UBS PACE Global Real Estate Securities
Investments
| | Brookfield Investment Management Inc.3
ING Clarion Real Estate Securities, LLC3 | | 0.420% up to $50 million
0.400% above $50 million
0.400% | |
|
UBS PACE Alternative Strategies Investments4
| | Analytic Investors, LLC
First Quadrant L.P.5
Goldman Sachs Asset Management, L.P.
Wellington Management Company, LLP
| | 0.450% up to $200 million
0.400% above $200 million
up to $400 million
0.300% above $400 million
0.750%
0.680% up to $300 million
0.640% above $300 million
up to $500 million
0.600% above $500 million
0 .750% up to $200 million
0.725% above $200 million | |
|
1 If the assets under Pzena's management are less than $10 million, Pzena receives 1.00% of the Portfolio's average daily net assets that it manages with a minimum annual fee of $35,000 and a maximum annual fee of $70,000.
2 Roxbury Capital Management, LLC became a sub-advisor effective May 25, 2010.
3 Brookfield Investment Management Inc. and ING Clarion Real Estate Securities, LLC replaced Goldman Sachs Asset Management, L.P. effective November 17, 2009.
4 Standard Life Investments (Corporate Funds) Limited became a sub-advisor effective August 5, 2010.
5 Effective August 9, 2010, the sub-advisory fee was increased to 0.90% of the average daily net assets of the Portfolio that First Quadrant L.P. manages.
309
UBS PACE Select Advisors Trust
Notes to financial statements
At July 31, 2010, certain Portfolios owe or are (owed by) UBS Global AM for investment management and administration fees, net of fee waivers/expense reimbursements and/or recoupments as follows:
| Portfolio | | Amounts due
to (owed by)
UBS Global AM | |
| UBS PACE Money Market Investments | | $ | (79,116 | ) | |
| UBS PACE Government Securities Fixed Income Investments | | | 278,537 | | |
| UBS PACE Intermediate Fixed Income Investments | | | 189,531 | | |
| UBS PACE Strategic Fixed Income Investments | | | 346,758 | | |
| UBS PACE Municipal Fixed Income Investments | | | 140,428 | | |
| UBS PACE Global Fixed Income Investments | | | 281,861 | | |
| UBS PACE High Yield Investments | | | 126,568 | | |
| UBS PACE Large Co Value Equity Investments | | | 676,977 | | |
| UBS PACE Large Co Growth Equity Investments | | | 618,210 | | |
| UBS PACE Small/Medium Co Value Equity Investments | | | 226,419 | | |
| UBS PACE Small/Medium Co Growth Equity Investments | | | 227,033 | | |
| UBS PACE International Equity Investments | | | 581,405 | | |
| UBS PACE International Emerging Markets Equity Investments | | | 249,704 | | |
| UBS PACE Global Real Estate Securities Investments | | | (22,428 | ) | |
| UBS PACE Alternative Strategies Investments | | | 503,669 | | |
UBS Global AM has entered into a written fee waiver agreement with each of UBS PACE Government Securities Fixed Income Investments, UBS PACE Global Fixed Income Investments and UBS PACE Large Co Growth Equity Investments under which UBS Global AM is contractually obligated to waive its management fees to the extent necessary to reflect the lower subadvisory fees paid by UBS Global AM to each of these Portfolio's sub-advisors: Pacific Investment Management Company LLC, Rogge Global Partners plc and SSgA Funds Management, Inc., respectively. For the year ended July 31, 2010, UBS Global AM was contractually obligated to waive $152,615, $250,550 and $290,487 in investment management and administration fees for UBS PACE Government Securities Fixed Income Investments, UBS PACE Global Fixed Income Investments and UBS PACE Large Co Growth Equity Investments, respectively.
Additionally, with respect to UBS PACE Money Market Investments, UBS Global AM may voluntarily waive fees and/or reimburse expenses from time to time in the event that the Portfolio's yield falls below a certain level. Once started, there is no guarantee that UBS Global AM would continue to voluntarily waive an additional portion of its fees and/or reimburse expenses. For the year ended July 31, 2010, UBS Global AM voluntarily waived and/or reimbursed expenses of $1,458,102 for UBS PACE Money Market Investments for that purpose.
UBS Global AM is contractually obligated to waive all or a portion of its investment management and administration fees and/or to reimburse the Portfolios for certain operating expenses in order to maintain the total annual ordinary operating expenses of each class (with certain exclusions such as dividend expense, borrowing costs and interest expense, if any) for the year ending November 30, 2010 at a level not to exceed amounts in the table below.
Each Portfolio will repay UBS Global AM for any such waived fees/reimbursed expenses during a three-year period following July 31, 2010, to the extent that ordinary operating expenses (with certain exclusions such as dividend expense, borrowing costs and interest expense) are otherwise below the applicable expense cap in effect at the time the fees or expenses were waived/reimbursed. For the year ended July 31, 2010, UBS Global AM had the following fee waiver/expense reimbursements, and recoupments. The recoupments are included in the investment management and administration fees on the Statement of operations. The fee
310
UBS PACE Select Advisors Trust
Notes to financial statements
waivers/expense reimbursements, portions of which are subject to repayment by the Portfolios through July 31, 2013, and recoupments for the year ended July 31, 2010, were as follows:
| Portfolio | | Class A
expense
cap | | Class B
expense
cap | | Class C
expense
cap | | Class Y
expense
cap | | Class P
expense
cap | | Fee waivers/
expense
reimbursement | | Recoupments | |
| UBS PACE Money Market Investments | | | N/A | | | | N/A | | | | N/A | | | | N/A | | | | 0.60 | % | | $ | 1,262,723 | | | | — | | |
UBS PACE Government Securities Fixed
Income Investments | | | 1.02 | % | | | 1.77 | % | | | 1.52 | % | | | 0.77 | % | | | 0.77 | | | | 468,521 | | | | — | | |
UBS PACE Intermediate Fixed
Income Investments | | | 0.93 | | | | 1.68 | | | | 1.43 | | | | 0.68 | | | | 0.68 | | | | 234,920 | | | | — | | |
| UBS PACE Strategic Fixed Income Investments | | | 1.06 | | | | 1.81 | | | | 1.56 | | | | 0.81 | | | | 0.81 | | | | 430,389 | | | | — | | |
UBS PACE Municipal Fixed Income
Investments | | | 0.93 | | | | 1.68 | | | | 1.43 | | | | 0.68 | | | | 0.68 | | | | 137,595 | | | | — | | |
| UBS PACE Global Fixed Income Investments | | | 1.25 | | | | 2.00 | | | | 1.75 | | | | 1.00 | | | | 1.00 | | | | 389,043 | | | $ | 16,447 | | |
| UBS PACE High Yield Investments | | | 1.35 | | | | 2.10 | 1 | | | 1.85 | | | | 1.10 | | | | 1.10 | | | | 174,480 | | | | 1,575 | | |
| UBS PACE Large Co Value Equity Investments | | | 1.27 | | | | 2.02 | | | | 2.02 | | | | 1.02 | | | | 1.02 | | | | 859 | | | | 3,382 | | |
UBS PACE Large Co Growth Equity
Investments | | | 1.30 | | | | 2.05 | | | | 2.05 | | | | 1.05 | | | | 1.05 | | | | 2,505 | | | | — | | |
UBS PACE Small/Medium Co Value
Equity Investments | | | 1.41 | | | | 2.16 | | | | 2.16 | | | | 1.16 | | | | 1.16 | | | | 300,298 | | | | — | | |
UBS PACE Small/Medium Co Growth
Equity Investments | | | 1.38 | | | | 2.13 | | | | 2.13 | | | | 1.13 | | | | 1.13 | | | | 338,574 | | | | 5,660 | | |
| UBS PACE International Equity Investments2 | | | 1.65 | | | | 2.40 | | | | 2.40 | | | | 1.40 | | | | 1.40 | | | | 86 | | | | — | | |
UBS PACE International Emerging Markets
Equity Investments2 | | | 2.25 | | | | 3.00 | | | | 3.00 | | | | 2.00 | | | | 2.00 | | | | — | | | | — | | |
UBS PACE Global Real Estate
Securities Investments | | | 1.45 | | | | N/A3 | | | | 2.20 | | | | 1.20 | | | | 1.20 | | | | 489,809 | | | | — | | |
| UBS PACE Alternative Strategies Investments | | | 1.95 | | | | 2.70 | | | | 2.70 | | | | 1.70 | | | | 1.70 | | | | 171,663 | | | | 1,423 | | |
1 Share class has not commenced operations
2 At a meeting held on September 15, 2010, the Board of Trustees for UBS PACE International Equity Investments and UBS PACE International Emerging Markets Equity Investments approved new written fee waiver/expense reimbursement agreements pursuant to which, effective December 1, 2010, UBS Global AM is contractually obligated to waive its management fees and/or reimburse expenses so that the funds' ordinary total operating expenses through November 30, 2011 (excluding dividend expense, borrowing costs and interest expense, if any) will not exceed the following amounts:
| | | Class A | | Class B | | Class C | | Class Y | | Class P | |
| UBS PACE International Equity Investments | | | 1.55 | % | | | 2.30 | % | | | 2.30 | % | | | 1.30 | % | | | 1.30 | % | |
| UBS PACE International Emerging Markets Equity Investments | | | 2.15 | | | | 2.90 | | | | 2.90 | | | | 1.90 | | | | 1.90 | | |
3 UBS PACE Global Real Estate Securities Investments does not offer Class B shares.
At July 31, 2010, the following Portfolios had remaining fee waivers/expense reimbursements subject to repayment to UBS Global AM and respective dates of expiration as follows:
| Portfolio | | Fee waivers/
expense
reimbursements
subject to
repayment | | Expires
July 31,
2011 | | Expires
July 31,
2012 | | Expires
July 31,
2013 | |
| UBS PACE Money Market Investments | | $ | 4,419,019 | | | $ | 1,426,962 | | | $ | 1,729,334 | | | $ | 1,262,723 | | |
| UBS PACE Government Securities Fixed Income Investments—Class A | | | 63,720 | | | | 5,648 | | | | 26,444 | | | | 31,628 | | |
| UBS PACE Government Securities Fixed Income Investments—Class B | | | 777 | | | | 334 | | | | 280 | | | | 163 | | |
| UBS PACE Government Securities Fixed Income Investments—Class C | | | 54,508 | | | | 17,897 | | | | 20,528 | | | | 16,083 | | |
311
UBS PACE Select Advisors Trust
Notes to financial statements
| Portfolio | | Fee waivers/
expense
reimbursements
subject to
repayment | | Expires
July 31,
2011 | | Expires
July 31,
2012 | | Expires
July 31,
2013 | |
| UBS PACE Government Securities Fixed Income Investments—Class Y | | $ | 90,670 | | | $ | 6,932 | | | $ | 42,938 | | | $ | 40,800 | | |
| UBS PACE Government Securities Fixed Income Investments—Class P | | | 889,807 | | | | 193,089 | | | | 316,871 | | | | 379,847 | | |
| UBS PACE Intermediate Fixed Income Investments—Class A | | | 123,475 | | | | 50,808 | | | | 40,388 | | | | 32,279 | | |
| UBS PACE Intermediate Fixed Income Investments—Class B | | | 1,037 | | | | 550 | | | | 259 | | | | 228 | | |
| UBS PACE Intermediate Fixed Income Investments—Class C | | | 12,709 | | | | 5,041 | | | | 4,223 | | | | 3,445 | | |
| UBS PACE Intermediate Fixed Income Investments—Class Y | | | 2,135 | | | | 817 | | | | 25 | | | | 1,293 | | |
| UBS PACE Intermediate Fixed Income Investments—Class P | | | 711,726 | | | | 304,567 | | | | 209,484 | | | | 197,675 | | |
| UBS PACE Strategic Fixed Income Investments—Class A | | | 30,097 | | | | 11,610 | | | | 8,462 | | | | 10,025 | | |
| UBS PACE Strategic Fixed Income Investments—Class B | | | 1,093 | | | | 537 | | | | 278 | | | | 278 | | |
| UBS PACE Strategic Fixed Income Investments—Class C | | | 2,711 | | | | 1,791 | | | | 798 | | | | 122 | | |
| UBS PACE Strategic Fixed Income Investments—Class Y | | | 1,522 | | | | — | | | | — | | | | 1,522 | | |
| UBS PACE Strategic Fixed Income Investments—Class P | | | 1,269,836 | | | | 490,956 | | | | 360,438 | | | | 418,442 | | |
| UBS PACE Municipal Fixed Income Investments—Class A | | | 95,158 | | | | 54,146 | | | | 23,896 | | | | 17,116 | | |
| UBS PACE Municipal Fixed Income Investments—Class B | | | 545 | | | | 387 | | | | 84 | | | | 74 | | |
| UBS PACE Municipal Fixed Income Investments—Class C | | | 20,380 | | | | 10,476 | | | | 5,657 | | | | 4,247 | | |
| UBS PACE Municipal Fixed Income Investments—Class Y | | | 534 | | | | 356 | | | | 106 | | | | 72 | | |
| UBS PACE Municipal Fixed Income Investments—Class P | | | 459,959 | | | | 214,715 | | | | 129,158 | | | | 116,086 | | |
| UBS PACE Global Fixed Income Investments—Class A | | | 18,289 | | | | 3,663 | | | | 14,626 | | | | — | | |
| UBS PACE Global Fixed Income Investments—Class B | | | 626 | | | | 433 | | | | 125 | | | | 68 | | |
| UBS PACE Global Fixed Income Investments—Class P | | | 1,344,123 | | | | 485,900 | | | | 469,248 | | | | 388,975 | | |
| UBS PACE High Yield Investments—Class A | | | 6,391 | | | | 2,293 | | | | 4,098 | | | | — | | |
| UBS PACE High Yield Investments—Class Y | | | 10 | | | | — | | | | 10 | | | | — | | |
| UBS PACE High Yield Investments—Class P | | | 673,407 | | | | 202,550 | | | | 296,377 | | | | 174,480 | | |
| UBS PACE Large Co Value Equity Investments—Class B | | | 2,250 | | | | 41 | | | | 1,350 | | | | 859 | | |
| UBS PACE Large Co Value Equity Investments—Class C | | | 2,092 | | | | — | | | | 2,092 | | | | — | | |
| UBS PACE Large Co Growth Equity Investments—Class B | | | 1,453 | | | | 598 | | | | 487 | | | | 368 | | |
| UBS PACE Large Co Growth Equity Investments—Class C | | | 6,703 | | | | — | | | | 4,566 | | | | 2,137 | | |
| UBS PACE Small/Medium Co Value Equity Investments—Class B | | | 798 | | | | 133 | | | | 490 | | | | 175 | | |
| UBS PACE Small/Medium Co Value Equity Investments—Class P | | | 764,634 | | | | — | | | | 464,511 | | | | 300,123 | | |
| UBS PACE Small/Medium Co Growth Equity Investments—Class B | | | 1,210 | | | | 585 | | | | 364 | | | | 261 | | |
| UBS PACE Small/Medium Co Growth Equity Investments—Class C | | | 1,606 | | | | — | | | | 1,606 | | | | — | | |
| UBS PACE Small/Medium Co Growth Equity Investments—Class P | | | 963,941 | | | | 77,670 | | | | 547,958 | | | | 338,313 | | |
| UBS PACE International Equity Investments—Class B | | | 277 | | | | — | | | | 191 | | | | 86 | | |
| UBS PACE Global Real Estate Securities Investments—Class A | | | 51,377 | | | | 15,153 | | | | 20,367 | | | | 15,857 | | |
| UBS PACE Global Real Estate Securities Investments—Class C | | | 2,978 | | | | 1,201 | | | | 1,009 | | | | 768 | | |
| UBS PACE Global Real Estate Securities Investments—Class Y | | | 189 | | | | — | | | | 39 | | | | 150 | | |
| UBS PACE Global Real Estate Securities Investments—Class P | | | 1,195,779 | | | | 278,584 | | | | 444,161 | | | | 473,034 | | |
| UBS PACE Alternative Strategies Investments—Class A | | | 64,489 | | | | — | | | | 28,060 | | | | 36,429 | | |
| UBS PACE Alternative Strategies Investments—Class B | | | 421 | | | | 329 | | | | 54 | | | | 38 | | |
| UBS PACE Alternative Strategies Investments—Class C | | | 477 | | | | — | | | | 405 | | | | 72 | | |
| UBS PACE Alternative Strategies Investments—Class Y | | | 6,086 | | | | — | | | | 6,086 | | | | — | | |
| UBS PACE Alternative Strategies Investments—Class P | | | 174,381 | | | | — | | | | 39,257 | | | | 135,124 | | |
UBS PACE Global Fixed Income Investments Class C and Class Y, UBS PACE High Yield Investments Class C, UBS PACE Large Co Value Equity Investments Class A, Class Y and Class P, UBS PACE Large Co Growth
312
UBS PACE Select Advisors Trust
Notes to financial statements
Equity Investments Class A, Class Y and Class P, UBS PACE Small/Medium Co Value Equity Investments Class A, Class C and Class Y, UBS PACE Small/Medium Co Growth Equity Investments Class A and Class Y, UBS PACE International Equity Investments Class A, Class C, Class Y and Class P and UBS PACE International Emerging Markets Equity Investments Class A, Class B, Class C, Class Y and Class P have no remaining fee waivers/expense reimbursements subject to repayment.
During the year ended July 31, 2010, the Portfolios listed below paid broker commissions to affiliates of the investment manager as follows:
Affiliated
broker | | UBS PACE
Large Co
Value
Equity
Investments | | UBS PACE
Large Co
Growth
Equity
Investments | | UBS PACE
Small/
Medium
Co Value
Equity
Investments | | UBS PACE
Small/
Medium
Co Growth
Equity
Investments | | UBS PACE
International
Equity
Investments | | UBS PACE
International
Emerging
Markets
Equity
Investments | | UBS PACE
Global
Real Estate
Securities
Investments | | UBS PACE
Alternative
Strategies
Investments | |
| UBS AG | | | — | | | | — | | | | — | | | | — | | | $ | 550 | | | $ | 16,350 | | | $ | 1,081 | | | $ | 324 | | |
UBS Securities
Asia Ltd. | | | — | | | | — | | | | — | | | | — | | | | — | | | | — | | | | 2,868 | | | | 238 | | |
UBS Securities
Canada Inc. | | | — | | | | — | | | | — | | | | — | | | | — | | | | — | | | | 7 | | | | — | | |
UBS
Securities LLC | | $ | 9,339 | | | $ | 1,122 | | | $ | 6,522 | | | $ | 2,201 | | | | — | | | | 2,421 | | | | 480 | | | | 2,912 | | |
Additional information regarding compensation to affiliate of a board member
Professor Meyer Feldberg serves as a senior advisor to Morgan Stanley, resulting in him being an interested trustee of the Portfolios. The Portfolios have been informed that Professor Feldberg's role at Morgan Stanley does not involve matters directly affecting any UBS funds. Portfolio transactions are executed through Morgan Stanley based on that firm's ability to provide best execution of the transactions. For the year ended July 31, 2010, the following Portfolios paid brokerage commissions to Morgan Stanley in the amounts as follows:
| UBS PACE Large Co Value Equity Investments | | $ | 53,033 | | |
| UBS PACE Large Co Growth Equity Investments | | | 119,199 | | |
| UBS PACE Small/Medium Co Value Equity Investments | | | 9,736 | | |
| UBS PACE Small/Medium Co Growth Equity Investments | | | 19,704 | | |
| UBS PACE International Equity Investments | | | 45,286 | | |
| UBS PACE International Emerging Markets Equity Investments | | | 83,852 | | |
| UBS PACE Global Real Estate Securities Investments | | | 7,684 | | |
| UBS PACE Alternative Strategies Investments | | | 154,364 | | |
During the year ended July 31, 2010, the following Portfolios purchased and sold certain securities (e.g., fixed income securities) in principal trades with Morgan Stanley having aggregate values as follows:
| UBS PACE Money Market Investments | | $ | 175,979,194 | | |
| UBS PACE Government Securities Fixed Income Investments | | | 5,010,956,518 | | |
| UBS PACE Intermediate Fixed Income Investments | | | 1,526,719,008 | | |
| UBS PACE Strategic Fixed Income Investments | | | 1,299,496,199 | | |
| UBS PACE Municipal Fixed Income Investments | | | 16,352,915 | | |
| UBS PACE Global Fixed Income Investments | | | 72,028,667 | | |
| UBS PACE High Yield Investments | | | 6,602,157 | | |
| UBS PACE Small/Medium Co Growth Equity Investments | | | 2,294,071 | | |
| UBS PACE Alternative Strategies Investments | | | 304,733,932 | | |
313
UBS PACE Select Advisors Trust
Notes to financial statements
Morgan Stanley received compensation in connection with these trades, which may have been in the form of a "mark-up" or "mark-down" of the price of the securities, a fee from the issuer for maintaining a commercial paper program, or some other form of compensation. Although the precise amount of this compensation is not generally known by the investment manager, it is believed that under normal circumstances it represents a small portion of the total value of the transactions.
Service and distribution plans
UBS Global Asset Management (US) Inc. ("UBS Global AM (US)") is the principal underwriter of each Portfolio's shares. Under separate plans of service and/or distribution pertaining to Class A, Class B and Class C shares, the Portfolios (with the exception of UBS PACE Money Market Investments, which only offers Class P shares, and UBS PACE Global Real Estate Securities Investments, which does not offer Class B shares) pay UBS Global AM (US) monthly service fees at the annual rate of 0.25% of the average daily net assets of Class A, Class B and Class C shares and monthly distribution fees (1) at the annual rate of 0.75% of the average daily net assets of Class B and Class C shares for UBS PACE Large Co Value Equity Investments, UBS PACE Large Co Growth Equity Investments, UBS PACE Small/Medium Co Value Equity Investments, UBS PACE Small/Medium Co Growth Equity Investments, UBS PACE International Equity Investments, UBS PACE Intern ational Emerging Markets Equity Investments, UBS PACE Global Real Estate Securities Investments and UBS PACE Alternative Strategies Investments Portfolios and (2) at the annual rate of 0.75% and 0.50% of the average daily net assets of Class B and Class C shares, respectively, for UBS PACE Government Securities Fixed Income Investments, UBS PACE Intermediate Fixed Income Investments, UBS PACE Strategic Fixed Income Investments, UBS PACE Municipal Fixed Income Investments, UBS PACE Global Fixed Income Investments and UBS PACE High Yield Investments Portfolios.
UBS Global AM (US) also receives the proceeds of the initial sales charges paid upon the purchase of Class A shares and the contingent deferred sales charges paid by shareholders upon certain redemptions of Class A, Class B and Class C shares.
At July 31, 2010, certain Portfolios owed UBS Global AM (US) service and distribution fees, and for the year ended July 31, 2010, certain Portfolios were informed by UBS Global AM (US) that it had earned sales charges as follows:
| Portfolio | | Service and distribution
fees owed | | Sales charges earned
by distributor | |
| UBS PACE Government Securities Fixed Income Investments—Class A | | $ | 19,288 | | | $ | 29,357 | | |
| UBS PACE Government Securities Fixed Income Investments—Class B | | | 132 | | | | 1,000 | | |
| UBS PACE Government Securities Fixed Income Investments—Class C | | | 15,412 | | | | 1,181 | | |
| UBS PACE Intermediate Fixed Income Investments—Class A | | | 9,062 | | | | 6,231 | | |
| UBS PACE Intermediate Fixed Income Investments—Class B | | | 132 | | | | 223 | | |
| UBS PACE Intermediate Fixed Income Investments—Class C | | | 2,993 | | | | 1,137 | | |
| UBS PACE Strategic Fixed Income Investments—Class A | | | 9,484 | | | | 44,799 | | |
| UBS PACE Strategic Fixed Income Investments—Class B | | | 252 | | | | 510 | | |
| UBS PACE Strategic Fixed Income Investments—Class C | | | 7,647 | | | | 437 | | |
| UBS PACE Municipal Fixed Income Investments—Class A | | | 17,721 | | | | 40,861 | | |
| UBS PACE Municipal Fixed Income Investments—Class B | | | 52 | | | | — | | |
| UBS PACE Municipal Fixed Income Investments—Class C | | | 10,023 | | | | 122 | | |
| UBS PACE Global Fixed Income Investments—Class A | | | 20,441 | | | | 10,526 | | |
| UBS PACE Global Fixed Income Investments—Class B | | | 138 | | | | 488 | | |
| UBS PACE Global Fixed Income Investments—Class C | | | 4,441 | | | | — | | |
314
UBS PACE Select Advisors Trust
Notes to financial statements
| Portfolio | | Service and distribution
fees owed | | Sales charges earned
by distributor | |
| UBS PACE High Yield Investments—Class A | | $ | 2,693 | | | $ | 69,150 | | |
| UBS PACE High Yield Investments—Class C | | | 1,745 | | | | 1,146 | | |
| UBS PACE Large Co Value Equity Investments—Class A | | | 29,871 | | | | 5,170 | | |
| UBS PACE Large Co Value Equity Investments—Class B | | | 137 | | | | 348 | | |
| UBS PACE Large Co Value Equity Investments—Class C | | | 12,823 | | | | 261 | | |
| UBS PACE Large Co Growth Equity Investments—Class A | | | 11,649 | | | | 3,903 | | |
| UBS PACE Large Co Growth Equity Investments—Class B | | | 72 | | | | 355 | | |
| UBS PACE Large Co Growth Equity Investments—Class C | | | 3,302 | | | | 78 | | |
| UBS PACE Small/Medium Co Value Equity Investments—Class A | | | 5,821 | | | | 3,808 | | |
| UBS PACE Small/Medium Co Value Equity Investments—Class B | | | 47 | | | | 20 | | |
| UBS PACE Small/Medium Co Value Equity Investments—Class C | | | 4,291 | | | | 18 | | |
| UBS PACE Small/Medium Co Growth Equity Investments—Class A | | | 6,698 | | | | 1,452 | | |
| UBS PACE Small/Medium Co Growth Equity Investments—Class B | | | 13 | | | | 85 | | |
| UBS PACE Small/Medium Co Growth Equity Investments—Class C | | | 2,711 | | | | 56 | | |
| UBS PACE International Equity Investments—Class A | | | 13,668 | | | | 4,112 | | |
| UBS PACE International Equity Investments—Class B | | | 20 | | | | 231 | | |
| UBS PACE International Equity Investments—Class C | | | 3,103 | | | | — | | |
| UBS PACE International Emerging Markets Equity Investments—Class A | | | 3,902 | | | | 2,544 | | |
| UBS PACE International Emerging Markets Equity Investments—Class B | | | 49 | | | | 122 | | |
| UBS PACE International Emerging Markets Equity Investments—Class C | | | 3,025 | | | | — | | |
| UBS PACE Global Real Estate Securities Investments—Class A | | | 802 | | | | 3,519 | | |
| UBS PACE Global Real Estate Securities Investments—Class C | | | 139 | | | | — | | |
| UBS PACE Alternative Strategies Investments—Class A | | | 12,103 | | | | 3,640 | | |
| UBS PACE Alternative Strategies Investments—Class B | | | — | | | | 73 | | |
| UBS PACE Alternative Strategies Investments—Class C | | | 5,762 | | | | 516 | | |
Transfer agency and related services fees
UBS Financial Services Inc. provides certain services to the Portfolios pursuant to a delegation of authority from BNY Mellon Investment Servicing (US) Inc. (formerly PNC Global Investment Servicing (U.S.), Inc.)("BNY Mellon"), the Portfolios' transfer agent, and was compensated for these services by BNY Mellon, not the Portfolios.
For the year ended July 31, 2010, UBS Financial Services Inc. received from BNY Mellon, not the Portfolios, total delegated services fees as follows:
| Portfolio | | Delegated
services
fees earned | |
| UBS PACE Money Market Investments | | $ | 927,123 | | |
| UBS PACE Government Securities Fixed Income Investments | | | 432,662 | | |
| UBS PACE Intermediate Fixed Income Investments | | | 223,668 | �� | |
| UBS PACE Strategic Fixed Income Investments | | | 562,405 | | |
| UBS PACE Municipal Fixed Income Investments | | | 102,368 | | |
| UBS PACE Global Fixed Income Investments | | | 578,433 | | |
| UBS PACE High Yield Investments | | | 235,606 | | |
| UBS PACE Large Co Value Equity Investments | | | 721,439 | | |
315
UBS PACE Select Advisors Trust
Notes to financial statements
| Portfolio | | Delegated
services
fees earned | |
| UBS PACE Large Co Growth Equity Investments | | $ | 667,601 | | |
| UBS PACE Small/Medium Co Value Equity Investments | | | 623,002 | | |
| UBS PACE Small/Medium Co Growth Equity Investments | | | 624,665 | | |
| UBS PACE International Equity Investments | | | 642,108 | | |
| UBS PACE International Emerging Markets Equity Investments | | | 543,254 | | |
| UBS PACE Global Real Estate Securities Investments | | | 221,469 | | |
| UBS PACE Alternative Strategies Investments | | | 279,609 | | |
For the year ended July 31, 2010, each Portfolio accrued transfer agency and related services fees payable to BNY Mellon on each class as follows:
| Portfolio | | Class A | | Class B | | Class C | | Class Y | | Class P | |
| UBS PACE Money Market Investments | | $ | — | | | $ | — | | | $ | — | | | $ | — | | | $ | 1,857,526 | | |
| UBS PACE Government Securities Fixed Income Investments | | | 88,637 | | | | 247 | | | | 31,252 | | | | 67,432 | | | | 662,468 | | |
| UBS PACE Intermediate Fixed Income Investments | | | 49,105 | | | | 290 | | | | 5,283 | | | | 2,130 | | | | 346,282 | | |
| UBS PACE Strategic Fixed Income Investments | | | 40,874 | | | | 547 | | | | 8,352 | | | | 4,384 | | | | 949,020 | | |
| UBS PACE Municipal Fixed Income Investments | | | 32,266 | | | | 87 | | | | 6,980 | | | | 95 | | | | 152,476 | | |
| UBS PACE Global Fixed Income Investments | | | 120,396 | | | | 319 | | | | 7,192 | | | | 6,899 | | | | 909,593 | | |
| UBS PACE High Yield Investments | | | 11,080 | | | | — | | | | 1,447 | | | | 10 | | | | 396,033 | | |
| UBS PACE Large Co Value Equity Investments | | | 178,139 | | | | 1,375 | | | | 28,043 | | | | 12,894 | | | | 1,074,845 | | |
| UBS PACE Large Co Growth Equity Investments | | | 82,788 | | | | 633 | | | | 11,080 | | | | 10,069 | | | | 1,072,811 | | |
| UBS PACE Small/Medium Co Value Equity Investments | | | 43,106 | | | | 352 | | | | 9,105 | | | | 728 | | | | 1,028,107 | | |
| UBS PACE Small/Medium Co Growth Equity Investments | | | 51,281 | | | | 349 | | | | 6,455 | | | | 265 | | | | 1,026,433 | | |
| UBS PACE International Equity Investments | | | 98,543 | | | | 251 | | | | 9,266 | | | | 18,381 | | | | 1,019,372 | | |
| UBS PACE International Emerging Markets Equity Investments | | | 31,741 | | | | 250 | | | | 6,214 | | | | 47,814 | | | | 900,726 | | |
| UBS PACE Global Real Estate Securities Investments | | | 10,378 | | | | — | | | | 531 | | | | 40 | | | | 371,123 | | |
| UBS PACE Alternative Strategies Investments | | | 79,948 | | | | 49 | | | | 4,938 | | | | 4,855 | | | | 400,053 | | |
Securities lending
Each Portfolio may lend securities up to 331/3% of its total assets to qualified broker-dealers or institutional investors. The loans are secured at all times by cash, US government securities or irrevocable letters of credit in an amount at least equal to the market value of the securities loaned, plus accrued interest and dividends, determined on a daily basis and adjusted accordingly. The Portfolio will regain ownership of loaned securities to exercise certain beneficial rights; however, each Portfolio may bear the risk of delay in recovery of, or even loss of rights in, the securities loaned should the borrower fail fina ncially. Each Portfolio receives compensation for lending its securities from interest or dividends earned on the cash, US government securities or irrevocable letters of credit held as collateral, net of fee rebates paid to the borrower plus reasonable administrative and custody fees. State Street Bank and Trust Company serves as the Portfolios' lending agent.
Bank line of credit
Each Portfolio, other than UBS PACE Money Market Investments and UBS PACE Large Co Growth Equity Investments, participates with other funds managed, advised or sub-advised by UBS Global AM in a $100 million committed credit facility with State Street Bank and Trust Company ("Committed Credit Facility"), to be utilized for temporary financing until the settlement of sales or purchases of portfolio securities, the
316
UBS PACE Select Advisors Trust
Notes to financial statements
repurchase or redemption of shares of each Portfolio at the request of shareholders and other temporary or emergency purposes. Under the Committed Credit Facility arrangement, each Portfolio has agreed to pay commitment fees, pro rata, based on the relative asset size of the funds in the Committed Credit Facility. Each Portfolio borrows at prevailing rates in effect at the time of borrowings. For the year ended July 31, 2010, the following Portfolios had borrowings as follows:
| Portfolio | | Average daily
amount of
borrowing
outstanding | | Days
outstanding | | Interest
expense | | Weighted average
annualized
interest rate | |
| UBS PACE Government Securities Fixed Income Investments | | $ | 8,352,342 | | | | 4 | | | $ | 1,075 | | | | 1.158 | % | |
| UBS PACE Intermediate Fixed Income Investments | | | 1,263,169 | | | | 3 | | | | 119 | | | | 1.130 | | |
| UBS PACE International Equity Investments | | | 2,873,473 | | | | 6 | | | | 322 | | | | 0.672 | | |
| UBS PACE International Emerging Market Equity Investments | | | 1,638,575 | | | | 81 | | | | 3,159 | | | | 0.857 | | |
| UBS PACE Alternative Strategies Investments | | | 2,097,849 | | | | 10 | | | | 488 | | | | 0.837 | | |
UBS PACE Large Co Growth Equity Investments participates with other funds advised by UBS Global AM, in a $75 million committed credit facility with JP Morgan Chase Bank ("JPMorgan Chase Bank Facility"), to be utilized for temporary financing until the settlement of sales or purchases of portfolio securities, the repurchase or redemption of shares of the Portfolio at the request of shareholders and other temporary or emergency purposes. Under the JPMorgan Chase Bank Facility arrangement, the Portfolio has agreed to pay commitment fees, pro rata, based on the relative asset size of the funds in the JPMorgan Chase Bank Facility. The Portfolio borrows at prevailing rates in effect at the time of borrowings. For the year ended July 31, 2010, the Portfolio did not borrow under the JPMorgan Chase Bank Facility.
Purchases and sales of securities
For the year ended July 31, 2010, aggregate purchases and sales of portfolio securities, excluding short-term securities and US Government and agency securities, were as follows:
| Portfolio | | Purchases | | Sales | |
| UBS PACE Government Securities Fixed Income Investments | | $ | 26,531,145 | | | $ | 80,368,792 | | |
| UBS PACE Intermediate Fixed Income Investments | | | 138,917,991 | | | | 148,293,631 | | |
| UBS PACE Strategic Fixed Income Investments | | | 164,689,230 | | | | 208,669,446 | | |
| UBS PACE Municipal Fixed Income Investments | | | 56,901,750 | | | | 30,345,420 | | |
| UBS PACE Global Fixed Income Investments | | | 355,732,815 | | | | 296,657,991 | | |
| UBS PACE High Yield Investments | | | 98,022,319 | | | | 56,553,176 | | |
| UBS PACE Large Co Value Equity Investments | | | 652,812,693 | | | | 696,831,208 | | |
| UBS PACE Large Co Growth Equity Investments | | | 872,268,616 | | | | 913,772,090 | | |
| UBS PACE Small/Medium Co Value Equity Investments | | | 299,446,961 | | | | 324,152,436 | | |
| UBS PACE Small/Medium Co Growth Equity Investments | | | 491,263,148 | | | | 524,616,830 | | |
| UBS PACE International Equity Investments | | | 481,006,229 | | | | 491,517,322 | | |
| UBS PACE International Emerging Markets Equity Investments | | | 162,076,548 | | | | 189,258,792 | | |
| UBS PACE Global Real Estate Securities Investments | | | 91,405,457 | | | | 79,077,440 | | |
| UBS PACE Alternative Strategies Investments | | | 523,766,153 | | | | 538,768,163 | | |
317
UBS PACE Select Advisors Trust
Notes to financial statements
For the year ended July 31, 2010, aggregate purchases and sales of US Government and agency securities, excluding short-term securities, were as follows:
| Portfolio | | Purchases | | Sales | |
| UBS PACE Government Securities Fixed Income Investments | | $ | 9,133,089,529 | | | $ | 9,120,202,227 | | |
| UBS PACE Intermediate Fixed Income Investments | | | 5,709,176,339 | | | | 4,494,596,404 | | |
| UBS PACE Strategic Fixed Income Investments | | | 1,673,466,359 | | | | 1,465,468,056 | | |
| UBS PACE Global Fixed Income Investments | | | 13,499,437 | | | | 23,479,748 | | |
| UBS PACE Alternative Strategies Investments | | | 238,438,720 | | | | 266,741,163 | | |
Commission recapture program
The following Portfolios participate in a brokerage commission recapture program: UBS PACE Large Co Value Equity Investments, UBS PACE Large Co Growth Equity Investments, UBS PACE Small/Medium Co Value Equity Investments, UBS PACE Small/Medium Co Growth Equity Investments, UBS PACE International Equity Investments, UBS PACE International Emerging Markets Equity Investments, UBS PACE Global Real Estate Securities Investments and UBS PACE Alternative Strategies Investments. These Portfolios have established commission recapture arrangements with certain participating brokers or dealers. If a Portfolio's investment sub-advisor chooses to execute a transaction through a participating broker subject to best price and execution, the broker will rebate a portion of the commission back to the Portfolio. Any collateral benefit received through participation in the commission recapture program is directed exclusively to the Portfolio. For the year ended July 31, 2010, the following Portfolios recorded recaptured commissions which are reflected on the Statement of operations within the net realized gains (losses) on investment activities:
| Portfolio | | Amount | |
| UBS PACE Large Co Value Equity Investments | | $ | 147,916 | | |
| UBS PACE Large Co Growth Equity Investments | | | 22,614 | | |
| UBS PACE Small/Medium Co Value Equity Investments | | | 120,781 | | |
| UBS PACE Small/Medium Co Growth Equity Investments | | | 242,410 | | |
| UBS PACE International Equity Investments | | | 8,751 | | |
| UBS PACE Global Real Estate Securities Investments | | | 17,077 | | |
| UBS PACE Alternative Strategies Investments | | | 2,676 | | |
318
UBS PACE Select Advisors Trust
Notes to financial statements
Shares of beneficial interest
There is an unlimited amount of $0.001 par value shares of beneficial interest authorized. Transactions in shares of beneficial interest for each of the Portfolios, except UBS PACE Money Market Investments, about which similar information is provided on the Statement of changes in net assets, were as follows:
UBS PACE Government Securities Fixed Income Investments
For the year ended July 31, 2010:
| | | Class A | | Class B | | Class C | |
| | | Shares | | Amount | | Shares | | Amount | | Shares | | Amount | |
| Shares sold | | | 728,713 | | | $ | 9,852,320 | | | | 5,617 | | | $ | 76,341 | | | | 138,831 | | | $ | 1,877,632 | | |
| Shares repurchased | | | (1,098,779 | ) | | | (14,815,822 | ) | | | (4,153 | ) | | | (56,643 | ) | | | (284,012 | ) | | | (3,824,901 | ) | |
| Shares converted from Class B to Class A | | | 3,556 | | | | 48,107 | | | | (3,554 | ) | | | (48,107 | ) | | | — | | | | — | | |
| Dividends reinvested | | | 342,102 | | | | 4,543,316 | | | | 550 | | | | 7,290 | | | | 92,411 | | | | 1,227,180 | | |
| Net decrease | | | (24,408 | ) | | $ | (372,079 | ) | | | (1,540 | ) | | $ | (21,119 | ) | | | (52,770 | ) | | $ | (720,089 | ) | |
| | | Class Y | | Class P | | | |
| | | Shares | | Amount | | Shares | | Amount | | | | | |
| Shares sold | | | 1,769,546 | | | $ | 23,862,711 | | | | 9,379,343 | | | $ | 126,498,461 | | | | | | | | | | |
| Shares repurchased | | | (1,318,594 | ) | | | (17,728,119 | ) | | | (8,472,594 | ) | | | (114,141,124 | ) | | | | | | | | | |
| Dividends reinvested | | | 224,552 | | | | 2,983,809 | | | | 2,307,855 | | | | 30,666,573 | | | | | | | | | | |
| Net increase | | | 675,504 | | | $ | 9,118,401 | | | | 3,214,604 | | | $ | 43,023,910 | | | | | | | | | | |
For the year ended July 31, 2009:
| | | Class A | | Class B | | Class C | |
| | | Shares | | Amount | | Shares | | Amount | | Shares | | Amount | |
| Shares sold | | | 794,704 | | | $ | 10,324,132 | | | | 4,608 | | | $ | 59,505 | | | | 187,121 | | | $ | 2,422,895 | | |
| Shares repurchased | | | (1,435,064 | ) | | | (18,693,940 | ) | | | (11,081 | ) | | | (143,809 | ) | | | (327,195 | ) | | | (4,265,308 | ) | |
| Shares converted from Class B to Class A | | | 41,278 | | | | 534,675 | | | | (41,259 | ) | | | (534,675 | ) | | | — | | | | — | | |
| Dividends reinvested | | | 245,499 | | | | 3,183,096 | | | | 952 | | | | 12,265 | | | | 65,462 | | | | 849,557 | | |
| Net decrease | | | (353,583 | ) | | $ | (4,652,037 | ) | | | (46,780 | ) | | $ | (606,714 | ) | | | (74,612 | ) | | $ | (992,856 | ) | |
| | | Class Y | | Class P | | | |
| | | Shares | | Amount | | Shares | | Amount | | | | | |
| Shares sold | | | 2,359,212 | | | $ | 30,552,270 | | | | 10,532,417 | | | $ | 137,379,082 | | | | | | | | | | |
| Shares repurchased | | | (1,558,509 | ) | | | (20,269,280 | ) | | | (22,899,522 | ) | | | (297,004,650 | ) | | | | | | | | | |
| Dividends reinvested | | | 139,038 | | | | 1,805,219 | | | | 1,814,928 | | | | 23,513,421 | | | | | | | | | | |
| Net increase (decrease) | | | 939,741 | | | $ | 12,088,209 | | | | (10,552,177 | ) | | $ | (136,112,147 | ) | | | | | | | | | |
319
UBS PACE Select Advisors Trust
Notes to financial statements
UBS PACE Intermediate Fixed Income Investments
For the year ended July 31, 2010:
| | | Class A | | Class B | | Class C | |
| | | Shares | | Amount | | Shares | | Amount | | Shares | | Amount | |
| Shares sold | | | 281,329 | | | $ | 3,310,190 | | | | 4,034 | | | $ | 47,518 | | | | 84,600 | | | $ | 995,456 | | |
| Shares repurchased | | | (703,084 | ) | | | (8,259,636 | ) | | | (1,917 | ) | | | (22,533 | ) | | | (154,565 | ) | | | (1,820,536 | ) | |
| Shares converted from Class B to Class A | | | 2,664 | | | | 31,143 | | | | (2,659 | ) | | | (31,143 | ) | | | — | | | | — | | |
| Dividends reinvested | | | 90,459 | | | | 1,061,686 | | | | 223 | | | | 2,622 | | | | 9,019 | | | | 105,968 | | |
| Net decrease | | | (328,632 | ) | | $ | (3,856,617 | ) | | | (319 | ) | | $ | (3,536 | ) | | | (60,946 | ) | | $ | (719,112 | ) | |
| | | Class Y | | Class P | | | |
| | | Shares | | Amount | | Shares | | Amount | | | | | |
| Shares sold | | | 47,283 | | | $ | 554,932 | | | | 12,008,075 | | | $ | 141,203,511 | | | | | | | | | | |
| Shares repurchased | | | (87,440 | ) | | | (1,024,060 | ) | | | (8,594,102 | ) | | | (101,065,548 | ) | | | | | | | | | |
| Dividends reinvested | | | 6,714 | | | | 78,814 | | | | 1,122,720 | | | | 13,186,851 | | | | | | | | | | |
| Net increase (decrease) | | | (33,443 | ) | | $ | (390,314 | ) | | | 4,536,693 | | | $ | 53,324,814 | | | | | | | | | | |
For the year ended July 31, 2009:
| | | Class A | | Class B | | Class C | |
| | | Shares | | Amount | | Shares | | Amount | | Shares | | Amount | |
| Shares sold | | | 508,717 | | | $ | 5,673,742 | | | | 5,548 | | | $ | 59,615 | | | | 162,600 | | | $ | 1,812,116 | | |
| Shares repurchased | | | (751,373 | ) | | | (8,370,574 | ) | | | (4,201 | ) | | | (48,125 | ) | | | (72,890 | ) | | | (816,207 | ) | |
| Shares converted from Class B to Class A | | | 2,715 | | | | 30,358 | | | | (2,711 | ) | | | (30,358 | ) | | | — | | | | — | | |
| Dividends reinvested | | | 119,581 | | | | 1,330,289 | | | | 290 | | | | 3,228 | | | | 10,949 | | | | 122,167 | | |
| Net increase (decrease) | | | (120,360 | ) | | $ | (1,336,185 | ) | | | (1,074 | ) | | $ | (15,640 | ) | | | 100,659 | | | $ | 1,118,076 | | |
| | | Class Y | | Class P | | | |
| | | Shares | | Amount | | Shares | | Amount | | | | | |
| Shares sold | | | 137,417 | | | $ | 1,531,926 | | | | 13,274,784 | | | $ | 147,790,899 | | | | | | | | | | |
| Shares repurchased | | | (63,002 | ) | | | (702,761 | ) | | | (19,267,717 | ) | | | (213,737,546 | ) | | | | | | | | | |
| Dividends reinvested | | | 7,218 | | | | 80,452 | | | | 1,334,036 | | | | 14,843,956 | | | | | | | | | | |
| Net increase (decrease) | | | 81,633 | | | $ | 909,617 | | | | (4,658,897 | ) | | $ | (51,102,691 | ) | | | | | | | | | |
UBS PACE Strategic Fixed Income Investments
For the year ended July 31, 2010:
| | | Class A | | Class B | | Class C | |
| | | Shares | | Amount | | Shares | | Amount | | Shares | | Amount | |
| Shares sold | | | 1,269,639 | | | $ | 17,649,022 | | | | 879 | | | $ | 11,691 | | | | 272,509 | | | $ | 3,806,220 | | |
| Shares repurchased | | | (792,786 | ) | | | (10,971,115 | ) | | | (2,823 | ) | | | (39,093 | ) | | | (124,012 | ) | | | (1,711,165 | ) | |
| Shares converted from Class B to Class A | | | 3,582 | | | | 49,561 | | | | (3,584 | ) | | | (49,561 | ) | | | — | | | | — | | |
| Dividends reinvested | | | 101,324 | | | | 1,400,996 | | | | 687 | | | | 9,459 | | | | 23,560 | | | | 325,832 | | |
| Net increase (decrease) | | | 581,759 | | | $ | 8,128,464 | | | | (4,841 | ) | | $ | (67,504 | ) | | | 172,057 | | | $ | 2,420,887 | | |
| | | Class Y | | Class P | | | |
| | | Shares | | Amount | | Shares | | Amount | | | | | |
| Shares sold | | | 99,028 | | | $ | 1,354,135 | | | | 12,390,311 | | | $ | 170,474,850 | | | | | | | | | | |
| Shares repurchased | | | (144,124 | ) | | | (2,001,353 | ) | | | (11,612,066 | ) | | | (160,807,710 | ) | | | | | | | | | |
| Dividends reinvested | | | 11,880 | | | | 163,743 | | | | 2,063,819 | | | | 28,495,696 | | | | | | | | | | |
| Net increase (decrease) | | | (33,216 | ) | | $ | (483,475 | ) | | | 2,842,064 | | | $ | 38,162,836 | | | | | | | | | | |
320
UBS PACE Select Advisors Trust
Notes to financial statements
UBS PACE Strategic Fixed Income Investments (concluded)
For the year ended July 31, 2009:
| | | Class A | | Class B | | Class C | |
| | | Shares | | Amount | | Shares | | Amount | | Shares | | Amount | |
| Shares sold | | | 1,158,554 | | | $ | 14,732,706 | | | | 20,511 | | | $ | 257,482 | | | | 360,847 | | | $ | 4,531,256 | | |
| Shares repurchased | | | (834,812 | ) | | | (10,596,812 | ) | | | (3,024 | ) | | | (38,773 | ) | | | (145,805 | ) | | | (1,860,777 | ) | |
| Shares converted from Class B to Class A | | | 4,220 | | | | 54,950 | | | | (4,221 | ) | | | (54,950 | ) | | | — | | | | — | | |
| Dividends reinvested | | | 239,230 | | | | 2,973,992 | | | | 1,826 | | | | 22,594 | | | | 50,492 | | | | 627,167 | | |
| Net increase | | | 567,192 | | | $ | 7,164,836 | | | | 15,092 | | | $ | 186,353 | | | | 265,534 | | | $ | 3,297,646 | | |
| | | Class Y | | Class P | | | |
| | | Shares | | Amount | | Shares | | Amount | | | | | |
| Shares sold | | | 124,187 | | | $ | 1,548,317 | | | | 10,383,796 | | | $ | 131,380,408 | | | | | | | | | | |
| Shares repurchased | | | (131,417 | ) | | | (1,641,523 | ) | | | (29,277,183 | ) | | | (370,944,752 | ) | | | | | | | | | |
| Dividends reinvested | | | 29,260 | | | | 363,729 | | | | 6,416,564 | | | | 79,811,700 | | | | | | | | | | |
| Net increase (decrease) | | | 22,030 | | | $ | 270,523 | | | | (12,476,823 | ) | | $ | (159,752,644 | ) | | | | | | | | | |
UBS PACE Municipal Fixed Income Investments
For the year ended July 31, 2010:
| | | Class A | | Class B | | Class C | |
| | | Shares | | Amount | | Shares | | Amount | | Shares | | Amount | |
| Shares sold | | | 729,755 | | | $ | 9,296,918 | | | | — | | | $ | — | | | | 127,864 | | | $ | 1,627,841 | | |
| Shares repurchased | | | (1,509,793 | ) | | | (19,186,226 | ) | | | — | | | | — | | | | (176,048 | ) | | | (2,234,934 | ) | |
| Shares converted from Class B to Class A | | | 3,647 | | | | 46,031 | | | | (3,644 | ) | | | (46,031 | ) | | | — | | | | — | | |
| Dividends reinvested | | | 145,060 | | | | 1,842,634 | | | | 127 | | | | 1,600 | | | | 23,373 | | | | 296,962 | | |
| Net decrease | | | (631,331 | ) | | $ | (8,000,643 | ) | | | (3,517 | ) | | $ | (44,431 | ) | | | (24,811 | ) | | $ | (310,131 | ) | |
| | | Class Y | | Class P | | | |
| | | Shares | | Amount | | Shares | | Amount | | | | | |
| Shares sold | | | — | | | $ | — | | | | 5,824,530 | | | $ | 74,011,168 | | | | | | | | | | |
| Shares repurchased | | | (2,240 | ) | | | (28,205 | ) | | | (3,716,258 | ) | | | (47,231,557 | ) | | | | | | | | | |
| Dividends reinvested | | | 116 | | | | 1,473 | | | | 498,842 | | | | 6,339,203 | | | | | | | | | | |
| Net increase (decrease) | | | (2,124 | ) | | $ | (26,732 | ) | | | 2,607,114 | | | $ | 33,118,814 | | | | | | | | | | |
For the year ended July 31, 2009:
| | | Class A | | Class B | | Class C | |
| | | Shares | | Amount | | Shares | | Amount | | Shares | | Amount | |
| Shares sold | | | 955,999 | | | $ | 11,591,980 | | | | 1,282 | | | $ | 15,656 | | | | 179,584 | | | $ | 2,143,204 | | |
| Shares repurchased | | | (1,208,678 | ) | | | (14,615,846 | ) | | | (4,854 | ) | | | (58,641 | ) | | | (106,948 | ) | | | (1,307,803 | ) | |
| Shares converted from Class B to Class A | | | 4,476 | | | | 54,425 | | | | (4,476 | ) | | | (54,425 | ) | | | — | | | | — | | |
| Dividends reinvested | | | 170,919 | | | | 2,076,191 | | | | 169 | | | | 2,063 | | | | 26,485 | | | | 321,829 | | |
| Net increase (decrease) | | | (77,284 | ) | | $ | (893,250 | ) | | | (7,879 | ) | | $ | (95,347 | ) | | | 99,121 | | | $ | 1,157,230 | | |
| | | Class Y | | Class P | | | |
| | | Shares | | Amount | | Shares | | Amount | | | | | |
| Shares sold | | | 1,017 | | | $ | 12,001 | | | | 6,342,348 | | | $ | 76,739,936 | | | | | | | | | | |
| Shares repurchased | | | (712 | ) | | | (8,858 | ) | | | (11,741,873 | ) | | | (141,649,274 | ) | | | | | | | | | |
| Dividends reinvested | | | 172 | | | | 2,094 | | | | 576,921 | | | | 7,000,558 | | | | | | | | | | |
| Net increase (decrease) | | | 477 | | | $ | 5,237 | | | | (4,822,604 | ) | | $ | (57,908,780 | ) | | | | | | | | | |
321
UBS PACE Select Advisors Trust
Notes to financial statements
UBS PACE Global Fixed Income Investments
For the year ended July 31, 2010:
| | | Class A | | Class B | | Class C | |
| | | Shares | | Amount | | Shares | | Amount | | Shares | | Amount | |
| Shares sold | | | 426,369 | | | $ | 4,923,082 | | | | 1,847 | | | $ | 22,267 | | | | 93,275 | | | $ | 1,081,590 | | |
| Shares repurchased | | | (1,175,359 | ) | | | (13,584,368 | ) | | | (2,404 | ) | | | (26,147 | ) | | | (114,266 | ) | | | (1,329,048 | ) | |
| Shares converted from Class B to Class A | | | 1,872 | | | | 21,921 | | | | (1,868 | ) | | | (21,921 | ) | | | — | | | | — | | |
| Dividends reinvested | | | 421,149 | | | | 4,859,108 | | | | 522 | | | | 6,037 | | | | 25,817 | | | | 297,937 | | |
| Net increase (decrease) | | | (325,969 | ) | | $ | (3,780,257 | ) | | | (1,903 | ) | | $ | (19,764 | ) | | | 4,826 | | | $ | 50,479 | | |
| | | Class Y | | Class P | | | |
| | | Shares | | Amount | | Shares | | Amount | | | | | |
| Shares sold | | | 44,952 | | | $ | 533,137 | | | | 9,245,770 | | | $ | 107,353,391 | | | | | | | | | | |
| Shares repurchased | | | (242,403 | ) | | | (2,810,513 | ) | | | (7,210,772 | ) | | | (83,287,599 | ) | | | | | | | | | |
| Dividends reinvested | | | 39,822 | | | | 459,531 | | | | 2,064,683 | | | | 23,791,549 | | | | | | | | | | |
| Net increase (decrease) | | | (157,629 | ) | | $ | (1,817,845 | ) | | | 4,099,681 | | | $ | 47,857,341 | | | | | | | | | | |
For the year ended July 31, 2009:
| | | Class A | | Class B | | Class C | |
| | | Shares | | Amount | | Shares | | Amount | | Shares | | Amount | |
| Shares sold | | | 466,380 | | | $ | 5,094,875 | | | | 3,570 | | | $ | 40,001 | | | | 91,793 | | | $ | 1,013,832 | | |
| Shares repurchased | | | (1,901,242 | ) | | | (20,414,425 | ) | | | (14,161 | ) | | | (156,962 | ) | | | (92,348 | ) | | | (981,653 | ) | |
| Shares converted from Class B to Class A | | | 15,903 | | | | 172,589 | | | | (15,881 | ) | | | (172,589 | ) | | | — | | | | — | | |
| Dividends reinvested | | | 296,581 | | | | 3,208,918 | | | | 322 | | | | 3,505 | | | | 17,268 | | | | 186,956 | | |
| Net increase (decrease) | | | (1,122,378 | ) | | $ | (11,938,043 | ) | | | (26,150 | ) | | $ | (286,045 | ) | | | 16,713 | | | $ | 219,135 | | |
| | | Class Y | | Class P | | | |
| | | Shares | | Amount | | Shares | | Amount | | | | | |
| Shares sold | | | 82,623 | | | $ | 880,745 | | | | 6,404,190 | | | $ | 69,138,944 | | | | | | | | | | |
| Shares repurchased | | | (312,929 | ) | | | (3,317,046 | ) | | | (21,733,322 | ) | | | (231,552,261 | ) | | | | | | | | | |
| Dividends reinvested | | | 31,926 | | | | 344,796 | | | | 1,546,584 | | | | 16,724,215 | | | | | | | | | | |
| Net decrease | | | (198,380 | ) | | $ | (2,091,505 | ) | | | (13,782,548 | ) | | $ | (145,689,102 | ) | | | | | | | | | |
UBS PACE High Yield Investments
For the year ended July 31, 2010:
| | | Class A | | Class C | | | |
| | | Shares | | Amount | | Shares | | Amount | | | | | |
| Shares sold | | | 691,126 | | | $ | 6,773,730 | | | | 105,595 | | | $ | 1,064,331 | | | | | | |
| Shares repurchased | | | (306,128 | ) | | | (2,956,039 | ) | | | (41,670 | ) | | | (409,248 | ) | | | | | |
| Dividends reinvested | | | 65,476 | | | | 644,671 | | | | 11,285 | | | | 110,746 | | | | | | |
| Net increase | | | 450,474 | | | $ | 4,462,362 | | | | 75,210 | | | $ | 765,829 | | | | | | |
| | | Class Y | | Class P | | | |
| | | Shares | | Amount | | Shares | | Amount | | | | | |
| Shares sold | | | — | | | | — | | | | 7,284,556 | | | $ | 71,144,838 | | | | | | |
| Shares repurchased | | | — | | | | — | | | | (4,630,407 | ) | | | (45,473,717 | ) | | | | | |
| Dividends reinvested | | | 67 | | | $ | 656 | | | | 1,500,995 | | | | 14,758,167 | | | | | | |
| Net increase | | | 67 | | | $ | 656 | | | | 4,155,144 | | | $ | 40,429,288 | | | | | | |
322
UBS PACE Select Advisors Trust
Notes to financial statements
UBS PACE High Yield Investments (concluded)
For the year ended July 31, 2009:
| | | Class A | | Class C1 | | | |
| | | Shares | | Amount | | Shares | | Amount | | | | | |
| Shares sold | | | 774,901 | | | $ | 5,974,010 | | | | 213,076 | | | $ | 1,681,927 | | | | | | |
| Shares repurchased | | | (210,539 | ) | | | (1,623,355 | ) | | | (12,105 | ) | | | (95,429 | ) | | | | | |
| Dividends reinvested | | | 37,621 | | | | 286,334 | | | | 2,820 | | | | 22,709 | | | | | | |
| Net increase | | | 601,983 | | | $ | 4,636,989 | | | | 203,791 | | | $ | 1,609,207 | | | | | | |
| | | Class Y2 | | Class P | | | |
| | | Shares | | Amount | | Shares | | Amount | | | | | |
| Shares sold | | | 732 | | | $ | 5,000 | | | | 7,202,359 | | | $ | 56,408,434 | | | | | | |
| Shares repurchased | | | — | | | | — | | | | (8,176,699 | ) | | | (63,172,121 | ) | | | | | |
| Dividends reinvested | | | 40 | | | | 309 | | | | 1,598,523 | | | | 12,055,172 | | | | | | |
| Net increase | | | 772 | | | $ | 5,309 | | | | 624,183 | | | $ | 5,291,485 | | | | | | |
UBS PACE Large Co Value Equity Investments
For the year ended July 31, 2010:
| | | Class A | | Class B | | Class C | |
| | | Shares | | Amount | | Shares | | Amount | | Shares | | Amount | |
| Shares sold | | | 478,776 | | | $ | 7,064,437 | | | | 322 | | | $ | 4,280 | | | | 27,826 | | | $ | 400,742 | | |
| Shares repurchased | | | (2,009,868 | ) | | | (29,646,475 | ) | | | (5,540 | ) | | | (81,835 | ) | | | (253,109 | ) | | | (3,721,875 | ) | |
| Shares converted from Class B to Class A | | | 14,394 | | | | 207,494 | | | | (14,332 | ) | | | (207,494 | ) | | | — | | | | — | | |
| Dividends reinvested | | | 89,586 | | | | 1,296,304 | | | | — | | | | — | | | | 2,021 | | | | 29,340 | | |
| Net decrease | | | (1,427,112 | ) | | $ | (21,078,240 | ) | | | (19,550 | ) | | $ | (285,049 | ) | | | (223,262 | ) | | $ | (3,291,793 | ) | |
| | | Class Y | | Class P | | | |
| | | Shares | | Amount | | Shares | | Amount | | | | | |
| Shares sold | | | 46,448 | | | $ | 677,794 | | | | 12,305,196 | | | $ | 181,080,814 | | | | | | | | | | |
| Shares repurchased | | | (701,510 | ) | | | (10,350,068 | ) | | | (14,320,429 | ) | | | (210,773,917 | ) | | | | | | | | | |
| Dividends reinvested | | | 21,785 | | | | 315,880 | | | | 704,054 | | | | 10,173,781 | | | | | | | | | | |
| Net decrease | | | (633,277 | ) | | $ | (9,356,394 | ) | | | (1,311,179 | ) | | $ | (19,519,322 | ) | | | | | | | | | |
For the year ended July 31, 2009:
| | | Class A | | Class B | | Class C | |
| | | Shares | | Amount | | Shares | | Amount | | Shares | | Amount | |
| Shares sold | | | 660,284 | | | $ | 7,930,768 | | | | 8,254 | | | $ | 93,264 | | | | 33,877 | | | $ | 393,827 | | |
| Shares repurchased | | | (2,870,387 | ) | | | (34,570,268 | ) | | | (10,569 | ) | | | (125,003 | ) | | | (281,109 | ) | | | (3,414,489 | ) | |
| Shares converted from Class B to Class A | | | 13,348 | | | | 153,186 | | | | (13,301 | ) | | | (153,186 | ) | | | — | | | | — | | |
| Dividends reinvested | | | 252,025 | | | | 2,923,492 | | | | 288 | | | | 3,364 | | | | 13,830 | | | | 160,984 | | |
| Net decrease | | | (1,944,730 | ) | | $ | (23,562,822 | ) | | | (15,328 | ) | | $ | (181,561 | ) | | | (233,402 | ) | | $ | (2,859,678 | ) | |
| | | Class Y | | Class P | | | |
| | | Shares | | Amount | | Shares | | Amount | | | | | |
| Shares sold | | | 210,794 | | | $ | 2,271,355 | | | | 20,080,494 | | | $ | 230,552,581 | | | | | | | | | | |
| Shares repurchased | | | (478,980 | ) | | | (5,700,488 | ) | | | (29,018,138 | ) | | | (347,132,745 | ) | | | | | | | | | |
| Dividends reinvested | | | 54,081 | | | | 627,879 | | | | 1,694,551 | | | | 19,605,951 | | | | | | | | | | |
| Net decrease | | | (214,105 | ) | | $ | (2,801,254 | ) | | | (7,243,093 | ) | | $ | (96,974,213 | ) | | | | | | | | | |
1 For the period January 21, 2009 (commencement of issuance) through July 31, 2009.
2 For the period December 26, 2008 (recommencement of issuance) through July 31, 2009.
323
UBS PACE Select Advisors Trust
Notes to financial statements
UBS PACE Large Co Growth Equity Investments
For the year ended July 31, 2010:
| | | Class A | | Class B | | Class C | |
| | | Shares | | Amount | | Shares | | Amount | | Shares | | Amount | |
| Shares sold | | | 360,614 | | | $ | 5,374,502 | | | | — | | | | — | | | | 11,242 | | | $ | 150,284 | | |
| Shares repurchased | | | (821,528 | ) | | | (12,255,768 | ) | | | (6,348 | ) | | $ | (83,644 | ) | | | (60,499 | ) | | | (835,844 | ) | |
| Shares converted from Class B to Class A | | | 3,150 | | | | 46,396 | | | | (3,398 | ) | | | (46,396 | ) | | | — | | | | — | | |
| Dividends reinvested | | | 7,175 | | | | 107,262 | | | | — | | | | — | | | | — | | | | — | | |
| Net decrease | | | (450,589 | ) | | $ | (6,727,608 | ) | | | (9,746 | ) | | $ | (130,040 | ) | | | (49,257 | ) | | $ | (685,560 | ) | |
| | | Class Y | | Class P | | | |
| | | Shares | | Amount | | Shares | | Amount | | | | | |
| Shares sold | | | 41,512 | | | $ | 629,541 | | | | 11,896,506 | | | $ | 180,391,030 | | | | | | | | | | |
| Shares repurchased | | | (458,112 | ) | | | (6,994,734 | ) | | | (13,763,085 | ) | | | (208,711,469 | ) | | | | | | | | | |
| Dividends reinvested | | | 6,572 | | | | 100,359 | | | | 261,629 | | | | 3,976,824 | | | | | | | | | | |
| Net decrease | | | (410,028 | ) | | $ | (6,264,834 | ) | | | (1,604,950 | ) | | $ | (24,343,615 | ) | | | | | | | | | |
For the year ended July 31, 2009:
| | | Class A | | Class B | | Class C | |
| | | Shares | | Amount | | Shares | | Amount | | Shares | | Amount | |
| Shares sold | | | 644,241 | | | $ | 7,861,600 | | | | 6,266 | | | $ | 67,411 | | | | 23,348 | | | $ | 253,122 | | |
| Shares repurchased | | | (1,136,486 | ) | | | (13,708,024 | ) | | | (6,538 | ) | | | (70,404 | ) | | | (81,212 | ) | | | (919,964 | ) | |
| Shares converted from Class B to Class A | | | 7,080 | | | | 90,720 | | | | (7,571 | ) | | | (90,720 | ) | | | — | | | | — | | |
| Dividends reinvested | | | 24,059 | | | | 276,436 | | | | 97 | | | | 1,047 | | | | 2,162 | | | | 23,264 | | |
| Net decrease | | | (461,106 | ) | | $ | (5,479,268 | ) | | | (7,746 | ) | | $ | (92,666 | ) | | | (55,702 | ) | | $ | (643,578 | ) | |
| | | Class Y | | Class P | | | |
| | | Shares | | Amount | | Shares | | Amount | | | | | |
| Shares sold | | | 163,249 | | | $ | 1,893,714 | | | | 17,204,825 | | | $ | 207,651,720 | | | | | | | | | | |
| Shares repurchased | | | (305,109 | ) | | | (3,752,192 | ) | | | (29,819,584 | ) | | | (366,300,315 | ) | | | | | | | | | |
| Dividends reinvested | | | 11,397 | | | | 133,685 | | | | 484,047 | | | | 5,648,826 | | | | | | | | | | |
| Net decrease | | | (130,463 | ) | | $ | (1,724,793 | ) | | | (12,130,712 | ) | | $ | (152,999,769 | ) | | | | | | | | | |
UBS PACE Small/Medium Co Value Equity Investments
For the year ended July 31, 2010:
| | | Class A | | Class B | | Class C | |
| | | Shares | | Amount | | Shares | | Amount | | Shares | | Amount | |
| Shares sold | | | 297,532 | | | $ | 4,074,207 | | | | 56 | | | $ | 830 | | | | 9,934 | | | $ | 128,678 | | |
| Shares repurchased | | | (404,304 | ) | | | (5,637,104 | ) | | | (234 | ) | | | (2,966 | ) | | | (120,560 | ) | | | (1,511,606 | ) | |
| Shares converted from Class B to Class A | | | 3,902 | | | | 55,684 | | | | (4,260 | ) | | | (55,684 | ) | | | — | | | | — | | |
| Dividends reinvested | | | 1,166 | | | | 15,652 | | | | — | | | | — | | | | — | | | | — | | |
| Net decrease | | | (101,704 | ) | | $ | (1,491,561 | ) | | | (4,438 | ) | | $ | (57,820 | ) | | | (110,626 | ) | | $ | (1,382,928 | ) | |
| | | Class Y | | Class P | | | |
| | | Shares | | Amount | | Shares | | Amount | | | | | |
| Shares sold | | | 25,574 | | | $ | 342,820 | | | | 4,314,115 | | | $ | 60,400,048 | | | | | | | | | | |
| Shares repurchased | | | (269,745 | ) | | | (3,763,238 | ) | | | (6,013,602 | ) | | | (84,714,764 | ) | | | | | | | | | |
| Dividends reinvested | | | 959 | | | | 13,160 | | | | 58,453 | | | | 797,906 | | | | | | | | | | |
| Net decrease | | | (243,212 | ) | | $ | (3,407,258 | ) | | | (1,641,034 | ) | | $ | (23,516,810 | ) | | | | | | | | | |
324
UBS PACE Select Advisors Trust
Notes to financial statements
UBS PACE Small/Medium Co Value Equity Investments (concluded)
For the year ended July 31, 2009:
| | | Class A | | Class B | | Class C | |
| | | Shares | | Amount | | Shares | | Amount | | Shares | | Amount | |
| Shares sold | | | 246,372 | | | $ | 2,616,610 | | | | 675 | | | $ | 9,455 | | | | 21,582 | | | $ | 222,857 | | |
| Shares repurchased | | | (824,188 | ) | | | (8,527,066 | ) | | | (4,666 | ) | | | (40,399 | ) | | | (152,975 | ) | | | (1,441,002 | ) | |
| Shares converted from Class B to Class A | | | 11,752 | | | | 129,112 | | | | (12,604 | ) | | | (129,112 | ) | | | — | | | | — | | |
| Dividends reinvested | | | 18,011 | | | | 178,128 | | | | 6 | | | | 55 | | | | 185 | | | | 1,701 | | |
| Net decrease | | | (548,053 | ) | | $ | (5,603,216 | ) | | | (16,589 | ) | | $ | (160,001 | ) | | | (131,208 | ) | | $ | (1,216,444 | ) | |
| | | Class Y | | Class P | | | |
| | | Shares | | Amount | | Shares | | Amount | | | | | |
| Shares sold | | | 124,253 | | | $ | 1,318,210 | | | | 7,961,183 | | | $ | 79,410,898 | | | | | | | | | | |
| Shares repurchased | | | (166,989 | ) | | | (1,665,642 | ) | | | (12,358,189 | ) | | | (130,657,574 | ) | | | | | | | | | |
| Dividends reinvested | | | 4,215 | | | | 42,610 | | | | 290,387 | | | | 2,918,328 | | | | | | | | | | |
| Net decrease | | | (38,521 | ) | | $ | (304,822 | ) | | | (4,106,619 | ) | | $ | (48,328,348 | ) | | | | | | | | | |
UBS PACE Small/Medium Co Growth Equity Investments
For the year ended July 31, 2010:
| | | Class A | | Class B | | Class C | |
| | | Shares | | Amount | | Shares | | Amount | | Shares | | Amount | |
| Shares sold | | | 372,728 | | | $ | 4,448,415 | | | | — | | | | — | | | | 5,911 | | | $ | 63,859 | | |
| Shares repurchased | | | (532,918 | ) | | | (6,433,244 | ) | | | (3,198 | ) | | $ | (34,983 | ) | | | (54,864 | ) | | | (602,918 | ) | |
| Shares converted from Class B to Class A | | | 2,174 | | | | 27,928 | | | | (2,395 | ) | | | (27,928 | ) | | | — | | | | — | | |
| Net decrease | | | (158,016 | ) | | $ | (1,956,901 | ) | | | (5,593 | ) | | $ | (62,911 | ) | | | (48,953 | ) | | $ | (539,059 | ) | |
| | | Class Y | | Class P | | | |
| | | Shares | | Amount | | Shares | | Amount | | | | | |
| Shares sold | | | 23,604 | | | $ | 280,777 | | | | 4,970,247 | | | $ | 61,184,582 | | | | | | | | | | |
| Shares repurchased | | | (415,257 | ) | | | (5,102,238 | ) | | | (6,588,473 | ) | | | (81,694,977 | ) | | | | | | | | | |
| Net decrease | | | (391,653 | ) | | $ | (4,821,461 | ) | | | (1,618,226 | ) | | $ | (20,510,395 | ) | | | | | | | | | |
For the year ended July 31, 2009:
| | | Class A | | Class B | | Class C | |
| | | Shares | | Amount | | Shares | | Amount | | Shares | | Amount | |
| Shares sold | | | 275,725 | | | $ | 2,618,914 | | | | 2,493 | | | $ | 18,607 | | | | 18,606 | | | $ | 183,786 | | |
| Shares repurchased | | | (688,549 | ) | | | (6,322,902 | ) | | | (2,560 | ) | | | (20,138 | ) | | | (95,360 | ) | | | (830,687 | ) | |
| Shares converted from Class B to Class A | | | 2,918 | | | | 25,851 | | | | (3,160 | ) | | | (25,851 | ) | | | — | | | | — | | |
| Net decrease | | | (409,906 | ) | | $ | (3,678,137 | ) | | | (3,227 | ) | | $ | (27,382 | ) | | | (76,754 | ) | | $ | (646,901 | ) | |
| | | Class Y | | Class P | | | |
| | | Shares | | Amount | | Shares | | Amount | | | | | |
| Shares sold | | | 136,334 | | | $ | 1,266,993 | | | | 8,477,168 | | | $ | 77,137,831 | | | | | | | | | | |
| Shares repurchased | | | (160,723 | ) | | | (1,523,761 | ) | | | (14,173,325 | ) | | | (133,492,602 | ) | | | | | | | | | |
| Net decrease | | | (24,389 | ) | | $ | (256,768 | ) | | | (5,696,157 | ) | | $ | (56,354,771 | ) | | | | | | | | | |
325
UBS PACE Select Advisors Trust
Notes to financial statements
UBS PACE International Equity Investments
For the year ended July 31, 2010:
| | | Class A | | Class B | | Class C | |
| | | Shares | | Amount | | Shares | | Amount | | Shares | | Amount | |
| Shares sold | | | 503,111 | | | $ | 6,154,751 | | | | — | | | | — | | | | 1,004 | | | $ | 14,453 | | |
| Shares repurchased | | | (1,050,216 | ) | | | (12,862,565 | ) | | | (2,628 | ) | | $ | (31,642 | ) | | | (54,910 | ) | | | (661,529 | ) | |
| Shares converted from Class B to Class A | | | 1,355 | | | | 16,554 | | | | (1,358 | ) | | | (16,554 | ) | | | — | | | | — | | |
| Dividends reinvested | | | 111,135 | | | | 1,369,177 | | | | 26 | | | | 324 | | | | 4,283 | | | | 51,910 | | |
| Net decrease | | | (434,615 | ) | | $ | (5,322,083 | ) | | | (3,960 | ) | | $ | (47,872 | ) | | | (49,623 | ) | | $ | (595,166 | ) | |
| | | Class Y | | Class P | | | |
| | | Shares | | Amount | | Shares | | Amount | | | | | |
| Shares sold | | | 123,787 | | | $ | 1,550,206 | | | | 13,345,211 | | | $ | 162,250,576 | | | | | | | | | | |
| Shares repurchased | | | (1,010,798 | ) | | | (12,327,501 | ) | | | (13,418,026 | ) | | | (161,928,300 | ) | | | | | | | | | |
| Dividends reinvested | | | 65,958 | | | | 810,623 | | | | 1,296,971 | | | | 15,914,200 | | | | | | | | | | |
| Net increase (decrease) | | | (821,053 | ) | | $ | (9,966,672 | ) | | | 1,224,156 | | | $ | 16,236,476 | | | | | | | | | | |
For the year ended July 31, 2009:
| | | Class A | | Class B | | Class C | |
| | | Shares | | Amount | | Shares | | Amount | | Shares | | Amount | |
| Shares sold | | | 571,939 | | | $ | 6,201,114 | | | | — | | | | — | | | | 8,873 | | | $ | 89,598 | | |
| Shares repurchased | | | (1,330,999 | ) | | | (13,944,210 | ) | | | (2,348 | ) | | $ | (30,919 | ) | | | (84,168 | ) | | | (889,223 | ) | |
| Shares converted from Class B to Class A | | | 3,892 | | | | 40,865 | | | | (3,932 | ) | | | (40,865 | ) | | | — | | | | — | | |
| Dividends reinvested | | | 275,755 | | | | 2,845,791 | | | | 133 | | | | 1,371 | | | | 13,339 | | | | 135,660 | | |
| Net decrease | | | (479,413 | ) | | $ | (4,856,440 | ) | | | (6,147 | ) | | $ | (70,413 | ) | | | (61,956 | ) | | $ | (663,965 | ) | |
| | | Class Y | | Class P | | | |
| | | Shares | | Amount | | Shares | | Amount | | | | | |
| Shares sold | | | 340,446 | | | $ | 3,224,877 | | | | 19,170,198 | | | $ | 192,830,013 | | | | | | | | | | |
| Shares repurchased | | | (808,911 | ) | | | (8,469,346 | ) | | | (28,623,459 | ) | | | (298,817,677 | ) | | | | | | | | | |
| Dividends reinvested | | | 157,137 | | | | 1,616,941 | | | | 3,107,946 | | | | 31,949,681 | | | | | | | | | | |
| Net decrease | | | (311,328 | ) | | $ | (3,627,528 | ) | | | (6,345,315 | ) | | $ | (74,037,983 | ) | | | | | | | | | |
UBS PACE International Emerging Markets Equity Investments
For the year ended July 31, 2010:
| | | Class A | | Class B | | Class C | |
| | | Shares | | Amount | | Shares | | Amount | | Shares | | Amount | |
| Shares sold | | | 293,755 | | | $ | 3,411,311 | | | | 2,997 | | | $ | 32,222 | | | | 59,539 | | | $ | 620,009 | | |
| Shares repurchased | | | (435,195 | ) | | | (5,038,895 | ) | | | (2,946 | ) | | | (33,469 | ) | | | (95,114 | ) | | | (1,013,907 | ) | |
| Shares converted from Class B to Class A | | | 7,921 | | | | 89,017 | | | | (8,423 | ) | | | (89,017 | ) | | | — | | | | — | | |
| Dividends reinvested | | | 20,292 | | | | 234,169 | | | | — | | | | — | | | | 3,397 | | | | 36,756 | | |
| Net decrease | | | (113,227 | ) | | $ | (1,304,398 | ) | | | (8,372 | ) | | $ | (90,264 | ) | | | (32,178 | ) | | $ | (357,142 | ) | |
| | | Class Y | | Class P | | | |
| | | Shares | | Amount | | Shares | | Amount | | | | | |
| Shares sold | | | 366,046 | | | $ | 4,338,509 | | | | 3,830,899 | | | $ | 45,173,569 | | | | | | | | | | |
| Shares repurchased | | | (1,745,193 | ) | | | (20,603,579 | ) | | | (4,891,148 | ) | | | (57,341,191 | ) | | | | | | | | | |
| Dividends reinvested | | | 46,841 | | | | 549,454 | | | | 251,595 | | | | 2,943,696 | | | | | | | | | | |
| Net decrease | | | (1,332,306 | ) | | $ | (15,715,616 | ) | | | (808,654 | ) | | $ | (9,223,926 | ) | | | | | | | | | |
326
UBS PACE Select Advisors Trust
Notes to financial statements
UBS PACE International Emerging Markets Equity Investments (concluded)
For the year ended July 31, 2009:
| | | Class A | | Class B | | Class C | |
| | | Shares | | Amount | | Shares | | Amount | | Shares | | Amount | |
| Shares sold | | | 308,284 | | | $ | 2,828,696 | | | | 628 | | | $ | 5,635 | | | | 29,331 | | | $ | 263,728 | | |
| Shares repurchased | | | (733,563 | ) | | | (7,326,792 | ) | | | (4,220 | ) | | | (38,619 | ) | | | (141,191 | ) | | | (1,622,283 | ) | |
| Shares converted from Class B to Class A | | | 4,436 | | | | 29,549 | | | | (4,723 | ) | | | (29,549 | ) | | | — | | | | — | | |
| Dividends reinvested | | | 562,820 | | | | 4,254,921 | | | | 4,671 | | | | 33,260 | | | | 114,037 | | | | 810,805 | | |
| Net increase (decrease) | | | 141,977 | | | $ | (213,626 | ) | | | (3,644 | ) | | $ | (29,273 | ) | | | 2,177 | | | $ | (547,750 | ) | |
| | | Class Y | | Class P | | | |
| | | Shares | | Amount | | Shares | | Amount | | | | | |
| Shares sold | | | 1,968,886 | | | $ | 16,393,043 | | | | 5,348,327 | | | $ | 48,647,585 | | | | | | | | | | |
| Shares repurchased | | | (1,088,099 | ) | | | (11,160,497 | ) | | | (9,634,416 | ) | | | (92,330,347 | ) | | | | | | | | | |
| Dividends reinvested | | | 591,234 | | | | 4,540,675 | | | | 6,768,940 | | | | 51,850,076 | | | | | | | | | | |
| Net increase | | | 1,472,021 | | | $ | 9,773,221 | | | | 2,482,851 | | | $ | 8,167,314 | | | | | | | | | | |
UBS PACE Global Real Estate Securities Investments
For the year ended July 31, 2010:
| | | Class A | | Class C | | | |
| | | Shares | | Amount | | Shares | | Amount | | | | | |
| Shares sold | | | 283,967 | | | $ | 1,491,573 | | | | 2,860 | | | $ | 14,196 | | | | | | |
| Shares repurchased | | | (254,559 | ) | | | (1,343,395 | ) | | | (1,174 | ) | | | (6,091 | ) | | | | | |
| Dividends reinvested | | | 52,970 | | | | 269,088 | | | | 2,443 | | | | 12,410 | | | | | | |
| Net increase | | | 82,378 | | | $ | 417,266 | | | | 4,129 | | | $ | 20,515 | | | | | | |
| | | Class Y | | Class P | | | |
| | | Shares | | Amount | | Shares | | Amount | | | | | |
| Shares sold | | | 17,273 | | | $ | 93,233 | | | | 4,722,449 | | | $ | 24,935,558 | | | | | | |
| Shares repurchased | | | — | | | | — | | | | (2,835,106 | ) | | | (14,855,925 | ) | | | | | |
| Dividends reinvested | | | 869 | | | | 4,423 | | | | 1,120,076 | | | | 5,690,179 | | | | | | |
| Net increase | | | 18,142 | | | $ | 97,656 | | | | 3,007,419 | | | $ | 15,769,812 | | | | | | |
For the year ended July 31, 2009:
| | | Class A | | Class C | | | |
| | | Shares | | Amount | | Shares | | Amount | | | | | |
| Shares sold | | | 290,554 | | | $ | 1,287,894 | | | | 30,714 | | | $ | 122,298 | | | | | | |
| Shares repurchased | | | (493,143 | ) | | | (2,608,638 | ) | | | (30,405 | ) | | | (125,190 | ) | | | | | |
| Dividends reinvested | | | 8,852 | | | | 39,833 | | | | 92 | | | | 416 | | | | | | |
| Net increase (decrease) | | | (193,737 | ) | | $ | (1,280,911 | ) | | | 401 | | | $ | (2,476 | ) | | | | | |
| | | Class Y1 | | Class P | | | |
| | | Shares | | Amount | | Shares | | Amount | | | | | |
| Shares sold | | | 2,675 | | | $ | 11,127 | | | | 6,764,544 | | | $ | 28,974,209 | | | | | | |
| Shares repurchased | | | — | | | | — | | | | (5,105,255 | ) | | | (22,874,570 | ) | | | | | |
| Dividends reinvested | | | — | | | | — | | | | 176,684 | | | | 793,310 | | | | | | |
| Net increase | | | 2,675 | | | $ | 11,127 | | | | 1,835,973 | | | $ | 6,892,949 | | | | | | |
1 For the period December 26, 2008 (recommencement of issuance) through July 31, 2009.
327
UBS PACE Select Advisors Trust
Notes to financial statements
UBS PACE Alternative Strategies Investments
For the year ended July 31, 2010:
| | | Class A | | Class B | | Class C | |
| | | Shares | | Amount | | Shares | | Amount | | Shares | | Amount | |
| Shares sold | | | 2,529,691 | | | $ | 23,129,053 | | | | — | | | | — | | | | 228,421 | | | $ | 2,039,743 | | |
| Shares repurchased | | | (3,794,681 | ) | | | (34,566,460 | ) | | | (3,392 | ) | | $ | (30,354 | ) | | | (220,007 | ) | | | (1,967,859 | ) | |
| Dividends reinvested | | | 18,849 | | | | 170,776 | | | | — | | | | — | | | | — | | | | — | | |
| Net increase (decrease) | | | (1,246,141 | ) | | $ | (11,266,631 | ) | | | (3,392 | ) | | $ | (30,354 | ) | | | 8,414 | | | $ | 71,884 | | |
| | | Class Y | | Class P | | | |
| | | Shares | | Amount | | Shares | | Amount | | | | | |
| Shares sold | | | 313,777 | | | $ | 2,854,661 | | | | 13,022,405 | | | $ | 119,119,763 | | | | | | | | | | |
| Shares repurchased | | | (1,658,490 | ) | | | (15,104,028 | ) | | | (10,188,891 | ) | | | (92,956,694 | ) | | | | | | | | | |
| Dividends reinvested | | | 3,063 | | | | 27,810 | | | | 246,494 | | | | 2,238,223 | | | | | | | | | | |
| Net increase (decrease) | | | (1,341,650 | ) | | $ | (12,221,557 | ) | | | 3,080,008 | | | $ | 28,401,292 | | | | | | | | | | |
For the year ended July 31, 2009:
| | | Class A | | Class B | | Class C | |
| | | Shares | | Amount | | Shares | | Amount | | Shares | | Amount | |
| Shares sold | | | 2,260,653 | | | $ | 20,193,719 | | | | 5,986 | | | $ | 47,632 | | | | 245,008 | | | $ | 2,036,513 | | |
| Shares repurchased | | | (9,335,513 | ) | | | (79,934,791 | ) | | | — | | | | — | | | | (258,877 | ) | | | (2,217,887 | ) | |
| Shares converted from Class B to Class A | | | 4,796 | | | | 39,330 | | | | (4,874 | ) | | | (39,330 | ) | | | — | | | | — | | |
| Dividends reinvested | | | 123,559 | | | | 1,014,423 | | | | 82 | | | | 660 | | | | 7,203 | | | | 58,485 | | |
| Net increase (decrease) | | | (6,946,505 | ) | | $ | (58,687,319 | ) | | | 1,194 | | | $ | 8,962 | | | | (6,666 | ) | | $ | (122,889 | ) | |
| | | Class Y | | Class P | | | |
| | | Shares | | Amount | | Shares | | Amount | | | | | |
| Shares sold | | | 485,333 | | | $ | 4,304,423 | | | | 11,356,471 | | | $ | 100,000,134 | | | | | | | | | | |
| Shares repurchased | | | (4,466,050 | ) | | | (38,519,549 | ) | | | (24,491,823 | ) | | | (208,257,527 | ) | | | | | | | | | |
| Dividends reinvested | | | 60,793 | | | | 499,722 | | | | 687,645 | | | | 5,659,320 | | | | | | | | | | |
| Net decrease | | | (3,919,924 | ) | | $ | (33,715,404 | ) | | | (12,447,707 | ) | | $ | (102,598,073 | ) | | | | | | | | | |
Redemption fees
Each class of each series of the Trust, with the exception of UBS PACE Money Market Investments, will impose a 1% redemption fee on shares sold or exchanged within 90 days of their purchase date, subject to limited exemptions as noted in the prospectuses. This amount is paid to the applicable Portfolio. The redemption fees earned by the Portfolios are disclosed in the Statement of changes in net assets. For the year ended July 31, 2010, redemption fees represent less than $0.005 per share.
US Treasury Temporary Guarantee Program for Money Market Funds
UBS PACE Money Market Investments Portfolio participated in the US Treasury Department Temporary Guarantee Program for Money Market Funds. The program covered shareholders of participating money market funds as of the close of business on September 19, 2008. The program expired on September 18, 2009. The Portfolio bore the cost of participating in this program, to the extent not offset by UBS Global AM's fee waivers/voluntary expense reimbursements. The Portfolio paid a fee of 0.01% of the value of the Portfolio's outstanding shares on September 19, 2008 (valued at $1.00 per share) for participation in the program for the initial coverage period of September 19, 2008, through December 18, 2008. The program
328
UBS PACE Select Advisors Trust
Notes to financial statements
was first extended until April 30, 2009, and the Portfolio paid a fee calculated in the same manner but at the rate of 0.015% for continued participation in the program through that date. The program was then extended a final time, providing coverage through September 18, 2009. In April, the Portfolio paid an additional fee for continued coverage for the period May 1, 2009, through September 18, 2009, calculated in the same manner and at the same 0.015% rate as for the initial extension period.
Federal tax status
Each of the Portfolios intends to distribute substantially all of its income and to comply with the other requirements of the Internal Revenue Code applicable to regulated investment companies. Accordingly, no provision for federal income taxes is required. In addition, by distributing during each calendar year substantially all of its net investment income, net realized capital gains and certain other amounts, if any, each Portfolio intends not to be subject to a federal excise tax.
The tax character of distributions paid during the fiscal years ended July 31, 2010 and July 31, 2009 were as follows:
| | | 2010 | | 2009 | |
| Portfolio | | Tax-
exempt
income | | Ordinary
Income | | Long term
realized
capital gains | | Return of
capital | | Tax-
exempt
income | | Ordinary
Income | | Long term
realized
capital gains | |
UBS PACE Money Market
Investments | | | — | | | $ | 54,050 | | | | — | | | | — | | | | — | | | $ | 5,188,699 | | | | — | | |
UBS PACE Government Securities
Fixed Income Investments | | | — | | | | 36,810,388 | | | $ | 5,636,347 | | | | — | | | | — | | | | 31,473,152 | | | | — | | |
UBS PACE Intermediate Fixed
Income Investments | | | — | | | | 15,576,758 | | | | — | | | | — | | | | — | | | | 17,340,284 | | | | — | | |
UBS PACE Strategic Fixed
Income Investments | | | — | | | | 30,831,986 | | | | 799,628 | | | | — | | | | — | | | | 72,003,648 | | | $ | 14,127,728 | | |
UBS PACE Municipal Fixed
Income Investments | | $ | 10,048,679 | | | | 10,260 | | | | — | | | | — | | | $ | 10,716,766 | | | | 29,103 | | | | — | | |
UBS PACE Global Fixed Income
Investments | | | — | | | | 30,716,473 | | | | — | | | $ | 1,050,578 | | | | — | | | | 21,847,836 | | | | — | | |
| UBS PACE High Yield Investments | | | — | | | | 15,132,172 | | | | 1,293,344 | | | | — | | | | — | | | | 12,761,815 | | | | — | | |
UBS PACE Large Co Value Equity
Investments | | | — | | | | 12,292,110 | | | | — | | | | — | | | | — | | | | 24,067,706 | | | | — | | |
UBS PACE Large Co Growth
Equity Investments | | | — | | | | 4,319,077 | | | | — | | | | — | | | | — | | | | 1,291,989 | | | | 4,940,277 | | |
UBS PACE Small/Medium Co
Value Equity Investments | | | — | | | | 848,966 | | | | — | | | | — | | | | — | | | | 3,121,118 | | | | 89,716 | | |
UBS PACE International Equity
Investments | | | — | | | | 18,770,499 | | | | — | | | | — | | | | — | | | | 37,591,109 | | | | — | | |
UBS PACE International Emerging
Markets Equity Investments | | | — | | | | 3,860,843 | | | | — | | | | — | | | | — | | | | 5,178,821 | | | | 57,546,514 | | |
UBS PACE Global Real Estate
Securities Investments | | | — | | | | 6,163,150 | | | | — | | | | — | | | | — | | | | 854,192 | | | | — | | |
UBS PACE Alternative Strategies
Investments | | | — | | | | 2,505,432 | | | | — | | | | — | | | | — | | | | 2,920,045 | | | | 4,443,762 | | |
329
UBS PACE Select Advisors Trust
Notes to financial statements
At July 31, 2010, the components of accumulated earnings (deficit) on a tax basis were as follows:
| Portfolio | | Undistributed
ordinary
income | | Undistributed
long-term
capital gains | | Accumulated
realized
capital and
other losses | | Unrealized
appreciation
(depreciation) | | Total | |
| UBS PACE Money Market Investments | | $ | 1,760 | | | | — | | | $ | (94 | ) | | | — | | | $ | 1,666 | | |
UBS PACE Government Securities Fixed
Income Investments | | | 22,720,646 | | | $ | 637,704 | | | | — | | | $ | 3,658,031 | | | | 27,016,381 | | |
| UBS PACE Intermediate Fixed Income Investments | | | 100,746 | | | | — | | | | (19,251,064 | ) | | | 11,228,379 | | | | (7,921,939 | ) | |
| UBS PACE Strategic Fixed Income Investments | | | 14,984,759 | | | | 567,783 | | | | — | | | | 22,057,455 | | | | 37,609,997 | | |
| UBS PACE Municipal Fixed Income Investments | | | — | | | | — | | | | (3,517,548 | ) | | | 16,552,619 | | | | 13,035,071 | | |
| UBS PACE Global Fixed Income Investments | | | — | | | | — | | | | (29,560,975 | ) | | | 23,844,634 | | | | (5,716,341 | ) | |
| UBS PACE High Yield Investments | | | 35,724 | | | | — | | | | (898,991 | ) | | | 11,689,545 | | | | 10,826,278 | | |
| UBS PACE Large Co Value Equity Investments | | | 6,223,572 | | | | — | | | | (344,884,881 | ) | | | (1,147,449 | ) | | | (339,808,758 | ) | |
| UBS PACE Large Co Growth Equity Investments | | | 1,654,666 | | | | — | | | | (239,068,046 | ) | | | 63,468,760 | | | | (173,944,620 | ) | |
UBS PACE Small/Medium Co Value
Equity Investments | | | 144,795 | | | | — | | | | (93,562,806 | ) | | | 21,086,825 | | | | (72,331,186 | ) | |
UBS PACE Small/Medium Co Growth
Equity Investments | | | — | | | | — | | | | (90,498,159 | ) | | | 20,056,865 | | | | (70,441,294 | ) | |
| UBS PACE International Equity Investments | | | 9,968,084 | | | | — | | | | (290,095,198 | ) | | | (33,162,234 | ) | | | (313,289,348 | ) | |
UBS PACE International Emerging Markets
Equity Investments | | | 2,079,029 | | | | — | | | | (56,806,568 | ) | | | 36,128,523 | | | | (18,599,016 | ) | |
| UBS PACE Global Real Estate Securities Investments | | | 2,622,267 | | | | — | | | | (47,164,484 | ) | | | 3,398,017 | | | | (41,144,200 | ) | |
| UBS PACE Alternative Strategies Investments | | | 5,589,980 | | | | — | | | | (128,117,681 | ) | | | (2,770,508 | ) | | | (125,298,209 | ) | |
At July 31, 2010, the following Portfolios had net capital loss carryforwards available as reductions, to the extent provided in the regulations, of future net realized gains. These losses expire as follows:
| | | Expiration dates | | | |
| Portfolio | | July 31,
2011 | | July 31,
2012 | | July 31,
2013 | | July 31,
2014 | | July 31,
2015 | | July 31,
2016 | | July 31,
2017 | | July 31,
2018 | | Total | |
UBS PACE Money
Market Investments | | | — | | | | — | | | | — | | | | — | | | | — | | | | — | | | | — | | | $ | 94 | | | $ | 94 | | |
UBS PACE
Intermediate Fixed
Income Investments | | $ | 1,504,703 | | | $ | 7,849,781 | | | | — | | | $ | 3,023,333 | | | $ | 1,958,404 | | | | — | | | | — | | | | 3,551,093 | | | | 17,887,314 | | |
UBS PACE Municipal
Fixed Income
Investments | | | — | | | | — | | | | — | | | | — | | | | 875,309 | | | $ | 1,051,765 | | | | — | | | | 1,510,257 | | | | 3,437,331 | | |
UBS PACE Global
Fixed Income
Investments | | | — | | | | — | | | | — | | | | — | | | | 6,340,375 | | | | 2,354,563 | | | $ | 765,140 | | | | 7,784,695 | | | | 17,244,773 | | |
UBS PACE Large Co
Value Equity
Investments | | | — | | | | — | | | | — | | | | — | | | | — | | | | — | | | | 138,871,199 | | | | 206,013,682 | | | | 344,884,881 | | |
UBS PACE Large Co
Growth Equity
Investments | | | — | | | | — | | | | — | | | | — | | | | — | | | | — | | | | 58,515,117 | | | | 180,552,929 | | | | 239,068,046 | | |
330
UBS PACE Select Advisors Trust
Notes to financial statements
| | | Expiration dates | | | |
| Portfolio | | July 31,
2011 | | July 31,
2012 | | July 31,
2013 | | July 31,
2014 | | July 31,
2015 | | July 31,
2016 | | July 31,
2017 | | July 31,
2018 | | Total | |
UBS PACE Small/
Medium Co Value
Equity Investments | | | — | | | | — | | | | — | | | | — | | | | — | | | | — | | | $ | 36,465,774 | | | $ | 57,096,822 | | | $ | 93,562,596 | | |
UBS PACE Small/
Medium Co Growth
Equity Investments | | | — | | | | — | | | | — | | | | — | | | | — | | | | — | | | | 66,552,548 | | | | 23,945,611 | | | | 90,498,159 | | |
UBS PACE
International Equity
Investments | | | — | | | | — | | | | — | | | | — | | | | — | | | | — | | | | 75,160,153 | | | | 214,851,703 | | | | 290,011,856 | | |
UBS PACE
International
Emerging Markets
Equity Investments | | | — | | | | — | | | | — | | | | — | | | | — | | | | — | | | | 14,417,167 | | | | 38,090,311 | | | | 52,507,478 | | |
UBS PACE Global
Real Estate Securities
Investments | | | — | | | | — | | | | — | | | | — | | | | — | | | $ | 20,265 | | | | 16,496,463 | | | | 26,828,947 | | | | 43,345,675 | | |
UBS PACE
Alternative Strategies
Investments | | | — | | | | — | | | | — | | | | — | | | | — | | | | — | | | | 35,871,690 | | | | 88,910,660 | | | | 124,782,350 | | |
During the fiscal year, the following Portfolio utilized capital loss carryforwards to offset current year realized gains:
| Portfolio | | Capital loss
carryforwards
utilized | |
| UBS PACE High Yield Investments | | $ | 4,809,397 | | |
In accordance with US Treasury regulations, the following Portfolios have elected to defer realized capital losses and foreign currency losses arising after October 31, 2009. Such losses are treated for tax purposes as arising on August 1, 2010:
| Portfolio | | Capital
losses | | Foreign
currency
losses | |
| UBS PACE Intermediate Fixed Income Investments | | $ | 1,287,406 | | | | — | | |
| UBS PACE Municipal Fixed Income Investments | | | 80,217 | | | | — | | |
| UBS PACE Global Fixed Income Investments | | | — | | | $ | 11,679,430 | | |
| UBS PACE High Yield Investments | | | — | | | | 898,991 | | |
| UBS PACE Small/Medium Co Value Equity Investments | | | — | | | | 210 | | |
| UBS PACE International Equity Investments | | | — | | | | 83,342 | | |
| UBS PACE International Emerging Markets Equity Investments | | | 4,179,002 | | | | 120,088 | | |
| UBS PACE Global Real Estate Securities Investments | | | 3,766,809 | | | | 52,000 | | |
| UBS PACE Alternative Strategies Investments | | | 3,335,331 | | | | — | | |
331
UBS PACE Select Advisors Trust
Notes to financial statements
At July 31, 2010, the effect of permanent "book/tax" reclassifications resulted in increases and decreases to components of the Portfolios' net assets as follows:
| Portfolio | | Accumulated
net investment
income/( loss) | | Accumulated
net realized
gain/(loss) | | Beneficial
interest | |
| UBS PACE Government Securities Fixed Income Investments | | $ | 908,065 | | | $ | (908,065 | ) | | | — | | |
| UBS PACE Intermediate Fixed Income Investments | | | (114,354 | ) | | | 114,354 | | | | — | | |
| UBS PACE Strategic Fixed Income Investments | | | 6,586,500 | | | | (6,586,500 | ) | | | — | | |
| UBS PACE Municipal Fixed Income Investments | | | 1,262 | | | | — | | | $ | (1,262 | ) | |
| UBS PACE Global Fixed Income Investments | | | 10,341,909 | | | | (10,341,909 | ) | | | — | | |
| UBS PACE High Yield Investments | | | (1,627,257 | ) | | | 1,627,257 | | | | — | | |
| UBS PACE Large Co Value Equity Investments | | | 6,371 | | | | — | | | | (6,371 | ) | |
| UBS PACE Large Co Growth Equity Investments | | | (53 | ) | | | 53 | | | | — | | |
| UBS PACE Small/Medium Co Value Equity Investments | | | (70,846 | ) | | | 74,537 | | | | (3,691 | ) | |
| UBS PACE Small/Medium Co Growth Equity Investments | | | 2,005,318 | | | | — | | | | (2,005,318 | ) | |
| UBS PACE International Equity Investments | | | 236,522 | | | | (236,522 | ) | | | — | | |
| UBS PACE International Emerging Markets Equity Investments | | | (182,877 | ) | | | 182,877 | | | | — | | |
| UBS PACE Global Real Estate Securities Investments | | | 3,859,025 | | | | (3,859,025 | ) | | | — | | |
| UBS PACE Alternative Strategies Investments | | | 2,639,509 | | | | (8,151,369 | ) | | | 5,511,860 | | |
These differences are primarily due to tax treatment of foreign currency and futures transactions, net operating losses, paydown gains and losses, distributions in excess of net investment income, disposition of PFIC investments, swap adjustments, REIT adjustments, expiration of capital loss carryforwards, tax character of distributions and adjustments for certain debt obligations.
As of and during the year ended July 31, 2010, the Portfolios did not have any liabilities for any unrecognized tax positions. The Portfolios recognize interest and penalties, if any, related to unrecognized tax positions as income tax expense in the Statements of operations. During the year ended July 31, 2010, the Portfolios did not incur any interest or penalties.
Each of the tax years in the four year period ended July 31, 2010, remains subject to examination by the Internal Revenue Service and state taxing authorities.
332
UBS PACE Select Advisors Trust
Report of Ernst & Young LLP, independent registered public accounting firm
The Board of Trustees and Shareholders of
UBS PACE Select Advisors Trust
We have audited the accompanying statements of assets and liabilities, including the portfolios of investments, of UBS PACE Select Advisors Trust (comprising, respectively, UBS PACE Money Market Investments, UBS PACE Government Securities Fixed Income Investments, UBS PACE Intermediate Fixed Income Investments, UBS PACE Strategic Fixed Income Investments, UBS PACE Municipal Fixed Income Investments, UBS PACE Global Fixed Income Investments, UBS PACE High Yield Investments, UBS PACE Large Co Value Equity Investments, UBS PACE Large Co Growth Equity Investments, UBS PACE Small/Medium Co Value Equity Investments, UBS PACE Small/Medium Co Growth Equity Investments, UBS PACE International Equity Investments, UBS PACE International Emerging Markets Equity Investments, UBS PACE Global Real Estate Securities Investments and UBS PA CE Alternative Strategies Investments, collectively the "Trust") as of July 31, 2010, and the related statements of operations for the year then ended, the statements of changes in net assets for each of the two years in the period then ended, and the financial highlights for each of the periods indicated therein. These financial statements and financial highlights are the responsibility of the Trust's management. Our responsibility is to express an opinion on these financial statements and financial highlights based on our audits.
We conducted our audits in accordance with the standards of the Public Company Accounting Oversight Board (United States). Those standards require that we plan and perform the audit to obtain reasonable assurance about whether the financial statements and financial highlights are free of material misstatement. We were not engaged to perform an audit of the Trust's internal control over financial reporting. Our audits included consideration of internal control over financial reporting as a basis for designing audit procedures that are appropriate in the circumstances, but not for the purpose of expressing an opinion on the effectiveness of the Trust's internal control over financial reporting. Accordingly, we express no such opinion. An audit also includes examining, on a test basis, evidence supporting the amounts and disclosures in the financial statements and financial highlights, assessing the accounting principles used and s ignificant estimates made by management, and evaluating the overall financial statement presentation. Our procedures included confirmation of securities owned as of July 31, 2010, by correspondence with the custodian and others, or by other appropriate auditing procedures where replies from others were not received. We believe that our audits provide a reasonable basis for our opinion.
In our opinion, the financial statements and financial highlights referred to above present fairly, in all material respects, the financial position of each of the respective series constituting UBS PACE Select Advisors Trust at July 31, 2010, the results of their operations for the year then ended, the changes in their net assets for each of the two years in the period then ended, and the financial highlights for each of the indicated periods, in conformity with US generally accepted accounting principles.

New York, New York
September 28, 2010
333
UBS PACE Select Advisors Trust
Tax information (unaudited)
We are required by subchapter M of the Internal Revenue Code of 1986, as amended, to advise you within 60 days of each Portfolio's fiscal year end (July 31, 2010) as to the federal tax status of distributions received by shareholders during such fiscal year. Accordingly, the percentage of dividends paid that qualify for the dividends received deduction for corporate shareholders and the amount of foreign tax credit to be passed through to shareholders are as follows:
| Portfolio | | Dividend
Received
Deduction | | Foreign
Tax
Credit | |
| UBS PACE Large Co Value Equity Investments | | | 100 | % | | | — | | |
| UBS PACE Large Co Growth Equity Investments | | | 100 | % | | | — | | |
| UBS PACE Small/Medium Co Value Equity Investments | | | 100 | % | | | — | | |
| UBS PACE International Equity Investments | | | — | | | $ | 2,038,567 | | |
| UBS PACE International Emerging Markets Equity Investments | | | — | | | | 1,138,496 | | |
| UBS PACE Global Real Estate Securities Investments | | | 1.19 | % | | | — | | |
| UBS PACE Alternative Strategies Investments | | | 10.95 | % | | | — | | |
Also, for the fiscal year ended July 31, 2010, the foreign source income for information reporting purposes for UBS PACE International Equity Investments and UBS PACE International Emerging Markets Equity Investments is $25,903,246 and $8,149,651, respectively.
For the period ended July 31, 2010, certain dividends paid by the Portfolios below may be subject to a maximum tax rate of 15%, as provided for by the Jobs and Growth Tax Relief Reconciliation Act of 2003. Of the distributions paid during the period, the amounts below represent the maximum amount that may be considered qualified dividend income.
| Portfolio | | Maximum amount
considered qualified
dividend income | |
| UBS PACE Large Co Value Equity Investments | | $ | 12,292,110 | | |
| UBS PACE Large Co Growth Equity Investments | | | 4,319,077 | | |
| UBS PACE Small/Medium Co Value Equity Investments | | | 848,966 | | |
| UBS PACE International Equity Investments | | | 18,770,499 | | |
| UBS PACE International Emerging Markets Equity Investments | | | 3,860,843 | | |
| UBS PACE Global Real Estate Securities Investments | | | 2,595,538 | | |
| UBS PACE Alternative Strategies Investments | | | 2,505,432 | | |
Dividends received by tax-exempt recipients (e.g., IRAs and Keoghs) need not be reported as taxable income. Some retirement trusts (e.g., corporate, Keogh and 403(b)(7) plans) may need this information for their annual information reporting.
Shareholders should not use the above information to prepare their tax returns. Since each Portfolio's fiscal year is not the calendar year, another notification will be sent with respect to calendar year 2010. Such notification, which will reflect the amount to be used by calendar year taxpayers on their federal income tax returns, will be made in conjunction with Form 1099 DIV and will be mailed in February 2011. Shareholders are advised to consult their own tax advisers with respect to the tax consequences of their investment in each of the Portfolios.
334
UBS PACE Select Advisors Trust
General information (unaudited)
Quarterly Form N-Q portfolio schedule
Each Portfolio will file its complete schedule of portfolio holdings with the Securities and Exchange Commission ("SEC") for the first and third quarters of each fiscal year on Form N-Q. The Portfolios' Forms N-Q are available on the SEC's Web site at http://www.sec.gov. The Portfolios' Forms N-Q may be reviewed and copied at the SEC's Public Reference Room in Washington, D.C. Information on the operation of the SEC's Public Reference Room may be obtained by calling 1-800-SEC 0330. Additionally, you may obtain copies of Forms N-Q from the Portfolios upon request by calling 1-800-647 1568.
Proxy voting policies, procedures and record
You may obtain a description of each Portfolio's (1) proxy voting policies, (2) proxy voting procedures and (3) information regarding how a Portfolio voted any proxies related to portfolio securities during the most recent 12-month period ended June 30 for which an SEC filing has been made, without charge, upon request by contacting a Portfolio directly at 1-800-647 1568, online on a Portfolio's Web site: www.ubs.com/ubsglobalam-proxy, or on the EDGAR Database on the SEC's Web site (http://www.sec.gov).
Other tax information
Pursuant to Section 871(k)(2)(C) of the Internal Revenue Code, UBS PACE Money Market Investments designates 100% of its "qualified short-term gains" (as defined in Section 871(k)(2)(D)) related to the distribution made in December 2009 as short-term capital gain dividends.
335
UBS PACE Select Advisors Trust
Board approvals of investment management and administration agreement and subadvisory agreements (unaudited)
May 2010 Board Meeting
Roxbury Capital Management, LLC
Background—At a meeting of the board of UBS PACE Select Advisors Trust (the "Trust") on May 12, 2010, the members of the board, including the Trustees who are not "interested persons" of the Trust (the "Independent Trustees") as defined in the Investment Company Act of 1940, as amended, considered and approved the proposed sub-advisory agreement between UBS Global Asset Management (Americas) Inc. ("UBS Global AM") and Roxbury Capital Management, LLC ("Roxbury")(the "Sub-Advisory Agreement") with respect to UBS PACE Large Co Growth Equity Investments (the "Portfolio"). In considering the approval of the Sub-Advisory Agreement, the board was able to draw on its knowledge of the Trust, its portfolios and UBS Global AM. The board took note of its knowledge of UBS Global AM and the investment management and sub-advisory agreements for the other portfo lios of the Trust, including the extensive materials the board had reviewed at its last annual contract renewal meeting for the portfolios in July 2009, and noted that it had at that time received a memorandum from its independent legal counsel discussing, among other things, the duties of the board members in considering approval of management and sub-advisory agreements. The board also received a memorandum from UBS Global AM discussing UBS Global AM's reasons for recommending Roxbury as a subadviser to the Portfolio.
In its consideration of the approval of the Sub-Advisory Agreement, the board considered the following factors:
Nature, extent and quality of the services under the Sub-Advisory Agreement—The board's evaluation of the services to be provided by Roxbury to the Portfolio took into account the board's knowledge and familiarity gained as board members of funds in the UBS New York fund complex, including the Trust and its portfolios. The board considered UBS Global AM's reasons for recommending Roxbury as an additional subadviser to the Portfolio, including its belief that Roxbury's investment style has the potential to improve risk adjusted returns as well as dampen overall Portfolio volatility during certain market environments. The board also received materials from Roxbury detailing its investment philosophy and met with representatives of Roxbury, who discussed with the board their investment philosophies and process and the backgrounds and qualifications of the portfolio management team. The board concluded that, overall, it was satisfied with the nature, extent and quality of services expected to be provided to the Portfolio under the proposed Sub-Advisory Agreement.
Sub-Advisory fee—The board reviewed and considered the proposed contractual sub-advisory fees to be payable by UBS Global AM to Roxbury in light of the nature, extent and quality of the sub-advisory services anticipated to be provided by Roxbury. The board noted that due to the proposed reallocation of assets from another subadviser of the Portfolio to Roxbury and a corresponding reduction in the fees waived by UBS Global AM, UBS Global AM anticipates that the addition of Roxbury as subadviser would result in a slight increase in the expenses borne by Portfolio shareholders and a slight decrease in the expenses of UBS Global AM. Taking all of the above into consideration, the board determined that the proposed sub-advisory fee was reasonable in light of the nature, extent and quality of the services proposed to be provided to the Portfolio under the Sub-Advisory Agreement.
Fund performance—The board received and considered composite performance information provided by Roxbury. The board also noted that, as Roxbury would be a new subadviser to the Portfolio, the current performance of the Portfolio was not a significant factor in the consideration of the approval of the Sub-Advisory Agreement.
336
UBS PACE Select Advisors Trust
Board approvals of investment management and administration agreement and subadvisory agreements (unaudited)
Adviser profitability—Profitability of UBS Global AM or its affiliates in providing services to the Portfolio was not a significant factor considered by the board, as the sub-advisory fee would be paid by UBS Global AM out of the management fee paid to it by the Portfolio, and not by the Portfolio. The board, however, reviewed information received from UBS Global AM showing that as a result of a reallocation of Portfolio assets from a current subadviser to Roxbury, it is anticipated that UBS Global AM will pay the Portfolio's subadvisers less on an aggregate basis and will also be waiving less under its fee waiver arrangement with the Portfolio, resulting in a net benefit to UBS Global AM. The board noted that it would take this into account as part of its annual consideration of UBS Global AM's role with regard to the Portfolio.
Economies of scale—The board noted that, as the sub-advisory fee for the Portfolio would be paid by UBS Global AM, not by the Portfolio, consideration of economies of scale with respect specifically to the sub-advisory fee was not relevant.
Other benefits to Roxbury—The board was informed by management that Roxbury's relationship with the Portfolio would be limited to its provision of sub-advisory services to the Portfolio and that therefore management believed that Roxbury would receive no tangible ancillary benefits as a result of its relationship with the Portfolio, with the exception of possible benefits from soft dollars (e.g., research credits related to transaction commissions) for the Portfolio (which would also potentially benefit the Portfolio). The board recognized that Roxbury could receive intangible benefits from its association with the Portfolio, such as increased name recognition or publicity from being selected as a subadviser to the Portfolio after an extensive review process. Similarly, the Portfolio could benefit from having a subadviser with an established or w ell-regarded reputation.
In light of all of the foregoing, the board approved the Sub-Advisory Agreement for the Portfolio.
No single factor reviewed by the board was identified by the board as the principal factor in determining whether to approve the Sub-Advisory Agreement. The Independent Trustees were advised by separate independent legal counsel throughout the process.
337
UBS PACE Select Advisors Trust
Board approvals of investment management and administration agreement and subadvisory agreements (unaudited)
July 2010 Board Meeting
Standard Life Investments (Corporate Funds) Limited
At a meeting of the board of UBS PACE Select Advisors Trust (the "Trust") on July 14-15, 2010, the members of the Board, including the Trustees who are not "interested persons" of the Trust as defined in the Investment Company Act of 1940, as amended (the "1940 Act"), considered and approved the proposed sub-advisory agreement between UBS Global Asset Management (Americas) Inc. ("UBS Global AM") and Standard Life Investments (Corporate Funds) Limited ("Standard Life")(the "Sub-Advisory Agreement") with respect to UBS PACE Alternative Strategies Investments (the "Portfolio"). In considering the approval of the Sub-Advisory Agreement, the board was able to draw on its knowledge of the Trust, its portfolios and UBS Global AM. The board took note of its knowledge of UBS Global AM and the investment management and sub-advisory agreements for the other portfolios of the Trust, including the extensive materials the board had reviewed i n connection with the annual reconsideration of the contracts for the portfolios at the meeting, and noted that it had received a memorandum from its independent legal counsel discussing, among other things, the duties of the board members in considering approval of management and sub-advisory agreements. The board also received a memorandum from UBS Global AM discussing UBS Global AM's reasons for recommending Standard Life as a subadviser to the Portfolio.
In its consideration of the approval of the Sub-Advisory Agreement, the board considered the following factors:
Nature, extent and quality of the services under the Sub-Advisory Agreement—The Board's evaluation of the services to be provided by Standard Life to the Portfolio took into account the board's knowledge and familiarity gained as board members of funds in the UBS New York fund complex, including the Trust and its portfolios. The board considered management's reasons for recommending Standard Life as an additional subadviser to the Portfolio, including its belief that the introduction of Standard Life's total return-oriented, multi-asset strategy to the Portfolio could serve to reduce the Portfolio's correlation to global equity market performance and could help the Portfolio to achieve its goal in a variety of global capital markets. The board also received materials from Standard Life detailing the subadviser's investment philosophy and met with representatives of Standard Life, who discussed with the board their investment philosophies and process and the backgrounds and qualifications of the portfolio management team. The board concluded that, overall, it was satisfied with the nature, extent and quality of services expected to be provided to the Portfolio under the proposed Sub-Advisory Agreement.
Sub-Advisory fees—The board reviewed and considered the proposed contractual sub-advisory fees to be payable by UBS Global AM to Standard Life in light of the nature, extent and quality of the sub-advisory services anticipated to be provided by Standard Life. The board noted that the fee, in conjunction with an increase in the fee of another subadviser of the Portfolio and a reduction in assets allocated to two other subadvisers to the Portfolio, is expected to result in a slight increase in the aggregate sub-advisory fees for the Portfolio; however, it would not result in an increase in the fees borne by the Portfolio's shareholders as the compensation to be paid to Standard Life and the other subadvisers would be paid by UBS Global AM, and not by the Portfolio. The board also noted that the Portfolio may incur certain additional expenses as a r esult of the addition of Standard Life to the Portfolio, however, as the Portfolio is near or over the expense cap levels for all share classes, most of these expenses are expected to be borne by UBS Global AM. Taking all of the above into consideration, the board determined that the proposed sub-advisory fee was reasonable in light of the nature, extent and quality of the services proposed to be provided to the Portfolio under the Sub-Advisory Agreement.
338
UBS PACE Select Advisors Trust
Board approvals of investment management and administration agreement and subadvisory agreements (unaudited)
Fund performance—The board received and considered composite performance information provided by Standard Life. The board also noted that, as Standard Life would be a new subadviser to the Portfolio, the current performance of the Portfolio was not a significant factor in the consideration of the approval of the Sub-Advisory Agreement.
Adviser profitability—Profitability of UBS Global AM or its affiliates in providing services to the Portfolio was not a significant factor considered by the board, as the sub-advisory fee would be paid by UBS Global AM out of the management fee paid to it by the Portfolio, and not by the Portfolio. The board, however, reviewed information received from UBS Global AM showing that as a result of the addition of Standard Life as a subadviser to the Portfolio, in combination with an increase in the fee of another subadviser of the Portfolio and a reduction in assets allocated to two other subadvisers to the Portfolio, UBS Global AM is expected to experience a slight increase in the aggregate sub-advisory fees it pays to the Portfolio's subadvisers.
Economies of scale—The board noted that, as the sub-advisory fees for the Portfolio would be paid by UBS Global AM, not by the Portfolio, consideration of economies of scale with respect specifically to the sub-advisory fees was not relevant.
Other benefits to Standard Life—The board was informed by management that Standard Life's relationship with the Portfolio would be limited to its provision of sub-advisory services to the Portfolio and that therefore management believed that Standard Life would not receive tangible ancillary benefits as a result of its relationship with the Portfolio, with the exception of possible benefits from soft dollars (e.g., research credits related to transaction commissions) for the Portfolio (which would also potentially benefit the Portfolio). The board recognized that Standard Life could receive intangible benefits from its association with the Portfolio, such as increased name recognition or publicity from being selected as a subadviser to the Portfolio after an extensive review process. Similarly, the Portfolio could benefit from having a subadviser with an established or well-regarded reputation.
In light of all of the foregoing, the board approved the Sub-Advisory Agreement for the Portfolio.
No single factor reviewed by the Board was identified by the Board as the principal factor in determining whether to approve the Sub-Advisory Agreement. The Independent Trustees were advised by separate independent legal counsel throughout the process.
339
UBS PACE Select Advisors Trust
Board approvals of investment management and administration agreement and subadvisory agreements (unaudited)
Background—At a meeting of the board of UBS PACE Select Advisors Trust (the "Trust") on July 14-15, 2010, the members of the board, including the Trustees who are not "interested persons" of the Trust ("Independent Trustees"), as defined in the Investment Company Act of 1940, as amended (the "1940 Act"), considered and approved the continuance of the investment management and administration agreement (the "Investment Management and Administration Agreement") between UBS Global Asset Management (Americas) Inc. ("UBS Global AM") and the Trust, on behalf of each series of the Trust (each a "Portfolio" and together the "Portfolios") and, for those Portfolios with Subadvisers, the subadvisory agreements for the Portfolios. (Throughout this discussion, each subadviser to a Portfolio is referred to as a "Subadviser" and each subadvisory agreement is ref erred to as a "Subadvisory Agreement.") In preparing for the meeting, the board members had requested and received extensive information from UBS Global AM to assist them, including information about the Portfolios' Subadvisers, as well as the management, subadvisory, administrative and distribution arrangements for the Portfolios. The Independent Trustees discussed the materials initially provided by management prior to the scheduled board meeting. The Independent Trustees also met in executive session after management's presentation was completed to review the disclosure that had been made to them at the meeting. At all of these sessions the Independent Trustees were joined by their independent legal counsel. The Independent Trustees also received a memorandum from their independent legal counsel discussing the duties of board members in considering approval of management, subadvisory, administration and distribution agreements.
In its consideration of the approval of the Investment Management and Administration Agreement and the Subadvisory Agreements (other than with respect to Roxbury Capital Management, LLC ("Roxbury") and Standard Life Investments (Corporate Funds) Limited), the board considered the following factors:
Nature, extent and quality of the services under the Investment Management and Administration Agreement and the Subadvisory Agreements—The board received and considered information regarding the nature, extent and quality of management services provided to the Portfolios by UBS Global AM and, for those Portfolios with Subadviser(s), subadvisory services provided by the particular Subadviser during the past year. The board also considered the nature, extent and quality of administrative, distribution, and shareholder services performed by UBS Global AM and its affiliates for the Portfolios and the resources devoted to, and the record of compliance with, each Portfolio's compliance policies and procedures. The board noted that it received information at regular meetings throughout the year regarding the services rendered by UBS Global AM concerning the management of each Portfolio's affairs and UBS Global AM's role in coordinating providers of other services to the Portfolios. The board noted the complexity of this process for the Portfolios, given their broad range of investment strategies. The board noted that UBS Global AM provided extensive oversight of the Subadvisers for the Portfolios and reported to the board at each regular meeting on the Subadvisers' performance and made recommendations with respect to Subadviser changes from time to time based on the performance of the Subadvisers and other relevant factors. The board's evaluation of the services provided by UBS Global AM and the Subadvisers took into account the board's knowledge and familiarity gained as board members of funds in the UBS New York fund complex, including the scope and quality of UBS Global AM's investment management and other capabilities and the quality of its administrative and other services. The board observed that the scope of services provided by UBS Global AM had ex panded over time as a result of regulatory and other developments, including maintaining and monitoring its own and the Portfolios' expanded compliance programs. It also was noted that the Investment Management and Administration Agreement under consideration had been approved by shareholders at a special meeting of shareholders held in 2008.
The board had available to it the qualifications, backgrounds and responsibilities of the senior personnel at UBS Global AM responsible for the Portfolios and had previously received information regarding the person,
340
UBS PACE Select Advisors Trust
Board approvals of investment management and administration agreement and subadvisory agreements (unaudited)
persons or portfolio management team primarily responsible for the day-to-day portfolio management of each Portfolio and recognized that the Portfolios' senior personnel at UBS Global AM report to the board regularly and that at each regular meeting the board receives a detailed report on each Portfolio's performance and receives more extensive information periodically from each Subadviser. The board also considered, based on its knowledge of UBS Global AM and its affiliates, the financial resources available to UBS Global AM and its parent organization, UBS AG. In that regard, the board received extensive financial information regarding UBS Global AM and noted that it was a wholly owned, indirect subsidiary of one of the largest financial services firms in the world. It was also noted that UBS Global AM had approximately $143 billion in assets under management as of March 31, 2010 and was part of the UBS Global Asset Management Division, which had approximately $560 billion of assets under management worldwide as of March 31, 2010. The board was also cognizant of, and considered, the regulatory and litigation actions and investigations occurring in the past few years involving UBS AG, UBS Global AM and certain of their affiliates.
The board concluded that, overall, it was satisfied with the nature, extent and quality of services provided (and expected to be provided) to the Portfolios under the Investment Management and Administration Agreement as well as under the Subadvisory Agreements.
Management and subadvisory fees and expense ratios—For each Portfolio, the board reviewed and considered the contractual management fee (each, a "Contractual Management Fee") payable by the Portfolio to UBS Global AM in light of the nature, extent and quality of the advisory and administrative services provided by UBS Global AM. The board also reviewed and considered the fee waiver and/or expense reimbursement arrangements for the Portfolio (if any) and considered the actual fee rate (after taking any waivers and reimbursements into account) (the "Actual Management Fee"). The board considered whether UBS Global AM had entered into one or more fee waiver and/or expense reimbursement agreements with a Portfolio under which UBS Global AM was contractually obligated to waive its management fees and/or reimburse the Portfolio so that the total ordinar y operating expenses of certain or all classes of a given Portfolio through November 30, 2010 (excluding extraordinary items, dividend expense, borrowing costs and/or interest expense, if any) would not exceed specified limits for each class (or, with respect to certain Portfolios, an agreement to waive a portion of its management fee). The board also considered that each Portfolio with such a fee waiver/reimbursement agreement had agreed to repay UBS Global AM for those waived fees and/or reimbursed expenses if the Portfolio can do so over the following three fiscal years without causing its expenses in any of those years to exceed the expense caps. Additionally, the board received and considered information comparing each Portfolio's Contractual Management Fee, Actual Management Fee and overall expenses with those of funds in a group of funds selected and provided by Lipper, Inc. ("Lipper"), an independent provider of investment company data (the "Expense Group"), and, when appropriate, the board also rece ived comparative data on a supplemental expense group of subadvised peers (which may include certain of the subadvised peers contained within the primary Expense Group) (the "Supplemental Expense Group"). The Board also noted that it had received supplemental information relating to net and gross fund yields and certain expense information for UBS money market funds, including UBS PACE Money Market Investments, as compared to peers in the respective Expense Group. A discussion of the board's considerations with respect to each Portfolio's fees is set forth below.
In connection with its consideration of each Portfolio's management fees, the board also received information on UBS Global AM's standard institutional account fees for accounts of a similar investment type to each of the Portfolios. The board noted that, in general, these fees were lower than the Contractual Management Fees and Actual Management Fees for the Portfolios, but also noted management's explanation that comparisons with such accounts may be of limited relevance given the different structures
341
UBS PACE Select Advisors Trust
Board approvals of investment management and administration agreement and subadvisory agreements (unaudited)
and regulatory requirements of mutual funds versus such accounts and the differences in the levels of services required by mutual funds and such accounts. The board also received information on fees charged to other mutual funds managed by UBS Global AM. The board did not receive comparative information from Lipper with respect to the subadvisory fees for those Portfolios with Subadvisers in connection with its consideration of subadvisory fees. The board observed that it had received certain information regarding fees, profitability, compensation from other similar funds, and economies of scale from certain Subadvisers as part of the summary of each Subadviser's responses to requests for due diligence materials in connection with the board's annual reconsideration of the Subadvisory Agreements; however, the board also observed that the compensation paid to a Subadviser is paid by UBS Global AM, not by the particular Portfolio a nd, accordingly, that the retention of a Subadviser generally does not increase the fees otherwise incurred by a Portfolio's shareholders (unless a management fee waiver level was affected by a subadvisory fee increase or a reallocation of assets).
Portfolio performance—For each Portfolio, the board received and considered (a) annualized total return information of the Portfolio compared to other funds (the "Performance Universe") selected by Lipper over the one-, three-, five-, ten- (or shorter for newer Portfolios) year and since inception periods ended April 30, 2010, and (b) annualized performance information for each year in the ten-year (or shorter) period ended April 30, 2010. The board was provided with a description of the methodology Lipper used to determine the similarity of a Portfolio with the funds included in its Performance Universe. The board also considered UBS Global AM's statement that while management believed that the Lipper peer groups were useful in evaluating Portfolio expenses relative to peers, they were less useful in evaluating performance, as in many cases th ey were broad-based and consisted of funds that did not necessarily have similar investment parameters to the applicable Portfolio. The board also noted that it had received information throughout the year at periodic intervals with respect to each Portfolio's performance, including in most cases with respect to certain benchmark indices, including with respect to each Subadviser's performance. Further discussion of the board's considerations with respect to each Portfolio's performance is set forth below.
Adviser profitability—The board received and considered a profitability analysis of UBS Global AM and its affiliates in providing services to each Portfolio, as well as information regarding enhancements to UBS Global AM's methodology for determining profitability. The board also received profitability information with respect to the UBS New York fund complex as a whole. UBS Global AM's profitability was considered not excessive in light of the nature, extent and quality of the services provided to the Portfolios. To the extent provided by a Subadviser, the board also reviewed information with respect to the Subadviser's profitability in providing services to a Portfolio. The board did not consider such Subadviser profitability information highly relevant as the subadvisory fees are paid by UBS Global AM, not by the relevant Portfolio.
Economies of scale—The board received and considered information from management regarding whether UBS Global AM realized economies of scale as the Portfolios' assets grew, whether the Portfolios have appropriately benefited from any economies of scale, and whether there is potential for realization of any further economies of scale for the Portfolios. The board considered whether economies of scale in the provision of services to the Portfolios were being passed along to the shareholders. The board noted that each Portfolio's Contractual Management Fee contained breakpoints, with the exception of UBS PACE Money Markets Investments. The board also noted that as of April 30, 2010, with the exception of UBS PACE Small/Medium Co Growth Equity Investments, UBS PACE Small/Medium Co Value Equity Investments, UBS PACE International Emerging Markets Equi ty Investments, UBS PACE Alternative Strategies Investments, UBS PACE Global Real Estate Securities Investments and UBS PACE High Yield Investments, for those Portfolios having breakpoints, each Portfolio's asset level exceeded at least its first breakpoint. Accordingly, the board determined that actual economies of scale existed for those Portfolios whose assets had reached
342
UBS PACE Select Advisors Trust
Board approvals of investment management and administration agreement and subadvisory agreements (unaudited)
the first breakpoint level and potential economies of scale existed for those Portfolios whose assets had not yet reached their first breakpoint level. The board also noted that to the extent a Portfolio's assets have increased over time, it has realized other economies of scale as certain expenses, such as fees for Trustees, auditor and legal fees and printing and postage, become a smaller percentage of overall assets. The board also took note that due to market weakness and asset outflows the economies of scale realized by certain Portfolios had deteriorated since the prior year. The board also took note of the relationship between any breakpoints in a subadvisory fee and the breakpoints in fees paid by the Portfolios to UBS Global AM.
Generally, in light of UBS Global AM's profitability data, the Actual Management Fee, the Contractual Management Fee and the breakpoints currently in place for the Portfolios, the board believed that UBS Global AM's sharing of potential and current economies of scale with the Portfolios was acceptable.
Other benefits to UBS Global AM and the Subadvisers—The board was informed by management that the subadvisers' relationships with the subadvised Portfolios were limited to their provision of subadvisory services to these Portfolios, and that therefore, management believed that the Subadvisers and their affiliates did not receive tangible ancillary benefits as a result of the Subadvisers' relationships with the subadvised Portfolios, with the exception of possible benefits from soft dollars (e.g., research credits related to transaction commissions) for the equity Portfolios (which would also potentially benefit such Portfolios) and possible limited benefits to certain affiliates of a Subadviser, such as broker-dealers (e.g., an affiliate's execution of portfolio transactions subject to detailed restrictions in SEC rules and board oversight proced ures). The board recognized that certain Subadvisers could receive intangible benefits from their association with the Trust, such as increased name recognition or publicity from being selected as Subadvisers to the Trust after an extensive review process. Similarly, a Portfolio could benefit from having a Subadviser with an established or well-regarded reputation. In light of the costs of providing investment management, administrative and other services to the Portfolios and UBS Global AM's ongoing commitment to the Portfolios, the profits and other ancillary benefits that UBS Global AM and its affiliates received were considered reasonable.
In the discussions that follow, reference is made to "quintile" placement in Lipper expense group and performance universe categories. With respect to expenses, the first quintile represents that 20% of the funds in the Expense Group with the lowest fees or expenses, as applicable, and the fifth quintile represents that 20% of the funds in the Expense Group with the highest fees or expenses, as applicable. With respect to performance, the first quintile represents that 20% of the funds in the Performance Universe with the best relative performance, and the fifth quintile represents that 20% of the funds in the Performance Universe with the worst relative performance. Lipper quintile placement information is calculated on a share class basis. References to quintile placement appearing below relate to Class A shares, and the board had information relevant to other share classes (e.g., Class P shares) during its considerations.
UBS PACE Large Co Growth Equity Investments
In approving the Investment Management and Administration Agreement and the Subadvisory Agreements with each of Delaware Management Company, Wellington Management Company, LLP, Marsico Capital Management, LLC and SSgA Funds Management, Inc., the board, including the Independent Trustees, also considered the following factors:
Portfolio performance—The comparative Lipper information showed that the Portfolio's performance was in the second quintile for the one-year period, in the third quintile for the three- and five-year periods and in
343
UBS PACE Select Advisors Trust
Board approvals of investment management and administration agreement and subadvisory agreements (unaudited)
the fourth quintile since inception. Management noted the Portfolio's improving performance relative to its Performance Universe over the short- and intermediate-term periods.
Management and subadvisory fees and expense ratios—The comparative Lipper information showed that the Portfolio's Contractual Management Fee and Actual Management Fee were in the fourth quintile, however, its total expenses were in the first quintile in the Portfolio's Expense Group for the comparison periods utilized in the Lipper report. Management also noted that within the Supplemental Expense Group that included only subadvised funds, only one other fund in the group had lower total expenses for the period.
UBS PACE Large Co Value Equity Investments
In approving the Investment Management and Administration Agreement and the Subadvisory Agreements with each of Pzena Investment Management, LLC, Westwood Management Corp. and Institutional Capital LLC, the board, including the Independent Trustees, also considered the following factors:
Portfolio performance—The comparative Lipper information showed that the Portfolio's performance was in the first quintile for the one- and five-year periods and in the second quintile for the three-year period and since inception.
Management and subadvisory fees and expense ratios—The comparative Lipper information showed that the Portfolio's Contractual Management Fee was in the third quintile, and its Actual Management Fee and total expenses were in the fourth quintile. Management noted that the Portfolio's Actual Management Fee and total expenses were slightly below the median of the Portfolio's Supplemental Expense Group that consisted of only sub-advised funds.
UBS PACE Small/Medium Co Growth Equity Investments
In approving the Investment Management and Administration Agreement and the Subadvisory Agreements with Copper Rock Capital Partners, LLC, Palisade Capital Management, L.L.C. and Riverbridge Partners, LLC, the board, including the Independent Trustees, also considered the following factors:
Portfolio performance—The comparative Lipper information showed that the Portfolio's performance was in the third quintile for the one- and three-year periods and since inception and in the fourth quintile for the five-year period.
Management and subadvisory fees and expense ratios—The comparative Lipper information showed that the Portfolio's Contractual Management Fee was in the fifth quintile and its Actual Management Fee and total expenses were in the third quintile. Management noted that the Portfolio's Actual Management Fee and total expenses were each below their respective medians, with each ranking in the third quintile. Management also noted that the Portfolio had the lowest Contractual Management Fee and Actual Management Fee as well as the second lowest total expenses when compared to the Portfolio's Supplemental Expense Group that consisted of only sub-advised funds.
UBS PACE Small/Medium Co Value Equity Investments
Background—In approving the Investment Management and Administration Agreement and the Subadvisory Agreements with each of Buckhead Capital Management, LLC, Metropolitan West Capital
344
UBS PACE Select Advisors Trust
Board approvals of investment management and administration agreement and subadvisory agreements (unaudited)
Management, LLC and Systematic Financial Management, L.P., the board, including the Independent Trustees, also considered the following factors:
Portfolio performance—The comparative Lipper information showed that the Portfolio's performance was in the third quintile for the one- and three-year periods and in the fifth quintile for the five-year period and since inception.
Management and subadvisory fees and expense ratios—The comparative Lipper information showed that the Portfolio's Contractual Management Fee and Actual Management Fee were in the third quintile and its total expenses were in the second quintile in the Portfolio's Expense Group for the comparison periods utilized in the Lipper report.
UBS PACE International Equity Investments
In approving the Investment Management and Administration Agreement and the Subadvisory Agreements with each of Martin Currie Inc., Mondrian Investment Partners Limited and J.P. Morgan Investment Management Inc., the board, including the Independent Trustees, also considered the following factors:
Portfolio performance—The comparative Lipper information showed that the Portfolio's performance was in the fifth quintile for the one- and three-year periods and in the fourth quintile for the 5-year period and since inception. Management noted to the board that although the Portfolio underperformed its peer group it had strong absolute performance over the one-year period and that management expected performance to improve as certain investment styles of the Subadvisers which are out of favor in the current market environment come back into favor.
Management and subadvisory fees and expense ratios—The comparative Lipper information showed that the Portfolio's Contractual Management Fee and its Actual Management Fee were in the fourth quintile and its total expenses were in the third quintile in the Portfolio's Expense Group for the comparison periods utilized in the Lipper report. Management noted that the Portfolio's Contractual Management Fee and total expenses were slightly below the median and its Actual Management Fee was at the median of the Portfolio's Supplemental Expense Group.
UBS PACE International Emerging Markets Equity Investments
In approving the Investment Management and Administration Agreement and the Subadvisory Agreements with each of Gartmore Global Partners and Mondrian Investment Partners Limited, the board, including the Independent Trustees, also considered the following factors:
Portfolio performance—The comparative Lipper information showed that the Portfolio's performance was in the fifth quintile for the one-year period and since inception, in the third quintile for the three-year period and in the fourth quintile for the five-year period. Management noted to the board that although the Portfolio underperformed its peer group it had strong absolute performance over the one-year period and that they expected performance to improve as certain investment styles of the Subadvisers which are out of favor in the current market environment come back into favor.
Management and subadvisory fees and expense ratios—The comparative Lipper information showed that the Portfolio's Contractual Management Fee, Actual Management Fee and total expenses were in the second quintile in the Portfolio's Expense Group for the comparison periods utilized in the Lipper report.
345
UBS PACE Select Advisors Trust
Board approvals of investment management and administration agreement and subadvisory agreements (unaudited)
UBS PACE Alternative Strategies Investments
In approving the Investment Management and Administration Agreement and the Subadvisory Agreements with each of Analytic Investors, LLC, Goldman Sachs Asset Management, L.P., First Quadrant L.P. and Wellington Management Company, LLP, the board, including the Independent Trustees, also considered the following factors:
Portfolio performance—The comparative Lipper information showed that the Portfolio's performance was in the fifth quintile for the one-year period and since inception and in the fourth-quintile for the three-year period. Management discussed with the board its belief that the Lipper peer group classification did not accurately reflect the complex strategies employed by the Portfolio and that the Portfolio's performance is meeting management's expectations given the global markets.
Management and subadvisory fees and expense ratios—The comparative Lipper information showed that the Portfolio's Contractual Management Fee, Actual Management Fee and total expenses were in the fifth quintile in the Portfolio's Expense Group for the comparison periods utilized in the Lipper report. Management discussed with the board the heterogeneous nature of the relatively small Lipper Expense Group Universe.
The board noted that management was seeking to increase the sub-advisory fee paid to First Quadrant L.P. due to an increase in the active level of risk in the investment strategy employed by First Quadrant L.P. The board noted that the compensation paid to First Quadrant L.P. is paid by UBS Global AM, not by the Portfolio, and that the increased fee would not result in an increase in fees to the Portfolio's shareholders.
In light of the complex strategies employed by the Portfolio, the board determined that the management fee and the subadvisory fees were reasonable in light of the nature, extent and quality of the services provided to the Portfolio.
UBS PACE Global Real Estate Securities Investments
In approving the Investment Management and Administration Agreement and the Subadvisory Agreement with ING Clarion Real Estate Securities, LLC and Brookfield Investment Management Inc., the board, including the Independent Trustees, also considered the following factors:
Portfolio performance—The comparative Lipper information showed that the Portfolio's performance was in the fifth quintile for the one- and three year periods and since inception. Management noted that the majority of the underperformance during the periods was attributable to a prior-subadvisor and that it expects the current Subadvisers to produce attractive risk-adjusted returns for the Portfolio over a full-market cycle in the future.
Management and subadvisory fees and expense ratios—The comparative Lipper information showed that the Portfolio's Contractual Management Fee and total expenses were in the third quintile, although its Actual Management Fee was in the first quintile in the Portfolio's Expense Group for the comparison periods utilized in the Lipper report.
346
UBS PACE Select Advisors Trust
Board approvals of investment management and administration agreement and subadvisory agreements (unaudited)
UBS PACE Government Securities Fixed Income Investments
In approving the Investment Management and Administration Agreement and the Subadvisory Agreement with Pacific Investment Management Company LLC, the board, including the Independent Trustees, also considered the following factors:
Portfolio performance—The comparative Lipper information showed that the Portfolio's performance was in the third quintile for the one-year period, in the first quintile for the three- and five-year periods and in the second quintile since inception.
Management and subadvisory fees and expense ratios—The comparative Lipper information showed that the Portfolio's Contractual Management Fee was in the fifth quintile and its Actual Management Fee and total expenses were in the fourth quintile in the Portfolio's Expense Group for the comparison periods utilized in the Lipper report. Management noted the relatively small size of the Portfolio's Supplemental Expense Group that consisted of only sub-advised funds. In making its determination, the board recognized that the Portfolio's Actual Management Fee was a significant cause of the Portfolio's higher total expenses relative to its Expense Group; however, in light of the Portfolio's performance versus its peers, the board determined that the management fee and the subadvisory fees were satisfactory. Nonetheless, the board noted that it would cont inue to monitor the Portfolio's expenses over the next year.
UBS PACE High Yield Investments
In approving the Investment Management and Administration Agreement and the Subadvisory Agreement with MacKay Shields LLC, the board, including the Independent Trustees, also considered the following factors:
Portfolio performance—The comparative Lipper information showed that the Portfolio was in the second quintile for the one-year period and in the first quintile for the three-year period and since inception.
Management and subadvisory fees and expense ratios—The comparative Lipper information showed that the Portfolio's Contractual Management Fee and Actual Management Fee were in the fourth quintile, while its total expenses were in the fifth quintile in the Portfolio's Expense Group for the comparison periods utilized in the Lipper report. Management noted that the Portfolio's Actual Management Fee was only slightly above the median and total expenses were lower than the median of the Portfolio's Supplemental Expense Group that consisted of only sub-advised funds.
UBS PACE Intermediate Fixed Income Investments
In approving the Investment Management and Administration Agreement and the Subadvisory Agreement with BlackRock Financial Management, Inc., the board, including the Independent Trustees, also considered the following factors:
Portfolio performance—The comparative Lipper information showed that the Portfolio's performance was in the fourth quintile for the one-year period and in the third quintile for the three- and five-year periods and in the fifth quintile since inception. Management noted that although the Portfolio outperformed its benchmark it underperformed its Lipper peer group. Management further noted that many of the Portfolio's peers within the Lipper classification have the ability to buy emerging markets debt and high yield
347
UBS PACE Select Advisors Trust
Board approvals of investment management and administration agreement and subadvisory agreements (unaudited)
instruments, both of which did well over the period, while the Portfolio is limited to investments in bonds that are investment grade at the time of purchase.
Management and subadvisory fees and expense ratios—The comparative Lipper information showed that the Portfolio's Contractual Management Fee was in the fourth quintile and its Actual Management Fee was in the third quintile and total expenses were in the fifth quintile in the Portfolio's Expense Group for the comparison periods utilized in the Lipper report. Management noted that although the Portfolio's total expenses were in the fifth quintile they were only slightly above the median.
UBS PACE Municipal Fixed Income Investments
In approving the Investment Management and Administration Agreement and the Subadvisory Agreement with Standish Mellon Asset Management Company LLC, the board, including the Independent Trustees, also considered the following factors:
Portfolio performance—The comparative Lipper information showed that the Portfolio's performance was in the fourth quintile for the one-year period and since inception and in the third quintile for the three- and five-year periods. Management noted that the Portfolio only slightly underperformed its benchmark and that it believed that the Portfolio's underperformance in comparison to the Portfolio's peer group was due to the fact that the peer group's investments were of a longer average maturity than the Portfolio's investments, which investments did well over the prior year.
Management and subadvisory fees and expense ratios—The comparative Lipper information showed that the Portfolio's Contractual Management Fee, Actual Management Fee and its total expenses were in the fourth quintile in the Portfolio's Expense Group for the comparison periods utilized in the Lipper report.
UBS PACE Strategic Fixed Income Investments
In approving the Investment Management and Administration Agreement and the Subadvisory Agreement with Pacific Investment Management Company LLC, the board, including the Independent Trustees, also considered the following factors:
Portfolio performance—The comparative Lipper information showed that the Portfolio's performance was in the first quintile for the one- three- and five-year periods and since inception.
Management and subadvisory fees and expense ratios—The comparative Lipper information showed that the Portfolio's Contractual Management Fee and Actual Management Fee were in the third quintile, and its total expenses were in the fifth quintile. Management noted its belief that the Portfolio uses more complex strategies and investments in comparison with many other funds in its Expense Group.
UBS PACE Global Fixed Income Investments
In approving the Investment Management and Administration Agreement and the Subadvisory Agreement with Rogge Global Partners plc, the board, including the Independent Trustees, also considered the following factors:
Portfolio performance—The comparative Lipper information showed that the Portfolio's performance was in the third quintile for the one- three- and five-year periods and in the fourth quintile since inception.
348
UBS PACE Select Advisors Trust
Board approvals of investment management and administration agreement and subadvisory agreements (unaudited)
Management noted that the Portfolio was reclassified by Lipper in September 2009 from a Global Income classification to an International Income classification.
Management and subadvisory fees and expense ratios—The comparative Lipper information showed that the Portfolio's Contractual Management Fee was in the third quintile and its Actual Management Fee and total expenses were in the fourth quintile in the Portfolio's Expense Group for the comparison periods utilized in the Lipper report.
UBS PACE Money Market Investments
In approving the Investment Management and Administration Agreement, the board, including the Independent Trustees, also considered the following factors:
Portfolio performance—The comparative Lipper information showed that the Portfolio's performance was in the fourth quintile for the one-year period, in the third quintile for the three-year period and in the second quintile for the five- and ten-year periods and since inception. Management noted that the Portfolio's performance was negatively impacted by several factors, including (i) the Federal Reserve's unprecedented accommodative monetary policy which has forced many funds to waive significant portions of their fees to avoid negative yields and (ii) management's continuing conservative positioning of the UBS money market funds with respect to credit, liquidity and diversification.
Management fees and expense ratios—The comparative Lipper information showed that the Portfolio's Contractual Management Fee was in the second quintile and its Actual Management Fee and total expenses were in the first quintile in the Portfolio's Expense Group for the comparison periods utilized in the Lipper report.
Conclusion
Based on its review and, in certain instances, management's explanations upon further questioning, the board concluded that each Portfolio's investment performance was satisfactory or acceptable and that each management fee and subadvisory fee was reasonable in light of the nature, extent and quality of the services provided to the Portfolio under the applicable Investment Management and Administration Agreement and Subadvisory Agreement or Subadvisory Agreements, respectively.
In light of all of the foregoing, the board approved the Investment Management and Administration Agreement for each Portfolio and, for those Portfolios with Subadvisers, the Subadvisory Agreement(s). No single factor reviewed by the board was identified by the board as the principal factor in determining whether to approve the Investment Management and Administration Agreement or, for the subadvised Portfolios, the Subadvisory Agreement(s). The Independent Trustees were advised by separate independent legal counsel throughout the process. The board discussed the proposed continuance of the Investment Management and Administration Agreement and the Subadvisory Agreements in private sessions with their independent legal counsel at which no representatives of UBS Global AM or the Subadvisers were present.
Roxbury Capital Management, LLC
At the meeting the board members, including the Independent Trustees, also considered and re-approved the Sub-Advisory Agreement with Roxbury. In preparing for the meeting, the board members had requested and received additional information from UBS Global AM to assist them in their annual contract review
349
UBS PACE Select Advisors Trust
Board approvals of investment management and administration agreement and subadvisory agreements (unaudited)
process. The additional information received by the board for the meeting did not in any way change the board's outlook with respect to Roxbury from that established at its meeting on May 12, 2010. In addition, since Roxbury had only assumed investment advisory responsibility with respect to a portion of the Portfolio's assets on May 25, 2010, the current performance of the Portfolio was deemed to be not material to the board's consideration of the approval of the Sub-Advisory Agreement due to the extremely short period during which Roxbury managed a portion of the Portfolio's assets. Given that no new information was presented to the board that would materially alter its determinations from its May 12, 2010 meeting, the board reaffirmed its determinations with respect to Roxbury and the Sub-Advisory Agreement, from its May 12, 2010 meeting. The board noted that the Sub-Advisory Agreement is terminable on 30 days' notice and tha t it would be prepared to re-evaluate the Portfolio's relationship with Roxbury in the event that additional information is presented to the board prior to its next annual contract reconsideration meeting that would have a material negative impact on any of its prior determinations. In light of the foregoing, the board re-approved the Sub-Advisory Agreement for the Portfolio. No single factor reviewed by the board was identified by the board as the principal factor in determining whether to re-approve the Sub-Advisory Agreement. The Independent Trustees were advised by separate independent legal counsel throughout the process. The board discussed the proposed continuance of the Sub-Advisory Agreement in a private session with independent legal counsel at which no representatives of UBS Global AM or Roxbury were present.
350
UBS PACE Select Advisors Trust
Supplemental information (unaudited)
Board of Trustees & Officers
The Trust is governed by a Board of Trustees which oversees the Portfolios' operations. Each Trustee serves an indefinite term of office. Officers are appointed by the trustees and serve at the pleasure of the Board. The table below shows, for each trustee and officer, his or her name, address and age, the position held with the Trust, the length of time served as a trustee or officer of the Trust, the trustee's or officer's principal occupations during the last five years, the number of portfolios in the UBS fund complex overseen by the trustee or for which a person served as an officer, and other directorships held by the trustee.
The Trust's Statement of Additional Information contains additional information about the trustees and is available, without charge, upon request by calling 1-800-647 1568.
Interested Trustees
| Name, address, and age | | Position(s)
held with
Trust | | Term of
office†
and
length of
time
served | | Principal
occupation(s)
during past
5 years | | Number of portfolios
in fund complex
overseen by trustee | | Other directorships held
by trustee | |
Meyer Feldberg††; 68
Morgan Stanley
1585 Broadway
36th Floor
New York, NY 10036 | | Trustee | | Since 2001 | | Professor Feldberg is Dean Emeritus and Professor of Leadership and Ethics at Columbia Business School, although on an extended leave of absence. He is also a senior advisor to Morgan Stanley (financial services) (since March 2005). Professor Feldberg also serves as president of New York City Global Partners (an organization located in part of the Office of the Mayor of the City of New York that promotes interaction with other cities around the world) (since May 2007). Prior to July 2004, he was Dean and Professor of Leadership and Ethics of the Graduate School of Business at Columbia University (since 1989). | | Professor Feldberg is a director or trustee of 27 investment companies (consisting of 59 portfolios) for which UBS Global AM or one of its affiliates serves as investment advisor, sub-advisor or manager. | | Professor Feldberg is also a director of Primedia Inc. (publishing), Macy's, Inc. (operator of department stores), Revlon, Inc. (cosmetics), SAPPI, Ltd. (producer of paper) and the New York City Ballet. | |
|
351
UBS PACE Select Advisors Trust
Supplemental information (unaudited)
Interested Trustees (concluded)
| Name, address, and age | | Position(s)
held with
Trust | | Term of
office†
and
length of
time
served | | Principal
occupation(s)
during past
5 years | | Number of portfolios
in fund complex
overseen by trustee | | Other directorships held
by trustee | |
| Barry M. Mandinach*; 54 | | Trustee | | Since July 2010 | | Mr. Mandinach is a managing director of UBS Global Asset Management (US) Inc. and UBS Global AM (collectively, "UBS Global AM-Americas region"). He has been with UBS Global AM-Americas region or its predecessors since 2001. He is the Head of Institutional & Wholesale Business (US) (since 2009) as well as Chief Marketing Officer (US) (since 2006). | | Mr. Mandinach is a director or trustee of 12 investment companies (consisting of 44 portfolios) for which UBS Global AM or one of its affiliates serves as investment advisor, sub-advisor or manager. | | None | |
|
352
UBS PACE Select Advisors Trust
Supplemental information (unaudited)
Independent Trustees
| Name, address, and age | | Position(s)
held with
Trust | | Term of
office†
and
length of
time
served | | Principal
occupation(s)
during past
5 years | | Number of portfolios
in fund complex
overseen by trustee | | Other directorships held
by trustee | |
Richard Q. Armstrong; 75
c/o Willkie Farr &
Gallagher LLP
787 Seventh Avenue
New York, NY
10019-6099 | | Trustee and Chairman of the Board of Trustees | | Since 2001 (Trustee) Since 2004 (Chairman of the Board of Trustees) | | Mr. Armstrong is chairman and principal of R.Q.A. Enterprises (management consulting firm) (since April 1991 and principal occupation since March 1995). Mr. Armstrong was president or chairman of a number of packaged goods companies (responsible for such brands as Canada Dry, Dr. Pepper, Adirondack Beverages and Moët Hennessy) (from 1982 until 1995). | | Mr. Armstrong is a director or trustee of 15 investment companies (consisting of 47 portfolios) for which UBS Global AM or one of its affiliates serves as investment advisor, sub-advisor or manager. | | None | |
|
Alan S. Bernikow; 69
207 Benedict Ave.
Staten Island, NY 10314 | | Trustee | | Since 2005 | | Mr. Bernikow is retired. He was a consultant on non-management matters for the firm of Deloitte & Touche (international accounting and consulting firm) (from June 2003 until 2007). Previously, he was deputy chief executive officer at Deloitte & Touche. | | Mr. Bernikow is a director or trustee of 15 investment companies (consisting of 47 portfolios) for which UBS Global AM or one of its affiliates serves as investment advisor, sub-advisor or manager. | | Mr. Bernikow is also a director of Revlon, Inc. (cosmetics) (and serves as the chair of its audit committee and as the chair of its compensation committee), a director of Mack-Cali Realty Corporation (real estate investment trust) (and serves as the chair of its audit committee); and a director of the Casual Male Retail Group, Inc. (menswear) (and serves as a member of its audit committee and as a member of its nominating and corporate governance committee). He is also a director of Premier American Bank, N.A. | |
|
353
UBS PACE Select Advisors Trust
Supplemental information (unaudited)
Independent Trustees (continued)
| Name, address, and age | | Position(s)
held with
Trust | | Term of
office†
and
length of
time
served | | Principal
occupation(s)
during past
5 years | | Number of portfolios
in fund complex
overseen by trustee | | Other directorships held
by trustee | |
Richard R. Burt; 63
McLarty Associates
900 17th Street, 8th Floor
Washington, D.C. 20006 | | Trustee | | Since 2001 | | Mr. Burt is a managing director to McLarty Associates (a consulting firm) with which he has been employed since April 2007. He was chairman of IEP Advisors (international investments and consulting firm) until February 2009. Prior to April 2007, he was chairman of Diligence Inc. (information and risk management firm). | | Mr. Burt is a director or trustee of 15 investment companies (consisting of 47 portfolios) for which UBS Global AM or one of its affiliates serves as investment advisor, sub-advisor or manager. | | Mr. Burt is also a director of Central Europe & Russia Fund, Inc., European Equity Fund, Inc. and The New Germany Fund, Inc. | |
|
Bernard H. Garil; 70
6754 Casa Grande Way
Delray Beach, FL 33446 | | Trustee | | Since 2005 | | Mr. Garil is retired (since 2001). He was a managing director at PIMCO Advisory Services (from 1999 to 2001) where he served as president of closed-end funds and vice-president of the variable insurance product funds advised by OpCap Advisors (until 2001). | | Mr. Garil is a director or trustee of 15 investment companies (consisting of 47 portfolios) for which UBS Global AM or one of its affiliates serves as investment advisor, sub-advisor or manager. | | Mr. Garil is also a director of OFI Trust Company (commercial trust company) and a trustee for the Brooklyn College Foundation, Inc. (charitable foundation). | |
|
354
UBS PACE Select Advisors Trust
Supplemental information (unaudited)
Independent Trustees (concluded)
| Name, address, and age | | Position(s)
held with
Trust | | Term of
office†
and
length of
time
served | | Principal
occupation(s)
during past
5 years | | Number of portfolios
in fund complex
overseen by trustee | | Other directorships held
by trustee | |
Heather R. Higgins; 51
255 E. 49th St.,
Suite 23D
New York, NY 10017 | | Trustee | | Since 2005 | | Ms. Higgins is the president and director of The Randolph Foundation (charitable foundation) (since 1991). Ms. Higgins also serves on the boards of several non-profit charitable groups, including the Independent Women's Forum (chairman), and the Philanthropy Roundtable (vice chairman). She also serves on the board of the Hoover Institution (from 2001 to 2007 and since January 2009). | | Ms. Higgins is a director or trustee of 15 investment companies (consisting of 47 portfolios) for which UBS Global AM or one of its affiliates serves as investment advisor, sub-advisor or manager. | | None | |
|
355
UBS PACE Select Advisors Trust
Supplemental information (unaudited)
Officers
| Name, address, and age | | Position(s)
held with
Trust | | Term of
office†
and
length of
time
served | | Principal occupation(s) during past 5 years;
number of portfolios in fund complex for which person serves as officer | |
| Joseph Allessie*; 45 | | Vice President and Assistant Secretary | | Since 2005 | | Mr. Allessie is an executive director (since 2007) (prior to which he was a director) and deputy general counsel (since 2005) UBS Global AM-Americas region. Prior to joining UBS Global AM-Americas region, he was senior vice president and general counsel of Kenmar Advisory Corp. (from 2004 to 2005). Prior to that Mr. Allessie was general counsel and secretary of GAM USA Inc., GAM Investments, GAM Services, GAM Funds, Inc. and the GAM Avalon Funds (from 1999 to 2004). Mr. Allessie is a vice president and assistant secretary of 19 investment companies (consisting of 101 portfolios) for which UBS Global AM-Americas region or one of its affiliates serves as investment advisor, sub-advisor or manager. | |
|
| Mark E. Carver*; 46 | | President | | Since May 2010 | | Mr. Carver is a managing director and Head of Product Development and Management-Americas for UBS Global AM-Americas region (since 2008). In this role, he oversees product development and management for both wholesale and institutional businesses. He is a member of the Americas Management Committee (since 2008) and the Regional Operating Committee (since 2008). Prior to 2008, Mr. Carver held a number of product-related or sales responsibilities with respect to funds, advisory programs and separately managed accounts. Mr. Carver joined a predecessor of an affiliated firm in 1985 and has been with UBS Global AM-Americas region (or its affiliates) since 1996. Mr. Carver is president of 19 investment companies (consisting of 101 portfolios) for which UBS Global AM or one of its affiliates serves as investment advisor, sub-advisor or manager. | |
|
| Caren Cunningham*; 50 | | Vice President and Assistant Secretary* | | Since 2007 | | Ms. Cunningham is an executive director and senior associate general counsel of UBS Global AM-Americas region (since 2007). Prior to joining UBS Global AM-Americas region, she was vice president and senior legal manager (distribution) of Pioneer Investment Management Limited (from 2005 to 2006). Prior to that Ms. Cunningham was assistant general counsel of Fidelity Investments (1999-2006). Ms. Cunningham is a vice president and assistant secretary of UBS PACE Select Advisors Trust (consisting of 15 portfolios) and an assistant secretary of 18 other investment companies (consisting of 86 portfolios) for which UBS Global AM-Americas region or one of its affiliates serves as investment advisor, sub-advisor or manager. | |
|
| Thomas Disbrow*; 44 | | Vice President and Treasurer | | Since 2000 (Vice President) Since 2004 (Treasurer) | | Mr. Disbrow is an executive director (since 2007) (prior to which he was a director) (since 2000) and head of the US mutual fund treasury administration department (since September 2006) of UBS Global AM-Americas region. Mr. Disbrow is a vice president and treasurer and/or principal accounting officer of 19 investment companies (consisting of 101 portfolios) for which UBS Global AM-Americas region or one of its affiliates serves as investment advisor, sub-advisor or manager. | |
|
| Michael J. Flook*; 45 | | Vice President and Assistant Treasurer | | Since 2006 | | Mr. Flook is a director (since March 2010) (prior to which he was an associate director) (since 2006) and a senior manager of the US mutual fund treasury administration department of UBS Global AM-Americas region. Prior to joining UBS Global AM-Americas region, he was a senior manager with The Reserve (asset management firm) from May 2005 to May 2006. Prior to that he was a senior manager with PFPC Worldwide since October 2000. Mr. Flook is a vice president and assistant treasurer of 19 investment companies (consisting of 101 portfolios) for which UBS Global AM-Americas region or one of its affiliates serves as investment advisor, sub-advisor or manager. | |
|
356
UBS PACE Select Advisors Trust
Supplemental information (unaudited)
Officers (continued)
| Name, address, and age | | Position(s)
held with
Trust | | Term of
office†
and
length of
time
served | | Principal occupation(s) during past 5 years;
number of portfolios in fund complex for which person serves as officer | |
| Mark F. Kemper**; 52 | | Vice President and Secretary | | Since 2004 | | Mr. Kemper is a managing director (since 2006) and head of the legal department of UBS Global AM-Americas region (since 2004). He was deputy general counsel of UBS Global AM-Americas region (from July 2001 to July 2004). He has been secretary of UBS Global AM-Americas since 1999 and assistant secretary of UBS Global Asset Management Trust Company since 1993 and secretary of UBS AM Holdings (USA) Inc. (since 2001). Mr. Kemper is vice president and secretary of 19 investment companies (consisting of 101 portfolios) for which UBS Global AM-Americas region or one of its affiliates serves as investment advisor, sub-advisor or manager. | |
|
| Joanne M. Kilkeary*; 42 | | Vice President and Assistant Treasurer | | Since 1999 | | Ms. Kilkeary is a director (since March 2008) (prior to which she was an associate director) (since 2000) and a senior manager (since 2004) of the US mutual fund treasury administration department of UBS Global AM-Americas region. Ms. Kilkeary is a vice president and assistant treasurer of 19 investment companies (consisting of 101 portfolios) for which UBS Global AM-Americas region or one of its affiliates serves as investment advisor, sub-advisor or manager. | |
|
| Tammie Lee*; 39 | | Vice President and Assistant Secretary | | Since 2005 | | Ms. Lee is an executive director (since March 2010) (prior to which she was a director) and associate general counsel of UBS Global AM-Americas region (since 2005). Prior to joining UBS Global AM-Americas region, she was vice president and counsel at Deutsche Asset Management/Scudder Investments from 2003 to 2005. Prior to that she was assistant vice president and counsel at Deutsche Asset Management/Scudder Investments from 2000 to 2003. Ms. Lee is a vice president and assistant secretary of 19 investment companies (consisting of 101 portfolios) for which UBS Global AM-Americas region or one of its affiliates serves as investment advisor, sub-advisor or manager. | |
|
| Steven J. LeMire*; 41 | | Vice President and Assistant Treasurer | | Since 2007 | | Mr. LeMire is a director and senior manager of the US mutual fund treasury administration department of UBS Global AM-Americas region (since 2007). Prior to joining UBS Global AM-Americas region, he was an independent consultant with Third River Capital, LLC (formerly Two Rivers Capital, LLC) (from 2005 to 2007). Prior to that, he was vice president of operations and fund administration with Oberweis Asset Management, Inc. (from 1997 to 2005). Mr. LeMire is a vice President and assistant treasurer of 19 investment companies (consisting of 101 portfolios) for which UBS Global AM-Americas region or one of its affiliates serves as investment advisor, sub-advisor or manager. | |
|
| Joseph McGill*; 48 | | Vice President and Chief Compliance Officer | | Since 2004 | | Mr. McGill is a managing director (since 2006) and chief compliance officer (since 2003) at UBS Global AM-Americas region. Prior to joining UBS Global AM-Americas region, he was assistant general counsel at JPMorgan Investment Management (from 1999 to 2003). Mr. McGill is a vice president and chief compliance officer of 19 investment companies (consisting of 101 portfolios) for which UBS Global AM-Americas region or one of its affiliates serves as investment advisor, sub-advisor or manager. | |
|
| Nancy D. Osborn*; 44 | | Vice President and Assistant Treasurer | | Since 2007 | | Mrs. Osborn is a director (since March 2010) (prior to which she was an associate director) and a senior manager of the US mutual fund treasury administration department of UBS Global AM-Americas region (since 2006). Prior to joining UBS Global AM-Americas region, she was an assistant vice president with Brown Brothers Harriman since April 1996. Mrs. Osborn is a vice president and assistant treasurer of 19 investment companies (consisting of 101 portfolios) for which UBS Global AM-Americas region or one of its affiliates serves as investment advisor, sub-advisor or manager. | |
|
357
UBS PACE Select Advisors Trust
Supplemental information (unaudited)
Officers (concluded)
| Name, address, and age | | Position(s)
held with
Trust | | Term of
office†
and
length of
time
served | | Principal occupation(s) during past 5 years;
number of portfolios in fund complex for which person serves as officer | |
| Robert Sabatino**; 37 | | Vice President | | Since 2001 | | Mr. Sabatino is a managing director (since March 2010) (prior to which he was an executive director) (since 2007), head of US taxable money markets (since 2008), and portfolio manager of UBS Global AM-Americas region in the short duration fixed income group (since 2001). From 1995 to 2001 he was a portfolio manager at Merrill Lynch Investment Managers responsible for the management of several retail and institutional money market funds. Mr. Sabatino is a vice president of six investment companies (consisting of 37 portfolios) for which UBS Global AM-Americas region or one of its affiliates serves as investment advisor, sub-advisor or manager. | |
|
| Eric Sanders*; 44 | | Vice President and Assistant Secretary | | Since 2005 | | Mr. Sanders is a director and associate general counsel of UBS Global AM-Americas region (since 2005). From 1996 until June 2005, he held various positions at Fred Alger & Company, Incorporated, the most recent being assistant vice president and associate general counsel. Mr. Sanders is a vice president and assistant secretary of 19 investment companies (consisting of 101 portfolios) for which UBS Global AM-Americas region or one of its affiliates serves as investment advisor, sub-advisor or manager. | |
|
| Andrew Shoup*; 54 | | Vice President and Chief Operating Officer | | Since 2006 | | Mr. Shoup is a managing director and global head of the treasury administration department of UBS Global AM-Americas region (since July 2006). Mr. Shoup is also a director of UBS (IRL) Fund p.l.c. (since December 2008). Prior to joining UBS Global AM-Americas region, he was chief administrative officer for the Legg Mason Partner Funds (formerly Smith Barney, Salomon Brothers, and CitiFunds mutual funds) from November 2003 to July 2006. Prior to that, he held various positions with Citigroup Asset Management and related companies with their domestic and offshore mutual funds since 1993. Additionally, he has worked for another mutual fund complex as well as spending eleven years in public accounting. Mr. Shoup is a vice president and chief operating officer of 19 investment companies (consisting of 101 portfolios) for which UBS Global AM-Americas region or one of its affiliates serves as investment advisor, sub-advisor or manager. | |
|
| Keith A. Weller*; 49 | | Vice President and Assistant Secretary | | Since 2000 | | Mr. Weller is an executive director and senior associate general counsel of UBS Global AM-Americas region (since 2005) and has been an attorney with affiliated entities since 1995. Mr. Weller is a vice president and assistant secretary of 19 investment companies (consisting of 101 portfolios) for which UBS Global AM-Americas region or one of its affiliates serves as investment advisor, sub-advisor or manager. | |
|
* This person's business address is 1285 Avenue of the Americas, New York, New York 10019-6028.
** This person's business address is One North Wacker Drive, Chicago, Illinois 60606.
† Each trustee holds office for an indefinite term. Officers are appointed by the trustees and serve at the pleasure of the Board.
†† Professor Feldberg is deemed an "interested person" of the Trust as defined in the Investment Company Act because he is a senior advisor to Morgan Stanley, a financial services firm with which the Trust may conduct transactions.
358
(This page has been left blank intentionally)
359
(This page has been left blank intentionally)
360

UBS PACE® Money Market
Investments
Annual Report
July 31, 2010
UBS PACE Money Market Investments
September 14, 2010
Dear Shareholder,
Performance
For the 12 months ended July 31, 2010, the Portfolio returned 0.01%, before the deduction of the maximum UBS PACE program fee. (The Portfolio declined 1.97%, after the deduction of the maximum UBS PACE program fee, for the same 12-month period.) Please remember that the UBS PACE program fee is assessed outside the Portfolio at the UBS PACE program account level. The program fee does not impact the determination of the Portfolio's net asset value per share. In comparison, the Citigroup Three-Month US Treasury Bill Index (the "benchmark") returned 0.12%, and the median return of the Lipper Money Market Funds category was 0.02%. (Returns over various time periods are shown in the "Performance at a glance" table on page 5. Please note that the returns shown do not reflect the deduction of taxes that a shareholder would pay on Portfolio distributions.)
Advisor's comments
Given pockets of weakness in the economy, including continued high unemployment, the Federal Reserve Board (the "Fed") maintained the federal funds rate at a historically low range between 0.00% and 0.25% during the reporting period. (The federal funds rate, or "fed funds" rate, is the rate that banks charge one another for funds they borrow on an
UBS PACE Money
Market Investments
Investment Advisor:
UBS Global Asset Management (Americas) Inc.
Portfolio Manager:
Robert Sabatino
Objective:
Current income consistent with preservation of capital and liquidity
Investment process:
The Portfolio is a money market mutual fund and seeks to maintain a stable price of $1.00 per share, although it may be possible to lose money by investing in this Portfolio. The Portfolio invests in a diversified portfolio of high-quality money market instruments of governmental and private issuers. Security selection is based on the assessment of relative values and changes in market and economic conditions.
1
UBS PACE Money Market Investments
overnight basis.) This caused the yields of the securities in which the Portfolio invests to remain very low, which, in turn, negatively impacted the Portfolio's yield.
When the reporting period began, the Portfolio's weighted average maturity was 45 days. However, as the reporting period progressed `and the credit markets stabilized, we increased the Portfolio's weighted average maturity, reaching 53 days on January 31, 2010. During the second half of the reporting period, we reduced the Portfolio's weighted average maturity, ending the period at 46 days, in order to minimize pricing volatility and to meet potential redemption requests in light of the effectiveness of the Securities and Exchange Commission's ("SEC") new requirements related to money market funds (see below for details). In addition, it was our expectation that interest rates would rise as the Fed began to take steps—ahead of any moves to increase the fed funds rate—to remove current high levels of liquidity from the market.
At the issuer level, we maintained a greater-than-usual level of diversification over the fiscal year by investing in smaller positions (typically around 5%), with the goal of reducing risk and keeping the Portfolio highly liquid. As the economic environment improved over the period, however, we gradually increased our single issuer exposure, typically purchasing up to 3% in single nongovernment issuers by the end of the reporting period. The Portfolio is generally able to hold up to 5% in any one issuer (subject to certain exceptions).
On a final note, on January 27, 2010, the SEC adopted rule amendments designed to strengthen the regulations governing money market funds. The amendments impose new liquidity, credit quality and maturity limits. They also enhance disclosures by, among other stipulations, requiring the monthly posting of portfolio holdings reports (beginning in October 2010). UBS Global Asset Management (Americas) Inc. ("UBS Global AM") welcomes the SEC's approval of these new requirements. We
2
UBS PACE Money Market Investments
believe that they will fortify the money market sector and are consistent with our long-standing conservative approach to the management of the Portfolio.
As always, we thank you for your continued support and welcome any comments or questions you may have.
Sincerely,
 | |  | |
|
Mark E. Carver
President,
UBS PACE Select Advisors Trust
Managing Director,
UBS Global Asset Management
(Americas) Inc. | | Robert Sabatino
Portfolio Manager,
UBS PACE Money Market
Investments
Managing Director,
UBS Global Asset Management
(Americas) Inc. | |
|
This letter is intended to assist shareholders in understanding how the Portfolio performed during the 12-months ended July 31, 2010. The views and opinions in this letter were current as of September 14, 2010. They are not guarantees of performance or investment results and should not be taken as investment advice.
Investment decisions reflect a variety of factors, and we reserve the right to change our views about individual securities, sectors and markets at any time. As a result, the views expressed should not be relied upon as a forecast of the Portfolio's future investment intent. We encourage you to consult your financial advisor regarding your personal investment program. Investors should carefully read and consider a mutual fund's investment objectives, risks, charges, and expenses before investing. The prospectus contains this and other information about a mutual fund. For a current prospectus, contact UBS Global Asset Management at 888-793 8637, or visit us on the Web at www.ubs.com/globalam-us.
3
UBS PACE Money Market Investments
Illustration of an assumed investment of $10,000 in the Portfolio (unaudited)
The following graph depicts the performance of UBS PACE Money Market Investments versus the Citigroup Three-Month US Treasury Bill Index over the 10 years ended July 31, 2010. The performance provided does not reflect the deduction of taxes that a shareholder would pay on Portfolio distributions. Past performance is no guarantee of future results. Returns will vary with market conditions. It is important to note that UBS PACE Money Market Investments is a professionally managed portfolio while the Index is not available for investment and is unmanaged. The comparison is shown for illustration purposes only.

4
UBS PACE Money Market Investments
Performance at a glance (unaudited)
| Average annual total returns for periods ended 07/31/10 | | 1 year | | 5 years | | 10 years | |
UBS PACE Money Market Investments
before deducting maximum UBS PACE
program fee1 | | | 0.01 | % | | | 2.58 | % | | | 2.36 | % | |
UBS PACE Money Market Investments
after deducting maximum UBS PACE
program fee1 | | | (1.97 | )% | | | 0.54 | % | | | 0.33 | % | |
| Citigroup Three-Month US Treasury Bill Index2 | | | 0.12 | % | | | 2.58 | % | | | 2.51 | % | |
| Lipper Money Market Funds median | | | 0.02 | % | | | 2.52 | % | | | 2.24 | % | |
For UBS PACE Money Market Investments, average annual total returns for periods ended June 30, 2010, after deduction of the maximum UBS PACE program fee, were as follows: 1-year period, (1.97)%; 5-year period, 0.59%; 10-year period, 0.39%.
For UBS PACE Money Market Investments, the 7-day current yield for the period ended July 31, 2010 was 0.01% (without maximum UBS PACE program fee and after fee waivers and/or expense reimbursements; the yield was (0.51)% before fee waivers and/or expense reimbursements). With the maximum UBS PACE program fee, the 7-day current yield was (1.99)% after fee waivers and/or expense reimbursements; the yield was (2.51)% before fee waivers and/or expense reimbursements. The Portfolio's yield quotation more closely reflects the current earnings of the Portfolio than the total return quotation. Yields will fluctuate and reflect fee waivers and/or expense reimbursements.
1 The maximum annual UBS PACE program fee is 2% of the value of UBS PACE assets. Prior to June 14, 2010, the maximum annual UBS PACE program fee was 1.5% of the value of UBS PACE assets.
2 The Citigroup Three-Month US Treasury Bill Index is an unmanaged index reflecting monthly return equivalents of yield averages that are not marked to the market and an average of the last three 3-month T-bill month-end rates. 3-month T-bills are the short-term debt obligations of the US government. Investors should note that indices do not reflect the deduction of fees and expenses.
Past performance does not predict future performance and the performance information provided does not reflect the deduction of taxes that a shareholder would pay on Portfolio distributions. The return of an investment will fluctuate. Performance results assume reinvestment of all dividends and capital gain distributions at net asset value on the payable dates. Current performance may be higher or lower than the performance data quoted.
Lipper peer group data calculated by Lipper Inc.; used with permission. The Lipper median is the return of the fund that places in the middle of a Lipper peer group.
An investment in UBS PACE Money Market Investments is not insured or guaranteed by the Federal Deposit Insurance Corporation or any other government agency. Although the Portfolio seeks to preserve the value of your investment at $1.00 per share, it is possible to lose money by investing in the Portfolio.
Not FDIC Insured. May lose value. No bank guarantee.
5
UBS PACE Money Market Investments
Understanding your Portfolio's expenses (unaudited)
As a shareholder of the Portfolio, you incur two types of costs: (1) ongoing program fees; and (2) ongoing Portfolio costs, including management fees and other Portfolio expenses. This example is intended to help you understand your ongoing costs (in dollars) of investing in the Portfolio and to compare these costs with the ongoing costs of investing in other mutual funds.
The example below is based on an investment of $1,000 invested at the beginning of the period and held for the entire period, February 1, 2010 to July 31, 2010.
Actual expenses
The first line in the table below provides information about actual account values and actual expenses. You may use the information in this line, together with the amount you invested, to estimate the expenses that you paid over a period. Simply divide your account value by $1,000 (for example, an $8,600 account value divided by $1,000 = 8.6), then multiply the result by the number in the first line under the heading entitled "Expenses paid during period" to estimate the expenses you paid on your account during this period.
Hypothetical example for comparison purposes
The second line in the table below provides information about hypothetical account values and hypothetical expenses based on the Portfolio's actual expense ratio and an assumed rate of return of 5% per year before expenses, which is not the Portfolio's actual return. The hypothetical account values and expenses may not be used to estimate the actual ending account balance or expenses you paid for the period. You may use this information to compare the ongoing costs of investing in the Portfolio and other funds. To do so, compare this 5% hypothetical example with the 5% hypothetical examples that appear in the shareholder reports of other funds.
6
UBS PACE Money Market Investments
Understanding your Portfolio's expenses (unaudited)
(concluded)
Please note that the expenses shown in the table are meant to highlight your ongoing Portfolio costs only and do not reflect any program fees. Therefore, the second line in the table is useful in comparing ongoing Portfolio costs only, and will not help you determine the relative total costs of owning different funds. In addition, if program fees were included, your costs would have been higher.
| |
| |
Beginning
account value
February 1, 2010 | |
Ending
account value
July 31, 2010 | | Expenses paid
during period1
02/01/10 to
07/31/10 | | Expense
ratio
during the
period | |
| Class P | | Actual | | $ | 1,000.00 | | | $ | 1,000.00 | | | $ | 1.24 | | | | 0.25 | % | |
| | Hypothetical
(5% annual
return before
expenses) | | | 1,000.00 | | | | 1,023.55 | | | | 1.25 | | | | 0.25 | | |
1 Expenses are equal to the Portfolio's annualized net expense ratio, multiplied by the average account value over the period, multiplied by 181 divided by 365 (to reflect the one-half year period).
7
UBS PACE Money Market Investments
Portfolio statistics (unaudited)
| Characteristics | | 07/31/10 | |
| Net assets (mm) | | $ | 386.2 | | |
| Number of holdings | | | 84 | | |
| Weighted average maturity | | | 46 days | | |
| Portfolio composition1 | | 07/31/10 | |
| Commercial paper | | | 40.8 | % | |
| US government and agency obligations | | | 26.6 | | |
| Certificates of deposit | | | 18.3 | | |
| Repurchase agreements | | | 12.5 | | |
| Short-term corporate obligations | | | 1.8 | | |
| Other assets less liabilities | | | 0.02 | | |
| Total | | | 100.0 | % | |
| Top 10 holdings1 | | 07/31/10 | |
Repurchase agreement with Deutsche Bank Securities,
0.200% due 08/02/10 | | | 12.3 | % | |
| Federal Home Loan Bank, 0.170% due 08/03/10 | | | 3.9 | | |
| PepsiCo, Inc., 0.150% due 08/03/10 | | | 2.6 | | |
| Federal Home Loan Bank, 0.120% due 08/25/10 | | | 2.6 | | |
| Nestle Finance International Ltd., 0.220% due 08/23/10 | | | 2.6 | | |
| Falcon Asset Securitization Corp., 0.200% due 08/02/10 | | | 1.9 | | |
| Dexia Credit Local, 0.430% due 08/05/10 | | | 1.7 | | |
| BNP Paribas Finance, 0.280% due 08/16/10 | | | 1.6 | | |
| Variable Funding Capital Corp., 0.270% due 08/20/10 | | | 1.6 | | |
| Federal National Mortgage Association, 0.350% due 04/26/11 | | | 1.5 | | |
| Total | | | 32.3 | % | |
1 Weightings represent percentages of the Portfolio's net assets as of July 31, 2010. The Portfolio is actively managed and its composition will vary over time.
2 Weighting represents less than 0.05% of the Portfolio's net assets as of July 31, 2010.
8
UBS PACE Money Market Investments
Statement of net assets—July 31, 2010
| Security description | | Face
amount | | Value | |
| US government and agency obligations—26.65% | |
| Federal Farm Credit Bank | |
| 0.500%, due 08/09/101 | | $ | 5,000,000 | | | $ | 4,999,444 | | |
| Federal Home Loan Bank | |
| 0.170%, due 08/03/101 | | | 15,000,000 | | | | 14,999,858 | | |
| 0.120%, due 08/25/101 | | | 10,000,000 | | | | 9,999,200 | | |
| 0.180%, due 08/25/101 | | | 5,000,000 | | | | 4,999,400 | | |
| 0.500%, due 10/15/10 | | | 2,100,000 | | | | 2,099,972 | | |
| 0.500%, due 10/29/10 | | | 4,000,000 | | | | 4,001,924 | | |
| 0.400%, due 01/04/11 | | | 2,000,000 | | | | 1,999,342 | | |
| 0.250%, due 01/14/111 | | | 5,000,000 | | | | 4,994,236 | | |
| 0.370%, due 02/22/111 | | | 2,000,000 | | | | 1,995,786 | | |
| 0.440%, due 04/19/111 | | | 2,000,000 | | | | 1,993,620 | | |
| 0.500%, due 05/17/111 | | | 2,000,000 | | | | 1,991,972 | | |
| 0.580%, due 05/27/11 | | | 2,000,000 | | | | 2,000,000 | | |
| Federal Home Loan Mortgage Corp.* | |
| 0.250%, due 10/05/101 | | | 4,000,000 | | | | 3,998,194 | | |
| 0.310%, due 11/16/101 | | | 2,000,000 | | | | 1,998,157 | | |
| 0.310%, due 12/07/101 | | | 5,000,000 | | | | 4,994,489 | | |
| 0.330%, due 12/07/101 | | | 4,000,000 | | | | 3,995,307 | | |
| 0.270%, due 01/14/111 | | | 4,000,000 | | | | 3,995,020 | | |
| 0.330%, due 05/02/111 | | | 4,000,000 | | | | 3,989,953 | | |
| Federal National Mortgage Association* | |
| 2.875%, due 10/12/10 | | | 1,300,000 | | | | 1,306,057 | | |
| 0.350%, due 04/26/111 | | | 6,000,000 | | | | 5,984,367 | | |
| 0.410%, due 07/06/111 | | | 4,000,000 | | | | 3,984,557 | | |
| US Treasury Bills | |
| 0.151%, due 08/19/101 | | | 5,000,000 | | | | 4,999,624 | | |
| 0.295%, due 07/28/111 | | | 2,000,000 | | | | 1,994,084 | | |
| US Treasury Notes | |
| 2.000%, due 09/30/10 | | | 3,000,000 | | | | 3,008,720 | | |
| 4.875%, due 04/30/11 | | | 2,500,000 | | | | 2,585,519 | | |
Total US government and agency obligations
(cost—$102,908,802) | | | 102,908,802 | | |
9
UBS PACE Money Market Investments
Statement of net assets—July 31, 2010
| Security description | | Face
amount | | Value | |
| Certificates of deposit—18.25% | |
| Banking-non-US—18.25% | |
| Bank of Montreal | |
| 0.270%, due 08/11/10 | | $ | 5,000,000 | | | $ | 5,000,000 | | |
| Bank of Nova Scotia | |
| 0.351%, due 08/17/102 | | | 2,750,000 | | | | 2,749,955 | | |
| Bank of Tokyo-Mitsubishi UFJ Ltd. | |
| 0.380%, due 08/06/10 | | | 5,000,000 | | | | 5,000,000 | | |
| 0.290%, due 08/20/10 | | | 3,000,000 | | | | 3,000,000 | | |
| Canadian Imperial Bank of Commerce | |
| 0.330%, due 08/02/102 | | | 3,500,000 | | | | 3,500,000 | | |
| Credit Agricole CIB | |
| 0.420%, due 09/27/10 | | | 3,000,000 | | | | 3,000,000 | | |
| Dexia Credit Local | |
| 0.430%, due 08/05/10 | | | 6,500,000 | | | | 6,500,000 | | |
| Dnb NOR ASA | |
| 0.500%, due 09/07/10 | | | 4,000,000 | | | | 4,000,000 | | |
| Lloyds TSB Bank PLC | |
| 0.300%, due 08/02/10 | | | 5,000,000 | | | | 5,000,000 | | |
| Mizuho Corporate Bank Ltd. | |
| 0.280%, due 08/23/10 | | | 4,000,000 | | | | 4,000,000 | | |
| National Australia Bank Ltd. | |
| 0.425%, due 08/31/102 | | | 3,000,000 | | | | 3,000,000 | | |
| National Bank of Canada | |
| 0.427%, due 08/03/102 | | | 4,000,000 | | | | 4,000,000 | | |
| Natixis | |
| 0.330%, due 08/02/102 | | | 5,000,000 | | | | 5,000,000 | | |
| Nordea Bank Finland | |
| 0.220%, due 08/30/10 | | | 2,000,000 | | | | 2,000,000 | | |
| Rabobank Nederland NV | |
| 0.200%, due 08/06/10 | | | 3,000,000 | | | | 3,000,000 | | |
| 0.347%, due 08/27/102 | | | 3,000,000 | | | | 3,000,000 | | |
| Royal Bank of Canada | |
| 0.430%, due 08/02/102 | | | 2,750,000 | | | | 2,750,000 | | |
10
UBS PACE Money Market Investments
Statement of net assets—July 31, 2010
| Security description | | Face
amount | | Value | |
| Certificates of deposit—(concluded) | |
| Banking-non-US—(concluded) | |
| Royal Bank of Scotland PLC | |
| 0.510%, due 10/20/10 | | $ | 4,000,000 | | | $ | 4,000,000 | | |
| Westpac Banking Corp. | |
| 0.270%, due 08/02/102 | | | 1,000,000 | | | | 1,000,000 | | |
| 0.280%, due 08/02/102 | | | 1,000,000 | | | | 1,000,000 | | |
| Total certificates of deposit (cost—$70,499,955) | | | 70,499,955 | | |
| Commercial paper1—40.82% | |
| Asset backed-banking—0.52% | |
| Atlantis One Funding | |
| 0.500%, due 09/09/10 | | | 2,000,000 | | | | 1,998,916 | | |
| Asset backed-miscellaneous—16.28% | |
| Atlantic Asset Securitization LLC | |
| 0.280%, due 08/18/10 | | | 5,000,000 | | | | 4,999,339 | | |
| Barton Capital LLC | |
| 0.300%, due 08/11/10 | | | 5,000,000 | | | | 4,999,583 | | |
| 0.290%, due 08/12/10 | | | 5,000,000 | | | | 4,999,557 | | |
| Bryant Park Funding LLC | |
| 0.300%, due 08/10/10 | | | 5,000,000 | | | | 4,999,625 | | |
| Ciesco LLC | |
| 0.270%, due 08/26/10 | | | 3,000,000 | | | | 2,999,438 | | |
| Fairway Finance Co. LLC | |
| 0.270%, due 08/24/10 | | | 3,000,000 | | | | 2,999,482 | | |
| Falcon Asset Securitization Corp. | |
| 0.200%, due 08/02/10 | | | 7,500,000 | | | | 7,499,958 | | |
| Liberty Street Funding LLC | |
| 0.300%, due 08/04/10 | | | 5,000,000 | | | | 4,999,875 | | |
| Ranger Funding Co. LLC | |
| 0.300%, due 08/26/10 | | | 4,000,000 | | | | 3,999,167 | | |
| Regency Markets No. 1 LLC | |
| 0.320%, due 08/16/10 | | | 5,000,000 | | | | 4,999,333 | | |
| Salisbury Receivables Co. LLC | |
| 0.300%, due 08/03/10 | | | 4,401,000 | | | | 4,400,927 | | |
11
UBS PACE Money Market Investments
Statement of net assets—July 31, 2010
| Security description | | Face
amount | | Value | |
| Commercial paper1—(continued) | |
| Asset backed-miscellaneous—(concluded) | |
| Thunderbay Funding | |
| 0.290%, due 08/16/10 | | $ | 5,000,000 | | | $ | 4,999,396 | | |
| Variable Funding Capital Corp. | |
| 0.270%, due 08/20/10 | | | 5,992,000 | | | | 5,991,146 | | |
| | | | 62,886,826 | | |
| Asset backed-securities—3.10% | |
| Clipper Receivables Co. LLC | |
| 0.470%, due 09/21/10 | | | 3,000,000 | | | | 2,998,002 | | |
| 0.370%, due 10/20/10 | | | 2,000,000 | | | | 1,998,356 | | |
| Grampian Funding LLC | |
| 0.570%, due 09/10/10 | | | 5,000,000 | | | | 4,996,833 | | |
| 0.510%, due 10/19/10 | | | 2,000,000 | | | | 1,997,762 | | |
| | | | 11,990,953 | | |
| Banking-non-US—2.07% | |
| Credit Suisse First Boston | |
| 0.370%, due 08/11/10 | | | 5,000,000 | | | | 4,999,486 | | |
| Natixis | |
| 0.530%, due 11/02/10 | | | 2,000,000 | | | | 1,997,262 | | |
| Westpac Securitization NZ Ltd. | |
| 0.417%, due 08/23/102,3 | | | 1,000,000 | | | | 1,000,000 | | |
| | | | 7,996,748 | | |
| Banking-US—7.77% | |
| Bank of America Corp. | |
| 0.220%, due 08/09/10 | | | 5,000,000 | | | | 4,999,756 | | |
| BNP Paribas Finance | |
| 0.280%, due 08/16/10 | | | 6,000,000 | | | | 5,999,300 | | |
| Danske Corp. | |
| 0.265%, due 08/18/10 | | | 5,000,000 | | | | 4,999,374 | | |
| JPMorgan Chase & Co. | |
| 0.220%, due 08/05/10 | | | 4,000,000 | | | | 3,999,902 | | |
| Societe Generale N.A., Inc. | |
| 0.220%, due 08/02/10 | | | 5,000,000 | | | | 4,999,969 | | |
| Toronto-Dominion Holdings USA, Inc. | |
| 0.230%, due 08/13/10 | | | 5,000,000 | | | | 4,999,617 | | |
| | | | 29,997,918 | | |
12
UBS PACE Money Market Investments
Statement of net assets—July 31, 2010
| Security description | | Face
amount | | Value | |
| Commercial paper1—(concluded) | |
| Beverage/bottling—2.59% | |
| PepsiCo, Inc. | |
| 0.150%, due 08/03/10 | | $ | 10,000,000 | | | $ | 9,999,917 | | |
| Energy-integrated—1.29% | |
| BP Capital Markets PLC | |
| 0.530%, due 08/26/10 | | | 5,000,000 | | | | 4,998,160 | | |
| Finance-captive automotive—1.07% | |
| Toyota Motor Credit Corp. | |
| 0.410%, due 10/13/10 | | | 4,120,000 | | | | 4,116,575 | | |
| Finance-noncaptive diversified—1.04% | |
| General Electric Capital Corp. | |
| 0.370%, due 10/13/10 | | | 4,000,000 | | | | 3,996,999 | | |
| Food/beverage—2.59% | |
| Nestle Finance International Ltd. | |
| 0.220%, due 08/23/10 | | | 10,000,000 | | | | 9,998,655 | | |
| Insurance-life—1.29% | |
| AXA Financial, Inc. | |
| 0.320%, due 08/04/10 | | | 5,000,000 | | | | 4,999,867 | | |
| Technology-software—1.21% | |
| Microsoft Corp. | |
| 0.160%, due 08/04/10 | | | 4,660,000 | | | | 4,659,938 | | |
| Total commercial paper (cost—$157,641,472) | | | 157,641,472 | | |
| Short-term corporate obligations—1.81% | |
| Banking-non-US—0.26% | |
| Commonwealth Bank of Australia | |
| 0.508%, due 10/28/102,3 | | | 1,000,000 | | | | 1,000,000 | | |
| Supranationals—1.55% | |
| International Bank for Reconstruction & Development | |
| 0.340%, due 08/23/101 | | | 5,000,000 | | | | 4,998,961 | | |
| 0.410%, due 11/01/101 | | | 1,000,000 | | | | 998,953 | | |
| | | | 5,997,914 | | |
| Total short-term corporate obligations (cost—$6,997,914) | | | 6,997,914 | | |
13
UBS PACE Money Market Investments
Statement of net assets—July 31, 2010
| Security description | | Face
amount | | Value | |
| Repurchase agreements—12.45% | |
Repurchase agreement dated 07/30/10
with Deutsche Bank Securities, 0.200%
due 08/02/10, collateralized by $9,130,000
Federal Home Loan Bank obligations,
2.500% to 5.500% due 06/03/14
to 07/15/36, $4,865,000
Federal Home Loan Mortgage Corp.
obligations, 0.579% due 02/03/12
and $32,716,000 Federal National
Mortgage Association obligations,
zero coupon to 6.125% due 01/03/11
to 10/13/15; (value—$48,454,779);
proceeds: $47,500,792 | | $ | 47,500,000 | | | $ | 47,500,000 | | |
Repurchase agreement dated 07/30/10
with State Street Bank & Trust Co., 0.010%
due 08/02/10, collateralized by $573,301
US Treasury Notes, 2.125% to 3.125%
due 04/30/15 to 04/30/17; (value—$591,605);
proceeds: $580,000 | | | 580,000 | | | | 580,000 | | |
| Total repurchase agreements (cost—$48,080,000) | | | 48,080,000 | | |
Total investments (cost—$386,128,143)
which approximates cost for
federal income tax purposes—99.98% | | | 386,128,143 | | |
| Other assets in excess of liabilities—0.02% | | | 89,055 | | |
Net assets (applicable to 386,217,453
shares of beneficial interest outstanding
equivalent to $1.00 per share)—100.00% | | $ | 386,217,198 | | |
* On September 7, 2008, the Federal Housing Finance Agency placed the Federal National Mortgage Association and the Federal Home Loan Mortgage Corporation into conservatorship, and the US Treasury guaranteed the debt issued by those organizations.
1 Rates shown are the discount rates at date of purchase.
2 Variable rate security. The maturity date reflects earlier of reset dates or stated maturity dates. The interest rate shown is the current rate as of July 31, 2010, and resets periodically.
3 Security exempt from registration pursuant to Rule 144A under the Securities Act of 1933. These securities, which represent 0.52% of net assets as of July 31, 2010, are considered liquid and may be resold in transactions exempt from registration, normally to qualified institutional buyers.
14
UBS PACE Money Market Investments
Statement of net assets—July 31, 2010
Affiliated issuer activity
The table below details the Portfolio's activity in an affiliated issuer during the year ended July 31, 2010. The advisor earns a management fee from UBS Private Money Market Fund LLC.
Security
description | | Value at
07/31/09 | | Purchases
during
the year
ended
07/31/10 | | Sales
during
the year
ended
07/31/10 | | Value at
07/31/10 | | Net
income
earned
from
affiliate
for the
year ended
07/31/10 | |
UBS Private
Money Market
Fund LLC | | $ | 9,894,000 | | | $ | — | | | $ | 9,894,000 | | | $ | — | | | $ | 87 | | |
The following is a summary of the fair valuations according to the inputs used as of July 31, 2010 in valuing the Portfolio's investments:
| | | Unadjusted
quoted
prices
in active
markets for
identical
investments
(Level 1) | |
Other
significant
observable
inputs
(Level 2) | |
Unobservable
inputs
(Level 3) | | Total | |
US government and
agency obligations | | $ | — | | | $ | 102,908,802 | | | $ | — | | | $ | 102,908,802 | | |
| Certificates of deposit | | | — | | | | 70,499,955 | | | | — | | | | 70,499,955 | | |
| Commercial paper | | | — | | | | 157,641,472 | | | | — | | | | 157,641,472 | | |
Short-term corporate
obligations | | | — | | | | 6,997,914 | | | | — | | | | 6,997,914 | | |
Repurchase
agreements | | | — | | | | 48,080,000 | | | | — | | | | 48,080,000 | | |
| Total | | $ | — | | | $ | 386,128,143 | | | $ | — | | | $ | 386,128,143 | | |
At July 31, 2010, there were no transfers between Level 1 and Level 2.
15
UBS PACE Money Market Investments
Statement of net assets—July 31, 2010
Issuer breakdown by country of origin (unaudited)
| | | Percentage of
total investments | |
| United States | | | 74.4 | % | |
| Canada | | | 4.7 | | |
| Japan | | | 4.2 | | |
| Switzerland | | | 3.9 | | |
| United Kingdom | | | 3.6 | | |
| France | | | 2.6 | | |
| Australia | | | 1.8 | | |
| Belgium | | | 1.7 | | |
| Netherlands | | | 1.6 | | |
| Norway | | | 1.0 | | |
| Finland | | | 0.5 | | |
| Total | | | 100.0 | % | |
Weighted average maturity—46 days
See accompanying notes to financial statements
16
UBS PACE Money Market Investments
Statement of operations
| | | For the year
ended
July 31, 2010 | |
| Investment income: | |
| Interest | | $ | 1,222,973 | | |
| Affiliated securities lending income | | | 87 | | |
| | | | 1,223,060 | | |
| Expenses: | |
| Transfer agency and related services fees | | | 1,857,526 | | |
| Investment management and administration fees | | | 1,521,353 | | |
| Reports and notices to shareholders | | | 226,677 | | |
| Professional fees | | | 108,660 | | |
| Custody and accounting fees | | | 58,109 | | |
| State registration fees | | | 46,895 | | |
| US Treasury Temporary Guarantee Program Participation fees | | | 29,569 | | |
| Insurance expense | | | 20,476 | | |
| Trustees' fees | | | 17,615 | | |
| Other expenses | | | 13,444 | | |
| | | | 3,900,324 | | |
Less: Fee waivers and/or expense reimbursements by
investment manager and administrator | | | (2,720,825 | ) | |
| Net expenses | | | 1,179,499 | | |
| Net investment income | | | 43,561 | | |
| Net realized loss from investments | | | (94 | ) | |
| Net increase in net assets resulting from operations | | $ | 43,467 | | |
Statement of changes in net assets
| | | Years ended July 31, | |
| | | 2010 | | 2009 | |
| From operations: | |
| Net investment income | | $ | 43,561 | | | $ | 5,113,515 | | |
| Net realized gain (loss) | | | (94 | ) | | | 43,603 | | |
| Net increase in net assets resulting from operations | | | 43,467 | | | | 5,157,118 | | |
| Dividends and distributions to shareholders from: | |
| Net investment income | | | (43,561 | ) | | | (5,113,515 | ) | |
| Net realized gains | | | (10,489 | ) | | | (75,184 | ) | |
| Total dividends and distributions to shareholders | | | (54,050 | ) | | | (5,188,699 | ) | |
| From beneficial interest transactions: | |
Net increase (decrease) in net assets from
beneficial interest transactions | | | (143,730,728 | ) | | | 6,747,394 | | |
| Net increase (decrease) in net assets | | | (143,741,311 | ) | | | 6,715,813 | | |
| Net assets: | |
| Beginning of year | | | 529,958,509 | | | | 523,242,696 | | |
| End of year | | $ | 386,217,198 | | | $ | 529,958,509 | | |
Accumulated undistributed net
investment income | | $ | — | | | $ | — | | |
See accompanying notes to financial statements
17
UBS PACE Money Market Investments
Financial highlights
Selected data for a share of beneficial interest outstanding throughout each year is presented below:
| | | Years ended July 31, | |
| | | 2010 | | 2009 | | 2008 | | 2007 | | 2006 | |
Net asset value,
beginning of year | | $ | 1.00 | | | $ | 1.00 | | | $ | 1.00 | | | $ | 1.00 | | | $ | 1.00 | | |
| Net investment income | | | 0.0001 | | | | 0.008 | | | | 0.033 | | | | 0.048 | | | | 0.038 | | |
Dividends from net
investment income | | | (0.000 | )1 | | | (0.008 | ) | | | (0.033 | ) | | | (0.048 | ) | | | (0.038 | ) | |
Distributions from net
realized gains | | | (0.000 | )1 | | | (0.000 | )1 | | | — | | | | — | | | | — | | |
Total dividends and
distributions | | | (0.000 | )1 | | | (0.008 | ) | | | (0.033 | ) | | | (0.048 | ) | | | (0.038 | ) | |
Net asset value,
end of year | | $ | 1.00 | | | $ | 1.00 | | | $ | 1.00 | | | $ | 1.00 | | | $ | 1.00 | | |
| Total investment return2 | | | 0.01 | % | | | 0.81 | % | | | 3.40 | % | | | 4.86 | % | | | 3.89 | % | |
| Ratios/supplemental data: | |
Net assets, end of
year (000's) | | $ | 386,217 | | | $ | 529,959 | | | $ | 523,243 | | | $ | 408,562 | | | $ | 342,573 | | |
Expenses to average net
assets, net of fee waivers
and/or expense
reimbursements by manager | | | 0.27 | % | | | 0.59 | % | | | 0.60 | % | | | 0.60 | % | | | 0.60 | % | |
Expenses to average net
assets, before fee waivers
and/or expense
reimbursements by manager | | | 0.90 | % | | | 0.89 | % | | | 0.93 | % | | | 0.92 | % | | | 0.99 | % | |
Net investment income to
average net assets | | | 0.01 | % | | | 0.78 | % | | | 3.27 | % | | | 4.75 | % | | | 3.89 | % | |
1 Amount represents less than $0.0005 per share.
2 Total investment return is calculated assuming a $10,000 investment on the first day of each year reported, reinvestment of all dividends and other distributions, if any, at net asset value on the payable dates, and a sale at net asset value on the last day of each year reported. The figures do not include program fees; results would be lower if these fees were included. Returns do not reflect the deduction of taxes that a shareholder would pay on Portfolio distributions.
See accompanying notes to financial statements
18
UBS PACE Money Market Investments
Notes to financial statements
Organization and significant accounting policies
UBS PACE Money Market Investments (the "Portfolio") is a diversified portfolio of UBS PACE Select Advisors Trust (the "Trust"), which was organized as a Delaware statutory trust under the laws of the State of Delaware by Certificate of Trust dated September 9, 1994, as amended June 9, 1995 and thereafter, and is registered with the Securities and Exchange Commission under the Investment Company Act of 1940, as amended, as an open-end management investment company. The trustees of the Trust have authority to issue an unlimited number of shares of beneficial interest, par value $0.001 per share.
The Trust has fifteen Portfolios available for investment, each having its own investment objectives and policies. Shares of the Portfolio currently are available only to participants in the UBS PACESM Select Advisors Program and the UBS PACESM Multi Advisor Program.
The Trust accounts separately for the assets, liabilities and operations of each Portfolio. Expenses directly attributable to each Portfolio are charged to that Portfolio's operations; expenses which are applicable to all Portfolios are allocated among them on a pro rata basis.
In the normal course of business, the Portfolio may enter into contracts that contain a variety of representations or that provide indemnification for certain liabilities. The Portfolio's maximum exposure under these arrangements is unknown, as this would involve future claims that may be made against the Portfolio that have not yet occurred. However, the Portfolio has not had prior claims or losses pursuant to these contracts and expects the risk of loss to be remote.
In June 2009, the Financial Accounting Standards Board ("FASB") established the FASB Accounting Standards CodificationTM ("Codification") as the single source of authoritative accounting principles recognized by the FASB in the preparation of financial
19
UBS PACE Money Market Investments
Notes to financial statements
statements in conformity with US generally accepted accounting principles ("GAAP"). The Codification supersedes existing and nongrandfathered, non-SEC accounting and reporting standards. The Codification did not change GAAP but rather organized it into a hierarchy where all guidance within the Codification carries an equal level of authority. The Codification became effective on July 1, 2009. The Codification did not have a material effect on the Portfolio's financial statements.
The preparation of financial statements in accordance with GAAP requires the Portfolio's management to make estimates and assumptions that affect the reported amounts and disclosures in the financial statements. Actual results could differ from those estimates. The following is a summary of significant accounting policies:
Valuation of investments—Investments are valued at amortized cost. Periodic review and monitoring of the valuation of the securities held by the Portfolio is performed in an effort to ensure that amortized cost approximates market value.
GAAP requires disclosure surrounding the various inputs that are used in determining the value of the Portfolio's investments. These inputs are summarized into the three broad levels listed below:
Level 1—Unadjusted quoted prices in active markets for identical investments.
Level 2—Other significant observable inputs, including but not limited to, quoted prices for similar investments, interest rates, prepayment speeds and credit risks.
Level 3—Unobservable inputs inclusive of the Portfolio's own assumptions in determining the fair value of investments.
In accordance with the requirements of GAAP, a fair value hierarchy has been included near the end of the Portfolio's Statement of net assets.
20
UBS PACE Money Market Investments
Notes to financial statements
In January 2010, FASB issued Accounting Standards Update ("ASU") No. 2010-06 "Improving Disclosures about Fair Value Measurements". ASU No. 2010-06 requires reporting entities to make new disclosures about amounts and reasons for significant transfers in and out of Level 1 and Level 2 fair value measurements as well as inputs and valuation techniques used to measure fair value for both recurring and nonrecurring fair value measurements that fall in either Level 2 or Level 3, and information on purchases, sales, issuances and settlements on a gross basis in the reconciliation of activity in Level 3 fair value measurements. The new and revised disclosures have been implemented for annual and interim periods beginning after December 15, 2009 except for the disclosures surrounding purchases, sales, issuances and settlements on a gross basis in the reconciliation of Level 3 fair value measurements, which are effective for annual and interim periods beginning after December 15, 2010.
Repurchase agreements—The Portfolio may purchase securities or other obligations from a bank or securities dealer (or its affiliate), subject to the seller's agreement to repurchase them at an agreed upon date (or upon demand) and price. The Portfolio maintains custody of the underlying obligations prior to their repurchase, either through its regular custodian or through a special "tri-party" custodian or sub-custodian that maintains a separate account for both the Portfolio and its counterparty. The underlying collateral is valued daily to ensure that the value, including accrued interest, is at least equal to the repurchase price. In the event of default of the obligation to repurchase, the Portfolio generally has the right to liquidate the collateral and apply the proceeds in satisfaction of the obligation. Repurchase agreements involving obl igations other than US government securities (such as commercial paper, corporate bonds and mortgage loans) may be subject to special risks and may not have the benefit of certain protections in the event of counterparty insolvency. If the seller (or seller's guarantor, if any) becomes insolvent, the Portfolio may suffer delays, costs and possible losses in connection with the disposition or retention of the collateral.
21
UBS PACE Money Market Investments
Notes to financial statements
Under certain circumstances, in the event of default or bankruptcy by the other party to the agreement, realization and/or retention of the collateral may be subject to legal proceedings. The Portfolio may participate in joint repurchase agreement transactions with other funds managed, advised or sub-advised by UBS Global Asset Management (Americas) Inc. ("UBS Global AM").
Under certain circumstances, the Portfolio may engage in a repurchase agreement transaction with a yield of zero in order to invest cash amounts remaining in its portfolio at the end of the day in order to avoid having the Portfolio assessed a fee for uninvested cash held in a business account at a bank.
Investment transactions, investment income and expenses—Investment transactions are recorded on the trade date. Realized gains and losses from investment transactions are calculated using the identified cost method. Interest income is recorded on an accrual basis. Discounts are accreted and premiums are amortized as adjustments to interest income and the identified cost of investments.
Dividends and distributions—Dividends and distributions to shareholders are recorded on the ex-dividend date. The amount of dividends and distributions is determined in accordance with federal income tax regulations, which may differ from GAAP. These "book/tax" differences are either considered temporary or permanent in nature. To the extent these differences are permanent in nature, such amounts are reclassified within the capital accounts based on their federal tax-basis treatment; temporary differences do not require reclassification.
Concentration of risk
The ability of the issuers of debt securities held by the Portfolio to meet their obligations may be affected by economic and political developments, including those particular to a specific industry, country, state or region.
22
UBS PACE Money Market Investments
Notes to financial statements
Investment management and administration fees and other transactions with affiliates
The Portfolio's Board of Trustees has approved an investment management and administration contract ("Management Contract") with UBS Global AM. In accordance with the Management Contract, the Portfolio pays UBS Global AM an investment management and administration fee, which is accrued daily and paid monthly, at an annual rate of 0.35% of the Portfolio's average daily net assets. At July 31, 2010, the Portfolio is owed $79,116 from UBS Global AM, representing investment management and administration fees net of fee waivers/expense reimbursements.
UBS Global AM has contractually undertaken to waive a portion of the Portfolio's investment management and administration fees and/or reimburse a portion of the Portfolio's other expenses, when necessary, to maintain the total ordinary annual operating expenses (excluding dividend expense, borrowing costs and interest expense, if any) through November 30, 2010 at a level not to exceed 0.60%. The Portfolio will make a payment to UBS Global AM for any previously waived fees/reimbursed expenses during the following three fiscal years to the extent that operating expenses are otherwise below the expense cap.
At July 31, 2010, the Portfolio had fee waivers/expense reimbursements subject to repayment and respective dates of expiration as follows:
Fee waivers/expense
reimbursements
subject to repayment | | Expires
July 31,
2011 | | Expires
July 31,
2012 | | Expires
July 31,
2013 | |
| $ | 4,419,019 | | | $ | 1,426,962 | | | $ | 1,729,334 | | | $ | 1,262,723 | | |
Additionally, UBS Global AM may voluntarily waive fees and/or reimburse expenses from time to time in the event that the Portfolio's yield falls below a certain level. Once started, there is no guarantee that UBS Global AM would continue to voluntarily waive an additional portion of its fees and/or reimburse expenses.
23
UBS PACE Money Market Investments
Notes to financial statements
For the year ended July 31, 2010, UBS Global AM voluntarily waived and/or reimbursed expenses of $1,458,102 for that purpose.
For the year ended July 31, 2010, UBS Global AM waived fees/reimbursed expenses, in total, of $2,720,825.
Additional information regarding compensation to affiliate of a board member
Professor Meyer Feldberg serves as a senior advisor to Morgan Stanley, resulting in him being an interested trustee of the Portfolio. The Portfolio has been informed that Professor Feldberg's role at Morgan Stanley does not involve matters directly affecting any UBS funds. Portfolio transactions are executed through Morgan Stanley based on that firm's ability to provide best execution of the transactions. During the year ended July 31, 2010, the Portfolio purchased and sold certain securities (e.g., fixed income securities) in principal trades with Morgan Stanley having an aggregate value of $175,979,194. Morgan Stanley received compensation in connection with these trades, which may have been in the form of a "mark-up" or "mark-down" of the price of the securities, a fee from the issuer for maintaining a commercial paper program, or some other form of compensation. Although the precise amount of this compensation is not general ly known by the Portfolio's investment manager, it is believed that under normal circumstances it represents a small portion of the total value of the transactions.
Transfer agency and related services fees
UBS Financial Services Inc. provides certain services to the Portfolio pursuant to a delegation of authority from BNY Mellon Investment Servicing (US) Inc. (formally PNC Global Investment Servicing (U.S.), Inc.)("BNY Mellon"), the Portfolio's transfer agent, and is compensated for these services by BNY Mellon, not the Portfolio.
For the year ended July 31, 2010, UBS Financial Services, Inc. received from BNY Mellon, not the Portfolio, $927,123 of the total
24
UBS PACE Money Market Investments
Notes to financial statements
transfer agency and related services fees paid by the Portfolio to BNY Mellon.
Securities lending
The Portfolio may lend securities up to 331/3% of its total assets to qualified broker-dealers or institutional investors. The loans are secured at all times by cash, US government securities or irrevocable letters of credit in an amount at least equal to the market value of the securities loaned, plus accrued interest and dividends, determined on a daily basis and adjusted accordingly. The Portfolio will regain ownership of loaned securities to exercise certain beneficial rights; however, the Portfolio may bear the risk of delay in recovery of, or even loss of rights in, the securities loaned should the borrower fail financ ially. The Portfolio receives compensation for lending its securities from interest or dividends earned on the cash, US government securities or irrevocable letters of credit held as collateral, net of fee rebates paid to the borrower plus reasonable administrative and custody fees. State Street Bank and Trust Company serves as the Portfolio's lending agent. At July 31, 2010, the Portfolio did not have any securities on loan.
Other liabilities and components of net assets
At July 31, 2010, the Portfolio had the following liabilities outstanding:
| Payable for shares of beneficial interest repurchased | | $ | 990,975 | | |
| Payable to custodian | | | 4,628 | | |
| Dividends payable to shareholders | | | 1,760 | | |
| Other accrued expenses* | | | 396,526 | | |
* Excludes investment management and administration fees.
At July 31, 2010, the components of net assets were as follows:
| Accumulated paid in capital | | $ | 386,217,292 | | |
| Accumulated net realized loss | | | (94 | ) | |
| Net assets | | $ | 386,217,198 | | |
25
UBS PACE Money Market Investments
Notes to financial statements
Shares of beneficial interest
There is an unlimited amount of $0.001 par value shares of beneficial interest authorized. Transactions in shares of beneficial interest, at $1.00 per share, were as follows:
| | | For the years ended July 31, | |
| | | 2010 | | 2009 | |
| Shares sold | | | 409,092,964 | | | | 993,352,180 | | |
| Shares repurchased | | | (552,857,220 | ) | | | (992,040,001 | ) | |
| Dividends reinvested | | | 33,528 | | | | 5,435,215 | | |
Net increase (decrease) in shares
outstanding | | | (143,730,728 | ) | | | 6,747,394 | | |
US Treasury Temporary Guarantee Program for Money Market Funds
The Portfolio participated in the US Treasury Department Temporary Guarantee Program for Money Market Funds. The program covered shareholders of participating money market funds as of the close of business on September 19, 2008. The program expired on September 18, 2009. The Portfolio bore the cost of participating in this program, to the extent not offset by UBS Global AM's fee waivers/voluntary expense reimbursements. The Portfolio paid a fee of 0.01% of the value of the Portfolio's outstanding shares on September 19, 2008 (valued at $1.00 per share) for participation in the program for the initial coverage period of September 19, 2008, through December 18, 2008. The program was first extended until April 30, 2009, and the Portfolio paid a fee calculated in the same manner but at the rate of 0.015% for continued participation in the program through that date. The program was then extended a final time, providing coverage throu gh September 18, 2009. In April, the Portfolio paid an additional fee for continued coverage for the period May 1, 2009, through September 18, 2009, calculated in the same manner and at the same 0.015% rate as for the initial extension period.
26
UBS PACE Money Market Investments
Notes to financial statements
Federal tax status
The Portfolio intends to distribute substantially all of its income and to comply with the other requirements of the Internal Revenue Code applicable to regulated investment companies. Accordingly, no provision for federal income taxes is required. In addition, by distributing during each calendar year substantially all of its net investment income, net realized capital gains and certain other amounts, if any, the Portfolio intends not to be subject to a federal excise tax.
The tax character of distributions paid during the fiscal years ended July 31, 2010 and July 31, 2009 was ordinary income.
At July 31, 2010 the components of accumulated earnings on a tax basis was undistributed ordinary income of $1,760 and accumulated realized capital losses of $94.
At July 31, 2010, the Portfolio had a capital loss carryforward of $94. This loss carryforward is available as a reduction, to the extent provided in the regulations, of future net realized capital gains and will expire on July 31, 2018.
As of and during the year ended July 31, 2010, the Portfolio did not have any liabilities for any unrecognized tax positions. The Portfolio recognizes interest and penalties, if any, related to unrecognized tax positions as income tax expense in the Statement of operations. During the year ended July 31, 2010, the Portfolio did not incur any interest or penalties.
Each of the tax years in the four year period ended July 31, 2010, remains subject to examination by the Internal Revenue Service and state taxing authorities.
27
UBS PACE Money Market Investments
Report of Ernst & Young LLP, independent
registered public accounting firm
The Board of Trustees and Shareholders of
UBS PACE Select Advisors Trust
We have audited the accompanying statement of net assets of UBS PACE Money Market Investments (one of the series comprising UBS PACE Select Advisors Trust) (the "Portfolio") as of July 31, 2010, and the related statement of operations for the year then ended, the statement of changes in net assets for each of the two years in the period then ended, and the financial highlights for each of the five years in the period then ended. These financial statements and financial highlights are the responsibility of the Portfolio's management. Our responsibility is to express an opinion on these financial statements and financial highlights based on our audits.
We conducted our audits in accordance with the standards of the Public Company Accounting Oversight Board (United States). Those standards require that we plan and perform the audit to obtain reasonable assurance about whether the financial statements and financial highlights are free of material misstatement. We were not engaged to perform an audit of the Portfolio's internal control over financial reporting. Our audits included consideration of internal control over financial reporting as a basis for designing audit procedures that are appropriate in the circumstances, but not for the purpose of expressing an opinion on the effectiveness of the Portfolio's internal control over financial reporting. Accordingly, we express no such opinion. An audit also includes examining, on a test basis, evidence supporting the amounts and disclosures in the financial statements and financial highlights, assessing the accounting principles us ed and significant estimates made by management, and evaluating the overall financial statement presentation. Our procedures included confirmation of securities owned as of July 31, 2010, by correspondence with the custodian and others, or by other appropriate auditing procedures where replies from others were not received. We believe that our audits provide a reasonable basis for our opinion.
28
UBS PACE Money Market Investments
Report of Ernst & Young LLP, independent
registered public accounting firm (concluded)
In our opinion, the financial statements and financial highlights referred to above present fairly, in all material respects, the financial position of UBS PACE Money Market Investments at July 31, 2010, the results of its operations for the year then ended, the changes in its net assets for each of the two years in the period then ended, and the financial highlights for each of the five years in the period then ended, in conformity with US generally accepted accounting principles.

New York, New York
September 28, 2010
29
UBS PACE Money Market Investments
General information (unaudited)
Quarterly Form N-Q portfolio schedule
The Portfolio will file its complete schedule of portfolio holdings with the Securities and Exchange Commission ("SEC") for the first and third quarters of each fiscal year on Form N-Q. The Portfolio's Forms N-Q are available on the SEC's Web site at http://www.sec.gov. The Portfolio's Forms N-Q may be reviewed and copied at the SEC's Public Reference Room in Washington, D.C. Information on the operation of the SEC's Public Reference Room may be obtained by calling 1-800-SEC 0330. Additionally, you may obtain copies of Forms N-Q from the Portfolio upon request by calling 1-800-647 1568.
Proxy voting policies, procedures and record
You may obtain a description of the Portfolio's (1) proxy voting policies, (2) proxy voting procedures and (3) information regarding how the Portfolio voted any proxies related to portfolio securities during the most recent 12-month period ended June 30 for which an SEC filing has been made, without charge, upon request by contacting the Portfolio directly at 1-800-647 1568, online on the Portfolio's Web site: www.ubs.com/ubsglobalam-proxy, or on the EDGAR Database on the SEC's Web site (http://www.sec.gov).
Other tax information
Pursuant to Section 871(k)(2)(C) of the Internal Revenue Code, UBS PACE Money Market Investments designates 100% of its "qualified short-term gains" (as defined in Section 871(k)(2)(D)) related to the distribution made in December 2009 as short-term capital gain dividends.
30
UBS PACE Money Market Investments
Board approval of investment management and administration agreement (unaudited)
Background—At a meeting of the board of UBS PACE Select Advisors Trust (the "Trust") on July 14-15, 2010, the members of the board, including the Trustees who are not "interested persons" of the Trust ("Independent Trustees"), as defined in the Investment Company Act of 1940, as amended (the "1940 Act"), considered and approved the continuance of the investment management and administration agreement (the "Investment Management and Administration Agreement") between UBS Global Asset Management (Americas) Inc. ("UBS Global AM") and the Trust, on behalf of UBS PACE Money Market Investments (the "Portfolio"). In preparing for the meeting, the board members had requested and received extensive information from UBS Global AM to assist them, including performance and expense information for other investment companies with similar investment objectives to the Portfolio. The Independent Trustees discussed the materials initially provided by management prior to the scheduled board meeting. The Independent Trustees also met in executive session after management's presentation was completed to review the disclosure that had been made to them at the meeting. At all of these sessions the Independent Trustees were joined by their independent legal counsel. The Independent Trustees also received a memorandum from their independent legal counsel discussing the duties of board members in considering approval of management, administration and distribution agreements.
In its consideration of the approval of the Investment Management and Administration Agreement, the board considered the following factors:
Nature, extent and quality of the services under the Investment Management and Administration Agreement—The board received and considered information regarding the nature, extent and quality of management services provided to the Portfolio by UBS Global AM. The board also considered the nature, extent and quality of administrative,
31
UBS PACE Money Market Investments
Board approval of investment management and administration agreement (unaudited)
distribution, and shareholder services performed by UBS Global AM and its affiliates for the Portfolio and the resources devoted to, and the record of compliance with, the Portfolio's compliance policies and procedures. The board noted that it received information at regular meetings throughout the year regarding the services rendered by UBS Global AM concerning the management of the Portfolio's affairs and UBS Global AM's role in coordinating providers of other services to the Portfolio. The board's evaluation of the services provided by UBS Global AM took into account the board's knowledge and familiarity gained as board members of funds in the UBS New York fund complex, including the scope and quality of UBS Global AM's investment management and other capabilities and the quality of its administrative and other services. The board observed that the scope of services provided by UBS Global AM had expanded over time as a result of regulatory and other developments, including maintaining and monitoring its own and the Portfolio's expanded compliance programs. It also was noted that the Investment Management and Administration Agreement under consideration had been approved by shareholders at a special meeting of shareholders held in 2008.
The board had available to it the qualifications, backgrounds and responsibilities of the Portfolio's senior personnel at UBS Global AM and had previously received information regarding the person primarily responsible for the day-to-day portfolio management of the Portfolio and recognized that the Portfolio's senior personnel at UBS Global AM report to the board regularly and that at each regular meeting the board receives a detailed report on the Portfolio's performance. The board also considered, based on its knowledge of UBS Global AM and its affiliates, the financial resources available to UBS Global AM and its parent organization, UBS AG. In that regard, the board received extensive financial information regarding UBS Global AM and noted that it was a wholly owned, indirect subsidiary of one of the largest financial services firms in the world. It was also noted that UBS Global AM had approximately
32
UBS PACE Money Market Investments
Board approval of investment management and administration agreement (unaudited)
$143 billion in assets under management and was part of the UBS Global Asset Management Division, which had approximately $560 billion of assets under management worldwide as of March 31, 2010. The board was also cognizant of, and considered, the regulatory and litigation actions and investigations occurring in the past few years involving UBS AG, UBS Global AM and certain of their affiliates.
The board concluded that, overall, it was satisfied with the nature, extent and quality of services provided (and expected to be provided) to the Portfolio under the Investment Management and Administration Agreement.
Management fees and expense ratios—The board reviewed and considered the contractual management fee (the "Contractual Management Fee") payable by the Portfolio to UBS Global AM in light of the nature, extent and quality of the management and administrative services provided by UBS Global AM. The board also reviewed and considered the fee waiver and/or expense reimbursement arrangements for the Portfolio and considered the actual fee rate (after taking any waivers and reimbursements into account) (the "Actual Management Fee"). The board considered that UBS Global AM had entered into an agreement with the Portfolio under which UBS Global AM was contractually obligated to waive its management fees and/or reimburse the Portfolio so that the total ordinary operating expenses of the Portfolio through November 30, 2010 (excluding extraordinary items, di vidend expense, borrowing costs and/or interest expense, if any) would not exceed a specified limit. The board also considered that the Portfolio had agreed to repay UBS Global AM for those waived fees and/or reimbursed expenses if the Portfolio can do so over the following three fiscal years without causing its expenses in any of those years to exceed the expense cap. Additionally, the board received and considered information comparing the Portfolio's Contractual Management Fee, Actual Management Fee and overall expenses with those of funds in a group of funds
33
UBS PACE Money Market Investments
Board approval of investment management and administration agreement (unaudited)
selected and provided by Lipper, Inc. ("Lipper"), an independent provider of investment company data (the "Expense Group"). The Board also noted that it had received supplemental information relating to net and gross fund yields and fiscal year-end expenses information for UBS money market funds, including the Portfolio, as compared to peers in the respective Expense Group. A discussion of the board's considerations with respect to the Portfolio's fees is set forth below.
In connection with its consideration of the Portfolio's management fees, the board also received information from UBS Global AM with respect to fees paid by institutional or separate accounts, however, in management's view, such fee information was not very relevant to the Portfolio because, among other reasons, separately managed and institutional accounts with a "cash" mandate were not subject to all of the constraints of Rule 2a-7 under the 1940 Act to which the Portfolio is subject and, therefore, were not totally comparable. The board also received information on fees charged to other mutual funds managed by UBS Global AM.
The comparative Lipper information showed that the Portfolio's Contractual Management Fee was in the second quintile and its Actual Management Fee and total expenses were in the first quintile in the Portfolio's Expense Group for the comparison periods utilized in the Lipper report. (The first quintile represents that 20% of the funds in the Expense Group with the lowest fees or expenses, as applicable, and the fifth quintile represents that 20% of the funds in the Expense Group with the highest fees or expenses, as applicable.)
Portfolio performance—The board received and considered (a) annualized total return information of the Portfolio compared to other funds (the "Performance Universe") selected by Lipper over the one-, three-, five-, ten-year and since inception periods ended April 30, 2010 and (b) annualized performance information for each year in the ten-year period
34
UBS PACE Money Market Investments
Board approval of investment management and administration agreement (unaudited)
ended April 30, 2010. The board was provided with a description of the methodology Lipper used to determine the similarity of the Portfolio with the funds included in its Performance Universe. The board also noted that it had received information throughout the year at periodic intervals with respect to the Portfolio's performance. The comparative Lipper information showed that the Portfolio's performance was in the fourth quintile for the one-year period, in the third quintile for the three-year period and in the second quintile for the five- and ten-year periods and since inception. (The first quintile represents that 20% of the funds in the Performance Universe with the best relative performance, and the fifth quintile represents that 20% of the funds in the Performance Universe with the worst relative performance.) Management noted that the Portfolio's performance was negatively impacted by several factors including (i) the Federal Reserve's unprecedented accommodative monetary policy which has forced many funds to waive significant portions of their fees to avoid negative yields and (ii) management's continuing conservative positioning of the UBS money market funds with respect to credit, liquidity and diversification.
Adviser profitability—The board received and considered a profitability analysis of UBS Global AM and its affiliates in providing services to the Portfolio, as well as information regarding enhancements to UBS Global AM's methodology in determining profitability. The board also received profitability information with respect to the UBS New York fund complex as a whole. UBS Global AM's profitability was considered not excessive in light of the nature, extent and quality of the services provided to the Portfolio.
Economies of scale—The board received and considered information from management regarding whether UBS Global AM realized economies of scale as the Portfolio's assets grew, whether the Portfolio has appropriately benefited from any economies of scale, and whether there is potential for realization
35
UBS PACE Money Market Investments
Board approval of investment management and administration agreement (unaudited)
of any further economies of scale for the Portfolio. The board considered whether economies of scale in the provision of services to the Portfolio were being passed along to the shareholders. The board noted that the Portfolio's Contractual Management Fee did not contain breakpoints. The board also noted that to the extent the Portfolio's assets increase over time, it will realize economies of scale as certain expenses, such as fees for Trustees, auditor and legal fees and printing and postage, become a smaller percentage of overall assets.
Generally, in light of UBS Global AM's profitability data, the Actual Management Fee and the Contractual Management Fee, the board believed that UBS Global AM's sharing of potential and current economies of scale with the Portfolio was acceptable.
Other benefits to UBS Global AM—The board considered other benefits received by UBS Global AM and its affiliates as a result of its relationship with the Portfolio, including the opportunity to offer additional products and services to Portfolio shareholders. In light of the costs of providing investment management, administrative and other services to the Portfolio and UBS Global AM's ongoing commitment to the Portfolio, the profits and other ancillary benefits that UBS Global AM and its affiliates received were considered reasonable.
In light of all of the foregoing, the board approved the Investment Management and Administration Agreement for the Portfolio. No single factor reviewed by the board was identified by the board as the principal factor in determining whether to approve the Investment Management and Administration Agreement. The Independent Trustees were advised by separate independent legal counsel throughout the process. The board discussed the proposed continuance of the Investment Management and Administration Agreement in private sessions with their independent legal counsel at which no representatives of UBS Global AM were present.
36
(This page intentionally left blank)
37
UBS PACE Money Market Investments
Supplemental information (unaudited)
Board of Trustees & Officers
The Trust is governed by a Board of Trustees which oversees the Portfolios' operations. Each Trustee serves an indefinite term of office. Officers are appointed by the trustees and serve at the pleasure of the Board. The table below shows, for each trustee and officer, his or her name, address and age, the position held with the Trust, the length of time served as a trustee or officer of the Trust, the trustee's or officer's principal occupations during the last five years, the number of portfolios in the UBS fund complex overseen by the trustee or for which a person served as an officer, and other directorships held by the trustee.
The Trust's Statement of Additional Information contains additional information about the trustees and is available, without charge, upon request by calling 1-800-647 1568.
Interested Trustees
| Name, address, and age | | Position(s)
held with
Trust | | Term of
office† and
length of
time served | | Principal occupation(s)
during past 5 years | | Number of portfolios
in fund complex
overseen by trustee | | Other directorships
held by trustee | |
Meyer Feldberg††; 68
Morgan Stanley
1585 Broadway
36th Floor
New York, NY 10036 | | Trustee | | Since 2001 | | Professor Feldberg is Dean Emeritus and Professor of Leadership and Ethics at Columbia Business School, although on an extended leave of absence. He is also a senior advisor to Morgan Stanley (financial services) (since March 2005). Professor Feldberg also serves as president of New York City Global Partners (an organization located in part of the Office of the Mayor of the City of New York that promotes interaction with other cities around the world) (since May 2007). Prior to July 2004, he was Dean and Professor of Leadership and Ethics of the Graduate School of Business at Columbia University (since 1989). | | Professor Feldberg is a director or trustee of 27 investment companies (consisting of 59 portfolios) for which UBS Global AM or one of its affiliates serves as investment advisor, sub-advisor or manager. | | Professor Feldberg is also a director of Primedia Inc. (publishing), Macy's, Inc. (operator of department stores), Revlon, Inc. (cosmetics), SAPPI, Ltd. (producer of paper) and the New York City Ballet. | |
|
38
UBS PACE Money Market Investments
Supplemental information (unaudited)
39
UBS PACE Money Market Investments
Supplemental information (unaudited)
Interested Trustees (concluded)
| Name, address, and age | | Position(s)
held with
Trust | | Term of
office† and
length of
time served | | Principal occupation(s)
during past 5 years | | Number of portfolios
in fund complex
overseen by trustee | | Other directorships
held by trustee | |
| Barry M. Mandinach*; 54 | | Trustee | | Since July 2010 | | Mr. Mandinach is a managing director of UBS Global Asset Management (US) Inc. and UBS Global AM (collectively, "UBS Global AM—Americas region"). He has been with UBS Global AM—Americas region or its predecessors since 2001. He is the Head of Institutional & Wholesale Business (US) (since 2009) as well as Chief Marketing Officer (US) (since 2006). | | Mr. Mandinach is a director or trustee of 12 investment companies (consisting of 44 portfolios) for which UBS Global AM or one of its affiliates serves as investment advisor, sub-advisor or manager. | | None | |
|
Independent Trustees
| Name, address, and age | | Position(s)
held with
Trust | | Term of
office† and
length of
time served | | Principal occupation(s)
during past 5 years | | Number of portfolios
in fund complex
overseen by trustee | | Other directorships
held by trustee | |
Richard Q. Armstrong; 75
c/o Willkie Farr &
Gallagher LLP
787 Seventh Avenue
New York, NY
10019-6099 | | Trustee and Chairman of the Board of Trustees | | Since 2001 (Trustee) Since 2004 (Chairman of the Board of Trustees) | | Mr. Armstrong is chairman and principal of R.Q.A. Enterprises (management consulting firm) (since April 1991 and principal occupation since March 1995). Mr. Armstrong was president or chairman of a number of packaged goods companies (responsible for such brands as Canada Dry, Dr. Pepper, Adirondack Beverages and Moët Hennessy) (from 1982 until 1995). | | Mr. Armstrong is a director or trustee of 15 investment companies (consisting of 47 portfolios) for which UBS Global AM or one of its affiliates serves as investment advisor, sub-advisor or manager. | | None | |
|
40
UBS PACE Money Market Investments
Supplemental information (unaudited)
41
UBS PACE Money Market Investments
Supplemental information (unaudited)
Independent Trustees (continued)
| Name, address, and age | | Position(s)
held with
Trust | | Term of
office† and
length of
time served | | Principal occupation(s)
during past 5 years | | Number of portfolios
in fund complex
overseen by trustee | | Other directorships
held by trustee | |
Alan S. Bernikow; 69
207 Benedict Ave.
Staten Island, NY 10314 | | Trustee | | Since 2005 | | Mr. Bernikow is retired. He was a consultant on non-management matters for the firm of Deloitte & Touche (international accounting and consulting firm) (from June 2003 until 2007). Previously, he was deputy chief executive officer at Deloitte & Touche. | | Mr. Bernikow is a director or trustee of 15 investment companies (consisting of 47 portfolios) for which UBS Global AM or one of its affiliates serves as investment advisor, sub-advisor or manager. | | Mr. Bernikow is also a director of Revlon, Inc. (cosmetics) (and serves as the chair of its audit committee and as the chair of its compensation committee), a director of Mack-Cali Realty Corporation (real estate investment trust) (and serves as the chair of its audit committee); and a director of the Casual Male Retail Group, Inc. (menswear) (and serves as a member of its audit committee and as a member of its nominating and corporate governance committee). He is also a director of Premier American Bank, N.A. | |
|
Richard R. Burt; 63
McLarty Associates
900 17th Street, 8th Floor
Washington, D.C. 20006 | | Trustee | | Since 2001 | | Mr. Burt is a managing director to McLarty Associates (a consulting firm) with which he has been employed since April 2007. He was chairman of IEP Advisors (international investments and consulting firm) until February 2009. Prior to April 2007, he was chairman of Diligence Inc. (information and risk management firm). | | Mr. Burt is a director or trustee of 15 investment companies (consisting of 47 portfolios) for which UBS Global AM or one of its affiliates serves as investment advisor, sub-advisor or manager. | | Mr. Burt is also a director of Central Europe & Russia Fund, Inc., European Equity Fund, Inc. and The New Germany Fund, Inc. | |
|
Bernard H. Garil; 70
6754 Casa Grande Way
Delray Beach, FL 33446 | | Trustee | | Since 2005 | | Mr. Garil is retired (since 2001). He was a managing director at PIMCO Advisory Services (from 1999 to 2001) where he served as president of closed-end funds and vice-president of the variable insurance product funds advised by OpCap Advisors (until 2001). | | Mr. Garil is a director or trustee of 15 investment companies (consisting of 47 portfolios) for which UBS Global AM or one of its affiliates serves as investment advisor, sub-advisor or manager. | | Mr. Garil is also a director of OFI Trust Company (commercial trust company) and a trustee for the Brooklyn College Foundation, Inc. (charitable foundation). | |
|
42
UBS PACE Money Market Investments
Supplemental information (unaudited)
43
UBS PACE Money Market Investments
Supplemental information (unaudited)
Independent Trustees (concluded)
| Name, address, and age | | Position(s)
held with
Trust | | Term of
office† and
length of
time served | | Principal occupation(s)
during past 5 years | | Number of portfolios
in fund complex
overseen by trustee | | Other directorships
held by trustee | |
Heather R. Higgins; 51
255 E. 49th St., Suite 23D
New York, NY 10017 | | Trustee | | Since 2005 | | Ms. Higgins is the president and director of The Randolph Foundation (charitable foundation) (since 1991). Ms. Higgins also serves on the boards of several non-profit charitable groups, including the Independent Women's Forum (chairman), and the Philanthropy Roundtable (vice chairman). She also serves on the board of the Hoover Institution (from 2001 to 2007 and since January 2009). | | Ms. Higgins is a director or trustee of 15 investment companies (consisting of 47 portfolios) for which UBS Global AM or one of its affiliates serves as investment advisor, sub-advisor or manager. | | None | |
|
44
UBS PACE Money Market Investments
Supplemental information (unaudited)
45
UBS PACE Money Market Investments
Supplemental information (unaudited)
Officers
| Name, address, and age | | Position(s)
held with
Trust | | Term of
office† and
length of
time served | | Principal occupation(s)
during past 5 years;
number of portfolios in fund complex
for which person serves as officer | |
| Joseph Allessie*; 45 | | Vice President and Assistant Secretary | | Since 2005 | | Mr. Allessie is an executive director (since 2007) (prior to which he was a director) and deputy general counsel (since 2005) UBS Global AM—Americas region. Prior to joining UBS Global AM—Americas region, he was senior vice president and general counsel of Kenmar Advisory Corp. (from 2004 to 2005). Prior to that Mr. Allessie was general counsel and secretary of GAM USA Inc., GAM Investments, GAM Services, GAM Funds, Inc. and the GAM Avalon Funds (from 1999 to 2004). Mr. Allessie is a vice president and assistant secretary of 19 investment companies (consisting of 101 portfolios) for which UBS Global AM—Americas region or one of its affiliates serves as investment advisor, sub-advisor or manager. | |
|
46
UBS PACE Money Market Investments
Supplemental information (unaudited)
Officers (continued)
| Name, address, and age | | Position(s)
held with
Trust | | Term of
office† and
length of
time served | | Principal occupation(s)
during past 5 years;
number of portfolios in fund complex
for which person serves as officer | |
| Mark E. Carver*; 46 | | President | | Since May 2010 | | Mr. Carver is a managing director and Head of Product Development and Management—Americas for UBS Global AM—Americas region (since 2008). In this role, he oversees product development and management for both wholesale and institutional businesses. He is a member of the Americas Management Committee (since 2008) and the Regional Operating Committee (since 2008). Prior to 2008, Mr. Carver held a number of product-related or sales responsibilities with respect to funds, advisory programs and separately managed accounts. Mr. Carver joined a predecessor of an affiliated firm in 1985 and has been with UBS Global AM—Americas region (or its affiliates) since 1996. Mr. Carver is president of 19 investment companies (consisting of 101 portfolios) for which UBS Global AM or one of its affiliates serves as investment advisor, sub-advisor or manager. | |
|
47
UBS PACE Money Market Investments
Supplemental information (unaudited)
Officers (continued)
| Name, address, and age | | Position(s)
held with
Trust | | Term of
office† and
length of
time served | | Principal occupation(s)
during past 5 years;
number of portfolios in fund complex
for which person serves as officer | |
| Caren Cunningham*; 50 | | Vice President and Assistant Secretary* | | Since 2007 | | Ms. Cunningham is an executive director and senior associate general counsel of UBS Global AM—Americas region (since 2007). Prior to joining UBS Global AM—Americas region, she was vice president and senior legal manager (distribution) of Pioneer Investment Management Limited (from 2005 to 2006). Prior to that Ms. Cunningham was assistant general counsel of Fidelity Investments (1999-2006). Ms. Cunningham is a vice president and assistant secretary of UBS PACE Select Advisors Trust (consisting of 15 portfolios) and an assistant secretary of 18 other investment companies (consisting of 86 portfolios) for which UBS Global AM—Americas region or one of its affiliates serves as investment advisor, sub-advisor or manager. | |
|
| Thomas Disbrow*; 44 | | Vice President and Treasurer | | Since 2000 (Vice President) Since 2004 (Treasurer) | | Mr. Disbrow is an executive director (since 2007) (prior to which he was a director) (since 2000) and head of the US mutual fund treasury administration department (since September 2006) of UBS Global AM—Americas region. Mr. Disbrow is a vice president and treasurer and/or principal accounting officer of 19 investment companies (consisting of 101 portfolios) for which UBS Global AM—Americas region or one of its affiliates serves as investment advisor, sub-advisor or manager. | |
|
48
UBS PACE Money Market Investments
Supplemental information (unaudited)
Officers (continued)
| Name, address, and age | | Position(s)
held with
Trust | | Term of
office† and
length of
time served | | Principal occupation(s)
during past 5 years;
number of portfolios in fund complex
for which person serves as officer | |
| Michael J. Flook*; 45 | | Vice President and Assistant Treasurer | | Since 2006 | | Mr. Flook is a director (since March 2010) (prior to which he was an associate director) (since 2006) and a senior manager of the US mutual fund treasury administration department of UBS Global AM—Americas region. Prior to joining UBS Global AM—Americas region, he was a senior manager with The Reserve (asset management firm) from May 2005 to May 2006. Prior to that he was a senior manager with PFPC Worldwide since October 2000. Mr. Flook is a vice president and assistant treasurer of 19 investment companies (consisting of 101 portfolios) for which UBS Global AM—Americas region or one of its affiliates serves as investment advisor, sub-advisor or manager. | |
|
| Mark F. Kemper**; 52 | | Vice President and Secretary | | Since 2004 | | Mr. Kemper is a managing director (since 2006) and head of the legal department of UBS Global AM—Americas region (since 2004). He was deputy general counsel of UBS Global AM—Americas region (from July 2001 to July 2004). He has been secretary of UBS Global AM—Americas since 1999 and assistant secretary of UBS Global Asset Management Trust Company since 1993 and secretary of UBS AM Holdings (USA) Inc. (since 2001). Mr. Kemper is vice president and secretary of 19 investment companies (consisting of 101 portfolios) for which UBS Global AM—Americas region or one of its affiliates serves as investment advisor, sub-advisor or manager. | |
|
49
UBS PACE Money Market Investments
Supplemental information (unaudited)
Officers (continued)
| Name, address, and age | | Position(s)
held with
Trust | | Term of
office† and
length of
time served | | Principal occupation(s)
during past 5 years;
number of portfolios in fund complex
for which person serves as officer | |
| Joanne M. Kilkeary*; 42 | | Vice President and Assistant Treasurer | | Since 1999 | | Ms. Kilkeary is a director (since March 2008) (prior to which she was an associate director) (since 2000) and a senior manager (since 2004) of the US mutual fund treasury administration department of UBS Global AM—Americas region. Ms. Kilkeary is a vice president and assistant treasurer of 19 investment companies (consisting of 101 portfolios) for which UBS Global AM—Americas region or one of its affiliates serves as investment advisor, sub-advisor or manager. | |
|
| Tammie Lee*; 39 | | Vice President and Assistant Secretary | | Since 2005 | | Ms. Lee is an executive director (since March 2010) (prior to which she was a director) and associate general counsel of UBS Global AM—Americas region (since 2005). Prior to joining UBS Global AM—Americas region, she was vice president and counsel at Deutsche Asset Management/Scudder Investments from 2003 to 2005. Prior to that she was assistant vice president and counsel at Deutsche Asset Management/Scudder Investments from 2000 to 2003. Ms. Lee is a vice president and assistant secretary of 19 investment companies (consisting of 101 portfolios) for which UBS Global AM—Americas region or one of its affiliates serves as investment advisor, sub-advisor or manager. | |
|
50
UBS PACE Money Market Investments
Supplemental information (unaudited)
Officers (continued)
| Name, address, and age | | Position(s)
held with
Trust | | Term of
office† and
length of
time served | | Principal occupation(s)
during past 5 years;
number of portfolios in fund complex
for which person serves as officer | |
| Steven J. LeMire*; 41 | | Vice President and Assistant Treasurer | | Since 2007 | | Mr. LeMire is a director and senior manager of the US mutual fund treasury administration department of UBS Global AM—Americas region (since 2007). Prior to joining UBS Global AM—Americas region, he was an independent consultant with Third River Capital, LLC (formerly Two Rivers Capital, LLC) (from 2005 to 2007). Prior to that, he was vice president of operations and fund administration with Oberweis Asset Management, Inc. (from 1997 to 2005). Mr. LeMire is a vice President and assistant treasurer of 19 investment companies (consisting of 101 portfolios) for which UBS Global AM—Americas region or one of its affiliates serves as investment advisor, sub-advisor or manager. | |
|
| Joseph McGill*; 48 | | Vice President and Chief Compliance Officer | | Since 2004 | | Mr. McGill is a managing director (since 2006) and chief compliance officer (since 2003) at UBS Global AM—Americas region. Prior to joining UBS Global AM—Americas region, he was assistant general counsel at JPMorgan Investment Management (from 1999 to 2003). Mr. McGill is a vice president and chief compliance officer of 19 investment companies (consisting of 101 portfolios) for which UBS Global AM—Americas region or one of its affiliates serves as investment advisor, sub-advisor or manager. | |
|
51
UBS PACE Money Market Investments
Supplemental information (unaudited)
Officers (continued)
| Name, address, and age | | Position(s)
held with
Trust | | Term of
office† and
length of
time served | | Principal occupation(s)
during past 5 years;
number of portfolios in fund complex
for which person serves as officer | |
| Nancy D. Osborn*; 44 | | Vice President and Assistant Treasurer | | Since 2007 | | Mrs. Osborn is a director (since March 2010) (prior to which she was an associate director) and a senior manager of the US mutual fund treasury administration department of UBS Global AM—Americas region (since 2006). Prior to joining UBS Global AM—Americas region, she was an assistant vice president with Brown Brothers Harriman since April 1996. Mrs. Osborn is a vice president and assistant treasurer of 19 investment companies (consisting of 101 portfolios) for which UBS Global AM—Americas region or one of its affiliates serves as investment advisor, sub-advisor or manager. | |
|
| Robert Sabatino**; 37 | | Vice President | | Since 2001 | | Mr. Sabatino is a managing director (since March 2010) (prior to which he was an executive director) (since 2007), head of US taxable money markets (since 2008), and portfolio manager of UBS Global AM—Americas region in the short duration fixed income group (since 2001). From 1995 to 2001 he was a portfolio manager at Merrill Lynch Investment Managers responsible for the management of several retail and institutional money market funds. Mr. Sabatino is a vice president of six investment companies (consisting of 37 portfolios) for which UBS Global AM—Americas region or one of its affiliates serves as investment advisor, sub-advisor or manager. | |
|
52
UBS PACE Money Market Investments
Supplemental information (unaudited)
Officers (continued)
| Name, address, and age | | Position(s)
held with
Trust | | Term of
office† and
length of
time served | | Principal occupation(s)
during past 5 years;
number of portfolios in fund complex
for which person serves as officer | |
| Eric Sanders*; 44 | | Vice President and Assistant Secretary | | Since 2005 | | Mr. Sanders is a director and associate general counsel of UBS Global AM—Americas region (since 2005). From 1996 until June 2005, he held various positions at Fred Alger & Company, Incorporated, the most recent being assistant vice president and associate general counsel. Mr. Sanders is a vice president and assistant secretary of 19 investment companies (consisting of 101 portfolios) for which UBS Global AM—Americas region or one of its affiliates serves as investment advisor, sub-advisor or manager. | |
|
53
UBS PACE Money Market Investments
Supplemental information (unaudited)
Officers (continued)
| Name, address, and age | | Position(s)
held with
Trust | | Term of
office† and
length of
time served | | Principal occupation(s)
during past 5 years;
number of portfolios in fund complex
for which person serves as officer | |
| Andrew Shoup*; 54 | | Vice President and Chief Operating Officer | | Since 2006 | | Mr. Shoup is a managing director and global head of the treasury administration department of UBS Global AM—Americas region (since July 2006). Mr. Shoup is also a director of UBS (IRL) Fund p.l.c. (since December 2008). Prior to joining UBS Global AM—Americas region, he was chief administrative officer for the Legg Mason Partner Funds (formerly Smith Barney, Salomon Brothers, and CitiFunds mutual funds) from November 2003 to July 2006. Prior to that, he held various positions with Citigroup Asset Management and related companies with their domestic and offshore mutual funds since 1993. Additionally, he has worked for another mutual fund complex as well as spending eleven years in public accounting. Mr. Shoup is a vice president and chief operating officer of 19 investment companies (consisting of 101 portfolios) for which UBS Global AM—Americas region or one of its affiliates serves as investment advisor, sub-advisor or manager. | |
|
54
UBS PACE Money Market Investments
Supplemental information (unaudited)
Officers (concluded)
| Name, address, and age | | Position(s)
held with
Trust | | Term of
office† and
length of
time served | | Principal occupation(s)
during past 5 years;
number of portfolios in fund complex
for which person serves as officer | |
| Keith A. Weller*; 49 | | Vice President and Assistant Secretary | | Since 2000 | | Mr. Weller is an executive director and senior associate general counsel of UBS Global AM—Americas region (since 2005) and has been an attorney with affiliated entities since 1995. Mr. Weller is a vice president and assistant secretary of 19 investment companies (consisting of 101 portfolios) for which UBS Global AM—Americas region or one of its affiliates serves as investment advisor, sub-advisor or manager. | |
|
* This person's business address is 1285 Avenue of the Americas, New York, New York 10019-6028.
** This person's business address is One North Wacker Drive, Chicago, Illinois 60606.
† Each trustee holds office for an indefinite term. Officers are appointed by the trustees and serve at the pleasure of the Board.
†† Professor Feldberg is deemed an "interested person" of the Trust as defined in the Investment Company Act because he is a senior advisor to Morgan Stanley, a financial services firm with which the Trust may conduct transactions.
55
(This page intentionally left blank)
56
Trustees
Richard Q. Armstrong
Chairman | |
|
| Alan S. Bernikow | |
|
| Richard R. Burt | |
|
| Meyer Feldberg | |
|
| Bernard H. Garil | |
|
| Heather R. Higgins | |
|
| Barry M. Mandinach | |
|
Principal Officers
Mark E. Carver
President | |
|
Mark F. Kemper
Vice President and Secretary | |
|
Thomas Disbrow
Vice President and Treasurer | |
|
Robert Sabatino
Vice President | |
|
Investment Manager and
Administrator
UBS Global Asset Management (Americas) Inc.
1285 Avenue of the Americas
New York, New York 10019-6028 | |
|
Principal Underwriter
UBS Global Asset Management (US) Inc.
1285 Avenue of the Americas
New York, New York 10019-6028 | |
|
This report is not to be used in connection with the offering of shares of the Portfolio unless accompanied or preceded by an effective prospectus.
© 2010 UBS Global Asset Management (Americas) Inc. All rights reserved.
PRESORTED
STANDARD
U.S. POSTAGE
PAID
COMPUTERSHARE

UBS Global Asset Management (Americas) Inc.
1285 Avenue of the Americas
New York, New York 10019-6028
Item 2. Code of Ethics.
The registrant has adopted a code of ethics that applies to its principal executive officer, principal financial officer, principal accounting officer or controller, or persons performing similar functions pursuant to Section 406 of the Sarbanes-Oxley Act of 2002. (The registrant has designated the code of ethics adopted pursuant to Sarbanes-Oxley as a “Code of Conduct” to lessen the risk of confusion with its separate code of ethics adopted pursuant to Rule 17j-1 under the Investment Company Act of 1940, as amended.)
Item 3. Audit Committee Financial Expert.
The registrant’s Board has determined that the following person serving on the registrant’s Audit Committee is an “audit committee financial expert” as defined in item 3 of Form N-CSR: Alan S. Bernikow. Mr. Bernikow is independent as defined in item 3 of Form N-CSR.
Item 4. Principal Accountant Fees and Services.
(a) Audit Fees:
For the fiscal years ended July 31, 2010 and July 31, 2009, the aggregate Ernst & Young LLP (E&Y) audit fees for professional services rendered to the registrant were approximately $854,350 and $854,350, respectively.
Fees included in the audit fees category are those associated with the annual audits of financial statements and services that are normally provided in connection with statutory and regulatory filings.
(b) Audit-Related Fees:
In each of the fiscal years ended July 31, 2010 and July 31, 2009, the aggregate audit-related fees billed by E&Y for services rendered to the registrant that are reasonably related to the performance of the audits of the financial statements, but not reported as audit fees, were approximately $40,900 and $60,099, respectively.
Fees included in the audit-related fees category are those associated with (1) the reading and providing of comments on the 2010 and 2009 semiannual financial statements and (2) review of the consolidated 2009, 2008 and 2007 reports on the profitability of the UBS Funds to UBS Global Asset Management (Americas) Inc. and its affiliates to assist the board members in their annual advisory/administration contract and service/distribution plan reviews.
There were no audit-related fees required to be approved pursuant to paragraph (c)(7)(ii) of Rule 2-01 of Regulation S-X during the fiscal years indicated above.
(c) Tax Fees:
In each of the fiscal years ended July 31, 2010 and July 31, 2009, the aggregate tax fees billed by E&Y for professional services rendered to the registrant were approximately $293,440 and $276,980, respectively.
Fees included in the tax fees category comprise all services performed by professional staff in the independent accountant’s tax division except those services related to the audits. This category comprises fees for review of tax compliance, tax return preparation and excise tax calculations.
There were no tax fees required to be approved pursuant to paragraph (c)(7)(ii) of Rule 2-01 of Regulation S-X during the fiscal years indicated above.
(d) All Other Fees:
In each of the fiscal years ended July 31, 2010 and July 31, 2009, there were no fees billed by E&Y for products and services, other than the services reported in Item 4(a)-(c) above, rendered to the registrant.
Fees included in the all other fees category would consist of services related to internal control reviews, strategy and other consulting, financial information systems design and implementation, consulting on other information systems, and other tax services unrelated to the registrant.
There were no “all other fees” required to be approved pursuant to paragraph (c)(7)(ii) of Rule 2-01 of Regulation S-X during the fiscal years indicated above.
(e) (1) Audit Committee Pre-Approval Policies and Procedures:
The registrant’s Audit Committee (“audit committee”) has adopted an “Audit Committee Charter (Amended and Restated as of May 12, 2004 — with revisions through July 2008)” (the “charter”). The charter contains the audit committee’s pre-approval policies and procedures. Reproduced below is an excerpt from the charter regarding pre-approval policies and procedures:
The [audit] Committee shall:
…
2. Pre-approve (a) all audit and permissible non-audit services(1) to be provided to the Fund and (b) all permissible non-audit services to be provided by the Fund’s independent auditors to UBS Global [Asset Management (Americas) Inc. (“UBS Global AM”)] and any Covered Service Providers, if the engagement relates directly to the operations and financial reporting of the Fund. In carrying out this responsibility, the Committee shall seek periodically from UBS Global [AM] and from the independent auditors a list of such audit and permissible non-audit services that can be expected to be rendered to the Fund, UBS Global [AM] or any Covered Service Providers by the Fund’s independent auditors, and an estimate of the fees sought to be paid in connection with such services. The Committee may delegate its responsibility to pre-approve any such audit and permissible non-audit services to a sub-committee consisting of the Chairperson of the Committee
and two other members of the Committee as the Chairperson, from time to time, may determine and appoint, and such sub-committee shall report to the Committee, at its next regularly scheduled meeting after the sub-committee’s meeting, its decision(s). From year to year, the Committee shall report to the Board whether this system of pre-approval has been effective and efficient or whether this Charter should be amended to allow for pre-approval pursuant to such policies and procedures as the Committee shall approve, including the delegation of some or all of the Committee’s pre-approval responsibilities to other persons (other than UBS Global [AM] or the Fund’s officers).
(1) The Committee will not approve non-audit services that the Committee believes may taint the independence of the auditors. Currently, permissible non-audit services include any professional services (including tax services) that are not prohibited services as described below, provided to the Fund by the independent auditors, other than those provided to the Fund in connection with an audit or a review of the financial statements of the Fund. Permissible non-audit services may not include: (i) bookkeeping or other services related to the accounting records or financial statements of the Fund; (ii) financial information systems design and implementation; (iii) appraisal or valuation services, fairness opinions or contribution-in-kind reports; (iv) actuarial services; (v) internal audit outsourcing services; (vi) management functions or human resources; (vii) broker or dealer, investment adviser or investment banking services; (viii) legal services and expert services unrelated to the audit; and (ix) any other service the Public Company Accounting Oversight Board determines, by regulation, is impermissible.
Pre-approval by the Committee of any permissible non-audit services is not required so long as: (i) the aggregate amount of all such permissible non-audit services provided to the Fund, UBS Global [AM] and any service providers controlling, controlled by or under common control with UBS Global [AM] that provide ongoing services to the Fund (“Covered Service Providers”) constitutes not more than 5% of the total amount of revenues paid to the independent auditors (during the fiscal year in which the permissible non-audit services are provided) by (a) the Fund, (b) its investment adviser and (c) any entity controlling, controlled by, or under common control with the investment adviser that provides ongoing services to the Fund during the fiscal year in which the services are provided that would have to be approved by the Committee; (ii) the permissible non-audit services were not recognized by the Fund at the time of the engagement to be non-audit services; and (iii) such services are promptly brought to the attention of the Committee and approved by the Committee (or its delegate(s)) prior to the completion of the audit.
(e) (2) Services approved pursuant to paragraph (c)(7)(i)(C) of Rule 2-01 of Regulation S-X:
Audit-Related Fees:
There were no amounts that were approved by the audit committee pursuant to the de minimis exception for the fiscal years ended July 31, 2010 and July 31, 2009 on behalf of the registrant.
There were no amounts that were required to be approved by the audit committee pursuant to the de minimis exception for the fiscal years ended July 31, 2010 and July 31, 2009 on behalf of the registrant’s service providers that relate directly to the operations and financial reporting of the registrant.
Tax Fees:
There were no amounts that were approved by the audit committee pursuant to the de minimis exception for the fiscal years ended July 31, 2010 and July 31, 2009 on behalf of the registrant.
There were no amounts that were required to be approved by the audit committee pursuant to the de minimis exception for the fiscal years ended July 31, 2010 and July 31, 2009 on behalf of the registrant’s service providers that relate directly to the operations and financial reporting of the registrant.
All Other Fees:
There were no amounts that were approved by the audit committee pursuant to the de minimis exception for the fiscal years ended July 31, 2010 and July 31, 2009 on behalf of the registrant.
There were no amounts that were required to be approved by the audit committee pursuant to the de minimis exception for the fiscal years ended July 31, 2010 and July 31, 2009 on behalf of the registrant’s service providers that relate directly to the operations and financial reporting of the registrant.
(f) According to E&Y, for the fiscal year ended July 31, 2010, the percentage of hours spent on the audit of the registrant’s financial statements for the most recent fiscal year that were attributed to work performed by persons who are not full-time, permanent employees of E&Y was 0%.
(g) For the fiscal years ended July 31, 2010 and July 31, 2009, the aggregate fees billed by E&Y of $564,340 and $2,376,239, respectively, for non-audit services rendered on behalf of the registrant (“covered”), its investment adviser (not including any sub-adviser whose role is primarily portfolio management and is subcontracted with or overseen by another investment adviser) and any entity controlling, controlled by, or under common control with the adviser (“non-covered”) that provides ongoing services to the registrant for each of the last two fiscal years of the registrant is shown in the table below:
| | 2010 | | 2009 | |
Covered Services | | $ | 334,340 | | $ | 337,079 | |
Non-Covered Services | | 230,000 | | 2,039,160 | |
| | | | | | | |
(h) The registrant’s audit committee was not required to consider whether the provision of non-audit services that were rendered to the registrant’s investment adviser (not including any sub-adviser whose role is primarily portfolio management and is subcontracted with or
overseen by another investment adviser), and any entity controlling, controlled by, or under common control with the investment adviser that provides ongoing services to the registrant that were not pre-approved pursuant to paragraph (c)(7)(ii) of Rule 2-01 of Regulation S-X is compatible with maintaining the principal accountant’s independence.
Item 5. Audit Committee of Listed Registrants.
Not applicable to the registrant.
Item 6. Investments.
(a) Included as part of the report to shareholders filed under Item 1 of this form.
(b) Not applicable.
Item 7. Disclosure of Proxy Voting Policies and Procedures for Closed-End Management Investment Companies.
Not applicable to the registrant.
Item 8. Portfolio Managers of Closed-End Management Investment Companies.
Not applicable to the registrant.
Item 9. Purchases of Equity Securities by Closed-End Management Investment Company and Affiliated Purchasers.
Not applicable to the registrant.
Item 10. Submission of Matters to a Vote of Security Holders.
(a) The registrant’s Board has established a Nominating and Corporate Governance Committee. The Nominating and Corporate Governance Committee will consider nominees recommended by shareholders if a vacancy occurs among those board members who are not “interested persons” as defined in Section 2(a)(19) of the Investment Company Act of 1940, as amended. In order to recommend a nominee, a shareholder should send a letter to the chairperson of the Nominating and Corporate Governance Committee, Richard R. Burt, care of the Secretary of the registrant at UBS Global Asset Management (Americas) Inc., UBS Building, One North Wacker Drive, Chicago, IL 60606, Attn: Mark Kemper, Secretary, and indicate on the envelope “Nominating and Corporate Governance Committee.” The shareholder’s letter should state the nominee’s name and should include the nominee’s resume or curriculum vitae, and must be accompanied by a written consent of the individual to stand for election if nominated for the Board and to serve if elected by shareholders.
Item 11. Controls and Procedures.
(a) The registrant’s principal executive officer and principal financial officer have concluded that the registrant’s disclosure controls and procedures (as defined in Rule 30a-3(c) under the Investment Company Act of 1940, as amended) are effective based on their evaluation of these controls and procedures as of a date within 90 days of the filing date of this document.
(b) The registrant’s principal executive officer and principal financial officer are aware of no changes in the registrant’s internal control over financial reporting (as defined in Rule 30a-3(d) under the Investment Company Act of 1940, as amended) that occurred during the registrant’s most recent fiscal half-year that has materially affected, or is reasonably likely to materially affect, the registrant’s internal control over financial reporting.
Item 12. Exhibits.
(a) (1) Code of Ethics as required pursuant to Section 406 of the Sarbanes-Oxley Act of 2002 (and designated by registrant as a “Code of Conduct”) is filed herewith as Exhibit EX-99.CODE ETH.
(a) (2) Certifications of principal executive officer and principal financial officer pursuant to Section 302 of the Sarbanes-Oxley Act of 2002 are attached hereto as Exhibit EX-99.CERT.
(a) (3) Written solicitation to purchase securities under Rule 23c-1 under the Investment Company Act of 1940 sent or given during the period covered by the report by or on behalf of the registrant to 10 or more persons — not applicable to the registrant.
(b) Certifications of principal executive officer and principal financial officer pursuant to Section 906 of the Sarbanes-Oxley Act of 2002 are attached hereto as Exhibit EX-99.906CERT.
SIGNATURES
Pursuant to the requirements of the Securities Exchange Act of 1934 and the Investment Company Act of 1940, the registrant has duly caused this report to be signed on its behalf by the undersigned, thereunto duly authorized.
UBS PACE Select Advisors Trust
By: | /s/ Mark E. Carver | |
| Mark E. Carver |
| President |
| |
Date: | October 11, 2010 |
Pursuant to the requirements of the Securities Exchange Act of 1934 and the Investment Company Act of 1940, this report has been signed below by the following persons on behalf of the registrant and in the capacities and on the dates indicated.
By: | /s/ Mark E. Carver | |
| Mark E. Carver |
| President |
| |
Date: | October 11, 2010 |
| |
By: | /s/ Thomas Disbrow | |
| Thomas Disbrow |
| Vice President and Treasurer |
| |
Date: | October 11, 2010 |