Item 1: Report to Shareholders| Capital Opportunity Fund | June 30, 2006 |
The views and opinions in this report were current as of June 30, 2006. They are not guarantees of performance or investment results and should not be taken as investment advice. Investment decisions reflect a variety of factors, and the managers reserve the right to change their views about individual stocks, sectors, and the markets at any time. As a result, the views expressed should not be relied upon as a forecast of the fund’s future investment intent. The report is certified under the Sarbanes-Oxley Act of 2002, which requires mutual funds and other public companies to affirm that, to the best of their knowledge, the information in their financial reports is fairly and accurately stated in all material respects.
REPORTS ON THE WEB
Sign up for our E-mail Program, and you can begin to receive updated fund reports and prospectuses online rather than through the mail. Log in to your account at troweprice.com for more information.
Fellow Shareholders
The first six months of 2006 brought good news and bad news for the U.S. stock market. The good news: a resilient economy and continued strength in corporate profits, which boosted stocks early in the year. The bad news: an unexpected spike in the inflation rate and rising interest rates, which put downward pressure on stocks late in the period and erased nearly all of the market’s earlier gains. When the dust settled, the major stock indexes managed to post modestly positive results for the six-month period.
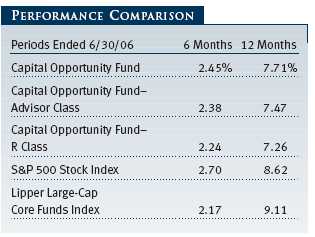
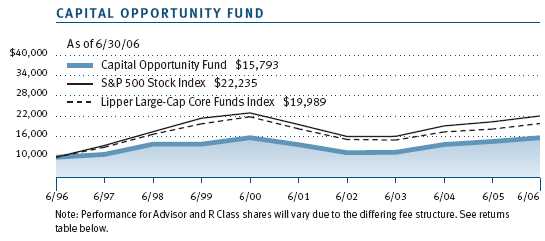
As the accompanying table shows, your fund’s return reflected the performance of the broader market. The Capital Opportunity Fund returned 2.45% in the first half of 2006, slightly behind the S&P 500 Stock Index and slightly ahead of the Lipper Large-Cap Core Funds Index. (Returns for Advisor and R Class shares reflected different fee structures.) For the 12 months ended June 30, 2006, the fund’s 7.71% return fell short of both the S&P 500 and the Lipper peer group index. Stock selection in the industrials and business services sector was the main reason behind the portfolio’s slight underperformance of the S&P 500 for the six-month period.
MARKET ENVIRONMENT
The U.S. economy bounced back in the first six months of 2006 after a brief slowdown caused by the destructive Gulf Coast hurricanes in the summer and fall of 2005. Economic growth surged to a 5.6% annual rate in the first quarter of the year and continued at a solid, though slower, pace in the second quarter. The healthy economy provided a further lift to corporate earnings growth, which continued to surpass expectations. Favorable economic and profit growth provided the catalyst for a stock market rally that lasted through the first four months of the year.
However, inflation concerns surfaced in the latter part of the six-month period as sharp increases in the consumer price index (off a low base) suggested that record-high prices for energy and other commodities were having a more substantial impact on retail prices. The Federal Reserve signaled its concern by continuing to raise short-term interest rates to their highest levels in more than five years. Jittery investors, who were expecting the Fed to indicate that its series of rate hikes was over, reacted by pushing stocks lower, and the market gave up most of its previous gains in the last six weeks of the period.
Small-cap stocks posted the best returns during the first half of 2006, but they also experienced the greatest volatility. The small-cap Russell 2000 Index returned 8.21%, well ahead of the 2.70% return of the large-cap S&P 500. Value stocks outperformed growth issues by a wide margin across all market capitalizations as investors grew increasingly risk averse.
Telecommunication services stocks were the best performers during the six-month period, benefiting from industry consolidation. The most economically sensitive sectors of the market—energy, materials, and industrials—also performed well. In contrast, the traditional growth sectors suffered the largest declines, led by information technology and health care. The widening investigation of stock option backdating had a large impact on these two sectors.
PORTFOLIO REVIEW
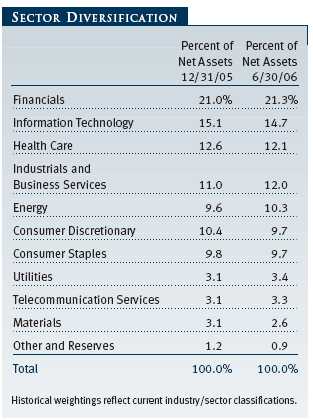
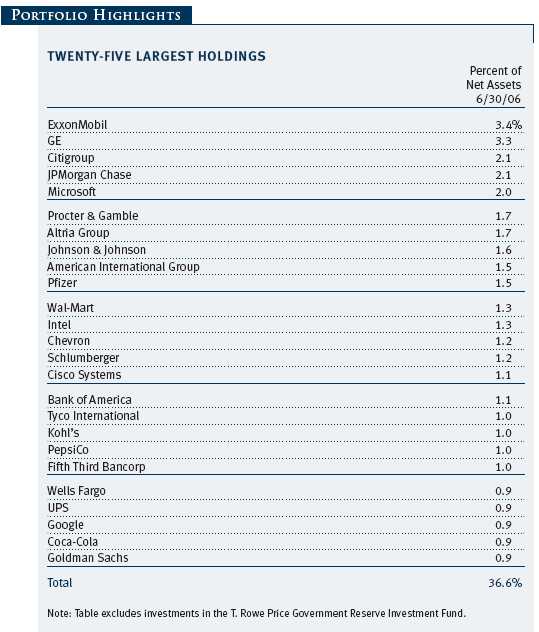
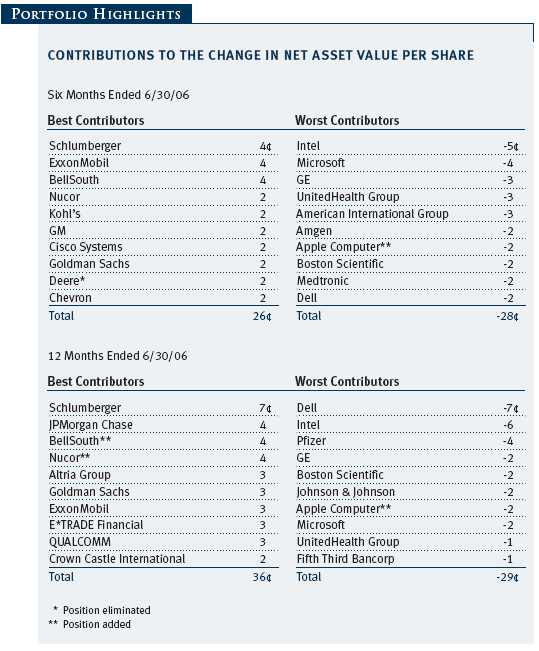
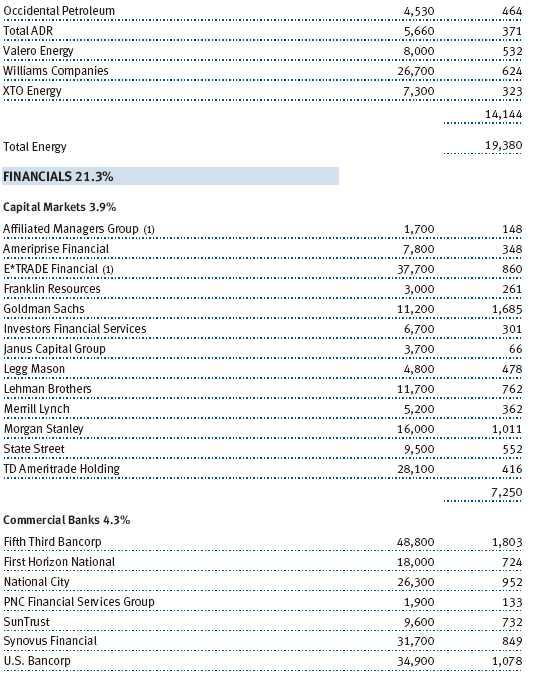
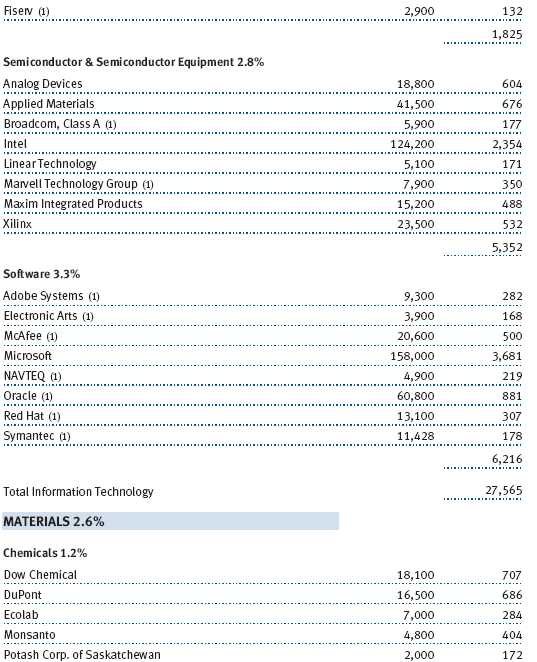
Energy stocks (10% of fund assets as of June 30, 2006) continued to have the most substantial positive impact on fund performance. In particular, energy equipment and services companies benefited from increased spending by oil production companies on infrastructure, equipment, and specialized services. The top contributor in the portfolio in the last six months was Schlumberger, the world’s largest oil field services company, which reported strong earnings as oil producers worldwide boosted spending to seek new sources of oil and gas. FMC Technologies, a smaller energy services provider, also performed well amid increasing demand for its undersea products. Oil and gas giant ExxonMobil, the fund’s largest holding as of June 30, was the second-best performance contributor in the portfolio. (Please refer to the fund’s portfolio of investments for a complete listing of the fund’s holdings and the amount each represents in the portfolio.)
The portfolio’s largest sector weighting was financials (21% of assets), which performed broadly in line with the overall market. Two of the best contributors in the sector were investment banks Goldman Sachs and JPMorgan Chase, both of which benefited from healthy capital markets and heavy merger activity. The fund’s exposure to real estate investment trusts (REITs) also contributed favorably to results; one of the better performers was office REIT CarrAmerica Realty, which was acquired by a private equity group. On the downside, global insurance conglomerate American International Group declined amid disappointing earnings and settlement costs related to scandals that led to the ouster of its long-time CEO more than a year ago. We maintained our position because the company has strong long-term fundamentals and the stock sells at an unusually discounted valuation.
Two of the smaller sectors within the portfolio, telecommunication services and utilities (each of which represented 3% of assets at the end of the period), posted strong returns in the first half of the year. In the telecommunications sector, we established a position in BellSouth early in the year. Improving profit margins at Cingular Wireless boosted BellSouth’s earnings, and the stock rose further following a takeover offer from AT&T. The top contributors in the utilities sector were diversified utility Duke Energy, which benefited from the strong performance of independent power producers, and Texas-based electric utility TXU.
Materials stocks, another small sector weighting in the portfolio (3% of assets), contributed the most to performance relative to the S&P 500. The outperformance in this sector was driven by metals and mining stocks, particularly steel producer Nucor and mining company BHP Billiton. Both companies benefited from strong demand and soaring prices.
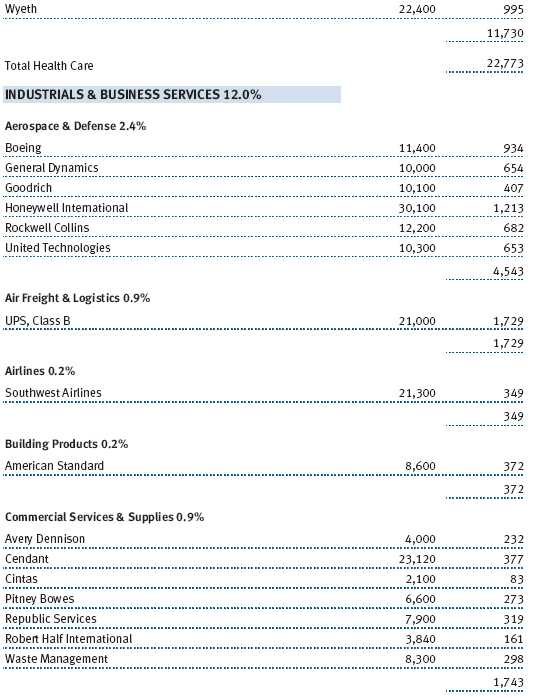
The portfolio’s industrials and business services stocks (12% of fund assets) produced solid gains but were nonetheless a primary cause of the fund’s underperformance versus the S&P 500. The main culprit here was our overweight in General Electric, which fell after reporting solid but unexciting results. We trimmed our position in GE but remain overweight because we believe the company is well positioned to prosper in the slowing economic environment that we foresee. On the positive side, farm machinery manufacturer Deere rallied on better-than-expected earnings. However, we sold our Deere holdings, preferring other industrial stocks such as Tyco International, where we feel the upside potential is greater.
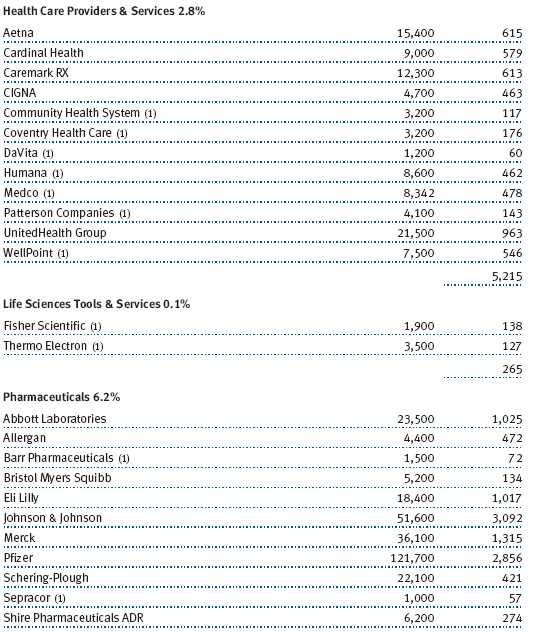
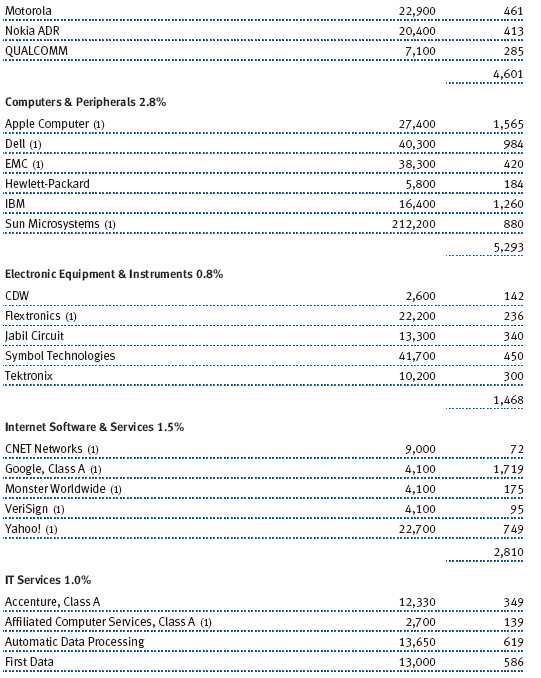
The only two sectors of the portfolio to post negative returns in the first half of 2006 were information technology (15% of assets) and health care (12% of assets). Many of the 10 worst contributors came from these sectors; among them were technology bellwethers Intel and Microsoft. Chipmaker Intel continued to lose market share to rival Advanced Micro Devices, while software titan Microsoft announced a $2 billion spending initiative that was not well received by the market. A newly established position in Apple Computer also failed to bear fruit as lower-than-expected iPod sales weighed on the stock.

In the health care sector, managed care company UnitedHealth Group, which is under investigation for backdating stock option grants to top executives, was one of the largest detractors in the portfolio. While we were disappointed to learn of the company’s options practices, we do not believe this issue will have a major impact on future profitability. Medical device makers Boston Scientific and Medtronic were also noteworthy detractors from performance. Both companies were hurt by concerns about product safety and slowing sales of implantable heart defibrillators.
NONINDEX HOLDINGS
Our investment approach involves maintaining neutral sector weightings compared with the S&P 500 and then adding value through individual stock selection. Typically, our search for potential capital appreciation leads us to invest a portion of the portfolio in stocks not represented in the index. On balance, these nonindex holdings contributed positively to performance in the first half of 2006. The leading performers included FMC Technologies and BHP Billiton, both of which were discussed previously, as well as wireless tower operator Crown Castle International and gaming company Wynn Resorts.
However, our position in nonindex stocks dropped from 9% to 7% of the portfolio during the period. The decline did not result from any specific reallocation on our part, but rather from merger activity and changes to the composition of the S&P 500. Several portfolio holdings were added to the S&P 500 in the first six months of 2006, including asset manager Legg Mason, networking systems provider Juniper Networks, and search firm Google. Other nonindex holdings—such as CarrAmerica Realty and wireless provider Nextel Partners—were taken out via acquisition.
OUTLOOK
Recent increases in inflation and interest rates have rattled equity investors, but we remain positive in our outlook for the stock market. We expect the economic expansion to continue in the second half of 2006 and into 2007, albeit at a slower rate, which should augur well for further revenue and profit growth at many public companies. In addition, corporate America has spent the last several years cutting costs and shoring up balance sheets, resulting in a much stronger financial position.
That said, earnings growth is likely to moderate in the coming quarters, increasing the importance of diligent stock selection. This plays right into our strength—using comprehensive analysis to find stocks that will produce the best results over the long run.
Respectfully submitted,

William J. Stromberg
President of the fund and chairman of its Investment Advisory Committee
July 17, 2006
The committee chairman has day-to-day responsibility for managing the portfolio and works with committee members in developing and executing the fund’s investment program.
RISKS OF INVESTING
As with all stock mutual funds, the fund’s share price can fall because of weakness in the stock market, a particular industry, or specific holdings. Stock markets can decline for many reasons, including adverse political or economic developments, changes in investor psychology, or heavy institutional selling. The prospects for an industry or company may deteriorate because of a variety of factors, including disappointing earnings or changes in the competitive environment.
GLOSSARY
Federal funds target rate: An overnight lending rate set by the Federal Reserve and used by banks to meet reserve requirements. Banks also use the fed funds rate as a benchmark for their prime lending rates.
Lipper indexes: Consist of a small number (10 to 30) of the largest mutual funds in a particular category as tracked by Lipper Inc.
Russell 2000 Index: Tracks the stocks of 2,000 small U.S. companies.
S&P 500 Stock Index: Tracks the stocks of 500 mostly large U.S. companies.
This chart shows the value of a hypothetical $10,000 investment in the fund over the past 10 fiscal year periods or since inception (for funds lacking 10-year records). The result is compared with benchmarks, which may include a broad-based market index and a peer group average or index. Market indexes do not include expenses, which are deducted from fund returns as well as mutual fund averages and indexes.
| AVERAGE ANNUAL COMPOUND TOTAL RETURN |
This table shows how the fund would have performed each year if its actual (or cumulative) returns had been earned at a constant rate.
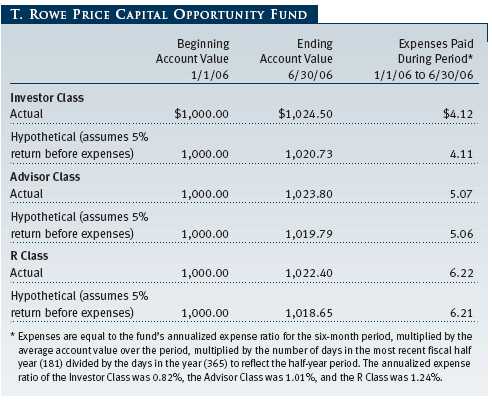
As a mutual fund shareholder, you may incur two types of costs: (1) transaction costs, such as redemption fees or sales loads, and (2) ongoing costs, including management fees, distribution and service (12b-1) fees, and other fund expenses. The following example is intended to help you understand your ongoing costs (in dollars) of investing in the fund and to compare these costs with the ongoing costs of investing in other mutual funds. The example is based on an investment of $1,000 invested at the beginning of the most recent six-month period and held for the entire period.
Please note that the fund has three share classes: The original share class (“investor class”) charges no distribution and service (12b-1) fee; Advisor Class shares are offered only through unaffiliated brokers and other financial intermediaries and charge a 0.25% 12b-1 fee; R Class shares are available to retirement plans serviced by intermediaries and charge a 0.50% 12b-1 fee. Each share class is presented separately in the table.
Actual Expenses
The first line of the following table (“Actual”) provides information about actual account values and expenses based on the fund’s actual returns. You may use the information in this line, together with your account balance, to estimate the expenses that you paid over the period. Simply divide your account value by $1,000 (for example, an $8,600 account value divided by $1,000 = 8.6), then multiply the result by the number in the first line under the heading “Expenses Paid During Period” to estimate the expenses you paid on your account during this period.
Hypothetical Example for Comparison Purposes
The information on the second line of the table (“Hypothetical”) is based on hypothetical account values and expenses derived from the fund’s actual expense ratio and an assumed 5% per year rate of return before expenses (not the fund’s actual return). You may compare the ongoing costs of investing in the fund with other funds by contrasting this 5% hypothetical example and the 5% hypothetical examples that appear in the shareholder reports of the other funds. The hypothetical account values and expenses may not be used to estimate the actual ending account balance or expenses you paid for the period.
Note: T. Rowe Price charges an annual small-account maintenance fee of $10, generally for accounts with less than $2,000 ($500 for UGMA/UTMA). The fee is waived for any investor whose T. Rowe Price mutual fund accounts total $25,000 or more, accounts employing automatic investing, and IRAs and other retirement plan accounts that utilize a prototype plan sponsored by T. Rowe Price (although a separate custodial or administrative fee may apply to such accounts). This fee is not included in the accompanying table. If you are subject to the fee, keep it in mind when you are estimating the ongoing expenses of investing in the fund and when comparing the expenses of this fund with other funds.
You should also be aware that the expenses shown in the table highlight only your ongoing costs and do not reflect any transaction costs, such as redemption fees or sales loads. Therefore, the second line of the table is useful in comparing ongoing costs only and will not help you determine the relative total costs of owning different funds. To the extent a fund charges transaction costs, however, the total cost of owning that fund is higher.
Unaudited

The accompanying notes are an integral part of these financial statements.
Unaudited
The accompanying notes are an integral part of these financial statements.
Unaudited
The accompanying notes are an integral part of these financial statements.
Unaudited


The accompanying notes are an integral part of these financial statements.
Unaudited

The accompanying notes are an integral part of these financial statements.
Unaudited

The accompanying notes are an integral part of these financial statements.
Unaudited
The accompanying notes are an integral part of these financial statements.
Unaudited
| NOTES TO FINANCIAL STATEMENTS |
NOTE 1 - SIGNIFICANT ACCOUNTING POLICIES
T. Rowe Price Capital Opportunity Fund, Inc. (the fund), is registered under the Investment Company Act of 1940 (the 1940 Act) as a diversified, open-end management investment company. The fund seeks to provide long-term capital growth by investing primarily in U.S. common stocks. The fund has three classes of shares: the Capital Opportunity Fund original share class, referred to in this report as the Investor Class, offered since November 30, 1994; the Capital Opportunity Fund—Advisor Class (Advisor Class), offered since December 31, 2004; and the Capital Opportunity Fund—R Class (R Class), offered since December 31, 2004. Advisor Class shares are sold only through unaffiliated brokers and other unaffiliated financial intermediaries, and R Class shares are available to retirement plans serviced by intermediaries. The Advisor Class and R Class each operate under separate Board-approved Rule 12b-1 plans, pursuant to which each class compensates financial intermediaries for distribu tion, shareholder servicing, and/or certain administrative services. Each class has exclusive voting rights on matters related solely to that class, separate voting rights on matters that relate to all classes, and, in all other respects, the same rights and obligations as the other classes.
The accompanying financial statements were prepared in accordance with accounting principles generally accepted in the United States of America, which require the use of estimates made by fund management. Fund management believes that estimates and security valuations are appropriate; however, actual results may differ from those estimates, and the security valuations reflected in the financial statements may differ from the value the fund ultimately realizes upon sale of the securities.
Valuation The fund values its investments and computes its net asset value per share at the close of the New York Stock Exchange (NYSE), normally 4 p.m. ET, each day that the NYSE is open for business. Equity securities listed or regularly traded on a securities exchange or in the over-the-counter (OTC) market are valued at the last quoted sale price or, for certain markets, the official closing price at the time the valuations are made, except for OTC Bulletin Board securities, which are valued at the mean of the latest bid and asked prices. A security that is listed or traded on more than one exchange is valued at the quotation on the exchange determined to be the primary market for such security. Listed securities not traded on a particular day are valued at the mean of the latest bid and asked prices for domestic securities and the last quoted sale price for international securities. Debt securities with original maturities of less than one year are valued at amortized cost in local currency, which approximates fair value when combined with accrued interest.
Investments in mutual funds are valued at the mutual fund’s closing net asset value per share on the day of valuation. Financial futures contracts are valued at closing settlement prices.
Other investments, including restricted securities, and those for which the above valuation procedures are inappropriate or are deemed not to reflect fair value are stated at fair value as determined in good faith by the T. Rowe Price Valuation Committee, established by the fund’s Board of Directors.
Most foreign markets close before the close of trading on the NYSE. If the fund determines that developments between the close of a foreign market and the close of the NYSE will, in its judgment, materially affect the value of some or all of its portfolio securities, which in turn will affect the fund’s share price, the fund will adjust the previous closing prices to reflect the fair value of the securities as of the close of the NYSE, as determined in good faith by the T. Rowe Price Valuation Committee, established by the fund’s Board of Directors. A fund may also fair value securities in other situations, such as when a particular foreign market is closed but the fund is open. In deciding whether to make fair value adjustments, the fund reviews a variety of factors, including developments in foreign markets, the performance of U.S. securities markets, and the performance of instruments trading in U.S. markets that represent foreign securities and baskets of foreign securities. The fund uses outside pricing services to provide it with closing market prices and information used for adjusting those prices. The fund cannot predict when and how often it will use closing prices and when it will adjust those prices to reflect fair value. As a means of evaluating its fair value process, the fund routinely compares closing market prices, the next day’s opening prices in the same markets, and adjusted prices.
Currency Translation Assets, including investments, and liabilities denominated in foreign currencies are translated into U.S. dollar values each day at the prevailing exchange rate, using the mean of the bid and asked prices of such currencies against U.S. dollars as quoted by a major bank. Purchases and sales of securities, income, and expenses are translated into U.S. dollars at the prevailing exchange rate on the date of the transaction. The effect of changes in foreign currency exchange rates on realized and unrealized security gains and losses is reflected as a component of security gains and losses.
Class Accounting The Advisor Class and R Class each pay distribution, shareholder servicing, and/or certain administrative expenses in the form of Rule 12b-1 fees, in an amount not exceeding 0.25% and 0.50%, respectively, of the class’s average daily net assets. Shareholder servicing, prospectus, and shareholder report expenses incurred by each class are charged directly to the class to which they relate. Expenses common to all classes, investment income, and realized and unrealized gains and losses are allocated to the classes based upon the relative daily net assets of each class.
Rebates and Credits Subject to best execution, the fund may direct certain security trades to brokers who have agreed to rebate a portion of the related brokerage commission to the fund in cash. Commission rebates are reflected as realized gain on securities in the accompanying financial statements and totaled $6,000 for the six months ended June 30, 2006. Additionally, the fund earns credits on temporarily uninvested cash balances at the custodian that reduce the fund’s custody charges. Custody expense in the accompanying financial statements is presented before reduction for credits.
Investment Transactions, Investment Income, and Distributions Income and expenses are recorded on the accrual basis. Premiums and discounts on debt securities are amortized for financial reporting purposes. Dividends received from mutual fund investments are reflected as dividend income; capital gain distributions are reflected as realized gain/loss. Dividend income and capital gain distributions are recorded on the ex-dividend date. Investment transactions are accounted for on the trade date. Realized gains and losses are reported on the identified cost basis. Payments (“variation margin”) made or received to settle the daily fluctuations in the value of futures contracts are recorded as unrealized gains or losses until the contracts are closed. Unsettled variation margin on futures contracts is reflected as other assets or liabilities, and unrealized gains and losses on futures contracts are reflected as the change in net unrealized gain or loss in the accompanying financial statements. Distributions to shareholders are recorded on the ex-dividend date. Income distributions are declared and paid by each class on an annual basis. Capital gain distributions, if any, are declared and paid by the fund, typically on an annual basis.
NOTE 2 - INVESTMENT TRANSACTIONS
Consistent with its investment objective, the fund engages in the following practices to manage exposure to certain risks or to enhance performance. The investment objective, policies, program, and risk factors of the fund are described more fully in the fund’s prospectus and Statement of Additional Information.
Restricted Securities The fund may invest in securities that are subject to legal or contractual restrictions on resale. Although certain of these securities may be readily sold, for example, under Rule 144A, others may be illiquid, their sale may involve substantial delays and additional costs, and prompt sale at an acceptable price may be difficult.
Futures Contracts During the six months ended June 30, 2006, the fund was a party to futures contracts, which provide for the future sale by one party and purchase by another of a specified amount of a specific financial instrument at an agreed upon price, date, time, and place. Risks arise from possible illiquidity of the futures market and from movements in security values.
Securities Lending The fund lends its securities to approved brokers to earn additional income. It receives as collateral cash and U.S. government securities valued at 102% to 105% of the value of the securities on loan. Cash collateral is invested in a money market pooled trust managed by the fund’s lending agent in accordance with investment guidelines approved by fund management. Collateral is maintained over the life of the loan in an amount not less than the value of loaned securities, as determined at the close of fund business each day; any additional collateral required due to changes in security values is delivered to the fund the next business day. Although risk is mitigated by the collateral, the fund could experience a delay in recovering its securities and a possible loss of income or value if the borrower fails to return the securities. Securities lending revenue recognized by the fund consists of earnings on invested collateral and borrowing fees, net of any rebates to the borrower and compensation to the lending agent. At June 30, 2006, there were no securities on loan.
Other Purchases and sales of portfolio securities, other than short-term securities, aggregated $57,674,000 and $50,530,000, respectively, for the six months ended June 30, 2006.
NOTE 3 - FEDERAL INCOME TAXES
No provision for federal income taxes is required since the fund intends to continue to qualify as a regulated investment company under Subchapter M of the Internal Revenue Code and distribute to shareholders all of its taxable income and gains. Federal income tax regulations differ from generally accepted accounting principles; therefore, distributions determined in accordance with tax regulations may differ in amount or character from net investment income and realized gains for financial reporting purposes. Financial reporting records are adjusted for permanent book/tax differences to reflect tax character. Financial records are not adjusted for temporary differences. The amount and character of tax-basis distributions and composition of net assets are finalized at fiscal year-end; accordingly, tax-basis balances have not been determined as of June 30, 2006.
The fund intends to retain realized gains to the extent of available capital loss carryforwards. As of December 31, 2005, the fund had $10,643,000 of unused capital loss carryforwards, of which $919,000 expire in 2009, $6,883,000 expire in 2010, and $2,841,000 that expire in 2011.
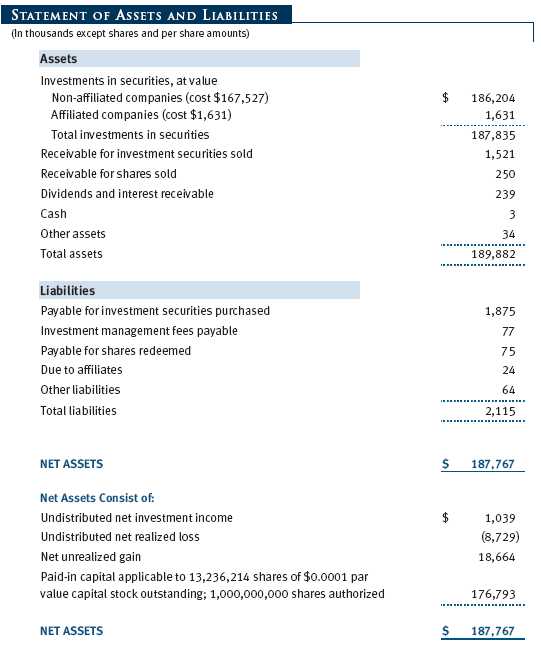
At June 30, 2006, the cost of investments for federal income tax purposes was $169,158,000. Net unrealized gain aggregated $18,664,000 at period-end, of which $24,560,000 related to appreciated investments and $5,896,000 related to depreciated investments.
NOTE 4 - RELATED PARTY TRANSACTIONS
The fund is managed by T. Rowe Price Associates, Inc. (the manager or Price Associates), a wholly owned subsidiary of T. Rowe Price Group, Inc. The investment management agreement between the fund and the manager provides for an annual investment management fee, which is computed daily and paid monthly. The fee consists of an individual fund fee, equal to 0.20% of the fund’s average daily net assets, and a group fee. The group fee rate is calculated based on the combined net assets of certain mutual funds sponsored by Price Associates (the group) applied to a graduated fee schedule, with rates ranging from 0.48% for the first $1 billion of assets to 0.29% for assets in excess of $160 billion. The fund’s group fee is determined by applying the group fee rate to the fund’s average daily net assets. At June 30, 2006, the effective annual group fee rate was 0.31%.
Each class is also subject to a contractual expense limitation through the limitation dates indicated in the table below. During the limitation period, the manager is required to waive its management fee and reimburse a class for any expenses, excluding interest, taxes, brokerage commissions, and extraordinary expenses, that would otherwise cause the class’s ratio of total expenses to average net assets (expense ratio) to exceed its expense limitation. Each class is required to repay the manager for expenses previously reimbursed and management fees waived to the extent the class’s net assets have grown or expenses have declined sufficiently to allow repayment without causing the class’s expense ratio to exceed its expense limitation. However, no repayment will be made more than three years after the date of any reimbursement or waiver or later than the repayment dates indicated in the table below.

At June 30, 2006, there were no amounts subject to repayment. For the six months ended June 30, 2006, each class operated below its expense limitation.
In addition, the fund has entered into service agreements with Price Associates and two wholly owned subsidiaries of Price Associates (collectively, Price). Price Associates computes the daily share prices and provides certain other administrative services to the fund. T. Rowe Price Services, Inc., provides shareholder and administrative services in its capacity as the fund’s transfer and dividend disbursing agent. T. Rowe Price Retirement Plan Services, Inc., provides subaccounting and recordkeeping services for certain retirement accounts invested in the Investor Class and R Class. For the six months ended June 30, 2006, expenses incurred pursuant to these service agreements were $51,000 for Price Associates, $79,000 for T. Rowe Price Services, Inc., and $7,000 for T. Rowe Price Retirement Plan Services, Inc. The total amount payable at period-end pursuant to these service agreements is reflected as Due to Affiliates in the accompanying financial statements.
The fund may invest in the T. Rowe Price Reserve Investment Fund and the T. Rowe Price Government Reserve Investment Fund (collectively, the T. Rowe Price Reserve Funds), open-end management investment companies managed by Price Associates and affiliates of the fund. The T. Rowe Price Reserve Funds are offered as cash management options to mutual funds, trusts, and other accounts managed by Price Associates and/or its affiliates, and are not available for direct purchase by members of the public. The T. Rowe Price Reserve Funds pay no investment management fees. During the six months ended June 30, 2006, dividend income from the T. Rowe Price Reserve Funds totaled $45,000, and the value of shares of the T. Rowe Price Reserve Funds held at June 30, 2006, and December 31, 2005, was $1,631,000 and $1,457,000, respectively.
As of June 30, 2006, T. Rowe Price Group, Inc. and/or its wholly owned subsidiaries owned 406,835 shares of the Investor Class, 18,850 shares of the Advisor Class, and 18,810 shares of the R Class, aggregating 3% of the fund’s net assets.
| INFORMATION ON PROXY VOTING POLICIES, PROCEDURES, AND RECORDS |
A description of the policies and procedures used by T. Rowe Price funds and portfolios to determine how to vote proxies relating to portfolio securities is available in each fund’s Statement of Additional Information, which you may request by calling 1-800-225-5132 or by accessing the SEC’s Web site, www.sec.gov. The description of our proxy voting policies and procedures is also available on our Web site, www.troweprice.com. To access it, click on the words “Company Info” at the top of our homepage for individual investors. Then, in the window that appears, click on the “Proxy Voting Policy” navigation button in the top left corner.
Each fund’s most recent annual proxy voting record is available on our Web site and through the SEC’s Web site. To access it through our Web site, follow the directions above, then click on the words “Proxy Voting Record” at the bottom of the Proxy Voting Policy page.
| HOW TO OBTAIN QUARTERLY PORTFOLIO HOLDINGS |
The fund files a complete schedule of portfolio holdings with the Securities and Exchange Commission for the first and third quarters of each fiscal year on Form N-Q. The fund’s Form N-Q is available electronically on the SEC’s Web site (www.sec.gov); hard copies may be reviewed and copied at the SEC’s Public Reference Room, 450 Fifth St. N.W., Washington, DC 20549. For more information on the Public Reference Room, call 1-800-SEC-0330.
| APPROVAL OF INVESTMENT MANAGEMENT AGREEMENT |
On March 8, 2006, the fund’s Board of Directors unanimously approved the investment advisory contract (Contract) between the fund and its investment manager, T. Rowe Price Associates, Inc. (Manager). The Board considered a variety of factors in connection with its review of the Contract, also taking into account information provided by the Manager during the course of the year, as discussed below:
Services Provided by the Manager
The Board considered the nature, quality, and extent of the services provided to the fund by the Manager. These services included, but were not limited to, management of the fund’s portfolio and a variety of activities related to portfolio management. The Board also reviewed the background and experience of the Manager’s senior management team and investment personnel involved in the management of the fund. The Board concluded that it was satisfied with the nature, quality, and extent of the services provided by the Manager.
Investment Performance of the Fund
The Board reviewed the fund’s average annual total return over the 1-, 3-, 5-, and 10-year periods as well as the fund’s year-by-year returns and compared these returns with previously agreed upon comparable performance measures and market data, including those supplied by Lipper and Morningstar, which are independent providers of mutual fund data. On the basis of this evaluation and the Board’s ongoing review of investment results, the Board concluded that the fund’s performance was satisfactory.
Costs, Benefits, Profits, and Economies of Scale
The Board reviewed detailed information regarding the revenues received by the Manager under the Contract and other benefits that the Manager (and its affiliates) may have realized from its relationship with the fund, including research received under “soft dollar” agreements. The Board noted that the use of soft dollars as a means of paying for third-party, non-broker research had been eliminated. The Board also received information on the estimated costs incurred and profits realized by the Manager and its affiliates from advising T. Rowe Price mutual funds, as well as estimates of the gross profits realized from managing the fund in particular. The Board concluded that the Manager’s profits were reasonable in light of the services provided to the fund. The Board also considered whether the fund or other funds benefit under the fee levels set forth in the Contract from any economies of scale realized by the Manager. Under the Contract, the fund pays a fee to the Manager composed of two components—a group fee rate based on the aggregate assets of certain T. Rowe Price mutual funds (including the fund) that declines at certain asset levels and an individual fund fee rate that is assessed on the assets of the fund. The Board concluded that the advisory fee structure for the fund continued to provide for a reasonable sharing of benefits from any economies of scale with the fund’s investors.
Fees
The Board reviewed the fund’s management fee rate, operating expenses, and total expense ratio (for the Investor Class, Advisor Class, and R Class) and compared them with fees and expenses of other comparable funds based on information and data supplied by Lipper. The information provided to the Board indicated that the fund’s management fee rate for all three classes and expense ratio for the Investor Class and Advisor Class were generally below the median for comparable funds and that the expense ratio for the R Class was generally above the median for comparable funds. The Board also reviewed the fee schedules for comparable privately managed accounts of the Manager and its affiliates. Management informed the Board that the Manager’s responsibilities for privately managed accounts are more limited than its responsibilities for the fund and other T. Rowe Price mutual funds that it or its affiliates advise. On the basis of the information provided, the Board concluded that the fees paid by the fund under the Contract were reasonable.
Approval of the Contract
As noted, the Board approved the continuation of the Contract. No single factor was considered in isolation or to be determinative to the decision. Rather, the Board concluded, in light of a weighting and balancing of all factors considered, that it was in the best interests of the fund to approve the continuation of the Contract, including the fees to be charged for services thereunder.
 Item 2. Code of Ethics.
A code of ethics, as defined in Item 2 of Form N-CSR, applicable to its principal executive officer, principal financial officer, principal accounting officer or controller, or persons performing similar functions is filed as an exhibit to the registrant’s annual Form N-CSR. No substantive amendments were approved or waivers were granted to this code of ethics during the registrant’s most recent fiscal half-year.
Item 3. Audit Committee Financial Expert.
Disclosure required in registrant’s annual Form N-CSR.
Item 4. Principal Accountant Fees and Services.
Disclosure required in registrant’s annual Form N-CSR.
Item 5. Audit Committee of Listed Registrants.
Not applicable.
Item 6. Schedule of Investments.
Not applicable. The complete schedule of investments is included in Item 1 of this Form N-CSR.
Item 7. Disclosure of Proxy Voting Policies and Procedures for Closed-End Management Investment Companies.
Not applicable.
Item 8. Portfolio Managers of Closed-End Management Investment Companies.
Not applicable.
Item 9. Purchases of Equity Securities by Closed-End Management Investment Company and Affiliated Purchasers.
Not applicable.
Item 10. Submission of Matters to a Vote of Security Holders.
Not applicable.
Item 11. Controls and Procedures.
(a) The registrant’s principal executive officer and principal financial officer have evaluated the registrant’s disclosure controls and procedures within 90 days of this filing and have concluded that the registrant’s disclosure controls and procedures were effective, as of that date, in ensuring that information required to be disclosed by the registrant in this Form N-CSR was recorded, processed, summarized, and reported timely.
(b) The registrant’s principal executive officer and principal financial officer are aware of no change in the registrant’s internal control over financial reporting that occurred during the registrant’s second fiscal quarter covered by this report that has materially affected, or is reasonably likely to materially affect, the registrant’s internal control over financial reporting.
Item 12. Exhibits.(a)(1) The registrant’s code of ethics pursuant to Item 2 of Form N-CSR is filed with the registrant’s annual Form N-CSR.
(2) Separate certifications by the registrant's principal executive officer and principal financial officer, pursuant to Section 302 of the Sarbanes-Oxley Act of 2002 and required by Rule 30a-2(a) under the Investment Company Act of 1940, are attached.
(3) Written solicitation to repurchase securities issued by closed-end companies: not applicable.
(b) A certification by the registrant's principal executive officer and principal financial officer, pursuant to Section 906 of the Sarbanes-Oxley Act of 2002 and required by Rule 30a-2(b) under the Investment Company Act of 1940, is attached.
| |
SIGNATURES |
| |
| | Pursuant to the requirements of the Securities Exchange Act of 1934 and the Investment |
| Company Act of 1940, the registrant has duly caused this report to be signed on its behalf by the |
| undersigned, thereunto duly authorized. |
| |
| T. Rowe Price Capital Opportunity Fund, Inc. |
| |
| |
| By | /s/ Edward C. Bernard |
| | Edward C. Bernard |
| | Principal Executive Officer |
| |
| Date | August 18, 2006 |
| |
| |
| | Pursuant to the requirements of the Securities Exchange Act of 1934 and the Investment |
| Company Act of 1940, this report has been signed below by the following persons on behalf of |
| the registrant and in the capacities and on the dates indicated. |
| |
| |
| By | /s/ Edward C. Bernard |
| | Edward C. Bernard |
| | Principal Executive Officer |
| |
| Date | August 18, 2006 |
| |
| |
| |
| By | /s/ Joseph A. Carrier |
| | Joseph A. Carrier |
| | Principal Financial Officer |
| |
| Date | August 18, 2006 |