Item 1: Report to Shareholders| Capital Opportunity Fund | June 30, 2007 |
The views and opinions in this report were current as of June 30, 2007. They are not guarantees of performance or investment results and should not be taken as investment advice. Investment decisions reflect a variety of factors, and the managers reserve the right to change their views about individual stocks, sectors, and the markets at any time. As a result, the views expressed should not be relied upon as a forecast of the fund’s future investment intent. The report is certified under the Sarbanes-Oxley Act, which requires mutual funds and other public companies to affirm that, to the best of their knowledge, the information in their financial reports is fairly and accurately stated in all material respects.
REPORTS ON THE WEB
Sign up for our E-mail Program, and you can begin to receive updated fund reports and prospectuses online rather than through the mail. Log in to your account at troweprice.com for more information.
Manager’s Letter
Fellow Shareholders
The U.S. stock market continued to move higher in the first half of 2007, extending a rally that has lasted for more than four years. Corporate earnings growth, though decelerating, continued to surpass expectations, and merger and acquisition activity remained robust thanks to private-equity firms and leveraged buyouts. As a result, stocks overcame bouts of volatility to produce solid gains for the six-month period.
HIGHLIGHTS
• U.S. large-cap stocks advanced on stronger-than-expected earnings growth and continued mergers and acquisitions.
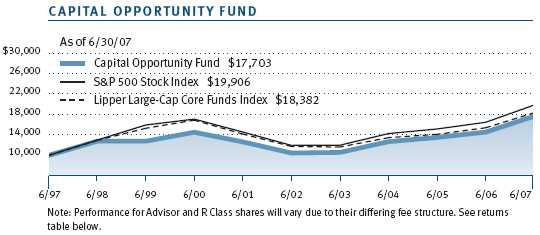
• The Capital Opportunity Fund outpaced the S&P 500 Stock Index and its Lipper index of similar funds over the six months ended June 30, 2007.
• Stock selection was the key to the fund’s outperformance, especially in the financials sector.
• We remain focused on our investment approach—maintaining sector neutrality versus the S&P 500 and using comprehensive research and analysis to select stocks that we believe will provide the most capital appreciation over time.
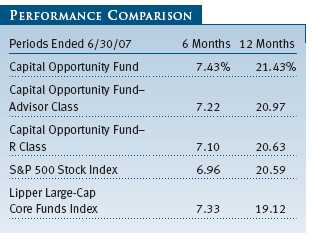
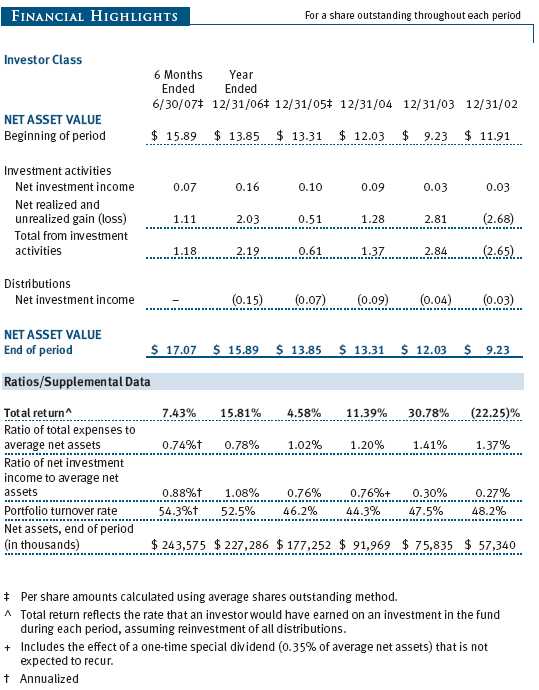
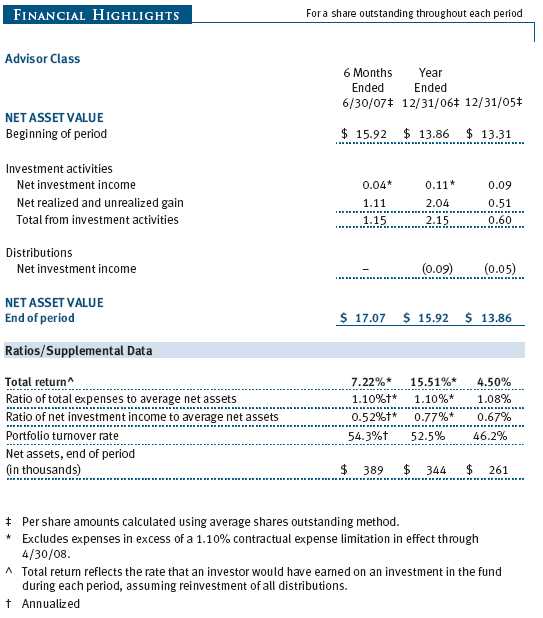
In this environment, your fund outpaced the broader market and its peer group. The Capital Opportunity Fund returned 7.43% for the first six months of 2007, ahead of both the S&P 500 Index and the Lipper Large-Cap Core Funds Index. (Returns for Advisor and R Class shares reflected a different fee structure.) Looking at the 12 months ended June 30, 2007, the fund returned 21.43%, ahead of both the index and the Lipper group. The fund’s outperformance of the S&P 500 in the first half of 2007 was driven by stock selection, which added value in eight of 10 market sectors, led by financials and utilities.
MARKET ENVIRONMENT
The U.S. economy weakened significantly in the first quarter of the year, growing at a scant 0.7% annualized rate. The continued slump in the housing market and declining consumer spending contributed to the slowdown. The economy appeared to rebound somewhat in the second quarter, boosted by strength in job growth and business spending, but growth remained below trend. Inflation, on the other hand, remained above trend as energy and some commodity prices rose during the six-month period. Consequently, the Federal Reserve held short-term interest rates steady, and market expectations of a Fed rate cut were unfulfilled.
Corporate earnings also slowed during the period, ending the S&P 500’s record streak of double-digit quarterly earnings growth. Nonetheless, profits generally exceeded expectations, led by multinational companies that benefited from improving economic conditions overseas. Following a record year in 2006, mergers and acquisitions continued at a lively pace as private-equity firms kept the leveraged buyout train rolling.

The better-than-expected earnings and brisk merger activity kept stocks on an upward trajectory, though the six-month period was not without volatility. Overall, however, the stock market enjoyed broad-based gains. Mid-cap stocks posted the best returns, followed by large-and small-cap issues—the large-cap S&P 500 Index’s 6.96% return edged out the small-cap Russell 2000 Index’s 6.45% return. Growth stocks, which have lagged their value-oriented peers since 2001, outperformed in the first half of 2007.
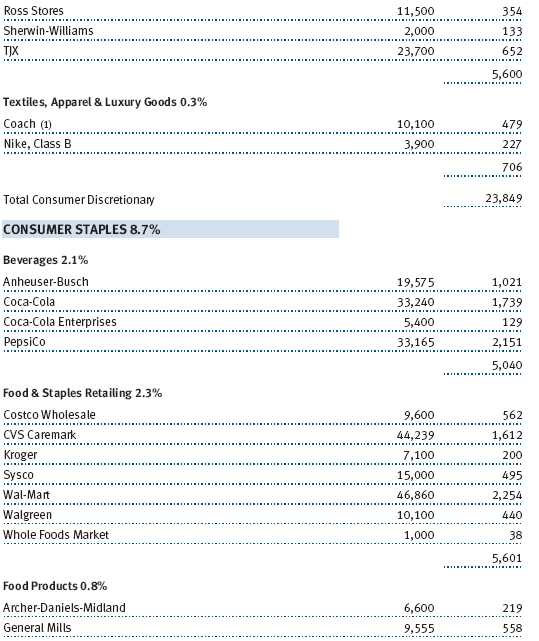
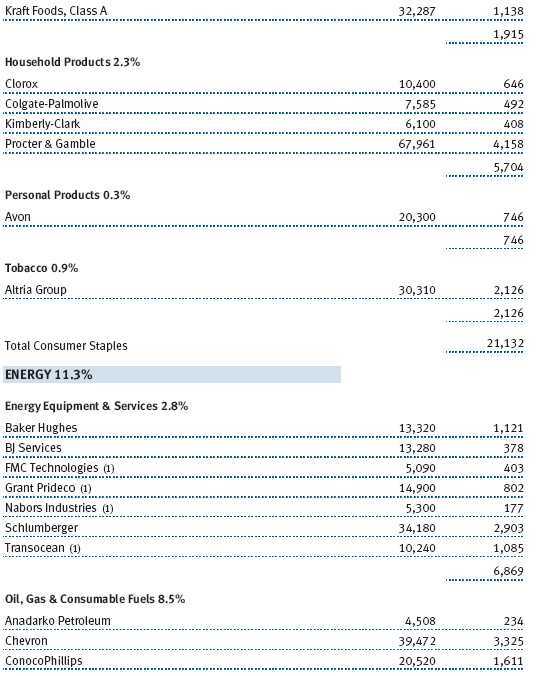
Energy stocks were the best performers during the six-month period, reflecting a 16% increase in the price of oil. Materials stocks also fared well, benefiting from higher commodity prices, while takeover speculation lifted telecommunication services stocks. The only sector of the market to decline was financials, which were hurt by rising interest rates and the deterioration of the subprime lending industry.
PORTFOLIO REVIEW
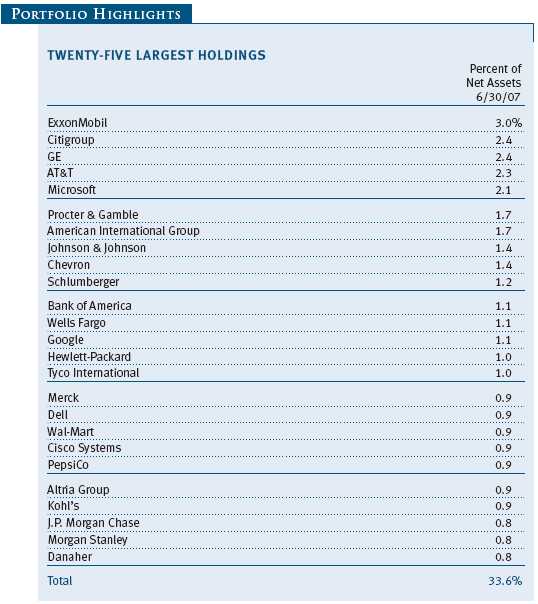
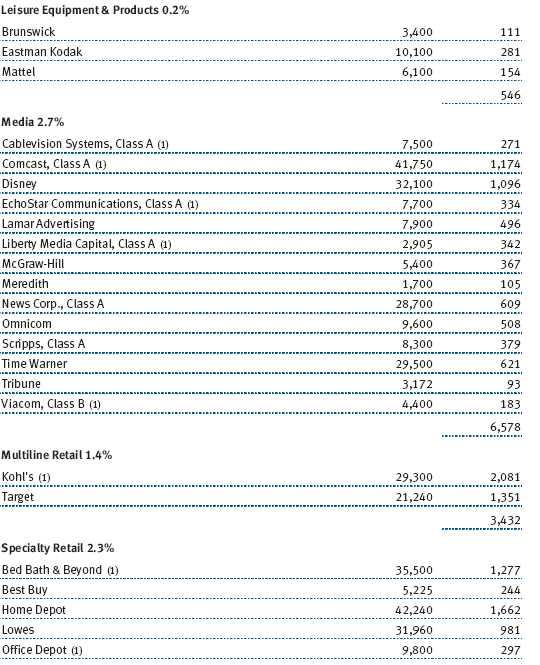
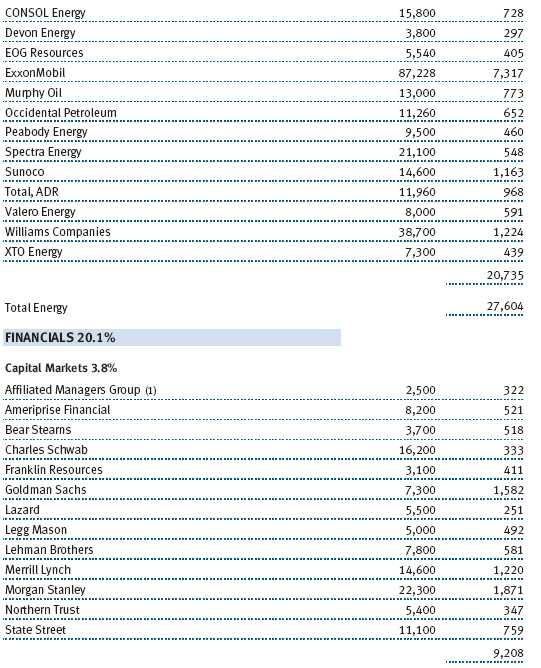
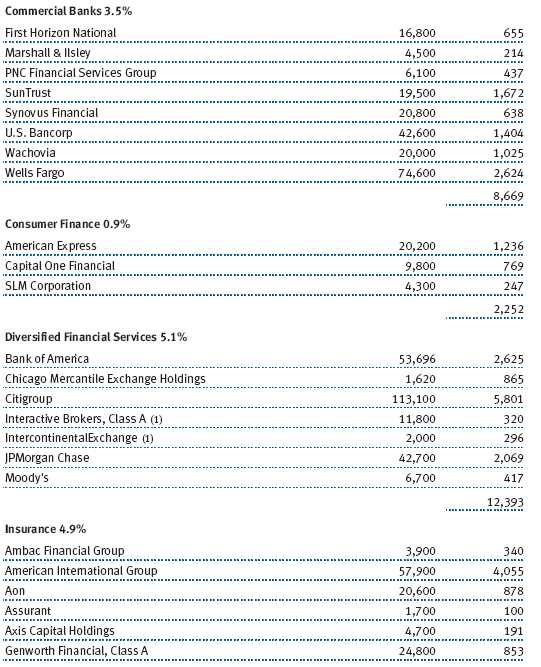
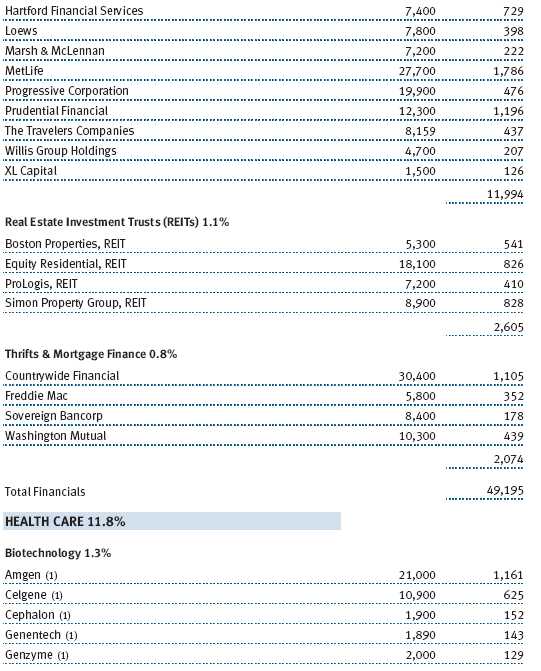
Our management approach for the Capital Opportunity Fund involves maintaining sector weightings that are similar to those in the S&P 500, then adding value through individual stock selection. Security selection was the key behind your fund’s outperformance in the first six months of 2007, and nowhere was it more valuable than in the portfolio’s largest sector weighting—financials, which represented 20% of assets as of June 30, 2007. On an absolute basis, the fund’s financial holdings performed poorly; four of the 10 worst performance contributors came from the financial sector, including diversified financial services companies Citigroup and Bank of America, as well as commercial bank U.S. Bancorp and mortgage finance company Countrywide Financial. (Please see the portfolio of investments for a complete listing of holdings and the amount each represents in the portfolio.)
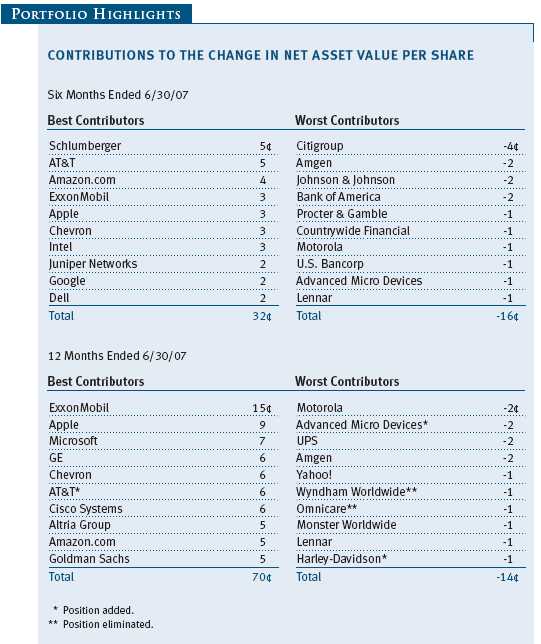
However, we limited our exposure to financial services firms such as Bank of America and commercial banks like Wachovia, which were the most vulnerable to rising interest rates and the subprime mortgage fallout. Instead, we focused on capital markets firms that were poised to benefit from robust merger and market activity. One of the best contributors was electronic financial exchange IntercontinentalExchange, which continued to build on its strong results from 2006. The company’s electronic platform has enormous operating leverage, and profit margins have expanded dramatically. Other top performers included custodial services provider Investors Financial Services, which was acquired by larger rival State Street, and insurer Aon, which has a new management team focusing on cost reductions and a stronger balance sheet.
Two of the smaller sectors in the portfolio, utilities and telecommunication services (a combined 7% of the portfolio as of June 30), posted strong results and were also important factors in the fund’s outperformance of the S&P 500. Our overweight positions in independent power producer Dynegy and electric utilities Reliant Energy and PPL were solid performers, thanks to healthy demand for power and a favorable pricing environment. In the telecom sector, our emphasis on wireless stocks paid off as subscriber growth and new technologies lifted the industry. Canadian telecom provider Rogers Communications was one of the top contributors, and we also benefited from our position in low-cost wireless provider MetroPCS Communications, which rallied sharply following its initial public offering in April. Telecom giant AT&T was the second-best absolute performance contributor in the portfolio.
Energy (11% of the portfolio at the end of the period) provided the biggest absolute contribution to performance, and it added value modestly compared with the index as well. Three of the top six absolute contributors were energy stocks, led by energy services provider Schlumberger. Strong drilling activity, especially overseas, increased demand for the oilfield services Schlumberger provides, leading to better-than-expected earnings. Oil production and refining companies ExxonMobil, the portfolio’s largest holding as of June 30, and Chevron were also strong performers as U.S. gasoline prices rose by approximately 30%, boosting refining margins.
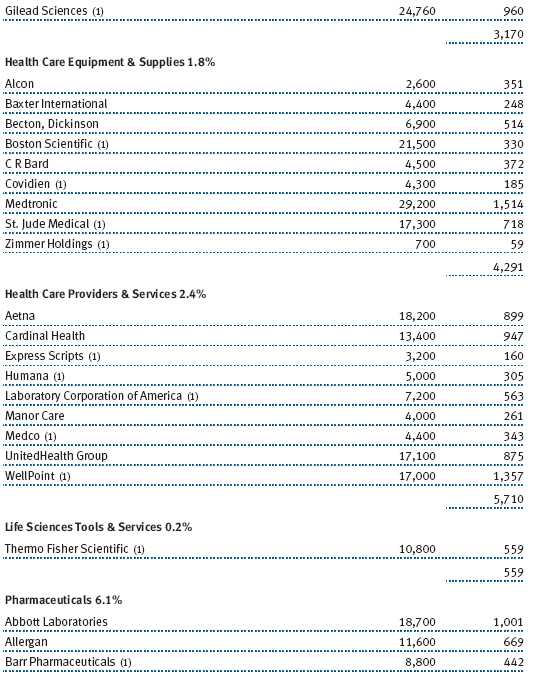
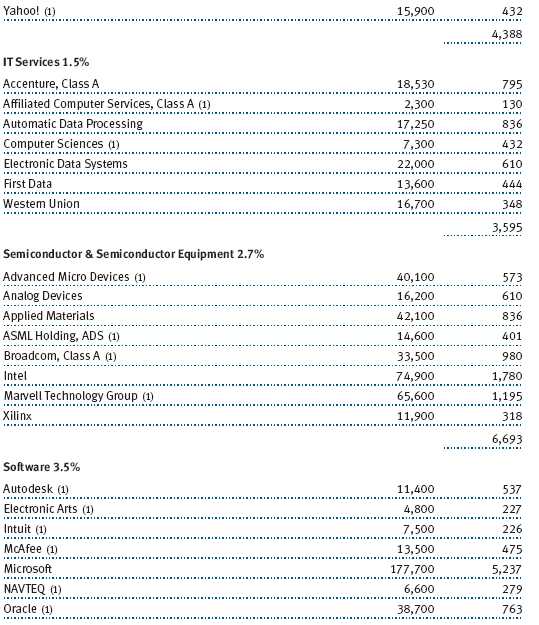
The information technology sector (16% of the portfolio) was another significant absolute contributor; five of the 10 best individual contributors came from this sector. Three of these were companies benefiting from hot market trends—Apple rode the enormous popularity of the iPod and the potential of the new iPhone; search engine Google generated substantial revenues from online advertising; and network products maker Juniper Networks rallied after launching several new products and is well positioned to benefit from the traction of video over the Internet and the wireless network build-out. The other two technology stocks on the top 10 performance list were computer maker Dell and semiconductor manufacturer Intel, both of which rebounded after some missteps and lost market share in 2006.
The portfolio’s industrials and business services stocks (12% of the portfolio as of June 30) posted solid absolute results but underperformed their counterparts in the S&P 500. Most of the weakness in this sector resulted from missed opportunities. For example, we were underweight in aerospace and defense company Honeywell International, which rallied sharply during the six-month period after reporting strong profits, raising earnings guidance, and increasing its stock buybacks. Our overweight in industrial tools manufacturer Danaher detracted as the company reported weaker organic growth than its competitors.
Finally, the consumer sectors of the portfolio (19% of assets) were mixed, with some of the best and worst contributors. On the positive side of the ledger, online retailer Amazon.com was the portfolio’s top contributor to relative performance, surging as profit margins expanded and the company raised its 2007 revenue forecast. The counterbalance, however, was our overweight in homebuilder Lennar, which fell sharply as the housing market continued to weaken. Home furnishings retailer Bed Bath & Beyond was also hurt by the housing slump, but we believe it now trades at a very compelling valuation. And management agrees—the company is aggressively buying back stock.
OUTLOOK
Moderate U.S. economic growth and stable Federal Reserve interest rate policy will likely characterize the second half of 2007. Although corporate profit growth almost certainly slowed in the second quarter, earnings estimates for the third and fourth quarters suggest that growth rates will begin to turn around by year-end. Despite these supportive factors, stocks face some challenges as well, such as further deterioration in the housing and mortgage markets, which could lead to a broader decline in U.S. consumption.
In this environment, we will remain focused on our investment approach—maintaining sector neutrality versus the S&P 500, and using comprehensive research and analysis to select stocks that we believe will provide the most capital appreciation over time.
As you were informed earlier in the year, William J. Stromberg has stepped down from the day-to-day management of the Capital Opportunity Fund to focus on expanded responsibilities in the firm. I want to thank Bill for his capable leadership of the fund over the past eight years and wish him well in his new responsibilities. The Investment Advisory Committee that is responsible for the oversight of your fund is made up of portfolio managers and equity analysts with many years of investment experience. Our team is also supported by one of the industry’s strongest global research platforms. We are confident that we can continue to provide you with attractive returns relative to our index through strong stock selection.
Respectfully submitted,

Anna M. Dopkin
President of the fund and chairman of its Investment Advisory Committee
July 17, 2007
The committee chairman has day-to-day responsibility for managing the portfolio and works with committee members in developing and executing the fund’s investment program.
SUPPLEMENT TO PROSPECTUS DATED MAY 1, 2007
ERRATUM
Effective May 1, 2007, the fund’s operating policy that sets forth the percentage of the fund’s “total bond assets” that may be invested in noninvestment-grade securities is hereby corrected to remove the word “bond” and refer to “total assets” instead.
RISKS OF INVESTING
As with all stock mutual funds, the fund’s share price can fall because of weakness in the stock market, a particular industry, or specific holdings. Stock markets can decline for many reasons, including adverse political or economic developments, changes in investor psychology, or heavy institutional selling. The prospects for an industry or company may deteriorate because of a variety of factors, including disappointing earnings or changes in the competitive environment.
GLOSSARY
Federal funds target rate: An overnight lending rate set by the Federal Reserve and used by banks to meet reserve requirements. Banks also use the fed funds rate as a benchmark for their prime lending rates.
Lipper indexes: Consist of a small number (10 to 30) of the largest mutual funds in a particular category as tracked by Lipper Inc.
Russell 2000 Index: Tracks the stocks of 2,000 small U.S. companies.
S&P 500 Stock Index: Tracks the stocks of 500 mostly large U.S. companies.
Performance and Expenses
This chart shows the value of a hypothetical $10,000 investment in the fund over the past 10 fiscal year periods or since inception (for funds lacking 10-year records). The result is compared with benchmarks, which may include a broad-based market index and a peer group average or index. Market indexes do not include expenses, which are deducted from fund returns as well as mutual fund averages and indexes.
| AVERAGE ANNUAL COMPOUND TOTAL RETURN |
This table shows how the fund would have performed each year if its actual (or cumulative) returns had been earned at a constant rate.

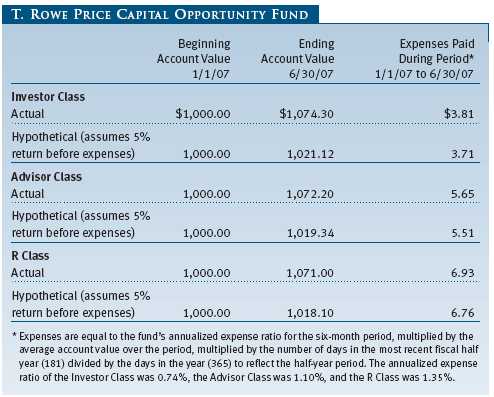
As a mutual fund shareholder, you may incur two types of costs: (1) transaction costs, such as redemption fees or sales loads, and (2) ongoing costs, including management fees, distribution and service (12b-1) fees, and other fund expenses. The following example is intended to help you understand your ongoing costs (in dollars) of investing in the fund and to compare these costs with the ongoing costs of investing in other mutual funds. The example is based on an investment of $1,000 invested at the beginning of the most recent six-month period and held for the entire period.
Please note that the fund has three share classes: The original share class (“investor class”) charges no distribution and service (12b-1) fee; Advisor Class shares are offered only through unaffiliated brokers and other financial intermediaries and charge a 0.25% 12b-1 fee; R Class shares are available to retirement plans serviced by intermediaries and charge a 0.50% 12b-1 fee. Each share class is presented separately in the table.
Actual Expenses
The first line of the following table (“Actual”) provides information about actual account values and expenses based on the fund’s actual returns. You may use the information in this line, together with your account balance, to estimate the expenses that you paid over the period. Simply divide your account value by $1,000 (for example, an $8,600 account value divided by $1,000 = 8.6), then multiply the result by the number in the first line under the heading “Expenses Paid During Period” to estimate the expenses you paid on your account during this period.
Hypothetical Example for Comparison Purposes
The information on the second line of the table (“Hypothetical”) is based on hypothetical account values and expenses derived from the fund’s actual expense ratio and an assumed 5% per year rate of return before expenses (not the fund’s actual return). You may compare the ongoing costs of investing in the fund with other funds by contrasting this 5% hypothetical example and the 5% hypothetical examples that appear in the shareholder reports of the other funds. The hypothetical account values and expenses may not be used to estimate the actual ending account balance or expenses you paid for the period.
Note: T. Rowe Price charges an annual small-account maintenance fee of $10, generally for accounts with less than $2,000 ($500 for UGMA/UTMA). The fee is waived for any investor whose T. Rowe Price mutual fund accounts total $25,000 or more, accounts employing automatic investing, and IRAs and other retirement plan accounts that utilize a prototype plan sponsored by T. Rowe Price (although a separate custodial or administrative fee may apply to such accounts). This fee is not included in the accompanying table. If you are subject to the fee, keep it in mind when you are estimating the ongoing expenses of investing in the fund and when comparing the expenses of this fund with other funds.
You should also be aware that the expenses shown in the table highlight only your ongoing costs and do not reflect any transaction costs, such as redemption fees or sales loads. Therefore, the second line of the table is useful in comparing ongoing costs only and will not help you determine the relative total costs of owning different funds. To the extent a fund charges transaction costs, however, the total cost of owning that fund is higher.
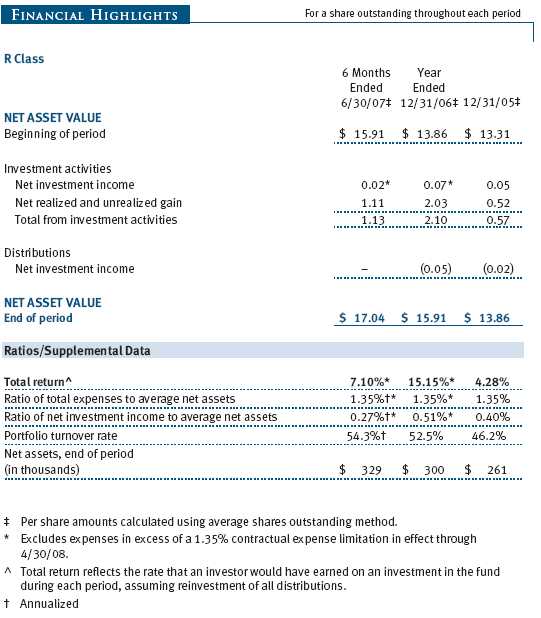
Unaudited
The accompanying notes are an integral part of these financial statements.
Unaudited
The accompanying notes are an integral part of these financial statements.
Unaudited
The accompanying notes are an integral part of these financial statements.
Unaudited


The accompanying notes are an integral part of these financial statements.
Unaudited

The accompanying notes are an integral part of these financial statements.
Unaudited

The accompanying notes are an integral part of these financial statements.
Unaudited

The accompanying notes are an integral part of these financial statements.
Unaudited
| NOTES TO FINANCIAL STATEMENTS |
NOTE 1 - SIGNIFICANT ACCOUNTING POLICIES
T. Rowe Price Capital Opportunity Fund, Inc. (the fund), is registered under the Investment Company Act of 1940 (the 1940 Act) as a diversified, open-end management investment company. The fund seeks to provide long-term capital growth by investing primarily in U.S. common stocks. The fund has three classes of shares: the Capital Opportunity Fund original share class, referred to in this report as the Investor Class, offered since November 30, 1994; the Capital Opportunity Fund—Advisor Class (Advisor Class), offered since December 31, 2004; and the Capital Opportunity Fund—R Class (R Class), offered since December 31, 2004. Advisor Class shares are sold only through unaffiliated brokers and other unaffiliated financial intermediaries, and R Class shares are available to retirement plans serviced by intermediaries. The Advisor Class and R Class each operate under separate Board-approved Rule 12b-1 plans, pursuant to which each class compensates financial intermediaries for distribution, shareholder servicing, and/or certain administrative services. Each class has exclusive voting rights on matters related solely to that class, separate voting rights on matters that relate to all classes, and, in all other respects, the same rights and obligations as the other classes.
The accompanying financial statements were prepared in accordance with accounting principles generally accepted in the United States of America, which require the use of estimates made by fund management. Fund management believes that estimates and security valuations are appropriate; however, actual results may differ from those estimates, and the security valuations reflected in the financial statements may differ from the value the fund ultimately realizes upon sale of the securities.
Valuation The fund values its investments and computes its net asset value per share at the close of the New York Stock Exchange (NYSE), normally 4 p.m. ET, each day that the NYSE is open for business. Equity securities listed or regularly traded on a securities exchange or in the over-the-counter (OTC) market are valued at the last quoted sale price or, for certain markets, the official closing price at the time the valuations are made, except for OTC Bulletin Board securities, which are valued at the mean of the latest bid and asked prices. A security that is listed or traded on more than one exchange is valued at the quotation on the exchange determined to be the primary market for such security. Listed securities not traded on a particular day are valued at the mean of the latest bid and asked prices for domestic securities and the last quoted sale price for international securities. Debt securities with original maturities of less than one year are valued at amortized cost in local currency, which approximates fair value when combined with accrued interest.
Investments in mutual funds are valued at the mutual fund’s closing net asset value per share on the day of valuation. Financial futures contracts are valued at closing settlement prices.
Other investments, including restricted securities, and those for which the above valuation procedures are inappropriate or are deemed not to reflect fair value are stated at fair value as determined in good faith by the T. Rowe Price Valuation Committee, established by the fund’s Board of Directors.
Most foreign markets close before the close of trading on the NYSE. If the fund determines that developments between the close of a foreign market and the close of the NYSE will, in its judgment, materially affect the value of some or all of its portfolio securities, which in turn will affect the fund’s share price, the fund will adjust the previous closing prices to reflect the fair value of the securities as of the close of the NYSE, as determined in good faith by the T. Rowe Price Valuation Committee, established by the fund’s Board of Directors. A fund may also fair value securities in other situations, such as when a particular foreign market is closed but the fund is open. In deciding whether to make fair value adjustments, the fund reviews a variety of factors, including developments in foreign markets, the performance of U.S. securities markets, and the performance of instruments trading in U.S. markets that represent foreign securities and baskets of foreign securities. The fund uses outside pricing services to provide it with closing market prices and information used for adjusting those prices. The fund cannot predict when and how often it will use closing prices and when it will adjust those prices to reflect fair value. As a means of evaluating its fair value process, the fund routinely compares closing market prices, the next day’s opening prices in the same markets, and adjusted prices.
Currency Translation Assets, including investments, and liabilities denominated in foreign currencies are translated into U.S. dollar values each day at the prevailing exchange rate, using the mean of the bid and asked prices of such currencies against U.S. dollars as quoted by a major bank. Purchases and sales of securities, income, and expenses are translated into U.S. dollars at the prevailing exchange rate on the date of the transaction. The effect of changes in foreign currency exchange rates on realized and unrealized security gains and losses is reflected as a component of security gains and losses.
Class Accounting The Advisor Class and R Class each pay distribution, shareholder servicing, and/or certain administrative expenses in the form of Rule 12b-1 fees, in an amount not exceeding 0.25% and 0.50%, respectively, of the class’s average daily net assets. Shareholder servicing, prospectus, and shareholder report expenses incurred by each class are charged directly to the class to which they relate. Expenses common to all classes, investment income, and realized and unrealized gains and losses are allocated to the classes based upon the relative daily net assets of each class.
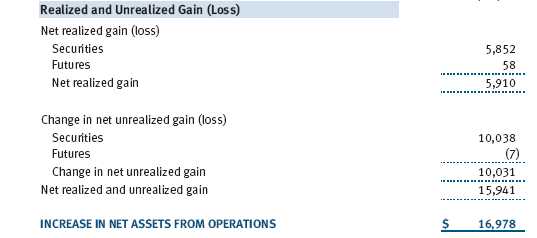
Rebates Subject to best execution, the fund may direct certain security trades to brokers who have agreed to rebate a portion of the related brokerage commission to the fund in cash. Commission rebates are reflected as realized gain on securities in the accompanying financial statements and totaled $5,000 for the six months ended June 30, 2007.
Investment Transactions, Investment Income, and Distributions Income and expenses are recorded on the accrual basis. Premiums and discounts on debt securities are amortized for financial reporting purposes. Dividends received from mutual fund investments are reflected as dividend income; capital gain distributions are reflected as realized gain/loss. Dividend income and capital gain distributions are recorded on the ex-dividend date. Any income tax-related interest and penalties would be classified as income tax expense. Investment transactions are accounted for on the trade date. Realized gains and losses are reported on the identified cost basis. Payments (“variation margin”) made or received to settle the daily fluctuations in the value of futures contracts are recorded as unrealized gains or losses until the contracts are closed. Unsettled variation margin on futures contracts is reflected as other assets or liabilities, and unrealized gains and losses on futures contracts are reflected as the change in net unrealized gain or loss in the accompanying financial statements. Distributions to shareholders are recorded on the ex-dividend date. Income distributions are declared and paid by each class on an annual basis. Capital gain distributions, if any, are declared and paid by the fund, typically on an annual basis.
New Accounting Pronouncements Effective June 29, 2007, the fund adopted Financial Accounting Standards Board (“FASB”) Interpretation No. 48 (“FIN 48”), Accounting for Uncertainty in Income Taxes, a clarification of FASB Statement No. 109, Accounting for Income Taxes. FIN 48 establishes financial accounting and disclosure requirements for recognition and measurement of tax positions taken or expected to be taken on an income tax return. The adoption of FIN 48 had no impact on the fund’s net assets or results of operations.
In September 2006, the FASB released the Statement of Financial Accounting Standard No. 157 (“FAS 157”), Fair Value Measurements. FAS 157 clarifies the definition of fair value and establishes the framework for measuring fair value, as well as proper disclosure of this methodology in the financial statements. It will be effective for the fund’s fiscal year beginning January 1, 2008. Management is evaluating the effects of FAS 157; however, it is not expected to have a material impact on the fund’s net assets or results of operations.
NOTE 2 - INVESTMENT TRANSACTIONS
Consistent with its investment objective, the fund engages in the following practices to manage exposure to certain risks or to enhance performance. The investment objective, policies, program, and risk factors of the fund are described more fully in the fund’s prospectus and Statement of Additional Information.
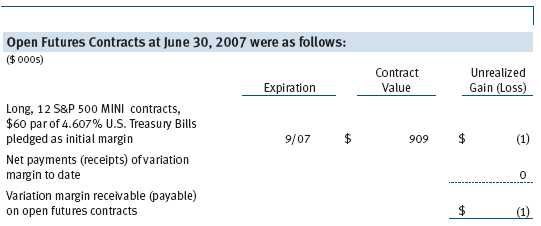
Futures Contracts During the six months ended June 30, 2007, the fund was a party to futures contracts, which provide for the future sale by one party and purchase by another of a specified amount of a specific financial instrument at an agreed upon price, date, time, and place. Risks arise from possible illiquidity of the futures market and from movements in security values.
Other Purchases and sales of portfolio securities, other than short-term securities, aggregated $64,494,000 and $63,646,000, respectively, for the six months ended June 30, 2007.
NOTE 3 - FEDERAL INCOME TAXES
No provision for federal income taxes is required since the fund intends to continue to qualify as a regulated investment company under Subchapter M of the Internal Revenue Code and distribute to shareholders all of its taxable income and gains. Federal income tax regulations differ from generally accepted accounting principles; therefore, distributions determined in accordance with tax regulations may differ in amount or character from net investment income and realized gains for financial reporting purposes. Financial reporting records are adjusted for permanent book/tax differences to reflect tax character. Financial records are not adjusted for temporary differences. The amount and character of tax-basis distributions and composition of net assets are finalized at fiscal year-end; accordingly, tax-basis balances have not been determined as of June 30, 2007.
The fund intends to retain realized gains to the extent of available capital loss carryforwards. As of December 31, 2006, the fund had $4,407,000 of unused capital loss carryforwards, of which $1,566,000 expire in 2010, and $2,841,000 expire in 2011.
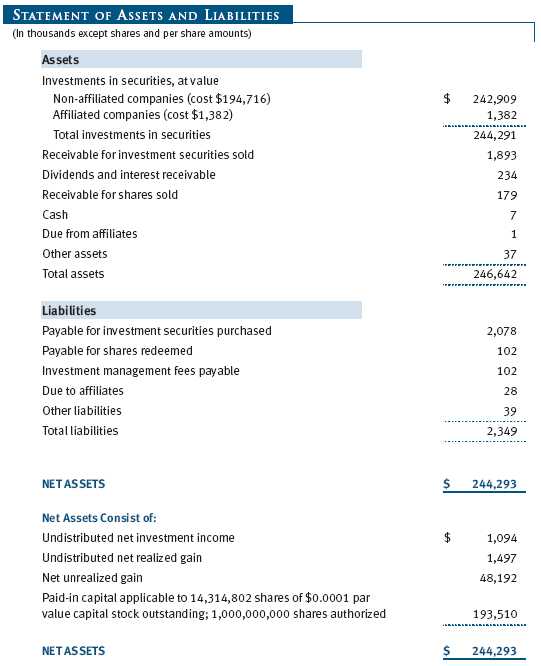
At June 30, 2007, the cost of investments for federal income tax purposes was $196,098,000. Net unrealized gain aggregated $48,192,000 at period-end, of which $49,952,000 related to appreciated investments and $1,760,000 related to depreciated investments.
NOTE 4 - RELATED PARTY TRANSACTIONS
The fund is managed by T. Rowe Price Associates, Inc. (the manager or Price Associates), a wholly owned subsidiary of T. Rowe Price Group, Inc. The investment management agreement between the fund and the manager provides for an annual investment management fee, which is computed daily and paid monthly. The fee consists of an individual fund fee, equal to 0.20% of the fund’s average daily net assets, and a group fee. The group fee rate is calculated based on the combined net assets of certain mutual funds sponsored by Price Associates (the group) applied to a graduated fee schedule, with rates ranging from 0.48% for the first $1 billion of assets to 0.285% for assets in excess of $220 billion. The fund’s group fee is determined by applying the group fee rate to the fund’s average daily net assets. At June 30, 2007, the effective annual group fee rate was 0.30%.
Each class is also subject to a contractual expense limitation through the limitation dates indicated in the table below. During the limitation period, the manager is required to waive its management fee and/or reimburse expenses, excluding interest, taxes, brokerage commissions, and extraordinary expenses, that would otherwise cause the class’s ratio of annualized total expenses to average net assets (expense ratio) to exceed its expense limitation. Each class is required to repay the manager for expenses previously reimbursed and management fees waived to the extent the class’s net assets have grown or expenses have declined sufficiently to allow repayment without causing the class’s expense ratio to exceed its expense limitation. However, no repayment will be made more than three years after the date of any reimbursement or waiver or later than the repayment dates indicated in the table below.

Pursuant to this agreement, expenses in the amount of $4,000 were reimbursed by the manager during the six months ended June 30, 2007. Including these amounts, expenses previously reimbursed by the manager in the amount of $16,000 remain subject to repayment at June 30, 2007. For the six months ended June 30, 2007, the Investor Class operated below its expense limitation.
In addition, the fund has entered into service agreements with Price Associates and two wholly owned subsidiaries of Price Associates (collectively, Price). Price Associates computes the daily share prices and provides certain other administrative services to the fund. T. Rowe Price Services, Inc., provides shareholder and administrative services in its capacity as the fund’s transfer and dividend disbursing agent. T. Rowe Price Retirement Plan Services, Inc., provides subaccounting and recordkeeping services for certain retirement accounts invested in the Investor Class and R Class. For the six months ended June 30, 2007, expenses incurred pursuant to these service agreements were $76,000 for Price Associates, $82,000 for T. Rowe Price Services, Inc., and $5,000 for T. Rowe Price Retirement Plan Services, Inc. The total amount payable at period-end pursuant to these service agreements is reflected as Due to Affiliates in the accompanying financial statements.
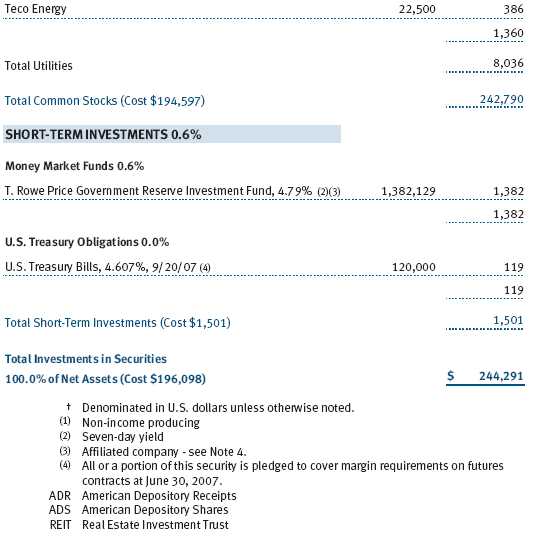
The fund may invest in the T. Rowe Price Reserve Investment Fund and the T. Rowe Price Government Reserve Investment Fund (collectively, the T. Rowe Price Reserve Investment Funds), open-end management investment companies managed by Price Associates and affiliates of the fund. The T. Rowe Price Reserve Investment Funds are offered as cash management options to mutual funds, trusts, and other accounts managed by Price Associates and/or its affiliates, and are not available for direct purchase by members of the public. The T. Rowe Price Reserve Investment Funds pay no investment management fees. During the six months ended June 30, 2007, dividend income from the T. Rowe Price Reserve Investment Funds totaled $44,000, and the value of shares of the T. Rowe Price Reserve Investment Funds held at June 30, 2007, and December 31, 2006, was $1,382,000 and $1,759,000, respectively.
As of June 30, 2007, T. Rowe Price Group, Inc., and/or its wholly owned subsidiaries owned 1,193,988 shares of the Investor Class, 18,956 shares of the Advisor Class, and 18,868 shares of the R Class, aggregating 9% of the fund’s net assets.
| INFORMATION ON PROXY VOTING POLICIES, PROCEDURES, AND RECORDS |
A description of the policies and procedures used by T. Rowe Price funds and portfolios to determine how to vote proxies relating to portfolio securities is available in each fund’s Statement of Additional Information, which you may request by calling 1-800-225-5132 or by accessing the SEC’s Web site, www.sec.gov. The description of our proxy voting policies and procedures is also available on our Web site, www.troweprice.com. To access it, click on the words “Company Info” at the top of our homepage for individual investors. Then, in the window that appears, click on the “Proxy Voting Policy” navigation button in the top left corner.
Each fund’s most recent annual proxy voting record is available on our Web site and through the SEC’s Web site. To access it through our Web site, follow the directions above, then click on the words “Proxy Voting Record” at the bottom of the Proxy Voting Policy page.
| HOW TO OBTAIN QUARTERLY PORTFOLIO HOLDINGS |
The fund files a complete schedule of portfolio holdings with the Securities and Exchange Commission for the first and third quarters of each fiscal year on Form N-Q. The fund’s Form N-Q is available electronically on the SEC’s Web site (www.sec.gov); hard copies may be reviewed and copied at the SEC’s Public Reference Room, 450 Fifth St. N.W., Washington, DC 20549. For more information on the Public Reference Room, call 1-800-SEC-0330.
| APPROVAL OF INVESTMENT MANAGEMENT AGREEMENT |
On March 7, 2007, the fund’s Board of Directors (Board) unanimously approved the investment advisory contract (Contract) between the fund and its investment manager, T. Rowe Price Associates, Inc. (Manager). The Board considered a variety of factors in connection with its review of the Contract, also taking into account information provided by the Manager during the course of the year, as discussed below:
Services Provided by the Manager
The Board considered the nature, quality, and extent of the services provided to the fund by the Manager. These services included, but were not limited to, management of the fund’s portfolio and a variety of related activities, as well as financial and administrative services, reporting, and communications. The Board also reviewed the background and experience of the Manager’s senior management team and investment personnel involved in the management of the fund. The Board concluded that it was satisfied with the nature, quality, and extent of the services provided by the Manager.
Investment Performance of the Fund
The Board reviewed the fund’s average annual total return over the 1-, 3-, 5-, and 10-year periods as well as the fund’s year-by-year returns and compared these returns with previously agreed upon comparable performance measures and market data, including those supplied by Lipper and Morningstar, which are independent providers of mutual fund data. On the basis of this evaluation and the Board’s ongoing review of investment results, the Board concluded that the fund’s performance was satisfactory.
Costs, Benefits, Profits, and Economies of Scale
The Board reviewed detailed information regarding the revenues received by the Manager under the Contract and other benefits that the Manager (and its affiliates) may have realized from its relationship with the fund, including research received under “soft dollar” agreements. The Board noted that soft dollars were not used to pay for third-party, non-broker research. The Board also received information on the estimated costs incurred and profits realized by the Manager and its affiliates from advising T. Rowe Price mutual funds, as well as estimates of the gross profits realized from managing the fund in particular. The Board concluded that the Manager’s profits were reasonable in light of the services provided to the fund. The Board also considered whether the fund or other funds benefit under the fee levels set forth in the Contract from any economies of scale realized by the Manager. Under the Contract, the fund pays a fee to the Manager composed of two components—a group fee rate based on the aggregate assets of certain T. Rowe Price mutual funds (including the fund) that declines at certain asset levels and an individual fund fee rate that is assessed on the assets of the fund. The Board concluded that the advisory fee structure for the fund continued to provide for a reasonable sharing of benefits from any economies of scale with the fund’s investors.
Fees
The Board reviewed the fund’s management fee rate, operating expenses, and total expense ratio (for the Investor Class, Advisor Class, and R Class) and compared them with fees and expenses of other comparable funds based on information and data supplied by Lipper. The information provided to the Board indicated that the fund’s management fee rate for all three classes and expense ratio for the Investor Class and Advisor Class were generally below the median for comparable funds and that the expense ratio for the R Class was above the median for comparable funds. The Board also reviewed the fee schedules for comparable privately managed accounts of the Manager and its affiliates. Management informed the Board that the Manager’s responsibilities for privately managed accounts are more limited than its responsibilities for the fund and other T. Rowe Price mutual funds that it or its affiliates advise. On the basis of the information provided, the Board concluded that the fees paid by the fund under the Contract were reasonable.
Approval of the Contract
As noted, the Board approved the continuation of the Contract. No single factor was considered in isolation or to be determinative to the decision. Rather, the Board concluded, in light of a weighting and balancing of all factors considered, that it was in the best interests of the fund to approve the continuation of the Contract, including the fees to be charged for services thereunder.
Item 2. Code of Ethics.
A code of ethics, as defined in Item 2 of Form N-CSR, applicable to its principal executive officer, principal financial officer, principal accounting officer or controller, or persons performing similar functions is filed as an exhibit to the registrant’s annual Form N-CSR. No substantive amendments were approved or waivers were granted to this code of ethics during the registrant’s most recent fiscal half-year.
Item 3. Audit Committee Financial Expert.
Disclosure required in registrant’s annual Form N-CSR.
Item 4. Principal Accountant Fees and Services.
Disclosure required in registrant’s annual Form N-CSR.
Item 5. Audit Committee of Listed Registrants.
Not applicable.
Item 6. Schedule of Investments.
Not applicable. The complete schedule of investments is included in Item 1 of this Form N-CSR.
Item 7. Disclosure of Proxy Voting Policies and Procedures for Closed-End Management Investment Companies.
Not applicable.
Item 8. Portfolio Managers of Closed-End Management Investment Companies.
Not applicable.
Item 9. Purchases of Equity Securities by Closed-End Management Investment Company and Affiliated Purchasers.
Not applicable.
Item 10. Submission of Matters to a Vote of Security Holders.
Not applicable.
Item 11. Controls and Procedures.
(a) The registrant’s principal executive officer and principal financial officer have evaluated the registrant’s disclosure controls and procedures within 90 days of this filing and have concluded that the registrant’s disclosure controls and procedures were effective, as of that date, in ensuring that information required to be disclosed by the registrant in this Form N-CSR was recorded, processed, summarized, and reported timely.
(b) The registrant’s principal executive officer and principal financial officer are aware of no change in the registrant’s internal control over financial reporting that occurred during the registrant’s second fiscal quarter covered by this report that has materially affected, or is reasonably likely to materially affect, the registrant’s internal control over financial reporting.
Item 12. Exhibits.(a)(1) The registrant’s code of ethics pursuant to Item 2 of Form N-CSR is filed with the registrant’s annual Form N-CSR.
(2) Separate certifications by the registrant's principal executive officer and principal financial officer, pursuant to Section 302 of the Sarbanes-Oxley Act of 2002 and required by Rule 30a-2(a) under the Investment Company Act of 1940, are attached.
(3) Written solicitation to repurchase securities issued by closed-end companies: not applicable.
(b) A certification by the registrant's principal executive officer and principal financial officer, pursuant to Section 906 of the Sarbanes-Oxley Act of 2002 and required by Rule 30a-2(b) under the Investment Company Act of 1940, is attached.
| | |
SIGNATURES |
| |
| | Pursuant to the requirements of the Securities Exchange Act of 1934 and the Investment |
| Company Act of 1940, the registrant has duly caused this report to be signed on its behalf by the |
| undersigned, thereunto duly authorized. |
| |
| T. Rowe Price Capital Opportunity Fund, Inc. |
| |
| |
| By | /s/ Edward C. Bernard |
| | Edward C. Bernard |
| | Principal Executive Officer |
| |
| Date | August 17, 2007 |
| |
| |
| |
| | Pursuant to the requirements of the Securities Exchange Act of 1934 and the Investment |
| Company Act of 1940, this report has been signed below by the following persons on behalf of |
| the registrant and in the capacities and on the dates indicated. |
| |
| |
| By | /s/ Edward C. Bernard |
| | Edward C. Bernard |
| | Principal Executive Officer |
| |
| Date | August 17, 2007 |
| |
| |
| |
| By | /s/ Joseph A. Carrier |
| | Joseph A. Carrier |
| | Principal Financial Officer |
| |
| Date | August 17, 2007 |