| UNITED STATES |
| SECURITIES AND EXCHANGE COMMISSION |
| Washington, D.C. 20549 |
| |
FORM N-CSR |
| |
CERTIFIED SHAREHOLDER REPORT OF REGISTERED |
MANAGEMENT INVESTMENT COMPANIES |
| |
| |
| |
| Investment Company Act File Number: 811-07225 |
|
| |
| T. Rowe Price Capital Opportunity Fund, Inc. |
|
| (Exact name of registrant as specified in charter) |
| |
| 100 East Pratt Street, Baltimore, MD 21202 |
|
| (Address of principal executive offices) |
| |
| David Oestreicher |
| 100 East Pratt Street, Baltimore, MD 21202 |
|
| (Name and address of agent for service) |
| |
| |
| Registrant’s telephone number, including area code: (410) 345-2000 |
| |
| |
| Date of fiscal year end: December 31 |
| |
| |
| Date of reporting period: June 30, 2008 |
Item 1: Report to Shareholders| Capital Opportunity Fund | June 30, 2008 |
The views and opinions in this report were current as of June 30, 2008. They are not guarantees of performance or investment results and should not be taken as investment advice. Investment decisions reflect a variety of factors, and the managers reserve the right to change their views about individual stocks, sectors, and the markets at any time. As a result, the views expressed should not be relied upon as a forecast of the fund’s future investment intent. The report is certified under the Sarbanes-Oxley Act, which requires mutual funds and other public companies to affirm that, to the best of their knowledge, the information in their financial reports is fairly and accurately stated in all material respects.
REPORTS ON THE WEB
Sign up for our E-mail Program, and you can begin to receive updated fund reports and prospectuses online rather than through the mail. Log in to your account at troweprice.com for more information.
Manager’s Letter
Fellow Shareholders
Pessimism reigned in the U.S. equity market during the first half of 2008. There were many things for investors to fret about—a broadening economic slowdown, further deterioration in the housing market, a deepening credit crunch, a seemingly never-ending string of mortgage-related losses in the financial sector, and higher inflation brought on by surging prices for oil, food, and other commodities. Consequently, the broad stock indexes suffered double-digit declines for the six months.

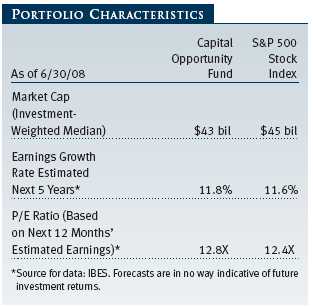
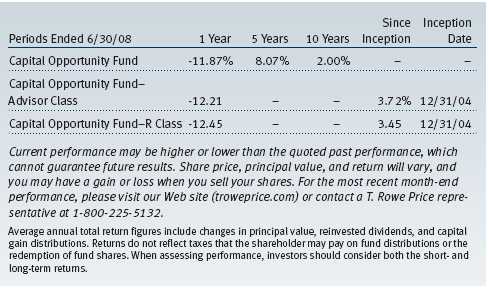
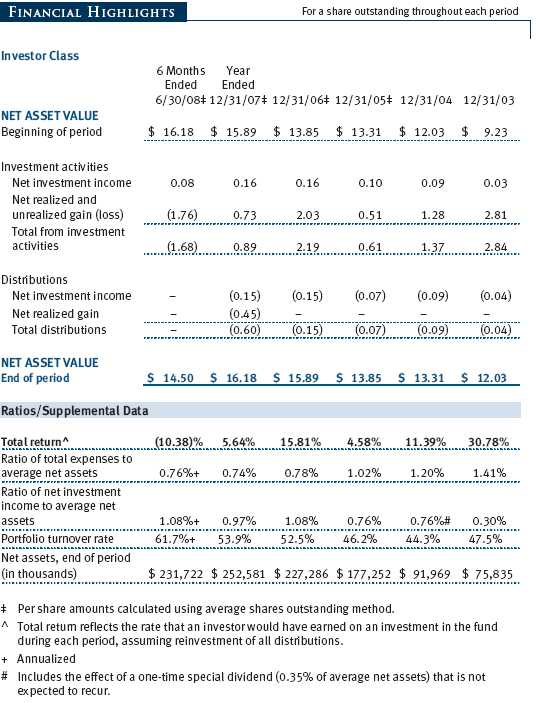
Your fund also produced a double-digit negative return for the six-month period, but it held up better than the broad market index and its peer group. As the accompanying table shows, the Capital Opportunity Fund returned -10.38% in the first six months of 2008, ahead of both the S&P 500 Stock Index and the Lipper Large-Cap Core Funds Index. (Returns for Advisor and R Class shares reflected a different fee structure.) The fund’s outperformance of the S&P 500 was broad based as stock selection contributed positively to results in nine of 10 market sectors, most notably information technology and telecommunication services.
HIGHLIGHTS
• Large-cap stocks fell during a turbulent first half of the year as financial companies continued to suffer from the collapse of the subprime lending market and investors worried about the slowing U.S. economy.
• The Capital Opportunity Fund declined but outpaced the S&P 500 Stock Index for the six months ended June 30, 2008.
• Stock selection in several sectors, especially information technology and telecommunication services, aided the fund’s performance, while consumer discretionary hurt relative results.
• The market sell-off has been painful, but it is creating many opportunities for this sector-neutral, yet research-intensive investment strategy. Participating analysts select stocks with the greatest total return potential relative to one another within each sector of the S&P 500.
MARKET ENVIRONMENTOne factor contributing to the stock market’s decline in the first half of the year was an increasingly weak U.S. economy. As measured by gross domestic product, the economy grew at an annual rate of just 1.0% in the first quarter of the year, on the heels of a 0.6% annual rate in the fourth quarter of 2007. As of this writing, expectations for the second quarter are more optimistic, but the improvement may be entirely due to a temporary catalyst—the tax rebate checks sent out by the federal government to stimulate economic activity.
In 2007, much of the slowdown in economic activity was driven by the sharp decline in the housing market. However, in the first half of 2008, the weakness spread to other sectors of the economy, most notably job growth and consumer spending. Employment peaked in December 2007 and has declined every month so far in 2008, erasing the 450,000 jobs created in the second half of 2007, while the unemployment rate rose from 5.0% to 5.5%. Consumer spending rose by 1.8% in the first half of 2008, but the bulk of the increase resulted from consumers paying more at the gas pump, where prices jumped to more than $4 a gallon in many parts of the country. Meanwhile, sales at auto dealerships, home furnishings stores, and department stores slumped.
Another factor adversely affecting equity market performance was the continued fallout from the subprime mortgage collapse and ensuing credit crunch. A host of banks and financial services companies continued to record large write-downs on mortgages and related investment securities, forcing many to raise additional capital to shore up their balance sheets. A lack of liquidity in the credit markets created difficulties for a variety of industries, from municipal bond insurers to student lenders to issuers of corporate debt.
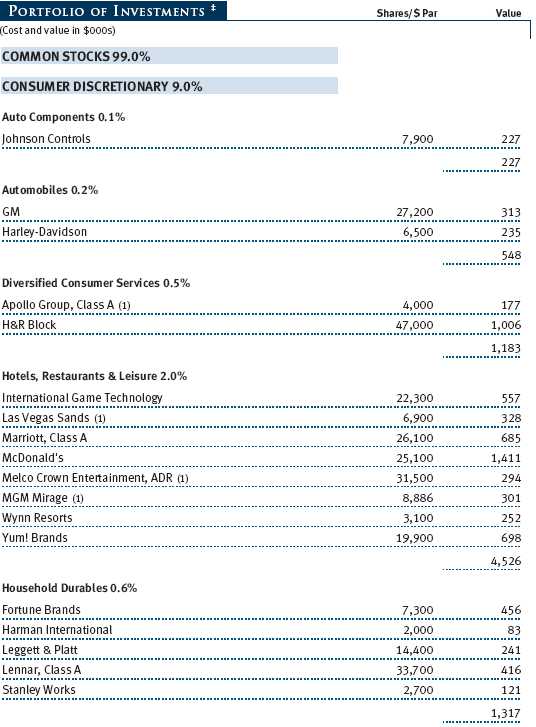
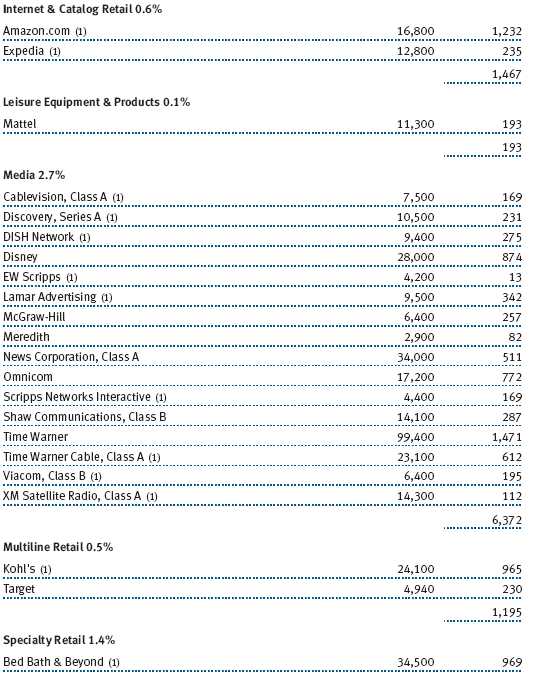
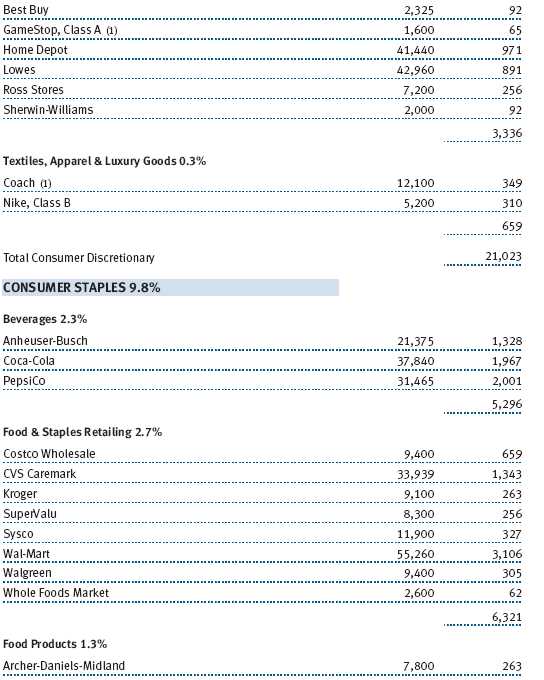
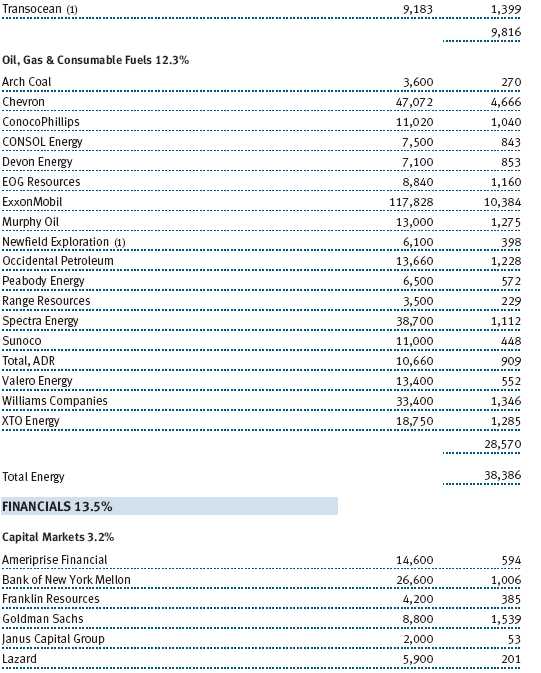
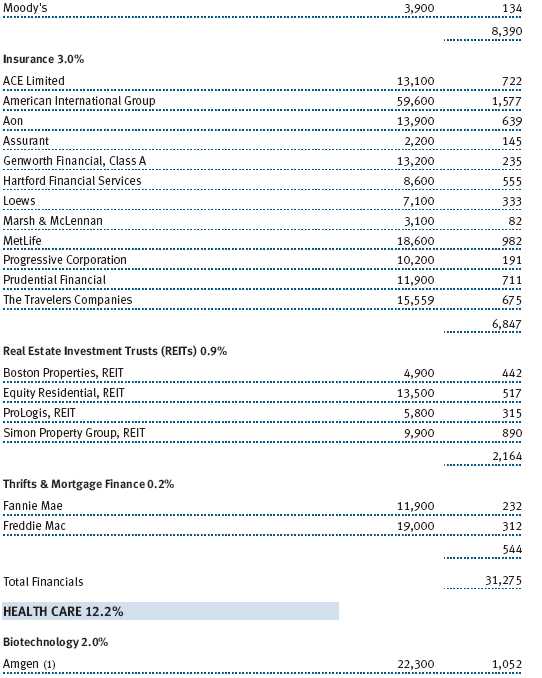
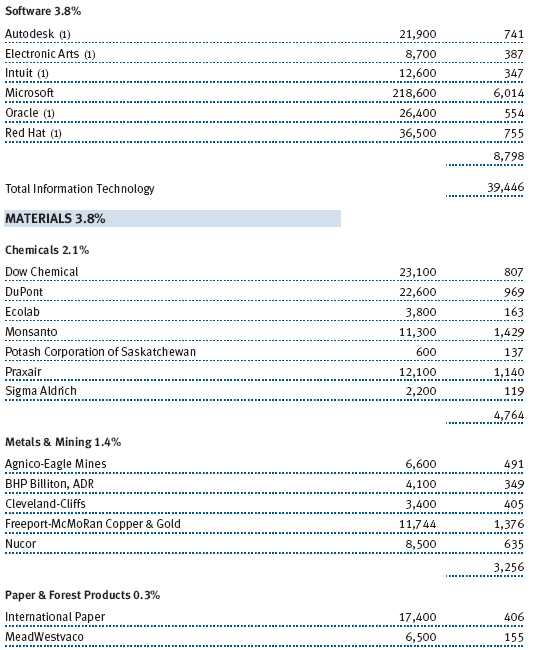
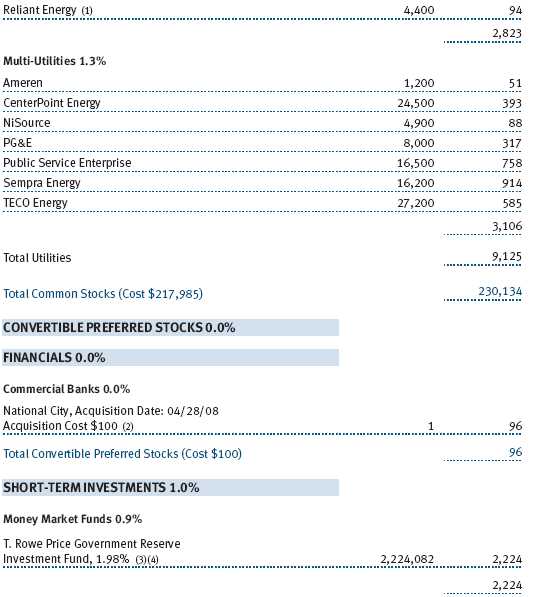
The mortgage and credit debacle appeared to reach bottom in mid-March, when losses at Bear Stearns left the venerable investment bank teetering on the brink of bankruptcy. At that point, the Federal Reserve stepped in and brokered a buyout of the company by JPMorgan Chase. The Fed’s bold move, along with its aggressive interest rate cuts and other efforts to provide liquidity to the credit markets, restored a measure of confidence and optimism in the financial markets. After suffering its worst quarterly return in nearly six years in the first quarter of the year, the stock market rallied sharply in April and May as investors concluded that the worst of the mortgage and credit problems were over. (Please see the portfolio of investments for a complete listing of holdings and the amount each represents in the portfolio.)
Unfortunately, this conclusion proved to be premature. Losses in the financial sector continued apace in the second quarter as delinquencies and foreclosures in the housing sector put additional downward pressure on the mortgage market. In addition, inflation came to the forefront as the price of oil soared by nearly 45% in the first half of the year, reaching a record high of more than $140 per barrel, and other commodity prices also rose substantially. As a result, stocks plunged in June, retracing all of their gains from April and May.
Overall, the broad equity indexes declined by more than 10% for the six months. Small- and mid-cap stocks held up the best—the small-cap Russell 2000 Index returned -9.37%, and the large-cap S&P 500 Index returned -11.91%. Growth stocks extended their outperformance from 2007, surpassing value shares in every capitalization segment of the market.
Sector performance changed very little from 2007. Energy and materials were the only sectors of the market to advance during the period as they continued to benefit from the sharp increase in commodity prices. Financials were by far the worst performers, while the economic downturn weighed on the consumer discretionary sector.
PORTFOLIO REVIEW
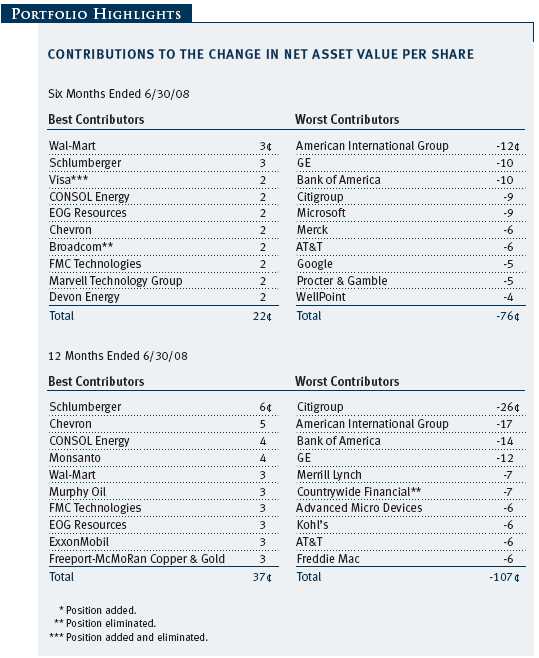
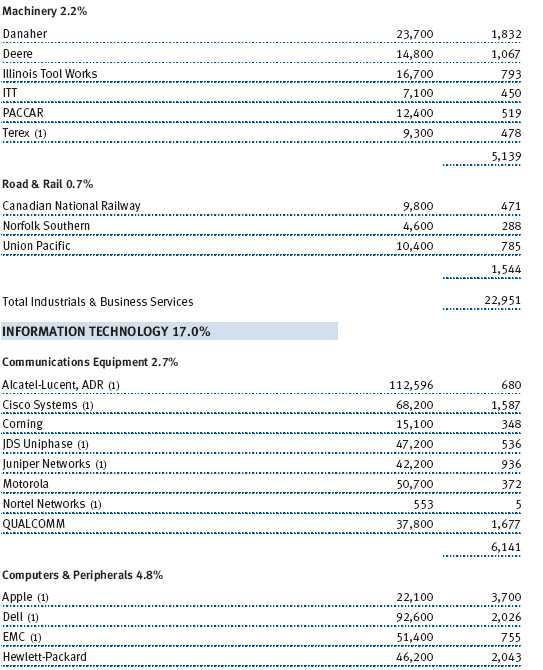
The largest sector weighting in the portfolio was information technology (17% of assets as of June 30, 2008). Although the fund’s technology holdings declined on an absolute basis, our stock selection in this sector contributed the most to your fund’s outperformance of the S&P 500. Five of the 10 best contributors to relative performance were technology stocks, led by semiconductor manufacturers Marvell Technology Group, Broadcom, and Xilinx. Marvell and Broadcom both enjoyed strong results as revenues increased and profit margins improved. Xilinx, which makes programmable logic chips, made some restructuring and cost-cutting moves that were well received by the market. Another strong performer during the period was credit card processor Visa, which went public in March. We participated in the initial public offering and watched the stock nearly double in a matter of weeks. In the wake of this strong runup, we exited the stock as we grew concerned about mounting losses in the credit card industry.
Stock selection also added value in the telecommunication services and health care sectors. Telecom services is the smallest sector in the portfolio (3% of assets at the end of the period), but it had an outsized impact on relative results. The key stock in this sector was Sprint Nextel, which plunged early in the year following the latest in a string of quarterly reports showing subscriber losses and declining profit margins. We avoided the stock during most of its precipitous drop, then added it to the portfolio in February after Sprint Nextel brought in new management and the valuation reached an attractive level. Since its addition to the portfolio, the stock has staged a modest recovery and outperformed the broader market.

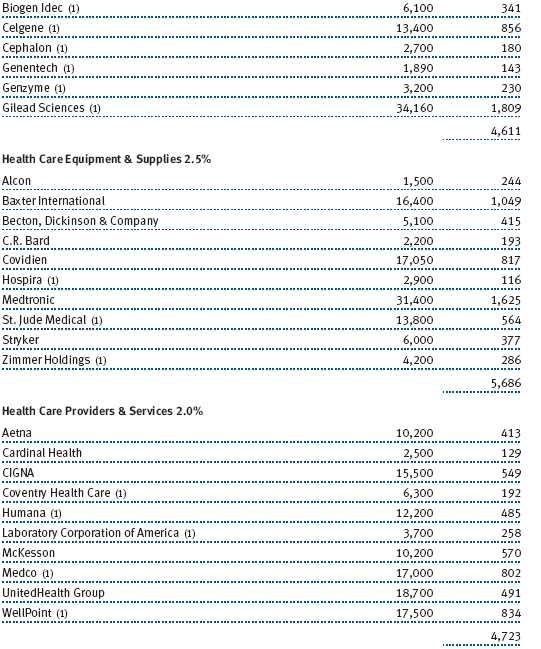
In the health care sector (12% of the portfolio as of June 30), an underweight position in pharmaceutical firm Pfizer contributed positively to relative performance. Pfizer’s stock slid on concerns about several of the company’s blockbuster medications (including Lipitor and Viagra) losing patent protection over the next few years. In addition, two of our biotechnology holdings, Gilead Sciences and Celgene, were favorable contributors. Gilead reported healthy earnings growth and raised its profit guidance for the full year thanks to robust sales of its franchise HIV drug, while Celgene benefited from improving sales growth in one of its core cancer drugs.
A couple of notable holdings in the consumer staples sector (10% of assets at period-end) aided performance in the first half of the year. Discount retailer Wal-Mart was the best absolute contributor to performance, benefiting from increased demand for discount consumer goods in an environment of slowing economic activity and $4-per-gallon gas. Brewing company Anheuser-Busch was another significant contributor, rallying after a premium takeover offer from European brewing giant InBev.
As with the broader market, energy stocks (16% of the portfolio as of June 30) generated the best absolute returns in the portfolio, reflecting the substantial increase in oil and natural gas prices. Six of the top 10 absolute performance contributors were energy stocks, led by equipment and services provider Schlumberger and coal producer CONSOL Energy. However, energy was also the only sector of the portfolio where stock selection detracted from performance compared with the S&P 500. This was due largely to our overweight position in oil refiner Sunoco, which fell sharply during the period. Higher oil prices combined with declining demand for fuel and other refined products to squeeze the company’s refining profit margins. We are maintaining our overweight in Sunoco as its valuation is near historically low levels and refining margins should recover when oil prices eventually ease.
Other noteworthy detractors from relative results came from the consumer discretionary sector (9% of assets at the end of the period). The economic downturn had a significant negative impact on the gaming industry, including portfolio holdings MGM Mirage, a casino operator, and gaming machine maker International Game Technology.
Finally, we would be remiss if we didn’t mention the financial sector (13% of the portfolio as of June 30), which had by far the biggest negative impact on absolute performance (although stock selection was neutral overall). Three of the four worst performers were financial stocks—financial services firms Bank of America and Citigroup, as well as insurer American International Group, which took bottom honors. All three companies reported substantial credit-related losses and raised capital during the period, but AIG also faced an SEC investigation and dismissed its CEO. There were some bright spots in our financial holdings, including real estate investment trusts, where Simon Property Group and Equity Residential Properties benefited both relative and absolute results. Our lighter exposure to some of the bigger landmines during the period—Wachovia, Bear Stearns, and Fannie Mae—also helped on a relative basis. Bear Stearns was eliminated.
OUTLOOK
The difficulties facing stocks in the first six months of 2008 have not abated and should remain a thorn in the side of the market as we move into the second half of the year. The housing downturn and the mortgage- and credit-related write-downs have been worse than we and many others anticipated. Meanwhile, the Fed finds itself caught between a slowing economy and rapidly rising inflation.
The silver lining is that the downward pressure on stocks has led to increasingly attractive valuations for companies that can deliver consistent growth. This presents opportunities for our research-intensive investment approach, in which we thoroughly analyze our investment universe to find stocks with the greatest capital appreciation potential while remaining sector-neutral relative to the S&P 500. We continue to believe this approach will generate superior long-term returns.
Respectfully submitted,

Anna M. Dopkin
President of the fund and chairman of its Investment Advisory Committee
July 17, 2008
The committee chairman has day-to-day responsibility for managing the portfolio and works with committee members in developing and executing the fund’s investment program.
RISKS OF INVESTING
As with all stock mutual funds, the fund’s share price can fall because of weakness in the stock market, a particular industry, or specific holdings. Stock markets can decline for many reasons, including adverse political or economic developments, changes in investor psychology, or heavy institutional selling. The prospects for an industry or company may deteriorate because of a variety of factors, including disappointing earnings or changes in the competitive environment.
GLOSSARY
Lipper indexes: Consist of a small number (10 to 30) of the largest mutual funds in a particular category as tracked by Lipper Inc.
Russell 2000 Index: Tracks the stocks of 2,000 small U.S. companies.
S&P 500 Stock Index: Tracks the stocks of 500 mostly large U.S. companies.

Performance and Expenses
This chart shows the value of a hypothetical $10,000 investment in the fund over the past 10 fiscal year periods or since inception (for funds lacking 10-year records). The result is compared with benchmarks, which may include a broad-based market index and a peer group average or index. Market indexes do not include expenses, which are deducted from fund returns as well as mutual fund averages and indexes.

| AVERAGE ANNUAL COMPOUND TOTAL RETURN |
This table shows how the fund would have performed each year if its actual (or cumulative) returns had been earned at a constant rate.
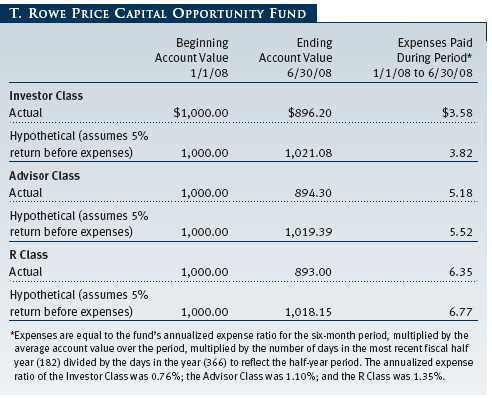
As a mutual fund shareholder, you may incur two types of costs: (1) transaction costs, such as redemption fees or sales loads, and (2) ongoing costs, including management fees, distribution and service (12b-1) fees, and other fund expenses. The following example is intended to help you understand your ongoing costs (in dollars) of investing in the fund and to compare these costs with the ongoing costs of investing in other mutual funds. The example is based on an investment of $1,000 invested at the beginning of the most recent six-month period and held for the entire period.
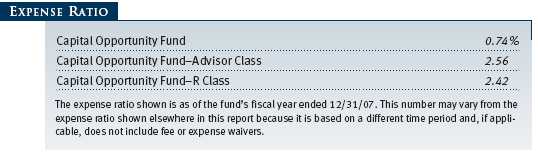
Please note that the fund has three share classes: The original share class (“investor class”) charges no distribution and service (12b-1) fee; Advisor Class shares are offered only through unaffiliated brokers and other financial intermediaries and charge a 0.25% 12b-1 fee; and R Class shares are available to retirement plans serviced by intermediaries and charge a 0.50% 12b-1 fee. Each share class is presented separately in the table.
Actual Expenses
The first line of the following table (“Actual”) provides information about actual account values and expenses based on the fund’s actual returns. You may use the information in this line, together with your account balance, to estimate the expenses that you paid over the period. Simply divide your account value by $1,000 (for example, an $8,600 account value divided by $1,000 = 8.6), then multiply the result by the number in the first line under the heading “Expenses Paid During Period” to estimate the expenses you paid on your account during this period.
Hypothetical Example for Comparison Purposes
The information on the second line of the table (“Hypothetical”) is based on hypothetical account values and expenses derived from the fund’s actual expense ratio and an assumed 5% per year rate of return before expenses (not the fund’s actual return). You may compare the ongoing costs of investing in the fund with other funds by contrasting this 5% hypothetical example and the 5% hypothetical examples that appear in the shareholder reports of the other funds. The hypothetical account values and expenses may not be used to estimate the actual ending account balance or expenses you paid for the period.
Note: T. Rowe Price charges an annual small-account maintenance fee of $10, generally for accounts with less than $2,000 ($500 for UGMA/UTMA). The fee is waived for any investor whose T. Rowe Price mutual fund accounts total $25,000 or more, accounts employing automatic investing, and IRAs and other retirement plan accounts that utilize a prototype plan sponsored by T. Rowe Price (although a separate custodial or administrative fee may apply to such accounts). This fee is not included in the accompanying table. If you are subject to the fee, keep it in mind when you are estimating the ongoing expenses of investing in the fund and when comparing the expenses of this fund with other funds.
You should also be aware that the expenses shown in the table highlight only your ongoing costs and do not reflect any transaction costs, such as redemption fees or sales loads. Therefore, the second line of the table is useful in comparing ongoing costs only and will not help you determine the relative total costs of owning different funds. To the extent a fund charges transaction costs, however, the total cost of owning that fund is higher.
Unaudited
The accompanying notes are an integral part of these financial statements.
Unaudited
The accompanying notes are an integral part of these financial statements.
Unaudited
The accompanying notes are an integral part of these financial statements.
Unaudited


The accompanying notes are an integral part of these financial statements.
Unaudited


The accompanying notes are an integral part of these financial statements.
Unaudited
The accompanying notes are an integral part of these financial statements.
Unaudited
The accompanying notes are an integral part of these financial statements.
Unaudited
| NOTES TO FINANCIAL STATEMENTS |
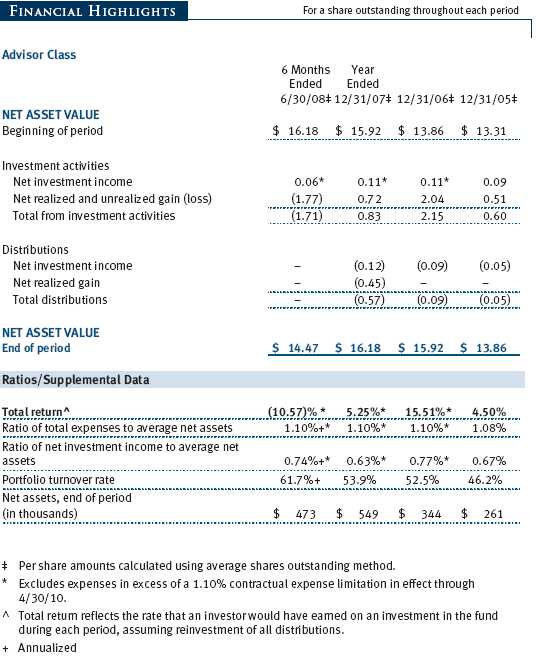
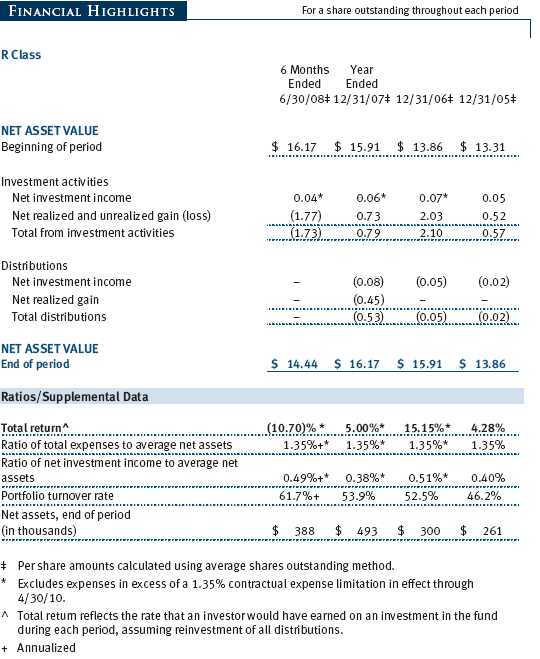
T. Rowe Price Capital Opportunity Fund, Inc. (the fund), is registered under the Investment Company Act of 1940 (the 1940 Act) as a diversified, open-end management investment company. The fund seeks to provide long-term capital growth by investing primarily in U.S. common stocks. The fund has three classes of shares: the Capital Opportunity Fund original share class, referred to in this report as the Investor Class, offered since November 30, 1994; the Capital Opportunity Fund—Advisor Class (Advisor Class), offered since December 31, 2004; and the Capital Opportunity Fund—R Class (R Class), offered since December 31, 2004. Advisor Class shares are sold only through unaffiliated brokers and other unaffiliated financial intermediaries, and R Class shares are available to retirement plans serviced by intermediaries. The Advisor Class and R Class each operate under separate Board-approved Rule 12b-1 plans, pursuant to which each class compensates financial intermediaries for distribution, shareholder servicing, and/or certain administrative services. Each class has exclusive voting rights on matters related solely to that class, separate voting rights on matters that relate to all classes, and, in all other respects, the same rights and obligations as the other classes.
NOTE 1 - SIGNIFICANT ACCOUNTING POLICIES
Basis of Preparation The accompanying financial statements were prepared in accordance with accounting principles generally accepted in the United States of America, which require the use of estimates made by fund management. Fund management believes that estimates and security valuations are appropriate; however, actual results may differ from those estimates, and the security valuations reflected in the financial statements may differ from the value the fund ultimately realizes upon sale of the securities.
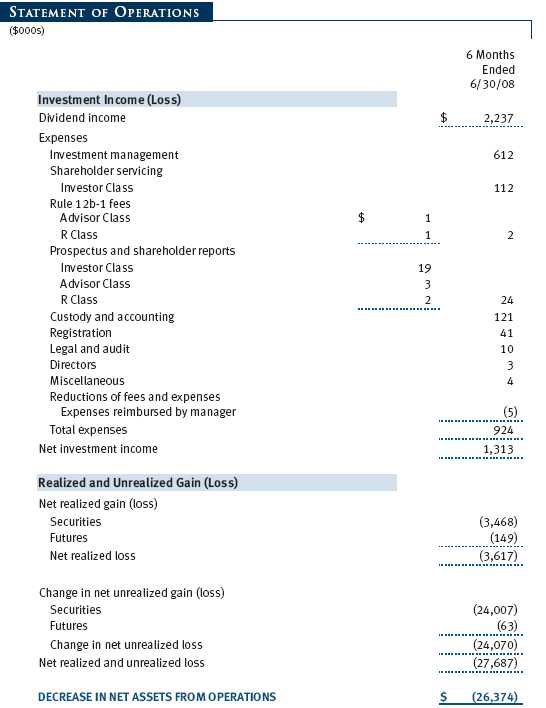
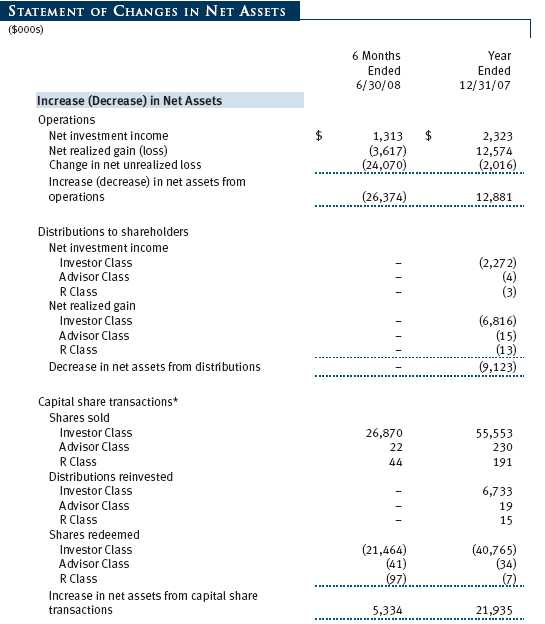
Investment Transactions, Investment Income, and Distributions Income and expenses are recorded on the accrual basis. Premiums and discounts on debt securities are amortized for financial reporting purposes. Dividends received from mutual fund investments are reflected as dividend income; capital gain distributions are reflected as realized gain/loss. Dividend income and capital gain distributions are recorded on the ex-dividend date. Income tax-related interest and penalties, if incurred, would be recorded as income tax expense. Investment transactions are accounted for on the trade date. Realized gains and losses are reported on the identified cost basis. Payments (“variation margin”) made or received to settle the daily fluctuations in the value of futures contracts are recorded as unrealized gains or losses until the contracts are closed. Unsettled variation margin on futures contracts is reflected as other assets or liabilities, and unrealized gains and losses on futures contracts are reflected as the change in net unrealized gain or loss in the accompanying financial statements. Distributions to shareholders are recorded on the ex-dividend date. Income distributions are declared and paid by each class on an annual basis. Capital gain distributions, if any, are declared and paid by the fund, typically on an annual basis.
Class Accounting The Advisor Class and R Class each pay distribution, shareholder servicing, and/or certain administrative expenses in the form of Rule 12b-1 fees, in an amount not exceeding 0.25% and 0.50%, respectively, of the class’s average daily net assets. Shareholder servicing, prospectus, and shareholder report expenses incurred by each class are charged directly to the class to which they relate. Expenses common to all classes, investment income, and realized and unrealized gains and losses are allocated to the classes based upon the relative daily net assets of each class.
Rebates Subject to best execution, the fund may direct certain security trades to brokers who have agreed to rebate a portion of the related brokerage commission to the fund in cash. Commission rebates are reflected as realized gain on securities in the accompanying financial statements and totaled $6,000 for the six months ended June 30, 2008.
New Accounting Pronouncements On January 1, 2008, the fund adopted Statement of Financial Accounting Standards No. 157 (FAS 157), Fair Value Measurements. FAS 157 defines fair value, establishes the framework for measuring fair value, and expands the disclosures of fair value measurements in the financial statements. Adoption of FAS 157 did not have a material impact on the fund’s net assets or results of operations.
In March 2008, the Financial Accounting Standards Board issued Statement of Financial Accounting Standards No. 161, Disclosures about Derivative Instruments and Hedging Activities (“FAS 161”), which is effective for fiscal years and interim periods beginning after November 15, 2008. FAS 161 requires enhanced disclosures about derivative and hedging activities, including how such activities are accounted for and their effect on financial position, performance and cash flows. Management is currently evaluating the impact the adoption of FAS 161 will have on the fund’s financial statements and related disclosures.
NOTE 2 - VALUATION
The fund’s investments are reported at fair value as defined under FAS 157. The fund values its investments and computes its net asset value per share at the close of the New York Stock Exchange (NYSE), normally 4 p.m. ET, each day that the NYSE is open for business.
Valuation Methods Equity securities listed or regularly traded on a securities exchange or in the over-the-counter (OTC) market are valued at the last quoted sale price or, for certain markets, the official closing price at the time the valuations are made, except for OTC Bulletin Board securities, which are valued at the mean of the latest bid and asked prices. A security that is listed or traded on more than one exchange is valued at the quotation on the exchange determined to be the primary market for such security. Listed securities not traded on a particular day are valued at the mean of the latest bid and asked prices for domestic securities and the last quoted sale price for international securities.
Debt securities with remaining maturities of less than one year at the time of acquisition generally use amortized cost in local currency to approximate fair value. However, if amortized cost is deemed not to reflect fair value or the fund holds a significant amount of such securities with remaining maturities of more than 60 days, the securities are valued at prices furnished by dealers who make markets in such securities or by an independent pricing service.
Investments in mutual funds are valued at the mutual fund’s closing net asset value per share on the day of valuation. Financial futures contracts are valued at closing settlement prices.
Other investments, including restricted securities, and those for which the above valuation procedures are inappropriate or are deemed not to reflect fair value are stated at fair value as determined in good faith by the T. Rowe Price Valuation Committee, established by the fund’s Board of Directors.
Valuation Inputs Various inputs are used to determine the value of the fund’s investments. These inputs are summarized in the three broad levels listed below:
Level 1 – quoted prices in active markets for identical securities
Level 2 – observable inputs other than Level 1 quoted prices (including, but not limited to, quoted prices for similar securities, interest rates, prepayment speeds, credit risk)
Level 3 – unobservable inputs
Observable inputs are those based on market data obtained from sources independent of the fund, and unobservable inputs reflect the fund’s own assumptions based on the best information available. The input levels are not necessarily an indication of the risk or liquidity associated with investments at that level. The following table summarizes the fund’s investments, based on the inputs used to determine their values on June 30, 2008:
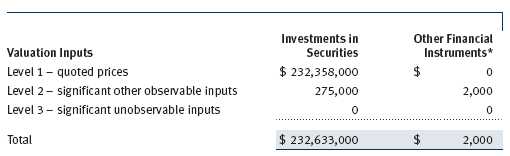
*Other financial instruments are derivative instruments not reflected in the Portfolio of Investments, such as futures contracts, forward currency exchange contracts, written options, and swaps, which are presented following the Portfolio of Investments.
NOTE 3 - INVESTMENT TRANSACTIONS
Consistent with its investment objective, the fund engages in the following practices to manage exposure to certain risks or to enhance performance. The investment objective, policies, program, and risk factors of the fund are described more fully in the fund’s prospectus and Statement of Additional Information.
Restricted Securities The fund may invest in securities that are subject to legal or contractual restrictions on resale. Prompt sale of such securities at an acceptable price may be difficult and may involve substantial delays and additional costs.
Futures Contracts During the six months ended June 30, 2008, the fund was a party to futures contracts, which provide for the future sale by one party and purchase by another of a specified amount of a specific financial instrument at an agreed upon price, date, time, and place. Risks arise from possible illiquidity of the futures market and from movements in security values.
Other Purchases and sales of portfolio securities, other than short-term securities, aggregated $81,621,000 and $74,651,000, respectively, for the six months ended June 30, 2008.
NOTE 4 - FEDERAL INCOME TAXES
No provision for federal income taxes is required since the fund intends to continue to qualify as a regulated investment company under Subchapter M of the Internal Revenue Code and distribute to shareholders all of its taxable income and gains. Distributions are determined in accordance with Federal income tax regulations, which differ from generally accepted accounting principles, and, therefore, may differ in amount or character from net investment income and realized gains for financial reporting purposes. Financial reporting records are adjusted for permanent book/tax differences to reflect tax character but are not adjusted for temporary differences. The amount and character of tax-basis distributions and composition of net assets are finalized at fiscal year-end; accordingly, tax-basis balances have not been determined as of June 30, 2008.
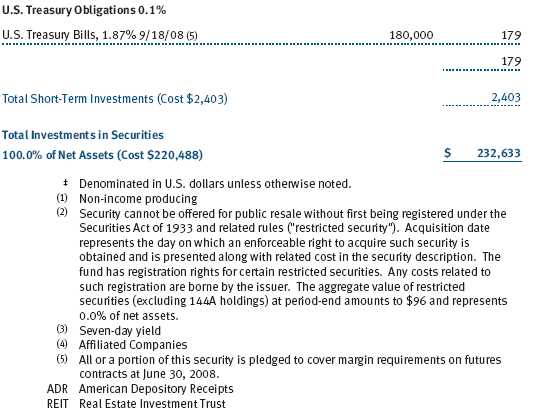
At June 30, 2008, the cost of investments for federal income tax purposes was $220,488,000. Net unrealized gain aggregated $12,075,000 at period-end, of which $35,708,000 related to appreciated investments and $23,633,000 related to depreciated investments.
NOTE 5 - RELATED PARTY TRANSACTIONS
The fund is managed by T. Rowe Price Associates, Inc. (the manager or Price Associates), a wholly owned subsidiary of T. Rowe Price Group, Inc. The investment management agreement between the fund and the manager provides for an annual investment management fee, which is computed daily and paid monthly. The fee consists of an individual fund fee, equal to 0.20% of the fund’s average daily net assets, and a group fee. The group fee rate is calculated based on the combined net assets of certain mutual funds sponsored by Price Associates (the group) applied to a graduated fee schedule, with rates ranging from 0.48% for the first $1 billion of assets to 0.285% for assets in excess of $220 billion. The fund’s group fee is determined by applying the group fee rate to the fund’s average daily net assets. At June 30, 2008, the effective annual group fee rate was 0.30%.
The Advisor Class and R Class are also subject to a contractual expense limitation through the limitation dates indicated in the table below. During the limitation period, the manager is required to waive its management fee and/or reimburse expenses, excluding interest, taxes, brokerage commissions, and extraordinary expenses, that would otherwise cause the class’s ratio of annualized total expenses to average net assets (expense ratio) to exceed its expense limitation. Each class is required to repay the manager for expenses previously reimbursed and management fees waived to the extent the class’s net assets have grown or expenses have declined sufficiently to allow repayment without causing the class’s expense ratio to exceed its expense limitation. However, no repayment will be made more than three years after the date of any reimbursement or waiver or later than the repayment dates indicated in the table below.

Pursuant to this agreement, expenses in the amount of $5,000 were reimbursed by the manager during the six months ended June 30, 2008. Including these amounts, expenses previously reimbursed by the manager in the amount of $27,000 remain subject to repayment at June 30, 2008.
In addition, the fund has entered into service agreements with Price Associates and two wholly owned subsidiaries of Price Associates (collectively, Price). Price Associates computes the daily share prices and provides certain other administrative services to the fund. T. Rowe Price Services, Inc., provides shareholder and administrative services in its capacity as the fund’s transfer and dividend disbursing agent. T. Rowe Price Retirement Plan Services, Inc., provides subaccounting and recordkeeping services for certain retirement accounts invested in the Investor Class and R Class. For the six months ended June 30, 2008, expenses incurred pursuant to these service agreements were $83,000 for Price Associates, $85,000 for T. Rowe Price Services, Inc., and $5,000 for T. Rowe Price Retirement Plan Services, Inc. The total amount payable at period-end pursuant to these service agreements is reflected as Due to Affiliates in the accompanying financial statements.
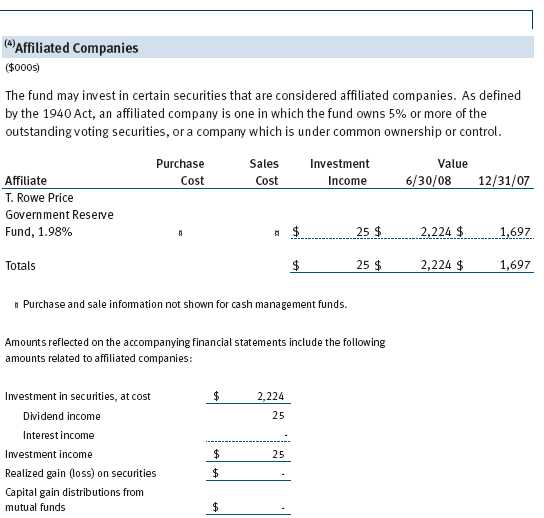
The fund may invest in the T. Rowe Price Reserve Investment Fund and the T. Rowe Price Government Reserve Investment Fund (collectively, the T. Rowe Price Reserve Investment Funds), open-end management investment companies managed by Price Associates and considered affiliates of the fund. The T. Rowe Price Reserve Investment Funds are offered as cash management options to mutual funds, trusts, and other accounts managed by Price Associates and/or its affiliates and are not available for direct purchase by members of the public. The T. Rowe Price Reserve Investment Funds pay no investment management fees.
As of June 30, 2008, T. Rowe Price Group, Inc., and/or its wholly owned subsidiaries owned 1,227,569 shares of the Investor Class, 19,631 shares of the Advisor Class, and 19,494 shares of the R Class, aggregating 8% of the fund’s net assets.
| INFORMATION ON PROXY VOTING POLICIES, PROCEDURES, AND RECORDS |
A description of the policies and procedures used by T. Rowe Price funds and portfolios to determine how to vote proxies relating to portfolio securities is available in each fund’s Statement of Additional Information, which you may request by calling 1-800-225-5132 or by accessing the SEC’s Web site, www.sec.gov. The description of our proxy voting policies and procedures is also available on our Web site, www.troweprice.com. To access it, click on the words “Company Info” at the top of our homepage for individual investors. Then, in the window that appears, click on the “Proxy Voting Policy” navigation button in the top left corner.
Each fund’s most recent annual proxy voting record is available on our Web site and through the SEC’s Web site. To access it through our Web site, follow the directions above, then click on the words “Proxy Voting Record” at the bottom of the Proxy Voting Policy page.
| HOW TO OBTAIN QUARTERLY PORTFOLIO HOLDINGS |
The fund files a complete schedule of portfolio holdings with the Securities and Exchange Commission for the first and third quarters of each fiscal year on Form N-Q. The fund’s Form N-Q is available electronically on the SEC’s Web site (www.sec.gov); hard copies may be reviewed and copied at the SEC’s Public Reference Room, 450 Fifth St. N.W., Washington, DC 20549. For more information on the Public Reference Room, call 1-800-SEC-0330.
| APPROVAL OF INVESTMENT MANAGEMENT AGREEMENT |
On March 4, 2008, the fund’s Board of Directors (Board) unanimously approved the investment advisory contract (Contract) between the fund and its investment manager, T. Rowe Price Associates, Inc. (Manager). The Board considered a variety of factors in connection with its review of the Contract, also taking into account information provided by the Manager during the course of the year, as discussed below:
Services Provided by the Manager
The Board considered the nature, quality, and extent of the services provided to the fund by the Manager. These services included, but were not limited to, management of the fund’s portfolio and a variety of related activities, as well as financial and administrative services, reporting, and communications. The Board also reviewed the background and experience of the Manager’s senior management team and investment personnel involved in the management of the fund. The Board concluded that it was satisfied with the nature, quality, and extent of the services provided by the Manager.
Investment Performance of the Fund
The Board reviewed the fund’s average annual total returns over the 1-, 3-, 5-, and 10-year periods as well as the fund’s year-by-year returns and compared these returns with previously agreed upon comparable performance measures and market data, including those supplied by Lipper and Morningstar, which are independent providers of mutual fund data. On the basis of this evaluation and the Board’s ongoing review of investment results, the Board concluded that the fund’s performance was satisfactory.
Costs, Benefits, Profits, and Economies of Scale
The Board reviewed detailed information regarding the revenues received by the Manager under the Contract and other benefits that the Manager (and its affiliates) may have realized from its relationship with the fund, including research received under “soft dollar” agreements. The Board noted that soft dollars were not used to pay for third-party, non-broker research. The Board also received information on the estimated costs incurred and profits realized by the Manager and its affiliates from advising T. Rowe Price mutual funds, as well as estimates of the gross profits realized from managing the fund in particular. The Board concluded that the Manager’s profits were reasonable in light of the services provided to the fund. The Board also considered whether the fund or other funds benefit under the fee levels set forth in the Contract from any economies of scale realized by the Manager. Under the Contract, the fund pays a fee to the Manager composed of two components—a group fee rate based on the aggregate assets of certain T. Rowe Price mutual funds (including the fund) that declines at certain asset levels and an individual fund fee rate that is assessed on the assets of the fund. The Board concluded that the advisory fee structure for the fund continued to provide for a reasonable sharing of benefits from any economies of scale with the fund’s investors.
Fees
The Board reviewed the fund’s management fee rate, operating expenses, and total expense ratio (for the Investor Class, Advisor Class, and R Class) and compared them with fees and expenses of other comparable funds based on information and data supplied by Lipper. The information provided to the Board indicated that the fund’s management fee rate for the Investor Class was above the median for certain groups of comparable funds and at or below the median for other groups of comparable funds, and the management fee rate for the Advisor Class and R Class were generally below the median for comparable funds. The information also showed that the expense ratio for the Investor Class and Advisor Class were generally below the median for comparable funds and the expense ratio for the R Class was above the median for comparable funds. The Board also reviewed the fee schedules for comparable privately managed accounts of the Manager and its affiliates. Management informed the Board that the Manager’s responsibilities for privately managed accounts are more limited than its responsibilities for the fund and other T. Rowe Price mutual funds that it or its affiliates advise. On the basis of the information provided, the Board concluded that the fees paid by the fund under the Contract were reasonable.
Approval of the Contract
As noted, the Board approved the continuation of the Contract. No single factor was considered in isolation or to be determinative to the decision. Rather, the Board concluded, in light of a weighting and balancing of all factors considered, that it was in the best interests of the fund to approve the continuation of the Contract, including the fees to be charged for services thereunder.
Item 2. Code of Ethics.
A code of ethics, as defined in Item 2 of Form N-CSR, applicable to its principal executive officer, principal financial officer, principal accounting officer or controller, or persons performing similar functions is filed as an exhibit to the registrant’s annual Form N-CSR. No substantive amendments were approved or waivers were granted to this code of ethics during the registrant’s most recent fiscal half-year.
Item 3. Audit Committee Financial Expert.
Disclosure required in registrant’s annual Form N-CSR.
Item 4. Principal Accountant Fees and Services.
Disclosure required in registrant’s annual Form N-CSR.
Item 5. Audit Committee of Listed Registrants.
Not applicable.
Item 6. Investments.
(a) Not applicable. The complete schedule of investments is included in Item 1 of this Form N-CSR.
(b) Not applicable.
Item 7. Disclosure of Proxy Voting Policies and Procedures for Closed-End Management Investment Companies.
Not applicable.
Item 8. Portfolio Managers of Closed-End Management Investment Companies.
Not applicable.
Item 9. Purchases of Equity Securities by Closed-End Management Investment Company and Affiliated Purchasers.
Not applicable.
Item 10. Submission of Matters to a Vote of Security Holders.
Not applicable.
Item 11. Controls and Procedures.
(a) The registrant’s principal executive officer and principal financial officer have evaluated the registrant’s disclosure controls and procedures within 90 days of this filing and have concluded that the registrant’s disclosure controls and procedures were effective, as of that date, in ensuring that information required to be disclosed by the registrant in this Form N-CSR was recorded, processed, summarized, and reported timely.
(b) The registrant’s principal executive officer and principal financial officer are aware of no change in the registrant’s internal control over financial reporting that occurred during the registrant’s second fiscal quarter covered by this report that has materially affected, or is reasonably likely to materially affect, the registrant’s internal control over financial reporting.
Item 12. Exhibits.
(a)(1) The registrant’s code of ethics pursuant to Item 2 of Form N-CSR is filed with the registrant’s annual Form N-CSR.
(2) Separate certifications by the registrant's principal executive officer and principal financial officer, pursuant to Section 302 of the Sarbanes-Oxley Act of 2002 and required by Rule 30a-2(a) under the Investment Company Act of 1940, are attached.
(3) Written solicitation to repurchase securities issued by closed-end companies: not applicable.
(b) A certification by the registrant's principal executive officer and principal financial officer, pursuant to Section 906 of the Sarbanes-Oxley Act of 2002 and required by Rule 30a-2(b) under the Investment Company Act of 1940, is attached.
| | |
SIGNATURES |
| |
| | Pursuant to the requirements of the Securities Exchange Act of 1934 and the Investment |
| Company Act of 1940, the registrant has duly caused this report to be signed on its behalf by the |
| undersigned, thereunto duly authorized. |
| |
| T. Rowe Price Capital Opportunity Fund, Inc. |
| |
| |
| |
| By | /s/ Edward C. Bernard |
| | Edward C. Bernard |
| | Principal Executive Officer |
| |
| Date | August 20, 2008 |
| |
| |
| |
| | Pursuant to the requirements of the Securities Exchange Act of 1934 and the Investment |
| Company Act of 1940, this report has been signed below by the following persons on behalf of |
| the registrant and in the capacities and on the dates indicated. |
| |
| |
| By | /s/ Edward C. Bernard |
| | Edward C. Bernard |
| | Principal Executive Officer |
| |
| Date | August 20, 2008 |
| |
| |
| |
| By | /s/ Gregory K. Hinkle |
| | Gregory K. Hinkle |
| | Principal Financial Officer |
| |
| Date | August 20, 2008 |