UNITED STATES
SECURITIES AND EXCHANGE COMMISSION
Washington, D.C. 20549
FORM N-CSR
CERTIFIED SHAREHOLDER REPORT
OF
REGISTERED MANAGEMENT COMPANY
| Investment Company Act file number: | 811-07239 |
| Name of Registrant: | Vanguard Horizon Funds |
| Address of Registrant: | P.O. Box 2600
Valley Forge, PA 19482 |
| Name and address of agent for service: | Heidi Stam, Esquire
P.O. Box 876
Valley Forge, PA 19482 |
Registrant’s telephone number, including area code: (610) 669-1000
| Date of fiscal year end: | September 30 |
| Date of reporting period: | October 1, 2006 - March 31, 2007 |
| Item 1: | Reports to Shareholders |
| |
Vanguard® Strategic Equity Fund |
| |
| |
| |
> Semiannual Report | |
| |
| |
| |
March 31, 2007 | |
| |
| |
| 
|
| |
| |
| |
| |
| |
| |
| |
> During the first half of its 2007 fiscal year, Vanguard Strategic Equity Fund returned 13.1%, well above the return of the broad U.S. stock market and nearly a full percentage point ahead of the average return of its peer mutual funds.
> The fund’s emphasis on mid- and small-capitalization shares, which performed well during the six months, helped drive its strong return and outperformance of the broad market.
> Steel companies dominated the top spots on the list of the fund’s best performers, while several software companies landed near the bottom.
Contents | |
| |
Your Fund’s Total Returns | 1 |
Chairman’s Letter | 2 |
Advisor’s Report | 6 |
Fund Profile | 8 |
Performance Summary | 9 |
Financial Statements | 10 |
About Your Fund’s Expenses | 25 |
Trustees Approve Advisory Arrangement | 27 |
Glossary | 28 |
Please note: The opinions expressed in this report are just that—informed opinions. They should not be considered promises or advice. Also, please keep in mind that the information and opinions cover the period through the date on the cover of this report. Of course, the risks of investing in your fund are spelled out in the prospectus.
Your Fund’s Total Returns
Six Months Ended March 31, 2007 | |
| Total |
| Returns |
Vanguard Strategic Equity Fund | 13.1% |
MSCI US Small + Mid Cap 2200 Index | 12.4 |
Average Mid-Cap Core Fund1 | 12.3 |
Dow Jones Wilshire 5000 Index | 8.9 |
Your Fund’s Performance at a Glance |
September 30, 2006–March 31, 2007 | | | | |
| | | Distributions Per Share |
| Starting | Ending | Income | Capital |
| Share Price | Share Price | Dividends | Gains |
Vanguard Strategic Equity Fund | $23.07 | $24.79 | $0.26 | $0.98 |
1 Derived from data provided by Lipper Inc.
1

Chairman’s Letter
Dear Shareholder,
During a six-month period that was good for large-capitalization shares but even better for mid- and small-cap stocks, Vanguard Strategic Equity Fund provided a return of 13.1%. This strong performance was comfortably ahead of the return of the broad market, and it topped the average return of similar funds as well as the return of an index benchmark that the fund closely follows.
The first table on page 1 shows the total returns (capital change plus reinvested distributions) for the fund and its comparative measures.
Six-month stock market return reflected disparate market moods
The broad U.S. stock market stitched together a solid six-month return from patches of strength and weakness. Stock prices rallied at the start of the period, pulled back in February—in part, a reaction to the Chinese market’s swoon—then recovered in March, buoyed by generally benign economic and corporate-profit reports.
Small-cap stocks outpaced large-caps, and international stocks outperformed their U.S. counterparts—patterns that have been in place for much of the past few years.
As the Fed sat tight, bonds produced coupon-like returns
The Federal Reserve Board remained offstage during the six months, keeping its target for the federal funds rate at 5.25% throughout the period. Despite some interim back-and-forth, longer-term bond yields
2
finished the period pretty much where they started. With rates—and prices—more or less stable, bonds’ returns were consistent with their coupons.
The broad taxable bond market returned 2.8% for the six-month period. The municipal securities market posted a return of 1.9%. Money market instruments, one of the fixed income market’s bright spots in recent months, returned 2.5% for the half-year, as measured by the Citigroup 3-Month Treasury Bill Index.
The fund’s gain was powered by industrials and consumer stocks
Your fund’s six-month return of 13.1% was excellent in absolute terms and solid when compared with the return of the broad
U.S. stock market and the MSCI US Small + Mid Cap 2200 Index. To be sure, a double-digit return in just a half-year is something to be grateful for, but it should never be something that you expect from any investment.
By design, the Strategic Equity Fund’s sector weightings vary little from those of the index benchmark. The fund’s advisor, Vanguard Quantitative Equity Group, uses computer models to identify the most promising stocks in each sector. This means that, although the weightings of the fund and the index will be similar, the returns within sectors will often be different. Attempting to make these differences positive is what active management is all about.
Market Barometer | | | |
| | | Total Returns |
| | Periods Ended March 31, 2007 |
| Six Months | One Year | Five Years1 |
Stocks | | | |
Russell 1000 Index (Large-caps) | 8.2% | 11.8% | 6.9% |
Russell 2000 Index (Small-caps) | 11.0 | 5.9 | 10.9 |
Dow Jones Wilshire 5000 Index (Entire market) | 8.9 | 11.4 | 7.8 |
MSCI All Country World Index ex USA (International) | 15.5 | 20.3 | 17.4 |
| | | |
Bonds | | | |
Lehman Aggregate Bond Index (Broad taxable market) | 2.8% | 6.6% | 5.4% |
Lehman Municipal Bond Index | 1.9 | 5.4 | 5.5 |
Citigroup 3-Month Treasury Bill Index | 2.5 | 5.0 | 2.5 |
| | | |
CPI | | | |
Consumer Price Index | 1.2% | 2.8% | 2.8% |
1 Annualized.
3
For both the fund and the index, all of the ten sectors recorded positive returns. The range of returns, however, was quite wide. Materials companies (which accounted for only about 5% of the fund and the index) recorded a heady gain of more than 40%, while financials and information technology concerns returned 5% and 6%, respectively.
The fund gained an edge over the index through its selections in the materials sector and the consumer discretionary sector (retailers and entertainment companies) but gave up some ground to the benchmark in financials and information technology shares. Specifically, terrific returns from steel companies helped boost the fund’s return, as did the strong performance of several retailers.
See the Advisor’s Report on page 6 for more details on the fund’s model and performance.
In its quest for superior performance, the fund has been aided by its extremely low expenses. The table below illustrates its significant cost advantage over competing funds. This advantage has helped maximize investors’ share of the long-term rewards produced by the advisor’s stock-picking talents. Over the past ten years, the fund’s average annual return is higher than the index’s return by nearly a full percentage point.
Annualized Expense Ratios1 | | |
Your fund compared with its peer group | | |
| | Average |
| | Mid-Cap |
| Fund | Core Fund |
Strategic Equity Fund | 0.31% | 1.83% |
1 Fund expense ratio reflects the six months ended March 31, 2007. Peer-group expense ratio is derived from data provided by Lipper Inc. and captures information through year-end 2006.
4
A stock-market guarantee: Prices will fluctuate
During the past six months, stock prices did what they have always done and will forever do: They fluctuated. When all was said and done, the fluctuations added up to a rewarding half-year for the Strategic Equity Fund. But, of course, volatility can have a downside as well.
Fortunately, the key to meeting your long-term investment goals does not involve calculating when market fluctuations will work against you and when they will work in your favor. Rather, it involves building a portfolio that is diversified among asset classes and within them. The Strategic Equity Fund can play an important role in such a portfolio by providing disciplined, low-cost exposure to mid- and small-cap stocks.
Thank you for investing with Vanguard.
Sincerely,

John J. Brennan
Chairman and Chief Executive Officer
April 12, 2007
5
Advisor’s Report
For the six months ended March 31, 2007, Vanguard Strategic Equity Fund returned 13.1%, topping the 12.4% gain of the fund’s market benchmark, the MSCI Small + Mid Cap 2200 Index. The broad U.S. stock market returned 8.9%.
The investment environment
During this period, small- and mid-capitalization stocks once again outperformed their large-cap brethren. Large-cap stocks, which are not included in our benchmark, were up about 7%, while mid-cap and small-cap stocks each gained about 12%.
Over the past several years, smaller stocks have tended to outperform larger stocks. This tendency has helped the fund’s benchmark index to outperform broad market averages, which are dominated by large-caps. Because our strategy ties the fund tightly to the benchmark, its rise helped lift our performance above the broad market.
However, it is likely that in some future period this market tendency will reverse. When that happens, the fund’s return—reflecting our portfolio risk control, which links us to our benchmark—will likely lag behind that of large-cap-dominated market indexes. We cannot predict when this change will occur, and we will not modify our management of the fund in an attempt to anticipate it. Our goal is to outperform the fund’s mid- and small-cap benchmark, not to time changes in market factors. In our opinion, the potential rewards associated with timing market factors are not worth the additional risk.
Our investment approach
In our report on the fund’s 2006 fiscal year, we lamented that, while our model had been successful in identifying attractive stocks, we had been unlucky when selecting the particular stocks that made up our portfolio. The “luck” component improved during the past six months. Our model was again quite successful at picking stocks for us to choose from, and we had the added benefit of good fortune in our choices.
To oversimplify, our fund’s performance has three components: the return of the benchmark, our model’s stock-picking ability, and some amount of luck. Over the long run, we expect that last component to average out to zero.
The heart of our process is our stock-selection model. It contains three elements, each of which measures a stock’s attractiveness relative to its capitalization and industry peers. The first element measures a stock’s valuation; the second evaluates earnings quality; and the last considers market sentiment. These three elements are combined into an overall rating for each stock. To construct our portfolio, we combine the stock ratings with risk measures to minimize our exposure to industry and other factors. The resulting portfolio should capture the benchmark’s return plus the result of our model’s stock selection.
The fund’s successes and shortfalls
Our best performance over the six months was in the materials industry, where our model picked United States Steel, Steel Dynamics, and AK Steel, each of which
6
was up dramatically for the period. Our model was also successful in the consumer durables and technology industries.
Conversely, the model underperformed in the software industry, picking RealNetworks and Transaction Systems Architects, both of which dropped in value. These disparate results in the same period are typical of a quantitative process like ours and of a portfolio that holds many securities.
The stock-specific risk we assume in the portfolio has paid off so far this year, but it could reward or punish us in the near term. We look forward to the remainder of the fiscal year, believing that the fund offers a strong mix of stocks with attractive valuation and growth characteristics relative to its underlying benchmark.
James D. Troyer,
Principal and Portfolio Manager
Joel M. Dickson, Principal
Vanguard Quantitative Equity Group
April 11, 2007
7
Fund Profile
As of March 31, 2007
Portfolio Characteristics | | |
| | Comparative | Broad |
| Fund | Index1 | Index2 |
Number of Stocks | 735 | 2,144 | 4,948 |
Median Market Cap | $4.1B | $4.1B | $30.6B |
Price/Earnings Ratio | 15.8x | 20.8x | 17.6x |
Price/Book Ratio | 2.5x | 2.6x | 2.8x |
Yield | 1.0% | 1.2% | 1.7% |
Return on Equity | 13.8% | 14.0% | 16.9% |
Earnings Growth Rate | 19.1% | 18.7% | 20.8% |
Foreign Holdings | 0.2% | 0.0% | 0.7% |
Turnover Rate | 75%3 | — | — |
Expense Ratio | 0.31%3 | — | — |
Short-Term Reserves | 0% | — | — |
Sector Diversification (% of portfolio) | |
| | Comparative | Broad |
| Fund | Index1 | Index2 |
Consumer Discretionary | 16% | 16% | 12% |
Consumer Staples | 3 | 3 | 9 |
Energy | 8 | 8 | 9 |
Financials | 21 | 21 | 22 |
Health Care | 10 | 10 | 11 |
Industrials | 13 | 13 | 11 |
Information Technology | 15 | 15 | 15 |
Materials | 6 | 6 | 4 |
Telecommunication | | | |
Services | 2 | 2 | 3 |
Utilities | 6 | 6 | 4 |
Volatility Measures4 | |
| Fund Versus | Fund Versus |
| Comparative Index1 | Broad Index2 |
R-Squared | 0.98 | 0.89 |
Beta | 1.06 | 1.47 |
Ten Largest Holdings5 (% of total net assets) |
| | |
Mirant Corp. | independent power | |
| producers and | |
| energy traders | 1.0% |
AmerisourceBergen Corp. | health care | |
| distributors | 1.0 |
Parker Hannifin Corp. | industrial machinery | 1.0 |
Cummins Inc. | construction and | |
| farm machinery and | |
| heavy trucks | 1.0 |
Safeco Corp. | property and | |
| casualty insurance | 0.9 |
Terex Corp. | construction and | |
| farm machinery and | |
| heavy trucks | 0.9 |
Nabors Industries, Inc. | oil and gas drilling | 0.9 |
Tesoro Petroleum Corp. | oil and gas refining | |
| and marketing | 0.9 |
Fiserv, Inc. | data processing and | |
| outsourced services | 0.9 |
Helmerich & Payne, Inc. | oil and gas drilling | 0.9 |
Top Ten | | 9.4% |
Investment Focus
1 MSCI US Small + Mid Cap 2200 Index.
2 Dow Jones Wilshire 5000 Index.
3 Annualized.
4 For an explanation of R-squared, beta, and other terms used here, see the Glossary on page 28.
5 “Ten Largest Holdings” excludes any temporary cash investments and equity index products.
8
Performance Summary
All of the returns in this report represent past performance, which is not a guarantee of future results that may be achieved by the fund. (Current performance may be lower or higher than the performance data cited. For performance data current to the most recent month-end, visit our website at www.vanguard.com/performance.) Note, too, that both investment returns and principal value can fluctuate widely, so an investor’s shares, when sold, could be worth more or less than their original cost. The returns shown do not reflect taxes that a shareholder would pay on fund distributions or on the sale of fund shares.
Fiscal-Year Total Returns (%): September 30, 1996–March 31, 2007

Average Annual Total Returns: Periods Ended March 31, 2007 |
| | | | |
| Inception Date | One Year | Five Years | Ten Years |
Strategic Equity Fund | 8/14/1995 | 9.01% | 13.52% | 13.04% |
1 Six months ended March 31, 2007.
2 The Spliced Small and Mid Cap Index reflects the returns of the Russell 2800 Index through May 31, 2003, and the MSCI US Small + Mid Cap 2200 Index thereafter.
Note: See Financial Highlights table on page 21 for dividend and capital gains information.
9
Financial Statements (unaudited)
Statement of Net Assets
As of March 31, 2007
The fund provides a complete list of its holdings four times in each fiscal year, at the quarter-ends. For the second and fourth fiscal quarters, the lists appear in the fund’s semiannual and annual reports to shareholders. For the first and third fiscal quarters, the fund files the lists with the Securities and Exchange Commission on Form N-Q. Shareholders can look up the fund’s Forms N-Q on the SEC’s website at www.sec.gov. Forms N-Q may also be reviewed and copied at the SEC’s Public Reference Room (see the back cover of this report for further information).
| | | Market |
| | | Value• |
| | Shares | ($000) |
Common Stocks (99.8%)1 | | |
Consumer Discretionary (16.3%) | | |
| Polo Ralph Lauren Corp. | 760,580 | 67,045 |
| Whirlpool Corp. | 757,800 | 64,345 |
| Darden Restaurants Inc. | 1,411,300 | 58,131 |
| Nordstrom, Inc. | 1,090,900 | 57,752 |
| Guess ?, Inc. | 1,375,800 | 55,706 |
| Royal Caribbean | | |
| Cruises, Ltd. | 1,076,319 | 45,378 |
| Phillips-Van Heusen Corp. | 719,100 | 42,283 |
| Brinker International, Inc. | 1,045,900 | 34,201 |
| Abercrombie & Fitch Co. | 449,300 | 34,003 |
| Men’s Wearhouse, Inc. | 603,350 | 28,388 |
| Lamar Advertising Co. | | |
| Class A | 419,021 | 26,386 |
| Cablevision Systems | | |
| NY Group Class A | 805,600 | 24,514 |
* | Liberty Media Corp.— | | |
| Capital Series A | 206,396 | 22,825 |
* | AutoNation, Inc. | 1,052,047 | 22,345 |
| Newell Rubbermaid, Inc. | 675,146 | 20,990 |
| Jackson Hewitt | | |
| Tax Service Inc. | 623,600 | 20,067 |
| Dillard’s Inc. | 572,100 | 18,725 |
* | Wyndham Worldwide Corp. | 518,500 | 17,707 |
* | Skechers U.S.A., Inc. | 501,200 | 16,825 |
| Ruby Tuesday, Inc. | 581,800 | 16,639 |
* | Payless ShoeSource, Inc. | 464,000 | 15,405 |
* | AnnTaylor Stores Corp. | 367,900 | 14,267 |
| VF Corp. | 171,994 | 14,210 |
| Sherwin-Williams Co. | 208,357 | 13,760 |
| Sinclair Broadcast Group, Inc. | 887,816 | 13,717 |
* | Gemstar-TV Guide | | |
| International, Inc. | 3,217,485 | 13,481 |
| Eastman Kodak Co. | 571,300 | 12,889 |
* | DSW Inc. Class A | 304,200 | 12,840 |
* | Jack in the Box Inc. | 176,900 | 12,229 |
| Liz Claiborne, Inc. | 285,000 | 12,212 |
| Thor Industries, Inc. | 300,000 | 11,817 |
* | Charming Shoppes, Inc. | 908,858 | 11,770 |
| Meredith Corp. | 193,320 | 11,095 |
* | Harris Interactive Inc. | 1,809,900 | 10,914 |
| Idearc Inc. | 310,175 | 10,887 |
| Jones Apparel Group, Inc. | 352,800 | 10,842 |
* | ITT Educational Services, Inc. | 130,500 | 10,634 |
| Bob Evans Farms, Inc. | 284,017 | 10,494 |
* | CSK Auto Corp. | 594,600 | 10,227 |
* | ^Chipotle Mexican Grill, Inc. | 161,600 | 10,035 |
| Tim Hortons, Inc. | 326,800 | 9,941 |
| E.W. Scripps Co. Class A | 216,100 | 9,655 |
* | Tenneco Automotive, Inc. | 375,400 | 9,558 |
| Mattel, Inc. | 343,400 | 9,468 |
| Washington Post Co. Class B | 12,378 | 9,451 |
| Belo Corp. Class A | 497,400 | 9,286 |
| ArvinMeritor, Inc. | 494,600 | 9,026 |
* | Dollar Tree Stores, Inc. | 217,490 | 8,317 |
* | Genesco, Inc. | 200,200 | 8,314 |
* | RCN Corp. | 305,580 | 7,808 |
| Modine Manufacturing Co. | 338,600 | 7,754 |
| Harte-Hanks, Inc. | 281,000 | 7,753 |
| Catalina Marketing Corp. | 238,170 | 7,521 |
| H & R Block, Inc. | 353,200 | 7,431 |
* | Mohawk Industries, Inc. | 90,425 | 7,419 |
| Kimball International, Inc. | | |
| Class B | 370,086 | 7,135 |
| Domino’s Pizza, Inc. | 218,100 | 7,082 |
* | ^Nutri/System Inc. | 134,276 | 7,037 |
* | JAKKS Pacific, Inc. | 285,500 | 6,823 |
| K-Swiss, Inc. | 252,351 | 6,819 |
* | Big Lots Inc. | 209,600 | 6,556 |
| Cato Corp. Class A | 280,050 | 6,550 |
| The McClatchy Co. Class A | 197,400 | 6,240 |
* | Visteon Corp. | 701,800 | 5,993 |
| Steven Madden, Ltd. | 177,780 | 5,191 |
| Brown Shoe Co., Inc. | 122,900 | 5,162 |
| Sonic Automotive, Inc. | 175,000 | 4,988 |
* | Cox Radio, Inc. | 350,331 | 4,782 |
* | ^Krispy Kreme Doughnuts, Inc. | 459,253 | 4,680 |
| *Lear Corp. | 112,600 | 4,111 |
| World Wrestling | | |
| Entertainment, Inc. | 209,087 | 3,408 |
10
| | | Market |
| | | Value• |
| | Shares | ($000) |
| Group 1 Automotive, Inc. | 83,500 | 3,321 |
* | Expedia, Inc. | 141,015 | 3,269 |
* | The Dress Barn, Inc. | 154,780 | 3,221 |
| Tempur-Pedic | | |
| International Inc. | 123,600 | 3,212 |
| Stewart Enterprises, Inc. | | |
| Class A | 395,258 | 3,186 |
| Ross Stores, Inc. | 86,749 | 2,984 |
| Sotheby’s | 66,278 | 2,948 |
* | Rent-A-Center, Inc. | 103,893 | 2,907 |
* | ^Select Comfort Corp. | 158,200 | 2,816 |
* | The Gymboree Corp. | 63,400 | 2,540 |
| Asbury Automotive | | |
| Group, Inc. | 86,300 | 2,438 |
| Dover Downs Gaming & | | |
| Entertainment, Inc. | 185,850 | 2,394 |
| Saks Inc. | 111,400 | 2,322 |
| Sealy Corp. | 130,500 | 2,281 |
* | Getty Images, Inc. | 46,800 | 2,276 |
| Ethan Allen Interiors, Inc. | 59,000 | 2,085 |
| American Greetings Corp. | | |
| Class A | 89,000 | 2,066 |
* | Steak n Shake Co. | 121,208 | 2,033 |
* | Spanish Broadcasting | | |
| System, Inc. | 499,974 | 2,000 |
| Building Materials | | |
| Holding Corp. | 103,900 | 1,882 |
| The Buckle, Inc. | 51,150 | 1,826 |
| Aaron Rents, Inc. | 68,800 | 1,819 |
| Movado Group, Inc. | 61,100 | 1,799 |
* | Papa John’s International, Inc. | 60,621 | 1,782 |
* | Scholastic Corp. | 54,600 | 1,698 |
| UniFirst Corp. | 44,200 | 1,696 |
* | The Warnaco Group, Inc. | 59,100 | 1,678 |
| Service Corp. International | 139,900 | 1,659 |
| International Speedway Corp. | 31,684 | 1,638 |
| FTD Group, Inc. | 98,900 | 1,635 |
| Interactive Data Corp. | 62,700 | 1,552 |
* | GSI Commerce, Inc. | 67,800 | 1,532 |
| Regal Entertainment Group | | |
| Class A | 76,747 | 1,525 |
| Wynn Resorts Ltd. | 12,300 | 1,167 |
| Sally Beauty Co. Inc. | 122,100 | 1,122 |
* | K2 Inc. | 79,200 | 958 |
* | O’Charley’s Inc. | 46,100 | 889 |
| RadioShack Corp. | 31,400 | 849 |
* | Penn National Gaming, Inc. | 18,966 | 805 |
| Kellwood Co. | 27,400 | 804 |
| Westwood One, Inc. | 101,602 | 698 |
| Haverty Furniture Cos., Inc. | 48,200 | 675 |
| OfficeMax, Inc. | 11,400 | 601 |
* | Vertrue Inc. | 11,600 | 558 |
| Xerium Technologies Inc. | 66,700 | 535 |
* | Audiovox Corp. | 35,500 | 523 |
| CSS Industries, Inc. | 12,700 | 476 |
* | Charlotte Russe Holding Inc. | 13,200 | 381 |
* | Jo-Ann Stores, Inc. | 13,300 | 362 |
| Wendy’s International, Inc. | 9,800 | 307 |
* | RC2 Corp. | 3,760 | 152 |
* | Town Sports International | | |
| Holdings, Inc. | 4,800 | 105 |
| Coinmach Service Corp. | | |
| Class A | 9,700 | 103 |
| | | 1,245,329 |
Consumer Staples (3.4%) | | |
| Carolina Group | 800,300 | 60,511 |
| The Pepsi Bottling Group, Inc. | 951,500 | 30,343 |
| The Estee Lauder Cos. Inc. | | |
| Class A | 381,400 | 18,631 |
| The Kroger Co. | 622,000 | 17,571 |
| Del Monte Foods Co. | 1,452,427 | 16,674 |
* | NBTY, Inc. | 287,283 | 15,237 |
| Longs Drug Stores, Inc. | 282,910 | 14,609 |
| Brown-Forman Corp. Class B | 155,107 | 10,169 |
* | Hansen Natural Corp. | 266,324 | 10,088 |
* | The Pantry, Inc. | 166,400 | 7,525 |
| ^The Andersons, Inc. | 160,600 | 7,131 |
| Molson Coors Brewing Co. | | |
| Class B | 56,400 | 5,337 |
* | Energizer Holdings, Inc. | 61,800 | 5,273 |
| Seaboard Corp. | 2,290 | 5,175 |
| J.M. Smucker Co. | 96,600 | 5,151 |
| Corn Products | | |
| International, Inc. | 135,500 | 4,822 |
| Ruddick Corp. | 120,700 | 3,631 |
* | Herbalife Ltd. | 69,700 | 2,732 |
* | Prestige Brands | | |
| Holdings Inc. | 227,500 | 2,696 |
* | Ralcorp Holdings, Inc. | 38,800 | 2,495 |
| Ingles Markets, Inc. | 44,400 | 1,813 |
* | Performance Food Group Co. | 57,991 | 1,790 |
* | Alliance One | | |
| International, Inc. | 186,300 | 1,720 |
| The Great Atlantic & | | |
| Pacific Tea Co., Inc. | 30,500 | 1,012 |
| ^Mannatech, Inc. | 62,984 | 1,012 |
* | USANA Health Sciences, Inc. | 21,000 | 984 |
* | Boston Beer Co., Inc. Class A | 28,000 | 934 |
| Weis Markets, Inc. | 18,300 | 818 |
| Premium Standard Farms Inc. | 34,770 | 732 |
| ^Vector Group Ltd. | 26,590 | 497 |
| The Topps Co., Inc. | 36,300 | 353 |
* | Wild Oats Markets Inc. | 16,667 | 303 |
| Universal Corp. (VA) | 2,600 | 160 |
| | | 257,929 |
Energy (8.3%) | | |
* | Nabors Industries, Inc. | 2,389,862 | 70,907 |
| Tesoro Petroleum Corp. | 704,400 | 70,743 |
| Helmerich & Payne, Inc. | 2,275,542 | 69,040 |
| Chesapeake Energy Corp. | 1,819,829 | 56,196 |
* | National Oilwell Varco Inc. | 586,100 | 45,593 |
| Tidewater Inc. | 744,100 | 43,589 |
11
| | | Market |
| | | Value• |
| | Shares | ($000) |
| ENSCO International, Inc. | 586,309 | 31,895 |
| Holly Corp. | 502,958 | 29,825 |
| Frontier Oil Corp. | 853,200 | 27,848 |
* | Cameron International Corp. | 425,500 | 26,717 |
* | Swift Energy Co. | 609,600 | 25,463 |
* | Unit Corp. | 405,012 | 20,490 |
| Noble Corp. | 233,511 | 18,373 |
* | Grey Wolf, Inc. | 2,017,419 | 13,517 |
* | Pioneer Drilling Co. | 957,400 | 12,149 |
* | Atwood Oceanics, Inc. | 189,600 | 11,128 |
| Hess Corp. | 148,027 | 8,211 |
* | Parker Drilling Co. | 639,200 | 6,002 |
* | Superior Energy | | |
| Services, Inc. | 163,347 | 5,631 |
| OMI Corp. | 197,200 | 5,297 |
* | NATCO Group Inc. | 139,200 | 4,749 |
* | ^Hercules Offshore, Inc. | 169,500 | 4,451 |
* | SEACOR Holdings Inc. | 43,300 | 4,261 |
* | Todco Class A | 99,525 | 4,014 |
* | Forest Oil Corp. | 95,700 | 3,193 |
| Overseas Shipholding | | |
| Group Inc. | 49,700 | 3,111 |
| GlobalSantaFe Corp. | 47,700 | 2,942 |
* | W-H Energy Services, Inc. | 50,200 | 2,346 |
| W&T Offshore, Inc. | 79,800 | 2,309 |
* | Bronco Drilling Co., Inc. | 89,745 | 1,487 |
* | Complete Production | | |
| Services, Inc. | 70,900 | 1,412 |
* | Global Industries Ltd. | 74,087 | 1,355 |
* | Basic Energy Services Inc. | 49,400 | 1,151 |
* | Trico Marine Services, Inc. | 24,700 | 920 |
| General Maritime Corp. | 30,200 | 872 |
* | Petroleum Development Corp. | 7,600 | 407 |
* | Mariner Energy Inc. | 9,000 | 172 |
| | | 637,766 |
Financials (21.1%) | | |
| Capital Markets (1.5%) | | |
| Ameriprise Financial, Inc. | 605,121 | 34,577 |
* | E*TRADE Financial Corp. | 1,342,169 | 28,481 |
| A.G. Edwards & Sons, Inc. | 384,700 | 26,614 |
| Raymond James | | |
| Financial, Inc. | 411,150 | 12,236 |
* | Knight Capital Group, Inc. | | |
| Class A | 472,753 | 7,488 |
| MCG Capital Corp. | 318,008 | 5,966 |
| SWS Group, Inc. | 42,500 | 1,054 |
| Gamco Investors Inc. Class A | 21,691 | 940 |
| Capital Southwest Corp. | 1,000 | 154 |
| | | |
| Commercial Banks (2.9%) | | |
| Synovus Financial Corp. | 1,999,957 | 64,679 |
| Huntington Bancshares Inc. | 1,929,251 | 42,154 |
| Colonial BancGroup, Inc. | 887,200 | 21,958 |
| Bank of Hawaii Corp. | 412,986 | 21,901 |
| TCF Financial Corp. | 298,300 | 7,863 |
| Wilmington Trust Corp. | 109,900 | 4,634 |
| City Holding Co. | 106,855 | 4,322 |
| BancorpSouth, Inc. | 170,933 | 4,179 |
| Hancock Holding Co. | 92,195 | 4,055 |
| Compass Bancshares Inc. | 53,700 | 3,695 |
| Whitney Holdings Corp. | 104,700 | 3,202 |
| Independent Bank Corp. (MI) | 149,035 | 3,036 |
| Trustmark Corp. | 92,400 | 2,591 |
| First Republic Bank | 46,531 | 2,499 |
| BancFirst Corp. | 49,522 | 2,295 |
| Hanmi Financial Corp. | 110,200 | 2,100 |
| Old National Bancorp | 100,800 | 1,833 |
| Park National Corp. | 18,600 | 1,757 |
| First Community | | |
| Bancshares, Inc. | 42,018 | 1,639 |
| F.N.B. Corp. | 96,400 | 1,624 |
| Great Southern Bancorp, Inc. | 46,480 | 1,361 |
| NBT Bancorp, Inc. | 56,252 | 1,318 |
| Community Trust Bancorp Inc. | 30,256 | 1,096 |
| Capital City Bank Group, Inc. | 26,900 | 896 |
| Sterling Financial Corp. (PA) | 38,588 | 857 |
| United Bankshares, Inc. | 23,881 | 837 |
| IBERIABANK Corp. | 14,700 | 818 |
| West Coast Bancorp | 24,842 | 794 |
| BOK Financial Corp. | 14,918 | 739 |
| Sandy Spring Bancorp, Inc. | 21,300 | 738 |
| Banner Corp. | 17,137 | 712 |
| Sky Financial Group, Inc. | 25,736 | 691 |
| First Source Corp. | 25,845 | 676 |
| Nara Bancorp, Inc. | 38,605 | 676 |
| United Community Banks, Inc. | 19,603 | 643 |
| Chittenden Corp. | 20,600 | 622 |
| First Indiana Corp. | 27,587 | 603 |
| Renasant Corp. | 23,500 | 580 |
| Suffolk Bancorp | 17,300 | 558 |
| Union Bankshares Corp. | 21,000 | 545 |
| Simmons First National Corp. | 17,942 | 540 |
| Peoples Bancorp, Inc. | 19,800 | 523 |
| Heartland Financial USA, Inc. | 19,469 | 521 |
| S.Y. Bancorp, Inc. | 20,700 | 515 |
| TriCo Bancshares | 21,042 | 498 |
| Tompkins Trustco, Inc. | 11,600 | 486 |
| First Financial Corp. (IN) | 15,000 | 464 |
| Wilshire Bancorp Inc. | 27,000 | 443 |
| Taylor Capital Group, Inc. | 10,300 | 361 |
| Provident Bankshares Corp. | 7,903 | 260 |
| Independent Bank Corp. (MA) | 7,411 | 244 |
| First Merchants Corp. | 7,586 | 180 |
| FirstMerit Corp. | 6,101 | 129 |
| | | |
| Consumer Finance (1.5%) | | |
* | AmeriCredit Corp. | 2,358,145 | 53,907 |
| The First Marblehead Corp. | 850,300 | 38,170 |
| Advanta Corp. Class B | 235,197 | 10,311 |
* | EZCORP, Inc. | 460,749 | 6,787 |
* | World Acceptance Corp. | 146,500 | 5,853 |
| Advance America, Cash | | |
| Advance Centers, Inc. | 14,723 | 227 |
12
| | | Market |
| | | Value• |
| | Shares | ($000) |
| Diversified Financial Services (0.4%) | | |
| Leucadia National Corp. | 864,290 | 25,427 |
* | Primus Guaranty, Ltd. | 250,000 | 3,075 |
| Resource America, Inc. | 65,020 | 1,536 |
| | | |
| Insurance (4.2%) | | |
| Safeco Corp. | 1,082,402 | 71,904 |
| First American Corp. | 763,821 | 38,741 |
| Nationwide Financial | | |
| Services, Inc. | 482,700 | 25,998 |
| W.R. Berkley Corp. | 680,735 | 22,546 |
* | Arch Capital Group Ltd. | 307,300 | 20,961 |
| Zenith National | | |
| Insurance Corp. | 375,909 | 17,769 |
| American Financial | | |
| Group, Inc. | 439,500 | 14,961 |
| Ohio Casualty Corp. | 499,483 | 14,960 |
* | Philadelphia Consolidated | | |
| Holding Corp. | 278,324 | 12,243 |
| PartnerRe Ltd. | 172,400 | 11,816 |
| Endurance Specialty | | |
| Holdings Ltd. | 310,400 | 11,094 |
| Platinum Underwriters | | |
| Holdings, Ltd. | 344,200 | 11,042 |
| Everest Re Group, Ltd. | 109,800 | 10,559 |
| The Hanover Insurance | | |
| Group Inc. | 191,400 | 8,827 |
| Axis Capital Holdings Ltd. | 232,380 | 7,868 |
| Odyssey Re Holdings Corp. | 156,700 | 6,160 |
| Aspen Insurance | | |
| Holdings Ltd. | 169,000 | 4,429 |
| Safety Insurance Group, Inc. | 100,020 | 4,013 |
| Transatlantic Holdings, Inc. | 24,700 | 1,608 |
| Baldwin & Lyons, Inc. Class B | 33,300 | 847 |
| Commerce Group, Inc. | 27,010 | 811 |
| Horace Mann Educators Corp. | 36,300 | 746 |
| National Western Life | | |
| Insurance Co. Class A | 2,720 | 666 |
| Crawford & Co. Class B | 110,900 | 643 |
| IPC Holdings Ltd. | 22,000 | 635 |
| Torchmark Corp. | 6,000 | 394 |
| Presidential Life Corp. | 19,000 | 375 |
| Montpelier Re Holdings Ltd. | 19,900 | 345 |
* | CNA Surety Corp. | 15,800 | 333 |
| RenaissanceRe Holdings Ltd. | 4,500 | 226 |
| | | |
| Real Estate Investment Trusts (7.1%) | | |
| Host Hotels & Resorts | | |
| Inc. REIT | 1,231,800 | 32,409 |
| Archstone-Smith Trust REIT | 537,400 | 29,170 |
| Boston Properties, Inc. REIT | 239,400 | 28,106 |
| Avalonbay Communities, | | |
| Inc. REIT | 202,300 | 26,299 |
| SL Green Realty Corp. REIT | 159,426 | 21,870 |
| Health Care Properties | | |
| Investors REIT | 565,600 | 20,379 |
| Plum Creek Timber | | |
| Co. Inc. REIT | 495,600 | 19,537 |
| ProLogis REIT | 299,224 | 19,429 |
| The Macerich Co. REIT | 203,700 | 18,814 |
| Apartment Investment & | | |
| Management Co. | | |
| Class A REIT | 322,000 | 18,576 |
| Federal Realty Investment | | |
| Trust REIT | 182,400 | 16,529 |
| UDR, Inc. REIT | 517,500 | 15,846 |
| Camden Property Trust REIT | 221,300 | 15,560 |
| General Growth | | |
| Properties Inc. REIT | 234,500 | 15,142 |
| Essex Property Trust, | | |
| Inc. REIT | 107,300 | 13,893 |
| Taubman Co. REIT | 232,600 | 13,488 |
| Regency Centers Corp. REIT | 151,700 | 12,675 |
| BRE Properties Inc. | | |
| Class A REIT | 197,300 | 12,459 |
| Kimco Realty Corp. REIT | 229,573 | 11,189 |
| iStar Financial Inc. REIT | 236,800 | 11,089 |
| Highwood Properties, | | |
| Inc. REIT | 280,400 | 11,073 |
| Mack-Cali Realty Corp. REIT | 212,700 | 10,131 |
| FelCor Lodging Trust, | | |
| Inc. REIT | 364,700 | 9,471 |
| Cousins Properties, | | |
| Inc. REIT | 282,100 | 9,270 |
| Maguire Properties, | | |
| Inc. REIT | 257,000 | 9,139 |
| Tanger Factory Outlet | | |
| Centers, Inc. REIT | 223,300 | 9,019 |
| American Campus | | |
| Communities, Inc. REIT | 250,000 | 7,572 |
| Rayonier Inc. REIT | 142,050 | 6,108 |
| Post Properties, Inc. REIT | 129,600 | 5,927 |
| New Plan Excel Realty | | |
| Trust REIT | 177,196 | 5,853 |
| Nationwide Health | | |
| Properties, Inc. REIT | 179,200 | 5,602 |
^Thornburg Mortgage, | | |
Inc. REIT | 214,300 | 5,572 |
Home Properties, Inc. REIT | 104,700 | 5,529 |
Colonial Properties | | |
Trust REIT | 120,800 | 5,517 |
HRPT Properties Trust REIT | 443,500 | 5,455 |
CapitalSource Inc. REIT | 171,400 | 4,307 |
Equity Inns, Inc. REIT | 257,300 | 4,215 |
KKR Financial Corp. REIT | 145,100 | 3,980 |
Innkeepers USA Trust REIT | 236,100 | 3,844 |
Sunstone Hotel Investors, | | |
Inc. REIT | 121,800 | 3,320 |
Developers Diversified | | |
Realty Corp. REIT | 47,900 | 3,013 |
Potlatch Corp. REIT | 65,400 | 2,994 |
13
| | Market |
| | Value• |
| Shares | ($000) |
| Senior Housing Properties | | |
| Trust REIT | 122,400 | 2,925 |
| LaSalle Hotel Properties REIT | 59,600 | 2,763 |
| Saul Centers, Inc. REIT | 45,600 | 2,595 |
| AMB Property Corp. REIT | 42,400 | 2,493 |
| Pennsylvania REIT | 48,100 | 2,132 |
| BioMed Realty Trust, | | |
| Inc. REIT | 79,500 | 2,091 |
| American Financial | | |
| Realty Trust REIT | 179,800 | 1,812 |
| ^Impac Mortgage Holdings, | | |
| Inc. REIT | 281,600 | 1,408 |
| Duke Realty Corp. REIT | 29,200 | 1,269 |
| GMH Communities | | |
| Trust REIT | 115,000 | 1,149 |
| ^Novastar Financial, Inc. REIT | 149,600 | 748 |
| Spirit Finance Corp. REIT | 44,600 | 665 |
| Digital Realty Trust, Inc. REIT | 16,600 | 662 |
| Highland Hospitality | | |
| Corp. REIT | 36,400 | 648 |
| Omega Healthcare | | |
| Investors, Inc. REIT | 33,500 | 575 |
| Longview Fibre Co. REIT | 23,300 | 574 |
| Deerfield Triarc Capital | | |
| Corp. REIT | 37,900 | 568 |
| Inland Real Estate Corp. REIT | 30,700 | 563 |
| MFA Mortgage Investments, | | |
| Inc. REIT | 71,500 | 551 |
| Acadia Realty Trust REIT | 20,100 | 524 |
| Hospitality Properties | | |
| Trust REIT | 10,700 | 501 |
| Ashford Hospitality | | |
| Trust REIT | 41,900 | 500 |
| RAIT Financial Trust REIT | 17,700 | 495 |
| Anthracite Capital Inc. REIT | 38,700 | 464 |
| First Potomac REIT | 16,000 | 457 |
| Sun Communities, Inc. REIT | 5,700 | 177 |
| Annaly Mortgage | | |
| Management Inc. REIT | 7,600 | 118 |
| | | |
| Real Estate Management & Development (0.9%) |
| Forest City Enterprise | | |
| Class A | 232,800 | 15,407 |
| * CB Richard Ellis Group, Inc. | 418,200 | 14,294 |
| ^The St. Joe Co. | 260,100 | 13,606 |
| Jones Lang LaSalle Inc. | 118,800 | 12,388 |
| * Realogy Corp. | 363,700 | 10,769 |
| | | |
| * Move, Inc. | 513,100 | 2,843 |
| | | |
| Thrifts & Mortgage Finance (2.6%) |
| ^IndyMac Bancorp, Inc. | 1,286,505 | 41,232 |
| ^Downey Financial Corp. | 417,000 | 26,913 |
| MGIC Investment Corp. | 417,164 | 24,579 |
| The PMI Group Inc. | 539,800 | 24,410 |
| ^Corus Bankshares Inc. | 1,251,628 | 21,353 |
| * ^First Federal Financial Corp. | 346,000 | 19,663 |
| BankUnited Financial Corp. | 565,400 | 11,992 |
| Radian Group, Inc. | 138,241 | 7,587 |
| Webster Financial Corp. | 94,200 | 4,523 |
| PFF Bancorp, Inc. | 117,600 | 3,567 |
| WSFS Financial Corp. | 45,550 | 2,937 |
| First Financial Holdings, Inc. | 63,953 | 2,213 |
| TierOne Corp. | 53,701 | 1,452 |
| City Bank Lynnwood (WA) | 42,509 | 1,365 |
* | Ocwen Financial Corp. | 63,100 | 812 |
| First Place Financial Corp. | 24,900 | 534 |
| United Community | | |
| Financial Corp. | 44,500 | 492 |
| ITLA Capital Corp. | 4,130 | 215 |
| | | 1,613,206 |
Health Care (9.5%) | | |
| AmerisourceBergen Corp. | 1,469,157 | 77,498 |
| Manor Care, Inc. | 1,002,700 | 54,507 |
* | Barr Pharmaceuticals Inc. | 1,109,200 | 51,411 |
* | Humana Inc. | 691,800 | 40,138 |
* | Laboratory Corp. of | | |
| America Holdings | 494,064 | 35,884 |
| Mylan Laboratories, Inc. | 1,625,114 | 34,355 |
* | Community Health | | |
| Systems, Inc. | 898,399 | 31,669 |
* | Sciele Pharma, Inc. | 1,305,308 | 30,910 |
* | Haemonetics Corp. | 651,299 | 30,448 |
* | Pediatrix Medical | | |
| Group, Inc. | 521,300 | 29,745 |
* | Kinetic Concepts, Inc. | 442,600 | 22,413 |
* | ImClone Systems, Inc. | 451,400 | 18,404 |
* | Apria Healthcare Group Inc. | 524,400 | 16,912 |
* | King Pharmaceuticals, Inc. | 821,900 | 16,167 |
* | WellCare Health Plans Inc. | 133,600 | 11,389 |
* | IDEXX Laboratories Corp. | 125,348 | 10,984 |
* | Viasys Healthcare Inc. | 305,200 | 10,374 |
| Valeant Pharmaceuticals | | |
| International | 580,900 | 10,044 |
* | Cephalon, Inc. | 135,574 | 9,654 |
* | Applera Corp.-Celera | | |
| Genomics Group | 679,500 | 9,649 |
| | | | |
* | Alkermes, Inc. | 613,175 | 9,467 |
* | ^Advanced Medical | | |
| Optics, Inc. | 242,694 | 9,028 |
* | Illumina, Inc. | 305,400 | 8,948 |
* | LifePoint Hospitals, Inc. | 223,300 | 8,535 |
* | Adams Respiratory | | |
| Therapeutics, Inc. | 251,358 | 8,453 |
* | Zoll Medical Corp. | 314,734 | 8,388 |
* | Lincare Holdings, Inc. | 218,596 | 8,012 |
* | MedCath Corp. | 256,420 | 7,000 |
* | ^Enzon Pharmaceuticals, Inc. | 842,300 | 6,865 |
| Medicis Pharmaceutical Corp. | 216,700 | 6,679 |
* | K-V Pharmaceutical Co. | | |
| Class A | 259,700 | 6,422 |
* | Techne Corp. | 108,521 | 6,197 |
* | Magellan Health | | |
| Services, Inc. | 136,403 | 5,729 |
14
| | | Market |
| | | Value• |
| | Shares | ($000) |
| Universal Health Services | | |
| Class B | 87,400 | 5,005 |
* | Immucor Inc. | 163,700 | 4,818 |
* | Par Pharmaceutical Cos. Inc. | 187,200 | 4,702 |
* | Palomar Medical | | |
| Technologies, Inc. | 110,057 | 4,397 |
* | Sierra Health Services, Inc. | 88,500 | 3,644 |
* | Kindred Healthcare, Inc. | 110,790 | 3,632 |
| IMS Health, Inc. | 120,900 | 3,586 |
| Perrigo Co. | 190,400 | 3,362 |
* | The Medicines Co. | 133,100 | 3,338 |
| Hillenbrand Industries, Inc. | 48,000 | 2,850 |
* | Ventana Medical | | |
| Systems, Inc. | 65,061 | 2,726 |
* | ^Telik, Inc. | 501,290 | 2,722 |
* | PAREXEL International Corp. | 75,650 | 2,721 |
* | Bruker BioSciences Corp. | 229,229 | 2,411 |
| Chemed Corp. | 47,200 | 2,311 |
* | Progenics | | |
| Pharmaceuticals, Inc. | 85,263 | 2,019 |
* | Bio-Rad Laboratories, Inc. | | |
| Class A | 27,500 | 1,921 |
* | ICU Medical, Inc. | 48,500 | 1,901 |
* | Tanox, Inc. | 94,526 | 1,773 |
* | Radiation Therapy | | |
| Services, Inc. | 51,900 | 1,590 |
| Alpharma, Inc. Class A | 64,100 | 1,544 |
* | New River | | |
| Pharmaceuticals Inc. | 21,938 | 1,396 |
| ^LCA-Vision Inc. | 33,000 | 1,359 |
| Datascope Corp. | 27,285 | 987 |
* | VCA Antech, Inc. | 26,300 | 955 |
| Young Innovations, Inc. | 34,000 | 925 |
* | BioMarin Pharmaceutical Inc. | 52,500 | 906 |
* | Noven Pharmaceuticals, Inc. | 38,685 | 897 |
| Vital Signs, Inc. | 15,855 | 824 |
| Mentor Corp. | 16,400 | 754 |
* | Greatbatch, Inc. | 29,478 | 752 |
* | Odyssey Healthcare, Inc. | 42,022 | 552 |
* | Alliance Imaging, Inc. | 37,800 | 330 |
* | AMN Healthcare | | |
| Services, Inc. | 13,900 | 314 |
* | Myriad Genetics, Inc. | 8,700 | 300 |
* | Merge Technologies, Inc. | 52,300 | 255 |
| Health Management | | |
| Associates Class A | 22,800 | 248 |
* | Digene Corp. | 5,600 | 237 |
* | eResearch Technology, Inc. | 29,100 | 229 |
* | AmSurg Corp. | 7,020 | 172 |
* | AMERIGROUP Corp. | 4,900 | 149 |
* | Genesis Healthcare Corp. | 2,300 | 145 |
| | | 727,937 |
Industrials (13.2%) | | |
| Parker Hannifin Corp. | 881,794 | 76,108 |
| Cummins Inc. | 506,700 | 73,330 |
* | Terex Corp. | 996,397 | 71,501 |
| Trinity Industries, Inc. | 1,518,120 | 63,640 |
* | AMR Corp. | 2,087,951 | 63,578 |
| Manpower Inc. | 858,575 | 63,337 |
| Cooper Industries, Inc. | | |
| Class A | 900,100 | 40,495 |
* | UAL Corp. | 998,129 | 38,099 |
| Steelcase Inc. | 1,445,062 | 28,742 |
| A.O. Smith Corp. | 578,000 | 22,091 |
| R.R. Donnelley & Sons Co. | 536,620 | 19,635 |
* | EMCOR Group, Inc. | 319,400 | 18,838 |
| Adesa, Inc. | 621,300 | 17,167 |
* | Allied Waste | | |
| Industries, Inc. | 1,306,788 | 16,452 |
| Ryder System, Inc. | 332,800 | 16,420 |
* | Gardner Denver Inc. | 449,960 | 15,681 |
| Con-way, Inc. | 293,400 | 14,623 |
| The Timken Co. | 471,200 | 14,282 |
* | McDermott International, Inc. | 259,750 | 12,723 |
* | NCI Building Systems, Inc. | 253,600 | 12,107 |
| Applied Industrial | | |
| Technology, Inc. | 474,975 | 11,651 |
| Lennox International Inc. | 313,200 | 11,181 |
| Republic Services, Inc. | | |
| Class A | 382,963 | 10,654 |
* | Foster Wheeler Ltd. | 180,400 | 10,534 |
| Herman Miller, Inc. | 312,641 | 10,470 |
| The Manitowoc Co., Inc. | 160,990 | 10,228 |
| Walter Industries, Inc. | 412,100 | 10,199 |
* | Genlyte Group, Inc. | 135,016 | 9,525 |
| Lincoln Electric Holdings, Inc. | 159,911 | 9,524 |
* | Thomas & Betts Corp. | 188,600 | 9,207 |
| Rockwell Automation, Inc. | 147,300 | 8,819 |
| Acuity Brands, Inc. | 149,500 | 8,139 |
* | United Rentals, Inc. | 293,900 | 8,082 |
| Kennametal, Inc. | 117,600 | 7,951 |
* | Labor Ready, Inc. | 407,500 | 7,738 |
| Harsco Corp. | 160,800 | 7,213 |
| Watsco, Inc. | 131,500 | 6,716 |
| Universal Forest | | |
| Products, Inc. | 132,908 | 6,586 |
* | ^Houston Wire & Cable Co. | 224,525 | 6,291 |
| Freightcar America Inc. | 126,087 | 6,074 |
* | General Cable Corp. | 112,500 | 6,011 |
| Apogee Enterprises, Inc. | 297,558 | 5,963 |
* | Consolidated Graphics, Inc. | 77,400 | 5,731 |
* | Continental Airlines, Inc. | | |
| Class B | 149,800 | 5,451 |
| Watson Wyatt & Co. Holdings | 111,700 | 5,434 |
* | Volt Information Sciences Inc. | 187,600 | 4,913 |
| Carlisle Co., Inc. | 109,804 | 4,714 |
| IKON Office Solutions, Inc. | 317,800 | 4,567 |
* | Cenveo Inc. | 178,300 | 4,333 |
* | Corrections Corp. of America | 79,950 | 4,222 |
* | United Stationers, Inc. | 69,430 | 4,160 |
| Crane Co. | 102,400 | 4,139 |
| McGrath RentCorp | 115,213 | 3,649 |
15
| | | Market |
| | | Value• |
| | Shares | ($000) |
| Teleflex Inc. | 49,800 | 3,390 |
* | Amerco, Inc. | 47,500 | 3,325 |
* | US Airways Group Inc. | 68,600 | 3,120 |
* | Spherion Corp. | 342,600 | 3,022 |
* | Mobile Mini, Inc. | 110,956 | 2,971 |
| Viad Corp. | 76,250 | 2,943 |
| The Toro Co. | 56,600 | 2,900 |
| Regal-Beloit Corp. | 60,900 | 2,825 |
* | Acco Brands Corp. | 110,110 | 2,653 |
| Central Parking Corp. | 114,300 | 2,535 |
* | American Commercial | | |
| Lines Inc. | 78,000 | 2,453 |
| Barnes Group, Inc. | 106,000 | 2,439 |
| Triumph Group, Inc. | 42,025 | 2,326 |
* | Alliant Techsystems, Inc. | 25,647 | 2,255 |
| John H. Harland Co. | 43,800 | 2,244 |
* | Swift Transportation Co., Inc. | 70,000 | 2,181 |
| Kelly Services, Inc. Class A | 60,846 | 1,959 |
| Ameron International Corp. | 27,900 | 1,837 |
* | CBIZ Inc. | 215,500 | 1,530 |
* | ABX Air, Inc. | 213,146 | 1,460 |
| Cintas Corp. | 40,000 | 1,444 |
| Eagle Bulk Shipping Inc. | 71,603 | 1,388 |
| American Woodmark Corp. | 37,600 | 1,382 |
* | Republic Airways | | |
| Holdings Inc. | 52,900 | 1,215 |
| J.B. Hunt Transport | | |
| Services, Inc. | 44,800 | 1,176 |
| Knoll, Inc. | 48,200 | 1,149 |
* | TransDigm Group, Inc. | 27,600 | 1,004 |
| NACCO Industries, Inc. | | |
| Class A | 7,100 | 976 |
* | Accuride Corp. | 65,900 | 962 |
| Ennis, Inc. | 34,500 | 923 |
| Kaydon Corp. | 18,400 | 783 |
* | H&E Equipment | | |
| Services, Inc. | 28,407 | 611 |
| Interface, Inc. | 36,831 | 589 |
* | Rush Enterprises, Inc. | | |
| Class B | 26,300 | 476 |
| Pacer International, Inc. | 14,100 | 380 |
* | K&F Industries Holdings | 13,700 | 369 |
* | Ceradyne, Inc. | 5,500 | 301 |
* | Goodman Global, Inc. | 15,070 | 266 |
* | ExpressJet Holdings, Inc. | 41,700 | 244 |
| Kaman Corp. Class A | 9,157 | 213 |
* | Insituform Technologies Inc. | | |
| Class A | 7,600 | 158 |
| CIRCOR International, Inc. | 3,800 | 136 |
| Tredegar Corp. | 5,800 | 132 |
| The Brink’s Co. | 1,300 | 82 |
| | | 1,005,645 |
Information Technology (14.6%) | | |
* | Fiserv, Inc. | 1,312,983 | 69,667 |
* | Novellus Systems, Inc. | 1,944,900 | 62,276 |
| Harris Corp. | 1,200,400 | 61,160 |
* | Computer Sciences Corp. | 968,200 | 50,472 |
* | Flextronics | | |
| International Ltd. | 4,597,200 | 50,293 |
* | Alliance Data Systems Corp. | 582,900 | 35,918 |
* | Arris Group Inc. | 2,388,551 | 33,631 |
* | Anixter International Inc. | 496,000 | 32,706 |
* | LAM Research Corp. | 677,498 | 32,073 |
* | RealNetworks, Inc. | 3,525,822 | 27,678 |
* | Lexmark International, Inc. | 472,100 | 27,599 |
* | CSG Systems | | |
| International, Inc. | 991,178 | 24,799 |
* | CommScope, Inc. | 506,000 | 21,707 |
* | Transaction Systems | | |
| Architects, Inc. | 583,991 | 18,915 |
* | TIBCO Software Inc. | 2,064,300 | 17,588 |
* | Avnet, Inc. | 481,600 | 17,405 |
* | Zoran Corp. | 1,003,750 | 17,084 |
* | Micron Technology, Inc. | 1,359,842 | 16,427 |
* | MEMC Electronic | | |
| Materials, Inc. | 262,800 | 15,920 |
* | j2 Global | | |
| Communications, Inc. | 571,867 | 15,852 |
* | Cadence Design | | |
| Systems, Inc. | 743,400 | 15,656 |
* | Nuance | | |
| Communications, Inc. | 1,008,299 | 15,437 |
* | Silicon Image, Inc. | 1,861,047 | 15,186 |
* | ^UTStarcom, Inc. | 1,761,889 | 14,606 |
* | Informatica Corp. | 1,081,656 | 14,527 |
* | Plexus Corp. | 835,800 | 14,334 |
| National | | |
| Semiconductor Corp. | 548,000 | 13,229 |
* | ON Semiconductor Corp. | 1,464,900 | 13,067 |
* | MicroStrategy Inc. | 97,919 | 12,376 |
* | Brocade Communications | | |
| Systems, Inc. | 1,278,943 | 12,176 |
* | Coherent, Inc. | 380,398 | 12,074 |
* | LSI Logic Corp. | 1,124,900 | 11,744 |
* | Amkor Technology, Inc. | 882,200 | 11,010 |
* | BMC Software, Inc. | 346,536 | 10,670 |
* | Western Digital Corp. | 629,300 | 10,579 |
| MTS Systems Corp. | 260,926 | 10,134 |
* | DST Systems, Inc. | 130,400 | 9,806 |
* | Interwoven Inc. | 566,966 | 9,582 |
* | Sybase, Inc. | 373,585 | 9,444 |
* | Convergys Corp. | 330,100 | 8,388 |
* | Sykes Enterprises, Inc. | 430,700 | 7,856 |
| Technitrol, Inc. | 297,500 | 7,792 |
* | Fairchild Semiconductor | | |
| International, Inc. | 456,900 | 7,639 |
* | SRA International, Inc. | 303,700 | 7,398 |
* | MPS Group, Inc. | 520,104 | 7,359 |
* | MKS Instruments, Inc. | 273,450 | 6,978 |
* | International Rectifier Corp. | 181,800 | 6,947 |
* | Benchmark Electronics, Inc. | 335,175 | 6,925 |
* | Advanced Energy | | |
| Industries, Inc. | 326,357 | 6,867 |
* | ManTech International Corp. | 198,900 | 6,645 |
16
| | | Market |
| | | Value• |
| | Shares | ($000) |
* | Cymer, Inc. | 147,102 | 6,112 |
* | EarthLink, Inc. | 828,473 | 6,089 |
* | Vishay Intertechnology, Inc. | 435,400 | 6,087 |
* | Dolby Laboratories Inc. | 175,400 | 6,053 |
* | Progress Software Corp. | 193,524 | 6,038 |
* | Quest Software, Inc. | 351,000 | 5,711 |
* | ^RF Micro Devices, Inc. | 874,726 | 5,450 |
* | eSPEED, Inc. Class A | 554,616 | 5,269 |
* | Tyler Technologies, Inc. | 412,500 | 5,239 |
* | Hyperion Solutions Corp. | 100,500 | 5,209 |
* | Ness Technologies Inc. | 398,300 | 5,090 |
| Molex, Inc. | 175,062 | 4,937 |
* | Ansoft Corp. | 154,547 | 4,890 |
| Park Electrochemical Corp. | 160,000 | 4,339 |
* | Teradyne, Inc. | 250,300 | 4,140 |
* | Mentor Graphics Corp. | 250,650 | 4,096 |
* | BearingPoint, Inc. | 521,900 | 3,998 |
* | Rofin-Sinar Technologies Inc. | 67,202 | 3,977 |
| MoneyGram | | |
| International, Inc. | 135,200 | 3,753 |
| Bel Fuse, Inc. Class B | 87,218 | 3,376 |
* | Euronet Worldwide, Inc. | 118,800 | 3,191 |
* | Forrester Research, Inc. | 106,500 | 3,020 |
| AVX Corp. | 191,800 | 2,915 |
* | Veeco Instruments, Inc. | 148,525 | 2,896 |
* | Itron, Inc. | 42,600 | 2,771 |
* | Vignette Corp. | 146,007 | 2,711 |
| United Online, Inc. | 188,768 | 2,648 |
| Fair Isaac, Inc. | 66,500 | 2,572 |
* | ^OmniVision Technologies, Inc. | 197,300 | 2,557 |
* | Kopin Corp. | 750,000 | 2,535 |
* | Macrovision Corp. | 95,400 | 2,390 |
| CTS Corp. | 165,300 | 2,284 |
| Jack Henry & Associates Inc. | 80,400 | 1,934 |
* | Avocent Corp. | 69,300 | 1,869 |
* | Silicon Storage | | |
| Technology, Inc. | 328,653 | 1,620 |
* | Keane, Inc. | 116,900 | 1,587 |
* | Ciber, Inc. | 200,700 | 1,579 |
* | Paxar Corp. | 52,500 | 1,507 |
* | VeriSign, Inc. | 59,200 | 1,487 |
* | JDA Software Group, Inc. | 88,400 | 1,329 |
* | Genesis Microchip Inc. | 120,773 | 1,122 |
| Methode Electronics, Inc. | | |
| Class A | 64,000 | 945 |
* | IXYS Corp. | 79,202 | 810 |
* | Asyst Technologies, Inc. | 107,016 | 752 |
* | Trident Microsystems, Inc. | 35,470 | 712 |
* | DealerTrack Holdings Inc. | 19,304 | 593 |
* | Mattson Technology, Inc. | 53,882 | 490 |
* | MICROS Systems, Inc. | 9,000 | 486 |
* | Entegris Inc. | 41,600 | 445 |
* | SYNNEX Corp. | 20,100 | 427 |
* | Rogers Corp. | 9,400 | 417 |
* | Skyworks Solutions, Inc. | 53,300 | 306 |
* | Atmel Corp. | 47,000 | 236 |
| infoUSA Inc. | 15,900 | 153 |
| | | 1,118,750 |
Materials (5.6%) | | |
| Celanese Corp. Series A | 2,000,000 | 61,680 |
| United States Steel Corp. | 511,800 | 50,755 |
| Nucor Corp. | 672,900 | 43,826 |
| Texas Industries, Inc. | 427,400 | 32,282 |
* | Pactiv Corp. | 801,964 | 27,058 |
* | AK Steel Holding Corp. | 1,098,235 | 25,688 |
| Eastman Chemical Co. | 385,760 | 24,430 |
| Greif Inc. Class A | 212,500 | 23,611 |
| Steel Dynamics, Inc. | 512,164 | 22,125 |
* | OM Group, Inc. | 490,100 | 21,898 |
| RPM International, Inc. | 916,000 | 21,160 |
| Chaparral Steel Co. | 252,706 | 14,700 |
| Reliance Steel & | | |
| Aluminum Co. | 298,700 | 14,457 |
| Ashland, Inc. | 216,200 | 14,183 |
| Commercial Metals Co. | 392,600 | 12,308 |
| Quanex Corp. | 144,400 | 6,115 |
| Koppers Holdings, Inc. | 111,200 | 2,853 |
| Sonoco Products Co. | 73,000 | 2,743 |
| Cleveland-Cliffs Inc. | 24,000 | 1,536 |
| Carpenter Technology Corp. | 11,600 | 1,401 |
| Spartech Corp. | 35,000 | 1,027 |
| H.B. Fuller Co. | 27,800 | 758 |
| Nalco Holding Co. | 29,100 | 695 |
| Neenah Paper Inc. | 6,200 | 246 |
| | | 427,535 |
Telecommunication Services (1.9%) | | |
| Embarq Corp. | 708,923 | 39,948 |
* | Qwest Communications | | |
| International Inc. | 2,526,100 | 22,710 |
* | Cincinnati Bell Inc. | 4,208,500 | 19,780 |
| Telephone & Data | | |
| Systems, Inc. | 276,945 | 16,511 |
* | Crown Castle | | |
| International Corp. | 393,700 | 12,650 |
| CenturyTel, Inc. | 164,600 | 7,438 |
| Alaska Communications | | |
| Systems Holdings, Inc. | 451,346 | 6,657 |
* | Syniverse Holdings Inc. | 403,700 | 4,255 |
* | ^Global Crossing Ltd. | 107,800 | 2,965 |
* | Leap Wireless | | |
| International, Inc. | 42,865 | 2,828 |
| North Pittsburgh | | |
| Systems, Inc. | 70,142 | 1,527 |
| IDT Corp. Class B | 130,000 | 1,475 |
* | General Communication, Inc. | 58,900 | 825 |
* | Fibertower Corp. | 49,900 | 259 |
| Surewest Communications | 9,600 | 239 |
| Citizens Communications Co. | 7,018 | 105 |
| | | 140,172 |
Utilities (5.9%) | | |
* | Mirant Corp. | 1,918,300 | 77,614 |
17
| | Market |
| | Value• |
| Shares | ($000) |
Xcel Energy, Inc. | 2,493,145 | 61,556 |
Northeast Utilities | 1,500,000 | 49,155 |
CenterPoint Energy Inc. | 2,259,449 | 40,535 |
Pinnacle West Capital Corp. | 515,129 | 24,855 |
Energen Corp. | 439,872 | 22,385 |
NiSource, Inc. | 854,935 | 20,895 |
Westar Energy, Inc. | 606,200 | 16,683 |
PNM Resources Inc. | 496,760 | 16,045 |
FirstEnergy Corp. | 234,300 | 15,520 |
Southwest Gas Corp. | 344,000 | 13,371 |
Puget Energy, Inc. | 423,500 | 10,875 |
UGI Corp. Holding Co. | 366,140 | 9,780 |
* NRG Energy, Inc. | 123,300 | 8,883 |
MDU Resources Group, Inc. | 299,350 | 8,603 |
OGE Energy Corp. | 202,300 | 7,849 |
Nicor Inc. | 147,700 | 7,152 |
NSTAR | 200,100 | 7,028 |
Energy East Corp. | 247,700 | 6,034 |
Atmos Energy Corp. | 180,601 | 5,649 |
TECO Energy, Inc. | 224,725 | 3,868 |
WGL Holdings Inc. | 90,800 | 2,904 |
IDACORP, Inc. | 84,096 | 2,846 |
Black Hills Corp. | 76,200 | 2,802 |
Northwest Natural Gas Co. | 58,600 | 2,676 |
ALLETE, Inc. | 54,835 | 2,556 |
* El Paso Electric Co. | 70,900 | 1,868 |
CH Energy Group, Inc. | 22,500 | 1,096 |
The Laclede Group, Inc. | 33,900 | 1,054 |
Portland General Electric Co. | 14,600 | 426 |
Constellation Energy | | |
Group, Inc. | 4,200 | 365 |
| | 452,928 |
Total Common Stocks | | |
(Cost $6,491,531) | | 7,627,197 |
Temporary Cash Investments (1.8%)1 | | |
Money Market Funds (1.8%) | | |
2 Vanguard Market Liquidity | | |
Fund, 5.288% | 34,541,530 | 34,542 |
2 Vanguard Market Liquidity | | |
Fund, 5.288%—Note E | 103,292,000 | 103,292 |
| | 137,834 |
| Face | Market |
| Amount | Value• |
| ($000) | ($000) |
U.S. Agency Obligation (0.0%) | | |
3 Federal National Mortgage Assn. | | |
4 5.192%, 4/25/07 | 2,000 | 1,993 |
Total Temporary Cash Investments | | |
(Cost $139,827) | | 139,827 |
Total Investments (101.6%) | | |
(Cost $6,631,358) | | 7,767,024 |
Other Assets and Liabilities (–1.6%) | | |
Other Assets—Note B | | 18,402 |
Liabilities—Note E | | (140,166) |
| | (121,764) |
Net Assets (100%) | | |
Applicable to 308,436,025 outstanding $.001 | | |
par value shares of beneficial interest | | |
(unlimited authorization) | | 7,645,260 |
Net Asset Value Per Share | | $24.79 |
| | |
| | |
| | |
At March 31, 2007, net assets consisted of:5 |
| Amount | Per |
| ($000) | Share |
Paid-in Capital | 6,083,649 | $19.73 |
Undistributed Net | | |
Investment Income | 3,135 | .01 |
Accumulated Net | | |
Realized Gains | 422,744 | 1.37 |
Unrealized Appreciation | | |
Investment Securities | 1,135,666 | 3.68 |
Futures Contracts | 66 | — |
Net Assets | 7,645,260 | $24.79 |
• See Note A in Notes to Financial Statements.
* Non-income-producing security.
^ Part of security position is on loan to broker-dealers. See Note E in Notes to Financial Statements.
1 The fund invests a portion of its cash reserves in equity markets through the use of index futures contracts. After giving effect to futures investments, the fund’s effective common stock and temporary cash investment positions represent 100.0% and 1.6%, respectively, of net assets. See Note C in Notes to Financial Statements.
2 Affiliated money market fund available only to Vanguard funds and certain trusts and accounts managed by Vanguard. Rate shown is the 7-day yield.
3 The issuer operates under a congressional charter; its securities are neither issued nor guaranteed by the U.S. government. If needed, access to additional funding from the U.S. Treasury (beyond the issuer’s line of credit) would require congressional action.
4 Securities with a value of $1,993,000 have been segregated as initial margin for open futures contracts.
5 See Note C in Notes to Financial Statements for the tax-basis components of net assets.
18
Statement of Operations
| Six Months Ended |
| March 31, 2007 |
| ($000) |
Investment Income | |
Income | |
Dividends | 41,722 |
Interest1 | 662 |
Security Lending | 1,524 |
Total Income | 43,908 |
Expenses | |
The Vanguard Group—Note B | |
Investment Advisory Services | 1,231 |
Management and Administrative | 8,782 |
Marketing and Distribution | 937 |
Custodian Fees | 95 |
Shareholders’ Reports | 91 |
Trustees’ Fees and Expenses | 5 |
Total Expenses | 11,141 |
Net Investment Income | 32,767 |
Realized Net Gain (Loss) | |
Investment Securities Sold | 438,882 |
Futures Contracts | 537 |
Realized Net Gain (Loss) | 439,419 |
Change In Unrealized Appreciation (Depreciation) | |
Investment Securities | 398,527 |
Futures Contracts | 49 |
Change in Unrealized Appreciation (Depreciation) | 398,576 |
Net Increase (Decrease) in Net Assets Resulting from Operations | 870,762 |
1 Interest income from an affiliated company of the fund was $581,000.
Statement of Changes in Net Assets
19
| Six Months Ended | Year Ended |
| Mar. 31, 2007 | Sept. 30, 2006 |
| ($000) | ($000) |
Increase (Decrease) in Net Assets | | |
Operations | | |
Net Investment Income | 32,767 | 74,818 |
Realized Net Gain (Loss) | 439,419 | 331,726 |
Change in Unrealized Appreciation (Depreciation) | 398,576 | (51,941) |
Net Increase (Decrease) in Net Assets Resulting from Operations | 870,762 | 354,603 |
Distributions | | |
Net Investment Income | (74,998) | (49,617) |
Realized Capital Gain1 | (282,684) | (340,229) |
Total Distributions | (357,682) | (389,846) |
Capital Share Transactions—Note F | | |
Issued | 676,382 | 2,273,341 |
Issued in Lieu of Cash Distributions | 338,748 | 365,856 |
Redeemed | (637,995) | (1,031,900) |
Net Increase (Decrease) from Capital Share Transactions | 377,135 | 1,607,297 |
Total Increase (Decrease) | 890,215 | 1,572,054 |
Net Assets | | |
Beginning of Period | 6,755,045 | 5,182,991 |
End of Period2 | 7,645,260 | 6,755,045 |
1 Includes fiscal 2007 and 2006 short-term gain distributions totaling $28,845,000 and $92,145,000, respectively. Short-term gain distributions are treated as ordinary income dividends for tax purposes.
2 Net Assets—End of Period includes undistributed net investment income of $3,135,000 and $45,366,000.
20
Financial Highlights
| Six Months | | | Nov. 1, | | | |
| Ended | Year Ended | 2003, to | |
For a Share Outstanding | Mar. 31, | September 30, | Sept. 30, | Year Ended October 31, |
Throughout Each Period | 2007 | 2006 | 2005 | 20041 | 2003 | 2002 | 2001 |
Net Asset Value, | | | | | | | |
Beginning of Period | $23.07 | $23.28 | $19.70 | $17.85 | $13.01 | $13.68 | $18.07 |
Investment Operations | | | | | | | |
Net Investment Income | .12 | .27 | .19 | .13 | .13 | .14 | .16 |
Net Realized and Unrealized | | | | | | | |
Gain (Loss) on Investments | 2.84 | 1.17 | 4.49 | 1.85 | 4.84 | (.67) | (1.31) |
Total from | | | | | | | |
Investment Operations | 2.96 | 1.44 | 4.68 | 1.98 | 4.97 | (.53) | (1.15) |
Distributions | | | | | | | |
Dividends from | | | | | | | |
Net Investment Income | (.26) | (.21) | (.14) | (.13) | (.13) | (.14) | (.21) |
Distributions from | | | | | | | |
Realized Capital Gains | (.98) | (1.44) | (.96) | — | — | — | (3.03) |
Total Distributions | (1.24) | (1.65) | (1.10) | (.13) | (.13) | (.14) | (3.24) |
Net Asset Value, | | | | | | | |
End of Period | $24.79 | $23.07 | $23.28 | $19.70 | $17.85 | $13.01 | $13.68 |
| | | | | | | |
Total Return2 | 13.07% | 6.49% | 24.32% | 11.14% | 38.55% | –4.02% | –6.48% |
| | | | | | | |
Ratios/Supplemental Data | | | | | | | |
Net Assets, | | | | | | | |
End of Period (Millions) | $7,645 | $6,755 | $5,183 | $2,953 | $1,714 | $876 | $767 |
Ratio of Total Expenses to | | | | | | | |
Average Net Assets | 0.31%* | 0.35% | 0.40% | 0.45%* | 0.50% | 0.50% | 0.54% |
Ratio of Net Investment | | | | | | | |
Income to Average Net Assets | 0.91%* | 1.18% | 0.99% | 0.83%* | 1.04% | 0.94% | 1.06% |
Portfolio Turnover Rate | 75%* | 80% | 75% | 66% | 100% | 73% | 82% |
1 The fund’s fiscal year-end changed from October 31 to September 30, effective September 30, 2004.
2 Total returns do not reflect the 1% fee assessed through April 6, 2001, on redemptions of shares held in the fund for less than five years.
* Annualized.
See accompanying Notes, which are an integral part of the Financial Statements.
21
Notes to Financial Statements
Vanguard Strategic Equity Fund is registered under the Investment Company Act of 1940 as an open-end investment company, or mutual fund. The fund files reports with the SEC under the company name Vanguard Horizon Funds.
A. The following significant accounting policies conform to generally accepted accounting principles for U.S. mutual funds. The fund consistently follows such policies in preparing its financial statements.
1. Security Valuation: Securities are valued as of the close of trading on the New York Stock Exchange (generally 4:00 p.m. Eastern time) on the valuation date. Equity securities are valued at the latest quoted sales prices or official closing prices taken from the primary market in which each security trades; such securities not traded on the valuation date are valued at the mean of the latest quoted bid and asked prices. Securities for which market quotations are not readily available, or whose values have been materially affected by events occurring before the fund’s pricing time but after the close of the securities’ primary markets, are valued by methods deemed by the board of trustees to represent fair value. Investments in Vanguard Market Liquidity Fund are valued at that fund’s net asset value. Temporary cash investments acquired over 60 days to maturity are valued using the latest bid prices or using valuations based on a matrix system (which considers such factors as security prices, yields, maturities, and ratings), both as furnished by independent pricing services. Other temporary cash investments are valued at amortized cost, which approximates market value.
2. Futures Contracts: The fund uses index futures contracts to a limited extent, with the objective of maintaining full exposure to the stock market while maintaining liquidity. The fund may purchase or sell futures contracts to achieve a desired level of investment, whether to accommodate portfolio turnover or cash flows from capital share transactions. The primary risks associated with the use of futures contracts are imperfect correlation between changes in market values of stocks held by the fund and the prices of futures contracts, and the possibility of an illiquid market.
Futures contracts are valued at their quoted daily settlement prices. The aggregate principal amounts of the contracts are not recorded in the Statement of Net Assets. Fluctuations in the value of the contracts are recorded in the Statement of Net Assets as an asset (liability) and in the Statement of Operations as unrealized appreciation (depreciation) until the contracts are closed, when they are recorded as realized futures gains (losses).
3. Federal Income Taxes: The fund intends to continue to qualify as a regulated investment company and distribute all of its taxable income. Accordingly, no provision for federal income taxes is required in the financial statements.
4. Distributions: Distributions to shareholders are recorded on the ex-dividend date.
5. Security Lending: The fund may lend its securities to qualified institutional borrowers to earn additional income. Security loans are required to be secured at all times by collateral at least equal to the market value of securities loaned. The fund invests cash collateral received in Vanguard Market Liquidity Fund, and records a liability for the return of the collateral, during the period the securities are on loan. Security lending income represents the income earned on investing cash collateral, less expenses associated with the loan.
6. Other: Dividend income is recorded on the ex-dividend date. Interest income includes income
distributions received from Vanguard Market Liquidity Fund and is accrued daily. Security transactions are accounted for on the date securities are bought or sold. Costs used to determine realized gains (losses) on the sale of investment securities are those of the specific securities sold.
22
B. The Vanguard Group furnishes at cost investment advisory, corporate management, administrative, marketing, and distribution services. The costs of such services are allocated to the fund under methods approved by the board of trustees. The fund has committed to provide up to 0.40% of its net assets in capital contributions to Vanguard. At March 31, 2007, the fund had contributed capital of $706,000 to Vanguard (included in Other Assets), representing 0.01% of the fund’s net assets and 0.70% of Vanguard’s capitalization. The fund’s trustees and officers are also directors and officers of Vanguard.
C. Distributions are determined on a tax basis and may differ from net investment income and realized capital gains for financial reporting purposes. Differences may be permanent or temporary. Permanent differences are reclassified among capital accounts in the financial statements to reflect their tax character. Temporary differences arise when certain items of income, expense, gain, or loss are recognized in different periods for financial statement and tax purposes; these differences will reverse at some time in the future. Differences in classification may also result from the treatment of short-term gains as ordinary income for tax purposes. The fund’s tax-basis capital gains and losses are determined only at the end of each fiscal year.
At March 31, 2007, the cost of investment securities for tax purposes was $6,631,358,000. Net unrealized appreciation of investment securities for tax purposes was $1,135,666,000, consisting of unrealized gains of $1,333,017,000 on securities that had risen in value since their purchase and $197,351,000 in unrealized losses on securities that had fallen in value since their purchase.
At March 31, 2007, the aggregate settlement value of open futures contracts expiring in June 2007 and the related unrealized appreciation (depreciation) were:
| | | ($000) |
| | Aggregate | Unrealized |
| Number of | Settlement | Appreciation |
Futures Contracts | Long Contracts | Value | (Depreciation) |
E-mini S&P 500 Index | 135 | 9,661 | (14) |
S&P 500 Index | 27 | 9,661 | 80 |
Unrealized appreciation (depreciation) on open futures contracts is required to be treated as realized gain (loss) for tax purposes.
D. During the six months ended March 31, 2007, the fund purchased $2,746,825,000 of investment securities and sold $2,704,152,000 of investment securities, other than temporary cash investments.
E. The market value of securities on loan to broker-dealers at March 31, 2007, was $98,514,000, for which the fund received cash collateral of $103,292,000.
23
F. Capital shares issued and redeemed were:
| Six Months Ended | | Year Ended |
| March 31, 2007 | | Sept. 30, 2006 |
| Shares | | Shares |
| (000) | | (000) |
Issued | 27,660 | | 98,757 |
Issued in Lieu of Cash Distributions | 14,281 | | 16,547 |
Redeemed | (26,332) | | (45,160) |
Net Increase (Decrease) in Shares Outstanding | 15,609 | | 70,144 |
G. In June 2006, the Financial Accounting Standards Board issued Interpretation No. 48 (“FIN 48”), “Accounting for Uncertainty in Income Taxes”. FIN 48 establishes the minimum threshold for recognizing, and a system for measuring, the benefits of tax-return positions in financial statements. FIN 48 will be effective for the fund’s fiscal year beginning October 1, 2007. Management is in the process of analyzing the fund’s tax positions for purposes of implementing FIN 48; based on the analysis completed to date, management does not believe the adoption of FIN 48 will result in any material impact to the fund’s financial statements.
24
About Your Fund’s Expenses
As a shareholder of the fund, you incur ongoing costs, which include costs for portfolio management, administrative services, and shareholder reports (like this one), among others. Operating expenses, which are deducted from a fund’s gross income, directly reduce the investment return of the fund.
A fund’s expenses are expressed as a percentage of its average net assets. This figure is known as the expense ratio. The following examples are intended to help you understand the ongoing costs (in dollars) of investing in your fund and to compare these costs with those of other mutual funds. The examples are based on an investment of $1,000 made at the beginning of the period shown and held for the entire period.
The table below illustrates your fund’s costs in two ways:
• Based on actual fund return. This section helps you to estimate the actual expenses that you paid over the period. The “Ending Account Value” shown is derived from the fund’s actual return, and the third column shows the dollar amount that would have been paid by an investor who started with $1,000 in the fund. You may use the information here, together with the amount you invested, to estimate the expenses that you paid over the period.
To do so, simply divide your account value by $1,000 (for example, an $8,600 account value divided by $1,000 = 8.6), then multiply the result by the number given for your fund under the heading “Expenses Paid During Period.”
• Based on hypothetical 5% yearly return. This section is intended to help you compare your fund’s costs with those of other mutual funds. It assumes that the fund had a yearly return of 5% before expenses, but that the expense ratio is unchanged. In this case—because the return used is not the fund’s actual return—the results do not apply to your investment. The example is useful in making comparisons because the Securities and Exchange Commission requires all mutual funds to calculate expenses based on a 5% return. You can assess your fund’s costs by comparing this hypothetical example with the hypothetical examples that appear in shareholder reports of other funds.
Six Months Ended March 31, 2007 | | | |
| Beginning | Ending | Expenses |
| Account Value | Account Value | Paid During |
Strategic Equity Fund | 9/30/2006 | 3/31/2007 | Period1 |
Based on Actual Fund Return | $1,000.00 | $1,130.73 | $1.65 |
Based on Hypothetical 5% Yearly Return | 1,000.00 | 1,023.39 | 1.56 |
1 The calculations are based on expenses incurred in the most recent six-month period. The fund’s annualized six-month expense ratio for that period is 0.31%. The dollar amounts shown as “Expenses Paid” are equal to the annualized expense ratio multiplied by the average account value over the period, multiplied by the number of days in the most recent six-month period, then divided by the number of days in the most recent 12-month period.
25
Note that the expenses shown in the table on page 25 are meant to highlight and help you compare ongoing costs only and do not reflect any transactional costs or account maintenance fees. They do not include your fund’s low-balance fee, which is described in the prospectus. If this fee were applied to your account, your costs would be higher. Your fund does not charge transaction fees, such as purchase or redemption fees, nor does it carry a “sales load.”
The calculations assume no shares were bought or sold during the period. Your actual costs may have been higher or lower, depending on the amount of your investment and the timing of any purchases or redemptions.
You can find more information about the fund’s expenses, including annual expense ratios, in the Financial Statements section of this report. For additional information on operating expenses and other shareholder costs, please refer to the fund prospectus.
26
Trustees Approve Advisory Arrangement
The board of trustees of Vanguard Strategic Equity Fund has renewed its investment advisory arrangement with The Vanguard Group, Inc. Vanguard—through its Quantitative Equity Group—serves as the fund’s investment advisor. The board determined that continuing the fund’s internalized management structure was in the best interests of the fund and its shareholders.
The board based its decision upon its most recent evaluation of the advisor’s investment staff, portfolio management process, and performance. The trustees considered the factors discussed below, among others; however, no single factor determined whether or not the board approved the arrangement. Rather, it was the totality of the circumstances that drove the board’s decision.
Nature, extent, and quality of services
The board considered the quality of the fund’s investment management over both the short and long term, and took into account the organizational depth and stability of the advisor. Vanguard has been managing investments for more than two decades. George U. Sauter, Vanguard managing director and chief investment officer, has been in the investment management business since 1985, and has led the Quantitative Equity Group since 1987. James D. Troyer, the manager primarily responsible for the day-to-day management of the fund, has worked in investment management since 1979. The Quantitative Equity Group adheres to a sound, disciplined investment management process; the team has considerable experience, stability, and depth.
The board concluded that Vanguard’s experience, stability, depth, and performance, among other factors, warranted continuation of the advisory arrangement.
Investment performance
The board considered the short- and long-term performance of the fund, including any periods of outperformance or underperformance of a relevant benchmark and peer group. The board noted that the fund has performed in line with expectations and that its results have been consistent with its investment strategy. The fund’s returns had exceeded the returns of its benchmark and peer group over the short and long terms. Information about the fund’s most recent performance can be found in the Performance Summary section of this report.
Cost
The board concluded that the fund’s expense ratio was far below the average expense ratio charged by funds in its peer group. The fund’s advisory expense ratio was also well below the peer-group average. Information about the fund’s expense ratio appears in the About Your Fund’s Expenses section of this report as well as in the Financial Statements section.
The board does not conduct a profitability analysis of Vanguard because of Vanguard’s unique “at-cost” structure. Unlike most other mutual fund management companies, Vanguard is owned by the funds it oversees, and produces “profits” only in the form of reduced expenses for fund shareholders.
The benefit of economies of scale
The board of trustees concluded that the fund’s low-cost arrangement with Vanguard ensures that the fund will realize economies of scale as it grows, with the cost to shareholders declining as fund assets increase.
The board will consider whether to renew the advisory arrangement again after a one-year period.
27
Glossary
Beta. A measure of the magnitude of a fund’s past share-price fluctuations in relation to the ups and downs of a given market index. The index is assigned a beta of 1.00. Compared with a given index, a fund with a beta of 1.20 typically would have seen its share price rise or fall by 12% when the index rose or fell by 10%. A fund’s beta should be reviewed in conjunction with its R-squared (see definition below). The lower the R-squared, the less correlation there is between the fund and the index, and the less reliable beta is as an indicator of volatility.
Earnings Growth Rate. The average annual rate of growth in earnings over the past five years for the stocks now in a fund.
Expense Ratio. The percentage of a fund’s average net assets used to pay its annual administrative and advisory expenses. These expenses directly reduce returns to investors.
Foreign Holdings. The percentage of a fund represented by stocks or depositary receipts of companies based outside the United States.
Inception Date. The date on which the assets of a fund (or one of its share classes) are first invested in accordance with the fund’s investment objective. For funds with a subscription period, the inception date is the day after that period ends. Investment performance is measured from the inception date.
Median Market Cap. An indicator of the size of companies in which a fund invests; the midpoint of market capitalization (market price x shares outstanding) of a fund’s stocks, weighted by the proportion of the fund’s assets invested in each stock. Stocks representing half of the fund’s assets have market capitalizations above the median, and the rest are below it.
Price/Book Ratio. The share price of a stock divided by its net worth, or book value, per share. For a fund, the weighted average price/book ratio of the stocks it holds.
Price/Earnings Ratio. The ratio of a stock’s current price to its per-share earnings over the past year. For a fund, the weighted average P/E of the stocks it holds. P/E is an indicator of market expectations about corporate prospects; the higher the P/E, the greater the expectations for a company’s future growth.
R-Squared. A measure of how much of a fund’s past returns can be explained by the returns from the market in general, as measured by a given index. If a fund’s total returns were precisely synchronized with an index’s returns, its R-squared would be 1.00. If the fund’s returns bore no relationship to the index’s returns, its R-squared would be 0.
Return on Equity. The annual average rate of return generated by a company during the past five years for each dollar of shareholder’s equity (net income divided by shareholder’s equity). For a fund, the weighted average return on equity for the companies whose stocks it holds.
Short-Term Reserves. The percentage of a fund invested in highly liquid, short-term securities that can be readily converted to cash.
Turnover Rate. An indication of the fund’s trading activity. Funds with high turnover rates incur higher transaction costs and may be more likely to distribute capital gains (which may be taxable to investors).
The turnover rate excludes in-kind transactions, which have minimal impact on costs.
Yield. A snapshot of a fund’s income from interest and dividends. The yield, expressed as a percentage of the fund’s net asset value, is based on income earned over the past 30 days and is annualized, or projected forward for the coming year. The index yield is based on the current annualized rate of income provided by securities in the index.
28
This page intentionally left blank.
This page intentionally left blank.
This page intentionally left blank.
The People Who Govern Your Fund
The trustees of your mutual fund are there to see that the fund is operated and managed in your best interests since, as a shareholder, you are a part owner of the fund. Your fund’s trustees also serve on the board of directors of The Vanguard Group, Inc., which is owned by the Vanguard funds and provides services to them on an at-cost basis.
A majority of Vanguard’s board members are independent, meaning that they have no affiliation with Vanguard or the funds they oversee, apart from the sizable personal investments they have made as private individuals.
Our independent board members bring distinguished backgrounds in business, academia, and public service to their task of working with Vanguard officers to establish the policies and oversee the activities of the funds. Among board members’ responsibilities are selecting investment advisors for the funds; monitoring fund operations, performance, and costs; reviewing contracts; nominating and selecting new trustees/directors; and electing Vanguard officers.
Each trustee serves a fund until its termination; or until the trustee’s retirement, resignation, or death; or otherwise as specified in the fund’s organizational documents. Any trustee may be removed at a shareholders’ meeting by a vote representing two-thirds of the net asset value of all shares of the fund together with shares of other Vanguard funds organized within the same trust. The table on these two pages shows information for each trustee and executive officer of the fund. The mailing address of the trustees and officers is P.O. Box 876, Valley Forge, PA 19482.
Chairman of the Board, Chief Executive Officer, and Trustee |
|
John J. Brennan1 | |
Born 1954 | Principal Occupation(s) During the Past Five Years: Chairman of the Board, Chief Executive |
Trustee since May 1987; | Officer, and Director/Trustee of The Vanguard Group, Inc., and of each of the investment |
Chairman of the Board and | companies served by The Vanguard Group. |
Chief Executive Officer | |
147 Vanguard Funds Overseen | |
| |
Independent Trustees | |
| |
Charles D. Ellis | |
Born 1937 | Principal Occupation(s) During the Past Five Years: Applecore Partners (pro bono ventures |
Trustee since January 2001 | in education); Senior Advisor to Greenwich Associates (international business strategy |
147 Vanguard Funds Overseen | consulting); Successor Trustee of Yale University; Overseer of the Stern School of Business |
| at New York University; Trustee of the Whitehead Institute for Biomedical Research. |
| |
Rajiv L. Gupta | |
Born 1945 | Principal Occupation(s) During the Past Five Years: Chairman and Chief Executive Officer |
Trustee since December 20012 | of Rohm and Haas Co. (chemicals); Board Member of the American Chemistry Council; |
147 Vanguard Funds Overseen | Director of Tyco International, Ltd. (diversified manufacturing and services) since 2005; |
| Trustee of Drexel University and of the Chemical Heritage Foundation. |
| |
Amy Gutmann | |
Born 1949 | Principal Occupation(s) During the Past Five Years: President of the University of |
Trustee since June 2006 | Pennsylvania since 2004; Professor in the School of Arts and Sciences, Annenberg School |
147 Vanguard Funds Overseen | for Communication, and Graduate School of Education of the University of Pennsylvania |
| since 2004; Provost (2001–2004) and Laurance S. Rockefeller Professor of Politics and the |
| University Center for Human Values (1990–2004), Princeton University; Director of Carnegie |
| Corporation of New York since 2005 and of Schuylkill River Development Corporation and |
| Greater Philadelphia Chamber of Commerce since 2004. |
JoAnn Heffernan Heisen | |
Born 1950 | Principal Occupation(s) During the Past Five Years: Corporate Vice President and Chief |
Trustee since July 1998 | Global Diversity Officer since 2006, Vice President and Chief Information Officer |
147 Vanguard Funds Overseen | (1997–2005), and Member of the Executive Committee of Johnson & Johnson |
| (pharmaceuticals/consumer products); Director of the University Medical Center |
| at Princeton and Women’s Research and Education Institute. |
| |
André F. Perold | |
Born 1952 | Principal Occupation(s) During the Past Five Years: George Gund Professor of Finance |
Trustee since December 2004 | and Banking, Harvard Business School; Senior Associate Dean, Director of Faculty |
147 Vanguard Funds Overseen | Recruiting, and Chair of Finance Faculty, Harvard Business School; Director and Chairman |
| of UNX, Inc. (equities trading firm) since 2003; Chair of the Investment Committee of |
| HighVista Strategies LLC (private investment firm) since 2005; Director of registered |
| investment companies advised by Merrill Lynch Investment Managers and affiliates |
| (1985–2004), Genbel Securities Limited (South African financial services firm) |
| (1999–2003), Gensec Bank (1999–2003), Sanlam, Ltd. (South African insurance |
| company) (2001–2003), and Stockback, Inc. (credit card firm) (2000–2002). |
| |
Alfred M. Rankin, Jr. | |
Born 1941 | Principal Occupation(s) During the Past Five Years: Chairman, President, Chief Executive |
Trustee since January 1993 | Officer, and Director of NACCO Industries, Inc. (forklift trucks/housewares/lignite); Director |
147 Vanguard Funds Overseen | of Goodrich Corporation (industrial products/aircraft systems and services). |
| |
J. Lawrence Wilson | |
Born 1936 | Principal Occupation(s) During the Past Five Years: Retired Chairman and Chief Executive |
Trustee since April 1985 | Officer of Rohm and Haas Co. (chemicals); Director of Cummins Inc. (diesel engines) and |
147 Vanguard Funds Overseen | AmerisourceBergen Corp. (pharmaceutical distribution); Trustee of Vanderbilt University |
| and of Culver Educational Foundation. |
| |
Executive Officers1 | |
| |
Heidi Stam | |
Born 1956 | Principal Occupation(s) During the Past Five Years: Managing Director of The Vanguard |
Secretary since July 2005 | Group, Inc., since 2006; General Counsel of The Vanguard Group since 2005; Secretary of |
147 Vanguard Funds Overseen | The Vanguard Group, and of each of the investment companies served by The Vanguard |
| Group, since 2005; Principal of The Vanguard Group (1997–2006). |
| |
Thomas J. Higgins | |
Born 1957 | Principal Occupation(s) During the Past Five Years: Principal of The Vanguard Group, Inc.; |
Treasurer since July 1998 | Treasurer of each of the investment companies served by The Vanguard Group. |
147 Vanguard Funds Overseen | |
Vanguard Senior Management Team | | |
| | |
R. Gregory Barton | Kathleen C. Gubanich | Michael S. Miller |
Mortimer J. Buckley | Paul A. Heller | Ralph K. Packard |
James H. Gately | F. William McNabb, III | George U. Sauter |
| | |
Founder | | |
John C. Bogle | | |
Chairman and Chief Executive Officer, 1974–1996 | |
1 Officers of the funds are “interested persons” as defined in the Investment Company Act of 1940.
2 December 2002 for Vanguard Equity Income Fund, Vanguard Growth Equity Fund, the Vanguard Municipal Bond Funds, and the Vanguard State Tax-Exempt Funds.
More information about the trustees is in the Statement of Additional Information, available from The Vanguard Group.
P.O. Box 2600
Valley Forge, PA 19482-2600
Connect with Vanguard® > www.vanguard.com
Fund Information > 800-662-7447 | Vanguard, Connect with Vanguard, and the ship logo are |
| trademarks of The Vanguard Group, Inc. |
Direct Investor Account Services > 800-662-2739 | |
| All other marks are the exclusive property of their |
Institutional Investor Services > 800-523-1036 | respective owners. |
| |
Text Telephone for the | |
Hearing-Impaired > 800-952-3335 | All comparative mutual fund data are from Lipper Inc. |
| or Morningstar, Inc., unless otherwise noted. |
| |
| |
| You can obtain a free copy of Vanguard’s proxy voting |
| guidelines by visiting our website, www.vanguard.com, |
This material may be used in conjunction | and searching for “proxy voting guidelines,” or by calling |
with the offering of shares of any Vanguard | |
fund only if preceded or accompanied by | |
the fund’s current prospectus. | Vanguard at 800-662-2739. They are also available from |
| the SEC’s website, www.sec.gov. In addition, you may |
| obtain a free report on how your fund voted the proxies for |
| securities it owned during the 12 months ended June 30. |
| To get the report, visit either www.vanguard.com |
| or www.sec.gov. |
| |
| You can review and copy information about your fund |
| at the SEC’s Public Reference Room in Washington, D.C. |
| To find out more about this public service, call the SEC |
| at 202-551-8090. Information about your fund is also |
| available on the SEC’s website, and you can receive |
| copies of this information, for a fee, by sending a |
| request in either of two ways: via e-mail addressed to |
| publicinfo@sec.gov or via regular mail addressed to the |
| Public Reference Section, Securities and Exchange |
| Commission, Washington, DC 20549-0102. |
| |
| |
| © 2007 The Vanguard Group, Inc. |
| All rights reserved. |
| Vanguard Marketing Corporation, Distributor. |
| |
| Q1142 052007 |
| |
| |
Vanguard® Capital Opportunity Fund |
| |
| |
| |
| |
> Semiannual Report | |
| |
| |
| |
| |
March 31, 2007 | |
| |
| |
| |
| |
| 
|
| |
| |
| |
| |
| |
| |
| |
| |
| |
> Vanguard Capital Opportunity Fund returned 6.2% for the six months ended March 31, lagging the return of its benchmark and the average return of multi-cap growth funds.
> The broad U.S. stock market gained 8.9% during a volatile first half of the fund’s fiscal year.
> The fund’s relative performance over the six months was reined in by its heavy weighting in information technology stocks.
Contents | |
| |
Your Fund’s Total Returns | 1 |
Chairman’s Letter | 2 |
Advisor’s Report | 6 |
Fund Profile | 8 |
Performance Summary | 9 |
Financial Statements | 10 |
About Your Fund’s Expenses | 21 |
Trustees Approve Advisory Agreement | 23 |
Glossary | 24 |
Please note: The opinions expressed in this report are just that—informed opinions. They should not be considered promises or advice. Also, please keep in mind that the information and opinions cover the period through the date on the cover of this report. Of course, the risks of investing in your fund are spelled out in the prospectus.
Your Fund’s Total Returns
Six Months Ended March 31, 2007 | |
| Total |
| Returns |
Vanguard Capital Opportunity Fund | |
Investor Shares | 6.2% |
Admiral™ Shares1 | 6.2 |
Russell Midcap Growth Index | 11.2 |
Average Multi-Cap Growth Fund2 | 8.6 |
Dow Jones Wilshire Composite 5000 Index | 8.9 |
Your Fund’s Performance at a Glance |
September 30, 2006–March 31, 2007 |
| | | Distributions Per Share |
| Starting | Ending | Income | Capital |
| Share Price | Share Price | Dividends | Gains |
Vanguard Capital Opportunity Fund | | | | |
Investor Shares | $36.11 | $36.46 | $0.070 | $1.857 |
Admiral Shares | 83.49 | 84.26 | 0.238 | 4.290 |
1 A lower-cost class of shares available to many longtime shareholders and to those with significant investments in the fund.
2 Derived from data provided by Lipper Inc.
1

Chairman’s Letter
Dear Shareholder,
During the fiscal half-year ended March 31, 2007, Vanguard Capital Opportunity Fund returned 6.2%. Although this was a respectable return on an absolute basis, it significantly lagged the return of the fund’s benchmark, the Russell Midcap Growth Index, and fell short of the average return for multi-cap growth funds. The fund’s relatively weak performance can be traced largely to its outsized commitment to information technology stocks.
Please note that as of March 31, the Capital Opportunity Fund remained closed to new investors. Existing shareholders were permitted to make additional purchases in the fund of up to $25,000 per calendar year.
Six-month stock market return reflected disparate market moods
The broad U.S. stock market stitched together a solid six-month return from patches of strength and weakness. Stock prices rallied at the start of the period, pulled back in February—in part, a reaction to the Chinese market’s swoon—then recovered in March, buoyed by generally benign economic and corporate-profit reports.
Small-capitalization stocks outpaced large-caps, and international stocks outperformed their U.S. counterparts—patterns that have been in place for much of the past few years.
2
As the Fed sat tight, bonds produced coupon-like returns
The Federal Reserve Board remained offstage during the six months, keeping its target for the federal funds rate at 5.25% throughout the period. Despite some interim back-and-forth, longer-term bond yields finished the period pretty much where they started. With rates—and prices—more or less stable, bonds’ returns were consistent with their coupons.
The broad taxable bond market returned 2.8% for the six-month period. The municipal securities market posted a return of 1.9%. Money market instruments, one of the fixed income market’s bright spots in recent months, returned 2.5% for the half-year, as measured by the Citigroup 3-Month Treasury Bill Index.
Amid short-term disappointments, a focus on long-term prospects
During the past few years, the Capital Opportunity Fund’s research-intensive approach has produced a portfolio that is heavily tilted toward information technology stocks. Over the past six months, many of these holdings, which represent the fund’s biggest sector commitment, earned modest absolute returns, restraining the fund’s overall performance.
Nonetheless, your fund’s advisor, PRIMECAP Management, believes that these holdings boast exceptional long-term growth prospects, particularly those companies that are positioned to participate in the ever-growing global reach of the Internet. A prime example is Research In Motion (RIM), which represented more
Market Barometer | | | |
| | | Total Returns |
| | Periods Ended March 31, 2007 |
| Six Months | One Year | Five Years1 |
Stocks | | | |
Russell 1000 Index (Large-caps) | 8.2% | 11.8% | 6.9% |
Russell 2000 Index (Small-caps) | 11.0 | 5.9 | 10.9 |
Dow Jones Wilshire 5000 Index (Entire market) | 8.9 | 11.4 | 7.8 |
MSCI All Country World Index ex USA (International) | 15.5 | 20.3 | 17.4 |
| | | |
Bonds | | | |
Lehman Aggregate Bond Index (Broad taxable market) | 2.8% | 6.6% | 5.4% |
Lehman Municipal Bond Index | 1.9 | 5.4 | 5.5 |
Citigroup 3-Month Treasury Bill Index | 2.5 | 5.0 | 2.5 |
| | | |
CPI | | | |
Consumer Price Index | 1.2% | 2.8% | 2.8% |
1 Annualized.
3
than 4% of the fund’s assets on average. RIM returned nearly 33% on the strength of robust sales for its BlackBerry Pearl handheld device that links users to their e-mail and other Web applications.
The six-month picture was not so rosy for some of the fund’s other communication equipment makers: Motorola was caught without a follow-up to its popular RAZR phone, and Corning was hurt by concerns about pricing for the glass in liquid-crystal displays. The fund’s fifth-largest holding, the semiconductor company NVIDIA, also turned in a negative return, and systems software maker Symantec, another top-ten holding, suffered through the weaker-than-expected performance of its data management center business.
After tech stocks, Capital Opportunity’s largest commitment has been to the stocks of companies that stand to benefit most from the growing needs of an aging population for prescription drugs and other health care. Here, the past six months were marked by negative returns from health care holdings with large weightings in the fund, such as Biogen Idec and Applera Corp.–Applied Biosystems Group.
The fund’s brighter spots over the fiscal half-year also included Monsanto, which earned double-digit returns on the strength of worldwide demand for agricultural products. The fund’s consumer discretionary stocks, which as a group made the biggest contribution to the fund’s return, added further ballast. Notable contributors here included DIRECTV Group, Men’s
Annualized Expense Ratios1 | | | |
Your fund compared with its peer group | | | |
| | | Average |
| Investor | Admiral | Multi-Cap |
| Shares | Shares | Growth Fund |
Capital Opportunity Fund | 0.47% | 0.39% | 1.49% |
1 Fund expense ratios reflect the six months ended March 31, 2007. Peer-group expense ratio is derived from data provided by Lipper Inc. and captures information through year-end 2006.
4
Wearhouse, and Nordstrom, whose return of 25.7% indicated that high-end consumers, at least, were still spending.
A longer-term view, and low costs, can offer the best outlook
Although a review of the fund’s fiscal half-year can reveal useful information about an advisor’s approach and assessment of the market’s risks and opportunities, it’s important to remember that six-month returns can provide a distorted view of a fund’s performance. That’s a fact of investing life no less true now than on occasions when Capital Opportunity has finished its reporting period well ahead of the pack.
Your fund’s approach—making long-term commitments to a relatively concentrated number of holdings—requires patience and conviction, on the part of both the fund’s managers and its investors.
Our unwavering view is that success in investing is best judged over longer time periods, and our counsel, as always, is that investors must try to avoid being distracted by the “noise” of short-term results or market swings. Create a broadly based portfolio of stock, bond, and money market mutual funds; keep costs low; and think long-term. That’s the best way to build an investment plan to stand the test of time and help you reach your financial goals.
Thank you for entrusting your assets to Vanguard.
Sincerely,

John J. Brennan
Chairman and Chief Executive Officer
April 18, 2007
5
Advisor’s Report
During the past six months, the Vanguard Capital Opportunity Fund returned 6.2%, trailing both the 11.2% return of the Russell Midcap Growth Index and the 8.6% average return for multi-cap growth funds.
Investment environment
The past six months were a challenging period for growth stocks. As they have for much of the past five years, investors favored stocks with high relative free cash flow and dividend yields and disfavored stocks that, in our view, have compelling growth prospects. The valuation differential between growth and value stocks is near a 20-year low, even as growth-oriented companies turn their compelling long-term opportunities into steady increases in current earnings.
As the environment has become tougher, we’ve become more optimistic about our portfolio. The compression in growth-stock valuations has given us opportunities to buy equities with exciting prospects at reasonable prices. We feel that the risk of further compression in growth-stock valuations is not significant. Even if the unusually narrow valuation differential between growth and value stocks were to persist, we would expect growth companies to outperform the broad market by virtue of their superior earnings growth. If growth stocks’ recent valuation compression reverses and the historical premium awarded to earnings growth begins to return, growth investors should see even stronger returns.
Our successes
Although the fund trailed its benchmarks during the six-month period, we enjoyed noteworthy performance from a number of investments, such as Research In Motion, our largest holding. The maker of the BlackBerry, the ubiquitous mobile e-mail device, is benefiting from a strong entry into consumer markets as well as continued growth in its core enterprise market. Agriculture giant Monsanto has benefited from high agricultural product prices, which have stimulated demand growth for its genetically enhanced, high-yielding seeds.
DIRECTV and apparel retailer Men’s Wearhouse also made strong six- month contributions.
Our shortfalls
Technology stocks accounted for most of the fund’s weakest performers. Health care stocks were another trouble spot during the six months. Semiconductor maker Micron suffered from a decline in prices for its core memory chips. Software company Symantec struggled with execution issues in its enterprise data backup business, and Motorola’s growth slowed down significantly, as the company has been caught without a follow-up to its highly successful RAZR handset.
Pfizer, a top-ten holding just six months ago, was among the bigger disappointments during the period. Pfizer’s long-term prospects depended heavily on its new cholesterol drug,
6
torcetrapib, which was expected to make an important contribution to revenues when Pfizer’s blockbuster cholesterol medication Lipitor begins to lose patent protection in 2010. When the new drug failed to perform as expected, Pfizer terminated clinical trials, causing us to revise our investment thesis and reduce our Pfizer position.
Outlook
In general, however, we remain very optimistic about the health care sector and the pharmaceuticals in particular. We expect these companies to benefit from a compelling and, in our view, underappreciated secular trend: a dramatic increase in pharmaceuticals use by the aging baby boom generation. People over age 65 consume twice the amount of prescription drugs per capita as younger people, and this area of consumption is relatively insensitive to the economic cycle. As the baby boomers reach their mid-60s, the industry stands to benefit from a period of strong and sustained earnings growth.
We remain pessimistic about most financial companies, a view reflected in our very modest exposure to this sector. Over the past few years, these companies have benefited from an environment of low interest rates and abundant global liquidity. This period seems to be nearing its end. The most visible sign of change is the recent distress in the subprime mortgage market. In our view, this turmoil reflects a potentially broader problem in the financial sector, which is the mispricing of credit and other risks during the past few years. The result could be problems with loans and other financing provided to consumers and businesses in other sectors of the economy.
In closing, we would like to thank you for entrusting your hard-earned capital with us. We will continue to work diligently to prove worthy of that trust.
Theo A. Kolokotrones | Howard B. Schow |
Portfolio Manager | Portfolio Manager |
| |
Joel P. Fried | Alfred W. Mordecai |
Portfolio Manager | Portfolio Manager |
| |
David H. Van Slooten |
Portfolio Manager |
PRIMECAP Management Company, LLP
April 18, 2007
7
Fund Profile
As of March 31, 2007
Portfolio Characteristics | | |
| | Comparative | Broad |
| Fund | Index1 | Index2 |
Number of Stocks | 121 | 534 | 4,948 |
Median Market Cap | $11.3B | $7.7B | $30.6B |
Price/Earnings Ratio | 23.7x | 23.2x | 17.6x |
Price/Book Ratio | 3.0x | 4.1x | 2.8x |
Yield | | 0.8% | 1.7% |
Investor Shares | 0.1% | | |
Admiral Shares | 0.2% | | |
Return on Equity | 11.8% | 18.2% | 16.9% |
Earnings Growth Rate | 24.5% | 22.3% | 20.8% |
Foreign Holdings | 11.9% | 0.0% | 0.7% |
Turnover Rate | 14%3 | — | — |
Expense Ratio | | — | — |
Investor Shares | 0.47%3 | | |
Admiral Shares | 0.39%3 | | |
Short-Term Reserves | 3% | — | — |
Sector Diversification (% of portfolio) | |
| | Comparative | Broad |
| Fund | Index1 | Index2 |
Consumer Discretionary | 14% | 22% | 12% |
Consumer Staples | 0 | 5 | 9 |
Energy | 7 | 8 | 9 |
Financials | 2 | 9 | 22 |
Health Care | 17 | 15 | 11 |
Industrials | 9 | 15 | 11 |
Information Technology | 42 | 18 | 15 |
Materials | 4 | 4 | 4 |
Telecommunication | | | |
Services | 2 | 2 | 3 |
Utilities | 0 | 2 | 4 |
Short-Term Reserves | 3% | — | — |
Volatility Measures4 | |
| Fund Versus | Fund Versus |
| Comparative Index1 | Broad Index2 |
R-Squared | 0.86 | 0.80 |
Beta | 1.04 | 1.46 |
Ten Largest Holdings5 (% of total net assets) |
| | |
Research In Motion Ltd. | communications | |
| equipment | 4.8% |
Corning, Inc. | communications | |
| equipment | 3.1 |
FedEx Corp. | air freight and | |
| logistics | 3.0 |
Monsanto Co. | fertilizers and | |
| agricultural | |
| chemicals | 2.9 |
NVIDIA Corp. | semiconductors | 2.8 |
ASML Holding (New York) | semiconductor | |
| equipment | 2.8 |
Biogen Idec Inc. | biotechnology | 2.6 |
Symantec Corp. | systems software | 2.5 �� |
Applera Corp.–Applied | life sciences tools | |
Biosystems Group | and services | 2.4 |
DIRECTV Group, Inc. | broadcasting and | |
| cable television | 2.2 |
Top Ten | | 29.1% |
Investment Focus

1 Russell Midcap Growth Index.
2 Dow Jones Wilshire 5000 Index.
3 Annualized.
4 For an explanation of R-squared, beta,and other terms used here, see the Glossary on page 24.
5 “Ten Largest Holdings” excludes any temporary cash investments and equity index products.
8
Performance Summary
All of the returns in this report represent past performance, which is not a guarantee of future results that may be achieved by the fund. (Current performance may be lower or higher than the performance data cited. For performance data current to the most recent month-end, visit our website at www.vanguard.com/performance.) Note, too, that both investment returns and principal value can fluctuate widely, so an investor’s shares, when sold, could be worth more or less than their original cost. The returns shown do not reflect taxes that a shareholder would pay on fund distributions or on the sale of fund shares.
Fiscal-Year Total Returns (%): September 30, 1996–March 31, 2007

Average Annual Total Returns: Periods Ended March 31, 2007 |
| | | | |
| Inception Date | One Year | Five Years | Ten Years |
Investor Shares2 | 8/14/1995 | 5.62% | 10.84% | 16.58% |
Admiral Shares2 | 11/12/2001 | 5.72 | 10.95 | 11.673 |
1 Six months ended March 31, 2007.
2 Total returns do not reflect the 1% fee assessed on redemptions after March 23, 2005, of shares held for less than one year, or the 1% fee previously assessed on shares held for less than five years.
3 Return since inception.
Note: See Financial Highlights tables on pages 15 and 16 for dividend and capital gains information.
9
Financial Statements (unaudited)
Statement of Net Assets
As of March 31, 2007
The fund provides a complete list of its holdings four times in each fiscal year, at the quarter-ends. For the second and fourth fiscal quarters, the lists appear in the fund’s semiannual and annual reports to shareholders. For the first and third fiscal quarters, the fund files the lists with the Securities and Exchange Commission on Form N-Q. Shareholders can look up the fund’s Forms N-Q on the SEC’s website at www.sec.gov. Forms N-Q may also be reviewed and copied at the SEC’s Public Reference Room (see the back cover of this report for further information).
| | | Market |
| | | Value• |
| | Shares | ($000) |
Common Stocks (97.2%) | | |
Consumer Discretionary (14.1%) | | |
* | DIRECTV Group, Inc. | 8,622,335 | 198,917 |
| Nordstrom, Inc. | 3,100,000 | 164,114 |
1 | Men’s Wearhouse, Inc. | 3,367,100 | 158,422 |
| TJX Cos., Inc. | 5,167,400 | 139,313 |
* | CarMax, Inc. | 4,194,600 | 102,935 |
*1 | The Dress Barn, Inc. | 4,400,000 | 91,564 |
* | Bed Bath & Beyond, Inc. | 2,195,000 | 88,173 |
* | Quiksilver, Inc. | 5,821,500 | 67,529 |
| Best Buy Co., Inc. | 952,500 | 46,406 |
| Lowe’s Cos., Inc. | 1,411,400 | 44,445 |
* | 99 Cents Only Stores | 2,400,000 | 35,352 |
| Harman International | | |
| Industries, Inc. | 339,600 | 32,629 |
| Yum! Brands, Inc. | 311,000 | 17,963 |
* | Chico’s FAS, Inc. | 633,100 | 15,467 |
| Abercrombie & Fitch Co. | 200,000 | 15,136 |
| Gentex Corp. | 900,000 | 14,625 |
| Tiffany & Co. | 250,000 | 11,370 |
*1 | Strattec Security Corp. | 220,000 | 9,541 |
* | DreamWorks | | |
| Animation SKG, Inc. | 282,000 | 8,624 |
* | Comcast Corp. Class A | 278,550 | 7,228 |
* | Expedia, Inc. | 300,000 | 6,954 |
| Mattel, Inc. | 240,000 | 6,617 |
* | REX Stores Corp. | 174,800 | 2,860 |
| E.W. Scripps Co. Class A | 31,000 | 1,385 |
* | Amazon.com, Inc. | 18,200 | 724 |
| | | 1,288,293 |
Consumer Staples (0.3%) | | |
*^ | Cott Corp. | 1,865,000 | 24,954 |
| | | |
Energy (7.3%) | | |
| Murphy Oil Corp. | 2,800,000 | 149,520 |
| ConocoPhillips Co. | 1,750,000 | 119,612 |
| Noble Energy, Inc. | 1,500,000 | 89,475 |
* | National Oilwell Varco Inc. | 1,005,560 | 78,223 |
| Arch Coal, Inc. | 2,495,000 | 76,572 |
| ^Pogo Producing Co. | 1,200,000 | 57,720 |
| Pioneer Natural | | |
| Resources Co. | 1,120,000 | 48,283 |
* | Hanover Compressor Co. | 1,350,000 | 30,038 |
* | Pride International, Inc. | 570,700 | 17,178 |
| | | 666,621 |
Financials (1.7%) | | |
| MBIA, Inc. | 562,500 | 36,838 |
| ^IndyMac Bancorp, Inc. | 882,500 | 28,284 |
| Capital One Financial Corp. | 335,000 | 25,279 |
| East West Bancorp, Inc. | 650,000 | 23,900 |
| The Chubb Corp. | 440,000 | 22,735 |
| TCF Financial Corp. | 330,000 | 8,699 |
| SLM Corp. | 50,000 | 2,045 |
* | Nymex Holdings Inc. | 13,800 | 1,873 |
| Commerce Bancorp, Inc. | 30,000 | 1,001 |
| | | 150,654 |
Health Care (16.7%) | | |
* | Biogen Idec Inc. | 5,292,200 | 234,868 |
| Applera Corp.–Applied | | |
| Biosystems Group | 7,448,400 | 220,249 |
* | Novartis AG ADR | 3,330,000 | 181,918 |
| Medtronic, Inc. | 3,133,100 | 153,710 |
| Eli Lilly & Co. | 2,507,900 | 134,699 |
* | Affymetrix, Inc. | 3,345,500 | 100,599 |
* | Boston Scientific Corp. | 6,857,700 | 99,711 |
| Roche Holdings AG | 550,000 | 97,248 |
* | Millipore Corp. | 1,255,000 | 90,950 |
* | BioMarin | | |
| Pharmaceutical Inc. | 4,670,500 | 80,613 |
| Pfizer Inc. | 1,929,600 | 48,742 |
* | Sepracor Inc. | 550,000 | 25,647 |
*^ | Dendreon Corp. | 1,525,000 | 19,718 |
* | Edwards Lifesciences Corp. | 300,000 | 15,210 |
* | Waters Corp. | 202,000 | 11,716 |
* | Amgen, Inc. | 100,000 | 5,588 |
*^ | Pharmacyclics, Inc. | 690,500 | 1,837 |
| | | 1,523,023 |
10
| | | Market |
| | | Value• |
| | Shares | ($000) |
Industrials (9.2%) | | |
| FedEx Corp. | 2,544,800 | 273,388 |
*1 | Thomas & Betts Corp. | 3,700,000 | 180,634 |
| Pall Corp. | 2,500,000 | 95,000 |
* | AMR Corp. | 3,030,000 | 92,263 |
| Avery Dennison Corp. | 1,139,800 | 73,244 |
| Fluor Corp. | 604,000 | 54,191 |
*^ | JetBlue Airways Corp. | 3,241,050 | 37,304 |
| Union Pacific Corp. | 125,000 | 12,694 |
| Chicago Bridge & | | |
| Iron Co. N.V. | 225,000 | 6,919 |
| Southwest Airlines Co. | 431,300 | 6,340 |
* | US Airways Group Inc. | 59,300 | 2,697 |
| | | 834,674 |
Information Technology (42.5%) | |
| Communications Equipment (12.2%) | |
* | Research In Motion Ltd. | 3,205,400 | 437,505 |
* | Corning, Inc. | 12,520,200 | 284,709 |
* | Comverse Technology, Inc. | 6,260,000 | 133,651 |
| Motorola, Inc. | 4,500,000 | 79,515 |
* | Avocent Corp. | 2,484,500 | 67,007 |
* | Nortel Networks Corp. | 2,323,500 | 55,880 |
| Plantronics, Inc. | 1,150,000 | 27,163 |
* | Ciena Corp. | 607,142 | 16,970 |
| QUALCOMM Inc. | 200,000 | 8,532 |
| | | |
| Computers & Peripherals (2.7%) | |
*1 | Emulex Corp. | 4,569,400 | 83,574 |
*^ | Avid Technology, Inc. | 2,035,000 | 70,981 |
| Hewlett-Packard Co. | 1,700,000 | 68,238 |
* | EMC Corp. | 1,375,000 | 19,044 |
* | Brocade Communications | | |
| Systems, Inc. | 500,000 | 4,760 |
* | Concurrent Computer Corp. | 626,414 | 983 |
| | | |
| Electronic Equipment & Instruments (1.8%) |
* | Trimble Navigation Ltd. | 3,000,000 | 80,520 |
| Tektronix, Inc. | 2,557,200 | 72,011 |
* | Coherent, Inc. | 500,000 | 15,870 |
| | | |
| Internet Software & Services (3.5%) | |
* | eBay Inc. | 3,600,000 | 119,340 |
* | VeriSign, Inc. | 3,450,000 | 86,664 |
* | Yahoo! Inc. | 2,159,100 | 67,558 |
* | Google Inc. | 92,350 | 42,311 |
| | | |
| Semiconductors & | | |
| Semiconductor Equipment (12.9%) | |
* | NVIDIA Corp. | 8,998,900 | 258,988 |
* | ASML Holding (New York) | 10,364,400 | 256,519 |
* | Micron Technology, Inc. | 10,350,000 | 125,028 |
* | Altera Corp. | 5,850,000 | 116,941 |
*1 | Rambus Inc. | 5,205,000 | 110,606 |
*1 | FormFactor Inc. | 2,420,500 | 108,317 |
| Intersil Corp. | 3,705,000 | 98,145 |
| Texas Instruments, Inc. | 1,275,000 | 38,378 |
* | Cymer, Inc. | 730,000 | 30,331 |
* | Entegris Inc. | 2,019,231 | 21,606 |
* | FEI Co. | 210,000 | 7,573 |
| Intel Corp. | 235,000 | 4,496 |
| | | |
| Software (9.4%) | | |
* | Symantec Corp. | 13,130,500 | 227,158 |
* | Adobe Systems, Inc. | 2,742,714 | 114,371 |
| Microsoft Corp. | 4,050,000 | 112,874 |
* | THQ Inc. | 3,150,000 | 107,699 |
* | Autodesk, Inc. | 2,340,000 | 87,984 |
* | Macrovision Corp. | 2,370,000 | 59,369 |
* | Citrix Systems, Inc. | 1,736,000 | 55,604 |
* | NAVTEQ Corp. | 1,370,000 | 47,265 |
*1 | The Descartes | | |
| Systems Group Inc. | 4,645,000 | 20,299 |
* | Intuit, Inc. | 460,000 | 12,586 |
* | McAfee Inc. | 250,000 | 7,270 |
* | Nuance | | |
| Communications, Inc. | 330,000 | 5,052 |
| | | 3,877,245 |
Materials (3.9%) | | |
| Monsanto Co. | 4,773,968 | 262,377 |
1 | Minerals Technologies, Inc. | 1,500,000 | 93,240 |
| | | 355,617 |
Telecommunication Services (1.5%) | |
| Sprint Nextel Corp. | 7,219,700 | 136,886 |
Total Common Stocks | | |
(Cost $5,645,811) | | 8,857,967 |
Temporary Cash Investments (4.0%) | |
2 | Vanguard Market Liquidity | | |
| Fund, 5.288% | 299,865,482 | 299,865 |
2 | Vanguard Market Liquidity | | |
| Fund, 5.288%—Note F | 64,314,400 | 64,314 |
Total Temporary Cash Investments | |
(Cost $364,179) | | 364,179 |
Total Investments (101.1%) | | |
(Cost $6,009,990) | | 9,222,146 |
Other Assets and Liabilities—Net (–1.2%) | (105,470) |
Net Assets (100%) | | 9,116,676 |
11
| Market |
| Value• |
| ($000) |
Statement of Assets and Liabilities | |
Assets | |
Investment in Securities, at Value | 9,222,146 |
Receivables for Investment | |
Securities Sold | 5,297 |
Receivables for Capital Shares Issued | 6,838 |
Other Assets—Note C | 7,474 |
Total Assets | 9,241,755 |
Liabilities | |
Security Lending Collateral | |
Payable to Brokers—Note F | 64,314 |
Payables for Investment | |
Securities Purchased | 10,712 |
Payables for Capital Shares Redeemed | 30,116 |
Other Liabilities | 19,937 |
Total Liabilities | 125,079 |
Net Assets | 9,116,676 |
At March 31, 2007, net assets consisted of:3 |
| Amount |
| ($000) |
Paid-in Capital | 5,793,534 |
Overdistributed Net Investment Income | (3,951) |
Accumulated Net Realized Gains | 114,919 |
Unrealized Appreciation | |
Investment Securities | 3,212,156 |
Foreign Currencies | 18 |
Net Assets | 9,116,676 |
| |
Investor Shares—Net Assets | |
Applicable to 137,665,198 outstanding | |
$.001 par value shares of beneficial | |
interest (unlimited authorization) | 5,019,640 |
Net Asset Value Per Share— | |
Investor Shares | $36.46 |
| |
Admiral Shares—Net Assets | |
Applicable to 48,622,148 outstanding | |
$.001 par value shares of beneficial | |
interest (unlimited authorization) | 4,097,036 |
Net Asset Value Per Share— | |
Admiral Shares | $84.26 |
• See Note A in Notes to Financial Statements .
* Non-income-producing security.
^ Part of security position is on loan to broker-dealers. See Note F in Notes to Financial Statements .
1 Considered an affiliated company of the fund as the fund owns more than 5% of the outstanding voting securities of such company. See Note H in Notes to Financial Statements .
2 Affiliated money market fund available only to Vanguard funds and certain trusts and accounts managed by Vanguard. Rate shown is the 7-day yield.
3 See Note D in Notes to Financial Statements for the tax-basis components of net assets.
ADR—American Depositary Receipt.
12
Statement of Operations
| Six Months Ended |
| March 31, 2007 |
| ($000) |
Investment Income | |
Income | |
Dividends1,2 | 24,627 |
Interest2 | 6,515 |
Security Lending | 362 |
Total Income | 31,504 |
Expenses | |
Investment Advisory Fees—Note B | 12,070 |
The Vanguard Group—Note C | |
Management and Administrative | |
Investor Shares | 5,033 |
Admiral Shares | 2,168 |
Marketing and Distribution | |
Investor Shares | 400 |
Admiral Shares | 305 |
Custodian Fees | 70 |
Shareholders’ Reports | |
Investor Shares | 33 |
Admiral Shares | 9 |
Trustees’ Fees and Expenses | 6 |
Total Expenses | 20,094 |
Net Investment Income | 11,410 |
Realized Net Gain (Loss) | |
Investment Securities Sold2 | 186,880 |
Foreign Currencies | 4 |
Realized Net Gain (Loss) | 186,884 |
Change in Unrealized Appreciation (Depreciation) | |
Investment Securities | 346,989 |
Foreign Currencies | 9 |
Change in Unrealized Appreciation (Depreciation) | 346,998 |
Net Increase (Decrease) in Net Assets Resulting from Operations | 545,292 |
1 Dividends are net of foreign withholding taxes of $771,000.
2 Dividend income, interest income, and realized net gain (loss) from affiliated companies of the fund were $503,000, $6,514,000, and $43,150,000, respectively.
13
Statement of Changes in Net Assets
| Six Months Ended | Year Ended |
| March 31, | September 30, |
| 2007 | 2006 |
| ($000) | ($000) |
Increase (Decrease) in Net Assets | | |
Operations | | |
Net Investment Income | 11,410 | 16,648 |
Realized Net Gain (Loss) | 186,884 | 457,492 |
Change in Unrealized Appreciation (Depreciation) | 346,998 | 643,108 |
Net Increase (Decrease) in Net Assets Resulting from Operations | 545,292 | 1,117,248 |
Distributions | | |
Net Investment Income | | |
Investor Shares | (9,611) | (8,621) |
Admiral Shares | (10,882) | (7,418) |
Realized Capital Gain 1 | | |
Investor Shares | (254,953) | (35,894) |
Admiral Shares | (196,140) | (22,044) |
Total Distributions | (471,586) | (73,977) |
Capital Share Transactions—Note G | | |
Investor Shares | (81,999) | (815,293) |
Admiral Shares | 324,527 | 337,555 |
Net Increase (Decrease) from Capital Share Transactions | 242,528 | (477,738) |
Total Increase (Decrease) | 316,234 | 565,533 |
Net Assets | | |
Beginning of Period | 8,800,442 | 8,234,909 |
End of Period2 | 9,116,676 | 8,800,442 |
1 Includes fiscal 2007 and 2006 short-term gain distributions totaling $7,045,000 and $32,891,000. Short-term gain distributions are treated as ordinary income dividends for tax purposes.
2 Net Assets—End of Period includes undistributed (overdistributed) net investment income of ($3,951,000) and $5,128,000.
14
Financial Highlights
Capital Opportunity Fund Investor Shares |
| | | | | | |
| Six Months | | Nov. 1, | | | |
| Ended | Year Ended | 2003 to | |
For a Share Outstanding | March 31, | September 30, | Sept. 30, | Year Ended October 31, |
Throughout Each Period | 2007 | 2006 | 2005 | 20041 | 2003 | 2002 | 2001 |
Net Asset Value, | | | | | | | |
Beginning of Period | $36.11 | $31.92 | $27.24 | $24.28 | $16.54 | $20.73 | $30.16 |
Investment Operations | | | | | | | |
Net Investment Income | .039 | .053 | .0902 | .017 | .009 | .01 | .07 |
Net Realized and Unrealized | | | | | | | |
Gain (Loss) on Investments3 | 2.238 | 4.421 | 4.731 | 2.956 | 7.744 | (4.13) | (7.42) |
Total from | | | | | | | |
Investment Operations | 2.277 | 4.474 | 4.821 | 2.973 | 7.753 | (4.12) | (7.35) |
Distributions | | | | | | | |
Dividends from | | | | | | | |
Net Investment Income | (.070) | (.055) | (.070) | (.013) | (.013) | (.07) | (.16) |
Distributions from | | | | | | | |
Realized Capital Gains | (1.857) | (.229) | (.071) | — | — | — | (1.92) |
Total Distributions | (1.927) | (.284) | (.141) | (.013) | (.013) | (.07) | (2.08) |
Net Asset Value, | | | | | | | |
End of Period | $36.46 | $36.11 | $31.92 | $27.24 | $24.28 | $16.54 | $20.73 |
| | | | | | | |
Total Return4 | 6.17% | 14.10% | 17.72% | 12.25% | 46.91% | –19.97% | –25.68% |
| | | | | | | |
Ratios/Supplemental Data | | | | | | | |
Net Assets, End of | | | | | | | |
Period (Millions) | $5,020 | $5,051 | $5,231 | $6,199 | $5,120 | $3,181 | $4,454 |
Ratio of Total Expenses to | | | | | | | |
Average Net Assets | 0.47%* | 0.49% | 0.51% | 0.52%* | 0.59% | 0.58% | 0.60% |
Ratio of Net Investment | | | | | | | |
Income to Average | | | | | | | |
Net Assets | 0.21%* | 0.15% | 0.33%2 | 0.06%* | 0.04% | 0.07% | 0.28% |
Portfolio Turnover Rate | 14%* | 11% | 12% | 10% | 14% | 14% | 20% |
1 The fund’s fiscal year-end changed from October 31 to September 30, effective September 30, 2004.
2 Net investment income per share and the ratio of net investment income to average net assets include $.047 and 0.16%, respectively, resulting from a special dividend from Microsoft Corp. in November 2004.
3 Includes increases from redemption fees of $.00, $.00, $.01, $.01, $.01, $.03, and $.03.
4 Total returns do not reflect the 1% fee assessed on redemptions after March 23, 2005, of shares held for less than one year, or the 1% fee previously assessed on redemptions of shares held for less than five years.
* Annualized.
15
Capital Opportunity Fund Admiral Shares | | | | | |
| | | | | | |
| Six Months | | Nov. 1, | Year | Nov. 12, |
| Ended | Year Ended | 2003 to | Ended | 20012 to |
For a Share Outstanding | March 31, | September 30, | Sept. 30, | Oct. 31, | Oct. 31, |
Throughout Each Period | 2007 | 2006 | 2005 | 20041 | 2003 | 2002 |
Net Asset Value, Beginning of Period | $83.49 | $73.77 | $62.96 | $56.11 | $38.22 | $50.00 |
Investment Operations | | | | | | |
Net Investment Income | .132 | .198 | .2913 | .096 | .062 | .07 |
Net Realized and Unrealized Gain (Loss) | | | | | | |
on Investments4 | 5.166 | 10.229 | 10.911 | 6.828 | 17.894 | (11.68) |
Total from Investment Operations | 5.298 | 10.427 | 11.202 | 6.924 | 17.956 | (11.61) |
Distributions | | | | | | |
Dividends from | | | | | | |
Net Investment Income | (.238) | (.178) | (.228) | (.074) | (.066) | (.17) |
Distributions from | | | | | | |
Realized Capital Gains | (4.290) | (.529) | (.164) | — | — | — |
Total Distributions | (4.528) | (.707) | (.392) | (.074) | (.066) | (.17) |
Net Asset Value, End of Period | $84.26 | $83.49 | $73.77 | $62.96 | $56.11 | $38.22 |
| | | | | | |
Total Return5 | 6.21% | 14.23% | 17.82% | 12.36% | 47.05% | –23.32% |
| | | | | | |
Ratios/Supplemental Data | | | | | | |
Net Assets, End of Period (Millions) | $4,097 | $3,750 | $3,004 | $1,337 | $840 | $395 |
Ratio of Total Expenses to | | | | | | |
Average Net Assets | 0.39%* | 0.40% | 0.42% | 0.41%* | 0.49% | 0.50%* |
Ratio of Net Investment Income to | | | | | | |
Average Net Assets | 0.29%* | 0.24% | 0.38%3 | 0.17%* | 0.14% | 0.17%* |
Portfolio Turnover Rate | 14%* | 11% | 12% | 10% | 14% | 14% |
1 The fund’s fiscal year-end changed from October 31 to September 30, effective September 30, 2004.
2 Inception.
3 Net investment income per share and the ratio of net investment income to average net assets include $.108 and 0.16%, respectively, resulting from a special dividend from Microsoft Corp. in November 2004.
4 Includes increases from redemption fees of $.00, $.00, $.01, $.03, $.03, and $.07.
5 Total returns do not reflect the 1% fee assessed on redemptions after March 23, 2005, of shares held for less than one year, or the 1% fee previously assessed on redemptions of shares held for less than five years.
* Annualized.
See accompanying Notes,which are an integral part of the Financial Statements .
16
Notes to Financial Statements
Vanguard Capital Opportunity Fund is registered under the Investment Company Act of 1940 as an open-end investment company, or mutual fund. The fund files reports with the SEC under the company name Vanguard Horizon Funds. The fund offers two classes of shares, Investor Shares and Admiral Shares. Investor Shares are available to any investor who meets the fund’s minimum purchase requirements. Admiral Shares are designed for investors who meet certain administrative, service, tenure, and account-size criteria.
A. The following significant accounting policies conform to generally accepted accounting principles for U.S. mutual funds. The fund consistently follows such policies in preparing its financial statements.
1. Security Valuation: Securities are valued as of the close of trading on the New York Stock Exchange (generally 4:00 p.m., Eastern time) on the valuation date. Equity securities are valued at the latest quoted sales prices or official closing prices taken from the primary market in which each security trades; such securities not traded on the valuation date are valued at the mean of the latest quoted bid and asked prices. Securities for which market quotations are not readily available, or whose values have been affected by events occurring before the fund’s pricing time but after the close of the securities’ primary markets, are valued at their fair values calculated according to procedures adopted by the board of trustees. These procedures include obtaining quotations from an independent pricing service, monitoring news to identify significant market- or security-specific events, and evaluating changes in the values of foreign market proxies (for example, ADRs, futures contracts, or exchange-traded funds) between the time the foreign markets close and the fund’s pricing time. When fair-value pricing is employed, the prices of securities used by a fund to calculate its net asset value may differ from quoted or published prices for the same securities. Investments in Vanguard Market Liquidity Fund are valued at that fund’s net asset value.
2. Foreign Currency: Securities and other assets and liabilities denominated in foreign currencies are translated into U.S. dollars at the exchange rates on the valuation date as employed by Morgan Stanley Capital International (MSCI) in the calculation of its indexes. As part of the fund’s fair-value procedures, exchange rates may be adjusted if they change significantly before the fund’s pricing time but after the time at which the MSCI rates are determined (generally 11:00 a.m., Eastern time).
Realized gains (losses) and unrealized appreciation (depreciation) on investment securities include the effects of changes in exchange rates since the securities were purchased, combined with the effects of changes in security prices. Fluctuations in the value of other assets and liabilities resulting from changes in exchange rates are recorded as unrealized foreign currency gains (losses) until the asset or liability is settled in cash, when they are recorded as realized foreign currency gains (losses).
3. Federal Income Taxes: The fund intends to continue to qualify as a regulated investment company and distribute all of its taxable income. Accordingly, no provision for federal income taxes is required in the financial statements.
4. Distributions: Distributions to shareholders are recorded on the ex-dividend date.
5. Security Lending: The fund may lend its securities to qualified institutional borrowers to earn additional income. Security loans are required to be secured at all times by collateral at least equal to the market value of securities loaned. The fund invests cash collateral received in Vanguard Market Liquidity Fund, and records a liability for the return of the collateral, during the period the securities are on loan. Security lending income represents the income earned on investing cash collateral, less expenses associated with the loan.
17
6. Other: Dividend income is recorded on the ex-dividend date. Interest income includes income distributions received from Vanguard Market Liquidity Fund and is accrued daily. Security transactions are accounted for on the date securities are bought or sold. Costs used to determine realized gains (losses) on the sale of investment securities are those of the specific securities sold. Fees assessed on redemptions of capital shares are credited to paid-in capital.
Each class of shares has equal rights as to assets and earnings, except that each class separately bears certain class-specific expenses related to maintenance of shareholder accounts (included in Management and Administrative expenses) and shareholder reporting. Marketing and distribution expenses are allocated to each class of shares based on a method approved by the board of trustees. Income, other non-class-specific expenses, and gains and losses on investments are allocated to each class of shares based on its relative net assets.
B. PRIMECAP Management Company provides investment advisory services to the fund for a fee calculated at an annual percentage rate of average net assets. For the six months ended March 31, 2007, the investment advisory fee represented an effective annual rate of 0.26% of the fund’s average net assets.
C. The Vanguard Group furnishes at cost corporate management, administrative, marketing, and distribution services. The costs of such services are allocated to the fund under methods approved by the board of trustees. The fund has committed to provide up to 0.40% of its net assets in capital contributions to Vanguard. At March 31, 2007, the fund had contributed capital of $867,000 to Vanguard (included in Other Assets), representing 0.01% of the fund’s net assets and 0.87% of Vanguard’s capitalization. The fund’s trustees and officers are also directors and officers of Vanguard.
D. Distributions are determined on a tax basis and may differ from net investment income and realized capital gains for financial reporting purposes. Differences may be permanent or temporary. Permanent differences are reclassified among capital accounts in the financial statements to reflect their tax character. Temporary differences arise when certain items of income, expense, gain, or loss are recognized in different periods for financial statement and tax purposes; these differences will reverse at some time in the future. Differences in classification may also result from the treatment of short-term gains as ordinary income for tax purposes. The fund’s tax-basis capital gains and losses are determined only at the end of each fiscal year.
During the six months ended March 31, 2007, the fund realized net foreign currency gains of $4,000, which increased distributable net income for tax purposes; accordingly, such gains have been reclassified from accumulated net realized gains to overdistributed net investment income.
At March 31, 2007, the cost of investment securities for tax purposes was $6,009,990,000. Net unrealized appreciation of investment securities for tax purposes was $3,212,156,000, consisting of unrealized gains of $3,474,815,000 on securities that had risen in value since their purchase and $262,659,000 in unrealized losses on securities that had fallen in value since their purchase.
E. During the six months ended March 31, 2007, the fund purchased $647,349,000 of investment securities and sold $932,443,000 of investment securities, other than temporary cash investments.
F. The market value of securities on loan to broker-dealers at March 31, 2007, was $61,562,000, for which the fund received cash collateral of $64,314,000.
18
G. Capital share transactions for each class of shares were:
| Six Months Ended | | Year Ended |
| March 31, 2007 | | September 30, 2006 |
| Amount | Shares | | Amount | Shares |
| ($000) | (000) | | ($000) | (000) |
Investor Shares | | | | | |
Issued | 180,356 | 4,830 | | 331,413 | 9,663 |
Issued in Lieu of Cash Distributions | 249,615 | 6,678 | | 42,032 | 1,273 |
Redeemed1 | (511,970) | (13,694) | | (1,188,738) | (34,982) |
Net Increase (Decrease)—Investor Shares | (81,999) | (2,186) | | (815,293) | (24,046) |
Admiral Shares | | | | | |
Issued | 329,535 | 3,782 | | 743,335 | 9,382 |
Issued in Lieu of Cash Distributions | 189,279 | 2,192 | | 26,959 | 353 |
Redeemed1 | (194,287) | (2,264) | | (432,739) | (5,543) |
Net Increase (Decrease)—Admiral Shares | 324,527 | 3,710 | | 337,555 | 4,192 |
H. Certain of the fund’s investments are in companies that are considered to be affiliated companies of the fund because the fund owns more than 5% of the outstanding voting securities of the company. Transactions during the six months ended March 31, 2007, in securities of these companies were as follows:
| | Current Period Transactions | |
| Sept. 30, 2006 | | Proceeds from | | Mar. 31, 2007 |
| Market | Purchases | Securities | Dividend | Market |
| Value | at Cost | Sold | Income | Value |
| ($000) | ($000) | ($000) | ($000) | ($000) |
BioMarin Pharmaceutical Inc. | 66,461 | — | — | — | n/a2 |
The Descartes Systems Group Inc. | 18,208 | — | — | — | 20,299 |
The Dress Barn, Inc. | 96,008 | — | — | — | 91,564 |
Emulex Corp. | 82,753 | 264 | — | — | 83,574 |
FormFactor Inc. | n/a3 | 74,009 | — | — | 108,317 |
Macrovision Corp. | 84,879 | — | 31,829 | — | n/a2 |
Men’s Wearhouse, Inc. | 132,676 | — | 9,048 | 347 | 158,422 |
Minerals Technologies, Inc. | 83,304 | — | 3,636 | 156 | 93,240 |
Rambus Inc. | 90,775 | — | — | — | 110,606 |
Strattec Security Corp. | 8,419 | — | — | — | 9,541 |
Thomas & Betts Corp. | 179,547 | — | 3,174 | — | 180,634 |
THQ Inc. | 143,371 | — | 58,532 | — | n/a2 |
| 986,401 | | | 503 | 856,197 |
1 Net of redemption fees of $248,000 and $294,000 (fund totals).
2 At March 31, 2007, the security is still held, but the issuer was no longer an affiliated company of the fund.
3 At September 30, 2006, the issuer was not an affiliated company of the fund.
19
I. In June 2006, the Financial Accounting Standards Board issued Interpretation No. 48 (“FIN 48”), “Accounting for Uncertainty in Income Taxes.” FIN 48 establishes the minimum threshold for recognizing, and a system for measuring, the benefits of tax-return positions in financial statements. FIN 48 will be effective for the fund’s fiscal year beginning October 1, 2007. Management is in the process of analyzing the fund’s tax positions for purposes of implementing FIN 48; based on the analysis completed to date, management does not believe the adoption of FIN 48 will result in any material impact to the fund’s financial statements.
20
About Your Fund’s Expenses
As a shareholder of the fund, you incur ongoing costs, which include costs for portfolio management, administrative services, and shareholder reports (like this one), among others. Operating expenses, which are deducted from a fund’s gross income, directly reduce the investment return of the fund.
A fund’s expenses are expressed as a percentage of its average net assets. This figure is known as the expense ratio. The following examples are intended to help you understand the ongoing costs (in dollars) of investing in your fund and to compare these costs with those of other mutual funds. The examples are based on an investment of $1,000 made at the beginning of the period shown and held for the entire period.
The table below illustrates your fund’s costs in two ways:
• Based on actual fund return. This section helps you to estimate the actual expenses that you paid over the period. The “Ending Account Value” shown is derived from the fund’s actual return, and the third column shows the dollar amount that would have been paid by an investor who started with $1,000 in the fund. You may use the information here, together with the amount you invested, to estimate the expenses that you paid over the period.
To do so, simply divide your account value by $1,000 (for example, an $8,600 account value divided by $1,000 = 8.6), then multiply the result by the number given for your fund under the heading “Expenses Paid During Period.”
• Based on hypothetical 5% yearly return. This section is intended to help you compare your fund’s costs with those of other mutual funds. It assumes that the fund had a yearly return of 5% before expenses, but that the expense ratio is unchanged. In this case—because the return used is not the fund’s actual return—the results do not apply to your investment. The example is useful in making comparisons because the Securities and Exchange Commission requires all mutual funds to calculate expenses based on a 5% return. You can assess your fund’s costs by comparing this hypothetical example with the hypothetical examples that appear in shareholder reports of other funds.
Six Months Ended March 31, 2007 | | | |
| Beginning | Ending | Expenses |
| Account Value | Account Value | Paid During |
Capital Opportunity Fund | 9/30/2006 | 3/31/2007 | Period1 |
Based on Actual Fund Return | | | |
Investor Shares | $1,000.00 | $1,061.74 | $2.42 |
Admiral Shares | 1,000.00 | 1,062.14 | 2.01 |
Based on Hypothetical 5% Yearly Return |
Investor Shares | $1,000.00 | $1,022.59 | $2.37 |
Admiral Shares | 1,000.00 | 1,022.99 | 1.97 |
1 The calculations are based on expenses incurred in the most recent six-month period. The fund’s annualized six-month expense ratios for that period are 0.47% for Investor Shares and 0.39% for Admiral Shares. The dollar amounts shown as “Expenses Paid” are equal to the annualized expense ratio multiplied by the average account value over the period, multiplied by the number of days in the most recent six-month period, then divided by the number of days in the most recent 12-month period.
21
Note that the expenses shown in the table are meant to highlight and help you compare ongoing costs only; they do not include your fund’s low-balance fee or the transaction fee on redemptions. These fees are fully described in the prospectus. Your fund does not carry a “sales load.”
The calculations assume no shares were bought or sold during the period. Your actual costs may have been higher or lower, depending on the amount of your investment and the timing of any purchases or redemptions.
You can find more information about the fund’s expenses, including annual expense ratios, in the Financial Statements section of this report. For additional information on operating expenses and other shareholder costs, please refer to the appropriate fund prospectus.
22
Trustees Approve Advisory Agreement
The board of trustees of Vanguard Capital Opportunity Fund has renewed the fund’s investment advisory agreement with PRIMECAP Management Company. The board determined that the retention of PRIMECAP Management was in the best interests of the fund and its shareholders.
The board based its decision upon an evaluation of PRIMECAP Management’s investment staff, portfolio management process, and performance. The trustees considered the factors discussed below, among others. However, no single factor determined whether the board approved the agreement. Rather, it was the totality of the circumstances that drove the board’s decision.
The board approved a change to the process for the quarterly calculation of PRIMECAP Management’s asset-based advisory fee. The calculation now will be based on the average daily net assets of the fund rather than on the average month-end net assets.
Nature, extent, and quality of services
The board considered the quality of the fund’s investment management over both the short and long term, and took into account the organizational depth and stability of the firm. The board noted that PRIMECAP Management, founded in 1983, is recognized for its long-term approach to growth equity investing. The firm has managed Vanguard Capital Opportunity Fund since 1998.
Five experienced portfolio managers are responsible for separate sub-portfolios, and each portfolio manager employs a fundamental, research-driven approach in seeking to identify companies with both long-term growth potential overlooked by the market and stock that is trading at attractive valuation levels.
The board concluded that the advisor’s experience, stability, depth, and performance, among other factors, warranted continuation of the advisory agreement.
Investment performance
The board considered the short- and long-term performance of the fund, including any periods of outperformance or underperformance of a relevant benchmark and peer group. The board noted that the fund has outperformed its benchmark and peer group over the last 1-, 3-, and 5-year periods. The board concluded that the advisor carried out the fund’s investment strategy in disciplined fashion, and the fund has performed in line with expectations. Information about the fund’s most recent performance can be found in the Performance Summary section of this report.
Cost
The board concluded that the fund’s expense ratio was far below the average expense ratio charged by funds in its peer group. The board noted that the fund’s advisory fee was also well below the peer-group average. Information about the fund’s expense ratio appears in the About Your Fund’s Expenses section of this report as well as in the Financial Statements section, which also includes information about the advisory fee rate. The board did not consider profitability of PRIMECAP Management in determining whether to approve the advisory fee, because PRIMECAP Management is independent of Vanguard and the advisory fee is the result of arm’s-length negotiations.
The benefit of economies of scale
The board concluded that the fund’s shareholders benefit from economies of scale because of the breakpoints in the fund’s advisory fee schedule. The breakpoints reduce the effective rate of the fee as the fund’s assets increase.
The advisory agreement will continue for one year and is renewable by the fund’s board after that for successive one-year periods.
23
Glossary
Beta. A measure of the magnitude of a fund’s past share-price fluctuations in relation to the ups and downs of a given market index. The index is assigned a beta of 1.00. Compared with a given index, a fund with a beta of 1.20 typically would have seen its share price rise or fall by 12% when the index rose or fell by 10%. A fund’s beta should be reviewed in conjunction with its R-squared (see definition below). The lower the R-squared, the less correlation there is between the fund and the index, and the less reliable beta is as an indicator of volatility.
Earnings Growth Rate. The average annual rate of growth in earnings over the past five years for the stocks now in a fund.
Expense Ratio. The percentage of a fund’s average net assets used to pay its annual administrative and advisory expenses. These expenses directly reduce returns to investors.
Foreign Holdings. The percentage of a fund represented by stocks or depositary receipts of companies based outside the United States.
Inception Date. The date on which the assets of a fund (or one of its share classes) are first invested in accordance with the fund’s investment objective. For funds with a subscription period, the inception date is the day after that period ends. Investment performance is measured from the inception date.
Median Market Cap. An indicator of the size of companies in which a fund invests; the midpoint of market capitalization (market price x shares outstanding) of a fund’s stocks, weighted by the proportion of the fund’s assets invested in each stock. Stocks representing half of the fund’s assets have market capitalizations above the median, and the rest are below it.
Price/Book Ratio. The share price of a stock divided by its net worth, or book value, per share. For a fund, the weighted average price/book ratio of the stocks it holds.
Price/Earnings Ratio. The ratio of a stock’s current price to its per-share earnings over the past year. For a fund, the weighted average P/E of the stocks it holds. P/E is an indicator of market expectations about corporate prospects; the higher the P/E, the greater the expectations for a company’s future growth.
R-Squared. A measure of how much of a fund’s past returns can be explained by the returns from the market in general, as measured by a given index. If a fund’s total returns were precisely synchronized with an index’s returns, its R-squared would be 1.00. If the fund’s returns bore no relationship to the index’s returns, its R-squared would be 0.
Return on Equity. The annual average rate of return generated by a company during the past five years for each dollar of shareholder’s equity (net income divided by shareholder’s equity). For a fund, the weighted average return on equity for the companies whose stocks it holds.
Short-Term Reserves. The percentage of a fund invested in highly liquid, short-term securities that can be readily converted to cash.
Turnover Rate. An indication of the fund’s trading activity. Funds with high turnover rates incur higher transaction costs and may be more likely to distribute capital gains (which may be taxable to investors). The turnover rate excludes in-kind transactions, which have minimal impact on costs.
Yield. A snapshot of a fund’s income from interest and dividends. The yield, expressed as a percentage of the fund’s net asset value, is based on income earned over the past 30 days and is annualized, or projected forward for the coming year. The index yield is based on the current annualized rate of income provided by securities in the index.
24
This page intentionally left blank.
This page intentionally left blank.
This page intentionally left blank.
The People Who Govern Your Fund
The trustees of your mutual fund are there to see that the fund is operated and managed in your best interests since, as a shareholder, you are a part owner of the fund. Your fund’s trustees also serve on the board of directors of The Vanguard Group, Inc., which is owned by the Vanguard funds and provides services to them on an at-cost basis.
A majority of Vanguard’s board members are independent, meaning that they have no affiliation with Vanguard or the funds they oversee, apart from the sizable personal investments they have made as private individuals.
Our independent board members bring distinguished backgrounds in business, academia, and public service to their task of working with Vanguard officers to establish the policies and oversee the activities of the funds. Among board members’ responsibilities are selecting investment advisors for the funds; monitoring fund operations, performance, and costs; reviewing contracts; nominating and selecting new trustees/directors; and electing Vanguard officers.
Each trustee serves a fund until its termination; or until the trustee’s retirement, resignation, or death; or otherwise as specified in the fund’s organizational documents. Any trustee may be removed at a shareholders’ meeting by a vote representing two-thirds of the net asset value of all shares of the fund together with shares of other Vanguard funds organized within the same trust. The table on these two pages shows information for each trustee and executive officer of the fund. The mailing address of the trustees and officers is P.O. Box 876, Valley Forge, PA 19482.
Chairman of the Board, Chief Executive Officer, and Trustee |
| |
John J. Brennan1 | |
Born 1954 | Principal Occupation(s) During the Past Five Years: Chairman of the Board, Chief Executive |
Trustee since May 1987; | Officer, and Director/Trustee of The Vanguard Group, Inc., and of each of the investment |
Chairman of the Board and | companies served by The Vanguard Group. |
Chief Executive Officer | |
147 Vanguard Funds Overseen | |
| |
Independent Trustees | |
| |
Charles D. Ellis | |
Born 1937 | Principal Occupation(s) During the Past Five Years: Applecore Partners (pro bono ventures |
Trustee since January 2001 | in education); Senior Advisor to Greenwich Associates (international business strategy |
147 Vanguard Funds Overseen | consulting); Successor Trustee of Yale University; Overseer of the Stern School of Business |
| at New York University; Trustee of the Whitehead Institute for Biomedical Research. |
| |
Rajiv L. Gupta | |
Born 1945 | Principal Occupation(s) During the Past Five Years: Chairman and Chief Executive Officer |
Trustee since December 20012 | of Rohm and Haas Co. (chemicals); Board Member of the American Chemistry Council; |
147 Vanguard Funds Overseen | Director of Tyco International, Ltd. (diversified manufacturing and services) since 2005; |
| Trustee of Drexel University and of the Chemical Heritage Foundation. |
| |
Amy Gutmann | |
Born 1949 | Principal Occupation(s) During the Past Five Years: President of the University of |
Trustee since June 2006 | Pennsylvania since 2004; Professor in the School of Arts and Sciences, Annenberg School |
147 Vanguard Funds Overseen | for Communication, and Graduate School of Education of the University of Pennsylvania |
| since 2004; Provost (2001–2004) and Laurance S. Rockefeller Professor of Politics and the |
| University Center for Human Values (1990–2004), Princeton University; Director of Carnegie |
| Corporation of New York since 2005 and of Schuylkill River Development Corporation and |
| Greater Philadelphia Chamber of Commerce since 2004. |
JoAnn Heffernan Heisen | |
Born 1950 | Principal Occupation(s) During the Past Five Years: Corporate Vice President and Chief |
Trustee since July 1998 | Global Diversity Officer since 2006, Vice President and Chief Information Officer |
147 Vanguard Funds Overseen | (1997–2005), and Member of the Executive Committee of Johnson & Johnson |
| (pharmaceuticals/consumer products); Director of the University Medical Center |
| at Princeton and Women’s Research and Education Institute. |
| |
André F. Perold | |
Born 1952 | Principal Occupation(s) During the Past Five Years: George Gund Professor of Finance |
Trustee since December 2004 | and Banking, Harvard Business School; Senior Associate Dean, Director of Faculty |
147 Vanguard Funds Overseen | Recruiting, and Chair of Finance Faculty, Harvard Business School; Director and Chairman |
| of UNX, Inc. (equities trading firm) since 2003; Chair of the Investment Committee of |
| HighVista Strategies LLC (private investment firm) since 2005; Director of registered |
| investment companies advised by Merrill Lynch Investment Managers and affiliates |
| (1985–2004), Genbel Securities Limited (South African financial services firm) |
| (1999–2003), Gensec Bank (1999–2003), Sanlam, Ltd. (South African insurance |
| company) (2001–2003), and Stockback, Inc. (credit card firm) (2000–2002). |
| |
Alfred M. Rankin, Jr. | |
Born 1941 | Principal Occupation(s) During the Past Five Years: Chairman, President, Chief Executive |
Trustee since January 1993 | Officer, and Director of NACCO Industries, Inc. (forklift trucks/housewares/lignite); Director |
147 Vanguard Funds Overseen | of Goodrich Corporation (industrial products/aircraft systems and services). |
| |
J. Lawrence Wilson | |
Born 1936 | Principal Occupation(s) During the Past Five Years: Retired Chairman and Chief Executive |
Trustee since April 1985 | Officer of Rohm and Haas Co. (chemicals); Director of Cummins Inc. (diesel engines) and |
147 Vanguard Funds Overseen | AmerisourceBergen Corp. (pharmaceutical distribution); Trustee of Vanderbilt University |
| and of Culver Educational Foundation. |
| |
Executive Officers1 | |
| |
Heidi Stam | |
Born 1956 | Principal Occupation(s) During the Past Five Years: Managing Director of The Vanguard |
Secretary since July 2005 | Group, Inc., since 2006; General Counsel of The Vanguard Group since 2005; Secretary of |
147 Vanguard Funds Overseen | The Vanguard Group, and of each of the investment companies served by The Vanguard |
| Group, since 2005; Principal of The Vanguard Group (1997–2006). |
| |
Thomas J. Higgins | |
Born 1957 | Principal Occupation(s) During the Past Five Years: Principal of The Vanguard Group, Inc.; |
Treasurer since July 1998 | Treasurer of each of the investment companies served by The Vanguard Group. |
147 Vanguard Funds Overseen | |
Vanguard Senior Management Team | | |
| | |
R. Gregory Barton | Kathleen C. Gubanich | Michael S. Miller |
Mortimer J. Buckley | Paul A. Heller | Ralph K. Packard |
James H. Gately | F. William McNabb, III | George U. Sauter |
| | |
Founder | | |
| | |
John C. Bogle | | |
Chairman and Chief Executive Officer, 1974–1996 | |
1 Officers of the funds are “interested persons” as defined in the Investment Company Act of 1940.
2 December 2002 for Vanguard Equity Income Fund, Vanguard Growth Equity Fund, the Vanguard Municipal Bond Funds, and the Vanguard State Tax-Exempt Funds.
More information about the trustees is in the Statement of Additional Information,available from The Vanguard Group.
P.O. Box 2600
Valley Forge, PA 19482-2600
Connect with Vanguard® > www.vanguard.com
Fund Information > 800-662-7447 | Vanguard, Admiral , Connect with Vanguard , and the ship |
| logo are trademarks of The Vanguard Group, Inc. |
Direct Investor Account Services > 800-662-2739 | |
| All other marks are the exclusive property of their |
Institutional Investor Services > 800-523-1036 | respective owners. |
| |
Text Telephone for the | |
Hearing-Impaired > 800-952-3335 | All comparative mutual fund data are from Lipper Inc. |
| or Morningstar, Inc., unless otherwise noted. |
| |
| |
| You can obtain a free copy of Vanguard’s proxy voting |
| guidelines by visiting our website, www.vanguard.com, |
This material may be used in conjunction | and searching for “proxy voting guidelines,” or by calling |
with the offering of shares of any Vanguard | Vanguard at 800-662-2739. They are also available from |
fund only if preceded or accompanied by | the SEC’s website, www.sec.gov. In addition, you may |
the fund’s current prospectus. | obtain a free report on how your fund voted the proxies for |
| securities it owned during the 12 months ended June 30. |
| To get the report, visit either www.vanguard.com |
| or www.sec.gov. |
| |
| You can review and copy information about your fund |
| at the SEC’s Public Reference Room in Washington, D.C. |
| To find out more about this public service, call the SEC |
| at 202-551-8090. Information about your fund is also |
| available on the SEC’s website, and you can receive |
| copies of this information, for a fee, by sending a |
| request in either of two ways: via e-mail addressed to |
| publicinfo@sec.gov or via regular mail addressed to the |
| Public Reference Section, Securities and Exchange |
| Commission, Washington, DC 20549-0102. |
| |
| |
| © 2007 The Vanguard Group, Inc. |
| All rights reserved. |
| Vanguard Marketing Corporation, Distributor. |
| |
| Q1112 052007 |
| |
Vanguard® Global Equity Fund |
| |
| |
| |
| |
> Semiannual Report | |
| |
| |
| |
| |
March 31, 2007 | |
| |
| |
| 
|
| |
| |
| |
| |
| |
| |
| |
| |
| |
> Vanguard Global Equity Fund returned 14.0% during the fiscal half-year, significantly outpacing both the average return of competing funds and the gain of its benchmark index.
> The fund’s U.S. holdings—like the fund itself—produced a return considerably higher than that of the broad U.S. stock market.
> Superior selection of U.S. stocks and an emphasis on emerging-market stocks were the largest contributors to the fund’s outperformance.
Contents | |
| |
Your Fund’s Total Returns | 1 |
Chairman’s Letter | 2 |
Advisors’ Report | 6 |
Fund Profile | 11 |
Performance Summary | 13 |
Financial Statements | 14 |
About Your Fund’s Expenses | 31 |
Trustees Approve Advisory Agreement | 33 |
Glossary | 34 |
Please note: The opinions expressed in this report are just that—informed opinions. They should not be considered promises or advice. Also, please keep in mind that the information and opinions cover the period through the date on the cover of this report. Of course, the risks of investing in your fund are spelled out in the prospectus.
Your Fund’s Total Returns
Six Months Ended March 31, 2007 | |
| Total |
| Returns |
Vanguard Global Equity Fund | 14.0% |
MSCI All Country World Index | 12.0 |
Average Global Fund1 | 11.2 |
Your Fund’s Performance at a Glance |
September 30, 2006–March 31, 2007 |
| | | Distributions Per Share |
| Starting | Ending | Income | Capital |
| Share Price | Share Price | Dividends | Gains |
Vanguard Global Equity Fund | $21.96 | $23.80 | $0.310 | $0.880 |
1 Derived from data provided by Lipper Inc.
1

Chairman’s Letter
Dear Shareholder,
Vanguard Global Equity Fund returned 14.0% during the six months ended March 31, significantly outpacing both its benchmark index and the average return of competing global funds. Your fund made the most of good markets domestically and internationally, benefiting from skillful stock selection in the United States and a tilt toward stocks in emerging markets.
The table on page 1 presents the total returns (capital changes plus reinvested distributions) for your fund and comparative measures.
Six-month stock market return reflected disparate market moods
The broad U.S. stock market stitched together a solid six-month return from patches of strength and weakness. Stock prices rallied at the start of the period, pulled back in February—in part, a reaction to the Chinese market’s swoon—then recovered in March, buoyed by generally benign economic and corporate-profit reports. Small-capitalization stocks outpaced large-caps.
International stocks—as measured by the Morgan Stanley Capital International (MSCI) All Country World Index ex USA—topped the returns of counterparts in the United States. The outperformance abroad continued a pattern that has existed for much of the past few years.
2
As the Fed sat tight, bonds produced coupon-like returns
The Federal Reserve Board remained offstage during the six months, keeping its target for the federal funds rate at 5.25% throughout the period. Despite some interim back-and-forth, longer-term bond yields finished the period pretty much where they started. With rates—and prices—more or less stable, bonds’ returns were consistent with their coupons.
The broad taxable bond market returned 2.8% for the six-month period. The municipal securities market posted a return of 1.9%. Money market instruments, one of the fixed income market’s bright spots in recent months, returned 2.5% for the half-year, as measured by the Citigroup 3-Month Treasury Bill Index.
Smart stock and market choices underpinned Global Equity’s return
During the past six months, the Global Equity Fund continued to benefit from the upswing in U.S. and international stock markets that has characterized much of the past few years. In addition, good investment choices helped the fund to provide returns over and above what the markets offered.
Excellent stock selection in the United States was the most important contributor to the fund’s strong relative performance. The fund’s U.S. holdings returned about 13%, compared with almost 8% for the U.S. stocks included in its market benchmark, the MSCI All Country World Index, and 9% for the broad U.S. market as measured by the Dow Jones Wilshire 5000 Index.
Market Barometer | | | |
| | | Total Returns |
| | Periods Ended March 31, 2007 |
| Six Months | One Year | Five Years1 |
Stocks | | | |
MSCI All Country World Index ex USA (International) | 15.5% | 20.3% | 17.4% |
Russell 1000 Index (Large-caps) | 8.2 | 11.8 | 6.9 |
Russell 2000 Index (Small-caps) | 11.0 | 5.9 | 10.9 |
Dow Jones Wilshire 5000 Index (Entire Market) | 8.9 | 11.4 | 7.8 |
| | | |
Bonds | | | |
Lehman Aggregate Bond Index (Broad Taxable Market) | 2.8% | 6.6% | 5.4% |
Lehman Municipal Bond Index | 1.9 | 5.4 | 5.5 |
Citigroup 3-Month Treasury Bill Index | 2.5 | 5.0 | 2.5 |
| | | |
CPI | | | |
Consumer Price Index | 1.2% | 2.8% | 2.8% |
1 Annualized.
3
The other major factor that helped the Global Equity Fund to surpass its benchmark was its exposure to emerging-market stocks. Over the past few years, the fund has shifted some assets from the developed world to emerging markets, which returned a collective 20% during the past six months. Among these markets, the five that contributed most to return in the period were Turkey, Spain, South Korea, South Africa, and the Philippines.
Steel-industry stocks were among the top performers
In both emerging and developed markets, the fund enjoyed notable success with stock selections in the materials and industrials sectors.
In the materials sector, the stocks of steel companies were significant contributors to Global Equity’s return. These included Nucor in the United States, POSCO in South Korea, JFE Holdings in Japan, and Eregli Demir ve Celik Fabrikalari in Turkey. Top contributors in the industrials sector included Terex, a U.S.-based machinery maker, and Deutsche Lufthansa airline.
Telecommunications services and energy companies also boosted the fund’s return. China Mobile’s 29% gain, and the fund’s sizable holding of the stock compared with the index, made it a top contributor to telecommunication returns.
Annualized Expense Ratios1 | | |
Your fund compared with its peer group | | |
| | Average |
| | Global |
| Fund | Fund |
Global Equity Fund | 0.66% | 1.56% |
1 Fund expense ratios reflect the six months ended March 31, 2007. Peer-group expense ratio is derived from data provided by Lipper Inc. and captures information through year-end 2006.
4
International stocks offer a wider world of opportunities
The U.S. market represents only about 45% of the global market for stocks—meaning that a sizable set of investment opportunities lies beyond the U.S. borders. The Global Equity Fund, whose three advisors search for stocks with high earnings potential almost anywhere in the world, gives you the opportunity to benefit from those opportunities. The fund’s long-term performance is a testament to the portfolio managers’ stock-picking skills, as you can see in the Performance Summary on page 13. In addition, the fund’s combination of U.S. and international investments offers diversification beyond what an all-U.S. portfolio could provide.
U.S. and international stocks and fixed income securities represent the basic building blocks of a sensible long-term portfolio. We advise investors to combine these different asset classes in proportions that reflect their own financial circumstances and goals. The Global Equity Fund can be a useful part of such a balanced investment plan.
Thank you for entrusting your assets to Vanguard.
Sincerely,

John J. Brennan
Chairman and Chief Executive Officer
April 19, 2007
5
Advisors’ Report
The Global Equity Fund returned 14.0% for the fiscal half-year ended March 31, 2007, reflecting the combined results of your fund’s independent investment advisors. The use of multiple advisors provides exposure to distinct, yet complementary, investment approaches to a particular market segment, enhancing the diversification of your fund.
The advisors, their percentage of fund assets managed, and a brief description of their investment strategies are presented in the table below. The advisors have also prepared a discussion of the investment opportunities in their markets and of how their portfolio positioning reflects this assessment.
Acadian Asset Management, Inc.
Portfolio Managers:
John Chisholm, CFA, Executive Vice
President and Co-Chief Investment Officer
Ronald Frashure, CFA, President and
Co-Chief Investment Officer
Brian Wolahan, CFA, Senior Vice President
and Co-Director of Research
Despite the volatility seen in late February and into early March, global equity markets were in firmly positive territory for the six months ended March 31, 2007, demonstrating continued resilience in light of high energy prices, inflationary pressures, and other global concerns. As markets return to normal levels of volatility,
Vanguard Global Equity Fund Investment Advisors | |
| | | |
| Fund Assets Managed | | |
Investment Advisor | % | $ Million | | Investment Strategy |
Acadian Asset Management, Inc. | 50 | $2,902 | | A quantitative, active, bottom-up investment process |
| | | | that combines stock and country/sector valuation to |
| | | | arrive at a return forecast for each of more than |
| | | | 25,000 securities in the global universe. |
Marathon Asset Management LLP | 26 | 1,494 | | A long-term and contrarian investment philosophy and |
| | | | process with a focus on industry capital cycle analysis |
| | | | and in-depth management assessment. |
AllianceBernstein L.P. | 23 | 1,332 | | A fundamentally based, research-driven approach, |
| | | | focused on finding companies whose long-term |
| | | | earnings power exceeds the level implied by their |
| | | | current stock price. Proprietary quantitative tools aid |
| | | | risk control and portfolio construction. |
Cash investments1 | 1 | 72 | | — |
| | | | | |
1 These short-term reserves are invested by Vanguard in equity index products to simulate investment in stocks. Each advisor may also maintain a modest cash position.
6
rising from the unusually low levels we have seen over the past several years, a wider range of valuations should reemerge, yielding more opportunities for active stock selection.
The portfolio focused on attractively valued stocks that appeared likely to rise in price based on earnings data, price characteristics, and quality. Our key overweightings, based on bottom-up stock selection, included emerging markets Korea, Taiwan, Turkey, and China. We also overweighted Spain, the Netherlands, and the United States, compared with the benchmark. Japan, the United Kingdom, Switzerland, and Canada were underweighted. Important active sector weightings included materials, financials, and telecommunication services.
Stock selection in the United States was the most significant contributor to active return for the portfolio. Selections in the materials and energy sectors delivered strong results, as commodity prices remained elevated over the period. Our focus on U.S. capital equipment stocks was also rewarded. Although capital spending and manufacturing softened during the period, these companies were able to profit from continued government contracts and firmer exports in the wake of a declining U.S. dollar.
The information technology sector posed a challenge for portfolio performance over the period, with many emerging Asian exporters suffering amid moderating demand for electronics components. Stock selection in some key European markets was also a drag on performance, particularly in the financials sector. Lending margins have faced pressure as the spread between short- and long-term rates has narrowed. In this environment, the European Central Bank raised rates three times during the six-month period.
Overall, our view is that global equity markets are likely to see muted returns in 2007 as several key issues remain in flux, including the impact of recent interest rate increases on key economies, the ability of the U.S. housing market to achieve a soft landing, the direction of oil prices, renewed inflation concerns in the United States, and the likelihood of ongoing geopolitical instability. Most markets will see some earnings growth, but it will be moderate compared with that of recent years.
Marathon Asset Management LLP
Portfolio Managers:
Jeremy Hosking, Investment Director
Neil M. Ostrer, Investment Director
William J. Arah, Investment Director
The geographical structure of the portfolio remains similar to that delineated in previous reports.
Looking forward, we expect to continue to gradually harvest some of the fund’s earlier investments in Southeast Asia and South Africa. We are comfortable with the majority of the fund’s holdings
7
in these regions, particularly with those where the insiders are trying to increase their ownership, but if the strong recent price appreciation continues, we will probably resume the process of reducing our exposure to these areas. The fund’s Japanese exposure is strongly biased away from what has performed well in Japan in recent years, namely cyclicals and momentum issues, and is significantly overweighted in larger-capitalization, cash-generative companies with a domestic bias and strong balance sheets.
In Europe, it is difficult to call an end to the private equity-driven boom in mergers and acquisitions, which is having a particularly positive effect on the valuation of mid- and small-cap European names in the fund. Notwithstanding the recent small increases in European interest rates, the stars are aligned for this boom to continue as companies, private equity, and infrastructure funds are all flush with cash. To the extent that the fund’s holdings continue to benefit from this takeover activity and/or there is further support for European cyclicals, this would provide further opportunity to switch into larger, more defensive businesses that offer more predictable cash flows and whose valuations lack any takeover premia.
In the United States, equities have been in a bull market for 31/2 years, driven by high profitability and record levels of free cash flow (FCF). In order to avoid what may be an excessive use of the FCF measure, firms that are sacrificing near-term profitability or cash flows to improve the long-term value creation potential of their organizations are becoming increasingly attractive. This is almost the opposite of the direction currently applauded by the markets (and private equity groups), and a reversal of the approach that Marathon has taken historically. However, those earlier investment decisions were often made against a background of modest valuation, low profitability, and a clear corporate tendency (outside a few sectors) toward corporate overinvestment. Such circumstances are no longer present today; indeed underinvestment is the new corporate fashion.
AllianceBernstein L.P.
Portfolio Managers:
Sharon E. Fay, CFA, Executive Vice
President and Chief Investment
Officer–Global Value Equities
Kevin F. Simms, Co-Chief Investment
Officer–International Value Equities and
Director of Research–Global and
International Value Equities
Henry S. D’Auria, CFA, Co-Chief Investment
Officer–International Value Equities and
Chief Investment Officer–Emerging
Markets
Global equity markets rallied strongly through the first several months of the period amid a supportive economic outlook, robust corporate earnings, and booming mergers and acquisitions (M&A) activity. In late February and early March, though, global markets plunged following a selloff in local Chinese equities and
8
worries about rising defaults on subprime mortgages in the United States. By the end of March, however, the markets had recovered as investors refocused on strong fundamentals and the continued M&A surge. For the period from October 1, 2006, through March 31, 2007, the MSCI All Country World Index returned 12.0% in U.S. dollars.
Our portfolio benefited from positive stock selection across most sectors, particularly materials. Steel companies—including JFE Holdings, Arcelor Mittal, and Usiminas—benefited from consolidation in the steel and other metals industries, along with continued strong demand. Partially offsetting these positives was stock selection in the financials and industrials sectors. Concerns over earnings and future growth hurt a number of financials holdings, including ING Groep and Sumitomo Mitsui Financial Group, while an indiscriminate selloff in reaction to the turmoil in the U.S. subprime mortgage sector hurt the Federal Home Loan Mortgage Corporation.
As value investors, we use our unique combination of fundamental and quantitative research to exploit the well-documented tendency of investors to overreact to short-term events. When the outlook for a company’s earnings seems poor, investors frequently extrapolate this weakness into the future and price securities accordingly. Our ability to determine whether a company’s strategy is likely to succeed and our willingness to act on views that are different from the consensus are crucial to our success.
Thus, we took advantage of the general decline in share prices to add exposure to companies whose valuations were, in our view, unjustly punished by the indiscriminate selloff. We also accelerated planned purchases of shares in other companies that our research had already identified as potentially attractive value opportunities. An example is Mitsubishi Chemical Holdings, which has been gradually reducing its exposure to pure cyclical commodities, such as ethylene, in favor of more sophisticated, higher-margin products.
We trimmed several stocks that have done well and invested in more attractively valued opportunities, such as German insurance company Allianz. We believe the company’s depressed share price doesn’t reflect the significant opportunity for cost savings in its German and Italian businesses.
However, these changes to the portfolio’s positioning occurred at the margin. Investors appear to expect that the current high levels of corporate profitability across almost all regions and sectors will be maintained; as a result, they are not differentiating between stocks with varying levels of risk. While volatility spiked briefly in February and March, stocks generally traded up and down together. Valuation spreads, therefore, remain tightly compressed and opportunities to purchase stocks trading at deep discounts compared with their peers remain somewhat limited.
9
Thus, the portfolio’s largest active positions remain similar to last quarter. Financials stocks continue to represent the single largest exposure, but our reasons for owning them vary by industry and geographic location. We continue to hold significant stakes in some oil companies, believing that strong demand, together with only gradual increases in supply, will keep oil prices elevated for longer than most investors expect. Our energy sector holdings are focused on companies with extensive reserves, which are less exposed to increases in exploration and production costs. We are also maintaining significant positions in several industrials and information technology companies.
10
Fund Profile
As of March 31, 2007
Portfolio Characteristics | | |
| | Comparative |
| Fund | Index1 |
Number of Stocks | 646 | 2,731 |
Turnover Rate | 70%2 | — |
Expense Ratio | 0.66%2 | — |
Short-Term Reserves | 1% | — |
Sector Diversification (% of portfolio) | |
| | Comparative |
| Fund | Index1 |
Consumer Discretionary | 12% | 11% |
Consumer Staples | 6 | 8 |
Energy | 10 | 10 |
Financials | 26 | 26 |
Health Care | 7 | 8 |
Industrials | 11 | 11 |
Information Technology | 8 | 10 |
Materials | 10 | 7 |
Telecommunication Services | 6 | 5 |
Utilities | 3 | 4 |
Short-Term Reserves | 1% | — |
Volatility Measures3 | |
| Fund Versus |
| Comparative Index1 |
R-Squared | 0.95 |
Beta | 1.16 |
Ten Largest Holdings4 (% of total net assets) |
| | |
BNP Paribas SA | diversified | |
| banks | 2.0% |
ING Groep NV | diversified | |
| financial services | 1.5 |
Pfizer Inc. | pharmaceuticals | 1.5 |
Lukoil Sponsored ADR | integrated | |
| oil and gas | 1.5 |
Royal Dutch Shell | integrated | |
PLC | oil and gas | 1.3 |
The Kroger Co. | food retail | 1.2 |
E.On AG | electric utilities | 1.1 |
Societe Generale | | |
Class A | diversified banks | 1.1 |
JFE Holdings, Inc. | steel | 1.1 |
AstraZeneca Group PLC | pharmaceuticals | 1.1 |
Top Ten | | 13.4% |
Allocation by Region (% of portfolio)

1 MSCI All Country World Index.
2 Annualized.
3 For an explanation of R-squared, beta, and other terms used here, see the Glossary on page 34.
4 “Ten Largest Holdings” excludes any temporary cash investments and equity index products.
11
Market Diversification (% of portfolio) |
| | Comparative |
| Fund1 | Index2 |
Europe | | |
United Kingdom | 9% | 10% |
France | 7 | 4 |
Germany | 6 | 3 |
Netherlands | 3 | 2 |
Italy | 2 | 2 |
Spain | 2 | 2 |
Sweden | 1 | 1 |
Switzerland | 1 | 3 |
Belgium | 1 | 1 |
Finland | 1 | 1 |
Subtotal | 33% | 29% |
Pacific | | |
Japan | 9% | 10% |
Australia | 2 | 3 |
Hong Kong | 2 | 1 |
Subtotal | 13% | 14% |
Emerging Markets | | |
South Korea | 3 | 1 |
Taiwan | 2 | 1 |
Russia | 2 | 1 |
Turkey | 2 | 0 |
South Africa | 1 | 1 |
Philippines | 1 | 0 |
Brazil | 1 | 1 |
Singapore | 1 | 0 |
China | 0 | 1 |
India | 0 | 1 |
Mexico | 0 | 1 |
Other Emerging Markets | 0 | 2 |
Subtotal | 13% | 10% |
North America | | |
United States | 37% | 44% |
Canada | 3 | 3 |
Subtotal | 40% | 47% |
Short-Term Reserves | 1% | — |
1 Country percentages exclude currency contracts held by the fund.
2 MSCI All Country World Index.
See page 34 for a glossary of investment terms.
12
Performance Summary
All of the returns in this report represent past performance, which is not a guarantee of future results that may be achieved by the fund. (Current performance may be lower or higher than the performance data cited. For performance data current to the most recent month-end, visit our website at www.vanguard.com/performance.) Note, too, that both investment returns and principal value can fluctuate widely, so an investor’s shares, when sold, could be worth more or less than their original cost. The returns shown do not reflect taxes that a shareholder would pay on fund distributions or on the sale of fund shares.
Fiscal-Year Total Returns (%): September 30, 1996–March 31, 2007
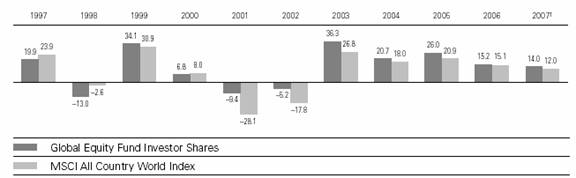
Average Annual Total Returns: Periods Ended March 31, 2007 |
| | | | |
| Inception Date | One Year | Five Years | Ten Years |
Global Equity Fund | 8/14/1995 | 18.22% | 16.76% | 12.75% |
1 Six months ended March 31, 2007.
Note: See Financial Highlights table on page 26 for dividend and capital gains information.
13
Financial Statements (unaudited)
Statement of Net Assets
As of March 31, 2007
The fund provides a complete list of its holdings four times in each fiscal year, at the quarter-ends. For the second and fourth fiscal quarters, the lists appear in the fund’s semiannual and annual reports to shareholders. For the first and third fiscal quarters, the fund files the lists with the Securities and Exchange Commission on Form N-Q. Shareholders can look up the fund’s Forms N-Q on the SEC’s website at www.sec.gov. Forms N-Q may also be reviewed and copied at the SEC’s Public Reference Room (see the back cover of this report for further information).
| | | Market |
| | | Value• |
| | Shares | ($000) |
Common Stocks (97.5%)1 | | |
Australia (1.9%) | | |
| QBE Insurance Group Ltd. | 1,164,924 | 29,625 |
| Coles Group Ltd. | 766,823 | 10,052 |
| Australia & New Zealand | | |
| Bank Group Ltd. | 418,132 | 10,018 |
| Zinifex Ltd. | 689,100 | 8,757 |
| Macquarie Airports Group | 2,142,137 | 6,897 |
| Leighton Holdings Ltd. | 245,444 | 6,637 |
| Macquarie | | |
| Infrastucture Group | 1,855,100 | 5,743 |
| Commonwealth | | |
| Bank of Australia | 138,792 | 5,627 |
| Suncorp-Metway Ltd. | 313,548 | 5,257 |
| Santos Ltd. | 598,245 | 4,874 |
| Tattersall’s Ltd. | 1,015,692 | 4,220 |
| Caltex Australia Ltd. | 217,383 | 4,176 |
| Orica Ltd. | 98,671 | 2,017 |
| Iluka Resources Ltd. | 420,516 | 2,000 |
| Amcor Ltd. | 302,310 | 1,840 |
| Alumina Ltd. | 204,000 | 1,204 |
| Rinker Group Ltd. | 65,098 | 947 |
| Rio Tinto Ltd. | 9,501 | 604 |
* | Suncorp-Metway | | |
| Ltd. Rights 4/20/07 | 41,806 | 179 |
| | | 110,674 |
Austria (0.1%) | | |
| Voestalpine AG | 51,176 | 3,700 |
| | | |
Belgium (0.9%) | | |
| Fortis (Amsterdam Shares) | 391,309 | 17,800 |
| Fortis | 310,100 | 14,132 |
| KBC Bank & | | |
| Verzekerings Holding | 86,783 | 10,769 |
| Dexia | 160,851 | 4,790 |
| Delhaize Group | 18,583 | 1,709 |
| InBev | 9,037 | 653 |
| | | 49,853 |
Brazil (0.6%) | | |
| Gerdau SA ADR | 451,350 | 8,183 |
| Usiminas-Usinas | | |
| Siderugicas de Minas | | |
| Gerais SA Pfd. | 165,300 | 8,061 |
| Uniao de Bancos | | |
| Brasileiros SA GDR | 79,500 | 6,953 |
| Petroleo Brasileiro SA Pfd. | 229,900 | 5,185 |
| Banco do Brasil SA | 137,800 | 4,496 |
| | | 32,878 |
Canada (3.3%) | | |
| ^Canadian Imperial | | |
| Bank of Commerce | 305,808 | 26,558 |
| Rogers Communications, | | |
| Inc. Class B | 735,800 | 24,103 |
| ^Bank of Nova | | |
| Scotia, Halifax | 453,000 | 20,886 |
* | Bombardier Inc. Class B | 4,268,200 | 17,241 |
| Imperial Oil Ltd. | 360,300 | 13,367 |
| Teck Cominco Ltd. Class B | 180,600 | 12,600 |
| EnCana Corp. | 220,900 | 11,182 |
| Alcan Inc. | 158,800 | 8,284 |
* | Nortel Networks Corp. | 298,833 | 7,187 |
| Nexen Inc. | 110,833 | 6,794 |
| Telus Corp.– | | |
| Non Voting Shares | 130,800 | 6,533 |
| Methanex Corp. | 227,200 | 5,067 |
* | ACE Aviation Holdings, Inc. | 174,100 | 4,597 |
| BCE Inc. | 142,465 | 4,032 |
| ING Canada Inc. | 84,063 | 3,772 |
| IPSCO, Inc. | 27,639 | 3,631 |
| Gerdau AmeriSteel Corp. | 293,000 | 3,474 |
* | Lundin Mining Corp. | 270,000 | 3,007 |
| Onex Corp. | 66,800 | 1,856 |
| ^Abitibi-Consolidated Inc. | 660,200 | 1,843 |
| Novelis Inc. | 31,760 | 1,408 |
| Biovail Corp. | 44,800 | 981 |
* | Fraser Papers Inc. | 198,800 | 944 |
* | LionOre Mining | | |
| International. Ltd. | 49,800 | 830 |
14
| | Market |
| | Value• |
| Shares | ($000) |
Rothmans Inc. | 5,600 | 100 |
Bell Aliant Regional | | |
Communications | | |
Income Fund | 630 | 16 |
| | 190,293 |
China (0.2%) | | |
China Petroleum | | |
& Chemical Corp. | 11,332,000 | 9,564 |
China Telecom Corp. Ltd. | 5,688,000 | 2,783 |
Tsingtao Brewery Co., Ltd. | 1,548,000 | 2,611 |
| | 14,958 |
Denmark (0.2%) | | |
* William Demant A/S | 65,300 | 5,748 |
* Vestas Wind Systems A/S | 95,699 | 5,316 |
Coloplast A/S B Shares | 35,400 | 2,987 |
* Topdanmark A/S | 3,925 | 754 |
| | 14,805 |
Finland (0.5%) | | |
Sampo Oyj A Shares | 242,900 | 7,376 |
^Metso Oyj | 139,900 | 7,371 |
Nokia Oyj | 296,700 | 6,813 |
^Outokumpu Oyj A Shares | 178,012 | 6,106 |
^TietoEnator Oyj B Shares | 78,020 | 2,262 |
| | 29,928 |
France (6.7%) | | |
BNP Paribas SA | 1,103,266 | 114,990 |
Societe Generale Class A | 377,253 | 65,001 |
Sanofi-Aventis | 245,780 | 21,311 |
Renault SA | 179,200 | 20,928 |
Vivendi SA | 474,831 | 19,284 |
Total SA | 268,700 | 18,706 |
Credit Agricole SA | 465,839 | 18,144 |
Air France | 383,704 | 17,488 |
Compagnie Generale | | |
des Etablissements | | |
Michelin SA | 136,800 | 15,072 |
Vinci SA | 75,363 | 11,710 |
Bouygues SA | 131,430 | 10,145 |
Cap Gemini SA | 124,669 | 9,456 |
Lagardere S.C.A. | 89,523 | 6,917 |
Alcatel-Lucent ADR | 572,560 | 6,768 |
AXA | 139,000 | 5,891 |
Carrefour SA | 70,208 | 5,128 |
Groupe Danone | 29,600 | 4,826 |
Thales SA | 79,700 | 4,631 |
SCOR SA | 134,840 | 3,629 |
Alcatel-Lucent | 212,600 | 2,503 |
Cie. de St. Gobain SA | 23,700 | 2,319 |
* Atos Origin SA | 26,400 | 1,771 |
| | 386,618 |
Germany (5.4%) | | |
E.On AG | 491,026 | 66,610 |
Allianz AG | 284,554 | 58,012 |
^Deutsche Lufthansa AG | 1,274,321 | 34,502 |
BASF AG | 225,200 | 25,252 |
Muenchener | | |
Rueckversicherungs– | | |
Gesellschaft AG | | |
(Registered) | 144,300 | 24,350 |
Man AG | 170,252 | 19,786 |
Bayerische | | |
Motoren Werke AG | 331,273 | 19,474 |
ThyssenKrupp AG | 299,795 | 14,829 |
Deutsche Bank AG | 107,953 | 14,485 |
^DaimlerChrysler AG | | |
(Registered) | 76,700 | 6,253 |
Fresenius Medical Care AG | 40,900 | 5,938 |
Salzgitter AG | 39,157 | 5,715 |
TUI AG | 213,200 | 5,252 |
Porsche AG | 3,146 | 4,801 |
Beiersdorf AG | 49,025 | 3,346 |
Deutsche Post AG | 82,200 | 2,473 |
Deutsche Boerse AG | 8,506 | 1,942 |
Continental AG | 11,323 | 1,458 |
Fresenius Medical Care | | |
AG ADR | 29,244 | 1,423 |
Heidelberger | | |
Druckmaschinen AG | 15,765 | 721 |
| | 316,622 |
Greece (0.1%) | | |
Public Power Corp. | 244,020 | 5,959 |
| | |
Hong Kong (1.7%) | | |
Jardine Matheson | | |
Holdings Ltd. | 965,102 | 20,396 |
New World | | |
Development Co., Ltd. | 7,550,300 | 17,051 |
Jardine Strategic | | |
Holdings Ltd. | 1,233,900 | 15,844 |
Television Broadcasts Ltd. | 1,068,000 | 6,664 |
Hong Kong Aircraft | | |
& Engineering Co., Ltd. | 430,400 | 6,548 |
Henderson Land | | |
Development Co. Ltd. | 1,117,000 | 6,512 |
China Netcom Group Corp. | | |
Hong Kong Ltd. | 2,273,500 | 5,909 |
First Pacific Co. Ltd. | 6,988,000 | 4,258 |
Wheelock and Co. Ltd. | 1,883,000 | 4,224 |
Hong Kong and Shanghai | | |
Hotels Ltd. | 2,571,128 | 4,055 |
SmarTone | | |
Telecommunications Ltd. | 2,082,790 | 2,399 |
Sino Land Co. | 952,000 | 2,044 |
Mandarin Oriental | | |
International Ltd. | 881,690 | 1,658 |
Next Media Ltd. | 4,192,000 | 1,440 |
I-Cable | | |
Communications Ltd. | 5,207,000 | 1,103 |
Silver Grant International | | |
Industries Ltd. | 1,752,000 | 452 |
15
| | | Market |
| | | Value• |
| | Shares | ($000) |
| Asia Satellite | | |
| Telecommunications | | |
| Holdings Ltd. | 148,500 | 334 |
| Kerry Properties Ltd. | 388 | 2 |
| | | 100,893 |
Hungary (0.1%) | | |
| Mol Hungarian | | |
| Oil and Gas Nyrt. | 44,000 | 5,031 |
| OTP Bank Rt. | 6,952 | 315 |
| | | 5,346 |
India (0.1%) | | |
| State Bank of India GDR | 66,230 | 4,160 |
| | | |
Indonesia (0.2%) | | |
| PT Semen Gresik Tbk | 1,155,000 | 5,017 |
* | PT Bank Indonesia Tbk | 66,769,036 | 4,008 |
| PT Indofood Sukses | | |
| Makmur Tbk | 10,823,000 | 1,796 |
| PT Matahari Putra | | |
| Prima Tbk | 19,851,300 | 1,498 |
| PT Gudang Garam Tbk | 1,149,900 | 1,328 |
* | PT Bank Pan Indonesia Tbk | | |
| Warrants Exp. 7/10/09 | 13,353,807 | 278 |
| PT Citra Marga | | |
| Nusaphala Persada Tbk | 774,000 | 167 |
* | PT Matahari Putra Prima | | |
| Warrants Exp. 7/21/10 | 3,859,975 | 54 |
* | PT Mulia Industrindo Tbk | 921,000 | 15 |
| | | 14,161 |
Ireland (0.1%) | | |
| Independent News | | |
| & Media PLC | 1,063,718 | 4,817 |
| Fyffes PLC | 512,200 | 773 |
* | Total Produce PLC | 512,200 | 566 |
* | Blackrock International | | |
| Land PLC | 462,500 | 309 |
| | | 6,465 |
Israel (0.2%) | | |
| Bank Hapoalim Ltd. | 2,147,071 | 10,295 |
| | | |
Italy (2.4%) | | |
* | Fiat SpA | 1,941,024 | 49,028 |
| Enel SpA | 4,067,231 | 43,405 |
| Eni SpA | 496,400 | 16,097 |
| Saipem SpA | 256,000 | 7,461 |
| Luxottica Group SpA ADR | 179,800 | 5,727 |
| Unicredito Italiano SpA | 528,100 | 5,011 |
| Fondiaria—Sai SpA | 98,100 | 4,497 |
* | Banca Popolare Italiana | 186,081 | 2,904 |
| Seat Pagine Gialle SpA | 3,936,100 | 2,421 |
| Fondiaria—Sai SpA RNC | 18,000 | 652 |
| | | | |
* | Natuzzi SpA-Sponsored ADR | 50,700 | 414 |
| | | 137,617 |
Japan (8.3%) | | |
JFE Holdings, Inc. | 1,093,300 | 64,428 |
Toyota Motor Corp. | 491,400 | 31,407 |
Central Japan Railway Co. | 2,227 | 25,235 |
Sumitomo Mitsui | | |
Financial Group, Inc. | 1,935 | 17,484 |
Tokyo Electric Power Co. | 477,500 | 16,267 |
Orix Corp. | 55,320 | 14,325 |
Sharp Corp. | 720,000 | 13,818 |
NTT Data Corp. | 2,479 | 12,527 |
Mitsui & Co., Ltd. | 656,000 | 12,321 |
Sumco Corp. | 293,700 | 12,135 |
Canon, Inc. | 223,300 | 11,966 |
Japan Tobacco, Inc. | 2,248 | 10,998 |
KDDI Corp. | 1,337 | 10,615 |
Mitsubishi Chemical | | |
Holdings Corp. | 1,110,500 | 9,419 |
East Japan Railway Co. | 1,160 | 9,004 |
Mitsui OSK Lines Ltd. | 771,000 | 8,520 |
Leopalace21 Corp. | 197,700 | 6,515 |
Fuji Photo Film Co., Ltd. | 159,000 | 6,491 |
Sumitomo Metal Mining Co. | 335,000 | 6,429 |
Mitsubishi Electric Corp. | 599,000 | 6,142 |
Nippon Telegraph | | |
and Telephone Corp. | 1,023 | 5,393 |
Kao Corp. | 177,000 | 5,165 |
Nippon Mining Holdings Inc. | 598,000 | 5,115 |
Tokyo Gas Co., Ltd. | 898,000 | 4,981 |
West Japan Railway Co. | 1,010 | 4,646 |
* ^Elpida Memory Inc. | 115,300 | 4,448 |
Mitsui Chemicals, Inc. | 488,000 | 4,244 |
Kirin Brewery Co., Ltd. | 284,000 | 4,091 |
Aozora Bank, Ltd. | 1,037,000 | 3,750 |
Takeda Pharmaceutical | | |
Co. Ltd. | 56,900 | 3,718 |
Suzuki Motor Corp. | 138,200 | 3,569 |
Sony Corp. | 70,100 | 3,536 |
NTT DoCoMo, Inc. | 1,883 | 3,462 |
FamilyMart Co., Ltd. | 114,900 | 3,183 |
Secom Co., Ltd. | 68,500 | 3,159 |
Sekisui House Ltd. | 200,000 | 3,099 |
Tanabe Seiyaku Co., Ltd. | 212,000 | 2,883 |
Matsushita Electric | | |
Works, Ltd. | 251,000 | 2,862 |
Seven and I Holdings Co., Ltd. | 91,700 | 2,774 |
TDK Corp. | 32,100 | 2,774 |
Sumitomo Heavy | | |
Industries Ltd. | 277,000 | 2,744 |
Sumitomo Trust | | |
& Banking Co., Ltd. | 264,000 | 2,733 |
Nippon Sanso Corp. | 290,000 | 2,608 |
Yamato Holdings Co., Ltd. | 159,000 | 2,554 |
Mizuho Financial Group, Inc. | 398 | 2,552 |
Namco Bandai Holdings Inc. | 160,650 | 2,493 |
Komatsu Ltd. | 119,000 | 2,487 |
Hitachi Ltd. | 319,000 | 2,475 |
16
| | Market |
| | Value• |
| Shares | ($000) |
Kawasaki Heavy | | |
Industries Ltd. | 587,000 | 2,471 |
JS Group Corp. | 114,000 | 2,461 |
Rengo Co., Ltd. | 434,000 | 2,452 |
Nippon Suisan Kaisha Ltd. | 372,000 | 2,421 |
Sumitomo Electric | | |
Industries Ltd. | 158,000 | 2,389 |
Daiwa Securities Group Inc. | 196,000 | 2,351 |
Sumitomo Forestry Co. | 218,000 | 2,292 |
Honda Motor Co., Ltd. | 65,100 | 2,264 |
Sompo Japan Insurance Inc. | 181,000 | 2,243 |
Bank of Fukuoka, Ltd. | 278,000 | 2,214 |
Nintendo Co. | 7,600 | 2,201 |
Mitsubishi Corp. | 94,000 | 2,166 |
Ricoh Co. | 95,000 | 2,128 |
Dai-Nippon Printing Co., Ltd. | 130,000 | 2,036 |
Nippon Oil Corp. | 241,000 | 1,942 |
Shinsei Bank, Ltd. | 399,000 | 1,904 |
Mitsubishi UFJ | | |
Financial Group | 169 | 1,900 |
Astellas Pharma Inc. | 42,800 | 1,836 |
Nippon Meat Packers, Inc. | 148,000 | 1,802 |
Ajinomoto Co., Inc. | 156,000 | 1,788 |
Alfresa Holdings Corp. | 28,200 | 1,786 |
Onward Kashiyama Co., Ltd. | 126,000 | 1,744 |
Bank of Yokohama Ltd. | 233,000 | 1,729 |
Bridgestone Corp. | 86,000 | 1,706 |
NEC Corp. | 308,000 | 1,643 |
Kinden Corp. | 164,000 | 1,466 |
Shiseido Co., Ltd. | 72,000 | 1,457 |
Chiba Bank Ltd. | 166,000 | 1,456 |
Ebara Corp. | 304,000 | 1,431 |
Brother Industries Ltd. | 103,000 | 1,388 |
Fuji Heavy Industries Ltd. | 268,000 | 1,385 |
Toyo Seikan Kaisha Ltd. | 68,000 | 1,363 |
Toppan Forms Co., Ltd. | 101,600 | 1,287 |
NGK Spark Plug Co. | 69,000 | 1,285 |
Ryosan Co., Ltd. | 48,500 | 1,242 |
Sankyo Co., Ltd. | 26,400 | 1,155 |
Yamatake Corp. | 50,000 | 1,155 |
Promise Co., Ltd. | 30,350 | 1,137 |
Marui Co., Ltd. | 91,600 | 1,116 |
Nippon Steel Corp. | 159,000 | 1,114 |
Shimizu Corp. | 176,000 | 1,074 |
Yamaha Motor Co., Ltd. | 33,000 | 920 |
Tokyo Ohka Kogyo Co., Ltd. | 35,400 | 883 |
Isetan Co. | 49,000 | 850 |
Nisshinbo Industries, Inc. | 63,000 | 785 |
Matsushita Electric | | |
Industrial Co., Ltd. | 28,000 | 563 |
Ohbayashi Corp. | 81,000 | 520 |
Daifuku Co., Ltd. | 36,000 | 519 |
Noritake Co., Ltd. | 81,000 | 402 |
Inabata & Co., Ltd. | 49,000 | 392 |
Fujitsu Fronttec Ltd. | 32,700 | 274 |
Seiko Epson Corp. | 2,500 | 73 |
| | 482,105 |
Malaysia (0.5%) | | |
| Bumiputra–Commerce | | |
| Holdings Bhd. | 3,107,619 | 8,935 |
| Resorts World Bhd. | 1,742,000 | 8,646 |
| Sime Darby Bhd. | 1,446,100 | 3,379 |
| British American | | |
| Tobacco Bhd. | 165,000 | 2,194 |
| Kumpulan Guthrie Bhd. | 965,000 | 1,439 |
* | Multi-Purpose | | |
| Holdings Bhd. | 1,855,000 | 1,241 |
* | Malaysian Airline | | |
| System Bhd. | 550,000 | 915 |
* | Multi-Purpose Holdings Bhd. | |
| Warrants Exp. 2/26/09 | 254,000 | 117 |
| | | 26,866 |
Mexico (0.1%) | | |
| America Movil SA | | |
| de CV Series L ADR | 46,200 | 2,208 |
| Telefonos de Mexico | | |
| SA Class L ADR | 32,000 | 1,069 |
| | | 3,277 |
Netherlands (3.2%) | | |
| ING Groep NV | 2,085,626 | 87,926 |
| Arcelor Mittal | 411,842 | 21,983 |
| Koninklijke KPN NV | 1,382,400 | 21,464 |
| Heineken NV | 389,298 | 20,283 |
| European Aeronautic | | |
| Defence and Space Co. | 463,200 | 14,348 |
| Koninklijke (Royal) | | |
| Philips Electronics NV | 134,171 | 5,096 |
* | Koninklijke Ahold NV | 422,299 | 4,941 |
| Koninklijke Boskalis | | |
| Westminster NV | 39,637 | 3,933 |
| Wolters Kluwer NV | 107,824 | 3,223 |
| | | 183,197 |
New Zealand (0.0%) | | |
| Telecom Corp. of | | |
| New Zealand Ltd. | 468,517 | 1,595 |
| PGG Wrightson Ltd. | 58,578 | 62 |
| | | 1,657 |
Norway (0.1%) | | |
| ^DnB NOR ASA | 216,900 | 3,035 |
| ^Statoil ASA | 109,200 | 2,936 |
| | | 5,971 |
Philippines (0.6%) | | |
| Ayala Corp. | 1,439,626 | 16,658 |
| Globe Telecom, Inc. | 419,400 | 10,666 |
| Jollibee Foods Corp. | 2,574,900 | 2,897 |
* | ABS-CBN | | |
| Broadcasting Corp. | 5,269,200 | 2,834 |
| Banco De Oro | 951,800 | 1,181 |
| Philippine Long Distance | | |
| Telephone Co. | 21,700 | 1,137 |
| | | 35,373 |
17
| | | Market |
| | | Value• |
| | Shares | ($000) |
Russia (2.2%) | | |
| Lukoil Sponsored ADR | 977,573 | 84,291 |
* | OAO Gazprom ADR | 667,097 | 27,937 |
* | Mobile TeleSystems ADR | 272,500 | 15,249 |
| Wimm-Bill-Dann Foods ADR | 21,800 | 1,741 |
| | | 129,218 |
Singapore (0.5%) | | |
| Great Eastern Holdings Ltd. | 692,000 | 8,953 |
* | STATS ChipPAC Ltd. | 4,016,000 | 4,831 |
| BIL International Ltd. | 4,553,000 | 4,795 |
* | GigaMedia Ltd. | 278,235 | 3,845 |
| Neptune Orient Lines Ltd. | 1,213,000 | 2,586 |
| United Industrial Corp., Ltd. | 1,062,000 | 2,026 |
| Yellow Pages | | |
| (Singapore) Ltd. | 466,000 | 396 |
| | | 27,432 |
South Africa (1.1%) | | |
| Sun International Ltd. | 549,866 | 10,441 |
* | Hosken Consolidated | | |
| Investments Ltd. | 1,103,148 | 9,173 |
| RMB Holdings Ltd. | 1,550,600 | 7,680 |
| Anglo American PLC | 145,345 | 7,666 |
| Nedbank Group Ltd. | 271,805 | 5,262 |
| Standard Bank Group Ltd. | 305,600 | 4,490 |
| FirstRand Ltd. | 1,329,636 | 4,487 |
| Tiger Brands Ltd. | 162,100 | 3,944 |
| Sanlan Ltd. | 1,258,700 | 3,455 |
| Anglo Platinum Ltd. | 18,000 | 2,830 |
| Gold Fields Ltd. | 62,340 | 1,149 |
| JD Group Ltd. | 88,246 | 1,082 |
| City Lodge Hotels Ltd. | 83,078 | 898 |
| New Clicks Holdings Ltd. | 301,750 | 526 |
| | | 63,083 |
South Korea (2.8%) | | |
| POSCO | 96,159 | 40,096 |
| KT Corp. | 549,660 | 24,635 |
* | Hynix Semiconductor Inc. | 700,390 | 24,027 |
| Samsung Electronics Co., Ltd. | 37,164 | 22,163 |
| Kookmin Bank | 65,500 | 5,891 |
* | LG Telecom Ltd. | 469,285 | 5,319 |
| Honam Petrochemical Corp. | 57,900 | 5,007 |
| Hyundai Mobis | 58,020 | 4,979 |
| Industrial Bank of Korea | 234,690 | 4,685 |
| Shinhan Financial Group Ltd. | 71,490 | 4,087 |
| Woori Finance | | |
| Holdings Co., Ltd. | 133,890 | 3,239 |
| Hyundai Motor Co., Ltd. | 77,640 | 3,039 |
| Samsung Electronics | | |
| Co., Ltd. Pfd. | 6,100 | 2,861 |
| Korea Telecom Freetel | 99,590 | 2,783 |
* | LG. Philips LCD Co., Ltd. | 61,300 | 2,135 |
| LG Corp. | 62,380 | 2,105 |
| Hyundai Heavy | | |
| Industries Co., Inc. | 6,548 | 1,303 |
| SK Telecom Co., Ltd. | 5,870 | 1,195 |
| Hyundai Mipo | | |
| Dockyard Co., Ltd. | 4,094 | 752 |
| Hyundai Motor Co. Ltd. | 5,000 | 350 |
| Korea Electric Power Corp. | 5,000 | 199 |
* | Korea Iron & Steel Co., Ltd. | 4,000 | 164 |
| Kiswire Ltd. | 3,000 | 95 |
| | | 161,109 |
Spain (1.6%) | | |
| Banco Bilbao Vizcaya | | |
| Argentaria SA | 1,436,238 | 35,143 |
| Repsol YPF SA | 347,700 | 11,675 |
| Acciona SA | 36,700 | 7,950 |
| Acerinox SA | 272,500 | 6,942 |
| Banco Popular Espanol SA | 316,500 | 6,524 |
| Fomento de Construc y | | |
| Contra SA | 62,661 | 6,435 |
| Banco Santander Central | | |
| Hispano SA | 320,577 | 5,703 |
| Telefonica SA | 197,009 | 4,347 |
| Iberia (Linea Aerea Espana) | 448,913 | 2,392 |
| Prosegur Cia de Seguridad | | |
| SA (Registered) | 37,100 | 1,406 |
| Viscofan SA | 60,700 | 1,368 |
* | Sogecable SA | 29,332 | 1,216 |
| | | 91,101 |
Sweden (1.2%) | | |
| Volvo AB B Shares | 218,300 | 18,356 |
| Electrolux AB Series B | 643,300 | 16,248 |
| ^Skandinaviska Enskilda | | |
| Banken AB A Shares | 296,800 | 9,461 |
| Scania AB Class B | 81,050 | 6,338 |
| Svenska Handelsbanken | | |
| AB A Shares | 176,100 | 5,218 |
| Telefonaktiebolaget LM | | |
| Ericsson AB Class B | 1,324,700 | 4,888 |
| ^Svenska Cellulosa | | |
| AB B Shares | 77,060 | 4,106 |
| Assa Abloy AB | 178,900 | 4,099 |
| Hoganas AB B Shares | 54,650 | 1,383 |
| | | 70,097 |
Switzerland (0.9%) | | |
| Credit Suisse Group | | |
| (Registered) | 234,600 | 16,810 |
| Cie. Financiere | | |
| Richemont AG | 109,600 | 6,120 |
| Roche Holdings AG | 31,800 | 5,623 |
| Novartis AG (Registered) | 100,840 | 5,505 |
| Geberit AG | 3,486 | 5,366 |
* | Logitech International SA | 141,900 | 3,938 |
| Adecco SA (Registered) | 60,800 | 3,848 |
| Zurich Financial Services AG | 11,092 | 3,193 |
| Publigroupe SA | 3,540 | 1,312 |
| Swatch Group AG (Bearer) | 3,699 | 975 |
| Phonak Holding AG | 12,100 | 925 |
| | | 53,615 |
18
| | | Market |
| | | Value• |
| | Shares | ($000) |
Taiwan (2.4%) | | |
| Taiwan Semiconductor | | |
| Manufacturing Co., Ltd. | 16,391,932 | 33,358 |
| United | | |
| Microelectronics Corp. | 31,068,105 | 17,719 |
| Powerchip | | |
| Semiconductor Corp. | 22,576,253 | 13,492 |
| Siliconware Precision | | |
| Industries Co. | 5,671,284 | 10,728 |
| China Steel Corp. | 9,503,000 | 10,699 |
| Chunghwa Telecom | | |
| Co., Ltd. | 5,464,780 | 10,561 |
| Asustek Computer Inc. | 4,278,000 | 10,045 |
| AU Optronics Corp. | 4,431,960 | 6,311 |
| Nan Ya Plastic Corp. | 2,217,000 | 4,146 |
| Compal Electronics Inc. | 4,694,588 | 3,966 |
| Formosa Chemicals | | |
| & Fibre Corp. | 1,871,000 | 3,582 |
| Powertech Technology Inc. | 740,000 | 2,853 |
* | ProMOS Technologies Inc. | 5,385,000 | 2,086 |
| Inotera Memories, Inc. | 1,617,000 | 1,814 |
| Taiwan Cellular Corp. | 1,407,000 | 1,507 |
* | Winbond Electronics Corp. | 4,017,000 | 1,423 |
| Mosel Vitelic Inc. | 1,109,000 | 1,356 |
| Universal Scientific | | |
| Industrial Co., Ltd. | 1,823,000 | 1,142 |
* | Advanced Semiconductor | | |
| Engineering Inc. | 890,000 | 1,058 |
| Ruentex Development | | |
| Co., Ltd. | 642,000 | 517 |
| Mitac International Corp. | 445,000 | 492 |
| U-Ming Marine | | |
| Transport Corp. | 249,000 | 413 |
| Vanguard International | | |
| Semiconductor Corp. | 261,585 | 220 |
| MediaTek Inc. | 16,000 | 183 |
| Foxconn Technology Co., Ltd. | 7,650 | 86 |
| | | 139,757 |
Thailand (0.4%) | | |
| Siam Cement Public | | |
| Co. Ltd. Non-Voting | | |
| Depositary Receipt | 986,200 | 6,648 |
| Advanced Info Service | | |
| Public Co. Ltd. (Foreign) | 2,826,000 | 5,410 |
| Siam Cement Public | | |
| Co. Ltd. (Foreign) | 664,300 | 4,547 |
| Kasikornbank Public | | |
| Co. Ltd. (Foreign) | 1,701,900 | 3,258 |
| PTT Public Co., Ltd. | | |
| (Foreign) | 300,400 | 1,785 |
| MBK Development | | |
| Public Co. Ltd. (Foreign) | 813,400 | 1,266 |
| Thanachart Capital | | |
| Public Co. Ltd. (Foreign) | 1,855,000 | 747 |
| GMM Grammy Public | | |
| Co. Ltd. Non-Voting | | |
| Depositary Receipt | 2,917,000 | 571 |
| Post Publishing Public | | |
| Co. Ltd. (Foreign) | 1,300,000 | 248 |
| Matichon PLC (Foreign) | 625,000 | 154 |
| GMM Grammy Public | | |
| Co. Ltd. (Foreign) | 642,000 | 126 |
| | | 24,760 |
Turkey (1.5%) | | |
| Eregli Demir ve Celik | | |
| Fabrikalari A.S. | 2,043,693 | 20,358 |
| Turkiye Garanti | | |
| Bankasi A.S. | 3,596,722 | 15,996 |
| Tupras-Turkiye Petrol | | |
| Rafinerileri A.S. | 666,109 | 14,816 |
| Dogan Sirketler Grubu | | |
| Holding A.S. | 3,348,725 | 5,518 |
| KOC Holding A.S. | 1,146,107 | 5,137 |
* | Yapi ve Kredi Bankasi A.S. | 2,016,572 | 4,257 |
* | Petkim Petrokimya | | |
| Holding A.S. | 729,730 | 3,701 |
| Turkcell Iletisim | | |
| Hizmetleri A.S. | 660,258 | 3,367 |
| Haci Omer Sabanci | | |
| Holding A.S. | 728,892 | 2,956 |
| Tofas Turk Otomobil | | |
| Fabrikasi A.S. | 661,482 | 2,511 |
| Petrol Ofisi A.S. | 499,656 | 2,128 |
| Akbank T.A.S. | 219,076 | 1,461 |
* | Vestel Elektronik Sanayi | | |
| ve Ticaret A.S. | 489,269 | 1,237 |
* | Turkiye Vakiflar | | |
| Bankasi T.A.O. | 491,189 | 1,105 |
* | Turk Hava Yollari | | |
| Anonim Ortakligi | 214,195 | 1,078 |
| Is Gayrimenkul Yatirim | | |
| Ortakligi A.S. | 277,082 | 626 |
| Anadolu Efes Biracilik | | |
| ve Malt Sanayii A.S. | 16,156 | 530 |
| | | 86,782 |
United Kingdom (8.4%) | | |
| Royal Dutch Shell | | |
| PLC Class A | | |
| (Amsterdam Shares) | 2,049,137 | 67,933 |
| AstraZeneca Group PLC | 1,140,270 | 61,268 |
| HBOS PLC | 1,115,411 | 22,984 |
| Vodafone Group PLC | 7,674,437 | 20,453 |
| Royal Bank of Scotland | | |
| Group PLC | 496,507 | 19,373 |
| Marks & Spencer | | |
| Group PLC | 1,202,356 | 15,961 |
| Rio Tinto PLC | 273,939 | 15,591 |
| Xstrata PLC | 287,490 | 14,716 |
| Aviva PLC | 920,300 | 13,553 |
| Antofagasta PLC | 1,295,495 | 13,179 |
19
| | | Market |
| | | Value• |
| | Shares | ($000) |
* | British Airways PLC | 1,338,058 | 12,778 |
| BP PLC | 1,089,600 | 11,738 |
| Home Retail Group | 1,183,400 | 10,351 |
| Barclays PLC | 615,105 | 8,693 |
| BAE Systems PLC | 946,600 | 8,553 |
| BT Group PLC | 1,292,667 | 7,711 |
| J. Sainsbury PLC | 710,200 | 7,659 |
| Capita Group PLC | 525,800 | 7,047 |
| Reckitt Benckiser PLC | 131,890 | 6,855 |
| Hanson Building | | |
| Materials PLC | 397,650 | 6,396 |
| Cable and Wireless PLC | 1,918,800 | 6,293 |
| Tesco PLC | 699,500 | 6,102 |
| Diageo PLC | 292,528 | 5,910 |
| GlaxoSmithKline PLC | 213,200 | 5,866 |
| Arriva PLC | 394,733 | 5,768 |
| ICAP PLC | 544,600 | 5,666 |
* | British Energy Group PLC | 586,000 | 5,609 |
| Reed Elsevier PLC | 440,100 | 5,256 |
| Greene King PLC | 242,200 | 5,240 |
| The Sage Group PLC | 1,029,900 | 5,225 |
* | MyTravel Group PLC | | |
| A Shares | 835,166 | 5,135 |
| Royal Dutch Shell PLC | | |
| Class B | 150,822 | 5,001 |
| Informa PLC | 413,400 | 4,941 |
| Provident Financial PLC | 295,856 | 4,672 |
| Intertek Testing | | |
| Services PLC | 252,100 | 4,487 |
| Stagecoach Group PLC | 1,254,723 | 4,423 |
| Enterprise Inns PLC | 334,400 | 4,393 |
| Kazakhmys PLC | 180,352 | 4,159 |
| Amvescap PLC | 353,700 | 3,889 |
| Carnival PLC | 76,414 | 3,677 |
| Compass Group PLC | 548,835 | 3,664 |
| WPP Group PLC | 235,300 | 3,561 |
* | Invensys PLC | 622,440 | 3,550 |
| Enodis PLC | 859,500 | 3,486 |
| Rexam PLC | 313,600 | 3,390 |
| Smiths Group PLC | 143,410 | 2,889 |
| ITV PLC | 1,199,435 | 2,572 |
| Hays PLC | 813,200 | 2,498 |
| Alliance Boots PLC | 118,277 | 2,383 |
| Bunzl PLC | 128,533 | 1,815 |
| International Power PLC | 230,660 | 1,797 |
| Ladbrokes PLC | 186,223 | 1,476 |
| Devro PLC | 375,500 | 1,003 |
| Homeserve PLC | 12,400 | 434 |
| Kier Group PLC | 3,500 | 165 |
| | | 489,187 |
United States (37.0%) | | |
| Consumer Discretionary (4.6%) | |
* | DIRECTV Group, Inc. | 1,835,600 | 42,347 |
| Clear Channel | | |
| Communications, Inc. | 595,500 | 20,866 |
| CBS Corp. | 563,700 | 17,244 |
| Cablevision Systems | | |
| NY Group Class A | 503,900 | 15,334 |
* | Comcast Corp. | | |
| Special Class A | 591,300 | 15,060 |
* | Liberty Global, Inc. Class A | 444,660 | 14,643 |
* | Liberty Global, Inc. Series C | 444,660 | 13,624 |
* | ^Marvel Entertainment, Inc. | 427,410 | 11,861 |
| Federated Department | | |
| Stores, Inc. | 233,500 | 10,519 |
| Time Warner, Inc. | 523,600 | 10,325 |
| American Greetings Corp. | | |
| Class A | 431,800 | 10,022 |
* | Priceline.com, Inc. | 160,200 | 8,532 |
| McDonald’s Corp. | 149,000 | 6,712 |
| Wendy’s International, Inc. | 195,300 | 6,113 |
* | ^Blue Nile Inc. | 137,500 | 5,591 |
* | PRIMEDIA Inc. | 2,072,800 | 5,514 |
* | Discovery Holding Co. | | |
| Class A | 284,850 | 5,449 |
* | Liberty Media Corp.– | | |
| Interactive Series A | 221,126 | 5,267 |
* | Liberty Media Corp.– | | |
| Capital Series A | 44,225 | 4,891 |
* | Blockbuster Inc. Class B | 770,100 | 4,621 |
* | Amazon.com, Inc. | 108,600 | 4,321 |
* | Fleetwood Enterprises, Inc. | 530,300 | 4,195 |
| Dow Jones & Co., Inc. | 114,600 | 3,950 |
| Black & Decker Corp. | 46,000 | 3,755 |
| Hasbro, Inc. | 116,200 | 3,326 |
* | Hanesbrands Inc. | 97,600 | 2,868 |
| CBS Corp. Class A | 86,000 | 2,633 |
* | NVR, Inc. | 3,900 | 2,594 |
* | 99 Cents Only Stores | 170,100 | 2,506 |
* | Viacom Inc. Class A | 50,300 | 2,065 |
| Sun-Times Media Group, Inc. | 321,800 | 1,596 |
* | Live Nation | 21,512 | 475 |
| Service Corp. International | 27,133 | 322 |
| | | |
| Consumer Staples (3.8%) | | |
| The Kroger Co. | 2,387,000 | 67,433 |
| Carolina Group | 671,043 | 50,738 |
| Altria Group, Inc. | 392,700 | 34,483 |
| Costco Wholesale Corp. | 581,500 | 31,308 |
| Safeway, Inc. | 343,600 | 12,589 |
| Sara Lee Corp. | 345,100 | 5,839 |
| The Estee Lauder Cos. Inc. | | |
| Class A | 79,700 | 3,893 |
| | | | |
| The Clorox Co. | 43,900 | 2,796 |
| Imperial Sugar Co. | 76,700 | 2,572 |
| ConAgra Foods, Inc. | 103,000 | 2,566 |
| Corn Products | | |
| International, Inc. | 65,600 | 2,335 |
* | USANA Health Sciences, Inc. | 15,600 | 731 |
| MGP Ingredients, Inc. | 34,300 | 699 |
20
| | | Market |
| | | Value• |
| | Shares | ($000) |
| Energy (4.2%) | | |
| ExxonMobil Corp. | 779,400 | 58,806 |
| Marathon Oil Corp. | 465,800 | 46,035 |
| Valero Energy Corp. | 500,600 | 32,284 |
| Tidewater Inc. | 536,700 | 31,440 |
| Tesoro Petroleum Corp. | 261,900 | 26,303 |
| Chevron Corp. | 270,400 | 19,999 |
| ConocoPhillips Co. | 170,200 | 11,633 |
| Frontier Oil Corp. | 255,800 | 8,349 |
| Western Refining, Inc. | 110,900 | 4,327 |
| Baker Hughes, Inc. | 63,200 | 4,179 |
| Alon USA Energy, Inc. | 39,500 | 1,430 |
| | | |
| Financials (8.0%) | | |
| MetLife, Inc. | 855,400 | 54,018 |
| The Chubb Corp. | 884,100 | 45,681 |
| The Hartford Financial | | |
| Services Group Inc. | 344,470 | 32,924 |
| The Travelers Cos., Inc. | 511,600 | 26,486 |
| Citigroup, Inc. | 414,500 | 21,280 |
| JPMorgan Chase & Co. | 424,100 | 20,518 |
* | Berkshire Hathaway Inc. | | |
| Class B | 5,063 | 18,429 |
| W.R. Berkley Corp. | 541,400 | 17,931 |
| Bank of America Corp. | 311,500 | 15,893 |
| Fannie Mae | 272,300 | 14,862 |
| Moody’s Corp. | 235,000 | 14,584 |
| Assurant, Inc. | 244,400 | 13,107 |
| Freddie Mac | 216,400 | 12,874 |
| XL Capital Ltd. Class A | 181,811 | 12,719 |
| ACE Ltd. | 195,450 | 11,152 |
| MBIA, Inc. | 158,800 | 10,400 |
| Axis Capital Holdings Ltd. | 279,077 | 9,450 |
| Merrill Lynch & Co., Inc. | 115,600 | 9,441 |
| Genworth Financial Inc. | 269,900 | 9,430 |
* | Arch Capital Group Ltd. | 137,303 | 9,365 |
| Lehman Brothers | | |
| Holdings, Inc. | 123,700 | 8,668 |
| The Goldman Sachs | | |
| Group, Inc. | 39,400 | 8,141 |
| American Express Co. | 132,497 | 7,473 |
| PartnerRe Ltd. | 95,310 | 6,533 |
| National City Corp. | 162,600 | 6,057 |
| Mercury General Corp. | 114,000 | 6,047 |
| Countrywide Financial Corp. | 175,695 | 5,910 |
* | First Federal Financial Corp. | 101,200 | 5,751 |
| American International | | |
| Group, Inc. | 84,900 | 5,707 |
| RenaissanceRe Holdings Ltd. | 90,956 | 4,561 |
| Bear Stearns Co., Inc. | 29,700 | 4,465 |
| MGIC Investment Corp. | 57,900 | 3,411 |
| The PMI Group Inc. | 58,500 | 2,645 |
| Zenith National | | |
| Insurance Corp. | 45,500 | 2,151 |
| Morgan Stanley | 15,700 | 1,237 |
| Ameriprise Financial, Inc. | 21,459 | 1,226 |
| American Financial | | |
| Group, Inc. | 32,550 | 1,108 |
| Endurance Specialty | | |
| Holdings Ltd. | 30,273 | 1,082 |
| | | |
| Health Care (4.4%) | | |
| Pfizer Inc. | 3,373,000 | 85,202 |
| AmerisourceBergen Corp. | 1,110,094 | 58,557 |
* | King Pharmaceuticals, Inc. | 2,036,070 | 40,049 |
* | Biogen Idec Inc. | 677,900 | 30,085 |
| Merck & Co., Inc. | 230,100 | 10,164 |
| Schering-Plough Corp. | 363,300 | 9,268 |
| McKesson Corp. | 153,900 | 9,009 |
* | WellPoint Inc. | 77,800 | 6,310 |
| Bristol-Myers Squibb Co. | 206,900 | 5,744 |
| Alpharma, Inc. Class A | 76,400 | 1,840 |
* | Bradley Pharmaceuticals, Inc. | 27,400 | 526 |
| | | |
| Industrials (4.5%) | | |
* | Terex Corp. | 536,939 | 38,531 |
| Cummins Inc. | 264,700 | 38,307 |
| General Electric Co. | 744,500 | 26,326 |
* | AMR Corp. | 541,500 | 16,489 |
| Pitney Bowes, Inc. | 303,500 | 13,776 |
* | US Airways Group Inc. | 297,900 | 13,548 |
* | Kansas City Southern | 368,700 | 13,118 |
* | Continental Airlines, Inc. | | |
| Class B | 318,600 | 11,594 |
* | Superior Essex Inc. | 329,100 | 11,410 |
| Parker Hannifin Corp. | 123,400 | 10,651 |
| Ingersoll-Rand Co. | 240,900 | 10,448 |
| Viad Corp. | 252,500 | 9,747 |
| Watson Wyatt | | |
| & Co. Holdings | 187,700 | 9,132 |
| Northrop Grumman Corp. | 92,800 | 6,888 |
| Eaton Corp. | 72,600 | 6,066 |
| Raytheon Co. | 92,400 | 4,847 |
| SPX Corp. | 67,800 | 4,760 |
| ^AMREP Corp. | 33,800 | 2,611 |
* | American Commercial | | |
| Lines Inc. | 76,052 | 2,392 |
| Robbins & Myers, Inc. | 54,400 | 2,029 |
| The Manitowoc Co., Inc. | 30,953 | 1,966 |
| PACCAR, Inc. | 24,150 | 1,773 |
| PW Eagle, Inc. | 53,200 | 1,758 |
| The Boeing Co. | 14,200 | 1,263 |
| Freightcar America Inc. | 24,400 | 1,175 |
* | Saia, Inc. | 35,700 | 848 |
* | Ceradyne, Inc. | 14,500 | 794 |
| Norfolk Southern Corp. | 5,700 | 288 |
* | Learning Tree | | |
| International, Inc. | 20,900 | 235 |
* | ^Northwest Airlines Corp. | | |
| Class A | 270,500 | 177 |
21
| | | Market |
| | | Value• |
| | Shares | ($000) |
| Information Technology (3.0%) | | |
* | Lexmark International, Inc. | 336,691 | 19,683 |
| Microsoft Corp. | 581,700 | 16,212 |
| Hewlett-Packard Co. | 361,600 | 14,515 |
* | Sun Microsystems, Inc. | 2,398,100 | 14,413 |
| Electronic Data | | |
| Systems Corp. | 515,600 | 14,272 |
* | Xerox Corp. | 832,900 | 14,068 |
| International Business | | |
| Machines Corp. | 140,100 | 13,206 |
* | Gartner, Inc. Class A | 536,500 | 12,849 |
* | Agere Systems Inc. | 525,570 | 11,888 |
| Accenture Ltd. | 257,500 | 9,924 |
* | DST Systems, Inc. | 77,300 | 5,813 |
* | Dell Inc. | 245,700 | 5,703 |
* | ^Komag, Inc. | 169,600 | 5,551 |
| MasterCard, Inc. Class A | 42,000 | 4,462 |
| Global Payments Inc. | 128,400 | 4,373 |
* | MicroStrategy Inc. | 12,500 | 1,580 |
* | Western Digital Corp. | 86,100 | 1,447 |
* | Forrester Research, Inc. | 37,000 | 1,049 |
* | Solectron Corp. | 242,800 | 765 |
| | | |
| Materials (2.3%) | | |
| Freeport-McMoRan | | |
| Copper & Gold, Inc. | | |
| Class B | 587,400 | 38,880 |
| Nucor Corp. | 460,700 | 30,005 |
| Lyondell Chemical Co. | 775,700 | 23,248 |
| Chaparral Steel Co. | 271,000 | 15,764 |
| Scotts Miracle-Gro Co. | 250,900 | 11,047 |
| Steel Dynamics, Inc. | 188,000 | 8,122 |
| Reliance Steel | | |
| & Aluminum Co. | 137,800 | 6,670 |
| | | |
Telecommunication Services (1.7%) |
* | Qwest Communications | | |
| International Inc. | 5,018,785 | 45,119 |
| Embarq Corp. | 381,870 | 21,518 |
| Sprint Nextel Corp. | 744,400 | 14,114 |
* | NII Holdings Inc. | 98,000 | 7,270 |
* | Level 3 | | |
| Communications, Inc. | 868,200 | 5,296 |
* | Cincinnati Bell Inc. | 994,400 | 4,674 |
| | | |
| Utilities (0.5%) | | |
| FirstEnergy Corp. | 273,049 | 18,087 |
| Entergy Corp. | 75,700 | 7,942 |
| OGE Energy Corp. | 47,200 | 1,831 |
| | | 2,145,686 |
Total Common Stocks | | |
(Cost $4,614,608) | | 5,655,498 | |
Temporary Cash Investments (4.8%)1 | |
Money Market Fund (4.7%) | | | |
2 Vanguard Market | | | |
Liquidity Fund, 5.288% | 162,225,771 | 162,226 | |
2 Vanguard Market | | | |
Liquidity Fund, | | | |
5.288%—Note F | 108,840,699 | 108,841 | |
| | 271,067 | |
| Face | | |
| Amount | | |
| ($000) | | |
U.S. Agency Obligation (0.1%) | |
3 Federal Home Loan Bank | | | |
4 5.207%, 4/4/07 | 5,000 | 4,999 | |
Total Temporary Cash Investments | |
(Cost $276,065) | | 276,066 | |
Total Investments (102.3%) | | | |
(Cost $4,890,673) | | 5,931,564 | |
Other Assets and Liabilities (–2.3%) | |
Receivables for Investment | | | |
Securities Sold | | 230,333 | |
Other Assets—Note C | | 53,227 | |
Payables for Investment | | | |
Securities Purchased | | (291,691) | |
Other Liabilities—Note F | | (123,467) | |
| | (131,598) | |
Net Assets (100%) | | | |
Applicable to 243,692,624 outstanding $.001 | |
par value shares of beneficial interest | |
(unlimited authorization) | | 5,799,966 | |
Net Asset Value Per Share | | $23.80 | |
| | | | |
22
At March 31, 2007, net assets consisted of:5 |
| Amount | Per |
| ($000) | Share |
Paid-in Capital | 4,559,556 | 18.71 |
Undistributed Net | | |
Investment Income | 11,129 | .05 |
Accumulated Net | | |
Realized Gains | 186,157 | .76 |
Unrealized Appreciation | | |
Investment Securities | 1,040,891 | 4.27 |
Futures Contracts | 1,928 | .01 |
Foreign Currencies and | | |
Forward Currency Contracts | 305 | — |
Net Assets | 5,799,966 | $23.80 |
• See Note A in Notes to Financial Statements.
* Non-income-producing security.
^ Part of security position is on loan to broker-dealers. See Note F in Notes to Financial Statements.
1 The fund invests a portion of its cash reserves in equity markets through the use of index futures contracts. After giving effe ct to futures investments, the fund’s effective common stock and temporary cash investment positions represent 99.1% and 3.2%, respectively, of net assets. See Note D in Notes to Financial Statements.
2 Affiliated money market fund available only to Vanguard funds and certain trusts and accounts managed by Vanguard. Rate shown is the 7-day yield.
3 The issuer operates under a congressional charter; its securities are neither issued nor guaranteed by the U.S. government. If needed, access to additional funding from the U.S. Treasury (beyond the issuer’s line of credit) would require congressional action.
4 Securities with a value of $4,999,000 and cash of $481,000 have been segregated as initial margin for open futures contracts.
5 See Note D in Notes to Financial Statements for the tax-basis components of net assets.
ADR—American Depositary Receipt.
GDR—Global Depositary Receipt.
23
Statement of Operations
| |
| |
| Six Months Ended |
| March 31, 2007 |
| ($000) |
Investment Income | |
Income | |
Dividends1 | 41,559 |
Interest2 | 4,182 |
Security Lending | 484 |
Total Income | 46,225 |
Expenses | |
Investment Advisory Fees—Note B | |
Basic Fee | 5,857 |
Performance Adjustment | 1,035 |
The Vanguard Group—Note C | |
Management and Administrative | 8,323 |
Marketing and Distribution | 616 |
Custodian Fees | 491 |
Shareholders’ Reports | 67 |
Trustees’ Fees and Expenses | 3 |
Total Expenses | 16,392 |
Net Investment Income | 29,833 |
Realized Net Gain (Loss) | |
Investment Securities Sold | 191,497 |
Futures Contracts | 2,945 |
Foreign Currencies and Forward Currency Contracts | (106) |
Realized Net Gain (Loss) | 194,336 |
Change in Unrealized Appreciation (Depreciation) | |
Investment Securities | 399,929 |
Futures Contracts | 1,063 |
Foreign Currencies and Forward Currency Contracts | 595 |
Change in Unrealized Appreciation (Depreciation) | 401,587 |
Net Increase (Decrease) in Net Assets Resulting from Operations | 625,756 |
1 Dividends are net of foreign withholding taxes of $2,065,000.
2 Interest income from an affiliated company of the fund was $4,101,000.
24
Statement of Changes in Net Assets
| | |
| | |
| Six Months Ended | Year Ended |
| Mar. 31, 2007 | Sept. 30, 2006 |
| ($000) | ($000) |
Increase (Decrease) in Net Assets | | |
Operations | | |
Net Investment Income | 29,833 | 58,112 |
Realized Net Gain (Loss) | 194,336 | 186,941 |
Change in Unrealized Appreciation (Depreciation) | 401,587 | 205,761 |
Net Increase (Decrease) in Net Assets Resulting from Operations | 625,756 | 450,814 |
Distributions | | |
Net Investment Income | (63,112) | (31,222) |
Realized Capital Gain 1 | (179,157) | (56,590) |
Total Distributions | (242,269) | (87,812) |
Capital Share Transactions—Note G | | |
Issued | 1,361,930 | 1,908,165 |
Issued in Lieu of Cash Distributions | 224,231 | 80,656 |
Redeemed | (361,119) | (462,226) |
Net Increase (Decrease) from Capital Share Transactions | 1,225,042 | 1,526,595 |
Total Increase (Decrease) | 1,608,529 | 1,889,597 |
Net Assets | | |
Beginning of Period | 4,191,437 | 2,301,840 |
End of Period2 | 5,799,966 | 4,191,437 |
1 Includes fiscal 2007 and 2006 short-term gain distributions totaling $70,849,000 and $20,164,000, respectively. Short-term gain distributions are treated as ordinary income dividends for tax purposes.
2 Net Assets—End of Period includes undistributed net investment income of $11,129,000 and $45,245,000.
25
Financial Highlights
| Six Months | Year | Nov. 1, | | | |
| Ended | Ended | 2003, to | |
For a Share Outstanding | Mar. 31, | Sept. 30, | Sept. 30, | Year Ended October 31, |
Throughout Each Period | 2007 | 2006 | 2005 | 20041 | 2003 | 2002 | 2001 |
Net Asset Value, | | | | | | | |
Beginning of Period | $21.96 | $19.72 | $16.08 | $14.46 | $10.48 | $11.31 | $13.71 |
Investment Operations | | | | | | | |
Net Investment Income | .12 | .320 | .25 | .191 | .12 | .09 | .13 |
Net Realized and Unrealized | | | | | | | |
Gain (Loss) on Investments | 2.91 | 2.595 | 3.87 | 1.624 | 3.96 | (.36) | (1.10) |
Total from | | | | | | | |
Investment Operations | 3.03 | 2.915 | 4.12 | 1.815 | 4.08 | (.27) | (.97) |
Distributions | | | | | | | |
Dividends from | | | | | | | |
Net Investment Income | (.31) | (.240) | (.21) | (.130) | (.08) | (.12) | (.26) |
Distributions from | | | | | | | |
Realized Capital Gains | (.88) | (.435) | (.27) | (.065) | (.02) | (.44) | (1.17) |
Total Distributions | (1.19) | (.675) | (.48) | (.195) | (.10) | (.56) | (1.43) |
Net Asset Value, | | | | | | | |
End of Period | $23.80 | $21.96 | $19.72 | $16.08 | $14.46 | $10.48 | $11.31 |
| | | | | | | |
Total Return2 | 14.02% | 15.22% | 25.99% | 12.64% | 39.25% | –2.78% | –7.72% |
| | | | | | | |
Ratios/Supplemental Data | | | | | | | |
Net Assets, | | | | | | | |
End of Period (Millions) | $5,800 | $4,191 | $2,302 | $965 | $664 | $223 | $144 |
Ratio of Total Expenses to | | | | | | | |
Average Net Assets3 | 0.66%* | 0.72% | 0.80% | 0.90%* | 1.05% | 1.19% | 1.08% |
Ratio of Net Investment | | | | | | | |
Income to Average | | | | | | | |
Net Assets | 1.19%* | 1.76% | 1.60% | 1.47%* | 1.14% | 0.86% | 1.10% |
Portfolio Turnover Rate | 70%* | 88% | 83% | 19% | 13% | 14% | 27% |
1 The fund’s fiscal year-end changed from October 31 to September 30, effective September 30, 2004.
2 Total returns do not reflect the 1% fee assessed through April 6, 2001, on redemptions of shares held for less than five years.
3 Includes performance-based investment advisory fee increases (decreases) of 0.04%, 0.05%, 0.06%, 0.08%, 0.11%, 0.17%, and 0.13%.
* Annualized.
See accompanying Notes,which are an integral part of the Financial Statements .
26
Notes to Financial Statements
Vanguard Global Equity Fund is registered under the Investment Company Act of 1940 as an open-end investment company, or mutual fund. The fund invests in securities of foreign issuers, which may subject it to investment risks not normally associated with investing in securities of United States corporations. The fund files reports with the SEC under the company name Vanguard Horizon Funds.
A. The following significant accounting policies conform to generally accepted accounting principles for U.S. mutual funds. The fund consistently follows such policies in preparing its financial statements.
1. Security Valuation: Securities are valued as of the close of trading on the New York Stock Exchange (generally 4:00 p.m. Eastern time) on the valuation date. Equity securities are valued at the latest quoted sales prices or official closing prices taken from the primary market in which each security trades; such securities not traded on the valuation date are valued at the mean of the latest quoted bid and asked prices. Securities for which market quotations are not readily available, or whose values have been affected by events occurring before the fund’s pricing time but after the close of the securities’ primary markets, are valued at their fair values calculated according to procedures adopted by the board of trustees. These procedures include obtaining quotations from an independent pricing service, monitoring news to identify significant market- or security-specific events, and evaluating changes in the values of foreign market proxies (for example, ADRs, futures contracts, or exchange-traded funds), between the time the foreign markets close and the fund’s pricing time. When fair-value pricing is employed, the prices of securities used by a fund to calculate its net asset value may differ from quoted or published prices for the same securities. Investments in Vanguard Market Liquidity Fund are valued at that fund’s net asset value. Temporary cash investments acquired over 60 days to maturity are valued using the latest bid prices or using valuations based on a matrix system (which considers such factors as security prices, yields, maturities, and ratings), both as furnished by independent pricing services. Other temporary cash investments are valued at amortized cost, which approximates market value.
2. Foreign Currency: Securities and other assets and liabilities denominated in foreign currencies are translated into U.S. dollars at the exchange rates on the valuation date as employed by Morgan Stanley Capital International (MSCI) in the calculation of its indexes. As part of the fund’s fair-value procedures, exchange rates may be adjusted if they change significantly before the fund’s pricing time but after the time at which the MSCI rates are determined (generally 11:00 a.m. Eastern time).
Realized gains (losses) and unrealized appreciation (depreciation) on investment securities include the effects of changes in exchange rates since the securities were purchased, combined with the effects of changes in security prices. Fluctuations in the value of other assets and liabilities resulting from changes in exchange rates are recorded as unrealized foreign currency gains (losses) until the asset or liability is settled in cash, when they are recorded as realized foreign currency gains (losses).
3. Futures and Forward Currency Contracts: The fund uses index futures contracts to a limited extent, with the objective of maintaining full exposure to U.S., European, and Pacific stock markets while maintaining liquidity. The fund may purchase or sell futures contracts to achieve a desired level of investment, whether to accommodate portfolio turnover or cash flows from capital share transactions. The primary risks associated with the use of futures contracts are imperfect correlation between changes in market values of stocks held by the fund and the prices of futures contracts, and the possibility of an illiquid market.
27
The fund also may enter into forward currency contracts to provide the appropriate currency exposure related to any open futures contracts, or to protect the value of securities and related receivables and payables against changes in foreign exchange rates. The primary risk associated with the fund’s use of these contracts is that a counterparty will fail to fulfill its obligation to pay gains due to the fund under the contracts.
Futures and forward currency contracts are valued at their quoted daily settlement prices. The aggregate principal amounts of the contracts are not recorded in the Statement of Net Assets. Fluctuations in the value of the contracts are recorded in the Statement of Net Assets as an asset (liability) and in the Statement of Operations as unrealized appreciation (depreciation) until the contracts are closed, when they are recorded as realized gains (losses) on futures or forward currency contracts.
4. Federal Income Taxes: The fund intends to continue to qualify as a regulated investment company and distribute all of its taxable income. Accordingly, no provision for federal income taxes is required in the financial statements.
5. Distributions: Distributions to shareholders are recorded on the ex-dividend date.
6. Security Lending: The fund may lend its securities to qualified institutional borrowers to earn additional income. Security loans are required to be secured at all times by collateral at least equal to the market value of securities loaned. The fund invests cash collateral received in Vanguard Market Liquidity Fund, and records a liability for the return of the collateral, during the period the securities are on loan. Security lending income represents the income earned on investing cash collateral, less expenses associated with the loan.
7. Other: Dividend income is recorded on the ex-dividend date. Interest income includes income distributions received from Vanguard Market Liquidity Fund and is accrued daily. Security transactions are accounted for on the date securities are bought or sold. Costs used to determine realized gains (losses) on the sale of investment securities are those of the specific securities sold.
B. Acadian Asset Management, Inc., Marathon Asset Management LLP, and AllianceBernstein L.P. each provide investment advisory services to a portion of the fund for a fee calculated at an annual percentage rate of average net assets managed by the advisor. The basic fee of Acadian Asset Management, Inc. is subject to quarterly adjustments based on performance since December 31, 2004, relative to the Morgan Stanley Capital International All Country World Index. The basic fee of Marathon Asset Management LLP is subject to quarterly adjustments based on performance for the preceding three years relative to the Morgan Stanley Capital International All Country World Index. In accordance with the advisory contract entered into with AllianceBernstein L.P. in April 2006, beginning on April 1, 2007, the investment advisory fee will be subject to quarterly adjustments based on performance since June 30, 2006, relative to the Morgan Stanley Capital International All Country World Index.
The Vanguard Group manages the cash reserves of the fund at an at-cost basis.
For the six months ended March 31, 2007, the aggregate investment advisory fee represented an effective annual basic rate of 0.23% of the fund’s average net assets before an increase of $1,035,000 (0.04%) based on performance.
C. The Vanguard Group furnishes at cost corporate management, administrative, marketing, and distribution services. The costs of such services are allocated to the fund under methods approved by the board of trustees. The fund has committed to provide up to 0.40% of its net assets in capital
28
contributions to Vanguard. At March 31, 2007, the fund had contributed capital of $524,000 to Vanguard (included in Other Assets), representing 0.01% of the fund’s net assets and 0.52% of Vanguard’s capitalization. The fund’s trustees and officers are also directors and officers of Vanguard.
D. Distributions are determined on a tax basis and may differ from net investment income and realized capital gains for financial reporting purposes. Differences may be permanent or temporary. Permanent differences are reclassified among capital accounts in the financial statements to reflect their tax character. Temporary differences arise when certain items of income, expense, gain, or loss are recognized in different periods for financial statement and tax purposes; these differences will reverse at some time in the future. Differences in classification may also result from the treatment of short-term gains as ordinary income for tax purposes. The fund’s tax-basis capital gains and losses are determined only at the end of each fiscal year.
During the six months ended March 31, 2007, the fund realized net foreign currency losses of $837,000, which decreased distributable net income for tax purposes; accordingly, such losses have been reclassified from accumulated net realized gains to undistributed net investment income. Certain of the fund’s investments are in securities considered to be “passive foreign investment companies,” for which any unrealized appreciation and/or realized gains are required to be included in distributable net income for tax purposes. Unrealized appreciation through September 30, 2006, on the fund’s passive foreign investment company holdings at March 31, 2007, was $6,155,000, all of which has been distributed and is reflected in the balance of undistributed income.
At March 31, 2007, the cost of investment securities for tax purposes was $4,896,828,000. Net unrealized appreciation of investment securities for tax purposes was $1,034,736,000, consisting of unrealized gains of $1,095,531,000 on securities that had risen in value since their purchase and $60,795,000 in unrealized losses on securities that had fallen in value since their purchase.
At March 31, 2007, the aggregate settlement value of open futures contracts expiring in June 2007 and the related unrealized appreciation (depreciation) were:
| | | ($000) |
| | Aggregate | Unrealized |
| Number of | Settlement | Appreciation |
Futures Contracts | Long Contracts | Value | (Depreciation) |
S&P 500 Index | 94 | 33,633 | 377 |
FTSE 100 Index | 200 | 24,815 | 539 |
Dow Jones EURO STOXX 50 Index | 242 | 13,240 | 741 |
Topix Index | 79 | 11,485 | 157 |
S&P ASX 200 Index | 54 | 6,581 | 114 |
Unrealized appreciation (depreciation) on open S&P 500 Index futures contracts is required to be treated as realized gain (loss) for tax purposes.
29
At March 31, 2007, the fund had open forward currency contracts to receive and deliver currencies as follows:
| | | | | | Unrealized |
| | | | | | Appreciation |
| | | Contract Amount (000) | | (Depreciation) |
Contract Settlement Date | | Receive | | Deliver | | ($000) |
6/15/07 | USD | 13,123 | CHF | 15,922 | | 63 |
6/20/07 | EUR | 9,390 | USD | 12,537 | | 70 |
6/13/07 | JPY | 1,337,451 | USD | 11,431 | | (186) |
6/20/07 | GBP | 5,196 | USD | 10,188 | | 131 |
6/27/07 | AUD | 8,004 | USD | 6,450 | | 166 |
AUD—Australian dollar. | | | | | | |
CHF—Swiss Franc. | | | | | | |
EUR—Euro. | | | | | | |
GBP—British pound. | | | | | | |
JPY—Japanese yen. | | | | | | |
USD—U.S. dollar. | | | | | | |
Unrealized appreciation (depreciation) on open forward currency contracts is treated as realized gain (loss) for tax purposes.
The fund had net unrealized foreign currency gains of $61,000 resulting from the translation of other assets and liabilities at March 31, 2007.
E. During the six months ended March 31, 2007, the fund purchased $2,759,662,000 of investment securities and sold $1,711,849,000 of investment securities, other than temporary cash investments.
F. The market value of securities on loan to broker-dealers at March 31, 2007, was $103,139,000, for which the fund received cash collateral of $108,841,000.
G. Capital shares issued and redeemed were:
| Six Months Ended | | Year Ended |
| March 31, 2007 | | September 30, 2006 |
| Shares | | Shares |
| (000) | | (000) |
Issued | 58,634 | | 92,291 |
Issued in Lieu of Cash Distributions | 9,809 | | 4,143 |
Redeemed | (15,580) | | (22,344) |
Net Increase (Decrease) in Shares Outstanding | 52,863 | | 74,090 |
H. In June 2006, the Financial Accounting Standards Board issued Interpretation No. 48 (“FIN 48”), “Accounting for Uncertainty in Income Taxes.” FIN 48 establishes the minimum threshold for recognizing, and a system for measuring, the benefits of tax-return positions in financial statements. FIN 48 will be effective for the fund’s fiscal year beginning October 1, 2007. Management is in the process of analyzing the fund’s tax positions for purposes of implementing FIN 48; based on the analysis completed to date, management does not believe the adoption of FIN 48 will result in any material impact to the fund’s financial statements.
30
About Your Fund’s Expenses
As a shareholder of the fund, you incur ongoing costs, which include costs for portfolio management, administrative services, and shareholder reports (like this one), among others. Operating expenses, which are deducted from a fund’s gross income, directly reduce the investment return of the fund.
A fund’s expenses are expressed as a percentage of its average net assets. This figure is known as the expense ratio. The following examples are intended to help you understand the ongoing costs (in dollars) of investing in your fund and to compare these costs with those of other mutual funds. The examples are based on an investment of $1,000 made at the beginning of the period shown and held for the entire period.
The table below illustrates your fund’s costs in two ways:
• Based on actual fund return. This section helps you to estimate the actual expenses that you paid over the period. The “Ending Account Value” shown is derived from the fund’s actual return, and the third column shows the dollar amount that would have been paid by an investor who started with $1,000 in the fund. You may use the information here, together with the amount you invested, to estimate the expenses that you paid over the period.
To do so, simply divide your account value by $1,000 (for example, an $8,600 account value divided by $1,000 = 8.6), then multiply the result by the number given for your fund under the heading “Expenses Paid During Period.”
• Based on hypothetical 5% yearly return. This section is intended to help you compare your fund’s costs with those of other mutual funds. It assumes that the fund had a yearly return of 5% before expenses, but that the expense ratio is unchanged. In this case—because the return used is not the fund’s actual return—the results do not apply to your investment. The example is useful in making comparisons because the Securities and Exchange Commission requires all mutual funds to calculate expenses based on a 5% return. You can assess your fund’s costs by comparing this hypothetical example with the hypothetical examples that appear in shareholder reports of other funds.
Six Months Ended March 31, 2007 | | | |
| Beginning | Ending | Expenses |
| Account Value | Account Value | Paid During |
Global Equity Fund | 9/30/2006 | 3/31/2007 | Period1 |
Based on Actual Fund Return | $1,000.00 | $1,140.21 | $3.52 |
Based on Hypothetical 5% Yearly Return | 1,000.00 | 1,021.64 | 3.33 |
1 The calculations are based on expenses incurred in the most recent six-month period. The fund’s annualized six-month expense ratio for that period is 0.66%. The dollar amounts shown as “Expenses Paid” are equal to the annualized expense ratio multiplied by the average account value over the period, multiplied by the number of days in the most recent six-month period, then divided by the number of days in the most recent 12-month period.
31
Note that the expenses shown in the table on page 31 are meant to highlight and help you compare ongoing costs only and do not reflect any transactional costs or account maintenance fees. They do not include your fund’s low-balance fee, which is described in the prospectus. If this fee were applied to your account, your costs would be higher. Your fund does not charge transaction fees, such as purchase or redemption fees, nor does it carry a “sales load.”
The calculations assume no shares were bought or sold during the period. Your actual costs may have been higher or lower, depending on the amount of your investment and the timing of any purchases or redemptions.
You can find more information about the fund’s expenses, including annual expense ratios for the past five years, in the Financial Statements section of this report. For additional information on operating expenses and other shareholder costs, please refer to the appropriate fund prospectus.
32
Trustees Approve Advisory Agreement
The board of trustees of Vanguard Global Equity Fund has renewed the fund’s investment advisory agreement with AllianceBernstein L.P., one of the fund’s three investment advisors. The board determined that the retention of AllianceBernstein was in the best interests of the fund and its shareholders.
(The board had previously acted to renew the fund’s agreements with its other investment advisors, Marathon Asset Management LLP and Acadian Asset Management, Inc. A report on those renewals was included in the fund’s annual report dated September 30, 2006.)
The board based its decision upon an evaluation of AllianceBernstein’s investment staff, portfolio management process, and performance. The trustees considered the factors discussed below, among others. However, no single factor determined whether the board approved the agreement. Rather, it was the totality of the circumstances that drove the board’s decision.
Nature, extent, and quality of services
The board considered the quality of the investment management provided to the fund by
AllianceBernstein, and took into account the organizational depth and stability of the advisory firm.
The board noted that AllianceBernstein is a global asset management firm with over $700 billion in assets under management as of December 31, 2006. AllianceBernstein provides diversified, global investment management services that include growth and value equities, blend strategies, and fixed income services to clients worldwide. AllianceBernstein has advised the fund since April 2006.
The board also noted that the investment team at AllianceBernstein employs a bottom-up, research-driven, and value-based equity investment philosophy in selecting stocks. The team relies on deep investment research capabilities to understand companies and industries that may be undergoing stress, and it seeks to exploit mispricings created by investor overreaction.
The board concluded that the advisor’s experience, stability, depth, and performance, among other factors, warranted continuation of the advisory agreement.
Investment performance
The board considered AllianceBernstein’s performance since the firm began managing a portion of the fund in 2006. The board concluded that AllianceBernstein has performed in line with expectations and that the advisor’s results have been consistent with the fund’s investment strategy. Information about the fund’s most recent performance can be found in the Performance Summary section of this report.
Cost
The board concluded that the fund’s expense ratio was far below the average expense ratio charged by funds in its peer group. AllianceBernstein’s advisory fee was also well below the peer-group average. Information about the fund’s expense ratio appears in the About Your Fund’s Expenses section of this report as well as in the Financial Statements section, which also includes information about the advisory fee rate. The board did not consider the profitability of AllianceBernstein in determining whether to approve the advisory fee, because the firm is independent of Vanguard and the advisory fee is the result of arm’s-length negotiations.
The benefit of economies of scale
The board concluded that the fund’s shareholders benefit from economies of scale because of breakpoints in AllianceBernstein’s advisory fee schedule, which reduce the effective rate of the fee as the fund’s assets managed by AllianceBernstein increase.
The advisory agreement will continue for one year and is renewable by the fund’s board after that for successive one-year periods.
33
Glossary
Beta. A measure of the magnitude of a fund’s past share-price fluctuations in relation to the ups and downs of a given market index. The index is assigned a beta of 1.00. Compared with a given index, a fund with a beta of 1.20 typically would have seen its share price rise or fall by 12% when the index rose or fell by 10%. A fund’s beta should be reviewed in conjunction with its R-squared (see definition below). The lower the R-squared, the less correlation there is between the fund and the index, and the less reliable beta is as an indicator of volatility.
Expense Ratio. The percentage of a fund’s average net assets used to pay its annual administrative and advisory expenses. These expenses directly reduce returns to investors.
Inception Date. The date on which the assets of a fund (or one of its share classes) are first invested in accordance with the fund’s investment objective. For funds with a subscription period, the inception date is the day after that period ends. Investment performance is measured from the inception date.
R-Squared. A measure of how much of a fund’s past returns can be explained by the returns from the market in general, as measured by a given index. If a fund’s total returns were precisely synchronized with an index’s returns, its R-squared would be 1.00. If the fund’s returns bore no relationship to the index’s returns, its R-squared would be 0.
Short-Term Reserves. The percentage of a fund invested in highly liquid, short-term securities that can be readily converted to cash.
Turnover Rate. An indication of the fund’s trading activity. Funds with high turnover rates incur higher transaction costs and may be more likely to distribute capital gains (which may be taxable to investors). The turnover rate excludes in-kind transactions, which have minimal impact on costs.
34
This page intentionally left blank.
The People Who Govern Your Fund
The trustees of your mutual fund are there to see that the fund is operated and managed in your best interests since, as a shareholder, you are a part owner of the fund. Your fund’s trustees also serve on the board of directors of The Vanguard Group, Inc., which is owned by the Vanguard funds and provides services to them on an at-cost basis.
A majority of Vanguard’s board members are independent, meaning that they have no affiliation with Vanguard or the funds they oversee, apart from the sizable personal investments they have made as private individuals.
Our independent board members bring distinguished backgrounds in business, academia, and public service to their task of working with Vanguard officers to establish the policies and oversee the activities of the funds. Among board members’ responsibilities are selecting investment advisors for the funds; monitoring fund operations, performance, and costs; reviewing contracts; nominating and selecting new trustees/directors; and electing Vanguard officers.
Each trustee serves a fund until its termination; or until the trustee’s retirement, resignation, or death; or otherwise as specified in the fund’s organizational documents. Any trustee may be removed at a shareholders’ meeting by a vote representing two-thirds of the net asset value of all shares of the fund together with shares of other Vanguard funds organized within the same trust. The table on these two pages shows information for each trustee and executive officer of the fund. The mailing address of the trustees and officers is P.O. Box 876, Valley Forge, PA 19482.
Chairman of the Board, Chief Executive Officer, and Trustee |
| |
John J. Brennan1 | |
Born 1954 | Principal Occupation(s) During the Past Five Years: Chairman of the Board, Chief Executive |
Trustee since May 1987; | Officer, and Director/Trustee of The Vanguard Group, Inc., and of each of the investment |
Chairman of the Board and | companies served by The Vanguard Group. |
Chief Executive Officer | |
147 Vanguard Funds Overseen | |
| |
Independent Trustees | |
| |
Charles D. Ellis | |
Born 1937 | Principal Occupation(s) During the Past Five Years: Applecore Partners (pro bono ventures |
Trustee since January 2001 | in education); Senior Advisor to Greenwich Associates (international business strategy |
147 Vanguard Funds Overseen | consulting); Successor Trustee of Yale University; Overseer of the Stern School of Business |
| at New York University; Trustee of the Whitehead Institute for Biomedical Research. |
| |
Rajiv L. Gupta | |
Born 1945 | Principal Occupation(s) During the Past Five Years: Chairman and Chief Executive Officer |
Trustee since December 20012 | of Rohm and Haas Co. (chemicals); Board Member of the American Chemistry Council; |
147 Vanguard Funds Overseen | Director of Tyco International, Ltd. (diversified manufacturing and services) since 2005; |
| Trustee of Drexel University and of the Chemical Heritage Foundation. |
| |
Amy Gutmann | |
Born 1949 | Principal Occupation(s) During the Past Five Years: President of the University of |
Trustee since June 2006 | Pennsylvania since 2004; Professor in the School of Arts and Sciences, Annenberg School |
147 Vanguard Funds Overseen | for Communication, and Graduate School of Education of the University of Pennsylvania |
| since 2004; Provost (2001–2004) and Laurance S. Rockefeller Professor of Politics and the |
| University Center for Human Values (1990–2004), Princeton University; Director of Carnegie |
| Corporation of New York since 2005 and of Schuylkill River Development Corporation and |
| Greater Philadelphia Chamber of Commerce since 2004. |
JoAnn Heffernan Heisen | |
Born 1950 | Principal Occupation(s) During the Past Five Years: Corporate Vice President and Chief |
Trustee since July 1998 | Global Diversity Officer since 2006, Vice President and Chief Information Officer |
147 Vanguard Funds Overseen | (1997–2005), and Member of the Executive Committee of Johnson & Johnson |
| (pharmaceuticals/consumer products); Director of the University Medical Center |
| at Princeton and Women’s Research and Education Institute. |
| |
André F. Perold | |
Born 1952 | Principal Occupation(s) During the Past Five Years: George Gund Professor of Finance |
Trustee since December 2004 | and Banking, Harvard Business School; Senior Associate Dean, Director of Faculty |
147 Vanguard Funds Overseen | Recruiting, and Chair of Finance Faculty, Harvard Business School; Director and Chairman |
| of UNX, Inc. (equities trading firm) since 2003; Chair of the Investment Committee of |
| HighVista Strategies LLC (private investment firm) since 2005; Director of registered |
| investment companies advised by Merrill Lynch Investment Managers and affiliates |
| (1985–2004), Genbel Securities Limited (South African financial services firm) |
| (1999–2003), Gensec Bank (1999–2003), Sanlam, Ltd. (South African insurance |
| company) (2001–2003), and Stockback, Inc. (credit card firm) (2000–2002). |
| |
Alfred M. Rankin, Jr. | |
Born 1941 | Principal Occupation(s) During the Past Five Years: Chairman, President, Chief Executive |
Trustee since January 1993 | Officer, and Director of NACCO Industries, Inc. (forklift trucks/housewares/lignite); Director |
147 Vanguard Funds Overseen | of Goodrich Corporation (industrial products/aircraft systems and services). |
| |
J. Lawrence Wilson | |
Born 1936 | Principal Occupation(s) During the Past Five Years: Retired Chairman and Chief Executive |
Trustee since April 1985 | Officer of Rohm and Haas Co. (chemicals); Director of Cummins Inc. (diesel engines) and |
147 Vanguard Funds Overseen | AmerisourceBergen Corp. (pharmaceutical distribution); Trustee of Vanderbilt University |
| and of Culver Educational Foundation. |
| |
Executive Officers1 | |
| |
Heidi Stam | |
Born 1956 | Principal Occupation(s) During the Past Five Years: Managing Director of The Vanguard |
Secretary since July 2005 | Group, Inc., since 2006; General Counsel of The Vanguard Group since 2005; Secretary of |
147 Vanguard Funds Overseen | The Vanguard Group, and of each of the investment companies served by The Vanguard |
| Group, since 2005; Principal of The Vanguard Group (1997–2006). |
| |
Thomas J. Higgins | |
Born 1957 | Principal Occupation(s) During the Past Five Years: Principal of The Vanguard Group, Inc.; |
Treasurer since July 1998 | Treasurer of each of the investment companies served by The Vanguard Group. |
147 Vanguard Funds Overseen | |
| |
Vanguard Senior Management Team |
| |
R. Gregory Barton | Kathleen C. Gubanich | Michael S. Miller |
Mortimer J. Buckley | Paul A. Heller | Ralph K. Packard |
James H. Gately | F. William McNabb, III | George U. Sauter |
| |
Founder | |
| |
John C. Bogle | |
Chairman and Chief Executive Officer, 1974–1996 |
1 Officers of the funds are “interested persons” as defined in the Investment Company Act of 1940.
2 December 2002 for Vanguard Equity Income Fund, Vanguard Growth Equity Fund, the Vanguard Municipal Bond Funds, and the Vanguard State Tax-Exempt Funds.
More information about the trustees is in the Statement of Additional Information,available from The Vanguard Group
.
P.O. Box 2600
Valley Forge, PA 19482-2600
Connect with Vanguard® > www.vanguard.com
Fund Information > 800-662-7447 | Vanguard, Connect with Vanguard ,and the ship logo are |
| trademarks of The Vanguard Group, Inc. |
Direct Investor Account Services > 800-662-2739 | |
| All other marks are the exclusive property of their |
Institutional Investor Services > 800-523-1036 | respective owners. |
| |
Text Telephone for the | |
Hearing-Impaired > 800-952-3335 | All comparative mutual fund data are from Lipper Inc. |
| or Morningstar, Inc., unless otherwise noted. |
| |
| |
| You can obtain a free copy of Vanguard’s proxy voting |
| guidelines by visiting our website, www.vanguard.com, |
This material may be used in conjunction | and searching for “proxy voting guidelines,” or by calling |
with the offering of shares of any Vanguard | Vanguard at 800-662-2739. They are also available from |
fund only if preceded or accompanied by | the SEC’s website, www.sec.gov. In addition, you may |
the fund’s current prospectus. | obtain a free report on how your fund voted the proxies for |
| securities it owned during the 12 months ended June 30. |
| To get the report, visit either www.vanguard.com |
| or www.sec.gov. |
| |
| |
| |
| You can review and copy information about your fund |
| at the SEC’s Public Reference Room in Washington, D.C. |
| To find out more about this public service, call the SEC |
| at 202-551-8090. Information about your fund is also |
| available on the SEC’s website, and you can receive |
| copies of this information, for a fee, by sending a |
| request in either of two ways: via e-mail addressed to |
| publicinfo@sec.gov or via regular mail addressed to the |
| Public Reference Section, Securities and Exchange |
| Commission, Washington, DC 20549-0102. |
| |
| |
| |
| |
| © 2007 The Vanguard Group, Inc. |
| All rights reserved. |
| Vanguard Marketing Corporation, Distributor. |
| |
| Q1292 052007 |
| |
Vanguard® Strategic Small-Cap Equity Fund |
| |
| |
| |
> Semiannual Report | |
| |
| |
| |
March 31, 2007 | |
| |
| |
| |
| 
|
| |
| |
| |
| |
| |
| |
| |
> During the first half of its 2007 fiscal year, Vanguard Strategic Small-Cap Equity Fund returned 12.3%, a hair short of the return of its small-capitalization market index, but ahead of the broad market and its mutual fund peers.
> The fund’s strong return—and its outperformance of the overall stock market—was driven by its emphasis on small-cap stocks, which registered solid returns during the six months.
> Steel companies, household product companies, and technology shares were among the fund’s top performers, while several finance-related companies were among its poorest performers.
Contents | |
| |
Your Fund’s Total Returns | 1 |
Chairman’s Letter | 2 |
Advisor’s Report | 6 |
Fund Profile | 8 |
Performance Summary | 9 |
Financial Statements | 10 |
About Your Fund’s Expenses | 23 |
Trustees Approve Advisory Arrangement | 25 |
Glossary | 26 |
Please note: The opinions expressed in this report are just that—informed opinions. They should not be considered promises or advice. Also, please keep in mind that the information and opinions cover the period through the date on the cover of this report. Of course, the risks of investing in your fund are spelled out in the prospectus.
Your Fund’s Total Returns
Six Months Ended March 31, 2007 | |
| Total |
| Returns |
Vanguard Strategic Small-Cap Equity Fund | 12.3% |
MSCI US Small Cap 1750 Index | 12.4 |
Average Small-Cap Core Fund1 | 11.2 |
Dow Jones Wilshire 5000 Index | 8.9 |
Your Fund’s Performance at a Glance | | | | |
September 30, 2006–March 31, 2007 | | | | |
| | | Distributions Per Share |
| Starting | Ending | Income | Capital |
| Share Price | Share Price | Dividends | Gains |
Vanguard Strategic Small-Cap Equity Fund | $19.04 | $21.22 | $0.150 | $0.000 |
1 Derived from data provided by Lipper Inc.
1

Chairman’s Letter
Dear Shareholder,
Vanguard Strategic Small-Cap Equity Fund returned 12.3% during the first half of its fiscal year, a six-month period that was especially favorable for small stocks. The fund’s strong performance was well ahead of the return of the broad U.S. stock market and was essentially in line with the small-cap index that it closely follows.
The first table on page 1 shows the total returns (capital change plus reinvested distributions) for the fund and its comparative measures.
Six-month stock market return reflected disparate market moods
The broad U.S. stock market stitched together a solid six-month return from patches of strength and weakness. Stock prices rallied at the start of the period, pulled back in February—in part, a reaction to the Chinese market’s swoon—then recovered in March, buoyed by generally benign economic and corporate-profit reports.
Small-capitalization stocks outpaced large-caps, and international stocks outperformed their U.S. counterparts—patterns that have been in place for much of the past few years.
As the Fed sat tight, bonds produced coupon-like returns
The Federal Reserve Board remained offstage during the six months, keeping its target for the federal funds rate at
2
5.25% throughout the period. Despite some interim back-and-forth, longer-term bond yields finished the period pretty much where they started. With rates—and prices—more or less stable, bond returns were consistent with their coupons.
The broad taxable bond market returned 2.8% for the six-month period. The municipal securities market posted a return of 1.9%. Money market instruments, one of the fixed income market’s bright spots in recent months, returned 2.5% for the half-year, as measured by the Citigroup 3-Month Treasury Bill Index.
Small-caps shine, drive fund’s return
Your fund’s six-month return of 12.3% was excellent in absolute terms and solid when compared with the return of the broad U.S.
stock market and the MSCI US Small Cap 1750 Index. A double-digit return in just a half-year is certainly something to be grateful for, but it should never be something that you expect from any investment.
By design, the Strategic Small-Cap Equity Fund’s sector weightings vary little from those of the index benchmark. The fund’s advisor, Vanguard Quantitative Equity Group, uses computer models to identify stocks in each sector that have the most promise of outpacing the index. This means that although the weightings of the fund and the index will be similar, the returns within sectors will often be different. Attempting to make these differences positive is what active management is all about.
Market Barometer | | | |
| | | Total Returns |
| | Periods Ended March 31, 2007 |
| Six Months | One Year | Five Years1 |
Stocks | | | |
Russell 1000 Index (Large-caps) | 8.2% | 11.8% | 6.9% |
Russell 2000 Index (Small-caps) | 11.0 | 5.9 | 10.9 |
Dow Jones Wilshire 5000 Index (Entire market) | 8.9 | 11.4 | 7.8 |
MSCI All Country World Index ex USA (International) | 15.5 | 20.3 | 17.4 |
| | | |
| | | |
Bonds | | | |
Lehman Aggregate Bond Index (Broad taxable market) | 2.8% | 6.6% | 5.4% |
Lehman Municipal Bond Index | 1.9 | 5.4 | 5.5 |
Citigroup 3-Month Treasury Bill Index | 2.5 | 5.0 | 2.5 |
| | | |
| | | |
CPI | | | |
Consumer Price Index | 1.2% | 2.8% | 2.8% |
1 Annualized.
3
For both the fund and the index, each of the ten sectors recorded positive returns. The range of returns among the sectors, however, was wide. Materials companies (which accounted for only about 7% of both the fund and the index) recorded a heady gain of more than 30%, while financials provided a small single-digit return.
The fund’s selections in the materials sector—primarily several big-gaining steel producers—gave the fund an edge over the index. However, the fund gave up some ground to the benchmark among consumer discretionary and financials stocks. Financials stocks, especially thrifts and mortgage finance companies that were stung by the fallout in the subprime market, had a difficult six months. Your fund’s performance in this sector—its largest sector, at an average of about 20% of assets—was a bit worse than the index’s; the fund’s financials stocks returned about 1%, while the index sector gained about 2.5%. See the Advisor’s Report on page 6 for more details on the fund’s stock-ranking model and performance.
At just a year old, the Strategic Small-Cap Equity Fund is a young fund. To more fully assess your fund’s performance, we will need to evaluate it over a longer time span. We believe, however, that the fund’s disciplined approach to selecting small-cap stocks and its low costs provide it with two important keys to long-term success.
Annualized Expense Ratios1 | | |
Your fund compared with its peer group | | |
| | Average |
| | Small-Cap |
| Fund | Core Fund |
Strategic Small-Cap Equity Fund | 0.39% | 1.50% |
1 Fund expense ratio reflects the six months ended March 31, 2007. Peer-group expense ratio is derived from data provided by Lipper Inc. and captures information through year-end 2006.
4
A stock market guarantee: Prices will fluctuate
During the past six months, stock prices did what they have always done and will forever do: They fluctuated. When all was said and done, the fluctuations added up to a rewarding half-year for your fund. But, of course, volatility can have a downside as well.
Fortunately, the key to meeting your long-term investment goals does not involve calculating when market fluctuations will work against you and when they will work in your favor. Rather, it involves building a portfolio that is diversified among asset classes and within them. The Strategic
Small-Cap Equity Fund can play an important role in such a portfolio by providing disciplined, low-cost exposure to small-cap stocks.
Thank you for investing with Vanguard.
Sincerely,

John J. Brennan
Chairman and Chief Executive Officer
April 16, 2007
5
Advisor’s Report
For the six months ended March 31, 2007, Vanguard Strategic Small-Cap Equity Fund returned 12.3%, slightly lagging the gain of the MSCI US Small Cap 1750 Index but topping the 11.2% average return of small-cap core mutual funds. The broad U.S. stock market returned 8.9%.
The investment environment
During this period, small- and mid-capitalization stocks once again outperformed their large-cap brethren. Large-cap stocks, which are not included in our benchmark, returned about 7%, while mid-cap and small-cap stocks each gained about 12%.
Over the past several years, smaller stocks have tended to outperform larger stocks. This tendency has caused the fund’s benchmark index to outperform broad market averages, which are dominated by large-cap stocks. Because our strategy ties the fund tightly to the benchmark, its rise helped lift our performance above the broad market.
However, it is likely that in some future period this market tendency will reverse. When that happens, the fund’s return—reflecting our portfolio risk control, which links us to our benchmark—will likely lag behind that of large-cap-dominated market indexes. We cannot predict when this change will occur, and we will not modify our management of the fund in an attempt to anticipate it. Our goal is to outperform the fund’s small-cap benchmark, not to time changes in market factors. In our opinion, the potential rewards associated with timing market factors are not worth the additional risk.
Our investment approach
During the past six months, our model was quite successful in evaluating stocks. Unfortunately, we were not able to translate that success into our portfolio’s return.
To oversimplify, our fund’s performance has three components: the return of the benchmark, our model’s stock-picking ability, and some amount of “luck.” The luck component during this period was negative, so despite the stock-picking success of our model, the specific stocks we placed in the portfolio did not perform as well.
This can occur for a number of reasons, the primary one being that we are unable to own every stock our model finds attractive. Since we must select a subset of those stocks to form our portfolio, there will be times when the subset we own doesn’t match the performance of all of the stocks we find attractive. Over the long run, though, we expect that this luck effect will average out to zero.
The heart of our process is our stock-selection model. It contains three elements, each of which measures a stock’s attractiveness relative to its capitalization and industry peers. The first element measures a stock’s valuation; the second evaluates earnings quality; and the last considers market sentiment.
6
These three elements are combined into an overall rating for each stock. To construct our portfolio, we combine the stock ratings with risk measures to minimize our exposure to industry-specific and other risks. The resulting portfolio should capture the benchmark’s return plus the result of our model’s stock selection.
The fund’s successes and shortfalls
Our best performance over the six months was in the materials industry, where our model picked Celanese, Steel Dynamics, and AK Steel, each of which was up dramatically for the period. Our model was also successful in the household products and technology industries. Conversely, the model underperformed in the banking industry, picking Whitney Holding, whose price fell.
These disparate results in the same period are typical of a quantitative process like ours and of a portfolio that holds many securities. We take significant stock-specific risk in the portfolio as we attempt to outperform our benchmark. Such risk can reward or punish us in the near term. Over the long term, however, our process has worked well across the funds that we manage.
We look forward to the remainder of this fiscal year, believing that the Strategic Small-Cap Equity Fund offers a mix of stocks with attractive valuation and growth characteristics relative to its underlying benchmark.
James P. Stetler, Principal and
Portfolio Manager
Joel M. Dickson, Principal
Vanguard Quantitative Equity Group
April 11, 2007
7
Fund Profile
As of March 31, 2007
Portfolio Characteristics | | |
| | Comparative | Broad |
| Fund | Index1 | Index2 |
Number of Stocks | 478 | 1,703 | 4,948 |
Median Market Cap | $1.7B | $1.8B | $30.6B |
Price/Earnings Ratio | 17.0x | 22.8x | 17.6x |
Price/Book Ratio | 2.4x | 2.5x | 2.8x |
Yield | 0.8% | 1.2% | 1.7% |
Return on Equity | 12.2% | 12.0% | 16.9% |
Earnings Growth Rate | 19.4% | 18.0% | 20.8% |
Foreign Holdings | 0.1% | 0.0% | 0.7% |
Turnover Rate | 56%3 | — | — |
Expense Ratio | 0.39%3 | — | — |
Short-Term Reserves | 0% | — | — |
Sector Diversification (% of portfolio) | |
| | Comparative | Broad |
| Fund | Index1 | Index2 |
Consumer Discretionary | 15% | 15% | 12% |
Consumer Staples | 3 | 3 | 9 |
Energy | 7 | 7 | 9 |
Financials | 20 | 20 | 22 |
Health Care | 10 | 10 | 11 |
Industrials | 16 | 16 | 11 |
Information Technology | 16 | 16 | 15 |
Materials | 7 | 7 | 4 |
Telecommunication | | | |
Services | 1 | 1 | 3 |
Utilities | 5 | 5 | 4 |
Ten Largest Holdings4 (% of total net assets) |
| | |
Avnet, Inc. | technology | |
| distributors | 0.5% |
Steel Dynamics, Inc. | steel | 0.5 |
Celanese Corp. Series A | commodity | |
| chemicals | 0.5 |
Brocade Communications | computer storage | |
Systems, Inc. | and peripherals | 0.5 |
The Manitowoc Co., Inc. | construction and | |
| farm machinery and | |
| heavy trucks | 0.5 |
Helmerich & Payne, Inc. | oil and gas drilling | 0.4 |
OGE Energy Corp. | multi-utilities | 0.4 |
NBTY, Inc. | personal products | 0.4 |
Trinity Industries, Inc. | construction and | |
| farm machinery and | |
| heavy trucks | 0.4 |
Mettler-Toledo | electronic equipment | |
International Inc. | manufacturers | 0.4 |
Top Ten | | 4.5% |
Investment Focus
1 MSCI US Small Cap 1750 Index.
2 Dow Jones Wilshire 5000 Index.
3 Annualized.
4 “Ten Largest Holdings” excludes any temporary cash investments and equity index products. See page 26 for a glossary of investment terms.
8
Performance Summary
All of the returns in this report represent past performance, which is not a guarantee of future results that may be achieved by the fund. (Current performance may be lower or higher than the performance data cited. For performance data current to the most recent month-end, visit our website at www.vanguard.com/performance.) Note, too, that both investment returns and principal value can fluctuate widely, so an investor’s shares, when sold, could be worth more or less than their original cost. The returns shown do not reflect taxes that a shareholder would pay on fund distributions or on the sale of fund shares.
Fiscal-Year Total Returns (%): April 24, 2006–March 31, 2007
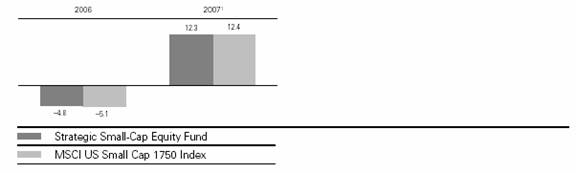
Average Annual Total Returns: Periods Ended March 31, 2007 |
| | |
| Inception Date | Since Inception |
Strategic Small-Cap Equity Fund | 4/24/2006 | 6.82% |
1 Six months ended March 31, 2007.
Note: See Financial Highlights table on page 19 for dividend and capital gains information.
9
Financial Statements (unaudited)
Statement of Net Assets
As of March 31, 2007
The fund provides a complete list of its holdings four times in each fiscal year, at the quarter-ends. For the second and fourth fiscal quarters, the lists appear in the fund’s semiannual and annual reports to shareholders. For the first and third fiscal quarters, the fund files the lists with the Securities and Exchange Commission on Form N-Q. Shareholders can look up the fund’s Forms N-Q on the SEC’s website at www.sec.gov. Forms N-Q may also be reviewed and copied at the SEC’s Public Reference Room (see the back cover of this report for further information).
| | | Market |
| | | Value• |
| | Shares | ($000) |
Common Stocks (99.7%)1 | | |
Consumer Discretionary (15.4%) | | |
| Phillips-Van Heusen Corp. | 17,700 | 1,041 |
* | AnnTaylor Stores Corp. | 24,345 | 944 |
| Saks Inc. | 44,461 | 927 |
| Men’s Wearhouse, Inc. | 18,955 | 892 |
* | Payless ShoeSource, Inc. | 25,003 | 830 |
* | Jack in the Box Inc. | 11,600 | 802 |
| Meredith Corp. | 13,800 | 792 |
| Tempur-Pedic International Inc. | 30,100 | 782 |
| Bob Evans Farms, Inc. | 21,087 | 779 |
| Domino’s Pizza, Inc. | 23,812 | 773 |
| OfficeMax, Inc. | 14,300 | 754 |
| Dillard’s Inc. | 23,033 | 754 |
* | Charming Shoppes, Inc. | 57,250 | 741 |
* | Gemstar–TV Guide | | |
| International, Inc. | 172,800 | 724 |
| Ruby Tuesday, Inc. | 25,298 | 724 |
| Burger King Holdings Inc. | 32,996 | 713 |
| Steven Madden, Ltd. | 24,395 | 712 |
| Jackson Hewitt | | |
| Tax Service Inc. | 21,652 | 697 |
| ArvinMeritor, Inc. | 37,800 | 690 |
* | Harris Interactive Inc. | 114,032 | 688 |
* | DSW Inc. Class A | 16,200 | 684 |
* | The Dress Barn, Inc. | 32,592 | 678 |
| Service Corp. International | 56,490 | 670 |
| Movado Group, Inc. | 22,703 | 669 |
| CSS Industries, Inc. | 17,700 | 663 |
| Sally Beauty Co. Inc. | 71,900 | 661 |
| Stewart Enterprises, Inc. | | |
| Class A | 81,920 | 660 |
| K-Swiss, Inc. | 24,205 | 654 |
| Asbury Automotive Group, Inc. | 22,557 | 637 |
| Sealy Corp. | 36,400 | 636 |
| Ethan Allen Interiors, Inc. | 17,928 | 634 |
| Harte-Hanks, Inc. | 22,846 | 630 |
| Dover Downs Gaming & | | |
| Entertainment, Inc. | 48,928 | 630 |
* | Penn National Gaming, Inc. | 14,600 | 619 |
| Brown Shoe Co., Inc. | 14,570 | 612 |
| Thor Industries, Inc. | 15,400 | 607 |
* | Charlotte Russe Holding Inc. | 20,100 | 580 |
* | WMS Industries, Inc. | 13,800 | 542 |
| American Greetings Corp. | | |
| Class A | 22,900 | 531 |
* | TRW Automotive | | |
| Holdings Corp. | 15,110 | 526 |
| Group 1 Automotive, Inc. | 13,189 | 525 |
| Kimball International, Inc. | | |
| Class B | 25,300 | 488 |
* | Skechers U.S.A., Inc. | 14,318 | 481 |
* | Papa John’s International, Inc. | 16,115 | 474 |
*^ Select Comfort Corp. | 26,069 | 464 |
| ITT Educational Services, Inc. | 5,600 | 456 |
| IHOP Corp. | 7,589 | 445 |
* | Cox Radio, Inc. | 31,806 | 434 |
* | Tenneco Automotive, Inc. | 16,600 | 423 |
* | Aeropostale, Inc. | 10,000 | 402 |
* | Spanish Broadcasting | | |
| System, Inc. | 100,065 | 400 |
| Catalina Marketing Corp. | 10,400 | 328 |
* | Visteon Corp. | 37,800 | 323 |
* | Bluegreen Corp. | 28,500 | 322 |
* | Laureate Education Inc. | 5,353 | 316 |
| Claire’s Stores, Inc. | 9,570 | 307 |
| Sotheby’s | 6,311 | 281 |
* | The Goodyear | | |
| Tire & Rubber Co. | 8,700 | 271 |
| Building Materials | | |
| Holding Corp. | 14,400 | 261 |
*^ Chipotle Mexican Grill, Inc. | 4,000 | 248 |
| Barnes & Noble, Inc. | 6,100 | 241 |
* | Dick’s Sporting Goods, Inc. | 3,600 | 210 |
| Ryland Group, Inc. | 4,130 | 174 |
* | Pacific Sunwear of | | |
| California, Inc. | 7,682 | 160 |
| United Auto Group, Inc. | 7,700 | 156 |
| John Wiley & Sons Class A | 4,100 | 155 |
* | Denny’s Corp. | 28,700 | 141 |
10
| | | Market |
| | | Value• |
| | Shares | ($000) |
| Choice Hotels International, Inc. | 3,800 | 135 |
| The Buckle, Inc. | 2,748 | 98 |
| CBRL Group, Inc. | 1,224 | 57 |
| | | 37,458 |
Consumer Staples (3.0%) | | |
* | NBTY, Inc. | 19,900 | 1,055 |
| Corn Products | | |
| International, Inc. | 26,905 | 958 |
| Del Monte Foods Co. | 68,061 | 781 |
| Ruddick Corp. | 24,881 | 748 |
* | Rite Aid Corp. | 99,700 | 575 |
| Lancaster Colony Corp. | 12,744 | 563 |
* | Prestige Brands Holdings Inc. | 45,100 | 534 |
| Longs Drug Stores, Inc. | 9,600 | 496 |
| ^Vector Group Ltd. | 21,843 | 409 |
| The Great Atlantic & | | |
| Pacific Tea Co., Inc. | 11,800 | 392 |
* | Hansen Natural Corp. | 7,500 | 284 |
| Alberto-Culver Co. | 7,800 | 178 |
* | Herbalife Ltd. | 4,500 | 176 |
* | Central Garden & Pet Co. | | |
| Class A | 7,530 | 111 |
| Premium Standard Farms Inc. | 2,186 | 46 |
| | | 7,306 |
Energy (7.0%) | | |
| Helmerich & Payne, Inc. | 35,428 | 1,075 |
* | Superior Energy Services, Inc. | 30,253 | 1,043 |
| Tidewater Inc. | 17,765 | 1,041 |
| Holly Corp. | 15,636 | 927 |
| Frontier Oil Corp. | 28,144 | 919 |
* | SEACOR Holdings Inc. | 8,371 | 824 |
* | W-H Energy Services, Inc. | 17,448 | 816 |
| OMI Corp. | 29,500 | 792 |
* | Unit Corp. | 15,190 | 768 |
* | Trico Marine Services, Inc. | 19,700 | 734 |
* | Grey Wolf, Inc. | 104,500 | 700 |
*^ Hercules Offshore, Inc. | 26,000 | 683 |
* | Parker Drilling Co. | 72,600 | 682 |
* | USEC Inc. | 39,700 | 645 |
* | Pioneer Drilling Co. | 50,600 | 642 |
* | TETRA Technologies, Inc. | 24,800 | 613 |
* | Basic Energy Services Inc. | 25,700 | 599 |
* | Swift Energy Co. | 13,829 | 578 |
* | Complete Production | | |
| Services, Inc. | 28,400 | 565 |
| W&T Offshore, Inc. | 15,352 | 444 |
* | Atwood Oceanics, Inc. | 6,259 | 367 |
* | Todco Class A | 7,372 | 297 |
* | Lone Star Technologies, Inc. | 3,350 | 221 |
| St. Mary Land & Exploration Co. | 5,886 | 216 |
* | Giant Industries, Inc. | 2,700 | 204 |
* | Hanover Compressor Co. | 8,900 | 198 |
* | Oil States International, Inc. | 4,100 | 132 |
| Berry Petroleum Class A | 3,900 | 120 |
| RPC Inc. | 5,300 | 88 |
| | | 16,933 |
Financials (19.9%) | | |
| Webster Financial Corp. | 19,908 | 956 |
| Bank of Hawaii Corp. | 17,900 | 949 |
| Raymond James Financial, Inc. | 31,900 | 949 |
* | Philadelphia Consolidated | | |
| Holding Corp. | 20,447 | 899 |
| American Financial Group, Inc. | 26,000 | 885 |
| ^Downey Financial Corp. | 11,936 | 770 |
| Odyssey Re Holdings Corp. | 19,400 | 763 |
| Mack-Cali Realty Corp. REIT | 15,920 | 758 |
| Taubman Co. REIT | 12,810 | 743 |
| BRE Properties Inc. | | |
| Class A REIT | 11,640 | 735 |
| Trustmark Corp. | 26,222 | 735 |
| Aspen Insurance | | |
| Holdings Ltd. | 28,000 | 734 |
| Zenith National | | |
| Insurance Corp. | 15,291 | 723 |
| Essex Property | | |
| Trust, Inc. REIT | 5,560 | 720 |
| The Hanover Insurance | | |
| Group Inc. | 15,400 | 710 |
| Reinsurance Group of | | |
| America, Inc. | 12,080 | 697 |
| Park National Corp. | 7,300 | 690 |
| United Bankshares, Inc. | 19,700 | 690 |
| Cash America International Inc. | 16,313 | 669 |
| HRPT Properties Trust REIT | 54,200 | 667 |
* | First Federal Financial Corp. | 11,628 | 661 |
| Commerce Group, Inc. | 21,600 | 649 |
* | Piper Jaffray Cos., Inc. | 10,286 | 637 |
| Susquehanna Bancshares, Inc. | 27,200 | 631 |
| Advanta Corp. Class B | 14,300 | 627 |
* | Primus Guaranty, Ltd. | 50,992 | 627 |
| BankUnited Financial Corp. | 29,500 | 626 |
| Hancock Holding Co. | 14,210 | 625 |
| BancFirst Corp. | 13,426 | 622 |
* | EZCORP, Inc. | 42,139 | 621 |
| Endurance Specialty | | |
| Holdings Ltd. | 16,800 | 600 |
| ^IndyMac Bancorp, Inc. | 18,631 | 597 |
| ^Corus Bankshares Inc. | 34,656 | 591 |
| Hanmi Financial Corp. | 31,000 | 591 |
| BancorpSouth, Inc. | 24,088 | 589 |
| Highwood Properties, Inc. | | |
| REIT | 14,810 | 585 |
| Nationwide Health | | |
| Properties, Inc. REIT | 18,400 | 575 |
| Community Trust Bancorp Inc. | 15,616 | 566 |
| Home Properties, Inc. REIT | 10,700 | 565 |
| Ohio Casualty Corp. | 18,700 | 560 |
| First Community | | |
| Bancshares, Inc. | 14,320 | 558 |
| Independent Bank Corp. (MI) | 26,955 | 549 |
| Mid-America Apartment | | |
| Communities, Inc. REIT | 9,570 | 538 |
| Maguire Properties, Inc. REIT | 14,680 | 522 |
11
| | | Market |
| | | Value• |
| | Shares | ($000) |
| Colonial Properties Trust REIT | 11,170 | 510 |
| Post Properties, Inc. REIT | 11,160 | 510 |
| City Holding Co. | 12,362 | 500 |
| Pennsylvania REIT | 11,270 | 500 |
| WSFS Financial Corp. | 7,750 | 500 |
| Cousins Properties, Inc. REIT | 15,100 | 496 |
| Safety Insurance Group, Inc. | 12,240 | 491 |
| Jones Lang LaSalle Inc. | 4,570 | 477 |
| Tanger Factory Outlet | | |
| Centers, Inc. REIT | 11,300 | 456 |
| Harleysville Group, Inc. | 13,598 | 442 |
| New Plan Excel | | |
| Realty Trust REIT | 13,000 | 429 |
| The First Marblehead Corp. | 9,550 | 429 |
| Peoples Bancorp, Inc. | 16,212 | 428 |
| PFF Bancorp, Inc. | 13,857 | 420 |
| Rayonier Inc. REIT | 9,620 | 414 |
| Cedar Shopping | | |
| Centers, Inc. REIT | 25,100 | 407 |
* | Affordable Residential | | |
| Communities | 33,100 | 401 |
| Annaly Mortgage | | |
| Management Inc. REIT | 25,600 | 396 |
| Glimcher Realty Trust REIT | 14,600 | 394 |
| Sterling Financial Corp. | 12,336 | 385 |
| IPC Holdings Ltd. | 13,300 | 384 |
| Brandywine Realty Trust REIT | 11,070 | 370 |
| Sterling Bancshares, Inc. | 32,892 | 368 |
| Thornburg Mortgage, Inc. REIT | 14,170 | 368 |
| Federal Realty | | |
| Investment Trust REIT | 3,970 | 360 |
| Camden Property Trust REIT | 4,900 | 345 |
| SL Green Realty Corp. REIT | 2,471 | 339 |
| Sun Communities, Inc. REIT | 10,700 | 332 |
| Sky Financial Group, Inc. | 12,103 | 325 |
| Anchor Bancorp Wisconsin Inc. | 11,357 | 322 |
| Old National Bancorp | 16,740 | 304 |
| Senior Housing | | |
| Properties Trust REIT | 12,200 | 292 |
| CBL & Associates | | |
| Properties, Inc. REIT | 6,210 | 278 |
| Health Care Inc. REIT | 6,300 | 277 |
| KKR Financial Corp. REIT | 10,030 | 275 |
| Great Southern Bancorp, Inc. | 9,200 | 269 |
| Whitney Holdings Corp. | 8,035 | 246 |
| Sunstone Hotel | | |
| Investors, Inc. REIT | 7,600 | 207 |
| Crescent Real | | |
| Estate, Inc. REIT | 9,960 | 200 |
| Washington REIT | 5,100 | 191 |
| Healthcare Realty | | |
| Trust Inc. REIT | 5,100 | 190 |
| LaSalle Hotel Properties REIT | 4,100 | 190 |
| Corporate Office | | |
| Properties Trust, Inc. REIT | 4,020 | 184 |
| Potlatch Corp. REIT | 4,000 | 183 |
| First Financial Corp. (IN) | 5,812 | 180 |
* | Knight Capital Group, Inc. | | |
| Class A | 11,100 | 176 |
| BioMed Realty Trust, Inc. REIT | 6,600 | 174 |
| Strategic Hotels and | | |
| Resorts, Inc. REIT | 7,600 | 174 |
| First Republic Bank | 3,145 | 169 |
| Advance America, Cash | | |
| Advance Centers, Inc. | 9,852 | 152 |
| Digital Realty Trust, Inc. REIT | 3,610 | 144 |
| U.S.B. Holding Co., Inc. | 6,186 | 140 |
| American Financial | | |
| Realty Trust REIT | 13,400 | 135 |
| LandAmerica Financial | | |
| Group, Inc. | 1,800 | 133 |
| ^American Home Mortgage | | |
| Investment Corp. REIT | 4,900 | 132 |
| FelCor Lodging Trust, Inc. REIT | 5,010 | 130 |
| Equity One, Inc. REIT | 4,400 | 117 |
| PS Business Parks, Inc. REIT | 1,620 | 114 |
| Redwood Trust, Inc. REIT | 2,000 | 104 |
| Franklin Street | | |
| Properties Corp. REIT | 5,270 | 101 |
| Friedman, Billings, | | |
| Ramsey Group, Inc. REIT | 16,600 | 92 |
| United Community Banks, Inc. | 2,600 | 85 |
| First Industrial | | |
| Realty Trust REIT | 1,800 | 82 |
| United Community | | |
| Financial Corp. | 6,599 | 73 |
| Equity Inns, Inc. REIT | 4,200 | 69 |
| Innkeepers USA Trust REIT | 3,700 | 60 |
* | Triad Guaranty, Inc. | 1,377 | 57 |
| West Coast Bancorp | 1,520 | 49 |
| Tompkins Trustco, Inc. | 690 | 29 |
| Newcastle Investment Corp. | | |
| REIT | 1,000 | 28 |
| Spirit Finance Corp. REIT | 1,800 | 27 |
* | Accredited Home | | |
| Lenders Holding Co. | 2,707 | 25 |
| GMH Communities Trust REIT | 2,080 | 21 |
| Lexington Realty Trust REIT | 1,000 | 21 |
| Inland Real Estate Corp. REIT | 1,100 | 20 |
| | | 48,551 |
Health Care (10.0%) | | |
* | Pediatrix Medical Group, Inc. | 17,540 | 1,001 |
* | WellCare Health Plans Inc. | 11,500 | 980 |
* | VCA Antech, Inc. | 23,790 | 864 |
| West Pharmaceutical | | |
| | | | |
| Services, Inc. | 18,190 | 845 |
| Mentor Corp. | 17,900 | 823 |
* | Magellan Health Services, Inc. | 18,994 | 798 |
* | Viasys Healthcare Inc. | 22,829 | 776 |
| STERIS Corp. | 26,600 | 706 |
* | Matria Healthcare, Inc. | 26,400 | 696 |
* | Illumina, Inc. | 23,600 | 691 |
12
| | | Market |
| | | Value• |
| | Shares | ($000) |
* | Sciele Pharma, Inc. | 28,984 | 686 |
* | K-V Pharmaceutical Co. | | |
| Class A | 27,143 | 671 |
* | Alliance Imaging, Inc. | 75,000 | 655 |
* | AMERIGROUP Corp. | 20,700 | 629 |
* | Bio-Rad Laboratories, Inc. | | |
| Class A | 8,706 | 608 |
* | BioMarin Pharmaceutical Inc. | 34,546 | 596 |
| Alpharma, Inc. Class A | 24,512 | 590 |
* | ViroPharma Inc. | 41,098 | 590 |
* | PAREXEL International Corp. | 16,132 | 580 |
* | MedCath Corp. | 21,252 | 580 |
* | Digene Corp. | 13,502 | 573 |
| Datascope Corp. | 15,731 | 569 |
* | Palomar Medical | | |
| Technologies, Inc. | 14,112 | 564 |
* | CONMED Corp. | 18,700 | 547 |
| Vital Signs, Inc. | 10,146 | 527 |
* | Enzon Pharmaceuticals, Inc. | 63,195 | 515 |
* | Haemonetics Corp. | 10,895 | 509 |
* | Alkermes, Inc. | 32,251 | 498 |
* | Psychiatric Solutions, Inc. | 12,000 | 484 |
* | Radiation Therapy | | |
| Services, Inc. | 15,183 | 465 |
* | Molina Healthcare Inc. | 15,006 | 459 |
* | The Medicines Co. | 17,600 | 441 |
* | Adams Respiratory | | |
| Therapeutics, Inc. | 12,400 | 417 |
* | IDEXX Laboratories Corp. | 4,415 | 387 |
* | Zoll Medical Corp. | 14,494 | 386 |
| Medicis Pharmaceutical Corp. | 11,900 | 367 |
* | Applera Corp.–Celera | | |
| Genomics Group | 22,200 | 315 |
* | Sierra Health Services, Inc. | 6,550 | 270 |
* | AMN Healthcare Services, Inc. | 10,139 | 229 |
* | United Surgical | | |
| Partners International, Inc. | 6,100 | 188 |
* | PSS World Medical, Inc. | 8,500 | 180 |
* | Tanox, Inc. | 9,300 | 174 |
* | United Therapeutics Corp. | 3,068 | 165 |
* | Genesis Healthcare Corp. | 2,122 | 134 |
*^ Diversa Corp. | 17,100 | 134 |
* | Noven Pharmaceuticals, Inc. | 4,500 | 104 |
* | eResearch Technology, Inc. | 13,000 | 102 |
* | Onyx Pharmaceuticals, Inc. | 4,000 | 99 |
* | Varian, Inc. | 1,100 | 64 |
* | SurModics, Inc. | 1,700 | 61 |
* | Symmetry Medical Inc. | 2,200 | 36 |
| | | 24,328 |
Industrials (16.0%) | | |
| The Manitowoc Co., Inc. | 17,800 | 1,131 |
| Trinity Industries, Inc. | 25,060 | 1,051 |
| Harsco Corp. | 23,278 | 1,044 |
* | Continental Airlines, Inc. | | |
| Class B | 27,212 | 990 |
| Ryder System, Inc. | 19,609 | 968 |
| Kennametal, Inc. | 13,867 | 938 |
| Acuity Brands, Inc. | 16,042 | 873 |
| Lennox International Inc. | 24,248 | 866 |
* | Gardner Denver Inc. | 24,700 | 861 |
* | United Rentals, Inc. | 30,882 | 849 |
* | Genlyte Group, Inc. | 11,861 | 837 |
* | United Stationers, Inc. | 13,541 | 811 |
| Herman Miller, Inc. | 23,954 | 802 |
* | Foster Wheeler Ltd. | 13,500 | 788 |
| Crane Co. | 19,500 | 788 |
* | Republic Airways Holdings Inc. | 34,300 | 788 |
| The Toro Co. | 15,009 | 769 |
| IKON Office Solutions, Inc. | 53,228 | 765 |
* | Cenveo Inc. | 31,368 | 762 |
| Carlisle Co., Inc. | 17,676 | 759 |
* | GrafTech International Ltd. | 83,100 | 755 |
* | TransDigm Group, Inc. | 20,500 | 746 |
| Steelcase Inc. | 37,474 | 745 |
* | Consolidated Graphics, Inc. | 10,053 | 744 |
| Lincoln Electric Holdings, Inc. | 12,365 | 736 |
* | American Commercial | | |
| Lines Inc. | 22,400 | 704 |
* | Old Dominion | | |
| Freight Line, Inc. | 24,400 | 703 |
| Triumph Group, Inc. | 12,667 | 701 |
| The Timken Co. | 23,000 | 697 |
| Eagle Bulk Shipping Inc. | 34,793 | 675 |
| A.O. Smith Corp. | 17,400 | 665 |
* | Thomas & Betts Corp. | 13,620 | 665 |
| Regal-Beloit Corp. | 13,984 | 649 |
* | Corrections Corp. of America | 12,000 | 634 |
| Mueller Industries Inc. | 21,000 | 632 |
| Adesa, Inc. | 21,800 | 602 |
* | Labor Ready, Inc. | 31,200 | 592 |
* | NCI Building Systems, Inc. | 12,400 | 592 |
* | CBIZ Inc. | 83,200 | 591 |
* | Kansas City Southern | 16,400 | 584 |
| Pacer International, Inc. | 21,400 | 577 |
* | Spherion Corp. | 58,565 | 517 |
* | EMCOR Group, Inc. | 8,500 | 501 |
| Teleflex Inc. | 6,831 | 465 |
* | K&F Industries Holdings | 17,100 | 461 |
| Interface, Inc. | 26,300 | 421 |
* | Builders FirstSource, Inc. | 25,069 | 403 |
* | Amerco, Inc. | 5,356 | 375 |
| American Woodmark Corp. | 10,010 | 368 |
* | WESCO International, Inc. | 5,615 | 353 |
* | Teletech Holdings Inc. | 9,100 | 334 |
| Watson Wyatt & Co. Holdings | 6,300 | 306 |
* | Accuride Corp. | 20,557 | 300 |
* | Armor Holdings, Inc. | 4,420 | 298 |
| Con-way, Inc. | 5,779 | 288 |
| John H. Harland Co. | 5,571 | 285 |
* | YRC Worldwide, Inc. | 6,382 | 257 |
* | Goodman Global, Inc. | 11,900 | 210 |
| Deluxe Corp. | 6,100 | 205 |
13
| | | Market |
| | | Value• |
| | Shares | ($000) |
* | Commercial Vehicle Group Inc. | 8,900 | 183 |
* | PHH Corp. | 5,800 | 177 |
| Kelly Services, Inc. Class A | 5,057 | 163 |
| Bluelinx Holdings Inc. | 15,000 | 157 |
| Watsco, Inc. | 3,000 | 153 |
* | Swift Transportation Co., Inc. | 4,740 | 148 |
* | Dollar Thrifty | | |
| Automotive Group, Inc. | 2,598 | 133 |
| Apogee Enterprises, Inc. | 2,942 | 59 |
| Tennant Co. | 1,800 | 57 |
| MSC Industrial Direct Co., Inc. | | |
| Class A | 900 | 42 |
| | | 39,048 |
Information Technology (15.8%) | | |
* | Avnet, Inc. | 33,899 | 1,225 |
* | Brocade Communications | | |
| Systems, Inc. | 119,100 | 1,134 |
* | Mettler-Toledo | | |
| International Inc. | 11,666 | 1,045 |
* | Convergys Corp. | 40,240 | 1,022 |
* | j2 Global Communications, Inc. | 30,500 | 845 |
* | ON Semiconductor Corp. | 93,824 | 837 |
* | Vishay Intertechnology, Inc. | 59,600 | 833 |
* | Amkor Technology, Inc. | 65,765 | 821 |
* | CommScope, Inc. | 18,900 | 811 |
* | Dolby Laboratories Inc. | 23,380 | 807 |
| Technitrol, Inc. | 30,690 | 804 |
* | SAVVIS, Inc. | 16,700 | 800 |
* | Arris Group Inc. | 55,610 | 783 |
* | Fairchild Semiconductor | | |
| International, Inc. | 46,500 | 777 |
* | Zoran Corp. | 45,116 | 768 |
* | Informatica Corp. | 56,092 | 753 |
* | Sybase, Inc. | 29,315 | 741 |
* | Advanced Energy | | |
| Industries, Inc. | 35,146 | 739 |
* | Interwoven Inc. | 43,628 | 737 |
* | Itron, Inc. | 10,900 | 709 |
* | Vignette Corp. | 37,900 | 704 |
* | Plexus Corp. | 40,965 | 703 |
* | MPS Group, Inc. | 49,250 | 697 |
* | Anixter International Inc. | 10,500 | 692 |
* | Silicon Image, Inc. | 84,200 | 687 |
* | Atmel Corp. | 134,800 | 678 |
* | Mentor Graphics Corp. | 41,107 | 672 |
| Syntel, Inc. | 19,352 | 671 |
| MoneyGram International, Inc. | 23,976 | 666 |
* | Covansys Corp. | 25,971 | 641 |
* | Coherent, Inc. | 20,158 | 640 |
* | MICROS Systems, Inc. | 11,774 | 636 |
* | Transaction Systems | | |
| Architects, Inc. | 19,200 | 622 |
* | Silicon Storage | | |
| Technology, Inc. | 124,800 | 615 |
*^ RF Micro Devices, Inc. | 96,800 | 603 |
* | BearingPoint, Inc. | 75,809 | 581 |
| Agilysys, Inc. | 24,905 | 560 |
* | CSG Systems | | |
| International, Inc. | 21,084 | 528 |
* | Cymer, Inc. | 12,682 | 527 |
* | RealNetworks, Inc. | 66,147 | 519 |
* | Sykes Enterprises, Inc. | 27,700 | 505 |
* | Ditech Networks Inc. | 61,716 | 501 |
* | TTM Technologies, Inc. | 50,600 | 483 |
* | Wright Express Corp. | 15,304 | 464 |
* | Newport Corp. | 27,200 | 445 |
| infoUSA Inc. | 46,100 | 443 |
* | SPSS, Inc. | 11,760 | 425 |
* | ManTech International Corp. | 12,525 | 418 |
* | Komag, Inc. | 12,700 | 416 |
| Gevity HR, Inc. | 20,214 | 399 |
* | Hyperion Solutions Corp. | 7,300 | 378 |
*^ OmniVision Technologies, Inc. | 28,768 | 373 |
* | Finisar Corp. | 96,400 | 337 |
* | Asyst Technologies, Inc. | 45,400 | 319 |
* | Emulex Corp. | 16,870 | 309 |
* | Veeco Instruments, Inc. | 15,400 | 300 |
| Global Payments Inc. | 7,100 | 242 |
| Imation Corp. | 5,300 | 214 |
* | Interdigital | | |
| Communications Corp. | 6,652 | 211 |
* | Tech Data Corp. | 5,800 | 208 |
| Acxiom Corp. | 8,003 | 171 |
| CTS Corp. | 11,100 | 153 |
* | Avocent Corp. | 5,303 | 143 |
* | eFunds Corp. | 5,269 | 140 |
* | LoopNet, Inc. | 6,800 | 116 |
| ADTRAN Inc. | 4,700 | 114 |
* | Websense, Inc. | 4,935 | 113 |
* | Trident Microsystems, Inc. | 5,512 | 111 |
* | Tyler Technologies, Inc. | 7,000 | 89 |
| Jack Henry & Associates Inc. | 3,100 | 75 |
* | Cirrus Logic, Inc. | 8,648 | 66 |
| Methode Electronics, Inc. | | |
| Class A | 3,998 | 59 |
* | Global Imaging Systems, Inc. | 3,000 | 59 |
* | TriQuint Semiconductor, Inc. | 9,000 | 45 |
* | Internap Network | | |
| Services Corp. | 2,600 | 41 |
* | eSPEED, Inc. Class A | 2,200 | 21 |
| | | 38,539 |
Materials (6.6%) | | |
| Steel Dynamics, Inc. | 27,566 | 1,191 |
| Celanese Corp. Series A | 37,722 | 1,163 |
| Chaparral Steel Co. | 17,076 | 993 |
| | | | |
| Albemarle Corp. | 23,200 | 959 |
| Cleveland-Cliffs Inc. | 14,223 | 910 |
| Commercial Metals Co. | 28,200 | 884 |
| Carpenter Technology Corp. | 7,000 | 845 |
| Quanex Corp. | 19,248 | 815 |
| Reliance Steel & | | |
| Aluminum Co. | 15,470 | 749 |
14
| | | Market |
| | | Value• |
| | Shares | ($000) |
| Greif Inc. Class A | 6,317 | 702 |
* | Century Aluminum Co. | 14,900 | 699 |
* | AK Steel Holding Corp. | 29,460 | 689 |
| Lubrizol Corp. | 13,100 | 675 |
* | OM Group, Inc. | 15,000 | 670 |
| Nalco Holding Co. | 27,300 | 652 |
| Metal Management, Inc. | 13,500 | 624 |
| H.B. Fuller Co. | 20,600 | 562 |
| Texas Industries, Inc. | 7,000 | 529 |
| Sensient Technologies Corp. | 17,570 | 453 |
| Westlake Chemical Corp. | 14,600 | 396 |
| Gibraltar Industries Inc. | 16,725 | 378 |
| Eagle Materials, Inc. | 5,555 | 248 |
| Silgan Holdings, Inc. | 2,511 | 128 |
* | Rockwood Holdings, Inc. | 2,700 | 75 |
| | | 15,989 |
Telecommunication Services (1.2%) | |
* | Cincinnati Bell Inc. | 149,900 | 705 |
| Surewest Communications | 26,938 | 670 |
* | Syniverse Holdings Inc. | 43,440 | 458 |
* | Cbeyond Inc. | 12,700 | 372 |
* | Leap Wireless | | |
| International, Inc. | 4,816 | 318 |
| North Pittsburgh | | |
| Systems, Inc. | 12,156 | 265 |
* | Dobson Communications Corp. | 19,009 | 163 |
| | | 2,951 |
Utilities (4.8%) | | |
| OGE Energy Corp. | 27,700 | 1,075 |
| Energen Corp. | 18,444 | 939 |
| Puget Energy, Inc. | 35,450 | 910 |
| PNM Resources Inc. | 27,903 | 901 |
| Atmos Energy Corp. | 27,600 | 863 |
| Westar Energy, Inc. | 30,800 | 848 |
| Southwest Gas Corp. | 21,048 | 818 |
| IDACORP, Inc. | 21,940 | 742 |
| ALLETE, Inc. | 15,504 | 723 |
| Black Hills Corp. | 19,500 | 717 |
* | El Paso Electric Co. | 26,000 | 685 |
| Avista Corp. | 25,828 | 626 |
| CMS Energy Corp. | 25,700 | 457 |
| CH Energy Group, Inc. | 8,500 | 414 |
| Vectren Corp. | 12,310 | 352 |
| Northeast Utilities | 7,123 | 233 |
| AGL Resources Inc. | 5,000 | 214 |
| Great Plains Energy, Inc. | 4,660 | 151 |
| | | 11,668 |
Total Common Stocks | | |
(Cost $227,649) | | 242,771 |
| | | Market |
| | | Value• |
| | Shares | ($000) |
Temporary Cash Investments (1.6%)1 | |
Money Market Funds (1.5%) |
2 | Vanguard Market Liquidity | | |
| Fund, 5.288% | 1,119,580 | 1,120 |
2 | Vanguard Market Liquidity | | |
| Fund, 5.288%—Note E | 2,653,800 | 2,654 |
| | | 3,774 |
| | | |
| | | Face |
| | | Amount |
| | | ($000) |
U.S. Agency Obligation (0.1%) | |
3 | Federal National | | |
| Mortgage Assn. | | |
4 | 5.201%, 4/25/07 | 200 | 199 |
Total Temporary Cash Investments | |
(Cost $3,973) | | 3,973 |
Total Investments (101.3%) | | |
(Cost $231,622) | | 246,744 |
Other Assets and Liabilities (–1.3%) | |
Other Assets—Note B | | 546 |
Liabilities—Note E | | (3,724) |
| | | (3,178) |
Net Assets (100%) | | |
Applicable to 11,478,571 outstanding | |
$.001 par value shares of beneficial | |
interest (unlimited authorization) | 243,566 |
Net Asset Value Per Share | | $21.22 |
15
At March 31, 2007, net assets consisted of:5 | |
| Amount | Per |
| ($000) | Share |
Paid-in Capital | 228,868 | $19.94 |
Undistributed Net | | |
Investment Income | 170 | .01 |
Accumulated Net | | |
Realized Losses | (608) | (.05) |
Unrealized Appreciation | | |
Investment Securities | 15,122 | 1.32 |
Futures Contracts | 14 | — |
Net Assets | 243,566 | $21.22 |
• See Note A in Notes to Financial Statements.
* Non-income-producing security.
^ Part of security position is on loan to broker-dealers. See Note E in Notes to Financial Statements.
1 The fund invests a portion of its cash reserves in equity markets through the use of index futures contracts. After giving effect to futures investments, the fund’s effective common stock and temporary cash investment positions represent 100.0% and 1.3%, respectively, of net assets. See Note C in Notes to Financial Statements.
2 Affiliated money market fund available only to Vanguard funds and certain trusts and accounts managed by Vanguard. Rate shown is the 7-day yield.
3 The issuer operates under a congressional charter; its securities are neither issued nor guaranteed by the U.S. government. If needed, access to additional funding from the U.S. Treasury (beyond the issuer’s line of credit) would require congressional action.
4 Securities with a value of $199,000 have been segregated as initial margin for open futures contracts.
5 See Note C in Notes to Financial Statements for the tax-basis components of net assets.
16
Statement of Operations
| Six Months Ended |
| March 31, 2007 |
| ($000) |
Investment Income | |
Income | |
Dividends | 1,156 |
Interest1 | 40 |
Security Lending | 23 |
Total Income | 1,219 |
Expenses | |
The Vanguard Group—Note B | |
Investment Advisory Services | 91 |
Management and Administrative | 286 |
Marketing and Distribution | 18 |
Custodian Fees | 11 |
Shareholders’ Reports | 5 |
Total Expenses | 411 |
Net Investment Income | 808 |
Realized Net Gain (Loss) | |
Investment Securities Sold | 1,688 |
Futures Contracts | 72 |
Realized Net Gain (Loss) | 1,760 |
Change in Unrealized Appreciation (Depreciation) | |
Investment Securities | 19,938 |
Futures Contracts | 14 |
Change in Unrealized Appreciation (Depreciation) | 19,952 |
Net Increase (Decrease) in Net Assets Resulting from Operations | 22,520 |
1 Interest income from an affiliated company of the fund was $29,000.
17
Statement of Changes in Net Assets
| Six Months Ended | April 201 to |
| March 31, | September 30, |
| 2007 | 2006 |
| ($000) | ($000) |
Increase (Decrease) in Net Assets | | |
Operations | | |
Net Investment Income | 808 | 834 |
Realized Net Gain (Loss) | 1,760 | (2,368) |
Change in Unrealized Appreciation (Depreciation) | 19,952 | (4,816) |
Net Increase (Decrease) in Net Assets Resulting from Operations | 22,520 | (6,350) |
Distributions | | |
Net Investment Income | (1,472) | — |
Realized Capital Gain | — | — |
Total Distributions | (1,472) | — |
Capital Share Transactions—Note F | | |
Issued | 75,185 | 210,458 |
Issued in Lieu of Cash Distributions | 1,347 | — |
Redeemed | (34,423) | (23,699) |
Net Increase (Decrease) from Capital Share Transactions | 42,109 | 186,759 |
Total Increase (Decrease) | 63,157 | 180,409 |
Net Assets | | |
Beginning of Period | 180,409 | — |
End of Period2 | 243,566 | 180,409 |
1 Commencement of subscription period for the fund.
2 Net Assets—End of Period includes undistributed net investment income of $170,000 and $834,000.
18
Financial Highlights
| Six Months | |
| Ended | Apr. 201 to |
| Mar. 31, | Sept. 30, |
For a Share Outstanding Throughout Each Period | 2007 | 2006 |
Net Asset Value, Beginning of Period | $19.04 | $20.00 |
Investment Operations | | |
Net Investment Income | .07 | .09 |
Net Realized and Unrealized Gain (Loss) on Investments | 2.26 | (1.05) |
Total from Investment Operations | 2.33 | (.96) |
Distributions | | |
Dividends from Net Investment Income | (.15) | — |
Distributions from Realized Capital Gains | — | — |
Total Distributions | (.15) | — |
Net Asset Value, End of Period | $21.22 | $19.04 |
| | |
Total Return | 12.26% | –4.85% |
| | |
Ratios/Supplemental Data | | |
Net Assets, End of Period (Millions) | $244 | $180 |
Ratio of Total Expenses to Average Net Assets | 0.39%* | 0.40%* |
Ratio of Net Investment Income to Average Net Assets | 0.78%* | 1.20%* |
Portfolio Turnover Rate | 56%* | 35% |
1 Subscription period for the fund was April 20, 2006, to April 24, 2006, during which time all assets were held in money market instruments. Performance measurement began April 24, 2006, at a net asset value of $20.01.
* Annualized.
See accompanying Notes, which are an integral part of the Financial Statements.
19
Notes to Financial Statements
Vanguard Strategic Small-Cap Equity Fund is registered under the Investment Company Act of 1940 as an open-end investment company, or mutual fund. The fund files reports with the SEC under the company name Vanguard Horizon Funds.
A. The following significant accounting policies conform to generally accepted accounting principles for U.S. mutual funds. The fund consistently follows such policies in preparing its financial statements.
1. Security Valuation: Securities are valued as of the close of trading on the New York Stock Exchange (generally 4:00 p.m. Eastern time) on the valuation date. Equity securities are valued at the latest quoted sales prices or official closing prices taken from the primary market in which each security trades; such securities not traded on the valuation date are valued at the mean of the latest quoted bid and asked prices. Securities for which market quotations are not readily available, or whose values have been materially affected by events occurring before the fund’s pricing time but after the close of the securities’ primary markets, are valued by methods deemed by the board of trustees to represent fair value. Investments in Vanguard Market Liquidity Fund are valued at that fund’s net asset value. Temporary cash investments acquired over 60 days to maturity are valued using the latest bid prices or using valuations based on a matrix system (which considers such factors as security prices, yields, maturities, and ratings), both as furnished by independent pricing services. Other temporary cash investments are valued at amortized cost, which approximates market value.
2. Futures Contracts: The fund uses index futures contracts to a limited extent, with the objective of maintaining full exposure to the stock market while maintaining liquidity. The fund may purchase or sell futures contracts to achieve a desired level of investment, whether to accommodate portfolio turnover or cash flows from capital share transactions. The primary risks associated with the use of futures contracts are imperfect correlation between changes in market values of stocks held by the fund and the prices of futures contracts, and the possibility of an illiquid market.
Futures contracts are valued at their quoted daily settlement prices. The aggregate principal amounts of the contracts are not recorded in the Statement of Net Assets. Fluctuations in the value of the contracts are recorded in the Statement of Net Assets as an asset (liability) and in the Statement of Operations as unrealized appreciation (depreciation) until the contracts are closed, when they are recorded as realized futures gains (losses).
3. Federal Income Taxes: The fund intends to continue to qualify as a regulated investment company and distribute all of its taxable income. Accordingly, no provision for federal income taxes is required in the financial statements.
4. Distributions: Distributions to shareholders are recorded on the ex-dividend date.
5. Security Lending: The fund may lend its securities to qualified institutional borrowers to earn additional income. Security loans are required to be secured at all times by collateral at least equal to the market value of securities loaned. The fund invests cash collateral received in Vanguard Market Liquidity Fund, and records a liability for the return of the collateral, during the period the securities are on loan. Security lending income represents the income earned on investing cash collateral, less expenses associated with the loan.
6. Other: Dividend income is recorded on the ex-dividend date. Interest income includes income distributions received from Vanguard Market Liquidity Fund and is accrued daily. Security transactions are accounted for on the date securities are bought or sold. Costs used to determine realized gains (losses) on the sale of investment securities are those of the specific securities sold.
20
B. The Vanguard Group furnishes at cost investment advisory, corporate management, administrative, marketing, and distribution services. The costs of such services are allocated to the fund under methods approved by the board of trustees. The fund has committed to provide up to 0.40% of its net assets in capital contributions to Vanguard. At March 31, 2007, the fund had contributed capital of $22,000 to Vanguard (included in Other Assets), representing 0.01% of the fund’s net assets and 0.02% of Vanguard’s capitalization. The fund’s trustees and officers are also directors and officers of Vanguard.
C. Distributions are determined on a tax basis and may differ from net investment income and realized capital gains for financial reporting purposes. Differences may be permanent or temporary. Permanent differences are reclassified among capital accounts in the financial statements to reflect their tax character. Temporary differences arise when certain items of income, expense, gain, or loss are recognized in different periods for financial statement and tax purposes; these differences will reverse at some time in the future. Differences in classification may also result from the treatment of short-term gains as ordinary income for tax purposes.
The fund’s tax-basis capital gains and losses are determined only at the end of each fiscal year. For tax purposes, at September 30, 2006, the fund had available realized losses of $2,355,000 to offset future net capital gains through September 30, 2015. The fund will use these capital losses to offset net taxable capital gains, if any, realized during the year ending September 30, 2007; should the fund realize net capital losses for the year, the losses will be added to the loss carryforward balances above.
At March 31, 2007, the cost of investment securities for tax purposes was $231,622,000. Net unrealized appreciation of investment securities for tax purposes was $15,122,000, consisting of unrealized gains of $24,732,000 on securities that had risen in value since their purchase and $9,610,000 in unrealized losses on securities that had fallen in value since their purchase.
At March 31, 2007, the aggregate settlement value of open futures contracts expiring in June 2007 and the related unrealized appreciation (depreciation) were:
| | | ($000) |
| | Aggregate | Unrealized |
| Number of | Settlement | Appreciation |
Futures Contracts | Long Contracts | Value | (Depreciation) |
Russell 2000 Index | 1 | 404 | 6 |
E-mini Russell 2000 Index | 4 | 323 | 8 |
Unrealized appreciation (depreciation) on open futures contracts is required to be treated as realized gain (loss) for tax purposes.
D. During the six months ended March 31, 2007, the fund purchased $99,647,000 of investment securities and sold $58,691,000 of investment securities, other than temporary cash investments.
E. The market value of securities on loan to broker-dealers at March 31, 2007, was $2,498,000, for which the fund received cash collateral of $2,654,000.
21
F. Capital shares issued and redeemed were:
| Six Months Ended | April 201 to |
| March 31, 2007 | Sept. 30, 2006 |
| Shares | Shares |
| (000) | (000) |
Issued | 3,610 | 10,744 |
Issued in Lieu of Cash Distributions | 65 | — |
Redeemed | (1,674) | (1,266) |
Net Increase (Decrease) in Shares Outstanding | 2,001 | 9,478 |
G. In June 2006, the Financial Accounting Standards Board issued Interpretation No. 48 (“FIN 48”), “Accounting for Uncertainty in Income Taxes.” FIN 48 establishes the minimum threshold for recognizing, and a system for measuring, the benefits of tax-return positions in financial statements. FIN 48 will be effective for the fund’s fiscal year beginning October 1, 2007. Management is in the process of analyzing the fund’s tax positions for purposes of implementing FIN 48; based on the analysis completed to date, management does not believe the adoption of FIN 48 will result in any material impact to the fund’s financial statements.
1 Commencement of subscription period for the fund.
22
About Your Fund’s Expenses
As a shareholder of the fund, you incur ongoing costs, which include costs for portfolio management, administrative services, and shareholder reports (like this one), among others. Operating expenses, which are deducted from a fund’s gross income, directly reduce the investment return of the fund.
A fund’s expenses are expressed as a percentage of its average net assets. This figure is known as the expense ratio. The following examples are intended to help you understand the ongoing costs (in dollars) of investing in your fund and to compare these costs with those of other mutual funds. The examples are based on an investment of $1,000 made at the beginning of the period shown and held for the entire period.
The table below illustrates your fund’s costs in two ways:
• Based on actual fund return. This helps you to estimate the actual expenses that you paid over the period. The “Ending Account Value” shown is derived from the fund’s actual return, and the third column shows the dollar amount that would have been paid by an investor who started with $1,000 in the fund. You may use the information here, together with the amount you invested, to estimate the expenses that you paid over the period.
To do so, simply divide your account value by $1,000 (for example, an $8,600 account value divided by $1,000 = 8.6), then multiply the result by the number given for your fund under the heading “Expenses Paid During Period.”
• Based on hypothetical 5% yearly return. This section is intended to help you compare your fund’s costs with those of other mutual funds. It assumes that the fund had a yearly return of 5% before expenses, but that the expense ratio is unchanged. In this case—because the return used is not the fund’s actual return—the results do not apply to your investment. The example is useful in making comparisons because the Securities and Exchange Commission requires all mutual funds to calculate expenses based on a 5% return. You can assess your fund’s costs by comparing this hypothetical example with the hypothetical examples that appear in shareholder reports of other funds.
Six Months Ended March 31, 2007 | | | |
| Beginning | Ending | Expenses |
| Account Value | Account Value | Paid During |
Strategic Small-Cap Equity Fund | 9/30/2006 | 3/31/2007 | Period1 |
Based on Actual Fund Return | $1,000.00 | $1,122.62 | $2.06 |
Based on Hypothetical 5% Yearly Return | 1,000.00 | 1,022.99 | 1.97 |
Note that the expenses shown in the table are meant to highlight and help you compare ongoing costs only and do not reflect any transactional costs or account maintenance fees. They do not include your fund’s low-balance fee, which is described in the prospectus. If this fee were applied to your account, your costs would be higher. Your fund does not charge transaction fees, such as purchase or redemption fees, nor does it carry a “sales load.”
1 The calculations are based on expenses incurred in the most recent six-month period. The fund’s annualized six-month expense ratio for that period is 0.39%. The dollar amounts shown as “Expenses Paid” are equal to the annualized expense ratio multiplied by the average account value over the period, multiplied by the number of days in the most recent six-month period, then divided by the number of days in the most recent 12-month period.
23
The calculations assume no shares were bought or sold during the period. Your actual costs may have been higher or lower, depending on the amount of your investment and the timing of any purchases or redemptions.
You can find more information about the fund’s expenses, including annual expense ratios for the past five years, in the Financial Statements section of this report. For additional information on operating expenses and other shareholder costs, please refer to the current fund prospectus.
24
Trustees Approve Advisory Arrangement
The board of trustees of Vanguard Strategic Small-Cap Equity Fund has renewed its investment advisory arrangement with The Vanguard Group, Inc. Vanguard—through its Quantitative Equity Group—serves as the fund’s investment advisor. The board determined that continuing the fund’s internalized management structure was in the best interests of the fund and its shareholders.
The board based its decision upon its most recent evaluation of the advisor’s investment staff, portfolio management process, and performance. The trustees considered the factors discussed below, among others; however, no single factor determined whether or not the board approved the arrangement. Rather, it was the totality of the circumstances that drove the board’s decision.
Nature, extent, and quality of services
The board considered the quality of the fund’s investment management since its inception in April 2006, and took into account the organizational depth and stability of the advisor. Vanguard has been managing investments for more than two decades. George U. Sauter, Vanguard managing director and chief investment officer, has been in the investment management business since 1985, and has led the Quantitative Equity Group since 1987. James P. Stetler, the manager primarily responsible for the day-to-day management of the fund, has worked in investment management since 1996. The Quantitative Equity Group adheres to a sound, disciplined investment management process; the team has considerable experience, stability, and depth.
The board concluded that Vanguard’s experience, stability, depth, and performance, among other factors, warranted continuation of the advisory arrangement.
Investment performance
The board considered the fund’s performance since inception, noting that the fund has performed in line with expectations and that its results have been consistent with its investment strategy. Since its inception, the fund’s returns have exceeded the returns of its benchmark and its peer group. Information about the fund’s most recent performance can be found in the Performance Summary section of this report.
Cost
The board concluded that the fund’s expense ratio was far below the average expense ratio charged by funds in its peer group. The fund’s advisory expense ratio was also well below the peer-group average. Information about the fund’s expense ratio appears in the About Your Fund’s Expenses section of this report as well as in the Financial Statements section.
The board does not conduct a profitability analysis of Vanguard because of Vanguard’s unique “at-cost” structure. Unlike most other mutual fund management companies, Vanguard is owned by the funds it oversees, and produces “profits” only in the form of reduced expenses for fund shareholders.
The benefit of economies of scale
The board of trustees concluded that the fund’s low-cost arrangement with Vanguard ensures that the fund will realize economies of scale as it grows, with the cost to shareholders declining as fund assets increase.
The board will consider whether to renew the advisory arrangement again after a one-year period.
25
Glossary
Earnings Growth Rate. The average annual rate of growth in earnings over the past five years for the stocks now in a fund.
Expense Ratio. The percentage of a fund’s average net assets used to pay its annual administrative and advisory expenses. These expenses directly reduce returns to investors.
Foreign Holdings. The percentage of a fund represented by stocks or depositary receipts of companies based outside the United States.
Inception Date. The date on which the assets of a fund (or one of its share classes) are first invested in accordance with the fund’s investment objective. For funds with a subscription period, the inception date is the day after that period ends. Investment performance is measured from the inception date.
Median Market Cap. An indicator of the size of companies in which a fund invests; the midpoint of market capitalization (market price x shares outstanding) of a fund’s stocks, weighted by the proportion of the fund’s assets invested in each stock. Stocks representing half of the fund’s assets have market capitalizations above the median, and the rest are below it.
Price/Book Ratio. The share price of a stock divided by its net worth, or book value, per share. For a fund, the weighted average price/book ratio of the stocks it holds.
Price/Earnings Ratio. The ratio of a stock’s current price to its per-share earnings over the past year. For a fund, the weighted average P/E of the stocks it holds. P/E is an indicator of market expectations about corporate prospects; the higher the P/E, the greater the expectations for a company’s future growth.
Return on Equity. The annual average rate of return generated by a company during the past five years for each dollar of shareholder’s equity (net income divided by shareholder’s equity). For a fund, the weighted average return on equity for the companies whose stocks it holds.
Short-Term Reserves. The percentage of a fund invested in highly liquid, short-term securities that can be readily converted to cash.
Turnover Rate. An indication of the fund’s trading activity. Funds with high turnover rates incur higher transaction costs and may be more likely to distribute capital gains (which may be taxable to investors). The turnover rate excludes in-kind transactions, which have minimal impact on costs.
Yield. A snapshot of a fund’s income from interest and dividends. The yield, expressed as a percentage of the fund’s net asset value, is based on income earned over the past 30 days and is annualized, or projected forward for the coming year. The index yield is based on the current annualized rate of income provided by securities in the index.
26
This page intentionally left blank.
The People Who Govern Your Fund
The trustees of your mutual fund are there to see that the fund is operated and managed in your best interests since, as a shareholder, you are a part owner of the fund. Your fund’s trustees also serve on the board of directors of The Vanguard Group, Inc., which is owned by the Vanguard funds and provides services to them on an at-cost basis.
A majority of Vanguard’s board members are independent, meaning that they have no affiliation with Vanguard or the funds they oversee, apart from the sizable personal investments they have made as private individuals.
Our independent board members bring distinguished backgrounds in business, academia, and public service to their task of working with Vanguard officers to establish the policies and oversee the activities of the funds.
Among board members’ responsibilities are selecting investment advisors for the funds; monitoring fund operations, performance, and costs; reviewing contracts; nominating and selecting new trustees/directors; and electing Vanguard officers.
Each trustee serves a fund until its termination; or until the trustee’s retirement, resignation, or death; or otherwise as specified in the fund’s organizational documents. Any trustee may be removed at a shareholders’ meeting by a vote representing two-thirds of the net asset value of all shares of the fund together with shares of other Vanguard funds organized within the same trust. The table on these two pages shows information for each trustee and executive officer of the fund. The mailing address of the trustees and officers is P.O. Box 876, Valley Forge, PA 19482.
Chairman of the Board, Chief Executive Officer, and Trustee |
| |
John J. Brennan1 | |
Born 1954 | Principal Occupation(s) During the Past Five Years: Chairman of the Board, Chief Executive |
Trustee since May 1987; | Officer, and Director/Trustee of The Vanguard Group, Inc., and of each of the investment |
Chairman of the Board and | companies served by The Vanguard Group. |
Chief Executive Officer | |
147 Vanguard Funds Overseen | |
| |
Independent Trustees | |
| |
Charles D. Ellis | |
Born 1937 | Principal Occupation(s) During the Past Five Years: Applecore Partners (pro bono ventures |
Trustee since January 2001 | in education); Senior Advisor to Greenwich Associates (international business strategy |
147 Vanguard Funds Overseen | consulting); Successor Trustee of Yale University; Overseer of the Stern School of Business |
| at New York University; Trustee of the Whitehead Institute for Biomedical Research. |
| |
Rajiv L. Gupta | |
Born 1945 | Principal Occupation(s) During the Past Five Years: Chairman and Chief Executive Officer |
Trustee since December 20012 | of Rohm and Haas Co. (chemicals); Board Member of the American Chemistry Council; |
147 Vanguard Funds Overseen | Director of Tyco International, Ltd. (diversified manufacturing and services) since 2005; |
| Trustee of Drexel University and of the Chemical Heritage Foundation. |
| |
Amy Gutmann | |
Born 1949 | Principal Occupation(s) During the Past Five Years: President of the University of |
Trustee since June 2006 | Pennsylvania since 2004; Professor in the School of Arts and Sciences, Annenberg School |
147 Vanguard Funds Overseen | for Communication, and Graduate School of Education of the University of Pennsylvania |
| since 2004; Provost (2001–2004) and Laurance S. Rockefeller Professor of Politics and the |
| University Center for Human Values (1990–2004), Princeton University; Director of Carnegie |
| Corporation of New York since 2005 and of Schuylkill River Development Corporation and |
| Greater Philadelphia Chamber of Commerce since 2004. |
JoAnn Heffernan Heisen | |
Born 1950 | Principal Occupation(s) During the Past Five Years: Corporate Vice President and Chief |
Trustee since July 1998 | Global Diversity Officer since 2006, Vice President and Chief Information Officer |
147 Vanguard Funds Overseen | (1997–2005), and Member of the Executive Committee of Johnson & Johnson |
| (pharmaceuticals/consumer products); Director of the University Medical Center |
| at Princeton and Women’s Research and Education Institute. |
| |
André F. Perold | |
Born 1952 | Principal Occupation(s) During the Past Five Years: George Gund Professor of Finance |
Trustee since December 2004 | and Banking, Harvard Business School; Senior Associate Dean, Director of Faculty |
147 Vanguard Funds Overseen | Recruiting, and Chair of Finance Faculty, Harvard Business School; Director and Chairman |
| of UNX, Inc. (equities trading firm) since 2003; Chair of the Investment Committee of |
| HighVista Strategies LLC (private investment firm) since 2005; Director of registered |
| investment companies advised by Merrill Lynch Investment Managers and affiliates |
| (1985–2004), Genbel Securities Limited (South African financial services firm) |
| (1999–2003), Gensec Bank (1999–2003), Sanlam, Ltd. (South African insurance |
| company) (2001–2003), and Stockback, Inc. (credit card firm) (2000–2002). |
| |
Alfred M. Rankin, Jr. | |
Born 1941 | Principal Occupation(s) During the Past Five Years: Chairman, President, Chief Executive |
Trustee since January 1993 | Officer, and Director of NACCO Industries, Inc. (forklift trucks/housewares/lignite); Director |
147 Vanguard Funds Overseen | of Goodrich Corporation (industrial products/aircraft systems and services). |
| |
J. Lawrence Wilson | |
Born 1936 | Principal Occupation(s) During the Past Five Years: Retired Chairman and Chief Executive |
Trustee since April 1985 | Officer of Rohm and Haas Co. (chemicals); Director of Cummins Inc. (diesel engines) and |
147 Vanguard Funds Overseen | AmerisourceBergen Corp. (pharmaceutical distribution); Trustee of Vanderbilt University |
| and of Culver Educational Foundation. |
| |
Executive Officers1 | |
| |
Heidi Stam | |
Born 1956 | Principal Occupation(s) During the Past Five Years: Managing Director of The Vanguard |
Secretary since July 2005 | Group, Inc., since 2006; General Counsel of The Vanguard Group since 2005; Secretary of |
147 Vanguard Funds Overseen | The Vanguard Group, and of each of the investment companies served by The Vanguard |
| Group, since 2005; Principal of The Vanguard Group (1997–2006). |
| |
Thomas J. Higgins | |
Born 1957 | Principal Occupation(s) During the Past Five Years: Principal of The Vanguard Group, Inc.; |
Treasurer since July 1998 | Treasurer of each of the investment companies served by The Vanguard Group. |
147 Vanguard Funds Overseen | |
Vanguard Senior Management Team | | |
| | |
R. Gregory Barton | Kathleen C. Gubanich | Michael S. Miller |
Mortimer J. Buckley | Paul A. Heller | Ralph K. Packard |
James H. Gately | F. William McNabb, III | George U. Sauter |
| | |
Founder | | |
| | |
John C. Bogle | | |
Chairman and Chief Executive Officer, 1974–1996 | |
1 Officers of the funds are “interested persons” as defined in the Investment Company Act of 1940.
2 December 2002 for Vanguard Equity Income Fund, Vanguard Growth Equity Fund, the Vanguard Municipal Bond Funds, and the Vanguard State Tax-Exempt Funds.
More information about the trustees is in the Statement of Additional Information, available from The Vanguard Group.
P.O. Box 2600
Valley Forge, PA 19482-2600
Connect with Vanguard® > www.vanguard.com
Fund Information > 800-662-7447 | Vanguard, Admiral, Connect with Vanguard, and the ship |
| logo are trademarks of The Vanguard Group, Inc. |
Direct Investor Account Services > 800-662-2739 | |
| All other marks are the exclusive property of their |
Institutional Investor Services > 800-523-1036 | respective owners. |
| |
Text Telephone for the | |
Hearing-Impaired > 800-952-3335 | All comparative mutual fund data are from Lipper Inc. |
| or Morningstar, Inc., unless otherwise noted |
| . |
| |
| You can obtain a free copy of Vanguard’s proxy voting |
| guidelines by visiting our website, www.vanguard.com, |
This material may be used in conjunction | and searching for “proxy voting guidelines,” or by calling |
with the offering of shares of any Vanguard | Vanguard at 800-662-2739. They are also available from |
fund only if preceded or accompanied by | the SEC’s website, www.sec.gov. In addition, you may |
the fund’s current prospectus. | obtain a free report on how your fund voted the proxies for |
| securities it owned during the 12 months ended June 30. |
| To get the report, visit either www.vanguard.com |
| or www.sec.gov. |
| |
| |
| |
| You can review and copy information about your fund |
| at the SEC’s Public Reference Room in Washington, D.C. |
| To find out more about this public service, call the SEC |
| at 202-551-8090. Information about your fund is also |
| available on the SEC’s website, and you can receive |
| copies of this information, for a fee, by sending a |
| request in either of two ways: via e-mail addressed to |
| publicinfo@sec.gov or via regular mail addressed to the |
| Public Reference Section, Securities and Exchange |
| Commission, Washington, DC 20549-0102. |
| |
| |
| |
| |
| © 2007 The Vanguard Group, Inc. |
| All rights reserved. |
| Vanguard Marketing Corporation, Distributor. |
| |
| Q6152 052007 |
Item 2: Not Applicable
Item 3: Not Applicable
Item 4: Not Applicable
Item 5: Not applicable.
Item 6: Not applicable.
Item 7: Not applicable.
Item 8: Not applicable.
Item 9: Not applicable.
Item 10: Not applicable.
Item 11: Controls and Procedures
(a) Disclosure Controls and Procedures. The Principal Executive and Financial Officers concluded that the Registrant's Disclosure Controls and Procedures are effective based on their evaluation of the Disclosure Controls and Procedures as of a date within 90 days of the filing date of this report.
(b) Internal Control Over Financial Reporting. There were no significant changes in Registrant‘s Internal Control Over Financial Reporting or in other factors that could significantly affect this control subsequent to the date of the evaluation, including any corrective actions with regard to significant deficiencies and material weaknesses.
Item 12: Exhibits.
Certifications.
Pursuant to the requirements of the Securities Exchange Act of 1934 and the Investment Company Act of 1940, the registrant has duly caused this report to be signed on its behalf by the undersigned, thereunto duly authorized.
| VANGUARD HORIZON FUNDS
|
| BY: | (signature)
|
| (HEIDI STAM)
JOHN J. BRENNAN*
CHIEF EXECUTIVE OFFICER |
Pursuant to the requirements of the Securities Exchange Act of 1934 and the Investment Company Act of 1940, this report has been signed below by the following persons on behalf of the registrant and in the capacities and on the dates indicated.
| VANGUARD HORIZON FUNDS
|
| BY: | (signature)
|
| (HEIDI STAM)
JOHN J. BRENNAN*
CHIEF EXECUTIVE OFFICER |
| VANGUARD HORIZON FUNDS
|
| BY: | (signature)
|
| (HEIDI STAM)
THOMAS J. HIGGINS*
TREASURER |
*By Power of Attorney. See File Number 002-65955-99, filed on July 27, 2006. Incorporated by Reference.