UNITED STATES
SECURITIES AND EXCHANGE COMMISSION
Washington, D.C. 20549
FORM N-CSR
CERTIFIED SHAREHOLDER REPORT
OF
REGISTERED MANAGEMENT INVESTMENT COMPANIES
Investment Company Act file number: 811-07239
Name of Registrant: Vanguard Horizon Funds
Address of Registrant: | P.O. Box 2600 |
| Valley Forge, PA 19482 |
| |
Name and address of agent for service: | Heidi Stam, Esquire |
| P.O. Box 876 |
| Valley Forge, PA 19482 |
| |
Registrant’s telephone number, including area code: (610) 669-1000
Date of fiscal year end: September 30
Date of reporting period: October 1, 2007–March 31, 2008
Item 1: Reports to Shareholders |

> | For the six months ended March 31, 2008, Vanguard Strategic Equity Fund returned –16.2%, trailing the returns of its comparative standards. |
> | As investors became more risk-averse during the challenging half-year, small- and mid-capitalization stocks modestly underperformed large-caps. |
> | Only one sector produced a positive return for the fund: Materials holdings benefited from continued strong demand for raw materials and industrial building blocks such as steel. |
Contents | |
| |
Your Fund’s Total Returns | 1 |
Chairman’s Letter | 2 |
Advisor’s Report | 6 |
Fund Profile | 7 |
Performance Summary | 9 |
Financial Statements | 10 |
About Your Fund’s Expenses | 29 |
Trustees Approve Advisory Arrangement | 31 |
Glossary | 32 |
Please note: The opinions expressed in this report are just that—informed opinions. They should not be considered promises or advice. Also, please keep in mind that the information and opinions cover the period through the date on the cover of this report. Of course, the risks of investing in your fund are spelled out in the prospectus.
Your Fund’s Total Returns
Six Months Ended March 31, 2008 | | |
| Ticker | Total |
| Symbol | Returns |
Vanguard Strategic Equity Fund | VSEQX | –16.2% |
MSCI US Small + Mid Cap 2200 Index | | –13.7 |
Average Mid-Cap Core Fund1 | | –12.8 |
Your Fund’s Performance at a Glance | | | | |
September 30, 2007–March 31, 2008 | | | | |
| | | Distributions Per Share |
| Starting | Ending | Income | Capital |
| Share Price | Share Price | Dividends | Gains |
Vanguard Strategic Equity Fund | $24.94 | $18.43 | $0.240 | $2.430 |
1 | Derived from data provided by Lipper Inc. |
1

Chairman’s Letter
Dear Shareholder,
Vanguard Strategic Equity Fund returned –16.2% for the fiscal half-year ended March 31, 2008, as jittery investors punished stocks across the board.
This performance was disappointing in comparison with the –13.7% return of the fund’s index benchmark and the –12.8% average return of its peer group. But as with any active investment strategy, the advisor’s disciplined, quantitative approach can be expected to experience periods of relative strength and weakness.
Stocks of all sorts sank amid credit-market concerns
The broad U.S. stock market declined –12.4% for the six months ended March 31 as investor sentiment turned bearish amid fears of a U.S. recession, the weakening of the U.S. dollar, and the tightening of global credit markets in reaction to the subprime-mortgage crisis that began in midsummer 2007.
Large-capitalization stocks fared a bit better than small-caps, growth stocks generally outpaced their value-oriented counterparts, and international stocks again outperformed U.S. stocks over the six months; nonetheless, each group posted a negative return.
2
Subprime-mortgage woes roiled the bond market
Credit markets seized up as trouble spread from subprime-mortgage-backed securities to other issues. Investors flocked to higher-quality government and corporate bonds, driving U.S. Treasury bond prices higher.
Unlike stocks, the broad taxable bond market pushed forward, posting a total return of 5.2% for the fiscal half-year as lower interest rates depressed yields and bumped up prices. By contrast, tax-exempt municipal bonds returned only 0.7% as fixed income investors moved in droves to Treasuries in search of the highest-quality, most-liquid securities. This, combined with concerns about the financial strength of the insurers backing certain municipal bonds, pushed municipal yields above those of Treasuries.
In response to the tumult in the credit markets and the deteriorating economic outlook, the Federal Reserve Board aggressively reduced its target for the federal funds rate. The Fed continued a series of rate cuts that began late last summer, ending with a 0.75 percentage-point cut in March. The target rate stood at 2.25% at the end of the period, the lowest level since early 2005.
Market Barometer | | | |
| | | Total Returns |
| | Periods Ended March 31, 2008 |
| Six Months | One Year | Five Years1 |
Stocks | | | |
Russell 1000 Index (Large-caps) | –12.4% | –5.4% | 11.9% |
Russell 2000 Index (Small-caps) | –14.0 | –13.0 | 14.9 |
Dow Jones Wilshire 5000 Index (Entire market) | –12.4 | –5.8 | 12.5 |
MSCI All Country World Index ex USA (International) | –9.6 | 2.6 | 24.0 |
| | | |
Bonds | | | |
Lehman U.S. Aggregate Bond Index (Broad taxable market) | 5.2% | 7.7% | 4.6% |
Lehman Municipal Bond Index | 0.7 | 1.9 | 3.9 |
Citigroup 3-Month Treasury Bill Index | 1.7 | 4.2 | 3.0 |
| | | |
CPI | | | |
Consumer Price Index | 2.4% | 4.0% | 3.0% |
1 Annualized.
3
Many stock selections proved unrewarding for the fund
The Strategic Equity Fund navigated exceptionally choppy waters during the past six months. As global stock markets retreated dramatically after soaring to record highs, small- and mid-capitalization stocks—favored a year ago—were beaten down somewhat indiscriminately. Compounding this problem was the unusual turmoil among stocks favored by the fund’s quantitative investment process.
Strategic Equity’s advisor—Vanguard Quantitative Equity Group—identifies potential stocks for the fund by using proprietary screening models with three components: valuation, improving earnings prospects, and market sentiment as reflected in stock price behavior. The advisor then uses the most promising stocks to build a portfolio with sector weightings and risk characteristics similar to those of the benchmark index. Within each sector, the advisor seeks to outperform the index by holding more winning stocks. (For more discussion of the models and your fund’s positioning, please see the Advisor’s Report on page 6.)
This approach worked very well in the materials sector, where the fund’s holdings rose 8% while the index’s stocks fell –5% during the fiscal half-year. The fund’s top performers included fertilizer producers—beneficiaries of the global agricultural boom—and steelmakers trying to satisfy robust world demand.
Annualized Expense Ratios1 | | |
Your Fund Compared With Its Peer Group | | |
| | Average |
| | Mid-Cap |
| Fund | Core Fund |
Strategic Equity Fund | 0.27% | 1.33% |
1 Fund expense ratio reflects the six months ended March 31, 2008. Peer-group expense ratio is derived from data provided by Lipper Inc. and captures information through year-end 2007.
4
Across the rest of the portfolio, however, stock selection proved mostly unrewarding, especially in the industrials sector—a leading detractor, down almost twice as much as the index. Many of the fund’s economically sensitive holdings posted double-digit declines; examples included stocks of airlines and companies involved in aerospace and defense, construction and engineering, and machinery.
Quantitative investment strategies have struggled over the last year or so, as the valuation component of the strategy has under performed. Your fund’s disciplined, risk-controlled investment process has proven rewarding in the past, and we expect it will be again in the future. Investors should not rush to judgment, whether short-term per-formance is gratifying or disappointing.
Tune out the noise in market ‘weather’ reports
When clouds darken the investment horizon, it can be tempting to run for shelter. And when skies clear, caution can seem needless. Neither impulse is likely to contribute to long-term investment success. Instead, we encourage you to invest with a long-term view, diversify within and across primary asset classes, and pay attention to costs.
Within a diversified portfolio driven by an appropriate asset allocation—one that is based on your own long-term goals and risk tolerance—the Strategic Equity Fund can play a useful role, giving you exposure to the growth opportunities that small- and mid-sized stocks can offer.
As I close this report to you, it’s my pleasure to introduce the fund’s new president, F. William McNabb III. Bill is a man of great character and integrity who is intimately familiar with all aspects of Vanguard—from how we serve our clients to how we invest for them.
Bill and I have worked together very closely for more than two decades. I’m thrilled that the fund’s board elected him president, effective March 1, and designated him to succeed me as chief executive officer, a role he will assume within a year, after an orderly transition. Bill and the rest of our team will serve you and our other clients extremely well in the years ahead.
Thank you for entrusting your assets to Vanguard.
Sincerely,

John J. Brennan
Chairman and Chief Executive Officer
April 14, 2008
5
Advisor’s Report
For the six months ended March 31, 2008, Vanguard Strategic Equity Fund returned –16.2%. The fund trailed the –12.8% average return of mid-cap core funds and the –13.7% return of the benchmark MSCI US Small + Mid Cap 2200 Index.
The investment environment
The broad United States stock market returned –12.4% for the half-year ended March 31. This was the largest six-month decline since late 2002.
Our investment approach
Our performance for the last six months has been disappointing. When performance is subpar, it would be nice to be able to hold one or two stocks accountable. But with a quantitative process such as the one we use to manage this fund, the entire model itself either succeeds or fails. For the last six months, our model was not successful in identifying stocks that would outperform our benchmark.
Our model performed especially poorly in the financials and information technology sectors, as exemplified by our investments in The First Marblehead Corporation, which packages student loans into asset-backed securities (down –80%) and ON Semiconductor (–50%). On the positive side, the model did well in the materials sector, where AK Steel and Steel Dynamics were both up over 40%.
Like all active management strategies, quantitative models can have extended periods of underperformance, such as we experienced over the past six months. We have lived through these periods before, most recently during the run-up associated with the Internet bubble in 1998–1999. Nonetheless, we remain confident in our process. The portfolio buys stocks that are offered at attractive prices relative to their expected earnings growth and that display a pattern of above-average profitability relative to their peers. We believe these characteristics are likely to produce good long-term returns, and we trust that they will eventually be favored by the market once again.
James D. Troyer, Principal and Portfolio Manager
Joel M. Dickson, Principal
Vanguard Quantitative Equity Group
April 10, 2008
6
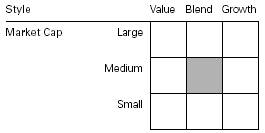
Fund Profile
As of March 31, 2008
Portfolio Characteristics | | |
| | Comparative | Broad |
| Fund | Index1 | Index2 |
Number of Stocks | 469 | 2,147 | 4,811 |
Median Market Cap | $4.0B | $3.7B | $33.8B |
Price/Earnings Ratio | 13.5x | 18.7x | 16.9x |
Price/Book Ratio | 2.1x | 2.2x | 2.4x |
Yield3 | 1.5% | 1.5% | 2.0% |
Return on Equity | 15.6% | 15.8% | 19.5% |
Earnings Growth Rate | 23.7% | 19.5% | 20.0% |
Foreign Holdings | 0.1% | 0.0% | 0.0% |
Turnover Rate | 90%4 | — | — |
Expense Ratio | 0.27%4 | — | — |
Short-Term Reserves | 0.0% | — | — |
Sector Diversification (% of equity exposure) |
| | Comparative | Broad |
| Fund | Index1 | Index2 |
Consumer Discretionary | 13.6% | 13.4% | 9.4% |
Consumer Staples | 4.2 | 4.2 | 9.6 |
Energy | 10.3 | 10.2 | 12.7 |
Financials | 18.2 | 18.2 | 17.7 |
Health Care | 10.0 | 10.0 | 11.7 |
Industrials | 15.9 | 16.0 | 12.2 |
Information Technology | 14.1 | 14.6 | 15.6 |
Materials | 6.3 | 6.1 | 4.1 |
Telecommunication Services | 1.8 | 1.7 | 3.1 |
Utilities | 5.6 | 5.6 | 3.9 |
Volatility Measures5 | |
| Fund Versus | Fund Versus |
| Comparative Index1 | Broad Index2 |
R-Squared | 0.97 | 0.86 |
Beta | 1.06 | 1.26 |
7
Ten Largest Holdings6 (% of total net assets) |
| | |
United States Steel Corp. | steel | 1.3% |
Parker Hannifin Corp. | industrial machinery | 1.2 |
Mirant Corp. | independent power producers and energy traders | 1.0 |
Whirlpool Corp. | household appliances | 1.0 |
Helmerich & Payne, Inc. | oil and gas drilling | 1.0 |
Computer Sciences Corp. | data processing and outsourced services | 1.0 |
Molson Coors Brewing Co. Class B | brewers | 1.0 |
Celanese Corp. Series A | commodity chemicals | 1.0 |
AK Steel Holding Corp. | steel | 0.9 |
Manpower Inc. | human resource and employment services | 0.9 |
Top Ten | | 10.3% |
Investment Focus
1 MSCI US Small + Mid Cap 2200 Index.
2 Dow Jones Wilshire 5000 Index.
3 30-day SEC yield for the fund; annualized dividend yield for the indexes. See Glossary on pages 25–26.
4 Annualized.
5 For an explanation of R-squared, beta, and other terms used here, see the Glossary on pages 25–26.
6 “Ten Largest Holdings” excludes any temporary cash investments and equity index products.
8
Performance Summary
All of the returns in this report represent past performance, which is not a guarantee of future results that may be achieved by the fund. (Current performance may be lower or higher than the performance data cited. For performance data current to the most recent month-end, visit our website at www.vanguard.com/performance.) Note, too, that both investment returns and principal value can fluctuate widely, so an investor’s shares, when sold, could be worth more or less than their original cost. The returns shown do not reflect taxes that a shareholder would pay on fund distributions or on the sale of fund shares.
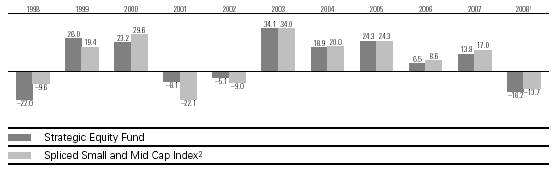
Fiscal Year Total Returns (%): September 30, 1997–March 31, 2008
Average Annual Total Returns: Periods Ended March 31, 2008 |
| | | | |
| Inception Date | One Year | Five Years | Ten Years |
Strategic Equity Fund3 | 8/14/1995 | –15.73% | 14.03% | 7.47% |
1 Six months ended March 31, 2008.
2 The Spliced Small and Mid Cap Index reflects the return of the Russell 2800 Index through May 31, 2003, and the MSCI US Small + Mid Cap 2200 Index thereafter.
3 Total returns do not include the account service fee that may be applicable to certain accounts with balances below $10,000.
Note: See Financial Highlights table on page 18 for dividend and capital gains information.
9
Financial Statements (unaudited)
Statement of Net Assets
As of March 31, 2008
The fund provides a complete list of its holdings four times in each fiscal year, at the quarter-ends. For the second and fourth fiscal quarters, the lists appear in the fund’s semiannual and annual reports to shareholders. For the first and third fiscal quarters, the fund files the lists with the Securities and Exchange Commission on Form N-Q. Shareholders can look up the fund’s Forms N-Q on the SEC’s website at www.sec.gov. Forms N-Q may also be reviewed and copied at the SEC’s Public Reference Room (see the back cover of this report for further information).
| | | Market |
| | | Value• |
| | Shares | ($000) |
Common Stocks (99.5%)1 | | |
Consumer Discretionary (13.5%) | | |
| Whirlpool Corp. | 635,700 | 55,166 |
* | AutoZone Inc. | 452,600 | 51,519 |
| Darden Restaurants Inc. | 1,559,232 | 50,753 |
^ | New York Times Co. Class A | 2,139,700 | 40,398 |
*^ | Mohawk Industries, Inc. | 546,125 | 39,108 |
* | Expedia, Inc. | 1,592,851 | 34,868 |
* | Dollar Tree,Inc. | 1,079,490 | 29,783 |
*^ | Priceline.com, Inc. | 237,100 | 28,656 |
| Men’s Wearhouse, Inc. | 1,066,150 | 24,809 |
| Newell Rubbermaid, Inc. | 919,326 | 21,025 |
| Brinker International, Inc. | 1,065,600 | 19,767 |
*^ | Chipotle Mexican Grill, Inc. | 161,600 | 18,330 |
| Cooper Tire & Rubber Co. | 1,166,000 | 17,455 |
| Meredith Corp. | 433,720 | 16,590 |
| Wyndham Worldwide Corp. | 711,900 | 14,722 |
* | Jack in the Box Inc. | 531,000 | 14,268 |
| Sherwin-Williams Co. | 278,957 | 14,238 |
* | JAKKS Pacific, Inc. | 505,199 | 13,928 |
* | Aeropostale, Inc. | 504,650 | 13,681 |
| The Stanley Works | 226,000 | 10,762 |
| Phillips-Van Heusen Corp. | 242,081 | 9,180 |
| Eastman Kodak Co. | 485,700 | 8,582 |
| Autoliv, Inc. | 168,914 | 8,479 |
| Bob Evans Farms, Inc. | 301,417 | 8,316 |
| Wendy’s International, Inc. | 356,600 | 8,223 |
| Sinclair Broadcast Group, Inc. | 887,816 | 7,910 |
* | Marvel Entertainment, Inc. | 265,800 | 7,121 |
| Regal Entertainment Group Class A | 359,947 | 6,943 |
* | Exide Technologies | 486,200 | 6,369 |
* | Aftermarket Technology Corp. | 326,100 | 6,339 |
| Burger King Holdings Inc. | 227,700 | 6,298 |
* | Big Lots Inc. | 280,000 | 6,244 |
* | DreamWorks Animation SKG, Inc. | 238,000 | 6,136 |
10
| | | Market |
| | | Value• |
| | Shares | ($000) |
* | ITT Educational Services, Inc. | 130,500 | 5,994 |
* | Lin TV Corp. | 597,872 | 5,746 |
| Family Dollar Stores, Inc. | 294,500 | 5,743 |
* | NVR, Inc. | 9,000 | 5,378 |
* | Lear Corp. | 207,400 | 5,374 |
| Sonic Automotive, Inc. | 254,800 | 5,236 |
* | The Gymboree Corp. | 128,400 | 5,121 |
| FTD Group, Inc. | 366,000 | 4,912 |
* | Hanesbrands Inc. | 165,000 | 4,818 |
* | Entravision | | |
| Communications Corp. | 661,600 | 4,406 |
* | Denny’s Corp. | 1,464,695 | 4,365 |
*^ | Vail Resorts Inc. | 90,000 | 4,346 |
| World Wrestling | | |
| Entertainment, Inc. | 209,087 | 3,891 |
| Sotheby’s | 129,578 | 3,746 |
| Idearc Inc. | 1,002,373 | 3,649 |
* | Helen of Troy Ltd. | 214,300 | 3,594 |
| CSS Industries, Inc. | 91,200 | 3,188 |
| Ross Stores, Inc. | 96,249 | 2,884 |
| American Greetings | | |
| Corp. Class A | 150,000 | 2,783 |
| Interactive Data Corp. | 96,534 | 2,748 |
| Black & Decker Corp. | 37,800 | 2,499 |
^ | Polaris Industries, Inc. | 60,500 | 2,481 |
| UniFirst Corp. | 65,103 | 2,415 |
| Dover Downs Gaming & | | |
| Entertainment, Inc. | 276,250 | 2,351 |
| E.W. Scripps Co. Class A | 55,600 | 2,336 |
| American Axle & | | |
| Manufacturing | | |
| Holdings, Inc. | 113,300 | 2,323 |
| Journal Communications, Inc. | 312,800 | 2,308 |
*^ | Jos. A. Bank Clothiers, Inc. | 99,800 | 2,046 |
* | Cablevision Systems NY | | |
| Group Class A | 93,600 | 2,006 |
* | Red Robin Gourmet | | |
| Burgers, Inc. | 50,000 | 1,879 |
| International Speedway Corp. | 45,200 | 1,862 |
11
| | | Market |
| | | Value• |
| | Shares | ($000) |
| Jackson Hewitt Tax Service Inc. | 147,400 | 1,691 |
* | Papa John’s International, Inc. | 69,021 | 1,671 |
| CBRL Group, Inc. | 41,300 | 1,477 |
^ | Ethan Allen Interiors, Inc. | 50,100 | 1,424 |
| Movado Group, Inc. | 70,400 | 1,372 |
| Service Corp. International | 119,907 | 1,216 |
* | AFC Enterprises, Inc. | 132,800 | 1,194 |
* | Westwood One, Inc. | 561,602 | 1,179 |
^ | Tempur-Pedic International Inc. | 77,800 | 856 |
| Regis Corp. | 16,600 | 456 |
* | Town Sports International | | |
| Holdings, Inc. | 56,800 | 364 |
| Landry’s Restaurants, Inc. | 35 | 1 |
| | | 751,295 |
Consumer Staples (4.2%) | | |
| Molson Coors Brewing Co. | | |
| Class B | 1,011,000 | 53,148 |
| Corn Products | | |
| International, Inc. | 818,000 | 30,381 |
* | NBTY, Inc. | 768,183 | 23,007 |
| The Clorox Co. | 330,700 | 18,731 |
| Carolina Group | 235,321 | 17,073 |
| The Pepsi Bottling | | |
| Group, Inc. | 496,000 | 16,819 |
^ | Nash-Finch Co. | 472,695 | 16,062 |
| The Kroger Co. | 445,200 | 11,308 |
* | Winn-Dixie Stores, Inc. | 552,411 | 9,921 |
| Coca-Cola Enterprises, Inc. | 401,985 | 9,728 |
| Universal Corp. (VA) | 127,836 | 8,377 |
| Alberto-Culver Co. | 148,900 | 4,081 |
* | Alliance One | | |
| International, Inc. | 574,500 | 3,470 |
* | Elizabeth Arden, Inc. | 170,300 | 3,397 |
| Herbalife Ltd. | 69,700 | 3,311 |
| PepsiAmericas, Inc. | 122,905 | 3,138 |
| Del Monte Foods Co. | 322,762 | 3,076 |
| National Beverage Corp. | 18,700 | 143 |
| | | 235,171 |
Energy (10.2%) | | |
| Helmerich & Payne, Inc. | 1,146,142 | 53,720 |
| ENSCO International, Inc. | 822,509 | 51,506 |
| Murphy Oil Corp. | 613,300 | 50,376 |
| Tidewater Inc. | 766,500 | 42,242 |
| Patterson-UTI Energy, Inc. | 1,359,269 | 35,586 |
* | Whiting Petroleum Corp. | 515,700 | 33,340 |
* | Bristow Group, Inc. | 555,400 | 29,808 |
* | Swift Energy Co. | 614,100 | 27,628 |
* | Cameron International Corp. | 655,000 | 27,274 |
| Noble Corp. | 496,022 | 24,637 |
| Sunoco, Inc. | 446,700 | 23,438 |
* | National Oilwell Varco Inc. | 400,500 | 23,381 |
| Frontier Oil Corp. | 857,300 | 23,370 |
| Noble Energy, Inc. | 295,800 | 21,534 |
12
| | | Market |
| | | Value• |
| | Shares | ($000) |
* | Grey Wolf, Inc. | 2,442,719 | 16,562 |
* | Nabors Industries, Inc. | 484,662 | 16,367 |
* | Bois d’Arc Energy, Inc. | 648,000 | 13,926 |
* | Comstock Resources, Inc. | 299,096 | 12,054 |
* | Ultra Petroleum Corp. | 148,200 | 11,486 |
* | Superior Energy Services, Inc. | 220,547 | 8,738 |
| Overseas Shipholding Group Inc. | 58,300 | 4,083 |
* | Oil States International, Inc. | 81,007 | 3,630 |
* | SEACOR Holdings Inc. | 42,500 | 3,628 |
* | Stone Energy Corp. | 64,300 | 3,364 |
* | W-H Energy Services, Inc. | 29,200 | 2,010 |
* | Gulfmark Offshore, Inc. | 31,700 | 1,735 |
* | Mariner Energy Inc. | 50,700 | 1,369 |
* | Rosetta Resources, Inc. | 64,900 | 1,277 |
| General Maritime Corp. | 51,300 | 1,211 |
* | PetroQuest Energy, Inc. | 23,600 | 409 |
| | | 569,689 |
Financials (18.2%) | | |
| Safeco Corp. | 1,057,002 | 46,381 |
| Ameriprise Financial, Inc. | 859,321 | 44,556 |
| Bank of Hawaii Corp. | 747,175 | 37,030 |
| Leucadia National Corp. | 790,990 | 35,769 |
| Associated Banc-Corp. | 1,094,923 | 29,158 |
| Endurance Specialty Holdings Ltd. | 787,700 | 28,830 |
| PartnerRe Ltd. | 347,919 | 26,546 |
* | Arch Capital Group Ltd. | 361,200 | 24,804 |
| Torchmark Corp. | 379,455 | 22,809 |
* | Nasdaq Stock Market Inc. | 540,300 | 20,888 |
| Host Hotels & Resorts Inc. REIT | 1,187,200 | 18,900 |
| W.R. Berkley Corp. | 680,735 | 18,850 |
| Cullen/Frost Bankers, Inc. | 351,700 | 18,654 |
| HCP, Inc. REIT | 521,000 | 17,615 |
| Pacific Capital Bancorp | 773,730 | 16,635 |
| Axis Capital Holdings Ltd. | 487,580 | 16,568 |
| Commerce Bancshares, Inc. | 368,030 | 15,468 |
| Synovus Financial Corp. | 1,386,950 | 15,340 |
| AMB Property Corp. REIT | 277,500 | 15,102 |
| The Macerich Co. REIT | 203,700 | 14,314 |
| Everest Re Group, Ltd. | 157,300 | 14,083 |
| Federal Realty Investment | | |
| Trust REIT | 178,800 | 13,937 |
^ | American Capital Strategies, Ltd. | 401,600 | 13,719 |
| SL Green Realty Corp. REIT | 165,226 | 13,461 |
| FirstMerit Corp. | 646,801 | 13,363 |
| Sterling Bancshares, Inc. | 1,321,300 | 13,134 |
^ | The St. Joe Co. | 284,200 | 12,201 |
| Ventas, Inc. REIT | 267,900 | 12,031 |
| Apartment Investment & | | |
| Management Co. | | |
| Class A REIT | 335,009 | 11,997 |
^ | Popular, Inc. | 1,025,400 | 11,956 |
13
| | | Market |
| | | Value• |
| | Shares | ($000) |
^ | First Commonwealth Financial Corp. | 978,620 | 11,342 |
| Hospitality Properties Trust REIT | 333,000 | 11,329 |
| Platinum Underwriters Holdings, Ltd. | 344,200 | 11,173 |
| Aspen Insurance Holdings Ltd. | 401,400 | 10,589 |
| Nationwide Health Properties, Inc. REIT | 313,400 | 10,577 |
| Janus Capital Group Inc. | 445,700 | 10,371 |
| Boston Properties, Inc. REIT | 111,700 | 10,284 |
^ | Colonial BancGroup, Inc. | 1,055,500 | 10,164 |
| Jones Lang LaSalle Inc. | 130,400 | 10,085 |
| Senior Housing Properties Trust REIT | 415,200 | 9,840 |
| Highwood Properties, Inc. REIT | 303,200 | 9,420 |
* | CB Richard Ellis Group, Inc. | 418,200 | 9,050 |
| Douglas Emmett, Inc. REIT | 405,100 | 8,937 |
| Trustmark Corp. | 400,200 | 8,916 |
| Digital Realty Trust, | | |
| Inc. REIT | 245,149 | 8,703 |
| Equity Lifestyle Properties, | | |
| Inc. REIT | 175,900 | 8,684 |
| Tanger Factory Outlet | | |
| Centers, Inc. REIT | 225,400 | 8,671 |
^ | The First Marblehead Corp. | 1,125,200 | 8,394 |
| F.N.B. Corp. | 536,100 | 8,369 |
| Mack-Cali Realty Corp. REIT | 212,700 | 7,596 |
| Kimco Realty Corp. REIT | 190,373 | 7,457 |
| Parkway Properties | | |
| Inc. REIT | 201,300 | 7,440 |
| Colonial Properties | | |
| Trust REIT | 300,660 | 7,231 |
| Sun Communities, | | |
| Inc. REIT | 346,300 | 7,099 |
| Healthcare Realty | | |
| Trust Inc. REIT | 258,900 | 6,770 |
| Odyssey Re Holdings Corp. | 181,700 | 6,677 |
| Pennsylvania REIT | 267,300 | 6,519 |
| Mid-America Apartment | | |
| Communities, Inc. REIT | 126,100 | 6,285 |
| Rayonier Inc. REIT | 142,050 | 6,171 |
| Avalonbay Communities, | | |
| Inc. REIT | 63,000 | 6,081 |
^ | CapitalSource Inc. REIT | 619,500 | 5,991 |
| Eaton Vance Corp. | 196,000 | 5,980 |
| City Holding Co. | 148,655 | 5,931 |
| S & T Bancorp, Inc. | 173,400 | 5,578 |
| NBT Bancorp, Inc. | 246,952 | 5,482 |
^ | JER Investors Trust | | |
| Inc. REIT | 620,900 | 5,265 |
| Plum Creek Timber Co. | | |
| Inc. REIT | 117,500 | 4,782 |
14
| | | Market |
| | | Value• |
| | Shares | ($000) |
* | Affiliated Managers Group, Inc. | 52,000 | 4,718 |
| Annaly Mortgage Management Inc. REIT | 307,500 | 4,711 |
* | TD Ameritrade Holding Corp. | 269,900 | 4,456 |
| FelCor Lodging Trust, Inc. REIT | 364,700 | 4,387 |
| WesBanco, Inc. | 166,214 | 4,107 |
| American Financial Realty | | |
| Trust REIT | 504,163 | 4,003 |
| Federated Investors, Inc. | 98,998 | 3,877 |
| Crystal River Capital | | |
| Inc. REIT | 424,000 | 3,786 |
| RenaissanceRe | | |
| Holdings Ltd. | 70,700 | 3,670 |
| Old National Bancorp | 194,500 | 3,501 |
^ | City Bank Lynnwood (WA) | 154,609 | 3,443 |
| iStar Financial Inc. REIT | 236,800 | 3,322 |
| WSFS Financial Corp. | 67,250 | 3,314 |
| Advanta Corp. Class B | 442,395 | 3,110 |
| Cash America | | |
| International Inc. | 80,100 | 2,916 |
| BancFirst Corp. | 60,622 | 2,775 |
* | Ocwen Financial Corp. | 619,700 | 2,751 |
| Potlatch Corp. REIT | 62,900 | 2,596 |
* | EZCORP, Inc. | 206,821 | 2,546 |
* | Philadelphia Consolidated | | |
| Holding Corp. | 78,224 | 2,519 |
* | Penson Worldwide, Inc. | 270,100 | 2,493 |
*^ | Virginia Commerce | | |
| Bancorp, Inc. | 211,400 | 2,427 |
| Gamco Investors Inc. | | |
| Class A | 45,666 | 2,300 |
| Developers Diversified | | |
| Realty Corp. REIT | 47,400 | 1,985 |
* | Guaranty Financial | | |
| Group, Inc. | 177,500 | 1,885 |
| LaSalle Hotel | | |
| Properties REIT | 59,600 | 1,712 |
| Sterling Bancorp | 100,808 | 1,566 |
| First Community | | |
| Bancshares, Inc. | 41,600 | 1,515 |
^ | Heartland Financial USA, Inc. | 65,000 | 1,375 |
*^ | Franklin Bank Corp. | 433,100 | 1,312 |
| Regency Centers Corp. REIT | 16,400 | 1,062 |
| Great Southern Bancorp, Inc. | 61,605 | 962 |
* | Knight Capital Group, | | |
| Inc. Class A | 54,653 | 888 |
| Anworth Mortgage | | |
| Asset Corp. REIT | 139,700 | 856 |
| First Place Financial Corp. | 55,600 | 723 |
| Willis Group Holdings Ltd. | 20,900 | 702 |
| Omega Healthcare | | |
| Investors, Inc. REIT | 33,500 | 582 |
| GMH Communities | | |
| Trust REIT | 61,100 | 530 |
15
| | | Market |
| | | Value• |
| | Shares | ($000) |
| SWS Group, Inc. | 42,500 | 520 |
| Republic Bancorp, Inc. Class A | 26,600 | 502 |
| Acadia Realty Trust REIT | 20,100 | 485 |
| MFA Mortgage Investments, Inc. REIT | 71,500 | 450 |
| Integra Bank Corp. | 25,674 | 416 |
^ | Thornburg Mortgage, Inc. REIT | 214,300 | 227 |
* | United America | | |
| Indemnity, Ltd. | 6,900 | 133 |
| Reinsurance Group of | | |
| America, Inc. | 2,000 | 109 |
| First Financial Bancorp | 7,500 | 101 |
| Max Re Capital Ltd. | 1,500 | 39 |
| East West Bancorp, Inc. | 1,100 | 20 |
| | | 1,011,717 |
Health Care (10.0%) | | |
| AmerisourceBergen Corp. | 1,254,757 | 51,420 |
| Perrigo Co. | 1,347,403 | 50,838 |
* | Intuitive Surgical, Inc. | 147,200 | 47,744 |
| Beckman Coulter, Inc. | 635,846 | 41,044 |
* | Humana Inc. | 808,600 | 36,274 |
* | Pediatrix Medical | | |
| Group, Inc. | 522,300 | 35,203 |
* | Lincare Holdings, Inc. | 1,139,396 | 32,028 |
* | PAREXEL | | |
| International Corp. | 1,018,900 | 26,593 |
* | Sciele Pharma, Inc. | 1,338,208 | 26,095 |
* | Express Scripts Inc. | 361,900 | 23,277 |
* | Apria Healthcare Group Inc. | 913,652 | 18,045 |
* | King Pharmaceuticals, Inc. | 1,912,600 | 16,640 |
*^ | Isis Pharmaceuticals, Inc. | 1,123,302 | 15,850 |
* | Invitrogen Corp. | 161,500 | 13,803 |
* | Cynosure Inc. | 453,900 | 9,668 |
* | Health Net Inc. | 238,300 | 7,340 |
* | Onyx Pharmaceuticals, Inc. | 252,500 | 7,330 |
* | Techne Corp. | 108,521 | 7,310 |
| Chemed Corp. | 167,200 | 7,056 |
* | Charles River | | |
| Laboratories, Inc. | 111,400 | 6,566 |
* | MedCath Corp. | 335,620 | 6,108 |
* | Warner Chilcott Ltd. | 285,900 | 5,146 |
* | DaVita, Inc. | 106,900 | 5,106 |
* | Watson Pharmaceuticals, Inc. | 171,300 | 5,023 |
* | PharMerica Corp. | 260,353 | 4,314 |
* | Kinetic Concepts, Inc. | 92,500 | 4,276 |
* | Xenoport Inc. | 103,340 | 4,182 |
* | Bruker BioSciences Corp. | 266,129 | 4,096 |
* | OSI Pharmaceuticals, Inc. | 101,800 | 3,806 |
* | Myriad Genetics, Inc. | 91,100 | 3,670 |
* | Par Pharmaceutical Cos. Inc. | 208,656 | 3,629 |
* | Skilled Healthcare Group Inc. | 300,398 | 3,298 |
| Mentor Corp. | 115,700 | 2,976 |
* | Align Technology, Inc. | 243,300 | 2,703 |
* | AMERIGROUP Corp. | 91,400 | 2,498 |
16
| | | Market |
| | | Value• |
| | Shares | ($000) |
* | Bio-Rad Laboratories, Inc. Class A | 27,500 | 2,446 |
| Cambrex Corp. | 338,200 | 2,344 |
* | Affymetrix, Inc. | 113,100 | 1,969 |
* | Martek Biosciences Corp. | 52,900 | 1,617 |
* | Emergent BioSolutions Inc. | 159,200 | 1,420 |
* | Albany Molecular Research, Inc. | 100,590 | 1,221 |
* | Gentiva Health Services, Inc. | 48,600 | 1,058 |
* | eResearch Technology, Inc. | 66,400 | 825 |
* | Endo Pharmaceuticals Holdings, Inc. | 24,800 | 594 |
* | ViroPharma Inc. | 40,500 | 362 |
* | CONMED Corp. | 7,000 | 179 |
* | AmSurg Corp. | 7,020 | 166 |
* | Amedisys Inc. | 1,500 | 59 |
| | | 555,215 |
Industrials (15.8%) | | |
| Parker Hannifin Corp. | 949,641 | 65,782 |
| Manpower Inc. | 922,175 | 51,882 |
| Cooper Industries, Inc. | | |
| Class A | 1,270,700 | 51,019 |
| The Manitowoc Co., Inc. | 1,241,380 | 50,648 |
* | Terex Corp. | 800,097 | 50,006 |
| Cummins Inc. | 980,982 | 45,930 |
* | AGCO Corp. | 731,500 | 43,802 |
^ | Trinity Industries, Inc. | 1,522,220 | 40,567 |
* | Allied Waste | | |
| Industries, Inc. | 3,516,088 | 38,009 |
* | Hertz Global Holdings Inc. | 2,244,609 | 27,070 |
*^ | TBS International Ltd. | 819,900 | 24,761 |
| Hubbell Inc. Class B | 540,500 | 23,614 |
* | Gardner Denver Inc. | 569,660 | 21,134 |
| A.O. Smith Corp. | 578,000 | 18,999 |
* | McDermott | | |
| International, Inc. | 343,300 | 18,820 |
* | Perini Corp. | 489,300 | 17,727 |
* | EnPro Industries, Inc. | 543,700 | 16,958 |
| R.R. Donnelley & Sons Co. | 544,120 | 16,492 |
* | United Stationers, Inc. | 345,230 | 16,467 |
| Steelcase Inc. | 1,464,962 | 16,202 |
| GATX Corp. | 381,120 | 14,890 |
* | EMCOR Group, Inc. | 654,900 | 14,545 |
* | Consolidated Graphics, Inc. | 249,300 | 13,973 |
* | Columbus McKinnon Corp. | 447,800 | 13,873 |
| Cubic Corp. | 460,132 | 13,082 |
| SPX Corp. | 98,800 | 10,364 |
| Con-way, Inc. | 207,043 | 10,244 |
| Ryder System, Inc. | 151,200 | 9,210 |
* | Volt Information | | |
| Sciences Inc. | 472,170 | 8,008 |
| Acuity Brands, Inc. | 182,600 | 7,843 |
* | Ceradyne, Inc. | 240,100 | 7,674 |
| Pacer International, Inc. | 462,422 | 7,598 |
| Herman Miller, Inc. | 308,741 | 7,586 |
| Kennametal, Inc. | 235,200 | 6,922 |
17
| | | Market |
| | | Value• |
| | Shares | ($000) |
* | TrueBlue, Inc. | 485,700 | 6,528 |
| Robbins & Myers, Inc. | 195,400 | 6,380 |
| Bowne & Co., Inc. | 329,500 | 5,025 |
| Apogee Enterprises, Inc. | 299,390 | 4,611 |
| UAL Corp. | 188,929 | 4,068 |
* | Spherion Corp. | 625,100 | 3,826 |
* | AMR Corp. | 385,951 | 3,481 |
| Alexander & Baldwin, Inc. | 78,900 | 3,399 |
* | Continental Airlines, Inc. Class B | 172,500 | 3,317 |
*^ | RSC Holdings Inc. | 288,900 | 3,149 |
| L-3 Communications Holdings, Inc. | 28,200 | 3,083 |
* | Republic Airways Holdings Inc. | 139,800 | 3,028 |
* | GrafTech International Ltd. | 171,900 | 2,787 |
| The Toro Co. | 66,000 | 2,732 |
* | Kansas City Southern | 62,800 | 2,519 |
| Triumph Group, Inc. | 44,025 | 2,506 |
* | United Rentals, Inc. | 131,900 | 2,485 |
| Crane Co. | 61,500 | 2,482 |
^ | Genco Shipping and Trading Ltd. | 41,200 | 2,325 |
* | Avis Budget Group, Inc. | 200,000 | 2,124 |
* | Rush Enterprises, Inc. Class A | 98,850 | 1,566 |
| TAL International Group, Inc. | 65,400 | 1,541 |
| Deluxe Corp. | 65,600 | 1,260 |
| Kelly Services, Inc. Class A | 58,946 | 1,212 |
| Rockwell Automation, Inc. | 17,100 | 982 |
* | Astec Industries, Inc. | 21,000 | 814 |
* | Alliant Techsystems, Inc. | 4,447 | 460 |
| Belden Inc. | 6,100 | 215 |
* | Kforce Inc. | 2,600 | 23 |
| | | 879,629 |
Information Technology (14.1%) | | |
* | Computer Sciences Corp. | 1,312,800 | 53,549 |
* | Avnet, Inc. | 1,529,600 | 50,064 |
*^ | Sybase, Inc. | 1,773,785 | 46,651 |
* | Hewitt Associates, Inc. | 1,032,300 | 41,055 |
* | BMC Software, Inc. | 1,074,336 | 34,937 |
* | Anixter International Inc. | 496,000 | 31,764 |
* | Amkor Technology, Inc. | 2,756,051 | 29,490 |
* | LAM Research Corp. | 720,498 | 27,537 |
*^ | OmniVision | | |
| Technologies, Inc. | 1,391,439 | 23,404 |
* | CommScope, Inc. | 646,400 | 22,514 |
* | Novellus Systems, Inc. | 1,037,200 | 21,833 |
| Seagate Technology | 911,500 | 19,087 |
* | Dolby Laboratories Inc. | 519,000 | 18,819 |
| National | | |
| Semiconductor Corp. | 1,001,300 | 18,344 |
* | Blue Coat Systems, Inc. | 819,647 | 18,065 |
* | Activision, Inc. | 540,397 | 14,758 |
* | Zoran Corp. | 1,079,150 | 14,741 |
18
| | | Market |
| | | Value• |
| | Shares | ($000) |
* | j2 Global Communications, Inc. | 635,467 | 14,184 |
* | SAVVIS, Inc. | 863,979 | 14,057 |
* | Metavante Technologies | 690,239 | 13,798 |
| Xilinx, Inc. | 552,500 | 13,122 |
* | RF Micro Devices, Inc. | 4,436,026 | 11,800 |
| Technitrol, Inc. | 463,100 | 10,712 |
* | Plexus Corp. | 369,866 | 10,375 |
* | CSG Systems International, Inc. | 903,778 | 10,276 |
* | Western Digital Corp. | 369,200 | 9,983 |
* | Synopsys, Inc. | 417,570 | 9,483 |
* | ManTech International Corp. | 199,200 | 9,036 |
* | Interwoven Inc. | 768,566 | 8,208 |
* | JDA Software Group, Inc. | 437,800 | 7,990 |
* | Cadence Design Systems, Inc. | 743,400 | 7,940 |
* | Sykes Enterprises, Inc. | 433,500 | 7,625 |
* | DST Systems, Inc. | 105,800 | 6,955 |
* | Flextronics International Ltd. | 732,700 | 6,880 |
* | Mattson Technology, Inc. | 1,012,020 | 6,163 |
* | Vignette Corp. | 462,407 | 6,108 |
* | Progress Software Corp. | 193,524 | 5,790 |
* | Compuware Corp. | 779,759 | 5,723 |
* | Tessera Technologies, Inc. | 269,100 | 5,597 |
* | Fairchild Semiconductor | | |
| International, Inc. | 456,900 | 5,446 |
| KLA-Tencor Corp. | 144,700 | 5,368 |
* | Lexmark International, Inc. | 167,500 | 5,146 |
* | Quantum Corp. | 2,338,902 | 5,005 |
| Broadridge Financial | | |
| Solutions LLC | 274,700 | 4,835 |
* | S1 Corp. | 678,316 | 4,823 |
| Fair Isaac, Inc. | 213,500 | 4,595 |
* | Parametric Technology Corp. | 263,298 | 4,208 |
* | NVIDIA Corp. | 212,250 | 4,200 |
* | Alliance Data Systems Corp. | 82,800 | 3,934 |
* | MKS Instruments, Inc. | 152,250 | 3,258 |
| United Online, Inc. | 307,968 | 3,252 |
* | Tech Data Corp. | 97,200 | 3,188 |
* | SAIC, Inc. | 169,300 | 3,147 |
* | Integrated Device | | |
| Technology Inc. | 335,900 | 3,000 |
* | Lawson Software, Inc. | 367,000 | 2,764 |
* | SRA International, Inc. | 100,000 | 2,431 |
* | Synchronoss | | |
| Technologies, Inc. | 119,600 | 2,396 |
* | Checkpoint Systems, Inc. | 87,800 | 2,357 |
* | Eagle Test Systems, Inc. | 203,200 | 2,134 |
* | Arrow Electronics, Inc. | 61,604 | 2,073 |
* | Cymer, Inc. | 63,600 | 1,656 |
| Plantronics, Inc. | 79,300 | 1,531 |
* | Ciber, Inc. | 299,000 | 1,465 |
* | MicroStrategy Inc. | 19,086 | 1,412 |
* | iGATE Corp. | 194,427 | 1,384 |
* | SPSS, Inc. | 34,400 | 1,334 |
19
| | | Market |
| | | Value• |
| | Shares | ($000) |
| MAXIMUS, Inc. | 35,649 | 1,309 |
| Methode Electronics, Inc. Class A | 79,900 | 934 |
| TNS Inc. | 38,400 | 793 |
* | Skyworks Solutions, Inc. | 92,100 | 670 |
* | Taleo Corp. Class A | 33,064 | 641 |
* | Magma Design Automation, Inc. | 65,038 | 622 |
* | CACI International, Inc. | 13,384 | 610 |
* | Kulicke & Soffa Industries, Inc. | 90,907 | 435 |
* | Chordiant Software, Inc. | 62,819 | 379 |
| infoUSA Inc. | 61,837 | 378 |
* | Manhattan Associates, Inc. | 16,100 | 369 |
* | MPS Group, Inc. | 27,404 | 324 |
* | Ansoft Corp. | 8,847 | 270 |
* | Credence Systems Corp. | 155,800 | 265 |
* | Emulex Corp. | 7,500 | 122 |
| | | 782,880 |
Materials (6.2%) | | |
| United States Steel Corp. | 552,500 | 70,096 |
| Celanese Corp. Series A | 1,358,400 | 53,046 |
| AK Steel Holding Corp. | 971,235 | 52,855 |
| Steel Dynamics, Inc. | 1,248,128 | 41,238 |
* | Terra Industries, Inc. | 861,700 | 30,616 |
| Eastman Chemical Co. | 478,260 | 29,867 |
| Greif Inc. Class A | 325,000 | 22,077 |
* | Owens-Illinois, Inc. | 348,500 | 19,666 |
| CF Industries Holdings, Inc. | 84,100 | 8,714 |
| Lubrizol Corp. | 116,900 | 6,489 |
| Ball Corp. | 118,900 | 5,462 |
| Cytec Industries, Inc. | 76,800 | 4,136 |
| Rock-Tenn Co. | 60,800 | 1,822 |
| Kaiser Aluminum Corp. | 16,728 | 1,159 |
| | | 347,243 |
Telecommunication Services (1.8%) | | |
| Embarq Corp. | 904,023 | 36,251 |
* | Cincinnati Bell Inc. | 4,000,300 | 17,041 |
| Telephone & Data | | |
| Systems, Inc. | 392,648 | 15,419 |
* | Syniverse Holdings Inc. | 827,900 | 13,793 |
| CenturyTel, Inc. | 164,600 | 5,471 |
| NTELOS Holdings Corp. | 206,500 | 4,997 |
| Alaska Communications Systems Holdings, Inc. | 184,946 | 2,264 |
| Qwest Communications International Inc. | 461,000 | 2,088 |
| | | 97,324 |
Utilities (5.5%) | | |
* | Mirant Corp. | 1,580,500 | 57,514 |
* | NRG Energy, Inc. | 1,222,900 | 47,681 |
20
| | | Market |
| | | Value• |
| | Shares | ($000) |
| Energen Corp. | 617,472 | 38,469 |
| Alliant Energy Corp. | 915,356 | 32,047 |
| Pepco Holdings, Inc. | 1,190,934 | 29,440 |
| Xcel Energy, Inc. | 1,252,545 | 24,988 |
| SCANA Corp. | 674,878 | 24,687 |
| WGL Holdings Inc. | 380,700 | 12,205 |
| CenterPoint Energy Inc. | 830,949 | 11,858 |
| ONEOK, Inc. | 249,400 | 11,131 |
| Atmos Energy Corp. | 225,411 | 5,748 |
| Portland General Electric Co. | 183,900 | 4,147 |
| The Laclede Group, Inc. | 113,600 | 4,048 |
| Southern Union Co. | 169,600 | 3,947 |
| Wisconsin Energy Corp. | 22,500 | 990 |
| | | 308,900 |
Total Common Stocks | | |
(Cost $5,673,634) | | 5,539,063 |
Temporary Cash Investments (2.9%)1 | | |
Money Market Funds (2.8%) | | |
2 | Vanguard Market Liquidity | | |
| Fund, 2.800% | 26,007,619 | 26,008 |
2 | Vanguard Market Liquidity | | |
| Fund, 2.800%—Note E | 130,372,100 | 130,372 |
| | | 156,380 |
| | | |
| | | |
| | Face | |
| | Amount | |
| | ($000) | |
U.S. Agency Obligations (0.1%) | | |
3 | Federal Home Loan Bank | | |
4 | 2.923%, 4/16/08 | 2,000 | 1,998 |
3 | Federal National Mortgage Assn. | | |
4 | 2.701%, 4/21/08 | 3,000 | 2,996 |
| | | 4,994 |
Total Temporary Cash Investments | | |
(Cost $161,373) | | 161,374 |
Total Investments (102.4%) | | |
(Cost $5,835,007) | | 5,700,437 |
Other Assets and Liabilities (–2.4%) | | |
Other Assets—Note B | | 15,342 |
Liabilities—Note E | | (147,907) |
| | | (132,565) |
Net Assets (100%) | | |
Applicable to 302,104,034 outstanding | | |
$.001 par value shares of beneficial | | |
interest (unlimited authorization) | | 5,567,872 |
Net Asset Value Per Share | | $18.43 |
21
At March 31, 2008, net assets consisted of:5 | |
| Amount | Per |
| ($000) | Share |
Paid-in Capital | 5,989,291 | $19.83 |
Undistributed Net | | |
Investment Income | 415 | — |
Accumulated Net | | |
Realized Losses | (287,979) | (.95) |
Unrealized Appreciation | | |
(Depreciation) | | |
Investment Securities | (134,570) | (.45) |
Futures Contracts | 715 | — |
Net Assets | 5,567,872 | $18.43 |
• | See Note A in Notes to Financial Statements. |
* Non-income-producing security.
^ Part of security position is on loan to broker-dealers. See Note E in Notes to Financial Statements.
1 The fund invests a portion of its cash reserves in equity markets through the use of index futures contracts. After giving effect to futures investments, the fund’s effective common stock and temporary cash investment positions represent 100.0% and 2.4%, respectively, of net assets. See Note C in Notes to Financial Statements.
2 Affiliated money market fund available only to Vanguard funds and certain trusts and accounts managed by Vanguard. Rate shown is the 7-day yield.
3 The issuer operates under a congressional charter; its securities are neither issued nor guaranteed by the U.S. government. If needed, access to additional funding from the U.S. Treasury (beyond the issuer’s line of credit) would require congressional action.
4 Securities with a value of $4,994,000 have been segregated as initial margin for open futures contracts.
5 See Note C in Notes to Financial Statements for the tax-basis components of net assets.
REIT—Real Estate Investment Trust.
22
Statement of Operations
| Six Months Ended |
| March 31, 2008 |
| ($000) |
Investment Income | |
Income | |
Dividends | 33,805 |
Interest1 | 459 |
Security Lending | 2,692 |
Total Income | 36,956 |
Expenses | |
The Vanguard Group—Note B | |
Investment Advisory Fees | 627 |
Management and Administrative | 7,090 |
Marketing and Distribution | 770 |
Custodian Fees | 120 |
Shareholders’ Reports | 76 |
Trustees’ Fees and Expenses | 5 |
Total Expenses | 8,688 |
Net Investment Income | 28,268 |
Realized Net Gain (Loss) | |
Investment Securities Sold | (244,799) |
Futures Contracts | (8,198) |
Realized Net Gain (Loss) | (252,997) |
Change in Unrealized Appreciation (Depreciation) | |
Investment Securities | (942,572) |
Futures Contracts | 400 |
Change in Unrealized Appreciation (Depreciation) | (942,172) |
Net Increase (Decrease) in Net Assets Resulting from Operations | (1,166,901) |
1 Interest income from an affiliated company of the fund was $389,000.
23
Statement of Changes in Net Assets
| Six Months Ended | Year Ended |
| March 31, | September 30, |
| 2008 | 2007 |
| ($000) | ($000) |
Increase (Decrease) in Net Assets | | |
Operations | | |
Net Investment Income | 28,268 | 78,672 |
Realized Net Gain (Loss) | (252,997) | 755,729 |
Change in Unrealized Appreciation (Depreciation) | (942,172) | 71,161 |
Net Increase (Decrease) in Net Assets Resulting from Operations | (1,166,901) | 905,562 |
Distributions | | |
Net Investment Income | (69,138) | (74,998) |
Realized Capital Gain1 | (700,018) | (282,684) |
Total Distributions | (769,156) | (357,682) |
Capital Share Transactions—Note F | | |
Issued | 400,085 | 1,437,921 |
Issued in Lieu of Cash Distributions | 726,972 | 338,749 |
Redeemed | (1,322,056) | (1,380,667) |
Net Increase (Decrease) from Capital Share Transactions | (194,999) | 396,003 |
Total Increase (Decrease) | (2,131,056) | 943,883 |
Net Assets | | |
Beginning of Period | 7,698,928 | 6,755,045 |
End of Period2 | 5,567,872 | 7,698,928 |
1 Includes fiscal 2008 and 2007 short-term gain distributions totaling $83,541,000 and $28,845,000, respectively. Short-term gain distributions are treated as ordinary income dividends for tax purposes.
2 Net Assets— End of Period includes undistributed net investment income of $415,000 and $41,285,000.
24
Financial Highlights
| Six Months | | | | Nov. 1, | | |
| Ended | | | | 2003, to | Year Ended |
For a Share Outstanding | March 31, | Year Ended September 30, | Sept. 30, | October 31, |
Throughout Each Period | 2008 | 2007 | 2006 | 2005 | 20041 | 2003 | 2002 |
Net Asset Value, | | | | | | | |
Beginning of Period | $24.94 | $23.07 | $23.28 | $19.70 | $17.85 | $13.01 | $13.68 |
Investment Operations | | | | | | | |
Net Investment Income | .11 | .27 | .27 | .19 | .13 | .13 | .14 |
Net Realized and | | | | | | | |
Unrealized Gain (Loss) | | | | | | | |
on Investments | (3.95) | 2.84 | 1.17 | 4.49 | 1.85 | 4.84 | (.67) |
Total from | | | | | | | |
Investment Operations | (3.84) | 3.11 | 1.44 | 4.68 | 1.98 | 4.97 | (.53) |
Distributions | | | | | | | |
Dividends from | | | | | | | |
Net Investment Income | (.24) | (.26) | (.21) | (.14) | (.13) | (.13) | (.14) |
Distributions from | | | | | | | |
Realized Capital Gains | (2.43) | (.98) | (1.44) | (.96) | — | — | — |
Total Distributions | (2.67) | (1.24) | (1.65) | (1.10) | (.13) | (.13) | (.14) |
Net Asset Value, | | | | | | | |
End of Period | $18.43 | $24.94 | $23.07 | $23.28 | $19.70 | $17.85 | $13.01 |
| | | | | | | |
Total Return2 | –16.23% | 13.76% | 6.49% | 24.32% | 11.14% | 38.55% | –4.02% |
| | | | | | | |
Ratios/Supplemental Data | | | | | | | |
Net Assets, | | | | | | | |
End of Period (Millions) | $5,568 | $7,699 | $6,755 | $5,183 | $2,953 | $1,714 | $876 |
Ratio of Total Expenses to | | | | | | | |
Average Net Assets | 0.27%* | 0.30% | 0.35% | 0.40% | 0.45%* | 0.50% | 0.50% |
Ratio of Net Investment | | | | | | | |
Income to Average | | | | | | | |
Net Assets | 0.88%* | 1.03% | 1.18% | 0.99% | 0.83%* | 1.04% | 0.94% |
Portfolio Turnover Rate | 90%* | 75% | 80% | 75% | 66% | 100% | 73% |
1 The fund’s fiscal year-end changed from October 31 to September 30, effective September 30, 2004.
2 Total returns do not reflect the account service fee that may be applicable to certain accounts with balances below $10,000.
See accompanying Notes, which are an integral part of the Financial Statements.
25
Notes to Financial Statements
Vanguard Strategic Equity Fund is registered under the Investment Company Act of 1940 as an open-end investment company, or mutual fund. The fund files reports with the SEC under the company name Vanguard Horizon Funds.
A. The following significant accounting policies conform to generally accepted accounting principles for U.S. mutual funds. The fund consistently follows such policies in preparing its financial statements.
1. Security Valuation: Securities are valued as of the close of trading on the New York Stock Exchange (generally 4 p.m., Eastern time) on the valuation date. Equity securities are valued at the latest quoted sales prices or official closing prices taken from the primary market in which each security trades; such securities not traded on the valuation date are valued at the mean of the latest quoted bid and asked prices. Securities for which market quotations are not readily available, or whose values have been materially affected by events occurring before the fund’s pricing time but after the close of the securities’ primary markets, are valued by methods deemed by the board of trustees to represent fair value. Investments in Vanguard Market Liquidity Fund are valued at that fund’s net asset value. Temporary cash investments acquired over 60 days to maturity are valued using the latest bid prices or using valuations based on a matrix system (which considers such factors as security prices, yields, maturities, and ratings), both as furnished by independent pricing services. Other temporary cash investments are valued at amortized cost, which approximates market value.
2. Futures Contracts: The fund uses index futures contracts to a limited extent, with the objective of maintaining full exposure to the stock market while maintaining liquidity. The fund may purchase or sell futures contracts to achieve a desired level of investment, whether to accommodate portfolio turnover or cash flows from capital share transactions. The primary risks associated with the use of futures contracts are imperfect correlation between changes in market values of stocks held by the fund and the prices of futures contracts, and the possibility of an illiquid market.
Futures contracts are valued at their quoted daily settlement prices. The aggregate principal amounts of the contracts are not recorded in the Statement of Net Assets. Fluctuations in the value of the contracts are recorded in the Statement of Net Assets as an asset (liability) and in the Statement of Operations as unrealized appreciation (depreciation) until the contracts are closed, when they are recorded as realized futures gains (losses).
3. Federal Income Taxes: The fund intends to continue to qualify as a regulated investment company and distribute all of its taxable income. Management has analyzed the fund’s tax positions taken on federal income tax returns for all open tax years (tax years ended September 30, 2004–2007) and for the period ended March 31, 2008, and has concluded that no provision for federal income tax is required in the fund’s financial statements.
4. Distributions: Distributions to shareholders are recorded on the ex-dividend date.
5. Security Lending: The fund may lend its securities to qualified institutional borrowers to earn additional income. Security loans are required to be secured at all times by collateral at least equal to the market value of securities loaned. The fund invests cash collateral received in Vanguard Market Liquidity Fund, and records a liability for the return of the collateral, during the period the securities are on loan. Security lending income represents the income earned on investing cash collateral, less expenses associated with the loan.
26
6. Other: Dividend income is recorded on the ex-dividend date. Interest income includes income distributions received from Vanguard Market Liquidity Fund and is accrued daily. Security transactions are accounted for on the date securities are bought or sold. Costs used to determine realized gains (losses) on the sale of investment securities are those of the specific securities sold.
B. The Vanguard Group furnishes at cost investment advisory, corporate management, administrative, marketing, and distribution services. The costs of such services are allocated to the fund under methods approved by the board of trustees. The fund has committed to provide up to 0.40% of its net assets in capital contributions to Vanguard. At March 31, 2008, the fund had contributed capital of $496,000 to Vanguard (included in Other Assets), representing 0.01% of the fund’s net assets and 0.50% of Vanguard’s capitalization. The fund’s trustees and officers are also directors and officers of Vanguard.
C. Distributions are determined on a tax basis and may differ from net investment income and realized capital gains for financial reporting purposes. Differences may be permanent or temporary. Permanent differences are reclassified among capital accounts in the financial statements to reflect their tax character. Temporary differences arise when certain items of income, expense, gain, or loss are recognized in different periods for financial statement and tax purposes; these differences will reverse at some time in the future. Differences in classification may also result from the treatment of short-term gains as ordinary income for tax purposes. The fund’s tax-basis capital gains and losses are determined only at the end of each fiscal year.
At March 31, 2008, the cost of investment securities for tax purposes was $5,835,007,000. Net unrealized depreciation of investment securities for tax purposes was $134,570,000, consisting of unrealized gains of $538,413,000 on securities that had risen in value since their purchase and $672,983,000 in unrealized losses on securities that had fallen in value since their purchase.
At March 31, 2008, the aggregate settlement value of open futures contracts expiring in June 2008 and the related unrealized appreciation (depreciation) were:
| | | ($000) |
| | Aggregate | Unrealized |
| Number of | Settlement | Appreciation |
Futures Contracts | Long Contracts | Value | (Depreciation) |
E-mini S&P Midcap Index | 200 | 15,630 | 199 |
Russell 2000 Index | 40 | 13,800 | 536 |
E-mini Russell 2000 Index | 23 | 1,587 | (20) |
Unrealized appreciation (depreciation) on open futures contracts is required to be treated as realized gain (loss) for tax purposes.
27
D. During the six months ended March 31, 2008, the fund purchased $2,929,172,000 of investment securities and sold $3,870,148,000 of investment securities, other than temporary cash investments.
E. The market value of securities on loan to broker-dealers at March 31, 2008, was $126,595,000, for which the fund received cash collateral of $130,372,000.
F. Capital shares issued and redeemed were:
| Six Months Ended | Year Ended |
| March 31, 2008 | September 30, 2007 |
| Shares | Shares |
| (000) | (000) |
Issued | 19,388 | 57,380 |
Issued in Lieu of Cash Distributions | 36,367 | 14,281 |
Redeemed | (62,317) | (55,822) |
Net Increase (Decrease) in Shares Outstanding | (6,562) | 15,839 |
28
About Your Fund’s Expenses
As a shareholder of the fund, you incur ongoing costs, which include costs for portfolio management, administrative services, and shareholder reports (like this one), among others. Operating expenses, which are deducted from a fund’s gross income, directly reduce the investment return of the fund.
A fund’s expenses are expressed as a percentage of its average net assets. This figure is known as the expense ratio. The following examples are intended to help you understand the ongoing costs (in dollars) of investing in your fund and to compare these costs with those of other mutual funds. The examples are based on an investment of $1,000 made at the beginning of the period shown and held for the entire period.
The table below illustrates your fund’s costs in two ways:
• Based on actual fund return. This section helps you to estimate the actual expenses that you paid over the period. The “Ending Account Value” shown is derived from the fund’s actual return, and the third column shows the dollar amount that would have been paid by an investor who started with $1,000 in the fund. You may use the information here, together with the amount you invested, to estimate the expenses that you paid over the period.
To do so, simply divide your account value by $1,000 (for example, an $8,600 account value divided by $1,000 = 8.6), then multiply the result by the number given for your fund under the heading “Expenses Paid During Period.”
• Based on hypothetical 5% yearly return. This section is intended to help you compare your fund’s costs with those of other mutual funds. It assumes that the fund had a yearly return of 5% before expenses, but that the expense ratio is unchanged. In this case—because the return used is not the fund’s actual return—the results do not apply to your investment. The example is useful in making comparisons because the Securities and Exchange Commission requires all mutual funds to calculate expenses based on a 5% return. You can assess your fund’s costs by comparing this hypothetical example with the hypothetical examples that appear in shareholder reports of other funds.
Six Months Ended March 31, 2008 | | | |
| Beginning | Ending | Expenses |
| Account Value | Account Value | Paid During |
Strategic Equity Fund | 9/30/2007 | 03/31/2008 | Period1 |
Based on Actual Fund Return | $1,000.00 | $837.68 | $1.24 |
Based on Hypothetical 5% Yearly Return | 1,000.00 | 1,023.65 | 1.37 |
1 The calculations are based on expenses incurred in the most recent six-month period. The fund’s annualized six-month expense ratio for that period is 0.27%. The dollar amounts shown as “Expenses Paid” are equal to the annualized expense ratio multiplied by the average account value over the period, multiplied by the number of days in the most recent six-month period, then divided by the number of days in the most recent 12-month period.
29
Note that the expenses shown in the table on page 22 are meant to highlight and help you compare ongoing costs only and do not reflect transaction costs incurred by the fund for buying and selling securities. Further, the expenses do not include the account service fee described in the prospectus. If such a fee were applied to your account, your costs would be higher. Your fund does not charge transaction fees, such as purchase or redemption fees, nor does it carry a “sales load.”
The calculations assume no shares were bought or sold during the period. Your actual costs may have been higher or lower, depending on the amount of your investment and the timing of any purchases or redemptions.
You can find more information about the fund’s expenses, including annual expense ratios, in the Financial Statements section of this report. For additional information on operating expenses and other shareholder costs, please refer to your fund’s current prospectus.
30
Trustees Approve Advisory Arrangement
The board of trustees of Vanguard Strategic Equity Fund has renewed its investment advisory arrangement with The Vanguard Group, Inc. Vanguard—through its Quantitative Equity Group—serves as the fund’s investment advisor. The board determined that continuing the fund’s internalized management structure was in the best interests of the fund and its shareholders.
The board based its decision upon an evaluation of the advisor’s investment staff, portfolio management process, and performance. The trustees considered the factors discussed below, among others. However, no single factor determined whether or not the board approved the arrangement. Rather, it was the totality of the circumstances that drove the board’s decision.
Nature, extent, and quality of services
The board considered the quality of the fund’s investment management over both the short and long term, and took into account the organizational depth and stability of the advisor. Vanguard has been managing investments for more than two decades. George U. Sauter, Vanguard managing director and chief investment officer, has been in the investment management business since 1985 and has led the Quantitative Equity Group since 1987. James D. Troyer, the manager primarily responsible for the day-to-day management of the fund, has worked in investment management since 1979. The Quantitative Equity Group adheres to a sound, disciplined investment management process; the team has considerable experience, stability, and depth.
The board concluded that Vanguard’s experience, stability, depth, and performance, among other factors, warranted continuation of the advisory arrangement.
Investment performance
The board considered the short- and long-term performance of the fund, including any periods of outperformance or underperformance of a relevant benchmark and peer group. The board concluded that the advisor has carried out the fund’s investment strategy in disciplined fashion, and that performance results have been within competitive norms. Information about the fund’s most recent performance can be found in the Performance Summary section of this report.
Cost
The board concluded that the fund’s expense ratio was significantly below the average expense ratio charged by funds in its peer group. The board noted that the fund’s advisory expenses were also well below the peer-group average. Information about the fund’s expense ratio appears in the About Your Fund’s Expenses section of this report as well as in the Financial Statements section.
The board does not conduct a profitability analysis of Vanguard because of Vanguard’s unique “at-cost” structure. Unlike most other mutual fund management companies, Vanguard is owned by the funds it oversees, and produces “profits” only in the form of reduced expenses for fund shareholders.
The benefit of economies of scale
The board of trustees concluded that the fund’s low-cost arrangement with Vanguard ensures that the fund will realize economies of scale as it grows, with the cost to shareholders declining as fund assets increase.
The board will consider whether to renew the advisory arrangement again after a one-year period.
31
Glossary
Beta. A measure of the magnitude of a fund’s past share-price fluctuations in relation to the ups and downs of a given market index. The index is assigned a beta of 1.00. Compared with a given index, a fund with a beta of 1.20 typically would have seen its share price rise or fall by 12% when the index rose or fell by 10%. For this report, beta is based on returns over the past 36 months for both the fund and the index. Note that a fund’s beta should be reviewed in conjunction with its R-squared (see definition below). The lower the R-squared, the less correlation there is between the fund and the index, and the less reliable beta is as an indicator of volatility.
Earnings Growth Rate. The average annual rate of growth in earnings over the past five years for the stocks now in a fund.
Equity Exposure. A measure that reflects a fund’s investments in stocks and stock futures. Any holdings in short-term reserves are excluded.
Expense Ratio. The percentage of a fund’s average net assets used to pay its annual administrative and advisory expenses. These expenses directly reduce returns to investors.
Foreign Holdings. The percentage of a fund represented by stocks or depositary receipts of companies based outside the United States.
Inception Date. The date on which the assets of a fund (or one of its share classes) are first invested in accordance with the fund’s investment objective. For funds with a subscription period, the inception date is the day after that period ends. Investment performance is measured from the inception date.
Median Market Cap. An indicator of the size of companies in which a fund invests; the midpoint of market capitalization (market price x shares outstanding) of a fund’s stocks, weighted by the proportion of the fund’s assets invested in each stock. Stocks representing half of the fund’s assets have market capitalizations above the median, and the rest are below it.
Price/Book Ratio. The share price of a stock divided by its net worth, or book value, per share. For a fund, the weighted average price/book ratio of the stocks it holds.
Price/Earnings Ratio. The ratio of a stock’s current price to its per-share earnings over the past year. For a fund, the weighted average P/E of the stocks it holds. P/E is an indicator of market expectations about corporate prospects; the higher the P/E, the greater the expectations for a company’s future growth.
R-Squared. A measure of how much of a fund’s past returns can be explained by the returns from the market in general, as measured by a given index. If a fund’s total returns were precisely synchronized with an index’s returns, its R-squared would be 1.00. If the fund’s returns bore no relationship to the index’s returns, its R-squared would be 0. For this report, R-squared is based on returns over the past 36 months for both the fund and the index.
Return on Equity. The annual average rate of return generated by a company during the past five years for each dollar of shareholder’s equity (net income divided by shareholder’s equity). For a fund, the weighted average return on equity for the companies whose stocks it holds.
Short-Term Reserves. The percentage of a fund invested in highly liquid, short-term securities that can be readily converted to cash.
Turnover Rate. An indication of the fund’s trading activity. Funds with high turnover rates incur higher transaction costs and may be more likely to distribute capital gains (which may be taxable to investors). The turnover rate excludes in-kind transactions, which have minimal impact on costs.
32
Yield. A fund’s 30-day SEC yield is derived using a formula specified by the U.S. Securities and Exchange Commission. Under the formula, data related to the fund’s security holdings in the previous 30 days are used to calculate the fund’s hypothetical net income for that period, which is then annualized and divided by the fund’s estimated average net assets over the calculation period. For the purposes of this calculation, a security’s income is based on its current market yield to maturity (in the case of bonds) or its projected dividend yield (for stocks). Because the SEC yield represents hypothetical annualized income, it will differ—at times significantly—from the fund’s actual experience. As a result, the fund’s income distributions may be higher or lower than implied by the SEC yield.
33
The People Who Govern Your Fund
The trustees of your mutual fund are there to see that the fund is operated and managed in your best interests since, as a shareholder, you are a part owner of the fund. Your fund’s trustees also serve on the board of directors of The Vanguard Group, Inc., which is owned by the Vanguard funds and provides services to them on an at-cost basis.
A majority of Vanguard’s board members are independent, meaning that they have no affiliation with Vanguard or the funds they oversee, apart from the sizable personal investments they have made as private individuals.
Our independent board members bring distinguished backgrounds in business, academia, and public service to their task of working with Vanguard officers to establish the policies and oversee the activities of the funds. Among board members’ responsibilities are selecting investment advisors for the funds; monitoring fund operations, performance, and costs; reviewing contracts; nominating and selecting new trustees/directors; and electing Vanguard officers.
Each trustee serves a fund until its termination; or until the trustee’s retirement, resignation, or death; or otherwise as specified in the fund’s organizational documents. Any trustee may be removed at a shareholders’ meeting by a vote representing two-thirds of the net asset value of all shares of the fund together with shares of other Vanguard funds organized within the same trust. The table on these two pages shows information for each trustee and executive officer of the fund. The mailing address of the trustees and officers is P.O. Box 876, Valley Forge, PA 19482.
Chairman of the Board, Chief Executive Officer, and Trustee |
| |
John J. Brennan1 | |
Born 1954 | Principal Occupation(s) During the Past Five Years: Chairman of the Board, Chief Executive |
Trustee since May 1987; | Officer, and Director/Trustee of The Vanguard Group, Inc., and of each of the investment |
Chairman of the Board and | companies served by The Vanguard Group; Director of Vanguard Marketing Corporation. |
Chief Executive Officer | |
155 Vanguard Funds Overseen | |
| |
Independent Trustees | |
| |
Charles D. Ellis | |
Born 1937 | Principal Occupation(s) During the Past Five Years: Applecore Partners (pro bono ventures |
Trustee since January 2001 | in education); Senior Advisor to Greenwich Associates (international business strategy |
155 Vanguard Funds Overseen | consulting); Successor Trustee of Yale University; Overseer of the Stern School of Business |
| at New York University; Trustee of the Whitehead Institute for Biomedical Research. |
| |
Emerson U. Fullwood | |
Born 1948 | Principal Occupation(s) During the Past Five Years: Executive Chief Staff and Marketing |
Trustee since January 2008 | Officer for North America since 2004 and Corporate Vice President of Xerox Corporation |
155 Vanguard Funds Overseen | (photocopiers and printers); Director of SPX Corporation (multi-industry manufacturing), |
| of the United Way of Rochester, and of the Boy Scouts of America. |
| |
Rajiv L. Gupta | |
Born 1945 | Principal Occupation(s) During the Past Five Years: Chairman, President, and |
Trustee since December 20012 | Chief Executive Officer of Rohm and Haas Co. (chemicals); Board Member of |
155 Vanguard Funds Overseen | the American Chemistry Council; Director of Tyco International, Ltd. (diversified |
| manufacturing and services) since 2005. |
| |
Amy Gutmann | |
Born 1949 | Principal Occupation(s) During the Past Five Years: President of the University of |
Trustee since June 2006 | Pennsylvania since 2004; Professor in the School of Arts and Sciences, Annenberg School |
155 Vanguard Funds Overseen | for Communication, and Graduate School of Education of the University of Pennsylvania |
| since 2004; Provost (2001–2004) and Laurance S. Rockefeller Professor of Politics and |
| the University Center for Human Values (1990–2004), Princeton University; Director of |
| Carnegie Corporation of New York since 2005 and of Schuylkill River Development |
| Corporation and Greater Philadelphia Chamber of Commerce since 2004; Trustee of |
| the National Constitution Center since 2007. |
JoAnn Heffernan Heisen | |
Born 1950 | Principal Occupation(s) During the Past Five Years: Corporate Vice President and |
Trustee since July 1998 | Chief Global Diversity Officer since 2006, Vice President and Chief Information |
155 Vanguard Funds Overseen | Officer (1997–2005), and Member of the Executive Committee of Johnson & |
| Johnson (pharmaceuticals/consumer products); Director of the University Medical |
| Center at Princeton and Women’s Research and Education Institute. |
| |
André F. Perold | |
Born 1952 | Principal Occupation(s) During the Past Five Years: George Gund Professor of Finance |
Trustee since December 2004 | and Banking, Harvard Business School; Senior Associate Dean and Director of Faculty |
155 Vanguard Funds Overseen | Recruiting, Harvard Business School; Director and Chairman of UNX, Inc. (equities |
| trading firm); Chair of the Investment Committee of HighVista Strategies LLC (private |
| investment firm) since 2005. |
| |
Alfred M. Rankin, Jr. | |
Born 1941 | Principal Occupation(s) During the Past Five Years: Chairman, President, Chief Executive |
Trustee since January 1993 | Officer, and Director of NACCO Industries, Inc. (forklift trucks/housewares/lignite); Director |
155 Vanguard Funds Overseen | of Goodrich Corporation (industrial products/aircraft systems and services). |
| |
| |
J. Lawrence Wilson | |
Born 1936 | Principal Occupation(s) During the Past Five Years: Retired Chairman and Chief Executive |
Trustee since April 1985 | Officer of Rohm and Haas Co. (chemicals); Director of Cummins Inc. (diesel engines) and |
155 Vanguard Funds Overseen | AmerisourceBergen Corp. (pharmaceutical distribution); Trustee of Vanderbilt University |
| and of Culver Educational Foundation. |
| |
| |
Executive Officers1 | |
| |
Thomas J. Higgins | |
Born 1957 | Principal Occupation(s) During the Past Five Years: Principal of The Vanguard Group, Inc.; |
Treasurer since July 1998 | Treasurer of each of the investment companies served by The Vanguard Group. |
155 Vanguard Funds Overseen | |
| |
| |
F. William McNabb III | |
Born 1957 | Principal Occupation(s) During the Past Five Years: President of The Vanguard Group, Inc., |
President since March 2008 | and of each of the investment companies served by The Vanguard Group since 2008; |
155 Vanguard Funds Overseen | Director of Vanguard Marketing Corporation; Managing Director of The Vanguard Group |
| (1995–2008). |
| |
Heidi Stam | |
Born 1956 | Principal Occupation(s) During the Past Five Years: Managing Director of The Vanguard |
Secretary since July 2005 | Group, Inc., since 2006; General Counsel of The Vanguard Group since 2005; Secretary of |
155 Vanguard Funds Overseen | The Vanguard Group, and of each of the investment companies served by The Vanguard |
| Group, since 2005; Director and Senior Vice President of Vanguard Marketing Corporation |
| since 2005; Principal of The Vanguard Group (1997–2006). |
Vanguard Senior Management Team |
| | | |
R. Gregory Barton | Kathleen C. Gubanich | Michael S. Miller | George U. Sauter |
Mortimer J. Buckley | Paul A. Heller | Ralph K. Packard | |
Founder |
|
John C. Bogle |
Chairman and Chief Executive Officer, 1974–1996 |
1 Officers of the funds are “interested persons” as defined in the Investment Company Act of 1940.
2 December 2002 for Vanguard Equity Income Fund, Vanguard Growth Equity Fund, the Vanguard Municipal Bond Funds, and the Vanguard State Tax-Exempt Funds.
More information about the trustees is in the Statement of Additional Information, available from The Vanguard Group.
| 
|
| P.O. Box 2600 |
| Valley Forge, PA 19482-2600 |
Connect with Vanguard® > www.vanguard.com
Fund Information > 800-662-7447 | Vanguard, Connect with Vanguard, and the ship logo are |
| trademarks of The Vanguard Group, Inc. |
Direct Investor Account Services > 800-662-2739 | |
| All other marks are the exclusive property of their |
Institutional Investor Services > 800-523-1036 | respective owners. |
| |
Text Telephone for People | All comparative mutual fund data are from Lipper Inc. |
With Hearing Impairment > 800-952-3335 | or Morningstar, Inc., unless otherwise noted. |
| |
| |
| You can obtain a free copy of Vanguard’s proxy voting |
This material may be used in conjunction | guidelines by visiting our website, www.vanguard.com, |
with the offering of shares of any Vanguard | and searching for “proxy voting guidelines,” or by |
fund only if preceded or accompanied by | calling Vanguard at 800-662-2739. The guidelines are |
the fund’s current prospectus. | also available from the SEC’s website, www.sec.gov. |
| In addition, you may obtain a free report on how your |
| fund voted the proxies for securities it owned during |
| the 12 months ended June 30. To get the report, visit |
| either www.vanguard.com or www.sec.gov. |
| |
| |
| You can review and copy information about your fund |
| at the SEC’s Public Reference Room in Washington, D.C. |
| To find out more about this public service, call the SEC |
| at 202-551-8090. Information about your fund is also |
| available on the SEC’s website, and you can receive |
| copies of this information, for a fee, by sending a |
| request in either of two ways: via e-mail addressed to |
| publicinfo@sec.gov or via regular mail addressed to the |
| Public Reference Section, Securities and Exchange |
| Commission, Washington, DC 20549-0102. |
| |
| |
| |
| |
| |
| © 2008 The Vanguard Group, Inc. |
| All rights reserved. |
| Vanguard Marketing Corporation, Distributor. |
| |
| Q1142 052008 |
> | The Investor Shares of Vanguard Capital Opportunity Fund returned –12.8% for the fiscal six months ended March 31, 2008. |
> | The fund’s return slightly lagged its benchmark, the Russell Midcap Growth Index, but outperformed the average return of its peers. |
> | U.S. equity markets lost –12.4% during a volatile six months. |
Contents | |
| |
Your Fund’s Total Returns | 1 |
Chairman’s Letter | 2 |
Advisor’s Report | 6 |
Fund Profile | 8 |
Performance Summary | 10 |
Financial Statements | 11 |
About Your Fund’s Expenses | 23 |
Trustees Approve Advisory Agreement | 25 |
Glossary | 26 |
Please note: The opinions expressed in this report are just that—informed opinions. They should not be considered promises or advice. Also, please keep in mind that the information and opinions cover the period through the date on the cover of this report. Of course, the risks of investing in your fund are spelled out in the prospectus.
Your Fund’s Total Returns
Six Months Ended March 31, 2008 | | |
| Ticker | Total |
| Symbol | Returns |
Vanguard Capital Opportunity Fund | | |
Investor Shares | VHCOX | –12.8% |
Admiral™ Shares1 | VHCAX | –12.7 |
Russell Midcap Growth Index | | –12.5 |
Average Multi-Cap Growth Fund2 | | –13.2 |
Your Fund’s Performance at a Glance |
September 30, 2007–March 31, 2008 |
| | | Distributions Per Share |
| Starting | Ending | Income | Capital |
| Share Price | Share Price | Dividends | Gains |
Vanguard Capital Opportunity Fund | | | | |
Investor Shares | $42.70 | $33.81 | $0.218 | $3.442 |
Admiral Shares | 98.71 | 78.13 | 0.577 | 7.952 |
1 A lower-cost class of shares available to many longtime shareholders and to those with significant investments in the fund.
2 Derived from data provided by Lipper Inc.
1

Chairman’s Letter
Dear Shareholder,
During the fiscal half-year ended March 31, 2008, Vanguard Capital Opportunity Fund returned –12.8% for Investor Shares and –12.7% for Admiral Shares. The fund fell just slightly below the result of its benchmark, the Russell Midcap Growth Index, but outpaced the average return of competing multi-cap growth funds by a bit.
Compared with the index, the fund’s materials, energy, health care, and consumer discretionary sectors performed well. The fund’s large stake in information technology companies and its stock picks in industrials hurt its return.
As of March 31, Vanguard Capital Opportunity Fund remained closed to new investors. Existing clients can continue to invest in the fund, which is also open to new accounts by Flagship members.
Stocks of all sorts sank amid credit-market concerns
The broad U.S. stock market declined –12.4% for the six months ended March 31 as investor sentiment turned bearish amid fears of a U.S. recession, the weakening U.S. dollar, and the tightening of global credit markets in reaction to the subprime-mortgage crisis that began in midsummer 2007.
Large-capitalization stocks fared a bit better than small-caps, growth stocks generally outpaced their value-oriented counterparts, and international stocks
2
again outperformed U.S. stocks over the six months; nonetheless, each stock group posted a negative return.
Bond markets were roiled by subprime-mortgage woes
Credit markets seized up as trouble spread from subprime-mortgage-backed securities to other issues. Investors flocked to higher-quality government and corporate bonds, driving U.S. Treasury bond prices higher.
Unlike stocks, the broad taxable bond market pushed forward, posting a total return of 5.2% for the fiscal half-year as lower interest rates depressed yields and bumped up prices. By contrast, tax-exempt municipal bonds returned only 0.7% as fixed income investors moved in droves to Treasuries in search of the highest-quality, most-liquid securities. This, combined with concerns about the financial strength of the insurers backing the highest-quality municipal bonds, pushed municipal yields above those of Treasuries.
In response to the tumult in the credit markets and the deteriorating economic outlook, the Federal Reserve Board reduced its target for the federal funds rate aggressively. The Fed continued a series of rate cuts that began late last summer, ending with a 0.75 percentage point cut in March. The target rate stood at 2.25% at the end of the period, the lowest level since early 2005.
Effective stock selection tempered tech sector shortfall
During the past couple of years, the Capital Opportunity Fund’s advisor, PRIMECAP Management Company,
Market Barometer | | | |
| | | Total Returns |
| | Periods Ended March 31, 2008 |
| Six Months | One Year | Five Years1 |
Stocks | | | |
Russell 1000 Index (Large-caps) | –12.4% | –5.4% | 11.9% |
Russell 2000 Index (Small-caps) | –14.0 | –13.0 | 14.9 |
Dow Jones Wilshire 5000 Index (Entire market) | –12.4 | –5.8 | 12.5 |
MSCI All Country World Index ex USA (International) | –9.6 | 2.6 | 24.0 |
| | | |
Bonds | | | |
Lehman U.S. Aggregate Bond Index (Broad taxable market) | 5.2% | 7.7% | 4.6% |
Lehman Municipal Bond Index | 0.7 | 1.9 | 3.9 |
Citigroup 3-Month Treasury Bill Index | 1.7 | 4.2 | 3.0 |
| | | |
CPI | | | |
Consumer Price Index | 2.4% | 4.0% | 3.0% |
1 Annualized.
3
has consistently allocated an outsized portion of the fund’s assets—nearly 45% during the past six months—to information technology stocks. Investing in tech companies with exceptional long-term growth prospects has benefited the fund in the past, but the tech sector recently has faced challenges due to a broad-based weakness in consumer and business spending, particularly among financial services companies.
The fund’s largest tech holding, Research In Motion, gained nearly 14% for the period, but other tech stocks, particularly those in the semiconductor business, were battered. FormFactor, a maker of products used to test microchips, posted a –57% return for the period, while NVIDIA, which makes chips used to generate interactive graphics, fell –45%. These two stocks alone reduced the fund’s return by more than 3 percentage points.
As a group, the industrials sector was the fund’s second-weakest performer. For example, AMR, the parent company of American Airlines, suffered a nearly –60% decline for the period as airlines and other major transportation-related stocks skidded with rising gas prices.
Even though prices of the fund’s health care stocks—representing the second-largest sector weighting after technology—declined during the six months, PRIMECAP Management’s favorable stock selection helped the fund sector to outperform that of the index. BioMarin Pharmaceutical was a star in the health care sector; the
Annualized Expense Ratios1 | | | |
Your Fund Compared With Its Peer Group | | | |
| | | Average |
| Investor | Admiral | Multi-Cap |
| Shares | Shares | Growth Fund |
Capital Opportunity Fund | 0.44% | 0.35% | 1.43% |
1 Fund expense ratios reflect the six months ended March 31, 2008. Peer-group expense ratio is derived from data provided by Lipper Inc. and captures information through year-end 2007.
4
company returned 42% for the period, bolstered by the FDA’s approval of the drug Kuvan.
The fund’s best performers were the materials and energy sectors. In materials, among individual holdings, steep global demand for fertilizer and agricultural chemicals helped Monsanto to return 30% during the six months. And in the energy sector, coal producer Arch Coal benefited from rising energy prices and international demand for coal.
Diversification and a longer-term perspective can reward shareholders
Capital Opportunity’s performance during the fiscal half-year provides a glimpse into the fund’s challenges, as well as its successes, in any short-term period. However, keep in mind that the fund advisor’s strategy is focused on investing in a concentrated number of holdings for the long term. The typical time horizon for a portfolio position is three to five years, a virtual eternity among active fund strategies. During periods of market volatility, such as the turbulence we’ve experienced recently, considerable patience and courage are often required by both the fund manager and investors to stick to the chosen strategy. Our experience suggests that, in the presence of a talented investment manager such as PRIMECAP Management, such courage and patience can be rewarded.
At Vanguard, we believe a balanced, diversified, and low-cost portfolio of mutual funds can help you capture market returns over the long term regardless of short-term volatility. The Capital Opportunity Fund can play an important role in diversifying the stock portion of such a portfolio.
As I close this report to you, it’s my pleasure to introduce the fund’s new president, F. William McNabb III. Bill is a man of great character and integrity who is intimately familiar with all aspects of Vanguard—from how we serve our clients to how we invest for our clients.
Bill and I have worked together very closely for more than two decades. I’m thrilled that the fund’s board elected him president, effective March 1, and designated him to succeed me as chief executive officer, a role he will assume within a year, after an orderly transition. Bill and the rest of our team will serve you and our other clients extremely well in the years ahead.
Thank you for entrusting your assets to Vanguard.

John J. Brennan
Chairman and Chief Executive Officer
April 11, 2008
5
Advisor’s Report
Over the past six months, the Investor and Admiral Shares of Vanguard Capital Opportunity Fund returned –12.8% and –12.7%, respectively. The Russell Midcap Growth Index returned –12.5%. The average return of multi-capitalization growth funds was –13.2%.
Investment environment
The signs of slowdown or recession that first appeared in late 2007 became more prominent in the first few months of 2008. The employment situation deteriorated, and retail sales took a turn for the worse, as high energy and commodity prices weighed on overextended household budgets. Gasoline and food prices are now at all-time highs. Persistent distress in the credit markets and concern about its spillover effects prompted the Federal Reserve Board to ease monetary policy, both to subdue the turmoil in the financial markets and spur growth in the broader economy.
Even as the economic picture has dimmed, however, stock market fundamentals have remained healthy. Over the past years, the markets have shown a certain level of resilience. With price/earning multiples at modest levels (16.0x for the Standard & Poor’s 500) and corporate balance sheets in strong shape with debt-to-capitalization levels of around 30% for the broad index, corporate America is on solid ground. In addition, foreign exposure for companies in the S&P 500 is now in excess of 40%, which helps provide a cushion for the weak U.S. dollar.
Management of the fund
Our primary objective is to find companies whose long-term fundamentals will evolve better than the current Wall Street consensus or valuation suggests. Our search often begins with companies and industries currently out of favor. When we identify these opportunities, we invest with a long-term perspective, expecting our selections to outperform the market over a three to five-year time horizon. We continually rely on research—meeting with companies, competitors, suppliers, and customers—to test our conviction in these holdings. In recent years, this process has led us to establish large positions in information technology and health care stocks.
We think that advances in the treatment of certain diseases such as Alzheimer’s, diabetes, and cancer will create significant opportunities for pharmaceutical and biological health care companies in the future. Furthermore, continued advances in the portability and ubiquity of technology will enable increases in productivity and efficiency on a global basis. During the past six months, however, our technology investments performed poorly in an unsettled market. (Needless to say, short-term ups and downs rarely have any bearing on the long-term investment thesis for our holdings.) Our investments in airlines and freight delivery companies such as FedEx also put pressure on returns as soaring energy prices compressed profit margins.
6
Our health care investments declined in value, but held up better than the market, in large part because of the strong performance of BioMarin Pharmaceutical, a fully integrated biotech company that recently received FDA approval for Kuvan, which reduces blood phenylalanine (Phe) levels in patients with hyperphenylalaninemia (HPA). Our other pharmaceuticals holdings also held up well on a relative basis. Strong returns from our investments in the materials and energy sectors helped offset some of the weakness in the rest of the portfolio. For example, Monsanto, one of the fund’s significant holdings over the past few years, rallied as the global agricultural boom gathered steam and the company capitalized on continued demand for genetically engineered seeds and herbicides. Our customarily low weighting in the hard-hit financials sector also worked to the fund’s benefit during the past six months, sparing us some of the broader market’s pain.
On balance, however, the bright spots were offset by below-benchmark returns in information technology and industrials, which kept six-month returns in line with the index result.
Outlook
We believe that 2008 will be a year in which fundamental investing will be rewarded. During turbulent economic times, the performance of fundamentally well-positioned and well-managed companies can diverge greatly from that of poorly positioned and poorly managed companies.
This past year saw a reversal of a six-year cycle that favored value investing over growth investing. Last year was the first year since 1999 that growth stocks outpaced value stocks, with the Russell 1000 Growth Index gaining 11.8% versus the Russell 1000 Value Index falling –0.2%. This sentiment favors companies that have greater growth prospects for the future and sectors such as information technology and health care, the fund’s two most significant exposures. We remain cautious about the financials sector. The recent tumult has clearly made banks and brokerages cheaper (or at least lower-priced), but a lack of transparency in these companies’ financial statements has kept us on the sidelines.
We thank you for entrusting your hard-earned capital with us. We will continue to work diligently to prove worthy of that trust, and we look forward to reporting to you six months hence.
Theo A. Kolokotrones | Howard B. Schow |
Portfolio Manager | Portfolio Manager |
| |
David H. Van Slooten |
Portfolio Manager |
| |
Joel P. Fried | Alfred W. Mordecai |
Portfolio Manager | Portfolio Manager |
| |
PRIMECAP Management Company |
April 15, 2008 |
7
Fund Profile
As of March 31, 2008
Portfolio Characteristics | | |
| | Comparative | Broad |
| Fund | Index1 | Index2 |
Number of Stocks | 124 | 543 | 4,811 |
Median Market Cap | $15.0B | $7.3B | $33.8B |
Price/Earnings Ratio | 23.5x | 19.3x | 16.9x |
Price/Book Ratio | 2.8x | 3.5x | 2.4x |
Yield3 | | 0.9% | 2.0% |
Investor Shares | 0.2% | | |
Admiral Shares | 0.3% | | |
Return on Equity | 14.4% | 19.7% | 19.5% |
Earnings Growth Rate | 24.7% | 25.7% | 20.0% |
Foreign Holdings | 13.4% | 0.0% | 0.0% |
Turnover Rate | 16%4 | — | — |
Expense Ratio | | — | — |
Investor Shares | 0.44%4 | | |
Admiral Shares | 0.35%4 | | |
Short-Term Reserves | 3.8% | — | — |
Sector Diversification (% of equity exposure) |
| | Comparative | Broad |
| Fund | Index1 | Index2 |
Consumer Discretionary | 13.0% | 15.9% | 9.4% |
Consumer Staples | 0.1 | 4.7 | 9.6 |
Energy | 7.0 | 13.1 | 12.7 |
Financials | 0.7 | 8.0 | 17.7 |
Health Care | 22.4 | 12.3 | 11.7 |
Industrials | 7.8 | 16.4 | 12.2 |
Information Technology | 42.7 | 18.8 | 15.6 |
Materials | 5.5 | 5.2 | 4.1 |
Telecommunication Services | 0.6 | 2.1 | 3.1 |
Utilities | 0.2 | 3.5 | 3.9 |
Volatility Measures5 | |
| Fund Versus | Fund Versus |
| Comparative Index1 | Broad Index2 |
R-Squared | 0.83 | 0.77 |
Beta | 0.96 | 1.18 |
8
Ten Largest Holdings6 (% of total net assets) |
| | |
| | |
Research In Motion Ltd. | communications equipment | 6.5% |
Monsanto Co. | fertilizers and agricultural chemicals | 5.2 |
Corning, Inc. | communications equipment | 3.2 |
Biogen Idec Inc. | biotechnology | 3.2 |
FedEx Corp. | air freight and logistics | 3.0 |
Eli Lilly & Co. | pharmaceuticals | 2.9 |
ASML Holding NV (New York Shares) | semiconductor equipment | 2.6 |
NVIDIA Corp. | semiconductors | 2.6 |
Applera Corp.– Applied Biosystems Group | group life sciences tools and services | 2.6 |
Murphy Oil Corp. | integrated oil and gas | 2.4 |
Top Ten | | 34.2% |
Investment Focus
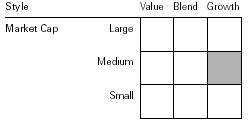
1 Russell Midcap Growth Index.
2 Dow Jones Wilshire 5000 Index.
3 30-day SEC yield for the fund; annualized dividend yield for the indexes. See the Glossary on pages 23–24.
4 Annualized.
5 For an explanation of R-squared, beta, and other terms used here, see the Glossary on pages 23–24.
6 “Ten Largest Holdings” excludes any temporary cash investments and equity index products.
9
Performance Summary
All of the returns in this report represent past performance, which is not a guarantee of future results that may be achieved by the fund. (Current performance may be lower or higher than the performance data cited. For performance data current to the most recent month-end, visit our website at www.vanguard.com/performance.) Note, too, that both investment returns and principal value can fluctuate widely, so an investor’s shares, when sold, could be worth more or less than their original cost. The returns shown do not reflect taxes that a shareholder would pay on fund distributions or on the sale of fund shares.
Fiscal-Year Total Returns (%): September 30, 1997–March 31, 2008
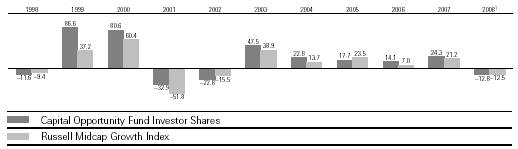
Average Annual Total Returns: Periods Ended March 31, 2008 |
| | | | |
| Inception Date | One Year | Five Years | Ten Years |
Investor Shares2 | 8/14/1995 | 2.15% | 19.11% | 15.29% |
Admiral Shares2 | 11/12/2001 | 2.22 | 19.22 | 10.133 |
1 Six months ended March 31, 2008.
2 Total returns do not reflect the 1% fee assessed on redemptions after March 23, 2005, of shares held for less than one year; nor do they include the 1% fee previously assessed on redemptions of shares held for less than five years, or, for Investor Shares only, the account service fee that may be applicable to certain accounts with balances below $10,000.
3 Return since inception.
Note: See Financial Highlights tables on pages 15–16 for dividend and capital gains information.
10
Financial Statements (unaudited)
Statement of Net Assets
As of March 31, 2008
The fund provides a complete list of its holdings four times in each fiscal year, at the quarter-ends. For the second and fourth fiscal quarters, the lists appear in the fund’s semiannual and annual reports to shareholders. For the first and third fiscal quarters, the fund files the lists with the Securities and Exchange Commission on Form N-Q. Shareholders can look up the fund’s Forms N-Q on the SEC’s website at www.sec.gov. Forms N-Q may also be reviewed and copied at the SEC’s Public Reference Room (see the back cover of this report for further information).
| | | Market |
| | | Value• |
| | Shares | ($000) |
Common Stocks (96.3%) | | |
Consumer Discretionary (12.5%) | | |
* | DIRECTV Group, Inc. | 8,222,335 | 203,832 |
| TJX Cos., Inc. | 5,317,400 | 175,846 |
| Whirlpool Corp. | 1,225,000 | 106,305 |
* | Bed Bath & Beyond, Inc. | 3,278,400 | 96,713 |
*^ | CarMax, Inc. | 4,194,600 | 81,459 |
1 | Men’s Wearhouse, Inc. | 2,800,000 | 65,156 |
*1 | The Dress Barn, Inc. | 4,970,000 | 64,312 |
| Nordstrom, Inc. | 1,923,000 | 62,690 |
* | Quiksilver, Inc. | 5,856,500 | 57,452 |
| Best Buy Co., Inc. | 952,500 | 39,491 |
| Lowe’s Cos., Inc. | 1,411,400 | 32,378 |
*^ | 99 Cents Only Stores | 2,200,000 | 21,758 |
* | O’Reilly Automotive, Inc. | 634,000 | 18,082 |
| Gentex Corp. | 1,000,000 | 17,150 |
* | Chico’s FAS, Inc. | 2,075,000 | 14,753 |
| Abercrombie & Fitch Co. | 200,000 | 14,628 |
* | Amazon.com, Inc. | 133,600 | 9,526 |
1 | Strattec Security Corp. | 220,000 | 9,313 |
* | Expedia, Inc. | 300,000 | 6,567 |
| | | 1,097,411 |
Consumer Staples (0.1%) | | |
* | Cott Corp. | 1,840,000 | 6,458 |
| | | |
Energy (6.7%) | | |
| Murphy Oil Corp. | 2,600,000 | 213,564 |
| Arch Coal, Inc. | 2,515,000 | 109,402 |
| Noble Energy, Inc. | 1,200,000 | 87,360 |
* | Plains Exploration & Production Co. | 1,200,400 | 63,789 |
* | National Oilwell Varco Inc. | 805,000 | 46,996 |
| ConocoPhillips Co. | 550,000 | 41,916 |
* | Exterran Holdings, Inc. | 326,750 | 21,088 |
* | Pride International, Inc. | 244,000 | 8,528 |
| | | 592,643 |
Financials (0.6%) | | |
| The Chubb Corp. | 390,000 | 19,297 |
| Capital One Financial Corp. | 355,000 | 17,473 |
| TCF Financial Corp. | 330,000 | 5,914 |
11
| | | Market |
| | | Value• |
| | Shares | ($000) |
^ | IndyMac Bancorp, Inc. | 985,000 | 4,886 |
| East West Bancorp, Inc. | 230,000 | 4,082 |
| MBIA, Inc. | 247,500 | 3,024 |
* | SLM Corp. | 50,000 | 767 |
* | MF Global Ltd. | 74,000 | 733 |
| Nymex Holdings Inc. | 300 | 27 |
| | | 56,203 |
Health Care (21.6%) | | |
* | Biogen Idec Inc. | 4,500,000 | 277,605 |
| Eli Lilly & Co. | 5,000,700 | 257,986 |
| Applera Corp.–Applied Biosystems Group | 6,973,400 | 229,146 |
| Medtronic, Inc. | 4,215,400 | 203,899 |
| Novartis AG ADR | 3,665,000 | 187,758 |
* | BioMarin Pharmaceutical Inc. | 4,670,500 | 165,196 |
| Roche Holdings AG | 725,000 | 136,641 |
* | Amgen, Inc. | 2,345,000 | 97,974 |
* | Boston Scientific Corp. | 7,287,700 | 93,793 |
* | Genentech, Inc. | 1,132,500 | 91,936 |
* | Millipore Corp. | 1,011,500 | 68,185 |
* | Affymetrix, Inc. | 3,105,500 | 54,067 |
* | Edwards Lifesciences Corp. | 300,000 | 13,365 |
* | Sepracor Inc. | 550,000 | 10,736 |
*^ | Dendreon Corp. | 1,525,000 | 7,350 |
* | Pharmacyclics, Inc. | 740,500 | 555 |
* | Waters Corp. | 7,000 | 390 |
* | Illumina, Inc. | 5,000 | 380 |
| | | 1,896,962 |
Industrials (7.5%) | | |
| FedEx Corp. | 2,810,900 | 260,486 |
*1 | Thomas & Betts Corp. | 3,311,000 | 120,421 |
| Pall Corp. | 2,066,500 | 72,472 |
* | McDermott International, Inc. | 1,208,600 | 66,255 |
* | AMR Corp. | 6,856,900 | 61,849 |
*^ | JetBlue Airways Corp. | 3,241,050 | 18,798 |
| Union Pacific Corp. | 125,000 | 15,672 |
| Avery Dennison Corp. | 315,000 | 15,514 |
12
| | | Market |
| | | Value• |
| | Shares | ($000) |
| Chicago Bridge & Iron Co. N.V. | 225,000 | 8,829 |
| Southwest Airlines Co. | 629,800 | 7,810 |
| Fluor Corp. | 19,100 | 2,696 |
* | Monster Worldwide Inc. | 77,250 | 1,870 |
| UAL Corp. | 70,450 | 1,517 |
* | US Airways Group Inc. | 119,700 | 1,066 |
| | | 655,255 |
InformationTechnology (41.2%) | | |
| Communications Equipment (11.7%) | | |
* | Research In Motion Ltd. | 5,093,870 | 571,685 |
| Corning, Inc. | 11,770,000 | 282,951 |
| Motorola, Inc. | 4,800,000 | 44,640 |
* | Avocent Corp. | 1,984,500 | 33,538 |
* | Comverse Technology, Inc. | 2,060,000 | 31,940 |
| Plantronics, Inc. | 1,150,000 | 22,206 |
* | Ciena Corp. | 607,142 | 18,718 |
* | Nortel Networks Corp. | 2,323,500 | 15,544 |
| QUALCOMM Inc. | 200,000 | 8,200 |
| | | |
| Computers & Peripherals (3.6%) | | |
* | Brocade Communications Systems, Inc. | 13,126,000 | 95,820 |
*1 | Emulex Corp. | 4,569,400 | 74,207 |
| Hewlett-Packard Co. | 1,200,000 | 54,792 |
*1^ | Avid Technology, Inc. | 2,037,500 | 49,593 |
* | SanDisk Corp. | 916,462 | 20,685 |
* | EMC Corp. | 1,375,000 | 19,717 |
| | | |
| Electronic Equipment & Instruments (1.1%) | | |
* | Trimble Navigation Ltd. | 2,900,000 | 82,911 |
* | Flextronics International Ltd. | 830,000 | 7,794 |
| Jabil Circuit, Inc. | 174,600 | 1,652 |
| | | |
| Internet Software & Services (3.7%) | | |
* | Google Inc. | 258,850 | 114,016 |
* | eBay Inc. | 3,600,000 | 107,424 |
* | VeriSign, Inc. | 2,030,000 | 67,477 |
* | Yahoo! Inc. | 677,868 | 19,611 |
* | Akamai Technologies, Inc. | 502,900 | 14,162 |
| | | |
| IT Services (0.6%) | | |
* | NeuStar, Inc. Class A | 2,131,000 | 56,429 |
| Satyam Computer Services Ltd. ADR | 15,000 | 339 |
| | | |
| Semiconductors & Semiconductor Equipment (13.4%) | | |
* | ASML Holding NV (New York Shares) | 9,346,133 | 231,878 |
* | NVIDIA Corp. | 11,678,350 | 231,115 |
* | Rambus Inc. | 5,205,000 | 121,329 |
| Altera Corp. | 6,150,000 | 113,344 |
*^ | Cree, Inc. | 4,003,900 | 111,949 |
13
| | | Market |
| | | Value• |
| | Shares | ($000) |
*1 | FormFactor Inc. | 5,240,500 | 100,094 |
| Intersil Corp. | 3,761,000 | 96,545 |
* | Micron Technology, Inc. | 10,350,000 | 61,789 |
| Texas Instruments, Inc. | 1,900,000 | 53,713 |
* | Cymer, Inc. | 730,000 | 19,009 |
* | Entegris Inc. | 2,019,231 | 14,518 |
| Xilinx, Inc. | 425,000 | 10,094 |
* | FEI Co. | 286,167 | 6,247 |
| Intel Corp. | 235,000 | 4,977 |
| | | |
| Software (7.1%) | | |
* | Symantec Corp. | 11,530,500 | 191,637 |
| Microsoft Corp. | 3,850,000 | 109,263 |
* | NAVTEQ Corp. | 1,101,000 | 74,868 |
* | Citrix Systems, Inc. | 1,750,000 | 51,328 |
* | Adobe Systems, Inc. | 1,413,000 | 50,289 |
* | Autodesk, Inc. | 1,500,000 | 47,220 |
* | THQ Inc. | 1,840,000 | 40,112 |
*1 | The Descartes Systems Group Inc. | 4,645,000 | 16,350 |
* | Macrovision Corp. | 1,155,000 | 15,593 |
* | Intuit, Inc. | 470,000 | 12,695 |
* | McAfee Inc. | 182,000 | 6,022 |
* | Nuance Communications, Inc. 320,000 | | 5,571 |
| | | 3,613,600 |
Materials (5.3%) | | |
| Monsanto Co. | 4,091,786 | 456,234 |
| Minerals Technologies, Inc. | 184,800 | 11,605 |
| | | 467,839 |
Telecommunication Services (0.6%) | | |
| Sprint Nextel Corp. | 7,261,700 | 48,581 |
| | | |
Utilities (0.2%) | | |
* | AES Corp. | 1,122,000 | 18,704 |
Total Common Stocks | | |
(Cost $6,184,985) | | 8,453,656 |
Temporary Cash Investments (4.4%) | | |
2 | Vanguard Market Liquidity | | |
| Fund, 2.800% 313,788,867 | | 313,789 |
2 | Vanguard Market Liquidity | | |
| Fund, 2.800%—Note G | 70,282,900 | 70,283 |
Total Temporary Cash Investments | | |
(Cost $384,072) | | 384,072 |
Total Investments (100.7%) | | |
(Cost $6,569,057) | | 8,837,728 |
Other Assets and Liabilities— | | |
Net (–0.7%) | | (59,269) |
Net Assets (100%) | | 8,778,459 |
14
| Market |
| Value• |
| ($000) |
Statement of Assets and Liabilities | |
Assets | |
Investment in Securities, at Value | 8,837,728 |
Receivables for Investment Securities Sold | 22,888 |
Receivables for Capital Shares Issued | 8,047 |
Other Assets—Note C | 8,415 |
Total Assets | 8,877,078 |
Liabilities | |
Security Lending Collateral Payable to Brokers—Note G | 70,283 |
Payables for Investment Securities Purchased | 2,885 |
Payables for Capital Shares Redeemed | 3,926 |
Other Liabilities | 21,525 |
Total Liabilities | 98,619 |
Net Assets | 8,778,459 |
At March 31, 2008, net assets consisted of:3 |
| Amount |
| ($000) |
Paid-in Capital | 6,181,109 |
Overdistributed Net Investment Income | (628) |
Accumulated Net Realized Gains | 329,240 |
Unrealized Appreciation | |
Investment Securities | 2,268,671 |
Foreign Currencies | 67 |
Net Assets | 8,778,459 |
| |
Investor Shares—Net Assets | |
Applicable to 132,207,747 outstanding | |
$.001 par value shares of beneficial | |
interest (unlimited authorization) | 4,470,074 |
Net Asset Value Per Share— | |
Investor Shares | $33.81 |
| |
Admiral Shares—Net Assets | |
Applicable to 55,141,855 outstanding | |
$.001 par value shares of beneficial | |
interest (unlimited authorization) | 4,308,385 |
Net Asset Value Per Share— | |
Admiral Shares | $78.13 |
• | See Note A in Notes to Financial Statements. |
* | Non-income-producing security. |
^ | Part of security position is on loan to broker-dealers. See Note G in Notes to Financial Statements. |
1 Considered an affiliated company of the fund as the fund owns more than 5% of the outstanding voting securities of such company. See Note I in Notes to Financial Statements.
2 Affiliated money market fund available only to Vanguard funds and certain trusts and accounts managed by Vanguard. Rate shown is the 7-day yield.
3 See Note E in Notes to Financial Statements for the tax-basis components of net assets.
ADR—American Depositary Receipt.
15
Statement of Operations
| Six Months Ended |
| March 31, 2008 |
| ($000) |
Investment Income | |
Income | |
Dividends1,2 | 58,085 |
Interest2 | 9,659 |
Security Lending | 1,900 |
Total Income | 69,644 |
Expenses | |
Investment Advisory Fees—Note B | 12,278 |
The Vanguard Group—Note C | |
Management and Administrative | |
Investor Shares | 3,872 |
Admiral Shares | 1,729 |
Marketing and Distribution | |
Investor Shares | 400 |
Admiral Shares | 360 |
Custodian Fees | 75 |
Shareholders’ Reports | |
Investor Shares | 20 |
Admiral Shares | 10 |
Trustees’ Fees and Expenses | 5 |
Total Expenses | 18,749 |
Expenses Paid Indirectly—Note D | (115) |
Net Expenses | 18,634 |
Net Investment Income | 51,010 |
Realized Net Gain (Loss) | |
Investment Securities Sold2 | 367,785 |
Foreign Currencies | (23) |
Realized Net Gain (Loss) | 367,762 |
Change in Unrealized Appreciation (Depreciation) | |
Investment Securities | (1,733,091) |
Foreign Currencies | 56 |
Change in Unrealized Appreciation (Depreciation) | (1,733,035) |
Net Increase (Decrease) in Net Assets Resulting from Operations | (1,314,263) |
1 Dividends are net of foreign withholding taxes of $1,297,000.
2 Dividend income, interest income, and realized net gain (loss) from affiliated companies of the fund were $453,000, $9,659,000, and $22,628,000, respectively.
16
Statement of Changes in Net Assets
| Six Months Ended | Year Ended |
| March 31, | September 30, |
| 2008 | 2007 |
| ($000) | ($000) |
Increase (Decrease) in Net Assets | | |
Operations | | |
Net Investment Income | 51,010 | 20,796 |
Realized Net Gain (Loss) | 367,762 | 895,690 |
Change in Unrealized Appreciation (Depreciation) | (1,733,035) | 1,136,597 |
Net Increase (Decrease) in Net Assets Resulting from Operations | (1,314,263) | 2,053,083 |
Distributions | | |
Net Investment Income | | |
Investor Shares | (26,947) | (9,611) |
Admiral Shares | (29,293) | (10,882) |
Realized Capital Gain1 | | |
Investor Shares | (425,469) | (254,953) |
Admiral Shares | (403,702) | (196,140) |
Total Distributions | (885,411) | (471,586) |
Capital Share Transactions—Note H | | |
Investor Shares | 189,102 | (500,766) |
Admiral Shares | 613,968 | 293,890 |
Net Increase (Decrease) from Capital Share Transactions | 803,070 | (206,876) |
Total Increase (Decrease) | (1,396,604) | 1,374,621 |
Net Assets | | |
Beginning of Period | 10,175,063 | 8,800,442 |
End of Period2 | 8,778,459 | 10,175,063 |
1 Includes fiscal 2008 and 2007 short-term gain distributions totaling $23,367,000 and $7,045,000, respectively. Short-term gain distributions are treated as ordinary income dividends for tax purposes.
2 Net Assets—End of Period includes undistributed (overdistributed) net investment income of ($628,000) and $4,625,000.
17
Financial Highlights
Investor Shares | | | | | | | |
| Six Months | | | | Nov. 1, | | |
| Ended | Year Ended | 2003, to | Year Ended |
For a Share Outstanding | March 31, | September 30, | Sept. 30, | October 31, |
Throughout Each Period | 2008 | 2007 | 2006 | 2005 | 20041 | 2003 | 2002 |
Net Asset Value, | | | | | | | |
Beginning of Period | $42.70 | $36.11 | $31.92 | $27.24 | $24.28 | $16.54 | $20.73 |
Investment Operations | | | | | | | |
Net Investment Income | .2032 | .070 | .053 | .0903 | .017 | .009 | .01 |
Net Realized and Unrealized | | | | | | | |
Gain (Loss) on Investments4 | (5.433) | 8.447 | 4.421 | 4.731 | 2.956 | 7.744 | (4.13) |
Total from | | | | | | | |
Investment Operations | (5.230) | 8.517 | 4.474 | 4.821 | 2.973 | 7.753 | (4.12) |
Distributions | | | | | | | |
Dividends from | | | | | | | |
Net Investment Income | (.218) | (.070) | (.055) | (.070) | (.013) | (.013) | (.07) |
Distributions from | | | | | | | |
Realized Capital Gains | (3.442) | (1.857) | (.229) | (.071) | — | — | — |
Total Distributions | (3.660) | (1.927) | (.284) | (.141) | (.013) | (.013) | (.07) |
Net Asset Value, | | | | | | | |
End of Period | $33.81 | $42.70 | $36.11 | $31.92 | $27.24 | $24.28 | $16.54 |
| | | | | | | |
Total Return5 | –12.78% | 24.35% | 14.10% | 17.72% | 12.25% | 46.91% | –19.97% |
| | | | | | | |
Ratios/Supplemental Data | | | | | | | |
Net Assets, End of | | | | | | | |
Period (Millions) | $4,470 | $5,415 | $5,051 | $5,231 | $6,199 | $5,120 | $3,181 |
Ratio of Total Expenses to | | | | | | | |
Average Net Assets | 0.44%* | 0.45% | 0.49% | 0.51% | 0.52%* | 0.59% | 0.58% |
Ratio of Net Investment | | | | | | | |
Income to Average | | | | | | | |
Net Assets | 0.71%2* | 0.18% | 0.15% | 0.33%3 | 0.06%* | 0.04% | 0.07% |
Portfolio Turnover Rate | 16%* | 14% | 11% | 12% | 10% | 14% | 14% |
1 The fund’s fiscal year-end changed from October 31 to September 30, effective September 30, 2004.
2 Net investment income per share and the ratio of net investment income to average net assets include $.125 and 0.32%, respectively, resulting from a special dividend from ASML Holding NV in October 2007.
3 Net investment income per share and the ratio of net investment income to average net assets include $.047 and 0.16%, respectively, resulting from a special dividend from Microsoft Corp. in November 2004.
4 Includes increases from redemption fees of $.00, $.00, $.00, $.01, $.01, $.01, and $.03.
5 Total returns do not reflect the 1% fee assessed on redemptions after March 23, 2005, of shares held for less than one year; nor do they include the 1% fee previously assessed on redemptions of shares held for less than five years, or the account service fee that may be applicable to certain accounts with balances below $10,000.
18
Admiral Shares | | | | | | | |
| Six Months | | | | Nov. 1, | Year | Nov. 12, |
| Ended | | | | 2003, to | Ended | 20012 to |
For a Share Outstanding | March 31, | Year Ended September 30, | Sept. 30, | Oct. 31, | Oct. 31, |
Throughout Each Period | 2008 | 2007 | 2006 | 2005 | 20041 | 2003 | 2002 |
Net Asset Value, | | | | | | | |
Beginning of Period | $98.71 | $83.49 | $73.77 | $62.96 | $56.11 | $38.22 | $50.00 |
Investment Operations | | | | | | | |
Net Investment Income | .5083 | .240 | .198 | .2914 | .096 | .062 | .07 |
Net Realized and Unrealized | | | | | | | |
Gain (Loss) on Investments5 | (12.559) | 19.508 | 10.229 | 10.911 | 6.828 | 17.894 | (11.68) |
Total from | | | | | | | |
Investment Operations | (12.051) | 19.748 | 10.427 | 11.202 | 6.924 | 17.956 | (11.61) |
Distributions | | | | | | | |
Dividends from | | | | | | | |
Net Investment Income | (.577) | (.238) | (.178) | (.228) | (.074) | (.066) | (.17) |
Distributions from | | | | | | | |
Realized Capital Gains | (7.952) | (4.290) | (.529) | (.164) | — | — | — |
Total Distributions | (8.529) | (4.528) | (.707) | (.392) | (.074) | (.066) | (.17) |
Net Asset Value, | | | | | | | |
End of Period | $78.13 | $98.71 | $83.49 | $73.77 | $62.96 | $56.11 | $38.22 |
| | | | | | | |
Total Return6 | –12.74% | 24.43% | 14.23% | 17.82% | 12.36% | 47.05% | –23.32% |
| | | | | | | |
Ratios/Supplemental Data | | | | | | | |
Net Assets, End of | | | | | | | |
Period (Millions) | $4,308 | $4,760 | $3,750 | $3,004 | $1,337 | $840 | $395 |
Ratio of Total Expenses to | | | | | | | |
Average Net Assets | 0.35%* | 0.37% | 0.40% | 0.42% | 0.41%* | 0.49% | 0.50%* |
Ratio of Net Investment | | | | | | | |
Income to Average | | | | | | | |
Net Assets | 0.80%3* | 0.26% | 0.24% | 0.38%4 | 0.17%* | 0.14% | 0.17%* |
Portfolio Turnover Rate | 16%* | 14% | 11% | 12% | 10% | 14% | 14% |
1 The fund’s fiscal year-end changed from October 31 to September 30, effective September 30, 2004.
2 Inception.
3 Net investment income per share and the ratio of net investment income to average net assets include $.289 and 0.32%, respectively, resulting from a special dividend from ASML Holding NV in October 2007.
4 Net investment income per share and the ratio of net investment income to average net assets include $.108 and 0.16%, respectively, resulting from a special dividend from Microsoft Corp. in November 2004.
5 Includes increases from redemption fees of $.00, $.00, $.00, $.01, $.03, $.03, and $.07.
6 Total returns do not reflect the 1% fee assessed on redemptions after March 23, 2005, of shares held for less than one year, or the 1% fee previously assessed on redemptions of shares held for less than five years.
See accompanying Notes, which are an integral part of the Financial Statements.
19
Notes to Financial Statements
Vanguard Capital Opportunity Fund is registered under the Investment Company Act of 1940 as an open-end investment company, or mutual fund. The fund files reports with the SEC under the company name Vanguard Horizon Funds. The fund offers two classes of shares, Investor Shares and Admiral Shares. Investor Shares are available to any investor who meets the fund’s minimum purchase requirements. Admiral Shares are designed for investors who meet certain administrative, service, tenure, and account-size criteria.
A. The following significant accounting policies conform to generally accepted accounting principles for U.S. mutual funds. The fund consistently follows such policies in preparing its financial statements.
1. Security Valuation: Securities are valued as of the close of trading on the New York Stock Exchange (generally 4 p.m., Eastern time) on the valuation date. Equity securities are valued at the latest quoted sales prices or official closing prices taken from the primary market in which each security trades; such securities not traded on the valuation date are valued at the mean of the latest quoted bid and asked prices. Securities for which market quotations are not readily available, or whose values have been affected by events occurring before the fund’s pricing time but after the close of the securities’ primary markets, are valued at their fair values calculated according to procedures adopted by the board of trustees. These procedures include obtaining quotations from an independent pricing service, monitoring news to identify significant market- or security-specific events, and evaluating changes in the values of foreign market proxies (for example, ADRs, futures contracts, or exchange-traded funds), between the time the foreign markets close and the fund’s pricing time. When fair-value pricing is employed, the prices of securities used by a fund to calculate its net asset value may differ from quoted or published prices for the same securities. Investments in Vanguard Market Liquidity Fund are valued at that fund’s net asset value.
2. Foreign Currency: Securities and other assets and liabilities denominated in foreign currencies are translated into U.S. dollars using exchange rates obtained from an independent third party as of the fund’s pricing time on the valuation date. Realized gains (losses) and unrealized appreciation (depreciation) on investment securities include the effects of changes in exchange rates since the securities were purchased, combined with the effects of changes in security prices. Fluctuations in the value of other assets and liabilities resulting from changes in exchange rates are recorded as unrealized foreign currency gains (losses) until the assets or liabilities are settled in cash, at which time they are recorded as realized foreign currency gains (losses).
3. Federal Income Taxes: The fund intends to continue to qualify as a regulated investment company and distribute all of its taxable income. Management has analyzed the fund’s tax positions taken on federal income tax returns for all open tax years (tax years ended September 30, 2004–2007) and for the period ended March 31, 2008, and has concluded that no provision for federal income tax is required in the fund’s financial statements.
4. Distributions: Distributions to shareholders are recorded on the ex-dividend date.
5. Security Lending: The fund may lend its securities to qualified institutional borrowers to earn additional income. Security loans are required to be secured at all times by collateral at least equal to the market value of securities loaned. The fund invests cash collateral received in Vanguard Market Liquidity Fund, and records a liability for the return of the collateral, during the period the securities are on loan. Security lending income represents the income earned on investing cash collateral, less expenses associated with the loan.
20
6. Other: Dividend income is recorded on the ex-dividend date. Interest income includes income distributions received from Vanguard Market Liquidity Fund and is accrued daily. Security transactions are accounted for on the date securities are bought or sold. Costs used to determine realized gains (losses) on the sale of investment securities are those of the specific securities sold. Fees assessed on redemptions of capital shares are credited to paid-in capital.
Each class of shares has equal rights as to assets and earnings, except that each class separately bears certain class-specific expenses related to maintenance of shareholder accounts (included in Management and Administrative expenses) and shareholder reporting. Marketing and distribution expenses are allocated to each class of shares based on a method approved by the board of trustees. Income, other non-class-specific expenses, and gains and losses on investments are allocated to each class of shares based on its relative net assets.
B. PRIMECAP Management Company provides investment advisory services to the fund for a fee calculated at an annual percentage rate of average net assets. For the six months ended March 31, 2008, the investment advisory fee represented an effective annual rate of 0.26% of the fund’s average net assets.
C. The Vanguard Group furnishes at cost corporate management, administrative, marketing, and distribution services. The costs of such services are allocated to the fund under methods approved by the board of trustees. The fund has committed to provide up to 0.40% of its net assets in capital contributions to Vanguard. At March 31, 2008, the fund had contributed capital of $765,000 to Vanguard (included in Other Assets), representing 0.01% of the fund’s net assets and 0.76% of Vanguard’s capitalization. The fund’s trustees and officers are also directors and officers of Vanguard.
D. The fund has asked its investment advisor to direct certain security trades, subject to obtaining the best price and execution, to brokers who have agreed to rebate to the fund part of the commissions generated. Such rebates are used solely to reduce the fund’s management and administrative expenses. The fund’s custodian bank has also agreed to reduce its fees when the fund maintains cash on deposit in the non-interest-bearing custody account. For the six months ended March 31, 2008, these arrangements reduced the fund’s management and administrative expenses by $65,000 and custodian fees by $50,000.
E. Distributions are determined on a tax basis and may differ from net investment income and realized capital gains for financial reporting purposes. Differences may be permanent or temporary. Permanent differences are reclassified among capital accounts in the financial statements to reflect their tax character. Temporary differences arise when certain items of income, expense, gain, or loss are recognized in different periods for financial statement and tax purposes; these differences will reverse at some time in the future. Differences in classification may also result from the treatment of short-term gains as ordinary income for tax purposes. The fund’s tax-basis capital gains and losses are determined only at the end of each fiscal year.
During the six months ended March 31, 2008, the fund realized net foreign currency losses of $23,000, which decreased distributable net income for tax purposes; accordingly, such losses have been reclassified from accumulated net realized gains to overdistributed net investment income.
At March 31, 2008, the cost of investment securities for tax purposes was $6,569,057,000. Net unrealized appreciation of investment securities for tax purposes was $2,268,671,000, consisting of unrealized gains of $3,275,237,000 on securities that had risen in value since their purchase and $1,006,566,000 in unrealized losses on securities that had fallen in value since their purchase.
21
F. During the six months ended March 31, 2008, the fund purchased $867,754,000 of investment securities and sold $725,680,000 of investment securities, other than temporary cash investments.
G. The market value of securities on loan to broker-dealers at March 31, 2008, was $67,967,000, for which the fund received cash collateral of $70,283,000.
H. Capital share transactions for each class of shares were:
| Six Months Ended | Year Ended |
| March 31, 2008 | September 30, 2007 |
| Amount | Shares | Amount | Shares |
| ($000) | (000) | ($000) | (000) |
Investor Shares | | | | |
Issued | 319,555 | 8,245 | 353,165 | 9,164 |
Issued in Lieu of Cash Distributions | 425,518 | 11,807 | 249,615 | 6,678 |
Redeemed1 | (555,971) | (14,667) | (1,103,546) | (28,870) |
Net Increase (Decrease)—Investor Shares | 189,102 | 5,385 | (500,766) | (13,028) |
Admiral Shares | | | | |
Issued | 508,362 | 5,595 | 623,496 | 6,994 |
Issued in Lieu of Cash Distributions | 392,708 | 4,717 | 189,279 | 2,192 |
Redeemed1 | (287,102) | (3,393) | (518,885) | (5,875) |
Net Increase (Decrease)—Admiral Shares | 613,968 | 6,919 | 293,890 | 3,311 |
I. Certain of the fund’s investments are in companies that are considered to be affiliated companies of the fund because the fund owns more than 5% of the outstanding voting securities of the company. Transactions during the six months ended March 31, 2008, in securities of these companies were as follows:
| | Current-Period Transactions | |
| Sept. 30, 2007 | | Proceeds from | | Mar. 31, 2008 |
| Market | Purchases | Securities | Dividend | Market |
| Value | at Cost | Sold | Income | Value |
| ($000) | ($000) | ($000) | ($000) | ($000) |
Avid Technology, Inc. | 55,176 | — | — | — | 49,593 |
Emulex Corp. | 87,595 | — | — | — | 74,207 |
FormFactor Inc. | 144,225 | 57,911 | — | — | 100,094 |
Men’s Wearhouse, Inc. | n/a2 | 7,879 | 6,674 | 338 | 65,156 |
Minerals Technologies, Inc. | 82,179 | — | 66,765 | 49 | n/a3 |
Rambus Inc. | 99,468 | — | — | — | n/a3 |
Strattec Security Corp. | 10,221 | — | — | 66 | 9,313 |
The Descartes Systems Group Inc. | 21,924 | — | — | — | 16,350 |
The Dress Barn, Inc. | 83,655 | 820 | — | — | 64,312 |
Thomas & Betts Corp. | 194,163 | — | 6 | — | 120,421 |
| 778,606 | | | 453 | 499,446 |
| | | | | | |
1 Net of redemption fees of $431,000 and $430,000 (fund totals).
2 At September 30, 2007, the issuer was not an affiliated company of the fund.
3 At March 31, 2008, the security was still held, but the issuer was no longer an affiliated company of the fund.
22
About Your Fund’s Expenses
As a shareholder of the fund, you incur ongoing costs, which include costs for portfolio management, administrative services, and shareholder reports (like this one), among others. Operating expenses, which are deducted from a fund’s gross income, directly reduce the investment return of the fund.
A fund’s expenses are expressed as a percentage of its average net assets. This figure is known as the expense ratio. The following examples are intended to help you understand the ongoing costs (in dollars) of investing in your fund and to compare these costs with those of other mutual funds. The examples are based on an investment of $1,000 made at the beginning of the period shown and held for the entire period.
The table below illustrates your fund’s costs in two ways:
• Based on actual fund return. This section helps you to estimate the actual expenses that you paid over the period. The “Ending Account Value” shown is derived from the fund’s actual return, and the third column shows the dollar amount that would have been paid by an investor who started with $1,000 in the fund. You may use the information here, together with the amount you invested, to estimate the expenses that you paid over the period.
To do so, simply divide your account value by $1,000 (for example, an $8,600 account value divided by $1,000 = 8.6), then multiply the result by the number given for your fund under the heading “Expenses Paid During Period.”
• Based on hypothetical 5% yearly return. This section is intended to help you compare your fund’s costs with those of other mutual funds. It assumes that the fund had a yearly return of 5% before expenses, but that the expense ratio is unchanged. In this case—because the return used is not the fund’s actual return—the results do not apply to your investment. The example is useful in making comparisons because the Securities and Exchange Commission requires all mutual funds to calculate expenses based on a 5% return. You can assess your fund’s costs by comparing this hypothetical example with the hypothetical examples that appear in shareholder reports of other funds.
Six Months Ended March 31, 2008 | | | |
| Beginning | Ending | Expenses |
| Account Value | Account Value | Paid During |
Capital Opportunity Fund | 9/30/2007 | 3/31/2008 | Period1 |
Based on Actual Fund Return | | | |
Investor Shares | $1,000.00 | $872.21 | $2.06 |
Admiral Shares | 1,000.00 | 872.59 | 1.64 |
Based on Hypothetical 5% Yearly Return | | | |
Investor Shares | $1,000.00 | $1,022.80 | $2.23 |
Admiral Shares | 1,000.00 | 1,023.25 | 1.77 |
1 The calculations are based on expenses incurred in the most recent six-month period. The fund’s annualized six-month expense ratios for that period are 0.44% for Investor Shares and 0.35% for Admiral Shares. The dollar amounts shown as “Expenses Paid” are equal to the annualized expense ratio multiplied by the average account value over the period, multiplied by the number of days in the most recent six-month period, then divided by the number of days in the most recent 12-month period.
23
Note that the expenses shown in the table are meant to highlight and help you compare ongoing costs only and do not reflect transaction costs incurred by the fund for buying and selling securities. Further, the expenses do not include the 1% fee on redemptions of shares held for less than one year, nor do they include the account service fee described in the prospectus. If such fees were applied to your account, your costs would be higher. Your fund does not carry a “sales load.”
The calculations assume no shares were bought or sold during the period. Your actual costs may have been higher or lower, depending on the amount of your investment and the timing of any purchases or redemptions.
You can find more information about the fund’s expenses, including annual expense ratios, in the Financial Statements section of this report. For additional information on operating expenses and other shareholder costs, please refer to your fund’s current prospectus.
24
Trustees Approve Advisory Agreement
The board of trustees of Vanguard Capital Opportunity Fund has renewed the fund’s investment advisory agreement with PRIMECAP Management Company. The board determined that the retention of PRIMECAP Management was in the best interests of the fund and its shareholders.
The board based its decision upon an evaluation of the advisor’s investment staff, portfolio management process, and performance. The trustees considered the factors discussed below, among others. However, no single factor determined whether or not the board approved the agreement. Rather, it was the totality of the circumstances that drove the board’s decision.
Nature, extent, and quality of services
The board considered the quality of the fund’s investment management over both the short and long term, and took into account the organizational depth and stability of the firm. The board noted that PRIMECAP Management, founded in 1983, is recognized for its long-term approach to growth equity investing. The firm has managed Vanguard Capital Opportunity Fund since 1998.
Five experienced portfolio managers are responsible for separate sub-portfolios, and each portfolio manager employs a fundamental, research-driven approach in seeking to identify companies with long-term growth potential overlooked by the market and stock that is trading at attractive valuation levels.
The board concluded that the advisor’s experience, stability, depth, and performance, among other factors, warranted continuation of the advisory agreement.
Investment performance
The board considered the short- and long-term performance of the fund, including any periods of outperformance or underperformance of a relevant benchmark and peer group. The board concluded that the advisor carried out the fund’s investment strategy in disciplined fashion, and that performance results have been within competitive norms. Information about the fund’s most recent performance can be found in the Performance Summary section of this report.
Cost
The board concluded that the fund’s expense ratio was far below the average expense ratio charged by funds in its peer group. The board noted that the fund’s advisory fee was also well below the peer-group average. Information about the fund’s expense ratio appears in the About Your Fund’s Expenses section of this report as well as in the Financial Statements section, which also includes information about the advisory fee rate.
The board did not consider profitability of PRIMECAP Management in determining whether to approve the advisory fee, because PRIMECAP Management is independent of Vanguard, and the advisory fee is the result of arm’s-length negotiations.
The benefit of economies of scale
The board concluded that the fund’s shareholders benefit from economies of scale because of the breakpoints in the fund’s advisory fee schedule. The breakpoints reduce the effective rate of the fee as the fund’s assets increase.
The board will consider whether to renew the advisory agreement again after a one-year period.
25
Glossary
Beta. A measure of the magnitude of a fund’s past share-price fluctuations in relation to the ups and downs of a given market index. The index is assigned a beta of 1.00. Compared with a given index, a fund with a beta of 1.20 typically would have seen its share price rise or fall by 12% when the index rose or fell by 10%. For this report, beta is based on returns over the past 36 months for both the fund and the index. Note that a fund’s beta should be reviewed in conjunction with its R-squared (see definition below). The lower the R-squared, the less correlation there is between the fund and the index, and the less reliable beta is as an indicator of volatility.
Earnings Growth Rate. The average annual rate of growth in earnings over the past five years for the stocks now in a fund.
Equity Exposure. A measure that reflects a fund’s investments in stocks and stock futures. Any holdings in short-term reserves are excluded.
Expense Ratio. The percentage of a fund’s average net assets used to pay its annual administrative and advisory expenses. These expenses directly reduce returns to investors.
Foreign Holdings. The percentage of a fund represented by stocks or depositary receipts of companies based outside the United States.
Inception Date. The date on which the assets of a fund (or one of its share classes) are first invested in accordance with the fund’s investment objective. For funds with a subscription period, the inception date is the day after that period ends. Investment performance is measured from the inception date.
Median Market Cap. An indicator of the size of companies in which a fund invests; the midpoint of market capitalization (market price x shares outstanding) of a fund’s stocks, weighted by the proportion of the fund’s assets invested in each stock. Stocks representing half of the fund’s assets have market capitalizations above the median, and the rest are below it.
Price/Book Ratio. The share price of a stock divided by its net worth, or book value, per share. For a fund, the weighted average price/book ratio of the stocks it holds.
Price/Earnings Ratio. The ratio of a stock’s current price to its per-share earnings over the past year. For a fund, the weighted average P/E of the stocks it holds. P/E is an indicator of market expectations about corporate prospects; the higher the P/E, the greater the expectations for a company’s future growth.
R-Squared. A measure of how much of a fund’s past returns can be explained by the returns from the market in general, as measured by a given index. If a fund’s total returns were precisely synchronized with an index’s returns, its R-squared would be 1.00. If the fund’s returns bore no relationship to the index’s returns, its R-squared would be 0. For this report, R-squared is based on returns over the past 36 months for both the fund and the index.
Return on Equity. The annual average rate of return generated by a company during the past five years for each dollar of shareholder’s equity (net income divided by shareholder’s equity). For a fund, the weighted average return on equity for the companies whose stocks it holds.
26
Short-Term Reserves. The percentage of a fund invested in highly liquid, short-term securities that can be readily converted to cash.
Turnover Rate. An indication of the fund’s trading activity. Funds with high turnover rates incur higher transaction costs and may be more likely to distribute capital gains (which may be taxable to investors). The turnover rate excludes in-kind transactions, which have minimal impact on costs.
Yield. A fund’s 30-day SEC yield is derived using a formula specified by the U.S. Securities and Exchange Commission. Under the formula, data related to the fund’s security holdings in the previous 30 days are used to calculate the fund’s hypothetical net income for that period, which is then annualized and divided by the fund’s estimated average net assets over the calculation period. For the purposes of this calculation, a security’s income is based on its current market yield to maturity (in the case of bonds) or its projected dividend yield (for stocks). Because the SEC yield represents hypothetical annualized income, it will differ—at times significantly—from the fund’s actual experience. As a result, the fund’s income distributions may be higher or lower than implied by the SEC yield.
27
This page intentionally left blank.
The People Who Govern Your Fund
The trustees of your mutual fund are there to see that the fund is operated and managed in your best interests since, as a shareholder, you are a part owner of the fund. Your fund’s trustees also serve on the board of directors of The Vanguard Group, Inc., which is owned by the Vanguard funds and provides services to them on an at-cost basis.
A majority of Vanguard’s board members are independent, meaning that they have no affiliation with Vanguard or the funds they oversee, apart from the sizable personal investments they have made as private individuals.
Our independent board members bring distinguished backgrounds in business, academia, and public service to their task of working with Vanguard officers to establish the policies and oversee the activities of the funds. Among board members’ responsibilities are selecting investment advisors for the funds; monitoring fund operations, performance, and costs; reviewing contracts; nominating and selecting new trustees/directors; and electing Vanguard officers.
Each trustee serves a fund until its termination; or until the trustee’s retirement, resignation, or death; or otherwise as specified in the fund’s organizational documents. Any trustee may be removed at a shareholders’ meeting by a vote representing two-thirds of the net asset value of all shares of the fund together with shares of other Vanguard funds organized within the same trust. The table on these two pages shows information for each trustee and executive officer of the fund. The mailing address of the trustees and officers is P.O. Box 876, Valley Forge, PA 19482.
Chairman of the Board, Chief Executive Officer, and Trustee |
| |
John J. Brennan1 | |
Born 1954 | Principal Occupation(s) During the Past Five Years: Chairman of the Board, Chief Executive |
Trustee since May 1987; | Officer, and Director/Trustee of The Vanguard Group, Inc., and of each of the investment |
Chairman of the Board and | companies served by The Vanguard Group; Director of Vanguard Marketing Corporation. |
Chief Executive Officer | |
155 Vanguard Funds Overseen | |
| |
Independent Trustees | |
| |
Charles D. Ellis | |
Born 1937 | Principal Occupation(s) During the Past Five Years: Applecore Partners (pro bono ventures |
Trustee since January 2001 | in education); Senior Advisor to Greenwich Associates (international business strategy |
155 Vanguard Funds Overseen | consulting); Successor Trustee of Yale University; Overseer of the Stern School of Business |
| at New York University; Trustee of the Whitehead Institute for Biomedical Research. |
| |
Emerson U. Fullwood | |
Born 1948 | Principal Occupation(s) During the Past Five Years: Executive Chief Staff and Marketing |
Trustee since January 2008 | Officer for North America since 2004 and Corporate Vice President of Xerox Corporation |
155 Vanguard Funds Overseen | (photocopiers and printers); Director of SPX Corporation (multi-industry manufacturing), |
| of the United Way of Rochester, and of the Boy Scouts of America. |
| |
Rajiv L. Gupta | |
Born 1945 | Principal Occupation(s) During the Past Five Years: Chairman, President, and |
Trustee since December 20012 | Chief Executive Officer of Rohm and Haas Co. (chemicals); Board Member of |
155 Vanguard Funds Overseen | the American Chemistry Council; Director of Tyco International, Ltd. (diversified |
| manufacturing and services) since 2005. |
| |
Amy Gutmann | |
Born 1949 | Principal Occupation(s) During the Past Five Years: President of the University of |
Trustee since June 2006 | Pennsylvania since 2004; Professor in the School of Arts and Sciences, Annenberg School |
155 Vanguard Funds Overseen | for Communication, and Graduate School of Education of the University of Pennsylvania |
| since 2004; Provost (2001–2004) and Laurance S. Rockefeller Professor of Politics and |
| the University Center for Human Values (1990–2004), Princeton University; Director of |
| Carnegie Corporation of New York since 2005 and of Schuylkill River Development |
| Corporation and Greater Philadelphia Chamber of Commerce since 2004; Trustee of |
| the National Constitution Center since 2007. |
JoAnn Heffernan Heisen | |
Born 1950 | Principal Occupation(s) During the Past Five Years: Corporate Vice President and |
Trustee since July 1998 | Chief Global Diversity Officer since 2006, Vice President and Chief Information |
155 Vanguard Funds Overseen | Officer (1997–2005), and Member of the Executive Committee of Johnson & |
| Johnson (pharmaceuticals/consumer products); Director of the University Medical |
| Center at Princeton and Women’s Research and Education Institute. |
| |
André F. Perold | |
Born 1952 | Principal Occupation(s) During the Past Five Years: George Gund Professor of Finance |
Trustee since December 2004 | and Banking, Harvard Business School; Senior Associate Dean and Director of Faculty |
155 Vanguard Funds Overseen | Recruiting, Harvard Business School; Director and Chairman of UNX, Inc. (equities |
| trading firm); Chair of the Investment Committee of HighVista Strategies LLC (private |
| investment firm) since 2005. |
| |
Alfred M. Rankin, Jr. | |
Born 1941 | Principal Occupation(s) During the Past Five Years: Chairman, President, Chief Executive |
Trustee since January 1993 | Officer, and Director of NACCO Industries, Inc. (forklift trucks/housewares/lignite); Director |
155 Vanguard Funds Overseen | of Goodrich Corporation (industrial products/aircraft systems and services). |
| |
| |
J. Lawrence Wilson | |
Born 1936 | Principal Occupation(s) During the Past Five Years: Retired Chairman and Chief Executive |
Trustee since April 1985 | Officer of Rohm and Haas Co. (chemicals); Director of Cummins Inc. (diesel engines) and |
155 Vanguard Funds Overseen | AmerisourceBergen Corp. (pharmaceutical distribution); Trustee of Vanderbilt University |
| and of Culver Educational Foundation. |
| |
| |
Executive Officers1 | |
| |
Thomas J. Higgins | |
Born 1957 | Principal Occupation(s) During the Past Five Years: Principal of The Vanguard Group, Inc.; |
Treasurer since July 1998 | Treasurer of each of the investment companies served by The Vanguard Group. |
155 Vanguard Funds Overseen | |
| |
| |
F. William McNabb III | |
Born 1957 | Principal Occupation(s) During the Past Five Years: President of The Vanguard Group, Inc., |
President since March 2008 | and of each of the investment companies served by The Vanguard Group since 2008; |
155 Vanguard Funds Overseen | Director of Vanguard Marketing Corporation; Managing Director of The Vanguard Group |
| (1995–2008). |
| |
Heidi Stam | |
Born 1956 | Principal Occupation(s) During the Past Five Years: Managing Director of The Vanguard |
Secretary since July 2005 | Group, Inc., since 2006; General Counsel of The Vanguard Group since 2005; Secretary of |
155 Vanguard Funds Overseen | The Vanguard Group, and of each of the investment companies served by The Vanguard |
| Group, since 2005; Director and Senior Vice President of Vanguard Marketing Corporation |
| since 2005; Principal of The Vanguard Group (1997–2006). |
Vanguard Senior Management Team |
| | | |
R. Gregory Barton | Kathleen C. Gubanich | Michael S. Miller | George U. Sauter |
Mortimer J. Buckley | Paul A. Heller | Ralph K. Packard | |
Founder |
|
John C. Bogle |
Chairman and Chief Executive Officer, 1974–1996 |
1 Officers of the funds are “interested persons” as defined in the Investment Company Act of 1940.
2 December 2002 for Vanguard Equity Income Fund, Vanguard Growth Equity Fund, the Vanguard Municipal Bond Funds, and the Vanguard State Tax-Exempt Funds.
More information about the trustees is in the Statement of Additional Information, available from The Vanguard Group.
| 
|
| P.O. Box 2600 |
| Valley Forge, PA 19482-2600 |
Connect with Vanguard® > www.vanguard.com
Fund Information > 800-662-7447 | Vanguard, Admiral, Connect with Vanguard, and the ship |
| logo are trademarks of The Vanguard Group, Inc. |
Direct Investor Account Services > 800-662-2739 | |
| All other marks are the exclusive property of their |
Institutional Investor Services > 800-523-1036 | respective owners. |
| |
Text Telephone for People | All comparative mutual fund data are from Lipper Inc. |
With Hearing Impairment > 800-952-3335 | or Morningstar, Inc., unless otherwise noted. |
| |
| |
| You can obtain a free copy of Vanguard’s proxy voting |
This material may be used in conjunction | guidelines by visiting our website, www.vanguard.com, |
with the offering of shares of any Vanguard | and searching for “proxy voting guidelines,” or by |
fund only if preceded or accompanied by | calling Vanguard at 800-662-2739. The guidelines are |
the fund’s current prospectus. | also available from the SEC’s website, www.sec.gov. |
| In addition, you may obtain a free report on how your |
| fund voted the proxies for securities it owned during |
| the 12 months ended June 30. To get the report, visit |
| either www.vanguard.com or www.sec.gov. |
| |
| |
| You can review and copy information about your fund |
| at the SEC’s Public Reference Room in Washington, D.C. |
| To find out more about this public service, call the SEC |
| at 202-551-8090. Information about your fund is also |
| available on the SEC’s website, and you can receive |
| copies of this information, for a fee, by sending a |
| request in either of two ways: via e-mail addressed to |
| publicinfo@sec.gov or via regular mail addressed to the |
| Public Reference Section, Securities and Exchange |
| Commission, Washington, DC 20549-0102. |
| |
| |
| |
| |
| © 2008 The Vanguard Group, Inc. |
| All rights reserved. |
| Vanguard Marketing Corporation, Distributor. |
| |
| Q1112 052008 |
> | Vanguard Global Equity Fund returned –14.2% during the first half of its fiscal year, underperforming its benchmark index and the average return of competing funds. |
> | The fund faced a global financial marketplace buffeted by concerns about the subprime mortgage crisis and a slowing U.S. economy. |
> | The fund’s investments in the financials and consumer discretionary sectors were particularly affected by the worldwide stock market downturn. |
See page 33 for a Notice to Shareholders concerning the fund’s investment advisors. |
Contents | |
| |
Your Fund’s Total Returns | 1 |
Chairman’s Letter | 2 |
Advisors’ Report | 6 |
Fund Profile | 11 |
Performance Summary | 14 |
Financial Statements | 15 |
About Your Fund’s Expenses | 42 |
Trustees Approve Advisory Agreements | 46 |
Glossary | 48 |
Please note: The opinions expressed in this report are just that—informed opinions. They should not be considered promises or advice. Also, please keep in mind that the information and opinions cover the period through the date on the cover of this report. Of course, the risks of investing in your fund are spelled out in the prospectus.
Your Fund’s Total Returns
Six Months Ended March 31, 2008 | | |
| Ticker | Total |
| Symbol | Returns |
Vanguard Global Equity Fund | VHGEX | –14.2% |
MSCI All Country World Index | | –10.7 |
Average Global Fund1 | | –11.1 |
Your Fund’s Performance at a Glance |
September 30, 2007–March 31, 2008 |
| | | Distributions Per Share |
| Starting | Ending | Income | Capital |
| Share Price | Share Price | Dividends | Gains |
Vanguard Global Equity Fund | $26.51 | $21.08 | $0.430 | $1.400 |
1 Derived from data provided by Lipper Inc.
1

Chairman’s Letter
Dear Shareholder,
When it comes to financial distress, especially in this era of intense global interconnectedness, there are essentially no borders. That explains much of the Global Equity Fund’s return for the fiscal half-year ended March 31, a period during which the heightened sense of uncertainty created by the U.S. subprime mortgage-market crisis cascaded around the world.
The Global Equity Fund returned –14.2%, a sharp reversal from its results for the previous five full fiscal years. The fund lagged both the –10.7% return of its benchmark index and the –11.1% average return for peer funds over the six months.
Stocks of all sorts sank amid credit-market concerns
The broad U.S. stock market declined –12.4% for the half-year as investor sentiment turned bearish amid fears of a U.S. recession, the weakening of the U.S. dollar, and the tightening of global credit markets in reaction to the subprime crisis that began in midsummer 2007.
Large-capitalization stocks fared a bit better than small-caps, growth stocks generally outpaced their value-oriented counterparts, and international stocks again outperformed U.S. stocks over the six months; nonetheless, each stock group posted a negative return.
2
Bond markets were roiled by subprime-mortgage woes
Credit markets seized up as trouble spread from subprime-mortgage-backed securities to other issues. In the United States, investors flocked to higher-quality government and corporate bonds, driving Treasury bond prices higher.
Unlike the stock market, the broad U.S. taxable bond market pushed forward, posting a total return of 5.2% for the fiscal half-year as lower interest rates depressed yields and bumped up prices. By contrast, tax-exempt municipal bonds returned only 0.7%, as fixed income investors moved in droves to Treasuries in search of the highest-quality, most-liquid securities and helped drive municipal yields above those of Treasuries.
In response to the tumult in the credit markets and the deteriorating economic outlook, the Federal Reserve Board reduced its target for the federal funds rate aggressively. The Fed continued a series of rate cuts that began late last summer, ending with a 0.75-percentage-point cut in March. The target rate stood at 2.25% at the end of the period, the lowest level since early 2005.
Stock picks came up short as the fund faced headwinds
The credit-market distress in the United States spilled over to many parts of the world during the fiscal half-year, discouraging lending and investing activity by financial institutions and boosting stock market uncertainty well beyond typical levels. Adding to the general pessimism
Market Barometer | | | |
| | | Total Returns |
| Periods Ended March 31, 2008 |
| Six Months | One Year | Five Years1 |
Stocks | | | |
MSCI All Country World Index ex USA (International) | –9.6% | 2.6% | 24.0% |
Russell 1000 Index (Large-caps) | –12.4 | –5.4 | 11.9 |
Russell 2000 Index (Small-caps) | –14.0 | –13.0 | 14.9 |
Dow Jones Wilshire 5000 Index (Entire market) | –12.4 | –5.8 | 12.5 |
| | | |
Bonds | | | |
Lehman U.S. Aggregate Bond Index (Broad taxable market) | 5.2% | 7.7% | 4.6% |
Lehman Municipal Bond Index | 0.7 | 1.9 | 3.9 |
Citigroup 3-Month Treasury Bill Index | 1.7 | 4.2 | 3.0 |
| | | |
CPI | | | |
Consumer Price Index | 2.4% | 4.0% | 3.0% |
1 Annualized.
3
were concerns over the likelihood of a slowdown in the U.S. economy, a linchpin of the global economy.
As the investment environment deteriorated, the Global Equity Fund’s lengthy run of double-digit, and benchmark-beating, gains came to a halt. With its –14.2% return for the six months ended March 31, the fund fell behind its comparative yardsticks.
The primary driver of the fund’s performance was its disappointing stock selection. Global Equity’s U.S. investments (about 38% of assets) returned –19%, compared with the broad U.S. stock market’s return of about –12%. In European developed markets, the fund’s investments (about 29% of assets, on average) returned –13%, compared with a –9% return for these markets within the benchmark index.
The fund overweighted its position in developed Asian and Pacific markets, but the stocks it held in these areas returned –16% compared with –14% for the markets in the index. Global Equity’s investments in developing nations, which made up about 11% of assets compared with the 13% level of recent years, played a small role in the fund’s overall return.
Across markets, the fund’s holdings in the financials, consumer discretionary, industrials, and energy sectors declined the most. Hardest-hit were financials and consumer discretionary stocks. Within the financials group, the major
Annualized Expense Ratios1 | | |
Your Fund Compared With Its Peer Group | | |
| | Average |
| Fund | Global Fund |
Global Equity Fund | 0.54% | 1.49% |
1 Fund expense ratio reflects the six months ended March 31, 2008. Peer-group expense ratio is derived from data provided by Lipper Inc. and captures information through year-end 2007.
4
detractors to return were France’s Société Générale, the commercial bank that sustained large losses from derivatives trading, and ING Groep, the Dutch global financial services company.
Diversity and balance can reduce investing’s inevitable risks
As the Global Equity Fund’s longer-term record suggests, exposure to world stock markets together with the U.S. market can be rewarding. But, as the past six months have reminded us, risk comes along for the ride.
That is why we at Vanguard continually urge investors to maintain a portfolio that is balanced among stocks, bonds, and cash reserves in a diversified mix based on their unique personal goals, time horizon, and tolerance for risk. With its worldwide exposure, the Global Equity Fund can be a useful building block in such a diversified portfolio.
Baillie Gifford of Scotland joins the fund’s multi-advisor team
A critical aspect of Global Equity’s approach to investing has been the deep skill of its advisors, Acadian Asset Management LLC, AllianceBernstein L.P., and Marathon Asset Management LLP. I’m pleased to announce that, on April 11, after the close of the fiscal half-year, we added Baillie Gifford Overseas Ltd. of Edinburgh, Scotland, as a fourth advisor to the fund. The addition of Baillie Gifford will complement the fund’s investment approach without changing its essential character.
We believe that the multi-manager approach employed by Global Equity, as well as other Vanguard funds, can benefit shareholders greatly through the diversity of thought that it brings to portfolio management in an ever-surprising, and ever more globalized, investment arena.
F. William McNabb named president of the fund
As I close this report to you, it’s my pleasure to introduce the fund’s new president, F. William McNabb III. Bill is a man of great character and integrity who is intimately familiar with all aspects of Vanguard—from how we serve our clients to how we invest for them.
Bill and I have worked together very closely for more than two decades. I’m thrilled that the fund’s board elected him president, effective March 1, and designated him to succeed me as chief executive officer, a role he will assume within a year, after an orderly transition. Bill and the rest of our team will serve you and our other clients extremely well in the years ahead.
Thank you for entrusting your assets to Vanguard.
Sincerely,

John J. Brennan
Chairman and Chief Executive Officer
April 14, 2008
5
Advisors’ Report
During the six months ended March 31, 2008, the Global Equity Fund returned –14.2%, reflecting the combined results of your fund’s independent investment advisors. The use of multiple advisors provides exposure to distinct, yet complementary, investment approaches to a particular market segment, enhancing the diversification of your fund.
The advisors, their percentage of fund assets managed, and brief descriptions of their investment strategies are presented in the table below. The advisors have also prepared discussions of the investment opportunities in their markets and of how their portfolio positioning reflects their assessments. These comments were prepared on April 17, 2008.
Acadian Asset Management LLC
Portfolio Managers:
John Chisholm, CFA, Executive Vice President and Co-Chief Investment Officer
Ronald Frashure, CFA, President and Chief Executive Officer
Brian Wolahan, CFA, Senior Vice President and Director of Alternative Strategies
Global equity markets experienced steep losses during the six months ended March 31, 2008, as market volatility climbed steadily after falling sharply from August 2007 highs. Markets swung from extreme to extreme as investors were whipsawed by alternating hopes and fears on several issues: trouble in the U.S. housing market, uncertainty about
Vanguard Global Equity Fund Investment Advisors |
|
| Fund Assets Managed | |
Investment Advisor | % | $ Million | Investment Strategy |
Acadian Asset Management LLC | 45 | 3,118 | A quantitative, active, bottom-up investment process |
| | | that combines stock and peer-group valuation to arrive |
| | | at a return forecast for each of the more than 25,000 |
| | | securities in the global universe. |
AllianceBernstein L.P. | 28 | 1,885 | A fundamentally based, research-driven approach, |
| | | focused on finding companies whose long-term |
| | | earnings power exceeds the level implied by their |
| | | current stock price. Proprietary quantitative tools aid |
| | | risk control and portfolio construction. |
Marathon Asset Management LLP | 21 | 1,447 | A long-term and contrarian investment philosophy and |
| | | process with a focus on industry capital cycle analysis |
| | | and in-depth management assessment. |
Cash Investments1 | 6 | 402 | — |
| | | | |
1 These short-term reserves are invested by Vanguard in equity index products to simulate investment in stocks. Each advisor may also maintain a modest cash position.
6
worldwide interest rates, the ongoing tightening of global credit, the possibility of a U.S. and world recession, and spiking energy and food prices.
As a result, investors have been focusing less on stock fundamentals and more on risk-avoidance; they’ve been following momentum and earnings trends more closely, sticking with perceived winners, and taking fewer risks on beat-up or otherwise undervalued stocks.
Our portfolio was focused on attractively valued stocks that appeared likely to rise in price, given their earnings data, price characteristics, and quality. Key overweighted markets, based on bottom-up stock selection, included Germany, the Netherlands, Sweden, and the United States. We also overweighted the emerging markets of Russia, Turkey, and Mexico. The United Kingdom, Switzerland, Canada, and Japan were underweighted. We overweighted materials, energy, and services.
Stock selection in the United States was the most significant detractor from relative return for the portfolio. Particularly detrimental were holdings in the services sector, affected by the environment of slowing consumer spending and rising initial claims for unemployment benefits. U.S. technology stocks also hurt the portfolio’s results. Companies within the group reported weaker-than-expected sales as businesses began to scale back their investments in equipment.
Stock selection within the telecommunications sector was a brighter spot, particularly in the emerging markets. Many wireless providers in developing nations posted sizable profit gains during the six-month period thanks to increases in subscribers and usage. Companies in the materials sector also realized notable gains, bolstered by record-high gold prices and continued demand for metals in China.
Overall, our view is that global equity markets will continue to demonstrate high volatility as investors’ confidence is tested by ongoing tightness in global credit markets, elevated commodity prices, and the growing likelihood of a recession in the United States. Many credit-linked assets still cannot be valued accurately, and market uncertainty will continue until the true extent of losses and write-offs is known. The ultimate impact on corporate profits remains to be seen, as does the extent to which problems in the U.S. housing market will work their way through to the broader economy and consumer spending.
However, as we move through the middle of the crisis and into the endgame, we will likely see markets respond positively. In the past, stocks have generally risen during recessions once investors had a clearer view of the likely duration and severity of the downturn. Clarity is lacking at the moment, making it difficult to pinpoint when we might see a market shift. However, we believe that such a shift will happen within the next six to twelve
7
months. Compared with the U.S. economy, other countries’ economies appear to be weathering the storm somewhat better. We expect that non-U.S. growth will slow from the pace of recent years, but outright recession looks unlikely outside of the United States.
AllianceBernstein L.P.
Portfolio Managers:
Sharon E. Fay, CFA, Executive Vice President and Chief Investment Officer–Global Value Equities
Kevin F. Simms, Co-Chief Investment Officer–International Value Equities and Director of Research–Global and International Value Equities
Henry S. D’Auria, CFA, Co-Chief Investment Officer–International Value Equities and Chief Investment Officer–Emerging Markets
Fears that the spreading financial crisis could undermine the global economy prompted a wholesale flight from risky assets over the past few months. Despite actions by central banks and governments to restore confidence, investor sentiment remained fragile.
While the basics of the current crisis are familiar—a run-up in asset prices and debt accumulation fueled by cheap credit—two new elements characterize today’s turbulence: securitization and mark-to-market accounting. Although securitization has helped distribute risk, as intended, it has also allowed what started as a local problem in the U.S. mortgage market to quickly become a global credit crisis. Mark-to-market accounting has improved transparency but has also fed a vicious downward spiral in asset prices.
Although crises inflict severe pain as they are unfolding, experience shows that they eventually pass. More importantly, we believe that lack of discrimination in the recent sell-off is creating significant pricing distortions that can be exploited by equity investors prepared to take a long-term view.
Assessing the impact of the credit crisis on our financials holdings has naturally been a top research priority. We constantly monitor our positions and have spent considerable time stress-testing the ability of our holdings’ balance sheets to withstand credit losses. While we anticipate further potential losses, we remain comfortable that our exposure to the sector reflects a proper balance between return potential and risks. Indeed, we’ve been adding to holdings where our research has detected compelling value opportunities. Some of the most attractive opportunities we see include the U.S.-based insurer AIG and the U.K.-based mortgage lender HBOS.
We also see opportunities in certain oil companies; despite the run-up in oil prices, energy stocks have not risen by the same magnitude. We expect oil prices to fall from their recent peaks as weaker demand helps rebuild inventories, but constraints all along the supply chain
8
should keep prices relatively high for the next several years. Thus, we have been increasing exposure to firms that will benefit from this environment, including Royal Dutch Shell, which is also benefiting from high refining margins; Petro-Canada, which has exposure to a potentially very attractive oil-sands project; and Norway’s StatoilHydro. We are also trimming some holdings, such as Petrobras, as they reach our estimate of fair value.
Stock selection in financials and the portfolio’s above-market exposure to the sector were the primary detractors from performance over the period. While aware of near-term risks, we continue to believe that our financials holdings will generate significant outperformance over time. Partially offsetting these detractors were gains in several energy holdings, including Petrobras and EnCana; in certain commodities stocks, such as Xstrata; and in the Brazilian steelmakers Usiminas and Gerdau, which benefited from continued robust demand.
Marathon Asset Management LLP
Portfolio Managers:
Jeremy J. Hosking, Investment Director
Neil M. Ostrer, Investment Director
William J. Arah, Investment Director
Over the last six months, global market volatility provided us with a number of compelling purchase opportunities. To take advantage of such opportunities we implemented a small asset-allocation move, ultimately increasing our U.S. weighting at the expense of the exposure to Japan.
Over the period, the main detractor from our performance was stock selection in North America, particularly the United States. Holdings that hurt us included Cablevision, which fell after a bid to take the company private failed, as well as stocks in the beleaguered financials group and among the oil-price-pressured airlines.
We have managed the global portfolio over the last nine months on the premise that financial problems would be constrained and that economic growth would slow but would not succumb to recession. In consequence, we maintained a fully invested equity position and made selective purchases in stress-affected sectors, such as banking and real estate. This optimistic thesis has been severely tested by the market in recent months because, contrary to expectations, the financial environment worsened at year-end instead of bottoming out. Regulators are turning financial companies’ stocks into fire-sale items by requiring mark-to-market pricing that reflects what seem to be extraordinary levels of potential defaults on loans. As we all know from the financial press, wholesale finance markets have been gridlocked.
At the risk of appearing Panglossian, we would point out that the financial sector’s problems are finite, the monetary authorities have adopted a very flexible
9
policy effectively throwing money at the problem, and, despite high loan spreads, there is little sign of contagion either geographically or outside the mortgage sectors. Finally, outside the financials sector, companies continue to buy back their shares in the belief they are undervalued.
The strategy of buying into sectors characterized by high levels of uncertainty and stress seems reasonable. The valuation elastic in the marketplace between the haves and have-nots continues to stretch, and such periods are always eventually followed by price action that favors the dogged contrarian buyer. In our opinion, investors who can afford to take a longer-term view have a significant competitive advantage in the current environment over those who are preoccupied with short-term performance.
10
Fund Profile
As of March 31, 2008
Portfolio Characteristics | | |
| | Comparative |
| Fund | Index1 |
Number of Stocks | 694 | 2,233 |
Turnover Rate | 74%2 | — |
Expense Ratio | 0.54%2 | — |
Short-Term Reserves | 1.0% | — |
Sector Diversification (% of equity exposure) |
| | Comparative |
| Fund | Index1 |
Consumer Discretionary | 12.6% | 9.1% |
Consumer Staples | 6.1 | 8.5 |
Energy | 13.1 | 11.9 |
Financials | 22.7 | 21.8 |
Health Care | 5.5 | 8.0 |
Industrials | 12.3 | 11.5 |
Information Technology | 7.5 | 10.5 |
Materials | 12.1 | 8.7 |
Telecommunication Services | 5.3 | 5.4 |
Utilities | 2.8 | 4.6 |
Volatility Measures3 | |
| Fund Versus |
| Comparative Index1 |
R-Squared | 0.97 |
Beta | 1.14 |
11
Ten Largest Holdings4 (% of total net assets) |
| | |
Royal Dutch Shell PLC | integrated oil and gas | 2.3% |
ING Groep NV | diversified financial services | 2.0 |
ExxonMobil Corp. | integrated oil and gas | 1.9 |
Nintendo Co. | home entertainment software | 1.7 |
LUKOIL Sponsored ADR | integrated oil and gas | 1.7 |
France Telecom SA | integrated telecommunication services | 1.5 |
Marathon Oil Corp. | integrated oil and gas | 1.5 |
E.On AG | electric utilities | 1.5 |
Deutsche Boerse AG | specialized finance | 1.2 |
Pfizer Inc. | pharmaceuticals | 1.1 |
Top Ten | | 16.4% |
Allocation by Region (% of portfolio)
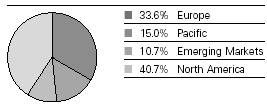
1 MSCI All Country World Index.
2 Annualized.
3 For an explanation of R-squared, beta, and other terms used here, see the Glossary on page 37.
4 “Ten Largest Holdings” excludes any temporary cash investments and equity index products.
12
Market Diversification (% of equity exposure) |
| | Comparative |
| Fund1 | Index2 |
Europe | | |
United Kingdom | 8.7% | 9.3% |
Germany | 6.7 | 4.0 |
France | 5.6 | 4.7 |
Netherlands | 3.2 | 1.2 |
Italy | 2.3 | 1.7 |
Belgium | 1.4 | 0.6 |
Spain | 1.1 | 1.9 |
Sweden | 1.1 | 1.1 |
Switzerland | 1.0 | 3.1 |
Other European Markets | 2.5 | 2.8 |
Subtotal | 33.6% | 30.4% |
Pacific | | |
Japan | 9.9% | 8.7% |
Australia | 2.8 | 2.8 |
Hong Kong | 1.8 | 1.0 |
Other Pacific Markets | 0.5 | 0.5 |
Subtotal | 15.0% | 13.0% |
Emerging Markets | | |
Russia | 1.9% | 1.1% |
South Korea | 1.8 | 1.6 |
Taiwan | 1.2 | 1.3 |
Other Emerging Markets | 5.8 | 7.3 |
Subtotal | 10.7% | 11.3% |
North America | | |
United States | 37.6% | 41.5% |
Canada | 3.1 | 3.8 |
Subtotal | 40.7% | 45.3% |
1 Country percentages exclude currency contracts held by the fund.
2 MSCI All Country World Index.
13
Performance Summary
All of the returns in this report represent past performance, which is not a guarantee of future results that may be achieved by the fund. (Current performance may be lower or higher than the performance data cited. For performance data current to the most recent month-end, visit our website at www.vanguard.com/performance.) Note, too, that both investment returns and principal value can fluctuate widely, so an investor’s shares, when sold, could be worth more or less than their original cost. The returns shown do not reflect taxes that a shareholder would pay on fund distributions or on the sale of fund shares.
Fiscal-Year Total Returns (%): September 30, 1997–March 31, 2008
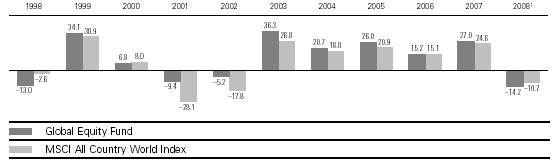
Average Annual Total Returns: Periods Ended March 31, 2008 |
| | | | |
| Inception Date | One Year | Five Years | Ten Years |
Global Equity Fund2 | 8/14/1995 | –4.38% | 20.00% | 10.23% |
1 Six months ended March 31, 2008.
2 Total returns do not include the account service fee that may be applicable to certain accounts with balances below $10,000.
Note: See Financial Highlights table on page 26 for dividend and capital gains information.
14
Financial Statements (unaudited)
Statement of Net Assets
As of March 31, 2008
The fund provides a complete list of its holdings four times in each fiscal year, at the quarter-ends. For the second and fourth fiscal quarters, the lists appear in the fund’s semiannual and annual reports to shareholders. For the first and third fiscal quarters, the fund files the lists with the Securities and Exchange Commission on Form N-Q. Shareholders can look up the fund’s Forms N-Q on the SEC’s website at www.sec.gov. Forms N-Q may also be reviewed and copied at the SEC’s Public Reference Room (see the back cover of this report for further information).
| | | Market |
| | | Value• |
| | Shares | ($000) |
Common Stocks (92.4%)1 | | |
Australia (2.4%) | | |
| BHP Billiton Ltd. | 2,022,298 | 66,455 |
| Qantas Airways Ltd. | 4,552,110 | 16,398 |
^ | Leighton Holdings Ltd. | 404,268 | 15,908 |
^ | Incitec Pivot Ltd. | 112,076 | 14,491 |
| Australian Stock Exchange Ltd. | 281,935 | 9,708 |
| BlueScope Steel Ltd. | 849,421 | 7,704 |
| Zinifex Ltd. | 689,100 | 6,291 |
| Macquarie Infrastructure Group | 1,974,474 | 5,040 |
| Santos Ltd. | 333,463 | 4,435 |
| Sims Group Ltd. | 114,907 | 3,127 |
| Australia & New Zealand Bank Group Ltd. | 146,324 | 3,036 |
| OneSteel Ltd. | 438,732 | 2,569 |
| Harvey Norman Holdings Ltd. | 566,435 | 2,034 |
| Amcor Ltd. | 203,799 | 1,334 |
| Orica Ltd. | 39,129 | 1,045 |
| Alumina Ltd. | 195,108 | 999 |
| Caltex Australia Ltd. | 69,841 | 834 |
| Iluka Resources Ltd. | 76,078 | 327 |
| | | 161,735 |
Austria (0.3%) | | |
| Erste Bank der Oesterreichischen Sparkassen AG | 161,559 | 10,479 |
| Voestalpine AG | 132,300 | 9,200 |
* | Oesterreichische Post AG | 20,216 | 880 |
* | BETandWIN.com Interactive Entertainment AG | 8,970 | 295 |
| | | 20,854 |
Belgium (1.4%) | | |
| Dexia | 1,470,472 | 41,953 |
| Fortis | 918,432 | 23,078 |
| KBC Bank & Verzekerings Holding | 142,978 | 18,544 |
15
| | | Market |
| | | Value• |
| | Shares | ($000) |
| Delhaize Group | 110,393 | 8,706 |
| InBev | 16,453 | 1,444 |
| | | 93,725 |
Brazil (0.7%) | | |
| Usiminas-Usinas Siderugicas de Minas Gerais SA Pfd. | 247,950 | 13,881 |
| Gerdau SA ADR | 451,350 | 13,798 |
| Uniao de Bancos Brasileiros SA GDR | 79,500 | 9,273 |
| Banco do Brasil SA | 413,400 | 5,447 |
| Itausa-Investimentos Itau SA | 606,500 | 3,515 |
| | | 45,914 |
Canada (3.0%) | | |
| Rogers Communications, Inc. Class B | 743,100 | 26,728 |
| Potash Corp. of Saskatchewan, Inc. | 145,900 | 22,671 |
* | Bombardier Inc. Class B | 4,182,000 | 22,286 |
| EnCana Corp. | 220,900 | 16,829 |
| Imperial Oil Ltd. | 280,100 | 14,681 |
| Canadian Imperial Bank of Commerce | 224,049 | 14,428 |
| Sun Life Financial Services of Canada | 298,844 | 13,972 |
| Teck Cominco Ltd. Class B | 329,800 | 13,524 |
| Petro-Canada | 221,900 | 9,668 |
^ | Royal Bank of Canada | 198,092 | 9,254 |
| Toronto-Dominion Bank | 112,800 | 6,935 |
| Methanex Corp. | 227,200 | 5,976 |
| BCE Inc. | 142,465 | 4,823 |
^ | Gerdau AmeriSteel Corp. | 293,000 | 4,176 |
| ATCO, Ltd. | 87,200 | 4,045 |
| ACE Aviation Holdings, Inc. | 182,700 | 3,747 |
* | HudBay Minerals, Inc. | 186,600 | 2,963 |
| Onex Corp. | 83,300 | 2,431 |
*^ | AbitibiBowater, Inc. | 182,846 | 2,366 |
* | Nortel Networks Corp. | 322,633 | 2,158 |
16
| | Market |
| | Value• |
| Shares | ($000) |
Nova Chemicals Corp. | 50,400 | 1,213 |
* CGI Group Inc. | 95,200 | 1,011 |
* Fraser Papers Inc. | 337,960 | 881 |
^Manitoba Telecom Services Inc. | 21,900 | 836 |
* Catalyst Paper Corp. | 660,000 | 604 |
Biovail Corp. | 44,800 | 482 |
^ING Canada Inc. | 8,377 | 298 |
Rothmans Inc. | 5,600 | 143 |
* Catalyst Paper Corp. Rights Exp. 4/7/08 | 384,400 | 47 |
Bell Aliant Regional Communications Income Fund | 630 | 18 |
| | 209,194 |
China (0.3%) | | |
China Petroleum & | | |
Chemical Corp. | 11,332,000 | 9,803 |
Tsingtao Brewery Co., Ltd. | 1,578,000 | 4,705 |
China Telecom Corp. Ltd. | 5,688,000 | 3,589 |
| | 18,097 |
Denmark (0.3%) | | |
* Vestas Wind Systems A/S | 68,949 | 7,590 |
*^William Demant A/S | 56,130 | 4,500 |
Coloplast A/S B Shares | 31,360 | 2,869 |
*^GN Store Nord A/S | 423,849 | 2,121 |
Novo Nordisk A/S B Shares | 15,950 | 1,098 |
Danske Bank A/S | 21,658 | 802 |
*^Topdanmark A/S | 3,925 | 662 |
^Bang & Olufsen A/S B Shares | 9,950 | 623 |
| | 20,265 |
Finland (0.6%) | | |
^Stora Enso Oyj R Shares | 1,173,300 | 13,568 |
Nokia Oyj | 345,222 | 10,899 |
Metso Oyj | 111,377 | 6,016 |
Sampo Oyj A Shares | 211,404 | 5,731 |
^TietoEnator Oyj B Shares | 66,680 | 1,646 |
^Wartsila Oyj B Shares | 12,190 | 823 |
^Outotec Oyj | 10,235 | 544 |
| | 39,227 |
France (5.0%) | | |
France Telecom SA | 3,068,198 | 103,078 |
Credit Agricole SA | 974,899 | 30,142 |
Vivendi SA | 750,049 | 29,339 |
Renault SA | 233,900 | 25,891 |
Sanofi-Aventis | 321,896 | 24,143 |
PSA Peugeot Citroen | 303,518 | 23,556 |
BNP Paribas SA | 182,248 | 18,377 |
Compagnie Generale des Etablissements Michelin SA | 136,800 | 14,327 |
Total SA | 154,682 | 11,460 |
Air France | 383,704 | 10,795 |
* Arkema | 135,800 | 7,612 |
17
| | | Market |
| | | Value• |
| | Shares | ($000) |
| Lagardere S.C.A. | 100,453 | 7,528 |
* | UbiSoft Entertainment SA | 83,488 | 7,192 |
| Carrefour SA | 68,864 | 5,314 |
| AXA | 119,745 | 4,331 |
| Thales SA | 59,582 | 3,856 |
| Neopost SA | 31,254 | 3,503 |
| Legrand SA | 95,720 | 3,004 |
| Alcatel-Lucent ADR | 479,973 | 2,765 |
| SCOR SA | 89,617 | 2,135 |
| Cie. de St. Gobain SA | 16,331 | 1,335 |
* | Atos Origin SA | 22,838 | 1,272 |
| Societe Generale Class A | 9,354 | 915 |
* | SA des Ciments Vicat | 9,770 | 838 |
| Thomson SA | 94,700 | 660 |
| Societe BIC SA | 9,361 | 577 |
* | Societe Generale NV–New | 2,338 | 225 |
| | | 344,170 |
Germany (6.2%) | | |
| E.On AG | 543,200 | 100,507 |
| Deutsche Boerse AG | 505,005 | 81,390 |
| BASF AG | 282,635 | 38,017 |
| Deutsche Lufthansa AG | 1,274,321 | 34,510 |
| Allianz AG | 163,200 | 32,271 |
| Muenchener Rueckversicherungs-Gesellschaft AG (Registered) | 161,590 | 31,665 |
| Man AG | 170,252 | 22,610 |
| Deutsche Bank AG | 179,003 | 20,230 |
| ThyssenKrupp AG | 311,677 | 17,893 |
*^ | TUI AG | 584,685 | 15,009 |
| Salzgitter AG | 39,157 | 6,821 |
^ | Daimler AG (Registered) | 78,897 | 6,744 |
| Fresenius Medical Care AG | 122,700 | 6,175 |
| Beiersdorf AG | 49,025 | 4,121 |
| Bayerische Motoren Werke AG | 46,041 | 2,538 |
| Deutsche Post AG | 70,297 | 2,147 |
| Siemens AG | 11,664 | 1,265 |
| Continental AG | 7,773 | 791 |
| Bayer AG | 9,061 | 726 |
| Fresenius Medical Care AG ADR | 11,744 | 591 |
| | | 426,021 |
Greece (0.0%) | | |
* | Alapis Holding Industrial and Commercial SA | 946,230 | 3,251 |
| | | |
Hong Kong (1.8%) | | |
| Jardine Matheson Holdings Ltd. | 930,302 | 29,503 |
| Jardine Strategic Holdings Ltd. | 1,266,400 | 21,387 |
| New World Development Co., Ltd. | 7,815,960 | 19,226 |
18
| | | Market |
| | | Value• |
| | Shares | ($000) |
| China Netcom Group Corp. Hong Kong Ltd. | 3,037,500 | 8,773 |
| Henderson Land Development Co. Ltd. | 1,028,000 | 7,407 |
| First Pacific Co. Ltd. | 10,152,000 | 6,714 |
| Television Broadcasts Ltd. | 1,123,000 | 6,045 |
| Wheelock and Co. Ltd. | 1,603,000 | 4,516 |
| Hong Kong and Shanghai Hotels Ltd. | 2,733,602 | 4,503 |
| Hong Kong Aircraft & Engineering Co., Ltd. | 226,000 | 3,749 |
| Esprit Holdings Ltd. | 243,346 | 2,953 |
| SmarTone Telecommunications Ltd. | 2,730,790 | 2,876 |
| Next Media Ltd. | 4,192,000 | 1,644 |
| Mandarin Oriental International Ltd. | 766,690 | 1,460 |
| I-Cable Communications Ltd. | 5,207,000 | 784 |
* | Midland Holdings Ltd. | 774,000 | 776 |
| Silver Grant International Industries Ltd. | 1,752,000 | 256 |
| | | 122,572 |
India (0.1%) | | |
| State Bank of India GDR | 66,230 | 5,633 |
| | | |
Indonesia (0.3%) | | |
| PT Semen Gresik Tbk | 11,586,500 | 6,348 |
* | PT Bank Indonesia Tbk | 72,481,036 | 5,083 |
| PT Indofood Sukses Makmur Tbk | 11,106,500 | 2,830 |
| PT Matahari Putra Prima Tbk | 19,910,800 | 1,286 |
| PT International Nickel Indonesia Tbk | 1,360,000 | 1,041 |
| PT Gudang Garam Tbk | 1,149,900 | 959 |
* | PT Bank Pan Indonesia Tbk Warrants Exp. 7/10/09 | 13,353,807 | 435 |
| PT Citra Marga Nusaphala Persada Tbk | 1,709,500 | 253 |
* | PT Mulia Industrindo Tbk | 921,000 | 33 |
* | PT Matahari Putra Prima Tbk Warrants Exp.7/21/10 | 3,859,975 | 16 |
| | | 18,284 |
Ireland (0.1%) | | |
| Independent News & Media PLC | 950,052 | 3,115 |
| Anglo Irish Bank Corp. PLC | 56,596 | 761 |
| DCC PLC | 31,060 | 734 |
| Paddy Power PLC | 16,052 | 583 |
| Fyffes PLC | 396,257 | 564 |
| CRH PLC | 14,698 | 558 |
| Total Produce PLC | 389,036 | 374 |
| | | 6,689 |
19
| | | Market |
| | | Value• |
| | Shares | ($000) |
Israel (0.3%) | | |
| Bank Leumi Le-Israel | 2,341,729 | 10,086 |
| Partner Communications Co. Ltd. | 367,010 | 8,273 |
| | | 18,359 |
Italy (2.1%) | | |
| Enel SpA | 3,737,889 | 39,695 |
| Fiat SpA | 1,247,650 | 28,910 |
| Eni SpA | 645,000 | 21,955 |
| Unicredito Italiano SpA | 2,689,040 | 18,017 |
| Finmeccanica SpA | 237,714 | 8,094 |
| Saipem SpA | 181,036 | 7,339 |
^ | Luxottica Group SpA ADR | 179,800 | 4,524 |
| Fondiaria-Sai SpA | 98,100 | 4,067 |
* | Prysmian SpA | 149,057 | 3,184 |
^ | Seat Pagine Gialle SpA | 11,626,413 | 2,011 |
* | Banco Popolare SpA | 95,595 | 1,585 |
| Luxottica Group SpA | 56,503 | 1,422 |
| Fondiaria-Sai SpA RNC | 18,000 | 488 |
* | Natuzzi SpA-Sponsored ADR | 50,700 | 188 |
| | | 141,479 |
Japan (9.1%) | | |
| Nintendo Co. | 220,100 | 115,157 |
| Sumitomo Mitsui Financial Group, Inc. | 9,678 | 64,289 |
| Mitsui OSK Lines Ltd. | 3,011,000 | 36,837 |
| Nippon Yusen Kabushiki Kaisha Co. | 3,221,000 | 30,541 |
| Marubeni Corp. | 3,377,000 | 24,848 |
| Nissan Motor Co., Ltd. | 2,923,500 | 24,510 |
| JFE Holdings, Inc. | 511,000 | 22,857 |
| Tokyo Electric Power Co. | 846,400 | 22,768 |
| Sharp Corp. | 1,059,000 | 18,177 |
| Mitsubishi Chemical Holdings Corp. | 2,352,500 | 15,669 |
| Fujitsu Ltd. | 2,345,000 | 15,509 |
| Kawasaki Kisen Kaisha Ltd. | 1,471,000 | 14,439 |
| Aisin Seiki Co., Ltd. | 368,000 | 13,879 |
| Nippon Steel Corp. | 2,547,000 | 13,022 |
| Toshiba Corp. | 1,807,000 | 12,144 |
| Orix Corp. | 82,120 | 11,326 |
| Toyota Motor Corp. | 215,300 | 10,879 |
| Itochu Corp. | 965,000 | 9,651 |
| Hitachi Ltd. | 1,503,000 | 8,974 |
| Nippon Mining Holdings Inc. | 1,310,000 | 7,040 |
* | Sanyo Electric Co., Ltd. | 2,505,000 | 5,334 |
| Daihatsu Motor Co., Ltd. | 430,000 | 5,195 |
| Kao Corp. | 144,000 | 4,097 |
| NEC Corp. | 1,048,000 | 4,058 |
| East Japan Railway Co. | 472 | 3,936 |
| Sojitz Holdings Corp. | 1,159,200 | 3,880 |
20
| | Market |
| | Value• |
| Shares | ($000) |
Nippon Telegraph and | | |
Telephone Corp. | 826 | 3,578 |
West Japan Railway Co. | 752 | 3,330 |
Mitsui Chemicals, Inc. | 488,000 | 3,272 |
Tokyo Gas Co., Ltd. | 748,000 | 3,049 |
Resona Holdings Inc. | 1,781 | 2,988 |
Mitsubishi Corp. | 93,900 | 2,873 |
Mitsubishi UFJ Financial Group | 328,200 | 2,871 |
FamilyMart Co., Ltd. | 78,800 | 2,858 |
Makita Corp. | 85,200 | 2,689 |
Secom Co., Ltd. | 51,200 | 2,519 |
Leopalace21 Corp. | 136,500 | 2,213 |
Seiko Epson Corp. | 82,100 | 2,212 |
Kirin Brewery Co., Ltd. | 113,000 | 2,154 |
Matsushita Electric Works, Ltd. | 207,000 | 2,149 |
Takeda Pharmaceutical Co. Ltd. | 42,700 | 2,144 |
Pacific Metals Co., Ltd. | 214,000 | 2,103 |
Sony Corp. | 51,500 | 2,071 |
KDDI Corp. | 336 | 2,067 |
Mitsumi Electric Co., Ltd. | 64,300 | 2,049 |
Yamato Holdings Co., Ltd. | 135,000 | 1,984 |
Seven and I Holdings Co., Ltd. | 77,700 | 1,972 |
Nisshin Steel Co. | 547,000 | 1,912 |
Nippon Meat Packers, Inc. | 128,000 | 1,900 |
Fuji Photo Film Co., Ltd. | 47,100 | 1,683 |
Namco Bandai Holdings Inc. | 120,450 | 1,640 |
Bridgestone Corp. | 94,000 | 1,622 |
Nippon Sanso Corp. | 196,000 | 1,587 |
Fukuoka Financial Group, Inc. | 295,000 | 1,547 |
Dai-Nippon Printing Co., Ltd. | 95,000 | 1,519 |
NTT DoCoMo, Inc. | 982 | 1,497 |
Marui Co., Ltd. | 139,700 | 1,496 |
Alfresa Holdings Corp. | 18,700 | 1,484 |
TDK Corp. | 23,800 | 1,417 |
Shiseido Co., Ltd. | 53,000 | 1,411 |
Sumitomo Electric Industries Ltd. | 109,900 | 1,405 |
JS Group Corp. | 91,100 | 1,380 |
Sekisui House Ltd. | 147,000 | 1,373 |
Tanabe Seiyaku Co., Ltd. | 116,000 | 1,360 |
Tokyo Electron Ltd. | 21,300 | 1,305 |
Fuji Heavy Industries Ltd. | 300,000 | 1,270 |
Toyo Seikan Kaisha Ltd. | 65,300 | 1,250 |
Sompo Japan Insurance Inc. | 140,000 | 1,248 |
Ajinomoto Co., Inc. | 120,000 | 1,222 |
Kawasaki Heavy Industries Ltd. | 527,000 | 1,184 |
Ricoh Co. | 71,000 | 1,175 |
^Mizuho Trust &Banking Co., Ltd. | 793,000 | 1,147 |
Astellas Pharma Inc. | 28,100 | 1,104 |
21
| | | Market |
| | | Value• |
| | Shares | ($000) |
| Nippon Oil Corp. | 174,000 | 1,097 |
| Kinden Corp. | 104,000 | 999 |
| NTT Data Corp. | 220 | 969 |
| Bank of Yokohama Ltd. | 137,000 | 937 |
| Yamatake Corp. | 31,800 | 899 |
| Sumitomo Forestry Co. | 128,000 | 890 |
| Onward Kashiyama Co., Ltd. | 86,000 | 882 |
| Nippon Suisan Kaisha Ltd. | 222,300 | 839 |
| Toppan Forms Co., Ltd. | 80,200 | 818 |
| Rohm Co., Ltd. | 12,300 | 769 |
| Ryosan Co., Ltd. | 29,800 | 709 |
| Omron Corp. | 33,700 | 698 |
| Shimizu Corp. | 145,000 | 672 |
| Chiba Bank Ltd. | 93,000 | 637 |
| Sumitomo Metal Mining Co. | 32,000 | 604 |
| Tokyo Ohka Kogyo Co., Ltd. | 25,800 | 570 |
| Sumitomo Trust & Banking Co., Ltd. | 77,000 | 534 |
| Isetan Co. | 34,900 | 399 |
| Ohbayashi Corp. | 81,000 | 343 |
| Hitachi Chemical Co., Ltd. | 13,600 | 258 |
| Fujitsu Fronttec Ltd. | 32,600 | 241 |
| Noritake Co., Ltd. | 58,000 | 235 |
| Inabata & Co., Ltd. | 22,700 | 122 |
| | | 624,420 |
Luxembourg (0.5%) | | |
| ArcelorMittal | 428,814 | 35,073 |
| | | |
Malaysia (0.5%) | | |
| Bumiputra-Commerce | | |
| Holdings Bhd. | 3,171,319 | 9,925 |
| Resorts World Bhd. | 8,843,700 | 9,558 |
* | Sime Darby Bhd. | 1,875,457 | 5,482 |
| AMMB Holdings Bhd. | 3,875,887 | 4,189 |
| British American Tobacco Bhd. | 165,000 | 2,195 |
| Malaysian Airline System Bhd. | 1,127,133 | 1,254 |
| Multi-Purpose Holdings Bhd. | 1,570,900 | 919 |
* | Resorts World Bhd. Rights Exp. 4/11/08 | 884,370 | 142 |
| Carlsberg Brewery Malaysia Bhd. | 109,600 | 141 |
* | Multi-Purpose Holdings Bhd. Warrants Exp. 2/26/09 | 254,000 | 75 |
* | Malaysian Airlines System Cvt. Pfd. | 183,333 | 46 |
| | | 33,926 |
Mexico (0.7%) | | |
| Grupo Mexico SA de CV | 3,001,018 | 19,933 |
| Telefonos de Mexico SA | 8,126,741 | 15,348 |
| Grupo Financerio Banorte SA de CV | 1,460,301 | 6,346 |
22
| | | Market |
| | | Value• |
| | Shares | ($000) |
| America Movil SA de CV Series L ADR | 46,200 | 2,942 |
| Telefonos de Mexico SA Class L ADR | 32,000 | 1,203 |
| | | 45,772 |
Netherlands (3.0%) | | |
| ING Groep NV | 3,692,591 | 138,050 |
| Heineken NV | 715,674 | 41,566 |
*^ | TomTom NV | 195,829 | 8,098 |
| Koninklijke Boskalis Westminster NV | 98,611 | 5,698 |
| Koninklijke KPN NV | 322,129 | 5,438 |
| Koninklijke (Royal) Philips Electronics NV | 122,979 | 4,708 |
| Wolters Kluwer NV | 123,337 | 3,271 |
| Akzo Nobel NV | 14,642 | 1,175 |
| Eurocastle Investment Ltd. | 23,452 | 281 |
| | | 208,285 |
New Zealand (0.0%) | | |
| Fletcher Building Ltd. | 257,862 | 1,701 |
^ | Telecom Corp. of New Zealand Ltd. | 284,906 | 840 |
| PGG Wrightson Ltd. | 21,889 | 36 |
| | | 2,577 |
Norway (0.6%) | | |
| Statoil ASA | 755,990 | 22,680 |
| Norsk Hydro ASA | 1,059,500 | 15,522 |
| DnB NOR ASA | 191,810 | 2,928 |
| Petroleum Geo-Services ASA | 117,750 | 2,923 |
| | | 44,053 |
Pakistan (0.0%) | | |
* | The Bank of Punjab | 776,187 | 821 |
* | Arif Habib Bank Ltd. | 83,500 | 35 |
| | | 856 |
Philippines (0.7%) | | |
| Ayala Corp. | 1,800,511 | 17,061 |
| Globe Telecom, Inc. | 428,800 | 15,501 |
| Philippine Long Distance Telephone Co. | 101,200 | 6,767 |
| ABS-CBN Broadcasting Corp. | 8,913,500 | 5,407 |
| Jollibee Foods Corp. | 2,657,200 | 3,046 |
| Banco De Oro | 1,066,800 | 1,333 |
* | Benpres Holdings Corp. | 15,742,000 | 1,001 |
| DMCI Holdings, Inc. | 5,230,000 | 991 |
| | | 51,107 |
Russia (1.9%) | | |
| LUKOIL Sponsored ADR | 1,343,220 | 115,120 |
| MMC Norilsk Nickel ADR | 413,600 | 11,666 |
| Novolipetsk Steel GDR | 25,091 | 1,080 |
| OAO Gazprom Sponsored ADR | 14,250 | 726 |
| | | 128,592 |
23
| | | Market |
| | | Value• |
| | Shares | ($000) |
Singapore (0.5%) | | |
| Great Eastern Holdings Ltd. | 733,000 | 8,650 |
| Neptune Orient Lines Ltd. | 2,827,000 | 6,746 |
* | STATS ChipPAC Ltd. | 7,211,000 | 5,895 |
| Keppel Corp., Ltd. | 529,000 | 3,851 |
* | GuocoLeisure Ltd. | 4,656,000 | 2,676 |
| Singapore Airlines Ltd. | 186,600 | 2,123 |
* | Golden Agri-Resources Ltd. | 2,458,000 | 1,801 |
| United Industrial Corp., Ltd. | 377,000 | 758 |
| Yellow Pages (Singapore) Ltd. | 704,000 | 424 |
| | | 32,924 |
South Africa (0.8%) | | |
| Hosken Consolidated Investments Ltd. | 1,103,148 | 10,475 |
| Anglo American PLC | 134,528 | 7,973 |
| Sun International Ltd. | 464,839 | 6,529 |
| Sanlan Ltd. | 2,096,100 | 4,942 |
| RMB Holdings Ltd. | 1,620,811 | 4,902 |
| Standard Bank Group Ltd. | 396,449 | 4,317 |
| Nedbank Group Ltd. | 275,074 | 3,968 |
| FirstRand Ltd. | 1,566,606 | 3,095 |
| Anglo Platinum Ltd. | 19,348 | 2,839 |
| Gold Fields Ltd. | 69,695 | 974 |
| City Lodge Hotels Ltd. | 83,078 | 768 |
| JD Group Ltd. | 145,983 | 659 |
| New Clicks Holdings Ltd. | 373,513 | 653 |
| AngloGold Ltd. | 16,363 | 551 |
| Discovery Holdings, Ltd. | 74,638 | 224 |
| Mondi Ltd. | 14,534 | 123 |
| | | 52,992 |
South Korea (1.8%) | | |
| KT Corp. | 612,040 | 29,097 |
| Hana Financial Group Inc. | 307,000 | 12,583 |
* | Hynix Semiconductor Inc. | 440,400 | 12,418 |
| Samsung Electronics Co., Ltd. | 17,190 | 10,870 |
| Samsung Electronics Co., Ltd. Pfd. | 18,000 | 8,157 |
| POSCO | 16,700 | 7,994 |
| Hyundai Motor Co., Ltd. | 79,700 | 6,365 |
| Hyundai Mobis | 73,830 | 5,775 |
| Honam Petrochemical Corp. | 66,197 | 5,416 |
| Kookmin Bank | 90,500 | 5,080 |
| Woori Finance Holdings Co., Ltd. | 253,640 | 4,441 |
| Shinhan Financial Group Co. Ltd. | 71,490 | 3,777 |
| Samsung SDI Co. Ltd. | 47,673 | 3,757 |
| Industrial Bank of Korea | 234,690 | 3,478 |
| Hyundai Motor Co., Ltd. 2nd Pfd. | 77,640 | 2,565 |
| Korea Iron & Steel Co., Ltd. | 4,000 | 297 |
| Korea Electric Power Corp. | 5,000 | 151 |
| | | 122,221 |
24
| | | Market |
| | | Value• |
| | Shares | ($000) |
Spain (0.9%) | | |
| Banco Santander Central Hispano SA | 811,956 | 16,176 |
| Repsol YPF SA | 419,200 | 14,442 |
| Acciona SA | 27,569 | 7,382 |
^ | Acerinox SA | 219,855 | 6,094 |
^ | Banco Popular Espanol SA | 250,947 | 4,549 |
| Telefonica SA | 130,438 | 3,748 |
| Industria de Diseno Textil SA | 34,291 | 1,903 |
| Prosegur Cia de Seguridad SA (Registered) | 30,977 | 1,301 |
| Viscofan SA | 53,995 | 1,236 |
| Iberia (Linea Aerea Espana) | 276,863 | 1,206 |
* | Sogecable SA | 27,263 | 1,196 |
| | | 59,233 |
Sweden (1.0%) | | |
| Electrolux AB Series B | 1,123,400 | 18,499 |
| Alfa Laval AB | 180,900 | 11,008 |
| Scania AB B Shares | 470,600 | 9,864 |
| Skandinaviska Enskilda Banken AB A Shares | 296,800 | 7,776 |
* | Kinnevik Investment AB Class B Shares | 272,000 | 5,165 |
| Svenska Handelsbanken AB A Shares | 155,600 | 4,535 |
| Telefonaktiebolaget LM Ericsson AB Class B | 1,977,400 | 3,879 |
| Assa Abloy AB | 192,140 | 3,488 |
* | Svenska Cellulosa AB B Shares | 181,590 | 3,311 |
| Hoganas AB B Shares | 52,700 | 1,255 |
| Modern Times Group AB B Shares | 17,020 | 1,188 |
* | SAS AB | 88,700 | 819 |
^ | TeliaSonera AB | 63,500 | 510 |
| | | 71,297 |
Switzerland (0.9%) | | |
| Credit Suisse Group (Registered) | 493,800 | 25,143 |
| UBS AG | 225,081 | 6,554 |
| Novartis AG (Registered) | 111,449 | 5,719 |
| Roche Holdings AG | 30,221 | 5,696 |
| Cie. Financiere Richemont AG | 69,332 | 3,892 |
| Adecco SA (Registered) | 67,108 | 3,877 |
| Zurich Financial Services AG | 11,092 | 3,496 |
* | Geberit AG | 21,764 | 3,244 |
* | Logitech International SA | 89,777 | 2,278 |
| Nestle SA (Registered) | 3,088 | 1,544 |
| Swatch Group AG (Bearer) | 3,699 | 990 |
| Publigroupe SA | 3,114 | 970 |
* | Georg Fischer AG (Registered) | 1,074 | 531 |
| Sonova Holding AG | 5,738 | 528 |
* | Galenica AG | 665 | 221 |
| | | 64,683 |
25
| | | Market |
| | | Value• |
| | Shares | ($000) |
Taiwan (1.0%) | | |
| AU Optronics Corp. | 12,282,194 | 21,210 |
| Taiwan Semiconductor Manufacturing Co., Ltd. | 4,216,267 | 8,725 |
| United Microelectronics Corp. | 14,061,202 | 8,566 |
| Compal Electronics Inc. | 8,752,935 | 8,417 |
| Siliconware Precision Industries Co. | 3,503,978 | 5,905 |
| China Steel Corp. | 3,683,280 | 5,859 |
| Asustek Computer Inc. | 1,687,000 | 4,969 |
| Taiwan Cellular Corp. | 1,069,382 | 2,058 |
| | | 65,709 |
Thailand (0.7%) | | |
| PTT Public Co. Ltd. (Foreign) | 1,466,400 | 14,797 |
| Advanced Info Service Public Co., Ltd. (Foreign) | 2,830,800 | 9,225 |
| Siam Cement Public Co. Ltd. NVDR | 986,200 | 6,728 |
| Kasikornbank Public Co. Ltd. (Foreign) | 1,837,800 | 5,398 |
| Siam Cement Public Co. Ltd. (Foreign) | 664,300 | 4,611 |
| Land and Houses Public Co. Ltd. (Foreign) | 6,191,900 | 2,014 |
| Thanachart Capital Public Co. Ltd. (Foreign) | 3,751,800 | 1,854 |
| MBK Development Public Co. Ltd. (Foreign) | 813,400 | 1,853 |
| GMM Grammy Public Co. Ltd. Non-Voting Depositary Receipt | 2,917,000 | 1,297 |
| GMM Grammy Public Co. Ltd. (Foreign) | 920,300 | 409 |
| Post Publishing Public Co. Ltd. (Foreign) | 1,300,000 | 216 |
| Matichon PLC (Foreign) | 625,000 | 169 |
| | | 48,571 |
Turkey (0.6%) | | |
| Eregli Demir ve Celik Fabrikalari A.S. | 2,286,931 | 16,078 |
| Tupras-Turkiye Petrol Rafinerileri A.S. | 666,109 | 14,759 |
* | Petkim Petrokimya Holding A.S. | 729,730 | 3,570 |
* | Dogan Sirketler Grubu Holding A.S. | 3,348,725 | 3,374 |
| Turkcell Iletisim Hizmetleri A.S. | 387,318 | 3,209 |
* | Turk Hava Yollari Anonim Ortakligi | 214,195 | 1,002 |
| | | 41,992 |
26
| | | Market |
| | | Value• |
| | Shares | ($000) |
United Kingdom (7.7%) | | |
| Royal Dutch Shell PLC Class A (Amsterdam Shares) | 4,335,473 | 149,528 |
| AstraZeneca Group PLC | 1,239,270 | 46,485 |
| Vodafone Group PLC | 11,692,043 | 34,754 |
| Royal Bank of Scotland Group PLC | 2,627,383 | 17,601 |
| Kazakhmys PLC | 554,652 | 17,588 |
| Xstrata PLC | 239,690 | 16,788 |
| HBOS PLC | 1,369,587 | 15,237 |
| Antofagasta PLC | 926,237 | 12,896 |
| Associated British Foods PLC | 710,900 | 12,348 |
| Aviva PLC | 1,003,358 | 12,303 |
| Rio Tinto PLC | 110,184 | 11,451 |
| BP PLC | 993,730 | 10,068 |
| GlaxoSmithKline PLC | 425,078 | 8,991 |
| British Energy Group PLC | 586,000 | 7,593 |
| Diageo PLC | 316,643 | 6,408 |
| BAE Systems PLC | 663,330 | 6,396 |
| Reckitt Benckiser Group PLC | 113,926 | 6,318 |
| ITV PLC | 4,956,701 | 6,236 |
* | British Airways PLC | 1,338,058 | 6,224 |
| Home Retail Group | 1,183,400 | 6,143 |
| Royal Dutch Shell PLC Class B | 177,906 | 5,993 |
| Rolls-Royce Group PLC | 744,290 | 5,962 |
| Capita Group PLC | 439,633 | 5,923 |
| Tesco PLC | 776,834 | 5,855 |
| Lloyds TSB Group PLC | 600,829 | 5,368 |
| Cable and Wireless PLC | 1,652,788 | 4,888 |
| Intertek Testing Services PLC | 229,003 | 4,698 |
| Thomas Cook Group PLC | 810,906 | 4,673 |
| Arriva PLC | 340,263 | 4,635 |
| ICAP PLC | 384,958 | 4,350 |
| Reed Elsevier PLC | 293,849 | 3,743 |
| Barclays PLC | 409,291 | 3,692 |
| The Sage Group PLC | 985,983 | 3,687 |
| Carnival PLC | 88,263 | 3,517 |
| TUI Travel PLC | 681,457 | 3,488 |
| 3i Group PLC | 202,822 | 3,342 |
| Compass Group PLC | 489,496 | 3,132 |
| Stagecoach Group PLC | 627,952 | 3,016 |
* | Invensys PLC | 632,719 | 2,822 |
| Informa PLC | 411,638 | 2,565 |
| Rexam PLC | 301,330 | 2,552 |
| WPP Group PLC | 198,397 | 2,369 |
| Enodis PLC | 836,842 | 2,311 |
| Provident Financial PLC | 133,763 | 2,248 |
| Enterprise Inns PLC | 235,093 | 1,873 |
| BT Group PLC | 432,154 | 1,866 |
| Smiths Group PLC | 87,521 | 1,634 |
| Bunzl PLC | 114,918 | 1,619 |
27
| | | Market |
| | | Value• |
| | Shares | ($000) |
| International Personal Finance | 334,406 | 1,513 |
| Hays PLC | 605,818 | 1,375 |
| Amec PLC | 85,291 | 1,225 |
| Ladbrokes PLC | 197,045 | 1,219 |
| Homeserve PLC | 29,010 | 1,107 |
| Wolseley PLC | 100,193 | 1,055 |
| The Berkeley Group Holdings PLC | 40,586 | 898 |
| Royal & Sun Alliance Insurance Group PLC | 343,000 | 876 |
| Michael Page International PLC | 139,321 | 837 |
^ | Carphone Warehouse PLC | 138,994 | 787 |
| Next PLC | 26,841 | 608 |
^ | HMV Group PLC | 212,900 | 550 |
| Devro PLC | 330,762 | 525 |
| Northgate PLC | 44,890 | 507 |
| Daily Mail and General Trust PLC | 56,660 | 487 |
* | Sportingbet PLC | 648,759 | 473 |
| Mondi PLC (South African Shares) | 36,336 | 303 |
| | | 527,522 |
United States (34.6%) | | |
| Consumer Discretionary (5.6%) | | |
* | DIRECTV Group, Inc. | 1,402,200 | 34,761 |
* | Cablevision Systems NY Group Class A | 1,520,200 | 32,578 |
* | Apollo Group, Inc. Class A | 650,866 | 28,117 |
*^ | Priceline.com, Inc. | 173,366 | 20,953 |
| Darden Restaurants Inc. | 542,659 | 17,664 |
* | Liberty Global, Inc. Class A | 474,260 | 16,163 |
* | Bally Technologies Inc. | 467,474 | 16,053 |
| Clear Channel Communications, Inc. | 529,900 | 15,484 |
| Hasbro, Inc. | 546,514 | 15,248 |
| CBS Corp. | 667,600 | 14,741 |
* | Liberty Global, Inc.Series C | 446,460 | 14,501 |
| Macy’s Inc. | 614,500 | 14,170 |
| Sotheby’s | 425,607 | 12,304 |
* | GameStop Corp. Class A | 198,000 | 10,239 |
| Time Warner, Inc. | 723,900 | 10,149 |
* | ITT Educational Services, Inc. | 203,992 | 9,369 |
*^ | Blue Nile Inc. | 168,500 | 9,124 |
* | Amazon.com, Inc. | 123,300 | 8,791 |
| American Greetings Corp. Class A | 445,900 | 8,271 |
| Eastman Kodak Co. | 385,700 | 6,815 |
* | Discovery Holding Co. Class A | 289,750 | 6,149 |
* | Jack in the Box Inc. | 225,056 | 6,047 |
| VF Corp. | 77,200 | 5,984 |
* | Liberty Media Corp. | 192,500 | 4,358 |
28
| | | Market |
| | | Value• |
| | Shares | ($000) |
| KB Home | 162,100 | 4,009 |
* | Liberty Media Corp.– Interactive Series A | 244,526 | 3,947 |
| Pulte Homes, Inc. | 266,300 | 3,875 |
*^ | Netflix.com, Inc. | 109,700 | 3,801 |
* | Hanesbrands Inc. | 125,000 | 3,650 |
* | Lear Corp. | 136,084 | 3,526 |
*^ | Fleetwood Enterprises, Inc. | 720,500 | 3,314 |
| CBRL Group, Inc. | 85,500 | 3,058 |
| Black & Decker Corp. | 46,000 | 3,041 |
^ | PRIMEDIA Inc. | 372,566 | 2,738 |
^ | Tempur-Pedic International Inc. | 242,646 | 2,669 |
| CBS Corp. Class A | 89,900 | 1,987 |
| Bob Evans Farms, Inc. | 50,900 | 1,404 |
* | Blockbuster Inc. Class B | 482,090 | 1,374 |
| Systemax Inc. | 101,700 | 1,227 |
| Jackson Hewitt Tax Service Inc. | 36,900 | 423 |
| Sherwin-Williams Co. | 5,000 | 255 |
* | Sun-Times Media Group, Inc. | 220,100 | 158 |
| Circuit City Stores, Inc. | 31,500 | 125 |
| | | |
| Consumer Staples (3.7%) | | |
| The Kroger Co. | 2,823,400 | 71,714 |
| Carolina Group | 671,043 | 48,684 |
| Costco Wholesale Corp. | 544,400 | 35,370 |
| Philip Morris International Inc. | 664,400 | 33,605 |
| Safeway, Inc. | 799,183 | 23,456 |
| Altria Group, Inc. | 664,400 | 14,750 |
| Bunge Ltd. | 120,926 | 10,506 |
| Alberto-Culver Co. | 241,934 | 6,631 |
* | Chiquita Brands International, Inc. | 119,000 | 2,750 |
* | Fresh Del Monte Produce Inc. | 65,718 | 2,392 |
| Casey’s General Stores, Inc. | 71,700 | 1,620 |
| Nash-Finch Co. | 44,700 | 1,519 |
^ | Imperial Sugar Co. | 76,700 | 1,444 |
^ | Cal-Maine Foods, Inc. | 23,100 | 771 |
| | | |
| Energy (5.4%) | | |
| ExxonMobil Corp. | 1,575,600 | 133,264 |
| Marathon Oil Corp. | 2,230,500 | 101,711 |
| Chevron Corp. | 681,100 | 58,139 |
| ConocoPhillips Co. | 546,700 | 41,664 |
| Tidewater Inc. | 536,700 | 29,578 |
| Baker Hughes, Inc. | 67,300 | 4,610 |
* | SEACOR Holdings Inc. | 17,600 | 1,502 |
*^ | USEC Inc. | 117,234 | 434 |
| | | |
| Financials (6.9%) | | |
| The Chubb Corp. | 884,100 | 43,745 |
| State Street Corp. | 507,600 | 40,100 |
| JPMorgan Chase & Co. | 863,300 | 37,079 |
| The Travelers Cos., Inc. | 588,800 | 28,174 |
29
| | | Market |
| | | Value• |
| | Shares | ($000) |
* | Berkshire Hathaway Inc.Class B | 5,353 | 23,943 |
| American International Group, Inc. | 506,000 | 21,885 |
| Merrill Lynch & Co., Inc. | 491,320 | 20,016 |
| Morgan Stanley | 419,500 | 19,171 |
| MetLife, Inc. | 295,900 | 17,831 |
| Assurant, Inc. | 244,400 | 14,874 |
| Citigroup, Inc. | 691,900 | 14,820 |
| Bank of America Corp. | 374,100 | 14,182 |
| The Goldman Sachs Group, Inc. | 75,600 | 12,503 |
| ACE Ltd. | 195,450 | 10,761 |
| Annaly Mortgage Management Inc. REIT | 647,700 | 9,923 |
| Federated Investors, Inc. | 244,100 | 9,559 |
| Axis Capital Holdings Ltd. | 279,077 | 9,483 |
* | Arch Capital Group Ltd. | 137,303 | 9,429 |
| XL Capital Ltd. Class A | 282,182 | 8,338 |
| Fannie Mae | 311,000 | 8,186 |
| Freddie Mac | 316,300 | 8,009 |
| PartnerRe Ltd. | 93,413 | 7,127 |
* | Interactive Brokers Group, Inc. | 272,859 | 7,004 |
| Moody’s Corp. | 198,100 | 6,900 |
| Lazard Ltd. Class A | 169,600 | 6,479 |
| Genworth Financial Inc. | 269,900 | 6,111 |
^ | MGIC Investment Corp. | 549,200 | 5,783 |
* | CB Richard Ellis Group, Inc. | 215,800 | 4,670 |
| American Express Co. | 106,697 | 4,665 |
| Washington Mutual, Inc. | 451,600 | 4,651 |
| The Hartford Financial Services Group Inc. | 57,000 | 4,319 |
| Mercury General Corp. | 87,500 | 3,877 |
| Aspen Insurance Holdings Ltd. | 144,584 | 3,814 |
* | Knight Capital Group, Inc. Class A | 193,200 | 3,138 |
| Fidelity National Financial, Inc. Class A | 134,600 | 2,467 |
*^ | First Federal Financial Corp. | 83,352 | 2,263 |
^ | MBIA, Inc. | 149,500 | 1,827 |
| Astoria Financial Corp. | 66,400 | 1,803 |
*2 | J.G. Wentworth Inc. | 147,900 | 1,775 |
| Ameriprise Financial, Inc. | 26,759 | 1,387 |
| W.R. Berkley Corp. | 45,100 | 1,249 |
| Endurance Specialty Holdings Ltd. | 30,273 | 1,108 |
| optionsXpress Holdings Inc. | 51,000 | 1,056 |
| Max Re Capital Ltd. | 36,949 | 968 |
| American Financial Group, Inc. | 32,550 | 832 |
| Countrywide Financial Corp. | 138,000 | 759 |
* | Liberty Media Corp.– Capital Series A | 48,125 | 757 |
30
| | | Market |
| | | Value• |
| | Shares | ($000) |
^ | Thornburg Mortgage, Inc.REIT | 573,800 | 608 |
| Bear Stearns Co., Inc. | 51,800 | 543 |
* | Turkiye Garanti Bankasi A.S. | 89,800 | 409 |
| | | |
| Health Care (3.4%) | | |
| Pfizer Inc. | 3,702,000 | 77,483 |
| AmerisourceBergen Corp. | 1,076,271 | 44,106 |
* | Medco Health Solutions, Inc. | 449,600 | 19,688 |
* | King Pharmaceuticals, Inc. | 2,036,070 | 17,714 |
| McKesson Corp. | 310,000 | 16,235 |
| Wyeth | 361,500 | 15,096 |
| Merck & Co., Inc. | 334,300 | 12,687 |
| UnitedHealth Group Inc. | 241,100 | 8,284 |
| CIGNA Corp. | 142,000 | 5,761 |
* | WellCare Health Plans Inc. | 100,800 | 3,926 |
| Schering-Plough Corp. | 262,600 | 3,784 |
* | WellPoint Inc. | 77,800 | 3,433 |
* | Health Management Associates Class A | 209,900 | 1,110 |
| Bristol-Myers Squibb Co. | 52,000 | 1,108 |
* | Healthspring, Inc. | 60,500 | 852 |
| | | |
| Industrials (4.0%) | | |
| Cummins Inc. | 829,200 | 38,823 |
| Parker Hannifin Corp. | 438,250 | 30,358 |
* | Terex Corp. | 429,072 | 26,817 |
| General Electric Co. | 685,300 | 25,363 |
| Northrop Grumman Corp. | 219,400 | 17,072 |
* | Kansas City Southern | 385,100 | 15,446 |
^ | Dryships Inc. | 237,002 | 14,199 |
| Watson Wyatt & Co. Holdings | 205,200 | 11,645 |
| Pitney Bowes, Inc. | 311,000 | 10,891 |
* | Superior Essex Inc. | 336,800 | 9,471 |
| Viad Corp. | 254,006 | 9,147 |
* | TBS International Ltd. | 254,095 | 7,674 |
^ | Excel Maritime Carriers, Ltd. | 250,378 | 7,349 |
| SPX Corp. | 67,800 | 7,112 |
| Raytheon Co. | 94,800 | 6,125 |
| Eaton Corp. | 72,600 | 5,784 |
* | United Stationers, Inc. | 115,122 | 5,491 |
| L-3 Communications Holdings, Inc. | 46,100 | 5,041 |
* | AMR Corp. | 443,000 | 3,996 |
* | GrafTech International Ltd. | 244,556 | 3,964 |
* | Northwest Airlines Corp. | 384,100 | 3,453 |
| The Manitowoc Co., Inc. | 61,906 | 2,526 |
* | United Rentals, Inc. | 120,800 | 2,276 |
| IKON Office Solutions, Inc. | 208,200 | 1,582 |
| Armstrong Worldwide Industries, Inc. | 40,500 | 1,444 |
* | US Airways Group Inc. | 157,600 | 1,404 |
* | PHH Corp. | 66,800 | 1,164 |
* | GeoEye Inc. | 29,777 | 774 |
31
| | | Market |
| | | Value• |
| | Shares | ($000) |
| Deluxe Corp. | 35,956 | 691 |
| Rollins, Inc. | 32,242 | 570 |
* | Northwest Airlines Corp.Class A | 270,500 | — |
| | | |
| Information Technology (2.4%) | | |
* | Western Digital Corp. | 1,093,200 | 29,560 |
| Hewlett-Packard Co. | 374,900 | 17,118 |
| Xerox Corp. | 840,900 | 12,588 |
* | Symantec Corp. | 744,200 | 12,369 |
* | Flextronics International Ltd. | 1,245,405 | 11,694 |
* | Gartner, Inc. Class A | 603,900 | 11,679 |
* | Lexmark International, Inc. | 336,691 | 10,343 |
* | Sun Microsystems, Inc. | 651,110 | 10,112 |
* | Amkor Technology, Inc. | 722,000 | 7,725 |
| Accenture Ltd. | 215,860 | 7,592 |
| Seagate Technology | 331,805 | 6,948 |
| Microsoft Corp. | 184,800 | 5,245 |
* | DST Systems, Inc. | 77,300 | 5,082 |
* | LSI Corp. | 982,431 | 4,863 |
* | Dell Inc. | 197,600 | 3,936 |
* | Avnet, Inc. | 87,300 | 2,857 |
* | Integrated Device Technology Inc. | 198,710 | 1,774 |
* | Forrester Research, Inc. | 43,700 | 1,162 |
* | Aspen Technologies, Inc. | 48,800 | 622 |
| | | |
| Materials (2.8%) | | |
* | The Mosaic Co. | 558,430 | 57,295 |
| Nucor Corp. | 460,700 | 31,208 |
| CF Industries Holdings, Inc. | 198,193 | 20,537 |
| Dow Chemical Co. | 506,900 | 18,679 |
| Cleveland-Cliffs Inc. | 150,399 | 18,021 |
| United States Steel Corp. | 126,400 | 16,036 |
| Scotts Miracle-Gro Co. | 265,900 | 8,620 |
| AK Steel Holding Corp. | 148,300 | 8,070 |
| NewMarket Corp. | 74,400 | 5,613 |
| Eastman Chemical Co. | 70,600 | 4,409 |
* | Century Aluminum Co. | 18,200 | 1,206 |
| | | |
| Telecommunication Services (0.4%) | | |
| AT&T Inc. | 199,400 | 7,637 |
| Sprint Nextel Corp. | 1,071,000 | 7,165 |
* | NII Holdings Inc. | 195,200 | 6,203 |
* | Cincinnati Bell Inc. | 1,225,200 | 5,219 |
*^ | Level 3Communications, Inc. | 1,123,700 | 2,382 |
| Embarq Corp. | 57,400 | 2,302 |
| | | |
| Utilities (0.0%) | | |
| OGE Energy Corp. | 47,200 | 1,471 |
* | Mirant Corp. | 29,700 | 1,081 |
| | | 2,374,430 |
Total Common Stocks | | |
(Cost $6,072,193) | | 6,331,704 |
32
| | | Market |
| | | Value• |
| | Shares | ($000) |
Temporary Cash Investments (9.4%)1 | | |
Money Market Fund (8.9%) | | |
3 | Vanguard Market Liquidity Fund, 2.800% | 455,155,529 | 455,156 |
3 | Vanguard Market Liquidity Fund, 2.800%—Note G | 156,544,538 | 156,545 |
| | | 611,701 |
| | Face | |
| | Amount | |
| | ($000) | |
U.S. Government & Agency Obligations (0.5%) | | |
4 | Federal Home Loan Bank | | |
5 | 2.752%, 4/23/08 | 7,000 | 6,991 |
5 | 2.758%, 5/16/08 | 9,800 | 9,774 |
4 | Federal Home Loan Mortgage Corp. | | |
5 | 3.607%, 4/7/08 | 7,000 | 6,998 |
| 2.072%, 7/11/08 | 10,000 | 9,940 |
| | | 33,703 |
Total Temporary Cash Investments | | |
(Cost $645,394) | | 645,404 |
Total Investments (101.8%) | | |
(Cost $6,717,587) | | 6,977,108 |
Other Assets and Liabilities (–1.8%) | | |
Other Assets—Note C | | 116,190 |
Liabilities—Note G | | (240,375) |
| | | (124,185) |
Net Assets (100%) | | |
Applicable to 325,167,073 outstanding | | |
$.001 par value shares of beneficial | | |
interest (unlimited authorization) | | 6,852,923 |
Net Asset Value Per Share | | $21.08 |
33
At March 31, 2008, net assets consisted of:6 | |
| Amount | Per |
| ($000) | Share |
Paid-in Capital | 6,628,225 | $20.39 |
Undistributed Net | | |
Investment Income | 13,488 | .04 |
Accumulated Net | | |
Realized Losses | (52,981) | (.16) |
Unrealized Appreciation | | |
Investment Securities | 259,521 | .80 |
Futures Contracts | 4,140 | .01 |
Foreign Currencies and | | |
Forward Currency Contracts | 530 | .00 |
Net Assets | 6,852,923 | $21.08 |
• | See Note A in Notes to Financial Statements. |
* | Non-income-producing security. |
^ | Part of security position is on loan to broker-dealers. See Note G in Notes to Financial Statements. |
1 The fund invests a portion of its cash reserves in equity markets through the use of index futures contracts. After giving effect to futures investments, the fund’s effective common stock and temporary cash investment positions represent 98.5% and 3.3%, respectively, of net assets. See Note E in Notes to Financial Statements.
2 Restricted security represents 0.0% of net assets.
3 Affiliated money market fund available only to Vanguard funds and certain trusts and accounts managed by Vanguard. Rate shown is the 7-day yield.
4 The issuer operates under a congressional charter; its securities are neither issued nor guaranteed by the U.S. government. If needed, access to additional funding from the U.S. Treasury (beyond the issuer’s line of credit) would require congressional action.
5 Securities with a value of $23,763,000 and cash of $1,552,000 have been segregated as initial margin for open futures contracts.
6 See Note E in Notes to Financial Statements for the tax-basis components of net assets.
ADR—American Depositary Receipt.
GDR—Global Depositary Receipt.
REIT—Real Estate Investment Trust.
34
Statement of Operations
| Six Months Ended |
| March 31, 2008 |
| ($000) |
Investment Income | |
Income | |
Dividends1 | 61,449 |
Interest2 | 8,829 |
Security Lending | 897 |
Total Income | 71,175 |
Expenses | |
Investment Advisory Fees—Note B | |
Basic Fee | 7,796 |
Performance Adjustment | (225) |
The Vanguard Group—Note C | |
Management and Administrative | 10,381 |
Marketing and Distribution | 944 |
Custodian Fees | 600 |
Shareholders’ Reports | 111 |
Trustees’ Fees and Expenses | 5 |
Total Expenses | 19,612 |
Expenses Paid Indirectly—Note D | (42) |
Net Expenses | 19,570 |
Net Investment Income | 51,605 |
Realized Net Gain (Loss) | |
Investment Securities Sold | 39,843 |
Futures Contracts | (57,463) |
Foreign Currencies and Forward Currency Contracts | 11,945 |
Realized Net Gain (Loss) | (5,675) |
Change in Unrealized Appreciation (Depreciation) | |
Investment Securities | (1,166,241) |
Futures Contracts | (5,044) |
Foreign Currencies and Forward Currency Contracts | (1,130) |
Change in Unrealized Appreciation (Depreciation) | (1,172,415) |
Net Increase (Decrease) in Net Assets Resulting from Operations | (1,126,485) |
1 Dividends are net of foreign withholding taxes of $3,468,000.
2 Interest income from an affiliated company of the fund was $8,414,000.
35
Statement of Changes in Net Assets
| Six Months Ended | Year Ended |
| March 31, | September 30, |
| 2008 | 2007 |
| ($000) | ($000) |
Increase (Decrease) in Net Assets | | |
Operations | | |
Net Investment Income | 51,605 | 116,967 |
Realized Net Gain (Loss) | (5,675) | 404,444 |
Change in Unrealized Appreciation (Depreciation) | (1,172,415) | 795,069 |
Net Increase (Decrease) in Net Assets Resulting from Operations | (1,126,485) | 1,316,480 |
Distributions | | |
Net Investment Income | (127,498) | (63,112) |
Realized Capital Gain1 | (415,110) | (179,158) |
Total Distributions | (542,608) | (242,270) |
Capital Share Transactions—Note H | | |
Issued | 1,316,593 | 2,937,614 |
Issued in Lieu of Cash Distributions | 503,325 | 224,234 |
Redeemed | (849,634) | (875,763) |
Net Increase (Decrease) from Capital Share Transactions | 970,284 | 2,286,085 |
Total Increase (Decrease) | (698,809) | 3,360,295 |
Net Assets | | |
Beginning of Period | 7,551,732 | 4,191,437 |
End of Period2 | 6,852,923 | 7,551,732 |
1 Includes fiscal 2008 and 2007 short-term gain distributions totaling $188,282,000 and $70,849,000, respectively. Short-term gain distributions are treated as ordinary income dividends for tax purposes.
2 Net Assets—End of Period includes undistributed net investment income of $13,488,000 and $89,224,000.
36
Financial Highlights
| Six Months | | | | Nov. 1, | | |
| Ended | | | | 2003, to | | |
For a Share Outstanding | Mar. 31, | Year Ended September 30, | Sept. 30, | Year Ended October 31, |
Throughout Each Period | 2008 | 2007 | 2006 | 2005 | 20041 | 2003 | 2002 |
Net Asset Value, | | | | | | | |
Beginning of Period | $26.51 | $21.96 | $19.72 | $16.08 | $14.46 | $10.48 | $11.31 |
Investment Operations | | | | | | | |
Net Investment Income | .16 | .492 | .320 | .25 | .191 | .12 | .09 |
Net Realized and Unrealized | | | | | | | |
Gain (Loss) on Investments | (3.76) | 5.25 | 2.595 | 3.87 | 1.624 | 3.96 | (.36) |
Total from | | | | | | | |
Investment Operations | (3.60) | 5.74 | 2.915 | 4.12 | 1.815 | 4.08 | (.27) |
Distributions | | | | | | | |
Dividends from Net | | | | | | | |
Investment Income | (.43) | (.31) | (.240) | (.21) | (.130) | (.08) | (.12) |
Distributions from | | | | | | | |
Realized Capital Gains | (1.40) | (.88) | (.435) | (.27) | (.065) | (.02) | (.44) |
Total Distributions | (1.83) | (1.19) | (.675) | (.48) | (.195) | (.10) | (.56) |
Net Asset Value, | | | | | | | |
End of Period | $21.08 | $26.51 | $21.96 | $19.72 | $16.08 | $14.46 | $10.48 |
| | | | | | | |
Total Return3 | –14.16% | 27.00% | 15.22% | 25.99% | 12.64% | 39.25% | –2.78% |
| | | | | | | |
Ratios/Supplemental Data | | | | | | | |
Net Assets, End of | | | | | | | |
Period (Millions) | $6,853 | $7,552 | $4,191 | $2,302 | $965 | $664 | $223 |
Ratio of Total Expenses to | | | | | | | |
Average Net Assets4 | 0.54%* | 0.64% | 0.72% | 0.80% | 0.90%* | 1.05% | 1.19% |
Ratio of Net Investment | | | | | | | |
Income to Average Net Assets | 1.42%* | 1.98% | 1.76% | 1.60% | 1.47%* | 1.14% | 0.86% |
Portfolio Turnover Rate | 74%* | 64% | 88% | 83% | 19% | 13% | 14% |
1 The fund’s fiscal year-end changed from October 31 to September 30, effective September 30, 2004.
2 Calculated based on average shares outstanding.
3 Total returns do not reflect the account service fee that may be applicable to certain accounts with balances below $10,000.
4 Includes performance-based investment advisory fee increases (decreases) of (0.01), 0.05%, 0.05%, 0.06%, 0.08%, 0.11%, and 0.17%.
See accompanying Notes, which are an integral part of the Financial Statements.
37
Notes to Financial Statements
Vanguard Global Equity Fund is registered under the Investment Company Act of 1940 as an open-end investment company, or mutual fund. The fund invests in securities of foreign issuers, which may subject it to investment risks not normally associated with investing in securities of United States corporations. The fund files reports with the SEC under the company name Vanguard Horizon Funds.
A. The following significant accounting policies conform to generally accepted accounting principles for U.S. mutual funds. The fund consistently follows such policies in preparing its financial statements.
1. Security Valuation: Securities are valued as of the close of trading on the New York Stock Exchange (generally 4 p.m., Eastern time) on the valuation date. Equity securities are valued at the latest quoted sales prices or official closing prices taken from the primary market in which each security trades; such securities not traded on the valuation date are valued at the mean of the latest quoted bid and asked prices. Securities for which market quotations are not readily available, or whose values have been affected by events occurring before the fund’s pricing time but after the close of the securities’ primary markets, are valued at their fair values calculated according to procedures adopted by the board of trustees. These procedures include obtaining quotations from an independent pricing service, monitoring news to identify significant market- or security-specific events, and evaluating changes in the values of foreign market proxies (for example, ADRs, futures contracts, or exchange-traded funds), between the time the foreign markets close and the fund’s pricing time. When fair-value pricing is employed, the prices of securities used by a fund to calculate its net asset value may differ from quoted or published prices for the same securities. Investments in Vanguard Market Liquidity Fund are valued at that fund’s net asset value. Temporary cash investments acquired over 60 days to maturity are valued using the latest bid prices or using valuations based on a matrix system (which considers such factors as security prices, yields, maturities, and ratings), both as furnished by independent pricing services. Other temporary cash investments are valued at amortized cost, which approximates market value.
2. Foreign Currency: Securities and other assets and liabilities denominated in foreign currencies are translated into U.S. dollars using exchange rates obtained from an independent third party as of the fund’s pricing time on the valuation date. Realized gains (losses) and unrealized appreciation (depreciation) on investment securities include the effects of changes in exchange rates since the securities were purchased, combined with the effects of changes in security prices. Fluctuations in the value of other assets and liabilities resulting from changes in exchange rates are recorded as unrealized foreign currency gains (losses) until the assets or liabilities are settled in cash, at which time they are recorded as realized foreign currency gains (losses).
3. Futures and Forward Currency Contracts: The fund uses index futures contracts to a limited extent, with the objective of maintaining full exposure to U.S., European, and Pacific stock markets while maintaining liquidity. The fund may purchase or sell futures contracts to achieve a desired level of investment, whether to accommodate portfolio turnover or cash flows from capital share transactions. The primary risks associated with the use of futures contracts are imperfect correlation between changes in market values of stocks held by the fund and the prices of futures contracts, and the possibility of an illiquid market.
The fund also may enter into forward currency contracts to provide the appropriate currency exposure related to any open futures contracts, or to protect the value of securities and related receivables and payables against changes in foreign exchange rates. The primary risk associated with the fund’s use of these contracts is that a counterparty will fail to fulfill its obligation to pay gains due to the fund under the contracts.
38
Futures and forward currency contracts are valued at their quoted daily settlement prices. The aggregate principal amounts of the contracts are not recorded in the Statement of Net Assets. Fluctuations in the value of the contracts are recorded in the Statement of Net Assets as an asset (liability) and in the Statement of Operations as unrealized appreciation (depreciation) until the contracts are closed, when they are recorded as realized gains (losses) on futures or forward currency contracts.
4. Federal Income Taxes: The fund intends to continue to qualify as a regulated investment company and distribute all of its taxable income. Management has analyzed the fund’s tax positions taken on federal income tax returns for all open tax years (tax years ended September 30, 2004—2007) and for the period ended March 31, 2008, and has concluded that no provision for federal income tax is required in the fund’s financial statements.
5. Distributions: Distributions to shareholders are recorded on the ex-dividend date.
6. Security Lending: The fund may lend its securities to qualified institutional borrowers to earn additional income. Security loans are required to be secured at all times by collateral at least equal to the market value of securities loaned. The fund invests cash collateral received in Vanguard Market Liquidity Fund, and records a liability for the return of the collateral, during the period the securities are on loan. Security lending income represents the income earned on investing cash collateral, less expenses associated with the loan.
7. Other: Dividend income is recorded on the ex-dividend date. Interest income includes income distributions received from Vanguard Market Liquidity Fund and is accrued daily. Security transactions are accounted for on the date securities are bought or sold. Costs used to determine realized gains (losses) on the sale of investment securities are those of the specific securities sold.
B. Acadian Asset Management LLC, AllianceBernstein L.P., and Marathon Asset Management LLP each provide investment advisory services to a portion of the fund for a fee calculated at an annual percentage rate of average net assets managed by the advisor. The basic fees of Acadian Asset Management LLC, and Marathon Asset Management LLP are subject to quarterly adjustments based on performance for the preceding three years, relative to the Morgan Stanley Capital International All Country World Index. The basic fee of AllianceBernstein L.P. is subject to quarterly adjustments based on performance since June 30, 2006, relative to the Morgan Stanley Capital International All Country World Index.
The Vanguard Group manages the cash reserves of the fund at an at-cost basis.
For the six months ended March 31, 2008, the aggregate investment advisory fee represented an effective annual basic rate of 0.21% of the fund’s average net assets before a decrease of $225,000 (0.01%) based on performance.
In April 2008, the board of trustees announced the addition of a fourth advisor, Baillie Gifford Overseas Ltd., to manage a portion of the fund’s assets.
C. The Vanguard Group furnishes at cost corporate management, administrative, marketing, and distribution services. The costs of such services are allocated to the fund under methods approved by the board of trustees. The fund has committed to provide up to 0.40% of its net assets in capital contributions to Vanguard. At March 31, 2008, the fund had contributed capital of $596,000 to Vanguard (included in Other Assets), representing 0.01% of the fund’s net assets and 0.60% of Vanguard’s capitalization. The fund’s trustees and officers are also directors and officers of Vanguard.
39
D. The fund’s custodian bank has agreed to reduce its fees when the fund maintains cash on deposit in the non-interest-bearing custody account. For the six months ended March 31, 2008, custodian fee offset arrangements reduced the fund’s expenses by $42,000.
E. Distributions are determined on a tax basis and may differ from net investment income and realized capital gains for financial reporting purposes. Differences may be permanent or temporary. Permanent differences are reclassified among capital accounts in the financial statements to reflect their tax character. Temporary differences arise when certain items of income, expense, gain, or loss are recognized in different periods for financial statement and tax purposes; these differences will reverse at some time in the future. Differences in classification may also result from the treatment of short-term gains as ordinary income for tax purposes. The fund’s tax-basis capital gains and losses are determined only at the end of each fiscal year.
During the six months ended March 31, 2008, the fund realized net foreign currency gains of $45,000, which increased distributable net income for tax purposes; accordingly, such gains have been reclassified from accumulated net realized losses to undistributed net investment income. Certain of the fund’s investments are in securities considered to be “passive foreign investment companies,” for which any unrealized appreciation and/or realized gains are required to be included in distributable net income for tax purposes. During the six months ended March 31, 2008, the fund realized gains on the sale of passive foreign investment companies of $112,000, which have been included in current and prior periods’ taxable income; accordingly, such gains have been reclassified from accumulated net realized losses to undistributed net investment income. Unrealized appreciation through the most recent mark-to-market date for tax purposes, on passive foreign investment company holdings at March 31, 2008, was $15,612,000, all of which has been distributed and is reflected in the balance of undistributed net income.
At March 31, 2008, the cost of investment securities for tax purposes was $6,733,199,000. Net unrealized appreciation of investment securities for tax purposes was $243,909,000, consisting of unrealized gains of $909,905,000 on securities that had risen in value since their purchase and $665,996,000 in unrealized losses on securities that had fallen in value since their purchase.
At March 31, 2008, the aggregate settlement value of open futures contracts expiring in June 2008 and the related unrealized appreciation (depreciation) were:
| | | ($000) |
| | Aggregate | Unrealized |
| Number of | Settlement | Appreciation |
Futures Contracts | Long Contracts | Value | (Depreciation) |
S&P 500 Index | 531 | 175,761 | (240) |
Dow Jones EURO STOXX 50 Index | 1,766 | 99,312 | 2,378 |
FTSE 100 Index | 513 | 58,203 | 1,018 |
Topix Index | 353 | 43,108 | 140 |
S&P ASX 200 Index | 239 | 29,431 | 1,088 |
MSCI Taiwan Index | 464 | 15,252 | (244) |
40
Unrealized appreciation (depreciation) on open S&P 500 Index futures contracts is required to be treated as realized gain (loss) for tax purposes.
At March 31, 2008, the fund had open forward currency contracts to receive and deliver currencies as follows:
| | | | | Unrealized |
| | | | | Appreciation |
| | | Contract Amount (000) | (Depreciation) |
Contract Settlement Date | Receive | Deliver | ($000) |
6/25/08 | EUR | 53,084 | USD | 83,780 | 401 |
6/25/08 | GBP | 35,984 | USD | 71,029 | (692) |
6/18/08 | JPY | 3,489,486 | USD | 35,215 | 1,113 |
6/25/08 | AUD | 32,029 | USD | 28,892 | (347) |
AUD—Australian dollar. | | | | | |
EUR—Euro. | | | | | |
GBP—British pound. | | | | | |
JPY—Japanese yen. | | | | | |
USD—U.S. dollar. | | | | | |
Unrealized appreciation (depreciation) on open forward currency contracts is treated as realized gain (loss) for tax purposes.
The fund had net unrealized foreign currency gains of $55,000 resulting from the translation of other assets and liabilities at March 31, 2008.
F. During the six months ended March 31, 2008, the fund purchased $2,899,018,000 of investment securities and sold $2,572,188,000 of investment securities, other than temporary cash investments.
G. The market value of securities on loan to broker-dealers at March 31, 2008, was $146,704,000, for which the fund received cash collateral of $156,545,000.
H. Capital shares issued and redeemed were:
| Six Months Ended | Year Ended |
| March 31, | September 30, |
| 2008 | 2007 |
| Shares | Shares |
| (000) | (000) |
Issued | 55,567 | 120,219 |
Issued in Lieu of Cash Distributions | 21,874 | 9,809 |
Redeemed | (37,128) | (36,004) |
Net Increase (Decrease) in Shares Outstanding | 40,313 | 94,024 |
41
About Your Fund’s Expenses
As a shareholder of the fund, you incur ongoing costs, which include costs for portfolio management, administrative services, and shareholder reports (like this one), among others. Operating expenses, which are deducted from a fund’s gross income, directly reduce the investment return of the fund.
A fund’s expenses are expressed as a percentage of its average net assets. This figure is known as the expense ratio. The following examples are intended to help you understand the ongoing costs (in dollars) of investing in your fund and to compare these costs with those of other mutual funds. The examples are based on an investment of $1,000 made at the beginning of the period shown and held for the entire period.
The table below illustrates your fund’s costs in two ways:
• Based on actual fund return. This section helps you to estimate the actual expenses that you paid over the period. The “Ending Account Value” shown is derived from the fund’s actual return, and the third column shows the dollar amount that would have been paid by an investor who started with $1,000 in the fund. You may use the information here, together with the amount you invested, to estimate the expenses that you paid over the period.
To do so, simply divide your account value by $1,000 (for example, an $8,600 account value divided by $1,000 = 8.6), then multiply the result by the number given for your fund under the heading “Expenses Paid During Period.”
• Based on hypothetical 5% yearly return. This section is intended to help you compare your fund’s costs with those of other mutual funds. It assumes that the fund had a yearly return of 5% before expenses, but that the expense ratio is unchanged. In this case—because the return used is not the fund’s actual return—the results do not apply to your investment. The example is useful in making comparisons because the Securities and Exchange Commission requires all mutual funds to calculate expenses based on a 5% return. You can assess your fund’s costs by comparing this hypothetical example with the hypothetical examples that appear in shareholder reports of other funds.
Six Months Ended March 31, 2008 | | | |
| Beginning | Ending | Expenses |
| Account Value | Account Value | Paid During |
Global Equity Fund | 9/30/2007 | 3/31/2008 | Period1 |
Based on Actual Fund Return | $1,000.00 | $858.41 | $2.51 |
Based on Hypothetical 5% Yearly Return | 1,000.00 | 1,022.30 | 2.73 |
1 The calculations are based on expenses incurred in the most recent fiscal half-year. The fund’s annualized six-month expense ratio for that period is 0.54%. The dollar amounts shown as “Expenses Paid” are equal to the annualized expense ratio multiplied by the average account value over the period, multiplied by the number of days in the most recent six-month period, then divided by the number of days in the most recent 12-month period.
42
Note that the expenses shown in the table on page 31 are meant to highlight and help you compare ongoing costs only and do not reflect transaction costs incurred by the fund for buying and selling securities. Further, the expenses do not include the account service fee described in the prospectus. If such a fee were applied to your account, your costs would be higher. Your fund does not charge transaction fees, such as purchase or redemption fees, nor does it carry a “sales load.”
The calculations assume no shares were bought or sold during the period. Your actual costs may have been higher or lower, depending on the amount of your investment and the timing of any purchases or redemptions.
You can find more information about the fund’s expenses, including annual expense ratios, in the Financial Statements section of this report. For additional information on operating expenses and other shareholder costs, please refer to your fund’s current prospectus.
43
Notice to Shareholders
Global Equity Fund Adds an Investment Advisor
The board of trustees of Vanguard Global Equity Fund has announced the addition of Baillie Gifford Overseas Ltd. (Baillie Gifford) to the fund’s investment advisory team. The fund’s board of trustees concluded that Baillie Gifford’s management team, investment approach, and experience are expected to complement the fund’s other investment advisors. The fund now features a team of four accomplished advisory firms.
Baillie Gifford Overseas Ltd., an investment advisory firm founded in 1983, is wholly owned by Baillie Gifford & Co., a Scottish investment firm. Founded in 1908, Baillie Gifford & Co., one of the largest independently owned investment management firms in the United Kingdom, manages money primarily for institutional clients. Baillie Gifford has successfully managed assets for Vanguard International Growth Fund since 2003.
The addition of Baillie Gifford will not result in a change to the fund’s investment management fees. The fund’s annualized expense ratio for the fiscal period ended March 31, 2008, was 0.54%. The expense ratio of the average global stock fund is 1.49% (derived from data provided by Lipper Inc.).
Additional Information
Vanguard Global Equity Fund has entered into a new investment advisory agreement with Baillie Gifford in addition to the fund’s current agreements with Acadian Asset Management LLC (Acadian), AllianceBernstein L.P. (AllianceBernstein), and Marathon Asset Management LLP (Marathon). This addition does not affect the fund’s investment objective or policies. The fee schedules for the other three advisors have not changed.
Under the terms of the new agreement, the fund will pay Baillie Gifford a fee at the end of each fiscal quarter. The fee is calculated by applying an annual percentage rate to the average daily net assets of the portion of the fund managed by Baillie Gifford during the quarter. In addition, the quarterly payments to Baillie Gifford may be increased or decreased by applying a performance adjustment. The adjustment is based on the cumulative total return of the portion of the fund managed by Baillie Gifford over a trailing 36-month period relative to the total return of the MSCI All-Country World Index over the same period. Transition rules apply to the fee calculation during the initial 36-month period.
The Global Equity Fund receives corporate, management, administrative, and distribution services on an at-cost basis from The Vanguard Group, Inc., P.O. Box 1110, Valley Forge, PA 19482.
Board Approval of the Investment Advisory Agreement With Baillie Gifford
Each of the Global Equity Fund's four investment advisors is responsible for managing the investment and reinvestment of its portion of the fund’s assets and for continually reviewing, supervising, and administering the fund’s investment program. Each advisor is subject to supervision and oversight by Vanguard’s Portfolio Review Department and by the officers and trustees of the fund. The board of trustees designates the proportion of fund assets to be managed by each advisor and may change these proportions at any time.
The board’s decision to add Baillie Gifford to the fund’s multimanager structure was based upon the board’s most recent evaluation of the fund’s current advisory team, portfolio management process, short- and long-term performance results, and current external advisory arrangements. In considering whether to approve the agreement, the board engaged in arm’s-length discussions with Baillie Gifford and considered the following factors, among others:
• The board considered the benefits to shareholders of adding Baillie Gifford as a new advisor to the fund, particularly in light of the nature, extent, and quality of services to be provided by Baillie Gifford. The board concluded that hiring Baillie Gifford is in the best interests of fund shareholders because
44
Baillie Gifford uses a bottom-up investment approach to seek high-quality companies that build earnings and cash flows faster than the market. The board also concluded that it is in the best interests of fund shareholders to add a high-quality advisor with a track record of success. The board noted that adding Baillie Gifford as an advisor would allow the fund to retain its character as a quality global equity offering. The fund would have a complement of four active advisors, each having the opportunity to generate superior returns. This combination provides an attractive blend of proven advisors and should benefit fund shareholders over the long term.
• The board analyzed the performance of other funds and accounts managed by Baillie Gifford. The board concluded that Baillie Gifford’s other investment portfolios have strong investment returns and have posted competitive results by outperforming relevant benchmarks and competitors over various short- and long-term periods.
• The board considered the fund's advisory fee schedule and estimated expense ratio and compared them with the average advisory fee and expense ratio of the fund’s peer group. The board concluded that the addition of Baillie Gifford would not result in a material change in the fund’s investment advisory fees and that these fees, together with the fund's estimated expense ratio, would remain at a substantial discount to those of the fund’s peers.
• The board considered the extent to which economies of scale would be realized as the fund grows, including a consideration of appropriate breakpoints in Baillie Gifford’s advisory fee schedule. By including asset-based breakpoints in the fee schedule, the trustees ensure that, if the portion of the fund managed by Baillie Gifford continues to grow, investors will capture economies of scale in the form of a lower advisory fee rate.
• Based on its informed business judgment, the board concluded that the course of action in the best interests of the fund and its shareholders was to approve the agreement to retain Baillie Gifford.
The new agreement will continue for two years from its effective date and is renewable after that for successive one-year periods. The agreement will be reviewed annually by the fund’s trustees, a majority of whom are not “interested persons” of either the fund or its advisors as defined in federal securities laws. The board may, at any time, reallocate the fund’s assets among the four advisors, or allocate assets of the fund to other investment advisors, without terminating or revising the new agreement with Baillie Gifford.
Background Information on Baillie Gifford Overseas Ltd.
Baillie Gifford Overseas Ltd., located at Calton Square, 1 Greenside Row, Edinburgh, EH1 3AN, Scotland, is wholly owned by Baillie Gifford & Co. As of December 31, 2007, Baillie Gifford & Co. had assets under management that totaled approximately $110 billion. The managers responsible for overseeing Baillie Gifford’s portion of Vanguard Global Equity Fund are:
Charles Plowden, Joint Senior Partner, Chief of Investment Staff, and lead Portfolio Manager of Baillie Gifford’s Global Alpha Portfolio Construction Group. He has worked in investment management with Baillie Gifford since 1983 and has co-managed a portion of the fund since 2008. Education: B.A., Oxford University.
Spencer Adair, CFA, Investment Manager of Global Alpha Strategy at Baillie Gifford. He has worked in investment management with Baillie Gifford since 2000 and has co-managed a portion of the fund since 2008. Education: B.Sc., University of St. Andrews.
Malcolm MacColl, Investment Manager of Global Alpha Strategy at Baillie Gifford. He has worked in investment management with Baillie Gifford since 1999 and has co-managed a portion of the fund since 2008. Education: M.A., M.Lit., University of St. Andrews.
45
Trustees Approve Advisory Agreements
The board of trustees of Vanguard Global Equity Fund has renewed the fund’s investment advisory agreements with Acadian Asset Management LLC, AllianceBernstein L.P., and Marathon Asset Management LLP. The board determined that the retention of the advisors was in the best interests of the fund and its shareholders.
The board based its decisions upon an evaluation of each advisor’s investment staff, portfolio management process, and performance. The trustees considered the factors discussed below, among others. However, no single factor determined whether the board approved the agreements. Rather, it was the totality of the circumstances that drove the board’s decision.
Nature, extent, and quality of services
The board considered the quality of the fund’s investment management over both the short and long term, and took into account the organizational depth and stability of each advisor. The board noted the following:
Acadian Asset Management. Founded in 1986, Acadian is a Boston-based investment management firm specializing in quantitative equity strategies for developed and emerging markets. The firm has advised the Global Equity Fund since 2004. Acadian’s investment process builds portfolios from the bottom up using proprietary valuation models. The investment team includes the three portfolio managers—John Chisholm, Ronald Frashure, and Brian Wolahan—who are all involved in the firm’s ongoing research.
AllianceBernstein. AllianceBernstein, founded in 1971, is a global asset management firm providing diversified investment services that include growth and value equity, blend, and fixed income strategies to clients worldwide. The investment team at AllianceBernstein employs a bottom-up, research-driven, and value-based equity investment philosophy in selecting stocks. It relies on deep investment research capabilities to understand companies and industries that may be undergoing stress, and it seeks to exploit mispricings created by investor overreaction. The firm has advised the Global Equity Fund since 2006.
Marathon Asset Management. Founded in 1986, Marathon Asset Management of London, England, has advised the Global Equity Fund since the fund’s inception in 1995. Marathon continues to use a bottom-up approach that focuses on stock selection. Its three regional teams focus on each company’s corporate strategy and industry competition, while sector analysis is conducted using long-term capital cycle data. Each of these teams is led by one of the firm’s three founders: Jeremy Hosking, William Arah, and Neil Ostrer.
The board concluded that each advisor’s experience, stability, depth, and performance, among other factors, warranted continuation of the advisory agreements.
Investment performance
The board considered the short- and long-term performance of the fund, including any periods of outperformance or underperformance of a relevant benchmark and peer group. The board concluded that each advisor has carried out the fund’s investment strategy in disciplined fashion, and that performance results have been within competitive norms. Information about the fund’s most recent performance can be found in the Performance Summary section of this report.
46
Cost
The board concluded that the fund’s expense ratio was far below the average expense ratio charged by funds in its peer group. The board noted that the fund’s advisory fees were also well below the peer-group average. Information about the fund’s expense ratio appears in the About Your Fund’s Expenses section of this report as well as in the Financial Statements section, which also includes information about the advisory fee rates.
The board did not consider profitability of the advisors in determining whether to approve the advisory fees, because Acadian, AllianceBernstein, and Marathon are independent of Vanguard, and the advisory fees are the result of arm’s-length negotiations.
The benefit of economies of scale
The board concluded that the fund’s shareholders benefit from economies of scale because of breakpoints in the fund’s advisory fee schedules. The breakpoints reduce the effective rate of the fees as the fund’s assets managed by each advisor increase.
The board will consider whether to renew the advisory agreements again after a one-year period.
47
Glossary
Beta. A measure of the magnitude of a fund’s past share-price fluctuations in relation to the ups and downs of a given market index. The index is assigned a beta of 1.00. Compared with a given index, a fund with a beta of 1.20 typically would have seen its share price rise or fall by 12% when the index rose or fell by 10%. For this report, beta is based on returns over the past 36 months for both the fund and the index. Note that a fund’s beta should be reviewed in conjunction with its R-squared (see definition below). The lower the R-squared, the less correlation there is between the fund and the index, and the less reliable beta is as an indicator of volatility.
Equity Exposure. A measure that reflects a fund’s investments in stocks and stock futures. Any holdings in short-term reserves are excluded.
Expense Ratio. The percentage of a fund’s average net assets used to pay its annual administrative and advisory expenses. These expenses directly reduce returns to investors.
Inception Date. The date on which the assets of a fund (or one of its share classes) are first invested in accordance with the fund’s investment objective. For funds with a subscription period, the inception date is the day after that period ends. Investment performance is measured from the inception date.
R-Squared. A measure of how much of a fund’s past returns can be explained by the returns from the market in general, as measured by a given index. If a fund’s total returns were precisely synchronized with an index’s returns, its R-squared would be 1.00. If the fund’s returns bore no relationship to the index’s returns, its R-squared would be 0. For this report, R-squared is based on returns over the past 36 months for both the fund and the index.
Short-Term Reserves. The percentage of a fund invested in highly liquid, short-term securities that can be readily converted to cash.
Turnover Rate. An indication of the fund’s trading activity. Funds with high turnover rates incur higher transaction costs and may be more likely to distribute capital gains (which may be taxable to investors). The turnover rate excludes in-kind transactions, which have minimal impact on costs.
This page intentionally left blank.
48
The People Who Govern Your Fund
The trustees of your mutual fund are there to see that the fund is operated and managed in your best interests since, as a shareholder, you are a part owner of the fund. Your fund’s trustees also serve on the board of directors of The Vanguard Group, Inc., which is owned by the Vanguard funds and provides services to them on an at-cost basis.
A majority of Vanguard’s board members are independent, meaning that they have no affiliation with Vanguard or the funds they oversee, apart from the sizable personal investments they have made as private individuals.
Our independent board members bring distinguished backgrounds in business, academia, and public service to their task of working with Vanguard officers to establish the policies and oversee the activities of the funds. Among board members’ responsibilities are selecting investment advisors for the funds; monitoring fund operations, performance, and costs; reviewing contracts; nominating and selecting new trustees/directors; and electing Vanguard officers.
Each trustee serves a fund until its termination; or until the trustee’s retirement, resignation, or death; or otherwise as specified in the fund’s organizational documents. Any trustee may be removed at a shareholders’ meeting by a vote representing two-thirds of the net asset value of all shares of the fund together with shares of other Vanguard funds organized within the same trust. The table on these two pages shows information for each trustee and executive officer of the fund. The mailing address of the trustees and officers is P.O. Box 876, Valley Forge, PA 19482.
Chairman of the Board, Chief Executive Officer, and Trustee |
| |
John J. Brennan1 | |
Born 1954 | Principal Occupation(s) During the Past Five Years: Chairman of the Board, Chief Executive |
Trustee since May 1987; | Officer, and Director/Trustee of The Vanguard Group, Inc., and of each of the investment |
Chairman of the Board and | companies served by The Vanguard Group; Director of Vanguard Marketing Corporation. |
Chief Executive Officer | |
155 Vanguard Funds Overseen | |
| |
Independent Trustees | |
| |
Charles D. Ellis | |
Born 1937 | Principal Occupation(s) During the Past Five Years: Applecore Partners (pro bono ventures |
Trustee since January 2001 | in education); Senior Advisor to Greenwich Associates (international business strategy |
155 Vanguard Funds Overseen | consulting); Successor Trustee of Yale University; Overseer of the Stern School of Business |
| at New York University; Trustee of the Whitehead Institute for Biomedical Research. |
| |
Emerson U. Fullwood | |
Born 1948 | Principal Occupation(s) During the Past Five Years: Executive Chief Staff and Marketing |
Trustee since January 2008 | Officer for North America since 2004 and Corporate Vice President of Xerox Corporation |
155 Vanguard Funds Overseen | (photocopiers and printers); Director of SPX Corporation (multi-industry manufacturing), |
| of the United Way of Rochester, and of the Boy Scouts of America. |
| |
Rajiv L. Gupta | |
Born 1945 | Principal Occupation(s) During the Past Five Years: Chairman, President, and |
Trustee since December 20012 | Chief Executive Officer of Rohm and Haas Co. (chemicals); Board Member of |
155 Vanguard Funds Overseen | the American Chemistry Council; Director of Tyco International, Ltd. (diversified |
| manufacturing and services) since 2005. |
| |
Amy Gutmann | |
Born 1949 | Principal Occupation(s) During the Past Five Years: President of the University of |
Trustee since June 2006 | Pennsylvania since 2004; Professor in the School of Arts and Sciences, Annenberg School |
155 Vanguard Funds Overseen | for Communication, and Graduate School of Education of the University of Pennsylvania |
| since 2004; Provost (2001–2004) and Laurance S. Rockefeller Professor of Politics and |
| the University Center for Human Values (1990–2004), Princeton University; Director of |
| Carnegie Corporation of New York since 2005 and of Schuylkill River Development |
| Corporation and Greater Philadelphia Chamber of Commerce since 2004; Trustee of |
| the National Constitution Center since 2007. |
JoAnn Heffernan Heisen | |
Born 1950 | Principal Occupation(s) During the Past Five Years: Corporate Vice President and |
Trustee since July 1998 | Chief Global Diversity Officer since 2006, Vice President and Chief Information |
155 Vanguard Funds Overseen | Officer (1997–2005), and Member of the Executive Committee of Johnson & |
| Johnson (pharmaceuticals/consumer products); Director of the University Medical |
| Center at Princeton and Women’s Research and Education Institute. |
| |
André F. Perold | |
Born 1952 | Principal Occupation(s) During the Past Five Years: George Gund Professor of Finance |
Trustee since December 2004 | and Banking, Harvard Business School; Senior Associate Dean and Director of Faculty |
155 Vanguard Funds Overseen | Recruiting, Harvard Business School; Director and Chairman of UNX, Inc. (equities |
| trading firm); Chair of the Investment Committee of HighVista Strategies LLC (private |
| investment firm) since 2005. |
| |
Alfred M. Rankin, Jr. | |
Born 1941 | Principal Occupation(s) During the Past Five Years: Chairman, President, Chief Executive |
Trustee since January 1993 | Officer, and Director of NACCO Industries, Inc. (forklift trucks/housewares/lignite); Director |
155 Vanguard Funds Overseen | of Goodrich Corporation (industrial products/aircraft systems and services). |
| |
| |
J. Lawrence Wilson | |
Born 1936 | Principal Occupation(s) During the Past Five Years: Retired Chairman and Chief Executive |
Trustee since April 1985 | Officer of Rohm and Haas Co. (chemicals); Director of Cummins Inc. (diesel engines) and |
155 Vanguard Funds Overseen | AmerisourceBergen Corp. (pharmaceutical distribution); Trustee of Vanderbilt University |
| and of Culver Educational Foundation. |
| |
| |
Executive Officers1 | |
| |
Thomas J. Higgins | |
Born 1957 | Principal Occupation(s) During the Past Five Years: Principal of The Vanguard Group, Inc.; |
Treasurer since July 1998 | Treasurer of each of the investment companies served by The Vanguard Group. |
155 Vanguard Funds Overseen | |
| |
| |
F. William McNabb III | |
Born 1957 | Principal Occupation(s) During the Past Five Years: President of The Vanguard Group, Inc., |
President since March 2008 | and of each of the investment companies served by The Vanguard Group since 2008; |
155 Vanguard Funds Overseen | Director of Vanguard Marketing Corporation; Managing Director of The Vanguard Group |
| (1995–2008). |
| |
Heidi Stam | |
Born 1956 | Principal Occupation(s) During the Past Five Years: Managing Director of The Vanguard |
Secretary since July 2005 | Group, Inc., since 2006; General Counsel of The Vanguard Group since 2005; Secretary of |
155 Vanguard Funds Overseen | The Vanguard Group, and of each of the investment companies served by The Vanguard |
| Group, since 2005; Director and Senior Vice President of Vanguard Marketing Corporation |
| since 2005; Principal of The Vanguard Group (1997–2006). |
Vanguard Senior Management Team |
| | | |
R. Gregory Barton | Kathleen C. Gubanich | Michael S. Miller | George U. Sauter |
Mortimer J. Buckley | Paul A. Heller | Ralph K. Packard | |
Founder |
|
John C. Bogle |
Chairman and Chief Executive Officer, 1974–1996 |
1 Officers of the funds are “interested persons” as defined in the Investment Company Act of 1940.
2 December 2002 for Vanguard Equity Income Fund, Vanguard Growth Equity Fund, the Vanguard Municipal Bond Funds, and the Vanguard State Tax-Exempt Funds.
More information about the trustees is in the Statement of Additional Information, available from The Vanguard Group.
| 
|
| P.O. Box 2600 |
| Valley Forge, PA 19482-2600 |
Connect with Vanguard® > www.vanguard.com
Fund Information > 800-662-7447 | Vanguard, Connect with Vanguard, and the ship logo |
| are trademarks of The Vanguard Group, Inc. |
Direct Investor Account Services > 800-662-2739 | |
| All other marks are the exclusive property of their |
Institutional Investor Services > 800-523-1036 | respective owners. |
| |
Text Telephone for People | All comparative mutual fund data are from Lipper Inc. |
With Hearing Impairment > 800-952-3335 | or Morningstar, Inc., unless otherwise noted. |
| |
| |
| You can obtain a free copy of Vanguard’s proxy voting |
| guidelines by visiting our website, www.vanguard.com, |
This material may be used in conjunction | and searching for “proxy voting guidelines,” or by |
with the offering of shares of any Vanguard | calling Vanguard at 800-662-2739. The guidelines are |
fund only if preceded or accompanied by | also available from the SEC’s website, www.sec.gov. |
the fund’s current prospectus. | In addition, you may obtain a free report on how your |
| fund voted the proxies for securities it owned during |
| the 12 months ended June 30. To get the report, visit |
| either www.vanguard.com or www.sec.gov. |
| |
| You can review and copy information about your fund |
| at the SEC’s Public Reference Room in Washington, D.C. |
| To find out more about this public service, call the SEC |
| at 202-551-8090. Information about your fund is also |
| available on the SEC’s website, and you can receive |
| copies of this information, for a fee, by sending a |
| request in either of two ways: via e-mail addressed to |
| publicinfo@sec.gov or via regular mail addressed to the |
| Public Reference Section, Securities and Exchange |
| Commission, Washington, DC 20549-0102. |
| |
| |
| |
| |
| |
| © 2008 The Vanguard Group, Inc. |
| All rights reserved. |
| Vanguard Marketing Corporation, Distributor. |
| |
| Q1292 052008 |
> | For the six months ended March 31, 2008, Vanguard Strategic Small-Cap Equity Fund returned –15.0%, matching the average return of its peers but trailing the return of its benchmark index. |
> | Small-capitalization stocks underperformed large-caps, which were favored as investors became more averse to risk during the challenging half-year. |
> | Only one sector in the fund produced a positive return: Materials holdings benefited from continued strong demand for raw materials and industrial commodities such as steel. |
Contents | |
| |
Your Fund’s Total Returns | 1 |
Chairman’s Letter | 2 |
Advisor’s Report | 6 |
Fund Profile | 8 |
Performance Summary | 10 |
Financial Statements | 11 |
About Your Fund’s Expenses | 29 |
Trustees Approve Advisory Arrangement | 31 |
Glossary | 32 |
Please note: The opinions expressed in this report are just that—informed opinions. They should not be considered promises or advice. Also, please keep in mind that the information and opinions cover the period through the date on the cover of this report. Of course, the risks of investing in your fund are spelled out in the prospectus.
Your Fund’s Total Returns
Six Months Ended March 31, 2008 | | |
| Ticker | Total |
| Symbol | Returns |
Vanguard Strategic Small-Cap Equity Fund | VSTCX | –15.0% |
MSCI US Small Cap 1750 Index | | –13.8 |
Average Small-Cap Core Fund1 | | –15.0 |
Your Fund’s Performance at a Glance | | | |
September 30, 2007–March 31, 2008 | | | | |
| | | Distributions Per Share |
| Starting | Ending | Income | Capital |
| Share Price | Share Price | Dividends | Gains |
Vanguard Strategic Small-Cap Equity Fund | $21.28 | $17.74 | $0.210 | $0.151 |
1 Derived from data provided by Lipper Inc.
1

Chairman’s Letter
Dear Shareholder,
Vanguard Strategic Small-Cap Equity Fund returned –15.0% for the fiscal half-year ended March 31, as jittery investors punished stocks across the board. A year ago, when markets were rising, investors preferred small-capitalization equities. But in the current pullback, large-cap stocks were favored, creating headwinds for your fund and its small-cap brethren. While disappointing in absolute terms, your fund’s return matched the average return for small-cap funds but fell behind the return of its small-cap index benchmark.
Stocks of all sorts sank amid credit-market concerns
The broad U.S. stock market declined –12.4% for the six months ended March 31 as investor sentiment turned bearish amid fears of a U.S. recession, the weakening U.S. dollar, and the tightening of global credit markets in reaction to the subprime-mortgage crisis that began in midsummer 2007. International stocks once again outperformed U.S. stocks, though most global markets finished the period in negative territory.
Bond markets were roiled by subprime-mortgage woes
Credit markets seized up as trouble spread from subprime-mortgage-backed securities to other issues. Investors flocked to higher-quality government and corporate bonds, driving U.S. Treasury bond prices higher.
2
Unlike stocks, the broad taxable bond market pushed forward, posting a total return of 5.2% for the fiscal half-year as lower interest rates depressed yields and bumped up prices. By contrast, tax-exempt municipal bonds returned only 0.7% as fixed income investors moved in droves to Treasuries in search of the highest-quality, most-liquid securities. This, combined with concerns about the financial strength of the insurers backing certain municipal bonds, pushed municipal yields above those of Treasuries.
In response to the tumult in the credit markets and the deteriorating economic outlook, the Federal Reserve Board aggressively reduced its target for the federal funds rate. The Fed continued a series of rate cuts that began late last summer, ending with a 0.75-percentage-point cut in March. The target rate stood at 2.25% at the end of the period, the lowest level since early 2005.
Stock selections produced mixed results
In the challenging fiscal half-year, only one of the Strategic Small-Cap Equity Fund’s ten sectors—materials—produced a positive return. Similarly, only one sector in the fund’s small-cap index benchmark produced a positive result, but it was energy. This divergence provides an interesting case study in how your fund is managed and how to evaluate its performance.
Market Barometer | | | |
| | | Total Returns |
| | Periods Ended March 31, 2008 |
| Six Months | One Year | Five Years1 |
Stocks | | | |
Russell 1000 Index (Large-caps) | –12.4% | –5.4% | 11.9% |
Russell 2000 Index (Small-caps) | –14.0 | –13.0 | 14.9 |
Dow Jones Wilshire 5000 Index (Entire market) | –12.4 | –5.8 | 12.5 |
MSCI All Country World Index ex USA (International) | –9.6 | 2.6 | 24.0 |
| | | |
Bonds | | | |
Lehman U.S. Aggregate Bond Index (Broad taxable market) | 5.2% | 7.7% | 4.6% |
Lehman Municipal Bond Index | 0.7 | 1.9 | 3.9 |
Citigroup 3-Month Treasury Bill Index | 1.7 | 4.2 | 3.0 |
| | | |
CPI | | | |
Consumer Price Index | 2.4% | 4.0% | 3.0% |
1 Annualized.
3
Your fund’s advisor—Vanguard Quantitative Equity Group—identifies stocks expected to offer the greatest potential for appreciation by using proprietary screening models with three components: valuation, improving earnings prospects, and market sentiment as reflected in stock price behavior. The advisor then uses the most promising stocks to build a portfolio with sector weightings and risk characteristics similar to those of the benchmark. Within each sector, the advisor seeks to outperform by holding more winning stocks. (For more discussion of the models and your fund’s positioning, please see the Advisor’s Report on page 6.)
This approach worked well in the materials sector, where your fund’s holdings rose 5% while the index’s stocks dropped –8%. The fund’s top performers included fertilizer producers—beneficiaries of the global agricultural boom—and companies involved in producing steel to satisfy robust global demand.
In contrast, stock selection in the energy sector was not rewarding. In the index, the sector rose 5%, while in the fund, it produced a slightly negative return, missing out on some impressive gains among oil and gas exploration and production companies and coal producers. Although the materials and energy sectors together represented less than 15% of the fund and its index, on average, this example illustrates that the portfolio management strategy relies primarily on stock picking to add value and to differentiate the performance of the fund from that of
Annualized Expense Ratios1 | | |
Your Fund Compared With Its Peer Group | | |
| | Average |
| | Small-Cap |
| Fund | Core Fund |
Strategic Small-Cap Equity Fund | 0.36% | 1.47% |
1 Fund expense ratio reflects the six months ended March 31, 2008. Peer-group expense ratio is derived from data provided by Lipper Inc. and captures information through year-end 2007.
4
its benchmark. When everything clicks—as in materials—you benefit from the value added by the advisor’s stock selection. And when stock picks miss, deviations from the holdings in the benchmark can cost you relative return.
Across the rest of the portfolio, the fund’s results more closely resembled those of its benchmark, except in the industrials sector—the leading detractor relative to the index. Several economically sensitive holdings posted double-digit declines, including companies involved in aerospace and defense, construction and engineering, and machinery.
Quantitative investment strategies have struggled over the last year or so, in part because they (like your fund) tend to favor stocks with relatively reasonable valuations and investors have favored more growth-oriented stocks. Whether short-term performance is gratifying or disappointing, investors should not rush to judgment—especially for this relatively new fund, which marks just its second anniversary in April.
Tune out the noise in market “weather” reports
When clouds darken the investment horizon, it can be appealing to run for shelter. And when skies clear, caution can seem needless. Neither impulse is likely to contribute to long-term investment success. Instead, we encourage you to invest with a long-term view, diversify within and across primary asset classes, and pay attention to costs. Within a diversified portfolio driven by an appropriate asset allocation based on your long-term goals and tolerance for risk, the Strategic Small-Cap Equity Fund can play a role in giving you exposure to the smaller corners of the U.S. stock market.
As I close this report to you, it’s my pleasure to introduce the fund’s new president, F. William McNabb III. Bill is a man of great character and integrity who is intimately familiar with all aspects of Vanguard—from how we serve our clients to how we invest for our clients.
Bill and I have worked together very closely for more than two decades. I’m thrilled that the fund’s board elected him president, effective March 1, and designated him to succeed me as chief executive officer, a role he will assume within a year, after an orderly transition. Bill and the rest of our team will serve you and our other clients extremely well in the years ahead.
Thank you for entrusting your assets to Vanguard.
Sincerely,

John J. Brennan
Chairman and Chief Executive Officer
April 14, 2008
5
Advisor’s Report
For the six months ended March 31, 2008, Vanguard Strategic Small-Cap Equity Fund returned –15.0%. The fund’s return matched the average return of small-cap core funds but lagged the –13.8% return of the benchmark MSCI US Small Cap 1750 Index.
The investment environment
The half-year ended March 31 was a difficult time for equity markets in the United States and abroad. The broad U.S. market was down –12.4%. International equities performed somewhat better, although the MSCI All Country World Index ex USA still lost –9.6%. Small-capitalization stocks were down more than the broader market and trailed the performance of their large-cap counterparts.
Our investment approach
Although we focus our investment process on longer-term results, we are disappointed by any period of under-performance. The fund’s performance relative to its benchmark depends on the ability of our stock-evaluation methodology to rank stocks relative to their industry and market-cap peers. As we’ve described in previous reports to you, this evaluation process uses three independent and distinct stock-selection models to rank companies based on their relative valuation, market sentiment, and earnings-quality characteristics.
When combined with our risk-control process, the resulting portfolio matches the benchmark’s exposure to industry, market capitalization, and other style risk factors. Relative to the benchmark, our portfolio will generally have a lower price-to-earnings profile, a return-on-equity premium, and a similar expected earnings growth rate and dividend yield.
The fund’s successes and shortfalls
When we dissect the fund’s six-month performance, there is a noticeable contrast between the two quarters of the fiscal period. For the fourth quarter of 2007, our valuation model was a large detractor from performance, and the portfolio’s return trailed that of its small-cap benchmark by more than 2 percentage points. In contrast, for the first quarter of 2008, all three models were positive contributors; the fund’s return outpaced that of its benchmark by about 1 percentage point.
Looking within sectors, our stock selections were strongest in materials, where Steel Dynamics and fertilizer maker CF Industries Holdings were up approximately 40%. Some of our weakest performers were in the industrials and energy sectors, including technical ceramics maker Ceradyne and oil and gas refiner and marketer Delek US Holdings, both of which were down substantially.
6
Over the long run, our quantitative process has demonstrated the ability to add value. We continue to believe that a portfolio of securities with attractive valuations, high earnings quality, and market acceptance—coupled with disciplined risk control—offers an attractive option as part of a diversified investment plan. We thank you for your investment and trust and look forward to the remainder of the fiscal year.
James P. Stetler, Principal and Portfolio Manager
Joel M. Dickson, Principal
Vanguard Quantitative Equity Group
April 11, 2008
7
Fund Profile
As of March 31, 2008
Portfolio Characteristics | | |
| | Comparative | Broad |
| Fund | Index1 | Index2 |
Number of Stocks | 435 | 1,718 | 4,811 |
Median Market Cap | $1.6B | $1.6B | $33.8B |
Price/Earnings Ratio | 14.0x | 20.1x | 16.9x |
Price/Book Ratio | 1.9x | 1.9x | 2.4x |
Yield3 | 1.2% | 1.4% | 2.0% |
Return on Equity | 13.0% | 13.2% | 19.5% |
Earnings Growth Rate | 21.4% | 17.3% | 20.0% |
Foreign Holdings | 0.8% | 0.0% | 0.0% |
Turnover Rate | 101%4 | — | — |
Expense Ratio | 0.36%4 | — | — |
Short-Term Reserves | 0.3% | — | — |
Sector Diversification (% of equity exposure) |
| | Comparative | Broad |
| Fund | Index1 | Index2 |
Consumer Discretionary | 13.5% | 13.2% | 9.4% |
Consumer Staples | 3.5 | 3.6 | 9.6 |
Energy | 9.0 | 9.0 | 12.7 |
Financials | 18.9 | 18.9 | 17.7 |
Health Care | 11.0 | 10.8 | 11.7 |
Industrials | 16.2 | 16.5 | 12.2 |
Information Technology | 16.1 | 16.2 | 15.6 |
Materials | 6.3 | 6.4 | 4.1 |
Telecommunication Services | 1.1 | 1.0 | 3.1 |
Utilities | 4.4 | 4.4 | 3.9 |
Ten Largest Holdings5 (% of total net assets) |
| | |
Helmerich & Payne, Inc. | oil and gas drilling | 0.6% |
Ryder System, Inc. | trucking | 0.5 |
Walter Industries, Inc. | industrial conglomerates | 0.5 |
Pediatrix Medical Group, Inc. | health care services | 0.5 |
Perrigo Co. | pharmaceuticals | 0.5 |
Superior Energy Services, Inc. | oil and gas equipment and services | 0.5 |
Tidewater Inc. | oil and gas equipment and services | 0.5 |
Mettler-Toledo International Inc. | electronic equipment manufacturers | 0.5 |
Unit Corp. | oil and gas drilling | 0.5 |
St. Mary Land & Exploration Co. | oil and gas exploration and production | 0.4 |
Top Ten | | 5.0% |
8
Investment Focus
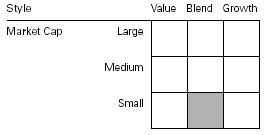
1 MSCI US Small Cap 1750 Index.
2 Dow Jones Wilshire 5000 Index.
3 30-day SEC yield for the fund; annualized dividend yield for the indexes. See the Glossary on page 25.
4 Annualized.
5 The holdings listed exclude any temporary cash investments and equity index products.
9
Performance Summary
All of the returns in this report represent past performance, which is not a guarantee of future results that may be achieved by the fund. (Current performance may be lower or higher than the performance data cited. For performance data current to the most recent month-end, visit our website at www.vanguard.com/performance.) Note, too, that both investment returns and principal value can fluctuate widely, so an investor’s shares, when sold, could be worth more or less than their original cost. The returns shown do not reflect taxes that a shareholder would pay on fund distributions or on the sale of fund shares.
Fiscal-Year Total Returns (%): April 24, 2006–March 31, 2008
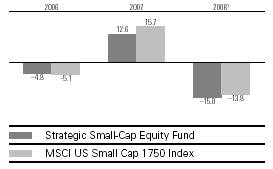
Average Annual Total Returns: Periods Ended March 31, 2008 | | |
| | | |
| | | Since |
| Inception Date | One Year | Inception |
Strategic Small-Cap Equity Fund2 | 4/24/2006 | –14.80% | –4.75% |
1 Six months ended March 31, 2008.
2 Total returns do not include the account service fee that may be applicable to certain accounts with balances below $10,000.
Note: See Financial Highlights table on page 18 for dividend and capital gains information.
10
Financial Statements (unaudited)
Statement of Net Assets
As of March 31, 2008
The fund provides a complete list of its holdings four times in each fiscal year, at the quarter-ends. For the second and fourth fiscal quarters, the lists appear in the fund’s semiannual and annual reports to shareholders. For the first and third fiscal quarters, the fund files the lists with the Securities and Exchange Commission on Form N-Q. Shareholders can look up the fund’s Forms N-Q on the SEC’s website at www.sec.gov. Forms N-Q may also be reviewed and copied at the SEC’s Public Reference Room (see the back cover of this report for further information).
| | | Market |
| | | Value• |
| | Shares | ($000) |
Common Stocks (99.4%)1 | | |
Consumer Discretionary (13.4%) | | |
* | Hanesbrands Inc. | 30,700 | 896 |
| Burger King Holdings Inc. | 31,996 | 885 |
* | Aeropostale, Inc. | 32,400 | 878 |
* | Big Lots Inc. | 38,000 | 847 |
| DeVry, Inc. | 20,000 | 837 |
* | DreamWorks | | |
| Animation SKG, Inc. | 32,400 | 835 |
* | Jack in the Box Inc. | 29,800 | 801 |
* | Lear Corp. | 30,100 | 780 |
| Regal Entertainment Group | | |
| Class A | 40,000 | 772 |
| Sotheby’s | 26,011 | 752 |
| Interactive Data Corp. | 25,400 | 723 |
* | Rent-A-Center, Inc. | 39,400 | 723 |
* | The Gymboree Corp. | 18,000 | 718 |
* | Chipotle Mexican Grill, Inc. | 6,100 | 692 |
| Phillips-Van Heusen Corp. | 18,000 | 683 |
| Snap-On Inc. | 12,900 | 656 |
| Bob Evans Farms, Inc. | 23,587 | 651 |
| CSS Industries, Inc. | 17,500 | 612 |
| Meredith Corp. | 15,700 | 601 |
| American Axle & | | |
| Manufacturing Holdings, Inc. | 29,100 | 596 |
| Brown Shoe Co., Inc. | 38,555 | 581 |
| Ethan Allen Interiors, Inc. | 19,428 | 552 |
* | Papa John’s International, Inc. | 22,415 | 543 |
| Men’s Wearhouse, Inc. | 23,255 | 541 |
*^ | Jos. A. Bank Clothiers, Inc. | 24,300 | 498 |
| Blyth, Inc. | 24,500 | 483 |
* | Denny’s Corp. | 161,700 | 482 |
| Barnes & Noble, Inc. | 15,700 | 481 |
| Cooper Tire & Rubber Co. | 31,700 | 475 |
| CBRL Group, Inc. | 13,124 | 469 |
| Asbury Automotive Group, Inc. | 32,657 | 449 |
| Movado Group, Inc. | 22,703 | 442 |
* | J. Crew Group, Inc. | 10,000 | 442 |
| John Wiley & Sons Class A | 11,000 | 437 |
11
| | | Market |
| | | Value• |
| | Shares | ($000) |
| Dover Downs Gaming & Entertainment, Inc. | 48,928 | 416 |
| American Greetings Corp. Class A | 22,100 | 410 |
| International Speedway Corp. | 8,500 | 350 |
* | Entravision | | |
| Communications Corp. | 49,200 | 328 |
| Sealy Corp. | 42,800 | 325 |
^ | Systemax Inc. | 26,400 | 318 |
| Oxford Industries, Inc. | 13,900 | 313 |
| UniFirst Corp. | 8,100 | 300 |
*^ | NutriSystem, Inc. | 19,900 | 300 |
* | The Dress Barn, Inc. | 22,292 | 288 |
^ | Tempur-Pedic International Inc. | 26,000 | 286 |
| Service Corp. International | 25,490 | 258 |
* | Deckers Outdoor Corp. | 1,800 | 194 |
* | Town Sports International | | |
| Holdings, Inc. | 29,548 | 189 |
| Sonic Automotive, Inc. | 9,200 | 189 |
| Choice Hotels | | |
| International, Inc. | 5,200 | 177 |
| Sinclair Broadcast Group, Inc. | 19,300 | 172 |
* | Gemstar-TV Guide | | |
| International, Inc. | 35,400 | 166 |
| World Wrestling | | |
| Entertainment, Inc. | 8,500 | 158 |
* | Exide Technologies | 11,000 | 144 |
* | Dick’s Sporting Goods, Inc. | 4,800 | 129 |
| The Buckle, Inc. | 2,748 | 123 |
* | Collective Brands, Inc. | 8,903 | 108 |
* | Chipotle Mexican Grill, Inc.Class B | 1,100 | 107 |
* | Aftermarket Technology Corp. | 3,700 | 72 |
* | Valassis Communications, Inc. | 6,400 | 69 |
* | The Warnaco Group, Inc. | 1,700 | 67 |
* | Sally Beauty Co. Inc. | 7,800 | 54 |
| | | 27,823 |
Consumer Staples (3.5%) | | |
| Corn Products | | |
| International, Inc. | 24,805 | 921 |
12
| | | Market |
| | | Value• |
| | Shares | ($000) |
| Universal Corp. (VA) | 12,800 | 839 |
* | NBTY, Inc. | 26,900 | 806 |
* | Winn-Dixie Stores, Inc. | 39,542 | 710 |
* | Alliance One International, Inc. | 114,300 | 690 |
| Nash-Finch Co. | 18,800 | 639 |
| Flowers Foods, Inc. | 18,800 | 465 |
| Alberto-Culver Co. | 15,800 | 433 |
| Longs Drug Stores, Inc. | 8,200 | 348 |
| Vector Group Ltd. | 16,800 | 296 |
* | Central European Distribution Corp. | 3,800 | 221 |
| Church & Dwight, Inc. | 4,000 | 217 |
*^ | USANA Health Sciences, Inc. | 9,300 | 205 |
| Herbalife Ltd. | 4,200 | 200 |
* | Elizabeth Arden, Inc. | 9,100 | 182 |
| Sanderson Farms, Inc. | 2,200 | 84 |
| | | 7,256 |
Energy (9.0%) | | |
| Helmerich & Payne, Inc. | 26,928 | 1,262 |
* | Superior Energy Services, Inc. | 25,153 | 997 |
| Tidewater Inc. | 17,965 | 990 |
* | Unit Corp. | 16,890 | 957 |
| St. Mary Land & | | |
| Exploration Co. | 24,086 | 927 |
* | Whiting Petroleum Corp. | 14,200 | 918 |
* | Oil States International, Inc. | 19,897 | 892 |
* | W-H Energy Services, Inc. | 12,848 | 885 |
* | Atwood Oceanics, Inc. | 9,159 | 840 |
* | SEACOR Holdings Inc. | 9,171 | 783 |
* | Swift Energy Co. | 16,629 | 748 |
* | Complete Production | | |
| Services, Inc. | 32,400 | 743 |
* | Gulfmark Offshore, Inc. | 13,500 | 739 |
* | Bois d’Arc Energy, Inc. | 30,400 | 653 |
* | Rosetta Resources, Inc. | 33,200 | 653 |
* | Dawson Geophysical Co. | 9,000 | 608 |
| General Maritime Corp. | 25,000 | 590 |
* | Willbros Group, Inc. | 18,800 | 575 |
* | Basic Energy Services Inc. | 25,700 | 567 |
* | Grey Wolf, Inc. | 68,100 | 462 |
| Frontier Oil Corp. | 15,444 | 421 |
* | Core Laboratories N.V. | 3,300 | 394 |
* | Cal Dive International, Inc. | 34,600 | 359 |
* | Helix Energy | | |
| Solutions Group, Inc. | 11,400 | 359 |
| Delek US Holdings, Inc. | 22,400 | 284 |
| Holly Corp. | 6,236 | 271 |
* | Continental Resources, Inc. | 6,900 | 220 |
* | ATP Oil & Gas Corp. | 5,900 | 193 |
| Cabot Oil & Gas Corp. | 2,200 | 112 |
* | Bristow Group, Inc. | 2,000 | 107 |
| Western Refining, Inc. | 4,200 | 57 |
| | | 18,566 |
13
| | | Market |
| | | Value• |
| | Shares | ($000) |
Financials (18.7%) | | |
| Bank of Hawaii Corp. | 18,000 | 892 |
| Aspen Insurance Holdings Ltd. | 32,100 | 847 |
| Endurance Specialty Holdings Ltd. | 22,100 | 809 |
| Platinum Underwriters Holdings, Ltd. | 24,900 | 808 |
| Reinsurance Group of America, Inc. | 14,680 | 799 |
| FirstMerit Corp. | 38,500 | 795 |
| First Niagara | | |
| Financial Group, Inc. | 57,600 | 783 |
* | Affiliated Managers Group, Inc. | 8,600 | 780 |
| IPC Holdings Ltd. | 27,600 | 773 |
| Odyssey Re Holdings Corp. | 19,600 | 720 |
| Cash America | | |
| International Inc. | 19,413 | 707 |
| Allied World Assurance | | |
| Holdings, Ltd. | 17,600 | 699 |
* | Knight Capital Group, Inc. Class A | 43,000 | 698 |
| Rayonier Inc. REIT | 15,820 | 687 |
| Nationwide Health | | |
| Properties, Inc. REIT | 20,100 | 678 |
* | SVB Financial Group | 15,400 | 672 |
| City Holding Co. | 16,662 | 665 |
| Pacific Capital Bancorp | 30,800 | 662 |
| First Community | | |
| Bancshares, Inc. | 17,550 | 639 |
| Univest Corp. of Pennsylvania | 24,300 | 636 |
| Taubman Co. REIT | 12,110 | 631 |
| Trustmark Corp. | 28,022 | 624 |
| First Financial Corp. (IN) | 20,000 | 616 |
| Max Re Capital Ltd. | 23,300 | 610 |
| Cathay General Bancorp | 28,800 | 597 |
* | Interactive Brokers Group, Inc. | 23,100 | 593 |
| Old Second Bancorp, Inc. | 21,900 | 582 |
| Wilmington Trust Corp. | 18,300 | 569 |
| City Bank Lynnwood (WA) | 24,400 | 543 |
| BancFirst Corp. | 11,826 | 541 |
| Digital Realty Trust, Inc. REIT | 14,810 | 526 |
| Senior Housing | | |
| Properties Trust REIT | 22,100 | 524 |
| The Hanover | | |
| Insurance Group Inc. | 12,400 | 510 |
* | Alleghany Corp. | 1,490 | 509 |
* | Philadelphia Consolidated | | |
| Holding Corp. | 15,242 | 491 |
| Douglas Emmett, Inc. REIT | 21,700 | 479 |
| Highwood Properties, Inc. REIT | 15,310 | 476 |
* | EZCORP, Inc. | 38,439 | 473 |
| Home Properties, Inc. REIT | 9,500 | 456 |
| Raymond James Financial, Inc. | 19,700 | 453 |
| Equity Lifestyle | | |
| Properties, Inc. REIT | 8,600 | 425 |
14
| | | Market |
| | | Value• |
| | Shares | ($000) |
| Mid-America Apartment Communities, Inc. REIT | 8,470 | 422 |
| United Bankshares, Inc. | 15,800 | 421 |
| National Retail Properties REIT | 19,000 | 419 |
| Advanta Corp. Class B | 58,450 | 411 |
| WSFS Financial Corp. | 8,350 | 411 |
| First Industrial Realty Trust REIT | 13,200 | 408 |
| Jones Lang LaSalle Inc. | 5,270 | 408 |
| Tanger Factory Outlet Centers, Inc. REIT | 10,500 | 404 |
*^ | First Federal Financial Corp. | 14,428 | 392 |
| Colonial Properties Trust REIT | 16,170 | 389 |
| Health Care Inc. REIT | 8,500 | 384 |
| Montpelier Re Holdings Ltd. | 23,400 | 376 |
| DCT Industrial Trust Inc. REIT | 37,600 | 374 |
^ | ASTA Funding, Inc. | 26,200 | 365 |
| HRPT Properties Trust REIT | 54,200 | 365 |
| WesBanco, Inc. | 14,700 | 363 |
| Equity One, Inc. REIT | 15,100 | 362 |
| American Campus | | |
| Communities, Inc. REIT | 13,200 | 361 |
| American Financial | | |
| Realty Trust REIT | 44,660 | 355 |
| Pennsylvania REIT | 13,470 | 329 |
| Cedar Shopping Centers, Inc. | | |
| REIT | 27,500 | 321 |
| Saul Centers, Inc. REIT | 6,300 | 317 |
| Parkway Properties Inc. REIT | 8,500 | 314 |
| Cullen/Frost Bankers, Inc. | 5,700 | 302 |
| Alexandria Real Estate | | |
| Equities, Inc. REIT | 3,000 | 278 |
| Baldwin & Lyons, Inc. Class B | 10,700 | 275 |
| Chemical Financial Corp. | 11,200 | 267 |
| Healthcare Realty Trust Inc. | | |
| REIT | 9,200 | 241 |
| Federal Realty | | |
| Investment Trust REIT | 3,070 | 239 |
| Sun Communities, Inc. REIT | 11,400 | 234 |
| Washington REIT | 6,300 | 211 |
| Post Properties, Inc. REIT | 5,260 | 203 |
| Potlatch Corp. REIT | 4,000 | 165 |
| Brandywine Realty Trust REIT | 9,070 | 154 |
| Realty Income Corp. REIT | 4,800 | 123 |
| Sunstone Hotel | | |
| Investors, Inc. REIT | 7,600 | 122 |
| LaSalle Hotel Properties REIT | 4,100 | 118 |
| Mack-Cali Realty Corp. REIT | 3,120 | 111 |
| Essex Property Trust, Inc. | | |
| REIT | 900 | 103 |
| Strategic Hotels and | | |
| Resorts, Inc. REIT | 7,600 | 100 |
| Independent Bank Corp. (MA) | 3,300 | 98 |
| Old National Bancorp | 5,340 | 96 |
| MCG Capital Corp. | 9,500 | 86 |
15
| | | Market |
| | | Value• |
| | Shares | ($000) |
| Franklin Street Properties Corp. REIT | 5,270 | 75 |
| Glimcher Realty Trust REIT | 6,300 | 75 |
| FelCor Lodging Trust, Inc. REIT | 5,010 | 60 |
| GMH Communities Trust REIT | 5,300 | 46 |
| East West Bancorp, Inc. | 2,300 | 41 |
| Great Southern Bancorp, Inc. | 2,500 | 39 |
| BRE Properties Inc. Class A REIT | 800 | 36 |
| Friedman, Billings, Ramsey Group, Inc. REIT | 16,600 | 28 |
| Community Trust Bancorp Inc. | 916 | 27 |
^ | Security Capital Assurance, Ltd. | 48,100 | 25 |
| National Penn Bancshares Inc. | 1,000 | 18 |
| Washington Trust | | |
| Bancorp, Inc. | 700 | 17 |
| Thornburg Mortgage, Inc. REIT | 14,170 | 15 |
* | MCG Capital Corp. | | |
| Rights Exp. 4/18/08 | 1,357 | 1 |
| | | 38,677 |
Health Care (10.9%) | | |
* | Pediatrix Medical Group, Inc. | 14,840 | 1,000 |
| Perrigo Co. | 26,500 | 1,000 |
* | OSI Pharmaceuticals, Inc. | 21,849 | 817 |
| West Pharmaceutical | | |
| Services, Inc. | 18,290 | 809 |
* | Onyx Pharmaceuticals, Inc. | 26,300 | 763 |
* | Myriad Genetics, Inc. | 18,700 | 753 |
| Analogic Corp. | 10,700 | 712 |
* | PAREXEL International Corp. | 26,064 | 680 |
* | CONMED Corp. | 26,100 | 669 |
| Datascope Corp. | 15,731 | 652 |
* | Psychiatric Solutions, Inc. | 19,100 | 648 |
* | BioMarin Pharmaceutical Inc. | 18,246 | 645 |
* | Cubist Pharmaceuticals, Inc. | 34,400 | 634 |
* | K-V Pharmaceutical Co. | | |
| Class A | 25,243 | 630 |
* | Apria Healthcare Group Inc. | 31,800 | 628 |
| Chemed Corp. | 14,400 | 608 |
* | AMERIGROUP Corp. | 22,100 | 604 |
* | Sciele Pharma, Inc. | 29,384 | 573 |
| STERIS Corp. | 20,400 | 547 |
| Medicis Pharmaceutical Corp. | 27,600 | 543 |
* | Sun Healthcare Group Inc. | 41,100 | 540 |
* | Haemonetics Corp. | 8,595 | 512 |
* | Cynosure Inc. | 23,600 | 503 |
* | Emergent BioSolutions Inc. | 52,900 | 472 |
* | Xenoport Inc. | 11,582 | 469 |
* | Healthspring, Inc. | 33,000 | 465 |
| Mentor Corp. | 17,400 | 448 |
* | Molina Healthcare Inc. | 18,206 | 445 |
* | XOMA Ltd. | 171,100 | 443 |
* | PDL BioPharma Inc. | 36,500 | 387 |
* | Amedisys Inc. | 9,800 | 386 |
16
| | | Market |
| | | Value• |
| | Shares | ($000) |
* | Applera Corp.–Celera Genomics Group | 25,300 | 372 |
* | Enzo Biochem, Inc. | 39,800 | 362 |
* | Acadia Pharmaceuticals Inc. | 36,200 | 328 |
* | Bio-Rad Laboratories, Inc. Class A | 3,606 | 321 |
* | Align Technology, Inc. | 28,700 | 319 |
* | AmSurg Corp. | 10,700 | 253 |
* | Immucor Inc. | 9,200 | 196 |
* | Cross Country Healthcare, Inc. | 14,864 | 184 |
* | Alliance Imaging, Inc. | 20,300 | 175 |
* | AMN Healthcare Services, Inc. | 10,139 | 156 |
* | Air Methods Corp. | 3,000 | 145 |
* | Omrix Biopharmaceuticals, Inc. | 9,356 | 131 |
| LCA-Vision Inc. | 10,000 | 125 |
* | Centene Corp. | 8,700 | 121 |
* | Skilled Healthcare Group Inc. | 11,000 | 121 |
* | Gentiva Health Services, Inc. | 3,400 | 74 |
* | eResearch Technology, Inc. | 5,700 | 71 |
* | Varian, Inc. | 1,000 | 58 |
* | MedCath Corp. | 2,952 | 54 |
* | Noven Pharmaceuticals, Inc. | 4,500 | 40 |
* | PSS World Medical, Inc. | 1,100 | 18 |
| Cambrex Corp. | 2,300 | 16 |
| | | 22,625 |
Industrials (16.1%) | | |
| Ryder System, Inc. | 17,609 | 1,073 |
| Walter Industries, Inc. | 16,500 | 1,033 |
* | Kansas City Southern | 22,200 | 890 |
* | Gardner Denver Inc. | 23,000 | 853 |
| GATX Corp. | 21,400 | 836 |
| Hubbell Inc. Class B | 19,100 | 834 |
| Trinity Industries, Inc. | 30,860 | 822 |
| Carlisle Co., Inc. | 24,300 | 813 |
* | GrafTech International Ltd. | 49,200 | 798 |
| Acuity Brands, Inc. | 18,542 | 796 |
| Kennametal, Inc. | 26,934 | 793 |
* | Corrections Corp. of America | 27,900 | 768 |
* | EMCOR Group, Inc. | 33,900 | 753 |
| Belden Inc. | 20,900 | 738 |
| Genco Shipping and | | |
| Trading Ltd. | 12,900 | 728 |
| Mueller Industries Inc. | 25,000 | 721 |
* | United Stationers, Inc. | 14,841 | 708 |
* | General Cable Corp. | 11,900 | 703 |
* | United Rentals, Inc. | 36,282 | 684 |
* | Republic Airways Holdings Inc. | 31,400 | 680 |
* | Columbus McKinnon Corp. | 21,900 | 678 |
| Watson Wyatt & Co. Holdings | 11,900 | 675 |
* | Perini Corp. | 18,600 | 674 |
* | TransDigm Group, Inc. | 17,000 | 630 |
| Lennox International Inc. | 17,448 | 628 |
* | RSC Holdings Inc. | 57,500 | 627 |
| The Toro Co. | 15,009 | 621 |
17
| | | Market |
| | | Value• |
| | Shares | ($000) |
| Robbins & Myers, Inc. | 18,500 | 604 |
* | Spherion Corp. | 94,640 | 579 |
* | Hexcel Corp. | 29,900 | 571 |
* | PHH Corp. | 32,600 | 568 |
* | Rush Enterprises, Inc. Class A | 35,598 | 564 |
| The Manitowoc Co., Inc. | 13,800 | 563 |
* | Consolidated Graphics, Inc. | 9,753 | 547 |
| Deluxe Corp. | 28,000 | 538 |
| Steelcase Inc. | 48,174 | 533 |
^ | HNI Corp. | 19,700 | 530 |
* | TrueBlue, Inc. | 39,307 | 528 |
| Kelly Services, Inc. Class A | 25,657 | 528 |
* | Avis Budget Group, Inc. | 48,900 | 519 |
*^ | TBS International Ltd. | 16,800 | 507 |
| Apogee Enterprises, Inc. | 32,942 | 507 |
* | FTI Consulting, Inc. | 7,000 | 497 |
* | Alliant Techsystems, Inc. | 4,500 | 466 |
| Alexander & Baldwin, Inc. | 10,200 | 439 |
| Applied Industrial Technology, Inc. | 14,600 | 436 |
* | Continental Airlines, Inc. Class B | 22,312 | 429 |
| Herman Miller, Inc. | 14,854 | 365 |
| Aircastle Ltd. | 29,500 | 332 |
* | URS Corp. | 9,800 | 320 |
| Skywest, Inc. | 14,600 | 308 |
| Armstrong Worldwide | | |
| Industries, Inc. | 7,700 | 274 |
* | NCI Building Systems, Inc. | 9,500 | 230 |
| Interline Brands, Inc. | 11,200 | 208 |
* | Amerco, Inc. | 2,856 | 163 |
* | Ladish Co., Inc. | 3,500 | 126 |
* | Volt Information Sciences Inc. | 5,600 | 95 |
| Xerium Technologies Inc. | 19,400 | 25 |
| Bowne & Co., Inc. | 1,500 | 23 |
| | | 33,479 |
Information Technology (16.0%) | | |
* | Mettler-Toledo | | |
| International Inc. | 10,166 | 987 |
* | Sybase, Inc. | 33,715 | 887 |
* | MICROS Systems, Inc. | 24,548 | 826 |
* | SAIC, Inc. | 44,200 | 822 |
* | Anixter International Inc. | 12,800 | 820 |
* | Plexus Corp. | 27,865 | 782 |
* | CommScope, Inc. | 22,400 | 780 |
* | Ciena Corp. | 24,200 | 746 |
* | Tech Data Corp. | 22,400 | 735 |
* | Checkpoint Systems, Inc. | 27,300 | 733 |
* | ManTech International Corp. | 15,825 | 718 |
* | Amkor Technology, Inc. | 66,965 | 716 |
* | Metavante Technologies | 35,600 | 712 |
* | Integrated Device | | |
| Technology Inc. | 77,200 | 689 |
| MAXIMUS, Inc. | 18,700 | 686 |
* | SPSS, Inc. | 17,560 | 681 |
18
| | | Market |
| | | Value• |
| | Shares | ($000) |
* | Zoran Corp. | 49,816 | 680 |
* | Synopsys, Inc. | 29,500 | 670 |
* | Skyworks Solutions, Inc. | 91,700 | 668 |
* | Vishay Intertechnology, Inc. | 73,000 | 661 |
| Technitrol, Inc. | 28,490 | 659 |
* | Fairchild Semiconductor International, Inc. | 54,200 | 646 |
| TNS Inc. | 31,000 | 640 |
* | j2 Global Communications, Inc. | 27,400 | 612 |
* | ADC Telecommunications, Inc. | 50,500 | 610 |
* | Sigma Designs, Inc. | 26,600 | 603 |
* | MPS Group, Inc. | 49,250 | 582 |
* | Insight Enterprises, Inc. | 31,900 | 558 |
* | Emulex Corp. | 34,370 | 558 |
* | Compuware Corp. | 75,000 | 551 |
| Methode Electronics, Inc. Class A | 46,900 | 548 |
* | Vignette Corp. | 41,000 | 542 |
* | Interwoven Inc. | 49,528 | 529 |
| United Online, Inc. | 49,800 | 526 |
* | Novatel Wireless, Inc. | 53,600 | 519 |
| Syntel, Inc. | 19,352 | 516 |
* | Multi-Fineline Electronix, Inc. | 25,800 | 484 |
* | Dolby Laboratories Inc. | 13,280 | 482 |
* | S1 Corp. | 67,218 | 478 |
* | Varian Semiconductor Equipment Associates, Inc. | 16,200 | 456 |
* | SAVVIS, Inc. | 24,797 | 403 |
* | Mattson Technology, Inc. | 64,200 | 391 |
* | Verigy Ltd. | 20,500 | 386 |
* | CSG Systems | | |
| International, Inc. | 33,184 | 377 |
* | Lawson Software, Inc. | 50,000 | 377 |
* | JDA Software Group, Inc. | 20,600 | 376 |
* | Omniture, Inc. | 14,800 | 344 |
* | Brocade Communications | | |
| Systems, Inc. | 45,900 | 335 |
* | Dycom Industries, Inc. | 26,200 | 315 |
* | Eagle Test Systems, Inc. | 29,900 | 314 |
* | RF Micro Devices, Inc. | 117,900 | 314 |
* | Semtech Corp. | 21,300 | 305 |
* | Quest Software, Inc. | 23,100 | 302 |
* | Novell, Inc. | 47,600 | 299 |
* | Equinix, Inc. | 4,400 | 293 |
* | Blue Coat Systems, Inc. | 13,100 | 289 |
* | iGATE Corp. | 37,171 | 265 |
* | ANADIGICS, Inc. | 31,300 | 205 |
| Broadridge Financial | | |
| Solutions LLC | 11,600 | 204 |
* | CMGI, Inc. | 15,200 | 202 |
* | Credence Systems Corp. | 109,900 | 187 |
| Jack Henry & Associates Inc. | 6,600 | 163 |
* | NeuStar, Inc. Class A | 4,800 | 127 |
* | Sykes Enterprises, Inc. | 5,400 | 95 |
* | Manhattan Associates, Inc. | 3,100 | 71 |
* | Riverbed Technology, Inc. | 4,300 | 64 |
19
| | | Market |
| | | Value• |
| | Shares | ($000) |
| MoneyGram International, Inc. | 23,976 | 45 |
* | Comtech Telecommunications Corp. | 900 | 35 |
| Bel Fuse, Inc. Class B | 800 | 22 |
* | Starent Networks Corp. | 1,600 | 22 |
| | | 33,225 |
Materials (6.3%) | | |
| Airgas, Inc. | 19,600 | 891 |
* | Terra Industries, Inc. | 25,000 | 888 |
| Cytec Industries, Inc. | 16,300 | 878 |
| Carpenter Technology Corp. | 14,900 | 834 |
| Greif Inc. Class A | 12,134 | 824 |
* | W.R. Grace & Co. | 35,700 | 815 |
* | OM Group, Inc. | 13,692 | 747 |
| Rock-Tenn Co. | 23,900 | 716 |
| Kaiser Aluminum Corp. | 9,800 | 679 |
| Commercial Metals Co. | 22,000 | 659 |
| Koppers Holdings, Inc. | 14,700 | 651 |
| Steel Dynamics, Inc. | 17,732 | 586 |
| Lubrizol Corp. | 10,300 | 572 |
| Cleveland-Cliffs Inc. | 4,723 | 566 |
* | Buckeye Technology, Inc. | 49,600 | 553 |
| RPM International, Inc. | 24,200 | 507 |
* | PolyOne Corp. | 62,887 | 401 |
| Olin Corp. | 14,200 | 281 |
* | Rockwood Holdings, Inc. | 8,200 | 269 |
| Quanex Corp. | 5,148 | 266 |
| Worthington Industries, Inc. | 15,400 | 260 |
| H.B. Fuller Co. | 9,400 | 192 |
| Silgan Holdings, Inc. | 1,311 | 65 |
| | | 13,100 |
Telecommunication Services (1.1%) | | |
* | Cincinnati Bell Inc. | 160,300 | 683 |
* | Syniverse Holdings Inc. | 39,340 | 655 |
| USA Mobility, Inc. | 49,500 | 353 |
| Alaska Communications Systems Holdings, Inc. | 21,500 | 263 |
* | Premiere Global Services, Inc. | 14,600 | 209 |
| NTELOS Holdings Corp. | 4,100 | 99 |
* | Centennial Communications Corp.Class A | 4,610 | 27 |
| | | 2,289 |
Utilities (4.4%) | | |
| UGI Corp. Holding Co. | 34,700 | 865 |
| Atmos Energy Corp. | 33,600 | 857 |
| Southern Union Co. | 34,800 | 810 |
| WGL Holdings Inc. | 22,400 | 718 |
| Portland General Electric Co. | 31,700 | 715 |
| Black Hills Corp. | 19,900 | 712 |
| The Laclede Group, Inc. | 19,500 | 695 |
| Westar Energy, Inc. | 28,300 | 644 |
| Energen Corp. | 9,644 | 601 |
| Northwest Natural Gas Co. | 12,500 | 543 |
| ALLETE, Inc. | 12,404 | 479 |
20
| | | Market |
| | | Value• |
| | Shares | ($000) |
| National Fuel Gas Co. | 9,800 | 463 |
* | El Paso Electric Co. | 19,000 | 406 |
| Vectren Corp. | 9,610 | 258 |
| Great Plains Energy, Inc. | 8,900 | 219 |
| OGE Energy Corp. | 5,800 | 181 |
| | | 9,166 |
Total Common Stocks | | |
(Cost $225,956) | | 206,206 |
Temporary Cash Investments (1.9%)1 | | |
Money Market Fund (1.8%) | | |
2 | Vanguard Market Liquidity Fund, 2.800% | 1,841,997 | 1,842 |
2 | Vanguard Market Liquidity Fund, 2.800%—Note E | 1,892,200 | 1,892 |
| | | 3,734 |
| | | |
| | Face | |
| | Amount | |
| | ($000) | |
U.S. Agency Obligation (0.1%) | | |
3 | Federal Home Loan Mortgage Corp. | | |
4 | 3.607%, 4/7/08 | 200 | 200 |
Total Temporary Cash Investments | | |
(Cost $3,934) | | 3,934 |
Total Investments (101.3%) | | |
(Cost $229,890) | | 210,140 |
Other Assets and Liabilities (–1.3%) | | |
Other Assets—Note B | | 697 |
Liabilities—Note E | | (3,337) |
| | | (2,640) |
Net Assets (100%) | | |
Applicable to 11,697,314 outstanding | | |
$.001 par value shares of beneficial | | |
interest (unlimited authorization) | | 207,500 |
Net Asset Value Per Share | | $17.74 |
21
At March 31, 2008, net assets consisted of:5 | |
| Amount | Per |
| (000) | Share |
Paid-in Capital | 237,523 | $20.31 |
Overdistributed Net | | |
Investment Income | (359) | (.03) |
Accumulated Net | | |
Realized Losses | (9,958) | (.85) |
Unrealized Appreciation/ | | |
Depreciation | | |
Investment Securities | (19,750) | (1.69) |
Futures Contracts | 44 | — |
Net Assets | 207,500 | $17.74 |
• | See Note A in Notes to Financial Statements. |
* | Non-income-producing security. |
^ | Part of security position is on loan to broker-dealers. See Note E in Notes to Financial Statements. |
1 The fund invests a portion of its cash reserves in equity markets through the use of index futures contracts. After giving effect to futures investments, the fund’s effective common stock and temporary cash investment positions represent 100.1% and 1.2%, respectively, of net assets. See Note C in Notes to Financial Statements.
2 Affiliated money market fund available only to Vanguard funds and certain trusts and accounts managed by Vanguard. Rate shown is the 7-day yield.
3 The issuer operates under a congressional charter; its securities are neither issued nor guaranteed by the U.S. government. If needed, access to additional funding from the U.S. Treasury (beyond the issuer’s line of credit) would require congressional action.
4 Securities with a value of $200,000 have been segregated as initial margin for open futures contracts.
5 See Note C in Notes to Financial Statements for the tax-basis components of net assets.
REIT—Real Estate Investment Trust.
22
Statement of Operations
| Six Months Ended |
| March 31, 2008 |
| ($000) |
Investment Income | |
Income | |
Dividends | 890 |
Interest1 | 35 |
Security Lending | 61 |
Total Income | 986 |
Expenses | |
The Vanguard Group—Note B | |
Investment Advisory Services | 89 |
Management and Administrative | 267 |
Marketing and Distribution | 32 |
Custodian Fees | 24 |
Shareholders’ Reports | 5 |
Total Expenses | 417 |
Net Investment Income | 569 |
Realized Net Gain (Loss) | |
Investment Securities Sold | (8,366) |
Futures Contracts | (309) |
Realized Net Gain (Loss) | (8,675) |
Change in Unrealized Appreciation (Depreciation) | |
Investment Securities | (30,529) |
Futures Contracts | 35 |
Change in Unrealized Appreciation (Depreciation) | (30,494) |
Net Increase (Decrease) in Net Assets Resulting from Operations | (38,600) |
1 Interest income from an affiliated company of the fund was $27,000.
23
Statement of Changes in Net Assets
| Six Months Ended | Year Ended |
| March 31, | September 30, |
| 2008 | 2007 |
| ($000) | ($000) |
Increase (Decrease) in Net Assets | | |
Operations | | |
Net Investment Income | 569 | 2,529 |
Realized Net Gain (Loss) | (8,675) | 3,133 |
Change in Unrealized Appreciation (Depreciation) | (30,494) | 15,604 |
Net Increase (Decrease) in Net Assets Resulting from Operations | (38,600) | 21,266 |
Distributions | | |
Net Investment Income | (2,555) | (1,472) |
Realized Capital Gain1 | (1,837) | — |
Total Distributions | (4,392) | (1,472) |
Capital Share Transactions—Note F | | |
Issued | 47,982 | 132,076 |
Issued in Lieu of Cash Distributions | 3,832 | 1,347 |
Redeemed | (58,323) | (76,625) |
Net Increase (Decrease) from Capital Share Transactions | (6,509) | 56,798 |
Total Increase (Decrease) | (49,501) | 76,592 |
Net Assets | | |
Beginning of Period | 257,001 | 180,409 |
End of Period2 | 207,500 | 257,001 |
1 Includes fiscal 2008 short-term gain distributions totaling $657,000. Short-term gain distributions are treated as ordinary income dividends for tax purposes.
2 Net Assets—End of Period includes undistributed (overdistributed) net investment income of ($359,000) and $1,627,000.
24
Financial Highlights
| Six Months | Year | April 20, |
| Ended | Ended | 20061 to |
| March 31, | Sept. 30, | Sept. 30, |
For a Share Outstanding Throughout Each Period | 2008 | 2007 | 2006 |
Net Asset Value, Beginning of Period | $21.28 | $19.04 | $20.00 |
Investment Operations | | | |
Net Investment Income | .050 | .22 | .09 |
Net Realized and Unrealized Gain (Loss) on Investments | (3.229) | 2.17 | (1.05) |
Total from Investment Operations | (3.179) | 2.39 | (.96) |
Distributions | | | |
Dividends from Net Investment Income | (.210) | (.15) | — |
Distributions from Realized Capital Gains | (.151) | — | — |
Total Distributions | (.361) | (.15) | — |
Net Asset Value, End of Period | $17.74 | $21.28 | $19.04 |
| | | |
Total Return2 | –15.04% | 12.58% | –4.85% |
| | | |
Ratios/Supplemental Data | | | |
Net Assets, End of Period (Millions) | $208 | $257 | $180 |
Ratio of Total Expenses to Average Net Assets | 0.36%* | 0.38% | 0.40%* |
Ratio of Net Investment Income to Average Net Assets | 0.71%* | 1.07% | 1.20%* |
Portfolio Turnover Rate | 101%* | 73% | 35% |
1 Subscription period for the fund was April 20, 2006, to April 24, 2006, during which time all assets were held in money market instruments. Performance measurement began April 24, 2006, at a net asset value of $20.01.
2 Total returns do not reflect the account service fee that may be applicable to certain accounts with balances below $10,000.
See accompanying Notes, which are an integral part of the Financial Statements.
25
Notes to Financial Statements
Vanguard Strategic Small-Cap Equity Fund is registered under the Investment Company Act of 1940 as an open-end investment company, or mutual fund. The fund files reports with the SEC under the company name Vanguard Horizon Funds.
A. The following significant accounting policies conform to generally accepted accounting principles for U.S. mutual funds. The fund consistently follows such policies in preparing its financial statements.
1. Security Valuation: Securities are valued as of the close of trading on the New York Stock Exchange (generally 4 p.m., Eastern time) on the valuation date. Equity securities are valued at the latest quoted sales prices or official closing prices taken from the primary market in which each security trades; such securities not traded on the valuation date are valued at the mean of the latest quoted bid and asked prices. Securities for which market quotations are not readily available, or whose values have been materially affected by events occurring before the fund’s pricing time but after the close of the securities’ primary markets, are valued by methods deemed by the board of trustees to represent fair value. Investments in Vanguard Market Liquidity Fund are valued at that fund’s net asset value. Temporary cash investments acquired over 60 days to maturity are valued using the latest bid prices or using valuations based on a matrix system (which considers such factors as security prices, yields, maturities, and ratings), both as furnished by independent pricing services. Other temporary cash investments are valued at amortized cost, which approximates market value.
2. Futures Contracts: The fund uses index futures contracts to a limited extent, with the objective of maintaining full exposure to the stock market while maintaining liquidity. The fund may purchase or sell futures contracts to achieve a desired level of investment, whether to accommodate portfolio turnover or cash flows from capital share transactions. The primary risks associated with the use of futures contracts are imperfect correlation between changes in market values of stocks held by the fund and the prices of futures contracts, and the possibility of an illiquid market.
Futures contracts are valued at their quoted daily settlement prices. The aggregate principal amounts of the contracts are not recorded in the Statement of Net Assets. Fluctuations in the value of the contracts are recorded in the Statement of Net Assets as an asset (liability) and in the Statement of Operations as unrealized appreciation (depreciation) until the contracts are closed, when they are recorded as realized futures gains (losses).
3. Federal Income Taxes: The fund intends to continue to qualify as a regulated investment company and distribute all of its taxable income. Management has analyzed the fund’s tax positions taken on federal income tax returns for all open tax years (tax years ended September 30, 2006–2007) and for the period ended March 31, 2008, and has concluded that no provision for federal income tax is required in the fund’s financial statements.
4. Distributions: Distributions to shareholders are recorded on the ex-dividend date.
5. Security Lending: The fund may lend its securities to qualified institutional borrowers to earn additional income. Security loans are required to be secured at all times by collateral at least equal to the market value of securities loaned. The fund invests cash collateral received in Vanguard Market Liquidity Fund, and records a liability for the return of the collateral, during the period the securities are on loan. Security lending income represents the income earned on investing cash collateral, less expenses associated with the loan.
26
6. Other: Dividend income is recorded on the ex-dividend date. Interest income includes income distributions received from Vanguard Market Liquidity Fund and is accrued daily. Security transactions are accounted for on the date securities are bought or sold. Costs used to determine realized gains (losses) on the sale of investment securities are those of the specific securities sold.
B. The Vanguard Group furnishes at cost investment advisory, corporate management, administrative, marketing, and distribution services. The costs of such services are allocated to the fund under methods approved by the board of trustees. The fund has committed to provide up to 0.40% of its net assets in capital contributions to Vanguard. At March 31, 2008, the fund had contributed capital of $18,000 to Vanguard (included in Other Assets), representing 0.01% of the fund’s net assets and 0.02% of Vanguard’s capitalization. The fund’s trustees and officers are also directors and officers of Vanguard.
C. Distributions are determined on a tax basis and may differ from net investment income and realized capital gains for financial reporting purposes. Differences may be permanent or temporary. Permanent differences are reclassified among capital accounts in the financial statements to reflect their tax character. Temporary differences arise when certain items of income, expense, gain, or loss are recognized in different periods for financial statement and tax purposes; these differences will reverse at some time in the future. Differences in classification may also result from the treatment of short-term gains as ordinary income for tax purposes. The fund’s tax-basis capital gains and losses are determined only at the end of each fiscal year.
At March 31, 2008, the cost of investment securities for tax purposes was $229,890,000. Net unrealized depreciation of investment securities for tax purposes was $19,750,000, consisting of unrealized gains of $14,002,000 on securities that had risen in value since their purchase and $33,752,000 in unrealized losses on securities that had fallen in value since their purchase.
At March 31, 2008, the aggregate settlement value of open futures contracts expiring in June 2008 and the related unrealized appreciation (depreciation) were:
| | | ($000) |
| | Aggregate | Unrealized |
| Number of | Settlement | Appreciation |
Futures Contracts | Long Contracts | Value | (Depreciation) |
Russell 2000 Index | 4 | 1,380 | 44 |
Unrealized appreciation (depreciation) on open futures contracts is required to be treated as realized gain (loss) for tax purposes.
D. During the six months ended March 31, 2008, the fund purchased $115,526,000 of investment securities and sold $125,111,000 of investment securities, other than temporary cash investments.
E. The market value of securities on loan to broker-dealers at March 31, 2008, was $1,723,000, for which the fund received cash collateral of $1,892,000.
27
F. Capital shares issued and redeemed were:
| Six Months Ended | Year Ended |
| March 31, 2008 | September 30, 2007 |
| Shares | Shares |
| (000) | (000) |
Issued | 2,421 | 6,183 |
Issued in Lieu of Cash Distributions | 203 | 65 |
Redeemed | (3,003) | (3,649) |
Net Increase (Decrease) in Shares Outstanding | (379) | 2,599 |
28
About Your Fund’s Expenses
As a shareholder of the fund, you incur ongoing costs, which include costs for portfolio management, administrative services, and shareholder reports (like this one), among others. Operating expenses, which are deducted from a fund’s gross income, directly reduce the investment return of the fund.
A fund’s expenses are expressed as a percentage of its average net assets. This figure is known as the expense ratio. The following examples are intended to help you understand the ongoing costs (in dollars) of investing in your fund and to compare these costs with those of other mutual funds. The examples are based on an investment of $1,000 made at the beginning of the period shown and held for the entire period.
The table below illustrates your fund’s costs in two ways:
• Based on actual fund return. This helps you to estimate the actual expenses that you paid over the period. The “Ending Account Value” shown is derived from the fund’s actual return, and the third column shows the dollar amount that would have been paid by an investor who started with $1,000 in the fund. You may use the information here, together with the amount you invested, to estimate the expenses that you paid over the period.
To do so, simply divide your account value by $1,000 (for example, an $8,600 account value divided by $1,000 = 8.6), then multiply the result by the number given for your fund under the heading “Expenses Paid During Period.”
• Based on hypothetical 5% yearly return. This section is intended to help you compare your fund’s costs with those of other mutual funds. It assumes that the fund had a yearly return of 5% before expenses, but that the expense ratio is unchanged. In this case—because the return used is not the fund’s actual return—the results do not apply to your investment. The example is useful in making comparisons because the Securities and Exchange Commission requires all mutual funds to calculate expenses based on a 5% return. You can assess your fund’s costs by comparing this hypothetical example with the hypothetical examples that appear in shareholder reports of other funds.
Six Months Ended March 31, 2008 | | | |
| Beginning | Ending | Expenses |
| Account Value | Account Value | Paid During |
Strategic Small-Cap Equity Fund | 9/30/2007 | 3/31/2008 | Period1 |
Based on Actual Fund Return | $1,000.00 | $849.57 | $1.66 |
Based on Hypothetical 5% Yearly Return | 1,000.00 | 1,023.20 | 1.82 |
Note that the expenses shown in the table are meant to highlight and help you compare ongoing costs only and do not reflect transaction costs incurred by the fund for buying and selling securities. Further, the expenses do not include the account service fee described in the prospectus. If such a fee were applied to your account, your costs would be higher. Your fund does not charge transaction fees, such as purchase or redemption fees, nor does it carry a “sales load.”
1 The calculations are based on expenses incurred in the most recent six-month period. The fund’s annualized six-month expense ratio for that period is 0.36%. The dollar amounts shown as “Expenses Paid” are equal to the annualized expense ratio multiplied by the average account value over the period, multiplied by the number of days in the most recent six-month period, then divided by the number of days in the most recent 12-month period.
29
The calculations assume no shares were bought or sold during the period. Your actual costs may have been higher or lower, depending on the amount of your investment and the timing of any purchases or redemptions.
You can find more information about the fund’s expenses, including annual expense ratios, in the Financial Statements section of this report. For additional information on operating expenses and other shareholder costs, please refer to your fund’s current prospectus.
30
Trustees Approve Advisory Arrangement
The board of trustees of Vanguard Strategic Small-Cap Equity Fund has renewed its investment advisory arrangement with The Vanguard Group, Inc. Vanguard—through its Quantitative Equity Group—serves as the fund’s investment advisor. The board determined that continuing the fund’s internalized management structure was in the best interests of the fund and its shareholders.
The board based its decision upon an evaluation of the advisor’s investment staff, portfolio management process, and performance. The trustees considered the factors discussed below, among others. However, no single factor determined whether the board approved the arrangement. Rather, it was the totality of the circumstances that drove the board’s decision.
Nature, extent, and quality of services
The board considered the quality of the fund’s investment management since its inception in April 2006, and took into account the organizational depth and stability of the advisor. The board noted that Vanguard has been managing investments for more than two decades. George U. Sauter, Vanguard managing director and chief investment officer, has been in the investment management business since 1985, and has led the Quantitative Equity Group since 1987. James P. Stetler, the manager primarily responsible for the day-to-day management of the fund, has worked in investment management since 1996. The Quantitative Equity Group adheres to a sound, disciplined investment management process; the team has considerable experience, stability, and depth.
The board concluded that Vanguard’s experience, stability, depth, and performance, among other factors, warranted continuation of the advisory arrangement.
Investment performance
The board considered the fund’s performance since inception, including periods of outperformance and underperformance of a relevant benchmark and peer group. The board concluded that the advisor has carried out the fund’s investment strategy in disciplined fashion, and that performance results have been within competitive norms. Information about the fund’s most recent performance can be found in the Performance Summary section of this report.
Cost
The board concluded that the fund’s expense ratio was far below the average expense ratio charged by funds in the fund’s peer group. The board noted that the fund’s advisory expenses were also well below the peer-group average. Information about the fund’s expense ratio appears in the About Your Fund’s Expenses section of this report as well as in the Financial Statements section.
The board does not conduct a profitability analysis of Vanguard because of Vanguard’s unique “at-cost” structure. Unlike most other mutual fund management companies, Vanguard is owned by the funds it oversees, and produces “profits” only in the form of reduced expenses for fund shareholders.
The benefit of economies of scale
The board of trustees concluded that the fund’s low-cost arrangement with Vanguard ensures that the fund will realize economies of scale as it grows, with the cost to shareholders declining as fund assets increase.
The board will consider whether to renew the advisory arrangement again after a one-year period.
31
Glossary
Earnings Growth Rate. The average annual rate of growth in earnings over the past five years for the stocks now in a fund.
Equity Exposure. A measure that reflects a fund’s investments in stocks and stock futures. Any holdings in short-term reserves are excluded.
Expense Ratio. The percentage of a fund’s average net assets used to pay its annual administrative and advisory expenses. These expenses directly reduce returns to investors.
Foreign Holdings. The percentage of a fund represented by stocks or depositary receipts of companies based outside the United States.
Inception Date. The date on which the assets of a fund (or one of its share classes) are first invested in accordance with the fund’s investment objective. For funds with a subscription period, the inception date is the day after that period ends. Investment performance is measured from the inception date.
Median Market Cap. An indicator of the size of companies in which a fund invests; the midpoint of market capitalization (market price x shares outstanding) of a fund’s stocks, weighted by the proportion of the fund’s assets invested in each stock. Stocks representing half of the fund’s assets have market capitalizations above the median, and the rest are below it.
Price/Book Ratio. The share price of a stock divided by its net worth, or book value, per share. For a fund, the weighted average price/book ratio of the stocks it holds.
Price/Earnings Ratio. The ratio of a stock’s current price to its per-share earnings over the past year. For a fund, the weighted average P/E of the stocks it holds. P/E is an indicator of market expectations about corporate prospects; the higher the P/E, the greater the expectations for a company’s future growth.
Return on Equity. The annual average rate of return generated by a company during the past five years for each dollar of shareholder’s equity (net income divided by shareholder’s equity). For a fund, the weighted average return on equity for the companies whose stocks it holds.
Short-Term Reserves. The percentage of a fund invested in highly liquid, short-term securities that can be readily converted to cash.
Turnover Rate. An indication of the fund’s trading activity. Funds with high turnover rates incur higher transaction costs and may be more likely to distribute capital gains (which may be taxable to investors). The turnover rate excludes in-kind transactions, which have minimal impact on costs.
Yield. A fund’s 30-day SEC yield is derived using a formula specified by the U.S. Securities and Exchange Commission. Under the formula, data related to the fund’s security holdings in the previous 30 days are used to calculate the fund’s hypothetical net income for that period, which is then annualized and divided by the fund’s estimated average net assets over the calculation period. For the purposes of this calculation, a security’s income is based on its current market yield to maturity (in the case of bonds) or its projected dividend yield (for stocks). Because the SEC yield represents hypothetical annualized income, it will differ—at times significantly—from the fund’s actual experience. As a result, the fund’s income distributions may be higher or lower than implied by the SEC yield.
32
This page intentionally left blank.
This page intentionally left blank.
The People Who Govern Your Fund
The trustees of your mutual fund are there to see that the fund is operated and managed in your best interests since, as a shareholder, you are a part owner of the fund. Your fund’s trustees also serve on the board of directors of The Vanguard Group, Inc., which is owned by the Vanguard funds and provides services to them on an at-cost basis.
A majority of Vanguard’s board members are independent, meaning that they have no affiliation with Vanguard or the funds they oversee, apart from the sizable personal investments they have made as private individuals.
Our independent board members bring distinguished backgrounds in business, academia, and public service to their task of working with Vanguard officers to establish the policies and oversee the activities of the funds. Among board members’ responsibilities are selecting investment advisors for the funds; monitoring fund operations, performance, and costs; reviewing contracts; nominating and selecting new trustees/directors; and electing Vanguard officers.
Each trustee serves a fund until its termination; or until the trustee’s retirement, resignation, or death; or otherwise as specified in the fund’s organizational documents. Any trustee may be removed at a shareholders’ meeting by a vote representing two-thirds of the net asset value of all shares of the fund together with shares of other Vanguard funds organized within the same trust. The table on these two pages shows information for each trustee and executive officer of the fund. The mailing address of the trustees and officers is P.O. Box 876, Valley Forge, PA 19482.
Chairman of the Board, Chief Executive Officer, and Trustee |
| |
John J. Brennan1 | |
Born 1954 | Principal Occupation(s) During the Past Five Years: Chairman of the Board, Chief Executive |
Trustee since May 1987; | Officer, and Director/Trustee of The Vanguard Group, Inc., and of each of the investment |
Chairman of the Board and | companies served by The Vanguard Group; Director of Vanguard Marketing Corporation. |
Chief Executive Officer | |
155 Vanguard Funds Overseen | |
| |
Independent Trustees | |
| |
Charles D. Ellis | |
Born 1937 | Principal Occupation(s) During the Past Five Years: Applecore Partners (pro bono ventures |
Trustee since January 2001 | in education); Senior Advisor to Greenwich Associates (international business strategy |
155 Vanguard Funds Overseen | consulting); Successor Trustee of Yale University; Overseer of the Stern School of Business |
| at New York University; Trustee of the Whitehead Institute for Biomedical Research. |
| |
Emerson U. Fullwood | |
Born 1948 | Principal Occupation(s) During the Past Five Years: Executive Chief Staff and Marketing |
Trustee since January 2008 | Officer for North America since 2004 and Corporate Vice President of Xerox Corporation |
155 Vanguard Funds Overseen | (photocopiers and printers); Director of SPX Corporation (multi-industry manufacturing), |
| of the United Way of Rochester, and of the Boy Scouts of America. |
| |
Rajiv L. Gupta | |
Born 1945 | Principal Occupation(s) During the Past Five Years: Chairman, President, and |
Trustee since December 20012 | Chief Executive Officer of Rohm and Haas Co. (chemicals); Board Member of |
155 Vanguard Funds Overseen | the American Chemistry Council; Director of Tyco International, Ltd. (diversified |
| manufacturing and services) since 2005. |
| |
Amy Gutmann | |
Born 1949 | Principal Occupation(s) During the Past Five Years: President of the University of |
Trustee since June 2006 | Pennsylvania since 2004; Professor in the School of Arts and Sciences, Annenberg School |
155 Vanguard Funds Overseen | for Communication, and Graduate School of Education of the University of Pennsylvania |
| since 2004; Provost (2001–2004) and Laurance S. Rockefeller Professor of Politics and |
| the University Center for Human Values (1990–2004), Princeton University; Director of |
| Carnegie Corporation of New York since 2005 and of Schuylkill River Development |
| Corporation and Greater Philadelphia Chamber of Commerce since 2004; Trustee of |
| the National Constitution Center since 2007. |
JoAnn Heffernan Heisen | |
Born 1950 | Principal Occupation(s) During the Past Five Years: Corporate Vice President and |
Trustee since July 1998 | Chief Global Diversity Officer since 2006, Vice President and Chief Information |
155 Vanguard Funds Overseen | Officer (1997–2005), and Member of the Executive Committee of Johnson & |
| Johnson (pharmaceuticals/consumer products); Director of the University Medical |
| Center at Princeton and Women’s Research and Education Institute. |
| |
André F. Perold | |
Born 1952 | Principal Occupation(s) During the Past Five Years: George Gund Professor of Finance |
Trustee since December 2004 | and Banking, Harvard Business School; Senior Associate Dean and Director of Faculty |
155 Vanguard Funds Overseen | Recruiting, Harvard Business School; Director and Chairman of UNX, Inc. (equities |
| trading firm); Chair of the Investment Committee of HighVista Strategies LLC (private |
| investment firm) since 2005. |
| |
Alfred M. Rankin, Jr. | |
Born 1941 | Principal Occupation(s) During the Past Five Years: Chairman, President, Chief Executive |
Trustee since January 1993 | Officer, and Director of NACCO Industries, Inc. (forklift trucks/housewares/lignite); Director |
155 Vanguard Funds Overseen | of Goodrich Corporation (industrial products/aircraft systems and services). |
| |
| |
J. Lawrence Wilson | |
Born 1936 | Principal Occupation(s) During the Past Five Years: Retired Chairman and Chief Executive |
Trustee since April 1985 | Officer of Rohm and Haas Co. (chemicals); Director of Cummins Inc. (diesel engines) and |
155 Vanguard Funds Overseen | AmerisourceBergen Corp. (pharmaceutical distribution); Trustee of Vanderbilt University |
| and of Culver Educational Foundation. |
| |
| |
Executive Officers1 | |
| |
Thomas J. Higgins | |
Born 1957 | Principal Occupation(s) During the Past Five Years: Principal of The Vanguard Group, Inc.; |
Treasurer since July 1998 | Treasurer of each of the investment companies served by The Vanguard Group. |
155 Vanguard Funds Overseen | |
| |
| |
F. William McNabb III | |
Born 1957 | Principal Occupation(s) During the Past Five Years: President of The Vanguard Group, Inc., |
President since March 2008 | and of each of the investment companies served by The Vanguard Group since 2008; |
155 Vanguard Funds Overseen | Director of Vanguard Marketing Corporation; Managing Director of The Vanguard Group |
| (1995–2008). |
| |
Heidi Stam | |
Born 1956 | Principal Occupation(s) During the Past Five Years: Managing Director of The Vanguard |
Secretary since July 2005 | Group, Inc., since 2006; General Counsel of The Vanguard Group since 2005; Secretary of |
155 Vanguard Funds Overseen | The Vanguard Group, and of each of the investment companies served by The Vanguard |
| Group, since 2005; Director and Senior Vice President of Vanguard Marketing Corporation |
| since 2005; Principal of The Vanguard Group (1997–2006). |
Vanguard Senior Management Team |
| | | |
R. Gregory Barton | Kathleen C. Gubanich | Michael S. Miller | George U. Sauter |
Mortimer J. Buckley | Paul A. Heller | Ralph K. Packard | |
Founder |
|
John C. Bogle |
Chairman and Chief Executive Officer, 1974–1996 |
1 Officers of the funds are “interested persons” as defined in the Investment Company Act of 1940.
2 December 2002 for Vanguard Equity Income Fund, Vanguard Growth Equity Fund, the Vanguard Municipal Bond Funds, and the Vanguard State Tax-Exempt Funds.
More information about the trustees is in the Statement of Additional Information, available from The Vanguard Group.
| 
|
| P.O. Box 2600 |
| Valley Forge, PA 19482-2600 |
Connect with Vanguard® > www.vanguard.com
Fund Information > 800-662-7447 | Vanguard, Connect with Vanguard, and the ship logo are |
| trademarks of The Vanguard Group, Inc. |
Direct Investor Account Services > 800-662-2739 | |
| All other marks are the exclusive property of their |
Institutional Investor Services > 800-523-1036 | respective owners. |
| |
Text Telephone for People | All comparative mutual fund data are from Lipper Inc. |
With Hearing Impairment > 800-952-3335 | or Morningstar, Inc., unless otherwise noted. |
| |
| |
| You can obtain a free copy of Vanguard’s proxy voting |
| guidelines by visiting our website, www.vanguard.com, |
This material may be used in conjunction | and searching for “proxy voting guidelines,” or by |
with the offering of shares of any Vanguard | calling Vanguard at 800-662-2739. The guidelines are |
fund only if preceded or accompanied by | also available from the SEC’s website, www.sec.gov. |
the fund’s current prospectus. | In addition, you may obtain a free report on how your |
| fund voted the proxies for securities it owned during |
| the 12 months ended June 30. To get the report, visit |
| either www.vanguard.com or www.sec.gov. |
| |
| |
| You can review and copy information about your fund |
| at the SEC’s Public Reference Room in Washington, D.C. |
| To find out more about this public service, call the SEC |
| at 202-551-8090. Information about your fund is also |
| available on the SEC’s website, and you can receive |
| copies of this information, for a fee, by sending a |
| request in either of two ways: via e-mail addressed to |
| publicinfo@sec.gov or via regular mail addressed to the |
| Public Reference Section, Securities and Exchange |
| Commission, Washington, DC 20549-0102. |
| |
| |
| |
| |
| |
| © 2008 The Vanguard Group, Inc. |
| All rights reserved. |
| Vanguard Marketing Corporation, Distributor. |
| |
| Q6152 052008 |
Item 2: Not Applicable.
Item 3: Not Applicable.
Item 4: Not Applicable.
Item 5: Not Applicable.
Item 6: Not Applicable.
Item 7: Not applicable.
Item 8: Not Applicable.
Item 9: Not Applicable.
Item 10: Not Applicable.
Item 11: Controls and Procedures.
(a) Disclosure Controls and Procedures. The Principal Executive and Financial Officers concluded that the Registrant's Disclosure Controls and Procedures are effective based on their evaluation of the Disclosure Controls and Procedures as of a date within 90 days of the filing date of this report.
(b) Internal Control Over Financial Reporting. There were no significant changes in Registrant’s Internal Control Over Financial Reporting or in other factors that could significantly affect this control subsequent to the date of the evaluation, including any corrective actions with regard to significant deficiencies and material weaknesses.
Item 12: Exhibits.
Pursuant to the requirements of the Securities Exchange Act of 1934 and the Investment Company Act of 1940, the registrant has duly caused this report to be signed on its behalf by the undersigned, thereunto duly authorized.
| VANGUARD HORIZON FUNDS |
| |
By: | (signature) |
| (HEIDI STAM) |
| JOHN J. BRENNAN* |
| CHIEF EXECUTIVE OFFICER |
| |
Date: May 13, 2008 |
Pursuant to the requirements of the Securities Exchange Act of 1934 and the Investment Company Act of 1940, this report has been signed below by the following persons on behalf of the registrant and in the capacities and on the dates indicated.
| VANGUARD HORIZON FUNDS |
| |
By: | (signature) |
| (HEIDI STAM) |
| JOHN J. BRENNAN* |
| CHIEF EXECUTIVE OFFICER |
| |
Date: May 13, 2008 |
| VANGUARD HORIZON FUNDS |
| |
By: | (signature) |
| (HEIDI STAM) |
| THOMAS J. HIGGINS* |
| TREASURER |
| |
Date: May 13, 2008 |
*By Power of Attorney. Filed on January 18, 2008, see File Number 2-29601. Incorporated by Reference.