UNITED STATES
SECURITIES AND EXCHANGE COMMISSION
Washington, D.C. 20549
FORM N-CSR
CERTIFIED SHAREHOLDER REPORT
OF
REGISTERED MANAGEMENT INVESTMENT COMPANIES
Investment Company Act file number: 811-07239
Name of Registrant: Vanguard Horizon Funds
Address of Registrant: | P.O. Box 2600 |
| Valley Forge, PA 19482 |
| |
Name and address of agent for service: | Heidi Stam, Esquire |
| P.O. Box 876 |
| Valley Forge, PA 19482 |
| |
Registrant’s telephone number, including area code: (610) 669-1000
Date of fiscal year end: September 30
Date of reporting period: October 1, 2008– March 31, 2009
Item 1: Reports to Shareholders |

> | Vanguard Strategic Equity Fund returned about –37% for the six months ended March 31, 2009. The fund’s return trailed that of its benchmark index and its peer-group average. |
> | The broad U.S. stock market returned about –31% for the period. Shares of small and mid-sized companies fared worse than those of large companies. |
> | Like the broad market, the fund experienced declines across all sectors. |
Contents | |
| |
Your Fund’s Total Returns | 1 |
President’s Letter | 2 |
Advisor’s Report | 6 |
Fund Profile | 8 |
Performance Summary | 9 |
Financial Statements | 10 |
About Your Fund’s Expenses | 26 |
Trustees Approve Advisory Arrangement | 28 |
Glossary | 29 |
Please note: The opinions expressed in this report are just that—informed opinions. They should not be considered promises or advice. Also, please keep in mind that the information and opinions cover the period through the date on the front of this report. Of course, the risks of investing in your fund are spelled out in the prospectus.
Your Fund’s Total Returns
Six Months Ended March 31, 2009 | | |
| Ticker | Total |
| Symbol | Returns |
Vanguard Strategic Equity Fund | VSEQX | –36.66% |
MSCI US Small + Mid Cap 2200 Index | | –33.95 |
Average Mid-Cap Core Fund1 | | –31.41 |
Your Fund’s Performance at a Glance | | | |
September 30, 2008–March 31, 2009 | | | |
| | | Distributions Per Share |
| Starting | Ending | Income | Capital |
| Share Price | Share Price | Dividends | Gains |
Vanguard Strategic Equity Fund | $16.42 | $10.18 | $0.241 | $0.000 |
1 Derived from data provided by Lipper Inc.
1

President’s Letter
Dear Shareholder,
Vanguard Strategic Equity Fund returned about –37% for the six-month period ended March 31, 2009, which ranks among the worst half-year spans for the fund since its inception in 1995. The fund trailed its benchmark and its peers for the period, as all ten of its industry sectors recorded negative double-digit returns. Returns for mid- and small-capitalization stocks—the fund’s primary areas of investment—trailed those of large-caps.
Extreme distress dappled with glimmers of hope
The six months ended March 31 witnessed extreme distress in global stock markets, with both U.S. and international stocks returning about –31%. The embattled financial sector continued to struggle, prompting regulators in the United States and abroad to take evermore-aggressive actions to help the big banks fortify their fragile balance sheets.
Even as the gloom intensified, a few signs of recovery appeared on the horizon. Toward the end of the period, the swift contraction in manufacturing activity seemed to lessen. And throughout the six months, news from the housing sector seemed to improve. From their lows in early March through the end of the period, global stock markets generated a double-digit return.
2
Credit-market turmoil provoked dramatic response
Developments in the fixed income market were, if anything, even more unusual. In the months after the September collapse of Lehman Brothers, a major presence in the bond market, the trading of corporate bonds came to a near standstill as investors stampeded into U.S. Treasury bonds—considered the safest, most liquid credits—driving prices higher and yields lower. The difference between the yields of Treasuries and corporate bonds surged to levels not seen since the 1930s.
The Federal Reserve Board responded to the credit-market and economic crises with a dramatic easing of monetary policy, reducing its target for short-term interest rates to an all-time low of 0% to 0.25%.
The Fed also created new programs designed to bring borrowers and lenders back to the market. For the six-month period, the Barclays Capital U.S. Aggregate Bond Index returned 4.70% on the strength of Treasuries and other government-backed bonds. The broad municipal bond market returned 5.00%.
Fund’s declines were steep and broad-based
The Strategic Equity Fund, managed by Vanguard Quantitative Equity Group, seeks to mirror the sector allocations of its benchmark while overweighting or underweighting individual stocks. As with other funds that use quantitative models, the fund’s strategy is based on the idea that many “small wins” achieved through
Market Barometer | |
| Total Returns |
| Periods Ended March 31, 2009 |
| Six Months | One Year | Five Years1 |
Stocks | | | |
Russell 1000 Index (Large-caps) | –30.59% | –38.27% | –4.54% |
Russell 2000 Index (Small-caps) | –37.17 | –37.50 | –5.24 |
Dow Jones Wilshire 5000 Index (Entire market) | –30.72 | –37.69 | –4.24 |
MSCI All Country World Index ex USA (International) | –30.54 | –46.18 | –0.24 |
| | | |
Bonds | | | |
Barclays Capital U.S. Aggregate Bond Index (Broad taxable market) | 4.70% | 3.13% | 4.13% |
Barclays Capital Municipal Bond Index | 5.00 | 2.27 | 3.21 |
Citigroup 3-Month Treasury Bill Index | 0.30 | 1.13 | 3.06 |
| | | |
CPI | | | |
Consumer Price Index | –2.78% | –0.38% | 2.57% |
1 Annualized.
3
its stock selection will enable the fund to outperform the benchmark over time, while maintaining a similar risk profile.
Amid the steep market declines of the past six months (and the fund’s return of about –37%), “keeping score” versus the benchmark seems quite secondary. Returns were negative across the spectrum, and ranged from –13% for telecommunications services to –54% for energy.
Not surprisingly, the fund’s largest areas of investment, on average, during the period—financials and industrials—were also the largest detractors from the fund’s overall performance. Financial stocks, which represented about 18% of the fund’s assets, on average, during the period, returned –40%. Real estate investment trusts (REITs) and insurance firms were areas of significant decline. Industrial stocks, which returned –47%, experienced weakness in areas ranging from office services to farm machinery.
Still, the fund made some key missteps relative to its benchmark, the MSCI US Small + Mid Cap 2200 Index. The industrial, energy, and health care sectors were among the fund’s worst performers on a relative basis.
The Strategic Equity Fund’s few bright spots involved a smattering of stocks that notched positive returns during the period. Several were within the consumer
Expense Ratios1 | | |
Your Fund Compared With Its Peer Group | | |
| | Average |
| | Mid-Cap |
| Fund | Core Fund |
Strategic Equity Fund | 0.32% | 1.30% |
1 The fund expense ratio shown is from the prospectus dated January 28, 2009, and represents estimated costs for the current fiscal year based on the fund’s current net assets. For the six months ended March 31, 2009, the annualized expense ratio was 0.31%. The peer-group expense ratio is derived from data provided by Lipper Inc. and captures information through year-end 2008.
4
discretionary sector, and included restaurants, auto parts stores, and dollar stores.
Respect for risk is crucial in bad times and good
Difficult times often yield valuable lessons. It’s been said that people who lived through the Great Depression developed a lifelong appreciation for thrift. The current economic environment certainly does not approach the widespread hardship experienced during the Depression, but if there’s a silver lining to the recent upheaval in the financial markets, perhaps it’s that today’s investors will gain a lifelong appreciation for market risk.
That means respecting the power of the markets to move up and down—and maintaining an investment strategy (and a long-term outlook) that can help you weather the swings. A portfolio that is balanced across stock, bond, and short-term funds can dampen volatility. We believe the Strategic Equity Fund, with its measured exposure to the economy’s mid-sized companies, can be a key component in a balanced investment strategy.
When the clouds clear from the current financial storm, and it looks like “smooth sailing” ahead, keep in mind that sticking with a balanced portfolio is not just a foul-weather tactic. As we witnessed in the autumn of 2008, the financial markets can move quickly and violently. Maintaining a balanced portfolio can help you capture the “ups” while also bracing for the unexpected “downs.”
Thank you for your continued confidence in Vanguard.
Sincerely,

F. William McNabb III
President and Chief Executive Officer
April 17, 2009
5
Advisor’s Report
For the six months ended March 31, 2009, Vanguard Strategic Equity Fund returned about –37%, while the fund’s benchmark, the MSCI US Small + Mid Cap 2200 Index, returned about –34%. For the most recent 18 months, the fund posted a cumulative return of about –53%; the benchmark returned about –48% for the same period. The overall market, as measured by the MSCI US Broad Market Index, notched a return of about –31% for the half-year and a cumulative return of about –46% for the 18-month period.
The attractively valued, high-quality stocks we prefer underperformed the market over the last six months. This is partly because financial firms, which have been at the center of the market storm, are usually value stocks, and they have pulled down the overall averages. But after adjusting for that effect, value stocks in all industries suffered relative to the fund’s benchmark. Since value stocks have lagged for so long, why do we persist in our preference? We base our view both on judgment and on empirical evidence. In our judgment, although the market is relatively effective in assigning prices to stocks, investors as a group can still overreact to new information.
This overreaction can cause prices to diverge a bit from “true” or “fair” value, providing opportunities to profit from these discrepancies. We identify potentially attractive stocks by looking at multiple signals. Market participants send some signals, such as measures of relative performance or changes in analysts’ opinions. Other signals are provided by company management, such as changes in capital spending or dividends. Finally, there are valuation signals, such as price-to-earnings ratios and yields. Over time, our signals have been an indication of future outperformance, although there are periods, sometimes measured in years, when the combination of these various signals is not effective.
Nonetheless, it seems that consistent exposure to these signals is rewarded over time. In recent months, many investors decided that they do not want any stock market exposure at all. In such an environment, we believe that our portfolio, with its P/E ratio of 10.4x and a return on equity (ROE) of 16.8%, is more attractive than our benchmark, with its P/E ratio of 19.7x and an ROE of 15.1%. These valuation metrics can be lost amid investors’ aversion to stock market risk at any level. Given our opinion that it is better to own attractive stocks at low multiples, we feel that our portfolio is well-positioned for the eventual market rebound.
Over the last six months, our best performance came in the retailing and banking industries. AutoZone and Dollar Tree were our most successful stocks in retail, while Ocwen Financial and Flushing Financial were leaders in banking. Energy and commercial services (a component of the industrials sector) were our worst performing industries. In energy,
6
PetroQuest Energy and Swift Energy were among the worst performers. American Reprographics and Interface were our worst stocks in commercial services.
Although we are dissatisfied with both the performance of the market overall and with our relative performance, we are confident that the stock market will post worthwhile returns for long-term investors in the future and that our investment strategy—based on valuation, market sentiment, and quality—will be successful. We thank you for your investment and look forward to the future.
James D. Troyer, CFA,
Principal and Portfolio Manager
Joel M. Dickson,
Principal
Vanguard Quantitative Equity Group
April 13, 2009
7
Strategic Equity Fund
Fund Profile
As of March 31, 2009
Portfolio Characteristics | | |
| | Comparative | Broad |
| Fund | Index1 | Index2 |
Number of Stocks | 733 | 2,178 | 4,489 |
Median Market Cap | $2.0B | $2.2B | $22.3B |
Price/Earnings Ratio | 10.4x | 19.7x | 15.0x |
Price/Book Ratio | 1.4x | 1.4x | 1.7x |
Yield3 | 2.0% | 2.2% | 2.7% |
Return on Equity | 16.8% | 15.1% | 20.2% |
Earnings Growth Rate | 18.6% | 15.2% | 15.0% |
Foreign Holdings | 0.0% | 0.0% | 0.0% |
Turnover Rate4 | 70% | — | — |
Expense Ratio5 | 0.32% | — | — |
Short-Term Reserves | 0.2% | — | — |
Sector Diversification (% of equity exposure) |
| | Comparative | Broad |
| Fund | Index1 | Index2 |
Consumer Discretionary | 15.6% | 14.3% | 9.4% |
Consumer Staples | 4.1 | 4.8 | 11.2 |
Energy | 6.9 | 7.3 | 12.3 |
Financials | 17.6 | 16.8 | 13.1 |
Health Care | 11.7 | 11.7 | 14.6 |
Industrials | 14.8 | 14.8 | 10.0 |
Information Technology | 16.2 | 16.6 | 17.7 |
Materials | 5.0 | 5.2 | 3.7 |
Telecommunication | | | |
Services | 2.3 | 2.1 | 3.6 |
Utilities | 5.8 | 6.4 | 4.4 |
Volatility Measures6 | |
| Fund Versus | Fund Versus |
| Comparative Index1 | Broad Index2 |
R-Squared | 0.98 | 0.93 |
Beta | 1.01 | 1.15 |
Ten Largest Holdings7 (% of total net assets) |
| | |
AutoZone Inc. | automotive retail | 1.1% |
Embarq Corp. | integrated | |
| telecommunication | |
| services | 1.1 |
Parker Hannifin Corp. | industrial machinery | 1.0 |
Dollar Tree, Inc. | general | |
| merchandise stores | 1.0 |
Cooper Industries, Inc. | electrical components | |
Class A | and equipment | 1.0 |
AmerisourceBergen Corp. | health care | |
| distributors | 1.0 |
Western Digital Corp. | computer storage | |
| and peripherals | 1.0 |
H & R Block, Inc. | specialized | |
| consumer services | 0.9 |
SCANA Corp. | multi-utilities | 0.9 |
Cephalon, Inc. | biotechnology | 0.9 |
Top Ten | | 9.9% |
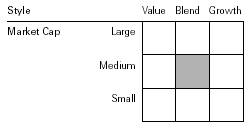
Investment Focus
1 MSCI US Small + Mid Cap 2200 Index.
2 Dow Jones Wilshire 5000 Index.
3 30-day SEC yield for the fund; annualized dividend yield for the indexes. See the Glossary.
4 Annualized.
5 The expense ratio shown is from the prospectus dated January 28, 2009, and represents estimated costs for the current fiscal year based on the fund’s current net assets. For the six months ended March 31, 2009, the annualized expense ratio was 0.31%.
6 For an explanation of R-squared, beta, and other terms used here, see the Glossary.
7 The holdings listed exclude any temporary cash investments and equity index products.
8
Strategic Equity Fund
Performance Summary
All of the returns in this report represent past performance, which is not a guarantee of future results that may be achieved by the fund. (Current performance may be lower or higher than the performance data cited. For performance data current to the most recent month-end, visit our website at www.vanguard.com/performance.) Note, too, that both investment returns and principal value can fluctuate widely, so an investor’s shares, when sold, could be worth more or less than their original cost. The returns shown do not reflect taxes that a shareholder would pay on fund distributions or on the sale of fund shares.
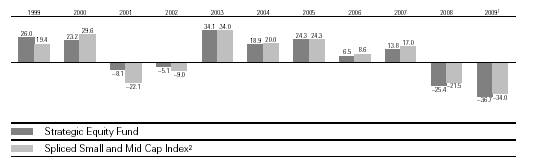
Fiscal-Year Total Returns (%): September 30, 1998–March 31, 2009
Average Annual Total Returns: Periods Ended March 31, 2009 |
| | | | |
| Inception Date | One Year | Five Years | Ten Years |
Strategic Equity Fund3 | 8/14/1995 | –43.57% | –6.68% | 2.66% |
1 Six months ended March 31, 2009.
2 The Spliced Small and Mid Cap Index reflects the return of the Russell 2800 Index through May 31, 2003, and the MSCI US Small + Mid Cap 2200 Index thereafter.
3 Total returns do not include the account service fee that may be applicable to certain accounts with balances below $10,000.
Note: See Financial Highlights table for dividend and capital gains information.
9
Strategic Equity Fund
Financial Statements (unaudited)
Statement of Net Assets
As of March 31, 2009
The fund provides a complete list of its holdings four times in each fiscal year, at the quarter-ends. For the second and fourth fiscal quarters, the lists appear in the fund’s semiannual and annual reports to shareholders. For the first and third fiscal quarters, the fund files the lists with the Securities and Exchange Commission on Form N-Q. Shareholders can look up the fund’s Forms N-Q on the SEC’s website at www.sec.gov. Forms N-Q may also be reviewed and copied at the SEC’s Public Reference Room (see the back cover of this report for further information).
| | | Market |
| | | Value• |
| | Shares | ($000) |
Common Stocks (97.7%)1 | | |
Consumer Discretionary (15.3%) | | |
* | AutoZone Inc. | 187,600 | 30,508 |
* | Dollar Tree, Inc. | 632,447 | 28,176 |
| H & R Block, Inc. | 1,449,950 | 26,375 |
| Polo Ralph Lauren Corp. | 563,289 | 23,799 |
* | Priceline.com, Inc. | 236,900 | 18,663 |
* | Marvel Entertainment, Inc. | 634,900 | 16,857 |
| Sherwin-Williams Co. | 321,857 | 16,727 |
| Whirlpool Corp. | 558,500 | 16,526 |
| Darden Restaurants Inc. | 435,032 | 14,904 |
* | Aeropostale, Inc. | 503,650 | 13,377 |
* | ITT Educational | | |
| Services, Inc. | 107,000 | 12,992 |
| Ross Stores, Inc. | 311,462 | 11,175 |
* | Big Lots Inc. | 480,385 | 9,982 |
| VF Corp. | 161,212 | 9,207 |
* | JAKKS Pacific, Inc. | 644,327 | 7,957 |
| Autoliv, Inc. | 387,614 | 7,198 |
| Bob Evans Farms, Inc. | 309,517 | 6,939 |
| DeVry, Inc. | 140,788 | 6,783 |
| The Stanley Works | 228,300 | 6,648 |
* | Interpublic Group of | | |
| Cos., Inc. | 1,589,364 | 6,548 |
| Cablevision Systems | | |
| NY Group Class A | 445,400 | 5,763 |
* | Rent-A-Center, Inc. | 273,198 | 5,292 |
* | Jarden Corp. | 412,528 | 5,227 |
* | Panera Bread Co. | 93,157 | 5,207 |
* | DreamWorks | | |
| Animation SKG, Inc. | 237,200 | 5,133 |
* | CEC Entertainment Inc. | 189,351 | 4,900 |
| Wyndham | | |
| Worldwide Corp. | 1,050,183 | 4,411 |
| Meredith Corp. | 253,620 | 4,220 |
* | Urban Outfitters, Inc. | 242,900 | 3,976 |
| International | | |
| Speedway Corp. | 178,547 | 3,939 |
| Polaris Industries, Inc. | 175,178 | 3,756 |
* | The Warnaco Group, Inc. | 154,659 | 3,712 |
| | | Market |
| | | Value• |
| | Shares | ($000) |
* | True Religion Apparel, Inc. | 310,939 | 3,672 |
* | WMS Industries, Inc. | 173,407 | 3,626 |
* | Helen of Troy Ltd. | 249,900 | 3,436 |
* | Exide Technologies | 1,086,700 | 3,260 |
| RadioShack Corp. | 375,078 | 3,214 |
* | Denny’s Corp. | 1,896,580 | 3,167 |
*,^ | Jos. A. Bank Clothiers, Inc. | 106,600 | 2,965 |
| UniFirst Corp. | 103,603 | 2,884 |
| Columbia Sportswear Co. | 86,258 | 2,581 |
* | The Children’s Place | | |
| Retail Stores, Inc. | 111,867 | 2,449 |
| Interactive Data Corp. | 95,734 | 2,380 |
| Burger King Holdings Inc. | 102,600 | 2,355 |
* | Jo-Ann Stores, Inc. | 144,038 | 2,354 |
| Snap-On Inc. | 82,500 | 2,071 |
* | Steiner Leisure Ltd. | 82,209 | 2,007 |
* | Collective Brands, Inc. | 198,273 | 1,931 |
| Regal Entertainment Group | | |
| Class A | 129,047 | 1,731 |
* | Penn National Gaming, Inc. | 63,708 | 1,539 |
* | Pre-Paid Legal Services, Inc. | 52,462 | 1,523 |
* | Bally Technologies Inc. | 81,090 | 1,494 |
* | Fuel Systems | | |
| Solutions, Inc. | 106,193 | 1,431 |
| CSS Industries, Inc. | 80,400 | 1,367 |
| Black & Decker Corp. | 39,700 | 1,253 |
* | Jack in the Box Inc. | 44,965 | 1,047 |
| KB Home | 78,954 | 1,041 |
* | Carter’s, Inc. | 52,200 | 982 |
* | Ascent Media Corp. | 37,700 | 943 |
* | Career Education Corp. | 39,200 | 939 |
| Sinclair Broadcast | | |
| Group, Inc. | 892,016 | 919 |
* | Timberland Co. | 74,111 | 885 |
| Genesco, Inc. | 46,373 | 873 |
| Tupperware Brands Corp. | 51,183 | 870 |
| Fisher Communications, Inc. | 87,709 | 856 |
| Fred’s, Inc. | 71,700 | 809 |
| WABCO Holdings Inc. | 65,144 | 802 |
* | Mediacom | | |
| Communications Corp. | 192,210 | 775 |
10
Strategic Equity Fund
| | | Market |
| | | Value• |
| | Shares | ($000) |
| The Buckle, Inc. | 23,450 | 749 |
| Regis Corp. | 51,100 | 738 |
* | The Wet Seal, Inc. Class A | 196,600 | 661 |
| Movado Group, Inc. | 80,600 | 608 |
| Cinemark Holdings Inc. | 61,500 | 577 |
| Service Corp. International | 158,307 | 553 |
| Limited Brands, Inc. | 59,200 | 515 |
| Pulte Homes, Inc. | 43,900 | 480 |
* | Isle of Capri Casinos, Inc. | 89,900 | 476 |
| CKE Restaurants Inc. | 55,500 | 466 |
| Weight Watchers | | |
| International, Inc. | 23,422 | 434 |
| Stage Stores, Inc. | 42,500 | 428 |
* | AFC Enterprises, Inc. | 91,626 | 413 |
| Scholastic Corp. | 25,700 | 387 |
| Foot Locker, Inc. | 36,900 | 387 |
* | Overstock.com, Inc. | 39,626 | 363 |
| Dover Downs Gaming | | |
| & Entertainment, Inc. | 117,872 | 362 |
| Cracker Barrel Old | | |
| Country Store Inc. | 12,300 | 352 |
* | Town Sports International | | |
| Holdings, Inc. | 110,000 | 329 |
| Wolverine World Wide, Inc. | 19,700 | 307 |
| Barnes & Noble, Inc. | 14,200 | 304 |
| Ryland Group, Inc. | 17,900 | 298 |
| Leggett & Platt, Inc. | 21,800 | 283 |
*,^ | Blockbuster Inc. Class A | 324,200 | 233 |
* | Cabela’s Inc. | 25,400 | 231 |
| Phillips-Van Heusen Corp. | 10,200 | 231 |
| Callaway Golf Co. | 31,600 | 227 |
| Sonic Automotive, Inc. | 128,429 | 205 |
* | Hot Topic, Inc. | 17,100 | 191 |
* | Papa John’s | | |
| International, Inc. | 7,700 | 176 |
* | Lincoln Educational Services | 9,100 | 167 |
| MDC Holdings, Inc. | 5,200 | 162 |
* | P.F. Chang’s China Bistro, Inc. | 6,600 | 151 |
| Oxford Industries, Inc. | 23,000 | 142 |
| D. R. Horton, Inc. | 13,500 | 131 |
| Advance Auto Parts, Inc. | 3,100 | 127 |
* | Quiksilver, Inc. | 96,100 | 123 |
| Scripps Networks Interactive | 5,300 | 119 |
| Cato Corp. Class A | 5,600 | 102 |
* | HSN, Inc. | 16,207 | 83 |
* | California Pizza Kitchen, Inc. | 5,700 | 75 |
| Family Dollar Stores, Inc. | 2,000 | 67 |
* | Unifi, Inc. | 92,800 | 59 |
| PRIMEDIA Inc. | 22,610 | 56 |
| Lennar Corp. Class A | 7,100 | 53 |
* | Brink’s Home | | |
| Security Holdings, Inc. | 2,200 | 50 |
| Stewart Enterprises, Inc.Class A | 11,900 | 39 |
* | The Gymboree Corp. | 1,800 | 38 |
* | Warner Music Group Corp. | 15,500 | 36 |
| | | Market |
| | | Value• |
| | Shares | ($000) |
| Speedway Motorsports, Inc. | 2,900 | 34 |
* | Lear Corp. | 40,451 | 30 |
| New York Times Co. Class A | 5,300 | 24 |
| Belo Corp. Class A | 34,600 | 21 |
| John Wiley & Sons Class A | 700 | 21 |
* | Zale Corp. | 6,700 | 13 |
* | Cox Radio, Inc. | 2,200 | 9 |
* | Ticketmaster | | |
| Entertainment Inc. | 1,600 | 6 |
| American Greetings Corp. | | |
| Class A | 1,073 | 5 |
* | Lin TV Corp. | 3,600 | 4 |
| Journal Communications, Inc. | 1,030 | 1 |
| | | 427,220 |
Consumer Staples (4.0%) | | |
* | Dr. Pepper | | |
| Snapple Group, Inc. | 1,025,800 | 17,346 |
* | Ralcorp Holdings, Inc. | 192,699 | 10,383 |
| Herbalife Ltd. | 658,952 | 9,871 |
| Molson Coors | | |
| Brewing Co. Class B | 287,025 | 9,839 |
| Cal-Maine Foods, Inc. | 420,197 | 9,408 |
| Nash-Finch Co. | 272,595 | 7,657 |
| Corn Products | | |
| International, Inc. | 274,766 | 5,825 |
| PepsiAmericas, Inc. | 321,305 | 5,542 |
* | Chiquita Brands | | |
| International, Inc. | 718,936 | 4,767 |
| Del Monte Foods Co. | 533,110 | 3,886 |
| SUPERVALU Inc. | 246,895 | 3,526 |
| Universal Corp. (VA) | 115,936 | 3,469 |
| The Pepsi Bottling | | |
| Group, Inc. | 152,840 | 3,384 |
| Lancaster Colony Corp. | 54,115 | 2,245 |
* | Alliance One | | |
| International, Inc. | 542,200 | 2,082 |
* | Energizer Holdings, Inc. | 39,300 | 1,953 |
* | The Pantry, Inc. | 90,863 | 1,600 |
* | Central Garden & Pet Co. | | |
| Class A | 182,100 | 1,369 |
* | Prestige Brands | | |
| Holdings Inc. | 238,903 | 1,238 |
* | Revlon, Inc. | 487,833 | 1,210 |
| Spartan Stores, Inc. | 74,124 | 1,142 |
| Village Super Market Inc. | | |
| Class A | 31,722 | 989 |
* | BJ’s Wholesale Club, Inc. | 23,200 | 742 |
| Bunge Ltd. | 11,500 | 651 |
* | Dean Foods Co. | 35,600 | 644 |
| Coca-Cola Bottling Co. | 6,400 | 333 |
| Alberto-Culver Co. | 14,100 | 319 |
| Vector Group Ltd. | 15,400 | 200 |
* | National Beverage Corp. | 10,330 | 95 |
| Flowers Foods, Inc. | 1,100 | 26 |
| | | 111,741 |
11
Strategic Equity Fund
| | | Market |
| | | Value• |
| | Shares | ($000) |
Energy (6.8%) | | |
| ENSCO International, Inc. | 803,609 | 21,215 |
| Murphy Oil Corp. | 429,200 | 19,215 |
| Helmerich & Payne, Inc. | 792,542 | 18,046 |
* | Plains Exploration & | | |
| Production Co. | 756,400 | 13,033 |
| Tidewater Inc. | 345,400 | 12,825 |
| Noble Corp. | 496,222 | 11,954 |
* | Comstock Resources, Inc. | 363,796 | 10,841 |
| El Paso Corp. | 1,723,154 | 10,770 |
| Massey Energy Co. | 788,712 | 7,982 |
* | Ultra Petroleum Corp. | 156,500 | 5,617 |
* | Mariner Energy Inc. | 708,500 | 5,491 |
* | SEACOR Holdings Inc. | 88,249 | 5,146 |
* | Denbury Resources, Inc. | 337,356 | 5,013 |
* | Superior Energy | | |
| Services, Inc. | 247,347 | 3,188 |
* | Oil States International, Inc. | 234,728 | 3,150 |
| World Fuel Services Corp. | 99,149 | 3,136 |
* | Encore Acquisition Co. | 132,102 | 3,074 |
* | Alpha Natural | | |
| Resources, Inc. | 162,660 | 2,887 |
* | Contango Oil & Gas Co. | 60,905 | 2,387 |
| Overseas Shipholding | | |
| Group Inc. | 91,909 | 2,084 |
* | Matrix Service Co. | 236,915 | 1,947 |
| Noble Energy, Inc. | 34,300 | 1,848 |
| Walter Industries, Inc. | 77,200 | 1,766 |
| Sunoco, Inc. | 64,500 | 1,708 |
* | Clayton Williams Energy, Inc. | 47,524 | 1,390 |
* | Pride International, Inc. | 64,200 | 1,154 |
* | Rosetta Resources, Inc. | 206,500 | 1,022 |
* | Gulfmark Offshore, Inc. | 39,900 | 952 |
| Foundation Coal | | |
| Holdings, Inc. | 64,000 | 918 |
* | Nabors Industries, Inc. | 90,662 | 906 |
| CARBO Ceramics Inc. | 30,800 | 876 |
* | Concho Resources, Inc. | 29,696 | 760 |
| Tesoro Corp. | 55,900 | 753 |
* | Newpark Resources, Inc. | 290,981 | 736 |
| Holly Corp. | 24,500 | 519 |
* | Vaalco Energy, Inc. | 88,146 | 466 |
| General Maritime Corp. | 65,178 | 456 |
* | CVR Energy, Inc. | 81,112 | 449 |
* | Whiting Petroleum Corp. | 16,100 | 416 |
* | Goodrich Petroleum Corp. | 19,750 | 382 |
* | McMoRan Exploration Co. | 68,200 | 321 |
| CONSOL Energy, Inc. | 12,000 | 303 |
| Southern Union Co. | 18,900 | 288 |
* | PHI Inc. Non-Voting Shares | 23,600 | 236 |
* | Veneco Inc. | 53,400 | 175 |
* | Swift Energy Co. | 20,400 | 149 |
* | Dresser Rand Group, Inc. | 5,500 | 122 |
* | James River Coal Co. | 8,300 | 102 |
* | Forest Oil Corp. | 3,200 | 42 |
| | | Market |
| | | Value• |
| | Shares | ($000) |
* | Unit Corp. | 1,900 | 40 |
* | Complete Production | | |
| Services, Inc. | 12,900 | 40 |
| St. Mary Land & | | |
| Exploration Co. | 2,100 | 28 |
* | International Coal Group, Inc. | 7,700 | 12 |
* | Energy Partners, Ltd. | 9,000 | 1 |
| | | 188,337 |
Financials (17.0%) | | |
| Cullen/Frost Bankers, Inc. | 547,053 | 25,679 |
| Unum Group | 1,882,000 | 23,525 |
| Bank of Hawaii Corp. | 677,564 | 22,346 |
* | TD Ameritrade | | |
| Holding Corp. | 1,579,307 | 21,810 |
* | Nasdaq Stock Market Inc. | 1,085,400 | 21,252 |
| Axis Capital Holdings Ltd. | 764,080 | 17,222 |
| FirstMerit Corp. | 866,391 | 15,768 |
* | Arch Capital Group Ltd. | 284,300 | 15,312 |
| Platinum Underwriters | | |
| Holdings, Ltd. | 491,800 | 13,947 |
| Torchmark Corp. | 454,947 | 11,933 |
| Annaly Capital | | |
| Management Inc. REIT | 851,900 | 11,816 |
| Aspen Insurance | | |
| Holdings Ltd. | 420,300 | 9,440 |
| HCP, Inc. REIT | 480,700 | 8,581 |
| Plum Creek Timber Co. Inc. | | |
| REIT | 271,900 | 7,904 |
* | EZCORP, Inc. | 675,417 | 7,815 |
| NBT Bancorp, Inc. | 352,499 | 7,628 |
| UMB Financial Corp. | 163,558 | 6,950 |
| PartnerRe Ltd. | 103,719 | 6,438 |
| IPC Holdings Ltd. | 218,100 | 5,897 |
* | Interactive Brokers | | |
| Group, Inc. | 361,024 | 5,823 |
| Federated Investors, Inc. | 251,530 | 5,599 |
| Nationwide Health | | |
| Properties, Inc. REIT | 249,300 | 5,532 |
* | The St. Joe Co. | 273,600 | 4,580 |
* | Ocwen Financial Corp. | 399,981 | 4,572 |
* | Knight Capital Group, Inc. | | |
| Class A | 307,948 | 4,539 |
| City Holding Co. | 163,555 | 4,463 |
| Highwood Properties, Inc. | | |
| REIT | 207,846 | 4,452 |
| Senior Housing | | |
| Properties Trust REIT | 316,300 | 4,435 |
| Host Hotels & Resorts Inc. | | |
| REIT | 1,117,400 | 4,380 |
| Associated Banc-Corp. | 278,623 | 4,302 |
| Rayonier Inc. REIT | 141,450 | 4,275 |
| Hospitality Properties Trust | | |
| REIT | 353,100 | 4,237 |
| American Financial Group, Inc. | 260,244 | 4,177 |
12
Strategic Equity Fund
| | | Market |
| | | Value• |
| | Shares | ($000) |
| National Retail Properties | | |
| REIT | 259,600 | 4,112 |
| BOK Financial Corp. | 117,527 | 4,061 |
| Mid-America Apartment | | |
| Communities, Inc. REIT | 124,508 | 3,839 |
| Healthcare Realty Trust Inc. | | |
| REIT | 253,954 | 3,807 |
| Home Properties, Inc. REIT | 123,756 | 3,793 |
| Mack-Cali Realty Corp. REIT | 189,900 | 3,762 |
| Washington REIT | 207,116 | 3,583 |
| Odyssey Re Holdings Corp. | 92,871 | 3,523 |
| PS Business Parks, Inc. REIT | 92,532 | 3,410 |
| Provident Financial | | |
| Services Inc. | 298,225 | 3,224 |
| Sun Communities, Inc. | | |
| REIT | 269,868 | 3,193 |
| Reinsurance Group of | | |
| America, Inc. | 96,507 | 3,126 |
| Bank of the Ozarks, Inc. | 133,233 | 3,075 |
| Republic Bancorp, Inc. | | |
| Class A | 163,411 | 3,051 |
| Sovran Self Storage, Inc. | | |
| REIT | 147,224 | 2,956 |
| First Financial | | |
| Bankshares, Inc. | 58,522 | 2,819 |
| Jones Lang LaSalle Inc. | 117,800 | 2,740 |
| American Physicians | | |
| Capital, Inc. | 66,557 | 2,724 |
| Entertainment | | |
| Properties Trust REIT | 170,700 | 2,690 |
| Avalonbay Communities, Inc. | | |
| REIT | 56,414 | 2,655 |
| Douglas Emmett, Inc. REIT | 352,800 | 2,607 |
| Willis Group Holdings Ltd. | 116,100 | 2,554 |
| BancFirst Corp. | 67,922 | 2,472 |
| Kilroy Realty Corp. REIT | 135,947 | 2,337 |
* | Amerisafe Inc. | 150,560 | 2,307 |
| Health Care Inc. REIT | 71,800 | 2,196 |
| Community Bank | | |
| System, Inc. | 129,761 | 2,174 |
| Ventas, Inc. REIT | 95,600 | 2,162 |
| Parkway Properties Inc. | | |
| REIT | 191,075 | 1,968 |
| Tompkins Trustco, Inc. | 42,569 | 1,830 |
* | Nelnet, Inc. | 200,193 | 1,770 |
* | FPIC Insurance Group, Inc. | 47,184 | 1,747 |
* | CNA Surety Corp. | 93,833 | 1,730 |
* | CB Richard Ellis Group, Inc. | 413,600 | 1,667 |
| WSFS Financial Corp. | 71,750 | 1,604 |
| Provident New York Bancorp, Inc. | 187,398 | 1,602 |
| First BanCorp Puerto Rico | 362,862 | 1,546 |
| Lakeland Financial Corp. | 79,936 | 1,534 |
| Employers Holdings, Inc. | 157,982 | 1,507 |
| Potlatch Corp. REIT | 62,100 | 1,440 |
| LTC Properties, Inc. REIT | 73,100 | 1,282 |
| | | Market |
| | | Value• |
| | Shares | ($000) |
| Suffolk Bancorp | 49,193 | 1,279 |
| Arrow Financial Corp. | 51,011 | 1,208 |
| Cash America | | |
| International Inc. | 72,200 | 1,131 |
| TriCo Bancshares | 66,980 | 1,121 |
| Berkshire Hills Bancorp, Inc. | 48,556 | 1,113 |
| Colonial Properties Trust | | |
| REIT | 286,560 | 1,092 |
| Federal Realty | | |
| Investment Trust REIT | 23,300 | 1,072 |
| Oriental Financial Group Inc. | 208,800 | 1,019 |
| Kimco Realty Corp. REIT | 130,773 | 996 |
| Extra Space Storage Inc. | | |
| REIT | 170,800 | 941 |
| First Community | | |
| Bancshares, Inc. | 80,600 | 941 |
^ | Pennsylvania REIT | 264,600 | 939 |
^ | Heartland Financial USA, Inc. | 68,500 | 927 |
| Prospect Energy Corp. | 108,022 | 920 |
| Westamerica Bancorporation | 19,700 | 898 |
| Safety Insurance Group, Inc. | 28,553 | 887 |
* | LaBranche & Co. Inc. | 235,229 | 880 |
| Saul Centers, Inc. REIT | 35,045 | 805 |
| First Commonwealth | | |
| Financial Corp. | 90,020 | 798 |
^ | Life Partners Holdings | 46,000 | 785 |
| Prosperity Bancshares, Inc. | 28,500 | 779 |
| Hudson City Bancorp, Inc. | 66,600 | 779 |
| S & T Bancorp, Inc. | 36,500 | 774 |
| New York Community | | |
| Bancorp, Inc. | 67,700 | 756 |
| CapitalSource Inc. REIT | 615,200 | 751 |
* | Crawford & Co. Class B | 110,600 | 743 |
| First Merchants Corp. | 68,030 | 734 |
| Simmons First | | |
| National Corp. | 29,009 | 731 |
| Financial Federal Corp. | 31,000 | 657 |
| Bank Mutual Corp. | 68,800 | 623 |
* | thinkorswim Group, Inc. | 71,100 | 614 |
^ | iStar Financial Inc. REIT | 201,800 | 567 |
| Anworth Mortgage | | |
| Asset Corp. REIT | 85,700 | 525 |
| First Source Corp. | 29,000 | 523 |
| The Hanover Insurance | | |
| Group Inc. | 17,900 | 516 |
| Clifton Savings Bancorp, Inc. | 51,581 | 516 |
| Winthrop Realty Trust REIT | 73,490 | 508 |
| Southside Bancshares, Inc. | 26,673 | 504 |
| Digital Realty Trust, Inc. REIT | 15,000 | 498 |
| International | | |
| Bancshares Corp. | 63,600 | 496 |
| Commerce Bancshares, Inc. | 12,701 | 461 |
| Omega Healthcare Investors, Inc. REIT | 32,200 | 453 |
| U-Store-It Trust REIT | 214,500 | 433 |
| Harleysville National Corp. | 70,689 | 428 |
13
Strategic Equity Fund
| | | Market |
| | | Value• |
| | Shares | ($000) |
| S.Y. Bancorp, Inc. | 16,900 | 411 |
| MFA Mortgage | | |
| Investments, Inc. REIT | 68,100 | 400 |
| BRE Properties Inc. Class A | | |
| REIT | 19,761 | 388 |
| Raymond James | | |
| Financial, Inc. | 18,500 | 364 |
* | First Cash Financial | | |
| Services, Inc. | 24,300 | 363 |
| LaSalle Hotel Properties | | |
| REIT | 57,800 | 338 |
| TrustCo Bank NY | 53,400 | 321 |
| Donegal Group Inc. Class A | 20,206 | 311 |
| Presidential Life Corp. | 39,553 | 308 |
| National Western Life | | |
| Insurance Co. Class A | 2,400 | 271 |
| SL Green Realty Corp. | | |
| REIT | 23,526 | 254 |
| Flushing Financial Corp. | 40,837 | 246 |
* | First Acceptance Corp. | 91,187 | 221 |
* | Beneficial Mutual | | |
| Bancorp, Inc. | 21,500 | 212 |
| Acadia Realty Trust REIT | 19,475 | 207 |
| Corporate Office | | |
| Properties Trust, Inc. REIT | 7,720 | 192 |
* | Investment Technology | | |
| Group, Inc. | 7,000 | 179 |
| Everest Re Group, Ltd. | 2,200 | 156 |
| Provident Bankshares Corp. | 20,180 | 142 |
| Park National Corp. | 2,500 | 139 |
| Wilshire Bancorp Inc. | 27,000 | 139 |
| Cincinnati Financial Corp. | 5,100 | 117 |
| Hercules Technology | | |
| Growth Capital, Inc. | 22,529 | 113 |
| The Macerich Co. REIT | 15,000 | 94 |
| Liberty Property Trust REIT | 4,900 | 93 |
| MB Financial, Inc. | 6,400 | 87 |
* | TradeStation Group, Inc. | 12,400 | 82 |
^ | Jer Investor Trust REIT | 118,671 | 77 |
| Regency Centers Corp. | | |
| REIT | 2,100 | 56 |
| Developers Diversified | | |
| Realty Corp. REIT | 21,200 | 45 |
| Univest Corp. | | |
| of Pennsylvania | 2,100 | 37 |
| First Financial Bancorp | 3,500 | 33 |
* | SVB Financial Group | 1,400 | 28 |
| Capitol Federal Financial | 600 | 23 |
| Equity One, Inc. REIT | 1,500 | 18 |
| Allied World | | |
| Assurance Holdings, Ltd. | 400 | 15 |
| BlackRock Kelso Capital Corp. | 1,200 | 5 |
| First Financial Holdings, Inc. | 300 | 2 |
| | | 473,416 |
| | | Market |
| | | Value• |
| | Shares | ($000) |
Health Care (11.4%) | | |
| AmerisourceBergen Corp. | 843,613 | 27,552 |
* | Cephalon, Inc. | 383,300 | 26,103 |
* | Isis Pharmaceuticals, Inc. | 1,457,602 | 21,879 |
* | Lincare Holdings, Inc. | 1,000,471 | 21,810 |
| STERIS Corp. | 790,943 | 18,413 |
* | Express Scripts Inc. | 314,200 | 14,507 |
* | Gen-Probe Inc. | 287,963 | 13,125 |
| Universal Health Services | | |
| Class B | 303,006 | 11,617 |
* | Myriad Genetics, Inc. | 232,600 | 10,576 |
| Omnicare, Inc. | 416,149 | 10,191 |
* | PAREXEL | | |
| International Corp. | 952,700 | 9,270 |
* | Onyx Pharmaceuticals, Inc. | 323,000 | 9,222 |
* | Cubist Pharmaceuticals, Inc. | 390,811 | 6,394 |
* | AMERIGROUP Corp. | 225,827 | 6,219 |
* | Emergent BioSolutions Inc. | 448,008 | 6,053 |
* | Watson | | |
| Pharmaceuticals, Inc. | 182,400 | 5,674 |
* | PharMerica Corp. | 339,573 | 5,650 |
* | Warner Chilcott Ltd. | 520,623 | 5,477 |
| Invacare Corp. | 325,354 | 5,215 |
| Cooper Cos., Inc. | 181,015 | 4,786 |
* | DaVita, Inc. | 98,900 | 4,347 |
* | OSI Pharmaceuticals, Inc. | 101,300 | 3,876 |
* | Emergency Medical | | |
| Services LP Class A | 121,473 | 3,813 |
* | Skilled Healthcare | | |
| Group Inc. | 436,383 | 3,583 |
* | Albany Molecular | | |
| Research, Inc. | 370,346 | 3,492 |
* | Valeant Pharmaceuticals | | |
| International | 175,000 | 3,113 |
* | Gentiva Health | | |
| Services, Inc. | 202,356 | 3,076 |
* | LifePoint Hospitals, Inc. | 144,835 | 3,021 |
| PDL BioPharma Inc. | 398,289 | 2,820 |
* | Questcor | | |
| Pharmaceuticals, Inc. | 534,310 | 2,629 |
* | Psychiatric Solutions, Inc. | 162,000 | 2,548 |
* | Cyberonics, Inc. | 189,784 | 2,518 |
* | Luminex Corp. | 138,000 | 2,501 |
* | Kensey Nash Corp. | 112,575 | 2,394 |
* | Merit Medical Systems, Inc. | 193,000 | 2,357 |
* | ViroPharma Inc. | 438,958 | 2,305 |
| Martek Biosciences Corp. | 119,600 | 2,183 |
* | Centene Corp. | 110,466 | 1,991 |
* | RehabCare Group, Inc. | 113,864 | 1,986 |
* | Bio-Rad Laboratories, Inc. | | |
| Class A | 30,100 | 1,984 |
| Owens & Minor, Inc. | 48,176 | 1,596 |
* | CONMED Corp. | 103,906 | 1,497 |
* | LHC Group Inc. | 62,521 | 1,393 |
* | AmSurg Corp. | 77,520 | 1,229 |
14
Strategic Equity Fund
| | | Market |
| | | Value• |
| | Shares | ($000) |
| Chemed Corp. | 29,800 | 1,159 |
* | American Medical | | |
| Systems Holdings, Inc. | 100,989 | 1,126 |
* | Nabi Biopharmaceuticals | 298,763 | 1,105 |
* | Dionex Corp. | 16,555 | 782 |
* | Kindred Healthcare, Inc. | 50,600 | 756 |
* | Cambrex Corp. | 326,503 | 744 |
* | CV Therapeutics, Inc. | 36,400 | 724 |
| Beckman Coulter, Inc. | 13,300 | 678 |
| Medicis | | |
| Pharmaceutical Corp. | 52,800 | 653 |
* | Henry Schein, Inc. | 14,400 | 576 |
* | Noven Pharmaceuticals, Inc. | 58,776 | 557 |
* | Cynosure Inc. | 79,327 | 483 |
* | eResearch Technology, Inc. | 89,900 | 473 |
* | Mylan Inc. | 33,700 | 452 |
* | Alnylam Pharmaceuticals Inc. | 22,370 | 426 |
* | CorVel Corp. | 19,425 | 393 |
* | King Pharmaceuticals, Inc. | 53,501 | 378 |
* | Endo Pharmaceuticals | | |
| Holdings, Inc. | 20,900 | 370 |
| Quest Diagnostics, Inc. | 7,100 | 337 |
| Ensign Group Inc. | 20,999 | 325 |
* | Cross Country | | |
| Healthcare, Inc. | 44,675 | 293 |
* | Res-Care, Inc. | 17,000 | 248 |
* | Hanger Orthopedic | | |
| Group, Inc. | 17,600 | 233 |
* | Alliance HealthCare | | |
| Services Inc. | 30,100 | 205 |
| Hill-Rom Holdings, Inc. | 17,900 | 177 |
* | Community Health | | |
| Systems, Inc. | 11,400 | 175 |
* | HealthSouth Corp. | 19,000 | 169 |
*,^ | Osiris Therapeutics, Inc. | 10,100 | 139 |
* | Sun Healthcare Group Inc. | 15,700 | 133 |
* | Kendle International Inc. | 6,200 | 130 |
* | Hospira, Inc. | 4,100 | 127 |
| Teleflex Inc. | 2,800 | 109 |
* | K-V Pharmaceutical Co. | | |
| Class A | 40,500 | 67 |
* | PSS World Medical, Inc. | 4,500 | 65 |
* | Alkermes, Inc. | 3,500 | 42 |
* | Healthspring, Inc. | 4,100 | 34 |
* | Facet Biotech Corp. | 2,700 | 26 |
* | Humana Inc. | 900 | 23 |
| Techne Corp. | 400 | 22 |
| | | 316,899 |
Industrials (14.4%) | | |
| Parker Hannifin Corp. | 834,741 | 28,365 |
| Cooper Industries, Inc. Class A | 1,087,500 | 28,123 |
| Goodrich Corp. | 677,976 | 25,689 |
| Ryder System, Inc. | 685,600 | 19,409 |
| Cummins Inc. | 665,572 | 16,939 |
* | AGCO Corp. | 831,300 | 16,293 |
| | | Market |
| | | Value• |
| | Shares | ($000) |
* | EMCOR Group, Inc. | 875,723 | 15,036 |
| Hubbell Inc. Class B | 539,900 | 14,556 |
| Fluor Corp. | 378,727 | 13,085 |
| Trinity Industries, Inc. | 1,342,820 | 12,273 |
* | Gardner Denver Inc. | 546,660 | 11,884 |
| Republic Services, Inc. | | |
| Class A | 623,519 | 10,693 |
*,2 | TBS International Ltd. | 1,412,617 | 10,383 |
| Manpower Inc. | 318,703 | 10,049 |
| GATX Corp. | 487,038 | 9,853 |
* | EnPro Industries, Inc. | 558,000 | 9,542 |
| Pitney Bowes, Inc. | 383,700 | 8,959 |
* | United Stationers, Inc. | 265,761 | 7,463 |
| J.B. Hunt Transport | | |
| Services, Inc. | 288,330 | 6,952 |
| R.R. Donnelley & Sons Co. | 945,045 | 6,927 |
| Flowserve Corp. | 120,694 | 6,773 |
| Comfort Systems USA, Inc. | 614,460 | 6,372 |
* | Sykes Enterprises, Inc. | 351,670 | 5,848 |
| Acuity Brands, Inc. | 188,100 | 4,240 |
| Triumph Group, Inc. | 110,221 | 4,210 |
* | GrafTech International Ltd. | 595,664 | 3,669 |
| Genco Shipping and | | |
| Trading Ltd. | 284,217 | 3,507 |
| Robbins & Myers, Inc. | 222,200 | 3,371 |
| Briggs & Stratton Corp. | 201,083 | 3,318 |
| Joy Global Inc. | 152,717 | 3,253 |
| Knoll, Inc. | 521,238 | 3,195 |
* | TransDigm Group, Inc. | 89,400 | 2,936 |
* | Alliant Techsystems, Inc. | 40,320 | 2,701 |
* | RSC Holdings Inc. | 476,500 | 2,506 |
* | Columbus McKinnon Corp. | 286,137 | 2,495 |
* | Allegiant Travel Co. | 54,000 | 2,455 |
| Werner Enterprises, Inc. | 157,437 | 2,380 |
| Herman Miller, Inc. | 223,000 | 2,377 |
| SPX Corp. | 50,300 | 2,365 |
| The Timken Co. | 167,931 | 2,344 |
| Steelcase Inc. | 460,152 | 2,305 |
* | School Specialty, Inc. | 126,288 | 2,221 |
| Bucyrus International, Inc. | 129,200 | 1,961 |
| Watson Wyatt & | | |
| Co. Holdings | 39,400 | 1,945 |
* | Perini Corp. | 155,800 | 1,916 |
* | ATC Technology Corp. | 169,700 | 1,901 |
* | Marten Transport, Ltd. | 96,657 | 1,806 |
* | Esterline Technologies Corp. | 77,150 | 1,558 |
| Lincoln Electric | | |
| Holdings, Inc. | 48,236 | 1,529 |
| Titan International, Inc. | 299,443 | 1,506 |
| Gibraltar Industries Inc. | 316,323 | 1,493 |
* | Cenveo Inc. | 439,751 | 1,429 |
* | Kirby Corp. | 53,600 | 1,428 |
* | Genesee & Wyoming Inc. | | |
| Class A | 61,600 | 1,309 |
| AAON, Inc. | 69,993 | 1,268 |
15
Strategic Equity Fund
| | | Market |
| | | Value• |
| | Shares | ($000) |
* | Republic Airways | | |
| Holdings Inc. | 186,200 | 1,207 |
* | Pike Electric Corp. | 124,699 | 1,153 |
| Federal Signal Corp. | 212,702 | 1,121 |
* | First Advantage Corp. | | |
| Class A | 74,600 | 1,028 |
* | Cornell Cos., Inc. | 62,516 | 1,023 |
| Interface, Inc. | 340,600 | 1,018 |
| Kaman Corp. Class A | 81,141 | 1,018 |
| Apogee Enterprises, Inc. | 90,166 | 990 |
| Textainer Group | | |
| Holdings Ltd. | 143,576 | 969 |
| The Standard Register Co. | 208,873 | 957 |
* | Powell Industries, Inc. | 20,272 | 716 |
* | Blount International, Inc. | 148,582 | 686 |
* | Waste Services, Inc. | 157,801 | 675 |
* | CBIZ Inc. | 91,384 | 637 |
* | EnerSys | 50,926 | 617 |
* | Beacon Roofing Supply, Inc. | 45,828 | 614 |
| Encore Wire Corp. | 28,507 | 611 |
| TAL International Group, Inc. | 82,400 | 603 |
| McGrath RentCorp | 37,600 | 593 |
* | Old Dominion | | |
| Freight Line, Inc. | 23,300 | 547 |
* | H&E Equipment | | |
| Services, Inc. | 71,756 | 470 |
| Tredegar Corp. | 27,331 | 446 |
* | American Commercial | | |
| Lines Inc. | 124,293 | 394 |
| CIRCOR International, Inc. | 17,228 | 388 |
* | American | | |
| Reprographics Co. | 103,900 | 368 |
* | Mastec Inc. | 30,300 | 366 |
| The Dun & | | |
| Bradstreet Corp. | 4,600 | 354 |
* | AMR Corp. | 110,327 | 352 |
* | Standard Parking Corp. | 21,068 | 346 |
| A.O. Smith Corp. | 13,700 | 345 |
| Standex International Corp. | 36,600 | 337 |
* | WESCO International, Inc. | 16,200 | 294 |
* | Chart Industries, Inc. | 33,600 | 265 |
| G & K Services, Inc. Class A | 13,600 | 257 |
| Macquarie | | |
| Infrastructure Co. LLC | 140,247 | 194 |
| Ennis, Inc. | 19,200 | 170 |
* | Hawaiian Holdings, Inc. | 43,900 | 164 |
| The Brink’s Co. | 5,800 | 153 |
* | DynCorp International Inc. | | |
| Class A | 11,100 | 148 |
* | Furmanite Corp. | 47,460 | 148 |
| ABM Industries Inc. | 8,900 | 146 |
| Dover Corp. | 4,200 | 111 |
| Granite Construction Co. | 2,900 | 109 |
* | Force Protection, Inc. | 19,500 | 94 |
| Lennox International Inc. | 2,500 | 66 |
| | | Market |
| | | Value• |
| | Shares | ($000) |
* | Energy Conversion | | |
| Devices, Inc. | 3,900 | 52 |
* | US Airways Group Inc. | 15,600 | 39 |
* | M&F Worldwide Corp. | 2,000 | 23 |
| Viad Corp. | 1,600 | 23 |
| | | 401,768 |
Information Technology (15.9%) | |
* | Western Digital Corp. | 1,410,000 | 27,269 |
* | Sybase, Inc. | 828,585 | 25,098 |
* | Hewitt Associates, Inc. | 830,230 | 24,708 |
* | Skyworks Solutions, Inc. | 2,988,916 | 24,091 |
* | Avnet, Inc. | 1,159,500 | 20,303 |
*,^ | Sohu.com Inc. | 483,886 | 19,989 |
* | Marvell Technology | | |
| Group Ltd. | 1,869,000 | 17,120 |
* | Dolby Laboratories Inc. | 488,600 | 16,666 |
* | CSG Systems | | |
| International, Inc. | 1,096,536 | 15,659 |
* | EarthLink, Inc. | 2,330,986 | 15,315 |
* | Metavante Technologies | 753,521 | 15,040 |
| Xilinx, Inc. | 781,816 | 14,980 |
* | Anixter International Inc. | 468,868 | 14,854 |
* | Integrated Device | | |
| Technology Inc. | 2,624,452 | 11,941 |
* | Lexmark International, Inc. | 641,839 | 10,828 |
* | QLogic Corp. | 934,228 | 10,389 |
* | ManTech | | |
| International Corp. | 229,000 | 9,595 |
* | Computer Sciences Corp. | 240,916 | 8,875 |
* | Plexus Corp. | 556,466 | 7,690 |
*,^ | Alliance Data | | |
| Systems Corp. | 189,381 | 6,998 |
| Altera Corp. | 370,567 | 6,503 |
* | Multi-Fineline | | |
| Electronix, Inc. | 329,204 | 5,544 |
* | JDA Software Group, Inc. | 449,575 | 5,193 |
* | Solera Holdings, Inc. | 209,080 | 5,181 |
| National | | |
| Semiconductor Corp. | 463,793 | 4,763 |
* | PMC Sierra Inc. | 745,011 | 4,753 |
* | S1 Corp. | 782,716 | 4,031 |
| United Online, Inc. | 889,720 | 3,968 |
* | NCR Corp. | 497,362 | 3,954 |
* | Silicon Image, Inc. | 1,477,714 | 3,547 |
* | SAIC, Inc. | 186,200 | 3,476 |
| Intersil Corp. | 295,000 | 3,393 |
* | Starent Networks Corp. | 185,992 | 2,941 |
* | Synopsys, Inc. | 140,470 | 2,912 |
| Black Box Corp. | 119,041 | 2,811 |
* | SYNNEX Corp. | 141,200 | 2,777 |
| Diebold, Inc. | 126,061 | 2,691 |
* | TiVo Inc. | 377,507 | 2,658 |
* | Cogent Inc. | 215,974 | 2,570 |
* | MKS Instruments, Inc. | 169,550 | 2,487 |
* | Perot Systems Corp. | 167,623 | 2,159 |
16
Strategic Equity Fund
| | | Market |
| | | Value• |
| | Shares | ($000) |
* | Flextronics | | |
| International Ltd. | 651,400 | 1,883 |
* | Ultratech, Inc. | 149,912 | 1,872 |
* | BigBand Networks Inc. | 266,608 | 1,746 |
* | TIBCO Software Inc. | 293,400 | 1,722 |
| ADTRAN Inc. | 105,200 | 1,705 |
| Acxiom Corp. | 229,496 | 1,698 |
* | j2 Global | | |
| Communications, Inc. | 76,165 | 1,667 |
* | Teradata Corp. | 100,902 | 1,637 |
* | Wind River Systems Inc. | 249,706 | 1,598 |
* | Affiliated Computer | | |
| Services, Inc. Class A | 33,000 | 1,580 |
* | Gartner, Inc. Class A | 137,700 | 1,516 |
* | Avocent Corp. | 116,351 | 1,413 |
* | Netlogic Microsystems Inc. | 43,900 | 1,206 |
| iGATE Corp. | 356,314 | 1,154 |
* | Ciber, Inc. | 422,286 | 1,153 |
* | TNS Inc. | 133,300 | 1,090 |
| Daktronics, Inc. | 156,854 | 1,027 |
| Syntel, Inc. | 48,323 | 995 |
* | Sapient Corp. | 217,300 | 971 |
* | Lawson Software, Inc. | 220,375 | 937 |
* | SPSS, Inc. | 32,716 | 930 |
* | Genpact, Ltd. | 103,484 | 917 |
* | Cirrus Logic, Inc. | 234,700 | 882 |
| Linear Technology Corp. | 36,500 | 839 |
| Broadridge Financial | | |
| Solutions LLC | 41,800 | 778 |
* | NetScout Systems, Inc. | 105,580 | 756 |
* | DTS Inc. | 29,200 | 703 |
| Take-Two Interactive | | |
| Software, Inc. | 83,500 | 697 |
* | Semtech Corp. | 51,113 | 682 |
| CTS Corp. | 183,015 | 661 |
* | 3Com Corp. | 213,100 | 658 |
*,^ | Synaptics Inc. | 23,600 | 632 |
* | NCI, Inc. | 23,500 | 611 |
* | InterDigital, Inc. | 20,700 | 534 |
* | Ariba, Inc. | 58,100 | 507 |
* | Net 1 UEPS | | |
| Technologies, Inc. | 31,900 | 485 |
* | Benchmark Electronics, Inc. | 42,908 | 481 |
* | Harmonic, Inc. | 73,900 | 480 |
* | OSI Systems Inc. | 31,071 | 474 |
* | Compuware Corp. | 62,500 | 412 |
* | ScanSource, Inc. | 22,000 | 409 |
| MAXIMUS, Inc. | 10,200 | 407 |
* | Manhattan Associates, Inc. | 22,400 | 388 |
* | Dice Holdings Inc. | 134,861 | 375 |
| Lender Processing | | |
| Services, Inc. | 12,200 | 373 |
* | Convergys Corp. | 30,700 | 248 |
* | Monotype Imaging | | |
| Holdings Inc. | 59,800 | 224 |
| | | Market |
| | | Value• |
| | Shares | ($000) |
* | Standard | | |
| Microsystem Corp. | 10,662 | 198 |
* | Harris Stratex | | |
| Networks, Inc. Class A | 49,333 | 190 |
* | SuccessFactors Inc. | 23,300 | 178 |
| Micrel, Inc. | 24,800 | 175 |
* | Tekelec | 12,400 | 164 |
* | UTStarcom, Inc. | 198,600 | 155 |
* | TriQuint Semiconductor, Inc. | 56,000 | 138 |
* | CACI International, Inc. | 3,300 | 120 |
* | Mettler-Toledo | | |
| International Inc. | 2,200 | 113 |
* | Ness Technologies Inc. | 37,200 | 110 |
* | Internet Brands Inc. | 16,628 | 98 |
| MTS Systems Corp. | 3,400 | 77 |
| Renaissance Learning, Inc. | 7,049 | 63 |
* | LSI Corp. | 19,000 | 58 |
* | Global Cash Access, Inc. | 11,700 | 45 |
* | EPIQ Systems, Inc. | 2,000 | 36 |
| Marchex, Inc. | 9,803 | 34 |
* | Airvana, Inc. | 5,002 | 29 |
* | Microsemi Corp. | 2,500 | 29 |
* | Veeco Instruments, Inc. | 3,846 | 26 |
* | Sanmina-SCI Corp. | 77,000 | 23 |
* | Atmel Corp. | 6,400 | 23 |
* | Ingram Micro, Inc. Class A | 1,400 | 18 |
| | | 441,933 |
Materials (4.9%) | | |
| Celanese Corp. Series A | 1,192,600 | 15,945 |
| Eastman Chemical Co. | 594,728 | 15,939 |
| Greif Inc. Class A | 449,700 | 14,971 |
* | Owens-Illinois, Inc. | 977,000 | 14,108 |
| Compass Minerals | | |
| International, Inc. | 212,600 | 11,984 |
| FMC Corp. | 242,400 | 10,457 |
| Schnitzer Steel | | |
| Industries, Inc. Class A | 175,900 | 5,522 |
| Cliffs Natural | | |
| Resources Inc. | 299,100 | 5,432 |
| Rock-Tenn Co. | 198,158 | 5,360 |
| Silgan Holdings, Inc. | 96,586 | 5,075 |
| Terra Industries, Inc. | 172,199 | 4,837 |
| Olin Corp. | 318,946 | 4,551 |
| Reliance Steel & | | |
| Aluminum Co. | 171,000 | 4,502 |
| Innophos Holdings Inc. | 260,924 | 2,943 |
| Glatfelter | 456,183 | 2,847 |
| Koppers Holdings, Inc. | 171,338 | 2,488 |
| CF Industries Holdings, Inc. | 28,007 | 1,992 |
| Ball Corp. | 39,300 | 1,706 |
| Airgas, Inc. | 40,600 | 1,373 |
| A. Schulman Inc. | 75,709 | 1,026 |
| Schweitzer-Mauduit International, Inc. | 53,339 | 985 |
* | Buckeye Technology, Inc. | 347,858 | 741 |
* | Pactiv Corp. | 38,618 | 563 |
17
Strategic Equity Fund
| | | Market |
| | | Value• |
| | Shares | ($000) |
| Worthington Industries, Inc. | 64,100 | 558 |
| NewMarket Corp. | 5,600 | 248 |
| Stepan Co. | 8,400 | 229 |
| Sensient Technologies Corp. | 6,300 | 148 |
| AK Steel Holding Corp. | 15,354 | 109 |
* | Clearwater Paper Corp. | 12,071 | 97 |
| Scotts Miracle-Gro Co. | 700 | 24 |
| | | 136,760 |
Telecommunication Services (2.3%) | |
| Embarq Corp. | 780,653 | 29,548 |
* | Syniverse Holdings Inc. | 1,152,703 | 18,167 |
* | Cincinnati Bell Inc. | 3,854,600 | 8,865 |
| Windstream Corp. | 306,200 | 2,468 |
| NTELOS Holdings Corp. | 135,973 | 2,466 |
* | Premiere Global | | |
| Services, Inc. | 145,290 | 1,281 |
| Atlantic Tele-Network, Inc. | 64,377 | 1,235 |
| Consolidated | | |
| Communications | | |
| Holdings, Inc. | 50,600 | 519 |
| USA Mobility, Inc. | 15,500 | 143 |
| CenturyTel, Inc. | 1,600 | 45 |
| | | 64,737 |
Utilities (5.7%) | | |
| SCANA Corp. | 845,678 | 26,123 |
| CenterPoint Energy Inc. | 2,185,108 | 22,791 |
| CMS Energy Corp. | 1,687,369 | 19,978 |
| Energen Corp. | 629,272 | 18,331 |
* | Mirant Corp. | 793,452 | 9,045 |
| Wisconsin Energy Corp. | 203,200 | 8,366 |
| Questar Corp. | 274,676 | 8,084 |
| Portland General Electric Co. | 340,700 | 5,993 |
| Atmos Energy Corp. | 238,911 | 5,524 |
| DTE Energy Co. | 179,381 | 4,969 |
| Pepco Holdings, Inc. | 390,834 | 4,878 |
* | NRG Energy, Inc. | 233,500 | 4,110 |
| IDACORP, Inc. | 144,444 | 3,374 |
| Vectren Corp. | 142,323 | 3,002 |
| WGL Holdings Inc. | 82,603 | 2,709 |
| NorthWestern Corp. | 109,597 | 2,354 |
| ONEOK, Inc. | 100,334 | 2,270 |
| Avista Corp. | 151,929 | 2,093 |
| DPL Inc. | 70,900 | 1,598 |
| NiSource, Inc. | 131,300 | 1,287 |
| UGI Corp. Holding Co. | 36,000 | 850 |
| Pinnacle West Capital Corp. | 22,200 | 590 |
| South Jersey Industries, Inc. | 13,890 | 486 |
* | El Paso Electric Co. | 29,100 | 410 |
| UniSource Energy Corp. | 6,800 | 192 |
| ITC Holdings Corp. | 417 | 18 |
| MGE Energy, Inc. | 300 | 9 |
| | | 159,434 |
Total Common Stocks | | |
(Cost $3,956,799) | | 2,722,245 |
| | | Market |
| | | Value• |
| | Shares | ($000) |
Temporary Cash Investments (2.8%)1 | |
Money Market Fund (1.0%) | | |
3,4 | Vanguard Market | | |
| Liquidity Fund, 0.440% | 26,685,444 | 26,685 |
| | | |
| | | |
| | Face | |
| | Amount | |
| | ($000) | |
Commercial Paper (1.3%) | | |
5 | Danske Corp. | | |
| 4.333%, 4/15/09 | 10,750 | 10,748 |
| General Electric Capital Corp. | |
| 3.874%, 4/15/09 | 16,000 | 15,999 |
| Santander Central Hispano | |
| Finance (Delaware), Inc. | | |
| 4.249%, 4/16/09 | 10,750 | 10,748 |
| | | 37,495 |
U.S. Government and Agency Obligations (0.5%) |
6,7 | Federal Home Loan | | |
| Mortgage Corp., | | |
| 1.206%, 4/30/09 | 3,000 | 3,000 |
6,7 | Federal Home Loan | | |
| Mortgage Corp., | | |
| 0.451%, 5/28/09 | 6,000 | 5,999 |
6,7 | Federal Home | | |
| Loan Bank, | | |
| 0.531%, 8/28/09 | 1,000 | 998 |
6,7 | Federal Home Loan | | |
| Mortgage Corp., | | |
| 0.562%, 8/31/09 | 3,000 | 2,996 |
| | | 12,993 |
Total Temporary Cash Investments | |
(Cost $77,109) | | 77,173 |
Total Investments (100.5%) | | |
(Cost $4,033,908) | | 2,799,418 |
Other Assets and Liabilities (–0.5%) | |
Other Assets | | 8,781 |
Liabilities4 | | (22,401) |
| | | (13,620) |
Net Assets (100%) | | |
Applicable to 273,628,330 outstanding | |
$.001 par value shares of beneficial | |
interest (unlimited authorization) | 2,785,798 |
Net Asset Value Per Share | | $10.18 |
18
Strategic Equity Fund
At March 31, 2009, net assets consisted of: | |
| Amount |
| ($000) |
Paid-in Capital | 5,616,815 |
Overdistributed Net Investment Income | (4,763) |
Accumulated Net Realized Losses | (1,594,273) |
Unrealized Appreciation (Depreciation) | |
Investment Securities | (1,234,490) |
Futures Contracts | 2,509 |
Net Assets | 2,785,798 |
• | See Note A in Notes to Financial Statements. |
* | Non-income-producing security. |
^ | Part of security position is on loan to broker-dealers. The total value of securities on loan is $8,843,000. |
1 The fund invests a portion of its cash reserves in equity markets through the use of index futures contracts. After giving effect to futures investments, the fund’s effective common stock and temporary cash investment positions represent 100.0% and 0.5%, respectively, of net assets.
2 Considered an affiliated company of the fund as the fund owns more than 5% of the outstanding voting securities of such company.
3 Affiliated money market fund available only to Vanguard funds and certain trusts and accounts managed by Vanguard. Rate shown is the 7-day yield.
4 Includes $9,266,000 of collateral received for securities on loan.
5 Security exempt from registration under Section 4(2) of the Securities Act of 1933. Such securities may be sold in transactions exempt from registration only to dealers in that program or other “accredited investors.” At March 31, 2009, the value of these securities was $10,748,000, representing 0.4% of net assets.
6 Securities with a value of $12,993,000 have been segregated as initial margin for open futures contracts.
7 The issuer operates under a congressional charter; its securities are not backed by the full faith and credit of the U.S. government.
REIT—Real Estate Investment Trust.
See accompanying Notes, which are an integral part of the Financial Statements.
19
Strategic Equity Fund
Statement of Operations
| Six Months Ended |
| March 31, 2009 |
| ($000) |
Investment Income | |
Income | |
Dividends1 | 23,717 |
Interest1 | 4,663 |
Security Lending | 1,453 |
Total Income | 29,833 |
Expenses | |
The Vanguard Group—Note B | |
Investment Advisory Services | 351 |
Management and Administrative | 3,739 |
Marketing and Distribution | 644 |
Custodian Fees | 46 |
Auditing Fees | 1 |
Shareholders’ Reports | 73 |
Trustees’ Fees and Expenses | 3 |
Total Expenses | 4,857 |
Net Investment Income | 24,976 |
Realized Net Gain (Loss) | |
Investment Securities Sold1 | (1,096,345) |
Futures Contracts | (126,958) |
Realized Net Gain (Loss) | (1,223,303) |
Change in Unrealized Appreciation (Depreciation) | |
Investment Securities | (550,898) |
Futures Contracts | 3,405 |
Change in Unrealized Appreciation (Depreciation) | (547,493) |
Net Increase (Decrease) in Net Assets Resulting from Operations | (1,745,820) |
1 Dividend income, interest income and realized net gain (loss) from affiliated companies of the fund were $0, $584,000, and $0, respectively.
See accompanying Notes, which are an integral part of the Financial Statements.
20
Strategic Equity Fund
Statement of Changes in Net Assets
| Six Months Ended | Year Ended |
| March 31, | September 30, |
| 2009 | 2008 |
| ($000) | ($000) |
Increase (Decrease) in Net Assets | | |
Operations | | |
Net Investment Income | 24,976 | 65,953 |
Realized Net Gain (Loss) | (1,223,303) | (331,389) |
Change in Unrealized Appreciation (Depreciation) | (547,493) | (1,492,805) |
Net Increase (Decrease) in Net Assets Resulting from Operations | (1,745,820) | (1,758,241) |
Distributions | | |
Net Investment Income | (67,840) | (69,137) |
Realized Capital Gain1 | — | (700,017) |
Total Distributions | (67,840) | (769,154) |
Capital Share Transactions | | |
Issued | 276,790 | 774,976 |
Issued in Lieu of Cash Distributions | 63,748 | 726,971 |
Redeemed | (562,742) | (1,851,818) |
Net Increase (Decrease) from Capital Share Transactions | (222,204) | (349,871) |
Total Increase (Decrease) | (2,035,864) | (2,877,266) |
Net Assets | | |
Beginning of Period | 4,821,662 | 7,698,928 |
End of Period2 | 2,785,798 | 4,821,662 |
1 Includes fiscal 2008 short-term gain distributions totaling $83,541,000. Short-term gain distributions are treated as ordinary income dividends for tax purposes.
2 Net Assets—End of Period includes undistributed (overdistributed) net investment income of ($4,763,000) and $38,101,000.
See accompanying Notes, which are an integral part of the Financial Statements.
21
Strategic Equity Fund
Financial Highlights
| Six Months | | | | | Nov. 1, | Year |
| Ended | | | | | 2003, to | Ended |
For a Share Outstanding | March 31, | Year Ended September 30, | Sept. 30, | Oct. 31, |
Throughout Each Period | 2009 | 2008 | 2007 | 2006 | 2005 | 20041 | 2003 |
Net Asset Value, | | | | | | | |
Beginning of Period | $16.42 | $24.94 | $23.07 | $23.28 | $19.70 | $17.85 | $13.01 |
Investment Operations | | | | | | | |
Net Investment Income | .091 | .240 | .270 | .270 | .190 | .130 | .130 |
Net Realized and | | | | | | | |
Unrealized Gain (Loss) | | | | | | | |
on Investments | (6.090) | (6.090) | 2.840 | 1.170 | 4.490 | 1.850 | 4.840 |
Total from | | | | | | | |
Investment Operations | (5.999) | (5.850) | 3.110 | 1.440 | 4.680 | 1.980 | 4.970 |
Distributions | | | | | | | |
Dividends from | | | | | | | |
Net Investment Income | (.241) | (.240) | (.260) | (.210) | (.140) | (.130) | (.130) |
Distributions from | | | | | | | |
Realized Capital Gains | — | (2.430) | (.980) | (1.440) | (.960) | — | — |
Total Distributions | (.241) | (2.670) | (1.240) | (1.650) | (1.100) | (.130) | (.130) |
Net Asset Value, | | | | | | | |
End of Period | $10.18 | $16.42 | $24.94 | $23.07 | $23.28 | $19.70 | $17.85 |
| | | | | | | |
Total Return2 | –36.66% | –25.37% | 13.76% | 6.49% | 24.32% | 11.14% | 38.55% |
| | | | | | | |
Ratios/Supplemental Data | | | | | | | |
Net Assets, | | | | | | | |
End of Period (Millions) | $2,786 | $4,822 | $7,699 | $6,755 | $5,183 | $2,953 | $1,714 |
Ratio of Total Expenses to | | | | | | | |
Average Net Assets | 0.31%3 | 0.25% | 0.30% | 0.35% | 0.40% | 0.45%3 | 0.50% |
Ratio of Net Investment | | | | | | | |
Income to Average | | | | | | | |
Net Assets | 1.84%3 | 1.09% | 1.03% | 1.18% | 0.99% | 0.83%3 | 1.04% |
Portfolio Turnover Rate | 70%3 | 79% | 75% | 80% | 75% | 66% | 100% |
1 The fund’s fiscal year-end changed from October 31 to September 30, effective September 30, 2004.
2 Total returns do not include the account service fee that may be applicable to certain accounts with balances below $10,000.
3 Annualized.
See accompanying Notes, which are an integral part of the Financial Statements.
22
Strategic Equity Fund
Notes to Financial Statements
Vanguard Strategic Equity Fund is registered under the Investment Company Act of 1940 as an open-end investment company, or mutual fund.
A. The following significant accounting policies conform to generally accepted accounting principles for U.S. mutual funds. The fund consistently follows such policies in preparing its financial statements.
1. Security Valuation: Securities are valued as of the close of trading on the New York Stock Exchange (generally 4 p.m., Eastern time) on the valuation date. Equity securities are valued at the latest quoted sales prices or official closing prices taken from the primary market in which each security trades; such securities not traded on the valuation date are valued at the mean of the latest quoted bid and asked prices. Securities for which market quotations are not readily available, or whose values have been materially affected by events occurring before the fund’s pricing time but after the close of the securities’ primary markets, are valued by methods deemed by the board of trustees to represent fair value. Investments in Vanguard Market Liquidity Fund are valued at that fund’s net asset value. Temporary cash investments acquired over 60 days to maturity are valued using the latest bid prices or using valuations based on a matrix system (which considers such factors as security prices, yields, maturities, and ratings), both as furnished by independent pricing services. Other temporary cash investments are valued at amortized cost, which approximates market value.
2. Futures Contracts: The fund uses index futures contracts to a limited extent, with the objective of maintaining full exposure to the stock market while maintaining liquidity. The fund may purchase or sell futures contracts to achieve a desired level of investment, whether to accommodate portfolio turnover or cash flows from capital share transactions. The primary risks associated with the use of futures contracts are imperfect correlation between changes in market values of stocks held by the fund and the prices of futures contracts, and the possibility of an illiquid market.
Futures contracts are valued at their quoted daily settlement prices. The aggregate principal amounts of the contracts are not recorded in the Statement of Net Assets. Fluctuations in the value of the contracts are recorded in the Statement of Net Assets as an asset (liability) and in the Statement of Operations as unrealized appreciation (depreciation) until the contracts are closed, when they are recorded as realized futures gains (losses).
3. Federal Income Taxes: The fund intends to continue to qualify as a regulated investment company and distribute all of its taxable income. Management has analyzed the fund’s tax positions taken on federal income tax returns for all open tax years (tax years ended September 30, 2005–2008) and for the period ended March 31, 2009, and has concluded that no provision for federal income tax is required in the fund’s financial statements.
4. Distributions: Distributions to shareholders are recorded on the ex-dividend date.
5. Security Lending: The fund may lend its securities to qualified institutional borrowers to earn additional income. Security loans are required to be secured at all times by collateral at least equal to the market value of securities loaned. The fund invests cash collateral received in Vanguard Market Liquidity Fund, and records a liability for the return of the collateral, during the period the securities are on loan. Security lending income represents the income earned on investing cash collateral, less expenses associated with the loan.
23
Strategic Equity Fund
6. Other: Dividend income is recorded on the ex-dividend date. Interest income includes income distributions received from Vanguard Market Liquidity Fund and is accrued daily. Security transactions are accounted for on the date securities are bought or sold. Costs used to determine realized gains (losses) on the sale of investment securities are those of the specific securities sold.
B. The Vanguard Group furnishes at cost investment advisory, corporate management, administrative, marketing, and distribution services. The costs of such services are allocated to the fund under methods approved by the board of trustees. The fund has committed to provide up to 0.40% of its net assets in capital contributions to Vanguard. At March 31, 2009, the fund had contributed capital of $730,000 to Vanguard (included in Other Assets), representing 0.03% of the fund’s net assets and 0.29% of Vanguard’s capitalization. The fund’s trustees and officers are also directors and officers of Vanguard.
C. Distributions are determined on a tax basis and may differ from net investment income and realized capital gains for financial reporting purposes. Differences may be permanent or temporary. Permanent differences are reclassified among capital accounts in the financial statements to reflect their tax character. Temporary differences arise when certain items of income, expense, gain, or loss are recognized in different periods for financial statement and tax purposes; these differences will reverse at some time in the future. Differences in classification may also result from the treatment of short-term gains as ordinary income for tax purposes.
The fund’s tax-basis capital gains and losses are determined only at the end of each fiscal year. For tax purposes, at September 30, 2008, the fund had available realized losses of $371,403,000 to offset future net capital gains through September 30, 2017. The fund will use these capital losses to offset net taxable capital gains, if any, realized during the year ending September 30, 2009; should the fund realize net capital losses for the year, the losses will be added to the loss carryforward balance above.
At March 31, 2009, the cost of investment securities for tax purposes was $4,033,908,000. Net unrealized depreciation of investment securities for tax purposes was $1,234,490,000, consisting of unrealized gains of $94,263,000 on securities that had risen in value since their purchase and $1,328,753,000 in unrealized losses on securities that had fallen in value since their purchase.
At March 31, 2009, the aggregate settlement value of open futures contracts expiring in June 2009 and the related unrealized appreciation (depreciation) were:
| | | ($000) |
| | Aggregate | Unrealized |
| Number of | Settlement | Appreciation |
Futures Contracts | Long Contracts | Value | (Depreciation) |
E-mini Russell 2000 Index | 954 | 40,191 | 1,607 |
S&P Midcap 400 Index | 84 | 20,492 | 888 |
E-mini S&P Midcap Index | 35 | 1,708 | 14 |
Unrealized appreciation (depreciation) on open futures contracts is required to be treated as realized gain (loss) for tax purposes.
D. During the six months ended March 31, 2009, the fund purchased $1,095,867,000 of investment securities and sold $1,514,739,000 of investment securities, other than temporary cash investments.
24
Strategic Equity Fund
E. Capital shares issued and redeemed were:
| Six Months Ended | Year Ended |
| March 31, 2009 | September 30, 2008 |
| Shares | Shares |
| (000) | (000) |
Issued | 24,695 | 39,124 |
Issued in Lieu of Cash Distributions | 5,712 | 36,367 |
Redeemed | (50,467) | (90,470) |
Net Increase (Decrease) in Shares Outstanding | (20,060) | (14,979) |
F. The fund has invested in a company that is considered to be an affiliated company of the fund because the fund owns more than 5% of the outstanding voting securities of the company. Transactions during the period in securities of this company were as follows:
| | | Current Period Transactions | |
| Sept. 30, 2008 | | Proceeds from | | March 31, 2009 |
| Market | Purchases | Securities | Dividend | Market |
| Value | at Cost | Sold | Income | Value |
| ($000) | ($000) | ($000) | ($000) | ($000) |
TBS International Ltd. | NA1 | 2,487 | 21 | — | 10,383 |
1 At September 30, 2008, the issuer was not an affiliated company of the fund. |
G. In September 2006, the Financial Accounting Standards Board issued Statement of Financial Accounting Standards No. 157 (“FAS 157”), “Fair Value Measurements.” FAS 157 establishes a framework for measuring fair value and expands disclosures about fair value measurements in financial statements.
The various inputs that may be used to determine the value of the fund’s investments are summarized in three broad levels. The inputs or methodologies used for valuing securities are not necessarily an indication of the risk associated with investing in those securities.
Level 1—Quoted prices in active markets for identical securities.
Level 2—Other significant observable inputs (including quoted prices for similar securities, interest rates, prepayment speeds, credit risk, etc.).
Level 3—Significant unobservable inputs (including the fund’s own assumptions used to determine the fair value of investments).
The following table summarizes the fund’s investments as of March 31, 2009, based on the inputs used to value them:
| Investments | Futures |
| in Securities | Contracts |
Valuation Inputs | ($000) | ($000) |
Level 1—Quoted prices | 2,748,930 | 2,509 |
Level 2—Other significant observable inputs | 50,488 | — |
Level 3—Significant unobservable inputs | — | — |
Total | 2,799,418 | 2,509 |
25
About Your Fund’s Expenses
As a shareholder of the fund, you incur ongoing costs, which include costs for portfolio management, administrative services, and shareholder reports (like this one), among others. Operating expenses, which are deducted from a fund’s gross income, directly reduce the investment return of the fund.
A fund’s expenses are expressed as a percentage of its average net assets. This figure is known as the expense ratio. The following examples are intended to help you understand the ongoing costs (in dollars) of investing in your fund and to compare these costs with those of other mutual funds. The examples are based on an investment of $1,000 made at the beginning of the period shown and held for the entire period.
The accompanying table illustrates your fund’s costs in two ways:
• Based on actual fund return. This section helps you to estimate the actual expenses that you paid over the period. The “Ending Account Value” shown is derived from the fund’s actual return, and the third column shows the dollar amount that would have been paid by an investor who started with $1,000 in the fund. You may use the information here, together with the amount you invested, to estimate the expenses that you paid over the period.
To do so, simply divide your account value by $1,000 (for example, an $8,600 account value divided by $1,000 = 8.6), then multiply the result by the number given for your fund under the heading “Expenses Paid During Period.”
• Based on hypothetical 5% yearly return. This section is intended to help you compare your fund’s costs with those of other mutual funds. It assumes that the fund had a yearly return of 5% before expenses, but that the expense ratio is unchanged. In this case—because the return used is not the fund’s actual return—the results do not apply to your investment. The example is useful in making comparisons because the Securities and Exchange Commission requires all mutual funds to calculate expenses based on a 5% return. You can assess your fund’s costs by comparing this hypothetical example with the hypothetical examples that appear in shareholder reports of other funds.
Six Months Ended March 31, 2009 | | | |
| Beginning | Ending | Expenses |
| Account Value | Account Value | Paid During |
Strategic Equity Fund | 9/30/2008 | 3/31/2009 | Period1 |
Based on Actual Fund Return | $1,000.00 | $633.36 | $1.26 |
Based on Hypothetical 5% Yearly Return | 1,000.00 | 1,023.39 | 1.56 |
1 The calculations are based on expenses incurred in the most recent six-month period. The fund’s annualized six-month expense ratio for that period is 0.31%. The dollar amounts shown as “Expenses Paid” are equal to the annualized expense ratio multiplied by the average account value over the period, multiplied by the number of days in the most recent six-month period, then divided by the number of days in the most recent 12-month period.
26
Note that the expenses shown in the table are meant to highlight and help you compare ongoing costs only and do not reflect transaction costs incurred by the fund for buying and selling securities. Further, the expenses do not include the account service fee described in the prospectus. If such a fee were applied to your account, your costs would be higher. Your fund does not charge transaction fees, such as purchase or redemption fees, nor does it carry a “sales load.”
The calculations assume no shares were bought or sold during the period. Your actual costs may have been higher or lower, depending on the amount of your investment and the timing of any purchases or redemptions.
You can find more information about the fund’s expenses, including annual expense ratios, in the Financial Statements section of this report. For additional information on operating expenses and other shareholder costs, please refer to your fund’s current prospectus.
27
Trustees Approve Advisory Arrangement
The board of trustees of Vanguard Strategic Equity Fund has renewed its investment advisory arrangement with The Vanguard Group, Inc. Vanguard—through its Quantitative Equity Group—serves as the fund’s investment advisor. The board determined that continuing the fund’s internalized management structure was in the best interests of the fund and its shareholders.
The board based its decision upon an evaluation of the advisor’s investment staff, portfolio management process, and performance. The trustees considered the factors discussed below, among others. However, no single factor determined whether or not the board approved the arrangement. Rather, it was the totality of the circumstances that drove the board’s decision.
Nature, extent, and quality of services
The board considered the quality of the fund’s investment management over both the short and long term, and took into account the organizational depth and stability of the advisor. Vanguard has been managing investments for more than two decades. George U. Sauter, Vanguard managing director and chief investment officer, has been in the investment management business since 1985, and has led the Quantitative Equity Group since 1987. James D. Troyer, the manager primarily responsible for the day-to-day management of the fund, has worked in investment management since 1979. The Quantitative Equity Group adheres to a sound, disciplined investment management process; the team has considerable experience, stability, and depth.
The board concluded that Vanguard’s experience, stability, depth, and performance, among other factors, warranted continuation of the advisory arrangement.
Investment performance
The board considered the short- and long-term performance of the fund, including any periods of outperformance or underperformance of a relevant benchmark and peer group. The board concluded that the advisor has carried out the fund’s investment strategy in disciplined fashion, and that performance results have been within competitive norms. Information about the fund’s most recent performance can be found in the Performance Summary section of this report.
Cost
The board concluded that the fund’s expense ratio was well below the average expense ratio charged by funds in the fund’s peer group. The board noted that the fund’s advisory expenses were also well below the peer-group average. Information about the fund’s expense ratio appears in the About Your Fund’s Expenses section of this report as well as in the Financial Statements section.
The board does not conduct a profitability analysis of Vanguard because of Vanguard’s unique “at-cost” structure. Unlike most other mutual fund management companies, Vanguard is owned by the funds it oversees, and produces “profits” only in the form of reduced expenses for fund shareholders.
The benefit of economies of scale
The board of trustees concluded that the fund’s low-cost arrangement with Vanguard ensures that the fund will realize economies of scale as it grows, with the cost to shareholders declining as fund assets increase.
The board will consider whether to renew the advisory arrangement again after a one-year period.
28
Glossary
Beta. A measure of the magnitude of a fund’s past share-price fluctuations in relation to the ups and downs of a given market index. The index is assigned a beta of 1.00. Compared with a given index, a fund with a beta of 1.20 typically would have seen its share price rise or fall by 12% when the index rose or fell by 10%. For this report, beta is based on returns over the past 36 months for both the fund and the index. Note that a fund’s beta should be reviewed in conjunction with its R-squared (see definition). The lower the R-squared, the less correlation there is between the fund and the index, and the less reliable beta is as an indicator of volatility.
Earnings Growth Rate. The average annual rate of growth in earnings over the past five years for the stocks now in a fund.
Equity Exposure. A measure that reflects a fund’s investments in stocks and stock futures. Any holdings in short-term reserves are excluded.
Expense Ratio. The percentage of a fund’s average net assets used to pay its annual administrative and advisory expenses. These expenses directly reduce returns to investors.
Foreign Holdings. The percentage of a fund represented by stocks or depositary receipts of companies based outside the United States.
Inception Date. The date on which the assets of a fund (or one of its share classes) are first invested in accordance with the fund’s investment objective. For funds with a subscription period, the inception date is the day after that period ends. Investment performance is measured from the inception date.
Median Market Cap. An indicator of the size of companies in which a fund invests; the midpoint of market capitalization (market price x shares outstanding) of a fund’s stocks, weighted by the proportion of the fund’s assets invested in each stock. Stocks representing half of the fund’s assets have market capitalizations above the median, and the rest are below it.
Price/Book Ratio. The share price of a stock divided by its net worth, or book value, per share. For a fund, the weighted average price/book ratio of the stocks it holds.
Price/Earnings Ratio. The ratio of a stock’s current price to its per-share earnings over the past year. For a fund, the weighted average P/E of the stocks it holds. P/E is an indicator of market expectations about corporate prospects; the higher the P/E, the greater the expectations for a company’s future growth.
R-Squared. A measure of how much of a fund’s past returns can be explained by the returns from the market in general, as measured by a given index. If a fund’s total returns were precisely synchronized with an index’s returns, its R-squared would be 1.00. If the fund’s returns bore no relationship to the index’s returns, its R-squared would be 0. For this report, R-squared is based on returns over the past 36 months for both the fund and the index.
Return on Equity. The annual average rate of return generated by a company during the past five years for each dollar of shareholder’s equity (net income divided by shareholder’s equity). For a fund, the weighted average return on equity for the companies whose stocks it holds.
Short-Term Reserves. The percentage of a fund invested in highly liquid, short-term securities that can be readily converted to cash.
29
Turnover Rate. An indication of the fund’s trading activity. Funds with high turnover rates incur higher transaction costs and may be more likely to distribute capital gains (which may be taxable to investors). The turnover rate excludes in-kind transactions, which have minimal impact on costs.
Yield. A fund’s 30-day SEC yield is derived using a formula specified by the U.S. Securities and Exchange Commission. Under the formula, data related to the fund’s security holdings in the previous 30 days are used to calculate the fund’s hypothetical net income for that period, which is then annualized and divided by the fund’s estimated average net assets over the calculation period. For the purposes of this calculation, a security’s income is based on its current market yield to maturity (in the case of bonds) or its projected dividend yield (for stocks). Because the SEC yield represents hypothetical annualized income, it will differ—at times significantly—from the fund’s actual experience. As a result, the fund’s income distributions may be higher or lower than implied by the SEC yield.
30
This page intentionally left blank.
The People Who Govern Your Fund
The trustees of your mutual fund are there to see that the fund is operated and managed in your best interests since, as a shareholder, you are a part owner of the fund. Your fund’s trustees also serve on the board of directors of The Vanguard Group, Inc., which is owned by the Vanguard funds and provides services to them on an at-cost basis.
A majority of Vanguard’s board members are independent, meaning that they have no affiliation with Vanguard or the funds they oversee, apart from the sizable personal investments they have made as private individuals. The independent board members have distinguished backgrounds in business, academia, and public service. Each of the trustees and executive officers oversees 157 Vanguard funds.
The following table provides information for each trustee and executive officer of the fund. More information about the trustees is in the Statement of Additional Information, which can be obtained, without charge, by contacting Vanguard at 800-662-7447, or online at www.vanguard.com.
Chairman of the Board and Interested Trustee | Rajiv L. Gupta |
| Born 1945. Trustee Since December 2001.2 Principal |
| Occupation(s) During the Past Five Years: Chairman |
John J. Brennan1 | and Chief Executive Officer of Rohm and Haas Co. |
Born 1954. Trustee Since May 1987. Chairman of | (chemicals); President of Rohm and Haas Co. |
the Board. Principal Occupation(s) During the Past Five | (2006–2008); Board Member of American Chemistry |
Years: Chairman of the Board and Director/Trustee of | Council; Director of Tyco International, Ltd. (diversified |
The Vanguard Group, Inc., and of each of the investment | manufacturing and services) and Hewlett-Packard Co. |
companies served by The Vanguard Group; Chief | (electronic computer manufacturing); Trustee of The |
Executive Officer and President of The Vanguard Group | Conference Board. |
and of each of the investment companies served by The | |
Vanguard Group (1996–2008). | |
| Amy Gutmann |
| Born 1949. Trustee Since June 2006. Principal |
Independent Trustees | Occupation(s) During the Past Five Years: President of |
| the University of Pennsylvania; Christopher H. Browne |
| Distinguished Professor of Political Science in the School |
Charles D. Ellis | of Arts and Sciences with Secondary Appointments |
Born 1937. Trustee Since January 2001. Principal | at the Annenberg School for Communication and the |
Occupation(s) During the Past Five Years: Applecore | Graduate School of Education of the University of |
Partners (pro bono ventures in education); Senior | Pennsylvania; Director of Carnegie Corporation of |
Advisor to Greenwich Associates (international business | New York, Schuylkill River Development Corporation, |
strategy consulting); Successor Trustee of Yale University; | and Greater Philadelphia Chamber of Commerce; |
Overseer of the Stern School of Business at New York | Trustee of the National Constitution Center. |
University; Trustee of the Whitehead Institute for | |
Biomedical Research. | |
| JoAnn Heffernan Heisen |
| Born 1950. Trustee Since July 1998. Principal |
Emerson U. Fullwood | Occupation(s) During the Past Five Years: Retired |
Born 1948. Trustee Since January 2008. Principal | Corporate Vice President, Chief Global Diversity Officer, |
Occupation(s) During the Past Five Years: Retired | and Member of the Executive Committee of Johnson & |
Executive Chief Staff and Marketing Officer for North | Johnson (pharmaceuticals/consumer products); Vice |
America and Corporate Vice President of Xerox | President and Chief Information Officer (1997–2005) |
Corporation (photocopiers and printers); Director of | of Johnson & Johnson; Director of the University |
SPX Corporation (multi-industry manufacturing), the | Medical Center at Princeton and Women’s Research |
United Way of Rochester, the Boy Scouts of America, | and Education Institute. |
Amerigroup Corporation (direct health and medical | |
insurance carriers), and Monroe Community College | |
Foundation. | |
André F. Perold | F. William McNabb III1 | |
Born 1952. Trustee Since December 2004. Principal | Born 1957. Chief Executive Officer Since August 2008. |
Occupation(s) During the Past Five Years: George Gund | President Since March 2008. Principal Occupation(s) |
Professor of Finance and Banking, Senior Associate | During the Past Five Years: Director of The Vanguard |
Dean, and Director of Faculty Recruiting, Harvard | Group, Inc., since 2008; Chief Executive Officer and |
Business School; Director and Chairman of UNX, Inc. | President of The Vanguard Group and of each of the |
(equities trading firm); Chair of the Investment | investment companies served by The Vanguard Group |
Committee of HighVista Strategies LLC (private | since 2008; Director of Vanguard Marketing Corporation; |
investment firm). | Managing Director of The Vanguard Group (1995–2008). |
| | |
| | |
Alfred M. Rankin, Jr. | Heidi Stam1 | |
Born 1941. Trustee Since January 1993. Principal | Born 1956. Secretary Since July 2005. Principal |
Occupation(s) During the Past Five Years: Chairman, | Occupation(s) During the Past Five Years: Managing |
President, Chief Executive Officer, and Director of | Director of The Vanguard Group, Inc., since 2006; |
NACCO Industries, Inc. (forklift trucks/housewares/ | General Counsel of The Vanguard Group since 2005; |
lignite); Director of Goodrich Corporation (industrial | Secretary of The Vanguard Group and of each of the |
products/aircraft systems and services). | investment companies served by The Vanguard Group |
| since 2005; Director and Senior Vice President of |
| Vanguard Marketing Corporation since 2005; Principal |
J. Lawrence Wilson | of The Vanguard Group (1997–2006). |
Born 1936. Trustee Since April 1985. Principal | |
Occupation(s) During the Past Five Years: Retired | | |
Chairman and Chief Executive Officer of Rohm and | Vanguard Senior Management Team |
Haas Co. (chemicals); Director of Cummins Inc. (diesel | | |
engines) and AmerisourceBergen Corp. (pharmaceutical | | |
distribution); Trustee of Vanderbilt University and of | R. Gregory Barton | Michael S. Miller |
Culver Educational Foundation. | Mortimer J. Buckley | James M. Norris |
| Kathleen C. Gubanich | Glenn W. Reed |
| Paul A. Heller | George U. Sauter |
Executive Officers | | |
| | |
| Founder | |
Thomas J. Higgins1 | | |
Born 1957. Chief Financial Officer Since September | | |
2008. Principal Occupation(s) During the Past Five | John C. Bogle | |
Years: Principal of The Vanguard Group, Inc.; Chief | Chairman and Chief Executive Officer, 1974–1996 |
Financial Officer of each of the investment companies | | |
served by The Vanguard Group since 2008; Treasurer | | |
of each of the investment companies served by The | | |
Vanguard Group (1998–2008). | | |
| | |
| | |
Kathryn J. Hyatt1 | | |
Born 1955. Treasurer Since November 2008. Principal | | |
Occupation(s) During the Past Five Years: Principal of | | |
The Vanguard Group, Inc.; Treasurer of each of the | | |
investment companies served by The Vanguard | | |
Group since 2008; Assistant Treasurer of each of the | | |
investment companies served by The Vanguard Group | | |
(1988–2008). | | |
1 These individuals are “interested persons” as defined in the Investment Company Act of 1940.
2 December 2002 for Vanguard Equity Income Fund, Vanguard Growth Equity Fund, the Vanguard Municipal Bond Funds, and the Vanguard State Tax-Exempt Funds.
| 
|
| P.O. Box 2600 |
| Valley Forge, PA 19482-2600 |
Connect with Vanguard® > www.vanguard.com
Fund Information > 800-662-7447 | All comparative mutual fund data are from Lipper Inc. |
| or Morningstar, Inc., unless otherwise noted. |
Direct Investor Account Services > 800-662-2739 | |
| |
Institutional Investor Services > 800-523-1036 | You can obtain a free copy of Vanguard’s proxy voting |
| guidelines by visiting our website, www.vanguard.com, |
Text Telephone for People | and searching for “proxy voting guidelines,” or by |
With Hearing Impairment > 800-952-3335 | calling Vanguard at 800-662-2739. The guidelines are |
| also available from the SEC’s website, www.sec.gov. |
| In addition, you may obtain a free report on how your |
This material may be used in conjunction | fund voted the proxies for securities it owned during |
with the offering of shares of any Vanguard | the 12 months ended June 30. To get the report, visit |
fund only if preceded or accompanied by | either www.vanguard.com or www.sec.gov. |
the fund’s current prospectus. | |
| |
| You can review and copy information about your fund |
CFA® is a trademark owned by CFA Institute. | at the SEC’s Public Reference Room in Washington, D.C. |
| To find out more about this public service, call the SEC |
| at 202-551-8090. Information about your fund is also |
The funds or securities referred to herein are not | available on the SEC’s website, and you can receive |
sponsored, endorsed, or promoted by MSCI, and MSCI | copies of this information, for a fee, by sending a |
bears no liability with respect to any such funds or | request in either of two ways: via e-mail addressed to |
securities. For any such funds or securities, the | publicinfo@sec.gov or via regular mail addressed to the |
prospectus or the Statement of Additional Information | Public Reference Section, Securities and Exchange |
contains a more detailed description of the limited | Commission, Washington, DC 20549-0102. |
relationship MSCI has with The Vanguard Group and | |
any related funds. | |
| |
| |
Russell is a trademark of The Frank Russell Company. | |
| |
| |
| |
| |
| |
| |
| |
| © 2009 The Vanguard Group, Inc. |
| All rights reserved. |
| Vanguard Marketing Corporation, Distributor. |
| |
| Q1142 052009 |
> | During the six months ended March 31, stocks continued to face stiff headwinds from credit-market turmoil and the global economic slowdown. |
> | Vanguard Capital Opportunity Fund returned about –24%, a disappointing absolute result that nevertheless outpaced the fund’s comparative standards. |
> | The advisor’s good stock selection within the fund’s sizable health care and information technology sectors helped support its performance relative to that of the benchmark index. |
Contents | |
| |
Your Fund’s Total Returns | 1 |
President’s Letter | 2 |
Advisor’s Report | 6 |
Fund Profile | 11 |
Performance Summary | 12 |
Financial Statements | 13 |
About Your Fund’s Expenses | 24 |
Trustees Approve Advisory Agreement | 26 |
Glossary | 27 |
Please note: The opinions expressed in this report are just that—informed opinions. They should not be considered promises or advice. Also, please keep in mind that the information and opinions cover the period through the date on the front of this report. Of course, the risks of investing in your fund are spelled out in the prospectus.
Your Fund’s Total Returns
Six Months Ended March 31, 2009 | | |
| Ticker | Total |
| Symbol | Returns |
Vanguard Capital Opportunity Fund | | |
Investor Shares | VHCOX | –23.55% |
Admiral™ Shares1 | VHCAX | –23.51 |
Russell Midcap Growth Index | | –29.81 |
Average Multi-Cap Growth Fund2 | | –27.45 |
Your Fund’s Performance at a Glance |
September 30, 2008–March 31, 2009 | | | | |
| | | Distributions Per Share |
| Starting | Ending | Income | Capital |
| Share Price | Share Price | Dividends | Gains |
Vanguard Capital Opportunity Fund | | | | |
Investor Shares | $29.41 | $20.29 | $0.114 | $2.062 |
Admiral Shares | 68.00 | 46.87 | 0.339 | 4.761 |
1 A lower-cost class of shares available to many longtime shareholders and to those with significant investments in the fund.
2 Derived from data provided by Lipper Inc.
1

President’s Letter
Dear Shareholder,
For the six months ended March 31, Vanguard Capital Opportunity Fund returned a disappointing –23.55% for Investor Shares and –23.51% for Admiral Shares. Still, the advisor’s careful stock selection in its two largest sectors—health care and information technology—kept the fund several steps ahead of the benchmark Russell Midcap Growth Index and the average return of multi-cap growth funds.
The first half of the fund’s 2009 fiscal year brought no relief for battered equities or investors. October was the worst month in the six-month span for the fund and its benchmark index as investors reacted to the deepening credit-market crisis and the slumping economy. In addition to steep losses, stock market volatility rose to levels not seen since the 1930s. For example, October encompassed not only two of the worst but also two of the best U.S. trading days since 1928 (based on percentage losses and gains).
Extreme distress dappled with glimmers of hope
The six months ended March 31 witnessed extreme distress in global stock markets, with both U.S. and international stocks returning about –31%. The embattled financial sector continued to struggle, prompting regulators in the United States and abroad to take ever-more-aggressive actions to help the big banks fortify their fragile balance sheets.
2
Even as the gloom intensified, a few signs of recovery appeared on the horizon. Toward the end of the period, the swift contraction in manufacturing activity seemed to lessen. And throughout the six months, news from the housing sector seemed to improve. From their early March lows through the end of the period, global stock markets generated a double-digit return.
Credit-market turmoil provoked dramatic response
Developments in the fixed income market were, if anything, even more unusual. In the months after the September collapse of Lehman Brothers, a major presence in the bond market, the trading of corporate bonds came to a near standstill as investors stampeded into U.S. Treasury bonds—considered the safest, most liquid credits—driving prices higher and yields lower. The difference between the yields of Treasuries and corporate bonds grew wider than it had been since the 1930s.
The Federal Reserve Board responded to the credit-market and economic crises with a dramatic easing of monetary policy, reducing its target for short-term interest rates to an all-time low of 0% to 0.25%. The Fed also created new programs designed to bring borrowers and lenders back to the market. For the six-month period, the Barclays Capital U.S. Aggregate Bond Index returned 4.70% on the strength of Treasuries and other government-backed bonds. The broad municipal bond market returned 5.00%.
Market Barometer | | | |
| | | Total Returns |
| | Periods Ended March 31, 2009 |
| Six Months | One Year | Five Years1 |
Stocks | | | |
Russell 1000 Index (Large-caps) | –30.59% | –38.27% | –4.54% |
Russell 2000 Index (Small-caps) | –37.17 | –37.50 | –5.24 |
Dow Jones Wilshire 5000 Index (Entire market) | –30.72 | –37.69 | –4.24 |
MSCI All Country World Index ex USA (International) | –30.54 | –46.18 | –0.24 |
| | | |
Bonds | | | |
Barclays Capital U.S. Aggregate Bond Index | | | |
(Broad taxable market) | 4.70% | 3.13% | 4.13% |
Barclays Capital Municipal Bond Index | 5.00 | 2.27 | 3.21 |
Citigroup 3-Month Treasury Bill Index | 0.30 | 1.13 | 3.06 |
| | | |
CPI | | | |
Consumer Price Index | –2.78% | –0.38% | 2.57% |
1 Annualized.
3
Stock selection helped the fund battle stiff headwinds
In recent years, PRIMECAP Management Company (the fund’s advisor) has established significant positions in health care and information technology in a bid to capitalize on products and services needed by aging baby boomers and in the expanding global use of computer chips and other electronics. Because health care and tech stocks together have for some time represented about two-thirds of the fund’s total assets—and have dominated its top-ten holdings—they have had an outsized impact on performance. The fiscal half-year was no exception: Health care and tech holdings accounted for about three-fifths of the fund’s return.
With all sectors in the fund and the benchmark index posting double-digit losses, the fund’s health care (–19%) and tech (–23%) stocks held up relatively well. Together, these two sectors contributed more than 4 percentage points to the fund’s return compared with that of its benchmark.
The health care sector overall can be somewhat recession-resistant. This appeared to be the case in the fund and the benchmark index, especially among some biotechnology and life-sciences companies. Two of the fund’s top-ten holdings—Amgen and Biogen Idec (a modest gainer)—performed relatively well. In addition, Genentech and other holdings benefited from takeovers. On the other hand, some large pharmaceutical companies, including top-ten holdings Eli Lilly and Novartis, came under pressure from the prospect of health care reform and a move toward generic drugs.
Among tech stocks, despite the ongoing woes of some of their major financial-institution customers, several semiconductor firms posted six-month gains, including
Expense Ratios1 | | | |
Your Fund Compared With Its Peer Group | | | |
| | | Average |
| Investor | Admiral | Multi-Cap |
| Shares | Shares | Growth Fund |
Capital Opportunity Fund | 0.52% | 0.43% | 1.41% |
1 The fund expense ratios shown are from the prospectus dated January 28, 2009, and represent estimated costs for the current fiscal year based on the fund’s current net assets. For the six months ended March 31, 2009, the annualized expense ratios were 0.51% for the Investor Shares and 0.42% for the Admiral Shares. The peer-group expense ratio is derived from data provided by Lipper Inc. and captures information through year-end 2008.
4
top-ten stock ASML Holding, a Netherlands-based supplier of lithography systems used in microchip manufacturing; FormFactor, a maker of devices used to test integrated circuits, or chips; Cree, a chip-maker specializing in light-emitting diodes (LEDs); and Micron Technology, a maker of memory chips and advanced memory technology.
The flip side of the fund’s heavy commitment to health care and technology stocks has been a relatively light investment in financial and industrial stocks. In financials (–40%), this was beneficial as banks, asset managers, and real estate firms continued to grapple with loan troubles and other credit-market distress. Among industrials (–44%), however, the results were mixed. FedEx, a top-ten holding, and some airlines (including AMR, parent of American Airlines) were hit hard by the economic slump and travel cutbacks.
For more on the advisor’s strategy and outlook, please see the Advisor’s Report following this letter.
Extraordinary markets demand extraordinary discipline
Investors have good reason to feel a bit shell-shocked by the sometimes-dramatic daily ups and downs of the stock market over the last several months. Most financial assets—not just stocks—suffered historic losses. Even more notable was the speed and breadth of the declines.
While investors can’t control what happened, they can control how they react to extraordinary events and how they position their portfolios. History has shown us that it’s important to maintain a disciplined investment plan that is balanced and diversified within and across asset classes, and is consistent with your time horizon, goals, and tolerance for risk.
Discipline, patience, and a long-term view are hallmarks of Vanguard Capital Opportunity Fund. These characteristics can help the fund weather the market’s inevitable setbacks and help investors capture the potential long-term rewards of investing in underappreciated growth stocks.
Thank you for entrusting your assets to Vanguard.
Sincerely,

F. William McNabb III
President and Chief Executive Officer
April 15, 2009
5
Advisor’s Report
For the six months ended March 31, Vanguard Capital Opportunity Fund returned –23.55% for Investor Shares and –23.51% for Admiral Shares. Although these results were more than 6 percentage points ahead of the return of the Russell Midcap Growth Index and almost 4 percentage points ahead of the average return of multi-cap growth competitors, they were disappointing on an absolute basis. Favorable stock selection overall, combined with our overweighted positions in the health care and information technology sectors, and our underweighted positions in the energy and financial sectors, helped relative performance.
Investment environment
The early signs of a slowdown in the U.S. economy that first appeared in late 2007 evolved into what has become the longest-running recession in the post-World War II era. At the same time, the global financial crisis that began in 2007 worsened throughout 2008, leading to the failure of several major global institutions.
In our annual report to you last October, we noted that the turmoil in financial markets was our most immediate concern. Indeed, this turmoil intensified in the final three months of 2008. Although some areas of the financial markets, such as interbank lending, have recently shown signs of stabilization, we believe it is still too early to determine whether the unprecedented U.S. and foreign government programs to address the credit crunch and bolster the financial system will prove effective.
A year ago, even as the economic picture was dimming, stock market fundamentals remained healthy and corporate America appeared to be on solid ground. By the second half of 2008, however, the situation had changed dramatically. The unwinding of years of underpriced risk and excessive leverage took its toll, spreading well beyond the financial sector to the broader economy, including Main Street. Liquidity vanished, consumer spending declined, and businesses reduced output.
In short, we view this period—and the unprecedented government intervention it engendered—as transformational. Not since the Depression have we experienced such a broad and steep simultaneous decline in value across virtually all sectors of every asset class—a notable exception being U.S. Treasuries. The true extent of the transformation is likely to become clearer only as the nature and degree of U.S. government involvement in the financial sector—and now in the auto industry—evolves.
Management of the fund
Despite the economic and credit-market upheavals, our primary objective remains the same. We seek to identify companies
6
whose long-term fundamentals will evolve significantly better than current valuation suggests. To help find these companies, we rely on rigorous fundamental research and meet not only with company management but also with competitors, suppliers, and customers. We invest with a long-term perspective, in the expectation that over a three- to five-year horizon, our choices will outperform the market.
This process has led us to make significant investments in health care and IT in recent years. We anticipate superior growth for these sectors, based on our expectation of growing demand for health care products and services and increasing global use of computers and electronics. For the half-year, the fund’s 30% average weighting in health care and 37% average weighting in tech were about twice those of the Russell Midcap Growth Index.
Our positioning within health care (–19%) was the major reason the fund performed ahead of the benchmark index for the six months. In part, this reflects the sector’s somewhat defensive nature as well as optimism surrounding biotech firms—including Amgen (–16%) and Biogen Idec (+4%), two of the fund’s top-ten holdings.
The Food and Drug Administration (FDA) is reviewing a biologics license application for denosumab, Amgen’s new treatment for osteoporosis and certain forms of cancer. A decision is expected in fourth-quarter 2009. Biogen Idec reported higher sales and earnings and was one of the fund’s largest positive contributors. Genentech (+7%) also rose as Roche completed its purchase of the company.
Among our weaker health care performers in the six months were top-ten holdings Eli Lilly (–22%) and Novartis (–26%). In February, an FDA advisory committee unanimously approved the use of Eli Lilly’s prasugrel, a blood thinner, for treatment of certain coronary patients. The FDA is not bound by the committee’s recommendation and has not yet responded to the filing for prasugrel, considered one of the most important drugs in Eli Lilly’s pipeline. In January, Novartis reported higher sales and earnings for 2008, and increased its dividend. Still, questions about the impact of health care reform weighed on both companies.
We remain convinced of the long-term growth potential of our health care stocks. Admittedly, large pharmaceutical companies, in particular, face uncertainty about the prospect of health care reform, increased scrutiny during the FDA approval process, Medicare reimbursement reviews, and generic competition. However, pharmaceutical stocks are well capitalized with, in our view, underappreciated drug treatment pipelines. In addition, health care companies—as well as tech companies—expense research and development costs as they are incurred,
7
meaning that their earnings are understated relative to businesses that amortize investments in future growth. We believe pharmaceutical companies have the potential to be rewarded as market leaders for above-market long-term growth rates.
Information technology (–23%) holdings were also important contributors to the fund’s relative return. Chip-makers and related companies represented about one-third of our tech holdings. As a group, these firms tend to lead in a cyclical economic recovery. Four of the fund’s semiconductor holdings had modest gains for the period: Netherlands-based ASML Holding, Cree, FormFactor, and Micron Technology. Software companies represented a smaller portion of our technology holdings and generally struggled amid the weakening economy. We believe changes in the technology industry over the last ten years, including more concentrated market share and a more global customer base, have improved fundamentals; we maintain our conviction in the companies we own.
The counterbalance to our heavy commitment to health care and information technology has been our light investment in the financial, energy, and industrial sectors relative to the respective index-sector weightings. These areas were among the market’s poorest performers for the six months.
For more than a decade, PRIMECAP Management has largely avoided investments in financials—especially banks and brokerage firms—reflecting our assessment that the sector’s opaque balance sheets made these businesses difficult to value. In addition, we viewed much of the growth in profits at financial institutions as resulting from increasingly higher leverage and thus unlikely to be sustained.
When oil prices reversed course last summer, the prices of most oil, gas, and coal-related companies came under pressure. Several of the fund’s energy holdings saw significant price declines: Arch Coal (–59%), Plains Exploration & Production (–51%), and Murphy Oil (–29%) combined to subtract almost 2 percentage points from the fund’s total return for the period.
Also hurting overall results were the fund’s industrial holdings. Many companies in the sector have faced decreasing demand and the need to significantly downsize fixed costs. Individual holdings that detracted from investment results included FedEx (–43%), one of the fund’s top-ten holdings; and airline companies AMR (–68%) and Southwest Airlines (–56%). We believe these companies have strong brands and have made the necessary adjustments to benefit from a potential recovery as demand picks up.
8
Outlook
As we enter the second half of the fund’s fiscal year, there is still a long list of reasons to be cautious about the markets—in spite of the March rally. Many economists fear the current U.S. recession will be the most severe in magnitude since the Great Depression. Although the dramatic declines in energy and commodity prices might help consumers, most other factors point to a protracted weak economic environment through calendar 2009. Corporate profits have been generally shrinking, job losses have been increasing, and the housing market has remained depressed. Access to credit for both consumers and businesses remains difficult as banks, hedge funds, and other financial institutions continue to reduce leverage and preserve capital.
Despite the U.S. Treasury’s injections of capital into numerous financial institutions, we remain concerned that the majority of them will continue to face mounting losses on loans and securities, which will be further magnified by the leverage on their balance sheets. As we write this report two weeks after the close of the fiscal period, it’s unclear whether actions by the U.S. government to restore credit flows and shore up the financial system will prove effective in the long run. There are legitimate concerns about the increased moral hazard and unintended consequences that are likely to result from the various rescue plans and stimulus bills.
Increased regulation and government involvement in private enterprise may result in slower long-term growth and lower market valuations. We are also concerned that the dramatic increase in money supply may result in inflation going forward.
In these uncertain times, we see many attractive investment opportunities. Companies with innovative products, strong competitive advantages, growing markets, and strong balance sheets are trading, in our assessment, at compelling valuations. For the six months, we contend that the decline in stocks of many high-quality companies is more a result of indiscriminate selling pressure than of deterioration in corporate earnings or growth prospects. We are confident that at some point over the next few years, we will look back at this period as a rare opportunity to buy great companies at extremely low valuations.
We believe that fundamental investing will be rewarded in 2009 and beyond. The general sentiment in the market has been negative—at least until recently—because of concerns about declining gross domestic product (GDP), rising unemployment, shrinking corporate profits, and an overextended U.S. consumer. We do not anticipate much growth in U.S. GDP in 2009, but we think our current holdings are well positioned to weather a minimal-growth environment. During turbulent
9
economic times, fundamentals matter most. In our judgment, the companies in which we have invested are generally well managed, possess healthy balance sheets, are well situated in their respective industries, and have greater growth prospects than current valuations reflect.
Theo A. Kolokotrones | | Howard B. Schow |
Portfolio Manager | | Portfolio Manager |
| David H. Van Slooten | |
| Portfolio Manager | |
Joel P. Fried | | Alfred W. Mordecai |
Portfolio Manager | | Portfolio Manager |
| | |
| | |
| | |
PRIMECAP Management Company | | |
April 14, 2009 | | |
10
Capital Opportunity Fund
Fund Profile
As of March 31, 2009
Portfolio Characteristics | | |
| | Comparative | Broad |
| Fund | Index1 | Index2 |
Number of Stocks | 106 | 500 | 4,489 |
Median Market Cap | $12.6B | $4.6B | $22.3B |
Price/Earnings Ratio | 37.1x | 15.1x | 15.0x |
Price/Book Ratio | 2.0x | 2.3x | 1.7x |
Yield3 | | 1.4% | 2.7% |
Investor Shares | 0.4% | | |
Admiral Shares | 0.4% | | |
Return on Equity | 16.1% | 21.3% | 20.2% |
Earnings Growth Rate | 14.7% | 20.2% | 15.0% |
Foreign Holdings | 11.6% | 0.0% | 0.0% |
Turnover Rate4 | 7% | — | — |
Expense Ratio5 | | — | — |
Investor Shares | 0.52% | | |
Admiral Shares | 0.43% | | |
Short-Term Reserves | 6.1% | — | — |
Sector Diversification (% of equity exposure) |
| | Comparative | Broad |
| Fund | Index1 | Index2 |
Consumer Discretionary | 15.1% | 19.3% | 9.4% |
Consumer Staples | 0.0 | 4.5 | 11.2 |
Energy | 4.8 | 8.2 | 12.3 |
Financials | 0.3 | 5.5 | 13.1 |
Health Care | 27.0 | 13.8 | 14.6 |
Industrials | 7.3 | 16.6 | 10.0 |
Information Technology | 39.2 | 21.0 | 17.7 |
Materials | 5.7 | 4.8 | 3.7 |
Telecommunication | | | |
Services | 0.5 | 3.0 | 3.6 |
Utilities | 0.1 | 3.3 | 4.4 |
Volatility Measures6 | |
| Fund Versus | Fund Versus |
| Comparative Index1 | Broad Index2 |
R-Squared | 0.93 | 0.88 |
Beta | 0.93 | 1.07 |
Ten Largest Holdings7 (% of total net assets) |
| | |
Monsanto Co. | fertilizers and | |
| agricultural | |
| chemicals | 5.3% |
Eli Lilly & Co. | pharmaceuticals | 4.7 |
Biogen Idec Inc. | biotechnology | 4.7 |
Research In Motion Ltd. | communications | |
| equipment | 3.7 |
DIRECTV Group, Inc. | cable and satellite | 3.4 |
Amgen Inc. | biotechnology | 3.2 |
ASML Holding NV | semiconductor | |
(New York Shares) | equipment | 3.0 |
Symantec Corp. | systems software | 2.8 |
FedEx Corp. | air freight and | |
| logistics | 2.6 |
Novartis AG ADR | pharmaceuticals | 2.5 |
Top Ten | | 35.9% |
Investment Focus
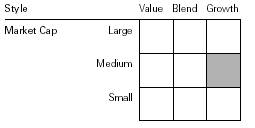
1 Russell Midcap Growth Index.
2 Dow Jones Wilshire 5000 Index.
3 30-day SEC yield for the fund; annualized dividend yield for the indexes. See the Glossary.
4 Annualized.
5 The expense ratios shown are from the prospectus dated January 28, 2009, and represent estimated costs for the current fiscal year based on the fund’s current net assets. For the six months ended March 31, 2009, the annualized expense ratios were 0.51% for the Investor Shares and 0.42% for the Admiral Shares.
6 For an explanation of R-squared, beta, and other terms used here, see the Glossary.
7 The holdings listed exclude any temporary cash investments and equity index products.
11
Capital Opportunity Fund
Performance Summary
All of the returns in this report represent past performance, which is not a guarantee of future results that may be achieved by the fund. (Current performance may be lower or higher than the performance data cited. For performance data current to the most recent month-end, visit our website at www.vanguard.com/performance.) Note, too, that both investment returns and principal value can fluctuate widely, so an investor’s shares, when sold, could be worth more or less than their original cost. The returns shown do not reflect taxes that a shareholder would pay on fund distributions or on the sale of fund shares.
Fiscal-Year Total Returns (%): September 30, 1998–March 31, 2009
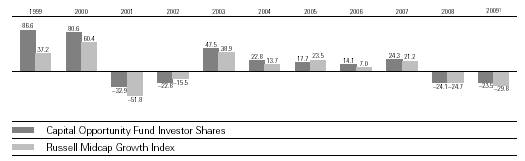
Average Annual Total Returns: Periods Ended March 31, 2009
| Inception Date | One Year | Five Years | Ten Years |
Investor Shares2 | 8/14/1995 | –33.50% | –0.72% | 8.20% |
Admiral Shares2 | 11/12/2001 | –33.42 | –0.63 | 2.873 |
1 Six months ended March 31, 2009.
2 Total returns do not reflect the 1% fee assessed on redemptions after March 23, 2005, of shares held for less than one year; nor do they include the 1% fee previously assessed on redemptions of shares held for less than five years, or, for Investor Shares only, the account service fee that may be applicable to certain accounts with balances below $10,000.
3 Return since inception.
12
Capital Opportunity Fund
Financial Statements (unaudited)
Statement of Net Assets
As of March 31, 2009
The fund provides a complete list of its holdings four times in each fiscal year, at the quarter-ends. For the second and fourth fiscal quarters, the lists appear in the fund’s semiannual and annual reports to shareholders. For the first and third fiscal quarters, the fund files the lists with the Securities and Exchange Commission on Form N-Q. Shareholders can look up the fund’s Forms N-Q on the SEC’s website at www.sec.gov. Forms N-Q may also be reviewed and copied at the SEC’s Public Reference Room (see the back cover of this report for further information).
| | | Market |
| | | Value• |
| | Shares | ($000) |
Common Stocks (94.0%) | | |
Consumer Discretionary (14.2%) | | |
* | DIRECTV Group, Inc. | 8,122,335 | 185,108 |
| TJX Cos., Inc. | 5,219,400 | 133,825 |
* | Bed Bath & Beyond, Inc. | 3,313,400 | 82,007 |
*,1 | The Dress Barn, Inc. | 4,851,500 | 59,625 |
* | CarMax, Inc. | 4,512,800 | 56,139 |
| Men’s Wearhouse, Inc. | 2,500,000 | 37,850 |
| Whirlpool Corp. | 1,191,100 | 35,245 |
| Best Buy Co., Inc. | 850,000 | 32,266 |
| Lowe’s Cos., Inc. | 1,411,400 | 25,758 |
| Nordstrom, Inc. | 1,500,000 | 25,125 |
* | O’Reilly Automotive, Inc. | 650,000 | 22,756 |
* | 99 Cents Only Stores | 2,200,000 | 20,328 |
* | Amazon.com, Inc. | 260,300 | 19,116 |
| Gentex Corp. | 1,431,100 | 14,254 |
* | Chico’s FAS, Inc. | 2,000,000 | 10,740 |
* | Quiksilver, Inc. | 5,796,500 | 7,420 |
| Abercrombie & Fitch Co. | 200,000 | 4,760 |
1 | Strattec Security Corp. | 217,000 | 1,810 |
| | | 774,132 |
Energy (4.5%) | | |
| Murphy Oil Corp. | 2,000,000 | 89,540 |
| Noble Energy, Inc. | 971,800 | 52,360 |
| Arch Coal, Inc. | 2,150,000 | 28,745 |
* | National Oilwell Varco Inc. | 827,400 | 23,755 |
* | Plains Exploration & | | |
| Production Co. | 1,166,500 | 20,099 |
| ConocoPhillips Co. | 400,000 | 15,664 |
* | Exterran Holdings, Inc. | 418,150 | 6,699 |
* | Pride International, Inc. | 285,000 | 5,124 |
* | Transocean Ltd. | 40,000 | 2,354 |
| | | 244,340 |
Financials (0.3%) | | |
| The Chubb Corp. | 390,000 | 16,505 |
| | | |
Health Care (25.4%) | | |
| Eli Lilly & Co. | 7,736,300 | 258,470 |
* | Biogen Idec Inc. | 4,847,600 | 254,111 |
* | Amgen Inc. | 3,467,700 | 171,721 |
| Novartis AG ADR | 3,660,000 | 138,458 |
| | | Market |
| | | Value• |
| | Shares | ($000) |
| Medtronic, Inc. | 4,472,800 | 131,813 |
| Roche Holdings AG | 833,000 | 114,329 |
* | Life Technologies Corp. | 2,071,845 | 67,294 |
* | Boston Scientific Corp. | 8,425,500 | 66,983 |
* | BioMarin | | |
| Pharmaceutical Inc. | 4,769,100 | 58,898 |
* | Millipore Corp. | 1,011,500 | 58,070 |
*,^ | Cerner Corp. | 420,500 | 18,489 |
* | Edwards | | |
| Lifesciences Corp. | 300,000 | 18,189 |
* | Illumina, Inc. | 212,000 | 7,895 |
* | Dendreon Corp. | 1,510,900 | 6,346 |
* | Affymetrix, Inc. | 1,425,500 | 4,661 |
* | Charles River | | |
| Laboratories, Inc. | 169,190 | 4,604 |
* | Waters Corp. | 60,000 | 2,217 |
* | Pharmacyclics, Inc. | 733,700 | 910 |
| | | 1,383,458 |
Industrials (6.9%) | | |
| FedEx Corp. | 3,202,750 | 142,490 |
*,1 | Thomas & Betts Corp. | 3,311,000 | 82,841 |
* | McDermott | | |
| International, Inc. | 2,465,000 | 33,006 |
| Pall Corp. | 1,400,000 | 28,602 |
| Southwest Airlines Co. | 3,992,100 | 25,270 |
* | AMR Corp. | 6,915,500 | 22,061 |
* | JetBlue Airways Corp. | 3,241,050 | 11,830 |
| Union Pacific Corp. | 250,000 | 10,278 |
| Expeditors International | | |
| of Washington, Inc. | 357,000 | 10,100 |
| Rockwell Automation, Inc. | 333,800 | 7,290 |
| Chicago Bridge & | | |
| Iron Co. N.V. | 315,000 | 1,975 |
* | US Airways Group Inc. | 57,000 | 144 |
| | | 375,887 |
Information Technology (36.8%) | | |
* | Research In Motion Ltd. | 4,679,600 | 201,550 |
| ASML Holding NV | | |
| (New York Shares) | 9,295,933 | 162,772 |
* | Symantec Corp. | 10,379,600 | 155,071 |
| Corning, Inc. | 10,132,400 | 134,457 |
13
Capital Opportunity Fund
| | | Market |
| | | Value• |
| | Shares | ($000) |
* | Google Inc. | 357,050 | 124,275 |
| Altera Corp. | 6,207,700 | 108,945 |
*,1 | FormFactor Inc. | 5,983,300 | 107,819 |
* | NVIDIA Corp. | 10,372,650 | 102,274 |
* | Cree, Inc. | 4,263,900 | 100,330 |
| Microsoft Corp. | 3,850,000 | 70,725 |
*,1 | Rambus Inc. | 5,235,000 | 49,523 |
* | Adobe Systems, Inc. | 2,220,000 | 47,486 |
| Texas Instruments, Inc. | 2,691,600 | 44,438 |
* | NeuStar, Inc. Class A | 2,628,500 | 44,027 |
* | Trimble Navigation Ltd. | 2,818,200 | 43,062 |
* | Citrix Systems, Inc. | 1,899,200 | 42,998 |
* | eBay Inc. | 3,400,000 | 42,704 |
* | Macrovision | | |
| Solutions Corp. | 2,393,600 | 42,582 |
| Intersil Corp. | 3,559,700 | 40,937 |
| Hewlett-Packard Co. | 1,250,000 | 40,075 |
* | SanDisk Corp. | 2,543,262 | 32,172 |
* | EMC Corp. | 2,625,000 | 29,925 |
* | Avocent Corp. | 1,984,500 | 24,092 |
* | Micron Technology, Inc. | 5,550,000 | 22,533 |
| Motorola, Inc. | 4,800,000 | 20,304 |
* | Autodesk, Inc. | 1,200,500 | 20,180 |
* | Brocade Communications | | |
| Systems, Inc. | 5,275,000 | 18,199 |
| Plantronics, Inc. | 1,150,000 | 13,881 |
* | Avid Technology, Inc. | 1,514,053 | 13,839 |
* | Emulex Corp. | 2,530,500 | 12,728 |
* | Intuit, Inc. | 470,000 | 12,690 |
*,1 | The Descartes Systems | | |
| Group Inc. | 4,645,000 | 12,402 |
* | Akamai Technologies, Inc. | 507,900 | 9,853 |
* | Comverse Technology, Inc. | 1,660,000 | 9,553 |
| Xilinx, Inc. | 430,000 | 8,239 |
* | Flextronics | | |
| International Ltd. | 2,400,000 | 6,936 |
* | Cymer, Inc. | 250,000 | 5,565 |
* | Ciena Corp. | 607,142 | 4,724 |
* | Nuance | | |
| Communications, Inc. | 425,000 | 4,616 |
* | FEI Co. | 295,000 | 4,552 |
| QUALCOMM Inc. | 85,000 | 3,307 |
* | Entegris Inc. | 2,019,231 | 1,737 |
* | THQ Inc. | 500,000 | 1,520 |
* | Apple Inc. | 12,000 | 1,261 |
| Jabil Circuit, Inc. | 220,000 | 1,223 |
| | | 2,002,081 |
| | Market |
| | Value• |
| Shares | ($000) |
Materials (5.3%) | | |
Monsanto Co. | 3,506,286 | 291,372 |
| | |
Telecommunication Services (0.5%) | |
* Sprint Nextel Corp. | 7,814,700 | 27,898 |
| | |
Utilities (0.1%) | | |
* AES Corp. | 1,192,000 | 6,925 |
Total Common Stocks | | |
(Cost $5,764,344) | | 5,122,598 |
Temporary Cash Investment (7.0%) | |
Money Market Fund (7.0%) | | |
2,3 Vanguard Market Liquidity | | |
Fund, 0.440% | | |
(Cost $381,231) | 381,230,666 | 381,231 |
Total Investments (101.0%) | | |
(Cost $6,145,575) | | 5,503,829 |
Other Assets and Liabilities (–1.0%) | |
Other Assets | | 20,101 |
Liabilities3 | | (77,054) |
| | (56,953) |
Net Assets (100%) | | 5,446,876 |
| | |
Statement of Assets and Liabilities | |
Assets | | |
Investments in Securities, at Value | 5,503,829 |
Receivables for Investment | | |
Securities Sold | | 1,372 |
Receivables for Capital Shares Issued | 8,336 |
Other Assets | | 10,393 |
Total Assets | | 5,523,930 |
Liabilities | | |
Payables for Investment | | |
Securities Purchased | | 51,001 |
Security Lending Collateral | | |
Payable to Brokers | | 4,050 |
Payables for Capital Shares Redeemed | 2,725 |
Other Liabilities | | 19,278 |
Total Liabilities | | 77,054 |
Net Assets | | 5,446,876 |
14
Capital Opportunity Fund
At March 31, 2009, net assets consisted of: |
| Amount |
| ($000) |
Paid-in Capital | 6,404,681 |
Undistributed Net Investment Income | 1,190 |
Accumulated Net Realized Losses | (317,211) |
Unrealized Appreciation (Depreciation) | |
Investment Securities | (641,746) |
Foreign Currencies | (38) |
Net Assets | 5,446,876 |
| |
Investor Shares—Net Assets | |
Applicable to 136,195,228 outstanding | |
$.001 par value shares of beneficial | |
interest (unlimited authorization) | 2,763,554 |
Net Asset Value Per Share— | |
Investor Shares | $20.29 |
| |
Admiral Shares—Net Assets | |
Applicable to 57,254,655 outstanding | |
$.001 par value shares of beneficial | |
interest (unlimited authorization) | 2,683,322 |
Net Asset Value Per Share— | |
Admiral Shares | $46.87 |
• | See Note A in Notes to Financial Statements. |
* | Non-income-producing security. |
^ | Part of security position is on loan to broker-dealers. The total value of securities on loan is $3,957,000. |
1 Considered an affiliated company of the fund as the fund owns more than 5% of the outstanding voting securities of such company.
2 Affiliated money market fund available only to Vanguard funds and certain trusts and accounts managed by Vanguard. Rate shown is the 7-day yield.
3 Includes $4,050,000 of collateral received for securities on loan.
ADR—American Depositary Receipt.
See accompanying Notes, which are an integral part of the Financial Statements.
15
Capital Opportunity Fund
Statement of Operations
| Six Months Ended |
| March 31, 2009 |
| ($000) |
Investment Income | |
Income | |
Dividends1,2 | 34,365 |
Interest2 | 1,141 |
Security Lending | 821 |
Total Income | 36,327 |
Expenses | |
Investment Advisory Fees—Note B | 7,221 |
The Vanguard Group—Note C | |
Management and Administrative—Investor Shares | 2,959 |
Management and Administrative—Admiral Shares | 1,628 |
Marketing and Distribution—Investor Shares | 434 |
Marketing and Distribution—Admiral Shares | 419 |
Custodian Fees | 53 |
Auditing Fees | 1 |
Shareholders’ Reports—Investor Shares | 29 |
Shareholders’ Reports—Admiral Shares | 11 |
Trustees’ Fees and Expenses | 4 |
Total Expenses | 12,759 |
Net Investment Income | 23,568 |
Realized Net Gain (Loss) | |
Investment Securities Sold2 | (318,804) |
Foreign Currencies | (32) |
Realized Net Gain (Loss) | (318,836) |
Change in Unrealized Appreciation (Depreciation) | |
Investment Securities | (1,517,549) |
Foreign Currencies | 1 |
Change in Unrealized Appreciation (Depreciation) | (1,517,548) |
Net Increase (Decrease) in Net Assets Resulting from Operations | (1,812,816) |
1 Dividends are net of foreign withholding taxes of $1,420,000.
2 Dividend income, interest income, and realized net gain (loss) from affiliated companies of the fund were $402,000, $1,141,000, and ($47,522,000), respectively.
See accompanying Notes, which are an integral part of the Financial Statements.
16
Capital Opportunity Fund
Statement of Changes in Net Assets
| Six Months Ended | Year Ended |
| March 31, | September 30, |
| 2009 | 2008 |
| ($000) | ($000) |
Increase (Decrease) in Net Assets | | |
Operations | | |
Net Investment Income | 23,568 | 66,358 |
Realized Net Gain (Loss) | (318,836) | 593,669 |
Change in Unrealized Appreciation (Depreciation) | (1,517,548) | (3,126,009) |
Net Increase (Decrease) in Net Assets Resulting from Operations | (1,812,816) | (2,465,982) |
Distributions | | |
Net Investment Income | | |
Investor Shares | (14,339) | (26,947) |
Admiral Shares | (18,037) | (29,293) |
Realized Capital Gain1 | | |
Investor Shares | (259,375) | (425,472) |
Admiral Shares | (253,316) | (403,705) |
Total Distributions | (545,067) | (885,417) |
Capital Share Transactions | | |
Investor Shares | 99,643 | 150,506 |
Admiral Shares | 67,219 | 663,727 |
Net Increase (Decrease) from Capital Share Transactions | 166,862 | 814,233 |
Total Increase (Decrease) | (2,191,021) | (2,537,166) |
Net Assets | | |
Beginning of Period | 7,637,897 | 10,175,063 |
End of Period2 | 5,446,876 | 7,637,897 |
1 Includes fiscal 2009 and 2008 short-term gain distributions totaling $0 and $23,367,000, respectively. Short-term gain distributions are treated as ordinary income dividends for tax purposes.
2 Net Assets—End of Period includes undistributed net investment income of $1,190,000 and $10,030,000.
See accompanying Notes, which are an integral part of the Financial Statements.
17
Capital Opportunity Fund
Financial Highlights
Investor Shares | | | | | | | |
| Six Months | | | | | Nov. 1, | Year |
| Ended | | | | | 2003, to | Ended |
For a Share Outstanding | March 31, | Year Ended September 30, | Sept. 30, | Oct. 31, |
Throughout Each Period | 2009 | 2008 | 2007 | 2006 | 2005 | 20041 | 2003 |
Net Asset Value, | | | | | | | |
Beginning of Period | $29.41 | $42.70 | $36.11 | $31.92 | $27.24 | $24.28 | $16.54 |
Investment Operations | | | | | | | |
Net Investment Income | .090 | .2542 | .070 | .053 | .0903 | .017 | .009 |
Net Realized and | | | | | | | |
Unrealized Gain (Loss) | | | | | | | |
on Investments4 | (7.034) | (9.884) | 8.447 | 4.421 | 4.731 | 2.956 | 7.744 |
Total from | | | | | | | |
Investment Operations | (6.944) | (9.630) | 8.517 | 4.474 | 4.821 | 2.973 | 7.753 |
Distributions | | | | | | | |
Dividends from Net | | | | | | | |
Investment Income | (.114) | (.218) | (.070) | (.055) | (.070) | (.013) | (.013) |
Distributions from | | | | | | | |
Realized Capital Gains | (2.062) | (3.442) | (1.857) | (.229) | (.071) | — | — |
Total Distributions | (2.176) | (3.660) | (1.927) | (.284) | (.141) | (.013) | (.013) |
Net Asset Value, | | | | | | | |
End of Period | $20.29 | $29.41 | $42.70 | $36.11 | $31.92 | $27.24 | $24.28 |
| | | | | | | |
Total Return5 | –23.55% | –24.13% | 24.35% | 14.10% | 17.72% | 12.25% | 46.91% |
| | | | | | | |
Ratios/Supplemental Data | | | | | | |
Net Assets, | | | | | | | |
End of Period (Millions) | $2,764 | $3,851 | $5,415 | $5,051 | $5,231 | $6,199 | $5,120 |
Ratio of Total Expenses to | | | | | | | |
Average Net Assets | 0.51%6 | 0.45% | 0.45% | 0.49% | 0.51% | 0.52%6 | 0.59% |
Ratio of Net Investment | | | | | | | |
Income to Average | | | | | | | |
Net Assets | 0.82%6 | 0.67%2 | 0.18% | 0.15% | 0.33%3 | 0.06%6 | 0.04% |
Portfolio Turnover Rate | 7%6 | 13% | 14% | 11% | 12% | 10% | 14% |
| | | | | | | | | |
1 The fund’s fiscal year-end changed from October 31 to September 30, effective September 30, 2004.
2 Net investment income per share and the ratio of net investment income to average net assets include $.125 and 0.33%, respectively, resulting from a special dividend from ASML Holding NV in October 2007.
3 Net investment income per share and the ratio of net investment income to average net assets include $.047 and 0.16%, respectively, resulting from a special dividend from Microsoft Corp. in November 2004.
4 Includes increases from redemption fees of $.00, $.00, $.00, $.00, $.01, $.01, and $.01.
5 Total returns do not reflect the 1% fee assessed on redemptions after March 23, 2005, of shares held for less than one year, nor do they include the 1% fee previously assessed on redemptions of shares held for less than five years, or the account service fee that may be applicable to certain accounts with balances below $10,000.
6 Annualized.
See accompanying Notes, which are an integral part of the Financial Statements.
18
Capital Opportunity Fund
Financial Highlights
Admiral Shares | | | | | | | |
| Six Months | | | | | Nov. 1, | Year |
| Ended | | | | | 2003, to | Ended |
For a Share Outstanding | March 31, | Year Ended September 30, | Sept. 30, | Oct. 31, |
Throughout Each Period | 2009 | 2008 | 2007 | 2006 | 2005 | 20041 | 2003 |
Net Asset Value, | | | | | | | |
Beginning of Period | $68.00 | $98.71 | $83.49 | $73.77 | $62.96 | $56.11 | $38.22 |
Investment Operations | | | | | | | |
Net Investment Income | .235 | .6642 | .240 | .198 | .2913 | .096 | .062 |
Net Realized and | | | | | | | |
Unrealized Gain (Loss) | | | | | | | |
on Investments4 | (16.265) | (22.845) | 19.508 | 10.229 | 10.911 | 6.828 | 17.894 |
Total from Investment | | | | | | | |
Operations | (16.030) | (22.181) | 19.748 | 10.427 | 11.202 | 6.924 | 17.956 |
Distributions | | | | | | | |
Dividends from Net | | | | | | | |
Investment Income | (.339) | (.577) | (.238) | (.178) | (.228) | (.074) | (.066) |
Distributions from | | | | | | | |
Realized Capital Gains | (4.761) | (7.952) | (4.290) | (.529) | (.164) | — | — |
Total Distributions | (5.100) | (8.529) | (4.528) | (.707) | (.392) | (.074) | (.066) |
Net Asset Value, | | | | | | | |
End of Period | $46.87 | $68.00 | $98.71 | $83.49 | $73.77 | $62.96 | $56.11 |
| | | | | | | |
Total Return5 | –23.51% | –24.05% | 24.43% | 14.23% | 17.82% | 12.36% | 47.05% |
| | | | | | | |
Ratios/Supplemental Data | | | | | | |
Net Assets, | | | | | | | |
End of Period (Millions) | $2,683 | $3,787 | $4,760 | $3,750 | $3,004 | $1,337 | $840 |
Ratio of Total Expenses to | | | | | | |
Average Net Assets | 0.42%6 | 0.36% | 0.37% | 0.40% | 0.42% | 0.41%6 | 0.49% |
Ratio of Net Investment | | | | | | | |
Income to Average | | | | | | | |
Net Assets | 0.91%6 | 0.76%2 | 0.26% | 0.24% | 0.38%3 | 0.17%6 | 0.14% |
Portfolio Turnover Rate | 7%6 | 13% | 14% | 11% | 12% | 10% | 14% |
| | | | | | | | | |
1 The fund’s fiscal year-end changed from October 31 to September 30, effective September 30, 2004.
2 Net investment income per share and the ratio of net investment income to average net assets include $.289 and 0.33%, respectively, resulting from a special dividend from ASML Holding NV in October 2007.
3 Net investment income per share and the ratio of net investment income to average net assets include $.108 and 0.16%, respectively, resulting from a special dividend from Microsoft Corp. in November 2004.
4 Includes increases from redemption fees of $.01, $.01, $.00, $.00, $.01, $.03, and $.03.
5 Total returns do not reflect the 1% fee assessed on redemptions after March 23, 2005, of shares held for less than one year, or the 1% fee previously assessed on redemptions of shares held for less than five years.
6 Annualized.
See accompanying Notes, which are an integral part of the Financial Statements.
19
Capital Opportunity Fund
Notes to Financial Statements
Vanguard Capital Opportunity Fund is registered under the Investment Company Act of 1940 as an open-end investment company, or mutual fund. The fund offers two classes of shares: Investor Shares and Admiral Shares. Investor Shares are available to any investor who meets the fund’s minimum purchase requirements. Admiral Shares are designed for investors who meet certain administrative, service, tenure, and account-size criteria.
A. The following significant accounting policies conform to generally accepted accounting principles for U.S. mutual funds. The fund consistently follows such policies in preparing its financial statements.
1. Security Valuation: Securities are valued as of the close of trading on the New York Stock Exchange (generally 4 p.m., Eastern time) on the valuation date. Equity securities are valued at the latest quoted sales prices or official closing prices taken from the primary market in which each security trades; such securities not traded on the valuation date are valued at the mean of the latest quoted bid and asked prices. Securities for which market quotations are not readily available, or whose values have been affected by events occurring before the fund’s pricing time but after the close of the securities’ primary markets, are valued at their fair values calculated according to procedures adopted by the board of trustees. These procedures include obtaining quotations from an independent pricing service, monitoring news to identify significant market- or security-specific events, and evaluating changes in the values of foreign market proxies (for example, ADRs, futures contracts, or exchange-traded funds), between the time the foreign markets close and the fund’s pricing time. When fair-value pricing is employed, the prices of securities used by a fund to calculate its net asset value may differ from quoted or published prices for the same securities. Investments in Vanguard Market Liquidity Fund are valued at that fund’s net asset value.
2. Foreign Currency: Securities and other assets and liabilities denominated in foreign currencies are translated into U.S. dollars using exchange rates obtained from an independent third party as of the fund’s pricing time on the valuation date. Realized gains (losses) and unrealized appreciation (depreciation) on investment securities include the effects of changes in exchange rates since the securities were purchased, combined with the effects of changes in security prices. Fluctuations in the value of other assets and liabilities resulting from changes in exchange rates are recorded as unrealized foreign currency gains (losses) until the assets or liabilities are settled in cash, at which time they are recorded as realized foreign currency gains (losses).
3. Federal Income Taxes: The fund intends to continue to qualify as a regulated investment company and distribute all of its taxable income. Management has analyzed the fund’s tax positions taken on federal income tax returns for all open tax years (tax years ended September 30, 2005–2008) and for the period ended March 31, 2009, and has concluded that no provision for federal income tax is required in the fund’s financial statements.
4. Distributions: Distributions to shareholders are recorded on the ex-dividend date.
5. Security Lending: The fund may lend its securities to qualified institutional borrowers to earn additional income. Security loans are required to be secured at all times by collateral at least equal to the market value of securities loaned. The fund invests cash collateral received in Vanguard Market Liquidity Fund, and records a liability for the return of the collateral, during the period the securities are on loan. Security lending income represents the income earned on investing cash collateral, less expenses associated with the loan.
20
Capital Opportunity Fund
6. Other: Dividend income is recorded on the ex-dividend date. Interest income includes income distributions received from Vanguard Market Liquidity Fund and is accrued daily. Security transactions are accounted for on the date securities are bought or sold. Costs used to determine realized gains (losses) on the sale of investment securities are those of the specific securities sold. Fees assessed on redemptions of capital shares are credited to paid-in capital.
Each class of shares has equal rights as to assets and earnings, except that each class separately bears certain class-specific expenses related to maintenance of shareholder accounts (included in Management and Administrative expenses) and shareholder reporting. Marketing and distribution expenses are allocated to each class of shares based on a method approved by the board of trustees. Income, other non-class-specific expenses, and gains and losses on investments are allocated to each class of shares based on its relative net assets.
B. PRIMECAP Management Company provides investment advisory services to the fund for a fee calculated at an annual percentage rate of average net assets. For the six months ended March 31, 2009, the investment advisory fee represented an effective annual rate of 0.26% of the fund’s average net assets.
C. The Vanguard Group furnishes at cost corporate management, administrative, marketing, and distribution services. The costs of such services are allocated to the fund under methods approved by the board of trustees. The fund has committed to provide up to 0.40% of its net assets in capital contributions to Vanguard. At March 31, 2009, the fund had contributed capital of $1,370,000 to Vanguard (included in Other Assets), representing 0.03% of the fund’s net assets and 0.55% of Vanguard’s capitalization. The fund’s trustees and officers are also directors and officers of Vanguard.
D. Distributions are determined on a tax basis and may differ from net investment income and realized capital gains for financial reporting purposes. Differences may be permanent or temporary. Permanent differences are reclassified among capital accounts in the financial statements to reflect their tax character. Temporary differences arise when certain items of income, expense, gain, or loss are recognized in different periods for financial statement and tax purposes; these differences will reverse at some time in the future. Differences in classification may also result from the treatment of short-term gains as ordinary income for tax purposes. The fund’s tax-basis capital gains and losses are determined only at the end of each fiscal year.
During the six months ended March 31, 2009, the fund realized net foreign currency losses of $32,000, which decreased distributable net income for tax purposes; accordingly, such losses have been reclassified from accumulated net realized losses to undistributed net investment income.
At March 31, 2009, the cost of investment securities for tax purposes was $6,145,575,000. Net unrealized depreciation of investment securities for tax purposes was $641,746,000, consisting of unrealized gains of $1,175,132,000 on securities that had risen in value since their purchase and $1,816,878,000 in unrealized losses on securities that had fallen in value since their purchase.
E. During the six months ended March 31, 2009, the fund purchased $185,607,000 of investment securities and sold $663,460,000 of investment securities, other than temporary cash investments.
21
Capital Opportunity Fund
F. Capital share transactions for each class of shares were:
| Six Months Ended | Year Ended |
| March 31, 2009 | September 30, 2008 |
| Amount | Shares | Amount | Shares |
| ($000) | (000) | ($000) | (000) |
Investor Shares | | | | |
Issued | 159,857 | 7,655 | 550,122 | 14,897 |
Issued in Lieu of Cash Distributions | 260,187 | 12,932 | 425,525 | 11,807 |
Redeemed1 | (320,401) | (15,323) | (825,141) | (22,596) |
Net Increase (Decrease)—Investor Shares | 99,643 | 5,264 | 150,506 | 4,108 |
Admiral Shares | | | | |
Issued | 168,408 | 3,468 | 754,541 | 8,655 |
Issued in Lieu of Cash Distributions | 245,987 | 5,296 | 392,708 | 4,717 |
Redeemed1 | (347,176) | (7,200) | (483,522) | (5,904) |
Net Increase (Decrease)—Admiral Shares | 67,219 | 1,564 | 663,727 | 7,468 |
1 Net of redemption fees for fiscal 2009 and 2008 of $587,000 and $784,000, respectively (fund totals). |
G. Certain of the fund’s investments are in companies that are considered to be affiliated companies of the fund because the fund owns more than 5% of the outstanding voting securities of the company. Transactions during the period in securities of these companies were as follows:
| | | Current Period Transactions | |
| Sept. 30, 2008 | | Proceeds from | | March 31, 2009 |
| Market | Purchases | Securities | Dividend | Market |
| Value | at Cost | Sold | Income | Value |
| ($000) | ($000) | ($000) | ($000) | ($000) |
Avid Technology, Inc. | 49,022 | — | 5,021 | — | NA1 |
Emulex Corp. | 48,755 | — | 14,868 | — | NA1 |
FormFactor Inc. | 106,096 | — | 1,749 | — | 107,819 |
Men’s Wearhouse, Inc. | 59,472 | — | 3,185 | 369 | NA1 |
Rambus Inc. | NA2 | — | — | — | 49,523 |
Strattec Security Corp. | 5,812 | — | 46 | 33 | 1,810 |
The Descartes | | | | | |
Systems Group Inc. | 17,047 | — | — | — | 12,402 |
The Dress Barn, Inc. | 75,991 | — | 1,116 | — | 59,625 |
Thomas & Betts Corp. | 129,361 | — | — | — | 82,841 |
| 491,556 | | | 402 | 314,020 |
1 At March 31, 2009, the security was still held, but the issuer was no longer an affiliated company of the fund.
2 | At September 30, 2008, the issuer was not an affiliated company of the fund. |
22
Capital Opportunity Fund
H. In September 2006, the Financial Accounting Standards Board issued Statement of Financial Accounting Standards No. 157 (“FAS 157”), “Fair Value Measurements.” FAS 157 establishes a framework for measuring fair value and expands disclosures about fair value measurements in financial statements.
The various inputs that may be used to determine the value of the fund’s investments are summarized in three broad levels. The inputs or methodologies used for valuing securities are not necessarily an indication of the risk associated with investing in those securities.
Level 1—Quoted prices in active markets for identical securities.
Level 2—Other significant observable inputs (including quoted prices for similar securities, interest rates, prepayment speeds, credit risk, etc.).
Level 3—Significant unobservable inputs (including the fund’s own assumptions used to determine the fair value of investments).
The following table summarizes the fund’s investments as of March 31, 2009, based on the inputs used to value them:
| Investments |
| in Securities |
Valuation Inputs | ($000) |
Level 1—Quoted prices | 5,389,500 |
Level 2—Other significant observable inputs | 114,329 |
Level 3—Significant unobservable inputs | — |
Total | 5,503,829 |
23
About Your Fund’s Expenses
As a shareholder of the fund, you incur ongoing costs, which include costs for portfolio management, administrative services, and shareholder reports (like this one), among others. Operating expenses, which are deducted from a fund’s gross income, directly reduce the investment return of the fund.
A fund’s expenses are expressed as a percentage of its average net assets. This figure is known as the expense ratio. The following examples are intended to help you understand the ongoing costs (in dollars) of investing in your fund and to compare these costs with those of other mutual funds. The examples are based on an investment of $1,000 made at the beginning of the period shown and held for the entire period.
The accompanying table illustrates your fund’s costs in two ways:
• Based on actual fund return. This section helps you to estimate the actual expenses that you paid over the period. The “Ending Account Value” shown is derived from the fund’s actual return, and the third column shows the dollar amount that would have been paid by an investor who started with $1,000 in the fund. You may use the information here, together with the amount you invested, to estimate the expenses that you paid over the period.
To do so, simply divide your account value by $1,000 (for example, an $8,600 account value divided by $1,000 = 8.6), then multiply the result by the number given for your fund under the heading “Expenses Paid During Period.”
• Based on hypothetical 5% yearly return. This section is intended to help you compare your fund’s costs with those of other mutual funds. It assumes that the fund had a yearly return of 5% before expenses, but that the expense ratio is unchanged. In this case—because the return used is not the fund’s actual return—the results do not apply to your investment. The example is useful in making comparisons because the Securities and Exchange Commission requires all mutual funds to calculate expenses based on a 5% return. You can assess your fund’s costs by comparing this hypothetical example with the hypothetical examples that appear in shareholder reports of other funds.
Six Months Ended March 31, 2009 | | | |
| Beginning | Ending | Expenses |
| Account Value | Account Value | Paid During |
Capital Opportunity Fund | 9/30/2008 | 3/31/2009 | Period1 |
Based on Actual Fund Return | | | |
Investor Shares | $1,000.00 | $764.52 | $2.24 |
Admiral Shares | 1,000.00 | 764.94 | 1.85 |
Based on Hypothetical 5% Yearly Return | | | |
Investor Shares | $1,000.00 | $1,022.39 | $2.57 |
Admiral Shares | 1,000.00 | 1,022.84 | 2.12 |
1 The calculations are based on expenses incurred in the most recent six-month period. The fund’s annualized six-month expense ratios for that period are 0.51% for Investor Shares and 0.42% for Admiral Shares. The dollar amounts shown as “Expenses Paid” are equal to the annualized expense ratio multiplied by the average account value over the period, multiplied by the number of days in the most recent six-month period, then divided by the number of days in the most recent 12-month period.
24
Note that the expenses shown in the table are meant to highlight and help you compare ongoing costs only and do not reflect transaction costs incurred by the fund for buying and selling securities. Further, the expenses do not include the 1% fee on redemptions of shares held for less than one year, nor do they include the account service fee described in the prospectus. If such fees were applied to your account, your costs would be higher. Your fund does not carry a “sales load.”
The calculations assume no shares were bought or sold during the period. Your actual costs may have been higher or lower, depending on the amount of your investment and the timing of any purchases or redemptions.
You can find more information about the fund’s expenses, including annual expense ratios, in the Financial Statements section of this report. For additional information on operating expenses and other shareholder costs, please refer to your fund’s current prospectus.
25
Trustees Approve Advisory Agreement
The board of trustees of Vanguard Capital Opportunity Fund has renewed the fund’s investment advisory agreement with PRIMECAP Management Company. The board determined that the retention of PRIMECAP Management was in the best interests of the fund and its shareholders.
The board based its decision upon an evaluation of the advisor’s investment staff, portfolio management process, and performance. The trustees considered the factors discussed below, among others. However, no single factor determined whether the board approved the agreement. Rather, it was the totality of the circumstances that drove the board’s decision.
Nature, extent, and quality of services
The board considered the quality of the fund’s investment management over both the short and long term, and took into account the organizational depth and stability of the firm. The board noted that PRIMECAP Management, founded in 1983, is recognized for its long-term approach to growth equity investing. The firm has managed Vanguard Capital Opportunity Fund since 1998.
Five experienced portfolio managers are responsible for separate subportfolios, and each portfolio manager employs a fundamental, research-driven approach in seeking to identify companies with long-term growth potential overlooked by the market and stock that is trading at attractive valuation levels.
The board concluded that the advisor’s experience, stability, depth, and performance, among other factors, warranted continuation of the advisory agreement.
Investment performance
The board considered the short- and long-term performance of the fund, including any periods of outperformance or underperformance of a relevant benchmark and peer group. The board concluded that the advisor carried out the fund’s investment strategy in disciplined fashion, and that performance results have been within competitive norms. Information about the fund’s most recent performance can be found in the Performance Summary section of this report.
Cost
The board concluded that the fund’s expense ratio was far below the average expense ratio charged by funds in its peer group. The board noted that the fund’s advisory fee was also well below the peer-group average. Information about the fund’s expense ratio appears in the About Your Fund’s Expenses section of this report as well as in the Financial Statements section, which also includes information about the advisory fee rate. The board did not consider profitability of PRIMECAP Management in determining whether to approve the advisory fee, because PRIMECAP Management is independent of Vanguard, and the advisory fee is the result of arm’s-length negotiations.
The benefit of economies of scale
The board concluded that the fund’s shareholders benefit from economies of scale because of the breakpoints in the fund’s advisory fee schedule. The breakpoints reduce the effective rate of the fee as the fund’s assets increase.
The board will consider whether to renew the advisory agreement again after a one-year period.
26
Glossary
Beta. A measure of the magnitude of a fund’s past share-price fluctuations in relation to the ups and downs of a given market index. The index is assigned a beta of 1.00. Compared with a given index, a fund with a beta of 1.20 typically would have seen its share price rise or fall by 12% when the index rose or fell by 10%. For this report, beta is based on returns over the past 36 months for both the fund and the index. Note that a fund’s beta should be reviewed in conjunction with its R-squared (see definition). The lower the R-squared, the less correlation there is between the fund and the index, and the less reliable beta is as an indicator of volatility.
Earnings Growth Rate. The average annual rate of growth in earnings over the past five years for the stocks now in a fund.
Equity Exposure. A measure that reflects a fund’s investments in stocks and stock futures. Any holdings in short-term reserves are excluded.
Expense Ratio. The percentage of a fund’s average net assets used to pay its annual administrative and advisory expenses. These expenses directly reduce returns to investors.
Foreign Holdings. The percentage of a fund represented by stocks or depositary receipts of companies based outside the United States.
Inception Date. The date on which the assets of a fund (or one of its share classes) are first invested in accordance with the fund’s investment objective. For funds with a subscription period, the inception date is the day after that period ends. Investment performance is measured from the inception date.
Median Market Cap. An indicator of the size of companies in which a fund invests; the midpoint of market capitalization (market price x shares outstanding) of a fund’s stocks, weighted by the proportion of the fund’s assets invested in each stock. Stocks representing half of the fund’s assets have market capitalizations above the median, and the rest are below it.
Price/Book Ratio. The share price of a stock divided by its net worth, or book value, per share. For a fund, the weighted average price/book ratio of the stocks it holds.
Price/Earnings Ratio. The ratio of a stock’s current price to its per-share earnings over the past year. For a fund, the weighted average P/E of the stocks it holds. P/E is an indicator of market expectations about corporate prospects; the higher the P/E, the greater the expectations for a company’s future growth.
R-Squared. A measure of how much of a fund’s past returns can be explained by the returns from the market in general, as measured by a given index. If a fund’s total returns were precisely synchronized with an index’s returns, its R-squared would be 1.00. If the fund’s returns bore no relationship to the index’s returns, its R-squared would be 0. For this report, R-squared is based on returns over the past 36 months for both the fund and the index.
Return on Equity. The annual average rate of return generated by a company during the past five years for each dollar of shareholder’s equity (net income divided by shareholder’s equity). For a fund, the weighted average return on equity for the companies whose stocks it holds.
Short-Term Reserves. The percentage of a fund invested in highly liquid, short-term securities that can be readily converted to cash.
27
Turnover Rate. An indication of the fund’s trading activity. Funds with high turnover rates incur higher transaction costs and may be more likely to distribute capital gains (which may be taxable to investors). The turnover rate excludes in-kind transactions, which have minimal impact on costs.
Yield. A fund’s 30-day SEC yield is derived using a formula specified by the U.S. Securities and Exchange Commission. Under the formula, data related to the fund’s security holdings in the previous 30 days are used to calculate the fund’s hypothetical net income for that period, which is then annualized and divided by the fund’s estimated average net assets over the calculation period. For the purposes of this calculation, a security’s income is based on its current market yield to maturity (in the case of bonds) or its projected dividend yield (for stocks). Because the SEC yield represents hypothetical annualized income, it will differ—at times significantly—from the fund’s actual experience. As a result, the fund’s income distributions may be higher or lower than implied by the SEC yield.
28
This page intentionally left blank.
This page intentionally left blank.
This page intentionally left blank.
The People Who Govern Your Fund
The trustees of your mutual fund are there to see that the fund is operated and managed in your best interests since, as a shareholder, you are a part owner of the fund. Your fund’s trustees also serve on the board of directors of The Vanguard Group, Inc., which is owned by the Vanguard funds and provides services to them on an at-cost basis.
A majority of Vanguard’s board members are independent, meaning that they have no affiliation with Vanguard or the funds they oversee, apart from the sizable personal investments they have made as private individuals. The independent board members have distinguished backgrounds in business, academia, and public service. Each of the trustees and executive officers oversees 157 Vanguard funds.
The following table provides information for each trustee and executive officer of the fund. More information about the trustees is in the Statement of Additional Information, which can be obtained, without charge, by contacting Vanguard at 800-662-7447, or online at www.vanguard.com.
Chairman of the Board and Interested Trustee | Rajiv L. Gupta |
| Born 1945. Trustee Since December 2001.2 Principal |
| Occupation(s) During the Past Five Years: Chairman |
John J. Brennan1 | and Chief Executive Officer of Rohm and Haas Co. |
Born 1954. Trustee Since May 1987. Chairman of | (chemicals); President of Rohm and Haas Co. |
the Board. Principal Occupation(s) During the Past Five | (2006–2008); Board Member of American Chemistry |
Years: Chairman of the Board and Director/Trustee of | Council; Director of Tyco International, Ltd. (diversified |
The Vanguard Group, Inc., and of each of the investment | manufacturing and services) and Hewlett-Packard Co. |
companies served by The Vanguard Group; Chief | (electronic computer manufacturing); Trustee of The |
Executive Officer and President of The Vanguard Group | Conference Board. |
and of each of the investment companies served by The | |
Vanguard Group (1996–2008). | |
| Amy Gutmann |
| Born 1949. Trustee Since June 2006. Principal |
Independent Trustees | Occupation(s) During the Past Five Years: President of |
| the University of Pennsylvania; Christopher H. Browne |
| Distinguished Professor of Political Science in the School |
Charles D. Ellis | of Arts and Sciences with Secondary Appointments |
Born 1937. Trustee Since January 2001. Principal | at the Annenberg School for Communication and the |
Occupation(s) During the Past Five Years: Applecore | Graduate School of Education of the University of |
Partners (pro bono ventures in education); Senior | Pennsylvania; Director of Carnegie Corporation of |
Advisor to Greenwich Associates (international business | New York, Schuylkill River Development Corporation, |
strategy consulting); Successor Trustee of Yale University; | and Greater Philadelphia Chamber of Commerce; |
Overseer of the Stern School of Business at New York | Trustee of the National Constitution Center. |
University; Trustee of the Whitehead Institute for | |
Biomedical Research. | |
| JoAnn Heffernan Heisen |
| Born 1950. Trustee Since July 1998. Principal |
Emerson U. Fullwood | Occupation(s) During the Past Five Years: Retired |
Born 1948. Trustee Since January 2008. Principal | Corporate Vice President, Chief Global Diversity Officer, |
Occupation(s) During the Past Five Years: Retired | and Member of the Executive Committee of Johnson & |
Executive Chief Staff and Marketing Officer for North | Johnson (pharmaceuticals/consumer products); Vice |
America and Corporate Vice President of Xerox | President and Chief Information Officer (1997–2005) |
Corporation (photocopiers and printers); Director of | of Johnson & Johnson; Director of the University |
SPX Corporation (multi-industry manufacturing), the | Medical Center at Princeton and Women’s Research |
United Way of Rochester, the Boy Scouts of America, | and Education Institute. |
Amerigroup Corporation (direct health and medical | |
insurance carriers), and Monroe Community College | |
Foundation. | |
André F. Perold | F. William McNabb III1 | |
Born 1952. Trustee Since December 2004. Principal | Born 1957. Chief Executive Officer Since August 2008. |
Occupation(s) During the Past Five Years: George Gund | President Since March 2008. Principal Occupation(s) |
Professor of Finance and Banking, Senior Associate | During the Past Five Years: Director of The Vanguard |
Dean, and Director of Faculty Recruiting, Harvard | Group, Inc., since 2008; Chief Executive Officer and |
Business School; Director and Chairman of UNX, Inc. | President of The Vanguard Group and of each of the |
(equities trading firm); Chair of the Investment | investment companies served by The Vanguard Group |
Committee of HighVista Strategies LLC (private | since 2008; Director of Vanguard Marketing Corporation; |
investment firm). | Managing Director of The Vanguard Group (1995–2008). |
| | |
| | |
Alfred M. Rankin, Jr. | Heidi Stam1 | |
Born 1941. Trustee Since January 1993. Principal | Born 1956. Secretary Since July 2005. Principal |
Occupation(s) During the Past Five Years: Chairman, | Occupation(s) During the Past Five Years: Managing |
President, Chief Executive Officer, and Director of | Director of The Vanguard Group, Inc., since 2006; |
NACCO Industries, Inc. (forklift trucks/housewares/ | General Counsel of The Vanguard Group since 2005; |
lignite); Director of Goodrich Corporation (industrial | Secretary of The Vanguard Group and of each of the |
products/aircraft systems and services). | investment companies served by The Vanguard Group |
| since 2005; Director and Senior Vice President of |
| Vanguard Marketing Corporation since 2005; Principal |
J. Lawrence Wilson | of The Vanguard Group (1997–2006). |
Born 1936. Trustee Since April 1985. Principal | |
Occupation(s) During the Past Five Years: Retired | | |
Chairman and Chief Executive Officer of Rohm and | Vanguard Senior Management Team |
Haas Co. (chemicals); Director of Cummins Inc. (diesel | | |
engines) and AmerisourceBergen Corp. (pharmaceutical | | |
distribution); Trustee of Vanderbilt University and of | R. Gregory Barton | Michael S. Miller |
Culver Educational Foundation. | Mortimer J. Buckley | James M. Norris |
| Kathleen C. Gubanich | Glenn W. Reed |
| Paul A. Heller | George U. Sauter |
Executive Officers | | |
| | |
| Founder | |
Thomas J. Higgins1 | | |
Born 1957. Chief Financial Officer Since September | | |
2008. Principal Occupation(s) During the Past Five | John C. Bogle | |
Years: Principal of The Vanguard Group, Inc.; Chief | Chairman and Chief Executive Officer, 1974–1996 |
Financial Officer of each of the investment companies | | |
served by The Vanguard Group since 2008; Treasurer | | |
of each of the investment companies served by The | | |
Vanguard Group (1998–2008). | | |
| | |
| | |
Kathryn J. Hyatt1 | | |
Born 1955. Treasurer Since November 2008. Principal | | |
Occupation(s) During the Past Five Years: Principal of | | |
The Vanguard Group, Inc.; Treasurer of each of the | | |
investment companies served by The Vanguard | | |
Group since 2008; Assistant Treasurer of each of the | | |
investment companies served by The Vanguard Group | | |
(1988–2008). | | |
1 These individuals are “interested persons” as defined in the Investment Company Act of 1940.
2 December 2002 for Vanguard Equity Income Fund, Vanguard Growth Equity Fund, the Vanguard Municipal Bond Funds, and the Vanguard State Tax-Exempt Funds.
| 
|
| P.O. Box 2600 |
| Valley Forge, PA 19482-2600 |
Connect with Vanguard® > www.vanguard.com
Fund Information > 800-662-7447 | All comparative mutual fund data are from Lipper Inc. |
| or Morningstar, Inc., unless otherwise noted. |
Direct Investor Account Services > 800-662-2739 | |
| |
Institutional Investor Services > 800-523-1036 | You can obtain a free copy of Vanguard’s proxy voting |
| guidelines by visiting our website, www.vanguard.com, |
Text Telephone for People | and searching for “proxy voting guidelines,” or by |
With Hearing Impairment > 800-952-3335 | calling Vanguard at 800-662-2739. The guidelines are |
| also available from the SEC’s website, www.sec.gov. |
| In addition, you may obtain a free report on how your |
| fund voted the proxies for securities it owned during |
This material may be used in conjunction | the 12 months ended June 30. To get the report, visit |
with the offering of shares of any Vanguard | either www.vanguard.com or www.sec.gov. |
fund only if preceded or accompanied by | |
the fund’s current prospectus. | |
| You can review and copy information about your fund |
| at the SEC’s Public Reference Room in Washington, D.C. |
The funds or securities referred to herein are not | To find out more about this public service, call the SEC |
sponsored, endorsed, or promoted by MSCI, and MSCI | at 202-551-8090. Information about your fund is also |
bears no liability with respect to any such funds or | available on the SEC’s website, and you can receive |
securities. For any such funds or securities, the | copies of this information, for a fee, by sending a |
prospectus or the Statement of Additional Information | request in either of two ways: via e-mail addressed to |
contains a more detailed description of the limited | publicinfo@sec.gov or via regular mail addressed to the |
relationship MSCI has with The Vanguard Group and | Public Reference Section, Securities and Exchange |
any related funds. | Commission, Washington, DC 20549-0102. |
| |
Russell is a trademark of The Frank Russell Company. | |
| |
| |
| |
| |
| |
| |
| |
| |
| |
| © 2009 The Vanguard Group, Inc. |
| All rights reserved. |
| Vanguard Marketing Corporation, Distributor. |
| |
| Q1112 052009 |
> | Vanguard Global Equity Fund returned about –34% during the first half of its fiscal year, underperforming its benchmark index and the average return of competing funds. |
> | All regions lost at least 25% of their stock market value, with developed markets suffering the most. Emerging markets plunged early in the period, then stabilized. |
> | Troubled financial stocks did the most damage, while the consumer discretionary, industrial, and materials sectors also dragged down returns. |
Contents | |
| |
Your Fund’s Total Returns | 1 |
President’s Letter | 2 |
Advisors’ Report | 6 |
Fund Profile | 12 |
Performance Summary | 14 |
Financial Statements | 15 |
About Your Fund’s Expenses | 34 |
Trustees Approve Advisory Agreements | 36 |
Glossary | 38 |
Please note: The opinions expressed in this report are just that—informed opinions. They should not be considered promises or advice. Also, please keep in mind that the information and opinions cover the period through the date on the front of this report. Of course, the risks of investing in your fund are spelled out in the prospectus.
Your Fund’s Total Returns
Six Months Ended March 31, 2009 | | |
| Ticker | Total |
| Symbol | Returns |
Vanguard Global Equity Fund | VHGEX | –33.90% |
MSCI All Country World Index | | –30.68 |
Average Global Fund1 | | –28.88 |
Your Fund’s Performance at a Glance | | | |
September 30, 2008–March 31, 2009 | | | |
| | | Distributions Per Share |
| Starting | Ending | Income | Capital |
| Share Price | Share Price | Dividends | Gains |
Vanguard Global Equity Fund | $16.64 | $10.48 | $0.573 | $0.000 |
1 Derived from data provided by Lipper Inc.
1

President’s Letter
Dear Shareholder,
Vanguard Global Equity Fund returned about –34% for the fiscal half-year ended March 31, 2009, as the credit market crisis that began in the United States spread to international markets, slowing trade and hampering economic growth.
Weakness was broad across sectors and regions. Developed markets in Europe and North America, weighed down by financial sector woes, were hit hardest. Emerging markets, which in recent years enjoyed robust growth, contracted sharply in the fourth quarter of 2008 as commodity prices shrank and exports fell, but then stabilized in the first three months of 2009.
The fund’s disappointing return trailed both the average return for its peer funds and the return of its market benchmark, the MSCI All Country World Index.
Extreme distress dappled with glimmers of hope
The six months ended March 31 witnessed extreme distress in global stock markets, with both U.S. and international stocks returning about –31%. The embattled financial sector continued to struggle, prompting regulators in the United States and abroad to take ever-more-aggressive actions to help the big banks fortify their fragile balance sheets.
Even as the gloom intensified, a few signs of recovery appeared on the horizon. Toward the end of the period, the swift contraction in U.S. manufacturing activity seemed to lessen. And throughout the six months, news from the housing sector seemed to
2
improve. From their lows in early March through the end of the period, global stock markets generated a double-digit return.
Credit-market turmoil provoked dramatic response
Developments in the U.S. fixed income market were, if anything, even more unusual. In the months after the September collapse of Lehman Brothers, a major presence in the bond market, the trading of corporate bonds came to a near standstill as investors stampeded into U.S. Treasury bonds—considered the safest, most liquid credits—driving prices higher and yields lower. The difference between the yields of Treasuries and corporate bonds surged to levels not seen since the 1930s.
The Federal Reserve Board responded to the credit-market and economic crises with a dramatic easing of monetary policy, reducing its target for short-term interest rates to an all-time low of 0% to 0.25%. The Fed also created new programs designed to bring borrowers and lenders back to the market. For the six-month period, the Barclays Capital U.S. Aggregate Bond Index returned 4.70% on the strength of Treasuries and other government-backed bonds. The broad municipal bond market returned 5.00%.
Crisis in U.S. financial markets echoed across the globe
During the fiscal half-year, fears of a deepening global recession stemming from the credit crisis in the United States reverberated throughout global stock markets.
Market Barometer | | | |
| | | Total Returns |
| | Periods Ended March 31, 2009 |
| Six Months | One Year | Five Years1 |
Stocks | | | |
MSCI All Country World Index ex USA (International) | –30.54% | –46.18% | –0.24% |
Russell 1000 Index (Large-caps) | –30.59 | –38.27 | –4.54 |
Russell 2000 Index (Small-caps) | –37.17 | –37.50 | –5.24 |
Dow Jones Wilshire 5000 Index (Entire market) | –30.72 | –37.69 | –4.24 |
| | | |
Bonds | | | |
Barclays Capital U.S. Aggregate Bond Index | | | |
(Broad taxable market) | 4.70% | 3.13% | 4.13% |
Barclays Capital Municipal Bond Index | 5.00 | 2.27 | 3.21 |
Citigroup 3-Month Treasury Bill Index | 0.30 | 1.13 | 3.06 |
| | | |
CPI | | | |
Consumer Price Index | –2.78% | –0.38% | 2.57% |
| | | | |
1 Annualized.
3
Vanguard Global Equity Fund, which invests in both value and growth stocks within developed as well as emerging markets worldwide, plunged by double digits as financial stocks crumbled, commodity prices fell, and emerging markets experienced a slowdown in demand for exports.
Not surprisingly, battered financial stocks and the consumer discretionary, industrial, and materials sectors, which are especially sensitive to the rhythms of the business cycle, did the most damage. German utility E.ON, Dutch financial services giant ING Groep, and Japanese electronics maker Hitachi were among the holdings that particularly hurt the fund’s returns relative to its benchmark index.
On the other hand, the fund was helped by its underweighting, on average, in financials, including a lighter exposure to some of the large banks embroiled in the global credit turmoil. The fund also made some profitable selections in the consumer staples arena.
Every region suffered double-digit losses
On a regional basis, the Global Equity Fund’s stocks in the United States, which constituted, on average, about 40% of the fund’s holdings, returned about –33%, pulling down the fund’s return by 11 percentage points and underperforming North American stocks in the benchmark index by nearly 3 percentage points. However, that drag was counterbalanced
Expense Ratios1 | | |
Your Fund Compared With Its Peer Group | | |
| | Average |
| Fund | Global Fund |
Global Equity Fund | 0.58% | 1.49% |
1 The fund expense ratio shown is from the prospectus dated January 28, 2009, and represents estimated costs for the current fiscal year based on the fund’s current net assets. For the six months ended March 31, 2009, the annualized expense ratio was 0.48%. The peer-group expense ratio is derived from data provided by Lipper Inc. and captures information through year-end 2008.
4
by the fund’s underweighting of U.S. companies, which made up about 45% of the index’s composition.
Developed markets in Europe and the Pacific region were relative detractors against the index for the period, led by poor stock selection in France and Japan. Measured strictly by their asset weightings, stocks in Japan, the United Kingdom, and Germany were the most influential detractors (besides U.S. stocks), collectively dragging down the fund’s total return by more than 8 percentage points. A rapid slowdown in worldwide trade and worries about protectionism were among the factors that cast a pall over those markets.
The fund’s overweighted position in emerging markets relative to its index was a small positive for the period, led by holdings in Taiwan and South Korea. Hints of a recovery in China, based partly on announced government stimulus spending and strong bank loan growth, helped drive a recovery in emerging markets stocks late in the period.
The long-term view keeps recent results in perspective
Despite years of strong returns, markets in the United States and abroad faced huge headwinds during the fiscal half-year.
Although such volatility may be jarring for some investors, it’s important not to let these short-term extremes blind us to the long-term case for equities, including international stocks. Stocks occasionally suffer steep declines, but these setbacks are an unavoidable trade-off for their potential to produce superior returns in the long term. Over time, the combination of U.S. and international stocks, such as the diversified portfolio held by Global Equity Fund, can help moderate an investor’s own portfolio volatility.
At Vanguard, we counsel investors to maintain a diversified portfolio of mutual funds consisting of U.S. and international stocks as well as bond and money market funds that fit their goals, time horizon, and risk tolerance. Even well-diversified portfolios have struggled recently, of course. But we believe that broad diversification among and within asset classes is the right long-term policy to help you weather occasional storms while putting you in a position to benefit from the inevitable return to better times.
The Global Equity Fund can play an important role in such a portfolio by offering investors broad exposure to stocks in markets around the world.
We appreciate your continued confidence in Vanguard.
Sincerely,

F. William McNabb III
President and Chief Executive Officer
April 17, 2009
5
Advisors’ Report
For the fiscal half-year ended March 31, 2009, the Global Equity Fund returned –33.90%. Your fund is managed by four independent advisors. This provides exposure to distinct, yet complementary, investment approaches, enhancing the fund’s diversification.
The advisors, the percentage and amount of fund assets each manages, and brief descriptions of their investment strategies are presented in the table below. Each advisor has also prepared a discussion of the investment environment that existed during the fiscal year and of how portfolio positioning reflects this assessment. These comments were prepared on April 20, 2009.
Acadian Asset Management LLC
Portfolio Managers:
John R. Chisholm, CFA, Executive Vice President and Co-Chief Investment Officer
Ronald D. Frashure, CFA, President and Chief Executive Officer
Brian K. Wolahan, CFA, Senior Vice President and Director of Alternative Strategies
In the trailing six-month period, some key investment themes emerged. It was a difficult environment for value, particularly in the U.S. market. In addition, investors continued the trend seen over the past year of ignoring recent earnings trends as they evaluated stocks. With the global
Vanguard Global Equity Fund Investment Advisors |
| Fund Assets | |
| Managed | |
Investment Advisor | % | $ Million | Investment Strategy |
Acadian Asset Management LLC | 36 | 1,060 | A quantitative, active, bottom-up investment process |
| | | that combines stock and peer-group valuation to arrive |
| | | at a return forecast for each of the more than 40,000 |
| | | securities in the global universe. |
AllianceBernstein L.P. | 31 | 920 | A fundamentally based, research-driven approach, |
| | | focused on finding companies whose long-term |
| | | earnings power exceeds the level implied by their |
| | | current stock price. Proprietary quantitative tools |
| | | aid risk control and portfolio construction. |
Marathon Asset Management LLP | 27 | 801 | A long-term and contrarian investment philosophy and |
| | | process with a focus on industry capital cycle analysis |
| | | and in-depth management assessment. |
Baillie Gifford Overseas Ltd. | 4 | 108 | The advisor seeks stocks that can generate above- |
| | | average growth in earnings and cash flow, producing |
| | | a bottom-up, stock-driven approach to country and |
| | | asset allocation. An in-depth view on each company |
| | | is measured against the consensus view, leading to |
| | | discrepancies and potential opportunities to add value. |
Cash investments | 2 | 64 | These short-term reserves are invested by Vanguard in |
| | | equity index products to simulate investment in stocks. |
| | | Each advisor may also maintain a modest cash position. |
6
economy still in free fall and many earnings downgrades expected, past earnings performance held less weight than usual. Late in the first quarter of 2009, however, investor sentiment abruptly swung upward, from deep pessimism to temporary euphoria. This led to a brief revival in value stocks, but was accompanied by the significant underperformance of momentum-based measures, as previously downbeaten stocks rose sharply.
Overall, it was a difficult period for quantitative processes. While value and momentum factors underperformed, investor sentiment was highly volatile and driven by short-term fears and expectations. Ongoing poor economic news and fears about the financial system vied with sporadic attempts to time the market bottom and get back into stocks before the expected turn. Our anecdotal evidence is that institutions, brokers, and hedge funds continued to face liquidity binds that led to forced sales of equities. Looking ahead, however, we believe that markets will eventually reconnect with the true fundamentals of company valuation and prospects.
Our portfolio was focused on attractively valued stocks that appeared likely to rise in price based on earnings data, price characteristics, and quality. Key overweighted markets, based on bottom-up stock selection, included the United States, Japan, and France. Emerging markets—Korea, Taiwan, and Turkey—were also overweighted. And Switzerland, the United Kingdom, Canada, Australia, and Spain were underweighted. Important active-sector weightings included services, health care, and telecommunication services.
Stock selection in the United States was the most significant detractor from our portfolio’s active return (that is, relative to the benchmark). Selections in energy and materials proved especially costly to return as commodity prices retreated steadily from their mid-2008 highs, with only a slight rebound late in the fiscal period. U.S. technology stocks also hurt our portfolio, as lower earnings and a cloudy business outlook led companies to reduce their expenditures on software, services, and hardware.
Stock selection in Japan also produced negative results. Again, technology stocks lagged, particularly in companies focused on consumer-oriented products as the global recession has curbed spending.
The portfolio’s underweighted allocations to the financial sector proved more successful, given the heightened uncertainty surrounding the health of many of these institutions and the potential impact of government recapitalization and stabilization efforts.
7
AllianceBernstein L.P.
Portfolio Managers:
Sharon E. Fay, CFA, Head of Value Equities and Co-Chief Investment Officer–Global Value Equities
Kevin F. Simms, Co-Chief Investment Officer–International Value Equities and Director of Research–Global and International Value Equities
Henry S. D’Auria, CFA, Co-Chief Investment Officer–International Value Equities and Chief Investment Officer–Emerging Markets Value Equities
Heightened investor anxiety during the fiscal half-year created a particularly fertile environment for value investing. As of a few weeks after the end of the fiscal period, the most attractive value stocks were selling at a deep discount to the market, and the value opportunity was remarkably diverse across sectors.
We expect these valuation distortions to correct as the crisis eventually subsides and risk appetite improves. History has shown that value stocks have strongly outperformed in the long run, and especially in the wake of previous bear markets.
Our investment approach weighs the opportunity from buying attractively valued stocks versus the risks that drive investor anxieties and make the stocks cheap.
The risks are currently acute, with the global economy contracting, the world’s financial system weak, and the profit outlook extremely uncertain. Moreover, the potential for unpredictable government intervention makes forecasting particularly difficult.
In this environment, we have repositioned our portfolio at the margin toward value stocks with strong balance sheets, strong market positions, and more visible near-term cash flows that should prove resilient in the downturn. However, given their sensitivity to the economic cycle, many of these companies should also thrive in an upturn.
For example, although we have trimmed stakes in Rénault and Nissan Motor to mitigate near-term risks, our research suggests that the stocks continue to offer significant long-term return potential, so we are maintaining active stakes. Both companies have substantial flexibility to weather the downturn, including untapped credit lines and the ability to sell valuable equity stakes.
Similarly, in industrial commodities, we have reduced holdings in companies with weak balance sheets or severely pressured earnings as a result of lower demand for raw materials and declining selling prices.
8
But we retain significant exposure to attractively valued names such as BASF, the German chemical company.
In telecoms, we initiated new positions in France Telecom, Telecom Italia, and BCE of Canada, all of which generate strong operational free cash flow. Our research suggests that each of these companies has room to cut discretionary expenditures, which would help to maintain dividends if free cash flow comes under pressure. Yet the stocks trade at significant discounts to the market and to the sector’s long-term history.
The portfolio retains significant active exposure to financials. But we have exited those banks most at risk of further dilution or nationalization, such as Royal Bank of Scotland Group and Citigroup. Our remaining financial holdings are diversified among banks and insurers that we believe will recover strongly when conditions improve.
In the six-month period, portfolio under-performance was driven largely by financial and industrial commodities stocks. Energy and health care holdings offset some of the damage. We believe that our response to the challenging environment positions the portfolio to generate a meaningful recovery as the year unfolds.
Marathon Asset Management LLP
Portfolio Managers:
Jeremy J. Hosking, Investment Director
Neil M. Ostrer, Investment Director
William J. Arah, Investment Director
The geographical structure of our portfolio remains similar to that of previous reports. Activity in the past six months remained low, although many opportunities were taken to increase existing holdings, given the markets’ steep and indiscriminate falls. Exposure to cyclical sectors, such as Hong Kong property companies or relatively highly geared cable television businesses, hurt the portfolio’s performance. Fortunately, the portfolio’s diversification meant that exposure to such businesses was tempered by holdings that demonstrated more resilience in a market downturn. Our large holdings included Costco, with its low-cost consumer proposition, as well as Gartner and Watson Wyatt, both consultancy firms with annuitylike income streams.
While our portfolio continued cautiously to increase exposure to banks, those deemed to be excessively precarious, such as the Bank of Ireland, were sold. Outside of banking, compelling opportunities emerged with U.S. homebuilders, an industry where lessened supply and greater purchase affordability herald a period of more favorable dynamics. Furthermore, the risk of shareholder dilution vis-à-vis banks is much
9
reduced, with the potential for significant upside remaining. We made additions to investments in KB Home and Pulte Homes throughout the period. Holdings in MBIA, the monoline bond insurer, were also increased on share-price weakness, as the firm’s management exploited the market dislocation by buying back lowly valued shares as well as discounted debt.
In general, we are encouraged that credit spreads have started to narrow and credit markets are starting to reopen—a bullish development, notwithstanding the increase in bond supply, because it means that companies should be able to refinance maturing liabilities. This is clearly positive for corporate bonds overall, as it reduces the default tendency and potentially explains some of the recent rally in equities. Unfortunately, we can offer no proof in advance of whether governments will succeed in reversing the current recession. In Marathon’s view, the probabilities favor backing the U.S. Federal Reserve and other central banks, not the current economic data. The fact that stock markets are discounting mechanisms encourages this view, as do the nearly Depression-level valuations. The fact that authorities in the United States and the United Kingdom are aware of credit-spread dispersion and are working to reduce it through “quantitative easing” means that conditions should become less severe as the year progresses. This implies that value-oriented equities should have a better year in 2009, despite poor economic news. At present, given prevailing prices, investing on the basis of successful intervention seems the safer strategy, and it is the one embedded in our portfolio.
Baillie Gifford Overseas Ltd.
Portfolio Managers:
Charles Plowden, Joint Senior Partner and Lead Portfolio Manager
Spencer Adair, CFA, Investment Manager
Malcolm MacColl, Investment Manager
The tremendous turbulence in global equity markets over the half-year will undoubtedly have a strong aftermath. We expect that in the Western world, 2009 will continue to see a significant economic downturn, many companies will go out of business, and unemployment will rise strongly—perhaps for many months. Although we might hope that government bailouts will help offset these difficult times, we also recognize that at some point, increasing taxation will be needed.
If we turn to the solid companies we invest in, we can start to make sense of the world. Our portfolio has benefited by not owning many high-profile financial companies that remain in turmoil, including Bank of America, Citigroup, and Wells Fargo. The banks’ lack of willingness to lend has caused a squeeze across a variety of industries and a related
10
inventory correction. We believe that we are nearing the end of this process, and our portfolio’s recent purchase of shares in Samsung Electronics reflects the view that as the semiconductor industry was an early casualty of the recession, it will recover more quickly. Samsung is a well-capitalized company and can emerge stronger relative to its competitors.
We continue to have faith in companies exposed to consumption in the East. China National Building Material has performed well, and Naspers (which owns a stake in Tencent, a highly popular Chinese web-site) has done likewise. Steady growth companies selling the staples of daily life, such as Walgreen, have seen a relative revival recently, and we believe it is time to start to reduce these positions.
Meanwhile, we are investing in strong growth franchises at very modest price/ earnings multiples. We have recently taken new positions in Cisco Systems, Olympus, and Walt Disney. Valuations for the wider market are at multiyear lows on a cyclically adjusted basis, and quality growth companies look especially attractive.
Although the news may continue to be dominated by gloomy headlines for the foreseeable future, the market may be willing to look through this and forecast the eventual recovery. We believe our portfolio is well placed for such an event because our holdings tend to have much lower debts (or much more cash) than their peers, and thus will survive the short-term gyrations. The strong competitive positions of our holdings mean that they can emerge with sustainable growth when the recovery occurs.
11
Global Equity Fund
Fund Profile
As of March 31, 2009
Portfolio Characteristics | | |
| | Comparative |
| Fund | Index1 |
Number of Stocks | 767 | 2,411 |
Turnover Rate2 | 75% | — |
Expense Ratio3 | 0.58% | — |
Short-Term Reserves | 1.1% | — |
Sector Diversification (% of equity exposure) |
| | Comparative |
| Fund | Index1 |
Consumer Discretionary | 13.5% | 8.8% |
Consumer Staples | 9.3 | 10.5 |
Energy | 10.6 | 12.5 |
Financials | 17.9 | 17.3 |
Health Care | 11.4 | 10.8 |
Industrials | 8.9 | 9.9 |
Information Technology | 11.5 | 11.8 |
Materials | 5.0 | 7.2 |
Telecommunication Services | 9.0 | 6.0 |
Utilities | 2.9 | 5.2 |
Volatility Measures4 | |
| Fund Versus |
| Comparative Index1 |
R-Squared | 0.99 |
Beta | 1.13 |
Ten Largest Holdings5 (% of total net assets) |
| | |
Royal Dutch Shell PLC | integrated oil | |
| and gas | 2.6% |
Pfizer Inc. | pharmaceuticals | 2.0 |
Altria Group, Inc. | tobacco | 1.9 |
France Telecom SA | integrated | |
| telecommunication | |
| services | 1.8 |
Sanofi-Aventis | pharmaceuticals | 1.6 |
Johnson & Johnson | pharmaceuticals | 1.4 |
McDonald’s Corp. | restaurants | 1.2 |
Automatic Data | data processing and | |
Processing, Inc. | outsourced services | 1.2 |
Sumitomo Mitsui | | |
Financial Group, Inc. | diversified banks | 1.0 |
State Street Corp. | asset management | |
| and custody banks | 0.9 |
Top Ten | | 15.6% |
Allocation by Region (% of equity exposure)
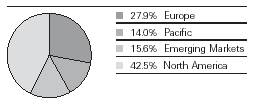
1 MSCI All Country World Index.
2 Annualized.
3 The fund expense ratio shown is from the prospectus dated January 28, 2009, and represents estimated costs for the current fiscal year based on the fund’s current net assets. For the six months ended March 31, 2009, the expense ratio was 0.48%.
4 For an explanation of R-squared, beta, and other terms used here, see the Glossary.
5 The holdings listed exclude any temporary cash investments and equity index products.
12
Global Equity Fund
Market Diversification (% of equity exposure) |
| | Comparative |
| Fund1 | Index2 |
Europe | | |
United Kingdom | 9.0% | 8.4% |
France | 6.5 | 4.3 |
Germany | 4.8 | 3.3 |
Switzerland | 1.7 | 3.3 |
Italy | 1.4 | 1.4 |
Netherlands | 1.1 | 0.9 |
Sweden | 1.0 | 0.9 |
Other European Markets | 2.4 | 3.8 |
Subtotal | 27.9% | 26.3% |
Pacific | | |
Japan | 10.2% | 9.9% |
Singapore | 1.5 | 0.5 |
Australia | 1.2 | 2.8 |
Hong Kong | 1.1 | 0.9 |
Subtotal | 14.0% | 14.1% |
Emerging Markets | | |
South Korea | 3.5% | 1.4% |
Taiwan | 3.2 | 1.3 |
Brazil | 1.2 | 1.6 |
South Africa | 1.0 | 0.8 |
Other Emerging Markets | 6.7 | 5.8 |
Subtotal | 15.6% | 10.9% |
North America | | |
United States | 39.8% | 44.9% |
Canada | 2.7 | 3.8 |
Subtotal | 42.5% | 48.7% |
1 Country percentages exclude currency contracts held by the fund.
2 MSCI All Country World Index.
13
Global Equity Fund
Performance Summary
All of the returns in this report represent past performance, which is not a guarantee of future results that may be achieved by the fund. (Current performance may be lower or higher than the performance data cited. For performance data current to the most recent month-end, visit our website at www.vanguard.com/performance.) Note, too, that both investment returns and principal value can fluctuate widely, so an investor’s shares, when sold, could be worth more or less than their original cost. The returns shown do not reflect taxes that a shareholder would pay on fund distributions or on the sale of fund shares.
Fiscal-Year Total Returns (%): September 30, 1998–March 31, 2009

Average Annual Total Returns: Periods Ended March 31, 2009 |
| | | | |
| Inception Date | One Year | Five Years | Ten Years |
Global Equity Fund2 | 8/14/1995 | –47.82% | –3.79% | 3.17% |
1 Six months ended March 31, 2009.
2 Total returns do not include the account service fee that may be applicable to certain accounts with balances below $10,000.
Note: See Financial Highlights table for dividend and capital gains information.
14
Global Equity Fund
Financial Statements (unaudited)
Statement of Net Assets
As of March 31, 2009
The fund provides a complete list of its holdings four times in each fiscal year, at the quarter-ends. For the second and fourth fiscal quarters, the lists appear in the fund’s semiannual and annual reports to shareholders. For the first and third fiscal quarters, the fund files the lists with the Securities and Exchange Commission on Form N-Q. Shareholders can look up the fund’s Forms N-Q on the SEC’s website at www.sec.gov. Forms N-Q may also be reviewed and copied at the SEC’s Public Reference Room (see the back cover of this report for further information).
| | | Market |
| | | Value• |
| | Shares | ($000) |
Common Stocks (96.0%)1 | | |
Australia (1.0%) | | |
| Australia & New Zealand | | |
| Bank Group Ltd. | 937,024 | 10,239 |
| Santos Ltd. | 493,658 | 5,810 |
^ | News Corp. CDI | | |
| Class B Shares | 631,000 | 4,906 |
| BHP Billiton Ltd. | 111,566 | 2,466 |
| Macquarie | | |
| Infrastructure Group | 2,050,356 | 2,101 |
| Amcor Ltd. | 649,296 | 2,008 |
| Brambles Ltd. | 271,843 | 907 |
| Orica Ltd. | 46,264 | 477 |
| Caltex Australia Ltd. | 69,841 | 434 |
| Alumina Ltd. | 246,453 | 222 |
* | Iluka Resources Ltd. | 76,078 | 213 |
| | | 29,783 |
Austria (0.0%) | | |
| Oesterreichische Post AG | 19,555 | 581 |
* | BETandWIN.com Interactive | |
| Entertainment AG | 8,217 | 228 |
| | | 809 |
Belgium (0.2%) | | |
| Delhaize Group | 40,000 | 2,596 |
| Groupe Bruxelles | | |
| Lambert SA | 30,257 | 2,054 |
| Anheuser-Busch InBev NV | 45,412 | 1,251 |
| | | 5,901 |
Brazil (1.2%) | | |
| Usiminas-Usinas Siderugicas | |
| de Minas Gerais SA Pfd. | 594,175 | 7,538 |
| Banco do Brasil SA | 974,600 | 7,197 |
| Itausa-Investimentos | | |
| Itau SA | 2,045,689 | 7,037 |
* | Itau Unibanco Banco | | |
| Multiplo SA | 607,882 | 6,614 |
| Petroleo Brasileiro | | |
| SA Series A ADR | 112,200 | 2,749 |
| Companhia Vale do | | |
| Rio Doce Sponsored ADR | 74,600 | 841 |
| | | Market |
| | | Value• |
| | Shares | ($000) |
| Centrais Electricas Brasileiras | | |
| SA Pfd. B Shares | 73,400 | 789 |
| Metalurgica Gerdau SA | 94,900 | 687 |
| Electropaulo | | |
| Metropolitana SA | 31,400 | 443 |
| Banco Nossa Caixa SA | 10,700 | 327 |
| Companhia de Saneamento | | |
| Basico do Estado | | |
| de Sao Paulo | 26,800 | 296 |
| | | 34,518 |
Canada (2.7%) | | |
| Rogers | | |
| Communications, Inc. | | |
| Class B | 757,200 | 17,447 |
| BCE Inc. | 554,665 | 11,051 |
| Petro-Canada | 376,300 | 10,109 |
| Bombardier Inc. Class B | 4,191,952 | 9,775 |
| Imperial Oil Ltd. | 253,800 | 9,219 |
| Nexen Inc. | 260,934 | 4,425 |
^ | Toronto-Dominion Bank | 112,800 | 3,888 |
| Canadian Imperial | | |
| Bank of Commerce | 71,241 | 2,592 |
| Sun Life Financial | | |
| Services of Canada | 132,144 | 2,394 |
^,* | ACE Aviation Holdings, Inc. | 410,000 | 1,805 |
| Onex Corp. | 83,300 | 1,023 |
^ | Ritchie Brothers | | |
| Auctioneers Inc. | 54,510 | 1,013 |
* | CGI Group Inc. | 95,200 | 769 |
^ | Royal Bank of Canada | 19,800 | 578 |
| Metro Inc. | 17,400 | 523 |
| ATCO, Ltd. | 17,800 | 508 |
^ | Biovail Corp. | 44,800 | 487 |
| Fairfax Financial | | |
| Holdings Ltd. | 1,750 | 456 |
^ | Groupe Aeroplan, Inc. | 58,600 | 364 |
* | Catalyst Paper Corp. | 1,158,844 | 129 |
* | Fraser Papers Inc. | 337,960 | 121 |
* | Nortel Networks Corp. | 241,295 | 53 |
| ING Canada Inc. | | — |
| | | 78,729 |
15
Global Equity Fund
| | | Market |
| | | Value• |
| | Shares | ($000) |
Chile (0.1%) | | |
| Enersis SA ADR | 197,300 | 2,979 |
| Banco Santander | | |
| Chile SA ADR | 29,600 | 1,017 |
| | | 3,996 |
China (0.8%) | | |
| China Petroleum & | | |
| Chemical Corp. | 20,116,000 | 12,890 |
| Tsingtao | | |
| Brewery Co., Ltd. | 2,150,000 | 4,663 |
| China Telecom Corp. Ltd. | 8,550,000 | 3,532 |
| China National Building | | |
| Material Co., Ltd. | 1,040,000 | 1,539 |
| China Mobile | | |
| (Hong Kong) Ltd. | 124,500 | 1,084 |
| Yanzhou Coal Mining | | |
| Co. Ltd. H Shares | 1,156,000 | 828 |
| | | 24,536 |
Czech Republic (0.2%) | | |
| Ceske Energeticke | | |
| Zavody a.s. | 128,600 | 4,599 |
| | | |
Denmark (0.4%) | | |
* | Vestas Wind Systems A/S | 65,019 | 2,856 |
^,* | William Demant A/S | 56,130 | 2,260 |
| Coloplast A/S B Shares | 32,210 | 1,980 |
^,* | GN Store Nord A/S | 420,379 | 1,127 |
| AP Moller-Maersk | | |
| A/S B Shares | 200 | 879 |
| Novo Nordisk A/S B Shares | 15,950 | 765 |
| Carlsberg A/S B Shares | 15,066 | 619 |
* | Danske Bank A/S | 23,524 | 198 |
^ | Bang & Olufsen | | |
| A/S B Shares | 11,224 | 142 |
| | | 10,826 |
Egypt (0.1%) | | |
| Al Ezz Steel Rebars SAE | 1,553,777 | 1,989 |
| Egyptian Financial Group- | | |
| Hermes Holding SAE | 223,300 | 604 |
| | | 2,593 |
Finland (0.6%) | | |
| Nokia Oyj | 660,962 | 7,730 |
| Sampo Oyj A Shares | 236,523 | 3,488 |
| Stora Enso Oyj R Shares | 768,268 | 2,721 |
^ | Metso Oyj | 178,529 | 2,109 |
^ | TietoEnator Oyj B Shares | 62,105 | 644 |
| Wartsila Oyj B Shares | 12,083 | 255 |
| | | 16,947 |
France (6.2%) | | |
| France Telecom SA | 2,288,886 | 52,180 |
| Sanofi-Aventis | 849,869 | 47,696 |
| Total SA | 260,446 | 12,879 |
| Renault SA | 509,200 | 10,470 |
| BNP Paribas SA | 240,944 | 9,941 |
| | | Market |
| | | Value• |
| | Shares | ($000) |
^ | ArcelorMittal | | |
| (Amsterdam Shares) | 458,262 | 9,350 |
| Credit Agricole SA | 773,493 | 8,534 |
^ | European Aeronautic | | |
| Defence and Space Co. | 396,733 | 4,610 |
| Carrefour SA | 83,950 | 3,275 |
| Lagardere S.C.A. | 99,687 | 2,797 |
| Thales SA | 64,812 | 2,454 |
| Neopost SA | 31,254 | 2,424 |
| Legrand SA | 130,665 | 2,270 |
| Arkema | 135,800 | 2,144 |
| Cie. de St. Gobain SA | 72,879 | 2,042 |
| SCOR SA | 89,617 | 1,842 |
| Axa | 117,068 | 1,405 |
* | Alcatel-Lucent ADR | 509,351 | 947 |
* | Groupe Eurotunnel SA | | |
| Warrants Exp. 12/30/11 | 7,192,966 | 908 |
| Essilor International SA | 22,218 | 858 |
| Electricite de France | 20,575 | 807 |
| Societe BIC SA | 15,210 | 747 |
| Nexans SA | 17,819 | 676 |
| Valeo SA | 46,215 | 676 |
| Atos Origin SA | 22,838 | 586 |
| Societe Generale Class A | 13,934 | 545 |
^,* | Groupe Eurotunnel SA | 83,076 | 441 |
| SA des Ciments Vicat | 9,138 | 405 |
| | | 183,909 |
Germany (4.6%) | | |
| E.ON AG | 908,074 | 25,185 |
| Allianz AG | 247,362 | 20,705 |
| Muenchener | | |
| Rueckversicherungs- | | |
| Gesellschaft AG | | |
| (Registered) | 127,800 | 15,562 |
| BASF AG | 451,924 | 13,658 |
^ | Deutsche Bank AG | 295,403 | 11,833 |
| Deutsche Lufthansa AG | 1,062,872 | 11,515 |
| Bayer AG | 211,061 | 10,084 |
| RWE AG | 97,430 | 6,823 |
| Fresenius Medical Care AG | 107,534 | 4,173 |
| Deutsche Telekom AG | 280,600 | 3,476 |
^ | Daimler AG (Registered) | 118,662 | 2,990 |
| Linde AG | 32,615 | 2,214 |
| Adidas AG | 49,463 | 1,642 |
| Bayerische Motoren | | |
| Werke AG | 45,687 | 1,318 |
| Celesio AG | 49,942 | 919 |
^ | ThyssenKrupp AG | 49,777 | 868 |
| Deutsche Post AG | 69,736 | 751 |
| Siemens AG | 11,664 | 666 |
| SAP AG | 16,320 | 571 |
^,* | Infineon Technologies AG | 460,606 | 531 |
| Fresenius Medical Care | | |
| AG ADR | 11,744 | 454 |
^,* | Q-Cells AG | 22,500 | 438 |
| | | 136,376 |
Global Equity Fund
| | | Market |
| | | Value• |
| | Shares | ($000) |
Greece (0.0%) | | |
| Bank of Cyprus | | |
| Public Co. Ltd. | 161,117 | 491 |
| | | |
Hong Kong (1.1%) | | |
| New World | | |
| Development Co., Ltd. | 8,279,813 | 8,265 |
| Henderson Land | | |
| Development Co. Ltd. | 1,033,000 | 3,939 |
| Television Broadcasts Ltd. | 1,126,000 | 3,602 |
| First Pacific Co. Ltd. | 10,152,000 | 3,480 |
| Wheelock and Co. Ltd. | 1,603,000 | 2,696 |
| Hong Kong Aircraft & | | |
| Engineering Co., Ltd. | 226,000 | 1,945 |
| SmarTone | | |
| Telecommunications Ltd. | 3,036,790 | 1,777 |
| Hong Kong and | | |
| Shanghai Hotels Ltd. | 2,784,038 | 1,753 |
| Midland Holdings Ltd. | 4,718,000 | 1,566 |
| Mandarin Oriental | | |
| International Ltd. | 766,690 | 609 |
* | Rehne | | |
| Commercial Holdings | 2,316,000 | 519 |
| Hong Kong Exchanges & | | |
| Clearing Ltd. | 54,000 | 510 |
| I-Cable | | |
| Communications Ltd. | 6,561,000 | 449 |
| Next Media Ltd. | 4,192,000 | 438 |
| Esprit Holdings Ltd. | 56,346 | 288 |
| Silver Grant International | | |
| Industries Ltd. | 1,752,000 | 192 |
| | | 32,028 |
India (0.9%) | | |
| Bank of India | 1,760,695 | 7,642 |
| Tata Iron and | | |
| Steel Co. Ltd. | 1,287,954 | 5,250 |
| State Bank of India GDR | 66,230 | 2,716 |
| Punjab National Bank Ltd. | 313,163 | 2,547 |
| Oil and Natural | | |
| Gas Corp. Ltd. | 158,292 | 2,442 |
| Gail India Ltd. | 421,430 | 2,047 |
| Axis Bank Ltd. | 192,835 | 1,580 |
| Bank of Baroda | 218,603 | 1,011 |
| State Bank of India | 31,439 | 663 |
| Canara Bank Ltd. | 176,423 | 579 |
| Union Bank of India Ltd. | 174,181 | 505 |
* | IFCI Ltd. | 931,692 | 356 |
| Bharat Petroleum Corp. Ltd. | 34,900 | 259 |
| | | 27,597 |
Indonesia (0.3%) | | |
| PT Semen Gresik Tbk | 11,586,500 | 3,736 |
* | PT Bank Indonesia Tbk | 70,022,036 | 3,264 |
| PT Matahari | | |
| Putra Prima Tbk | 19,910,800 | 968 |
| PT Indofood Sukses Makmur Tbk | 11,106,500 | 906 |
| | | Market |
| | | Value• |
| | Shares | ($000) |
| PT Gudang Garam Tbk | 1,149,900 | 590 |
* | PT Bank Pan Indonesia Tbk | | |
| Warrants Exp. 7/10/09 | 13,353,807 | 130 |
| PT Citra Marga | | |
| Nusaphala Persada Tbk | 1,709,500 | 125 |
* | PT Mulia Industrindo Tbk | 921,000 | 23 |
* | PT Matahari | | |
| Putra Prima Tbk | | |
| Warrants Exp. 7/21/10 | 3,859,975 | 4 |
| | | 9,746 |
Ireland (0.1%) | | |
| CRH PLC | 61,153 | 1,318 |
| DCC PLC | 28,986 | 439 |
| Fyffes PLC | 1,283,082 | 349 |
| Paddy Power PLC | 16,052 | 251 |
| Paddy Power PLC | | |
| (U.K. Shares) | 9,642 | 154 |
| Total Produce PLC | 389,036 | 140 |
| Independent News & | | |
| Media PLC | 936,699 | 137 |
| Anglo Irish Bank Corp. PLC | 122,273 | 35 |
| | | 2,823 |
Israel (0.2%) | | |
| Partner | | |
| Communications Co. Ltd. | 367,010 | 5,532 |
| Teva Pharmaceutical | | |
| Industries Ltd. | | |
| Sponsored ADR | 27,200 | 1,225 |
| | | 6,757 |
Italy (1.3%) | | |
| Eni SpA | 521,200 | 10,092 |
| Telecom Italia SpA | 4,642,300 | 5,985 |
| Intesa Sanpaolo SpA | 2,077,600 | 5,714 |
| Saipem SpA | 186,440 | 3,317 |
| Luxottica Group SpA ADR | 179,800 | 2,769 |
^ | Fiat SpA | 376,976 | 2,640 |
| Telecom Italia SpA RNC | 1,472,355 | 1,497 |
| Pirelli & C. Accomandita | | |
| per Azioni SpA | 6,059,531 | 1,414 |
| Parmalat SpA | 572,658 | 1,179 |
| UniCredit SpA | 636,608 | 1,048 |
^ | Luxottica Group SpA | 61,709 | 954 |
| Finmeccanica SpA | 39,845 | 496 |
| Banco Popolare SpA | 94,543 | 434 |
| Seat Pagine Gialle SpA | | |
| Rights Exp. 4/17/09 | 51,027 | 318 |
| Fondiaria-Sai SpA | 20,598 | 241 |
* | Natuzzi SpA-Sponsored ADR | 50,700 | 58 |
^,* | Seat Pagine Gialle SpA | 51,027 | 48 |
| | | 38,204 |
Japan (9.7%) | | |
| Sumitomo Mitsui | | |
| Financial Group, Inc. | 856,900 | 30,173 |
| Nippon Telegraph and | | |
| Telephone Corp. | 549,000 | 20,952 |
17
Global Equity Fund
| | | Market |
| | | Value• |
| | Shares | ($000) |
| Sony Corp. | 981,300 | 20,298 |
| Mitsui & Co., Ltd. | 1,452,000 | 14,792 |
| Fast Retailing Co., Ltd. | 100,600 | 11,519 |
| Marubeni Corp. | 3,377,000 | 10,636 |
| Hitachi Ltd. | 3,861,000 | 10,564 |
| Fujitsu Ltd. | 2,345,000 | 8,799 |
| Nissan Motor Co., Ltd. | 2,423,400 | 8,759 |
^ | Sharp Corp. | 1,059,000 | 8,474 |
| Mitsubishi Corp. | 596,700 | 7,910 |
| Tokyo Electric Power Co. | 303,800 | 7,593 |
| Daito Trust | | |
| Construction Co., Ltd. | 219,200 | 7,390 |
| Mitsubishi Chemical | | |
| Holdings Corp. | 1,860,500 | 6,421 |
| Seiko Epson Corp. | 343,900 | 4,730 |
^ | Toshiba Corp. | 1,807,000 | 4,707 |
| West Japan Railway Co. | 1,159 | 3,675 |
| Kao Corp. | 160,000 | 3,122 |
| Toyo Seikan Kaisha Ltd. | 206,800 | 3,053 |
| Nippon Oil Corp. | 595,000 | 2,965 |
| Mitsui Trust Holding Inc. | 894,000 | 2,781 |
| Aisin Seiki Co., Ltd. | 162,500 | 2,608 |
| Isuzu Motors Ltd. | 2,025,000 | 2,487 |
| Nippon Sheet | | |
| Glass Co., Ltd. | 952,000 | 2,380 |
| Yamato Holdings Co., Ltd. | 226,000 | 2,143 |
| Tokyo Gas Co., Ltd. | 598,000 | 2,098 |
| Mitsubishi UFJ | | |
| Financial Group | 412,000 | 2,030 |
| Secom Co., Ltd. | 53,600 | 1,985 |
| Denso Corp. | 97,900 | 1,979 |
| NEC Corp. | 686,000 | 1,866 |
| Sumitomo Electric | | |
| Industries Ltd. | 209,500 | 1,765 |
^ | Shinsei Bank, Ltd. | 1,697,000 | 1,724 |
| Ajinomoto Co., Inc. | 240,000 | 1,701 |
| NTT DoCoMo, Inc. | 1,242 | 1,692 |
| Matsushita | | |
| Electric Works, Ltd. | 230,000 | 1,684 |
| East Japan Railway Co. | 32,100 | 1,673 |
| KDDI Corp. | 354 | 1,667 |
| Mitsui Sumitomo Insurance | |
| Group Holdings, Inc. | 70,400 | 1,659 |
| Toyota Tsusho Corp. | 159,600 | 1,560 |
| Fuji Photo Film Co., Ltd. | 70,800 | 1,558 |
| Canon, Inc. | 52,600 | 1,533 |
^ | Kawasaki Heavy Industries Ltd. | 733,000 | 1,472 |
| Hitachi Chemical Co., Ltd. | 111,600 | 1,350 |
| Dai-Nippon Printing Co., Ltd. | 146,000 | 1,346 |
| Kyowa Hakko Kogyo Co. | 155,000 | 1,322 |
| Chubu Electric Power Co. | 59,500 | 1,311 |
| Asahi Breweries Ltd. | 109,300 | 1,311 |
| JS Group Corp. | 114,400 | 1,294 |
| Nippon Sanso Corp. | 196,000 | 1,294 |
| Fuji Heavy Industries Ltd. | 381,000 | 1,268 |
| | | Market |
| | | Value• |
| | Shares | ($000) |
^ | Isetan Mitsukoshi | | |
| Holdings Ltd. | 163,300 | 1,264 |
| Nippon Meat Packers, Inc. | 118,000 | 1,240 |
| Astellas Pharma Inc. | 39,400 | 1,219 |
| Namco Bandai Holdings Inc. | 120,450 | 1,209 |
| Rohm Co., Ltd. | 23,900 | 1,194 |
| Sompo Japan Insurance Inc. | 225,000 | 1,179 |
^ | Mizuho Financial Group, Inc. | 590,000 | 1,152 |
| Sekisui House Ltd. | 136,000 | 1,041 |
| Kinden Corp. | 125,000 | 1,022 |
| Ohbayashi Corp. | 208,000 | 1,015 |
| Fukuoka Financial Group, Inc. | 324,000 | 998 |
| Seven and I | | |
| Holdings Co., Ltd. | 44,700 | 987 |
| Japan Tobacco, Inc. | 347 | 928 |
| Toppan Forms Co., Ltd. | 80,200 | 912 |
| Tanabe Seiyaku Co., Ltd. | 88,000 | 876 |
| Shiseido Co., Ltd. | 59,000 | 865 |
| Sumitomo Forestry Co. | 128,000 | 853 |
| Toyota Motor Corp. | 24,700 | 785 |
| Alfresa Holdings Corp. | 21,400 | 784 |
| Toppan Printing Co., Ltd. | 114,000 | 782 |
| Leopalace21 Corp. | 127,800 | 764 |
| Marui Co., Ltd. | 130,200 | 700 |
| Shimizu Corp. | 167,000 | 699 |
| Yamaguchi | | |
| Financial Group, Inc. | 71,000 | 673 |
| Bank of Yokohama Ltd. | 156,000 | 669 |
| Dai Nippon | | |
| Pharmaceutical Co., Ltd. | 80,000 | 668 |
| Nippon Paper Group, Inc. | 27,300 | 665 |
| Ricoh Co. | 54,000 | 653 |
| Nintendo Co. | 2,200 | 644 |
| Kyushu Electric | | |
| Power Co., Inc. | 28,300 | 635 |
| Ryosan Co., Ltd. | 29,800 | 623 |
^ | Olympus Corp. | 38,000 | 620 |
| NTT Data Corp. | 220 | 603 |
| Yamada Denki Co., Ltd. | 14,860 | 586 |
^ | Nippon Suisan Kaisha Ltd. | 222,300 | 585 |
| TDK Corp. | 15,400 | 582 |
| Tokyo Electron Ltd. | 15,300 | 573 |
| Onward | | |
| Kashiyama Co., Ltd. | 86,000 | 569 |
| Yaskawa Electric Corp. | 130,000 | 569 |
| Yamatake Corp. | 31,800 | 549 |
| NSK Ltd. | 141,000 | 547 |
| Oriental Land Co., Ltd. | 8,400 | 535 |
^ | Takefuji Corp. | 107,660 | 509 |
| Idemitsu Kosan Co. Ltd. | 6,600 | 499 |
^,* | NEC Electronics Corp. | 65,300 | 401 |
| Omron Corp. | 33,700 | 400 |
| Tokyo Ohka Kogyo Co., Ltd. | 25,800 | 360 |
| Nippon Express Co., Ltd. | 114,000 | 359 |
| Mazda Motor Corp. | 190,000 | 322 |
18
Global Equity Fund
| | | Market |
| | | Value• |
| | Shares | ($000) |
| Takeda | | |
| Pharmaceutical Co. Ltd. | 8,000 | 278 |
| Hitachi Metals Ltd. | 38,000 | 270 |
| Fujitsu Fronttec Ltd. | 32,100 | 249 |
| Tohoku Electric Power Co. | 10,700 | 236 |
| Toyo Suisan Kaisha, Ltd. | 11,000 | 227 |
| Noritake Co., Ltd. | 58,000 | 160 |
| Inabata & Co., Ltd. | 22,700 | 59 |
| | | 287,418 |
Luxembourg (0.0%) | | |
| Reinet Investments SA | 9,096 | 84 |
| | | |
Malaysia (0.7%) | | |
| Bumiputra-Commerce | | |
| Holdings Bhd. | 3,193,119 | 6,006 |
| Resorts World Bhd. | 9,447,000 | 5,547 |
| Sime Darby Bhd. | 1,875,457 | 2,935 |
| AMMB Holdings Bhd. | 3,927,587 | 2,812 |
| British American | | |
| Tobacco Bhd. | 165,000 | 2,061 |
| Malaysian Airline | | |
| System Bhd. | 1,605,433 | 1,264 |
| Telekom Malaysia Bhd. | 734,500 | 709 |
| Multi-Purpose | | |
| Holdings Bhd. | 1,824,900 | 555 |
| Carlsberg Brewery | | |
| Malaysia Bhd. | 109,600 | 102 |
| Malaysian Airlines | | |
| System Cvt. Pfd. | 183,333 | 37 |
| | | 22,028 |
Mexico (0.2%) | | |
| America Movil SA de | | |
| CV Series L ADR | 87,900 | 2,380 |
| Grupo Mexico SA de CV | 1,620,550 | 1,191 |
| Wal-Mart de Mexico SA | 298,100 | 696 |
| Telefonos de Mexico SA | | |
| Class L ADR | 33,943 | 511 |
| Cemex SA CPO | 760,200 | 479 |
| Telmex Internacional SAB | | |
| Class L ADR | 33,620 | 308 |
| | | 5,565 |
Morocco (0.0%) | | |
* | Maroc Telecom | 22,195 | 404 |
| | | |
Netherlands (1.1%) | | |
^ | Koninklijke (Royal) Philips | | |
| Electronics NV | 601,571 | 8,904 |
| ING Groep NV | 1,126,700 | 6,174 |
| Koninklijke KPN NV | 329,272 | 4,396 |
| Aegon NV | 758,449 | 2,940 |
| Heineken NV | 89,157 | 2,533 |
| Wolters Kluwer NV | 126,730 | 2,054 |
| Koninklijke Boskalis | | |
| Westminster NV | 92,367 | 1,856 |
| Reed Elsevier NV | 167,800 | 1,796 |
| | | Market |
| | | Value• |
| | Shares | ($000) |
| Akzo Nobel NV | 15,434 | 584 |
| Eurocastle Investment Ltd. | 275,977 | 99 |
| | | 31,336 |
New Zealand (0.0%) | | |
| Telecom Corp. of | | |
| New Zealand Ltd. | 284,906 | 371 |
| PGG Wrightson Ltd. | 23,388 | 14 |
| | | 385 |
Norway (0.5%) | | |
| StatoilHydro ASA | 607,890 | 10,638 |
| Norsk Hydro ASA | 598,800 | 2,253 |
| DnB NOR ASA | 203,710 | 914 |
| Seadrill Ltd. | 52,833 | 511 |
| | | 14,316 |
Philippines (0.8%) | | |
| Ayala Corp. | 2,160,613 | 9,217 |
| Globe Telecom, Inc. | 426,680 | 7,381 |
| ABS-CBN | | |
| Broadcasting Corp. | 10,077,900 | 3,547 |
| Jollibee Foods Corp. | 2,065,400 | 1,861 |
| Banco De Oro | 1,248,200 | 659 |
| DMCI Holdings, Inc. | 5,230,000 | 432 |
* | Benpres Holdings Corp. | 15,742,000 | 372 |
| | | 23,469 |
Poland (0.3%) | | |
| KGHM Polska Miedz SA | 259,267 | 3,427 |
| Polski Koncern Naftowy SA | 469,846 | 3,240 |
| Telekomunikacja Polska SA | 235,969 | 1,278 |
| | | 7,945 |
Russia (0.9%) | | |
| LUKOIL Sponsored ADR | 479,665 | 17,984 |
| MMC Norilsk Nickel ADR | 1,043,756 | 6,256 |
| OAO Gazprom-Sponsored | | |
| ADR (U.K. Shares) | 115,700 | 1,714 |
| OAO Gazprom-Sponsored | | |
| ADR (U.S. Shares) | 15,167 | 225 |
| | | 26,179 |
Singapore (1.4%) | | |
| Jardine Matheson | | |
| Holdings Ltd. | 930,302 | 16,916 |
| Jardine Strategic | | |
| Holdings Ltd. | 1,272,400 | 12,611 |
| DBS Group Holdings Ltd. | 716,000 | 3,992 |
| Great Eastern Holdings Ltd. | 733,000 | 3,922 |
* | STATS ChipPAC Ltd. | 8,551,000 | 1,773 |
| Neptune Orient Lines Ltd. | 1,213,000 | 943 |
| GuocoLeisure Ltd. | 4,656,000 | 858 |
| Golden Agri-Resources Ltd. | 3,796,069 | 688 |
* | Genting International PLC | 884,370 | 306 |
| United Industrial Corp., Ltd. | 377,000 | 253 |
| Jardine Matheson | | |
| Holdings Ltd. (U.S. Shares) | 4,800 | 90 |
| Yellow Pages | | |
| (Singapore) Ltd. | 704,000 | 77 |
| | | 42,429 |
19
Global Equity Fund
| | | Market |
| | | Value• |
| | Shares | ($000) |
South Africa (1.0%) | | |
| Hosken Consolidated | | |
| Investments Ltd. | 1,347,966 | 5,723 |
| Standard Bank Group Ltd. | 481,195 | 4,038 |
| Sun International Ltd. | 464,839 | 3,526 |
| RMB Holdings Ltd. | 1,620,811 | 3,521 |
| Naspers Ltd. | 147,700 | 2,499 |
| Nedbank Group Ltd. | 275,074 | 2,472 |
| FirstRand Ltd. | 1,566,606 | 1,997 |
| Sasol Ltd. | 61,678 | 1,788 |
| Anglo Platinum Ltd. | 19,348 | 973 |
| Gold Fields Ltd. | 69,695 | 783 |
| AngloGold Ltd. | 20,395 | 740 |
| New Clicks Holdings Ltd. | 373,513 | 590 |
| JD Group Ltd. | 145,983 | 509 |
| Aveng Ltd. | 184,935 | 509 |
| City Lodge Hotels Ltd. | 70,616 | 480 |
| Discovery Holdings, Ltd. | 74,638 | 197 |
| Mondi Ltd. | 14,534 | 42 |
| | | 30,387 |
South Korea (3.5%) | | |
| KT Corp. | 612,040 | 17,029 |
| LG. Philips LCD Co., Ltd. | 769,170 | 15,699 |
| Samsung | | |
| Electronics Co., Ltd. | 32,960 | 13,618 |
| LG Electronics Inc. | 194,534 | 12,943 |
* | KB Financial Group, Inc. | 360,100 | 8,711 |
| SK Telecom Co., Ltd. | 60,247 | 8,380 |
| LG Chem Ltd. | 89,293 | 5,652 |
| Hana Financial Group Inc. | 307,000 | 4,678 |
| Daewoo | | |
| Shipbuilding & Marine | | |
| Engineering Co., Ltd. | 271,790 | 4,280 |
| Samsung | | |
| Electronics Co., Ltd. Pfd. | 18,000 | 4,127 |
* | Korea Telecom Freetel | 145,360 | 2,916 |
| Honam Petrochemical Corp. | 35,769 | 1,552 |
2 | Samsung | | |
| Electronics Co., Ltd. GDR | 5,600 | 1,143 |
| SK Holdings Co Ltd | 11,789 | 925 |
| Hyundai Mipo | | |
| Dockyard Co., Ltd. | 4,513 | 427 |
| POSCO | 1,000 | 266 |
| Korea Gas Corp. | 3,271 | 96 |
* | Korea Electric Power Corp. | 5,000 | 92 |
| | | 102,534 |
Spain (0.5%) | | |
| Acciona SA | 27,507 | 2,830 |
^ | Acerinox SA | 226,282 | 2,636 |
| Telefonica SA | 130,438 | 2,601 |
| Banco Santander SA | 320,785 | 2,212 |
| Industria de Diseno Textil SA | 34,291 | 1,336 |
| Viscofan SA | 53,995 | 1,049 |
| | | Market |
| | | Value• |
| | Shares | ($000) |
| Prosegur Cia de | | |
| Seguridad SA (Registered) | 30,977 | 834 |
| Banco Santander SA ADR | 17,216 | 119 |
| | | 13,617 |
Sweden (1.0%) | | |
| Telefonaktiebolaget LM | | |
| Ericsson AB Class B | 1,474,125 | 11,919 |
| Svenska Cellulosa | | |
| AB B Shares | 696,450 | 5,286 |
^ | Svenska Handelsbanken | | |
| AB A Shares | 268,290 | 3,791 |
^ | Electrolux AB Series B | 315,700 | 2,471 |
| Assa Abloy AB | 190,100 | 1,779 |
| Atlas Copco AB B Shares | 249,834 | 1,701 |
^,* | Investor AB A Shares | 89,516 | 1,080 |
^ | Investor AB B Shares | 78,468 | 992 |
| Hoganas AB B Shares | 52,700 | 476 |
| TeliaSonera AB | 63,500 | 305 |
| Modern Times Group | | |
| AB B Shares | 15,780 | 269 |
| | | 30,069 |
Switzerland (1.7%) | | |
| Credit Suisse Group | | |
| (Registered) | 439,300 | 13,376 |
* | UBS AG | 1,116,962 | 10,472 |
| Nestle SA (Registered) | 132,750 | 4,485 |
| Roche Holdings AG | 32,104 | 4,406 |
| Novartis AG (Registered) | 115,404 | 4,366 |
| Schindler Holding AG | | |
| (Bearer Participation | | |
| Certificates) | 54,141 | 2,557 |
| Adecco SA (Registered) | 70,392 | 2,200 |
| Compagnie Financiere | | |
| Richemont SA | 135,787 | 2,120 |
| Geberit AG | 21,715 | 1,951 |
| ABB Ltd. | 76,500 | 1,067 |
* | Logitech International SA | 89,777 | 929 |
| Julius Baer Holding, Ltd. | 29,300 | 720 |
| Swiss Re (Registered) | 30,000 | 490 |
| Clariant AG | 104,066 | 404 |
| Sonova Holding AG | 5,738 | 346 |
| Publigroupe SA | 4,433 | 202 |
| | | 50,091 |
Taiwan (3.1%) | | |
| AU Optronics Corp. | 25,921,558 | 21,580 |
| Chunghwa | | |
| Telecom Co., Ltd. | 8,504,171 | 15,509 |
| Quanta Computer Inc. | 9,704,830 | 12,264 |
| Fubon Financial | | |
| Holding Co., Ltd. | 17,841,000 | 10,784 |
| United | | |
| Microelectronics Corp. | 26,629,956 | 8,693 |
| Compal Electronics Inc. | 11,938,329 | 8,574 |
| Siliconware Precision | | |
| Industries Co. | 3,539,018 | 3,721 |
20
Global Equity Fund
| | | Market |
| | | Value• |
| | Shares | ($000) |
| Taiwan Semiconductor | | |
| Manufacturing Co., Ltd. | 2,082,892 | 3,137 |
| China Steel Corp. | 3,793,778 | 2,490 |
| Taiwan Semiconductor | | |
| Manufacturing Co., Ltd. | | |
| ADR | 147,640 | 1,321 |
| Far EasTone | | |
| Telecommunications | | |
| Co., Ltd. | 1,036,000 | 1,066 |
| Mitac International Corp. | 1,743,000 | 708 |
* | Chung Hung Steel Corp. | 1,274,092 | 433 |
* | Tatung Co., Ltd. | 2,093,000 | 413 |
| Pou Chen Corp. | 479,000 | 264 |
| Inventec Co., Ltd. | 587,000 | 237 |
| Innolux Display Corp. | 225,000 | 219 |
| | | 91,413 |
Thailand (0.8%) | | |
| Advanced Info Service | | |
| Public Co., Ltd. (Foreign) | 2,830,800 | 6,599 |
| PTT | | |
| Public Co. Ltd. (Foreign) | 1,250,600 | 5,381 |
| Siam Cement | | |
| Public Co. Ltd. NVDR | 986,200 | 2,741 |
| Kasikornbank | | |
| Public Co. Ltd. (Foreign) | 1,847,000 | 2,355 |
| Siam Cement | | |
| Public Co. Ltd. (Foreign) | 664,300 | 1,838 |
| MBK Development | | |
| Public Co. Ltd. (Foreign) | 813,400 | 1,159 |
| Thanachart Capital | | |
| Public Co. Ltd. (Foreign) | 3,856,900 | 1,045 |
| GMM Grammy | | |
| Public Co. Ltd. | | |
| Non-Voting | | |
| Depositary Receipt | 2,917,000 | 898 |
| Land and Houses | | |
| Public Co. Ltd. (Foreign) | 6,191,900 | 523 |
| GMM Grammy | | |
| Public Co. Ltd. (Foreign) | 1,688,200 | 520 |
| Post Publishing | | |
| Public Co. Ltd. (Foreign) | 1,300,000 | 203 |
| Matichon PLC (Foreign) | 625,000 | 118 |
| | | 23,380 |
Turkey (0.3%) | | |
| Tupras-Turkiye Petrol | | |
| Rafinerileri A.S. | 525,464 | 5,264 |
* | Dogan Sirketler | | |
| Grubu Holding A.S. | 5,469,582 | 1,800 |
* | Turk Hava Yollari | | |
| Anonim Ortakligi | 214,195 | 842 |
* | KOC Holding A.S. | 541,756 | 761 |
| | | 8,667 |
| | | Market |
| | | Value• |
| | Shares | ($000) |
United Kingdom (8.6%) | | |
| Royal Dutch Shell | | |
| PLC Class A | | |
| (Amsterdam Shares) | 3,250,527 | 72,516 |
| Vodafone Group PLC | 12,656,652 | 22,066 |
| GlaxoSmithKline PLC | 1,039,579 | 16,191 |
| BP PLC | 2,313,264 | 15,511 |
| Centrica PLC | 3,676,700 | 12,002 |
| Barclays PLC | 3,306,438 | 7,020 |
| Lloyds Banking | | |
| Group PLC | 6,487,570 | 6,568 |
| Associated British | | |
| Foods PLC | 710,900 | 6,525 |
| Aviva PLC | 1,570,330 | 4,870 |
| Capita Group PLC | 447,029 | 4,348 |
| Reckitt Benckiser | | |
| Group PLC | 114,861 | 4,309 |
| Rolls-Royce Group PLC | 970,776 | 4,089 |
| Royal Dutch Shell PLC | | |
| Class B | 183,217 | 3,986 |
| Tesco PLC | 781,384 | 3,733 |
| Diageo PLC | 321,745 | 3,593 |
| Cable and Wireless PLC | 1,615,001 | 3,230 |
| BHP Billiton PLC | 161,076 | 3,177 |
| BAE Systems PLC | 645,876 | 3,098 |
| Thomas Cook Group PLC | 892,975 | 3,075 |
| Intertek Testing | | |
| Services PLC | 217,608 | 2,760 |
| HSBC Holdings PLC | 480,066 | 2,673 |
| Bunzl PLC | 320,744 | 2,512 |
| TUI Travel PLC | 765,120 | 2,511 |
| The Sage Group PLC | 997,935 | 2,418 |
| British American | | |
| Tobacco PLC | 103,762 | 2,397 |
* | Anglo American PLC | 137,702 | 2,333 |
| Compass Group PLC | 489,496 | 2,239 |
| Reed Elsevier PLC | 305,984 | 2,194 |
^ | Wolseley PLC | 656,647 | 2,168 |
| Carnival PLC | 88,987 | 2,021 |
| Antofagasta PLC | 266,000 | 1,925 |
| Arriva PLC | 357,337 | 1,899 |
| Rio Tinto PLC | 50,056 | 1,681 |
| ICAP PLC | 384,958 | 1,676 |
^ | Provident Financial PLC | 131,580 | 1,577 |
| Informa PLC | 413,312 | 1,557 |
* | Invensys PLC | 636,107 | 1,515 |
| Rexam PLC | 301,330 | 1,164 |
* | WPP PLC | 193,113 | 1,086 |
| Michael Page International PLC | 406,363 | 1,069 |
| Stagecoach Group PLC | 589,519 | 1,013 |
| Ladbrokes PLC | 353,483 | 928 |
| Smiths Group PLC | 87,521 | 839 |
* | Cairn Energy PLC | 25,719 | 802 |
| Amec PLC | 85,291 | 651 |
| Hays PLC | 605,818 | 632 |
21
Global Equity Fund
| | | Market |
| | | Value• |
| | Shares | ($000) |
* | The Berkeley Group | | |
| Holdings PLC | 48,842 | 621 |
| Aggreko PLC | 87,698 | 617 |
| Royal & Sun Alliance | | |
| Insurance Group PLC | 320,989 | 599 |
* | Sportingbet PLC | 912,747 | 590 |
| Next PLC | 30,890 | 586 |
| ITV PLC | 1,997,353 | 544 |
| Homeserve PLC | 27,858 | 467 |
| International | | |
| Personal Finance | 331,088 | 427 |
| Devro PLC | 330,762 | 416 |
* | HSBC Holdings PLC | | |
| Rights exp. 04/03/2009 | 200,027 | 405 |
| Lonmin PLC | 19,714 | 403 |
^ | HMV Group PLC | 215,229 | 400 |
| Carphone Warehouse PLC | 208,373 | 374 |
| Man Group PLC | 116,750 | 366 |
| Royal Bank of Scotland | | |
| Group PLC | 1,028,758 | 363 |
| Galiform PLC | 1,285,986 | 308 |
| Enterprise Inns PLC | 235,093 | 228 |
| Daily Mail and | | |
| General Trust PLC | 57,575 | 193 |
| Mondi PLC | | |
| (South African Shares) | 36,336 | 84 |
| Northgate PLC | 45,511 | 42 |
^ | Bradford & Bingley PLC | 642,595 | — |
| | | 254,180 |
United States (37.9%) | | |
| Consumer Discretionary (7.3%) | |
| McDonald’s Corp. | 631,653 | 34,469 |
| Cablevision Systems | | |
| NY Group Class A | 1,429,492 | 18,498 |
| Time Warner Inc. | 619,955 | 11,965 |
* | Priceline.com, Inc. | 134,344 | 10,584 |
| Home Depot, Inc. | 443,700 | 10,454 |
* | Amazon.com, Inc. | 140,466 | 10,316 |
* | Dollar Tree, Inc. | 221,000 | 9,845 |
| Family Dollar Stores, Inc. | 222,300 | 7,418 |
* | Liberty Global, Inc. Class A | 504,382 | 7,344 |
| CBS Corp. | 1,796,649 | 6,899 |
* | Liberty Global, Inc. Series C | 415,931 | 5,877 |
^,* | Blue Nile Inc. | 185,167 | 5,583 |
| Macy’s Inc. | 614,500 | 5,469 |
| Pulte Homes, Inc. | 440,788 | 4,818 |
| J.C. Penney Co., Inc. (Holding Co.) | 237,300 | 4,763 |
* | Viacom Inc. Class B | 263,300 | 4,576 |
| Lowe’s Cos., Inc. | 221,700 | 4,046 |
* | Time Warner Cable Inc. | 155,615 | 3,859 |
| Aaron Rents, Inc. | 137,600 | 3,668 |
* | Liberty Media Corp. | 181,308 | 3,617 |
| News Corp., Class B | 431,000 | 3,319 |
* | Aeropostale, Inc. | 121,200 | 3,219 |
| | | Market |
| | | Value• |
| | Shares | ($000) |
| The Gap, Inc. | 233,300 | 3,031 |
| KB Home | 226,197 | 2,981 |
* | Hot Topic, Inc. | 219,395 | 2,455 |
* | Rent-A-Center, Inc. | 110,992 | 2,150 |
* | Discovery | | |
| Communications Inc. | | |
| Class A | 130,290 | 2,087 |
| American Greetings Corp. | | |
| Class A | 410,976 | 2,079 |
* | Discovery | | |
| Communications Inc. | | |
| Class C | 130,648 | 1,914 |
| Sotheby’s | 207,724 | 1,869 |
* | Carter’s, Inc. | 77,700 | 1,461 |
* | Hanesbrands Inc. | 140,119 | 1,341 |
| PRIMEDIA Inc. | 539,135 | 1,332 |
| The Buckle, Inc. | 38,300 | 1,223 |
* | Career Education Corp. | 49,400 | 1,184 |
| Omnicom Group Inc. | 44,063 | 1,031 |
* | Liberty Media Corp.- | | |
| Capital Series A | 112,199 | 783 |
* | The Children’s Place | | |
| Retail Stores, Inc. | 31,500 | 689 |
* | Liberty Media Corp.- | | |
| Interactive Series A | 225,367 | 654 |
* | Mohawk Industries, Inc. | 21,609 | 645 |
| UniFirst Corp. | 22,100 | 615 |
* | CC Media Holdings, Inc. | 292,110 | 578 |
* | Bed Bath & Beyond, Inc. | 23,300 | 577 |
* | Big Lots Inc. | 27,700 | 576 |
| International | | |
| Game Technology | 56,400 | 520 |
* | Lincoln Educational Services | 27,600 | 506 |
| The Walt Disney Co. | 24,700 | 449 |
* | Ascent Media Corp. | 13,402 | 335 |
| CBS Corp. Class A | 85,148 | 334 |
| Sherwin-Williams Co. | 5,502 | 286 |
* | Blockbuster Inc. Class B | 470,128 | 212 |
* | Fleetwood | | |
| Enterprises, Inc. | 2,250,448 | 83 |
* | Sun-Times | | |
| Media Group, Inc. | 130,959 | 3 |
| | | |
| Consumer Staples (6.8%) | | |
| Altria Group, Inc. | 3,549,245 | 56,859 |
| Costco Wholesale Corp. | 516,343 | 23,917 |
| Wal-Mart Stores, Inc. | 320,799 | 16,714 |
| The Kroger Co. | 775,647 | 16,459 |
| Philip Morris | | |
| International Inc. | 455,402 | 16,203 |
| Archer-Daniels-Midland Co. | 360,300 | 10,009 |
| Safeway, Inc. | 399,983 | 8,076 |
* | BJ’s Wholesale Club, Inc. | 245,200 | 7,844 |
| Bunge Ltd. | 124,100 | 7,030 |
* | Fresh Del Monte Produce Inc. | 354,617 | 5,823 |
22
Global Equity Fund
| | | Market |
| | | Value• |
| | Shares | ($000) |
| Walgreen Co. | 177,690 | 4,613 |
| The Estee Lauder Cos. Inc. | | |
| Class A | 141,972 | 3,500 |
| Kimberly-Clark Corp. | 68,026 | 3,137 |
| PepsiCo, Inc. | 56,849 | 2,926 |
| Casey’s General Stores, Inc. | 85,094 | 2,269 |
| Herbalife Ltd. | 150,749 | 2,258 |
| Nash-Finch Co. | 72,300 | 2,031 |
| Lancaster Colony Corp. | 42,962 | 1,782 |
| Del Monte Foods Co. | 201,347 | 1,468 |
* | The Pantry, Inc. | 64,980 | 1,144 |
* | Darling International, Inc. | 304,942 | 1,131 |
* | Central Garden & | | |
| Pet Co. Class A | 112,730 | 848 |
| Whole Foods Market, Inc. | 48,400 | 813 |
* | Chiquita Brands | | |
| International, Inc. | 122,000 | 809 |
| Universal Corp. (VA) | 26,500 | 793 |
| Diamond Foods, Inc. | 22,681 | 633 |
| Imperial Sugar Co. | 74,115 | 533 |
| | | |
| Energy (2.7%) | | |
| ConocoPhillips Co. | 639,600 | 25,047 |
| Chevron Corp. | 284,300 | 19,116 |
| ExxonMobil Corp. | 141,000 | 9,602 |
| Apache Corp. | 149,100 | 9,556 |
| Sunoco, Inc. | 265,700 | 7,036 |
| Devon Energy Corp. | 72,100 | 3,222 |
| Schlumberger Ltd. | 55,186 | 2,242 |
| EOG Resources, Inc. | 40,159 | 2,199 |
* | National Oilwell Varco Inc. | 31,414 | 902 |
| Baker Hughes Inc. | 11,500 | 328 |
| Western Refining, Inc. | 10,373 | 124 |
| | | |
| Financials (5.2%) | | |
| State Street Corp. | 903,166 | 27,799 |
* | Berkshire Hathaway Inc. | | |
| Class B | 5,744 | 16,198 |
| The Travelers Cos., Inc. | 221,100 | 8,986 |
| MetLife, Inc. | 345,500 | 7,867 |
| Morgan Stanley | 314,600 | 7,163 |
| New York | | |
| Community Bancorp, Inc. | 628,600 | 7,021 |
| The Goldman | | |
| Sachs Group, Inc. | 56,700 | 6,011 |
* | Knight Capital | | |
| Group, Inc. Class A | 395,900 | 5,836 |
| JPMorgan Chase & Co. | 215,527 | 5,729 |
| Lazard Ltd. Class A | 180,103 | 5,295 |
| Moody’s Corp. | 222,071 | 5,090 |
* | Arch Capital Group Ltd. | 77,150 | 4,155 |
| Rayonier Inc. REIT | 135,500 | 4,095 |
| Torchmark Corp. | 150,400 | 3,945 |
* | MBIA, Inc. | 612,845 | 2,807 |
| Platinum Underwriters Holdings, Ltd. | 98,637 | 2,797 |
| | | Market |
| | | Value• |
| | Shares | ($000) |
| Fidelity National | | |
| Financial, Inc. Class A | 134,600 | 2,626 |
| Mercury General Corp. | 87,500 | 2,599 |
* | PHH Corp. | 183,426 | 2,577 |
| Bank of America Corp. | 373,312 | 2,546 |
| FirstMerit Corp. | 120,800 | 2,199 |
| Bank of Hawaii Corp. | 63,300 | 2,088 |
| The Hartford Financial | | |
| Services Group Inc. | 231,400 | 1,816 |
| Prosperity Bancshares, Inc. | 61,056 | 1,670 |
* | Markel Corp. | 5,270 | 1,496 |
| American Express Co. | 105,380 | 1,436 |
| SL Green Realty Corp. REIT | 132,300 | 1,429 |
^ | Citigroup Inc. | 524,618 | 1,327 |
* | CB Richard Ellis Group, Inc. | 305,814 | 1,232 |
| CVB Financial Corp. | 141,603 | 939 |
| Genworth Financial Inc. | 441,110 | 838 |
| Protective Life Corp. | 150,213 | 789 |
| Progressive Corp. of Ohio | 55,570 | 747 |
| First Financial | | |
| Bankshares, Inc. | 14,300 | 689 |
* | Conseco, Inc. | 743,031 | 684 |
| MGIC Investment Corp. | 440,500 | 626 |
| Republic Bancorp, Inc. | | |
| Class A | 27,308 | 510 |
| Provident Financial | | |
| Services Inc. | 45,320 | 490 |
| PS Business Parks, Inc. REIT | 8,400 | 310 |
| Turkiye Garanti Bankasi A.S. | 149,300 | 211 |
| Ameriprise Financial, Inc. | 9,332 | 191 |
* | Ocwen Financial Corp. | 11,758 | 134 |
*,3 | J.G. Wentworth Inc. | 147,900 | 37 |
| Washington Mutual, Inc. | 166,300 | 9 |
| | | |
| Health Care (7.5%) | | |
| Pfizer Inc. | 4,285,800 | 58,373 |
| Johnson & Johnson | 795,675 | 41,853 |
| AmerisourceBergen Corp. | 836,371 | 27,316 |
| Merck & Co., Inc. | 659,100 | 17,631 |
| CIGNA Corp. | 831,399 | 14,624 |
| UnitedHealth Group Inc. | 469,800 | 9,833 |
* | Watson | | |
| Pharmaceuticals, Inc. | 275,700 | 8,577 |
| Wyeth | 188,600 | 8,117 |
| Cardinal Health, Inc. | 235,800 | 7,423 |
* | King Pharmaceuticals, Inc. | 634,670 | 4,487 |
* | Community | | |
| Health Systems, Inc. | 271,600 | 4,166 |
| Omnicare, Inc. | 130,482 | 3,196 |
| Eli Lilly & Co. | 77,800 | 2,599 |
* | WellPoint Inc. | 52,938 | 2,010 |
* | Gentiva Health Services, Inc. | 77,300 | 1,175 |
| Bristol-Myers Squibb Co. | 52,000 | 1,140 |
| Schering-Plough Corp. | 43,800 | 1,031 |
| IMS Health, Inc. | 79,918 | 997 |
23
Global Equity Fund
| | | Market |
| | | Value• |
| | Shares | ($000) |
* | Questcor | | |
| Pharmaceuticals, Inc. | 200,010 | 984 |
* | HLTH Corp. | 90,500 | 937 |
* | Patterson Companies, Inc. | 48,592 | 916 |
* | Emergency Medical | | |
| Services LP Class A | 25,200 | 791 |
| PDL BioPharma Inc. | 109,930 | 778 |
* | Kindred Healthcare, Inc. | 40,322 | 603 |
* | Medco Health Solutions, Inc. | 13,800 | 570 |
* | Health Management | | |
| Associates Class A | 209,900 | 542 |
| | | |
| Industrials (1.3%) | | |
| Watson Wyatt & | | |
| Co. Holdings | 194,068 | 9,581 |
* | Kansas City Southern | 330,250 | 4,198 |
| Viad Corp. | 277,770 | 3,922 |
| Pitney Bowes, Inc. | 161,804 | 3,778 |
* | Delta Air Lines Inc. | 590,630 | 3,325 |
| L-3 Communications | | |
| Holdings, Inc. | 46,100 | 3,126 |
| Raytheon Co. | 78,280 | 3,048 |
* | AMR Corp. | 617,930 | 1,971 |
| Northrop Grumman Corp. | 26,501 | 1,157 |
| The Timken Co. | 66,674 | 931 |
* | US Airways Group Inc. | 364,985 | 923 |
| Armstrong Worldwide Industries, Inc. | 74,337 | 819 |
| Deere & Co. | 22,424 | 737 |
| The Brink’s Co. | 18,900 | 500 |
* | AGCO Corp. | 15,400 | 302 |
| Standex International Corp. | 19,500 | 179 |
* | Ultrapetrol Bahamas Ltd. | 54,900 | 148 |
* | NCI Building Systems, Inc. | 48,683 | 108 |
| | | |
| Information Technology (5.3%) | | |
| Automatic Data | | |
| Processing, Inc. | 971,100 | 34,144 |
* | Computer Sciences Corp. | 421,500 | 15,528 |
| Hewlett-Packard Co. | 280,073 | 8,979 |
| Motorola, Inc. | 1,986,800 | 8,404 |
* | Gartner, Inc. Class A | 624,708 | 6,878 |
* | Lexmark International, Inc. | 336,691 | 5,680 |
| Microsoft Corp. | 305,020 | 5,603 |
* | NVIDIA Corp. | 556,000 | 5,482 |
| Corning, Inc. | 404,744 | 5,371 |
| Broadridge Financial Solutions LLC | 278,300 | 5,179 |
| Xerox Corp. | 1,011,766 | 4,604 |
* | Western Digital Corp. | 236,700 | 4,578 |
* | Sun Microsystems, Inc. | 616,174 | 4,510 |
* | eBay Inc. | 344,702 | 4,330 |
| Accenture Ltd. | 153,340 | 4,215 |
* | Tech Data Corp. | 171,800 | 3,742 |
* | LSI Corp. | 955,665 | 2,905 |
* | EarthLink, Inc. | 440,720 | 2,896 |
* | DST Systems, Inc. | 58,663 | 2,031 |
| | | Market |
| | | Value• |
| | Shares | ($000) |
| International Business | | |
| Machines Corp. | 19,700 | 1,909 |
* | Integrated Device | | |
| Technology Inc. | 418,310 | 1,903 |
* | Metavante Technologies | 77,700 | 1,551 |
* | Ingram Micro, Inc. Class A | 118,500 | 1,498 |
* | Avocent Corp. | 118,284 | 1,436 |
* | Google Inc. | 4,075 | 1,418 |
* | 3Com Corp. | 407,581 | 1,259 |
* | Cisco Systems, Inc. | 67,600 | 1,134 |
* | Perot Systems Corp. | 69,900 | 900 |
* | Forrester Research, Inc. | 43,700 | 899 |
* | Compuware Corp. | 135,535 | 893 |
* | Hewitt Associates, Inc. | 29,400 | 875 |
| Black Box Corp. | 31,279 | 739 |
| Microchip Technology, Inc. | 34,188 | 724 |
* | CACI International, Inc. | 18,900 | 690 |
* | Amkor Technology, Inc. | 252,151 | 676 |
* | SINA.com | 27,000 | 628 |
* | JDA Software Group, Inc. | 49,800 | 575 |
* | Unisys Corp. | 1,053,138 | 558 |
| MAXIMUS, Inc. | 12,700 | 506 |
* | Adaptec, Inc. | 173,900 | 417 |
* | Integral Systems, Inc. | 38,962 | 335 |
* | Dell Inc. | 25,900 | 246 |
* | Telecommunication | | |
| Systems, Inc. | 25,327 | 232 |
| | | |
| Materials (0.5%) | | |
| Scotts Miracle-Gro Co. | 261,064 | 9,059 |
| Compass Minerals | | |
| International, Inc. | 47,000 | 2,649 |
| Praxair, Inc. | 17,943 | 1,207 |
| Innophos Holdings Inc. | 79,400 | 896 |
| Olin Corp. | 35,484 | 506 |
| Huntsman Corp. | 130,200 | 408 |
| United States Steel Corp. | 19,109 | 404 |
| Olympic Steel, Inc. | 20,500 | 311 |
^,* | AbitibiBowater, Inc. | 218,435 | 142 |
| | | |
| Telecommunication Services (1.0%) | |
| AT&T Inc. | 663,700 | 16,725 |
* | Sprint Nextel Corp. | 1,570,400 | 5,606 |
* | Cincinnati Bell Inc. | 1,441,142 | 3,315 |
* | NII Holdings Inc. | 210,335 | 3,155 |
* | Level 3 | | |
| Communications, Inc. | 2,150,482 | 1,978 |
| | | |
| Utilities (0.3%) | | |
| Wisconsin Energy Corp. | 149,700 | 6,163 |
| The Laclede Group, Inc. | 63,500 | 2,475 |
| CH Energy Group, Inc. | 6,326 | 297 |
| | | 1,118,402 |
Total Common Stocks | | |
(Cost $4,164,963) | | 2,835,466 |
24
Global Equity Fund
| | Face | Market |
| | Amount | Value• |
| | ($000) | ($000) |
Convertible Bonds (0.1%) | | |
Consumer Discretionary (0.0%) | | |
| Sotheby’s, 3.125%, 6/15/13 | 787 | 508 |
| | | |
Financials (0.0%) | | |
| SL Green Realty Corp., | | |
| 3.000%, 3/30/27 | 1,032 | 633 |
| | | |
Telecommunication Services (0.1%) | |
| NII Holdings, 3.125%, 6/15/12 | 2,998 | 2,084 |
Total Convertible Bonds | | |
(Cost $2,915) | | 3,225 |
| | | |
| | Shares | |
Temporary Cash Investments (6.7%)1 | |
Money Market Fund (5.8%) | | |
4,5 | Vanguard Market | | |
| Liquidity Fund, 0.440% | 170,076,032 | 170,076 |
| | | |
| | Face | |
| | Amount | |
| | ($000) | |
U.S. Government and Agency Obligations (0.9%) |
6 | Federal Home Loan | | |
| Mortgage Corp., | | |
| 1.206%, 4/30/09 | 7,000 | 7,000 |
6,7 | Federal Home Loan | | |
| Mortgage Corp., | | |
| 0.592%, 8/26/09 | 15,000 | 14,981 |
6,7 | Federal National | | |
| Mortgage Assn., | | |
| 0.541%, 7/30/09 | 5,000 | 4,996 |
| | | 26,977 |
Total Temporary Cash Investments | |
(Cost $197,024) | | 197,053 |
Total Investments (102.8%) | |
(Cost $4,364,902) | 3,035,744 |
Other Assets and Liabilities (–2.8%) | |
Other Assets | 40,717 |
Liabilities5 | (123,798) |
| (83,081) |
Net Assets (100%) | |
Applicable to 281,698,371 outstanding | |
$.001 par value shares of beneficial | |
interest (unlimited authorization) | 2,952,663 |
Net Asset Value Per Share | $10.48 |
At March 31, 2009, net assets consisted of: | |
| Amount |
| ($000) |
Paid-in Capital | 6,025,865 |
Overdistributed Net | |
Investment Income | (6,387) |
Accumulated Net Realized Losses | (1,741,308) |
Unrealized Appreciation (Depreciation) | |
Investment Securities | (1,329,158) |
Futures Contracts | 5,802 |
Foreign Currencies and | |
Forward Currency Contracts | (2,151) |
Net Assets | 2,952,663 |
• | See Note A in Notes to Financial Statements. |
^ | Part of security position is on loan to broker-dealers. The total value of securities on loan is $84,200,000. |
* | Non-income-producing security. |
1 The fund invests a portion of its cash reserves in equity markets through the use of index futures contracts. After giving effect to futures investments, the fund’s effective common stock and temporary cash investment positions represent 98.7% and 4.0%, respectively, of net assets.
2 Security exempt from registration under Rule 144A of the Securities Act of 1933. Such securities may be sold in transactions exempt from registration, normally to qualified institutional buyers. At March 31, 2009, the value of this security represented 0.0% of net assets.
3 Restricted security represents 0.0% of net assets.
4 Affiliated money market fund available only to Vanguard funds and certain trusts and accounts managed by Vanguard. Rate shown is the 7-day yield.
5 Includes $86,862,000 of collateral received for securities on loan.
6 The issuer operates under a congressional charter; its securities are not backed by the full faith and credit of the U.S. government.
7 Securities with a value of $19,977,000 and cash of $2,505,000 have been segregated as initial margin for open futures contracts.
ADR—American Depositary Receipt.
GDR—Global Depositary Receipt.
REIT—Real Estate Investment Trust.
See accompanying Notes, which are an integral part of the Financial Statements.
25
Global Equity Fund
Statement of Operations
| Six Months Ended |
| March 31, 2009 |
| ($000) |
Investment Income | |
Income | |
Dividends1 | 43,196 |
Interest2 | 1,290 |
Security Lending | 1,112 |
Total Income | 45,598 |
Expenses | |
Investment Advisory Fees—Note B | |
Basic Fee | 4,125 |
Performance Adjustment | (2,173) |
The Vanguard Group—Note C | |
Management and Administrative | 5,155 |
Marketing and Distribution | 763 |
Custodian Fees | 215 |
Shareholders’ Reports | 53 |
Trustees’ Fees and Expenses | 3 |
Total Expenses | 8,141 |
Expenses Paid Indirectly | (17) |
Net Expenses | 8,124 |
Net Investment Income | 37,474 |
Realized Net Gain (Loss) | |
Investment Securities Sold | (1,376,720) |
Futures Contracts | (59,684) |
Foreign Currencies and Forward Currency Contracts | (6,101) |
Realized Net Gain (Loss) | (1,442,505) |
Change in Unrealized Appreciation (Depreciation) | |
Investment Securities | (311,426) |
Futures Contracts | 6,136 |
Foreign Currencies and Forward Currency Contracts | (1,698) |
Change in Unrealized Appreciation (Depreciation) | (306,988) |
Net Increase (Decrease) in Net Assets Resulting from Operations | (1,712,019) |
1 Dividends are net of foreign withholding taxes of $2,325,000.
2 Interest income from an affiliated company of the fund was $956,000.
See accompanying Notes, which are an integral part of the Financial Statements.
26
Global Equity Fund
Statement of Changes in Net Assets
| Six Months Ended | Year Ended |
| March 31, | September 30, |
| 2009 | 2008 |
| ($000) | ($000) |
Increase (Decrease) in Net Assets | | |
Operations | | |
Net Investment Income | 37,474 | 165,132 |
Realized Net Gain (Loss) | (1,442,505) | (258,939) |
Change in Unrealized Appreciation (Depreciation) | (306,988) | (2,455,125) |
Net Increase (Decrease) in Net Assets Resulting from Operations | (1,712,019) | (2,548,932) |
Distributions | | |
Net Investment Income | (163,433) | (127,498) |
Realized Capital Gain1 | — | (415,111) |
Total Distributions | (163,433) | (542,609) |
Capital Share Transactions | | |
Issued | 271,966 | 1,886,150 |
Issued in Lieu of Cash Distributions | 150,796 | 503,326 |
Redeemed | (755,123) | (1,689,191) |
Net Increase (Decrease) from Capital Share Transactions | (332,361) | 700,285 |
Total Increase (Decrease) | (2,207,813) | (2,391,256) |
Net Assets | | |
Beginning of Period | 5,160,476 | 7,551,732 |
End of Period2 | 2,952,663 | 5,160,476 |
1 Includes fiscal 2008 short-term gain distributions totaling $188,283,000. Short-term gain distributions are treated as ordinary income dividends for tax purposes.
2 Net Assets—End of Period includes undistributed (overdistributed) net investment income of ($6,387,000) and $123,465,000.
See accompanying Notes, which are an integral part of the Financial Statements.
27
Global Equity Fund
Financial Highlights
| Six Months | | | | | Nov. 1, | Year |
| Ended | | | | | 2003, to | Ended |
For a Share Outstanding | March 31, | Year Ended September 30, | Sept. 30, | Oct. 31, |
Throughout Each Period | 2009 | 2008 | 2007 | 2006 | 2005 | 20041 | 2003 |
Net Asset Value, | | | | | | | |
Beginning of Period | $16.64 | $26.51 | $21.96 | $19.72 | $16.08 | $14.46 | $10.48 |
Investment Operations | | | | | | | |
Net Investment Income | .165 | .529 | .4902 | .320 | .250 | .191 | .120 |
Net Realized and Unrealized | | | | | | | |
Gain (Loss) on Investments | (5.752) | (8.569) | 5.250 | 2.595 | 3.870 | 1.624 | 3.960 |
Total from | | | | | | | |
Investment Operations | (5.587) | (8.040) | 5.740 | 2.915 | 4.120 | 1.815 | 4.080 |
Distributions | | | | | | | |
Dividends from Net | | | | | | | |
Investment Income | (.573) | (.430) | (.310) | (.240) | (.210) | (.130) | (.080) |
Distributions from | | | | | | | |
Realized Capital Gains | — | (1.400) | (.880) | (.435) | (.270) | (.065) | (.020) |
Total Distributions | (.573) | (1.830) | (1.190) | (.675) | (.480) | (.195) | (.100) |
Net Asset Value, | | | | | | | |
End of Period | $10.48 | $16.64 | $26.51 | $21.96 | $19.72 | $16.08 | $14.46 |
| | | | | | | |
Total Return3 | –33.90% | –32.24% | 27.00% | 15.22% | 25.99% | 12.64% | 39.25% |
| | | | | | | |
Ratios/Supplemental Data | | | | | | | |
Net Assets, End of | | | | | | | |
Period (Millions) | $2,953 | $5,160 | $7,552 | $4,191 | $2,302 | $965 | $664 |
Ratio of Total Expenses to | | | | | | | |
Average Net Assets4 | 0.48%5 | 0.51% | 0.64% | 0.72% | 0.80% | 0.90%5 | 1.05% |
Ratio of Net Investment | | | | | | | |
Income to Average | | | | | | | |
Net Assets | 2.22%5 | 2.35% | 1.98% | 1.76% | 1.60% | 1.47%5 | 1.14% |
Portfolio Turnover Rate | 75%5 | 73% | 64% | 88% | 83% | 19% | 13% |
1 The fund’s fiscal year-end changed from October 31 to September 30, effective September 30, 2004.
2 Calculated based on average shares outstanding.
3 Total returns do not include the account service fee that may be applicable to certain accounts with balances below $10,000.
4 Includes performance-based investment advisory fee increases (decreases) of (0.13%), (0.02%), 0.05%, 0.05%, 0.06%, 0.08%, and 0.11%.
5 Annualized.
See accompanying Notes, which are an integral part of the Financial Statements.
28
Global Equity Fund
Notes to Financial Statements
Vanguard Global Equity Fund is registered under the Investment Company Act of 1940 as an open-end investment company, or mutual fund. The fund invests in securities of foreign issuers, which may subject it to investment risks not normally associated with investing in securities of United States corporations.
A. The following significant accounting policies conform to generally accepted accounting principles for U.S. mutual funds. The fund consistently follows such policies in preparing its financial statements.
1. Security Valuation: Securities are valued as of the close of trading on the New York Stock Exchange (generally 4 p.m., Eastern time) on the valuation date. Equity securities are valued at the latest quoted sales prices or official closing prices taken from the primary market in which each security trades; such securities not traded on the valuation date are valued at the mean of the latest quoted bid and asked prices. Securities for which market quotations are not readily available, or whose values have been affected by events occurring before the fund’s pricing time but after the close of the securities’ primary markets, are valued at their fair values calculated according to procedures adopted by the board of trustees. These procedures include obtaining quotations from an independent pricing service, monitoring news to identify significant market- or security-specific events, and evaluating changes in the values of foreign market proxies (for example, ADRs, futures contracts, or exchange-traded funds), between the time the foreign markets close and the fund’s pricing time. When fair-value pricing is employed, the prices of securities used by a fund to calculate its net asset value may differ from quoted or published prices for the same securities. Investments in Vanguard Market Liquidity Fund are valued at that fund’s net asset value. Temporary cash investments acquired over 60 days to maturity are valued using the latest bid prices or using valuations based on a matrix system (which considers such factors as security prices, yields, maturities, and ratings), both as furnished by independent pricing services. Other temporary cash investments are valued at amortized cost, which approximates market value.
2. Foreign Currency: Securities and other assets and liabilities denominated in foreign currencies are translated into U.S. dollars using exchange rates obtained from an independent third party as of the fund’s pricing time on the valuation date. Realized gains (losses) and unrealized appreciation (depreciation) on investment securities include the effects of changes in exchange rates since the securities were purchased, combined with the effects of changes in security prices. Fluctuations in the value of other assets and liabilities resulting from changes in exchange rates are recorded as unrealized foreign currency gains (losses) until the assets or liabilities are settled in cash, at which time they are recorded as realized foreign currency gains (losses).
3. Futures and Forward Currency Contracts: The fund uses index futures contracts to a limited extent, with the objective of maintaining full exposure to the stock market while maintaining liquidity. The fund may purchase or sell futures contracts to achieve a desired level of investment, whether to accommodate portfolio turnover or cash flows from capital share transactions. The primary risks associated with the use of futures contracts are imperfect correlation between changes in market values of stocks held by the fund and the prices of futures contracts, and the possibility of an illiquid market.
The fund may also enter into forward currency contracts to provide the appropriate currency exposure related to any open futures contracts or to protect the value of securities and related receivables and payables against changes in foreign exchange rates. The primary risk associated with the fund’s use of these contracts is that a counterparty will fail to fulfill its obligation to pay gains due to the fund under the contracts.
29
Global Equity Fund
Futures and forward currency contracts are valued at their quoted daily settlement prices. The aggregate principal amounts of the contracts are not recorded in the Statement of Net Assets. Fluctuations in the value of the contracts are recorded in the Statement of Net Assets as an asset (liability) and in the Statement of Operations as unrealized appreciation (depreciation) until the contracts are closed, when they are recorded as realized gains (losses) on futures or forward currency contracts.
4. Federal Income Taxes: The fund intends to continue to qualify as a regulated investment company and distribute all of its taxable income. Management has analyzed the fund’s tax positions taken on federal income tax returns for all open tax years (tax years ended September 30, 2005–2008), and for the period ended March 31, 2009, and has concluded that no provision for federal income tax is required in the fund’s financial statements.
5. Distributions: Distributions to shareholders are recorded on the ex-dividend date.
6. Security Lending: The fund may lend its securities to qualified institutional borrowers to earn additional income. Security loans are required to be secured at all times by collateral at least equal to the market value of securities loaned. The fund invests cash collateral received in Vanguard Market Liquidity Fund, and records a liability for the return of the collateral, during the period the securities are on loan. Security lending income represents the income earned on investing cash collateral, less expenses associated with the loan.
7. Other: Dividend income is recorded on the ex-dividend date. Interest income includes income distributions received from Vanguard Market Liquidity Fund and is accrued daily. Security transactions are accounted for on the date securities are bought or sold. Costs used to determine realized gains (losses) on the sale of investment securities are those of the specific securities sold.
B. Acadian Asset Management LLC, AllianceBernstein L.P., Baillie Gifford Overseas Ltd., and Marathon Asset Management LLP, each provide investment advisory services to a portion of the fund for a fee calculated at an annual percentage rate of average net assets managed by the advisor. The basic fees of Acadian Asset Management LLC and Marathon Asset Management LLP are subject to quarterly adjustments based on performance for the preceding three years relative to the Morgan Stanley Capital International All Country World Index. The basic fee of AllianceBernstein L.P. is subject to quarterly adjustments based on performance since June 30, 2006, relative to the Morgan Stanley Capital International All Country World Index. In accordance with the advisory contract entered into with Baillie Gifford Overseas Ltd. in April 2008, beginning April 1, 2009, the investment advisory fee will be subject to quarterly adjustments based on performance since June 30, 2008, relative to the Morgan Stanley Capital International All Country World Index.
The Vanguard Group manages the cash reserves of the fund at an at-cost basis.
For the six months ended March 31, 2009, the aggregate investment advisory fee represented an effective annual basic rate of 0.24% of the fund’s average net assets, before a decrease of $2,173,000 (0.13%) based on performance.
C. The Vanguard Group furnishes at cost corporate management, administrative, marketing, and distribution services. The costs of such services are allocated to the fund under methods approved by the board of trustees. The fund has committed to provide up to 0.40% of its net assets in capital contributions to Vanguard. At March 31, 2009, the fund had contributed capital of $771,000 to Vanguard (included in Other Assets), representing 0.03% of the fund’s net assets and 0.31% of Vanguard’s capitalization. The fund’s trustees and officers are also directors and officers of Vanguard.
30
Global Equity Fund
D. The fund’s custodian bank has agreed to reduce its fees when the fund maintains cash on deposit in the non-interest-bearing custody account. For the six months ended March 31, 2009, custodian fee offset arrangements reduced the fund’s expenses by $17,000 (an annual rate of 0.00% of average net assets).
E. Distributions are determined on a tax basis and may differ from net investment income and realized capital gains for financial reporting purposes. Differences may be permanent or temporary. Permanent differences are reclassified among capital accounts in the financial statements to reflect their tax character. Temporary differences arise when certain items of income, expense, gain, or loss are recognized in different periods for financial statement and tax purposes; these differences will reverse at some time in the future. Differences in classification may also result from the treatment of short-term gains as ordinary income for tax purposes.
During the six months ended March 31, 2009, the fund realized net foreign currency losses of $3,893,000, which decreased distributable net income for tax purposes; accordingly, such losses have been reclassified from accumulated net realized losses to overdistributed net investment income.
Certain of the fund’s investments are in securities considered to be “passive foreign investment companies,” for which any unrealized appreciation and/or realized gains are required to be included in distributable net income for tax purposes. Unrealized appreciation through the most recent mark-to-market date for tax purposes on passive foreign investment company holdings at March 31, 2009, was $13,820,000, all of which has been distributed and is reflected in the balance of overdistributed net investment income.
The fund’s tax-basis capital gains and losses are determined only at the end of each fiscal year. For tax purposes, at September 30, 2008, the fund had available realized losses of $299,469,000 to offset future net capital gains through September 30, 2017. The fund will use these capital losses to offset net taxable capital gains, if any, realized during the year ending September 30, 2009; should the fund realize net capital losses for the year, the losses will be added to the loss carryforward balance above.
At March 31, 2009, the cost of investment securities for tax purposes was $4,378,722,000. Net unrealized depreciation of investment securities for tax purposes was $1,342,978,000, consisting of unrealized gains of $161,003,000 on securities that had risen in value since their purchase and $1,503,981,000 in unrealized losses on securities that had fallen in value since their purchase.
At March 31, 2009, the aggregate settlement value of open futures contracts expiring through June 2009 and the related unrealized appreciation (depreciation) were:
| | | ($000) |
| Number of | Aggregate | Unrealized |
| Long (Short) | Settlement | Appreciation |
Futures Contracts | Contracts | Value | (Depreciation) |
S&P 500 Index | 192 | 38,150 | 4,339 |
Dow Jones EURO STOXX 50 Index | 635 | 16,803 | 260 |
Topix Index | 115 | 9,047 | 933 |
FTSE 100 Index | 131 | 7,295 | 142 |
S&P ASX 200 Index | 81 | 5,017 | 237 |
MSCI Taiwan Index | 123 | 2,380 | (109) |
Unrealized appreciation (depreciation) on open S&P 500 Index futures contracts is required to be treated as realized gain (loss) for tax purposes.
31
Global Equity Fund
At March 31, 2009, the fund had open forward currency contracts to receive and deliver currencies as follows:
| | | | | Unrealized |
| | | | | Appreciation |
| | | Contract Amount (000) | (Depreciation) |
Contract Settlement Date | | Receive | | Deliver | ($000) |
6/15/09 | USD | 9,952 | SEK | 82,241 | (595) |
6/15/09 | USD | 44,337 | GBP | 30,924 | 518 |
6/15/09 | USD | 23,487 | CAD | 29,525 | 268 |
6/15/09 | USD | 35,807 | EUR | 26,966 | (1,473) |
6/15/09 | USD | 20,082 | CHF | 22,794 | (347) |
6/24/09 | EUR | 9,169 | USD | 12,175 | (412) |
6/17/09 | JPY | 907,925 | USD | 9,204 | (47) |
6/24/09 | GBP | 4,953 | USD | 7,102 | (126) |
6/24/09 | AUD | 7,104 | USD | 4,910 | 251 |
AUD—Australian dollar.
EUR—Euro.
GBP—British pound.
JPY—Japanese yen.
USD—U.S. Dollar.
CHF—Swiss franc.
CAD—Canadian dollar.
SEK—Swedish krona.
Unrealized appreciation (depreciation) on open forward currency contracts is treated as realized gain (loss) for tax purposes.
The fund had net unrealized foreign currency losses of $188,000 resulting from the translation of other assets and liabilities at March 31, 2009.
F. During the six months ended March 31, 2009, the fund purchased $1,264,646,000 of investment securities and sold $1,687,244,000 of investment securities, other than temporary cash investments.
G. Capital shares issued and redeemed were:
| Six Months Ended | Year Ended |
| March 31, 2009 | September 30, 2008 |
| Shares | Shares |
| (000) | (000) |
Issued | 23,306 | 82,584 |
Issued in Lieu of Cash Distributions | 13,022 | 21,874 |
Redeemed | (64,666) | (79,275) |
Net Increase (Decrease) in Shares Outstanding | (28,338) | 25,183 |
32
Global Equity Fund
H. In September 2006, the Financial Accounting Standards Board issued Statement of Financial Accounting Standards No. 157 (“FAS 157”), “Fair Value Measurements.” FAS 157 establishes a framework for measuring fair value and expands disclosures about fair value measurements in financial statements.
The various inputs that may be used to determine the value of the fund’s investments are summarized in three broad levels. The inputs or methodologies used for valuing securities are not necessarily an indication of the risk associated with investing in those securities.
Level 1—Quoted prices in active markets for identical securities.
Level 2—Other significant observable inputs (including quoted prices for similar securities, interest rates, prepayment speeds, credit risk, etc.).
Level 3—Significant unobservable inputs (including the fund’s own assumptions used to determine the fair value of investments).
The following table summarizes the fund’s investments as of March 31, 2009, based on the inputs used to value them:
| | | Forward |
| Investments | Futures | Currency |
| in Securities | Contracts | Contracts |
Valuation Inputs | ($000) | ($000) | ($000) |
Level 1—Quoted prices | 1,418,234 | 5,802 | (1,963) |
Level 2—Other significant observable inputs | 1,617,473 | — | — |
Level 3—Significant unobservable inputs | 37 | — | — |
Total | 3,035,744 | 5,802 | (1,963) |
The following table summarizes changes in investments valued based on Level 3 inputs during the six months ended March 31, 2009:
| Investments |
| in Securities |
Amount Valued Based on Level 3 Inputs | ($000) |
Balance as of September 30, 2008 | 1,775 |
Change in Unrealized Appreciation (Depreciation) | (1,738) |
Balance as of March 31, 2009 | 37 |
33
About Your Fund’s Expenses
As a shareholder of the fund, you incur ongoing costs, which include costs for portfolio management, administrative services, and shareholder reports (like this one), among others. Operating expenses, which are deducted from a fund’s gross income, directly reduce the investment return of the fund.
A fund’s expenses are expressed as a percentage of its average net assets. This figure is known as the expense ratio. The following examples are intended to help you understand the ongoing costs (in dollars) of investing in your fund and to compare these costs with those of other mutual funds. The examples are based on an investment of $1,000 made at the beginning of the period shown and held for the entire period.
The accompanying table illustrates your fund’s costs in two ways:
• Based on actual fund return. This section helps you to estimate the actual expenses that you paid over the period. The “Ending Account Value” shown is derived from the fund’s actual return, and the third column shows the dollar amount that would have been paid by an investor who started with $1,000 in the fund. You may use the information here, together with the amount you invested, to estimate the expenses that you paid over the period.
To do so, simply divide your account value by $1,000 (for example, an $8,600 account value divided by $1,000 = 8.6), then multiply the result by the number given for your fund under the heading “Expenses Paid During Period.”
• Based on hypothetical 5% yearly return. This section is intended to help you compare your fund’s costs with those of other mutual funds. It assumes that the fund had a yearly return of 5% before expenses, but that the expense ratio is unchanged. In this case—because the return used is not the fund’s actual return—the results do not apply to your investment. The example is useful in making comparisons because the Securities and Exchange Commission requires all mutual funds to calculate expenses based on a 5% return. You can assess your fund’s costs by comparing this hypothetical example with the hypothetical examples that appear in shareholder reports of other funds.
Six Months Ended March 31, 2009 | | | |
| Beginning | Ending | Expenses |
| Account Value | Account Value | Paid During |
Global Equity Fund | 9/30/2008 | 3/31/2009 | Period1 |
Based on Actual Fund Return | $1,000.00 | $660.97 | $1.99 |
Based on Hypothetical 5% Yearly Return | 1,000.00 | 1,022.54 | 2.42 |
1 The calculations are based on expenses incurred in the most recent six-month period. The fund’s annualized six-month expense ratio for that period is 0.48%. The dollar amounts shown as “Expenses Paid” are equal to the annualized expense ratio multiplied by the average account value over the period, multiplied by the number of days in the most recent six-month period, then divided by the number of days in the most recent 12-month period.
34
Note that the expenses shown in the table are meant to highlight and help you compare ongoing costs only and do not reflect transaction costs incurred by the fund for buying and selling securities. Further, the expenses do not include the account service fee described in the prospectus. If such a fee were applied to your account, your costs would be higher. Your fund does not charge transaction fees, such as purchase or redemption fees, nor does it carry a “sales load.”
The calculations assume no shares were bought or sold during the period. Your actual costs may have been higher or lower, depending on the amount of your investment and the timing of any purchases or redemptions.
You can find more information about the fund’s expenses, including annual expense ratios, in the Financial Statements section of this report. For additional information on operating expenses and other shareholder costs, please refer to your fund’s current prospectus.
35
Trustees Approve Advisory Agreements
The board of trustees of Vanguard Global Equity Fund has renewed the fund’s investment advisory agreements with Acadian Asset Management LLC, AllianceBernstein L.P., Marathon Asset Management LLP, and Baillie Gifford Overseas Ltd. The board determined that the retention of the advisors was in the best interests of the fund and its shareholders.
The board based its decisions upon an evaluation of each advisor’s investment staff, portfolio management process, and performance. The trustees considered the factors discussed below, among others. However, no single factor determined whether the board approved the agreements. Rather, it was the totality of the circumstances that drove the board’s decision.
Nature, extent, and quality of services
The board considered the quality of the fund’s investment management over both the short and long term, and took into account the organizational depth and stability of each advisor. The board noted the following:
Acadian Asset Management. Founded in 1986, Acadian is a Boston-based investment management firm specializing in quantitative equity strategies for developed and emerging markets. The firm has advised the Global Equity Fund since 2004. Acadian’s investment process builds portfolios from the bottom up using proprietary valuation models. The investment team includes the three portfolio managers—John R. Chisholm, Ronald D. Frashure, and Brian K. Wolahan—who are all involved in the firm’s ongoing research.
AllianceBernstein. AllianceBernstein, founded in 1971, is a global asset management firm providing diversified, global investment management services that include growth and value equities, blend strategies, and fixed income services to clients worldwide. The investment team at AllianceBernstein employs a bottom-up, research-driven, and value-based equity investment philosophy in selecting stocks. It relies on deep investment research capabilities to understand companies and industries that may be undergoing stress, and it seeks to exploit mispricings created by investor overreaction. The firm has advised the Global Equity Fund since 2006.
Marathon Asset Management. Founded in 1986, Marathon Asset Management of London, England, has advised the Global Equity Fund since the fund’s inception in 1995. Marathon continues to use a bottom-up approach that focuses on stock selection. Its three regional teams focus on each company’s corporate strategy and industry competition, while sector analysis is conducted using long-term capital cycle data. Each of these teams is led by one of the firm’s three founders: Jeremy J. Hosking, Neil M. Ostrer, and William J. Arah.
Baillie Gifford Overseas. Founded in 1983, Baillie Gifford is among the largest independently owned investment management firms in the United Kingdom. Baillie Gifford is a unit of Baillie Gifford & Co., founded in 1908. The advisor employs a sound process, building a diversified portfolio of high-quality stocks from across the globe. Stocks are selected using fundamental research conducted by Baillie Gifford’s Edinburgh-based analysts. Baillie Gifford has advised the Global Equity Fund since 2008.
The board concluded that each advisor’s experience, stability, depth, and performance, among other factors, warranted continuation of the advisory agreements.
36
Investment performance
The board considered the short- and long-term performance of the fund, including any periods of outperformance or underperformance of a relevant benchmark and peer group. The board concluded that each advisor has carried out its investment strategy in disciplined fashion, and that performance results remain competitive. Information about the fund’s most recent performance can be found in the Performance Summary section of this report.
Cost
The board concluded that the fund’s expense ratio was far below the average expense ratio charged by funds in its peer group. The board noted that the fund’s advisory fees were also well below the peer-group average. Information about the fund’s expense ratio appears in the About Your Fund’s Expenses section of this report as well as in the Financial Statements section, which also includes information about the advisory fee rates.
The board did not consider profitability of the advisors in determining whether to approve the advisory fees, because Acadian, AllianceBernstein, Marathon, and Baillie Gifford are independent of Vanguard, and the advisory fees are the result of arm’s-length negotiations.
The benefit of economies of scale
The board concluded that the fund’s shareholders benefit from economies of scale because of breakpoints in the fund’s advisory fee schedules. The breakpoints reduce the effective rate of the fees as the fund’s assets managed by each advisor increase.
The board will consider whether to renew the advisory agreements again after a one-year period.
37
Glossary
Beta. A measure of the magnitude of a fund’s past share-price fluctuations in relation to the ups and downs of a given market index. The index is assigned a beta of 1.00. Compared with a given index, a fund with a beta of 1.20 typically would have seen its share price rise or fall by 12% when the index rose or fell by 10%. For this report, beta is based on returns over the past 36 months for both the fund and the index. Note that a fund’s beta should be reviewed in conjunction with its R-squared (see definition). The lower the R-squared, the less correlation there is between the fund and the index, and the less reliable beta is as an indicator of volatility.
Equity Exposure. A measure that reflects a fund’s investments in stocks and stock futures. Any holdings in short-term reserves are excluded.
Expense Ratio. The percentage of a fund’s average net assets used to pay its annual administrative and advisory expenses. These expenses directly reduce returns to investors.
Inception Date. The date on which the assets of a fund (or one of its share classes) are first invested in accordance with the fund’s investment objective. For funds with a subscription period, the inception date is the day after that period ends. Investment performance is measured from the inception date.
R-Squared. A measure of how much of a fund’s past returns can be explained by the returns from the market in general, as measured by a given index. If a fund’s total returns were precisely synchronized with an index’s returns, its R-squared would be 1.00. If the fund’s returns bore no relationship to the index’s returns, its R-squared would be 0. For this report, R-squared is based on returns over the past 36 months for both the fund and the index.
Short-Term Reserves. The percentage of a fund invested in highly liquid, short-term securities that can be readily converted to cash.
Turnover Rate. An indication of the fund’s trading activity. Funds with high turnover rates incur higher transaction costs and may be more likely to distribute capital gains (which may be taxable to investors). The turnover rate excludes in-kind transactions, which have minimal impact on costs.
38
This page intentionally left blank.
The People Who Govern Your Fund
The trustees of your mutual fund are there to see that the fund is operated and managed in your best interests since, as a shareholder, you are a part owner of the fund. Your fund’s trustees also serve on the board of directors of The Vanguard Group, Inc., which is owned by the Vanguard funds and provides services to them on an at-cost basis.
A majority of Vanguard’s board members are independent, meaning that they have no affiliation with Vanguard or the funds they oversee, apart from the sizable personal investments they have made as private individuals. The independent board members have distinguished backgrounds in business, academia, and public service. Each of the trustees and executive officers oversees 157 Vanguard funds.
The following table provides information for each trustee and executive officer of the fund. More information about the trustees is in the Statement of Additional Information, which can be obtained, without charge, by contacting Vanguard at 800-662-7447, or online at www.vanguard.com.
Chairman of the Board and Interested Trustee | Rajiv L. Gupta |
| Born 1945. Trustee Since December 2001.2 Principal |
| Occupation(s) During the Past Five Years: Chairman |
John J. Brennan1 | and Chief Executive Officer of Rohm and Haas Co. |
Born 1954. Trustee Since May 1987. Chairman of | (chemicals); President of Rohm and Haas Co. |
the Board. Principal Occupation(s) During the Past Five | (2006–2008); Board Member of American Chemistry |
Years: Chairman of the Board and Director/Trustee of | Council; Director of Tyco International, Ltd. (diversified |
The Vanguard Group, Inc., and of each of the investment | manufacturing and services) and Hewlett-Packard Co. |
companies served by The Vanguard Group; Chief | (electronic computer manufacturing); Trustee of The |
Executive Officer and President of The Vanguard Group | Conference Board. |
and of each of the investment companies served by The | |
Vanguard Group (1996–2008). | |
| Amy Gutmann |
| Born 1949. Trustee Since June 2006. Principal |
Independent Trustees | Occupation(s) During the Past Five Years: President of |
| the University of Pennsylvania; Christopher H. Browne |
| Distinguished Professor of Political Science in the School |
Charles D. Ellis | of Arts and Sciences with Secondary Appointments |
Born 1937. Trustee Since January 2001. Principal | at the Annenberg School for Communication and the |
Occupation(s) During the Past Five Years: Applecore | Graduate School of Education of the University of |
Partners (pro bono ventures in education); Senior | Pennsylvania; Director of Carnegie Corporation of |
Advisor to Greenwich Associates (international business | New York, Schuylkill River Development Corporation, |
strategy consulting); Successor Trustee of Yale University; | and Greater Philadelphia Chamber of Commerce; |
Overseer of the Stern School of Business at New York | Trustee of the National Constitution Center. |
University; Trustee of the Whitehead Institute for | |
Biomedical Research. | |
| JoAnn Heffernan Heisen |
| Born 1950. Trustee Since July 1998. Principal |
Emerson U. Fullwood | Occupation(s) During the Past Five Years: Retired |
Born 1948. Trustee Since January 2008. Principal | Corporate Vice President, Chief Global Diversity Officer, |
Occupation(s) During the Past Five Years: Retired | and Member of the Executive Committee of Johnson & |
Executive Chief Staff and Marketing Officer for North | Johnson (pharmaceuticals/consumer products); Vice |
America and Corporate Vice President of Xerox | President and Chief Information Officer (1997–2005) |
Corporation (photocopiers and printers); Director of | of Johnson & Johnson; Director of the University |
SPX Corporation (multi-industry manufacturing), the | Medical Center at Princeton and Women’s Research |
United Way of Rochester, the Boy Scouts of America, | and Education Institute. |
Amerigroup Corporation (direct health and medical | |
insurance carriers), and Monroe Community College | |
Foundation. | |
André F. Perold | F. William McNabb III1 | |
Born 1952. Trustee Since December 2004. Principal | Born 1957. Chief Executive Officer Since August 2008. |
Occupation(s) During the Past Five Years: George Gund | President Since March 2008. Principal Occupation(s) |
Professor of Finance and Banking, Senior Associate | During the Past Five Years: Director of The Vanguard |
Dean, and Director of Faculty Recruiting, Harvard | Group, Inc., since 2008; Chief Executive Officer and |
Business School; Director and Chairman of UNX, Inc. | President of The Vanguard Group and of each of the |
(equities trading firm); Chair of the Investment | investment companies served by The Vanguard Group |
Committee of HighVista Strategies LLC (private | since 2008; Director of Vanguard Marketing Corporation; |
investment firm). | Managing Director of The Vanguard Group (1995–2008). |
| | |
| | |
Alfred M. Rankin, Jr. | Heidi Stam1 | |
Born 1941. Trustee Since January 1993. Principal | Born 1956. Secretary Since July 2005. Principal |
Occupation(s) During the Past Five Years: Chairman, | Occupation(s) During the Past Five Years: Managing |
President, Chief Executive Officer, and Director of | Director of The Vanguard Group, Inc., since 2006; |
NACCO Industries, Inc. (forklift trucks/housewares/ | General Counsel of The Vanguard Group since 2005; |
lignite); Director of Goodrich Corporation (industrial | Secretary of The Vanguard Group and of each of the |
products/aircraft systems and services). | investment companies served by The Vanguard Group |
| since 2005; Director and Senior Vice President of |
| Vanguard Marketing Corporation since 2005; Principal |
J. Lawrence Wilson | of The Vanguard Group (1997–2006). |
Born 1936. Trustee Since April 1985. Principal | |
Occupation(s) During the Past Five Years: Retired | | |
Chairman and Chief Executive Officer of Rohm and | Vanguard Senior Management Team |
Haas Co. (chemicals); Director of Cummins Inc. (diesel | | |
engines) and AmerisourceBergen Corp. (pharmaceutical | | |
distribution); Trustee of Vanderbilt University and of | R. Gregory Barton | Michael S. Miller |
Culver Educational Foundation. | Mortimer J. Buckley | James M. Norris |
| Kathleen C. Gubanich | Glenn W. Reed |
| Paul A. Heller | George U. Sauter |
Executive Officers | | |
| | |
| Founder | |
Thomas J. Higgins1 | | |
Born 1957. Chief Financial Officer Since September | | |
2008. Principal Occupation(s) During the Past Five | John C. Bogle | |
Years: Principal of The Vanguard Group, Inc.; Chief | Chairman and Chief Executive Officer, 1974–1996 |
Financial Officer of each of the investment companies | | |
served by The Vanguard Group since 2008; Treasurer | | |
of each of the investment companies served by The | | |
Vanguard Group (1998–2008). | | |
| | |
| | |
Kathryn J. Hyatt1 | | |
Born 1955. Treasurer Since November 2008. Principal | | |
Occupation(s) During the Past Five Years: Principal of | | |
The Vanguard Group, Inc.; Treasurer of each of the | | |
investment companies served by The Vanguard | | |
Group since 2008; Assistant Treasurer of each of the | | |
investment companies served by The Vanguard Group | | |
(1988–2008). | | |
1 These individuals are “interested persons” as defined in the Investment Company Act of 1940.
2 December 2002 for Vanguard Equity Income Fund, Vanguard Growth Equity Fund, the Vanguard Municipal Bond Funds, and the Vanguard State Tax-Exempt Funds.
| 
|
| P.O. Box 2600 |
| Valley Forge, PA 19482-2600 |
Connect with Vanguard® > www.vanguard.com
Fund Information > 800-662-7447 | All comparative mutual fund data are from Lipper Inc. |
| or Morningstar, Inc., unless otherwise noted. |
Direct Investor Account Services > 800-662-2739 | |
| |
Institutional Investor Services > 800-523-1036 | You can obtain a free copy of Vanguard’s proxy voting |
| guidelines by visiting our website, www.vanguard.com, |
Text Telephone for People | and searching for “proxy voting guidelines,” or by |
With Hearing Impairment > 800-952-3335 | calling Vanguard at 800-662-2739. The guidelines are |
| also available from the SEC’s website, www.sec.gov. |
| In addition, you may obtain a free report on how your |
| fund voted the proxies for securities it owned during |
This material may be used in conjunction | the 12 months ended June 30. To get the report, visit |
with the offering of shares of any Vanguard | either www.vanguard.com or www.sec.gov. |
fund only if preceded or accompanied by | |
the fund’s current prospectus. | |
| You can review and copy information about your fund |
| at the SEC’s Public Reference Room in Washington, D.C. |
CFA® is a trademark owned by CFA Institute. | To find out more about this public service, call the SEC |
| at 202-551-8090. Information about your fund is also |
| available on the SEC’s website, and you can receive |
The funds or securities referred to herein are not | copies of this information, for a fee, by sending a |
sponsored, endorsed, or promoted by MSCI, and MSCI | request in either of two ways: via e-mail addressed to |
bears no liability with respect to any such funds or | publicinfo@sec.gov or via regular mail addressed to the |
securities. For any such funds or securities, the | Public Reference Section, Securities and Exchange |
prospectus or the Statement of Additional Information | Commission, Washington, DC 20549-0102. |
contains a more detailed description of the limited | |
relationship MSCI has with The Vanguard Group and | |
any related funds. | |
| |
| |
Russell is a trademark of The Frank Russell Company. | |
| |
| |
| |
| |
| |
| |
| |
| © 2009 The Vanguard Group, Inc. |
| All rights reserved. |
| Vanguard Marketing Corporation, Distributor. |
| |
| Q1292 052009 |
> | Vanguard Strategic Small-Cap Equity Fund returned about –38% for the six months ended March 31, 2009. |
> | The broad U.S. stock market returned about –31%. Shares of small-capitalization companies fared worse than those of large companies for the period. |
> | The fund, like the overall stock market, registered significant declines in every industry sector. |
Contents | |
| |
Your Fund’s Total Returns | 1 |
President’s Letter | 2 |
Advisor’s Report | 6 |
Fund Profile | 8 |
Performance Summary | 9 |
Financial Statements | 10 |
About Your Fund’s Expenses | 23 |
Trustees Approve Advisory Arrangement | 25 |
Glossary | 26 |
Please note: The opinions expressed in this report are just that—informed opinions. They should not be considered promises or advice. Also, please keep in mind that the information and opinions cover the period through the date on the front of this report. Of course, the risks of investing in your fund are spelled out in the prospectus.
Your Fund’s Total Returns
Six Months Ended March 31, 2009 | | |
| Ticker | Total |
| Symbol | Returns |
Vanguard Strategic Small-Cap Equity Fund | VSTCX | –38.33% |
MSCI US Small Cap 1750 Index | | –36.65 |
Average Small-Cap Core Fund1 | | –35.27 |
Your Fund’s Performance at a Glance | | | | |
September 30, 2008–March 31, 2009 | | | | |
| | | Distributions Per Share |
| Starting | Ending | Income | Capital |
| Share Price | Share Price | Dividends | Gains |
Vanguard Strategic Small-Cap Equity Fund | $16.60 | $10.09 | $0.168 | $0.000 |
1 Derived from data provided by Lipper Inc.
1

President’s Letter
Dear Shareholder,
It was a challenging half-year for stocks, and an especially difficult period for small caps. Vanguard Strategic Small-Cap Equity Fund returned about –38% for the fiscal period ended March 31, 2009. The fund’s return lagged the result of its benchmark and the average return for small-cap core funds. All ten of the fund’s sectors posted double-digit declines.
Extreme distress dappled with glimmers of hope
The six months ended March 31 witnessed extreme distress in global stock markets, with both U.S. and international stocks returning about –31%. The embattled financial sector continued to struggle, prompting regulators in the United States and abroad to take ever-more-aggressive actions to help the big banks fortify their fragile balance sheets.
Even as the gloom intensified, a few signs of recovery appeared on the horizon. Toward the end of the period, the swift contraction in manufacturing activity seemed to lessen. And throughout the six months, news from the housing sector seemed to improve. From their lows in early March through the end of the period, global stock markets generated a double-digit return.
2
Credit-market turmoil provoked dramatic response
Developments in the fixed income market were, if anything, even more unusual. In the months after the September collapse of Lehman Brothers, a major presence in the bond market, the trading of corporate bonds came to a near standstill as investors stampeded into U.S. Treasury bonds—considered the safest, most liquid credits—driving prices higher and yields lower. The difference between the yields of Treasuries and corporate bonds surged to levels not seen since the 1930s.
The Federal Reserve Board responded to the credit-market and economic crises with a dramatic easing of monetary policy, reducing its target for short-term interest rates to an all-time low of 0% to 0.25%. The Fed also created new programs designed to bring borrowers and lenders back to the market. For the six-month period, the Barclays Capital U.S. Aggregate Bond Index returned 4.70% on the strength of Treasuries and other government-backed bonds. The broad municipal bond market returned 5.00%.
Fund posted declines across all sectors
Vanguard Strategic Small-Cap Equity Fund seeks to mirror the sector allocations of its benchmark index while overweighting or underweighting individual stocks. Using this approach, the fund’s advisor, Vanguard Quantitative Equity Group, attempts to select stocks that will result in many
Market Barometer | | | |
| | | Total Returns |
| | Periods Ended March 31, 2009 |
| Six Months | One Year | Five Years1 |
Stocks | | | |
Russell 1000 Index (Large-caps) | –30.59% | –38.27% | –4.54% |
Russell 2000 Index (Small-caps) | –37.17 | –37.50 | –5.24 |
Dow Jones Wilshire 5000 Index (Entire market) | –30.72 | –37.69 | –4.24 |
MSCI All Country World Index ex USA (International) | –30.54 | –46.18 | –0.24 |
| | | |
Bonds | | | |
Barclays Capital U.S. Aggregate Bond Index | | | |
(Broad taxable market) | 4.70% | 3.13% | 4.13% |
Barclays Capital Municipal Bond Index | 5.00 | 2.27 | 3.21 |
Citigroup 3-Month Treasury Bill Index | 0.30 | 1.13 | 3.06 |
| | | |
CPI | | | |
Consumer Price Index | –2.78% | –0.38% | 2.57% |
1 Annualized.
3
“small wins” versus the index’s results, while maintaining a risk profile similar to that of the index.
But the market’s steep declines over the past six months (and the fund’s return of about –38%) made “keeping score” versus the benchmark seem quite secondary. Returns were negative across corporate America, ranging from –25% for the utilities sector to –59% for energy.
Among the fund’s larger areas of investment, the financial sector weighed heavily on absolute performance during the period. Although the advisor’s stock selections stayed a few steps ahead of the benchmark, this performance was of little comfort amid the double-digit declines of banks, insurance firms, and real estate investment trusts. Industrial stocks returned –49%, weighed down by poor results from machinery, building products, electrical equipment, and transportation companies.
Information technology stocks registered –29% as semiconductor and consulting firms were among those hurt by tightening corporate IT budgets. The past six months were also difficult for the fund’s consumer discretionary holdings. These companies, which compete for our spare dollars, limped to a –38% return. The health care sector returned –31%, with pronounced weakness in health care facility and pharmaceutical stocks.
Expense Ratios1 | | |
Your Fund Compared With Its Peer Group | | |
| | Average |
| | Small-Cap |
| Fund | Core Fund |
Strategic Small-Cap Equity Fund | 0.45% | 1.43% |
1 The fund expense ratio shown is from the prospectus dated January 28, 2009, and represents estimated costs for the current fiscal year based on the fund’s current net assets. For the six months ended March 31, 2009, the fund’s annualized expense ratio was 0.44%. The peer-group expense ratio is derived from data provided by Lipper Inc. and captures information through year-end 2008.
4
Only a relative handful of the fund’s holdings finished the period with a positive return. Restaurants, education services, minerals, and soft drink companies provided a few bright spots in an environment of widespread weakness.
Don’t try to outsmart a market recovery
During bear markets, prognosticators often debate which area of the financial markets will lead the way in a recovery. Small-cap stocks? High-yield bonds? Emerging markets? Blue chips? During the deepest of market downturns—like the current one—the prognosticating can take on an air of desperation, given the level of most investors’ account balances. The urge to play catch-up by picking tomorrow’s hot sector can be strong.
But often, attempts to tactically position an investment portfolio for a rebound can be an exercise in frustration. Rather than pin your hopes on a narrow segment of the market that may—or may not—be ready to outperform, we advise investors to hold a portfolio that is balanced across, and diversified within, the major asset classes (stock, bond, and money market funds) to fit personal goals, time horizon, and risk tolerance. Such an approach can enable investors to participate in market rallies while insulating against weaker-performing areas. We believe the Strategic Small-Cap Equity Fund can be a useful part of such a broad-based strategy.
Thank you for investing with Vanguard.
Sincerely,

F. William McNabb III
President and Chief Executive Officer
April 17, 2009
5
Advisor’s Report
The equity market’s negative momentum in 2008 continued through most of the first calendar quarter of 2009. For the six months ended March 31, small-capitalization stocks (as measured by the MSCI US Small Cap 1750 Index) returned about –37%, while the Strategic Small-Cap Equity Fund returned about –38%.
Small-cap stocks declined more than 20% during the first two months of 2009, as the market reacted very skeptically to the government’s initial stimulus announcements. However, as the government revealed additional plans, small-caps staged a rebound in March. Has the market reached a bottom? That remains to be seen. But it is certain that first-quarter earnings reports—particularly those in the financial sector—will be scrutinized, and that the market will be influenced by those results.
We are disappointed with the fund’s six-month result, as we lagged the benchmark by 1.68%. In dissecting the period, our two quarterly results were as different as night and day. For the first three months (October–December 2008), the fund outperformed the benchmark. However, the second three months (January–March 2009) were brutal, with most of the shortfall occurring in March.
The Strategic Small-Cap Equity Fund’s performance relative to its small-cap benchmark hinges on our ability to accurately rank stocks against their industry and market-cap peers, predicting the outperformers from the underperformers and effectively implementing those decisions in our portfolio. This evaluation process analyzes companies based on several criteria: relative valuation characteristics, market sentiment and momentum factors, the quality and direction of earnings, and management decisions on certain company attributes.
We still believe strongly that the formula for long-term success includes finding companies with attractive valuation and sentiment characteristics and high-quality balance sheets. Unfortunately, these characteristics have not been rewarded in recent periods. Conversely, we do not believe that buying overvalued, low-quality companies is a good strategy for long-term success.
During the half-year, our stock-selection results were strongest in the financial sector as we underweighted some of the sector’s poorest performers such as Apollo Investment, Affiliated Managers, and StanCorp Financial Group. We also benefited from an overweighted position in Ocwen Financial, one of the few positive performers in the sector.
6
Our stock selection was most disappointing in the industrials sector, where Pacer International, American Reprographics, and Gibraltar Industries were the major stumbling blocks. The utilities sector was another drag on relative performance, with Hawaiian Electric Industries and ITC Holdings as notable detractors. Consumer staples companies NBTY and Chiquita Brands International also failed to meet our expectations during the period.
James P. Stetler,
Principal and Portfolio Manager
Joel M. Dickson, Principal
Vanguard Quantitative Equity Group
April 13, 2009
7
Strategic Small-Cap Equity Fund
Fund Profile
As of March 31, 2009
Portfolio Characteristics | | |
| | Comparative | Broad |
| Fund | Index1 | Index2 |
Number of Stocks | 445 | 1,736 | 4,489 |
Median Market Cap | $0.8B | $0.9B | $22.3B |
Price/Earnings Ratio | 9.0x | 10.7x | 15.0x |
Price/Book Ratio | 1.3x | 1.3x | 1.7x |
Yield3 | 1.7% | 2.1% | 2.7% |
Return on Equity | 13.1% | 12.5% | 20.2% |
Earnings Growth Rate | 15.5% | 12.2% | 15.0% |
Foreign Holdings | 0.1% | 0.0% | 0.0% |
Turnover Rate4 | 88% | — | — |
Expense Ratio5 | 0.45% | — | — |
Short-Term Reserves | 0.1% | — | — |
Sector Diversification (% of equity exposure) |
| | Comparative | Broad |
| Fund | Index1 | Index2 |
Consumer Discretionary | 14.0% | 13.2% | 9.4% |
Consumer Staples | 3.0 | 3.6 | 11.2 |
Energy | 5.6 | 5.2 | 12.3 |
Financials | 20.6 | 20.1 | 13.1 |
Health Care | 13.2 | 13.0 | 14.6 |
Industrials | 14.6 | 15.0 | 10.0 |
Information Technology | 18.7 | 19.3 | 17.7 |
Materials | 4.2 | 4.6 | 3.7 |
Telecommunication | | | |
Services | 1.7 | 1.3 | 3.6 |
Utilities | 4.4 | 4.7 | 4.4 |
Ten Largest Holdings6 (% of total net assets) |
| | |
Gen-Probe Inc. | health care | |
| equipment | 0.8% |
Skyworks Solutions, Inc. | semiconductors | 0.7 |
Atmos Energy Corp. | gas utilities | 0.6 |
Rent-A-Center, Inc. | home furnishing | |
| retail | 0.6 |
The Warnaco Group, Inc. | apparel, accessories | |
| and luxury goods | 0.6 |
Sybase, Inc. | systems software | 0.6 |
Vectren Corp. | multi-utilities | 0.6 |
Aeropostale, Inc. | apparel—retail | 0.6 |
Metavante Technologies | data processing and | |
| outsourced services | 0.6 |
Compass Minerals | diversified metals | |
International, Inc. | and mining | 0.6 |
Top Ten | | 6.3% |
Investment Focus
1 MSCI US Small Cap 1750 Index.
2 Dow Jones Wilshire 5000 Index.
3 30-day SEC yield for the fund; annualized dividend yield for the indexes. See the Glossary.
4 Annualized.
5 The fund expense ratio shown is from the prospectus dated January 28, 2009, and represents estimated costs for the current fiscal year based on the fund’s current net assets. For the six months ended March 31, 2009, the fund’s annualized expense ratio was 0.44%.
6 The holdings listed exclude any temporary cash investments and equity index products.
8
Strategic Small-Cap Equity Fund
Performance Summary
All of the returns in this report represent past performance, which is not a guarantee of future results that may be achieved by the fund. (Current performance may be lower or higher than the performance data cited. For performance data current to the most recent month-end, visit our website at www.vanguard.com/performance.) Note, too, that both investment returns and principal value can fluctuate widely, so an investor’s shares, when sold, could be worth more or less than their original cost. The returns shown do not reflect taxes that a shareholder would pay on fund distributions or on the sale of fund shares.
Fiscal-Year Total Returns (%): April 24, 2006–March 31, 2009
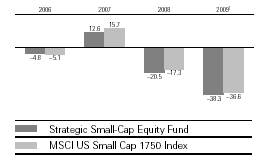
Average Annual Total Returns: Periods Ended March 31, 2009 | | |
| | | |
| | | Since |
| Inception Date | One Year | Inception |
Strategic Small-Cap Equity Fund2 | 4/24/2006 | –42.30% | –19.71% |
1 Six months ended March 31, 2009.
2 Total returns do not include the account service fee that may be applicable to certain accounts with balances below $10,000.
Note: See Financial Highlights table for dividend and capital gains information.
9
Strategic Small-Cap Equity Fund
Financial Statements (unaudited)
Statement of Net Assets
As of March 31, 2009
The fund provides a complete list of its holdings four times in each fiscal year, at the quarter-ends. For the second and fourth fiscal quarters, the lists appear in the fund’s semiannual and annual reports to shareholders. For the first and third fiscal quarters, the fund files the lists with the Securities and Exchange Commission on Form N-Q. Shareholders can look up the fund’s Forms N-Q on the SEC’s website at www.sec.gov. Forms N-Q may also be reviewed and copied at the SEC’s Public Reference Room (see the back cover of this report for further information).
| | | Market |
| | | Value• |
| | Shares | ($000) |
Common Stocks (98.3%)1 | | |
Consumer Discretionary (13.8%) | | |
* | Rent-A-Center, Inc. | 37,700 | 730 |
* | The Warnaco Group, Inc. | 29,700 | 713 |
* | Aeropostale, Inc. | 26,200 | 696 |
* | Big Lots Inc. | 31,700 | 659 |
* | Panera Bread Co. | 10,900 | 609 |
* | CEC Entertainment Inc. | 23,200 | 600 |
* | WMS Industries, Inc. | 25,500 | 533 |
* | Marvel Entertainment, Inc. | 18,500 | 491 |
| Bob Evans Farms, Inc. | 21,687 | 486 |
| Snap-On Inc. | 19,200 | 482 |
* | Jarden Corp. | 37,900 | 480 |
* | Papa John’s | | |
| International, Inc. | 20,915 | 478 |
| John Wiley & Sons Class A | 14,300 | 426 |
* | Jos. A. Bank Clothiers, Inc. | 15,200 | 423 |
| Finish Line, Inc. | 62,800 | 416 |
* | The Children’s Place | | |
| Retail Stores, Inc. | 18,900 | 414 |
| Cracker Barrel | | |
| Old Country Store Inc. | 13,124 | 376 |
* | The Gymboree Corp. | 17,400 | 372 |
* | DreamWorks | | |
| Animation SKG, Inc. | 17,100 | 370 |
* | Steiner Leisure Ltd. | 14,300 | 349 |
| Interactive Data Corp. | 13,900 | 346 |
* | P.F. Chang’s China Bistro, Inc. | 15,100 | 346 |
| International Speedway Corp. | 15,400 | 340 |
| Polaris Industries, Inc. | 14,100 | 302 |
* | Pre-Paid Legal Services, Inc. | 10,300 | 299 |
| Fisher Communications, Inc. | 26,173 | 255 |
| Systemax Inc. | 18,400 | 238 |
* | Exide Technologies | 78,600 | 236 |
* | Fossil, Inc. | 14,900 | 234 |
* | Brink’s Home Security | | |
| Holdings, Inc. | 9,800 | 221 |
* | Sally Beauty Co. Inc. | 37,300 | 212 |
* | Denny’s Corp. | 126,672 | 212 |
| Columbia Sportswear Co. | 6,900 | 206 |
| | | Market |
| | | Value• |
| | Shares | ($000) |
* | True Religion Apparel, Inc. | 16,900 | 200 |
* | Jo-Ann Stores, Inc. | 12,100 | 198 |
* | Town Sports International | | |
| Holdings, Inc. | 66,048 | 197 |
* | Mediacom | | |
| Communications Corp. | 44,700 | 180 |
| Movado Group, Inc. | 22,703 | 171 |
* | JAKKS Pacific, Inc. | 13,600 | 168 |
| CSS Industries, Inc. | 9,500 | 162 |
* | Collective Brands, Inc. | 16,500 | 161 |
| Barnes & Noble, Inc. | 7,500 | 160 |
* | Overstock.com, Inc. | 17,200 | 157 |
| Oxford Industries, Inc. | 20,000 | 123 |
* | Bally Technologies Inc. | 6,200 | 114 |
| Service Corp. International | 32,190 | 112 |
* | Steven Madden, Ltd. | 4,600 | 86 |
* | The Wet Seal, Inc. Class A | 25,700 | 86 |
* | Fuel Systems Solutions, Inc. | 6,300 | 85 |
* | Carter’s, Inc. | 4,100 | 77 |
| Tempur-Pedic International Inc. | 9,600 | 70 |
| Regis Corp. | 4,400 | 64 |
| Genesco, Inc. | 2,700 | 51 |
* | Blockbuster Inc. Class A | 66,700 | 48 |
| Meredith Corp. | 2,300 | 38 |
| Cinemark Holdings Inc. | 3,200 | 30 |
* | Quiksilver, Inc. | 16,200 | 21 |
| Phillips-Van Heusen Corp. | 900 | 20 |
| UniFirst Corp. | 700 | 20 |
| Tupperware Brands Corp. | 1,100 | 19 |
| | | 16,368 |
Consumer Staples (2.9%) | | |
| Corn Products | | |
| International, Inc. | 27,505 | 583 |
| Village Super Market Inc. | | |
| Class A | 11,293 | 352 |
* | Alliance One | | |
| International, Inc. | 88,200 | 339 |
| Cal-Maine Foods, Inc. | 14,400 | 322 |
| Nash-Finch Co. | 9,500 | 267 |
| Herbalife Ltd. | 16,800 | 252 |
10
Strategic Small-Cap Equity Fund
| | | Market |
| | | Value• |
| | Shares | ($000) |
| Del Monte Foods Co. | 29,200 | 213 |
* | Chiquita Brands | | |
| International, Inc. | 31,700 | 210 |
| Coca-Cola Bottling Co. | 3,900 | 203 |
| Spartan Stores, Inc. | 12,800 | 197 |
* | BJ’s Wholesale Club, Inc. | 4,400 | 141 |
| Nu Skin Enterprises, Inc. | 12,500 | 131 |
| Lancaster Colony Corp. | 3,000 | 124 |
* | Prestige Brands Holdings Inc. | 18,600 | 96 |
* | The Pantry, Inc. | 1,615 | 29 |
| | | 3,459 |
Energy (5.5%) | | |
| Foundation Coal | | |
| Holdings, Inc. | 42,100 | 604 |
* | Concho Resources, Inc. | 22,200 | 568 |
* | Matrix Service Co. | 67,542 | 555 |
* | Encore Acquisition Co. | 22,400 | 521 |
* | Contango Oil & Gas Co. | 11,200 | 439 |
* | Comstock Resources, Inc. | 13,600 | 405 |
* | Oil States International, Inc. | 27,197 | 365 |
| Overseas Shipholding | | |
| Group Inc. | 14,700 | 333 |
* | PHI Inc. Non-Voting Shares | 32,000 | 319 |
* | CVR Energy, Inc. | 57,500 | 319 |
| World Fuel Services Corp. | 7,700 | 244 |
* | Mariner Energy Inc. | 29,000 | 225 |
* | Gulfmark Offshore, Inc. | 8,600 | 205 |
* | SEACOR Holdings Inc. | 3,500 | 204 |
* | Superior Energy | | |
| Services, Inc. | 13,253 | 171 |
| Walter Industries, Inc. | 6,600 | 151 |
| Berry Petroleum Class A | 13,500 | 148 |
* | McMoRan Exploration Co. | 24,600 | 116 |
* | Clayton Williams Energy, Inc. | 3,800 | 111 |
* | Goodrich Petroleum Corp. | 5,400 | 105 |
| Core Laboratories N.V. | 1,400 | 102 |
| St. Mary Land & | | |
| Exploration Co. | 6,686 | 88 |
* | Newpark Resources, Inc. | 32,300 | 82 |
* | Vaalco Energy, Inc. | 11,300 | 60 |
| General Maritime Corp. | 6,714 | 47 |
| CARBO Ceramics Inc. | 500 | 14 |
| | | 6,501 |
Financials (20.3%) | | |
* | Ocwen Financial Corp. | 57,359 | 656 |
| FirstMerit Corp. | 33,500 | 610 |
* | Knight Capital Group, Inc. | | |
| Class A | 41,100 | 606 |
| Bank of Hawaii Corp. | 18,300 | 603 |
| Allied World Assurance Holdings, Ltd. | 15,500 | 589 |
| UMB Financial Corp. | 13,800 | 586 |
| IPC Holdings Ltd. | 19,000 | 514 |
* | Interactive Brokers Group, Inc. | 31,600 | 510 |
| | | Market |
| | | Value• |
| | Shares | ($000) |
| Platinum Underwriters | | |
| Holdings, Ltd. | 17,200 | 488 |
| The Hanover Insurance | | |
| Group Inc. | 16,800 | 484 |
| Odyssey Re Holdings Corp. | 12,700 | 482 |
| Horace Mann | | |
| Educators Corp. | 54,300 | 454 |
| American Physicians | | |
| Capital, Inc. | 11,079 | 453 |
* | Dollar Financial Corp. | 46,756 | 445 |
| Trustmark Corp. | 23,222 | 427 |
| First Niagara Financial | | |
| Group, Inc. | 35,900 | 391 |
| Senior Housing | | |
| Properties Trust REIT | 27,000 | 378 |
| Aspen Insurance | | |
| Holdings Ltd. | 16,700 | 375 |
| First Financial Corp. (IN) | 10,100 | 373 |
| Highwood Properties, Inc. | | |
| REIT | 16,310 | 349 |
| Safety Insurance Group, Inc. | 10,400 | 323 |
* | Stifel Financial Corp. | 7,350 | 318 |
| City Holding Co. | 11,662 | 318 |
| Cullen/Frost Bankers, Inc. | 6,700 | 314 |
| BancFirst Corp. | 8,426 | 307 |
| National Retail Properties | | |
| REIT | 19,300 | 306 |
* | EZCORP, Inc. | 25,839 | 299 |
* | CNA Surety Corp. | 16,031 | 296 |
* | Nelnet, Inc. | 33,200 | 293 |
| Raymond James | | |
| Financial, Inc. | 14,800 | 292 |
| Home Properties, Inc. REIT | 9,400 | 288 |
| Astoria Financial Corp. | 31,300 | 288 |
| Mid-America Apartment | | |
| Communities, Inc. REIT | 9,070 | 280 |
| Healthcare Realty Trust Inc. | | |
| REIT | 18,600 | 279 |
| WesBanco, Inc. | 12,000 | 274 |
| United Bankshares, Inc. | 15,800 | 272 |
| Washington REIT | 15,200 | 263 |
| Cash America | | |
| International Inc. | 16,213 | 254 |
| TriCo Bancshares | 15,000 | 251 |
* | SVB Financial Group | 12,300 | 246 |
| Corporate Office | | |
| Properties Trust, Inc. REIT | 9,700 | 241 |
* | Investment Technology | | |
| Group, Inc. | 9,300 | 237 |
| Financial Federal Corp. | 11,100 | 235 |
| PS Business Parks, Inc. REIT | 6,336 | 233 |
| Provident Financial Services Inc. | 21,500 | 232 |
| HRPT Properties Trust REIT | 71,100 | 227 |
| Univest Corp. of Pennsylvania | 12,900 | 226 |
11
Strategic Small-Cap Equity Fund
| | | Market |
| | | Value• |
| | Shares | ($000) |
| Oriental Financial Group Inc. | 45,100 | 220 |
| Sun Communities, Inc. REIT | 17,300 | 205 |
| Kilroy Realty Corp. REIT | 11,900 | 205 |
* | FPIC Insurance Group, Inc. | 5,500 | 204 |
| Bank of the Ozarks, Inc. | 8,500 | 196 |
| R.L.I. Corp. | 3,800 | 191 |
| Sovran Self Storage, Inc. REIT | 9,400 | 189 |
| WSFS Financial Corp. | 8,350 | 187 |
| NBT Bancorp, Inc. | 8,600 | 186 |
| Equity Lifestyle | | |
| Properties, Inc. REIT | 4,800 | 183 |
| Digital Realty Trust, Inc. REIT | 5,310 | 176 |
| Entertainment | | |
| Properties Trust REIT | 11,100 | 175 |
* | Amerisafe Inc. | 11,400 | 175 |
| Alexandria Real | | |
| Estate Equities, Inc. REIT | 4,600 | 167 |
| Prospect Energy Corp. | 19,200 | 164 |
| Douglas Emmett, Inc. REIT | 21,900 | 162 |
| Saul Centers, Inc. REIT | 7,002 | 161 |
| LTC Properties, Inc. REIT | 9,100 | 160 |
* | ProAssurance Corp. | 3,200 | 149 |
| Baldwin & Lyons, Inc. | | |
| Class B | 7,783 | 147 |
| BRE Properties Inc. Class A | | |
| REIT | 7,400 | 145 |
| Republic Bancorp, Inc. | | |
| Class A | 7,600 | 142 |
| Realty Income Corp. REIT | 7,400 | 139 |
| Winthrop Realty Trust REIT | 19,300 | 133 |
| Provident New York | | |
| Bancorp, Inc. | 15,043 | 129 |
| Life Partners Holdings | 7,300 | 124 |
| Jones Lang LaSalle Inc. | 5,270 | 123 |
| Parkway Properties Inc. | | |
| REIT | 11,800 | 122 |
| Extra Space Storage Inc. | | |
| REIT | 22,000 | 121 |
| Brandywine Realty Trust | | |
| REIT | 41,900 | 119 |
| First BanCorp Puerto Rico | 27,200 | 116 |
* | LaBranche & Co. Inc. | 30,900 | 116 |
| Pennsylvania REIT | 30,870 | 110 |
| First Financial | | |
| Bankshares, Inc. | 2,100 | 101 |
| Berkshire Hills Bancorp, Inc. | 4,400 | 101 |
| Suffolk Bancorp | 3,800 | 99 |
| Lakeland Financial Corp. | 5,100 | 98 |
| Community Bank | | |
| System, Inc. | 5,800 | 97 |
| Simmons First National Corp. | 3,800 | 96 |
| Potlatch Corp. REIT | 4,000 | 93 |
| Colonial Properties Trust REIT | 21,870 | 83 |
| Essex Property Trust, Inc. REIT | 1,400 | 80 |
| U-Store-It Trust REIT | 39,300 | 79 |
| | | Market |
| | | Value• |
| | Shares | ($000) |
| Mack-Cali Realty Corp. REIT | 3,820 | 76 |
| Pacific Capital Bancorp | 10,200 | 69 |
| Franklin Street | | |
| Properties Corp. REIT | 5,270 | 65 |
| Westamerica Bancorporation | 1,400 | 64 |
| Presidential Life Corp. | 7,900 | 62 |
* | thinkorswim Group, Inc. | 7,000 | 60 |
| Tompkins Trustco, Inc. | 1,300 | 56 |
| Clifton Savings Bancorp, Inc. | 5,322 | 53 |
| Arrow Financial Corp. | 2,072 | 49 |
| First Industrial Realty Trust | | |
| REIT | 12,200 | 30 |
| LaSalle Hotel Properties | | |
| REIT | 4,100 | 24 |
| S.Y. Bancorp, Inc. | 900 | 22 |
| First Source Corp. | 1,200 | 22 |
| MFA Mortgage | | |
| Investments, Inc. REIT | 3,500 | 21 |
| TrustCo Bank NY | 3,400 | 20 |
| Sunstone Hotel Investors, Inc REIT | 7,526 | 20 |
| Prosperity Bancshares, Inc. | 600 | 16 |
| Bank Mutual Corp. | 1,805 | 16 |
* | Crawford & Co. Class B | 2,200 | 15 |
| Omega Healthcare | | |
| Investors, Inc. REIT | 800 | 11 |
| | | 24,104 |
Health Care (12.9%) | | |
* | Gen-Probe Inc. | 20,700 | 943 |
* | AMERIGROUP Corp. | 24,900 | 686 |
* | Isis Pharmaceuticals, Inc. | 43,200 | 648 |
| STERIS Corp. | 27,400 | 638 |
* | OSI Pharmaceuticals, Inc. | 15,449 | 591 |
* | Onyx Pharmaceuticals, Inc. | 18,000 | 514 |
* | Valeant Pharmaceuticals | | |
| International | 28,700 | 511 |
* | LifePoint Hospitals, Inc. | 23,100 | 482 |
| Owens & Minor, Inc. | 13,600 | 451 |
| Chemed Corp. | 11,500 | 447 |
| PDL BioPharma Inc. | 62,500 | 442 |
* | Cubist Pharmaceuticals, Inc. | 26,400 | 432 |
* | Myriad Genetics, Inc. | 9,200 | 418 |
* | Luminex Corp. | 22,500 | 408 |
| Cooper Cos., Inc. | 14,600 | 386 |
* | Albany Molecular | | |
| Research, Inc. | 37,779 | 356 |
* | Bio-Rad Laboratories, Inc. | | |
| Class A | 5,206 | 343 |
* | Alexion Pharmaceuticals, Inc. | 8,700 | 328 |
* | Sun Healthcare Group Inc. | 38,100 | 322 |
* | Molina Healthcare Inc. | 16,906 | 321 |
* | Emergency Medical | | |
| Services LP Class A | 10,200 | 320 |
* | Psychiatric Solutions, Inc. | 20,300 | 319 |
* | Questcor | | |
| Pharmaceuticals, Inc. | 59,700 | 294 |
12
Strategic Small-Cap Equity Fund
| | | Market |
| | | Value• |
| | Shares | ($000) |
* | CorVel Corp. | 14,500 | 293 |
* | Kensey Nash Corp. | 13,600 | 289 |
* | Amedisys Inc. | 9,900 | 272 |
* | Gentiva Health Services, Inc. | 17,900 | 272 |
* | Emergent BioSolutions Inc. | 19,500 | 263 |
* | CONMED Corp. | 17,700 | 255 |
* | Alnylam Pharmaceuticals Inc. | 13,200 | 251 |
* | AthenaHealth Inc. | 9,400 | 227 |
* | Healthspring, Inc. | 26,000 | 218 |
* | AmSurg Corp. | 13,700 | 217 |
* | PharMerica Corp. | 12,500 | 208 |
* | RehabCare Group, Inc. | 11,800 | 206 |
* | Cyberonics, Inc. | 15,191 | 202 |
* | HealthSouth Corp. | 22,500 | 200 |
* | LHC Group Inc. | 8,100 | 180 |
* | Nabi Biopharmaceuticals | 47,250 | 175 |
* | Skilled Healthcare Group Inc. | 20,614 | 169 |
* | Centene Corp. | 8,800 | 159 |
| Ensign Group Inc. | 8,200 | 127 |
* | eResearch Technology, Inc. | 16,800 | 88 |
* | Masimo Corp. | 2,700 | 78 |
* | Facet Biotech Corp. | 6,480 | 61 |
* | Edwards Lifesciences Corp. | 1,000 | 61 |
* | American Medical | | |
| Systems Holdings, Inc. | 5,000 | 56 |
* | Cambrex Corp. | 16,400 | 37 |
* | Watson Pharmaceuticals, Inc. | 800 | 25 |
| Martek Biosciences Corp. | 1,300 | 24 |
* | Hanger Orthopedic Group, Inc. | 1,500 | 20 |
* | Dionex Corp. | 400 | 19 |
* | Thoratec Corp. | 700 | 18 |
| Invacare Corp. | 1,100 | 18 |
| Teleflex Inc. | 400 | 16 |
| | | 15,304 |
Industrials (14.4%) | | |
| Watson Wyatt & | | |
| Co. Holdings | 13,000 | 642 |
* | TransDigm Group, Inc. | 17,900 | 588 |
* | EMCOR Group, Inc. | 33,100 | 568 |
| The Brink’s Co. | 21,400 | 566 |
| Ameron International Corp. | 10,100 | 532 |
| Triumph Group, Inc. | 13,800 | 527 |
| Briggs & Stratton Corp. | 31,800 | 525 |
* | Kirby Corp. | 19,600 | 522 |
| Lennox International Inc. | 18,448 | 488 |
| The Timken Co. | 34,400 | 480 |
| Apogee Enterprises, Inc. | 42,942 | 471 |
* | GrafTech International Ltd. | 74,500 | 459 |
* | Sykes Enterprises, Inc. | 26,057 | 433 |
* | WESCO International, Inc. | 23,900 | 433 |
| GATX Corp. | 20,000 | 405 |
* | Gardner Denver Inc. | 17,900 | 389 |
| Acuity Brands, Inc. | 16,042 | 362 |
| Textainer Group Holdings Ltd. | 51,956 | 351 |
| | | Market |
| | | Value• |
| | Shares | ($000) |
| A.O. Smith Corp. | 13,900 | 350 |
| Robbins & Myers, Inc. | 22,700 | 344 |
| Knoll, Inc. | 54,300 | 333 |
* | First Advantage Corp. | | |
| Class A | 22,800 | 314 |
| Genco Shipping and | | |
| Trading Ltd. | 24,200 | 299 |
* | EnerSys | 23,676 | 287 |
| Werner Enterprises, Inc. | 18,900 | 286 |
* | Genesee & Wyoming Inc. | | |
| Class A | 13,400 | 285 |
* | Esterline Technologies Corp. | 14,100 | 285 |
* | Marten Transport, Ltd. | 14,900 | 278 |
| Deluxe Corp. | 28,000 | 270 |
* | Mastec Inc. | 22,300 | 270 |
* | RSC Holdings Inc. | 50,400 | 265 |
| Titan International, Inc. | 52,700 | 265 |
* | Chart Industries, Inc. | 33,300 | 262 |
| EnergySolutions | 29,400 | 254 |
* | TBS International Ltd. | 33,600 | 247 |
* | Energy Conversion | | |
| Devices, Inc. | 18,500 | 245 |
| Herman Miller, Inc. | 21,600 | 230 |
* | Pike Electric Corp. | 24,300 | 225 |
| Gibraltar Industries Inc. | 43,762 | 207 |
| The Standard Register Co. | 43,160 | 198 |
* | Cenveo Inc. | 57,600 | 187 |
* | Republic Airways | | |
| Holdings Inc. | 28,800 | 187 |
* | Allegiant Travel Co. | 4,000 | 182 |
| Federal Signal Corp. | 33,100 | 174 |
* | Cornell Cos., Inc. | 10,531 | 172 |
| Comfort Systems USA, Inc. | 15,000 | 156 |
| AAON, Inc. | 8,200 | 149 |
| Armstrong Worldwide | | |
| Industries, Inc. | 12,500 | 138 |
* | Blount International, Inc. | 27,779 | 128 |
* | American Reprographics Co. | 33,800 | 120 |
* | US Airways Group Inc. | 45,200 | 114 |
| Lincoln Electric Holdings, Inc. | 3,100 | 98 |
* | American | | |
| Commercial Lines Inc. | 30,300 | 96 |
* | ATC Technology Corp. | 7,900 | 88 |
* | Waste Services, Inc. | 19,946 | 85 |
* | M&F Worldwide Corp. | 3,000 | 35 |
* | Beacon Roofing Supply, Inc. | 2,600 | 35 |
* | Standard Parking Corp. | 1,700 | 28 |
| Encore Wire Corp. | 1,300 | 28 |
| MSC Industrial | | |
| Direct Co., Inc. Class A | 800 | 25 |
* | Powell Industries, Inc. | 693 | 24 |
| Carlisle Co., Inc. | 1,100 | 22 |
* | Alliant Techsystems, Inc. | 300 | 20 |
| | | 17,031 |
13
Strategic Small-Cap Equity Fund
| | | Market |
| | | Value• |
| | Shares | ($000) |
Information Technology (18.4%) | | |
* | Skyworks Solutions, Inc. | 100,700 | 812 |
* | Sybase, Inc. | 23,482 | 711 |
* | Metavante Technologies | 34,600 | 691 |
* | 3Com Corp. | 213,000 | 658 |
* | Starent Networks Corp. | 41,400 | 655 |
* | QLogic Corp. | 56,700 | 630 |
* | PMC Sierra Inc. | 92,600 | 591 |
* | Sohu.com Inc. | 14,100 | 582 |
* | SPSS, Inc. | 20,360 | 579 |
* | Multi-Fineline | | |
| Electronix, Inc. | 33,400 | 562 |
* | Solera Holdings, Inc. | 21,900 | 543 |
* | j2 Global | | |
| Communications, Inc. | 24,500 | 536 |
* | EarthLink, Inc. | 81,300 | 534 |
* | Compuware Corp. | 79,000 | 521 |
* | AsiaInfo Holdings, Inc. | 29,700 | 500 |
| Diebold, Inc. | 23,000 | 491 |
* | Integrated Device | | |
| Technology Inc. | 104,200 | 474 |
* | Genpact, Ltd. | 52,200 | 462 |
* | JDA Software Group, Inc. | 39,400 | 455 |
* | Dolby Laboratories Inc. | 12,380 | 422 |
* | Cabot Microelectronics Corp. | 17,300 | 416 |
* | Gartner, Inc. Class A | 35,700 | 393 |
* | Ultratech, Inc. | 31,000 | 387 |
* | Lawson Software, Inc. | 90,800 | 386 |
* | Anixter International Inc. | 12,000 | 380 |
* | ManTech International Corp. | 8,925 | 374 |
| Syntel, Inc. | 18,152 | 374 |
* | Net 1 UEPS | | |
| Technologies, Inc. | 24,300 | 370 |
* | Plexus Corp. | 26,265 | 363 |
* | MKS Instruments, Inc. | 24,700 | 362 |
* | Avocent Corp. | 28,800 | 350 |
| iGATE Corp. | 106,871 | 346 |
* | Sapient Corp. | 71,900 | 321 |
* | Tekelec | 23,700 | 314 |
* | BigBand Networks Inc. | 45,732 | 300 |
* | CSG Systems International, Inc. | 20,784 | 297 |
* | S1 Corp. | 56,718 | 292 |
* | Cogent Inc. | 23,900 | 284 |
* | Silicon Image, Inc. | 112,500 | 270 |
* | Riverbed Technology, Inc. | 19,400 | 254 |
* | TNS Inc. | 27,300 | 223 |
* | Perot Systems Corp. | 17,100 | 220 |
* | Synaptics Inc. | 7,300 | 195 |
* | Semtech Corp. | 14,500 | 194 |
* | Monolithic Power Systems | 12,100 | 188 |
* | Silicon Laboratories Inc. | 6,900 | 182 |
| Black Box Corp. | 7,500 | 177 |
* | Quantum Corp. | 258,800 | 173 |
* | Emulex Corp. | 34,370 | 173 |
* | SAIC, Inc. | 8,100 | 151 |
| | | Market |
| | | Value• |
| | Shares | ($000) |
* | InterDigital, Inc. | 5,700 | 147 |
* | Microsemi Corp. | 11,800 | 137 |
| Daktronics, Inc. | 20,700 | 136 |
* | Wind River Systems Inc. | 20,900 | 134 |
* | TiVo Inc. | 17,900 | 126 |
| Acxiom Corp. | 15,200 | 112 |
* | Netlogic Microsystems Inc. | 4,000 | 110 |
| Jack Henry & Associates Inc. | 6,600 | 108 |
* | ATMI, Inc. | 4,600 | 71 |
| Micrel, Inc. | 9,500 | 67 |
* | DTS Inc. | 2,686 | 65 |
* | NetScout Systems, Inc. | 8,400 | 60 |
* | IAC/InterActiveCorp | 3,500 | 53 |
* | OSI Systems Inc. | 3,400 | 52 |
* | Ciber, Inc. | 16,200 | 44 |
* | Insight Enterprises, Inc. | 13,800 | 42 |
* | Netezza Corp. | 6,200 | 42 |
* | Harris Stratex Networks, Inc. | | |
| Class A | 10,900 | 42 |
* | NeuStar, Inc. Class A | 2,200 | 37 |
* | Harmonic, Inc. | 5,100 | 33 |
| ADTRAN Inc. | 2,000 | 32 |
* | ScanSource, Inc. | 1,400 | 26 |
* | Cirrus Logic, Inc. | 6,800 | 26 |
* | Comtech | | |
| Telecommunications Corp. | 900 | 22 |
* | TIBCO Software Inc. | 3,500 | 21 |
| Broadridge Financial | | |
| Solutions LLC | 900 | 17 |
* | SINA.com | 500 | 12 |
| | | 21,892 |
Materials (4.1%) | | |
| Compass Minerals | | |
| International, Inc. | 12,200 | 688 |
| Olin Corp. | 38,400 | 548 |
| Rock-Tenn Co. | 18,300 | 495 |
| Silgan Holdings, Inc. | 8,200 | 431 |
| Greif Inc. Class A | 11,034 | 367 |
| Innophos Holdings Inc. | 31,500 | 355 |
| Koppers Holdings, Inc. | 22,400 | 325 |
| Airgas, Inc. | 9,600 | 325 |
| Glatfelter | 43,637 | 272 |
| Worthington Industries, Inc. | 27,700 | 241 |
| Carpenter Technology Corp. | 16,100 | 227 |
| Schnitzer Steel | | |
| Industries, Inc. Class A | 6,100 | 192 |
| Scotts Miracle-Gro Co. | 4,300 | 149 |
* | Buckeye Technology, Inc. | 51,500 | 110 |
| Schweitzer-Mauduit | | |
| International, Inc. | 5,600 | 103 |
| A. Schulman Inc. | 2,200 | 30 |
| AptarGroup Inc. | 700 | 22 |
| Stepan Co. | 600 | 17 |
| | | 4,897 |
14
Strategic Small-Cap Equity Fund
| | | Market |
| | | Value• |
| | Shares | ($000) |
Telecommunication Services (1.7%) | | |
* | Syniverse Holdings Inc. | 36,340 | 573 |
* | Premiere Global | | |
| Services, Inc. | 48,300 | 426 |
* | Cincinnati Bell Inc. | 160,300 | 369 |
| NTELOS Holdings Corp. | 16,900 | 307 |
* | Cogent | | |
| Communications | | |
| Group, Inc. | 16,100 | 116 |
| Atlantic Tele-Network, Inc. | 4,404 | 84 |
* | Centennial | | |
| Communications Corp. | | |
| Class A | 10,110 | 83 |
| | | 1,958 |
Utilities (4.3%) | | |
| Atmos Energy Corp. | 31,800 | 735 |
| Vectren Corp. | 33,500 | 707 |
| NorthWestern Corp. | 28,900 | 621 |
| IDACORP, Inc. | 22,600 | 528 |
| UGI Corp. Holding Co. | 22,200 | 524 |
| WGL Holdings Inc. | 13,600 | 446 |
| Avista Corp. | 30,400 | 419 |
| UIL Holdings Corp. | 13,400 | 299 |
| Aqua America, Inc. | 13,700 | 274 |
| UniSource Energy Corp. | 8,300 | 234 |
| Southwest Gas Corp. | 8,800 | 185 |
| CMS Energy Corp. | 7,200 | 85 |
| Cleco Corp. | 3,500 | 76 |
| South Jersey Industries, Inc. | 600 | 21 |
| | | 5,154 |
Total Common Stocks | | |
(Cost $162,740) | | 116,668 |
Temporary Cash Investments (1.8%)1 | | |
Money Market Fund (0.1%) | | |
2 | Vanguard Market | | |
| Liquidity Fund, 0.440% | 80,073 | 80 |
| | Face | Market |
| | Amount | Value• |
| | ($000) | ($000) |
Commercial Paper (1.5%) | | |
3 | Danske Corp. | | |
| 4.333%, 4/15/09 | 600 | 600 |
| General Electric Capital Corp. | | |
| 3.874%, 4/15/09 | 600 | 600 |
| Santander Central Hispano | | |
| Finance (Delaware), Inc. | | |
| 4.249%, 4/16/09 | 600 | 600 |
| | | 1,800 |
U.S. Government and Agency Obligations (0.2%) |
4,5 | Federal National | | |
| Mortgage Assn., | | |
| 0.401%, 4/20/09 | 200 | 200 |
4,5 | Federal Home Loan | | |
| Mortgage Corp., | | |
| 0.592%, 8/26/09 | 100 | 100 |
| | | 300 |
Total Temporary Cash Investments | |
(Cost $2,177) | | 2,180 |
Total Investments (100.1%) | | |
(Cost $164,917) | | 118,848 |
Other Assets and Liabilities (–0.1%) | |
Other Assets | | 587 |
Liabilities | | (738) |
| | | (151) |
Net Assets (100%) | | |
Applicable to 11,760,162 outstanding | |
$.001 par value shares of beneficial | |
interest (unlimited authorization) | | 118,697 |
Net Asset Value Per Share | | $10.09 |
15
Strategic Small-Cap Equity Fund
At March 31, 2009, net assets consisted of: | |
| Amount |
| ($000) |
Paid-in Capital | 240,465 |
Overdistributed Net | |
Investment Income | (192) |
Accumulated Net Realized Losses | (75,601) |
Unrealized Appreciation (Depreciation) | |
Investment Securities | (46,069) |
Futures Contracts | 94 |
Net Assets | 118,697 |
• | See Note A in Notes to Financial Statements. |
* | Non-income-producing security. |
1 The fund invests a portion of its cash reserves in equity markets through the use of index futures contracts. After giving effect to futures investments, the fund’s effective common stock and temporary cash investment positions represent 100.0% and 0.1%, respectively, of net assets.
2 Affiliated money market fund available only to Vanguard funds and certain trusts and accounts managed by Vanguard. Rate shown is the 7-day yield.
3 Security exempt from registration under Section 4(2) of the Securities Act of 1933. Such securities may be sold in transactions exempt from registration only to dealers in that program or other “accredited investors.” At March 31, 2009, the value of these securities was $600,000, representing 0.5% of net assets.
4 The issuer operates under a congressional charter; its securities are not backed by the full faith and credit of the U.S. government.
5 Securities with a value of $300,000 have been segregated as initial margin for open futures contracts.
REIT—Real Estate Investment Trust.
See accompanying Notes, which are an integral part of the Financial Statements.
16
Strategic Small-Cap Equity Fund
Statement of Operations
| Six Months Ended |
| March 31, 2009 |
| ($000) |
Investment Income | |
Income | |
Dividends | 890 |
Interest1 | 201 |
Security Lending | 50 |
Total Income | 1,141 |
Expenses | |
The Vanguard Group—Note B | |
Investment Advisory Services | 63 |
Management and Administrative | 178 |
Marketing and Distribution | 28 |
Custodian Fees | 15 |
Auditing Fees | 1 |
Shareholders’ Reports | 7 |
Total Expenses | 292 |
Net Investment Income | 849 |
Realized Net Gain (Loss) | |
Investment Securities Sold | (47,202) |
Futures Contracts | (6,321) |
Realized Net Gain (Loss) | (53,523) |
Change in Unrealized Appreciation (Depreciation) | |
Investment Securities | (23,638) |
Futures Contracts | 234 |
Change in Unrealized Appreciation (Depreciation) | (23,404) |
Net Increase (Decrease) in Net Assets Resulting from Operations | (76,078) |
1 Interest income from an affiliated company of the fund was $33,000.
See accompanying Notes, which are an integral part of the Financial Statements.
17
Strategic Small-Cap Equity Fund
Statement of Changes in Net Assets
| Six Months Ended | Year Ended |
| March 31, | September 30, |
| 2009 | 2008 |
| ($000) | ($000) |
Increase (Decrease) in Net Assets | | |
Operations | | |
Net Investment Income | 849 | 1,837 |
Realized Net Gain (Loss) | (53,523) | (20,795) |
Change in Unrealized Appreciation (Depreciation) | (23,404) | (33,359) |
Net Increase (Decrease) in Net Assets Resulting from Operations | (76,078) | (52,317) |
Distributions | | |
Net Investment Income | (1,950) | (2,555) |
Realized Capital Gain1 | — | (1,837) |
Total Distributions | (1,950) | (4,392) |
Capital Share Transactions | | |
Issued | 20,872 | 79,470 |
Issued in Lieu of Cash Distributions | 1,815 | 3,832 |
Redeemed | (25,760) | (83,796) |
Net Increase (Decrease) from Capital Share Transactions | (3,073) | (494) |
Total Increase (Decrease) | (81,101) | (57,203) |
Net Assets | | |
Beginning of Period | 199,798 | 257,001 |
End of Period2 | 118,697 | 199,798 |
1 Includes fiscal 2008 short-term gain distributions totaling $657,000. Short-term gain distributions are treated as ordinary income dividends for tax purposes.
2 Net Assets—End of Period includes undistributed (overdistributed) net investment income of ($192,000) and $909,000.
See accompanying Notes, which are an integral part of the Financial Statements.
18
Strategic Small-Cap Equity Fund
Financial Highlights
| Six Months | | | April 20, |
| Ended | Year Ended | 20061 to |
| March 31, | September 30, | Sept. 30, |
For a Share Outstanding Throughout Each Period | 2009 | 2008 | 2007 | 2006 |
Net Asset Value, Beginning of Period | $16.60 | $21.28 | $19.04 | $20.00 |
Investment Operations | | | | |
Net Investment Income | .072 | .160 | .220 | .090 |
Net Realized and Unrealized Gain (Loss) on Investments | (6.414) | (4.479) | 2.170 | (1.050) |
Total from Investment Operations | (6.342) | (4.319) | 2.390 | (.960) |
Distributions | | | | |
Dividends from Net Investment Income | (.168) | (.210) | (.150) | — |
Distributions from Realized Capital Gains | — | (.151) | — | — |
Total Distributions | (.168) | (.361) | (.150) | — |
Net Asset Value, End of Period | $10.09 | $16.60 | $21.28 | $19.04 |
| | | | |
Total Return2 | –38.33% | –20.50% | 12.58% | –4.85% |
| | | | |
Ratios/Supplemental Data | | | | |
Net Assets, End of Period (Millions) | $119 | $200 | $257 | $180 |
Ratio of Total Expenses to Average Net Assets | 0.44%3 | 0.38% | 0.38% | 0.40%3 |
Ratio of Net Investment Income to Average Net Assets | 1.52%3 | 0.83% | 1.07% | 1.20%3 |
Portfolio Turnover Rate | 88%3 | 99% | 73% | 35% |
| | | | | |
1 Subscription period for the fund was April 20, 2006, to April 24, 2006, during which time all assets were held in money market instruments. Performance measurement began April 24, 2006, at a net asset value of $20.01.
2 Total returns do not include the account service fee that may be applicable to certain accounts with balances below $10,000.
3 Annualized.
See accompanying Notes, which are an integral part of the Financial Statements.
19
Strategic Small-Cap Equity Fund
Notes to Financial Statements
Vanguard Strategic Small-Cap Equity Fund is registered under the Investment Company Act of 1940 as an open-end investment company, or mutual fund.
A. The following significant accounting policies conform to generally accepted accounting principles for U.S. mutual funds. The fund consistently follows such policies in preparing its financial statements.
1. Security Valuation: Securities are valued as of the close of trading on the New York Stock Exchange (generally 4 p.m., Eastern time) on the valuation date. Equity securities are valued at the latest quoted sales prices or official closing prices taken from the primary market in which each security trades; such securities not traded on the valuation date are valued at the mean of the latest quoted bid and asked prices. Securities for which market quotations are not readily available, or whose values have been materially affected by events occurring before the fund’s pricing time but after the close of the securities’ primary markets, are valued by methods deemed by the board of trustees to represent fair value. Investments in Vanguard Market Liquidity Fund are valued at that fund’s net asset value. Temporary cash investments acquired over 60 days to maturity are valued using the latest bid prices or using valuations based on a matrix system (which considers such factors as security prices, yields, maturities, and ratings), both as furnished by independent pricing services. Other temporary cash investments are valued at amortized cost, which approximates market value.
2. Futures Contracts: The fund uses index futures contracts to a limited extent, with the objective of maintaining full exposure to the stock market while maintaining liquidity. The fund may purchase or sell futures contracts to achieve a desired level of investment, whether to accommodate portfolio turnover or cash flows from capital share transactions. The primary risks associated with the use of futures contracts are imperfect correlation between changes in market values of stocks held by the fund and the prices of futures contracts, and the possibility of an illiquid market.
Futures contracts are valued at their quoted daily settlement prices. The aggregate principal amounts of the contracts are not recorded in the Statement of Net Assets. Fluctuations in the value of the contracts are recorded in the Statement of Net Assets as an asset (liability) and in the Statement of Operations as unrealized appreciation (depreciation) until the contracts are closed, when they are recorded as realized futures gains (losses).
3. Federal Income Taxes: The fund intends to continue to qualify as a regulated investment company and distribute all of its taxable income. Management has analyzed the fund’s tax positions taken on federal income tax returns for all open tax years (tax years ended September 30, 2006–2008) and for the period ended March 31, 2009, and has concluded that no provision for federal income tax is required in the fund’s financial statements.
4. Distributions: Distributions to shareholders are recorded on the ex-dividend date.
5. Security Lending: The fund may lend its securities to qualified institutional borrowers to earn additional income. Security loans are required to be secured at all times by collateral at least equal to the market value of securities loaned. The fund invests cash collateral received in Vanguard Market Liquidity Fund, and records a liability for the return of the collateral, during the period the securities are on loan. Security lending income represents the income earned on investing cash collateral, less expenses associated with the loan.
6. Other: Dividend income is recorded on the ex-dividend date. Interest income includes income distributions received from Vanguard Market Liquidity Fund and is accrued daily. Security transactions are accounted for on the date securities are bought or sold. Costs used to determine realized gains (losses) on the sale of investment securities are those of the specific securities sold.
20
Strategic Small-Cap Equity Fund
B. The Vanguard Group furnishes at cost investment advisory, corporate management, administrative, marketing, and distribution services. The costs of such services are allocated to the fund under methods approved by the board of trustees. The fund has committed to provide up to 0.40% of its net assets in capital contributions to Vanguard. At March 31, 2009, the fund had contributed capital of $31,000 to Vanguard (included in Other Assets), representing 0.03% of the fund’s net assets and 0.01% of Vanguard’s capitalization. The fund’s trustees and officers are also directors and officers of Vanguard.
C. Distributions are determined on a tax basis and may differ from net investment income and realized capital gains for financial reporting purposes. Differences may be permanent or temporary. Permanent differences are reclassified among capital accounts in the financial statements to reflect their tax character. Temporary differences arise when certain items of income, expense, gain, or loss are recognized in different periods for financial statement and tax purposes; these differences will reverse at some time in the future. Differences in classification may also result from the treatment of short-term gains as ordinary income for tax purposes.
The fund’s tax-basis capital gains and losses are determined only at the end of each fiscal year. For tax purposes, at September 30, 2008, the fund had available realized losses of $22,223,000 to offset future net capital gains through September 30, 2017. The fund will use these capital losses to offset net taxable capital gains, if any, realized during the year ending September 30, 2009; should the fund realize net capital losses for the year, the losses will be added to the loss carryforward balance above.
At March 31, 2009, the cost of investment securities for tax purposes was $164,917,000. Net unrealized depreciation of investment securities for tax purposes was $46,069,000, consisting of unrealized gains of $4,760,000 on securities that had risen in value since their purchase and $50,829,000 in unrealized losses on securities that had fallen in value since their purchase.
At March 31, 2009, the aggregate settlement value of open futures contracts expiring in June 2009 and the related unrealized appreciation (depreciation) were:
| | | ($000) |
| Number of | Aggregate | Unrealized |
| Long (Short) | Settlement | Appreciation |
Futures Contracts | Contracts | Value | (Depreciation) |
E-mini Russell 2000 Index | 42 | 1,769 | 75 |
S&P Midcap 400 Index | 1 | 244 | 19 |
Unrealized appreciation (depreciation) on open futures contracts is required to be treated as realized gain (loss) for tax purposes.
D. During the six months ended March 31, 2009, the fund purchased $58,324,000 of investment securities and sold $68,001,000 of investment securities, other than temporary cash investments.
21
Strategic Small-Cap Equity Fund
E. Capital shares issued and redeemed were:
| Six Months Ended | Year Ended |
| March 31, 2009 | September 30, 2008 |
| Shares | Shares |
| (000) | (000) |
Issued | 1,826 | 4,152 |
Issued in Lieu of Cash Distributions | 157 | 203 |
Redeemed | (2,256) | (4,398) |
Net Increase (Decrease) in Shares Outstanding | (273) | (43) |
F. In September 2006, the Financial Accounting Standards Board issued Statement of Financial Accounting Standards No. 157 (“FAS 157”), “Fair Value Measurements.” FAS 157 establishes a framework for measuring fair value and expands disclosures about fair value measurements in financial statements.
The various inputs that may be used to determine the value of the fund’s investments are summarized in three broad levels. The inputs or methodologies used for valuing securities are not necessarily an indication of the risk associated with investing in those securities.
Level 1—Quoted prices in active markets for identical securities.
Level 2—Other significant observable inputs (including quoted prices for similar securities, interest rates, prepayment speeds, credit risk, etc.).
Level 3—Significant unobservable inputs (including the fund’s own assumptions used to determine the fair value of investments).
The following table summarizes the fund’s investments as of March 31, 2009, based on the inputs used to value them:
| Investments | Futures |
| in Securities | Contracts |
Valuation Inputs | ($000) | ($000) |
Level 1—Quoted prices | 116,748 | 94 |
Level 2—Other significant observable inputs | 2,100 | — |
Level 3—Significant unobservable inputs | — | — |
Total | 118,848 | 94 |
22
About Your Fund’s Expenses
As a shareholder of the fund, you incur ongoing costs, which include costs for portfolio management, administrative services, and shareholder reports (like this one), among others. Operating expenses, which are deducted from a fund’s gross income, directly reduce the investment return of the fund.
A fund’s expenses are expressed as a percentage of its average net assets. This figure is known as the expense ratio. The following examples are intended to help you understand the ongoing costs (in dollars) of investing in your fund and to compare these costs with those of other mutual funds. The examples are based on an investment of $1,000 made at the beginning of the period shown and held for the entire period.
The accompanying table illustrates your fund’s costs in two ways:
• Based on actual fund return. This helps you to estimate the actual expenses that you paid over the period. The “Ending Account Value” shown is derived from the fund’s actual return, and the third column shows the dollar amount that would have been paid by an investor who started with $1,000 in the fund. You may use the information here, together with the amount you invested, to estimate the expenses that you paid over the period.
To do so, simply divide your account value by $1,000 (for example, an $8,600 account value divided by $1,000 = 8.6), then multiply the result by the number given for your fund under the heading “Expenses Paid During Period.”
• Based on hypothetical 5% yearly return. This section is intended to help you compare your fund’s costs with those of other mutual funds. It assumes that the fund had a yearly return of 5% before expenses, but that the expense ratio is unchanged. In this case—because the return used is not the fund’s actual return—the results do not apply to your investment. The example is useful in making comparisons because the Securities and Exchange Commission requires all mutual funds to calculate expenses based on a 5% return. You can assess your fund’s costs by comparing this hypothetical example with the hypothetical examples that appear in shareholder reports of other funds.
Six Months Ended March 31, 2009 | | | |
| Beginning | Ending | Expenses |
| Account Value | Account Value | Paid During |
Strategic Small-Cap Equity Fund | 9/30/2008 | 3/31/2009 | Period1 |
Based on Actual Fund Return | $1,000.00 | $616.66 | $1.77 |
Based on Hypothetical 5% Yearly Return | 1,000.00 | 1,022.74 | 2.22 |
Note that the expenses shown in the table are meant to highlight and help you compare ongoing costs only and do not reflect transaction costs incurred by the fund for buying and selling securities. Further, the expenses do not include the account service fee described in the prospectus. If such a fee were applied to your account, your costs would be higher. Your fund does not charge transaction fees, such as purchase or redemption fees, nor does it carry a “sales load.”
1 The calculations are based on expenses incurred in the most recent six-month period. The fund’s annualized six-month expense ratio for that period is 0.44%. The dollar amounts shown as “Expenses Paid” are equal to the annualized expense ratio multiplied by the average account value over the period, multiplied by the number of days in the most recent six-month period, then divided by the number of days in the most recent 12-month period.
23
The calculations assume no shares were bought or sold during the period. Your actual costs may have been higher or lower, depending on the amount of your investment and the timing of any purchases or redemptions.
You can find more information about the fund’s expenses, including annual expense ratios, in the Financial Statements section of this report. For additional information on operating expenses and other shareholder costs, please refer to your fund’s current prospectus.
24
Trustees Approve Advisory Arrangement
The board of trustees of Vanguard Strategic Small-Cap Equity Fund has renewed its investment advisory arrangement with The Vanguard Group, Inc. Vanguard—through its Quantitative Equity Group—serves as the fund’s investment advisor. The board determined that continuing the fund’s internalized management structure was in the best interests of the fund and its shareholders.
The board based its decision upon an evaluation of the advisor’s investment staff, portfolio management process, and performance. The trustees considered the factors discussed below, among others. However, no single factor determined whether or not the board approved the arrangement. Rather, it was the totality of the circumstances that drove the board’s decision.
Nature, extent, and quality of services
The board considered the quality of the fund’s investment management since its inception in 2006, and took into account the organizational depth and stability of the advisor. The board noted that Vanguard has been managing investments for more than two decades. George U. Sauter, Vanguard managing director and chief investment officer, has been in the investment management business since 1985, and has led the Quantitative Equity Group since 1987. The Quantitative Equity Group adheres to a sound, disciplined investment management process; the team has considerable experience, stability, and depth.
The board concluded that Vanguard’s experience, stability, depth, and performance, among other factors, warranted continuation of the advisory arrangement.
Investment performance
The board considered the fund’s performance since inception, including periods of outperformance and underperformance of a relevant benchmark and peer group. The board concluded that the advisor has carried out the fund’s investment strategy in disciplined fashion, and that performance results remain competitive. Information about the fund’s most recent performance can be found in the Performance Summary section of this report.
Cost
The board concluded that the fund’s expense ratio was far below the average expense ratio charged by funds in its peer group. The board noted that the fund’s advisory expenses were also well below the peer-group average. Information about the fund’s expense ratio appears in the About Your Fund’s Expenses section of this report as well as in the Financial Statements section.
The board does not conduct a profitability analysis of Vanguard because of Vanguard’s unique “at-cost” structure. Unlike most other mutual fund management companies, Vanguard is owned by the funds it oversees, and produces “profits” only in the form of reduced expenses for fund shareholders.
The benefit of economies of scale
The board of trustees concluded that the fund’s low-cost arrangement with Vanguard ensures that the fund will realize economies of scale as it grows, with the cost to shareholders declining as fund assets increase.
The board will consider whether to renew the advisory arrangement again after a one-year period.
25
Glossary
Earnings Growth Rate. The average annual rate of growth in earnings over the past five years for the stocks now in a fund.
Equity Exposure. A measure that reflects a fund’s investments in stocks and stock futures. Any holdings in short-term reserves are excluded.
Expense Ratio. The percentage of a fund’s average net assets used to pay its annual administrative and advisory expenses. These expenses directly reduce returns to investors.
Foreign Holdings. The percentage of a fund represented by stocks or depositary receipts of companies based outside the United States.
Inception Date. The date on which the assets of a fund (or one of its share classes) are first invested in accordance with the fund’s investment objective. For funds with a subscription period, the inception date is the day after that period ends. Investment performance is measured from the inception date.
Median Market Cap. An indicator of the size of companies in which a fund invests; the midpoint of market capitalization (market price x shares outstanding) of a fund’s stocks, weighted by the proportion of the fund’s assets invested in each stock. Stocks representing half of the fund’s assets have market capitalizations above the median, and the rest are below it.
Price/Book Ratio. The share price of a stock divided by its net worth, or book value, per share. For a fund, the weighted average price/book ratio of the stocks it holds.
Price/Earnings Ratio. The ratio of a stock’s current price to its per-share earnings over the past year. For a fund, the weighted average P/E of the stocks it holds. P/E is an indicator of market expectations about corporate prospects; the higher the P/E, the greater the expectations for a company’s future growth.
Return on Equity. The annual average rate of return generated by a company during the past five years for each dollar of shareholder’s equity (net income divided by shareholder’s equity). For a fund, the weighted average return on equity for the companies whose stocks it holds.
Short-Term Reserves. The percentage of a fund invested in highly liquid, short-term securities that can be readily converted to cash.
Turnover Rate. An indication of the fund’s trading activity. Funds with high turnover rates incur higher transaction costs and may be more likely to distribute capital gains (which may be taxable to investors). The turnover rate excludes in-kind transactions, which have minimal impact on costs.
Yield. A fund’s 30-day SEC yield is derived using a formula specified by the U.S. Securities and Exchange Commission. Under the formula, data related to the fund’s security holdings in the previous 30 days are used to calculate the fund’s hypothetical net income for that period, which is then annualized and divided by the fund’s estimated average net assets over the calculation period. For the purposes of this calculation, a security’s income is based on its current market yield to maturity (in the case of bonds) or its projected dividend yield (for stocks). Because the SEC yield represents hypothetical annualized income, it will differ—at times significantly—from the fund’s actual experience. As a result, the fund’s income distributions may be higher or lower than implied by the SEC yield.
26
This page intentionally left blank.
The People Who Govern Your Fund
The trustees of your mutual fund are there to see that the fund is operated and managed in your best interests since, as a shareholder, you are a part owner of the fund. Your fund’s trustees also serve on the board of directors of The Vanguard Group, Inc., which is owned by the Vanguard funds and provides services to them on an at-cost basis.
A majority of Vanguard’s board members are independent, meaning that they have no affiliation with Vanguard or the funds they oversee, apart from the sizable personal investments they have made as private individuals. The independent board members have distinguished backgrounds in business, academia, and public service. Each of the trustees and executive officers oversees 157 Vanguard funds.
The following table provides information for each trustee and executive officer of the fund. More information about the trustees is in the Statement of Additional Information, which can be obtained, without charge, by contacting Vanguard at 800-662-7447, or online at www.vanguard.com.
Chairman of the Board and Interested Trustee | Rajiv L. Gupta |
| Born 1945. Trustee Since December 2001.2 Principal |
| Occupation(s) During the Past Five Years: Chairman |
John J. Brennan1 | and Chief Executive Officer of Rohm and Haas Co. |
Born 1954. Trustee Since May 1987. Chairman of | (chemicals); President of Rohm and Haas Co. |
the Board. Principal Occupation(s) During the Past Five | (2006–2008); Board Member of American Chemistry |
Years: Chairman of the Board and Director/Trustee of | Council; Director of Tyco International, Ltd. (diversified |
The Vanguard Group, Inc., and of each of the investment | manufacturing and services) and Hewlett-Packard Co. |
companies served by The Vanguard Group; Chief | (electronic computer manufacturing); Trustee of The |
Executive Officer and President of The Vanguard Group | Conference Board. |
and of each of the investment companies served by The | |
Vanguard Group (1996–2008). | |
| Amy Gutmann |
| Born 1949. Trustee Since June 2006. Principal |
Independent Trustees | Occupation(s) During the Past Five Years: President of |
| the University of Pennsylvania; Christopher H. Browne |
| Distinguished Professor of Political Science in the School |
Charles D. Ellis | of Arts and Sciences with Secondary Appointments |
Born 1937. Trustee Since January 2001. Principal | at the Annenberg School for Communication and the |
Occupation(s) During the Past Five Years: Applecore | Graduate School of Education of the University of |
Partners (pro bono ventures in education); Senior | Pennsylvania; Director of Carnegie Corporation of |
Advisor to Greenwich Associates (international business | New York, Schuylkill River Development Corporation, |
strategy consulting); Successor Trustee of Yale University; | and Greater Philadelphia Chamber of Commerce; |
Overseer of the Stern School of Business at New York | Trustee of the National Constitution Center. |
University; Trustee of the Whitehead Institute for | |
Biomedical Research. | |
| JoAnn Heffernan Heisen |
| Born 1950. Trustee Since July 1998. Principal |
Emerson U. Fullwood | Occupation(s) During the Past Five Years: Retired |
Born 1948. Trustee Since January 2008. Principal | Corporate Vice President, Chief Global Diversity Officer, |
Occupation(s) During the Past Five Years: Retired | and Member of the Executive Committee of Johnson & |
Executive Chief Staff and Marketing Officer for North | Johnson (pharmaceuticals/consumer products); Vice |
America and Corporate Vice President of Xerox | President and Chief Information Officer (1997–2005) |
Corporation (photocopiers and printers); Director of | of Johnson & Johnson; Director of the University |
SPX Corporation (multi-industry manufacturing), the | Medical Center at Princeton and Women’s Research |
United Way of Rochester, the Boy Scouts of America, | and Education Institute. |
Amerigroup Corporation (direct health and medical | |
insurance carriers), and Monroe Community College | |
Foundation. | |
André F. Perold | F. William McNabb III1 | |
Born 1952. Trustee Since December 2004. Principal | Born 1957. Chief Executive Officer Since August 2008. |
Occupation(s) During the Past Five Years: George Gund | President Since March 2008. Principal Occupation(s) |
Professor of Finance and Banking, Senior Associate | During the Past Five Years: Director of The Vanguard |
Dean, and Director of Faculty Recruiting, Harvard | Group, Inc., since 2008; Chief Executive Officer and |
Business School; Director and Chairman of UNX, Inc. | President of The Vanguard Group and of each of the |
(equities trading firm); Chair of the Investment | investment companies served by The Vanguard Group |
Committee of HighVista Strategies LLC (private | since 2008; Director of Vanguard Marketing Corporation; |
investment firm). | Managing Director of The Vanguard Group (1995–2008). |
| | |
| | |
Alfred M. Rankin, Jr. | Heidi Stam1 | |
Born 1941. Trustee Since January 1993. Principal | Born 1956. Secretary Since July 2005. Principal |
Occupation(s) During the Past Five Years: Chairman, | Occupation(s) During the Past Five Years: Managing |
President, Chief Executive Officer, and Director of | Director of The Vanguard Group, Inc., since 2006; |
NACCO Industries, Inc. (forklift trucks/housewares/ | General Counsel of The Vanguard Group since 2005; |
lignite); Director of Goodrich Corporation (industrial | Secretary of The Vanguard Group and of each of the |
products/aircraft systems and services). | investment companies served by The Vanguard Group |
| since 2005; Director and Senior Vice President of |
| Vanguard Marketing Corporation since 2005; Principal |
J. Lawrence Wilson | of The Vanguard Group (1997–2006). |
Born 1936. Trustee Since April 1985. Principal | |
Occupation(s) During the Past Five Years: Retired | | |
Chairman and Chief Executive Officer of Rohm and | Vanguard Senior Management Team |
Haas Co. (chemicals); Director of Cummins Inc. (diesel | | |
engines) and AmerisourceBergen Corp. (pharmaceutical | | |
distribution); Trustee of Vanderbilt University and of | R. Gregory Barton | Michael S. Miller |
Culver Educational Foundation. | Mortimer J. Buckley | James M. Norris |
| Kathleen C. Gubanich | Glenn W. Reed |
| Paul A. Heller | George U. Sauter |
Executive Officers | | |
| | |
| Founder | |
Thomas J. Higgins1 | | |
Born 1957. Chief Financial Officer Since September | | |
2008. Principal Occupation(s) During the Past Five | John C. Bogle | |
Years: Principal of The Vanguard Group, Inc.; Chief | Chairman and Chief Executive Officer, 1974–1996 |
Financial Officer of each of the investment companies | | |
served by The Vanguard Group since 2008; Treasurer | | |
of each of the investment companies served by The | | |
Vanguard Group (1998–2008). | | |
| | |
| | |
Kathryn J. Hyatt1 | | |
Born 1955. Treasurer Since November 2008. Principal | | |
Occupation(s) During the Past Five Years: Principal of | | |
The Vanguard Group, Inc.; Treasurer of each of the | | |
investment companies served by The Vanguard | | |
Group since 2008; Assistant Treasurer of each of the | | |
investment companies served by The Vanguard Group | | |
(1988–2008). | | |
1 These individuals are “interested persons” as defined in the Investment Company Act of 1940.
2 December 2002 for Vanguard Equity Income Fund, Vanguard Growth Equity Fund, the Vanguard Municipal Bond Funds, and the Vanguard State Tax-Exempt Funds.
| 
|
| P.O. Box 2600 |
| Valley Forge, PA 19482-2600 |
Connect with Vanguard® > www.vanguard.com
Fund Information > 800-662-7447 | All comparative mutual fund data are from Lipper Inc. |
| or Morningstar, Inc., unless otherwise noted. |
Direct Investor Account Services > 800-662-2739 | |
| |
Institutional Investor Services > 800-523-1036 | You can obtain a free copy of Vanguard’s proxy voting |
| guidelines by visiting our website, www.vanguard.com, |
Text Telephone for People | and searching for “proxy voting guidelines,” or by |
With Hearing Impairment > 800-952-3335 | calling Vanguard at 800-662-2739. The guidelines are |
| also available from the SEC’s website, www.sec.gov. |
| In addition, you may obtain a free report on how your |
| fund voted the proxies for securities it owned during |
This material may be used in conjunction | the 12 months ended June 30. To get the report, visit |
with the offering of shares of any Vanguard | either www.vanguard.com or www.sec.gov. |
fund only if preceded or accompanied by | |
the fund’s current prospectus. | |
| You can review and copy information about your fund |
| at the SEC’s Public Reference Room in Washington, D.C. |
The funds or securities referred to herein are not | To find out more about this public service, call the SEC |
sponsored, endorsed, or promoted by MSCI, and MSCI | at 202-551-8090. Information about your fund is also |
bears no liability with respect to any such funds or | available on the SEC’s website, and you can receive |
securities. For any such funds or securities, the | copies of this information, for a fee, by sending a |
prospectus or the Statement of Additional Information | request in either of two ways: via e-mail addressed to |
contains a more detailed description of the limited | publicinfo@sec.gov or via regular mail addressed to the |
relationship MSCI has with The Vanguard Group and | Public Reference Section, Securities and Exchange |
any related funds. | Commission, Washington, DC 20549-0102. |
| |
| |
Russell is a trademark of The Frank Russell Company. | |
| |
| |
| |
| |
| |
| |
| |
| |
| © 2009 The Vanguard Group, Inc. |
| All rights reserved. |
| Vanguard Marketing Corporation, Distributor. |
| |
| Q6152 052009 |
Item 2: Not Applicable.
Item 3: Not Applicable.
Item 4: Not Applicable.
Item 5: Not Applicable.
Item 6: Not Applicable.
Item 7: Not Applicable.
Item 8: Not Applicable.
Item 9: Not Applicable.
Item 10: Not Applicable.
Item 11: Controls and Procedures.
(a) Disclosure Controls and Procedures. The Principal Executive and Financial Officers concluded that the Registrant's Disclosure Controls and Procedures are effective based on their evaluation of the Disclosure Controls and Procedures as of a date within 90 days of the filing date of this report.
(b) Internal Control Over Financial Reporting. There were no significant changes in Registrant’s Internal Control Over Financial Reporting or in other factors that could significantly affect this control subsequent to the date of the evaluation, including any corrective actions with regard to significant deficiencies and material weaknesses.
Item 12: Exhibits.
Pursuant to the requirements of the Securities Exchange Act of 1934 and the Investment Company Act of 1940, the registrant has duly caused this report to be signed on its behalf by the undersigned, thereunto duly authorized.
| VANGUARD HORIZON FUNDS |
| |
By: | /s/ F. WILLIAM MCNABB III* |
| F. WILLIAM MCNABB III |
| CHIEF EXECUTIVE OFFICER |
| |
Date: May 18, 2009 |
Pursuant to the requirements of the Securities Exchange Act of 1934 and the Investment Company Act of 1940, this report has been signed below by the following persons on behalf of the registrant and in the capacities and on the dates indicated.
| VANGUARD HORIZON FUNDS |
| |
By: | /s/ F. WILLIAM MCNABB III* |
| F. WILLIAM MCNABB III |
| CHIEF EXECUTIVE OFFICER |
| |
Date: May 18, 2009 |
| VANGUARD HORIZON FUNDS |
| |
By: | /s/ THOMAS J. HIGGINS* |
| THOMAS J. HIGGINS |
| CHIEF FINANCIAL OFFICER |
| |
Date: May 18, 2009 |
* By: /s/ Heidi Stam
Heidi Stam, pursuant to a Power of Attorney filed on January 18, 2008, see file Number 2-29601, Incorporated by Reference; and pursuant to a Power of Attorney filed on September 26, 2008, see File Number 2-47371, Incorporated by Reference.