UNITED STATES
SECURITIES AND EXCHANGE COMMISSION
Washington, D.C. 20549
FORM N-CSR
CERTIFIED SHAREHOLDER REPORT
OF
REGISTERED MANAGEMENT INVESTMENT COMPANIES
| | |
| Investment Company Act file number: | 811-07239 |
Name of Registrant: | Vanguard Horizon Funds |
Address of Registrant: | P.O. Box 2600 |
| | Valley Forge, PA 19482 |
Name and address of agent for service: | Heidi Stam, Esquire |
| | P.O. Box 876 |
| | Valley Forge, PA 19482 |
Registrant’s telephone number, including area code: (610) 669-1000 |
Date of fiscal year end: September 30 | |
Date of reporting period: October 1, 2012 – March 31, 2013 |
Item 1: Reports to Shareholders | |

Semiannual Report | March 31, 2013
Vanguard Strategic Equity Fund

> For the six months ended March 31, 2013, Vanguard Strategic Equity Fund
returned about 18%.
> The fund outpaced its benchmark and peer-group funds.
> The strong performance was largely a result of stock selection in the consumer
discretionary, industrial, and energy sectors.
| |
| Contents | |
| Your Fund’s Total Returns. | 1 |
| Chairman’s Letter. | 2 |
| Advisor’s Report. | 7 |
| Fund Profile. | 9 |
| Performance Summary. | 10 |
| Financial Statements. | 11 |
| About Your Fund’s Expenses. | 24 |
| Trustees Approve Advisory Arrangement. | 26 |
| Glossary. | 27 |
Please note: The opinions expressed in this report are just that—informed opinions. They should not be considered promises or advice.
Also, please keep in mind that the information and opinions cover the period through the date on the front of this report. Of course, the
risks of investing in your fund are spelled out in the prospectus.
See the Glossary for definitions of investment terms used in this report.
About the cover: Our cover photograph shows rigging on the HMSSurprise, a replica of an 18th-century Royal Navy frigate. It
was featured in the 2003 movie Master and Commander: The Far Side of the World, which was based on Patrick O’Brian’s sea
novels, set amid the Napoleonic Wars. Vanguard was named for another ship of that era, the HMSVanguard, which was the
flagship of British Admiral Horatio Nelson at the Battle of the Nile.
Your Fund’s Total Returns
| |
| Six Months Ended March 31, 2013 | |
| | Total |
| | Returns |
| Vanguard Strategic Equity Fund | 18.01% |
| MSCI US Small + Mid Cap 2200 Index | 16.33 |
| Mid-Cap Core Funds Average | 15.76 |
| Mid-Cap Core Funds Average: Derived from data provided by Lipper Inc. |
| | | | |
| Your Fund’s Performance at a Glance | | | | |
| September 30, 2012, Through March 31, 2013 | | | | |
| | | | Distributions Per Share |
| | Starting | Ending | Income | Capital |
| | Share Price | Share Price | Dividends | Gains |
| Vanguard Strategic Equity Fund | $21.02 | $24.40 | $0.350 | $0.000 |
1

Chairman’s Letter
Dear Shareholder,
During the six months ended March 31, 2013, investors’ anxieties about corporate profits, the fiscal U.S. deficit, and fresh troubles in Europe gave way to greater optimism about the strength of the U.S. economy, especially with regard to the labor and housing markets.
The improvement in market sentiment led to a shift away from safer assets toward riskier investments offering potentially higher returns, a trend that favored small-and mid-capitalization stocks more than their large-cap counterparts.
Vanguard Strategic Equity Fund returned 18.01% for the six months ended March 31, 2013, more than 1 percentage point above the return of its benchmark index (16.33%) and more than 2 percentage points ahead of the average return for peer funds (15.76%).
The fund’s gains were broad-based. Eight of ten industry sectors posted double-digit returns. In relative terms, the fund’s sectors performed roughly in line with or a little below those of the benchmark. The exceptions were consumer discretionary, industrials, and energy, where strong stock selection led to returns of more than 20% in each of the three sectors.
Global equity markets delivered a powerful rally
Global stocks advanced for the fifth straight month to finish the half-year ended March 31 with impressive gains. The Standard & Poor’s 500 Index closed
2
at a record high on the period’s final business day after global financial markets in recent months shrugged off the U.S. “fiscal cliff” crisis, the unsettled Italian national elections, and a controversial bailout package for Cyprus.
Peter Westaway, Vanguard’s chief European economist, said that the latest developments in Europe had been “rather bad,” but that the market had for the most part already priced in these events. “As always,” he said, “we think investors should assess their portfolios carefully and avoid making impulsive moves.”
U.S. equities returned more than 11% as the economic recovery slowly built momentum, the housing market rebounded further, and the labor market improved.
International equities were up more than 9%. Returns were about 16% in the Pacific region, where Japan’s accommodative monetary policy has helped spark the nation’s stock market, and nearly 10% in Europe. Emerging-markets stocks rose about 4%.
Bond returns barely budged as yields lingered near lows
The broad U.S. taxable bond market scraped out a minuscule gain of 0.09% for the half-year as U.S. Treasury yields remained just slightly above their all-time lows. Although the yield of the benchmark
10-year Treasury note increased during the six months and topped 2.00% at various times, it closed the period at about 1.85%. (Bond prices and yields move in opposite directions.)
| | | |
| Market Barometer | | | |
| |
| | Total Returns |
| | Periods Ended March 31, 2013 |
| | Six | One | Five Years |
| | Months | Year | (Annualized) |
| Stocks | | | |
| Russell 1000 Index (Large-caps) | 11.10% | 14.43% | 6.15% |
| Russell 2000 Index (Small-caps) | 14.48 | 16.30 | 8.24 |
| Russell 3000 Index (Broad U.S. market) | 11.35 | 14.56 | 6.32 |
| MSCI All Country World Index ex USA (International) | 9.20 | 8.36 | -0.39 |
| |
| Bonds | | | |
| Barclays U.S. Aggregate Bond Index (Broad taxable market) | 0.09% | 3.77% | 5.47% |
| Barclays Municipal Bond Index (Broad tax-exempt market) | 0.96 | 5.25 | 6.10 |
| Citigroup Three-Month U.S. Treasury Bill Index | 0.05 | 0.08 | 0.30 |
| |
| CPI | | | |
| Consumer Price Index | 0.59% | 1.47% | 1.74% |
3
Municipal bonds returned almost 1% for the six months despite price declines in March. And returns of money market funds and savings accounts barely registered as short-term interest rates remained between 0% and 0.25%, under the Federal Reserve’s four-year-old policy.
Robert Auwaerter, head of Vanguard’s Fixed Income Group, doesn’t anticipate abrupt policy changes from the central bank. “We don’t see the Fed changing course in the near term,” he said, “and when the Fed does, we expect it’ll go slowly so as not to undo the efforts made to keep interest rates low and to stimulate the economy.”
The fund’s quantitative model found pockets of outperformance
Not all quantitative funds are the same; their investment strategies vary greatly, and so do the models they rely on to execute those strategies. As explained in more detail in the Advisor’s Report that follows, Vanguard’s Equity Investment Group, which manages this fund, uses a proprietary quantitative model to compare approximately 2,200 small- and mid-cap U.S. stocks. The aim is to single out those the model indicates are most likely to outperform over the long term because of their attractive valuations, strong balance sheets, and positive earnings momentum. The advisor counts on its choice of stocks
| | |
| Expense Ratios | | |
| Your Fund Compared With Its Peer Group | | |
| | | Peer Group |
| | Fund | Average |
| Strategic Equity Fund | 0.29% | 1.23% |
The fund expense ratio shown is from the prospectus dated January 25, 2013, and represents estimated costs for the current fiscal year. For
the six months ended March 31, 2013, the fund’s annualized expense ratio was 0.28%. The peer-group expense ratio is derived from data
provided by Lipper Inc. and captures information through year-end 2012.
Peer group: Mid-Cap Core Funds.
4
(which totaled about 420 on March 31) to outpace the benchmark without taking on additional risk through market capitalization tilts or sector bets.
The fund’s model was successful over the six-month period in generating a return for the fund that exceeded its benchmark’s by 1.68 percentage points. Quantitative analysis relating to quality (the strength of a company’s balance sheet and the sustainability of its earnings) and especially valuation (which measures the price the advisor pays for earnings and cash flows) helped identify stocks that significantly outperformed their peers in three of the benchmark’s ten sectors. A limited number of holdings among restaurants, casinos, media companies, and retailers helped the consumer discretionary sector make a big contribution to the fund’s performance. It returned about 23%, compared with about 17% for the benchmark.
The fund’s choices in industrials led to a sector return of about 32%, compared with about 26% for its counterpart in the benchmark. A few airline stocks in the portfolio soared on further consolidation in the industry, which should lead to greater pricing power and higher margins. Construction-related stocks were another bright spot.
Energy stocks returned about 23% for the fund, compared with more than 14% for the benchmark. A large part of the fund’s outperformance came from a handful of
holdings in oil and gas refining. Margins in this business traditionally tend to be quite low, but recent expansion in domestic oil production helped lower costs, which translated into higher profits.
Among the other sectors, health care and consumer staples tempered the fund’s result compared with that of the benchmark.
Low cost is key no matter how a fund is managed
Keeping costs low has been a key part of our index funds’ success—the less expensive it is for an index fund to track its benchmark, the more returns get passed on to its investors.
But the same principle—low cost—is just as important to our actively managed funds. Outperforming an index through active management has historically proven to be a challenge in itself, so the higher management fees and transaction costs associated with such funds tend to set the bar for outperforming even higher.
That’s why, regardless of a fund’s management style, at Vanguard we focus on trying to give investors the best chance for investment success by keeping our fund costs low. (You can read an analysis of the impact of costs on the performance of actively managed funds in The Case for Vanguard Active Management: Solving the Low-Cost/Top-Talent Paradox? at vanguard. com/research.)
5
The low-cost advantage doesn’t guarantee outperformance, of course. Even in those cases where an active stock fund outper-forms over long periods, it doesn’t necessarily mean that investors earned more than the index results every year—or even every decade. And investors have no way of knowing beforehand which funds will outperform.
But for those willing to accept the greater risks that come with active investing, we believe Vanguard’s low costs, along with our talented advisors, can improve the odds.
As always, thank you for entrusting your assets to Vanguard.
Sincerely,

F. William McNabb III
Chairman and Chief Executive Officer
April 16, 2013
6
Advisor’s Report
For the six-month period ended March 31, 2013, Vanguard Strategic Equity Fund returned 18.01%, outperforming its benchmark by 1.68 percentage points.
While U.S. equities in general experienced above-average returns, the mid- and small-capitalization stocks in the fund’s benchmark, the MSCI US Small + Mid Cap 2200 Index (16.33%), outpaced larger-cap equities, as measured by the MSCI US
Large Cap 300 Index (9.46%). Performance within the benchmark was broad-based, with nine of ten sectors generating positive returns. Market returns were best in industrials, consumer staples, and financials. Telecommunication services was the sole negative performer for the semiannual period.
The returns of the two quarters were quite different. During the final quarter of 2012, the benchmark was up around 3% as investors dealt with the election results and Hurricane Sandy while contemplating the potential repercussions of the looming “fiscal cliff.” Fortunately, Congress and
President Obama finally reached an agreement early in the new year, averting the worst of the fiscal cliff, including certain tax hikes that would probably have put the anemic recovery at risk. Investor fears seemed to abate and cash came into the U.S. equity market, helping to push mid- and small-cap stocks up 13.14% for the first quarter of 2013.
Over the six months, volatility in equity returns declined relative to most of 2012—a year in which volatility was driven in large part by global macroeconomic events. Sentiment about lackluster global economic growth, European and U.S. central bank actions, and the fiscal cliff contributed significantly to market volatility during the year. While the United States is not without its problems, our modest economic recovery is expected to continue. Corporate balance sheets remain strong, there is ample liquidity in the economy, housing data continue to improve, and unemployment statistics are moving in the right direction, although at a snail’s pace.
The fluctuations in the direction of the market reinforced our conviction that attempting to time investments is not profitable. Our aim, instead, is to identify individual stocks that have characteristics that will enable them to outperform over the long run. We select stocks by using a model with five components: valuation, growth, management decisions, market sentiment, and quality. We then construct our portfolio, with the goal of minimizing exposure to risks that our research indicates do not improve returns.
Our risk-control process neutralizes our exposure to market-capitalization, volatility, and industry risks relative to our bench-mark. In our view, such risk exposures
7
are not justified by the rewards. The effect of these risk controls can be seen by analyzing the fund’s tracking error
(a measure of performance volatility relative to its benchmark). The trailing three-year tracking error of 2.3% is well within an acceptable range given the risk tolerance for this fund.
The results from our stock selection model were encouraging over the last six months as we had positive contributions from four of our five components. Our valuation measurement was our strongest performer, while the manage-ment decisions component was relatively neutral over the period.
The model’s effectiveness over the period across sectors was mixed, as we were able to produce positive stock selection results in four of the ten sectors in the benchmark, with the strongest results in consumer discretionary and industrials. Selection results were neutral in four sectors, while we underperformed in consumer staples and health care.
At the individual stock level, the largest return contributions came from overweight positions in Delta Air Lines, Virgin Media, and Western Refining. In addition, when comparing the portfolio’s performance with that of its benchmark, we benefited
from underweighting or avoiding poor-performing stocks such as Cliffs Natural Resources and Allied Nevada Gold.
Unfortunately, we could not avoid all bad performers. Overweight positions in IAC/ InterActive, Affymax, and Wellcare Health Plans were a drag on performance. Also, underweighting Netflix, United Continental, and Micron Technology hurt our overall outperformance relative to our benchmark.
We thank you for your investment and look forward to the second half of the fiscal year.
James D. Troyer, CFA
Principal and Portfolio Manager
James P. Stetler
Principal and Portfolio Manager
Michael R. Roach, CFA
Portfolio Manager
Vanguard Equity Investment Group
April 22, 2013
8
Strategic Equity Fund
Fund Profile
As of March 31, 2013
| | | |
| Portfolio Characteristics | | | |
| | | MSCI US | DJ U.S. |
| | | Small + | Total |
| | | Mid Cap | Market |
| | | 2200 | FA |
| | Fund | Index | Index |
| Number of Stocks | 420 | 2,165 | 3,586 |
| Median Market Cap | $4.2B | $4.7B | $40.0B |
| Price/Earnings Ratio | 16.2x | 23.0x | 18.1x |
| Price/Book Ratio | 2.4x | 2.2x | 2.3x |
| Return on Equity | 10.4% | 11.4% | 16.6% |
| Earnings Growth Rate | 11.6% | 8.5% | 9.6% |
| Dividend Yield | 1.4% | 1.4% | 2.0% |
| Foreign Holdings | 0.0% | 0.0% | 0.0% |
| Turnover Rate | | | |
| (Annualized) | 63% | — | — |
| Ticker Symbol | VSEQX | — | — |
| Expense Ratio1 | 0.29% | — | — |
| 30-Day SEC Yield | 1.10% | — | — |
| Short-Term Reserves | 0.4% | — | — |
| | | |
| Sector Diversification (% of equity exposure) |
| | | MSCI US | DJ U.S. |
| | | Small + | Total |
| | | Mid Cap | Market |
| | | 2200 | FA |
| | Fund | Index | Index |
| Consumer Discretionary | 15.6% | 16.2% | 12.4% |
| Consumer Staples | 4.9 | 4.5 | 9.5 |
| Energy | 6.7 | 7.1 | 10.1 |
| Financials | 20.7 | 20.4 | 17.3 |
| Health Care | 10.5 | 10.6 | 12.2 |
| Industrials | 14.3 | 14.4 | 11.1 |
| Information Technology | 15.6 | 15.1 | 17.4 |
| Materials | 5.8 | 6.0 | 3.8 |
| Telecommunication | | | |
| Services | 0.5 | 0.8 | 2.6 |
| Utilities | 5.4 | 4.9 | 3.6 |
| | |
| Volatility Measures | | |
| | MSCI US | DJ U.S. |
| | Small + | Total |
| | Mid Cap | Market |
| | 2200 | FA |
| | Index | Index |
| R-Squared | 0.99 | 0.95 |
| Beta | 1.03 | 1.18 |
| These measures show the degree and timing of the fund’s fluctuations compared with the indexes over 36 months. |
| | |
| Ten Largest Holdings (% of total net assets) |
| Delta Air Lines Inc. | Airlines | 1.1% |
| Western Digital Corp. | Computer Storage & | |
| | Peripherals | 1.0 |
| O'Reilly Automotive Inc. | Automotive Retail | 1.0 |
| Seagate Technology plc | Computer Storage & | |
| | Peripherals | 1.0 |
| Actavis Inc. | Pharmaceuticals | 1.0 |
| Tesoro Corp. | Oil & Gas Refining & | |
| | Marketing | 0.9 |
| Textron Inc. | Aerospace & | |
| | Defense | 0.9 |
| Triumph Group Inc. | Aerospace & | |
| | Defense | 0.9 |
| Harley-Davidson Inc. | Motorcycle | |
| | Manufacturers | 0.9 |
| ResMed Inc. | Health Care | |
| | Equipment | 0.9 |
| Top Ten | | 9.6% |
| The holdings listed exclude any temporary cash investments and equity index products. |
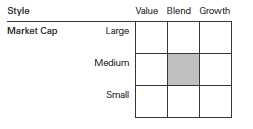
Investment Focus
1 The expense ratio shown is from the prospectus dated January 25, 2013, and represents estimated costs for the current fiscal year. For the
six months ended March 31, 2013, the annualized expense ratio was 0.28%.
9
Strategic Equity Fund
Performance Summary
All of the returns in this report represent past performance, which is not a guarantee of future results that may be achieved by the fund. (Current performance may be lower or higher than the performance data cited. For performance data current to the most recent month-end, visit our website at vanguard.com/performance.) Note, too, that both investment returns and principal value can fluctuate widely, so an investor’s shares, when sold, could be worth more or less than their original cost. The returns shown do not reflect taxes that a shareholder would pay on fund distributions or on the sale of fund shares.
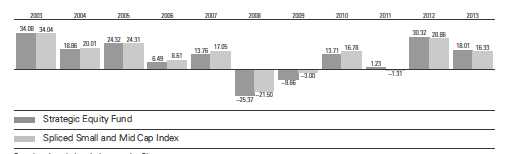
Fiscal-Year Total Returns (%): September 30, 2002, Through March 31, 2013
For a benchmark description, see the Glossary.
Note: For 2013, performance data reflect the six months ended March 31, 2013.
| | | | |
| Average Annual Total Returns: Periods Ended March 31, 2013 | | | |
| |
| | Inception | One | Five | Ten |
| | Date | Year | Years | Years |
| Strategic Equity Fund | 8/14/1995 | 18.46% | 7.34% | 10.63% |
See Financial Highlights for dividend and capital gains information.
10
Strategic Equity Fund
Financial Statements (unaudited)
Statement of Net Assets
As of March 31, 2013
The fund reports a complete list of its holdings in regulatory filings four times in each fiscal year, at the quarter-ends. For the second and fourth fiscal quarters, the lists appear in the fund’s semiannual and annual reports to shareholders. For the first and third fiscal quarters, the fund files the lists with the Securities and Exchange Commission on Form N-Q. Shareholders can look up the fund’s Forms N-Q on the SEC’s website at sec.gov. Forms N-Q may also be reviewed and copied at the SEC’s Public Reference Room (see the back cover of this report for further information).
| | | |
| | | | Market |
| | | | Value |
| | | Shares | ($000) |
| Common Stocks (99.4%)1 | | |
| Consumer Discretionary (15.5%) | |
| * | O’ReillyAutomotive Inc. | 369,500 | 37,892 |
| | Harley-Davidson Inc. | 636,200 | 33,909 |
| | Wyndham Worldwide Corp. | 513,900 | 33,136 |
| * | PulteGroup Inc. | 1,521,500 | 30,795 |
| | Dillard’s Inc. Class A | 315,370 | 24,772 |
| | ExpediaInc. | 396,150 | 23,773 |
| | Gannett Co. Inc. | 1,036,200 | 22,662 |
| ^ | Buckle Inc. | 445,000 | 20,759 |
| | Brinker International Inc. | 516,950 | 19,463 |
| | Domino’s Pizza Inc. | 375,720 | 19,327 |
| *,^ | Coinstar Inc. | 302,190 | 17,654 |
| ^ | Regal Entertainment | | |
| | Group Class A | 1,029,900 | 17,168 |
| * | Jarden Corp. | 346,950 | 14,867 |
| ^ | Sturm Ruger & Co. Inc. | 273,700 | 13,885 |
| | Foot Locker Inc. | 400,000 | 13,696 |
| * | Conn’s Inc. | 358,900 | 12,884 |
| * | Tenneco Inc. | 277,995 | 10,928 |
| | PetSmart Inc. | 169,700 | 10,538 |
| | Sinclair Broadcast | | |
| | Group Inc. Class A | 502,640 | 10,173 |
| | Virgin Media Inc. | 203,900 | 9,985 |
| | Thor Industries Inc. | 251,500 | 9,253 |
| | Polaris Industries Inc. | 92,482 | 8,554 |
| *,^ | Smith& Wesson | | |
| | Holding Corp. | 934,500 | 8,410 |
| | American Eagle | | |
| | Outfitters Inc. | 447,600 | 8,370 |
| | Starwood Hotels & | | |
| | Resorts Worldwide Inc. | 129,400 | 8,247 |
| | PVH Corp. | 75,000 | 8,011 |
| | H&R Block Inc. | 250,300 | 7,364 |
| * | ANN Inc. | 253,400 | 7,354 |
| | Cheesecake Factory Inc. | 185,500 | 7,162 |
| | Newell Rubbermaid Inc. | 261,600 | 6,828 |
| | Genuine Parts Co. | 85,000 | 6,630 |
| * | LeapFrog Enterprises Inc. | 702,400 | 6,013 |
| | | |
| | Whirlpool Corp. | 48,900 | 5,793 |
| | Abercrombie & Fitch Co. | 123,600 | 5,710 |
| | Dana Holding Corp. | 284,500 | 5,073 |
| | Brown Shoe Co. Inc. | 312,300 | 4,997 |
| * | Grand Canyon | | |
| | Education Inc. | 180,300 | 4,578 |
| * | Jack in the Box Inc. | 128,200 | 4,434 |
| | Stage Stores Inc. | 160,900 | 4,164 |
| | Leggett & Platt Inc. | 118,200 | 3,993 |
| | NACCO Industries Inc. | | |
| | Class A | 71,600 | 3,821 |
| | Rent-A-Center Inc. | 103,400 | 3,820 |
| * | Goodyear Tire & | | |
| | Rubber Co. | 291,300 | 3,673 |
| * | Mohawk Industries Inc. | 30,900 | 3,495 |
| * | TRW Automotive | | |
| | Holdings Corp. | 60,400 | 3,322 |
| | Cracker Barrel Old | | |
| | Country Store Inc. | 40,800 | 3,299 |
| | Nordstrom Inc. | 54,400 | 3,004 |
| | Brunswick Corp. | 81,700 | 2,796 |
| * | Lamar Advertising Co. | | |
| | Class A | 53,300 | 2,591 |
| | Lear Corp. | 44,400 | 2,436 |
| * | Liberty Interactive Corp. | | |
| | Class A | 104,300 | 2,230 |
| * | Charter Communications | | |
| | Inc. Class A | 20,800 | 2,167 |
| | Service Corp. International | 128,200 | 2,145 |
| * | Hanesbrands Inc. | 46,200 | 2,105 |
| | GameStop Corp. Class A | 75,100 | 2,101 |
| | Scholastic Corp. | 78,000 | 2,079 |
| * | Red Robin Gourmet | | |
| | Burgers Inc. | 43,300 | 1,974 |
| | Cooper Tire & Rubber Co. | 74,900 | 1,922 |
| | International Game | | |
| | Technology | 115,000 | 1,897 |
| * | Marriott Vacations | | |
| | Worldwide Corp. | 41,500 | 1,781 |
11
| | | |
| Strategic Equity Fund | | |
| |
| |
| |
| | | | Market |
| | | | Value |
| | | Shares | ($000) |
| | Chico’s FAS Inc. | 105,800 | 1,777 |
| | Dunkin’ Brands Group Inc. | 47,800 | 1,763 |
| * | Journal Communications | | |
| | Inc. Class A | 215,261 | 1,447 |
| ^ | Blyth Inc. | 74,600 | 1,295 |
| | OfficeMaxInc. | 69,750 | 810 |
| | | | 588,954 |
| Consumer Staples (4.9%) | | |
| * | Dean Foods Co. | 1,623,704 | 29,438 |
| | Ingredion Inc. | 328,600 | 23,764 |
| | CloroxCo. | 205,800 | 18,219 |
| | JM Smucker Co. | 147,800 | 14,656 |
| ^ | Herbalife Ltd. | 315,978 | 11,833 |
| | Energizer Holdings Inc. | 117,500 | 11,718 |
| | Safeway Inc. | 398,100 | 10,490 |
| | Universal Corp. | 157,800 | 8,843 |
| | Tyson Foods Inc. Class A | 350,000 | 8,687 |
| | Lancaster Colony Corp. | 108,519 | 8,356 |
| | Coca-Cola Enterprises Inc. | 203,500 | 7,513 |
| * | Rite Aid Corp. | 3,486,300 | 6,624 |
| ^ | SUPERVALUInc. | 1,189,400 | 5,995 |
| | Sanderson Farms Inc. | 96,900 | 5,293 |
| | Nu Skin Enterprises Inc. | | |
| | Class A | 100,900 | 4,460 |
| * | Green Mountain | | |
| | Coffee Roasters Inc. | 64,300 | 3,650 |
| *,^ | USANA Health | | |
| | Sciences Inc. | 65,700 | 3,175 |
| * | Pilgrim’s Pride Corp. | 229,900 | 2,113 |
| * | Central Garden and | | |
| | Pet Co. Class A | 60,800 | 500 |
| | | | 185,327 |
| Energy (6.7%) | | |
| | Tesoro Corp. | 611,600 | 35,809 |
| | Helmerich & Payne Inc. | 482,092 | 29,263 |
| | Western Refining Inc. | 797,400 | 28,236 |
| | Core Laboratories NV | 192,000 | 26,481 |
| | Delek US Holdings Inc. | 554,800 | 21,893 |
| * | Rosetta Resources Inc. | 311,645 | 14,828 |
| | Energy XXI Bermuda Ltd. | 531,200 | 14,459 |
| | HollyFrontier Corp. | 257,700 | 13,259 |
| | Cabot Oil & Gas Corp. | 145,000 | 9,804 |
| * | Stone Energy Corp. | 323,212 | 7,030 |
| | Rentech Inc. | 2,371,200 | 5,572 |
| * | EPLOil & Gas Inc. | 190,800 | 5,115 |
| * | Plains Exploration & | | |
| | Production Co. | 102,400 | 4,861 |
| * | ExterranHoldings Inc. | 153,600 | 4,147 |
| * | Denbury Resources Inc. | 209,800 | 3,913 |
| | Alon USA Energy Inc. | 204,900 | 3,903 |
| * | Geospace Technologies | | |
| | Corp. | 34,500 | 3,723 |
| * | Vaalco Energy Inc. | 460,100 | 3,492 |
| | | |
| * | Hornbeck Offshore | | |
| | Services Inc. | 70,000 | 3,252 |
| | Bristow Group Inc. | 34,300 | 2,262 |
| * | Ultra Petroleum Corp. | 111,400 | 2,239 |
| | Diamond Offshore | | |
| | Drilling Inc. | 29,300 | 2,038 |
| | RPC Inc. | 129,400 | 1,963 |
| * | ION Geophysical Corp. | 280,100 | 1,908 |
| | Patterson-UTI Energy Inc. | 78,200 | 1,864 |
| | Berry Petroleum Co. | | |
| | Class A | 18,800 | 870 |
| | | | 252,184 |
| Financials (20.4%) | | |
| | Huntington | | |
| | Bancshares Inc. | 4,332,800 | 32,019 |
| | Torchmark Corp. | 488,795 | 29,230 |
| | KeyCorp | 2,599,930 | 25,895 |
| *,^ | World Acceptance Corp. | 299,819 | 25,745 |
| | Discover Financial Services | 569,925 | 25,555 |
| * | Arch Capital Group Ltd. | 484,226 | 25,456 |
| | American Financial | | |
| | Group Inc. | 502,189 | 23,794 |
| | NASDAQ OMX Group Inc. | 729,200 | 23,553 |
| | Regions Financial Corp. | 2,460,300 | 20,150 |
| | Host Hotels & | | |
| | Resorts Inc. | 1,097,100 | 19,188 |
| | Assurant Inc. | 409,700 | 18,441 |
| | CapitalSource Inc. | 1,779,900 | 17,123 |
| | Kimco Realty Corp. | 759,500 | 17,013 |
| | Allied World Assurance | | |
| | Co. Holdings AG | 170,900 | 15,846 |
| | Moody’s Corp. | 290,900 | 15,511 |
| | OmegaHealthcare | | |
| | Investors Inc. | 440,600 | 13,377 |
| | Weingarten Realty | | |
| | Investors | 419,500 | 13,235 |
| | Protective Life Corp. | 349,800 | 12,523 |
| | ExtraSpace Storage Inc. | 313,540 | 12,313 |
| | Brandywine Realty Trust | 806,832 | 11,981 |
| | CBL& Associates | | |
| | Properties Inc. | 499,374 | 11,785 |
| | First Industrial | | |
| | Realty Trust Inc. | 687,825 | 11,782 |
| | East West Bancorp Inc. | 454,200 | 11,659 |
| ^ | Lexington Realty Trust | 952,700 | 11,242 |
| | EPRProperties | 215,200 | 11,201 |
| | Douglas Emmett Inc. | 448,200 | 11,174 |
| | Ryman Hospitality | | |
| | Properties | 240,500 | 11,003 |
| * | Sunstone Hotel | | |
| | Investors Inc. | 881,000 | 10,845 |
| | DCT Industrial Trust Inc. | 1,460,300 | 10,806 |
| | Regency Centers Corp. | 202,700 | 10,725 |
| * | American Capital Ltd. | 713,089 | 10,408 |
12
| | | |
| Strategic Equity Fund | | |
| |
| |
| |
| | | | Market |
| | | | Value |
| | | Shares | ($000) |
| | Post Properties Inc. | 215,300 | 10,141 |
| | National Retail | | |
| | Properties Inc. | 271,100 | 9,806 |
| * | St. Joe Co. | 417,200 | 8,866 |
| | Nelnet Inc. Class A | 234,312 | 7,920 |
| * | Credit Acceptance Corp. | 62,622 | 7,649 |
| | Pennsylvania REIT | 390,400 | 7,570 |
| | Medical Properties | | |
| | Trust Inc. | 461,000 | 7,394 |
| | Bank of Hawaii Corp. | 141,900 | 7,210 |
| | Validus Holdings Ltd. | 186,600 | 6,973 |
| | Montpelier Re | | |
| | Holdings Ltd. | 244,300 | 6,364 |
| | EverestRe Group Ltd. | 47,400 | 6,155 |
| | Apartment Investment & | | |
| | Management Co. Class A | 190,200 | 5,832 |
| | Platinum Underwriters | | |
| | Holdings Ltd. | 103,000 | 5,748 |
| | Macerich Co. | 88,500 | 5,698 |
| | Primerica Inc. | 171,100 | 5,609 |
| * | Portfolio Recovery | | |
| | Associates Inc. | 42,500 | 5,394 |
| | Lincoln National Corp. | 163,300 | 5,325 |
| | Retail Properties of | | |
| | America Inc. | 345,100 | 5,107 |
| *,^ | Nationstar Mortgage | | |
| | Holdings Inc. | 138,400 | 5,107 |
| * | Howard Hughes Corp. | 58,800 | 4,928 |
| | Realty Income Corp. | 105,600 | 4,789 |
| | Umpqua Holdings Corp. | 338,000 | 4,482 |
| | Provident Financial | | |
| | Services Inc. | 293,425 | 4,481 |
| * | Texas Capital | | |
| | Bancshares Inc. | 110,600 | 4,474 |
| | Unum Group | 151,300 | 4,274 |
| * | Forest City Enterprises | | |
| | Inc. Class A | 233,800 | 4,155 |
| | Liberty Property Trust | 99,200 | 3,943 |
| | Sovran Self Storage Inc. | 59,800 | 3,857 |
| | Cathay General Bancorp | 185,510 | 3,732 |
| | Home Properties Inc. | 55,500 | 3,520 |
| | Hospitality | | |
| | Properties Trust | 125,200 | 3,436 |
| | Apollo Residential | | |
| | Mortgage Inc. | 153,400 | 3,419 |
| | PartnerRe Ltd. | 36,600 | 3,408 |
| | CNOFinancial Group Inc. | 277,200 | 3,174 |
| * | First Cash Financial | | |
| | Services Inc. | 53,200 | 3,104 |
| * | iStar Financial Inc. | 279,055 | 3,039 |
| | PrivateBancorp Inc. | 152,500 | 2,884 |
| | Axis Capital Holdings Ltd. | 64,400 | 2,680 |
| | Ramco-Gershenson | | |
| | Properties Trust | 148,300 | 2,491 |
| | | |
| * | Ocwen Financial Corp. | 60,900 | 2,309 |
| | National Penn | | |
| | Bancshares Inc. | 210,800 | 2,253 |
| | HCC Insurance Holdings Inc. | 53,400 | 2,244 |
| | STAGIndustrial Inc. | 104,300 | 2,218 |
| | Webster Financial Corp. | 90,500 | 2,196 |
| * | FlagstarBancorp Inc. | 157,100 | 2,188 |
| | Home Loan Servicing | | |
| | Solutions Ltd. | 90,900 | 2,121 |
| | RenaissanceRe | | |
| | Holdings Ltd. | 22,300 | 2,051 |
| | Corporate Office | | |
| | Properties Trust | 76,000 | 2,028 |
| | Stewart Information | | |
| | Services Corp. | 77,400 | 1,971 |
| | Federated Investors Inc. | | |
| | Class B | 83,100 | 1,967 |
| | Synovus Financial Corp. | 706,400 | 1,957 |
| | Susquehanna | | |
| | Bancshares Inc. | 157,400 | 1,957 |
| | Geo Group Inc. | 51,600 | 1,941 |
| | BOK Financial Corp. | 31,121 | 1,939 |
| | Associated Banc-Corp | 126,000 | 1,914 |
| | First American | | |
| | Financial Corp. | 73,600 | 1,882 |
| * | Popular Inc. | 65,700 | 1,814 |
| | City Holding Co. | 43,405 | 1,727 |
| | Oritani Financial Corp. | 94,900 | 1,470 |
| | CBOEHoldings Inc. | 33,900 | 1,252 |
| | Republic Bancorp Inc. | | |
| | Class A | 50,311 | 1,139 |
| | Bancfirst Corp. | 25,783 | 1,075 |
| | MFA Financial Inc. | 92,300 | 860 |
| | Camden National Corp. | 25,345 | 838 |
| | American Capital | | |
| | Agency Corp. | 21,300 | 698 |
| | XLGroup plc Class A | 21,400 | 648 |
| | | | 771,373 |
| Health Care (10.5%) | | |
| * | Actavis Inc. | 400,900 | 36,927 |
| | ResMed Inc. | 714,783 | 33,137 |
| | OmnicareInc. | 798,700 | 32,523 |
| * | Mylan Inc. | 986,300 | 28,544 |
| | AmerisourceBergen Corp. | | |
| | Class A | 420,504 | 21,635 |
| * | Regeneron | | |
| | Pharmaceuticals Inc. | 120,200 | 21,203 |
| * | Cyberonics Inc. | 375,700 | 17,587 |
| * | Pharmacyclics Inc. | 196,700 | 15,817 |
| * | Thoratec Corp. | 400,200 | 15,008 |
| * | Cubist Pharmaceuticals Inc. | 280,800 | 13,147 |
| * | Sirona Dental Systems Inc. | 171,600 | 12,652 |
| * | Magellan Health | | |
| | Services Inc. | 237,100 | 11,279 |
13
| | | | |
| Strategic Equity Fund | | | |
| |
| |
| |
| | | | | Market |
| | | | | Value |
| | | | Shares | ($000) |
| * | Charles River Laboratories | | | |
| | International Inc. | | 250,900 | 11,107 |
| * | Edwards Lifesciences Corp. | 133,700 | 10,985 |
| * | Medicines Co. | | 267,875 | 8,952 |
| *,^ | Arena Pharmaceuticals Inc. | | 844,000 | 6,929 |
| | Chemed Corp. | | 79,400 | 6,350 |
| * | Infinity Pharmaceuticals Inc. | | 114,200 | 5,535 |
| * | ABIOMED Inc. | | 294,600 | 5,500 |
| * | Life Technologies Corp. | | 85,000 | 5,494 |
| ^ | PDL BioPharma Inc. | | 732,900 | 5,358 |
| * | CareFusion Corp. | | 134,400 | 4,703 |
| | Analogic Corp. | | 58,200 | 4,599 |
| * | Bio-Reference Labs Inc. | | 170,700 | 4,435 |
| * | Vertex Pharmaceuticals Inc. | 75,000 | 4,124 |
| ^ | Questcor | | | |
| | Pharmaceuticals Inc. | | 112,400 | 3,657 |
| * | Mettler-Toledo | | | |
| | International Inc. | | 16,300 | 3,475 |
| * | Nektar Therapeutics | | 302,900 | 3,332 |
| * | Genomic Health Inc. | | 117,008 | 3,309 |
| * | ICU Medical Inc. | | 49,600 | 2,924 |
| * | Wright Medical Group Inc. | | 119,700 | 2,850 |
| * | NPS Pharmaceuticals Inc. | | 268,900 | 2,740 |
| | West Pharmaceutical | | | |
| | Services Inc. | | 41,800 | 2,714 |
| | Select Medical | | | |
| | Holdings Corp. | | 279,300 | 2,514 |
| * | PAREXEL International | | | |
| | Corp. | | 58,600 | 2,315 |
| * | Covance Inc. | | 31,000 | 2,304 |
| * | Bruker Corp. | | 119,200 | 2,277 |
| | Ensign Group Inc. | | 67,000 | 2,238 |
| * | Alkermes plc | | 92,900 | 2,203 |
| * | Tenet Healthcare Corp. | | 45,300 | 2,155 |
| * | Health Management | | | |
| | Associates Inc. Class A | | 162,800 | 2,095 |
| * | Molina Healthcare Inc. | | 58,700 | 1,812 |
| * | United Therapeutics Corp. | | 29,700 | 1,808 |
| * | Auxilium | | | |
| | Pharmaceuticals Inc. | | 92,500 | 1,598 |
| * | Gentiva Health Services Inc. | 104,400 | 1,130 |
| * | Bio-Rad Laboratories Inc. | | | |
| | Class A | | 8,200 | 1,033 |
| ^ | Spectrum | | | |
| | Pharmaceuticals Inc. | | 133,900 | 999 |
| * | SurModics Inc. | | 30,200 | 823 |
| *,^ | Affymax Inc. | | 248,400 | 345 |
| | | | | 396,180 |
| Industrials (14.2%) | | | |
| * | Delta Air Lines Inc. | 2,528,200 | 41,741 |
| | Textron Inc. | 1,176,200 | 35,062 |
| | Triumph Group Inc. | | 432,266 | 33,933 |
| | Dun & Bradstreet Corp. | | 350,600 | 29,328 |
| * | US Airways Group Inc. | 1,507,900 | 25,589 |
| | | | |
| | Cintas Corp. | | 568,900 | 25,106 |
| | Trinity Industries Inc. | | 538,200 | 24,397 |
| * | Terex Corp. | | 706,300 | 24,311 |
| | Huntington Ingalls | | | |
| | Industries Inc. | | 425,600 | 22,697 |
| | A.O. Smith Corp. | | 284,100 | 20,901 |
| * | EnerSys Inc. | | 448,557 | 20,445 |
| * | Alaska Air Group Inc. | | 298,890 | 19,117 |
| * | USG Corp. | | 679,300 | 17,961 |
| | Avery Dennison Corp. | | 262,600 | 11,310 |
| | Rockwell Collins Inc. | | 177,700 | 11,216 |
| | ADT Corp. | | 197,600 | 9,671 |
| | Lincoln Electric | | | |
| | Holdings Inc. | | 163,600 | 8,864 |
| | AMERCO | | 45,740 | 7,938 |
| | Hyster-Yale Materials | | | |
| | Handling Inc. | | 135,600 | 7,741 |
| | Steelcase Inc. Class A | | 518,400 | 7,636 |
| | Hubbell Inc. Class B | | 74,900 | 7,274 |
| * | Fortune Brands | | | |
| | Home & Security Inc. | 191,400 | 7,164 |
| * | JetBlue Airways Corp. | 1,032,600 | 7,125 |
| | Toro Co. | | 154,700 | 7,122 |
| | Robert Half | | | |
| | International Inc. | | 179,300 | 6,729 |
| * | Hertz Global Holdings Inc. | 274,000 | 6,099 |
| | Masco Corp. | | 300,000 | 6,075 |
| | L-3 Communications | | | |
| | Holdings Inc. | | 75,000 | 6,069 |
| | Equifax Inc. | | 94,600 | 5,448 |
| * | AECOM Technology Corp. | 162,600 | 5,333 |
| | ITT Corp. | | 179,300 | 5,097 |
| | Deluxe Corp. | | 122,413 | 5,068 |
| | Standex International Corp. | 76,450 | 4,222 |
| | RR Donnelley & Sons Co. | 344,200 | 4,148 |
| * | Hexcel Corp. | | 125,400 | 3,638 |
| | ExelisInc. | | 330,500 | 3,599 |
| | Pall Corp. | | 51,500 | 3,521 |
| | Lennox International Inc. | 55,000 | 3,492 |
| * | Armstrong World | | | |
| | Industries Inc. | | 58,800 | 3,286 |
| * | Taser International Inc. | 408,300 | 3,246 |
| | GATXCorp. | | 61,400 | 3,191 |
| * | General Cable Corp. | | 83,500 | 3,059 |
| | FlowserveCorp. | | 17,700 | 2,968 |
| | Mueller Industries Inc. | 48,800 | 2,601 |
| | Crane Co. | | 37,900 | 2,117 |
| | Southwest Airlines Co. | 150,000 | 2,022 |
| | Mine Safety Appliances Co. | 40,500 | 2,010 |
| | Brink’s Co. | | 70,800 | 2,001 |
| | Manitowoc Co. Inc. | | 94,500 | 1,943 |
| | Manpower Inc. | | 33,100 | 1,877 |
| | Carlisle Cos. Inc. | | 26,800 | 1,817 |
| * | Trex Co. Inc. | | 30,200 | 1,485 |
14
| | | |
| Strategic Equity Fund | | |
| |
| |
| |
| | | | Market |
| | | | Value |
| | | Shares | ($000) |
| | G&KServices Inc. Class A | 31,100 | 1,415 |
| | Mueller Water Products Inc. | |
| | Class A | 165,600 | 982 |
| | | | 538,207 |
| Information Technology (15.5%) | |
| | Western Digital Corp. | 771,900 | 38,811 |
| | Seagate Technology plc | 1,023,550 | 37,421 |
| * | Gartner Inc. | 608,991 | 33,135 |
| * | Alliance Data | | |
| | Systems Corp. | 202,200 | 32,734 |
| | Anixter International Inc. | 407,408 | 28,486 |
| * | LSI Corp. | 3,850,200 | 26,104 |
| * | Fiserv Inc. | 293,200 | 25,752 |
| * | Cadence Design | | |
| | Systems Inc. | 1,827,400 | 25,456 |
| | Maxim Integrated | | |
| | Products Inc. | 748,850 | 24,450 |
| | IAC/InterActiveCorp | 512,000 | 22,876 |
| * | CACIInternational Inc. | | |
| | Class A | 349,000 | 20,197 |
| * | CoreLogic Inc. | 626,000 | 16,188 |
| * | CommVault Systems Inc. | 192,000 | 15,740 |
| * | Avnet Inc. | 378,500 | 13,702 |
| | Lender Processing | | |
| | Services Inc. | 509,400 | 12,969 |
| * | Kulicke & Soffa | | |
| | Industries Inc. | 1,094,400 | 12,651 |
| | Avago Technologies Ltd. | | |
| | Class A | 285,600 | 10,259 |
| | MAXIMUSInc. | 113,540 | 9,080 |
| | Heartland Payment | | |
| | Systems Inc. | 268,500 | 8,852 |
| | AOL Inc. | 225,900 | 8,695 |
| * | Brocade Communications | | |
| | Systems Inc. | 1,503,200 | 8,673 |
| * | Tech Data Corp. | 182,700 | 8,333 |
| * | LinkedIn Corp. Class A | 42,100 | 7,412 |
| | DST Systems Inc. | 103,230 | 7,357 |
| * | Freescale | | |
| | Semiconductor Ltd. | 491,400 | 7,317 |
| | Jack Henry & | | |
| | Associates Inc. | 156,400 | 7,227 |
| | NVIDIA Corp. | 460,200 | 5,900 |
| * | Ingram Micro Inc. | 299,500 | 5,894 |
| * | Manhattan Associates Inc. | 79,200 | 5,884 |
| | Fidelity National Information | |
| | Services Inc. | 130,000 | 5,151 |
| * | Advanced Energy | | |
| | Industries Inc. | 276,100 | 5,053 |
| | Plantronics Inc. | 110,900 | 4,901 |
| * | Electronicsfor Imaging Inc. | 187,600 | 4,758 |
| * | Unisys Corp. | 205,900 | 4,684 |
| | Computer Sciences Corp. | 93,900 | 4,623 |
| * | Ultratech Inc. | 115,400 | 4,562 |
| | | |
| * | Acxiom Corp. | 223,200 | 4,553 |
| | Total System Services Inc. | 180,600 | 4,475 |
| * | SYNNEXCorp. | 113,274 | 4,191 |
| * | Insight Enterprises Inc. | 198,800 | 4,099 |
| * | MEMC Electronic | | |
| | Materials Inc. | 889,900 | 3,916 |
| * | Arris Group Inc. | 225,000 | 3,863 |
| * | ElectronicArts Inc. | 210,000 | 3,717 |
| *,^ | Advanced Micro | | |
| | Devices Inc. | 1,456,735 | 3,715 |
| | Amphenol Corp. Class A | 43,800 | 3,270 |
| | Mentor Graphics Corp. | 150,000 | 2,708 |
| | Harris Corp. | 53,200 | 2,465 |
| | Diebold Inc. | 75,800 | 2,298 |
| | KLA-Tencor Corp. | 39,100 | 2,062 |
| * | Vantiv Inc. Class A | 86,600 | 2,056 |
| * | Cardtronics Inc. | 74,596 | 2,048 |
| * | Aspen Technology Inc. | 61,500 | 1,986 |
| | Broadridge Financial | | |
| | Solutions Inc. | 79,000 | 1,962 |
| * | Zebra Technologies Corp. | 40,700 | 1,918 |
| * | NeuStar Inc. Class A | 41,200 | 1,917 |
| * | Integrated Device | | |
| | Technology Inc. | 249,800 | 1,866 |
| | FEI Co. | 28,300 | 1,827 |
| * | Aruba Networks Inc. | 71,900 | 1,779 |
| * | Itron Inc. | 31,500 | 1,462 |
| * | FormFactor Inc. | 267,200 | 1,256 |
| * | Flextronics | | |
| | International Ltd. | 134,670 | 910 |
| * | Quantum Corp. | 537,800 | 688 |
| | | | 588,294 |
| Materials (5.8%) | | |
| | Eastman Chemical Co. | 467,986 | 32,698 |
| | CF Industries Holdings Inc. | 170,200 | 32,401 |
| | Axiall Corp. | 474,200 | 29,476 |
| | Valspar Corp. | 389,900 | 24,271 |
| | Westlake Chemical Corp. | 143,286 | 13,397 |
| * | WR Grace & Co. | 144,800 | 11,224 |
| * | Graphic Packaging | | |
| | Holding Co. | 1,154,119 | 8,644 |
| | NewMarket Corp. | 32,822 | 8,546 |
| | Buckeye Technologies Inc. | 279,608 | 8,374 |
| | American Vanguard Corp. | 244,500 | 7,467 |
| | Schweitzer-Mauduit | | |
| | International Inc. | 128,878 | 4,992 |
| | Huntsman Corp. | 226,600 | 4,213 |
| | Kaiser Aluminum Corp. | 54,400 | 3,517 |
| | Rock Tenn Co. Class A | 36,800 | 3,415 |
| * | Headwaters Inc. | 292,100 | 3,184 |
| | Neenah Paper Inc. | 93,600 | 2,879 |
| * | Chemtura Corp. | 125,500 | 2,712 |
| | Worthington Industries Inc. | 71,500 | 2,215 |
| | Minerals Technologies Inc. | 52,600 | 2,183 |
15
| | | | |
| Strategic Equity Fund | | | |
| |
| |
| |
| | | | | Market |
| | | | | Value |
| | | | Shares | ($000) |
| | Ball Corp. | | 41,000 | 1,951 |
| | Bemis Co. Inc. | | 48,200 | 1,945 |
| | Steel Dynamics Inc. | | 121,500 | 1,928 |
| * | Owens-IllinoisInc. | | 72,300 | 1,927 |
| | Packaging Corp. of America | 42,700 | 1,916 |
| * | SunCoke Energy Inc. | | 114,600 | 1,871 |
| * | Louisiana-Pacific Corp. | 83,700 | 1,808 |
| | | | | 219,154 |
| Telecommunication Services (0.5%) | |
| * | MetroPCS | | | |
| | Communications Inc. | 1,650,287 | 17,988 |
| | Frontier | | | |
| | Communications Corp. | 478,000 | 1,902 |
| | | | | 19,890 |
| Utilities (5.4%) | | | |
| | Ameren Corp. | | 846,800 | 29,655 |
| | Pinnacle West Capital Corp. | 387,700 | 22,444 |
| | DTEEnergy Co. | | 328,050 | 22,419 |
| | Portland General Electric Co. | 687,500 | 20,852 |
| | American Water | | | |
| | Works Co. Inc. | | 466,800 | 19,344 |
| | PNM Resources Inc. | | 662,335 | 15,426 |
| | NV Energy Inc. | | 766,500 | 15,353 |
| | Southwest Gas Corp. | 271,640 | 12,892 |
| | Vectren Corp. | | 230,700 | 8,171 |
| | Wisconsin Energy Corp. | 189,500 | 8,128 |
| | Black Hills Corp. | | 110,800 | 4,880 |
| | AES Corp. | | 361,500 | 4,544 |
| | CenterPoint Energy Inc. | 172,000 | 4,121 |
| | CMS Energy Corp. | | 146,900 | 4,104 |
| | Integrys Energy Group Inc. | 46,100 | 2,681 |
| | AGL Resources Inc. | | 49,900 | 2,093 |
| | Atmos Energy Corp. | | 45,500 | 1,942 |
| | Aqua America Inc. | | 60,900 | 1,915 |
| | MGE Energy Inc. | | 25,000 | 1,386 |
| | Laclede Group Inc. | | 27,600 | 1,179 |
| | | | | 203,529 |
| Total Common Stocks | | | |
| (Cost $2,916,427) | | | 3,763,092 |
| Temporary Cash Investments (2.0%)1 | |
| Money Market Fund (1.9%) | | |
| 2,3 | Vanguard Market | | | |
| | Liquidity Fund, | | | |
| | 0.147% | 72,721,342 | 72,721 |
| | | |
| | | Face | Market |
| | | Amount | Value |
| | | ($000) | ($000) |
| U.S. Government and Agency Obligations (0.1%) |
| 4,5 | Fannie Mae | | |
| | Discount Notes, | | |
| | 0.100%, 5/8/13 | 500 | 500 |
| 5,6 | Federal Home Loan | | |
| | Bank Discount Notes, | | |
| | 0.110%, 5/15/13 | 500 | 500 |
| 5,6 | Federal Home Loan | | |
| | Bank Discount Notes, | | |
| | 0.120%, 6/5/13 | 1,000 | 1,000 |
| | | | 2,000 |
| Total Temporary Cash Investments | |
| (Cost $74,721) | | 74,721 |
| Total Investments (101.4%) | | |
| (Cost $2,991,148) | | 3,837,813 |
| Other Assets and Liabilities (-1.4%) | |
| Other Assets | | 9,578 |
| Liabilities3 | | (60,906) |
| | | | (51,328) |
| Net Assets (100%) | | |
| Applicable to 155,168,823 outstanding | |
| $.001 par value shares of beneficial | |
| interest (unlimited authorization) | 3,786,485 |
| Net Asset Value Per Share | | $24.40 |
16
Strategic Equity Fund
| |
| At March 31, 2013, net assets consisted of: |
| | Amount |
| | ($000) |
| Paid-in Capital | 3,755,305 |
| Overdistributed Net Investment Income | (1,658) |
| Accumulated Net Realized Losses | (814,009) |
| Unrealized Appreciation (Depreciation) | |
| Investment Securities | 846,665 |
| Futures Contracts | 182 |
| Net Assets | 3,786,485 |
See Note A in Notes to Financial Statements.
* Non-income-producing security.
^ Part of security position is on loan to broker-dealers. The total value of securities on loan is $34,771,000.
1 The fund invests a portion of its cash reserves in equity markets through the use of index futures contracts. After giving effect to futures
investments, the fund’s effective common stock and temporary cash investment positions represent 100.0% and 1.4%, respectively,
of net assets.
2 Affiliated money market fund available only to Vanguard funds and certain trusts and accounts managed by Vanguard. Rate shown is
the 7-day yield.
3 Includes $36,622,000 of collateral received for securities on loan.
4 The issuer was placed under federal conservatorship in September 2008; since that time, its daily operations have been managed by the
Federal Housing Finance Agency and it receives capital from the U.S. Treasury, as needed to maintain a positive net worth, in exchange
for senior preferred stock.
5 Securities with a value of $1,500,000 have been segregated as initial margin for open futures contracts.
6 The issuer operates under a congressional charter; its securities are generally neither guaranteed by the U.S. Treasury nor backed by the
full faith and credit of the U.S. government.
REIT—Real Estate Investment Trust.
See accompanying Notes, which are an integral part of the Financial Statements.
17
Strategic Equity Fund
Statement of Operations
| |
| | SixMonths Ended |
| | March 31, 2013 |
| | ($000) |
| Investment Income | |
| Income | |
| Dividends | 34,804 |
| Interest1 | 25 |
| Security Lending | 1,116 |
| Total Income | 35,945 |
| Expenses | |
| The Vanguard Group—Note B | |
| Investment Advisory Services | 704 |
| Management and Administrative | 3,774 |
| Marketing and Distribution | 250 |
| Custodian Fees | 20 |
| Shareholders’ Reports | 28 |
| Trustees’ Fees and Expenses | 3 |
| Total Expenses | 4,779 |
| Net Investment Income | 31,166 |
| Realized Net Gain (Loss) | |
| Investment Securities Sold | 169,566 |
| Futures Contracts | 2,977 |
| Realized Net Gain (Loss) | 172,543 |
| Change in Unrealized Appreciation (Depreciation) | |
| Investment Securities | 368,863 |
| Futures Contracts | 622 |
| Change in Unrealized Appreciation (Depreciation) | 369,485 |
| Net Increase (Decrease) in Net Assets Resulting from Operations | 573,194 |
| 1 Interest income from an affiliated company of the fund was $23,000. |
See accompanying Notes, which are an integral part of the Financial Statements.
18
Strategic Equity Fund
Statement of Changes in Net Assets
| | |
| | Six Months Ended | Year Ended |
| | March 31, | September 30, |
| | 2013 | 2012 |
| | ($000) | ($000) |
| Increase (Decrease) in Net Assets | | |
| Operations | | |
| Net Investment Income | 31,166 | 39,685 |
| Realized Net Gain (Loss) | 172,543 | 293,306 |
| Change in Unrealized Appreciation (Depreciation) | 369,485 | 477,419 |
| Net Increase (Decrease) in Net Assets Resulting from Operations | 573,194 | 810,410 |
| Distributions | | |
| Net Investment Income | (52,913) | (32,559) |
| Realized Capital Gain | — | — |
| Total Distributions | (52,913) | (32,559) |
| Capital Share Transactions | | |
| Issued | 205,029 | 237,519 |
| Issued in Lieu of Cash Distributions | 49,011 | 30,266 |
| Redeemed | (241,432) | (548,498) |
| Net Increase (Decrease) from Capital Share Transactions | 12,608 | (280,713) |
| Total Increase (Decrease) | 532,889 | 497,138 |
| Net Assets | | |
| Beginning of Period | 3,253,596 | 2,756,458 |
| End of Period1 | 3,786,485 | 3,253,596 |
| 1 Net Assets—End of Period includes undistributed (overdistributed) net investment income of ($1,658,000) and $20,089,000. |
See accompanying Notes, which are an integral part of the Financial Statements.
19
Strategic Equity Fund
Financial Highlights
| | | | | | | |
| | Six Months | | | | | |
| | | Ended | | | | | |
| For a Share Outstanding | March 31, | Year Ended September 30, |
| Throughout Each Period | | 2013 | 2012 | 2011 | 2010 | 2009 | 2008 |
| Net Asset Value, Beginning of Period | $21.02 | $16.30 | $16.30 | $14.52 | $16.42 | $24.94 |
| Investment Operations | | | | | | | |
| Net Investment Income | | . 209 | .249 | .210 | .221 | .184 | .240 |
| Net Realized and Unrealized Gain (Loss) | | | | | | |
| on Investments | | 3.521 | 4.667 | .017 | 1.759 | (1.843) | (6.090) |
| Total from Investment Operations | | 3.730 | 4.916 | .227 | 1.980 | (1.659) | (5.850) |
| Distributions | | | | | | | |
| Dividends from Net Investment Income | (. 350) | (.196) | (. 227) | (. 200) | (. 241) | (.240) |
| Distributions from Realized Capital Gains | — | — | — | — | — | (2.430) |
| Total Distributions | | (.350) | (.196) | (. 227) | (. 200) | (. 241) | (2.670) |
| Net Asset Value, End of Period | | $24.40 | $21.02 | $16.30 | $16.30 | $14.52 | $16.42 |
| |
| Total Return1 | | 18.01% | 30.32% | 1.23% | 13.71% | -9.66% | -25.37% |
| |
| Ratios/Supplemental Data | | | | | | | |
| Net Assets, End of Period (Millions) | $3,786 | $3,254 | $2,756 | $3,103 | $3,549 | $4,822 |
| Ratio of Total Expenses to | | | | | | | |
| Average Net Assets | | 0.28% | 0.29% | 0.30% | 0.30% | 0.30% | 0.25% |
| Ratio of Net Investment Income to | | | | | | |
| Average Net Assets | | 1.56% | 1.25% | 1.09% | 1.37% | 1.47% | 1.09% |
| Portfolio Turnover Rate | | 63% | 67% | 73% | 60% | 60% | 79% |
The expense ratio, net income ratio, and turnover rate for the current period have been annualized.
1 Total returns do not include account service fees that may have applied in the periods shown. Fund prospectuses provide information about
any applicable account service fees.
See accompanying Notes, which are an integral part of the Financial Statements.
20
Strategic Equity Fund
Notes to Financial Statements
Vanguard Strategic Equity Fund is registered under the Investment Company Act of 1940 as an open-end investment company, or mutual fund.
A. The following significant accounting policies conform to generally accepted accounting principles for U.S. mutual funds. The fund consistently follows such policies in preparing its financial statements.
1. Security Valuation: Securities are valued as of the close of trading on the New York Stock Exchange (generally 4 p.m., Eastern time) on the valuation date. Equity securities are valued at the latest quoted sales prices or official closing prices taken from the primary market in which each security trades; such securities not traded on the valuation date are valued at the mean of the latest quoted bid and asked prices. Securities for which market quotations are not readily available, or whose values have been materially affected by events occurring before the fund’s pricing time but after the close of the securities’ primary markets, are valued by methods deemed by the board of trustees to represent fair value. Investments in Vanguard Market Liquidity Fund are valued at that fund’s net asset value.
Temporary cash investments acquired over 60 days to maturity are valued using the latest bid prices or using valuations based on a matrix system (which considers such factors as security prices, yields, maturities, and ratings), both as furnished by independent pricing services. Other temporary cash investments are valued at amortized cost, which approximates market value.
2. Futures Contracts: The fund uses index futures contracts to a limited extent, with the objective of maintaining full exposure to the stock market while maintaining liquidity. The fund may purchase or sell futures contracts to achieve a desired level of investment, whether to accommodate portfolio turnover or cash flows from capital share transactions. The primary risks associated with the use of futures contracts are imperfect correlation between changes in market values of stocks held by the fund and the prices of futures contracts, and the possibility of an illiquid market.
Futures contracts are valued at their quoted daily settlement prices. The aggregate principal amounts of the contracts are not recorded in the Statement of Net Assets. Fluctuations in the value of the contracts are recorded in the Statement of Net Assets as an asset (liability) and in the Statement of Operations as unrealized appreciation (depreciation) until the contracts are closed, when they are recorded as realized futures gains (losses).
During the six months ended March 31, 2013, the fund’s average investments in long and short futures contracts each represented less than 1% of net assets, based on quarterly average aggregate settlement values.
3. Federal Income Taxes: The fund intends to continue to qualify as a regulated investment company and distribute all of its taxable income. Management has analyzed the fund’s tax positions taken for all open federal income tax years (September 30, 2009–2012), and for the period ended March 31, 2013, and has concluded that no provision for federal income tax is required in the fund’s financial statements.
4. Distributions: Distributions to shareholders are recorded on the ex-dividend date.
5. Security Lending: The fund may lend its securities to qualified institutional borrowers to earn additional income. Security loans are required to be secured at all times by collateral at least equal to the market value of securities loaned. Daily market fluctuations could cause the value of loaned securities to be more or less than the value of the collateral received. When this occurs, the collateral is adjusted on the next business day. The fund invests cash collateral received in Vanguard Market
21
Strategic Equity Fund
Liquidity Fund, and records a liability for the return of the collateral, during the period the securities are on loan. Security lending income represents fees charged to borrowers plus income earned on investing cash collateral, less expenses associated with the loan.
6. Other: Dividend income is recorded on the ex-dividend date. Interest income includes income distributions received from Vanguard Market Liquidity Fund and is accrued daily. Security transactions are accounted for on the date securities are bought or sold. Costs used to determine realized gains (losses) on the sale of investment securities are those of the specific securities sold.
B. The Vanguard Group furnishes at cost corporate management, administrative, marketing, and distribution services. The costs of such services are allocated to the fund under methods approved by the board of trustees. The fund has committed to provide up to 0.40% of its net assets in capital contributions to Vanguard. At March 31, 2013, the fund had contributed capital of $462,000 to Vanguard (included in Other Assets), representing 0.01% of the fund’s net assets and 0.18% of Vanguard’s capitalization. The fund’s trustees and officers are also directors and officers of Vanguard.
C. Various inputs may be used to determine the value of the fund’s investments. These inputs are summarized in three broad levels for financial statement purposes. The inputs or methodologies used to value securities are not necessarily an indication of the risk associated with investing in those securities.
Level 1—Quoted prices in active markets for identical securities.
Level 2—Other significant observable inputs (including quoted prices for similar securities, interestrates, prepayment speeds, credit risk, etc.).
Level 3—Significant unobservable inputs (including the fund’s own assumptions used to determine the fair value of investments).
The following table summarizes the market value of the fund’s investments as of March 31, 2013, based on the inputs used to value them:
| | | |
| | Level 1 | Level 2 | Level 3 |
| Investments | ($000) | ($000) | ($000) |
| Common Stocks | 3,763,092 | — | — |
| Temporary Cash Investments | 72,721 | 2,000 | — |
| Futures Contracts—Assets1 | 66 | — | — |
| Total | 3,835,879 | 2,000 | — |
| 1 Represents variation margin on the last day of the reporting period. |
D. At March 31, 2013, the aggregate settlement value of open futures contracts and the related unrealized appreciation (depreciation) were:
| | | | |
| | | | ($000) |
| | | | Aggregate | |
| | | Number of | Settlement | Unrealized |
| | | Long (Short) | Value | Appreciation |
| Futures Contracts | Expiration | Contracts | Long (Short) | (Depreciation) |
| E-mini Russell 2000 Index | June 2013 | 188 | 17,839 | 69 |
| E-mini S&P MidCap 400 Index | June 2013 | 51 | 5,870 | 113 |
Unrealized appreciation (depreciation) on open futures contracts is required to be treated as realized
gain (loss) for tax purposes.
22
Strategic Equity Fund
E. Distributions are determined on a tax basis and may differ from net investment income and realized capital gains for financial reporting purposes. Differences may be permanent or temporary. Permanent differences are reclassified among capital accounts in the financial statements to reflect their tax character. Temporary differences arise when certain items of income, expense, gain, or loss are recognized in different periods for financial statement and tax purposes; these differences will reverse at some time in the future. Differences in classification may also result from the treatment of short-term gains as ordinary income for tax purposes.
The fund’s tax-basis capital gains and losses are determined only at the end of each fiscal year. For tax purposes, at September 30, 2012, the fund had available capital losses totaling $986,991,000 to offset future net capital gains. Of this amount, $954,229,000 is subject to expiration on September 30, 2018. Capital losses of $32,762,000 realized beginning in fiscal 2012 may be carried forward indefinitely under the Regulated Investment Company Modernization Act of 2010, but must be used before any expiring loss carryforwards. The fund will use these capital losses to offset net taxable capital gains, if any, realized during the year ending September 30, 2013; should the fund realize net capital losses for the year, the losses will be added to the loss carryfor-ward balance above.
At March 31, 2013, the cost of investment securities for tax purposes was $2,991,148,000. Net unrealized appreciation of investment securities for tax purposes was $846,665,000, consisting of unrealized gains of $884,040,000 on securities that had risen in value since their purchase and $37,375,000 in unrealized losses on securities that had fallen in value since their purchase.
F. During the six months ended March 31, 2013, the fund purchased $1,068,393,000 of investment securities and sold $1,073,785,000 of investment securities, other than temporary cash investments.
G. Capital shares issued and redeemed were:
| | |
| | Six Months Ended | Year Ended |
| | March 31, 2013 | September 30, 2012 |
| | Shares | Shares |
| | (000) | (000) |
| Issued | 9,046 | 12,157 |
| Issued in Lieu of Cash Distributions | 2,331 | 1,630 |
| Redeemed | (10,981) | (28,154) |
| Net Increase (Decrease) in Shares Outstanding | 396 | (14,367) |
H. In preparing the financial statements as of March 31, 2013, management considered the impact of subsequent events for potential recognition or disclosure in these financial statements.
23
About Your Fund’s Expenses
As a shareholder of the fund, you incur ongoing costs, which include costs for portfolio management, administrative services, and shareholder reports (like this one), among others. Operating expenses, which are deducted from a fund’s gross income, directly reduce the investment return of the fund.
A fund’s expenses are expressed as a percentage of its average net assets. This figure is known as the expense ratio. The following examples are intended to help you understand the ongoing costs (in dollars) of investing in your fund and to compare these costs with those of other mutual funds. The examples are based on an investment of $1,000 made at the beginning of the period shown and held for the entire period.
The accompanying table illustrates your fund’s costs in two ways:
• Based on actual fund return. This section helps you to estimate the actual expenses that you paid over the period. The ”Ending Account Value“ shown is derived from the fund‘s actual return, and the third column shows the dollar amount that would have been paid by an investor who started with $1,000 in the fund. You may use the information here, together with the amount you invested, to estimate the expenses that you paid over the period.
To do so, simply divide your account value by $1,000 (for example, an $8,600 account value divided by $1,000 = 8.6), then multiply the result by the number given for your fund under the heading ”Expenses Paid During Period.“
• Based on hypothetical 5% yearly return. This section is intended to help you compare your fund‘s costs with those of other mutual funds. It assumes that the fund had a yearly return of 5% before expenses, but that the expense ratio is unchanged. In this case—because the return used is not the fund’s actual return—the results do not apply to your investment. The example is useful in making comparisons because the Securities and Exchange Commission requires all mutual funds to calculate expenses based on a 5% return. You can assess your fund’s costs by comparing this hypothetical example with the hypothetical examples that appear in shareholder reports of other funds.
Note that the expenses shown in the table are meant to highlight and help you compare ongoing costs only and do not reflect transaction costs incurred by the fund for buying and selling securities. Further, the expenses do not include any purchase, redemption, or account service fees described in the fund prospectus. If such fees were applied to your account, your costs would be higher. Your fund does not carry a “sales load.”
The calculations assume no shares were bought or sold during the period. Your actual costs may have been higher or lower, depending on the amount of your investment and the timing of any purchases or redemptions.
You can find more information about the fund’s expenses, including annual expense ratios, in the Financial Statements section of this report. For additional information on operating expenses and other shareholder costs, please refer to your fund’s current prospectus.
24
| | | |
| Six Months Ended March 31, 2013 | | | |
| | Beginning | Ending | Expenses |
| | Account Value | Account Value | Paid During |
| Strategic Equity Fund | 9/30/2012 | 3/31/2013 | Period |
| Based on Actual Fund Return | $1,000.00 | $1,180.12 | $1.52 |
| Based on Hypothetical 5% Yearly Return | 1,000.00 | 1,023.54 | 1.41 |
The calculations are based on expenses incurred in the most recent six-month period. The fund’s annualized six-month expense ratio for that
period is 0.28%. The dollar amounts shown as “Expenses Paid” are equal to the annualized expense ratio multiplied by the average account
value over the period, multiplied by the number of days in the most recent six-month period, then divided by the number of days in the most
recent 12-month period.
25
Trustees Approve Advisory Arrangement
The board of trustees of Vanguard Strategic Equity Fund has renewed the fund’s investment advisory arrangement with The Vanguard Group, Inc. (Vanguard). Vanguard—through its Equity Investment Group—serves as the investment advisor to the fund. The board determined that continuing the fund’s internalized management structure was in the best interests of the fund and its shareholders.
The board based its decision upon an evaluation of the advisor’s investment staff, portfolio manage-ment process, and performance. The trustees considered the factors discussed below, among others. However, no single factor determined whether the board approved the arrangement. Rather, it was the totality of the circumstances that drove the board’s decision.
Nature, extent, and quality of services
The board considered the quality of the fund’s investment management services over both the short and long term, and took into account the organizational depth and stability of the advisor. The board noted that Vanguard has been managing investments for more than three decades. The Equity Investment Group adheres to a sound, disciplined investment management process; the team has considerable experience, stability, and depth.
The board concluded that Vanguard’s experience, stability, depth, and performance, among other factors, warranted continuation of the advisory arrangement.
Investment performance
The board considered the short- and long-term performance of the fund, including any periods of outperformance or underperformance relative to a benchmark index and peer group. The board concluded that the performance was such that the advisory arrangement should continue. Information about the fund’s most recent performance can be found in the Performance Summary section of this report.
Cost
The board concluded that the fund’s expense ratio was well below the average expense ratio charged by funds in its peer group and that the fund’s advisory fee rate was also well below its peer-group average. Information about the fund’s expenses appears in the About Your Fund’s Expenses section of this report as well as in the Financial Statements section.
The board does not conduct a profitability analysis of Vanguard, because of Vanguard’s unique “at-cost” structure. Unlike most other mutual fund management companies, Vanguard is owned by the funds it oversees, and produces “profits” only in the form of reduced expenses for fund shareholders.
The benefit of economies of scale
The board concluded that the fund’s at-cost arrangement with Vanguard ensures that the fund will realize economies of scale as it grows, with the cost to shareholders declining as fund assets increase.
The board will consider whether to renew the advisory arrangement again after a one-year period.
26
Glossary
30-Day SEC Yield. A fund’s 30-day SEC yield is derived using a formula specified by the U.S. Securities and Exchange Commission. Under the formula, data related to the fund’s security holdings in the previous 30 days are used to calculate the fund’s hypothetical net income for that period, which is then annualized and divided by the fund’s estimated average net assets over the calculation period. For the purposes of this calculation, a security’s income is based on its current market yield to maturity (for bonds), its actual income (for asset-backed securities), or its projected dividend yield (for stocks). Because the SEC yield represents hypothetical annualized income, it will differ—at times significantly—from the fund’s actual experience. As a result, the fund’s income distributions may be higher or lower than implied by the SEC yield.
Beta. A measure of the magnitude of a fund’s past share-price fluctuations in relation to the ups and downs of a given market index. The index is assigned a beta of 1.00. Compared with a given index, a fund with a beta of 1.20 typically would have seen its share price rise or fall by 12% when the index rose or fell by 10%. For this report, beta is based on returns over the past 36 months for both the fund and the index. Note that a fund’s beta should be reviewed in conjunction with its R-squared (see definition). The lower the R-squared, the less correlation there is between the fund and the index, and the less reliable beta is as an indicator of volatility.
Dividend Yield. Dividend income earned by stocks, expressed as a percentage of the aggregate market value (or of net asset value, for a fund). The yield is determined by dividing the amount of the annual dividends by the aggregate value (or net asset value) at the end of the period. For a fund, the dividend yield is based solely on stock holdings and does not include any income produced by other investments.
Earnings Growth Rate. The average annual rate of growth in earnings over the past five years for the stocks now in a fund.
Equity Exposure. A measure that reflects a fund’s investments in stocks and stock futures. Any holdings in short-term reserves are excluded.
Expense Ratio. A fund’s total annual operating expenses expressed as a percentage of the fund’s average net assets. The expense ratio includes management and administrative expenses, but does not include the transaction costs of buying and selling portfolio securities.
Foreign Holdings. The percentage of a fund represented by securities or depositary receipts of companies based outside the United States.
Inception Date. The date on which the assets of a fund (or one of its share classes) are first invested in accordance with the fund’s investment objective. For funds with a subscription period, the inception date is the day after that period ends. Investment performance is measured from the inception date.
Median Market Cap. An indicator of the size of companies in which a fund invests; the midpoint of market capitalization (market price x shares outstanding) of a fund’s stocks, weighted by the proportion of the fund’s assets invested in each stock. Stocks representing half of the fund’s assets have market capitalizations above the median, and the rest are below it.
Price/Book Ratio. The share price of a stock divided by its net worth, or book value, per share. For a fund, the weighted average price/book ratio of the stocks it holds.
27
Price/Earnings Ratio. The ratio of a stock’s current price to its per-share earnings over the past year. For a fund, the weighted average P/E of the stocks it holds. P/E is an indicator of market expectations about corporate prospects; the higher the P/E, the greater the expectations for a company’s future growth.
R-Squared. A measure of how much of a fund’s past returns can be explained by the returns from the market in general, as measured by a given index. If a fund’s total returns were precisely synchronized with an index’s returns, its R-squared would be 1.00. If the fund’s returns bore no relationship to the index’s returns, its R-squared would be 0. For this report, R-squared is based on returns over the past 36 months for both the fund and the index.
Return on Equity. The annual average rate of return generated by a company during the past five years for each dollar of shareholder’s equity (net income divided by shareholder’s equity). For a fund, the weighted average return on equity for the companies whose stocks it holds.
Short-Term Reserves. The percentage of a fund invested in highly liquid, short-term securities that can be readily converted to cash.
Turnover Rate. An indication of the fund’s trading activity. Funds with high turnover rates incur higher transaction costs and may be more likely to distribute capital gains (which may be taxable to investors). The turnover rate excludes in-kind transactions, which have minimal impact on costs.
Benchmark Information
Spliced Small and Mid Cap Index: Russell 2800 Index through May 31, 2003; MSCI US Small +
Mid Cap 2200 Index thereafter.
28
This page intentionally left blank.
This page intentionally left blank.
This page intentionally left blank.
The People Who Govern Your Fund
The trustees of your mutual fund are there to see that the fund is operated and managed in your best interests since, as a shareholder, you are a part owner of the fund. Your fund’s trustees also serve on the board of directors of The Vanguard Group, Inc., which is owned by the Vanguard funds and provides services to them on an at-cost basis.
A majority of Vanguard’s board members are independent, meaning that they have no affiliation with Vanguard or the funds they oversee, apart from the sizable personal investments they have made as private individuals. The independent board members have distinguished backgrounds in business, academia, and public service. Each of the trustees and executive officers oversees 180 Vanguard funds.
The following table provides information for each trustee and executive officer of the fund. More information about the trustees is in the Statement of Additional Information, which can be obtained, without charge, by contacting Vanguard at 800-662-7447, or online at vanguard.com.
| InterestedTrustee1 | and Delphi Automotive LLP (automotive components); |
| | Senior Advisor at New Mountain Capital; Trustee of |
| F. William McNabb III | The Conference Board. |
| Born 1957. Trustee Since July 2009. Chairman of the | |
| Board. Principal Occupation(s) During the Past Five | Amy Gutmann |
| Years: Chairman of the Board of The Vanguard Group, | Born 1949. Trustee Since June 2006. Principal |
| Inc., and of each of the investment companies served | Occupation(s) During the Past Five Years: President |
| by The Vanguard Group, since January 2010; Director | of the University of Pennsylvania; Christopher H. |
| of The Vanguard Group since 2008; Chief Executive | Browne Distinguished Professor of Political Science |
| Officer and President of The Vanguard Group and of | in the School of Arts and Sciences with secondary |
| each of the investment companies served by The | appointments at the Annenberg School for |
| Vanguard Group since 2008; Director of Vanguard | Communication and the Graduate School of Education |
| Marketing Corporation; Managing Director of The | of the University of Pennsylvania; Member of the |
| Vanguard Group (1995–2008). | National Commission on the Humanities and Social |
| | Sciences; Trustee of Carnegie Corporation of New |
| | York and of the National Constitution Center; Chair |
| IndependentTrustees | of the U.S. Presidential Commission for the Study |
| of Bioethical Issues. |
| Emerson U. Fullwood | |
| Born 1948. Trustee Since January 2008. Principal | JoAnn Heffernan Heisen |
| Occupation(s) During the Past Five Years: Executive | Born 1950. Trustee Since July 1998. Principal |
| Chief Staff and Marketing Officer for North America | Occupation(s) During the Past Five Years: Corporate |
| and Corporate Vice President (retired 2008) of Xerox | Vice President and Chief Global Diversity Officer |
| Corporation (document management products and | (retired 2008) and Member of the Executive |
| services); Executive in Residence and 2010 | Committee (1997–2008) of Johnson & Johnson |
| Distinguished Minett Professor at the Rochester | (pharmaceuticals/medical devices/consumer |
| Institute of Technology; Director of SPX Corporation | products); Director of Skytop Lodge Corporation |
| (multi-industry manufacturing), the United Way of | (hotels), the University Medical Center at Princeton, |
| Rochester, Amerigroup Corporation (managed health | the Robert Wood Johnson Foundation, and the Center |
| care), the University of Rochester Medical Center, | for Talent Innovation; Member of the Advisory Board |
| Monroe Community College Foundation, and North | of the Maxwell School of Citizenship and Public Affairs |
| Carolina A&T University. | at Syracuse University. |
| |
| Rajiv L. Gupta | F. Joseph Loughrey |
| Born 1945. Trustee Since December 2001. 2 | Born 1949. Trustee Since October 2009. Principal |
| Principal Occupation(s) During the Past Five Years: | Occupation(s) During the Past Five Years: President |
| Chairman and Chief Executive Officer (retired 2009) | and Chief Operating Officer (retired 2009) of Cummins |
| and President (2006–2008) of Rohm and Haas Co. | Inc. (industrial machinery); Chairman of the Board of |
| (chemicals); Director of Tyco International, Ltd. | Hillenbrand, Inc. (specialized consumer services); |
| (diversified manufacturing and services), Hewlett- | Director of SKF AB (industrial machinery), the Lumina |
| Packard Co. (electronic computer manufacturing), | |
| | |
| Foundation for Education, and Oxfam America; | Executive Officers | |
| Chairman of the Advisory Council for the College of | | |
| Arts and Letters and Member of the Advisory Board to | Glenn Booraem | |
| the Kellogg Institute for International Studies at the | Born 1967. Controller Since July 2010. Principal |
| University of Notre Dame. | Occupation(s) During the Past Five Years: Principal |
| | of The Vanguard Group, Inc.; Controller of each of |
| Mark Loughridge | the investment companies served by The Vanguard |
| Born 1953. Trustee Since March 2012. Principal | Group; Assistant Controller of each of the investment |
| Occupation(s) During the Past Five Years: Senior Vice | companies served by The Vanguard Group (2001–2010). |
| President and Chief Financial Officer at IBM (information | | |
| technology services); Fiduciary Member of IBM’s | Thomas J. Higgins | |
| Retirement Plan Committee. | Born 1957. Chief Financial Officer Since September |
| | 2008. Principal Occupation(s) During the Past Five |
| Scott C. Malpass | Years: Principal of The Vanguard Group, Inc.; Chief |
| Born 1962. Trustee Since March 2012. Principal | Financial Officer of each of the investment companies |
| Occupation(s) During the Past Five Years: Chief | served by The Vanguard Group; Treasurer of each of |
| Investment Officer and Vice President at the University | the investment companies served by The Vanguard |
| of Notre Dame; Assistant Professor of Finance at the | Group (1998–2008). | |
| Mendoza College of Business at Notre Dame; Member | | |
| of the Notre Dame 403(b) Investment Committee; | Kathryn J. Hyatt | |
| Director of TIFF Advisory Services, Inc. (investment | Born 1955. Treasurer Since November 2008. Principal |
| advisor); Member of the Investment Advisory | Occupation(s) During the Past Five Years: Principal of |
| Committees of the Financial Industry Regulatory | The Vanguard Group, Inc.; Treasurer of each of the |
| Authority (FINRA) and of Major League Baseball. | investment companies served by The Vanguard |
| | Group; Assistant Treasurer of each of the investment |
| André F. Perold | companies served by The Vanguard Group (1988–2008). |
| Born 1952. Trustee Since December 2004. Principal | | |
| Occupation(s) During the Past Five Years: George | Heidi Stam | |
| Gund Professor of Finance and Banking at the Harvard | Born 1956. Secretary Since July 2005. Principal |
| Business School (retired 2011); Chief Investment | Occupation(s) During the Past Five Years: Managing |
| Officer and Managing Partner of HighVista Strategies | Director of The Vanguard Group, Inc.; General Counsel |
| LLC (private investment firm); Director of Rand | of The Vanguard Group; Secretary of The Vanguard |
| Merchant Bank; Overseer of the Museum of Fine | Group and of each of the investment companies |
| Arts Boston. | served by The Vanguard Group; Director and Senior |
| | Vice President of Vanguard Marketing Corporation. |
| | |
| Alfred M. Rankin, Jr. | | |
| Born 1941. Trustee Since January 1993. Principal | Vanguard Senior ManagementTeam |
| Occupation(s) During the Past Five Years: Chairman, | | |
| President, and Chief Executive Officer of NACCO | Mortimer J. Buckley | Chris D. McIsaac |
| Industries, Inc. (housewares/lignite) and of Hyster-Yale | Kathleen C. Gubanich | Michael S. Miller |
| Materials Handling, Inc. (forklift trucks); Director of | Paul A. Heller | James M. Norris |
| the National Association of Manufacturers; Chairman | Martha G. King | Glenn W. Reed |
| of the Board of University Hospitals of Cleveland; | John T. Marcante | |
| Advisory Chairman of the Board of The Cleveland | | |
| Museum of Art. | | |
| | Chairman Emeritus and Senior Advisor |
| | |
| Peter F. Volanakis | | |
| Born 1955. Trustee Since July 2009. Principal | John J. Brennan | |
| Occupation(s) During the Past Five Years: President | Chairman, 1996–2009 | |
| and Chief Operating Officer (retired 2010) of Corning | | |
| Incorporated (communications equipment); Director | Chief Executive Officer and President, 1996–2008 |
| of SPX Corporation (multi-industry manufacturing); | | |
| Overseer of the Amos Tuck School of Business | | |
| Administration at Dartmouth College; Advisor to the | Founder | |
| Norris Cotton Cancer Center. | John C. Bogle | |
| | | |
| Chairman and Chief Executive Officer, 1974–1996 |
1 Mr. McNabb is considered an “interested person,” as defined in the Investment Company Act of 1940, because he is an officer of the
Vanguard funds.
2 December 2002 for Vanguard Equity Income Fund, Vanguard Growth Equity Fund, the Vanguard Municipal Bond Funds, and the Vanguard
State Tax-Exempt Funds.

| | |
| | | P.O. Box 2600 |
| | | Valley Forge, PA 19482-2600 |
| |
| |
| |
| Connect with Vanguard® > vanguard.com |
| |
| |
| |
| Fund Information > 800-662-7447 | | CFA® is a trademark owned by CFA Institute. |
| Direct Investor Account Services > 800-662-2739 | |
| Institutional Investor Services > 800-523-1036 | |
| Text Telephone for People | | |
| With Hearing Impairment > 800-749-7273 | |
| |
| This material may be used in conjunction | |
| with the offering of shares of any Vanguard | |
| fund only if preceded or accompanied by | |
| the fund’s current prospectus. | |
| |
| All comparative mutual fund data are from Lipper Inc. or | |
| Morningstar, Inc., unless otherwise noted. | |
| |
| You can obtain a free copy of Vanguard’s proxy voting | |
| guidelines by visiting vanguard.com/proxyreporting or by | |
| calling Vanguard at 800-662-2739. The guidelines are | |
| also available from the SEC’s website, sec.gov. In | |
| addition, you may obtain a free report on how your fund | |
| voted the proxies for securities it owned during the 12 | |
| months ended June 30. To get the report, visit either | |
| vanguard.com/proxyreporting or sec.gov. | |
| |
| You can review and copy information about your fund at | |
| the SEC’s Public Reference Room in Washington, D.C. To | |
| find out more about this public service, call the SEC at | |
| 202-551-8090. Information about your fund is also | |
| available on the SEC’s website, and you can receive | |
| copies of this information, for a fee, by sending a | |
| request in either of two ways: via e-mail addressed to | |
| publicinfo@sec.gov or via regular mail addressed to the | |
| Public Reference Section, Securities and Exchange | |
| Commission, Washington, DC 20549-1520. | |
| |
| |
| | | © 2013 The Vanguard Group, Inc. |
| | | All rights reserved. |
| | | Vanguard Marketing Corporation, Distributor. |
| |
| | | Q1142 052013 |

Semiannual Report | March 31, 2013
Vanguard Capital Opportunity Fund

> Vanguard Capital Opportunity Fund returned about 22% for the six months
ended March 31, 2013, surpassing the performance of its benchmark index and
the average return of peer funds.
> The broad U.S. stock market advanced more than 11% as the nation’s economic
recovery continued and corporate earnings remained strong.
> Health care and information technology, the fund’s two largest sectors,
contributed the most to its results.
| |
| Contents | |
| Your Fund’s Total Returns. | 1 |
| Chairman’s Letter. | 2 |
| Advisor’s Report. | 7 |
| Fund Profile. | 10 |
| Performance Summary. | 11 |
| Financial Statements. | 12 |
| About Your Fund’s Expenses. | 22 |
| Trustees Approve Advisory Agreement. | 24 |
| Glossary. | 25 |
Please note: The opinions expressed in this report are just that—informed opinions. They should not be considered promises or advice.
Also, please keep in mind that the information and opinions cover the period through the date on the front of this report. Of course, the
risks of investing in your fund are spelled out in the prospectus.
See the Glossary for definitions of investment terms used in this report.
About the cover: Our cover photograph shows rigging on the HMSSurprise, a replica of an 18th-century Royal Navy frigate. It
was featured in the 2003 movie Master and Commander: The Far Side of the World, which was based on Patrick O’Brian’s sea
novels, set amid the Napoleonic Wars. Vanguard was named for another ship of that era, the HMSVanguard, which was the
flagship of British Admiral Horatio Nelson at the Battle of the Nile.
Your Fund’s Total Returns
| |
| Six Months Ended March 31, 2013 | |
| | Total |
| | Returns |
| Vanguard Capital Opportunity Fund | |
| Investor Shares | 22.16% |
| Admiral™ Shares | 22.21 |
| Russell Midcap Growth Index | 13.39 |
| Multi-Cap Growth Funds Average | 8.88 |
| Multi-Cap Growth Funds Average: Derived from data provided by Lipper Inc. |
| Admiral Shares carry lower expenses and are available to investors who meet certain account-balance requirements. |
| | | | |
| Your Fund’s Performance at a Glance | | | | |
| September 30, 2012, Through March 31, 2013 | | | | |
| | | | Distributions Per Share |
| | Starting | Ending | Income | Capital |
| | Share Price | Share Price | Dividends | Gains |
| Vanguard Capital Opportunity Fund | | | | |
| Investor Shares | $33.22 | $39.06 | $0.385 | $0.930 |
| Admiral Shares | 76.75 | 90.21 | 0.953 | 2.147 |
1

Chairman’s Letter
Dear Shareholder,
Vanguard Capital Opportunity Fund, propelled by healthy financial markets and solid stock choices, registered impressive gains for the six-month period ended March 31. The fund returned about 22%, significantly ahead of the 13% result of its benchmark, the Russell Midcap Growth Index, and the nearly 9% average return of its peers.
The fund’s outstanding performance was a welcome departure from some recent fiscal periods, when its holdings weren’t quite in step with market trends and business developments. The management team’s ability to persevere through the inevitable volatility has often led to periods of reward, and its record over longer time periods is noteworthy. Indeed, patience and commitment are crucial to the investment process of PRIMECAP Management Company, which marked its 15th anniversary as the fund’s advisor in February.
On another note, after careful consideration of the fund’s size and cash flow, on April 3 Capital Opportunity’s board of trustees reopened the fund to all individual investors for the first time since 2004. At the same time, the $25,000 annual contribution limit for these investors was removed.
Global equity markets delivered a powerful rally
Global stocks advanced for the fifth straight month to finish the half year ended March 31 with impressive gains. The S&P 500 Index closed at a record high on the
2
period’s final business day after global financial markets in recent months shrugged off the U.S. “fiscal cliff” crisis, the unsettled Italian national elections, and a controversial bailout package for Cyprus.
Peter Westaway, Vanguard’s chief European economist, said that the latest developments in Europe had been “rather bad,” but that the market had for the most part already priced in these events. “As always,” he said, “we think investors should assess their portfolios carefully and avoid making impulsive moves.”
U.S. equities returned more than 11% as the economic recovery kept slowly building momentum; the housing market rebounded further, and the labor market improved. International equities were up
more than 9%. Returns were about 16% for developed markets in the Pacific region, where Japan’s accommodative monetary policy has helped spark the nation’s stock market, and nearly 10% in Europe. Emerging markets stocks rose about 4%.
Bond returns barely budged as yields lingered near lows
The broad U.S. taxable bond market scraped out a minuscule gain of 0.09% for the half year as U.S. Treasury yields remained just slightly above their all-time lows. Although the yield of the benchmark 10-year Treasury note increased during the six months and topped 2.00% at various times, it closed the period at about 1.85%. (Bond prices and yields move in opposite directions.)
| | | |
| Market Barometer | | | |
| |
| | Total Returns |
| | Periods Ended March 31, 2013 |
| | Six | One | Five Years |
| | Months | Year | (Annualized) |
| Stocks | | | |
| Russell 1000 Index (Large-caps) | 11.10% | 14.43% | 6.15% |
| Russell 2000 Index (Small-caps) | 14.48 | 16.30 | 8.24 |
| Russell 3000 Index (Broad U.S. market) | 11.35 | 14.56 | 6.32 |
| MSCI All Country World Index ex USA (International) | 9.20 | 8.36 | -0.39 |
| |
| Bonds | | | |
| Barclays U.S. Aggregate Bond Index (Broad taxable market) | 0.09% | 3.77% | 5.47% |
| Barclays Municipal Bond Index (Broad tax-exempt market) | 0.96 | 5.25 | 6.10 |
| Citigroup Three-Month U.S. Treasury Bill Index | 0.05 | 0.08 | 0.30 |
| |
| CPI | | | |
| Consumer Price Index | 0.59% | 1.47% | 1.74% |
3
Municipal bonds returned almost 1% for the six months despite price declines in March. And returns of money market funds and savings accounts barely registered as short-term interest rates remained between 0% and 0.25%, under the Federal Reserve’s four-year-old policy.
Robert Auwaerter, head of Vanguard’s Fixed Income Group, doesn’t anticipate abrupt policy changes from the central bank. “We don’t see the Fed changing course in the near term,” he said, “and when the Fed does, we expect it’ll go slowly so as not to undo the efforts made to keep interest rates low and to stimulate the economy.”
Health care and technology stocks led the fund’s superior returns
PRIMECAP Management’s patience and conviction are inherent in the company’s investment approach, which combines fundamental research, individual decision-making, and unwavering discipline with a long-term investment horizon. Overall, the advisor applies a contrarian strategy as it searches for growth stocks undervalued by the market.
PRIMECAP Management’s rigorous selection process results in a portfolio that is more concentrated than the Russell Midcap Growth Index (the fund’s holdings numbered about 120 as of March 31,
| | | |
| Expense Ratios | | | |
| Your Fund Compared With Its Peer Group | | | |
| | Investor | Admiral | Peer Group |
| | Shares | Shares | Average |
| Capital Opportunity Fund | 0.48% | 0.41% | 1.31% |
The fund expense ratios shown are from the prospectus dated January 25, 2013, and represent estimated costs for the current fiscal year. For
the six months ended March 31, 2013, the fund’s annualized expense ratios were 0.48% for Investor Shares and 0.41% for Admiral Shares.
The peer-group expense ratio is derived from data provided by Lipper Inc. and captures information through year-end 2012.
Peer group: Multi-Cap Growth Funds.
4
compared to about 460 for the benchmark). The fund is also likely to perform very differently from the benchmark as the advisor aims to exceed it over the long term.
Capital Opportunity traditionally maintains a heavy exposure to the health care and information technology sectors. PRIMECAP Management’s commitment to these industries was particularly strong over the past six months as the fund held more than 70% of its assets in the two sectors on average, including nearly 38% in health care.
Over the past few years, the advisor has gradually increased its exposure to health care––as well as made astute stock choices within it––as long-term trends have produced a favorable environment for the industry. The sector was the fund’s most productive, advancing almost 25% over the period and adding about 9 percentage points to return.
The fund benefited from both its overall allocation and its specific health care holdings, particularly in the pharmaceutical and biotechnology industries. Companies in both fields have profited from improved pipelines of new medicines as well as a more favorable regulatory climate at the Food and Drug Administration. Decreasing costs and streamlined operations have further boosted the bottom line.
In technology, several of Capital Opportunity’s holdings in the semiconductor, software, and communication
equipment industries enjoyed standout performances. In some instances, innovative new products and services proved attractive to investors and customers. In others, organizational restructuring set the stage for increased profits, and the market reacted favorably to the makings of a turnaround.
None of the industry sectors recorded a negative result for the fund, although its holdings in the consumer discretionary sector trailed the returns of those in the benchmark.
For more about the advisor’s strategy and the fund’s positioning during the six months, please see the Advisor’s Report that follows this letter.
Low cost and talent drive successful active management
Investors sometimes ask whether it’s a contradiction that Vanguard, a champion of index investing, offers actively managed mutual funds. To understand how active funds fit into our philosophy, consider for a moment why indexing has proved its mettle: It’s a generally low-cost, tax-efficient way to build a diversified portfolio that lets you keep more of your fund’s returns. Because index funds seek to track the overall market or a segment of it, they typically cost much less to run than funds that are actively managed in an effort to outperform the market. And the less you pay for a fund, the more of its returns come back to you.
5
The same principle—low cost—drives our approach to active funds. The other essential ingredient is talent. Some wonder how we can afford to hire top active managers when we place such importance on keeping investing costs low. The answer lies in key characteristics of Vanguard’s structure and culture—our mutual ownership, our large scale, a long-term perspective, and a rigorous oversight process, which I lead. (You can read more about our approach in The Case for Vanguard Active Management: Solving the Low-Cost/Top-Talent Paradox? at vanguard.com/research.)
These enduring advantages don’t guarantee outperformance, of course. Even in those cases where an active stock fund outperforms over long periods, it doesn’t necessarily mean that investors earned more than the index results every year—or even every decade. And investors have no way of knowing beforehand which funds will outperform.
But for those willing to accept the greater risks that come with active investing, we believe Vanguard’s combination of talented advisors and low costs can improve the odds.
As always, thank you for entrusting your assets to Vanguard.
Sincerely,

F. William McNabb III
Chairman and Chief Executive Officer
April 16, 2013
6
Advisor’s Report
For the six months ended March 31, 2013, Vanguard Capital Opportunity Fund returned 22.16% for Investor Shares and 22.21% for Admiral Shares, exceeding both the 13.39% return of its benchmark, the unmanaged Russell Midcap Growth Index, and the 8.88% average return of its multi-capitalization growth fund competitors. Favorable stock selection in the information technology and health care sectors were the main reasons for the positive performance.
The Investment environment
The economic environment for the past six months was clouded by uncertainty over the fiscal challenges faced by the federal government. Although the passage of the American Taxpayer Relief Act of 2012 in early January averted the tax issues related to the “fiscal cliff,” it only delayed budget sequestration until March, when automatic spending reductions began to take effect. We expect that the federal spending cuts, along with higher payroll and other taxes, will have a negative impact on U.S. economic growth. Meanwhile, Europe continues to face difficulties due to sovereign debt crises, as evidenced by the recent unconventional bailout of Cyprus.
The stock market shrugged off these challenges, with the S&P 500 Index returning more than 10% for the period. Continued monetary stimulus by central banks in the United States, Europe, and Japan likely contributed to the strong
gains. The U.S. housing market recovery appears to be accelerating, aided by the current low-interest-rate environment. The corporate sector remains an area of strength, with profit margins near all-time highs. Consumer spending growth has resumed, despite the expiration of the payroll tax holiday at the beginning of 2013.
Management of the fund
While our focus is on the long term, we are encouraged by the fund’s returns for the past six months. After generally lagging the Russell Midcap Growth Index for two-and-a-half years, results improved dramatically. We remain committed to our investment philosophy, which is to identify companies that, over time, will exceed the market’s expectations.
This strategy has led us to build and maintain significant investments in health care and information technology companies that we believe offer the potential for higher returns than the overall market. As of March 31, 2013, these two sectors made up more than 70% of the fund’s assets (versus about 30% of the Russell Midcap Growth Index). Eight of the ten largest holdings are either health care or information technology stocks.
Information technology
Positive stock selection led the fund’s IT holdings to return 22.2%. Standouts were Cree (+115%), Research In Motion (+93%), Electronic Arts (+40%), Symantec (+37%), and Adobe Systems (+34%).
7
We believe that the technology companies in the fund remain attractively valued. In fact, the price/earnings ratio of the sector relative to the S&P 500 Index is at its lowest level since 1990. Many of these stocks have free cash flow yields of more than 7%, placing them in the index’s top quintile of non-financial companies. These metrics appear even more compelling when we consider the strong prospects and growing cash balances that characterize many of the fund’s IT holdings. We maintain the view expressed in previous letters that these companies should benefit as consumers and businesses use computers for an ever-increasing number of tasks, driving growth in demand for semiconductors, computer hardware, software, storage, networking, and technology-driven services such as consulting and data analytics.
Health care
Holdings in health care returned 24.7%, driven by positive stock selection. Some of the fund’s largest positions were among the top contributors to relative returns, including BioMarin (+55%), Roche (+29%), Biogen Idec (+29%), Amgen (+23%), and Eli Lilly (+22%).
We remain excited about our health care stocks. Global demographic trends and ongoing innovation should sustain the sector’s growth over the foreseeable future. Aging populations worldwide, along with rising standards of living in emerging markets, should lead to greater demand for its products. As the elderly cohort increases, spending will grow
because older age groups typically consume three times as many health care resources as the general population. In addition, the willingness and ability to spend more should rise in developing nations as household wealth increases.
At the same time, the industry’s considerable investment in research and development over the years is driving the design of new and more effective therapies for many diseases, such as cancer, diabetes, and Alzheimer’s. The precipitous decline in the cost of genetic sequencing is allowing researchers to identify unknown diseases and to rapidly develop therapies that improve the standard of care and save lives. Increasingly, drugs developed based on genetic research are providing higher cure rates with fewer side effects than conventional treatments.
Other sector highlights
Stock selection in industrials also boosted the fund’s results. Southwest Airlines (+54%), Rockwell Automation (+26%), and FedEx (+16%) were among the leaders. Stock picks and an underweight position in the energy sector helped as well, as did an underweight position in utilities. In the materials sector, a significant position in Monsanto (+17%) contributed.
A significant underweight position in financials hurt relative performance for the period. This was partially offset by stock selection, mainly Charles Schwab (+40%), the fund’s largest position in financials. Poor stock picks in consumer
8
discretionary also restrained results. Ascena Retail Group (–14%) and Carnival (–3%) were the biggest relative laggards among consumer discretionary holdings.
The outlook
As we assess the remainder of the fiscal year, we are more cautious in our outlook for U.S. equities than we were a year ago. The S&P 500 Index has appreciated significantly and is trading at an all-time high, and we believe valuations are stretched in some segments of the market. We have concerns regarding economic growth, which could pressure revenue and earnings expansion. Furthermore, the ongoing uncertainties surrounding fiscal and tax policies are discouraging consumers and companies from making investment decisions.
However, stocks remain attractively valued relative to bonds and most other asset classes, increasing the likelihood that net investment flows from bonds and money market funds could support equity prices. From mid-2007 to year-end 2012, domestic stock funds experienced more than $600 billion in net outflows, while bond funds gained over $1.1 trillion in net inflows. If investors develop a greater tolerance for risk as they seek higher returns, this trend could reverse, leading to higher equity prices. Preliminary estimates indicate that domestic stock funds gained nearly $20 billion in net inflows in the first quarter of 2013, the largest quarterly inflow since the second quarter of 2009.
We are more optimistic about investment opportunities in certain segments of the market. Specifically, valuations in health care and information technology appear attractive. The price/earnings ratios of these sectors relative to the overall S&P 500 Index are below their 15-year averages. Health care is trading in line with the index instead of at its typical 10% premium, and information technology is trading at a 10% discount instead of at its historical 35% premium. But in the second half of 2012, revenue growth rates in these sectors exceeded those of the other eight in the index, each of which is trading above its 15-year average.
PRIMECAP Management Company April 12, 2013
9
Capital Opportunity Fund
Fund Profile
As of March 31, 2013
| | |
| Share-Class Characteristics | |
| | Investor | Admiral |
| | Shares | Shares |
| Ticker Symbol | VHCOX | VHCAX |
| Expense Ratio1 | 0.48% | 0.41% |
| 30-Day SEC Yield | 0.59% | 0.66% |
| | | |
| Portfolio Characteristics | | | |
| | | | DJ U.S. |
| | | Russell | Total |
| | | Midcap | Market |
| | | Growth | FA |
| | Fund | Index | Index |
| Number of Stocks | 120 | 459 | 3,586 |
| Median Market Cap | $22.5B | $9.9B | $40.0B |
| Price/Earnings Ratio | 26.1x | 24.3x | 18.1x |
| Price/Book Ratio | 3.0x | 4.8x | 2.3x |
| Return on Equity | 16.2% | 18.8% | 16.6% |
| Earnings Growth Rate | 12.6% | 13.6% | 9.6% |
| Dividend Yield | 1.1% | 1.1% | 2.0% |
| Foreign Holdings | 11.1% | 0.0% | 0.0% |
| Turnover Rate | | | |
| (Annualized) | 6% | — | — |
| Short-Term Reserves | 2.9% | — | — |
| | | |
| Sector Diversification (% of equity exposure) |
| | | | DJ U.S. |
| | | Russell | Total |
| | | Midcap | Market |
| | | Growth | FA |
| | Fund | Index | Index |
| Consumer Discretionary | 9.4% | 24.8% | 12.4% |
| Consumer Staples | 0.0 | 8.0 | 9.5 |
| Energy | 1.8 | 5.7 | 10.1 |
| Financials | 1.8 | 8.3 | 17.3 |
| Health Care | 38.8 | 12.6 | 12.2 |
| Industrials | 11.2 | 15.6 | 11.1 |
| Information Technology | 33.8 | 16.4 | 17.4 |
| Materials | 2.9 | 6.2 | 3.8 |
| Telecommunication | | | |
| Services | 0.0 | 1.7 | 2.6 |
| Utilities | 0.3 | 0.7 | 3.6 |
| | |
| Volatility Measures | | |
| | | DJ U.S. |
| | Russell | Total |
| | Midcap | Market |
| | Growth | FA |
| | Index | Index |
| R-Squared | 0.92 | 0.94 |
| Beta | 0.98 | 1.13 |
| These measures show the degree and timing of the fund’s fluctuations compared with the indexes over 36 months. |
| | |
| Ten Largest Holdings (% of total net assets) |
| Biogen Idec Inc. | Biotechnology | 6.3% |
| Amgen Inc. | Biotechnology | 6.0 |
| Eli Lilly & Co. | Pharmaceuticals | 4.5 |
| Roche Holding AG | Pharmaceuticals | 4.2 |
| BioMarin Pharmaceutical | | |
| Inc. | Biotechnology | 3.4 |
| FedEx Corp. | Air Freight & | |
| | Logistics | 3.1 |
| Google Inc. Class A | Internet Software & | |
| | Services | 2.8 |
| Monsanto Co. | Fertilizers & | |
| | Agricultural | |
| | Chemicals | 2.8 |
| Novartis AG ADR | Pharmaceuticals | 2.6 |
| Medtronic Inc. | Health Care | |
| | Equipment | 2.6 |
| Top Ten | | 38.3% |
| The holdings listed exclude any temporary cash investments and equity index products. |
Investment Focus
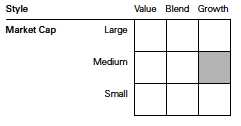
1 The expense ratios shown are from the prospectus dated January 25, 2013, and represent estimated costs for the current fiscal year. For the six months ended March 31, 2013, the annualized expense ratios were 0.48% for Investor Shares and 0.41% for Admiral Shares.
10
Capital Opportunity Fund
Performance Summary
All of the returns in this report represent past performance, which is not a guarantee of future results that may be achieved by the fund. (Current performance may be lower or higher than the performance data cited. For performance data current to the most recent month-end, visit our website at vanguard.com/performance.) Note, too, that both investment returns and principal value can fluctuate widely, so an investor’s shares, when sold, could be worth more or less than their original cost. The returns shown do not reflect taxes that a shareholder would pay on fund distributions or on the sale of fund shares.
Fiscal-Year Total Returns (%): September 30, 2002, Through March 31, 2013
Note: For 2013, performance data reflect the six months ended March 31, 2013.
| | | | |
| Average Annual Total Returns: Periods Ended March 31, 2013 | | |
| |
| | Inception | One | Five | Ten |
| | Date | Year | Years | Years |
| Investor Shares | 8/14/1995 | 23.50% | 7.20% | 13.00% |
| Admiral Shares | 11/12/2001 | 23.58 | 7.28 | 13.09 |
See Financial Highlights for dividend and capital gains information.
11
Capital Opportunity Fund
Financial Statements (unaudited)
Statement of Net Assets
As of March 31, 2013
The fund reports a complete list of its holdings in regulatory filings four times in each fiscal year, at the quarter-ends. For the second and fourth fiscal quarters, the lists appear in the fund’s semiannual and annual reports to shareholders. For the first and third fiscal quarters, the fund files the lists with the Securities and Exchange Commission on Form N-Q. Shareholders can look up the fund’s Forms N-Q on the SEC’s website at sec.gov. Forms N-Q may also be reviewed and copied at the SEC’s Public Reference Room (see the back cover of this report for further information).
| | | |
| | | | Market |
| | | | Value |
| | | Shares | ($000) |
| Common Stocks (97.3%) | | |
| Consumer Discretionary (9.2%) | |
| * | CarMax Inc. | 4,186,797 | 174,589 |
| * | DIRECTV | 2,371,276 | 134,238 |
| | TJX Cos. Inc. | 2,580,000 | 120,615 |
| | Carnival Corp. | 2,038,900 | 69,934 |
| * | Ascena Retail Group Inc. | 2,735,200 | 50,738 |
| * | DreamWorks Animation | | |
| | SKG Inc. Class A | 2,510,000 | 47,590 |
| * | Bed Bath & Beyond Inc. | 703,700 | 45,332 |
| | Royal Caribbean | | |
| | Cruises Ltd. | 1,318,000 | 43,784 |
| *,^ | Tesla Motors Inc. | 1,109,200 | 42,028 |
| | Las Vegas Sands Corp. | 340,000 | 19,159 |
| * | Amazon.com Inc. | 54,700 | 14,577 |
| | L Brands Inc. | 214,100 | 9,562 |
| | Lowe’s Cos. Inc. | 245,000 | 9,290 |
| | Ross Stores Inc. | 99,900 | 6,056 |
| | Nordstrom Inc. | 100,000 | 5,523 |
| | Gentex Corp. | 100,000 | 2,001 |
| | | | 795,016 |
| Energy (1.8%) | | |
| | Cabot Oil & Gas Corp. | 710,400 | 48,030 |
| | Noble Energy Inc. | 283,000 | 32,732 |
| | Oceaneering | | |
| | International Inc. | 250,000 | 16,603 |
| | National Oilwell Varco Inc. | 231,000 | 16,343 |
| * | Transocean Ltd. | 312,900 | 16,258 |
| | Ensco plc Class A | 143,340 | 8,600 |
| * | Southwestern Energy Co. | 160,000 | 5,962 |
| | Range Resources Corp. | 55,000 | 4,457 |
| * | Cameron | | |
| | International Corp. | 35,000 | 2,282 |
| | | | 151,267 |
| Financials (1.7%) | | |
| | Charles Schwab Corp. | 6,865,000 | 121,442 |
| | Chubb Corp. | 300,000 | 26,259 |
| | CME Group Inc. | 7,400 | 454 |
| | | | 148,155 |
| | | |
| Health Care (37.7%) | | |
| * | Biogen Idec Inc. | 2,810,438 | 542,162 |
| | Amgen Inc. | 5,087,600 | 521,530 |
| | Eli Lilly & Co. | 6,819,000 | 387,251 |
| | Roche Holding AG | 1,561,578 | 364,040 |
| * | BioMarin | | |
| | Pharmaceutical Inc. | 4,743,600 | 295,337 |
| | Novartis AG ADR | 3,131,000 | 223,052 |
| | Medtronic Inc. | 4,709,200 | 221,144 |
| * | Life Technologies Corp. | 2,875,945 | 185,872 |
| * | QIAGEN NV | 7,119,600 | 150,081 |
| * | Illumina Inc. | 1,198,100 | 64,697 |
| * | Boston Scientific Corp. | 7,216,300 | 56,359 |
| * | Pharmacyclics Inc. | 645,100 | 51,872 |
| | Abbott Laboratories | 1,099,600 | 38,838 |
| * | Seattle Genetics Inc. | 1,054,000 | 37,428 |
| * | Edwards | | |
| | Lifesciences Corp. | 280,000 | 23,005 |
| * | ImmunoGen Inc. | 1,280,000 | 20,557 |
| * | Charles River Laboratories | |
| | International Inc. | 400,300 | 17,721 |
| | PerkinElmer Inc. | 496,900 | 16,716 |
| * | Affymetrix Inc. | 2,700,600 | 12,747 |
| *,^ | Dendreon Corp. | 2,329,000 | 11,016 |
| * | Waters Corp. | 99,500 | 9,344 |
| * | InterMune Inc. | 913,900 | 8,271 |
| | Zimmer Holdings Inc. | 54,000 | 4,062 |
| * | Cerner Corp. | 5,000 | 474 |
| | | | 3,263,576 |
| Industrials (10.9%) | | |
| | FedEx Corp. | 2,754,430 | 270,485 |
| | Southwest Airlines Co. | 10,935,100 | 147,405 |
| | Rockwell Automation Inc. | 956,000 | 82,551 |
| ^ | Ritchie Bros | | |
| | Auctioneers Inc. | 2,962,000 | 64,276 |
| * | JetBlue Airways Corp. | 6,940,150 | 47,887 |
| | Union Pacific Corp. | 325,000 | 46,283 |
| * | United Continental | | |
| | Holdings Inc. | 1,385,000 | 44,334 |
| * | Delta Air Lines Inc. | 2,500,000 | 41,275 |
12
| | | |
| Capital Opportunity Fund | | |
| |
| |
| |
| | | | Market |
| | | | Value |
| | | Shares | ($000) |
| * | Jacobs Engineering | | |
| | Group Inc. | 651,000 | 36,612 |
| * | AECOM | | |
| | Technology Corp. | 1,090,000 | 35,752 |
| | C.H. Robinson | | |
| | Worldwide Inc. | 564,100 | 33,541 |
| | European Aeronautic | | |
| | Defence and | | |
| | Space Co. NV | 626,440 | 31,929 |
| | IDEX Corp. | 300,000 | 16,026 |
| | Chicago Bridge & | | |
| | Iron Co. NV | 250,000 | 15,525 |
| | Babcock & Wilcox Co. | 500,000 | 14,205 |
| | Expeditors International | | |
| | of Washington Inc. | 380,000 | 13,570 |
| * | US Airways Group Inc. | 57,000 | 967 |
| | | | 942,623 |
| Information Technology (32.9%) | |
| * | Google Inc. Class A | 309,605 | 245,836 |
| * | Cree Inc. | 3,944,900 | 215,825 |
| * | Symantec Corp. | 8,286,200 | 204,503 |
| * | Adobe Systems Inc. | 4,104,500 | 178,587 |
| | Texas Instruments Inc. | 4,526,400 | 160,597 |
| | Altera Corp. | 4,320,000 | 153,230 |
| * | Trimble Navigation Ltd. | 4,911,200 | 147,140 |
| ^ | ASML Holding NV | 1,854,000 | 126,090 |
| * | Electronic Arts Inc. | 6,909,000 | 122,289 |
| | Microsoft Corp. | 4,100,000 | 117,301 |
| | Corning Inc. | 8,080,000 | 107,706 |
| *,^ | Research In Motion Ltd. | 7,108,700 | 102,721 |
| * | SanDisk Corp. | 1,632,248 | 89,774 |
| * | Flextronics | | |
| | International Ltd. | 11,409,000 | 77,125 |
| * | NeuStar Inc. Class A | 1,623,416 | 75,538 |
| * | EMC Corp. | 2,375,000 | 56,739 |
| | Visa Inc. Class A | 326,930 | 55,526 |
| * | Micron Technology Inc. | 5,550,000 | 55,389 |
| | Plantronics Inc. | 1,150,000 | 50,818 |
| | NVIDIA Corp. | 3,590,000 | 46,024 |
| *,1 | Descartes Systems | | |
| | Group Inc. | 4,645,000 | 44,406 |
| | QUALCOMM Inc. | 599,325 | 40,125 |
| * | NetApp Inc. | 1,026,700 | 35,072 |
| | Hewlett-Packard Co. | 1,150,000 | 27,416 |
| *,1 | FormFactor Inc. | 5,634,700 | 26,483 |
| * | Nuance | | |
| | Communications Inc. | 1,250,000 | 25,225 |
| * | Rambus Inc. | 4,400,000 | 24,684 |
| | Motorola Solutions Inc. | 375,000 | 24,011 |
| | | |
| | Intuit Inc. | 350,000 | 22,977 |
| | FEI Co. | 330,000 | 21,301 |
| * | Entegris Inc. | 2,019,231 | 19,910 |
| * | Cymer Inc. | 200,000 | 19,220 |
| | Jabil Circuit Inc. | 1,000,000 | 18,480 |
| | KLA-Tencor Corp. | 350,000 | 18,459 |
| | Accenture plc Class A | 181,700 | 13,804 |
| | Mastercard Inc. Class A | 22,100 | 11,959 |
| | Xilinx Inc. | 300,000 | 11,451 |
| | Apple Inc. | 24,000 | 10,623 |
| * | Ciena Corp. | 607,142 | 9,720 |
| | Analog Devices Inc. | 200,000 | 9,298 |
| * | Brocade Communications | |
| | Systems Inc. | 1,100,000 | 6,347 |
| *,^ | Smart Technologies Inc. | | |
| | Class A | 4,371,304 | 6,076 |
| | Applied Materials Inc. | 300,000 | 4,044 |
| * | F5 Networks Inc. | 22,325 | 1,989 |
| * | ExactTarget Inc. | 24,000 | 558 |
| * | Facebook Inc. Class A | 100 | 3 |
| * | Workday Inc. Class A | 25 | 2 |
| | | | 2,842,401 |
| Materials (2.8%) | | |
| | Monsanto Co. | 2,278,786 | 240,708 |
| * | Boise Cascade Co. | 33,900 | 1,151 |
| | | | 241,859 |
| Utilities (0.3%) | | |
| | Public Service Enterprise | | |
| | Group Inc. | 505,600 | 17,362 |
| | AES Corp. | 1,000,000 | 12,570 |
| | | | 29,932 |
| Total Common Stocks | | |
| (Cost $4,873,968) | | 8,414,829 |
| Temporary Cash Investment (4.8%) | |
| Money Market Fund (4.8%) | | |
| 2,3 | Vanguard Market Liquidity | |
| | Fund, 0.147% | | |
| | (Cost $417,819) | 417,818,752 | 417,819 |
| Total Investments (102.1%) | | |
| (Cost $5,291,787) | | 8,832,648 |
| Other Assets and Liabilities (-2.1%) | |
| Other Assets | | 19,386 |
| Liabilities3 | | (200,784) |
| | | | (181,398) |
| Net Assets (100%) | | 8,651,250 |
13
| |
| Capital Opportunity Fund | |
| |
| |
| |
| At March 31, 2013, net assets consisted of: |
| | Amount |
| | ($000) |
| Paid-in Capital | 4,822,132 |
| Overdistributed Net Investment Income | (24,780) |
| Accumulated Net Realized Gains | 312,987 |
| Unrealized Appreciation (Depreciation) | |
| Investment Securities | 3,540,861 |
| Foreign Currencies | 50 |
| Net Assets | 8,651,250 |
| |
| |
| Investor Shares—Net Assets | |
| Applicable to 66,990,969 outstanding | |
| $.001 par value shares of beneficial | |
| interest (unlimited authorization) | 2,616,770 |
| Net Asset Value Per Share— | |
| Investor Shares | $39.06 |
| |
| |
| Admiral Shares—Net Assets | |
| Applicable to 66,891,678 outstanding | |
| $.001 par value shares of beneficial | |
| interest (unlimited authorization) | 6,034,480 |
| Net Asset Value Per Share— | |
| Admiral Shares | $90.21 |
See Note A in Notes to Financial Statements.
* Non-income-producing security.
^ Part of security position is on loan to broker-dealers. The total value of securities on loan is $164,632,000.
1 Considered an affiliated company of the fund as the fund owns more than 5% of the outstanding voting securities of such company.
2 Affiliated money market fund available only to Vanguard funds and certain trusts and accounts managed by Vanguard. Rate shown is the
7-day yield.
3 Includes $167,437,000 of collateral received for securities on loan.
ADR—American Depositary Receipt.
See accompanying Notes, which are an integral part of the Financial Statements.
14
Capital Opportunity Fund
Statement of Operations
| |
| | Six Months Ended |
| | March 31, 2013 |
| | ($000) |
| Investment Income | |
| Income | |
| Dividends1,2 | 53,140 |
| Interest2 | 148 |
| Security Lending | 2,054 |
| Total Income | 55,342 |
| Expenses | |
| Investment Advisory Fees—Note B | 10,107 |
| The Vanguard Group—Note C | |
| Management and Administrative—Investor Shares | 2,442 |
| Management and Administrative—Admiral Shares | 3,570 |
| Marketing and Distribution—Investor Shares | 193 |
| Marketing and Distribution—Admiral Shares | 369 |
| Custodian Fees | 53 |
| Shareholders’ Reports—Investor Shares | 30 |
| Shareholders’ Reports—Admiral Shares | 17 |
| Trustees’ Fees and Expenses | 11 |
| Total Expenses | 16,792 |
| Net Investment Income | 38,550 |
| Realized Net Gain (Loss) | |
| Investment Securities Sold2 | 312,405 |
| Foreign Currencies | (76) |
| Realized Net Gain (Loss) | 312,329 |
| Change in Unrealized Appreciation (Depreciation) | |
| Investment Securities | 1,240,889 |
| Foreign Currencies | (60) |
| Change in Unrealized Appreciation (Depreciation) | 1,240,829 |
| Net Increase (Decrease) in Net Assets Resulting from Operations | 1,591,708 |
1 Dividends are net of foreign withholding taxes of $3,127,000.
2 Dividend income, interest income, and realized net gain (loss) from affiliated companies of the fund were $0, $148,000, and
($4,995,000), respectively.
See accompanying Notes, which are an integral part of the Financial Statements.
15
Capital Opportunity Fund
Statement of Changes in Net Assets
| | |
| | Six Months Ended | Year Ended |
| | March 31, | September 30, |
| | 2013 | 2012 |
| | ($000) | ($000) |
| Increase (Decrease) in Net Assets | | |
| Operations | | |
| Net Investment Income | 38,550 | 53,016 |
| Realized Net Gain (Loss) | 312,329 | 221,332 |
| Change in Unrealized Appreciation (Depreciation) | 1,240,829 | 1,331,299 |
| Net Increase (Decrease) in Net Assets Resulting from Operations | 1,591,708 | 1,605,647 |
| Distributions | | |
| Net Investment Income1 | | |
| Investor Shares | (26,621) | (13,132) |
| Admiral Shares | (61,680) | (28,694) |
| Realized Capital Gain2 | | |
| Investor Shares | (64,306) | (119,830) |
| Admiral Shares | (138,957) | (224,279) |
| Total Distributions | (291,564) | (385,935) |
| Capital Share Transactions | | |
| Investor Shares | (218,474) | (401,140) |
| Admiral Shares | 93,047 | (96,730) |
| Net Increase (Decrease) from Capital Share Transactions | (125,427) | (497,870) |
| Total Increase (Decrease) | 1,174,717 | 721,842 |
| Net Assets | | |
| Beginning of Period | 7,476,533 | 6,754,691 |
| End of Period3 | 8,651,250 | 7,476,533 |
1 Fiscal 2013 distributions from net investment income include $34,400,000 from a dividend received from ASML Holding NV. Subsequent
to the fund’s distribution from net investment income made in December 2012, the ASML dividend was reallocated to return of capital.
The reallocation will reduce the fund’s net investment income distribution in December 2013.
2 Includes fiscal 2013 and 2012 short-term gain distributions totaling $0 and $1,640,000, respectively. Short-term gain distributions are
treated as ordinary income dividends for tax purposes.
3 Net Assets—End of Period includes undistributed (overdistributed) net investment income of ($24,780,000) and $25,047,000.
See accompanying Notes, which are an integral part of the Financial Statements.
16
Capital Opportunity Fund
Financial Highlights
| | | | | | | |
| Investor Shares | | | | | | | |
| | Six Months | | | | | |
| | | Ended | | | | | |
| For a Share Outstanding | March 31, | Year Ended September 30, |
| Throughout Each Period | | 2013 | 2012 | 2011 | 2010 | 2009 | 2008 |
| Net Asset Value, Beginning of Period | $33.22 | $28.17 | $29.59 | $27.71 | $29.41 | $42.70 |
| Investment Operations | | | | | | | |
| Net Investment Income | | .170 | .216 | .151 | .106 | .121 | .2541 |
| Net Realized and Unrealized Gain (Loss) | | | | | | |
| on Investments | | 6.985 | 6.464 | (1.450) | 1.871 | .355 | (9.884) |
| Total from Investment Operations | | 7.155 | 6.680 | (1.299) | 1.977 | .476 | (9.630) |
| Distributions | | | | | | | |
| Dividends from Net Investment Income | (.385)2 | (.161) | (.121) | (.097) | (.114) | (.218) |
| Distributions from Realized Capital Gains | (.930) | (1.469) | — | — | (2.062) | (3.442) |
| Total Distributions | | (1.315) | (1.630) | (.121) | (.097) | (2.176) | (3.660) |
| Net Asset Value, End of Period | | $39.06 | $33.22 | $28.17 | $29.59 | $27.71 | $29.41 |
| |
| Total Return 3 | | 22.16% | 24.62% | -4.45% | 7.14% | 4.41% | -24.13% |
| |
| Ratios/Supplemental Data | | | | | | | |
| Net Assets, End of Period (Millions) | $2,617 | $2,432 | $2,412 | $3,675 | $3,903 | $3,851 |
| Ratio of Total Expenses to | | | | | | | |
| Average Net Assets | | 0.48% | 0.48% | 0.48% | 0.48% | 0.50% | 0.45% |
| Ratio of Net Investment Income to | | | | | | |
| Average Net Assets | | 0.91% | 0.67% | 0.45% | 0.36% | 0.50% | 0.67%1 |
| Portfolio Turnover Rate | | 6% | 9% | 9% | 8% | 12% | 13% |
The expense ratio, net income ratio, and turnover rate for the current period have been annualized.
1 Net investment income per share and the ratio of net investment income to average net assets include $.125 and 0.33%, respectively,
resulting from a special dividend received from ASML Holding NV in October 2007.
2 Fiscal 2013 dividends from net investment income include $.157 per share from a dividend received from ASML Holding NV. Subsequent to
the payment of the fund’s dividend from net investment income in December 2012, the ASML dividend was reallocated to return of capital.
The reallocation will reduce the fund’s dividend from net investment income in December 2013. The reallocation had no impact on net
assets, net asset values per share, or total returns.
3 Total returns do not include transaction or account service fees that may have applied in the periods shown. Fund prospectuses provide
information about any applicable transaction and account service fees.
See accompanying Notes, which are an integral part of the Financial Statements.
17
Capital Opportunity Fund
Financial Highlights
| | | | | | | |
| Admiral Shares | | | | | | | |
| | Six Months | | | | | |
| | | Ended | | | | | |
| For a Share Outstanding | March 31, | Year Ended September 30, |
| Throughout Each Period | | 2013 | 2012 | 2011 | 2010 | 2009 | 2008 |
| Net Asset Value, Beginning of Period | $76.75 | $65.10 | $68.38 | $64.04 | $68.00 | $98.71 |
| Investment Operations | | | | | | | |
| Net Investment Income | | .429 | .559 | .400 | .298 | .329 | .6641 |
| Net Realized and Unrealized Gain (Loss) | | | | | | |
| on Investments | | 16.131 | 14.917 | (3.358) | 4.315 | .811 | (22.845) |
| Total from Investment Operations | | 16.560 | 15.476 | (2.958) | 4.613 | 1.140 | (22.181) |
| Distributions | | | | | | | |
| Dividends from Net Investment Income | (.953)2 | (.434) | (.322) | (.273) | (.339) | (.577) |
| Distributions from Realized Capital Gains | (2.147) | (3.392) | — | — | (4.761) | (7.952) |
| Total Distributions | | (3.100) | (3.826) | (.322) | (.273) | (5.100) | (8.529) |
| Net Asset Value, End of Period | | $90.21 | $76.75 | $65.10 | $68.38 | $64.04 | $68.00 |
| |
| Total Return 3 | | 22.21% | 24.69% | -4.39% | 7.21% | 4.52% | -24.05% |
| |
| Ratios/Supplemental Data | | | | | | | |
| Net Assets, End of Period (Millions) | $6,034 | $5,045 | $4,342 | $4,223 | $3,938 | $3,787 |
| Ratio of Total Expenses to | | | | | | | |
| Average Net Assets | | 0.41% | 0.41% | 0.41% | 0.41% | 0.41% | 0.36% |
| Ratio of Net Investment Income to | | | | | | |
| Average Net Assets | | 0.98% | 0.74% | 0.52% | 0.43% | 0.59% | 0.76%1 |
| Portfolio Turnover Rate | | 6% | 9% | 9% | 8% | 12% | 13% |
The expense ratio, net income ratio, and turnover rate for the current period have been annualized.
1 Net investment income per share and the ratio of net investment income to average net assets include $.289 and 0.33%, respectively,
resulting from a special dividend received from ASML Holding NV in October 2007.
2 Fiscal 2013 dividends from net investment income include $.363 per share from a dividend received from ASML Holding NV. Subsequent to
the payment of the fund’s dividend from net investment income in December 2012, the ASML dividend was reallocated to return of capital.
The reallocation will reduce the fund’s dividend from net investment income in December 2013. The reallocation had no impact on net
assets, net asset values per share, or total returns.
3 Total returns do not include transaction or account service fees that may have applied in the periods shown. Fund prospectuses provide
information about any applicable transaction and account service fees.
See accompanying Notes, which are an integral part of the Financial Statements.
18
Capital Opportunity Fund
Notes to Financial Statements
Vanguard Capital Opportunity Fund is registered under the Investment Company Act of 1940 as an open-end investment company, or mutual fund. The fund offers two classes of shares: Investor Shares and Admiral Shares. Investor Shares are available to any investor who meets the fund’s minimum purchase requirements. Admiral Shares are designed for investors who meet certain administrative, service, and account-size criteria
A. The following significant accounting policies conform to generally accepted accounting principles for U.S. mutual funds. The fund consistently follows such policies in preparing its financial statements.
1. Security Valuation: Securities are valued as of the close of trading on the New York Stock Exchange (generally 4 p.m., Eastern time) on the valuation date. Equity securities are valued at the latest quoted sales prices or official closing prices taken from the primary market in which each security trades; such securities not traded on the valuation date are valued at the mean of the latest quoted bid and asked prices. Securities for which market quotations are not readily available, or whose values have been affected by events occurring before the fund’s pricing time but after the close of the securities’ primary markets, are valued at their fair values calculated according to procedures adopted by the board of trustees. These procedures include obtaining quotations from an independent pricing service, monitoring news to identify significant market- or security-specific events, and evaluating changes in the values of foreign market proxies (for example, ADRs, futures contracts, or exchange-traded funds), between the time the foreign markets close and the fund’s pricing time. When fair-value pricing is employed, the prices of securities used by a fund to calculate its net asset value may differ from quoted or published prices for the same securities. Investments in Vanguard Market Liquidity Fund are valued at that fund’s net asset value.
2. Foreign Currency: Securities and other assets and liabilities denominated in foreign currencies are translated into U.S. dollars using exchange rates obtained from an independent third party as of the fund’s pricing time on the valuation date. Realized gains (losses) and unrealized appreciation (depreciation) on investment securities include the effects of changes in exchange rates since the securities were purchased, combined with the effects of changes in security prices. Fluctuations in the value of other assets and liabilities resulting from changes in exchange rates are recorded as unrealized foreign currency gains (losses) until the assets or liabilities are settled in cash, at which time they are recorded as realized foreign currency gains (losses).
3. Federal Income Taxes: The fund intends to continue to qualify as a regulated investment company and distribute all of its taxable income. Management has analyzed the fund’s tax positions taken for all open federal income tax years (September 30, 2009–2012), and for the period ended March 31, 2013, and has concluded that no provision for federal income tax is required in the fund’s financial statements.
4. Distributions: Distributions to shareholders are recorded on the ex-dividend date.
5. Security Lending: The fund may lend its securities to qualified institutional borrowers to earn additional income. Security loans are required to be secured at all times by collateral at least equal to the market value of securities loaned. Daily market fluctuations could cause the value of loaned securities to be more or less than the value of the collateral received. When this occurs, the collateral is adjusted on the next business day. The fund invests cash collateral received in Vanguard Market Liquidity Fund, and records a liability for the return of the collateral, during the period the securities are on loan. Security lending income represents fees charged to borrowers plus income earned on investing cash collateral, less expenses associated with the loan.
19
Capital Opportunity Fund
6. Other: Dividend income is recorded on the ex-dividend date. Interest income includes income distributions received from Vanguard Market Liquidity Fund and is accrued daily. Security transactions are accounted for on the date securities are bought or sold. Costs used to determine realized gains (losses) on the sale of investment securities are those of the specific securities sold.
Each class of shares has equal rights as to assets and earnings, except that each class separately bears certain class-specific expenses related to maintenance of shareholder accounts (included in Management and Administrative expenses) and shareholder reporting. Marketing and distribution expenses are allocated to each class of shares based on a method approved by the board of trustees. Income, other non-class-specific expenses, and gains and losses on investments are allocated to each class of shares based on its relative net assets.
B. PRIMECAP Management Company, provides investment advisory services to the fund for a fee calculated at an annual percentage rate of average net assets. For the six months ended March 31, 2013, the investment advisory fee represented an effective annual rate of 0.26% of the fund’s average net assets.
C. The Vanguard Group furnishes at cost corporate management, administrative, marketing, and distribution services. The costs of such services are allocated to the fund under methods approved by the board of trustees. The fund has committed to provide up to 0.40% of its net assets in capital contributions to Vanguard. At March 31, 2013, the fund had contributed capital of $1,051,000 to Vanguard (included in Other Assets), representing 0.01% of the fund’s net assets and 0.42% of Vanguard’s capitalization. The fund’s trustees and officers are also directors and officers of Vanguard.
D. Various inputs may be used to determine the value of the fund’s investments. These inputs are summarized in three broad levels for financial statement purposes. The inputs or methodologies used to value securities are not necessarily an indication of the risk associated with investing in those securities.
Level 1—Quoted prices in active markets for identical securities.
Level 2—Other significant observable inputs (including quoted prices for similar securities, interest
rates, prepayment speeds, credit risk, etc.).
Level 3—Significant unobservable inputs (including the fund’s own assumptions used to determine
the fair value of investments).
The following table summarizes the market value of the fund’s investments as of March 31, 2013, based on the inputs used to value them:
| | | |
| | Level 1 | Level 2 | Level 3 |
| Investments | ($000) | ($000) | ($000) |
| Common Stocks | 8,018,860 | 395,969 | — |
| Temporary Cash Investments | 417,819 | — | — |
| Total | 8,436,679 | 395,969 | — |
E. Distributions are determined on a tax basis and may differ from net investment income and realized capital gains for financial reporting purposes. Differences may be permanent or temporary. Permanent differences are reclassified among capital accounts in the financial statements to reflect their tax character. Temporary differences arise when certain items of income, expense, gain, or loss are recognized in different periods for financial statement and tax purposes; these differences will
20
Capital Opportunity Fund
reverse at some time in the future. Differences in classification may also result from the treatment of short-term gains as ordinary income for tax purposes. The fund’s tax-basis capital gains and losses are determined only at the end of each fiscal year.
During the six months ended March 31, 2013, the fund realized net foreign currency losses of $76,000, which decreased distributable net income for tax purposes; accordingly, such losses have been reclassified from accumulated net realized gains to overdistributed net investment income.
At March 31, 2013, the cost of investment securities for tax purposes was $5,291,787,000. Net unrealized appreciation of investment securities for tax purposes was $3,540,861,000, consisting of unrealized gains of $3,933,909,000 on securities that had risen in value since their purchase and $393,048,000 in unrealized losses on securities that had fallen in value since their purchase.
F. During the six months ended March 31, 2013, the fund purchased $215,063,000 of investment securities and sold $687,488,000 of investment securities, other than temporary cash investments.
G. Capital share transactions for each class of shares were:
| | | | |
| | Six Months Ended | Year Ended |
| | March 31, 2013 | September 30, 2012 |
| | Amount | Shares | Amount | Shares |
| | ($000) | (000) | ($000) | (000) |
| Investor Shares | | | | |
| Issued | 117,020 | 3,281 | 169,576 | 5,405 |
| Issued in Lieu of Cash Distributions | 87,176 | 2,584 | 127,508 | 4,438 |
| Redeemed1 | (422,670) | (12,086) | (698,224) | (22,264) |
| Net Increase (Decrease) —Investor Shares | (218,474) | (6,221) | (401,140) | (12,421) |
| Admiral Shares | | | | |
| Issued | 269,783 | 3,322 | 459,825 | 6,387 |
| Issued in Lieu of Cash Distributions | 184,289 | 2,366 | 231,561 | 3,491 |
| Redeemed1 | (361,025) | (4,529) | (788,116) | (10,843) |
| Net Increase (Decrease) —Admiral Shares | 93,047 | 1,159 | (96,730) | (965) |
| 1 Net of redemption fees for fiscal 2012 of $131,000 (fund total). Effective May 23, 2012, the redemption fee was eliminated. |
H. Certain of the fund’s investments are in companies that are considered to be affiliated companies of the fund because the fund owns more than 5% of the outstanding voting securities of the company. Transactions during the period in securities of these companies were as follows:
| | | | | |
| | | Current Period Transactions | |
| | Sept. 30, 2012 | | Proceeds from | | March 31, 2013 |
| | Market | Purchases | Securities | Dividend | Market |
| | Value | at Cost | Sold | Income | Value |
| | ($000) | ($000) | ($000) | ($000) | ($000) |
| Descartes Systems Group Inc. | 40,644 | — | — | — | 44,406 |
| FormFactor Inc. | 32,250 | — | 631 | — | 26,483 |
| | 72,894 | | | | 70,889 |
I. In preparing the financial statements as of March 31, 2013, management considered the impact of subsequent events for potential recognition or disclosure in these financial statements.
21
About Your Fund’s Expenses
As a shareholder of the fund, you incur ongoing costs, which include costs for portfolio management, administrative services, and shareholder reports (like this one), among others. Operating expenses, which are deducted from a fund’s gross income, directly reduce the investment return of the fund.
A fund’s expenses are expressed as a percentage of its average net assets. This figure is known as the expense ratio. The following examples are intended to help you understand the ongoing costs (in dollars) of investing in your fund and to compare these costs with those of other mutual funds. The examples are based on an investment of $1,000 made at the beginning of the period shown and held for the entire period.
The accompanying table illustrates your fund’s costs in two ways:
• Based on actual fund return. This section helps you to estimate the actual expenses that you paid over the period. The ”Ending Account Value“ shown is derived from the fund‘s actual return, and the third column shows the dollar amount that would have been paid by an investor who started with $1,000 in the fund. You may use the information here, together with the amount you invested, to estimate the expenses that you paid over the period.
To do so, simply divide your account value by $1,000 (for example, an $8,600 account value divided by $1,000 = 8.6), then multiply the result by the number given for your fund under the heading ”Expenses Paid During Period.“
• Based on hypothetical 5% yearly return. This section is intended to help you compare your fund‘s costs with those of other mutual funds. It assumes that the fund had a yearly return of 5% before expenses, but that the expense ratio is unchanged. In this case—because the return used is not the fund’s actual return—the results do not apply to your investment. The example is useful in making comparisons because the Securities and Exchange Commission requires all mutual funds to calculate expenses based on a 5% return. You can assess your fund’s costs by comparing this hypothetical example with the hypothetical examples that appear in shareholder reports of other funds.
Note that the expenses shown in the table are meant to highlight and help you compare ongoing costs only and do not reflect transaction costs incurred by the fund for buying and selling securities. Further, the expenses do not include any purchase, redemption, or account service fees described in the fund prospectus. If such fees were applied to your account, your costs would be higher. Your fund does not carry a “sales load.”
The calculations assume no shares were bought or sold during the period. Your actual costs may have been higher or lower, depending on the amount of your investment and the timing of any purchases or redemptions.
You can find more information about the fund’s expenses, including annual expense ratios, in the Financial Statements section of this report. For additional information on operating expenses and other shareholder costs, please refer to your fund’s current prospectus.
22
| | | |
| Six Months Ended March 31, 2013 | | | |
| | Beginning | Ending | Expenses |
| | Account Value | Account Value | Paid During |
| Capital Opportunity Fund | 9/30/2012 | 3/31/2013 | Period |
| Based on Actual Fund Return | | | |
| Investor Shares | $1,000.00 | $1,221.62 | $2.66 |
| Admiral Shares | 1,000.00 | 1,222.15 | 2.27 |
| Based on Hypothetical 5% Yearly Return | | | |
| Investor Shares | $1,000.00 | $1,022.54 | $2.42 |
| Admiral Shares | 1,000.00 | 1,022.89 | 2.07 |
The calculations are based on expenses incurred in the most recent six-month period. The fund’s annualized six-month expense ratios for that
period are 0.48% for Investor Shares and 0.41% for Admiral Shares. The dollar amounts shown as “Expenses Paid” are equal to the
annualized expense ratio multiplied by the average account value over the period, multiplied by the number of days in the most recent
six-month period, then divided by the number of days in the most recent 12-month period.
23
Trustees Approve Advisory Agreement
The board of trustees of Vanguard Capital Opportunity Fund has renewed the fund’s investment advisory agreement with PRIMECAP Management Company (PRIMECAP Management). The board determined that the retention of the advisor was in the best interests of the fund and its shareholders.
The board based its decision upon an evaluation of the advisor’s investment staff, portfolio management process, and performance. The trustees considered the factors discussed below, among others. However, no single factor determined whether the board approved the agreement. Rather, it was the totality of the circumstances that drove the board’s decision.
Nature, extent, and quality of services
The board considered the quality of the fund’s investment management services over both the short and long term, and took into account the organizational depth and stability of the advisor. The board noted that PRIMECAP Management, founded in 1983, is recognized for its long-term approach to growth-equity investing. Five experienced portfolio managers are responsible for separate sub-portfolios, and each portfolio manager employs a fundamental, research-driven approach in seeking to identify companies with long-term growth potential overlooked by the market and whose stock is trading at attractive valuation levels. The firm has managed the fund since 1998.
The board concluded that the advisor’s experience, stability, depth, and performance, among other factors, warranted continuation of the advisory agreement.
Investment performance
The board considered the short- and long-term performance of the fund, including any periods of outperformance or underperformance relative to a benchmark index and peer group. The board concluded that the performance was such that the advisory arrangement should continue. Information about the fund’s most recent performance can be found in the Performance Summary section of this report.
Cost
The board concluded that the fund’s expense ratio was well below the average expense ratio charged by funds in its peer group and that the fund’s advisory fee rate was also well below its peer-group average. Information about the fund’s expenses appears in the About Your Fund’s Expenses section of this report as well as in the Financial Statements section, which also includes information about the fund’s advisory fee rate.
The board did not consider profitability of PRIMECAP Management in determining whether to approve the advisory fee, because PRIMECAP Management is independent of Vanguard, and the advisory fee is the result of arm’s-length negotiations.
The benefit of economies of scale
The board concluded that the fund’s shareholders benefit from economies of scale because of the breakpoints in the fund’s advisory fee schedule. The breakpoints reduce the effective rate of the fee as the fund’s assets increase.
The board will consider whether to renew the advisory agreement again after a one-year period.
24
Glossary
30-Day SEC Yield. A fund’s 30-day SEC yield is derived using a formula specified by the U.S. Securities and Exchange Commission. Under the formula, data related to the fund’s security holdings in the previous 30 days are used to calculate the fund’s hypothetical net income for that period, which is then annualized and divided by the fund’s estimated average net assets over the calculation period. For the purposes of this calculation, a security’s income is based on its current market yield to maturity (for bonds), its actual income (for asset-backed securities), or its projected dividend yield (for stocks). Because the SEC yield represents hypothetical annualized income, it will differ—at times significantly—from the fund’s actual experience. As a result, the fund’s income distributions may be higher or lower than implied by the SEC yield.
Beta. A measure of the magnitude of a fund’s past share-price fluctuations in relation to the ups and downs of a given market index. The index is assigned a beta of 1.00. Compared with a given index, a fund with a beta of 1.20 typically would have seen its share price rise or fall by 12% when the index rose or fell by 10%. For this report, beta is based on returns over the past 36 months for both the fund and the index. Note that a fund’s beta should be reviewed in conjunction with its R-squared (see definition). The lower the R-squared, the less correlation there is between the fund and the index, and the less reliable beta is as an indicator of volatility.
Dividend Yield. Dividend income earned by stocks, expressed as a percentage of the aggregate market value (or of net asset value, for a fund). The yield is determined by dividing the amount of the annual dividends by the aggregate value (or net asset value) at the end of the period. For a fund, the dividend yield is based solely on stock holdings and does not include any income produced by other investments.
Earnings Growth Rate. The average annual rate of growth in earnings over the past five years for the stocks now in a fund.
Equity Exposure. A measure that reflects a fund’s investments in stocks and stock futures. Any holdings in short-term reserves are excluded.
Expense Ratio. A fund’s total annual operating expenses expressed as a percentage of the fund’s average net assets. The expense ratio includes management and administrative expenses, but does not include the transaction costs of buying and selling portfolio securities.
Foreign Holdings. The percentage of a fund represented by securities or depositary receipts of companies based outside the United States.
Inception Date. The date on which the assets of a fund (or one of its share classes) are first invested in accordance with the fund’s investment objective. For funds with a subscription period, the inception date is the day after that period ends. Investment performance is measured from the inception date.
Median Market Cap. An indicator of the size of companies in which a fund invests; the midpoint of market capitalization (market price x shares outstanding) of a fund’s stocks, weighted by the proportion of the fund’s assets invested in each stock. Stocks representing half of the fund’s assets have market capitalizations above the median, and the rest are below it.
Price/Book Ratio. The share price of a stock divided by its net worth, or book value, per share. For a fund, the weighted average price/book ratio of the stocks it holds.
25
Price/Earnings Ratio. The ratio of a stock’s current price to its per-share earnings over the past year. For a fund, the weighted average P/E of the stocks it holds. P/E is an indicator of market expectations about corporate prospects; the higher the P/E, the greater the expectations for a company’s future growth.
R-Squared. A measure of how much of a fund’s past returns can be explained by the returns from the market in general, as measured by a given index. If a fund’s total returns were precisely synchronized with an index’s returns, its R-squared would be 1.00. If the fund’s returns bore no relationship to the index’s returns, its R-squared would be 0. For this report, R-squared is based on returns over the past 36 months for both the fund and the index.
Return on Equity. The annual average rate of return generated by a company during the past five years for each dollar of shareholder’s equity (net income divided by shareholder’s equity). For a fund, the weighted average return on equity for the companies whose stocks it holds.
Short-Term Reserves. The percentage of a fund invested in highly liquid, short-term securities that can be readily converted to cash.
Turnover Rate. An indication of the fund’s trading activity. Funds with high turnover rates incur higher transaction costs and may be more likely to distribute capital gains (which may be taxable to investors). The turnover rate excludes in-kind transactions, which have minimal impact on costs.
26
This page intentionally left blank.
The People Who Govern Your Fund
The trustees of your mutual fund are there to see that the fund is operated and managed in your best interests since, as a shareholder, you are a part owner of the fund. Your fund’s trustees also serve on the board of directors of The Vanguard Group, Inc., which is owned by the Vanguard funds and provides services to them on an at-cost basis.
A majority of Vanguard’s board members are independent, meaning that they have no affiliation with Vanguard or the funds they oversee, apart from the sizable personal investments they have made as private individuals. The independent board members have distinguished backgrounds in business, academia, and public service. Each of the trustees and executive officers oversees 180 Vanguard funds.
The following table provides information for each trustee and executive officer of the fund. More information about the trustees is in the Statement of Additional Information, which can be obtained, without charge, by contacting Vanguard at 800-662-7447, or online at vanguard.com.
| |
| InterestedTrustee1 | and Delphi Automotive LLP (automotive components); |
| | Senior Advisor at New Mountain Capital; Trustee of |
| F. William McNabb III | The Conference Board. |
| Born 1957. Trustee Since July 2009. Chairman of the | |
| Board. Principal Occupation(s) During the Past Five | Amy Gutmann |
| Years: Chairman of the Board of The Vanguard Group, | Born 1949. Trustee Since June 2006. Principal |
| Inc., and of each of the investment companies served | Occupation(s) During the Past Five Years: President |
| by The Vanguard Group, since January 2010; Director | of the University of Pennsylvania; Christopher H. |
| of The Vanguard Group since 2008; Chief Executive | Browne Distinguished Professor of Political Science |
| Officer and President of The Vanguard Group and of | in the School of Arts and Sciences with secondary |
| each of the investment companies served by The | appointments at the Annenberg School for |
| Vanguard Group since 2008; Director of Vanguard | Communication and the Graduate School of Education |
| Marketing Corporation; Managing Director of The | of the University of Pennsylvania; Member of the |
| Vanguard Group (1995–2008). | National Commission on the Humanities and Social |
| | Sciences; Trustee of Carnegie Corporation of New |
| | York and of the National Constitution Center; Chair |
| IndependentTrustees | of the U. S. Presidential Commission for the Study |
| | of Bioethical Issues. |
| Emerson U. Fullwood | |
| Born 1948. Trustee Since January 2008. Principal | JoAnn Heffernan Heisen |
| Occupation(s) During the Past Five Years: Executive | Born 1950. Trustee Since July 1998. Principal |
| Chief Staff and Marketing Officer for North America | Occupation(s) During the Past Five Years: Corporate |
| and Corporate Vice President (retired 2008) of Xerox | Vice President and Chief Global Diversity Officer |
| Corporation (document management products and | (retired 2008) and Member of the Executive |
| services); Executive in Residence and 2010 | Committee (1997–2008) of Johnson & Johnson |
| Distinguished Minett Professor at the Rochester | (pharmaceuticals/medical devices/consumer |
| Institute of Technology; Director of SPX Corporation | products); Director of Skytop Lodge Corporation |
| (multi-industry manufacturing), the United Way of | (hotels), the University Medical Center at Princeton, |
| Rochester, Amerigroup Corporation (managed health | the Robert Wood Johnson Foundation, and the Center |
| care), the University of Rochester Medical Center, | for Talent Innovation; Member of the Advisory Board |
| Monroe Community College Foundation, and North | of the Maxwell School of Citizenship and Public Affairs |
| Carolina A&T University. | at Syracuse University. |
| |
| Rajiv L. Gupta | F. Joseph Loughrey |
| Born 1945. Trustee Since December 2001.2 | Born 1949. Trustee Since October 2009. Principal |
| Principal Occupation(s) During the Past Five Years: | Occupation(s) During the Past Five Years: President |
| Chairman and Chief Executive Officer (retired 2009) | and Chief Operating Officer (retired 2009) of Cummins |
| and President (2006–2008) of Rohm and Haas Co. | Inc. (industrial machinery); Chairman of the Board of |
| (chemicals); Director of Tyco International, Ltd. | Hillenbrand, Inc. (specialized consumer services); |
| (diversified manufacturing and services), Hewlett- | Director of SKF AB (industrial machinery), the Lumina |
| Packard Co. (electronic computer manufacturing), | |
| | |
| Foundation for Education, and Oxfam America; | Executive Officers | |
| Chairman of the Advisory Council for the College of | | |
| Arts and Letters and Member of the Advisory Board to | Glenn Booraem | |
| the Kellogg Institute for International Studies at the | Born 1967. Controller Since July 2010. Principal |
| University of Notre Dame. | Occupation(s) During the Past Five Years: Principal |
| | of The Vanguard Group, Inc.; Controller of each of |
| Mark Loughridge | the investment companies served by The Vanguard |
| Born 1953. Trustee Since March 2012. Principal | Group; Assistant Controller of each of the investment |
| Occupation(s) During the Past Five Years: Senior Vice | companies served by The Vanguard Group (2001–2010). |
| President and Chief Financial Officer at IBM (information | | |
| technology services); Fiduciary Member of IBM’s | Thomas J. Higgins | |
| Retirement Plan Committee. | Born 1957. Chief Financial Officer Since September |
| | 2008. Principal Occupation(s) During the Past Five |
| Scott C. Malpass | Years: Principal of The Vanguard Group, Inc.; Chief |
| Born 1962. Trustee Since March 2012. Principal | Financial Officer of each of the investment companies |
| Occupation(s) During the Past Five Years: Chief | served by The Vanguard Group; Treasurer of each of |
| Investment Officer and Vice President at the University | the investment companies served by The Vanguard |
| of Notre Dame; Assistant Professor of Finance at the | Group (1998–2008). | |
| Mendoza College of Business at Notre Dame; Member | | |
| of the Notre Dame 403(b) Investment Committee; | Kathryn J. Hyatt | |
| Director of TIFF Advisory Services, Inc. (investment | Born 1955. Treasurer Since November 2008. Principal |
| advisor); Member of the Investment Advisory | Occupation(s) During the Past Five Years: Principal of |
| Committees of the Financial Industry Regulatory | The Vanguard Group, Inc.; Treasurer of each of the |
| Authority (FINRA) and of Major League Baseball. | investment companies served by The Vanguard |
| | Group; Assistant Treasurer of each of the investment |
| André F. Perold | companies served by The Vanguard Group (1988–2008). |
| Born 1952. Trustee Since December 2004. Principal | | |
| Occupation(s) During the Past Five Years: George | Heidi Stam | |
| Gund Professor of Finance and Banking at the Harvard | Born 1956. Secretary Since July 2005. Principal |
| Business School (retired 2011); Chief Investment | Occupation(s) During the Past Five Years: Managing |
| Officer and Managing Partner of HighVista Strategies | Director of The Vanguard Group, Inc.; General Counsel |
| LLC (private investment firm); Director of Rand | of The Vanguard Group; Secretary of The Vanguard |
| Merchant Bank; Overseer of the Museum of Fine | Group and of each of the investment companies |
| Arts Boston. | served by The Vanguard Group; Director and Senior |
| | Vice President of Vanguard Marketing Corporation. |
| | |
| Alfred M. Rankin, Jr. | | |
| Born 1941. Trustee Since January 1993. Principal | Vanguard Senior ManagementTeam |
| Occupation(s) During the Past Five Years: Chairman, | | |
| President, and Chief Executive Officer of NACCO | Mortimer J. Buckley | Chris D. McIsaac |
| Industries, Inc. (housewares/lignite) and of Hyster-Yale | Kathleen C. Gubanich | Michael S. Miller |
| Materials Handling, Inc. (forklift trucks); Director of | Paul A. Heller | James M. Norris |
| the National Association of Manufacturers; Chairman | Martha G. King | Glenn W. Reed |
| of the Board of University Hospitals of Cleveland; | John T. Marcante | |
| Advisory Chairman of the Board of The Cleveland | | |
| Museum of Art. | | |
| | Chairman Emeritus and Senior Advisor |
| Peter F. Volanakis | | |
| Born 1955. Trustee Since July 2009. Principal | John J. Brennan | |
| Occupation(s) During the Past Five Years: President | Chairman, 1996–2009 | |
| and Chief Operating Officer (retired 2010) of Corning | Chief Executive Officer and President, 1996–2008 |
| Incorporated (communications equipment); Director | | |
| of SPX Corporation (multi-industry manufacturing); | Founder | |
| Overseer of the Amos Tuck School of Business | John C. Bogle | |
| Administration at Dartmouth College; Advisor to the | | |
| Norris Cotton Cancer Center. | Chairman and Chief Executive Officer, 1974–1996 |
1 Mr. McNabb is considered an “interested person,” as defined in the Investment Company Act of 1940, because he is an officer of the
Vanguard funds.
2 December 2002 for Vanguard Equity Income Fund, Vanguard Growth Equity Fund, the Vanguard Municipal Bond Funds, and the Vanguard
State Tax-Exempt Funds.

| |
| | P.O. Box 2600 |
| | Valley Forge, PA 19482-2600 |
| |
| |
| |
| Connect with Vanguard® > vanguard.com |
| |
| |
| |
| Fund Information > 800-662-7447 | |
| Direct Investor Account Services > 800-662-2739 | |
| Institutional Investor Services > 800-523-1036 | |
| Text Telephone for People | |
| With Hearing Impairment > 800-749-7273 | |
| |
| This material may be used in conjunction | |
| with the offering of shares of any Vanguard | |
| fund only if preceded or accompanied by | |
| the fund’s current prospectus. | |
| |
| All comparative mutual fund data are from Lipper Inc. or | |
| Morningstar, Inc., unless otherwise noted. | |
| |
| You can obtain a free copy of Vanguard’s proxy voting | |
| guidelines by visiting vanguard.com/proxyreporting or by | |
| calling Vanguard at 800-662-2739. The guidelines are | |
| also available from the SEC’s website, sec.gov. In | |
| addition, you may obtain a free report on how your fund | |
| voted the proxies for securities it owned during the 12 | |
| months ended June 30. To get the report, visit either | |
| vanguard.com/proxyreporting or sec.gov. | |
| |
| You can review and copy information about your fund at | |
| the SEC’s Public Reference Room in Washington, D.C. To | |
| find out more about this public service, call the SEC at | |
| 202-551-8090. Information about your fund is also | |
| available on the SEC’s website, and you can receive | |
| copies of this information, for a fee, by sending a | |
| request in either of two ways: via e-mail addressed to | |
| publicinfo@sec.gov or via regular mail addressed to the | |
| Public Reference Section, Securities and Exchange | |
| Commission, Washington, DC 20549-1520. | |
| |
| |
| | © 2013 The Vanguard Group, Inc. |
| | All rights reserved. |
| | Vanguard Marketing Corporation, Distributor. |
| |
| | Q1112 052013 |

Semiannual Report | March 31, 2013
Vanguard Global Equity Fund

> Vanguard Global Equity Fund returned 13.10% for the six months ended
March 31, 2013. This return was higher than that of its benchmark as well as the
average return of its peer funds.
> Developed markets rose smartly, while emerging markets posted more modest
gains.
> The fund’s U.S., Canadian, and European holdings outperformed, while its
Pacific region stocks lagged.
| |
| Contents | |
| Your Fund’s Total Returns. | 1 |
| Chairman’s Letter. | 2 |
| Advisors’ Report. | 8 |
| Fund Profile. | 12 |
| Performance Summary. | 14 |
| Financial Statements. | 15 |
| About Your Fund’s Expenses. | 30 |
| Trustees Approve Advisory Agreements. | 32 |
| Glossary. | 34 |
Please note: The opinions expressed in this report are just that—informed opinions. They should not be considered promises or advice.
Also, please keep in mind that the information and opinions cover the period through the date on the front of this report. Of course, the
risks of investing in your fund are spelled out in the prospectus.
See the Glossary for definitions of investment terms used in this report.
About the cover: Our cover photograph shows rigging on the HMSSurprise, a replica of an 18th-century Royal Navy frigate. It
was featured in the 2003 movie Master and Commander: The Far Side of the World, which was based on Patrick O’Brian’s sea
novels, set amid the Napoleonic Wars. Vanguard was named for another ship of that era, the HMSVanguard, which was the
flagship of British Admiral Horatio Nelson at the Battle of the Nile.
Your Fund’s Total Returns
| |
| Six Months Ended March 31, 2013 | |
| | Total |
| | Returns |
| Vanguard Global Equity Fund | 13.10% |
| MSCI All Country World Index | 9.57 |
| Global Funds Average | 10.25 |
| Global Funds Average: Derived from data provided by Lipper Inc. |
| | | | |
| Your Fund’s Performance at a Glance | | | | |
| September 30, 2012, Through March 31, 2013 | | | | |
| | | | Distributions Per Share |
| | Starting | Ending | Income | Capital |
| | Share Price | Share Price | Dividends | Gains |
| Vanguard Global Equity Fund | $18.21 | $20.22 | $0.342 | $0.000 |
1

Chairman’s Letter
Dear Shareholder,
Vanguard Global Equity Fund returned 13.10% for the six months ended March 31, 2013. This return was more than 3 percentage points higher than that of the fund’s comparative index and nearly 3 percentage points higher than the average return of its peer funds.
Markets around the world experienced strong gains during the period. The fund’s stock holdings in North America and Europe did particularly well. The one area that underperformed for the fund—developed markets in the Pacific region—still rose smartly.
Global equity markets delivered a powerful rally
Global stocks advanced for the fifth straight month to finish the half-year ended March 31 with impressive gains.
The Standard & Poor’s 500 Index closed at a record high on the period’s final business day after global financial markets in recent months shrugged off the U.S. “fiscal cliff” crisis, the unsettled Italian national elections, and a controversial bailout package for Cyprus.
Peter Westaway, Vanguard’s chief European economist, said that the latest developments in Europe had been “rather bad,” but that the market had for the most part already priced in these events. “As always,” he said, “we think investors should assess their portfolios carefully and avoid making impulsive moves.”
2
U.S. equities returned more than 11% as the economic recovery kept slowly building momentum; the housing market rebounded further, and the labor market improved. International equities were up more than 9%. Returns were about 16% in the Pacific region, where Japan’s accommodative monetary policy has helped spark the nation’s stock market, and nearly 10% in Europe. Emerging markets stocks rose about 4%.
Bond returns barely budged as yields lingered near lows
The broad U.S. taxable bond market scraped out a minuscule gain of 0.09% for the half-year as U.S. Treasury yields remained just slightly above their all-time lows. Although the yield of the benchmark
10-year Treasury note increased during
the six months and topped 2.00% at various times, it closed the period at about 1.85%. (Bond prices and yields move in opposite directions.)
Municipal bonds returned almost 1% for the six months despite price declines in March. And returns of money market funds and savings accounts barely registered as short-term interest rates remained between 0% and 0.25%, under the Federal Reserve’s four-year-old policy.
Robert Auwaerter, head of Vanguard’s
Fixed Income Group, doesn’t anticipate abrupt policy changes from the central bank. “We don’t see the Fed changing course in the near term,” he said, “and when the Fed does, we expect it’ll go
| | | |
| Market Barometer | | | |
| |
| | Total Returns |
| | Periods Ended March 31, 2013 |
| | Six | One | Five Years |
| | Months | Year | (Annualized) |
| Stocks | | | |
| Russell 1000 Index (Large-caps) | 11.10% | 14.43% | 6.15% |
| Russell 2000 Index (Small-caps) | 14.48 | 16.30 | 8.24 |
| Russell 3000 Index (Broad U.S. market) | 11.35 | 14.56 | 6.32 |
| MSCI All Country World Index ex USA (International) | 9.20 | 8.36 | -0.39 |
| |
| Bonds | | | |
| Barclays U.S. Aggregate Bond Index (Broad taxable market) | 0.09% | 3.77% | 5.47% |
| Barclays Municipal Bond Index (Broad tax-exempt market) | 0.96 | 5.25 | 6.10 |
| Citigroup Three-Month U.S. Treasury Bill Index | 0.05 | 0.08 | 0.30 |
| |
| CPI | | | |
| Consumer Price Index | 0.59% | 1.47% | 1.74% |
3
slowly so as not to undo the efforts made to keep interest rates low and to stimulate the economy.”
U.S. stocks provided the fund with meaningful gains
Vanguard Global Equity Fund invests in hundreds of stocks in about 40 developed and emerging markets around the world. The fund’s three advisors—
Marathon Asset Management, Baillie Gifford Overseas, and Acadian Asset Management—have been modestly underweighting U.S. stocks and modestly overweighting emerging markets relative to the benchmark, the MSCI All Country World Index.
For the six months, the fund’s U.S. holdings advanced about 16%, easily outperforming the overall U.S. market. Because the fund’s U.S. portfolio made up about 44% of its assets at the end of the period, the strong showing by the three advisors’ U.S. selections was the biggest factor in the fund’s superior overall performance. Holdings in the energy and information technology sectors provided the biggest boost in the U.S. portfolio. The fund’s Canadian stocks (11%) also did much better than those in the benchmark (2%).
Returns for the fund’s European portfolio (16%), which made up about a quarter of fund assets at the end of the period,
| | |
| Expense Ratios | | |
| Your Fund Compared With Its Peer Group | | |
| | | Peer Group |
| | Fund | Average |
| Global Equity Fund | 0.59% | 1.42% |
The fund expense ratio shown is from the prospectus dated March 1, 2013, and represents estimated costs for the current fiscal year. For the
six months ended March 31, 2013, the fund’s annualized expense ratio was 0.61%. The peer-group expense ratio is derived from data
provided by Lipper Inc. and captures information through year-end 2012.
Peer group: Global Funds.
4
outdistanced the index’s European holdings by about 6 percentage points. The most meaningful gains came from the region’s largest market, the United Kingdom, where the advisors’ selections returned 16% compared with the benchmark’s 7%.
Proving that bargain shopping can be profitable, the advisors also reaped big gains when they significantly overweighted holdings in two small European countries that have experienced deep economic problems in recent years: Greece (46%) and Ireland (30%). Both nations are still grappling with onerous sovereign and bank debt loads, but after deep sell-offs in their markets, optimism about the countries’ fiscal restructuring gained the upper hand among investors.
Pacific and emerging markets weren’t as strong for the fund
Results were a bit less auspicious in the Pacific region’s developed markets. Although the fund’s holdings rose 13%, they lagged their counterparts in the benchmark by about 3 percentage points.
The chief reason for this lag was stock selection in Japan, where stocks rose sharply in response to the new prime minister’s advocacy of aggressive monetary easing to boost the economy and preempt deflation. The index’s Japanese stocks returned 18%, but the fund’s Japanese portfolio returned only 11%. In Australia, the fund’s holdings
performed in line with the market, but the fund had a smaller weighting in the country than the index did.
In emerging markets, the fund’s returns were tamer, at a comparatively modest 5%. Overall, the advisors’ selections slightly outperformed the benchmark.
The top contributors for the fund were the Philippines, Thailand, and Turkey; markets that tapped the brakes a bit included China, Mexico, and Malaysia.
In terms of sectors, the fund’s industrial holdings (21%) posted the highest return, in part because of soaring results from several airline stocks. The fund’s best relative performance came in the energy sector, particularly among U.S. companies that have been riding the boom in U.S. energy production. Only one sector—utilities, the smallest—failed to advance.
Low cost and talent drive successful active management
Investors sometimes ask whether it’s a contradiction that Vanguard, a champion of index investing, offers actively managed mutual funds. To understand how active funds fit into our philosophy, consider for a moment why indexing has proved its mettle: It’s a generally low-cost, tax-efficient way to build a diversified portfolio that lets you keep more of your fund’s returns. Because index funds seek to track the overall market or a segment of it, they typically cost much less to run than funds that are actively managed in an effort to
5
outperform the market. And the less you pay for a fund, the more of its returns come back to you.
The same principle—low cost—drives our approach to active funds. The other essential ingredient is talent.
| Investment insight |
| The difference between U.S. and non-U.S. returns is still meaningful |
| Stocks outside the United States have always performed differently than U.S. stocks. |
| As the accompanying chart shows, the difference between the two groups has |
| lessened in recent years, even as each group takes its turn outperforming the other. |
| |
| Despite the closer correlation seen of late, the returns of non-U.S. stocks remain |
| different enough to offer a diversification benefit. That’s why we continue to suggest |
| that investors consider allocating a portion of their stock assets to international |
| markets, which collectively make up close to 55% of global market capitalization. |
| (As of March 31, 2013, Vanguard Global Equity Fund had about 56% of its assets |
| invested outside the United States.) Our research indicates that a 20% allocation |
| to non-U.S. stocks may be a reasonable starting point for investors to consider for |
| their overall stock holdings. |
| |
| For more insight on this topic, see our research paper Considerations for Investing |
| in Non-U.S. Equities on vanguard.com/research. |
| |
| |
| Trailing 12-month return differential between U. S. and non-U. S. stocks |
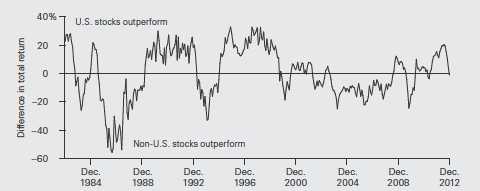
| Notes: U.S. equities are represented by the MSCI USA Index; international equities are represented by the MSCI World Index |
| ex USA from 1982 through 1987 and the MSCI All Country World Index ex USA thereafter. Data are through December 31, 2012. |
| Sources: Vanguard, Thomson Reuters Datastream, and MSCI. |
6
Some wonder how we can afford to hire top active managers when we place such importance on keeping investing costs low. The answer lies in five key characteristics of Vanguard’s structure and culture—our mutual ownership, our large scale, performance incentives aligned with investors’ interests, a long-term perspective, and a rigorous oversight process, which I lead. (You can read more about our approach in The Case for Vanguard Active Management: Solving the Low-Cost/Top-Talent Paradox? at vanguard.com/research.)
These enduring advantages don’t guarantee outperformance, of course. Even in those cases where an active stock fund outperforms over long periods, that doesn’t necessarily mean shareholders earned more than the index
results every year—or even every decade. And investors have no way of knowing beforehand which funds will outperform.
But for those willing to accept the greater risks that come with active investing, we believe Vanguard’s combination of talented advisors and low costs can improve the odds.
As always, thank you for your confidence in Vanguard.
Sincerely,

F. William McNabb III
Chairman and Chief Executive Officer
April 16, 2013
7
Advisors’ Report
For the six months ended March 31, 2013, the Global Equity Fund returned 13.10%. Your fund is managed by three independent advisors, a strategy that enhances the fund’s diversification by providing exposure to distinct, yet complementary, investment approaches. It’s not uncommon for different advisors to have different views about individual securities or the broader investment environment.
The advisors, the percentage of fund assets each manages, and brief descriptions of their investment strategies are presented in the table below. Each advisor has also prepared a discussion of the investment environment that existed during the fiscal period and of how
portfolio positioning reflects this assessment. These comments were prepared on April 18, 2013.
Marathon Asset Management LLP
Portfolio Managers:
Neil M. Ostrer, Co-head of Global Equity
William J. Arah, Co-head of Global Equity
The portfolio extended its run of robust performance into 2013 thanks to strong stock selection across all regions (with the modest exception of Japan). U.S. stock selection was by far the top contributor to relative return, followed by selection in the United Kingdom and Canada. An overweight position in Japan helped
| | | |
| Vanguard Global Equity Fund Investment Advisors | |
| |
| | Fund Assets Managed | |
| Investment Advisor | % | $ Million | Investment Strategy |
| Marathon Asset Management | 33 | 1,412 | A long-term and contrarian investment philosophy and |
| LLP | | | process with a focus on industry capital cycle analysis |
| | | | and in-depth management assessment. |
| Baillie Gifford Overseas Ltd. | 32 | 1,367 | The advisor seeks stocks that can generate |
| | | | above-average growth in earnings and cash flow, |
| | | | producing a bottom-up, stock-driven approach to |
| | | | country and asset allocation. An in-depth view on each |
| | | | company is measured against the consensus view, |
| | | | leading to discrepancies and potential opportunities to |
| | | | add value. |
| Acadian Asset Management LLC | 32 | 1,352 | A quantitative, active, bottom-up investment process |
| | | | that combines stock and peer-group valuation to arrive |
| | | | at a return forecast for each of more than 40,000 |
| | | | securities in the global universe. |
| Cash Investments | 3 | 128 | These short-term reserves are invested by Vanguard in |
| | | | equity index products to simulate investment in stocks. |
| | | | Each advisor may also maintain a modest cash |
| | | | position. |
8
returns, as the market outperformed relative to other global markets. An underweighted allocation to the United States and an overweighted allocation to Hong Kong and the Philippines also added value.
Financials performed well in general.
The portfolio benefited from a position in Bank of America, as the company made significant steps to repair its balance sheet, and in AIG, which is in the midst of a turnaround after having been at the epicenter of the financial crisis. The portfolio also benefited from not owning Apple. Delta and US Airways rose sharply, and there was a notable contribution from the Pulte Group. This homebuilder continued its strong run, reflecting improving sentiment in the U.S. housing sector. In Asia excluding Japan, Ayala, the Philippine conglomerate, was the best-performing holding as the Philippine market attracted strong liquidity flows and investor attention.
Valuations in Europe and Japan, where expectations continue to be depressed, remain relatively cheap compared with the United States and other global markets.
While concerns over Eurozone sovereign debt and the U.S. fiscal situation are likely to resurface periodically, the effects of austerity appear to be more fully discounted in Europe and Japan. In Japan, the macroeconomic momentum trade (sell yen, buy the Nikkei) has further to go, with the “drip” of good news almost certain to continue up to this summer’s Upper House elections. Longer term, it is the micro factors that appear compelling, with
changing corporate attitudes towards releveraging, mergers and acquisitions, corporate efficiency, and shareholder returns likely to finally entice key domestic investors to return.
The European sovereign-debt crisis looks set to rumble on in a cyclical manner, and certain sectors remain more vulnerable in the current climate. In particular, the Cypriot bailout has underscored the fragility of bank funding structures. Higher-return businesses, particularly those with sources of growing demand either domestically or abroad, are likely to continue to prosper. Accordingly, the portfolio will increase its emphasis on reasonably valued cash flows in these regions, funded by sales of businesses that have benefited from more benign environments where expectations have become stretched. Exposure to southeast Asian markets is likely to decline as a result.
Baillie Gifford Overseas Ltd.
Portfolio Managers:
Charles Plowden, Joint Senior Partner
and Lead Portfolio Manager
Spencer Adair, CFA, Investment Manager
Malcolm MacColl, Investment Manager
Stock markets, notably those in developed economies, have risen strongly over the past six months in reaction to an improving U.S. economy, bold rhetoric from Japan with regard to targeting inflation and growth, and the continued stabilization in certain European countries. In the United States, the Dow Jones Industrial Average closed at a record high in March,
9
surpassing levels last reached in 2007. Emerging markets, on the other hand, have been relatively weak; the reorientation of the Chinese economy from reliance on exports and building out its infrastructure to a greater emphasis on domestic consumption continues to weigh on investor sentiment.
We continue to have strengthening conviction in companies that are genuinely innovative. This has led us to take a position in Tesla Motors, a U.S. producer of electric vehicles. We believe that Tesla is a disruptive innovator and stands a significant chance of gaining share in the multi-trillion-dollar auto industry. Its ambition is not to be the best electric auto manufacturer but rather to outshine traditional auto companies by addressing the two key weaknesses of electric vehicles: range and recharging time.
We are also intrigued by the increasing use of social media, which allows organizations to capitalize on rapidly expanding markets. Two companies benefiting from this theme are Facebook and Weight Watchers, both recent purchases. The latter is successfully using online tools to target men, who historically have been less enthusiastic than women when it comes to attending the traditional face-to-face weekly meetings.
We believe global markets will continue to progress as the world slowly emerges from the clutches of the credit crisis, but we also expect to continue to see occasional volatility. At the time of this writing, for example, fears over a Cyprus bailout have depressed sentiment, and such fears should continue to dominate a media that thrives on gloom and despondency. However, fundamentals are improving and opportunities for buying excellent growth companies abound. We are excited about the future and firmly believe that over the long term we can continue to deliver attractive returns for the fund.
Acadian Asset Management LLC
Portfolio Managers:
John R. Chisholm, CFA,
Chief Investment Officer
Ronald D. Frashure, CFA,
Chairman
Brian K. Wolahan, CFA,
Senior Vice President, Director of
Portfolio Management
World equity markets were firmly in positive territory for the six months. The dominant market theme was investors’ expectations of moderate economic recovery—an extension of generally favorable sentiment that began in the third quarter of 2012 on the heels of measures from key central banks around the globe to stimulate and support growth.
10
Investors mostly shrugged off possible risks to the market outlook, particularly with regard to the uncertain U.S. fiscal situation and the potential for renewed financial crises in Europe. Instead, they favored a more optimistic view of global growth and corporate earnings. Although returns across individual equity markets varied greatly, emerging markets’ gains were more muted compared with those of developed markets; as a whole, the asset class was held back somewhat by worries about the possibility for abrupt slowing in China and by exposure to the commodities-related industries that realized disappointing results in early 2013.
Companies that were out of favor in the first half of 2012 began to attract investor attention in the latter part of the year, and these “risk-on” companies continued to perform well into the first quarter of this year. Investors also appear to have paid more attention to both company earnings and sell-side estimates. Underperformance of safer, high-quality stocks, which began in the second half of 2012, substantially diminished in the first quarter of 2013.
These trends point to the increasing selectivity of market participants.
Our portfolio focused on attractively valued stocks that appeared likely to rise in price based on earnings data, price characteristics, and quality. Overweighted markets, based on bottom-up stock selection, included the United States and Japan, as well as Korea, Taiwan, and Poland. We underweighted the United Kingdom, Switzerland, and Australia.
Energy and health care remained important sector weightings for our portfolio.
Solid gains from our stock selection offset value lost to country allocations. Selections in the United States, particularly in the energy sector, outperformed notably. Stock selection in France, Germany, and Canada also contributed to relative returns. Less successful for the portfolio: stock selection in Japan, an overweighting of Korea, and a lack of exposure to Switzerland. The portfolio’s overweighting of emerging markets, along with stock selection in these markets, also detracted from relative returns. Sector allocations—particularly an underweighting of financials and an overweighting of energy and telecoms—were costly.
11
Global Equity Fund
Fund Profile
As of March 31, 2013
| | |
| Portfolio Characteristics | | |
| | | MSCI All |
| | | Country |
| | | World |
| | Fund | Index |
| Number of Stocks | 695 | 2,422 |
| Median Market Cap | $22.0B | $40.0B |
| Price/Earnings Ratio | 15.5x | 16.6x |
| Price/Book Ratio | 1.9x | 1.9x |
| Return on Equity | 16.2% | 16.6% |
| Earnings Growth Rate | 10.5% | 7.6% |
| Dividend Yield | 2.1% | 2.6% |
| Turnover Rate | | |
| (Annualized) | 95% | — |
| Ticker Symbol | VHGEX | — |
| Expense Ratio1 | 0.59% | — |
| Short-Term Reserves | 0.2% | — |
| | |
| Sector Diversification (% of equity exposure) |
| | | MSCI All |
| | | Country |
| | Fund | World Index |
| Consumer Discretionary | 13.8% | 10.9% |
| Consumer Staples | 11.9 | 10.8 |
| Energy | 7.5 | 10.2 |
| Financials | 20.1 | 21.3 |
| Health Care | 10.2 | 9.9 |
| Industrials | 13.0 | 10.5 |
| Information Technology | 14.1 | 11.9 |
| Materials | 5.2 | 6.8 |
| Telecommunication Services | 3.3 | 4.2 |
| Utilities | 0.9 | 3.5 |
| |
| Volatility Measures | |
| | MSCI All |
| | Country |
| | World Index |
| R-Squared | 0.98 |
| Beta | 1.03 |
| These measures show the degree and timing of the fund’s fluctuations compared with the index over 36 months. |
| | |
| Ten Largest Holdings (% of total net assets) |
| Samsung Electronics Co. | | |
| Ltd. | Semiconductors | 1.3% |
| Svenska Handelsbanken | | |
| AB Class A | Diversified Banks | 1.1 |
| Nestle SA | Packaged Foods & | |
| | Meats | 1.0 |
| Omnicom Group Inc. | Advertising | 1.0 |
| Roche Holding AG | Pharmaceuticals | 1.0 |
| eBay Inc. | Internet Software & | |
| | Services | 0.9 |
| Prudential plc | Life & Health | |
| | Insurance | 0.9 |
| Royal Dutch Shell plc | Integrated Oil & Gas | 0.8 |
| Cie Financiere | Apparel, Accessories | |
| Richemont SA | & Luxury Goods | 0.8 |
| Taiwan Semiconductor | | |
| Manufacturing Co. Ltd. | Semiconductors | 0.8 |
| Top Ten | | 9.6% |
| The holdings listed exclude any temporary cash investments and equity index products. |
Allocation by Region (% of equity exposure)
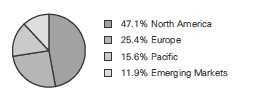
1 The expense ratio shown is from the prospectus dated March 1, 2013, and represents estimated costs for the current fiscal year. For the six
months ended March 31, 2013, the annualized expense ratio was 0.61%.
12
Global Equity Fund
| | |
| Market Diversification (% of equity exposure) |
| | | MSCI All |
| | | Country |
| | | World |
| | Fund | Index |
| Europe | | |
| United Kingdom | 8.4% | 8.0% |
| Switzerland | 4.0 | 3.4 |
| Sweden | 2.8 | 1.2 |
| France | 2.4 | 3.4 |
| Germany | 2.0 | 3.1 |
| Denmark | 1.0 | 0.4 |
| Ireland | 1.0 | 0.1 |
| Other | 3.8 | 3.8 |
| Subtotal | 25.4% | 23.4% |
| Pacific | | |
| Japan | 9.5% | 7.8% |
| South Korea | 3.0 | 1.8 |
| Hong Kong | 1.3 | 1.2 |
| Australia | 1.1 | 3.4 |
| Other | 0.7 | 0.8 |
| Subtotal | 15.6% | 15.0% |
| Emerging Markets | | |
| China | 3.2% | 2.2% |
| Taiwan | 2.0 | 1.3 |
| South Africa | 1.4 | 0.9 |
| Brazil | 1.2 | 1.6 |
| Turkey | 1.2 | 0.3 |
| Other | 2.9 | 4.1 |
| Subtotal | 11.9% | 10.4% |
| North America | | |
| United States | 44.4% | 47.0% |
| Canada | 2.7 | 4.0 |
| Subtotal | 47.1% | 51.0% |
| Middle East | 0.0% | 0.2% |

Global Equity Fund
Performance Summary
All of the returns in this report represent past performance, which is not a guarantee of future results that may be achieved by the fund. (Current performance may be lower or higher than the performance data cited. For performance data current to the most recent month-end, visit our website at vanguard.com/performance.) Note, too, that both investment returns and principal value can fluctuate widely, so an investor’s shares, when sold, could be worth more or less than their original cost. The returns shown do not reflect taxes that a shareholder would pay on fund distributions or on the sale of fund shares.
Fiscal-Year Total Returns (%): September 30, 2002, Through March 31, 2013
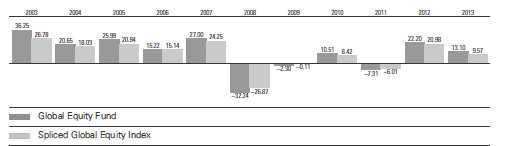
For a benchmark description, see the Glossary.
Note: For 2013, performance data reflect the six months ended March 31, 2013.
| | | | |
| Average Annual Total Returns: Periods Ended March 31, 2013 | | | |
| |
| | Inception | One | Five | Ten |
| | Date | Year | Years | Years |
| Global Equity Fund | 8/14/1995 | 13.97% | 1.77% | 10.51% |
See Financial Highlights for dividend and capital gains information.
14
Global Equity Fund
Financial Statements (unaudited)
Statement of Net Assets—Investments Summary
As of March 31, 2013
This Statement summarizes the fund’s holdings by asset type. Details are reported for each of the fund’s 50 largest individual holdings and for investments that, in total for any issuer, represent more than 1% of the fund’s net assets. The total value of smaller holdings is reported as a single amount within each category.
The fund reports a complete list of its holdings in regulatory filings four times in each fiscal year, at the quarter-ends. For the second and fourth fiscal quarters, the complete listing of the fund’s holdings is available electronically on vanguard.com and on the Securities and Exchange Commission’s website (sec.gov), or you can have it mailed to you without charge by calling 800-662-7447. For the first and third fiscal quarters, the fund files the lists with the SEC on Form N-Q. Shareholders can look up the fund’s Forms N-Q on the SEC’s website. Forms N-Q may also be reviewed and copied at the SEC’s Public Reference Room (see the back cover of this report for further information).
| | | |
| | | Market | Percentage |
| | | Value | of Net |
| | Shares | ($000) | Assets |
| Common Stocks | | | |
| Argentina † | | 7,819 | 0.2% |
| |
| Australia † | | 41,953 | 1.0% |
| |
| Austria † | | 1,872 | 0.0% |
| |
| Belgium † | | 15,597 | 0.4% |
| |
| Brazil † | | 49,145 | 1.2% |
| |
| Canada | | | |
| Rogers Communications Inc. Class B | 473,570 | 24,190 | 0.6% |
| Bank of Montreal | 344,900 | 21,709 | 0.5% |
| ^ Agrium Inc. | 221,500 | 21,599 | 0.5% |
| Canada—Other † | | 47,190 | 1.1% |
| | | 114,688 | 2.7% |
| |
| Chile † | | 6,297 | 0.2% |
| |
| China | | | |
| Mindray Medical International Ltd. ADR | 624,580 | 24,946 | 0.6% |
| Bank of China Ltd. | 44,122,000 | 20,528 | 0.5% |
| China Construction Bank Corp. | 20,374,000 | 16,701 | 0.4% |
| China Resources Enterprise Ltd. | 3,641,901 | 10,822 | 0.3% |
| China Mobile Ltd. | 988,000 | 10,479 | 0.2% |
| Industrial & Commercial Bank of China Ltd. | 12,001,000 | 8,440 | 0.2% |
| Agricultural Bank of China Ltd. | 10,201,000 | 4,909 | 0.1% |
| China—Other † | | 38,053 | 0.9% |
| | | 134,878 | 3.2% |
15
Global Equity Fund
| | | |
| | | Market | Percentage |
| | | Value | of Net |
| | Shares | ($000) | Assets |
| Cyprus † | | 797 | 0.0% |
| Denmark † | | 42,671 | 1.0% |
| Egypt † | | 1,888 | 0.0% |
| Finland † | | 17,028 | 0.4% |
| France | | | |
| Sanofi | 260,549 | 26,572 | 0.6% |
| European Aeronautic Defence and Space Co. NV | 490,268 | 24,988 | 0.6% |
| France—Other † | | 44,556 | 1.1% |
| | | 96,116 | 2.3% |
| Germany † | | 77,757 | 1.8% |
| Greece | | | |
| Coca Cola Hellenic Bottling Co. SA | 886,445 | 23,766 | 0.6% |
| Hong Kong | | | |
| Jardine Matheson Holdings Ltd. | 302,000 | 19,692 | 0.5% |
| Hong Kong—Other † | | 33,864 | 0.8% |
| | | 53,556 | 1.3% |
| Hungary † | | 302 | 0.0% |
| India † | | 9,135 | 0.2% |
| Indonesia † | | 8,330 | 0.2% |
| Ireland | | | |
| Ryanair Holdings plc ADR | 581,222 | 24,283 | 0.6% |
| Ireland—Other † | | 18,175 | 0.4% |
| | | 42,458 | 1.0% |
| Italy † | | 22,487 | 0.5% |
| Japan | | | |
| ^ Nippon Telegraph & Telephone Corp | . 633,100 | 27,608 | 0.6% |
| Japan—Other † | | 361,076 | 8.5% |
| | | 388,684 | 9.1% |
| Malaysia † | | 12,771 | 0.3% |
| Mexico † | | 26,890 | 0.6% |
| Netherlands † | | 28,600 | 0.7% |
| New Zealand † | | 1,169 | 0.0% |
| Norway † | | 31,590 | 0.7% |
| Philippines † | | 13,581 | 0.3% |
16
| | | |
| Global Equity Fund | | | |
| |
| |
| |
| | | Market | Percentage |
| | | Value | of Net |
| | Shares | ($000) | Assets |
| Poland † | | 9,955 | 0.2% |
| |
| Russia † | | 7,796 | 0.2% |
| |
| Singapore | | | |
| DBSGroup Holdings Ltd. | 1,851,000 | 23,957 | 0.6% |
| Singapore—Other † | | 6,348 | 0.1% |
| | | 30,305 | 0.7% |
| |
| South Africa | | | |
| Naspers Ltd. | 423,190 | 26,367 | 0.6% |
| South Africa—Other † | | 33,518 | 0.8% |
| | | 59,885 | 1.4% |
| |
| South Korea | | | |
| Samsung Electronics Co. Ltd. | 22,695 | 31,148 | 0.8% |
| Samsung Electronics Co. Ltd. GDR | 33,350 | 22,455 | 0.5% |
| South Korea—Other † | | 72,466 | 1.7% |
| | | 126,069 | 3.0% |
| |
| Spain † | | 9,378 | 0.2% |
| |
| Sweden | | | |
| SvenskaHandelsbanken AB Class A | 1,138,293 | 48,686 | 1.1% |
| Atlas Copco AB Class B | 790,469 | 20,028 | 0.5% |
| Sweden—Other† | | 50,493 | 1.2% |
| | | 119,207 | 2.8% |
| |
| Switzerland | | | |
| Nestle SA | 616,737 | 44,636 | 1.0% |
| Roche Holding AG | 176,551 | 41,158 | 1.0% |
| Cie Financiere Richemont SA | 430,583 | 33,901 | 0.8% |
| Switzerland—Other† | | 48,222 | 1.1% |
| | | 167,917 | 3.9% |
| |
| Taiwan | | | |
| Taiwan Semiconductor Manufacturing Co. Ltd. ADR | 1,530,472 | 26,440 | 0.6% |
| Fubon Financial Holding Co. Ltd. | 13,957,279 | 19,977 | 0.5% |
| Taiwan—Other † | | 36,614 | 0.9% |
| | | 83,031 | 2.0% |
| |
| Thailand † | | 22,481 | 0.5% |
| |
| Turkey † | | 48,186 | 1.1% |
| |
| United Arab Emirates † | | 291 | 0.0% |
17
| | | |
| Global Equity Fund | | | |
| |
| |
| |
| | | Market | Percentage |
| | | Value | of Net |
| | Shares | ($000) | Assets |
| United Kingdom | | | |
| Prudential plc | 2,428,224 | 39,438 | 0.9% |
| Royal Dutch Shell plc Class A | 993,384 | 32,173 | 0.8% |
| Rolls-Royce Holdings plc | 1,368,819 | 23,554 | 0.6% |
| Wolseley plc | 437,077 | 21,798 | 0.5% |
| United Kingdom—Other † | | 222,558 | 5.2% |
| | | 339,521 | 8.0% |
| |
| United States | | | |
| Consumer Discretionary | | | |
| OmnicomGroup Inc. | 708,609 | 41,737 | 1.0% |
| * Amazon.com Inc. | 117,853 | 31,407 | 0.7% |
| Comcast Corp. Class A | 628,072 | 26,385 | 0.6% |
| McDonald’s Corp. | 210,843 | 21,019 | 0.5% |
| Consumer Discretionary—Other † | | 165,720 | 3.9% |
| | | 286,268 | 6.7% |
| |
| Consumer Staples | | | |
| Tyson Foods Inc. Class A | 1,110,798 | 27,570 | 0.6% |
| Costco Wholesale Corp. | 228,364 | 24,232 | 0.6% |
| CVS Caremark Corp. | 439,804 | 24,185 | 0.6% |
| Consumer Staples—Other † | | 133,683 | 3.1% |
| | | 209,670 | 4.9% |
| |
| Energy | | | |
| Phillips 66 | 381,280 | 26,678 | 0.6% |
| ConocoPhillips | 397,108 | 23,866 | 0.6% |
| Marathon Petroleum Corp. | 255,532 | 22,896 | 0.5% |
| Valero Energy Corp. | 476,649 | 21,683 | 0.5% |
| Tesoro Corp. | 352,648 | 20,648 | 0.5% |
| Energy—Other † | | 68,163 | 1.6% |
| | | 183,934 | 4.3% |
| |
| Exchange-Traded Fund | | | |
| 1 Vanguard FTSE Emerging Markets ETF | 443,472 | 19,021 | 0.5% |
| |
| Financials | | | |
| JPMorgan Chase & Co. | 666,204 | 31,618 | 0.7% |
| Goldman Sachs Group Inc. | 160,567 | 23,627 | 0.6% |
| * Markel Corp. | 40,684 | 20,484 | 0.5% |
| Financials—Other † | | 198,210 | 4.6% |
| | | 273,939 | 6.4% |
| Health Care | | | |
| Merck & Co. Inc. | 534,404 | 23,637 | 0.6% |
| Health Care—Other † | | 187,463 | 4.4% |
| | | 211,100 | 5.0% |
| Industrials | | | |
| Northrop Grumman Corp. | 310,986 | 21,816 | 0.5% |
| * Alaska Air Group Inc. | 339,396 | 21,708 | 0.5% |
| 3M Co. | 194,832 | 20,712 | 0.5% |
| Industrials—Other † | | 71,363 | 1.7% |
| | | 135,599 | 3.2% |
18
| | | | |
| Global Equity Fund | | | |
| |
| |
| | | | Market | Percentage |
| | | | Valuet | of Net |
| | | Shares | ($000) | Assets |
| Information Technology | | | |
| * | eBay Inc. | 746,173 | 40,458 | 1.0% |
| | OracleCorp. | 976,768 | 31,589 | 0.7% |
| | Mastercard Inc. Class A | 45,812 | 24,790 | 0.6% |
| * | Google Inc. Class A | 29,052 | 23,068 | 0.5% |
| | Computer Sciences Corp. | 423,476 | 20,848 | 0.5% |
| | InformationTechnology—Other † | | 229,828 | 5.4% |
| | | | 370,581 | 8.7% |
| |
| Materials † | | 95,299 | 2.2% |
| |
| Telecommunication Services † | | 302 | 0.0% |
| | | | 1,785,713 | 41.9% |
| Total Common Stocks (Cost $3,471,479) | | 4,081,560 | 95.8%2 |
| |
| | | Coupon | | |
| Temporary Cash Investments | | | |
| Money Market Fund | | | |
| 3,4 | Vanguard Market Liquidity Fund | 0.147% 156,126,711 | 156,127 | 3.7% |
| |
| 5,6 | U.S. Government and Agency Obligations † | | 6,499 | 0.1% |
| Total Temporary Cash Investments (Cost $162,626) | | 162,626 | 3.8%2 |
| Total Investments (Cost $3,634,105) | | 4,244,186 | 99.6% |
| Other Assets and Liabilities | | | |
| Other Assets | | 101,236 | 2.4% |
| Liabilities4 | | (86,247) | (2.0%) |
| | | | 14,989 | 0.4% |
| Net Assets | | 4,259,175 | 100.0% |
| |
| Net Assets | | | |
| Applicable to 210,666,675 outstanding $.001 par value shares of beneficial | | |
| interest (unlimited authorization) | | | 4,259,175 |
| Net Asset Value Per Share | | | $20.22 |
19
| |
| Global Equity Fund | |
| |
| |
| |
| At March 31, 2013, net assets consisted of: | |
| | Amount |
| | ($000) |
| Paid-in Capital | 4,943,714 |
| Overdistributed Net Investment Income | (9,501) |
| Accumulated Net Realized Losses | (1,285,759) |
| Unrealized Appreciation (Depreciation) | |
| Investment Securities | 610,081 |
| Futures Contracts | 626 |
| Forward Currency Contracts | 27 |
| Foreign Currencies | (13) |
| Net Assets | 4,259,175 |
See Note A in Notes to Financial Statements.
* Non-income-producing security.
^ Part of security position is on loan to broker-dealers. The total value of securities on loan is $44,562,000.
† Represents the aggregate value, by category, of securities that are not among the 50 largest holdings and, in total for any issuer, represent
1% or less of net assets.
1 Considered an affiliated company of the fund as the issuer is another member of The Vanguard Group.
2 The fund invests a portion of its cash reserves in equity markets through the use of index futures contracts. After giving effect to futures
investments, the fund’s effective common stock and temporary cash investment positions represent 98.3% and 1.3%, respectively, of net
assets.
3 Affiliated money market fund available only to Vanguard funds and certain trusts and accounts managed by Vanguard. Rate shown is the
7-day yield.
4 Includes $47,116,000 of collateral received for securities on loan.
5 Securities with a value of $5,432,000 have been segregated as initial margin for open futures contracts.
6 Securities with a value of $120,000 are segregated as collateral for forward currency contracts that were terminated but have not yet
settled.
ADR—American Depositary Receipt.
GDR—Global Depositary Receipt.
See accompanying Notes, which are an integral part of the Financial Statements.
20
| |
| Global Equity Fund | |
| |
| |
| Statement of Operations | |
| |
| | SixMonths Ended |
| | March 31, 2013 |
| | ($000) |
| Investment Income | |
| Income | |
| Dividends1,2 | 43,511 |
| Interest2 | 119 |
| Security Lending | 652 |
| Total Income | 44,282 |
| Expenses | |
| Investment Advisory Fees—Note B | |
| Basic Fee | 4,905 |
| Performance Adjustment | 1,380 |
| The Vanguard Group—Note C | |
| Management and Administrative | 5,330 |
| Marketing and Distribution | 340 |
| Custodian Fees | 317 |
| Shareholders’ Reports | 28 |
| Trustees’ Fees and Expenses | 7 |
| Total Expenses | 12,307 |
| Net Investment Income | 31,975 |
| Realized Net Gain (Loss) | |
| Investment Securities Sold2 | 553,811 |
| Futures Contracts | 11,544 |
| Foreign Currencies and Forward Currency Contracts | (3,470) |
| Realized Net Gain (Loss) | 561,885 |
| Change in Unrealized Appreciation (Depreciation) | |
| Investment Securities | (93,316) |
| Futures Contracts | 1,148 |
| Foreign Currencies and Forward Currency Contracts | 1 |
| Change in Unrealized Appreciation (Depreciation) | (92,167) |
| Net Increase (Decrease) in Net Assets Resulting from Operations | 501,693 |
1 Dividends are net of foreign withholding taxes of $1,622,000.
2 Dividend income, interest income, and realized net gain (loss) from affiliated companies of the fund were $220,000, $118,000, and
$1,912,000, respectively.
See accompanying Notes, which are an integral part of the Financial Statements.
21
| | |
| Global Equity Fund | | |
| |
| |
| Statement of Changes in Net Assets | | |
| |
| | Six Months Ended | Year Ended |
| | March 31, | September 30, |
| | 2013 | 2012 |
| | ($000) | ($000) |
| Increase (Decrease) in Net Assets | | |
| Operations | | |
| Net Investment Income | 31,975 | 66,820 |
| Realized Net Gain (Loss) | 561,885 | (21,470) |
| Change in Unrealized Appreciation (Depreciation) | (92,167) | 665,717 |
| Net Increase (Decrease) in Net Assets Resulting from Operations | 501,693 | 711,067 |
| Distributions | | |
| Net Investment Income | (71,970) | (76,902) |
| Realized Capital Gain | — | — |
| Total Distributions | (71,970) | (76,902) |
| Capital Share Transactions | | |
| Issued | 294,393 | 452,881 |
| Issued in Lieu of Cash Distributions | 68,497 | 72,488 |
| Redeemed | (386,686) | (636,233) |
| Net Increase (Decrease) from Capital Share Transactions | (23,796) | (110,864) |
| Total Increase (Decrease) | 405,927 | 523,301 |
| Net Assets | | |
| Beginning of Period | 3,853,248 | 3,329,947 |
| End of Period1 | 4,259,175 | 3,853,248 |
1 Net Assets—End of Period includes undistributed (overdistributed) net investment income of ($9,501,000) and $30,043,000.
See accompanying Notes, which are an integral part of the Financial Statements.
22
| | | | | | | |
| Global Equity Fund | | | | | | | |
| |
| |
| Financial Highlights | | | | | | |
| |
| |
| | Six Months | | | | | |
| | | Ended | | | | | |
| For a Share Outstanding | March 31, | Year Ended March 31, |
| Throughout Each Period | | 2013 | 2012 | 2011 | 2010 | 2009 | 2008 |
| Net Asset Value, Beginning of Period | $18.21 | $15.24 | $16.74 | $15.49 | $16.64 | $26.51 |
| Investment Operations | | | | | | | |
| Net Investment Income | | .153 | .320 | .3451 | .314 | .371 | .529 |
| Net Realized and Unrealized Gain (Loss) | | | | | | |
| on Investments | | 2.199 | 3.012 | (1.525) | 1.292 | (.948) | (8.569) |
| Total from Investment Operations | | 2.352 | 3.332 | (1.180) | 1.606 | (.577) | (8.040) |
| Distributions | | | | | | | |
| Dividends from Net Investment Income | (.342) | (.362) | (.320) | (.356) | (.573) | (.430) |
| Distributions from Realized Capital Gains | — | — | — | — | — | (1.400) |
| Total Distributions | | (.342) | (.362) | (.320) | (.356) | (.573) | (1.830) |
| Net Asset Value, End of Period | | $20.22 | $18.21 | $15.24 | $16.74 | $15.49 | $16.64 |
| |
| Total Return2 | | 13.10% | 22.20% | -7.31% | 10.51% | -2.30% | -32.24% |
| |
| Ratios/Supplemental Data | | | | | | | |
| Net Assets, End of Period (Millions) | $4,259 | $3,853 | $3,330 | $3,906 | $3,813 | $5,160 |
| Ratio of Total Expenses to | | | | | | | |
| Average Net Assets3 | | 0.61% | 0.57% | 0.54% | 0.44% | 0.47% | 0.51% |
| Ratio of Net Investment Income to | | | | | | |
| Average Net Assets | | 1.59% | 1.82% | 1.92% | 1.94% | 2.55% | 2.35% |
| Portfolio Turnover Rate | | 95% | 67% | 44% | 64% | 71% | 73% |
The expense ratio, net income ratio, and turnover rate for the current period have been annualized.
1 Calculated based on average shares outstanding.
2 Total returns do not include account service fees that may have applied in the periods shown. Fund prospectuses provide information about
any applicable account service fees.
3 Includes performance-based investment advisory fee increases (decreases) of 0.07%, 0.02%, (0.02%), (0.11%), (0.13%), and (0.02%).
See accompanying Notes, which are an integral part of the Financial Statements.
23
Global Equity Fund
Notes to Financial Statements
Vanguard Global Equity Fund is registered under the Investment Company Act of 1940 as an open-end investment company, or mutual fund. The fund invests in securities of foreign issuers, which may subject it to investment risks not normally associated with investing in securities of United States corporations.
A. The following significant accounting policies conform to generally accepted accounting principles for U.S. mutual funds. The fund consistently follows such policies in preparing its financial statements.
1. Security Valuation: Securities are valued as of the close of trading on the New York Stock Exchange (generally 4 p.m., Eastern time) on the valuation date. Equity securities are valued at the latest quoted sales prices or official closing prices taken from the primary market in which each security trades; such securities not traded on the valuation date are valued at the mean of the latest quoted bid and asked prices. Bonds, and temporary cash investments acquired over 60 days to maturity, are valued using the latest bid prices or using valuations based on a matrix system (which considers such factors as security prices, yields, maturities, and ratings), both as furnished by independent pricing services. Investments in Vanguard Market Liquidity Fund are valued at that fund’s net asset value. Other temporary cash investments are valued at amortized cost, which approximates market value. Securities for which market quotations are not readily available, or whose values have been affected by events occurring before the fund’s pricing time but after the close of the securities’ primary markets, are valued at their fair values calculated according to procedures adopted by the board of trustees. These procedures include obtaining quotations from an independent pricing service, monitoring news to identify significant market- or security-specific events, and evaluating changes in the values of foreign market proxies (for example, ADRs, futures contracts, or exchange-traded funds), between the time the foreign markets close and the fund’s pricing time. When fair-value pricing is employed, the prices of securities used by a fund to calculate its net asset value may differ from quoted or published prices for the same securities.
2. Foreign Currency: Securities and other assets and liabilities denominated in foreign currencies are translated into U.S. dollars using exchange rates obtained from an independent third party as of the fund’s pricing time on the valuation date. Realized gains (losses) and unrealized appreciation (depreciation) on investment securities include the effects of changes in exchange rates since the securities were purchased, combined with the effects of changes in security prices. Fluctuations in the value of other assets and liabilities resulting from changes in exchange rates are recorded as unrealized foreign currency gains (losses) until the assets or liabilities are settled in cash, at which time they are recorded as realized foreign currency gains (losses).
3. Futures and Forward Currency Contracts: The fund uses index futures contracts to a limited extent, with the objective of maintaining full exposure to the stock market while maintaining liquidity. The fund may purchase or sell futures contracts to achieve a desired level of investment, whether to accommodate portfolio turnover or cash flows from capital share transactions. The primary risks associated with the use of futures contracts are imperfect correlation between changes in market values of stocks held by the fund and the prices of futures contracts, and the possibility of an illiquid market.
The fund also enters into forward currency contracts to provide the appropriate currency exposure related to any open futures contracts or to protect the value of securities and related receivables and payables against changes in foreign exchange rates. The primary risk associated with the fund’s use of these contracts is that a counterparty will fail to fulfill its obligation to pay gains due to the fund under the contracts. The fund attempts to mitigate this risk by, among other things, performing a credit analysis of counterparties, monitoring exposure to counterparties, and requiring counterparties
24
Global Equity Fund
to post collateral to secure such exposure. The forward currency contracts contain provisions whereby a counterparty may terminate open contracts if the fund’s net assets decline below a certain level, triggering a payment by the fund if the fund is in a net liability position at the time of the termination. The payment amount would be reduced by any collateral the fund has posted. Any assets posted as collateral for open contracts are noted in the Statement of Net Assets. The value of collateral received or posted is compared daily to the value of the forward currency contracts exposure with each counterparty, and any difference, if in excess of a specified minimum transfer amount, is adjusted and settled within two business days.
Futures contracts are valued at their quoted daily settlement prices. Forward currency contracts are valued at their quoted daily prices obtained from an independent third party, adjusted for currency risk based on the expiration date of each contract. The aggregate principal amounts of the contracts are not recorded in the Statement of Net Assets. Fluctuations in the value of the contracts are recorded in the Statement of Net Assets as an asset (liability) and in the Statement of Operations as unrealized appreciation (depreciation) until the contracts are closed, when they are recorded as realized gains (losses) on futures or forward currency contracts.
During the six months ended March 31, 2013, the fund’s average investment in long futures contracts represented 3% of net assets, based on quarterly average aggregate settlement values. The fund’s average investment in forward currency contracts represented 2% of net assets, based on quarterly average notional amounts.
4. Federal Income Taxes: The fund intends to continue to qualify as a regulated investment company and distribute all of its taxable income. Management has analyzed the fund’s tax positions taken for all open federal income tax years (September 30, 2009–2012), and for the period ended March 31, 2013, and has concluded that no provision for federal income tax is required in the fund’s financial statements.
5. Distributions: Distributions to shareholders are recorded on the ex-dividend date.
6. Security Lending: The fund may lend its securities to qualified institutional borrowers to earn additional income. Security loans are required to be secured at all times by collateral at least equal to the market value of securities loaned. Daily market fluctuations could cause the value of loaned securities to be more or less than the value of the collateral received. When this occurs, the collateral is adjusted on the next business day. The fund invests cash collateral received in Vanguard Market Liquidity Fund, and records a liability for the return of the collateral, during the period the securities are on loan. Security lending income represents fees charged to borrowers plus income earned on investing cash collateral, less expenses associated with the loan.
7. Other: Dividend income is recorded on the ex-dividend date. Interest income includes income distributions received from Vanguard Market Liquidity Fund and is accrued daily. Security transactions are accounted for on the date securities are bought or sold. Costs used to determine realized gains (losses) on the sale of investment securities are those of the specific securities sold.
B. Marathon Asset Management LLP, Baillie Gifford Overseas Ltd., and Acadian Asset Management LLC each provide investment advisory services to a portion of the fund for a fee calculated at an annual percentage rate of average net assets managed by the advisor. The basic fees of Marathon
Asset Management LLP, Baillie Gifford Overseas Ltd., and Acadian Asset Management LLC are subject to quarterly adjustments based on performance for the preceding three years relative to the MSCI All Country World Index.
25
Global Equity Fund
The Vanguard Group manages the cash reserves of the fund on an at-cost basis.
For the six months ended March 31, 2013, the aggregate investment advisory fee represented an effective annual basic rate of 0.24% of the fund’s average net assets, before an increase of $1,380,000 (0.07%) based on performance.
C. The Vanguard Group furnishes at cost corporate management, administrative, marketing, and distribution services. The costs of such services are allocated to the fund under methods approved by the board of trustees. The fund has committed to provide up to 0.40% of its net assets in capital contributions to Vanguard. At March 31, 2013, the fund had contributed capital of $537,000 to Vanguard (included in Other Assets), representing 0.01% of the fund’s net assets and 0.21% of Vanguard’s capitalization. The fund’s trustees and officers are also directors and officers of Vanguard.
D. Various inputs may be used to determine the value of the fund’s investments. These inputs are summarized in three broad levels for financial statement purposes. The inputs or methodologies used to value securities are not necessarily an indication of the risk associated with investing in those securities.
Level 1—Quoted prices in active markets for identical securities.
Level 2—Other significant observable inputs (including quoted prices for similar securities, interest
rates, prepayment speeds, credit risk, etc.).
Level 3—Significant unobservable inputs (including the fund’s own assumptions used to determine
the fair value of investments).
The following table summarizes the market value of the fund’s investments as of March 31, 2013, based on the inputs used to value them:
| | | |
| | Level 1 | Level 2 | Level 3 |
| Investments | ($000) | ($000) | ($000) |
| Common Stocks—International | 930,954 | 1,364,893 | — |
| Common Stocks—United States | 1,785,713 | — | — |
| Temporary Cash Investments | 156,127 | 6,499 | — |
| Futures Contracts—Assets1 | 245 | — | — |
| Futures Contracts— Liabilities1 | (57) | — | — |
| Forward Currency Contracts—Assets | — | 181 | — |
| Forward Currency Contracts—Liabilities | — | (154) | — |
| Total | 2,872,982 | 1,371,419 | — |
| 1 Represents variation margin on the last day of the reporting period. |
$612,684,000 of securities that are valued in this report based on Level 1 inputs are normally valued based on Level 2 inputs. These securities were valued based on March 29, 2013, closing prices because their local markets were open while U.S. markets were closed.
26
Global Equity Fund
E. At March 31, 2013, the fair values of derivatives were reflected in the Statement of Net Assets as follows:
| | | |
| | | Foreign | |
| | Equity | Exchange | |
| | Contracts | Contracts | Total |
| Statement of Net Assets Caption | ($000) | ($000) | ($000) |
| Other Assets | 245 | 181 | 426 |
| Liabilities | (57) | (154) | (211) |
Realized net gain (loss) and the change in unrealized appreciation (depreciation) on derivatives for the six months ended March 31, 2013, were:
| | | |
| | | Foreign | |
| | Equity | Exchange | |
| | Contracts | Contracts | Total |
| Realized Net Gain (Loss) on Derivatives | ($000) | ($000) | ($000) |
| Futures Contracts | 11,544 | — | 11,544 |
| Forward Currency Contracts | — | (2,587) | (2,587) |
| Realized Net Gain (Loss) on Derivatives | 11,544 | (2,587) | 8,957 |
| |
| Change in Unrealized Appreciation (Depreciation) on Derivatives | | | |
| Futures Contracts | 1,148 | — | 1,148 |
| Forward Currency Contracts | — | 112 | 112 |
| Change in Unrealized Appreciation (Depreciation) on Derivatives | 1,148 | 112 | 1,260 |
At March 31, 2013, the aggregate settlement value of open futures contracts and the related
unrealized appreciation (depreciation) were:
| | | | |
| | | | ($000) |
| | | | Aggregate | |
| | | Number of | Settlement | Unrealized |
| | | Long (Short) | Value | Appreciation |
| Futures Contracts | Expiration | Contracts | Long (Short) | (Depreciation) |
| E-mini S&P 500 Index | June 2013 | 452 | 35,317 | 135 |
| S&P 500 Index | June 2013 | 76 | 29,691 | 514 |
| FTSE 100 Index | June 2013 | 145 | 14,028 | (11) |
| Dow Jones EURO STOXX 50 Index | June 2013 | 389 | 12,764 | (90) |
| Topix Index | June 2013 | 91 | 10,133 | 134 |
| S&P ASX 200 Index | June 2013 | 48 | 6,207 | (56) |
Unrealized appreciation (depreciation) on open E-mini S&P 500 Index, S&P 500 Index, FTSE 100 Index, and Dow Jones EURO STOXX 50 Index futures contracts is required to be treated as realized gain (loss) for tax purposes.
27
Global Equity Fund
At March 31, 2013, the fund had open forward currency contracts to receive and deliver currencies as follows. Unrealized appreciation (depreciation) on open forward currency contracts is treated as realized gain (loss) for tax purposes.
| | | | | | |
| | | | | | | Unrealized |
| | Contract | | | | | Appreciation |
| | Settlement | Contract Amount (000) | (Depreciation) |
| Counterparty | Date | | Receive | | Deliver | ($000) |
| Morgan Stanley Capital Services Inc. | 6/26/13 | GBP | 9,244 | USD | 13,865 | 165 |
| Morgan Stanley Capital Services Inc. | 6/26/13 | EUR | 10,056 | USD | 13,028 | (106) |
| Morgan Stanley Capital Services Inc. | 6/18/13 | JPY | 921,350 | USD | 9,852 | (47) |
| Morgan Stanley Capital Services Inc. | 6/25/13 | AUD | 3,742 | USD | 3,877 | (1) |
| Morgan Stanley Capital Services Inc. | 6/25/13 | AUD | 2,308 | USD | 2,375 | 16 |
| AUD—Australian dollar. |
| EUR—Euro. |
| GBP—British pound. |
| JPY—Japanese yen. |
| USD—U.S. dollar. |
F. Distributions are determined on a tax basis and may differ from net investment income and realized capital gains for financial reporting purposes. Differences may be permanent or temporary. Permanent differences are reclassified among capital accounts in the financial statements to reflect their tax character. Temporary differences arise when certain items of income, expense, gain, or loss are recognized in different periods for financial statement and tax purposes; these differences will reverse at some time in the future. Differences in classification may also result from the treatment of short-term gains as ordinary income for tax purposes.
During the six months ended March 31, 2013, the fund realized net foreign currency losses of $883,000, which decreased distributable net income for tax purposes; accordingly, such losses have been reclassified from accumulated net realized losses to overdistributed net investment income. Certain of the fund’s investments are in securities considered to be “passive foreign investment companies,” for which any unrealized appreciation and/or realized gains are required to be included in distributable net income for tax purposes. During the six months ended March 31, 2013, the fund realized gains on the sale of passive foreign investment companies of $1,334,000, which have been included in current and prior periods’ taxable income; accordingly, such gains have been reclassified from accumulated net realized losses to overdistributed net investment income. Passive foreign investment companies held at March 31, 2013, had unrealized appreciation of $3,005,000 as of October 31, 2012, the most recent mark-to-market date for tax purposes. This amount has been distributed and is reflected in the balance of overdistributed net investment income.
The fund’s tax-basis capital gains and losses are determined only at the end of each fiscal year. For tax purposes, at September 30, 2012, the fund had available capital losses totaling $1,848,613,000 to offset future net capital gains. Of this amount, $1,796,004,000 is subject to expiration dates; $565,722,000 may be used to offset future net capital gains through September 30, 2017, and $1,230,282,000 through September 30, 2018. Capital losses of $52,609,000 realized beginning in fiscal 2012 may be carried forward indefinitely under the Regulated Investment Company Modernization Act of 2010, but must be used before any expiring loss carryforwards. The fund
28
Global Equity Fund
will use these capital losses to offset net taxable capital gains, if any, realized during the year ending
September 30, 2013; should the fund realize net capital losses for the year, the losses will be added to the loss carryforward balance above.
At March 31, 2013, the cost of investment securities for tax purposes was $3,637,110,000. Net unrealized appreciation of investment securities for tax purposes was $607,076,000, consisting of unrealized gains of $724,180,000 on securities that had risen in value since their purchase and $117,104,000 in unrealized losses on securities that had fallen in value since their purchase.
G. During the six months ended March 31, 2013, the fund purchased $1,837,468,000 of investment securities and sold $1,968,682,000 of investment securities, other than temporary cash investments.
| | |
| H. Capital shares issued and redeemed were: | | |
| | Six Months Ended | Year Ended |
| | March 31,2013 | September 30, 2012 |
| | Shares | Shares |
| | (000) | (000) |
| Issued | 15,647 | 26,113 |
| Issued in Lieu of Cash Distributions | 3,713 | 4,542 |
| Redeemed | (20,328) | (37,464) |
| Net Increase (Decrease) in Shares Outstanding | (968) | (6,809) |
I. In preparing the financial statements as of March 31, 2013, management considered the impact of subsequent events for potential recognition or disclosure in these financial statements.
29
About Your Fund’s Expenses
As a shareholder of the fund, you incur ongoing costs, which include costs for portfolio management, administrative services, and shareholder reports (like this one), among others. Operating expenses, which are deducted from a fund’s gross income, directly reduce the investment return of the fund.
A fund’s expenses are expressed as a percentage of its average net assets. This figure is known as the expense ratio. The following examples are intended to help you understand the ongoing costs (in dollars) of investing in your fund and to compare these costs with those of other mutual funds. The examples are based on an investment of $1,000 made at the beginning of the period shown and held for the entire period.
The accompanying table illustrates your fund’s costs in two ways:
• Based on actual fund return. This section helps you to estimate the actual expenses that you paid over the period. The ”Ending Account Value“ shown is derived from the fund‘s actual return, and the third column shows the dollar amount that would have been paid by an investor who started with $1,000 in the fund. You may use the information here, together with the amount you invested, to estimate the expenses that you paid over the period.
To do so, simply divide your account value by $1,000 (for example, an $8,600 account value divided by $1,000 = 8.6), then multiply the result by the number given for your fund under the heading ”Expenses Paid During Period.“
• Based on hypothetical 5% yearly return. This section is intended to help you compare your fund‘s costs with those of other mutual funds. It assumes that the fund had a yearly return of 5% before expenses, but that the expense ratio is unchanged. In this case—because the return used is not the fund’s actual return—the results do not apply to your investment. The example is useful in making comparisons because the Securities and Exchange Commission requires all mutual funds to calculate expenses based on a 5% return. You can assess your fund’s costs by comparing this hypothetical example with the hypothetical examples that appear in shareholder reports of other funds.
Note that the expenses shown in the table are meant to highlight and help you compare ongoing costs only and do not reflect transaction costs incurred by the fund for buying and selling securities. Further, the expenses do not include any purchase, redemption, or account service fees described in the fund prospectus. If such fees were applied to your account, your costs would be higher. Your fund does not carry a “sales load.”
The calculations assume no shares were bought or sold during the period. Your actual costs may have been higher or lower, depending on the amount of your investment and the timing of any purchases or redemptions.
You can find more information about the fund’s expenses, including annual expense ratios, in the Financial Statements section of this report. For additional information on operating expenses and other shareholder costs, please refer to your fund’s current prospectus.
30
| | | |
| Six Months Ended March 31, 2013 | | | |
| | Beginning | Ending | Expenses |
| | Account Value | Account Value | Paid During |
| Global Equity Fund | 9/30/2012 | 3/31/2013 | Period |
| Based on Actual Fund Return | $1,000.00 | $1,130.96 | $3.24 |
| Based on Hypothetical 5% Yearly Return | 1,000.00 | 1,021.89 | 3.07 |
The calculations are based on expenses incurred in the most recent six-month period. The fund’s annualized six-month expense ratio for that
period is 0.61%. The dollar amounts shown as “Expenses Paid” are equal to the annualized expense ratio multiplied by the average account
value over the period, multiplied by the number of days in the most recent six-month period, then divided by the number of days in the most
recent 12-month period.
31
Trustees Approve Advisory Agreements
The board of trustees of Vanguard Global Equity Fund has renewed the fund’s investment advisory agreements with Acadian Asset Management LLC (Acadian), Baillie Gifford Overseas Ltd. (Baillie Gifford), and Marathon Asset Management LLP (Marathon). The board determined that the retention of the advisors was in the best interests of the fund and its shareholders.
The board based its decisions upon an evaluation of each advisor’s investment staff, portfolio management process, and performance. The trustees considered the factors discussed below, among others. However, no single factor determined whether the board approved the agreements. Rather, it was the totality of the circumstances that drove the board’s decisions.
Nature, extent, and quality of services
The board considered the quality of the fund’s investment management services over both the short and long term, and took into account the organizational depth and stability of each advisor. The board noted the following:
Acadian. Acadian, founded in 1986, is a Boston-based investment management firm specializing in quantitative equity strategies for developed and emerging markets. Acadian employs a quantitative investment process that selects global stocks. The firm’s investment process builds portfolios from the bottom up using proprietary valuation models measuring more than 20 stock factors and focusing on those that have proven most effective in predicting returns. The result is a rating of all securities in the Acadian database in terms of each stock’s expected return relative to its country and sector group. Acadian has managed a portion of the fund since 2004.
Baillie Gifford. Baillie Gifford, a unit of Baillie Gifford & Co., founded in 1908, is among the largest independently owned investment management firms in the United Kingdom. Baillie Gifford’s investment approach is based on long-term investments in well-researched and well-managed businesses that enjoy sustainable competitive advantages in their marketplaces. The firm employs a fundamental bottom-up approach to identify growth companies, screening them for quality, then value. The main factors considered are sustainable earnings growth, cash-flow generation, profitability, interest coverage, and valuation. Baillie Gifford has managed a portion of the fund since 2008.
Marathon. Marathon, founded in 1986, continues to use a bottom-up approach that focuses on stock selection. Traditional company analysis is de-emphasized in favor of assessing enterprise value, corporate strategy, industry competition, and prospective rate of return on new investments. Sector analysis is conducted using long-term capital cycle data, and country allocations tend to reflect monetary conditions and investor confidence. Marathon has advised the fund since its inception in 1995.
The board concluded that each advisor’s experience, stability, depth, and performance, among other factors, warranted continuation of the advisory agreements.
32
Investment performance
The board considered the short- and long-term performance of the fund and each advisor, including any periods of outperformance or underperformance relative to a benchmark index and peer group. The board concluded that the performance was such that the advisory arrangement should continue. Information about the fund’s most recent performance can be found in the Performance Summary section of this report.
Cost
The board concluded that the fund’s expense ratio was well below the average expense ratio charged by funds in its peer group and that the fund’s advisory fee rate was also well below the peer-group average. Information about the fund’s expenses appears in the About Your Fund’s Expenses section of this report as well as in the Financial Statements section, which also includes information about the fund’s advisory fee rate.
The board did not consider profitability of the fund’s advisors in determining whether to approve the advisory fees, because the firms are independent of Vanguard and the advisory fees are the result of arm’s-length negotiations.
The benefit of economies of scale
The board concluded that the fund’s shareholders benefit from economies of scale because of breakpoints in the advisory fee schedules. The breakpoints reduce the effective rate of the fees as the fund’s assets managed by each advisor increase.
The board will consider whether to renew the advisory agreements again after a one-year period.
33
Glossary
Beta. A measure of the magnitude of a fund’s past share-price fluctuations in relation to the ups and downs of a given market index. The index is assigned a beta of 1.00. Compared with a given index, a fund with a beta of 1.20 typically would have seen its share price rise or fall by 12% when the index rose or fell by 10%. For this report, beta is based on returns over the past 36 months for both the fund and the index. Note that a fund’s beta should be reviewed in conjunction with its R-squared (see definition). The lower the R-squared, the less correlation there is between the fund and the index, and the less reliable beta is as an indicator of volatility.
Dividend Yield. Dividend income earned by stocks, expressed as a percentage of the aggregate market value (or of net asset value, for a fund). The yield is determined by dividing the amount of the annual dividends by the aggregate value (or net asset value) at the end of the period. For a fund, the dividend yield is based solely on stock holdings and does not include any income produced by other investments.
Earnings Growth Rate. The average annual rate of growth in earnings over the past five years for the stocks now in a fund.
Equity Exposure. A measure that reflects a fund’s investments in stocks and stock futures. Any holdings in short-term reserves are excluded.
Expense Ratio. A fund’s total annual operating expenses expressed as a percentage of the fund’s average net assets. The expense ratio includes management and administrative expenses, but does not include the transaction costs of buying and selling portfolio securities.
Inception Date. The date on which the assets of a fund (or one of its share classes) are first invested in accordance with the fund’s investment objective. For funds with a subscription period, the inception date is the day after that period ends. Investment performance is measured from the inception date.
Median Market Cap. An indicator of the size of companies in which a fund invests; the midpoint of market capitalization (market price x shares outstanding) of a fund’s stocks, weighted by the proportion of the fund’s assets invested in each stock. Stocks representing half of the fund’s assets have market capitalizations above the median, and the rest are below it.
Price/Book Ratio. The share price of a stock divided by its net worth, or book value, per share. For a fund, the weighted average price/book ratio of the stocks it holds.
Price/Earnings Ratio. The ratio of a stock’s current price to its per-share earnings over the past year. For a fund, the weighted average P/E of the stocks it holds. P/E is an indicator of market expectations about corporate prospects; the higher the P/E, the greater the expectations for a company’s future growth.
R-Squared. A measure of how much of a fund’s past returns can be explained by the returns from the market in general, as measured by a given index. If a fund’s total returns were precisely synchronized with an index’s returns, its R-squared would be 1.00. If the fund’s returns bore no relationship to the index’s returns, its R-squared would be 0. For this report, R-squared is based on returns over the past 36 months for both the fund and the index.
34
Return on Equity. The annual average rate of return generated by a company during the past five years for each dollar of shareholder’s equity (net income divided by shareholder’s equity). For a fund, the weighted average return on equity for the companies whose stocks it holds.
Short-Term Reserves. The percentage of a fund invested in highly liquid, short-term securities that can be readily converted to cash.
Turnover Rate. An indication of the fund’s trading activity. Funds with high turnover rates incur higher transaction costs and may be more likely to distribute capital gains (which may be taxable to investors). The turnover rate excludes in-kind transactions, which have minimal impact on costs.
Benchmark Information
Spliced Global Equity Index: MSCI All Country World Index returns gross of taxes through March 31, 2007; MSCI All Country World Index returns net of withholding taxes thereafter.

The People Who Govern Your Fund
The trustees of your mutual fund are there to see that the fund is operated and managed in your best interests since, as a shareholder, you are a part owner of the fund. Your fund’s trustees also serve on the board of directors of The Vanguard Group, Inc., which is owned by the Vanguard funds and provides services to them on an at-cost basis.
A majority of Vanguard’s board members are independent, meaning that they have no affiliation with Vanguard or the funds they oversee, apart from the sizable personal investments they have made as private individuals. The independent board members have distinguished backgrounds in business, academia, and public service. Each of the trustees and executive officers oversees 180 Vanguard funds.
The following table provides information for each trustee and executive officer of the fund. More information about the trustees is in the Statement of Additional Information, which can be obtained, without charge, by contacting Vanguard at 800-662-7447, or online at vanguard.com.
| |
| InterestedTrustee1 | and Delphi Automotive LLP (automotive components); |
| | Senior Advisor at New Mountain Capital; Trustee of |
| F. William McNabb III | The Conference Board. |
| Born 1957. Trustee Since July 2009. Chairman of the | |
| Board. Principal Occupation(s) During the Past Five | Amy Gutmann |
| Years: Chairman of the Board of The Vanguard Group, | Born 1949. Trustee Since June 2006. Principal |
| Inc., and of each of the investment companies served | Occupation(s) During the Past Five Years: President |
| by The Vanguard Group, since January 2010; Director | of the University of Pennsylvania; Christopher H. |
| of The Vanguard Group since 2008; Chief Executive | Browne Distinguished Professor of Political Science |
| Officer and President of The Vanguard Group and of | in the School of Arts and Sciences with secondary |
| each of the investment companies served by The | appointments at the Annenberg School for |
| Vanguard Group since 2008; Director of Vanguard | Communication and the Graduate School of Education |
| Marketing Corporation; Managing Director of The | of the University of Pennsylvania; Member of the |
| Vanguard Group (1995–2008). | National Commission on the Humanities and Social |
| | Sciences; Trustee of Carnegie Corporation of New |
| | York and of the National Constitution Center; Chair |
| IndependentTrustees | of the U.S. Presidential Commission for the Study |
| | of Bioethical Issues. |
| Emerson U. Fullwood | |
| Born 1948. Trustee Since January 2008. Principal | |
| Occupation(s) During the Past Five Years: Executive | JoAnn Heffernan Heisen |
| Chief Staff and Marketing Officer for North America | Born 1950. Trustee Since July 1998. Principal |
| and Corporate Vice President (retired 2008) of Xerox | Occupation(s) During the Past Five Years: Corporate |
| Corporation (document management products and | Vice President and Chief Global Diversity Officer |
| services); Executive in Residence and 2010 | (retired 2008) and Member of the Executive |
| Distinguished Minett Professor at the Rochester | Committee (1997–2008) of Johnson & Johnson |
| Institute of Technology; Director of SPX Corporation | (pharmaceuticals/medical devices/consumer |
| (multi-industry manufacturing), the United Way of | products); Director of Skytop Lodge Corporation |
| Rochester, Amerigroup Corporation (managed health | (hotels), the University Medical Center at Princeton, |
| care), the University of Rochester Medical Center, | the Robert Wood Johnson Foundation, and the Center |
| Monroe Community College Foundation, and North | for Talent Innovation; Member of the Advisory Board |
| Carolina A&T University. | of the Maxwell School of Citizenship and Public Affairs |
| | at Syracuse University. |
| |
| Rajiv L. Gupta | F. Joseph Loughrey |
| Born 1945. Trustee Since December 2001. 2 | Born 1949. Trustee Since October 2009. Principal |
| Principal Occupation(s) During the Past Five Years: | Occupation(s) During the Past Five Years: President |
| Chairman and Chief Executive Officer (retired 2009) | and Chief Operating Officer (retired 2009) of Cummins |
| and President (2006–2008) of Rohm and Haas Co. | Inc. (industrial machinery); Chairman of the Board of |
| (chemicals); Director of Tyco International, Ltd. | Hillenbrand, Inc. (specialized consumer services); |
| (diversified manufacturing and services), Hewlett- | Director of SKF AB (industrial machinery), the Lumina |
| Packard Co. (electronic computer manufacturing), | |
| | |
| Foundation for Education, and Oxfam America; | Executive Officers | |
| Chairman of the Advisory Council for the College of | | |
| Arts and Letters and Member of the Advisory Board to | Glenn Booraem | |
| the Kellogg Institute for International Studies at the | Born 1967. Controller Since July 2010. Principal |
| University of Notre Dame. | Occupation(s) During the Past Five Years: Principal |
| | of The Vanguard Group, Inc.; Controller of each of |
| Mark Loughridge | the investment companies served by The Vanguard |
| Born 1953. Trustee Since March 2012. Principal | Group; Assistant Controller of each of the investment |
| Occupation(s) During the Past Five Years: Senior Vice | companies served by The Vanguard Group (2001–2010). |
| President and Chief Financial Officer at IBM (information | | |
| technology services); Fiduciary Member of IBM’s | Thomas J. Higgins | |
| Retirement Plan Committee. | Born 1957. Chief Financial Officer Since September |
| | 2008. Principal Occupation(s) During the Past Five |
| Scott C. Malpass | Years: Principal of The Vanguard Group, Inc.; Chief |
| Born 1962. Trustee Since March 2012. Principal | Financial Officer of each of the investment companies |
| Occupation(s) During the Past Five Years: Chief | served by The Vanguard Group; Treasurer of each of |
| Investment Officer and Vice President at the University | the investment companies served by The Vanguard |
| of Notre Dame; Assistant Professor of Finance at the | Group (1998–2008). | |
| Mendoza College of Business at Notre Dame; Member | | |
| of the Notre Dame 403(b) Investment Committee; | Kathryn J. Hyatt | |
| Director of TIFF Advisory Services, Inc. (investment | Born 1955. Treasurer Since November 2008. Principal |
| advisor); Member of the Investment Advisory | Occupation(s) During the Past Five Years: Principal of |
| Committees of the Financial Industry Regulatory | The Vanguard Group, Inc.; Treasurer of each of the |
| Authority (FINRA) and of Major League Baseball. | investment companies served by The Vanguard |
| | Group; Assistant Treasurer of each of the investment |
| André F. Perold | companies served by The Vanguard Group (1988–2008). |
| Born 1952. Trustee Since December 2004. Principal | | |
| Occupation(s) During the Past Five Years: George | Heidi Stam | |
| Gund Professor of Finance and Banking at the Harvard | Born 1956. Secretary Since July 2005. Principal |
| Business School (retired 2011); Chief Investment | Occupation(s) During the Past Five Years: Managing |
| Officer and Managing Partner of HighVista Strategies | Director of The Vanguard Group, Inc.; General Counsel |
| LLC (private investment firm); Director of Rand | of The Vanguard Group; Secretary of The Vanguard |
| Merchant Bank; Overseer of the Museum of Fine | Group and of each of the investment companies |
| Arts Boston. | served by The Vanguard Group; Director and Senior |
| | Vice President of Vanguard Marketing Corporation. |
| Alfred M. Rankin, Jr. | | |
| Born 1941. Trustee Since January 1993. Principal | Vanguard Senior ManagementTeam |
| Occupation(s) During the Past Five Years: Chairman, | | |
| President, and Chief Executive Officer of NACCO | Mortimer J. Buckley | Chris D. McIsaac |
| Industries, Inc. (housewares/lignite) and of Hyster-Yale | Kathleen C. Gubanich | Michael S. Miller |
| Materials Handling, Inc. (forklift trucks); Director of | Paul A. Heller | James M. Norris |
| the National Association of Manufacturers; Chairman | Martha G. King | Glenn W. Reed |
| of the Board of University Hospitals of Cleveland; | John T. Marcante | |
| Advisory Chairman of the Board of The Cleveland | | |
| Museum of Art. | | |
| | Chairman Emeritus and Senior Advisor |
| Peter F. Volanakis | | |
| Born 1955. Trustee Since July 2009. Principal | John J. Brennan | |
| Occupation(s) During the Past Five Years: President | Chairman, 1996–2009 | |
| and Chief Operating Officer (retired 2010) of Corning | Chief Executive Officer and President, 1996–2008 |
| Incorporated (communications equipment); Director | | |
| of SPX Corporation (multi-industry manufacturing); | Founder | |
| Overseer of the Amos Tuck School of Business | John C. Bogle | |
| Administration at Dartmouth College; Advisor to the | | |
| Norris Cotton Cancer Center. | Chairman and Chief Executive Officer, 1974–1996 |
1 Mr. McNabb is considered an “interested person,” as defined in the Investment Company Act of 1940, because he is an officer of the
Vanguard funds.
2 December 2002 for Vanguard Equity Income Fund, Vanguard Growth Equity Fund, the Vanguard Municipal Bond Funds, and the Vanguard
State Tax-Exempt Funds.

| | |
| | | P.O. Box 2600 |
| | | Valley Forge, PA 19482-2600 |
| |
| |
| |
| Connect with Vanguard® > vanguard.com |
| |
| |
| |
| Fund Information > 800-662-7447 | | CFA® is a trademark owned by CFA Institute. |
| Direct Investor Account Services > 800-662-2739 | |
| Institutional Investor Services > 800-523-1036 | |
| Text Telephone for People | | |
| With Hearing Impairment > 800-749-7273 | |
| |
| This material may be used in conjunction | |
| with the offering of shares of any Vanguard | |
| fund only if preceded or accompanied by | |
| the fund’s current prospectus. | |
| |
| All comparative mutual fund data are from Lipper Inc. or | |
| Morningstar, Inc., unless otherwise noted. | |
| |
| You can obtain a free copy of Vanguard’s proxy voting | |
| guidelines by visiting vanguard.com/proxyreporting or by | |
| calling Vanguard at 800-662-2739. The guidelines are | |
| also available from the SEC’s website, sec.gov. In | |
| addition, you may obtain a free report on how your fund | |
| voted the proxies for securities it owned during the 12 | |
| months ended June 30. To get the report, visit either | |
| vanguard.com/proxyreporting or sec.gov. | |
| |
| You can review and copy information about your fund at | |
| the SEC’s Public Reference Room in Washington, D.C. To | |
| find out more about this public service, call the SEC at | |
| 202-551-8090. Information about your fund is also | |
| available on the SEC’s website, and you can receive | |
| copies of this information, for a fee, by sending a | |
| request in either of two ways: via e-mail addressed to | |
| publicinfo@sec.gov or via regular mail addressed to the | |
| Public Reference Section, Securities and Exchange | |
| Commission, Washington, DC 20549-1520. | |
| |
| |
| | | © 2013 The Vanguard Group, Inc. |
| | | All rights reserved. |
| | | Vanguard Marketing Corporation, Distributor. |
| |
| | | Q1292 052013 |

Semiannual Report | March 31, 2013
Vanguard Strategic Small-Cap
Equity Fund

> For the six months ended March 31, 2013, Vanguard Strategic Small-Cap Equity
Fund returned 17.43%, as small-capitalization stocks continued to outpace
large-cap stocks.
> The fund’s return was ahead of the 15.99% return of its benchmark index and
the 14.91% average return of peer-group funds.
> Good selection among industrial, consumer staples, and materials stocks
helped the fund to surpass its benchmarks.
| |
| Contents | |
| Your Fund’s Total Returns. | 1 |
| Chairman’s Letter. | 2 |
| Advisor’s Report. | 6 |
| Fund Profile. | 8 |
| Performance Summary. | 9 |
| Financial Statements. | 10 |
| About Your Fund’s Expenses. | 22 |
| Trustees Approve Advisory Arrangement. | 24 |
| Glossary. | 25 |
Please note: The opinions expressed in this report are just that—informed opinions. They should not be considered promises or advice.
Also, please keep in mind that the information and opinions cover the period through the date on the front of this report. Of course, the
risks of investing in your fund are spelled out in the prospectus.
See the Glossary for definitions of investment terms used in this report.
About the cover: Our cover photograph shows rigging on the HMSSurprise, a replica of an 18th-century Royal Navy frigate. It
was featured in the 2003 movie Master and Commander: The Far Side of the World, which was based on Patrick O’Brian’s sea
novels, set amid the Napoleonic Wars. Vanguard was named for another ship of that era, the HMSVanguard, which was the
flagship of British Admiral Horatio Nelson at the Battle of the Nile.
Your Fund’s Total Returns
| |
| Six Months Ended March 31, 2013 | |
| | Total |
| | Returns |
| Vanguard Strategic Small-Cap Equity Fund | 17.43% |
| MSCI US Small Cap 1750 Index | 15.99 |
| Small-Cap Core Funds Average | 14.91 |
| Small-Cap Core Funds Average: Derived from data provided by Lipper Inc. |
| | | | |
| Your Fund’s Performance at a Glance | | | | |
| September 30, 2012, Through March 31, 2013 | | | | |
| | | | Distributions Per Share |
| | Starting | Ending | Income | Capital |
| | Share Price | Share Price | Dividends | Gains |
| Vanguard Strategic Small-Cap Equity Fund | $21.37 | $24.68 | $0.360 | $0.000 |
1

Chairman’s Letter
Dear Shareholder,
Vanguard Strategic Small-Cap Equity Fund rode the rally in small-capitalization stocks during the six months ended March 31, 2013. The advisor’s stock-selection methodology gave performance an extra boost. The fund returned 17.43%, compared with the 15.99% posted by its benchmark index and the 14.91% average return of peer-group funds.
The advisor, Vanguard Equity Investment Group, employs a quantitative approach, using a set of computer models to analyze factors such as the financial strength of issuers and stock valuation, reviewing thousands of stocks in the process. While the advisor’s models search for stocks that can potentially outperform their sectors in the benchmark index, the models simultaneously seek to keep the fund’s risk profile in line with that of the index.
During the period, the advisor’s approach was most successful among stocks in the industrial, consumer staples, and materials sectors, and least successful among health care and information technology stocks. The Advisor’s Report provides details of these results.
Global equity markets delivered a powerful rally
Though stock markets abroad weren’t as ebullient as the U.S. market, they nonetheless advanced for five straight months to finish the half year ended March 31 with impressive overall gains. During the period, global financial markets
2
seemed to shrug off the U.S. “fiscal cliff” threat, the unsettled Italian national elections, and a controversial bailout package for Cyprus.
Peter Westaway, Vanguard’s chief European economist, said that the latest developments in the European sovereign-debt crisis had been “rather bad,” but that the market had for the most part already priced in these events. “As always,” he said, “we think investors should assess their portfolios carefully and avoid making impulsive moves.”
The broad U.S. market returned more than 11% as the economic recovery slowly built momentum, the housing market rebounded further, and the labor market improved. International equities
overall were up more than 9%. Returns were about 16% for developed markets in the Pacific region, where Japan’s accommodative monetary policy has helped spark the nation’s stock market, and nearly 10% in Europe. Emerging-market stocks rose about 4%.
Bond returns barely budged as yields lingered near lows
The broad U.S. taxable bond market scraped out a minuscule gain of 0.09% for the half-year as U.S. Treasury yields remained just slightly above their all-time lows. Although the yield of the benchmark 10-year Treasury note increased during the six months and topped 2.00% at various times, it closed the period at about 1.85%. (Bond prices and yields move in opposite directions.)
| | | |
| Market Barometer | | | |
| |
| | Total Returns |
| | Periods Ended March 31, 2013 |
| | Six | One | Five Years |
| | Months | Year | (Annualized) |
| Stocks | | | |
| Russell 1000 Index (Large-caps) | 11.10% | 14.43% | 6.15% |
| Russell 2000 Index (Small-caps) | 14.48 | 16.30 | 8.24 |
| Russell 3000 Index (Broad U.S. market) | 11.35 | 14.56 | 6.32 |
| MSCI All Country World Index ex USA (International) | 9.20 | 8.36 | -0.39 |
| |
| Bonds | | | |
| Barclays U.S. Aggregate Bond Index (Broad taxable market) | 0.09% | 3.77% | 5.47% |
| Barclays Municipal Bond Index (Broad tax-exempt market) | 0.96 | 5.25 | 6.10 |
| Citigroup Three-Month U.S. Treasury Bill Index | 0.05 | 0.08 | 0.30 |
| |
| CPI | | | |
| Consumer Price Index | 0.59% | 1.47% | 1.74% |
3
Municipal bonds returned almost 1% for the half year despite price declines in March. And returns of money market funds and savings accounts barely registered as short-term interest rates remained between 0% and 0.25%, under the Federal Reserve’s four-year-old policy.
Robert Auwaerter, head of Vanguard’s Fixed Income Group, doesn’t anticipate abrupt policy changes from the central bank. “We don’t see the Fed changing course in the near term,” he said, “and when the Fed does, we expect it’ll go slowly so as not to undo the efforts made to keep interest rates low and to stimulate the economy.”
Industrial stocks helped returns; tech and health care detracted
Against the backdrop of an economic recovery that seems to be strengthening, although at an uneven pace, the advisor’s focus on industrial stocks was particularly effective for the Strategic Small-Cap Equity Fund. Helping drive returns were manufacturers of machinery, building products, and electrical equipment as well as providers of office services. But the largest influence on industrial-sector returns was the advisor’s selection of airline stocks.
Together, stock selections in the consumer staples and materials sectors matched the contribution from industrials.
| | |
| Expense Ratios | | |
| Your Fund Compared With Its Peer Group | | |
| | | Peer Group |
| | Fund | Average |
| Strategic Small-Cap Equity Fund | 0.40% | 1.34% |
The fund expense ratio shown is from the prospectus dated January 25, 2013, and represents estimated costs for the current fiscal year. For
the six months ended March 31, 2013, the fund’s annualized expense ratio was 0.38%. The peer-group expense ratio is derived from data
provided by Lipper Inc. and captures information through year-end 2012.
Peer group: Small-Cap Core Funds.
4
In consumer staples, food product companies did well for the fund; in materials, commodity chemical companies stood out. Other contributors to return included stocks in the financial, energy, and telecommunication sectors.
The advisor’s selections in the information technology and health care sectors detracted from the fund’s return. In information technology, disappointing choices centered on IT services companies and makers of electronic equipment and instruments. In health care, the laggards were biotechnology and pharmaceutical firms.
Low cost and talent drive successful active management
Keeping costs low has been a key part of our index funds’ success—the less expensive it is for an index fund to track its benchmark, the more returns get passed on to its investors.
The same principle—low cost—is just as important to our actively managed funds. Outperforming an index through active management has historically proven to be a challenge in itself, and the higher management fees and transaction costs associated with such funds tend to move the bar even higher. That’s why, regardless of a fund’s management style, at Vanguard we focus on trying to give investors the best chance for investment success by keeping our fund costs low. (You can read an analysis of the impact of costs on the performance of actively managed funds
in The Case for Vanguard Active Management: Solving the Low-Cost/ Top-Talent Paradox? at vanguard.com/ research.)
And, of course, we look for talent. Fortunately, when it comes to quantitative equity strategies, we don’t need to look far: Your fund’s advisor, Vanguard Equity Investment Group, has significant expertise in this area.
Neither low costs nor talent can guarantee outperformance, of course. Even in those cases where an active stock fund outperforms over long periods, it doesn’t necessarily mean that investors earned more than the index results every year—or even every decade. And investors have no way of knowing beforehand which funds will outperform.
But for those willing to accept the greater risks that come with active investing, we believe Vanguard’s combination of talented advisors and low costs can improve the odds.
As always, thank you for entrusting your assets to Vanguard.
Sincerely,

F. William McNabb III
Chairman and Chief Executive Officer
April 16, 2013
5
Advisor’s Report
For the six months ended March 31, 2013, Vanguard Strategic Small-Cap Equity Fund returned a robust 17.43%, outpacing its MSCI Small Cap 1750 benchmark by 1.44 percentage points. While U.S. equities in general experienced above-average returns for the period, small-capitalization stocks outgained larger-caps by around 5 percentage points. The small-cap benchmark returned 15.99%, compared with a large-cap benchmark, the MSCI US Prime Market 750 Index, which returned 10.68%.
Globally, the United States and other developed markets were the place to be, posting returns above 11%, while emerging markets were up less than 4%. Performance within the small-cap benchmark was broad-based, with nine of ten industry sectors generating gains. Returns were highest in industrials (+27%), the consumer discretionary sector (+16%), and financials (+18%), while the telecommunications sector (–0.7%) was the sole decliner.
Returns in the period’s two quarters were quite different. In the final three months of 2012, small-caps were up around 2.8% as investors digested the results of the presidential election, assessed the impact of Hurricane Sandy, and contemplated the pending “fiscal cliff.” Fortunately, the cliff threat ended when Congress and President Obama finally reached an agreement early in the new year, avoiding certain tax hikes that were sure to put the anemic recovery at risk. Investors’ fears seemed to abate and new cash came into
the U.S. equity market, helping to push small-cap stock returns to almost 13% for the first quarter of 2013.
Over the past six months, equity returns have been less volatile than in most of 2012, a year in which volatility was driven in large part by global macroeconomic events. Lackluster economic growth worldwide, European and U.S. central bank actions, and the fiscal cliff all contributed to market volatility through the year. Although the United States is certainly not problem-free, given its serious budget and deficit issues, the modest economic recovery is expected to continue. Corporate balance sheets remain strong; there is ample liquidity in the economy accompanied by historically low interest rates; housing data continues to improve; and unemployment statistics are moving in the right direction, although at a snail’s pace.
For the six-month period, our stock-selection models were very effective in distinguishing the outperformers from the underperformers in each industry group. Our growth model was a slight detractor, but all four of the other components (valuation, quality, management decisions, and sentiment) contributed to performance.
Our stock selections improved relative return in seven of the ten sector groups, most notably in industrials, consumer staples, and materials. In the industrial sector, Alaska Air, Amerco, and US Airways contributed the most to our relative results. In consumer staples
6
our most successful picks were Pilgrim’s Pride and Susser Holdings, and in materials they were Axiall and Westlake Chemical. However, our overall selections in technology and health care detracted from our results relative to the benchmark. OSI Systems and Cardtronics in tech and Affymax and Auxilium Pharmaceuticals in health care did not perform as expected.
James P. Stetler,
Principal and Portfolio Manager
James D. Troyer, CFA
Principal and Portfolio Manager
Michael R. Roach, CFA
Portfolio Manager
Vanguard Equity Investment Group
April 10, 2013
7
Strategic Small-Cap Equity Fund
Fund Profile
As of March 31, 2013
| | | |
| Portfolio Characteristics | | | |
| | | | DJ U.S. |
| | | MSCI US | Total |
| | | Small Cap | Market |
| | | 1750 | FA |
| | Fund | Index | Index |
| Number of Stocks | 350 | 1,719 | 3,586 |
| Median Market Cap | $2.1B | $2.0B | $40.0B |
| Price/Earnings Ratio | 17.5x | 25.7x | 18.1x |
| Price/Book Ratio | 2.1x | 2.0x | 2.3x |
| Return on Equity | 9.2% | 8.9% | 16.6% |
| Earnings Growth Rate | 13.5% | 6.7% | 9.6% |
| Dividend Yield | 1.3% | 1.4% | 2.0% |
| Foreign Holdings | 0.0% | 0.0% | 0.0% |
| Turnover Rate | | | |
| (Annualized) | 69% | — | — |
| Ticker Symbol | VSTCX | — | — |
| Expense Ratio1 | 0.40% | — | — |
| 30-Day SEC Yield | 0.88% | — | — |
| Short-Term Reserves | -0.1% | — | — |
| | | |
| Sector Diversification (% of equity exposure) |
| | | | DJ U.S. |
| | | MSCI US | Total |
| | | Small Cap | Market |
| | | 1750 | FA |
| | Fund | Index | Index |
| Consumer Discretionary | 13.3% | 13.2% | 12.4% |
| Consumer Staples | 3.5 | 3.1 | 9.5 |
| Energy | 5.3 | 5.5 | 10.1 |
| Financials | 24.4 | 24.5 | 17.3 |
| Health Care | 11.3 | 11.6 | 12.2 |
| Industrials | 16.7 | 16.6 | 11.1 |
| Information Technology | 16.3 | 16.3 | 17.4 |
| Materials | 5.1 | 5.0 | 3.8 |
| Telecommunication | | | |
| Services | 0.6 | 0.8 | 2.6 |
| Utilities | 3.5 | 3.4 | 3.6 |
| | |
| Volatility Measures | | |
| | | DJ U.S. |
| | | Total |
| | MSCI US | Market |
| | Small Cap | FA |
| | 1750 Index | Index |
| R-Squared | 0.99 | 0.94 |
| Beta | 1.02 | 1.25 |
| These measures show the degree and timing of the fund’s fluctuations compared with the indexes over 36 months. |
| | |
| Ten Largest Holdings (% of total net assets) |
| American Capital Ltd. | Asset Management | |
| | & Custody Banks | 0.8% |
| Alaska Air Group Inc. | Airlines | 0.8 |
| Trinity Industries Inc. | Construction & Farm | |
| | Machinery & Heavy | |
| | Trucks | 0.7 |
| Domino's Pizza Inc. | Restaurants | 0.7 |
| MAXIMUS Inc. | Data Processing & | |
| | Outsourced Services | 0.7 |
| Terex Corp. | Construction & Farm | |
| | Machinery & Heavy | |
| | Trucks | 0.7 |
| Cadence Design | | |
| Systems Inc. | Application Software | 0.7 |
| AO Smith Corp. | Building Products | 0.7 |
| US Airways Group Inc. | Airlines | 0.7 |
| CommVault Systems | | |
| Inc. | Systems Software | 0.7 |
| Top Ten | | 7.2% |
| The holdings listed exclude any temporary cash investments and equity index products. |
Investment Focus
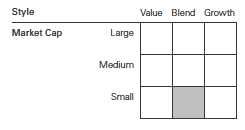
1 The expense ratio shown is from the prospectus dated January 25, 2013, and represents estimated costs for the current fiscal year. For the
six months ended March 31, 2013, the annualized expense ratio was 0.38%.
8
Strategic Small-Cap Equity Fund
Performance Summary
All of the returns in this report represent past performance, which is not a guarantee of future results that may be achieved by the fund. (Current performance may be lower or higher than the performance data cited. For performance data current to the most recent month-end, visit our website at vanguard.com/performance.) Note, too, that both investment returns and principal value can fluctuate widely, so an investor’s shares, when sold, could be worth more or less than their original cost. The returns shown do not reflect taxes that a shareholder would pay on fund distributions or on the sale of fund shares.
Fiscal-Year Total Returns (%): April 24, 2006, Through March 31, 2013
Note: For 2013, performance data reflect the six months ended March 31, 2013.
| | | | |
| Average Annual Total Returns: Periods Ended March 31, 2013 | | | |
| |
| | Inception | One | Five | Since |
| | Date | Year | Years | Inception |
| Strategic Small-Cap Equity Fund | 4/24/2006 | 18.77% | 8.12% | 4.36% |
See Financial Highlights for dividend and capital gains information.
9
Strategic Small-Cap Equity Fund
Financial Statements (unaudited)
Statement of Net Assets
As of March 31, 2013
The fund reports a complete list of its holdings in regulatory filings four times in each fiscal year, at the quarter-ends. For the second and fourth fiscal quarters, the lists appear in the fund’s semiannual and annual reports to shareholders. For the first and third fiscal quarters, the fund files the lists with the Securities and Exchange Commission on Form N-Q. Shareholders can look up the fund’s Forms N-Q on the SEC’s website at sec.gov. Forms N-Q may also be reviewed and copied at the SEC’s Public Reference Room (see the back cover of this report for further information).
| | | |
| | | | Market |
| | | | Value |
| | | Shares | ($000) |
| Common Stocks (99.1%)1 | | |
| Consumer Discretionary (13.2%) | |
| | Domino’s Pizza Inc. | 42,600 | 2,191 |
| | Brinker International Inc. | 54,200 | 2,041 |
| * | Hanesbrands Inc. | 39,000 | 1,777 |
| | Dillard’s Inc. Class A | 21,850 | 1,716 |
| * | ANN Inc. | 55,700 | 1,616 |
| | Regal Entertainment Group | | |
| | Class A | 95,700 | 1,595 |
| * | Papa John’s | | |
| | International Inc. | 25,115 | 1,553 |
| | Service Corp. International | 90,100 | 1,507 |
| | Thor Industries Inc. | 40,900 | 1,505 |
| ^,* | Coinstar Inc. | 25,400 | 1,484 |
| | Movado Group Inc. | 43,800 | 1,468 |
| * | Journal Communications | | |
| | Inc. Class A | 209,375 | 1,407 |
| * | Smith & Wesson | | |
| | Holding Corp. | 153,800 | 1,384 |
| | Foot Locker Inc. | 40,100 | 1,373 |
| | Brown Shoe Co. Inc. | 85,600 | 1,370 |
| | Buckle Inc. | 27,500 | 1,283 |
| | Chico’s FAS Inc. | 75,000 | 1,260 |
| * | Conn’s Inc. | 32,300 | 1,160 |
| | Stage Stores Inc. | 43,100 | 1,115 |
| | Cheesecake Factory Inc. | 27,100 | 1,046 |
| | Brunswick Corp. | 25,700 | 879 |
| * | Tenneco Inc. | 22,000 | 865 |
| | Cinemark Holdings Inc. | 28,200 | 830 |
| * | LeapFrog Enterprises Inc. | 88,900 | 761 |
| | NACCO Industries Inc. | | |
| | Class A | 13,842 | 739 |
| * | Corinthian Colleges Inc. | 350,400 | 736 |
| | Dana Holding Corp. | 39,200 | 699 |
| | Belo Corp. Class A | 64,400 | 633 |
| | Sturm Ruger & Co. Inc. | 9,900 | 502 |
| | Cooper Tire & Rubber Co. | 19,200 | 493 |
| | Cracker Barrel Old Country | | |
| | Store Inc. | 5,300 | 429 |
| | | |
| | Valassis Communications | | |
| | Inc. | 11,400 | 341 |
| * | Grand Canyon Education | | |
| | Inc. | 12,600 | 320 |
| * | Overstock.com Inc. | 23,100 | 285 |
| * | Sonic Corp. | 21,800 | 281 |
| * | Marriott Vacations | | |
| | Worldwide Corp. | 6,400 | 275 |
| * | Children’s Place Retail | | |
| | Stores Inc. | 5,200 | 233 |
| | Stewart Enterprises Inc. | | |
| | Class A | 19,100 | 177 |
| | Destination Maternity Corp. | 6,000 | 140 |
| | OfficeMax Inc. | 11,900 | 138 |
| * | Carter’s Inc. | 2,300 | 132 |
| * | Asbury Automotive | | |
| | Group Inc. | 3,500 | 128 |
| * | Jack in the Box Inc. | 3,500 | 121 |
| | Ameristar Casinos Inc. | 4,500 | 118 |
| | PetMed Express Inc. | 8,300 | 111 |
| | Hot Topic Inc. | 5,300 | 74 |
| * | New York & Co. Inc. | 17,400 | 71 |
| | Big 5 Sporting Goods Corp. | 4,500 | 70 |
| | | | 40,432 |
| Consumer Staples (3.5%) | | |
| * | Dean Foods Co. | 110,300 | 2,000 |
| * | Susser Holdings Corp. | 35,800 | 1,830 |
| * | Pilgrim’s Pride Corp. | 191,100 | 1,756 |
| | Nu Skin Enterprises Inc. | | |
| | Class A | 38,500 | 1,702 |
| * | Rite Aid Corp. | 653,400 | 1,241 |
| | Universal Corp. | 18,500 | 1,037 |
| * | USANA Health | | |
| | Sciences Inc. | 8,500 | 411 |
| | Sanderson Farms Inc. | 4,900 | 267 |
| | SUPERVALU Inc. | 48,800 | 246 |
| * | Seneca Foods Corp. | | |
| | Class A | 4,400 | 145 |
| | | | 10,635 |
10
Strategic Small-Cap Equity Fund
| | | |
| | | | Market |
| | | | Value |
| | | Shares | ($000) |
| Energy (5.2%) | | |
| | Western Refining Inc. | 52,800 | 1,870 |
| | Delek US Holdings Inc. | 44,400 | 1,752 |
| * | Rosetta Resources Inc. | 35,600 | 1,694 |
| * | EPL Oil & Gas Inc. | 62,300 | 1,670 |
| | HollyFrontier Corp. | 29,434 | 1,514 |
| | RPC Inc. | 93,700 | 1,421 |
| | Bristow Group Inc. | 18,300 | 1,207 |
| * | Vaalco Energy Inc. | 158,300 | 1,202 |
| * | Exterran Holdings Inc. | 32,300 | 872 |
| | Energy XXI Bermuda Ltd. | 30,900 | 841 |
| * | Stone Energy Corp. | 25,400 | 553 |
| | Alon USA Energy Inc. | 22,700 | 433 |
| * | Hercules Offshore Inc. | 54,500 | 404 |
| * | Parker Drilling Co. | 77,100 | 330 |
| | Rentech Inc. | 79,100 | 186 |
| * | Willbros Group Inc. | 9,700 | 95 |
| * | Era Group Inc. | 4,000 | 84 |
| | | | 16,128 |
| Financials (24.2%) | | |
| * | American Capital Ltd. | 164,300 | 2,398 |
| | Allied World Assurance Co. | | |
| | Holdings AG | 21,400 | 1,984 |
| | CNO Financial Group Inc. | 171,000 | 1,958 |
| * | Credit Acceptance Corp. | 15,712 | 1,919 |
| | Protective Life Corp. | 53,300 | 1,908 |
| * | World Acceptance Corp. | 20,800 | 1,786 |
| | Nelnet Inc. Class A | 51,148 | 1,729 |
| | Webster Financial Corp. | 69,830 | 1,694 |
| | CapitalSource Inc. | 176,000 | 1,693 |
| | Cathay General Bancorp | 83,200 | 1,674 |
| | Chemical Financial Corp. | 57,900 | 1,527 |
| | Umpqua Holdings Corp. | 112,900 | 1,497 |
| * | Nationstar Mortgage | | |
| | Holdings Inc. | 38,250 | 1,411 |
| | Primerica Inc. | 41,500 | 1,360 |
| | Glacier Bancorp Inc. | 70,400 | 1,336 |
| | Omega Healthcare | | |
| | Investors Inc. | 42,500 | 1,290 |
| | Apartment Investment & | | |
| | Management Co. Class A | 40,800 | 1,251 |
| | Extra Space Storage Inc. | 31,800 | 1,249 |
| | National Retail | | |
| | Properties Inc. | 34,200 | 1,237 |
| | Platinum Underwriters | | |
| | Holdings Ltd. | 21,800 | 1,217 |
| | CBL & Associates | | |
| | Properties Inc. | 50,900 | 1,201 |
| * | Portfolio Recovery | | |
| | Associates Inc. | 9,400 | 1,193 |
| | WesBanco Inc. | 49,411 | 1,183 |
| | Home Properties Inc. | 17,600 | 1,116 |
| | EPR Properties | 20,900 | 1,088 |
| | Brandywine Realty Trust | 72,400 | 1,075 |
| * | Howard Hughes Corp. | 12,500 | 1,048 |
| | | |
| | Highwoods Properties Inc. | 26,100 | 1,033 |
| | Medical Properties Trust Inc. | 64,100 | 1,028 |
| | Lexington Realty Trust | 86,300 | 1,018 |
| | RLJ Lodging Trust | 43,600 | 992 |
| * | Forest City Enterprises Inc. | | |
| | Class A | 55,400 | 985 |
| | DCT Industrial Trust Inc. | 132,700 | 982 |
| | Post Properties Inc. | 20,400 | 961 |
| | First Industrial Realty | | |
| | Trust Inc. | 54,800 | 939 |
| | Ryman Hospitality | | |
| | Properties | 19,300 | 883 |
| | Ramco-Gershenson | | |
| | Properties Trust | 51,900 | 872 |
| | PrivateBancorp Inc. | 46,000 | 870 |
| | Oritani Financial Corp. | 55,800 | 864 |
| | Republic Bancorp Inc. | | |
| | Class A | 37,854 | 857 |
| | Pennsylvania REIT | 44,100 | 855 |
| * | Sunstone Hotel | | |
| | Investors Inc. | 68,800 | 847 |
| | Cardinal Financial Corp. | 46,200 | 840 |
| * | Flagstar Bancorp Inc. | 58,400 | 814 |
| | Inland Real Estate Corp. | 80,400 | 811 |
| * | St. Joe Co. | 37,800 | 803 |
| | Retail Properties of | | |
| | America Inc. | 54,100 | 801 |
| * | FelCor Lodging Trust Inc. | 133,800 | 796 |
| | Franklin Street Properties | | |
| | Corp. | 52,800 | 772 |
| | Mack-Cali Realty Corp. | 26,900 | 770 |
| | Investors Real Estate Trust | 75,600 | 746 |
| | Coresite Realty Corp. | 20,600 | 721 |
| | CapLease Inc. | 113,100 | 720 |
| | Montpelier Re Holdings Ltd. | 27,100 | 706 |
| | First Potomac Realty Trust | 47,300 | 702 |
| | Douglas Emmett Inc. | 27,400 | 683 |
| | Washington Federal Inc. | 38,000 | 665 |
| | Heartland Financial USA Inc. | 25,800 | 652 |
| | Select Income REIT | 23,800 | 630 |
| | EverBank Financial Corp. | 36,800 | 567 |
| | First American | | |
| | Financial Corp. | 22,100 | 565 |
| * | Popular Inc. | 19,000 | 525 |
| | Associated Banc-Corp | 32,400 | 492 |
| | Universal Health Realty | | |
| | Income Trust | 8,500 | 491 |
| | Parkway Properties Inc. | 26,000 | 482 |
| * | Piper Jaffray Cos. | 13,000 | 446 |
| | Federated Investors Inc. | | |
| | Class B | 16,300 | 386 |
| | BBCN Bancorp Inc. | 29,000 | 379 |
| | Synovus Financial Corp. | 90,000 | 249 |
| | STAG Industrial Inc. | 10,800 | 230 |
| * | Wilshire Bancorp Inc. | 33,600 | 228 |
11
Strategic Small-Cap Equity Fund
| | | |
| | | | Market |
| | | | Value |
| | | Shares | ($000) |
| | Horace Mann | | |
| | Educators Corp. | 10,900 | 227 |
| | Sterling Financial Corp. | 9,600 | 208 |
| * | Encore Capital Group Inc. | 6,100 | 184 |
| | PacWest Bancorp | 6,200 | 181 |
| | Provident Financial | | |
| | Services Inc. | 10,700 | 163 |
| | MainSource Financial | | |
| | Group Inc. | 11,200 | 157 |
| | Home BancShares Inc. | 4,100 | 154 |
| * | Citizens Republic | | |
| | Bancorp Inc. | 6,000 | 135 |
| | Union First Market | | |
| | Bankshares Corp. | 6,600 | 129 |
| | United Fire Group Inc. | 5,000 | 127 |
| | Mid-America Apartment | | |
| | Communities Inc. | 1,600 | 111 |
| | GAMCO Investors Inc. | 1,870 | 99 |
| | HFF Inc. Class A | 4,900 | 98 |
| * | Southwest Bancorp Inc. | 7,400 | 93 |
| * | Netspend Holdings Inc. | 5,800 | 92 |
| | MB Financial Inc. | 3,400 | 82 |
| | Washington Trust | | |
| | Bancorp Inc. | 3,000 | 82 |
| | Stewart Information | | |
| | Services Corp. | 3,100 | 79 |
| | Crawford & Co. Class B | 8,300 | 63 |
| | | | 74,144 |
| Health Care (11.2%) | | |
| | Community Health | | |
| | Systems Inc. | 41,300 | 1,957 |
| * | Charles River Laboratories | | |
| | International Inc. | 43,500 | 1,926 |
| * | Cubist Pharmaceuticals Inc. | 38,200 | 1,789 |
| * | PAREXEL International Corp. | 43,800 | 1,731 |
| | Chemed Corp. | 20,500 | 1,640 |
| | PDL BioPharma Inc. | 214,400 | 1,567 |
| * | Cyberonics Inc. | 31,500 | 1,475 |
| * | Pharmacyclics Inc. | 18,300 | 1,471 |
| * | Alkermes plc | 61,100 | 1,449 |
| * | Team Health Holdings Inc. | 39,500 | 1,437 |
| * | Gentiva Health Services Inc. | 125,000 | 1,352 |
| * | Magellan Health | | |
| | Services Inc. | 28,400 | 1,351 |
| * | Thoratec Corp. | 31,000 | 1,162 |
| | Questcor | | |
| | Pharmaceuticals Inc. | 35,200 | 1,145 |
| * | Auxilium | | |
| | Pharmaceuticals Inc. | 60,900 | 1,052 |
| * | SurModics Inc. | 38,231 | 1,042 |
| | STERIS Corp. | 24,800 | 1,032 |
| | Select Medical | | |
| | Holdings Corp. | 108,300 | 975 |
| | West Pharmaceutical | | |
| | Services Inc. | 13,700 | 890 |
| | | |
| * | Bio-Reference Labs Inc. | 31,900 | 829 |
| * | Medicines Co. | 22,800 | 762 |
| * | ICU Medical Inc. | 12,300 | 725 |
| * | Nektar Therapeutics | 57,700 | 635 |
| * | Sirona Dental Systems Inc. | 8,200 | 605 |
| * | Genomic Health Inc. | 16,200 | 458 |
| * | Molina Healthcare Inc. | 14,100 | 435 |
| * | AMN Healthcare | | |
| | Services Inc. | 26,200 | 415 |
| | Cantel Medical Corp. | 13,700 | 412 |
| | Meridian Bioscience Inc. | 17,200 | 393 |
| * | Bruker Corp. | 18,500 | 353 |
| | Abaxis Inc. | 6,600 | 312 |
| * | Santarus Inc. | 17,300 | 300 |
| * | NPS Pharmaceuticals Inc. | 27,400 | 279 |
| * | ABIOMED Inc. | 10,500 | 196 |
| * | Orthofix International NV | 4,800 | 172 |
| * | Symmetry Medical Inc. | 10,000 | 114 |
| * | United Therapeutics Corp. | 1,700 | 103 |
| * | Infinity Pharmaceuticals Inc. | 2,000 | 97 |
| * | Isis Pharmaceuticals Inc. | 5,500 | 93 |
| * | Ironwood Pharmaceuticals | | |
| | Inc. Class A | 4,700 | 86 |
| * | Dyax Corp. | 18,600 | 81 |
| * | Affymax Inc. | 39,800 | 55 |
| | | | 34,353 |
| Industrials (16.6%) | | |
| * | Alaska Air Group Inc. | 37,200 | 2,379 |
| | Trinity Industries Inc. | 49,300 | 2,235 |
| * | Terex Corp. | 62,700 | 2,158 |
| | A.O. Smith Corp. | 28,700 | 2,111 |
| * | US Airways Group Inc. | 124,400 | 2,111 |
| | Triumph Group Inc. | 26,500 | 2,080 |
| | Deluxe Corp. | 50,000 | 2,070 |
| | Mine Safety Appliances Co. | 38,200 | 1,895 |
| | Lincoln Electric Holdings Inc. | 34,300 | 1,858 |
| | AMERCO | 10,500 | 1,822 |
| * | EnerSys Inc. | 38,676 | 1,763 |
| | Crane Co. | 30,700 | 1,715 |
| | Steelcase Inc. Class A | 112,400 | 1,656 |
| | AZZ Inc. | 34,300 | 1,653 |
| | Hyster-Yale Materials | | |
| | Handling Inc. | 28,184 | 1,609 |
| * | AECOM Technology Corp. | 48,800 | 1,601 |
| | Apogee Enterprises Inc. | 52,300 | 1,514 |
| | GATX Corp. | 27,200 | 1,414 |
| * | USG Corp. | 50,300 | 1,330 |
| | Actuant Corp. Class A | 39,800 | 1,219 |
| * | Kadant Inc. | 46,585 | 1,165 |
| * | Armstrong World | | |
| | Industries Inc. | 20,000 | 1,118 |
| | Standex International Corp. | 19,800 | 1,093 |
| | G&K Services Inc. Class A | 22,500 | 1,024 |
| | Mueller Water Products Inc. | | |
| | Class A | 153,600 | 911 |
12
Strategic Small-Cap Equity Fund
| | | |
| | | | Market |
| | | | Value |
| | | Shares | ($000) |
| | ITT Corp. | 27,500 | 782 |
| * | American Woodmark Corp. | 20,600 | 701 |
| * | Taser International Inc. | 74,700 | 594 |
| | LB Foster Co. Class A | 13,200 | 585 |
| | Brink’s Co. | 20,000 | 565 |
| | United Stationers Inc. | 14,400 | 557 |
| * | Republic Airways | | |
| | Holdings Inc. | 43,900 | 507 |
| | Alliant Techsystems Inc. | 6,600 | 478 |
| * | Saia Inc. | 12,500 | 452 |
| | American Railcar | | |
| | Industries Inc. | 9,100 | 425 |
| | US Ecology Inc. | 15,031 | 399 |
| * | Swift Transportation Co. | 28,100 | 398 |
| | SkyWest Inc. | 22,900 | 368 |
| | FreightCar America Inc. | 16,400 | 358 |
| | Quad/Graphics Inc. | 12,800 | 306 |
| | Kforce Inc. | 16,700 | 273 |
| | UniFirst Corp. | 2,900 | 262 |
| * | JetBlue Airways Corp. | 37,000 | 255 |
| | Kimball International Inc. | | |
| | Class B | 25,900 | 235 |
| * | Ducommun Inc. | 11,500 | 228 |
| * | GenCorp Inc. | 11,000 | 146 |
| * | Columbus McKinnon Corp. | 6,000 | 115 |
| | Allegiant Travel Co. | | |
| | Class A | 1,100 | 98 |
| | John Bean | | |
| | Technologies Corp. | 3,900 | 81 |
| | Exponent Inc. | 1,500 | 81 |
| * | Trex Co. Inc. | 1,400 | 69 |
| | | | 50,822 |
| Information Technology (16.1%) | |
| | MAXIMUS Inc. | 27,366 | 2,188 |
| * | Cadence Design | | |
| | Systems Inc. | 154,800 | 2,156 |
| * | CommVault Systems Inc. | 25,400 | 2,082 |
| | AOL Inc. | 52,700 | 2,028 |
| * | Brocade Communications | | |
| | Systems Inc. | 310,000 | 1,789 |
| * | CoreLogic Inc. | 67,300 | 1,740 |
| | Lender Processing | | |
| | Services Inc. | 67,600 | 1,721 |
| * | Advanced Energy | | |
| | Industries Inc. | 92,200 | 1,687 |
| * | Manhattan Associates Inc. | 22,700 | 1,686 |
| * | Spansion Inc. Class A | 126,600 | 1,629 |
| * | Tech Data Corp. | 35,700 | 1,628 |
| | Anixter International Inc. | 23,200 | 1,622 |
| * | Gartner Inc. | 29,600 | 1,611 |
| * | CACI International Inc. | | |
| | Class A | 27,250 | 1,577 |
| * | Kulicke & Soffa | | |
| | Industries Inc. | 135,000 | 1,561 |
| * | Unisys Corp. | 67,012 | 1,525 |
| | | |
| * | Aspen Technology Inc. | 46,500 | 1,501 |
| * | Zebra Technologies Corp. | 30,800 | 1,452 |
| * | SYNNEX Corp. | 39,100 | 1,447 |
| * | Global Cash Access | | |
| | Holdings Inc. | 181,600 | 1,280 |
| * | Itron Inc. | 22,400 | 1,039 |
| * | Ciena Corp. | 64,600 | 1,034 |
| | Diebold Inc. | 32,800 | 995 |
| | Heartland Payment | | |
| | Systems Inc. | 27,300 | 900 |
| | Broadridge Financial | | |
| | Solutions Inc. | 35,400 | 879 |
| * | Insight Enterprises Inc. | 41,448 | 855 |
| * | Arris Group Inc. | 47,500 | 816 |
| * | NCR Corp. | 29,400 | 810 |
| * | Silicon Graphics | | |
| | International Corp. | 57,500 | 791 |
| * | Applied Micro | | |
| | Circuits Corp. | 101,600 | 754 |
| * | Magnachip Semiconductor | | |
| | Corp. | 38,900 | 673 |
| | Jack Henry & | | |
| | Associates Inc. | 14,400 | 665 |
| | Plantronics Inc. | 13,800 | 610 |
| * | MEMC Electronic | | |
| | Materials Inc. | 107,100 | 471 |
| * | Cirrus Logic Inc. | 16,000 | 364 |
| | Booz Allen Hamilton | | |
| | Holding Corp. | 22,300 | 300 |
| * | Quantum Corp. | 233,900 | 299 |
| * | CSG Systems | | |
| | International Inc. | 14,100 | 299 |
| * | TeleTech Holdings Inc. | 13,700 | 291 |
| * | Entropic | | |
| | Communications Inc. | 70,900 | 289 |
| * | MaxLinear Inc. | 40,800 | 253 |
| * | Acxiom Corp. | 11,000 | 224 |
| * | Seachange International Inc. | 18,800 | 224 |
| * | Sigma Designs Inc. | 45,600 | 222 |
| * | Benchmark Electronics Inc. | 10,900 | 196 |
| * | DSP Group Inc. | 23,700 | 191 |
| | Daktronics Inc. | 16,900 | 177 |
| * | Euronet Worldwide Inc. | 6,100 | 161 |
| * | PTC Inc. | 6,100 | 156 |
| * | Aviat Networks Inc. | 42,900 | 145 |
| * | RF Micro Devices Inc. | 26,800 | 143 |
| * | TeleCommunication | | |
| | Systems Inc. Class A | 49,700 | 111 |
| * | Electronics for Imaging Inc. | 3,700 | 94 |
| * | Extreme Networks | 22,400 | 75 |
| * | ModusLink Global | | |
| | Solutions Inc. | 22,300 | 74 |
| * | Intermec Inc. | 5,600 | 55 |
| | | | 49,545 |
13
Strategic Small-Cap Equity Fund
| | | |
| | | | Market |
| | | | Value |
| | | Shares | ($000) |
| Materials (5.1%) | | |
| | NewMarket Corp. | 7,500 | 1,953 |
| * | Chemtura Corp. | 81,100 | 1,753 |
| | Axiall Corp. | 27,500 | 1,709 |
| | Westlake Chemical Corp. | 17,400 | 1,627 |
| | Neenah Paper Inc. | 38,444 | 1,183 |
| | PH Glatfelter Co. | 50,200 | 1,174 |
| * | Graphic Packaging | | |
| | Holding Co. | 150,800 | 1,129 |
| | Myers Industries Inc. | 80,500 | 1,124 |
| | Worthington Industries Inc. | 31,200 | 967 |
| | Schweitzer-Mauduit | | |
| | International Inc. | 21,200 | 821 |
| * | SunCoke Energy Inc. | 27,200 | 444 |
| * | Headwaters Inc. | 38,000 | 414 |
| | Buckeye Technologies Inc. | 9,700 | 290 |
| | Kaiser Aluminum Corp. | 4,000 | 259 |
| | A Schulman Inc. | 6,200 | 196 |
| | Minerals Technologies Inc. | 2,900 | 120 |
| * | OMNOVA Solutions Inc. | 14,300 | 110 |
| | Tredegar Corp. | 3,400 | 100 |
| * | Coeur d’Alene Mines Corp. | 5,000 | 94 |
| | Eagle Materials Inc. | 1,400 | 93 |
| | | | 15,560 |
| Telecommunication Services (0.6%) | |
| * | premiere Global Services Inc. | 75,400 | 829 |
| | Atlantic Tele-Network Inc. | 12,900 | 626 |
| | IDT Corp. Class B | 23,300 | 281 |
| | Shenandoah | | |
| | Telecommunications Co. | 5,800 | 88 |
| | | | 1,824 |
| Utilities (3.4%) | | |
| | PNM Resources Inc. | 79,100 | 1,842 |
| | Portland General Electric Co. | 60,500 | 1,835 |
| | Black Hills Corp. | 40,900 | 1,801 |
| | Laclede Group Inc. | 28,500 | 1,217 |
| | American States Water Co. | 18,900 | 1,088 |
| | Atmos Energy Corp. | 24,400 | 1,042 |
| | Vectren Corp. | 17,700 | 627 |
| | MGE Energy Inc. | 8,500 | 471 |
| | Avista Corp. | 9,900 | 271 |
| | Otter Tail Corp. | 5,600 | 175 |
| | Chesapeake Utilities Corp. | 2,300 | 113 |
| | CH Energy Group Inc. | 1,500 | 98 |
| | | | 10,580 |
| Total Common Stocks | | |
| (Cost $241,887) | | 304,023 |
| | |
| | | Market |
| | | Value |
| | Shares | ($000) |
| Temporary Cash Investments (0.8%)1 | |
| Money Market Fund (0.7%) | | |
| 2,3 Vanguard Market | | |
| Liquidity Fund, 0.147% | 2,227,999 | 2,228 |
| |
| | Face | |
| | Amount | |
| | ($000) | |
| U.S. Government and Agency Obligations (0.1%) |
| 4,5 Federal Home Loan Bank Discount | |
| Notes, 0.139%, 5/29/13 | 100 | 100 |
| Total Temporary Cash Investments | |
| (Cost $2,328) | | 2,328 |
| Total Investments (99.9%) | | |
| (Cost $244,215) | | 306,351 |
| Other Assets and Liabilities (0.1%) | |
| Other Assets | | 1,379 |
| Liabilities3 | | (1,017) |
| | | 362 |
| Net Assets (100%) | | |
| Applicable to 12,428,464 outstanding | |
| $.001 par value shares of beneficial | |
| interest (unlimited authorization) | 306,713 |
| Net Asset Value Per Share | | $24.68 |
14
Strategic Small-Cap Equity Fund
| |
| At March 31, 2013, net assets consisted of: | |
| | Amount |
| | ($000) |
| Paid-in Capital | 265,712 |
| Overdistributed Net Investment Income | (483) |
| Accumulated Net Realized Losses | (20,664) |
| Unrealized Appreciation (Depreciation) | |
| Investment Securities | 62,136 |
| Futures Contracts | 12 |
| Net Assets | 306,713 |
See Note A in Notes to Financial Statements.
^ Part of security position is on loan to broker-dealers. The total value of securities on loan is $263,000.
* Non-income-producing security.
1 The fund invests a portion of its cash reserves in equity markets through the use of index futures contracts. After giving effect to futures
investments, the fund’s effective common stock and temporary cash investment positions represent 99.9% and 0.0%, respectively, of net
assets.
2 Affiliated money market fund available only to Vanguard funds and certain trusts and accounts managed by Vanguard. Rate shown is the
7-day yield.
3 Includes $270,000 of collateral received for securities on loan.
4 The issuer operates under a congressional charter; its securities are generally neither guaranteed by the U.S. Treasury nor backed by the
full faith and credit of the U.S. government.
5 Securities with a value of $100,000 have been segregated as initial margin for open futures contracts.
REIT—Real Estate Investment Trust.
See accompanying Notes, which are an integral part of the Financial Statements.
15
Strategic Small-Cap Equity Fund
Statement of Operations
| |
| | Six Months Ended |
| | March 31, 2013 |
| | ($000) |
| Investment Income | |
| Income | |
| Dividends | 2,747 |
| Interest1 | 1 |
| Security Lending | 47 |
| Total Income | 2,795 |
| Expenses | |
| The Vanguard Group—Note B | |
| Investment Advisory Services | 134 |
| Management and Administrative | 347 |
| Marketing and Distribution | 26 |
| Custodian Fees | 4 |
| Shareholders’ Reports | 2 |
| Total Expenses | 513 |
| Net Investment Income | 2,282 |
| Realized Net Gain (Loss) | |
| Investment Securities Sold | 15,991 |
| Futures Contracts | 187 |
| Realized Net Gain (Loss) | 16,178 |
| Change in Unrealized Appreciation (Depreciation) | |
| Investment Securities | 25,905 |
| Futures Contracts | 41 |
| Change in Unrealized Appreciation (Depreciation) | 25,946 |
| Net Increase (Decrease) in Net Assets Resulting from Operations | 44,406 |
| 1 Interest income from an affiliated company of the fund was $1,000. |
See accompanying Notes, which are an integral part of the Financial Statements.
16
Strategic Small-Cap Equity Fund
Statement of Changes in Net Assets
| | |
| | Six Months Ended | Year Ended |
| | March 31, | September 30, |
| | 2013 | 2012 |
| | ($000) | ($000) |
| Increase (Decrease) in Net Assets | | |
| Operations | | |
| Net Investment Income | 2,282 | 2,906 |
| Realized Net Gain (Loss) | 16,178 | 15,584 |
| Change in Unrealized Appreciation (Depreciation) | 25,946 | 48,050 |
| Net Increase (Decrease) in Net Assets Resulting from Operations | 44,406 | 66,540 |
| Distributions | | |
| Net Investment Income | (4,284) | (2,511) |
| Realized Capital Gain | — | — |
| Total Distributions | (4,284) | (2,511) |
| Capital Share Transactions | | |
| Issued | 31,876 | 45,193 |
| Issued in Lieu of Cash Distributions | 3,965 | 2,343 |
| Redeemed | (28,425) | (75,381) |
| Net Increase (Decrease) from Capital Share Transactions | 7,416 | (27,845) |
| Total Increase (Decrease) | 47,538 | 36,184 |
| Net Assets | | |
| Beginning of Period | 259,175 | 222,991 |
| End of Period1 | 306,713 | 259,175 |
| 1 Net Assets—End of Period includes undistributed (overdistributed) net investment income of ($483,000) and $1,519,000. |
See accompanying Notes, which are an integral part of the Financial Statements.
17
Strategic Small-Cap Equity Fund
Financial Highlights
| | | | | | | |
| | | Six Months | | | | | |
| | | Ended | | | | | |
| For a Share Outstanding | | March 31, | Year Ended September 30, |
| Throughout Each Period | | 2013 | 2012 | 2011 | 2010 | 2009 | 2008 |
| Net Asset Value, Beginning of Period | | $21.37 | $16.44 | $16.53 | $14.32 | $16.60 | $21.28 |
| Investment Operations | | | | | | | |
| Net Investment Income | | .196 | . 238 | .176 | .154 | .145 | .160 |
| Net Realized and Unrealized Gain (Loss) | | | | | | | |
| on Investments | | 3.474 | 4.888 | (.126) | 2.216 | (2.257) | (4.479) |
| Total from Investment Operations | | 3.670 | 5.126 | . 050 | 2.370 | (2.112) | (4.319) |
| Distributions | | | | | | | |
| Dividends from Net Investment Income | | (. 360) | (.196) | (.140) | (.160) | (.168) | (. 210) |
| Distributions from Realized Capital Gains | | — | — | — | — | — | (.151) |
| Total Distributions | | (. 360) | (.196) | (.140) | (.160) | (.168) | (. 361) |
| Net Asset Value, End of Period | | $24.68 | $21.37 | $16.44 | $16.53 | $14.32 | $16.60 |
| |
| Total Return1 | | 17.43% | 31.38% | 0.20% | 16.70% | -12.48% | -20.50% |
| |
| Ratios/Supplemental Data | | | | | | | |
| Net Assets, End of Period (Millions) | $307 | $259 | $223 | $178 | $165 | $200 |
| Ratio of Total Expenses to | | | | | | | |
| Average Net Assets | | 0.38% | 0.38% | 0.38% | 0.43% | 0.43% | 0.38% |
| Ratio of Net Investment Income to | | | | | | |
| Average Net Assets | | 1.40% | 1.16% | 0.89% | 0.98% | 1.18% | 0.83% |
| Portfolio Turnover Rate | | 69% | 66% | 64% | 66% | 76% | 99% |
| The expense ratio, net income ratio, and turnover rate for the current period have been annualized. |
| 1 Total returns do not include account service fees that may have applied in the periods shown. Fund prospectuses provide information about |
| any applicable account service fees. |
See accompanying Notes, which are an integral part of the Financial Statements.
18
Strategic Small-Cap Equity Fund
Notes to Financial Statements
Vanguard Strategic Small-Cap Equity Fund is registered under the Investment Company Act of 1940 as an open-end investment company, or mutual fund.
A. The following significant accounting policies conform to generally accepted accounting principles for U.S. mutual funds. The fund consistently follows such policies in preparing its financial statements.
1. Security Valuation: Securities are valued as of the close of trading on the New York Stock Exchange (generally 4 p.m., Eastern time) on the valuation date. Equity securities are valued at the latest quoted sales prices or official closing prices taken from the primary market in which each security trades; such securities not traded on the valuation date are valued at the mean of the latest quoted bid and asked prices. Securities for which market quotations are not readily available, or whose values have been materially affected by events occurring before the fund’s pricing time but after the close of the securities’ primary markets, are valued by methods deemed by the board of trustees to represent fair value. Investments in Vanguard Market Liquidity Fund are valued at that fund’s net asset value. Temporary cash investments acquired over 60 days to maturity are valued using the latest bid prices or using valuations based on a matrix system (which considers such factors as security prices, yields, maturities, and ratings), both as furnished by independent pricing services. Other temporary cash investments are valued at amortized cost, which approximates market value.
2. Futures Contracts: The fund uses index futures contracts to a limited extent, with the objective of maintaining full exposure to the stock market while maintaining liquidity. The fund may purchase or sell futures contracts to achieve a desired level of investment, whether to accommodate portfolio turnover or cash flows from capital share transactions. The primary risks associated with the use of futures contracts are imperfect correlation between changes in market values of stocks held by the fund and the prices of futures contracts, and the possibility of an illiquid market.
Futures contracts are valued at their quoted daily settlement prices. The aggregate principal amounts of the contracts are not recorded in the Statement of Net Assets. Fluctuations in the value of the contracts are recorded in the Statement of Net Assets as an asset (liability) and in the Statement of Operations as unrealized appreciation (depreciation) until the contracts are closed, when they are recorded as realized futures gains (losses).
During the six months ended March 31, 2013, the fund’s average investments in long and short futures contracts each represented less than 1% of net assets, based on quarterly average aggregate settlement values.
3. Federal Income Taxes: The fund intends to continue to qualify as a regulated investment company and distribute all of its taxable income. Management has analyzed the fund’s tax positions taken for all open federal income tax years (September 30, 2009–2012), and for the period ended March 31, 2013, and has concluded that no provision for federal income tax is required in the fund’s financial statements.
4. Distributions: Distributions to shareholders are recorded on the ex-dividend date.
5. Security Lending: The fund may lend its securities to qualified institutional borrowers to earn additional income. Security loans are required to be secured at all times by collateral at least equal to the market value of securities loaned. Daily market fluctuations could cause the value of loaned securities to be more or less than the value of the collateral received. When this occurs, the collateral is adjusted on the next business day. The fund invests cash collateral received in Vanguard Market Liquidity Fund, and records a liability for the return of the collateral, during the period the securities are on loan. Security lending income represents fees charged to borrowers plus income earned on investing cash collateral, less expenses associated with the loan.
19
Strategic Small-Cap Equity Fund
6. Other: Dividend income is recorded on the ex-dividend date. Interest income includes income distributions received from Vanguard Market Liquidity Fund and is accrued daily. Security transactions are accounted for on the date securities are bought or sold. Costs used to determine realized gains (losses) on the sale of investment securities are those of the specific securities sold.
B. The Vanguard Group furnishes at cost investment advisory, corporate management, administrative, marketing, and distribution services. The costs of such services are allocated to the fund under methods approved by the board of trustees. The fund has committed to provide up to 0.40% of its net assets in capital contributions to Vanguard. At March 31, 2013, the fund had contributed capital of $37,000 to Vanguard (included in Other Assets), representing 0.01% of the fund’s net assets and 0.01% of Vanguard’s capitalization. The fund’s trustees and officers are also directors and officers of Vanguard.
C. Various inputs may be used to determine the value of the fund’s investments. These inputs are summarized in three broad levels for financial statement purposes. The inputs or methodologies used to value securities are not necessarily an indication of the risk associated with investing in those securities.
Level 1—Quoted prices in active markets for identical securities.
Level 2—Other significant observable inputs (including quoted prices for similar securities, interest rates, prepayment speeds, credit risk, etc.).
Level 3—Significant unobservable inputs (including the fund’s own assumptions used to determine the fair value of investments).
The following table summarizes the market value of the fund’s investments as of March 31, 2013, based on the inputs used to value them:
| | | |
| | Level 1 | Level 2 | Level 3 |
| Investments | ($000) | ($000) | ($000) |
| Common Stocks | 304,023 | — | — |
| Temporary Cash Investments | 2,228 | 100 | — |
| Futures Contracts—Assets1 | 4 | — | — |
| Futures Contracts—Liabilities1 | (1) | — | — |
| Total | 306,254 | 100 | — |
| 1 Represents variation margin on the last day of the reporting period. |
D. At March 31, 2013, the aggregate settlement value of open futures contracts and the related unrealized appreciation (depreciation) were:
| | | | |
| | | | ($000) |
| | | | Aggregate | |
| | | Number of | Settlement | Unrealized |
| | | Long (Short) | Value | Appreciation |
| Futures Contracts | Expiration | Contracts | Long (Short) | (Depreciation) |
| E-mini Russell 2000 Index | June 2013 | 26 | 2,467 | 12 |
Unrealized appreciation (depreciation) on open futures contracts is required to be treated as realized gain (loss) for tax purposes.
20
Strategic Small-Cap Equity Fund
E. Distributions are determined on a tax basis and may differ from net investment income and realized capital gains for financial reporting purposes. Differences may be permanent or temporary. Permanent differences are reclassified among capital accounts in the financial statements to reflect their tax character. Temporary differences arise when certain items of income, expense, gain, or loss are recognized in different periods for financial statement and tax purposes; these differences will reverse at some time in the future. Differences in classification may also result from the treatment of short-term gains as ordinary income for tax purposes.
The fund’s tax-basis capital gains and losses are determined only at the end of each fiscal year.
For tax purposes, at September 30, 2012, the fund had available capital losses totaling $36,878,000 to offset future net capital gains. Of this amount, $33,186,000 is subject to expiration on September 30, 2018. Capital losses of $3,692,000 realized beginning in fiscal 2012 may be carried forward indefinitely under the Regulated Investment Company Modernization Act of 2010, but must be used before any expiring loss carryforwards. The fund will use these capital losses to offset net taxable capital gains, if any, realized during the year ending September 30, 2013; should the fund realize net capital losses for the year, the losses will be added to the loss carryforward balance above.
At March 31, 2013, the cost of investment securities for tax purposes was $244,215,000. Net unrealized appreciation of investment securities for tax purposes was $62,136,000, consisting of unrealized gains of $66,892,000 on securities that had risen in value since their purchase and $4,756,000 in unrealized losses on securities that had fallen in value since their purchase.
F. During the six months ended March 31, 2013, the fund purchased $98,784,000 of investment securities and sold $93,937,000 of investment securities, other than temporary cash investments.
G. Capital shares issued and redeemed were:
| | |
| | Six Months Ended | Year Ended |
| | March 31, 2013 | September 30, 2012 |
| | Shares | Shares |
| | (000) | (000) |
| Issued | 1,402 | 2,260 |
| Issued in Lieu of Cash Distributions | 185 | 128 |
| Redeemed | (1,286) | (3,827) |
| Net Increase (Decrease) in Shares Outstanding | 301 | (1,439) |
H. In preparing the financial statements as of March 31, 2013, management considered the impact of subsequent events for potential recognition or disclosure in these financial statements.
21
About Your Fund’s Expenses
As a shareholder of the fund, you incur ongoing costs, which include costs for portfolio management, administrative services, and shareholder reports (like this one), among others. Operating expenses, which are deducted from a fund’s gross income, directly reduce the investment return of the fund.
A fund’s expenses are expressed as a percentage of its average net assets. This figure is known as the expense ratio. The following examples are intended to help you understand the ongoing costs (in dollars) of investing in your fund and to compare these costs with those of other mutual funds. The examples are based on an investment of $1,000 made at the beginning of the period shown and held for the entire period.
The accompanying table illustrates your fund’s costs in two ways:
• Based on actual fund return. This section helps you to estimate the actual expenses that you paid over the period. The ”Ending Account Value“ shown is derived from the fund‘s actual return, and the third column shows the dollar amount that would have been paid by an investor who started with $1,000 in the fund. You may use the information here, together with the amount you invested, to estimate the expenses that you paid over the period.
To do so, simply divide your account value by $1,000 (for example, an $8,600 account value divided by $1,000 = 8.6), then multiply the result by the number given for your fund under the heading ”Expenses Paid During Period.“
• Based on hypothetical 5% yearly return. This section is intended to help you compare your fund‘s costs with those of other mutual funds. It assumes that the fund had a yearly return of 5% before expenses, but that the expense ratio is unchanged. In this case—because the return used is not the fund’s actual return—the results do not apply to your investment. The example is useful in making comparisons because the Securities and Exchange Commission requires all mutual funds to calculate expenses based on a 5% return. You can assess your fund’s costs by comparing this hypothetical example with the hypothetical examples that appear in shareholder reports of other funds.
Note that the expenses shown in the table are meant to highlight and help you compare ongoing costs only and do not reflect transaction costs incurred by the fund for buying and selling securities. Further, the expenses do not include any purchase, redemption, or account service fees described in the fund prospectus. If such fees were applied to your account, your costs would be higher. Your fund does not carry a “sales load.”
The calculations assume no shares were bought or sold during the period. Your actual costs may have been higher or lower, depending on the amount of your investment and the timing of any purchases or redemptions.
You can find more information about the fund’s expenses, including annual expense ratios, in the Financial Statements section of this report. For additional information on operating expenses and other shareholder costs, please refer to your fund’s current prospectus.
22
| | | |
| Six Months Ended March 31, 2013 | | | |
| | Beginning | Ending | Expenses |
| | Account Value | Account Value | Paid During |
| Strategic Small-Cap Equity Fund | 9/30/2012 | 3/31/2013 | Period |
| Based on Actual Fund Return | $1,000.00 | $1,174.33 | $2.06 |
| Based on Hypothetical 5% Yearly Return | 1,000.00 | 1,023.04 | 1.92 |
The calculations are based on expenses incurred in the most recent six-month period. The fund’s annualized six-month expense ratio for that
period is 0.38%. The dollar amounts shown as “Expenses Paid” are equal to the expense ratio multiplied by the average account value over
the period, multiplied by the number of days in the most recent six-month period, then divided by the number of days in the most recent
12-month period.
23
Trustees Approve Advisory Arrangement
The board of trustees of Vanguard Strategic Small-Cap Equity Fund has renewed the fund’s investment advisory arrangement with The Vanguard Group, Inc. (Vanguard). Vanguard—through its Equity Investment Group—serves as the investment advisor to the fund. The board determined that continuing the fund’s internalized management structure was in the best interests of the fund and its shareholders.
The board based its decision upon an evaluation of the advisor’s investment staff, portfolio management process, and performance. The trustees considered the factors discussed below, among others. However, no single factor determined whether the board approved the arrangement. Rather, it was the totality of the circumstances that drove the board’s decision.
Nature, extent, and quality of services
The board considered the quality of the fund’s investment management services since its inception in 2006, and took into account the organizational depth and stability of the advisor. The board noted that Vanguard has been managing investments for more than three decades. The Equity Investment Group adheres to a sound, disciplined investment management process; the team has considerable experience, stability, and depth.
The board concluded that Vanguard’s experience, stability, depth, and performance, among other factors, warranted continuation of the advisory arrangement.
Investment performance
The board considered the short- and long-term performance of the fund, including any periods of outperformance or underperformance relative to a benchmark index and peer group. The board concluded that the performance was such that the advisory arrangement should continue. Information about the fund’s most recent performance can be found in the Performance Summary section of this report.
Cost
The board concluded that the fund’s expense ratio was well below the average expense ratio charged by funds in its peer group and that the fund’s advisory fee rate was also well below its peer-group average. Information about the fund’s expenses appears in the About Your Fund’s Expenses section of this report as well as in the Financial Statements section.
The board does not conduct a profitability analysis of Vanguard, because of Vanguard’s unique “at-cost” structure. Unlike most other mutual fund management companies, Vanguard is owned by the funds it oversees, and produces “profits” only in the form of reduced expenses for fund shareholders.
The benefit of economies of scale
The board concluded that the fund’s at-cost arrangement with Vanguard ensures that the fund will realize economies of scale as it grows, with the cost to shareholders declining as fund assets increase.
The board will consider whether to renew the advisory arrangement again after a one-year period.
24
Glossary
30-Day SEC Yield. A fund’s 30-day SEC yield is derived using a formula specified by the U.S. Securities and Exchange Commission. Under the formula, data related to the fund’s security holdings in the previous 30 days are used to calculate the fund’s hypothetical net income for that period, which is then annualized and divided by the fund’s estimated average net assets over the calculation period. For the purposes of this calculation, a security’s income is based on its current market yield to maturity (for bonds), its actual income (for asset-backed securities), or its projected dividend yield (for stocks). Because the SEC yield represents hypothetical annualized income, it will differ—at times significantly—from the fund’s actual experience. As a result, the fund’s income distributions may be higher or lower than implied by the SEC yield.
Beta. A measure of the magnitude of a fund’s past share-price fluctuations in relation to the ups and downs of a given market index. The index is assigned a beta of 1.00. Compared with a given index, a fund with a beta of 1.20 typically would have seen its share price rise or fall by 12% when the index rose or fell by 10%. For this report, beta is based on returns over the past 36 months for both the fund and the index. Note that a fund’s beta should be reviewed in conjunction with its R-squared (see definition). The lower the R-squared, the less correlation there is between the fund and the index, and the less reliable beta is as an indicator of volatility.
Dividend Yield. Dividend income earned by stocks, expressed as a percentage of the aggregate market value (or of net asset value, for a fund). The yield is determined by dividing the amount of the annual dividends by the aggregate value (or net asset value) at the end of the period. For a fund, the dividend yield is based solely on stock holdings and does not include any income produced by other investments.
Earnings Growth Rate. The average annual rate of growth in earnings over the past five years for the stocks now in a fund.
Equity Exposure. A measure that reflects a fund’s investments in stocks and stock futures. Any holdings in short-term reserves are excluded.
Expense Ratio. A fund’s total annual operating expenses expressed as a percentage of the fund’s average net assets. The expense ratio includes management and administrative expenses, but does not include the transaction costs of buying and selling portfolio securities.
Foreign Holdings. The percentage of a fund represented by securities or depositary receipts of companies based outside the United States.
Inception Date. The date on which the assets of a fund (or one of its share classes) are first invested in accordance with the fund’s investment objective. For funds with a subscription period, the inception date is the day after that period ends. Investment performance is measured from the inception date.
Median Market Cap. An indicator of the size of companies in which a fund invests; the midpoint of market capitalization (market price x shares outstanding) of a fund’s stocks, weighted by the proportion of the fund’s assets invested in each stock. Stocks representing half of the fund’s assets have market capitalizations above the median, and the rest are below it.
Price/Book Ratio. The share price of a stock divided by its net worth, or book value, per share. For a fund, the weighted average price/book ratio of the stocks it holds.
25
Price/Earnings Ratio. The ratio of a stock’s current price to its per-share earnings over the past year. For a fund, the weighted average P/E of the stocks it holds. P/E is an indicator of market expectations about corporate prospects; the higher the P/E, the greater the expectations for a company’s future growth.
R-Squared. A measure of how much of a fund’s past returns can be explained by the returns from the market in general, as measured by a given index. If a fund’s total returns were precisely synchronized with an index’s returns, its R-squared would be 1.00. If the fund’s returns bore no relationship to the index’s returns, its R-squared would be 0. For this report, R-squared is based on returns over the past 36 months for both the fund and the index.
Return on Equity. The annual average rate of return generated by a company during the past five years for each dollar of shareholder’s equity (net income divided by shareholder’s equity). For a fund, the weighted average return on equity for the companies whose stocks it holds.
Short-Term Reserves. The percentage of a fund invested in highly liquid, short-term securities that can be readily converted to cash.
Turnover Rate. An indication of the fund’s trading activity. Funds with high turnover rates incur higher transaction costs and may be more likely to distribute capital gains (which may be taxable to investors). The turnover rate excludes in-kind transactions, which have minimal impact on costs.
26
This page intentionally left blank.
The People Who Govern Your Fund
The trustees of your mutual fund are there to see that the fund is operated and managed in your best interests since, as a shareholder, you are a part owner of the fund. Your fund’s trustees also serve on the board of directors of The Vanguard Group, Inc., which is owned by the Vanguard funds and provides services to them on an at-cost basis.
A majority of Vanguard’s board members are independent, meaning that they have no affiliation with Vanguard or the funds they oversee, apart from the sizable personal investments they have made as private individuals. The independent board members have distinguished backgrounds in business, academia, and public service. Each of the trustees and executive officers oversees 180 Vanguard funds.
The following table provides information for each trustee and executive officer of the fund. More information about the trustees is in the Statement of Additional Information, which can be obtained, without charge, by contacting Vanguard at 800-662-7447, or online at vanguard.com.
| |
| InterestedTrustee1 | and Delphi Automotive LLP (automotive components); |
| | Senior Advisor at New Mountain Capital; Trustee of |
| F. William McNabb III | The Conference Board. |
| Born 1957. Trustee Since July 2009. Chairman of the | |
| Board. Principal Occupation(s) During the Past Five | Amy Gutmann |
| Years: Chairman of the Board of The Vanguard Group, | Born 1949. Trustee Since June 2006. Principal |
| Inc., and of each of the investment companies served | Occupation(s) During the Past Five Years: President |
| by The Vanguard Group, since January 2010; Director | of the University of Pennsylvania; Christopher H. |
| of The Vanguard Group since 2008; Chief Executive | Browne Distinguished Professor of Political Science |
| Officer and President of The Vanguard Group and of | in the School of Arts and Sciences with secondary |
| each of the investment companies served by The | appointments at the Annenberg School for |
| Vanguard Group since 2008; Director of Vanguard | Communication and the Graduate School of Education |
| Marketing Corporation; Managing Director of The | of the University of Pennsylvania; Member of the |
| Vanguard Group (1995–2008). | National Commission on the Humanities and Social |
| | Sciences; Trustee of Carnegie Corporation of New |
| | York and of the National Constitution Center; Chair |
| IndependentTrustees | of the U. S. Presidential Commission for the Study |
| | of Bioethical Issues. |
| Emerson U. Fullwood | |
| Born 1948. Trustee Since January 2008. Principal | JoAnn Heffernan Heisen |
| Occupation(s) During the Past Five Years: Executive | Born 1950. Trustee Since July 1998. Principal |
| Chief Staff and Marketing Officer for North America | Occupation(s) During the Past Five Years: Corporate |
| and Corporate Vice President (retired 2008) of Xerox | Vice President and Chief Global Diversity Officer |
| Corporation (document management products and | (retired 2008) and Member of the Executive |
| services); Executive in Residence and 2010 | Committee (1997–2008) of Johnson & Johnson |
| Distinguished Minett Professor at the Rochester | (pharmaceuticals/medical devices/consumer |
| Institute of Technology; Director of SPX Corporation | products); Director of Skytop Lodge Corporation |
| (multi-industry manufacturing), the United Way of | (hotels), the University Medical Center at Princeton, |
| Rochester, Amerigroup Corporation (managed health | the Robert Wood Johnson Foundation, and the Center |
| care), the University of Rochester Medical Center, | for Talent Innovation; Member of the Advisory Board |
| Monroe Community College Foundation, and North | of the Maxwell School of Citizenship and Public Affairs |
| Carolina A&T University. | at Syracuse University. |
| |
| Rajiv L. Gupta | F. Joseph Loughrey |
| Born 1945. Trustee Since December 2001.2 | Born 1949. Trustee Since October 2009. Principal |
| Principal Occupation(s) During the Past Five Years: | Occupation(s) During the Past Five Years: President |
| Chairman and Chief Executive Officer (retired 2009) | and Chief Operating Officer (retired 2009) of Cummins |
| and President (2006–2008) of Rohm and Haas Co. | Inc. (industrial machinery); Chairman of the Board of |
| (chemicals); Director of Tyco International, Ltd. | Hillenbrand, Inc. (specialized consumer services); |
| (diversified manufacturing and services), Hewlett- | Director of SKF AB (industrial machinery), the Lumina |
| Packard Co. (electronic computer manufacturing), | |
| | |
| Foundation for Education, and Oxfam America; | Executive Officers | |
| Chairman of the Advisory Council for the College of | | |
| Arts and Letters and Member of the Advisory Board to | Glenn Booraem | |
| the Kellogg Institute for International Studies at the | Born 1967. Controller Since July 2010. Principal |
| University of Notre Dame. | Occupation(s) During the Past Five Years: Principal |
| | of The Vanguard Group, Inc.; Controller of each of |
| Mark Loughridge | the investment companies served by The Vanguard |
| Born 1953. Trustee Since March 2012. Principal | Group; Assistant Controller of each of the investment |
| Occupation(s) During the Past Five Years: Senior Vice | companies served by The Vanguard Group (2001–2010). |
| President and Chief Financial Officer at IBM (information | | |
| technology services); Fiduciary Member of IBM’s | Thomas J. Higgins | |
| Retirement Plan Committee. | Born 1957. Chief Financial Officer Since September |
| | 2008. Principal Occupation(s) During the Past Five |
| Scott C. Malpass | Years: Principal of The Vanguard Group, Inc.; Chief |
| Born 1962. Trustee Since March 2012. Principal | Financial Officer of each of the investment companies |
| Occupation(s) During the Past Five Years: Chief | served by The Vanguard Group; Treasurer of each of |
| Investment Officer and Vice President at the University | the investment companies served by The Vanguard |
| of Notre Dame; Assistant Professor of Finance at the | Group (1998–2008). | |
| Mendoza College of Business at Notre Dame; Member | | |
| of the Notre Dame 403(b) Investment Committee; | Kathryn J. Hyatt | |
| Director of TIFF Advisory Services, Inc. (investment | Born 1955. Treasurer Since November 2008. Principal |
| advisor); Member of the Investment Advisory | Occupation(s) During the Past Five Years: Principal of |
| Committees of the Financial Industry Regulatory | The Vanguard Group, Inc.; Treasurer of each of the |
| Authority (FINRA) and of Major League Baseball. | investment companies served by The Vanguard |
| | Group; Assistant Treasurer of each of the investment |
| André F. Perold | companies served by The Vanguard Group (1988–2008). |
| Born 1952. Trustee Since December 2004. Principal | | |
| Occupation(s) During the Past Five Years: George | Heidi Stam | |
| Gund Professor of Finance and Banking at the Harvard | Born 1956. Secretary Since July 2005. Principal |
| Business School (retired 2011); Chief Investment | Occupation(s) During the Past Five Years: Managing |
| Officer and Managing Partner of HighVista Strategies | Director of The Vanguard Group, Inc.; General Counsel |
| LLC (private investment firm); Director of Rand | of The Vanguard Group; Secretary of The Vanguard |
| Merchant Bank; Overseer of the Museum of Fine | Group and of each of the investment companies |
| Arts Boston. | served by The Vanguard Group; Director and Senior |
| | Vice President of Vanguard Marketing Corporation. |
| Alfred M. Rankin, Jr. | | |
| Born 1941. Trustee Since January 1993. Principal | Vanguard Senior ManagementTeam |
| Occupation(s) During the Past Five Years: Chairman, | | |
| President, and Chief Executive Officer of NACCO | Mortimer J. Buckley | Chris D. McIsaac |
| Industries, Inc. (housewares/lignite) and of Hyster-Yale | Kathleen C. Gubanich | Michael S. Miller |
| Materials Handling, Inc. (forklift trucks); Director of | Paul A. Heller | James M. Norris |
| the National Association of Manufacturers; Chairman | Martha G. King | Glenn W. Reed |
| of the Board of University Hospitals of Cleveland; | John T. Marcante | |
| Advisory Chairman of the Board of The Cleveland | | |
| Museum of Art. | | |
| | Chairman Emeritus and Senior Advisor |
| Peter F. Volanakis | | |
| Born 1955. Trustee Since July 2009. Principal | John J. Brennan | |
| Occupation(s) During the Past Five Years: President | Chairman, 1996–2009 | |
| and Chief Operating Officer (retired 2010) of Corning | Chief Executive Officer and President, 1996–2008 |
| Incorporated (communications equipment); Director | | |
| of SPX Corporation (multi-industry manufacturing); | Founder | |
| Overseer of the Amos Tuck School of Business | John C. Bogle | |
| Administration at Dartmouth College; Advisor to the | | |
| Norris Cotton Cancer Center. | Chairman and Chief Executive Officer, 1974–1996 |
1 Mr. McNabb is considered an “interested person,” as defined in the Investment Company Act of 1940, because he is an officer of the
Vanguard funds.
2 December 2002 for Vanguard Equity Income Fund, Vanguard Growth Equity Fund, the Vanguard Municipal Bond Funds, and the Vanguard
State Tax-Exempt Funds.

| | |
| | | P.O. Box 2600 |
| | | Valley Forge, PA 19482-2600 |
| |
| |
| |
| Connect with Vanguard® > vanguard.com |
| |
| |
| |
| Fund Information > 800-662-7447 | | CFA® is a trademark owned by CFA Institute. |
| Direct Investor Account Services > 800-662-2739 | |
| Institutional Investor Services > 800-523-1036 | |
| Text Telephone for People | | |
| With Hearing Impairment > 800-749-7273 | |
| |
| This material may be used in conjunction | |
| with the offering of shares of any Vanguard | |
| fund only if preceded or accompanied by | |
| the fund’s current prospectus. | |
| |
| All comparative mutual fund data are from Lipper Inc. or | |
| Morningstar, Inc., unless otherwise noted. | |
| |
| You can obtain a free copy of Vanguard’s proxy voting | |
| guidelines by visiting vanguard.com/proxyreporting or by | |
| calling Vanguard at 800-662-2739. The guidelines are | |
| also available from the SEC’s website, sec.gov. In | |
| addition, you may obtain a free report on how your fund | |
| voted the proxies for securities it owned during the 12 | |
| months ended June 30. To get the report, visit either | |
| vanguard.com/proxyreporting or sec.gov. | |
| |
| You can review and copy information about your fund at | |
| the SEC’s Public Reference Room in Washington, D.C. To | |
| find out more about this public service, call the SEC at | |
| 202-551-8090. Information about your fund is also | |
| available on the SEC’s website, and you can receive | |
| copies of this information, for a fee, by sending a | |
| request in either of two ways: via e-mail addressed to | |
| publicinfo@sec.gov or via regular mail addressed to the | |
| Public Reference Section, Securities and Exchange | |
| Commission, Washington, DC 20549-1520. | |
| |
| |
| | | © 2013 The Vanguard Group, Inc. |
| | | All rights reserved. |
| | | Vanguard Marketing Corporation, Distributor. |
| |
| | | Q6152 052013 |
Item 2: Code of Ethics.
Not Applicable.
Item 3: Audit Committee Financial Expert.
Not Applicable.
Item 4: Principal Accountant Fees and Services.
Not Applicable.
Item 5: Audit Committee of Listed Registrants.
Not Applicable.
Item 6: Investments.
Vanguard® Global Equity Fund
Schedule of Investments
March 31, 2013
| | |
| | | Market |
| | | Value |
| | Shares | ($000) |
| |
| Common Stocks (95.8%)1 | | |
| Argentina (0.2%) | | |
| Arcos Dorados Holdings Inc. Class A | 592,347 | 7,819 |
| |
| Australia (1.0%) | | |
| Brambles Ltd. | 1,704,100 | 15,109 |
| Amcor Ltd. | 860,621 | 8,338 |
| Cochlear Ltd. | 62,731 | 4,456 |
| Australia & New Zealand Banking Group Ltd. | 119,124 | 3,553 |
| BHP Billiton Ltd. | 56,500 | 1,932 |
| Iluka Resources Ltd. | 195,603 | 1,923 |
| * BlueScope Steel Ltd. | 330,346 | 1,735 |
| Santos Ltd. | 123,280 | 1,601 |
| Orica Ltd. | 54,925 | 1,404 |
| DuluxGroup Ltd. | 179,926 | 836 |
| Fairfax Media Ltd. | 1,056,552 | 695 |
| * Alumina Ltd. | 319,693 | 371 |
| | | 41,953 |
| Austria (0.0%) | | |
| Andritz AG | 15,413 | 1,037 |
| Oesterreichische Post AG | 19,393 | 835 |
| | | 1,872 |
| Belgium (0.4%) | | |
| Anheuser-Busch InBev NV | 156,886 | 15,597 |
| |
| Brazil (1.2%) | | |
| BM&FBovespa SA | 2,024,900 | 13,618 |
| Banco do Brasil SA | 615,000 | 8,333 |
| Petroleo Brasileiro SA ADR Type A | 430,000 | 7,804 |
| Odontoprev SA | 1,443,553 | 6,579 |
| Vale SA Prior Pfd. | 262,800 | 4,349 |
| EDP - Energias do Brasil SA | 573,700 | 3,606 |
| * Cia de Saneamento Basico do Estado de Sao Paulo ADR | 57,310 | 2,735 |
| Cremer SA | 119,600 | 769 |
| Petroleo Brasileiro SA ADR | 33,000 | 547 |
| Duratex SA | 59,500 | 476 |
| Diagnosticos da America SA | 57,400 | 329 |
| | | 49,145 |
| Canada (2.7%) | | |
| Rogers Communications Inc. Class B | 473,570 | 24,190 |
| Bank of Montreal | 344,900 | 21,709 |
| ^ Agrium Inc. | 221,500 | 21,599 |
| Fairfax Financial Holdings Ltd. | 41,970 | 16,380 |
| Magna International Inc. | 231,400 | 13,601 |
| ^ Ritchie Bros Auctioneers Inc. | 398,952 | 8,657 |
| Imperial Oil Ltd. | 89,539 | 3,660 |
| BCE Inc. | 48,599 | 2,271 |
| Bank of Montreal | 27,947 | 1,759 |
| Saputo Inc. | 11,200 | 569 |
| Empire Co. Ltd. Class A | 4,500 | 293 |
| | | 114,688 |
| Chile (0.2%) | | |
| Enersis SA ADR | 218,805 | 4,210 |
| Vina Concha y Toro SA | 1,035,181 | 2,087 |
| | | 6,297 |
| China (3.2%) | | |
| Mindray Medical International Ltd. ADR | 624,580 | 24,946 |
| Bank of China Ltd. | 44,122,000 | 20,528 |
| China Construction Bank Corp. | 20,374,000 | 16,701 |
| Tsingtao Brewery Co. Ltd. | 2,078,000 | 13,259 |
| China Resources Enterprise Ltd. | 3,641,901 | 10,822 |
| China Mobile Ltd. | 988,000 | 10,479 |
| * Baidu Inc. ADR | 118,700 | 10,410 |
| |
| |
| |
| |
| 1 | | |
| | | |
| Vanguard® Global Equity Fund | | |
| Schedule of Investments | | |
| March 31, 2013 | | |
| |
| | | | Market |
| | | | Value |
| | | Shares | ($000) |
| | Industrial & Commercial Bank of China Ltd. | 12,001,000 | 8,440 |
| | Shandong Weigao Group Medical Polymer Co. Ltd. | 7,728,000 | 7,002 |
| | Agricultural Bank of China Ltd. | 10,201,000 | 4,909 |
| | Shui On Land Ltd. | 6,823,500 | 2,943 |
| | Yingde Gases Group Co. Ltd. | 2,186,000 | 2,441 |
| | China Mengniu Dairy Co. Ltd. | 262,000 | 752 |
| * | Giant Interactive Group Inc. ADR | 62,850 | 409 |
| * | Ctrip.com International Ltd. ADR | 16,275 | 348 |
| | Yip's Chemical Holdings Ltd. | 308,000 | 331 |
| | Weiqiao Textile Co. | 283,846 | 158 |
| | | | 134,878 |
| Cyprus (0.0%) | | |
| | Globaltrans Investment plc GDR | 50,498 | 797 |
| |
| Denmark (1.0%) | | |
| | Carlsberg A/S Class B | 186,181 | 18,152 |
| | Coloplast A/S Class B | 126,435 | 6,813 |
| * | Jyske Bank A/S | 196,377 | 6,702 |
| | GN Store Nord A/S | 213,730 | 3,806 |
| | Novo Nordisk A/S Class B | 18,617 | 3,001 |
| * | William Demant Holding A/S | 27,961 | 2,343 |
| * | Vestas Wind Systems A/S | 99,103 | 794 |
| * | Topdanmark A/S | 27,555 | 661 |
| * | Danske Bank A/S | 22,247 | 399 |
| | | | 42,671 |
| Egypt (0.0%) | | |
| | Ezz Steel | 1,397,944 | 1,888 |
| |
| Finland (0.4%) | | |
| | Sampo | 177,335 | 6,840 |
| *,^ | Metso Oyj | 91,932 | 3,928 |
| * | Tikkurila Oyj | 182,821 | 3,850 |
| ^ | Tieto Oyj | 62,751 | 1,331 |
| | Wartsila OYJ Abp | 14,104 | 636 |
| | Cargotec Oyj Class B | 10,629 | 327 |
| *,^ | Outokumpu Oyj | 151,829 | 116 |
| | | | 17,028 |
| France (2.3%) | | |
| | Sanofi | 260,549 | 26,572 |
| | European Aeronautic Defence and Space Co. NV | 490,268 | 24,988 |
| | BNP Paribas SA | 236,481 | 12,159 |
| | Legrand SA | 200,127 | 8,731 |
| | Air Liquide SA | 29,228 | 3,555 |
| | L'Oreal SA | 19,482 | 3,091 |
| | AXA SA | 114,651 | 1,981 |
| | Euler Hermes SA | 21,219 | 1,956 |
| | Carrefour SA | 65,148 | 1,785 |
| | Thales SA | 40,450 | 1,712 |
| | ArcelorMittal | 111,438 | 1,448 |
| | Eurofins Scientific | 6,801 | 1,430 |
| | Neopost SA | 23,680 | 1,421 |
| | Groupe Eurotunnel SA | 172,443 | 1,375 |
| *,^ | Air France-KLM | 127,798 | 1,208 |
| | Edenred | 18,613 | 610 |
| | Technip SA | 5,835 | 599 |
| | Total SA | 10,245 | 491 |
| | Imerys SA | 5,426 | 354 |
| | SA des Ciments Vicat | 5,298 | 330 |
| | Nexity SA | 9,290 | 320 |
| | | | 96,116 |
| Germany (1.8%) | | |
| | Deutsche Lufthansa AG | 603,079 | 11,796 |
| | Deutsche Post AG | 414,183 | 9,558 |
| | Deutsche Boerse AG | 151,974 | 9,219 |
2
| | |
| Vanguard® Global Equity Fund | | |
| Schedule of Investments | | |
| March 31, 2013 | | |
| |
| | | Market |
| | | Value |
| | Shares | ($000) |
| Muenchener Rueckversicherungs AG | 43,972 | 8,242 |
| Merck KGaA | 41,915 | 6,331 |
| BASF SE | 63,085 | 5,539 |
| Fresenius Medical Care AG & Co. KGaA | 80,680 | 5,455 |
| Bayerische Motoren Werke AG | 38,792 | 3,357 |
| Daimler AG | 55,361 | 3,019 |
| Henkel AG & Co. KGaA Prior Pfd. | 30,708 | 2,958 |
| Deutsche Telekom AG | 216,005 | 2,287 |
| Suedzucker AG | 44,182 | 1,867 |
| E.ON SE | 82,458 | 1,443 |
| Bayer AG | 11,501 | 1,189 |
| Siemens AG | 9,013 | 972 |
| * TUI AG | 69,403 | 747 |
| Adidas AG | 6,610 | 687 |
| Freenet AG | 26,631 | 648 |
| Volkswagen AG Prior Pfd. | 2,811 | 560 |
| Hannover Rueckversicherung SE | 6,790 | 535 |
| GEA Group AG | 14,940 | 493 |
| Axel Springer AG | 7,979 | 347 |
| Gildemeister AG | 14,555 | 307 |
| Celesio AG | 10,701 | 201 |
| | | 77,757 |
| Greece (0.6%) | | |
| Coca Cola Hellenic Bottling Co. SA | 886,445 | 23,766 |
| |
| Hong Kong (1.3%) | | |
| Jardine Matheson Holdings Ltd. | 302,000 | 19,692 |
| Hutchison Whampoa Ltd. | 629,000 | 6,576 |
| Esprit Holdings Ltd. | 4,197,314 | 5,071 |
| CLP Holdings Ltd. | 479,000 | 4,199 |
| Television Broadcasts Ltd. | 472,000 | 3,581 |
| HSBC Holdings plc | 318,800 | 3,424 |
| First Pacific Co. Ltd. | 1,850,000 | 2,508 |
| Hongkong & Shanghai Hotels | 1,429,376 | 2,451 |
| SmarTone Telecommunications Holdings Ltd. | 1,005,460 | 1,661 |
| New World Development Co. Ltd. | 647,000 | 1,100 |
| Henderson Land Development Co. Ltd. | 150,000 | 1,029 |
| Hong Kong Aircraft Engineering Co. Ltd. | 56,000 | 802 |
| Midland Holdings Ltd. | 1,204,000 | 533 |
| Goodbaby International Holdings Ltd. | 619,000 | 364 |
| * Next Media Ltd. | 2,098,000 | 316 |
| Texwinca Holdings Ltd. | 178,823 | 189 |
| Hong Kong Television Network Ltd. ADR | 9,300 | 60 |
| | | 53,556 |
| Hungary (0.0%) | | |
| OTP Bank plc | 16,712 | 302 |
| |
| India (0.2%) | | |
| CESC Ltd. | 845,529 | 4,123 |
| * Idea Cellular Ltd. | 1,764,457 | 3,702 |
| Tata Consultancy Services Ltd. | 19,780 | 574 |
| Havells India Ltd. | 39,403 | 468 |
| Indian Bank | 82,605 | 268 |
| | | 9,135 |
| Indonesia (0.2%) | | |
| Bank Negara Indonesia Persero Tbk PT | 12,626,611 | 6,578 |
| Telekomunikasi Indonesia Persero Tbk PT ADR | 31,453 | 1,418 |
| Gajah Tunggal Tbk PT | 1,297,186 | 334 |
| | | 8,330 |
| Ireland (1.0%) | | |
| Ryanair Holdings plc ADR | 581,222 | 24,283 |
| Dragon Oil plc | 756,147 | 7,462 |
| CRH plc | 207,172 | 4,585 |
| Paddy Power plc | 25,384 | 2,292 |
3
| | | |
| Vanguard® Global Equity Fund | | |
| Schedule of Investments | | |
| March 31, 2013 | | |
| |
| | | | Market |
| | | | Value |
| | | Shares | ($000) |
| * | Bank of Ireland | 11,005,742 | 2,177 |
| | DCC plc (London Shares) | 28,986 | 1,001 |
| | Irish Continental Group plc | 22,411 | 571 |
| | DCC plc | 2,032 | 71 |
| * | Independent News & Media plc | 318,558 | 16 |
| * | Irish Bank Resolution Corp. Ltd. | 122,273 | — |
| | | | 42,458 |
| Italy (0.5%) | | |
| | Piaggio & C SPA | 1,880,856 | 4,831 |
| | Luxottica Group SPA ADR | 88,891 | 4,470 |
| | Saipem SPA | 121,722 | 3,741 |
| | Fiat Industrial SPA | 268,118 | 3,024 |
| | Enel SPA | 764,733 | 2,507 |
| | Luxottica Group SPA | 17,912 | 899 |
| * | Fiat SPA | 161,872 | 865 |
| * | UniCredit SPA | 128,263 | 551 |
| | Exor SPA | 19,437 | 545 |
| | Davide Campari-Milano SPA | 65,460 | 510 |
| | Intesa Sanpaolo SPA (Registered) | 277,319 | 409 |
| * | Finmeccanica SPA | 28,037 | 135 |
| | | | 22,487 |
| Japan (9.1%) | | |
| ^ | Nippon Telegraph & Telephone Corp. | 633,100 | 27,608 |
| | Namco Bandai Holdings Inc. | 1,089,650 | 19,273 |
| | Hitachi Ltd. | 3,234,000 | 18,655 |
| | Daito Trust Construction Co. Ltd. | 217,200 | 18,505 |
| | Daiwa House Industry Co. Ltd. | 848,000 | 16,395 |
| | Yamaha Motor Co. Ltd. | 1,164,400 | 15,957 |
| | Otsuka Holdings Co. Ltd. | 423,100 | 14,832 |
| | Inpex Corp. | 2,671 | 14,187 |
| | Fujitsu Ltd. | 2,761,000 | 11,380 |
| | Kao Corp. | 288,700 | 9,446 |
| | Toyota Motor Corp. | 179,100 | 9,247 |
| | NTT Data Corp. | 2,726 | 9,078 |
| | Sumitomo Mitsui Financial Group Inc. | 219,400 | 8,798 |
| | Tokyo Electron Ltd. | 194,800 | 8,619 |
| * | Olympus Corp. | 362,000 | 8,502 |
| | Astellas Pharma Inc. | 149,800 | 8,052 |
| | East Japan Railway Co. | 94,000 | 7,709 |
| | Rohm Co. Ltd. | 190,200 | 6,971 |
| | KDDI Corp. | 166,222 | 6,834 |
| | Mitsubishi UFJ Financial Group Inc. | 1,126,400 | 6,677 |
| | Yamato Holdings Co. Ltd. | 359,100 | 6,638 |
| | Secom Co. Ltd. | 124,200 | 6,399 |
| | Seven & I Holdings Co. Ltd. | 171,400 | 5,672 |
| ^ | Dainippon Sumitomo Pharma Co. Ltd. | 268,700 | 5,009 |
| | MS&AD Insurance Group Holdings | 223,300 | 4,901 |
| | ITOCHU Corp. | 402,600 | 4,837 |
| | Dai-ichi Life Insurance Co. Ltd. | 3,464 | 4,655 |
| | Central Japan Railway Co. | 42,000 | 4,426 |
| | Alfresa Holdings Corp. | 80,800 | 4,369 |
| | Isetan Mitsukoshi Holdings Ltd. | 298,700 | 4,309 |
| | FUJIFILM Holdings Corp. | 219,500 | 4,281 |
| | Kirin Holdings Co. Ltd. | 243,000 | 3,900 |
| | Tokyo Gas Co. Ltd. | 695,000 | 3,795 |
| | LIXIL Group Corp. | 192,100 | 3,792 |
| | Mitsubishi Estate Co. Ltd. | 129,000 | 3,557 |
| | Toyo Suisan Kaisha Ltd. | 116,000 | 3,549 |
| | Sekisui House Ltd. | 241,000 | 3,274 |
| | Nippon Meat Packers Inc. | 183,000 | 3,015 |
| | Obayashi Corp. | 624,000 | 2,983 |
| | Sumitomo Electric Industries Ltd. | 239,600 | 2,955 |
| | Dentsu Inc. | 96,800 | 2,870 |
| | West Japan Railway Co. | 54,200 | 2,600 |
4
| | |
| Vanguard® Global Equity Fund | | |
| Schedule of Investments | | |
| March 31, 2013 | | |
| |
| | | Market |
| | | Value |
| | Shares | ($000) |
| NTT DOCOMO Inc. | 1,682 | 2,539 |
| Marui Group Co. Ltd. | 233,700 | 2,421 |
| Toyo Seikan Group Holdings Ltd. | 168,200 | 2,366 |
| Sumitomo Forestry Co. Ltd. | 201,900 | 2,170 |
| JX Holdings Inc. | 362,750 | 2,008 |
| Mitsubishi Heavy Industries Ltd. | 349,000 | 1,983 |
| NKSJ Holdings Inc. | 83,800 | 1,748 |
| Onward Holdings Co. Ltd. | 193,000 | 1,730 |
| Chiba Bank Ltd. | 230,000 | 1,649 |
| Sega Sammy Holdings Inc. | 80,500 | 1,634 |
| NSK Ltd. | 208,000 | 1,580 |
| Fukuoka Financial Group Inc. | 306,000 | 1,570 |
| Toyota Tsusho Corp. | 59,100 | 1,531 |
| Hitachi Metals Ltd. | 141,000 | 1,320 |
| Shimizu Corp. | 391,000 | 1,271 |
| Bank of Yokohama Ltd. | 219,000 | 1,268 |
| Daihatsu Motor Co. Ltd. | 61,000 | 1,265 |
| Shiseido Co. Ltd. | 84,800 | 1,195 |
| SKY Perfect JSAT Holdings Inc. | 2,509 | 1,179 |
| Calsonic Kansei Corp. | 259,000 | 1,164 |
| Japan Airlines Co. Ltd. | 25,000 | 1,161 |
| ^ Yamada Denki Co. Ltd. | 23,740 | 1,083 |
| USS Co. Ltd. | 8,690 | 1,020 |
| Azbil Corp. | 47,200 | 992 |
| Taiyo Nippon Sanso Corp. | 144,000 | 976 |
| Kinden Corp. | 128,000 | 857 |
| HIS Co. Ltd. | 13,500 | 613 |
| Nippon Suisan Kaisha Ltd. | 278,200 | 532 |
| Arnest One Corp. | 26,400 | 520 |
| IT Holdings Corp. | 34,900 | 461 |
| Kyowa Hakko Kirin Co. Ltd. | 40,000 | 456 |
| Toho Holdings Co. Ltd. | 19,400 | 448 |
| Resorttrust Inc. | 15,600 | 436 |
| Misawa Homes Co. Ltd. | 28,000 | 434 |
| Nippo Corp. | 34,000 | 413 |
| Gulliver International Co. Ltd. | 6,790 | 398 |
| Seino Holdings Co. Ltd. | 45,000 | 389 |
| Fuji Soft Inc. | 16,300 | 388 |
| Aoyama Trading Co. Ltd. | 14,900 | 375 |
| TS Tech Co. Ltd. | 13,100 | 373 |
| Maeda Road Construction Co. Ltd. | 27,000 | 365 |
| Nihon Unisys Ltd. | 39,100 | 341 |
| MediPal Holdings Corp. | 23,500 | 332 |
| Ryosan Co. Ltd. | 17,000 | 326 |
| Bridgestone Corp. | 9,500 | 320 |
| Konaka Co. Ltd. | 27,400 | 316 |
| Suzuken Co. Ltd. | 8,300 | 309 |
| Geo Holdings Corp. | 244 | 307 |
| ^ Iwatani Corp. | 65,000 | 300 |
| Round One Corp. | 38,700 | 280 |
| Kuroda Electric Co. Ltd. | 21,700 | 258 |
| Tokyo Ohka Kogyo Co. Ltd. | 11,300 | 239 |
| Yellow Hat Ltd. | 14,700 | 229 |
| Kawai Musical Instruments Manufacturing Co. Ltd. | 103,000 | 187 |
| Fujitsu Frontech Ltd. | 25,500 | 148 |
| | | 388,684 |
| Malaysia (0.3%) | | |
| Malayan Banking Bhd. | 3,135,600 | 9,468 |
| Tenaga Nasional Bhd. | 1,022,500 | 2,384 |
| Multi-Purpose Holdings Bhd. | 785,710 | 919 |
| | | 12,771 |
| Mexico (0.6%) | | |
| America Movil SAB de CV ADR | 578,685 | 12,129 |
| * Cemex SAB de CV ADR | 373,132 | 4,556 |
5
| | | |
| Vanguard® Global Equity Fund | | |
| Schedule of Investments | | |
| March 31, 2013 | | |
| |
| | | | Market |
| | | | Value |
| | | Shares | ($000) |
| | Grupo Comercial Chedraui SA de CV | 1,200,700 | 4,064 |
| | Grupo Financiero Banorte SAB de CV | 456,656 | 3,648 |
| * | Grupo Financiero Santander Mexico SAB de CV ADR | 161,563 | 2,493 |
| | | | 26,890 |
| Netherlands (0.7%) | | |
| | Unilever NV | 464,617 | 19,037 |
| | Heineken NV | 63,820 | 4,814 |
| | Koninklijke Boskalis Westminster NV | 69,661 | 2,771 |
| | Koninklijke KPN NV | 260,934 | 879 |
| | ASML Holding NV | 9,068 | 611 |
| | Randstad Holding NV | 9,712 | 399 |
| | TNT Express NV | 9,343 | 68 |
| | PostNL NV | 10,477 | 21 |
| | | | 28,600 |
| New Zealand (0.0%) | | |
| | Telecom Corp. of New Zealand Ltd. | 523,109 | 1,027 |
| | Chorus Ltd. | 53,504 | 126 |
| | PGG Wrightson Ltd. | 51,996 | 16 |
| | | | 1,169 |
| Norway (0.7%) | | |
| | Statoil ASA | 538,050 | 13,135 |
| | Schibsted ASA | 206,281 | 9,231 |
| | Norsk Hydro ASA | 1,488,817 | 6,482 |
| | DNB ASA | 174,376 | 2,566 |
| * | Storebrand ASA | 44,696 | 176 |
| | | | 31,590 |
| Philippines (0.3%) | | |
| | ABS-CBN Holdings Corp. | 6,292,311 | 6,399 |
| | Lopez Holdings Corp. | 21,029,149 | 3,714 |
| | Energy Development Corp. | 21,941,800 | 3,468 |
| | | | 13,581 |
| Poland (0.2%) | | |
| | KGHM Polska Miedz SA | 188,382 | 9,130 |
| | Bank Pekao SA | 11,220 | 542 |
| | Tauron Polska Energia SA | 215,055 | 283 |
| | | | 9,955 |
| Russia (0.2%) | | |
| | Sberbank of Russia ADR | 590,826 | 7,562 |
| | LSR Group GDR | 54,767 | 234 |
| | | | 7,796 |
| Singapore (0.7%) | | |
| | DBS Group Holdings Ltd. | 1,851,000 | 23,957 |
| | Great Eastern Holdings Ltd. | 251,000 | 3,646 |
| * | STATS ChipPAC Ltd. | 2,633,000 | 960 |
| | GuocoLeisure Ltd. | 1,209,000 | 860 |
| | United Industrial Corp. Ltd. | 163,000 | 402 |
| | Oversea-Chinese Banking Corp. Ltd. | 46,000 | 396 |
| | Yoma Strategic Holdings Ltd. | 137,000 | 84 |
| | | | 30,305 |
| South Africa (1.4%) | | |
| | Naspers Ltd. | 423,190 | 26,367 |
| | Clicks Group Ltd. | 1,951,153 | 12,321 |
| | Standard Bank Group Ltd. | 470,952 | 6,064 |
| | MTN Group Ltd. | 317,134 | 5,573 |
| | RMI Holdings | 1,053,842 | 2,672 |
| | Nedbank Group Ltd. | 77,034 | 1,596 |
| | Anglo American plc Ordinary Shares | 58,794 | 1,532 |
| | Remgro Ltd. | 68,390 | 1,363 |
| | Old Mutual plc | 406,135 | 1,250 |
| | Liberty Holdings Ltd. | 43,283 | 565 |
| * | Murray & Roberts Holdings Ltd. | 130,822 | 335 |
| | MMI Holdings Ltd. | 97,905 | 247 |
| | | | 59,885 |
6
| | |
| Vanguard® Global Equity Fund | | |
| Schedule of Investments | | |
| March 31, 2013 | | |
| |
| | | Market |
| | | Value |
| | Shares | ($000) |
| South Korea (3.0%) | | |
| Samsung Electronics Co. Ltd. | 22,695 | 31,148 |
| Samsung Electronics Co. Ltd. GDR | 33,350 | 22,455 |
| Hyundai Motor Co. | 96,278 | 19,384 |
| SK Holdings Co. Ltd. | 60,007 | 9,196 |
| Kia Motors Corp. | 175,852 | 8,788 |
| Hana Financial Group Inc. | 203,006 | 7,216 |
| Woori Finance Holdings Co. Ltd. | 596,130 | 6,805 |
| Shinhan Financial Group Co. Ltd. | 105,260 | 3,822 |
| NHN Corp. | 14,481 | 3,605 |
| * LG Display Co. Ltd. | 118,130 | 3,387 |
| Kolon Industries Inc. | 57,592 | 2,837 |
| KB Financial Group Inc. | 78,059 | 2,631 |
| SK Telecom Co. Ltd. | 8,519 | 1,382 |
| Hyundai Mobis | 4,657 | 1,287 |
| KT Corp. | 39,440 | 1,251 |
| Hankook Tire Co. Ltd. | 20,236 | 875 |
| | | 126,069 |
| Spain (0.2%) | | |
| * Banco Santander SA | 395,393 | 2,679 |
| Viscofan SA | 38,147 | 2,001 |
| Acerinox SA | 122,638 | 1,260 |
| Acciona SA | 19,921 | 1,091 |
| Mediaset Espana Comunicacion SA | 143,840 | 1,038 |
| Telefonica SA | 67,793 | 918 |
| Distribuidora Internacional de Alimentacion SA | 56,300 | 391 |
| | | 9,378 |
| Sweden (2.8%) | | |
| Svenska Handelsbanken AB Class A | 1,138,293 | 48,686 |
| Atlas Copco AB Class B | 790,469 | 20,028 |
| Investor AB Class B | 459,043 | 13,279 |
| Volvo AB Class B | 870,388 | 12,707 |
| Swedish Match AB | 272,631 | 8,463 |
| Assa Abloy AB Class B | 151,698 | 6,202 |
| Nordea Bank AB | 275,449 | 3,125 |
| Telefonaktiebolaget LM Ericsson Class B | 212,420 | 2,661 |
| Hoganas AB Class B | 29,543 | 1,463 |
| Modern Times Group AB Class B | 26,801 | 1,067 |
| Skandinaviska Enskilda Banken AB Class A | 101,513 | 1,021 |
| Millicom International Cellular SA | 3,656 | 292 |
| Oriflame Cosmetics SA | 6,251 | 213 |
| | | 119,207 |
| Switzerland (3.9%) | | |
| Nestle SA | 616,737 | 44,636 |
| Roche Holding AG | 176,551 | 41,158 |
| Cie Financiere Richemont SA | 430,583 | 33,901 |
| Schindler Holding AG | 131,289 | 19,257 |
| Novartis AG | 164,164 | 11,700 |
| Geberit AG | 42,840 | 10,563 |
| Adecco SA | 38,359 | 2,104 |
| UBS AG | 118,063 | 1,816 |
| Sonova Holding AG | 12,277 | 1,474 |
| ^ Logitech International SA | 67,514 | 458 |
| Helvetia Holding AG | 1,055 | 426 |
| ABB Ltd. | 18,695 | 424 |
| | | 167,917 |
| Taiwan (2.0%) | | |
| Taiwan Semiconductor Manufacturing Co. Ltd. ADR | 1,530,472 | 26,440 |
| Fubon Financial Holding Co. Ltd. | 13,957,279 | 19,977 |
| Hon Hai Precision Industry Co. Ltd. | 4,039,000 | 11,252 |
| United Microelectronics Corp. | 20,388,000 | 7,636 |
| Delta Electronics Inc. | 1,557,000 | 6,639 |
| Taiwan Semiconductor Manufacturing Co. Ltd. | 1,852,099 | 6,225 |
| Yungtay Engineering Co. Ltd. | 1,309,000 | 2,627 |
7
| | |
| Vanguard® Global Equity Fund | | |
| Schedule of Investments | | |
| March 31, 2013 | | |
| |
| | | Market |
| | | Value |
| | Shares | ($000) |
| Taishin Financial Holding Co. Ltd. | 3,987,981 | 1,667 |
| Giant Manufacturing Co. Ltd. | 77,000 | 429 |
| King Yuan Electronics Co. Ltd. | 203,000 | 139 |
| | | 83,031 |
| Thailand (0.5%) | | |
| * Advanced Info Service PCL (Local) | 549,800 | 4,506 |
| Thanachart Capital PCL | 2,928,100 | 4,350 |
| Advanced Info Service PCL | 491,700 | 4,030 |
| Bangkok Bank PCL (Foreign) | 472,200 | 3,741 |
| Krung Thai Bank PCL | 3,563,900 | 3,042 |
| MBK PCL (Foreign) | 262,600 | 1,661 |
| Total Access Communication PCL | 248,500 | 829 |
| * Total Access Communication PCL (Local) | 96,416 | 322 |
| | | 22,481 |
| Turkey (1.1%) | | |
| Turkiye Is Bankasi | 4,506,991 | 17,337 |
| BIM Birlesik Magazalar AS | 209,617 | 10,253 |
| Turkiye Garanti Bankasi AS | 1,608,233 | 8,586 |
| Tupras Turkiye Petrol Rafinerileri AS | 147,955 | 4,498 |
| Turkiye Garanti Bankasi AS ADR | 603,200 | 3,259 |
| KOC Holding AS | 484,927 | 2,814 |
| Ulker Biskuvi Sanayi AS | 97,041 | 732 |
| * Asya Katilim Bankasi AS | 328,240 | 432 |
| * Turkcell Iletisim Hizmetleri AS | 40,912 | 275 |
| | | 48,186 |
| United Arab Emirates (0.0%) | | |
| * DP World Ltd. | 20,737 | 291 |
| |
| United Kingdom (8.0%) | | |
| Prudential plc | 2,428,224 | 39,438 |
| Royal Dutch Shell plc Class A (Amsterdam Shares) | 993,384 | 32,173 |
| Rolls-Royce Holdings plc | 1,368,819 | 23,554 |
| Wolseley plc | 437,077 | 21,798 |
| Reckitt Benckiser Group plc | 241,668 | 17,351 |
| Bunzl plc | 757,531 | 14,953 |
| Vodafone Group plc | 5,164,745 | 14,656 |
| British American Tobacco plc | 257,989 | 13,834 |
| BP plc | 1,627,511 | 11,445 |
| Intertek Group plc | 162,380 | 8,391 |
| Hays plc | 5,496,106 | 8,089 |
| WPP plc | 432,013 | 6,904 |
| BP plc ADR | 152,632 | 6,464 |
| BHP Billiton plc | 208,389 | 6,069 |
| Rio Tinto plc | 117,958 | 5,556 |
| Aggreko plc | 199,806 | 5,423 |
| Diageo plc | 171,318 | 5,398 |
| AstraZeneca plc | 101,809 | 5,107 |
| Compass Group plc | 398,713 | 5,103 |
| Unilever plc | 119,531 | 5,056 |
| Capita plc | 329,562 | 4,505 |
| Sage Group plc | 666,882 | 3,478 |
| Informa plc | 416,767 | 3,342 |
| Rightmove plc | 122,237 | 3,310 |
| Tesco plc | 545,062 | 3,168 |
| Royal Dutch Shell plc Class B | 91,166 | 3,032 |
| BAE Systems plc | 482,427 | 2,897 |
| Provident Financial plc | 114,596 | 2,729 |
| Reed Elsevier plc | 218,210 | 2,596 |
| Experian plc | 148,198 | 2,569 |
| ITV plc | 1,295,973 | 2,555 |
| Barclays plc | 567,441 | 2,525 |
| * Thomas Cook Group plc | 1,383,402 | 2,369 |
| Rexam plc | 294,224 | 2,363 |
| International Personal Finance plc | 343,876 | 2,333 |
8
| | | |
| Vanguard® Global Equity Fund | | |
| Schedule of Investments | | |
| March 31, 2013 | | |
| |
| | | | Market |
| | | | Value |
| | | Shares | ($000) |
| | Spectris plc | 61,534 | 2,297 |
| * | Lloyds Banking Group plc | 2,964,788 | 2,209 |
| | G4S plc | 480,417 | 2,135 |
| | Carnival plc | 55,109 | 1,927 |
| | Stagecoach Group plc | 404,407 | 1,912 |
| | TUI Travel plc | 365,338 | 1,812 |
| | 3i Group plc | 370,887 | 1,786 |
| | Admiral Group plc | 81,159 | 1,647 |
| | Smiths Group plc | 85,680 | 1,641 |
| | ICAP plc | 306,853 | 1,358 |
| ^ | Glencore International plc | 245,558 | 1,332 |
| | QinetiQ Group plc | 406,008 | 1,282 |
| | WH Smith plc | 100,150 | 1,137 |
| | IG Group Holdings plc | 136,168 | 1,107 |
| | Homeserve plc | 356,925 | 1,087 |
| | Devro plc | 180,755 | 964 |
| | Cable & Wireless Communications plc | 1,461,553 | 932 |
| | Ladbrokes plc | 248,155 | 852 |
| | Associated British Foods plc | 29,154 | 843 |
| * | Cairn Energy plc | 189,278 | 788 |
| | British Sky Broadcasting Group plc | 55,804 | 750 |
| | Mondi plc | 52,859 | 720 |
| | Home Retail Group plc | 270,351 | 640 |
| | Bwin.Party Digital Entertainment plc | 254,834 | 557 |
| | Millennium & Copthorne Hotels plc | 61,041 | 529 |
| | AMEC plc | 32,480 | 522 |
| | IMI plc | 26,117 | 516 |
| * | Barratt Developments plc | 121,864 | 509 |
| | Jupiter Fund Management plc | 100,087 | 499 |
| | GlaxoSmithKline plc | 21,277 | 498 |
| | Smith & Nephew plc | 41,365 | 478 |
| | Daily Mail & General Trust plc | 43,689 | 472 |
| | Centrica plc | 81,505 | 456 |
| | Petrofac Ltd. | 20,116 | 439 |
| | Michael Page International plc | 66,652 | 429 |
| | Standard Chartered plc | 15,503 | 403 |
| | Close Brothers Group plc | 24,522 | 392 |
| | National Express Group plc | 102,274 | 319 |
| | CSR plc | 42,081 | 309 |
| | Anglo American plc London Shares | 7,120 | 184 |
| | Northgate plc | 29,242 | 139 |
| | GVC Holdings plc | 28,002 | 112 |
| * | Perform Group plc | 9,640 | 68 |
| * | Connaught plc | 103,081 | — |
| | | | 339,521 |
| United States (41.9%) | | |
| Consumer Discretionary (6.7%) | | |
| | Omnicom Group Inc. | 708,609 | 41,737 |
| * | Amazon.com Inc. | 117,853 | 31,407 |
| | Comcast Corp. Class A | 628,072 | 26,385 |
| | McDonald's Corp. | 210,843 | 21,019 |
| | Walt Disney Co. | 281,439 | 15,986 |
| * | CarMax Inc. | 378,869 | 15,799 |
| * | Mohawk Industries Inc. | 133,799 | 15,135 |
| | Harley-Davidson Inc. | 281,453 | 15,001 |
| | Dillard's Inc. Class A | 186,659 | 14,662 |
| | Royal Caribbean Cruises Ltd. | 426,739 | 14,176 |
| | CBS Corp. Class B | 217,179 | 10,140 |
| * | TripAdvisor Inc. | 190,873 | 10,025 |
| | Time Warner Inc. | 162,349 | 9,355 |
| * | Bed Bath & Beyond Inc. | 139,061 | 8,958 |
| | Cooper Tire & Rubber Co. | 314,102 | 8,060 |
| *,^ | Tesla Motors Inc. | 171,988 | 6,517 |
| * | priceline.com Inc. | 9,283 | 6,386 |
9
| | |
| Vanguard® Global Equity Fund | | |
| Schedule of Investments | | |
| March 31, 2013 | | |
| |
| | | Market |
| | | Value |
| | Shares | ($000) |
| ^ Weight Watchers International Inc. | 95,471 | 4,020 |
| Sotheby's | 72,945 | 2,729 |
| * Hanesbrands Inc. | 51,201 | 2,333 |
| * Red Robin Gourmet Burgers Inc. | 36,818 | 1,679 |
| Scholastic Corp. | 30,070 | 801 |
| * Discovery Communications Inc. Class A | 8,620 | 679 |
| * Multimedia Games Holding Co. Inc. | 24,709 | 516 |
| Bob Evans Farms Inc. | 12,098 | 516 |
| * TravelCenters of America LLC | 37,490 | 359 |
| Brinker International Inc. | 9,107 | 343 |
| * Discovery Communications Inc. | 4,892 | 340 |
| Nexstar Broadcasting Group Inc. Class A | 16,629 | 299 |
| PetMed Express Inc. | 21,134 | 283 |
| Destination Maternity Corp. | 11,763 | 275 |
| Brown Shoe Co. Inc. | 14,357 | 230 |
| ^ Blyth Inc. | 6,774 | 118 |
| * Sun-Times Media Group Inc. Class A | 130,959 | — |
| | | 286,268 |
| Consumer Staples (4.9%) | | |
| Tyson Foods Inc. Class A | 1,110,798 | 27,570 |
| Costco Wholesale Corp. | 228,364 | 24,232 |
| CVS Caremark Corp. | 439,804 | 24,185 |
| PepsiCo Inc. | 242,391 | 19,175 |
| Coca-Cola Co. | 472,528 | 19,109 |
| Procter & Gamble Co. | 235,687 | 18,162 |
| * Smithfield Foods Inc. | 659,284 | 17,458 |
| Philip Morris International Inc. | 181,303 | 16,808 |
| Colgate-Palmolive Co. | 108,359 | 12,790 |
| Estee Lauder Cos. Inc. Class A | 174,398 | 11,167 |
| Kroger Co. | 195,293 | 6,472 |
| Universal Corp. | 78,879 | 4,420 |
| Sanderson Farms Inc. | 43,996 | 2,403 |
| Clorox Co. | 26,487 | 2,345 |
| Ingredion Inc. | 21,229 | 1,535 |
| * Omega Protein Corp. | 52,359 | 563 |
| * Medifast Inc. | 19,104 | 438 |
| Cal-Maine Foods Inc. | 8,504 | 362 |
| * Harbinger Group Inc. | 31,329 | 259 |
| * Central Garden and Pet Co. Class A | 26,454 | 217 |
| | | 209,670 |
| Energy (4.3%) | | |
| Phillips 66 | 381,280 | 26,678 |
| ConocoPhillips | 397,108 | 23,866 |
| Marathon Petroleum Corp. | 255,532 | 22,896 |
| Valero Energy Corp. | 476,649 | 21,683 |
| Tesoro Corp. | 352,648 | 20,648 |
| EOG Resources Inc. | 129,912 | 16,638 |
| Exxon Mobil Corp. | 134,764 | 12,144 |
| * Ultra Petroleum Corp. | 509,313 | 10,237 |
| National Oilwell Varco Inc. | 136,297 | 9,643 |
| Western Refining Inc. | 237,234 | 8,400 |
| Delek US Holdings Inc. | 186,554 | 7,361 |
| Alon USA Energy Inc. | 107,854 | 2,055 |
| PBF Energy Inc. | 29,895 | 1,111 |
| * Green Plains Renewable Energy Inc. | 50,160 | 574 |
| | | 183,934 |
| Exchange-Traded Fund (0.5%) | | |
| 2 Vanguard FTSE Emerging Markets ETF | 443,472 | 19,021 |
| |
| Financials (6.4%) | | |
| JPMorgan Chase & Co. | 666,204 | 31,618 |
| Goldman Sachs Group Inc. | 160,567 | 23,627 |
| * Markel Corp. | 40,684 | 20,484 |
10
| | |
| Vanguard® Global Equity Fund | | |
| Schedule of Investments | | |
| March 31, 2013 | | |
| |
| | | Market |
| | | Value |
| | Shares | ($000) |
| Moody's Corp. | 339,884 | 18,123 |
| * Berkshire Hathaway Inc. Class B | 153,847 | 16,031 |
| New York Community Bancorp Inc. | 1,070,730 | 15,365 |
| * American International Group Inc. | 334,772 | 12,996 |
| First Republic Bank/CA | 328,569 | 12,689 |
| Franklin Resources Inc. | 72,669 | 10,959 |
| * PHH Corp. | 408,128 | 8,963 |
| American Express Co. | 126,945 | 8,564 |
| Legg Mason Inc. | 263,507 | 8,472 |
| Progressive Corp. | 327,879 | 8,286 |
| SL Green Realty Corp. | 86,379 | 7,438 |
| US Bancorp | 208,495 | 7,074 |
| * CBRE Group Inc. Class A | 255,887 | 6,461 |
| Assurant Inc. | 127,931 | 5,758 |
| Piedmont Office Realty Trust Inc. Class A | 272,671 | 5,342 |
| Lazard Ltd. Class A | 149,505 | 5,103 |
| M&T Bank Corp. | 48,513 | 5,005 |
| Chubb Corp. | 55,138 | 4,826 |
| TD Ameritrade Holding Corp. | 221,205 | 4,561 |
| Wells Fargo & Co. | 118,356 | 4,378 |
| RenaissanceRe Holdings Ltd. | 40,897 | 3,762 |
| Huntington Bancshares Inc. | 444,697 | 3,286 |
| Cash America International Inc. | 61,761 | 3,241 |
| CNO Financial Group Inc. | 276,325 | 3,164 |
| * World Acceptance Corp. | 31,273 | 2,685 |
| * Piper Jaffray Cos. | 44,676 | 1,532 |
| * Altisource Portfolio Solutions SA | 17,085 | 1,192 |
| First American Financial Corp. | 45,041 | 1,152 |
| Stewart Information Services Corp. | 26,115 | 665 |
| Republic Bancorp Inc. Class A | 27,308 | 618 |
| * Altisource Residential Corp. | 15,557 | 311 |
| Calamos Asset Management Inc. Class A | 17,710 | 208 |
| | | 273,939 |
| Health Care (5.0%) | | |
| Merck & Co. Inc. | 534,404 | 23,637 |
| Johnson & Johnson | 238,649 | 19,457 |
| Eli Lilly & Co. | 304,668 | 17,302 |
| * Life Technologies Corp. | 246,917 | 15,958 |
| WellPoint Inc. | 222,350 | 14,726 |
| * Waters Corp. | 155,539 | 14,607 |
| AbbVie Inc. | 351,274 | 14,325 |
| Abbott Laboratories | 305,006 | 10,773 |
| * Seattle Genetics Inc. | 276,700 | 9,826 |
| Pfizer Inc. | 312,556 | 9,020 |
| * United Therapeutics Corp. | 144,309 | 8,784 |
| Humana Inc. | 124,634 | 8,613 |
| * QIAGEN NV | 382,200 | 8,057 |
| * Illumina Inc. | 132,900 | 7,177 |
| * Intuitive Surgical Inc. | 11,256 | 5,529 |
| Cigna Corp. | 86,179 | 5,375 |
| PDL BioPharma Inc. | 668,897 | 4,890 |
| * Express Scripts Holding Co. | 61,678 | 3,556 |
| * PAREXEL International Corp. | 72,826 | 2,877 |
| * Covance Inc. | 22,168 | 1,647 |
| * Molina Healthcare Inc. | 41,665 | 1,286 |
| * Magellan Health Services Inc. | 20,913 | 995 |
| * Emergent Biosolutions Inc. | 47,130 | 659 |
| * Mettler-Toledo International Inc. | 2,486 | 530 |
| * Cambrex Corp. | 32,835 | 420 |
| * Pozen Inc. | 55,485 | 292 |
| * PharMerica Corp. | 20,090 | 281 |
| * Amedisys Inc. | 24,215 | 269 |
11
| | |
| Vanguard® Global Equity Fund | | |
| Schedule of Investments | | |
| March 31, 2013 | | |
| |
| | | Market |
| | | Value |
| | Shares | ($000) |
| * Triple-S Management Corp. Class B | 13,306 | 232 |
| | | 211,100 |
| Industrials (3.2%) | | |
| Northrop Grumman Corp. | 310,986 | 21,816 |
| * Alaska Air Group Inc. | 339,396 | 21,708 |
| 3M Co. | 194,832 | 20,712 |
| Southwest Airlines Co. | 874,105 | 11,783 |
| Deere & Co. | 115,091 | 9,895 |
| Emerson Electric Co. | 164,913 | 9,214 |
| Towers Watson & Co. Class A | 102,479 | 7,104 |
| Kansas City Southern | 61,908 | 6,866 |
| * US Airways Group Inc. | 312,317 | 5,300 |
| General Electric Co. | 172,264 | 3,983 |
| * JetBlue Airways Corp. | 505,650 | 3,489 |
| Alliant Techsystems Inc. | 38,163 | 2,764 |
| Norfolk Southern Corp. | 29,704 | 2,289 |
| Raytheon Co. | 29,286 | 1,722 |
| * Hawaiian Holdings Inc. | 238,232 | 1,372 |
| SkyWest Inc. | 82,745 | 1,328 |
| * Republic Airways Holdings Inc. | 106,831 | 1,233 |
| * Saia Inc. | 16,197 | 586 |
| Kimball International Inc. Class B | 48,535 | 440 |
| Sauer-Danfoss Inc. | 5,544 | 324 |
| Standex International Corp. | 5,537 | 306 |
| * Consolidated Graphics Inc. | 7,804 | 305 |
| Argan Inc. | 20,418 | 304 |
| Aircastle Ltd. | 19,310 | 264 |
| * Trex Co. Inc. | 5,335 | 262 |
| FreightCar America Inc. | 10,543 | 230 |
| | | 135,599 |
| Information Technology (8.7%) | | |
| * eBay Inc. | 746,173 | 40,458 |
| Oracle Corp. | 976,768 | 31,589 |
| Mastercard Inc. Class A | 45,812 | 24,790 |
| * Google Inc. Class A | 29,052 | 23,068 |
| Computer Sciences Corp. | 423,476 | 20,848 |
| Microsoft Corp. | 547,603 | 15,667 |
| FLIR Systems Inc. | 584,508 | 15,203 |
| Accenture plc Class A | 187,975 | 14,280 |
| Visa Inc. Class A | 82,737 | 14,052 |
| Analog Devices Inc. | 271,942 | 12,643 |
| Linear Technology Corp. | 325,261 | 12,480 |
| Xilinx Inc. | 325,798 | 12,436 |
| * Gartner Inc. | 203,450 | 11,070 |
| Intel Corp. | 456,900 | 9,983 |
| Altera Corp. | 255,128 | 9,049 |
| Paychex Inc. | 255,588 | 8,963 |
| Cisco Systems Inc. | 424,605 | 8,879 |
| Automatic Data Processing Inc. | 136,128 | 8,851 |
| * CACI International Inc. Class A | 137,847 | 7,977 |
| Dolby Laboratories Inc. Class A | 235,095 | 7,890 |
| * Teradyne Inc. | 447,635 | 7,261 |
| Seagate Technology plc | 190,679 | 6,971 |
| * Facebook Inc. Class A | 241,526 | 6,178 |
| * Teradata Corp. | 85,183 | 4,984 |
| * Alliance Data Systems Corp. | 25,312 | 4,098 |
| * LSI Corp. | 539,719 | 3,659 |
| * Sapient Corp. | 273,963 | 3,340 |
| * Flextronics International Ltd. | 483,029 | 3,265 |
| * CoreLogic Inc./United States | 123,178 | 3,185 |
| DST Systems Inc. | 39,542 | 2,818 |
| AOL Inc. | 66,606 | 2,564 |
| * Kulicke & Soffa Industries Inc. | 174,695 | 2,020 |
| * Unisys Corp. | 80,796 | 1,838 |
12
| | | | | |
| Vanguard® Global Equity Fund | | | | |
| Schedule of Investments | | | | |
| March 31, 2013 | | | | |
| |
| | | | | | Market |
| | | | | | Value |
| | | | | Shares | ($000) |
| * | CSG Systems International Inc. | | | 72,359 | 1,533 |
| * | Brocade Communications Systems Inc. | | | 245,982 | 1,419 |
| | Heartland Payment Systems Inc. | | | 39,393 | 1,299 |
| | Convergys Corp. | | | 62,069 | 1,057 |
| * | Magnachip Semiconductor Corp. | | | 57,252 | 991 |
| * | ValueClick Inc. | | | 29,891 | 883 |
| * | Euronet Worldwide Inc. | | | 25,608 | 675 |
| * | Photronics Inc. | | | 54,881 | 367 |
| | | | | | 370,581 |
| Materials (2.2%) | | | | |
| | LyondellBasell Industries NV Class A | | | 256,623 | 16,242 |
| | Bemis Co. Inc. | | | 274,297 | 11,071 |
| | Praxair Inc. | | | 97,216 | 10,844 |
| | Domtar Corp. | | | 136,721 | 10,612 |
| | Sigma-Aldrich Corp. | | | 131,961 | 10,251 |
| | CF Industries Holdings Inc. | | | 46,933 | 8,935 |
| | Monsanto Co. | | | 35,344 | 3,733 |
| | Scotts Miracle-Gro Co. Class A | | | 85,007 | 3,676 |
| | Boise Inc. | | | 415,368 | 3,597 |
| | Greif Inc. Class A | | | 66,975 | 3,591 |
| * | Graphic Packaging Holding Co. | | | 390,469 | 2,925 |
| * | Chemtura Corp. | | | 130,599 | 2,822 |
| | Minerals Technologies Inc. | | | 53,490 | 2,220 |
| | Rock Tenn Co. Class A | | | 13,584 | 1,260 |
| | PH Glatfelter Co. | | | 42,530 | 994 |
| | Myers Industries Inc. | | | 56,409 | 787 |
| | Neenah Paper Inc. | | | 19,183 | 590 |
| | Schweitzer-Mauduit International Inc. | | | 9,113 | 353 |
| * | Resolute Forest Products Inc. | | | 21,116 | 342 |
| | Sonoco Products Co. | | | 8,290 | 290 |
| * | Mercer International Inc. | | | 23,757 | 164 |
| | | | | | 95,299 |
| Telecommunication Services (0.0%) | | | | |
| * | Vonage Holdings Corp. | | | 104,523 | 302 |
| |
| | | | | | 1,785,713 |
| |
| Total Common Stocks (Cost $3,471,479) | | | | 4,081,560 |
| |
| |
| | | Coupon | | | |
| |
| Temporary Cash Investments (3.8%)1 | | | | |
| Money Market Fund (3.7%) | | | | |
| 3,4 | Vanguard Market Liquidity Fund | 0.147% | | 156,126,711 | 156,127 |
| |
| |
| | | | | Face | |
| | | | Maturity | Amount | |
| | | | Date | ($000) | |
| U.S. Government and Agency Obligations (0.1%) | | | | |
| 5,6 | Federal Home Loan Bank Discount Notes | 0.110% | 5/15/13 | 1,000 | 1,000 |
| 5,6,7 | Federal Home Loan Bank Discount Notes | 0.120% | 5/31/13 | 3,000 | 2,999 |
| 6,7,8 | Freddie Mac Discount Notes | 0.100% | 4/3/13 | 2,500 | 2,500 |
| |
| | | | | | 6,499 |
| |
| Total Temporary Cash Investments (Cost $162,626) | | | | 162,626 |
| |
| Total Investments (99.6%) (Cost $3,634,105) | | | | 4,244,186 |
| Other Assets and Liabilities—Net (0.4%) | | | | 14,989 |
| |
| Net Assets (100%) | | | | 4,259,175 |
| * Non-income-producing security. |
13
Vanguard® Global Equity Fund
Schedule of Investments
March 31, 2013
^ Part of security position is on loan to broker-dealers. The total value of securities on loan is $44,562,000.
1 The fund invests a portion of its cash reserves in equity markets through the use of index futures contracts. After giving effect to futures
investments, the fund's effective common stock and temporary cash investment positions represent 98.3% and 1.3%, respectively, of net
assets.
2 Considered an affiliated company of the fund as the issuer is another member of The Vanguard Group.
3 Affiliated money market fund available only to Vanguard funds and certain trusts and accounts managed by Vanguard. Rate shown is the 7-day
yield.
4 Includes $47,116,000 of collateral received for securities on loan.
5 The issuer operates under a congressional charter; its securities are generally neither guaranteed by the U.S. Treasury nor backed by the full
faith and credit of the U.S. government.
6 Securities with a value of $5,432,000 have been segregated as initial margin for open futures contracts.
7 Securities with a value of $120,000 are segregated as collateral for forward currency contracts that were terminated but have not yet settled.
8 The issuer was placed under federal conservatorship in September 2008; since that time, its daily operations have been managed by the Federal
Housing Finance Agency and it receives capital from the U.S. Treasury, as needed to maintain a positive net worth, in exchange for senior
preferred stock.
ADR—American Depositary Receipt.
GDR—Global Depositary Receipt.
14
© 2013 The Vanguard Group. Inc.
All rights reserved.
Vanguard Marketing Corporation, Distributor.
SNA 1292 052013
Item 7: Disclosure of Proxy Voting Policies and Procedures for Closed-End Management
Investment Companies.
Not Applicable.
Item 8: Portfolio Managers of Closed-End Management Investment Companies.
Not Applicable.
Item 9: Purchase of Equity Securities by Closed-End Management Investment Company and
Affiliated Purchasers.
Not Applicable.
Item 10: Submission of Matters to a Vote of Security Holders.
Not Applicable.
Item 11: Controls and Procedures.
(a) Disclosure Controls and Procedures. The Principal Executive and Financial Officers concluded that the Registrant’s Disclosure Controls and Procedures are effective based on their evaluation of the Disclosure Controls and Procedures as of a date within 90 days of the filing date of this report.
(b) Internal Control Over Financial Reporting. There were no significant changes in Registrant’s Internal Control Over Financial Reporting or in other factors that could significantly affect this control subsequent to the date of the evaluation, including any corrective actions with regard to significant deficiencies and material weaknesses.
Item 12: Exhibits.
(a) Certifications.
Pursuant to the requirements of the Securities Exchange Act of 1934 and the Investment Company Act of 1940, the registrant has duly caused this report to be signed on its behalf by the undersigned, thereunto duly authorized.
| |
| | VANGUARD HORIZON FUNDS |
| |
| |
| BY: | /s/ F. WILLIAM MCNABB III* |
| | F. WILLIAM MCNABB III |
| | CHIEF EXECUTIVE OFFICER |
| |
| Date: May 17, 2013 |
Pursuant to the requirements of the Securities Exchange Act of 1934 and the Investment Company Act of 1940, this report has been signed below by the following persons on behalf of the registrant and in the capacities and on the dates indicated.
| |
| | VANGUARD HORIZON FUNDS |
| |
| BY: | /s/ F. WILLIAM MCNABB III* |
| | F. WILLIAM MCNABB III |
| | CHIEF EXECUTIVE OFFICER |
Date: May 17, 2013 |
| VANGUARD HORIZON FUNDS |
| |
| BY: | /s/ THOMAS J. HIGGINS* |
| | THOMAS J. HIGGINS |
| | CHIEF FINANCIAL OFFICER |
Date: May 17, 2013 |
* By: /s/ Heidi Stam
Heidi Stam, pursuant to a Power of Attorney filed on March 27, 2012 see file Number 2-11444, Incorporated by Reference.