UNITED STATES
SECURITIES AND EXCHANGE COMMISSION
Washington, D.C. 20549
FORM N-CSR
CERTIFIED SHAREHOLDER REPORT
OF
REGISTERED MANAGEMENT INVESTMENT COMPANIES
| |
Investment Company Act file number: 811-07239 |
| Name of Registrant: | Vanguard Horizon Funds |
Address of Registrant: | P.O. Box 2600 |
| | Valley Forge, PA 19482 |
Name and address of agent for service: | Heidi Stam, Esquire |
| | P.O. Box 876 |
| | Valley Forge, PA 19482 |
Registrant’s telephone number, including area code: (610) 669-1000 |
| Date of fiscal year end: September 30 | |
| Date of reporting period: October 1, 2014 – March 31, 2015 |
Item 1: Reports to Shareholders
Semiannual Report | March 31, 2015
Vanguard Strategic Equity Fund
The mission continues
On May 1, 1975, Vanguard began operations, a fledgling company based on the simple but revolutionary idea that a mutual fund company should be managed solely in the interest of its investors.
Four decades later, that revolutionary spirit continues to animate the enterprise. Vanguard remains on a mission to give investors the best chance of investment success.
As we mark our 40th anniversary, we thank you for entrusting your assets to Vanguard and giving us the opportunity to help you reach your financial goals in the decades to come.
| |
| Contents | |
| Your Fund’s Total Returns. | 1 |
| Chairman’s Letter. | 2 |
| Advisor’s Report. | 8 |
| Fund Profile. | 10 |
| Performance Summary. | 11 |
| Financial Statements. | 12 |
| About Your Fund’s Expenses. | 26 |
| Trustees Approve Advisory Arrangement. | 28 |
| Glossary. | 29 |
Please note: The opinions expressed in this report are just that—informed opinions. They should not be considered promises or advice.
Also, please keep in mind that the information and opinions cover the period through the date on the front of this report. Of course, the risks of investing in your fund are spelled out in the prospectus.
See the Glossary for definitions of investment terms used in this report.
About the cover: Since our founding, Vanguard has drawn inspiration from the enterprise and valor demonstrated by British naval hero Horatio Nelson and his command at the Battle of the Nile in 1798. The photograph displays a replica of a merchant ship from the same era as Nelson’s flagship, the HMS Vanguard.
Your Fund’s Total Returns
| |
| Six Months Ended March 31, 2015 | |
| | Total |
| | Returns |
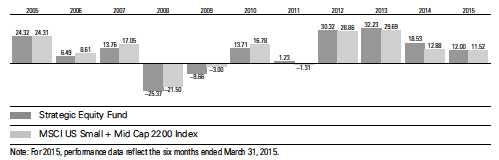
| Vanguard Strategic Equity Fund | 12.00% |
| MSCI US Small + Mid Cap 2200 Index | 11.52 |
| Mid-Cap Core Funds Average | 9.28 |
| Mid-Cap Core Funds Average: Derived from data provided by Lipper, a Thomson Reuters Company. | |
| | | | | |
| Your Fund’s Performance at a Glance | | | | |
| September 30, 2014, Through March 31, 2015 | | | | |
| | | | Distributions Per Share |
| | Starting | Ending | Income | Capital |
| | Share Price | Share Price | Dividends | Gains |
| Vanguard Strategic Equity Fund | $32.02 | $33.84 | $0.354 | $1.519 |

Chairman’s Letter
Dear Shareholder,
Although U.S. stocks produced solid returns for the six months ended March 31, 2015, their path upward was a choppy one. A strong U.S. dollar, the prospect of rising interest rates, and tepid growth abroad contributed to some retrenchment at times. But other factors buoyed stocks, including the improving labor market, growing consumer confidence, and the Federal Reserve’s patience in holding interest rates low.
Given the muted outlook for growth internationally, the domestic focus of many small- and mid-capitalization stocks helped them outperform the broad U.S. stock market. Vanguard Strategic Equity Fund returned 12.00% for the six months, outpacing the 11.52% return of its benchmark, the MSCI US Small + Mid Cap 2200 Index, and the 9.28% average return of its peer group.
Results by sector varied widely. Six of the ten market sectors produced double-digit returns for the fund, with health care and information technology taking the top spots. In contrast, energy posted a double-digit decline, and materials was in negative territory as well. The fund’s outperformance of its benchmark was driven by superior results in information technology and industrials, which helped offset some subpar results elsewhere, most notably in materials and consumer staples.
2
The Fed’s cautious approach was favorable for U.S. stocks
The broad U.S. stock market returned about 7% for the six months. Stocks bounced back after declining markedly at the start of the period and enduring bouts of turmoil in subsequent months. Investors’ concerns included the strength of the dollar and how that would affect the profits of U.S.-based multinational corporations.
Overall, stocks responded favorably to both the Fed’s cautious approach to raising short-term interest rates and the monetary stimulus efforts of other nations’ central banks. A strong rebound in February, when the broad market notched its largest monthly gain since October 2011, helped lift returns for the period.
International stocks had a slightly negative return as the dollar’s strength against many foreign currencies hurt results. Without this currency effect, stocks outside the United States generally advanced. The developed markets of the Pacific, particularly Japan, were especially strong.
Global central bank stimulus helped drive up bond prices
Bond prices, too, were supported by accommodative monetary policies from central banks and by investors who sought safe-haven assets amid turbulence in the stock market. The broad U.S. taxable bond market returned 3.43%. The yield of the 10-year U.S. Treasury note ended March at 1.95%, down from 2.48% six months earlier. (Bond prices and yields move in opposite directions.)
| | | |
| Market Barometer | | | |
| | | | Total Returns |
| | | Periods Ended March 31, 2015 |
| | Six | One | Five Years |
| | Months | Year | (Annualized) |
| Stocks | | | |
| Russell 1000 Index (Large-caps) | 6.55% | 12.73% | 14.73% |
| Russell 2000 Index (Small-caps) | 14.46 | 8.21 | 14.57 |
| Russell 3000 Index (Broad U.S. market) | 7.13 | 12.37 | 14.71 |
| FTSE All-World ex US Index (International) | -0.08 | -0.21 | 5.19 |
| |
| Bonds | | | |
| Barclays U.S. Aggregate Bond Index (Broad taxable market) | 3.43% | 5.72% | 4.41% |
| Barclays Municipal Bond Index (Broad tax-exempt market) | 2.40 | 6.62 | 5.11 |
| Citigroup Three-Month U.S. Treasury Bill Index | 0.00 | 0.03 | 0.06 |
| |
| CPI | | | |
| Consumer Price Index | -0.80% | -0.07% | 1.64% |
3
Municipal bonds returned 2.40%, though results faded later in the period as more bonds were issued.
International bond markets (as measured by the Barclays Global Aggregate Index ex USD) returned –7.49%, a reflection of foreign currencies’ weakness relative to the dollar. International bonds hedged to eliminate the effect of currency exchange rates produced positive returns.
The Fed’s target of 0%–0.25% for short-term interest rates continued to cap returns for money market funds and savings accounts.
Strength in a few sectors offset disappointment in others
Vanguard Equity Investment Group, through its Quantitative Equity Group, serves as the advisor for the fund. It uses a proprietary computer model to sift through vast amounts of quantitative data on small- and mid-cap stocks. The aim is to single out quality stocks with high growth potential and attractive valuation that, when put together in a portfolio, don’t differ much from the MSCI US Small + Mid Cap 2200 Index in terms of risk. It’s a rigorous exercise: The fund held fewer than one-quarter of the stocks in its benchmark during the half year.
| | |
| Expense Ratios | | |
| Your Fund Compared With Its Peer Group | | |
| | | Peer Group |
| | Fund | Average |
| Strategic Equity Fund | 0.27% | 1.19% |
| The fund expense ratio shown is from the prospectus dated January 27, 2015, and represents estimated costs for the current fiscal year. For the six months ended March 31, 2015, the fund’s annualized expense ratio was 0.25%. The peer-group expense ratio is derived from data provided by Lipper, a Thomson Reuters Company, and captures information through year-end 2014. |
|
|
| |
| Peer group: Mid-Cap Core Funds. | | |
4
Health care turned in the strongest sector performance for the benchmark, returning more than 30%. Merger and acquisition activity ran high as many biotechnology and pharmaceutical companies looked for opportunities to grow faster and become more efficient. New drugs moving closer to market also fueled investor interest. The fund’s strong returns in managed health care and life science stocks made up for poorer results in biotech. As a result, the fund finished a little ahead of its benchmark in this sector.
|
| Marking the sixth anniversary of the bull market |
| |
| There’s been a long and steep climb in the U.S. stock market in the six years since the worst |
| of the financial crisis. |
| |
| The dark line in the chart below traces the rise in the Russell 3000 Index from a low of 390 |
| on March 9, 2009, to 1,241 on March 9, 2015—an increase of roughly 220% in 72 months. |
| |
| The robustness and duration of the advance defied the predictions of some market pundits. |
| Of course, the financial crisis caught many of them off guard as well. The lighter line below |
| charts the drop of about 60% in the index in 17 months, from its pre-crisis peak of 908 on |
| October 9, 2007. |
| |
| These sharp and unexpected movements illustrate the challenge of trying to time the markets. |
| Instead of trying to guess which way the wind will blow (and for how long), investors are |
| generally better off staying committed to their investment plan through market ups and downs. |
| Rebalancing your portfolio from time to time will help keep market movements from pushing |
| your allocation to stocks and bonds off target. |
| |
| The performance of the U.S. stock market since the start of the financial crisis |
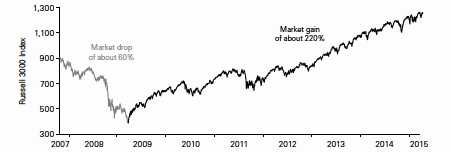
| Sources: Vanguard, based on data for the Russell 3000 Index. |
5
At the other end of the performance spectrum, energy stocks in the benchmark declined by roughly 25%. Here, the fund’s performance was more or less even with that of the benchmark. Its lean allocation to oil and gas stocks, which were hurt by the sharp fall in the price of crude oil, contributed positively, but its positions in energy equipment and services companies detracted.
Where the fund did significantly outpace its benchmark was in information technology and industrials. The advisor’s company-by-company screening process resulted in the fund’s holding a narrow slice of technology stocks, among them a handful of semiconductor and software holdings that turned in strong performances.
In industrials, the airline segment has been benefiting from consolidation among carriers, better pricing power, and lower fuel costs. The segment as a whole performed very well in the benchmark, and the fund’s more limited holdings did even better. The advisor’s holdings among aerospace and defense stocks also helped results.
In materials and consumer staples, however, the fund’s returns lagged those of its benchmark. The main detractors were among steel and aluminum producers and chemical companies in materials, and food and beverage stocks in consumer staples.
More information about the advisor’s management of the fund can be found in the Advisor’s Report that follows this letter.
Our focus on balanced investing has roots going back many decades
On May 1, Vanguard will celebrate its 40th anniversary. Although many things have changed since 1975, our investment philosophy has not. From the start, we’ve focused on four timeless, straightforward principles that we believe help give clients the best chance for investment success:
• Goals. Create clear, appropriate investment goals.
• Balance. Develop a suitable asset allocation using broadly diversified funds.
• Cost. Minimize cost.
• Discipline. Maintain perspective and long-term discipline.
Although Vanguard has followed all these principles since its founding, one—the focus on balanced investing—is in the company’s DNA. That’s because our predecessor company, Wellington
6
Management, was a pioneer in this respect, launching a fund in 1929 that included both stocks and bonds.
Vanguard Wellington™ Fund got its start on the eve of the Great Depression, but it thrived over the long term, thanks in large part to its balancing of stocks and bonds. This strategy continues to define the fund, now one of the nation’s largest balanced funds.
As we embark on our fifth decade, we’ll continue to emphasize the importance of balanced, diversified investing. How investors allocate assets between stocks and bonds has an enormous effect on the risks and returns of their portfolios. And broad diversification reduces exposure to specific risks, while providing opportunities to benefit from the market’s current leaders. (You can read more in Vanguard’s Principles for Investing Success, available at vanguard.com/research.)
As always, thank you for investing with Vanguard.
Sincerely,

F. William McNabb III
Chairman and Chief Executive Officer
April 17, 2015
Advisor’s Report
For the fiscal half year ended March 31, 2015, Vanguard Strategic Equity Fund returned 12.00%, outperforming its benchmark by 48 basis points (a basis point is one-hundredth of a percentage point). Overall, equities continued to produce strong returns. The broad U.S. equity market was up about 7%. Returns of small-capitalization stocks were roughly double those of large-caps, and growth-oriented stocks outpaced value stocks by a wide margin. Globally, the U.S. equity market generated the lion’s share of returns as countries outside the United States were down slightly. Emerging markets in particular continued to underperform.
Performance within the benchmark was generally strong for all sectors except energy. Results were best in health care, consumer discretionary, and consumer staples. Although returns for utilities, telecommunication services, and materials stocks were positive, they underperformed; returns for energy stocks were negative.
The U.S. economy continued to build on its positive momentum. Fourth-quarter GDP growth came in at an annual rate of 2.2%—down from 5% in the third quarter but still encouraging. Although job growth slowed in March, the unemployment rate has declined to 5.5% and the country appears to be approaching full employment.
However, the past six months have not been without challenges. The harsh winter in many parts of the country is believed to have hurt first-quarter growth, and tepid sales have boosted wholesale inventory levels, leaving little motivation to restock warehouses. Uncertainty remains about when, and to what extent, the Federal Reserve will begin raising interest rates. Additionally, the strength of the U.S. dollar has increased the price of exports by as much as 20%, challenging revenue and profit results of multinationals.
Although it’s important to understand how our overall performance is affected by the macroeconomic factors we’ve described, our approach to investing focuses on specific fundamentals—not on technical analysis of stock price movements. We compare all the stocks in our investment universe within the same industry groups in order to identify those with characteristics that we believe will enable them to outperform over the long run.
To do this, we use a strict quantitative process that systematically focuses on five key themes: (1) high quality—healthy balance sheets and consistent cash flow generation; (2) effective use of capital—sound investment policies that prefer internal to external funding; (3) consistent earnings growth—a demonstrated ability to increase earnings year after year; (4) strong market sentiment—market confirmation of our view; and (5) reasonable valuation—avoidance of overpriced stocks.
Using these themes, we generate a composite expected return for all the stocks in our universe each day, seeking to capitalize on investor biases across the market. We then monitor our portfolio,
8
based on those scores, and make adjustments when appropriate to maximize expected return while minimizing exposure to risks relative to the benchmark (such as industry selection) that our research indicates do not improve returns.
For the half year, our growth, sentiment, quality, and valuation models were positive contributors to performance. Our management decisions model, however, did not perform as expected. As a result, the model’s effectiveness over the period across sectors was mixed. We had positive stock selection results in five of the ten sectors. Our strongest results were in information technology and industrials, and the weakest were in consumer staples and materials.
At the individual stock level, the largest contributors came from overweight positions in Electronic Arts, Centene, and Qorvo. In addition, compared with the benchmark, we benefited from underweighting or avoiding poorly performing stocks such as NetApp and Genworth Financial.
Unfortunately, we were not able to avoid all bad performers. Overweight positions in Trinity Industries, Greenbrier Companies, and United Rentals detracted from results. Underweighting Pharmacyclics and Avago Technologies—companies that were not positively identified by the fundamentals in our model—hurt overall relative performance.
We continue to believe that constructing a portfolio that focuses on the key fundamentals described above will benefit investors over the long term, while recognizing that risk can reward or punish us in the near term. We believe that the fund offers a strong mix of stocks with attractive valuation and growth characteristics relative to its underlying benchmark.
We thank you for your investment and look forward to the second half of the fiscal year.
Portfolio Managers:
James D. Troyer, CFA, Principal
James P. Stetler, Principal
Michael R. Roach, CFA
Vanguard Equity Investment Group
April 21, 2015
9
Strategic Equity Fund
Fund Profile
As of March 31, 2015
| | | | |
| Portfolio Characteristics | | |
| | | MSCI US | DJ |
| | | Small + | U.S. Total |
| | | Mid Cap | Market |
| | Fund | 2200 Index | FA Index |
| Number of Stocks | 440 | 2,167 | 3,757 |
| Median Market Cap | $5.0B | $6.4B | $46.5B |
| Price/Earnings Ratio | 17.8x | 27.2x | 21.4x |
| Price/Book Ratio | 2.8x | 2.6x | 2.8x |
| Return on Equity | 13.2% | 13.7% | 17.5% |
| Earnings Growth | | | |
| Rate | 15.8% | 13.7% | 13.5% |
| Dividend Yield | 1.4% | 1.4% | 1.9% |
| Foreign Holdings | 1.0% | 0.0% | 0.0% |
| Turnover Rate | | | |
| (Annualized) | 68% | — | — |
| | | — | — |
| Ticker Symbol | VSEQX | | |
| Expense Ratio1 | 0.27% | — | — |
| 30-Day SEC Yield | 1.23% | — | — |
| Short-Term Reserves | 0.4% | — | — |
| | | | |
| Sector Diversification (% of equity exposure) |
| | | MSCI US | |
| | | Small + | DJ |
| | | Mid Cap | U.S. Total |
| | | 2200 | Market |
| | Fund | Index | FA Index |
| Consumer | | | |
| Discretionary | 16.9% | 16.3% | 13.4% |
| Consumer Staples | 5.4 | 4.7 | 8.4 |
| Energy | 5.0 | 5.3 | 7.3 |
| Financials | 20.2 | 20.3 | 17.6 |
| Health Care | 12.2 | 11.9 | 14.6 |
| Industrials | 13.5 | 14.0 | 11.1 |
| Information | | | |
| Technology | 15.5 | 16.1 | 19.0 |
| Materials | 5.7 | 5.8 | 3.5 |
| Telecommunication | | | |
| Services | 1.0 | 0.9 | 2.0 |
| Utilities | 4.6 | 4.7 | 3.1 |
| | |
| Volatility Measures | | |
| | MSCI US | DJ |
| | Small + | U.S. Total |
| | Mid Cap | Market |
| | 2200 Index | FA Index |
| R-Squared | 0.96 | 0.90 |
| Beta | 0.98 | 1.08 |
| These measures show the degree and timing of the fund’s fluctuations compared with the indexes over 36 months. |
|
| | |
| Ten Largest Holdings (% of total net assets) |
| Electronic Arts Inc. | Home Entertainment | |
| | Software | 1.1% |
| Edwards Lifesciences | Health Care | |
| Corp. | Equipment | 1.0 |
| Qorvo Inc. | Semiconductors | 1.0 |
| Tesoro Corp. | Oil & Gas Refining & | |
| | Marketing | 1.0 |
| Centene Corp. | Managed Health | |
| | Care | 0.9 |
| AmerisourceBergen | Health Care | |
| Corp. | Distributors | 0.9 |
| Bunge Ltd. | Agricultural Products | 0.9 |
| Spirit AeroSystems | Aerospace & | |
| Holdings Inc. | Defense | 0.9 |
| Hanesbrands Inc. | Apparel, Accessories | |
| | & Luxury Goods | 0.9 |
| Huntington Ingalls | Aerospace & | |
| Industries Inc. | Defense | 0.9 |
| Top Ten | | 9.5% |
| The holdings listed exclude any temporary cash investments and equity index products. |
|
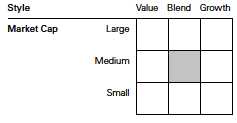
Investment Focus
1 The expense ratio shown is from the prospectus dated January 27, 2015, and represents estimated costs for the current fiscal year. For the six months ended March 31, 2015, the annualized expense ratio was 0.25%.
10
Strategic Equity Fund
Performance Summary
All of the returns in this report represent past performance, which is not a guarantee of future results that may be achieved by the fund. (Current performance may be lower or higher than the performance data cited. For performance data current to the most recent month-end, visit our website at vanguard.com/performance.) Note, too, that both investment returns and principal value can fluctuate widely, so an investor’s shares, when sold, could be worth more or less than their original cost. The returns shown do not reflect taxes that a shareholder would pay on fund distributions or on the sale of fund shares.
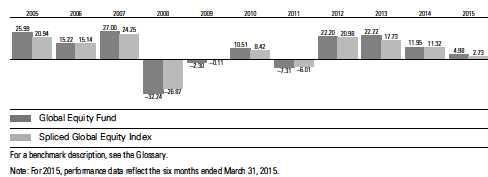
Fiscal-Year Total Returns (%): September 30, 2004, Through March 31, 2015
| | | | | |
| Average Annual Total Returns: Periods Ended March 31, 2015 | | | |
| |
| | Inception | One | Five | Ten |
| | Date | Year | Years | Years |
| Strategic Equity Fund | 8/14/1995 | 14.29% | 18.19% | 9.06% |
See Financial Highlights for dividend and capital gains information.
11
Strategic Equity Fund
Financial Statements (unaudited)
Statement of Net Assets
As of March 31, 2015
The fund reports a complete list of its holdings in regulatory filings four times in each fiscal year, at the quarter-ends. For the second and fourth fiscal quarters, the lists appear in the fund’s semiannual and annual reports to shareholders. For the first and third fiscal quarters, the fund files the lists with the Securities and Exchange Commission on Form N-Q. Shareholders can look up the fund’s Forms N-Q on the SEC’s website at sec.gov. Forms N-Q may also be reviewed and copied at the SEC’s Public Reference Room (see the back cover of this report for further information).
| | | |
| | | | Market |
| | | | Value |
| | | Shares | ($000) |
| Common Stocks (99.7%)1 | | |
| Consumer Discretionary (16.8%) | |
| | Hanesbrands Inc. | 1,702,800 | 57,061 |
| * | Skechers U.S.A. Inc. | | |
| | Class A | 759,600 | 54,623 |
| | Best Buy Co. Inc. | 1,440,800 | 54,448 |
| * | Murphy USA Inc. | 691,800 | 50,066 |
| * | O’Reilly Automotive Inc. | 229,400 | 49,605 |
| | Big Lots Inc. | 993,000 | 47,694 |
| | Dillard’s Inc. Class A | 337,170 | 46,027 |
| | Cablevision Systems Corp. | | |
| | Class A | 2,405,200 | 44,015 |
| | Domino’s Pizza Inc. | 435,820 | 43,822 |
| | Brinker International Inc. | 684,950 | 42,166 |
| * | Live Nation | | |
| | Entertainment Inc. | 1,173,100 | 29,597 |
| ^ | Outerwall Inc. | 434,390 | 28,722 |
| * | Starz | 810,400 | 27,886 |
| | Jack in the Box Inc. | 275,000 | 26,378 |
| * | Iconix Brand Group Inc. | 703,600 | 23,690 |
| | Cooper Tire & Rubber Co. | 542,200 | 23,228 |
| | Royal Caribbean | | |
| | Cruises Ltd. | 271,900 | 22,255 |
| * | Visteon Corp. | 225,900 | 21,777 |
| | Expedia Inc. | 223,100 | 21,000 |
| | Wyndham | | |
| | Worldwide Corp. | 226,100 | 20,455 |
| * | Madison Square | | |
| | Garden Co. Class A | 225,800 | 19,114 |
| | Whirlpool Corp. | 90,900 | 18,367 |
| | Dana Holding Corp. | 822,300 | 17,400 |
| | Buckle Inc. | 315,100 | 16,098 |
| | Nutrisystem Inc. | 743,200 | 14,849 |
| | Marriott Vacations | | |
| | Worldwide Corp. | 178,400 | 14,459 |
| * | Strayer Education Inc. | 262,400 | 14,015 |
| * | NVR Inc. | 10,200 | 13,552 |
| | Lear Corp. | 116,400 | 12,899 |
| | | |
| | | | Market |
| | | | Value |
| | | Shares | ($000) |
| | H&R Block Inc. | 382,100 | 12,254 |
| * | Barnes & Noble Inc. | 508,300 | 12,072 |
| | Carter’s Inc. | 128,800 | 11,910 |
| | Brown Shoe Co. Inc. | 358,800 | 11,769 |
| * | BJ’s Restaurants Inc. | 222,100 | 11,205 |
| * | Grand Canyon | | |
| | Education Inc. | 256,000 | 11,085 |
| * | Tower International Inc. | 368,200 | 9,794 |
| * | Burlington Stores Inc. | 149,600 | 8,889 |
| * | American Axle & | | |
| | Manufacturing | | |
| | Holdings Inc. | 341,700 | 8,826 |
| * | Fossil Group Inc. | 85,100 | 7,017 |
| * | News Corp. Class B | 433,800 | 6,884 |
| | Cato Corp. Class A | 167,600 | 6,637 |
| * | Vince Holding Corp. | 236,900 | 4,395 |
| | Hasbro Inc. | 69,200 | 4,376 |
| | Tupperware Brands Corp. | 62,200 | 4,293 |
| | Columbia Sportswear Co. | 67,200 | 4,093 |
| | Starwood Hotels & | | |
| | Resorts Worldwide Inc. | 48,000 | 4,008 |
| | Leggett & Platt Inc. | 85,700 | 3,950 |
| | PVH Corp. | 36,100 | 3,847 |
| * | Universal Electronics Inc. | 67,700 | 3,821 |
| * | Denny’s Corp. | 331,700 | 3,781 |
| | Foot Locker Inc. | 55,000 | 3,465 |
| | Harman International | | |
| | Industries Inc. | 22,300 | 2,980 |
| * | lululemon athletica Inc. | 46,200 | 2,958 |
| * | Deckers Outdoor Corp. | 34,000 | 2,478 |
| * | G-III Apparel Group Ltd. | 11,200 | 1,262 |
| * | Liberty Interactive Corp. | | |
| | Class A | 40,200 | 1,173 |
| * | FTD Cos. Inc. | 37,100 | 1,111 |
| * | Kirkland’s Inc. | 40,300 | 957 |
| * | Unifi Inc. | 12,800 | 462 |
| * | Ruby Tuesday Inc. | 76,400 | 459 |
| | Clear Channel Outdoor | | |
| | Holdings Inc. Class A | 43,800 | 443 |
12
Strategic Equity Fund
| | | |
| | | | Market |
| | | | Value |
| | | Shares | ($000) |
| * | 1-800-Flowers.com Inc. | | |
| | Class A | 27,800 | 329 |
| | Carriage Services Inc. | | |
| | Class A | 9,600 | 229 |
| | | | 1,048,480 |
| Consumer Staples (5.4%) | | |
| | Bunge Ltd. | 703,000 | 57,899 |
| ^ | Sanderson Farms Inc. | 595,400 | 47,424 |
| ^ | Pilgrim’s Pride Corp. | 1,910,300 | 43,154 |
| * | Rite Aid Corp. | 4,117,700 | 35,783 |
| | Clorox Co. | 234,800 | 25,920 |
| * | Monster Beverage Corp. | 179,600 | 24,856 |
| * | SUPERVALU Inc. | 1,993,700 | 23,187 |
| | Pinnacle Foods Inc. | 537,600 | 21,939 |
| | Cal-Maine Foods Inc. | 367,300 | 14,347 |
| | ConAgra Foods Inc. | 218,900 | 7,996 |
| | Dr Pepper Snapple | | |
| | Group Inc. | 100,000 | 7,848 |
| * | USANA Health | | |
| | Sciences Inc. | 70,000 | 7,778 |
| | Lancaster Colony Corp. | 71,419 | 6,797 |
| | Ingles Markets Inc. Class A | 73,000 | 3,612 |
| | Energizer Holdings Inc. | 20,000 | 2,761 |
| | Fresh Del Monte | | |
| | Produce Inc. | 66,500 | 2,587 |
| | Ingredion Inc. | 32,700 | 2,545 |
| * | Medifast Inc. | 25,500 | 764 |
| | Village Super Market Inc. | | |
| | Class A | 6,400 | 201 |
| | | | 337,398 |
| Energy (5.0%) | | |
| | Tesoro Corp. | 656,600 | 59,941 |
| | Green Plains Inc. | 1,570,400 | 44,835 |
| | Core Laboratories NV | 280,400 | 29,299 |
| * | Oil States International Inc. | 679,022 | 27,005 |
| * | Newfield Exploration Co. | 558,700 | 19,605 |
| | Nabors Industries Ltd. | 1,424,200 | 19,440 |
| | Plains GP Holdings LP | | |
| | Class A | 668,800 | 18,974 |
| | SM Energy Co. | 318,800 | 16,475 |
| | Targa Resources Corp. | 128,100 | 12,271 |
| * | Kosmos Energy Ltd. | 1,375,400 | 10,879 |
| | Western Refining Inc. | 187,300 | 9,251 |
| | Alon USA Energy Inc. | 440,700 | 7,302 |
| | Bristow Group Inc. | 77,200 | 4,203 |
| * | SEACOR Holdings Inc. | 57,700 | 4,020 |
| | ONEOK Inc. | 82,000 | 3,956 |
| | World Fuel Services Corp. | 60,500 | 3,477 |
| * | Southwestern Energy Co. | 145,800 | 3,381 |
| ^ | Paragon Offshore plc | 2,535,500 | 3,296 |
| * | Pioneer Energy | | |
| | Services Corp. | 575,800 | 3,121 |
| * | WPX Energy Inc. | 258,700 | 2,828 |
| | | |
| | | | Market |
| | | | Value |
| | | Shares | ($000) |
| | Energen Corp. | 40,000 | 2,640 |
| * | Clayton Williams | | |
| | Energy Inc. | 34,600 | 1,752 |
| * | Newpark Resources Inc. | 157,600 | 1,436 |
| * | Helix Energy Solutions | | |
| | Group Inc. | 89,700 | 1,342 |
| * | Gran Tierra Energy Inc. | 466,700 | 1,274 |
| * | VAALCO Energy Inc. | 150,300 | 368 |
| | | | 312,371 |
| Financials (20.1%) | | |
| | Voya Financial Inc. | 1,269,900 | 54,745 |
| | CIT Group Inc. | 1,213,100 | 54,735 |
| | Everest Re Group Ltd. | 307,500 | 53,505 |
| | Huntington | | |
| | Bancshares Inc. | 4,182,800 | 46,220 |
| | RenaissanceRe | | |
| | Holdings Ltd. | 418,700 | 41,757 |
| | AmTrust Financial | | |
| | Services Inc. | 707,300 | 40,305 |
| | PartnerRe Ltd. | 313,100 | 35,797 |
| | Navient Corp. | 1,692,900 | 34,417 |
| | Radian Group Inc. | 1,636,200 | 27,472 |
| | KeyCorp | 1,863,730 | 26,390 |
| * | World Acceptance Corp. | 347,619 | 25,348 |
| | Aspen Insurance | | |
| | Holdings Ltd. | 533,500 | 25,197 |
| | Host Hotels & | | |
| | Resorts Inc. | 1,199,900 | 24,214 |
| * | PRA Group Inc. | 407,300 | 22,125 |
| | Hospitality | | |
| | Properties Trust | 643,000 | 21,213 |
| | Extra Space Storage Inc. | 313,540 | 21,186 |
| * | MGIC Investment Corp. | 2,165,200 | 20,851 |
| | Apartment Investment | | |
| | & Management Co. | 519,000 | 20,428 |
| | Kimco Realty Corp. | 759,500 | 20,393 |
| | Corrections Corp. | | |
| | of America | 478,732 | 19,274 |
| | Ryman Hospitality | | |
| | Properties Inc. | 313,000 | 19,065 |
| | Weingarten Realty | | |
| | Investors | 528,900 | 19,030 |
| | GEO Group Inc. | 435,000 | 19,027 |
| | Omega Healthcare | | |
| | Investors Inc. | 460,000 | 18,662 |
| | Retail Properties | | |
| | of America Inc. | 1,085,100 | 17,394 |
| | Axis Capital Holdings Ltd. | 328,400 | 16,939 |
| * | Credit Acceptance Corp. | 85,661 | 16,704 |
| | Regions Financial Corp. | 1,766,200 | 16,691 |
| * | Strategic Hotels | | |
| | & Resorts Inc. | 1,336,000 | 16,606 |
| | EPR Properties | 275,900 | 16,562 |
| | Associated Banc-Corp | 854,300 | 15,890 |
13
Strategic Equity Fund
| | | |
| | | | Market |
| | | | Value |
| | | Shares | ($000) |
| | DuPont Fabros | | |
| | Technology Inc. | 484,000 | 15,817 |
| | RLJ Lodging Trust | 472,700 | 14,800 |
| | Regency Centers Corp. | 202,700 | 13,792 |
| * | Springleaf Holdings Inc. | 264,800 | 13,709 |
| | Sovran Self Storage Inc. | 145,900 | 13,706 |
| | Reinsurance Group of | | |
| | America Inc. Class A | 143,920 | 13,412 |
| | Allied World Assurance Co. | | |
| | Holdings AG | 330,200 | 13,340 |
| | Pennsylvania REIT | 560,800 | 13,027 |
| | Ashford Hospitality | | |
| | Trust Inc. | 1,321,500 | 12,713 |
| | Brandywine Realty Trust | 757,032 | 12,097 |
| | Columbia Property | | |
| | Trust Inc. | 436,100 | 11,783 |
| | Comerica Inc. | 236,200 | 10,660 |
| ^ | Lexington Realty Trust | 1,072,800 | 10,546 |
| | Equity LifeStyle | | |
| | Properties Inc. | 189,300 | 10,402 |
| | CoreSite Realty Corp. | 209,300 | 10,189 |
| | BioMed Realty Trust Inc. | 434,800 | 9,853 |
| | PrivateBancorp Inc. | 275,800 | 9,700 |
| | Summit Hotel | | |
| | Properties Inc. | 639,800 | 9,002 |
| | UDR Inc. | 260,900 | 8,878 |
| * | Investment Technology | | |
| | Group Inc. | 273,800 | 8,299 |
| | Nelnet Inc. Class A | 170,912 | 8,088 |
| | Hersha Hospitality Trust | | |
| | Class A | 1,224,400 | 7,922 |
| | CBL & Associates | | |
| | Properties Inc. | 397,000 | 7,861 |
| | Washington Federal Inc. | 334,700 | 7,298 |
| | Healthcare Trust of | | |
| | America Inc. Class A | 258,400 | 7,199 |
| | National Retail | | |
| | Properties Inc. | 171,500 | 7,026 |
| | Inland Real Estate Corp. | 638,500 | 6,826 |
| | Validus Holdings Ltd. | 157,500 | 6,631 |
| | Lamar Advertising Co. | | |
| | Class A | 110,600 | 6,555 |
| | Montpelier Re | | |
| | Holdings Ltd. | 168,249 | 6,467 |
| | RAIT Financial Trust | 899,300 | 6,169 |
| | Camden Property Trust | 78,000 | 6,094 |
| | Taubman Centers Inc. | 74,800 | 5,769 |
| | Chambers Street | | |
| | Properties | 718,300 | 5,660 |
| * | Piper Jaffray Cos. | 102,200 | 5,361 |
| | Alexandria Real Estate | | |
| | Equities Inc. | 53,900 | 5,284 |
| | Cathay General Bancorp | 185,510 | 5,278 |
| | HCI Group Inc. | 103,400 | 4,743 |
| | | |
| | | | Market |
| | | | Value |
| | | Shares | ($000) |
| | Government Properties | | |
| | Income Trust | 193,400 | 4,419 |
| | LaSalle Hotel Properties | 108,700 | 4,224 |
| | Highwoods Properties Inc. | 87,100 | 3,987 |
| | Home Properties Inc. | 55,500 | 3,846 |
| | CyrusOne Inc. | 122,100 | 3,800 |
| | National Health | | |
| | Investors Inc. | 47,300 | 3,359 |
| * | Western Alliance Bancorp | 106,900 | 3,169 |
| | Astoria Financial Corp. | 236,400 | 3,061 |
| | Chesapeake Lodging Trust | 89,400 | 3,024 |
| * | Walker & Dunlop Inc. | 156,100 | 2,768 |
| | Ramco-Gershenson | | |
| | Properties Trust | 148,300 | 2,758 |
| | Capitol Federal | | |
| | Financial Inc. | 204,200 | 2,552 |
| | First Horizon National Corp. | 176,300 | 2,519 |
| | Apollo Residential | | |
| | Mortgage Inc. | 153,400 | 2,447 |
| | Rayonier Inc. | 90,500 | 2,440 |
| | Brixmor Property Group Inc. | 83,600 | 2,220 |
| | International | | |
| | Bancshares Corp. | 63,900 | 1,663 |
| | HCC Insurance | | |
| | Holdings Inc. | 29,000 | 1,643 |
| | Medical Properties | | |
| | Trust Inc. | 103,200 | 1,521 |
| * | Cowen Group Inc. Class A | 288,100 | 1,498 |
| | Acadia Realty Trust | 38,300 | 1,336 |
| | Northfield Bancorp Inc. | 86,100 | 1,276 |
| | WSFS Financial Corp. | 15,100 | 1,142 |
| | Whitestone REIT | 67,000 | 1,064 |
| | CareTrust REIT Inc. | 77,627 | 1,053 |
| * | Beneficial Bancorp Inc. | 90,631 | 1,023 |
| | Universal Health Realty | | |
| | Income Trust | 15,100 | 849 |
| | State Bank Financial Corp. | 38,500 | 808 |
| * | Capital Bank Financial Corp. | 28,100 | 776 |
| | First Commonwealth | | |
| | Financial Corp. | 85,900 | 773 |
| | Great Southern Bancorp Inc. | 17,000 | 670 |
| | Digital Realty Trust Inc. | 9,700 | 640 |
| * | First NBC Bank Holding Co. | 19,100 | 630 |
| | Flushing Financial Corp. | 25,600 | 514 |
| | S&T Bancorp Inc. | 15,600 | 443 |
| | Stock Yards Bancorp Inc. | 12,800 | 441 |
| | First Busey Corp. | 64,700 | 433 |
| | Lakeland Financial Corp. | 10,300 | 418 |
| | First Community | | |
| | Bancshares Inc. | 18,200 | 319 |
| | 1st Source Corp. | 8,400 | 270 |
| | CoBiz Financial Inc. | 18,500 | 228 |
| | One Liberty Properties Inc. | 9,100 | 222 |
| | First Bancorp | 11,100 | 195 |
14
Strategic Equity Fund
| | | |
| | | | Market |
| | | | Value |
| | | Shares | ($000) |
| | Federal Agricultural | | |
| | Mortgage Corp. | 6,100 | 172 |
| | MainSource Financial | | |
| | Group Inc. | 8,400 | 165 |
| | German American | | |
| | Bancorp Inc. | 4,700 | 138 |
| | Saul Centers Inc. | 2,100 | 120 |
| | Univest Corp. of | | |
| | Pennsylvania | 5,100 | 101 |
| | | | 1,253,235 |
| Health Care (12.2%) | | |
| * | Edwards Lifesciences | | |
| | Corp. | 435,300 | 62,013 |
| * | Centene Corp. | 837,900 | 59,231 |
| | AmerisourceBergen | | |
| | Corp. Class A | 512,900 | 58,301 |
| | Omnicare Inc. | 699,700 | 53,919 |
| * | Quintiles Transnational | | |
| | Holdings Inc. | 801,700 | 53,690 |
| * | Charles River Laboratories | | |
| | International Inc. | 645,600 | 51,190 |
| * | PAREXEL International | | |
| | Corp. | 702,100 | 48,438 |
| | CR Bard Inc. | 281,600 | 47,126 |
| * | Depomed Inc. | 1,580,000 | 35,408 |
| * | United Therapeutics Corp. | 142,600 | 24,589 |
| | ResMed Inc. | 311,583 | 22,365 |
| *,^ | Merrimack | | |
| | Pharmaceuticals Inc. | 1,616,400 | 19,203 |
| * | Affymetrix Inc. | 1,512,300 | 18,994 |
| * | Hologic Inc. | 506,700 | 16,734 |
| * | Isis Pharmaceuticals Inc. | 240,900 | 15,338 |
| * | Health Net Inc. | 236,500 | 14,306 |
| | Chemed Corp. | 116,300 | 13,886 |
| * | Infinity | | |
| | Pharmaceuticals Inc. | 992,300 | 13,872 |
| * | Hospira Inc. | 148,100 | 13,009 |
| * | VCA Inc. | 236,900 | 12,987 |
| | PDL BioPharma Inc. | 1,739,100 | 12,234 |
| * | ABIOMED Inc. | 152,800 | 10,937 |
| *,^ | Sequenom Inc. | 2,683,000 | 10,598 |
| * | Medivation Inc. | 72,000 | 9,293 |
| * | Natus Medical Inc. | 209,700 | 8,277 |
| | Universal Health | | |
| | Services Inc. Class B | 63,500 | 7,475 |
| * | Lannett Co. Inc. | 103,900 | 7,035 |
| * | Bruker Corp. | 323,400 | 5,973 |
| * | Mettler-Toledo | | |
| | International Inc. | 16,300 | 5,357 |
| | Ensign Group Inc. | 107,300 | 5,028 |
| * | Henry Schein Inc. | 34,000 | 4,747 |
| | West Pharmaceutical | | |
| | Services Inc. | 56,500 | 3,402 |
| | | |
| | | | Market |
| | | | Value |
| | | Shares | ($000) |
| | Phibro Animal Health | | |
| | Corp. Class A | 87,200 | 3,088 |
| * | SciClone | | |
| | Pharmaceuticals Inc. | 237,000 | 2,100 |
| * | Impax Laboratories Inc. | 43,500 | 2,039 |
| * | Greatbatch Inc. | 34,300 | 1,984 |
| * | Laboratory Corp. | | |
| | of America Holdings | 14,074 | 1,775 |
| * | Sagent Pharmaceuticals Inc. | 73,500 | 1,709 |
| * | Surgical Care Affiliates Inc. | 14,200 | 487 |
| * | SurModics Inc. | 12,900 | 336 |
| * | Orthofix International NV | 9,300 | 334 |
| * | Amphastar | | |
| | Pharmaceuticals Inc. | 20,700 | 310 |
| * | Triple-S Management | | |
| | Corp. Class B | 15,200 | 302 |
| | | | 759,419 |
| Industrials (13.5%) | | |
| * | Spirit AeroSystems | | |
| | Holdings Inc. Class A | 1,094,000 | 57,118 |
| | Huntington Ingalls | | |
| | Industries Inc. | 393,500 | 55,149 |
| | Cintas Corp. | 670,600 | 54,741 |
| * | JetBlue Airways Corp. | 2,806,000 | 54,016 |
| * | United Rentals Inc. | 582,400 | 53,092 |
| | Trinity Industries Inc. | 1,481,500 | 52,608 |
| ^ | Greenbrier Cos. Inc. | 825,500 | 47,879 |
| | Pitney Bowes Inc. | 1,893,000 | 44,145 |
| | Southwest Airlines Co. | 955,500 | 42,329 |
| | Alaska Air Group Inc. | 638,980 | 42,288 |
| | AO Smith Corp. | 568,200 | 37,308 |
| * | Meritor Inc. | 1,903,700 | 24,006 |
| | Deluxe Corp. | 281,613 | 19,510 |
| | L-3 Communications | | |
| | Holdings Inc. | 154,100 | 19,384 |
| | Masco Corp. | 626,900 | 16,738 |
| * | Hawaiian Holdings Inc. | 732,900 | 16,142 |
| | Rockwell Collins Inc. | 152,700 | 14,743 |
| | Pall Corp. | 111,500 | 11,194 |
| * | Orbital ATK Inc. | 134,900 | 10,337 |
| | SPX Corp. | 114,700 | 9,738 |
| | Stanley Black & Decker Inc. | 93,000 | 8,869 |
| | ManpowerGroup Inc. | 98,300 | 8,469 |
| * | Enphase Energy Inc. | 639,976 | 8,441 |
| | Carlisle Cos. Inc. | 74,300 | 6,882 |
| | Korn/Ferry International | 206,700 | 6,794 |
| | Hyster-Yale Materials | | |
| | Handling Inc. | 89,500 | 6,559 |
| | GATX Corp. | 111,200 | 6,447 |
| | Standex International Corp. | 78,050 | 6,410 |
| * | Teledyne Technologies Inc. | 59,500 | 6,350 |
| | IDEX Corp. | 72,900 | 5,528 |
| | Robert Half | | |
| | International Inc. | 84,000 | 5,084 |
15
Strategic Equity Fund
| | | |
| | | | Market |
| | | | Value |
| | | Shares | ($000) |
| * | United Continental | | |
| | Holdings Inc. | 74,080 | 4,982 |
| | Douglas Dynamics Inc. | 206,600 | 4,719 |
| | Toro Co. | 66,200 | 4,642 |
| | Cubic Corp. | 80,800 | 4,183 |
| | AMERCO | 12,440 | 4,110 |
| | Aircastle Ltd. | 179,000 | 4,020 |
| * | Blount International Inc. | 311,200 | 4,008 |
| | Corporate Executive | | |
| | Board Co. | 49,800 | 3,977 |
| | Steelcase Inc. Class A | 202,600 | 3,837 |
| | Allegion plc | 56,400 | 3,450 |
| | ITT Corp. | 85,800 | 3,424 |
| | KAR Auction Services Inc. | 87,200 | 3,308 |
| | Allison Transmission | | |
| | Holdings Inc. | 100,000 | 3,194 |
| | G&K Services Inc. Class A | 43,100 | 3,126 |
| | ArcBest Corp. | 81,700 | 3,096 |
| | Acuity Brands Inc. | 12,500 | 2,102 |
| * | American Woodmark Corp. | 36,100 | 1,976 |
| | Argan Inc. | 50,902 | 1,841 |
| | Quanex Building | | |
| | Products Corp. | 91,900 | 1,814 |
| | KBR Inc. | 120,000 | 1,738 |
| | ESCO Technologies Inc. | 43,900 | 1,711 |
| | Harsco Corp. | 89,100 | 1,538 |
| | HNI Corp. | 27,700 | 1,528 |
| | Briggs & Stratton Corp. | 66,500 | 1,366 |
| * | Aerovironment Inc. | 48,600 | 1,288 |
| * | Moog Inc. Class A | 15,500 | 1,163 |
| * | Engility Holdings Inc. | 36,000 | 1,081 |
| | Griffon Corp. | 54,500 | 950 |
| | Federal Signal Corp. | 51,300 | 810 |
| | Heidrick & Struggles | | |
| | International Inc. | 30,700 | 755 |
| | Hillenbrand Inc. | 16,100 | 497 |
| * | Wabash National Corp. | 29,600 | 417 |
| | Insteel Industries Inc. | 12,700 | 275 |
| * | Northwest Pipe Co. | 8,400 | 193 |
| | Global Brass & Copper | | |
| | Holdings Inc. | 7,100 | 110 |
| | | | 839,527 |
| Information Technology (15.5%) | |
| * | Electronic Arts Inc. | 1,145,000 | 67,343 |
| * | Qorvo Inc. | 752,862 | 60,003 |
| | Computer Sciences Corp. | 827,800 | 54,039 |
| * | Gartner Inc. | 610,091 | 51,156 |
| * | Manhattan Associates Inc. | 994,800 | 50,347 |
| * | Aspen Technology Inc. | 1,273,700 | 49,025 |
| | Booz Allen Hamilton | | |
| | Holding Corp. Class A | 1,644,800 | 47,600 |
| | Lexmark International | | |
| | Inc. Class A | 1,048,400 | 44,389 |
| * | ARRIS Group Inc. | 1,486,400 | 42,949 |
| | | |
| | | | Market |
| | | | Value |
| | | Shares | ($000) |
| | CDW Corp. | 1,107,000 | 41,225 |
| *,^ | Advanced Micro | | |
| | Devices Inc. | 11,760,635 | 31,518 |
| | DST Systems Inc. | 253,270 | 28,039 |
| | Heartland Payment | | |
| | Systems Inc. | 578,800 | 27,117 |
| | Skyworks Solutions Inc. | 245,000 | 24,081 |
| | MAXIMUS Inc. | 359,480 | 23,999 |
| | Broadridge Financial | | |
| | Solutions Inc. | 433,100 | 23,825 |
| | Jack Henry & | | |
| | Associates Inc. | 329,300 | 23,015 |
| | Harris Corp. | 236,900 | 18,658 |
| | Marvell Technology | | |
| | Group Ltd. | 1,123,400 | 16,514 |
| * | Take-Two Interactive | | |
| | Software Inc. | 593,000 | 15,095 |
| * | Anixter International Inc. | 195,108 | 14,854 |
| * | Fiserv Inc. | 174,000 | 13,816 |
| * | Cirrus Logic Inc. | 369,500 | 12,290 |
| | Brocade Communications | | |
| | Systems Inc. | 1,031,700 | 12,241 |
| | NVIDIA Corp. | 578,500 | 12,105 |
| | Avnet Inc. | 269,100 | 11,975 |
| * | Tech Data Corp. | 198,900 | 11,490 |
| | SYNNEX Corp. | 146,074 | 11,284 |
| | Science Applications | | |
| | International Corp. | 219,500 | 11,271 |
| | Lam Research Corp. | 158,200 | 11,111 |
| * | MicroStrategy Inc. | | |
| | Class A | 64,200 | 10,862 |
| | Cypress | | |
| | Semiconductor Corp. | 749,300 | 10,573 |
| * | Super Micro Computer Inc. | 287,400 | 9,545 |
| * | CommScope | | |
| | Holding Co. Inc. | 238,221 | 6,799 |
| * | Blackhawk Network | | |
| | Holdings Inc. | 181,300 | 6,485 |
| | EarthLink Holdings Corp. | 1,459,200 | 6,479 |
| * | Flextronics | | |
| | International Ltd. | 363,000 | 4,601 |
| * | Cimpress NV | 50,000 | 4,219 |
| * | Freescale | | |
| | Semiconductor Ltd. | 103,400 | 4,215 |
| *,^ | VASCO Data Security | | |
| | International Inc. | 190,700 | 4,108 |
| * | Ciena Corp. | 209,600 | 4,047 |
| | Jabil Circuit Inc. | 161,100 | 3,766 |
| * | Blackhawk Network | | |
| | Holdings Inc. Class B | 104,836 | 3,727 |
| * | Sanmina Corp. | 122,200 | 2,956 |
| | Blackbaud Inc. | 57,200 | 2,710 |
| * | CACI International Inc. | | |
| | Class A | 22,900 | 2,059 |
16
Strategic Equity Fund
| | | |
| | | | Market |
| | | | Value |
| | | Shares | ($000) |
| * | Sykes Enterprises Inc. | 76,000 | 1,889 |
| * | Global Cash Access | | |
| | Holdings Inc. | 240,300 | 1,831 |
| | Diebold Inc. | 48,300 | 1,713 |
| * | OmniVision | | |
| | Technologies Inc. | 60,900 | 1,606 |
| | CSG Systems | | |
| | International Inc. | 51,600 | 1,568 |
| * | ePlus Inc. | 17,500 | 1,521 |
| * | Angie’s List Inc. | 238,600 | 1,401 |
| * | Itron Inc. | 29,300 | 1,070 |
| * | Progress Software Corp. | 34,900 | 948 |
| * | Fairchild Semiconductor | | |
| | International Inc. Class A | 44,100 | 802 |
| * | Quantum Corp. | 487,000 | 779 |
| | TeleTech Holdings Inc. | 20,500 | 522 |
| * | Rambus Inc. | 39,000 | 490 |
| | PC Connection Inc. | 7,700 | 201 |
| | | | 965,866 |
| Materials (5.6%) | | |
| | CF Industries | | |
| | Holdings Inc. | 191,000 | 54,183 |
| | United States Steel Corp. | 2,178,600 | 53,158 |
| | Alcoa Inc. | 3,884,983 | 50,194 |
| | Ball Corp. | 573,700 | 40,526 |
| * | Century Aluminum Co. | 2,343,894 | 32,346 |
| | Avery Dennison Corp. | 570,100 | 30,164 |
| * | Berry Plastics Group Inc. | 653,189 | 23,639 |
| | Bemis Co. Inc. | 270,300 | 12,518 |
| * | Stillwater Mining Co. | 950,600 | 12,282 |
| | Graphic Packaging | | |
| | Holding Co. | 636,819 | 9,259 |
| | Neenah Paper Inc. | 117,200 | 7,330 |
| * | Mercer International Inc. | 319,700 | 4,910 |
| | Valspar Corp. | 52,100 | 4,378 |
| | International Flavors | | |
| | & Fragrances Inc. | 36,600 | 4,297 |
| | NewMarket Corp. | 8,922 | 4,263 |
| * | Ferro Corp. | 242,000 | 3,037 |
| | Calgon Carbon Corp. | 129,200 | 2,722 |
| | Sonoco Products Co. | 46,700 | 2,123 |
| | Innophos Holdings Inc. | 9,600 | 541 |
| | United States Lime | | |
| | & Minerals Inc. | 1,600 | 103 |
| | | | 351,973 |
| Telecommunication Services (1.0%) | |
| | Frontier | | |
| | Communications Corp. | 4,651,600 | 32,794 |
| * | Level 3 | | |
| | Communications Inc. | 404,800 | 21,794 |
| | | |
| | | | Market |
| | | | Value |
| | | Shares | ($000) |
| | Inteliquent Inc. | 192,600 | 3,032 |
| * | Cincinnati Bell Inc. | 300,700 | 1,061 |
| * | General Communication | | |
| | Inc. Class A | 66,500 | 1,048 |
| | | | 59,729 |
| Utilities (4.6%) | | |
| | Entergy Corp. | 638,300 | 49,462 |
| | Vectren Corp. | 728,200 | 32,143 |
| | WGL Holdings Inc. | 519,100 | 29,277 |
| | AES Corp. | 2,198,800 | 28,255 |
| | Portland General | | |
| | Electric Co. | 735,400 | 27,276 |
| | DTE Energy Co. | 247,200 | 19,946 |
| | New Jersey | | |
| | Resources Corp. | 625,400 | 19,425 |
| | UGI Corp. | 557,350 | 18,164 |
| | Pinnacle West Capital Corp. | 206,900 | 13,190 |
| | PNM Resources Inc. | 387,735 | 11,322 |
| | Ameren Corp. | 256,900 | 10,841 |
| | American States Water Co. | 175,700 | 7,009 |
| | Atmos Energy Corp. | 121,200 | 6,702 |
| | Great Plains Energy Inc. | 152,000 | 4,055 |
| | IDACORP Inc. | 52,600 | 3,307 |
| | Westar Energy Inc. Class A | 84,700 | 3,283 |
| | Avista Corp. | 72,000 | 2,461 |
| | Unitil Corp. | 27,600 | 960 |
| | Northwest Natural Gas Co. | 15,400 | 738 |
| | California Water | | |
| | Service Group | 11,900 | 292 |
| | Connecticut Water | | |
| | Service Inc. | 5,200 | 189 |
| | | | 288,297 |
| Total Common Stocks | | |
| (Cost $4,927,355) | | 6,216,295 |
| Temporary Cash Investments (1.6%)1 | |
| Money Market Fund (1.6%) | | |
| 2,3 | Vanguard Market | | |
| | Liquidity Fund, | | |
| | 0.128% | 99,043,000 | 99,043 |
17
Strategic Equity Fund
| | |
| | Face | Market |
| | Amount | Value |
| | ($000) | ($000) |
| U.S. Government and Agency Obligations (0.0%) |
| 4,5 Fannie Mae Discount | | |
| Notes, 0.170%, 6/17/15 | 1,500 | 1,500 |
| Total Temporary Cash Investments | |
| (Cost $100,543) | | 100,543 |
| Total Investments (101.3%) | | |
| (Cost $5,027,898) | | 6,316,838 |
| Other Assets and Liabilities (-1.3%) | |
| Other Assets | | 40,984 |
| Liabilities3 | | (121,346) |
| | | (80,362) |
| Net Assets (100%) | | |
| Applicable to 184,314,169 outstanding | |
| $.001 par value shares of beneficial | |
| interest (unlimited authorization) | 6,236,476 |
| Net Asset Value Per Share | | $33.84 |
| | |
| At March 31, 2015, net assets consisted of: |
| | Amount |
| | ($000) |
| Paid-in Capital | 4,677,369 |
| Undistributed Net Investment Income | 15,341 |
| Accumulated Net Realized Gains | 254,719 |
| Unrealized Appreciation (Depreciation) | |
| Investment Securities | 1,288,940 |
| Futures Contracts | 107 |
| Net Assets | 6,236,476 |
See Note A in Notes to Financial Statements.
* Non-income-producing security.
^ Includes partial security positions on loan to broker-dealers. The total value of securities on loan is $52,813,000.
1 The fund invests a portion of its cash reserves in equity markets through the use of index futures contracts. After giving effect to futures investments, the fund’s effective common stock and temporary cash investment positions represent 100.0% and 1.3%, respectively, of net assets.
2 Affiliated money market fund available only to Vanguard funds and certain trusts and accounts managed by Vanguard. Rate shown is the 7-day yield.
3 Includes $56,099,000 of collateral received for securities on loan.
4 The issuer was placed under federal conservatorship in September 2008; since that time, its daily operations have been managed by the Federal Housing Finance Agency and it receives capital from the U.S. Treasury, as needed to maintain a positive net worth, in exchange for senior preferred stock.
5 Securities with a value of $1,400,000 have been segregated as initial margin for open futures contracts.
REIT—Real Estate Investment Trust.
See accompanying Notes, which are an integral part of the Financial Statements.
18
Strategic Equity Fund
Statement of Operations
| |
| | Six Months Ended |
| | March 31, 2015 |
| | ($000) |
| Investment Income | |
| Income | |
| Dividends | 46,793 |
| Interest1 | 26 |
| Securities Lending | 1,747 |
| Total Income | 48,566 |
| Expenses | |
| The Vanguard Group—Note B | |
| Investment Advisory Services | 742 |
| Management and Administrative | 5,993 |
| Marketing and Distribution | 456 |
| Custodian Fees | 36 |
| Shareholders’ Reports | 16 |
| Trustees’ Fees and Expenses | 3 |
| Total Expenses | 7,246 |
| Net Investment Income | 41,320 |
| Realized Net Gain (Loss) | |
| Investment Securities Sold | 304,896 |
| Futures Contracts | 1,990 |
| Realized Net Gain (Loss) | 306,886 |
| Change in Unrealized Appreciation (Depreciation) | |
| Investment Securities | 305,069 |
| Futures Contracts | 836 |
| Change in Unrealized Appreciation (Depreciation) | 305,905 |
| Net Increase (Decrease) in Net Assets Resulting from Operations | 654,111 |
| 1 Interest income from an affiliated company of the fund was $26,000. | |
See accompanying Notes, which are an integral part of the Financial Statements.
19
Strategic Equity Fund
Statement of Changes in Net Assets
| | |
| | Six Months Ended | Year Ended |
| | March 31, | September 30, |
| | 2015 | 2014 |
| | ($000) | ($000) |
| Increase (Decrease) in Net Assets | | |
| Operations | | |
| Net Investment Income | 41,320 | 59,506 |
| Realized Net Gain (Loss) | 306,886 | 731,563 |
| Change in Unrealized Appreciation (Depreciation) | 305,905 | 6,972 |
| Net Increase (Decrease) in Net Assets Resulting from Operations | 654,111 | 798,041 |
| Distributions | | |
| Net Investment Income | (60,071) | (56,549) |
| Realized Capital Gain | (257,764) | — |
| Total Distributions | (317,835) | (56,549) |
| Capital Share Transactions | | |
| Issued | 556,366 | 895,563 |
| Issued in Lieu of Cash Distributions | 301,091 | 52,365 |
| Redeemed | (349,407) | (536,280) |
| Net Increase (Decrease) from Capital Share Transactions | 508,050 | 411,648 |
| Total Increase (Decrease) | 844,326 | 1,153,140 |
| Net Assets | | |
| Beginning of Period | 5,392,150 | 4,239,010 |
| End of Period1 | 6,236,476 | 5,392,150 |
| 1 Net Assets—End of Period includes undistributed (overdistributed) net investment income of $15,341,000 and $34,092,000. |
See accompanying Notes, which are an integral part of the Financial Statements.
20
Strategic Equity Fund
Financial Highlights
| | | | | | |
| | Six Months | | | | | |
| | Ended | | | | | |
| For a Share Outstanding | March 31, | | | Year Ended September 30, |
| Throughout Each Period | 2015 | 2014 | 2013 | 2012 | 2011 | 2010 |
| Net Asset Value, Beginning of Period | $32.02 | $27.34 | $21.02 | $16.30 | $16.30 | $14.52 |
| Investment Operations | | | | | | |
| Net Investment Income | . 235 | . 361 | . 4261 | .249 | .210 | .221 |
| Net Realized and Unrealized Gain (Loss) | | | | | | |
| on Investments | 3.458 | 4.679 | 6.244 | 4.667 | .017 | 1.759 |
| Total from Investment Operations | 3.693 | 5.040 | 6.670 | 4.916 | .227 | 1.980 |
| Distributions | | | | | | |
| Dividends from Net Investment Income | (. 354) | (. 360) | (. 350) | (.196) | (. 227) | (. 200) |
| Distributions from Realized Capital Gains | (1.519) | — | — | — | — | — |
| Total Distributions | (1.873) | (. 360) | (. 350) | (.196) | (. 227) | (. 200) |
| Net Asset Value, End of Period | $33.84 | $32.02 | $27.34 | $21.02 | $16.30 | $16.30 |
| |
| Total Return2 | 12.00% | 18.53% | 32.23% | 30.32% | 1.23% | 13.71% |
| |
| Ratios/Supplemental Data | | | | | | |
| Net Assets, End of Period (Millions) | $6,236 | $5,392 | $4,239 | $3,254 | $2,756 | $3,103 |
| Ratio of Total Expenses to | | | | | | |
| Average Net Assets | 0.25% | 0.27% | 0.28% | 0.29% | 0.30% | 0.30% |
| Ratio of Net Investment Income to | | | | | | |
| Average Net Assets | 1.41% | 1.19% | 1.75%1 | 1.25% | 1.09% | 1.37% |
| Portfolio Turnover Rate | 68% | 60% | 64% | 67% | 73% | 60% |
| The expense ratio, net income ratio, and turnover rate for the current period have been annualized. | | |
1 Net investment income per share and the ratio of net investment income to average net assets include $.043 and 0.18%, respectively, resulting from a special dividend received in connection with a merger between T-Mobile US Inc. and Metro PCS Communications Inc. in May 2013.
2 Total returns do not include account service fees that may have applied in the periods shown. Fund prospectuses provide information about any applicable account service fees. |
|
|
|
|
See accompanying Notes, which are an integral part of the Financial Statements.
21
Strategic Equity Fund
Notes to Financial Statements
Vanguard Strategic Equity Fund is registered under the Investment Company Act of 1940 as an open-end investment company, or mutual fund.
A. The following significant accounting policies conform to generally accepted accounting principles for U.S. investment companies. The fund consistently follows such policies in preparing its financial statements.
1. Security Valuation: Securities are valued as of the close of trading on the New York Stock Exchange (generally 4 p.m., Eastern time) on the valuation date. Equity securities are valued at the latest quoted sales prices or official closing prices taken from the primary market in which each security trades; such securities not traded on the valuation date are valued at the mean of the latest quoted bid and asked prices. Securities for which market quotations are not readily available, or whose values have been materially affected by events occurring before the fund’s pricing time but after the close of the securities’ primary markets, are valued by methods deemed by the board of trustees to represent fair value. Investments in Vanguard Market Liquidity Fund are valued at that fund’s net asset value. Temporary cash investments acquired over 60 days to maturity are valued using the latest bid prices or using valuations based on a matrix system (which considers such factors as security prices, yields, maturities, and ratings), both as furnished by independent pricing services. Other temporary cash investments are valued at amortized cost, which approximates market value.
2. Futures Contracts: The fund uses index futures contracts to a limited extent, with the objective of maintaining full exposure to the stock market while maintaining liquidity. The fund may purchase or sell futures contracts to achieve a desired level of investment, whether to accommodate portfolio turnover or cash flows from capital share transactions. The primary risks associated with the use of futures contracts are imperfect correlation between changes in market values of stocks held by the fund and the prices of futures contracts, and the possibility of an illiquid market. Counterparty risk involving futures is mitigated because a regulated clearinghouse is the counterparty instead of the clearing broker. To further mitigate counterparty risk, the fund trades futures contracts on an exchange, monitors the financial strength of its clearing brokers and clearinghouse, and has entered into clearing agreements with its clearing brokers. The clearinghouse imposes initial margin requirements to secure the fund’s performance and requires daily settlement of variation margin representing changes in the market value of each contract.
Futures contracts are valued at their quoted daily settlement prices. The aggregate settlement values of the contracts are not recorded in the Statement of Net Assets. Fluctuations in the value of the contracts are recorded in the Statement of Net Assets as an asset (liability) and in the Statement of Operations as unrealized appreciation (depreciation) until the contracts are closed, when they are recorded as realized futures gains (losses).
During the six months ended March 31, 2015, the fund’s average investments in long and short futures contracts represented less than 1% and 0% of net assets, respectively, based on the average of aggregate settlement values at each quarter-end during the period.
3. Federal Income Taxes: The fund intends to continue to qualify as a regulated investment company and distribute all of its taxable income. Management has analyzed the fund’s tax positions taken for all open federal income tax years (September 30, 2011–2014), and for the period ended March 31, 2015, and has concluded that no provision for federal income tax is required in the fund’s financial statements.
22
Strategic Equity Fund
4. Distributions: Distributions to shareholders are recorded on the ex-dividend date.
5. Securities Lending: To earn additional income, the fund lends its securities to qualified institutional borrowers. Security loans are required to be secured at all times by collateral in an amount at least equal to the market value of securities loaned. Daily market fluctuations could cause the value of loaned securities to be more or less than the value of the collateral received. When this occurs, the collateral is adjusted and settled on the next business day. The fund further mitigates its counterparty risk by entering into securities lending transactions only with a diverse group of prequalified counter-parties, monitoring their financial strength, and entering into master securities lending agreements with its counterparties. The master securities lending agreements provide that, in the event of a counterparty’s default (including bankruptcy), the fund may terminate any loans with that borrower, determine the net amount owed, and sell or retain the collateral up to the net amount owed to the fund; however, such actions may be subject to legal proceedings. While collateral mitigates counter-party risk, in the absence of a default the fund may experience delays and costs in recovering the securities loaned. The fund invests cash collateral received in Vanguard Market Liquidity Fund, and records a liability in the Statement of Net Assets for the return of the collateral, during the period the securities are on loan. Securities lending income represents fees charged to borrowers plus income earned on invested cash collateral, less expenses associated with the loan.
6. Credit Facility: The fund and certain other funds managed by The Vanguard Group participate in a $3 billion committed credit facility provided by a syndicate of lenders pursuant to a credit agreement that may be renewed annually; each fund is individually liable for its borrowings, if any, under the credit facility. Borrowings may be utilized for temporary and emergency purposes, and are subject to the fund’s regulatory and contractual borrowing restrictions. The participating funds are charged administrative fees and an annual commitment fee of 0.06% of the undrawn amount of the facility; these fees are allocated to the funds based on a method approved by the fund’s board of trustees and included in Management and Administrative expenses on the fund’s Statement of Operations. Any borrowings under this facility bear interest at a rate equal to the higher of the federal funds rate or LIBOR reference rate plus an agreed-upon spread.
The fund had no borrowings outstanding at March 31, 2015, or at any time during the period then ended.
7. Other: Dividend income is recorded on the ex-dividend date. Interest income includes income distributions received from Vanguard Market Liquidity Fund and is accrued daily. Premiums and discounts on debt securities purchased are amortized and accreted, respectively, to interest income over the lives of the respective securities. Security transactions are accounted for on the date securities are bought or sold. Costs used to determine realized gains (losses) on the sale of investment securities are those of the specific securities sold.
B. The Vanguard Group furnishes at cost investment advisory, corporate management, administrative, marketing, and distribution services. The costs of such services are allocated to the fund based on methods approved by the board of trustees. The fund has committed to invest up to 0.40% of its net assets in Vanguard. At March 31, 2015, the fund had contributed capital of $557,000 to Vanguard (included in Other Assets), representing 0.01% of the fund’s net assets and 0.22% of Vanguard’s capitalization. The fund’s trustees and officers are also directors and officers of Vanguard.
23
Strategic Equity Fund
C. Various inputs may be used to determine the value of the fund’s investments. These inputs are summarized in three broad levels for financial statement purposes. The inputs or methodologies used to value securities are not necessarily an indication of the risk associated with investing in those securities.
Level 1—Quoted prices in active markets for identical securities.
Level 2—Other significant observable inputs (including quoted prices for similar securities, interest rates, prepayment speeds, credit risk, etc.).
Level 3—Significant unobservable inputs (including the fund’s own assumptions used to determine the fair value of investments).
The following table summarizes the market value of the fund’s investments as of March 31, 2015, based on the inputs used to value them:
| | | |
| | Level 1 | Level 2 | Level 3 |
| Investments | ($000) | ($000) | ($000) |
| Common Stocks | 6,216,295 | — | — |
| Temporary Cash Investments | 99,043 | 1,500 | — |
| Futures Contracts—Assets1 | 20 | — | — |
| Futures Contracts—Liabilities1 | (94) | — | — |
| Total | 6,315,264 | 1,500 | — |
| 1 Represents variation margin on the last day of the reporting period. | | | |
D. At March 31, 2015, the aggregate settlement value of open futures contracts and the related unrealized appreciation (depreciation) were:
| | | | |
| | | | | ($000) |
| | | | Aggregate | |
| | | Number of | Settlement | Unrealized |
| | | Long (Short) | Value | Appreciation |
| Futures Contracts | Expiration | Contracts | Long (Short) | (Depreciation) |
| E-mini S&P MidCap 400 Index | June 2015 | 64 | 9,727 | 57 |
| E-mini Russell 2000 Index | June 2015 | 72 | 8,992 | 50 |
| | | | | 107 |
Unrealized appreciation (depreciation) on open futures contracts is required to be treated as realized gain (loss) for tax purposes.
E. Distributions are determined on a tax basis and may differ from net investment income and realized capital gains for financial reporting purposes. Differences may be permanent or temporary. Permanent differences are reclassified among capital accounts in the financial statements to reflect their tax character. Temporary differences arise when certain items of income, expense, gain, or loss are recognized in different periods for financial statement and tax purposes. These differences will reverse at some time in the future. Differences in classification may also result from the treatment of short-term gains as ordinary income for tax purposes. The fund’s tax-basis capital gains and losses are determined only at the end of each fiscal year.
24
Strategic Equity Fund
At March 31, 2015, the cost of investment securities for tax purposes was $5,027,898,000. Net unrealized appreciation of investment securities for tax purposes was $1,288,940,000, consisting of unrealized gains of $1,436,080,000 on securities that had risen in value since their purchase and $147,140,000 in unrealized losses on securities that had fallen in value since their purchase.
F. During the six months ended March 31, 2015, the fund purchased $2,222,107,000 of investment securities and sold $1,980,164,000 of investment securities, other than temporary cash investments.
G. Capital shares issued and redeemed were:
| | |
| | Six Months Ended | Year Ended |
| | March 31, 2015 | September 30, 2014 |
| | Shares | Shares |
| | (000) | (000) |
| Issued | 17,031 | 29,053 |
| Issued in Lieu of Cash Distributions | 9,610 | 1,751 |
| Redeemed | (10,735) | (17,464) |
| Net Increase (Decrease) in Shares Outstanding | 15,906 | 13,340 |
H. Management has determined that no material events or transactions occurred subsequent to March 31, 2015, that would require recognition or disclosure in these financial statements.
25
About Your Fund’s Expenses
As a shareholder of the fund, you incur ongoing costs, which include costs for portfolio management, administrative services, and shareholder reports (like this one), among others. Operating expenses, which are deducted from a fund’s gross income, directly reduce the investment return of the fund.
A fund’s expenses are expressed as a percentage of its average net assets. This figure is known as the expense ratio. The following examples are intended to help you understand the ongoing costs (in dollars) of investing in your fund and to compare these costs with those of other mutual funds. The examples are based on an investment of $1,000 made at the beginning of the period shown and held for the entire period.
The accompanying table illustrates your fund’s costs in two ways:
• Based on actual fund return. This section helps you to estimate the actual expenses that you paid over the period. The ”Ending Account Value“ shown is derived from the fund‘s actual return, and the third column shows the dollar amount that would have been paid by an investor who started with $1,000 in the fund. You may use the information here, together with the amount you invested, to estimate the expenses that you paid over the period.
To do so, simply divide your account value by $1,000 (for example, an $8,600 account value divided by $1,000 = 8.6), then multiply the result by the number given for your fund under the heading ”Expenses Paid During Period.“
• Based on hypothetical 5% yearly return. This section is intended to help you compare your fund‘s costs with those of other mutual funds. It assumes that the fund had a yearly return of 5% before expenses, but that the expense ratio is unchanged. In this case—because the return used is not the fund’s actual return—the results do not apply to your investment. The example is useful in making comparisons because the Securities and Exchange Commission requires all mutual funds to calculate expenses based on a 5% return. You can assess your fund’s costs by comparing this hypothetical example with the hypothetical examples that appear in shareholder reports of other funds.
Note that the expenses shown in the table are meant to highlight and help you compare ongoing costs only and do not reflect transaction costs incurred by the fund for buying and selling securities. Further, the expenses do not include any purchase, redemption, or account service fees described in the fund prospectus. If such fees were applied to your account, your costs would be higher. Your fund does not carry a “sales load.”
The calculations assume no shares were bought or sold during the period. Your actual costs may have been higher or lower, depending on the amount of your investment and the timing of any purchases or redemptions.
You can find more information about the fund’s expenses, including annual expense ratios, in the Financial Statements section of this report. For additional information on operating expenses and other shareholder costs, please refer to your fund’s current prospectus.
26
| | | |
| Six Months Ended March 31, 2015 | | | |
| |
| | Beginning | Ending | Expenses |
| | Account Value | Account Value | Paid During |
| Strategic Equity Fund | 9/30/2014 | 3/31/2015 | Period |
| Based on Actual Fund Return | $1,000.00 | $1,120.02 | $1.32 |
| Based on Hypothetical 5% Yearly Return | 1,000.00 | 1,023.68 | 1.26 |
| The calculations are based on expenses incurred in the most recent six-month period. The fund’s annualized six-month expense ratio for that period is 0.25%. The dollar amounts shown as “Expenses Paid” are equal to the annualized expense ratio multiplied by the average account value over the period, multiplied by the number of days in the most recent six-month period, then divided by the number of days in the most recent 12-month period. |
|
|
|
27
Trustees Approve Advisory Arrangement
The board of trustees of Vanguard Strategic Equity Fund has renewed the fund’s investment advisory arrangement with The Vanguard Group, Inc. (Vanguard). Vanguard’s Equity Investment Group—through its Quantitative Equity Group—serves as the investment advisor to the fund. The board determined that continuing the fund’s internalized management structure was in the best interests of the fund and its shareholders.
The board based its decision upon an evaluation of the advisor’s investment staff, portfolio management process, and performance. The trustees considered the factors discussed below, among others. However, no single factor determined whether the board approved the arrangement. Rather, it was the totality of the circumstances that drove the board’s decision.
Nature, extent, and quality of services
The board considered the quality of the fund’s investment management services over both the short and long term, and took into account the organizational depth and stability of the advisor. The board noted that Vanguard has been managing investments for more than three decades. The Quantitative Equity Group adheres to a sound, disciplined investment management process; the team has considerable experience, stability, and depth.
The board concluded that Vanguard’s experience, stability, depth, and performance, among other factors, warranted continuation of the advisory arrangement.
Investment performance
The board considered the short- and long-term performance of the fund, including any periods of outperformance or underperformance relative to a benchmark index and peer group. The board concluded that the performance was such that the advisory arrangement should continue. Information about the fund’s most recent performance can be found in the Performance Summary section of this report.
Cost
The board concluded that the fund’s expense ratio was well below the average expense ratio charged by funds in its peer group and that the fund’s advisory fee rate was also well below its peer-group average. Information about the fund’s expenses appears in the About Your Fund’s Expenses section of this report as well as in the Financial Statements section.
The board does not conduct a profitability analysis of Vanguard, because of Vanguard’s unique “at-cost” structure. Unlike most other mutual fund management companies, Vanguard is owned by the funds it oversees, and produces “profits” only in the form of reduced expenses for fund shareholders.
The benefit of economies of scale
The board concluded that the fund’s at-cost arrangement with Vanguard ensures that the fund will realize economies of scale as it grows, with the cost to shareholders declining as fund assets increase.
The board will consider whether to renew the advisory arrangement again after a one-year period.
28
Glossary
30-Day SEC Yield. A fund’s 30-day SEC yield is derived using a formula specified by the U.S. Securities and Exchange Commission. Under the formula, data related to the fund’s security holdings in the previous 30 days are used to calculate the fund’s hypothetical net income for that period, which is then annualized and divided by the fund’s estimated average net assets over the calculation period. For the purposes of this calculation, a security’s income is based on its current market yield to maturity (for bonds), its actual income (for asset-backed securities), or its projected dividend yield (for stocks). Because the SEC yield represents hypothetical annualized income, it will differ—at times significantly—from the fund’s actual experience. As a result, the fund’s income distributions may be higher or lower than implied by the SEC yield.
Beta. A measure of the magnitude of a fund’s past share-price fluctuations in relation to the ups and downs of a given market index. The index is assigned a beta of 1.00. Compared with a given index, a fund with a beta of 1.20 typically would have seen its share price rise or fall by 12% when the index rose or fell by 10%. For this report, beta is based on returns over the past 36 months for both the fund and the index. Note that a fund’s beta should be reviewed in conjunction with its R-squared (see definition). The lower the R-squared, the less correlation there is between the fund and the index, and the less reliable beta is as an indicator of volatility.
Dividend Yield. Dividend income earned by stocks, expressed as a percentage of the aggregate market value (or of net asset value, for a fund). The yield is determined by dividing the amount of the annual dividends by the aggregate value (or net asset value) at the end of the period. For a fund, the dividend yield is based solely on stock holdings and does not include any income produced by other investments.
Earnings Growth Rate. The average annual rate of growth in earnings over the past five years for the stocks now in a fund.
Equity Exposure. A measure that reflects a fund’s investments in stocks and stock futures. Any holdings in short-term reserves are excluded.
Expense Ratio. A fund’s total annual operating expenses expressed as a percentage of the fund’s average net assets. The expense ratio includes management and administrative expenses, but does not include the transaction costs of buying and selling portfolio securities.
Foreign Holdings. The percentage of a fund represented by securities or depositary receipts of companies based outside the United States.
Inception Date. The date on which the assets of a fund (or one of its share classes) are first invested in accordance with the fund’s investment objective. For funds with a subscription period, the inception date is the day after that period ends. Investment performance is measured from the inception date.
Median Market Cap. An indicator of the size of companies in which a fund invests; the midpoint of market capitalization (market price x shares outstanding) of a fund’s stocks, weighted by the proportion of the fund’s assets invested in each stock. Stocks representing half of the fund’s assets have market capitalizations above the median, and the rest are below it.
Price/Book Ratio. The share price of a stock divided by its net worth, or book value, per share. For a fund, the weighted average price/book ratio of the stocks it holds.
29
Price/Earnings Ratio. The ratio of a stock’s current price to its per-share earnings over the past year. For a fund, the weighted average P/E of the stocks it holds. P/E is an indicator of market expectations about corporate prospects; the higher the P/E, the greater the expectations for a company’s future growth.
R-Squared. A measure of how much of a fund’s past returns can be explained by the returns from the market in general, as measured by a given index. If a fund’s total returns were precisely synchronized with an index’s returns, its R-squared would be 1.00. If the fund’s returns bore no relationship to the index’s returns, its R-squared would be 0. For this report, R-squared is based on returns over the past 36 months for both the fund and the index.
Return on Equity. The annual average rate of return generated by a company during the past five years for each dollar of shareholder’s equity (net income divided by shareholder’s equity). For a fund, the weighted average return on equity for the companies whose stocks it holds.
Short-Term Reserves. The percentage of a fund invested in highly liquid, short-term securities that can be readily converted to cash.
Turnover Rate. An indication of the fund’s trading activity. Funds with high turnover rates incur higher transaction costs and may be more likely to distribute capital gains (which may be taxable to investors). The turnover rate excludes in-kind transactions, which have minimal impact on costs.
30
This page intentionally left blank.
The People Who Govern Your Fund
The trustees of your mutual fund are there to see that the fund is operated and managed in your best interests since, as a shareholder, you are a part owner of the fund. Your fund’s trustees also serve on the board of directors of The Vanguard Group, Inc., which is owned by the Vanguard funds and provides services to them on an at-cost basis.
A majority of Vanguard’s board members are independent, meaning that they have no affiliation with Vanguard or the funds they oversee, apart from the sizable personal investments they have made as private individuals. The independent board members have distinguished backgrounds in business, academia, and public service. Each of the trustees and executive officers oversees 178 Vanguard funds.
The following table provides information for each trustee and executive officer of the fund. More information about the trustees is in the Statement of Additional Information, which can be obtained, without charge, by contacting Vanguard at 800-662-7447, or online at vanguard.com.
| |
| InterestedTrustee1 | Rajiv L. Gupta |
| | Born 1945. Trustee Since December 2001.2 Principal |
| F. William McNabb III | Occupation(s) During the Past Five Years and Other |
| Born 1957. Trustee Since July 2009. Chairman of | Experience: Chairman and Chief Executive Officer |
| the Board. Principal Occupation(s) During the Past | (retired 2009) and President (2006–2008) of |
| Five Years and Other Experience: Chairman of the | Rohm and Haas Co. (chemicals); Director of Tyco |
| Board of The Vanguard Group, Inc., and of each of | International PLC (diversified manufacturing and |
| the investment companies served by The Vanguard | services), Hewlett-Packard Co. (electronic computer |
| Group, since January 2010; Director of The Vanguard | manufacturing), and Delphi Automotive PLC |
| Group since 2008; Chief Executive Officer and | (automotive components); Senior Advisor at New |
| President of The Vanguard Group, and of each of | Mountain Capital. |
| the investment companies served by The Vanguard | |
| Group, since 2008; Director of Vanguard Marketing | Amy Gutmann |
| Corporation; Managing Director of The Vanguard | Born 1949. Trustee Since June 2006. Principal |
| Group (1995–2008). | Occupation(s) During the Past Five Years and |
| | Other Experience: President of the University of |
| IndependentTrustees | Pennsylvania; Christopher H. Browne Distinguished |
| | Professor of Political Science, School of Arts and |
| Emerson U. Fullwood | Sciences, and Professor of Communication, Annenberg |
| Born 1948. Trustee Since January 2008. Principal | School for Communication, with secondary faculty |
| Occupation(s) During the Past Five Years and | appointments in the Department of Philosophy, School |
| Other Experience: Executive Chief Staff and | of Arts and Sciences, and at the Graduate School of |
| Marketing Officer for North America and Corporate | Education, University of Pennsylvania; Trustee of the |
| Vice President (retired 2008) of Xerox Corporation | National Constitution Center; Chair of the Presidential |
| (document management products and services); | Commission for the Study of Bioethical Issues. |
| Executive in Residence and 2009–2010 Distinguished | |
| Minett Professor at the Rochester Institute of | JoAnn Heffernan Heisen |
| Technology; Director of SPX Corporation (multi-industry | Born 1950. Trustee Since July 1998. Principal |
| manufacturing), the United Way of Rochester, | Occupation(s) During the Past Five Years and Other |
| Amerigroup Corporation (managed health care), the | Experience: Corporate Vice President and Chief |
| University of Rochester Medical Center, Monroe | Global Diversity Officer (retired 2008) and Member |
| Community College Foundation, and North Carolina | of the Executive Committee (1997–2008) of Johnson |
| A&T University. | & Johnson (pharmaceuticals/medical devices/ |
| | consumer products); Director of Skytop Lodge |
| | Corporation (hotels), the University Medical Center |
| | at Princeton, the Robert Wood Johnson Foundation, |
| | and the Center for Talent Innovation; Member of |
| | the Advisory Board of the Institute for Women’s |
| | Leadership at Rutgers University. |
| | |
| F. Joseph Loughrey | Executive Officers | |
| Born 1949. Trustee Since October 2009. Principal | | |
| Occupation(s) During the Past Five Years and Other | Glenn Booraem | |
| Experience: President and Chief Operating Officer | Born 1967. Controller Since July 2010. Principal |
| (retired 2009) of Cummins Inc. (industrial machinery); | Occupation(s) During the Past Five Years and Other |
| Chairman of the Board of Hillenbrand, Inc. (specialized | Experience: Principal of The Vanguard Group, Inc.; |
| consumer services), and of Oxfam America; Director | Controller of each of the investment companies served |
| of SKF AB (industrial machinery), Hyster-Yale Materials | by The Vanguard Group; Assistant Controller of each of |
| Handling, Inc. (forklift trucks), the Lumina Foundation | the investment companies served by The Vanguard |
| for Education, and the V Foundation for Cancer | Group (2001–2010). | |
| Research; Member of the Advisory Council for the | | |
| College of Arts and Letters and of the Advisory Board | Thomas J. Higgins | |
| to the Kellogg Institute for International Studies, both | Born 1957. Chief Financial Officer Since September |
| at the University of Notre Dame. | 2008. Principal Occupation(s) During the Past Five |
| Years and Other Experience: Principal of The Vanguard |
| Mark Loughridge | Group, Inc.; Chief Financial Officer of each of the |
| Born 1953. Trustee Since March 2012. Principal | investment companies served by The Vanguard Group; |
| Occupation(s) During the Past Five Years and Other | Treasurer of each of the investment companies served |
| Experience: Senior Vice President and Chief Financial | by The Vanguard Group (1998–2008). |
| Officer (retired 2013) at IBM (information technology | |
| services); Fiduciary Member of IBM’s Retirement Plan | Kathryn J. Hyatt | |
| Committee (2004–2013); Director of the Dow Chemical | Born 1955. Treasurer Since November 2008. Principal |
| Company; Member of the Council on Chicago Booth. | Occupation(s) During the Past Five Years and Other |
| Experience: Principal of The Vanguard Group, Inc.; |
| Scott C. Malpass | Treasurer of each of the investment companies served |
| Born 1962. Trustee Since March 2012. Principal | by The Vanguard Group; Assistant Treasurer of each of |
| Occupation(s) During the Past Five Years and Other | the investment companies served by The Vanguard |
| Experience: Chief Investment Officer and Vice | Group (1988–2008). | |
| President at the University of Notre Dame; Assistant | | |
| Professor of Finance at the Mendoza College of | Heidi Stam | |
| Business at Notre Dame; Member of the Notre Dame | Born 1956. Secretary Since July 2005. Principal |
| 403(b) Investment Committee; Board Member of | Occupation(s) During the Past Five Years and Other |
| TIFF Advisory Services, Inc., and Catholic Investment | Experience: Managing Director of The Vanguard |
| Services, Inc. (investment advisors); Member of | Group, Inc.; General Counsel of The Vanguard Group; |
| the Investment Advisory Committee of Major | Secretary of The Vanguard Group and of each of the |
| League Baseball. | investment companies served by The Vanguard Group; |
| Director and Senior Vice President of Vanguard |
| André F. Perold | Marketing Corporation. | |
| Born 1952. Trustee Since December 2004. Principal | | |
| Occupation(s) During the Past Five Years and Other | Vanguard Senior ManagementTeam |
| Experience: George Gund Professor of Finance and | | |
| Banking, Emeritus at the Harvard Business School | Mortimer J. Buckley | Chris D. McIsaac |
| (retired 2011); Chief Investment Officer and Managing | Kathleen C. Gubanich | Michael S. Miller |
| Partner of HighVista Strategies LLC (private investment | Paul A. Heller | James M. Norris |
| firm); Director of Rand Merchant Bank; Overseer of | Martha G. King | Glenn W. Reed |
| the Museum of Fine Arts Boston. | John T. Marcante | |
| | |
| Peter F. Volanakis | Chairman Emeritus and Senior Advisor |
| Born 1955. Trustee Since July 2009. Principal | | |
| Occupation(s) During the Past Five Years and Other | John J. Brennan | |
| Experience: President and Chief Operating Officer | Chairman, 1996–2009 | |
| (retired 2010) of Corning Incorporated (communications | Chief Executive Officer and President, 1996–2008 |
| equipment); Trustee of Colby-Sawyer College; | | |
| Member of the Advisory Board of the Norris Cotton | Founder | |
| Cancer Center and of the Advisory Board of the | | |
| Parthenon Group (strategy consulting). | John C. Bogle | |
| | Chairman and Chief Executive Officer, 1974–1996 |
1 Mr. McNabb is considered an “interested person,” as defined in the Investment Company Act of 1940, because he is an officer of the Vanguard funds.
2 December 2002 for Vanguard Equity Income Fund, the Vanguard Municipal Bond Funds, and the Vanguard State Tax-Exempt Funds.
| |  |
| | | P.O. Box 2600 |
| | | Valley Forge, PA 19482-2600 |
| |
| |
| |
| Connect with Vanguard® > vanguard.com | |
| |
| |
| |
| Fund Information > 800-662-7447 | | CFA® is a registered trademark owned by CFA Institute. |
| Direct Investor Account Services > 800-662-2739 | |
| Institutional Investor Services > 800-523-1036 | |
| Text Telephone for People | | |
| Who Are Deaf or Hard of Hearing> 800-749-7273 | |
| |
| This material may be used in conjunction | |
| with the offering of shares of any Vanguard | |
| fund only if preceded or accompanied by | |
| the fund’s current prospectus. | |
| |
| All comparative mutual fund data are from Lipper, a | |
| Thomson Reuters Company, or Morningstar, Inc., unless | |
| otherwise noted. | | |
| |
| You can obtain a free copy of Vanguard’s proxy voting | |
| guidelines by visiting vanguard.com/proxyreporting or by | |
| calling Vanguard at 800-662-2739. The guidelines are | |
| also available from the SEC’s website, sec.gov. In | |
| addition, you may obtain a free report on how your fund | |
| voted the proxies for securities it owned during the 12 | |
| months ended June 30. To get the report, visit either | |
| vanguard.com/proxyreporting or sec.gov. | |
| |
| You can review and copy information about your fund at | |
| the SEC’s Public Reference Room in Washington, D.C. To | |
| find out more about this public service, call the SEC at | |
| 202-551-8090. Information about your fund is also | |
| available on the SEC’s website, and you can receive | |
| copies of this information, for a fee, by sending a | |
| request in either of two ways: via e-mail addressed to | |
| publicinfo@sec.gov or via regular mail addressed to the | |
| Public Reference Section, Securities and Exchange | |
| Commission, Washington, DC 20549-1520. | |
| |
| | | © 2015 The Vanguard Group, Inc. |
| | | All rights reserved. |
| | | Vanguard Marketing Corporation, Distributor. |
| |
| | | Q1142 052015 |

Semiannual Report | March 31, 2015
Vanguard Capital Opportunity Fund
The mission continues
On May 1, 1975, Vanguard began operations, a fledgling company based on the simple but revolutionary idea that a mutual fund company should be managed solely in the interest of its investors.
Four decades later, that revolutionary spirit continues to animate the enterprise. Vanguard remains on a mission to give investors the best chance of investment success.
As we mark our 40th anniversary, we thank you for entrusting your assets to Vanguard and giving us the opportunity to help you reach your financial goals in the decades to come.
| |
| Contents | |
| Your Fund’s Total Returns. | 1 |
| Chairman’s Letter. | 2 |
| Advisor’s Report. | 8 |
| Fund Profile. | 12 |
| Performance Summary. | 14 |
| Financial Statements. | 15 |
| About Your Fund’s Expenses. | 26 |
| Trustees Approve Advisory Arrangement. | 28 |
| Glossary. | 29 |
Please note: The opinions expressed in this report are just that—informed opinions. They should not be considered promises or advice. Also, please keep in mind that the information and opinions cover the period through the date on the front of this report. Of course, the risks of investing in your fund are spelled out in the prospectus.
See the Glossary for definitions of investment terms used in this report.
About the cover: Since our founding, Vanguard has drawn inspiration from the enterprise and valor demonstrated by British naval hero Horatio Nelson and his command at the Battle of the Nile in 1798. The photograph displays a replica of a merchant ship from the same era as Nelson’s flagship, the HMS Vanguard.
Your Fund’s Total Returns
| |
| Six Months Ended March 31, 2015 | |
| | Total |
| | Returns |
| Vanguard Capital Opportunity Fund | |
| Investor Shares | 11.28% |
| Admiral™ Shares | 11.31 |
| Russell Midcap Growth Index | 11.53 |
| Multi-Cap Growth Funds Average | 8.85 |
| Multi-Cap Growth Funds Average: Derived from data provided by Lipper, a Thomson Reuters Company. | |
| Admiral Shares carry lower expenses and are available to investors who meet certain account-balance requirements. | |
| | | | | |
| Your Fund’s Performance at a Glance | | | | |
| September 30, 2014, Through March 31, 2015 | | | | |
| | | | Distributions Per Share |
| | Starting | Ending | Income | Capital |
| | Share Price | Share Price | Dividends | Gains |
| Vanguard Capital Opportunity Fund | | | | |
| Investor Shares | $51.42 | $54.97 | $0.308 | $1.877 |
| Admiral Shares | 118.79 | 126.92 | 0.816 | 4.334 |
1

Chairman’s Letter
Dear Shareholder,
Although U.S. stocks of all sizes and styles logged positive returns for the six months ended March 31, 2015, results nonetheless varied significantly. Small-capitalization growth stocks were the leaders, large-cap value stocks performed moderately well, and the other segments fell in between.
Vanguard Capital Opportunity Fund, which invests primarily in mid- and large-cap growth stocks, produced strong results. Investor Shares returned 11.28% and Admiral Shares 11.31%, a bit behind the benchmark Russell Midcap Growth Index but more than 2 percentage points ahead of the average return of the fund’s peers.
Within the fund’s two dominant sectors, health care holdings drove returns over the period, but information technology was a trouble spot. Strong results from industrial stocks offset much of that weakness, and a minimal exposure to the struggling energy sector offered another boost.
The Fed’s cautious approach has helped the U.S. stock market
The broad U.S. stock market returned about 7% for the six months. Stocks were resilient after declining markedly at the start of the period and enduring subsequent bouts of turmoil. Investors’ concerns included the strength of the dollar and how it would affect the profits of U.S.-based multinational corporations.
2
Overall, stocks responded favorably to both the Federal Reserve’s cautious approach to raising short-term interest rates and the monetary stimulus efforts of other nations’ central banks. A strong rebound in February, when the broad market notched its largest monthly gain since October 2011, helped lift returns.
International stocks had a slightly negative return as the dollar’s strength against many foreign currencies hurt results. Without this currency effect, stocks outside of the United States generally advanced. The developed markets of the Pacific, particularly Japan, were especially strong.
Bond prices received a boost from central bank stimulus
Bond prices also were supported by accommodative monetary policies from the world’s central banks and investors who sought safe-haven assets amid turbulence in the stock market. The broad U.S. taxable bond market returned 3.43%. The yield of the 10-year Treasury note ended March at 1.95%, down from 2.48% six months earlier. (Bond prices and yields move in opposite directions.)
Municipal bonds returned 2.40%, although results faded later in the period as more bonds were issued.
| | | |
| Market Barometer | | | |
| |
| | | | Total Returns |
| | | Periods Ended March 31, 2015 |
| | Six | One | Five Years |
| | Months | Year | (Annualized) |
| Stocks | | | |
| Russell 1000 Index (Large-caps) | 6.55% | 12.73% | 14.73% |
| Russell 2000 Index (Small-caps) | 14.46 | 8.21 | 14.57 |
| Russell 3000 Index (Broad U.S. market) | 7.13 | 12.37 | 14.71 |
| FTSE All-World ex US Index (International) | -0.08 | -0.21 | 5.19 |
| |
| Bonds | | | |
| Barclays U.S. Aggregate Bond Index (Broad taxable market) | 3.43% | 5.72% | 4.41% |
| Barclays Municipal Bond Index (Broad tax-exempt market) | 2.40 | 6.62 | 5.11 |
| Citigroup Three-Month U.S. Treasury Bill Index | 0.00 | 0.03 | 0.06 |
| |
| CPI | | | |
| Consumer Price Index | -0.80% | -0.07% | 1.64% |
3
International bond markets (as measured by the Barclays Global Aggregate Index ex USD) returned –7.49%, a reflection of foreign currencies’ weakness relative to the dollar. International bonds hedged to eliminate the effect of currency exchange rates produced positive returns.
The Fed’s target of 0%–0.25% for short-term interest rates continued to cap returns for money market funds and savings accounts.
Health care stocks moved ahead, but technology selections suffered
Although its benchmark is the Russell Midcap Growth Index, the Capital Opportunity Fund isn’t neatly classified or characterized. The portfolio includes large-, mid- and small-cap stocks, and its focus on growth involves a noticeably contrarian tilt. PRIMECAP Management Company, the fund’s advisor, seeks stocks with solid long-term growth prospects that are undervalued by the market.
In the hands of its experienced and skilled portfolio managers, the fund’s flexible marching orders have resulted in a portfolio that looks much different from its benchmark. The advisor maintained exposure of more than 30% apiece, on average, to health care and technology over the period. Allocations to six of the remaining eight sectors collectively totaled about 6%.
| | | |
| Expense Ratios | | | |
| Your Fund Compared With Its Peer Group | | | |
| | Investor | Admiral | Peer Group |
| | Shares | Shares | Average |
| Capital Opportunity Fund | 0.47% | 0.40% | 1.28% |
The fund expense ratios shown are from the prospectus dated January 27, 2015, and represent estimated costs for the current fiscal year. For the six months ended March 31, 2015, the fund’s annualized expense ratios were 0.46% for Investor Shares and 0.39% for Admiral Shares.
The peer-group expense ratio is derived from data provided by Lipper, a Thomson Reuters Company, and captures information through year-end 2014.
Peer group: Multi-Cap Growth Funds.
4
The health care and technology industries, where innovation and patience are crucial to success, dovetail well with the advisor’s long-term investment strategy and thorough research process. When PRIMECAP Management invests in stocks of companies that meet its strict criteria, it generally does so for years, rather than months, at a time. If it believes a company is sound, its prospects bright, and its management team sharp, the advisor tends to hold on, even amid occasional detours through short-term underperformance.
|
| Marking the sixth anniversary of the bull market |
| |
| There’s been a long and steep climb in the U.S. stock market in the six years since the worst |
| of the financial crisis. |
| |
| The dark line in the chart below traces the rise in the Russell 3000 Index from a low of 390 |
| on March 9, 2009, to 1,241 on March 9, 2015—an increase of roughly 220% in 72 months. |
| |
| The robustness and duration of the advance defied the predictions of some market pundits. |
| Of course, the financial crisis caught many of them off guard as well. The lighter line below |
| charts the drop of about 60% in the index in 17 months, from its pre-crisis peak of 908 on |
| October 9, 2007. |
| |
| These sharp and unexpected movements illustrate the challenge of trying to time the markets. |
| Instead of trying to guess which way the wind will blow (and for how long), investors are |
| generally better off staying committed to their investment plan through market ups and downs. |
| Rebalancing your portfolio from time to time will help keep market movements from pushing |
| your allocation to stocks and bonds off target. |
The performance of the U.S. stock market since the start of the financial crisis
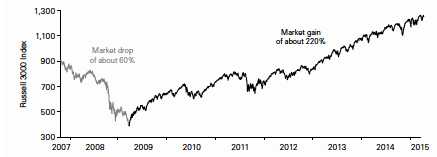
Sources: Vanguard, based on data for the Russell 3000 Index.
5
In the latest fiscal half year, health care was the fund’s largest contributor, adding more than 7 percentage points to return, more than twice that of any other sector. This outperformance was mostly a result of a large allocation to the sector and its biotechnology holdings. And it’s a tribute to PRIMECAP Management, which recently added James Marchetti to its roster of distinguished portfolio managers.
The biotechnology firms the advisor focused on cultivate rich drug pipelines that either are quite productive now or are expected to be in the years ahead. The anticipation of possible merger and acquisition activity also fueled returns. However, Capital Opportunity had weaker results in the pharmaceutical sector, where the stocks it owned didn’t measure up to those of the benchmark.
Technology, a frequent source of past success, disappointed, as the advisor’s holdings produced tepid returns of about 1%, compared with almost 14% for the benchmark. The fund’s choices among hardware and semiconductor stocks were at odds with the market.
Stock selection was strongest in industrials, where the fund’s holdings returned about 20%, more than double the sector’s return for the benchmark. Most of the strength came from airlines, where pricing advantages have benefited some larger firms and lower fuel prices have generally improved profitability.
Consumer discretionary stocks also lifted performance. Investments in automotive and internet retailers thrived, and holdings in the hotels and resorts area were mostly on target with consumer trends. The drop in oil prices pummeled the energy sector, but the advisor’s tiny allocation there provided an advantage.
For more about the advisor’s strategy and the fund’s positioning during the six months, please see the Advisor’s Report that follows this letter.
Our commitment to balanced investing has roots reaching back many decades
On May 1, Vanguard will celebrate its 40th anniversary. Although many things have changed since 1975, our investment philosophy has not. From the start, we’ve focused on four timeless, straightforward principles that we believe help give clients the best chance for investment success:
• Goals. Create clear, appropriate investment goals.
• Balance. Develop a suitable asset allocation using broadly diversified funds.
• Cost. Minimize cost.
• Discipline. Maintain perspective and long-term discipline.
6
Vanguard has followed all of these principles since its founding, and one of them—the focus on balanced investing—is in the company’s DNA. That’s because our predecessor company, Wellington Management, was a pioneer in this respect, launching a fund in 1929 that included both stocks and bonds.
Vanguard Wellington™ Fund got its start on the eve of the Great Depression, but it thrived over the long term, thanks in large part to its balancing of stocks and bonds. And this strategy continues to define the fund, now one of the nation’s largest balanced funds.
As we embark on our fifth decade, we’ll continue to emphasize the importance of balanced, diversified investing. How investors allocate assets between stocks and bonds has an enormous effect on their portfolio’s risks and returns. And broad diversification reduces exposure to specific risks, while providing opportunities to benefit from the market’s current leaders. (You can read more in Vanguard’s Principles for Investing Success, available at vanguard.com/research.)
As always, thank you for investing with Vanguard.
Sincerely,

F. William McNabb III
Chairman and Chief Executive Officer
April 17, 2015
7
Advisor’s Report
For the six months ended March 31, 2015, Vanguard Capital Opportunity Fund returned 11.28% for Investor Shares and 11.31% for Admiral Shares, trailing the 11.53% return of its benchmark, the unmanaged Russell Midcap Growth Index, while exceeding the 8.85% average return of its multi-capitalization growth fund competitors and the 5.93% return of the unmanaged S&P 500 Index. Relative to the S&P 500 Index, favorable sector allocations and positive stock selection contributed roughly equally to the fund’s outperformance.
The investment environment
Over the six months, U.S. equities continued to appreciate, with the S&P 500 Index reaching a new high during the first quarter of 2015. Small-capitalization stocks, as measured by the Russell 2000 Index, widely outperformed large-capitalization stocks, as measured by the Russell 1000 Index. Within each index, stocks with higher price/earnings ratios and higher forecasted growth rates outperformed stocks with lower P/E ratios and lower forecasted growth rates.
The U.S. economy continued to expand, as real gross domestic product (GDP) grew 5.0% in the third quarter of 2014 and 2.2% in the fourth. The labor market improved further, with the unemployment rate declining over the period to 5.5%, the lowest level since May 2008. Inflation remained low, in part because of falling energy prices; the gasoline component of the Consumer Price Index declined 33% from February 2014 to February 2015.
Lower gasoline prices contributed to improving consumer confidence and a higher savings rate over the past several months.
The U.S. dollar strengthened, notably against the euro, which declined from $1.26 on September 30 to $1.08 on March 31 as the European Central Bank began purchasing sovereign bonds. The strong dollar hurts U.S. exporters, including many of the fund’s information technology companies, by increasing the cost of their dollar-denominated products and services sold in countries whose currencies have depreciated relative to the dollar or by reducing the dollar value of their products and services sold in foreign currencies.
The Federal Reserve concluded its asset purchase program in October. In March, 15 of 17 participants in the Fed’s policymaking Federal Open Market Committee indicated that it would be appropriate to begin increasing the target range for the federal funds rate, currently at 0–0.25%, in 2015.
On the geopolitical front, in early April the United States and five other world powers reached a controversial preliminary deal with Iran to limit its nuclear program in exchange for lifting economic sanctions. The Middle East remained mired in conflict, with ongoing civil wars in Yemen, Syria, and Iraq. In Africa, one terrorist group, Boko Haram, massacred civilians in Nigeria, and another, Al-Shabaab, did the same in Kenya.
8
Outlook for U.S. equities
We are less optimistic about the outlook for U.S. equities than we have been in recent years, though we continue to find individual stocks that are attractively valued. We also believe that stocks are a more attractive investment than bonds at current prices. As of March 31, the S&P 500 was trading for approximately 17.3 times 2015 consensus estimated earnings per share of $120, a higher level than the average of the past 15 years. The index also appears more expensive on a price-to-sales multiple basis, because profit margins are near record highs.
Portfolio update and outlook
For the six-month period, the portfolio was overweighted in health care, information technology, and industrials. These sectors constituted 79% of the fund’s holdings on average (compared with about 45% of the benchmark’s) and contained the fund’s ten largest holdings at the period’s end.
The fund’s overweight position in health care, the top-contributing sector for the six months, and its underweight position in energy, the worst-performing, helped relative results. Favorable stock selection, particularly in health care and industrials, was partially offset by unfavorable stock selection in information technology. In health care, Pharmacyclics (+118%), BioMarin (+73%), Boston Scientific (+50%), Biogen (+28%), Medtronic (+28%), and Amgen (+15%) were the largest positive contributors.
Favorable stock selection in industrials was attributable to the fund’s airline holdings, notably JetBlue Airways (+81%), American Airlines (+49%), United Continental Holdings (+44%), Southwest Airlines (+32%), and Delta Air Lines (+25%). In information technology, losses in SanDisk (–35%), Micron (–21%), Trimble (–17%), NetApp (–17%), and Cree (–13%) were only partially offset by gains in Electronic Arts (+65%), Flextronics (+23%), Texas Instruments (+22%), and Altera (+21%). The fund’s underweight position in Apple (+25%) also hurt relative returns in the information technology sector.
Health care
We remain confident in the fundamental long-term outlook for the health care industry. Increasing worldwide demand for its products will be driven by demographic trends and by the industry’s ability to develop more effective therapies for a range of diseases and conditions. For example, Biogen, one of the fund’s largest holdings, recently reported positive data in an early-stage trial studying its Alzheimer’s disease treatment, rekindling researcher and investor enthusiasm over the potential of this class of drug. Eli Lilly, another top-ten holding, has a similar promising drug in late-stage clinical trials.
Another area of tremendous progress is in the treatment of hepatitis C virus liver infections. Five years ago, the standard treatment for this deadly disease consisted of a year-long regimen, including hard-to-tolerate weekly injections, and the resulting cure rate was about 50%. Recently, Gilead and Abbvie, which the fund did not hold during the period, received FDA approval
9
for their oral therapies, which can achieve cure rates of about 95% in as little as eight to 12 weeks, and further improvements are on the horizon.
Although our long-term outlook for health care is positive, it is tempered by increasing concerns about reimbursement and pricing for approved drugs and biologics. Payers recently have been able to extract higher-than-expected pricing concessions from Abbvie and Gilead as they competed for market share with their new drugs. This has resulted in investor concern that pricing pressure may similarly make its way into other therapeutic areas, such as diabetes, rheumatoid arthritis, and multiple sclerosis.
Ultimately, we feel that high-value therapies that are unique in the market and substantially improve patient outcomes will continue to garner favorable pricing from reimbursement authorities. As we think ahead to our stock positioning in health care, we will focus to an even greater extent on the more innovative biotechnology/pharmaceutical companies with the most distinctive pipelines. Given the uncertain pricing outlook, we feel that it might be harder for the large biotech and pharmaceutical groups to maintain their relative outperformance. Increasingly, we see more attractive opportunities in other health care areas, such as life science research tools and diagnostics.
Information technology
We continue to believe that many of the funds’ information technology holdings are attractively valued. The P/E multiple of the sector relative to that of the broader S&P 500 is near a multi decade low. The tech companies in the S&P 500 are also far better-capitalized than companies in other sectors. Many of the funds’ tech holdings have considerable percentages of their market capitalization in net cash on their balance sheets. Valuations for these holdings, which are already at reasonable multiples, are even more attractive when their net cash balances are considered.
A fundamental technology shift occurring today is the transition from client-server to internet-based, or cloud, architectures, which allow users to rent software applications and computing resources and consume them as services over the internet. This model is more flexible than the traditional model of purchasing perpetual or term-based licenses to software applications and running these applications on local servers. We believe that Microsoft and Intel, which are nearly synonymous with the client-server era of computing, are good examples of companies that are evolving to remain relevant in the cloud era. Microsoft has reengineered and repriced many of its software applications to be delivered as services, while the servers that power the cloud’s data centers overwhelmingly use Intel processors.
Industrials
Within industrials, we still find the airline industry to be attractive for equity investment despite its recent outperformance. The industry has consolidated significantly over the past decade, and today the four largest airlines constitute roughly 85% of industry capacity. Capacity has been reduced by 9% since 2007, and utilization is at historically high levels, giving the
10
airlines the opportunity to raise ticket prices. Furthermore, the industry has established new, high-margin ancillary revenue streams, which are becoming meaningful drivers of profitability. Finally, the recent drop in crude oil prices has been a significant boost to the airlines as jet fuel averages roughly 25% of an airline’s costs.
Conclusion
We remain committed to our investment philosophy, which is to invest in attractively priced individual stocks for the long term. This “bottom-up” approach often results in portfolios that bear little resemblance to market indexes; therefore, our results often deviate substantially. Furthermore, our long-term investment horizon results in low portfolio turnover, which creates the possibility of extended periods of underperformance when the stocks in our portfolio fall out of favor. We nonetheless believe that this approach can generate superior results for investors over the long term.
PRIMECAP Management Company
April 13, 2015
Capital Opportunity Fund
Fund Profile
As of March 31, 2015
| | | |
| Share-Class Characteristics | |
| | Investor | Admiral |
| | Shares | Shares |
| Ticker Symbol | VHCOX | VHCAX |
| Expense Ratio1 | 0.47% | 0.40% |
| 30-Day SEC Yield | 0.52% | 0.59% |
| | | | |
| Portfolio Characteristics | | |
| | | Russell | DJ |
| | | Midcap | U.S. Total |
| | | Growth | Market |
| | Fund | Index | FA Index |
| Number of Stocks | 135 | 550 | 3,757 |
| Median Market Cap | $36.8B | $12.8B | $46.5B |
| Price/Earnings Ratio | 28.0x | 29.4x | 21.4x |
| Price/Book Ratio | 3.9x | 5.5x | 2.8x |
| Return on Equity | 16.8% | 20.2% | 17.5% |
| Earnings Growth | | | |
| Rate | 15.2% | 18.1% | 13.5% |
| Dividend Yield | 1.0% | 1.0% | 1.9% |
| Foreign Holdings | 11.5% | 0.0% | 0.0% |
| Turnover Rate | | | |
| (Annualized) | 8% | — | — |
| Short-Term Reserves | 5.3% | — | — |
| | | |
| Volatility Measures | | |
| | Russell | DJ |
| | Midcap | U.S. Total |
| | Growth | Market |
| | Index | FA Index |
| R-Squared | 0.87 | 0.78 |
| Beta | 0.94 | 0.99 |
| These measures show the degree and timing of the fund’s fluctuations compared with the indexes over 36 months. |
|
| | | |
| Ten Largest Holdings (% of total net assets) |
| Biogen Inc. | Biotechnology | 7.9% |
| Amgen Inc. | Biotechnology | 5.2 |
| BioMarin Pharmaceutical | | |
| Inc. | Biotechnology | 4.1 |
| Eli Lilly & Co. | Pharmaceuticals | 3.7 |
| Southwest Airlines Co. | Airlines | 3.4 |
| Roche Holding AG | Pharmaceuticals | 3.0 |
| FedEx Corp. | Air Freight & | |
| | Logistics | 2.6 |
| Google Inc. | Internet Software & | |
| | Services | 2.3 |
| Novartis AG | Pharmaceuticals | 2.1 |
| Adobe Systems Inc. | Application Software | 2.1 |
| Top Ten | | 36.4% |
| The holdings listed exclude any temporary cash investments and equity index products. |
|
Investment Focus
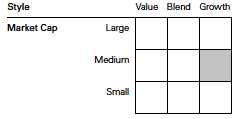
1 The expense ratios shown are from the prospectus dated January 27, 2015, and represent estimated costs for the current fiscal year. For the six months ended March 31, 2015, the annualized expense ratios were 0.46% for Investor Shares and 0.39% for Admiral Shares.
12
Capital Opportunity Fund
| | | |
| Sector Diversification (% of equity exposure) |
| | | Russell | DJ |
| | | Midcap | U.S. Total |
| | | Growth | Market |
| | Fund | Index | FA Index |
| Consumer | | | |
| Discretionary | 10.9% | 23.0% | 13.4% |
| Consumer Staples | 0.0 | 8.1 | 8.4 |
| Energy | 0.8 | 4.8 | 7.3 |
| Financials | 2.6 | 9.5 | 17.6 |
| Health Care | 37.1 | 14.5 | 14.6 |
| Industrials | 16.6 | 15.7 | 11.1 |
| Information | | | |
| Technology | 30.0 | 18.4 | 19.0 |
| Materials | 2.0 | 4.8 | 3.5 |
| Telecommunication | | | |
| Services | 0.0 | 1.0 | 2.0 |
| Utilities | 0.0 | 0.2 | 3.1 |
13
Capital Opportunity Fund
Performance Summary
All of the returns in this report represent past performance, which is not a guarantee of future results that may be achieved by the fund. (Current performance may be lower or higher than the performance data cited. For performance data current to the most recent month-end, visit our website at vanguard.com/performance.) Note, too, that both investment returns and principal value can fluctuate widely, so an investor’s shares, when sold, could be worth more or less than their original cost. The returns shown do not reflect taxes that a shareholder would pay on fund distributions or on the sale of fund shares.
Fiscal-Year Total Returns (%): September 30, 2004, Through March 31, 2015
| | | | | |
| Average Annual Total Returns: Periods Ended March 31, 2015 | | | |
| |
| | Inception | One | Five | Ten |
| | Date | Year | Years | Years |
| Investor Shares | 8/14/1995 | 17.69% | 15.71% | 11.26% |
| Admiral Shares | 11/12/2001 | 17.76 | 15.79 | 11.35 |
See Financial Highlights for dividend and capital gains information.
14
Capital Opportunity Fund
Financial Statements (unaudited)
Statement of Net Assets
As of March 31, 2015
The fund reports a complete list of its holdings in regulatory filings four times in each fiscal year, at the quarter-ends. For the second and fourth fiscal quarters, the lists appear in the fund’s semiannual and annual reports to shareholders. For the first and third fiscal quarters, the fund files the lists with the Securities and Exchange Commission on Form N-Q. Shareholders can look up the fund’s Forms N-Q on the SEC’s website at sec.gov. Forms N-Q may also be reviewed and copied at the SEC’s Public Reference Room (see the back cover of this report for further information).
| | | |
| | | | Market |
| | | | Value |
| | | Shares | ($000) |
| Common Stocks (94.9%) | | |
| Consumer Discretionary (10.3%) | |
| * | CarMax Inc. | 4,191,397 | 289,248 |
| | TJX Cos. Inc. | 2,580,000 | 180,729 |
| * | DIRECTV | 2,081,476 | 177,134 |
| | Carnival Corp. | 3,522,600 | 168,521 |
| *,^ | Tesla Motors Inc. | 684,566 | 129,225 |
| | Royal Caribbean | | |
| | Cruises Ltd. | 1,325,000 | 108,451 |
| *,^ | DreamWorks Animation | | |
| | SKG Inc. Class A | 2,510,000 | 60,742 |
| * | Bed Bath & Beyond Inc. | 703,700 | 54,027 |
| | Gildan Activewear Inc. | | |
| | Class A | 1,497,900 | 44,218 |
| * | Sony Corp. ADR | 1,495,800 | 40,057 |
| * | Norwegian Cruise Line | | |
| | Holdings Ltd. | 704,000 | 38,023 |
| | L Brands Inc. | 369,900 | 34,878 |
| | Ross Stores Inc. | 296,000 | 31,187 |
| | Tribune Media Co. Class A | 480,000 | 29,189 |
| * | Shutterfly Inc. | 582,500 | 26,352 |
| * | Ascena Retail Group Inc. | 1,675,200 | 24,307 |
| * | Amazon.com Inc. | 62,530 | 23,267 |
| | Las Vegas Sands Corp. | 340,000 | 18,714 |
| * | Urban Outfitters Inc. | 79,600 | 3,634 |
| | Newell Rubbermaid Inc. | 86,200 | 3,368 |
| | Tribune Publishing Co. | 120,000 | 2,328 |
| | Carter’s Inc. | 16,520 | 1,528 |
| | | | 1,489,127 |
| Energy (0.8%) | | |
| | Cabot Oil & Gas Corp. | 1,285,800 | 37,970 |
| ^ | Transocean Ltd. | 1,349,642 | 19,799 |
| | National Oilwell Varco Inc. | 336,000 | 16,797 |
| ^ | Frank’s International NV | 803,200 | 15,020 |
| | Noble Energy Inc. | 200,000 | 9,780 |
| * | Southwestern Energy Co. | 366,334 | 8,495 |
| * | Cameron | | |
| | International Corp. | 79,700 | 3,596 |
| | Ensco plc Class A | 143,340 | 3,020 |
| | | | 114,477 |
| | | |
| | | | Market |
| | | | Value |
| | | Shares | ($000) |
| Financials (2.4%) | | |
| | Charles Schwab Corp. | 7,605,500 | 231,511 |
| | CME Group Inc. | 454,150 | 43,013 |
| | Chubb Corp. | 321,000 | 32,453 |
| | Discover Financial | | |
| | Services | 462,100 | 26,039 |
| * | E*TRADE Financial Corp. | 340,100 | 9,712 |
| | JPMorgan Chase & Co. | 38,000 | 2,302 |
| | Progressive Corp. | 79,600 | 2,165 |
| | | | 347,195 |
| Health Care (35.2%) | | |
| * | Biogen Inc. | 2,690,438 | 1,136,011 |
| | Amgen Inc. | 4,646,400 | 742,727 |
| * | BioMarin | | |
| | Pharmaceutical Inc. | 4,769,100 | 594,325 |
| | Eli Lilly & Co. | 7,400,000 | 537,610 |
| | Roche Holding AG | 1,561,578 | 429,109 |
| | Novartis AG ADR | 3,115,400 | 307,210 |
| * | Illumina Inc. | 1,220,100 | 226,499 |
| * | QIAGEN NV | 8,390,000 | 211,428 |
| | Medtronic plc | 2,409,500 | 187,917 |
| * | Pharmacyclics Inc. | 593,700 | 151,957 |
| * | Boston Scientific Corp. | 7,162,800 | 127,140 |
| | Thermo Fisher | | |
| | Scientific Inc. | 533,600 | 71,684 |
| | Abbott Laboratories | 1,299,600 | 60,210 |
| *,^ | Seattle Genetics Inc. | 1,620,000 | 57,267 |
| * | Charles River Laboratories | | |
| | International Inc. | 661,000 | 52,411 |
| | PerkinElmer Inc. | 913,200 | 46,701 |
| * | Edwards | | |
| | Lifesciences Corp. | 280,000 | 39,889 |
| * | Affymetrix Inc. | 2,700,600 | 33,920 |
| * | Waters Corp. | 154,000 | 19,145 |
| * | ImmunoGen Inc. | 1,280,000 | 11,456 |
| | Agilent Technologies Inc. | 233,000 | 9,681 |
| | Zimmer Holdings Inc. | 54,000 | 6,346 |
| * | Cerner Corp. | 10,000 | 733 |
| | | | 5,061,376 |
15
Capital Opportunity Fund
| | | |
| | | | Market |
| | | | Value |
| | | Shares | ($000) |
| Industrials (15.8%) | | |
| | Southwest Airlines Co. | 10,935,100 | 484,425 |
| | FedEx Corp. | 2,293,974 | 379,538 |
| * | United Continental | | |
| | Holdings Inc. | 4,186,200 | 281,522 |
| | Airbus Group NV | 2,893,040 | 188,080 |
| | Delta Air Lines Inc. | 3,854,000 | 173,276 |
| * | JetBlue Airways Corp. | 6,940,150 | 133,598 |
| | Rockwell Automation Inc. | 988,000 | 114,598 |
| | American Airlines | | |
| | Group Inc. | 2,085,000 | 110,046 |
| * | Jacobs Engineering | | |
| | Group Inc. | 2,069,419 | 93,455 |
| | Ritchie Bros | | |
| | Auctioneers Inc. | 2,962,000 | 73,872 |
| | Union Pacific Corp. | 672,000 | 72,784 |
| | IDEX Corp. | 585,000 | 44,361 |
| * | AECOM | 1,380,000 | 42,532 |
| | Curtiss-Wright Corp. | 325,000 | 24,031 |
| | CH Robinson | | |
| | Worldwide Inc. | 315,000 | 23,064 |
| * | Spirit Airlines Inc. | 158,235 | 12,241 |
| | Alaska Air Group Inc. | 110,000 | 7,280 |
| | Chicago Bridge & | | |
| | Iron Co. NV | 100,000 | 4,926 |
| * | Esterline | | |
| | Technologies Corp. | 30,631 | 3,505 |
| | | | 2,267,134 |
| Information Technology (28.5%) | |
| * | Adobe Systems Inc. | 4,124,500 | 304,966 |
| | Texas Instruments Inc. | 4,896,400 | 280,001 |
| | NetApp Inc. | 5,728,000 | 203,115 |
| | Altera Corp. | 4,610,000 | 197,815 |
| | Microsoft Corp. | 4,750,000 | 193,111 |
| | Corning Inc. | 8,080,000 | 183,254 |
| | ASML Holding NV | 1,805,040 | 182,363 |
| * | Flextronics | | |
| | International Ltd. | 13,149,200 | 166,666 |
| * | Google Inc. Class A | 298,530 | 165,595 |
| * | Google Inc. Class C | 298,530 | 163,594 |
| * | Micron Technology Inc. | 5,830,000 | 158,168 |
| * | Trimble Navigation Ltd. | 5,841,200 | 147,198 |
| | SanDisk Corp. | 2,272,277 | 144,562 |
| *,^ | Cree Inc. | 3,944,900 | 140,005 |
| | NVIDIA Corp. | 6,479,800 | 135,590 |
| | QUALCOMM Inc. | 1,510,975 | 104,771 |
| | EMC Corp. | 3,510,000 | 89,716 |
| *,^ | BlackBerry Ltd. | 9,358,700 | 83,573 |
| | Visa Inc. Class A | 1,233,920 | 80,711 |
| * | Electronic Arts Inc. | 1,300,000 | 76,459 |
| | Hewlett-Packard Co. | 2,290,000 | 71,356 |
| *,1 | Descartes Systems | | |
| | Group Inc. | 4,645,000 | 69,954 |
| | Plantronics Inc. | 1,150,000 | 60,892 |
| | Symantec Corp. | 2,398,300 | 56,036 |
| * | Rambus Inc. | 4,400,000 | 55,330 |
| | | |
| | | | Market |
| | | | Value |
| | | Shares | ($000) |
| *,1 | FormFactor Inc. | 5,809,700 | 51,532 |
| | KLA-Tencor Corp. | 843,900 | 49,191 |
| *,^ | NeuStar Inc. Class A | 1,713,566 | 42,188 |
| * | eBay Inc. | 710,100 | 40,959 |
| | FEI Co. | 478,000 | 36,491 |
| | Intuit Inc. | 370,000 | 35,875 |
| * | Nuance | | |
| | Communications Inc. | 2,470,000 | 35,445 |
| * | VMware Inc. Class A | 399,700 | 32,779 |
| | Apple Inc. | 259,000 | 32,227 |
| * | F5 Networks Inc. | 263,325 | 30,267 |
| * | Entegris Inc. | 2,019,231 | 27,643 |
| | Jabil Circuit Inc. | 1,000,000 | 23,380 |
| | MasterCard Inc. Class A | 244,500 | 21,122 |
| * | Keysight Technologies Inc. | 470,000 | 17,461 |
| | Broadcom Corp. Class A | 380,000 | 16,452 |
| | Analog Devices Inc. | 225,000 | 14,175 |
| *,^ | Mobileye NV | 284,231 | 11,946 |
| * | Ciena Corp. | 607,142 | 11,724 |
| * | Yahoo! Inc. | 256,800 | 11,411 |
| | Brocade Communications | | |
| | Systems Inc. | 900,000 | 10,679 |
| | Applied Materials Inc. | 340,000 | 7,670 |
| *,^ | SMART Technologies Inc. 4,321,304 | 5,272 |
| * | Alibaba Group | | |
| | Holding Ltd. ADR | 36,200 | 3,013 |
| | Telefonaktiebolaget | | |
| | LM Ericsson ADR | 230,000 | 2,887 |
| *,^ | Arista Networks Inc. | 28,900 | 2,038 |
| | Motorola Solutions Inc. | 25,150 | 1,677 |
| * | salesforce.com inc | 23,500 | 1,570 |
| * | Workday Inc. Class A | 10,000 | 844 |
| * | Twitter Inc. | 12,680 | 635 |
| | | | 4,093,354 |
| Materials (1.9%) | | |
| | Monsanto Co. | 2,378,786 | 267,708 |
| |
| Telecommunication Services (0.0%) | |
| * | Sprint Corp. | 230,000 | 1,090 |
| Total Common Stocks | | |
| (Cost $6,202,334) | | 13,641,461 |
| Temporary Cash Investment (6.1%) | |
| Money Market Fund (6.1%) | | |
| 2,3 | Vanguard Market Liquidity | | |
| | Fund, 0.128% | | |
| | (Cost $879,969) | 879,968,539 | 879,969 |
| Total Investments (101.0%) | | |
| (Cost $7,082,303) | | 14,521,430 |
| Other Assets and Liabilities (-1.0%) | |
| Other Assets | | 176,359 |
| Liabilities3 | | (317,340) |
| | | | (140,981) |
| Net Assets (100%) | | 14,380,449 |
16
Capital Opportunity Fund
| |
| At March 31, 2015, net assets consisted of: |
| | Amount |
| | ($000) |
| Paid-in Capital | 6,719,808 |
| Undistributed Net Investment Income | 21,361 |
| Accumulated Net Realized Gains | 200,350 |
| Unrealized Appreciation (Depreciation) | |
| Investment Securities | 7,439,127 |
| Foreign Currencies | (197) |
| Net Assets | 14,380,449 |
| |
| Investor Shares—Net Assets | |
| Applicable to 51,027,781 outstanding | |
| $.001 par value shares of beneficial | |
| interest (unlimited authorization) | 2,804,776 |
| Net Asset Value Per Share— | |
| Investor Shares | $54.97 |
| |
| Admiral Shares—Net Assets | |
| Applicable to 91,207,365 outstanding | |
| $.001 par value shares of beneficial | |
| interest (unlimited authorization) | 11,575,673 |
| Net Asset Value Per Share— | |
| Admiral Shares | $126.92 |
See Note A in Notes to Financial Statements.
* Non-income-producing security.
^ Includes partial security positions on loan to broker-dealers. The total value of securities on loan is $111,923,000.
1 Considered an affiliated company of the fund as the fund owns more than 5% of the outstanding voting securities of such company.
2 Affiliated money market fund available only to Vanguard funds and certain trusts and accounts managed by Vanguard. Rate shown is the 7-day yield.
3 Includes $115,776,000 of collateral received for securities on loan.
ADR—American Depositary Receipt.
See accompanying Notes, which are an integral part of the Financial Statements.
17
Capital Opportunity Fund
Statement of Operations
| |
| | Six Months Ended |
| | March 31, 2015 |
| | ($000) |
| Investment Income | |
| Income | |
| Dividends1 | 89,860 |
| Interest | 472 |
| Securities Lending | 1,266 |
| Total Income | 91,598 |
| Expenses | |
| Investment Advisory Fees—Note B | 16,577 |
| The Vanguard Group—Note C | |
| Management and Administrative—Investor Shares | 2,848 |
| Management and Administrative—Admiral Shares | 7,023 |
| Marketing and Distribution—Investor Shares | 226 |
| Marketing and Distribution—Admiral Shares | 733 |
| Custodian Fees | 96 |
| Shareholders’ Reports—Investor Shares | 21 |
| Shareholders’ Reports—Admiral Shares | 13 |
| Trustees’ Fees and Expenses | 11 |
| Total Expenses | 27,548 |
| Net Investment Income | 64,050 |
| Realized Net Gain (Loss) | |
| Investment Securities Sold | 299,250 |
| Foreign Currencies | (220) |
| Realized Net Gain (Loss) | 299,030 |
| Change in Unrealized Appreciation (Depreciation) | |
| Investment Securities | 1,091,461 |
| Foreign Currencies | 29 |
| Change in Unrealized Appreciation (Depreciation) | 1,091,490 |
| Net Increase (Decrease) in Net Assets Resulting from Operations | 1,454,570 |
| 1 Dividends are net of foreign withholding taxes of $3,436,000. | |
See accompanying Notes, which are an integral part of the Financial Statements.
18
Capital Opportunity Fund
Statement of Changes in Net Assets
| | |
| | Six Months Ended | Year Ended |
| | March 31, | September 30, |
| | 2015 | 2014 |
| | ($000) | ($000) |
| Increase (Decrease) in Net Assets | | |
| Operations | | |
| Net Investment Income | 64,050 | 75,621 |
| Realized Net Gain (Loss) | 299,030 | 435,273 |
| Change in Unrealized Appreciation (Depreciation) | 1,091,490 | 1,638,778 |
| Net Increase (Decrease) in Net Assets Resulting from Operations | 1,454,570 | 2,149,672 |
| Distributions | | |
| Net Investment Income | | |
| Investor Shares | (16,335) | (4,359) |
| Admiral Shares | (69,765) | (19,984) |
| Realized Capital Gain1 | | |
| Investor Shares | (99,545) | (100,744) |
| Admiral Shares | (370,542) | (305,893) |
| Total Distributions | (556,187) | (430,980) |
| Capital Share Transactions | | |
| Investor Shares | (180,555) | (341,836) |
| Admiral Shares | 818,889 | 820,230 |
| Net Increase (Decrease) from Capital Share Transactions | 638,334 | 478,394 |
| Total Increase (Decrease) | 1,536,717 | 2,197,086 |
| Net Assets | | |
| Beginning of Period | 12,843,732 | 10,646,646 |
| End of Period2 | 14,380,449 | 12,843,732 |
| 1 Includes fiscal 2015 and 2014 short-term gain distributions totaling $10,268,000 and $28,347,000, respectively. Short-term gain distributions are treated as ordinary income dividends for tax purposes. |
|
| 2 Net Assets—End of Period includes undistributed (overdistributed) net investment income of $21,361,000 and $43,631,000. |
See accompanying Notes, which are an integral part of the Financial Statements.
19
Capital Opportunity Fund
Financial Highlights
| | | | | | |
| Investor Shares | | | | | | |
| | Six Months | | | | | |
| | Ended | | | | | |
| For a Share Outstanding | March 31, | | | Year Ended September 30, |
| Throughout Each Period | 2015 | 2014 | 2013 | 2012 | 2011 | 2010 |
| Net Asset Value, Beginning of Period | $51.42 | $44.57 | $33.22 | $28.17 | $29.59 | $27.71 |
| Investment Operations | | | | | | |
| Net Investment Income | .233 | .272 | .270 | .216 | .151 | .106 |
| Net Realized and Unrealized Gain (Loss) | | | | | | |
| on Investments | 5.502 | 8.314 | 12.395 | 6.464 | (1.450) | 1.871 |
| Total from Investment Operations | 5.735 | 8.586 | 12.665 | 6.680 | (1.299) | 1.977 |
| Distributions | | | | | | |
| Dividends from Net Investment Income | (.308) | (.072)1 | (. 385)1 | (.161) | (.121) | (. 097) |
| Distributions from Realized Capital Gains | (1.877) | (1.664) | (.930) | (1.469) | — | — |
| Total Distributions | (2.185) | (1.736) | (1.315) | (1.630) | (.121) | (.097) |
| Net Asset Value, End of Period | $54.97 | $51.42 | $44.57 | $33.22 | $28.17 | $29.59 |
| |
| Total Return2 | 11.28% | 19.85% | 39.40% | 24.62% | -4.45% | 7.14% |
| |
| Ratios/Supplemental Data | | | | | | |
| Net Assets, End of Period (Millions) | $2,805 | $2,793 | $2,720 | $2,432 | $2,412 | $3,675 |
| Ratio of Total Expenses to | | | | | | |
| Average Net Assets | 0.46% | 0.47% | 0.48% | 0.48% | 0.48% | 0.48% |
| Ratio of Net Investment Income to | | | | | | |
| Average Net Assets | 0.82% | 0.57% | 0.68% | 0.67% | 0.45% | 0.36% |
| Portfolio Turnover Rate | 8% | 7% | 9% | 9% | 9% | 8% |
| The expense ratio, net income ratio, and turnover rate for the current period have been annualized. | | |
| 1 Fiscal 2013 dividends from net investment income include $.157 per share from a dividend received from ASML Holding NV. Subsequent to the payment of the fund’s dividend from net investment income in December 2012, the ASML dividend was reallocated to return of capital. The reallocation reduced the fund’s dividend from net investment income in December 2013. The reallocation had no impact on net assets, net asset values per share, or total returns. |
|
|
|
| 2 Total returns do not include transaction or account service fees that may have applied in the periods shown. Fund prospectuses provide information about any applicable transaction and account service fees. |
|
See accompanying Notes, which are an integral part of the Financial Statements.
20
Capital Opportunity Fund
Financial Highlights
| | | | | | |
| Admiral Shares | | | | | | |
| | Six Months | | | | | |
| | Ended | | | | | |
| For a Share Outstanding | March 31, | | | Year Ended September 30, |
| Throughout Each Period | 2015 | 2014 | 2013 | 2012 | 2011 | 2010 |
| Net Asset Value, Beginning of Period | $118.79 | $102.97 | $76.75 | $65.10 | $68.38 | $64.04 |
| Investment Operations | | | | | | |
| Net Investment Income | . 591 | .728 | .707 | . 559 | . 400 | . 298 |
| Net Realized and Unrealized Gain (Loss) | | | | | | |
| on Investments | 12.689 | 19.185 | 28.613 | 14.917 | (3.358) | 4.315 |
| Total from Investment Operations | 13.280 | 19.913 | 29.320 | 15.476 | (2.958) | 4.613 |
| Distributions | | | | | | |
| Dividends from Net Investment Income | (.816) | (.251)1 | (. 953)1 | (. 434) | (. 322) | (. 273) |
| Distributions from Realized Capital Gains | (4.334) | (3.842) | (2.147) | (3.392) | — | — |
| Total Distributions | (5.150) | (4.093) | (3.100) | (3.826) | (.322) | (.273) |
| Net Asset Value, End of Period | $126.92 | $118.79 | $102.97 | $76.75 | $65.10 | $68.38 |
| |
| Total Return2 | 11.31% | 19.94% | 39.50% | 24.69% | -4.39% | 7.21% |
| |
| Ratios/Supplemental Data | | | | | | |
| Net Assets, End of Period (Millions) | $11,576 | $10,051 | $7,927 | $5,045 | $4,342 | $4,223 |
| Ratio of Total Expenses to | | | | | | |
| Average Net Assets | 0.39% | 0.40% | 0.41% | 0.41% | 0.41% | 0.41% |
| Ratio of Net Investment Income to | | | | | | |
| Average Net Assets | 0.89% | 0.64% | 0.75% | 0.74% | 0.52% | 0.43% |
| Portfolio Turnover Rate | 8% | 7% | 9% | 9% | 9% | 8% |
| The expense ratio, net income ratio, and turnover rate for the current period have been annualized. | | |
| 1 Fiscal 2013 dividends from net investment income include $.363 per share from a dividend received from ASML Holding NV. Subsequent to the payment of the fund’s dividend from net investment income in December 2012, the ASML dividend was reallocated to return of capital. The reallocation reduced the fund’s dividend from net investment income in December 2013. The reallocation had no impact on net assets, net asset values per share, or total returns. |
|
|
|
| 2 Total returns do not include transaction or account service fees that may have applied in the periods shown. Fund prospectuses provide information about any applicable transaction and account service fees. |
|
See accompanying Notes, which are an integral part of the Financial Statements.
21
Capital Opportunity Fund
Notes to Financial Statements
Vanguard Capital Opportunity Fund is registered under the Investment Company Act of 1940 as an open-end investment company, or mutual fund. The fund offers two classes of shares: Investor Shares and Admiral Shares. Investor Shares are available to any investor who meets the fund’s minimum purchase requirements. Admiral Shares are designed for investors who meet certain administrative, service, and account-size criteria.
A. The following significant accounting policies conform to generally accepted accounting principles for U.S. investment companies. The fund consistently follows such policies in preparing its financial statements.
1. Security Valuation: Securities are valued as of the close of trading on the New York Stock Exchange (generally 4 p.m., Eastern time) on the valuation date. Equity securities are valued at the latest quoted sales prices or official closing prices taken from the primary market in which each security trades; such securities not traded on the valuation date are valued at the mean of the latest quoted bid and asked prices. Securities for which market quotations are not readily available, or whose values have been affected by events occurring before the fund’s pricing time but after the close of the securities’ primary markets, are valued at their fair values calculated according to procedures adopted by the board of trustees. These procedures include obtaining quotations from an independent pricing service, monitoring news to identify significant market- or security-specific events, and evaluating changes in the values of foreign market proxies (for example, ADRs, futures contracts, or exchange-traded funds), between the time the foreign markets close and the fund’s pricing time. When fair-value pricing is employed, the prices of securities used by a fund to calculate its net asset value may differ from quoted or published prices for the same securities. Investments in Vanguard Market Liquidity Fund are valued at that fund’s net asset value.
2. Foreign Currency: Securities and other assets and liabilities denominated in foreign currencies are translated into U.S. dollars using exchange rates obtained from an independent third party as of the fund’s pricing time on the valuation date. Realized gains (losses) and unrealized appreciation (depreciation) on investment securities include the effects of changes in exchange rates since the securities were purchased, combined with the effects of changes in security prices. Fluctuations in the value of other assets and liabilities resulting from changes in exchange rates are recorded as unrealized foreign currency gains (losses) until the assets or liabilities are settled in cash, at which time they are recorded as realized foreign currency gains (losses).
3. Federal Income Taxes: The fund intends to continue to qualify as a regulated investment company and distribute all of its taxable income. Management has analyzed the fund’s tax positions taken for all open federal income tax years (September 30, 2011–2014), and for the period ended March 31, 2015, and has concluded that no provision for federal income tax is required in the fund’s financial statements.
4. Distributions: Distributions to shareholders are recorded on the ex-dividend date.
5. Securities Lending: To earn additional income, the fund lends its securities to qualified institutional borrowers. Security loans are required to be secured at all times by collateral in an amount at least equal to the market value of securities loaned. Daily market fluctuations could cause the value of loaned securities to be more or less than the value of the collateral received. When this occurs, the collateral is adjusted and settled on the next business day. The fund further mitigates its counterparty risk by entering into securities lending transactions only with a diverse group of prequalified counterparties, monitoring their financial strength, and entering into master securities lending agreements with its counterparties. The master securities lending agreements provide that, in the event of a counterparty’s default (including bankruptcy), the fund may terminate any loans with that borrower, determine the net amount owed, and sell or retain the collateral up to the net amount owed
22
Capital Opportunity Fund
to the fund; however, such actions may be subject to legal proceedings. While collateral mitigates counterparty risk, in the absence of a default the fund may experience delays and costs in recovering the securities loaned. The fund invests cash collateral received in Vanguard Market Liquidity Fund, and records a liability in the Statement of Net Assets for the return of the collateral, during the period the securities are on loan. Securities lending income represents fees charged to borrowers plus income earned on invested cash collateral, less expenses associated with the loan.
6. Credit Facility: The fund and certain other funds managed by The Vanguard Group participate in a $3 billion committed credit facility provided by a syndicate of lenders pursuant to a credit agreement that may be renewed annually; each fund is individually liable for its borrowings, if any, under the credit facility. Borrowings may be utilized for temporary and emergency purposes, and are subject to the fund’s regulatory and contractual borrowing restrictions. The participating funds are charged administrative fees and an annual commitment fee of 0.06% of the undrawn amount of the facility; these fees are allocated to the funds based on a method approved by the fund’s board of trustees and included in Management and Administrative expenses on the fund’s Statement of Operations. Any borrowings under this facility bear interest at a rate equal to the higher of the federal funds rate or LIBOR reference rate plus an agreed-upon spread.
The fund had no borrowings outstanding at March 31, 2015, or at any time during the period then ended.
7. Other: Dividend income is recorded on the ex-dividend date. Interest income includes income distributions received from Vanguard Market Liquidity Fund and is accrued daily. Security transactions are accounted for on the date securities are bought or sold. Costs used to determine realized gains (losses) on the sale of investment securities are those of the specific securities sold.
Each class of shares has equal rights as to assets and earnings, except that each class separately bears certain class-specific expenses related to maintenance of shareholder accounts (included in Management and Administrative expenses) and shareholder reporting. Marketing and distribution expenses are allocated to each class of shares based on a method approved by the board of trustees. Income, other non-class-specific expenses, and gains and losses on investments are allocated to each class of shares based on its relative net assets.
B. PRIMECAP Management Company provides investment advisory services to the fund for a fee calculated at an annual percentage rate of average net assets. For the six months ended March 31, 2015, the investment advisory fee represented an effective annual rate of 0.24% of the fund’s average net assets.
C. The Vanguard Group furnishes at cost corporate management, administrative, marketing, and distribution services. The costs of such services are allocated to the fund based on methods approved by the board of trustees. The fund has committed to invest up to 0.40% of its net assets in Vanguard. At March 31, 2015, the fund had contributed capital of $1,301,000 to Vanguard (included in Other Assets), representing 0.01% of the fund’s net assets and 0.52% of Vanguard’s capitalization. The fund’s trustees and officers are also directors and officers of Vanguard.
23
Capital Opportunity Fund
D. Various inputs may be used to determine the value of the fund’s investments. These inputs are summarized in three broad levels for financial statement purposes. The inputs or methodologies used to value securities are not necessarily an indication of the risk associated with investing in those securities.
Level 1—Quoted prices in active markets for identical securities.
Level 2—Other significant observable inputs (including quoted prices for similar securities, interest rates, prepayment speeds, credit risk, etc.).
Level 3—Significant unobservable inputs (including the fund’s own assumptions used to determine the fair value of investments).
The following table summarizes the market value of the fund’s investments as of March 31, 2015, based on the inputs used to value them:
| | | |
| | Level 1 | Level 2 | Level 3 |
| Investments | ($000) | ($000) | ($000) |
| Common Stocks | 13,024,272 | 617,189 | — |
| Temporary Cash Investments | 879,969 | — | — |
| Total | 13,904,241 | 617,189 | — |
E. Distributions are determined on a tax basis and may differ from net investment income and realized capital gains for financial reporting purposes. Differences may be permanent or temporary. Permanent differences are reclassified among capital accounts in the financial statements to reflect their tax character. Temporary differences arise when certain items of income, expense, gain, or loss are recognized in different periods for financial statement and tax purposes. These differences will reverse at some time in the future. Differences in classification may also result from the treatment of short-term gains as ordinary income for tax purposes. The fund’s tax-basis capital gains and losses are determined only at the end of each fiscal year.
At March 31, 2015, the cost of investment securities for tax purposes was $7,082,303,000. Net unrealized appreciation of investment securities for tax purposes was $7,439,127,000, consisting entirely of unrealized gains on securities that had risen in value since their purchase.
F. During the six months ended March 31, 2015, the fund purchased $563,958,000 of investment securities and sold $543,692,000 of investment securities, other than temporary cash investments.
24
Capital Opportunity Fund
G. Capital share transactions for each class of shares were:
| | | | |
| | Six Months Ended | | Year Ended |
| | March 31, 2015 | September 30, 2014 |
| | Amount | Shares | Amount | Shares |
| | ($000) | (000) | ($000) | (000) |
| Investor Shares | | | | |
| Issued | 241,357 | 4,561 | 486,523 | 10,295 |
| Issued in Lieu of Cash Distributions | 111,604 | 2,090 | 101,413 | 2,267 |
| Redeemed | (533,516) | (9,933) | (929,772) | (19,277) |
| Net Increase (Decrease)—Investor Shares | (180,555) | (3,282) | (341,836) | (6,715) |
| Admiral Shares | | | | |
| Issued | 762,422 | 6,149 | 1,283,265 | 11,628 |
| Issued in Lieu of Cash Distributions | 403,935 | 3,277 | 299,123 | 2,896 |
| Redeemed | (347,468) | (2,834) | (762,158) | (6,891) |
| Net Increase (Decrease)—Admiral Shares | 818,889 | 6,592 | 820,230 | 7,633 |
H. Certain of the fund’s investments are in companies that are considered to be affiliated companies of the fund because the fund owns more than 5% of the outstanding voting securities of the company or the issuer is another member of The Vanguard Group. Transactions during the period in securities of these companies were as follows:
| | | | | | |
| | | | Current Period Transactions | |
| | Sept. 30, | | Proceeds | | | March 31, |
| | 2014 | | from | | Capital Gain | 2015 |
| | Market | Purchases | Securities | | Distributions | Market |
| | Value | at Cost | Sold1 | Income | Received | Value |
| | ($000) | ($000) | ($000) | ($000) | ($000) | ($000) |
| Descartes Systems Group Inc. | 64,147 | — | — | — | — | 69,954 |
| FormFactor Inc. | 41,656 | — | — | — | — | 51,532 |
| Vanguard Market Liquidity Fund | 728,974 | NA2 | NA 2 | 472 | — | 879,969 |
| Total | 834,777 | | | 472 | — | 1,001,455 |
| 1 Includes net realized gain (loss) on affiliated investment securities sold of $0. | | | |
| 2 Not applicable—purchases and sales are for temporary cash investment purposes. | | | |
I. Management has determined that no material events or transactions occurred subsequent to March 31, 2015, that would require recognition or disclosure in these financial statements.
25
About Your Fund’s Expenses
As a shareholder of the fund, you incur ongoing costs, which include costs for portfolio management, administrative services, and shareholder reports (like this one), among others. Operating expenses, which are deducted from a fund’s gross income, directly reduce the investment return of the fund.
A fund’s expenses are expressed as a percentage of its average net assets. This figure is known as the expense ratio. The following examples are intended to help you understand the ongoing costs (in dollars) of investing in your fund and to compare these costs with those of other mutual funds. The examples are based on an investment of $1,000 made at the beginning of the period shown and held for the entire period.
The accompanying table illustrates your fund’s costs in two ways:
• Based on actual fund return. This section helps you to estimate the actual expenses that you paid over the period. The ”Ending Account Value“ shown is derived from the fund‘s actual return, and the third column shows the dollar amount that would have been paid by an investor who started with $1,000 in the fund. You may use the information here, together with the amount you invested, to estimate the expenses that you paid over the period.
To do so, simply divide your account value by $1,000 (for example, an $8,600 account value divided by $1,000 = 8.6), then multiply the result by the number given for your fund under the heading ”Expenses Paid During Period.“
• Based on hypothetical 5% yearly return. This section is intended to help you compare your fund‘s costs with those of other mutual funds. It assumes that the fund had a yearly return of 5% before expenses, but that the expense ratio is unchanged. In this case—because the return used is not the fund’s actual return—the results do not apply to your investment. The example is useful in making comparisons because the Securities and Exchange Commission requires all mutual funds to calculate expenses based on a 5% return. You can assess your fund’s costs by comparing this hypothetical example with the hypothetical examples that appear in shareholder reports of other funds.
Note that the expenses shown in the table are meant to highlight and help you compare ongoing costs only and do not reflect transaction costs incurred by the fund for buying and selling securities. Further, the expenses do not include any purchase, redemption, or account service fees described in the fund prospectus. If such fees were applied to your account, your costs would be higher. Your fund does not carry a “sales load.”
The calculations assume no shares were bought or sold during the period. Your actual costs may have been higher or lower, depending on the amount of your investment and the timing of any purchases or redemptions.
You can find more information about the fund’s expenses, including annual expense ratios, in the Financial Statements section of this report. For additional information on operating expenses and other shareholder costs, please refer to your fund’s current prospectus.
26
| | | |
| Six Months Ended March 31, 2015 | | | |
| | Beginning | Ending | Expenses |
| | Account Value | Account Value | Paid During |
| Capital Opportunity Fund | 9/30/2014 | 3/31/2015 | Period |
| Based on Actual Fund Return | | | |
| Investor Shares | $1,000.00 | $1,112.78 | $2.42 |
| Admiral Shares | 1,000.00 | 1,113.07 | 2.05 |
| Based on Hypothetical 5% Yearly Return | | | |
| Investor Shares | $1,000.00 | $1,022.64 | $2.32 |
| Admiral Shares | 1,000.00 | 1,022.99 | 1.97 |
| The calculations are based on expenses incurred in the most recent six-month period. The fund’s annualized six-month expense ratios for that period are 0.46% for Investor Shares and 0.39% for Admiral Shares. The dollar amounts shown as “Expenses Paid” are equal to the annualized expense ratio multiplied by the average account value over the period, multiplied by the number of days in the most recent six-month period, then divided by the number of days in the most recent 12-month period. |
|
|
|
Trustees Approve Advisory Arrangement
The board of trustees of Vanguard Capital Opportunity Fund has renewed the fund’s investment advisory arrangement with PRIMECAP Management Company (PRIMECAP Management). The board determined that renewing the fund’s advisory arrangement was in the best interests of the fund and its shareholders.
The board based its decision upon an evaluation of the advisor’s investment staff, portfolio management process, and performance. The trustees considered the factors discussed below, among others. However, no single factor determined whether the board approved the arrangement. Rather, it was the totality of the circumstances that drove the board’s decision.
Nature, extent, and quality of services
The board considered the quality of the fund’s investment management services over both the short and long term, and took into account the organizational depth and stability of the advisor. The board noted that PRIMECAP Management, founded in 1983, is recognized for its long-term approach to growth-equity investing. Five experienced portfolio managers are responsible for separate sub-portfolios, and each portfolio manager employs a fundamental, research-driven approach in seeking to identify companies with long-term growth potential that the market has yet to appreciate. The multi-counselor approach that the advisor employs is designed to emphasize individual decision-making and enable each portfolio manager to invest only in his highest-conviction ideas. PRIMECAP Management has managed the fund since 1998.
The board concluded that the advisor’s experience, stability, depth, and performance, among other factors, warranted continuation of the advisory arrangement.
Investment performance
The board considered the short- and long-term performance of the fund, including any periods of outperformance or underperformance relative to a benchmark index and peer group. The board concluded that the performance was such that the advisory arrangement should continue. Information about the fund’s most recent performance can be found in the Performance Summary section of this report.
Cost
The board concluded that the fund’s expense ratio was well below the average expense ratio charged by funds in its peer group and that the fund’s advisory fee rate was also well below its peer-group average. Information about the fund’s expenses appears in the About Your Fund’s Expenses section of this report as well as in the Financial Statements section, which also includes information about fund’s advisory fee rate.
The board did not consider profitability of PRIMECAP Management in determining whether to approve the advisory fee, because PRIMECAP Management is independent of Vanguard, and the advisory fee is the result of arm’s-length negotiations.
The benefit of economies of scale
The board concluded that the fund’s shareholders benefit from economies of scale because of the breakpoints in the fund’s advisory fee schedule. The breakpoints reduce the effective rate of the fee as the fund’s assets increase.
The board will consider whether to renew the advisory arrangement again after a one-year period.
28
Glossary
30-Day SEC Yield. A fund’s 30-day SEC yield is derived using a formula specified by the U.S. Securities and Exchange Commission. Under the formula, data related to the fund’s security holdings in the previous 30 days are used to calculate the fund’s hypothetical net income for that period, which is then annualized and divided by the fund’s estimated average net assets over the calculation period. For the purposes of this calculation, a security’s income is based on its current market yield to maturity (for bonds), its actual income (for asset-backed securities), or its projected dividend yield (for stocks). Because the SEC yield represents hypothetical annualized income, it will differ—at times significantly—from the fund’s actual experience. As a result, the fund’s income distributions may be higher or lower than implied by the SEC yield.
Beta. A measure of the magnitude of a fund’s past share-price fluctuations in relation to the ups and downs of a given market index. The index is assigned a beta of 1.00. Compared with a given index, a fund with a beta of 1.20 typically would have seen its share price rise or fall by 12% when the index rose or fell by 10%. For this report, beta is based on returns over the past 36 months for both the fund and the index. Note that a fund’s beta should be reviewed in conjunction with its R-squared (see definition). The lower the R-squared, the less correlation there is between the fund and the index, and the less reliable beta is as an indicator of volatility.
Dividend Yield. Dividend income earned by stocks, expressed as a percentage of the aggregate market value (or of net asset value, for a fund). The yield is determined by dividing the amount of the annual dividends by the aggregate value (or net asset value) at the end of the period. For a fund, the dividend yield is based solely on stock holdings and does not include any income produced by other investments.
Earnings Growth Rate. The average annual rate of growth in earnings over the past five years for the stocks now in a fund.
Equity Exposure. A measure that reflects a fund’s investments in stocks and stock futures. Any holdings in short-term reserves are excluded.
Expense Ratio. A fund’s total annual operating expenses expressed as a percentage of the fund’s average net assets. The expense ratio includes management and administrative expenses, but does not include the transaction costs of buying and selling portfolio securities.
Foreign Holdings. The percentage of a fund represented by securities or depositary receipts of companies based outside the United States.
Inception Date. The date on which the assets of a fund (or one of its share classes) are first invested in accordance with the fund’s investment objective. For funds with a subscription period, the inception date is the day after that period ends. Investment performance is measured from the inception date.
Median Market Cap. An indicator of the size of companies in which a fund invests; the midpoint of market capitalization (market price x shares outstanding) of a fund’s stocks, weighted by the proportion of the fund’s assets invested in each stock. Stocks representing half of the fund’s assets have market capitalizations above the median, and the rest are below it.
Price/Book Ratio. The share price of a stock divided by its net worth, or book value, per share. For a fund, the weighted average price/book ratio of the stocks it holds.
29
Price/Earnings Ratio. The ratio of a stock’s current price to its per-share earnings over the past year. For a fund, the weighted average P/E of the stocks it holds. P/E is an indicator of market expectations about corporate prospects; the higher the P/E, the greater the expectations for a company’s future growth.
R-Squared. A measure of how much of a fund’s past returns can be explained by the returns from the market in general, as measured by a given index. If a fund’s total returns were precisely synchronized with an index’s returns, its R-squared would be 1.00. If the fund’s returns bore no relationship to the index’s returns, its R-squared would be 0. For this report, R-squared is based on returns over the past 36 months for both the fund and the index.
Return on Equity. The annual average rate of return generated by a company during the past five years for each dollar of shareholder’s equity (net income divided by shareholder’s equity). For a fund, the weighted average return on equity for the companies whose stocks it holds.
Short-Term Reserves. The percentage of a fund invested in highly liquid, short-term securities that can be readily converted to cash.
Turnover Rate. An indication of the fund’s trading activity. Funds with high turnover rates incur higher transaction costs and may be more likely to distribute capital gains (which may be taxable to investors). The turnover rate excludes in-kind transactions, which have minimal impact on costs.
This page intentionally left blank.
The People Who Govern Your Fund
The trustees of your mutual fund are there to see that the fund is operated and managed in your best interests since, as a shareholder, you are a part owner of the fund. Your fund’s trustees also serve on the board of directors of The Vanguard Group, Inc., which is owned by the Vanguard funds and provides services to them on an at-cost basis.
A majority of Vanguard’s board members are independent, meaning that they have no affiliation with Vanguard or the funds they oversee, apart from the sizable personal investments they have made as private individuals. The independent board members have distinguished backgrounds in business, academia, and public service. Each of the trustees and executive officers oversees 178 Vanguard funds.
The following table provides information for each trustee and executive officer of the fund. More information about the trustees is in the Statement of Additional Information, which can be obtained, without charge, by contacting Vanguard at 800-662-7447, or online at vanguard.com.
| |
| InterestedTrustee1 | Rajiv L. Gupta |
| | Born 1945. Trustee Since December 2001.2 Principal |
| F. William McNabb III | Occupation(s) During the Past Five Years and Other |
| Born 1957. Trustee Since July 2009. Chairman of | Experience: Chairman and Chief Executive Officer |
| the Board. Principal Occupation(s) During the Past | (retired 2009) and President (2006–2008) of |
| Five Years and Other Experience: Chairman of the | Rohm and Haas Co. (chemicals); Director of Tyco |
| Board of The Vanguard Group, Inc., and of each of | International PLC (diversified manufacturing and |
| the investment companies served by The Vanguard | services), Hewlett-Packard Co. (electronic computer |
| Group, since January 2010; Director of The Vanguard | manufacturing), and Delphi Automotive PLC |
| Group since 2008; Chief Executive Officer and | (automotive components); Senior Advisor at New |
| President of The Vanguard Group, and of each of | Mountain Capital. |
| the investment companies served by The Vanguard | |
| Group, since 2008; Director of Vanguard Marketing | Amy Gutmann |
| Corporation; Managing Director of The Vanguard | Born 1949. Trustee Since June 2006. Principal |
| Group (1995–2008). | Occupation(s) During the Past Five Years and |
| | Other Experience: President of the University of |
| IndependentTrustees | Pennsylvania; Christopher H. Browne Distinguished |
| | Professor of Political Science, School of Arts and |
| Emerson U. Fullwood | Sciences, and Professor of Communication, Annenberg |
| Born 1948. Trustee Since January 2008. Principal | School for Communication, with secondary faculty |
| Occupation(s) During the Past Five Years and | appointments in the Department of Philosophy, School |
| Other Experience: Executive Chief Staff and | of Arts and Sciences, and at the Graduate School of |
| Marketing Officer for North America and Corporate | Education, University of Pennsylvania; Trustee of the |
| Vice President (retired 2008) of Xerox Corporation | National Constitution Center; Chair of the Presidential |
| (document management products and services); | Commission for the Study of Bioethical Issues. |
| Executive in Residence and 2009–2010 Distinguished | |
| Minett Professor at the Rochester Institute of | JoAnn Heffernan Heisen |
| Technology; Director of SPX Corporation (multi-industry | Born 1950. Trustee Since July 1998. Principal |
| manufacturing), the United Way of Rochester, | Occupation(s) During the Past Five Years and Other |
| Amerigroup Corporation (managed health care), the | Experience: Corporate Vice President and Chief |
| University of Rochester Medical Center, Monroe | Global Diversity Officer (retired 2008) and Member |
| Community College Foundation, and North Carolina | of the Executive Committee (1997–2008) of Johnson |
| A&T University. | & Johnson (pharmaceuticals/medical devices/ |
| | consumer products); Director of Skytop Lodge |
| | Corporation (hotels), the University Medical Center |
| | at Princeton, the Robert Wood Johnson Foundation, |
| | and the Center for Talent Innovation; Member of |
| | the Advisory Board of the Institute for Women’s |
| | Leadership at Rutgers University. |
| | |
| F. Joseph Loughrey | Executive Officers | |
| Born 1949. Trustee Since October 2009. Principal | | |
| Occupation(s) During the Past Five Years and Other | Glenn Booraem | |
| Experience: President and Chief Operating Officer | Born 1967. Controller Since July 2010. Principal |
| (retired 2009) of Cummins Inc. (industrial machinery); | Occupation(s) During the Past Five Years and Other |
| Chairman of the Board of Hillenbrand, Inc. (specialized | Experience: Principal of The Vanguard Group, Inc.; |
| consumer services), and of Oxfam America; Director | Controller of each of the investment companies served |
| of SKF AB (industrial machinery), Hyster-Yale Materials | by The Vanguard Group; Assistant Controller of each of |
| Handling, Inc. (forklift trucks), the Lumina Foundation | the investment companies served by The Vanguard |
| for Education, and the V Foundation for Cancer | Group (2001–2010). | |
| Research; Member of the Advisory Council for the | | |
| College of Arts and Letters and of the Advisory Board | Thomas J. Higgins | |
| to the Kellogg Institute for International Studies, both | Born 1957. Chief Financial Officer Since September |
| at the University of Notre Dame. | 2008. Principal Occupation(s) During the Past Five |
| Years and Other Experience: Principal of The Vanguard |
| Mark Loughridge | Group, Inc.; Chief Financial Officer of each of the |
| Born 1953. Trustee Since March 2012. Principal | investment companies served by The Vanguard Group; |
| Occupation(s) During the Past Five Years and Other | Treasurer of each of the investment companies served |
| Experience: Senior Vice President and Chief Financial | by The Vanguard Group (1998–2008). |
| Officer (retired 2013) at IBM (information technology | |
| services); Fiduciary Member of IBM’s Retirement Plan | Kathryn J. Hyatt | |
| Committee (2004–2013); Director of the Dow Chemical | Born 1955. Treasurer Since November 2008. Principal |
| Company; Member of the Council on Chicago Booth. | Occupation(s) During the Past Five Years and Other |
| Experience: Principal of The Vanguard Group, Inc.; |
| Scott C. Malpass | Treasurer of each of the investment companies served |
| Born 1962. Trustee Since March 2012. Principal | by The Vanguard Group; Assistant Treasurer of each of |
| Occupation(s) During the Past Five Years and Other | the investment companies served by The Vanguard |
| Experience: Chief Investment Officer and Vice | Group (1988–2008). | |
| President at the University of Notre Dame; Assistant | | |
| Professor of Finance at the Mendoza College of | Heidi Stam | |
| Business at Notre Dame; Member of the Notre Dame | Born 1956. Secretary Since July 2005. Principal |
| 403(b) Investment Committee; Board Member of | Occupation(s) During the Past Five Years and Other |
| TIFF Advisory Services, Inc., and Catholic Investment | Experience: Managing Director of The Vanguard |
| Services, Inc. (investment advisors); Member of | Group, Inc.; General Counsel of The Vanguard Group; |
| the Investment Advisory Committee of Major | Secretary of The Vanguard Group and of each of the |
| League Baseball. | investment companies served by The Vanguard Group; |
| Director and Senior Vice President of Vanguard |
| André F. Perold | Marketing Corporation. | |
| Born 1952. Trustee Since December 2004. Principal | | |
| Occupation(s) During the Past Five Years and Other | Vanguard Senior ManagementTeam |
| Experience: George Gund Professor of Finance and | | |
| Banking, Emeritus at the Harvard Business School | Mortimer J. Buckley | Chris D. McIsaac |
| (retired 2011); Chief Investment Officer and Managing | Kathleen C. Gubanich | Michael S. Miller |
| Partner of HighVista Strategies LLC (private investment | Paul A. Heller | James M. Norris |
| firm); Director of Rand Merchant Bank; Overseer of | Martha G. King | Glenn W. Reed |
| the Museum of Fine Arts Boston. | John T. Marcante | |
| | |
| Peter F. Volanakis | Chairman Emeritus and Senior Advisor |
| Born 1955. Trustee Since July 2009. Principal | | |
| Occupation(s) During the Past Five Years and Other | John J. Brennan | |
| Experience: President and Chief Operating Officer | Chairman, 1996–2009 | |
| (retired 2010) of Corning Incorporated (communications | Chief Executive Officer and President, 1996–2008 |
| equipment); Trustee of Colby-Sawyer College; | | |
| Member of the Advisory Board of the Norris Cotton | Founder | |
| Cancer Center and of the Advisory Board of the | | |
| Parthenon Group (strategy consulting). | John C. Bogle | |
| | Chairman and Chief Executive Officer, 1974–1996 |
1 Mr. McNabb is considered an “interested person,” as defined in the Investment Company Act of 1940, because he is an officer of the Vanguard funds.
2 December 2002 for Vanguard Equity Income Fund, the Vanguard Municipal Bond Funds, and the Vanguard State Tax-Exempt Funds.
|  |
| | P.O. Box 2600 |
| | Valley Forge, PA 19482-2600 |
| |
| |
| |
| Connect with Vanguard® > vanguard.com | |
| |
| |
| |
| Fund Information > 800-662-7447 | |
| Direct Investor Account Services > 800-662-2739 | |
| Institutional Investor Services > 800-523-1036 | |
| Text Telephone for People | |
| Who Are Deaf or Hard of Hearing> 800-749-7273 | |
| |
| This material may be used in conjunction | |
| with the offering of shares of any Vanguard | |
| fund only if preceded or accompanied by | |
| the fund’s current prospectus. | |
| |
| All comparative mutual fund data are from Lipper, a | |
| Thomson Reuters Company, or Morningstar, Inc., unless | |
| otherwise noted. | |
| |
| You can obtain a free copy of Vanguard’s proxy voting | |
| guidelines by visiting vanguard.com/proxyreporting or by | |
| calling Vanguard at 800-662-2739. The guidelines are | |
| also available from the SEC’s website, sec.gov. In | |
| addition, you may obtain a free report on how your fund | |
| voted the proxies for securities it owned during the 12 | |
| months ended June 30. To get the report, visit either | |
| vanguard.com/proxyreporting or sec.gov. | |
| |
| You can review and copy information about your fund at | |
| the SEC’s Public Reference Room in Washington, D.C. To | |
| find out more about this public service, call the SEC at | |
| 202-551-8090. Information about your fund is also | |
| available on the SEC’s website, and you can receive | |
| copies of this information, for a fee, by sending a | |
| request in either of two ways: via e-mail addressed to | |
| publicinfo@sec.gov or via regular mail addressed to the | |
| Public Reference Section, Securities and Exchange | |
| Commission, Washington, DC 20549-1520. | |
| |
| | © 2015 The Vanguard Group, Inc. |
| | All rights reserved. |
| | Vanguard Marketing Corporation, Distributor. |
| |
| | Q1112 052015 |
Semiannual Report | March 31, 2015
Vanguard Global Equity Fund
The mission continues
On May 1, 1975, Vanguard began operations, a fledgling company based on the simple but revolutionary idea that a mutual fund company should be managed solely in the interest of its investors.
Four decades later, that revolutionary spirit continues to animate the enterprise. Vanguard remains on a mission to give investors the best chance of investment success.
As we mark our 40th anniversary, we thank you for entrusting your assets to Vanguard and giving us the opportunity to help you reach your financial goals in the decades to come.
| |
| Contents | |
| Your Fund’s Total Returns. | 1 |
| Chairman’s Letter. | 2 |
| Advisors’ Report. | 8 |
| Fund Profile. | 12 |
| Performance Summary. | 14 |
| Financial Statements. | 15 |
| About Your Fund’s Expenses. | 30 |
| Trustees Approve Advisory Arrangements. | 32 |
| Glossary. | 34 |
Please note: The opinions expressed in this report are just that—informed opinions. They should not be considered promises or advice. Also, please keep in mind that the information and opinions cover the period through the date on the front of this report. Of course, the risks of investing in your fund are spelled out in the prospectus.
See the Glossary for definitions of investment terms used in this report.
About the cover: Since our founding, Vanguard has drawn inspiration from the enterprise and valor demonstrated by British naval hero Horatio Nelson and his command at the Battle of the Nile in 1798. The photograph displays a replica of a merchant ship from the same era as Nelson’s flagship, the HMS Vanguard.
Your Fund’s Total Returns
| | |
| Six Months Ended March 31, 2015 | |
| | Total |
| | Returns |
| Vanguard Global Equity Fund | 4.98% |
| MSCI All Country World Index | 2.73 |
| Global Funds Average | 2.99 |
| Global Funds Average: Derived from data provided by Lipper, a Thomson Reuters Company. | |
| | | | | |
| Your Fund’s Performance at a Glance | | | | |
| September 30, 2014, Through March 31, 2015 | | | | |
| | | | Distributions Per Share |
| | Starting | Ending | Income | Capital |
| | Share Price | Share Price | Dividends | Gains |
| Vanguard Global Equity Fund | $24.19 | $25.01 | $0.375 | $0.000 |

Chairman’s Letter
Dear Shareholder,
Vanguard Global Equity Fund returned about 5% for the six months ended March 31, 2015, outpacing its comparative standards as it did in the previous full fiscal year. Your fund earned some of its best returns in markets that struggled in the not too distant past, such as Italy—underscoring the benefits of diversification and of patience with markets’ cyclical nature.
Even though U.S. equities accounted for almost half the fund’s assets, foreign currency translation effects played a significant role in its performance for U.S. dollar-based investors. For example, the MSCI Europe Index returned about –1% in dollars but more than 11% in local currencies—a significant difference given that Europe made up about one-fifth of fund assets. Overall, the fund advanced nearly 10% in local currencies, almost double its return in dollars.
Central banks’ actions helped stock markets forge ahead
The broad global stock market rally generally persisted over the six months, despite some ups and downs. However, the relative strength of U.S. and international stocks notably shifted. After lagging the broad U.S. market for each calendar year from 2010 through 2014, international stocks took the lead in the first quarter of 2015.
2
The dollar’s strengthening against many foreign currencies meant that the six-month returns of international stocks for dollar-based investors were modestly negative. Without this currency effect, however, stock markets outside the United States generally advanced—especially developed European and Pacific markets. Significant monetary stimulus moves by several foreign central banks helped boost investor sentiment.
The broad U.S. stock market returned about 7%, after declining markedly at the start of the period and enduring bouts of turmoil in subsequent months. Investors’ concerns included the strength of the dollar and how that would affect the profits of U.S.-based multinational corporations.
Overall, stocks responded favorably to the Federal Reserve’s cautious approach to raising short-term interest rates and the pro-growth policies abroad. A strong rebound in February, when the broad market notched its largest monthly gain since October 2011, helped lift U.S. returns for the period.
Stimulus policies overseas also bolstered bond prices
Bond prices, too, were supported by central banks’ accommodative policies and by investors who sought safe-haven assets amid stock market turbulence. International bond markets (as measured by the Barclays Global Aggregate Index ex USD) returned –7.49%, a reflection of foreign currencies’ weakness relative to
| | | |
| Market Barometer | | | |
| | | | Total Returns |
| | | Periods Ended March 31, 2015 |
| | Six | One | Five Years |
| | Months | Year | (Annualized) |
| Stocks | | | |
| Russell 1000 Index (Large-caps) | 6.55% | 12.73% | 14.73% |
| Russell 2000 Index (Small-caps) | 14.46 | 8.21 | 14.57 |
| Russell 3000 Index (Broad U.S. market) | 7.13 | 12.37 | 14.71 |
| FTSE All-World ex US Index (International) | -0.08 | -0.21 | 5.19 |
| |
| Bonds | | | |
| Barclays U.S. Aggregate Bond Index (Broad taxable market) | 3.43% | 5.72% | 4.41% |
| Barclays Municipal Bond Index (Broad tax-exempt market) | 2.40 | 6.62 | 5.11 |
| Citigroup Three-Month U.S. Treasury Bill Index | 0.00 | 0.03 | 0.06 |
| |
| CPI | | | |
| Consumer Price Index | -0.80% | -0.07% | 1.64% |
3
the dollar. International bonds hedged to eliminate the effect of currency exchange rates produced positive returns.
The broad U.S. taxable bond market returned 3.43%. The yield of the 10-year U.S. Treasury note ended March at 1.95%, down from 2.48% six months earlier. (Bond prices and yields move in opposite directions.) Municipal bonds returned 2.40%, though results faded later in the period as more bonds were issued. The Fed’s target of 0%–0.25% for short-term interest rates continued to cap returns for money market funds and savings accounts.
Stocks rose despite concerns, but the pace in U.S. dollars was muted
Stocks proved resilient and in some cases buoyant, even though the dollar’s strength trimmed the returns of non-U.S. stocks for U.S.-based investors. (The balance of this discussion addresses returns in dollars, not local currency.) Several concerns contributed to stock market volatility during the period—including tepid global economic growth, the implications of falling oil prices, and Greece’s elections and financial woes.
| | |
| Expense Ratios | | |
| Your Fund Compared With Its Peer Group | | |
| | | Peer Group |
| | Fund | Average |
| Global Equity Fund | 0.61% | 1.33% |
| The fund expense ratio shown is from the prospectus dated January 27, 2015, and represents estimated costs for the current fiscal year. For the six months ended March 31, 2015, the fund’s annualized expense ratio was 0.60%. The peer-group expense ratio is derived from data provided by Lipper, a Thomson Reuters Company, and captures information through year-end 2014. |
|
|
| |
| Peer group: Global Funds. | | |
4
Still, the European Central Bank’s long-awaited announcement that it would begin a multimonth bond-buying program sparked a global rally in stocks and bonds, driving interest rates even lower and making stocks seem more attractive to some investors. And a bailout extension agreement for Greece at least temporarily reduced uncertainty about its remaining in the Eurozone.
|
| Marking the sixth anniversary of the bull market |
| |
| There’s been a long and steep climb in the U.S. stock market in the six years since the worst |
| of the financial crisis. |
| |
| The dark line in the chart below traces the rise in the Russell 3000 Index from a low of 390 |
| on March 9, 2009, to 1,241 on March 9, 2015—an increase of roughly 220% in 72 months. |
| |
| The robustness and duration of the advance defied the predictions of some market pundits. |
| Of course, the financial crisis caught many of them off guard as well. The lighter line below |
| charts the drop of about 60% in the index in 17 months, from its pre-crisis peak of 908 on |
| October 9, 2007. |
| |
| These sharp and unexpected movements illustrate the challenge of trying to time the markets. |
| Instead of trying to guess which way the wind will blow (and for how long), investors are |
| generally better off staying committed to their investment plan through market ups and downs. |
| Rebalancing your portfolio from time to time will help keep market movements from pushing |
| your allocation to stocks and bonds off target. |
| |
| The performance of the U.S. stock market since the start of the financial crisis |
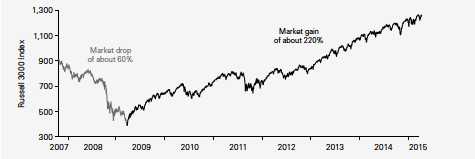
| Sources: Vanguard, based on data for the Russell 3000 Index. |
5
Vanguard Global Equity Fund’s three advisors evaluate global opportunities for long-term capital appreciation among both growth- and value-oriented companies of all sizes. This pursuit often means that almost 50% of fund assets are invested in U.S.-based companies. Strong performance by some industrials—notably airlines that benefited from lower jet fuel prices—lifted the fund’s North American holdings, despite weakness among Canadian and U.S. energy companies as oil prices fell.
Among European developed markets, returns varied widely, with double-digit gains in some countries and declines in others (including Greece). Most developed markets in the Pacific advanced. Emerging markets generally struggled, finishing in the red. Falling oil prices hurt exporters Brazil and Russia, as did political turmoil involving Brazil’s state-owned oil company and Russia’s strife with Ukraine.
The advisors outperformed the benchmark in developed as well as emerging markets. Some of their greatest strength came from the United States and Europe, including the United Kingdom and Italy.
Among the ten industry groups, returns were mixed. The energy sector was the worst performer, with a double-digit decline. Nevertheless, the advisors’ smaller stake in energy helped your fund.
And in most other sectors, allocation and stock selection boosted the fund’s relative performance.
The Advisors’ Report that follows this letter provides additional details about the management of the fund during the six months.
Our focus on balanced investing has roots going back many decades
On May 1, Vanguard will celebrate its 40th anniversary. Although many things have changed since 1975, our investment philosophy has not. From the start, we’ve focused on four timeless, straightforward principles that we believe help give clients the best chance for investment success:
• Goals. Create clear, appropriate investment goals.
• Balance. Develop a suitable asset allocation using broadly diversified funds.
• Cost. Minimize cost.
• Discipline. Maintain perspective and long-term discipline.
Although Vanguard has followed all these principles since its founding, one—the focus on balanced investing—is in the company’s DNA. That’s because our predecessor company, Wellington Management, was a pioneer in this respect, launching a fund in 1929 that included both stocks and bonds.
6
The WellingtonTM Fund got its start on the eve of the Great Depression, but it thrived over the long term, thanks in large part to its balancing of stocks and bonds. And this strategy continues to define the fund, now one of the nation’s largest balanced funds.
As we embark on our fifth decade, we’ll continue to emphasize the importance of balanced, diversified investing. How investors allocate assets between stocks and bonds has an enormous effect on the risks and returns of their portfolios. And broad diversification reduces exposure to specific risks, while providing opportunities
to benefit from the market’s current leaders. (You can read more in Vanguard’s Principles for Investing Success, available at vanguard.com/research.)
As always, thank you for investing with Vanguard.
Sincerely,

F. William McNabb III
Chairman and Chief Executive Officer
April 17, 2015
7
Advisors’ Report
For the six months ended March 31, 2015, Vanguard Global Equity Fund returned 4.98%, outpacing its benchmark index and the average return of peer funds. Your fund is managed by three independent advisors, a strategy that enhances the fund’s diversification by providing exposure to distinct yet complementary investment approaches. It’s not uncommon for different advisors to have different views about individual securities or the broader investment environment.
The advisors, the amount and percentage of fund assets each manages, and brief descriptions of their investment strategies are presented in the table below. Each advisor has also prepared a discussion of the investment environment that existed during the half year and its effect on portfolio positioning. These comments were prepared on April 13, 2015.
| | | | |
| Vanguard Global Equity Fund Investment Advisors | | |
| |
| | Fund Assets Managed | | |
| Investment Advisor | % | $ Million | | Investment Strategy |
| Baillie Gifford Overseas Ltd. | 33 | 1,513 | | A long-term, active, bottom-up investment approach is |
| | | | | used to identify companies that can generate |
| | | | | above-average growth in earnings and cash flow. |
| Marathon Asset Management | 33 | 1,500 | | A long-term and contrarian investment philosophy and |
| LLP | | | | process with a focus on industry capital cycle analysis |
| | | | | and in-depth management assessment. |
| Acadian Asset Management LLC | 32 | 1,493 | | A quantitative, active, bottom-up investment process |
| | | | | that combines stock and peer-group valuation to arrive |
| | | | | at a return forecast for each of more than 35,000 |
| | | | | securities in the global universe. |
| Cash Investments | 2 | 103 | | These short-term reserves are invested by Vanguard in |
| | | | | equity index products to simulate investment in stocks. |
| | | | | Each advisor may also maintain a modest cash |
| | | | | position. |
8
Baillie Gifford Overseas Ltd.
Portfolio Managers:
Charles Plowden, Joint Senior Partner
and Lead Portfolio Manager
Spencer Adair, CFA,
Partner and Investment Manager,
Global Alpha Strategy
Malcolm MacColl,
Partner and Investment Manager,
Global Alpha Strategy
Global markets moved up modestly over the six months, recognizing the benefits of lower oil prices, quantitative easing in Europe, and a strong U.S. economy. We, however, continue to focus our efforts on picking stocks from around the world that have durable competitive advantages and outstanding long-term growth prospects.
Against this backdrop, we performed well. We have tended to avoid most areas of commodity exposure. Two larger holdings, Royal Caribbean and Ryanair, should continue to benefit from lower fuel prices, the former for its cruise liners and the latter for its aircraft. Strength in the U.S. economy bolstered other contributors, including CarMax (a used-car retailer) and Wolseley (a plumbing and building supplies distributor). Exposure to Chinese internet service businesses and to growth in Asian savings markets also helped a number of stocks, including Naspers, a proxy for Chinese online leader Tencent, and Prudential plc, an insurance leader in Asia.
Portfolio turnover remains consistent with our objective of owning companies for at least five years. New purchases over the last few months have, to an extent, reflected continued confidence in the U.S. recovery. In particular, we think freight services provider C.H. Robinson and holding company Leucadia National (whose principal asset is the Jefferies investment bank) will benefit from a stronger and more confident American market; both have considerable domestic exposure so should not be sidelined by the stronger dollar. After visits to Japan last year, we bought shares in MS&AD Insurance Group as an explicit beneficiary of Prime Minister Shinzo Abe’s economic reforms, along with CyberAgent, a disruptive force in digital advertising, microblogging, and social gaming.
We sold a number of companies whose growth prospects were acceptable but perhaps a little underwhelming in a recovering global economy. These include China Mobile, Swedish holding company Investor, New York Community Bank, pharmaceutical company Roche, Denmark’s Jyske Bank, and U.K.-based business supplies company Bunzl.
Our portfolio remains oriented toward the U.S. recovery, Asian consumer growth, and technological innovation. Although the pace of the global recovery varies widely, we think there are opportunities to find underappreciated growth even in slower-moving areas such as Europe. Many exciting new ideas from across the globe
9
are being considered for purchase, and this continuing abundance of interesting stock opportunities keeps us optimistic about future returns.
Marathon Asset Management LLP
Portfolio Managers:
Neil M. Ostrer, Co-Head of Global Equity
William J. Arah, Co-Head of Global Equity
After a brief correction in October, global markets were relatively steadfast and climbed to new highs. Our regional allocations primarily drove our success, as our overweighting of Japan and underweighting of the United States proved beneficial. Our underweighting of the lagging energy sector also helped.
Stock selection was positive overall, as detractors in emerging markets were more than offset by a strong contribution from Europe, particularly the United Kingdom. Korean holdings Lotte Shopping and Hana Financial were among the largest negative influences. An underweighting of the strong U.S. dollar led to a negative currency impact.
U.S. insurers Travelers and Alleghany contributed significantly as steady growth in book value helped results. Other notable performers included Analog Devices, 3M, and Oracle. Conversely, Canadian Natural Resources and Superior Energy Services underperformed as their shares fell in lockstep with the plunging oil price. In Europe, U.K.-based holdings Rightmove and Betfair added value. In Japan, strong contributors included yen-sensitive Sumitomo Chemical and insurance group MS&AD, which saw interest from foreign investors.
The U.S. economy is likely to recover from 2015’s weak first quarter as the lower oil price and a resumption of wage growth help consumers; however, valuations and profit margins both remain high. Low interest rates have most likely created many pockets of excess in asset valuations that may not be exposed until rates rise.
Although growth in many European countries is still by no means buoyant, the start of quantitative easing by the European Central Bank (ECB) is an important positive development, not the least in that the weakening of the euro is boosting Eurozone exports while a stronger dollar is helping British and Nordic exporters. Having taken so long to reach consensus on its stimulus effort, the ECB seems unlikely to scale it back for a while. This will further support markets and should outweigh concerns about the situations in Greece and Ukraine and the tensions in the Middle East. In Japan, although corporate governance reforms continue to exceed expectations, “Abenomics” has made little progress in two areas: mergers and acquisitions, and a shift in household balance sheets from cash. We remain highly optimistic on both these points, but clearly, until domestic equity demand picks up, global developments will drive market volatility.
10
Acadian Asset Management LLC
Portfolio Managers:
John R. Chisholm, CFA,
Executive Vice President and
Chief Investment Officer
Brian K. Wolahan, CFA,
Senior Vice President,
Senior Portfolio Manager
Investors shrugged off a number of macroeconomic concerns, including weakness in Europe and Japan, slowing in China, the growing likelihood of an imminent Fed rate increase, and sharply falling oil prices. Markets generally responded favorably to U.S. economic strength, particularly in the labor market; to improved valuations; and to overall solid earnings. They also reacted well to central bank responses to economic faltering in key regions—most notably, the January announcement of quantitative easing in Europe. The positive effects of euro weakness on the region’s exports, coupled with additional stimulus, helped provide an inflection point for European growth in early 2015. Japan, meanwhile, returned to growth in the fourth quarter of 2014 after two consecutive GDP contractions that followed last April’s sales tax increase.
Results in emerging markets were wide-ranging and driven by numerous local forces across individual countries, and concern grew about the economic health of larger markets, particularly China, Brazil, and Russia. On balance, lower oil prices were expected to be a positive catalyst for consumers and businesses and for growth in oil-dependent countries more broadly.
We focus on attractively valued stocks that appear likely to rise in price based on earnings data, price characteristics, and quality. Key overweighted markets, based on bottom-up stock selection, included the United States, Canada, Taiwan, South Korea, and India. We were underweighted in the United Kingdom, France, Switzerland, and Japan. Our sector focus remained on information technology, with more modest overweightings in financials and telecommunication services.
Successful stock selection, especially in the United States, helped offset the moderate value lost to country allocations. Within the United States, we added notable value with selections in industrials, particularly airlines, as well as in health care. Holdings in the United Kingdom, Japan, and Norway included some detractors. In terms of top-down positioning, our overweight allocation to emerging markets was costly, as was an underweight allocation to Japan. Overweighting Canada and Norway also detracted from returns.
11
Global Equity Fund
Fund Profile
As of March 31, 2015
| | | |
| Portfolio Characteristics | | |
| | | MSCI All |
| | | Country |
| | Fund | World Index |
| Number of Stocks | 766 | 2,459 |
| Median Market Cap | $20.6B | $45.1B |
| Price/Earnings Ratio | 18.5x | 19.6x |
| Price/Book Ratio | 2.3x | 2.3x |
| Return on Equity | 15.8% | 16.6% |
| Earnings Growth | | |
| Rate | 12.9% | 12.2% |
| Dividend Yield | 1.8% | 2.4% |
| Turnover Rate | | |
| (Annualized) | 39% | — |
| Ticker Symbol | VHGEX | — |
| Expense Ratio1 | 0.61% | — |
| Short-Term Reserves | 1.9% | — |
| | | |
| Sector Diversification (% of equity exposure) |
| | | MSCI All |
| | | Country |
| | Fund | World Index |
| Consumer Discretionary | 13.3% | 12.4% |
| Consumer Staples | 8.6 | 9.7 |
| Energy | 5.5 | 7.5 |
| Financials | 24.6 | 21.5 |
| Health Care | 9.6 | 12.2 |
| Industrials | 12.6 | 10.5 |
| Information Technology | 18.4 | 13.9 |
| Materials | 4.2 | 5.4 |
| Telecommunication Services | 2.4 | 3.7 |
| Utilities | 0.8 | 3.2 |
| | |
| Volatility Measures | |
| | MSCI All |
| | Country |
| | World Index |
| R-Squared | 0.97 |
| Beta | 1.00 |
| These measures show the degree and timing of the fund’s fluctuations compared with the index over 36 months. |
|
| | | |
| Ten Largest Holdings (% of total net assets) |
| Samsung Electronics Co. | Technology | |
| Ltd. | Hardware, Storage & | |
| | Peripherals | 1.4% |
| Taiwan Semiconductor | | |
| Manufacturing Co. Ltd. | Semiconductors | 1.3 |
| Royal Caribbean Cruises | Hotels, Resorts & | |
| Ltd. | Cruise Lines | 1.2 |
| Naspers Ltd. | Cable & Satellite | 1.2 |
| Prudential plc | Life & Health | |
| | Insurance | 1.1 |
| Wells Fargo & Co. | Diversified Banks | 1.1 |
| Anthem Inc. | Managed Health | |
| | Care | 1.1 |
| Nestle SA | Packaged Foods & | |
| | Meats | 1.0 |
| Berkshire Hathaway Inc. | Multi-Sector Holdings | 0.8 |
| Colgate-Palmolive Co. | Household Products | 0.8 |
| Top Ten | | 11.0% |
| The holdings listed exclude any temporary cash investments and equity index products. |
|
Allocation by Region (% of equity exposure)
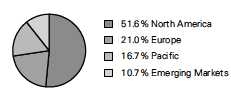
1 The expense ratio shown is from the prospectus dated January 27, 2015, and represents estimated costs for the current fiscal year. For the six months ended March 31, 2015, the annualized expense ratio was 0.60%.
12
Global Equity Fund
| | | |
| Market Diversification (% of equity exposure) |
| | | MSCI All |
| | | Country |
| | | World |
| | Fund | Index |
| Europe | | |
| United Kingdom | 7.2% | 6.9% |
| Switzerland | 2.6 | 3.2 |
| Germany | 2.2 | 3.3 |
| Ireland | 1.7 | 0.1 |
| Sweden | 1.6 | 1.1 |
| Other | 5.7 | 8.1 |
| Subtotal | 21.0% | 22.7% |
| Pacific | | |
| Japan | 9.3% | 7.7% |
| Australia | 2.8 | 2.5 |
| South Korea | 2.7 | 1.6 |
| Hong Kong | 1.3 | 1.1 |
| Other | 0.6 | 0.5 |
| Subtotal | 16.7% | 13.4% |
| Emerging Markets | | |
| Taiwan | 2.8% | 1.3% |
| China | 2.5 | 2.4 |
| South Africa | 1.5 | 0.8 |
| India | 1.4 | 0.8 |
| Other | 2.5 | 3.4 |
| Subtotal | 10.7% | 8.7% |
| North America | | |
| United States | 48.4% | 51.6% |
| Canada | 3.2 | 3.3 |
| Subtotal | 51.6% | 54.9% |
| Middle East | 0.0% | 0.3% |
13
Global Equity Fund
Performance Summary
All of the returns in this report represent past performance, which is not a guarantee of future results that may be achieved by the fund. (Current performance may be lower or higher than the performance data cited. For performance data current to the most recent month-end, visit our website at vanguard.com/performance.) Note, too, that both investment returns and principal value can fluctuate widely, so an investor’s shares, when sold, could be worth more or less than their original cost. The returns shown do not reflect taxes that a shareholder would pay on fund distributions or on the sale of fund shares.
Fiscal-Year Total Returns (%): September 30, 2004, Through March 31, 2015
| | | | | |
| Average Annual Total Returns: Periods Ended March 31, 2015 | | | |
| |
| | Inception | One | Five | Ten |
| | Date | Year | Years | Years |
| Global Equity Fund | 8/14/1995 | 6.03% | 10.79% | 6.71% |
See Financial Highlights for dividend and capital gains information.
14
Global Equity Fund
Financial Statements (unaudited)
Statement of Net Assets—Investments Summary
As of March 31, 2015
This Statement summarizes the fund’s holdings by asset type. Details are reported for each of the fund’s 50 largest individual holdings and for investments that, in total for any issuer, represent more than 1% of the fund’s net assets. The total value of smaller holdings is reported as a single amount within each category.
The fund reports a complete list of its holdings in regulatory filings four times in each fiscal year, at the quarter-ends. For the second and fourth fiscal quarters, the complete listing of the fund’s holdings is available electronically on vanguard.com and on the Securities and Exchange Commission’s website (sec.gov), or you can have it mailed to you without charge by calling 800-662-7447. For the first and third fiscal quarters, the fund files the lists with the SEC on Form N-Q. Shareholders can look up the fund’s Forms N-Q on the SEC’s website. Forms N-Q may also be reviewed and copied at the SEC’s Public Reference Room (see the back cover of this report for further information).
| | | |
| | | Market | Percentage |
| | | Value• | of Net |
| | Shares | ($000) | Assets |
| Common Stocks | | | |
| Argentina † | | 2,530 | 0.1% |
| |
| Australia | | | |
| Commonwealth Bank of Australia | 390,539 | 27,701 | 0.6% |
| Australia & New Zealand Banking Group Ltd. | 921,371 | 25,633 | 0.6% |
| National Australia Bank Ltd. | 847,170 | 24,800 | 0.5% |
| Australia—Other † | | 45,829 | 1.0% |
| | | 123,963 | 2.7% |
| |
| Austria † | | 3,244 | 0.1% |
| |
| Belgium † | | 4,811 | 0.1% |
| |
| Brazil † | | 28,801 | 0.6% |
| |
| Canada | | | |
| Magna International Inc. | 523,400 | 27,981 | 0.6% |
| Canada—Other † | | 117,028 | 2.6% |
| | | 145,009 | 3.2% |
| |
| Chile † | | 10,508 | 0.2% |
| |
| China | | | |
| * Baidu Inc. ADR | 117,933 | 24,577 | 0.5% |
| China Mobile Ltd. | 1,863,000 | 24,279 | 0.5% |
| China—Other † | | 62,938 | 1.4% |
| | | 111,794 | 2.4% |
| |
| Colombia † | | 1,443 | 0.0% |
| |
| Cyprus † | | 707 | 0.0% |
15
| | | |
| Global Equity Fund | | | |
| |
| | | Market | Percentage |
| | | Value• | of Net |
| | Shares | ($000) | Assets |
| Czech Republic † | | 1,262 | 0.0% |
| Denmark † | | 38,598 | 0.8% |
| Finland † | | 23,886 | 0.5% |
| France † | | 41,781 | 0.9% |
| Germany † | | 97,105 | 2.1% |
| Greece † | | 117 | 0.0% |
| Hong Kong | | | |
| AIA Group Ltd. | 4,109,200 | 25,799 | 0.6% |
| Hong Kong—Other † | | 33,357 | 0.7% |
| | | 59,156 | 1.3% |
| India † | | 65,095 | 1.4% |
| Indonesia † | | 1,210 | 0.0% |
| Ireland | | | |
| Ryanair Holdings plc ADR | 458,230 | 30,596 | 0.6% |
| CRH plc | 898,319 | 23,341 | 0.5% |
| Ireland—Other † | | 21,658 | 0.5% |
| | | 75,595 | 1.6% |
| | | | |
| Italy † | | 36,214 | 0.8% |
| Japan | | | |
| MS&AD Insurance Group Holdings Inc. | 1,052,000 | 29,452 | 0.6% |
| Nippon Telegraph & Telephone Corp. | 366,000 | 22,594 | 0.5% |
| Japan—Other † | | 362,837 | 7.9% |
| | | 414,883 | 9.0% |
| Malaysia † | | 9,279 | 0.2% |
| Mexico † | | 29,590 | 0.6% |
| Netherlands | | | |
| Unilever NV | 539,542 | 22,546 | 0.5% |
| Netherlands—Other † | | 18,794 | 0.4% |
| | | 41,340 | 0.9% |
| New Zealand † | | 1,910 | 0.0% |
| Norway † | | 38,975 | 0.9% |
| Other | | | |
| 1 Vanguard FTSE Emerging Markets ETF | 194,736 | 7,959 | 0.2% |
| Peru † | | 920 | 0.0% |
16
| | | |
| Global Equity Fund | | | |
| |
| |
| |
| | | Market | Percentage |
| | | Value• | of Net |
| | Shares | ($000) | Assets |
| Philippines † | | 2,635 | 0.1% |
| |
| Poland † | | 4,935 | 0.1% |
| |
| Russia † | | 8,123 | 0.2% |
| |
| Singapore | | | |
| DBS Group Holdings Ltd. | 1,563,400 | 23,182 | 0.5% |
| Singapore—Other † | | 5,988 | 0.1% |
| | | 29,170 | 0.6% |
| South Africa | | | |
| Naspers Ltd. | 357,757 | 54,877 | 1.2% |
| South Africa—Other † | | 13,398 | 0.3% |
| | | 68,275 | 1.5% |
| South Korea | | | |
| Samsung Electronics Co. Ltd. | 31,846 | 41,296 | 0.9% |
| Samsung Electronics Co. Ltd. GDR | 38,400 | 24,697 | 0.5% |
| South Korea—Other † | | 55,811 | 1.2% |
| | | 121,804 | 2.6% |
| |
| Spain † | | 21,294 | 0.5% |
| |
| Sweden | | | |
| Svenska Handelsbanken AB Class A | 617,003 | 27,788 | 0.6% |
| Sweden—Other † | | 45,609 | 1.0% |
| | | 73,397 | 1.6% |
| Switzerland | | | |
| Nestle SA | 642,003 | 48,345 | 1.1% |
| Switzerland—Other † | | 69,902 | 1.5% |
| | | 118,247 | 2.6% |
| Taiwan | | | |
| Taiwan Semiconductor Manufacturing Co. Ltd. ADR | 2,202,258 | 51,709 | 1.1% |
| Hon Hai Precision Industry Co. Ltd. | 9,808,760 | 28,712 | 0.6% |
| Fubon Financial Holding Co. Ltd. | 13,957,279 | 25,019 | 0.6% |
| Taiwan Semiconductor Manufacturing Co. Ltd. | 1,674,577 | 7,783 | 0.2% |
| Taiwan—Other † | | 15,681 | 0.3% |
| | | 128,904 | 2.8% |
| |
| Thailand † | | 4,688 | 0.1% |
| |
| Turkey † | | 4,209 | 0.1% |
| |
| United Arab Emirates † | | 5,829 | 0.1% |
| |
| United Kingdom | | | |
| Prudential plc | 2,027,915 | 50,324 | 1.1% |
| Royal Dutch Shell plc Class A | 870,489 | 25,974 | 0.6% |
| Reckitt Benckiser Group plc | 288,676 | 24,799 | 0.5% |
| 2 United Kingdom—Other † | | 215,879 | 4.7% |
| | | 316,976 | 6.9% |
17
| | | |
| Global Equity Fund | | | |
| |
| |
| |
| | | Market | Percentage |
| | | Value• | of Net |
| | Shares | ($000) | Assets |
| United States | | | |
| Consumer Discretionary | | | |
| Royal Caribbean Cruises Ltd. | 694,786 | 56,868 | 1.2% |
| * Amazon.com Inc. | 83,141 | 30,937 | 0.7% |
| * CarMax Inc. | 336,884 | 23,248 | 0.5% |
| Consumer Discretionary—Other † | | 168,074 | 3.7% |
| | | 279,127 | 6.1% |
| Consumer Staples | | | |
| Colgate-Palmolive Co. | 538,728 | 37,355 | 0.8% |
| Procter & Gamble Co. | 279,073 | 22,867 | 0.5% |
| Consumer Staples—Other † | | 96,050 | 2.1% |
| | | 156,272 | 3.4% |
| |
| Energy † | | 134,902 | 2.9% |
| |
| Financials | | | |
| Wells Fargo & Co. | 908,097 | 49,401 | 1.1% |
| * Berkshire Hathaway Inc. Class B | 263,927 | 38,090 | 0.8% |
| Travelers Cos. Inc. | 302,247 | 32,682 | 0.7% |
| * Markel Corp. | 39,897 | 30,679 | 0.7% |
| TD Ameritrade Holding Corp. | 806,950 | 30,067 | 0.7% |
| M&T Bank Corp. | 235,106 | 29,858 | 0.7% |
| First Republic Bank | 432,147 | 24,671 | 0.5% |
| Voya Financial Inc. | 563,534 | 24,294 | 0.5% |
| Moody’s Corp. | 224,321 | 23,285 | 0.5% |
| Financials—Other † | | 189,824 | 4.1% |
| | | 472,851 | 10.3% |
| Health Care | | | |
| Anthem Inc. | 315,129 | 48,659 | 1.0% |
| * United Therapeutics Corp. | 178,550 | 30,788 | 0.7% |
| * Waters Corp. | 211,095 | 26,243 | 0.6% |
| Johnson & Johnson | 247,669 | 24,916 | 0.5% |
| Health Care—Other † | | 184,874 | 4.0% |
| | | 315,480 | 6.8% |
| Industrials | | | |
| Alaska Air Group Inc. | 404,305 | 26,757 | 0.6% |
| * JetBlue Airways Corp. | 1,279,051 | 24,622 | 0.5% |
| Northrop Grumman Corp. | 138,105 | 22,229 | 0.5% |
| Industrials—Other † | | 118,747 | 2.6% |
| | | 192,355 | 4.2% |
| Information Technology | | | |
| * eBay Inc. | 543,763 | 31,364 | 0.7% |
| * Google Inc. Class C | 52,624 | 28,838 | 0.6% |
| Computer Sciences Corp. | 421,523 | 27,517 | 0.6% |
| FLIR Systems Inc. | 794,163 | 24,841 | 0.6% |
| Information Technology—Other † | | 370,169 | 8.0% |
| | | 482,729 | 10.5% |
| Materials | | | |
| Praxair Inc. | 264,600 | 31,948 | 0.7% |
| Materials—Other † | | 57,315 | 1.2% |
| | | 89,263 | 1.9% |
18
Global Equity Fund
| | | | |
| | | | Market | Percentage |
| | | | Value• | of Net |
| | | | ($000) | Assets |
| Telecommunication Services † | | | 421 | 0.0% |
| | | | 2,123,400 | 46.1% |
| Total Common Stocks (Cost $3,724,470) | | | 4,449,571 | 96.5%3 |
| |
| | Coupon | Shares | | |
| Temporary Cash Investments | | | | |
| Money Market Fund | | | | |
| 4,5 Vanguard Market Liquidity Fund | 0.128% | 217,896,336 | 217,896 | 4.7% |
| |
| 6U.S. Government and Agency Obligations † | | | 7,500 | 0.2% |
| Total Temporary Cash Investments (Cost $225,396) | | | 225,396 | 4.9%3 |
| 7Total Investments (Cost $3,949,866) | | | 4,674,967 | 101.4% |
| Other Assets and Liabilities | | | | |
| Other Assets | | | 132,183 | 2.9% |
| Liabilities5 | | | (198,069) | (4.3%) |
| | | | (65,886) | (1.4%) |
| Net Assets | | | 4,609,081 | 100.0% |
| |
| Net Assets | | | | |
| Applicable to 184,314,097 outstanding $.001 par value shares of | | | |
| beneficial interest (unlimited authorization) | | | | 4,609,081 |
| Net Asset Value Per Share | | | | $25.01 |
19
Global Equity Fund
| |
| At March 31, 2015, net assets consisted of: | |
| | Amount |
| | ($000) |
| Paid-in Capital | 4,330,633 |
| Undistributed Net Investment Income | 536 |
| Accumulated Net Realized Losses | (447,844) |
| Unrealized Appreciation (Depreciation) | |
| Investment Securities | 725,101 |
| Futures Contracts | 757 |
| Forward Currency Contracts | 301 |
| Foreign Currencies | (403) |
| Net Assets | 4,609,081 |
• See Note A in Notes to Financial Statements.
* Non-income-producing security.
† Represents the aggregate value, by category, of securities that are not among the 50 largest holdings and, in total for any issuer, represent 1% or less of net assets.
1 Considered an affiliated company of the fund as the issuer is another member of The Vanguard Group.
2 Certain of the fund’s securities are exempt from registration under Rule 144A of the Securities Act of 1933. Such securities may be sold in transactions exempt from registration, normally to qualified institutional buyers. At March 31, 2015, the aggregate value of these securities was $3,711,000, representing 0.1% of net assets.
3 The fund invests a portion of its cash reserves in equity markets through the use of index futures contracts. After giving effect to futures investments, the fund’s effective common stock and temporary cash investment positions represent 98.3% and 3.1%, respectively, of net assets.
4 Affiliated money market fund available only to Vanguard funds and certain trusts and accounts managed by Vanguard. Rate shown is the 7-day yield.
5 Includes $55,181,000 of collateral received for securities on loan.
6 Securities with a value of $4,500,000 have been segregated as initial margin for open futures contracts.
7 The total value of securities on loan is $50,709,000.
ADR—American Depositary Receipt.
GDR—Global Depositary Receipt.
See accompanying Notes, which are an integral part of the Financial Statements.
20
Global Equity Fund
Statement of Operations
| |
| | Six Months Ended |
| | March 31, 2015 |
| | ($000) |
| Investment Income | |
| Income | |
| Dividends1,2 | 40,264 |
| Interest2 | 89 |
| Securities Lending | 986 |
| Total Income | 41,339 |
| Expenses | |
| Investment Advisory Fees—Note B | |
| Basic Fee | 5,456 |
| Performance Adjustment | 1,894 |
| The Vanguard Group—Note C | |
| Management and Administrative | 5,626 |
| Marketing and Distribution | 368 |
| Custodian Fees | 248 |
| Shareholders’ Reports | 19 |
| Trustees’ Fees and Expenses | 5 |
| Total Expenses | 13,616 |
| Net Investment Income | 27,723 |
| Realized Net Gain (Loss) | |
| Investment Securities Sold2 | 156,516 |
| Futures Contracts | 6,305 |
| Foreign Currencies and Forward Currency Contracts | (7,674) |
| Realized Net Gain (Loss) | 155,147 |
| Change in Unrealized Appreciation (Depreciation) | |
| Investment Securities | 35,190 |
| Futures Contracts | 1,153 |
| Foreign Currencies and Forward Currency Contracts | 1,494 |
| Change in Unrealized Appreciation (Depreciation) | 37,837 |
| Net Increase (Decrease) in Net Assets Resulting from Operations | 220,707 |
| 1 Dividends are net of foreign withholding taxes of $2,046,000. | |
| 2 Dividend income, interest income, and realized net gain (loss) from affiliated companies of the fund were $74,000, $85,000, and ($6,000), respectively. |
|
See accompanying Notes, which are an integral part of the Financial Statements.
21
Global Equity Fund
Statement of Changes in Net Assets
| | |
| | Six Months Ended | Year Ended |
| | March 31, | September 30, |
| | 2015 | 2014 |
| | ($000) | ($000) |
| Increase (Decrease) in Net Assets | | |
| Operations | | |
| Net Investment Income | 27,723 | 67,559 |
| Realized Net Gain (Loss) | 155,147 | 482,349 |
| Change in Unrealized Appreciation (Depreciation) | 37,837 | (26,154) |
| Net Increase (Decrease) in Net Assets Resulting from Operations | 220,707 | 523,754 |
| Distributions | | |
| Net Investment Income | (69,095) | (72,177) |
| Realized Capital Gain | — | — |
| Total Distributions | (69,095) | (72,177) |
| Capital Share Transactions | | |
| Issued | 228,546 | 464,225 |
| Issued in Lieu of Cash Distributions | 65,332 | 68,763 |
| Redeemed | (367,873) | (951,643) |
| Net Increase (Decrease) from Capital Share Transactions | (73,995) | (418,655) |
| Total Increase (Decrease) | 77,617 | 32,922 |
| Net Assets | | |
| Beginning of Period | 4,531,464 | 4,498,542 |
| End of Period1 | 4,609,081 | 4,531,464 |
| 1 Net Assets—End of Period includes undistributed (overdistributed) net investment income of $536,000 and $43,277,000. | |
See accompanying Notes, which are an integral part of the Financial Statements.
22
Global Equity Fund
Financial Highlights
| | | | | | |
| | Six Months | | | | | |
| | Ended | | | | | |
| For a Share Outstanding | March 31, | | | Year Ended September 30, |
| Throughout Each Period | 2015 | 2014 | 2013 | 2012 | 2011 | 2010 |
| Net Asset Value, Beginning of Period | $24.19 | $21.94 | $18.21 | $15.24 | $16.74 | $15.49 |
| Investment Operations | | | | | | |
| Net Investment Income | .154 | .353 | .342 | .320 | .3451 | .314 |
| Net Realized and Unrealized Gain (Loss) | | | | | | |
| on Investments | 1.041 | 2.255 | 3.730 | 3.012 | (1.525) | 1.292 |
| Total from Investment Operations | 1.195 | 2.608 | 4.072 | 3.332 | (1.180) | 1.606 |
| Distributions | | | | | | |
| Dividends from Net Investment Income | (. 375) | (. 358) | (. 342) | (. 362) | (. 320) | (. 356) |
| Distributions from Realized Capital Gains | — | — | — | — | — | — |
| Total Distributions | (. 375) | (. 358) | (. 342) | (. 362) | (. 320) | (. 356) |
| Net Asset Value, End of Period | $25.01 | $24.19 | $21.94 | $18.21 | $15.24 | $16.74 |
| |
| Total Return2 | 4.98% | 11.95% | 22.72% | 22.20% | -7.31% | 10.51% |
| |
| Ratios/Supplemental Data | | | | | | |
| Net Assets, End of Period (Millions) | $4,609 | $4,531 | $4,499 | $3,853 | $3,330 | $3,906 |
| Ratio of Total Expenses to | | | | | | |
| Average Net Assets3 | 0.60% | 0.61% | 0.61% | 0.57% | 0.54% | 0.44% |
| Ratio of Net Investment Income to | | | | | | |
| Average Net Assets | 1.15% | 1.45% | 1.69% | 1.82% | 1.92% | 1.94% |
| Portfolio Turnover Rate | 39% | 45% | 70% | 67% | 44% | 64% |
| The expense ratio, net income ratio, and turnover rate for the current period have been annualized. | | |
| 1 Calculated based on average shares outstanding. | | | | | | |
| 2 Total returns do not include account service fees that may have applied in the periods shown. Fund prospectuses provide information about any applicable account service fees. |
|
| 3 Includes performance-based investment advisory fee increases (decreases) of 0.08%, 0.08%, 0.07%, 0.02%, (0.02%), and (0.11%). |
See accompanying Notes, which are an integral part of the Financial Statements.
23
Global Equity Fund
Notes to Financial Statements
Vanguard Global Equity Fund is registered under the Investment Company Act of 1940 as an open-end investment company, or mutual fund. The fund invests in securities of foreign issuers, which may subject it to investment risks not normally associated with investing in securities of United States corporations.
A. The following significant accounting policies conform to generally accepted accounting principles for U.S. investment companies. The fund consistently follows such policies in preparing its financial statements.
1. Security Valuation: Securities are valued as of the close of trading on the New York Stock Exchange (generally 4 p.m., Eastern time) on the valuation date. Equity securities are valued at the latest quoted sales prices or official closing prices taken from the primary market in which each security trades; such securities not traded on the valuation date are valued at the mean of the latest quoted bid and asked prices. Bonds, and temporary cash investments acquired over 60 days to maturity, are valued using the latest bid prices or using valuations based on a matrix system (which considers such factors as security prices, yields, maturities, and ratings), both as furnished by independent pricing services. Investments in Vanguard Market Liquidity Fund are valued at that fund’s net asset value. Other temporary cash investments are valued at amortized cost, which approximates market value. Securities for which market quotations are not readily available, or whose values have been affected by events occurring before the fund’s pricing time but after the close of the securities’ primary markets, are valued at their fair values calculated according to procedures adopted by the board of trustees. These procedures include obtaining quotations from an independent pricing service, monitoring news to identify significant market- or security-specific events, and evaluating changes in the values of foreign market proxies (for example, ADRs, futures contracts, or exchange-traded funds), between the time the foreign markets close and the fund’s pricing time. When fair-value pricing is employed, the prices of securities used by a fund to calculate its net asset value may differ from quoted or published prices for the same securities.
2. Foreign Currency: Securities and other assets and liabilities denominated in foreign currencies are translated into U.S. dollars using exchange rates obtained from an independent third party as of the fund’s pricing time on the valuation date. Realized gains (losses) and unrealized appreciation (depreciation) on investment securities include the effects of changes in exchange rates since the securities were purchased, combined with the effects of changes in security prices. Fluctuations in the value of other assets and liabilities resulting from changes in exchange rates are recorded as unrealized foreign currency gains (losses) until the assets or liabilities are settled in cash, at which time they are recorded as realized foreign currency gains (losses).
3. Futures and Forward Currency Contracts: The fund uses index futures contracts to a limited extent, with the objective of maintaining full exposure to the stock market while maintaining liquidity. The fund may purchase or sell futures contracts to achieve a desired level of investment, whether to accommodate portfolio turnover or cash flows from capital share transactions. The primary risks associated with the use of futures contracts are imperfect correlation between changes in market values of stocks held by the fund and the prices of futures contracts, and the possibility of an illiquid market. Counterparty risk involving futures is mitigated because a regulated clearinghouse is the counterparty instead of the clearing broker. To further mitigate counterparty risk, the fund trades futures contracts on an exchange, monitors the financial strength of its clearing brokers and clearing-house, and has entered into clearing agreements with its clearing brokers. The clearinghouse imposes initial margin requirements to secure the fund’s performance and requires daily settlement of variation margin representing changes in the market value of each contract.
24
Global Equity Fund
The fund enters into forward currency contracts to provide the appropriate currency exposure related to any open futures contracts or to protect the value of securities and related receivables and payables against changes in foreign exchange rates. The fund’s risks in using these contracts include movement in the values of the foreign currencies relative to the U.S. dollar and the ability of the counterparties to fulfill their obligations under the contracts. The fund mitigates its counterparty risk by entering into forward currency contracts only with a diverse group of prequalified counterparties, monitoring their financial strength, entering into master netting arrangements with its counterparties, and requiring its counterparties to transfer collateral as security for their performance. The master netting arrangements provide that, in the event of a counterparty’s default (including bankruptcy), the fund may terminate the forward currency contracts, determine the net amount owed by either party in accordance with its master netting arrangements, and sell or retain any collateral held up to the net amount owed to the fund under the master netting arrangements. The forward currency contracts contain provisions whereby a counterparty may terminate open contracts if the fund’s net assets decline below a certain level, triggering a payment by the fund if the fund is in a net liability position at the time of the termination. The payment amount would be reduced by any collateral the fund has pledged. Any assets pledged as collateral for open contracts are noted in the Statement of Net Assets. The value of collateral received or pledged is compared daily to the value of the forward currency contracts exposure with each counterparty, and any difference, if in excess of a specified minimum transfer amount, is adjusted and settled within two business days.
Futures contracts are valued at their quoted daily settlement prices. Forward currency contracts are valued at their quoted daily prices obtained from an independent third party, adjusted for currency risk based on the expiration date of each contract. The aggregate settlement values and notional amounts of the contracts are not recorded in the Statement of Net Assets. Fluctuations in the value of the contracts are recorded in the Statement of Net Assets as an asset (liability) and in the Statement of Operations as unrealized appreciation (depreciation) until the contracts are closed, when they are recorded as realized gains (losses) on futures or forward currency contracts.
During the six months ended March 31, 2015, the fund’s average investments in long and short futures contracts represented 2% and 0% of net assets, respectively, based on the average of aggregate settlement values at each quarter-end during the period. The fund’s average investment in forward currency contracts represented less than 1% of net assets, based on the average of notional amounts at each quarter-end during the period.
4. Federal Income Taxes: The fund intends to continue to qualify as a regulated investment company and distribute all of its taxable income. Management has analyzed the fund’s tax positions taken for all open federal income tax years (September 30, 2011–2014), and for the period ended March 31, 2015, and has concluded that no provision for federal income tax is required in the fund’s financial statements.
5. Distributions: Distributions to shareholders are recorded on the ex-dividend date.
6. Securities Lending: To earn additional income, the fund lends its securities to qualified institutional borrowers. Security loans are required to be secured at all times by collateral in an amount at least equal to the market value of securities loaned. Daily market fluctuations could cause the value of loaned securities to be more or less than the value of the collateral received. When this occurs, the collateral is adjusted and settled on the next business day. The fund further mitigates its counterparty risk by entering into securities lending transactions only with a diverse group of prequalified counter-parties, monitoring their financial strength, and entering into master securities lending agreements with its counterparties. The master securities lending agreements provide that, in the event of a
25
Global Equity Fund
counterparty’s default (including bankruptcy), the fund may terminate any loans with that borrower, determine the net amount owed, and sell or retain the collateral up to the net amount owed to the fund; however, such actions may be subject to legal proceedings. While collateral mitigates counter-party risk, in the absence of a default the fund may experience delays and costs in recovering the securities loaned. The fund invests cash collateral received in Vanguard Market Liquidity Fund, and records a liability in the Statement of Net Assets for the return of the collateral, during the period the securities are on loan. Securities lending income represents fees charged to borrowers plus income earned on invested cash collateral, less expenses associated with the loan.
7. Credit Facility: The fund and certain other funds managed by The Vanguard Group participate in a $3 billion committed credit facility provided by a syndicate of lenders pursuant to a credit agreement that may be renewed annually; each fund is individually liable for its borrowings, if any, under the credit facility. Borrowings may be utilized for temporary and emergency purposes, and are subject to the fund’s regulatory and contractual borrowing restrictions. The participating funds are charged administrative fees and an annual commitment fee of 0.06% of the undrawn amount of the facility; these fees are allocated to the funds based on a method approved by the fund’s board of trustees and included in Management and Administrative expenses on the fund’s Statement of Operations. Any borrowings under this facility bear interest at a rate equal to the higher of the federal funds rate or LIBOR reference rate plus an agreed-upon spread.
The fund had no borrowings outstanding at March 31, 2015, or at any time during the period then ended.
8. Other: Dividend income is recorded on the ex-dividend date. Interest income includes income distributions received from Vanguard Market Liquidity Fund and is accrued daily. Premiums and discounts on debt securities purchased are amortized and accreted, respectively, to interest income over the lives of the respective securities. Security transactions are accounted for on the date securities are bought or sold. Costs used to determine realized gains (losses) on the sale of investment securities are those of the specific securities sold.
B. Baillie Gifford Overseas Ltd., Marathon Asset Management LLP, and Acadian Asset Management LLC each provide investment advisory services to a portion of the fund for a fee calculated at an annual percentage rate of average net assets managed by the advisor. The basic fees of Baillie Gifford Overseas Ltd., Marathon Asset Management LLP, and Acadian Asset Management LLC are subject to quarterly adjustments based on performance for the preceding three years relative to the MSCI All Country World Index.
The Vanguard Group manages the cash reserves of the fund on an at-cost basis.
For the six months ended March 31, 2015, the aggregate investment advisory fee represented an effective annual basic rate of 0.24% of the fund’s average net assets, before an increase of $1,894,000 (0.08%) based on performance.
C. The Vanguard Group furnishes at cost corporate management, administrative, marketing, and distribution services. The costs of such services are allocated to the fund based on methods approved by the board of trustees. The fund has committed to invest up to 0.40% of its net assets in Vanguard. At March 31, 2015, the fund had contributed capital of $422,000 to Vanguard (included in Other Assets), representing 0.01% of the fund’s net assets and 0.17% of Vanguard’s capitalization. The fund’s trustees and officers are also directors and officers of Vanguard.
26
Global Equity Fund
D. Various inputs may be used to determine the value of the fund’s investments. These inputs are summarized in three broad levels for financial statement purposes. The inputs or methodologies used to value securities are not necessarily an indication of the risk associated with investing in those securities.
Level 1—Quoted prices in active markets for identical securities.
Level 2—Other significant observable inputs (including quoted prices for similar securities, interest rates, prepayment speeds, credit risk, etc.).
Level 3—Significant unobservable inputs (including the fund’s own assumptions used to determine the fair value of investments).
The following table summarizes the market value of the fund’s investments as of March 31, 2015, based on the inputs used to value them:
| | | |
| | Level 1 | Level 2 | Level 3 |
| Investments | ($000) | ($000) | ($000) |
| Common Stocks—International | 374,471 | 1,951,700 | — |
| Common Stocks—United States | 2,123,400 | — | — |
| Temporary Cash Investments | 217,896 | 7,500 | — |
| Futures Contracts—Assets1 | 22 | — | — |
| Futures Contracts—Liabilities1 | (655) | — | — |
| Forward Currency Contracts—Assets | — | 301 | — |
| Total | 2,715,134 | 1,959,501 | — |
| 1 Represents variation margin on the last day of the reporting period. | | | |
E. At March 31, 2015, the fair values of derivatives were reflected in the Statement of Net Assets as follows:
| | | |
| | | Foreign | |
| | Equity | Exchange | |
| | Contracts | Contracts | Total |
| Statement of Net Assets Caption | ($000) | ($000) | ($000) |
| Other Assets | 22 | 301 | 323 |
| Liabilities | (655) | — | (655) |
Realized net gain (loss) and the change in unrealized appreciation (depreciation) on derivatives for the six months ended March 31, 2015, were:
| | | |
| | | Foreign | |
| | Equity | Exchange | |
| | Contracts | Contracts | Total |
| Realized Net Gain (Loss) on Derivatives | ($000) | ($000) | ($000) |
| Futures Contracts | 6,305 | — | 6,305 |
| Forward Currency Contracts | — | (4,862) | (4,862) |
| Realized Net Gain (Loss) on Derivatives | 6,305 | (4,862) | 1,443 |
27
Global Equity Fund
| | | |
| | | Foreign | |
| | Equity | Exchange | |
| | Contracts | Contracts | Total |
| Change in Unrealized Appreciation (Depreciation) on Derivatives | ($000) | ($000) | ($000) |
| Futures Contracts | 1,153 | — | 1,153 |
| Forward Currency Contracts | — | 993 | 993 |
| Change in Unrealized Appreciation (Depreciation) on Derivatives | 1,153 | 993 | 2,146 |
At March 31, 2015, the aggregate settlement value of open futures contracts and the related unrealized appreciation (depreciation) were:
| | | | |
| | | | | ($000) |
| | | | Aggregate | |
| | | Number of | Settlement | Unrealized |
| | | Long (Short) | Value | Appreciation |
| Futures Contracts | Expiration | Contracts | Long (Short) | (Depreciation) |
| S&P 500 Index | June 2015 | 73 | 37,610 | 296 |
| E-mini S&P MidCap 400 Index | June 2015 | 95 | 14,438 | 254 |
| Dow Jones EURO STOXX 50 Index | June 2015 | 267 | 10,412 | 63 |
| FTSE 100 Index | June 2015 | 99 | 9,886 | (16) |
| Topix Index | June 2015 | 64 | 8,237 | 130 |
| S&P ASX 200 Index | June 2015 | 33 | 3,710 | 30 |
| | | | | 757 |
Unrealized appreciation (depreciation) on open S&P 500 Index, E-mini S&P MidCap 400 Index, Dow Jones EURO STOXX 50 Index, and FTSE 100 Index futures contracts is required to be treated as realized gain (loss) for tax purposes.
At March 31, 2015, the fund had open forward currency contracts to receive and deliver currencies as follows. Unrealized appreciation (depreciation) on open forward currency contracts is treated as realized gain (loss) for tax purposes.
| | | | | | |
| | | | | | | Unrealized |
| | Contract | | | | | Appreciation |
| | Settlement | | | Contract Amount (000) | (Depreciation) |
| Counterparty | Date | | Receive | | Deliver | ($000) |
| BNP Paribas | 6/24/15 | EUR | 9,647 | USD | 10,243 | 142 |
| BNP Paribas | 6/24/15 | GBP | 6,674 | USD | 9,833 | 61 |
| Bank of America, N.A. | 6/16/15 | JPY | 972,643 | USD | 8,024 | 95 |
| Bank of America, N.A. | 6/23/15 | AUD | 4,819 | USD | 3,650 | 3 |
| | | | | | | 301 |
AUD—Australian dollar.
EUR—Euro.
GBP—British pound.
JPY—Japanese yen.
USD—U.S. dollar.
28
Global Equity Fund
F. Distributions are determined on a tax basis and may differ from net investment income and realized capital gains for financial reporting purposes. Differences may be permanent or temporary. Permanent differences are reclassified among capital accounts in the financial statements to reflect their tax character. Temporary differences arise when certain items of income, expense, gain, or loss are recognized in different periods for financial statement and tax purposes. These differences will reverse at some time in the future. Differences in classification may also result from the treatment of short-term gains as ordinary income for tax purposes.
During the six months ended March 31, 2015, the fund realized net foreign currency losses of $2,812,000, which decreased distributable net income for tax purposes; accordingly, such losses have been reclassified from accumulated net realized losses to undistributed net investment income.
The fund’s tax-basis capital gains and losses are determined only at the end of each fiscal year. For tax purposes, at September 30, 2014, the fund had available capital losses totaling $606,349,000 to offset future net capital gains through September 30, 2018. The fund will use these capital losses to offset net taxable capital gains, if any, realized during the year ending September 30, 2015; should the fund realize net capital losses for the year, the losses will be added to the loss carryforward balance above.
At March 31, 2015, the cost of investment securities for tax purposes was $3,957,447,000. Net unrealized appreciation of investment securities for tax purposes was $717,520,000, consisting of unrealized gains of $903,188,000 on securities that had risen in value since their purchase and $185,668,000 in unrealized losses on securities that had fallen in value since their purchase.
G. During the six months ended March 31, 2015, the fund purchased $849,568,000 of investment securities and sold $993,004,000 of investment securities, other than temporary cash investments.
H. Capital shares issued and redeemed were:
| | |
| | Six Months Ended | Year Ended |
| | March 31, 2015 | September 30, 2014 |
| | Shares | Shares |
| | (000) | (000) |
| Issued | 9,380 | 19,482 |
| Issued in Lieu of Cash Distributions | 2,678 | 2,958 |
| Redeemed | (15,104) | (40,101) |
| Net Increase (Decrease) in Shares Outstanding | (3,046) | (17,661) |
I. Management has determined that no material events or transactions occurred subsequent to March 31, 2015, that would require recognition or disclosure in these financial statements.
29
About Your Fund’s Expenses
As a shareholder of the fund, you incur ongoing costs, which include costs for portfolio management, administrative services, and shareholder reports (like this one), among others. Operating expenses, which are deducted from a fund’s gross income, directly reduce the investment return of the fund.
A fund’s expenses are expressed as a percentage of its average net assets. This figure is known as the expense ratio. The following examples are intended to help you understand the ongoing costs (in dollars) of investing in your fund and to compare these costs with those of other mutual funds. The examples are based on an investment of $1,000 made at the beginning of the period shown and held for the entire period.
The accompanying table illustrates your fund’s costs in two ways:
• Based on actual fund return. This section helps you to estimate the actual expenses that you paid over the period. The ”Ending Account Value“ shown is derived from the fund‘s actual return, and the third column shows the dollar amount that would have been paid by an investor who started with $1,000 in the fund. You may use the information here, together with the amount you invested, to estimate the expenses that you paid over the period.
To do so, simply divide your account value by $1,000 (for example, an $8,600 account value divided by $1,000 = 8.6), then multiply the result by the number given for your fund under the heading ”Expenses Paid During Period.“
• Based on hypothetical 5% yearly return. This section is intended to help you compare your fund‘s costs with those of other mutual funds. It assumes that the fund had a yearly return of 5% before expenses, but that the expense ratio is unchanged. In this case—because the return used is not the fund’s actual return—the results do not apply to your investment. The example is useful in making comparisons because the Securities and Exchange Commission requires all mutual funds to calculate expenses based on a 5% return. You can assess your fund’s costs by comparing this hypothetical example with the hypothetical examples that appear in shareholder reports of other funds.
Note that the expenses shown in the table are meant to highlight and help you compare ongoing costs only and do not reflect transaction costs incurred by the fund for buying and selling securities. Further, the expenses do not include any purchase, redemption, or account service fees described in the fund prospectus. If such fees were applied to your account, your costs would be higher. Your fund does not carry a “sales load.”
The calculations assume no shares were bought or sold during the period. Your actual costs may have been higher or lower, depending on the amount of your investment and the timing of any purchases or redemptions.
You can find more information about the fund’s expenses, including annual expense ratios, in the Financial Statements section of this report. For additional information on operating expenses and other shareholder costs, please refer to your fund’s current prospectus.
30
| | | |
| Six Months Ended March 31, 2015 | | | |
| |
| | Beginning | Ending | Expenses |
| | Account Value | Account Value | Paid During |
| Global Equity Fund | 9/30/2014 | 3/31/2015 | Period |
| Based on Actual Fund Return | $1,000.00 | $1,049.79 | $3.07 |
| Based on Hypothetical 5% Yearly Return | 1,000.00 | 1,021.94 | 3.02 |
| The calculations are based on expenses incurred in the most recent six-month period. The fund’s annualized six-month expense ratio for that period is 0.60%. The dollar amounts shown as “Expenses Paid” are equal to the annualized expense ratio multiplied by the average account value over the period, multiplied by the number of days in the most recent six-month period, then divided by the number of days in the most recent 12-month period. |
|
|
|
31
Trustees Approve Advisory Arrangements
The board of trustees of Vanguard Global Equity Fund has renewed the fund’s investment advisory arrangements with Acadian Asset Management LLC (Acadian), Baillie Gifford Overseas Ltd. (Baillie Gifford), and Marathon Asset Management LLP (Marathon-London). The board determined that renewing the fund’s advisory arrangements was in the best interests of the fund and its shareholders.
The board based its decisions upon an evaluation of each advisor’s investment staff, portfolio management process, and performance. The trustees considered the factors discussed below, among others. However, no single factor determined whether the board approved the arrangements. Rather, it was the totality of the circumstances that drove the board’s decisions.
Nature, extent, and quality of services
The board reviewed the quality of the fund’s investment management services over both the short and long term, and took into account the organizational depth and stability of each advisor. The board considered the following:
Acadian. Acadian, founded in 1986, is a Boston-based investment management firm specializing in quantitative equity strategies for developed and emerging markets. Acadian employs a quantitative investment process that selects global stocks. The firm’s investment process builds portfolios from the bottom up using proprietary valuation models measuring approximately 20 stock factors and focusing on those that have proven most effective in predicting returns. The result is a rating of all securities in the Acadian database in terms of each stock’s expected return relative to its region and industry (for developed markets) and country (for emerging markets) peer groups. A portfolio optimization program is used to balance the expected return of the stocks with such considerations as the benchmark index, desired level of risk, and transaction cost estimates. Acadian has managed a portion of the fund since 2004.
Baillie Gifford. Baillie Gifford, a unit of Baillie Gifford & Co., founded in 1908, is among the largest independently owned investment management firms in the United Kingdom. Baillie Gifford’s investment approach is based on long-term investments in well-researched and well-managed businesses that enjoy sustainable competitive advantages in their marketplaces. The team invests in four categories of growth stocks: (1) growth stalwarts, or companies with durable franchises; (2) rapid growth, or early stage companies with innovative products or services and a large opportunity for future growth; (3) cyclical growth, or companies highly subject to capital cycles that have strong structural growth prospects and management teams with high capital allocation; and (4) latent growth, or companies that are temporarily out of favor but have the ability to accelerate earnings growth over time. Baillie Gifford has managed a portion of the fund since 2008.
Marathon-London. Marathon-London, founded in 1986, continues to use a bottom-up approach that focuses on stock selection. Traditional company analysis is de-emphasized in favor of assessing enterprise value, corporate strategy, industry competition, and prospective rate of return on new investments. Sector analysis is conducted using long-term capital cycle data, and country allocations tend to reflect monetary conditions and investor confidence. Marathon-London has advised the fund since its inception in 1995.
The board concluded that each advisor’s experience, stability, depth, and performance, among other factors, warranted continuation of the advisory arrangements.
32
Investment performance
The board considered the short- and long-term performance of the fund and each advisor, including any periods of outperformance or underperformance relative to a benchmark index and peer group. The board concluded that the performance was such that each advisory arrangement should continue. Information about the fund’s most recent performance can be found in the Performance Summary section of this report.
Cost
The board concluded that the fund’s expense ratio was well below the average expense ratio charged by funds in its peer group and that the fund’s advisory fee rate was also well below the peer-group average. Information about the fund’s expenses appears in the About Your Fund’s Expenses section of this report as well as in the Financial Statements section, which also includes information about the fund’s advisory fee rate.
The board did not consider profitability of Acadian, Baillie Gifford, or Marathon-London in determining whether to approve the advisory fees, because the firms are independent of Vanguard and the advisory fees are the result of arm’s-length negotiations.
The benefit of economies of scale
The board concluded that the fund’s shareholders benefit from economies of scale because of breakpoints in the advisory fee schedules for Acadian, Baillie Gifford, and Marathon-London. The breakpoints reduce the effective rate of the fees as the fund’s assets managed by each advisor increase.
The board will consider whether to renew the advisory arrangements again after a one-year period.
33
Glossary
Beta. A measure of the magnitude of a fund’s past share-price fluctuations in relation to the ups and downs of a given market index. The index is assigned a beta of 1.00. Compared with a given index, a fund with a beta of 1.20 typically would have seen its share price rise or fall by 12% when the index rose or fell by 10%. For this report, beta is based on returns over the past 36 months for both the fund and the index. Note that a fund’s beta should be reviewed in conjunction with its R-squared (see definition). The lower the R-squared, the less correlation there is between the fund and the index, and the less reliable beta is as an indicator of volatility.
Dividend Yield. Dividend income earned by stocks, expressed as a percentage of the aggregate market value (or of net asset value, for a fund). The yield is determined by dividing the amount of the annual dividends by the aggregate value (or net asset value) at the end of the period. For a fund, the dividend yield is based solely on stock holdings and does not include any income produced by other investments.
Earnings Growth Rate. The average annual rate of growth in earnings over the past five years for the stocks now in a fund.
Equity Exposure. A measure that reflects a fund’s investments in stocks and stock futures. Any holdings in short-term reserves are excluded.
Expense Ratio. A fund’s total annual operating expenses expressed as a percentage of the fund’s average net assets. The expense ratio includes management and administrative expenses, but does not include the transaction costs of buying and selling portfolio securities.
Inception Date. The date on which the assets of a fund (or one of its share classes) are first invested in accordance with the fund’s investment objective. For funds with a subscription period, the inception date is the day after that period ends. Investment performance is measured from the inception date.
Median Market Cap. An indicator of the size of companies in which a fund invests; the midpoint of market capitalization (market price x shares outstanding) of a fund’s stocks, weighted by the proportion of the fund’s assets invested in each stock. Stocks representing half of the fund’s assets have market capitalizations above the median, and the rest are below it.
Price/Book Ratio. The share price of a stock divided by its net worth, or book value, per share. For a fund, the weighted average price/book ratio of the stocks it holds.
Price/Earnings Ratio. The ratio of a stock’s current price to its per-share earnings over the past year. For a fund, the weighted average P/E of the stocks it holds. P/E is an indicator of market expectations about corporate prospects; the higher the P/E, the greater the expectations for a company’s future growth.
R-Squared. A measure of how much of a fund’s past returns can be explained by the returns from the market in general, as measured by a given index. If a fund’s total returns were precisely synchronized with an index’s returns, its R-squared would be 1.00. If the fund’s returns bore no relationship to the index’s returns, its R-squared would be 0. For this report, R-squared is based on returns over the past 36 months for both the fund and the index.
34
Return on Equity. The annual average rate of return generated by a company during the past five years for each dollar of shareholder’s equity (net income divided by shareholder’s equity). For a fund, the weighted average return on equity for the companies whose stocks it holds.
Short-Term Reserves. The percentage of a fund invested in highly liquid, short-term securities that can be readily converted to cash.
Turnover Rate. An indication of the fund’s trading activity. Funds with high turnover rates incur higher transaction costs and may be more likely to distribute capital gains (which may be taxable to investors). The turnover rate excludes in-kind transactions, which have minimal impact on costs.
Benchmark Information
Spliced Global Equity Index: MSCI All Country World Index returns gross of taxes through March 31, 2007; MSCI All Country World Index returns net of withholding taxes thereafter.
35
The People Who Govern Your Fund
The trustees of your mutual fund are there to see that the fund is operated and managed in your best interests since, as a shareholder, you are a part owner of the fund. Your fund’s trustees also serve on the board of directors of The Vanguard Group, Inc., which is owned by the Vanguard funds and provides services to them on an at-cost basis.
A majority of Vanguard’s board members are independent, meaning that they have no affiliation with Vanguard or the funds they oversee, apart from the sizable personal investments they have made as private individuals. The independent board members have distinguished backgrounds in business, academia, and public service. Each of the trustees and executive officers oversees 178 Vanguard funds.
The following table provides information for each trustee and executive officer of the fund. More information about the trustees is in the Statement of Additional Information, which can be obtained, without charge, by contacting Vanguard at 800-662-7447, or online at vanguard.com.
| |
| InterestedTrustee1 | Rajiv L. Gupta |
| | Born 1945. Trustee Since December 2001.2 Principal |
| F. William McNabb III | Occupation(s) During the Past Five Years and Other |
| Born 1957. Trustee Since July 2009. Chairman of | Experience: Chairman and Chief Executive Officer |
| the Board. Principal Occupation(s) During the Past | (retired 2009) and President (2006–2008) of |
| Five Years and Other Experience: Chairman of the | Rohm and Haas Co. (chemicals); Director of Tyco |
| Board of The Vanguard Group, Inc., and of each of | International PLC (diversified manufacturing and |
| the investment companies served by The Vanguard | services), Hewlett-Packard Co. (electronic computer |
| Group, since January 2010; Director of The Vanguard | manufacturing), and Delphi Automotive PLC |
| Group since 2008; Chief Executive Officer and | (automotive components); Senior Advisor at New |
| President of The Vanguard Group, and of each of | Mountain Capital. |
| the investment companies served by The Vanguard | |
| Group, since 2008; Director of Vanguard Marketing | Amy Gutmann |
| Corporation; Managing Director of The Vanguard | Born 1949. Trustee Since June 2006. Principal |
| Group (1995–2008). | Occupation(s) During the Past Five Years and |
| | Other Experience: President of the University of |
| IndependentTrustees | Pennsylvania; Christopher H. Browne Distinguished |
| | Professor of Political Science, School of Arts and |
| Emerson U. Fullwood | Sciences, and Professor of Communication, Annenberg |
| Born 1948. Trustee Since January 2008. Principal | School for Communication, with secondary faculty |
| Occupation(s) During the Past Five Years and | appointments in the Department of Philosophy, School |
| Other Experience: Executive Chief Staff and | of Arts and Sciences, and at the Graduate School of |
| Marketing Officer for North America and Corporate | Education, University of Pennsylvania; Trustee of the |
| Vice President (retired 2008) of Xerox Corporation | National Constitution Center; Chair of the Presidential |
| (document management products and services); | Commission for the Study of Bioethical Issues. |
| Executive in Residence and 2009–2010 Distinguished | |
| Minett Professor at the Rochester Institute of | JoAnn Heffernan Heisen |
| Technology; Director of SPX Corporation (multi-industry | Born 1950. Trustee Since July 1998. Principal |
| manufacturing), the United Way of Rochester, | Occupation(s) During the Past Five Years and Other |
| Amerigroup Corporation (managed health care), the | Experience: Corporate Vice President and Chief |
| University of Rochester Medical Center, Monroe | Global Diversity Officer (retired 2008) and Member |
| Community College Foundation, and North Carolina | of the Executive Committee (1997–2008) of Johnson |
| A&T University. | & Johnson (pharmaceuticals/medical devices/ |
| | consumer products); Director of Skytop Lodge |
| | Corporation (hotels), the University Medical Center |
| | at Princeton, the Robert Wood Johnson Foundation, |
| | and the Center for Talent Innovation; Member of |
| | the Advisory Board of the Institute for Women’s |
| | Leadership at Rutgers University. |
| | |
| F. Joseph Loughrey | Executive Officers | |
| Born 1949. Trustee Since October 2009. Principal | | |
| Occupation(s) During the Past Five Years and Other | Glenn Booraem | |
| Experience: President and Chief Operating Officer | Born 1967. Controller Since July 2010. Principal |
| (retired 2009) of Cummins Inc. (industrial machinery); | Occupation(s) During the Past Five Years and Other |
| Chairman of the Board of Hillenbrand, Inc. (specialized | Experience: Principal of The Vanguard Group, Inc.; |
| consumer services), and of Oxfam America; Director | Controller of each of the investment companies served |
| of SKF AB (industrial machinery), Hyster-Yale Materials | by The Vanguard Group; Assistant Controller of each of |
| Handling, Inc. (forklift trucks), the Lumina Foundation | the investment companies served by The Vanguard |
| for Education, and the V Foundation for Cancer | Group (2001–2010). | |
| Research; Member of the Advisory Council for the | | |
| College of Arts and Letters and of the Advisory Board | Thomas J. Higgins | |
| to the Kellogg Institute for International Studies, both | Born 1957. Chief Financial Officer Since September |
| at the University of Notre Dame. | 2008. Principal Occupation(s) During the Past Five |
| Years and Other Experience: Principal of The Vanguard |
| Mark Loughridge | Group, Inc.; Chief Financial Officer of each of the |
| Born 1953. Trustee Since March 2012. Principal | investment companies served by The Vanguard Group; |
| Occupation(s) During the Past Five Years and Other | Treasurer of each of the investment companies served |
| Experience: Senior Vice President and Chief Financial | by The Vanguard Group (1998–2008). |
| Officer (retired 2013) at IBM (information technology | |
| services); Fiduciary Member of IBM’s Retirement Plan | Kathryn J. Hyatt | |
| Committee (2004–2013); Director of the Dow Chemical | Born 1955. Treasurer Since November 2008. Principal |
| Company; Member of the Council on Chicago Booth. | Occupation(s) During the Past Five Years and Other |
| Experience: Principal of The Vanguard Group, Inc.; |
| Scott C. Malpass | Treasurer of each of the investment companies served |
| Born 1962. Trustee Since March 2012. Principal | by The Vanguard Group; Assistant Treasurer of each of |
| Occupation(s) During the Past Five Years and Other | the investment companies served by The Vanguard |
| Experience: Chief Investment Officer and Vice | Group (1988–2008). | |
| President at the University of Notre Dame; Assistant | | |
| Professor of Finance at the Mendoza College of | Heidi Stam | |
| Business at Notre Dame; Member of the Notre Dame | Born 1956. Secretary Since July 2005. Principal |
| 403(b) Investment Committee; Board Member of | Occupation(s) During the Past Five Years and Other |
| TIFF Advisory Services, Inc., and Catholic Investment | Experience: Managing Director of The Vanguard |
| Services, Inc. (investment advisors); Member of | Group, Inc.; General Counsel of The Vanguard Group; |
| the Investment Advisory Committee of Major | Secretary of The Vanguard Group and of each of the |
| League Baseball. | investment companies served by The Vanguard Group; |
| Director and Senior Vice President of Vanguard |
| André F. Perold | Marketing Corporation. | |
| Born 1952. Trustee Since December 2004. Principal | | |
| Occupation(s) During the Past Five Years and Other | Vanguard Senior ManagementTeam |
| Experience: George Gund Professor of Finance and | | |
| Banking, Emeritus at the Harvard Business School | Mortimer J. Buckley | Chris D. McIsaac |
| (retired 2011); Chief Investment Officer and Managing | Kathleen C. Gubanich | Michael S. Miller |
| Partner of HighVista Strategies LLC (private investment | Paul A. Heller | James M. Norris |
| firm); Director of Rand Merchant Bank; Overseer of | Martha G. King | Glenn W. Reed |
| the Museum of Fine Arts Boston. | John T. Marcante | |
| |
| Peter F. Volanakis | Chairman Emeritus and Senior Advisor | |
| Born 1955. Trustee Since July 2009. Principal | | |
| Occupation(s) During the Past Five Years and Other | John J. Brennan | |
| Experience: President and Chief Operating Officer | Chairman, 1996–2009 | |
| (retired 2010) of Corning Incorporated (communications | Chief Executive Officer and President, 1996–2008 |
| equipment); Trustee of Colby-Sawyer College; | | |
| Member of the Advisory Board of the Norris Cotton | Founder | |
| Cancer Center and of the Advisory Board of the | | |
| Parthenon Group (strategy consulting). | John C. Bogle | |
| | Chairman and Chief Executive Officer, 1974–1996 |
1 Mr. McNabb is considered an “interested person,” as defined in the Investment Company Act of 1940, because he is an officer of the Vanguard funds.
2 December 2002 for Vanguard Equity Income Fund, the Vanguard Municipal Bond Funds, and the Vanguard State Tax-Exempt Funds.
| 
|
| | P.O. Box 2600 |
| | Valley Forge, PA 19482-2600 |
| |
| |
| |
| Connect with Vanguard® >vanguard.com | |
| |
| |
| |
| Fund Information > 800-662-7447 | CFA® is a registered trademark owned by CFA Institute. |
| Direct Investor Account Services > 800-662-2739 | |
| Institutional Investor Services > 800-523-1036 | |
| Text Telephone for People | |
| Who Are Deaf or Hard of Hearing> 800-749-7273 | |
| |
| This material may be used in conjunction | |
| with the offering of shares of any Vanguard | |
| fund only if preceded or accompanied by | |
| the fund’s current prospectus. | |
| |
| All comparative mutual fund data are from Lipper, a | |
| Thomson Reuters Company, or Morningstar, Inc., unless | |
| otherwise noted. | |
| |
| You can obtain a free copy of Vanguard’s proxy voting | |
| guidelines by visiting vanguard.com/proxyreporting or by | |
| calling Vanguard at 800-662-2739. The guidelines are | |
| also available from the SEC’s website, sec.gov. In | |
| addition, you may obtain a free report on how your fund | |
| voted the proxies for securities it owned during the 12 | |
| months ended June 30. To get the report, visit either | |
| vanguard.com/proxyreporting or sec.gov. | |
| |
| You can review and copy information about your fund at | |
| the SEC’s Public Reference Room in Washington, D.C. To | |
| find out more about this public service, call the SEC at | |
| 202-551-8090. Information about your fund is also | |
| available on the SEC’s website, and you can receive | |
| copies of this information, for a fee, by sending a | |
| request in either of two ways: via e-mail addressed to | |
| publicinfo@sec.gov or via regular mail addressed to the | |
| Public Reference Section, Securities and Exchange | |
| Commission, Washington, DC 20549-1520. | |
| |
| | © 2015 The Vanguard Group, Inc. |
| | All rights reserved. |
| | Vanguard Marketing Corporation, Distributor. |
| |
| | Q1292 052015 |

Semiannual Report | March 31, 2015
Vanguard Strategic Small-Cap Equity Fund
The mission continues
On May 1, 1975, Vanguard began operations, a fledgling company based on the simple but revolutionary idea that a mutual fund company should be managed solely in the interest of its investors.
Four decades later, that revolutionary spirit continues to animate the enterprise. Vanguard remains on a mission to give investors the best chance of investment success.
As we mark our 40th anniversary, we thank you for entrusting your assets to Vanguard and giving us the opportunity to help you reach your financial goals in the decades to come.
| |
| Contents | |
| Your Fund’s Total Returns. | 1 |
| Chairman’s Letter. | 2 |
| Advisor’s Report. | 8 |
| Fund Profile. | 10 |
| Performance Summary. | 11 |
| Financial Statements. | 12 |
| About Your Fund’s Expenses. | 25 |
| Trustees Approve Advisory Arrangement. | 27 |
| Glossary. | 28 |
Please note: The opinions expressed in this report are just that—informed opinions. They should not be considered promises or advice. Also, please keep in mind that the information and opinions cover the period through the date on the front of this report. Of course, the risks of investing in your fund are spelled out in the prospectus.
See the Glossary for definitions of investment terms used in this report.
About the cover: Since our founding, Vanguard has drawn inspiration from the enterprise and valor demonstrated by British naval hero Horatio Nelson and his command at the Battle of the Nile in 1798. The photograph displays a replica of a merchant ship from the same era as Nelson’s flagship, the HMS Vanguard.
Your Fund’s Total Returns
| |
| Six Months Ended March 31, 2015 | |
| | Total |
| | Returns |
| Vanguard Strategic Small-Cap Equity Fund | 13.10% |
| MSCI US Small Cap 1750 Index | 11.83 |
| Small-Cap Core Funds Average | 11.17 |
| Small-Cap Core Funds Average: Derived from data provided by Lipper, a Thomson Reuters Company. | |
| | | | | |
| Your Fund’s Performance at a Glance | | | | |
| September 30, 2014, Through March 31, 2015 | | | | |
| | | | Distributions Per Share |
| | Starting | Ending | Income | Capital |
| | Share Price | Share Price | Dividends | Gains |
| Vanguard Strategic Small-Cap Equity Fund | $30.91 | $32.07 | $0.246 | $2.431 |
1

Chairman’s Letter
Dear Shareholder,
Although U.S. stocks produced solid returns for the six months ended March 31, 2015, they traced a choppy path. A strong U.S. dollar, the prospect of rising interest rates, and tepid growth abroad contributed to some retrenchment at times. But results were buoyed by other factors, including the improving labor market, rising consumer confidence, and patience from the Federal Reserve in holding rates low.
Given the muted outlook for growth abroad, the domestic focus of many small-capitalization stocks helped them outperform the U.S. stock market as a whole. Vanguard Strategic Small-Cap Equity Fund returned 13.10%, outpacing the 11.83% return of its benchmark, the MSCI US Small Cap 1750 Index, and the average return of 11.17% for its peer group.
Sector results varied widely. Seven out of ten sectors produced double-digit returns for the fund, with health care taking the top spot. In contrast, energy holdings posted a double-digit decline, and materials stocks also dipped into negative territory. Superior returns in information technology, industrials, and, especially, financials drove the fund’s performance against the benchmark. These results offset subpar returns in several other sectors, including materials, consumer staples, and consumer discretionary.
The Fed’s cautious approach was favorable for U.S. stocks
The broad U.S. stock market returned about 7% for the six months. Stocks were resilient after declining markedly at the start of the period and enduring subsequent bouts of turmoil. Investors’ concerns included the strength of the dollar and how that would affect the profits of U.S.-based multinational corporations.
Overall, stocks responded favorably to both the Fed’s cautious approach to raising short-term interest rates and the monetary stimulus efforts of other nations’ central banks. A strong rebound in February, when the broad market notched its largest monthly gain since October 2011, helped lift returns for the period.
International stocks had a slightly negative return as the dollar’s strength against many foreign currencies hurt results. Without this currency effect, stocks outside the United States generally advanced. The developed markets of the Pacific, particularly Japan, were especially strong.
Global central bank stimulus helped drive up bond prices
Bond prices, too, were supported by accommodative monetary policies from central banks and by investors who sought safe-haven assets amid turbulence in the stock market. The broad U.S. taxable bond market returned 3.43%. The yield of the 10-year U.S. Treasury note ended March at 1.95%, down from 2.48% six months earlier. (Bond prices and yields move in opposite directions.)
| | | | |
| Market Barometer | | | |
| |
| | | | Total Returns |
| | | Periods Ended March 31, 2015 |
| | Six | One | Five Years |
| | Months | Year | (Annualized) |
| Stocks | | | |
| Russell 1000 Index (Large-caps) | 6.55% | 12.73% | 14.73% |
| Russell 2000 Index (Small-caps) | 14.46 | 8.21 | 14.57 |
| Russell 3000 Index (Broad U.S. market) | 7.13 | 12.37 | 14.71 |
| FTSE All-World ex US Index (International) | -0.08 | -0.21 | 5.19 |
| |
| Bonds | | | |
| Barclays U.S. Aggregate Bond Index (Broad taxable market) | 3.43% | 5.72% | 4.41% |
| Barclays Municipal Bond Index (Broad tax-exempt market) | 2.40 | 6.62 | 5.11 |
| Citigroup Three-Month U.S. Treasury Bill Index | 0.00 | 0.03 | 0.06 |
| |
| CPI | | | |
| Consumer Price Index | -0.80% | -0.07% | 1.64% |
3
Municipal bonds returned 2.40%, though results faded later in the period as more bonds were issued.
International bond markets (as measured by the Barclays Global Aggregate Index ex USD) returned –7.49%, a reflection of foreign currencies’ weakness relative to the dollar. International bonds hedged to eliminate the effect of currency exchange rates produced positive returns.
The Fed’s target of 0%–0.25% for short-term interest rates continued to cap returns for money market funds and savings accounts.
Strength in a few sectors offset disappointments in others
Vanguard Equity Investment Group, through its Quantitative Equity Group, serves as the advisor for the fund. It uses a proprietary computer model to sift through vast amounts of quantitative data on small-cap stocks. The aim is to single out quality stocks with high growth potential and attractive valuation that, when combined in a portfolio, are similar to the MSCI US Small Cap 1750 Index in terms of risk. It’s a rigorous exercise that resulted in the fund holding about one-fifth the number of stocks included in the benchmark during the half year.
| | | |
| Expense Ratios | | |
| Your Fund Compared With Its Peer Group | | |
| | | Peer Group |
| | Fund | Average |
| Strategic Small-Cap Equity Fund | 0.38% | 1.29% |
| The fund expense ratio shown is from the prospectus dated January 27, 2015, and represents estimated costs for the current fiscal year. For the six months ended March 31, 2015, the fund’s annualized expense ratio was 0.37%. The peer-group expense ratio is derived from data provided by Lipper, a Thomson Reuters Company, and captures information through year-end 2014. |
|
|
|
Peer group: Small-Cap Core Funds.
4
Health care turned in the strongest sector performance—more than 27%—for the benchmark. Mergers and acquisitions ran high as many biotechnology and pharmaceutical companies looked for opportunities to grow faster and become more efficient. New drugs moving closer to market also fueled investor interest.
The fund lagged its benchmark in this sector, as strong returns from its health care provider and life science holdings didn’t fully make up for its disappointing returns in biotech.
|
| Marking the sixth anniversary of the bull market |
| |
| There’s been a long and steep climb in the U.S. stock market in the six years since the worst |
| of the financial crisis. |
| |
| The dark line in the chart below traces the rise in the Russell 3000 Index from a low of 390 |
| on March 9, 2009, to 1,241 on March 9, 2015—an increase of roughly 220% in 72 months. |
| |
| The robustness and duration of the advance defied the predictions of some market pundits. |
| Of course, the financial crisis caught many of them off guard as well. The lighter line below |
| charts the drop of about 60% in the index in 17 months, from its pre-crisis peak of 908 on |
| October 9, 2007. |
| |
| These sharp and unexpected movements illustrate the challenge of trying to time the markets. |
| Instead of trying to guess which way the wind will blow (and for how long), investors are |
| generally better off staying committed to their investment plan through market ups and downs. |
| Rebalancing your portfolio from time to time will help keep market movements from pushing |
| your allocation to stocks and bonds off target. |
| |
| The performance of the U.S. stock market since the start of the financial crisis |
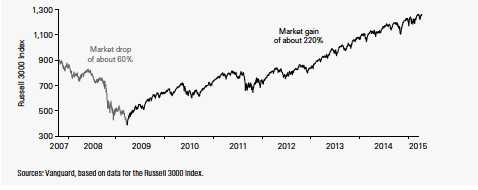
5
At the other end of the performance spectrum, energy posted a decline of almost –33% for the benchmark; the fund’s relative results were subpar as well. It benefited from a lean allocation to oil and gas stocks hurt by the sharp fall in the price of oil and its avoidance of coal-related stocks. But that didn’t fully compensate for its positions in energy equipment and services companies, which lost even more ground.
The fund did significantly outpace its benchmark in financials. Here, the advisor’s company-by-company screening process found stocks that performed well in a number of segments, including consumer finance, real estate investment trusts, investment banking, and insurance.
Other top contributors to relative results were information technology and industrials. A handful of internet software and data processing holdings boosted the fund’s showing in the tech sector. In industrials, the airline segment was a bright spot—it’s been benefiting from consolidation among carriers, better pricing power, and lower fuel costs. Selection was positive among aerospace and defense stocks as well.
In the materials, consumer staples, and consumer discretionary sectors, however, the fund lagged its benchmark. The main detractors were mining companies, packaged food producers, and educational service providers.
More information about the advisor’s management of the fund can be found in the Advisor’s Report that follows this letter.
Our focus on balanced investing has roots going back many decades
On May 1, Vanguard will celebrate its 40th anniversary. Although many things have changed since 1975, our investment philosophy has not. From the start, we’ve focused on four timeless, straightforward principles that we believe help give clients the best chance for investment success:
• Goals. Create clear, appropriate investment goals.
• Balance. Develop a suitable asset allocation using broadly diversified funds.
• Cost. Minimize cost.
• Discipline. Maintain perspective and long-term discipline.
Vanguard has followed all these principles since its founding, and one—the focus on balanced investing—is in the company’s DNA. That’s because our predecessor company, Wellington Management, was a pioneer in this respect, launching a fund in 1929 that included both stocks and bonds.
Vanguard Wellington™ Fund got its start on the eve of the Great Depression, but it thrived over the long term, thanks in large part to its balancing of stocks and bonds. And this strategy continues to define the fund, now one of the nation’s largest balanced funds.
6
As we embark on our fifth decade, we’ll continue to emphasize the importance of balanced, diversified investing. How investors allocate assets between stocks and bonds has an enormous effect on the risks and returns of their portfolios. And broad diversification reduces exposure to specific risks, while providing opportunities to benefit from the market’s current leaders. (You can read more in Vanguard’s Principles for Investing Success, available at vanguard.com/research.)
As always, thank you for investing with Vanguard.
Sincerely,

F. William McNabb III
Chairman and Chief Executive Officer
April 17, 2015
Advisor’s Report
For the fiscal half year ended March 31, 2015, Vanguard Strategic Small-Cap Fund returned 13.10%, outpacing its benchmark, the MSCI Small Cap 1750 Index, by a little more than 1 percentage point. The broad U.S. equity market gained more than 7%. Large- and mid-capitalization stocks, up a little less than that, were easily bested by small-caps, and growth-oriented stocks beat their value counterparts.
Overall, the U.S. equity market continued to outperform international developed and emerging markets. Nine of ten sectors in the benchmark posted positive returns. Results were best in health care, consumer discretionary, and utilities. The energy sector, affected by the price decline of oil, returned about –32%.
Moving into 2015, the U.S. economy built on its momentum. Fourth-quarter 2014 GDP growth came in at an annual rate of 2.2%—down from 5% in the third quarter but still encouraging. Although job growth slowed in March, the unemployment rate has declined to 5.5% and the country appears to be approaching full employment.
However, the past six months have not been without challenges. The harsh winter in many parts of the country is thought to have hurt first-quarter growth. Wholesale inventory levels grew on tepid sales, leaving little motivation to restock warehouses. Uncertainty remained as to when the Federal Reserve would begin raising interest rates and to what extent it would raise them. Additionally, the strength of the U.S. dollar increased the price of exports by as much as 20%, challenging revenue and profit results of multinationals.
Although it’s important to understand how our overall performance is affected by the macroeconomic factors we’ve described, our approach to investing focuses on specific fundamentals—not on technical analysis of stock price movements. We compare all the stocks in our investment universe within the same industry groups in order to identify those with characteristics that we believe will enable them to outperform over the long run.
To do this, we use a strict quantitative process that systematically focuses on five key themes: (1) high quality—healthy balance sheets and consistent cash flow generation; (2) effective use of capital—sound investment policies that prefer internal to external funding; (3) consistent earnings growth—a demonstrated ability to increase earnings year after year; (4) strong market sentiment—market confirmation of our view; and (5) reasonable valuation—avoidance of overpriced stocks.
Using these themes, we generate a composite expected return for all the stocks we follow each day, seeking to capitalize on investor biases. We then monitor our portfolio based on those scores and make adjustments when appropriate to maximize expected return while minimizing exposure to risks relative to the benchmark (such as industry selection) that our research indicates do not improve returns.
8
For the half year, our growth and management decisions models helped the fund’s performance. Our quality and sentiment models did not perform as expected, however, and our valuation model was neutral.
Our stock selection over the six months was successful in only five of the ten index sectors; it was particularly strong in financials, information technology, and industrials.
In financials, Investment Technology Group, Credit Acceptance Corporation, and Springleaf Holdings contributed the most to relative performance. In technology, Qorvo, Manhattan Associates, and MAXIMUS drove results; airlines JetBlue Airways, Hawaiian Holdings, and Alaska Air Group did the same in industrials.
Unfortunately, we were not able to avoid all laggards. Our selections in the consumer discretionary sector disappointed, as Vince Holdings and DeVry Education Group underperformed. OraSure Technologies and Infinity Pharmaceuticals, both in health care, also detracted.
Portfolio Managers:
James P. Stetler, Principal
James D. Troyer, CFA, Principal
Michael R. Roach, CFA
Vanguard Equity Investment Group
April 21, 2015
9
Strategic Small-Cap Equity Fund
Fund Profile
As of March 31, 2015
| | | | |
| Portfolio Characteristics | | |
| | | MSCI US | DJ |
| | | Small Cap | U.S. Total |
| | | 1750 | Market |
| | Fund | Index | FA Index |
| Number of Stocks | 332 | 1,726 | 3,757 |
| Median Market Cap | $2.5B | $2.8B | $46.5B |
| Price/Earnings Ratio | 20.0x | 30.6x | 21.4x |
| Price/Book Ratio | 2.7x | 2.4x | 2.8x |
| Return on Equity | 11.3% | 11.5% | 17.5% |
| Earnings Growth | | | |
| Rate | 16.3% | 12.6% | 13.5% |
| Dividend Yield | 1.4% | 1.4% | 1.9% |
| Foreign Holdings | 0.3% | 0.0% | 0.0% |
| Turnover Rate | | | |
| (Annualized) | 66% | — | — |
| Ticker Symbol | VSTCX | — | — |
| Expense Ratio1 | 0.38% | — | — |
| 30-Day SEC Yield | 1.09% | — | — |
| Short-Term Reserves | 0.8% | — | — |
| | | | |
| Sector Diversification (% of equity exposure) |
| | | | DJ |
| | | | U.S. |
| | | MSCI US | Total |
| | | Small Cap | Market |
| | | 1750 | FA |
| | Fund | Index | Index |
| Consumer | | | |
| Discretionary | 14.3% | 14.3% | 13.4% |
| Consumer Staples | 3.9 | 3.1 | 8.4 |
| Energy | 4.1 | 4.4 | 7.3 |
| Financials | 23.7 | 23.7 | 17.6 |
| Health Care | 13.0 | 13.3 | 14.6 |
| Industrials | 15.5 | 16.0 | 11.1 |
| Information | | | |
| Technology | 15.5 | 16.1 | 19.0 |
| Materials | 5.7 | 5.3 | 3.5 |
| Telecommunication | | | |
| Services | 0.6 | 0.6 | 2.0 |
| Utilities | 3.7 | 3.2 | 3.1 |
| | | |
| Volatility Measures | | |
| | MSCI US | DJ |
| | Small Cap | U.S. Total |
| | 1750 | Market |
| | Index | FA Index |
| R-Squared | 0.96 | 0.83 |
| Beta | 0.98 | 1.16 |
| These measures show the degree and timing of the fund’s fluctuations compared with the indexes over 36 months. |
|
| | | |
| Ten Largest Holdings (% of total net assets) |
| Centene Corp. | Managed Health | |
| | Care | 0.8% |
| Spirit AeroSystems | Aerospace & | |
| Holdings Inc. | Defense | 0.7 |
| Huntington Ingalls | Aerospace & | |
| Industries Inc. | Defense | 0.7 |
| JetBlue Airways Corp. | Airlines | 0.7 |
| Targa Resources Corp. | Oil & Gas Storage & | |
| | Transportation | 0.7 |
| Newfield Exploration Co. | Oil & Gas Exploration | |
| | & Production | 0.7 |
| VCA Inc. | Health Care Facilities | 0.7 |
| Blackhawk Network | Data Processing & | |
| Holdings Inc. | Outsourced Services | 0.7 |
| Madison Square Garden | Movies & | |
| Co. | Entertainment | 0.7 |
| MAXIMUS Inc. | Data Processing & | |
| | Outsourced Services | 0.7 |
| Top Ten | | 7.1% |
| The holdings listed exclude any temporary cash investments and equity index products. |
|
Investment Focus
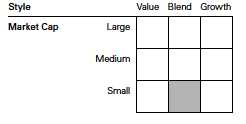
1 The expense ratio shown is from the prospectus dated January 27, 2015, and represents estimated costs for the current fiscal year. For the six months ended March 31, 2015, the annualized expense ratio was 0.37%.
10
Strategic Small-Cap Equity Fund
Performance Summary
All of the returns in this report represent past performance, which is not a guarantee of future results that may be achieved by the fund. (Current performance may be lower or higher than the performance data cited. For performance data current to the most recent month-end, visit our website at vanguard.com/performance.) Note, too, that both investment returns and principal value can fluctuate widely, so an investor’s shares, when sold, could be worth more or less than their original cost. The returns shown do not reflect taxes that a shareholder would pay on fund distributions or on the sale of fund shares.
Fiscal-Year Total Returns (%): April 24, 2006, Through March 31, 2015
| | | | | |
| Average Annual Total Returns: Periods Ended March 31, 2015 | | | |
| |
| | Inception | One | Five | Since |
| | Date | Year | Years | Inception |
| Strategic Small-Cap Equity Fund | 4/24/2006 | 11.51% | 17.65% | 7.68% |
See Financial Highlights for dividend and capital gains information.
11
Strategic Small-Cap Equity Fund
Financial Statements (unaudited)
Statement of Net Assets
As of March 31, 2015
The fund reports a complete list of its holdings in regulatory filings four times in each fiscal year, at the quarter-ends. For the second and fourth fiscal quarters, the lists appear in the fund’s semiannual and annual reports to shareholders. For the first and third fiscal quarters, the fund files the lists with the Securities and Exchange Commission on Form N-Q. Shareholders can look up the fund’s Forms N-Q on the SEC’s website at sec.gov. Forms N-Q may also be reviewed and copied at the SEC’s Public Reference Room (see the back cover of this report for further information).
| | | |
| | | | Market |
| | | | Value• |
| | | Shares | ($000) |
| Common Stocks (99.4%)1 | | |
| Consumer Discretionary (14.2%) | |
| * | Madison Square Garden Co. | | |
| | Class A | 64,300 | 5,443 |
| * | Murphy USA Inc. | 70,000 | 5,066 |
| * | Skechers U.S.A. Inc. Class A | 69,200 | 4,976 |
| | Jack in the Box Inc. | 51,200 | 4,911 |
| | Brinker International Inc. | 79,700 | 4,906 |
| | Cooper Tire & Rubber Co. | 114,100 | 4,888 |
| | Big Lots Inc. | 92,300 | 4,433 |
| | Outerwall Inc. | 66,700 | 4,410 |
| | Cato Corp. Class A | 109,600 | 4,340 |
| * | Universal Electronics Inc. | 74,900 | 4,227 |
| | Marriott Vacations | | |
| | Worldwide Corp. | 51,600 | 4,182 |
| | Domino’s Pizza Inc. | 39,300 | 3,952 |
| * | American Axle & | | |
| | Manufacturing Holdings | | |
| | Inc. | 151,600 | 3,916 |
| | Dillard’s Inc. Class A | 28,550 | 3,897 |
| * | Burlington Stores Inc. | 62,500 | 3,714 |
| | Nutrisystem Inc. | 178,700 | 3,570 |
| * | Strayer Education Inc. | 65,200 | 3,482 |
| * | Vince Holding Corp. | 181,600 | 3,369 |
| * | Starz | 93,518 | 3,218 |
| * | Denny’s Corp. | 258,800 | 2,950 |
| * | Barnes & Noble Inc. | 120,800 | 2,869 |
| | DeVry Education Group Inc. | 81,100 | 2,705 |
| * | Tower International Inc. | 100,100 | 2,663 |
| | Dana Holding Corp. | 110,000 | 2,328 |
| * | Kirkland’s Inc. | 94,300 | 2,240 |
| | Sonic Corp. | 65,400 | 2,073 |
| | Time Inc. | 85,800 | 1,925 |
| * | Iconix Brand Group Inc. | 57,100 | 1,923 |
| * | ServiceMaster Global | | |
| | Holdings Inc. | 54,100 | 1,826 |
| | New York Times Co. | | |
| | Class A | 130,200 | 1,792 |
| | Brown Shoe Co. Inc. | 50,600 | 1,660 |
| | | |
| | | | Market |
| | | | Value• |
| | | Shares | ($000) |
| | AMC Entertainment | | |
| | Holdings Inc. | 39,500 | 1,402 |
| * | BJ’s Restaurants Inc. | 17,600 | 888 |
| * | Deckers Outdoor Corp. | 11,300 | 823 |
| * | Unifi Inc. | 22,000 | 794 |
| | CST Brands Inc. | 17,100 | 749 |
| | Cracker Barrel Old Country | | |
| | Store Inc. | 4,700 | 715 |
| | Stage Stores Inc. | 24,800 | 568 |
| * | Grand Canyon Education Inc. | 12,600 | 546 |
| | Wolverine World Wide Inc. | 15,100 | 505 |
| | Cinemark Holdings Inc. | 10,000 | 451 |
| | American Eagle Outfitters | | |
| | Inc. | 21,900 | 374 |
| | John Wiley & Sons Inc. | | |
| | Class A | 6,000 | 367 |
| | Children’s Place Inc. | 5,200 | 334 |
| * | Citi Trends Inc. | 11,000 | 297 |
| * | Diamond Resorts | | |
| | International Inc. | 7,800 | 261 |
| | | | 116,928 |
| Consumer Staples (3.9%) | | |
| | Pinnacle Foods Inc. | 126,800 | 5,175 |
| * | SUPERVALU Inc. | 392,500 | 4,565 |
| | Sanderson Farms Inc. | 56,800 | 4,524 |
| | Cal-Maine Foods Inc. | 110,000 | 4,297 |
| * | Rite Aid Corp. | 333,000 | 2,894 |
| | Ingles Markets Inc. Class A | 46,500 | 2,301 |
| ^ | Pilgrim’s Pride Corp. | 100,250 | 2,265 |
| | Fresh Del Monte Produce | | |
| | Inc. | 56,305 | 2,191 |
| * | USANA Health Sciences Inc. | 15,700 | 1,744 |
| | Spectrum Brands Holdings | | |
| | Inc. | 10,100 | 904 |
| | Lancaster Colony Corp. | 4,900 | 466 |
| * | Medifast Inc. | 11,200 | 336 |
| | Vector Group Ltd. | 11,000 | 242 |
| * | Central Garden and Pet Co. | | |
| | Class A | 15,300 | 162 |
| | | | 32,066 |
12
Strategic Small-Cap Equity Fund
| | | |
| | | | Market |
| | | | Value• |
| | | Shares | ($000) |
| Energy (4.1%) | | |
| | Targa Resources Corp. | 58,300 | 5,585 |
| * | Newfield Exploration Co. | 156,200 | 5,481 |
| | Green Plains Inc. | 150,700 | 4,302 |
| * | Oil States International Inc. | 103,600 | 4,120 |
| | Alon USA Energy Inc. | 212,800 | 3,526 |
| | World Fuel Services Corp. | 60,300 | 3,466 |
| * | Kosmos Energy Ltd. | 314,000 | 2,484 |
| | Western Refining Inc. | 32,000 | 1,580 |
| ^ | Paragon Offshore plc | 895,100 | 1,164 |
| | Delek US Holdings Inc. | 28,400 | 1,129 |
| * | Helix Energy Solutions | | |
| | Group Inc. | 40,300 | 603 |
| * | Abraxas Petroleum Corp. | 75,100 | 244 |
| | | | 33,684 |
| Financials (23.5%) | | |
| | Assured Guaranty Ltd. | 194,115 | 5,123 |
| | Radian Group Inc. | 301,800 | 5,067 |
| * | Investment Technology | | |
| | Group Inc. | 164,200 | 4,977 |
| * | MGIC Investment Corp. | 509,400 | 4,906 |
| * | Springleaf Holdings Inc. | 93,500 | 4,840 |
| * | Credit Acceptance Corp. | 24,022 | 4,684 |
| | Associated Banc-Corp | 236,700 | 4,403 |
| | Allied World Assurance Co. | | |
| | Holdings AG | 107,900 | 4,359 |
| | International Bancshares | | |
| | Corp. | 162,600 | 4,232 |
| | AmTrust Financial Services | | |
| | Inc. | 74,000 | 4,217 |
| | First Horizon National Corp. | 289,000 | 4,130 |
| * | Walker & Dunlop Inc. | 230,400 | 4,085 |
| | RenaissanceRe Holdings | | |
| | Ltd. | 40,500 | 4,039 |
| | PrivateBancorp Inc. | 110,500 | 3,886 |
| | Aspen Insurance Holdings | | |
| | Ltd. | 82,000 | 3,873 |
| * | Western Alliance Bancorp | 129,600 | 3,841 |
| | Hospitality Properties Trust | 92,800 | 3,061 |
| | HCI Group Inc. | 64,900 | 2,977 |
| | Weingarten Realty Investors | 80,600 | 2,900 |
| * | Forest City Enterprises Inc. | | |
| | Class A | 110,000 | 2,807 |
| | Nelnet Inc. Class A | 58,848 | 2,785 |
| | Washington Federal Inc. | 127,300 | 2,776 |
| | Validus Holdings Ltd. | 64,922 | 2,733 |
| | GEO Group Inc. | 59,100 | 2,585 |
| | CBL & Associates | | |
| | Properties Inc. | 130,500 | 2,584 |
| | EPR Properties | 42,500 | 2,551 |
| | Ryman Hospitality | | |
| | Properties Inc. | 40,600 | 2,473 |
| | Post Properties Inc. | 43,100 | 2,454 |
| | Cathay General Bancorp | 83,200 | 2,367 |
| | | |
| | | | Market |
| | | | Value• |
| | | Shares | ($000) |
| | Piedmont Office Realty | | |
| | Trust Inc. Class A | 122,700 | 2,283 |
| | Retail Properties of | | |
| | America Inc. | 141,200 | 2,263 |
| | Omega Healthcare | | |
| | Investors Inc. | 54,500 | 2,211 |
| | LaSalle Hotel Properties | 56,800 | 2,207 |
| | Chambers Street Properties | 279,100 | 2,199 |
| * | World Acceptance Corp. | 30,100 | 2,195 |
| | BioMed Realty Trust Inc. | 96,500 | 2,187 |
| | RLJ Lodging Trust | 69,200 | 2,167 |
| | Healthcare Trust of America | | |
| | Inc. Class A | 76,650 | 2,135 |
| | Corrections Corp. | | |
| | of America | 52,412 | 2,110 |
| | DiamondRock Hospitality | | |
| | Co. | 142,800 | 2,018 |
| | Pennsylvania REIT | 84,700 | 1,968 |
| | Janus Capital Group Inc. | 113,600 | 1,953 |
| | Home Properties Inc. | 27,900 | 1,933 |
| | CoreSite Realty Corp. | 38,100 | 1,855 |
| | CubeSmart | 76,400 | 1,845 |
| * | Marcus & Millichap Inc. | 48,800 | 1,829 |
| * | First NBC Bank Holding Co. | 54,100 | 1,784 |
| | Sovran Self Storage Inc. | 18,900 | 1,775 |
| * | Strategic Hotels & Resorts | | |
| | Inc. | 142,100 | 1,766 |
| | Ashford Hospitality Trust | | |
| | Inc. | 183,600 | 1,766 |
| * | Capital Bank Financial Corp. | 63,700 | 1,759 |
| | WesBanco Inc. | 53,811 | 1,753 |
| | Summit Hotel Properties | | |
| | Inc. | 123,300 | 1,735 |
| | DuPont Fabros Technology | | |
| | Inc. | 52,600 | 1,719 |
| | Hersha Hospitality Trust | | |
| | Class A | 258,100 | 1,670 |
| | Chatham Lodging Trust | 56,100 | 1,650 |
| | FelCor Lodging Trust Inc. | 142,900 | 1,642 |
| | Chesapeake Lodging Trust | 46,600 | 1,576 |
| | CyrusOne Inc. | 50,500 | 1,572 |
| | Medical Properties Trust | | |
| | Inc. | 103,500 | 1,526 |
| | Capitol Federal Financial Inc. | 112,300 | 1,404 |
| | Inland Real Estate Corp. | 129,100 | 1,380 |
| | Government Properties | | |
| | Income Trust | 59,600 | 1,362 |
| | Montpelier Re Holdings Ltd. | 35,179 | 1,352 |
| | Pebblebrook Hotel Trust | 28,600 | 1,332 |
| | Lexington Realty Trust | 131,500 | 1,293 |
| | Universal Health Realty | | |
| | Income Trust | 22,800 | 1,283 |
| | OFG Bancorp | 77,900 | 1,271 |
| | Ramco-Gershenson | | |
| | Properties Trust | 64,800 | 1,205 |
13
Strategic Small-Cap Equity Fund
| | | |
| | | | Market |
| | | | Value• |
| | | Shares | ($000) |
| | First Commonwealth | | |
| | Financial Corp. | 129,400 | 1,165 |
| * | Beneficial Bancorp Inc. | 93,059 | 1,051 |
| | Select Income REIT | 40,200 | 1,005 |
| | Highwoods Properties Inc. | 21,300 | 975 |
| | One Liberty Properties Inc. | 39,600 | 967 |
| * | Heritage Insurance | | |
| | Holdings Inc. | 42,300 | 931 |
| * | E*TRADE Financial Corp. | 32,200 | 919 |
| | NorthStar Realty Finance | | |
| | Corp. | 44,800 | 812 |
| | Franklin Street Properties | | |
| | Corp. | 62,400 | 800 |
| * | Essent Group Ltd. | 31,000 | 741 |
| | Flushing Financial Corp. | 36,300 | 729 |
| | Brandywine Realty Trust | 42,300 | 676 |
| | National General Holdings | | |
| | Corp. | 31,500 | 589 |
| | Fulton Financial Corp. | 46,300 | 571 |
| | Associated Estates Realty | | |
| | Corp. | 22,900 | 565 |
| * | Enova International Inc. | 26,700 | 526 |
| | EastGroup Properties Inc. | 6,400 | 385 |
| | First Industrial Realty Trust | | |
| | Inc. | 17,000 | 364 |
| * | Cowen Group Inc. Class A | 70,000 | 364 |
| * | First BanCorp | 53,700 | 333 |
| | CBOE Holdings Inc. | 5,600 | 321 |
| * | KCG Holdings Inc. Class A | 25,900 | 318 |
| | Altisource Residential Corp. | 14,600 | 305 |
| | 1st Source Corp. | 7,200 | 231 |
| | Home Loan Servicing | | |
| | Solutions Ltd. | 12,200 | 202 |
| | Northfield Bancorp Inc. | 13,100 | 194 |
| | BancFirst Corp. | 3,100 | 189 |
| | | | 192,876 |
| Health Care (12.9%) | | |
| * | Centene Corp. | 93,600 | 6,617 |
| * | VCA Inc. | 99,600 | 5,460 |
| * | ABIOMED Inc. | 73,000 | 5,225 |
| * | PAREXEL International | | |
| | Corp. | 75,400 | 5,202 |
| * | Charles River | | |
| | Laboratories International | | |
| | Inc. | 65,200 | 5,170 |
| * | Health Net Inc. | 80,400 | 4,863 |
| * | Merrimack Pharmaceuticals | | |
| | Inc. | 373,200 | 4,434 |
| * | Lannett Co. Inc. | 65,000 | 4,401 |
| | Ensign Group Inc. | 93,500 | 4,381 |
| * | Depomed Inc. | 188,700 | 4,229 |
| * | Greatbatch Inc. | 72,600 | 4,200 |
| * | Sequenom Inc. | 1,062,000 | 4,195 |
| * | Natus Medical Inc. | 106,038 | 4,185 |
| | | |
| | | | Market |
| | | | Value• |
| | | Shares | ($000) |
| * | Infinity Pharmaceuticals | | |
| | Inc. | 297,400 | 4,158 |
| * | Affymetrix Inc. | 323,500 | 4,063 |
| | Chemed Corp. | 28,400 | 3,391 |
| | Phibro Animal Health Corp. | | |
| | Class A | 80,300 | 2,843 |
| * | Align Technology Inc. | 50,600 | 2,722 |
| * | Orthofix International NV | 68,700 | 2,466 |
| * | United Therapeutics Corp. | 13,300 | 2,293 |
| * | AMN Healthcare Services | | |
| | Inc. | 95,800 | 2,210 |
| * | Amedisys Inc. | 81,900 | 2,193 |
| | PDL BioPharma Inc. | 290,200 | 2,042 |
| * | SciClone Pharmaceuticals | | |
| | Inc. | 221,400 | 1,962 |
| * | Nektar Therapeutics | 175,300 | 1,928 |
| * | Bruker Corp. | 104,400 | 1,928 |
| * | Prestige Brands Holdings | | |
| | Inc. | 32,900 | 1,411 |
| | Quality Systems Inc. | 87,100 | 1,392 |
| * | Surgical Care Affiliates Inc. | 39,100 | 1,342 |
| | Abaxis Inc. | 19,900 | 1,276 |
| * | SurModics Inc. | 40,231 | 1,047 |
| | Kindred Healthcare Inc. | 19,532 | 465 |
| * | Alder Biopharmaceuticals | | |
| | Inc. | 15,400 | 445 |
| * | HealthStream Inc. | 17,200 | 433 |
| * | Triple-S Management Corp. | | |
| | Class B | 18,800 | 374 |
| * | ICU Medical Inc. | 3,500 | 326 |
| * | Ophthotech Corp. | 4,800 | 223 |
| * | Spectrum Pharmaceuticals | | |
| | Inc. | 29,700 | 180 |
| | | | 105,675 |
| Industrials (15.4%) | | |
| * | Spirit AeroSystems | | |
| | Holdings Inc. Class A | 115,800 | 6,046 |
| | Huntington Ingalls | | |
| | Industries Inc. | 42,400 | 5,942 |
| * | JetBlue Airways Corp. | 290,900 | 5,600 |
| * | Hawaiian Holdings Inc. | 207,700 | 4,575 |
| | Corporate Executive Board | | |
| | Co. | 57,000 | 4,552 |
| ^ | Greenbrier Cos. Inc. | 77,600 | 4,501 |
| | Pitney Bowes Inc. | 191,900 | 4,475 |
| * | Enphase Energy Inc. | 338,500 | 4,465 |
| | GATX Corp. | 76,400 | 4,430 |
| | Aircastle Ltd. | 194,200 | 4,362 |
| * | American Woodmark Corp. | 76,700 | 4,198 |
| | Deluxe Corp. | 58,700 | 4,067 |
| | Douglas Dynamics Inc. | 174,300 | 3,981 |
| | AO Smith Corp. | 57,400 | 3,769 |
| | Alaska Air Group Inc. | 56,200 | 3,719 |
| * | Republic Airways Holdings | | |
| | Inc. | 268,235 | 3,688 |
14
Strategic Small-Cap Equity Fund
| | | |
| | | | Market |
| | | | Value• |
| | | Shares | ($000) |
| * | Meritor Inc. | 274,600 | 3,463 |
| | SPX Corp. | 40,100 | 3,405 |
| | Korn/Ferry International | 102,900 | 3,382 |
| | Harsco Corp. | 193,300 | 3,336 |
| * | Blount International Inc. | 250,100 | 3,221 |
| | ESCO Technologies Inc. | 71,200 | 2,775 |
| * | GenCorp Inc. | 116,700 | 2,706 |
| | Trinity Industries Inc. | 73,900 | 2,624 |
| | ArcBest Corp. | 68,900 | 2,611 |
| | AMERCO | 7,900 | 2,610 |
| | Toro Co. | 36,500 | 2,560 |
| | Quanex Building Products | | |
| | Corp. | 125,800 | 2,483 |
| | G&K Services Inc. Class A | 31,900 | 2,314 |
| * | ACCO Brands Corp. | 238,900 | 1,985 |
| | Federal Signal Corp. | 121,600 | 1,920 |
| | Matson Inc. | 41,700 | 1,758 |
| * | United Rentals Inc. | 16,700 | 1,522 |
| | Heidrick & Struggles | | |
| | International Inc. | 55,500 | 1,364 |
| | Standex International Corp. | 16,500 | 1,355 |
| | Argan Inc. | 29,800 | 1,078 |
| | Insperity Inc. | 20,601 | 1,077 |
| | HNI Corp. | 15,900 | 877 |
| | Griffon Corp. | 41,500 | 723 |
| | Woodward Inc. | 13,600 | 694 |
| | Multi-Color Corp. | 7,900 | 548 |
| | Cubic Corp. | 8,600 | 445 |
| | Lindsay Corp. | 5,300 | 404 |
| * | Moog Inc. Class A | 2,400 | 180 |
| | Kforce Inc. | 8,000 | 179 |
| | | | 125,969 |
| Information Technology (15.4%) | |
| | MAXIMUS Inc. | 80,432 | 5,370 |
| * | ARRIS Group Inc. | 173,400 | 5,010 |
| | Booz Allen Hamilton | | |
| | Holding Corp. Class A | 170,800 | 4,943 |
| | Broadridge Financial | | |
| | Solutions Inc. | 89,800 | 4,940 |
| * | Manhattan Associates Inc. | 97,600 | 4,940 |
| * | Aspen Technology Inc. | 122,400 | 4,711 |
| | DST Systems Inc. | 39,558 | 4,379 |
| * | Infinera Corp. | 220,900 | 4,345 |
| * | Blackhawk Network | | |
| | Holdings Inc. | 120,057 | 4,294 |
| * | Qorvo Inc. | 53,375 | 4,254 |
| * | Super Micro Computer Inc. | 124,100 | 4,121 |
| | Science Applications | | |
| | International Corp. | 79,700 | 4,093 |
| | Tessera Technologies Inc. | 99,700 | 4,016 |
| * | Sanmina Corp. | 163,600 | 3,957 |
| | Cypress Semiconductor | | |
| | Corp. | 277,863 | 3,921 |
| | EarthLink Holdings Corp. | 859,300 | 3,815 |
| * | Sykes Enterprises Inc. | 152,800 | 3,797 |
| | | |
| | | | Market |
| | | | Value• |
| | | Shares | ($000) |
| * | OmniVision Technologies | | |
| | Inc. | 143,400 | 3,781 |
| | Lexmark International Inc. | | |
| | Class A | 84,900 | 3,595 |
| | Heartland Payment | | |
| | Systems Inc. | 65,800 | 3,083 |
| | Blackbaud Inc. | 64,400 | 3,051 |
| | SYNNEX Corp. | 39,100 | 3,020 |
| * | Advanced Micro Devices | | |
| | Inc. | 1,016,500 | 2,724 |
| * | Tech Data Corp. | 45,500 | 2,629 |
| * | MicroStrategy Inc. Class A | 14,900 | 2,521 |
| | TeleTech Holdings Inc. | 94,000 | 2,392 |
| * | Constant Contact Inc. | 59,500 | 2,274 |
| | Brocade Communications | | |
| | Systems Inc. | 171,500 | 2,035 |
| * | ePlus Inc. | 21,100 | 1,834 |
| | CSG Systems | | |
| | International Inc. | 47,700 | 1,450 |
| * | Amkor Technology Inc. | 162,400 | 1,435 |
| * | Quantum Corp. | 871,200 | 1,394 |
| | Leidos Holdings Inc. | 31,100 | 1,305 |
| * | Global Cash Access | | |
| | Holdings Inc. | 154,200 | 1,175 |
| * | Blackhawk Network | | |
| | Holdings Inc. Class B | 32,700 | 1,162 |
| *,^ | Ambarella Inc. | 15,195 | 1,150 |
| * | WebMD Health Corp. | 23,600 | 1,035 |
| * | PMC-Sierra Inc. | 110,900 | 1,029 |
| * | Anixter International Inc. | 12,400 | 944 |
| * | Benchmark Electronics Inc. | 38,100 | 916 |
| | Pegasystems Inc. | 34,400 | 748 |
| | InterDigital Inc. | 14,700 | 746 |
| * | ShoreTel Inc. | 108,200 | 738 |
| * | Ingram Micro Inc. | 25,000 | 628 |
| *,^ | VASCO Data Security | | |
| | International Inc. | 26,800 | 577 |
| * | Plexus Corp. | 12,200 | 497 |
| * | Sigma Designs Inc. | 50,000 | 402 |
| * | MaxLinear Inc. | 40,800 | 332 |
| * | Carbonite Inc. | 20,200 | 289 |
| | Marchex Inc. Class B | 54,900 | 224 |
| * | Magnachip Semiconductor | | |
| | Corp. | 38,900 | 213 |
| | | | 126,234 |
| Materials (5.7%) | | |
| * | Berry Plastics Group Inc. | 143,735 | 5,202 |
| | United States Steel Corp. | 209,000 | 5,100 |
| * | Chemtura Corp. | 176,300 | 4,811 |
| * | Mercer International Inc. | 274,700 | 4,219 |
| | Graphic Packaging Holding | | |
| | Co. | 288,800 | 4,199 |
| * | Century Aluminum Co. | 303,800 | 4,192 |
| | Bemis Co. Inc. | 90,000 | 4,168 |
| | Neenah Paper Inc. | 49,644 | 3,105 |
15
Strategic Small-Cap Equity Fund
| | | |
| | | | Market |
| | | | Value• |
| | | Shares | ($000) |
| * | Stillwater Mining Co. | 217,100 | 2,805 |
| | Schweitzer-Mauduit | | |
| | International Inc. | 49,700 | 2,292 |
| * | Ferro Corp. | 155,000 | 1,945 |
| | Innophos Holdings Inc. | 21,500 | 1,212 |
| | Scotts Miracle-Gro Co. | | |
| | Class A | 13,400 | 900 |
| | Sonoco Products Co. | 17,000 | 773 |
| | A Schulman Inc. | 12,000 | 578 |
| | Materion Corp. | 13,600 | 523 |
| | Domtar Corp. | 10,200 | 472 |
| | | | 46,496 |
| Telecommunication Services (0.6%) | |
| | Inteliquent Inc. | 179,500 | 2,825 |
| * | General Communication | | |
| | Inc. Class A | 50,400 | 794 |
| * | Cincinnati Bell Inc. | 178,100 | 629 |
| | IDT Corp. Class B | 23,300 | 414 |
| | | | 4,662 |
| Utilities (3.7%) | | |
| | Vectren Corp. | 117,100 | 5,169 |
| | WGL Holdings Inc. | 87,100 | 4,912 |
| | New Jersey Resources | | |
| | Corp. | 154,600 | 4,802 |
| | American States Water Co. | 105,400 | 4,204 |
| | Portland General Electric | | |
| | Co. | 96,500 | 3,579 |
| | Great Plains Energy Inc. | 124,200 | 3,314 |
| | IDACORP Inc. | 50,800 | 3,194 |
| | Unitil Corp. | 17,300 | 602 |
| | Atmos Energy Corp. | 8,300 | 459 |
| | | | 30,235 |
| Total Common Stocks | | |
| (Cost $676,911) | | 814,825 |
| | | |
| | | | Market |
| | | | Value• |
| | | Shares | ($000) |
| Temporary Cash Investments (1.7%)1 | |
| Money Market Fund (1.7%) | |
| 2,3 | Vanguard Market Liquidity | |
| | Fund, 0.128% | 13,598,684 | 13,599 |
| |
| | | Face | |
| | | Amount | |
| | | ($000) | |
| U.S. Government and Agency Obligations (0.0%) |
| 4,5 | Federal Home Loan Bank | |
| | Discount Notes, 0.080%, | | |
| | 5/8/15 | 200 | 200 |
| 4,5 | Federal Home Loan Bank | |
| | Discount Notes, 0.060%, | |
| | 5/20/15 | 200 | 200 |
| | | | 400 |
| Total Temporary Cash Investments | |
| (Cost $13,999) | | 13,999 |
| Total Investments (101.1%) | |
| (Cost $690,910) | | 828,824 |
| Other Assets and Liabilities (-1.1%) | |
| Other Assets | | 13,664 |
| Liabilities3 | | (22,734) |
| | | | (9,070) |
| Net Assets (100%) | | |
| Applicable to 25,559,255 outstanding | |
| $.001 par value shares of beneficial | |
| interest (unlimited authorization) | 819,754 |
| Net Asset Value Per Share | $32.07 |
16
Strategic Small-Cap Equity Fund
| |
| At March 31, 2015, net assets consisted of: | |
| | Amount |
| | ($000) |
| Paid-in Capital | 671,176 |
| Undistributed Net Investment Income | 2,555 |
| Accumulated Net Realized Gains | 8,098 |
| Unrealized Appreciation (Depreciation) | |
| Investment Securities | 137,914 |
| Futures Contracts | 11 |
| Net Assets | 819,754 |
• See Note A in Notes to Financial Statements.
* Non-income-producing security.
^ Includes partial security positions on loan to broker-dealers. The total value of securities on loan is $2,622,000.
1 The fund invests a portion of its cash reserves in equity markets through the use of index futures contracts. After giving effect to futures investments, the fund’s effective common stock and temporary cash investment positions represent 100.0% and 1.1%, respectively, of net assets.
2 Affiliated money market fund available only to Vanguard funds and certain trusts and accounts managed by Vanguard. Rate shown is the 7-day yield.
3 Includes $2,782,000 of collateral received for securities on loan.
4 The issuer operates under a congressional charter; its securities are generally neither guaranteed by the U.S. Treasury nor backed by the full faith and credit of the U.S. government.
5 Securities with a value of $400,000 have been segregated as initial margin for open futures contracts.
REIT—Real Estate Investment Trust.
See accompanying Notes, which are an integral part of the Financial Statements.
17
Strategic Small-Cap Equity Fund
Statement of Operations
| |
| | Six Months Ended |
| | March 31, 2015 |
| | ($000) |
| Investment Income | |
| Income | |
| Dividends | 5,876 |
| Interest1 | 4 |
| Securities Lending | 218 |
| Total Income | 6,098 |
| Expenses | |
| The Vanguard Group—Note B | |
| Investment Advisory Services | 235 |
| Management and Administrative | 891 |
| Marketing and Distribution | 66 |
| Custodian Fees | 9 |
| Shareholders’ Reports | 4 |
| Total Expenses | 1,205 |
| Net Investment Income | 4,893 |
| Realized Net Gain (Loss) | |
| Investment Securities Sold | 7,594 |
| Futures Contracts | 488 |
| Realized Net Gain (Loss) | 8,082 |
| Change in Unrealized Appreciation (Depreciation) | |
| Investment Securities | 67,489 |
| Futures Contracts | 102 |
| Change in Unrealized Appreciation (Depreciation) | 67,591 |
| Net Increase (Decrease) in Net Assets Resulting from Operations | 80,566 |
| 1 Interest income from an affiliated company of the fund was $4,000. | |
See accompanying Notes, which are an integral part of the Financial Statements.
18
Strategic Small-Cap Equity Fund
Statement of Changes in Net Assets
| | |
| | Six Months Ended | Year Ended |
| | March 31, | September 30, |
| | 2015 | 2014 |
| | ($000) | ($000) |
| Increase (Decrease) in Net Assets | | |
| Operations | | |
| Net Investment Income | 4,893 | 4,634 |
| Realized Net Gain (Loss) | 8,082 | 54,256 |
| Change in Unrealized Appreciation (Depreciation) | 67,591 | (10,336) |
| Net Increase (Decrease) in Net Assets Resulting from Operations | 80,566 | 48,554 |
| Distributions | | |
| Net Investment Income | (4,646) | (3,377) |
| Realized Capital Gain1 | (45,914) | (4,018) |
| Total Distributions | (50,560) | (7,395) |
| Capital Share Transactions | | |
| Issued | 285,669 | 229,407 |
| Issued in Lieu of Cash Distributions | 47,237 | 6,904 |
| Redeemed | (88,319) | (109,249) |
| Net Increase (Decrease) from Capital Share Transactions | 244,587 | 127,062 |
| Total Increase (Decrease) | 274,593 | 168,221 |
| Net Assets | | |
| Beginning of Period | 545,161 | 376,940 |
| End of Period2 | 819,754 | 545,161 |
| 1 Includes fiscal 2015 and 2014 short-term gain distributions totaling $6,762,000 and $451,000, respectively. Short-term gain distributions are treated as ordinary income dividends for tax purposes. |
|
| 2 Net Assets—End of Period includes undistributed (overdistributed) net investment income of $2,555,000 and $2,308,000. |
See accompanying Notes, which are an integral part of the Financial Statements.
19
Strategic Small-Cap Equity Fund
Financial Highlights
| | | | | | |
| | Six Months | | | | | |
| | Ended | | | | | |
| For a Share Outstanding | March 31, | | | Year Ended September 30, |
| Throughout Each Period | 2015 | 2014 | 2013 | 2012 | 2011 | 2010 |
| Net Asset Value, Beginning of Period | $30.91 | $27.94 | $21.37 | $16.44 | $16.53 | $14.32 |
| Investment Operations | | | | | | |
| Net Investment Income | .215 | .277 | .345 | .238 | .176 | .154 |
| Net Realized and Unrealized Gain (Loss) | | | | | | |
| on Investments | 3.622 | 3.201 | 6.585 | 4.888 | (.126) | 2.216 |
| Total from Investment Operations | 3.837 | 3.478 | 6.930 | 5.126 | .050 | 2.370 |
| Distributions | | | | | | |
| Dividends from Net Investment Income | (. 246) | (. 232) | (. 360) | (.196) | (.140) | (.160) |
| Distributions from Realized Capital Gains | (2.431) | (.276) | — | — | — | — |
| Total Distributions | (2.677) | (. 508) | (. 360) | (.196) | (.140) | (.160) |
| Net Asset Value, End of Period | $32.07 | $30.91 | $27.94 | $21.37 | $16.44 | $16.53 |
| |
| Total Return1 | 13.10% | 12.48% | 32.94% | 31.38% | 0.20% | 16.70% |
| |
| Ratios/Supplemental Data | | | | | | |
| Net Assets, End of Period (Millions) | $820 | $545 | $377 | $259 | $223 | $178 |
| Ratio of Total Expenses to | | | | | | |
| Average Net Assets | 0.37% | 0.38% | 0.38% | 0.38% | 0.38% | 0.43% |
| Ratio of Net Investment Income to | | | | | | |
| Average Net Assets | 1.33% | 0.96% | 1.40% | 1.16% | 0.89% | 0.98% |
| Portfolio Turnover Rate | 66% | 64% | 64% | 66% | 64% | 66% |
| The expense ratio, net income ratio, and turnover rate for the current period have been annualized. | | |
| 1 Total returns do not include account service fees that may have applied in the periods shown. Fund prospectuses provide information about any applicable account service fees. |
|
See accompanying Notes, which are an integral part of the Financial Statements.
20
Strategic Small-Cap Equity Fund
Notes to Financial Statements
Vanguard Strategic Small-Cap Equity Fund is registered under the Investment Company Act of 1940 as an open-end investment company, or mutual fund.
A. The following significant accounting policies conform to generally accepted accounting principles for U.S. investment companies. The fund consistently follows such policies in preparing its financial statements.
1. Security Valuation: Securities are valued as of the close of trading on the New York Stock Exchange (generally 4 p.m., Eastern time) on the valuation date. Equity securities are valued at the latest quoted sales prices or official closing prices taken from the primary market in which each security trades; such securities not traded on the valuation date are valued at the mean of the latest quoted bid and asked prices. Securities for which market quotations are not readily available, or whose values have been materially affected by events occurring before the fund’s pricing time but after the close of the securities’ primary markets, are valued by methods deemed by the board of trustees to represent fair value. Investments in Vanguard Market Liquidity Fund are valued at that fund’s net asset value. Temporary cash investments acquired over 60 days to maturity are valued using the latest bid prices or using valuations based on a matrix system (which considers such factors as security prices, yields, maturities, and ratings), both as furnished by independent pricing services. Other temporary cash investments are valued at amortized cost, which approximates market value.
2. Futures Contracts: The fund uses index futures contracts to a limited extent, with the objective of maintaining full exposure to the stock market while maintaining liquidity. The fund may purchase or sell futures contracts to achieve a desired level of investment, whether to accommodate portfolio turnover or cash flows from capital share transactions. The primary risks associated with the use of futures contracts are imperfect correlation between changes in market values of stocks held by the fund and the prices of futures contracts, and the possibility of an illiquid market. Counterparty risk involving futures is mitigated because a regulated clearinghouse is the counterparty instead of the clearing broker. To further mitigate counterparty risk, the fund trades futures contracts on an exchange, monitors the financial strength of its clearing brokers and clearinghouse, and has entered into clearing agreements with its clearing brokers. The clearinghouse imposes initial margin requirements to secure the fund’s performance and requires daily settlement of variation margin representing changes in the market value of each contract.
Futures contracts are valued at their quoted daily settlement prices. The aggregate settlement values of the contracts are not recorded in the Statement of Net Assets. Fluctuations in the value of the contracts are recorded in the Statement of Net Assets as an asset (liability) and in the Statement of Operations as unrealized appreciation (depreciation) until the contracts are closed, when they are recorded as realized futures gains (losses).
During the six months ended March 31, 2015, the fund’s average investments in long and short futures contracts represented less than 1% and 0% of net assets, respectively, based on the average of aggregate settlement values at each quarter-end during the period.
3. Federal Income Taxes: The fund intends to continue to qualify as a regulated investment company and distribute all of its taxable income. Management has analyzed the fund’s tax positions taken for all open federal income tax years (September 30, 2011–2014), and for the period ended March 31, 2015, and has concluded that no provision for federal income tax is required in the fund’s financial statements.
21
Strategic Small-Cap Equity Fund
4. Distributions: Distributions to shareholders are recorded on the ex-dividend date.
5. Securities Lending: To earn additional income, the fund lends its securities to qualified institutional borrowers. Security loans are required to be secured at all times by collateral in an amount at least equal to the market value of securities loaned. Daily market fluctuations could cause the value of loaned securities to be more or less than the value of the collateral received. When this occurs, the collateral is adjusted and settled on the next business day. The fund further mitigates its counterparty risk by entering into securities lending transactions only with a diverse group of prequalified counterparties, monitoring their financial strength, and entering into master securities lending agreements with its counterparties. The master securities lending agreements provide that, in the event of a counterparty’s default (including bankruptcy), the fund may terminate any loans with that borrower, determine the net amount owed, and sell or retain the collateral up to the net amount owed to the fund; however, such actions may be subject to legal proceedings. While collateral mitigates counterparty risk, in the absence of a default the fund may experience delays and costs in recovering the securities loaned. The fund invests cash collateral received in Vanguard Market Liquidity Fund, and records a liability in the Statement of Net Assets for the return of the collateral, during the period the securities are on loan. Securities lending income represents fees charged to borrowers plus income earned on invested cash collateral, less expenses associated with the loan.
6. Credit Facility: The fund and certain other funds managed by The Vanguard Group participate in a $3 billion committed credit facility provided by a syndicate of lenders pursuant to a credit agreement that may be renewed annually; each fund is individually liable for its borrowings, if any, under the credit facility. Borrowings may be utilized for temporary and emergency purposes, and are subject to the fund’s regulatory and contractual borrowing restrictions. The participating funds are charged administrative fees and an annual commitment fee of 0.06% of the undrawn amount of the facility; these fees are allocated to the funds based on a method approved by the fund’s board of trustees and included in Management and Administrative expenses on the fund’s Statement of Operations. Any borrowings under this facility bear interest at a rate equal to the higher of the federal funds rate or LIBOR reference rate plus an agreed-upon spread.
The fund had no borrowings outstanding at March 31, 2015, or at any time during the period then ended.
7. Other: Dividend income is recorded on the ex-dividend date. Interest income includes income distributions received from Vanguard Market Liquidity Fund and is accrued daily. Premiums and discounts on debt securities purchased are amortized and accreted, respectively, to interest income over the lives of the respective securities. Security transactions are accounted for on the date securities are bought or sold. Costs used to determine realized gains (losses) on the sale of investment securities are those of the specific securities sold.
B. The Vanguard Group furnishes at cost investment advisory, corporate management, administrative, marketing, and distribution services. The costs of such services are allocated to the fund based on methods approved by the board of trustees. The fund has committed to invest up to 0.40% of its net assets in Vanguard. At March 31, 2015, the fund had contributed capital of $69,000 to Vanguard (included in Other Assets), representing 0.01% of the fund’s net assets and 0.03% of Vanguard’s capitalization. The fund’s trustees and officers are also directors and officers of Vanguard.
22
Strategic Small-Cap Equity Fund
C. Various inputs may be used to determine the value of the fund’s investments. These inputs are summarized in three broad levels for financial statement purposes. The inputs or methodologies used to value securities are not necessarily an indication of the risk associated with investing in those securities.
Level 1—Quoted prices in active markets for identical securities.
Level 2—Other significant observable inputs (including quoted prices for similar securities, interest rates, prepayment speeds, credit risk, etc.).
Level 3—Significant unobservable inputs (including the fund’s own assumptions used to determine the fair value of investments).
The following table summarizes the market value of the fund’s investments as of March 31, 2015, based on the inputs used to value them:
| | | |
| | Level 1 | Level 2 | Level 3 |
| Investments | ($000) | ($000) | ($000) |
| Common Stocks | 814,825 | — | — |
| Temporary Cash Investments | 13,599 | 400 | — |
| Futures Contracts—Assets1 | 10 | — | — |
| Futures Contracts—Liabilities1 | (34) | — | — |
| Total | 828,400 | 400 | — |
| 1 Represents variation margin on the last day of the reporting period. | | | |
D. At March 31, 2015, the aggregate settlement value of open futures contracts and the related unrealized appreciation (depreciation) were:
| | | | |
| | | | | ($000) |
| | | | Aggregate | |
| | | Number of | Settlement | Unrealized |
| | | Long (Short) | Value | Appreciation |
| Futures Contracts | Expiration | Contracts | Long (Short) | (Depreciation) |
| E-mini Russell 2000 Index | June 2015 | 37 | 4,621 | 11 |
Unrealized appreciation (depreciation) on open futures contracts is required to be treated as realized gain (loss) for tax purposes.
E. Distributions are determined on a tax basis and may differ from net investment income and realized capital gains for financial reporting purposes. Differences may be permanent or temporary. Permanent differences are reclassified among capital accounts in the financial statements to reflect their tax character. Temporary differences arise when certain items of income, expense, gain, or loss are recognized in different periods for financial statement and tax purposes. These differences will reverse at some time in the future. Differences in classification may also result from the treatment of short-term gains as ordinary income for tax purposes. The fund’s tax-basis capital gains and losses are determined only at the end of each fiscal year.
23
Strategic Small-Cap Equity Fund
At March 31, 2015, the cost of investment securities for tax purposes was $690,910,000. Net unrealized appreciation of investment securities for tax purposes was $137,914,000, consisting of unrealized gains of $156,553,000 on securities that had risen in value since their purchase and $18,639,000 in unrealized losses on securities that had fallen in value since their purchase.
F. During the six months ended March 31, 2015, the fund purchased $416,768,000 of investment securities and sold $218,199,000 of investment securities, other than temporary cash investments.
G. Capital shares issued and redeemed were:
| | |
| | Six Months Ended | Year Ended |
| | March 31, 2015 | September 30, 2014 |
| | Shares | Shares |
| | (000) | (000) |
| Issued | 9,158 | 7,470 |
| Issued in Lieu of Cash Distributions | 1,590 | 228 |
| Redeemed | (2,827) | (3,550) |
| Net Increase (Decrease) in Shares Outstanding | 7,921 | 4,148 |
H. Management has determined that no material events or transactions occurred subsequent to March 31, 2015, that would require recognition or disclosure in these financial statements.
24
About Your Fund’s Expenses
As a shareholder of the fund, you incur ongoing costs, which include costs for portfolio management, administrative services, and shareholder reports (like this one), among others. Operating expenses, which are deducted from a fund’s gross income, directly reduce the investment return of the fund.
A fund’s expenses are expressed as a percentage of its average net assets. This figure is known as the expense ratio. The following examples are intended to help you understand the ongoing costs (in dollars) of investing in your fund and to compare these costs with those of other mutual funds. The examples are based on an investment of $1,000 made at the beginning of the period shown and held for the entire period.
The accompanying table illustrates your fund’s costs in two ways:
• Based on actual fund return. This section helps you to estimate the actual expenses that you paid over the period. The ”Ending Account Value“ shown is derived from the fund‘s actual return, and the third column shows the dollar amount that would have been paid by an investor who started with $1,000 in the fund. You may use the information here, together with the amount you invested, to estimate the expenses that you paid over the period.
To do so, simply divide your account value by $1,000 (for example, an $8,600 account value divided by $1,000 = 8.6), then multiply the result by the number given for your fund under the heading ”Expenses Paid During Period.“
• Based on hypothetical 5% yearly return. This section is intended to help you compare your fund‘s costs with those of other mutual funds. It assumes that the fund had a yearly return of 5% before expenses, but that the expense ratio is unchanged. In this case—because the return used is not the fund’s actual return—the results do not apply to your investment. The example is useful in making comparisons because the Securities and Exchange Commission requires all mutual funds to calculate expenses based on a 5% return. You can assess your fund’s costs by comparing this hypothetical example with the hypothetical examples that appear in shareholder reports of other funds.
Note that the expenses shown in the table are meant to highlight and help you compare ongoing costs only and do not reflect transaction costs incurred by the fund for buying and selling securities. Further, the expenses do not include any purchase, redemption, or account service fees described in the fund prospectus. If such fees were applied to your account, your costs would be higher. Your fund does not carry a “sales load.”
The calculations assume no shares were bought or sold during the period. Your actual costs may have been higher or lower, depending on the amount of your investment and the timing of any purchases or redemptions.
You can find more information about the fund’s expenses, including annual expense ratios, in the Financial Statements section of this report. For additional information on operating expenses and other shareholder costs, please refer to your fund’s current prospectus.
25
| | | |
| Six Months Ended March 31, 2015 | | | |
| |
| | Beginning | Ending | Expenses |
| | Account Value | Account Value | Paid During |
| Strategic Small-Cap Equity Fund | 9/30/2014 | 3/31/2015 | Period |
| Based on Actual Fund Return | $1,000.00 | $1,131.01 | $1.97 |
| Based on Hypothetical 5% Yearly Return | 1,000.00 | 1,023.09 | 1.87 |
| The calculations are based on expenses incurred in the most recent six-month period. The fund’s annualized six-month expense ratio for that period is 0.37%. The dollar amounts shown as “Expenses Paid” are equal to the expense ratio multiplied by the average account value over the period, multiplied by the number of days in the most recent six-month period, then divided by the number of days in the most recent 12-month period. |
|
|
|
26
Trustees Approve Advisory Arrangement
The board of trustees of Vanguard Strategic Small-Cap Equity Fund has renewed the fund’s investment advisory arrangement with The Vanguard Group, Inc. (Vanguard). Vanguard’s Equity Investment Group—through its Quantitative Equity Group—serves as the investment advisor to the fund. The board determined that continuing the fund’s internalized management structure was in the best interests of the fund and its shareholders.
The board based its decision upon an evaluation of the advisor’s investment staff, portfolio management process, and performance. The trustees considered the factors discussed below, among others. However, no single factor determined whether the board approved the arrangement. Rather, it was the totality of the circumstances that drove the board’s decision.
Nature, extent, and quality of services
The board considered the quality of the fund’s investment management services over both the short and long term, and took into account the organizational depth and stability of the advisor. The board noted that Vanguard has been managing investments for more than three decades. The Quantitative Equity Group adheres to a sound, disciplined investment management process; the team has considerable experience, stability, and depth.
The board concluded that Vanguard’s experience, stability, depth, and performance, among other factors, warranted continuation of the advisory arrangement.
Investment performance
The board considered the short- and long-term performance of the fund, including any periods of outperformance or underperformance relative to a benchmark index and peer group. The board concluded that the performance was such that the advisory arrangement should continue. Information about the fund’s most recent performance can be found in the Performance Summary section of this report.
Cost
The board concluded that the fund’s expense ratio was well below the average expense ratio charged by funds in its peer group and that the fund’s advisory fee rate was also well below its peer-group average. Information about the fund’s expenses appears in the About Your Fund’s Expenses section of this report as well as in the Financial Statements section.
The board does not conduct a profitability analysis of Vanguard, because of Vanguard’s unique “at-cost” structure. Unlike most other mutual fund management companies, Vanguard is owned by the funds it oversees, and produces “profits” only in the form of reduced expenses for fund shareholders.
The benefit of economies of scale
The board concluded that the fund’s at-cost arrangement with Vanguard ensures that the fund will realize economies of scale as it grows, with the cost to shareholders declining as fund assets increase.
The board will consider whether to renew the advisory arrangement again after a one-year period.
27
Glossary
30-Day SEC Yield. A fund’s 30-day SEC yield is derived using a formula specified by the U.S. Securities and Exchange Commission. Under the formula, data related to the fund’s security holdings in the previous 30 days are used to calculate the fund’s hypothetical net income for that period, which is then annualized and divided by the fund’s estimated average net assets over the calculation period. For the purposes of this calculation, a security’s income is based on its current market yield to maturity (for bonds), its actual income (for asset-backed securities), or its projected dividend yield (for stocks). Because the SEC yield represents hypothetical annualized income, it will differ—at times significantly—from the fund’s actual experience. As a result, the fund’s income distributions may be higher or lower than implied by the SEC yield.
Beta. A measure of the magnitude of a fund’s past share-price fluctuations in relation to the ups and downs of a given market index. The index is assigned a beta of 1.00. Compared with a given index, a fund with a beta of 1.20 typically would have seen its share price rise or fall by 12% when the index rose or fell by 10%. For this report, beta is based on returns over the past 36 months for both the fund and the index. Note that a fund’s beta should be reviewed in conjunction with its R-squared (see definition). The lower the R-squared, the less correlation there is between the fund and the index, and the less reliable beta is as an indicator of volatility.
Dividend Yield. Dividend income earned by stocks, expressed as a percentage of the aggregate market value (or of net asset value, for a fund). The yield is determined by dividing the amount of the annual dividends by the aggregate value (or net asset value) at the end of the period. For a fund, the dividend yield is based solely on stock holdings and does not include any income produced by other investments.
Earnings Growth Rate. The average annual rate of growth in earnings over the past five years for the stocks now in a fund.
Equity Exposure. A measure that reflects a fund’s investments in stocks and stock futures. Any holdings in short-term reserves are excluded.
Expense Ratio. A fund’s total annual operating expenses expressed as a percentage of the fund’s average net assets. The expense ratio includes management and administrative expenses, but does not include the transaction costs of buying and selling portfolio securities.
Foreign Holdings. The percentage of a fund represented by securities or depositary receipts of companies based outside the United States.
Inception Date. The date on which the assets of a fund (or one of its share classes) are first invested in accordance with the fund’s investment objective. For funds with a subscription period, the inception date is the day after that period ends. Investment performance is measured from the inception date.
Median Market Cap. An indicator of the size of companies in which a fund invests; the midpoint of market capitalization (market price x shares outstanding) of a fund’s stocks, weighted by the proportion of the fund’s assets invested in each stock. Stocks representing half of the fund’s assets have market capitalizations above the median, and the rest are below it.
Price/Book Ratio. The share price of a stock divided by its net worth, or book value, per share. For a fund, the weighted average price/book ratio of the stocks it holds.
28
Price/Earnings Ratio. The ratio of a stock’s current price to its per-share earnings over the past year. For a fund, the weighted average P/E of the stocks it holds. P/E is an indicator of market expectations about corporate prospects; the higher the P/E, the greater the expectations for a company’s future growth.
R-Squared. A measure of how much of a fund’s past returns can be explained by the returns from the market in general, as measured by a given index. If a fund’s total returns were precisely synchronized with an index’s returns, its R-squared would be 1.00. If the fund’s returns bore no relationship to the index’s returns, its R-squared would be 0. For this report, R-squared is based on returns over the past 36 months for both the fund and the index.
Return on Equity. The annual average rate of return generated by a company during the past five years for each dollar of shareholder’s equity (net income divided by shareholder’s equity). For a fund, the weighted average return on equity for the companies whose stocks it holds.
Short-Term Reserves. The percentage of a fund invested in highly liquid, short-term securities that can be readily converted to cash.
Turnover Rate. An indication of the fund’s trading activity. Funds with high turnover rates incur higher transaction costs and may be more likely to distribute capital gains (which may be taxable to investors). The turnover rate excludes in-kind transactions, which have minimal impact on costs.
29
This page intentionally left blank.
This page intentionally left blank.
The People Who Govern Your Fund
The trustees of your mutual fund are there to see that the fund is operated and managed in your best interests since, as a shareholder, you are a part owner of the fund. Your fund’s trustees also serve on the board of directors of The Vanguard Group, Inc., which is owned by the Vanguard funds and provides services to them on an at-cost basis.
A majority of Vanguard’s board members are independent, meaning that they have no affiliation with Vanguard or the funds they oversee, apart from the sizable personal investments they have made as private individuals. The independent board members have distinguished backgrounds in business, academia, and public service. Each of the trustees and executive officers oversees 178 Vanguard funds.
The following table provides information for each trustee and executive officer of the fund. More information about the trustees is in the Statement of Additional Information, which can be obtained, without charge, by contacting Vanguard at 800-662-7447, or online at vanguard.com.
| |
| InterestedTrustee1 | Rajiv L. Gupta |
| | Born 1945. Trustee Since December 2001.2 Principal |
| F. William McNabb III | Occupation(s) During the Past Five Years and Other |
| Born 1957. Trustee Since July 2009. Chairman of | Experience: Chairman and Chief Executive Officer |
| the Board. Principal Occupation(s) During the Past | (retired 2009) and President (2006–2008) of |
| Five Years and Other Experience: Chairman of the | Rohm and Haas Co. (chemicals); Director of Tyco |
| Board of The Vanguard Group, Inc., and of each of | International PLC (diversified manufacturing and |
| the investment companies served by The Vanguard | services), Hewlett-Packard Co. (electronic computer |
| Group, since January 2010; Director of The Vanguard | manufacturing), and Delphi Automotive PLC |
| Group since 2008; Chief Executive Officer and | (automotive components); Senior Advisor at New |
| President of The Vanguard Group, and of each of | Mountain Capital. |
| the investment companies served by The Vanguard | |
| Group, since 2008; Director of Vanguard Marketing | Amy Gutmann |
| Corporation; Managing Director of The Vanguard | Born 1949. Trustee Since June 2006. Principal |
| Group (1995–2008). | Occupation(s) During the Past Five Years and |
| | Other Experience: President of the University of |
| IndependentTrustees | Pennsylvania; Christopher H. Browne Distinguished |
| | Professor of Political Science, School of Arts and |
| Emerson U. Fullwood | Sciences, and Professor of Communication, Annenberg |
| Born 1948. Trustee Since January 2008. Principal | School for Communication, with secondary faculty |
| Occupation(s) During the Past Five Years and | appointments in the Department of Philosophy, School |
| Other Experience: Executive Chief Staff and | of Arts and Sciences, and at the Graduate School of |
| Marketing Officer for North America and Corporate | Education, University of Pennsylvania; Trustee of the |
| Vice President (retired 2008) of Xerox Corporation | National Constitution Center; Chair of the Presidential |
| (document management products and services); | Commission for the Study of Bioethical Issues. |
| Executive in Residence and 2009–2010 Distinguished | |
| Minett Professor at the Rochester Institute of | JoAnn Heffernan Heisen |
| Technology; Director of SPX Corporation (multi-industry | Born 1950. Trustee Since July 1998. Principal |
| manufacturing), the United Way of Rochester, | Occupation(s) During the Past Five Years and Other |
| Amerigroup Corporation (managed health care), the | Experience: Corporate Vice President and Chief |
| University of Rochester Medical Center, Monroe | Global Diversity Officer (retired 2008) and Member |
| Community College Foundation, and North Carolina | of the Executive Committee (1997–2008) of Johnson |
| A&T University. | & Johnson (pharmaceuticals/medical devices/ |
| | consumer products); Director of Skytop Lodge |
| | Corporation (hotels), the University Medical Center |
| | at Princeton, the Robert Wood Johnson Foundation, |
| | and the Center for Talent Innovation; Member of |
| | the Advisory Board of the Institute for Women’s |
| | Leadership at Rutgers University. |
| | |
| F. Joseph Loughrey | Executive Officers | |
| Born 1949. Trustee Since October 2009. Principal | | |
| Occupation(s) During the Past Five Years and Other | Glenn Booraem | |
| Experience: President and Chief Operating Officer | Born 1967. Controller Since July 2010. Principal |
| (retired 2009) of Cummins Inc. (industrial machinery); | Occupation(s) During the Past Five Years and Other |
| Chairman of the Board of Hillenbrand, Inc. (specialized | Experience: Principal of The Vanguard Group, Inc.; |
| consumer services), and of Oxfam America; Director | Controller of each of the investment companies served |
| of SKF AB (industrial machinery), Hyster-Yale Materials | by The Vanguard Group; Assistant Controller of each of |
| Handling, Inc. (forklift trucks), the Lumina Foundation | the investment companies served by The Vanguard |
| for Education, and the V Foundation for Cancer | Group (2001–2010). | |
| Research; Member of the Advisory Council for the | | |
| College of Arts and Letters and of the Advisory Board | Thomas J. Higgins | |
| to the Kellogg Institute for International Studies, both | Born 1957. Chief Financial Officer Since September |
| at the University of Notre Dame. | 2008. Principal Occupation(s) During the Past Five |
| Years and Other Experience: Principal of The Vanguard |
| Mark Loughridge | Group, Inc.; Chief Financial Officer of each of the |
| Born 1953. Trustee Since March 2012. Principal | investment companies served by The Vanguard Group; |
| Occupation(s) During the Past Five Years and Other | Treasurer of each of the investment companies served |
| Experience: Senior Vice President and Chief Financial | by The Vanguard Group (1998–2008). |
| Officer (retired 2013) at IBM (information technology | |
| services); Fiduciary Member of IBM’s Retirement Plan | Kathryn J. Hyatt | |
| Committee (2004–2013); Director of the Dow Chemical | Born 1955. Treasurer Since November 2008. Principal |
| Company; Member of the Council on Chicago Booth. | Occupation(s) During the Past Five Years and Other |
| Experience: Principal of The Vanguard Group, Inc.; |
| Scott C. Malpass | Treasurer of each of the investment companies served |
| Born 1962. Trustee Since March 2012. Principal | by The Vanguard Group; Assistant Treasurer of each of |
| Occupation(s) During the Past Five Years and Other | the investment companies served by The Vanguard |
| Experience: Chief Investment Officer and Vice | Group (1988–2008). | |
| President at the University of Notre Dame; Assistant | | |
| Professor of Finance at the Mendoza College of | Heidi Stam | |
| Business at Notre Dame; Member of the Notre Dame | Born 1956. Secretary Since July 2005. Principal |
| 403(b) Investment Committee; Board Member of | Occupation(s) During the Past Five Years and Other |
| TIFF Advisory Services, Inc., and Catholic Investment | Experience: Managing Director of The Vanguard |
| Services, Inc. (investment advisors); Member of | Group, Inc.; General Counsel of The Vanguard Group; |
| the Investment Advisory Committee of Major | Secretary of The Vanguard Group and of each of the |
| League Baseball. | investment companies served by The Vanguard Group; |
| Director and Senior Vice President of Vanguard |
| André F. Perold | Marketing Corporation. | |
| Born 1952. Trustee Since December 2004. Principal | | |
| Occupation(s) During the Past Five Years and Other | Vanguard Senior ManagementTeam |
| Experience: George Gund Professor of Finance and | | |
| Banking, Emeritus at the Harvard Business School | Mortimer J. Buckley | Chris D. McIsaac |
| (retired 2011); Chief Investment Officer and Managing | Kathleen C. Gubanich | Michael S. Miller |
| Partner of HighVista Strategies LLC (private investment | Paul A. Heller | James M. Norris |
| firm); Director of Rand Merchant Bank; Overseer of | Martha G. King | Glenn W. Reed |
| the Museum of Fine Arts Boston. | John T. Marcante | |
| | |
| Peter F. Volanakis | Chairman Emeritus and Senior Advisor |
| Born 1955. Trustee Since July 2009. Principal | | |
| Occupation(s) During the Past Five Years and Other | John J. Brennan | |
| Experience: President and Chief Operating Officer | Chairman, 1996–2009 | |
| (retired 2010) of Corning Incorporated (communications | Chief Executive Officer and President, 1996–2008 |
| equipment); Trustee of Colby-Sawyer College; | | |
| Member of the Advisory Board of the Norris Cotton | Founder | |
| Cancer Center and of the Advisory Board of the | | |
| Parthenon Group (strategy consulting). | John C. Bogle | |
| | Chairman and Chief Executive Officer, 1974–1996 |
1 Mr. McNabb is considered an “interested person,” as defined in the Investment Company Act of 1940, because he is an officer of the Vanguard funds.
2 December 2002 for Vanguard Equity Income Fund, the Vanguard Municipal Bond Funds, and the Vanguard State Tax-Exempt Funds.
| |  |
| | | P.O. Box 2600 |
| | | Valley Forge, PA 19482-2600 |
| |
| |
| |
| Connect with Vanguard® > vanguard.com | |
| |
| |
| |
| Fund Information > 800-662-7447 | | CFA® is a registered trademark owned by CFA Institute. |
| Direct Investor Account Services > 800-662-2739 | |
| Institutional Investor Services > 800-523-1036 | |
| Text Telephone for People | | |
| Who Are Deaf or Hard of Hearing> 800-749-7273 | |
| |
| This material may be used in conjunction | |
| with the offering of shares of any Vanguard | |
| fund only if preceded or accompanied by | |
| the fund’s current prospectus. | |
| |
| All comparative mutual fund data are from Lipper, a | |
| Thomson Reuters Company, or Morningstar, Inc., unless | |
| otherwise noted. | | |
| |
| You can obtain a free copy of Vanguard’s proxy voting | |
| guidelines by visiting vanguard.com/proxyreporting or by | |
| calling Vanguard at 800-662-2739. The guidelines are | |
| also available from the SEC’s website, sec.gov. In | |
| addition, you may obtain a free report on how your fund | |
| voted the proxies for securities it owned during the 12 | |
| months ended June 30. To get the report, visit either | |
| vanguard.com/proxyreporting or sec.gov. | |
| |
| You can review and copy information about your fund at | |
| the SEC’s Public Reference Room in Washington, D.C. To | |
| find out more about this public service, call the SEC at | |
| 202-551-8090. Information about your fund is also | |
| available on the SEC’s website, and you can receive | |
| copies of this information, for a fee, by sending a | |
| request in either of two ways: via e-mail addressed to | |
| publicinfo@sec.gov or via regular mail addressed to the | |
| Public Reference Section, Securities and Exchange | |
| Commission, Washington, DC 20549-1520. | |
| |
| | | © 2015 The Vanguard Group, Inc. |
| | | All rights reserved. |
| | | Vanguard Marketing Corporation, Distributor. |
| |
| | | Q6152 052015 |
Item 2: Code of Ethics.
Not Applicable.
Item 3: Audit Committee Financial Expert.
Not Applicable.
Item 4: Principal Accountant Fees and Services.
(a) Audit Fees.
Not Applicable.
Item 5: Audit Committee of Listed Registrants.
Not Applicable.
Item 6: Investments.
| | |
| Vanguard® Global Equity Fund | | |
| Schedule of Investments | | |
| March 31, 2015 | | |
| |
| | | Market |
| | | Value |
| | Shares | ($000) |
| Common Stocks (96.5%)1 | | |
| Argentina (0.1%) | | |
| ^ Arcos Dorados Holdings Inc. Class A | 513,147 | 2,530 |
| |
| Australia (2.7%) | | |
| Commonwealth Bank of Australia | 390,539 | 27,701 |
| Australia & New Zealand Banking Group Ltd. | 921,371 | 25,633 |
| National Australia Bank Ltd. | 847,170 | 24,800 |
| Brambles Ltd. | 1,526,550 | 13,350 |
| Amcor Ltd. | 622,458 | 6,632 |
| Caltex Australia Ltd. | 225,339 | 5,980 |
| * Qantas Airways Ltd. | 1,485,254 | 3,523 |
| Alumina Ltd. | 1,850,513 | 2,252 |
| Coca-Cola Amatil Ltd. | 259,169 | 2,122 |
| Fairfax Media Ltd. | 2,010,793 | 1,456 |
| Toll Holdings Ltd. | 187,186 | 1,259 |
| Orica Ltd. | 79,499 | 1,207 |
| Iluka Resources Ltd. | 183,529 | 1,183 |
| BHP Billiton Ltd. | 46,989 | 1,092 |
| BlueScope Steel Ltd. | 324,013 | 1,027 |
| Transpacific Industries Group Ltd. | 1,683,657 | 1,016 |
| DuluxGroup Ltd. | 134,340 | 654 |
| SAI Global Ltd. | 171,630 | 540 |
| ALS Ltd. | 134,956 | 507 |
| Metcash Ltd. | 426,638 | 502 |
| Sigma Pharmaceuticals Ltd. | 697,944 | 472 |
| Ansell Ltd. | 13,576 | 284 |
| Santos Ltd. | 50,021 | 271 |
| GUD Holdings Ltd. | 33,504 | 210 |
| Orora Ltd. | 107,206 | 185 |
| Premier Investments Ltd. | 10,829 | 105 |
| | | 123,963 |
| Austria (0.1%) | | |
| Oesterreichische Post AG | 25,172 | 1,240 |
| Wienerberger AG | 75,274 | 1,201 |
| ANDRITZ AG | 13,452 | 803 |
| | | 3,244 |
| Belgium (0.1%) | | |
| Anheuser-Busch InBev NV | 39,383 | 4,811 |
| |
| Brazil (0.6%) | | |
| Banco do Brasil SA | 911,200 | 6,541 |
| BM&FBovespa SA - Bolsa de Valores Mercadorias e Futuros | 1,834,600 | 6,415 |
| Itau Unibanco Holding SA Preference Shares | 214,100 | 2,369 |
| Alpargatas SA Preference Shares | 700,500 | 2,149 |
| EDP - Energias do Brasil SA | 610,500 | 1,980 |
| MRV Engenharia e Participacoes SA | 763,200 | 1,920 |
| TOTVS SA | 155,100 | 1,774 |
| Cia Energetica de Minas Gerais ADR | 353,507 | 1,446 |
| * B2W Cia Digital | 189,581 | 1,185 |
| Grupo BTG Pactual | 116,200 | 929 |
| Vale SA Preference Shares | 154,700 | 749 |
| LPS Brasil Consultoria de Imoveis SA | 301,700 | 487 |
| Cia Paranaense de Energia ADR | 42,997 | 450 |
| Banco Bradesco SA Preference Shares | 31,560 | 293 |
| * Brasil Pharma SA | 534,956 | 114 |
| | | 28,801 |
| Canada (3.2%) | | |
| Magna International Inc. | 523,400 | 27,981 |
| Canadian Imperial Bank of Commerce | 266,400 | 19,313 |
| Toronto-Dominion Bank | 423,800 | 18,139 |
| Bank of Montreal | 299,500 | 17,948 |
| Fairfax Financial Holdings Ltd. | 29,785 | 16,638 |
| Royal Bank of Canada | 255,200 | 15,362 |
1
| | |
| Vanguard® Global Equity Fund | | |
| Schedule of Investments | | |
| March 31, 2015 | | |
| |
| | | Market |
| | | Value |
| | Shares | ($000) |
| Canadian Natural Resources Ltd. | 327,983 | 10,053 |
| Ritchie Bros Auctioneers Inc. | 343,596 | 8,569 |
| Rogers Communications Inc. Class B | 179,247 | 6,001 |
| Brookfield Asset Management Inc. Class A | 87,711 | 4,691 |
| * CGI Group Inc. Class A | 7,400 | 314 |
| | | 145,009 |
| Chile (0.2%) | | |
| Enersis SA ADR | 350,783 | 5,704 |
| Cia Cervecerias Unidas SA | 222,487 | 2,310 |
| * Quinenco SA | 721,478 | 1,481 |
| Sociedad Quimica y Minera de Chile SA ADR | 29,314 | 535 |
| * Cia Sud Americana de Vapores SA | 12,222,299 | 478 |
| | | 10,508 |
| China (2.4%) | | |
| * Baidu Inc. ADR | 117,933 | 24,577 |
| China Mobile Ltd. | 1,863,000 | 24,279 |
| * Alibaba Group Holding Ltd. ADR | 186,008 | 15,483 |
| Mindray Medical International Ltd. ADR | 426,897 | 11,676 |
| China Resources Enterprise Ltd. | 5,598,994 | 10,978 |
| Tsingtao Brewery Co. Ltd. | 1,312,000 | 8,798 |
| Shandong Weigao Group Medical Polymer Co. Ltd. | 4,262,000 | 3,755 |
| China Mengniu Dairy Co. Ltd. | 499,000 | 2,658 |
| * Li Ning Co. Ltd. | 4,285,333 | 2,430 |
| China Telecom Corp. Ltd. | 2,414,000 | 1,543 |
| Ajisen China Holdings Ltd. | 1,787,000 | 1,029 |
| China Merchants Holdings International Co. Ltd. | 228,000 | 894 |
| Wumart Stores Inc. | 1,137,000 | 823 |
| Daphne International Holdings Ltd. | 2,094,000 | 703 |
| Yingde Gases Group Co. Ltd. | 627,000 | 468 |
| TravelSky Technology Ltd. | 362,000 | 417 |
| Want Want China Holdings Ltd. | 383,557 | 408 |
| Shenzhou International Group Holdings Ltd. | 78,456 | 354 |
| Goodbaby International Holdings Ltd. | 1,084,000 | 351 |
| Shenguan Holdings Group Ltd. | 555,588 | 170 |
| | | 111,794 |
| Colombia (0.0%) | | |
| Bancolombia SA ADR | 36,700 | 1,443 |
| |
| Cyprus (0.0%) | | |
| * Global Ports Investments plc GDR | 96,886 | 481 |
| Globaltrans Investment plc GDR | 50,250 | 226 |
| | | 707 |
| Czech Republic (0.0%) | | |
| Komercni banka as | 5,850 | 1,262 |
| |
| Denmark (0.8%) | | |
| Carlsberg A/S Class B | 168,885 | 13,926 |
| Coloplast A/S Class B | 88,832 | 6,711 |
| ^ Vestas Wind Systems A/S | 144,238 | 5,947 |
| Novo Nordisk A/S Class B | 77,621 | 4,144 |
| GN Store Nord A/S | 126,155 | 2,817 |
| * William Demant Holding A/S | 27,055 | 2,297 |
| * Jyske Bank A/S | 35,886 | 1,509 |
| * Topdanmark A/S | 24,364 | 729 |
| Danske Bank A/S | 19,671 | 518 |
| | | 38,598 |
| Finland (0.5%) | | |
| Sampo Oyj Class A | 140,030 | 7,063 |
| Tikkurila Oyj | 262,097 | 4,998 |
| ^ Neste Oil Oyj | 185,198 | 4,860 |
| ^ Metso Oyj | 48,876 | 1,428 |
| UPM-Kymmene Oyj | 72,571 | 1,410 |
| ^ Nokian Renkaat Oyj | 40,688 | 1,213 |
| Wartsila OYJ Abp | 20,401 | 902 |
2
| | | |
| Vanguard® Global Equity Fund | | |
| Schedule of Investments | | |
| March 31, 2015 | | |
| |
| | | | Market |
| | | | Value |
| | | Shares | ($000) |
| | Stora Enso Oyj | 85,140 | 875 |
| | Tieto Oyj | 18,385 | 432 |
| | Valmet Oyj | 31,121 | 373 |
| | Cargotec Oyj Class B | 9,591 | 332 |
| | | | 23,886 |
| France (0.9%) | | |
| | Air Liquide SA | 66,178 | 8,520 |
| | Legrand SA | 114,377 | 6,196 |
| | L'Oreal SA | 32,257 | 5,941 |
| | BNP Paribas SA | 57,206 | 3,481 |
| | Groupe Eurotunnel SE | 177,645 | 2,547 |
| | Airbus Group NV | 32,231 | 2,095 |
| | AXA SA | 77,368 | 1,947 |
| | Eurofins Scientific SE | 5,930 | 1,596 |
| ^,* | Air France-KLM | 143,433 | 1,261 |
| | Neopost SA | 22,621 | 1,244 |
| | Sanofi | 12,541 | 1,239 |
| | Edenred | 44,550 | 1,112 |
| | ArcelorMittal | 103,842 | 974 |
| | TOTAL SA | 17,119 | 851 |
| | Thales SA | 14,295 | 793 |
| | Vicat | 8,494 | 622 |
| | Vallourec SA | 20,546 | 501 |
| | Imerys SA | 4,896 | 359 |
| | Technip SA | 5,199 | 314 |
| | Carrefour SA | 5,612 | 188 |
| | | | 41,781 |
| Germany (2.1%) | | |
| | SAP SE | 292,603 | 21,149 |
| | Merck KGaA | 163,301 | 18,276 |
| | Deutsche Boerse AG | 166,971 | 13,626 |
| * | QIAGEN NV | 315,500 | 7,951 |
| | Fresenius Medical Care AG & Co. KGaA | 66,775 | 5,551 |
| | BASF SE | 45,930 | 4,547 |
| | Volkswagen AG Preference Shares | 16,014 | 4,247 |
| | Bayerische Motoren Werke AG | 32,685 | 4,070 |
| | Deutsche Telekom AG | 185,933 | 3,401 |
| | K&S AG | 81,388 | 2,652 |
| | Axel Springer SE | 25,601 | 1,511 |
| | Hannover Rueck SE | 14,143 | 1,461 |
| | Symrise AG | 18,168 | 1,146 |
| | CTS Eventim AG & Co. KGaA | 34,113 | 1,072 |
| | RHOEN-KLINIKUM AG | 41,107 | 1,021 |
| | E.ON SE | 66,513 | 989 |
| | Deutsche Lufthansa AG | 68,435 | 958 |
| | TUI AG | 48,930 | 857 |
| | Brenntag AG | 11,238 | 671 |
| | GEA Group AG | 13,210 | 635 |
| | Fielmann AG | 8,715 | 582 |
| | adidas AG | 5,895 | 466 |
| | Gerresheimer AG | 4,827 | 266 |
| | | | 97,105 |
| Greece (0.0%) | | |
| * | Alpha Bank AE | 394,381 | 117 |
| |
| Hong Kong (1.3%) | | |
| | AIA Group Ltd. | 4,109,200 | 25,799 |
| | Jardine Matheson Holdings Ltd. | 243,200 | 15,368 |
| | Hutchison Whampoa Ltd. | 455,000 | 6,307 |
| | HSBC Holdings plc | 397,600 | 3,402 |
| | Esprit Holdings Ltd. | 2,898,114 | 2,940 |
| | First Pacific Co. Ltd. | 1,727,250 | 1,723 |
| | Hongkong & Shanghai Hotels | 981,200 | 1,383 |
| | Television Broadcasts Ltd. | 219,900 | 1,359 |
3
| | | |
| Vanguard® Global Equity Fund | | |
| Schedule of Investments | | |
| March 31, 2015 | | |
| |
| | | | Market |
| | | | Value |
| | | Shares | ($000) |
| | SmarTone Telecommunications Holdings Ltd. | 240,694 | 460 |
| | Stella International Holdings Ltd. | 78,754 | 188 |
| | Texwinca Holdings Ltd. | 144,823 | 132 |
| | New World Development Co. Ltd. | 82,000 | 95 |
| | | | 59,156 |
| India (1.4%) | | |
| | HCL Technologies Ltd. | 1,040,456 | 16,254 |
| * | ICICI Bank Ltd. | 3,093,295 | 15,661 |
| | Tata Motors Ltd. | 1,773,983 | 15,483 |
| | Housing Development Finance Corp. Ltd. | 357,800 | 7,523 |
| | CESC Ltd. | 213,622 | 2,062 |
| * | Axis Bank Ltd. | 219,917 | 1,972 |
| | Bharti Airtel Ltd. | 297,583 | 1,869 |
| | Tata Motors Ltd. ADR | 36,562 | 1,647 |
| * | Bank of Baroda | 367,906 | 963 |
| | Maruti Suzuki India Ltd. | 15,990 | 945 |
| | Hindustan Unilever Ltd. | 51,243 | 716 |
| | | | 65,095 |
| Indonesia (0.0%) | | |
| | Telekomunikasi Indonesia Persero Tbk PT ADR | 17,078 | 743 |
| | XL Axiata Tbk PT | 1,405,000 | 467 |
| | | | 1,210 |
| Ireland (1.6%) | | |
| | Ryanair Holdings plc ADR | 458,230 | 30,596 |
| | CRH plc | 898,319 | 23,341 |
| * | Bank of Ireland | 48,753,773 | 18,602 |
| | Paddy Power plc | 26,110 | 2,239 |
| | Irish Continental Group plc | 183,526 | 817 |
| * | Irish Bank Resolution Corp. Ltd. | 122,273 | — |
| | | | 75,595 |
| Italy (0.8%) | | |
| * | Fiat Chrysler Automobiles NV | 1,066,568 | 17,315 |
| | Luxottica Group SPA ADR | 69,634 | 4,368 |
| ^,* | Piaggio & C SPA | 1,361,659 | 4,149 |
| | UniCredit SPA | 449,929 | 3,051 |
| | CNH Industrial NV | 230,676 | 1,891 |
| | EXOR SPA | 35,006 | 1,588 |
| ^,* | Saipem SPA | 132,608 | 1,349 |
| | Luxottica Group SPA | 17,106 | 1,083 |
| | Intesa Sanpaolo SPA (Registered) | 243,570 | 827 |
| | Davide Campari-Milano SPA | 59,070 | 412 |
| * | Saras SPA | 104,270 | 181 |
| | | | 36,214 |
| Japan (9.0%) | | |
| | MS&AD Insurance Group Holdings Inc. | 1,052,000 | 29,452 |
| | Nippon Telegraph & Telephone Corp. | 366,000 | 22,594 |
| | Daito Trust Construction Co. Ltd. | 155,700 | 17,386 |
| | Mizuho Financial Group Inc. | 9,609,400 | 16,888 |
| | Inpex Corp. | 1,517,200 | 16,718 |
| | SMC Corp. | 52,700 | 15,692 |
| | THK Co. Ltd. | 562,000 | 14,281 |
| | Tokyo Electron Ltd. | 195,200 | 13,540 |
| * | Olympus Corp. | 328,400 | 12,176 |
| | Secom Co. Ltd. | 173,400 | 11,566 |
| | Rohm Co. Ltd. | 160,900 | 10,995 |
| | CyberAgent Inc. | 186,400 | 10,676 |
| | Toyota Motor Corp. | 141,500 | 9,877 |
| | FUJIFILM Holdings Corp. | 253,700 | 9,026 |
| | Japan Exchange Group Inc. | 286,500 | 8,295 |
| | Daiwa House Industry Co. Ltd. | 410,000 | 8,081 |
| | Sumitomo Mitsui Financial Group Inc. | 209,500 | 8,025 |
| | Hitachi Ltd. | 1,058,000 | 7,226 |
| | Seven & i Holdings Co. Ltd. | 170,500 | 7,165 |
4
| | |
| Vanguard® Global Equity Fund | | |
| Schedule of Investments | | |
| March 31, 2015 | | |
| |
| | | Market |
| | | Value |
| | Shares | ($000) |
| Sumitomo Chemical Co. Ltd. | 1,313,000 | 6,739 |
| Dai-ichi Life Insurance Co. Ltd. | 434,800 | 6,307 |
| Sompo Japan Nipponkoa Holdings Inc. | 187,200 | 5,820 |
| Kao Corp. | 115,400 | 5,762 |
| NTT Data Corp. | 130,700 | 5,677 |
| Mitsubishi UFJ Financial Group Inc. | 915,400 | 5,669 |
| East Japan Railway Co. | 70,200 | 5,625 |
| Fujitsu Ltd. | 801,000 | 5,463 |
| JFE Holdings Inc. | 237,500 | 5,242 |
| Shiseido Co. Ltd. | 277,800 | 4,928 |
| USS Co. Ltd. | 273,500 | 4,726 |
| Kirin Holdings Co. Ltd. | 341,400 | 4,478 |
| Mitsubishi Estate Co. Ltd. | 190,000 | 4,406 |
| Isetan Mitsukoshi Holdings Ltd. | 266,400 | 4,402 |
| West Japan Railway Co. | 79,600 | 4,173 |
| Resona Holdings Inc. | 810,700 | 4,023 |
| Obayashi Corp. | 616,000 | 3,993 |
| Yamato Holdings Co. Ltd. | 165,300 | 3,810 |
| Alfresa Holdings Corp. | 242,600 | 3,419 |
| Mitsubishi Heavy Industries Ltd. | 611,000 | 3,362 |
| Mitsubishi Corp. | 165,800 | 3,332 |
| Tokio Marine Holdings Inc. | 85,700 | 3,235 |
| Toyota Industries Corp. | 54,800 | 3,134 |
| Nintendo Co. Ltd. | 20,100 | 2,949 |
| Marui Group Co. Ltd. | 254,600 | 2,885 |
| Sumitomo Electric Industries Ltd. | 217,300 | 2,848 |
| Toyo Seikan Group Holdings Ltd. | 193,100 | 2,824 |
| Japan Tobacco Inc. | 88,300 | 2,792 |
| Toyo Suisan Kaisha Ltd. | 78,400 | 2,758 |
| Dentsu Inc. | 60,400 | 2,584 |
| Tohoku Electric Power Co. Inc. | 226,700 | 2,575 |
| Otsuka Holdings Co. Ltd. | 77,900 | 2,437 |
| Sekisui House Ltd. | 163,800 | 2,378 |
| Central Japan Railway Co. | 13,000 | 2,349 |
| Bandai Namco Holdings Inc. | 116,550 | 2,269 |
| LIXIL Group Corp. | 94,300 | 2,232 |
| Astellas Pharma Inc. | 131,100 | 2,148 |
| Mitsubishi Logistics Corp. | 129,000 | 2,008 |
| NH Foods Ltd. | 82,000 | 1,890 |
| Chiba Bank Ltd. | 227,000 | 1,664 |
| Azbil Corp. | 53,200 | 1,441 |
| Onward Holdings Co. Ltd. | 191,000 | 1,332 |
| Shimizu Corp. | 193,000 | 1,305 |
| Bank of Yokohama Ltd. | 215,000 | 1,259 |
| Sega Sammy Holdings Inc. | 80,100 | 1,167 |
| Sumitomo Forestry Co. Ltd. | 106,400 | 1,162 |
| Yamada Denki Co. Ltd. | 277,100 | 1,141 |
| Nippon Suisan Kaisha Ltd. | 319,300 | 969 |
| * Sony Corp. | 34,200 | 915 |
| Kawasaki Kisen Kaisha Ltd. | 242,000 | 650 |
| Asahi Glass Co. Ltd. | 92,000 | 603 |
| Japan Airlines Co. Ltd. | 19,100 | 594 |
| Asahi Kasei Corp. | 61,000 | 582 |
| Kinden Corp. | 44,000 | 549 |
| Daiwa Securities Group Inc. | 59,000 | 464 |
| Hitachi Metals Ltd. | 29,000 | 444 |
| Sumitomo Heavy Industries Ltd. | 61,000 | 399 |
| ANA Holdings Inc. | 136,000 | 364 |
| SKY Perfect JSAT Holdings Inc. | 47,300 | 293 |
| Konaka Co. Ltd. | 27,400 | 169 |
| Yellow Hat Ltd. | 5,000 | 107 |
| | | 414,883 |
| Malaysia (0.2%) | | |
| Tenaga Nasional Bhd. | 1,789,400 | 6,928 |
5
| | |
| Vanguard® Global Equity Fund | | |
| Schedule of Investments | | |
| March 31, 2015 | | |
| |
| | | Market |
| | | Value |
| | Shares | ($000) |
| AirAsia Bhd. | 2,683,800 | 1,723 |
| Top Glove Corp. Bhd. | 231,500 | 343 |
| DiGi.Com Bhd. | 167,500 | 285 |
| | | 9,279 |
| Mexico (0.6%) | | |
| America Movil SAB de CV ADR | 1,078,219 | 22,061 |
| America Movil SAB de CV | 5,852,249 | 6,008 |
| * Grupo Comercial Chedraui SA de CV | 502,800 | 1,521 |
| | | 29,590 |
| Netherlands (0.9%) | | |
| Unilever NV | 539,542 | 22,546 |
| Heineken NV | 54,096 | 4,129 |
| Boskalis Westminster NV | 58,662 | 2,891 |
| Koninklijke Ahold NV | 119,467 | 2,354 |
| Koninklijke Philips NV | 73,939 | 2,098 |
| Koninklijke KPN NV | 557,245 | 1,889 |
| Akzo Nobel NV | 23,042 | 1,742 |
| Koninklijke Vopak NV | 29,390 | 1,622 |
| ASML Holding NV | 7,965 | 808 |
| Wolters Kluwer NV | 20,760 | 678 |
| Randstad Holding NV | 9,610 | 583 |
| | | 41,340 |
| New Zealand (0.0%) | | |
| Spark New Zealand Ltd. | 850,252 | 1,891 |
| PGG Wrightson Ltd. | 51,996 | 19 |
| | | 1,910 |
| Norway (0.9%) | | |
| Statoil ASA | 1,125,341 | 19,898 |
| Schibsted ASA | 304,802 | 17,625 |
| DNB ASA | 66,643 | 1,069 |
| Yara International ASA | 7,543 | 383 |
| | | 38,975 |
| Other (0.2%) | | |
| 2 Vanguard FTSE Emerging Markets ETF | 194,736 | 7,959 |
| |
| Peru (0.0%) | | |
| Cia de Minas Buenaventura SAA ADR | 90,856 | 920 |
| |
| Philippines (0.1%) | | |
| Energy Development Corp. | 10,414,500 | 1,977 |
| Lopez Holdings Corp. | 3,440,549 | 658 |
| | | 2,635 |
| Poland (0.1%) | | |
| PGE Polska Grupa Energetyczna SA | 787,654 | 4,327 |
| Bank Pekao SA | 7,379 | 358 |
| Tauron Polska Energia SA | 215,055 | 250 |
| | | 4,935 |
| Russia (0.2%) | | |
| Sberbank of Russia ADR | 1,200,276 | 5,261 |
| Lukoil OAO ADR | 25,798 | 1,192 |
| * Yandex NV Class A | 63,523 | 963 |
| O'Key Group SA GDR | 191,830 | 707 |
| | | 8,123 |
| Singapore (0.6%) | | |
| DBS Group Holdings Ltd. | 1,563,400 | 23,182 |
| Great Eastern Holdings Ltd. | 198,000 | 3,595 |
| United Overseas Bank Ltd. | 47,000 | 788 |
| GuocoLeisure Ltd. | 849,200 | 568 |
| Singapore Airlines Ltd. | 51,800 | 451 |
| * Haw Par Corp. Ltd. | 47,200 | 296 |
| United Industrial Corp. Ltd. | 116,300 | 290 |
| | | 29,170 |
6
| | |
| Vanguard® Global Equity Fund | | |
| Schedule of Investments | | |
| March 31, 2015 | | |
| |
| | | Market |
| | | Value |
| | Shares | ($000) |
| South Africa (1.5%) | | |
| Naspers Ltd. | 357,757 | 54,877 |
| Standard Bank Group Ltd. | 329,407 | 4,552 |
| FirstRand Ltd. | 739,098 | 3,398 |
| Old Mutual plc | 507,627 | 1,682 |
| MTN Group Ltd. | 96,766 | 1,631 |
| * Telkom SA SOC Ltd. | 136,655 | 891 |
| Anglo American plc Ordinary Shares | 46,338 | 700 |
| Liberty Holdings Ltd. | 26,883 | 372 |
| * Anglo American Platinum Ltd. | 7,044 | 172 |
| * African Bank Investments Ltd. | 2,597,627 | — |
| | | 68,275 |
| South Korea (2.6%) | | |
| Samsung Electronics Co. Ltd. | 31,846 | 41,296 |
| Samsung Electronics Co. Ltd. GDR | 38,400 | 24,697 |
| * SK Hynix Inc. | 539,404 | 22,033 |
| SK Holdings Co. Ltd. | 46,854 | 7,169 |
| * LG Display Co. Ltd. | 199,021 | 5,632 |
| Shinhan Financial Group Co. Ltd. | 110,400 | 4,148 |
| Hyundai Motor Co. | 21,942 | 3,323 |
| Lotte Shopping Co. Ltd. | 12,125 | 2,592 |
| Hana Financial Group Inc. | 88,648 | 2,293 |
| LG Uplus Corp. | 188,850 | 1,871 |
| KB Financial Group Inc. | 51,285 | 1,810 |
| S-1 Corp. | 17,272 | 1,305 |
| * KT Corp. | 47,994 | 1,255 |
| Kolon Industries Inc. | 21,438 | 967 |
| Hite Jinro Co. Ltd. | 31,550 | 631 |
| GS Home Shopping Inc. | 1,984 | 397 |
| CJ O Shopping Co. Ltd. | 1,865 | 385 |
| | | 121,804 |
| Spain (0.5%) | | |
| Distribuidora Internacional de Alimentacion SA | 1,526,419 | 11,912 |
| * Banco Santander SA | 316,226 | 2,371 |
| Viscofan SA | 34,721 | 2,122 |
| * Acerinox SA | 110,297 | 1,855 |
| * Mediaset Espana Comunicacion SA | 100,840 | 1,262 |
| * Acciona SA | 15,793 | 1,216 |
| Telefonica SA | 38,658 | 550 |
| * Telefonica SA Rights Exp. 04/13/2015 | 38,658 | 6 |
| | | 21,294 |
| Sweden (1.6%) | | |
| Svenska Handelsbanken AB Class A | 617,003 | 27,788 |
| Atlas Copco AB Class B | 643,517 | 19,003 |
| ^ Volvo AB Class B | 773,375 | 9,360 |
| Assa Abloy AB Class B | 102,882 | 6,128 |
| ^ Electrolux AB Class B | 99,320 | 2,837 |
| Telefonaktiebolaget LM Ericsson Class B | 184,490 | 2,316 |
| Swedish Match AB | 51,343 | 1,510 |
| Nordea Bank AB | 108,692 | 1,324 |
| Modern Times Group MTG AB Class B | 34,343 | 1,052 |
| Millicom International Cellular SA | 14,279 | 1,032 |
| BillerudKorsnas AB | 22,507 | 362 |
| L E Lundbergforetagen AB Class B | 6,634 | 303 |
| Peab AB | 37,897 | 299 |
| Oriflame Cosmetics SA | 6,251 | 83 |
| | | 73,397 |
| Switzerland (2.6%) | | |
| Nestle SA | 642,003 | 48,345 |
| Schindler Holding AG | 112,312 | 18,640 |
| Novartis AG | 146,111 | 14,421 |
| Cie Financiere Richemont SA | 174,610 | 14,030 |
| Geberit AG | 23,508 | 8,797 |
| Roche Holding AG | 19,885 | 5,464 |
7
| | |
| Vanguard® Global Equity Fund | | |
| Schedule of Investments | | |
| March 31, 2015 | | |
| |
| | | Market |
| | | Value |
| | Shares | ($000) |
| Adecco SA | 37,344 | 3,104 |
| * UBS Group AG | 115,888 | 2,173 |
| Sonova Holding AG | 8,697 | 1,207 |
| Logitech International SA | 91,351 | 1,203 |
| Helvetia Holding AG | 939 | 505 |
| ABB Ltd. | 16,870 | 358 |
| | | 118,247 |
| Taiwan (2.8%) | | |
| Taiwan Semiconductor Manufacturing Co. Ltd. ADR | 2,202,258 | 51,709 |
| Hon Hai Precision Industry Co. Ltd. | 9,808,760 | 28,712 |
| Fubon Financial Holding Co. Ltd. | 13,957,279 | 25,019 |
| United Microelectronics Corp. | 19,630,000 | 9,726 |
| Taiwan Semiconductor Manufacturing Co. Ltd. | 1,674,577 | 7,783 |
| Yungtay Engineering Co. Ltd. | 1,438,000 | 3,334 |
| Delta Electronics Inc. | 327,000 | 2,060 |
| Pegatron Corp. | 115,000 | 310 |
| Chroma ATE Inc. | 101,000 | 251 |
| | | 128,904 |
| Thailand (0.1%) | | |
| Bangkok Bank PCL (Foreign) | 465,100 | 2,650 |
| Thanachart Capital PCL | 1,478,700 | 1,579 |
| Krung Thai Bank PCL (Foreign) | 655,500 | 459 |
| | | 4,688 |
| Turkey (0.1%) | | |
| Turkiye Garanti Bankasi AS | 870,360 | 2,838 |
| Tupras Turkiye Petrol Rafinerileri AS | 45,500 | 1,078 |
| KOC Holding AS | 64,271 | 293 |
| | | 4,209 |
| United Arab Emirates (0.1%) | | |
| * Dragon Oil plc | 660,747 | 5,829 |
| |
| United Kingdom (6.9%) | | |
| Prudential plc | 2,027,915 | 50,324 |
| Royal Dutch Shell plc Class A | 870,489 | 25,974 |
| Reckitt Benckiser Group plc | 288,676 | 24,799 |
| Wolseley plc | 354,461 | 20,951 |
| Rolls-Royce Holdings plc | 1,258,803 | 17,754 |
| WPP plc | 471,932 | 10,718 |
| * Coca-Cola HBC AG | 543,459 | 9,776 |
| Hays plc | 4,309,788 | 9,727 |
| Bunzl plc | 240,645 | 6,524 |
| Compass Group plc | 325,762 | 5,655 |
| BP plc | 855,234 | 5,544 |
| Rightmove plc | 121,859 | 5,406 |
| Capita plc | 286,102 | 4,730 |
| ITV plc | 1,231,494 | 4,611 |
| Intertek Group plc | 123,602 | 4,578 |
| Unilever plc | 108,348 | 4,521 |
| Aggreko plc | 190,176 | 4,302 |
| * Lloyds Banking Group plc | 3,685,774 | 4,272 |
| Jupiter Fund Management plc | 658,128 | 3,993 |
| Diageo plc | 133,069 | 3,677 |
| Provident Financial plc | 91,446 | 3,648 |
| 3 Merlin Entertainments plc | 537,903 | 3,522 |
| Barclays plc | 943,892 | 3,407 |
| Reed Elsevier plc | 197,512 | 3,397 |
| BAE Systems plc | 409,855 | 3,176 |
| G4S plc | 706,372 | 3,096 |
| Carnival plc | 52,734 | 2,579 |
| 3i Group plc | 354,329 | 2,532 |
| TUI AG | 139,386 | 2,445 |
| ICAP plc | 297,184 | 2,318 |
| Royal Dutch Shell plc Class B | 73,410 | 2,287 |
| BP plc ADR | 57,926 | 2,266 |
8
| | | |
| Vanguard® Global Equity Fund | | |
| Schedule of Investments | | |
| March 31, 2015 | | |
| |
| | | | Market |
| | | | Value |
| | | Shares | ($000) |
| | Experian plc | 136,321 | 2,257 |
| | DCC plc | 37,722 | 2,247 |
| | International Personal Finance plc | 312,617 | 2,217 |
| | Standard Chartered plc | 132,218 | 2,142 |
| * | Betfair Group plc | 63,701 | 2,106 |
| * | Thomas Cook Group plc | 954,345 | 2,055 |
| | Admiral Group plc | 90,486 | 2,049 |
| | Daily Mail & General Trust plc | 156,495 | 2,047 |
| | HomeServe plc | 361,380 | 2,044 |
| | BHP Billiton plc | 92,213 | 2,024 |
| | Rio Tinto plc | 45,892 | 1,893 |
| | Rexam plc | 219,505 | 1,881 |
| | Stagecoach Group plc | 347,416 | 1,797 |
| | Glencore plc | 400,804 | 1,692 |
| | Spectris plc | 52,747 | 1,687 |
| | IG Group Holdings plc | 150,969 | 1,585 |
| | Vodafone Group plc | 459,666 | 1,504 |
| | WH Smith plc | 75,263 | 1,446 |
| | Cable & Wireless Communications plc | 1,522,887 | 1,373 |
| | Tullow Oil plc | 312,114 | 1,308 |
| | Informa plc | 155,047 | 1,294 |
| | Moneysupermarket.com Group plc | 316,741 | 1,262 |
| | Smiths Group plc | 76,247 | 1,261 |
| | Inchcape plc | 99,922 | 1,175 |
| | Tesco plc | 298,385 | 1,065 |
| | Sky plc | 65,281 | 960 |
| | Devro plc | 185,816 | 785 |
| ^ | Serco Group plc | 376,098 | 763 |
| | Barratt Developments plc | 93,789 | 733 |
| | Amec Foster Wheeler plc | 49,921 | 668 |
| | Berendsen plc | 38,445 | 636 |
| | Smith & Nephew plc | 36,575 | 624 |
| | Michael Page International plc | 72,495 | 559 |
| | Close Brothers Group plc | 21,682 | 500 |
| * | Just Eat plc | 76,801 | 495 |
| | Millennium & Copthorne Hotels plc | 54,531 | 464 |
| | GlaxoSmithKline plc | 18,979 | 437 |
| | Northgate plc | 47,476 | 415 |
| | IMI plc | 20,621 | 389 |
| | National Express Group plc | 92,290 | 387 |
| * | SSP Group plc | 87,723 | 386 |
| | British American Tobacco plc | 6,414 | 332 |
| | GVC Holdings plc | 46,142 | 326 |
| | Centrica plc | 73,549 | 275 |
| | Petrofac Ltd. | 18,152 | 256 |
| | Antofagasta plc | 22,918 | 248 |
| * | Serco Group plc Rights Expire 4/16/2015 | 376,098 | 229 |
| *,3 | Non-Standard Finance plc | 115,857 | 189 |
| | | | 316,976 |
| United States (46.1%) | | |
| Consumer Discretionary (6.1%) | | |
| | Royal Caribbean Cruises Ltd. | 694,786 | 56,868 |
| * | Amazon.com Inc. | 83,141 | 30,937 |
| * | CarMax Inc. | 336,884 | 23,248 |
| | McDonald's Corp. | 220,153 | 21,452 |
| | Harley-Davidson Inc. | 349,167 | 21,208 |
| | Dillard's Inc. Class A | 147,573 | 20,145 |
| | Omnicom Group Inc. | 177,942 | 13,876 |
| | Cablevision Systems Corp. Class A | 720,541 | 13,186 |
| * | Murphy USA Inc. | 180,820 | 13,086 |
| | Time Warner Inc. | 142,703 | 12,050 |
| * | TripAdvisor Inc. | 137,243 | 11,415 |
| ^,* | Tesla Motors Inc. | 54,373 | 10,264 |
9
| | | |
| Vanguard® Global Equity Fund | | |
| Schedule of Investments | | |
| March 31, 2015 | | |
| |
| | | | Market |
| | | | Value |
| | | Shares | ($000) |
| | Cooper Tire & Rubber Co. | 151,629 | 6,496 |
| * | News Corp. Class A | 221,590 | 3,548 |
| | Cracker Barrel Old Country Store Inc. | 22,221 | 3,381 |
| * | Skechers U.S.A. Inc. Class A | 37,795 | 2,718 |
| | Big Lots Inc. | 48,505 | 2,330 |
| | AMC Entertainment Holdings Inc. | 61,657 | 2,188 |
| | Bloomin' Brands Inc. | 88,009 | 2,141 |
| | Texas Roadhouse Inc. Class A | 46,415 | 1,691 |
| * | TravelCenters of America LLC | 76,819 | 1,340 |
| | Sonic Corp. | 41,369 | 1,311 |
| * | American Axle & Manufacturing Holdings Inc. | 28,920 | 747 |
| * | Denny's Corp. | 38,048 | 434 |
| | Ruth's Hospitality Group Inc. | 23,318 | 370 |
| * | Unifi Inc. | 10,209 | 368 |
| * | Citi Trends Inc. | 13,254 | 358 |
| | New Media Investment Group Inc. | 14,542 | 348 |
| | Cato Corp. Class A | 8,745 | 346 |
| | Speedway Motorsports Inc. | 14,086 | 320 |
| | Rocky Brands Inc. | 14,203 | 307 |
| * | Deckers Outdoor Corp. | 4,139 | 302 |
| * | Nautilus Inc. | 19,738 | 301 |
| * | Build-A-Bear Workshop Inc. | 2,100 | 41 |
| | Ethan Allen Interiors Inc. | 200 | 6 |
| * | Sun-Times Media Group Inc. Class A | 130,959 | — |
| | | | 279,127 |
| Consumer Staples (3.4%) | | |
| | Colgate-Palmolive Co. | 538,728 | 37,355 |
| | Procter & Gamble Co. | 279,073 | 22,867 |
| | Coca-Cola Co. | 466,214 | 18,905 |
| | Archer-Daniels-Midland Co. | 314,485 | 14,907 |
| | Kroger Co. | 174,577 | 13,383 |
| ^ | Pilgrim's Pride Corp. | 577,852 | 13,054 |
| | Estee Lauder Cos. Inc. Class A | 89,597 | 7,451 |
| | Costco Wholesale Corp. | 46,950 | 7,113 |
| | Bunge Ltd. | 84,146 | 6,930 |
| | Dr Pepper Snapple Group Inc. | 57,634 | 4,523 |
| | Cal-Maine Foods Inc. | 109,170 | 4,264 |
| | Sanderson Farms Inc. | 43,996 | 3,504 |
| * | Omega Protein Corp. | 52,359 | 717 |
| | Casey's General Stores Inc. | 7,882 | 710 |
| * | Medifast Inc. | 16,191 | 485 |
| | Ingles Markets Inc. Class A | 2,100 | 104 |
| | | | 156,272 |
| Energy (2.9%) | | |
| | EOG Resources Inc. | 213,558 | 19,581 |
| | Valero Energy Corp. | 269,679 | 17,157 |
| | PBF Energy Inc. Class A | 472,937 | 16,042 |
| | Tesoro Corp. | 153,519 | 14,015 |
| | Delek US Holdings Inc. | 323,169 | 12,846 |
| ^,* | Ultra Petroleum Corp. | 722,895 | 11,299 |
| | Superior Energy Services Inc. | 368,011 | 8,221 |
| | Marathon Petroleum Corp. | 58,666 | 6,007 |
| | World Fuel Services Corp. | 91,682 | 5,270 |
| | Western Refining Inc. | 101,016 | 4,989 |
| | National Oilwell Varco Inc. | 75,643 | 3,781 |
| | Green Plains Inc. | 97,410 | 2,781 |
| | Alon USA Energy Inc. | 121,759 | 2,018 |
| | HollyFrontier Corp. | 44,028 | 1,773 |
| | Atwood Oceanics Inc. | 55,615 | 1,563 |
| | Noble Corp. plc | 99,516 | 1,421 |
| * | SEACOR Holdings Inc. | 19,329 | 1,347 |
| * | REX American Resources Corp. | 20,076 | 1,221 |
| * | Cloud Peak Energy Inc. | 163,071 | 949 |
| * | Pioneer Energy Services Corp. | 158,611 | 860 |
10
| | | |
| Vanguard® Global Equity Fund | | |
| Schedule of Investments | | |
| March 31, 2015 | | |
| |
| | | | Market |
| | | | Value |
| | | Shares | ($000) |
| | Oceaneering International Inc. | 15,734 | 848 |
| * | Renewable Energy Group Inc. | 61,950 | 571 |
| * | Newpark Resources Inc. | 24,541 | 224 |
| * | Pacific Ethanol Inc. | 10,977 | 118 |
| | | | 134,902 |
| Financials (10.3%) | | |
| | Wells Fargo & Co. | 908,097 | 49,401 |
| * | Berkshire Hathaway Inc. Class B | 263,927 | 38,090 |
| | Travelers Cos. Inc. | 302,247 | 32,682 |
| * | Markel Corp. | 39,897 | 30,679 |
| | TD Ameritrade Holding Corp. | 806,950 | 30,067 |
| | M&T Bank Corp. | 235,106 | 29,858 |
| | First Republic Bank | 432,147 | 24,671 |
| | Voya Financial Inc. | 563,534 | 24,294 |
| | Moody's Corp. | 224,321 | 23,285 |
| | US Bancorp | 454,526 | 19,849 |
| | American Express Co. | 221,428 | 17,298 |
| | Chubb Corp. | 159,385 | 16,114 |
| * | Alleghany Corp. | 29,346 | 14,292 |
| | Franklin Resources Inc. | 266,932 | 13,699 |
| | Loews Corp. | 335,196 | 13,686 |
| | Aflac Inc. | 205,624 | 13,162 |
| * | Howard Hughes Corp. | 53,000 | 8,216 |
| | Financial Engines Inc. | 190,870 | 7,984 |
| | CYS Investments Inc. | 837,289 | 7,460 |
| | Leucadia National Corp. | 332,500 | 7,411 |
| * | PHH Corp. | 264,222 | 6,386 |
| | JPMorgan Chase & Co. | 79,627 | 4,824 |
| | American Equity Investment Life Holding Co. | 150,411 | 4,381 |
| | Aspen Insurance Holdings Ltd. | 92,159 | 4,353 |
| | Bank of New York Mellon Corp. | 107,932 | 4,343 |
| * | St. Joe Co. | 228,165 | 4,235 |
| | Goldman Sachs Group Inc. | 20,190 | 3,795 |
| | RenaissanceRe Holdings Ltd. | 35,153 | 3,506 |
| * | Piper Jaffray Cos. | 51,456 | 2,699 |
| | Endurance Specialty Holdings Ltd. | 40,827 | 2,496 |
| | Solar Capital Ltd. | 91,845 | 1,859 |
| | United Community Banks Inc. | 54,899 | 1,037 |
| | Everest Re Group Ltd. | 5,235 | 911 |
| | Fidelity & Guaranty Life | 40,198 | 852 |
| * | INTL. FCStone Inc. | 27,066 | 805 |
| | Apollo Residential Mortgage Inc. | 43,347 | 691 |
| * | Investment Technology Group Inc. | 21,612 | 655 |
| | NASDAQ OMX Group Inc. | 11,622 | 592 |
| * | MBIA Inc. | 40,911 | 380 |
| | Gain Capital Holdings Inc. | 34,802 | 340 |
| | Employers Holdings Inc. | 12,406 | 335 |
| | RE/MAX Holdings Inc. | 9,987 | 332 |
| | AG Mortgage Investment Trust Inc. | 16,578 | 312 |
| * | Ambac Financial Group Inc. | 12,212 | 296 |
| | Calamos Asset Management Inc. Class A | 17,710 | 238 |
| | | | 472,851 |
| Health Care (6.8%) | | |
| | Anthem Inc. | 315,129 | 48,659 |
| * | United Therapeutics Corp. | 178,550 | 30,788 |
| * | Waters Corp. | 211,095 | 26,243 |
| | Johnson & Johnson | 247,669 | 24,916 |
| * | Centene Corp. | 301,056 | 21,282 |
| ^,* | Myriad Genetics Inc. | 447,318 | 15,835 |
| * | Charles River Laboratories International Inc. | 194,580 | 15,428 |
| * | Health Net Inc. | 248,673 | 15,042 |
| | Baxter International Inc. | 182,778 | 12,520 |
| * | PAREXEL International Corp. | 180,355 | 12,443 |
| | Pfizer Inc. | 353,236 | 12,289 |
11
| | |
| Vanguard® Global Equity Fund | | |
| Schedule of Investments | | |
| March 31, 2015 | | |
| |
| | | Market |
| | | Value |
| | Shares | ($000) |
| PDL BioPharma Inc. | 1,188,769 | 8,363 |
| Abbott Laboratories | 171,360 | 7,939 |
| * Seattle Genetics Inc. | 215,000 | 7,600 |
| * Varian Medical Systems Inc. | 52,644 | 4,953 |
| * Magellan Health Inc. | 68,379 | 4,843 |
| Aetna Inc. | 43,109 | 4,593 |
| * Intuitive Surgical Inc. | 8,519 | 4,302 |
| HealthSouth Corp. | 90,359 | 4,008 |
| * Depomed Inc. | 131,723 | 2,952 |
| * Quintiles Transnational Holdings Inc. | 43,023 | 2,881 |
| ResMed Inc. | 40,084 | 2,877 |
| * Halyard Health Inc. | 54,817 | 2,697 |
| * LifePoint Hospitals Inc. | 36,300 | 2,666 |
| Cigna Corp. | 18,312 | 2,370 |
| * Premier Inc. Class A | 61,256 | 2,302 |
| * Emergent Biosolutions Inc. | 73,935 | 2,127 |
| * Molina Healthcare Inc. | 30,330 | 2,041 |
| Omnicare Inc. | 24,113 | 1,858 |
| * Cambrex Corp. | 32,835 | 1,301 |
| * Affymetrix Inc. | 91,726 | 1,152 |
| * Repligen Corp. | 31,894 | 968 |
| * Sagent Pharmaceuticals Inc. | 34,545 | 803 |
| * Luminex Corp. | 37,026 | 593 |
| * Triple-S Management Corp. Class B | 28,538 | 567 |
| * Bio-Rad Laboratories Inc. Class A | 3,781 | 511 |
| * Addus HomeCare Corp. | 18,449 | 425 |
| * Hyperion Therapeutics Inc. | 8,015 | 368 |
| * Cynosure Inc. Class A | 11,937 | 366 |
| * Merit Medical Systems Inc. | 18,475 | 356 |
| Select Medical Holdings Corp. | 20,193 | 300 |
| * Infinity Pharmaceuticals Inc. | 20,461 | 286 |
| * Healthways Inc. | 13,962 | 275 |
| * Five Star Quality Care Inc. | 40,229 | 179 |
| * Alliance HealthCare Services Inc. | 6,889 | 153 |
| * Symmetry Surgical Inc. | 8,121 | 60 |
| | | 315,480 |
| Industrials (4.2%) | | |
| Alaska Air Group Inc. | 404,305 | 26,757 |
| * JetBlue Airways Corp. | 1,279,051 | 24,622 |
| Northrop Grumman Corp. | 138,105 | 22,229 |
| Southwest Airlines Co. | 367,944 | 16,300 |
| Lincoln Electric Holdings Inc. | 213,507 | 13,961 |
| CH Robinson Worldwide Inc. | 177,445 | 12,993 |
| 3M Co. | 72,479 | 11,955 |
| Emerson Electric Co. | 206,337 | 11,683 |
| * NOW Inc. | 464,208 | 10,045 |
| * Hawaiian Holdings Inc. | 397,071 | 8,746 |
| * Clean Harbors Inc. | 138,364 | 7,856 |
| MSC Industrial Direct Co. Inc. Class A | 72,714 | 5,250 |
| Expeditors International of Washington Inc. | 57,600 | 2,775 |
| Towers Watson & Co. Class A | 17,441 | 2,305 |
| Werner Enterprises Inc. | 70,677 | 2,220 |
| Insperity Inc. | 42,416 | 2,218 |
| Aircastle Ltd. | 60,395 | 1,356 |
| Argan Inc. | 34,880 | 1,262 |
| * ACCO Brands Corp. | 95,315 | 792 |
| * RPX Corp. | 53,302 | 767 |
| AAR Corp. | 23,533 | 722 |
| SkyWest Inc. | 42,694 | 624 |
| * American Woodmark Corp. | 10,504 | 575 |
| Huntington Ingalls Industries Inc. | 4,015 | 563 |
| * Vectrus Inc. | 20,431 | 521 |
| Kimball International Inc. Class B | 48,535 | 509 |
| Douglas Dynamics Inc. | 17,198 | 393 |
12
| | | |
| Vanguard® Global Equity Fund | | |
| Schedule of Investments | | |
| March 31, 2015 | | |
| |
| | | | Market |
| | | | Value |
| | | Shares | ($000) |
| * | CRA International Inc. | 12,066 | 376 |
| * | MYR Group Inc. | 11,954 | 375 |
| * | Engility Holdings Inc. | 12,114 | 364 |
| * | Ducommun Inc. | 12,486 | 323 |
| * | CBIZ Inc. | 33,815 | 316 |
| | Quad/Graphics Inc. | 13,326 | 306 |
| * | Blount International Inc. | 22,078 | 284 |
| * | Republic Airways Holdings Inc. | 900 | 12 |
| | | | 192,355 |
| Information Technology (10.5%) | | |
| * | eBay Inc. | 543,763 | 31,364 |
| * | Google Inc. Class C | 52,624 | 28,838 |
| | Computer Sciences Corp. | 421,523 | 27,517 |
| | FLIR Systems Inc. | 794,163 | 24,841 |
| | Oracle Corp. | 483,642 | 20,869 |
| | Visa Inc. Class A | 279,016 | 18,250 |
| | MasterCard Inc. Class A | 209,303 | 18,082 |
| | Jabil Circuit Inc. | 733,873 | 17,158 |
| | Xilinx Inc. | 386,146 | 16,334 |
| | Linear Technology Corp. | 345,022 | 16,147 |
| | Analog Devices Inc. | 232,276 | 14,633 |
| | Dolby Laboratories Inc. Class A | 369,004 | 14,081 |
| | Intel Corp. | 450,180 | 14,077 |
| | Teradyne Inc. | 719,162 | 13,556 |
| | QUALCOMM Inc. | 192,100 | 13,320 |
| | Xerox Corp. | 925,062 | 11,887 |
| | Lexmark International Inc. Class A | 244,383 | 10,347 |
| | Texas Instruments Inc. | 178,637 | 10,215 |
| * | Facebook Inc. Class A | 115,008 | 9,455 |
| | Microsoft Corp. | 215,381 | 8,756 |
| | DST Systems Inc. | 70,903 | 7,850 |
| | Convergys Corp. | 318,184 | 7,277 |
| | Booz Allen Hamilton Holding Corp. Class A | 245,453 | 7,103 |
| * | Zillow Group Inc. Class A | 67,906 | 6,811 |
| | Broadridge Financial Solutions Inc. | 123,661 | 6,803 |
| * | OmniVision Technologies Inc. | 245,429 | 6,472 |
| * | Amkor Technology Inc. | 719,237 | 6,354 |
| | MAXIMUS Inc. | 92,520 | 6,177 |
| | Science Applications International Corp. | 120,233 | 6,174 |
| * | Google Inc. Class A | 10,449 | 5,796 |
| | Vishay Intertechnology Inc. | 413,978 | 5,721 |
| * | Twitter Inc. | 104,690 | 5,243 |
| * | Tech Data Corp. | 82,081 | 4,742 |
| | Altera Corp. | 109,390 | 4,694 |
| * | Cirrus Logic Inc. | 139,147 | 4,628 |
| | Paychex Inc. | 74,820 | 3,712 |
| | Amdocs Ltd. | 60,707 | 3,303 |
| * | Kulicke & Soffa Industries Inc. | 207,401 | 3,242 |
| * | Euronet Worldwide Inc. | 54,964 | 3,229 |
| | ManTech International Corp. Class A | 80,486 | 2,732 |
| * | Benchmark Electronics Inc. | 107,978 | 2,595 |
| | Tessera Technologies Inc. | 62,926 | 2,535 |
| | Accenture plc Class A | 25,135 | 2,355 |
| | CSG Systems International Inc. | 72,359 | 2,199 |
| | Automatic Data Processing Inc. | 24,933 | 2,135 |
| * | Flextronics International Ltd. | 165,403 | 2,097 |
| * | Keysight Technologies Inc. | 53,912 | 2,003 |
| * | Sanmina Corp. | 75,171 | 1,818 |
| * | Sykes Enterprises Inc. | 54,007 | 1,342 |
| | Jack Henry & Associates Inc. | 17,625 | 1,232 |
| ^,* | NeuStar Inc. Class A | 50,022 | 1,232 |
| * | Insight Enterprises Inc. | 43,008 | 1,227 |
| * | Aspen Technology Inc. | 30,084 | 1,158 |
| * | Progress Software Corp. | 41,832 | 1,137 |
13
| | | | | |
| Vanguard® Global Equity Fund | | | | |
| Schedule of Investments | | | | |
| March 31, 2015 | | | | |
| |
| | | | | | Market |
| | | | | | Value |
| | | | | Shares | ($000) |
| * | Manhattan Associates Inc. | | | 21,835 | 1,105 |
| * | EnerNOC Inc. | | | 83,187 | 948 |
| * | Net 1 UEPS Technologies Inc. | | | 60,242 | 824 |
| * | Dice Holdings Inc. | | | 90,578 | 808 |
| * | Genpact Ltd. | | | 28,528 | 663 |
| * | ePlus Inc. | | | 6,096 | 530 |
| * | Kimball Electronics Inc. | | | 36,401 | 515 |
| * | ExlService Holdings Inc. | | | 13,715 | 510 |
| * | Photronics Inc. | | | 54,881 | 467 |
| * | Constant Contact Inc. | | | 11,279 | 431 |
| * | United Online Inc. | | | 25,472 | 406 |
| * | Rogers Corp. | | | 4,163 | 342 |
| | Pericom Semiconductor Corp. | | | 21,426 | 331 |
| * | EchoStar Corp. Class A | | | 6,171 | 319 |
| * | Global Cash Access Holdings Inc. | | | 41,082 | 313 |
| | TeleTech Holdings Inc. | | | 12,295 | 313 |
| * | Fairchild Semiconductor International Inc. Class A | | | 17,203 | 313 |
| | EarthLink Holdings Corp. | | | 68,432 | 304 |
| | Leidos Holdings Inc. | | | 7,094 | 298 |
| * | Autobytel Inc. | | | 9,100 | 134 |
| | | | | | 482,729 |
| Materials (1.9%) | | | | |
| | Praxair Inc. | | | 264,600 | 31,948 |
| | Martin Marietta Materials Inc. | | | 145,451 | 20,334 |
| | Monsanto Co. | | | 123,899 | 13,944 |
| | Sigma-Aldrich Corp. | | | 46,897 | 6,484 |
| | Bemis Co. Inc. | | | 131,302 | 6,081 |
| | Sonoco Products Co. | | | 58,998 | 2,682 |
| | Avery Dennison Corp. | | | 33,952 | 1,796 |
| | Neenah Paper Inc. | | | 26,926 | 1,684 |
| | Greif Inc. Class A | | | 22,986 | 903 |
| * | Mercer International Inc. | | | 57,584 | 884 |
| * | Clearwater Paper Corp. | | | 13,406 | 875 |
| * | Boise Cascade Co. | | | 20,805 | 779 |
| * | Chemtura Corp. | | | 12,821 | 350 |
| * | US Concrete Inc. | | | 9,355 | 317 |
| | Schnitzer Steel Industries Inc. | | | 12,734 | 202 |
| | | | | | 89,263 |
| Telecommunication Services (0.0%) | | | | |
| | IDT Corp. Class B | | | 13,786 | 245 |
| | Inteliquent Inc. | | | 11,193 | 176 |
| | | | | | 421 |
| | | | | | 2,123,400 |
| Total Common Stocks (Cost $3,724,470) | | | | 4,449,571 |
| |
| | | Coupon | | | |
| Temporary Cash Investments (4.9%)1 | | | | |
| Money Market Fund (4.7%) | | | | |
| 4,5 | Vanguard Market Liquidity Fund | 0.128% | | 217,896,336 | 217,896 |
| |
| | | | | Face | |
| | | | Maturity | Amount | |
| | | | Date | ($000) | |
| U.S. Government and Agency Obligations (0.2%) | | | | |
| 6,7 | Fannie Mae Discount Notes | 0.130% | 4/27/15 | 3,100 | 3,100 |
| 7,8 | Federal Home Loan Bank Discount Notes | 0.100% | 4/24/15 | 300 | 300 |
| 7,8 | Federal Home Loan Bank Discount Notes | 0.063% | 4/29/15 | 2,000 | 2,000 |
14
| | | | | |
| Vanguard® Global Equity Fund | | | | |
| Schedule of Investments | | | | |
| March 31, 2015 | | | | |
| |
| | | | | Face | Market |
| | | | Maturity | Amount | Value |
| | | Coupon | Date | ($000) | ($000) |
| 8 | Federal Home Loan Bank Discount Notes | 0.060% | 5/8/15 | 500 | 500 |
| 8 | Federal Home Loan Bank Discount Notes | 0.070% | 5/15/15 | 1,000 | 1,000 |
| 6 | Freddie Mac Discount Notes | 0.131% | 6/8/15 | 600 | 600 |
| | | | | | 7,500 |
| Total Temporary Cash Investments (Cost $225,396) | | | | 225,396 |
| Total Investments (101.4%) (Cost $3,949,866) | | | | 4,674,967 |
| Other Assets and Liabilities—Net (-1.4%) | | | | (65,886) |
| Net Assets (100%) | | | | 4,609,081 |
^ Includes partial security positions on loan to broker-dealers. The total value of securities on loan is $50,709,000.
* Non-income-producing security.
1 The fund invests a portion of its cash reserves in equity markets through the use of index futures contracts. After giving effect to futures investments, the fund's effective common stock and temporary cash investment positions represent 98.3% and 3.1%, respectively, of net assets.
2 Considered an affiliated company of the fund as the issuer is another member of The Vanguard Group.
3 Security exempt from registration under Rule 144A of the Securities Act of 1933. Such securities may be sold in transactions exempt from registration, normally to qualified institutional buyers. At March 31, 2015, the aggregate value of these securities was $3,711,000, representing 0.1% of net assets.
4 Affiliated money market fund available only to Vanguard funds and certain trusts and accounts managed by Vanguard. Rate shown is the 7-day yield.
5 Includes $55,181,000 of collateral received for securities on loan.
6 The issuer was placed under federal conservatorship in September 2008; since that time, its daily operations have been managed by the Federal Housing Finance Agency and it receives capital from the U.S. Treasury, as needed to maintain a positive net worth, in exchange for senior preferred stock.
7 Securities with a value of $4,500,000 have been segregated as initial margin for open futures contracts.
8 The issuer operates under a congressional charter; its securities are generally neither guaranteed by the U.S. Treasury nor backed by the full faith and credit of the U.S. government.
ADR—American Depositary Receipt.
GDR—Global Depositary Receipt.
15
© 2015 The Vanguard Group. Inc.
All rights reserved.
Vanguard Marketing Corporation, Distributor.
SNA 1292 052015
Item 7: Disclosure of Proxy Voting Policies and Procedures for Closed-End Management Investment Companies.
Not Applicable.
Item 8: Portfolio Managers of Closed-End Management Investment Companies.
Not Applicable.
Item 9: Purchase of Equity Securities by Closed-End Management Investment Company and Affiliated Purchasers.
Not Applicable.
Item 10: Submission of Matters to a Vote of Security Holders.
Not Applicable.
Item 11: Controls and Procedures.
(a) Disclosure Controls and Procedures. The Principal Executive and Financial Officers concluded that the Registrant’s Disclosure Controls and Procedures are effective based on their evaluation of the Disclosure Controls and Procedures as of a date within 90 days of the filing date of this report.
(b) Internal Control Over Financial Reporting. There were no significant changes in Registrant’s Internal Control Over Financial Reporting or in other factors that could significantly affect this control subsequent to the date of the evaluation, including any corrective actions with regard to significant deficiencies and material weaknesses.
Item 12: Exhibits.
(a) Certifications.
Pursuant to the requirements of the Securities Exchange Act of 1934 and the Investment Company Act of 1940, the registrant has duly caused this report to be signed on its behalf by the undersigned, thereunto duly authorized.
| |
| | VANGUARD HORIZON FUNDS |
| |
| BY: | /s/ F. WILLIAM MCNABB III* |
| | F. WILLIAM MCNABB III |
| | CHIEF EXECUTIVE OFFICER |
| |
| Date: May 21, 2015 |
Pursuant to the requirements of the Securities Exchange Act of 1934 and the Investment Company Act of 1940, this report has been signed below by the following persons on behalf of the registrant and in the capacities and on the dates indicated.
| |
| | VANGUARD HORIZON FUNDS |
| |
| BY: | /s/ F. WILLIAM MCNABB III* |
| | F. WILLIAM MCNABB III |
| | CHIEF EXECUTIVE OFFICER |
Date: May 21, 2015 |
| | VANGUARD HORIZON FUNDS |
| |
| BY: | /s/ THOMAS J. HIGGINS* |
| | THOMAS J. HIGGINS |
| | CHIEF FINANCIAL OFFICER |
| Date: May 21, 2015 |
* By: /s/ Heidi Stam
Heidi Stam, pursuant to a Power of Attorney filed on April 22, 2014 see file Number
2-17620, Incorporated by Reference.