UNITED STATES
SECURITIES AND EXCHANGE COMMISSION
Washington, D.C. 20549
FORM N-CSR
CERTIFIED SHAREHOLDER REPORT OF
REGISTERED MANAGEMENT INVESTMENT COMPANIES
Investment Company Act file number: 811-07239
Name of Registrant: Vanguard Horizon Funds
| |
| Address of Registrant: | P.O. Box 2600 |
| | Valley Forge, PA 19482 |
| |
| Name and address of agent for service: | Heidi Stam, Esquire |
| | P.O. Box 876 |
| | Valley Forge, PA 19482 |
Registrant’s telephone number, including area code: (610) 669-1000
Date of fiscal year end: September 30
Date of reporting period: October 1, 2015 – March 31, 2016
Item 1: Reports to Shareholders

Semiannual Report | March 31, 2016
Vanguard Strategic Equity Fund
Vanguard’s Principles for Investing Success
We want to give you the best chance of investment success. These principles, grounded in Vanguard’s research and experience, can put you on the right path.
Goals. Create clear, appropriate investment goals.
Balance. Develop a suitable asset allocation using broadly diversified funds. Cost. Minimize cost.
Discipline. Maintain perspective and long-term discipline.
A single theme unites these principles: Focus on the things you can control.
We believe there is no wiser course for any investor.
| |
| Contents | |
| Your Fund’s Total Returns. | 1 |
| Chairman’s Letter. | 2 |
| Advisor’s Report. | 8 |
| Fund Profile. | 10 |
| Performance Summary. | 11 |
| Financial Statements. | 12 |
| About Your Fund’s Expenses. | 25 |
| Trustees Approve Advisory Arrangement. | 27 |
| Glossary. | 28 |
Please note: The opinions expressed in this report are just that—informed opinions. They should not be considered promises or advice. Also, please keep in mind that the information and opinions cover the period through the date on the front of this report. Of course, the risks of investing in your fund are spelled out in the prospectus.
See the Glossary for definitions of investment terms used in this report.
About the cover: Pictured is a sailing block on the Brilliant, a 1932 schooner docked in Mystic, Connecticut. A type of pulley, the sailing block helps coordinate the setting of the sails. At Vanguard, the intricate coordination of technology and people allows us to help millions of clients around the world reach their financial goals.
Your Fund’s Total Returns
| |
| Six Months Ended March 31, 2016 | |
| | Total |
| | Returns |
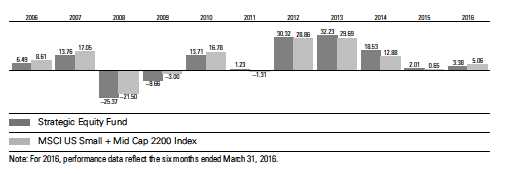
| Vanguard Strategic Equity Fund | 3.38% |
| MSCI US Small + Mid Cap 2200 Index | 5.06 |
| Mid-Cap Core Funds Average | 3.97 |
| Mid-Cap Core Funds Average: Derived from data provided by Lipper, a Thomson Reuters Company. | |
| | | | | |
| Your Fund’s Performance at a Glance | | | | |
| September 30, 2015, Through March 31, 2016 | | | | |
| | | | Distributions Per Share |
| | Starting | Ending | Income | Capital |
| | Share Price | Share Price | Dividends | Gains |
| Vanguard Strategic Equity Fund | $30.82 | $28.42 | $0.507 | $2.967 |
1

Chairman’s Letter
Dear Shareholder,
Amid considerable stock market volatility, Vanguard Strategic Equity Fund returned 3.38% for the six months ended March 31, 2016. The fund’s benchmark, the MSCI US Small + Mid Cap 2200 Index, returned 5.06%, and the average return for its peers was 3.97%.
Anyone hoping that the financial markets might become a bit more settled after the Federal Reserve’s long-anticipated rate increase—announced December 16—would have been disappointed. Stocks retreated from December through mid-February before rebounding to finish the period higher. These sharp shifts led investors to favor safer assets, a trend that generally benefited larger-capitalization stocks and more defensive sectors.
Returns for the fund ranged from double-digit gains in utilities and materials to a double-digit decline in energy. Compared with its benchmark, the fund displayed strong stock selection in the health care sector, which was offset by subpar returns from its energy, consumer staples, and consumer discretionary holdings.
Stocks charted an uneven course
en route to a solid outcome
The broad U.S. stock market returned about 7% for the six months. The period began and ended strongly, with fluctuations in the middle as China’s economic slowdown and falling oil and commodity prices worried investors.
Stocks rallied in March as investors again seemed encouraged by news about monetary policy, especially after the Fed indicated that it would raise interest rates fewer times in 2016 than previously anticipated. International stocks returned about 3% for the period after surging more than 8% in March. Stocks from emerging markets and from developed Pacific markets outperformed developed European stocks, which were nearly flat. U.S. dollar-based investors benefited as many foreign currencies strengthened against the dollar, a turnabout from the trend of recent years.
Bonds produced gains following a subpar start
The broad U.S. taxable bond market returned 2.44% for the fiscal half year. Returns were weak in the first three months, which culminated with the Fed’s quarter-percentage-point interest rate increase in December.
But with stocks volatile and the Fed indicating it would proceed cautiously with future rate hikes, bonds rallied in the final three months. The yield of the 10-year U.S. Treasury note closed at 1.77% at the end of March, down from 2.05% six months earlier. (Bond prices and yields move in opposite directions.)
| | | | |
| Market Barometer | | | |
| |
| | | | Total Returns |
| | | Periods Ended March 31, 2016 |
| | Six | One | Five Years |
| | Months | Year | (Annualized) |
| Stocks | | | |
| Russell 1000 Index (Large-caps) | 7.75% | 0.50% | 11.35% |
| Russell 2000 Index (Small-caps) | 2.02 | -9.76 | 7.20 |
| Russell 3000 Index (Broad U.S. market) | 7.30 | -0.34 | 11.01 |
| FTSE All-World ex US Index (International) | 3.09 | -8.53 | 0.70 |
| |
| Bonds | | | |
| Barclays U.S. Aggregate Bond Index (Broad taxable market) | 2.44% | 1.96% | 3.78% |
| Barclays Municipal Bond Index (Broad tax-exempt market) | 3.20 | 3.98 | 5.59 |
| Citigroup Three-Month U.S. Treasury Bill Index | 0.06 | 0.08 | 0.04 |
| |
| CPI | | | |
| Consumer Price Index | 0.08% | 0.85% | 1.28% |
3
Returns for money market funds and savings accounts remained limited by the Fed’s still-low target rate of 0.25%–0.5%.
International bond markets (as measured by the Barclays Global Aggregate Index ex USD) returned almost 7%. Like stocks, international bond returns for U.S.-based investors benefited from dollar weakness. Even in local currencies, however, international bond returns were solidly positive, boosted in part by additional stimulus measures in Europe and Asia to combat weak growth and low inflation.
Selection among consumer-related stocks crimped the fund’s return
Vanguard Quantitative Equity Group, the fund’s advisor, uses a disciplined, data-driven process to assess the relative attractiveness of stocks—with the goal of providing a long-term return greater than that of the benchmark while tightly controlling risk. Similar to a traditional fund manager, QEG analyzes criteria that research has shown can contribute to long-term outperformance, including valuation, revenue and earnings growth, dividend policy, reinvestment decisions, and balance sheet quality.
A proprietary computer model helps QEG systematically screen and rank stocks within each of the industry groups in the fund’s investable universe—in this case, well over 2,000 small- and mid-cap stocks. This investment process has been developed and refined over more than three decades, and is supported by an experienced in-house research team.
| | | |
| Expense Ratios | | |
| Your Fund Compared With Its Peer Group | | |
| | | Peer Group |
| | Fund | Average |
| Strategic Equity Fund | 0.21% | 1.18% |
| The fund expense ratio shown is from the prospectus dated January 28, 2016, and represents estimated costs for the current fiscal year. For the six months ended March 31, 2016, the fund’s annualized expense ratio was 0.19%. The peer-group expense ratio is derived from data provided by Lipper, a Thomson Reuters Company, and captures information through year-end 2015. |
|
|
|
| |
| Peer group: Mid-Cap Core Funds. | | |
4
QEG generally keeps your fund’s sector exposures aligned closely with those of the index; it doesn’t favor or shun a particular sector in the attempt to improve performance relative to the benchmark. Positioning within industry sub-groups can make a difference, but what often matters more is how the fund’s 400-plus holdings perform.
This strategy has produced above-benchmark returns for the fund over its last five fiscal years, but, as with any active
|
| |
| Vanguard’s growth translates into lower costs for you |
| |
| Research indicates that lower-cost investments have tended to outperform higher-cost ones. |
| So it’s little wonder that funds with lower expense ratios—including those at Vanguard—have |
| dominated the industry’s cash inflows in recent years. |
| |
| Vanguard has long been a low-cost leader, with expenses well below those of many other |
| investment management companies. That cost difference remains a powerful advantage for |
| Vanguard clients. Why? Because a lower expense ratio allows a fund to pass along a greater |
| share of its returns to its investors. |
| |
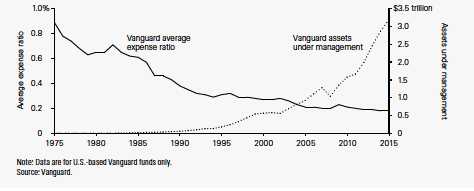
| What’s more, as you can see in the chart below, we’ve been able to lower our costs continually |
| as our assets under management have grown. Our steady growth has not been an explicit |
| business objective. Rather, we focus on putting our clients’ interests first at all times, and |
| giving them the best chance for investment success. But economies of scale—the cost |
| efficiencies that come with our growth—have allowed us to keep lowering our fund costs, |
| even as we invest in our people and technology. |
| |
| The benefit of economies of scale |
5
investment strategy, it works better under some market conditions than others.
For the six months under review, the fund trailed its benchmark, as investors’ concerns about the global macroeconomic environment took precedence over company-specific fundamentals.
Compared with the benchmark, the fund’s health care holdings were a bright spot. The screening process here led to outperformance in the biotechnology segment and among tools and services stocks in the life sciences field.
At the other end of the spectrum, the fund lagged in the beleaguered energy sector. Some of the fund’s refining and marketing holdings struggled amid a gasoline glut and refinery production cutbacks.
The screening process met with even less success among consumer-related stocks. In consumer staples, food producers and retailers in particular disappointed. And in consumer discretionary, stocks in the auto parts, footwear, and hospitality segments weighed on the fund’s performance.
The Advisor’s Report that follows this letter provides additional details about the management of the fund during the fiscal half year.
Consider rebalancing to manage your risk
Let’s say you’ve taken the time to carefully create an appropriate asset allocation for your investment portfolio. Your efforts have produced a diversified mix of stock, bond, and money market funds tailored to your goals, time horizon, and risk tolerance.
But what should you do when your portfolio drifts from its original asset allocation as the financial markets rise or fall? Consider rebalancing to bring it back to the proper mix.
Just one year of outsized returns can throw your allocation out of whack. Take 2013 as an example. That year, the broad stock market (as measured by the Russell 3000 Index) returned 33.55% and the broad taxable bond market (as measured by the Barclays U.S. Aggregate Bond Index) returned –2.02%. A hypothetical portfolio that tracked the broad domestic market indexes and started the year with 60% stocks and 40% bonds would have ended with a more aggressive mix of 67% stocks and 33% bonds.
Rebalancing to bring your portfolio back to its original targets would require you to shift assets away from areas that have been performing well toward those that have been falling behind. That isn’t easy or intuitive. It’s a way to minimize risk rather than maximize returns and to stick with your investment plan through different types of markets. (You can read more about our approach in Best Practices for Portfolio Rebalancing at vanguard.com/research.)
It’s not necessary to check your portfolio every day or every month, much less rebalance it that frequently. It may be more appropriate to monitor it annually or semiannually and rebalance when your allocation swings 5 percentage points or more from its target.
6
It’s important, of course, to be aware of the tax implications. You’ll want to consult with your tax advisor, but generally speaking, it may be a good idea to make any asset changes within a tax-advantaged retirement account or to direct new cash flows into the underweighted asset class.
However you go about it, keeping your asset allocation from drifting too far off target can help you stay on track with the investment plan you’ve crafted to meet your financial goals.
As always, thank you for investing with Vanguard.
Sincerely,

F. William McNabb III
Chairman and Chief Executive Officer
April 13, 2016
7
Advisor’s Report
For the fiscal half year ended March 31, 2016, Vanguard Strategic Equity Fund had a total return of 3.38%, underperforming its benchmark by 1.68 percentage points. Overall, stocks fared well during the period, with the broad U.S. equity market, as measured by the MSCI US Investable Market Index, returning 7.31%. (Index returns are based on MSCI indexes.) Large-capitalization stocks performed better than smaller-caps, and value-oriented stocks outpaced growth stocks. Developed market equities didn’t do as well as their U.S. counterparts. Emerging markets stocks staged a recovery compared with the prior six-month period, climbing more than 6%.
Performances by sector within the benchmark were mixed. The best performers were utilities, consumer staples, and materials, while energy and health care posted declines.
In late 2015, the U.S. economy continued to grow, but at a slower pace. Fourth-quarter real GDP came in at 1.4%, compared with 2.0% in the third quarter, with the deceleration attributed primarily to downturns in nonresidential fixed investment, exports, and state and local government spending. Corporate profits decreased 8.1% in the final quarter of 2015, reflecting the largest quarterly decline since the first quarter of 2011. However, the U.S. job market improved further. In March, total nonfarm payrolls rose by 215,000, and the unemployment rate stood at 5.0%.
Oil prices declined significantly in the first quarter of 2016 but have since recovered, increasing over 40% from their mid-February low. This volatility spilled over into the global stock markets, as they saw similar price movements in the same quarter. The U.S. Federal Reserve raised interest rates in December, after keeping rates near zero since 2008. Additional interest rate hikes are expected later this year, but changes are likely to be gradual and will depend on global economic data. Meanwhile, several of the world’s central banks, including the European Central Bank and the Bank of Japan, are experimenting with negative interest rates in an attempt to spur economic growth.
Although we seek to understand the impact of macroeconomic factors on portfolio performance, our investment process is centered on specific stock fundamentals. We use a disciplined, quantitative approach, not technical analysis of stock price movements. Our model aims to systematically identify stocks within each industry group in our investment universe that are more likely to exhibit long-term outperformance.
Our model focuses on five key themes that we believe attractive stocks tend to exhibit: high quality (healthy balance sheets and consistent cash flow generation); effective management decisions regarding the use of capital (sound investment policies that favor internal over external funding); consistent earnings growth (a demonstrated ability to increase earnings year
8
after year); strong momentum (a market confirmation of our view); and reasonable valuations (we try to avoid overpriced stocks). This framework helps us to identify and take advantage of inefficiencies in the market caused by persistent biases in investor behavior.
Using the results of our model, we then construct and review our portfolio daily with the goal of maximizing expected return while minimizing exposure to risks that our research indicates do not improve returns, such as deviations from sector weightings relative to the benchmark.
For this period, the management decisions, quality, and valuation components of our model made positive contributions to performance. The growth and momentum components of the model, however, did not perform as expected. As a result, our stock selection was positive in three sectors, more or less flat in two, and negative in five. The strongest selection results were in health care, utilities, and materials; the poorest results were in consumer discretionary, consumer staples, and energy.
At the individual stock level, the largest performance contributions came from overweight positions in Affymetrix, Ionis Pharmaceuticals, and Charles River Laboratories. (As of the end of the period, Affymetrix and Ionis Pharmaceuticals were no longer held by the fund.) In addition, when comparing the portfolio’s performance with that of its benchmark, we benefited from underweighting or avoiding poorly performing stocks such as Endo International and Alkermes plc.
Unfortunately, we were not able to avoid all bad performers. Overweight positions in Outerwall, Skechers U.S.A., and American Axle & Manufacturing Holdings detracted from results. Also, underweighting Mattel and Michael Kors Holdings, which were not identified for inclusion in the fund by our model, hurt our overall performance relative to our benchmark.
We continue to believe that constructing a portfolio that focuses on the key fundamentals described above will benefit investors over the long term, while recognizing that risk can reward or punish us in the near term. We look forward to the second half of the fiscal year, feeling that the fund offers a strong mix of stocks with attractive valuation and growth characteristics relative to its underlying benchmark.
We thank you for your investment.
Portfolio Managers:
Michael R. Roach, CFA
James P. Stetler, Principal
Binbin Guo, Principal, Head of Equity
Research and Portfolio Strategies
April 19, 2016
9
Strategic Equity Fund
Fund Profile
As of March 31, 2016
| | | | |
| Portfolio Characteristics | | |
| | | MSCI US | DJ |
| | | Small + | U.S. Total |
| | | Mid Cap | Market |
| | Fund 2200 Index | FA Index |
| Number of Stocks | 398 | 2,166 | 3,900 |
| Median Market Cap | $4.1B | $6.2B | $52.5B |
| Price/Earnings Ratio | 18.1x | 27.1x | 21.8x |
| Price/Book Ratio | 2.3x | 2.4x | 2.7x |
| Return on Equity | 14.0% | 13.4% | 17.5% |
| Earnings Growth | | | |
| Rate | 13.5% | 10.3% | 8.0% |
| Dividend Yield | 2.0% | 1.7% | 2.1% |
| Foreign Holdings | 0.6% | 0.0% | 0.0% |
| Turnover Rate | | | |
| (Annualized) | 68% | — | — |
| Ticker Symbol | VSEQX | — | — |
| Expense Ratio1 | 0.21% | — | — |
| 30-Day SEC Yield | 1.70% | — | — |
| Short-Term Reserves | 0.0% | — | — |
| | | | |
| Sector Diversification (% of equity exposure) |
| | | MSCI US | |
| | | Small + | DJ |
| | | Mid Cap | U.S. Total |
| | | 2200 | Market |
| | Fund | Index | FA Index |
| Consumer | | | |
| Discretionary | 16.1% | 16.3% | 13.6% |
| Consumer Staples | 5.1 | 5.1 | 9.2 |
| Energy | 4.4 | 4.5 | 6.1 |
| Financials | 22.5 | 22.4 | 17.4 |
| Health Care | 9.8 | 9.7 | 13.7 |
| Industrials | 14.1 | 14.2 | 10.7 |
| Information | | | |
| Technology | 15.4 | 15.4 | 20.1 |
| Materials | 5.8 | 5.8 | 3.2 |
| Telecommunication | | | |
| Services | 0.9 | 0.9 | 2.5 |
| Utilities | 5.9 | 5.7 | 3.5 |
| | | |
| Volatility Measures | | |
| | MSCI US | DJ |
| | Small + | U.S. Total |
| | Mid Cap | Market |
| | 2200 Index | FA Index |
| R-Squared | 0.97 | 0.90 |
| Beta | 0.98 | 1.05 |
| These measures show the degree and timing of the fund’s |
| fluctuations compared with the indexes over 36 months. |
| | | |
| Ten Largest Holdings (% of total net assets) |
| Tyson Foods Inc. | Packaged Foods & | |
| | Meats | 1.1% |
| FirstEnergy Corp. | Electric Utilities | 1.0 |
| Sealed Air Corp. | Paper Packaging | 1.0 |
| Avery Dennison Corp. | Paper Packaging | 0.9 |
| Cintas Corp. | Diversified Support | |
| | Services | 0.9 |
| Best Buy Co. Inc. | Computer & | |
| | Electronics Retail | 0.9 |
| Everest Re Group Ltd. | Reinsurance | 0.9 |
| Centene Corp. | Managed Health | |
| | Care | 0.9 |
| Leggett & Platt Inc. | Home Furnishings | 0.9 |
| Darden Restaurants Inc. | Restaurants | 0.9 |
| Top Ten | | 9.4% |
| The holdings listed exclude any temporary cash investments and equity index products. |
|
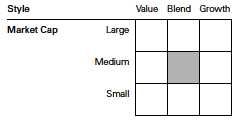
Investment Focus
1 The expense ratio shown is from the prospectus dated January 28, 2016, and represents estimated costs for the current fiscal year. For the six
months ended March 31, 2016, the annualized expense ratio was 0.19%.
10
Strategic Equity Fund
Performance Summary
All of the returns in this report represent past performance, which is not a guarantee of future results that may be achieved by the fund. (Current performance may be lower or higher than the performance data cited. For performance data current to the most recent month-end, visit our website at vanguard.com/performance.) Note, too, that both investment returns and principal value can fluctuate widely, so an investor’s shares, when sold, could be worth more or less than their original cost. The returns shown do not reflect taxes that a shareholder would pay on fund distributions or on the sale of fund shares.
Fiscal-Year Total Returns (%): September 30, 2005, Through March 31, 2016
| | | | | |
| Average Annual Total Returns: Periods Ended March 31, 2016 | | | |
| |
| | Inception | One | Five | Ten |
| | Date | Year | Years | Years |
| Strategic Equity Fund | 8/14/1995 | -5.85% | 11.60% | 6.25% |
See Financial Highlights for dividend and capital gains information.
11
Strategic Equity Fund
Financial Statements (unaudited)
Statement of Net Assets
As of March 31, 2016
The fund reports a complete list of its holdings in regulatory filings four times in each fiscal year, at the quarter-ends. For the second and fourth fiscal quarters, the lists appear in the fund’s semiannual and annual reports to shareholders. For the first and third fiscal quarters, the fund files the lists with the Securities and Exchange Commission on Form N-Q. Shareholders can look up the fund’s Forms N-Q on the SEC’s website at sec.gov. Forms N-Q may also be reviewed and copied at the SEC’s Public Reference Room (see the back cover of this report for further information).
| | | |
| | | | Market |
| | | | Value• |
| | | Shares | ($000) |
| Common Stocks (99.6%)1 | | |
| Consumer Discretionary (16.1%) | |
| | Best Buy Co. Inc. | 1,617,700 | 52,478 |
| | Leggett & Platt Inc. | 1,065,132 | 51,552 |
| | Darden Restaurants Inc. | 768,861 | 50,976 |
| | American Eagle | | |
| | Outfitters Inc. | 3,020,800 | 50,357 |
| | Big Lots Inc. | 978,700 | 44,325 |
| | Cooper Tire | | |
| | & Rubber Co. | 1,006,961 | 37,278 |
| | Abercrombie | | |
| | & Fitch Co. | 1,103,978 | 34,819 |
| | Hasbro Inc. | 423,500 | 33,922 |
| | Foot Locker Inc. | 458,914 | 29,600 |
| ^ | Outerwall Inc. | 791,143 | 29,264 |
| * | American Axle & | | |
| | Manufacturing | | |
| | Holdings Inc. | 1,878,039 | 28,903 |
| | DR Horton Inc. | 720,000 | 21,766 |
| * | NVR Inc. | 12,200 | 21,135 |
| | Brinker International Inc. | 438,698 | 20,158 |
| * | Boyd Gaming Corp. | 956,570 | 19,763 |
| * | Helen of Troy Ltd. | 186,200 | 19,307 |
| ^ | World Wrestling | | |
| | Entertainment Inc. | | |
| | Class A | 1,055,512 | 18,640 |
| * | Express Inc. | 857,029 | 18,349 |
| * | Michael Kors | | |
| | Holdings Ltd. | 317,049 | 18,059 |
| * | Smith & Wesson | | |
| | Holding Corp. | 675,680 | 17,987 |
| * | Skechers U.S.A. Inc. | | |
| | Class A | 570,084 | 17,359 |
| | Carter’s Inc. | 157,366 | 16,583 |
| | Nordstrom Inc. | 284,755 | 16,291 |
| * | Madison Square | | |
| | Garden Co. Class A | 96,884 | 16,118 |
| | Whirlpool Corp. | 82,767 | 14,926 |
| | Jack in the Box Inc. | 226,522 | 14,468 |
| | | |
| | | | Market |
| | | | Value• |
| | | Shares | ($000) |
| | Wyndham Worldwide | | |
| | Corp. | 171,748 | 13,127 |
| | PVH Corp. | 131,400 | 13,017 |
| * | Penn National Gaming Inc. | 761,419 | 12,708 |
| | News Corp. Class B | 956,072 | 12,668 |
| * | Strayer Education Inc. | 257,500 | 12,553 |
| * | MSG Networks Inc. | 662,218 | 11,450 |
| | Interpublic Group | | |
| | of Cos. Inc. | 498,620 | 11,443 |
| | Gannett Co. Inc. | 688,059 | 10,417 |
| | Nutrisystem Inc. | 495,102 | 10,333 |
| * | BJ’s Restaurants Inc. | 242,200 | 10,068 |
| | Caleres Inc. | 351,900 | 9,955 |
| | Tower International Inc. | 341,290 | 9,283 |
| | News Corp. Class A | 708,200 | 9,044 |
| | GameStop Corp. Class A | 252,100 | 7,999 |
| | Cablevision Systems | | |
| | Corp. Class A | 189,800 | 6,263 |
| ^ | Cracker Barrel Old | | |
| | Country Store Inc. | 40,000 | 6,107 |
| * | Denny’s Corp. | 553,200 | 5,731 |
| | Cato Corp. Class A | 137,900 | 5,316 |
| | Bloomin’ Brands Inc. | 294,100 | 4,962 |
| | Sinclair Broadcast | | |
| | Group Inc. Class A | 149,615 | 4,601 |
| * | Burlington Stores Inc. | 75,266 | 4,233 |
| | Sturm Ruger & Co. Inc. | 60,630 | 4,146 |
| * | Michaels Cos. Inc. | 123,800 | 3,463 |
| * | Grand Canyon | | |
| | Education Inc. | 67,652 | 2,891 |
| | AMC Entertainment | | |
| | Holdings Inc. | 100,600 | 2,816 |
| | Children’s Place Inc. | 32,600 | 2,721 |
| | Cheesecake Factory Inc. | 47,873 | 2,542 |
| * | Pinnacle Entertainment Inc. | 58,041 | 2,037 |
| | DineEquity Inc. | 18,571 | 1,735 |
| | Oxford Industries Inc. | 21,200 | 1,425 |
| * | Liberty Media Corp. | | |
| | Class A | 36,464 | 1,409 |
| | Ethan Allen Interiors Inc. | 42,962 | 1,367 |
| * | Unifi Inc. | 44,600 | 1,022 |
12
Strategic Equity Fund
| | | |
| | | | Market |
| | | | Value• |
| | | Shares | ($000) |
| * | ServiceMaster Global | | |
| | Holdings Inc. | 26,200 | 987 |
| | Libbey Inc. | 43,000 | 800 |
| | | | 935,022 |
| Consumer Staples (5.1%) | | |
| | Tyson Foods Inc. Class A | 946,696 | 63,107 |
| ^ | Cal-Maine Foods Inc. | 812,700 | 42,187 |
| | Bunge Ltd. | 586,161 | 33,218 |
| | Dean Foods Co. | 1,676,787 | 29,042 |
| * | SUPERVALU Inc. | 3,937,323 | 22,679 |
| | Clorox Co. | 146,505 | 18,468 |
| * | USANA Health | | |
| | Sciences Inc. | 131,000 | 15,906 |
| * | Pilgrim’s Pride Corp. | 577,077 | 14,658 |
| *,^ | Herbalife Ltd. | 206,513 | 12,713 |
| | ConAgra Foods Inc. | 284,400 | 12,690 |
| | Ingles Markets Inc. | | |
| | Class A | 228,951 | 8,586 |
| | Universal Corp. | 120,500 | 6,846 |
| ^ | Natural Health | | |
| | Trends Corp. | 205,201 | 6,802 |
| | Fresh Del Monte | | |
| | Produce Inc. | 99,841 | 4,200 |
| | Campbell Soup Co. | 44,900 | 2,864 |
| ^ | Coty Inc. Class A | 67,900 | 1,890 |
| * | Central Garden & Pet Co. | 33,600 | 549 |
| * | Seneca Foods Corp. | | |
| | Class A | 4,400 | 153 |
| | | | 296,558 |
| Energy (4.4%) | | |
| | Tesoro Corp. | 545,500 | 46,919 |
| | PBF Energy Inc. Class A | 1,413,112 | 46,915 |
| | Noble Corp. plc | 3,585,705 | 37,112 |
| | Western Refining Inc. | 836,100 | 24,322 |
| | Ensco plc Class A | 1,852,422 | 19,210 |
| | Alon USA Energy Inc. | 1,743,823 | 17,996 |
| | Rowan Cos. plc Class A | 1,091,127 | 17,567 |
| | Core Laboratories NV | 149,600 | 16,817 |
| | HollyFrontier Corp. | 208,300 | 7,357 |
| | Plains GP Holdings LP | | |
| | Class A | 727,820 | 6,325 |
| | Chesapeake Energy Corp. | 1,250,000 | 5,150 |
| * | Cameron International | | |
| | Corp. | 54,526 | 3,656 |
| | CVR Energy Inc. | 119,095 | 3,108 |
| | Atwood Oceanics Inc. | 201,131 | 1,844 |
| | | | 254,298 |
| Financials (22.4%) | | |
| | Everest Re Group Ltd. | 263,260 | 51,975 |
| | Regions Financial Corp. | 6,392,877 | 50,184 |
| * | MGIC Investment Corp. | 6,327,730 | 48,534 |
| | Assured Guaranty Ltd. | 1,855,360 | 46,941 |
| | Voya Financial Inc. | 1,307,400 | 38,921 |
| | Huntington | | |
| | Bancshares Inc. | 4,014,900 | 38,302 |
| | Navient Corp. | 3,163,358 | 37,865 |
| | | |
| | | | Market |
| | | | Value• |
| | | Shares | ($000) |
| | AmTrust Financial | | |
| | Services Inc. | 1,307,156 | 33,829 |
| | Digital Realty Trust Inc. | 351,319 | 31,088 |
| | Lamar Advertising Co. | | |
| | Class A | 498,968 | 30,687 |
| | Hospitality Properties | | |
| | Trust | 1,118,171 | 29,699 |
| | MSCI Inc. Class A | 397,462 | 29,444 |
| | KeyCorp | 2,565,993 | 28,329 |
| | Aspen Insurance | | |
| | Holdings Ltd. | 527,400 | 25,157 |
| | Communications Sales | | |
| | & Leasing Inc. | 1,130,407 | 25,152 |
| | DuPont Fabros | | |
| | Technology Inc. | 597,109 | 24,201 |
| | Universal Insurance | | |
| | Holdings Inc. | 1,322,925 | 23,548 |
| | Popular Inc. | 802,061 | 22,947 |
| | GEO Group Inc. | 652,585 | 22,625 |
| | EPR Properties | 316,000 | 21,052 |
| | Kimco Realty Corp. | 697,200 | 20,065 |
| | Weingarten Realty | | |
| | Investors | 530,135 | 19,891 |
| | CoreSite Realty Corp. | 281,617 | 19,716 |
| | Sovran Self Storage Inc. | 165,100 | 19,474 |
| | Ryman Hospitality | | |
| | Properties Inc. | 338,700 | 17,436 |
| * | Walker & Dunlop Inc. | 716,400 | 17,387 |
| | Government Properties | | |
| | Income Trust | 952,295 | 16,998 |
| | Spirit Realty Capital Inc. | 1,503,356 | 16,913 |
| | CyrusOne Inc. | 367,558 | 16,779 |
| *,^ | Credit Acceptance Corp. | 92,361 | 16,768 |
| | First American | | |
| | Financial Corp. | 428,000 | 16,311 |
| | Regency Centers Corp. | 202,700 | 15,172 |
| | Corrections Corp. | | |
| | of America | 461,132 | 14,779 |
| | Great Western | | |
| | Bancorp Inc. | 537,620 | 14,661 |
| | CBL & Associates | | |
| | Properties Inc. | 1,227,050 | 14,602 |
| ^ | Lexington Realty Trust | 1,668,692 | 14,351 |
| | Equity LifeStyle | | |
| | Properties Inc. | 189,300 | 13,768 |
| | Reinsurance Group of | | |
| | America Inc. Class A | 138,820 | 13,361 |
| *,^ | World Acceptance Corp. | 343,586 | 13,029 |
| | Summit Hotel | | |
| | Properties Inc. | 1,057,800 | 12,662 |
| *,^ | LendingTree Inc. | 125,439 | 12,265 |
| | Washington Federal Inc. | 529,900 | 12,002 |
| | Omega Healthcare | | |
| | Investors Inc. | 319,300 | 11,271 |
| | Cathay General Bancorp | 393,800 | 11,156 |
13
Strategic Equity Fund
| | | |
| | | | Market |
| | | | Value• |
| | | Shares | ($000) |
| | Hersha Hospitality Trust | | |
| | Class A | 512,813 | 10,943 |
| | Equinix Inc. | 32,294 | 10,680 |
| | PrivateBancorp Inc. | 275,800 | 10,646 |
| | Mack-Cali Realty Corp. | 399,641 | 9,392 |
| | Gaming and Leisure | | |
| | Properties Inc. | 298,959 | 9,244 |
| | Axis Capital Holdings Ltd. | 162,600 | 9,018 |
| | RLJ Lodging Trust | 392,400 | 8,978 |
| | Ashford Hospitality | | |
| | Trust Inc. | 1,343,418 | 8,571 |
| ^ | Apple Hospitality | | |
| | REIT Inc. | 386,841 | 7,663 |
| | Heritage Insurance | | |
| | Holdings Inc. | 477,261 | 7,622 |
| * | Realogy Holdings Corp. | 209,916 | 7,580 |
| | Pennsylvania REIT | 328,677 | 7,182 |
| | Unum Group | 229,054 | 7,082 |
| * | Santander Consumer | | |
| | USA Holdings Inc. | 661,637 | 6,941 |
| *,^ | Cowen Group Inc. | | |
| | Class A | 1,809,804 | 6,895 |
| | Gramercy Property Trust | 799,249 | 6,754 |
| | HCI Group Inc. | 199,900 | 6,657 |
| | Camden Property Trust | 78,000 | 6,559 |
| | Mid-America Apartment | | |
| | Communities Inc. | 62,165 | 6,354 |
| | Macerich Co. | 76,457 | 6,058 |
| | Validus Holdings Ltd. | 121,951 | 5,755 |
| | CubeSmart | 161,500 | 5,378 |
| | Synovus Financial Corp. | 185,752 | 5,370 |
| * | BofI Holding Inc. | 247,200 | 5,275 |
| | UDR Inc. | 134,001 | 5,163 |
| | First Industrial Realty | | |
| | Trust Inc. | 219,500 | 4,991 |
| | Extra Space Storage Inc. | 53,028 | 4,956 |
| | Alexandria Real Estate | | |
| | Equities Inc. | 53,900 | 4,899 |
| | Care Capital Properties Inc. | 163,891 | 4,399 |
| | NorthStar Realty | | |
| | Finance Corp. | 334,023 | 4,382 |
| * | INTL. FCStone Inc. | 147,000 | 3,929 |
| | Nelnet Inc. Class A | 89,812 | 3,536 |
| | RAIT Financial Trust | 1,114,800 | 3,500 |
| | Central Pacific | | |
| | Financial Corp. | 158,300 | 3,446 |
| | TCF Financial Corp. | 255,995 | 3,138 |
| * | Flagstar Bancorp Inc. | 144,100 | 3,092 |
| | Post Properties Inc. | 51,000 | 3,047 |
| | Senior Housing | | |
| | Properties Trust | 169,013 | 3,024 |
| | National Health | | |
| | Investors Inc. | 43,630 | 2,902 |
| | Associated Banc-Corp | 159,550 | 2,862 |
| | Primerica Inc. | 62,445 | 2,781 |
| | Ramco-Gershenson | | |
| | Properties Trust | 139,900 | 2,522 |
| | | |
| | | | Market |
| | | | Value• |
| | | Shares | ($000) |
| | Select Income REIT | 99,462 | 2,293 |
| | Progressive Corp. | 65,000 | 2,284 |
| * | Piper Jaffray Cos. | 43,700 | 2,166 |
| | Brixmor Property | | |
| | Group Inc. | 83,600 | 2,142 |
| | CenterState Banks Inc. | 130,000 | 1,936 |
| | Old National Bancorp | 155,879 | 1,900 |
| * | First NBC Bank Holding Co. | 85,200 | 1,754 |
| | International | | |
| | Bancshares Corp. | 63,900 | 1,576 |
| | Universal Health Realty | | |
| | Income Trust | 26,700 | 1,502 |
| | Medical Properties | | |
| | Trust Inc. | 103,200 | 1,340 |
| | Maiden Holdings Ltd. | 96,600 | 1,250 |
| | Cardinal Financial Corp. | 56,200 | 1,144 |
| | Great Southern | | |
| | Bancorp Inc. | 28,000 | 1,040 |
| | Agree Realty Corp. | 12,000 | 462 |
| | Getty Realty Corp. | 20,412 | 405 |
| | Monmouth Real Estate | | |
| | Investment Corp. | 18,800 | 224 |
| | One Liberty Properties Inc. | 8,100 | 181 |
| | United Fire Group Inc. | 3,100 | 136 |
| | Capital Bank Financial Corp. | 3,900 | 120 |
| | Federal Agricultural | | |
| | Mortgage Corp. | 1,700 | 64 |
| | EMC Insurance Group Inc. | 1,000 | 26 |
| | | | 1,304,408 |
| Health Care (9.7%) | | |
| * | Centene Corp. | 840,619 | 51,757 |
| * | Hologic Inc. | 1,464,714 | 50,533 |
| * | Quintiles Transnational | | |
| | Holdings Inc. | 701,503 | 45,668 |
| * | Charles River Laboratories | | |
| | International Inc. | 599,025 | 45,490 |
| * | Molina Healthcare Inc. | 679,209 | 43,802 |
| * | Amsurg Corp. | 507,643 | 37,870 |
| * | INC Research Holdings Inc. | | |
| | Class A | 780,013 | 32,144 |
| * | United Therapeutics Corp. | 197,949 | 22,057 |
| | CR Bard Inc. | 104,000 | 21,078 |
| * | AMN Healthcare | | |
| | Services Inc. | 578,925 | 19,458 |
| * | PAREXEL International | | |
| | Corp. | 308,787 | 19,370 |
| * | VCA Inc. | 278,700 | 16,078 |
| | Chemed Corp. | 116,300 | 15,753 |
| | ResMed Inc. | 271,283 | 15,686 |
| * | Amedisys Inc. | 283,442 | 13,702 |
| * | PRA Health Sciences Inc. | 304,500 | 13,020 |
| | Bruker Corp. | 324,866 | 9,096 |
| * | LifePoint Health Inc. | 127,728 | 8,845 |
| * | Infinity | | |
| | Pharmaceuticals Inc. | 1,596,095 | 8,411 |
| * | Natus Medical Inc. | 204,570 | 7,862 |
14
Strategic Equity Fund
| | | |
| | | | Market |
| | | | Value• |
| | | Shares | ($000) |
| | Universal Health | | |
| | Services Inc. Class B | 60,122 | 7,498 |
| * | ICU Medical Inc. | 71,263 | 7,418 |
| * | Sucampo Pharmaceuticals | | |
| | Inc. Class A | 588,000 | 6,427 |
| *,^ | Merrimack | | |
| | Pharmaceuticals Inc. | 602,103 | 5,040 |
| * | Prestige Brands | | |
| | Holdings Inc. | 88,038 | 4,700 |
| | PDL BioPharma Inc. | 1,342,300 | 4,470 |
| * | Alere Inc. | 81,647 | 4,132 |
| | Owens & Minor Inc. | 93,837 | 3,793 |
| * | Array BioPharma Inc. | 1,143,256 | 3,373 |
| *,^ | NewLink Genetics Corp. | 182,344 | 3,319 |
| | Quality Systems Inc. | 216,851 | 3,305 |
| *,^ | Sequenom Inc. | 2,272,456 | 3,204 |
| * | Masimo Corp. | 64,971 | 2,718 |
| * | LHC Group Inc. | 66,100 | 2,350 |
| | Phibro Animal Health | | |
| | Corp. Class A | 83,084 | 2,247 |
| * | Emergent BioSolutions Inc. | 45,300 | 1,647 |
| *,^ | Insys Therapeutics Inc. | 67,641 | 1,082 |
| * | Surgical Care Affiliates Inc. | 17,753 | 822 |
| * | Triple-S Management Corp. | |
| | Class B | 32,000 | 795 |
| *,^ | Orexigen Therapeutics Inc. | 939,300 | 528 |
| | | | 566,548 |
| Industrials (14.0%) | | |
| | Cintas Corp. | 590,914 | 53,070 |
| | Huntington Ingalls | | |
| | Industries Inc. | 364,450 | 49,908 |
| * | Spirit AeroSystems | | |
| | Holdings Inc. Class A | 1,073,108 | 48,676 |
| * | Hawaiian Holdings Inc. | 973,195 | 45,925 |
| | AO Smith Corp. | 550,346 | 41,997 |
| | Pitney Bowes Inc. | 1,893,000 | 40,775 |
| | Masco Corp. | 1,219,345 | 38,348 |
| | Owens Corning | 809,300 | 38,264 |
| * | Wabash National Corp. | 2,815,314 | 37,162 |
| * | JetBlue Airways Corp. | 1,700,100 | 35,906 |
| | Trinity Industries Inc. | 1,828,946 | 33,488 |
| * | United Rentals Inc. | 454,200 | 28,247 |
| * | American Woodmark Corp. | 360,482 | 26,888 |
| | BWX Technologies Inc. | 749,436 | 25,151 |
| | Alaska Air Group Inc. | 305,546 | 25,061 |
| ^ | Greenbrier Cos. Inc. | 863,700 | 23,873 |
| * | Meritor Inc. | 2,451,546 | 19,760 |
| | Deluxe Corp. | 313,182 | 19,571 |
| | Comfort Systems | | |
| | USA Inc. | 420,300 | 13,353 |
| | Stanley Black | | |
| | & Decker Inc. | 125,233 | 13,176 |
| | GATX Corp. | 254,959 | 12,111 |
| | Aircastle Ltd. | 448,800 | 9,981 |
| | CEB Inc. | 149,007 | 9,645 |
| | General Cable Corp. | 721,900 | 8,814 |
| | | |
| | | | Market |
| | | | Value• |
| | | Shares | ($000) |
| | Interface Inc. Class A | 469,196 | 8,699 |
| | RR Donnelley & Sons Co. | 499,994 | 8,200 |
| * | Virgin America Inc. | 208,587 | 8,043 |
| | Briggs & Stratton Corp. | 311,836 | 7,459 |
| | Allison Transmission | | |
| | Holdings Inc. | 270,000 | 7,285 |
| | ManpowerGroup Inc. | 84,900 | 6,913 |
| | Herman Miller Inc. | 211,665 | 6,538 |
| | ADT Corp. | 154,469 | 6,373 |
| | Global Brass & Copper | | |
| | Holdings Inc. | 251,500 | 6,275 |
| | Steelcase Inc. Class A | 399,339 | 5,958 |
| | Hyster-Yale Materials | | |
| | Handling Inc. | 83,607 | 5,568 |
| | Standex International Corp. | 62,650 | 4,875 |
| | Graco Inc. | 56,720 | 4,762 |
| | Douglas Dynamics Inc. | 202,203 | 4,633 |
| | Korn/Ferry International | 160,300 | 4,535 |
| | Equifax Inc. | 31,761 | 3,630 |
| * | Dycom Industries Inc. | 54,719 | 3,539 |
| | Manitowoc Co. Inc. | 666,011 | 2,884 |
| | SkyWest Inc. | 128,300 | 2,565 |
| | Ennis Inc. | 108,100 | 2,113 |
| | Griffon Corp. | 110,800 | 1,712 |
| | Heidrick & Struggles | | |
| | International Inc. | 56,200 | 1,332 |
| | Tetra Tech Inc. | 39,519 | 1,178 |
| | John Bean | | |
| | Technologies Corp. | 17,200 | 970 |
| * | Babcock & Wilcox | | |
| | Enterprises Inc. | 38,500 | 824 |
| * | ACCO Brands Corp. | 64,300 | 577 |
| | National Presto | | |
| | Industries Inc. | 6,000 | 502 |
| | Federal Signal Corp. | 37,200 | 493 |
| | | | 817,585 |
| Information Technology (15.3%) | |
| *,^ | Advanced Micro | | |
| | Devices Inc. | 17,331,703 | 49,395 |
| | Booz Allen Hamilton | | |
| | Holding Corp. Class A | 1,611,238 | 48,788 |
| | CSRA Inc. | 1,775,176 | 47,752 |
| | CDW Corp. | 1,144,700 | 47,505 |
| * | Aspen Technology Inc. | 1,280,696 | 46,272 |
| * | Cirrus Logic Inc. | 1,258,437 | 45,820 |
| * | Manhattan Associates Inc. | 734,841 | 41,790 |
| | NVIDIA Corp. | 1,055,800 | 37,618 |
| * | Tech Data Corp. | 486,400 | 37,341 |
| * | First Data Corp. Class A | 2,785,094 | 36,039 |
| | Computer Sciences Corp. | 994,108 | 34,187 |
| | DST Systems Inc. | 276,270 | 31,155 |
| | SYNNEX Corp. | 287,438 | 26,614 |
| * | Synaptics Inc. | 322,509 | 25,717 |
| * | ARRIS International plc | 1,100,608 | 25,226 |
| | Broadridge Financial | | |
| | Solutions Inc. | 414,100 | 24,560 |
15
Strategic Equity Fund
| | | |
| | | | Market |
| | | | Value• |
| | | Shares | ($000) |
| | Avnet Inc. | 505,236 | 22,382 |
| | Lexmark International Inc. | | |
| | Class A | 653,379 | 21,842 |
| *,^ | Fitbit Inc. Class A | 1,305,096 | 19,772 |
| * | Gartner Inc. | 191,996 | 17,155 |
| * | MicroStrategy Inc. Class A | 91,600 | 16,462 |
| * | Ciena Corp. | 854,285 | 16,249 |
| * | CACI International Inc. | | |
| | Class A | 143,277 | 15,288 |
| | EarthLink Holdings Corp. | 2,549,800 | 14,457 |
| * | GoDaddy Inc. Class A | 406,747 | 13,150 |
| | Lam Research Corp. | 127,900 | 10,565 |
| | Leidos Holdings Inc. | 207,117 | 10,422 |
| * | Blackhawk Network | | |
| | Holdings Inc. | 267,636 | 9,180 |
| | Science Applications | | |
| | International Corp. | 171,000 | 9,121 |
| | Jabil Circuit Inc. | 445,152 | 8,578 |
| * | Inphi Corp. | 221,195 | 7,375 |
| * | Gigamon Inc. | 235,900 | 7,318 |
| * | Sykes Enterprises Inc. | 233,100 | 7,035 |
| | CSG Systems | | |
| | International Inc. | 153,794 | 6,945 |
| * | ON Semiconductor Corp. | 710,537 | 6,814 |
| * | Mellanox | | |
| | Technologies Ltd. | 111,969 | 6,083 |
| | Ingram Micro Inc. | 124,363 | 4,466 |
| | MAXIMUS Inc. | 83,963 | 4,420 |
| * | Angie’s List Inc. | 507,000 | 4,091 |
| | Heartland Payment | | |
| | Systems Inc. | 36,844 | 3,558 |
| * | Cadence Design | | |
| | Systems Inc. | 140,000 | 3,301 |
| * | ePlus Inc. | 38,400 | 3,092 |
| *,^ | Ambarella Inc. | 68,437 | 3,059 |
| | Western Union Co. | 130,363 | 2,515 |
| * | Sanmina Corp. | 106,000 | 2,478 |
| * | Super Micro Computer Inc. | 65,488 | 2,232 |
| * | Flextronics | | |
| | International Ltd. | 158,252 | 1,909 |
| * | F5 Networks Inc. | 17,695 | 1,873 |
| * | Advanced Energy | | |
| | Industries Inc. | 50,300 | 1,750 |
| * | Monster Worldwide Inc. | 373,800 | 1,219 |
| * | Photronics Inc. | 95,271 | 992 |
| | | | 892,927 |
| Materials (5.8%) | | |
| | Sealed Air Corp. | 1,152,833 | 55,347 |
| | Avery Dennison Corp. | 744,990 | 53,721 |
| | Bemis Co. Inc. | 803,864 | 41,624 |
| * | Chemtura Corp. | 1,116,482 | 29,475 |
| * | Berry Plastics Group Inc. | 811,861 | 29,349 |
| *,^ | Trinseo SA | 426,150 | 15,687 |
| | Domtar Corp. | 342,884 | 13,887 |
| | Cabot Corp. | 281,214 | 13,591 |
| | | |
| | | | Market |
| | | | Value• |
| | | Shares | ($000) |
| | Graphic Packaging | | |
| | Holding Co. | 1,007,401 | 12,945 |
| | Reliance Steel | | |
| | & Aluminum Co. | 115,759 | 8,009 |
| | AptarGroup Inc. | 93,300 | 7,316 |
| | Newmont Mining Corp. | 244,782 | 6,506 |
| | Westlake Chemical Corp. | 129,389 | 5,991 |
| | Commercial Metals Co. | 343,860 | 5,835 |
| * | Axalta Coating | | |
| | Systems Ltd. | 184,815 | 5,397 |
| | Huntsman Corp. | 377,378 | 5,019 |
| | Neenah Paper Inc. | 76,100 | 4,845 |
| * | Ferro Corp. | 395,358 | 4,693 |
| | Kaiser Aluminum Corp. | 49,711 | 4,203 |
| | Mercer International Inc. | 394,796 | 3,731 |
| * | US Concrete Inc. | 45,049 | 2,684 |
| * | Kraton Performance | | |
| | Polymers Inc. | 110,500 | 1,912 |
| | Worthington Industries Inc. | 42,773 | 1,524 |
| * | Koppers Holdings Inc. | 55,200 | 1,240 |
| * | AK Steel Holding Corp. | 158,577 | 655 |
| | | | 335,186 |
| Telecommunication Services (0.9%) | |
| | Telephone & Data | | |
| | Systems Inc. | 454,872 | 13,687 |
| * | Level 3 | | |
| | Communications Inc. | 206,113 | 10,893 |
| | Frontier | | |
| | Communications Corp. | 1,217,000 | 6,803 |
| | Inteliquent Inc. | 337,605 | 5,419 |
| * | Cincinnati Bell Inc. | 1,327,700 | 5,138 |
| ^ | Windstream Holdings Inc. | 413,342 | 3,175 |
| * | General Communication | | |
| | Inc. Class A | 91,400 | 1,674 |
| | Cogent Communications | | |
| | Holdings Inc. | 37,085 | 1,447 |
| | Shenandoah | | |
| | Telecommunications Co. | 49,400 | 1,321 |
| * | Vonage Holdings Corp. | 140,400 | 642 |
| * | United States Cellular Corp. | 9,600 | 439 |
| * | FairPoint | | |
| | Communications Inc. | 19,500 | 290 |
| | | | 50,928 |
| Utilities (5.9%) | | |
| | FirstEnergy Corp. | 1,660,870 | 59,741 |
| | UGI Corp. | 1,253,182 | 50,491 |
| | WGL Holdings Inc. | 611,302 | 44,240 |
| | Entergy Corp. | 508,726 | 40,332 |
| | Vectren Corp. | 626,800 | 31,691 |
| | AES Corp. | 1,952,105 | 23,035 |
| | New Jersey | | |
| | Resources Corp. | 509,883 | 18,575 |
| | Ameren Corp. | 367,776 | 18,426 |
| | CMS Energy Corp. | 362,700 | 15,393 |
| | Pinnacle West | | |
| | Capital Corp. | 115,791 | 8,692 |
16
Strategic Equity Fund
| | | |
| | | | Market |
| | | | Value• |
| | | Shares | ($000) |
| | NiSource Inc. | 253,776 | 5,979 |
| | PNM Resources Inc. | 166,127 | 5,602 |
| | Atmos Energy Corp. | 53,434 | 3,968 |
| | ONE Gas Inc. | 59,586 | 3,641 |
| | American States Water Co. | 90,088 | 3,546 |
| | Avista Corp. | 74,239 | 3,027 |
| * | Talen Energy Corp. | 324,800 | 2,923 |
| | Unitil Corp. | 37,500 | 1,593 |
| | | | 340,895 |
| Total Common Stocks | | |
| (Cost $5,322,326) | | 5,794,355 |
| Temporary Cash Investments (2.3%)1 | |
| Money Market Fund (2.3%) | | |
| 2,3 | Vanguard Market | | |
| | Liquidity Fund, | | |
| | 0.495% | 134,680,975 | 134,681 |
| |
| | | Face | |
| | | Amount | |
| | | ($000) | |
| U.S. Government and Agency Obligations (0.0%) |
| 4 | Federal Home Loan Bank | | |
| | Discount Notes, | | |
| | 0.501%, 5/3/16 | 100 | 100 |
| 4 | Federal Home Loan Bank | | |
| | Discount Notes, | | |
| | 0.411%, 6/2/16 | 100 | 100 |
| 4,5 | Federal Home Loan Bank | | |
| | Discount Notes, 0.401%– | | |
| | 0.516%, 8/31/16 | 1,100 | 1,098 |
| 5 | United States Treasury | | |
| | Bill, 0.428%, 8/4/16 | 300 | 299 |
| | | | 1,597 |
| Total Temporary Cash Investments | |
| (Cost $136,278) | | 136,278 |
| Total Investments (101.9%) | | |
| (Cost $5,458,604) | | 5,930,633 |
| | |
| | Amount |
| | ($000) |
| Other Assets and Liabilities (-1.9%) | |
| Other Assets | |
| Investment in Vanguard | 483 |
| Receivables for Accrued Income | 8,098 |
| Receivables for Capital Shares Issued | 5,520 |
| 5Other Assets | 157 |
| Total Other Assets | 14,258 |
| Liabilities | |
| Payables for Investment Securities | |
| Purchased | (5,133) |
| Collateral for Securities on Loan | (109,708) |
| Payables for Capital Shares Redeemed | (2,648) |
| Payables to Vanguard | (7,373) |
| Other Liabilities | (8) |
| Total Liabilities | (124,870) |
| Net Assets (100%) | |
| Applicable to 204,776,822 outstanding | |
| $.001 par value shares of beneficial | |
| interest (unlimited authorization) | 5,820,021 |
| Net Asset Value Per Share | $28.42 |
| | |
| At March 31, 2016, net assets consisted of: |
| | Amount |
| | ($000) |
| Paid-in Capital | 5,322,609 |
| Undistributed Net Investment Income | 14,318 |
| Accumulated Net Realized Gains | 10,441 |
| Unrealized Appreciation (Depreciation) | |
| Investment Securities | 472,029 |
| Futures Contracts | 624 |
| Net Assets | 5,820,021 |
• See Note A in Notes to Financial Statements.
* Non-income-producing security.
^ Includes partial security positions on loan to broker-dealers. The total value of securities on loan is $107,199,000.
1 The fund invests a portion of its cash reserves in equity markets through the use of index futures contracts. After giving effect to futures investments, the fund’s effective common stock and temporary cash investment positions represent 100.0% and 1.9%, respectively, of net assets.
2 Affiliated money market fund available only to Vanguard funds and certain trusts and accounts managed by Vanguard. Rate shown is the 7-day yield.
3 Includes $109,708,000 of collateral received for securities on loan.
4 The issuer operates under a congressional charter; its securities are generally neither guaranteed by the U.S. Treasury nor backed by the full faith and credit of the U.S. government.
5 Securities with a value of $1,298,000 and cash of $100,000 have been segregated as initial margin for open futures contracts.
REIT—Real Estate Investment Trust.
See accompanying Notes, which are an integral part of the Financial Statements.
17
Strategic Equity Fund
Statement of Operations
| |
| | Six Months Ended |
| | March 31, 2016 |
| | ($000) |
| Investment Income | |
| Income | |
| Dividends | 54,552 |
| Interest1 | 43 |
| Securities Lending | 5,952 |
| Total Income | 60,547 |
| Expenses | |
| The Vanguard Group—Note B | |
| Investment Advisory Services | 767 |
| Management and Administrative | 3,885 |
| Marketing and Distribution | 613 |
| Custodian Fees | 35 |
| Shareholders’ Reports | 35 |
| Trustees’ Fees and Expenses | 2 |
| Total Expenses | 5,337 |
| Net Investment Income | 55,210 |
| Realized Net Gain (Loss) | |
| Investment Securities Sold | 38,281 |
| Futures Contracts | 122 |
| Realized Net Gain (Loss) | 38,403 |
| Change in Unrealized Appreciation (Depreciation) | |
| Investment Securities | 97,688 |
| Futures Contracts | 822 |
| Change in Unrealized Appreciation (Depreciation) | 98,510 |
| Net Increase (Decrease) in Net Assets Resulting from Operations | 192,123 |
| 1 Interest income from an affiliated company of the fund was $40,000. |
See accompanying Notes, which are an integral part of the Financial Statements.
18
Strategic Equity Fund
Statement of Changes in Net Assets
| | |
| | Six Months Ended | Year Ended |
| | March 31, | September 30, |
| | 2016 | 2015 |
| | ($000) | ($000) |
| Increase (Decrease) in Net Assets | | |
| Operations | | |
| Net Investment Income | 55,210 | 84,421 |
| Realized Net Gain (Loss) | 38,403 | 613,463 |
| Change in Unrealized Appreciation (Depreciation) | 98,510 | (608,999) |
| Net Increase (Decrease) in Net Assets Resulting from Operations | 192,123 | 88,885 |
| Distributions | | |
| Net Investment Income | (93,924) | (60,071) |
| Realized Capital Gain | (549,653) | (257,765) |
| Total Distributions | (643,577) | (317,836) |
| Capital Share Transactions | | |
| Issued | 388,312 | 1,082,468 |
| Issued in Lieu of Cash Distributions | 602,796 | 301,093 |
| Redeemed | (459,083) | (807,310) |
| Net Increase (Decrease) from Capital Share Transactions | 532,025 | 576,251 |
| Total Increase (Decrease) | 80,571 | 347,300 |
| Net Assets | | |
| Beginning of Period | 5,739,450 | 5,392,150 |
| End of Period1 | 5,820,021 | 5,739,450 |
| 1 Net Assets—End of Period includes undistributed (overdistributed) net investment income of $14,318,000 and $53,032,000. |
See accompanying Notes, which are an integral part of the Financial Statements.
19
Strategic Equity Fund
Financial Highlights
| | | | | | |
| | Six Months | | | | | |
| | Ended | | | | | |
| For a Share Outstanding | March 31, | | | Year Ended September 30, |
| Throughout Each Period | 2016 | 2015 | 2014 | 2013 | 2012 | 2011 |
| Net Asset Value, | | | | | | |
| Beginning of Period | $30.82 | $32.02 | $27.34 | $21.02 | $16.30 | $16.30 |
| Investment Operations | | | | | | |
| Net Investment Income | . 292 | . 466 | . 361 | . 4261 | .249 | .210 |
| Net Realized and Unrealized Gain (Loss) | | | | | | |
| on Investments | .782 | .207 | 4.679 | 6.244 | 4.667 | .017 |
| Total from Investment Operations | 1.074 | .673 | 5.040 | 6.670 | 4.916 | .227 |
| Distributions | | | | | | |
| Dividends from Net Investment Income | (. 507) | (. 354) | (. 360) | (. 350) | (.196) | (. 227) |
| Distributions from Realized Capital Gains | (2.967) | (1.519) | — | — | — | — |
| Total Distributions | (3.474) | (1.873) | (.360) | (.350) | (.196) | (.227) |
| Net Asset Value, End of Period | $28.42 | $30.82 | $32.02 | $27.34 | $21.02 | $16.30 |
| |
| Total Return2 | 3.38% | 2.01% | 18.53% | 32.23% | 30.32% | 1.23% |
| |
| Ratios/Supplemental Data | | | | | | |
| Net Assets, End of Period (Millions) | $5,820 | $5,739 | $5,392 | $4,239 | $3,254 | $2,756 |
| Ratio of Total Expenses to | | | | | | |
| Average Net Assets | 0.19% | 0.21% | 0.27% | 0.28% | 0.29% | 0.30% |
| Ratio of Net Investment Income to | | | | | | |
| Average Net Assets | 1.89% | 1.41% | 1.19% | 1.75%1 | 1.25% | 1.09% |
| Portfolio Turnover Rate | 68% | 70% | 60% | 64% | 67% | 73% |
The expense ratio, net income ratio, and turnover rate for the current period have been annualized.
1 Net investment income per share and the ratio of net investment income to average net assets include $.043 and 0.18%, respectively, resulting from a special dividend received in connection with a merger between T-Mobile US Inc. and Metro PCS Communications Inc. in May 2013.
2 Total returns do not include account service fees that may have applied in the periods shown. Fund prospectuses provide information about any applicable account service fees.
See accompanying Notes, which are an integral part of the Financial Statements.
20
Strategic Equity Fund
Notes to Financial Statements
Vanguard Strategic Equity Fund is registered under the Investment Company Act of 1940 as an open-end investment company, or mutual fund.
A. The following significant accounting policies conform to generally accepted accounting principles for U.S. investment companies. The fund consistently follows such policies in preparing its financial statements.
1. Security Valuation: Securities are valued as of the close of trading on the New York Stock Exchange (generally 4 p.m., Eastern time) on the valuation date. Equity securities are valued at the latest quoted sales prices or official closing prices taken from the primary market in which each security trades; such securities not traded on the valuation date are valued at the mean of the latest quoted bid and asked prices. Securities for which market quotations are not readily available, or whose values have been materially affected by events occurring before the fund’s pricing time but after the close of the securities’ primary markets, are valued by methods deemed by the board of trustees to represent fair value. Investments in Vanguard Market Liquidity Fund are valued at that fund’s net asset value. Temporary cash investments acquired over 60 days to maturity are valued using the latest bid prices or using valuations based on a matrix system (which considers such factors as security prices, yields, maturities, and ratings), both as furnished by independent pricing services. Other temporary cash investments are valued at amortized cost, which approximates market value.
2. Futures Contracts: The fund uses index futures contracts to a limited extent, with the objective of maintaining full exposure to the stock market while maintaining liquidity. The fund may purchase or sell futures contracts to achieve a desired level of investment, whether to accommodate portfolio turnover or cash flows from capital share transactions. The primary risks associated with the use of futures contracts are imperfect correlation between changes in market values of stocks held by the fund and the prices of futures contracts, and the possibility of an illiquid market. Counterparty risk involving futures is mitigated because a regulated clearinghouse is the counterparty instead of the clearing broker. To further mitigate counterparty risk, the fund trades futures contracts on an exchange, monitors the financial strength of its clearing brokers and clearinghouse, and has entered into clearing agreements with its clearing brokers. The clearinghouse imposes initial margin requirements to secure the fund’s performance and requires daily settlement of variation margin representing changes in the market value of each contract.
Futures contracts are valued at their quoted daily settlement prices. The aggregate settlement values of the contracts are not recorded in the Statement of Net Assets. Fluctuations in the value of the contracts are recorded in the Statement of Net Assets as an asset (liability) and in the Statement of Operations as unrealized appreciation (depreciation) until the contracts are closed, when they are recorded as realized futures gains (losses).
During the six months ended March 31, 2016, the fund’s average investments in long and short futures contracts represented less than 1% and 0% of net assets, respectively, based on the average of aggregate settlement values at each quarter-end during the period.
3. Federal Income Taxes: The fund intends to continue to qualify as a regulated investment company and distribute all of its taxable income. Management has analyzed the fund’s tax positions taken for all open federal income tax years (September 30, 2012–2015), and for the period ended March 31, 2016, and has concluded that no provision for federal income tax is required in the fund’s financial statements.
21
Strategic Equity Fund
4. Distributions: Distributions to shareholders are recorded on the ex-dividend date.
5. Securities Lending: To earn additional income, the fund lends its securities to qualified institutional borrowers. Security loans are subject to termination by the fund at any time, and are required to be secured at all times by collateral in an amount at least equal to the market value of securities loaned. Daily market fluctuations could cause the value of loaned securities to be more or less than the value of the collateral received. When this occurs, the collateral is adjusted and settled on the next business day. The fund further mitigates its counterparty risk by entering into securities lending transactions only with a diverse group of prequalified counterparties, monitoring their financial strength, and entering into master securities lending agreements with its counterparties. The master securities lending agreements provide that, in the event of a counterparty’s default (including bankruptcy), the fund may terminate any loans with that borrower, determine the net amount owed, and sell or retain the collateral up to the net amount owed to the fund; however, such actions may be subject to legal proceedings. While collateral mitigates counterparty risk, in the absence of a default the fund may experience delays and costs in recovering the securities loaned. The fund invests cash collateral received in Vanguard Market Liquidity Fund, and records a liability in the Statement of Net Assets for the return of the collateral, during the period the securities are on loan. Securities lending income represents fees charged to borrowers plus income earned on invested cash collateral, less expenses associated with the loan.
6. Credit Facility: The fund and certain other funds managed by The Vanguard Group (“Vanguard”) participate in a $3.1 billion committed credit facility provided by a syndicate of lenders pursuant to a credit agreement that may be renewed annually; each fund is individually liable for its borrowings, if any, under the credit facility. Borrowings may be utilized for temporary and emergency purposes, and are subject to the fund’s regulatory and contractual borrowing restrictions. The participating funds are charged administrative fees and an annual commitment fee of 0.10% of the undrawn amount of the facility; these fees are allocated to the funds based on a method approved by the fund’s board of trustees and included in Management and Administrative expenses on the fund’s Statement of Operations. Any borrowings under this facility bear interest at a rate based upon the higher of the one-month London Interbank Offered Rate, federal funds effective rate, or overnight bank funding rate plus an agreed-upon spread.
The fund had no borrowings outstanding at March 31, 2016, or at any time during the period then ended.
7. Other: Dividend income is recorded on the ex-dividend date. Interest income includes income distributions received from Vanguard Market Liquidity Fund and is accrued daily. Premiums and discounts on debt securities purchased are amortized and accreted, respectively, to interest income over the lives of the respective securities. Security transactions are accounted for on the date securities are bought or sold. Costs used to determine realized gains (losses) on the sale of investment securities are those of the specific securities sold.
B. In accordance with the terms of a Funds’ Service Agreement (the “FSA”) between Vanguard and the fund, Vanguard furnishes to the fund investment advisory, corporate management, administrative, marketing, and distribution services at Vanguard’s cost of operations (as defined by the FSA). These costs of operations are allocated to the fund based on methods and guidelines approved by the board of trustees. Vanguard does not require reimbursement in the current period for certain costs of operations (such as deferred compensation/benefits and risk/insurance costs); the fund’s liability for these costs of operations is included in Payables to Vanguard on the Statement of Net Assets.
22
Strategic Equity Fund
Upon the request of Vanguard, the fund may invest up to 0.40% of its net assets as capital in Vanguard. At March 31, 2016, the fund had contributed to Vanguard capital in the amount of $483,000, representing 0.01% of the fund’s net assets and 0.19% of Vanguard’s capitalization. The fund’s trustees and officers are also directors and employees, respectively, of Vanguard.
C. Various inputs may be used to determine the value of the fund’s investments. These inputs are summarized in three broad levels for financial statement purposes. The inputs or methodologies used to value securities are not necessarily an indication of the risk associated with investing in those securities.
Level 1—Quoted prices in active markets for identical securities.
Level 2—Other significant observable inputs (including quoted prices for similar securities, interest rates, prepayment speeds, credit risk, etc.).
Level 3—Significant unobservable inputs (including the fund’s own assumptions used to determine the fair value of investments).
The following table summarizes the market value of the fund’s investments as of March 31, 2016, based on the inputs used to value them:
| | | |
| | Level 1 | Level 2 | Level 3 |
| Investments | ($000) | ($000) | ($000) |
| Common Stocks | 5,794,355 | — | — |
| Temporary Cash Investments | 134,681 | 1,597 | — |
| Futures Contracts—Assets1 | 45 | — | — |
| Futures Contracts—Liabilities1 | (8) | — | — |
| Total | 5,929,073 | 1,597 | — |
| 1 Represents variation margin on the last day of the reporting period. | | | |
D. At March 31, 2016, the aggregate settlement value of open futures contracts and the related unrealized appreciation (depreciation) were:
| | | | |
| | | | | ($000) |
| | | | Aggregate | |
| | | Number of | Settlement | Unrealized |
| | | Long (Short) | Value | Appreciation |
| Futures Contracts | Expiration | Contracts | Long (Short) | (Depreciation) |
| E-mini S&P Mid-Cap 400 Index | June 2016 | 89 | 12,827 | 432 |
| E-mini Russell 2000 Index | June 2016 | 114 | 12,649 | 192 |
| | | | | 624 |
Unrealized appreciation (depreciation) on open futures contracts is required to be treated as realized gain (loss) for tax purposes.
E. Distributions are determined on a tax basis and may differ from net investment income and realized capital gains for financial reporting purposes. Differences may be permanent or temporary. Permanent differences are reclassified among capital accounts in the financial statements to reflect their tax character. Temporary differences arise when certain items of income, expense, gain, or loss are recognized in different periods for financial statement and tax purposes. These differences will
23
Strategic Equity Fund
reverse at some time in the future. Differences in classification may also result from the treatment of short-term gains as ordinary income for tax purposes. The fund’s tax-basis capital gains and losses are determined only at the end of each fiscal year.
At March 31, 2016, the cost of investment securities for tax purposes was $5,458,983,000.
Net unrealized appreciation of investment securities for tax purposes was $471,650,000, consisting of unrealized gains of $892,613,000 on securities that had risen in value since their purchase and $420,963,000 in unrealized losses on securities that had fallen in value since their purchase.
F. During the six months ended March 31, 2016, the fund purchased $1,947,011,000 of investment securities and sold $1,996,823,000 of investment securities, other than temporary cash investments.
G. Capital shares issued and redeemed were:
| | |
| | Six Months Ended | Year Ended |
| | March 31, 2016 | September 30, 2015 |
| | Shares | Shares |
| | (000) | (000) |
| Issued | 13,404 | 32,774 |
| Issued in Lieu of Cash Distributions | 21,011 | 9,610 |
| Redeemed | (15,893) | (24,537) |
| Net Increase (Decrease) in Shares Outstanding | 18,522 | 17,847 |
H. Management has determined that no material events or transactions occurred subsequent to March 31, 2016, that would require recognition or disclosure in these financial statements.
24
About Your Fund’s Expenses
As a shareholder of the fund, you incur ongoing costs, which include costs for portfolio management, administrative services, and shareholder reports (like this one), among others. Operating expenses, which are deducted from a fund’s gross income, directly reduce the investment return of the fund.
A fund’s expenses are expressed as a percentage of its average net assets. This figure is known as the expense ratio. The following examples are intended to help you understand the ongoing costs (in dollars) of investing in your fund and to compare these costs with those of other mutual funds. The examples are based on an investment of $1,000 made at the beginning of the period shown and held for the entire period.
The accompanying table illustrates your fund’s costs in two ways:
• Based on actual fund return. This section helps you to estimate the actual expenses that you paid over the period. The ”Ending Account Value“ shown is derived from the fund‘s actual return, and the third column shows the dollar amount that would have been paid by an investor who started with $1,000 in the fund. You may use the information here, together with the amount you invested, to estimate the expenses that you paid over the period.
To do so, simply divide your account value by $1,000 (for example, an $8,600 account value divided by $1,000 = 8.6), then multiply the result by the number given for your fund under the heading ”Expenses Paid During Period.“
• Based on hypothetical 5% yearly return. This section is intended to help you compare your fund‘s costs with those of other mutual funds. It assumes that the fund had a yearly return of 5% before expenses, but that the expense ratio is unchanged. In this case—because the return used is not the fund’s actual return—the results do not apply to your investment. The example is useful in making comparisons because the Securities and Exchange Commission requires all mutual funds to calculate expenses based on a 5% return. You can assess your fund’s costs by comparing this hypothetical example with the hypothetical examples that appear in shareholder reports of other funds.
Note that the expenses shown in the table are meant to highlight and help you compare ongoing costs only and do not reflect transaction costs incurred by the fund for buying and selling securities. Further, the expenses do not include any purchase, redemption, or account service fees described in the fund prospectus. If such fees were applied to your account, your costs would be higher. Your fund does not carry a “sales load.”
The calculations assume no shares were bought or sold during the period. Your actual costs may have been higher or lower, depending on the amount of your investment and the timing of any purchases or redemptions.
You can find more information about the fund’s expenses, including annual expense ratios, in the Financial Statements section of this report. For additional information on operating expenses and other shareholder costs, please refer to your fund’s current prospectus.
25
| | | | |
| Six Months Ended March 31, 2016 | | | |
| |
| | Beginning | Ending | Expenses |
| | Account Value | Account Value | Paid During |
| Strategic Equity Fund | 9/30/2015 | 3/31/2016 | Period |
| Based on Actual Fund Return | $1,000.00 | $1,033.79 | $0.97 |
| Based on Hypothetical 5% Yearly Return | 1,000.00 | 1,024.05 | 0.96 |
| The calculations are based on expenses incurred in the most recent six-month period. The fund’s annualized six-month expense ratio for that period is 0.19%. The dollar amounts shown as “Expenses Paid” are equal to the annualized expense ratio multiplied by the average account value over the period, multiplied by the number of days in the most recent six-month period, then divided by the number of days in the most recent 12-month period (183/366). |
|
|
|
26
Trustees Approve Advisory Arrangement
The board of trustees of Vanguard Strategic Equity Fund has renewed the fund’s investment advisory arrangement with The Vanguard Group, Inc. (Vanguard)—through its Quantitative Equity Group.
The board determined that continuing the fund’s internalized management structure was in the best interests of the fund and its shareholders.
The board based its decision upon an evaluation of the advisor’s investment staff, portfolio management process, and performance. The trustees considered the factors discussed below, among others. However, no single factor determined whether the board approved the arrangement. Rather, it was the totality of the circumstances that drove the board’s decision.
Nature, extent, and quality of services
The board reviewed the quality of the fund’s investment management services over both the short and long term, and took into account the organizational depth and stability of the advisor. The board considered that Vanguard has been managing investments for more than three decades. The Quantitative Equity Group adheres to a sound, disciplined investment management process; the team has considerable experience, stability, and depth.
The board concluded that Vanguard’s experience, stability, depth, and performance, among other factors, warranted continuation of the advisory arrangement.
Investment performance
The board considered the short- and long-term performance of the fund, including any periods of outperformance or underperformance relative to a benchmark index and peer group. The board concluded that the performance was such that the advisory arrangement should continue. Information about the fund’s most recent performance can be found in the Performance Summary section of this report.
Cost
The board concluded that the fund’s expense ratio was well below the average expense ratio charged by funds in its peer group and that the fund’s advisory fee rate was also well below its peer-group average. Information about the fund’s expenses appears in the About Your Fund’s Expenses section of this report as well as in the Financial Statements section.
The board does not conduct a profitability analysis of Vanguard because of Vanguard’s unique “at-cost” structure. Unlike most other mutual fund management companies, Vanguard is owned by the funds it oversees, and produces “profits” only in the form of reduced expenses for fund shareholders.
The benefit of economies of scale
The board concluded that the fund’s at-cost arrangement with Vanguard ensures that the fund will realize economies of scale as it grows, with the cost to shareholders declining as fund assets increase.
The board will consider whether to renew the advisory arrangement again after a one-year period.
27
Glossary
30-Day SEC Yield. A fund’s 30-day SEC yield is derived using a formula specified by the U.S. Securities and Exchange Commission. Under the formula, data related to the fund’s security holdings in the previous 30 days are used to calculate the fund’s hypothetical net income for that period, which is then annualized and divided by the fund’s estimated average net assets over the calculation period. For the purposes of this calculation, a security’s income is based on its current market yield to maturity (for bonds), its actual income (for asset-backed securities), or its projected dividend yield (for stocks). Because the SEC yield represents hypothetical annualized income, it will differ—at times significantly—from the fund’s actual experience. As a result, the fund’s income distributions may be higher or lower than implied by the SEC yield.
Beta. A measure of the magnitude of a fund’s past share-price fluctuations in relation to the ups and downs of a given market index. The index is assigned a beta of 1.00. Compared with a given index, a fund with a beta of 1.20 typically would have seen its share price rise or fall by 12% when the index rose or fell by 10%. For this report, beta is based on returns over the past 36 months for both the fund and the index. Note that a fund’s beta should be reviewed in conjunction with its R-squared (see definition). The lower the R-squared, the less correlation there is between the fund and the index, and the less reliable beta is as an indicator of volatility.
Dividend Yield. Dividend income earned by stocks, expressed as a percentage of the aggregate market value (or of net asset value, for a fund). The yield is determined by dividing the amount of the annual dividends by the aggregate value (or net asset value) at the end of the period. For a fund, the dividend yield is based solely on stock holdings and does not include any income produced by other investments.
Earnings Growth Rate. The average annual rate of growth in earnings over the past five years for the stocks now in a fund.
Equity Exposure. A measure that reflects a fund’s investments in stocks and stock futures. Any holdings in short-term reserves are excluded.
Expense Ratio. A fund’s total annual operating expenses expressed as a percentage of the fund’s average net assets. The expense ratio includes management and administrative expenses, but does not include the transaction costs of buying and selling portfolio securities.
Foreign Holdings. The percentage of a fund represented by securities or depositary receipts of companies based outside the United States.
Inception Date. The date on which the assets of a fund (or one of its share classes) are first invested in accordance with the fund’s investment objective. For funds with a subscription period, the inception date is the day after that period ends. Investment performance is measured from the inception date.
Median Market Cap. An indicator of the size of companies in which a fund invests; the midpoint of market capitalization (market price x shares outstanding) of a fund’s stocks, weighted by the proportion of the fund’s assets invested in each stock. Stocks representing half of the fund’s assets have market capitalizations above the median, and the rest are below it.
Price/Book Ratio. The share price of a stock divided by its net worth, or book value, per share. For a fund, the weighted average price/book ratio of the stocks it holds.
28
Price/Earnings Ratio. The ratio of a stock’s current price to its per-share earnings over the past year. For a fund, the weighted average P/E of the stocks it holds. P/E is an indicator of market expectations about corporate prospects; the higher the P/E, the greater the expectations for a company’s future growth.
R-Squared. A measure of how much of a fund’s past returns can be explained by the returns from the market in general, as measured by a given index. If a fund’s total returns were precisely synchronized with an index’s returns, its R-squared would be 1.00. If the fund’s returns bore no relationship to the index’s returns, its R-squared would be 0. For this report, R-squared is based on returns over the past 36 months for both the fund and the index.
Return on Equity. The annual average rate of return generated by a company during the past five years for each dollar of shareholder’s equity (net income divided by shareholder’s equity). For a fund, the weighted average return on equity for the companies whose stocks it holds.
Short-Term Reserves. The percentage of a fund invested in highly liquid, short-term securities that can be readily converted to cash.
Turnover Rate. An indication of the fund’s trading activity. Funds with high turnover rates incur higher transaction costs and may be more likely to distribute capital gains (which may be taxable to investors). The turnover rate excludes in-kind transactions, which have minimal impact on costs.
29
This page intentionally left blank.
This page intentionally left blank.
The People Who Govern Your Fund
The trustees of your mutual fund are there to see that the fund is operated and managed in your best interests since, as a shareholder, you are a part owner of the fund. Your fund’s trustees also serve on the board of directors of The Vanguard Group, Inc., which is owned by the Vanguard funds and provides services to them on an at-cost basis.
A majority of Vanguard’s board members are independent, meaning that they have no affiliation with Vanguard or the funds they oversee, apart from the sizable personal investments they have made as private individuals. The independent board members have distinguished backgrounds in business, academia, and public service. Each of the trustees and executive officers oversees 198 Vanguard funds.
The following table provides information for each trustee and executive officer of the fund. More information about the trustees is in the Statement of Additional Information, which can be obtained, without charge, by contacting Vanguard at 800-662-7447, or online at vanguard.com.
| |
| InterestedTrustee1 | Rajiv L. Gupta |
| | Born 1945. Trustee Since December 2001.2 Principal |
| F. William McNabb III | Occupation(s) During the Past Five Years and Other |
| Born 1957. Trustee Since July 2009. Chairman of | Experience: Chairman and Chief Executive Officer |
| the Board. Principal Occupation(s) During the Past | (retired 2009) and President (2006–2008) of |
| Five Years and Other Experience: Chairman of the | Rohm and Haas Co. (chemicals); Director of Tyco |
| Board of The Vanguard Group, Inc., and of each of | International PLC (diversified manufacturing and |
| the investment companies served by The Vanguard | services), HP Inc. (printer and personal computer |
| Group, since January 2010; Director of The Vanguard | manufacturing), and Delphi Automotive PLC |
| Group since 2008; Chief Executive Officer and | (automotive components); Senior Advisor at |
| President of The Vanguard Group, and of each of | New Mountain Capital. |
| the investment companies served by The Vanguard | |
| Group, since 2008; Director of Vanguard Marketing | Amy Gutmann |
| Corporation; Managing Director of The Vanguard | Born 1949. Trustee Since June 2006. Principal |
| Group (1995–2008). | Occupation(s) During the Past Five Years and |
| Other Experience: President of the University of |
| IndependentTrustees | Pennsylvania; Christopher H. Browne Distinguished |
| Professor of Political Science, School of Arts and |
| Emerson U. Fullwood | Sciences, and Professor of Communication, Annenberg |
| Born 1948. Trustee Since January 2008. Principal | School for Communication, with secondary faculty |
| Occupation(s) During the Past Five Years and Other | appointments in the Department of Philosophy, School |
| Experience: Executive Chief Staff and Marketing | of Arts and Sciences, and at the Graduate School of |
| Officer for North America and Corporate Vice President | Education, University of Pennsylvania; Trustee of the |
| (retired 2008) of Xerox Corporation (document manage- | National Constitution Center; Chair of the Presidential |
| ment products and services); Executive in Residence | Commission for the Study of Bioethical Issues. |
| and 2009–2010 Distinguished Minett Professor at | |
| the Rochester Institute of Technology; Lead Director | JoAnn Heffernan Heisen |
| of SPX FLOW, Inc. (multi-industry manufacturing); | Born 1950. Trustee Since July 1998. Principal |
| Director of the United Way of Rochester, the University | Occupation(s) During the Past Five Years and |
| of Rochester Medical Center, Monroe Community | Other Experience: Corporate Vice President and |
| College Foundation, North Carolina A&T University, | Chief Global Diversity Officer (retired 2008) and |
| and Roberts Wesleyan College. | Member of the Executive Committee (1997–2008) |
| of Johnson & Johnson (pharmaceuticals/medical |
| devices/consumer products); Director of Skytop |
| Lodge Corporation (hotels) and the Robert Wood |
| Johnson Foundation; Member of the Advisory |
| Board of the Institute for Women’s Leadership |
| at Rutgers University. |
Experience: President and Chief Operating Officer | | |
| F. Joseph Loughrey | Executive Officers | |
| Born 1949. Trustee Since October 2009. Principal | | |
| Occupation(s) During the Past Five Years and Other | Glenn Booraem | |
| Experience: President and Chief Operating Officer | Born 1967. Treasurer Since May 2015. Principal |
| (retired 2009) of Cummins Inc. (industrial machinery); | Occupation(s) During the Past Five Years and |
| Chairman of the Board of Hillenbrand, Inc. (specialized | Other Experience: Principal of The Vanguard Group, |
| consumer services), and of Oxfam America; Director | Inc.; Treasurer of each of the investment companies |
| of SKF AB (industrial machinery), Hyster-Yale Materials | served by The Vanguard Group; Controller of each of |
| Handling, Inc. (forklift trucks), the Lumina Foundation | the investment companies served by The Vanguard |
| for Education, and the V Foundation for Cancer | Group (2010–2015); Assistant Controller of each of |
| Research; Member of the Advisory Council for the | the investment companies served by The Vanguard |
| College of Arts and Letters and of the Advisory Board | Group (2001–2010). | |
| to the Kellogg Institute for International Studies, both | | |
| at the University of Notre Dame. | Thomas J. Higgins | |
| Born 1957. Chief Financial Officer Since September |
| Mark Loughridge | 2008. Principal Occupation(s) During the Past Five |
| Born 1953. Trustee Since March 2012. Principal | Years and Other Experience: Principal of The Vanguard |
| Occupation(s) During the Past Five Years and Other | Group, Inc.; Chief Financial Officer of each of the |
| Experience: Senior Vice President and Chief Financial | investment companies served by The Vanguard Group; |
| Officer (retired 2013) at IBM (information technology | Treasurer of each of the investment companies served |
| services); Fiduciary Member of IBM’s Retirement Plan | by The Vanguard Group (1998–2008). |
| Committee (2004–2013); Director of the Dow Chemical | |
| Company; Member of the Council on Chicago Booth. | Peter Mahoney | |
| Born 1974. Controller Since May 2015. Principal |
| Scott C. Malpass | Occupation(s) During the Past Five Years and |
| Born 1962. Trustee Since March 2012. Principal | Other Experience: Head of Global Fund Accounting |
| Occupation(s) During the Past Five Years and Other | at The Vanguard Group, Inc.; Controller of each of the |
| Experience: Chief Investment Officer and Vice | investment companies served by The Vanguard Group; |
| President at the University of Notre Dame; Assistant | Head of International Fund Services at The Vanguard |
| Professor of Finance at the Mendoza College of | Group (2008–2014). | |
| Business at Notre Dame; Member of the Notre Dame | | |
| 403(b) Investment Committee, the Board of Advisors | Heidi Stam | |
| for Spruceview Capital Partners, and the Investment | Born 1956. Secretary Since July 2005. Principal |
| Advisory Committee of Major League Baseball; Board | Occupation(s) During the Past Five Years and Other |
| Member of TIFF Advisory Services, Inc., and Catholic | Experience: Managing Director of The Vanguard |
| Investment Services, Inc. (investment advisors). | Group, Inc.; General Counsel of The Vanguard Group; |
| Secretary of The Vanguard Group and of each of the |
| André F. Perold | investment companies served by The Vanguard Group; |
| Born 1952. Trustee Since December 2004. Principal | Director and Senior Vice President of Vanguard |
| Occupation(s) During the Past Five Years and Other | Marketing Corporation. | |
| Experience: George Gund Professor of Finance and | | |
| Banking, Emeritus at the Harvard Business School | Vanguard Senior ManagementTeam |
| (retired 2011); Chief Investment Officer and Managing | | |
| Partner of HighVista Strategies LLC (private investment | Mortimer J. Buckley | James M. Norris |
| firm); Director of Rand Merchant Bank; Overseer of | Kathleen C. Gubanich | Thomas M. Rampulla |
| the Museum of Fine Arts Boston. | Martha G. King | Glenn W. Reed |
| John T. Marcante | Karin A. Risi |
| Peter F. Volanakis | Chris D. McIsaac | |
| Born 1955. Trustee Since July 2009. Principal | |
| Occupation(s) During the Past Five Years and Other | Chairman Emeritus and Senior Advisor |
| (retired 2010) of Corning Incorporated (communications | John J. Brennan | |
| equipment); Trustee of Colby-Sawyer College and | Chairman, 1996–2009 |
| Chairman of its Finance and Enrollment Committee; | Chief Executive Officer and President, 1996–2008 |
| Member of the Advisory Board of the Norris Cotton | | |
| Cancer Center. | Founder | |
| John C. Bogle | |
| Chairman and Chief Executive Officer, 1974–1996 |
1 Mr. McNabb is considered an “interested person,” as defined in the Investment Company Act of 1940, because he is an officer of the Vanguard funds.
2 December 2002 for Vanguard Equity Income Fund, the Vanguard Municipal Bond Funds, and the Vanguard State Tax-Exempt Funds.
|  |
| | P.O. Box 2600 |
| | Valley Forge, PA 19482-2600 |
| |
| |
| |
| Connect with Vanguard® > vanguard.com | |
| |
| |
| |
| Fund Information > 800-662-7447 | CFA® is a registered trademark owned by CFA Institute. |
| Direct Investor Account Services > 800-662-2739 | |
| Institutional Investor Services > 800-523-1036 | |
| Text Telephone for People | |
| Who Are Deaf or Hard of Hearing> 800-749-7273 | |
| |
| This material may be used in conjunction | |
| with the offering of shares of any Vanguard | |
| fund only if preceded or accompanied by | |
| the fund’s current prospectus. | |
| |
| All comparative mutual fund data are from Lipper, a | |
| Thomson Reuters Company, or Morningstar, Inc., unless | |
| otherwise noted. | |
| |
| You can obtain a free copy of Vanguard’s proxy voting | |
| guidelines by visiting vanguard.com/proxyreporting or by | |
| calling Vanguard at 800-662-2739. The guidelines are | |
| also available from the SEC’s website, sec.gov. In | |
| addition, you may obtain a free report on how your fund | |
| voted the proxies for securities it owned during the 12 | |
| months ended June 30. To get the report, visit either | |
| vanguard.com/proxyreporting or sec.gov. | |
| |
| You can review and copy information about your fund at | |
| the SEC’s Public Reference Room in Washington, D.C. To | |
| find out more about this public service, call the SEC at | |
| 202-551-8090. Information about your fund is also | |
| available on the SEC’s website, and you can receive | |
| copies of this information, for a fee, by sending a | |
| request in either of two ways: via email addressed to | |
| publicinfo@sec.gov or via regular mail addressed to the | |
| Public Reference Section, Securities and Exchange | |
| Commission, Washington, DC 20549-1520. | |
| |
| | © 2016 The Vanguard Group, Inc. |
| | All rights reserved. |
| | Vanguard Marketing Corporation, Distributor. |
| |
| | Q1142 052016 |

Semiannual Report | March 31, 2016
Vanguard Capital Opportunity Fund
Vanguard’s Principles for Investing Success
We want to give you the best chance of investment success. These principles, grounded in Vanguard’s research and experience, can put you on the right path.
Goals. Create clear, appropriate investment goals.
Balance. Develop a suitable asset allocation using broadly diversified funds. Cost. Minimize cost.
Discipline. Maintain perspective and long-term discipline.
A single theme unites these principles: Focus on the things you can control.
We believe there is no wiser course for any investor.
| |
| Contents | |
| Your Fund’s Total Returns. | 1 |
| Chairman’s Letter. | 2 |
| Advisor’s Report. | 8 |
| Fund Profile. | 12 |
| Performance Summary. | 13 |
| Financial Statements. | 14 |
| About Your Fund’s Expenses. | 25 |
| Trustees Approve Advisory Arrangement. | 27 |
| Glossary. | 28 |
Please note: The opinions expressed in this report are just that—informed opinions. They should not be considered promises or advice. Also, please keep in mind that the information and opinions cover the period through the date on the front of this report. Of course, the risks of investing in your fund are spelled out in the prospectus.
See the Glossary for definitions of investment terms used in this report.
About the cover: Pictured is a sailing block on the Brilliant, a 1932 schooner docked in Mystic, Connecticut. A type of pulley, the sailing block helps coordinate the setting of the sails. At Vanguard, the intricate coordination of technology and people allows us to help millions of clients around the world reach their financial goals.
Your Fund’s Total Returns
| |
| Six Months Ended March 31, 2016 | |
| | Total |
| | Returns |
| Vanguard Capital Opportunity Fund | |
| Investor Shares | 4.20% |
| Admiral™ Shares | 4.24 |
| Russell Midcap Growth Index | 4.72 |
| Multi-Cap Growth Funds Average | 2.63 |
| Multi-Cap Growth Funds Average: Derived from data provided by Lipper, a Thomson Reuters Company. | |
| Admiral Shares carry lower expenses and are available to investors who meet certain account-balance requirements. | |
| | | | | |
| Your Fund’s Performance at a Glance | | | | |
| September 30, 2015, Through March 31, 2016 | | | | |
| | | | Distributions Per Share |
| | Starting | Ending | Income | Capital |
| | Share Price | Share Price | Dividends | Gains |
| Vanguard Capital Opportunity Fund | | | | |
| Investor Shares | $50.25 | $49.74 | $0.299 | $2.426 |
| Admiral Shares | 116.06 | 114.84 | 0.791 | 5.600 |
1

Chairman’s Letter
Dear Shareholder,
Although the broad U.S. stock market delivered generally strong results over the six months ended March 31, 2016, mid-capitalization growth stocks weren’t among the best performers. Vanguard Capital Opportunity Fund, a multi-cap growth fund with mostly mid-cap exposure, trailed the broader market but was more competitive when measured against its comparative standards.
The fund returned about 4%. It was a step behind its benchmark, the Russell Midcap Growth Index, but outpaced the average return of competing multi-cap growth funds by more than 1 percentage point.
Stocks charted an uneven course en route to a solid outcome
The broad U.S. stock market returned about 7% over the six months. The period began and ended strongly, with fluctuations in the middle as China’s economic slowdown and falling oil and commodity prices worried investors.
Stocks rallied in March as investors again seemed encouraged by news about monetary policy. The Federal Reserve indicated after a mid-March meeting that it would raise interest rates fewer times in 2016 than previously anticipated. And central bankers in Europe and Asia kept up stimulus measures to combat weak growth and low inflation.
2
International stocks returned about 3% after surging more than 8% in March. Stocks from emerging markets and from developed markets of the Pacific region outperformed European stocks, which were nearly flat.
Bonds produced gains following a subpar start
After posting weak results for the first three months of the fiscal half year, bonds managed solid gains in the final three. The broad U.S. taxable bond market returned 2.44%.
Bonds proved attractive as the stock market fluctuated and the Fed proceeded cautiously with rate hikes. The yield of the 10-year U.S. Treasury note closed at 1.77% at the end of March, down from 2.05% six months earlier. (Bond prices and yields move in opposite directions.)
Returns for money market funds and savings accounts remained limited by the Fed’s target rate of 0.25%–0.5%—still low despite rising a quarter of a percentage point in December.
International bond markets (as measured by the Barclays Global Aggregate Index ex USD) returned 6.90%, boosted by foreign currencies’ strength against the dollar, a turnabout from the trend of recent years. Even without this currency benefit, however, their returns were solidly positive.
| | | | |
| Market Barometer | | | |
| |
| | | | Total Returns |
| | | Periods Ended March 31, 2016 |
| | Six | One | Five Years |
| | Months | Year | (Annualized) |
| Stocks | | | |
| Russell 1000 Index (Large-caps) | 7.75% | 0.50% | 11.35% |
| Russell 2000 Index (Small-caps) | 2.02 | -9.76 | 7.20 |
| Russell 3000 Index (Broad U.S. market) | 7.30 | -0.34 | 11.01 |
| FTSE All-World ex US Index (International) | 3.09 | -8.53 | 0.70 |
| |
| Bonds | | | |
| Barclays U.S. Aggregate Bond Index (Broad taxable market) | 2.44% | 1.96% | 3.78% |
| Barclays Municipal Bond Index (Broad tax-exempt market) | 3.20 | 3.98 | 5.59 |
| Citigroup Three-Month U.S. Treasury Bill Index | 0.06 | 0.08 | 0.04 |
| |
| CPI | | | |
| Consumer Price Index | 0.08% | 0.85% | 1.28% |
3
Technology stocks surged while health care slumped
Vanguard Capital Opportunity Fund’s overall results in its more than two decades of existence have been impressive. Since its 1995 launch, the fund has posted an average annual return of nearly 12%. Over the same period, the broad market has returned more than 8% and the benchmark Russell Midcap Growth Index close to 9%. The average return of multi-cap growth funds was almost 7%.
PRIMECAP Management Company, the fund’s advisor, deserves credit for such outstanding long-term outperformance, which is rare in the mutual fund industry. Over the years, PRIMECAP Management has displayed high degrees of conviction, patience, and skill in creating and maintaining a portfolio that bears little resemblance to the benchmark index.
Capital Opportunity’s long-term outperformance has, however, been marked by occasional stretches of short-term underperformance. Although long-term investors have been rewarded, the risk of trailing the benchmark is always a real possibility with a portfolio that diverges so much from the index.
The information technology and health care sectors, the fund’s largest holdings over the years, once again drove results, for better and worse. Technology powered the fund over the six months, and health care hindered it. Of course, in other periods the
| | | | |
| Expense Ratios | | | |
| Your Fund Compared With Its Peer Group | | | |
| | Investor | Admiral | Peer Group |
| | Shares | Shares | Average |
| Capital Opportunity Fund | 0.45% | 0.38% | 1.25% |
| The fund expense ratios shown are from the prospectus dated January 28, 2016, and represent estimated costs for the current fiscal year. For the six months ended March 31, 2016, the fund’s annualized expense ratios were 0.43% for Investor Shares and 0.37% for Admiral Shares. The peer-group expense ratio is derived from data provided by Lipper, a Thomson Reuters Company, and captures information through year-end 2015. |
|
|
|
|
| |
| Peer group: Multi-Cap Growth Funds. | | | |
4
reverse has been true, which highlights my preceding point about the need for patience on the part of both the fund’s advisor and its shareholders.
Capital Opportunity devoted more than 30% of its portfolio to technology stocks, which surged about 15%. By comparison, the technology stocks included in the benchmark rose just about 2%. The advisor’s electronic equipment, internet, semiconductor, software, and hardware holdings were all strong. Competition is fierce within the industry as corporations gravitate toward cloud computing and consumers opt for the latest gadgets. PRIMECAP Management’s research and insight into this sector is invaluable.
| |
| Vanguard’s growth translates into lower costs for you |
| |
| Research indicates that lower-cost investments have tended to outperform higher-cost ones. |
| So it’s little wonder that funds with lower expense ratios—including those at Vanguard—have |
| dominated the industry’s cash inflows in recent years. |
| |
| Vanguard has long been a low-cost leader, with expenses well below those of many other |
| investment management companies. That cost difference remains a powerful advantage for |
| Vanguard clients. Why? Because a lower expense ratio allows a fund to pass along a greater |
| share of its returns to its investors. |
| |
| What’s more, as you can see in the chart below, we’ve been able to lower our costs continually |
| as our assets under management have grown. Our steady growth has not been an explicit |
| business objective. Rather, we focus on putting our clients’ interests first at all times, and |
| giving them the best chance for investment success. But economies of scale—the cost |
| efficiencies that come with our growth—have allowed us to keep lowering our fund costs, |
| even as we invest in our people and technology. |
| |
| The benefit of economies of scale |
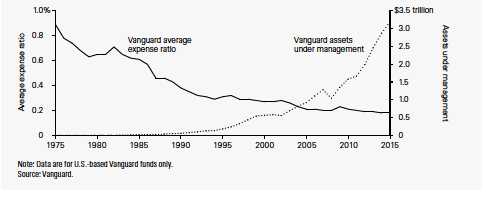
5
Health care stocks also made up more than 30% of Capital Opportunity’s portfolio. Neither this large allocation nor its specific holdings helped as the fund’s health care stocks returned about –6%, behind the –2% result of those in the benchmark. Most of the weakness came from pharmaceutical and biotechnology stocks, which slid amid concerns that future profitability might be affected by increased regulatory pressures. A slowdown in merger and acquisition activity hurt too, and biotechnology stocks felt the burden of high valuations.
On a more positive note, the industrial sector, the fund’s third-largest, provided a boost with returns of about 10%. Airline and air freight and logistic firms were responsible for most of the gain as lower fuel prices saved costs. The only other sector to which the fund had 10% or more exposure was consumer discretionary, where returns were just 1%.
For more about the advisor’s strategy and the fund’s positioning during the six months, please see the Advisor’s Report that follows this letter.
Consider rebalancing to manage your risk
Let’s say you’ve taken the time to carefully create an appropriate asset allocation for your investment portfolio. Your efforts have produced a diversified mix of stock, bond, and money market funds tailored to your goals, time horizon, and risk tolerance.
But what should you do when your portfolio drifts from its original asset allocation as the financial markets rise or fall? Consider rebalancing to bring it back to the proper mix.
Just one year of outsized returns can throw your allocation out of whack. Take 2013 as an example. That year, the broad stock market (as measured by the Russell 3000 Index) returned 33.55% and the broad taxable bond market (as measured by the Barclays U.S. Aggregate Bond Index) returned –2.02%. A hypothetical portfolio that tracked the broad domestic market indexes and started the year with 60% stocks and 40% bonds would have ended with a more aggressive mix of 67% stocks and 33% bonds.
Rebalancing to bring your portfolio back to its original parameters would require you to shift assets away from areas that have been performing well toward those that have been falling behind. That isn’t easy or intuitive. It’s a way to minimize risk rather than maximizing returns and to stick with your investment plan through different types of markets. (You can read more about our approach in Best Practices for Portfolio Rebalancing at vanguard.com/research.)
It’s not necessary to check your portfolio every day or every month, much less rebalance it that frequently. Consider monitoring it annually or semiannually and rebalancing when your allocation swings 5 percentage points or more from its target.
6
Be aware of the tax implications of selling. When rebalancing, make any asset changes within a tax-advantaged retirement account, if possible, or direct new cash flows into the underweighted asset class.
Keeping your asset allocation from drifting too far off target can help you stay on track with the investment plan you’ve crafted to meet your financial goals.
As always, thank you for investing with Vanguard.
Sincerely,

F. William McNabb III
Chairman and Chief Executive Officer
April 14, 2016
7
Advisor’s Report
For the six months ended March 31, 2016, Vanguard Capital Opportunity Fund returned 4.20% for Investor Shares and 4.24% for Admiral Shares. These results trailed the 4.72% return of the fund’s benchmark, the unmanaged Russell Midcap Growth Index, and the 8.49% return of the unmanaged Standard & Poor’s 500 Index.
The fund’s underperformance was largely due to unfavorable health care and consumer discretionary stock picks, an overweighted position in health care, and underweighted positions in telecommunication services and utilities. These negatives were partially offset by an overweighted position and favorable stock selection in information technology and an underweight to financials.
The investment environment
The period was characterized by significant volatility in various financial markets worldwide, including the U.S. equity markets. Stocks gained from the beginning of October through December, then sold off sharply in January and early February before rallying into the end of March. The February stock market trough roughly coincided with the bottom in West Texas Intermediate crude oil, which fell to $26 per barrel before rebounding to end March at $38.
Contrary to the expectations of many investors, Treasury bond yields fell as the Federal Reserve signaled it would raise interest rates more gradually than it had planned. Faced with lower net interest margins, financials underperformed the S&P 500 by nearly 8%, with some of the largest banks and brokerages faring far worse. Sluggish economic growth and below-target inflation led central banks in Europe and Japan to introduce negative short-term interest rates and ramp up government bond purchases, pressuring already-low long-term rates. Ten-year German and Japanese bonds currently yield within 15 basis points of 0%—an unprecedented situation.
Relative to those of other developed countries, the U.S. economy was a bright spot as real gross domestic product (GDP) continued to expand at a modest pace (+2.4% in 2015). Supported by rising incomes, healthy household balance sheets, low inflation (in part due to falling energy prices), and improving access to historically inexpensive credit, U.S. consumer spending appeared solid. We are concerned, however, by the unfolding presidential election. Candidates on both sides have vilified U.S. corporations and espoused trade policies that could harm global companies, including many of the fund’s holdings.
Outlook for U.S. equities
S&P 500 earnings per share were expected to decline 7% in the first calendar quarter of 2016, the worst performance since third-quarter 2009. Even excluding the troubled energy sector, they were expected to fall 2%. Trading at approximately 16.5 times the next 12 months’ estimated earnings per share, the index appears fully valued by historical standards. However, with the 10-year Treasury bond yielding 1.7%,
8
well below the index’s dividend yield of 2.3%, we continue to believe that stocks represent a more attractive investment than bonds at current prices.
We find certain stocks to be attractively valued, notably the fund’s biotechnology holdings. After a period of significant underperformance, they now trade at a discount to the S&P 500 price-to-earnings multiple in spite of their far superior long-term growth prospects.
Portfolio update and outlook
The fund’s total return exceeded that of the S&P 500 during the fourth calendar quarter because of favorable sector allocations and strong selection in information technology. However, this was more than offset by relative underperformance during the first quarter of 2016. Sector allocations (an overweight to health care and underweights to consumer staples, utilities, and telecommunications) dragged on results, and several of the fund’s largest health care holdings declined.
After several consecutive years of outperformance, the fund’s health care stocks lagged the S&P 500 Index for the six-month period. Biotechnology holdings (defined as the AMEX Biotechnology Index) were hit especially hard, declining 14% compared to a 3% increase in the S&P 500 health care sector. The drop was precipitated by high-profile generic drug price increases and subsequent broader scrutiny of the entire biotechnology and pharmaceutical industry. Among the fund’s biotechnology and pharmaceutical stocks,
BioMarin (–22%), Novartis (–19%), Eli Lilly and Company (–13%), Biogen (–11%), and Roche (–3%) detracted most. The fund’s largest life sciences tools holdings, QIAGEN (–13%) and Illumina (–8%), also fared poorly.
Biotechnology and pharmaceutical stocks comprised 23% of assets as of March 31, more than double the S&P 500 Index weighting of 9%. In spite of the near-term uncertainty and current political rhetoric over drug pricing, we believe that the industry’s fundamentals remain intact. Demand for health care products should continue to grow, driven by demographic trends as well as the industry’s ability to develop new, safer, and more effective therapies. We believe that companies that develop novel therapies that extend lives and represent meaningful advancements will ultimately receive favorable pricing and reimbursement for their products.
The fund also remains overweighted in information technology stocks, which made up 33% of assets as of March 31, compared to a 21% weighting in the S&P 500 Index. S&P 500 internet (+21%) and software (+20%) stocks significantly outpaced the information technology sector (+12%), while semiconductors (+11%) and hardware (+1%) lagged. Semiconductor holdings outperformed because of strong gains in NVIDIA (+46%), KLA-Tencor (+48%), and Texas Instruments (+18%), although these were partially offset by losses in Micron Technology (–30%).
9
The fund’s internet stocks performed in line with the index, but its software picks did less well because of a high relative weighting in Adobe Systems (+14%). Hardware holdings soared primarily because of strong gains in SanDisk (+40%), which agreed to be acquired by Western Digital, and a minimal position in Apple (which remained flat). Results were partially offset by losses in NetApp (–7%).
Other significant contributors in information technology included Trimble Navigation (+51%), Corning (+24%), and Flextronics (+14%). Although Gartner expects global IT spending to fall 0.5% (+1.6% in constant currency) in 2016, we remain confident in the long-term outlook for the fund’s sector holdings.
Adobe and Microsoft, the fund’s largest software companies, are successfully transforming their products and business models to adapt to cloud computing, whereby internet resources are consumed on-demand. Alphabet and Alibaba, the largest internet holdings, are growing rapidly as consumers worldwide spend more time and money on internet-based services. Texas Instruments and NVIDIA, two of the fund’s biggest semiconductors, stand to benefit from trends such as virtual reality, artificial intelligence, and the incorporation of connectivity into more objects.
Approximately 10% of the fund’s assets were invested in airline stocks as of March 31. Industry fundamentals remain strong, with robust traffic leading to high load factors, and lower fuel costs boosting earnings. Nevertheless, investors remain leery. We recognize that terrorism presents a significant risk and are especially concerned after the recent attacks in Paris and Brussels. However, we believe that structural changes over the last several years, particularly industry consolidation, have enabled airlines to prosper under normal conditions. Furthermore, global passenger traffic growth of 6% far exceeds real global GDP growth. In spite of these positives, several of our airline holdings trade at among the lowest price-to-earnings multiples in the S&P 500.
The fund remains significantly underweighted in energy stocks. We have found few compelling investments in the sector as we believe current valuations (over 60 times forward earnings per share) assume a significant increase in oil prices. We view declining production costs and slower demand from China and other emerging markets as secular, not cyclical, trends. Furthermore, new technologies such as vehicle electrification may reduce oil demand over the long term.
Telecommunication services, utilities, and consumer staples stocks rallied strongly during the six months as investors flocked to perceived safe havens. However, in our opinion, they now appear stretched relative to their growth prospects. For example, consumer staples stocks trade for 21 times forward earnings per share. This makes the sector the most expensive on a price-to-earnings basis except for the reeling energy sector, in spite of minimal expected revenue growth.
10
Conclusion
We remain committed to our investment philosophy, which is to invest in attractively priced stocks for the long term. This “bottom-up” approach often results in portfolios that bear little resemblance to market indexes; therefore, our results often deviate substantially from these indexes. Furthermore, our long-term investment horizon results in low portfolio turnover, which creates the possibility for extended periods of underperformance when our holdings fall out of favor. We nonetheless believe that this approach can generate superior results for shareholders over the long term.
PRIMECAP Management Company
April 18, 2016
Capital Opportunity Fund
Fund Profile
As of March 31, 2016
| | | |
| Share-Class Characteristics | |
| |
| | Investor | Admiral |
| | Shares | Shares |
| Ticker Symbol | VHCOX | VHCAX |
| Expense Ratio1 | 0.45% | 0.38% |
| 30-Day SEC Yield | 0.72% | 0.80% |
| | | | |
| Portfolio Characteristics | | |
| | | Russell | DJ |
| | | Midcap | U.S. Total |
| | | Growth | Market |
| | Fund | Index | FA Index |
| Number of Stocks | 139 | 498 | 3,900 |
| Median Market Cap | $36.8B | $12.2B | $52.5B |
| Price/Earnings Ratio | 22.9x | 26.4x | 21.8x |
| Price/Book Ratio | 3.3x | 5.3x | 2.7x |
| Return on Equity | 15.7% | 20.8% | 17.5% |
| Earnings Growth | | | |
| Rate | 10.5% | 13.7% | 8.0% |
| Dividend Yield | 1.2% | 1.2% | 2.1% |
| Foreign Holdings | 11.4% | 0.0% | 0.0% |
| Turnover Rate | | | |
| (Annualized) | 7% | — | — |
| Short-Term Reserves | 3.2% | — | — |
| | | | |
| Sector Diversification (% of equity exposure) |
| | | Russell | DJ |
| | | Midcap | U.S. Total |
| | | Growth | Market |
| | Fund | Index | FA Index |
| Consumer | | | |
| Discretionary | 10.3% | 25.1% | 13.6% |
| Consumer Staples | 0.0 | 8.3 | 9.2 |
| Energy | 0.6 | 0.8 | 6.1 |
| Financials | 3.6 | 12.2 | 17.4 |
| Health Care | 31.4 | 12.5 | 13.7 |
| Industrials | 18.2 | 16.4 | 10.7 |
| Information | | | |
| Technology | 33.4 | 19.1 | 20.1 |
| Materials | 1.6 | 5.1 | 3.2 |
| Telecommunication | | | |
| Services | 0.9 | 0.4 | 2.5 |
| Utilities | 0.0 | 0.1 | 3.5 |
| | | |
| Volatility Measures | | |
| | Russell | DJ |
| | Midcap | U.S. Total |
| | Growth | Market |
| | Index | FA Index |
| R-Squared | 0.91 | 0.82 |
| Beta | 0.95 | 0.98 |
| These measures show the degree and timing of the fund’s fluctuations compared with the indexes over 36 months. |
|
| | | |
| Ten Largest Holdings (% of total net assets) |
| Biogen Inc. | Biotechnology | 5.4% |
| Amgen Inc. | Biotechnology | 5.2 |
| Eli Lilly & Co. | Pharmaceuticals | 4.1 |
| Southwest Airlines Co. | Airlines | 3.8 |
| Alphabet Inc. | Internet Software & | |
| | Services | 3.3 |
| BioMarin Pharmaceutical | | |
| Inc. | Biotechnology | 3.0 |
| Roche Holding AG | Pharmaceuticals | 2.9 |
| FedEx Corp. | Air Freight & | |
| | Logistics | 2.9 |
| Adobe Systems Inc. | Application Software | 2.7 |
| Texas Instruments Inc. | Semiconductors | 2.2 |
| Top Ten | | 35.5% |
| The holdings listed exclude any temporary cash investments and equity index products. |
|
Investment Focus
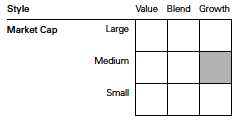
1 The expense ratios shown are from the prospectus dated January 28, 2016, and represent estimated costs for the current fiscal year. For the six months ended March 31, 2016, the annualized expense ratios were 0.43% for Investor Shares and 0.37% for Admiral Shares.
12
Capital Opportunity Fund
Performance Summary
All of the returns in this report represent past performance, which is not a guarantee of future results that may be achieved by the fund. (Current performance may be lower or higher than the performance data cited. For performance data current to the most recent month-end, visit our website at vanguard.com/performance.) Note, too, that both investment returns and principal value can fluctuate widely, so an investor’s shares, when sold, could be worth more or less than their original cost. The returns shown do not reflect taxes that a shareholder would pay on fund distributions or on the sale of fund shares.
Fiscal-Year Total Returns (%): September 30, 2005, Through March 31, 2016
Average Annual Total Returns: Periods Ended March 31, 2016
| | | | |
| | Inception | One | Five | Ten |
| | Date | Year | Years | Years |
| Investor Shares | 8/14/1995 | -4.75% | 12.17% | 8.27% |
| Admiral Shares | 11/12/2001 | -4.68 | 12.25 | 8.35 |
See Financial Highlights for dividend and capital gains information.
13
Capital Opportunity Fund
Financial Statements (unaudited)
Statement of Net Assets
As of March 31, 2016
The fund reports a complete list of its holdings in regulatory filings four times in each fiscal year, at the quarter-ends. For the second and fourth fiscal quarters, the lists appear in the fund’s semiannual and annual reports to shareholders. For the first and third fiscal quarters, the fund files the lists with the Securities and Exchange Commission on Form N-Q. Shareholders can look up the fund’s Forms N-Q on the SEC’s website at sec.gov. Forms N-Q may also be reviewed and copied at the SEC’s Public Reference Room (see the back cover of this report for further information).
| | | |
| | | | Market |
| | | | Value• |
| | | Shares | ($000) |
| Common Stocks (97.9%) | | |
| Consumer Discretionary (10.1%) | |
| * | CarMax Inc. | 4,393,897 | 224,528 |
| | TJX Cos. Inc. | 2,605,900 | 204,172 |
| | Carnival Corp. | 3,522,600 | 185,888 |
| *,^ | Tesla Motors Inc. | 637,566 | 146,493 |
| | Royal Caribbean | | |
| | Cruises Ltd. | 1,327,000 | 109,013 |
| * | DreamWorks Animation | | |
| | SKG Inc. Class A | 2,510,000 | 62,624 |
| | L Brands Inc. | 522,600 | 45,889 |
| | Gildan Activewear Inc. | | |
| | Class A | 1,441,500 | 43,980 |
| | Sony Corp. ADR | 1,570,800 | 40,401 |
| * | Norwegian Cruise Line | | |
| | Holdings Ltd. | 724,000 | 40,030 |
| * | Amazon.com Inc. | 64,630 | 38,367 |
| * | Bed Bath & Beyond Inc. | 703,700 | 34,932 |
| | Ross Stores Inc. | 506,400 | 29,321 |
| * | Shutterfly Inc. | 557,250 | 25,840 |
| | Tribune Media Co. | | |
| | Class A | 499,000 | 19,137 |
| * | Ascena Retail Group Inc. | 1,675,200 | 18,528 |
| | Las Vegas Sands Corp. | 340,000 | 17,571 |
| | Carter’s Inc. | 81,220 | 8,559 |
| | Newell Rubbermaid Inc. | 86,200 | 3,818 |
| * | Cabela’s Inc. | 47,600 | 2,318 |
| * | AutoZone Inc. | 2,000 | 1,593 |
| | Marriott International Inc. | | |
| | Class A | 20,000 | 1,424 |
| | Tribune Publishing Co. | 120,000 | 926 |
| | Lowe’s Cos. Inc. | 10,600 | 803 |
| | Hilton Worldwide | | |
| | Holdings Inc. | 34,000 | 766 |
| | | | 1,306,921 |
| Energy (0.5%) | | |
| | Cabot Oil & Gas Corp. | 1,290,000 | 29,296 |
| *,^ | Southwestern Energy Co. | 1,825,000 | 14,728 |
| | National Oilwell Varco Inc. | 275,000 | 8,553 |
| | | |
| | | | Market |
| | | | Value• |
| | | Shares | ($000) |
| * | Cameron International Corp. | 79,700 | 5,344 |
| ^ | Transocean Ltd. | 566,000 | 5,173 |
| ^ | Frank’s International NV | 250,000 | 4,120 |
| | Ensco plc Class A | 143,340 | 1,486 |
| | | | 68,700 |
| Financials (3.5%) | | |
| | Charles Schwab Corp. | 7,576,500 | 212,293 |
| * | E*TRADE Financial Corp. | 3,694,900 | 90,488 |
| | Northern Trust Corp. | 736,700 | 48,011 |
| | JPMorgan Chase & Co. | 760,600 | 45,043 |
| | Discover Financial Services | 515,100 | 26,229 |
| | Progressive Corp. | 445,600 | 15,658 |
| | CME Group Inc. | 162,950 | 15,651 |
| | Chubb Ltd. | 2,407 | 287 |
| | | | 453,660 |
| Health Care (30.8%) | | |
| * | Biogen Inc. | 2,690,438 | 700,375 |
| | Amgen Inc. | 4,510,400 | 676,244 |
| | Eli Lilly & Co. | 7,444,500 | 536,078 |
| * | BioMarin | | |
| | Pharmaceutical Inc. | 4,634,100 | 382,221 |
| | Roche Holding AG | 1,524,800 | 374,400 |
| | Novartis AG ADR | 3,015,400 | 218,436 |
| * | Illumina Inc. | 1,220,100 | 197,790 |
| * | QIAGEN NV | 8,220,000 | 183,635 |
| | Medtronic plc | 2,083,100 | 156,232 |
| * | Boston Scientific Corp. | 6,608,800 | 124,312 |
| | Thermo Fisher | | |
| | Scientific Inc. | 533,600 | 75,552 |
| * | Seattle Genetics Inc. | 1,836,500 | 64,443 |
| | Abbott Laboratories | 1,299,600 | 54,362 |
| * | Edwards Lifesciences | | |
| | Corp. | 560,000 | 49,398 |
| * | Charles River Laboratories | | |
| | International Inc. | 626,000 | 47,538 |
| | PerkinElmer Inc. | 957,000 | 47,333 |
| * | Affymetrix Inc. | 2,700,600 | 37,835 |
| * | Waters Corp. | 152,000 | 20,052 |
| * | ImmunoGen Inc. | 1,280,000 | 10,906 |
14
Capital Opportunity Fund
| | | |
| | | | Market |
| | | | Value• |
| | | Shares | ($000) |
| | Agilent Technologies Inc. | 233,000 | 9,285 |
| | Zimmer Biomet | | |
| | Holdings Inc. | 50,000 | 5,332 |
| | AstraZeneca plc ADR | 102,000 | 2,872 |
| * | Cerner Corp. | 10,000 | 530 |
| | | | 3,975,161 |
| Industrials (17.8%) | | |
| | Southwest Airlines Co. | 10,935,100 | 489,893 |
| | FedEx Corp. | 2,293,974 | 373,275 |
| * | United Continental | | |
| | Holdings Inc. | 4,346,200 | 260,164 |
| | Delta Air Lines Inc. | 4,382,000 | 213,316 |
| | Airbus Group SE | 2,893,040 | 191,686 |
| | American Airlines | | |
| | Group Inc. | 3,789,400 | 155,403 |
| * | JetBlue Airways Corp. | 6,940,150 | 146,576 |
| * | Jacobs Engineering | | |
| | Group Inc. | 2,233,419 | 97,265 |
| ^ | Ritchie Bros | | |
| | Auctioneers Inc. | 2,937,000 | 79,534 |
| | Rockwell Automation Inc. | 620,450 | 70,576 |
| | Union Pacific Corp. | 672,000 | 53,458 |
| * | AECOM | 1,660,000 | 51,111 |
| | IDEX Corp. | 615,000 | 50,971 |
| | Curtiss-Wright Corp. | 500,000 | 37,835 |
| | CH Robinson | | |
| | Worldwide Inc. | 180,000 | 13,361 |
| * | Spirit Airlines Inc. | 168,235 | 8,072 |
| | Alaska Air Group Inc. | 60,000 | 4,921 |
| | Chicago Bridge & Iron | | |
| | Co. NV | 100,000 | 3,659 |
| * | Esterline Technologies | | |
| | Corp. | 30,631 | 1,963 |
| | | | 2,303,039 |
| Information Technology (32.7%) | |
| * | Adobe Systems Inc. | 3,759,200 | 352,613 |
| | Texas Instruments Inc. | 4,921,400 | 282,587 |
| | Microsoft Corp. | 4,750,000 | 262,342 |
| | SanDisk Corp. | 2,834,377 | 215,639 |
| * | Alphabet Inc. Class A | 279,730 | 213,406 |
| | NVIDIA Corp. | 5,959,400 | 212,333 |
| * | Alphabet Inc. Class C | 283,674 | 211,323 |
| | NetApp Inc. | 7,489,200 | 204,380 |
| * | Flextronics | | |
| | International Ltd. | 14,727,302 | 177,611 |
| * | Alibaba Group | | |
| | Holding Ltd. ADR | 2,204,200 | 174,198 |
| | Corning Inc. | 8,080,000 | 168,791 |
| * | Trimble Navigation Ltd. | 6,440,400 | 159,722 |
| | ASML Holding NV | 1,325,000 | 133,017 |
| *,^ | Cree Inc. | 3,944,900 | 114,797 |
| | KLA-Tencor Corp. | 1,418,300 | 103,266 |
| | EMC Corp. | 3,513,800 | 93,643 |
| | | |
| | | | Market |
| | | | Value• |
| | | Shares | ($000) |
| *,1 | Descartes Systems | | |
| | Group Inc. | 4,645,000 | 90,624 |
| | Visa Inc. Class A | 1,101,400 | 84,235 |
| | QUALCOMM Inc. | 1,623,700 | 83,036 |
| *,^ | BlackBerry Ltd. | 9,408,200 | 76,112 |
| * | Micron Technology Inc. | 7,230,000 | 75,698 |
| * | Rambus Inc. | 4,980,000 | 68,475 |
| | Hewlett Packard | | |
| | Enterprise Co. | 2,668,000 | 47,304 |
| * | Nuance | | |
| | Communications Inc. | 2,495,000 | 46,632 |
| | Plantronics Inc. | 1,150,000 | 45,069 |
| *,1 | FormFactor Inc. | 5,809,700 | 42,237 |
| *,^ | NeuStar Inc. Class A | 1,653,416 | 40,674 |
| * | Electronic Arts Inc. | 570,000 | 37,683 |
| | Intuit Inc. | 350,000 | 36,404 |
| | HP Inc. | 2,820,000 | 34,742 |
| | Telefonaktiebolaget LM | | |
| | Ericsson ADR | 3,230,000 | 32,397 |
| | Apple Inc. | 261,000 | 28,446 |
| * | PayPal Holdings Inc. | 733,100 | 28,298 |
| *,^ | VMware Inc. Class A | 536,700 | 28,075 |
| * | Entegris Inc. | 2,019,231 | 27,502 |
| | Jabil Circuit Inc. | 1,175,000 | 22,642 |
| | FEI Co. | 248,000 | 22,074 |
| * | Keysight Technologies Inc. | 708,161 | 19,644 |
| * | eBay Inc. | 732,600 | 17,480 |
| * | Yahoo! Inc. | 474,300 | 17,459 |
| * | F5 Networks Inc. | 160,000 | 16,936 |
| | Analog Devices Inc. | 230,000 | 13,614 |
| | Intel Corp. | 400,000 | 12,940 |
| | Teradyne Inc. | 580,000 | 12,522 |
| * | Ciena Corp. | 500,000 | 9,510 |
| | Applied Materials Inc. | 385,000 | 8,154 |
| *,^ | Mobileye NV | 146,031 | 5,445 |
| | Brocade Communications | | |
| | Systems Inc. | 400,000 | 4,232 |
| * | salesforce.com inc | 26,400 | 1,949 |
| | MasterCard Inc. Class A | 15,000 | 1,418 |
| *,^ | SMART Technologies Inc. | 3,674,304 | 1,323 |
| *,^ | Arista Networks Inc. | 15,500 | 978 |
| * | Workday Inc. Class A | 10,000 | 768 |
| * | Twitter Inc. | 12,680 | 210 |
| | | | 4,222,609 |
| Materials (1.6%) | | |
| | Monsanto Co. | 2,318,786 | 203,450 |
| |
| Telecommunication Services (0.9%) | |
| | AT&T Inc. | 2,906,266 | 113,839 |
| *,^ | Sprint Corp. | 230,000 | 800 |
| | | | 114,639 |
| Total Common Stocks | | |
| (Cost $6,628,561) | | 12,648,179 |
15
Capital Opportunity Fund
| | |
| | | Market |
| | | Value• |
| | Shares | ($000) |
| Temporary Cash Investment (4.0%) | |
| Money Market Fund (4.0%) | |
| 2,3 Vanguard Market Liquidity | |
| Fund, 0.495% | | |
| (Cost $518,858) | 518,858,000 | 518,858 |
| Total Investments (101.9%) | |
| (Cost $7,147,419) | | 13,167,037 |
| |
| | | Amount |
| | | ($000) |
| Other Assets and Liabilities (-1.9%) | |
| Other Assets | | |
| Investment in Vanguard | 1,109 |
| Receivables for Investment Securities Sold 1,830 |
| Receivables for Accrued Income | 12,483 |
| Receivables for Capital Shares Issued | 2,365 |
| Other Assets | | 5,409 |
| Total Other Assets | | 23,196 |
| Liabilities | | |
| Payables for Investment Securities | |
| Purchased | | (778) |
| Collateral for Securities on Loan | (106,027) |
| Payables for Investment Advisor | (7,718) |
| Payables for Capital Shares Redeemed | (139,608) |
| Payables to Vanguard | | (18,019) |
| Other Liabilities | | (5) |
| Total Liabilities | | (272,155) |
| Net Assets (100%) | | 12,918,078 |
| | |
| At March 31, 2016, net assets consisted of: |
| | Amount |
| | ($000) |
| Paid-in Capital | 6,662,511 |
| Undistributed Net Investment Income | 23,031 |
| Accumulated Net Realized Gains | 212,973 |
| Unrealized Appreciation (Depreciation) | |
| Investment Securities | 6,019,618 |
| Foreign Currencies | (55) |
| Net Assets | 12,918,078 |
| |
| Investor Shares—Net Assets | |
| Applicable to 44,721,074 outstanding | |
| $.001 par value shares of beneficial | |
| interest (unlimited authorization) | 2,224,558 |
| Net Asset Value Per Share— | |
| Investor Shares | $49.74 |
| |
| Admiral Shares—Net Assets | |
| Applicable to 93,115,830 outstanding | |
| $.001 par value shares of beneficial | |
| interest (unlimited authorization) | 10,693,520 |
| Net Asset Value Per Share— | |
| Admiral Shares | $114.84 |
• See Note A in Notes to Financial Statements.
* Non-income-producing security.
^ Includes partial security positions on loan to broker-dealers. The total value of securities on loan is $102,768,000.
1 Considered an affiliated company of the fund as the fund owns more than 5% of the outstanding voting securities of such company.
2 Affiliated money market fund available only to Vanguard funds and certain trusts and accounts managed by Vanguard. Rate shown is the 7-day yield.
3 Includes $106,027,000 of collateral received for securities on loan.
ADR—American Depositary Receipt.
See accompanying Notes, which are an integral part of the Financial Statements.
16
Capital Opportunity Fund
Statement of Operations
| |
| | Six Months Ended |
| | March 31, 2016 |
| | ($000) |
| Investment Income | |
| Income | |
| Dividends1 | 79,224 |
| Interest | 1,040 |
| Securities Lending | 884 |
| Total Income | 81,148 |
| Expenses | |
| Investment Advisory Fees—Note B | 15,973 |
| The Vanguard Group—Note C | |
| Management and Administrative—Investor Shares | 1,882 |
| Management and Administrative—Admiral Shares | 6,148 |
| Marketing and Distribution—Investor Shares | 236 |
| Marketing and Distribution—Admiral Shares | 392 |
| Custodian Fees | 94 |
| Shareholders’ Reports—Investor Shares | 19 |
| Shareholders’ Reports—Admiral Shares | 25 |
| Trustees’ Fees and Expenses | 7 |
| Total Expenses | 24,776 |
| Net Investment Income | 56,372 |
| Realized Net Gain (Loss) | |
| Investment Securities Sold | 251,321 |
| Foreign Currencies | (37) |
| Realized Net Gain (Loss) | 251,284 |
| Change in Unrealized Appreciation (Depreciation) | |
| Investment Securities | 231,465 |
| Foreign Currencies | 157 |
| Change in Unrealized Appreciation (Depreciation) | 231,622 |
| Net Increase (Decrease) in Net Assets Resulting from Operations | 539,278 |
| 1 Dividends are net of foreign withholding taxes of $3,331,000. | |
See accompanying Notes, which are an integral part of the Financial Statements.
17
Capital Opportunity Fund
Statement of Changes in Net Assets
| | |
| | Six Months Ended | Year Ended |
| | March 31, | September 30, |
| | 2016 | 2015 |
| | ($000) | ($000) |
| Increase (Decrease) in Net Assets | | |
| Operations | | |
| Net Investment Income | 56,372 | 98,542 |
| Realized Net Gain (Loss) | 251,284 | 706,716 |
| Change in Unrealized Appreciation (Depreciation) | 231,622 | (559,499) |
| Net Increase (Decrease) in Net Assets Resulting from Operations | 539,278 | 245,759 |
| Distributions | | |
| Net Investment Income | | |
| Investor Shares | (13,445) | (16,335) |
| Admiral Shares | (71,675) | (69,765) |
| Realized Capital Gain1 | | |
| Investor Shares | (109,093) | (99,546) |
| Admiral Shares | (507,435) | (370,543) |
| Total Distributions | (701,648) | (556,189) |
| Capital Share Transactions | | |
| Investor Shares | (29,832) | (487,925) |
| Admiral Shares | 248,341 | 816,562 |
| Net Increase (Decrease) from Capital Share Transactions | 218,509 | 328,637 |
| Total Increase (Decrease) | 56,139 | 18,207 |
| Net Assets | | |
| Beginning of Period | 12,861,939 | 12,843,732 |
| End of Period2 | 12,918,078 | 12,861,939 |
| 1 Includes fiscal 2016 and 2015 short-term gain distributions totaling $3,304,000 and $10,268,000, respectively. Short-term gain distributions are treated as ordinary income dividends for tax purposes. |
|
| 2 Net Assets—End of Period includes undistributed (overdistributed) net investment income of $23,031,000 and $51,816,000. |
See accompanying Notes, which are an integral part of the Financial Statements.
18
Capital Opportunity Fund
Financial Highlights
| | | | | | | |
| Investor Shares | | | | | | |
| | Six Months | | | | | |
| | Ended | | | | | |
| For a Share Outstanding | March 31, | | | Year Ended September 30, |
| Throughout Each Period | 2016 | 2015 | 2014 | 2013 | 2012 | 2011 |
| Net Asset Value, Beginning of Period | $50.25 | $51.42 | $44.57 | $33.22 | $28.17 | $29.59 |
| Investment Operations | | | | | | |
| Net Investment Income | .208 | .349 | .272 | .270 | .216 | .151 |
| Net Realized and Unrealized Gain (Loss) | | | | | | |
| on Investments | 2.007 | .666 | 8.314 | 12.395 | 6.464 | (1.450) |
| Total from Investment Operations | 2.215 | 1.015 | 8.586 | 12.665 | 6.680 | (1.299) |
| Distributions | | | | | | |
| Dividends from Net Investment Income | (. 299) | (. 308) | (. 072)1 | (. 385)1 | (.161) | (.121) |
| Distributions from Realized Capital Gains | (2.426) | (1.877) | (1.664) | (.930) | (1.469) | — |
| Total Distributions | (2.725) | (2.185) | (1.736) | (1.315) | (1.630) | (.121) |
| Net Asset Value, End of Period | $49.74 | $50.25 | $51.42 | $44.57 | $33.22 | $28.17 |
| |
| Total Return2 | 4.20% | 1.72% | 19.85% | 39.40% | 24.62% | -4.45% |
| |
| Ratios/Supplemental Data | | | | | | |
| Net Assets, End of Period (Millions) | $2,225 | $2,283 | $2,793 | $2,720 | $2,432 | $2,412 |
| Ratio of Total Expenses to | | | | | | |
| Average Net Assets | 0.43% | 0.45% | 0.47% | 0.48% | 0.48% | 0.48% |
| Ratio of Net Investment Income to | | | | | | |
| Average Net Assets | 0.80% | 0.65% | 0.57% | 0.68% | 0.67% | 0.45% |
| Portfolio Turnover Rate | 7% | 7% | 7% | 9% | 9% | 9% |
| The expense ratio, net income ratio, and turnover rate for the current period have been annualized. | | |
| 1 Fiscal 2013 dividends from net investment income include $.157 per share from a dividend received from ASML Holding NV. Subsequent to the payment of the fund’s dividend from net investment income in December 2012, the ASML dividend was reallocated to return of capital. The reallocation reduced the fund’s dividend from net investment income in December 2013. The reallocation had no impact on net assets, net asset values per share, or total returns. |
|
|
|
| 2 Total returns do not include transaction or account service fees that may have applied in the periods shown. Fund prospectuses provide information about any applicable transaction and account service fees. |
|
See accompanying Notes, which are an integral part of the Financial Statements.
19
Capital Opportunity Fund
Financial Highlights
| | | | | | | |
| Admiral Shares | | | | | | |
| | Six Months | | | | | |
| | Ended | | | | | |
| For a Share Outstanding | March 31, | | | Year Ended September 30, |
| Throughout Each Period | 2016 | 2015 | 2014 | 2013 | 2012 | 2011 |
| Net Asset Value, Beginning of Period | $116.06 | $118.79 | $102.97 | $76.75 | $65.10 | $68.38 |
| Investment Operations | | | | | | |
| Net Investment Income | . 517 | . 916 | .728 | .707 | . 559 | . 400 |
| Net Realized and Unrealized Gain (Loss) | | | | | | |
| on Investments | 4.654 | 1.504 | 19.185 | 28.613 | 14.917 | (3.358) |
| Total from Investment Operations | 5.171 | 2.420 | 19.913 | 29.320 | 15.476 | (2.958) |
| Distributions | | | | | | |
| Dividends from Net Investment Income | (.791) | (. 816) | (. 251)1 | (. 953)1 | (. 434) | (. 322) |
| Distributions from Realized Capital Gains | (5.600) | (4.334) | (3.842) | (2.147) | (3.392) | — |
| Total Distributions | (6.391) | (5.150) | (4.093) | (3.100) | (3.826) | (.322) |
| Net Asset Value, End of Period | $114.84 | $116.06 | $118.79 | $102.97 | $76.75 | $65.10 |
| |
| Total Return2 | 4.24% | 1.78% | 19.94% | 39.50% | 24.69% | -4.39% |
| |
| Ratios/Supplemental Data | | | | | | |
| Net Assets, End of Period (Millions) | $10,694 | $10,579 | $10,051 | $7,927 | $5,045 | $4,342 |
| Ratio of Total Expenses to | | | | | | |
| Average Net Assets | 0.37% | 0.38% | 0.40% | 0.41% | 0.41% | 0.41% |
| Ratio of Net Investment Income to | | | | | | |
| Average Net Assets | 0.86% | 0.72% | 0.64% | 0.75% | 0.74% | 0.52% |
| Portfolio Turnover Rate | 7% | 7% | 7% | 9% | 9% | 9% |
| The expense ratio, net income ratio, and turnover rate for the current period have been annualized. | | |
| 1 Fiscal 2013 dividends from net investment income include $.363 per share from a dividend received from ASML Holding NV. Subsequent to the payment of the fund’s dividend from net investment income in December 2012, the ASML dividend was reallocated to return of capital. The reallocation reduced the fund’s dividend from net investment income in December 2013. The reallocation had no impact on net assets, net asset values per share, or total returns. |
|
|
|
| 2 Total returns do not include transaction fees that may have applied in the periods shown. Fund prospectuses provide information about any applicable transaction fees. |
|
See accompanying Notes, which are an integral part of the Financial Statements.
20
Capital Opportunity Fund
Notes to Financial Statements
Vanguard Capital Opportunity Fund is registered under the Investment Company Act of 1940 as an open-end investment company, or mutual fund. The fund offers two classes of shares: Investor Shares and Admiral Shares. Investor Shares are available to any investor who meets the fund’s minimum purchase requirements. Admiral Shares are designed for investors who meet certain administrative, service, and account-size criteria.
A. The following significant accounting policies conform to generally accepted accounting principles for U.S. investment companies. The fund consistently follows such policies in preparing its financial statements.
1. Security Valuation: Securities are valued as of the close of trading on the New York Stock Exchange (generally 4 p.m., Eastern time) on the valuation date. Equity securities are valued at the latest quoted sales prices or official closing prices taken from the primary market in which each security trades; such securities not traded on the valuation date are valued at the mean of the latest quoted bid and asked prices. Securities for which market quotations are not readily available, or whose values have been affected by events occurring before the fund’s pricing time but after the close of the securities’ primary markets, are valued at their fair values calculated according to procedures adopted by the board of trustees. These procedures include obtaining quotations from an independent pricing service, monitoring news to identify significant market- or security-specific events, and evaluating changes in the values of foreign market proxies (for example, ADRs, futures contracts, or exchange-traded funds), between the time the foreign markets close and the fund’s pricing time. When fair-value pricing is employed, the prices of securities used by a fund to calculate its net asset value may differ from quoted or published prices for the same securities. Investments in Vanguard Market Liquidity Fund are valued at that fund’s net asset value.
2. Foreign Currency: Securities and other assets and liabilities denominated in foreign currencies are translated into U.S. dollars using exchange rates obtained from an independent third party as of the fund’s pricing time on the valuation date. Realized gains (losses) and unrealized appreciation (depreciation) on investment securities include the effects of changes in exchange rates since the securities were purchased, combined with the effects of changes in security prices. Fluctuations in the value of other assets and liabilities resulting from changes in exchange rates are recorded as unrealized foreign currency gains (losses) until the assets or liabilities are settled in cash, at which time they are recorded as realized foreign currency gains (losses).
3. Federal Income Taxes: The fund intends to continue to qualify as a regulated investment company and distribute all of its taxable income. Management has analyzed the fund’s tax positions taken for all open federal income tax years (September 30, 2012–2015), and for the period ended March 31, 2016, and has concluded that no provision for federal income tax is required in the fund’s financial statements.
4. Distributions: Distributions to shareholders are recorded on the ex-dividend date.
5. Securities Lending: To earn additional income, the fund lends its securities to qualified institutional borrowers. Security loans are subject to termination by the fund at any time, and are required to be secured at all times by collateral in an amount at least equal to the market value of securities loaned. Daily market fluctuations could cause the value of loaned securities to be more or less than the value of the collateral received. When this occurs, the collateral is adjusted and settled on the next business day. The fund further mitigates its counterparty risk by entering into securities lending transactions only with a diverse group of prequalified counterparties, monitoring their financial strength, and entering into master securities lending agreements with its counterparties. The master securities
21
Capital Opportunity Fund
lending agreements provide that, in the event of a counterparty’s default (including bankruptcy), the fund may terminate any loans with that borrower, determine the net amount owed, and sell or retain the collateral up to the net amount owed to the fund; however, such actions may be subject to legal proceedings. While collateral mitigates counterparty risk, in the absence of a default the fund may experience delays and costs in recovering the securities loaned. The fund invests cash collateral received in Vanguard Market Liquidity Fund, and records a liability in the Statement of Net Assets for the return of the collateral, during the period the securities are on loan. Securities lending income represents fees charged to borrowers plus income earned on invested cash collateral, less expenses associated with the loan.
6. Credit Facility: The fund and certain other funds managed by The Vanguard Group (“Vanguard”) participate in a $3.1 billion committed credit facility provided by a syndicate of lenders pursuant to a credit agreement that may be renewed annually; each fund is individually liable for its borrowings, if any, under the credit facility. Borrowings may be utilized for temporary and emergency purposes, and are subject to the fund’s regulatory and contractual borrowing restrictions. The participating funds are charged administrative fees and an annual commitment fee of 0.10% of the undrawn amount of the facility; these fees are allocated to the funds based on a method approved by the fund’s board of trustees and included in Management and Administrative expenses on the fund’s Statement of Operations. Any borrowings under this facility bear interest at a rate based upon the higher of the one-month London Interbank Offered Rate, federal funds effective rate, or overnight bank funding rate plus an agreed-upon spread.
The fund had no borrowings outstanding at March 31, 2016, or at any time during the period then ended.
7. Other: Dividend income is recorded on the ex-dividend date. Interest income includes income distributions received from Vanguard Market Liquidity Fund and is accrued daily. Security transactions are accounted for on the date securities are bought or sold. Costs used to determine realized gains (losses) on the sale of investment securities are those of the specific securities sold.
Each class of shares has equal rights as to assets and earnings, except that each class separately bears certain class-specific expenses related to maintenance of shareholder accounts (included in Management and Administrative expenses) and shareholder reporting. Marketing and distribution expenses are allocated to each class of shares based on a method approved by the board of trustees. Income, other non-class-specific expenses, and gains and losses on investments are allocated to each class of shares based on its relative net assets.
B. PRIMECAP Management Company provides investment advisory services to the fund for a fee calculated at an annual percentage rate of average net assets. For the six months ended March 31, 2016, the investment advisory fee represented an effective annual rate of 0.24% of the fund’s average net assets.
C. In accordance with the terms of a Funds’ Service Agreement (the “FSA”) between Vanguard and the fund, Vanguard furnishes to the fund corporate management, administrative, marketing, and distribution services at Vanguard’s cost of operations (as defined by the FSA). These costs of operations are allocated to the fund based on methods and guidelines approved by the board of trustees. Vanguard does not require reimbursement in the current period for certain costs of operations (such as deferred compensation/benefits and risk/insurance costs); the fund’s liability for these costs of operations is included in Payables to Vanguard on the Statement of Net Assets.
22
Capital Opportunity Fund
Upon the request of Vanguard, the fund may invest up to 0.40% of its net assets as capital in Vanguard. At March 31, 2016, the fund had contributed to Vanguard capital in the amount of $1,109,000, representing 0.01% of the fund’s net assets and 0.44% of Vanguard’s capitalization. The fund’s trustees and officers are also directors and employees, respectively, of Vanguard.
D. Various inputs may be used to determine the value of the fund’s investments. These inputs are summarized in three broad levels for financial statement purposes. The inputs or methodologies used to value securities are not necessarily an indication of the risk associated with investing in those securities.
Level 1—Quoted prices in active markets for identical securities.
Level 2—Other significant observable inputs (including quoted prices for similar securities, interest rates, prepayment speeds, credit risk, etc.).
Level 3—Significant unobservable inputs (including the fund’s own assumptions used to determine the fair value of investments).
The following table summarizes the market value of the fund’s investments as of March 31, 2016, based on the inputs used to value them:
| | | | |
| | Level 1 | Level 2 | Level 3 |
| Investments | ($000) | ($000) | ($000) |
| Common Stocks | 12,082,093 | 566,086 | — |
| Temporary Cash Investments | 518,858 | — | — |
| Total | 12,600,951 | 566,086 | — |
E. Distributions are determined on a tax basis and may differ from net investment income and realized capital gains for financial reporting purposes. Differences may be permanent or temporary. Permanent differences are reclassified among capital accounts in the financial statements to reflect their tax character. Temporary differences arise when certain items of income, expense, gain, or loss are recognized in different periods for financial statement and tax purposes. These differences will reverse at some time in the future. Differences in classification may also result from the treatment of short-term gains as ordinary income for tax purposes. The fund’s tax-basis capital gains and losses are determined only at the end of each fiscal year.
During the six months ended March 31, 2016, the fund realized net foreign currency losses of $37,000, which decreased distributable net income for tax purposes; accordingly, such losses have been reclassified from accumulated net realized gains to undistributed net investment income.
At March 31, 2016, the cost of investment securities for tax purposes was $7,147,419,000. Net unrealized appreciation of investment securities for tax purposes was $6,019,618,000, consisting of unrealized gains of $6,501,286,000 on securities that had risen in value since their purchase and $481,668,000 in unrealized losses on securities that had fallen in value since their purchase.
F. During the six months ended March 31, 2016, the fund purchased $487,498,000 of investment securities and sold $448,363,000 of investment securities, other than temporary cash investments.
23
Capital Opportunity Fund
G. Capital share transactions for each class of shares were:
| | | | |
| | Six Months Ended | | Year Ended |
| | March 31, 2016 | September 30, 2015 |
| | Amount | Shares | Amount | Shares |
| | ($000) | (000) | ($000) | (000) |
| Investor Shares | | | | |
| Issued | 118,453 | 2,373 | 365,789 | 6,845 |
| Issued in Lieu of Cash Distributions | 117,285 | 2,266 | 111,603 | 2,090 |
| Redeemed | (265,570) | (5,347) | (965,317) | (17,816) |
| Net Increase (Decrease)—Investor Shares | (29,832) | (708) | (487,925) | (8,881) |
| Admiral Shares | | | | |
| Issued | 269,019 | 2,342 | 1,187,443 | 9,514 |
| Issued in Lieu of Cash Distributions | 526,393 | 4,406 | 403,938 | 3,277 |
| Redeemed | (547,071) | (4,783) | (774,819) | (6,256) |
| Net Increase (Decrease)—Admiral Shares | 248,341 | 1,965 | 816,562 | 6,535 |
H. Certain of the fund’s investments are in companies that are considered to be affiliated companies of the fund because the fund owns more than 5% of the outstanding voting securities of the company or the issuer is another member of The Vanguard Group. Transactions during the period in securities of these companies were as follows:
| | | | | | |
| | | | Current Period Transactions | |
| | Sept. 30, | | Proceeds | | | March 31, |
| | 2015 | | from | | Capital Gain | 2016 |
| | Market | Purchases | Securities | | Distributions | Market |
| | Value | at Cost | Sold | Income | Received | Value |
| | ($000) | ($000) | ($000) | ($000) | ($000) | ($000) |
| Descartes Systems Group Inc. | 82,170 | — | — | — | — | 90,624 |
| FormFactor Inc. | 39,390 | — | — | — | — | 42,237 |
| Vanguard Market Liquidity Fund | 877,225 | NA1 | NA1 | 1,040 | — | 518,858 |
| Total | 998,785 | | | 1,040 | — | 651,719 |
| 1 Not applicable—purchases and sales are for temporary cash investment purposes. | | | |
I. Management has determined that no material events or transactions occurred subsequent to March 31, 2016, that would require recognition or disclosure in these financial statements.
24
About Your Fund’s Expenses
As a shareholder of the fund, you incur ongoing costs, which include costs for portfolio management, administrative services, and shareholder reports (like this one), among others. Operating expenses, which are deducted from a fund’s gross income, directly reduce the investment return of the fund.
A fund’s expenses are expressed as a percentage of its average net assets. This figure is known as the expense ratio. The following examples are intended to help you understand the ongoing costs (in dollars) of investing in your fund and to compare these costs with those of other mutual funds. The examples are based on an investment of $1,000 made at the beginning of the period shown and held for the entire period.
The accompanying table illustrates your fund’s costs in two ways:
• Based on actual fund return. This section helps you to estimate the actual expenses that you paid over the period. The ”Ending Account Value“ shown is derived from the fund‘s actual return, and the third column shows the dollar amount that would have been paid by an investor who started with $1,000 in the fund. You may use the information here, together with the amount you invested, to estimate the expenses that you paid over the period.
To do so, simply divide your account value by $1,000 (for example, an $8,600 account value divided by $1,000 = 8.6), then multiply the result by the number given for your fund under the heading ”Expenses Paid During Period.“
• Based on hypothetical 5% yearly return. This section is intended to help you compare your fund‘s costs with those of other mutual funds. It assumes that the fund had a yearly return of 5% before expenses, but that the expense ratio is unchanged. In this case—because the return used is not the fund’s actual return—the results do not apply to your investment. The example is useful in making comparisons because the Securities and Exchange Commission requires all mutual funds to calculate expenses based on a 5% return. You can assess your fund’s costs by comparing this hypothetical example with the hypothetical examples that appear in shareholder reports of other funds.
Note that the expenses shown in the table are meant to highlight and help you compare ongoing costs only and do not reflect transaction costs incurred by the fund for buying and selling securities. Further, the expenses do not include any purchase, redemption, or account service fees described in the fund prospectus. If such fees were applied to your account, your costs would be higher. Your fund does not carry a “sales load.”
The calculations assume no shares were bought or sold during the period. Your actual costs may have been higher or lower, depending on the amount of your investment and the timing of any purchases or redemptions.
You can find more information about the fund’s expenses, including annual expense ratios, in the Financial Statements section of this report. For additional information on operating expenses and other shareholder costs, please refer to your fund’s current prospectus.
25
| | | | |
| Six Months Ended March 31, 2016 | | | |
| | Beginning | Ending | Expenses |
| | Account Value | Account Value | Paid During |
| Capital Opportunity Fund | 9/30/2015 | 3/31/2016 | Period |
| Based on Actual Fund Return | | | |
| Investor Shares | $1,000.00 | $1,041.97 | $2.20 |
| Admiral Shares | 1,000.00 | 1,042.42 | 1.89 |
| Based on Hypothetical 5% Yearly Return | | | |
| Investor Shares | $1,000.00 | $1,022.85 | $2.17 |
| Admiral Shares | 1,000.00 | 1,023.15 | 1.87 |
| The calculations are based on expenses incurred in the most recent six-month period. The fund’s annualized six-month expense ratios for that period are 0.43% for Investor Shares and 0.37% for Admiral Shares. The dollar amounts shown as “Expenses Paid” are equal to the annualized expense ratio multiplied by the average account value over the period, multiplied by the number of days in the most recent six-month period, then divided by the number of days in the most recent 12-month period (183/366). |
|
|
|
26
Trustees Approve Advisory Arrangement
The board of trustees of Vanguard Capital Opportunity Fund has renewed the fund’s investment advisory arrangement with PRIMECAP Management Company (PRIMECAP Management). The board determined that renewing the fund’s advisory arrangement was in the best interests of the fund and its shareholders.
The board based its decision upon an evaluation of the advisor’s investment staff, portfolio management process, and performance. The trustees considered the factors discussed below, among others. However, no single factor determined whether the board approved the arrangement. Rather, it was the totality of the circumstances that drove the board’s decision.
Nature, extent, and quality of services
The board reviewed the quality of the fund’s investment management services over both the short and long term and took into account the organizational depth and stability of the advisor. The board considered that PRIMECAP Management, founded in 1983, is recognized for its long-term approach to growth-equity investing. The portfolio managers are responsible for separate sub-portfolios, and each portfolio manager employs a fundamental, research-driven approach in seeking to identify companies with long-term growth potential that the market has yet to appreciate. The multi-counselor approach that the advisor employs is designed to emphasize individual decision-making and enable each portfolio manager to invest only in his or her highest-conviction ideas. PRIMECAP’s fundamental research focuses on developing opinions independent from Wall Street’s consensus and maintaining a long-term horizon. PRIMECAP Management has managed the fund since 1998.
The board concluded that the advisor’s experience, stability, depth, and performance, among other factors, warranted continuation of the advisory arrangement.
Investment performance
The board considered the short- and long-term performance of the fund, including any periods of outperformance or underperformance relative to a benchmark index and peer group. The board concluded that the performance was such that the advisory arrangement should continue. Information about the fund’s most recent performance can be found in the Performance Summary section of this report.
Cost
The board concluded that the fund’s expense ratio was well below the average expense ratio charged by funds in its peer group and that the fund’s advisory fee rate was also well below its peer-group average. Information about the fund’s expenses appears in the About Your Fund’s Expenses section of this report as well as in the Financial Statements section, which also includes information about the fund’s advisory fee rate.
The board did not consider profitability of PRIMECAP Management in determining whether to approve the advisory fee because PRIMECAP Management is independent of Vanguard and the advisory fee is the result of arm’s-length negotiations.
The benefit of economies of scale
The board concluded that the fund’s shareholders benefit from economies of scale because of the breakpoints in the fund’s advisory fee schedule. The breakpoints reduce the effective rate of the fee as the fund’s assets increase.
The board will consider whether to renew the advisory arrangement again after a one-year period.
27
Glossary
30-Day SEC Yield. A fund’s 30-day SEC yield is derived using a formula specified by the U.S. Securities and Exchange Commission. Under the formula, data related to the fund’s security holdings in the previous 30 days are used to calculate the fund’s hypothetical net income for that period, which is then annualized and divided by the fund’s estimated average net assets over the calculation period. For the purposes of this calculation, a security’s income is based on its current market yield to maturity (for bonds), its actual income (for asset-backed securities), or its projected dividend yield (for stocks). Because the SEC yield represents hypothetical annualized income, it will differ—at times significantly—from the fund’s actual experience. As a result, the fund’s income distributions may be higher or lower than implied by the SEC yield.
Beta. A measure of the magnitude of a fund’s past share-price fluctuations in relation to the ups and downs of a given market index. The index is assigned a beta of 1.00. Compared with a given index, a fund with a beta of 1.20 typically would have seen its share price rise or fall by 12% when the index rose or fell by 10%. For this report, beta is based on returns over the past 36 months for both the fund and the index. Note that a fund’s beta should be reviewed in conjunction with its R-squared (see definition). The lower the R-squared, the less correlation there is between the fund and the index, and the less reliable beta is as an indicator of volatility.
Dividend Yield. Dividend income earned by stocks, expressed as a percentage of the aggregate market value (or of net asset value, for a fund). The yield is determined by dividing the amount of the annual dividends by the aggregate value (or net asset value) at the end of the period. For a fund, the dividend yield is based solely on stock holdings and does not include any income produced by other investments.
Earnings Growth Rate. The average annual rate of growth in earnings over the past five years for the stocks now in a fund.
Equity Exposure. A measure that reflects a fund’s investments in stocks and stock futures. Any holdings in short-term reserves are excluded.
Expense Ratio. A fund’s total annual operating expenses expressed as a percentage of the fund’s average net assets. The expense ratio includes management and administrative expenses, but does not include the transaction costs of buying and selling portfolio securities.
Foreign Holdings. The percentage of a fund represented by securities or depositary receipts of companies based outside the United States.
Inception Date. The date on which the assets of a fund (or one of its share classes) are first invested in accordance with the fund’s investment objective. For funds with a subscription period, the inception date is the day after that period ends. Investment performance is measured from the inception date.
Median Market Cap. An indicator of the size of companies in which a fund invests; the midpoint of market capitalization (market price x shares outstanding) of a fund’s stocks, weighted by the proportion of the fund’s assets invested in each stock. Stocks representing half of the fund’s assets have market capitalizations above the median, and the rest are below it.
Price/Book Ratio. The share price of a stock divided by its net worth, or book value, per share. For a fund, the weighted average price/book ratio of the stocks it holds.
28
Price/Earnings Ratio. The ratio of a stock’s current price to its per-share earnings over the past year. For a fund, the weighted average P/E of the stocks it holds. P/E is an indicator of market expectations about corporate prospects; the higher the P/E, the greater the expectations for a company’s future growth.
R-Squared. A measure of how much of a fund’s past returns can be explained by the returns from the market in general, as measured by a given index. If a fund’s total returns were precisely synchronized with an index’s returns, its R-squared would be 1.00. If the fund’s returns bore no relationship to the index’s returns, its R-squared would be 0. For this report, R-squared is based on returns over the past 36 months for both the fund and the index.
Return on Equity. The annual average rate of return generated by a company during the past five years for each dollar of shareholder’s equity (net income divided by shareholder’s equity). For a fund, the weighted average return on equity for the companies whose stocks it holds.
Short-Term Reserves. The percentage of a fund invested in highly liquid, short-term securities that can be readily converted to cash.
Turnover Rate. An indication of the fund’s trading activity. Funds with high turnover rates incur higher transaction costs and may be more likely to distribute capital gains (which may be taxable to investors). The turnover rate excludes in-kind transactions, which have minimal impact on costs.
29
This page intentionally left blank.
This page intentionally left blank.
The People Who Govern Your Fund
The trustees of your mutual fund are there to see that the fund is operated and managed in your best interests since, as a shareholder, you are a part owner of the fund. Your fund’s trustees also serve on the board of directors of The Vanguard Group, Inc., which is owned by the Vanguard funds and provides services to them on an at-cost basis.
A majority of Vanguard’s board members are independent, meaning that they have no affiliation with Vanguard or the funds they oversee, apart from the sizable personal investments they have made as private individuals. The independent board members have distinguished backgrounds in business, academia, and public service. Each of the trustees and executive officers oversees 198 Vanguard funds.
The following table provides information for each trustee and executive officer of the fund. More information about the trustees is in the Statement of Additional Information, which can be obtained, without charge, by contacting Vanguard at 800-662-7447, or online at vanguard.com.
| | |
| InterestedTrustee1 | Rajiv L. Gupta |
| Born 1945. Trustee Since December 2001.2 Principal |
| F. William McNabb III | Occupation(s) During the Past Five Years and Other |
| Born 1957. Trustee Since July 2009. Chairman of | Experience: Chairman and Chief Executive Officer |
| the Board. Principal Occupation(s) During the Past | (retired 2009) and President (2006–2008) of |
| Five Years and Other Experience: Chairman of the | Rohm and Haas Co. (chemicals); Director of Tyco |
| Board of The Vanguard Group, Inc., and of each of | International PLC (diversified manufacturing and |
| the investment companies served by The Vanguard | services), HP Inc. (printer and personal computer |
| Group, since January 2010; Director of The Vanguard | manufacturing), and Delphi Automotive PLC |
| Group since 2008; Chief Executive Officer and | (automotive components); Senior Advisor at |
| President of The Vanguard Group, and of each of | New Mountain Capital. |
| the investment companies served by The Vanguard | |
| Group, since 2008; Director of Vanguard Marketing | Amy Gutmann |
| Corporation; Managing Director of The Vanguard | Born 1949. Trustee Since June 2006. Principal |
| Group (1995–2008). | Occupation(s) During the Past Five Years and |
| Other Experience: President of the University of |
| IndependentTrustees | Pennsylvania; Christopher H. Browne Distinguished |
| Professor of Political Science, School of Arts and |
| Emerson U. Fullwood | Sciences, and Professor of Communication, Annenberg |
| Born 1948. Trustee Since January 2008. Principal | School for Communication, with secondary faculty |
| Occupation(s) During the Past Five Years and Other | appointments in the Department of Philosophy, School |
| Experience: Executive Chief Staff and Marketing | of Arts and Sciences, and at the Graduate School of |
| Officer for North America and Corporate Vice President | Education, University of Pennsylvania; Trustee of the |
| (retired 2008) of Xerox Corporation (document manage- | National Constitution Center; Chair of the Presidential |
| ment products and services); Executive in Residence | Commission for the Study of Bioethical Issues. |
| and 2009–2010 Distinguished Minett Professor at | |
| the Rochester Institute of Technology; Lead Director | JoAnn Heffernan Heisen |
| of SPX FLOW, Inc. (multi-industry manufacturing); | Born 1950. Trustee Since July 1998. Principal |
| Director of the United Way of Rochester, the University | Occupation(s) During the Past Five Years and |
| of Rochester Medical Center, Monroe Community | Other Experience: Corporate Vice President and |
| College Foundation, North Carolina A&T University, | Chief Global Diversity Officer (retired 2008) and |
| and Roberts Wesleyan College. | Member of the Executive Committee (1997–2008) |
| of Johnson & Johnson (pharmaceuticals/medical |
| devices/consumer products); Director of Skytop |
| Lodge Corporation (hotels) and the Robert Wood |
| Johnson Foundation; Member of the Advisory |
| Board of the Institute for Women’s Leadership |
| at Rutgers University. |
| | |
| F. Joseph Loughrey | Executive Officers | |
| Born 1949. Trustee Since October 2009. Principal | | |
| Occupation(s) During the Past Five Years and Other | Glenn Booraem | |
| Experience: President and Chief Operating Officer | Born 1967. Treasurer Since May 2015. Principal |
| (retired 2009) of Cummins Inc. (industrial machinery); | Occupation(s) During the Past Five Years and |
| Chairman of the Board of Hillenbrand, Inc. (specialized | Other Experience: Principal of The Vanguard Group, |
| consumer services), and of Oxfam America; Director | Inc.; Treasurer of each of the investment companies |
| of SKF AB (industrial machinery), Hyster-Yale Materials | served by The Vanguard Group; Controller of each of |
| Handling, Inc. (forklift trucks), the Lumina Foundation | the investment companies served by The Vanguard |
| for Education, and the V Foundation for Cancer | Group (2010–2015); Assistant Controller of each of |
| Research; Member of the Advisory Council for the | the investment companies served by The Vanguard |
| College of Arts and Letters and of the Advisory Board | Group (2001–2010). | |
| to the Kellogg Institute for International Studies, both | | |
| at the University of Notre Dame. | Thomas J. Higgins | |
| Born 1957. Chief Financial Officer Since September |
| Mark Loughridge | 2008. Principal Occupation(s) During the Past Five |
| Born 1953. Trustee Since March 2012. Principal | Years and Other Experience: Principal of The Vanguard |
| Occupation(s) During the Past Five Years and Other | Group, Inc.; Chief Financial Officer of each of the |
| Experience: Senior Vice President and Chief Financial | investment companies served by The Vanguard Group; |
| Officer (retired 2013) at IBM (information technology | Treasurer of each of the investment companies served |
| services); Fiduciary Member of IBM’s Retirement Plan | by The Vanguard Group (1998–2008). |
| Committee (2004–2013); Director of the Dow Chemical | |
| Company; Member of the Council on Chicago Booth. | Peter Mahoney | |
| Born 1974. Controller Since May 2015. Principal |
| Scott C. Malpass | Occupation(s) During the Past Five Years and |
| Born 1962. Trustee Since March 2012. Principal | Other Experience: Head of Global Fund Accounting |
| Occupation(s) During the Past Five Years and Other | at The Vanguard Group, Inc.; Controller of each of the |
| Experience: Chief Investment Officer and Vice | investment companies served by The Vanguard Group; |
| President at the University of Notre Dame; Assistant | Head of International Fund Services at The Vanguard |
| Professor of Finance at the Mendoza College of | Group (2008–2014). | |
| Business at Notre Dame; Member of the Notre Dame | | |
| 403(b) Investment Committee, the Board of Advisors | Heidi Stam |
| for Spruceview Capital Partners, and the Investment | Born 1956. Secretary Since July 2005. Principal |
| Advisory Committee of Major League Baseball; Board | Occupation(s) During the Past Five Years and Other |
| Member of TIFF Advisory Services, Inc., and Catholic | Experience: Managing Director of The Vanguard |
| Investment Services, Inc. (investment advisors). | Group, Inc.; General Counsel of The Vanguard Group; |
| Secretary of The Vanguard Group and of each of the |
| André F. Perold | investment companies served by The Vanguard Group; |
| Born 1952. Trustee Since December 2004. Principal | Director and Senior Vice President of Vanguard |
| Occupation(s) During the Past Five Years and Other | Marketing Corporation. | |
| Experience: George Gund Professor of Finance and | | |
| Banking, Emeritus at the Harvard Business School | Vanguard Senior ManagementTeam |
| (retired 2011); Chief Investment Officer and Managing | | |
| Partner of HighVista Strategies LLC (private investment | Mortimer J. Buckley | James M. Norris |
| firm); Director of Rand Merchant Bank; Overseer of | Kathleen C. Gubanich | Thomas M. Rampulla |
| the Museum of Fine Arts Boston. | Martha G. King | Glenn W. Reed |
| John T. Marcante | Karin A. Risi |
| Peter F. Volanakis | Chris D. McIsaac | |
| Born 1955. Trustee Since July 2009. Principal | |
| Occupation(s) During the Past Five Years and Other | Chairman Emeritus and Senior Advisor |
| Experience: President and Chief Operating Officer | |
| (retired 2010) of Corning Incorporated (communications | John J. Brennan |
| equipment); Trustee of Colby-Sawyer College and | Chairman, 1996–2009 |
| Chairman of its Finance and Enrollment Committee; | Chief Executive Officer and President, 1996–2008 |
| Member of the Advisory Board of the Norris Cotton | |
| Cancer Center. | Founder |
| | |
| John C. Bogle |
| Chairman and Chief Executive Officer, 1974–1996 | |
| | | |
| | |
1 Mr. McNabb is considered an “interested person,” as defined in the Investment Company Act of 1940, because he is an officer of the Vanguard funds.
2 December 2002 for Vanguard Equity Income Fund, the Vanguard Municipal Bond Funds, and the Vanguard State Tax-Exempt Funds.
|  |
| | P.O. Box 2600 |
| | Valley Forge, PA 19482-2600 |
| |
| |
| |
| Connect with Vanguard® > vanguard.com | |
| |
| |
| |
| Fund Information > 800-662-7447 | |
| Direct Investor Account Services > 800-662-2739 | |
| Institutional Investor Services > 800-523-1036 | |
| Text Telephone for People | |
| Who Are Deaf or Hard of Hearing> 800-749-7273 | |
| |
| This material may be used in conjunction | |
| with the offering of shares of any Vanguard | |
| fund only if preceded or accompanied by | |
| the fund’s current prospectus. | |
| |
| All comparative mutual fund data are from Lipper, a | |
| Thomson Reuters Company, or Morningstar, Inc., unless | |
| otherwise noted. | |
| |
| You can obtain a free copy of Vanguard’s proxy voting | |
| guidelines by visiting vanguard.com/proxyreporting or by | |
| calling Vanguard at 800-662-2739. The guidelines are | |
| also available from the SEC’s website, sec.gov. In | |
| addition, you may obtain a free report on how your fund | |
| voted the proxies for securities it owned during the 12 | |
| months ended June 30. To get the report, visit either | |
| vanguard.com/proxyreporting or sec.gov. | |
| |
| You can review and copy information about your fund at | |
| the SEC’s Public Reference Room in Washington, D.C. To | |
| find out more about this public service, call the SEC at | |
| 202-551-8090. Information about your fund is also | |
| available on the SEC’s website, and you can receive | |
| copies of this information, for a fee, by sending a | |
| request in either of two ways: via email addressed to | |
| publicinfo@sec.gov or via regular mail addressed to the | |
| Public Reference Section, Securities and Exchange | |
| Commission, Washington, DC 20549-1520. | |
| |
| | © 2016 The Vanguard Group, Inc. |
| | All rights reserved. |
| | Vanguard Marketing Corporation, Distributor. |
| |
| | Q1112 052016 |

Semiannual Report | March 31, 2016
Vanguard Global Equity Fund
Vanguard’s Principles for Investing Success
We want to give you the best chance of investment success. These principles, grounded in Vanguard’s research and experience, can put you on the right path.
Goals. Create clear, appropriate investment goals.
Balance. Develop a suitable asset allocation using broadly diversified funds. Cost. Minimize cost.
Discipline. Maintain perspective and long-term discipline.
A single theme unites these principles: Focus on the things you can control.
We believe there is no wiser course for any investor.
| |
| Contents | |
| Your Fund’s Total Returns. | 1 |
| Chairman’s Letter. | 2 |
| Advisors’ Report. | 7 |
| Fund Profile. | 11 |
| Performance Summary. | 13 |
| Financial Statements. | 14 |
| About Your Fund’s Expenses. | 30 |
| Trustees Approve Advisory Arrangements. | 32 |
| Glossary. | 34 |
Please note: The opinions expressed in this report are just that—informed opinions. They should not be considered promises or advice. Also, please keep in mind that the information and opinions cover the period through the date on the front of this report. Of course, the risks of investing in your fund are spelled out in the prospectus.
See the Glossary for definitions of investment terms used in this report.
About the cover: Pictured is a sailing block on the Brilliant, a 1932 schooner docked in Mystic, Connecticut. A type of pulley, the sailing block helps coordinate the setting of the sails. At Vanguard, the intricate coordination of technology and people allows us to help millions of clients around the world reach their financial goals.
Your Fund’s Total Returns
| | |
| Six Months Ended March 31, 2016 | |
| | Total |
| | Returns |
| Vanguard Global Equity Fund | 4.99% |
| MSCI All Country World Index | 5.28 |
| Global Funds Average | 4.18 |
| Global Funds Average: Derived from data provided by Lipper, a Thomson Reuters Company. | |
| | | | | |
| Your Fund’s Performance at a Glance | | | | |
| September 30, 2015, Through March 31, 2016 | | | | |
| | | | Distributions Per Share |
| | Starting | Ending | Income | Capital |
| | Share Price | Share Price | Dividends | Gains |
| Vanguard Global Equity Fund | $22.85 | $23.58 | $0.405 | $0.000 |
1

Chairman’s Letter
Dear Shareholder,
Amid considerable stock market volatility, Vanguard Global Equity Fund returned about 5% for the six months ended March 31, 2016. This placed it in line with its benchmark index and ahead of the average return of international peer funds.
Your fund’s holdings outperformed the benchmark’s in emerging markets but lagged in the United States—a reversal from its previous 12-months’ results.
Currency effects also reversed. In recent letters, I’ve discussed the role of the stronger U.S. dollar, which—broadly speaking—had been trimming international stocks’ returns when translated into dollars for U.S. investors. For the six months covered in this report, however, currency effects were more nuanced. The dollar’s weakness against Japan’s yen and the euro boosted returns from markets using those currencies when translated into dollars for U.S.-based investors. But dollar strength against the British pound took a bite out of U.K stock returns. Currency translation effects were minimal for emerging markets overall.
En route to solid half-year results, stocks charted an uneven course
The broad U.S. stock market returned about 7% for the six months. The period began and ended strongly, with fluctuations in the middle as China’s economic slowdown and falling oil and commodity prices worried investors.
2
Stocks rallied in March as investors again seemed encouraged by news about monetary policy, especially after the Federal Reserve indicated that it would raise interest rates fewer times in 2016 than had been expected.
International stocks returned about 3% after surging more than 8% in March. Stocks from emerging markets and from developed Pacific markets outperformed developed European stocks, which were nearly flat.
Bonds produced gains following a subpar start
The broad U.S. taxable bond market returned more than 2% for the fiscal half year. Returns were weak in the first three months, which culminated with the Fed’s quarter-percentage-point interest rate increase in December.
But with stocks volatile and the Fed indicating it would proceed cautiously with future rate hikes, bonds rallied in the final three months. The yield of the 10-year U.S. Treasury note closed at 1.77% at the end of March, down from 2.05% six months earlier. (Bond prices and yields move in opposite directions.)
Returns for money market funds and savings accounts remained limited by the Fed’s still-low target rate of 0.25%–0.5%.
International bond markets (as measured by the Barclays Global Aggregate Index ex USD) returned almost 7%. Like stocks,
| | | | |
| Market Barometer | | | |
| |
| | | | Total Returns |
| | | Periods Ended March 31, 2016 |
| | Six | One | Five Years |
| | Months | Year | (Annualized) |
| Stocks | | | |
| Russell 1000 Index (Large-caps) | 7.75% | 0.50% | 11.35% |
| Russell 2000 Index (Small-caps) | 2.02 | -9.76 | 7.20 |
| Russell 3000 Index (Broad U.S. market) | 7.30 | -0.34 | 11.01 |
| FTSE All-World ex US Index (International) | 3.09 | -8.53 | 0.70 |
| |
| Bonds | | | |
| Barclays U.S. Aggregate Bond Index (Broad taxable market) | 2.44% | 1.96% | 3.78% |
| Barclays Municipal Bond Index (Broad tax-exempt market) | 3.20 | 3.98 | 5.59 |
| Citigroup Three-Month U.S. Treasury Bill Index | 0.06 | 0.08 | 0.04 |
| |
| CPI | | | |
| Consumer Price Index | 0.08% | 0.85% | 1.28% |
3
international bond returns for U.S.-based investors benefited from dollar weakness. Even in local currencies, however, international bond returns were solidly positive. They were helped by the additional stimulus measures taken in Europe and Asia to combat weak growth and low inflation.
Emerging markets lifted the fund; developed markets had mixed returns
Anyone expecting markets to settle down a bit after the Fed’s long-anticipated rate increase would have been disappointed. In January, many U.S. and international stock markets fell into or near bear market territory, in part because of concerns about global economic growth, especially in China. (A decline of 20% or more lasting at least two months generally qualifies as a bear market.)
Much has been written about slower growth in China as its leaders transition the economy from one heavily dependent on investment and exports toward one driven more by domestic consumption and services. Although this long-term process isn’t “news,” markets still tend to react—and sometimes overreact—to each new release of Chinese data. The world’s most populous nation and second-largest economy matters because so many other countries, both emerging and developed, depend on exports to it. Several bouts of dramatic swings in mainland China’s stock markets have also unsettled investors.
| | | |
| Expense Ratios | | |
| Your Fund Compared With Its Peer Group | | |
| | | Peer Group |
| | Fund | Average |
| Global Equity Fund | 0.57% | 1.27% |
| The fund expense ratio shown is from the prospectus dated January 28, 2016, and represents estimated costs for the current fiscal year. For the six months ended March 31, 2016, the fund’s annualized expense ratio was 0.52%. The peer-group expense ratio is derived from data provided by Lipper, a Thomson Reuters Company, and captures information through year-end 2015. |
|
|
|
| |
| Peer group: Global Funds. | | |
4
Even as the China constituents in the benchmark index declined, the advisors’ China selections posted a double-digit advance. This helped the Global Equity Fund outperform the benchmark’s return from emerging markets. Developed Europe, which made up about 20% of fund assets, was another source of strength: In some of the largest European markets, the fund outpaced the benchmark. It also did so in Japan.
In contrast, the fund’s U.S. holdings were a step behind the benchmark’s nearly 8% return from U.S. stocks. By virtue
|
| Vanguard’s growth translates into lower costs for you |
| |
| Research indicates that lower-cost investments have tended to outperform higher-cost ones. |
| So it’s little wonder that funds with lower expense ratios—including those at Vanguard—have |
| dominated the industry’s cash inflows in recent years. |
| |
| Vanguard has long been a low-cost leader, with expenses well below those of many other |
| investment management companies. That cost difference remains a powerful advantage for |
| Vanguard clients. Why? Because a lower expense ratio allows a fund to pass along a greater |
| share of its returns to its investors. |
| |
| What’s more, as you can see in the chart below, we’ve been able to lower our costs continually |
| as our assets under management have grown. Our steady growth has not been an explicit |
| business objective. Rather, we focus on putting our clients’ interests first at all times, and |
| giving them the best chance for investment success. But economies of scale—the cost |
| efficiencies that come with our growth—have allowed us to keep lowering our fund costs, |
| even as we invest in our people and technology. |
| |
| The benefit of economies of scale |
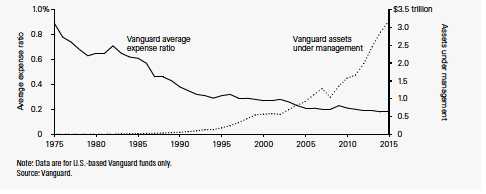
5
of their size—about half of total assets—the fund’s U.S. stocks are a major driver of both its absolute and relative results.
Almost all industry sectors finished the period in positive territory. Compared with the benchmark, the advisors’ sizable commitment to, and selection among, information technology stocks was helpful. Health care and financials also enhanced returns, while energy holdings weighed on results.
For more about the advisors’ strategies and the fund’s positioning during the six months, see the Advisors’ Report that follows this letter.
Consider rebalancing to manage your risk
After you’ve created an investment portfolio—with a diversified mix of stock, bond, and money market funds tailored to your goals, time horizon, and risk tolerance—what’s next?
As stocks and bonds rise or fall over time, and your portfolio drifts from its original asset allocation, you should consider rebalancing back to your targets. Just one year of outsized returns can throw your allocation out of whack. Take, for example, a year like 2013, when the broad U.S. stock market returned nearly 34% and the broad taxable bond market declined: A hypothetical simple portfolio that started that year with 60% stocks and 40% bonds would have ended it with a more aggressive mix of 67% stocks and 33% bonds.
Rebalancing means shifting dollars from assets that have performed well toward those that have fallen behind. That isn’t easy or intuitive—but it helps to manage risk, because over time riskier assets tend to grow faster. (You can read more about our approach in Best Practices for Portfolio Rebalancing at vanguard.com/research.)
You might consider, for example, monitoring your portfolio annually or semiannually and rebalancing when your allocations shift about 5 percentage points from their targets.
It’s important, of course, to be aware of the tax implications. You’ll want to consult with your tax advisor, but generally speaking, it may be a good idea to make any asset changes within a tax-advantaged retirement account, or to direct new cash flows into the underweighted asset class.
However you go about it, keeping your asset allocation from drifting too far off target can help you stay on track with the investment plan you’ve crafted to meet your financial goals.
As always, thank you for investing with Vanguard.
Sincerely,

F. William McNabb III
Chairman and Chief Executive Officer
April 18, 2016
Advisors’ Report
For the six months ended March 31, 2016, Vanguard Global Equity Fund returned 4.99%, in line with its benchmark index and ahead of the average return of its peers. Your fund is managed by three independent advisors, a strategy that enhances the fund’s diversification by providing exposure to distinct yet complementary investment approaches. It’s not uncommon for different advisors to have different views about individual securities or the broader investment environment.
The advisors, the amount and percentage of fund assets each manages, and brief descriptions of their investment strategies are presented in the table below. Each advisor has also prepared a discussion of the investment environment that existed during the half year and its effect on portfolio positioning. These comments were prepared on April 12, 2016.
Marathon Asset Management LLP
Portfolio Managers:
Neil M. Ostrer, Co-Head of Global Equity
William J. Arah, Co-Head of Global Equity
Global markets rallied after a volatile summer of mounting concerns over a China economic slowdown and a further softening of commodity prices. Recently those concerns have abated, with most emerging markets rising sharply and commodity prices firming.
| | | | | |
| Vanguard Global Equity Fund Investment Advisors | | |
| |
| | Fund Assets Managed | | |
| Investment Advisor | % | $ Million | | Investment Strategy |
| Marathon Asset Management | 33 | 1,413 | | A long-term and contrarian investment philosophy and |
| LLP | | | | process with a focus on industry capital cycle analysis |
| | | | | and in-depth management assessment. |
| Baillie Gifford Overseas Ltd. | 33 | 1,399 | | A long-term, active, bottom-up investment approach is |
| | | | | used to identify companies that can generate |
| | | | | above-average growth in earnings and cash flow. |
| Acadian Asset Management LLC | 32 | 1,372 | | A quantitative, active, bottom-up investment process |
| | | | | that combines stock and peer-group valuation to arrive |
| | | | | at a return forecast for each of more than 35,000 |
| | | | | securities in the global universe. |
| Cash Investments | 2 | 88 | | These short-term reserves are invested by Vanguard in |
| | | | | equity index products to simulate investment in stocks. |
| | | | | Each advisor may also maintain a modest cash |
| | | | | position. |
7
Stock selection supported our portfolio’s results, but regional allocations—especially an overweight to Japan and a marked underweight to the United States—hindered them. Corresponding currency exposure contributed slightly.
U.S. stock selection was particularly strong, led by several larger stakes in high-quality businesses. Our overweighting of blue-chip consumer staples companies Johnson & Johnson and Procter & Gamble helped. Broad positive sentiment across the property and casualty insurance industry buoyed Travelers Company, while McDonald’s rallied on improved sentiment and comparative sales data. Not owning several larger U.S. equity benchmark constituents—for example, AT&T, Verizon, General Electric, and Facebook—hurt performance, as did a lack of exposure to the U.S. oil majors.
In Canada, an overweight to Canadian Natural Resources lifted returns as oil prices rallied. Not owning scandal-plagued Valeant Pharmaceuticals also helped. Although our overweight to Europe hurt performance slightly, stock selection—especially an overweight to Danish wind turbine manufacturer Vestas Wind Systems—helped it. The Japanese market lagged overall; our overweight detracted, and the Bank of Japan’s shift to negative interest weighed on several of our financial holdings, including supraregional bank Resona and Dai-Ichi Life Insurance.
We remain underweight to North America, as valuations and profit margins are elevated. We favor defensive high-quality businesses where company-specific changes are occurring and where the market is undervaluing the persistence of the company’s returns. We also hold capital cycle “clusters” of investments within diverse industries such as insurance, semiconductors, coatings/ paints, and southern timberlands. Overweights to Europe and Japan continue. In Europe, the ongoing and enhanced quantitative easing program, the much weaker oil price, and the Fed’s decision to take their tightening program slowly should benefit risk asset prices.
Areas of concern include weakness in emerging-market economies (especially China, Brazil, and Russia) and the slight slowdown in the U.S. economy. Heightened geopolitical uncertainty persists as the United Kingdom moves toward its Brexit referendum. The possibility of a Fed tightening in the not-too-distant future is another concern, and increased terrorist activity in Europe is unsettling.
Despite foreign selling pressure, 2016 is on track to be a record year for share buybacks in Japan, as trust banks and the Bank of Japan continue to buy. With valuations compelling and recent events increasing pressure on management to change, our micro outlook remains positive. Shorter-term volatility in the Japanese market will remain high, but any end to foreign selling should trigger a sharp rebound.
8
Baillie Gifford Overseas Ltd.
Portfolio Managers:
Charles Plowden, Joint Senior Partner
and Investment Manager
Spencer Adair, CFA,
Partner and Investment Manager,
Global Alpha Strategy
Malcolm MacColl,
Partner and Investment Manager,
Global Alpha Strategy
Although global stock markets ended the half year higher than they began it, the volatility seen during the period reminded us that equity investing is not always a smooth ride. Toward the end of 2015 and early in 2016, share price moves were broadly negative, as investors worried about a slowdown in the Chinese economy and interest rate rises in the United States. Observant readers will note these concerns are not new. However, as the new year progressed sentiment improved, perhaps bolstered by an increase in the oil price and recognition that the U.S. economy is growing steadily.
Against this backdrop, stock selection helped our results. Despite negative headlines surrounding China, Baidu (search engine) and Alibaba (e-commerce) boosted our performance. Both companies stand to benefit from the new direction of the Chinese economy, which is increasingly consumption-driven. More important, they have been investing for the future, and this is paying off with impressive rates of growth. Elsewhere, Alphabet (formerly Google) and Amazon have also been strong contributors. While these online giants operate closer to home, they share with their Chinese peers the same willingness to invest to drive long-term returns. We continue to search for such forward-thinking companies.
Portfolio turnover remains low, consistent with our long-term approach. However, we have sought to take advantage of stock market volatility in order to buy high-quality companies at attractive prices. We have increased existing holdings in SAP (software producer) and Moody’s (credit ratings agency), and we have bought a new holding in Novo Nordisk (the world’s leading insulin producer). Conversely, we have sold companies whose growth prospects now look less compelling. These include Twitter (social media platform), which we think is struggling to compete with Facebook, and PayPal (online payments), which has failed to sufficiently invest to establish market dominance.
Although speculation about the rate of global growth will likely persist, we remain positive and confident in the positioning of our portfolio, which is well diversified across a range of growth companies. Regardless of what global economies may do in the short term, we remain focused on finding the best companies across the world; it is these businesses that will drive returns in the long run.
9
Acadian Asset Management LLC
Portfolio Managers:
John R. Chisholm, CFA,
Executive Vice President and
Chief Investment Officer
Brendan O. Bradley, Ph.D.,
Senior Vice President and
Director of Portfolio Management
In late 2015, global equity markets were buoyed by an October rally in which cyclical segments recovered and volatility retreated from earlier levels. For much of the remainder of the quarter, investors fluctuated between optimism driven by strength of the U.S. economy and hopes for continued central bank easing in Japan and Europe, and pessimism fueled in part by geopolitical worries, disappointing signals from the European Central Bank and Bank of Japan, and pronounced weakness in energy prices.
Following the Federal Reserve’s December decision to raise interest rates for the first time in over nine years, market reaction was mixed. It alternated between excitement over what the move signaled for the health of the U.S. economy (as well as indications of a modest tightening path) and renewed concern as a number of other factors weighed on sentiment.
Volatility returned to financial markets at the start of 2016, with major equity indices posting steep losses amid renewed worries about economic growth, particularly in China and other emerging markets, as well as about the effect of plunging oil prices on already-weak inflation around the globe. Indications of a more cautious stance from the Fed, ramifications from energy price weakness, and a banking sector under mounting pressures helped solidify a “risk-off” tone. But global equities regained some ground in March on the back of more stable oil prices and the Fed’s decision to leave rates on hold.
We focus on attractively valued stocks that appear likely to rise in price based on earnings data, price characteristics, and quality. Key overweighted markets, based on bottom-up stock selection, included Taiwan, the U.S., Canada, and South Korea. We were underweight in the United Kingdom, France, Switzerland, and Spain. In terms of sectors, our focus was on energy, information technology, and health care. We notably underweighted consumer discretionary, materials, and consumer staples.
Some stock selections disappointed, but we added value at the country level. The majority of our disappointments came from the United States, where energy holdings were most costly. Our U.S. consumer discretionary and information technology holdings also hurt performance. Conversely, our selections in Japan were a bright spot. From a country allocation standpoint, underweighting of the United Kingdom and Switzerland and overweighting of Taiwan helped results.
10
Global Equity Fund
Fund Profile
As of March 31, 2016
| | | |
| Portfolio Characteristics | | |
| | | MSCI All |
| | | Country |
| | Fund | World Index |
| Number of Stocks | 820 | 2,474 |
| Median Market Cap | $19.5B | $43.4B |
| Price/Earnings Ratio | 19.8x | 19.7x |
| Price/Book Ratio | 2.2x | 2.0x |
| Return on Equity | 15.9% | 16.8% |
| Earnings Growth | | |
| Rate | 8.2% | 7.6% |
| Dividend Yield | 2.0% | 2.6% |
| Turnover Rate | | |
| (Annualized) | 38% | — |
| Ticker Symbol | VHGEX | — |
| Expense Ratio1 | 0.57% | — |
| Short-Term Reserves | 1.4% | — |
| | | |
| Sector Diversification (% of equity exposure) |
| | | MSCI All |
| | | Country |
| | Fund | World Index |
| Consumer Discretionary | 12.1% | 12.9% |
| Consumer Staples | 10.1 | 10.7 |
| Energy | 5.1 | 6.5 |
| Financials | 20.4 | 20.4 |
| Health Care | 11.6 | 11.7 |
| Industrials | 13.3 | 10.5 |
| Information Technology | 18.6 | 15.0 |
| Materials | 3.8 | 4.8 |
| Telecommunication Services | 3.9 | 4.0 |
| Utilities | 1.1 | 3.5 |
| | |
| Volatility Measures | |
| | MSCI All |
| | Country |
| | World Index |
| R-Squared | 0.96 |
| Beta | 0.95 |
| These measures show the degree and timing of the fund’s fluctuations compared with the index over 36 months. |
|
| | | |
| Ten Largest Holdings (% of total net assets) |
| Taiwan Semiconductor | | |
| Manufacturing Co. Ltd. | Semiconductors | 1.5% |
| Amazon.com Inc. | Internet Retail | 1.4 |
| Samsung Electronics Co. | Technology | |
| Ltd. | Hardware, Storage & | |
| | Peripherals | 1.3 |
| Anthem Inc. | Managed Health | |
| | Care | 1.2 |
| Procter & Gamble Co. | Household Products | 1.2 |
| Royal Caribbean Cruises | Hotels, Resorts & | |
| Ltd. | Cruise Lines | 1.1 |
| Alphabet Inc. | Internet Software & | |
| | Services | 1.1 |
| Prudential plc | Life & Health | |
| | Insurance | 1.0 |
| Naspers Ltd. | Cable & Satellite | 1.0 |
| Berkshire Hathaway Inc. | Multi-Sector Holdings | 0.9 |
| Top Ten | | 11.7% |
| The holdings listed exclude any temporary cash investments and equity index products. |
|
Allocation by Region (% of equity exposure)
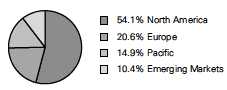
1 The expense ratio shown is from the prospectus dated January 28, 2016, and represents estimated costs for the current fiscal year. For the six months ended March 31, 2016, the annualized expense ratio was 0.52%.
11
Global Equity Fund
| | | |
| Market Diversification (% of equity exposure) |
| | | MSCI All |
| | | Country |
| | | World |
| | Fund | Index |
| Europe | | |
| United Kingdom | 6.3% | 6.5% |
| Germany | 2.7 | 3.1 |
| Switzerland | 2.4 | 3.1 |
| Ireland | 2.1 | 0.2 |
| Sweden | 1.4 | 1.0 |
| Denmark | 1.3 | 0.7 |
| Netherlands | 1.0 | 1.0 |
| Other | 3.4 | 6.3 |
| Subtotal | 20.6% | 21.9% |
| Pacific | | |
| Japan | 9.2% | 7.5% |
| South Korea | 2.5 | 1.6 |
| Hong Kong | 1.4 | 1.1 |
| Australia | 1.3 | 2.4 |
| Other | 0.5 | 0.6 |
| Subtotal | 14.9% | 13.2% |
| Emerging Markets | | |
| Taiwan | 3.0% | 1.3% |
| China | 2.2 | 2.4 |
| South Africa | 1.3 | 0.7 |
| India | 1.2 | 0.8 |
| Other | 2.7 | 3.1 |
| Subtotal | 10.4% | 8.3% |
| North America | | |
| United States | 50.6% | 53.3% |
| Canada | 3.5 | 3.1 |
| Subtotal | 54.1% | 56.4% |
| Middle East | 0.0% | 0.2% |
12
Global Equity Fund
Performance Summary
All of the returns in this report represent past performance, which is not a guarantee of future results that may be achieved by the fund. (Current performance may be lower or higher than the performance data cited. For performance data current to the most recent month-end, visit our website at vanguard.com/performance.) Note, too, that both investment returns and principal value can fluctuate widely, so an investor’s shares, when sold, could be worth more or less than their original cost. The returns shown do not reflect taxes that a shareholder would pay on fund distributions or on the sale of fund shares.
Fiscal-Year Total Returns (%): September 30, 2005, Through March 31, 2016
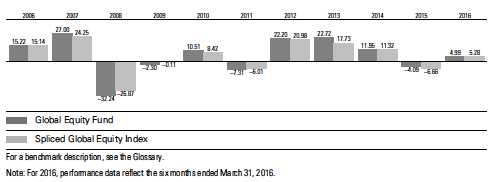
| | | | | |
| Average Annual Total Returns: Periods Ended March 31, 2016 | | | |
| |
| | Inception | One | Five | Ten |
| | Date | Year | Years | Years |
| Global Equity Fund | 8/14/1995 | -4.08% | 6.61% | 4.20% |
See Financial Highlights for dividend and capital gains information.
13
Global Equity Fund
Financial Statements (unaudited)
Statement of Net Assets—Investments Summary
As of March 31, 2016
This Statement summarizes the fund’s holdings by asset type. Details are reported for each of the fund’s 50 largest individual holdings and for investments that, in total for any issuer, represent more than 1% of the fund’s net assets. The total value of smaller holdings is reported as a single amount within each category.
The fund reports a complete list of its holdings in regulatory filings four times in each fiscal year, at the quarter-ends. For the second and fourth fiscal quarters, the complete listing of the fund’s holdings is available electronically on vanguard.com and on the Securities and Exchange Commission’s website (sec.gov), or you can have it mailed to you without charge by calling 800-662-7447. For the first and third fiscal quarters, the fund files the lists with the SEC on Form N-Q. Shareholders can look up the fund’s Forms N-Q on the SEC’s website. Forms N-Q may also be reviewed and copied at the SEC’s Public Reference Room (see the back cover of this report for further information).
| | | |
| | | Market | Percentage |
| | | Value• | of Net |
| | Shares | ($000) | Assets |
| Common Stocks | | | |
| Australia † | | 50,633 | 1.2% |
| |
| Austria † | | 2,713 | 0.1% |
| |
| Belgium † | | 3,887 | 0.1% |
| |
| Brazil † | | 23,901 | 0.6% |
| |
| Canada | | | |
| Toronto-Dominion Bank | 531,800 | 22,955 | 0.5% |
| Royal Bank of Canada | 369,800 | 21,307 | 0.5% |
| Bank of Montreal | 325,800 | 19,785 | 0.5% |
| Canada—Other † | | 83,041 | 1.9% |
| | | 147,088 | 3.4% |
| |
| Chile † | | 12,218 | 0.3% |
| |
| China | | | |
| * Baidu Inc. ADR | 112,803 | 21,532 | 0.5% |
| China Mobile Ltd. | 1,920,500 | 21,269 | 0.5% |
| * Alibaba Group Holding Ltd. ADR | 264,258 | 20,884 | 0.5% |
| China—Other † | | 27,715 | 0.6% |
| | | 91,400 | 2.1% |
| |
| Colombia † | | 2,265 | 0.1% |
| |
| Cyprus † | | 1,066 | 0.0% |
| |
| Czech Republic † | | 628 | 0.0% |
| |
| Denmark † | | 52,860 | 1.2% |
14
| | | | |
| Global Equity Fund | | | |
| |
| |
| | | Market | Percentage |
| | | Value• | of Net |
| | Shares | ($000) | Assets |
| Finland † | | 19,957 | 0.5% |
| France † | | 28,720 | 0.7% |
| Germany | | | |
| SAP SE | 438,797 | 35,309 | 0.8% |
| Germany—Other † | | 73,252 | 1.7% |
| | | 108,561 | 2.5% |
| |
| Greece † | | 2,162 | 0.1% |
| Hong Kong | | | |
| AIA Group Ltd. | 3,915,000 | 22,253 | 0.5% |
| Hong Kong—Other † | | 35,603 | 0.9% |
| | | 57,856 | 1.4% |
| |
| India † | | 47,304 | 1.1% |
| Indonesia † | | 6,241 | 0.1% |
| Ireland | | | |
| CRH plc | 1,344,502 | 37,934 | 0.9% |
| Ryanair Holdings plc ADR | 363,887 | 31,229 | 0.7% |
| Ireland—Other † | | 19,671 | 0.5% |
| | | 88,834 | 2.1% |
| |
| Israel † | | 979 | 0.0% |
| Italy † | | 22,556 | 0.5% |
| Japan | | | |
| MS&AD Insurance Group Holdings Inc. | 1,187,400 | 33,094 | 0.8% |
| Nippon Telegraph & Telephone Corp. | 713,100 | 30,804 | 0.7% |
| Daito Trust Construction Co. Ltd. | 147,600 | 20,935 | 0.5% |
| NTT Data Corp. | 127,500 | 6,394 | 0.2% |
| NTT DOCOMO Inc. | 194,800 | 4,428 | 0.1% |
| NTT Urban Development Corp. | 181,500 | 1,776 | 0.0% |
| Japan—Other † | | 279,760 | 6.5% |
| | | 377,191 | 8.8% |
| |
| Luxembourg † | | 341 | 0.0% |
| Malaysia † | | 10,742 | 0.3% |
| Mexico † | | 4,432 | 0.1% |
| Netherlands | | | |
| Unilever NV | 593,391 | 26,678 | 0.6% |
| Netherlands—Other † | | 13,906 | 0.4% |
| | | 40,584 | 1.0% |
| |
| New Zealand † | | 1,681 | 0.0% |
| Norway † | | 34,162 | 0.8% |
15
| | | | |
| Global Equity Fund | | | |
| |
| |
| |
| | | Market | Percentage |
| | | Value• | of Net |
| | Shares | ($000) | Assets |
| Other | | | |
| 1 Vanguard FTSE Emerging Markets ETF | 278,580 | 9,633 | 0.2% |
| |
| Peru † | | 7,838 | 0.2% |
| |
| Philippines † | | 2,033 | 0.0% |
| |
| Poland † | | 4,604 | 0.1% |
| |
| Qatar † | | 1,599 | 0.0% |
| |
| Russia † | | 21,469 | 0.5% |
| |
| Singapore † | | 22,419 | 0.5% |
| |
| South Africa | | | |
| Naspers Ltd. | 294,227 | 41,015 | 1.0% |
| South Africa—Other † | | 13,549 | 0.3% |
| | | 54,564 | 1.3% |
| South Korea | | | |
| Samsung Electronics Co. Ltd. | 33,878 | 38,879 | 0.9% |
| Samsung Electronics Co. Ltd. GDR | 32,887 | 18,707 | 0.4% |
| South Korea—Other † | | 48,892 | 1.2% |
| | | 106,478 | 2.5% |
| |
| Spain † | | 15,997 | 0.4% |
| |
| Sweden | | | |
| Svenska Handelsbanken AB Class A | 1,788,596 | 22,690 | 0.5% |
| Sweden—Other † | | 36,458 | 0.9% |
| | | 59,148 | 1.4% |
| Switzerland | | | |
| Nestle SA | 369,713 | 27,588 | 0.6% |
| Switzerland—Other † | | 71,412 | 1.7% |
| | | 99,000 | 2.3% |
| Taiwan | | | |
| Taiwan Semiconductor Manufacturing Co. Ltd. ADR | 2,061,237 | 54,004 | 1.3% |
| Hon Hai Precision Industry Co. Ltd. | 10,135,198 | 26,678 | 0.6% |
| Chunghwa Telecom Co. Ltd. | 6,275,000 | 21,352 | 0.5% |
| Taiwan Semiconductor Manufacturing Co. Ltd. | 2,160,577 | 10,777 | 0.2% |
| Taiwan—Other † | | 13,021 | 0.3% |
| | | 125,832 | 2.9% |
| |
| Thailand † | | 4,574 | 0.1% |
| |
| Turkey † | | 2,394 | 0.1% |
| |
| United Kingdom | | | |
| Prudential plc | 2,210,527 | 41,135 | 1.0% |
| Reckitt Benckiser Group plc | 225,195 | 21,722 | 0.5% |
| Royal Dutch Shell plc Class A | 875,023 | 21,205 | 0.5% |
| Wolseley plc | 338,620 | 19,115 | 0.5% |
| 2 United Kingdom—Other † | | 155,330 | 3.6% |
| | | 258,507 | 6.1% |
16
| | | |
| Global Equity Fund | | | |
| |
| |
| |
| | | Market | Percentage |
| | | Value• | of Net |
| | Shares | ($000) | Assets |
| United States | | | |
| Consumer Discretionary | | | |
| * Amazon.com Inc. | 104,267 | 61,897 | 1.4% |
| Royal Caribbean Cruises Ltd. | 590,794 | 48,534 | 1.1% |
| * CarMax Inc. | 409,012 | 20,901 | 0.5% |
| Comcast Corp. Class A | 316,627 | 19,340 | 0.5% |
| Consumer Discretionary—Other † | | 122,145 | 2.9% |
| | | 272,817 | 6.4% |
| Consumer Staples | | | |
| Procter & Gamble Co. | 599,034 | 49,307 | 1.2% |
| Colgate-Palmolive Co. | 535,459 | 37,830 | 0.9% |
| PepsiCo Inc. | 271,082 | 27,780 | 0.7% |
| Coca-Cola Co. | 482,217 | 22,370 | 0.5% |
| Consumer Staples—Other † | | 91,655 | 2.1% |
| | | 228,942 | 5.4% |
| Energy | | | |
| Valero Energy Corp. | 313,701 | 20,121 | 0.5% |
| Energy—Other † | | 103,331 | 2.4% |
| | | 123,452 | 2.9% |
| Financials | | | |
| * Berkshire Hathaway Inc. Class B | 270,638 | 38,398 | 0.9% |
| * Markel Corp. | 35,603 | 31,743 | 0.7% |
| First Republic Bank | 434,254 | 28,939 | 0.7% |
| Moody’s Corp. | 294,954 | 28,481 | 0.7% |
| TD Ameritrade Holding Corp. | 794,464 | 25,049 | 0.6% |
| US Bancorp | 497,303 | 20,185 | 0.5% |
| Travelers Cos. Inc. | 170,454 | 19,894 | 0.5% |
| Financials—Other † | | 168,245 | 3.9% |
| | | 360,934 | 8.5% |
| Health Care | | | |
| Anthem Inc. | 376,549 | 52,337 | 1.2% |
| Johnson & Johnson | 324,072 | 35,065 | 0.8% |
| * Waters Corp. | 200,553 | 26,457 | 0.6% |
| Health Care—Other † | | 250,981 | 5.9% |
| | | 364,840 | 8.5% |
| Industrials | | | |
| Alaska Air Group Inc. | 271,581 | 22,275 | 0.5% |
| Industrials—Other † | | 171,041 | 4.0% |
| | | 193,316 | 4.5% |
| Information Technology | | | |
| * Alphabet Inc. Class C | 53,332 | 39,730 | 0.9% |
| Visa Inc. Class A | 279,016 | 21,339 | 0.5% |
| Linear Technology Corp. | 449,606 | 20,034 | 0.5% |
| * Alphabet Inc. Class A | 7,590 | 5,790 | 0.1% |
| Information Technology—Other † | | 337,386 | 7.9% |
| | | 424,279 | 9.9% |
| Materials | | | |
| Praxair Inc. | 269,045 | 30,792 | 0.7% |
| Materials—Other † | | 45,534 | 1.1% |
| | | 76,326 | 1.8% |
| |
| Other † | | — | 0.0% |
17
| | | | | |
| Global Equity Fund | | | | |
| |
| |
| | | | Market | Percentage |
| | | | Value• | of Net |
| | | Shares | ($000) | Assets |
| Telecommunication Services | | | | |
| AT&T Inc. | | 762,215 | 29,856 | 0.7% |
| Telecommunication Services—Other † | | | 8,947 | 0.2% |
| | | | 38,803 | 0.9% |
| | | | 2,083,709 | 48.8% |
| Total Common Stocks (Cost $3,732,846) | | | 4,120,760 | 96.5%3 |
| |
| | Coupon | | | |
| Temporary Cash Investments | | | | |
| Money Market Fund | | | | |
| 4,5 Vanguard Market Liquidity Fund | 0.495% | 164,325,710 | 164,326 | 3.8% |
| |
| 6U.S. Government and Agency Obligations † | | | 7,996 | 0.2% |
| Total Temporary Cash Investments (Cost $172,322) | | | 172,322 | 4.0%3 |
| 7Total Investments (Cost $3,905,168) | | | 4,293,082 | 100.5% |
| | |
| | | Amount |
| | | ($000) |
| Other Assets and Liabilities | | |
| Other Assets | | |
| Investment in Vanguard | 356 | |
| Receivables for Investment Securities Sold | 8,218 | |
| Receivables for Accrued Income | 14,097 | |
| Receivables for Capital Shares Issued | 751 | |
| Other Assets | 10,309 | |
| Total Other Assets | 33,731 | 0.8% |
| Liabilities | | |
| Payables for Investment Securities Purchased | (3,990) | |
| Collateral for Securities on Loan | (37,132) | |
| Payables to Investment Advisor | (3,003) | |
| Payables for Capital Shares Redeemed | (1,643) | |
| Payables to Vanguard | (8,746) | |
| Other Liabilities | (430) | |
| Total Liabilities | (54,944) | (1.3%) |
| Net Assets | 4,271,869 | 100.0% |
| |
| Net Assets | | |
| Applicable to 181,139,165 outstanding $.001 par value shares of | | |
| beneficial interest (unlimited authorization) | | 4,271,869 |
| Net Asset Value Per Share | | 23.58 |
18
Global Equity Fund
| | |
| At March 31, 2016, net assets consisted of: | |
| | Amount |
| | ($000) |
| Paid-in Capital | 4,252,534 |
| Undistributed Net Investment Income | 245 |
| Accumulated Net Realized Losses | (370,206) |
| Unrealized Appreciation (Depreciation) | |
| Investment Securities | 387,914 |
| Futures Contracts | 971 |
| Forward Currency Contracts | 434 |
| Foreign Currencies | (23) |
| Net Assets | 4,271,869 |
• See Note A in Notes to Financial Statements.
* Non-income-producing security.
† Represents the aggregate value, by category, of securities that are not among the 50 largest holdings and, in total for any issuer, represent 1% or less of net assets.
1 Considered an affiliated company of the fund as the issuer is another member of The Vanguard Group.
2 Certain of the fund’s securities are exempt from registration under Rule 144A of the Securities Act of 1933. Such securities may be sold in transactions exempt from registration, normally to qualified institutional buyers. At March 31, 2016, the aggregate value of these securities was $3,256,000, representing 0.1% of net assets.
3 The fund invests a portion of its cash reserves in equity markets through the use of index futures contracts. After giving effect to futures investments, the fund’s effective common stock and temporary cash investment positions represent 98.3% and 2.2%, respectively, of net assets.
4 Affiliated money market fund available only to Vanguard funds and certain trusts and accounts managed by Vanguard. Rate shown is the 7-day yield.
5 Includes $37,132,000 of collateral received for securities on loan.
6 Securities with a value of $4,799,000 have been segregated as initial margin for open futures contracts.
7 The total value of securities on loan is $34,594,000.
ADR—American Depositary Receipt.
GDR—Global Depositary Receipt.
See accompanying Notes, which are an integral part of the Financial Statements.
19
Global Equity Fund
Statement of Operations
| |
| | Six Months Ended |
| | March 31, 2016 |
| | ($000) |
| Investment Income | |
| Income | |
| Dividends1,2 | 41,031 |
| Interest2 | 242 |
| Securities Lending | 1,017 |
| Total Income | 42,290 |
| Expenses | |
| Investment Advisory Fees—Note B | |
| Basic Fee | 5,119 |
| Performance Adjustment | 1,245 |
| The Vanguard Group—Note C | |
| Management and Administrative | 4,118 |
| Marketing and Distribution | 265 |
| Custodian Fees | 256 |
| Shareholders’ Reports | 31 |
| Trustees’ Fees and Expenses | 3 |
| Total Expenses | 11,037 |
| Net Investment Income | 31,253 |
| Realized Net Gain (Loss) | |
| Investment Securities Sold2 | (3,309) |
| Futures Contracts | 824 |
| Foreign Currencies and Forward Currency Contracts | (252) |
| Realized Net Gain (Loss) | (2,737) |
| Change in Unrealized Appreciation (Depreciation) | |
| Investment Securities | 173,110 |
| Futures Contracts | 2,473 |
| Foreign Currencies and Forward Currency Contracts | 1,165 |
| Change in Unrealized Appreciation (Depreciation) | 176,748 |
| Net Increase (Decrease) in Net Assets Resulting from Operations | 205,264 |
| 1 Dividends are net of foreign withholding taxes of $2,188,000. | |
| 2 Dividend income, interest income, and realized net gain (loss) from affiliated companies of the fund were $221,000, $232,000, and ($91,000), respectively. |
|
See accompanying Notes, which are an integral part of the Financial Statements.
20
Global Equity Fund
Statement of Changes in Net Assets
| | |
| | Six Months Ended | Year Ended |
| | March 31, | September 30, |
| | 2016 | 2015 |
| | ($000) | ($000) |
| Increase (Decrease) in Net Assets | | |
| Operations | | |
| Net Investment Income | 31,253 | 67,373 |
| Realized Net Gain (Loss) | (2,737) | 237,228 |
| Change in Unrealized Appreciation (Depreciation) | 176,748 | (475,371) |
| Net Increase (Decrease) in Net Assets Resulting from Operations | 205,264 | (170,770) |
| Distributions | | |
| Net Investment Income | (72,900) | (69,095) |
| Realized Capital Gain | — | — |
| Total Distributions | (72,900) | (69,095) |
| Capital Share Transactions | | |
| Issued | 200,604 | 435,287 |
| Issued in Lieu of Cash Distributions | 68,287 | 65,332 |
| Redeemed | (272,887) | (648,717) |
| Net Increase (Decrease) from Capital Share Transactions | (3,996) | (148,098) |
| Total Increase (Decrease) | 128,368 | (387,963) |
| Net Assets | | |
| Beginning of Period | 4,143,501 | 4,531,464 |
| End of Period1 | 4,271,869 | 4,143,501 |
| 1 Net Assets—End of Period includes undistributed (overdistributed) net investment income of $245,000 and $42,018,000. | |
See accompanying Notes, which are an integral part of the Financial Statements.
21
Global Equity Fund
Financial Highlights
| | | | | | |
| | Six Months | | | | | |
| | Ended | | | | | |
| For a Share Outstanding | March 31, | | | Year Ended September 30, |
| Throughout Each Period | 2016 | 2015 | 2014 | 2013 | 2012 | 2011 |
| Net Asset Value, Beginning of Period | $22.85 | $24.19 | $21.94 | $18.21 | $15.24 | $16.74 |
| Investment Operations | | | | | | |
| Net Investment Income | .175 | .373 | .353 | .342 | .320 | .3451 |
| Net Realized and Unrealized Gain (Loss) | | | | | | |
| on Investments | .960 | (1.338) | 2.255 | 3.730 | 3.012 | (1.525) |
| Total from Investment Operations | 1.135 | (.965) | 2.608 | 4.072 | 3.332 | (1.180) |
| Distributions | | | | | | |
| Dividends from Net Investment Income | (. 405) | (. 375) | (. 358) | (. 342) | (. 362) | (. 320) |
| Distributions from Realized Capital Gains | — | — | — | — | — | — |
| Total Distributions | (. 405) | (. 375) | (. 358) | (. 342) | (. 362) | (. 320) |
| Net Asset Value, End of Period | $23.58 | $22.85 | $24.19 | $21.94 | $18.21 | $15.24 |
| |
| Total Return2 | 4.99% | -4.09% | 11.95% | 22.72% | 22.20% | -7.31% |
| |
| Ratios/Supplemental Data | | | | | | |
| Net Assets, End of Period (Millions) | $4,272 | $4,144 | $4,531 | $4,499 | $3,853 | $3,330 |
| Ratio of Total Expenses to | | | | | | |
| Average Net Assets3 | 0.52% | 0.57% | 0.61% | 0.61% | 0.57% | 0.54% |
| Ratio of Net Investment Income to | | | | | | |
| Average Net Assets | 1.49% | 1.49% | 1.45% | 1.69% | 1.82% | 1.92% |
| Portfolio Turnover Rate | 38% | 36% | 45% | 70% | 67% | 44% |
| The expense ratio, net income ratio, and turnover rate for the current period have been annualized. | | |
| 1 Calculated based on average shares outstanding. | | | | | | |
| 2 Total returns do not include account service fees that may have applied in the periods shown. Fund prospectuses provide information about any applicable account service fees. |
|
| 3 Includes performance-based investment advisory fee increases (decreases) of 0.06%, 0.08%, 0.08%, 0.07%, 0.02%, and (0.02%). |
See accompanying Notes, which are an integral part of the Financial Statements.
22
Global Equity Fund
Notes to Financial Statements
Vanguard Global Equity Fund is registered under the Investment Company Act of 1940 as an open-end investment company, or mutual fund. The fund invests in securities of foreign issuers, which may subject it to investment risks not normally associated with investing in securities of U.S. corporations.
A. The following significant accounting policies conform to generally accepted accounting principles for U.S. investment companies. The fund consistently follows such policies in preparing its financial statements.
1. Security Valuation: Securities are valued as of the close of trading on the New York Stock Exchange (generally 4 p.m., Eastern time) on the valuation date. Equity securities are valued at the latest quoted sales prices or official closing prices taken from the primary market in which each security trades; such securities not traded on the valuation date are valued at the mean of the latest quoted bid and asked prices. Securities for which market quotations are not readily available, or whose values have been affected by events occurring before the fund’s pricing time but after the close of the securities’ primary markets, are valued at their fair values calculated according to procedures adopted by the board of trustees. These procedures include obtaining quotations from an independent pricing service, monitoring news to identify significant market- or security-specific events, and evaluating changes in the values of foreign market proxies (for example, ADRs, futures contracts, or exchange-traded funds), between the time the foreign markets close and the fund’s pricing time. When fair-value pricing is employed, the prices of securities used by a fund to calculate its net asset value may differ from quoted or published prices for the same securities. Investments in Vanguard Market Liquidity Fund are valued at that fund’s net asset value. Temporary cash investments acquired over 60 days to maturity are valued using the latest bid prices or using valuations based on a matrix system (which considers such factors as security prices, yields, maturities, and ratings), both as furnished by independent pricing services. Other temporary cash investments are valued at amortized cost, which approximates market value.
2. Foreign Currency: Securities and other assets and liabilities denominated in foreign currencies are translated into U.S. dollars using exchange rates obtained from an independent third party as of the fund’s pricing time on the valuation date. Realized gains (losses) and unrealized appreciation (depreciation) on investment securities include the effects of changes in exchange rates since the securities were purchased, combined with the effects of changes in security prices. Fluctuations in the value of other assets and liabilities resulting from changes in exchange rates are recorded as unrealized foreign currency gains (losses) until the assets or liabilities are settled in cash, at which time they are recorded as realized foreign currency gains (losses).
3. Futures and Forward Currency Contracts: The fund uses index futures contracts to a limited extent, with the objective of maintaining full exposure to the stock market while maintaining liquidity. The fund may purchase or sell futures contracts to achieve a desired level of investment, whether to accommodate portfolio turnover or cash flows from capital share transactions. The primary risks associated with the use of futures contracts are imperfect correlation between changes in market values of stocks held by the fund and the prices of futures contracts, and the possibility of an illiquid market. Counterparty risk involving futures is mitigated because a regulated clearinghouse is the counterparty instead of the clearing broker. To further mitigate counterparty risk, the fund trades futures contracts on an exchange, monitors the financial strength of its clearing brokers and clearinghouse, and has entered into clearing agreements with its clearing brokers. The clearinghouse imposes initial margin requirements to secure the fund’s performance and requires daily settlement of variation margin representing changes in the market value of each contract.
23
Global Equity Fund
The fund enters into forward currency contracts to provide the appropriate currency exposure related to any open futures contracts or to protect the value of securities and related receivables and payables against changes in foreign exchange rates. The fund’s risks in using these contracts include movement in the values of the foreign currencies relative to the U.S. dollar and the ability of the counterparties to fulfill their obligations under the contracts. The fund mitigates its counterparty risk by entering into forward currency contracts only with a diverse group of prequalified counterparties, monitoring their financial strength, entering into master netting arrangements with its counterparties, and requiring its counterparties to transfer collateral as security for their performance. The master netting arrangements provide that, in the event of a counterparty’s default (including bankruptcy), the fund may terminate the forward currency contracts, determine the net amount owed by either party in accordance with its master netting arrangements, and sell or retain any collateral held up to the net amount owed to the fund under the master netting arrangements. The forward currency contracts contain provisions whereby a counterparty may terminate open contracts if the fund’s net assets decline below a certain level, triggering a payment by the fund if the fund is in a net liability position at the time of the termination. The payment amount would be reduced by any collateral the fund has pledged. Any assets pledged as collateral for open contracts are noted in the Statement of Net Assets. The value of collateral received or pledged is compared daily to the value of the forward currency contracts exposure with each counterparty, and any difference, if in excess of a specified minimum transfer amount, is adjusted and settled within two business days.
Futures contracts are valued at their quoted daily settlement prices. Forward currency contracts are valued at their quoted daily prices obtained from an independent third party, adjusted for currency risk based on the expiration date of each contract. The aggregate settlement values and notional amounts of the contracts are not recorded in the Statement of Net Assets. Fluctuations in the value of the contracts are recorded in the Statement of Net Assets as an asset (liability) and in the Statement of Operations as unrealized appreciation (depreciation) until the contracts are closed, when they are recorded as realized gains (losses) on futures or forward currency contracts.
During the six months ended March 31, 2016, the fund’s average investments in long and short futures contracts represented 2% and 0% of net assets, respectively, based on the average of aggregate settlement values at each quarter-end during the period. The fund’s average investment in forward currency contracts represented less than 1% of net assets, based on the average of notional amounts at each quarter-end during the period.
4. Federal Income Taxes: The fund intends to continue to qualify as a regulated investment company and distribute all of its taxable income. Management has analyzed the fund’s tax positions taken for all open federal income tax years (September 30, 2012–2015), and for the period ended March 31, 2016, and has concluded that no provision for federal income tax is required in the fund’s financial statements.
5. Distributions: Distributions to shareholders are recorded on the ex-dividend date.
6. Securities Lending: To earn additional income, the fund lends its securities to qualified institutional borrowers. Security loans are subject to termination by the fund at any time, and are required to be secured at all times by collateral in an amount at least equal to the market value of securities loaned. Daily market fluctuations could cause the value of loaned securities to be more or less than the value of the collateral received. When this occurs, the collateral is adjusted and settled on the next business day. The fund further mitigates its counterparty risk by entering into securities lending transactions only with a diverse group of prequalified counterparties, monitoring their financial strength, and entering into master securities lending agreements with its counterparties. The master securities
24
Global Equity Fund
lending agreements provide that, in the event of a counterparty’s default (including bankruptcy), the fund may terminate any loans with that borrower, determine the net amount owed, and sell or retain the collateral up to the net amount owed to the fund; however, such actions may be subject to legal proceedings. While collateral mitigates counterparty risk, in the absence of a default the fund may experience delays and costs in recovering the securities loaned. The fund invests cash collateral received in Vanguard Market Liquidity Fund, and records a liability in the Statement of Net Assets for the return of the collateral, during the period the securities are on loan. Securities lending income represents fees charged to borrowers plus income earned on invested cash collateral, less expenses associated with the loan.
7. Credit Facility: The fund and certain other funds managed by The Vanguard Group (“Vanguard”) participate in a $3.1 billion committed credit facility provided by a syndicate of lenders pursuant to a credit agreement that may be renewed annually; each fund is individually liable for its borrowings, if any, under the credit facility. Borrowings may be utilized for temporary and emergency purposes, and are subject to the fund’s regulatory and contractual borrowing restrictions. The participating funds are charged administrative fees and an annual commitment fee of 0.10% of the undrawn amount of the facility; these fees are allocated to the funds based on a method approved by the fund’s board of trustees and included in Management and Administrative expenses on the fund’s Statement of Operations. Any borrowings under this facility bear interest at a rate based upon the higher of the one-month London Interbank Offered Rate, federal funds effective rate, or overnight bank funding rate plus an agreed-upon spread.
The fund had no borrowings outstanding at March 31, 2016, or at any time during the period then ended.
8. Other: Dividend income is recorded on the ex-dividend date. Interest income includes income distributions received from Vanguard Market Liquidity Fund and is accrued daily. Premiums and discounts on debt securities purchased are amortized and accreted, respectively, to interest income over the lives of the respective securities. Security transactions are accounted for on the date securities are bought or sold. Costs used to determine realized gains (losses) on the sale of investment securities are those of the specific securities sold.
B. The investment advisory firms Marathon Asset Management LLP, Baillie Gifford Overseas Ltd., and Acadian Asset Management LLC each provide investment advisory services to a portion of the fund for a fee calculated at an annual percentage rate of average net assets managed by the advisor. The basic fees of Marathon Asset Management LLP, Baillie Gifford Overseas Ltd., and Acadian Asset Management LLC are subject to quarterly adjustments based on performance relative to the MSCI All Country World Index for the preceding three years.
Vanguard manages the cash reserves of the fund as described below.
For the six months ended March 31, 2016, the aggregate investment advisory fee represented an effective annual basic rate of 0.24% of the fund’s average net assets, before an increase of $1,245,000 (0.06%) based on performance.
C. In accordance with the terms of a Funds’ Service Agreement (the “FSA”) between Vanguard and the fund, Vanguard furnishes to the fund corporate management, administrative, marketing, distribution, and cash management services at Vanguard’s cost of operations (as defined by the FSA). These costs of operations are allocated to the fund based on methods and guidelines approved by the board of trustees. Vanguard does not require reimbursement in the current period for certain costs of operations (such as deferred compensation/benefits and risk/insurance costs); the fund’s liability for these costs of operations is included in Payables to Vanguard on the Statement of Net Assets.
25
Global Equity Fund
Upon the request of Vanguard, the fund may invest up to 0.40% of its net assets as capital in Vanguard. At March 31, 2016, the fund had contributed to Vanguard capital in the amount of $356,000, representing 0.01% of the fund’s net assets and 0.14% of Vanguard’s capitalization. The fund’s trustees and officers are also directors and employees, respectively, of Vanguard.
D. Various inputs may be used to determine the value of the fund’s investments. These inputs are summarized in three broad levels for financial statement purposes. The inputs or methodologies used to value securities are not necessarily an indication of the risk associated with investing in those securities.
Level 1—Quoted prices in active markets for identical securities.
Level 2—Other significant observable inputs (including quoted prices for similar securities, interest rates, prepayment speeds, credit risk, etc.).
Level 3—Significant unobservable inputs (including the fund’s own assumptions used to determine the fair value of investments).
The following table summarizes the market value of the fund’s investments as of March 31, 2016, based on the inputs used to value them:
| | | |
| | Level 1 | Level 2 | Level 3 |
| Investments | ($000) | ($000) | ($000) |
| Common Stocks—International | 368,600 | 1,668,451 | — |
| Common Stocks—United States | 2,083,709 | — | — |
| Temporary Cash Investments | 164,326 | 7,996 | — |
| Futures Contracts—Assets1 | 45 | — | — |
| Futures Contracts—Liabilities1 | (357) | — | — |
| Forward Currency Contracts—Assets | — | 507 | — |
| Forward Currency Contracts—Liabilities | — | (73) | — |
| Total | 2,616,323 | 1,676,881 | — |
| 1 Represents variation margin on the last day of the reporting period. | | | |
E. At March 31, 2016, the fair values of derivatives were reflected in the Statement of Net Assets as follows:
| | | |
| | | Foreign | |
| | Equity | Exchange | |
| | Contracts | Contracts | Total |
| Statement of Net Assets Caption | ($000) | ($000) | ($000) |
| Other Assets | 45 | 507 | 552 |
| Liabilities | (357) | (73) | (430) |
26
Global Equity Fund
Realized net gain (loss) and the change in unrealized appreciation (depreciation) on derivatives for the year ended March 31, 2016, were:
| | | |
| | | Foreign | |
| | Equity | Exchange | |
| | Contracts | Contracts | Total |
| Realized Net Gain (Loss) on Derivatives | ($000) | ($000) | ($000) |
| Futures Contracts | 824 | — | 824 |
| Forward Currency Contracts | — | (276) | (276) |
| Realized Net Gain (Loss) on Derivatives | 824 | (276) | 548 |
| |
| Change in Unrealized Appreciation (Depreciation) on Derivatives | | | |
| Futures Contracts | 2,473 | — | 2,473 |
| Forward Currency Contracts | — | 804 | 804 |
| Change in Unrealized Appreciation (Depreciation) on Derivatives | 2,473 | 804 | 3,277 |
At March 31, 2016, the aggregate settlement value of open futures contracts and the related unrealized appreciation (depreciation) were:
| | | | |
| | | | | ($000) |
| | | | Aggregate | |
| | | Number of | Settlement | Unrealized |
| | | Long (Short) | Value | Appreciation |
| Futures Contracts | Expiration | Contracts | Long (Short) | (Depreciation) |
| E-mini S&P 500 Index | June 2016 | 467 | 47,903 | 978 |
| Dow Jones EURO STOXX 50 Index | June 2016 | 369 | 12,325 | (269) |
| Topix Index | June 2016 | 60 | 7,193 | 291 |
| FTSE 100 Index | June 2016 | 76 | 6,678 | 9 |
| S&P ASX 200 Index | June 2016 | 32 | 3,118 | (38) |
| | | | | 971 |
Unrealized appreciation (depreciation) on open E-mini S&P 500 Index, Dow Jones EURO STOXX 50 Index, and FTSE 100 Index futures contracts is required to be treated as realized gain (loss) for tax purposes.
27
Global Equity Fund
At March 31, 2016, the fund had open forward currency contracts to receive and deliver currencies as follows. Unrealized appreciation (depreciation) on open forward currency contracts is treated as realized gain (loss) for tax purposes.
| | | | | | |
| | | | | | | Unrealized |
| | Contract | | | | | Appreciation |
| | Settlement | | | Contract Amount (000) | (Depreciation) |
| Counterparty | Date | | Receive | | Deliver | ($000) |
| Deutsche Bank AG | 6/22/16 | EUR | 12,481 | USD | 13,854 | 386 |
| BNP Paribas | 6/14/16 | JPY | 904,901 | USD | 8,052 | 6 |
| Deutsche Bank AG | 6/22/16 | GBP | 5,098 | USD | 7,380 | (56) |
| Morgan Stanley Capital Services LLC | 6/21/16 | AUD | 4,845 | USD | 3,586 | 114 |
| BNP Paribas | 6/22/16 | GBP | 153 | USD | 222 | (2) |
| Barclays Bank PLC | 6/22/16 | USD | 1,618 | EUR | 1,429 | (12) |
| Barclays Bank PLC | 6/14/16 | USD | 1,102 | JPY | 123,750 | — |
| Citibank, N.A. | 6/22/16 | USD | 871 | GBP | 606 | 1 |
| JPMorgan Chase Bank, N.A. | 6/21/16 | USD | 569 | AUD | 749 | (3) |
| | | | | | | 434 |
| AUD—Australian dollar. | | | | | | |
| EUR—Euro. | | | | | | |
| GBP—British pound. | | | | | | |
| JPY—Japanese yen. | | | | | | |
| USD—U.S. dollar. | | | | | | |
F. Distributions are determined on a tax basis and may differ from net investment income and realized capital gains for financial reporting purposes. Differences may be permanent or temporary. Permanent differences are reclassified among capital accounts in the financial statements to reflect their tax character. Temporary differences arise when certain items of income, expense, gain, or loss are recognized in different periods for financial statement and tax purposes. These differences will reverse at some time in the future. Differences in classification may also result from the treatment of short-term gains as ordinary income for tax purposes.
During the six months ended March 31, 2016, the fund realized net foreign currency gains of $24,000, which increased distributable net income for tax purposes; accordingly, such gains have been reclassified from accumulated net realized losses to undistributed net investment income. Certain of the fund’s investments are in securities considered to be passive foreign investment companies, for which any unrealized appreciation and/or realized gains are required to be included in distributable net investment income for tax purposes. During the six months ended March 31, 2016, the fund realized gains on the sale of passive foreign investment companies of $10,000, which have been included in current and prior periods’ taxable income; accordingly, such gains have been reclassified from accumulated net realized losses to undistributed net investment income. Passive foreign investment companies held at March 31, 2016, had unrealized appreciation of $7,412,000, all of which has been distributed and is reflected in the balance of undistributed net investment income.
The fund realized gains on the sale of securities that were subject to capital gains tax in certain foreign countries. Capital gains taxes reduce realized gains for financial statement purposes but are treated as an expense for tax purposes. Accordingly, $160,000 of capital gains tax has been reclassified from accumulated net realized losses to undistributed net investment income.
28
Global Equity Fund
The fund’s tax-basis capital gains and losses are determined only at the end of each fiscal year. For tax purposes, at September 30, 2015, the fund had available capital losses totaling $369,785,000 to offset future net capital gains. Of this amount, $343,681,000 is subject to expiration on September 30, 2018. Capital losses of $26,104,000 realized beginning in fiscal 2012 may be carried forward indefinitely under the Regulated Investment Company Modernization Act of 2010, but must be used before any expiring loss carryforwards. The fund will use these capital losses to offset net taxable capital gains, if any, realized during the year ending September 30, 2016; should the fund realize net capital losses for the year, the losses will be added to the loss carryforward balance above.
At March 31, 2016, the cost of investment securities for tax purposes was $3,912,580,000. Net unrealized appreciation of investment securities for tax purposes was $380,502,000, consisting of unrealized gains of $694,910,000 on securities that had risen in value since their purchase and $314,408,000 in unrealized losses on securities that had fallen in value since their purchase.
G. During the six months ended March 31, 2016, the fund purchased $769,264,000 of investment securities and sold $807,243,000 of investment securities, other than temporary cash investments.
H. Capital shares issued and redeemed were:
| | |
| | Six Months Ended | Year Ended |
| | March 31, 2016 | September 30, 2015 |
| | Shares | Shares |
| | (000) | (000) |
| Issued | 8,615 | 17,696 |
| Issued in Lieu of Cash Distributions | 2,933 | 2,678 |
| Redeemed | (11,752) | (26,391) |
| Net Increase (Decrease) in Shares Outstanding | (204) | (6,017) |
I. Management has determined that no material events or transactions occurred subsequent to March 31, 2016, that would require recognition or disclosure in these financial statements.
29
About Your Fund’s Expenses
As a shareholder of the fund, you incur ongoing costs, which include costs for portfolio management, administrative services, and shareholder reports (like this one), among others. Operating expenses, which are deducted from a fund’s gross income, directly reduce the investment return of the fund.
A fund’s expenses are expressed as a percentage of its average net assets. This figure is known as the expense ratio. The following examples are intended to help you understand the ongoing costs (in dollars) of investing in your fund and to compare these costs with those of other mutual funds. The examples are based on an investment of $1,000 made at the beginning of the period shown and held for the entire period.
The accompanying table illustrates your fund’s costs in two ways:
• Based on actual fund return. This section helps you to estimate the actual expenses that you paid over the period. The ”Ending Account Value“ shown is derived from the fund‘s actual return, and the third column shows the dollar amount that would have been paid by an investor who started with $1,000 in the fund. You may use the information here, together with the amount you invested, to estimate the expenses that you paid over the period.
To do so, simply divide your account value by $1,000 (for example, an $8,600 account value divided by $1,000 = 8.6), then multiply the result by the number given for your fund under the heading ”Expenses Paid During Period.“
• Based on hypothetical 5% yearly return. This section is intended to help you compare your fund‘s costs with those of other mutual funds. It assumes that the fund had a yearly return of 5% before expenses, but that the expense ratio is unchanged. In this case—because the return used is not the fund’s actual return—the results do not apply to your investment. The example is useful in making comparisons because the Securities and Exchange Commission requires all mutual funds to calculate expenses based on a 5% return. You can assess your fund’s costs by comparing this hypothetical example with the hypothetical examples that appear in shareholder reports of other funds.
Note that the expenses shown in the table are meant to highlight and help you compare ongoing costs only and do not reflect transaction costs incurred by the fund for buying and selling securities. Further, the expenses do not include any purchase, redemption, or account service fees described in the fund prospectus. If such fees were applied to your account, your costs would be higher. Your fund does not carry a “sales load.”
The calculations assume no shares were bought or sold during the period. Your actual costs may have been higher or lower, depending on the amount of your investment and the timing of any purchases or redemptions.
You can find more information about the fund’s expenses, including annual expense ratios, in the Financial Statements section of this report. For additional information on operating expenses and other shareholder costs, please refer to your fund’s current prospectus.
30
| | | | |
| Six Months Ended March 31, 2016 | | | |
| |
| | Beginning | Ending | Expenses |
| | Account Value | Account Value | Paid During |
| Global Equity Fund | 9/30/2015 | 3/31/2016 | Period |
| Based on Actual Fund Return | $1,000.00 | $1,049.90 | $2.66 |
| Based on Hypothetical 5% Yearly Return | 1,000.00 | 1,022.40 | 2.63 |
| The calculations are based on expenses incurred in the most recent six-month period. The fund’s annualized six-month expense ratio for that period is 0.52%. The dollar amounts shown as “Expenses Paid” are equal to the annualized expense ratio multiplied by the average account value over the period, multiplied by the number of days in the most recent six-month period, then divided by the number of days in the most recent 12-month period (183/366). |
|
|
|
31
Trustees Approve Advisory Arrangements
The board of trustees of Vanguard Global Equity Fund has renewed the fund’s investment advisory arrangements with Acadian Asset Management LLC (Acadian), Baillie Gifford Overseas Ltd. (Baillie Gifford), and Marathon Asset Management LLP (Marathon-London). The board determined that renewing the fund’s advisory arrangements was in the best interests of the fund and its shareholders.
The board based its decisions upon an evaluation of each advisor’s investment staff, portfolio management process, and performance. The trustees considered the factors discussed below, among others. However, no single factor determined whether the board approved the arrangements. Rather, it was the totality of the circumstances that drove the board’s decisions.
Nature, extent, and quality of services
The board reviewed the quality of the fund’s investment management services over both the short and long term, and took into account the organizational depth and stability of each advisor. The board considered the following:
Acadian. Founded in 1986, Acadian is a Boston-based investment management firm specializing in quantitative equity strategies for developed and emerging markets. Acadian employs a quantitative investment process that selects global stocks. The firm’s investment process builds portfolios from the bottom up using proprietary valuation models measuring over 20 stock factors and focusing on those that have proven most effective in predicting returns. The result is a rating of all securities in the Acadian database in terms of each stock’s expected return relative to its country- and sector-level group. A portfolio optimization program is used to balance the expected return of the stocks with such considerations as the benchmark index, desired level of risk, and transaction cost estimates. Acadian has managed a portion of the fund since 2004.
Baillie Gifford. Founded in 1908, Baillie Gifford, a unit of Baillie Gifford & Co., is among the largest independently owned investment management firms in the United Kingdom. Baillie Gifford’s investment approach is based on long-term investments in well-researched and well-managed businesses that enjoy sustainable competitive advantages in their marketplaces. The team invests in four categories of growth stocks: (1) growth stalwarts, or companies with durable franchises; (2) rapid growth, or early stage companies with innovative products or services and a large opportunity for future growth; (3) cyclical growth, or companies highly subject to capital cycles that have strong structural growth prospects and management teams with high capital allocation ability; and (4) latent growth, or companies that are temporarily out of favor but have the ability to accelerate earnings growth over time. Baillie Gifford has managed a portion of the fund since 2008.
Marathon-London. Founded in 1986, Marathon-London uses a bottom-up approach that focuses on stock selection. Traditional company analysis is de-emphasized in favor of assessing enterprise value, corporate strategy, industry competition, and prospective rate of return on new investments. Sector analysis is conducted using long-term capital cycle data to identify sectors with favorable supply and demand dynamics enabling above-average profitability, and country allocations tend to reflect monetary conditions and investor confidence. Marathon-London has advised the fund since its inception in 1995.
The board concluded that each advisor’s experience, stability, depth, and performance, among other factors, warranted continuation of the advisory arrangements.
32
Investment performance
The board considered the short- and long-term performance of the fund and each advisor, including any periods of outperformance or underperformance relative to a benchmark index and peer group. The board concluded that the performance was such that each advisory arrangement should continue. Information about the fund’s most recent performance can be found in the Performance Summary section of this report.
Cost
The board concluded that the fund’s expense ratio was well below the average expense ratio charged by funds in its peer group and that the fund’s advisory fee rate was also well below the peer-group average. Information about the fund’s expenses appears in the About Your Fund’s Expenses section of this report as well as in the Financial Statements section, which also includes information about the fund’s advisory fee rate.
The board did not consider profitability of Acadian, Baillie Gifford, or Marathon-London in determining whether to approve the advisory fees, because the firms are independent of Vanguard and the advisory fees are the result of arm’s-length negotiations.
The benefit of economies of scale
The board concluded that the fund’s shareholders benefit from economies of scale because of breakpoints in the advisory fee schedules for Acadian, Baillie Gifford, and Marathon-London. The breakpoints reduce the effective rate of the fees as the fund’s assets managed by each advisor increase.
The board will consider whether to renew the advisory arrangements again after a one-year period.
33
Glossary
Beta. A measure of the magnitude of a fund’s past share-price fluctuations in relation to the ups and downs of a given market index. The index is assigned a beta of 1.00. Compared with a given index, a fund with a beta of 1.20 typically would have seen its share price rise or fall by 12% when the index rose or fell by 10%. For this report, beta is based on returns over the past 36 months for both the fund and the index. Note that a fund’s beta should be reviewed in conjunction with its R-squared (see definition). The lower the R-squared, the less correlation there is between the fund and the index, and the less reliable beta is as an indicator of volatility.
Dividend Yield. Dividend income earned by stocks, expressed as a percentage of the aggregate market value (or of net asset value, for a fund). The yield is determined by dividing the amount of the annual dividends by the aggregate value (or net asset value) at the end of the period. For a fund, the dividend yield is based solely on stock holdings and does not include any income produced by other investments.
Earnings Growth Rate. The average annual rate of growth in earnings over the past five years for the stocks now in a fund.
Equity Exposure. A measure that reflects a fund’s investments in stocks and stock futures. Any holdings in short-term reserves are excluded.
Expense Ratio. A fund’s total annual operating expenses expressed as a percentage of the fund’s average net assets. The expense ratio includes management and administrative expenses, but does not include the transaction costs of buying and selling portfolio securities.
Inception Date. The date on which the assets of a fund (or one of its share classes) are first invested in accordance with the fund’s investment objective. For funds with a subscription period, the inception date is the day after that period ends. Investment performance is measured from the inception date.
Median Market Cap. An indicator of the size of companies in which a fund invests; the midpoint of market capitalization (market price x shares outstanding) of a fund’s stocks, weighted by the proportion of the fund’s assets invested in each stock. Stocks representing half of the fund’s assets have market capitalizations above the median, and the rest are below it.
Price/Book Ratio. The share price of a stock divided by its net worth, or book value, per share. For a fund, the weighted average price/book ratio of the stocks it holds.
Price/Earnings Ratio. The ratio of a stock’s current price to its per-share earnings over the past year. For a fund, the weighted average P/E of the stocks it holds. P/E is an indicator of market expectations about corporate prospects; the higher the P/E, the greater the expectations for a company’s future growth.
R-Squared. A measure of how much of a fund’s past returns can be explained by the returns from the market in general, as measured by a given index. If a fund’s total returns were precisely synchronized with an index’s returns, its R-squared would be 1.00. If the fund’s returns bore no relationship to the index’s returns, its R-squared would be 0. For this report, R-squared is based on returns over the past 36 months for both the fund and the index.
34
Return on Equity. The annual average rate of return generated by a company during the past five years for each dollar of shareholder’s equity (net income divided by shareholder’s equity). For a fund, the weighted average return on equity for the companies whose stocks it holds.
Short-Term Reserves. The percentage of a fund invested in highly liquid, short-term securities that can be readily converted to cash.
Turnover Rate. An indication of the fund’s trading activity. Funds with high turnover rates incur higher transaction costs and may be more likely to distribute capital gains (which may be taxable to investors). The turnover rate excludes in-kind transactions, which have minimal impact on costs.
Benchmark Information
Spliced Global Equity Index: MSCI All Country World Index returns gross of taxes through March 31, 2007; MSCI All Country World Index returns net of withholding taxes thereafter.
The People Who Govern Your Fund
The trustees of your mutual fund are there to see that the fund is operated and managed in your best interests since, as a shareholder, you are a part owner of the fund. Your fund’s trustees also serve on the board of directors of The Vanguard Group, Inc., which is owned by the Vanguard funds and provides services to them on an at-cost basis.
A majority of Vanguard’s board members are independent, meaning that they have no affiliation with Vanguard or the funds they oversee, apart from the sizable personal investments they have made as private individuals. The independent board members have distinguished backgrounds in business, academia, and public service. Each of the trustees and executive officers oversees 198 Vanguard funds.
The following table provides information for each trustee and executive officer of the fund. More information about the trustees is in the Statement of Additional Information, which can be obtained, without charge, by contacting Vanguard at 800-662-7447, or online at vanguard.com.
| |
| InterestedTrustee1 | Rajiv L. Gupta |
| Born 1945. Trustee Since December 2001.2 Principal |
| F. William McNabb III | Occupation(s) During the Past Five Years and Other |
| Born 1957. Trustee Since July 2009. Chairman of | Experience: Chairman and Chief Executive Officer |
| the Board. Principal Occupation(s) During the Past | (retired 2009) and President (2006–2008) of |
| Five Years and Other Experience: Chairman of the | Rohm and Haas Co. (chemicals); Director of Tyco |
| Board of The Vanguard Group, Inc., and of each of | International PLC (diversified manufacturing and |
| the investment companies served by The Vanguard | services), HP Inc. (printer and personal computer |
| Group, since January 2010; Director of The Vanguard | manufacturing), and Delphi Automotive PLC |
| Group since 2008; Chief Executive Officer and | (automotive components); Senior Advisor at |
| President of The Vanguard Group, and of each of | New Mountain Capital. |
| the investment companies served by The Vanguard | |
| Group, since 2008; Director of Vanguard Marketing | Amy Gutmann |
| Corporation; Managing Director of The Vanguard | Born 1949. Trustee Since June 2006. Principal |
| Group (1995–2008). | Occupation(s) During the Past Five Years and |
| Other Experience: President of the University of |
| IndependentTrustees | Pennsylvania; Christopher H. Browne Distinguished |
| Professor of Political Science, School of Arts and |
| Emerson U. Fullwood | Sciences, and Professor of Communication, Annenberg |
| Born 1948. Trustee Since January 2008. Principal | School for Communication, with secondary faculty |
| Occupation(s) During the Past Five Years and Other | appointments in the Department of Philosophy, School |
| Experience: Executive Chief Staff and Marketing | of Arts and Sciences, and at the Graduate School of |
| Officer for North America and Corporate Vice President | Education, University of Pennsylvania; Trustee of the |
| (retired 2008) of Xerox Corporation (document manage- | National Constitution Center; Chair of the Presidential |
| ment products and services); Executive in Residence | Commission for the Study of Bioethical Issues. |
| and 2009–2010 Distinguished Minett Professor at | |
| the Rochester Institute of Technology; Lead Director | JoAnn Heffernan Heisen |
| of SPX FLOW, Inc. (multi-industry manufacturing); | Born 1950. Trustee Since July 1998. Principal |
| Director of the United Way of Rochester, the University | Occupation(s) During the Past Five Years and |
| of Rochester Medical Center, Monroe Community | Other Experience: Corporate Vice President and |
| College Foundation, North Carolina A&T University, | Chief Global Diversity Officer (retired 2008) and |
| and Roberts Wesleyan College. | Member of the Executive Committee (1997–2008) |
| of Johnson & Johnson (pharmaceuticals/medical |
| devices/consumer products); Director of Skytop |
| Lodge Corporation (hotels) and the Robert Wood |
| Johnson Foundation; Member of the Advisory |
| Board of the Institute for Women’s Leadership |
| at Rutgers University. |
| | | |
| F. Joseph Loughrey | Executive Officers | |
| Born 1949. Trustee Since October 2009. Principal | | |
| Occupation(s) During the Past Five Years and Other | Glenn Booraem | |
| Experience: President and Chief Operating Officer | Born 1967. Treasurer Since May 2015. Principal |
| (retired 2009) of Cummins Inc. (industrial machinery); | Occupation(s) During the Past Five Years and |
| Chairman of the Board of Hillenbrand, Inc. (specialized | Other Experience: Principal of The Vanguard Group, |
| consumer services), and of Oxfam America; Director | Inc.; Treasurer of each of the investment companies |
| of SKF AB (industrial machinery), Hyster-Yale Materials | served by The Vanguard Group; Controller of each of |
| Handling, Inc. (forklift trucks), the Lumina Foundation | the investment companies served by The Vanguard |
| for Education, and the V Foundation for Cancer | Group (2010–2015); Assistant Controller of each of |
| Research; Member of the Advisory Council for the | the investment companies served by The Vanguard |
| College of Arts and Letters and of the Advisory Board | Group (2001–2010). | |
| to the Kellogg Institute for International Studies, both | | |
| at the University of Notre Dame. | Thomas J. Higgins | |
| Born 1957. Chief Financial Officer Since September |
| Mark Loughridge | 2008. Principal Occupation(s) During the Past Five |
| Born 1953. Trustee Since March 2012. Principal | Years and Other Experience: Principal of The Vanguard |
| Occupation(s) During the Past Five Years and Other | Group, Inc.; Chief Financial Officer of each of the |
| Experience: Senior Vice President and Chief Financial | investment companies served by The Vanguard Group; |
| Officer (retired 2013) at IBM (information technology | Treasurer of each of the investment companies served |
| services); Fiduciary Member of IBM’s Retirement Plan | by The Vanguard Group (1998–2008). |
| Committee (2004–2013); Director of the Dow Chemical | |
| Company; Member of the Council on Chicago Booth. | Peter Mahoney | |
| Born 1974. Controller Since May 2015. Principal |
| Scott C. Malpass | Occupation(s) During the Past Five Years and |
| Born 1962. Trustee Since March 2012. Principal | Other Experience: Head of Global Fund Accounting |
| Occupation(s) During the Past Five Years and Other | at The Vanguard Group, Inc.; Controller of each of the |
| Experience: Chief Investment Officer and Vice | investment companies served by The Vanguard Group; |
| President at the University of Notre Dame; Assistant | Head of International Fund Services at The Vanguard |
| Professor of Finance at the Mendoza College of | Group (2008–2014). | |
| Business at Notre Dame; Member of the Notre Dame | | |
| 403(b) Investment Committee, the Board of Advisors | Heidi Stam |
| for Spruceview Capital Partners, and the Investment | Born 1956. Secretary Since July 2005. Principal |
| Advisory Committee of Major League Baseball; Board | Occupation(s) During the Past Five Years and Other |
| Member of TIFF Advisory Services, Inc., and Catholic | Experience: Managing Director of The Vanguard |
| Investment Services, Inc. (investment advisors). | Group, Inc.; General Counsel of The Vanguard Group; |
| Secretary of The Vanguard Group and of each of the |
| André F. Perold | investment companies served by The Vanguard Group; |
| Born 1952. Trustee Since December 2004. Principal | Director and Senior Vice President of Vanguard |
| Occupation(s) During the Past Five Years and Other | Marketing Corporation. | |
| Experience: George Gund Professor of Finance and | | |
| Banking, Emeritus at the Harvard Business School | Vanguard Senior ManagementTeam |
| (retired 2011); Chief Investment Officer and Managing | | |
| Partner of HighVista Strategies LLC (private investment | Mortimer J. Buckley | James M. Norris |
| firm); Director of Rand Merchant Bank; Overseer of | Kathleen C. Gubanich | Thomas M. Rampulla |
| the Museum of Fine Arts Boston. | Martha G. King | Glenn W. Reed |
| John T. Marcante | Karin A. Risi |
| Peter F. Volanakis | Chris D. McIsaac | |
| Born 1955. Trustee Since July 2009. Principal | | |
| Occupation(s) During the Past Five Years and Other | Chairman Emeritus and Senior Advisor |
| Experience: President and Chief Operating Officer | John J. Brennan | |
| (retired 2010) of Corning Incorporated (communications | Chairman, 1996–2009 | |
| equipment); Trustee of Colby-Sawyer College and | Chief Executive Officer and President, 1996–2008 |
| Chairman of its Finance and Enrollment Committee; | |
| Member of the Advisory Board of the Norris Cotton | Founder | |
| Cancer Center. | John C. Bogle | |
| Chairman and Chief Executive Officer, 1974–1996 |
| | |
1 Mr. McNabb is considered an “interested person,” as defined in the Investment Company Act of 1940, because he is an officer of the Vanguard funds.
2 December 2002 for Vanguard Equity Income Fund, the Vanguard Municipal Bond Funds, and the Vanguard State Tax-Exempt Funds.
| |  |
| | | P.O. Box 2600 |
| | | Valley Forge, PA 19482-2600 |
| |
| |
| |
| Connect with Vanguard® > vanguard.com | |
| |
| |
| |
| Fund Information > 800-662-7447 | | CFA® is a registered trademark owned by CFA Institute. |
| Direct Investor Account Services > 800-662-2739 | |
| Institutional Investor Services > 800-523-1036 | |
| Text Telephone for People | | |
| Who Are Deaf or Hard of Hearing> 800-749-7273 | |
| |
| This material may be used in conjunction | |
| with the offering of shares of any Vanguard | |
| fund only if preceded or accompanied by | |
| the fund’s current prospectus. | |
| |
| All comparative mutual fund data are from Lipper, a | |
| Thomson Reuters Company, or Morningstar, Inc., unless | |
| otherwise noted. | | |
| |
| You can obtain a free copy of Vanguard’s proxy voting | |
| guidelines by visiting vanguard.com/proxyreporting or by | |
| calling Vanguard at 800-662-2739. The guidelines are | |
| also available from the SEC’s website, sec.gov. In | |
| addition, you may obtain a free report on how your fund | |
| voted the proxies for securities it owned during the 12 | |
| months ended June 30. To get the report, visit either | |
| vanguard.com/proxyreporting or sec.gov. | |
| |
| You can review and copy information about your fund at | |
| the SEC’s Public Reference Room in Washington, D.C. To | |
| find out more about this public service, call the SEC at | |
| 202-551-8090. Information about your fund is also | |
| available on the SEC’s website, and you can receive | |
| copies of this information, for a fee, by sending a | |
| request in either of two ways: via email addressed to | |
| publicinfo@sec.gov or via regular mail addressed to the | |
| Public Reference Section, Securities and Exchange | |
| Commission, Washington, DC 20549-1520. | |
| |
| | | © 2016 The Vanguard Group, Inc. |
| | | All rights reserved. |
| | | Vanguard Marketing Corporation, Distributor. |
| |
| | | Q1292 052016 |

Semiannual Report | March 31, 2016
Vanguard Strategic Small-Cap Equity Fund
Vanguard’s Principles for Investing Success
We want to give you the best chance of investment success. These principles, grounded in Vanguard’s research and experience, can put you on the right path.
Goals. Create clear, appropriate investment goals.
Balance. Develop a suitable asset allocation using broadly diversified funds. Cost. Minimize cost.
Discipline. Maintain perspective and long-term discipline.
A single theme unites these principles: Focus on the things you can control.
We believe there is no wiser course for any investor.
| |
| Contents | |
| Your Fund’s Total Returns. | 1 |
| Chairman’s Letter. | 2 |
| Advisor’s Report. | 8 |
| Fund Profile. | 10 |
| Performance Summary. | 11 |
| Financial Statements. | 12 |
| About Your Fund’s Expenses. | 24 |
| Trustees Approve Advisory Arrangement. | 26 |
| Glossary. | 27 |
Please note: The opinions expressed in this report are just that—informed opinions. They should not be considered promises or advice. Also, please keep in mind that the information and opinions cover the period through the date on the front of this report. Of course, the risks of investing in your fund are spelled out in the prospectus.
See the Glossary for definitions of investment terms used in this report.
About the cover: Pictured is a sailing block on the Brilliant, a 1932 schooner docked in Mystic, Connecticut. A type of pulley, the sailing block helps coordinate the setting of the sails. At Vanguard, the intricate coordination of technology and people allows us to help millions of clients around the world reach their financial goals.
Your Fund’s Total Returns
| | |
| Six Months Ended March 31, 2016 | |
| | Total |
| | Returns |
| Vanguard Strategic Small-Cap Equity Fund | 3.22% |
| MSCI US Small Cap 1750 Index | 3.90 |
| Small-Cap Core Funds Average | 3.14 |
| Small-Cap Core Funds Average: Derived from data provided by Lipper, a Thomson Reuters Company. | |
| | | | | |
| Your Fund’s Performance at a Glance | | | | |
| September 30, 2015, Through March 31, 2016 | | | | |
| | | | Distributions Per Share |
| | Starting | Ending | Income | Capital |
| | Share Price | Share Price | Dividends | Gains |
| Vanguard Strategic Small-Cap Equity Fund | $28.95 | $29.21 | $0.340 | $0.336 |
1

Chairman’s Letter
Dear Shareholder,
Amid considerable stock market volatility, Vanguard Strategic Small-Cap Equity Fund returned about 3% for the six months ended March 31, 2016. This placed it a bit behind the return of its benchmark, and further behind the broad U.S. market, but slightly ahead of its peers’ average return.
Anyone hoping that markets might become a bit more settled after the Federal Reserve’s long-anticipated December rate increase would have been disappointed. Many U.S. and international stock markets slipped in December and fell even more in January, in part because of concerns about slower global economic growth. Overall, stocks of smaller companies were hit harder as investors sought safe harbors in bonds and larger-company stocks.
Once again, returns varied widely by sector. Utilities earned the best return for the fund, about 20%, while its energy holdings posted a double-digit decline. Compared with the benchmark, strong stock selection within the health care, information technology, and industrial sectors gave the fund an edge, but couldn’t make up for disappointments in energy.
Stocks charted an uneven course en route to a solid outcome
The broad U.S. stock market returned about 7% for the six months. The period began and ended strongly, with fluctuations in the middle as China’s economic slowdown and falling oil and commodity prices worried investors.
2
Stocks rallied in March as investors again seemed encouraged by news about monetary policy, especially after the Fed indicated that it would raise interest rates fewer times in 2016 than previously anticipated.
International stocks returned about 3% after surging more than 8% in March. Stocks from emerging markets and from developed Pacific markets outperformed developed European stocks, which were nearly flat. U.S. dollar-based investors benefited as many foreign currencies strengthened against the dollar, a turn-about from the trend of recent years.
Bonds produced gains following a subpar start
The broad U.S. taxable bond market returned 2.44% for the fiscal half year. Returns were weak in the first three months, which culminated with the Fed’s quarter-percentage-point interest rate increase in December.
But, with stocks volatile and the Fed indicating it would proceed cautiously with future rate hikes, bonds rallied in the final three months. The yield of the 10-year U.S. Treasury note closed at 1.77% at the end of March, down from 2.05% six months earlier. (Bond prices and yields move in opposite directions.)
| | | | |
| Market Barometer | | | |
| |
| | | | Total Returns |
| | | Periods Ended March 31, 2016 |
| | Six | One | Five Years |
| | Months | Year | (Annualized) |
| Stocks | | | |
| Russell 1000 Index (Large-caps) | 7.75% | 0.50% | 11.35% |
| Russell 2000 Index (Small-caps) | 2.02 | -9.76 | 7.20 |
| Russell 3000 Index (Broad U.S. market) | 7.30 | -0.34 | 11.01 |
| FTSE All-World ex US Index (International) | 3.09 | -8.53 | 0.70 |
| |
| Bonds | | | |
| Barclays U.S. Aggregate Bond Index (Broad taxable market) | 2.44% | 1.96% | 3.78% |
| Barclays Municipal Bond Index (Broad tax-exempt market) | 3.20 | 3.98 | 5.59 |
| Citigroup Three-Month U.S. Treasury Bill Index | 0.06 | 0.08 | 0.04 |
| |
| CPI | | | |
| Consumer Price Index | 0.08% | 0.85% | 1.28% |
3
Returns for money market funds and savings accounts remained limited by the Fed’s still-low target rate of 0.25%–0.5%.
International bond markets (as measured by the Barclays Global Aggregate Index ex USD) returned almost 7%. Like those of stocks, international bond returns for U.S.-based investors benefited from dollar weakness. Even in local currencies, however, international bond returns were solidly positive, boosted in part by additional stimulus measures in Europe and Asia to combat weak growth and low inflation.
Larger sectors lifted fund results as energy and others lagged
Vanguard Quantitative Equity Group (QEG), the fund’s advisor, uses a disciplined, data-driven process to assess the relative attractiveness of stocks—with the goal of providing a long-term return greater than that of the benchmark, while tightly controlling risk. Similar to a traditional fund manager, QEG analyzes several criteria that research has shown can contribute to long-term outperformance. Those criteria include revenue and earnings growth, dividend policy, reinvestment decisions, and balance sheet quality.
| | | |
| Expense Ratios | | |
| Your Fund Compared With Its Peer Group | | |
| | | Peer Group |
| | Fund | Average |
| Strategic Small-Cap Equity Fund | 0.34% | 1.25% |
| The fund expense ratio shown is from the prospectus dated January 28, 2016, and represents estimated costs for the current fiscal year. For the six months ended March 31, 2016, the fund’s annualized expense ratio was 0.31%. The peer-group expense ratio is derived from data provided by Lipper, a Thomson Reuters Company, and captures information through year-end 2015. |
|
|
|
| |
| Peer group: Small-Cap Core Funds. | | |
4
A proprietary computer model helps QEG systematically screen and rank stocks within each of the industry groups in the fund’s investable universe—in this case, about 1,750 small-capitalization stocks. This investment process has been developed and refined over more than three decades, and is supported by an experienced in-house research team.
Because your fund’s sector exposures generally align closely with those of the index, sector weightings don’t contribute significantly to performance relative to the benchmark—although positioning within industry sub-groups can make a difference. What often matters more is how the fund’s 300-plus holdings perform. And in the period under review, investors’
|
| Vanguard’s growth translates into lower costs for you |
| |
| Research indicates that lower-cost investments have tended to outperform higher-cost ones. |
| So it’s little wonder that funds with lower expense ratios—including those at Vanguard—have |
| dominated the industry’s cash inflows in recent years. |
| |
| Vanguard has long been a low-cost leader, with expenses well below those of many other |
| investment management companies. That cost difference remains a powerful advantage for |
| Vanguard clients. Why? Because a lower expense ratio allows a fund to pass along a greater |
| share of its returns to its investors. |
| |
| What’s more, as you can see in the chart below, we’ve been able to lower our costs continually |
| as our assets under management have grown. Our steady growth has not been an explicit |
| business objective. Rather, we focus on putting our clients’ interests first at all times, and |
| giving them the best chance for investment success. But economies of scale—the cost |
| efficiencies that come with our growth—have allowed us to keep lowering our fund costs, |
| even as we invest in our people and technology. |
| |
| The benefit of economies of scale |
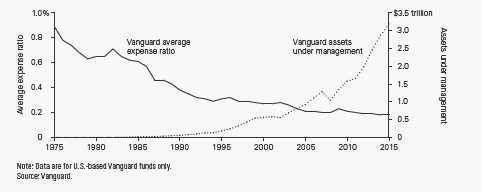
5
concerns about the global macroeconomic environment tended to overtake company-specific fundamentals.
For the six months, the valuation and quality indicators, or signals, in QEG’s model were successful. However, the momentum signal held back results—which isn’t surprising as momentum-based strategies often underperform when markets are especially volatile and winning streaks can end abruptly.
As I mentioned, the fund outperformed its benchmark index in the information technology and health care sectors, which together accounted for about 30% of fund assets, on average. Selections among industrials, another large sector, were also helpful. At the other end of the spectrum, the fund lagged in the beleaguered energy sector. Some of the fund’s refining and marketing holdings struggled amid a gasoline glut and refinery production cutbacks. Consumer staples was another weak sector.
The Advisor’s Report that follows this letter provides additional details about the management of the fund during the fiscal half year.
Consider rebalancing to manage your risk
After you’ve created an investment portfolio—with a diversified mix of stock, bond, and money market funds tailored to your goals, time horizon, and risk tolerance—what’s next?
As stocks and bonds rise or fall over time, and your portfolio drifts from its original asset allocation, you should consider rebalancing back to your targets. Just one year of outsized returns can throw your allocation out of whack. Take a year like 2013, when the broad U.S. stock market returned nearly 34% and the broad taxable bond market declined. A hypothetical simple portfolio that started the year with 60% stocks and 40% bonds would have ended with a more aggressive mix of 67% stocks and 33% bonds.
Rebalancing means shifting dollars from assets that have performed well toward those that have fallen behind. That isn’t easy or intuitive, but it helps to manage risk because over time riskier assets tend to grow faster. (You can read more about our approach in Best Practices for Portfolio Rebalancing at vanguard.com/research.)
You might consider, for example, monitoring your portfolio annually or semiannually and rebalancing when your allocations shift about 5 percentage points from their targets. And it’s important, of course, to be aware of the tax implications of selling. You’ll want to consult with your tax advisor, but generally speaking, it may be a good idea to make any asset changes within a tax-advantaged retirement account or to direct new cash flows into the underweighted asset class.
6
Keeping your asset allocation from drifting too far off target can help you stay on track with the investment plan you’ve crafted to meet your financial goals.
As always, thank you for investing with Vanguard.
Sincerely,

F. William McNabb III
Chairman and Chief Executive Officer
April 15, 2016
Advisor’s Report
For the fiscal half year ended March 31, 2016, Vanguard Strategic Small Cap Equity Fund returned 3.22%, lagging its MSCI Small Cap 1750 Index return of 3.90%. The broad U.S. equity market returned more than 7%, led by large-capitalization stocks. The broad U.S. market again outperformed other developed markets, while emerging markets rebounded to return more than 6%.
In late 2015, the U.S. economy continued to grow, but at a slower pace. Fourth-quarter real GDP grew 1.4%, compared with 2.0% in the third quarter. The deceleration was primarily attributed to downturns in nonresidential fixed investment, exports, and state and local government spending. Corporate profits decreased 8.1% in the fourth quarter, the largest quarterly decline since the first quarter of 2011.
The U.S. job market has continued to improve in 2016. Total nonfarm payroll employment rose by 215,000 in March, and the unemployment rate was slightly higher at 5.0%. Oil prices declined significantly early this year, but have since risen more than 40% from their mid-February low. This volatility spilled over into the global stock markets.
The Federal Reserve raised interest rates in December after keeping them near zero since 2008. Further gradual interest rate hikes are expected later this year, but depend on global economic data. Meanwhile, several central banks, including the European Central Bank and the Bank of Japan, are experimenting with negative interest rates in an attempt to spur economic growth.
Although we seek to understand the impact of macroeconomic factors on portfolio performance, our investment process is centered on specific stock fundamentals. We use a disciplined, quantitative approach, not technical analysis of stock price movements. Our model aims to systematically identify stocks in our investment universe, within each industry group, that are more likely to exhibit long-term outperformance.
We believe that attractive stocks exhibit five key themes: 1) high quality—healthy balance sheets and consistent cash flow generation; 2) effective management decisions regarding use of capital—sound investment policies that favor internal over external funding; 3) consistent earnings growth—a demonstrated ability to grow earnings year after year; 4) strong momentum—market confirmation of our view; and 5) reasonable valuation—avoidance of overpriced stocks. This helps us take advantage of inefficiencies in the market caused by persistent biases in investor behavior.
Using the results of our model, we then construct and review our portfolio daily with the goal of maximizing expected return, while minimizing exposure to risks relative to the benchmark (such as industry selection) that our research indicates do not improve returns.
8
In the half year, performance within the MSCI Small Cap benchmark was broad-based—eight of ten sectors generated positive returns. Utilities and telecommunication services were among the best performers in the benchmark, while energy and health care declined.
Our stock selection results across sectors over the six months were mixed. Our outperformance in sectors including health care, information technology, and industrials was more than offset by some weakness in energy, consumer staples, and financials.
In health care, Affymetrix (+64%), Amedisys (+27%), and Charles River Laboratories International (+19%) were some of our largest contributors to relative performance. In information technology, Angie’s List (+60%), Heartland Payment Systems (+54%), and Ingram Micro (+32%) helped. Hawaiian Holdings (+91%), Huntington Ingalls Industries (+28%), and Wabash National (+24%) drove results in industrials.
Our disappointments in energy included Alon USA Energy (–41%) and CVR Energy (–34%), which hurt our relative performance. In consumer staples, SUPERVALU (–19%) and Ingles Markets (–20%) did not perform as expected, and in financials we saw underperformance from First NBC Bank Holdings (–41%) and Universal Insurance Holdings (–38%).
Portfolio Managers:
Michael R. Roach, CFA
James P. Stetler, Principal
Binbin Guo, Principal, Head of Equity
Research and Portfolio Strategies
Vanguard Quantitative Equity Group
April 21, 2016
9
Strategic Small-Cap Equity Fund
Fund Profile
As of March 31, 2016
| | | | |
| Portfolio Characteristics | | |
| | | MSCI US | DJ |
| | | Small Cap | U.S. Total |
| | | 1750 | Market |
| | Fund | Index | FA Index |
| Number of Stocks | 309 | 1,734 | 3,900 |
| Median Market Cap | $2.0B | $2.5B | $52.5B |
| Price/Earnings Ratio | 18.4x | 31.0x | 21.8x |
| Price/Book Ratio | 2.1x | 2.1x | 2.7x |
| Return on Equity | 11.7% | 11.3% | 17.5% |
| Earnings Growth | | | |
| Rate | 11.6% | 9.5% | 8.0% |
| Dividend Yield | 1.9% | 1.8% | 2.1% |
| Foreign Holdings | 0.2% | 0.0% | 0.0% |
| Turnover Rate | | | |
| (Annualized) | 82% | — | — |
| Ticker Symbol | VSTCX | — | — |
| Expense Ratio1 | 0.34% | — | — |
| 30-Day SEC Yield | 1.51% | — | — |
| Short-Term Reserves | 0.1% | — | — |
| | | | |
| Sector Diversification (% of equity exposure) |
| | | | DJ |
| | | | U.S. |
| | | MSCI US | Total |
| | | Small Cap | Market |
| | | 1750 | FA |
| | Fund | Index | Index |
| Consumer | | | |
| Discretionary | 14.6% | 14.6% | 13.6% |
| Consumer Staples | 3.1 | 3.1 | 9.2 |
| Energy | 3.8 | 3.9 | 6.1 |
| Financials | 26.5 | 26.4 | 17.4 |
| Health Care | 12.1 | 12.0 | 13.7 |
| Industrials | 13.6 | 13.6 | 10.7 |
| Information | | | |
| Technology | 16.4 | 16.5 | 20.1 |
| Materials | 5.1 | 5.1 | 3.2 |
| Telecommunication | | | |
| Services | 0.7 | 0.7 | 2.5 |
| Utilities | 4.1 | 4.1 | 3.5 |
| | | |
| Volatility Measures | | |
| | MSCI US | DJ |
| | Small Cap | U.S. Total |
| | 1750 | Market |
| | Index | FA Index |
| R-Squared | 0.97 | 0.82 |
| Beta | 0.96 | 1.08 |
| These measures show the degree and timing of the fund’s fluctuations compared with the indexes over 36 months. |
|
| | | |
| Ten Largest Holdings (% of total net assets) |
| CSRA Inc. | IT Consulting & | |
| | Other Services | 0.7% |
| Hospitality Properties | | |
| Trust | Hotel & Resort REITs | 0.7 |
| WGL Holdings Inc. | Gas Utilities | 0.7 |
| Amsurg Corp. | Health Care Facilities | 0.7 |
| Cabot Corp. | Commodity | |
| | Chemicals | 0.7 |
| Booz Allen Hamilton | IT Consulting & | |
| Holding Corp. | Other Services | 0.7 |
| PBF Energy Inc. | Oil & Gas Refining & | |
| | Marketing | 0.7 |
| DuPont Fabros | | |
| Technology Inc. | Specialized REITs | 0.7 |
| Boyd Gaming Corp. | Casinos & Gaming | 0.7 |
| Children's Place Inc. | Apparel Retail | 0.6 |
| Top Ten | | 6.9% |
| The holdings listed exclude any temporary cash investments and equity index products. |
|
Investment Focus
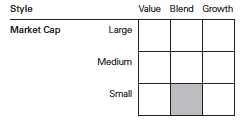
1 The expense ratio shown is from the prospectus dated January 28, 2016, and represents estimated costs for the current fiscal year. For the six months ended March 31, 2016, the annualized expense ratio was 0.31%.
10
Strategic Small-Cap Equity Fund
Performance Summary
All of the returns in this report represent past performance, which is not a guarantee of future results that may be achieved by the fund. (Current performance may be lower or higher than the performance data cited. For performance data current to the most recent month-end, visit our website at vanguard.com/performance.) Note, too, that both investment returns and principal value can fluctuate widely, so an investor’s shares, when sold, could be worth more or less than their original cost. The returns shown do not reflect taxes that a shareholder would pay on fund distributions or on the sale of fund shares.
Fiscal-Year Total Returns (%): April 24, 2006, Through March 31, 2016
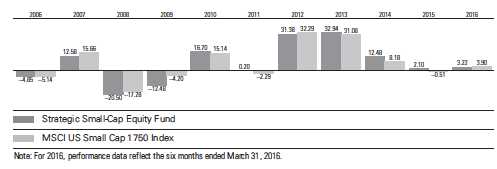
| | | | | |
| Average Annual Total Returns: Periods Ended March 31, 2016 | | | |
| |
| | Inception | One | Five | Since |
| | Date | Year | Years | Inception |
| Strategic Small-Cap Equity Fund | 4/24/2006 | -6.82% | 10.21% | 6.12% |
See Financial Highlights for dividend and capital gains information.
11
Strategic Small-Cap Equity Fund
Financial Statements (unaudited)
Statement of Net Assets
As of March 31, 2016
The fund reports a complete list of its holdings in regulatory filings four times in each fiscal year, at the quarter-ends. For the second and fourth fiscal quarters, the lists appear in the fund’s semiannual and annual reports to shareholders. For the first and third fiscal quarters, the fund files the lists with the Securities and Exchange Commission on Form N-Q. Shareholders can look up the fund’s Forms N-Q on the SEC’s website at sec.gov. Forms N-Q may also be reviewed and copied at the SEC’s Public Reference Room (see the back cover of this report for further information).
| | | |
| | | | Market |
| | | | Value• |
| | | Shares | ($000) |
| Common Stocks (99.4%)1 | | |
| Consumer Discretionary (14.5%) | |
| * | Boyd Gaming Corp. | 369,624 | 7,636 |
| | Children’s Place Inc. | 91,424 | 7,631 |
| | American Eagle | | |
| | Outfitters Inc. | 451,300 | 7,523 |
| * | Express Inc. | 340,175 | 7,283 |
| | Abercrombie & Fitch Co. | 225,245 | 7,104 |
| * | Smith & Wesson Holding | | |
| | Corp. | 247,829 | 6,597 |
| ^ | Outerwall Inc. | 172,451 | 6,379 |
| | Sturm Ruger & Co. Inc. | 92,499 | 6,325 |
| ^ | World Wrestling | | |
| | Entertainment Inc. | | |
| | Class A | 353,800 | 6,248 |
| * | American Axle & | | |
| | Manufacturing | | |
| | Holdings Inc. | 398,939 | 6,140 |
| | Big Lots Inc. | 121,780 | 5,515 |
| * | Penn National Gaming Inc. | 329,130 | 5,493 |
| * | Strayer Education Inc. | 112,218 | 5,471 |
| | Gannett Co. Inc. | 354,629 | 5,369 |
| | Cato Corp. Class A | 137,494 | 5,300 |
| | Cooper Tire & Rubber Co. | 141,971 | 5,256 |
| ^ | Cracker Barrel Old | | |
| | Country Store Inc. | 32,669 | 4,988 |
| | Carter’s Inc. | 46,350 | 4,884 |
| * | Denny’s Corp. | 454,974 | 4,714 |
| * | MSG Networks Inc. | 270,638 | 4,679 |
| *,^ | Diamond Resorts | | |
| | International Inc. | 175,700 | 4,270 |
| * | TRI Pointe Group Inc. | 310,770 | 3,661 |
| | Bloomin’ Brands Inc. | 208,305 | 3,514 |
| | Domino’s Pizza Inc. | 25,857 | 3,410 |
| * | Madison Square Garden | | |
| | Co. Class A | 17,985 | 2,992 |
| | AMC Entertainment | | |
| | Holdings Inc. | 102,671 | 2,874 |
| | | |
| | | | Market |
| | | | Value• |
| | | Shares | ($000) |
| * | ServiceMaster Global | | |
| | Holdings Inc. | 68,801 | 2,592 |
| * | Skechers U.S.A. Inc. | | |
| | Class A | 81,394 | 2,478 |
| | Wolverine World Wide Inc. | 133,694 | 2,463 |
| | Ruth’s Hospitality Group Inc. | 123,562 | 2,275 |
| | Sonic Corp. | 61,687 | 2,169 |
| | New York Times Co. | | |
| | Class A | 142,696 | 1,778 |
| | GNC Holdings Inc. Class A | 52,408 | 1,664 |
| | Sinclair Broadcast Group | | |
| | Inc. Class A | 53,664 | 1,650 |
| | Libbey Inc. | 85,197 | 1,585 |
| | Tower International Inc. | 56,646 | 1,541 |
| | Bob Evans Farms Inc. | 32,578 | 1,521 |
| * | Cooper-Standard Holding Inc. | 20,516 | 1,474 |
| | Movado Group Inc. | 52,286 | 1,439 |
| | Ethan Allen Interiors Inc. | 44,173 | 1,406 |
| * | BJ’s Restaurants Inc. | 25,100 | 1,043 |
| | Jack in the Box Inc. | 14,643 | 935 |
| * | Pinnacle Entertainment Inc. | 19,000 | 667 |
| * | Dave & Buster’s | | |
| | Entertainment Inc. | 14,955 | 580 |
| | | | 170,516 |
| Consumer Staples (3.1%) | | |
| ^ | Cal-Maine Foods Inc. | 126,200 | 6,551 |
| | Dean Foods Co. | 371,599 | 6,436 |
| | Universal Corp. | 109,846 | 6,241 |
| * | USANA Health | | |
| | Sciences Inc. | 36,091 | 4,382 |
| * | SUPERVALU Inc. | 726,970 | 4,187 |
| | Ingles Markets Inc. Class A | 94,395 | 3,540 |
| | Fresh Del Monte | | |
| | Produce Inc. | 47,539 | 2,000 |
| * | Central Garden & Pet Co. | 101,321 | 1,656 |
| * | Central Garden & Pet Co. | | |
| | Class A | 78,593 | 1,280 |
| | | | 36,273 |
12
Strategic Small-Cap Equity Fund
| | | |
| | | | Market |
| | | | Value• |
| | | Shares | ($000) |
| Energy (3.8%) | | |
| | PBF Energy Inc. Class A | 230,498 | 7,653 |
| | Rowan Cos. plc Class A | 402,069 | 6,473 |
| | Western Refining Inc. | 209,607 | 6,098 |
| | Noble Corp. plc | 485,008 | 5,020 |
| | Alon USA Energy Inc. | 387,159 | 3,996 |
| * | TETRA Technologies Inc. | 628,242 | 3,989 |
| | CVR Energy Inc. | 142,155 | 3,710 |
| | Atwood Oceanics Inc. | 401,164 | 3,679 |
| * | McDermott | | |
| | International Inc. | 596,400 | 2,439 |
| | World Fuel Services Corp. | 33,212 | 1,613 |
| | | | 44,670 |
| Financials (26.3%) | | |
| | Hospitality Properties Trust | 298,320 | 7,923 |
| | DuPont Fabros | | |
| | Technology Inc. | 188,463 | 7,638 |
| | Gaming and Leisure | | |
| | Properties Inc. | 245,395 | 7,588 |
| | Assured Guaranty Ltd. | 291,216 | 7,368 |
| | Government Properties | | |
| | Income Trust | 407,775 | 7,279 |
| * | MGIC Investment Corp. | 933,556 | 7,160 |
| | Mack-Cali Realty Corp. | 301,969 | 7,096 |
| | Synovus Financial Corp. | 233,359 | 6,746 |
| | Great Western Bancorp Inc. | 246,385 | 6,719 |
| | Select Income REIT | 280,316 | 6,461 |
| | CBL & Associates | | |
| | Properties Inc. | 542,585 | 6,457 |
| | PrivateBancorp Inc. | 163,716 | 6,319 |
| * | Walker & Dunlop Inc. | 257,179 | 6,242 |
| | Washington Federal Inc. | 272,453 | 6,171 |
| | Capital Bank Financial Corp. | 197,555 | 6,095 |
| | Spirit Realty Capital Inc. | 537,711 | 6,049 |
| | CenterState Banks Inc. | 397,249 | 5,915 |
| | CBOE Holdings Inc. | 90,530 | 5,914 |
| | Lexington Realty Trust | 680,643 | 5,854 |
| | GEO Group Inc. | 168,733 | 5,850 |
| | Central Pacific Financial | | |
| | Corp. | 267,500 | 5,824 |
| * | Flagstar Bancorp Inc. | 271,320 | 5,823 |
| ^ | Universal Insurance | | |
| | Holdings Inc. | 322,170 | 5,735 |
| | Popular Inc. | 191,731 | 5,485 |
| * | INTL. FCStone Inc. | 202,332 | 5,408 |
| | Aspen Insurance | | |
| | Holdings Ltd. | 109,871 | 5,241 |
| | HCI Group Inc. | 146,830 | 4,889 |
| | Heritage Insurance | | |
| | Holdings Inc. | 301,459 | 4,814 |
| | Xenia Hotels & Resorts Inc. | 296,377 | 4,629 |
| | Cathay General Bancorp | 159,126 | 4,508 |
| | EPR Properties | 67,257 | 4,481 |
| | First American Financial | | |
| | Corp. | 115,267 | 4,393 |
| | | |
| | | | Market |
| | | | Value• |
| | | Shares | ($000) |
| | CoreSite Realty Corp. | 60,812 | 4,258 |
| | Hersha Hospitality Trust | | |
| | Class A | 197,412 | 4,213 |
| | CubeSmart | 124,527 | 4,147 |
| | Ramco-Gershenson | | |
| | Properties Trust | 225,363 | 4,063 |
| | Nelnet Inc. Class A | 100,228 | 3,946 |
| | Ryman Hospitality | | |
| | Properties Inc. | 75,200 | 3,871 |
| *,^ | Credit Acceptance Corp. | 21,322 | 3,871 |
| * | Cowen Group Inc. Class A | 992,906 | 3,783 |
| | International Bancshares | | |
| | Corp. | 145,623 | 3,591 |
| ^ | Apple Hospitality REIT Inc. | 178,386 | 3,534 |
| * | First NBC Bank Holding Co. | 170,280 | 3,506 |
| | Getty Realty Corp. | 161,641 | 3,205 |
| | Primerica Inc. | 71,324 | 3,176 |
| | Summit Hotel | | |
| | Properties Inc. | 263,900 | 3,159 |
| | Care Capital Properties Inc. | 116,237 | 3,120 |
| | Weingarten Realty Investors | 83,070 | 3,117 |
| | NorthStar Realty Finance | | |
| | Corp. | 222,669 | 2,921 |
| | Piedmont Office Realty | | |
| | Trust Inc. Class A | 128,987 | 2,620 |
| | TCF Financial Corp. | 208,384 | 2,555 |
| * | Essent Group Ltd. | 115,000 | 2,392 |
| | Monmouth Real Estate | | |
| | Investment Corp. | 194,570 | 2,313 |
| *,^ | BofI Holding Inc. | 107,926 | 2,303 |
| | Maiden Holdings Ltd. | 155,360 | 2,010 |
| | Corrections Corp. of | | |
| | America | 62,272 | 1,996 |
| | Old National Bancorp | 160,366 | 1,955 |
| | Universal Health Realty | | |
| | Income Trust | 33,000 | 1,856 |
| | Oritani Financial Corp. | 106,948 | 1,815 |
| | AmTrust Financial | | |
| | Services Inc. | 69,485 | 1,798 |
| *,^ | World Acceptance Corp. | 45,300 | 1,718 |
| | Cardinal Financial Corp. | 80,120 | 1,630 |
| | Old Republic International | | |
| | Corp. | 88,340 | 1,615 |
| | RLJ Lodging Trust | 69,200 | 1,583 |
| | First Industrial Realty | | |
| | Trust Inc. | 66,484 | 1,512 |
| | Equity LifeStyle | | |
| | Properties Inc. | 20,600 | 1,498 |
| | CNO Financial Group Inc. | 81,014 | 1,452 |
| * | KCG Holdings Inc. Class A | 106,336 | 1,271 |
| | Chatham Lodging Trust | 58,533 | 1,254 |
| | Federal Agricultural | | |
| | Mortgage Corp. | 32,970 | 1,244 |
| | RAIT Financial Trust | 393,300 | 1,235 |
| | CyrusOne Inc. | 24,318 | 1,110 |
13
Strategic Small-Cap Equity Fund
| | | |
| | | | Market |
| | | | Value• |
| | | Shares | ($000) |
| | Ashford Hospitality | | |
| | Trust Inc. | 173,618 | 1,108 |
| | Retail Opportunity | | |
| | Investments Corp. | 54,998 | 1,107 |
| | One Liberty Properties Inc. | 47,185 | 1,057 |
| | Medical Properties Trust Inc. | 78,894 | 1,024 |
| | Sovran Self Storage Inc. | 7,993 | 943 |
| | MarketAxess Holdings Inc. | 6,639 | 829 |
| | Flushing Financial Corp. | 36,300 | 785 |
| | Franklin Street Properties | | |
| | Corp. | 62,400 | 662 |
| * | Piper Jaffray Cos. | 12,602 | 625 |
| | Cousins Properties Inc. | 59,578 | 618 |
| | BBCN Bancorp Inc. | 38,040 | 578 |
| | First Financial Bancorp | 30,948 | 563 |
| | National Penn | | |
| | Bancshares Inc. | 50,300 | 535 |
| * | FCB Financial Holdings Inc. | | |
| | Class A | 16,005 | 532 |
| | Fulton Financial Corp. | 39,204 | 525 |
| | Brookline Bancorp Inc. | 46,055 | 507 |
| | Great Southern Bancorp Inc. | 12,877 | 478 |
| | Investment Technology | | |
| | Group Inc. | 9,800 | 217 |
| | | | 308,983 |
| Health Care (12.0%) | | |
| * | Amsurg Corp. | 104,465 | 7,793 |
| * | Charles River Laboratories | | |
| | International Inc. | 99,013 | 7,519 |
| * | Molina Healthcare Inc. | 114,763 | 7,401 |
| * | Amedisys Inc. | 152,838 | 7,388 |
| | Bruker Corp. | 263,205 | 7,370 |
| * | Prestige Brands | | |
| | Holdings Inc. | 136,979 | 7,313 |
| * | AMN Healthcare | | |
| | Services Inc. | 214,612 | 7,213 |
| * | INC Research Holdings | | |
| | Inc. Class A | 157,633 | 6,496 |
| * | PRA Health Sciences Inc. | 146,531 | 6,266 |
| | Owens & Minor Inc. | 153,137 | 6,190 |
| * | Emergent BioSolutions Inc. | 167,800 | 6,100 |
| | Chemed Corp. | 44,000 | 5,960 |
| * | VCA Inc. | 99,600 | 5,746 |
| | Quality Systems Inc. | 333,087 | 5,076 |
| * | PharMerica Corp. | 226,658 | 5,011 |
| * | LHC Group Inc. | 133,500 | 4,747 |
| * | LifePoint Health Inc. | 62,332 | 4,316 |
| * | Centene Corp. | 67,138 | 4,134 |
| * | Infinity Pharmaceuticals Inc. | 700,240 | 3,690 |
| * | Sucampo Pharmaceuticals | | |
| | Inc. Class A | 310,600 | 3,395 |
| *,^ | Merrimack | | |
| | Pharmaceuticals Inc. | 388,869 | 3,255 |
| * | ICU Medical Inc. | 26,597 | 2,769 |
| | | |
| | | | Market |
| | | | Value• |
| | | Shares | ($000) |
| * | Triple-S Management Corp. | | |
| | Class B | 98,157 | 2,440 |
| * | Cambrex Corp. | 55,181 | 2,428 |
| * | Array BioPharma Inc. | 805,880 | 2,377 |
| | Phibro Animal Health Corp. | | |
| | Class A | 86,575 | 2,341 |
| * | Orthofix International NV | 43,671 | 1,813 |
| * | Merit Medical Systems Inc. | 67,651 | 1,251 |
| * | Surgical Care Affiliates Inc. | 25,359 | 1,174 |
| * | Nektar Therapeutics | 55,549 | 764 |
| *,^ | Sequenom Inc. | 340,900 | 481 |
| * | Acorda Therapeutics Inc. | 14,600 | 386 |
| *,^ | Orexigen Therapeutics Inc. | 349,700 | 197 |
| | | | 140,800 |
| Industrials (13.6%) | | |
| * | Hawaiian Holdings Inc. | 159,801 | 7,541 |
| | BWX Technologies Inc. | 224,514 | 7,535 |
| * | Wabash National Corp. | 509,677 | 6,728 |
| | Comfort Systems USA Inc. | 211,245 | 6,711 |
| | GATX Corp. | 139,549 | 6,629 |
| * | American Woodmark Corp. | 88,743 | 6,619 |
| | Global Brass & Copper | | |
| | Holdings Inc. | 262,054 | 6,538 |
| | Interface Inc. Class A | 352,375 | 6,533 |
| | General Cable Corp. | 502,380 | 6,134 |
| | Briggs & Stratton Corp. | 256,024 | 6,124 |
| * | Meritor Inc. | 717,124 | 5,780 |
| | SkyWest Inc. | 286,397 | 5,725 |
| * | ACCO Brands Corp. | 614,835 | 5,521 |
| | Huntington Ingalls | | |
| | Industries Inc. | 39,733 | 5,441 |
| | Aircastle Ltd. | 228,119 | 5,073 |
| * | Spirit AeroSystems | | |
| | Holdings Inc. Class A | 101,300 | 4,595 |
| * | Virgin America Inc. | 108,759 | 4,194 |
| | West Corp. | 174,765 | 3,988 |
| | John Bean Technologies | | |
| | Corp. | 69,522 | 3,922 |
| | Ennis Inc. | 198,650 | 3,884 |
| | Douglas Dynamics Inc. | 168,996 | 3,872 |
| | AO Smith Corp. | 47,662 | 3,637 |
| | Deluxe Corp. | 55,381 | 3,461 |
| | Pitney Bowes Inc. | 141,238 | 3,042 |
| | Greenbrier Cos. Inc. | 107,665 | 2,976 |
| | Herman Miller Inc. | 94,256 | 2,912 |
| * | Aerojet Rocketdyne | | |
| | Holdings Inc. | 152,086 | 2,491 |
| | Heidrick & Struggles | | |
| | International Inc. | 97,589 | 2,313 |
| | CEB Inc. | 33,808 | 2,188 |
| | Brink’s Co. | 62,356 | 2,094 |
| * | Aegion Corp. Class A | 99,147 | 2,091 |
| | Tetra Tech Inc. | 53,676 | 1,601 |
| | Manitowoc Co. Inc. | 367,532 | 1,591 |
| | Steelcase Inc. Class A | 93,475 | 1,395 |
14
Strategic Small-Cap Equity Fund
| | | |
| | | | Market |
| | | | Value• |
| | | Shares | ($000) |
| | Griffon Corp. | 83,915 | 1,296 |
| | Universal Forest | | |
| | Products Inc. | 11,187 | 960 |
| * | TriNet Group Inc. | 65,367 | 938 |
| | National Presto | | |
| | Industries Inc. | 11,200 | 938 |
| * | Dycom Industries Inc. | 13,231 | 856 |
| * | JetBlue Airways Corp. | 40,414 | 854 |
| * | Lydall Inc. | 23,400 | 761 |
| | Kforce Inc. | 33,900 | 664 |
| | American Railcar | | |
| | Industries Inc. | 13,218 | 538 |
| * | Babcock & Wilcox | | |
| | Enterprises Inc. | 23,900 | 511 |
| | | | 159,195 |
| Information Technology (16.3%) | |
| | CSRA Inc. | 299,800 | 8,065 |
| | Booz Allen Hamilton | | |
| | Holding Corp. Class A | 255,243 | 7,729 |
| *,^ | Advanced Micro | | |
| | Devices Inc. | 2,650,010 | 7,553 |
| | Leidos Holdings Inc. | 149,037 | 7,500 |
| * | Tech Data Corp. | 96,300 | 7,393 |
| * | CACI International Inc. | | |
| | Class A | 67,210 | 7,171 |
| | CSG Systems | | |
| | International Inc. | 156,974 | 7,089 |
| | SYNNEX Corp. | 75,800 | 7,018 |
| * | Cirrus Logic Inc. | 190,675 | 6,942 |
| * | Sykes Enterprises Inc. | 225,788 | 6,814 |
| * | Aspen Technology Inc. | 187,509 | 6,775 |
| | Jabil Circuit Inc. | 345,327 | 6,654 |
| * | Mellanox Technologies Ltd. | 117,943 | 6,408 |
| * | NETGEAR Inc. | 157,214 | 6,347 |
| * | GoDaddy Inc. Class A | 190,389 | 6,155 |
| * | Manhattan Associates Inc. | 105,500 | 6,000 |
| * | Synaptics Inc. | 74,750 | 5,961 |
| | EarthLink Holdings Corp. | 1,005,808 | 5,703 |
| * | Sanmina Corp. | 211,632 | 4,948 |
| * | Gigamon Inc. | 159,400 | 4,945 |
| * | ePlus Inc. | 59,754 | 4,811 |
| * | Ciena Corp. | 236,264 | 4,494 |
| * | Angie’s List Inc. | 467,600 | 3,774 |
| * | ARRIS International plc | 160,454 | 3,678 |
| * | MicroStrategy Inc. Class A | 18,809 | 3,380 |
| * | Viavi Solutions Inc. | 476,287 | 3,267 |
| * | Super Micro Computer Inc. | 91,761 | 3,127 |
| * | ShoreTel Inc. | 361,226 | 2,687 |
| | TeleTech Holdings Inc. | 94,000 | 2,609 |
| | Ingram Micro Inc. | 71,953 | 2,584 |
| | Computer Sciences Corp. | 72,912 | 2,507 |
| * | ON Semiconductor Corp. | 244,757 | 2,347 |
| * | Inphi Corp. | 62,661 | 2,089 |
| * | Sigma Designs Inc. | 293,500 | 1,996 |
| * | Avid Technology Inc. | 268,690 | 1,816 |
| | | |
| | | | Market |
| | | | Value• |
| | | Shares | ($000) |
| * | Monster Worldwide Inc. | 553,563 | 1,805 |
| * | Plexus Corp. | 45,445 | 1,796 |
| * | Benchmark Electronics Inc. | 77,026 | 1,775 |
| | Heartland Payment | | |
| | Systems Inc. | 15,700 | 1,516 |
| * | WebMD Health Corp. | 23,600 | 1,478 |
| * | Rudolph Technologies Inc. | 88,262 | 1,206 |
| | Travelport Worldwide Ltd. | 58,827 | 804 |
| | Pegasystems Inc. | 24,600 | 624 |
| * | Xcerra Corp. | 92,022 | 600 |
| | DST Systems Inc. | 5,243 | 591 |
| * | Photronics Inc. | 56,790 | 591 |
| * | FormFactor Inc. | 69,200 | 503 |
| | | | 191,625 |
| Materials (5.0%) | | |
| | Cabot Corp. | 160,706 | 7,767 |
| | Bemis Co. Inc. | 128,246 | 6,640 |
| *,^ | Trinseo SA | 175,576 | 6,463 |
| | Commercial Metals Co. | 352,583 | 5,983 |
| | Domtar Corp. | 138,219 | 5,598 |
| * | Kraton Performance | | |
| | Polymers Inc. | 285,106 | 4,932 |
| * | Chemtura Corp. | 150,062 | 3,962 |
| | Mercer International Inc. | 404,224 | 3,820 |
| * | Koppers Holdings Inc. | 165,642 | 3,722 |
| | Rayonier Advanced | | |
| | Materials Inc. | 283,618 | 2,694 |
| | Innospec Inc. | 60,600 | 2,628 |
| | Schnitzer Steel | | |
| | Industries Inc. | 128,297 | 2,366 |
| | Schweitzer-Mauduit | | |
| | International Inc. | 65,000 | 2,046 |
| * | US Concrete Inc. | 10,518 | 627 |
| | | | 59,248 |
| Telecommunication Services (0.7%) | |
| * | Cincinnati Bell Inc. | 1,304,627 | 5,049 |
| | Telephone & Data | | |
| | Systems Inc. | 58,877 | 1,772 |
| | Inteliquent Inc. | 45,196 | 725 |
| | Windstream Holdings Inc. | 41,400 | 318 |
| | | | 7,864 |
| Utilities (4.1%) | | |
| | WGL Holdings Inc. | 108,050 | 7,820 |
| | ONE Gas Inc. | 122,943 | 7,512 |
| | Ormat Technologies Inc. | 123,738 | 5,103 |
| | IDACORP Inc. | 63,049 | 4,703 |
| | Avista Corp. | 107,282 | 4,375 |
| | Vectren Corp. | 75,000 | 3,792 |
| | American States Water Co. | 94,509 | 3,720 |
| | Chesapeake Utilities Corp. | 50,651 | 3,189 |
| | Unitil Corp. | 68,945 | 2,929 |
| | Southwest Gas Corp. | 20,553 | 1,353 |
| | Great Plains Energy Inc. | 41,328 | 1,333 |
| | New Jersey Resources Corp. | 32,345 | 1,178 |
15
Strategic Small-Cap Equity Fund
| | | |
| | | | Market |
| | | | Value• |
| | | Shares | ($000) |
| | Otter Tail Corp. | 23,700 | 702 |
| | Laclede Group Inc. | 7,421 | 503 |
| | | | 48,212 |
| Total Common Stocks | | |
| (Cost $1,110,435) | | 1,167,386 |
| Temporary Cash Investments (2.3%)1 | |
| Money Market Fund (2.2%) | | |
| 2,3 | Vanguard Market | | |
| | Liquidity Fund, | | |
| | 0.495% | 26,019,000 | 26,019 |
| |
| | | Face | |
| | | Amount | |
| | | ($000) | |
| U.S. Government and Agency Obligations (0.1%) |
| 4,5 | Federal Home Loan Bank | | |
| | Discount Notes, | | |
| | 0.411%, 6/2/16 | 200 | 200 |
| 4 | Federal Home Loan Bank | | |
| | Discount Notes, | | |
| | 0.511%, 9/2/16 | 100 | 100 |
| 5,6 | Freddie Mac Discount Notes, | |
| | 0.220%, 4/15/16 | 200 | 200 |
| | | | 500 |
| Total Temporary Cash Investments | |
| (Cost $26,519) | | 26,519 |
| Total Investments (101.7%) | | |
| (Cost $1,136,954) | | 1,193,905 |
| |
| | Amount |
| | ($000) |
| Other Assets and Liabilities (-1.7%) | |
| Other Assets | |
| Investment in Vanguard | 96 |
| Receivables for Investment Securities Sold 1,797 |
| Receivables for Accrued Income | 1,466 |
| Receivables for Capital Shares Issued | 1,587 |
| Other Assets | 13 |
| Total Other Assets | 4,959 |
| Payables for Investment Securities | |
| Purchased | (3,063) |
| Collateral for Securities on Loan | (20,101) |
| Payables for Capital Shares Redeemed | (751) |
| Payables to Vanguard | (708) |
| Total Liabilities | (24,623) |
| Net Assets (100%) | |
| Applicable to 40,198,189 outstanding | |
| $.001 par value shares of beneficial | |
| interest (unlimited authorization) | 1,174,241 |
| Net Asset Value Per Share | $29.21 |
| |
| |
| At March 31, 2016, net assets consisted of: |
| | Amount |
| | ($000) |
| Paid-in Capital | 1,111,762 |
| Undistributed Net Investment Income | 2,360 |
| Accumulated Net Realized Gains | 3,025 |
| Unrealized Appreciation (Depreciation) | |
| Investment Securities | 56,951 |
| Futures Contracts | 143 |
| Net Assets | 1,174,241 |
• See Note A in Notes to Financial Statements.
* Non-income-producing security.
^ Includes partial security positions on loan to broker-dealers. The total value of securities on loan is $19,422,000.
1 The fund invests a portion of its cash reserves in equity markets through the use of index futures contracts. After giving effect to futures investments, the fund’s effective common stock and temporary cash investment positions represent 99.9% and 1.8%, respectively, of net assets.
2 Affiliated money market fund available only to Vanguard funds and certain trusts and accounts managed by Vanguard. Rate shown is the 7-day yield.
3 Includes $20,101,000 of collateral received for securities on loan.
4 The issuer operates under a congressional charter; its securities are generally neither guaranteed by the U.S. Treasury nor backed by the full faith and credit of the U.S. government.
5 Securities with a value of $400,000 have been segregated as initial margin for open futures contracts.
6 The issuer was placed under federal conservatorship in September 2008; since that time, its daily operations have been managed by the Federal Housing Finance Agency and it receives capital from the U.S. Treasury, as needed to maintain a positive net worth, in exchange for senior preferred stock.
REIT—Real Estate Investment Trust.
See accompanying Notes, which are an integral part of the Financial Statements.
16
Strategic Small-Cap Equity Fund
Statement of Operations
| |
| | Six Months Ended |
| | March 31, 2016 |
| | ($000) |
| Investment Income | |
| Income | |
| Dividends | 7,922 |
| Interest1 | 16 |
| Securities Lending | 697 |
| Total Income | 8,635 |
| Expenses | |
| The Vanguard Group—Note B | |
| Investment Advisory Services | 300 |
| Management and Administrative | 1,144 |
| Marketing and Distribution | 144 |
| Custodian Fees | 9 |
| Shareholders’ Reports | 15 |
| Trustees’ Fees and Expenses | — |
| Total Expenses | 1,612 |
| Net Investment Income | 7,023 |
| Realized Net Gain (Loss) | |
| Investment Securities Sold | 3,793 |
| Futures Contracts | (104) |
| Realized Net Gain (Loss) | 3,689 |
| Change in Unrealized Appreciation (Depreciation) | |
| Investment Securities | 29,539 |
| Futures Contracts | 270 |
| Change in Unrealized Appreciation (Depreciation) | 29,809 |
| Net Increase (Decrease) in Net Assets Resulting from Operations | 40,521 |
| 1 Interest income from an affiliated company of the fund was $16,000. | |
See accompanying Notes, which are an integral part of the Financial Statements.
17
Strategic Small-Cap Equity Fund
Statement of Changes in Net Assets
| | |
| | Six Months Ended | Year Ended |
| | March 31, | September 30, |
| | 2016 | 2015 |
| | ($000) | ($000) |
| Increase (Decrease) in Net Assets | | |
| Operations | | |
| Net Investment Income | 7,023 | 10,602 |
| Realized Net Gain (Loss) | 3,689 | 14,991 |
| Change in Unrealized Appreciation (Depreciation) | 29,809 | (43,049) |
| Net Increase (Decrease) in Net Assets Resulting from Operations | 40,521 | (17,456) |
| Distributions | | |
| Net Investment Income | (11,861) | (4,646) |
| Realized Capital Gain1 | (11,722) | (45,915) |
| Total Distributions | (23,583) | (50,561) |
| Capital Share Transactions | | |
| Issued | 333,372 | 586,229 |
| Issued in Lieu of Cash Distributions | 22,050 | 47,237 |
| Redeemed | (143,305) | (165,424) |
| Net Increase (Decrease) from Capital Share Transactions | 212,117 | 468,042 |
| Total Increase (Decrease) | 229,055 | 400,025 |
| Net Assets | | |
| Beginning of Period | 945,186 | 545,161 |
| End of Period2 | 1,174,241 | 945,186 |
1 Includes fiscal 2016 and 2015 short-term gain distributions totaling $0 and $6,762,000, respectively. Short-term gain distributions are treated as ordinary income dividends for tax purposes.
2 Net Assets—End of Period includes undistributed (overdistributed) net investment income of $2,360,000 and $7,198,000. |
|
|
See accompanying Notes, which are an integral part of the Financial Statements.
18
Strategic Small-Cap Equity Fund
Financial Highlights
| | | | | | |
| | Six Months | | | | | |
| | Ended | | | | | |
| For a Share Outstanding | March 31, | | | Year Ended September 30, |
| Throughout Each Period | 2016 | 2015 | 2014 | 2013 | 2012 | 2011 |
| Net Asset Value, Beginning of Period | $28.95 | $30.91 | $27.94 | $21.37 | $16.44 | $16.53 |
| Investment Operations | | | | | | |
| Net Investment Income | .1931 | .368 | .277 | .345 | .238 | .176 |
| Net Realized and Unrealized Gain (Loss) | | | | | | |
| on Investments | .743 | .349 | 3.201 | 6.585 | 4.888 | (.126) |
| Total from Investment Operations | .936 | .717 | 3.478 | 6.930 | 5.126 | .050 |
| Distributions | | | | | | |
| Dividends from Net Investment Income | (. 340) | (. 246) | (. 232) | (. 360) | (.196) | (.140) |
| Distributions from Realized Capital Gains | (.336) | (2.431) | (.276) | — | — | — |
| Total Distributions | (. 676) | (2.677) | (. 508) | (. 360) | (.196) | (.140) |
| Net Asset Value, End of Period | $29.21 | $28.95 | $30.91 | $27.94 | $21.37 | $16.44 |
| |
| Total Return2 | 3.22% | 2.10% | 12.48% | 32.94% | 31.38% | 0.20% |
| |
| Ratios/Supplemental Data | | | | | | |
| Net Assets, End of Period (Millions) | $1,174 | $945 | $545 | $377 | $259 | $223 |
| Ratio of Total Expenses to | | | | | | |
| Average Net Assets | 0.31% | 0.34% | 0.38% | 0.38% | 0.38% | 0.38% |
| Ratio of Net Investment Income to | | | | | | |
| Average Net Assets | 1.47% | 1.34% | 0.96% | 1.40% | 1.16% | 0.89% |
| Portfolio Turnover Rate | 82% | 62% | 64% | 64% | 66% | 64% |
| The expense ratio, net income ratio, and turnover rate for the current period have been annualized. | | |
1 Calculated based on average shares outstanding.
2 Total returns do not include transaction fees that may have applied in the periods shown. Fund prospectuses provide information about any applicable transaction fees. |
|
|
See accompanying Notes, which are an integral part of the Financial Statements.
19
Strategic Small-Cap Equity Fund
Notes to Financial Statements
Vanguard Strategic Small-Cap Equity Fund is registered under the Investment Company Act of 1940 as an open-end investment company, or mutual fund.
A. The following significant accounting policies conform to generally accepted accounting principles for U.S. investment companies. The fund consistently follows such policies in preparing its financial statements.
1. Security Valuation: Securities are valued as of the close of trading on the New York Stock Exchange (generally 4 p.m., Eastern time) on the valuation date. Equity securities are valued at the latest quoted sales prices or official closing prices taken from the primary market in which each security trades; such securities not traded on the valuation date are valued at the mean of the latest quoted bid and asked prices. Securities for which market quotations are not readily available, or whose values have been materially affected by events occurring before the fund’s pricing time but after the close of the securities’ primary markets, are valued by methods deemed by the board of trustees to represent fair value. Investments in Vanguard Market Liquidity Fund are valued at that fund’s net asset value. Temporary cash investments acquired over 60 days to maturity are valued using the latest bid prices or using valuations based on a matrix system (which considers such factors as security prices, yields, maturities, and ratings), both as furnished by independent pricing services. Other temporary cash investments are valued at amortized cost, which approximates market value.
2. Futures Contracts: The fund uses index futures contracts to a limited extent, with the objective of maintaining full exposure to the stock market while maintaining liquidity. The fund may purchase or sell futures contracts to achieve a desired level of investment, whether to accommodate portfolio turnover or cash flows from capital share transactions. The primary risks associated with the use of futures contracts are imperfect correlation between changes in market values of stocks held by the fund and the prices of futures contracts, and the possibility of an illiquid market. Counterparty risk involving futures is mitigated because a regulated clearinghouse is the counterparty instead of the clearing broker. To further mitigate counterparty risk, the fund trades futures contracts on an exchange, monitors the financial strength of its clearing brokers and clearinghouse, and has entered into clearing agreements with its clearing brokers. The clearinghouse imposes initial margin requirements to secure the fund’s performance and requires daily settlement of variation margin representing changes in the market value of each contract.
Futures contracts are valued at their quoted daily settlement prices. The aggregate settlement values of the contracts are not recorded in the Statement of Net Assets. Fluctuations in the value of the contracts are recorded in the Statement of Net Assets as an asset (liability) and in the Statement of Operations as unrealized appreciation (depreciation) until the contracts are closed, when they are recorded as realized futures gains (losses).
During the six months ended March 31, 2016, the fund’s average investments in long and short futures contracts represented less than 1% and 0% of net assets, respectively, based on the average of aggregate settlement values at each quarter-end during the period.
3. Federal Income Taxes: The fund intends to continue to qualify as a regulated investment company and distribute all of its taxable income. Management has analyzed the fund’s tax positions taken for all open federal income tax years (September 30, 2012–2015), and for the period ended March 31, 2016, and has concluded that no provision for federal income tax is required in the fund’s financial statements.
4. Distributions: Distributions to shareholders are recorded on the ex-dividend date.
20
Strategic Small-Cap Equity Fund
5. Securities Lending: To earn additional income, the fund lends its securities to qualified institutional borrowers. Security loans are subject to termination by the fund at any time, and are required to be secured at all times by collateral in an amount at least equal to the market value of securities loaned. Daily market fluctuations could cause the value of loaned securities to be more or less than the value of the collateral received. When this occurs, the collateral is adjusted and settled on the next business day. The fund further mitigates its counterparty risk by entering into securities lending transactions only with a diverse group of prequalified counterparties, monitoring their financial strength, and entering into master securities lending agreements with its counterparties. The master securities lending agreements provide that, in the event of a counterparty’s default (including bankruptcy), the fund may terminate any loans with that borrower, determine the net amount owed, and sell or retain the collateral up to the net amount owed to the fund; however, such actions may be subject to legal proceedings. While collateral mitigates counterparty risk, in the absence of a default the fund may experience delays and costs in recovering the securities loaned. The fund invests cash collateral received in Vanguard Market Liquidity Fund, and records a liability in the Statement of Net Assets for the return of the collateral, during the period the securities are on loan. Securities lending income represents fees charged to borrowers plus income earned on invested cash collateral, less expenses associated with the loan.
6. Credit Facility: The fund and certain other funds managed by The Vanguard Group (“Vanguard”) participate in a $3.1 billion committed credit facility provided by a syndicate of lenders pursuant to a credit agreement that may be renewed annually; each fund is individually liable for its borrowings, if any, under the credit facility. Borrowings may be utilized for temporary and emergency purposes, and are subject to the fund’s regulatory and contractual borrowing restrictions. The participating funds are charged administrative fees and an annual commitment fee of 0.10% of the undrawn amount of the facility; these fees are allocated to the funds based on a method approved by the fund’s board of trustees and included in Management and Administrative expenses on the fund’s Statement of Operations. Any borrowings under this facility bear interest at a rate based upon the higher of the one-month London Interbank Offered Rate, federal funds effective rate, or overnight bank funding rate plus an agreed-upon spread.
The fund had no borrowings outstanding at March 31, 2016, or at any time during the period then ended.
7. Other: Dividend income is recorded on the ex-dividend date. Interest income includes income distributions received from Vanguard Market Liquidity Fund and is accrued daily. Premiums and discounts on debt securities purchased are amortized and accreted, respectively, to interest income over the lives of the respective securities. Security transactions are accounted for on the date securities are bought or sold. Costs used to determine realized gains (losses) on the sale of investment securities are those of the specific securities sold.
B. In accordance with the terms of a Funds’ Service Agreement (the “FSA”) between Vanguard and the fund, Vanguard furnishes to the fund investment advisory, corporate management, administrative, marketing, and distribution services at Vanguard’s cost of operations (as defined by the FSA). These costs of operations are allocated to the fund based on methods and guidelines approved by the board of trustees. Vanguard does not require reimbursement in the current period for certain costs of operations (such as deferred compensation/benefits and risk/insurance costs); the fund’s liability for these costs of operations is included in Payables to Vanguard on the Statement of Net Assets.
21
Strategic Small-Cap Equity Fund
Upon the request of Vanguard, the fund may invest up to 0.40% of its net assets as capital in Vanguard. At March 31, 2016, the fund had contributed to Vanguard capital in the amount of $96,000, representing 0.01% of the fund’s net assets and 0.04% of Vanguard’s capitalization. The fund’s trustees and officers are also directors and employees, respectively, of Vanguard.
C. Various inputs may be used to determine the value of the fund’s investments. These inputs are summarized in three broad levels for financial statement purposes. The inputs or methodologies used to value securities are not necessarily an indication of the risk associated with investing in those securities.
Level 1—Quoted prices in active markets for identical securities.
Level 2—Other significant observable inputs (including quoted prices for similar securities, interest rates, prepayment speeds, credit risk, etc.).
Level 3—Significant unobservable inputs (including the fund’s own assumptions used to determine the fair value of investments).
The following table summarizes the market value of the fund’s investments as of March 31, 2016, based on the inputs used to value them:
| | | |
| | Level 1 | Level 2 | Level 3 |
| Investments | ($000) | ($000) | ($000) |
| Common Stocks | 1,167,386 | — | — |
| Temporary Cash Investments | 26,019 | 500 | — |
| Futures Contracts—Assets1 | 13 | — | — |
| Total | 1,193,418 | 500 | — |
| 1 Represents variation margin on the last day of the reporting period. | | | |
D. At March 31, 2016, the aggregate settlement value of open futures contracts and the related unrealized appreciation (depreciation) were:
| | | | |
| | | | | ($000) |
| | | | Aggregate | |
| | | Number of | Settlement | Unrealized |
| | | Long (Short) | Value | Appreciation |
| Futures Contracts | Expiration | Contracts | Long (Short) | (Depreciation) |
| E-mini Russell 2000 Index | June 2016 | 52 | 5,770 | 143 |
Unrealized appreciation (depreciation) on open futures contracts is required to be treated as realized gain (loss) for tax purposes.
E. Distributions are determined on a tax basis and may differ from net investment income and realized capital gains for financial reporting purposes. Differences may be permanent or temporary. Permanent differences are reclassified among capital accounts in the financial statements to reflect their tax character. Temporary differences arise when certain items of income, expense, gain, or loss are recognized in different periods for financial statement and tax purposes. These differences will reverse at some time in the future. Differences in classification may also result from the treatment of short-term gains as ordinary income for tax purposes. The fund’s tax-basis capital gains and losses are determined only at the end of each fiscal year.
22
Strategic Small-Cap Equity Fund
At March 31, 2016, the cost of investment securities for tax purposes was $1,137,311,000. Net unrealized appreciation of investment securities for tax purposes was $56,594,000, consisting of unrealized gains of $130,180,000 on securities that had risen in value since their purchase and $73,586,000 in unrealized losses on securities that had fallen in value since their purchase.
F. During the six months ended March 31, 2016, the fund purchased $626,309,000 of investment securities and sold $429,710,000 of investment securities, other than temporary cash investments.
G. Capital shares issued and redeemed were:
| | |
| | Six Months Ended | Year Ended |
| | March 31, 2016 | September 30, 2015 |
| | Shares | Shares |
| | (000) | (000) |
| Issued | 11,818 | 18,723 |
| Issued in Lieu of Cash Distributions | 751 | 1,590 |
| Redeemed | (5,025) | (5,297) |
| Net Increase (Decrease) in Shares Outstanding | 7,544 | 15,016 |
H. Management has determined that no material events or transactions occurred subsequent to March 31, 2016, that would require recognition or disclosure in these financial statements.
23
About Your Fund’s Expenses
As a shareholder of the fund, you incur ongoing costs, which include costs for portfolio management, administrative services, and shareholder reports (like this one), among others. Operating expenses, which are deducted from a fund’s gross income, directly reduce the investment return of the fund.
A fund’s expenses are expressed as a percentage of its average net assets. This figure is known as the expense ratio. The following examples are intended to help you understand the ongoing costs (in dollars) of investing in your fund and to compare these costs with those of other mutual funds. The examples are based on an investment of $1,000 made at the beginning of the period shown and held for the entire period.
The accompanying table illustrates your fund’s costs in two ways:
• Based on actual fund return. This section helps you to estimate the actual expenses that you paid over the period. The ”Ending Account Value“ shown is derived from the fund‘s actual return, and the third column shows the dollar amount that would have been paid by an investor who started with $1,000 in the fund. You may use the information here, together with the amount you invested, to estimate the expenses that you paid over the period.
To do so, simply divide your account value by $1,000 (for example, an $8,600 account value divided by $1,000 = 8.6), then multiply the result by the number given for your fund under the heading ”Expenses Paid During Period.“
• Based on hypothetical 5% yearly return. This section is intended to help you compare your fund‘s costs with those of other mutual funds. It assumes that the fund had a yearly return of 5% before expenses, but that the expense ratio is unchanged. In this case—because the return used is not the fund’s actual return—the results do not apply to your investment. The example is useful in making comparisons because the Securities and Exchange Commission requires all mutual funds to calculate expenses based on a 5% return. You can assess your fund’s costs by comparing this hypothetical example with the hypothetical examples that appear in shareholder reports of other funds.
Note that the expenses shown in the table are meant to highlight and help you compare ongoing costs only and do not reflect transaction costs incurred by the fund for buying and selling securities. Further, the expenses do not include any purchase, redemption, or account service fees described in the fund prospectus. If such fees were applied to your account, your costs would be higher. Your fund does not carry a “sales load.”
The calculations assume no shares were bought or sold during the period. Your actual costs may have been higher or lower, depending on the amount of your investment and the timing of any purchases or redemptions.
You can find more information about the fund’s expenses, including annual expense ratios, in the Financial Statements section of this report. For additional information on operating expenses and other shareholder costs, please refer to your fund’s current prospectus.
24
| | | | |
| Six Months Ended March 31, 2016 | | | |
| |
| | Beginning | Ending | Expenses |
| | Account Value | Account Value | Paid During |
| Strategic Small-Cap Equity Fund | 9/30/2015 | 3/31/2016 | Period |
| Based on Actual Fund Return | $1,000.00 | $1,032.20 | $1.57 |
| Based on Hypothetical 5% Yearly Return | 1,000.00 | 1,023.45 | 1.57 |
| The calculations are based on expenses incurred in the most recent six-month period. The fund’s annualized six-month expense ratio for that period is 0.31%. The dollar amounts shown as “Expenses Paid” are equal to the annualized expense ratio multiplied by the average account value over the period, multiplied by the number of days in the most recent six-month period, then divided by the number of days in the most recent 12-month period (183/366). |
|
|
|
25
Trustees Approve Advisory Arrangement
The board of trustees of Vanguard Strategic Small-Cap Equity Fund has renewed the fund’s investment advisory arrangement with The Vanguard Group, Inc. (Vanguard)—through its Quantitative Equity Group. The board determined that continuing the fund’s internalized management structure was in the best interests of the fund and its shareholders.
The board based its decision upon an evaluation of the advisor’s investment staff, portfolio management process, and performance. The trustees considered the factors discussed below, among others. However, no single factor determined whether the board approved the arrangement. Rather, it was the totality of the circumstances that drove the board’s decision.
Nature, extent, and quality of services
The board reviewed the quality of the fund’s investment management services over both the short and long term, and took into account the organizational depth and stability of the advisor. The board considered that Vanguard has been managing investments for more than three decades. The Quantitative Equity Group adheres to a sound, disciplined investment management process; the team has considerable experience, stability, and depth.
The board concluded that Vanguard’s experience, stability, depth, and performance, among other factors, warranted continuation of the advisory arrangement.
Investment performance
The board considered the short- and long-term performance of the fund, including any periods of outperformance or underperformance relative to a benchmark index and peer group. The board concluded that the performance was such that the advisory arrangement should continue. Information about the fund’s most recent performance can be found in the Performance Summary section of this report.
Cost
The board concluded that the fund’s expense ratio was well below the average expense ratio charged by funds in its peer group and that the fund’s advisory fee rate was also well below its peer-group average. Information about the fund’s expenses appears in the About Your Fund’s Expenses section of this report as well as in the Financial Statements section.
The board does not conduct a profitability analysis of Vanguard because of Vanguard’s unique “at-cost” structure. Unlike most other mutual fund management companies, Vanguard is owned by the funds it oversees, and produces “profits” only in the form of reduced expenses for fund shareholders.
The benefit of economies of scale
The board concluded that the fund’s at-cost arrangement with Vanguard ensures that the fund will realize economies of scale as it grows, with the cost to shareholders declining as fund assets increase.
The board will consider whether to renew the advisory arrangement again after a one-year period.
26
Glossary
30-Day SEC Yield. A fund’s 30-day SEC yield is derived using a formula specified by the U.S. Securities and Exchange Commission. Under the formula, data related to the fund’s security holdings in the previous 30 days are used to calculate the fund’s hypothetical net income for that period, which is then annualized and divided by the fund’s estimated average net assets over the calculation period. For the purposes of this calculation, a security’s income is based on its current market yield to maturity (for bonds), its actual income (for asset-backed securities), or its projected dividend yield (for stocks). Because the SEC yield represents hypothetical annualized income, it will differ—at times significantly—from the fund’s actual experience. As a result, the fund’s income distributions may be higher or lower than implied by the SEC yield.
Beta. A measure of the magnitude of a fund’s past share-price fluctuations in relation to the ups and downs of a given market index. The index is assigned a beta of 1.00. Compared with a given index, a fund with a beta of 1.20 typically would have seen its share price rise or fall by 12% when the index rose or fell by 10%. For this report, beta is based on returns over the past 36 months for both the fund and the index. Note that a fund’s beta should be reviewed in conjunction with its R-squared (see definition). The lower the R-squared, the less correlation there is between the fund and the index, and the less reliable beta is as an indicator of volatility.
Dividend Yield. Dividend income earned by stocks, expressed as a percentage of the aggregate market value (or of net asset value, for a fund). The yield is determined by dividing the amount of the annual dividends by the aggregate value (or net asset value) at the end of the period. For a fund, the dividend yield is based solely on stock holdings and does not include any income produced by other investments.
Earnings Growth Rate. The average annual rate of growth in earnings over the past five years for the stocks now in a fund.
Equity Exposure. A measure that reflects a fund’s investments in stocks and stock futures. Any holdings in short-term reserves are excluded.
Expense Ratio. A fund’s total annual operating expenses expressed as a percentage of the fund’s average net assets. The expense ratio includes management and administrative expenses, but does not include the transaction costs of buying and selling portfolio securities.
Foreign Holdings. The percentage of a fund represented by securities or depositary receipts of companies based outside the United States.
Inception Date. The date on which the assets of a fund (or one of its share classes) are first invested in accordance with the fund’s investment objective. For funds with a subscription period, the inception date is the day after that period ends. Investment performance is measured from the inception date.
Median Market Cap. An indicator of the size of companies in which a fund invests; the midpoint of market capitalization (market price x shares outstanding) of a fund’s stocks, weighted by the proportion of the fund’s assets invested in each stock. Stocks representing half of the fund’s assets have market capitalizations above the median, and the rest are below it.
Price/Book Ratio. The share price of a stock divided by its net worth, or book value, per share. For a fund, the weighted average price/book ratio of the stocks it holds.
27
Price/Earnings Ratio. The ratio of a stock’s current price to its per-share earnings over the past year. For a fund, the weighted average P/E of the stocks it holds. P/E is an indicator of market expectations about corporate prospects; the higher the P/E, the greater the expectations for a company’s future growth.
R-Squared. A measure of how much of a fund’s past returns can be explained by the returns from the market in general, as measured by a given index. If a fund’s total returns were precisely synchronized with an index’s returns, its R-squared would be 1.00. If the fund’s returns bore no relationship to the index’s returns, its R-squared would be 0. For this report, R-squared is based on returns over the past 36 months for both the fund and the index.
Return on Equity. The annual average rate of return generated by a company during the past five years for each dollar of shareholder’s equity (net income divided by shareholder’s equity). For a fund, the weighted average return on equity for the companies whose stocks it holds.
Short-Term Reserves. The percentage of a fund invested in highly liquid, short-term securities that can be readily converted to cash.
Turnover Rate. An indication of the fund’s trading activity. Funds with high turnover rates incur higher transaction costs and may be more likely to distribute capital gains (which may be taxable to investors). The turnover rate excludes in-kind transactions, which have minimal impact on costs.
28
This page intentionally left blank.
This page intentionally left blank.
This page intentionally left blank.
The People Who Govern Your Fund
The trustees of your mutual fund are there to see that the fund is operated and managed in your best interests since, as a shareholder, you are a part owner of the fund. Your fund’s trustees also serve on the board of directors of The Vanguard Group, Inc., which is owned by the Vanguard funds and provides services to them on an at-cost basis.
A majority of Vanguard’s board members are independent, meaning that they have no affiliation with Vanguard or the funds they oversee, apart from the sizable personal investments they have made as private individuals. The independent board members have distinguished backgrounds in business, academia, and public service. Each of the trustees and executive officers oversees 198 Vanguard funds.
The following table provides information for each trustee and executive officer of the fund. More information about the trustees is in the Statement of Additional Information, which can be obtained, without charge, by contacting Vanguard at 800-662-7447, or online at vanguard.com.
| |
| InterestedTrustee1 | Rajiv L. Gupta |
| Born 1945. Trustee Since December 2001.2 Principal |
| F. William McNabb III | Occupation(s) During the Past Five Years and Other |
| Born 1957. Trustee Since July 2009. Chairman of | Experience: Chairman and Chief Executive Officer |
| the Board. Principal Occupation(s) During the Past | (retired 2009) and President (2006–2008) of |
| Five Years and Other Experience: Chairman of the | Rohm and Haas Co. (chemicals); Director of Tyco |
| Board of The Vanguard Group, Inc., and of each of | International PLC (diversified manufacturing and |
| the investment companies served by The Vanguard | services), HP Inc. (printer and personal computer |
| Group, since January 2010; Director of The Vanguard | manufacturing), and Delphi Automotive PLC |
| Group since 2008; Chief Executive Officer and | (automotive components); Senior Advisor at |
| President of The Vanguard Group, and of each of | New Mountain Capital. |
| the investment companies served by The Vanguard | |
| Group, since 2008; Director of Vanguard Marketing | Amy Gutmann |
| Corporation; Managing Director of The Vanguard | Born 1949. Trustee Since June 2006. Principal |
| Group (1995–2008). | Occupation(s) During the Past Five Years and |
| Other Experience: President of the University of |
| Independent Trustees | Pennsylvania; Christopher H. Browne Distinguished |
| Professor of Political Science, School of Arts and |
| Emerson U. Fullwood | Sciences, and Professor of Communication, Annenberg |
| Born 1948. Trustee Since January 2008. Principal | School for Communication, with secondary faculty |
| Occupation(s) During the Past Five Years and Other | appointments in the Department of Philosophy, School |
| Experience: Executive Chief Staff and Marketing | of Arts and Sciences, and at the Graduate School of |
| Officer for North America and Corporate Vice President | Education, University of Pennsylvania; Trustee of the |
| (retired 2008) of Xerox Corporation (document manage- | National Constitution Center; Chair of the Presidential |
| ment products and services); Executive in Residence | Commission for the Study of Bioethical Issues. |
| and 2009–2010 Distinguished Minett Professor at | |
| the Rochester Institute of Technology; Lead Director | JoAnn Heffernan Heisen |
| of SPX FLOW, Inc. (multi-industry manufacturing); | Born 1950. Trustee Since July 1998. Principal |
| Director of the United Way of Rochester, the University | Occupation(s) During the Past Five Years and |
| of Rochester Medical Center, Monroe Community | Other Experience: Corporate Vice President and |
| College Foundation, North Carolina A&T University, | Chief Global Diversity Officer (retired 2008) and |
| and Roberts Wesleyan College. | Member of the Executive Committee (1997–2008) |
| of Johnson & Johnson (pharmaceuticals/medical |
| devices/consumer products); Director of Skytop |
| Lodge Corporation (hotels) and the Robert Wood |
| Johnson Foundation; Member of the Advisory |
| Board of the Institute for Women’s Leadership |
| at Rutgers University. |
| | |
| F. Joseph Loughrey | Executive Officers | |
| Born 1949. Trustee Since October 2009. Principal | | |
| Occupation(s) During the Past Five Years and Other | Glenn Booraem | |
| Experience: President and Chief Operating Officer | Born 1967. Treasurer Since May 2015. Principal |
| (retired 2009) of Cummins Inc. (industrial machinery); | Occupation(s) During the Past Five Years and |
| Chairman of the Board of Hillenbrand, Inc. (specialized | Other Experience: Principal of The Vanguard Group, |
| consumer services), and of Oxfam America; Director | Inc.; Treasurer of each of the investment companies |
| of SKF AB (industrial machinery), Hyster-Yale Materials | served by The Vanguard Group; Controller of each of |
| Handling, Inc. (forklift trucks), the Lumina Foundation | the investment companies served by The Vanguard |
| for Education, and the V Foundation for Cancer | Group (2010–2015); Assistant Controller of each of |
| Research; Member of the Advisory Council for the | the investment companies served by The Vanguard |
| College of Arts and Letters and of the Advisory Board | Group (2001–2010). | |
| to the Kellogg Institute for International Studies, both | | |
| at the University of Notre Dame. | Thomas J. Higgins |
| Born 1957. Chief Financial Officer Since September |
| Mark Loughridge | 2008. Principal Occupation(s) During the Past Five |
| Born 1953. Trustee Since March 2012. Principal | Years and Other Experience: Principal of The Vanguard |
| Occupation(s) During the Past Five Years and Other | Group, Inc.; Chief Financial Officer of each of the |
| Experience: Senior Vice President and Chief Financial | investment companies served by The Vanguard Group; |
| Officer (retired 2013) at IBM (information technology | Treasurer of each of the investment companies served |
| services); Fiduciary Member of IBM’s Retirement Plan | by The Vanguard Group (1998–2008). |
| Committee (2004–2013); Director of the Dow Chemical | |
| Company; Member of the Council on Chicago Booth. | Peter Mahoney | |
| Born 1974. Controller Since May 2015. Principal |
| Scott C. Malpass | Occupation(s) During the Past Five Years and |
| Born 1962. Trustee Since March 2012. Principal | Other Experience: Head of Global Fund Accounting |
| Occupation(s) During the Past Five Years and Other | at The Vanguard Group, Inc.; Controller of each of the |
| Experience: Chief Investment Officer and Vice | investment companies served by The Vanguard Group; |
| President at the University of Notre Dame; Assistant | Head of International Fund Services at The Vanguard |
| Professor of Finance at the Mendoza College of | Group (2008–2014). | |
| Business at Notre Dame; Member of the Notre Dame | | |
| 403(b) Investment Committee, the Board of Advisors | Heidi Stam | |
| for Spruceview Capital Partners, and the Investment | Born 1956. Secretary Since July 2005. Principal |
| Advisory Committee of Major League Baseball; Board | Occupation(s) During the Past Five Years and Other |
| Member of TIFF Advisory Services, Inc., and Catholic | Experience: Managing Director of The Vanguard |
| Investment Services, Inc. (investment advisors). | Group, Inc.; General Counsel of The Vanguard Group; |
| Secretary of The Vanguard Group and of each of the |
| André F. Perold | investment companies served by The Vanguard Group; |
| Born 1952. Trustee Since December 2004. Principal | Director and Senior Vice President of Vanguard |
| Occupation(s) During the Past Five Years and Other | Marketing Corporation. | |
| Experience: George Gund Professor of Finance and | | |
| Banking, Emeritus at the Harvard Business School | Vanguard Senior ManagementTeam |
| (retired 2011); Chief Investment Officer and Managing | | |
| Partner of HighVista Strategies LLC (private investment | Mortimer J. Buckley | James M. Norris |
| firm); Director of Rand Merchant Bank; Overseer of | Kathleen C. Gubanich | Thomas M. Rampulla |
| the Museum of Fine Arts Boston. | Martha G. King | Glenn W. Reed |
| John T. Marcante | Karin A. Risi |
| Peter F. Volanakis | Chris D. McIsaac | |
| Born 1955. Trustee Since July 2009. Principal | | |
| Occupation(s) During the Past Five Years and Other | Chairman Emeritus and Senior Advisor |
| Experience: President and Chief Operating Officer | | |
| (retired 2010) of Corning Incorporated (communications | John J. Brennan | |
| equipment); Trustee of Colby-Sawyer College and | Chairman, 1996–2009 | |
| Chairman of its Finance and Enrollment Committee; | Chief Executive Officer and President, 1996–2008 |
| Member of the Advisory Board of the Norris Cotton | | |
| Cancer Center. | Founder | |
| | |
| | John C. Bogle | |
| | Chairman and Chief Executive Officer, 1974–1996 |
1 Mr. McNabb is considered an “interested person,” as defined in the Investment Company Act of 1940, because he is an officer of the Vanguard funds.
2 December 2002 for Vanguard Equity Income Fund, the Vanguard Municipal Bond Funds, and the Vanguard State Tax-Exempt Funds.
| |  |
| | | P.O. Box 2600 |
| | | Valley Forge, PA 19482-2600 |
| |
| |
| |
| Connect with Vanguard® > vanguard.com | |
| |
| |
| |
| Fund Information > 800-662-7447 | | CFA® is a registered trademark owned by CFA Institute. |
| Direct Investor Account Services > 800-662-2739 | |
| Institutional Investor Services > 800-523-1036 | |
| Text Telephone for People | | |
| Who Are Deaf or Hard of Hearing> 800-749-7273 | |
| |
| This material may be used in conjunction | |
| with the offering of shares of any Vanguard | |
| fund only if preceded or accompanied by | |
| the fund’s current prospectus. | |
| |
| All comparative mutual fund data are from Lipper, a | |
| Thomson Reuters Company, or Morningstar, Inc., unless | |
| otherwise noted. | | |
| |
| You can obtain a free copy of Vanguard’s proxy voting | |
| guidelines by visiting vanguard.com/proxyreporting or by | |
| calling Vanguard at 800-662-2739. The guidelines are | |
| also available from the SEC’s website, sec.gov. In | |
| addition, you may obtain a free report on how your fund | |
| voted the proxies for securities it owned during the 12 | |
| months ended June 30. To get the report, visit either | |
| vanguard.com/proxyreporting or sec.gov. | |
| |
| You can review and copy information about your fund at | |
| the SEC’s Public Reference Room in Washington, D.C. To | |
| find out more about this public service, call the SEC at | |
| 202-551-8090. Information about your fund is also | |
| available on the SEC’s website, and you can receive | |
| copies of this information, for a fee, by sending a | |
| request in either of two ways: via email addressed to | |
| publicinfo@sec.gov or via regular mail addressed to the | |
| Public Reference Section, Securities and Exchange | |
| Commission, Washington, DC 20549-1520. | |
| |
| | | © 2016 The Vanguard Group, Inc. |
| | | All rights reserved. |
| | | Vanguard Marketing Corporation, Distributor. |
| |
| | | Q6152 052016 |
Item 2: Code of Ethics.
Not Applicable.
Item 3: Audit Committee Financial Expert.
Not Applicable.
Item 4: Principal Accountant Fees and Services.
(a) Audit Fees.
Not Applicable.
Item 5: Audit Committee of Listed Registrants.
Not Applicable.
Item 6: Investments.
| | | |
| Vanguard® Global Equity Fund | | |
| Schedule of Investments | | |
| March 31, 2016 | | |
| |
| | | | Market |
| | | | Value |
| | | Shares | ($000) |
| Common Stocks (96.5%)1 | | |
| Australia (1.2%) | | |
| | Brambles Ltd. | 1,526,550 | 14,142 |
| | Caltex Australia Ltd. | 416,910 | 10,874 |
| | Qantas Airways Ltd. | 2,503,330 | 7,814 |
| | BlueScope Steel Ltd. | 430,487 | 2,036 |
| | Coca-Cola Amatil Ltd. | 295,946 | 2,004 |
| | Alumina Ltd. | 1,698,842 | 1,690 |
| | Orica Ltd. | 121,892 | 1,434 |
| * | Newcrest Mining Ltd. | 104,788 | 1,356 |
| | Fairfax Media Ltd. | 1,667,797 | 1,098 |
| | Cleanaway Waste Management Ltd. | 1,795,367 | 1,057 |
| | ALS Ltd. | 283,264 | 866 |
| | Iluka Resources Ltd. | 172,527 | 865 |
| | BHP Billiton Ltd. | 53,517 | 692 |
| *,^ | Metcash Ltd. | 512,921 | 683 |
| | DuluxGroup Ltd. | 123,062 | 591 |
| | Amcor Ltd. | 51,501 | 565 |
| | Asaleo Care Ltd. | 364,715 | 508 |
| | Sigma Pharmaceuticals Ltd. | 578,839 | 470 |
| | Regis Resources Ltd. | 246,581 | 457 |
| | GUD Holdings Ltd. | 75,607 | 403 |
| | Spotless Group Holdings Ltd. | 367,394 | 356 |
| | Santos Ltd. | 105,524 | 327 |
| | Orora Ltd. | 107,206 | 205 |
| | Premier Investments Ltd. | 10,829 | 140 |
| | | | 50,633 |
| Austria (0.1%) | | |
| | Wienerberger AG | 63,398 | 1,217 |
| | Oesterreichische Post AG | 19,764 | 803 |
| * | ANDRITZ AG | 12,646 | 693 |
| | | | 2,713 |
| Belgium (0.1%) | | |
| | Anheuser-Busch InBev SA/NV | 31,286 | 3,887 |
| |
| Brazil (0.6%) | | |
| | BM&FBovespa SA - Bolsa de Valores Mercadorias e Futuros | 1,834,600 | 7,847 |
| | MRV Engenharia e Participacoes SA | 670,500 | 2,208 |
| | Alpargatas SA Preference Shares | 876,882 | 1,890 |
| | EDP - Energias do Brasil SA | 473,900 | 1,661 |
| | Natura Cosmeticos SA | 214,726 | 1,585 |
| | Ambev SA | 250,700 | 1,312 |
| | Itausa - Investimentos Itau SA Preference Shares | 563,376 | 1,280 |
| | TOTVS SA | 157,600 | 1,192 |
| | BTG Pactual Group | 177,900 | 860 |
| | Tim Participacoes SA | 340,035 | 757 |
| | Cia Energetica de Minas Gerais ADR | 307,244 | 694 |
| * | B2W Cia Digital | 145,381 | 578 |
| | Cia Brasileira de Distribuicao Grupo Pao de Acucar Preference Shares | 41,090 | 570 |
| | Banco Bradesco SA Preference Shares | 65,560 | 494 |
| | Vale SA Preference Shares | 145,400 | 460 |
| | Ultrapar Participacoes SA | 15,500 | 301 |
| | LPS Brasil Consultoria de Imoveis SA | 291,100 | 212 |
| | | | 23,901 |
| Canada (3.4%) | | |
| | Toronto-Dominion Bank | 531,800 | 22,955 |
| | Royal Bank of Canada | 369,800 | 21,307 |
| | Bank of Montreal | 325,800 | 19,785 |
| | Magna International Inc. | 400,900 | 17,234 |
| ^ | Canadian Imperial Bank of Commerce | 218,100 | 16,293 |
| | Fairfax Financial Holdings Ltd. | 27,770 | 15,551 |
| | Ritchie Bros Auctioneers Inc. | 343,596 | 9,305 |
| | BCE Inc. | 144,162 | 6,565 |
1
| | |
| Vanguard® Global Equity Fund | | |
| Schedule of Investments | | |
| March 31, 2016 | | |
| |
| | | Market |
| | | Value |
| | Shares | ($000) |
| Canadian Natural Resources Ltd. | 237,694 | 6,429 |
| Rogers Communications Inc. Class B | 129,839 | 5,199 |
| Brookfield Asset Management Inc. Class A | 95,737 | 3,330 |
| Cenovus Energy Inc. | 83,000 | 1,080 |
| CCL Industries Inc. Class B | 2,900 | 550 |
| Constellation Software Inc. | 1,300 | 532 |
| * CGI Group Inc. Class A | 6,200 | 296 |
| George Weston Ltd. | 3,300 | 295 |
| Imperial Oil Ltd. | 8,300 | 277 |
| * Kinross Gold Corp. | 30,714 | 105 |
| | | 147,088 |
| Chile (0.3%) | | |
| Enersis Americas SA ADR | 564,716 | 7,850 |
| Cia Cervecerias Unidas SA | 167,577 | 1,889 |
| Quinenco SA | 817,877 | 1,502 |
| Cia Cervecerias Unidas SA ADR | 13,772 | 309 |
| Empresa Nacional de Electricidad SA ADR | 6,469 | 269 |
| * Cia Sud Americana de Vapores SA | 11,489,644 | 234 |
| Sociedad Quimica y Minera de Chile SA ADR | 5,329 | 109 |
| * Enaex SA | 5,437 | 56 |
| | | 12,218 |
| China (2.1%) | | |
| * Baidu Inc. ADR | 112,803 | 21,532 |
| China Mobile Ltd. | 1,920,500 | 21,269 |
| * Alibaba Group Holding Ltd. ADR | 264,258 | 20,884 |
| NetEase Inc. ADR | 34,154 | 4,904 |
| Tsingtao Brewery Co. Ltd. | 1,214,000 | 4,621 |
| * Autohome Inc. ADR | 153,602 | 4,292 |
| China Telecom Corp. Ltd. | 5,360,000 | 2,838 |
| China Resources Beer Holdings Company Ltd. | 934,994 | 1,742 |
| China Mengniu Dairy Co. Ltd. | 1,075,000 | 1,712 |
| Want Want China Holdings Ltd. | 2,267,557 | 1,681 |
| * Li Ning Co. Ltd. | 2,742,833 | 1,270 |
| CNOOC Ltd. | 925,913 | 1,081 |
| Ajisen China Holdings Ltd. | 1,682,000 | 625 |
| TravelSky Technology Ltd. | 340,000 | 557 |
| * Goodbaby International Holdings Ltd. | 1,019,000 | 550 |
| Tingyi Cayman Islands Holding Corp. | 473,608 | 529 |
| Shenzhou International Group Holdings Ltd. | 74,456 | 406 |
| CITIC Ltd. | 225,000 | 342 |
| China Merchants Holdings International Co. Ltd. | 100,000 | 297 |
| * Daphne International Holdings Ltd. | 2,016,000 | 268 |
| | | 91,400 |
| Colombia (0.1%) | | |
| Bancolombia SA ADR | 43,967 | 1,503 |
| Almacenes Exito SA | 145,832 | 762 |
| | | 2,265 |
| Cyprus (0.0%) | | |
| * Global Ports Investments plc GDR | 269,523 | 849 |
| * Globaltrans Investment plc GDR | 50,250 | 217 |
| | | 1,066 |
| Czech Republic (0.0%) | | |
| Komercni banka as | 2,847 | 628 |
| |
| Denmark (1.2%) | | |
| Novo Nordisk A/S Class B | 291,246 | 15,772 |
| Carlsberg A/S Class B | 154,003 | 14,643 |
| Vestas Wind Systems A/S | 143,754 | 10,129 |
| Coloplast A/S Class B | 71,842 | 5,436 |
| * William Demant Holding A/S | 22,310 | 2,241 |
| ^ GN Store Nord A/S | 100,761 | 2,104 |
| * H Lundbeck A/S | 28,164 | 929 |
| * Topdanmark A/S | 22,904 | 582 |
2
| | |
| Vanguard® Global Equity Fund | | |
| Schedule of Investments | | |
| March 31, 2016 | | |
| |
| | | Market |
| | | Value |
| | Shares | ($000) |
| Danske Bank A/S | 18,492 | 522 |
| ISS A/S | 12,512 | 502 |
| | | 52,860 |
| Finland (0.5%) | | |
| Neste Oyj | 185,198 | 6,086 |
| Sampo Oyj Class A | 113,502 | 5,376 |
| * Tikkurila Oyj | 246,385 | 4,475 |
| Nokian Renkaat Oyj | 31,689 | 1,118 |
| Wartsila Oyj Abp | 16,321 | 738 |
| Amer Sports Oyj | 21,528 | 625 |
| UPM-Kymmene Oyj | 33,495 | 605 |
| Tieto Oyj | 18,385 | 479 |
| Metso Oyj | 19,097 | 455 |
| | | 19,957 |
| France (0.7%) | | |
| L'Oreal SA | 31,313 | 5,601 |
| Legrand SA | 99,550 | 5,564 |
| BNP Paribas SA | 46,681 | 2,345 |
| Eurofins Scientific SE | 4,708 | 1,724 |
| Airbus Group SE | 25,634 | 1,698 |
| AXA SA | 61,485 | 1,442 |
| * Air France-KLM | 145,694 | 1,384 |
| Groupe Eurotunnel SE | 116,130 | 1,300 |
| Edenred | 54,406 | 1,055 |
| Thales SA | 11,533 | 1,008 |
| Zodiac Aerospace | 45,339 | 905 |
| Sanofi | 10,574 | 850 |
| ^ ArcelorMittal | 142,616 | 643 |
| TOTAL SA | 13,659 | 622 |
| Vicat SA | 6,807 | 441 |
| Neopost SA | 20,971 | 440 |
| Technip SA | 7,012 | 389 |
| JCDecaux SA | 8,428 | 369 |
| Elis SA | 17,248 | 335 |
| Imerys SA | 4,662 | 325 |
| Virbac SA | 933 | 162 |
| Vallourec SA | 18,126 | 118 |
| | | 28,720 |
| Germany (2.5%) | | |
| SAP SE | 438,797 | 35,309 |
| Deutsche Boerse AG | 197,306 | 16,799 |
| Merck KGaA | 154,069 | 12,816 |
| * Deutsche Lufthansa AG | 651,968 | 10,522 |
| * QIAGEN NV | 315,500 | 7,048 |
| Fresenius Medical Care AG & Co. KGaA | 53,978 | 4,762 |
| * Deutsche Telekom AG | 155,878 | 2,795 |
| BASF SE | 36,513 | 2,746 |
| Bayerische Motoren Werke AG | 26,768 | 2,457 |
| Volkswagen AG Preference Shares | 14,195 | 1,802 |
| Axel Springer SE | 26,330 | 1,417 |
| adidas AG | 11,570 | 1,351 |
| Brenntag AG | 23,355 | 1,331 |
| Gerresheimer AG | 15,600 | 1,221 |
| Symrise AG | 14,573 | 976 |
| CTS Eventim AG & Co. KGaA | 26,922 | 955 |
| E.ON SE | 89,547 | 856 |
| Rheinmetall AG | 10,161 | 810 |
| Hannover Rueck SE | 5,641 | 656 |
| GEA Group AG | 12,418 | 606 |
| Fielmann AG | 6,854 | 520 |
| HOCHTIEF AG | 3,318 | 405 |
| TUI AG-DI | 25,734 | 401 |
| | | 108,561 |
3
| | | |
| Vanguard® Global Equity Fund | | |
| Schedule of Investments | | |
| March 31, 2016 | | |
| |
| | | | Market |
| | | | Value |
| | | Shares | ($000) |
| Greece (0.1%) | | |
| | Grivalia Properties REIC AE | 132,272 | 1,103 |
| * | JUMBO SA | 27,231 | 368 |
| | OPAP SA | 42,679 | 299 |
| | Alpha Bank AE | 118,625 | 261 |
| * | Fourlis Holdings SA | 40,629 | 131 |
| | | | 2,162 |
| Hong Kong (1.4%) | | |
| | AIA Group Ltd. | 3,915,000 | 22,253 |
| | Jardine Matheson Holdings Ltd. | 243,100 | 13,866 |
| | Sands China Ltd. | 1,676,400 | 6,844 |
| | CK Hutchison Holdings Ltd. | 331,300 | 4,304 |
| * | Esprit Holdings Ltd. | 3,504,114 | 3,276 |
| | HSBC Holdings plc | 366,400 | 2,279 |
| | First Pacific Co. Ltd. | 1,811,250 | 1,352 |
| | Television Broadcasts Ltd. | 253,300 | 912 |
| | Hongkong & Shanghai Hotels Ltd. | 737,200 | 783 |
| | Stella International Holdings Ltd. | 248,673 | 586 |
| | Cheung Kong Property Holdings Ltd. | 88,692 | 572 |
| | SmarTone Telecommunications Holdings Ltd. | 226,194 | 377 |
| | Dairy Farm International Holdings Ltd. | 38,600 | 233 |
| | Texwinca Holdings Ltd. | 144,823 | 141 |
| | New World Development Co. Ltd. | 82,000 | 78 |
| | | | 57,856 |
| India (1.1%) | | |
| | ICICI Bank Ltd. | 4,521,094 | 16,242 |
| | Housing Development Finance Corp. Ltd. | 702,622 | 11,725 |
| | Tata Consultancy Services Ltd. | 156,372 | 5,951 |
| | Reliance Industries Ltd. | 152,951 | 2,414 |
| | HCL Technologies Ltd. | 182,986 | 2,249 |
| | Bharat Petroleum Corp. Ltd. | 155,306 | 2,120 |
| | ITC Ltd. | 290,948 | 1,441 |
| | CESC Ltd. | 200,815 | 1,433 |
| | Bharti Airtel Ltd. | 246,190 | 1,304 |
| | Infosys Ltd. ADR | 39,575 | 753 |
| | Axis Bank Ltd. | 101,415 | 680 |
| | Bank of Baroda | 192,998 | 428 |
| | Indian Oil Corp. Ltd. | 51,042 | 303 |
| | Hindustan Petroleum Corp. Ltd. | 21,936 | 261 |
| | | | 47,304 |
| Indonesia (0.1%) | | |
| | Telekomunikasi Indonesia Persero Tbk PT | 18,377,400 | 4,632 |
| | Telekomunikasi Indonesia Persero Tbk PT ADR | 17,078 | 869 |
| * | XL Axiata Tbk PT | 1,321,000 | 398 |
| | Unilever Indonesia Tbk PT | 105,600 | 342 |
| | | | 6,241 |
| Ireland (2.1%) | | |
| | CRH plc | 1,344,502 | 37,934 |
| | Ryanair Holdings plc ADR | 363,887 | 31,229 |
| * | Bank of Ireland | 46,817,426 | 13,541 |
| * | Paddy Power Betfair plc | 18,976 | 2,639 |
| | Paddy Power Betfair plc | 17,743 | 2,475 |
| | Irish Continental Group plc | 164,164 | 1,016 |
| * | Irish Bank Resolution Corp. Ltd. | 122,273 | — |
| | | | 88,834 |
| Israel (0.0%) | | |
| * | Taro Pharmaceutical Industries Ltd. | 6,832 | 979 |
| |
| Italy (0.5%) | | |
| | Fiat Chrysler Automobiles NV | 693,924 | 5,600 |
| * | Ferrari NV | 69,392 | 2,882 |
| | Luxottica Group SPA ADR | 51,779 | 2,848 |
| ^ | Piaggio & C SPA | 1,067,620 | 2,258 |
| | CNH Industrial NV | 265,413 | 1,802 |
4
| | |
| Vanguard® Global Equity Fund | | |
| Schedule of Investments | | |
| March 31, 2016 | | |
| |
| | | Market |
| | | Value |
| | Shares | ($000) |
| UniCredit SPA | 443,754 | 1,600 |
| * Saipem SPA | 3,976,937 | 1,591 |
| Luxottica Group SPA | 16,888 | 930 |
| EXOR SPA | 24,451 | 875 |
| Recordati SPA | 32,620 | 816 |
| Intesa Sanpaolo SPA (Registered) | 228,970 | 633 |
| Davide Campari-Milano SPA | 55,529 | 554 |
| * Saras SPA | 104,270 | 167 |
| | | 22,556 |
| Japan (8.8%) | | |
| MS&AD Insurance Group Holdings Inc. | 1,187,400 | 33,094 |
| Nippon Telegraph & Telephone Corp. | 713,100 | 30,804 |
| Daito Trust Construction Co. Ltd. | 147,600 | 20,935 |
| Olympus Corp. | 328,400 | 12,750 |
| Daiwa House Industry Co. Ltd. | 431,900 | 12,140 |
| Secom Co. Ltd. | 162,600 | 12,065 |
| SMC Corp. | 48,300 | 11,192 |
| FUJIFILM Holdings Corp. | 226,700 | 8,961 |
| Japan Exchange Group Inc. | 573,000 | 8,766 |
| CyberAgent Inc. | 186,400 | 8,666 |
| THK Co. Ltd. | 470,400 | 8,659 |
| * Tokyo Electric Power Co. Inc. | 1,496,000 | 8,218 |
| Daiichi Sankyo Co. Ltd. | 334,700 | 7,429 |
| Japan Airlines Co. Ltd. | 185,400 | 6,797 |
| Toyota Motor Corp. | 126,400 | 6,704 |
| Seven & i Holdings Co. Ltd. | 152,500 | 6,498 |
| NTT Data Corp. | 127,500 | 6,394 |
| Obayashi Corp. | 647,000 | 6,377 |
| Kirin Holdings Co. Ltd. | 437,500 | 6,129 |
| Rohm Co. Ltd. | 145,200 | 6,107 |
| West Japan Railway Co. | 89,100 | 5,502 |
| East Japan Railway Co. | 62,400 | 5,383 |
| Sompo Japan Nipponkoa Holdings Inc. | 168,800 | 4,784 |
| Kao Corp. | 89,100 | 4,751 |
| Dai-ichi Life Insurance Co. Ltd. | 387,900 | 4,701 |
| Shiseido Co. Ltd. | 201,100 | 4,480 |
| NTT DOCOMO Inc. | 194,800 | 4,428 |
| Hitachi Ltd. | 944,000 | 4,424 |
| Sumitomo Mitsui Financial Group Inc. | 139,100 | 4,223 |
| Alfresa Holdings Corp. | 216,400 | 4,153 |
| Mizuho Financial Group Inc. | 2,673,300 | 3,984 |
| Japan Post Holdings Co. Ltd. | 294,900 | 3,945 |
| USS Co. Ltd. | 237,700 | 3,793 |
| Toyo Seikan Group Holdings Ltd. | 187,500 | 3,509 |
| Tokio Marine Holdings Inc. | 102,900 | 3,477 |
| Bandai Namco Holdings Inc. | 150,050 | 3,271 |
| Tohoku Electric Power Co. Inc. | 252,800 | 3,258 |
| Mitsubishi Estate Co. Ltd. | 169,000 | 3,137 |
| Otsuka Holdings Co. Ltd. | 83,700 | 3,040 |
| Yamato Holdings Co. Ltd. | 150,500 | 3,001 |
| LIXIL Group Corp. | 145,500 | 2,968 |
| Nintendo Co. Ltd. | 19,600 | 2,786 |
| Central Japan Railway Co. | 14,800 | 2,617 |
| Resona Holdings Inc. | 713,100 | 2,543 |
| Tokyo Electron Ltd. | 38,700 | 2,520 |
| Sumitomo Dainippon Pharma Co. Ltd. | 218,400 | 2,512 |
| JFE Holdings Inc. | 187,000 | 2,511 |
| Mitsubishi Heavy Industries Ltd. | 641,000 | 2,381 |
| Sumitomo Chemical Co. Ltd. | 518,000 | 2,345 |
| NEC Corp. | 931,000 | 2,340 |
| Toyo Suisan Kaisha Ltd. | 61,200 | 2,197 |
| Inpex Corp. | 288,800 | 2,187 |
| Nomura Holdings Inc. | 465,300 | 2,078 |
| Fuji Media Holdings Inc. | 177,000 | 1,942 |
5
| | |
| Vanguard® Global Equity Fund | | |
| Schedule of Investments | | |
| March 31, 2016 | | |
| |
| | | Market |
| | | Value |
| | Shares | ($000) |
| Mitsubishi UFJ Financial Group Inc. | 411,400 | 1,906 |
| Marui Group Co. Ltd. | 125,700 | 1,801 |
| NTT Urban Development Corp. | 181,500 | 1,776 |
| Mitsubishi Corp. | 104,900 | 1,775 |
| Japan Tobacco Inc. | 41,100 | 1,711 |
| Mitsubishi Logistics Corp. | 128,000 | 1,679 |
| Nippon Television Holdings Inc. | 101,070 | 1,666 |
| Isetan Mitsukoshi Holdings Ltd. | 141,000 | 1,646 |
| Shimizu Corp. | 174,000 | 1,474 |
| Fujitsu Ltd. | 389,000 | 1,438 |
| Azbil Corp. | 47,500 | 1,215 |
| Nippon Suisan Kaisha Ltd. | 248,900 | 1,208 |
| ^ Yamada Denki Co. Ltd. | 249,700 | 1,180 |
| Onward Holdings Co. Ltd. | 172,000 | 1,174 |
| Chiba Bank Ltd. | 206,000 | 1,026 |
| Sumitomo Electric Industries Ltd. | 83,700 | 1,015 |
| NH Foods Ltd. | 44,000 | 968 |
| Toyota Industries Corp. | 20,200 | 907 |
| * Concordia Financial Group Ltd. | 193,000 | 874 |
| Sumitomo Forestry Co. Ltd. | 60,300 | 692 |
| Mixi Inc. | 17,200 | 638 |
| Dentsu Inc. | 10,600 | 532 |
| Rohto Pharmaceutical Co. Ltd. | 26,400 | 481 |
| Adastria Co. Ltd. | 14,400 | 437 |
| Oracle Corp. Japan | 7,100 | 398 |
| Suzuken Co. Ltd. | 11,100 | 377 |
| Megmilk Snow Brand Co. Ltd. | 14,700 | 369 |
| Ulvac Inc. | 11,000 | 359 |
| Konami Holdings Corp. | 12,000 | 355 |
| Coca-Cola West Co. Ltd. | 14,200 | 351 |
| Kaken Pharmaceutical Co. Ltd. | 5,700 | 345 |
| Kinden Corp. | 23,800 | 292 |
| Nexon Co. Ltd. | 16,400 | 280 |
| Taisei Corp. | 41,000 | 271 |
| Furukawa Electric Co. Ltd. | 116,000 | 250 |
| Saizeriya Co. Ltd. | 12,000 | 247 |
| Astellas Pharma Inc. | 16,700 | 222 |
| | | 377,191 |
| Luxembourg (0.0%) | | |
| * Stabilus SA | 7,076 | 341 |
| |
| Malaysia (0.3%) | | |
| Tenaga Nasional Bhd. | 2,702,400 | 9,654 |
| Public Bank Bhd. (Local) | 184,900 | 890 |
| Top Glove Corp. Bhd. | 153,900 | 198 |
| | | 10,742 |
| Mexico (0.1%) | | |
| Wal-Mart de Mexico SAB de CV | 732,926 | 1,740 |
| America Movil SAB de CV ADR | 50,624 | 786 |
| Alfa SAB de CV Class A | 317,772 | 638 |
| * Controladora Vuela Cia de Aviacion SAB de CV ADR | 22,550 | 475 |
| Grupo Comercial Chedraui SA de CV | 104,345 | 332 |
| Grupo Aeroportuario del Pacifico SAB de CV ADR | 3,482 | 309 |
| Unifin Financiera SAB de CV SOFOM ENR | 54,369 | 152 |
| | | 4,432 |
| Netherlands (1.0%) | | |
| Unilever NV | 593,391 | 26,678 |
| Heineken NV | 41,036 | 3,713 |
| Koninklijke Ahold NV | 96,272 | 2,162 |
| Koninklijke KPN NV | 448,253 | 1,877 |
| Akzo Nobel NV | 26,023 | 1,774 |
| Koninklijke Philips NV | 58,537 | 1,667 |
| Boskalis Westminster | 37,222 | 1,459 |
| ASML Holding NV | 7,487 | 754 |
6
| | | |
| Vanguard® Global Equity Fund | | |
| Schedule of Investments | | |
| March 31, 2016 | | |
| |
| | | | Market |
| | | | Value |
| | | Shares | ($000) |
| | Randstad Holding NV | 9,034 | 500 |
| | | | 40,584 |
| New Zealand (0.0%) | | |
| | Spark New Zealand Ltd. | 661,222 | 1,667 |
| | PGG Wrightson Ltd. | 51,996 | 14 |
| | | | 1,681 |
| Norway (0.8%) | | |
| | Statoil ASA | 1,050,864 | 16,413 |
| | Schibsted ASA Class A | 299,185 | 8,729 |
| * | Schibsted ASA Class B | 299,185 | 8,280 |
| | DNB ASA | 62,648 | 740 |
| | | | 34,162 |
| Other (0.2%) | | |
| 2 | Vanguard FTSE Emerging Markets ETF | 278,580 | 9,633 |
| |
| Peru (0.2%) | | |
| | Credicorp Ltd. | 55,030 | 7,209 |
| * | Cia de Minas Buenaventura SAA ADR | 85,410 | 629 |
| | | | 7,838 |
| Philippines (0.0%) | | |
| | Energy Development Corp. | 9,790,200 | 1,251 |
| | Lopez Holdings Corp. | 3,234,349 | 491 |
| | Manila Electric Co. | 41,420 | 291 |
| | | | 2,033 |
| Poland (0.1%) | | |
| | PGE Polska Grupa Energetyczna SA | 738,109 | 2,760 |
| | Polski Koncern Naftowy ORLEN SA | 52,760 | 1,044 |
| | Polskie Gornictwo Naftowe i Gazownictwo SA | 347,186 | 494 |
| | Bank Pekao SA | 6,937 | 306 |
| | | | 4,604 |
| Qatar (0.0%) | | |
| | Barwa Real Estate Co. | 129,964 | 1,292 |
| | Ooredoo QSC | 12,035 | 307 |
| | | | 1,599 |
| Russia (0.5%) | | |
| * | Yandex NV Class A | 775,635 | 11,883 |
| ^ | Sberbank of Russia PJSC ADR | 1,155,279 | 8,020 |
| | Lukoil PJSC ADR | 28,350 | 1,087 |
| | O'Key Group SA GDR | 272,171 | 479 |
| | | | 21,469 |
| Singapore (0.5%) | | |
| | DBS Group Holdings Ltd. | 1,537,600 | 17,516 |
| | Great Eastern Holdings Ltd. | 148,900 | 2,485 |
| | United Overseas Bank Ltd. | 40,800 | 571 |
| * | GL Ltd. | 798,300 | 518 |
| | Singapore Airlines Ltd. | 51,800 | 439 |
| | Venture Corp. Ltd. | 47,900 | 297 |
| | Haw Par Corp. Ltd. | 41,500 | 258 |
| | United Industrial Corp. Ltd. | 110,700 | 241 |
| | Super Group Ltd. | 128,800 | 94 |
| | | | 22,419 |
| South Africa (1.3%) | | |
| | Naspers Ltd. | 294,227 | 41,015 |
| | MTN Group Ltd. | 500,847 | 4,574 |
| | Standard Bank Group Ltd. | 298,255 | 2,669 |
| | Anglo American plc Ordinary Shares | 205,619 | 1,603 |
| | Bidvest Group Ltd. | 61,286 | 1,547 |
| | Old Mutual plc | 404,214 | 1,119 |
| * | Sappi Ltd. | 137,120 | 606 |
| | Telkom SA SOC Ltd. | 131,882 | 513 |
| | Brait SE | 34,470 | 390 |
| | Grindrod Ltd. | 457,371 | 356 |
| * | Anglo American Platinum Ltd. | 7,044 | 172 |
7
| | |
| Vanguard® Global Equity Fund | | |
| Schedule of Investments | | |
| March 31, 2016 | | |
| |
| | | Market |
| | | Value |
| | Shares | ($000) |
| * African Bank Investments Ltd. | 2,597,627 | — |
| | | 54,564 |
| South Korea (2.5%) | | |
| Samsung Electronics Co. Ltd. | 33,878 | 38,879 |
| Samsung Electronics Co. Ltd. GDR | 32,887 | 18,707 |
| SK Hynix Inc. | 671,528 | 16,531 |
| LG Display Co. Ltd. | 221,057 | 5,118 |
| Shinhan Financial Group Co. Ltd. | 100,685 | 3,544 |
| Korea Electric Power Corp. | 63,494 | 3,326 |
| KT Corp. | 108,469 | 2,818 |
| Hyundai Motor Co. | 20,627 | 2,753 |
| Lotte Shopping Co. Ltd. | 11,398 | 2,503 |
| SK Holdings Co. Ltd. | 10,247 | 2,000 |
| Hana Financial Group Inc. | 83,340 | 1,808 |
| LG Electronics Inc. | 27,106 | 1,461 |
| LG Uplus Corp. | 109,036 | 1,054 |
| KB Financial Group Inc. | 37,797 | 1,049 |
| S-1 Corp. | 11,523 | 891 |
| SK Innovation Co. Ltd. | 5,032 | 758 |
| Hite Jinro Co. Ltd. | 29,663 | 750 |
| LG Corp. | 11,394 | 683 |
| S-Oil Corp. | 7,270 | 623 |
| Kia Motors Corp. | 9,888 | 418 |
| CJ O Shopping Co. Ltd. | 1,753 | 303 |
| GS Home Shopping Inc. | 1,865 | 303 |
| Samsung Fire & Marine Insurance Co. Ltd. | 766 | 198 |
| | | 106,478 |
| Spain (0.4%) | | |
| Distribuidora Internacional de Alimentacion SA | 1,526,419 | 7,909 |
| Banco Popular Espanol SA | 1,496,311 | 3,883 |
| Viscofan SA | 27,614 | 1,651 |
| * Acerinox SA | 92,459 | 1,068 |
| Mediaset Espana Comunicacion SA | 85,229 | 978 |
| * ACS Actividades de Construccion y Servicios SA | 12,464 | 371 |
| Banco Santander SA | 31,187 | 137 |
| | | 15,997 |
| Sweden (1.4%) | | |
| Svenska Handelsbanken AB Class A | 1,788,596 | 22,690 |
| Atlas Copco AB Class B | 643,517 | 15,144 |
| Volvo AB Class B | 773,375 | 8,471 |
| * Assa Abloy AB Class B | 233,003 | 4,587 |
| Sandvik AB | 146,095 | 1,509 |
| Telefonaktiebolaget LM Ericsson Class B | 147,211 | 1,474 |
| NCC AB Class B | 29,019 | 1,056 |
| Millicom International Cellular SA | 17,639 | 962 |
| Nordea Bank AB | 92,404 | 886 |
| Modern Times Group MTG AB Class B | 28,831 | 863 |
| Swedish Match AB | 20,194 | 685 |
| L E Lundbergforetagen AB Class B | 6,634 | 362 |
| Peab AB | 37,897 | 335 |
| * Oriflame Holding AG | 6,251 | 124 |
| | | 59,148 |
| Switzerland (2.3%) | | |
| Nestle SA | 369,713 | 27,588 |
| Schindler Holding AG | 103,396 | 19,049 |
| Cie Financiere Richemont SA | 166,070 | 10,969 |
| Novartis AG | 141,813 | 10,260 |
| Geberit AG | 17,362 | 6,487 |
| OC Oerlikon Corp. AG | 605,523 | 6,245 |
| ^ Galenica AG | 3,044 | 4,568 |
| Roche Holding AG | 15,769 | 3,872 |
| Lonza Group AG | 16,473 | 2,785 |
| Adecco SA | 29,879 | 1,944 |
8
| | |
| Vanguard® Global Equity Fund | | |
| Schedule of Investments | | |
| March 31, 2016 | | |
| |
| | | Market |
| | | Value |
| | Shares | ($000) |
| UBS Group AG | 119,778 | 1,927 |
| Logitech International SA | 72,633 | 1,154 |
| Sonova Holding AG | 8,193 | 1,046 |
| Helvetia Holding AG | 882 | 504 |
| DKSH Holding AG | 4,859 | 332 |
| Tecan Group AG | 1,775 | 270 |
| | | 99,000 |
| Taiwan (2.9%) | | |
| Taiwan Semiconductor Manufacturing Co. Ltd. ADR | 2,061,237 | 54,004 |
| Hon Hai Precision Industry Co. Ltd. | 10,135,198 | 26,678 |
| Chunghwa Telecom Co. Ltd. | 6,275,000 | 21,352 |
| Taiwan Semiconductor Manufacturing Co. Ltd. | 2,160,577 | 10,777 |
| United Microelectronics Corp. | 18,021,000 | 7,404 |
| Yungtay Engineering Co. Ltd. | 1,274,000 | 1,819 |
| Teco Electric and Machinery Co. Ltd. | 1,885,190 | 1,537 |
| Delta Electronics Inc. | 269,488 | 1,188 |
| Chroma ATE Inc. | 368,000 | 791 |
| Formosa Petrochemical Corp. | 98,000 | 282 |
| | | 125,832 |
| Thailand (0.1%) | | |
| Bangkok Bank PCL (Foreign) | 437,200 | 2,260 |
| Kasikornbank PCL (Foreign) | 162,000 | 803 |
| Thai Oil PCL | 334,400 | 657 |
| IRPC PCL | 2,207,400 | 316 |
| Thanachart Capital PCL | 256,200 | 275 |
| Siam Cement PCL NVDR | 19,850 | 263 |
| | | 4,574 |
| Turkey (0.1%) | | |
| Turkiye Garanti Bankasi AS | 818,187 | 2,394 |
| |
| United Kingdom (6.1%) | | |
| Prudential plc | 2,210,527 | 41,135 |
| Reckitt Benckiser Group plc | 225,195 | 21,722 |
| Royal Dutch Shell plc Class A | 875,023 | 21,205 |
| Wolseley plc | 338,620 | 19,115 |
| Rolls-Royce Holdings plc | 1,269,547 | 12,408 |
| WPP plc | 517,968 | 12,056 |
| Hays plc | 4,314,027 | 7,489 |
| Coca-Cola HBC AG | 272,025 | 5,769 |
| Rightmove plc | 89,089 | 5,380 |
| Compass Group plc | 264,590 | 4,664 |
| Intertek Group plc | 100,578 | 4,567 |
| Unilever plc | 86,136 | 3,884 |
| Bunzl plc | 133,795 | 3,881 |
| Jupiter Fund Management plc | 631,598 | 3,705 |
| Capita plc | 231,783 | 3,460 |
| BP plc | 691,207 | 3,458 |
| ITV plc | 939,713 | 3,247 |
| Provident Financial plc | 74,786 | 3,178 |
| Rotork plc | 1,184,639 | 3,106 |
| Aggreko plc | 190,176 | 2,937 |
| RELX NV | 157,808 | 2,928 |
| 3 Merlin Entertainments plc | 438,143 | 2,913 |
| Lloyds Banking Group plc | 2,974,618 | 2,897 |
| Diageo plc | 106,235 | 2,865 |
| DCC plc | 30,013 | 2,647 |
| BAE Systems plc | 332,083 | 2,422 |
| Experian plc | 120,106 | 2,144 |
| Admiral Group plc | 73,321 | 2,083 |
| Barclays plc | 908,430 | 1,950 |
| 3i Group plc | 295,546 | 1,933 |
| Carnival plc | 35,874 | 1,927 |
| HomeServe plc | 282,911 | 1,750 |
9
| | | |
| Vanguard® Global Equity Fund | | |
| Schedule of Investments | | |
| March 31, 2016 | | |
| |
| | | | Market |
| | | | Value |
| | | Shares | ($000) |
| | TUI AG | 110,243 | 1,705 |
| | ICAP plc | 242,827 | 1,652 |
| | Rexam plc | 174,410 | 1,585 |
| | G4S plc | 579,078 | 1,580 |
| | WH Smith plc | 59,593 | 1,552 |
| | SSP Group plc | 372,104 | 1,548 |
| | Daily Mail & General Trust plc | 152,094 | 1,518 |
| | Royal Dutch Shell plc Class B | 60,245 | 1,466 |
| * | Serco Group plc | 980,475 | 1,443 |
| | Moneysupermarket.com Group plc | 301,605 | 1,375 |
| | IG Group Holdings plc | 119,170 | 1,367 |
| | Cable & Wireless Communications plc | 1,230,140 | 1,357 |
| | British American Tobacco plc | 22,821 | 1,334 |
| | Informa plc | 131,242 | 1,306 |
| | Vodafone Group plc | 376,702 | 1,197 |
| | Glencore plc | 517,373 | 1,163 |
| | Standard Chartered plc | 170,629 | 1,154 |
| | Spectris plc | 43,412 | 1,146 |
| | International Personal Finance plc | 260,237 | 1,089 |
| | Rio Tinto plc | 37,589 | 1,054 |
| | Stagecoach Group plc | 283,708 | 1,025 |
| * | Thomas Cook Group plc | 764,229 | 1,018 |
| * | Tesco plc | 349,705 | 960 |
| | Pets at Home Group plc | 234,587 | 907 |
| | Berendsen plc | 49,781 | 859 |
| | BGEO Group plc | 29,194 | 850 |
| | BHP Billiton plc | 75,151 | 842 |
| | GVC Holdings plc | 115,493 | 837 |
| | Sky plc | 52,079 | 765 |
| * | Just Eat plc | 140,556 | 761 |
| | Barratt Developments plc | 88,166 | 708 |
| | Devro plc | 166,949 | 705 |
| | Smith & Nephew plc | 34,382 | 566 |
| | Amec Foster Wheeler plc | 80,504 | 519 |
| | Michael Page International plc | 84,378 | 516 |
| | Close Brothers Group plc | 25,668 | 464 |
| | National Express Group plc | 86,758 | 428 |
| | Inchcape plc | 38,107 | 395 |
| | Antofagasta plc | 54,004 | 363 |
| | GlaxoSmithKline plc | 17,842 | 361 |
| *,3 | Non-Standard Finance plc | 331,333 | 343 |
| | Petrofac Ltd. | 25,045 | 331 |
| | Millennium & Copthorne Hotels plc | 51,262 | 306 |
| | St. James's Place plc | 21,598 | 284 |
| | IMI plc | 19,636 | 268 |
| | Abcam plc | 30,390 | 257 |
| | Centrica plc | 71,680 | 234 |
| | Northgate plc | 37,787 | 219 |
| | | | 258,507 |
| United States (48.8%) | | |
| Consumer Discretionary (6.4%) | | |
| * | Amazon.com Inc. | 104,267 | 61,897 |
| | Royal Caribbean Cruises Ltd. | 590,794 | 48,534 |
| * | CarMax Inc. | 409,012 | 20,901 |
| | Comcast Corp. Class A | 316,627 | 19,340 |
| | McDonald's Corp. | 134,770 | 16,938 |
| | Omnicom Group Inc. | 196,962 | 16,393 |
| *,^ | Tesla Motors Inc. | 54,373 | 12,493 |
| | Harley-Davidson Inc. | 219,409 | 11,262 |
| * | TripAdvisor Inc. | 156,343 | 10,397 |
| | Time Warner Inc. | 133,822 | 9,709 |
| * | Michael Kors Holdings Ltd. | 112,480 | 6,407 |
| | Cooper Tire & Rubber Co. | 169,976 | 6,293 |
| | Abercrombie & Fitch Co. | 172,610 | 5,444 |
10
| | | |
| Vanguard® Global Equity Fund | | |
| Schedule of Investments | | |
| March 31, 2016 | | |
| |
| | | | Market |
| | | | Value |
| | | Shares | ($000) |
| | Gannett Co. Inc. | 355,509 | 5,382 |
| * | AutoZone Inc. | 6,136 | 4,889 |
| | Children's Place Inc. | 46,235 | 3,859 |
| * | Smith & Wesson Holding Corp. | 102,221 | 2,721 |
| | Williams-Sonoma Inc. | 46,588 | 2,550 |
| | Wolverine World Wide Inc. | 104,799 | 1,930 |
| | TJX Cos. Inc. | 12,253 | 960 |
| | Big Lots Inc. | 15,300 | 693 |
| | Sturm Ruger & Co. Inc. | 9,253 | 633 |
| * | TravelCenters of America LLC | 76,819 | 520 |
| * | Carrols Restaurant Group Inc. | 31,947 | 461 |
| * | Regis Corp. | 26,945 | 409 |
| * | Vera Bradley Inc. | 15,147 | 308 |
| | Speedway Motorsports Inc. | 14,086 | 279 |
| * | Tenneco Inc. | 5,314 | 274 |
| * | Chuy's Holdings Inc. | 8,622 | 268 |
| * | Strayer Education Inc. | 4,841 | 236 |
| * | Ruby Tuesday Inc. | 42,835 | 230 |
| | Rocky Brands Inc. | 14,203 | 181 |
| | Capella Education Co. | 490 | 26 |
| * | Sun-Times Media Group Inc. Class A | 130,959 | — |
| | | | 272,817 |
| Consumer Staples (5.4%) | | |
| | Procter & Gamble Co. | 599,034 | 49,307 |
| | Colgate-Palmolive Co. | 535,459 | 37,830 |
| | PepsiCo Inc. | 271,082 | 27,780 |
| | Coca-Cola Co. | 482,217 | 22,370 |
| | Wal-Mart Stores Inc. | 259,392 | 17,766 |
| | Hershey Co. | 171,849 | 15,826 |
| *,^ | Pilgrim's Pride Corp. | 577,852 | 14,677 |
| | Dean Foods Co. | 411,841 | 7,133 |
| | Estee Lauder Cos. Inc. Class A | 72,344 | 6,823 |
| | Mead Johnson Nutrition Co. | 77,765 | 6,608 |
| | Bunge Ltd. | 95,741 | 5,426 |
| | Costco Wholesale Corp. | 34,175 | 5,385 |
| | Sanderson Farms Inc. | 56,671 | 5,111 |
| | Altria Group Inc. | 62,544 | 3,919 |
| * | USANA Health Sciences Inc. | 8,381 | 1,018 |
| | Kraft Heinz Co. | 8,695 | 683 |
| * | Omega Protein Corp. | 23,511 | 398 |
| | John B Sanfilippo & Son Inc. | 4,896 | 338 |
| | SpartanNash Co. | 9,284 | 281 |
| * | National Beverage Corp. | 6,224 | 263 |
| | | | 228,942 |
| Energy (2.9%) | | |
| | Valero Energy Corp. | 313,701 | 20,121 |
| | PBF Energy Inc. Class A | 494,608 | 16,421 |
| | EOG Resources Inc. | 219,720 | 15,947 |
| | Apache Corp. | 316,558 | 15,451 |
| | Tesoro Corp. | 169,188 | 14,552 |
| | Western Refining Inc. | 233,122 | 6,781 |
| | Marathon Petroleum Corp. | 168,872 | 6,279 |
| | World Fuel Services Corp. | 99,662 | 4,842 |
| | Delek US Holdings Inc. | 263,062 | 4,009 |
| | National Oilwell Varco Inc. | 115,526 | 3,593 |
| | Superior Energy Services Inc. | 265,305 | 3,552 |
| | HollyFrontier Corp. | 97,461 | 3,442 |
| | CVR Energy Inc. | 83,889 | 2,189 |
| | Alon USA Energy Inc. | 146,862 | 1,516 |
| * | REX American Resources Corp. | 20,076 | 1,114 |
| | Noble Corp. plc | 101,882 | 1,054 |
| * | Renewable Energy Group Inc. | 88,038 | 831 |
| * | Par Pacific Holdings Inc. | 40,293 | 756 |
| | Atwood Oceanics Inc. | 76,943 | 706 |
11
| | |
| Vanguard® Global Equity Fund | | |
| Schedule of Investments | | |
| March 31, 2016 | | |
| |
| | | Market |
| | | Value |
| | Shares | ($000) |
| * Exterran Corp. | 15,974 | 247 |
| Rowan Cos. plc Class A | 3,015 | 49 |
| | | 123,452 |
| Financials (8.5%) | | |
| * Berkshire Hathaway Inc. Class B | 270,638 | 38,398 |
| * Markel Corp. | 35,603 | 31,743 |
| First Republic Bank | 434,254 | 28,939 |
| Moody's Corp. | 294,954 | 28,481 |
| TD Ameritrade Holding Corp. | 794,464 | 25,049 |
| US Bancorp | 497,303 | 20,185 |
| Travelers Cos. Inc. | 170,454 | 19,894 |
| Voya Financial Inc. | 563,534 | 16,776 |
| Wells Fargo & Co. | 312,233 | 15,100 |
| American Express Co. | 245,098 | 15,049 |
| Loews Corp. | 311,891 | 11,933 |
| * Alleghany Corp. | 21,647 | 10,741 |
| Chubb Ltd. | 79,619 | 9,487 |
| Aflac Inc. | 149,028 | 9,410 |
| Rayonier Inc. | 325,425 | 8,031 |
| Franklin Resources Inc. | 182,300 | 7,119 |
| CYS Investments Inc. | 837,289 | 6,816 |
| M&T Bank Corp. | 58,573 | 6,502 |
| Financial Engines Inc. | 190,870 | 5,999 |
| Willis Towers Watson plc | 47,589 | 5,647 |
| Leucadia National Corp. | 301,500 | 4,875 |
| * Howard Hughes Corp. | 45,936 | 4,864 |
| RenaissanceRe Holdings Ltd. | 39,124 | 4,688 |
| Endurance Specialty Holdings Ltd. | 61,415 | 4,013 |
| Hartford Financial Services Group Inc. | 83,036 | 3,826 |
| Weyerhaeuser Co. | 114,957 | 3,561 |
| JPMorgan Chase & Co. | 58,236 | 3,449 |
| T. Rowe Price Group Inc. | 43,861 | 3,222 |
| Validus Holdings Ltd. | 65,461 | 3,089 |
| American Equity Investment Life Holding Co. | 66,202 | 1,112 |
| American International Group Inc. | 19,943 | 1,078 |
| * INTL. FCStone Inc. | 20,311 | 543 |
| Goldman Sachs Group Inc. | 3,125 | 491 |
| Cash America International Inc. | 11,539 | 446 |
| GAIN Capital Holdings Inc. | 34,802 | 228 |
| Calamos Asset Management Inc. Class A | 17,710 | 150 |
| | | 360,934 |
| Health Care (8.5%) | | |
| Anthem Inc. | 376,549 | 52,337 |
| Johnson & Johnson | 324,072 | 35,065 |
| * Waters Corp. | 200,553 | 26,457 |
| * Centene Corp. | 301,056 | 18,536 |
| * Charles River Laboratories International Inc. | 236,357 | 17,949 |
| * Myriad Genetics Inc. | 470,740 | 17,620 |
| * United Therapeutics Corp. | 130,952 | 14,592 |
| * Mettler-Toledo International Inc. | 36,432 | 12,560 |
| * PAREXEL International Corp. | 194,233 | 12,184 |
| Bruker Corp. | 399,709 | 11,192 |
| * VWR Corp. | 394,253 | 10,668 |
| * Prestige Brands Holdings Inc. | 197,674 | 10,554 |
| * Bio-Rad Laboratories Inc. Class A | 76,183 | 10,416 |
| * Mallinckrodt plc | 162,378 | 9,950 |
| * Seattle Genetics Inc. | 279,918 | 9,822 |
| * INC Research Holdings Inc. Class A | 231,047 | 9,521 |
| * Emergent BioSolutions Inc. | 233,236 | 8,478 |
| Abbott Laboratories | 184,307 | 7,710 |
| Merck & Co. Inc. | 113,225 | 5,991 |
| * PRA Health Sciences Inc. | 132,812 | 5,679 |
| Baxter International Inc. | 132,272 | 5,434 |
| * Alnylam Pharmaceuticals Inc. | 85,961 | 5,396 |
12
| | |
| Vanguard® Global Equity Fund | | |
| Schedule of Investments | | |
| March 31, 2016 | | |
| |
| | | Market |
| | | Value |
| | Shares | ($000) |
| * Intuitive Surgical Inc. | 8,519 | 5,120 |
| * Varian Medical Systems Inc. | 60,483 | 4,840 |
| * Magellan Health Inc. | 61,505 | 4,178 |
| PDL BioPharma Inc. | 1,043,258 | 3,474 |
| * WellCare Health Plans Inc. | 35,993 | 3,338 |
| * LifePoint Health Inc. | 43,744 | 3,029 |
| * Amedisys Inc. | 53,584 | 2,590 |
| * Five Prime Therapeutics Inc. | 59,216 | 2,406 |
| * Molina Healthcare Inc. | 30,330 | 1,956 |
| * Luminex Corp. | 89,233 | 1,731 |
| * Enanta Pharmaceuticals Inc. | 54,840 | 1,611 |
| * Cambrex Corp. | 32,835 | 1,445 |
| * Sucampo Pharmaceuticals Inc. Class A | 121,534 | 1,328 |
| * Genomic Health Inc. | 42,719 | 1,058 |
| * NewLink Genetics Corp. | 53,566 | 975 |
| * Orthofix International NV | 18,593 | 772 |
| * Spectrum Pharmaceuticals Inc. | 113,928 | 725 |
| * Supernus Pharmaceuticals Inc. | 47,057 | 718 |
| * Triple-S Management Corp. Class B | 28,538 | 709 |
| * Cytokinetics Inc. | 78,250 | 552 |
| Quality Systems Inc. | 33,783 | 515 |
| * Lannett Co. Inc. | 23,656 | 424 |
| * Fluidigm Corp. | 43,009 | 347 |
| Computer Programs & Systems Inc. | 6,408 | 334 |
| * BioSpecifics Technologies Corp. | 9,084 | 316 |
| Chemed Corp. | 2,184 | 296 |
| Invacare Corp. | 22,293 | 294 |
| Phibro Animal Health Corp. Class A | 10,840 | 293 |
| * Heska Corp. | 9,672 | 276 |
| * Amphastar Pharmaceuticals Inc. | 19,837 | 238 |
| * SurModics Inc. | 11,690 | 215 |
| * Applied Genetic Technologies Corp. | 15,032 | 210 |
| * Cross Country Healthcare Inc. | 16,734 | 195 |
| * Five Star Quality Care Inc. | 40,229 | 92 |
| * Symmetry Surgical Inc. | 8,121 | 80 |
| * Alliance HealthCare Services Inc. | 6,889 | 49 |
| | | 364,840 |
| Industrials (4.5%) | | |
| Alaska Air Group Inc. | 271,581 | 22,275 |
| * JetBlue Airways Corp. | 834,005 | 17,614 |
| CH Robinson Worldwide Inc. | 207,904 | 15,433 |
| * Hawaiian Holdings Inc. | 292,703 | 13,813 |
| Lincoln Electric Holdings Inc. | 225,654 | 13,217 |
| * Stericycle Inc. | 75,283 | 9,500 |
| 3M Co. | 55,889 | 9,313 |
| * NOW Inc. | 469,553 | 8,320 |
| Emerson Electric Co. | 152,438 | 8,290 |
| * Kirby Corp. | 133,748 | 8,064 |
| United Technologies Corp. | 62,267 | 6,233 |
| Wabtec Corp. | 75,022 | 5,948 |
| Union Pacific Corp. | 69,700 | 5,545 |
| * Clean Harbors Inc. | 100,014 | 4,935 |
| Comfort Systems USA Inc. | 129,868 | 4,126 |
| Southwest Airlines Co. | 91,607 | 4,104 |
| MSC Industrial Direct Co. Inc. Class A | 52,616 | 4,015 |
| * Atlas Air Worldwide Holdings Inc. | 75,470 | 3,190 |
| Expeditors International of Washington Inc. | 65,008 | 3,173 |
| Universal Forest Products Inc. | 35,414 | 3,039 |
| * Quanta Services Inc. | 129,676 | 2,925 |
| Insperity Inc. | 51,346 | 2,656 |
| BWX Technologies Inc. | 54,985 | 1,845 |
| Herman Miller Inc. | 59,040 | 1,824 |
| United Parcel Service Inc. Class B | 15,069 | 1,589 |
| * MRC Global Inc. | 118,321 | 1,555 |
13
| | | |
| Vanguard® Global Equity Fund | | |
| Schedule of Investments | | |
| March 31, 2016 | | |
| |
| | | | Market |
| | | | Value |
| | | Shares | ($000) |
| | Fastenal Co. | 28,643 | 1,403 |
| | PACCAR Inc. | 24,600 | 1,345 |
| * | American Woodmark Corp. | 17,384 | 1,297 |
| | Insteel Industries Inc. | 32,183 | 984 |
| | SkyWest Inc. | 42,694 | 853 |
| * | Wabash National Corp. | 56,116 | 741 |
| | Brady Corp. Class A | 24,692 | 663 |
| * | RPX Corp. | 53,302 | 600 |
| | Briggs & Stratton Corp. | 24,844 | 594 |
| | Kimball International Inc. Class B | 48,535 | 551 |
| | Global Brass & Copper Holdings Inc. | 16,817 | 420 |
| * | Vectrus Inc. | 13,793 | 314 |
| | Heidrick & Struggles International Inc. | 13,045 | 309 |
| * | Titan Machinery Inc. | 22,144 | 256 |
| | Ennis Inc. | 13,055 | 255 |
| * | Ducommun Inc. | 12,486 | 190 |
| | | | 193,316 |
| Information Technology (9.9%) | | |
| * | Alphabet Inc. Class C | 53,332 | 39,730 |
| | Visa Inc. Class A | 279,016 | 21,339 |
| | Linear Technology Corp. | 449,606 | 20,034 |
| | MasterCard Inc. Class A | 199,029 | 18,808 |
| * | Facebook Inc. Class A | 156,015 | 17,801 |
| | Oracle Corp. | 410,855 | 16,808 |
| | Xerox Corp. | 1,432,669 | 15,989 |
| | Teradyne Inc. | 681,072 | 14,704 |
| | Computer Sciences Corp. | 421,523 | 14,496 |
| | Xilinx Inc. | 298,870 | 14,175 |
| | Texas Instruments Inc. | 231,321 | 13,283 |
| * | eBay Inc. | 498,232 | 11,888 |
| | Dolby Laboratories Inc. Class A | 257,922 | 11,209 |
| | CSRA Inc. | 411,755 | 11,076 |
| | Intel Corp. | 337,929 | 10,932 |
| | Convergys Corp. | 374,533 | 10,401 |
| | Accenture plc Class A | 78,943 | 9,110 |
| | Analog Devices Inc. | 148,882 | 8,812 |
| | QUALCOMM Inc. | 170,876 | 8,739 |
| | Leidos Holdings Inc. | 164,675 | 8,286 |
| * | Tech Data Corp. | 107,624 | 8,262 |
| | Microsoft Corp. | 145,544 | 8,038 |
| | Jabil Circuit Inc. | 386,197 | 7,442 |
| | NVIDIA Corp. | 207,505 | 7,393 |
| | Amdocs Ltd. | 121,343 | 7,332 |
| | FLIR Systems Inc. | 208,843 | 6,881 |
| * | PayPal Holdings Inc. | 176,362 | 6,808 |
| *,^ | GrubHub Inc. | 245,647 | 6,173 |
| * | MicroStrategy Inc. Class A | 32,632 | 5,865 |
| * | Alphabet Inc. Class A | 7,590 | 5,790 |
| | DST Systems Inc. | 50,957 | 5,746 |
| | Paychex Inc. | 86,921 | 4,695 |
| | SYNNEX Corp. | 45,460 | 4,209 |
| | CSG Systems International Inc. | 88,150 | 3,981 |
| | Automatic Data Processing Inc. | 40,201 | 3,606 |
| * | Manhattan Associates Inc. | 61,168 | 3,479 |
| * | Sanmina Corp. | 146,218 | 3,419 |
| * | Rackspace Hosting Inc. | 153,765 | 3,320 |
| *,^ | Zillow Group Inc. | 135,812 | 3,223 |
| | Intuit Inc. | 27,222 | 2,831 |
| | ManTech International Corp. Class A | 67,194 | 2,150 |
| *,^ | Zillow Group Inc. Class A | 67,906 | 1,735 |
| * | LogMeIn Inc. | 33,428 | 1,687 |
| * | Sykes Enterprises Inc. | 54,007 | 1,630 |
| * | NETGEAR Inc. | 40,175 | 1,622 |
| | Ingram Micro Inc. | 36,237 | 1,301 |
14
| | | | | |
| Vanguard® Global Equity Fund | | | | |
| Schedule of Investments | | | | |
| March 31, 2016 | | | | |
| |
| | | | | | Market |
| | | | | | Value |
| | | | | Shares | ($000) |
| * | Insight Enterprises Inc. | | | 43,008 | 1,232 |
| | EarthLink Holdings Corp. | | | 149,361 | 847 |
| * | Benchmark Electronics Inc. | | | 31,619 | 729 |
| * | CACI International Inc. Class A | | | 6,142 | 655 |
| * | Net 1 UEPS Technologies Inc. | | | 60,242 | 554 |
| * | Amkor Technology Inc. | | | 93,211 | 549 |
| * | DHI Group Inc. | | | 65,894 | 532 |
| * | Genpact Ltd. | | | 16,510 | 449 |
| * | Kimball Electronics Inc. | | | 36,401 | 407 |
| | TeleTech Holdings Inc. | | | 12,295 | 341 |
| * | QLogic Corp. | | | 25,328 | 340 |
| * | Gigamon Inc. | | | 10,410 | 323 |
| * | United Online Inc. | | | 25,472 | 294 |
| * | Photronics Inc. | | | 26,408 | 275 |
| * | RetailMeNot Inc. | | | 28,413 | 228 |
| * | Finisar Corp. | | | 12,203 | 223 |
| | Hackett Group Inc. | | | 3,100 | 47 |
| * | Cray Inc. | | | 389 | 16 |
| | | | | | 424,279 |
| Materials (1.8%) | | | | |
| | Praxair Inc. | | | 269,045 | 30,792 |
| | Martin Marietta Materials Inc. | | | 114,538 | 18,270 |
| | Monsanto Co. | | | 183,846 | 16,131 |
| * | Axalta Coating Systems Ltd. | | | 123,648 | 3,610 |
| * | Chemtura Corp. | | | 107,007 | 2,825 |
| | PPG Industries Inc. | | | 25,155 | 2,805 |
| | Stepan Co. | | | 20,180 | 1,116 |
| | Mercer International Inc. | | | 57,584 | 544 |
| | KMG Chemicals Inc. | | | 10,096 | 233 |
| | | | | | 76,326 |
| Other (0.0%) | | | | |
| * | Washington Mutual Inc. Escrow | | | 166,300 | — |
| |
| Telecommunication Services (0.9%) | | | | |
| | AT&T Inc. | | | 762,215 | 29,856 |
| | CenturyLink Inc. | | | 239,863 | 7,666 |
| | Telephone & Data Systems Inc. | | | 12,682 | 382 |
| | Atlantic Tele-Network Inc. | | | 4,940 | 375 |
| * | United States Cellular Corp. | | | 6,775 | 309 |
| | IDT Corp. Class B | | | 13,786 | 215 |
| | | | | | 38,803 |
| | | | | | 2,083,709 |
| Total Common Stocks (Cost $3,732,846) | | | | 4,120,760 |
| |
| | | Coupon | | | |
| Temporary Cash Investments (4.0%)1 | | | | |
| Money Market Fund (3.8%) | | | | |
| 4,5 | Vanguard Market Liquidity Fund | 0.495% | | 164,325,710 | 164,326 |
| |
| | | | | Face | |
| | | | Maturity | Amount | |
| | | | Date | ($000) | |
| U.S. Government and Agency Obligations (0.2%) | | | | |
| 6,7 | Federal Home Loan Bank Discount Notes | 0.250% | 4/15/16 | 3,000 | 3,000 |
| 6,7 | Federal Home Loan Bank Discount Notes | 0.411% | 6/2/16 | 1,000 | 999 |
| 6,7 | Federal Home Loan Bank Discount Notes | 0.476% | 8/12/16 | 2,000 | 1,997 |
| 7 | United States Treasury Note/Bond | 0.375% | 5/31/16 | 2,000 | 2,000 |
| | | | | | 7,996 |
| Total Temporary Cash Investments (Cost $172,322) | | | | 172,322 |
15
| |
| Vanguard® Global Equity Fund | |
| Schedule of Investments | |
| March 31, 2016 | |
| Total Investments (100.5%) (Cost $3,905,168) | 4,293,082 |
| Other Assets and Liabilities—Net (-0.5%)5 | (21,213) |
| Net Assets (100%) | 4,271,869 |
* Non-income-producing security.
^ Includes partial security positions on loan to broker-dealers. The total value of securities on loan is $34,594,000.
1 The fund invests a portion of its cash reserves in equity markets through the use of index futures contracts. After giving effect to futures investments, the fund's effective common stock and temporary cash investment positions represent 98.3% and 2.2%, respectively, of net assets.
2 Considered an affiliated company of the fund as the issuer is another member of The Vanguard Group.
3 Security exempt from registration under Rule 144A of the Securities Act of 1933. Such securities may be sold in transactions exempt from registration, normally to qualified institutional buyers. At March 31, 2016, the aggregate value of these securities was $3,256,000, representing 0.1% of net assets.
4 Affiliated money market fund available only to Vanguard funds and certain trusts and accounts managed by Vanguard. Rate shown is the 7-day yield.
5 Includes $37,132,000 of collateral received for securities on loan.
6 The issuer operates under a congressional charter; its securities are generally neither guaranteed by the U.S. Treasury nor backed by the full faith and credit of the U.S. government.
7 Securities with a value of $4,799,000 have been segregated as initial margin for open futures contracts.
ADR—American Depositary Receipt.
GDR—Global Depositary Receipt.
NVDR—Non-Voting Depository Receipt.
16
This page intentionally left blank.
© 2016 The Vanguard Group, Inc.
All rights reserved.
Vanguard Marketing Corporation, Distributor.
SNA1292 052016
Item 7: Disclosure of Proxy Voting Policies and Procedures for Closed-End Management Investment Companies.
Not Applicable.
Item 8: Portfolio Managers of Closed-End Management Investment Companies.
Not Applicable.
Item 9: Purchase of Equity Securities by Closed-End Management Investment Company and Affiliated Purchasers.
Not Applicable.
Item 10: Submission of Matters to a Vote of Security Holders.
Not Applicable.
Item 11: Controls and Procedures.
(a) Disclosure Controls and Procedures. The Principal Executive and Financial Officers concluded that the Registrant’s Disclosure Controls and Procedures are effective based on their evaluation of the Disclosure Controls and Procedures as of a date within 90 days of the filing date of this report.
(b) Internal Control Over Financial Reporting. There were no significant changes in Registrant’s Internal Control Over Financial Reporting or in other factors that could significantly affect this control subsequent to the date of the evaluation, including any corrective actions with regard to significant deficiencies and material weaknesses.
Item 12: Exhibits.
(a) Certifications.
Pursuant to the requirements of the Securities Exchange Act of 1934 and the Investment Company Act of 1940, the registrant has duly caused this report to be signed on its behalf by the undersigned, thereunto duly authorized.
| |
| | VANGUARD HORIZON FUNDS |
| |
| BY: | /s/ F. WILLIAM MCNABB III* |
| | F. WILLIAM MCNABB III |
| | CHIEF EXECUTIVE OFFICER |
| Date: May 18, 2016 |
|
Pursuant to the requirements of the Securities Exchange Act of 1934 and the Investment Company Act of 1940, this report has been signed below by the following persons on behalf of the registrant and in the capacities and on the dates indicated.
| |
| | VANGUARD HORIZON FUNDS |
| |
| |
| BY: | /s/ F. WILLIAM MCNABB III* |
| | F. WILLIAM MCNABB III |
| | CHIEF EXECUTIVE OFFICER |
| |
| Date: May 18, 2016 |
| |
| | VANGUARD HORIZON FUNDS |
| |
| |
| BY: | /s/ THOMAS J. HIGGINS* |
| | THOMAS J. HIGGINS |
| | CHIEF FINANCIAL OFFICER |
Date: May 18, 2016
* By: /s/ Heidi Stam
Heidi Stam, pursuant to a Power of Attorney filed on April 22, 2014 see file Number
2-17620, Incorporated by Reference.