UNITED STATES
SECURITIES AND EXCHANGE COMMISSION
Washington, D.C. 20549
FORM N-CSR
CERTIFIED SHAREHOLDER REPORT
OF
REGISTERED MANAGEMENT INVESTMENT COMPANIES
Investment Company Act file number: 811-07239
Name of Registrant: Vanguard Horizon Funds
Address of Registrant:
P.O. Box 2600
Valley Forge, PA 19482
Name and address of agent for service:
Heidi Stam, Esquire
P.O. Box 876
Valley Forge, PA 19482
Registrant’s telephone number, including area code: (610) 669-1000
Date of fiscal year end: September 30
Date of reporting period: October 1, 2010 – March 31, 2011
Item 1: Reports to Shareholders
 |
| Vanguard Strategic Equity Fund |
| Semiannual Report |
| March 31, 2011 |
|
 |
|
|
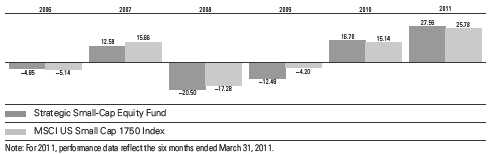
> For the six months ended March 31, 2011, Vanguard Strategic Equity Fund returned 25.95%.
> The fund’s return outpaced the return of its benchmark and the average return of peer-group funds.
> The fund edged out the benchmark index in eight of the ten industry sectors.
| |
| Contents | |
| Your Fund’s Total Returns. | 1 |
| Chairman’s Letter. | 2 |
| Advisor’s Report. | 6 |
| Fund Profile. | 8 |
| Performance Summary. | 9 |
| Financial Statements. | 10 |
| About Your Fund’s Expenses. | 23 |
| Trustees Approve Advisory Arrangement. | 25 |
| Glossary. | 26 |
Please note: The opinions expressed in this report are just that—informed opinions. They should not be considered promises or advice.
Also, please keep in mind that the information and opinions cover the period through the date on the front of this report. Of course, the
risks of investing in your fund are spelled out in the prospectus.
See the Glossary for definitions of investment terms used in this report.
Cover photograph: Jean Maher.
Your Fund’s Total Returns
| |
| Six Months Ended March 31, 2011 | |
| | Total |
| | Returns |
| Vanguard Strategic Equity Fund | 25.95% |
| MSCI US Small + Mid Cap 2200 Index | 24.12 |
| Mid-Cap Core Funds Average | 22.18 |
| | | | |
| Your Fund’s Performance at a Glance | | | | |
| September 30, 2010 , Through March 31, 2011 | | | | |
| | | | Distributions Per Share |
| | Starting | Ending | Income | Capital |
| | Share Price | Share Price | Dividends | Gains |
| Vanguard Strategic Equity Fund | $16.30 | $20.28 | $0.227 | $0.000 |
1

Chairman’s Letter
Dear Shareholder,
Over the six months ended March 31, 2011, stock prices rose substantially. Vanguard Strategic Equity Fund made the most of this propitious climate, returning 25.95%, almost 2 percentage points more than its benchmark index, the MSCI US Small + Mid Cap 2200 Index, and almost 4 percentage points more than its peer group.
The fund’s stock selections were the product of its quantitative approach. The fund’s advisor, Vanguard Quantitative Equity Group, uses complementary models in its attempt to identify those stocks in the benchmark index that appear to boast the best combination of reasonable valuations and attractive growth prospects and to assemble them in a portfolio with a risk profile similar to that of the index.
Please note that, after the close of the period, Vanguard lowered the minimum investment requirement for the Investor Shares of most Vanguard funds to $3,000. This change, effective May 11, reflects our efforts to simplify our approach to offering Investor Shares and to increase the accessibility of Vanguard funds.
Despite distressing headlines, stock markets rallied
Global stock markets produced exceptional returns for the six months ended March 31, a period punctuated by unnerving developments such as political upheaval in the Middle East and North Africa, new sovereign debt dilemmas in Europe, and a nuclear emergency in
2
Japan. On a more optimistic note, the U.S. economy continued to grind into gear. Job growth picked up, fueling hopes that the good news might be persistent enough to bring down the high unemployment rate.
The broad U.S. stock market returned more than 18%. The stocks of smaller companies, which are keenly sensitive to the rhythms of the business cycle, did even better. Non-U.S. stock markets trailed their American counterparts, though as a group, their six-month return topped 10%. European stocks performed best.
All but the shortest-term rates moved higher, affecting bond prices
With the exception of the shortest-term securities, the rates on fixed income investments moved higher during the six-month period. At the start of the period, the 10-year U.S. Treasury note yielded a meager 2.51%. By the end, the rate had climbed to 3.45% as investors demanded more compensation for the possibility that inflation will continue to accelerate from financial-crisis lows.
Rising rates put short-term pressure on bond prices. The broad U.S. taxable bond market produced a slightly negative return. The broad municipal bond market, which came under pressure both from rising rates and concern (exaggerated, in Vanguard’s view) about the financial strength of state and municipal borrowers, returned –3.68%.
As it has since December 2008, the Federal Reserve held its target for short-term interest rates near 0%. This stance
| | | |
| Market Barometer | | | |
| |
| | | | Total Returns |
| | | Periods Ended March 31, 2011 |
| | Six | One | Five Years |
| | Months | Year | (Annualized) |
| Stocks | | | |
| Russell 1000 Index (Large-caps) | 18.13% | 16.69% | 2.93% |
| Russell 2000 Index (Small-caps) | 25.48 | 25.79 | 3.35 |
| Dow Jones U.S. Total Stock Market Index | 18.51 | 17.50 | 3.27 |
| MSCI All Country World Index ex USA (International) | 10.85 | 13.15 | 3.59 |
| |
| Bonds | | | |
| Barclays Capital U.S. Aggregate Bond Index (Broad | | | |
| taxable market) | -0.88% | 5.12% | 6.03% |
| Barclays Capital Municipal Bond Index (Broad | | | |
| tax-exempt market) | -3.68 | 1.63 | 4.14 |
| Citigroup Three-Month U.S. Treasury Bill Index | 0.06 | 0.15 | 2.09 |
| |
| CPI | | | |
| Consumer Price Index | 2.30% | 2.68% | 2.26% |
3
kept the returns available from money market instruments, such as the 3-month Treasury bill, in the same neighborhood.
Cyclical industrials and materials helped boost relative return
Through its quantitative investment process, Vanguard Strategic Equity Fund selects a subset of the roughly 2,200 stocks in its benchmark index. At the end of March, the fund held 458 stocks. The fund’s portfolio returned nearly 26% for the six-month period, while the benchmark index returned just over 24%.
The fund’s industrial and materials stocks were top performers compared with those in the benchmark. Among industrials, notable strengths included manufacturers of construction equipment, farm machinery, and heavy trucks as well as firms engaged in equipment renting and leasing. Airline stocks, however, detracted. In the materials sector, the fund’s better performers included metals and mining stocks.
In energy, with oil prices climbing to more than $100 a barrel during the six-month period, the fund’s holdings also provided an advantage over the benchmark. Companies involved in oil and gas exploration and production provided the greatest lift.
Information technology stocks were another major contributor to the benchmark-beating results, as holdings in businesses that provide IT services helped returns. But in the consumer
| | |
| Expense Ratios | | |
| Your Fund Compared With Its Peer Group | | |
| | | Peer Group |
| | Fund | Average |
| Strategic Equity Fund | 0.31% | 1.36% |
The fund expense ratio shown is from the prospectus dated April 29, 2011, and represents estimated costs for the current fiscal year. For the six months ended March 31, 2011, the fund’s annualized expense ratio was 0.30%. The peer-group expense ratio is derived from data provided by Lipper Inc. and captures information through year-end 2010.
Peer group: Mid-Cap Core Funds.
4
discretionary and health care sectors, the fund’s holdings modestly trailed those in the benchmark index.
Focus on future goals, not the current market
For some time now, the stock market has been recovering from the turmoil created by the financial crisis. Its performance over the last six months has been impressive. Of course, we can’t be sure what the future holds, but we know that the market will continue to experience ups and downs.
The best way to tune out the distractions caused by these unpredictable but inevitable fluctuations is to focus on the drivers of long-term investment success that are within your control. Maintain an allocation to stock, bond, and money market funds consistent with your goals and tolerance for market gyrations; pay attention to costs; and strive to make contributions to your investment program that are commensurate with your eventual needs.
Vanguard Strategic Equity Fund, with its experienced management team, can play an important role in a well-balanced portfolio assembled to help you reach your goals. And the fund’s low expenses will enable you to keep more of the return on your investment.
On another matter, Joel Dickson, who previously oversaw Vanguard’s Active Quantitative Equity Management Group, has assumed a new leadership role at Vanguard in our Investment Strategy Group. Sandip Bhagat, who already had been overseeing Vanguard’s active and index quantitative equity strategies, is now directly managing the Quantitative Equity Group’s researchers, portfolio managers, and traders.
I would like to thank Joel for the services he has provided to the Strategic Equity Fund. Jim Troyer will continue as portfolio manager of the fund.
As always, thank you for entrusting your assets to Vanguard.
Sincerely,

F. William McNabb III
Chairman and Chief Executive Officer
May 11, 2011
5
Advisor’s Report
For the six months ended March 31, 2011, the Strategic Equity Fund returned 25.95%, outperforming its benchmark index, the MSCI US Small + Mid Cap 2200 Index, by almost 2 percentage points.
U.S. equity markets continued to rebound from their low points of two years ago. Strong corporate earnings and better-than-expected job growth buoyed stocks despite the volatility brought on by political turmoil abroad, the ongoing European sovereign debt crisis, and the natural disaster in Japan.
The equity markets did experience a pullback in mid-February as investors digested news of the protests in the Middle East and Northern Africa along with a double-digit increase in crude oil prices—but the market then stabilized and moved up to levels not seen since mid-2008.
While overall fund performance has been affected by the macroeconomic factors described above, our approach to investing focuses on specific stock fundamentals. As we believe there is no single indicator for picking attractive stocks, our model is diversified across five factors:
• Valuation, which measures the price we pay for earnings and cash flows.
• Growth, which considers the growth of earnings in relation to how much we pay for them.
• Management decisions, which looks at the actions taken by company managers—who are privy to better knowledge of a company’s prospects and earnings than any market participant, and whose opinions about their firm’s future may be reflected in their purchases and sales of its stock.
• Market sentiment, which captures investors’ opinions of a company as revealed through their activity in the market.
• Quality, which measures balance-sheet strength and the sustainability of earnings.
Our risk-control process then neutralizes our exposure to market capitalization, volatility, and industry risks relative to the fund’s benchmark. In our view, such risk exposures are not justified by the rewards available.
Our stock-selection model performed well, with three of the components making a positive contribution over the last six months. The fund benefited most from the growth measure, while the market sentiment and quality components also helped. The management decisions and value indicators reduced our return.
We were able to produce positive stock-selection results over the period in eight of the ten industry sectors, demonstrating the model’s breadth. Compared with the overall return of the benchmark index, energy (+54%), industrials (+33%), and materials (+33%) stocks were our strongest holdings, while financials (+17%), utilities (+16%), and consumer staples (+19%) underperformed.
At the individual stock level, the largest contributions came from overweight positions in Walter Energy (+67%),
6
Helmerich & Payne (+70%), and Verifone Systems (+77%). In comparison with the benchmark index, we benefited from underweighting or avoiding poorly performing stocks such as Akamai Technologies (–24%), Motorola Mobility (–26%), and Expedia (–19%).
Unfortunately, we were not able to avoid all laggards. Overweight positions in Valassis Communications (–14%), Platinum Underwriters (–12%), and Lexmark International (–17%) directly lowered performance. And underweight positions in some companies not positively identified by our model, such as Massey Energy (+121%), Salesforce.com (+24%), and Green Mountain Coffee Roasters (+107%), hurt our performance relative to the benchmark.
While we cannot predict how broad political or economic events will affect the markets, we are confident that long-term investors can achieve worthwhile returns. With that in mind, we believe that equity exposure will continue to play an important role in a diversified investment strategy. Within that plan, we believe a portfolio of companies with lower relative price/ earnings and price/cash flow ratios, growth rates near that of the market, a higher return on equity, quality balance sheets, and positive market sentiment is an attractive investment.
We thank you for your investment and look forward to the coming months.
James D. Troyer, CFA
Principal and Portfolio Manager
April 12, 2011
7
Strategic Equity Fund
Fund Profile
As of March 31, 2011
| | | |
| Portfolio Characteristics | | |
| | | MSCI US | |
| | | Small + | DJ |
| | | Mid Cap | U.S. Total |
| | | 2200 | Market |
| | Fund | Index | Index |
| Number of Stocks | 458 | 2,164 | 3,817 |
| Median Market Cap | $4.0B | $4.2B | $31.4B |
| Price/Earnings Ratio | 17.9x | 23.6x | 17.9x |
| Price/Book Ratio | 2.6x | 2.2x | 2.3x |
| Return on Equity | 12.8% | 12.8% | 18.9% |
| Earnings Growth Rate | 8.8% | 5.8% | 5.9% |
| Dividend Yield | 1.1% | 1.2% | 1.7% |
| Foreign Holdings | 0.1% | 0.0% | 0.0% |
| Turnover Rate | | | |
| (Annualized) | 64% | — | — |
| Ticker Symbol | VSEQX | — | — |
| Expense Ratio1 | 0.31% | — | — |
| 30-Day SEC Yield | 0.80% | — | — |
| Short-Term Reserves | 0.1% | — | — |
| | | |
| Sector Diversification (% of equity exposure) |
| | | MSCI US | |
| | | Small + | DJ |
| | | Mid Cap | U.S. Total |
| | | 2200 | Market |
| | Fund | Index | Index |
| Consumer | | | |
| Discretionary | 16.1% | 15.1% | 11.8% |
| Consumer Staples | 3.9 | 3.6 | 9.2 |
| Energy | 9.2 | 9.1 | 11.8 |
| Financials | 17.9 | 18.4 | 16.2 |
| Health Care | 10.6 | 10.7 | 10.7 |
| Industrials | 13.6 | 14.0 | 11.6 |
| Information | | | |
| Technology | 15.9 | 16.5 | 18.5 |
| Materials | 6.3 | 6.6 | 4.5 |
| Telecommunication | | | |
| Services | 1.3 | 1.2 | 2.6 |
| Utilities | 5.2 | 4.8 | 3.1 |
| | |
| Volatility Measures | | |
| | MSCI US | |
| | Small + | DJ |
| | Mid Cap | U.S. Total |
| | 2200 | Market |
| | Index | Index |
| R-Squared | 0.99 | 0.95 |
| Beta | 1.00 | 1.18 |
These measures show the degree and timing of the fund’s fluctuations compared with the indexes over 36 months.
| | |
| Ten Largest Holdings (% of total net assets) |
| Humana Inc. | Managed Health | |
| | Care | 1.1% |
| Altera Corp. | Semiconductors | 1.1 |
| Joy Global Inc. | Construction & | |
| | Farm Machinery & | |
| | Heavy Trucks | 1.1 |
| AmerisourceBergen | Health Care | |
| Corp. Class A | Distributors | 1.0 |
| Cimarex Energy Co. | Oil & Gas | |
| | Exploration & | |
| | Production | 1.0 |
| Helmerich & Payne Inc. | Oil & Gas Drilling | 1.0 |
| El Paso Corp. | Oil & Gas Storage & | |
| | Transportation | 1.0 |
| Ross Stores Inc. | Apparel Retail | 1.0 |
| Eastman Chemical Co. | Diversified | |
| | Chemicals | 1.0 |
| Limited Brands Inc. | Apparel Retail | 0.9 |
| Top Ten | | 10.2% |
The holdings listed exclude any temporary cash investments and equity index products.
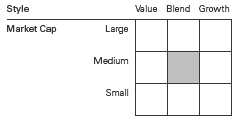
Investment Focus
1 The expense ratio shown is from the prospectus dated April 29, 2011, and represents estimated costs for the current fiscal year. For the six months ended March 31, 2011, the annualized expense ratio was 0.30%.
8
Strategic Equity Fund
Performance Summary
All of the returns in this report represent past performance, which is not a guarantee of future results that may be achieved by the fund. (Current performance may be lower or higher than the performance data cited. For performance data current to the most recent month-end, visit our website at vanguard.com/performance.) Note, too, that both investment returns and principal value can fluctuate widely, so an investor’s shares, when sold, could be worth more or less than their original cost. The returns shown do not reflect taxes that a shareholder would pay on fund distributions or on the sale of fund shares.
Fiscal-Year Total Returns (%): September 30, 2000, Through March 31, 2011
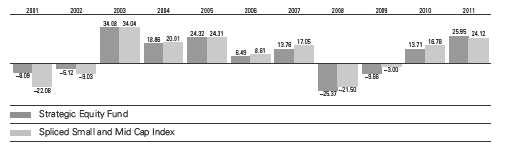
Spliced Small and Mid Cap Index: Russell 2800 Index through May 31, 2003; MSCI US Small + Mid Cap 2200 Index thereafter.
Note: For 2011, performance data reflect the six months ended March 31, 2011.
| | | | |
| Average Annual Total Returns: Periods Ended March 31, 2011 | | | |
| |
| | Inception | One | Five | Ten |
| | Date | Year | Years | Years |
| Strategic Equity Fund | 8/14/1995 | 25.41% | 1.15% | 7.67% |
See Financial Highlights for dividend and capital gains information.
9
Strategic Equity Fund
Financial Statements (unaudited)
Statement of Net Assets
As of March 31, 2011
The fund reports a complete list of its holdings in regulatory filings four times in each fiscal year, at the quarter-ends. For the second and fourth fiscal quarters, the lists appear in the fund’s semiannual and annual reports to shareholders. For the first and third fiscal quarters, the fund files the lists with the Securities and Exchange Commission on Form N-Q. Shareholders can look up the fund’s Forms N-Q on the SEC’s website at sec.gov. Forms N-Q may also be reviewed and copied at the SEC’s Public Reference Room (see the back cover of this report for further information).
| | | |
| | | | Market |
| | | | Value |
| | | Shares | ($000) |
| Common Stocks (99.2%)1 | | |
| Consumer Discretionary (16.0%) | |
| | Ross Stores Inc. | 507,362 | 36,084 |
| | Limited Brands Inc. | 1,044,400 | 34,340 |
| * | Dollar Tree Inc. | 587,720 | 32,630 |
| | Williams-Sonoma Inc. | 771,871 | 31,261 |
| * | Tempur-Pedic | | |
| | International Inc. | 602,099 | 30,502 |
| * | TRW Automotive | | |
| | Holdings Corp. | 553,148 | 30,467 |
| | Sotheby’s | 497,900 | 26,190 |
| * | Fossil Inc. | 262,100 | 24,546 |
| | Whirlpool Corp. | 282,611 | 24,124 |
| | Newell Rubbermaid Inc. | 1,183,800 | 22,646 |
| | Dillard’s Inc. Class A | 525,600 | 21,087 |
| * | Valassis | | |
| | Communications Inc. | 707,130 | 20,606 |
| | Gannett Co. Inc. | 1,151,350 | 17,535 |
| | Cablevision Systems Corp. | | |
| | Class A | 461,900 | 15,986 |
| ^,* | China MediaExpress | | |
| | Holdings Inc. | 1,252,000 | 14,811 |
| | Advance Auto Parts Inc. | 207,400 | 13,610 |
| | Autoliv Inc. | 170,514 | 12,657 |
| * | Panera Bread Co. Class A | 98,062 | 12,454 |
| ^,* | Coinstar Inc. | 246,700 | 11,329 |
| * | Domino’s Pizza Inc. | 575,100 | 10,599 |
| * | Warnaco Group Inc. | 181,859 | 10,401 |
| * | Tenneco Inc. | 239,895 | 10,184 |
| * | Dana Holding Corp. | 573,425 | 9,972 |
| * | CROCS Inc. | 491,000 | 8,759 |
| | Polaris Industries Inc. | 98,941 | 8,610 |
| * | Ulta Salon Cosmetics | | |
| | & Fragrance Inc. | 172,700 | 8,312 |
| * | Denny’s Corp. | 1,838,665 | 7,465 |
| | Bob Evans Farms Inc. | 206,751 | 6,740 |
| | Cracker Barrel | | |
| | Old Country Store Inc. | 134,823 | 6,625 |
| | | |
| | | | Market |
| | | | Value |
| | | Shares | ($000) |
| * | Chipotle Mexican Grill Inc. | | |
| | Class A | 22,500 | 6,128 |
| * | DineEquity Inc. | 94,800 | 5,212 |
| | Leggett & Platt Inc. | 201,750 | 4,943 |
| * | Helen of Troy Ltd. | 152,500 | 4,484 |
| | Meredith Corp. | 128,820 | 4,370 |
| | PF Chang’s China | | |
| | Bistro Inc. | 89,802 | 4,148 |
| | Scholastic Corp. | 128,139 | 3,465 |
| | Brinker International Inc. | 123,350 | 3,121 |
| * | AFC Enterprises Inc. | 136,445 | 2,064 |
| * | Liberty Global Inc. Class A | 49,531 | 2,051 |
| | Sinclair Broadcast | | |
| | Group Inc. Class A | 142,400 | 1,786 |
| * | Liberty Media Corp. - | | |
| | Interactive | 89,400 | 1,434 |
| * | Pier 1 Imports Inc. | 125,900 | 1,278 |
| | Finish Line Inc. Class A | 59,300 | 1,177 |
| * | Shutterfly Inc. | 21,800 | 1,141 |
| | Lincoln Educational | | |
| | Services Corp. | 69,871 | 1,110 |
| * | Journal Communications Inc. | | |
| | Class A | 171,561 | 1,029 |
| * | Quiksilver Inc. | 220,900 | 976 |
| * | ITT Educational | | |
| | Services Inc. | 12,600 | 909 |
| | Virgin Media Inc. | 32,700 | 909 |
| | Cato Corp. Class A | 36,294 | 889 |
| * | DSW Inc. Class A | 21,100 | 843 |
| * | Belo Corp. Class A | 92,500 | 815 |
| * | Saks Inc. | 69,934 | 791 |
| | Washington Post Co. | | |
| | Class B | 1,800 | 788 |
| * | Liberty Media Corp. - Starz | 8,900 | 691 |
| * | EW Scripps Co. Class A | 67,900 | 672 |
| * | Cheesecake Factory Inc. | 21,800 | 656 |
| * | Ruby Tuesday Inc. | 45,250 | 593 |
| * | Biglari Holdings Inc. | 1,160 | 491 |
| * | Jakks Pacific Inc. | 21,000 | 406 |
10
Strategic Equity Fund
| | | | |
| | | | | Market |
| | | | | Value |
| | | | Shares | ($000) |
| | Harman International | | | |
| | Industries Inc. | | 8,032 | 376 |
| | Blyth Inc. | | 9,000 | 292 |
| * | Kenneth Cole | | | |
| | Productions Inc. Class A | 17,900 | 232 |
| | | | | 580,802 |
| Consumer Staples (3.8%) | | |
| | Coca-Cola Enterprises Inc. 1,224,400 | 33,426 |
| | Dr Pepper Snapple | | | |
| | Group Inc. | | 866,808 | 32,211 |
| | Herbalife Ltd. | | 300,579 | 24,455 |
| | Tyson Foods Inc. Class A | 679,700 | 13,043 |
| | Lancaster Colony Corp. | 121,619 | 7,370 |
| | Ruddick Corp. | | 182,300 | 7,035 |
| * | Boston Beer Co. Inc. | | | |
| | Class A | | 63,800 | 5,909 |
| | B&G Foods Inc. Class A | 266,200 | 4,997 |
| * | Central Garden and Pet Co. | | |
| | Class A | | 449,679 | 4,141 |
| * | Constellation Brands Inc. | | |
| | Class A | | 203,000 | 4,117 |
| | Casey’s General Stores Inc. | 29,735 | 1,160 |
| * | Smithfield Foods Inc. | | 42,100 | 1,013 |
| | National Beverage Corp. | 31,100 | 427 |
| ^ | Cal-Maine Foods Inc. | | 13,700 | 404 |
| | | | | 139,708 |
| Energy (9.2%) | | | |
| | Cimarex Energy Co. | | 321,191 | 37,014 |
| | Helmerich & Payne Inc. | 533,742 | 36,663 |
| | El Paso Corp. | 2,034,254 | 36,617 |
| | Pioneer Natural | | | |
| | Resources Co. | | 299,300 | 30,505 |
| * | Newfield Exploration Co. | 304,251 | 23,126 |
| | Sunoco Inc. | | 488,000 | 22,248 |
| | SM Energy Co. | | 292,300 | 21,686 |
| | Core Laboratories NV | | 208,800 | 21,333 |
| * | Oil States International Inc. | 270,128 | 20,567 |
| * | Whiting Petroleum Corp. | 262,200 | 19,259 |
| * | Complete Production | | | |
| | Services Inc. | | 380,500 | 12,104 |
| * | International Coal | | | |
| | Group Inc. | | 824,283 | 9,314 |
| * | Rosetta Resources Inc. | 145,745 | 6,929 |
| | Southern Union Co. | | 133,442 | 3,819 |
| * | Stone Energy Corp. | | 113,512 | 3,788 |
| | SEACOR Holdings Inc. | 37,700 | 3,486 |
| * | Gulfport Energy Corp. | | 95,696 | 3,459 |
| * | Cloud Peak Energy Inc. | 151,300 | 3,267 |
| * | Clayton Williams | | | |
| | Energy Inc. | | 26,500 | 2,801 |
| | RPC Inc. | | 80,800 | 2,046 |
| | QEP Resources Inc. | | 49,500 | 2,007 |
| * | Warren Resources Inc. | 325,000 | 1,654 |
| * | Tetra Technologies Inc. | 94,990 | 1,463 |
| | | |
| | | | Market |
| | | | Value |
| | | Shares | ($000) |
| | Crosstex Energy Inc. | 111,875 | 1,113 |
| | W&T Offshore Inc. | 48,750 | 1,111 |
| * | Oceaneering | | |
| | International Inc. | 11,700 | 1,046 |
| * | Forest Oil Corp. | 25,900 | 980 |
| * | Venoco Inc. | 46,600 | 796 |
| * | Petroquest Energy Inc. | 76,400 | 715 |
| * | Swift Energy Co. | 16,600 | 708 |
| | Berry Petroleum Co. | | |
| | Class A | 13,800 | 696 |
| * | OYO Geospace Corp. | 5,650 | 557 |
| * | Gran Tierra Energy Inc. | 59,500 | 480 |
| | | | 333,357 |
| Financials (17.7%) | | |
| | Torchmark Corp. | 457,997 | 30,448 |
| | Bank of Hawaii Corp. | 536,164 | 25,639 |
| | Unum Group | 946,085 | 24,835 |
| * | Arch Capital Group Ltd. | 248,892 | 24,688 |
| * | World Acceptance Corp. | 333,918 | 21,771 |
| | Platinum Underwriters | | |
| | Holdings Ltd. | 526,000 | 20,035 |
| | American Financial | | |
| | Group Inc. | 539,689 | 18,900 |
| | New York Community | | |
| | Bancorp Inc. | 1,083,970 | 18,709 |
| * | CB Richard Ellis Group Inc. | | |
| | Class A | 675,200 | 18,028 |
| | Ventas Inc. | 329,528 | 17,893 |
| | Macerich Co. | 351,678 | 17,419 |
| | Plum Creek Timber Co. Inc. | 397,400 | 17,331 |
| * | American Capital Ltd. | 1,728,489 | 17,112 |
| | Rayonier Inc. | 239,764 | 14,940 |
| | Apartment Investment | | |
| | & Management Co. | 532,500 | 13,563 |
| | CBL & Associates | | |
| | Properties Inc. | 758,574 | 13,214 |
| | KeyCorp | 1,413,450 | 12,551 |
| | RenaissanceRe | | |
| | Holdings Ltd. | 181,050 | 12,491 |
| | Lexington Realty Trust | 1,245,600 | 11,646 |
| | Sun Communities Inc. | 324,743 | 11,577 |
| * | Ezcorp Inc. Class A | 350,217 | 10,993 |
| | Bank of the Ozarks Inc. | 244,487 | 10,686 |
| | Assurant Inc. | 266,000 | 10,244 |
| | Cash America | | |
| | International Inc. | 213,500 | 9,832 |
| | Camden Property Trust | 171,400 | 9,739 |
| | Nelnet Inc. Class A | 441,112 | 9,629 |
| | Highwoods Properties Inc. | 270,246 | 9,461 |
| | Ashford Hospitality | | |
| | Trust Inc. | 851,790 | 9,387 |
| | BOK Financial Corp. | 174,621 | 9,024 |
| * | Credit Acceptance Corp. | 119,379 | 8,471 |
| | AvalonBay Communities Inc. | 70,000 | 8,406 |
| | Hospitality Properties Trust | 362,400 | 8,390 |
11
Strategic Equity Fund
| | | |
| | | | Market |
| | | | Value |
| | | Shares | ($000) |
| | Pennsylvania Real Estate | | |
| | Investment Trust | 492,382 | 7,026 |
| | UMB Financial Corp. | 185,388 | 6,925 |
| * | CIT Group Inc. | 161,000 | 6,851 |
| | Brandywine Realty Trust | 559,032 | 6,787 |
| | City Holding Co. | 190,355 | 6,731 |
| | CapitalSource Inc. | 921,200 | 6,485 |
| * | NASDAQ OMX Group Inc. | 248,890 | 6,431 |
| | Equity Lifestyle | | |
| | Properties Inc. | 108,383 | 6,248 |
| | Colonial Properties Trust | 313,160 | 6,028 |
| | Duke Realty Corp. | 392,800 | 5,503 |
| | SL Green Realty Corp. | 66,875 | 5,029 |
| | Montpelier Re Holdings Ltd. | 273,800 | 4,838 |
| | Validus Holdings Ltd. | 134,300 | 4,476 |
| | International | | |
| | Bancshares Corp. | 238,425 | 4,373 |
| | Provident Financial | | |
| | Services Inc. | 293,425 | 4,343 |
| * | iStar Financial Inc. | 468,755 | 4,303 |
| | Legg Mason Inc. | 108,875 | 3,929 |
| | Post Properties Inc. | 94,500 | 3,709 |
| | Extra Space Storage Inc. | 164,400 | 3,405 |
| | Allied World Assurance Co. | | |
| | Holdings Ltd. | 52,300 | 3,279 |
| * | First Cash Financial | | |
| | Services Inc. | 84,501 | 3,262 |
| | Community Bank | | |
| | System Inc. | 132,561 | 3,217 |
| * | First Industrial Realty | | |
| | Trust Inc. | 261,425 | 3,108 |
| | Ares Capital Corp. | 181,412 | 3,066 |
| | Republic Bancorp Inc. | | |
| | Class A | 153,611 | 2,992 |
| | Glimcher Realty Trust | 296,100 | 2,739 |
| * | Signature Bank | 44,000 | 2,482 |
| | First Financial | | |
| | Bankshares Inc. | 48,210 | 2,477 |
| | Endurance Specialty | | |
| | Holdings Ltd. | 49,935 | 2,438 |
| | Provident New York | | |
| | Bancorp | 209,469 | 2,162 |
| | Bancfirst Corp. | 49,783 | 2,125 |
| | Arrow Financial Corp. | 67,678 | 1,674 |
| | Tompkins Financial Corp. | 39,520 | 1,642 |
| | FBL Financial Group Inc. | | |
| | Class A | 51,500 | 1,582 |
| * | FPIC Insurance Group Inc. | 38,540 | 1,461 |
| | Discover Financial Services | 59,625 | 1,438 |
| | First Citizens | | |
| | BancShares Inc. Class A | 6,500 | 1,304 |
| * | Forest City Enterprises Inc. | | |
| | Class A | 63,480 | 1,195 |
| | Infinity Property | | |
| | & Casualty Corp. | 20,071 | 1,194 |
| | | | |
| | | | | Market |
| | | | | Value |
| | | | Shares | ($000) |
| | Getty Realty Corp. | | 52,000 | 1,190 |
| | Taubman Centers Inc. | | 20,550 | 1,101 |
| | Southside Bancshares Inc. | 51,396 | 1,100 |
| * | Internet Capital Group Inc. | 77,100 | 1,095 |
| | GAMCO Investors Inc. | 22,500 | 1,043 |
| | NewAlliance Bancshares Inc. | 69,304 | 1,028 |
| | CapLease Inc. | | 173,700 | 952 |
| | Dime Community | | | |
| | Bancshares Inc. | | 59,798 | 883 |
| | Camden National Corp. | 25,345 | 868 |
| | Rockville Financial Inc. | 82,900 | 865 |
| | Erie Indemnity Co. Class A | 10,300 | 732 |
| * | Strategic Hotels | | | |
| | & Resorts Inc. | | 109,700 | 708 |
| | Medical Properties Trust Inc. | 60,000 | 694 |
| | NBT Bancorp Inc. | | 29,730 | 678 |
| | Amtrust Financial | | | |
| | Services Inc. | | 35,500 | 677 |
| | Weingarten Realty Investors | 26,300 | 659 |
| | United Bankshares Inc. | 23,285 | 617 |
| | Fulton Financial Corp. | | 52,900 | 588 |
| | MFA Financial Inc. | | 61,600 | 505 |
| | Axis Capital Holdings Ltd. | 14,290 | 499 |
| | Flagstone Reinsurance | | |
| | Holdings SA | | 50,800 | 458 |
| | MarketAxess Holdings Inc. | 18,000 | 436 |
| | Protective Life Corp. | | 13,730 | 364 |
| * | Sunstone Hotel | | | |
| | Investors Inc. | | 35,400 | 361 |
| * | FelCor Lodging Trust Inc. | 50,419 | 309 |
| | Piedmont Office Realty | | |
| | Trust Inc. Class A | | 14,759 | 286 |
| | 1st Source Corp. | | 9,707 | 194 |
| | | | | 644,199 |
| Health Care (10.5%) | | | |
| * | Humana Inc. | | 576,600 | 40,327 |
| | AmerisourceBergen Corp. | | |
| | Class A | | 957,604 | 37,883 |
| | Perrigo Co. | | 423,800 | 33,701 |
| | STERIS Corp. | | 756,343 | 26,124 |
| * | Incyte Corp. Ltd. | 1,563,700 | 24,785 |
| | Lincare Holdings Inc. | | 808,006 | 23,966 |
| | Cooper Cos. Inc. | | 337,115 | 23,413 |
| * | Watson | | | |
| | Pharmaceuticals Inc. | | 351,900 | 19,710 |
| * | AMERIGROUP Corp. | | 222,860 | 14,319 |
| | Invacare Corp. | | 410,354 | 12,770 |
| * | Waters Corp. | | 133,300 | 11,584 |
| * | Targacept Inc. | | 404,150 | 10,746 |
| * | Varian Medical | | | |
| | Systems Inc. | | 154,400 | 10,444 |
| * | Endo Pharmaceuticals | | | |
| | Holdings Inc. | | 256,925 | 9,804 |
| * | Sirona Dental Systems Inc. | 171,200 | 8,587 |
12
Strategic Equity Fund
| | | |
| | | | Market |
| | | | Value |
| | | Shares | ($000) |
| * | Magellan Health | | |
| | Services Inc. | 138,700 | 6,807 |
| * | LifePoint Hospitals Inc. | 143,135 | 5,751 |
| * | Cephalon Inc. | 59,600 | 4,517 |
| * | Bruker Corp. | 210,087 | 4,380 |
| * | Skilled Healthcare | | |
| | Group Inc. | 274,100 | 3,944 |
| * | Health Management | | |
| | Associates Inc. Class A | 361,348 | 3,939 |
| * | Par Pharmaceutical Cos. Inc. | 109,221 | 3,395 |
| * | Medicines Co. | 206,150 | 3,358 |
| * | Kensey Nash Corp. | 120,471 | 3,001 |
| * | Cepheid Inc. | 103,620 | 2,903 |
| | Chemed Corp. | 39,400 | 2,624 |
| * | Akorn Inc. | 435,742 | 2,514 |
| | Medicis Pharmaceutical | | |
| | Corp. Class A | 77,900 | 2,496 |
| * | Nabi Biopharmaceuticals | 419,767 | 2,439 |
| | Universal American Corp. | 97,400 | 2,231 |
| * | Corvel Corp. | 35,369 | 1,881 |
| * | Inspire Pharmaceuticals Inc. | 464,500 | 1,839 |
| | PDL BioPharma Inc. | 285,920 | 1,658 |
| * | Bio-Rad Laboratories Inc. | | |
| | Class A | 13,700 | 1,646 |
| * | Mettler-Toledo | | |
| | International Inc. | 9,251 | 1,591 |
| * | Impax Laboratories Inc. | 56,100 | 1,428 |
| * | Greatbatch Inc. | 47,400 | 1,254 |
| * | Community Health | | |
| | Systems Inc. | 29,300 | 1,172 |
| * | Nektar Therapeutics | 123,672 | 1,171 |
| * | Genomic Health Inc. | 37,008 | 910 |
| * | Codexis Inc. | 68,300 | 810 |
| * | Micromet Inc. | 115,342 | 647 |
| * | Triple-S Management Corp. | | |
| | Class B | 22,869 | 471 |
| * | Enzon Pharmaceuticals Inc. | 42,300 | 461 |
| * | Salix Pharmaceuticals Ltd. | 11,205 | 393 |
| * | Charles River Laboratories | | |
| | International Inc. | 9,950 | 382 |
| * | Emergency Medical | | |
| | Services Corp. Class A | 2,767 | 176 |
| | | | 380,352 |
| Industrials (13.4%) | | |
| | Joy Global Inc. | 387,637 | 38,302 |
| | Rockwell Automation Inc. | 359,450 | 34,022 |
| | Timken Co. | 606,080 | 31,698 |
| * | United Rentals Inc. | 887,962 | 29,551 |
| * | Navistar International Corp. | 373,000 | 25,860 |
| | Manitowoc Co. Inc. | 936,600 | 20,493 |
| | Pitney Bowes Inc. | 743,400 | 19,098 |
| * | Oshkosh Corp. | 505,000 | 17,867 |
| * | Avis Budget Group Inc. | 871,900 | 15,616 |
| | Waste Connections Inc. | 479,450 | 13,803 |
| | KBR Inc. | 351,700 | 13,284 |
| | | |
| | | | Market |
| | | | Value |
| | | Shares | ($000) |
| * | Stericycle Inc. | 144,000 | 12,769 |
| * | United Continental | | |
| | Holdings Inc. | 533,800 | 12,272 |
| * | US Airways Group Inc. | 1,233,900 | 10,747 |
| | Avery Dennison Corp. | 226,900 | 9,521 |
| | RR Donnelley & Sons Co. | 479,500 | 9,072 |
| * | Sauer-Danfoss Inc. | 173,943 | 8,859 |
| | Donaldson Co. Inc. | 142,400 | 8,728 |
| | Cubic Corp. | 148,520 | 8,540 |
| * | Polypore International Inc. | 139,000 | 8,004 |
| | Toro Co. | 118,400 | 7,840 |
| | Gardner Denver Inc. | 90,252 | 7,042 |
| * | EnerSys | 172,657 | 6,863 |
| | Triumph Group Inc. | 75,583 | 6,685 |
| | Briggs & Stratton Corp. | 274,543 | 6,218 |
| * | Consolidated Graphics Inc. | 110,773 | 6,052 |
| | Applied Industrial | | |
| | Technologies Inc. | 179,200 | 5,960 |
| | TAL International Group Inc. | 143,955 | 5,221 |
| * | Meritor Inc. | 284,887 | 4,835 |
| | Dover Corp. | 68,150 | 4,480 |
| * | Trimas Corp. | 207,600 | 4,463 |
| | NACCO Industries Inc. | | |
| | Class A | 39,000 | 4,316 |
| | Werner Enterprises Inc. | 154,737 | 4,096 |
| * | Corrections Corp. | | |
| | of America | 161,300 | 3,936 |
| | Seaboard Corp. | 1,436 | 3,465 |
| * | Macquarie Infrastructure | | |
| | Co. LLC | 141,900 | 3,386 |
| | Armstrong World | | |
| | Industries Inc. | 63,500 | 2,938 |
| * | WABCO Holdings Inc. | 45,415 | 2,799 |
| | Crane Co. | 55,400 | 2,683 |
| * | Alaska Air Group Inc. | 42,165 | 2,674 |
| * | Amerco Inc. | 26,700 | 2,590 |
| | Great Lakes Dredge | | |
| | & Dock Corp. | 338,000 | 2,579 |
| | Knoll Inc. | 118,010 | 2,474 |
| * | Acacia Research - | | |
| | Acacia Technologies | 69,895 | 2,392 |
| | Deluxe Corp. | 86,113 | 2,285 |
| * | M&F Worldwide Corp. | 88,000 | 2,211 |
| | Schawk Inc. Class A | 112,800 | 2,193 |
| | Standex International Corp. | 57,750 | 2,188 |
| * | Blount International Inc. | 135,182 | 2,160 |
| * | Thomas & Betts Corp. | 32,800 | 1,951 |
| * | SFN Group Inc. | 120,450 | 1,697 |
| | United Stationers Inc. | 19,961 | 1,418 |
| * | Sensata Technologies | | |
| | Holding NV | 37,400 | 1,299 |
| * | Dollar Thrifty Automotive | | |
| | Group Inc. | 18,540 | 1,237 |
| * | AGCO Corp. | 19,950 | 1,097 |
| | Tredegar Corp. | 48,720 | 1,051 |
13
Strategic Equity Fund
| | | |
| | | | Market |
| | | | Value |
| | | Shares | ($000) |
| | Ryder System Inc. | 20,600 | 1,042 |
| * | ACCO Brands Corp. | 107,615 | 1,027 |
| | Actuant Corp. Class A | 35,400 | 1,027 |
| * | Atlas Air Worldwide | | |
| | Holdings Inc. | 14,100 | 983 |
| | Corporate Executive | | |
| | Board Co. | 24,212 | 977 |
| | HEICO Corp. | 15,600 | 975 |
| * | WESCO International Inc. | 15,200 | 950 |
| | Vicor Corp. | 56,790 | 937 |
| * | Esterline Technologies Corp. | 12,610 | 892 |
| | HNI Corp. | 27,466 | 867 |
| | Rollins Inc. | 37,650 | 764 |
| | Tennant Co. | 16,316 | 686 |
| | Interface Inc. Class A | 33,645 | 622 |
| | Watts Water Technologies | | |
| | Inc. Class A | 16,200 | 619 |
| | Lawson Products Inc. | 23,370 | 538 |
| | Quanex Building | | |
| | Products Corp. | 23,780 | 467 |
| | Kennametal Inc. | 1,100 | 43 |
| | | | 488,296 |
| Information Technology (15.8%) | |
| | Altera Corp. | 881,600 | 38,808 |
| * | VeriFone Systems Inc. | 612,750 | 33,671 |
| * | Teradata Corp. | 648,487 | 32,878 |
| * | Electronic Arts Inc. | 1,663,900 | 32,496 |
| * | Novellus Systems Inc. | 760,500 | 28,237 |
| | Anixter International Inc. | 397,468 | 27,779 |
| * | Lexmark International Inc. | | |
| | Class A | 714,006 | 26,447 |
| * | Gartner Inc. | 578,509 | 24,107 |
| * | TIBCO Software Inc. | 881,569 | 24,023 |
| * | Atmel Corp. | 1,384,000 | 18,864 |
| * | SanDisk Corp. | 408,800 | 18,842 |
| ^,* | Power-One Inc. | 2,042,250 | 17,870 |
| * | Avnet Inc. | 511,600 | 17,440 |
| * | Advanced Micro | | |
| | Devices Inc. | 2,027,500 | 17,437 |
| | Solera Holdings Inc. | 296,380 | 15,145 |
| * | Vishay Intertechnology Inc. | 816,450 | 14,484 |
| * | RF Micro Devices Inc. | 1,937,306 | 12,418 |
| * | IAC/InterActiveCorp | 393,300 | 12,149 |
| * | Fiserv Inc. | 183,800 | 11,528 |
| * | JDS Uniphase Corp. | 433,916 | 9,043 |
| | Avago Technologies Ltd. | 285,600 | 8,882 |
| * | Aruba Networks Inc. | 257,500 | 8,714 |
| | Opnet Technologies Inc. | 206,474 | 8,050 |
| * | Lam Research Corp. | 131,200 | 7,434 |
| * | Netscout Systems Inc. | 260,955 | 7,129 |
| | iGate Corp. | 353,714 | 6,639 |
| * | Silicon Image Inc. | 708,200 | 6,353 |
| * | MICROS Systems Inc. | 111,600 | 5,516 |
| * | Cardtronics Inc. | 262,576 | 5,343 |
| | DST Systems Inc. | 99,950 | 5,279 |
| | | |
| | | | Market |
| | | | Value |
| | | Shares | ($000) |
| * | Lattice Semiconductor Corp. | 855,850 | 5,050 |
| * | Powerwave | | |
| | Technologies Inc. | 993,700 | 4,482 |
| * | Anadigics Inc. | 986,400 | 4,419 |
| | Plantronics Inc. | 110,900 | 4,061 |
| * | Tech Data Corp. | 78,300 | 3,982 |
| * | SYNNEX Corp. | 113,274 | 3,708 |
| * | Kemet Corp. | 232,650 | 3,450 |
| * | Teradyne Inc. | 186,917 | 3,329 |
| | MAXIMUS Inc. | 37,470 | 3,041 |
| * | Unisys Corp. | 93,356 | 2,915 |
| * | TriQuint Semiconductor Inc. | 217,395 | 2,807 |
| * | Manhattan Associates Inc. | 72,200 | 2,362 |
| * | Kulicke & Soffa | | |
| | Industries Inc. | 248,375 | 2,322 |
| * | Quantum Corp. | 879,300 | 2,216 |
| * | Mentor Graphics Corp. | 150,000 | 2,195 |
| * | Interactive Intelligence Inc. | 48,069 | 1,861 |
| * | Fairchild Semiconductor | | |
| | International Inc. Class A | 99,750 | 1,816 |
| * | Insight Enterprises Inc. | 101,600 | 1,730 |
| | CTS Corp. | 137,752 | 1,488 |
| | Micrel Inc. | 95,800 | 1,291 |
| * | Veeco Instruments Inc. | 25,000 | 1,271 |
| * | Radiant Systems Inc. | 62,000 | 1,097 |
| * | Ultratech Inc. | 34,600 | 1,017 |
| | MKS Instruments Inc. | 24,700 | 823 |
| * | MicroStrategy Inc. Class A | 6,100 | 820 |
| * | Omnivision | | |
| | Technologies Inc. | 22,500 | 799 |
| * | Novatel Wireless Inc. | 138,300 | 755 |
| * | Flextronics International Ltd. | 97,870 | 731 |
| * | Netgear Inc. | 18,800 | 610 |
| * | Progress Software Corp. | 20,400 | 593 |
| | Blackbaud Inc. | 21,400 | 583 |
| * | Magma Design | | |
| | Automation Inc. | 81,800 | 558 |
| * | Liquidity Services Inc. | 28,700 | 513 |
| * | Silicon Graphics | | |
| | International Corp. | 23,150 | 495 |
| | National Instruments Corp. | 12,769 | 418 |
| * | IXYS Corp. | 20,200 | 271 |
| | Renaissance Learning Inc. | 11,200 | 132 |
| | | | 573,016 |
| Materials (6.3%) | | |
| | Eastman Chemical Co. | 359,938 | 35,749 |
| | Domtar Corp. | 356,475 | 32,717 |
| | Walter Energy Inc. | 235,750 | 31,928 |
| | Ashland Inc. | 352,300 | 20,349 |
| * | Rockwood Holdings Inc. | 324,650 | 15,979 |
| | Cytec Industries Inc. | 211,200 | 11,483 |
| ^ | Rock-Tenn Co. Class A | 132,958 | 9,221 |
| | Silgan Holdings Inc. | 229,160 | 8,740 |
| | Lubrizol Corp. | 56,200 | 7,529 |
| | Innophos Holdings Inc. | 157,285 | 7,252 |
14
Strategic Equity Fund
| | | | |
| | | | | Market |
| | | | | Value |
| | | | Shares | ($000) |
| | Boise Inc. | | 604,800 | 5,540 |
| | Buckeye Technologies Inc. | 171,258 | 4,663 |
| * | Ferro Corp. | | 259,600 | 4,307 |
| | Schweitzer-Mauduit | | | |
| | International Inc. | | 81,639 | 4,132 |
| * | Clearwater Paper Corp. | 45,271 | 3,685 |
| * | KapStone Paper and | | | |
| | Packaging Corp. | | 161,600 | 2,775 |
| | Stepan Co. | | 38,226 | 2,771 |
| * | Noranda Aluminum | | | |
| | Holding Corp. | | 164,400 | 2,639 |
| * | Graphic Packaging | | | |
| | Holding Co. | | 458,329 | 2,484 |
| * | Solutia Inc. | | 96,600 | 2,454 |
| * | Innospec Inc. | | 76,300 | 2,437 |
| | PolyOne Corp. | | 119,150 | 1,693 |
| * | TPC Group Inc. | | 48,050 | 1,387 |
| | Neenah Paper Inc. | | 51,400 | 1,129 |
| | Albemarle Corp. | | 14,600 | 873 |
| | NewMarket Corp. | | 5,222 | 826 |
| | Haynes International Inc. | 13,200 | 732 |
| | Westlake Chemical Corp. | 10,986 | 617 |
| | Cabot Corp. | | 11,797 | 546 |
| * | WR Grace & Co. | | 13,200 | 506 |
| | | | | 227,143 |
| Telecommunication Services (1.3%) | |
| * | MetroPCS | | | |
| | Communications Inc. | 2,002,787 | 32,525 |
| | USA Mobility Inc. | | 292,378 | 4,237 |
| * | Vonage Holdings Corp. | 805,050 | 3,671 |
| * | United States Cellular Corp. | 59,316 | 3,054 |
| | Consolidated | | | |
| | Communications | | | |
| | Holdings Inc. | | 68,874 | 1,290 |
| | Telephone & Data | | | |
| | Systems Inc. | | 35,400 | 1,193 |
| | | | | 45,970 |
| Utilities (5.2%) | | | |
| | Oneok Inc. | | 491,045 | 32,841 |
| | CMS Energy Corp. | 1,528,962 | 30,029 |
| | Atmos Energy Corp. | | 483,211 | 16,478 |
| | Integrys Energy Group Inc. | 252,950 | 12,777 |
| | Northeast Utilities | | 323,000 | 11,176 |
| | Southwest Gas Corp. | | 257,800 | 10,047 |
| * | El Paso Electric Co. | | 299,100 | 9,093 |
| | DTE Energy Co. | | 176,850 | 8,659 |
| | DPL Inc. | | 285,650 | 7,830 |
| | Pinnacle West Capital Corp. | 165,900 | 7,099 |
| | IDACORP Inc. | | 169,844 | 6,471 |
| | Portland General | | | |
| | Electric Co. | | 181,000 | 4,302 |
| | NSTAR | | 87,655 | 4,056 |
| | Avista Corp. | | 161,629 | 3,739 |
| | CenterPoint Energy Inc. | 211,408 | 3,712 |
| | | |
| | | | Market |
| | | | Value |
| | | Shares | ($000) |
| | Hawaiian Electric | | |
| | Industries Inc. | 141,780 | 3,516 |
| | Alliant Energy Corp. | 83,700 | 3,258 |
| | NorthWestern Corp. | 88,397 | 2,678 |
| | Nicor Inc. | 31,150 | 1,673 |
| | OGE Energy Corp. | 32,900 | 1,663 |
| | WGL Holdings Inc. | 40,471 | 1,578 |
| | Unisource Energy Corp. | 37,700 | 1,362 |
| | Cleco Corp. | 36,700 | 1,258 |
| | Questar Corp. | 50,900 | 888 |
| | PNM Resources Inc. | 58,735 | 876 |
| | Piedmont Natural | | |
| | Gas Co. Inc. | 8,700 | 264 |
| | Laclede Group Inc. | 6,900 | 263 |
| | | | 187,586 |
| Total Common Stocks | | |
| (Cost $2,629,010) | | 3,600,429 |
| Temporary Cash Investments (1.4%)1 | |
| Money Market Fund (1.3%) | | |
| 2,3 | Vanguard Market | | |
| | Liquidity Fund, 0.208% | 48,081,958 | 48,082 |
| |
| | | Face | |
| | | Amount | |
| | | ($000) | |
| U.S. Government and Agency Obligations (0.1%) |
| 4,5 | Fannie Mae | | |
| | Discount Notes, | | |
| | 0.240%, 6/22/11 | 1,500 | 1,499 |
| 4,5 | Freddie Mac | | |
| | Discount Notes, | | |
| | 0.281%, 6/21/11 | 200 | 200 |
| | | | 1,699 |
| Total Temporary Cash Investments | |
| (Cost $49,781) | | 49,781 |
| Total Investments (100.6%) | | |
| (Cost $2,678,791) | | 3,650,210 |
| Other Assets and Liabilities (-0.6%) | |
| Other Assets | | 40,548 |
| Liabilities3 | | (61,906) |
| | | | (21,358) |
| Net Assets (100%) | | |
| Applicable to 178,901,573 outstanding | |
| $.001 par value shares of beneficial | |
| interest (unlimited authorization) | 3,628,852 |
| Net Asset Value Per Share | | $20.28 |
15
Strategic Equity Fund
| |
| At March 31, 2011, net assets consisted of: |
| | Amount |
| | ($000) |
| Paid-in Capital | 4,204,306 |
| Overdistributed Net Investment Income | (5,250) |
| Accumulated Net Realized Losses | (1,542,818) |
| Unrealized Appreciation (Depreciation) | |
| Investment Securities | 971,419 |
| Futures Contracts | 1,195 |
| Net Assets | 3,628,852 |
See Note A in Notes to Financial Statements.
* Non-income-producing security.
^ Part of security position is on loan to broker-dealers. The total value of securities on loan is $14,478,000.
1 The fund invests a portion of its cash reserves in equity markets through the use of index futures contracts. After giving effect to futures investments, the fund’s effective common stock and temporary cash investment positions represent 100.0% and 0.6%, respectively, of net assets.
2 Affiliated money market fund available only to Vanguard funds and certain trusts and accounts managed by Vanguard. Rate shown is the 7-day yield.
3 Includes $15,733,000 of collateral received for securities on loan.
4 The issuer operates under a congressional charter; its securities are not backed by the full faith and credit of the U.S. government.
5 Securities with a value of $1,699,000 have been segregated as initial margin for open futures contracts.
See accompanying Notes, which are an integral part of the Financial Statements.
16
Strategic Equity Fund
| |
| Statement of Operations | |
| |
| | Six Months Ended |
| | March 31, 2011 |
| | ($000) |
| Investment Income | |
| Income | |
| Dividends | 23,155 |
| Interest1 | 34 |
| Security Lending | 514 |
| Total Income | 23,703 |
| Expenses | |
| The Vanguard Group—Note B | |
| Investment Advisory Services | 699 |
| Management and Administrative | 3,920 |
| Marketing and Distribution | 345 |
| Custodian Fees | 30 |
| Shareholders’ Reports | 31 |
| Trustees’ Fees and Expenses | 3 |
| Total Expenses | 5,028 |
| Net Investment Income | 18,675 |
| Realized Net Gain (Loss) | |
| Investment Securities Sold | 254,709 |
| Futures Contracts | 4,011 |
| Realized Net Gain (Loss) | 258,720 |
| Change in Unrealized Appreciation (Depreciation) | |
| Investment Securities | 497,681 |
| Futures Contracts | 637 |
| Change in Unrealized Appreciation (Depreciation) | 498,318 |
| Net Increase (Decrease) in Net Assets Resulting from Operations | 775,713 |
| 1 Interest income from an affiliated company of the fund was $29,000. | |
See accompanying Notes, which are an integral part of the Financial Statements.
17
Strategic Equity Fund
| | |
| Statement of Changes in Net Assets | | |
| |
| | Six Months Ended | Year Ended |
| | March 31, | September 30, |
| | 2011 | 2010 |
| | ($000) | ($000) |
| Increase (Decrease) in Net Assets | | |
| Operations | | |
| Net Investment Income | 18,675 | 44,404 |
| Realized Net Gain (Loss) | 258,720 | 138,850 |
| Change in Unrealized Appreciation (Depreciation) | 498,318 | 236,245 |
| Net Increase (Decrease) in Net Assets Resulting from Operations | 775,713 | 419,499 |
| Distributions | | |
| Net Investment Income | (41,795) | (44,385) |
| Realized Capital Gain | — | — |
| Total Distributions | (41,795) | (44,385) |
| Capital Share Transactions | | |
| Issued | 185,309 | 265,701 |
| Issued in Lieu of Cash Distributions | 39,080 | 41,702 |
| Redeemed | (432,597) | (1,128,109) |
| Net Increase (Decrease) from Capital Share Transactions | (208,208) | (820,706) |
| Total Increase (Decrease) | 525,710 | (445,592) |
| Net Assets | | |
| Beginning of Period | 3,103,142 | 3,548,734 |
| End of Period1 | 3,628,852 | 3,103,142 |
| 1 Net Assets—End of Period includes undistributed (overdistributed) net investment income of ($5,250,000) and $17,870,000. |
See accompanying Notes, which are an integral part of the Financial Statements.
18
Strategic Equity Fund
Financial Highlights
| | | | | | |
| | Six Months | | | | | |
| | Ended | | | | | |
| For a Share Outstanding | March 31, | | | Year Ended September 30, |
| Throughout Each Period | 2011 | 2010 | 2009 | 2008 | 2007 | 2006 |
| Net Asset Value, Beginning of Period | $16.30 | $14.52 | $16.42 | $24.94 | $23.07 | $23.28 |
| Investment Operations | | | | | | |
| Net Investment Income | .104 | .221 | .184 | .240 | .270 | .270 |
| Net Realized and Unrealized Gain (Loss) | | | | | | |
| on Investments | 4.103 | 1.759 | (1.843) | (6.090) | 2.840 | 1.170 |
| Total from Investment Operations | 4.207 | 1.980 | (1.659) | (5.850) | 3.110 | 1.440 |
| Distributions | | | | | | |
| Dividends from Net Investment Income | (.227) | (.200) | (.241) | (.240) | (.260) | (.210) |
| Distributions from Realized Capital Gains | — | — | — | (2.430) | (.980) | (1.440) |
| Total Distributions | (.227) | (.200) | (.241) | (2.670) | (1.240) | (1.650) |
| Net Asset Value, End of Period | $20.28 | $16.30 | $14.52 | $16.42 | $24.94 | $23.07 |
| |
| Total Return1 | 25.95% | 13.71% | -9.66% | -25.37% | 13.76% | 6.49% |
| |
| Ratios/Supplemental Data | | | | | | |
| Net Assets, End of Period (Millions) | $3,629 | $3,103 | $3,549 | $4,822 | $7,699 | $6,755 |
| Ratio of Total Expenses to | | | | | | |
| Average Net Assets | 0.30% | 0.30% | 0.30% | 0.25% | 0.30% | 0.35% |
| Ratio of Net Investment Income to | | | | | | |
| Average Net Assets | 1.11% | 1.37% | 1.47% | 1.09% | 1.03% | 1.18% |
| Portfolio Turnover Rate | 64% | 60% | 60% | 79% | 75% | 80% |
The expense ratio, net income ratio, and turnover rate for the current period have been annualized.
1 Total returns do not include account service fees that may have applied in the periods shown. Fund prospectuses provide information about any applicable account service fees.
See accompanying Notes, which are an integral part of the Financial Statements.
19
Strategic Equity Fund
Notes to Financial Statements
Vanguard Strategic Equity Fund is registered under the Investment Company Act of 1940 as an open-end investment company, or mutual fund.
A. The following significant accounting policies conform to generally accepted accounting principles for U.S. mutual funds. The fund consistently follows such policies in preparing its financial statements.
1. Security Valuation: Securities are valued as of the close of trading on the New York Stock Exchange (generally 4 p.m., Eastern time) on the valuation date. Equity securities are valued at the latest quoted sales prices or official closing prices taken from the primary market in which each security trades; such securities not traded on the valuation date are valued at the mean of the latest quoted bid and asked prices. Securities for which market quotations are not readily available, or whose values have been materially affected by events occurring before the fund’s pricing time but after the close of the securities’ primary markets, are valued by methods deemed by the board of trustees to represent fair value. Investments in Vanguard Market Liquidity Fund are valued at that fund’s net asset value. Temporary cash investments acquired over 60 days to maturity are valued using the latest bid prices or using valuations based on a matrix system (which considers such factors as security prices, yields, maturities, and ratings), both as furnished by independent pricing services. Other temporary cash investments are valued at amortized cost, which approximates market value.
2. Futures Contracts: The fund uses index futures contracts to a limited extent, with the objective of maintaining full exposure to the stock market while maintaining liquidity. The fund may purchase or sell futures contracts to achieve a desired level of investment, whether to accommodate portfolio turnover or cash flows from capital share transactions. The primary risks associated with the use of futures contracts are imperfect correlation between changes in market values of stocks held by the fund and the prices of futures contracts, and the possibility of an illiquid market.
Futures contracts are valued at their quoted daily settlement prices. The aggregate principal amounts of the contracts are not recorded in the Statement of Net Assets. Fluctuations in the value of the contracts are recorded in the Statement of Net Assets as an asset (liability) and in the Statement of Operations as unrealized appreciation (depreciation) until the contracts are closed, when they are recorded as realized futures gains (losses).
3. Federal Income Taxes: The fund intends to continue to qualify as a regulated investment company and distribute all of its taxable income. Management has analyzed the fund’s tax positions taken for all open federal income tax years (September 30, 2007–2010), and for the period ended March 31, 2011, and has concluded that no provision for federal income tax is required in the fund’s financial statements.
4. Distributions: Distributions to shareholders are recorded on the ex-dividend date.
5. Security Lending: The fund may lend its securities to qualified institutional borrowers to earn additional income. Security loans are required to be secured at all times by collateral at least equal to the market value of securities loaned. The fund invests cash collateral received in Vanguard Market Liquidity Fund, and records a liability for the return of the collateral, during the period the securities are on loan. Security lending income represents fees charged to borrowers plus income earned on investing cash collateral, less expenses associated with the loan.
6. Other: Dividend income is recorded on the ex-dividend date. Interest income includes income distributions received from Vanguard Market Liquidity Fund and is accrued daily. Security transactions are accounted for on the date securities are bought or sold. Costs used to determine realized gains (losses) on the sale of investment securities are those of the specific securities sold.
20
Strategic Equity Fund
B. The Vanguard Group furnishes at cost investment advisory, corporate management, administrative, marketing, and distribution services. The costs of such services are allocated to the fund under methods approved by the board of trustees. The fund has committed to provide up to 0.40% of its net assets in capital contributions to Vanguard. At March 31, 2011, the fund had contributed capital of $574,000 to Vanguard (included in Other Assets), representing 0.02% of the fund’s net assets and 0.23% of Vanguard’s capitalization. The fund’s trustees and officers are also directors and officers of Vanguard.
C. Various inputs may be used to determine the value of the fund’s investments. These inputs are summarized in three broad levels for financial statement purposes. The inputs or methodologies used to value securities are not necessarily an indication of the risk associated with investing in those securities.
Level 1—Quoted prices in active markets for identical securities.
Level 2—Other significant observable inputs (including quoted prices for similar securities, interest rates, prepayment speeds, credit risk, etc.).
Level 3—Significant unobservable inputs (including the fund’s own assumptions used to determine the fair value of investments).
The following table summarizes the fund’s investments as of March 31, 2011, based on the inputs used to value them:
| | | |
| | Level 1 | Level 2 | Level 3 |
| Investments | ($000) | ($000) | ($000) |
| Common Stocks | 3,600,429 | — | — |
| Temporary Cash Investments | 48,082 | 1,699 | — |
| Futures Contracts—Assets1 | 130 | — | — |
| Futures Contracts—Liabilities1 | (13) | — | — |
| Total | 3,648,628 | 1,699 | — |
| 1 Represents variation margin on the last day of the reporting period. | | | |
D. At March 31, 2011, the aggregate settlement value of open futures contracts and the related unrealized appreciation (depreciation) were:
| | | | |
| | | | | ($000) |
| | | | Aggregate | |
| | | Number of | Settlement | Unrealized |
| | | Long (Short) | Value | Appreciation |
| Futures Contracts | Expiration | Contracts | Long (Short) | (Depreciation) |
| E-mini Russell 2000 Index | June 2011 | 259 | 21,800 | 824 |
| S&P MidCap 400 Index | June 2011 | 10 | 4,935 | 275 |
| E-mini S&P MidCap 400 Index | June 2011 | 20 | 1,974 | 96 |
Unrealized appreciation (depreciation) on open futures contracts is required to be treated as realized gain (loss) for tax purposes.
E. Distributions are determined on a tax basis and may differ from net investment income and realized capital gains for financial reporting purposes. Differences may be permanent or temporary. Permanent differences are reclassified among capital accounts in the financial statements to reflect their tax character. Temporary differences arise when certain items of income, expense, gain, or loss are
21
Strategic Equity Fund
recognized in different periods for financial statement and tax purposes; these differences will reverse at some time in the future. Differences in classification may also result from the treatment of short-term gains as ordinary income for tax purposes.
The fund’s tax-basis capital gains and losses are determined only at the end of each fiscal year. For tax purposes, at September 30, 2010, the fund had available capital loss carryforwards totaling $1,800,489,000 to offset future net capital gains of $755,793,000 through September 30, 2017, and $1,044,696,000 through September 30, 2018. The fund will use these capital losses to offset net taxable capital gains, if any, realized during the year ending September 30, 2011; should the fund realize net capital losses for the year, the losses will be added to the loss carryforward balance above.
At March 31, 2011, the cost of investment securities for tax purposes was $2,678,791,000. Net unrealized appreciation of investment securities for tax purposes was $971,419,000, consisting of unrealized gains of $1,003,425,000 on securities that had risen in value since their purchase and $32,006,000 in unrealized losses on securities that had fallen in value since their purchase.
F. During the six months ended March 31, 2011, the fund purchased $1,064,294,000 of investment securities and sold $1,291,589,000 of investment securities, other than temporary cash investments.
G. Capital shares issued and redeemed were:
| | |
| | Six Months Ended | Year Ended |
| | March 31, 2011 | September 30, 2010 |
| | Shares | Shares |
| | (000) | (000) |
| Issued | 9,939 | 16,900 |
| Issued in Lieu of Cash Distributions | 2,125 | 2,690 |
| Redeemed | (23,579) | (73,654) |
| Net Increase (Decrease) in Shares Outstanding | (11,515) | (54,064) |
H. In preparing the financial statements as of March 31, 2011, management considered the impact of subsequent events for potential recognition or disclosure in these financial statements.
22
About Your Fund’s Expenses
As a shareholder of the fund, you incur ongoing costs, which include costs for portfolio management, administrative services, and shareholder reports (like this one), among others. Operating expenses, which are deducted from a fund’s gross income, directly reduce the investment return of the fund.
A fund’s expenses are expressed as a percentage of its average net assets. This figure is known as the expense ratio. The following examples are intended to help you understand the ongoing costs (in dollars) of investing in your fund and to compare these costs with those of other mutual funds. The examples are based on an investment of $1,000 made at the beginning of the period shown and held for the entire period.
The accompanying table illustrates your fund’s costs in two ways:
• Based on actual fund return. This section helps you to estimate the actual expenses that you paid over the period. The ”Ending Account Value“ shown is derived from the fund‘s actual return, and the third column shows the dollar amount that would have been paid by an investor who started with $1,000 in the fund. You may use the information here, together with the amount you invested, to estimate the expenses that you paid over the period.
To do so, simply divide your account value by $1,000 (for example, an $8,600 account value divided by $1,000 = 8.6), then multiply the result by the number given for your fund under the heading ”Expenses Paid During Period.“
• Based on hypothetical 5% yearly return. This section is intended to help you compare your fund‘s costs with those of other mutual funds. It assumes that the fund had a yearly return of 5% before expenses, but that the expense ratio is unchanged. In this case—because the return used is not the fund’s actual return—the results do not apply to your investment. The example is useful in making comparisons because the Securities and Exchange Commission requires all mutual funds to calculate expenses based on a 5% return. You can assess your fund’s costs by comparing this hypothetical example with the hypothetical examples that appear in shareholder reports of other funds.
Note that the expenses shown in the table are meant to highlight and help you compare ongoing costs only and do not reflect transaction costs incurred by the fund for buying and selling securities. Further, the expenses do not include the account service fee described in the prospectus. If such a fee were applied to your account, your costs would be higher. Your fund does not charge transaction fees, such as purchase or redemption fees, nor does it carry a “sales load.”
The calculations assume no shares were bought or sold during the period. Your actual costs may have been higher or lower, depending on the amount of your investment and the timing of any purchases or redemptions.
You can find more information about the fund’s expenses, including annual expense ratios, in the Financial Statements section of this report. For additional information on operating expenses and other shareholder costs, please refer to your fund’s current prospectus.
23
| | | |
| Six Months Ended March 31, 2011 | | | |
| | Beginning | Ending | Expenses |
| | Account Value | Account Value | Paid During |
| Strategic Equity Fund | 9/30/2010 | 3/31/2011 | Period |
| Based on Actual Fund Return | $1,000.00 | $1,259.53 | $1.69 |
| Based on Hypothetical 5% Yearly Return | 1,000.00 | 1,023.44 | 1.51 |
The calculations are based on expenses incurred in the most recent six-month period. The fund’s annualized six-month expense ratio for that period is 0.30%. The dollar amounts shown as “Expenses Paid” are equal to the annualized expense ratio multiplied by the average account value over the period, multiplied by the number of days in the most recent six-month period, then divided by the number of days in the most recent 12-month period.
24
Trustees Approve Advisory Arrangement
The board of trustees of Vanguard Strategic Equity Fund has renewed the fund’s investment advisory arrangement with The Vanguard Group, Inc. Vanguard—through its Quantitative Equity Group—serves as the investment advisor to the fund. The board determined that continuing the fund’s internalized management structure was in the best interests of the fund and its shareholders.
The board based its decision upon an evaluation of the advisor’s investment staff, portfolio management process, and performance. The trustees considered the factors discussed below, among others. However, no single factor determined whether the board approved the arrangement. Rather, it was the totality of the circumstances that drove the board’s decision.
Nature, extent, and quality of services
The board considered the quality of the fund’s investment management over both the short and long term, and took into account the organizational depth and stability of the advisor. The board noted that Vanguard has been managing investments for more than three decades. The Quantitative Equity Group adheres to a sound, disciplined investment management process; the team has considerable experience, stability, and depth.
The board concluded that Vanguard’s experience, stability, depth, and performance, among other factors, warranted continuation of the advisory arrangement.
Investment performance
The board considered the short- and long-term performance of the fund, including any periods of outperformance or underperformance of a relevant benchmark and peer group. The board concluded that the advisor has carried out the fund’s investment strategy in disciplined fashion, and that the fund has modestly underperformed its benchmark and outperformed its peer group over the short term (the last one-year period) and long term (since the inception of the fund). Information about the fund’s most recent performance can be found in the Performance Summary section of this report.
Cost
The board concluded that the fund’s expense ratio was well below the average expense ratio charged by funds in its peer group and that the fund’s advisory fee rate was also well below its peer-group average. Information about the fund’s expenses appears in the About Your Fund’s Expenses section of this report as well as in the Financial Statements section.
The board does not conduct a profitability analysis of Vanguard, because of Vanguard’s unique “at-cost” structure. Unlike most other mutual fund management companies, Vanguard is owned by the funds it oversees, and produces “profits” only in the form of reduced expenses for fund shareholders.
The benefit of economies of scale
The board concluded that the fund’s low-cost arrangement with Vanguard ensures that the fund will realize economies of scale as it grows, with the cost to shareholders declining as fund assets increase.
The board will consider whether to renew the advisory arrangement again after a one-year period.
25
Glossary
30-Day SEC Yield. A fund’s 30-day SEC yield is derived using a formula specified by the U.S. Securities and Exchange Commission. Under the formula, data related to the fund’s security holdings in the previous 30 days are used to calculate the fund’s hypothetical net income for that period, which is then annualized and divided by the fund’s estimated average net assets over the calculation period. For the purposes of this calculation, a security’s income is based on its current market yield to maturity (in the case of bonds) or its projected dividend yield (for stocks). Because the SEC yield represents hypothetical annualized income, it will differ—at times significantly—from the fund’s actual experience. As a result, the fund’s income distributions may be higher or lower than implied by the SEC yield.
Beta. A measure of the magnitude of a fund’s past share-price fluctuations in relation to the ups and downs of a given market index. The index is assigned a beta of 1.00. Compared with a given index, a fund with a beta of 1.20 typically would have seen its share price rise or fall by 12% when the index rose or fell by 10%. For this report, beta is based on returns over the past 36 months for both the fund and the index. Note that a fund’s beta should be reviewed in conjunction with its R-squared (see definition). The lower the R-squared, the less correlation there is between the fund and the index, and the less reliable beta is as an indicator of volatility.
Dividend Yield. Dividend income earned by stocks, expressed as a percentage of the aggregate market value (or of net asset value, for a fund). The yield is determined by dividing the amount of the annual dividends by the aggregate value (or net asset value) at the end of the period. For a fund, the dividend yield is based solely on stock holdings and does not include any income produced by other investments.
Earnings Growth Rate. The average annual rate of growth in earnings over the past five years for the stocks now in a fund.
Equity Exposure. A measure that reflects a fund’s investments in stocks and stock futures. Any holdings in short-term reserves are excluded.
Expense Ratio. The percentage of a fund’s average net assets used to pay its annual administrative and advisory expenses. These expenses directly reduce returns to investors.
Foreign Holdings. The percentage of a fund represented by stocks or depositary receipts of companies based outside the United States.
Inception Date. The date on which the assets of a fund (or one of its share classes) are first invested in accordance with the fund’s investment objective. For funds with a subscription period, the inception date is the day after that period ends. Investment performance is measured from the inception date.
Median Market Cap. An indicator of the size of companies in which a fund invests; the midpoint of market capitalization (market price x shares outstanding) of a fund’s stocks, weighted by the proportion of the fund’s assets invested in each stock. Stocks representing half of the fund’s assets have market capitalizations above the median, and the rest are below it.
Price/Book Ratio. The share price of a stock divided by its net worth, or book value, per share. For a fund, the weighted average price/book ratio of the stocks it holds.
26
Price/Earnings Ratio. The ratio of a stock’s current price to its per-share earnings over the past year. For a fund, the weighted average P/E of the stocks it holds. P/E is an indicator of market expectations about corporate prospects; the higher the P/E, the greater the expectations for a company’s future growth.
R-Squared. A measure of how much of a fund’s past returns can be explained by the returns from the market in general, as measured by a given index. If a fund’s total returns were precisely synchronized with an index’s returns, its R-squared would be 1.00. If the fund’s returns bore no relationship to the index’s returns, its R-squared would be 0. For this report, R-squared is based on returns over the past 36 months for both the fund and the index.
Return on Equity. The annual average rate of return generated by a company during the past five years for each dollar of shareholder’s equity (net income divided by shareholder’s equity). For a fund, the weighted average return on equity for the companies whose stocks it holds.
Short-Term Reserves. The percentage of a fund invested in highly liquid, short-term securities that can be readily converted to cash.
Turnover Rate. An indication of the fund’s trading activity. Funds with high turnover rates incur higher transaction costs and may be more likely to distribute capital gains (which may be taxable to investors). The turnover rate excludes in-kind transactions, which have minimal impact on costs.
27
The People Who Govern Your Fund
The trustees of your mutual fund are there to see that the fund is operated and managed in your best interests since, as a shareholder, you are a part owner of the fund. Your fund’s trustees also serve on the board of directors of The Vanguard Group, Inc., which is owned by the Vanguard funds and provides services to them on an at-cost basis.
A majority of Vanguard’s board members are independent, meaning that they have no affiliation with Vanguard or the funds they oversee, apart from the sizable personal investments they have made as private individuals. The independent board members have distinguished backgrounds in business, academia, and public service. Each of the trustees and executive officers oversees 179 Vanguard funds.
The following table provides information for each trustee and executive officer of the fund. More information about the trustees is in the Statement of Additional Information, which can be obtained, without charge, by contacting Vanguard at 800-662-7447, or online at vanguard.com.
| |
| Interested Trustee1 | and President (2006–2008) of Rohm and Haas Co. |
| | (chemicals); Director of Tyco International, Ltd. |
| F. William McNabb III | (diversified manufacturing and services) and Hewlett- |
| Born 1957. Trustee Since July 2009. Chairman of the | Packard Co. (electronic computer manufacturing); |
| Board. Principal Occupation(s) During the Past Five | Senior Advisor at New Mountain Capital; Trustee |
| Years: Chairman of the Board of The Vanguard Group, | of The Conference Board; Member of the Board of |
| Inc., and of each of the investment companies served | Managers of Delphi Automotive LLP (automotive |
| by The Vanguard Group, since January 2010; Director | components). |
| of The Vanguard Group since 2008; Chief Executive | |
| Officer and President of The Vanguard Group and of | Amy Gutmann |
| each of the investment companies served by The | Born 1949. Trustee Since June 2006. Principal |
| Vanguard Group since 2008; Director of Vanguard | Occupation(s) During the Past Five Years: President |
| Marketing Corporation; Managing Director of The | of the University of Pennsylvania; Christopher H. |
| Vanguard Group (1995–2008). | Browne Distinguished Professor of Political Science |
| | in the School of Arts and Sciences with secondary |
| | appointments at the Annenberg School for Commu- |
| Independent Trustees | nication and the Graduate School of Education |
| | of the University of Pennsylvania; Director of |
| Emerson U. Fullwood | Carnegie Corporation of New York, Schuylkill River |
| Born 1948. Trustee Since January 2008. Principal | Development Corporation, and Greater Philadelphia |
| Occupation(s) During the Past Five Years: Executive | Chamber of Commerce; Trustee of the National |
| Chief Staff and Marketing Officer for North America | Constitution Center; Chair of the Presidential |
| and Corporate Vice President (retired 2008) of Xerox | Commission for the Study of Bioethical Issues. |
| Corporation (document management products and | |
| services); Executive in Residence and 2010 | JoAnn Heffernan Heisen |
| Distinguished Minett Professor at the Rochester | Born 1950. Trustee Since July 1998. Principal |
| Institute of Technology; Director of SPX Corporation | Occupation(s) During the Past Five Years: Corporate |
| (multi-industry manufacturing), the United Way of | Vice President and Chief Global Diversity Officer |
| Rochester, Amerigroup Corporation (managed health | (retired 2008) and Member of the Executive |
| care), the University of Rochester Medical Center, | Committee (1997–2008) of Johnson & Johnson |
| Monroe Community College Foundation, and North | (pharmaceuticals/consumer products); Director of |
| Carolina A&T University. | Skytop Lodge Corporation (hotels), the University |
| | Medical Center at Princeton, the Robert Wood |
| Rajiv L. Gupta | Johnson Foundation, and the Center for Work Life |
| Born 1945. Trustee Since December 2001.2 | Policy; Member of the Advisory Board of the |
| Principal Occupation(s) During the Past Five Years: | Maxwell School of Citizenship and Public Affairs |
| Chairman and Chief Executive Officer (retired 2009) | at Syracuse University. |
| | |
| F. Joseph Loughrey | Thomas J. Higgins | |
| Born 1949. Trustee Since October 2009. Principal | Born 1957. Chief Financial Officer Since September |
| Occupation(s) During the Past Five Years: President | 2008. Principal Occupation(s) During the Past Five |
| and Chief Operating Officer (retired 2009) and Vice | Years: Principal of The Vanguard Group, Inc.; Chief |
| Chairman of the Board (2008–2009) of Cummins Inc. | Financial Officer of each of the investment companies |
| (industrial machinery); Director of SKF AB (industrial | served by The Vanguard Group since 2008; Treasurer |
| machinery), Hillenbrand, Inc. (specialized consumer | of each of the investment companies served by The |
| services), the Lumina Foundation for Education, and | Vanguard Group (1998–2008). |
| Oxfam America; Chairman of the Advisory Council | | |
| for the College of Arts and Letters and Member | Kathryn J. Hyatt | |
| of the Advisory Board to the Kellogg Institute for | Born 1955. Treasurer Since November 2008. Principal |
| International Studies at the University of Notre Dame. | Occupation(s) During the Past Five Years: Principal |
| | of The Vanguard Group, Inc.; Treasurer of each of |
| André F. Perold | the investment companies served by The Vanguard |
| Born 1952. Trustee Since December 2004. Principal | Group since 2008; Assistant Treasurer of each of the |
| Occupation(s) During the Past Five Years: George | investment companies served by The Vanguard Group |
| Gund Professor of Finance and Banking at the Harvard | (1988–2008). | |
| Business School; Chair of the Investment Committee | | |
| of HighVista Strategies LLC (private investment firm). | Heidi Stam | |
| | Born 1956. Secretary Since July 2005. Principal |
| Alfred M. Rankin, Jr. | Occupation(s) During the Past Five Years: Managing |
| Born 1941. Trustee Since January 1993. Principal | Director of The Vanguard Group, Inc., since 2006; |
| Occupation(s) During the Past Five Years: Chairman, | General Counsel of The Vanguard Group since 2005; |
| President, and Chief Executive Officer of NACCO | Secretary of The Vanguard Group and of each of the |
| Industries, Inc. (forklift trucks/housewares/lignite); | investment companies served by The Vanguard Group |
| Director of Goodrich Corporation (industrial products/ | since 2005; Director and Senior Vice President of |
| aircraft systems and services) and the National | Vanguard Marketing Corporation since 2005; |
| Association of Manufacturers; Chairman of the | Principal of The Vanguard Group (1997–2006). |
| Federal Reserve Bank of Cleveland; Vice Chairman | | |
| of University Hospitals of Cleveland; President of | | |
| the Board of The Cleveland Museum of Art. | Vanguard Senior Management Team |
| |
| Peter F. Volanakis | R. Gregory Barton | Michael S. Miller |
| Born 1955. Trustee Since July 2009. Principal | Mortimer J. Buckley | James M. Norris |
| Occupation(s) During the Past Five Years: President | Kathleen C. Gubanich | Glenn W. Reed |
| and Chief Operating Officer (retired 2010) of Corning | Paul A. Heller | George U. Sauter |
| Incorporated (communications equipment); Director of | | |
| Corning Incorporated (2000–2010) and Dow Corning | | |
| (2001–2010); Overseer of the Amos Tuck School of | Chairman Emeritus and Senior Advisor |
| Business Administration at Dartmouth College. | | |
| | John J. Brennan | |
| | Chairman, 1996–2009 | |
| Executive Officers | Chief Executive Officer and President, 1996–2008 |
| |
| Glenn Booraem | | |
| Born 1967. Controller Since July 2010. Principal | Founder | |
| Occupation(s) During the Past Five Years: Principal | | |
| of The Vanguard Group, Inc.; Controller of each of | John C. Bogle | |
| the investment companies served by The Vanguard | Chairman and Chief Executive Officer, 1974–1996 |
| Group since 2010; Assistant Controller of each of | | |
| the investment companies served by The Vanguard | | |
| Group (2001–2010). | | |
1 Mr. McNabb is considered an “interested person,” as defined in the Investment Company Act of 1940, because he is an officer of the
Vanguard funds.
2 December 2002 for Vanguard Equity Income Fund, Vanguard Growth Equity Fund, the Vanguard Municipal Bond Funds, and the Vanguard
State Tax-Exempt Funds.
|  |
| P.O. Box 2600 |
| Valley Forge, PA 19482-2600 |
Connect with Vanguard® > vanguard.com
| |
| Fund Information > 800-662-7447 | CFA® is a trademark owned by CFA Institute. |
| Direct Investor Account Services > 800-662-2739 | |
| Institutional Investor Services > 800-523-1036 | |
| Text Telephone for People | |
| With Hearing Impairment > 800-749-7273 | |
| |
| This material may be used in conjunction | |
| with the offering of shares of any Vanguard | |
| fund only if preceded or accompanied by | |
| the fund’s current prospectus. | |
| |
| All comparative mutual fund data are from Lipper Inc. or | |
| Morningstar, Inc., unless otherwise noted. | |
| |
| You can obtain a free copy of Vanguard’s proxy voting | |
| guidelines by visiting vanguard.com/proxyreporting or by | |
| calling Vanguard at 800-662-2739. The guidelines are | |
| also available from the SEC’s website, sec.gov. In | |
| addition, you may obtain a free report on how your fund | |
| voted the proxies for securities it owned during the 12 | |
| months ended June 30. To get the report, visit either | |
| vanguard.com/proxyreporting or sec.gov. | |
| |
| You can review and copy information about your fund at | |
| the SEC’s Public Reference Room in Washington, D.C. To | |
| find out more about this public service, call the SEC at | |
| 202-551-8090. Information about your fund is also | |
| available on the SEC’s website, and you can receive | |
| copies of this information, for a fee, by sending a | |
| request in either of two ways: via e-mail addressed to | |
| publicinfo@sec.gov or via regular mail addressed to the | |
| Public Reference Section, Securities and Exchange | |
| Commission, Washington, DC 20549-1520. | |
| | © 2011 The Vanguard Group, Inc. |
| | All rights reserved. |
| | Vanguard Marketing Corporation, Distributor. |
| |
| | Q1142 052011 |
 |
| Vanguard Capital Opportunity Fund |
| Semiannual Report |
|
| March 31, 2011 |
|
 |
|
|
> Vanguard Capital Opportunity Fund returned nearly 19% for the six months ended March 31, 2011, in line with the average return of peer funds.
> The fund, which is diversified across companies of various sizes, lagged its Russell Midcap Growth Index benchmark.
> Information technology, the fund’s largest sector, provided a modest lead over the benchmark but couldn’t make up for the weakness in health care holdings.
| |
| Contents | |
| Your Fund’s Total Returns. | 1 |
| Chairman’s Letter. | 2 |
| Advisor’s Report. | 6 |
| Fund Profile. | 10 |
| Performance Summary. | 11 |
| Financial Statements. | 12 |
| About Your Fund’s Expenses. | 23 |
| Trustees Approve Advisory Agreement. | 25 |
| Glossary. | 26 |
Please note: The opinions expressed in this report are just that—informed opinions. They should not be considered promises or advice. Also, please keep in mind that the information and opinions cover the period through the date on the front of this report. Of course, the risks of investing in your fund are spelled out in the prospectus.
See the Glossary for definitions of investment terms used in this report.
Cover photograph: Jean Maher.
Your Fund’s Total Returns
| |
| Six Months Ended March 31, 2011 | |
| | Total |
| | Returns |
| Vanguard Capital Opportunity Fund | |
| Investor Shares | 18.72% |
| Admiral™ Shares | 18.74 |
| Russell Midcap Growth Index | 22.96 |
| Multi-Cap Growth Funds Average | 18.91 |
Multi-Cap Growth Funds Average: Derived from data provided by Lipper Inc.
Admiral Shares carry lower expenses and are available to investors who meet certain account-balance requirements.
| | | | |
| Your Fund’s Performance at a Glance | | | | |
| September 30, 2010 , Through March 31, 2011 | | | | |
| | | | Distributions Per Share |
| | Starting | Ending | Income | Capital |
| | Share Price | Share Price | Dividends | Gains |
| Vanguard Capital Opportunity Fund | | | | |
| Investor Shares | $29.59 | $35.00 | $0.121 | $0.000 |
| Admiral Shares | 68.38 | 80.85 | 0.322 | 0.000 |
1

Chairman’s Letter
Dear Shareholder,
U.S. equity markets proved resilient in the face of multiple uncertainties—including the geopolitical upheaval in the Middle East and North Africa, Japan’s devastating earthquake and tsunami, and budget gridlock in Washington. For the six months ended March 31, Vanguard Capital Opportunity Fund returned 18.72% for Investor Shares and 18.74% for Admiral Shares.
As we have noted in past letters, your fund has certain characteristics—including a concentration in information technology and health care stocks—that differ markedly from those of its benchmark and some of its peer funds. This can make short-term performance comparisons less meaningful. Nevertheless, the fund’s six-month result was in line with the average return for multi-capitalization growth funds and the broad U.S. stock market’s return, while it lagged the Russell Midcap Growth Index’s return. Mid-cap stocks again generally outperformed large-caps—which represented almost half of the fund’s holdings.
2
Despite distressing headlines, stock markets rallied
Most global stock markets produced exceptional returns for the six months ended March 31, a period punctuated by some unnerving developments around the world. In the United States, the economy continued its extended recovery. Job growth picked up, fueling hopes that the good news might be persistent enough to bring down the high unemployment rate.
The broad U.S. stock market returned more than 18%. The stocks of smaller companies, which are keenly sensitive to the rhythms of the business cycle, did even better. Non-U.S. stock markets trailed their American counterparts, though as a group, their six-month return topped 10%. European stocks performed best.
All but the shortest-term rates moved higher, affecting bond prices
With the exception of the shortest-term securities, the rates on fixed income investments moved higher during the half-year. At the start of the period, the 10-year U.S. Treasury note yielded a meager 2.51%. By the end, the rate had climbed to 3.45% as investors demanded more compensation for the possibility that inflation will continue to accelerate from financial-crisis lows.
Rising rates put short-term pressure on bond prices. The broad U.S. taxable bond market produced a slightly negative return. The broad municipal bond market, which came under pressure both from rising rates and concern (exaggerated, in Vanguard’s view) about the financial strength of state and municipal borrowers, returned –3.68%.
| | | |
| Market Barometer | | | |
| |
| | | Total Returns |
| | | Periods Ended March 31, 2011 |
| | Six | One | Five Years |
| | Months | Year | (Annualized) |
| Stocks | | | |
| Russell 1000 Index (Large-caps) | 18.13% | 16.69% | 2.93% |
| Russell 2000 Index (Small-caps) | 25.48 | 25.79 | 3.35 |
| Dow Jones U.S. Total Stock Market Index | 18.51 | 17.50 | 3.27 |
| MSCI All Country World Index ex USA (International) | 10.85 | 13.15 | 3.59 |
| |
| Bonds | | | |
| Barclays Capital U.S. Aggregate Bond Index (Broad | | | |
| taxable market) | -0.88% | 5.12% | 6.03% |
| Barclays Capital Municipal Bond Index (Broad | | | |
| tax-exempt market) | -3.68 | 1.63 | 4.14 |
| Citigroup Three-Month U.S. Treasury Bill Index | 0.06 | 0.15 | 2.09 |
| |
| CPI | | | |
| Consumer Price Index | 2.30% | 2.68% | 2.26% |
3
As it has since December 2008, the Federal Reserve held its target for short-term interest rates near 0%. This stance kept the returns available from money market instruments, such as the 3-month Treasury bill, in the same neighborhood.
The fund’s long-term investments posted mixed short-term results
PRIMECAP Management Company, the Capital Opportunity Fund’s advisor, anticipates exceptional long-term growth in demand for information technology and health care—especially in fast-growing emerging markets. These two sectors represented more than 60% of the fund’s value, on average, during the six months, compared with slightly more than 35% of the Russell Midcap Growth Index.
IT and health care stocks have helped your low-turnover fund deliver superior returns over the long run, but it would be unrealistic to expect them to outperform in every time period.
Returns were strong across the technology sector, in part thanks to consumers’ enthusiasm for tablet computers and smartphones. Representing almost 40% of assets, IT was responsible for an even greater share of the fund’s return. Three of Capital Opportunity’s top-ten holdings—Altera, Research In Motion, and Netherlands-based ASML Holding—together added more than 3 percentage points to its gains.
In contrast, the overall performance of the fund’s health care holdings was anemic: The sector returned 20% for
| | | |
| Expense Ratios | | | |
| Your Fund Compared With Its Peer Group | | | |
| | Investor | Admiral | Peer Group |
| | Shares | Shares | Average |
| Capital Opportunity Fund | 0.48% | 0.41% | 1.45% |
The fund expense ratios shown are from the prospectus dated January 26, 2011, and represent estimated costs for the current fiscal year. For the six months ended March 31, 2011, the fund’s annualized expense ratios were 0.48% for Investor Shares and 0.41% for Admiral Shares. The peer-group expense ratio is derived from data provided by Lipper Inc. and captures information through year-end 2010.
Peer group: Multi-Cap Growth Funds.
4
the benchmark index but less than half that much for the fund. Concerns including expiring patents and regulatory review of new treatments held back top-ten stocks Amgen and Eli Lilly. On the plus side, two other top-ten stocks—Biogen Idec and Roche Holding—advanced more than 30% and almost 10%, respectively, during the period.
As the economy continued to grind into gear, industrial stocks benefited. Electrical component makers Thomas & Betts and Rockwell Automation each rose roughly 50%, adding to last year’s sizable gains. Monsanto, a leader in genetically modified seeds—as well as the fund’s largest holding and its only stock in the materials sector—began to recover ground lost in the last two years.
For the period, the fund’s total return was about 4 percentage points behind that of the Russell Midcap Growth Index. Keep in mind, however, that the fund holds 100-plus stocks, compared with almost 500 stocks in the index, and that some of these holdings are not included in the index—such as Monsanto and ASML, which helped, and some pharmaceutical giants that lagged. Also, PRIMECAP manages the fund with a three- to five-year investment horizon rather than with an eye toward short-term results.
Spread your nest egg across multiple baskets
By almost any measure, equity returns in the last six months were exceptional. Both the broad U.S. market and the Russell Midcap Growth Index advanced each month, although at a slower pace amid March’s global events. Of course, market currents can change swiftly, and periods of strength are often followed by stretches of weakness.
As I write this letter, many investors are concerned about higher oil prices—could they derail the U.S. economic recovery, and what do they mean for inflation and short-term interest rates? After evaluating several scenarios, Vanguard’s economists concluded that if benchmark U.S. crude oil prices were to rise to $120 a barrel in the coming months, the U.S. economic recovery would likely be weaker than expected. Oil prices would likely need to persist at $150 per barrel to generate another U.S. recession.
One of the ways you can try to buffer your nest egg from such shocks is to develop allocations to stock, bond, and money market funds in proportions consistent with your goals and ability to withstand the stock market’s unpredictable swings. With the advisor’s long-term investing horizon, Vanguard Capital Opportunity Fund can play a useful role in a diversified portfolio by providing low-cost exposure to companies with attractive growth potential.
Thank you for entrusting your assets to Vanguard.
Sincerely,

F. William McNabb III
President and Chief Executive Officer
April 13, 2011
5
Advisor’s Report
For the six months ended March 31, 2011, Vanguard Capital Opportunity Fund returned 18.72% for Investor Shares and 18.74% for Admiral Shares, trailing the 22.96% return of its benchmark, the Russell Midcap Growth Index, and slightly lagging the 18.91% average return of multi-cap growth fund competitors. While the fund provided good returns, we are disappointed with its performance relative to the index. The fund’s holdings in the health care and consumer discretionary sectors hurt its results, although this was partially offset by stock selection in materials and information technology and an underweighting of the telecommunication services sector.
Investment environment
The U.S. stock market provided strong returns during the past six months, extending the rally that began last summer. For example, the S&P 500 Index rose almost 30% from June 2010 through March 2011 and has nearly doubled from the lows reached in March 2009.
The U.S. economy continued its recovery from the recession; gross domestic product grew just over 3% in the fourth quarter of 2010. Consumer spending continued to rebound, rising about 4% in the fourth quarter of 2010, the highest rate of growth since the fourth quarter of 2006. Industrial production increased as companies rebuilt inventories and returned to growth mode. Capacity utilization also began to tighten.
However, there are reasons for caution regarding the sustainability of this recovery. Unemployment is persistently high at almost 9%, housing markets remain weak, and governments at the federal, state, and local levels face significant fiscal challenges. Meanwhile, the unrest in the Middle East and the tragic earthquakes in Japan have added uncertainty to the global economic outlook.
Management of the fund
Our investment approach remains consistent. We rely on fundamental research to find companies whose revenues and earnings will, in our opinion, grow more rapidly over a three- to five-year time frame than current valuations might suggest. Our focus is on assessing the fundamental value of a company relative to its current market value.
This investment strategy has led us to build and maintain significant investments in health care and information technology companies that we believe offer the potential for higher returns than the overall market. These two sectors composed slightly more than 60% of the fund’s holdings (versus not quite 37% of the Russell Midcap Growth Index). Six-month returns for both sectors in the Russell Midcap Growth Index trailed the benchmark’s overall return. In the fund, poor stock selection in health care further hurt returns. However, positive selection in information technology helped.
6
Health care
In the Russell Midcap Growth Index, the health care sector returned 20.1%. The fund’s holdings in health care fared significantly worse, returning 8.8%. Three of the largest detractors from the fund’s sector return, and also from its overall return, were Eli Lilly (–1%), Amgen (–3%), and Novartis (–2%). The fund’s stake in Biogen Idec (+31%) was one of the few bright spots in the sector during this period.
Health care holdings have hurt the fund’s performance relative to the index for the last two years. We built considerable positions in large pharmaceutical, biotechnology, and medical device companies based on the view that new product introductions combined with growing demand from an aging global population would lead to growth in revenues and earnings that would more than offset patent expirations. Our thesis has been challenged by several factors. Large, sophisticated buyers such as governments and managed health plans have increased pricing pressure and limited unit growth relative to our expectations. At the same time, the rate of innovation in the industry has been disappointing. The industry has also faced additional regulatory challenges as the U.S. Food and Drug Administration has adopted a more risk-averse and conservative approach to reviewing new products and monitoring existing ones.
We believe there are several reasons to remain optimistic about the prospects for large pharmaceutical, biotechnology, and medical device companies. First, market expectations are low as implied by current valuation multiples, which are well below those of the overall market. Second, these companies generate significant positive cash flows from their existing products and have strong balance sheets. Third, the aging global population and rising living standards in emerging markets should lead to increased demand for health care products. Fourth, we believe that a more fundamental understanding of diseases and their causes will lead to improved treatments, resulting in future growth for these companies.
The pace of scientific development is difficult to predict, but the potential for better treatments for diseases such as cancer, diabetes, and Alzheimer’s is enormous, as are the possibilities for personalized medicines based on an improving understanding of the human genome.
Technology
The information technology sector returned 19.4% in the Russell Midcap Growth Index, trailing the index’s total return. However, thanks to positive stock selection, the fund’s information technology holdings returned 21.3%. Among the largest contributors were ASML Holding (+50%), Altera (+46%), NVIDIA (+58%), and Trimble Navigation
7
(+44%). These results were partially offset by subpar returns from Cree (–15%), Rambus (–5%), and Google (+12%).
Innovation continues unabated in technology, leading, in our judgment, to many attractive investment opportunities. One of the most significant developments in recent years has been the emergence of cloud computing, which, broadly speaking, refers to the availability of processing power and computer storage as a utility that can be accessed anywhere, anytime, and on any device. The migration to the cloud has been led by consumers eager to access the benefits of new devices and services such as smartphones, tablets, and social networking, as well as existing services such as internet search, e-mail, and online storage of photos and videos. In contrast, businesses have been more cautious, but they could eventually represent an even larger opportunity.
Surprisingly, when investors think about the cloud, they seem to think primarily of relatively new (and privately owned) companies such as Facebook, Twitter, and Groupon. These are indeed exciting new enterprises. However, we believe that many of the companies in our portfolio that provide core services and enabling infrastructure, such as Google, Microsoft, and EMC Corp., will also benefit significantly as consumers and businesses increasingly embrace cloud computing over the next few years. Furthermore, these companies trade at very low valuation multiples and enjoy exceptionally strong balance sheets.
Other sector highlights
Poor stock selection in the consumer discretionary and industrial sectors hurt the fund’s results. DIRECTV (+12%), 99 Cents Only Stores (–19%), and Whirlpool (+7%) were some of the biggest detractors among consumer discretionary holdings. Several industrial stocks that are highly sensitive to oil prices, such as Southwest Airlines (–3%), FedEx (+10%), AMR (+3%), and JetBlue (–6%), were also notable detractors.
On a positive note, favorable stock selection in materials more than offset the fund’s underweighted position in the sector, which had the second-highest return in the benchmark index (energy was in first place). Monsanto (+52%), our sole holding in materials and the largest holding in the fund overall, boosted results. Minimal holdings in telecommunication services—the index’s weakest sector, with a return of only 2.2%—also helped relative returns.
Outlook
Looking to the rest of fiscal year 2011 and beyond, we continue to view U.S. equities as an attractive investment opportunity, especially relative to most other asset classes. Valuation multiples remain below historical averages despite a low interest rate environment. Many companies, having recovered from the recent recession with more efficient operations and improved balance sheets, are generating accelerating growth in revenues and earnings. Despite
8
the rise in energy and commodity prices, inflation seems manageable, at least in the near term, for consumers and businesses.
Some macro-level concerns continue to temper our generally positive assessment. Fiscal and monetary policy, increased regulatory burdens, and political unrest in the Middle East inject an element of risk. Domestically, fiscal challenges faced by the federal, state, and local governments raise great uncertainty about future budgets and tax policies. Overseas, many developed countries such as Greece, Portugal, Ireland, and Spain continue to face massive fiscal problems. In addition, it is unclear how and when the political and social turmoil in the Middle East will be resolved and what the outcome will mean for oil prices.
On balance, we are positive in our outlook for U.S. equities, and we remain committed to the fund’s substantial position in technology and health care companies—areas in which we expect innovation to continue to accelerate, leading to greater growth opportunities than the market currently expects.
PRIMECAP Management Company
April 14, 2011
Capital Opportunity Fund
Fund Profile
As of March 31, 2011
| | |
| Share-Class Characteristics | |
| | Investor | Admiral |
| | Shares | Shares |
| Ticker Symbol | VHCOX | VHCAX |
| Expense Ratio1 | 0.48% | 0.41% |
| 30-Day SEC Yield | 0.37% | 0.44% |
| | | |
| Portfolio Characteristics | | |
| | | Russell | DJ |
| | | Midcap | U.S. Total |
| | | Growth | Market |
| | Fund | Index | Index |
| Number of Stocks | 115 | 490 | 3,817 |
| Median Market Cap | $14.1B | $8.2B | $31.4B |
| Price/Earnings Ratio | 18.6x | 23.8x | 17.9x |
| Price/Book Ratio | 2.9x | 4.0x | 2.3x |
| Return on Equity | 17.7% | 19.1% | 18.9% |
| Earnings Growth Rate | 13.6% | 9.1% | 5.9% |
| Dividend Yield | 0.9% | 0.8% | 1.7% |
| Foreign Holdings | 12.2% | 0.0% | 0.0% |
| Turnover Rate | | | |
| (Annualized) | 6% | — | — |
| Short-Term Reserves | 2.0% | — | — |
| | | |
| Sector Diversification (% of equity exposure) |
| | | Russell | DJ |
| | | Midcap | U.S. Total |
| | | Growth | Market |
| | Fund | Index | Index |
| Consumer | | | |
| Discretionary | 11.8% | 19.8% | 11.8% |
| Consumer Staples | 0.0 | 5.3 | 9.2 |
| Energy | 6.6 | 6.5 | 11.8 |
| Financials | 0.3 | 7.2 | 16.2 |
| Health Care | 23.4 | 13.4 | 10.7 |
| Industrials | 14.3 | 16.0 | 11.6 |
| Information | | | |
| Technology | 38.1 | 22.8 | 18.5 |
| Materials | 4.1 | 7.0 | 4.5 |
| Telecommunication | | | |
| Services | 0.4 | 1.7 | 2.6 |
| Utilities | 1.0 | 0.3 | 3.1 |
| | |
| Volatility Measures | | |
| | Russell | DJ |
| | Midcap | U.S. Total |
| | Growth | Market |
| | Index | Index |
| R-Squared | 0.95 | 0.92 |
| Beta | 0.95 | 1.09 |
These measures show the degree and timing of the fund’s fluctuations compared with the indexes over 36 months.
| | |
| Ten Largest Holdings (% of total net assets) |
| Monsanto Co. | Fertilizers & | |
| | Agricultural | |
| | Chemicals | 4.0% |
| Altera Corp. | Semiconductors | 3.7 |
| Biogen Idec Inc. | Biotechnology | 3.5 |
| Research In Motion Ltd. | Communications | |
| | Equipment | 3.3 |
| Eli Lilly & Co. | Pharmaceuticals | 3.1 |
| DIRECTV Class A | Cable & Satellite | 3.1 |
| FedEx Corp. | Air Freight & | |
| | Logistics | 3.1 |
| Amgen Inc. | Biotechnology | 2.9 |
| Roche Holding AG | Pharmaceuticals | 2.6 |
| ASML Holding NV ADR | Semiconductor | |
| | Equipment | 2.4 |
| Top Ten | | 31.7% |
The holdings listed exclude any temporary cash investments and equity index products.
Investment Focus
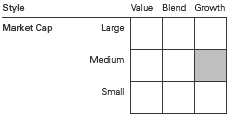
1 The expense ratios shown are from the prospectus dated January 26, 2011, and represent estimated costs for the current fiscal year. For the six months ended March 31, 2011, the annualized expense ratios were 0.48% for Investor Shares and 0.41% for Admiral Shares.
10
Capital Opportunity Fund
Performance Summary
All of the returns in this report represent past performance, which is not a guarantee of future results that may be achieved by the fund. (Current performance may be lower or higher than the performance data cited. For performance data current to the most recent month-end, visit our website at vanguard.com/performance.) Note, too, that both investment returns and principal value can fluctuate widely, so an investor’s shares, when sold, could be worth more or less than their original cost. The returns shown do not reflect taxes that a shareholder would pay on fund distributions or on the sale of fund shares.
Fiscal-Year Total Returns (%): September 30, 2000, Through March 31, 2011
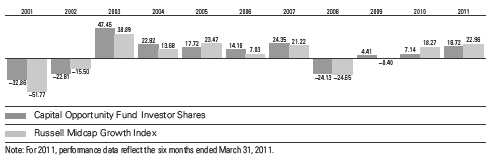
| | | | |
| Average Annual Total Returns: Periods Ended March 31, 2011 | | | |
| |
| | Inception | One | Five | Ten |
| | Date | Year | Years | Years |
| Investor Shares | 8/14/1995 | 11.24% | 4.50% | 6.66% |
| Admiral Shares | 11/12/2001 | 11.30 | 4.59 | 8.471 |
| 1 Return since inception. | | | | |
Vanguard fund returns do not reflect the 1% fee on redemptions of shares held for less than one year.
See Financial Highlights for dividend and capital gains information.
11
Capital Opportunity Fund
Financial Statements (unaudited)
Statement of Net Assets
As of March 31, 2011
The fund reports a complete list of its holdings in regulatory filings four times in each fiscal year, at the quarter-ends. For the second and fourth fiscal quarters, the lists appear in the fund’s semiannual and annual reports to shareholders. For the first and third fiscal quarters, the fund files the lists with the Securities and Exchange Commission on Form N-Q. Shareholders can look up the fund’s Forms N-Q on the SEC’s website at sec.gov. Forms N-Q may also be reviewed and copied at the SEC’s Public Reference Room (see the back cover of this report for further information).
| | | |
| | | | Market |
| | | | Value |
| | | Shares | ($000) |
| Common Stocks (97.9%) | | |
| Consumer Discretionary (11.5%) | |
| * | DIRECTV Class A | 5,846,376 | 273,611 |
| * | Bed Bath & Beyond Inc. | 3,097,600 | 149,521 |
| *,1 | Ascena Retail Group Inc. | 4,539,500 | 147,125 |
| * | CarMax Inc. | 4,346,797 | 139,532 |
| | Whirlpool Corp. | 1,191,100 | 101,672 |
| | TJX Cos. Inc. | 1,600,000 | 79,568 |
| | Gentex Corp. | 1,484,800 | 44,915 |
| * | Quiksilver Inc. | 4,461,500 | 19,720 |
| * | Amazon.com Inc. | 85,000 | 15,311 |
| | Carnival Corp. | 389,800 | 14,953 |
| | Nordstrom Inc. | 290,000 | 13,015 |
| | Lowe’s Cos. Inc. | 400,000 | 10,572 |
| * | O’Reilly Automotive Inc. | 150,000 | 8,619 |
| 1 | Strattec Security Corp. | 214,000 | 7,164 |
| * | DreamWorks Animation | | |
| | SKG Inc. Class A | 155,000 | 4,329 |
| | | | 1,029,627 |
| Energy (6.5%) | | |
| | Murphy Oil Corp. | 1,600,000 | 117,472 |
| | Noble Energy Inc. | 958,200 | 92,610 |
| * | Oceaneering International | | |
| | Inc. | 986,000 | 88,198 |
| | National Oilwell Varco Inc. | 1,036,000 | 82,124 |
| * | McDermott International | | |
| | Inc. | 3,000,000 | 76,170 |
| * | Plains Exploration & | | |
| | Production Co. | 1,100,000 | 39,853 |
| | ConocoPhillips | 300,000 | 23,958 |
| | Cabot Oil & Gas Corp. | 345,000 | 18,275 |
| * | Pride International Inc. | 415,000 | 17,824 |
| * | Exterran Holdings Inc. | 641,700 | 15,227 |
| * | Transocean Ltd. | 100,000 | 7,795 |
| | | | 579,506 |
| Financials (0.3%) | | |
| | Chubb Corp. | 390,000 | 23,911 |
| | | |
| | | | Market |
| | | | Value |
| | | Shares | ($000) |
| Health Care (22.9%) | | |
| * | Biogen Idec Inc. | 4,252,100 | 312,062 |
| | Eli Lilly & Co. | 7,814,700 | 274,843 |
| * | Amgen Inc. | 4,818,200 | 257,533 |
| | Roche Holding AG | 1,619,000 | 231,137 |
| | Medtronic Inc. | 5,241,800 | 206,265 |
| | Novartis AG ADR | 3,370,000 | 183,160 |
| * | Dendreon Corp. | 4,428,500 | 165,759 |
| * | BioMarin Pharmaceutical | | |
| | Inc. | 5,023,400 | 126,238 |
| * | Life Technologies Corp. | 2,071,445 | 108,585 |
| * | Boston Scientific Corp. | 8,249,700 | 59,315 |
| * | Cerner Corp. | 378,800 | 42,123 |
| * | Illumina Inc. | 463,400 | 32,470 |
| * | Edwards Lifesciences | | |
| | Corp. | 300,000 | 26,100 |
| * | Waters Corp. | 89,000 | 7,734 |
| * | Pharmacyclics Inc. | 1,045,062 | 6,155 |
| * | Affymetrix Inc. | 856,498 | 4,462 |
| * | Charles River Laboratories | | |
| | International Inc. | 70,000 | 2,687 |
| * | InterMune Inc. | 27,000 | 1,274 |
| | | | 2,047,902 |
| Industrials (14.0%) | | |
| | FedEx Corp. | 2,918,650 | 273,040 |
| *,1 | Thomas & Betts Corp. | 3,100,000 | 184,357 |
| | Rockwell Automation Inc. | 1,915,000 | 181,255 |
| | Southwest Airlines Co. | 9,919,100 | 125,278 |
| | Pall Corp. | 1,400,000 | 80,654 |
| ^ | Ritchie Bros Auctioneers | | |
| | Inc. | 2,572,500 | 72,416 |
| * | Babcock & Wilcox Co. | 1,800,000 | 60,084 |
| * | AMR Corp. | 8,907,100 | 57,540 |
| | CH Robinson Worldwide | | |
| | Inc. | 735,000 | 54,485 |
| * | JetBlue Airways Corp. | 5,940,150 | 37,245 |
| | Union Pacific Corp. | 307,000 | 30,187 |
| | Expeditors International of | | |
| | Washington Inc. | 585,000 | 29,332 |
12
Capital Opportunity Fund
| | | |
| | | | Market |
| | | | Value |
| | | Shares | ($000) |
| * | Aecom Technology Corp. | 820,000 | 22,739 |
| | SPX Corp. | 242,200 | 19,228 |
| | Chicago Bridge & | | |
| | Iron Co. NV | 368,930 | 15,001 |
| * | Jacobs Engineering | | |
| | Group Inc. | 65,000 | 3,343 |
| * | European Aeronautic | | |
| | Defence and Space | | |
| | Co. NV | 50,050 | 1,458 |
| * | US Airways Group Inc. | 57,000 | 496 |
| | | | 1,248,138 |
| Information Technology (37.3%) | |
| | Altera Corp. | 7,514,400 | 330,784 |
| * | Research In Motion Ltd. | 5,272,900 | 298,288 |
| | ASML Holding NV ADR | 4,832,489 | 215,046 |
| * | NVIDIA Corp. | 10,884,050 | 200,920 |
| * | Symantec Corp. | 10,325,300 | 191,431 |
| * | Cree Inc. | 4,124,900 | 190,405 |
| * | Google Inc. Class A | 303,400 | 177,856 |
| | Corning Inc. | 8,580,000 | 177,005 |
| * | Electronic Arts Inc. | 7,893,600 | 154,162 |
| * | Trimble Navigation Ltd. | 2,778,800 | 140,441 |
| * | Rambus Inc. | 5,235,000 | 103,653 |
| | Microsoft Corp. | 3,875,000 | 98,270 |
| | Texas Instruments Inc. | 2,816,600 | 97,342 |
| * | Adobe Systems Inc. | 2,590,000 | 85,884 |
| * | Flextronics International | | |
| | Ltd. | 10,096,700 | 75,422 |
| * | EMC Corp. | 2,825,000 | 75,004 |
| * | NeuStar Inc. Class A | 2,631,000 | 67,301 |
| * | SanDisk Corp. | 1,399,948 | 64,524 |
| * | Micron Technology Inc. | 5,550,000 | 63,603 |
| *,1 | FormFactor Inc. | 5,756,700 | 59,294 |
| | Hewlett-Packard Co. | 1,350,000 | 55,309 |
| * | Smart Technologies Inc. | | |
| | Class A | 4,672,304 | 47,704 |
| | Plantronics Inc. | 1,150,000 | 42,113 |
| | Intersil Corp. Class A | 3,214,200 | 40,017 |
| *,1 | Descartes Systems | | |
| | Group Inc. | 4,645,000 | 30,936 |
| * | Motorola Solutions Inc. | 685,714 | 30,645 |
| * | Intuit Inc. | 470,000 | 24,957 |
| * | eBay Inc. | 800,000 | 24,832 |
| | QUALCOMM Inc. | 390,000 | 21,384 |
| * | Entegris Inc. | 2,019,231 | 17,709 |
| * | Rovi Corp. | 300,000 | 16,095 |
| * | Ciena Corp. | 607,142 | 15,761 |
| * | Motorola Mobility | | |
| | Holdings Inc. | 600,000 | 14,640 |
| * | Cymer Inc. | 250,000 | 14,145 |
| | Xilinx Inc. | 430,000 | 14,104 |
| * | FEI Co. | 355,000 | 11,971 |
| * | Nuance Communications | | |
| | Inc. | 600,000 | 11,736 |
| | | |
| | | | Market |
| | | | Value |
| | | Shares | ($000) |
| * | Brocade Communications | | |
| | Systems Inc. | 1,350,000 | 8,302 |
| * | Apple Inc. | 22,000 | 7,666 |
| | Jabil Circuit Inc. | 245,100 | 5,007 |
| * | Citrix Systems Inc. | 65,000 | 4,775 |
| * | Yahoo! Inc. | 250,000 | 4,162 |
| | Accenture plc Class A | 49,700 | 2,732 |
| | KLA-Tencor Corp. | 50,000 | 2,368 |
| * | Akamai Technologies Inc. | 39,000 | 1,482 |
| | Visa Inc. Class A | 8,000 | 589 |
| | Mastercard Inc. Class A | 1,300 | 327 |
| * | Avid Technology Inc. | 10,000 | 223 |
| | | | 3,338,326 |
| Materials (4.0%) | | |
| | Monsanto Co. | 4,946,986 | 357,469 |
| |
| Telecommunication Services (0.4%) | |
| * | Sprint Nextel Corp. | 7,814,700 | 36,260 |
| |
| Utilities (1.0%) | | |
| * | AES Corp. | 4,688,425 | 60,950 |
| | Public Service Enterprise | | |
| | Group Inc. | 1,005,600 | 31,686 |
| | | | 92,636 |
| Total Common Stocks | | |
| (Cost $5,790,474) | | 8,753,775 |
| Temporary Cash Investment (2.4%) | |
| Money Market Fund (2.4%) | | |
| 2,3 | Vanguard Market Liquidity | | |
| | Fund, 0.208% | | |
| | (Cost $213,929) | 213,928,531 | 213,929 |
| Total Investments (100.3%) | | |
| (Cost $6,004,403) | | 8,967,704 |
| Other Assets and Liabilities (-0.3%) | |
| Other Assets | | 42,331 |
| Liabilities3 | | (67,510) |
| | | | (25,179) |
| Net Assets (100%) | | 8,942,525 |
13
Capital Opportunity Fund
| |
| | Market |
| | Value |
| | ($000) |
| Statement of Assets and Liabilities | |
| Assets | |
| Investments in Securities, at Value | 8,967,704 |
| Receivables for Investment | |
| Securities Sold | 24,158 |
| Receivables for Capital Shares Issued | 5,294 |
| Other Assets | 12,879 |
| Total Assets | 9,010,035 |
| Liabilities | |
| Security Lending Collateral | |
| Payable to Brokers | 35,905 |
| Other Liabilities | 31,605 |
| Total Liabilities | 67,510 |
| Net Assets | 8,942,525 |
| |
| At March 31, 2011, net assets consisted of: |
| | Amount |
| | ($000) |
| Paid-in Capital | 5,914,848 |
| Undistributed Net Investment Income | 4,725 |
| Accumulated Net Realized Gains | 59,414 |
| Unrealized Appreciation (Depreciation) | |
| Investment Securities | 2,963,301 |
| Foreign Currencies | 237 |
| Net Assets | 8,942,525 |
| |
| Investor Shares—Net Assets | |
| Applicable to 92,119,992 outstanding | |
| $.001 par value shares of beneficial | |
| interest (unlimited authorization) | 3,224,114 |
| Net Asset Value Per Share— | |
| Investor Shares | $35.00 |
| |
| Admiral Shares—Net Assets | |
| Applicable to 70,726,647 outstanding | |
| $.001 par value shares of beneficial | |
| interest (unlimited authorization) | 5,718,411 |
| Net Asset Value Per Share— | |
| Admiral Shares | $80.85 |
See Note A in Notes to Financial Statements.
* Non-income-producing security.
^ Part of security position is on loan to broker-dealers. The total value of securities on loan is $34,853,000.
1 Considered an affiliated company of the fund as the fund owns more than 5% of the outstanding voting securities of such company.
2 Affiliated money market fund available only to Vanguard funds and certain trusts and accounts managed by Vanguard. Rate shown is the 7-day yield.
3 Includes $35,905,000 of collateral received for securities on loan.
ADR—American Depositary Receipt.
See accompanying Notes, which are an integral part of the Financial Statements.
14
Capital Opportunity Fund
| |
| Statement of Operations | |
| |
| | Six Months Ended |
| | March 31, 2011 |
| | ($000) |
| Investment Income | |
| Income | |
| Dividends1,2 | 43,623 |
| Interest2 | 242 |
| Security Lending | 351 |
| Total Income | 44,216 |
| Expenses | |
| Investment Advisory Fees—Note B | 11,114 |
| The Vanguard Group—Note C | |
| Management and Administrative—Investor Shares | 3,177 |
| Management and Administrative—Admiral Shares | 3,438 |
| Marketing and Distribution—Investor Shares | 360 |
| Marketing and Distribution—Admiral Shares | 446 |
| Custodian Fees | 67 |
| Shareholders’ Reports—Investor Shares | 32 |
| Shareholders’ Reports—Admiral Shares | 9 |
| Trustees’ Fees and Expenses | 7 |
| Total Expenses | 18,650 |
| Net Investment Income | 25,566 |
| Realized Net Gain (Loss) | |
| Investment Securities Sold2 | 203,966 |
| Foreign Currencies | 26 |
| Realized Net Gain (Loss) | 203,992 |
| Change in Unrealized Appreciation (Depreciation) | |
| Investment Securities | 1,215,420 |
| Foreign Currencies | 128 |
| Change in Unrealized Appreciation (Depreciation) | 1,215,548 |
| Net Increase (Decrease) in Net Assets Resulting from Operations | 1,445,106 |
1 Dividends are net of foreign withholding taxes of $2,909,000.
2 Dividend income, interest income, and realized net gain (loss) from affiliated companies of the fund were $257,000, $242,000, and $1,579,000, respectively.
See accompanying Notes, which are an integral part of the Financial Statements.
15
Capital Opportunity Fund
| | |
| Statement of Changes in Net Assets | | |
| |
| | Six Months Ended | Year Ended |
| | March 31, | September 30, |
| | 2011 | 2010 |
| | ($000) | ($000) |
| Increase (Decrease) in Net Assets | | |
| Operations | | |
| Net Investment Income | 25,566 | 32,364 |
| Realized Net Gain (Loss) | 203,992 | 221,849 |
| Change in Unrealized Appreciation (Depreciation) | 1,215,548 | 287,744 |
| Net Increase (Decrease) in Net Assets Resulting from Operations | 1,445,106 | 541,957 |
| Distributions | | |
| Net Investment Income | | |
| Investor Shares | (11,536) | (13,472) |
| Admiral Shares | (22,920) | (16,758) |
| Realized Capital Gain | | |
| Investor Shares | — | — |
| Admiral Shares | — | — |
| Total Distributions | (34,456) | (30,230) |
| Capital Share Transactions | | |
| Investor Shares | (1,014,368) | (485,711) |
| Admiral Shares | 647,963 | 31,018 |
| Net Increase (Decrease) from Capital Share Transactions | (366,405) | (454,693) |
| Total Increase (Decrease) | 1,044,245 | 57,034 |
| Net Assets | | |
| Beginning of Period | 7,898,280 | 7,841,246 |
| End of Period1 | 8,942,525 | 7,898,280 |
| 1 Net Assets—End of Period includes undistributed net investment income of $4,725,000 and $13,589,000. | |
See accompanying Notes, which are an integral part of the Financial Statements.
16
Capital Opportunity Fund
Financial Highlights
| | | | | | |
| Investor Shares | | | | | | |
| | Six Months | | | | | |
| | Ended | | | | | |
| For a Share Outstanding | March 31, | | | Year Ended September 30, |
| Throughout Each Period | 2011 | 2010 | 2009 | 2008 | 2007 | 2006 |
| Net Asset Value, Beginning of Period | $29.59 | $27.71 | $29.41 | $42.70 | $36.11 | $31.92 |
| Investment Operations | | | | | | |
| Net Investment Income | .092 | .106 | .121 | .2541 | .070 | .053 |
| Net Realized and Unrealized Gain (Loss) | | | | | | |
| on Investments | 5.439 | 1.871 | .355 | (9.884) | 8.447 | 4.421 |
| Total from Investment Operations | 5.531 | 1.977 | .476 | (9.630) | 8.517 | 4.474 |
| Distributions | | | | | | |
| Dividends from Net Investment Income | (.121) | (.097) | (.114) | (.218) | (.070) | (.055) |
| Distributions from Realized Capital Gains | — | — | (2.062) | (3.442) | (1.857) | (.229) |
| Total Distributions | (.121) | (.097) | (2.176) | (3.660) | (1.927) | (.284) |
| Net Asset Value, End of Period | $35.00 | $29.59 | $27.71 | $29.41 | $42.70 | $36.11 |
| |
| Total Return2 | 18.72% | 7.14% | 4.41% | -24.13% | 24.35% | 14.10% |
| |
| Ratios/Supplemental Data | | | | | | |
| Net Assets, End of Period (Millions) | $3,224 | $3,675 | $3,903 | $3,851 | $5,415 | $5,051 |
| Ratio of Total Expenses to | | | | | | |
| Average Net Assets | 0.48% | 0.48% | 0.50% | 0.45% | 0.45% | 0.49% |
| Ratio of Net Investment Income to | | | | | | |
| Average Net Assets | 0.55% | 0.36% | 0.50% | 0.67%1 | 0.18% | 0.15% |
| Portfolio Turnover Rate | 6% | 8% | 12% | 13% | 14% | 11% |
The expense ratio, net income ratio, and turnover rate for the current period have been annualized.
1 Net investment income per share and the ratio of net investment income to average net assets include $.125 and 0.33%, respectively, resulting from a special dividend from ASML Holding NV in October 2007.
2 Total returns do not include transaction and account service fees that may have applied in the periods shown. Fund prospectuses provide information about any applicable transaction and account service fees.
See accompanying Notes, which are an integral part of the Financial Statements.
17
Capital Opportunity Fund
Financial Highlights
| | | | | | |
| Admiral Shares | | | | | | |
| | Six Months | | | | | |
| | Ended | | | | | |
| For a Share Outstanding | March 31, | | | Year Ended September 30, |
| Throughout Each Period | 2011 | 2010 | 2009 | 2008 | 2007 | 2006 |
| Net Asset Value, Beginning of Period | $68.38 | $64.04 | $68.00 | $98.71 | $83.49 | $73.77 |
| Investment Operations | | | | | | |
| Net Investment Income | .235 | .298 | .329 | .6641 | .240 | .198 |
| Net Realized and Unrealized Gain (Loss) | | | | | | |
| on Investments | 12.557 | 4.315 | .811 | (22.845) | 19.508 | 10.229 |
| Total from Investment Operations | 12.792 | 4.613 | 1.140 | (22.181) | 19.748 | 10.427 |
| Distributions | | | | | | |
| Dividends from Net Investment Income | (.322) | (.273) | (.339) | (.577) | (.238) | (.178) |
| Distributions from Realized Capital Gains | — | — | (4.761) | (7.952) | (4.290) | (.529) |
| Total Distributions | (.322) | (.273) | (5.100) | (8.529) | (4.528) | (.707) |
| Net Asset Value, End of Period | $80.85 | $68.38 | $64.04 | $68.00 | $98.71 | $83.49 |
| |
| Total Return2 | 18.74% | 7.21% | 4.52% | -24.05% | 24.43% | 14.23% |
| |
| Ratios/Supplemental Data | | | | | | |
| Net Assets, End of Period (Millions) | $5,718 | $4,223 | $3,938 | $3,787 | $4,760 | $3,750 |
| Ratio of Total Expenses to | | | | | | |
| Average Net Assets | 0.41% | 0.41% | 0.41% | 0.36% | 0.37% | 0.40% |
| Ratio of Net Investment Income to | | | | | | |
| Average Net Assets | 0.62% | 0.43% | 0.59% | 0.76%1 | 0.26% | 0.24% |
| Portfolio Turnover Rate | 6% | 8% | 12% | 13% | 14% | 11% |
The expense ratio, net income ratio, and turnover rate for the current period have been annualized.
1 Net investment income per share and the ratio of net investment income to average net assets include $.289 and 0.33%, respectively, resulting from a special dividend from ASML Holding NV in October 2007.
2 Total returns do not include transaction fees that may have applied in the periods shown. Fund prospectuses provide information about any applicable transaction fees.
See accompanying Notes, which are an integral part of the Financial Statements.
18
Capital Opportunity Fund
Notes to Financial Statements
Vanguard Capital Opportunity Fund is registered under the Investment Company Act of 1940 as an open-end investment company, or mutual fund. The fund offers two classes of shares: Investor Shares and Admiral Shares. Investor Shares are available to any investor who meets the fund’s minimum purchase requirements. Admiral Shares are designed for investors who meet certain administrative, service, and account-size criteria.
A. The following significant accounting policies conform to generally accepted accounting principles for U.S. mutual funds. The fund consistently follows such policies in preparing its financial statements.
1. Security Valuation: Securities are valued as of the close of trading on the New York Stock Exchange (generally 4 p.m., Eastern time) on the valuation date. Equity securities are valued at the latest quoted sales prices or official closing prices taken from the primary market in which each security trades; such securities not traded on the valuation date are valued at the mean of the latest quoted bid and asked prices. Securities for which market quotations are not readily available, or whose values have been affected by events occurring before the fund’s pricing time but after the close of the securities’ primary markets, are valued at their fair values calculated according to procedures adopted by the board of trustees. These procedures include obtaining quotations from an independent pricing service, monitoring news to identify significant market- or security-specific events, and evaluating changes in the values of foreign market proxies (for example, ADRs, futures contracts, or exchange-traded funds), between the time the foreign markets close and the fund’s pricing time. When fair-value pricing is employed, the prices of securities used by a fund to calculate its net asset value may differ from quoted or published prices for the same securities. Investments in Vanguard Market Liquidity Fund are valued at that fund’s net asset value.
2. Foreign Currency: Securities and other assets and liabilities denominated in foreign currencies are translated into U.S. dollars using exchange rates obtained from an independent third party as of the fund’s pricing time on the valuation date. Realized gains (losses) and unrealized appreciation (depreciation) on investment securities include the effects of changes in exchange rates since the securities were purchased, combined with the effects of changes in security prices. Fluctuations in the value of other assets and liabilities resulting from changes in exchange rates are recorded as unrealized foreign currency gains (losses) until the assets or liabilities are settled in cash, at which time they are recorded as realized foreign currency gains (losses).
3. Federal Income Taxes: The fund intends to continue to qualify as a regulated investment company and distribute all of its taxable income. Management has analyzed the fund’s tax positions taken for all open federal income tax years (September 30, 2007–2010), and for the period ended March 31, 2011, and has concluded that no provision for federal income tax is required in the fund’s financial statements.
4. Distributions: Distributions to shareholders are recorded on the ex-dividend date.
5. Security Lending: The fund may lend its securities to qualified institutional borrowers to earn additional income. Security loans are required to be secured at all times by collateral at least equal to the market value of securities loaned. The fund invests cash collateral received in Vanguard Market Liquidity Fund, and records a liability for the return of the collateral, during the period the securities are on loan. Security lending income represents fees charged to borrowers plus income earned on investing cash collateral, less expenses associated with the loan.
19
Capital Opportunity Fund
6. Other: Dividend income is recorded on the ex-dividend date. Interest income includes income distributions received from Vanguard Market Liquidity Fund and is accrued daily. Security transactions are accounted for on the date securities are bought or sold. Costs used to determine realized gains (losses) on the sale of investment securities are those of the specific securities sold. Fees assessed on redemptions of capital shares are credited to paid-in capital.
Each class of shares has equal rights as to assets and earnings, except that each class separately bears certain class-specific expenses related to maintenance of shareholder accounts (included in Management and Administrative expenses) and shareholder reporting. Marketing and distribution expenses are allocated to each class of shares based on a method approved by the board of trustees. Income, other non-class-specific expenses, and gains and losses on investments are allocated to each class of shares based on its relative net assets.
B. PRIMECAP Management Company provides investment advisory services to the fund for a fee calculated at an annual percentage rate of average net assets. For the six months ended March 31, 2011, the investment advisory fee represented an effective annual basic rate of 0.26% of the fund’s average net assets.
C. The Vanguard Group furnishes at cost corporate management, administrative, marketing, and distribution services. The costs of such services are allocated to the fund under methods approved by the board of trustees. The fund has committed to provide up to 0.40% of its net assets in capital contributions to Vanguard. At March 31, 2011, the fund had contributed capital of $1,468,000 to Vanguard (included in Other Assets), representing 0.02% of the fund’s net assets and 0.59% of Vanguard’s capitalization. The fund’s trustees and officers are also directors and officers of Vanguard.
D. Various inputs may be used to determine the value of the fund’s investments. These inputs are summarized in three broad levels for financial statement purposes. The inputs or methodologies used to value securities are not necessarily an indication of the risk associated with investing in those securities.
Level 1—Quoted prices in active markets for identical securities.
Level 2—Other significant observable inputs (including quoted prices for similar securities, interest rates, prepayment speeds, credit risk, etc.).
Level 3—Significant unobservable inputs (including the fund’s own assumptions used to determine the fair value of investments).
The following table summarizes the fund’s investments as of March 31, 2011, based on the inputs used to value them:
| | | |
| | Level 1 | Level 2 | Level 3 |
| Investments | ($000) | ($000) | ($000) |
| Common Stocks | 8,521,180 | 232,595 | — |
| Temporary Cash Investments | 213,929 | — | — |
| Total | 8,735,109 | 232,595 | — |
E. Distributions are determined on a tax basis and may differ from net investment income and realized capital gains for financial reporting purposes. Differences may be permanent or temporary. Permanent differences are reclassified among capital accounts in the financial statements to reflect their tax character. Temporary differences arise when certain items of income, expense, gain, or loss are
20
Capital Opportunity Fund
recognized in different periods for financial statement and tax purposes; these differences will reverse at some time in the future. Differences in classification may also result from the treatment of short-term gains as ordinary income for tax purposes.
During the six months ended March 31, 2011, the fund realized net foreign currency gains of $26,000, which increased distributable net income for tax purposes; accordingly, such gains have been reclassified from accumulated net realized gains to undistributed net investment income.
The fund’s tax-basis capital gains and losses are determined only at the end of each fiscal year. For tax purposes, at September 30, 2010, the fund had available capital loss carryforwards totaling $146,093,000 to offset future net capital gains of $42,246,000 through September 30, 2017, and $103,847,000 through September 30, 2018. The fund will use these capital losses to offset net taxable capital gains, if any, realized during the year ending September 30, 2011; should the fund realize net capital losses for the year, the losses will be added to the loss carryforward balances above.
At March 31, 2011, the cost of investment securities for tax purposes was $6,004,403,000. Net unrealized appreciation of investment securities for tax purposes was $2,963,301,000, consisting of unrealized gains of $3,711,198,000 on securities that had risen in value since their purchase and $747,897,000 in unrealized losses on securities that had fallen in value since their purchase.
F. During the six months ended March 31, 2011, the fund purchased $242,331,000 of investment securities and sold $625,990,000 of investment securities, other than temporary cash investments.
G. Certain of the fund’s investments are in companies that are considered to be affiliated companies of the fund because the fund owns more than 5% of the outstanding voting securities of the company. Transactions during the period in securities of these companies were as follows:
| | | | | |
| | | | Current Period Transactions | |
| | Sept. 30, 2010 | | Proceeds from | | Mar. 31, 2011 |
| | Market | Purchases | Securities | Dividend | Market |
| | Value | at Cost | Sold | Income | Value |
| | ($000) | ($000) | ($000) | ($000) | ($000) |
| Ascena Retail Group Inc.1 | 113,869 | — | 6,574 | — | 147,125 |
| Descartes Systems Group Inc. | 29,774 | — | — | — | 30,936 |
| FormFactor Inc. | 49,508 | — | — | — | 59,294 |
| Strattec Security Corp. | 5,337 | — | — | 257 | 7,164 |
| Thomas & Betts Corp. | 127,162 | — | — | — | 184,357 |
| | 325,650 | | | 257 | 428,876 |
| 1 In January 2011, Dress Barn Inc. changed its name to Ascena Retail Group, Inc. | | | |
21
Capital Opportunity Fund
H. Capital share transactions for each class of shares were:
| | | | |
| | Six Months Ended | | Year Ended |
| | March 31, 2011 | September 30, 2010 |
| | Amount | Shares | Amount | Shares |
| | ($000) | (000) | ($000) | (000) |
| Investor Shares | | | | |
| Issued | 135,408 | 4,070 | 322,612 | 10,951 |
| Issued in Lieu of Cash Distributions | 11,042 | 335 | 12,722 | 435 |
| Redeemed1 | (1,160,818) | (36,471) | (821,045) | (28,030) |
| Net Increase (Decrease)—Investor Shares | (1,014,368) | (32,066) | (485,711) | (16,644) |
| Admiral Shares | | | | |
| Issued | 958,518 | 13,059 | 516,424 | 7,530 |
| Issued in Lieu of Cash Distributions | 20,865 | 274 | 15,104 | 224 |
| Redeemed1 | (331,420) | (4,366) | (500,510) | (7,493) |
| Net Increase (Decrease)—Admiral Shares | 647,963 | 8,967 | 31,018 | 261 |
| 1 Net of redemption fees for fiscal 2011 and 2010 of $160,000 and $653,000, respectively (fund totals). | | |
I. In preparing the financial statements as of March 31, 2011, management considered the impact of subsequent events for potential recognition or disclosure in these financial statements.
22
About Your Fund’s Expenses
As a shareholder of the fund, you incur ongoing costs, which include costs for portfolio management, administrative services, and shareholder reports (like this one), among others. Operating expenses, which are deducted from a fund’s gross income, directly reduce the investment return of the fund.
A fund’s expenses are expressed as a percentage of its average net assets. This figure is known as the expense ratio. The following examples are intended to help you understand the ongoing costs (in dollars) of investing in your fund and to compare these costs with those of other mutual funds. The examples are based on an investment of $1,000 made at the beginning of the period shown and held for the entire period.
The accompanying table illustrates your fund’s costs in two ways:
• Based on actual fund return. This section helps you to estimate the actual expenses that you paid over the period. The ”Ending Account Value“ shown is derived from the fund‘s actual return, and the third column shows the dollar amount that would have been paid by an investor who started with $1,000 in the fund. You may use the information here, together with the amount you invested, to estimate the expenses that you paid over the period.
To do so, simply divide your account value by $1,000 (for example, an $8,600 account value divided by $1,000 = 8.6), then multiply the result by the number given for your fund under the heading ”Expenses Paid During Period.“
• Based on hypothetical 5% yearly return. This section is intended to help you compare your fund‘s costs with those of other mutual funds. It assumes that the fund had a yearly return of 5% before expenses, but that the expense ratio is unchanged. In this case—because the return used is not the fund’s actual return—the results do not apply to your investment. The example is useful in making comparisons because the Securities and Exchange Commission requires all mutual funds to calculate expenses based on a 5% return. You can assess your fund’s costs by comparing this hypothetical example with the hypothetical examples that appear in shareholder reports of other funds.
Note that the expenses shown in the table are meant to highlight and help you compare ongoing costs only and do not reflect transaction costs incurred by the fund for buying and selling securities. Further, the expenses do not include the 1% fee on redemptions of shares held for less than one year, nor do they include the account service fee described in the prospectus. If such fees were applied to your account, your costs would be higher. Your fund does not carry a “sales load.”
The calculations assume no shares were bought or sold during the period. Your actual costs may have been higher or lower, depending on the amount of your investment and the timing of any purchases or redemptions.
You can find more information about the fund’s expenses, including annual expense ratios, in the Financial Statements section of this report. For additional information on operating expenses and other shareholder costs, please refer to your fund’s current prospectus.
23
| | | |
| Six Months Ended March 31, 2011 | | | |
| | Beginning | Ending | Expenses |
| | Account Value | Account Value | Paid During |
| Capital Opportunity Fund | 9/30/2010 | 3/31/2011 | Period |
| Based on Actual Fund Return | | | |
| Investor Shares | $1,000.00 | $1,187.17 | $2.62 |
| Admiral Shares | 1,000.00 | 1,187.36 | 2.24 |
| Based on Hypothetical 5% Yearly Return | | | |
| Investor Shares | $1,000.00 | $1,022.54 | $2.42 |
| Admiral Shares | 1,000.00 | 1,022.89 | 2.07 |
The calculations are based on expenses incurred in the most recent six-month period. The fund’s annualized six-month expense ratios for that period are 0.48% for Investor Shares and 0.41% for Admiral Shares. The dollar amounts shown as “Expenses Paid” are equal to the annualized expense ratio multiplied by the average account value over the period, multiplied by the number of days in the most recent six-month period, then divided by the number of days in the most recent 12-month period.
24
Trustees Approve Advisory Agreement
The board of trustees of Vanguard Capital Opportunity Fund has renewed the fund’s investment advisory agreement with PRIMECAP Management Company. The board determined that the retention of the advisor was in the best interests of the fund and its shareholders.
The board based its decision upon an evaluation of the advisor’s investment staff, portfolio management process, and performance. The trustees considered the factors discussed below, among others. However, no single factor determined whether the board approved the agreement. Rather, it was the totality of the circumstances that drove the board’s decision.
Nature, extent, and quality of services
The board considered the quality of the fund’s investment management over both the short and long term, and took into account the organizational depth and stability of the advisor. The board noted that PRIMECAP Management, founded in 1983, is recognized for its long-term approach to growth-equity investing. Five experienced portfolio managers are responsible for separate sub-portfolios, and each portfolio manager employs a fundamental, research-driven approach in seeking to identify companies with long-term growth potential overlooked by the market and whose stock is trading at attractive valuation levels. The firm has managed the fund since 1998.
The board concluded that the advisor’s experience, stability, depth, and performance, among other factors, warranted continuation of the advisory agreement.
Investment performance
The board considered the short- and long-term performance of the fund, including any periods of outperformance or underperformance of a relevant benchmark and peer group. The board concluded that the advisor has carried out the fund’s investment strategy in disciplined fashion and that the fund has modestly underperformed its benchmark and peer group over the short-term, but has outperformed both over the long-term. Information about the fund’s most recent performance can be found in the Performance Summary section of this report.
Cost
The board concluded that the fund’s expense ratio was well below the average expense ratio charged by funds in its peer group and that the fund’s advisory fee rate was also well below its peer-group average. Information about the fund’s expenses appears in the About Your Fund’s Expenses section of this report as well as in the Financial Statements section, which also includes information about the fund’s advisory fee rate.
The board did not consider profitability of PRIMECAP Management in determining whether to approve the advisory fee, because PRIMECAP Management is independent of Vanguard, and the advisory fee is the result of arm’s-length negotiations.
The benefit of economies of scale
The board concluded that the fund’s shareholders benefit from economies of scale because of the breakpoints in the fund’s advisory fee schedule. The breakpoints reduce the effective rate of the fee as the fund’s assets increase.
The board will consider whether to renew the advisory agreement again after a one-year period.
25
Glossary
30-Day SEC Yield. A fund’s 30-day SEC yield is derived using a formula specified by the U.S. Securities and Exchange Commission. Under the formula, data related to the fund’s security holdings in the previous 30 days are used to calculate the fund’s hypothetical net income for that period, which is then annualized and divided by the fund’s estimated average net assets over the calculation period. For the purposes of this calculation, a security’s income is based on its current market yield to maturity (in the case of bonds) or its projected dividend yield (for stocks). Because the SEC yield represents hypothetical annualized income, it will differ—at times significantly—from the fund’s actual experience. As a result, the fund’s income distributions may be higher or lower than implied by the SEC yield.
Beta. A measure of the magnitude of a fund’s past share-price fluctuations in relation to the ups and downs of a given market index. The index is assigned a beta of 1.00. Compared with a given index, a fund with a beta of 1.20 typically would have seen its share price rise or fall by 12% when the index rose or fell by 10%. For this report, beta is based on returns over the past 36 months for both the fund and the index. Note that a fund’s beta should be reviewed in conjunction with its R-squared (see definition). The lower the R-squared, the less correlation there is between the fund and the index, and the less reliable beta is as an indicator of volatility.
Dividend Yield. Dividend income earned by stocks, expressed as a percentage of the aggregate market value (or of net asset value, for a fund). The yield is determined by dividing the amount of the annual dividends by the aggregate value (or net asset value) at the end of the period. For a fund, the dividend yield is based solely on stock holdings and does not include any income produced by other investments.
Earnings Growth Rate. The average annual rate of growth in earnings over the past five years for the stocks now in a fund.
Equity Exposure. A measure that reflects a fund’s investments in stocks and stock futures. Any holdings in short-term reserves are excluded.
Expense Ratio. The percentage of a fund’s average net assets used to pay its annual administrative and advisory expenses. These expenses directly reduce returns to investors.
Foreign Holdings. The percentage of a fund represented by stocks or depositary receipts of companies based outside the United States.
Inception Date. The date on which the assets of a fund (or one of its share classes) are first invested in accordance with the fund’s investment objective. For funds with a subscription period, the inception date is the day after that period ends. Investment performance is measured from the inception date.
Median Market Cap. An indicator of the size of companies in which a fund invests; the midpoint of market capitalization (market price x shares outstanding) of a fund’s stocks, weighted by the proportion of the fund’s assets invested in each stock. Stocks representing half of the fund’s assets have market capitalizations above the median, and the rest are below it.
Price/Book Ratio. The share price of a stock divided by its net worth, or book value, per share. For a fund, the weighted average price/book ratio of the stocks it holds.
26
Price/Earnings Ratio. The ratio of a stock’s current price to its per-share earnings over the past year. For a fund, the weighted average P/E of the stocks it holds. P/E is an indicator of market expectations about corporate prospects; the higher the P/E, the greater the expectations for a company’s future growth.
R-Squared. A measure of how much of a fund’s past returns can be explained by the returns from the market in general, as measured by a given index. If a fund’s total returns were precisely synchronized with an index’s returns, its R-squared would be 1.00. If the fund’s returns bore no relationship to the index’s returns, its R-squared would be 0. For this report, R-squared is based on returns over the past 36 months for both the fund and the index.
Return on Equity. The annual average rate of return generated by a company during the past five years for each dollar of shareholder’s equity (net income divided by shareholder’s equity). For a fund, the weighted average return on equity for the companies whose stocks it holds.
Short-Term Reserves. The percentage of a fund invested in highly liquid, short-term securities that can be readily converted to cash.
Turnover Rate. An indication of the fund’s trading activity. Funds with high turnover rates incur higher transaction costs and may be more likely to distribute capital gains (which may be taxable to investors). The turnover rate excludes in-kind transactions, which have minimal impact on costs.
27
The People Who Govern Your Fund
The trustees of your mutual fund are there to see that the fund is operated and managed in your best interests since, as a shareholder, you are a part owner of the fund. Your fund’s trustees also serve on the board of directors of The Vanguard Group, Inc., which is owned by the Vanguard funds and provides services to them on an at-cost basis.
A majority of Vanguard’s board members are independent, meaning that they have no affiliation with Vanguard or the funds they oversee, apart from the sizable personal investments they have made as private individuals. The independent board members have distinguished backgrounds in business, academia, and public service. Each of the trustees and executive officers oversees 179 Vanguard funds.
The following table provides information for each trustee and executive officer of the fund. More information about the trustees is in the Statement of Additional Information, which can be obtained, without charge, by contacting Vanguard at 800-662-7447, or online at vanguard.com.
| |
| Interested Trustee1 | and President (2006–2008) of Rohm and Haas Co. |
| | (chemicals); Director of Tyco International, Ltd. |
| F. William McNabb III | (diversified manufacturing and services) and Hewlett- |
| Born 1957. Trustee Since July 2009. Chairman of the | Packard Co. (electronic computer manufacturing); |
| Board. Principal Occupation(s) During the Past Five | Senior Advisor at New Mountain Capital; Trustee |
| Years: Chairman of the Board of The Vanguard Group, | of The Conference Board; Member of the Board of |
| Inc., and of each of the investment companies served | Managers of Delphi Automotive LLP (automotive |
| by The Vanguard Group, since January 2010; Director | components). |
| of The Vanguard Group since 2008; Chief Executive | |
| Officer and President of The Vanguard Group and of | Amy Gutmann |
| each of the investment companies served by The | Born 1949. Trustee Since June 2006. Principal |
| Vanguard Group since 2008; Director of Vanguard | Occupation(s) During the Past Five Years: President |
| Marketing Corporation; Managing Director of The | of the University of Pennsylvania; Christopher H. |
| Vanguard Group (1995–2008). | Browne Distinguished Professor of Political Science |
| | in the School of Arts and Sciences with secondary |
| | appointments at the Annenberg School for Commu- |
| Independent Trustees | nication and the Graduate School of Education |
| | of the University of Pennsylvania; Director of |
| Emerson U. Fullwood | Carnegie Corporation of New York, Schuylkill River |
| Born 1948. Trustee Since January 2008. Principal | Development Corporation, and Greater Philadelphia |
| Occupation(s) During the Past Five Years: Executive | Chamber of Commerce; Trustee of the National |
| Chief Staff and Marketing Officer for North America | Constitution Center; Chair of the Presidential |
| and Corporate Vice President (retired 2008) of Xerox | Commission for the Study of Bioethical Issues. |
| Corporation (document management products and | |
| services); Executive in Residence and 2010 | JoAnn Heffernan Heisen |
| Distinguished Minett Professor at the Rochester | Born 1950. Trustee Since July 1998. Principal |
| Institute of Technology; Director of SPX Corporation | Occupation(s) During the Past Five Years: Corporate |
| (multi-industry manufacturing), the United Way of | Vice President and Chief Global Diversity Officer |
| Rochester, Amerigroup Corporation (managed health | (retired 2008) and Member of the Executive |
| care), the University of Rochester Medical Center, | Committee (1997–2008) of Johnson & Johnson |
| Monroe Community College Foundation, and North | (pharmaceuticals/consumer products); Director of |
| Carolina A&T University. | Skytop Lodge Corporation (hotels), the University |
| | Medical Center at Princeton, the Robert Wood |
| Rajiv L. Gupta | Johnson Foundation, and the Center for Work Life |
| Born 1945. Trustee Since December 2001.2 | Policy; Member of the Advisory Board of the |
| Principal Occupation(s) During the Past Five Years: | Maxwell School of Citizenship and Public Affairs |
| Chairman and Chief Executive Officer (retired 2009) | at Syracuse University. |
| | |
| F. Joseph Loughrey | Thomas J. Higgins | |
| Born 1949. Trustee Since October 2009. Principal | Born 1957. Chief Financial Officer Since September |
| Occupation(s) During the Past Five Years: President | 2008. Principal Occupation(s) During the Past Five |
| and Chief Operating Officer (retired 2009) and Vice | Years: Principal of The Vanguard Group, Inc.; Chief |
| Chairman of the Board (2008–2009) of Cummins Inc. | Financial Officer of each of the investment companies |
| (industrial machinery); Director of SKF AB (industrial | served by The Vanguard Group since 2008; Treasurer |
| machinery), Hillenbrand, Inc. (specialized consumer | of each of the investment companies served by The |
| services), the Lumina Foundation for Education, and | Vanguard Group (1998–2008). |
| Oxfam America; Chairman of the Advisory Council | | |
| for the College of Arts and Letters and Member | Kathryn J. Hyatt | |
| of the Advisory Board to the Kellogg Institute for | Born 1955. Treasurer Since November 2008. Principal |
| International Studies at the University of Notre Dame. | Occupation(s) During the Past Five Years: Principal |
| | of The Vanguard Group, Inc.; Treasurer of each of |
| André F. Perold | the investment companies served by The Vanguard |
| Born 1952. Trustee Since December 2004. Principal | Group since 2008; Assistant Treasurer of each of the |
| Occupation(s) During the Past Five Years: George | investment companies served by The Vanguard Group |
| Gund Professor of Finance and Banking at the Harvard | (1988–2008). | |
| Business School; Chair of the Investment Committee | | |
| of HighVista Strategies LLC (private investment firm). | Heidi Stam | |
| | Born 1956. Secretary Since July 2005. Principal |
| Alfred M. Rankin, Jr. | Occupation(s) During the Past Five Years: Managing |
| Born 1941. Trustee Since January 1993. Principal | Director of The Vanguard Group, Inc., since 2006; |
| Occupation(s) During the Past Five Years: Chairman, | General Counsel of The Vanguard Group since 2005; |
| President, and Chief Executive Officer of NACCO | Secretary of The Vanguard Group and of each of the |
| Industries, Inc. (forklift trucks/housewares/lignite); | investment companies served by The Vanguard Group |
| Director of Goodrich Corporation (industrial products/ | since 2005; Director and Senior Vice President of |
| aircraft systems and services) and the National | Vanguard Marketing Corporation since 2005; |
| Association of Manufacturers; Chairman of the | Principal of The Vanguard Group (1997–2006). |
| Federal Reserve Bank of Cleveland; Vice Chairman | | |
| of University Hospitals of Cleveland; President of | | |
| the Board of The Cleveland Museum of Art. | Vanguard Senior Management Team |
| |
| Peter F. Volanakis | R. Gregory Barton | Michael S. Miller |
| Born 1955. Trustee Since July 2009. Principal | Mortimer J. Buckley | James M. Norris |
| Occupation(s) During the Past Five Years: President | Kathleen C. Gubanich | Glenn W. Reed |
| and Chief Operating Officer (retired 2010) of Corning | Paul A. Heller | George U. Sauter |
| Incorporated (communications equipment); Director of | | |
| Corning Incorporated (2000–2010) and Dow Corning | | |
| (2001–2010); Overseer of the Amos Tuck School of | Chairman Emeritus and Senior Advisor |
| Business Administration at Dartmouth College. | | |
| | John J. Brennan | |
| | Chairman, 1996–2009 | |
| Executive Officers | Chief Executive Officer and President, 1996–2008 |
| |
| Glenn Booraem | | |
| Born 1967. Controller Since July 2010. Principal | Founder | |
| Occupation(s) During the Past Five Years: Principal | | |
| of The Vanguard Group, Inc.; Controller of each of | John C. Bogle | |
| the investment companies served by The Vanguard | Chairman and Chief Executive Officer, 1974–1996 |
| Group since 2010; Assistant Controller of each of | | |
| the investment companies served by The Vanguard | | |
| Group (2001–2010). | | |
1 Mr. McNabb is considered an “interested person,” as defined in the Investment Company Act of 1940, because he is an officer of the Vanguard funds.
2 December 2002 for Vanguard Equity Income Fund, Vanguard Growth Equity Fund, the Vanguard Municipal Bond Funds, and the Vanguard State Tax-Exempt Funds.
|  |
| P.O. Box 2600 |
| Valley Forge, PA 19482-2600 |
Connect with Vanguard® > vanguard.com
| Fund Information > 800-662-7447 | |
| Direct Investor Account Services > 800-662-2739 | |
| Institutional Investor Services > 800-523-1036 | |
| Text Telephone for People | |
| With Hearing Impairment > 800-749-7273 | |
| |
| This material may be used in conjunction | |
| with the offering of shares of any Vanguard | |
| fund only if preceded or accompanied by | |
| the fund’s current prospectus. | |
| |
| All comparative mutual fund data are from Lipper Inc. or | |
| Morningstar, Inc., unless otherwise noted. | |
| |
| You can obtain a free copy of Vanguard’s proxy voting | |
| guidelines by visiting vanguard.com/proxyreporting or by | |
| calling Vanguard at 800-662-2739. The guidelines are | |
| also available from the SEC’s website, sec.gov. In | |
| addition, you may obtain a free report on how your fund | |
| voted the proxies for securities it owned during the 12 | |
| months ended June 30. To get the report, visit either | |
| vanguard.com/proxyreporting or sec.gov. | |
| |
| You can review and copy information about your fund at | |
| the SEC’s Public Reference Room in Washington, D.C. To | |
| find out more about this public service, call the SEC at | |
| 202-551-8090. Information about your fund is also | |
| available on the SEC’s website, and you can receive | |
| copies of this information, for a fee, by sending a | |
| request in either of two ways: via e-mail addressed to | |
| publicinfo@sec.gov or via regular mail addressed to the | |
| Public Reference Section, Securities and Exchange | |
| Commission, Washington, DC 20549-1520. | |
| | © 2011 The Vanguard Group, Inc. |
| | All rights reserved. |
| | Vanguard Marketing Corporation, Distributor. |
| |
| | Q1112 052011 |
 |
| Vanguard Global Equity Fund |
| Semiannual Report |
| March 31, 2011 |
|
 |
|
|
> Vanguard Global Equity Fund returned 13.79% for the six months ended March 31, 2011, a bit more than the returns of its comparative standards.
> The fund’s North American, principally U.S., stock selections were the most powerful engine of performance.
> As the global economic recovery fought through stiff headwinds, the fund earned strong returns in materials and consumer-oriented stocks.
| |
| Contents | |
| Your Fund’s Total Returns. | 1 |
| Chairman’s Letter. | 2 |
| Advisors’ Report. | 6 |
| Fund Profile. | 11 |
| Performance Summary. | 13 |
| Financial Statements. | 14 |
| About Your Fund’s Expenses. | 36 |
| Trustees Approve Advisory Agreements. | 38 |
| Glossary. | 40 |
Please note: The opinions expressed in this report are just that—informed opinions. They should not be considered promises or advice.
Also, please keep in mind that the information and opinions cover the period through the date on the front of this report. Of course, the
risks of investing in your fund are spelled out in the prospectus.
See the Glossary for definitions of investment terms used in this report.
Cover photograph: Jean Maher.
Your Fund’s Total Returns
| |
| Six Months Ended March 31, 2011 | |
| | Total |
| | Returns |
| Vanguard Global Equity Fund | 13.79% |
| MSCI All Country World Index | 13.54 |
| Global Funds Average | 13.35 |
| | | | |
| Your Fund’s Performance at a Glance | | | | |
| September 30, 2010 , Through March 31, 2011 | | | | |
| | | | Distributions Per Share |
| | Starting | Ending | Income | Capital |
| | Share Price | Share Price | Dividends | Gains |
| Vanguard Global Equity Fund | $16.74 | $18.71 | $0.320 | $0.000 |
1

Chairman’s Letter
Dear Shareholder,
Vanguard Global Equity Fund returned 13.79% for the fiscal half-year ended March 31, edging past its benchmark index, the MSCI All Country World Index, and its peers among global funds.
All sectors and regions contributed positively to returns. The North American market, dominated by the United States, was the top-performing region. European developed markets posted a double-digit return despite the ongoing sovereign debt crisis in the region. And while emerging markets produced a decent return, the performance of the fund’s stock selections in these markets—unlike in North America and Europe—didn’t keep pace with that of the broader indexes.
Around the globe, the fund enjoyed success in materials, consumer discretionary, and consumer staples stocks. Returns were also strong in the energy sector, though the fund failed to make the most of the surge in the stock prices of global energy giants.
Despite distressing headlines, stock markets rallied
Global stock markets produced exceptional returns for the six months ended March 31, a period punctuated by unnerving developments such as political upheaval in the Middle East and North Africa, new sovereign debt dilemmas in Europe, and a nuclear emergency in Japan. On a more optimistic note, the U.S. economy continued to grind into gear. Job growth
2
picked up, fueling hopes that the good news might be persistent enough to bring down the high unemployment rate.
The broad U.S. stock market returned more than 18%. The stocks of smaller companies, which are keenly sensitive to the rhythms of the business cycle, did even better. As a group, non-U.S. stock markets trailed their American counterparts, with a six-month return that topped 10%.
All but the shortest-term rates moved higher, affecting bond prices
With the exception of the shortest-term securities, the rates on fixed income investments moved higher during the six-month period. At the start of the period, the 10-year U.S. Treasury note yielded a meager 2.51%. By the end, the rate had climbed to 3.45% as investors demanded more compensation for the possibility that inflation will continue to accelerate from financial-crisis lows.
Rising rates put short-term pressure on bond prices. The broad U.S. taxable bond market produced a slightly negative return. The broad municipal bond market, which came under pressure both from rising rates and concern (exaggerated, in Vanguard’s view) about the financial strength of state and municipal borrowers, returned –3.68%.
As it has since December 2008, the Federal Reserve held its target for short-term interest rates near 0%. This stance kept the returns available from money market instruments, such as the 3-month Treasury bill, in the same neighborhood.
| | | |
| Market Barometer | | | |
| |
| | | Total Returns |
| | | Periods Ended March 31, 2011 |
| | Six | One | Five Years |
| | Months | Year | (Annualized) |
| Stocks | | | |
| Russell 1000 Index (Large-caps) | 18.13% | 16.69% | 2.93% |
| Russell 2000 Index (Small-caps) | 25.48 | 25.79 | 3.35 |
| Dow Jones U.S. Total Stock Market Index | 18.51 | 17.50 | 3.27 |
| MSCI All Country World Index ex USA (International) | 10.85 | 13.15 | 3.59 |
| |
| Bonds | | | |
| Barclays Capital U.S. Aggregate Bond Index (Broad | | | |
| taxable market) | -0.88% | 5.12% | 6.03% |
| Barclays Capital Municipal Bond Index (Broad | | | |
| tax-exempt market) | -3.68 | 1.63 | 4.14 |
| Citigroup Three-Month U.S. Treasury Bill Index | 0.06 | 0.15 | 2.09 |
| |
| CPI | | | |
| Consumer Price Index | 2.30% | 2.68% | 2.26% |
3
U.S. strength drives returns
Global equities posted strong gains even as fast-rising energy prices and the catastrophe in Japan threatened to cast a shadow on consumer confidence and investor optimism. The markets continued to signal that the period’s unsettling events were not expected to short-circuit the global economic recovery.
The Global Equity Fund earned positive returns in all regions. The fund enjoyed notable success in North America, benefiting both from generally buoyant stock prices and skillful stock selection.
The bulk of the North American holdings were U.S. stocks, which accounted for roughly 40% of fund assets. The fund’s selections returned more than 20%.
Stocks in Europe’s developed markets, representing about one-quarter of total assets, were the second-best performers, returning almost 12%—even as the Continent’s weaker economies grappled with budgetary challenges.
Developed markets in the Pacific Rim—primarily Japan and Hong Kong—returned about 9%, in line with the region’s return in the benchmark index.
Although returns were respectable, at better than 7%, the fund enjoyed the least success relative to its benchmark index in emerging markets. An above-benchmark commitment to the Philippines and subpar stock selection in a number of smaller Asian markets restrained performance.
| | |
| Expense Ratios | | |
| Your Fund Compared With Its Peer Group | | |
| | | Peer Group |
| | Fund | Average |
| Global Equity Fund | 0.44% | 1.46% |
The fund expense ratio shown is from the prospectus dated January 26, 2011, and represents estimated costs for the current fiscal year. For the six months ended March 31, 2011, the fund’s annualized expense ratio was 0.51%. The increase from the estimated expense ratio reflects a performance-based investment advisory fee adjustment. When the performance adjustment is positive, the fund’s expenses increase; when it is negative, expenses decrease. The peer-group expense ratio is derived from data provided by Lipper Inc. and captures information through year-end 2010.
Peer group: Global Funds.
4
These shortfalls were partially offset by a sizable stake in high-returning stocks from South Korea.
Materials benefit from the global recovery
Around the globe, the fund earned the highest returns in the materials and energy sectors. The continuing global economic recovery and rising commodities prices drove share prices higher for many metals and mining holdings, and energy stocks rallied on rising oil prices and the gradual clearing of some of the clouds that have hung over the sector since the Gulf oil spill.
While materials selections were strong on both an absolute and a relative basis, the fund’s performance compared with the benchmark came up a little short in the surging energy sector, largely because of its limited exposure to the multinational oil giants.
Consumer-oriented companies such as food processors and retailers were another source of strength. Consumer spending has been on the rebound in the developed world, even as the growth of middle-class consumers in emerging markets creates new markets for retailers, restaurants, food producers, and makers of household goods. During the past six months, the fund’s selections in the consumer staples and consumer discretionary sectors yielded double-digit, benchmark-beating returns.
Geopolitical risks underscore the need to diversify
The headline-grabbing events of the last few months are a reminder that conditions in any part of the world can turn on a dime. That’s why it is dangerous to concentrate investments in regions of the world where current conditions seem to indicate superior future returns.
Instead, Vanguard advises investors to build a diversified portfolio of stock, bond, and money market funds consistent with their goals and risk tolerance. The Global Equity Fund can provide broad diversification within such a portfolio’s stock component, with investments in the large U.S. market, in developed countries in Europe and Asia, and in fast-growing economies in the emerging markets. The fund’s assets are deployed across the globe by four talented advisory firms, giving investors the opportunity to capitalize on their investment insights.
Thank you for investing with Vanguard.
Sincerely,

F. William McNabb III
Chairman and Chief Executive Officer
April 14, 2011
5
Advisors’ Report
For the fiscal half-year ended March 31, 2011, the Global Equity Fund returned 13.79%. Your fund is managed by four independent advisors. This provides exposure to distinct, yet complementary, investment approaches, enhancing the fund’s diversification. It’s not uncommon for different advisors to have different views about individual securities or the broader investment environment.
The advisors, the amount and percentage of fund assets each manages, and brief descriptions of their investment strategies are presented in the table below. Each advisor has also prepared a discussion of the investment environment that existed during the fiscal period and of how portfolio positioning reflects this assessment. These comments were prepared on April 20, 2011.
| | | |
| Vanguard Global Equity Fund Investment Advisors | |
| | Fund Assets Managed | |
| Investment Advisor | % | $ Million | Investment Strategy |
| Marathon Asset Management | 39 | 1,711 | A long-term and contrarian investment philosophy and |
| LLP | | | process with a focus on industry capital cycle analysis |
| | | | and in-depth management assessment. |
| Acadian Asset Management LLC | 35 | 1,485 | A quantitative, active, bottom-up investment process |
| | | | that combines stock and peer-group valuation to arrive |
| | | | at a return forecast for each of more than 40,000 |
| | | | securities in the global universe. |
| AllianceBernstein L.P. | 19 | 808 | A fundamentally based, research-driven approach, |
| | | | focused on finding companies whose long-term |
| | | | earnings power exceeds the level implied by their |
| | | | current stock price. Proprietary quantitative tools aid |
| | | | risk control and portfolio construction. |
| Baillie Gifford Overseas Ltd. | 5 | 210 | The advisor seeks stocks that can generate |
| | | | above-average growth in earnings and cash flow, |
| | | | producing a bottom-up, stock-driven approach to |
| | | | country and asset allocation. An in-depth view on each |
| | | | company is measured against the consensus view, |
| | | | leading to discrepancies and potential opportunities to |
| | | | add value. |
| Cash Investments | 2 | 82 | These short-term reserves are invested by Vanguard in |
| | | | equity index products to simulate investment in stocks. |
| | | | Each advisor may also maintain a modest cash |
| | | | position. |
6
Marathon Asset Management LLP
Portfolio Managers:
Jeremy J. Hosking, Investment Director
Neil M. Ostrer, Investment Director
William J. Arah, Investment Director
During the six-month period under review, our portion of the portfolio suffered from an overweighting in Asia outside of Japan, Hong Kong in particular, and an underweight position in the U.S. market. As the price of oil rose, our decision to underweight energy also hurt relative return. The energy theme was also evident at the stock level, where our decision not to hold Exxon Mobil and our investment in Delta Air Lines restrained returns. Overall, however, stock selection added value during the period. Cablevision was the best performer as it continued to benefit from its capital allocation decisions.
We increased our exposure to financials in the United States and Europe. In Japan, we increased exposure to financials as well, particularly insurers in the wake of the Tohoku earthquake, largely at the expense of more defensive Japanese companies. Elsewhere in Asia, we took profits in some of the Southeast Asian names that have performed well in recent times, while making purchases in a number of Thai companies, as the market remains a good value relative to its peers.
Despite rising commodity prices, likely interest rate increases, and political uncertainty in the Middle East, monetary policy in the developed markets is designed to encourage private sector risk tolerance. A bull market in equities seems not an improbable consequence of such policies, especially given that investors tend to push prices to extremes. Over the next few months, emerging markets may also participate, unlike the past six months, in which investors rotated their exposures into other markets. Although there are clouds on the horizon, the valuation of our portfolio is not extended, and there are few signs in any market of overexuberance.
Acadian Asset Management LLC
Portfolio Managers:
John R. Chisholm, CFA, Executive Vice President and Chief Investment Officer
Ronald D. Frashure, CFA, President and Chief Executive Officer
Brian K. Wolahan, CFA, Senior Vice President and Director of Alternative Strategies
Turmoil in the Middle East and North Africa, a nuclear crisis in Japan, and Europe’s continued fiscal problems all failed to truly rattle investors over the period. While volatile, the general trajectory of economic news was positive, and investors showed signs of cautious optimism. The U.S. economy and equity market continued to improve. There was
7
increased support for Europe, driven by growing expectations that favorable economic conditions would overcome the continued debt problems of smaller European nations. Emerging markets were volatile, but did not experience widespread contagion from the countries gripped by political unrest.
The portfolio benefited from stock selection, particularly in the United States, where such holdings as ConocoPhillips, Chevron, and Humana were among the top contributors to relative performance. Stock selection was also successful in the United Kingdom, Australia, Poland, Japan, and Hong Kong.
A market overweighting in South Korea, combined with successful stock selection, was also a key source of value added. The portfolio also gained from underweighting the United Kingdom, Spain, and Brazil and from overweighting the United States. Sector positions were a positive overall, especially the overweighting in materials and underweighting in staples.
Our decisions on country weightings netted to a slight negative, particularly the overweightings in India and Japan. Stock selection detracted in only a few markets, with China and Germany the most notable examples. In China, a focus on telecoms was not rewarded, while in Germany the main culprit was industrial holdings such as Deutsche Post.
AllianceBernstein L.P.
Portfolio Managers:
Sharon E. Fay, CFA, Head of Bernstein Value Equities and Chief Investment Officer–Global Value Equities
Kevin F. Simms, Co-Chief Investment Officer–International Value Equities and Director of Research–Global and International Value Equities
Henry S. D’Auria, CFA, Co-Chief Investment Officer–International Value Equities and Chief Investment Officer–Emerging Markets Value Equities
Global equities rose over the six-month period, as the economic recovery continued and corporate profitability improved. Unrest in the Middle East and North Africa and the earthquake and tsunami in Japan added new uncertainty. However, we expect anxiety to abate as the year unfolds, enabling our fundamental research insights to be rewarded.
The portfolio performed well during the period. Positioning in consumer cyclicals and consumer staples added the most to relative returns. Technology and capital equipment stocks underperformed, with some detractors affected by the disaster in Japan.
8
We are closely monitoring the situation in Japan and making portfolio adjustments that we believe are appropriate. While the economic outlook in Japan remains uncertain, we have identified stocks that may have fallen victim to market panic, as well as stocks outside Japan where the outlook has improved.
Meanwhile, conditions in equity markets look encouraging, even when accounting for the disruptions in March. The unusual correlation of stock prices last year has started to subside as investors discriminate more closely among companies. That’s good news for value investors, especially as spreads between the cheapest and most expensive quintiles of stocks have narrowed only slightly from their peak. This suggests that the renewed value recovery is just starting. In this environment, we expect research insights to be rewarded.
We are positioned across several industries in attractively valued companies that generate strong cash flow, including cyclical areas such as technology and industrial commodities, as well as in more defensive sectors such as telecom and consumer staples.
Despite new challenges, we’re confident that our disciplined value approach is likely to yield results in an environment where insightful research can make a big difference.
Baillie Gifford Overseas Ltd.
Portfolio Managers:
Charles Plowden, Joint Senior Partner and Lead Portfolio Manager
Spencer Adair, CFA, Investment Manager
Malcolm MacColl, Investment Manager
After a period of strong markets toward the end of 2010, global indexes have become distracted by unrest in North Africa and the Middle East and the terrible disaster in Japan. While the initial impacts of these events have kept news wires buzzing, the secondary effects will be more enduring for the world economy. These are currently difficult to assess, but higher oil prices, the resulting moderate downward pressure on global growth, and a reassessment of nuclear energy are the most likely medium-term outcomes.
Additional negative factors include concerns over sovereign debt in Europe and unpredictable weather patterns. These have affected some soft commodity prices and have added to the inflationary burden in developing economies.
Remarkably, given these events, global indexes rose strongly during the period. In our view, the recent news has masked positive trends. The global economy continues to recover strongly, with many of the companies in which we have holdings reporting that their underlying businesses are very healthy. As a result,
9
we continue to view the world from an optimistic position. The demand for goods and services in emerging markets remains strong (despite the Chinese authorities’ efforts to try to cool domestic demand), interest rates remain low in many developed markets, and stock market valuations appear moderate to us.
As usual, our transaction activity has been very low and consistent with a holding period of around five years. We have taken profits in those companies where we believe market expectations are too hopeful (notably in Chinese internet providers), and reinvested the proceeds in companies with differentiated growth drivers. Our recent new purchases include three health care companies—Clicks (South African pharmacies), Mindray (a low-cost medical device manufacturer), and Intuitive Surgical (robotic surgery).
10
Global Equity Fund
Fund Profile
As of March 31, 2011
| | |
| Portfolio Characteristics | | |
| | | MSCI All |
| | | Country |
| | | World |
| | Fund | Index |
| Number of Stocks | 875 | 2,460 |
| Median Market Cap | $17.1B | $37.1B |
| Price/Earnings Ratio | 13.5x | 14.9x |
| Price/Book Ratio | 1.7x | 1.9x |
| Return on Equity | 16.0% | 18.9% |
| Earnings Growth Rate | 5.5% | 4.1% |
| Dividend Yield | 2.1% | 2.5% |
| Turnover Rate | | |
| (Annualized) | 47% | — |
| Ticker Symbol | VHGEX | — |
| Expense Ratio1 | 0.44% | — |
| Short-Term Reserves | 0.1% | — |
| | |
| Sector Diversification (% of equity exposure) |
| | | MSCI All |
| | | Country |
| | | World |
| | Fund | Index |
| Consumer Discretionary | 15.8% | 9.7% |
| Consumer Staples | 6.8 | 9.0 |
| Energy | 9.5 | 12.5 |
| Financials | 20.6 | 20.8 |
| Health Care | 9.4 | 8.0 |
| Industrials | 13.6 | 11.0 |
| Information Technology | 9.6 | 11.5 |
| Materials | 8.2 | 9.1 |
| Telecommunication | | |
| Services | 4.9 | 4.6 |
| Utilities | 1.6 | 3.8 |
| |
| Volatility Measures | |
| | MSCI All |
| | Country |
| | World |
| | Index |
| R-Squared | 0.99 |
| Beta | 1.10 |
These measures show the degree and timing of the fund’s fluctuations compared with the index over 36 months.
| | |
| Ten Largest Holdings (% of total net assets) |
| Royal Dutch Shell plc | Integrated Oil & | |
| | Gas | 1.3% |
| Rio Tinto plc | Diversified Metals | |
| | & Mining | 1.2 |
| Cablevision Systems | | |
| Corp. Class A | Cable & Satellite | 1.1 |
| ConocoPhillips | Integrated Oil & | |
| | Gas | 0.9 |
| Chevron Corp. | Integrated Oil & | |
| | Gas | 0.9 |
| Jardine Matheson | Industrial | |
| Holdings Ltd. | Conglomerates | 0.8 |
| Johnson & Johnson | Pharmaceuticals | 0.8 |
| Travelers Cos Inc. | Property & Casualty | |
| | Insurance | 0.8 |
| Jardine Strategic | Industrial | |
| Holdings Ltd. | Conglomerates | 0.8 |
| Liberty Global Inc. | Cable & Satellite | 0.7 |
| Top Ten | | 9.3% |
The holdings listed exclude any temporary cash investments and equity index products.
Allocation by Region (% of equity exposure)
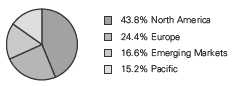
1 The expense ratio shown is from the prospectus dated January 26, 2011, and represents estimated costs for the current fiscal year. For the six months ended March 31, 2011, the annualized expense ratio was 0.51%. The increase from the estimated expense ratio reflects a performance-based investment advisory fee adjustment. When the performance adjustment is positive, the fund’s expenses increase; when it is negative, expenses decrease.
11
Global Equity Fund
| | |
| Market Diversification (% of equity exposure) |
| | | MSCI All |
| | | Country |
| | | World |
| | Fund | Index |
| Europe | | |
| United Kingdom | 9.2% | 8.2% |
| France | 3.8 | 3.9 |
| Germany | 3.0 | 3.3 |
| Switzerland | 1.7 | 3.0 |
| Italy | 1.5 | 1.1 |
| Netherlands | 1.2 | 1.0 |
| Sweden | 1.1 | 1.3 |
| Other | 2.9 | 3.4 |
| Subtotal | 24.4% | 25.2% |
| Pacific | | |
| Japan | 8.3% | 7.9% |
| Hong Kong | 3.8 | 1.1 |
| Australia | 2.3 | 3.4 |
| Other | 0.8 | 0.7 |
| Subtotal | 15.2% | 13.1% |
| Emerging Markets | | |
| South Korea | 3.4% | 2.0% |
| China | 1.9 | 2.4 |
| India | 1.4 | 1.0 |
| South Africa | 1.4 | 1.0 |
| Taiwan | 1.3 | 1.5 |
| Philippines | 1.3 | 0.1 |
| Malaysia | 1.2 | 0.4 |
| Thailand | 1.1 | 0.2 |
| Other | 3.6 | 5.5 |
| Subtotal | 16.6% | 14.1% |
| North America | | |
| United States | 40.5% | 42.8% |
| Canada | 3.3 | 4.8 |
| Subtotal | 43.8% | 47.6% |
12
Global Equity Fund
Performance Summary
All of the returns in this report represent past performance, which is not a guarantee of future results that may be achieved by the fund. (Current performance may be lower or higher than the performance data cited. For performance data current to the most recent month-end, visit our website at vanguard.com/performance.) Note, too, that both investment returns and principal value can fluctuate widely, so an investor’s shares, when sold, could be worth more or less than their original cost. The returns shown do not reflect taxes that a shareholder would pay on fund distributions or on the sale of fund shares.
Fiscal-Year Total Returns (%): September 30, 2000, Through March 31, 2011
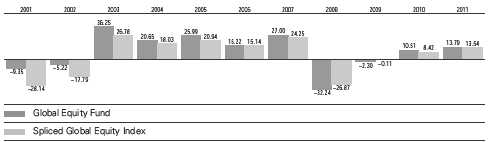
Spliced Global Equity Index: MSCI All Country World Index returns gross of taxes through March 31, 2007; MSCI All Country World Index returns net of withholding taxes applicable to Luxembourg holding companies thereafter.
Note: For 2011, performance data reflect the six months ended March 31, 2011.
| | | | |
| Average Annual Total Returns: Periods Ended March 31, 2011 | | | |
| |
| | Inception | One | Five | Ten |
| | Date | Year | Years | Years |
| Global Equity Fund | 8/14/1995 | 16.29% | 1.85% | 8.16% |
See Financial Highlights for dividend and capital gains information.
13
Global Equity Fund
Financial Statements (unaudited)
Statement of Net Assets
As of March 31, 2011
The fund reports a complete list of its holdings in regulatory filings four times in each fiscal year, at the quarter-ends. For the second and fourth fiscal quarters, the lists appear in the fund’s semiannual and annual reports to shareholders. For the first and third fiscal quarters, the fund files the lists with the Securities and Exchange Commission on Form N-Q. Shareholders can look up the fund’s Forms N-Q on the SEC’s website at sec.gov. Forms N-Q may also be reviewed and copied at the SEC’s Public Reference Room (see the back cover of this report for further information).
| | |
| | | Market |
| | | Value |
| | Shares | ($000) |
| Common Stocks (96.9%)1 | | |
| Australia (1.9%) | | |
| Santos Ltd. | 1,806,986 | 29,054 |
| Rio Tinto Ltd. | 290,635 | 25,474 |
| National Australia | | |
| Bank Ltd. | 226,300 | 6,048 |
| Australia & New Zealand | | |
| Banking Group Ltd. | 174,900 | 4,305 |
| BHP Billiton Ltd. | 86,638 | 4,158 |
| Brambles Ltd. | 480,876 | 3,520 |
| Amcor Ltd. | 442,771 | 3,232 |
| Iluka Resources Ltd. | 190,044 | 2,615 |
| Orica Ltd. | 69,866 | 1,908 |
| Alumina Ltd. | 544,419 | 1,388 |
| Challenger Ltd. | 162,067 | 826 |
| Beach Energy Ltd. | 500,099 | 501 |
| DuluxGroup Ltd. | 69,181 | 194 |
| | | 83,223 |
| Austria (0.1%) | | |
| Oesterreichische Post AG | 29,996 | 1,028 |
| Andritz AG | 10,903 | 1,017 |
| OMV AG | 20,062 | 907 |
| bwin Interactive | | |
| Entertainment AG | 19,007 | 714 |
| | | 3,666 |
| Belgium (0.4%) | | |
| Delhaize Group SA | 77,738 | 6,333 |
| Anheuser-Busch InBev NV | 90,678 | 5,170 |
| Groupe Bruxelles Lambert | | |
| SA | 30,257 | 2,827 |
| * KBC Groep NV | 59,700 | 2,247 |
| | | 16,577 |
| Brazil (0.8%) | | |
| Vale SA Class B Pfd. ADR | 502,700 | 14,840 |
| Banco do Brasil SA | 435,500 | 7,856 |
| * OGX Petroleo e Gas | | |
| Participacoes SA | 267,300 | 3,204 |
| | | |
| | | | Market |
| | | | Value |
| | | Shares | ($000) |
| | Petroleo Brasileiro SA | | |
| | ADR Type A | 71,700 | 2,548 |
| | Itau Unibanco Holding | | |
| | SA ADR | 93,525 | 2,249 |
| | BM&FBovespa SA | 243,200 | 1,765 |
| | Odontoprev SA | 75,851 | 1,236 |
| | Cia Ferro Ligas da Bahia - | | |
| | Ferbasa Prior Pfd. | 75,400 | 586 |
| | | | 34,284 |
| Canada (3.3%) | | |
| | Bombardier Inc. Class B | 4,132,369 | 30,391 |
| | Rogers Communications | | |
| | Inc. Class B | 753,748 | 27,398 |
| * | Research In Motion Ltd. | 283,690 | 16,048 |
| | Imperial Oil Ltd. | 218,542 | 11,167 |
| | Magna International Inc. | 224,800 | 10,777 |
| | Nexen Inc. | 388,842 | 9,694 |
| | BCE Inc. | 142,465 | 5,175 |
| * | ACE Aviation Holdings Inc. | | |
| | Class A | 404,559 | 4,845 |
| | National Bank of Canada | 59,600 | 4,844 |
| | Agrium Inc. | 47,200 | 4,359 |
| | Onex Corp. | 100,331 | 3,518 |
| | Fairfax Financial Holdings | | |
| | Ltd. | 7,379 | 2,783 |
| * | CGI Group Inc. Class A | 126,700 | 2,657 |
| * | New Gold Inc. | 198,453 | 2,336 |
| ^ | Ritchie Bros Auctioneers | | |
| | Inc. | 76,607 | 2,156 |
| | Saputo Inc. | 31,600 | 1,426 |
| | Toronto-Dominion Bank | 15,100 | 1,336 |
| | Groupe Aeroplan Inc. | 86,213 | 1,168 |
| | Yellow Media Inc. | 83,441 | 474 |
| * | Catalyst Paper Corp. | 1,158,844 | 400 |
| | Centerra Gold Inc. | 20,200 | 363 |
| * | Fraser Papers Inc. | 337,960 | 23 |
| | Penn West Petroleum Ltd. | 770 | 21 |
| * | Nortel Networks Corp. | 241,295 | 6 |
| | | | 143,365 |
14
Global Equity Fund
| | | |
| | | | Market |
| | | | Value |
| | | Shares | ($000) |
| Chile (0.1%) | | |
| | Enersis SA ADR | 244,112 | 5,082 |
| |
| China (1.9%) | | |
| | China Mobile Ltd. | 2,571,500 | 23,737 |
| | China Petroleum | | |
| | & Chemical Corp. | 21,452,000 | 21,420 |
| | Tsingtao Brewery Co. | | |
| | Ltd. | 1,990,000 | 9,480 |
| | Dongfeng Motor Group | | |
| | Co. Ltd. | 4,156,000 | 7,070 |
| | Bank of China Ltd. | 9,869,000 | 5,488 |
| * | Sohu.com Inc. | 59,709 | 5,335 |
| | China National Building | | |
| | Material Co. Ltd. | 738,000 | 2,705 |
| *,^ | Shanda Interactive | | |
| | Entertainment Ltd. ADR | 33,600 | 1,411 |
| * | Baidu Inc. ADR | 9,600 | 1,323 |
| * | Sina Corp. | 12,100 | 1,295 |
| * | Mindray Medical | | |
| | International Ltd. ADR | 37,177 | 937 |
| | Silver Grant International | 1,692,000 | 662 |
| | | | 80,863 |
| Czech Republic (0.1%) | | |
| | Komercni Banka AS | 9,681 | 2,441 |
| |
| Denmark (0.6%) | | |
| * | Danske Bank A/S | 214,636 | 4,744 |
| | Coloplast A/S Class B | 31,613 | 4,573 |
| | Novo Nordisk A/S | | |
| | Class B | 29,057 | 3,649 |
| | Carlsberg A/S Class B | 32,122 | 3,454 |
| * | William Demant Holding | | |
| | A/S | 38,789 | 3,353 |
| | GN Store Nord A/S | 343,380 | 3,216 |
| * | Vestas Wind Systems | | |
| | A/S | 56,451 | 2,450 |
| * | Jyske Bank A/S | 23,304 | 1,036 |
| * | Topdanmark A/S | 3,899 | 647 |
| * | Bang & Olufsen A/S | 33,672 | 495 |
| | AP Moller - Maersk A/S | | |
| | Class B | 46 | 432 |
| | | | 28,049 |
| Egypt (0.1%) | | |
| * | Ezz Steel | 1,397,944 | 2,447 |
| | Egyptian Financial | | |
| | Group-Hermes Holding | 223,300 | 820 |
| | | | 3,267 |
| Finland (0.5%) | | |
| | Sampo Oyj | 229,018 | 7,293 |
| | Metso Oyj | 120,845 | 6,484 |
| | Stora Enso Oyj | 225,780 | 2,688 |
| | Tieto Oyj | 53,415 | 977 |
| | Wartsila Oyj | 24,166 | 942 |
| | | |
| | | | Market |
| | | | Value |
| | | Shares | ($000) |
| | Cargotec Oyj Class B | 15,037 | 732 |
| | Nokia Oyj | 70,491 | 600 |
| | Outokumpu Oyj | 26,850 | 465 |
| | Kone Oyj Class B | 5,113 | 294 |
| | | | 20,475 |
| France (3.6%) | | |
| | Sanofi-Aventis SA | 393,996 | 27,609 |
| | Total SA | 409,908 | 24,977 |
| * | European Aeronautic | | |
| | Defence and Space | | |
| | Co. NV | 527,374 | 15,360 |
| | Bouygues SA | 234,800 | 11,271 |
| | BNP Paribas | 119,183 | 8,713 |
| * | Renault SA | 143,100 | 7,907 |
| | Vivendi SA | 249,964 | 7,131 |
| | Societe Generale | 109,270 | 7,098 |
| * | Peugeot SA | 167,756 | 6,618 |
| | ArcelorMittal | 143,230 | 5,178 |
| | Legrand SA | 117,822 | 4,901 |
| | Cap Gemini SA | 76,776 | 4,458 |
| | Carrefour SA | 79,013 | 3,491 |
| | AXA SA | 142,215 | 2,972 |
| | Neopost SA | 29,648 | 2,596 |
| | Groupe Eurotunnel SA | 239,488 | 2,545 |
| | Thales SA | 50,328 | 2,008 |
| | Arkema SA | 22,013 | 2,001 |
| | Lagardere SCA | 33,523 | 1,430 |
| | Societe BIC SA | 15,210 | 1,352 |
| | Eurofins Scientific | 11,975 | 1,056 |
| * | Edenred | 33,785 | 1,019 |
| * | Valeo SA | 16,155 | 941 |
| | Technip SA | 8,255 | 880 |
| | SA des Ciments Vicat | 9,138 | 776 |
| * | Alcatel-Lucent ADR | 131,498 | 764 |
| * | Cie Generale de | | |
| | Geophysique - Veritas | 17,005 | 615 |
| | Imerys SA | 7,677 | 563 |
| | Alstom SA | 8,304 | 491 |
| | APERAM | 7,161 | 288 |
| *,^ | Eurofins Scientific | | |
| | Warrants Exp. 06/29/2017 | 249 | 4 |
| | | | 157,013 |
| Germany (2.8%) | | |
| | BASF SE | 320,011 | 27,622 |
| | E.ON AG | 484,973 | 14,748 |
| | Allianz SE | 87,200 | 12,210 |
| | Deutsche Post AG | 667,792 | 12,003 |
| | Muenchener | | |
| | Rueckversicherungs AG | 53,224 | 8,367 |
| * | Daimler AG | 105,116 | 7,407 |
| | Henkel AG & Co. KGaA | | |
| | Prior Pfd. | 113,360 | 7,017 |
| | Fresenius Medical Care | | |
| | AG & Co. KGaA | 92,662 | 6,216 |
15
Global Equity Fund
| | | |
| | | | Market |
| | | | Value |
| | | Shares | ($000) |
| * | Deutsche Lufthansa AG | 285,282 | 6,041 |
| | Bayerische Motoren Werke | |
| | AG | 47,881 | 3,975 |
| | Deutsche Boerse AG | 27,166 | 2,057 |
| | Infineon Technologies AG | 190,360 | 1,942 |
| | Porsche Automobil Holding | |
| | SE Prior Pfd. | 29,102 | 1,895 |
| | Siemens AG | 11,664 | 1,596 |
| | Deutsche Bank AG | 15,904 | 932 |
| | Suedzucker AG | 33,188 | 925 |
| | Fresenius Medical Care | | |
| | AG & Co. KGaA ADR | 10,741 | 725 |
| | Hannover | | |
| | Rueckversicherung AG | 13,240 | 722 |
| | Bayer AG | 9,061 | 700 |
| | GEA Group AG | 21,137 | 695 |
| | Axel Springer AG | 3,763 | 608 |
| | Adidas AG | 9,352 | 588 |
| * | Commerzbank AG | 75,167 | 584 |
| | Celesio AG | 15,140 | 370 |
| * | Porsche Automobil Holding | |
| | SE Rights Exp. 04/12/2011 | 29,102 | 252 |
| | MLP AG | 18,763 | 173 |
| | | | 120,370 |
| Greece (0.1%) | | |
| | Coca Cola Hellenic Bottling | |
| | Co. SA | 105,569 | 2,833 |
| |
| Hong Kong (3.8%) | | |
| | Jardine Matheson | | |
| | Holdings Ltd. | 803,902 | 35,800 |
| | Jardine Strategic | | |
| | Holdings Ltd. | 1,239,400 | 33,100 |
| | New World Development | | |
| | Ltd. | 8,284,424 | 14,607 |
| | First Pacific Co. Ltd. | 12,155,600 | 10,871 |
| | SmarTone | | |
| | Telecommunications | | |
| | Holding Ltd. | 6,167,580 | 10,229 |
| | Hutchison Whampoa Ltd. | 802,000 | 9,491 |
| | Henderson Land | | |
| | Development Co. Ltd. | 1,027,630 | 7,121 |
| | Wheelock & Co. Ltd. | 1,784,000 | 6,695 |
| | Hongkong & Shanghai | | |
| | Hotels | 3,515,075 | 6,431 |
| | Television Broadcasts Ltd. 1,097,000 | 6,430 |
| | Esprit Holdings Ltd. | 1,378,043 | 6,318 |
| | CLP Holdings Ltd. | 611,000 | 4,939 |
| | Midland Holdings Ltd. | 5,156,000 | 4,009 |
| | Hong Kong Aircraft | | |
| | Engineering Co. Ltd. | 178,400 | 2,478 |
| | Mandarin Oriental | | |
| | International Ltd. | 806,690 | 1,689 |
| | Hong Kong Exchanges | | |
| | and Clearing Ltd. | 54,000 | 1,172 |
| | | |
| | | | Market |
| | | | Value |
| | | Shares | ($000) |
| | Cathay Pacific Airways | | |
| | Ltd. | 409,000 | 980 |
| * | Next Media Ltd. | 6,072,000 | 764 |
| * | I-CABLE Communications | | |
| | Ltd. | 6,402,000 | 657 |
| | City Telecom HK Ltd. | | |
| | ADR | 17,300 | 262 |
| * | Henderson Land | | |
| | Development Co. Ltd. | | |
| | Warrants Exp. | | |
| | 06/01/2011 | 205,800 | 12 |
| | | | 164,055 |
| India (1.4%) | | |
| | Punjab National Bank Ltd. | 540,514 | 14,688 |
| | Bank of Baroda | 606,970 | 13,122 |
| | Bank of India | 686,630 | 7,319 |
| | Canara Bank | 411,343 | 5,775 |
| 3 | Tata Steel Ltd. | | |
| | Warrants Exp. | | |
| | 12/23/2014 | 256,500 | 3,565 |
| | Allahabad Bank | 623,815 | 3,216 |
| | Dena Bank | 1,146,752 | 2,674 |
| | IDBI Bank Ltd. | 602,190 | 1,923 |
| | Indian Bank | 223,019 | 1,164 |
| | Oriental Bank of | | |
| | Commerce | 129,500 | 1,130 |
| 3 | Hindalco Industries Ltd. | | |
| | GDR | 239,376 | 1,116 |
| | Tata Steel Ltd. GDR | 63,300 | 873 |
| | Vijaya Bank | 433,437 | 772 |
| | Union Bank of India | 80,249 | 625 |
| | Andhra Bank | 122,011 | 413 |
| | | | 58,375 |
| Indonesia (0.6%) | | |
| * | Bank Pan Indonesia | | |
| | Tbk PT | 75,662,343 | 10,069 |
| | Indofood Sukses | | |
| | Makmur Tbk PT | 8,878,500 | 5,502 |
| | Matahari Putra Prima | | |
| | Tbk PT | 23,927,775 | 3,933 |
| | Semen Gresik Persero | | |
| | Tbk PT | 2,372,000 | 2,477 |
| | Gudang Garam Tbk PT | 316,400 | 1,520 |
| | Bank Negara Indonesia | | |
| | Persero Tbk PT | 2,338,111 | 1,066 |
| | Gajah Tunggal Tbk PT | 2,642,500 | 674 |
| | Citra Marga Nusaphala | | |
| | Persada Tbk PT | 1,618,000 | 217 |
| * | Mulia Industrindo Tbk PT | 921,000 | 42 |
| | | | 25,500 |
| Ireland (0.2%) | | |
| | CRH plc | 87,415 | 2,008 |
| | Paddy Power plc | 42,500 | 1,860 |
| * | Dragon Oil plc | 137,335 | 1,316 |
16
Global Equity Fund
| | | |
| | | | Market |
| | | | Value |
| | | Shares | ($000) |
| | DCC plc | 28,986 | 921 |
| | Ryanair Holdings plc ADR | 28,878 | 803 |
| | DCC plc | 18,173 | 578 |
| * | Independent News | | |
| | & Media plc | 441,239 | 389 |
| | Fyffes plc | 470,421 | 279 |
| * | Irish Continental Group plc | 10,926 | 275 |
| * | Anglo Irish Bank Corp. Ltd. | 122,273 | — |
| | | | 8,429 |
| Italy (1.4%) | | |
| | Enel SPA | 3,083,122 | 19,423 |
| | Saipem SPA | 157,085 | 8,345 |
| | UniCredit SPA | 2,771,282 | 6,831 |
| | Telecom Italia SPA | | |
| | (Registered) | 3,703,100 | 5,691 |
| | Luxottica Group | | |
| | SPA ADR | 155,327 | 5,092 |
| * | Fiat Industrial SPA | 322,884 | 4,636 |
| | Telecom Italia SPA | | |
| | (Bearer) | 2,707,300 | 3,637 |
| | Fiat SPA | 322,884 | 2,918 |
| | Luxottica Group SPA | 61,709 | 2,014 |
| | Parmalat SPA | 324,841 | 1,087 |
| | Finmeccanica SPA | 50,286 | 632 |
| | Davide Campari-Milano | | |
| | SPA | 92,610 | 626 |
| | Intesa Sanpaolo SPA | | |
| | (Registered) | 169,997 | 502 |
| | Mediaset SPA | 44,016 | 279 |
| | Banco Popolare SC | 82,039 | 245 |
| | | | 61,958 |
| Japan (8.0%) | | |
| | Nippon Telegraph | | |
| | & Telephone Corp. | 629,200 | 28,103 |
| | Sony Corp. | 581,300 | 18,541 |
| | Astellas Pharma Inc. | 463,800 | 17,176 |
| | Hitachi Ltd. | 3,112,000 | 16,200 |
| | Marubeni Corp. | 2,085,000 | 14,984 |
| | Mitsui & Co. Ltd. | 728,500 | 13,043 |
| | Daito Trust Construction | | |
| | Co. Ltd. | 187,000 | 12,863 |
| | Japan Tobacco Inc. | 3,227 | 11,667 |
| | Fujitsu Ltd. | 1,900,000 | 10,737 |
| | Nissan Motor Co. Ltd. | 1,102,800 | 9,796 |
| | Sharp Corp. | 821,000 | 8,144 |
| | Sumitomo Mitsui Financial | | |
| | Group Inc. | 235,900 | 7,319 |
| | JFE Holdings Inc. | 231,200 | 6,769 |
| | Mitsubishi Corp. | 229,400 | 6,361 |
| | JX Holdings Inc. | 900,870 | 6,053 |
| | Bridgestone Corp. | 284,900 | 5,958 |
| | ORIX Corp. | 57,070 | 5,349 |
| | NTT Data Corp. | 1,703 | 5,259 |
| | | |
| | | | Market |
| | | | Value |
| | | Shares | ($000) |
| | Sumitomo Electric | | |
| | Industries Ltd. | 326,300 | 4,519 |
| | Tokyo Electric Power | | |
| | Co. Inc. | 775,300 | 4,321 |
| * | Yamaha Motor Co. Ltd. | 233,900 | 4,073 |
| | Toyota Motor Corp. | 96,700 | 3,838 |
| | Asahi Glass Co. Ltd. | 305,000 | 3,837 |
| | Inpex Corp. | 471 | 3,563 |
| | FUJIFILM Holdings Corp. | 110,700 | 3,431 |
| | Kao Corp. | 133,000 | 3,319 |
| | JS Group Corp. | 125,100 | 3,244 |
| | Mitsui Fudosan Co. Ltd. | 197,000 | 3,238 |
| | Toyota Tsusho Corp. | 187,200 | 3,086 |
| | Mitsubishi UFJ Financial | | |
| | Group Inc. | 667,000 | 3,073 |
| | Yamato Holdings Co. Ltd. | 193,000 | 2,992 |
| | Tokyo Gas Co. Ltd. | 655,000 | 2,988 |
| | Namco Bandai Holdings | | |
| | Inc. | 269,550 | 2,937 |
| | MS&AD Insurance Group | | |
| | Holdings | 123,600 | 2,821 |
| | Toyo Seikan Kaisha Ltd. | 165,300 | 2,706 |
| | Secom Co. Ltd. | 55,400 | 2,576 |
| | Toshiba Corp. | 522,000 | 2,552 |
| | East Japan Railway Co. | 43,800 | 2,432 |
| | Seven & I Holdings Co. Ltd. | 89,700 | 2,285 |
| | Sumitomo Corp. | 157,700 | 2,254 |
| | Chubu Electric Power Co. | | |
| | Inc. | 92,500 | 2,059 |
| | Rohm Co. Ltd. | 31,400 | 1,973 |
| | Dowa Holdings Co. Ltd. | 305,000 | 1,899 |
| | Olympus Corp. | 64,800 | 1,805 |
| * | Elpida Memory Inc. | 139,700 | 1,797 |
| | Kawasaki Heavy Industries | | |
| | Ltd. | 395,000 | 1,740 |
| | Panasonic Corp. | 136,600 | 1,730 |
| | NKSJ Holdings Inc. | 262,000 | 1,710 |
| | Omron Corp. | 60,500 | 1,703 |
| | West Japan Railway Co. | 434 | 1,673 |
| | Hitachi Chemical Co. Ltd. | 81,100 | 1,652 |
| | Dainippon Screen | | |
| | Manufacturing Co. Ltd. | 148,000 | 1,549 |
| | Obayashi Corp. | 347,000 | 1,539 |
| | Yamada Denki Co. Ltd. | 22,390 | 1,505 |
| | Mitsubishi Estate Co. Ltd. | 88,000 | 1,487 |
| | Isetan Mitsukoshi Holdings | | |
| | Ltd. | 163,300 | 1,472 |
| | Fukuoka Financial Group | | |
| | Inc. | 354,000 | 1,472 |
| | Aeon Co. Ltd. | 125,600 | 1,455 |
| | Mitsubishi Heavy Industries | | |
| | Ltd. | 301,000 | 1,383 |
| | Nippon Meat Packers Inc. | 109,000 | 1,375 |
| | Sekisui House Ltd. | 146,000 | 1,363 |
| | Kyowa Hakko Kirin Co. Ltd. | 145,000 | 1,360 |
17
| | | |
| | | | Market |
| | | | Value |
| | | Shares | ($000) |
| | Shinsei Bank Ltd. | 1,098,000 | 1,294 |
| | Alfresa Holdings Corp. | 32,300 | 1,240 |
| | Shiseido Co. Ltd. | 71,000 | 1,230 |
| | NSK Ltd. | 140,000 | 1,208 |
| | Shimizu Corp. | 269,000 | 1,193 |
| | Sumitomo Forestry Co. | | |
| | Ltd. | 128,000 | 1,160 |
| | Sumitomo Rubber | | |
| | Industries Ltd. | 113,800 | 1,159 |
| | NTT DoCoMo Inc. | 656 | 1,145 |
| | Kinden Corp. | 125,000 | 1,141 |
| | Bank of Yokohama Ltd. | 236,000 | 1,122 |
| | Idemitsu Kosan Co. Ltd. | 9,300 | 1,087 |
| | Tokyo Electron Ltd. | 19,200 | 1,059 |
| | Dai-ichi Life Insurance Co. | | |
| | Ltd. | 672 | 1,013 |
| | Dentsu Inc. | 34,100 | 881 |
| | Yaskawa Electric Corp. | 74,000 | 877 |
| | Chiba Bank Ltd. | 156,000 | 874 |
| | Marui Group Co. Ltd. | 130,200 | 842 |
| | Yamatake Corp. | 31,800 | 779 |
| | Taiyo Nippon Sanso Corp. | 90,000 | 751 |
| | Ryosan Co. Ltd. | 29,800 | 718 |
| | Hitachi Metals Ltd. | 56,000 | 706 |
| | Onward Holdings Co. Ltd. | 88,000 | 653 |
| | K’s Holdings Corp. | 21,900 | 632 |
| | Toppan Forms Co. Ltd. | 68,500 | 596 |
| | Sega Sammy Holdings Inc. | 33,900 | 588 |
| | Nippon Suisan Kaisha Ltd. | 206,800 | 575 |
| | Tokyo Ohka Kogyo Co. Ltd. | 25,800 | 532 |
| | Oriental Land Co. Ltd. | 6,300 | 501 |
| | Toyo Suisan Kaisha Ltd. | 23,000 | 499 |
| | Mitsubishi Tanabe Pharma | | |
| | Corp. | 29,300 | 475 |
| | Aisin Seiki Co. Ltd. | 13,000 | 452 |
| | IT Holdings Corp. | 34,900 | 365 |
| | IHI Corp. | 144,000 | 351 |
| | Seino Holdings Corp. | 45,000 | 340 |
| | Arnest One Corp. | 30,300 | 303 |
| | Nagase & Co. Ltd. | 25,000 | 298 |
| | Daihatsu Motor Co. Ltd. | 20,000 | 292 |
| | Fuji Soft Inc. | 16,300 | 262 |
| | Alpine Electronics Inc. | 23,000 | 258 |
| | Toho Gas Co. Ltd. | 50,000 | 258 |
| | Nihon Unisys Ltd. | 39,100 | 257 |
| | EDION Corp. | 29,600 | 252 |
| | Noritake Co. Ltd. | 58,000 | 246 |
| | Fujitsu Frontech Ltd. | 32,100 | 241 |
| | Takasago Thermal | | |
| | Engineering Co. Ltd. | 26,000 | 230 |
| | Daicel Chemical Industries | | |
| | Ltd. | 36,000 | 222 |
| * | JVC Kenwood Holdings | | |
| | Inc. | 38,100 | 185 |
| | | |
| | | | Market |
| | | | Value |
| | | Shares | ($000) |
| | Inabata & Co. Ltd. | 22,700 | 139 |
| | Dai Nippon Printing Co. | | |
| | Ltd. | 11,000 | 134 |
| | Otsuka Holdings Co. Ltd. | 4,000 | 99 |
| | Ajinomoto Co. Inc. | 9,000 | 94 |
| | | | 341,916 |
| Malaysia (1.2%) | | |
| | CIMB Group Holdings | | |
| | Bhd. | 5,877,238 | 15,901 |
| | Genting Malaysia Bhd. | 10,494,400 | 12,738 |
| | AMMB Holdings Bhd. | 3,845,187 | 8,235 |
| | Sime Darby Bhd. | 2,205,257 | 6,716 |
| | British American | | |
| | Tobacco Malaysia Bhd. | 160,400 | 2,544 |
| * | Malaysian Airline System | | |
| | Bhd. | 3,108,366 | 1,887 |
| | Multi-Purpose Holdings | | |
| | Bhd. | 1,886,190 | 1,668 |
| | Telekom Malaysia Bhd. | 1,218,275 | 1,625 |
| | Carlsberg Brewery-Malay | | |
| | Bhd. | 109,600 | 267 |
| | | | 51,581 |
| Mexico (0.2%) | | |
| | America Movil SAB de | | |
| | CV ADR | 100,440 | 5,836 |
| | Wal-Mart de Mexico | | |
| | SAB de CV | 596,200 | 1,786 |
| | Telefonos de Mexico | | |
| | SAB de CV ADR | 33,943 | 620 |
| | Alfa SAB de CV Class A | 46,400 | 604 |
| | | | 8,846 |
| Morocco (0.0%) | | |
| | Maroc Telecom | 22,195 | 432 |
| |
| Netherlands (1.2%) | | |
| * | ING Groep NV | 1,318,500 | 16,737 |
| * | Aegon NV | 870,400 | 6,517 |
| | Koninklijke DSM NV | 99,579 | 6,123 |
| | Koninklijke KPN NV | 320,736 | 5,469 |
| | Heineken NV | 89,157 | 4,869 |
| | Koninklijke Boskalis | | |
| | Westminster NV | 85,758 | 4,536 |
| | Wolters Kluwer NV | 100,762 | 2,356 |
| | Akzo Nobel NV | 15,434 | 1,062 |
| | Koninklijke Philips | | |
| | Electronics NV | 27,074 | 867 |
| * | Randstad Holding NV | 13,740 | 765 |
| | ASML Holding NV | 16,662 | 741 |
| | Nutreco NV | 7,888 | 578 |
| | TNT NV | 12,503 | 321 |
| * | Eurocastle Investment | | |
| | Ltd. | 275,977 | 102 |
| | | | 51,043 |
18
Global Equity Fund
| | | |
| | | | Market |
| | | | Value |
| | | Shares | ($000) |
| New Zealand (0.0%) | | |
| | Telecom Corp. of | | |
| | New Zealand Ltd. | 338,300 | 520 |
| * | PGG Wrightson Ltd. | 51,996 | 20 |
| | | | 540 |
| Norway (0.3%) | | |
| | Statoil ASA | 352,764 | 9,770 |
| | DnB NOR ASA | 218,112 | 3,344 |
| * | Storebrand ASA | 63,234 | 542 |
| | | | 13,656 |
| Philippines (1.3%) | | |
| | Ayala Corp. | 2,061,103 | 18,267 |
| | ABS-CBN Holdings Corp. | 13,521,188 | 14,388 |
| | Globe Telecom Inc. | 415,520 | 8,523 |
| | DMCI Holdings Inc. | 5,100,700 | 4,391 |
| | Jollibee Foods Corp. | 1,999,520 | 4,017 |
| * | Lopez Holdings Corp. | 24,122,129 | 3,017 |
| | Banco de Oro Unibank | | |
| | Inc. | 1,226,200 | 1,467 |
| | | | 54,070 |
| Poland (0.5%) | | |
| | KGHM Polska Miedz SA | 293,323 | 18,606 |
| * | Polski Koncern Naftowy | | |
| | Orlen SA | 147,234 | 2,730 |
| | | | 21,336 |
| Portugal (0.1%) | | |
| | EDP - Energias de | | |
| | Portugal SA | 750,900 | 2,923 |
| |
| Russia (0.9%) | | |
| | Lukoil OAO ADR | 300,774 | 21,534 |
| | Gazprom OAO ADR | 526,450 | 17,042 |
| | Gazprom OAO ADR | | |
| | (U.S. Shares) | 15,167 | 491 |
| | | | 39,067 |
| Singapore (0.8%) | | |
| | DBS Group Holdings Ltd. | 1,175,000 | 13,642 |
| | Great Eastern Holdings | | |
| | Ltd. | 711,000 | 8,587 |
| | STATS ChipPAC Ltd. | 8,335,000 | 4,761 |
| | GuocoLeisure Ltd. | 6,166,000 | 3,687 |
| * | Genting Singapore plc | 1,025,244 | 1,667 |
| | United Industrial Corp. | | |
| | Ltd. | 368,000 | 830 |
| | Golden Agri-Resources | | |
| | Ltd. | 1,010,000 | 552 |
| | Global Yellow Pages Ltd. | 2,403,000 | 325 |
| | Yangzijiang Shipbuilding | | |
| | Holdings Ltd. | 200,000 | 287 |
| * | Global Yellow Pages Ltd. | | |
| | Warrants Exp. | | |
| | 08/13/2014 | 704,000 | 24 |
| | | | 34,362 |
| | | |
| | | | Market |
| | | | Value |
| | | Shares | ($000) |
| South Africa (1.4%) | | |
| | Hosken Consolidated | | |
| | Investments Ltd. | 1,449,794 | 16,704 |
| | RMB Holdings Ltd. | 1,373,537 | 5,674 |
| | Sun International Ltd. | 419,009 | 5,599 |
| | Nedbank Group Ltd. | 262,971 | 5,497 |
| | FirstRand Ltd. | 1,382,692 | 4,105 |
| | Naspers Ltd. | 73,302 | 3,943 |
| | Clicks Group Ltd. | 585,698 | 3,679 |
| | JD Group Ltd. | 336,905 | 2,411 |
| | RMI Holdings | 1,373,537 | 2,365 |
| | Anglo Platinum Ltd. | 21,049 | 2,164 |
| | Standard Bank Group Ltd. | 86,631 | 1,330 |
| | Gold Fields Ltd. | 69,285 | 1,209 |
| | AngloGold Ashanti Ltd. | 20,395 | 977 |
| | Imperial Holdings Ltd. | 44,305 | 747 |
| | City Lodge Hotels Ltd. | 70,616 | 703 |
| | MMI Holdings Ltd. | 233,351 | 573 |
| | Discovery Holdings Ltd. | 74,638 | 420 |
| | Mondi Ltd. | 14,936 | 146 |
| | | | 58,246 |
| South Korea (3.4%) | | |
| | Samsung Electronics Co. | | |
| | Ltd. | 32,390 | 27,466 |
| | Hyundai Motor Co. | 102,650 | 18,971 |
| | Kia Motors Corp. | 298,371 | 18,751 |
| | LG Corp. | 214,612 | 15,982 |
| | Hana Financial Group Inc. | 340,630 | 14,709 |
| | KB Financial Group Inc. | 266,340 | 13,932 |
| | LG Display Co. Ltd. | 314,470 | 9,856 |
| | Woori Finance Holdings | | |
| | Co. Ltd. | 707,110 | 9,361 |
| | LG Electronics Inc. | 83,270 | 7,962 |
| | SK Holdings Co. Ltd. | 33,004 | 4,958 |
| 3 | Samsung Electronics Co. | | |
| | Ltd. GDR | 5,600 | 2,378 |
| | POSCO | 1,000 | 459 |
| | SK Telecom Co. Ltd. | 2,930 | 436 |
| * | Korea Electric Power Corp. | 5,000 | 123 |
| | | | 145,344 |
| Spain (0.5%) | | |
| | Banco Santander SA | 451,460 | 5,266 |
| | Acerinox SA | 168,586 | 3,327 |
| | Acciona SA | 25,747 | 2,797 |
| | Inditex SA | 34,291 | 2,751 |
| * | Gestevision Telecinco SA | 194,202 | 2,221 |
| | Telefonica SA | 83,321 | 2,090 |
| | Viscofan SA | 46,874 | 1,860 |
| | Banco Santander SA ADR | 17,899 | 210 |
| | | | 20,522 |
| Sweden (1.1%) | | |
| * | Volvo AB Class B | 653,234 | 11,483 |
| | Svenska Handelsbanken | | |
| | AB Class A | 278,337 | 9,129 |
19
Global Equity Fund
| | | |
| | | | Market |
| | | | Value |
| | | Shares | ($000) |
| | Assa Abloy AB Class B | 194,875 | 5,600 |
| | Telefonaktiebolaget LM | | |
| | Ericsson Class B | 360,408 | 4,637 |
| | Atlas Copco AB Class B | 187,334 | 4,525 |
| | Swedish Match AB | 78,892 | 2,619 |
| | Investor AB Class B | 78,468 | 1,903 |
| | Nordea Bank AB | 131,997 | 1,444 |
| | Hoganas AB Class B | 37,599 | 1,398 |
| | Svenska Cellulosa AB | | |
| | Class B | 78,849 | 1,269 |
| | Modern Times Group AB | | |
| | Class B | 15,780 | 1,197 |
| | Electrolux AB Class B | 40,789 | 1,051 |
| | Scania AB Class B | 40,831 | 947 |
| | Oriflame Cosmetics SA | 8,844 | 457 |
| | Boliden AB | 14,261 | 307 |
| * | CDON Group AB | 15,780 | 86 |
| | | | 48,052 |
| Switzerland (1.7%) | | |
| | Roche Holding AG | 95,739 | 13,668 |
| | Novartis AG | 181,957 | 9,853 |
| | Cie Financiere Richemont | | |
| | SA | 139,706 | 8,055 |
| * | UBS AG | 402,423 | 7,240 |
| | Nestle SA | 114,097 | 6,534 |
| | Schindler Holding AG | | |
| | (Bearer) | 37,561 | 4,514 |
| * | Clariant AG | 244,166 | 4,399 |
| | Geberit AG | 18,989 | 4,130 |
| | Adecco SA | 62,740 | 4,119 |
| | Allied World Assurance | | |
| | Co. Holdings Ltd. | 40,219 | 2,521 |
| | ABB Ltd. | 95,048 | 2,282 |
| | Julius Baer Group Ltd. | 44,759 | 1,938 |
| * | Logitech International SA | 74,502 | 1,343 |
| | Sonova Holding AG | 14,526 | 1,291 |
| | Helvetia Holding AG | 1,492 | 617 |
| | Swiss Reinsurance Co. | | |
| | Ltd. | 9,756 | 556 |
| * | PubliGroupe AG | 2,177 | 285 |
| | | | 73,345 |
| Taiwan (1.3%) | | |
| | Fubon Financial Holding | | |
| | Co. Ltd. | 13,435,663 | 17,819 |
| | United Microelectronics | | |
| | Corp. | 21,180,000 | 10,988 |
| * | AU Optronics Corp. | 11,010,700 | 9,589 |
| | Taiwan Semiconductor | | |
| | Manufacturing Co. Ltd. | 2,303,431 | 5,520 |
| | Taiwan Semiconductor | | |
| | Manufacturing Co. Ltd. | | |
| | ADR | 197,978 | 2,411 |
| * | Pegatron Corp. | 1,706,000 | 1,935 |
| * | Taishin Financial Holding | | |
| | Co. Ltd. | 3,420,761 | 1,934 |
| | | |
| | | | Market |
| | | | Value |
| | | Shares | ($000) |
| | Chunghwa Telecom Co. | | |
| | Ltd. | 489,800 | 1,527 |
| | Uni-President Enterprises | | |
| | Corp. | 1,081,799 | 1,482 |
| | Lite-On Technology Corp. | 719,579 | 886 |
| | Yageo Corp. | 1,392,000 | 679 |
| | Inventec Co. Ltd. | 677,985 | 345 |
| | Gigabyte Technology Co. | | |
| | Ltd. | 314,000 | 303 |
| | Compal Electronics Inc. | 304,928 | 303 |
| | Chin-Poon Industrial Co. | 337,000 | 275 |
| | Radiant Opto-Electronics | | |
| | Corp. | 65,000 | 156 |
| * | King Yuan Electronics Co. | | |
| | Ltd. | 203,000 | 112 |
| | | | 56,264 |
| Thailand (1.1%) | | |
| | Kasikornbank PCL | | |
| | (Foreign) | 2,086,700 | 9,066 |
| | Siam Cement PCL | | |
| | (Foreign) | 622,900 | 7,804 |
| | Bangkok Bank PCL | | |
| | (Foreign) | 1,134,800 | 6,503 |
| | MBK PCL (Foreign) | 1,657,300 | 5,297 |
| | Thanachart Capital PCL | 4,915,300 | 5,284 |
| | Advanced Info Service | | |
| | PCL (Foreign) | 1,516,500 | 4,512 |
| | Siam Cement PCL NVDR | 286,300 | 3,324 |
| | Land and Houses PCL | | |
| | (Foreign) | 9,090,900 | 2,093 |
| | GMM Grammy PCL | | |
| | NVDR | 2,917,000 | 1,456 |
| | GMM Grammy PCL | | |
| | (Foreign) | 1,688,200 | 843 |
| * | Bangkok Bank PCL (Local) | 94,700 | 538 |
| * | Big C Supercenter PCL | 164,900 | 432 |
| | Post Publishing PCL | | |
| | (Foreign) | 1,300,000 | 187 |
| | Matichon PCL (Foreign) | 625,000 | 143 |
| | | | 47,482 |
| Turkey (0.3%) | | |
| | Haci Omer Sabanci | | |
| | Holding AS (Bearer) | 894,416 | 4,152 |
| | Turkiye Garanti Bankasi | | |
| | AS ADR | 481,600 | 2,232 |
| | Turkiye Is Bankasi | 642,900 | 2,053 |
| | Turkiye Vakiflar | | |
| | Bankasi Tao | 566,900 | 1,415 |
| | BIM Birlesik Magazalar AS | 37,593 | 1,265 |
| | Turkiye Garanti Bankasi AS | 267,100 | 1,246 |
| | Anadolu Efes Biracilik Ve | | |
| | Malt Sanayii AS | 80,800 | 1,145 |
| | | | 13,508 |
20
Global Equity Fund
| | | |
| | | | Market |
| | | | Value |
| | | Shares | ($000) |
| United Kingdom (8.8%) | | |
| | Royal Dutch Shell plc | | |
| | Class A | 1,346,647 | 48,989 |
| | Rio Tinto plc | 396,450 | 28,028 |
| | Vodafone Group plc | 8,946,522 | 25,496 |
| * | Lloyds Banking Group | | |
| | plc | 20,077,642 | 18,656 |
| | BP plc | 2,255,898 | 16,574 |
| | AstraZeneca plc | 324,754 | 14,920 |
| | BHP Billiton plc | 269,602 | 10,674 |
| | Xstrata plc | 440,903 | 10,287 |
| | Rolls-Royce Group plc | 1,017,756 | 10,092 |
| | Imperial Tobacco Group | | |
| | plc | 308,229 | 9,511 |
| | BAE Systems plc | 1,639,353 | 8,544 |
| | Invensys plc | 1,416,372 | 7,840 |
| | Intertek Group plc | 206,415 | 6,737 |
| | Anglo American plc | 124,863 | 6,479 |
| | Royal Dutch Shell plc | | |
| | Class B | 175,938 | 6,389 |
| * | Wolseley plc | 183,781 | 6,187 |
| | Reckitt Benckiser Group | | |
| | plc | 109,081 | 5,599 |
| | Diageo plc | 287,297 | 5,461 |
| | Capita Group plc | 428,653 | 5,109 |
| | Tesco plc | 781,384 | 4,773 |
| | Compass Group plc | 520,623 | 4,680 |
| | Prudential plc | 413,000 | 4,677 |
| | Barclays plc | 985,046 | 4,423 |
| | Thomas Cook Group plc | 1,522,937 | 4,161 |
| | Bunzl plc | 339,880 | 4,057 |
| | Michael Page | | |
| | International plc | 478,292 | 3,938 |
| | Sage Group plc | 859,330 | 3,833 |
| | Carnival plc | 92,456 | 3,637 |
| * | Cookson Group plc | 318,200 | 3,513 |
| | Informa plc | 509,734 | 3,403 |
| | ICAP plc | 392,992 | 3,326 |
| * | Horizon Acquisition Co. | | |
| | plc | 211,184 | 3,263 |
| | Centrica plc | 573,965 | 2,993 |
| | Unilever plc | 93,769 | 2,857 |
| | Rightmove plc | 173,809 | 2,650 |
| | WPP plc | 209,017 | 2,576 |
| * | Inchcape plc | 447,940 | 2,486 |
| | TUI Travel plc | 663,990 | 2,415 |
| * | Howden Joinery Group | | |
| | plc | 1,369,911 | 2,408 |
| | Smiths Group plc | 113,153 | 2,352 |
| | International Personal | | |
| | Finance plc | 454,709 | 2,346 |
| | Reed Elsevier plc | 268,647 | 2,325 |
| * | Royal Bank of Scotland | | |
| | Group plc | 3,531,433 | 2,317 |
| | Provident Financial plc | 145,765 | 2,246 |
| | G4S plc | 540,728 | 2,213 |
| | | |
| | | | Market |
| | | | Value |
| | | Shares | ($000) |
| | HSBC Holdings plc | 213,269 | 2,203 |
| * | ITV plc | 1,765,450 | 2,188 |
| | Stagecoach Group plc | 633,202 | 2,187 |
| | British American Tobacco | | |
| | plc | 54,434 | 2,183 |
| | Rexam plc | 356,558 | 2,079 |
| | Experian plc | 158,025 | 1,956 |
| * | Cairn Energy plc | 257,190 | 1,906 |
| | Homeserve plc | 250,691 | 1,788 |
| * | Premier Foods plc | 3,973,700 | 1,780 |
| | Cable & Wireless | | |
| | Communications plc | 1,992,764 | 1,454 |
| | Man Group plc | 345,750 | 1,362 |
| | Next plc | 40,467 | 1,284 |
| | Devro plc | 266,692 | 1,207 |
| | Cable & Wireless | | |
| | Worldwide plc | 1,399,089 | 1,177 |
| | AMEC plc | 58,557 | 1,120 |
| | Aggreko plc | 38,698 | 977 |
| | WH Smith plc | 138,420 | 963 |
| | British Sky Broadcasting | | |
| | Group plc | 72,267 | 957 |
| | Sthree plc | 143,910 | 944 |
| | Hays plc | 502,744 | 937 |
| | Admiral Group plc | 35,360 | 881 |
| * | Berkeley Group Holdings | | |
| | plc | 48,842 | 815 |
| | Sportingbet plc | 912,747 | 719 |
| | Millennium & Copthorne | | |
| | Hotels plc | 86,358 | 700 |
| | RSA Insurance Group plc | 320,989 | 676 |
| | Smith & Nephew plc | 58,521 | 659 |
| | Ladbrokes plc | 297,675 | 632 |
| | Paragon Group of Cos. plc | 223,800 | 611 |
| * | Carphone Warehouse | | |
| | Group plc | 104,186 | 609 |
| * | Jupiter Fund Management | | |
| | plc | 130,781 | 603 |
| | GlaxoSmithKline plc | 30,102 | 574 |
| | Anglo American plc | 10,073 | 518 |
| | Aviva plc | 74,193 | 515 |
| | Close Brothers Group plc | 34,692 | 470 |
| | TalkTalk Telecom Group | | |
| | plc | 208,373 | 460 |
| | Daily Mail & General Trust | | |
| | plc | 57,575 | 456 |
| * | National Express Group | | |
| | plc | 112,685 | 443 |
| | Mondi plc | 37,385 | 361 |
| * | Barratt Developments plc | 172,408 | 304 |
| * | PartyGaming plc | 82,853 | 266 |
| | Petrofac Ltd. | 11,008 | 263 |
| * | Northgate plc | 50,062 | 255 |
| | HMV Group plc | 215,229 | 53 |
| | Connaught plc | 103,081 | 28 |
| | | | 377,963 |
21
Global Equity Fund
| | | |
| | | | Market |
| | | | Value |
| | | Shares | ($000) |
| United States (39.1%) | | |
| | Consumer Discretionary (7.7%) | |
| | Cablevision Systems Corp. | | |
| | Class A | 1,344,908 | 46,547 |
| * | Amazon.com Inc. | 164,803 | 29,686 |
| *,^ | Liberty Global Inc. Class A | 445,379 | 18,443 |
| * | priceline.com Inc. | 35,143 | 17,798 |
| | Comcast Corp. Class A | 582,007 | 14,387 |
| * | Liberty Global Inc. | 339,048 | 13,558 |
| *,^ | Blue Nile Inc. | 178,329 | 9,628 |
| | Time Warner Inc. | 258,171 | 9,217 |
| | Lowe’s Cos. Inc. | 341,800 | 9,034 |
| | Time Warner Cable Inc. | 126,158 | 9,000 |
| | Sotheby’s | 164,700 | 8,663 |
| | American Greetings Corp. | | |
| | Class A | 353,430 | 8,341 |
| | News Corp. Class A | 472,100 | 8,290 |
| * | MGM Resorts International | 533,413 | 7,014 |
| * | Pulte Group Inc. | 895,109 | 6,624 |
| | CBS Corp. Class B | 255,835 | 6,406 |
| | Gap Inc. | 281,500 | 6,379 |
| | Kohl’s Corp. | 118,800 | 6,301 |
| *,^ | Garmin Ltd. | 139,413 | 4,720 |
| | Cooper Tire & Rubber Co. | 181,051 | 4,662 |
| | Brinker International Inc. | 180,424 | 4,565 |
| * | ITT Educational Services | | |
| | Inc. | 61,432 | 4,432 |
| * | Ford Motor Co. | 275,900 | 4,114 |
| * | General Motors Co. | 132,300 | 4,105 |
| * | K12 Inc. | 119,865 | 4,039 |
| * | Apollo Group Inc. Class A | 94,259 | 3,932 |
| | VF Corp. | 39,240 | 3,866 |
| * | Hanesbrands Inc. | 140,387 | 3,796 |
| * | AutoZone Inc. | 13,312 | 3,642 |
| * | Liberty Media Corp. - | | |
| | Interactive | 225,941 | 3,624 |
| * | DIRECTV Class A | 72,006 | 3,370 |
| | Dillard’s Inc. Class A | 83,412 | 3,346 |
| * | Liberty Media Corp. - | | |
| | Capital | 44,434 | 3,273 |
| * | Royal Caribbean Cruises | | |
| | Ltd. | 68,800 | 2,839 |
| | KB Home | 227,133 | 2,826 |
| | Omnicom Group Inc. | 56,224 | 2,758 |
| | International Game | | |
| | Technology | 157,171 | 2,551 |
| | News Corp. Class B | 122,200 | 2,275 |
| *,^ | CC Media Holdings Inc. | | |
| | Class A | 292,110 | 2,191 |
| | Foot Locker Inc. | 108,750 | 2,145 |
| | CBS Corp. Class A | 85,148 | 2,139 |
| | H&R Block Inc. | 105,673 | 1,769 |
| * | Mohawk Industries Inc. | 25,590 | 1,565 |
| | Interpublic Group of Cos. | | |
| | Inc. | 118,031 | 1,484 |
| | | |
| | | | Market |
| | | | Value |
| | | Shares | ($000) |
| | PRIMEDIA Inc. | 293,765 | 1,431 |
| * | Discovery | | |
| | Communications Inc. | | |
| | Class A | 34,831 | 1,390 |
| * | Liberty Media Corp. - | | |
| | Starz | 17,561 | 1,363 |
| * | Madison Square Garden | | |
| | Inc. Class A | 42,252 | 1,140 |
| * | Bed Bath & Beyond Inc. | 23,300 | 1,125 |
| * | DISH Network Corp. | | |
| | Class A | 46,088 | 1,123 |
| | Walt Disney Co. | 24,700 | 1,064 |
| * | Discovery | | |
| | Communications Inc. | 26,743 | 942 |
| | Finish Line Inc. Class A | 41,182 | 817 |
| * | Coinstar Inc. | 14,361 | 659 |
| | Weight Watchers | | |
| | International Inc. | 8,428 | 591 |
| | Bob Evans Farms Inc. | 14,892 | 485 |
| * | Biglari Holdings Inc. | 1,130 | 479 |
| | Sturm Ruger & Co. Inc. | 20,139 | 463 |
| | Lincoln Educational | | |
| | Services Corp. | 22,932 | 364 |
| | Sinclair Broadcast Group | | |
| | Inc. | | |
| | Class A | 29,011 | 364 |
| * | Cavco Industries Inc. | 8,044 | 363 |
| * | Jakks Pacific Inc. | 18,443 | 357 |
| * | Ascent Media Corp. | | |
| | Class A | 2,330 | 114 |
| * | Fleetwood Enterprises | | |
| | Inc. | 2,250,448 | 2 |
| * | Sun-Times Media Group | | |
| | Inc. Class A | 130,959 | 1 |
| |
| | Consumer Staples (3.5%) | | |
| | Costco Wholesale Corp. | 372,680 | 27,325 |
| | Tyson Foods Inc. Class A | 993,071 | 19,057 |
| | Lorillard Inc. | 182,534 | 17,343 |
| | Kroger Co. | 526,635 | 12,623 |
| | Estee Lauder Cos. Inc. | | |
| | Class A | 120,358 | 11,598 |
| | Bunge Ltd. | 157,100 | 11,363 |
| | Altria Group Inc. | 406,737 | 10,587 |
| | Philip Morris International | | |
| | Inc. | 131,994 | 8,663 |
| * | Smithfield Foods Inc. | 247,740 | 5,961 |
| * | Constellation Brands Inc. | | |
| | Class A | 221,400 | 4,490 |
| | Walgreen Co. | 97,051 | 3,896 |
| | PepsiCo Inc. | 56,849 | 3,662 |
| | Archer-Daniels-Midland | | |
| | Co. | 77,451 | 2,789 |
| | Dr Pepper Snapple | | |
| | Group Inc. | 59,456 | 2,209 |
22
Global Equity Fund
| | | |
| | | | Market |
| | | | Value |
| | | Shares | ($000) |
| | Whole Foods Market Inc. | 31,200 | 2,056 |
| | Wal-Mart Stores Inc. | 30,999 | 1,614 |
| | Corn Products International | | |
| | Inc. | 16,746 | 868 |
| | Hormel Foods Corp. | 18,483 | 515 |
| * | Chiquita Brands | | |
| | International Inc. | 26,879 | 412 |
| | B&G Foods Inc. Class A | 20,045 | 376 |
| | Universal Corp. | 8,595 | 374 |
| * | Omega Protein Corp. | 25,332 | 342 |
| | Cal-Maine Foods Inc. | 10,217 | 301 |
| | Fresh Del Monte Produce | | |
| | Inc. | 10,956 | 286 |
| * | Central Garden and Pet | | |
| | Co. Class A | 27,301 | 251 |
| * | Alliance One International | | |
| | Inc. | 57,800 | 232 |
| | SUPERVALU Inc. | 16,485 | 147 |
| |
| | Energy (3.2%) | | |
| | ConocoPhillips | 480,672 | 38,387 |
| | Chevron Corp. | 341,125 | 36,647 |
| | Devon Energy Corp. | 334,288 | 30,678 |
| | Hess Corp. | 108,600 | 9,254 |
| | Marathon Oil Corp. | 157,500 | 8,396 |
| | SEACOR Holdings Inc. | 37,303 | 3,449 |
| * | Newfield Exploration Co. | 40,300 | 3,063 |
| | EOG Resources Inc. | 23,282 | 2,759 |
| | Valero Energy Corp. | 73,221 | 2,184 |
| | National Oilwell Varco Inc. | 18,814 | 1,491 |
| * | CVR Energy Inc. | 56,485 | 1,308 |
| | Baker Hughes Inc. | 11,500 | 844 |
| * | Stone Energy Corp. | 20,013 | 668 |
| |
| | Financials (6.9%) | | |
| | Travelers Cos. Inc. | 558,998 | 33,249 |
| | Annaly Capital | | |
| | Management Inc. | 1,296,874 | 22,630 |
| | Capital One Financial Corp. | 416,020 | 21,616 |
| | JPMorgan Chase & Co. | 446,789 | 20,597 |
| * | Berkshire Hathaway Inc. | | |
| | Class B | 230,250 | 19,256 |
| | SL Green Realty Corp. | 239,079 | 17,979 |
| | Bank of America Corp. | 1,316,354 | 17,547 |
| | Legg Mason Inc. | 403,172 | 14,550 |
| * | CB Richard Ellis Group Inc. | | |
| | Class A | 484,945 | 12,948 |
| | Lazard Ltd. Class A | 296,445 | 12,326 |
| | Wells Fargo & Co. | 313,900 | 9,951 |
| | BB&T Corp. | 325,200 | 8,927 |
| * | MBIA Inc. | 784,137 | 7,873 |
| | American Express Co. | 166,558 | 7,528 |
| | Morgan Stanley | 205,450 | 5,613 |
| | Marshall & Ilsley Corp. | 670,600 | 5,358 |
| | Moody’s Corp. | 148,129 | 5,023 |
| | | |
| | | | Market |
| | | | Value |
| | | Shares | ($000) |
| * | CIT Group Inc. | 103,891 | 4,421 |
| | M&T Bank Corp. | 46,082 | 4,077 |
| | Regions Financial Corp. | 536,400 | 3,894 |
| | Mercury General Corp. | 87,648 | 3,430 |
| * | Citigroup Inc. | 686,718 | 3,035 |
| * | Markel Corp. | 7,262 | 3,010 |
| | Prosperity Bancshares Inc. | 66,622 | 2,849 |
| * | MGIC Investment Corp. | 315,122 | 2,801 |
| | Synovus Financial Corp. | 1,113,400 | 2,672 |
| | Assurant Inc. | 65,173 | 2,510 |
| ^ | Federated Investors Inc. | | |
| | Class B | 87,649 | 2,345 |
| | Reinsurance Group | | |
| | of America Inc. Class A | 37,024 | 2,324 |
| | New York Community | | |
| | Bancorp Inc. | 109,840 | 1,896 |
| | Montpelier Re Holdings | | |
| | Ltd. | 91,800 | 1,622 |
| | Cash America International | | |
| | Inc. | 34,831 | 1,604 |
| | Everest Re Group Ltd. | 15,041 | 1,326 |
| | KeyCorp | 132,667 | 1,178 |
| | Progressive Corp. | 55,570 | 1,174 |
| * | World Acceptance Corp. | 16,390 | 1,069 |
| | American Equity | | |
| | Investment Life | | |
| | Holding Co. | 62,120 | 815 |
| * | CNO Financial Group Inc. | 100,521 | 755 |
| ^ | RAIT Financial Trust | 277,024 | 682 |
| | Symetra Financial Corp. | 43,115 | 586 |
| * | ProAssurance Corp. | 9,226 | 585 |
| | Ameriprise Financial Inc. | 9,332 | 570 |
| | Waddell & Reed Financial | | |
| | Inc. Class A | 13,218 | 537 |
| | Republic Bancorp Inc. | | |
| | Class A | 27,308 | 532 |
| | BGC Partners Inc. Class A | 48,052 | 446 |
| * | National Financial Partners | | |
| | Corp. | 22,384 | 330 |
| | Calamos Asset | | |
| | Management Inc. | | |
| | Class A | 17,710 | 294 |
| | Advance America Cash | | |
| | Advance Centers Inc. | 45,200 | 240 |
| | Horace Mann Educators | | |
| | Corp. | 3,655 | 61 |
| | Meadowbrook Insurance | | |
| | Group Inc. | 4,783 | 50 |
| * | Washington Mutual Inc. | 166,300 | 8 |
| *,2 | JG Wentworth Inc. | 1 | — |
| |
| | Health Care (6.5%) | | |
| | Johnson & Johnson | 590,270 | 34,973 |
| | UnitedHealth Group Inc. | 614,287 | 27,766 |
| | Eli Lilly & Co. | 687,994 | 24,197 |
23
Global Equity Fund
| | | |
| | | | Market |
| | | | Value |
| | | Shares | ($000) |
| * | Humana Inc. | 327,224 | 22,886 |
| | Cardinal Health Inc. | 533,407 | 21,939 |
| * | Forest Laboratories Inc. | 659,876 | 21,314 |
| | WellPoint Inc. | 292,133 | 20,388 |
| | Pfizer Inc. | 863,600 | 17,540 |
| * | Biogen Idec Inc. | 185,407 | 13,607 |
| | Bristol-Myers Squibb Co. | 355,138 | 9,386 |
| * | Cephalon Inc. | 119,426 | 9,050 |
| * | Gilead Sciences Inc. | 206,200 | 8,751 |
| * | Health Net Inc. | 185,735 | 6,074 |
| * | Healthspring Inc. | 148,465 | 5,548 |
| | Aetna Inc. | 147,255 | 5,512 |
| * | Par Pharmaceutical | | |
| | Cos. Inc. | 134,755 | 4,188 |
| * | Endo Pharmaceuticals | | |
| | Holdings Inc. | 84,899 | 3,240 |
| * | Magellan Health | | |
| | Services Inc. | 61,045 | 2,996 |
| * | Kindred Healthcare Inc. | 108,338 | 2,587 |
| * | Waters Corp. | 26,521 | 2,305 |
| * | Health Management | | |
| | Associates Inc. Class A | 209,900 | 2,288 |
| * | AMERIGROUP Corp. | 29,375 | 1,887 |
| | Medicis Pharmaceutical | | |
| | Corp. Class A | 51,951 | 1,665 |
| * | Impax Laboratories Inc. | 55,963 | 1,424 |
| | Patterson Cos. Inc. | 34,392 | 1,107 |
| * | Intuitive Surgical Inc. | 3,069 | 1,023 |
| | Merck & Co. Inc. | 25,259 | 834 |
| * | Medco Health Solutions | | |
| | Inc. | 13,800 | 775 |
| | CIGNA Corp. | 16,115 | 714 |
| * | Thermo Fisher Scientific | | |
| | Inc. | 11,578 | 643 |
| | Universal American Corp. | 28,000 | 641 |
| | PDL BioPharma Inc. | 61,201 | 355 |
| | Invacare Corp. | 10,493 | 327 |
| * | Insmed Inc. | 35,390 | 237 |
| |
| | Industrials (3.0%) | | |
| * | Kansas City Southern | 319,163 | 17,378 |
| * | Oshkosh Corp. | 424,130 | 15,006 |
| * | Delta Air Lines Inc. | 1,479,421 | 14,498 |
| | Northrop Grumman Corp. | 193,501 | 12,135 |
| | Ingersoll-Rand plc | 218,300 | 10,546 |
| | Towers Watson & Co. | | |
| | Class A | 189,563 | 10,513 |
| | Viad Corp. | 305,697 | 7,318 |
| | Raytheon Co. | 127,479 | 6,485 |
| * | AMR Corp. | 925,604 | 5,979 |
| | Parker Hannifin Corp. | 46,600 | 4,412 |
| * | US Airways Group Inc. | 488,743 | 4,257 |
| | Eaton Corp. | 61,000 | 3,382 |
| | Expeditors International | | |
| | of Washington Inc. | 46,439 | 2,329 |
| | Deere & Co. | 22,424 | 2,173 |
| | | |
| | | | Market |
| | | | Value |
| | | Shares | ($000) |
| *,^ | Ultrapetrol Bahamas Ltd. | 363,983 | 1,849 |
| | Brink’s Co. | 53,965 | 1,787 |
| * | Huntington Ingalls | | |
| | Industries Inc. | 32,250 | 1,338 |
| * | Stericycle Inc. | 12,676 | 1,124 |
| * | Hawaiian Holdings Inc. | 159,762 | 960 |
| * | AGCO Corp. | 15,400 | 847 |
| | Heidrick & Struggles | | |
| | International Inc. | 28,147 | 783 |
| | Deluxe Corp. | 28,243 | 750 |
| | Standex International Corp. | 19,500 | 739 |
| | Unifirst Corp. | 13,221 | 701 |
| | Pitney Bowes Inc. | 26,200 | 673 |
| * | Consolidated Graphics Inc. | 7,804 | 426 |
| * | GenCorp Inc. | 52,040 | 311 |
| | Great Lakes Dredge | | |
| | & Dock Corp. | 35,287 | 269 |
| | JB Hunt Transport | | |
| | Services Inc. | 5,521 | 251 |
| |
| | Information Technology (5.1%) | |
| | International Business | | |
| | Machines Corp. | 120,096 | 19,584 |
| * | Gartner Inc. | 459,712 | 19,156 |
| * | Dell Inc. | 1,295,931 | 18,804 |
| | Computer Sciences Corp. | 381,791 | 18,605 |
| | Hewlett-Packard Co. | 428,880 | 17,571 |
| * | Western Digital Corp. | 392,459 | 14,635 |
| * | Lexmark International Inc. | | |
| | Class A | 322,807 | 11,957 |
| * | eBay Inc. | 308,853 | 9,587 |
| * | Seagate Technology plc | 632,232 | 9,104 |
| | Corning Inc. | 406,944 | 8,395 |
| * | Vishay Intertechnology Inc. | 467,877 | 8,300 |
| * | Flextronics International | | |
| | Ltd. | 1,022,272 | 7,636 |
| * | LSI Corp. | 958,780 | 6,520 |
| * | Motorola Solutions Inc. | 138,700 | 6,199 |
| | DST Systems Inc. | 104,406 | 5,515 |
| * | Alliance Data Systems | | |
| | Corp. | 55,496 | 4,767 |
| | Microsoft Corp. | 187,113 | 4,745 |
| | TE Connectivity Ltd. | 134,810 | 4,694 |
| | FLIR Systems Inc. | 101,717 | 3,521 |
| | Xerox Corp. | 316,371 | 3,369 |
| * | AOL Inc. | 165,547 | 3,233 |
| * | Google Inc. Class A | 4,949 | 2,901 |
| | Forrester Research Inc. | 73,198 | 2,803 |
| | Cisco Systems Inc. | 67,600 | 1,159 |
| * | VistaPrint NV | 21,200 | 1,100 |
| * | CACI International Inc. | | |
| | Class A | 17,436 | 1,069 |
| * | Photronics Inc. | 83,300 | 747 |
| * | CSG Systems | | |
| | International Inc. | 36,367 | 725 |
| * | EchoStar Corp. Class A | 18,708 | 708 |
24
Global Equity Fund
| | | |
| | | | Market |
| | | | Value |
| | | Shares | ($000) |
| * | Net 1 UEPS Technologies | | |
| | Inc. | 64,457 | 554 |
| * | Insight Enterprises Inc. | 24,200 | 412 |
| * | Vishay Precision Group Inc. | 22,504 | 353 |
| |
| | Materials (2.2%) | | |
| | Freeport-McMoRan Copper | | |
| | & Gold Inc. | 333,148 | 18,506 |
| | Domtar Corp. | 149,766 | 13,746 |
| | MeadWestvaco Corp. | 409,443 | 12,418 |
| | Dow Chemical Co. | 259,800 | 9,808 |
| | Scotts Miracle-Gro Co. | | |
| | Class A | 122,405 | 7,081 |
| | Monsanto Co. | 94,297 | 6,814 |
| | Alcoa Inc. | 169,000 | 2,983 |
| | Cabot Corp. | 63,412 | 2,935 |
| | Rock-Tenn Co. Class A | 37,013 | 2,567 |
| | Commercial Metals Co. | 129,300 | 2,233 |
| * | AbitibiBowater Inc. | 78,674 | 2,114 |
| | Praxair Inc. | 17,943 | 1,823 |
| * | Clearwater Paper Corp. | 21,549 | 1,754 |
| | Boise Inc. | 182,723 | 1,674 |
| | Minerals Technologies Inc. | 22,108 | 1,515 |
| | Innophos Holdings Inc. | 23,742 | 1,095 |
| | Temple-Inland Inc. | 45,517 | 1,065 |
| * | KapStone Paper and | | |
| | Packaging Corp. | 44,552 | 765 |
| | Buckeye Technologies Inc. | 24,400 | 664 |
| * | Ferro Corp. | 32,996 | 547 |
| * | Omnova Solutions Inc. | 58,800 | 463 |
| | Sherwin-Williams Co. | 5,502 | 462 |
| | Stepan Co. | 5,024 | 364 |
| | PH Glatfelter Co. | 27,000 | 360 |
| * | Mercer International Inc. | 23,757 | 322 |
| | Schweitzer-Mauduit | | |
| | International Inc. | 4,778 | 242 |
| |
| | Telecommunication Services (0.9%) | |
| | AT&T Inc. | 458,931 | 14,043 |
| * | NII Holdings Inc. | 210,534 | 8,773 |
| | Verizon Communications | | |
| | Inc. | 207,673 | 8,004 |
| * | Level 3 Communications | | |
| | Inc. | 2,159,498 | 3,174 |
| * | Cincinnati Bell Inc. | 837,923 | 2,246 |
| | Telephone & Data | | |
| | Systems Inc. | 42,111 | 1,419 |
| | USA Mobility Inc. | 21,200 | 307 |
| |
| | Utilities (0.1%) | | |
| | Edison International | 72,300 | 2,646 |
| | | | 1,679,894 |
| Total Common Stocks | | |
| (Cost $3,235,364) | | 4,160,217 |
| | | |
| | | | Market |
| | | | Value |
| | | Shares | ($000) |
| Preferred Stocks (0.0%) | | |
| | Malaysian Airline | | |
| | System Bhd. Pfd. | | |
| | (Cost $75) | 183,333 | 53 |
| |
| | | Face | |
| | | Amount | |
| | | ($000) | |
| Convertible Bonds (0.1%) | | |
| Consumer Discretionary (0.0%) | |
| | Sotheby’s Cvt., | | |
| | 3.125%, 6/15/13 | 787 | 1,294 |
| |
| Financials (0.0%) | | |
| 3 | SL Green Realty | | |
| | Corp. Cvt., 3.000%, | | |
| | 3/30/27 | 1,032 | 1,020 |
| |
| Industrials (0.0%) | | |
| | AMR Corp. Cvt., | | |
| | 6.250%, 10/15/14 | 452 | 476 |
| | US Airways Group Inc. | | |
| | Cvt., 7.250%, 5/15/14 | 184 | 393 |
| | | | 869 |
| Telecommunication Services (0.1%) | |
| | NII Holdings Inc. Cvt., | | |
| | 3.125%, 6/15/12 | 2,998 | 3,013 |
| Total Convertible Bonds | | |
| (Cost $4,342) | | 6,196 |
| |
| | | Shares | |
| Temporary Cash Investments (4.4%)1 | |
| Money Market Fund (4.2%) | | |
| 4,5 | Vanguard Market | | |
| | Liquidity Fund, | | |
| | 0.208% | 179,152,806 | 179,153 |
| |
| | | Face | |
| | | Amount | |
| | | ($000) | |
| U.S. Government and Agency Obligations (0.2%) |
| 6,7 | Fannie Mae | | |
| | Discount Notes, | | |
| | 0.140%, 6/22/11 | 550 | 550 |
| 6,7 | Federal Home Loan | | |
| | Bank Discount Notes, | | |
| | 0.150%, 5/24/11 | 3,500 | 3,499 |
| 6,7 | Freddie Mac | | |
| | Discount Notes, | | |
| | 0.210%, 5/23/11 | 5,000 | 4,999 |
| 8 | United States | | |
| | Treasury Bill, | | |
| | 0.053%, 4/21/11 | 1,500 | 1,500 |
25
Global Equity Fund
| | |
| | Face | Market |
| | Amount | Value |
| | ($000) | ($000) |
| 7 United States | | |
| Treasury Bill, | | |
| 0.200%, 6/30/11 | 1,000 | 999 |
| | | 11,547 |
| Total Temporary Cash Investments | |
| (Cost $190,699) | | 190,700 |
| Total Investments (101.4%) | | |
| (Cost $3,430,480) | | 4,357,166 |
| Other Assets and Liabilities (-1.4%)7 | |
| Other Assets7 | | 32,131 |
| Liabilities5 | | (93,629) |
| | | (61,498) |
| Net Assets (100%) | | |
| Applicable to 229,542,395 outstanding | |
| $.001 par value shares of beneficial | |
| interest (unlimited authorization) | 4,295,668 |
| Net Asset Value Per Share | | $18.71 |
| |
| At March 31, 2011, net assets consisted of: |
| | Amount |
| | ($000) |
| Paid-in Capital | 5,275,692 |
| Overdistributed Net Investment Income | (10,077) |
| Accumulated Net Realized Losses | (1,898,570) |
| Unrealized Appreciation (Depreciation) | |
| Investment Securities | 926,686 |
| Futures Contracts | 1,264 |
| Forward Currency Contracts | 672 |
| Foreign Currencies | 1 |
| Net Assets | 4,295,668 |
See Note A in Notes to Financial Statements.
* Non-income-producing security.
^ Part of security position is on loan to broker-dealers. The total value of securities on loan is $57,732,000.
1 The fund invests a portion of its cash reserves in equity markets through the use of index futures contracts. After giving effect to futures investments, the fund’s effective common stock and temporary cash investment positions represent 99.8% and 1.5%, respectively,
of net assets.
2 Restricted security represents 0.0% of net assets.
3 Security exempt from registration under Rule 144A of the Securities Act of 1933. Such securities may be sold in transactions exempt from registration, normally to qualified institutional buyers. At March 31, 2011, the aggregate value of these securities was $8,079,000, representing 0.2% of net assets.
4 Affiliated money market fund available only to Vanguard funds and certain trusts and accounts managed by Vanguard. Rate shown is the 7-day yield.
5 Includes $61,712,000 of collateral received for securities on loan.
6 The issuer operates under a congressional charter; its securities are not backed by the full faith and credit of the U.S. government.
7 Securities with a value of $10,047,000 and cash of $500,000 have been segregated as initial margin for open futures contracts.
8 Securities with a value of $105,000 have been segregated as collateral for open forward currency contracts.
ADR—American Depositary Receipt.
GDR—Global Depositary Receipt.
NVDR—Non-Voting Depositary Receipt.
See accompanying Notes, which are an integral part of the Financial Statements.
26
Global Equity Fund
| |
| Statement of Operations | |
| |
| | Six Months Ended |
| | March 31, 2011 |
| | ($000) |
| Investment Income | |
| Income | |
| Dividends1 | 38,832 |
| Interest2 | 466 |
| Security Lending | 657 |
| Total Income | 39,955 |
| Expenses | |
| Investment Advisory Fees—Note B | |
| Basic Fee | 5,117 |
| Performance Adjustment | (708) |
| The Vanguard Group—Note C | |
| Management and Administrative | 5,353 |
| Marketing and Distribution | 458 |
| Custodian Fees | 376 |
| Shareholders’ Reports | 42 |
| Trustees’ Fees and Expenses | 4 |
| Total Expenses | 10,642 |
| Net Investment Income | 29,313 |
| Realized Net Gain (Loss) | |
| Investment Securities Sold | 169,266 |
| Futures Contracts | 9,965 |
| Foreign Currencies and Forward Currency Contracts | 1,738 |
| Realized Net Gain (Loss) | 180,969 |
| Change in Unrealized Appreciation (Depreciation) | |
| Investment Securities | 322,275 |
| Futures Contracts | 1,414 |
| Foreign Currencies and Forward Currency Contracts | (1,014) |
| Change in Unrealized Appreciation (Depreciation) | 322,675 |
| Net Increase (Decrease) in Net Assets Resulting from Operations | 532,957 |
| 1 Dividends are net of foreign withholding taxes of $2,092,000. | |
| 2 Interest income from an affiliated company of the fund was $129,000. | |
See accompanying Notes, which are an integral part of the Financial Statements.
27
Global Equity Fund
| | |
| Statement of Changes in Net Assets | | |
| |
| | Six Months Ended | Year Ended |
| | March 31, | September 30, |
| | 2011 | 2010 |
| | ($000) | ($000) |
| Increase (Decrease) in Net Assets | | |
| Operations | | |
| Net Investment Income | 29,313 | 73,355 |
| Realized Net Gain (Loss) | 180,969 | 2,446 |
| Change in Unrealized Appreciation (Depreciation) | 322,675 | 295,336 |
| Net Increase (Decrease) in Net Assets Resulting from Operations | 532,957 | 371,137 |
| Distributions | | |
| Net Investment Income | (73,523) | (85,415) |
| Realized Capital Gain | — | — |
| Total Distributions | (73,523) | (85,415) |
| Capital Share Transactions | | |
| Issued | 270,711 | 548,911 |
| Issued in Lieu of Cash Distributions | 69,613 | 80,356 |
| Redeemed | (409,928) | (822,546) |
| Net Increase (Decrease) from Capital Share Transactions | (69,604) | (193,279) |
| Total Increase (Decrease) | 389,830 | 92,443 |
| Net Assets | | |
| Beginning of Period | 3,905,838 | 3,813,395 |
| End of Period1 | 4,295,668 | 3,905,838 |
| 1 Net Assets—End of Period includes undistributed (overdistributed) net investment income of ($10,077,000) and $32,787,000. |
See accompanying Notes, which are an integral part of the Financial Statements.
28
Global Equity Fund
Financial Highlights
| | | | | | |
| | Six Months | | | | | |
| | Ended | | | | | |
| For a Share Outstanding | March 31, | | | Year Ended September 30, |
| Throughout Each Period | 2011 | 2010 | 2009 | 2008 | 2007 | 2006 |
| Net Asset Value, Beginning of Period | $16.74 | $15.49 | $16.64 | $26.51 | $21.96 | $19.72 |
| Investment Operations | | | | | | |
| Net Investment Income | .131 | .314 | .371 | .529 | .4901 | .320 |
| Net Realized and Unrealized Gain (Loss) | | | | | | |
| on Investments | 2.159 | 1.292 | (.948) | (8.569) | 5.250 | 2.595 |
| Total from Investment Operations | 2.290 | 1.606 | (.577) | (8.040) | 5.740 | 2.915 |
| Distributions | | | | | | |
| Dividends from Net Investment Income | (.320) | (.356) | (.573) | (.430) | (.310) | (.240) |
| Distributions from Realized Capital Gains | — | — | — | (1.400) | (.880) | (.435) |
| Total Distributions | (.320) | (.356) | (.573) | (1.830) | (1.190) | (.675) |
| Net Asset Value, End of Period | $18.71 | $16.74 | $15.49 | $16.64 | $26.51 | $21.96 |
| |
| Total Return2 | 13.79% | 10.51% | -2.30% | -32.24% | 27.00% | 15.22% |
| |
| Ratios/Supplemental Data | | | | | | |
| Net Assets, End of Period (Millions) | $4,296 | $3,906 | $3,813 | $5,160 | $7,552 | $4,191 |
| Ratio of Total Expenses to | | | | | | |
| Average Net Assets3 | 0.51% | 0.44% | 0.47% | 0.51% | 0.64% | 0.72% |
| Ratio of Net Investment Income to | | | | | | |
| Average Net Assets | 1.41% | 1.94% | 2.55% | 2.35% | 1.98% | 1.76% |
| Portfolio Turnover Rate | 47% | 64% | 71% | 73% | 64% | 88% |
The expense ratio, net income ratio, and turnover rate for the current period have been annualized.
1 Calculated based on average shares outstanding.
2 Total returns do not include account service fees that may have applied in the periods shown. Fund prospectuses provide information about
any applicable account service fees.
3 Includes performance-based investment advisory fee increases (decreases) of (0.03%), (0.11%), (0.13%), (0.02%), 0.05%, and 0.05%.
See accompanying Notes, which are an integral part of the Financial Statements.
29
Global Equity Fund
Notes to Financial Statements
Vanguard Global Equity Fund is registered under the Investment Company Act of 1940 as an open-end investment company, or mutual fund. The fund invests in securities of foreign issuers, which may subject it to investment risks not normally associated with investing in securities of United States corporations.
A. The following significant accounting policies conform to generally accepted accounting principles for U.S. mutual funds. The fund consistently follows such policies in preparing its financial statements.
1. Security Valuation: Securities are valued as of the close of trading on the New York Stock Exchange (generally 4 p.m., Eastern time) on the valuation date. Equity securities are valued at the latest quoted sales prices or official closing prices taken from the primary market in which each security trades; such securities not traded on the valuation date are valued at the mean of the latest quoted bid and asked prices. Bonds, and temporary cash investments acquired over 60 days to maturity, are valued using the latest bid prices or using valuations based on a matrix system (which considers such factors as security prices, yields, maturities, and ratings), both as furnished by independent pricing services. Investments in Vanguard Market Liquidity Fund are valued at that fund’s net asset value. Other temporary cash investments are valued at amortized cost, which approximates market value. Securities for which market quotations are not readily available, or whose values have been affected by events occurring before the fund’s pricing time but after the close of the securities’ primary markets, are valued at their fair values calculated according to procedures adopted by the board of trustees. These procedures include obtaining quotations from an independent pricing service, monitoring news to identify significant market- or security-specific events, and evaluating changes in the values of foreign market proxies (for example, ADRs, futures contracts, or exchange-traded funds), between the time the foreign markets close and the fund’s pricing time. When fair-value pricing is employed, the prices of securities used by a fund to calculate its net asset value may differ from quoted or published prices for the same securities.
2. Foreign Currency: Securities and other assets and liabilities denominated in foreign currencies are translated into U.S. dollars using exchange rates obtained from an independent third party as of the fund’s pricing time on the valuation date. Realized gains (losses) and unrealized appreciation (depreciation) on investment securities include the effects of changes in exchange rates since the securities were purchased, combined with the effects of changes in security prices. Fluctuations in the value of other assets and liabilities resulting from changes in exchange rates are recorded as unrealized foreign currency gains (losses) until the assets or liabilities are settled in cash, at which time they are recorded as realized foreign currency gains (losses).
3. Futures and Forward Currency Contracts: The fund uses index futures contracts to a limited extent, with the objective of maintaining full exposure to the stock market while maintaining liquidity. The fund may purchase or sell futures contracts to achieve a desired level of investment, whether to accommodate portfolio turnover or cash flows from capital share transactions. The primary risks associated with the use of futures contracts are imperfect correlation between changes in market values of stocks held by the fund and the prices of futures contracts, and the possibility of an illiquid market.
30
Global Equity Fund
The fund also enters into forward currency contracts to provide the appropriate currency exposure related to any open futures contracts or to protect the value of securities and related receivables and payables against changes in foreign exchange rates. The primary risk associated with the fund’s use of these contracts is that a counterparty will fail to fulfill its obligation to pay gains due to the fund under the contracts. Counterparty risk is mitigated by entering into forward currency contracts only with highly rated counterparties, by a master netting arrangement between the fund and the counterparty, and by the posting of collateral by the counterparty. The forward currency contracts contain provisions whereby a counterparty may terminate open contracts if the fund’s net assets decline below a certain level, triggering a payment by the fund if the fund is in a net liability position at the time of the termination. The payment amount would be reduced by any collateral the fund has posted. Any securities posted as collateral for open contracts are noted in the Statement of Net Assets.
Futures contracts are valued at their quoted daily settlement prices. Forward currency contracts are valued at their quoted daily prices obtained from an independent third party, adjusted for currency risk based on the expiration date of each contract. The aggregate principal amounts of the contracts are not recorded in the Statement of Net Assets. Fluctuations in the value of the contracts are recorded in the Statement of Net Assets as an asset (liability) and in the Statement of Operations as unrealized appreciation (depreciation) until the contracts are closed, when they are recorded as realized gains (losses) on futures or forward currency contracts.
4. Federal Income Taxes: The fund intends to continue to qualify as a regulated investment company and distribute all of its taxable income. Management has analyzed the fund’s tax positions taken for all open federal income tax years (September 30, 2007–2010), and for the period ended March 31, 2011, and has concluded that no provision for federal income tax is required in the fund’s financial statements.
5. Distributions: Distributions to shareholders are recorded on the ex-dividend date.
6. Security Lending: The fund may lend its securities to qualified institutional borrowers to earn additional income. Security loans are required to be secured at all times by collateral at least equal to the market value of securities loaned. The fund invests cash collateral received in Vanguard Market Liquidity Fund, and records a liability for the return of the collateral, during the period the securities are on loan. Security lending income represents fees charged to borrowers plus income earned on investing cash collateral, less expenses associated with the loan.
7. Other: Dividend income is recorded on the ex-dividend date. Interest income includes income distributions received from Vanguard Market Liquidity Fund and is accrued daily. Security transactions are accounted for on the date securities are bought or sold. Costs used to determine realized gains (losses) on the sale of investment securities are those of the specific securities sold.
B. Marathon Asset Management LLP, Acadian Asset Management LLC, AllianceBernstein L.P., and Baillie Gifford Overseas Ltd. each provide investment advisory services to a portion of the fund for a fee calculated at an annual percentage rate of average net assets managed by the advisor. The basic fees of Marathon Asset Management LLP and Acadian Asset Management LLC are subject to quarterly adjustments based on performance for the preceding three years relative to the MSCI All Country World Index. The basic fee of AllianceBernstein L.P. is subject to quarterly adjustments based on performance since June 30, 2006, relative to the MSCI All Country World Index. The basic fee of Baillie Gifford Overseas Ltd. is subject to quarterly adjustments based on performance since June 30, 2008, relative to the MSCI All Country World Index.
31
Global Equity Fund
The Vanguard Group manages the cash reserves of the fund on an at-cost basis.
For the six months ended March 31, 2011, the aggregate investment advisory fee represented an effective annual basic rate of 0.25% of the fund’s average net assets, before a decrease of $708,000 (0.03%) based on performance.
C. The Vanguard Group furnishes at cost corporate management, administrative, marketing, and distribution services. The costs of such services are allocated to the fund under methods approved by the board of trustees. The fund has committed to provide up to 0.40% of its net assets in capital contributions to Vanguard. At March 31, 2011, the fund had contributed capital of $702,000 to Vanguard (included in Other Assets), representing 0.02% of the fund’s net assets and 0.28% of Vanguard’s capitalization. The fund’s trustees and officers are also directors and officers of Vanguard.
D. Various inputs may be used to determine the value of the fund’s investments. These inputs are summarized in three broad levels for financial statement purposes. The inputs or methodologies used to value securities are not necessarily an indication of the risk associated with investing in those securities.
Level 1—Quoted prices in active markets for identical securities.
Level 2—Other significant observable inputs (including quoted prices for similar securities, interest rates, prepayment speeds, credit risk, etc.).
Level 3—Significant unobservable inputs (including the fund’s own assumptions used to determine the fair value of investments).
The following table summarizes the fund’s investments as of March 31, 2011, based on the inputs used to value them:
| | | |
| | Level 1 | Level 2 | Level 3 |
| Investments | ($000) | ($000) | ($000) |
| Common Stocks—International | 216,876 | 2,263,424 | 23 |
| Common Stocks—Domestic | 1,679,894 | — | — |
| Preferred Stocks | — | 53 | — |
| Convertible Bonds | — | 6,196 | — |
| Temporary Cash Investments | 179,153 | 11,547 | — |
| Futures Contracts—Liabilities1 | (213) | — | — |
| Forward Currency Contracts—Assets | ��� | 869 | — |
| Forward Currency Contracts—Liabilities | — | (197) | — |
| Total | 2,075,710 | 2,281,892 | 23 |
| 1 Represents variation margin on the last day of the reporting period. | | | |
32
Global Equity Fund
The following table summarizes changes in investments valued based on Level 3 inputs during the six months ended March 31, 2011:
| |
| | Investments in |
| | Common Stocks— |
| | International |
| Amount Valued Based on Level 3 Inputs | ($000) |
| Balance as of September 30, 2010 | 57 |
| Net Realized Gain (Loss) | (1,695) |
| Change in Unrealized Appreciation (Depreciation) | 1,661 |
| Balance as of March 31, 2011 | 23 |
E. At March 31, 2011, the fair values of derivatives were reflected in the Statement of Net Assets as follows:
| | | |
| | | Foreign | |
| | Equity | Exchange | |
| | Contracts1 | Contracts | Total |
| Statement of Net Assets Caption | ($000) | ($000) | ($000) |
| Other Assets | — | 869 | 869 |
| Liabilities | (213) | (197) | (410) |
| 1 Represents variation margin on the last day of the reporting period. | | | |
Realized net gain (loss) and the change in unrealized appreciation (depreciation) on derivatives for the six months ended March 31, 2011, were:
| | | |
| | | Foreign | |
| | Equity | Exchange | |
| | Contracts | Contracts | Total |
| Realized Net Gain (Loss) on Derivatives | ($000) | ($000) | ($000) |
| Futures Contracts | 9,965 | — | 9,965 |
| Forward Currency Contracts | — | 2,083 | 2,083 |
| Realized Net Gain (Loss) on Derivatives | 9,965 | 2,083 | 12,048 |
| Change in Unrealized Appreciation (Depreciation) on Derivatives | | | |
| Futures Contracts | 1,414 | — | 1,414 |
| Forward Currency Contracts | — | (830) | (830) |
| Change in Unrealized Appreciation (Depreciation) on Derivatives | 1,414 | (830) | 584 |
33
Global Equity Fund
At March 31, 2011, the aggregate settlement value of open futures contracts and the related unrealized appreciation (depreciation) were:
| | | | |
| | | | | ($000) |
| | | | Aggregate | |
| | | Number of | Settlement | Unrealized |
| | | Long (Short) | Value | Appreciation |
| Futures Contracts | Expiration | Contracts | Long (Short) | (Depreciation) |
| S&P 500 Index | June 2011 | 175 | 57,794 | 883 |
| Dow Jones EURO STOXX 50 Index | June 2011 | 536 | 21,633 | 265 |
| FTSE 100 Index | June 2011 | 161 | 15,186 | 262 |
| S&P ASX 200 Index | June 2011 | 106 | 13,333 | 684 |
| Topix Index | June 2011 | 114 | 11,912 | (947) |
| E-mini S&P 500 Index | June 2011 | 69 | 4,557 | 105 |
| MSCI Taiwan Index | April 2011 | 48 | 1,474 | 12 |
Unrealized appreciation (depreciation) on open S&P 500 Index, E-mini S&P 500 Index, and FTSE 100 Index futures is required to be treated as realized gain (loss) for tax purposes.
At March 31, 2011, the fund had open forward currency contracts to receive and deliver currencies as follows. Unrealized appreciation (depreciation) on open forward currency contracts is treated as realized gain (loss) for tax purposes.
| | | | | | |
| | | | | | | Unrealized |
| | Contract | | | | | Appreciation |
| | Settlement | | | Contract Amount (000) | (Depreciation) |
| Counterparty | Date | | Receive | | Deliver | ($000) |
| UBS AG | 6/22/11 | EUR | 15,057 | USD | 21,331 | 321 |
| UBS AG | 6/22/11 | GBP | 9,311 | USD | 14,907 | (140) |
| UBS AG | 6/15/11 | JPY | 1,065,718 | USD | 12,865 | (33) |
| UBS AG | 6/22/11 | AUD | 12,231 | USD | 12,516 | 548 |
| Goldman Sachs Bank USA | 4/15/11 | USD | 8,758 | CAD | 8,508 | (24) |
| AUD—Australian dollar. | | | | | | |
| CAD—Canadian dollar. | | | | | | |
| EUR—Euro. | | | | | | |
| GBP—British pound. | | | | | | |
| JPY—Japanese yen. | | | | | | |
| USD—U.S. dollar. | | | | | | |
At March 31, 2011, the counterparty had deposited in a segregated account securities with a value sufficient to cover substantially all amounts due to the fund in connection with open forward currency contracts.
F. Distributions are determined on a tax basis and may differ from net investment income and realized capital gains for financial reporting purposes. Differences may be permanent or temporary. Permanent differences are reclassified among capital accounts in the financial statements to reflect their tax character. Temporary differences arise when certain items of income, expense, gain, or loss are recognized in different periods for financial statement and tax purposes; these differences will reverse at some time in the future. Differences in classification may also result from the treatment of short-term gains as ordinary income for tax purposes.
34
Global Equity Fund
During the six months ended March 31, 2011, the fund realized net foreign currency losses of $345,000, which decreased distributable net income for tax purposes; accordingly, such losses have been reclassified from accumulated net realized losses to overdistributed net investment income. Certain of the fund’s investments are in securities considered to be “passive foreign investment companies,” for which any unrealized appreciation and/or realized gains are required to be included in distributable net income for tax purposes. During the six months ended March 31, 2011, the fund realized gains on the sale of passive foreign investment companies of $1,965,000, which have been included in current and prior periods’ taxable income; accordingly, such gains have been reclassified from accumulated net realized losses to overdistributed net investment income. Unrealized appreciation through the most recent mark-to-market date for tax purposes on passive foreign investment company holdings at March 31, 2011, was $18,608,000, all of which has been distributed and is reflected in the balance of overdistributed net investment income.
The fund’s realized losses for the six months ended March 31, 2011, include $274,000 of capital gain tax paid on sales of Indian securities. This tax is treated as a decrease in taxable income; accordingly, this amount has been reclassified from accumulated net realized losses to overdistributed net investment income.
The fund’s tax-basis capital gains and losses are determined only at the end of each fiscal year. For tax purposes, at September 30, 2010, the fund had available capital loss carryforwards totaling $2,062,156,000 to offset future net capital gains of $831,873,000 through September 30, 2017, and $1,230,283,000 through September 30, 2018. In addition, the fund realized losses of $14,361,000 during the period from November 1, 2009, through September 30, 2010, which are deferred and will be treated as realized for tax purposes in fiscal 2011. The fund will use these capital losses to offset net taxable capital gains, if any, realized during the year ending September 30, 2011; should the fund realize net capital losses for the year, the losses will be added to the loss carryforward balance above.
At March 31, 2011, the cost of investment securities for tax purposes was $3,449,088,000. Net unrealized appreciation of investment securities for tax purposes was $908,078,000, consisting of unrealized gains of $1,092,560,000 on securities that had risen in value since their purchase and $184,482,000 in unrealized losses on securities that had fallen in value since their purchase.
G. During the six months ended March 31, 2011, the fund purchased $934,984,000 of investment securities and sold $1,026,611,000 of investment securities, other than temporary cash investments.
H. Capital shares issued and redeemed were:
| | |
| | Six Months Ended | Year Ended |
| | March 31, 2011 | September 30, 2010 |
| | Shares | Shares |
| | (000) | (000) |
| Issued | 15,078 | 34,742 |
| Issued in Lieu of Cash Distributions | 3,933 | 5,099 |
| Redeemed | (22,793) | (52,655) |
| Net Increase (Decrease) in Shares Outstanding | (3,782) | (12,814) |
I. In preparing the financial statements as of March 31, 2011, management considered the impact of subsequent events for potential recognition or disclosure in these financial statements.
35
About Your Fund’s Expenses
As a shareholder of the fund, you incur ongoing costs, which include costs for portfolio management, administrative services, and shareholder reports (like this one), among others. Operating expenses, which are deducted from a fund’s gross income, directly reduce the investment return of the fund.
A fund’s expenses are expressed as a percentage of its average net assets. This figure is known as the expense ratio. The following examples are intended to help you understand the ongoing costs (in dollars) of investing in your fund and to compare these costs with those of other mutual funds. The examples are based on an investment of $1,000 made at the beginning of the period shown and held for the entire period.
The accompanying table illustrates your fund’s costs in two ways:
• Based on actual fund return. This section helps you to estimate the actual expenses that you paid over the period. The ”Ending Account Value“ shown is derived from the fund‘s actual return, and the third column shows the dollar amount that would have been paid by an investor who started with $1,000 in the fund. You may use the information here, together with the amount you invested, to estimate the expenses that you paid over the period.
To do so, simply divide your account value by $1,000 (for example, an $8,600 account value divided by $1,000 = 8.6), then multiply the result by the number given for your fund under the heading ”Expenses Paid During Period.“
• Based on hypothetical 5% yearly return. This section is intended to help you compare your fund‘s costs with those of other mutual funds. It assumes that the fund had a yearly return of 5% before expenses, but that the expense ratio is unchanged. In this case—because the return used is not the fund’s actual return—the results do not apply to your investment. The example is useful in making comparisons because the Securities and Exchange Commission requires all mutual funds to calculate expenses based on a 5% return. You can assess your fund’s costs by comparing this hypothetical example with the hypothetical examples that appear in shareholder reports of other funds.
Note that the expenses shown in the table are meant to highlight and help you compare ongoing costs only and do not reflect transaction costs incurred by the fund for buying and selling securities. Further, the expenses do not include the account service fee described in the prospectus. If such a fee were applied to your account, your costs would be higher. Your fund does not charge transaction fees, such as purchase or redemption fees, nor does it carry a “sales load.”
The calculations assume no shares were bought or sold during the period. Your actual costs may have been higher or lower, depending on the amount of your investment and the timing of any purchases or redemptions.
You can find more information about the fund’s expenses, including annual expense ratios, in the Financial Statements section of this report. For additional information on operating expenses and other shareholder costs, please refer to your fund’s current prospectus.
36
| | | |
| Six Months Ended March 31, 2011 | | | |
| | Beginning | Ending | Expenses |
| | Account Value | Account Value | Paid During |
| Global Equity Fund | 9/30/2010 | 3/31/2011 | Period |
| Based on Actual Fund Return | $1,000.00 | $1,137.89 | $2.72 |
| Based on Hypothetical 5% Yearly Return | 1,000.00 | 1,022.39 | 2.57 |
The calculations are based on expenses incurred in the most recent six-month period. The fund’s annualized six-month expense ratio for that period is 0.51%. The dollar amounts shown as “Expenses Paid” are equal to the annualized expense ratio multiplied by the average account value over the period, multiplied by the number of days in the most recent six-month period, then divided by the number of days in the most recent 12-month period.
37
Trustees Approve Advisory Agreements
The board of trustees of Vanguard Global Equity Fund has renewed the fund’s investment advisory agreements with Acadian Asset Management LLC, AllianceBernstein L.P., Baillie Gifford Overseas Ltd., and Marathon Asset Management LLP. The board determined that the retention of the advisors was in the best interests of the fund and its shareholders.
The board based its decisions upon an evaluation of each advisor’s investment staff, portfolio management process, and performance. The trustees considered the factors discussed below, among others. However, no single factor determined whether the board approved the agreements. Rather, it was the totality of the circumstances that drove the board’s decisions.
Nature, extent, and quality of services
The board considered the quality of the fund’s investment management over both the short and long term, and took into account the organizational depth and stability of each advisor. The board noted the following:
Acadian Asset Management LLC. Acadian, founded in 1986, is a Boston-based investment management firm specializing in quantitative equity strategies for developed and emerging markets. Acadian’s investment process builds portfolios from the bottom up using proprietary valuation models. The members of the investment team—which includes the three portfolio managers, John Chisholm, Ronald Frashure, and Brian Wolahan—are all involved in the firm’s ongoing research. Acadian has managed a portion of the fund since 2004.
AllianceBernstein L.P. AllianceBernstein, founded in 1971, is a global asset management firm that provides diversified, global investment management services involving growth and value equities, blend strategies, and fixed income securities to clients worldwide. The investment team at AllianceBernstein employs a bottom-up, research-driven, value-based equity investment philosophy in selecting stocks. It relies on deep investment research to understand companies and industries that may be undergoing stress, and it seeks to exploit mispricings created by investor overreaction. AllianceBernstein has managed a portion of the fund since 2006.
Baillie Gifford Overseas Ltd. Baillie Gifford, a unit of Baillie Gifford & Co., founded in 1908, is among the largest independently owned investment management firms in the United Kingdom. The advisor employs a sound process, building a diversified portfolio of high-quality stocks from across the globe. Stocks are selected using fundamental research conducted by Baillie Gifford’s Edinburgh-based analysts. Baillie Gifford has managed a portion of the fund since 2008.
Marathon Asset Management LLP. Marathon, founded in 1986, continues to use a bottom-up approach that focuses on stock selection. Historically, the portfolio was managed by the three founders (Jeremy Hosking, Neil Ostrer, and William Arah), who were all regional specialists. The process has evolved in recent years to focus on global generalists rather than regional specialists. While the three founders don’t plan to retire for years, they have transitioned the firm to a multicounselor approach, allocating 25% of the portfolio to four members of the firm’s second generation. Marathon has advised the fund since its inception in 1995.
The board concluded that each advisor’s experience, stability, depth, and performance, among other factors, warranted continuation of the advisory agreements.
38
Investment performance
The board considered the short- and long-term performance of the fund, including any periods of outperformance or underperformance of a relevant benchmark and peer group. The board concluded that each advisor has carried out the fund’s investment strategy in disciplined fashion and that performance results have allowed the fund to remain competitive versus its benchmark and peer group. Information about the fund’s most recent performance can be found in the Performance Summary section of this report.
Cost
The board concluded that the fund’s expense ratio was well below the average expense ratio charged by funds in its peer group and that the fund’s advisory fee rate was also well below the fund’s peer-group average. Information about the fund’s expenses appears in the About Your Fund’s Expenses section of this report as well as in the Financial Statements section, which also includes information about the fund’s advisory fee rate.
The board did not consider profitability of the fund’s advisors in determining whether to approve the advisory fees, because the firms are independent of Vanguard, and the advisory fees are the result of arm’s-length negotiations.
The benefit of economies of scale
The board concluded that the fund’s shareholders benefit from economies of scale because of breakpoints in the advisory fee schedules. The breakpoints reduce the effective rate of the fees as the fund’s assets managed by each advisor increase.
The board will consider whether to renew the advisory agreements again after a one-year period.
39
Glossary
Beta. A measure of the magnitude of a fund’s past share-price fluctuations in relation to the ups and downs of a given market index. The index is assigned a beta of 1.00. Compared with a given index, a fund with a beta of 1.20 typically would have seen its share price rise or fall by 12% when the index rose or fell by 10%. For this report, beta is based on returns over the past 36 months for both the fund and the index. Note that a fund’s beta should be reviewed in conjunction with its R-squared (see definition). The lower the R-squared, the less correlation there is between the fund and the index, and the less reliable beta is as an indicator of volatility.
Dividend Yield. Dividend income earned by stocks, expressed as a percentage of the aggregate market value (or of net asset value, for a fund). The yield is determined by dividing the amount of the annual dividends by the aggregate value (or net asset value) at the end of the period. For a fund, the dividend yield is based solely on stock holdings and does not include any income produced by other investments.
Earnings Growth Rate. The average annual rate of growth in earnings over the past five years for the stocks now in a fund.
Equity Exposure. A measure that reflects a fund’s investments in stocks and stock futures. Any holdings in short-term reserves are excluded.
Expense Ratio. The percentage of a fund’s average net assets used to pay its annual administrative and advisory expenses. These expenses directly reduce returns to investors.
Inception Date. The date on which the assets of a fund (or one of its share classes) are first invested in accordance with the fund’s investment objective. For funds with a subscription period, the inception date is the day after that period ends. Investment performance is measured from the inception date.
Median Market Cap. An indicator of the size of companies in which a fund invests; the midpoint of market capitalization (market price x shares outstanding) of a fund’s stocks, weighted by the proportion of the fund’s assets invested in each stock. Stocks representing half of the fund’s assets have market capitalizations above the median, and the rest are below it.
Price/Book Ratio. The share price of a stock divided by its net worth, or book value, per share. For a fund, the weighted average price/book ratio of the stocks it holds.
Price/Earnings Ratio. The ratio of a stock’s current price to its per-share earnings over the past year. For a fund, the weighted average P/E of the stocks it holds. P/E is an indicator of market expectations about corporate prospects; the higher the P/E, the greater the expectations for a company’s future growth.
R-Squared. A measure of how much of a fund’s past returns can be explained by the returns from the market in general, as measured by a given index. If a fund’s total returns were precisely synchronized with an index’s returns, its R-squared would be 1.00. If the fund’s returns bore no relationship to the index’s returns, its R-squared would be 0. For this report, R-squared is based on returns over the past 36 months for both the fund and the index.
Return on Equity. The annual average rate of return generated by a company during the past five years for each dollar of shareholder’s equity (net income divided by shareholder’s equity). For a fund, the weighted average return on equity for the companies whose stocks it holds.
40
Short-Term Reserves. The percentage of a fund invested in highly liquid, short-term securities that can be readily converted to cash.
Turnover Rate. An indication of the fund’s trading activity. Funds with high turnover rates incur higher transaction costs and may be more likely to distribute capital gains (which may be taxable to investors). The turnover rate excludes in-kind transactions, which have minimal impact on costs.
41
This page intentionally left blank.
This page intentionally left blank.
The People Who Govern Your Fund
The trustees of your mutual fund are there to see that the fund is operated and managed in your best interests since, as a shareholder, you are a part owner of the fund. Your fund’s trustees also serve on the board of directors of The Vanguard Group, Inc., which is owned by the Vanguard funds and provides services to them on an at-cost basis.
A majority of Vanguard’s board members are independent, meaning that they have no affiliation with Vanguard or the funds they oversee, apart from the sizable personal investments they have made as private individuals. The independent board members have distinguished backgrounds in business, academia, and public service. Each of the trustees and executive officers oversees 179 Vanguard funds.
The following table provides information for each trustee and executive officer of the fund. More information about the trustees is in the Statement of Additional Information, which can be obtained, without charge, by contacting Vanguard at 800-662-7447, or online at vanguard.com.
| |
| Interested Trustee1 | and President (2006–2008) of Rohm and Haas Co. |
| | (chemicals); Director of Tyco International, Ltd. |
| F. William McNabb III | (diversified manufacturing and services) and Hewlett- |
| Born 1957. Trustee Since July 2009. Chairman of the | Packard Co. (electronic computer manufacturing); |
| Board. Principal Occupation(s) During the Past Five | Senior Advisor at New Mountain Capital; Trustee |
| Years: Chairman of the Board of The Vanguard Group, | of The Conference Board; Member of the Board of |
| Inc., and of each of the investment companies served | Managers of Delphi Automotive LLP (automotive |
| by The Vanguard Group, since January 2010; Director | components). |
| of The Vanguard Group since 2008; Chief Executive | |
| Officer and President of The Vanguard Group and of | Amy Gutmann |
| each of the investment companies served by The | Born 1949. Trustee Since June 2006. Principal |
| Vanguard Group since 2008; Director of Vanguard | Occupation(s) During the Past Five Years: President |
| Marketing Corporation; Managing Director of The | of the University of Pennsylvania; Christopher H. |
| Vanguard Group (1995–2008). | Browne Distinguished Professor of Political Science |
| | in the School of Arts and Sciences with secondary |
| | appointments at the Annenberg School for Commu- |
| Independent Trustees | nication and the Graduate School of Education |
| | of the University of Pennsylvania; Director of |
| Emerson U. Fullwood | Carnegie Corporation of New York, Schuylkill River |
| Born 1948. Trustee Since January 2008. Principal | Development Corporation, and Greater Philadelphia |
| Occupation(s) During the Past Five Years: Executive | Chamber of Commerce; Trustee of the National |
| Chief Staff and Marketing Officer for North America | Constitution Center; Chair of the Presidential |
| and Corporate Vice President (retired 2008) of Xerox | Commission for the Study of Bioethical Issues. |
| Corporation (document management products and | |
| services); Executive in Residence and 2010 | JoAnn Heffernan Heisen |
| Distinguished Minett Professor at the Rochester | Born 1950. Trustee Since July 1998. Principal |
| Institute of Technology; Director of SPX Corporation | Occupation(s) During the Past Five Years: Corporate |
| (multi-industry manufacturing), the United Way of | Vice President and Chief Global Diversity Officer |
| Rochester, Amerigroup Corporation (managed health | (retired 2008) and Member of the Executive |
| care), the University of Rochester Medical Center, | Committee (1997–2008) of Johnson & Johnson |
| Monroe Community College Foundation, and North | (pharmaceuticals/consumer products); Director of |
| Carolina A&T University. | Skytop Lodge Corporation (hotels), the University |
| | Medical Center at Princeton, the Robert Wood |
| Rajiv L. Gupta | Johnson Foundation, and the Center for Work Life |
| Born 1945. Trustee Since December 2001. 2 | Policy; Member of the Advisory Board of the |
| Principal Occupation(s) During the Past Five Years: | Maxwell School of Citizenship and Public Affairs |
| Chairman and Chief Executive Officer (retired 2009) | at Syracuse University. |
| | |
| F. Joseph Loughrey | Thomas J. Higgins | |
| Born 1949. Trustee Since October 2009. Principal | Born 1957. Chief Financial Officer Since September |
| Occupation(s) During the Past Five Years: President | 2008. Principal Occupation(s) During the Past Five |
| and Chief Operating Officer (retired 2009) and Vice | Years: Principal of The Vanguard Group, Inc.; Chief |
| Chairman of the Board (2008–2009) of Cummins Inc. | Financial Officer of each of the investment companies |
| (industrial machinery); Director of SKF AB (industrial | served by The Vanguard Group since 2008; Treasurer |
| machinery), Hillenbrand, Inc. (specialized consumer | of each of the investment companies served by The |
| services), the Lumina Foundation for Education, and | Vanguard Group (1998–2008). |
| Oxfam America; Chairman of the Advisory Council | | |
| for the College of Arts and Letters and Member | Kathryn J. Hyatt | |
| of the Advisory Board to the Kellogg Institute for | Born 1955. Treasurer Since November 2008. Principal |
| International Studies at the University of Notre Dame. | Occupation(s) During the Past Five Years: Principal |
| | of The Vanguard Group, Inc.; Treasurer of each of |
| André F. Perold | the investment companies served by The Vanguard |
| Born 1952. Trustee Since December 2004. Principal | Group since 2008; Assistant Treasurer of each of the |
| Occupation(s) During the Past Five Years: George | investment companies served by The Vanguard Group |
| Gund Professor of Finance and Banking at the Harvard | (1988–2008). | |
| Business School; Chair of the Investment Committee | | |
| of HighVista Strategies LLC (private investment firm). | Heidi Stam | |
| | Born 1956. Secretary Since July 2005. Principal |
| Alfred M. Rankin, Jr. | Occupation(s) During the Past Five Years: Managing |
| Born 1941. Trustee Since January 1993. Principal | Director of The Vanguard Group, Inc., since 2006; |
| Occupation(s) During the Past Five Years: Chairman, | General Counsel of The Vanguard Group since 2005; |
| President, and Chief Executive Officer of NACCO | Secretary of The Vanguard Group and of each of the |
| Industries, Inc. (forklift trucks/housewares/lignite); | investment companies served by The Vanguard Group |
| Director of Goodrich Corporation (industrial products/ | since 2005; Director and Senior Vice President of |
| aircraft systems and services) and the National | Vanguard Marketing Corporation since 2005; |
| Association of Manufacturers; Chairman of the | Principal of The Vanguard Group (1997–2006). |
| Federal Reserve Bank of Cleveland; Vice Chairman | | |
| of University Hospitals of Cleveland; President of | | |
| the Board of The Cleveland Museum of Art. | Vanguard Senior Management Team |
| |
| Peter F. Volanakis | R. Gregory Barton | Michael S. Miller |
| Born 1955. Trustee Since July 2009. Principal | Mortimer J. Buckley | James M. Norris |
| Occupation(s) During the Past Five Years: President | Kathleen C. Gubanich | Glenn W. Reed |
| and Chief Operating Officer (retired 2010) of Corning | Paul A. Heller | George U. Sauter |
| Incorporated (communications equipment); Director of | | |
| Corning Incorporated (2000–2010) and Dow Corning | | |
| (2001–2010); Overseer of the Amos Tuck School of | Chairman Emeritus and Senior Advisor |
| Business Administration at Dartmouth College. | | |
| | John J. Brennan | |
| | Chairman, 1996–2009 | |
| Executive Officers | Chief Executive Officer and President, 1996–2008 |
| |
| Glenn Booraem | | |
| Born 1967. Controller Since July 2010. Principal | Founder | |
| Occupation(s) During the Past Five Years: Principal | | |
| of The Vanguard Group, Inc.; Controller of each of | John C. Bogle | |
| the investment companies served by The Vanguard | Chairman and Chief Executive Officer, 1974–1996 |
| Group since 2010; Assistant Controller of each of | | |
| the investment companies served by The Vanguard | | |
| Group (2001–2010). | | |
1 Mr. McNabb is considered an “interested person,” as defined in the Investment Company Act of 1940, because he is an officer of the Vanguard funds.
2 December 2002 for Vanguard Equity Income Fund, Vanguard Growth Equity Fund, the Vanguard Municipal Bond Funds, and the Vanguard State Tax-Exempt Funds.
|  |
| P.O. Box 2600 |
| Valley Forge, PA 19482-2600 |
Connect with Vanguard® > vanguard.com
| |
| Fund Information > 800-662-7447 | CFA® is a trademark owned by CFA Institute. |
| Direct Investor Account Services > 800-662-2739 | |
| Institutional Investor Services > 800-523-1036 | |
| Text Telephone for People | |
| With Hearing Impairment > 800-749-7273 | |
| |
| This material may be used in conjunction | |
| with the offering of shares of any Vanguard | |
| fund only if preceded or accompanied by | |
| the fund’s current prospectus. | |
| |
| All comparative mutual fund data are from Lipper Inc. or | |
| Morningstar, Inc., unless otherwise noted. | |
| |
| You can obtain a free copy of Vanguard’s proxy voting | |
| guidelines by visiting vanguard.com/proxyreporting or by | |
| calling Vanguard at 800-662-2739. The guidelines are | |
| also available from the SEC’s website, sec.gov. In | |
| addition, you may obtain a free report on how your fund | |
| voted the proxies for securities it owned during the 12 | |
| months ended June 30. To get the report, visit either | |
| vanguard.com/proxyreporting or sec.gov. | |
| |
| You can review and copy information about your fund at | |
| the SEC’s Public Reference Room in Washington, D.C. To | |
| find out more about this public service, call the SEC at | |
| 202-551-8090. Information about your fund is also | |
| available on the SEC’s website, and you can receive | |
| copies of this information, for a fee, by sending a | |
| request in either of two ways: via e-mail addressed to | |
| publicinfo@sec.gov or via regular mail addressed to the | |
| Public Reference Section, Securities and Exchange | |
| Commission, Washington, DC 20549-1520. | |
| | © 2011 The Vanguard Group, Inc. |
| | All rights reserved. |
| | Vanguard Marketing Corporation, Distributor. |
| |
| | Q1292 052011 |
 |
| Vanguard Strategic Small-Cap |
| Equity Fund Semiannual Report |
|
| March 31, 2011 |
|
 |
|
> For the six months ended March 31, 2011, Vanguard Strategic Small-Cap Equity Fund returned 27.56%.
> The fund’s result outpaced the return of its benchmark index and the average return of peer-group funds.
> The fund’s two largest sectors, financials and information technology, helped boost its return.
| |
| Contents | |
| Your Fund’s Total Returns. | 1 |
| Chairman’s Letter. | 2 |
| Advisor’s Report. | 6 |
| Fund Profile. | 7 |
| Performance Summary. | 8 |
| Financial Statements. | 9 |
| About Your Fund’s Expenses. | 21 |
| Trustees Approve Advisory Arrangement. | 23 |
| Glossary. | 24 |
Please note: The opinions expressed in this report are just that—informed opinions. They should not be considered promises or advice. Also, please keep in mind that the information and opinions cover the period through the date on the front of this report. Of course, the risks of investing in your fund are spelled out in the prospectus.
See the Glossary for definitions of investment terms used in this report.
Cover photograph: Jean Maher.
Your Fund’s Total Returns
| |
| Six Months Ended March 31, 2011 | |
| | Total |
| | Returns |
| Vanguard Strategic Small-Cap Equity Fund | 27.56% |
| MSCI US Small Cap 1750 Index | 25.78 |
| Small-Cap Core Funds Average | 24.71 |
| Small-Cap Core Funds Average: Derived from data provided by Lipper Inc. | |
| | | | |
| Your Fund’s Performance at a Glance | | | | |
| September 30, 2010 , Through March 31, 2011 | | | | |
| | | | Distributions Per Share |
| | Starting | Ending | Income | Capital |
| | Share Price | Share Price | Dividends | Gains |
| Vanguard Strategic Small-Cap Equity Fund | $16.53 | $20.93 | $0.140 | $0.000 |
1

Chairman’s Letter
Dear Shareholder,
Over the six months ended March 31, 2011, stock prices rose substantially. Vanguard Strategic Small-Cap Equity Fund made the most of this propitious climate, returning 27.56%, almost 2 percentage points more than its benchmark index, the MSCI US Small Cap 1750 Index, and almost 3 percentage points ahead of the average return of peer-group funds.
The fund’s stock selections were the product of its quantitative approach. The fund’s advisor, Vanguard Quantitative Equity Group, uses complementary models in its attempt to identify those stocks in the benchmark index that appear to boast the best combination of reasonable valuations and attractive growth prospects and to assemble them in a portfolio with a risk profile similar to that of the index.
Please note that the fund’s estimated expense ratio, as reported in the most recent prospectus, has increased. (See the table on page 4.) The increase is related to a change in the calculation for the expense ratio, which must now reflect “acquired fund fees and expenses” from some of the fund’s holdings. These expenses are not paid to Vanguard, and are not direct costs paid by fund shareholders. Like operating expenses of other companies held by a fund, these expenses are already reflected in the fund’s performance figures. The reported increase will not reduce the return of the fund and will have no economic impact on shareholders.
2
Despite distressing headlines, stock markets rallied
Global stock markets produced exceptional returns for the six months ended March 31, a period punctuated by unnerving developments such as political upheaval in the Middle East and North Africa, new sovereign debt dilemmas in Europe, and a nuclear emergency in Japan. On a more optimistic note, the U.S. economy continued to grind into gear. Job growth picked up, fueling hopes that the good news might be persistent enough to bring down the high unemployment rate.
The broad U.S. stock market returned more than 18%. The stocks of smaller companies, which are keenly sensitive to the rhythms of the business cycle, did even better. Non-U.S. stock markets trailed their American counterparts, though as a group, their six-month return topped 10%. European stocks performed best.
All but the shortest-term rates moved higher, affecting bond prices
With the exception of the shortest-term securities, the rates on fixed income investments moved higher during the six-month period. At the start of the period, the 10-year U.S. Treasury note yielded a meager 2.51%. By the end, the rate had climbed to 3.45% as investors demanded more compensation for the possibility that inflation will continue to accelerate from financial-crisis lows.
Rising rates put short-term pressure on bond prices. The broad U.S. taxable bond market produced a slightly negative return.
| | | |
| Market Barometer | | | |
| |
| | | Total Returns |
| | | Periods Ended March 31, 2011 |
| | Six | One | Five Years |
| | Months | Year | (Annualized) |
| Stocks | | | |
| Russell 1000 Index (Large-caps) | 18.13% | 16.69% | 2.93% |
| Russell 2000 Index (Small-caps) | 25.48 | 25.79 | 3.35 |
| Dow Jones U.S. Total Stock Market Index | 18.51 | 17.50 | 3.27 |
| MSCI All Country World Index ex USA (International) | 10.85 | 13.15 | 3.59 |
| |
| Bonds | | | |
| Barclays Capital U.S. Aggregate Bond Index (Broad | | | |
| taxable market) | -0.88% | 5.12% | 6.03% |
| Barclays Capital Municipal Bond Index (Broad | | | |
| tax-exempt market) | -3.68 | 1.63 | 4.14 |
| Citigroup Three-Month U.S. Treasury Bill Index | 0.06 | 0.15 | 2.09 |
| |
| CPI | | | |
| Consumer Price Index | 2.30% | 2.68% | 2.26% |
3
The broad municipal bond market, which came under pressure both from rising rates and concern (exaggerated, in Vanguard’s view) about the financial strength of state and municipal borrowers, returned –3.68%.
As it has since December 2008, the Federal Reserve held its target for short-term interest rates near 0%. This stance kept the returns available from money market instruments, such as the 3-month Treasury bill, in the same neighborhood.
REIT results helped boost financials
Through its quantitative investment process, Vanguard Strategic Small-Cap Equity Fund’s advisor selects a subset of the roughly 1,750 stocks in the fund’s benchmark index. At the end of March, the fund held 428 stocks. The fund’s portfolio returned 27.56% for the six-month period, while the benchmark index returned 25.78%.
The fund’s financial stocks, especially real estate investment trusts, were among its top performers compared with the benchmark, even as investors began to question whether the two-year-long rally in REITs would continue. The fund’s holdings in information technology were also rewarding. Stock selection was particularly strong among firms that provide computer and wireless network services and manufacturers of semiconductor products. Together, the fund’s two largest sectors added 1 percentage point to its total return compared with that of the benchmark.
| | |
| Expense Ratios | | |
| Your Fund Compared With Its Peer Group | | |
| | | Peer Group |
| | Fund | Average |
| Strategic Small-Cap Equity Fund | 0.48% | 1.38% |
The fund expense ratio shown is from the prospectus dated April 29, 2011, and represents estimated costs for the current fiscal year. For the six months ended March 31, 2011, the fund’s annualized expense ratio was 0.42%. The peer-group expense ratio is derived from data provided by Lipper Inc. and captures information through year-end 2010.
Peer group: Small-Cap Core Funds.
4
Health care and consumer discretionary stocks, a smaller slice of fund assets, also made notable contributions to the fund’s benchmark-beating performance. Health care standouts included suppliers of products such as blood-transfusion devices, biotech firms, and manufacturers of scientific equipment. Within consumer discretionary, specialty retailers, such as computer and electronics stores, provided a boost.
Focus on future goals, not the current market
For some time now, the stock market has been recovering from the turmoil created by the financial crisis. Its performance over the last six months has been impressive. Of course, we can’t be sure what the future holds, but we know that the market will continue to experience ups and downs.
The best way to tune out the distractions caused by these unpredictable but inevitable fluctuations is to focus on the drivers of long-term investment success that are within your control: Maintain an allocation to stock, bond, and money market funds consistent with your goals and tolerance for market gyrations, pay attention to costs, and strive to make contributions to your investment program that are commensurate with your eventual needs.
Vanguard Strategic Small-Cap Equity Fund, with its experienced management team, can play an important role in a well-balanced portfolio assembled to help you reach your goals. And the fund’s low expenses can help you to keep more of the return on your investment.
On another matter, Joel Dickson, who previously oversaw Vanguard’s Active Quantitative Equity Management Group, has assumed a new leadership role at Vanguard in our Investment Strategy Group. Sandip Bhagat, who already had been overseeing Vanguard’s active and index quantitative equity strategies, is now directly managing the Quantitative Equity Group’s researchers, portfolio managers, and traders.
I would like to thank Joel for the services he has provided to the Strategic Small-Cap Equity Fund. Jim Stetler will continue as portfolio manager of the fund.
As always, thank you for entrusting your assets to Vanguard.
Sincerely,

F. William McNabb III
Chairman and Chief Executive Officer
April 13, 2011
5
Advisor’s Report
For the six months ended March 31, 2011, the Strategic Small-Cap Equity Fund returned 27.56%, outpacing its benchmark index by nearly 2 percentage points.
U.S. equity markets continued to rebound from the low points reached more than two years ago. Strong corporate earnings and better-than-expected job growth buoyed stocks despite the volatility brought on by political turmoil abroad, the continuing European sovereign-debt crisis, and the natural disaster in Japan. Markets experienced a shock in mid-February as investors digested news of the protests in the Middle East and Northern Africa along with a double-digit increase in crude oil prices—but the market then stabilized and moved up to levels not seen since mid-2008.
Small-capitalization stocks, the focus of your investment in the Strategic Small-Cap Equity Fund, outperformed their large-cap counterparts by about 7 percentage points for the period, led by the returns of energy, information technology, and materials companies. Utilities and financials were weaker, although all ten sectors provided positive returns.
While overall fund performance has been affected by the macroeconomic factors described above, our approach to investing focuses on specific stock fundamentals. As we believe there is no single indicator for identifying attractive stocks, our company evaluation process is diversified across multiple factors: valuation, growth, quality, management decisions, and market sentiment. For the six months, our growth, management decision, and market sentiment indicators were the most effective components of our model, while the quality and valuation measures detracted.
Our stock selection added value in seven of ten sectors and was strongest in health care, financials, consumer discretionary, and information technology.
In health care, selections including Bruker Biosciences and Cepheid contributed most to our performance in comparison with the benchmark. World Acceptance Corp. and First Industrial Realty were top performers in the financial sector. In consumer discretionary, Sinclair Broadcast Group and Tempur-Pedic International led, while VeriFone Systems and Riverbed Technology were the largest contributors to our relative returns in information technology.
Results in materials, energy, and telecommunications slightly lagged, primarily because we either did not own or held underweight positions in companies that performed exceptionally well during the period, such as SandRidge Energy and independent refiner Holly Corporation, which both returned more than 100%.
We thank you for your investment and look forward to the coming months.
James P. Stetler
Principal and Portfolio Manager
Vanguard Quantitative Equity Group
April 20, 2011
6
Strategic Small-Cap Equity Fund
Fund Profile
As of March 31, 2011
| | | |
| Portfolio Characteristics | | |
| | | | DJ |
| | | MSCI US | U.S. Total |
| | | Small Cap | Market |
| | Fund | 1750 Index | Index |
| Number of Stocks | 428 | 1,711 | 3,817 |
| Median Market Cap | $1.7B | $1.8B | $31.4B |
| Price/Earnings Ratio | 18.3x | 26.9x | 17.9x |
| Price/Book Ratio | 2.4x | 2.1x | 2.3x |
| Return on Equity | 10.0% | 9.9% | 18.9% |
| Earnings Growth Rate | 9.8% | 4.3% | 5.9% |
| Dividend Yield | 1.1% | 1.1% | 1.7% |
| Foreign Holdings | 0.4% | 0.0% | 0.0% |
| Turnover Rate | | | |
| (Annualized) | 49% | — | — |
| Ticker Symbol | VSTCX | — | — |
| Expense Ratio1 | 0.48% | — | — |
| 30-Day SEC Yield | 0.73% | — | — |
| Short-Term Reserves | 1.1% | — | — |
| | | |
| Sector Diversification (% of equity exposure) |
| | | | DJ |
| | | MSCI US | U.S. Total |
| | | Small Cap | Market |
| | Fund 1750 Index | Index |
| Consumer | | | |
| Discretionary | 13.6% | 13.5% | 11.8% |
| Consumer Staples | 2.8 | 2.5 | 9.2 |
| Energy | 7.1 | 6.8 | 11.8 |
| Financials | 19.2 | 19.7 | 16.2 |
| Health Care | 11.1 | 11.2 | 10.7 |
| Industrials | 16.3 | 16.4 | 11.6 |
| Information | | | |
| Technology | 18.9 | 19.0 | 18.5 |
| Materials | 6.7 | 6.5 | 4.5 |
| Telecommunication | | | |
| Services | 0.7 | 0.9 | 2.6 |
| Utilities | 3.6 | 3.5 | 3.1 |
| | |
| Volatility Measures | | |
| | | DJ |
| | MSCI US | U.S. Total |
| | Small Cap | Market |
| | 1750 Index | Index |
| R-Squared | 0.99 | 0.93 |
| Beta | 0.95 | 1.18 |
These measures show the degree and timing of the fund’s fluctuations compared with the indexes over 36 months.
| | |
| Ten Largest Holdings (% of total net assets) |
| VeriFone Systems Inc. | Data Processing & | |
| | Outsourced | |
| | Services | 0.8% |
| Oil States International | Oil & Gas | |
| Inc. | Equipment & | |
| | Services | 0.7 |
| Tempur-Pedic | | |
| International Inc. | Home Furnishings | 0.7 |
| Panera Bread Co. | Restaurants | 0.7 |
| Gartner Inc. | IT Consulting & | |
| | Other Services | 0.7 |
| Vishay Intertechnology | Electronic | |
| Inc. | Components | 0.6 |
| EnerSys | Electrical | |
| | Components & | |
| | Equipment | 0.6 |
| Waste Connections Inc. | Environmental & | |
| | Facilities Services | 0.6 |
| Stone Energy Corp. | Oil & Gas | |
| | Exploration & | |
| | Production | 0.6 |
| Williams-Sonoma Inc. | Home Furnishing | |
| | Retail | 0.6 |
| Top Ten | | 6.6% |
The holdings listed exclude any temporary cash investments and equity index products.
Investment Focus
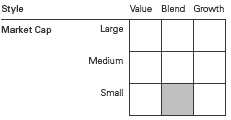
1 The expense ratio shown is from the prospectus dated April 29, 2011, and represents estimated costs for the current fiscal year. For the six months ended March 31, 2011, the annualized expense ratio was 0.42%.
7
Strategic Small-Cap Equity Fund
Performance Summary
All of the returns in this report represent past performance, which is not a guarantee of future results that may be achieved by the fund. (Current performance may be lower or higher than the performance data cited. For performance data current to the most recent month-end, visit our website at vanguard.com/performance.) Note, too, that both investment returns and principal value can fluctuate widely, so an investor’s shares, when sold, could be worth more or less than their original cost. The returns shown do not reflect taxes that a shareholder would pay on fund distributions or on the sale of fund shares.
Fiscal-Year Total Returns (%): April 24, 2006, Through March 31, 2011
| | | |
| Average Annual Total Returns: Periods Ended March 31, 2011 | | |
| |
| | Inception | One | Since |
| | Date | Year | Inception |
| Strategic Small-Cap Equity Fund | 4/24/2006 | 29.12% | 2.13% |
See Financial Highlights for dividend and capital gains information.
8
Strategic Small-Cap Equity Fund
Financial Statements (unaudited)
Statement of Net Assets
As of March 31, 2011
The fund reports a complete list of its holdings in regulatory filings four times in each fiscal year, at the quarter-ends. For the second and fourth fiscal quarters, the lists appear in the fund’s semiannual and annual reports to shareholders. For the first and third fiscal quarters, the fund files the lists with the Securities and Exchange Commission on Form N-Q. Shareholders can look up the fund’s Forms N-Q on the SEC’s website at sec.gov. Forms N-Q may also be reviewed and copied at the SEC’s Public Reference Room (see the back cover of this report for further information).
| | | |
| | | | Market |
| | | | Value |
| | | Shares | ($000) |
| Common Stocks (99.0%)1 | | |
| Consumer Discretionary (13.5%) | | |
| * | Tempur-Pedic | | |
| | International Inc. | 36,900 | 1,869 |
| * | Panera Bread Co. Class A | 14,500 | 1,842 |
| | Williams-Sonoma Inc. | 40,018 | 1,621 |
| | Polaris Industries Inc. | 17,200 | 1,497 |
| | Sotheby’s | 27,300 | 1,436 |
| * | Warnaco Group Inc. | 24,400 | 1,395 |
| | Finish Line Inc. Class A | 67,100 | 1,332 |
| | Rent-A-Center Inc. | 37,700 | 1,316 |
| | Sinclair Broadcast Group Inc. | | |
| | Class A | 99,100 | 1,243 |
| * | TRW Automotive | | |
| | Holdings Corp. | 20,460 | 1,127 |
| | Dillard’s Inc. Class A | 26,800 | 1,075 |
| | Cooper Tire & Rubber Co. | 41,500 | 1,069 |
| * | Dana Holding Corp. | 61,200 | 1,064 |
| | Express Inc. | 51,500 | 1,006 |
| | Cracker Barrel Old | | |
| | Country Store Inc. | 20,024 | 984 |
| * | ANN Inc. | 31,800 | 926 |
| * | Valassis Communications | | |
| | Inc. | 31,700 | 924 |
| | CEC Entertainment Inc. | 23,200 | 875 |
| * | Timberland Co. Class A | 19,800 | 818 |
| * | Sally Beauty Holdings Inc. | 58,100 | 814 |
| * | Saks Inc. | 68,600 | 776 |
| * | Ruby Tuesday Inc. | 56,600 | 742 |
| | PF Chang’s China Bistro Inc. | 15,900 | 734 |
| | American Greetings Corp. | | |
| | Class A | 29,200 | 689 |
| * | Pier 1 Imports Inc. | 65,800 | 668 |
| * | Domino’s Pizza Inc. | 34,800 | 641 |
| * | Biglari Holdings Inc. | 1,247 | 528 |
| * | Deckers Outdoor Corp. | 5,783 | 498 |
| * | JOS A Bank Clothiers Inc. | 9,450 | 481 |
| | PEP Boys-Manny Moe | | |
| | & Jack | 37,300 | 474 |
| | | |
| | | | Market |
| | | | Value |
| | | Shares | ($000) |
| * | Papa John’s International | | |
| | Inc. | 13,615 | 431 |
| | Oxford Industries Inc. | 12,500 | 427 |
| * | Journal Communications | | |
| | Inc. | | |
| | Class A | 61,975 | 372 |
| * | Coinstar Inc. | 8,000 | 367 |
| * | Denny’s Corp. | 89,572 | 364 |
| | Jones Group Inc. | 24,600 | 338 |
| | Scholastic Corp. | 12,400 | 335 |
| * | Steven Madden Ltd. | 6,900 | 324 |
| * | Cheesecake Factory Inc. | 10,300 | 310 |
| * | Standard Pacific Corp. | 80,500 | 300 |
| * | New York Times Co. Class A | 31,700 | 300 |
| * | DSW Inc. Class A | 7,500 | 300 |
| * | Movado Group Inc. | 18,400 | 270 |
| | Cato Corp. Class A | 11,000 | 270 |
| | Stein Mart Inc. | 22,700 | 230 |
| * | AFC Enterprises Inc. | 13,400 | 203 |
| * | iRobot Corp. | 6,000 | 197 |
| ^,* | China MediaExpress | | |
| | Holdings Inc. | 11,404 | 135 |
| * | Ulta Salon Cosmetics | | |
| | & Fragrance Inc. | 2,600 | 125 |
| * | Kenneth Cole | | |
| | Productions Inc. Class A | 9,000 | 117 |
| | Lincoln Educational | | |
| | Services Corp. | 6,738 | 107 |
| * | Shutterfly Inc. | 1,800 | 94 |
| * | American Axle | | |
| | & Manufacturing | | |
| | Holdings Inc. | 5,100 | 64 |
| * | CROCS Inc. | 3,400 | 61 |
| * | DineEquity Inc. | 900 | 50 |
| | | | 36,555 |
| Consumer Staples (2.8%) | | |
| | B&G Foods Inc. Class A | 73,700 | 1,383 |
| | Ruddick Corp. | 25,700 | 992 |
| * | Boston Beer Co. Inc. | | |
| | Class A | 10,100 | 935 |
9
Strategic Small-Cap Equity Fund
| | | |
| | | | Market |
| | | | Value |
| | | Shares | ($000) |
| | Lancaster Colony Corp. | 11,500 | 697 |
| | Nu Skin Enterprises Inc. | | |
| | Class A | 20,500 | 589 |
| * | TreeHouse Foods Inc. | 7,800 | 444 |
| * | Central Garden and Pet Co. | | |
| | Class A | 46,506 | 428 |
| | Casey’s General Stores Inc. | 10,792 | 421 |
| * | Revlon Inc. Class A | 24,300 | 386 |
| | Inter Parfums Inc. | 12,700 | 235 |
| | Coca-Cola Bottling Co. | | |
| | Consolidated | 3,000 | 201 |
| | J&J Snack Foods Corp. | 2,900 | 136 |
| * | Pantry Inc. | 8,500 | 126 |
| | National Beverage Corp. | 8,800 | 121 |
| * | Susser Holdings Corp. | 8,800 | 115 |
| | Herbalife Ltd. | 1,400 | 114 |
| | Corn Products | | |
| | International Inc. | 2,000 | 104 |
| * | Rite Aid Corp. | 44,200 | 47 |
| | | | 7,474 |
| Energy (7.0%) | | |
| * | Oil States International Inc. | 25,697 | 1,957 |
| * | Stone Energy Corp. | 48,800 | 1,628 |
| * | International Coal Group Inc. | 126,517 | 1,430 |
| | RPC Inc. | 56,450 | 1,429 |
| | World Fuel Services Corp. | 34,100 | 1,385 |
| * | Complete Production | | |
| | Services Inc. | 43,300 | 1,377 |
| | Core Laboratories NV | 13,400 | 1,369 |
| | SM Energy Co. | 17,300 | 1,283 |
| * | OYO Geospace Corp. | 9,900 | 976 |
| * | Gulfport Energy Corp. | 25,200 | 911 |
| | Crosstex Energy Inc. | 63,600 | 633 |
| * | Energy Partners Ltd. | 35,000 | 630 |
| * | Petroquest Energy Inc. | 64,114 | 600 |
| | Frontier Oil Corp. | 12,200 | 358 |
| | Berry Petroleum Co. Class A | 6,700 | 338 |
| * | Gran Tierra Energy Inc. | 40,300 | 325 |
| * | McMoRan Exploration Co. | 18,100 | 321 |
| * | Energy XXI Bermuda Ltd. | 9,130 | 311 |
| * | Swift Energy Co. | 6,700 | 286 |
| * | James River Coal Co. | 10,600 | 256 |
| * | Tetra Technologies Inc. | 16,300 | 251 |
| * | Clayton Williams Energy Inc. | 2,100 | 222 |
| | CARBO Ceramics Inc. | 1,500 | 212 |
| * | Newpark Resources Inc. | 26,700 | 210 |
| * | Cloud Peak Energy Inc. | 4,200 | 91 |
| * | Venoco Inc. | 5,229 | 89 |
| | | | 18,878 |
| Financials (19.1%) | | |
| * | World Acceptance Corp. | 24,300 | 1,584 |
| * | Signature Bank | 27,100 | 1,528 |
| | Endurance Specialty | | |
| | Holdings Ltd. | 31,100 | 1,518 |
| | | |
| | | | Market |
| | | | Value |
| | | Shares | ($000) |
| | Ares Capital Corp. | 74,600 | 1,261 |
| | CapitalSource Inc. | 171,000 | 1,204 |
| | Bank of Hawaii Corp. | 23,600 | 1,129 |
| | Meadowbrook Insurance | | |
| | Group Inc. | 104,900 | 1,086 |
| | FNB Corp. | 103,000 | 1,086 |
| | Camden Property Trust | 19,100 | 1,085 |
| | Allied World Assurance Co. | | |
| | Holdings Ltd. | 16,700 | 1,047 |
| | Platinum Underwriters | | |
| | Holdings Ltd. | 26,800 | 1,021 |
| | Cash America | | |
| | International Inc. | 21,213 | 977 |
| | Taubman Centers Inc. | 18,200 | 975 |
| | Apartment Investment | | |
| | & Management Co. | 36,600 | 932 |
| | CBL & Associates | | |
| | Properties Inc. | 52,600 | 916 |
| | Highwoods Properties Inc. | 25,500 | 893 |
| * | Credit Acceptance Corp. | 12,310 | 874 |
| | Developers Diversified | | |
| | Realty Corp. | 60,400 | 846 |
| | Post Properties Inc. | 21,400 | 840 |
| * | Forest City Enterprises Inc. | | |
| | Class A | 44,600 | 840 |
| | Nelnet Inc. Class A | 38,100 | 832 |
| * | American Capital Ltd. | 82,900 | 821 |
| | MarketAxess Holdings Inc. | 33,400 | 808 |
| | Community Bank | | |
| | System Inc. | 33,000 | 801 |
| | Extra Space Storage Inc. | 38,000 | 787 |
| | Potlatch Corp. | 19,100 | 768 |
| | International Bancshares | | |
| | Corp. | 41,400 | 759 |
| | Lexington Realty Trust | 79,900 | 747 |
| * | ProAssurance Corp. | 11,500 | 729 |
| | Bank of the Ozarks Inc. | 16,600 | 726 |
| | Medical Properties Trust Inc. | 62,200 | 720 |
| * | First Industrial Realty | | |
| | Trust Inc. | 60,100 | 715 |
| | Prosperity Bancshares Inc. | 16,300 | 697 |
| | Infinity Property | | |
| | & Casualty Corp. | 11,400 | 678 |
| * | Strategic Hotels | | |
| | & Resorts Inc. | 103,900 | 670 |
| | Getty Realty Corp. | 28,800 | 659 |
| | City Holding Co. | 18,562 | 656 |
| | Colonial Properties Trust | 34,070 | 656 |
| | Ashford Hospitality | | |
| | Trust Inc. | 58,200 | 641 |
| | U-Store-It Trust | 59,600 | 627 |
| | Glimcher Realty Trust | 66,400 | 614 |
| | Sun Communities Inc. | 17,000 | 606 |
| | United Bankshares Inc. | 22,600 | 599 |
10
Strategic Small-Cap Equity Fund
| | | |
| | | | Market |
| | | | Value |
| | | Shares | ($000) |
| | Pennsylvania Real Estate | | |
| | Investment Trust | 40,826 | 583 |
| | Amtrust Financial | | |
| | Services Inc. | 30,500 | 582 |
| | Brandywine Realty Trust | 47,600 | 578 |
| | Montpelier Re Holdings Ltd. | 32,500 | 574 |
| | Park National Corp. | 8,500 | 568 |
| | WesBanco Inc. | 27,400 | 567 |
| | National Retail Properties | | |
| | Inc. | 21,100 | 551 |
| | Trustmark Corp. | 23,222 | 544 |
| | Unitrin Inc. | 17,400 | 537 |
| | UMB Financial Corp. | 13,800 | 515 |
| * | Sunstone Hotel Investors | | |
| | Inc. | 45,526 | 464 |
| | CapLease Inc. | 81,800 | 448 |
| | First Citizens BancShares | | |
| | Inc. | | |
| | Class A | 2,214 | 444 |
| * | FPIC Insurance Group Inc. | 11,700 | 443 |
| | Equity Lifestyle | | |
| | Properties Inc. | 6,700 | 386 |
| | Dime Community | | |
| | Bancshares Inc. | 25,300 | 373 |
| | Aspen Insurance | | |
| | Holdings Ltd. | 13,000 | 358 |
| | Winthrop Realty Trust | 27,600 | 338 |
| | Cardinal Financial Corp. | 27,700 | 323 |
| | Parkway Properties Inc. | 18,900 | 321 |
| | S&T Bancorp Inc. | 13,300 | 287 |
| | First Financial | | |
| | Bankshares Inc. | 4,100 | 211 |
| | NBT Bancorp Inc. | 8,600 | 196 |
| | Advance America Cash | | |
| | Advance Centers Inc. | 36,730 | 195 |
| | Community Trust | | |
| | Bancorp Inc. | 6,600 | 183 |
| | Southside Bancshares Inc. | 8,400 | 180 |
| | NewAlliance Bancshares Inc. | 12,000 | 178 |
| | Provident New York Bancorp | 15,943 | 165 |
| | Washington Trust | | |
| | Bancorp Inc. | 6,900 | 164 |
| | Fulton Financial Corp. | 14,700 | 163 |
| | OneBeacon Insurance | | |
| | Group Ltd. Class A | 12,000 | 162 |
| | Bancfirst Corp. | 3,326 | 142 |
| | First Financial Corp. | 4,200 | 140 |
| | Protective Life Corp. | 5,200 | 138 |
| | 1st Source Corp. | 6,799 | 136 |
| | Hersha Hospitality Trust | | |
| | Class A | 22,600 | 134 |
| | MainSource Financial | | |
| | Group Inc. | 11,200 | 112 |
| | Provident Financial | | |
| | Services Inc. | 7,400 | 110 |
| | | |
| | | | Market |
| | | | Value |
| | | Shares | ($000) |
| | Rockville Financial Inc. | 10,161 | 106 |
| | Capital Southwest Corp. | 1,139 | 104 |
| | GAMCO Investors Inc. | 2,200 | 102 |
| | Flushing Financial Corp. | 6,800 | 101 |
| | FBL Financial Group Inc. | | |
| | Class A | 3,000 | 92 |
| | MFA Financial Inc. | 11,200 | 92 |
| | PS Business Parks Inc. | 1,536 | 89 |
| | Republic Bancorp Inc. | | |
| | Class A | 4,400 | 86 |
| | Great Southern Bancorp Inc. | 3,700 | 79 |
| | Camden National Corp. | 2,200 | 75 |
| * | Ezcorp Inc. Class A | 2,100 | 66 |
| | Primerica Inc. | 2,500 | 64 |
| | Danvers Bancorp Inc. | 2,800 | 60 |
| | | | 51,567 |
| Health Care (11.0%) | | |
| | Cooper Cos. Inc. | 22,800 | 1,584 |
| * | AMERIGROUP Corp. | 24,300 | 1,561 |
| * | Health Net Inc. | 47,400 | 1,550 |
| * | Bruker Corp. | 70,000 | 1,460 |
| * | Cepheid Inc. | 47,100 | 1,320 |
| * | Health Management | | |
| | Associates Inc. Class A | 119,900 | 1,307 |
| * | Sirona Dental Systems Inc. | 25,400 | 1,274 |
| * | Impax Laboratories Inc. | 49,500 | 1,260 |
| * | Magellan Health Services | | |
| | Inc. | 25,000 | 1,227 |
| * | Par Pharmaceutical Cos. Inc. | 35,800 | 1,113 |
| * | American Medical Systems | | |
| | Holdings Inc. | 47,800 | 1,034 |
| | STERIS Corp. | 28,500 | 984 |
| | Chemed Corp. | 14,300 | 953 |
| * | LifePoint Hospitals Inc. | 23,100 | 928 |
| | Medicis Pharmaceutical | | |
| | Corp. Class A | 26,100 | 836 |
| * | Healthsouth Corp. | 31,600 | 789 |
| | PDL BioPharma Inc. | 125,700 | 729 |
| | Invacare Corp. | 23,400 | 728 |
| | Universal American Corp. | 31,400 | 719 |
| * | Molina Healthcare Inc. | 17,706 | 708 |
| * | Corvel Corp. | 12,400 | 659 |
| * | Healthspring Inc. | 16,800 | 628 |
| * | Targacept Inc. | 19,700 | 524 |
| * | Questcor | | |
| | Pharmaceuticals Inc. | 33,300 | 480 |
| * | Medicines Co. | 25,600 | 417 |
| * | Arqule Inc. | 58,000 | 415 |
| * | Sunrise Senior Living Inc. | 31,300 | 373 |
| * | Greatbatch Inc. | 13,600 | 360 |
| * | Nabi Biopharmaceuticals | 57,200 | 332 |
| * | Affymetrix Inc. | 61,500 | 320 |
| * | Emergency Medical | | |
| | Services Corp. Class A | 4,280 | 272 |
| * | Dionex Corp. | 2,200 | 260 |
11
Strategic Small-Cap Equity Fund
| | | |
| | | | Market |
| | | | Value |
| | | Shares | ($000) |
| * | Kindred Healthcare Inc. | 10,000 | 239 |
| * | Air Methods Corp. | 3,400 | 229 |
| * | Triple-S Management Corp. | | |
| | Class B | 11,000 | 226 |
| * | Durect Corp. | 59,400 | 214 |
| * | Idenix Pharmaceuticals Inc. | 54,100 | 180 |
| * | Medivation Inc. | 8,200 | 153 |
| * | Enzon Pharmaceuticals Inc. | 13,600 | 148 |
| | National Healthcare Corp. | 3,100 | 144 |
| * | Kensey Nash Corp. | 5,600 | 140 |
| * | Codexis Inc. | 9,900 | 117 |
| * | Genomic Health Inc. | 4,500 | 111 |
| * | Akorn Inc. | 19,000 | 110 |
| * | Inspire Pharmaceuticals Inc. | 25,600 | 101 |
| | Hill-Rom Holdings Inc. | 2,600 | 99 |
| | Atrion Corp. | 500 | 87 |
| * | Sucampo Pharmaceuticals | | |
| | Inc. Class A | 20,000 | 84 |
| * | Osiris Therapeutics Inc. | 10,000 | 73 |
| * | Emergent Biosolutions Inc. | 3,000 | 73 |
| * | Assisted Living Concepts Inc. | |
| | Class A | 1,800 | 70 |
| | | | 29,702 |
| Industrials (16.1%) | | |
| * | EnerSys | 41,576 | 1,653 |
| | Waste Connections Inc. | 56,700 | 1,632 |
| * | Sauer-Danfoss Inc. | 31,700 | 1,615 |
| * | WESCO International Inc. | 23,900 | 1,494 |
| * | United Rentals Inc. | 44,600 | 1,484 |
| * | Avis Budget Group Inc. | 81,000 | 1,451 |
| | Toro Co. | 21,600 | 1,430 |
| * | Oshkosh Corp. | 38,900 | 1,376 |
| | Timken Co. | 24,900 | 1,302 |
| | Deluxe Corp. | 48,000 | 1,274 |
| | Kennametal Inc. | 31,900 | 1,244 |
| | Applied Industrial | | |
| | Technologies Inc. | 37,200 | 1,237 |
| * | Alaska Air Group Inc. | 19,200 | 1,218 |
| * | Esterline Technologies Corp. | 15,900 | 1,124 |
| | Cubic Corp. | 16,600 | 955 |
| | Briggs & Stratton Corp. | 41,500 | 940 |
| * | Trimas Corp. | 43,400 | 933 |
| | Great Lakes Dredge | | |
| | & Dock Corp. | 118,400 | 903 |
| | Gardner Denver Inc. | 11,300 | 882 |
| | TAL International Group Inc. | 21,467 | 779 |
| | Armstrong World | | |
| | Industries Inc. | 16,800 | 777 |
| | AO Smith Corp. | 17,150 | 760 |
| | Brady Corp. Class A | 21,100 | 753 |
| * | Macquarie Infrastructure Co. | | |
| | LLC | 31,100 | 742 |
| * | Consolidated Graphics Inc. | 13,100 | 716 |
| | Actuant Corp. Class A | 24,500 | 711 |
| * | Hawaiian Holdings Inc. | 110,400 | 664 |
| | | |
| | | | Market |
| | | | Value |
| | | Shares | ($000) |
| * | ACCO Brands Corp. | 66,400 | 633 |
| * | Meritor Inc. | 37,142 | 630 |
| * | Amerco Inc. | 6,100 | 592 |
| | NACCO Industries Inc. | | |
| | Class A | 5,342 | 591 |
| | Watts Water | | |
| | Technologies Inc. Class A | 14,900 | 569 |
| | Steelcase Inc. Class A | 50,000 | 569 |
| | Crane Co. | 11,600 | 562 |
| * | Exponent Inc. | 12,000 | 535 |
| * | Thomas & Betts Corp. | 9,000 | 535 |
| | Werner Enterprises Inc. | 18,900 | 500 |
| * | M&F Worldwide Corp. | 19,600 | 492 |
| * | Blount International Inc. | 30,500 | 487 |
| | Nordson Corp. | 3,900 | 449 |
| | Albany International Corp. | 17,600 | 438 |
| | Seaboard Corp. | 172 | 415 |
| | Vicor Corp. | 23,900 | 394 |
| * | Corrections Corp. of America | 16,000 | 390 |
| | Standex International Corp. | 9,700 | 368 |
| | Tennant Co. | 8,500 | 357 |
| * | EMCOR Group Inc. | 11,400 | 353 |
| * | United Continental | | |
| | Holdings Inc. | 15,000 | 345 |
| | G&K Services Inc. Class A | 9,700 | 323 |
| * | Atlas Air Worldwide | | |
| | Holdings Inc. | 4,200 | 293 |
| | United Stationers Inc. | 4,100 | 291 |
| * | Kadant Inc. | 9,885 | 259 |
| | Knoll Inc. | 11,000 | 231 |
| * | Dollar Thrifty Automotive | | |
| | Group Inc. | 3,245 | 217 |
| | Raven Industries Inc. | 3,500 | 215 |
| | Healthcare Services | | |
| | Group Inc. | 9,600 | 169 |
| * | Furmanite Corp. | 19,500 | 156 |
| * | US Airways Group Inc. | 16,200 | 141 |
| | Schawk Inc. Class A | 7,200 | 140 |
| | HEICO Corp. | 1,900 | 119 |
| | HEICO Corp. Class A | 2,500 | 112 |
| | LB Foster Co. Class A | 2,600 | 112 |
| * | Ladish Co. Inc. | 2,048 | 112 |
| | Viad Corp. | 4,000 | 96 |
| | Interface Inc. Class A | 5,100 | 94 |
| * | Acacia Research - | | |
| | Acacia Technologies | 2,700 | 92 |
| | HNI Corp. | 2,900 | 92 |
| * | Dolan Co. | 6,400 | 78 |
| * | WABCO Holdings Inc. | 1,000 | 62 |
| | | | 43,657 |
| Information Technology (18.7%) | | |
| * | VeriFone Systems Inc. | 40,600 | 2,231 |
| * | Gartner Inc. | 43,200 | 1,800 |
| * | Vishay Intertechnology Inc. | 96,400 | 1,710 |
| * | MICROS Systems Inc. | 32,200 | 1,592 |
12
Strategic Small-Cap Equity Fund
| | | |
| | | | Market |
| | | | Value |
| | | Shares | ($000) |
| | Anixter International Inc. | 22,200 | 1,552 |
| | Solera Holdings Inc. | 30,200 | 1,543 |
| * | Tech Data Corp. | 29,400 | 1,495 |
| * | Teradyne Inc. | 80,431 | 1,432 |
| ^,* | Veeco Instruments Inc. | 27,700 | 1,408 |
| * | Fairchild Semiconductor | | |
| | International Inc. Class A | 77,200 | 1,405 |
| * | Silicon Image Inc. | 144,550 | 1,297 |
| | MAXIMUS Inc. | 15,533 | 1,261 |
| | Opnet Technologies Inc. | 30,600 | 1,193 |
| * | Atmel Corp. | 86,200 | 1,175 |
| * | RF Micro Devices Inc. | 182,694 | 1,171 |
| * | Unisys Corp. | 37,260 | 1,163 |
| * | Take-Two Interactive | | |
| | Software Inc. | 75,400 | 1,159 |
| * | Netscout Systems Inc. | 42,400 | 1,158 |
| * | TriQuint Semiconductor Inc. | 83,568 | 1,079 |
| * | Powerwave | | |
| | Technologies Inc. | 238,400 | 1,075 |
| | Micrel Inc. | 73,400 | 989 |
| | Syntel Inc. | 18,752 | 979 |
| * | TIBCO Software Inc. | 35,800 | 976 |
| * | MicroStrategy Inc. Class A | 7,100 | 955 |
| * | Interactive Intelligence Inc. | 24,222 | 938 |
| * | Lattice Semiconductor | | |
| | Corp. | 147,600 | 871 |
| ^,* | Power-One Inc. | 98,583 | 863 |
| * | Cardtronics Inc. | 41,700 | 849 |
| * | Quantum Corp. | 311,500 | 785 |
| * | Sanmina-SCI Corp. | 63,200 | 708 |
| * | JDS Uniphase Corp. | 33,600 | 700 |
| * | Verint Systems Inc. | 19,350 | 694 |
| * | TeleTech Holdings Inc. | 34,500 | 669 |
| * | Plexus Corp. | 18,747 | 657 |
| * | Acxiom Corp. | 41,400 | 594 |
| * | Kemet Corp. | 38,300 | 568 |
| * | OSI Systems Inc. | 15,100 | 567 |
| * | Aruba Networks Inc. | 16,300 | 552 |
| | iGate Corp. | 28,871 | 542 |
| * | Avid Technology Inc. | 24,204 | 540 |
| * | Insight Enterprises Inc. | 29,800 | 508 |
| * | QLogic Corp. | 27,300 | 506 |
| | Plantronics Inc. | 13,800 | 505 |
| * | Newport Corp. | 27,800 | 496 |
| * | Manhattan Associates Inc. | 15,000 | 491 |
| * | Brightpoint Inc. | 43,500 | 472 |
| * | SYNNEX Corp. | 14,300 | 468 |
| | MercadoLibre Inc. | 5,500 | 449 |
| * | Synaptics Inc. | 15,100 | 408 |
| * | Mantech International Corp. | | |
| | Class A | 8,925 | 378 |
| * | Liquidity Services Inc. | 20,904 | 373 |
| * | Radiant Systems Inc. | 13,900 | 246 |
| * | Kulicke & Soffa | | |
| | Industries Inc. | 23,200 | 217 |
| | | |
| | | | Market |
| | | | Value |
| | | Shares | ($000) |
| | Pulse Electronics Corp. | 34,800 | 211 |
| | Blackbaud Inc. | 7,700 | 210 |
| * | Mentor Graphics Corp. | 13,800 | 202 |
| * | Entegris Inc. | 19,200 | 168 |
| * | Extreme Networks | 42,600 | 149 |
| * | Global Cash Access | | |
| | Holdings Inc. | 38,500 | 126 |
| | Stamps.com Inc. | 9,100 | 121 |
| * | Ancestry.com Inc. | 3,000 | 106 |
| * | DSP Group Inc. | 13,700 | 105 |
| * | Silicon Graphics | | |
| | International Corp. | 4,900 | 105 |
| * | Netgear Inc. | 3,100 | 101 |
| * | Cadence Design | | |
| | Systems Inc. | 10,200 | 99 |
| | Renaissance Learning Inc. | 7,500 | 88 |
| * | RealNetworks Inc. | 21,900 | 81 |
| | Heartland Payment | | |
| | Systems Inc. | 4,000 | 70 |
| * | Websense Inc. | 3,000 | 69 |
| * | Anadigics Inc. | 13,300 | 60 |
| | | | 50,483 |
| Materials (6.6%) | | |
| | Domtar Corp. | 17,000 | 1,560 |
| | Rock-Tenn Co. Class A | 22,000 | 1,526 |
| | PolyOne Corp. | 93,100 | 1,323 |
| | Innophos Holdings Inc. | 27,200 | 1,254 |
| | Boise Inc. | 136,802 | 1,253 |
| * | Rockwood Holdings Inc. | 24,600 | 1,211 |
| * | Clearwater Paper Corp. | 14,000 | 1,140 |
| | Silgan Holdings Inc. | 26,666 | 1,017 |
| | Cabot Corp. | 19,200 | 889 |
| * | Solutia Inc. | 33,000 | 838 |
| | Buckeye Technologies Inc. | 29,100 | 792 |
| * | Innospec Inc. | 24,700 | 789 |
| | Ashland Inc. | 11,548 | 667 |
| | NewMarket Corp. | 3,600 | 570 |
| | Schweitzer-Mauduit | | |
| | International Inc. | 9,900 | 501 |
| | Cytec Industries Inc. | 8,900 | 484 |
| | Neenah Paper Inc. | 20,944 | 460 |
| | Stepan Co. | 4,100 | 297 |
| | Arch Chemicals Inc. | 7,000 | 291 |
| * | TPC Group Inc. | 8,600 | 248 |
| * | KapStone Paper and | | |
| | Packaging Corp. | 11,300 | 194 |
| * | Hecla Mining Co. | 18,600 | 169 |
| * | Graphic Packaging | | |
| | Holding Co. | 29,400 | 159 |
| * | WR Grace & Co. | 2,300 | 88 |
| | Wausau Paper Corp. | 10,000 | 76 |
| * | Noranda Aluminum | | |
| | Holding Corp. | 4,700 | 76 |
| | | | 17,872 |
13
Strategic Small-Cap Equity Fund
| | | |
| | | | Market |
| | | | Value |
| | | Shares | ($000) |
| Telecommunication Services (0.7%) | |
| | USA Mobility Inc. | 44,300 | 642 |
| * | Vonage Holdings Corp. | 135,500 | 618 |
| | NTELOS Holdings Corp. | 16,900 | 311 |
| * | General Communication Inc. | | |
| | Class A | 19,900 | 218 |
| | Consolidated | | |
| | Communications | | |
| | Holdings Inc. | 4,500 | 84 |
| | | | 1,873 |
| Utilities (3.5%) | | |
| | Atmos Energy Corp. | 41,400 | 1,412 |
| | Hawaiian Electric | | |
| | Industries Inc. | 52,100 | 1,292 |
| | IDACORP Inc. | 31,000 | 1,181 |
| | WGL Holdings Inc. | 25,700 | 1,002 |
| | Southwest Gas Corp. | 23,400 | 912 |
| | NorthWestern Corp. | 28,900 | 876 |
| | Unisource Energy Corp. | 19,900 | 719 |
| | Portland General Electric Co. | 24,000 | 570 |
| | Cleco Corp. | 13,700 | 470 |
| | Laclede Group Inc. | 10,200 | 389 |
| | Nicor Inc. | 5,200 | 279 |
| * | El Paso Electric Co. | 8,100 | 246 |
| | PNM Resources Inc. | 13,900 | 207 |
| | MGE Energy Inc. | 1,700 | 69 |
| | | | 9,624 |
| Total Common Stocks | | |
| (Cost $197,309) | | 267,685 |
| | |
| | | Market |
| | | Value |
| | Shares | ($000) |
| Temporary Cash Investments (2.4%)1 | |
| Money Market Fund (2.3%) | |
| 2,3 Vanguard Market | | |
| Liquidity Fund, | | |
| 0.208% | 6,260,659 | 6,261 |
| |
| | Face | |
| | Amount | |
| | ($000) | |
| U.S. Government and Agency Obligations (0.1%) |
| 4,5 Fannie Mae | | |
| Discount Notes, | | |
| 0.235%, 6/15/11 | 200 | 200 |
| Total Temporary Cash Investments | |
| (Cost $6,460) | | 6,461 |
| Total Investments (101.4%) | |
| (Cost $203,769) | | 274,146 |
| Other Assets and Liabilities (-1.4%) | |
| Other Assets | | 1,528 |
| Liabilities3 | | (5,391) |
| | | (3,863) |
| Net Assets (100%) | | |
| Applicable to 12,911,968 outstanding | |
| $.001 par value shares of beneficial | |
| interest (unlimited authorization) | 270,283 |
| Net Asset Value Per Share | $20.93 |
| |
| At March 31, 2011, net assets consisted of: | |
| | Amount |
| | ($000) |
| Paid-in Capital | 269,697 |
| Overdistributed Net Investment Income | (162) |
| Accumulated Net Realized Losses | (69,663) |
| Unrealized Appreciation (Depreciation) | |
| Investment Securities | 70,377 |
| Futures Contracts | 34 |
| Net Assets | 270,283 |
See Note A in Notes to Financial Statements.
* Non-income-producing security.
^ Part of security position is on loan to broker-dealers. The total value of securities on loan is $819,000.
1 The fund invests a portion of its cash reserves in equity markets through the use of index futures contracts. After giving effect to futures investments, the fund’s effective common stock and temporary cash investment positions represent 100.0% and 1.4%, respectively, of net assets.
2 Affiliated money market fund available only to Vanguard funds and certain trusts and accounts managed by Vanguard. Rate shown is the 7-day yield.
3 Includes $881,000 of collateral received for securities on loan.
4 Securities with a value of $200,000 have been segregated as initial margin for open futures contracts.
5 The issuer operates under a congressional charter; its securities are not backed by the full faith and credit of the U.S. government.
See accompanying Notes, which are an integral part of the Financial Statements.
14
Strategic Small-Cap Equity Fund
| |
| Statement of Operations | |
| |
| | Six Months Ended |
| | March 31, 2011 |
| | ($000) |
| Investment Income | |
| Income | |
| Dividends | 1,326 |
| Interest1 | 4 |
| Security Lending | 24 |
| Total Income | 1,354 |
| Expenses | |
| The Vanguard Group—Note B | |
| Investment Advisory Services | 113 |
| Management and Administrative | 309 |
| Marketing and Distribution | 22 |
| Custodian Fees | 7 |
| Shareholders’ Reports | 3 |
| Total Expenses | 454 |
| Net Investment Income | 900 |
| Realized Net Gain (Loss) | |
| Investment Securities Sold | 9,698 |
| Futures Contracts | 262 |
| Realized Net Gain (Loss) | 9,960 |
| Change in Unrealized Appreciation (Depreciation) | |
| Investment Securities | 41,191 |
| Futures Contracts | (6) |
| Change in Unrealized Appreciation (Depreciation) | 41,185 |
| Net Increase (Decrease) in Net Assets Resulting from Operations | 52,045 |
| 1 Interest income from an affiliated company of the fund was $3,000. | |
See accompanying Notes, which are an integral part of the Financial Statements.
15
Strategic Small-Cap Equity Fund
| | |
| Statement of Changes in Net Assets | | |
| |
| | Six Months Ended | Year Ended |
| | March 31, | September 30, |
| | 2011 | 2010 |
| | ($000) | ($000) |
| Increase (Decrease) in Net Assets | | |
| Operations | | |
| Net Investment Income | 900 | 1,618 |
| Realized Net Gain (Loss) | 9,960 | 8,133 |
| Change in Unrealized Appreciation (Depreciation) | 41,185 | 14,638 |
| Net Increase (Decrease) in Net Assets Resulting from Operations | 52,045 | 24,389 |
| Distributions | | |
| Net Investment Income | (1,572) | (1,717) |
| Realized Capital Gain | — | — |
| Total Distributions | (1,572) | (1,717) |
| Capital Share Transactions | | |
| Issued | 65,919 | 42,151 |
| Issued in Lieu of Cash Distributions | 1,479 | 1,618 |
| Redeemed | (25,686) | (52,860) |
| Net Increase (Decrease) from Capital Share Transactions | 41,712 | (9,091) |
| Total Increase (Decrease) | 92,185 | 13,581 |
| Net Assets | | |
| Beginning of Period | 178,098 | 164,517 |
| End of Period1 | 270,283 | 178,098 |
| 1 Net Assets—End of Period includes undistributed (overdistributed) net investment income of ($162,000) and $510,000. | |
See accompanying Notes, which are an integral part of the Financial Statements.
16
Strategic Small-Cap Equity Fund
| | | | | | |
| Financial Highlights | | | | | | |
| |
| |
| | Six Months | | | | | April 20, |
| | Ended | | | | | 20061 to |
| For a Share Outstanding | March 31, | Year Ended September 30, | Sept. 30, |
| Throughout Each Period | 2011 | 2010 | 2009 | 2008 | 2007 | 2006 |
| Net Asset Value, Beginning of Period | $16.53 | $14.32 | $16.60 | $21.28 | $19.04 | $20.00 |
| Investment Operations | | | | | | |
| Net Investment Income | .080 | .154 | .145 | .160 | .220 | .090 |
| Net Realized and Unrealized Gain (Loss) | | | | | | |
| on Investments | 4.460 | 2.216 | (2.257) | (4.479) | 2.170 | (1.050) |
| Total from Investment Operations | 4.540 | 2.370 | (2.112) | (4.319) | 2.390 | (.960) |
| Distributions | | | | | | |
| Dividends from Net Investment Income | (.140) | (.160) | (.168) | (.210) | (.150) | — |
| Distributions from Realized Capital Gains | — | — | — | (.151) | — | — |
| Total Distributions | (.140) | (.160) | (.168) | (.361) | (.150) | — |
| Net Asset Value, End of Period | $20.93 | $16.53 | $14.32 | $16.60 | $21.28 | $19.04 |
| |
| Total Return2 | 27.56% | 16.70% | -12.48% | -20.50% | 12.58% | -4.85% |
| |
| Ratios/Supplemental Data | | | | | | |
| Net Assets, End of Period (Millions) | $270 | $178 | $165 | $200 | $257 | $180 |
| Ratio of Total Expenses to | | | | | | |
| Average Net Assets | 0.42% | 0.43% | 0.43% | 0.38% | 0.38% | 0.40%3 |
| Ratio of Net Investment Income to | | | | | | |
| Average Net Assets | 0.83% | 0.98% | 1.18% | 0.83% | 1.07% | 1.20%3 |
| Portfolio Turnover Rate | 49% | 66% | 76% | 99% | 73% | 35% |
The expense ratio, net income ratio, and turnover rate for the current period have been annualized.
1 Subscription period for the fund was April 20, 2006, to April 24, 2006, during which time all assets were held in money market instruments. Performance measurement began April 24, 2006, at a net asset value of $20.01.
2 Total returns do not include account service fees that may have applied in the periods shown. Fund prospectuses provide information about any applicable account service fees.
3 Annualized.
See accompanying Notes, which are an integral part of the Financial Statements.
17
Strategic Small-Cap Equity Fund
Notes to Financial Statements
Vanguard Strategic Small-Cap Equity Fund is registered under the Investment Company Act of 1940 as an open-end investment company, or mutual fund.
A. The following significant accounting policies conform to generally accepted accounting principles for U.S. mutual funds. The fund consistently follows such policies in preparing its financial statements.
1. Security Valuation: Securities are valued as of the close of trading on the New York Stock Exchange (generally 4 p.m., Eastern time) on the valuation date. Equity securities are valued at the latest quoted sales prices or official closing prices taken from the primary market in which each security trades; such securities not traded on the valuation date are valued at the mean of the latest quoted bid and asked prices. Securities for which market quotations are not readily available, or whose values have been materially affected by events occurring before the fund’s pricing time but after the close of the securities’ primary markets, are valued by methods deemed by the board of trustees to represent fair value. Investments in Vanguard Market Liquidity Fund are valued at that fund’s net asset value. Temporary cash investments acquired over 60 days to maturity are valued using the latest bid prices or using valuations based on a matrix system (which considers such factors as security prices, yields, maturities, and ratings), both as furnished by independent pricing services. Other temporary cash investments are valued at amortized cost, which approximates market value.
2. Futures Contracts: The fund uses index futures contracts to a limited extent, with the objective of maintaining full exposure to the stock market while maintaining liquidity. The fund may purchase or sell futures contracts to achieve a desired level of investment, whether to accommodate portfolio turnover or cash flows from capital share transactions. The primary risks associated with the use of futures contracts are imperfect correlation between changes in market values of stocks held by the fund and the prices of futures contracts, and the possibility of an illiquid market.
Futures contracts are valued at their quoted daily settlement prices. The aggregate principal amounts of the contracts are not recorded in the Statement of Net Assets. Fluctuations in the value of the contracts are recorded in the Statement of Net Assets as an asset (liability) and in the Statement of Operations as unrealized appreciation (depreciation) until the contracts are closed, when they are recorded as realized futures gains (losses).
3. Federal Income Taxes: The fund intends to continue to qualify as a regulated investment company and distribute all of its taxable income. Management has analyzed the fund’s tax positions taken for all open federal income tax years (September 30, 2007–2010), and for the period ended March 31, 2011, and has concluded that no provision for federal income tax is required in the fund’s financial statements.
4. Distributions: Distributions to shareholders are recorded on the ex-dividend date.
5. Security Lending: The fund may lend its securities to qualified institutional borrowers to earn additional income. Security loans are required to be secured at all times by collateral at least equal to the market value of securities loaned. The fund invests cash collateral received in Vanguard Market Liquidity Fund, and records a liability for the return of the collateral, during the period the securities are on loan. Security lending income represents fees charged to borrowers plus income earned on investing cash collateral, less expenses associated with the loan.
6. Other: Dividend income is recorded on the ex-dividend date. Interest income includes income distributions received from Vanguard Market Liquidity Fund and is accrued daily. Security transactions are accounted for on the date securities are bought or sold. Costs used to determine realized gains (losses) on the sale of investment securities are those of the specific securities sold.
18
Strategic Small-Cap Equity Fund
B. The Vanguard Group furnishes at cost investment advisory, corporate management, administrative, marketing, and distribution services. The costs of such services are allocated to the fund under methods approved by the board of trustees. The fund has committed to provide up to 0.40% of its net assets in capital contributions to Vanguard. At March 31, 2011, the fund had contributed capital of $40,000 to Vanguard (included in Other Assets), representing 0.01% of the fund’s net assets and 0.02% of Vanguard’s capitalization. The fund’s trustees and officers are also directors and officers of Vanguard.
C. Various inputs may be used to determine the value of the fund’s investments. These inputs are summarized in three broad levels for financial statement purposes. The inputs or methodologies used to value securities are not necessarily an indication of the risk associated with investing in those securities.
Level 1—Quoted prices in active markets for identical securities.
Level 2—Other significant observable inputs (including quoted prices for similar securities, interest rates, prepayment speeds, credit risk, etc.).
Level 3—Significant unobservable inputs (including the fund’s own assumptions used to determine the fair value of investments).
The following table summarizes the fund’s investments as of March 31, 2011, based on the inputs used to value them:
| | | |
| | Level 1 | Level 2 | Level 3 |
| Investments | ($000) | ($000) | ($000) |
| Common Stocks | 267,685 | — | — |
| Temporary Cash Investments | 6,261 | 200 | — |
| Futures Contracts—Assets1 | 12 | — | — |
| Futures Contracts—Liabilities1 | (2) | — | — |
| Total | 273,956 | 200 | — |
| 1 Represents variation margin on the last day of the reporting period. | | | |
D. At March 31, 2011, the aggregate settlement value of open futures contracts and the related unrealized appreciation (depreciation) were:
| | | | |
| | | | | ($000) |
| | | | Aggregate | |
| | | Number of | Settlement | Unrealized |
| | | Long (Short) | Value | Appreciation |
| Futures Contracts | Expiration | Contracts | Long (Short) | (Depreciation) |
| E-mini Russell 2000 Index | June 2011 | 32 | 2,693 | 34 |
Unrealized appreciation (depreciation) on open futures contracts is required to be treated as realized gain (loss) for tax purposes.
19
Strategic Small-Cap Equity Fund
E. Distributions are determined on a tax basis and may differ from net investment income and realized capital gains for financial reporting purposes. Differences may be permanent or temporary. Permanent differences are reclassified among capital accounts in the financial statements to reflect their tax character. Temporary differences arise when certain items of income, expense, gain, or loss are recognized in different periods for financial statement and tax purposes; these differences will reverse at some time in the future. Differences in classification may also result from the treatment of short-term gains as ordinary income for tax purposes.
The fund’s tax-basis capital gains and losses are determined only at the end of each fiscal year. For tax purposes, at September 30, 2010, the fund had available capital loss carryforwards totaling $79,532,000 to offset future net capital gains of $31,060,000 through September 30, 2017, and $48,472,000 through September 30, 2018. The fund will use these capital losses to offset net taxable capital gains, if any, realized during the year ending September 30, 2011; should the fund realize net capital losses for the year, the losses will be added to the loss carryforward balance above.
At March 31, 2011, the cost of investment securities for tax purposes was $203,769,000. Net unrealized appreciation of investment securities for tax purposes was $70,377,000, consisting of unrealized gains of $72,942,000 on securities that had risen in value since their purchase and $2,565,000 in unrealized losses on securities that had fallen in value since their purchase.
F. During the six months ended March 31, 2011, the fund purchased $93,095,000 of investment securities and sold $52,890,000 of investment securities, other than temporary cash investments.
G. Capital shares issued and redeemed were:
| | |
| | Six Months Ended | Year Ended |
| | March 31, 2011 | September 30, 2010 |
| | Shares | Shares |
| | (000) | (000) |
| Issued | 3,415 | 2,676 |
| Issued in Lieu of Cash Distributions | 79 | 111 |
| Redeemed | (1,354) | (3,504) |
| Net Increase (Decrease) in Shares Outstanding | 2,140 | (717) |
H. In preparing the financial statements as of March 31, 2011, management considered the impact of subsequent events for potential recognition or disclosure in these financial statements.
20
About Your Fund’s Expenses
As a shareholder of the fund, you incur ongoing costs, which include costs for portfolio management, administrative services, and shareholder reports (like this one), among others. Operating expenses, which are deducted from a fund’s gross income, directly reduce the investment return of the fund.
A fund’s expenses are expressed as a percentage of its average net assets. This figure is known as the expense ratio. The following examples are intended to help you understand the ongoing costs (in dollars) of investing in your fund and to compare these costs with those of other mutual funds. The examples are based on an investment of $1,000 made at the beginning of the period shown and held for the entire period.
The accompanying table illustrates your fund’s costs in two ways:
• Based on actual fund return. This section helps you to estimate the actual expenses that you paid over the period. The ”Ending Account Value“ shown is derived from the fund‘s actual return, and the third column shows the dollar amount that would have been paid by an investor who started with $1,000 in the fund. You may use the information here, together with the amount you invested, to estimate the expenses that you paid over the period.
To do so, simply divide your account value by $1,000 (for example, an $8,600 account value divided by $1,000 = 8.6), then multiply the result by the number given for your fund under the heading ”Expenses Paid During Period.“
• Based on hypothetical 5% yearly return. This section is intended to help you compare your fund‘s costs with those of other mutual funds. It assumes that the fund had a yearly return of 5% before expenses, but that the expense ratio is unchanged. In this case—because the return used is not the fund’s actual return—the results do not apply to your investment. The example is useful in making comparisons because the Securities and Exchange Commission requires all mutual funds to calculate expenses based on a 5% return. You can assess your fund’s costs by comparing this hypothetical example with the hypothetical examples that appear in shareholder reports of other funds.
Note that the expenses shown in the table are meant to highlight and help you compare ongoing costs only and do not reflect transaction costs incurred by the fund for buying and selling securities. Further, the expenses do not include the account service fee described in the prospectus. If such a fee were applied to your account, your costs would be higher. Your fund does not charge transaction fees, such as purchase or redemption fees, nor does it carry a “sales load.”
The calculations assume no shares were bought or sold during the period. Your actual costs may have been higher or lower, depending on the amount of your investment and the timing of any purchases or redemptions.
You can find more information about the fund’s expenses, including annual expense ratios, in the Financial Statements section of this report. For additional information on operating expenses and other shareholder costs, please refer to your fund’s current prospectus.
21
| | | |
| Six Months Ended March 31, 2011 | | | |
| | Beginning | Ending | Expenses |
| | Account Value | Account Value | Paid During |
| Strategic Small-Cap Equity Fund | 9/30/2010 | 3/31/2011 | Period |
| Based on Actual Fund Return | $1,000.00 | $1,275.60 | $2.38 |
| Based on Hypothetical 5% Yearly Return | 1,000.00 | 1,022.84 | 2.12 |
The calculations are based on expenses incurred in the most recent six-month period. The fund’s annualized six-month expense ratio for that period is 0.42%. The dollar amounts shown as “Expenses Paid” are equal to the expense ratio multiplied by the average account value over the period, multiplied by the number of days in the most recent six-month period, then divided by the number of days in the most recent 12-month period.
22
Trustees Approve Advisory Arrangement
The board of trustees of Vanguard Strategic Small-Cap Equity Fund has renewed the fund’s investment advisory arrangement with The Vanguard Group, Inc. Vanguard—through its Quantitative Equity Group—serves as the investment advisor to the fund. The board determined that continuing the fund’s internalized management structure was in the best interests of the fund and its shareholders.
The board based its decision upon an evaluation of the advisor’s investment staff, portfolio management process, and performance. The trustees considered the factors discussed below, among others. However, no single factor determined whether the board approved the arrangement. Rather, it was the totality of the circumstances that drove the board’s decision.
Nature, extent, and quality of services
The board considered the quality of the fund’s investment management since its inception in 2006, and took into account the organizational depth and stability of the advisor. The board noted that Vanguard has been managing investments for more than three decades. The Quantitative Equity Group adheres to a sound, disciplined investment management process; the team has considerable experience, stability, and depth.
The board concluded that Vanguard’s experience, stability, depth, and performance, among other factors, warranted continuation of the advisory arrangement.
Investment performance
The board considered the fund’s performance since inception, including any periods of outperformance or underperformance of a relevant benchmark and peer group. The board concluded that the advisor has carried out the fund’s investment strategy in disciplined fashion, and that the fund has outperformed its benchmark and peer group over the last one-year period, but has underperformed both over the longer term. Information about the fund’s most recent performance can be found in the Performance Summary section of this report.
Cost
The board concluded that the fund’s expense ratio was well below the average expense ratio charged by funds in its peer group and that the fund’s advisory fee rate was also well below its peer-group average. Information about the fund’s expenses appears in the About Your Fund’s Expenses section of this report as well as in the Financial Statements section.
The board does not conduct a profitability analysis of Vanguard, because of Vanguard’s unique “at-cost” structure. Unlike most other mutual fund management companies, Vanguard is owned by the funds it oversees, and produces “profits” only in the form of reduced expenses for fund shareholders.
The benefit of economies of scale
The board concluded that the fund’s low-cost arrangement with Vanguard ensures that the fund will realize economies of scale as it grows, with the cost to shareholders declining as fund assets increase.
The board will consider whether to renew the advisory arrangement again after a one-year period.
23
Glossary
30-Day SEC Yield. A fund’s 30-day SEC yield is derived using a formula specified by the U.S. Securities and Exchange Commission. Under the formula, data related to the fund’s security holdings in the previous 30 days are used to calculate the fund’s hypothetical net income for that period, which is then annualized and divided by the fund’s estimated average net assets over the calculation period. For the purposes of this calculation, a security’s income is based on its current market yield to maturity (in the case of bonds) or its projected dividend yield (for stocks). Because the SEC yield represents hypothetical annualized income, it will differ—at times significantly—from the fund’s actual experience. As a result, the fund’s income distributions may be higher or lower than implied by the SEC yield.
Beta. A measure of the magnitude of a fund’s past share-price fluctuations in relation to the ups and downs of a given market index. The index is assigned a beta of 1.00. Compared with a given index, a fund with a beta of 1.20 typically would have seen its share price rise or fall by 12% when the index rose or fell by 10%. For this report, beta is based on returns over the past 36 months for both the fund and the index. Note that a fund’s beta should be reviewed in conjunction with its R-squared (see definition). The lower the R-squared, the less correlation there is between the fund and the index, and the less reliable beta is as an indicator of volatility.
Dividend Yield. Dividend income earned by stocks, expressed as a percentage of the aggregate market value (or of net asset value, for a fund). The yield is determined by dividing the amount of the annual dividends by the aggregate value (or net asset value) at the end of the period. For a fund, the dividend yield is based solely on stock holdings and does not include any income produced by other investments.
Earnings Growth Rate. The average annual rate of growth in earnings over the past five years for the stocks now in a fund.
Equity Exposure. A measure that reflects a fund’s investments in stocks and stock futures. Any holdings in short-term reserves are excluded.
Expense Ratio. The percentage of a fund’s average net assets used to pay its annual administrative and advisory expenses. These expenses directly reduce returns to investors.
Foreign Holdings. The percentage of a fund represented by stocks or depositary receipts of companies based outside the United States.
Inception Date. The date on which the assets of a fund (or one of its share classes) are first invested in accordance with the fund’s investment objective. For funds with a subscription period, the inception date is the day after that period ends. Investment performance is measured from the inception date.
Median Market Cap. An indicator of the size of companies in which a fund invests; the midpoint of market capitalization (market price x shares outstanding) of a fund’s stocks, weighted by the proportion of the fund’s assets invested in each stock. Stocks representing half of the fund’s assets have market capitalizations above the median, and the rest are below it.
Price/Book Ratio. The share price of a stock divided by its net worth, or book value, per share. For a fund, the weighted average price/book ratio of the stocks it holds.
24
Price/Earnings Ratio. The ratio of a stock’s current price to its per-share earnings over the past year. For a fund, the weighted average P/E of the stocks it holds. P/E is an indicator of market expectations about corporate prospects; the higher the P/E, the greater the expectations for a company’s future growth.
R-Squared. A measure of how much of a fund’s past returns can be explained by the returns from the market in general, as measured by a given index. If a fund’s total returns were precisely synchronized with an index’s returns, its R-squared would be 1.00. If the fund’s returns bore no relationship to the index’s returns, its R-squared would be 0. For this report, R-squared is based on returns over the past 36 months for both the fund and the index.
Return on Equity. The annual average rate of return generated by a company during the past five years for each dollar of shareholder’s equity (net income divided by shareholder’s equity). For a fund, the weighted average return on equity for the companies whose stocks it holds.
Short-Term Reserves. The percentage of a fund invested in highly liquid, short-term securities that can be readily converted to cash.
Turnover Rate. An indication of the fund’s trading activity. Funds with high turnover rates incur higher transaction costs and may be more likely to distribute capital gains (which may be taxable to investors). The turnover rate excludes in-kind transactions, which have minimal impact on costs.
25
This page intentionally left blank.
This page intentionally left blank.
The People Who Govern Your Fund
The trustees of your mutual fund are there to see that the fund is operated and managed in your best interests since, as a shareholder, you are a part owner of the fund. Your fund’s trustees also serve on the board of directors of The Vanguard Group, Inc., which is owned by the Vanguard funds and provides services to them on an at-cost basis.
A majority of Vanguard’s board members are independent, meaning that they have no affiliation with Vanguard or the funds they oversee, apart from the sizable personal investments they have made as private individuals. The independent board members have distinguished backgrounds in business, academia, and public service. Each of the trustees and executive officers oversees 179 Vanguard funds.
The following table provides information for each trustee and executive officer of the fund. More information about the trustees is in the Statement of Additional Information, which can be obtained, without charge, by contacting Vanguard at 800-662-7447, or online at vanguard.com.
| |
| Interested Trustee1 | and President (2006–2008) of Rohm and Haas Co. |
| | (chemicals); Director of Tyco International, Ltd. |
| F. William McNabb III | (diversified manufacturing and services) and Hewlett- |
| Born 1957. Trustee Since July 2009. Chairman of the | Packard Co. (electronic computer manufacturing); |
| Board. Principal Occupation(s) During the Past Five | Senior Advisor at New Mountain Capital; Trustee |
| Years: Chairman of the Board of The Vanguard Group, | of The Conference Board; Member of the Board of |
| Inc., and of each of the investment companies served | Managers of Delphi Automotive LLP (automotive |
| by The Vanguard Group, since January 2010; Director | components). |
| of The Vanguard Group since 2008; Chief Executive | |
| Officer and President of The Vanguard Group and of | Amy Gutmann |
| each of the investment companies served by The | Born 1949. Trustee Since June 2006. Principal |
| Vanguard Group since 2008; Director of Vanguard | Occupation(s) During the Past Five Years: President |
| Marketing Corporation; Managing Director of The | of the University of Pennsylvania; Christopher H. |
| Vanguard Group (1995–2008). | Browne Distinguished Professor of Political Science |
| | in the School of Arts and Sciences with secondary |
| | appointments at the Annenberg School for Commu- |
| Independent Trustees | nication and the Graduate School of Education |
| | of the University of Pennsylvania; Director of |
| Emerson U. Fullwood | Carnegie Corporation of New York, Schuylkill River |
| Born 1948. Trustee Since January 2008. Principal | Development Corporation, and Greater Philadelphia |
| Occupation(s) During the Past Five Years: Executive | Chamber of Commerce; Trustee of the National |
| Chief Staff and Marketing Officer for North America | Constitution Center; Chair of the Presidential |
| and Corporate Vice President (retired 2008) of Xerox | Commission for the Study of Bioethical Issues. |
| Corporation (document management products and | |
| services); Executive in Residence and 2010 | JoAnn Heffernan Heisen |
| Distinguished Minett Professor at the Rochester | Born 1950. Trustee Since July 1998. Principal |
| Institute of Technology; Director of SPX Corporation | Occupation(s) During the Past Five Years: Corporate |
| (multi-industry manufacturing), the United Way of | Vice President and Chief Global Diversity Officer |
| Rochester, Amerigroup Corporation (managed health | (retired 2008) and Member of the Executive |
| care), the University of Rochester Medical Center, | Committee (1997–2008) of Johnson & Johnson |
| Monroe Community College Foundation, and North | (pharmaceuticals/consumer products); Director of |
| Carolina A&T University. | Skytop Lodge Corporation (hotels), the University |
| | Medical Center at Princeton, the Robert Wood |
| Rajiv L. Gupta | Johnson Foundation, and the Center for Work Life |
| Born 1945. Trustee Since December 2001.2 | Policy; Member of the Advisory Board of the |
| Principal Occupation(s) During the Past Five Years: | Maxwell School of Citizenship and Public Affairs |
| Chairman and Chief Executive Officer (retired 2009) | at Syracuse University. |
| | |
| F. Joseph Loughrey | Thomas J. Higgins | |
| Born 1949. Trustee Since October 2009. Principal | Born 1957. Chief Financial Officer Since September |
| Occupation(s) During the Past Five Years: President | 2008. Principal Occupation(s) During the Past Five |
| and Chief Operating Officer (retired 2009) and Vice | Years: Principal of The Vanguard Group, Inc.; Chief |
| Chairman of the Board (2008–2009) of Cummins Inc. | Financial Officer of each of the investment companies |
| (industrial machinery); Director of SKF AB (industrial | served by The Vanguard Group since 2008; Treasurer |
| machinery), Hillenbrand, Inc. (specialized consumer | of each of the investment companies served by The |
| services), the Lumina Foundation for Education, and | Vanguard Group (1998–2008). |
| Oxfam America; Chairman of the Advisory Council | | |
| for the College of Arts and Letters and Member | Kathryn J. Hyatt | |
| of the Advisory Board to the Kellogg Institute for | Born 1955. Treasurer Since November 2008. Principal |
| International Studies at the University of Notre Dame. | Occupation(s) During the Past Five Years: Principal |
| | of The Vanguard Group, Inc.; Treasurer of each of |
| André F. Perold | the investment companies served by The Vanguard |
| Born 1952. Trustee Since December 2004. Principal | Group since 2008; Assistant Treasurer of each of the |
| Occupation(s) During the Past Five Years: George | investment companies served by The Vanguard Group |
| Gund Professor of Finance and Banking at the Harvard | (1988–2008). | |
| Business School; Chair of the Investment Committee | | |
| of HighVista Strategies LLC (private investment firm). | Heidi Stam | |
| | Born 1956. Secretary Since July 2005. Principal |
| Alfred M. Rankin, Jr. | Occupation(s) During the Past Five Years: Managing |
| Born 1941. Trustee Since January 1993. Principal | Director of The Vanguard Group, Inc., since 2006; |
| Occupation(s) During the Past Five Years: Chairman, | General Counsel of The Vanguard Group since 2005; |
| President, and Chief Executive Officer of NACCO | Secretary of The Vanguard Group and of each of the |
| Industries, Inc. (forklift trucks/housewares/lignite); | investment companies served by The Vanguard Group |
| Director of Goodrich Corporation (industrial products/ | since 2005; Director and Senior Vice President of |
| aircraft systems and services) and the National | Vanguard Marketing Corporation since 2005; |
| Association of Manufacturers; Chairman of the | Principal of The Vanguard Group (1997–2006). |
| Federal Reserve Bank of Cleveland; Vice Chairman | | |
| of University Hospitals of Cleveland; President of | | |
| the Board of The Cleveland Museum of Art. | Vanguard Senior Management Team |
| |
| Peter F. Volanakis | R. Gregory Barton | Michael S. Miller |
| Born 1955. Trustee Since July 2009. Principal | Mortimer J. Buckley | James M. Norris |
| Occupation(s) During the Past Five Years: President | Kathleen C. Gubanich | Glenn W. Reed |
| and Chief Operating Officer (retired 2010) of Corning | Paul A. Heller | George U. Sauter |
| Incorporated (communications equipment); Director of | | |
| Corning Incorporated (2000–2010) and Dow Corning | | |
| (2001–2010); Overseer of the Amos Tuck School of | Chairman Emeritus and Senior Advisor |
| Business Administration at Dartmouth College. | | |
| | John J. Brennan | |
| | Chairman, 1996–2009 | |
| Executive Officers | Chief Executive Officer and President, 1996–2008 |
| |
| Glenn Booraem | | |
| Born 1967. Controller Since July 2010. Principal | Founder | |
| Occupation(s) During the Past Five Years: Principal | | |
| of The Vanguard Group, Inc.; Controller of each of | John C. Bogle | |
| the investment companies served by The Vanguard | Chairman and Chief Executive Officer, 1974–1996 |
| Group since 2010; Assistant Controller of each of | | |
| the investment companies served by The Vanguard | | |
| Group (2001–2010). | | |
1 Mr. McNabb is considered an “interested person,” as defined in the Investment Company Act of 1940, because he is an officer of the Vanguard funds.
2 December 2002 for Vanguard Equity Income Fund, Vanguard Growth Equity Fund, the Vanguard Municipal Bond Funds, and the Vanguard State Tax-Exempt Funds.
|  |
| P.O. Box 2600 |
| Valley Forge, PA 19482-2600 |
Connect with Vanguard® > vanguard.com
| |
| Fund Information > 800-662-7447 | |
| Direct Investor Account Services > 800-662-2739 | |
| Institutional Investor Services > 800-523-1036 | |
| Text Telephone for People | |
| With Hearing Impairment > 800-749-7273 | |
| |
| This material may be used in conjunction | |
| with the offering of shares of any Vanguard | |
| fund only if preceded or accompanied by | |
| the fund’s current prospectus. | |
| |
| All comparative mutual fund data are from Lipper Inc. or | |
| Morningstar, Inc., unless otherwise noted. | |
| |
| You can obtain a free copy of Vanguard’s proxy voting | |
| guidelines by visiting vanguard.com/proxyreporting or by | |
| calling Vanguard at 800-662-2739. The guidelines are | |
| also available from the SEC’s website, sec.gov. In | |
| addition, you may obtain a free report on how your fund | |
| voted the proxies for securities it owned during the 12 | |
| months ended June 30. To get the report, visit either | |
| vanguard.com/proxyreporting or sec.gov. | |
| |
| You can review and copy information about your fund at | |
| the SEC’s Public Reference Room in Washington, D.C. To | |
| find out more about this public service, call the SEC at | |
| 202-551-8090. Information about your fund is also | |
| available on the SEC’s website, and you can receive | |
| copies of this information, for a fee, by sending a | |
| request in either of two ways: via e-mail addressed to | |
| publicinfo@sec.gov or via regular mail addressed to the | |
| Public Reference Section, Securities and Exchange | |
| Commission, Washington, DC 20549-1520. | |
| | © 2011 The Vanguard Group, Inc. |
| | All rights reserved. |
| | Vanguard Marketing Corporation, Distributor. |
| |
| | Q6152 052011 |
Item 2: Code of Ethics.
Not Applicable.
Item 3: Audit Committee Financial Expert.
Not Applicable.
Item 4: Principal Accountant Fees and Services.
Not Applicable.
Item 5: Audit Committee of Listed Registrants.
Not Applicable.
Item 6: Investments.
Not Applicable.
Item 7: Disclosure of Proxy Voting Policies and Procedures for Closed-End Management Investment Companies.
Not Applicable.
Item 8: Portfolio Managers of Closed-End Management Investment Companies.
Not Applicable.
Item 9: Purchase of Equity Securities by Closed-End Management Investment Company and Affiliated Purchasers.
Not Applicable.
Item 10: Submission of Matters to a Vote of Security Holders.
Not Applicable.
Item 11: Controls and Procedures.
(a) Disclosure Controls and Procedures. The Principal Executive and Financial Officers concluded that the Registrant's Disclosure Controls and Procedures are effective based on their evaluation of the Disclosure Controls and Procedures as of a date within 90 days of the filing date of this report.
(b) Internal Control Over Financial Reporting. There were no significant changes in Registrant’s Internal Control Over Financial Reporting or in other factors that could significantly affect this control subsequent to the date of the evaluation, including any corrective actions with regard to significant deficiencies and material weaknesses.
Item 12: Exhibits.
(a) Code of Ethics.
(b) Certifications.
Pursuant to the requirements of the Securities Exchange Act of 1934 and the Investment Company Act of 1940, the registrant has duly caused this report to be signed on its behalf by the undersigned, thereunto duly authorized.
| |
| | VANGUARD HORIZON FUNDS |
| |
| By: | /s/ F. WILLIAM MCNABB III* |
| | F. WILLIAM MCNABB III |
| | CHIEF EXECUTIVE OFFICER |
| |
| Date: May 19, 2011 | |
Pursuant to the requirements of the Securities Exchange Act of 1934 and the Investment Company Act of 1940, this report has been signed below by the following persons on behalf of the registrant and in the capacities and on the dates indicated.
| |
| | VANGUARD HORIZON FUNDS |
| |
| By: | /s/ F. WILLIAM MCNABB III* |
| | F. WILLIAM MCNABB III |
| | CHIEF EXECUTIVE OFFICER |
| |
| Date: May 19, 2011 | |
| |
| | VANGUARD HORIZON FUNDS |
| |
| By: | /s/ THOMAS J. HIGGINS* |
| | THOMAS J. HIGGINS |
| | CHIEF FINANCIAL OFFICER |
| |
| Date: May 19, 2011 | |
* By: /s/ Heidi Stam
Heidi Stam, pursuant to a Power of Attorney filed on April 26, 2010, see file Number 33-53683, Incorporated by Reference.